Embed Size (px)
Citation preview
EasyChair Preprint№ 3745
AMUVAM Model for the Valuation andPrioritization of the Environmental Assets of theEcosystem of the Pacucha Lagoon,Andahuaylas, Peru.
Abel Isaias Barrial Lujan, Maria del Carmen Delgado Laime,Mary Luz Huamán Carrión, Fidelia Tapia Tadeo,Yalmar Ponce Atencio and Yobana Rodrigo Cabezas
EasyChair preprints are intended for rapiddissemination of research results and areintegrated with the rest of EasyChair.
July 4, 2020
AMUVAM model for the valuation and prioritization of the environmental
assets of the ecosystem of the Pacucha lagoon, Andahuaylas, Peru.
1st Abel Isaías Barrial Lujan*
Faculty of Engineering
Universidad Nacional José María
Arguedas
Andahuaylas, Apurímac, Peru
*Corresponding author
4th Fidelia Tapia Tadeo
Faculty of Engineering
Universidad Nacional José María
Arguedas
Andahuaylas, Apurímac, Peru
2nd Maria del Carmen Delgado
Faculty of Engineering
Universidad Nacional José María
Arguedas
Andahuaylas, Apurímac, Peru
5th Yalmar Ponce Atencio
Faculty of Engineering
Universidad Nacional José María
Arguedas
Andahuaylas, Apurímac, Peru
3rd Mary Luz Huamán Carrión
Faculty of Engineering
Universidad Nacional José María
Arguedas
Andahuaylas, Apurímac, Peru
6th Yobana Rodrigo Cabezas
Faculty of Engineering
Universidad Tecnologica de los
Andes
Andahuaylas, Apurímac, Peru
Abstract—Currently there is a consensus in the scientific
community that many of the goods and services
generated by environmental assets aren´t detected by the
market due to they are intangible asset as tangible, it is
difficult, and in some cases impossible. For this reason,
the objective of the present work was the economic
valuation and to know the prioritization of the
environmental assets of the ecosystem of the Pacucha
lagoon and, through the AMUVAM model made up of
AHP and the method of updating income, through the
survey of a group of experts (46 people) in the judgment
of the researcher, it was possible to determine the total
economic value amounting to $ 20,793,456.81, whose
prioritization gives the direct use value with a weight
(29.57%), followed by existence value (18.28 %), indirect
use value 18.23% legacy value (17.66%) and option value
(16.26%). In addition, in the interest of knowing the
existence value, the economic value is $ 3,801,788.67 to
this component of the VET, experts prioritize the
biodiversity subcomponent (51.41%), followed by
cultural heritage and visual landscape (27.07% and
21.52%) respectively. Obtaining this economic value
would turn out to be a very important tool that allows us
to evaluate and compare the different benefits of said
asset for conservation and sustainability in a way that
improves the management of its resources.
Keywords—Ecosystem; multi-criteria method; Pacucha
lagoon; environmental asset and economic valuation
I. INTRODUCTION
The natural ecosystem provides society with a large
number of flows of goods and services that contribute to
social welfare directly and indirectly. Furthermore, these
flows represent the support of sustainability in the trade and
economy of the countries. However, in the market society in
which we find ourselves, the importance of all kinds of goods
or assets is fundamentally understood through the expression
of their monetary value [1]. Therefore, one of the best ways
to demonstrate and transmit the importance of an
environmental asset will be by determining the economic
value of the goods and services they provide.
When referring to economic valuation in the
environmental field, it is evident that we are talking about
assigning a monetary value to the goods and services that
environmental systems provide us in a defined geographical
environment. This fact is controversial for some researchers,
since they argue that it does not make sense to define a value
for a good that has no market and that will never be the
subject of a transaction. On the other hand, in other social
sectors, fundamentally environmentalists, it is thought that
obtaining the value of an environmental space is the first step
on the road to its privatization [2]. However, different
authors who have contributed to the study of economic
valuation and consider that valuing the environment
economically means being able to have an indicator of its
importance in the well-being of society, which allows it to be
compared with other components of this well-being. [3]
express this idea in a similar way: "In order to compare, you
need a common denominator, and this is money." [4] and [5]
also justify the valuation of these assets in order to better use
public resources. For both authors, estimating the value of
environmental assets can serve to justify and enable the
distribution of the public budget among the different
alternatives for public investment, as well as among the
different initiatives for the conservation, preservation or
restoration of environmental assets. Thus, knowledge of this
economic value is key for government intervention to
improve market efficiency, in a Pareto sense, since it allows
justifying and prioritizing administrative decisions regarding
the use of its resources.
In environmental valuation there are already a series of
methods used in a large number of works that, using different
approaches, seek to determine a monetary value of either the
asset considered or the services that asset produces. The best
known are the cost of the trip [6], the contingent valuation
method [7]; [8] and the hedonic value method [9] within the
focus of Environmental Economics. On the other hand, and
from an Ecological Economics perspective, the most
representative are the Energy Analysis [10] and the
Emergetic Analysis [11].
This work, a methodology different from the previous
ones is presented with the dual purpose of increasing the
instruments available to obtain the value of environmental
assets and to provide a new valuation perspective. It includes
multi-criteria evaluation systems, where multiple valuation
languages take place, which take into account ethnic and
cultural specificities. Biophysical indicators are as
important, or more, than the prices generated by the market.
In this sense, we fundamentally consider the economic
valuation and prioritization of the environmental assets of
the ecosystem of the Pacucha lagoon, Andahuaylas - Peru.
Applying the AMUVAM model (analytical multi-criteria
valuation method) that is based on the Analysis of the Theory
of Multicriteria Decision such as The Hierarchical Analytical
Process (AHP) and income update rate [2]. For this purpose,
it is necessary to arrive at the estimation of an Indicator of
Total Economic Value (TEV); which in turn, is made up of
the components of direct use value (DUV), indirect use value
(IUV), option value and / or Co-option (OV), existence value
(EV) and legacy or future value (LV). The prioritization of
the components of environmental assets is achieved by
means of the weighting that indicates the importance of each
of the criteria (in this study it becomes the components of the
TEV). This weighting using the AHP methodologist is
extracted from the survey that was carried out on a group of
experts of 46 people with qualities that possess a vast
knowledge of the asset to be valued, being representatives of
the different sectors, whose institutional function and
professional work is linked to the Pacucha lagoon. For this,
the fundamental table of paired comparisons was used,
where each of the respondents indicated the relative
importance according to the criteria they initially identified.
In order to find the final weight of each criterion, the
importance of each expert was first calculated according to
the experience studies registered in the survey in each
category. In the case of the rent update rate method, the
calculations considered the economic benefits derived from
agriculture, livestock, fishing and recreation (tourism)
activities; that is, the value of an economic good that
becomes equal to the present value of the sum of future rents
or Gains (Income-Expenses) that a good can generate for its
owner. Despite this, we are aware that expressing some of
the components of the value of an environmental asset
through a monetary unit may be debatable.
This way, the valuation of an environmental asset of an
economic type means being able to have an indicator of its
importance in the well-being of society, which allows it to be
compared with other components of this well-being, the total
economic value (TEV). Thus, knowledge of this economic
value is key for government intervention to improve market
efficiency, in a Pareto sense, since it allows justifying and
prioritizing administrative decisions regarding the use of its
resources. Lack of valuation of these resources can lead to
economic actions and activities that lead to inappropriate use
or overexploitation, causing a negative change in the
condition and care of natural resources.
II. MATERIALS AND METHODS
2.1. Scope of the study
For the present study, the environmental assets of the ecosystem of the Pacucha lagoon have been considered. This lagoon is located in the Pacucha district, which is located 16.1 km from the capital of the Andahuaylas province, at an altitude of 3,125.00 meters above sea level. Located between the coordinates: 13 ° 36´27´´ south latitude and 79 ° 19´30´´ west longitude, it has an extension of 728.00 has [12]. Its dimensions are, maximum length 3,970.00 m on the east-west axis; maximum width 2,680.00 m; maximum depth 30.00 m, water volume 118,010,495.00 m3. [13], and the environmental asset of this resource is delimited in detail with the different components of the total economic value (TEV).
The Pacucha lagoon is considered one of the largest and
most beautiful lagoons in Peru. In addition to being a tourist
place, it is the source of the most important agricultural
system within the economic corridor of the Apurímac region.
Its importance lies in the fact that its water volume and
nutritional components of its waters are productive.
Currently, different fish species such as trout, lake silverside
and common carp have been exploited [14]. The lagoon
water resources are used to agricultural activities, mainly for
the production of potatoes of various varieties, corn and
vegetables; and in livestock activities for raising cattle,
sheep, pigs, and minor animals such as guinea pigs and
chickens, which provides food sources and economic
resources for the benefit of people living in the surrounding
communities. Another primary characteristic of the water in
the Pacucha lagoon is its temperature, which ranges between
15 ° C in June and July and a maximum of 19 ° C in March
and April [13], which allows to house on its banks plants
such as totora, species of adapted and endemic flora, for
instance, Atajo, Molle, Fennel, parsley, aloe, marcco,
artemiza, amor seco, santa maría, llaulli, cedroncillo, Ajenjo,
mutuy, dandelion, turnip, broom, manayupa, alfalfa, clover,
hierba buena, oregano, wild mallow, llantén, sweet grass,
lengua de vaca, romanza, ruda, totora, aguaymanto,
eucalyptus, cypress, pine, kishka, yahuarchoncca
ayaczapatilla and nettle. On the other hand, birds such as:
Rayador negro, Yanavico, Garza bueyera, Garcita Blanca,
Bandurria, Rascón, Ave fría andina, Playerito de Baird,
Sandpiper, Faláropo Tricolor, Playero coleador, Andean
Gull, Junquero, Neotropical Cormorant, Wild Duck , Andean
coot, Barcino duck, Jergón duck, Sambullidor and moorhen.
In addition, in this natural space activities such as the famous
boat rides are carried out as a tourist activity.
2.2. Methodology of economic valuation of the
environmental asset using AMUVAM
The economic value of environmental goods and services were quantified using the AMUVAM method described by [2]. This is a method of valuation of environmental assets which is composed of two techniques, the AHP (Analytic Hierarchy Process) developed by [15], that includes the selection of alternatives based on a series of criteria or variables, and the Income Update Method established by
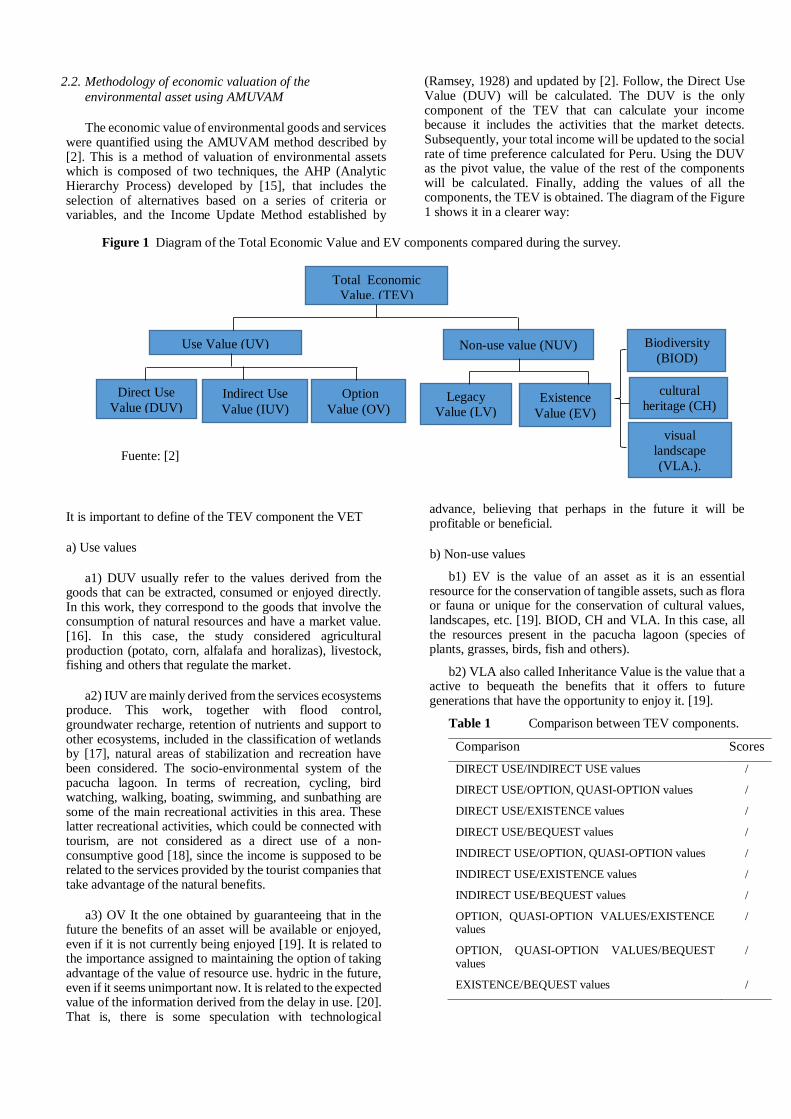
(Ramsey, 1928) and updated by [2]. Follow, the Direct Use Value (DUV) will be calculated. The DUV is the only component of the TEV that can calculate your income because it includes the activities that the market detects. Subsequently, your total income will be updated to the social rate of time preference calculated for Peru. Using the DUV as the pivot value, the value of the rest of the components will be calculated. Finally, adding the values of all the components, the TEV is obtained. The diagram of the Figure 1 shows it in a clearer way:
Figure 1 Diagram of the Total Economic Value and EV components compared during the survey.
Fuente: [2]
It is important to define of the TEV component the VET
a) Use values
a1) DUV usually refer to the values derived from the goods that can be extracted, consumed or enjoyed directly. In this work, they correspond to the goods that involve the consumption of natural resources and have a market value. [16]. In this case, the study considered agricultural production (potato, corn, alfalafa and horalizas), livestock, fishing and others that regulate the market.
a2) IUV are mainly derived from the services ecosystems produce. This work, together with flood control, groundwater recharge, retention of nutrients and support to other ecosystems, included in the classification of wetlands by [17], natural areas of stabilization and recreation have been considered. The socio-environmental system of the pacucha lagoon. In terms of recreation, cycling, bird watching, walking, boating, swimming, and sunbathing are some of the main recreational activities in this area. These latter recreational activities, which could be connected with tourism, are not considered as a direct use of a non-consumptive good [18], since the income is supposed to be related to the services provided by the tourist companies that take advantage of the natural benefits.
a3) OV It the one obtained by guaranteeing that in the future the benefits of an asset will be available or enjoyed, even if it is not currently being enjoyed [19]. It is related to the importance assigned to maintaining the option of taking advantage of the value of resource use. hydric in the future, even if it seems unimportant now. It is related to the expected value of the information derived from the delay in use. [20]. That is, there is some speculation with technological
advance, believing that perhaps in the future it will be profitable or beneficial.
b) Non-use values
b1) EV is the value of an asset as it is an essential resource for the conservation of tangible assets, such as flora or fauna or unique for the conservation of cultural values, landscapes, etc. [19]. BIOD, CH and VLA. In this case, all the resources present in the pacucha lagoon (species of plants, grasses, birds, fish and others).
b2) VLA also called Inheritance Value is the value that a active to bequeath the benefits that it offers to future generations that have the opportunity to enjoy it. [19].
Table 1 Comparison between TEV components.
Comparison Scores
DIRECT USE/INDIRECT USE values /
DIRECT USE/OPTION, QUASI-OPTION values /
DIRECT USE/EXISTENCE values /
DIRECT USE/BEQUEST values /
INDIRECT USE/OPTION, QUASI-OPTION values /
INDIRECT USE/EXISTENCE values /
INDIRECT USE/BEQUEST values /
OPTION, QUASI-OPTION VALUES/EXISTENCE values
/
OPTION, QUASI-OPTION VALUES/BEQUEST values
/
EXISTENCE/BEQUEST values /
Total Economic
Value. (TEV)
Use Value (UV) Non-use value (NUV)
Direct Use
Value (DUV) Existence
Value (EV)
Indirect Use
Value (IUV) Legacy
Value (LV)
Option
Value (OV)
Biodiversity
(BIOD)
visual
landscape
(VLA.).
cultural
heritage (CH)
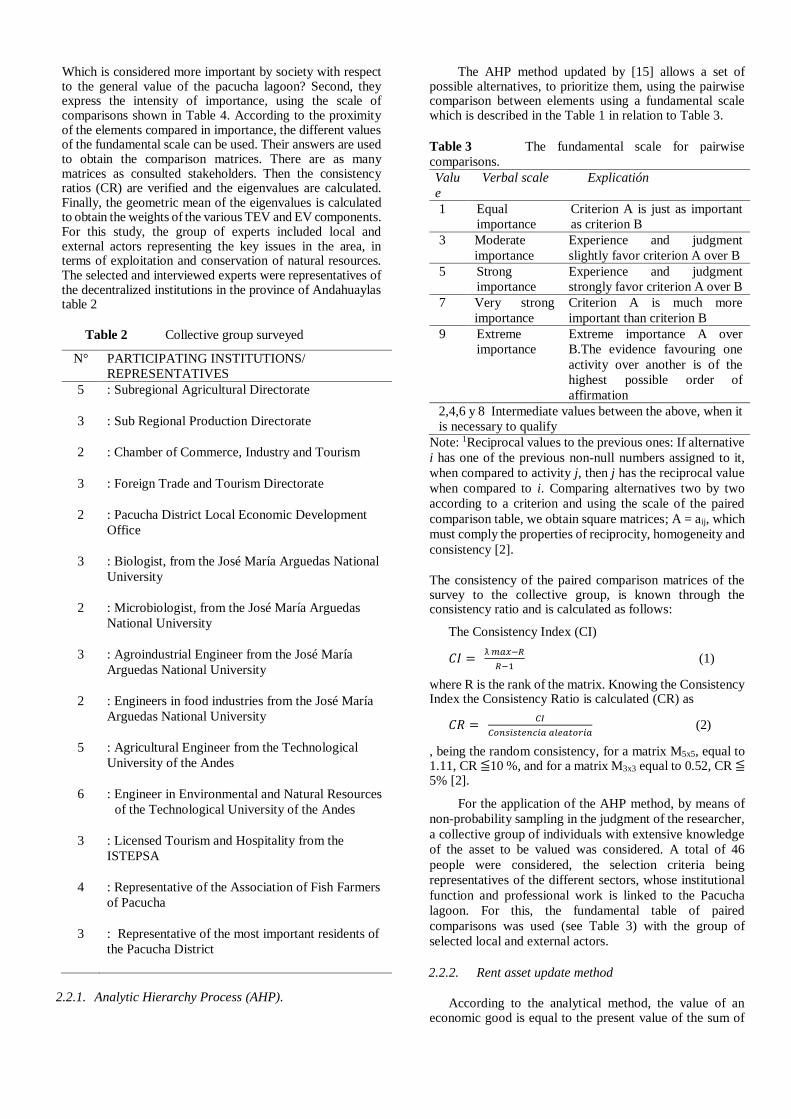
Which is considered more important by society with respect to the general value of the pacucha lagoon? Second, they express the intensity of importance, using the scale of comparisons shown in Table 4. According to the proximity of the elements compared in importance, the different values of the fundamental scale can be used. Their answers are used to obtain the comparison matrices. There are as many matrices as consulted stakeholders. Then the consistency ratios (CR) are verified and the eigenvalues are calculated. Finally, the geometric mean of the eigenvalues is calculated to obtain the weights of the various TEV and EV components. For this study, the group of experts included local and external actors representing the key issues in the area, in terms of exploitation and conservation of natural resources. The selected and interviewed experts were representatives of the decentralized institutions in the province of Andahuaylas table 2
Table 2 Collective group surveyed
N° PARTICIPATING INSTITUTIONS/
REPRESENTATIVES
5 : Subregional Agricultural Directorate
3 : Sub Regional Production Directorate
2 : Chamber of Commerce, Industry and Tourism
3 : Foreign Trade and Tourism Directorate
2 : Pacucha District Local Economic Development
Office
3 : Biologist, from the José María Arguedas National
University
2 : Microbiologist, from the José María Arguedas
National University
3 : Agroindustrial Engineer from the José María
Arguedas National University
2 : Engineers in food industries from the José María
Arguedas National University
5 : Agricultural Engineer from the Technological
University of the Andes
6 : Engineer in Environmental and Natural Resources
of the Technological University of the Andes
3 : Licensed Tourism and Hospitality from the
ISTEPSA
4 : Representative of the Association of Fish Farmers
of Pacucha
3 : Representative of the most important residents of
the Pacucha District
2.2.1. Analytic Hierarchy Process (AHP).
The AHP method updated by [15] allows a set of possible alternatives, to prioritize them, using the pairwise comparison between elements using a fundamental scale which is described in the Table 1 in relation to Table 3.
Table 3 The fundamental scale for pairwise
comparisons.
Valu
e
Verbal scale Explicatión
1 Equal
importance
Criterion A is just as important
as criterion B
3 Moderate
importance
Experience and judgment
slightly favor criterion A over B
5 Strong
importance
Experience and judgment
strongly favor criterion A over B
7 Very strong
importance
Criterion A is much more
important than criterion B
9 Extreme
importance
Extreme importance A over
B.The evidence favouring one
activity over another is of the
highest possible order of
affirmation
2,4,6 y 8 Intermediate values between the above, when it
is necessary to qualify
Note: 1Reciprocal values to the previous ones: If alternative
i has one of the previous non-null numbers assigned to it,
when compared to activity j, then j has the reciprocal value
when compared to i. Comparing alternatives two by two
according to a criterion and using the scale of the paired
comparison table, we obtain square matrices; A = aij, which
must comply the properties of reciprocity, homogeneity and
consistency [2].
The consistency of the paired comparison matrices of the survey to the collective group, is known through the consistency ratio and is calculated as follows:
The Consistency Index (CI)
𝐶𝐼 = ƛ 𝑚𝑎𝑥−𝑅
𝑅−1 (1)
where R is the rank of the matrix. Knowing the Consistency Index the Consistency Ratio is calculated (CR) as
𝐶𝑅 = 𝐶𝐼
𝐶𝑜𝑛𝑠𝑖𝑠𝑡𝑒𝑛𝑐𝑖𝑎 𝑎𝑙𝑒𝑎𝑡𝑜𝑟𝑖𝑎 (2)
, being the random consistency, for a matrix M5x5, equal to 1.11, CR ≦10 %, and for a matrix M3x3 equal to 0.52, CR ≦ 5% [2].
For the application of the AHP method, by means of
non-probability sampling in the judgment of the researcher,
a collective group of individuals with extensive knowledge
of the asset to be valued was considered. A total of 46
people were considered, the selection criteria being
representatives of the different sectors, whose institutional
function and professional work is linked to the Pacucha
lagoon. For this, the fundamental table of paired
comparisons was used (see Table 3) with the group of
selected local and external actors.
2.2.2. Rent asset update method
According to the analytical method, the value of an economic good is equal to the present value of the sum of
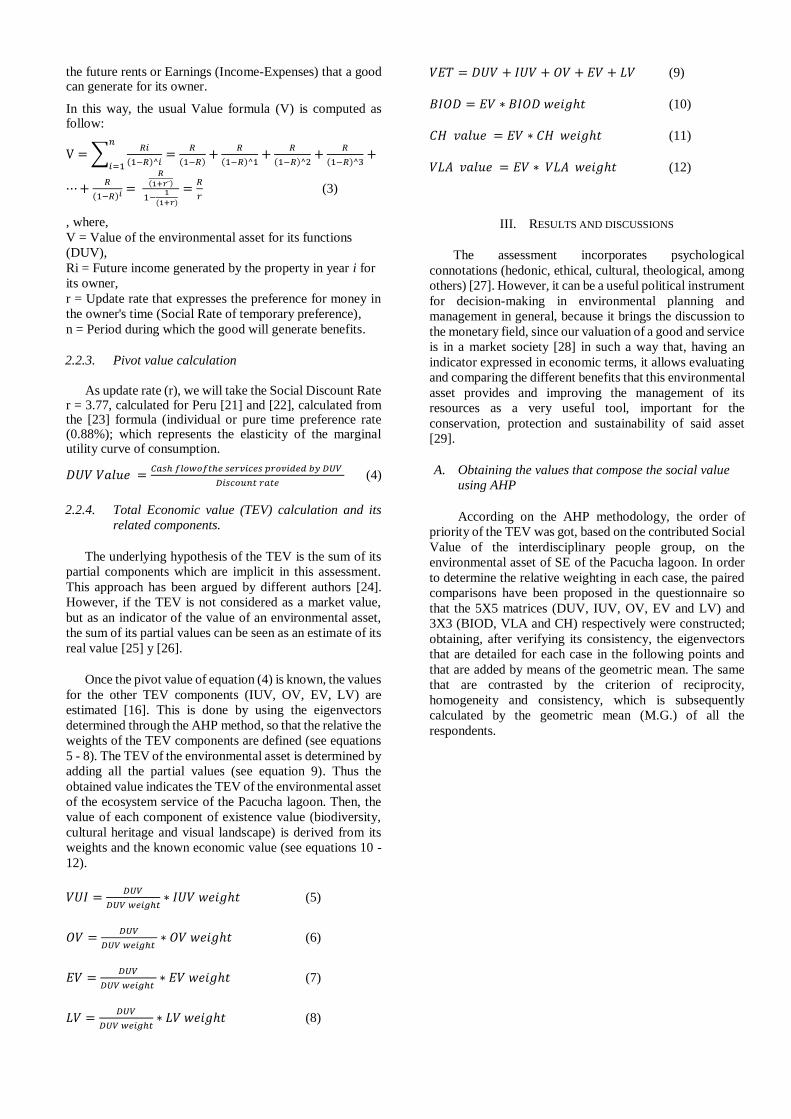
the future rents or Earnings (Income-Expenses) that a good can generate for its owner.
In this way, the usual Value formula (V) is computed as follow:
V = ∑𝑅𝑖
(1−𝑅)^𝑖
𝑛
𝑖=1=
𝑅
(1−𝑅)+
𝑅
(1−𝑅)^1+
𝑅
(1−𝑅)^2+
𝑅
(1−𝑅)^3+
⋯ +𝑅
(1−𝑅)𝑖 =
𝑅(1+𝑟¨)
1−1
(1+𝑟)
=𝑅
𝑟 (3)
, where,
V = Value of the environmental asset for its functions
(DUV),
Ri = Future income generated by the property in year i for
its owner,
r = Update rate that expresses the preference for money in
the owner's time (Social Rate of temporary preference),
n = Period during which the good will generate benefits.
2.2.3. Pivot value calculation
As update rate (r), we will take the Social Discount Rate
r = 3.77, calculated for Peru [21] and [22], calculated from the [23] formula (individual or pure time preference rate (0.88%); which represents the elasticity of the marginal utility curve of consumption.
𝐷𝑈𝑉 𝑉𝑎𝑙𝑢𝑒 =𝐶𝑎𝑠ℎ 𝑓𝑙𝑜𝑤𝑜𝑓𝑡ℎ𝑒 𝑠𝑒𝑟𝑣𝑖𝑐𝑒𝑠 𝑝𝑟𝑜𝑣𝑖𝑑𝑒𝑑 𝑏𝑦 𝐷𝑈𝑉
𝐷𝑖𝑠𝑐𝑜𝑢𝑛𝑡 𝑟𝑎𝑡𝑒 (4)
2.2.4. Total Economic value (TEV) calculation and its
related components.
The underlying hypothesis of the TEV is the sum of its
partial components which are implicit in this assessment.
This approach has been argued by different authors [24].
However, if the TEV is not considered as a market value,
but as an indicator of the value of an environmental asset,
the sum of its partial values can be seen as an estimate of its
real value [25] y [26].
Once the pivot value of equation (4) is known, the values
for the other TEV components (IUV, OV, EV, LV) are
estimated [16]. This is done by using the eigenvectors
determined through the AHP method, so that the relative the
weights of the TEV components are defined (see equations
5 - 8). The TEV of the environmental asset is determined by
adding all the partial values (see equation 9). Thus the
obtained value indicates the TEV of the environmental asset
of the ecosystem service of the Pacucha lagoon. Then, the
value of each component of existence value (biodiversity,
cultural heritage and visual landscape) is derived from its
weights and the known economic value (see equations 10 -
12).
𝑉𝑈𝐼 =𝐷𝑈𝑉
𝐷𝑈𝑉 𝑤𝑒𝑖𝑔ℎ𝑡∗ 𝐼𝑈𝑉 𝑤𝑒𝑖𝑔ℎ𝑡 (5)
𝑂𝑉 =𝐷𝑈𝑉
𝐷𝑈𝑉 𝑤𝑒𝑖𝑔ℎ𝑡 ∗ 𝑂𝑉 𝑤𝑒𝑖𝑔ℎ𝑡 (6)
𝐸𝑉 =𝐷𝑈𝑉
𝐷𝑈𝑉 𝑤𝑒𝑖𝑔ℎ𝑡 ∗ 𝐸𝑉 𝑤𝑒𝑖𝑔ℎ𝑡 (7)
𝐿𝑉 =𝐷𝑈𝑉
𝐷𝑈𝑉 𝑤𝑒𝑖𝑔ℎ𝑡∗ 𝐿𝑉 𝑤𝑒𝑖𝑔ℎ𝑡 (8)
𝑉𝐸𝑇 = 𝐷𝑈𝑉 + 𝐼𝑈𝑉 + 𝑂𝑉 + 𝐸𝑉 + 𝐿𝑉 (9)
𝐵𝐼𝑂𝐷 = 𝐸𝑉 ∗ 𝐵𝐼𝑂𝐷 𝑤𝑒𝑖𝑔ℎ𝑡 (10)
𝐶𝐻 𝑣𝑎𝑙𝑢𝑒 = 𝐸𝑉 ∗ 𝐶𝐻 𝑤𝑒𝑖𝑔ℎ𝑡 (11)
𝑉𝐿𝐴 𝑣𝑎𝑙𝑢𝑒 = 𝐸𝑉 ∗ 𝑉𝐿𝐴 𝑤𝑒𝑖𝑔ℎ𝑡 (12)
III. RESULTS AND DISCUSSIONS
The assessment incorporates psychological
connotations (hedonic, ethical, cultural, theological, among
others) [27]. However, it can be a useful political instrument
for decision-making in environmental planning and
management in general, because it brings the discussion to
the monetary field, since our valuation of a good and service
is in a market society [28] in such a way that, having an
indicator expressed in economic terms, it allows evaluating
and comparing the different benefits that this environmental
asset provides and improving the management of its
resources as a very useful tool, important for the
conservation, protection and sustainability of said asset
[29].
A. Obtaining the values that compose the social value
using AHP
According on the AHP methodology, the order of
priority of the TEV was got, based on the contributed Social
Value of the interdisciplinary people group, on the
environmental asset of SE of the Pacucha lagoon. In order
to determine the relative weighting in each case, the paired
comparisons have been proposed in the questionnaire so
that the 5X5 matrices (DUV, IUV, OV, EV and LV) and
3X3 (BIOD, VLA and CH) respectively were constructed;
obtaining, after verifying its consistency, the eigenvectors
that are detailed for each case in the following points and
that are added by means of the geometric mean. The same
that are contrasted by the criterion of reciprocity,
homogeneity and consistency, which is subsequently
calculated by the geometric mean (M.G.) of all the
respondents.
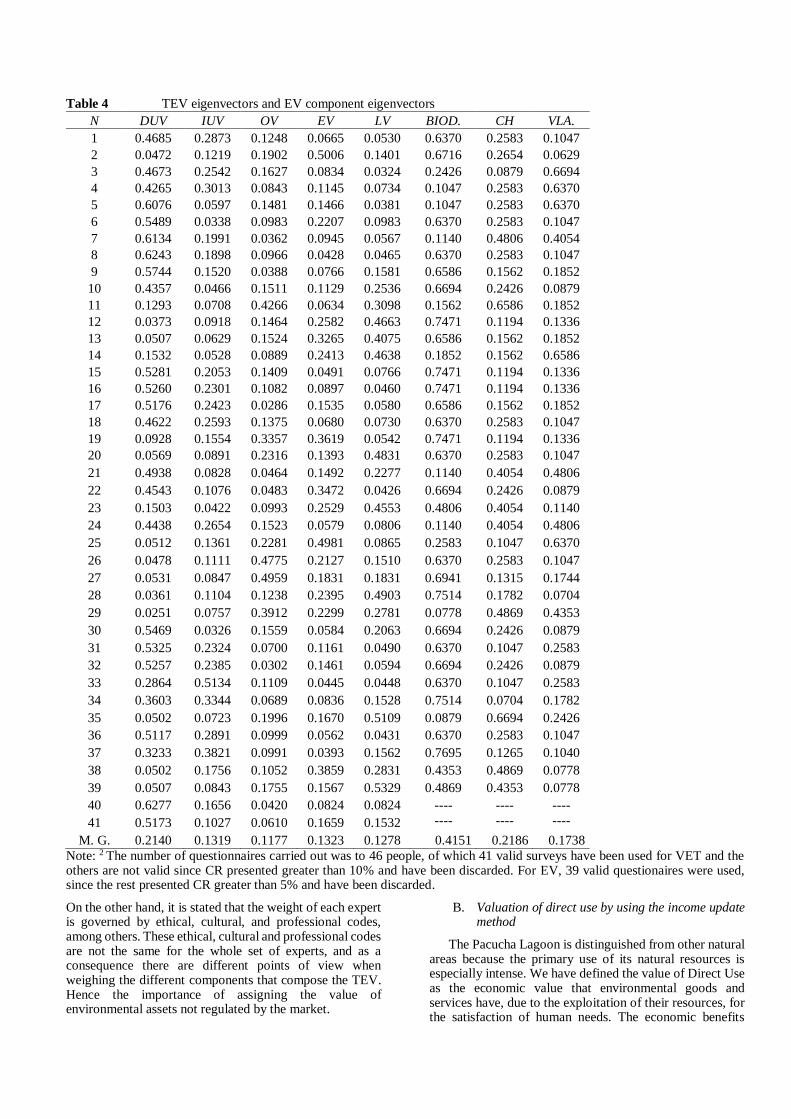
Table 4 TEV eigenvectors and EV component eigenvectors
N DUV IUV OV EV LV BIOD. CH VLA.
1 0.4685 0.2873 0.1248 0.0665 0.0530 0.6370 0.2583 0.1047
2 0.0472 0.1219 0.1902 0.5006 0.1401 0.6716 0.2654 0.0629
3 0.4673 0.2542 0.1627 0.0834 0.0324 0.2426 0.0879 0.6694
4 0.4265 0.3013 0.0843 0.1145 0.0734 0.1047 0.2583 0.6370
5 0.6076 0.0597 0.1481 0.1466 0.0381 0.1047 0.2583 0.6370
6 0.5489 0.0338 0.0983 0.2207 0.0983 0.6370 0.2583 0.1047
7 0.6134 0.1991 0.0362 0.0945 0.0567 0.1140 0.4806 0.4054
8 0.6243 0.1898 0.0966 0.0428 0.0465 0.6370 0.2583 0.1047
9 0.5744 0.1520 0.0388 0.0766 0.1581 0.6586 0.1562 0.1852
10 0.4357 0.0466 0.1511 0.1129 0.2536 0.6694 0.2426 0.0879
11 0.1293 0.0708 0.4266 0.0634 0.3098 0.1562 0.6586 0.1852
12 0.0373 0.0918 0.1464 0.2582 0.4663 0.7471 0.1194 0.1336
13 0.0507 0.0629 0.1524 0.3265 0.4075 0.6586 0.1562 0.1852
14 0.1532 0.0528 0.0889 0.2413 0.4638 0.1852 0.1562 0.6586
15 0.5281 0.2053 0.1409 0.0491 0.0766 0.7471 0.1194 0.1336
16 0.5260 0.2301 0.1082 0.0897 0.0460 0.7471 0.1194 0.1336
17 0.5176 0.2423 0.0286 0.1535 0.0580 0.6586 0.1562 0.1852
18 0.4622 0.2593 0.1375 0.0680 0.0730 0.6370 0.2583 0.1047
19 0.0928 0.1554 0.3357 0.3619 0.0542 0.7471 0.1194 0.1336
20 0.0569 0.0891 0.2316 0.1393 0.4831 0.6370 0.2583 0.1047
21 0.4938 0.0828 0.0464 0.1492 0.2277 0.1140 0.4054 0.4806
22 0.4543 0.1076 0.0483 0.3472 0.0426 0.6694 0.2426 0.0879
23 0.1503 0.0422 0.0993 0.2529 0.4553 0.4806 0.4054 0.1140
24 0.4438 0.2654 0.1523 0.0579 0.0806 0.1140 0.4054 0.4806
25 0.0512 0.1361 0.2281 0.4981 0.0865 0.2583 0.1047 0.6370
26 0.0478 0.1111 0.4775 0.2127 0.1510 0.6370 0.2583 0.1047
27 0.0531 0.0847 0.4959 0.1831 0.1831 0.6941 0.1315 0.1744
28 0.0361 0.1104 0.1238 0.2395 0.4903 0.7514 0.1782 0.0704
29 0.0251 0.0757 0.3912 0.2299 0.2781 0.0778 0.4869 0.4353
30 0.5469 0.0326 0.1559 0.0584 0.2063 0.6694 0.2426 0.0879
31 0.5325 0.2324 0.0700 0.1161 0.0490 0.6370 0.1047 0.2583
32 0.5257 0.2385 0.0302 0.1461 0.0594 0.6694 0.2426 0.0879
33 0.2864 0.5134 0.1109 0.0445 0.0448 0.6370 0.1047 0.2583
34 0.3603 0.3344 0.0689 0.0836 0.1528 0.7514 0.0704 0.1782
35 0.0502 0.0723 0.1996 0.1670 0.5109 0.0879 0.6694 0.2426
36 0.5117 0.2891 0.0999 0.0562 0.0431 0.6370 0.2583 0.1047
37 0.3233 0.3821 0.0991 0.0393 0.1562 0.7695 0.1265 0.1040
38 0.0502 0.1756 0.1052 0.3859 0.2831 0.4353 0.4869 0.0778
39 0.0507 0.0843 0.1755 0.1567 0.5329 0.4869 0.4353 0.0778
40 0.6277 0.1656 0.0420 0.0824 0.0824 ---- ---- ----
41 0.5173 0.1027 0.0610 0.1659 0.1532 ---- ---- ----
M. G. 0.2140 0.1319 0.1177 0.1323 0.1278 0.4151 0.2186 0.1738
Note: 2 The number of questionnaires carried out was to 46 people, of which 41 valid surveys have been used for VET and the others are not valid since CR presented greater than 10% and have been discarded. For EV, 39 valid questionaires were used, since the rest presented CR greater than 5% and have been discarded.
On the other hand, it is stated that the weight of each expert is governed by ethical, cultural, and professional codes, among others. These ethical, cultural and professional codes are not the same for the whole set of experts, and as a consequence there are different points of view when weighing the different components that compose the TEV. Hence the importance of assigning the value of environmental assets not regulated by the market.
B. Valuation of direct use by using the income update method
The Pacucha Lagoon is distinguished from other natural areas because the primary use of its natural resources is especially intense. We have defined the value of Direct Use as the economic value that environmental goods and services have, due to the exploitation of their resources, for the satisfaction of human needs. The economic benefits
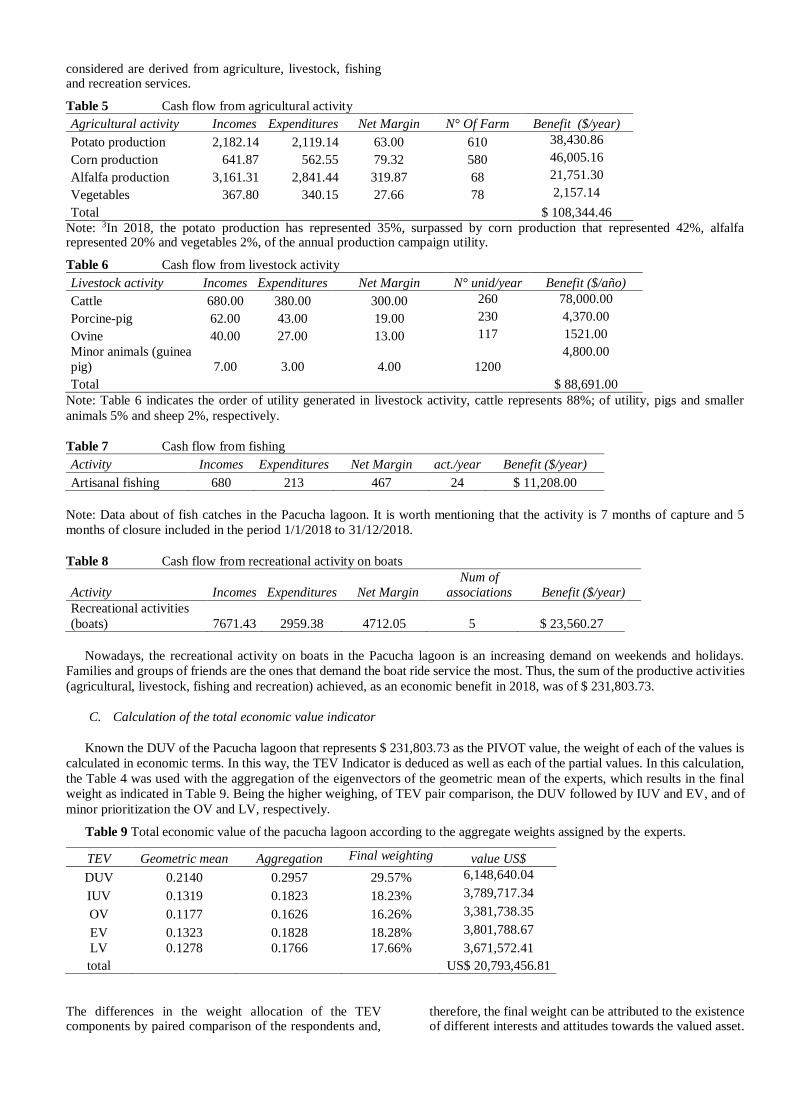
considered are derived from agriculture, livestock, fishing and recreation services.
Table 5 Cash flow from agricultural activity
Agricultural activity Incomes Expenditures Net Margin N° Of Farm Benefit ($/year)
Potato production 2,182.14 2,119.14 63.00 610 38,430.86
Corn production 641.87 562.55 79.32 580 46,005.16
Alfalfa production 3,161.31 2,841.44 319.87 68 21,751.30
Vegetables 367.80 340.15 27.66 78 2,157.14
Total $ 108,344.46
Note: 3In 2018, the potato production has represented 35%, surpassed by corn production that represented 42%, alfalfa represented 20% and vegetables 2%, of the annual production campaign utility.
Table 6 Cash flow from livestock activity
Livestock activity Incomes Expenditures Net Margin N° unid/year Benefit ($/año)
Cattle 680.00 380.00 300.00 260 78,000.00
Porcine-pig 62.00 43.00 19.00 230 4,370.00
Ovine 40.00 27.00 13.00 117 1521.00
Minor animals (guinea
pig) 7.00 3.00 4.00
1200
4,800.00
Total $ 88,691.00
Note: Table 6 indicates the order of utility generated in livestock activity, cattle represents 88%; of utility, pigs and smaller
animals 5% and sheep 2%, respectively.
Table 7 Cash flow from fishing
Activity Incomes Expenditures Net Margin act./year Benefit ($/year)
Artisanal fishing 680 213 467 24 $ 11,208.00
Note: Data about of fish catches in the Pacucha lagoon. It is worth mentioning that the activity is 7 months of capture and 5
months of closure included in the period 1/1/2018 to 31/12/2018.
Table 8 Cash flow from recreational activity on boats
Activity Incomes Expenditures Net Margin
Num of
associations Benefit ($/year)
Recreational activities
(boats) 7671.43 2959.38 4712.05 5 $ 23,560.27
Nowadays, the recreational activity on boats in the Pacucha lagoon is an increasing demand on weekends and holidays.
Families and groups of friends are the ones that demand the boat ride service the most. Thus, the sum of the productive activities
(agricultural, livestock, fishing and recreation) achieved, as an economic benefit in 2018, was of $ 231,803.73.
C. Calculation of the total economic value indicator
Known the DUV of the Pacucha lagoon that represents $ 231,803.73 as the PIVOT value, the weight of each of the values is
calculated in economic terms. In this way, the TEV Indicator is deduced as well as each of the partial values. In this calculation,
the Table 4 was used with the aggregation of the eigenvectors of the geometric mean of the experts, which results in the final
weight as indicated in Table 9. Being the higher weighing, of TEV pair comparison, the DUV followed by IUV and EV, and of
minor prioritization the OV and LV, respectively.
Table 9 Total economic value of the pacucha lagoon according to the aggregate weights assigned by the experts.
TEV Geometric mean Aggregation Final weighting value US$
DUV 0.2140 0.2957 29.57% 6,148,640.04
IUV 0.1319 0.1823 18.23% 3,789,717.34
OV 0.1177 0.1626 16.26% 3,381,738.35
EV 0.1323 0.1828 18.28% 3,801,788.67
LV 0.1278 0.1766 17.66% 3,671,572.41
total US$ 20,793,456.81
The differences in the weight allocation of the TEV components by paired comparison of the respondents and,
therefore, the final weight can be attributed to the existence of different interests and attitudes towards the valued asset.
This finding is in agreement with the reports of authors working in the field of ecosystem resource management who have reported differences in weight allocation between different expert groups. Hence, the Indicator of the Total Economic Value of Laguna de Pacucha amounts to US $ 20,793,456.81 / year for 728 hectares, equivalent to $ 28,562.44 / year in one hectare. Despite the lack of consensus on the importance of the different components of the TEV, it is observed that some of the components receive similar weights as the IUV and EV. However, the highest weight is the direct use value DUV that reaches 29.57%, the value of bequest and option are lower percentage by weight between 16 and 17.7% respectively. The knowledge of the environmental situation of the ecosystem benefits of the "Laguna de los Padres" wetland in Argentina, allowed us to express in economic terms an approximate measure possibly undervalued amounting to more than 138 million pesos / year. [28]. While in Peru, the estimated annual economic values of the Llancahue estuary water production ecosystem service reached between 11 and 25 US $ per m3; which is equivalent between US$ 83,742,593 and US$ 190,324,075 in total [30]. Likewise, they found US $ 320,580.78 as the annual value of enjoying the Sausacocha lagoon in the La Libertad region. However, in the case of the Pacucha lagoon, it is equivalent to US$ 176.20 per m3 and US $28,562.44 as annual value per hectare, as described above. On one side, the work of. [20] indicates that the average value is of 3,274 US $ / ha / year, derived from 200 wetland studies. His study is a synthesis of work. developed by [31] and [32]. This value does not take into account services such as ornamentals and medicinal resources, historical and spiritual values, or sediment control [16]. On the other side, [33] provide an average value of $ 3,463 / ha / year for the non-commercial benefits of the coastal area of Catalonia, based on a transfer of spatial value assessment, also show the average value by county. For the Ebro river delta counties, a Ramsar wetland, the evaluation of which was the use of human land, estimates a range of values between US $ 3,672 and US $ 4,123 / ha / year. The illustrated data of the aforementioned authors is significantly different from the estimated economic values for the Pacucha lagoon. This is due to the fact that they used traditional valuation methods whose disadvantage of considering both their intangible and tangible aspects is difficult, and in some cases impossible to grasp of the components of the TEV, as indicated [16]. However, for the present work, the AMUVAM model was used, which allows estimating a TEV, using direct and indirect economic variables and social variables.
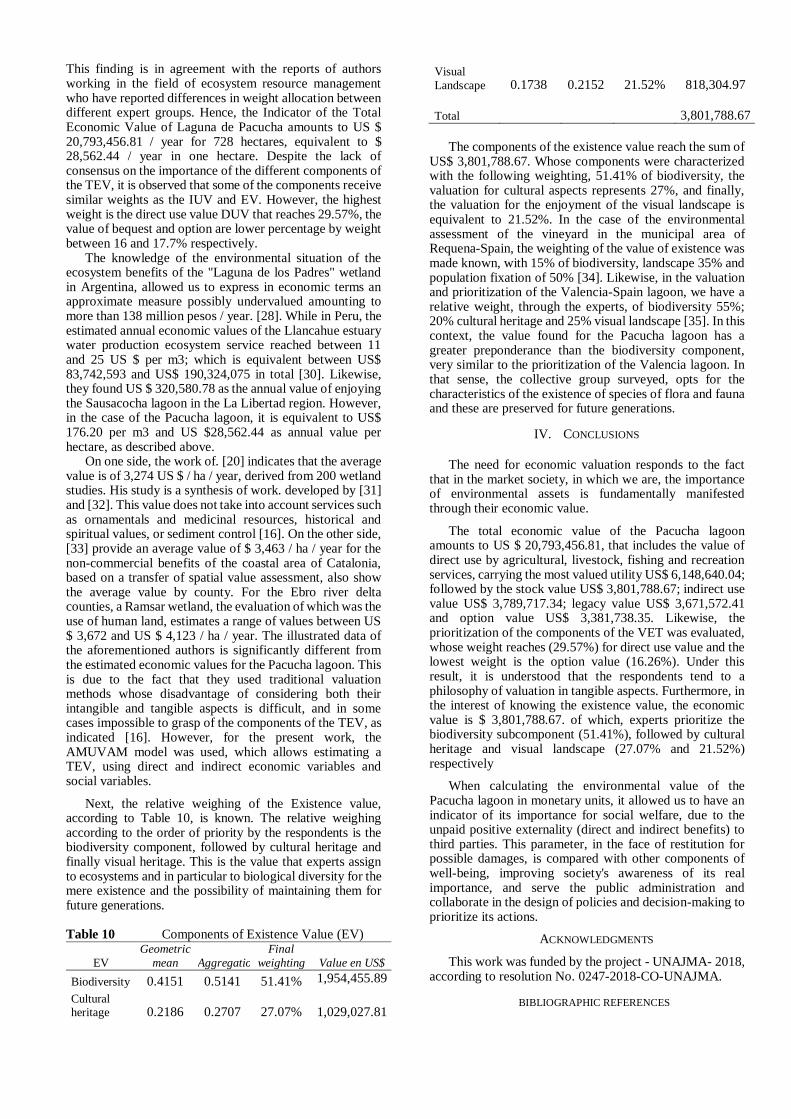
Next, the relative weighing of the Existence value, according to Table 10, is known. The relative weighing according to the order of priority by the respondents is the biodiversity component, followed by cultural heritage and finally visual heritage. This is the value that experts assign to ecosystems and in particular to biological diversity for the mere existence and the possibility of maintaining them for future generations. Table 10 Components of Existence Value (EV)
EV
Geometric
mean Aggregation
Final
weighting Value en US$
Biodiversity 0.4151 0.5141 51.41% 1,954,455.89
Cultural heritage 0.2186 0.2707 27.07%
1,029,027.81
Visual
Landscape 0.1738 0.2152 21.52%
818,304.97
Total
3,801,788.67
The components of the existence value reach the sum of US$ 3,801,788.67. Whose components were characterized with the following weighting, 51.41% of biodiversity, the valuation for cultural aspects represents 27%, and finally, the valuation for the enjoyment of the visual landscape is equivalent to 21.52%. In the case of the environmental assessment of the vineyard in the municipal area of Requena-Spain, the weighting of the value of existence was made known, with 15% of biodiversity, landscape 35% and population fixation of 50% [34]. Likewise, in the valuation and prioritization of the Valencia-Spain lagoon, we have a relative weight, through the experts, of biodiversity 55%; 20% cultural heritage and 25% visual landscape [35]. In this context, the value found for the Pacucha lagoon has a greater preponderance than the biodiversity component, very similar to the prioritization of the Valencia lagoon. In that sense, the collective group surveyed, opts for the characteristics of the existence of species of flora and fauna and these are preserved for future generations.
IV. CONCLUSIONS
The need for economic valuation responds to the fact that in the market society, in which we are, the importance of environmental assets is fundamentally manifested through their economic value.
The total economic value of the Pacucha lagoon amounts to US $ 20,793,456.81, that includes the value of direct use by agricultural, livestock, fishing and recreation services, carrying the most valued utility US$ 6,148,640.04; followed by the stock value US$ 3,801,788.67; indirect use value US$ 3,789,717.34; legacy value US$ 3,671,572.41 and option value US$ 3,381,738.35. Likewise, the prioritization of the components of the VET was evaluated, whose weight reaches (29.57%) for direct use value and the lowest weight is the option value (16.26%). Under this result, it is understood that the respondents tend to a philosophy of valuation in tangible aspects. Furthermore, in the interest of knowing the existence value, the economic value is $ 3,801,788.67. of which, experts prioritize the biodiversity subcomponent (51.41%), followed by cultural heritage and visual landscape (27.07% and 21.52%) respectively
When calculating the environmental value of the Pacucha lagoon in monetary units, it allowed us to have an indicator of its importance for social welfare, due to the unpaid positive externality (direct and indirect benefits) to third parties. This parameter, in the face of restitution for possible damages, is compared with other components of well-being, improving society's awareness of its real importance, and serve the public administration and collaborate in the design of policies and decision-making to prioritize its actions.
ACKNOWLEDGMENTS
This work was funded by the project - UNAJMA- 2018, according to resolution No. 0247-2018-CO-UNAJMA.
BIBLIOGRAPHIC REFERENCES
[1] J. Osorio y F. Correa, «Valoración económica de costos ambientales:
marco conceptual y métodos de estimación": Medillen,» 2004.
[2] J. Aznar y A. V. Estruch, Valoración de activos ambientales: teoría y
casos, Segunda Edicion ed., Valencia: Universitat Politècnica de
València, 2015.
[3] A. Algarra, P. Costa y J. Sotelo, «El medio ambiente en la política
económica: hacia un modelo de integración en España,» Mundi-
Prensa, Madrid, 2002.
[4] F. Cardells, «Valoración de los recursos ambientales y naturales,»
Universidad Politécnica de Valencia - Centro de ingeniería económica,
Valencia, 2001.
[5] D. Azqueta, «Valoración económica de la calidad ambiental,»
McGraw Hill, Madrid, 1994.
[6] A. Garrido, J. Gómez, V. Lucio y M. Múgica, Estudio del uso y
valoración del Parque regional de la Cuenca Alta del Manzanares
(Madrid) mediante el método del coste del viaje, Madrid: McGraw-
Hill, 1996.
[7] ,. L. Pérez, J. Barreiro, R. Barberán y B. Álvarez, El valor de Uso
recreativo del Parque Nacional de Ordesa y Monte Perdido: Coste del
viaje versus Valoración Contingente, Madrid: McGraw-Hill, 1996.
[8] A. Caparrós y P. Campos, «Valoración de los usos recreativo y
paisajístico en los pinares de la sierra de Guadarrama,» Revista
Española de Estudios Agrosociales y Pesqueros, nº 195, pp. 121-146,
2002.
[9] S. Griliches, Price Indexes and Quality Change . Studies in New
Methods of Measurement., Massachusetts.: Harvard University Press,
1971.
[10] M. T. Brown y R. A. Herendeen, «Embodied Energy Analysis and
Emergy Analysis: a Comparative View,» Ecological Economics, vol.
19, pp. 219-235, 1996.
[11] H. T. Odum, «Self-organization, Transformity and Information,»
Science, vol. 242, pp. 1132-1139, 1998.
[12] G. Earth, «https://earth.google.com/web/,» 10 junio 2019. [En línea].
Available: https://earth.google.com/web/.
[13] DIRCETUR, «Dirección Regional de Comercio Exterior y Turismo,»
20 setiembre 2018. [En línea]. Available:
http://www4.congreso.gob.pe/congresista/2006/aleonz/Apurimac.pdf.
[14] ETP, «Enciclopedia Turistica De Peru: Laguna de Pacucha
Apurimac,» 20 agosto 2009. [En línea]. Available:
http://encicloturismoperu.blogspot.com/2009/08/laguna-de-pacucha-
apurimac.html. [Último acceso: 15 setiembre 2019].
[15] T. Saaty, «The Analytic Hierarchy Process, RWS,» Int. J. Services
Sciences, vol. 1, nº 1, p. 86, 1980.
[16] V. Estruch y M. Valles, «The economic value of landscape aesthetics
in albufera natural park through the analytic multicriteria valuation
method,» Int. J. of Design & Nature and Ecodynamics., vol. 3, pp.
281-302, 2017.
[17] E. Barbier, «Valuing environmental functions: tropical Wetlands,»
Land Economics, vol. 70, nº 2, p. 133–173, 2004.
[18] P. Champ, K. Boyle y T. Brown, A Primer on Non-Market Valuation,
Boston : Kluwer Academic Publishers, 2003.
[19] J. Garcia y A. S. Baldarrama, «Modelo AMUVAM para la Valuación
de Espacios Eco-Tecnológicos. Caso de Estudio: Vialidad Solar
Proyectada en la Ciudad De Tijuana,» Revista de Direito da Cidade,
vol. 10, nº 3, pp. 1813-1841, 2018.
[20] R. De Groot, M. Stuip, C. Finlayson y N. Davidson, «Valuing
wetlands: guidance for valuing the benefits derived from wetland
ecosystem services, Ramsar Convention Secretariat, Gland,
Switzerland & Secretariat of the Convention on Biological Diversity,
Montreal, Canada. Ramsar Technical,» Report No. 3/CBD Technical
Series No. 27, 2006.
[21] CIUP, «Cálculo de la tasa social de descuento para proyectos de
inversión pública ambientales,» 2011.
[22] MEF, «Informe de actualización de proyecciones macroeconómicas
2019-2022,» Ministerio de Economía Y Finanzas, Lima, 2019.
[23] F. Ramsey, «Amathematical the oryofsaving.,» Economic Journal,
vol. 38, nº 543, 1928.
[24] R. Keeney y H. Raiffa, «Decisions with Multiple Objectives:,»
Preferences and Value Trade-Offs, Wiley: , New York, 1993.
[25] S. Colombo, J. Calatrava y N. Hanley, «Analysing the social benefits
of soil conservation measures using stated preference methods,»
Ecological Economics, vol. 58, nº 4, p. 850–861., 2006.
[26] J. Mogas, P. Riera y J. Bennett, «A comparison of contingent valuation
and choice modelling with second-order interactions,» Journal of
Forest Economics, vol. 12, nº 1, p. 5–30, 2006.
[27] J. Goldberg, «Valoración económica de las cuencas hidrográficas: Una
herramienta para el mejoramiento de la gestión de los recursos
hídricos,» nº 4-8, 2007.
[28] A. Iwan, E. Guerrero, A. Bocanegra y A. Romanelli, «Valoración
económica de los servicios ecosistémicos de una Laguna del sudeste
bonaerense (Argentina),» nº 68, 2017.
[29] J. Roig, Valoración del Parque Natural la Font Roja mediante la
aplicación del método AMUVAM, Valencia, España: Universidad
Politécnica de Valencia, 2016.
[30] D. Nuñez, «valoracion economica del servicio ecosistemico de
produccion de agua, del bosque de la cuenca de Llancahue, decima
region,» Universidad Austral de Chile, Valdivia, 2004.
[31] K. Schuijt y L. Brander, Living Waters: Conserving the Source of Life.
The Economic Value of the World’s Wetlands, WWF, Gland
(Switzerland)., 2014.
[32] R. Costanza, The value of the world’s ecosystem services and natural
capital. Nature, 387, 1997.
[33] J. Brenner, J. Jiménez, R. Sardá y A. Garola, «An assessment of the
non-market value of the ecosystem services provided by the Catalan
coastal zone, Spain. Ocean and Coastal Management,» , vol. 53, p. 27–
38, 2010.
[34] M. Peris, «Valoración de viñedos mediante métodos multicriterio.
Aplicación a la valoración del viñedo del término municipal de
Requena,,» Ojeando La Agenda, vol. 22, pp. 24-45, 2013.
[35] L. Casanova, J. Aznar y V. Estruch, «Valoración económica y
priorización del paisaje de la albufera de Valencia.,» landscape
architectural review, pp. 47-52, 2010.
[36] J. Osorio y F. Correa, «Valoración económica de costos ambientales:
marco conceptual y métodos de estimación.,» Medillen, 2004.
[37] P. Brink, R. De Groot, M. Kettunen y M. Walpole, «The Economics
of Biodiversity and Ecosystems: Scoping the Science,» research, p.
11, 2008.
[38] M. Peris, «Valoración de viñedos mediante métodos multicriterio.
Aplicación a la valoración del viñedo del término municipal de
Requena,» Ojeando La Agenda, nº 22, pp. 24-45, 2003.
![Bahlo / Fladrich (2016) - Transkriptband Jugendsprache. Gesprochene Sprache in der Peer-Group. Berlin: Retorika. [PREPRINT per Email verfügbar]](https://img.pdfslide.net/doc/110x75/634cde1db5aff40b380ebe63/bahlo-fladrich-2016-transkriptband-jugendsprache-gesprochene-sprache-in-der.jpg)


![De eruditione comparanda in humanioribus. Studia z dziejów erudycji humanistycznej w XVII wieku, Lublin, Wydawnictwo KUL, 2012 [preprint]](https://img.pdfslide.net/doc/110x75/63216ef8bc33ec48b20e5b2e/de-eruditione-comparanda-in-humanioribus-studia-z-dziejow-erudycji-humanistycznej.jpg)