Embed Size (px)
Citation preview

Resource productivity, environmental tax reform and sustainable growth in Europe
Differences in ETR between CEEC and Germany / UK
(working paper) Stefan Speck
November 2007
petrE (see http://www.petre.org.uk/papers.htm) is part of the Anglo-German Foundation research policy initiative: Creating sustainable growth in Europe (see
http://www.agf.org.uk/currentprogramme/CreatingSustainableGrowthInEurope.php)

PAPER FOR THE
MID-TERM CONFERENCE OF THE ANGLO-GERMAN FOUNDATION PROJECT
‘PRODUCTIVITY AND ENVIRONMENTAL TAX REFORM IN EUROPE’
(petrE)
---------------------------------------------------------------------------------
Differences in ETR between CEEC and Germany/UK
Stefan Speck1
Version - November 2007
Work in progress 1. Introduction The concept of an environmental tax reform (ETR) is widely accepted as a reform proposal of the national tax system shifting the burden of taxes from conventional taxes, such as the ones levied on labour and capital, to environmentally related activities, such as taxes levied on resource use, in particular energy, or environmental pollution. The underlying rationale of the tax shifting programme is to address multiple policy objectives assuring that the tax burdens are distributed fairer from an environmental and sustainable perspective. The concept behind this approach is that positive welfare gains will be generated through reducing taxes levied on labour or capital and increasing taxes on environmentally related activities hence helping avoid ‘welfare-reducing’ activities. Furthermore, the imperative behind this tax shifting programme is one of revenue neutrality meaning that the increase in one is balanced by the reduction of the other, guaranteeing that there is no change in the overall tax burden at the national level. The motivation for implementing this policy instrument is to ensure that the tax burden falls more on 'bads' than ‘goods’ by guaranteeing that the price signals – as a consequence of introducing environmentally related taxes – provide an incentive to consumers and producers to change behaviour. The basis for implementing environmental taxes within an ETR is the generally accepted premise that taxes are a tool for reaching political objectives effectively and in a cost-minimising way. A typical case is an increase in the tax on energy (whose use leads to pollution, e.g. externalities), and a simultaneous reduction in labour taxes, such as income taxes or social security contributions paid by employers and / or employees, aiming to increase employment (see for a more detailed discussion: EEA 2005).
1 Sustainable Europe Research Institute (SERI) – Vierthalergasse 6, 1120 Vienna, Austria, email: [email protected]

2
The main focus of this paper is to highlight the ETRs implemented in the old EU Member States, in particular focusing on the UK and Germany, and to study the most recent developments regarding ETRs in the new EU Member States. The centre of attention lies on the situation in Estonia and the Czech Republic as the former country already implemented an ETR and the latter will do it at the beginning of 2008. Thereby the paper addresses the question how the theoretical ETR concept has been transposed in the different countries and whether there are any differences between old and new EU Member States detectable. Special attention is given to the discussion of the recycling mechanism adopted and also to the question of the future potential of an ETR in particular in the context of climate change policies. 2. The development of ETR in Europe Already in the 1980s the concept of an ETR was discussed in the literature as Binswanger and colleagues (Binswanger et al. 1983) underlined the principle of a tax shifting programme by levying a tax on energy consumption and to recycle back the revenues by reducing labour taxes and/or social security contributions. This early approach follows the revenue neutrality principle which is regularly seen as one of the cornerstones. Since then the basic idea of an ETR2 has not really changed in the European context. Interesting to know is the fact that the European Commission promoted already in 1993 the ETR concept as the Delor White Paper on Growth, Competitiveness and Employment stated: … if the twin challenge of unemployment/environmental pollution is to be addressed, a swap can be envisaged between reducing labour costs through increased pollution charges (EC 1993). The rationale for launching an ETR is clearly stated in the Delor paper as the achievement of environmental and economic/environment policy objectives are linked. The theoretical foundation goes back to the ‘double dividend’ hypothesis (Pearce 1991 and Repetto et al. 1992). The theory behind the ETR concept is the assumption that an ETR can trigger off both improvements in environment (eg an environmental benefit via the reduction of environmental pollution or the reduction in resource use) and in the economy, in particular by reducing unemployment as a consequence of a reduction of the tax burden levied on labour (eg an economic/employment benefit – see for example Goulder 1995, Ekins 1999). Since then the European Commission is regularly expressing its support for the implementation of ETR. For example, the 2003 Energy Taxation Directive (EC 2003) states: Fiscal arrangements made in connection with the implementation of this Community framework for the taxation of energy products and electricity are a matter for each Member State to decide. In this regard, Member States might decide not to increase the overall tax burden if they consider that the implementation of such a principle of tax neutrality could contribute to the restructuring and the modernisation of their tax systems by encouraging behaviour conducive to greater protection of the environment and increased labour use. 2 It has to be stated that several terms, such as ‘ecological tax reform’ or ‘green tax reform’ are being used for describing an environmental tax reform (ETR). In this context it is useful to mention that an ‘environmental fiscal reform (EFR)’ is a broader approach as it not only include a tax shifting programme but also the reform of subsidies (see for a more detailed discussion: EEA 2005, Chapter 4).
3
In the 1990s several European countries started to implement ETRs into national policy programmes. The frontrunners have been the Nordic countries (Sweden, Denmark, Norway, and Finland) followed by the Netherlands, Germany and the UK. However, large differences between the individual ETRs are recognizable. This is not surprising as tax shifting programmes are launched to achieve country specific policy objectives which differ between countries. It is not only the national policy objectives, but also the structure of the fiscal system that can differ between countries as discussed below. The ETRs implemented so far in EU Member States differ widely in terms of (see for a detailed analysis of the ETRs implemented: Speck 2006):
• environmental taxes: all countries either increased already existing energy/CO2 taxes or introduced new taxes levied on energy products which were so far tax exempt. In the past, differences existed in terms which energy products are subject to energy/CO2 taxes. This has changed as the 2003 Energy Taxation Directive set minimum tax rates for all energy products with the exception of heat and renewables. Nevertheless, differences are still common regarding the actual energy/CO2 tax rates, the economic sectors affected and the special tax provisions provided to industry. This last issue is of central significance as special tax provisions in form of reduced energy/CO2 tax rates are granted to industries as a consequence of the potential fear of losing international competitiveness.
• recycling mechanism used in the different countries: three different options for reducing labour taxes are being used by EU Member States: • reduction in income tax rates; this option is often used as a measure to
compensate households for higher energy taxes. Businesses are not affected by this measure. This policy option has been applied in Finland and Sweden. Sweden is a particular interesting case as the ETRs implemented are part of a major fiscal programmes aiming to reduce the high income tax rates. Some of the revenue losses from reduced income tax rates are being offset by the increase in revenues generated from energy/CO2 taxes.
• reduction in social security contributions which must be further distinguished:
o reduction in employers’ social security contributions; this policy will reduce labour costs paid by employers. Therefore it is the recycling option which is probably most in line with the political objective of reducing employers’ labour costs as a condition for providing new jobs and hence to reduce unemployment.
o reduction in employees’ social security contributions; this policy option affects employees as their net wage increases.
o this policy option of reducing social security contributions is in widespread use in Denmark, Germany, the Netherlands, and the UK.
• the third and last option is lump-sum transfers to households. The underlying reason for adopting this policy, as implemented for example in the Netherlands, is to compensate the part of the society which does not pay income taxes or social security contributions but are facing higher energy bills (for example pensioners and students).

4
• in addition, the generated revenues are used for supporting environmental investments, in particular in the field of renewables and improvement in energy efficiency measures.
• the scope of ETR in terms of revenues shifted. In the case of Germany the ETR shifted up to 1 percent of GDP as compared to a meagre 0.1 percent of GDP in the UK. However, it must be kept in mind that the design of these two ETRs varies immensely with regard to the sector coverage (all sectors in the German case – household, service and industry – as compared to industry in the UK case) and energy taxes implemented.
As mentioned above the fiscal systems differ to a large degree between EU Member States as shown in Tables 1 and 2. Table 1: Revenue structure according to economic function as % of GDP in selected EU Member States in 2005
Czech Republic Denmark Estonia Germany Netherlan
ds Sweden UK
Taxes on consumption 11.4 16.1 12.9 10.1 12.1 13.1 11.4
Labour taxes 17.8 24.8 15.4 22.3 17.7 31.2 14.4
- employed 17.8 19.8 15.1 19.5 15.3 27.1 14.2
- paid by employers 10.4 0.5 10 7 4.2 13.7 3.9
- paid by employees 7.5 19.3 5.1 12.5 11.1 13.4 10.4
Capital taxes 7.1 9.6 2.5 6.4 8.3 6.3 11.1
TOTAL TAXES incl. social contributions 36.3 50.3 30.9 38.3 38.2 51.3 37
Environmental taxes 2.8 5.8 2.2 2.5 4 2.9 2.5
- energy 2.5 2.3 1.9 2.1 2.1 2.5 2
- transport 0.3 2.2 0.1 0.4 1.3 0.3 0.5
- pollution/resource 0 1.3 0.2 0 0.6 0.1 0.1
Source: Eurostat 2007 It is well-known that the EU is a ‘high tax area’ (Eurostat 2007). However, large differences exist between individual EU Member States as the total tax ratio to GDP ratio amounted between 30.9 percent and 51.3 percent as shown in the countries shown in Table 13. There are several issues which deserve some special attention:
• the ratio total tax to GDP is lowest in the new EU Member States when compared to the old EU Member States;
• revenues generated from taxes on consumption are high in Denmark but rather similar in the other countries studied above;
• an uneven result can also be found when assessing the labour taxes to GDP ratio. The two high tax countries Denmark and Sweden have the highest share; and
3 The EU tax to GDP ratio of 39.6 percent (EU 27) exceeds the Japanese and US ratios by about 13 percentage points (Eurostat 2007).

5
• the range of capital taxes is also rather inconsistent. Differences are also identifiable with regard to the environmental tax to GDP ratio in terms of size and structure. In general, energy taxes are accruing the biggest share of revenue. The revenues from transport and pollution/resource taxes are small with the exception of Denmark and to a lesser degree with regard to the Netherlands. Table 2a: Structure of revenues as % of GDP in selected EU Member States in 2005
Czech Republic Denmark Estonia Germany Netherlan
ds Sweden UK EU
Indirect taxes 11.9 17.9 13.5 12.1 13.1 17.3 13.3 13.8
- VAT 7.2 10 8.8 6.2 7.3 9.3 6.8 6.9
Direct taxes 9.3 31.4 7.1 10.3 11.9 20.1 16.8 13.2
- personal income 4.6 24.6 5.6 8.6 6.7 15.6 10.5 9.2
Social contributions 15.1 1.1 10.4 16.3 13.1 13.8 6.9 12.8 - paid by employers 10.4 0 10 7 4.1 10.8 3.9 7.3
- paid by employees 3.6 1.1 0.3 6.4 6.5 2.8 2.9 4.0
- paid by self- employed 1 0 0 2.9 2.6 0.3 0.2 1.5
TOTAL TAXES incl. social contributions 36.3 50.4 31 38.7 38.1 51.2 37 39.7
EU: EU-25 weighted average Source: Eurostat 2007 Table 2b: Structure of revenues as % of total taxes (incl social contributions) in selected EU Member States in 2005
Czech Republic Denmark Estonia Germany Netherlan
ds Sweden UK EU
Indirect taxes 32.8 35.5 43.5 31.3 34.4 33.8 35.9 34.8
- VAT 19.8 19.8 28.4 16.0 19.2 18.2 18.4 17.4
Direct taxes 25.6 62.3 22.9 26.6 31.2 39.3 45.4 33.2
- personal income 12.7 48.8 18.1 22.2 17.6 30.5 28.4 23.2
Social contributions 41.6 2.2 33.5 42.1 34.4 27.0 18.6 32.2 - paid by employers 28.7 0 32.3 18.1 10.8 21.1 10.5 18.4
- paid by employees 9.9 2.2 1.0 16.5 17.1 5.5 7.8 10.1
- paid by self- and non-employed 2.8 0 0 7.5 6.8 0.6 0.5 3.8
TOTAL TAXES incl. social contributions 100 100 100 100 100 100 100 100
EU: EU-25 weighted average Source: Eurostat 2007 These differences are also highlighted in Tables 2a and 2b. The figures presented in this table are in particular interesting in the context of the different recycling options of an ETR. The biggest extreme can be found when comparing Denmark with the Czech Republic and Estonia. Denmark heavily relies on direct taxes and there on taxes on personal income and not at all on social contributions. The revenues raised by personal income tax in the two new EU Member States are only a fraction when

6
compared to Denmark but, in contrast, the contribution of the social contributions is rather high. The social contribution to total tax revenue ratio is higher only in Germany. Another aspect of the social contribution systems is rather interesting as Tables 2a and 2b reveals the breakdown of the payees. Again there is consistent picture: the share between employers and employees is rather similar in Germany and the UK while in the Netherlands the biggest share has to be paid by employees. A completely different model can be found in the Czech Republic, Estonia and Sweden as employers are contributing a higher share than employees. These tables clearly shed light on the fact that the fiscal and tax systems differ widely between EU Member States and that the design of the recycling measures introduced as part of an ETR must be clearly adjusted to the national systems. Interesting to remind is the fact that ETRs have been launched as part of a policy programme to reduce unemployment via the reduction in labour taxes. High labour costs, in particular with regard to other labour costs (‘non-wage costs’) are in countries, such as Germany, regularly seen as one of the reasons for unemployment. This problem was approached by the German ETR as the employers’ social security contributions were reduced. Based on this data it can be concluded that such a policy of promoting employment by reducing employers’ social security contribution is not available for Denmark because of the different fiscal system. The total labour costs in the manufacturing industry were comparable in Denmark and Germany in 2004: 30.72 Euro per hour in Denmark compared to 31.15 Euro per hour in Germany (Statistisches Bundesamt 2007a). However, the non-wage costs in percentage of gross wages amounted to 33 percent in Germany (including 20 percent employers’ social security contribution) compared to a meagre 18 percent in Denmark (Statistisches Bundesamt 2007b). This overview - although rather brief and far from exhaustive - shed some light on the concept and principles of ETRs. The following chapters discuss the ETRs as implemented in the two old EU Member States, Germany the UK, in more detail as well as those in Estonia and the Czech Republic. 3. ETRs implemented in Germany and the UK 3.1 Germany The potential of an ETR was already discussed in the early 1990s but it took until April 1999 before the ETR was finally implemented. The then launched ETR was very broad as all economic sectors were affected. The existing excise duties were increased and a new tax on electricity was introduced. However, electricity taxation was not a new phenomenon in Germany as a tax on electricity consumption was in place until 1995 when the scheme was abolished. This tax scheme was known under the term ‘Kohlepfennig’. The revenues of this tax were earmarked for the subsidisation of the German coal industry. The tax was an ad-valorem tax and the rates were differentiated between industry and households. When launching the ETR in April 1999 the clearly defined objectives of the German government were:
• to improve environmental protection and in particular to reduce greenhouse gas emissions as a means of climate change mitigation (environmental objective); and

7
• to reduce the employers’ and employees’ statutory pension contributions (social security contributions) in order to reduce labour costs and to increase employment (economic/employment objective).
The ETR was phased in during the years 1999 and 2003:
• The revenue raising side of the ETR: The main policies have been an increase in existing energy taxes and the introduction of an electricity tax.
o Mineral oil taxes on transport fuels (petrol and diesel) were gradually and steadily increased in five steps between April 1999 and 2003.
o Taxes on natural gas and light heating fuels were increased in 1999 and another increase on the natural gas tax took place in 2003.
o Taxes on heavy fuel oil were increased in 2000 and again in 2003. However, the tax on heavy fuel oil used for electricity generation was reduced in 2000 so that the heavy fuel oil tax is equal for all purposes.
o Introduction of an electricity tax in 1999: The tax rate was gradually increased in five annual steps.
o The increase in the tax rates imposed on the manufacturing industry and the agricultural sector for energy products other than transport fuels are lower than the standard increase because of the fear of hampering the competitiveness of German industry.
• The recycling mechanism of the German ETR: The ETR was planned to be revenue neutral. However, the German government refrained from this policy goal in the last years by using a small fraction (less than 10% of total revenue raised) for the consolidation process of the federal budget. The major share of the revenues were used in a tax shifting programme by reducing employers’ and employees’ social security contributions which are being paid by the two groups equally (i.e. in a 50:50 ratio). Furthermore, a small fraction of around 1% has been earmarked for the promotion of renewable energy. The total volume of the tax shifting programme was 18.7 billion Euro in 2003 (around 0.9% of GDP). The adopted recycling mechanism meant that the employers and employees pension contribution could have been reduced by 1.8% from 20.3% in 1998 to 19.5% in 2003. It is estimated that without the introduction of the ETR the total pension contribution would be in the range of 21.2% in 2003 as a consequence of the economic and demographic development in Germany.
From the start of the ETR manufacturing industry, agriculture and forestry was granted special energy tax provision in form of reduced energy tax rates and also a ceiling with regard to the total tax burden. The scheme was slightly revised in 2003 the fundamentals remained the same (Bach 2004).
• Initially manufacturing industry, as well as agriculture, fishery and forestry sector was granted a tax relief of 80 percent for energy products other than transport fuels (ie heating fuels, natural gas and electricity). The tax relief affected only the tax rates which were imposed as part of the ETR and were only available on the condition that the base amount (‘Sockelbelastung’) of 512.5 EUR per annum– electricity and heating fuels - was exceeded.

8
• Furthermore manufacturing sector was eligible for an additional tax option – companies could apply for a tax cap (‘Spitzenausgleich’). If the tax burden from increased energy tax rates was 20 percent higher than their tax relief from the reduction in pension contributions, companies were refunded the full differential amount. The outcome of this provision was that the majority of German industries had an effective marginal tax rate of zero percent.
• The tax relief for the manufacturing sector, agriculture, fishery and forestry was reduced at the beginning of 2003. All companies of these sectors have been granted a tax relief of only 40 percent of the standard energy tax rates for electricity, heating oil and natural gas but only for energy consumption exceeding the base amount (‘Sockelbelastung’) which have been kept constant. However, only the increase in energy tax rates as a result of the ETR are reduced, i.e. the increases in the tax rates which took place since 1999. This policy change means that the effective tax rate is now 60 percent of the standard rate as compared to a meagre 20 percent between April 1999 and 2002. In addition, the additional tax option (‘Spitzenausgleich’) is still applicable to the manufacturing industry but it was also revised. The new rule stipulates that a company is eligible for a refund if the energy tax burden is greater than its tax relief from the reduction in the pension contributions payable by the company. However, the refund currently amounts only to 95 percent of the differential amount. The outcome of this revision is that companies which are receiving the tax refund are now facing a tax rate of three percent as compared to the zero percent rule under the 1999 regulation.
Transport fuels were contributing the biggest slice of total ETR revenues amounting to more than 10 billion Euro in 2003 (around 56 percent of total ETR revenues of 18.7 billion Euro). The newly introduced tax on electricity amounted to 6.5 billion Euro. A rather large share came from the tax on natural gas and the contribution from the taxes levied on light fuel oil and heavy fuel oil are almost negligible. What is important in this context is to assess the loss of revenues as a consequence of the granting of special tax provisions. The German government regularly publishes an overview of subsidies (the so called ‘Subventionsbericht’). The tax measures discussed above are not negligible in terms of loss of revenues and were in the range of around 4 billion Euro in 2003 (see for a further discussion on special tax privileges: Section 5). It is necessary to look at the development of the rate of contribution to the different social insurances when an attempt is made to assess the recycling measure, ie the reduction of the contribution to the pension fund. Table 3 reveals that the rate was reduced in 1999 leading to a temporary reduction in the total rate as shown in the last column of Table 3. The reduction of the rate to the pension fund was offset by an increase in the health insurance contribution during the period between 1999 and 2003. However, it has to be argued that without ETR the total rate of contribution would have been even higher. Table 3: Development of the rate of contribution to social insurances in Germany (in percent of wage costs)4
4 In general the rate of contribution is split evenly between the employer and the employee.

9
Pension fund –
Rentenver-sicherung
Health insurance – Krankenver-sicherung
Unemployment insurance –
Arbeitslosenver-sicherung
Nursing/care insurance – Pflegever-sicherung
Total - insgesamt
1995 18.6 13.2 6.5 1 39.3
1996 19.2 13.4 6.5 1.7 40.8
1997 20.3 13.3 6.5 1.7 41.8
1998 20.3 13.6 6.5 1.7 42.1
1999 20.3 (until March) 19.5 (April) 13.5 6.5 1.7 42.0
41.2 2000 19.3 13.5 6.5 1.7 41
2001 19.1 13.5 6.5 1.7 40.8
2002 19.1 14 6.5 1.7 41.3
2003 19.5 14.4 6.5 1.7 42.1
2004 19.5 14.3 6.5 1.7 42
2005 19.5 14.2 6.5 1.7 41.9
2006 19.5 13.3 6.5 1.7 41
2007 19.9 14.2 4.2 1.7 40
Source: Time series of social security contributions at www.deutsche-rentenversicherung.de The analysis of the macroeconomic effects of the ETR shows some positive results with regard to economic activity (increase in GDP) and also in terms of a slight increase in employment. The environmental objectives of the ETR are also achieved as the simulation results reveal a reduction in energy demand and a reduction in greenhouse gas emissions (see for more information: COMETR 2007). The German ETR has achieved the underlying principle of an ETR namely the shifting of the tax burden from labour to energy use. However, it has to be stated as already revealed in the tables above that the revenues generated from environmental taxes are only a small fraction of the social contribution and therefore it cannot be expected that the revenues of an ETR will lead to a dramatic reduction in the contribution of the social insurances under the given tax and fiscal policy. The ETR induced tax increases ceased in 2003 and since then all tax rates have remained constant meaning that the real value of the tax rates dropped slightly, ie a freeze in the tax rates. However, the end user prices of all energy products including electricity increased mainly as a consequence of the dramatic increase in the world oil price. The reported ETR tax revenue dropped from 18.7 billion Euro in 2003 to 17.8 billion Euro and thereby the amount earmarked for the tax shifting programme (contribution to the pension fund) remained almost constant (16.1 billion Euro in 2003 and 15.9 billion Euro in 2005) (BMF 2006). The share of the ETR induced tax revenues amounts to about one third of all environmental tax revenues which have been highest in 2003 (57 billion Euro) and slightly dropped since then to 55 billion Euro in 2005. However, massive tax provisions in terms of energy tax reduction are in place in Germany as presented in Table 4. The total loss of revenues caused by the tax reductions and exemptions sums up to 8 billion Euro in 2005, ie about 15 percent of the total environmental tax revenues.
10
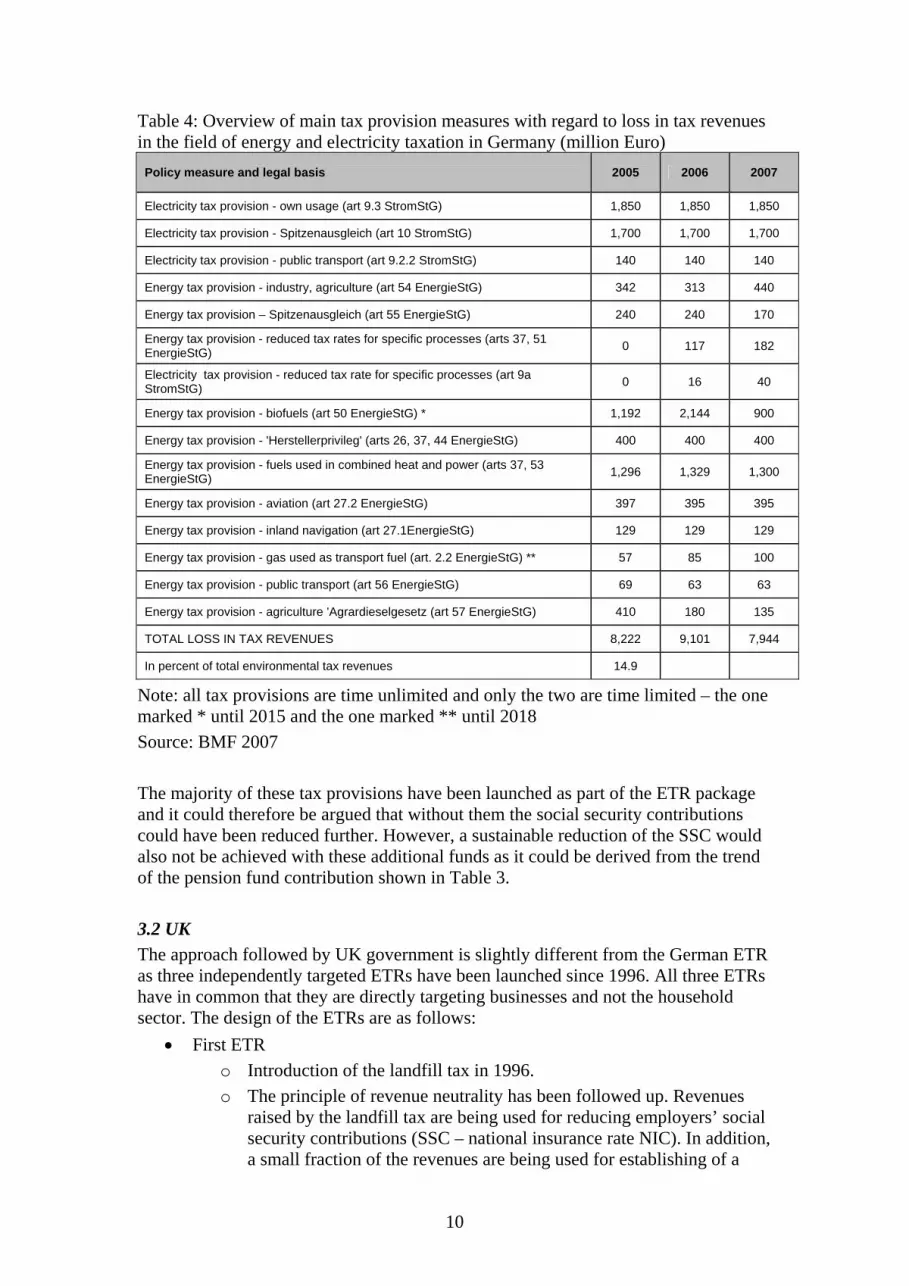
Table 4: Overview of main tax provision measures with regard to loss in tax revenues in the field of energy and electricity taxation in Germany (million Euro)
Policy measure and legal basis 2005 2006 2007
Electricity tax provision - own usage (art 9.3 StromStG) 1,850 1,850 1,850
Electricity tax provision - Spitzenausgleich (art 10 StromStG) 1,700 1,700 1,700
Electricity tax provision - public transport (art 9.2.2 StromStG) 140 140 140
Energy tax provision - industry, agriculture (art 54 EnergieStG) 342 313 440
Energy tax provision – Spitzenausgleich (art 55 EnergieStG) 240 240 170
Energy tax provision - reduced tax rates for specific processes (arts 37, 51 EnergieStG) 0 117 182
Electricity tax provision - reduced tax rate for specific processes (art 9a StromStG) 0 16 40
Energy tax provision - biofuels (art 50 EnergieStG) * 1,192 2,144 900
Energy tax provision - 'Herstellerprivileg' (arts 26, 37, 44 EnergieStG) 400 400 400
Energy tax provision - fuels used in combined heat and power (arts 37, 53 EnergieStG) 1,296 1,329 1,300
Energy tax provision - aviation (art 27.2 EnergieStG) 397 395 395
Energy tax provision - inland navigation (art 27.1EnergieStG) 129 129 129
Energy tax provision - gas used as transport fuel (art. 2.2 EnergieStG) ** 57 85 100
Energy tax provision - public transport (art 56 EnergieStG) 69 63 63
Energy tax provision - agriculture 'Agrardieselgesetz (art 57 EnergieStG) 410 180 135
TOTAL LOSS IN TAX REVENUES 8,222 9,101 7,944
In percent of total environmental tax revenues 14.9
Note: all tax provisions are time unlimited and only the two are time limited – the one marked * until 2015 and the one marked ** until 2018 Source: BMF 2007 The majority of these tax provisions have been launched as part of the ETR package and it could therefore be argued that without them the social security contributions could have been reduced further. However, a sustainable reduction of the SSC would also not be achieved with these additional funds as it could be derived from the trend of the pension fund contribution shown in Table 3. 3.2 UK The approach followed by UK government is slightly different from the German ETR as three independently targeted ETRs have been launched since 1996. All three ETRs have in common that they are directly targeting businesses and not the household sector. The design of the ETRs are as follows:
• First ETR o Introduction of the landfill tax in 1996. o The principle of revenue neutrality has been followed up. Revenues
raised by the landfill tax are being used for reducing employers’ social security contributions (SSC – national insurance rate NIC). In addition, a small fraction of the revenues are being used for establishing of a

11
special fund. The fund supports investment in waste related issues as well as research activities in the waste field.
o The landfill tax revenues were around 1.1 billion Euro in 2005 and this would mean that the total tax shift could be in the range of 0.16 percent of GDP in the year 2005. The actual tax shifting programme is smaller as not the whole tax revenues are used for reducing labour taxes as discussed above.5
• Second ETR o Introduction of the climate change levy in April 2001. o Again the principle of revenue neutrality is adhered and the major part
of the revenues is used for lowering employers’ SSC. The remaining part is utilised to set up the Carbon Trust. This fund again assists investment in energy issues and research activities.
o The dimension of the tax shifting programme would be around 0.16 percent of GDP (2005) assuming that the total CCL revenue of 1.1 billion Euro would be used.
• Third ETR o So far, the latest ETR took place in 2002 when the UK government
introduced the aggregates tax. o The third ETR follows exactly the first and second tax shifting
programmes in the way that the revenues generated by the aggregates tax compensate the reduction in employers’ SSC and to establish the special fund (‘Sustainability Fund’).
o The size of the third ETR tax revenue is smaller when compared to the two other ETRs as it amounts to about 0.5 billion Euro in 2005, ie around 0.07 percent of GDP (2005).
As can easily be recognized the scope of the ETRs is different as not only energy taxes have been introduced. In addition, the size of all three ETRs together is rather small compared to the German case as the total tax revenues of the three taxes amounted to about 0.40 percent of GDP during 2005. The overall tax shifting programme is smaller as a fraction of the revenues is being used for some special funds as discussed above. All ETRs have in common that the same recycling measure has been applied, ie a reduction of the employers’ social security contributions. This policy approach should guarantee that the total tax burden of the industry as a whole remains almost the same. But this policy clearly causes that the tax liability of different industrial sectors is affected differently, ie some sectors are net winners and others are net losers. Some form of granting special tax treatment is also part of the climate change levy (CCL) scheme. Energy intensive companies are eligible for an 80 percent tax discounts when agreeing to stringent energy efficiency improvement targets. These
5 It is worthwhile to mention that the UK government announced in the 2007 Budget that the standard rate of landfill will increase by £8 per tonne annually starting from 1 April 2008 and lasting at least until 2010-11. These increases will still be following the revenue neutrality principle but the recycling mechanism will be revised as the additional revenues from businesses will be recycled back to businesses through the reduction in corporation taxes and no more through the reduction in employers’ social security contributions (see http://www.hm-treasury.gov.uk/media/F/D/bud07_chapter7_273.pdf).

12
regulations have been introduced because of concerns of losing of international competitiveness of the UK industry as a consequence of the introduction of the CCL. The approach chosen by the UK government was to give conditional tax exemptions to energy intensive companies. The concept behind this approach is that companies are facing a reduced tax liability when they enter into legally binding climate change agreements (CCA) requiring adoption of energy saving reduction programme (OECD 2005)6. Rather interesting is the UK approach of defining the term energy intensive industries. It was decided that this policy was limited to those energy intensive industries which are already registered as energy intensive under the EU Integrated Pollution and Prevention Control (IPPC) Directive but has been extended to other economic sectors in the meantime. This is insofar interesting because the approach clearly limits the special tax provisions to really energy intensive industries as compared to the German situation where the selection process of industries eligible for special tax treatment is based on statistical classification. The German approach must be challenged because the concept of using statistical categories as the basis for providing tax relief does not take into account the issue of energy intensity. The consequence of this approach is that companies can disproportionately profit from the ETR as they are entitled to tax relief although they cannot be described as energy intensive. Table 5: Development of national insurance rates in the UK (in percent)
1994/1995
1995/1996
1996/1997
1997/1998
1998/1999
1999/2000
2000/2001
2001/2002
2002/2003
2003/2004
2004/2005
2005/2006
2006/2007
Paid by employee 10.00 10.00 10.00 10.00 10.00 10.00 10.00 10.00 10.00 11.00 11.00 11.00 11.00
Paid by employer 10.45 10.45 10.20 10.00 10.00 12.20 12.20 11.90 11.80 12.80 12.80 12.80 12.80
Source: http://www.taxhistory.co.uk/National%20Insurance%20rates.htm until the fiscal year 2005/2006 and http://www.hmrc.gov.uk/rates/nic.htm for the fiscal year 2006/2007 Table 5 shows the development of the basic national insurance rates paid by employees and employers. Although the rates have increased over time the effects of the ETRs are recognizable as a reduction in employers’ NIC came along with the introduction of the ETR. It could therefore be argued in the same way as in Germany that the ETRs have led to a smaller increase in the employers’ NIC rates as compared to a situation without ETRs. 4. ETRs in the new EU Member States During recent years support for ETRs has also been growing in the new EU Member States. The frontrunners are Estonia which already launched an ETR and the Czech Republic. The Estonian ETR – as well as the one to be implemented in the Czech Republic at the beginning of 2008 – is closely following the tradition and concept of ETRs implemented in other EU member states. Both countries and also all other new EU Member States are facing somehow the same challenge as they have to transpose
6 Ex ante assessment of the environmental effects of the CCL predicts savings of about 3.5 million tonnes carbon annually by 2010 – see Cambridge Econometrics 2005, Modelling the Initial Effects of the Climate Change Levy.

13
the 2003 Energy Taxation Directive into national law during the coming years7. This is insofar of some interest as taxes levied on energy products are the main revenue sources. 4.1 Estonia In July 2005 the Estonian government approved the ETR to be implemented in two phases during 2005 and 2013. The first phase started in 2006 and is planned to last until the end of 2008 and is followed by the second phase which should continue until 2013. The use of environmental taxes and charges for environmental policy is nothing new in Estonia (Speck et al. 2001 and Nordic Council 2006). Energy taxes as well as a rather complex and comprehensive system of air and water pollution charges and natural resources taxes are in place for many years. In 2006, the Estonian government already started a process of gradually increasing the rates of the pollution charges and natural resources taxes during the period between 2006 and 2009 thereby increasing the revenues from around 600 million EEK (2005 – 39 million Euro) to about 900 million EEK (58 million Euro) in 2009 (Lüpsik 2006, Kraav and Lüpsik 2007a and 2007b). What is more important in terms of a tax shifting programme is the increase in existing excise duties levied on transport fuels plus the introduction of a tax on natural gas and to apply an electricity output tax. As of summer 2007 the energy tax rates for unleaded petrol is about 288 Euro per 1000 litres and for diesel 245 Euro per 1000 litres which undercut the minimum excise duties of 358 Euro per litres and 302 Euro per 1000 litres respectively as laid down in the 2003 Energy Taxation Directive by a relatively large margin. Interesting to note is also the fact that Estonia did not plan to grant any tax provision in form of a lower tax burden to industry with regard to natural gas and electricity which would be in accordance with the relevant directive as the minimum excise duties for business use of these energy products are lower than the ones for non-business use (Lüpsik 2005 and Lelumees 2007). It is forecasted that the revenues of energy taxes will increase from 3,350 million EEK in 2005 (214 million Euro) to 5,703 million Eek in 2010 (364 million Euro) (Ministry of Finance 2007). Furthermore, the re-introduction of transport taxes is planned during the first phase8. These additional revenues are planned to be used to offset the marginal personal income tax rate from 23 percent in 2006 to 20 percent in 2009. In addition, some tax exemptions, such as an increase in the basic allowance and further exemptions for pensioners and families with more than two children are part of the overall policy package. This tax shifting programme is following the tradition of the Swedish ETRs where the revenues from energy and CO2 taxes are regularly being used for reducing the marginal income tax rates. This rather low personal income tax rate is no exception in the new EU Member States as the majority of them either already introduced or will be introducing a flat tax on personal income as well as on corporate income. However, the share of non-wage costs as part of the overall labour costs are in Estonia higher than the EU
7 New EU Member States have been provided with transition periods with regard to the full transposition of the Energy Taxation Directive (see Directive 2004/74/EC and 2004/75/EC). 8 In 2004 a general excise tax on motor vehicles was repealed and since then only a tax on heavy good vehicles (HGV) is in place (Nordic Council 2006).

14
average as the social security contributions (the so called social tax in Estonia) are fully paid by employers and amounts to 33 percent of the taxable amount (Ministry of Finance 2007). The main principle of the Estonian ETR – as stressed by a report published by the Ministry of Finance (Lelumees 2007) - is to shift the tax burden from income to taxes and charges levied on the use of natural resources and environmental pollution. Thereby the policy objectives of improving the competitiveness of Estonia, supporting the economic development and reducing unemployment should be achieved. This last objective is rather interesting as other recycling mechanisms, such as reduction of social security contributions, are in general assessed more effective in reducing unemployment than the reduction of personal income taxes (see for example: OECD 2001). However, the adoption of this recycling mechanism is probably not an option for the Estonian government as the social security contribution paid by employees is rather negligible (see Tables 2.a and 2.b) and therefore the only way of offsetting the increase in energy costs caused by energy tax increases and households are facing is the reduction of the marginal income tax rate and an increase in the basic allowance. 4.2 Czech Republic The introduction of an ETR in the Czech Republic comes along with a major revision of the tax system as the personal income tax will be converted into a flat tax with a rate of 15 percent as compared to the current situation of marginal income tax rates ranging from 12 to 32 percent depending on the size of the income. However, the taxable amount, ie the employment income, will include the gross income including all social security contributions. It is again worthwhile to state that the share of non-wage labour costs in the Czech Republic are exceeding the EU average as they were 39 percent of gross income in 2004 and the biggest share are the employers’ social security contributions (35 percent of gross income, Statistisches Bundesamt 2007b). Considering that the taxable income under the new law includes employer’s social security contribution the effective flat income tax rate will be around 20 percent. According to the new tax law the corporate income tax rates will be gradually reduced from the current level of 24 percent to 19 percent in 2010. Czech Republic also made widespread use of environmental taxes and charges in environmental policy including taxes levied on different energy products (excise duties are in place for all energy products apart from the ones levied on coal and coke, electricity and natural gas for heating usage) and air and water pollution charges. Revenues generated from pollution charges are earmarked for the State Environmental Fund (REC 2001) and do not constitute income for the state budget. The environmental fund serves as the implementing agency for ISPA (Instrument for Structural Policies for Pre-Accession) projects using the fund’s income to provide the necessary co-financing of EU funds (see for more information: http://www.sfzp.cz). The ETR is planned to be introduced in three stages. The first stage starting in 2008 will introduce new energy taxes based on the 2003 Energy Taxation Directive. New taxes for electricity, solid fuels (coal and coke) and natural gas for heating purposes are set in line with the minimum rates of the directive meaning that the tax rates will be differentiated between business and non-business use9 (Zimmermannova 2007a
9 The tax rates for business use are 50 percent lower than the rates for non-business use (see EC 2003 Annex I, Table C).

15
and 2007b). The ETR is planned to be fiscal neutral as the revenues will be used for reducing social security contribution. In contrast to the situation in Estonia employers and employees are subject to social security contributions. The employers’ rate is 24 percent and 8 percent for employees and the basis is the gross wage/income. However, the rates will not be decreased from the beginning as the Czech government will review the ETR, in particular with regard to the revenues raised, after several months and then decide about the cut in SSC rates. This approach differs from the German and UK experience as the cut in SSC was introduced at the same time as energy taxes were increased. In the second stage which is planned for 2009/2010 the Czech government is considering to introduce a CO2 tax which should replace the current scheme of air pollution charges. This approach could have some dire consequences for the State Environmental Fund as tax revenues constitute income for the state budget which is not the case of the current scheme of pollution charges. This could mean that the State Environmental Fund could be loosing a large part of its income. A third stage to be implemented after 2012 is under political discussion but no indication of the actual design is published so far. It can be concluded that the planned Czech ETR follows the well-known concept already implemented in other European countries. It can be expected that the new energy taxes implemented during the first stage will not significantly increase total energy tax revenues as the actual rates are rather low when compared to already existing rates in other European countries. In addition, international experiences affirm that taxes on transport fuels are the main revenue generating instruments and that energy taxes levied on other energy products are not so important in terms of their revenue generating function. This implies that less revenue will be available for the reduction of social security contribution - taking into account the revenue neutrality principle -and therefore the SSC rates cannot be reduced significantly. 5. Discussion 5.1 The latest development of ETR When assessing the efficacy of ETRs in the public discourse it often seems that the revenue generating capacity of environmental taxes as a policy tool to reduce other taxes takes the centre stage. This is slightly surprising as the rationale for introducing environmental taxes is not necessarily the revenue generating capacity but rather to improve the environmental situation by influencing the behaviour of economic agents. However, the situation with regard to taxes levied on energy products is somewhat different considering that the first transport fuel taxes have been implemented as early as 60 to 70 years ago in the Nordic countries when environmental considerations played a negligible role. Energy taxes are nowadays perceived and used as a policy instrument in the context of climate policy and energy security issues with principal objective to reduce the consumption of energy products. A drop in the consumption of taxable energy products can therefore be assessed as an indicator of success in this context. Table 6 shows the development of the consumption of transport fuels and of the revenues raised by the taxes levied on petrol and diesel in Germany10. It reveals that
10 The analysis of the revenue generating potential of environmental taxes reveals the importance of transport fuels (petrol and diesel) as they are accruing about 63 percent of all environmental tax revenue in Germany and even 75 percent in the UK in 2005.

16
petrol consumption dropped by more than 20 percent between 2000 and 2005 and diesel by around 6 percent (ie the total drop was about 14 percent). In contrast, the total tax revenues increased by less than 1 percent during the same period. Table 6: Development of consumption of transport fuels and tax revenues in Germany
Petrol Diesel Petrol Diesel Total –
petrol and diesel
Share of petrol and diesel tax
revenue to total env tax revenue
Consumption Tax revenues Tax revenues
1000 m3 1000 m3 mill Euro mill Euro mill Euro In percent
1998 40,792 32,487 20,426 10,300 30,726 73.4
1999 40,898 34,018 21,435 11,588 33,023 72.9
2000 39,069 33,780 21,960 12,783 34,743 72.1
2001 37,884 34,257 22,455 14,012 36,467 68.3
2002 36,620 33,843 22,831 14,882 37,713 68.7
2003 34,891 33,105 22,823 15,573 38,396 67.3
2004 33,117 33,296 21,666 15,663 37,329 66.5
2005 30,683 31,788 20,073 14,954 35,027 63.4
Source: Statistisches Bundesamt, Mineraloelreport, and author’s calculation It has to be mentioned that although the energy tax rates in Germany have not been revised since 2003 (see Table 7) the prices of these energy products increased as a consequence of the increase in the world market of oil products. Energy taxes contributed to the reduced consumption but other factors were probably the driving factors behind this development. Table 7: Development of transport fuel prices and taxes in Germany
Diesel Petrol unleaded
end-user price (incl VAT) energy tax end-user price
(incl VAT) energy tax
2000 0.76 0.38 0.96 0.56
2001 0.82 0.41 0.97 0.59
2002 0.81 0.44 0.99 0.62
2003 0.90 0.47 1.11 0.65
2004 0.88 0.47 1.08 0.65
2005 0.97 0.47 1.11 0.65
Source: DG Energy, Energy data (prices) and Speck 2006 (tax rates) A similar development – at least in the case of petrol consumption – can be reported from the UK where the consumption of petrol is declining since 2001. On the opposite, the diesel consumption in the UK is increasing. During the period 2000 and 2005 transport fuel (petrol and diesel) consumption increased by about 4 percent as compared to an overall decline in Germany. The increase in revenues was smaller amounting to less than 1 percent as during this period tax rates have not been increased to a degree of 1990s under the fuel duty escalator. It can be expected that taxes on diesel will replace petrol taxes as the biggest revenue raiser very soon which
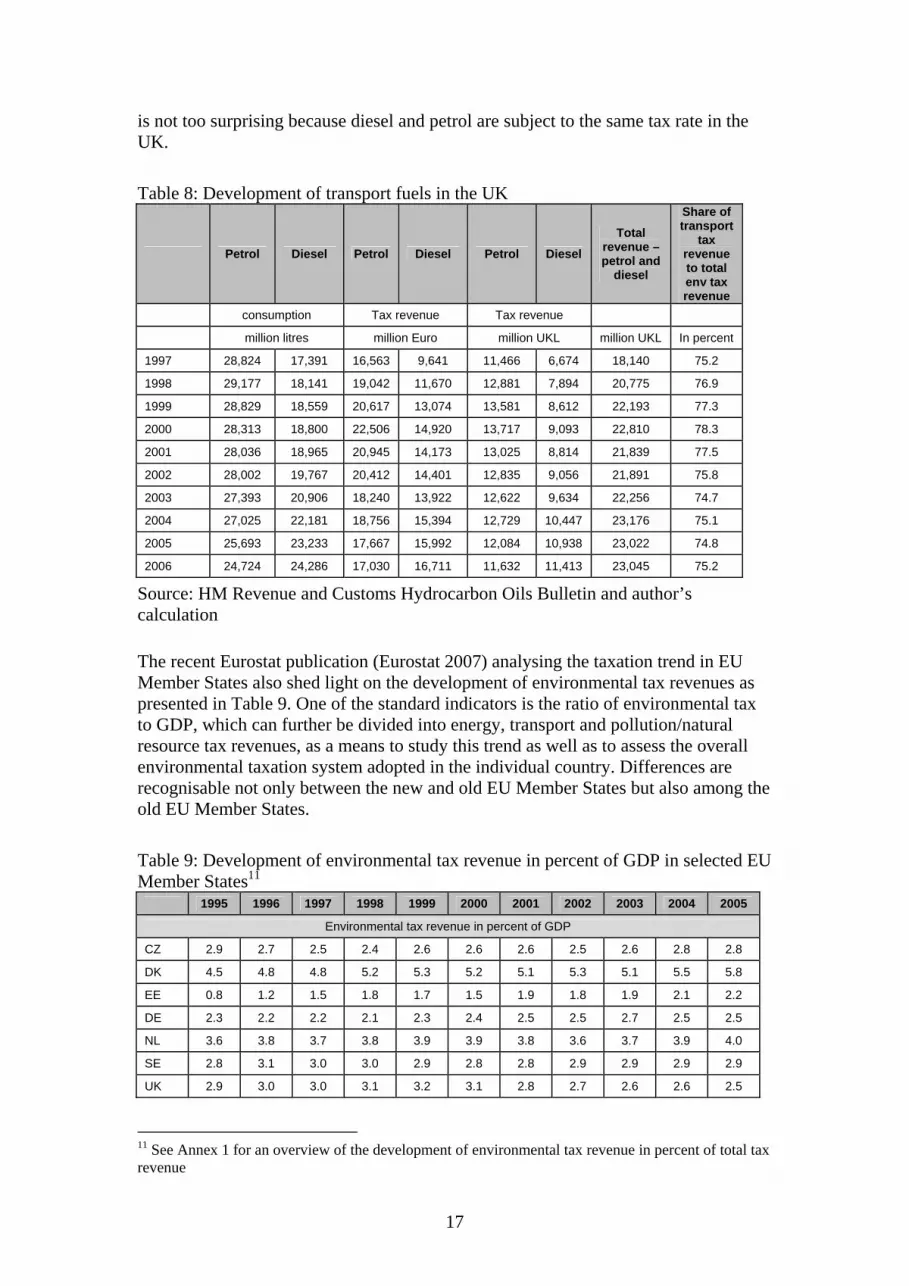
17
is not too surprising because diesel and petrol are subject to the same tax rate in the UK. Table 8: Development of transport fuels in the UK
Petrol Diesel Petrol Diesel Petrol Diesel Total
revenue – petrol and
diesel
Share of transport
tax revenue to total env tax revenue
consumption Tax revenue Tax revenue
million litres million Euro million UKL million UKL In percent
1997 28,824 17,391 16,563 9,641 11,466 6,674 18,140 75.2
1998 29,177 18,141 19,042 11,670 12,881 7,894 20,775 76.9
1999 28,829 18,559 20,617 13,074 13,581 8,612 22,193 77.3
2000 28,313 18,800 22,506 14,920 13,717 9,093 22,810 78.3
2001 28,036 18,965 20,945 14,173 13,025 8,814 21,839 77.5
2002 28,002 19,767 20,412 14,401 12,835 9,056 21,891 75.8
2003 27,393 20,906 18,240 13,922 12,622 9,634 22,256 74.7
2004 27,025 22,181 18,756 15,394 12,729 10,447 23,176 75.1
2005 25,693 23,233 17,667 15,992 12,084 10,938 23,022 74.8
2006 24,724 24,286 17,030 16,711 11,632 11,413 23,045 75.2
Source: HM Revenue and Customs Hydrocarbon Oils Bulletin and author’s calculation The recent Eurostat publication (Eurostat 2007) analysing the taxation trend in EU Member States also shed light on the development of environmental tax revenues as presented in Table 9. One of the standard indicators is the ratio of environmental tax to GDP, which can further be divided into energy, transport and pollution/natural resource tax revenues, as a means to study this trend as well as to assess the overall environmental taxation system adopted in the individual country. Differences are recognisable not only between the new and old EU Member States but also among the old EU Member States. Table 9: Development of environmental tax revenue in percent of GDP in selected EU Member States11
1995 1996 1997 1998 1999 2000 2001 2002 2003 2004 2005
Environmental tax revenue in percent of GDP
CZ 2.9 2.7 2.5 2.4 2.6 2.6 2.6 2.5 2.6 2.8 2.8
DK 4.5 4.8 4.8 5.2 5.3 5.2 5.1 5.3 5.1 5.5 5.8
EE 0.8 1.2 1.5 1.8 1.7 1.5 1.9 1.8 1.9 2.1 2.2
DE 2.3 2.2 2.2 2.1 2.3 2.4 2.5 2.5 2.7 2.5 2.5
NL 3.6 3.8 3.7 3.8 3.9 3.9 3.8 3.6 3.7 3.9 4.0
SE 2.8 3.1 3.0 3.0 2.9 2.8 2.8 2.9 2.9 2.9 2.9
UK 2.9 3.0 3.0 3.1 3.2 3.1 2.8 2.7 2.6 2.6 2.5
11 See Annex 1 for an overview of the development of environmental tax revenue in percent of total tax revenue

18
EU 2.8 2.8 2.8 2.8 2.9 2.8 2.7 2.7 2.7 2.7 2.6
Energy tax revenue in percent of GDP
CZ 2.3 2.2 2.1 2.0 2.2 2.1 2.3 2.2 2.3 2.4 2.5
DK 2.1 2.3 2.2 2.4 2.6 2.5 2.7 2.6 2.6 2.5 2.3
EE 0.6 0.9 1.3 1.6 1.4 1.2 1.6 1.5 1.6 1.8 1.9
DE 1.9 1.8 1.8 1.7 1.9 2.0 2.1 2.2 2.3 2.2 2.1
NL 1.7 1.8 1.9 1.9 1.9 1.9 1.9 1.9 1.9 2.0 2.1
SE 2.4 2.7 2.6 2.6 2.5 2.4 2.4 2.5 2.5 2.5 2.5
UK 2.3 2.4 2.3 2.5 2.5 2.4 2.3 2.2 2.1 2.1 2.0
EU 2.1 2.1 2.1 2.1 2.2 2.1 2.0 2.0 2.1 2.0 1.9
Transport tax revenue in percent of GDP
CZ 0.4 0.4 0.3 0.3 0.4 0.3 0.3 0.3 0.3 0.3 0.4
DK 2.1 2.1 2.1 2.3 2.2 1.8 1.7 1.9 1.8 2.0 2.1
EE 0.2 0.2 0.2 0.2 0.2 0.1 0.1 0.1 0.0 0.1 0.2
DE 0.4 0.4 0.4 0.4 0.4 0.3 0.4 0.4 0.3 0.4 0.4
NL 1.3 1.5 1.3 1.4 1.5 1.4 1.3 1.2 1.2 1.3 1.3
SE 0.3 0.4 0.3 0.3 0.3 0.3 0.3 0.3 0.3 0.3 0.4
UK 0.6 0.6 0.6 0.6 0.6 0.6 0.5 0.5 0.5 0.5 0.5
EU 0.6 0.6 0.6 0.6 0.6 0.6 0.6 0.6 0.6 0.6 0.6
Pollution / natural resource tax revenue in percent of GDP
CZ 0.2 0.2 0.1 0.1 0.1 0.1 0.0 0.0 0.0 0.0 0.0
DK12 0.3 0.4 0.5 0.6 0.6 0.8 0.8 0.8 0.8 1.0 1.3
EE 0.0 0.0 0.0 0.0 0.2 0.2 0.3 0.3 0.3 0.2 0.2
DE 0.0 0.0 0.0 0.0 0.0 0.0 0.0 0.0 0.0 0.0 0.0
NL 0.6 0.6 0.6 0.6 0.5 0.5 0.5 0.6 0.6 0.6 0.6
SE 0.0 0.1 0.0 0.0 0.0 0.1 0.1 0.1 0.1 0.1 0.1
UK 0.0 0.0 0.0 0.0 0.0 0.0 0.1 0.1 0.1 0.1 0.1
EU 0.1 0.1 0.1 0.1 0.1 0.1 0.1 0.1 0.1 0.1 0.1
Note: EU: EU-25 weighted average Source: Eurostat 2007 Revenues from environmental tax vary between 2.2 percent (Estonia) and 5.8 percent (Denmark) with the EU average of 2.6 percent at the EU-25 in 2005 meaning that Germany and the UK are slightly below the average. This data also indicates that energy taxes are in general the largest revenue earner and that the ratio of energy taxes to GDP is rather similar between the countries presented in Table 913. In general, Eurostat spots a trend of declining revenues from environmental taxes during the most recent years at the EU level although this trend is not so clearly identifiable with regard to the countries listed in the table above (Eurostat 2007).
12 The rather high share of pollution/natural resource taxes to GDP in the case of Denmark may be caused by the fact that the Danish CO2 tax is considered as a pollution tax and the revenues of this tax are reported under this category. In general, revenues from CO2 taxes are reported under the category of energy taxes. Based on data of the Danish Ministry of Taxation the share of CO2 taxes is around 0.3 percent of GDP. 13 When assessing the ratio environmental tax revenues to total tax revenues the finding is slightly different (see Table A.1 in Annex 1). The reason is that the new EU Member States have in general a lower total tax revenue to GDP ratio (see Table 1).

19
Eurostat therefore concludes that ‘… the evidence from the survey of environmental taxation is sobering. Despite the added urgency in the public debate, the taxman’s efforts to reducing energy consumption are letting up, at least in the EU-15. This may be justified by greater efforts done elsewhere, as in emission trading; but is nevertheless at odds with the perceptions of the general public as well as with oft-stated policy objectives (Eurostat 2007, p.10)’. The freeze in energy tax rates as seen in Denmark and Germany during the last years14 is rather obvious as the ratio energy tax to GDP dropped in all these countries as compared to the situation in the Netherlands and Sweden, where energy taxes are either indexed (Netherlands) or have been increased as part of a major fiscal programme (Sweden, see for more information: Speck 2006). Furthermore, this overview is interesting as some apparent differences in the environmental taxation system can be found, in particular in the context of transport taxes. Denmark and the Netherlands introduced some heavy sales taxes on vehicles and introduced pollution and natural resource taxes. This is in sharp contrast to Germany where the revenues generated from this type of taxes are rather negligible. It can be argued that the introduction of the German ETR is reflected in the development of the ratio environmental tax to GDP as this ratio increased from 2.1 percent in 1998 to 2.7 percent in 2003 and has since then fallen back to 2.5 percent. In contrast, the introduction of the ETR based on the CCL in 1999 in the UK does not provide a clear signal, which is also not too surprising as the revenues from the CCL have been low and the CCL rates have been frozen for the whole period shown in the table. As discussed above, one of the repeatedly mentioned objectives of ETRs is to reduce labour taxes and thereby to lower labour costs as a means to increase employment since high labour costs are seen as a cause for the high unemployment in countries, such as Germany. The discussion in Section 3.1 and Table 3 revealed a temporary reduction in the social contribution in absolute terms. Interesting is also to study the development of the implicit tax rate15 (ITR) on labour which reveals a declining trend – at least by some of the EU Member States presented in Table 10. The declining trend is in particular observable in Denmark, Estonia and Germany. However, the reduction in the ITR in these countries did not really happen as a consequence of an ETR. This is rather obvious as the decline in the ITR in the two old EU Member States occurred at a time when there was no more any ETR related activities. Table 10: Development of the implicit tax rate (ITR) on labour in selected EU Member States
1995 1996 1997 1998 1999 2000 2001 2002 2003 2004 2005
CZ 40.5 39.5 40.3 40.7 40.5 40.7 40.3 41.2 41.4 41.7 41.3
DK 40.1 40.2 40.6 38.8 40.1 40.9 40.7 38.8 38.0 37.4 37.3
EE 39.2 39.1 38.5 39.8 39.5 37.8 37.3 37.8 36.5 35.2 33.1
DE 39.4 39.6 40.6 40.6 40.4 40.7 40.5 40.4 40.3 39.1 38.7
NL 34.4 33.3 32.5 32.9 33.6 34.3 30.3 30.4 30.8 30.6 30.7
SE 48.4 49.7 50.0 51.0 50.5 49.2 47.9 46.6 46.4 46.4 46.4
14 The Danish energy tax rates have been frozen since 2002 and the German ones since 2003. 15 ITR on labour is defined as the sum of all direct and indirect taxes and employees' and employers' social contributions levied on employed labour income divided by the total compensation of employees working in the economic territory (Eurostat 2007).

20
UK 25.8 24.8 24.4 25.0 25.1 25.3 25.0 24.1 24.3 24.9 25.5
EU 37.0 37.4 37.5 37.7 37.4 37.3 36.9 36.6 36.7 36.3 36.6
Note: EU: EU-25 weighted average Source: Eurostat 2007 It may be argued that one of the objectives of ETRs as implemented in countries, such as Germany - namely the financing of cuts in labour taxation and thereby achieving an increase in employment from increases in environmental taxation – is rather difficult to be realized although not completely impossible as shown in a recent analysis of ETRs (COMETR 2007). However, a policy programme leading to a massive reduction in labour taxation by offsetting the revenue losses via an increase in environmental taxes would require a dramatic u-turn of the current taxation policies. As shown above (see Table 3 for Germany and Table 5 for the UK) the rates of contributions have been reduced when the ETR has been launched. The reduction of the SSC rate was not sustainable in the sense that the rates remained at the lower level. Other policy factors forced that the rates were increased afterwards. It could also be argued that these rate increases could have been avoided if either the existing energy tax rates would have been further increased and thereby generated additional revenues or, new environmental or energy taxes as part of the ETR would have been launched. Another option – as discussed and originally planned in Germany - would be the scrapping of environmentally damaging subsidies thereby freeing up resources which could be used in the context of an ETR. 5.2 Future Potential of ETR – raising additional revenues in the medium-to long-run When putting the revenue generating capacity of environmental taxes to the fore, it is obvious that Germany and the UK are lagging compared to the forerunner, such as Denmark and the Netherlands (see Table 9). What immediately strikes one attention is the fact that the latter two countries are raising large amounts of revenues from transport taxes. However, this policy has to be critically scrutinised, in particular in the context of the EC proposal on passenger car taxation16 as registration taxes should be abolished until 2016, ie the revenues raised by these taxes may therefore be raised by increasing the annual circulation taxes as raised in the proposal. Registration taxes are the main revenue earner in these two countries in the field of transport taxes17 and therefore it would be rather questionable for countries currently not having any registration taxes to plan a restructuring of the current transport taxation scheme18. The proposal further includes a plan to make the inclusion of a carbon dioxide element in the annual circulation tax structure obligatory. This policy is already in place in the UK and is planned to be implemented in Germany shortly. However, the German government plans the restructuring of the annual circulation taxation system
16 Proposal for a Council Directive on passenger car related taxes COM(2005)561 final, Brussels 5.7.2005 17 The Danish registration tax amounted to about 25 percent of all environmental taxes in 2005. 18 The Danish registration tax can double the price of a vehicle and in case a revenue neutral vehicle tax swap is envisaged the annual registration taxes would have to be increased dramatically. However, it is questionable whether the proposal setting a common framework for private vehicle taxation without harmonising the tax rates will be adopted in near future as it is a tax measure requiring the approval by all 27 EU Member States.

21
in a revenue neutral way meaning that there will be no additional revenues raised19. In addition, it is established in the German federal system that the revenues of the annual circulation taxes are not part of the federal budget but are allocated to the budgets of the individual states (Länder). When analysing the potential of an ETR, the discussion of the EU Emission Trading Scheme (ETS) must be considered. Currently discussion are ongoing, in particular between Sweden and Denmark on the one side and the EC on the other whether energy/CO2 taxation and emission trading can work together or whether economic sectors covered under the EU ETS should be fully exempt from any energy/CO2 taxes20. This issue is also of significance in the context of the medium- to long-term financing of ETR measures as the approval of this policy would affect the revenues generated from energy/CO2 taxes – but only on the small scale. The emission trading directive determines the possibility for EU Member States to allocate at least 90 percent of allowances free of charge for the five year period (2008-2012) meaning that up to 10 percent can be auctioned. Germany will make use of this option and the national allocation plan for the second trading period (2008-2012) foresees the auctioning of up to 40 million tonnes annually (less than the maximum of the 10 percent ceiling) which would generate 800 million Euro assuming a carbon allowance price of 20 Euro per tonne of CO221. Different proposals of how the receipts from auctioning carbon allowances may be used are floating around. For example, up to 400 million Euro of the revenues are available for climate policy measures in the German budget 2008 and around one quarter of the German receipts from the auctioning process will be dedicated to adaptation and technology transfer to developing countries22. The UK government intends to auction or sell seven percent of the total quantity of allowances during the second trading period23. The funds accrued via the auctioning of allowances during the period 2008-2012 are expected not to be overly large and so far no detailed plans to use these resources for extending ETRs are discussed. As mentioned above these funds are expected to be rather used for national and international climate policy strategies. Finally it seems worthwhile to assess the potential of raising additional revenues from transport fuels with the aim of having a sustainable funding mechanism in place for funding the recycling mechanism of ETRs. As shown above, the total transport fuel
19 See point 18 of the joint paper ‘Eckpunkte für ein integriertes Energie- und Klimaprogramm’ of the Federal Ministry for the Environment, Nature Conservation, and Nuclear Safety and the Federal Ministry of Economics and Technology http://www.bmu.de/files/pdfs/allgemein/application/pdf/klimapaket_aug2007.pdf (published in August 2007). 20 The latest Swedish development is interesting in this context as the Swedish government plans in the Budget 2008 to split the current CO2 taxes between economic sector which are part of the EU ETS and those which are not. The former will be eligible for a further reduction of the CO2 tax rate. 21 Presume a full (100 percent) auctioning total revenues would be in the range of 9 bill Euro in Germany and 5 billion Euro in the UK. These revenues would be about 16 percent of the total environmental tax revenue in Germany (based on total environmental tax revenue of 55 billion Euro in 2005) and 12 percent in the UK (based on 45 billion Euro in 2005). When looking into the German case, it is interesting to consider that the receipts of the full auctioning are almost the same as the revenue losses caused by the special tax provisions listed in Table 4. 22 See Ends Europe Daily ‘Environment council sets out EU plan for Bali’, Issue 2419, 30 October 2007. 23 see National Allocation Plan for Phase II at http://www.defra.gov.uk/environment/climatechange/trading/eu/phase2/pdf/nap-phase2.pdf

22
consumption (petrol and diesel fuel) dropped since the year 2000 in Germany. During the first three years (2000–2003) revenues from these taxes were still increasing as the drop in consumption was offset by higher tax rates and by an increase in diesel consumption. Since 2004 the tax revenues are also decreasing as the tax rates have been frozen at the 2003 level. Interesting to note is that this declining trend of transport fuel consumption is not considered in the 2006 forecast of the European Commission (EC 2006) which reported an increase of the final energy demand of the German transport sector between 2000 and 2005. As part of the German government’s climate policy strategy the Federal Ministry of Economics and Technology commissioned a study developing energy scenarios until 2020 (ewi/prognos 2007). The findings of this study concerning the road transport sector are noteworthy as the research indicates a reduction of 17 percent of all transport fuels during the period 2005-2020. A reduction of 48 percent is forecasted for petrol (including bio fuels) as compared to an increase in diesel consumption (including bio diesel) of about 8 percent (ewi/prognos 2007, p. 95, Table 6.6-4). The increase in diesel consumption is driven by an increase of freight transport (3 percent) and the personal transport is forecasted to drop by 19 percent between 2005 and 202024. The reduction in energy consumption will be beneficial in terms of achieving CO2 reduction targets but it will also lead to reduced energy tax revenues although energy taxation remained constant in real values in the study25. 6. Summary The complexity between climate policy issues, ie the reduction of carbon dioxide emissions and of energy demand respectively, and the policies of promoting ETR as a policy tool for achieving economic/employment and environmental objectives simultaneously, can be expected to become more evident in due course. Policy makers are facing thereby often the challenge to correct market failures by internalizing the external costs associated with energy usage/carbon dioxide emissions and to generate revenues as to fund public spending. But this means in reality that multiple objectives are addressed with a single instrument which may cause further problems and high costs as Tinbergen proved theoretically (1952). The dilemma between the possible different functions of taxes, ie revenue-raising taxes vs incentive taxes, clearly comes to the fore and also the different policy objectives of the ETR concept/approach. When assessing the current and future potential of ETRs it seems that the new EU Member States are in a slightly different position as they are at the beginning of making full use of energy taxes as required under the 2003 Energy Taxation Directive. It could be argued that they, in particular Czech Republic, are in a similar situation than Germany as the German ETR started with the implementation of an electricity tax and increases in other already existing energy taxes as it will be done in the Czech Republic in 2008. Estonia has further to fulfil the minimum excise rates for transport fuels which – based on international experiences – is even more significant in terms of the revenue generating potential as compared to taxes levied on other energy products, such as electricity. 24 The growth in freight road transport measured in ton kilometres shows an increase of 43 percent as compared to decrease of about 2 percent in terms of person kilometres driven by personal transport during the period 2005-2020. 25 This development would mean that transport fuel tax revenues would drop by around 24 percent during this period.

23
In this context it is necessary to highlight the fact that the UK does not levy an energy tax on the consumption of natural gas and electricity of households and the service sector and it has therefore be stated that the UK is falling behind in terms of energy taxation at the EU 27 level. Other policy objectives must probably have a higher significance for the UK government hampering the introduction of energy taxation26. In the past revenue stability of energy taxes have never been a problem as energy consumption grew along the growth of GDP but at a lower rate leading to a relative decoupling and simultaneously to a drop in energy intensity at the EU level in EU Member States. Revenues of energy taxes have therefore increased caused by an increase in the tax base and often accompanied by an increase in tax rates. However, this trend is on the reverse in some EU Member States, in particular in those which have CO2 reduction target as part of the Kyoto process, such as Germany and the UK27. Under these conditions and the even more ambitious future CO2 reduction targets, revenue stability would require that tax rates would have to be increased to offset the reduction in energy consumption or to introduce new environmental taxes. This discussion tries to highlight the potential dilemma countries may face in the medium- to long-term when applying an ETR as a policy instrument under the current fiscal and tax policies of EU Member States. It could be asked whether the revenues of environmental / energy taxes could be utilised in the energy field instead of reducing other taxes, such as social security payments or income taxes. Other areas of increased finance requirements – also in the environmental field - are identifiable. For example, the most current proposal of revising the guidelines on state aid for environmental protection plan to increase the aid intensity for investments into renewable energies and for aid for energy saving measures. These investments are obviously need of support measures and are in line of the wider EU energy and climate policies of increasing the share of renewable in total energy consumption and / or reducing CO2 emissions. Revenues accrued from energy taxes could be hypothecated by national governments for supporting such investments which is already done in countries, such as Germany, Denmark and the UK as part of their ETRs. However, the share of revenues to be utilised for these policies is almost negligible when compared to the total ETR revenues. In the German case about 100 million Euro, ie less than 1 percent of total ETR revenues, are earmarked for incentive programmes for renewables. Reference Bach S. 2004, Be- und Entlastungswirkungen der ökologischen Steuerreform nach Produktionsbereichen, final report of a research project commissioned by the German Environmental Protection Agency, Deutsches Institut für Wirtschaftsforschung (DIW), Berlin, Germany Binswanger H.C., H. Frisch and H.G. Nutzinger (eds.) 1983, Arbeit ohne Umweltzerstörung. Strategien für eine neue Wirtschaftspolitik. Fischer, Frankfurt/Main, Germany
26 It should also be mentioned that the UK levies a reduced VAT rate on the non-business use of natural gas, electricity and coal. 27 See Table A.2 for an overview of the trend in final energy consumption in the transport sector in selected EU Member States between 1997 and 2005.

24
Bundesministerium der Finanzen (BMF) 2006, Ökologische Steuerreform, April 2006, Berlin, Germany Bundesministerium der Finanzen (BMF) 2007, Einundzwanzigster Subventionsbericht – Bericht der Bundesregierung über die Entwicklung der Finanzbeihilfen des Bundes und Steuervergünstigungen für die Jahre 2005-2008, Berlin, Germany http://www.bundesfinanzministerium.de/cln_04/nn_3790/DE/Aktuelles/Pressemitteilungen/2007/08/20071508__PM092a,templateId=raw,property=publicationFile.pdf COMETR 2007, Policy Brief (a summary of COMETR findings), http://www2.dmu.dk/cometr/Partner%20only/Brussels/policy%20brief/COMETR_Policy_Brief_Mar_2007.pdf Ekins P. 1999, European Environmental Taxes and Charges: Recent Experiences, Issues and Trends, Ecological Economics, Vol.31, pp.39-62 Ewi/prognos 2007, Energieszenarien für den Energiegipfel 2007, Endbericht für das Ministerium für Wirtschaft und Technologie, Basel/Köln, 8. August 2007 European Commission (EC) 1993, Growth, Competitiveness and Employment: the Challenges and Ways Forward into the 21st Century, COM(93)700 final, Brussels, Belgium European Commission (EC) 2003, Council Directive 2003/96/EC of 27 October 2003 restructuring the Community framework for the taxation of energy products and electricity, Official Journal of the European Union, L283, 31.10.2003 European Commission (EC) 2006, European Energy and Transport Trends to 2030 update 2005, DG Energy and Transport, Brussels, Belgium European Environment Agency (EEA) 2005, Market-based instruments for environmental policy in Europe, EEA Technical Report No8/2005, Copenhagen, Denmark Eurostat 2007, Taxation trends in the European Union, 2007 edition, Luxembourg Kraav E and S. Lüpsik 2007a, Estonian Ecological Tax Reform, presentation at the COMETR workshop 22 May 2007, Prague, Czech Republic Kraav E and S. Lüpsik 2007b, Ecological Tax Reform in Estonia and Innovation Perspectives in the Energy Sector, paper presented at the 8th International Environmental Taxation Conference 17-19 October 2007, Munich, Germany Lelumees L. 2007, Carrying out the ecological tax reform in Estonia, paper downloaded on September 19, 2007 at http://www.fin.ee/index.php?id=621 Lüpsik S. 2005, Estonian Ecological Tax Reform successfully launched, Paper presented at the seventh Annual Global Conference on Environmental Taxation, October 23-24, 2006, Ottawa, Canada Ministry of Finance 2007, Estonian Tax and Tax Structure, presentation downloaded on October 30, 2007 at http://www.fin.ee/?id=621 Nordic Council of Ministers 2006, The Use of Economic Instruments in Nordic and Baltic Environmental Policy 2001-2005, TemaNord 2006:525, Copenhagen, Denmark Organisation of Economic Co-operation and Development (OECD) 2001, Environmentally related taxes in OECD countries: Issues and strategies, Paris, France Pearce D.W. 1991, The Role of Carbon Taxes in Adjusting to Global Warming, Economic Journal, Vol.101, pp.938-948

25
Regional Environmental Center (REC) 2001, Environmental Funds in Candidate Countries, eds: S. Speck, J. McNicholas and M. Markovic, Szentendre, Hungary Repetto R. et al. 1992, Green Fees: How a Tax Shift Can Work for the Environment and the Economy, World Resources Institute, Washington, USA Speck S., J. McNicholas and M Markovic 2001, Environmental taxes in an enlarged Europe, Regional Environmental Center, Szentendre, Hungary Speck S. 2006, Overview of Environmental Tax Reforms in EU Member States, a paper written as part of the EC funded project ‘COMETR – competitiveness effects of environmental tax reforms’, National Environmental Research Institute / University of Aarhus, Denmark Statistisches Bundesamt 2007a, Arbeitskosten: Wo steht Deutschland in Europa? Februar 2007. Statistisches Bundesamt 2007b, Lohnnebenkosten im europäischen Vergleich, Februar 2007. Tinbergen J. 1952, On the Theory of Economic Policy, North-Holland Publishing Company, Amsterdam, The Netherlands Zimmermannova J. 2007a, Ecological Tax Reform in the Czech Republic – May 2007, paper downloaded on September 19, 2007 at http://www.ieep.cz/download/projekty/www_com/czech_republic.pdf Zimmermannova J. 2007b, Energy Taxation and its Impact on Industry in the Czech Republic, paper presented at the 8th International Environmental Taxation Conference 17-19 October 2007, Munich, Germany
26
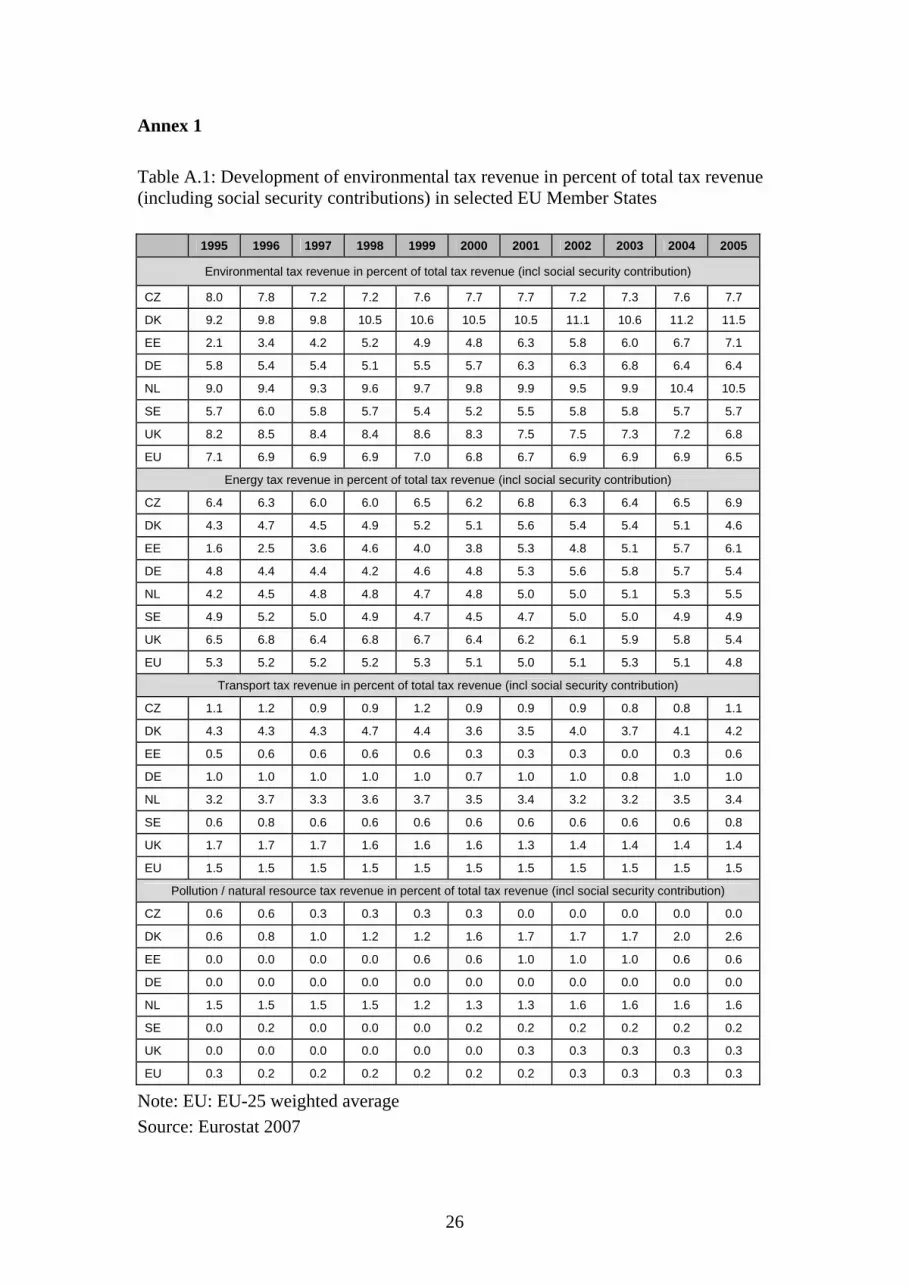
Annex 1 Table A.1: Development of environmental tax revenue in percent of total tax revenue (including social security contributions) in selected EU Member States
1995 1996 1997 1998 1999 2000 2001 2002 2003 2004 2005
Environmental tax revenue in percent of total tax revenue (incl social security contribution)
CZ 8.0 7.8 7.2 7.2 7.6 7.7 7.7 7.2 7.3 7.6 7.7
DK 9.2 9.8 9.8 10.5 10.6 10.5 10.5 11.1 10.6 11.2 11.5
EE 2.1 3.4 4.2 5.2 4.9 4.8 6.3 5.8 6.0 6.7 7.1
DE 5.8 5.4 5.4 5.1 5.5 5.7 6.3 6.3 6.8 6.4 6.4
NL 9.0 9.4 9.3 9.6 9.7 9.8 9.9 9.5 9.9 10.4 10.5
SE 5.7 6.0 5.8 5.7 5.4 5.2 5.5 5.8 5.8 5.7 5.7
UK 8.2 8.5 8.4 8.4 8.6 8.3 7.5 7.5 7.3 7.2 6.8
EU 7.1 6.9 6.9 6.9 7.0 6.8 6.7 6.9 6.9 6.9 6.5
Energy tax revenue in percent of total tax revenue (incl social security contribution)
CZ 6.4 6.3 6.0 6.0 6.5 6.2 6.8 6.3 6.4 6.5 6.9
DK 4.3 4.7 4.5 4.9 5.2 5.1 5.6 5.4 5.4 5.1 4.6
EE 1.6 2.5 3.6 4.6 4.0 3.8 5.3 4.8 5.1 5.7 6.1
DE 4.8 4.4 4.4 4.2 4.6 4.8 5.3 5.6 5.8 5.7 5.4
NL 4.2 4.5 4.8 4.8 4.7 4.8 5.0 5.0 5.1 5.3 5.5
SE 4.9 5.2 5.0 4.9 4.7 4.5 4.7 5.0 5.0 4.9 4.9
UK 6.5 6.8 6.4 6.8 6.7 6.4 6.2 6.1 5.9 5.8 5.4
EU 5.3 5.2 5.2 5.2 5.3 5.1 5.0 5.1 5.3 5.1 4.8
Transport tax revenue in percent of total tax revenue (incl social security contribution)
CZ 1.1 1.2 0.9 0.9 1.2 0.9 0.9 0.9 0.8 0.8 1.1
DK 4.3 4.3 4.3 4.7 4.4 3.6 3.5 4.0 3.7 4.1 4.2
EE 0.5 0.6 0.6 0.6 0.6 0.3 0.3 0.3 0.0 0.3 0.6
DE 1.0 1.0 1.0 1.0 1.0 0.7 1.0 1.0 0.8 1.0 1.0
NL 3.2 3.7 3.3 3.6 3.7 3.5 3.4 3.2 3.2 3.5 3.4
SE 0.6 0.8 0.6 0.6 0.6 0.6 0.6 0.6 0.6 0.6 0.8
UK 1.7 1.7 1.7 1.6 1.6 1.6 1.3 1.4 1.4 1.4 1.4
EU 1.5 1.5 1.5 1.5 1.5 1.5 1.5 1.5 1.5 1.5 1.5
Pollution / natural resource tax revenue in percent of total tax revenue (incl social security contribution)
CZ 0.6 0.6 0.3 0.3 0.3 0.3 0.0 0.0 0.0 0.0 0.0
DK 0.6 0.8 1.0 1.2 1.2 1.6 1.7 1.7 1.7 2.0 2.6
EE 0.0 0.0 0.0 0.0 0.6 0.6 1.0 1.0 1.0 0.6 0.6
DE 0.0 0.0 0.0 0.0 0.0 0.0 0.0 0.0 0.0 0.0 0.0
NL 1.5 1.5 1.5 1.5 1.2 1.3 1.3 1.6 1.6 1.6 1.6
SE 0.0 0.2 0.0 0.0 0.0 0.2 0.2 0.2 0.2 0.2 0.2
UK 0.0 0.0 0.0 0.0 0.0 0.0 0.3 0.3 0.3 0.3 0.3
EU 0.3 0.2 0.2 0.2 0.2 0.2 0.2 0.3 0.3 0.3 0.3
Note: EU: EU-25 weighted average Source: Eurostat 2007

27
Table A.2: Trends in final energy consumption in the transport sector in selected EU Member States between 1997 and 2005
change in
petrol consumption
change in diesel
consumption
change in transport fuel (petrol, diesel)
Czech Republic 11.6 182.0 77.2
Denmark -4.8 27.6 13.9
Estonia -3.1 9.9 6.0
France -26.7 20.6 5.5
Germany -23.5 7.8 -2.8
Netherlands -1.1 26.3 11.7
Austria -3.0 76.1 38.4
Sweden -6.4 41.8 12.6
UK -15.7 28.3 11.7
Source: Eurostat - Energy yearly statistics.


