Embed Size (px)
Citation preview


Exploring Geospatial and Socio economic factors contributing for malaria prevalence in Aysaita Woreda, Afar Regional State, Ethiopia
2 Idris Mahmud, 2013
A thesis submitted to the school of graduate studies of Addis Ababa
University in partial fulfillment of the requirements for the degree of
Master of Science (M.sc) in Remote sensing and GIS.
BY: IDRIS MAHMUD
ADVISOR: Dr. K.V. SURYABHAGAVAN
JUNE 2013
Addis Ababa

Exploring geospatial and socio economic factors
contributing for malaria prevalence in Aysaita woreda,
Afar Regional state, Ethiopia.
By
Idris Mahmud
Faculty of Natural Science
School of Earth Sciences
Remote Sensing and GIS
Approval by Board of Examiners
Dr. Seifu Kebede _________________________
Chairman, Department
Dr. K.V Surya Bhagavan ___________________________
Advisor
Dr. ----------------------- ___________________________
Examiner
Dr. ------------------------------ ___________________________
Examiner

Exploring Geospatial and Socio economic factors contributing for malaria prevalence in Aysaita Woreda, Afar Regional State, Ethiopia
i Idris Mahmud, 2013
D E C L A R A T I O N I hereby declare that the dissertation entitled “Exploring geospatial and socio economic
factors contributing for malaria prevalence in Aysaita woreda, Afar regional state, Ethiopia”
has been carried out by me under the supervision of Dr. K.V Suryabhagavan, School of Earth
Sciences, Addis Ababa University, Addis Ababa during the year 2012 - 2013 as a part of
Master of Science program in Remote Sensing and GIS. I further declare that this work has
not been submitted to any other University or Institution for the award of any degree or
diploma.
Place: Addis Ababa
Date: June, 2013
Idris Mahmud

Exploring Geospatial and Socio economic factors contributing for malaria prevalence in Aysaita Woreda, Afar Regional State, Ethiopia
ii Idris Mahmud, 2013
ACKNOWLEDGMENTS
First and foremost I would like to thank the almighty God, my savior, who made it possible
for me, to begin and finish my study successfully.
My profound gratitude with appreciation goes to my advisor, Dr. K. V. Suryabhagavan, for
his esteemed, constructive and consistent follow‐ups and guidance throughout the work
devoting his valuable time.
It is hardly possible to find appropriate words to express my gratefulness to all my friends
and Health bureau of afar region especially Mr. Mohammed Ahmed head of Health office in
Samara and Jamal in Aysaita health bureau for what they did for me.
I am extremely grateful to APDA (Afar pastoralist Development Association) for their
economic, encouragement and moral support.

Exploring Geospatial and Socio economic factors contributing for malaria prevalence in Aysaita Woreda, Afar Regional State, Ethiopia
iii Idris Mahmud, 2013
Abstract
Malaria found throughout the world except the frozen part of our world. It has been affecting
human beings since the dawn of history. Currently, it is one of the major tropical diseases
specially affecting the health of the peoples and the economic development of many
developing countries, particularly in sub-Saharan Africa. The study area (Aysaita woreda) is
considered as one of the most malaria susceptible area which is located in North East of
Ethiopia. Its geographic locations which is suitable for malaria to develop and reproduce, like
overflow of awash river due to the rainy season on high lands, environmental conditions
including temperature, elevation, seasonality, and vegetation cover. Biological and social
factors also share in influencing vector development and malaria transmission. Therefore,
this study has attempt in identifying and mapping of malaria prone area with the use of
Remote Sensing and GIS technology. Possible geospatial and socio economic factors were
identified, assessed and finally overlaid with the help of malaria risk computation model.
Based on this model the mapping of malaria risk includes hazard, element at risk, and
vulnerability. These layers were prioritized according to their degree of influence. Pair wise
comparison of the factors was carried out to develop the following weights for each factor in
IDRISI software. The weights given for the factors was computed, Combined and analyzed
in ArcGIS environment using spatial analyst tool and the final output map produced. And it
shows that 46.45 percent, 53.24 percent and 0.31 percent of the total area are subject to High,
Moderate and Low respectively. Hence, it is possible to conclude that 99.69 percent of the
study area is under epidemic area (high and moderate). Only 0.31 percent is in low epidemic
area. Furthermore, the produced map of malaria risk area which can be used as an input for
policy makers and other responsible bodies. Besides these groups, the experts in the field will
benefit more by acquiring readymade information which serves as a spring board for national
malaria eradication and prevention program.
Key words: Remote Sensing and GIS, Malaria risk, Malaria Hazard

Exploring Geospatial and Socio economic factors contributing for malaria prevalence in Aysaita Woreda, Afar Regional State, Ethiopia
iv Idris Mahmud, 2013
Table of content
Acknowledgement ............................................................................................. i
Abstract ............................................................................................................ ii
Table of content ............................................................................................... iii
List of table ...................................................................................................... vi
List of figure ................................................................................................... vii
Abriviation ....................................................................................................... ix
1. Introduction .................................................................................................. 1
1.1 General background ................................................................................................................ 1
1.2 Problem statement ................................................................................................................... 3
1.3 Significant of the study ............................................................................................................ 4
1.4 Objective ................................................................................................................................. 4
1.4.1 General objective .............................................................................................................. 4
1.4.2 Specific objective ............................................................................................................. 5
1.6 Organization of the research .................................................................................................... 5
2. Literature review ........................................................................................... 6
2.1 Malaria distribution in the world .............................................................................................. 6
2.2 Over view of Malaria distribution and status in Ethiopia .......................................................... 8
2.3 Importance of mapping malaria risk areas ................................................................................ 9
2.4 Malaria and the mosquito vector group .................................................................................. 10
2.5 Factors influence malaria incidence ....................................................................................... 11
2.5.1 Temperature ................................................................................................................... 11
2.5.2 Rainfall .......................................................................................................................... 12
2.5.3 Humidity ........................................................................................................................ 12
2.5.4 Altitude .......................................................................................................................... 13
2.5.5 Slope .............................................................................................................................. 13
2.5.6 Landuse/Landcover ........................................................................................................ 13
2.6 GIS and RS Technique in malaria risk map ............................................................................ 14
3. Material and Methods ..................................................................................16
3.1 Study Area ............................................................................................................................ 16

Exploring Geospatial and Socio economic factors contributing for malaria prevalence in Aysaita Woreda, Afar Regional State, Ethiopia
v Idris Mahmud, 2013
3.1.1 Topography of the study area .......................................................................................... 17
3.1.2 Population ...................................................................................................................... 18
3.1.3 Population density .......................................................................................................... 19
3.1.4 Health facility ................................................................................................................. 20
3.1.5 Major climate variables................................................................................................... 21
3.2 Data used ............................................................................................................................. 22
3.3 Methodology and Analysis ................................................................................................... 23
3.3.1 Assessment of malaria hazard areas ............................................................................... 27
3.3.2 Assessment of malaria risk.............................................................................................. 28
3.4 Data analysis ........................................................................................................................ 31
3.4.1 Parameter for identifying malaria hazard area ................................................................ 31
3.4.1.1 Altitude.................................................................................................................... 31
3.4.1.2 Slope ....................................................................................................................... 32
3.4.1.3 Temperature............................................................................................................. 33
3.4.1.4 Rainfall .................................................................................................................... 35
3.4.1.5 Distance from River ................................................................................................. 36
3.4.2 Socio-Economic Factors for Identifying Malaria Risk Areas .......................................... 37
3.4.2.1 Distance from Health Facilities .............................................................................. 38
3.4.2.2 Landuse/Landcover ................................................................................................. 39
3.4.2.3 Population Density ................................................................................................... 42
4. Results and Discussion .................................................................................43
4.1 Malaria cases versus Temprature ........................................................................................... 43
4.2 Malaria cases versus Rainfall ................................................................................................. 44
4.3 Identifying malaria Hazard areas ........................................................................................... 45
4.4 Identifying area of malaria at risk .......................................................................................... 48
4.5 Comparing malaria Risk with kebeles which are labeled as Malarious by wereda health bureau ................................................................................................................................................... 51
4.6 Malaria Risk model Verification ............................................................................................ 51
5. Conclusion and Recommendations ..............................................................55
5.1 Conclusion ............................................................................................................................ 55
5.2 Recommendation................................................................................................................... 56
Reference .........................................................................................................58

Exploring Geospatial and Socio economic factors contributing for malaria prevalence in Aysaita Woreda, Afar Regional State, Ethiopia
vi Idris Mahmud, 2013
List of tables
Table 3.1 Average monthly Temperature and Rainfall ..................................... 21
Table 3.2 Data source ...................................................................................... 23
Table 3.3 Pair-wise comparison of factor layers for Hazard map .................... 27
Table 3.4 Pair-wise comparison of factor layers for malaria risk map ............. 30
Table 3.5 Area coverage of each Landuse/landcover ....................................... 40
Table 3.6 Accuracy assessment for Landuse/landcover .................................... 41
Table 4.1 Malaria cases and Min and Max Temperature of 1999-2010 ............ 43
Table 4.2 Malaria cases and mean annual Rainfall of 1999-2010 ..................... 45
Table 4.3 Derived factor maps and weight of malaria hazard .......................... 46
Table 4.4 Derived factor maps and weight of Malaria Risk ............................. 49
Table 4.5 Comparison of Malaria cases data with risk model result ................ 53

Exploring Geospatial and Socio economic factors contributing for malaria prevalence in Aysaita Woreda, Afar Regional State, Ethiopia
vii Idris Mahmud, 2013
List of figures
Figure 2.1 World malaria distribution ................................................................ 7
Figure 2.2 Malaria epidemic risk in Ethiopia ..................................................... 9
Figure 3.1 location map of study area .............................................................. 16
Figure 3.2 Altitude map ................................................................................... 17
Figure 3.3 Population map ............................................................................... 18
Figure 3.4 Population Density map .................................................................. 19
Figure 3.5 Health facility map.......................................................................... 20
Figure 3.6 Average monthly Temperature and Rainfall of 1999-2010.............. 22
Figure 3.7 Methodology flow chart .................................................................. 26
Figure 3.8 Flow chart of assessment of malaria hazard .................................... 28
Figure 3.9 Flow chart of assessment of malaria risk ......................................... 30
Figure 3.10 Reclassified Altitude map ............................................................. 32
Figure 3.11 Reclassified Slope map ................................................................. 33
Figure 3.12 Reclassified Temperature map ...................................................... 35
Figure 3.13 Reclassified Rainfall map ............................................................. 36
Figure 3.14 Reclassified distance from river map ............................................ 37
Figure 3.15 Reclassified distance from Health facility map ............................. 44
Figure 3.16 Landuse/landcover map of year 2011 ............................................ 41
Figure 3.17 Reclassified Population density map ............................................. 42
Figure 4.1 Malaria cases verses Min and Max Temperature of 1999-2010 ....... 44

Exploring Geospatial and Socio economic factors contributing for malaria prevalence in Aysaita Woreda, Afar Regional State, Ethiopia
viii Idris Mahmud, 2013
Figure 4.2 Malaria cases and mean annual Rainfall of 1999-2010 ................... 45
Figure 4.3 Malaria Hazard map ........................................................................ 47
Figure 4.4 Malaria Risk map ............................................................................ 50
Figure 4.5 Kebele wise Malaria Risk map ........................................................ 52
Figure 4.6 Comparison of Health facility report with malaria risk map ........... 53
Figure 4.7 Comparison of Health center reports versus malaria risk .............. 54

Exploring Geospatial and Socio economic factors contributing for malaria prevalence in Aysaita Woreda, Afar Regional State, Ethiopia
ix Idris Mahmud, 2013
Abbreviation
AHP Analytical hierarchy process
CDC Centers for Disease Control
CSA Central Statistical Agency
DEM Digital Elevation Model
EMA Ethiopian Mapping Agency
ETM Enhanced Thematic Mapper
FMOH Federal Ministry of Health
GIS Geographic Information System
GPS Global Positioning System
IDW Inverse Distance Weight
Km kilometer
M - meter
MAX maximum
MIN minimum
NDVI Normalized Difference Vegetation Index
P Plasmodium
RS Remote sensing
Sq – square
UNICEF United Nations Children’s Fund
WHO World Health Organization
WLC Weighted Linear Combination

Exploring Geospatial and Socio economic factors contributing for malaria prevalence in Aysaita Woreda, Afar Regional State, Ethiopia
1 Idris Mahmud, 2013
Chapter one 1. Introduction 1.1 General background Malaria has been affecting human beings since the dawn of history. Currently, it is one of
the major tropical diseases specially affecting the health of the peoples and the economic
development of many developing countries, particularly in sub-Saharan Africa. It is
transmitted from human to human by the female Anopheles mosquito. It is caused by five
species of parasites of the genus Plasmodium that affect humans (P. falciparum, P. vivax, P.
ovale, P. malariae and P. knowlesi). Malaria due to P. Falciparum is the most deadly form
and it predominates in Africa; P. vivax is less dangerous but more widespread, and the other
three species are found much less frequently. Malaria parasites are transmitted to humans by
the bite of infected female mosquitoes of more than 30 anopheline species. Globally, an
estimated 3.3 billion people were at risk of malaria in 2011, with populations living in sub-
Saharan Africa having the highest risk of acquiring malaria: approximately 80% of cases and
90% of deaths are estimated occur in the WHO African Region, The infective parasite enters
the bloodstream, and after developing and multiplying in the liver, quickly begins to move
and destroy the red blood cells of its human host. Individuals most susceptible to the disease
include pregnant women and their unborn babies, children, people infected with HIV/AIDS
and non-immune adults (people from areas of with no malaria, or travelers to the continent).
But, Mostly affects the children under five years of age and pregnant women. (WHO 2012).
According to the latest WHO estimates, there were about 219 million cases of malaria in
2010 and an estimated 660 000 deaths. Africa is the most affected continent: about 90% of
all malaria deaths occur there. Between 2000 and 2010, malaria mortality rates fell by 26%
around the world. In the WHO African Region the decrease was 33%. During this period, an
estimated 1.1 million malaria deaths were averted globally, primarily as a result of a scale-up
of interventions (WHO 2012).
Malaria in Ethiopia has different names in different languages. This obviously indicates the
extent of the spread of the dreadful (very bad) disease that had long lived with people. In the
past, the cause of the disease was associated with more lack of awareness and/or ignorance.

Exploring Geospatial and Socio economic factors contributing for malaria prevalence in Aysaita Woreda, Afar Regional State, Ethiopia
2 Idris Mahmud, 2013
Historically, the Italians had associated the disease with water in ponds and swampy/marshy
areas and offensive smell. As a result, they gave the disease the name malaria which meant
“bad air.” (Ethiopian Federal Ministry of Health, 2003)
The problem of malaria is very severe (series) in Ethiopia, where it has been the major cause
of illness and death for many years. According to records from the Ethiopian Federal
Ministry of Health, 75% of the country is malarious with about 68% of the total population
living in areas at risk of malaria. This means Approximately 52 million people. Every year it
is the leading cause of outpatient consultations, admissions and death. It is seasonal in the
highland fringe areas and of relatively longer transmission duration in lowland areas, river
basins and valleys. The cold zone, which covers areas higher than 2,500 meters (m) above
sea level, has a mean annual temperature of 10–15oC. This highland area is considered free
of local malaria transmission. The midland area, ranging in altitude from 1,500–2,500m with
a mean annual temperature between 15–20oC, has diverse malaria transmission patterns. In
the hot lowland zone, located in areas below 1,500m above sea level, where the mean annual
temperature varies from 20–25oC, malaria transmission is endemic, and its intensity and
duration are mainly dictated by the amount and duration of rainfall. (Ghebreyesus, et al,
2006).
Communicable diseases and malnutrition are major health problems in the Afar region.
Malaria, tuberculosis, Pneumonia, upper respiratory diseases diarrhea and gardiasis are
among the most prevalent diseases in the region. The climate and the topography of the area
create favorable situations for the growth of disease vectors like mosquitoes, flies and snails.
About 70 – 80% of diseases in the region are communicable diseases. The risks of morbidity
and mortality caused by Plasmodium falciparum and plasmodium vivax vary spatially and
temporally. Those are the types of malaria disease and are commonly found in afar region.
Plasmodium Falciparum accounts for 60% of cases, while Plasmodium Vivax is 40%. (WHO
Horn of Africa Initiative, 2003)
Aysaita woreda is one of malaria endemic area in Ethiopia. Its elevation is 300 meter above
sea level. It has average temperature of 30oC which is suitable for malaria distribution.
Malaria is a Vector borne disease. The vector Anopheles mosquitoes are particularly
influenced by environmental conditions. Indeed, insect vectors in particular are very sensitive

Exploring Geospatial and Socio economic factors contributing for malaria prevalence in Aysaita Woreda, Afar Regional State, Ethiopia
3 Idris Mahmud, 2013
to their environments, which in turn determine their presence, and development. As a
consequence, climatic as well as landscape and land cover factors greatly influence the
spatial distribution of vectors and the diseases they transmit.
Today’s technology provides valuable information on such environmental conditions.
Remote Sensing and Geographic Information System (GIS) techniques are one of the best
techniques, which can help epidemiologists to identify vector focuses. These technologies,
allow them to relate disease occurrence indexes and environmental characteristics, enabling
the exact observation of geographic area and the determination of how some physical factors
(rivers, mountains, vegetation) can influence the spreading or controlling of the disease.
Generally GIS enabled researchers to locate high malaria prevalence areas and populations at
risk, identify areas in need of resources, and make decisions on resource allocation. And also
Remote Sensing and GIS have created new opportunities for public health administrators to
enhance planning, analysis and monitoring of vector born disease elimination.(Praveen
Kumar, et al, 2011) Somehow in this study the technique of remote sensing and GIS is to
explore geospatial and socio economic factors contributing malaria prevalence for Aysaita
woreda, afar Region, Ethiopia.
1.2 Problem statement Malaria is ranked as the leading communicable disease in Ethiopia, especially in Afar which
is located in the North-East of Ethiopia, geographically located at altitude of 300 meter above
sea level and has temperature of 30oC, which is suitable for malaria distribution and
Availability of Awash River also have effect. They are prone areas to malaria disease and
many people are dying of this. The risks of morbidity and mortality caused by Plasmodium
falciparum and plasmodium vivax which are very common types found in Afar region, vary
spatially and temporally.
The study area (Aysaita woreda), is resulting in different factors that makes it to be epidemic
area like its geographic locations which is suitable for malaria to develop and reproduce,
overflow of awash river due to the rainy season on high lands and waters that are collected
during rainy season and also like environmental conditions including temperature, elevation
and vegetation cover. Biological and social factors also share in influencing vector

Exploring Geospatial and Socio economic factors contributing for malaria prevalence in Aysaita Woreda, Afar Regional State, Ethiopia
4 Idris Mahmud, 2013
development and malaria transmission. These are some conditions that contribute a lot for the
prevalence of malaria. These serious problems affect the living system of the local people in
different means as the area is susceptible for the disease. However, their life depends on crop
production and livestock rearing.
According to Alen (2002), before the development of GIS technology, the only way to assess
human risk was manually monitor larval and adult mosquito populations. This time
consuming and tiresome fieldwork has been costly and not frequently put in practice
especially in countries with fewer resources. Now a day by using remote sensing and GIS
technique, it is possible to produce thematic and attribute map for each malaria support
factors and to measure the level of risk for the study area. Therefore to identifying and
mapping the malaria risk areas by considering geospatial and socio economic factors that can
contribute malaria prevalence in the study areas are needed.
1.3 Significant of the study This study is aimed at using GIS and RS tools for identification of malaria prone areas and
The ability of identifying risk areas will greatly enable decision makers use and ensure that
the scarce resource implemented to the most high risk areas and can make the radiations and
prevention task successful and will substantially reduce costs of prevention with efficient
targeting of high risk areas. Applying GIS and RS for visualizing and analyzing
epidemiological data will provide valuable information for evaluation and monitoring.
1.4 Objective
1.4.1 General objective
The general objective of this study is to assess malaria prone areas using Remote
Sensing and GIS and to develop malaria risk and hazard zone map.

Exploring Geospatial and Socio economic factors contributing for malaria prevalence in Aysaita Woreda, Afar Regional State, Ethiopia
5 Idris Mahmud, 2013
1.4.2 Specific objective
To identify environmental and Socio economic factors that contributes for
malaria incidence in the study area.
To show the relationship between malaria incidence and climatic variables
such as temperature and rainfall of the study area.
To allocate on map malaria risk areas using remote sensing and GIS
technique.
To identify, classify and map areas at risk of malaria that will help the
decision-makers to better allocate limited resources in the fight against the
disease.
1.6 Organization of the research
The study is organized in five chapters from introductory part up to recommendation.
Chapter one provides research background, problem definition, objectives and scope of the
research. Chapter two provides a literature review on malaria transmission, history of malaria
and use of RS and GIS technology in the study. Chapter three provides description and
background of the study area, Methodology and analysis part. Chapter four provides the
output of the study which is Results and discussion, and finally Chapter Five is about
conclusion and recommendations.

Exploring Geospatial and Socio economic factors contributing for malaria prevalence in Aysaita Woreda, Afar Regional State, Ethiopia
6 Idris Mahmud, 2013
Chapter Two 2. Literature review 2.1 Malaria distribution in the world Malaria has been one of the most prominent and ancient disease. Which is one of the greatest
burden to mankind, with a mortality rate that is unmatched by any other modern disease other
than tuberculosis. This dreadful disease caused by five different parasites with the same
genus (plasmodium falciparum, plasmodium vivax, plasmodium oval, plasmodium malariae
and plasmodium knowlesi), WHO (2010).
According to the World Health Organization (WHO) 2010 World Malaria Report, the
estimated number of global malaria deaths has fallen from about 985,000 in 2000 to about
781,000 in 2009.Similar improvements were also documented in the 2010 United Nations
Children’s Fund (UNICEF) Progress for Children report and in a 2009 Lancet article, Levels
and trends in under-5 mortality, 1990–2008.
In spite of this progress, malaria remains one of the major public health problems on the
African continent, with about 80% of malaria deaths occurring in African children under five
years of age (figure 2.1). Malaria also places a heavy burden on individual families and
national health systems. In many African countries, 30% or more of outpatient visits and
hospital admissions in children under five are reported to be caused by malaria. Economists
estimate that malaria accounts for approximately 40% of public health expenditures in some
countries in Africa and causes an annual loss of $12 billion, or 1.3% of the continent’s gross
domestic product. Because most malaria transmission occurs in rural areas, the greatest
burden of the disease usually falls on families who have lower incomes and whose access to
health care is most limited (WHO 2012).
During the past decade, global malaria prevention and control efforts have been scaled up,
with notable progress in sub-Saharan Africa, where the vast majority of malaria cases occur.
The number of long-lasting insecticidal nets delivered to malaria-endemic countries in sub-
Saharan Africa increased from 5.6 million in 2004 to 145 million in 2010. Programs to spray
the interiors of buildings with insecticides were also expanded, with the number of people
protected in sub-Saharan Africa rising from 10 million in 2005 to 81 million in 2010.

Exploring Geospatial and Socio economic factors contributing for malaria prevalence in Aysaita Woreda, Afar Regional State, Ethiopia
7 Idris Mahmud, 2013
However, malaria transmission still occurs in 99 countries around the world, and the malaria
burden continues to cripple health systems in many African countries. In 2010, this entirely
preventable and treatable disease caused an estimated 655 000 deaths worldwide. About 560
000 of the victims were children under five years of age, which means malaria killed one
child every minute (World malaria report 2012).
Figure 2.1. World malaria distributions
Source: http://www.nature.com/nrmicro/journal/v4/n9_supp/fig_tab/nrmicro1525_F2.html

Exploring Geospatial and Socio economic factors contributing for malaria prevalence in Aysaita Woreda, Afar Regional State, Ethiopia
8 Idris Mahmud, 2013
2.2 Over view of Malaria distribution and status in Ethiopia Malaria is a leading health problem in Ethiopia (Figure 2.2). About two-thirds of the
population lives in areas where malaria is transmitted. It is the leading communicable disease
in Ethiopia. It contributes up to 20% of under-five years of age deaths. In Ethiopia generally
low land and moderate areas below 2000 meters altitude are considered Malarious. (Federal
Ministry of Health, 2011).
According to UNICEF, Out of an estimated 9 million malaria cases annually in Ethiopia,
only 4-5 million will be treated in a health facility. The remainder will often have no medical
support. It is estimated that only 20% of children under five years of age that contract malaria
are treated in a facility. P. Falciparum and P. Vivax is two common malarial parasites in the
region. The former is considered the more severe of the two and almost all deaths occur by
infection from this parasite. P. Falciparum can rapidly become resistant to malarial treatment
and poses a significant challenge to malarial medicine. (http://www.unicef.org/
ethiopia/malaria.html)
Overall, according to the Federal Ministry of Health (FMOH), malaria accounts for up to
12% of outpatient consultations and 10% of health facility admissions. About 75% of the
country has malaria transmission (areas which are found at altitude of<2,000 m), with about
68% (i.e. 50 million) of the country’s total population living in areas at risk of malaria as
shown in figure 2.2. The FMOH estimates that there are 5 – 10 million clinical malaria cases
each year. However, of these, at present, only 1,349,659 are reported at national level, with
245,499 (18%) being confirmed by a diagnostic test (note, this does not include data from all
health posts). According to FMOH reports, approximately 70,000 people die of malaria each
year in Ethiopia. (Federal Ministry of Health (2011), cited in Malaria Operational plan
(MOP), Ethiopia, 2011).

Exploring Geospatial and Socio economic factors contributing for malaria prevalence in Aysaita Woreda, Afar Regional State, Ethiopia
9 Idris Mahmud, 2013
Figure 2.2. Malaria epidemic risk map Source from Abdlesemed Jamal, 2012.
2.3 Importance of mapping malaria risk areas The need for maps of malaria distribution has been recognized by malaria epidemiologists
for as long as the disease has been studied (Gill 1920; Boyd 1930; Lysenko &Beljaev1969).
It becomes important in mapping malaria distribution and risk. Such maps would make it
possible to target control measures at high risk areas and greatly increase the cost efficiency
of malaria control programs. Most risk maps that have been developed so far have used as
key inputs climatic models and information on weather data such as rainfall, temperature,
and relative humidity, which are too a large extent determine the survival and reproduction of
the mosquito and the development of the parasite in the vector. Other studies have used
different indicators of vector presence, reproduction, and survival, such as vegetation
Exploring Geospatial and Socio economic factors contributing for malaria prevalence in Aysaita Woreda, Afar Regional State, Ethiopia
10 Idris Mahmud, 2013
patterns, land use, and soil moisture. The environmental and climatic variables are then
linked with entomological (the study of insects) and epidemiological information to identify
geographical areas at high risk for malaria. These have covered either vast areas, such as the
efforts to map the malaria risk in Africa or a relatively limited number of villages (Wim, et
al, 2003). GIS and Remote Sensing offers powerful tools to present spatial information on
malaria risk areas. Such information has important implications for the disease eradication
strategy to be employed. GIS allows policy makers to easily understand and visualize the
problems in relation to the available resources and target resources to those communities in
need.
2.4 Malaria and the mosquito vector group Malaria found throughout the world except the frozen part of our world. It is transmited by
anapholes mosquito, generally bite at night and usually rest on a surface (such as the wall of
a house) before or after feeding. Unfortunatly Africa is home for some of the most effective
malaria vectors. Which are caused by five species of parasites of the genus Plasmodium that
affect humans (P. falciparum, P. vivax, P. ovale, P. malariae and P. knowlesi).Malaria due to
P. Falciparum is the most deadly form and it is predominates in Africa. It is generally
confined to tropical and subtropical regions because thedevelopment of the parasite in the
mosquito is greatly retarded when the temperature falls below 20oC. At this temperature,
Three weeks are required for maturation of sporozoites. P.falciparum is the chief infection in
areas of endemic malaria in Africa, and is also responsible for the great regional epidemics,
which were a feature of malaria in North West India and Sri Lanka. P. vivax is less
dangerous but more widespread, it occurs in most of the temperate zones and also in large
areas of the tropics (Gilles and Warrell, 1993).It is found mostly in Asia, Latin America, and
in some parts of Africa (CDC, 2004). Thus, P. vivax contributes substantially to the disease
burden (morbidity) of malaria, with a resulting social and economic impact.
The two other species are less frequently encountered. P. ovale is found mostly in Africa
(especially West Africa) and the islands of the western Pacific. It is biologically and
morphologically very similar to P. vivax. However, differs from P. vivax as it can infect
individuals who are negative for the Duffy blood group, which is the case for many residents
of sub Saharan Africa. This explains the greater prevalence of P. ovale (rather than P. vivax)

Exploring Geospatial and Socio economic factors contributing for malaria prevalence in Aysaita Woreda, Afar Regional State, Ethiopia
11 Idris Mahmud, 2013
in most of Africa. The fourth one is, P. malariae is found worldwide and causes a long
lasting, chronic infection that in some cases can last a lifetime. In some patients, P. malariae
can cause serious complications (CDC, 2004).
The four Plasmodium species known to cause malaria are listed above, and a fifth species,
Plasmodium knowlesi, is typically found in nature as macaques (monkeys) and has recently
been identified as a clinically significant pathogen in humans. This is an emerging infection
that was reported for the first time in humans in 1965 (chin, et al, 2008). It accounts for up to
70% of malaria cases in South East Asia particularly the forested areas where it is mostly
found. This parasite is transmitted by the bite of an Anopheles leucosphyrus mosquito
(McCutchan, et al, 2008).
Although the infecting parasite was initially identified as P. falciparum, one day later it was
then identified as P. malariae and it was only confirmed to be P. knowlesi after the infected
blood was used to inoculate Rhesus monkeys (Coggeshall, 1940).
2.5 factors influence malaria incidence The distribution of malaria is governed by a large number of factors relating to the parasite,
the vector and the host. Among these are climatic and environmental factors, particularly
those that affect habitat and breeding sites of the Anopheles mosquito vectors such as
temperature, precipitation, humidity, presence of water, vegetation, migration and man to
vector contact etc.
2.5.1 Temperature
Temperature plays an important role in the variability of malaria transmission by regulating
the development rate of mosquito larvae and influencing the survival rate of adult
mosquitoes. In cold temperatures the larvae develop very slowly and in many cases they may
be eaten by predators and may never live to transmit the disease (Grover-Kopec, et al, 2006).
At 26ºC the extrinsic incubation period of this malaria species is about 9-10 days whereas at
20- 22ºC it may take as long as 15-20 days. In highland areas, where cold temperatures
preclude vector and/or parasite development during part/or all of the year, increased
prevalence rates may be closely associated with higher than average minimum temperatures
(Bouma, et al, 1994).

Exploring Geospatial and Socio economic factors contributing for malaria prevalence in Aysaita Woreda, Afar Regional State, Ethiopia
12 Idris Mahmud, 2013
Therefore generally we can say that in the cooler the ambient temperature, the slower the
malaria parasite develops. The warmer the ambient temperature, the faster the malaria
parasite develops. If the incubation period takes longer than the life of the mosquito, the
parasite will never infect a human. In some places, especially at higher elevations, malaria
does not exist or is seasonal because, with cooler temperatures the mosquitoes die before the
parasites are mature.
2.5.2 Rainfall
Malaria vectors depend on rainfall, since it provides breeding sites for the mosquitoes to lay
their eggs. The amount and the seasonality of rainfall are important parameters in
determining the location of mosquito breeding habitats as well as the total density of adult
mosquitoes. Breeding increases dramatically in the rainy season when water collects in
stagnant bodies and these provide ample breeding ground through wells, ponds, water tanks
and paddy fields. (Yazoume, et al, 2008)
During periods of heavy rainfall, breeding may be hampered due to the excess water resulted
from heavy rain make the streams and the pools move fast and torrential (rushing the
streams), so it flushing away the eggs and larvae. Excessive rains may also have the opposite
effect increase vector populations in many circumstances by increasing available Anopheles
breeding sites. According to Yazoume, et a,. (2008)
In general, high transmission is often related to either excessive rainfall, creating additional
vector- breeding places, or exceptionally low rainfall causing the pooling of rivers and
streams to form major breeding sites. In such instances, malaria can become epidemic, and
several devastating epidemics have occurred after the failure of the southwest monsoon
(Konradsen, et al, 2000).
2.5.3 Humidity
Rainfall apart from creating mosquito breeding sites, affects malaria transmission through
increasing humidity, which in turn will help to increase the longevity of the adult vectors.
The optimum temperature for development of malaria parasite is between 25oC to 30
oC and
average relative humidity at least 60 %. These temperature and relative humidity conditions

Exploring Geospatial and Socio economic factors contributing for malaria prevalence in Aysaita Woreda, Afar Regional State, Ethiopia
13 Idris Mahmud, 2013
increase the longevity and density of mosquitoes and thus initiate malaria transmission, if
parasite load exists in the community (Yazoume, et al, 2008) sited in aster tirunesh, 2010.
2.5.4 Altitude
Altitude is one the factors that contribute for malaria transmission. The transmission level
varies from altitude to altitude. The cold zone, which covers areas higher than 2,500 meters
(m) above sea level, has a mean annual temperature of 10–15oC. This highland area is
considered free of local malaria transmission. The midland area, ranging in altitude from
1,500–2,500m with a mean annual temperature between 15–20oC, has diverse malaria
transmission patterns. In the hot lowland zone, located in areas below 1,500m above sea
level, where the mean annual temperature varies from 20–25oC, malaria transmission is
endemic, and its intensity and duration are mainly dictated by the amount and duration of
rainfall. (Ghebreyesus, et al, 2006).The Malaria prevalence is observed up to 3500 meter
above sea level, even though it decreases with increase in altitude (Graves, et al, 2008).
Altitude and temperature are explicitly linked, with every 100 m increase in height
corresponding to an approximately 0.5°C decline in temperature. The use of altitude can be
confusing, however, with the limit for malaria transmission variously reported above 2000 m
in Ethiopia (Covell, 1957)
2.5.5 Slope
Slope is an important habitat characteristic for many species (Jenness, 2007). Steeper slope
does not favor plant and animal dwelling relative to gentle slopes. It is a measurement of how
steep the ground surface is, the steeper the surface, the greater the slope. Generally flat
topography characterized by restricted natural drainage. It is more pronounced with the type
of soils. Therefore, without the existence of efficient water drainage systems can led to the
creation of stagnant water pools and used as a crucial factor of water stagnates, which in turn,
encourage the breeding and survival of mosquito (Malhotra and Aruna, 1995) cited in aster,
(2010).
2.5.6 Land use/Land cover
Land cover affects the temperature of larval habitats directly and food conditions and other
factors indirectly, but the synergistic effects of these factors may be more significant to larval

Exploring Geospatial and Socio economic factors contributing for malaria prevalence in Aysaita Woreda, Afar Regional State, Ethiopia
14 Idris Mahmud, 2013
survivorship. Different kinds of land cover indicate different types of residential areas
suitable for various vectors. Productivity of malaria vectors is significantly higher in aquatic
habitats located in farmlands compared with those in swamps and forests. Pupation rate was
significantly greater and development time was shorter in habitats in farmlands compared
with other land cover types (Munga, et al, 2006).
The type and distribution of vegetation can influence mosquito populations. The presence of
vegetation creates microclimatic conditions which are moderate temperature and humidity, it
is suitable for mosquitoes. Land cover can be measured directly by field observation or
indirectly by satellite imagery. Satellite imagery can quantify the amount of vegetation by
Normalized Difference Vegetation Index (NDVI) (Yazoume, et al, 2008).
2.6 GIS and RS Technique in malaria risk map GIS is defined as an information system that is used to input, store, retrieve, manipulate,
analyze and output geographically referenced data or spatial data.GIS is an umbrella term
which integrates wide range of datasets available from different sources including Remote
sensing (RS) and Global Positioning System (GPS). All methods of collecting information
about earth without touching it are forms of remote sensing. Satellites, radars and aerial
photographs are the different ways of acquiring remotely sensed data. GPS is a system of
twenty-four satellites that allows the co-ordinates of any point on or near earth’s surface to be
measured with extremely high precision.
GIS and Remote Sensing offers powerful tools to present spatial information on malaria risk
areas. Such information has important implications for the disease eradication strategy to be
employed. GIS allows policy makers to easily understand and visualize the problems in
relation to the available resources and target resources to those communities in need.
Therefore, GIS is often termed as core of spatial technology having built-in power to analyze
integrated dataset and to present the results as useful information to assist decision making.
(Boulos, et al, 2001).
GIS mapping has assisted in monitoring and evaluation of malaria control activities in
various countries. In comparison with tables and charts, maps developed using GIS are more
effective means for communicating messages clearly even to those who are not familiar with

Exploring Geospatial and Socio economic factors contributing for malaria prevalence in Aysaita Woreda, Afar Regional State, Ethiopia
15 Idris Mahmud, 2013
the technology. Therefore, GIS is a potentially powerful tool for epidemiology, in mapping
diseases and their determinants, quantifying risk, linking diseases and their potential risk
actors, and creating databases for further statistical and epidemiological analyses. For malaria
research and control, GIS has great potential since it has the capacity to integrate information
on all aspects of malaria including the environmental factors, infrastructure and demography.
GIS has been intensively used in malaria research to examine the link between environmental
factors and malaria transmission risk (Yazoume, et al, 1988).
Exploring Geospatial and Socio economic factors contributing for malaria prevalence in Aysaita Woreda, Afar Regional State, Ethiopia
16 Idris Mahmud, 2013
Chapter Three 3. Material and Methods
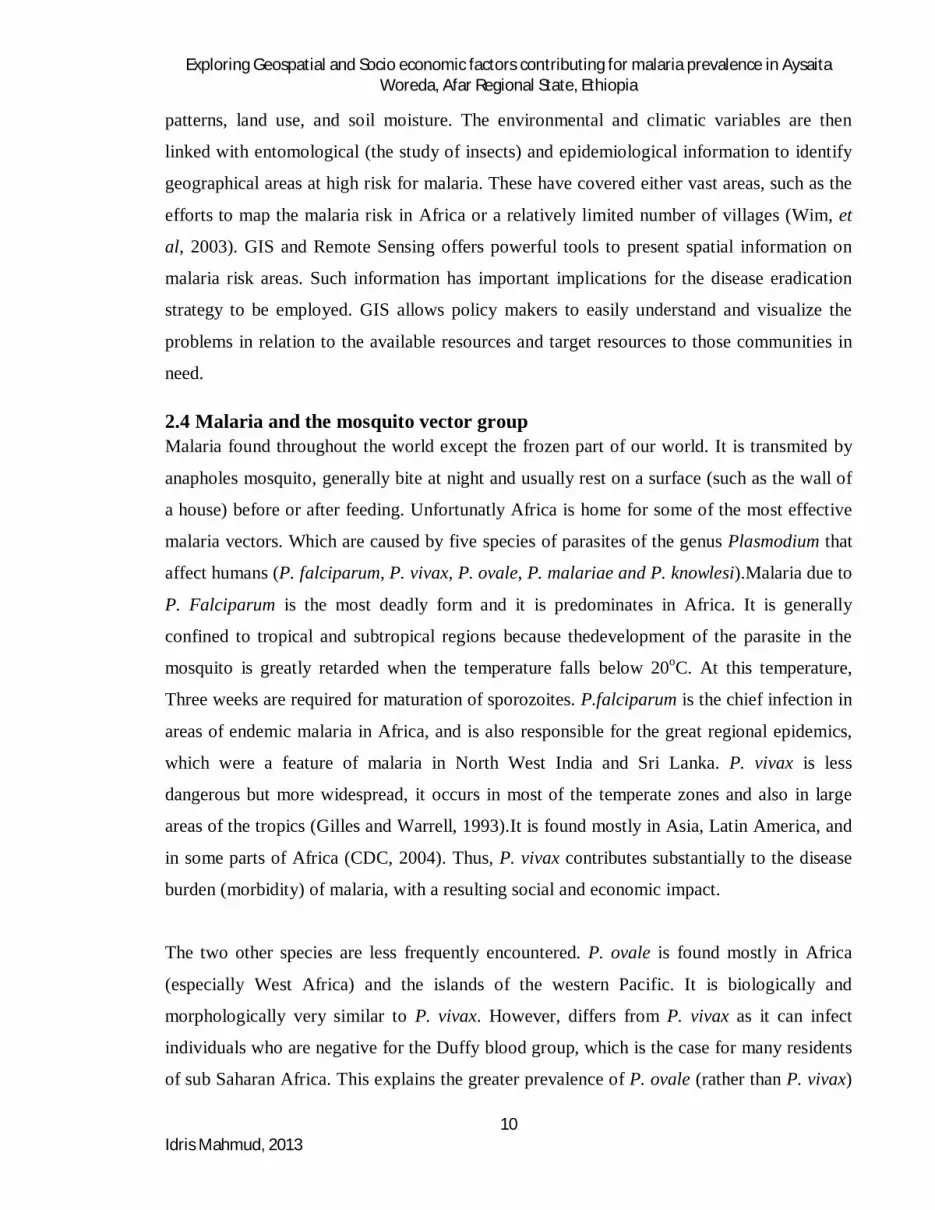
3.1 Study Area Aysaita is one of the woreda found in the Afar Region of Ethiopia and before 2007 was the
capital of the Afar Region of Ethiopia. Part of the Administrative Zone 1, Aysaita is bordered
on the south by Afambo, on the west by Dubti, then on the north by Elidar woreda, and on
the east by Djibouti. The major town in Aysaita woreda is Aysaita. It have 13 kebeles where
two are located inside Aysaita town, namely kebele 01 and kebele 02. The denser population
is also in Aysaita town. The Part of the shoreline of Lake Gargori (abihi bad) lies within the
boundaries of this woreda. The study area bounded by latitude 11o 39′ – 11o 36′N and
longitude of 41o 24′ – 41o 36′E covering a total area of 1731 km2 and an elevation of 300
meters (figure 3.1). It is 50 kilometers south by unpaved road from Awash–Asseb highway.
The total population of this woreda is 77,383. The life of the people in this woreda is depends
on crop production and livestock rearing.
Figure 3.1. Location map of study area

Exploring Geospatial and Socio economic factors contributing for malaria prevalence in Aysaita Woreda, Afar Regional State, Ethiopia
17 Idris Mahmud, 2013
3.1.1 Topography of the study area
Elevation is known to define the ecology of malaria transmission through temperature. At
certain altitudes malaria transmission does not occur because of extreme temperatures that
inhibit the mosquito and parasite life cycle. The altitude of the study area ranges from 270 up
to 1378 meter above sea level. Most part of the study area is characterized by flat lying
topography which covers more than half of the area having altitude of from 0 up to 270m, the
medium ranged areas are from 270m up to 600m above sea level and the higher altitude of
this study area is from 600m up to 1378m above sea level as shown in figure 3.2.
Figure 3.2. Altitude map

Exploring Geospatial and Socio economic factors contributing for malaria prevalence in Aysaita Woreda, Afar Regional State, Ethiopia
18 Idris Mahmud, 2013
3.1.2 Population
Based on statistical data of health bureau in Aysaita woreda, the total population of this
woreda is 77,383. The major town in Aysaita woreda is Aysaita; it is highly populated with
more than 22,350 people. It has a population density of 34.7. While 16,052 or 31.60% are
urban inhabitants, a further 9,358 or 18.42% are pastoralists. A total of 11,096 households
were counted in this woreda, which results in an average of 4.6 persons to a household, and
11,404 housing units. This woreda is consists of 13 kebele. Kebele 01 and kebele 02 are
found in Aysaita town. The Population of this woreda by kebeles is clearly shown in figure
3.3.
Figure 3.3. Population map

Exploring Geospatial and Socio economic factors contributing for malaria prevalence in Aysaita Woreda, Afar Regional State, Ethiopia
19 Idris Mahmud, 2013
3.1.3 Population density
The Population density indicates the number of people per area. From the map shown in
figure 3.4, Aysaita woreda is characterized by an average population density ranging 94-445
people per km2. These areas cover the West part of the study area, while the Aysaita town
and Berga kebele are densely populated with more than 255 up to 445people per km2. the rest
of the kebeles have population density of below 94 people per km2. In relation to malaria
transmission with the population density is directly proportional, which means that higher
population density, will cause higher malaria transmission.
Figure 3.4. Population density map

Exploring Geospatial and Socio economic factors contributing for malaria prevalence in Aysaita Woreda, Afar Regional State, Ethiopia
20 Idris Mahmud, 2013
3.1.4 Health facility
Aysaita woreda have total number of nine health facilities as shown in figure 3.5. From this,
one is hospital which is found in Aysaita town kebele 02 and the rest eight are health post
and there is one newly constructing health posts. Malaria diagnostic laboratories were found
only at the hospital in kebele 02. There were trained Community Health Workers in the
district serving the community. Most of the Health centers are found in the center part of the
study area where there is access to road for transportation. Four kebeles does not get any
health facility center. Especially for Ehayle kebele doesn’t have any way to get access from
the woreda. Instead if there is any need for that kebele they travel from Dubti woreda.
Figure 3.5. Health facility map

Exploring Geospatial and Socio economic factors contributing for malaria prevalence in Aysaita Woreda, Afar Regional State, Ethiopia
21 Idris Mahmud, 2013
3.1.5 Major climate variables
The Afar regions climate experienced four rainy seasons throughout the year; the ‘Karma’
rain considered the main rainy season and lasts for a period of approximately 2 months and
comes from the highlands (in the months of July and August). The second season is ‘Daddah’
and comes from the direction of the red sea (in the months of November and December or
winter rains) and is now the most unreliable often giving only a single shower. ‘Suggum’ is
the third or short rainy season (in the months of March and April). The regional decrease in
rain has seen the ‘Karma’ rainfall for only 15 days, then the ‘Suggum’ rain for 1-2 days only.
Now the region generally sees rain in only one of these periods. The emerging pattern has
been that if the ‘karma’ rains come, then the ‘suggum’ rains fail or vice versa, and these are
at a much reduced quantity than usual. The rainfall that has fallen has occurred in patches
and is not distributed evenly throughout the area. Rainfall has also been reduced in the
highlands which in turn affects the amount of water flowing through numerous rivers and
siphoning off of water for irrigation has further reduced water flow. (Vanessa Moss and logia
councilor, 2009)
Climate feature have direct influence on the spreading of mosquito and their survival. The
average temperature of the study area is suitable for spread and survival of mosquito. Which
is the average maximum temperature of the study area are 33.15, the average minimum
temperature is 29.1 and average rainfall is 12.54millimeter as shown in figure 3.6. The
temperature of the study area is higher in between March and June. And after June rainy
season will follow for about three month. The monthly climatic data collected from
meteorology agency of Ethiopia from 1999 up to 2010 G.C. from seven stations. In table 3.1
is shown that the mean maximum and minimum temperature of the study area.
Table 3.1. Average monthly temperature and rainfall value
Jan Feb Mar Apr May Jun Jul Aug Seb Oct Nov Dec
Temperature Min(oC)
24.4
25.3
27.7
29.8 31.9
32.3 30.5 30.4
32.4
30.1
28.8
25.3
Temperature Max(oC)
28.7
30.1
31.8
34.9 37.1
37.9 36.7 34.4
33.9
31.9 31
29.4
Rainfall(mm)
1.75
6.03
13.9
14.3 1.53
3.51 23.6 56.7 14
5.74
3.49
5.96

Exploring Geospatial and Socio economic factors contributing for malaria prevalence in Aysaita Woreda, Afar Regional State, Ethiopia
22 Idris Mahmud, 2013
Figure 3.6. Average monthly temperature and rainfall in 1999-2010.
3.2 Data used As shown in table 3.2, Different data of primary and secondary sources were collected from
field survey and respective institutions. Climatic data which constitute temperature and rain
fall of the study area was taken from National meteorology agency of Ethiopia. Shape files of
the study area which is comprised of different thematic and attribute data of road, rivers,
existing town, rural kebeles, and woreda boundary were taken from EMA. Satellite image
landsat ETM+ obtained in 2011 having 30m Resolution is used for LULC classification and
for accuracy assessment ground truth data collected by using GPS. And also it has been used
to collect locations of different types of health institutions within the study area and also the
location of the kebeles. Elevation and other topographic data were taken from SRTM data of
USGS.
0
10
20
30
40
50
60
20
22
24
26
28
30
32
34
36
38
40
Jan Feb Mar Apr May Jun Jul Aug Sep Oct Nov Dec
Tem
pera
ture
in (
o C)
TMP.MIN(oC) TMP.MAX(oC) Rainfall(mm)
Rai
nfal
l in
(mm
)
(Months)

Exploring Geospatial and Socio economic factors contributing for malaria prevalence in Aysaita Woreda, Afar Regional State, Ethiopia
23 Idris Mahmud, 2013
Table 3.2. Data source Data Data source availability Toposheet EMA YES Satellite image Landsat ETM+ 2011 EMA Yes STRM AAU server Yes Climatic data Meteorology of Ethiopia Yes Mobility and morbidity data Afar health bureau Yes Population data CSA Yes GPS data Field yes Literature Books and Internet yes
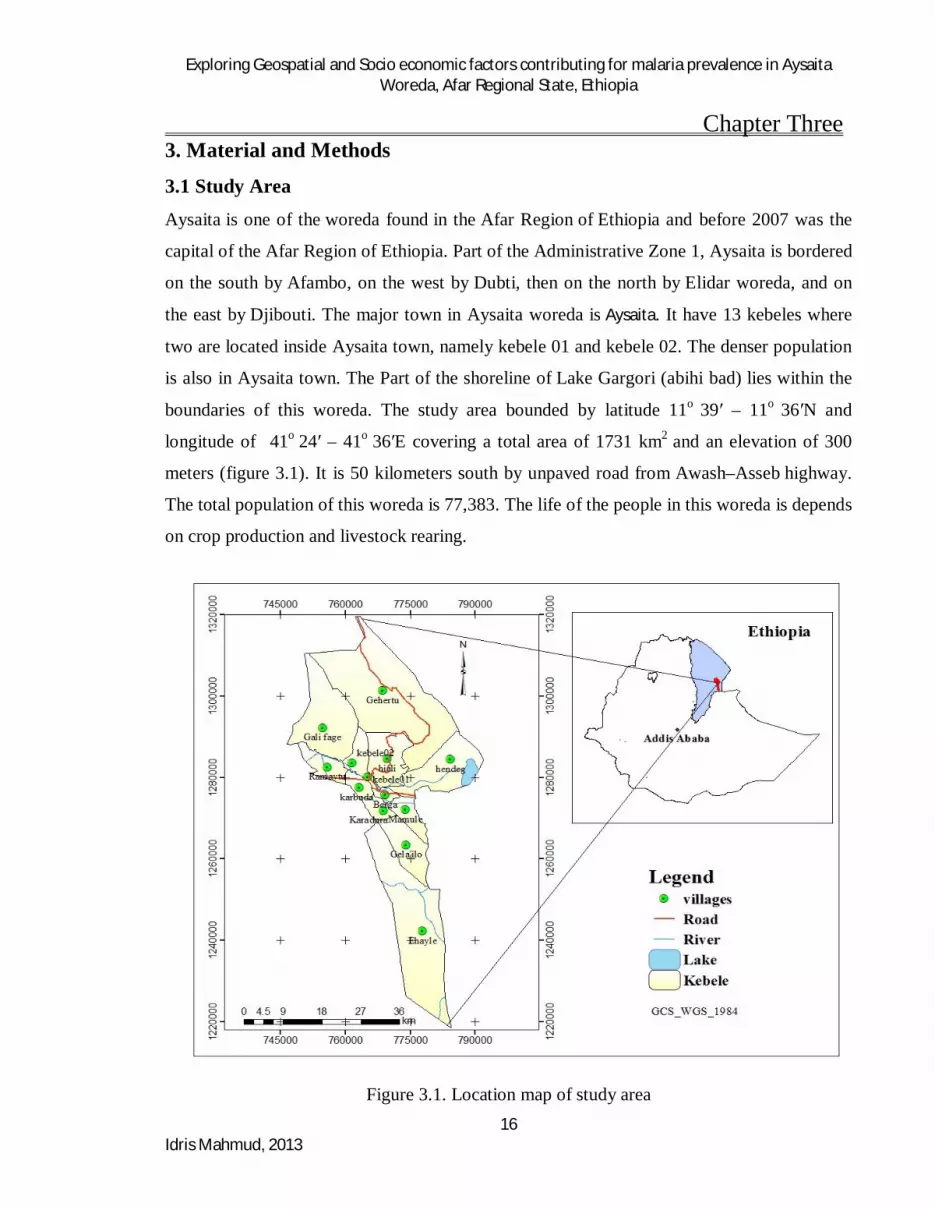
3.3 Methodology and Analysis The summarized activities and flow charts of the methodology of this study are shown in
figure 3.7. The objective or aims of this research is at assessment of malaria prone areas by
identify environmental factors like altitude, temperature, rainfall, distance from rivers, lake
and swampy area, that will contribute malaria prevalence. And map malaria risk areas by
using different software like ArcGIS 10.1 and ERDAS Imagine 9.2.
Environmental factors including temperature, Rainfall, altitude, slope and Distance from
River were combined by weighted multi criteria evaluation for mapping malaria hazard area
at the district level. Similarly, risk map was developed by overlaying weighted hazard, land
use/land cover, population density and distance from health facilities.
The collected data like population, Health facilities GPS data, temperature, rainfall, satellite
image and STRM 30m resolution data are needed for assessment of malaria risk map and
done by using different techniques of Remote Sensing and GIS technology. Create shape
files of the factors. Different techniques are applied to achieve the objective of this study is
like Buffering and overlay are two of the most common operations in disease modeling. A
buffer zone is an area that is within a given distance from a map feature. Points, lines, or
polygons can be buffered. Buffers are used to identify areas surrounding geographic features.
The 2000m is the average flight distance of the mosquito (Wim, et al., 2003). For example by
considering this we can buffer distance from water bodies and generally we can say from

Exploring Geospatial and Socio economic factors contributing for malaria prevalence in Aysaita Woreda, Afar Regional State, Ethiopia
24 Idris Mahmud, 2013
mosquito breeding site. An overlay is the primary way to combine information from two or
more separate themes. Overlays are most common for polygonal data, and perform a
geometric intersection, which results in a new layer with the combined attributes of both
initial layers. And also some calculation is also done to calculate the average monthly climate
data using Microsoft excel.
A monthly alert threshold was proposed for all the health facility centres. This threshold is
calculated as the monthly average of presumed malaria cases during the six years. The risk
maps were validated with the results of the investigation in health facility centres, which had
posted an alert. Only nine such centres were included in the study area, and were defined or
renamed as the villages in which they operate. These villages were superimposed on the risk
map.
On the second phase after prepared all the factors in the form of shape file, the weighting
preceded will be applied in order to analyze the factors done on the first phase. The factors
present different units. They were standardized to a continuous common numeric range on a
0 to 255-byte scale. Fuzzy method was used for their standardization. Fuzzy set membership
is the result of data classification according to the possibility of belonging to a class in which
the boundaries between classes are not distinct. Consequently, the transition between
membership and non-membership of the area is gradual.
The technique developed by Saaty (1977), cited by Rakotomanana, et al, (2007) was used for
factor weighting. This is a decision-making procedure known as the Analytical Hierarchy
Process (AHP). It includes a pair-wise comparison in which only two variables were
considered at a time. The continuous rating scale of Saaty (1977) was used to rate factors
with the following values, 9 (extremely important), 7 (very highly important), 5 (highly
important), 3 (moderately important) and 1 (equally important).
Inversely, less important variables were rated 1/3 (moderately less important), 1/5 (much less
important), 1/7 (very much less important) and 1/9 (extremely less important). The pair-wise
comparison table was completed with the values corresponding to the degree of importance
of the factors based on the correlation study. For example, if the temperature was extremely
more important than indoor insecticide spraying, one could enter 9 on the scale; and

Exploring Geospatial and Socio economic factors contributing for malaria prevalence in Aysaita Woreda, Afar Regional State, Ethiopia
25 Idris Mahmud, 2013
consequently indoor insecticide spraying would be extremely less important than
temperature, so 1/9 would be entered.
Factors weights were calculated from the table of pair-wise comparisons and scaled with
IDRISI Version 3.2 release 2 (Clark University, 950 Main street Worcester USA). The
weights have to sum to one as required by the WLC procedure. The ratio consistency was
calculated as the ratio of the index of coherence in the initial matrix to the random index of
the matrix with the same dimension. It indicated the probability that the matrix ratings were
randomly generated. If the ratio consistency is higher than 0.10, pair-wise comparison had to
bere-evaluated.
Exploring Geospatial and Socio economic factors contributing for malaria prevalence in Aysaita Woreda, Afar Regional State, Ethiopia
26 Idris Mahmud, 2013
CLIMATIC DATA LANDSAT ETM+ 2011
TOPOGRAPHIC MAP 1:50,000
Climatic data 1998-2010
RAINFALL, TEMPRATURE
Calculate the average of monthly
Interpolate by kriging and reclassify create shape file
Classify LULC type by using ERDAS
River map
Distance from river map Rainfall map
Land use map
RECLASSIFY
MALARIA RISK MAP
DIGITAZATIO
Temperature map
STRM 30M
DEM
Slope map
Altitude map
Contour
Ground truth and office data
Health facility map
Pop den map
RECLASSIFY
OVERLAY
OVERLAY
MALARIA HZARD MAP

Exploring Geospatial and Socio economic factors contributing for malaria prevalence in Aysaita Woreda, Afar Regional State, Ethiopia
27 Idris Mahmud, 2013
3.3.1 Assessment of malaria hazard areas
Hazard is defined as the inherent capacity of a chemical substance to cause adverse affect
in human and animals and to the environment, while risk is defined as the probability that
a particular adverse effect will be observed under certain specified condition, exposure or
use, WHO (2012). Hazard map, therefore, a map that highlights areas which are
vulnerable for breeding and maintenance of malaria vectors and parasites, was prepared
by weighting and overlaying environmental factors (Jeefoo, et al, 2008) (figure 3.8).
The collected data, like altitude, slopes, temperature, rainfall and Distance from River.
are used for assessment of malaria hazard map. These are done by using different remote
sensing and GIS techniques. Temperature and rainfall data are collected from
meteorological agency of Ethiopia year of 1999 - 2010. The temperature calculated as the
average of maximum and minimum temperature of 12 years. The rainfall also Calculated
the monthly average using Microsoft excel. Interpolation and reclassification process are
done using ArcGIS10.1. For the altitude and the slope are generated from STRM data.
This STRM data imported using global mapper convert to DEM file and patched using
3DEM software. At the result Slope and altitude Layer created using ArcGIS 10.1 spatial
Analysis tool. From landsat ETM+ satellite image year of 2011 downloaded. Layer
stacking process done using ERDAS Imagine software to combine all the bands. And
also using this software supervised classification is done. After all this environmental
factors reclassified using different RS and GIS technique the malaria hazard map is
generated (figure 3.8), and weighting and overlay analysis process also applied (table
3.3).
Table 3.3. Pair-wise comparison of factor layers for Hazard map.
Layer Rainfall
Temperature Elevation Slope Distance from river
Weight (%)
Rainfall 1 45% Temperature 1/3 1 26% Elevation 1/3 1/3 1 14% Slope 1/5 1/5 1/3 1 7% Distance from river 1/7 1/3 1/3 1/3 1 8%

Exploring Geospatial and Socio economic factors contributing for malaria prevalence in Aysaita Woreda, Afar Regional State, Ethiopia
28 Idris Mahmud, 2013
Figure 3.8. Flow chart of Assessment of malaria Hazard map
3.3.2 Assessment of malaria risk
All the input environmental factor were given weights and overlaid and the new malaria
hazard map were produced, further the malaria risk map were generated. The basis for
this map is the risk computation model which is developed by Shook (1999).
Slope map
Elevation map
Rainfall map
Temperature map
OVERLAY
MALARIA HAZARD MAP
Distance from river map
Exploring Geospatial and Socio economic factors contributing for malaria prevalence in Aysaita Woreda, Afar Regional State, Ethiopia
29 Idris Mahmud, 2013
Risk = (Hazard) * (Element at Risk) * (Vulnerability)
R = H * E * V
“Hazard (H)” is the probability of occurrence of a potential damaging natural
phenomenon within a specified period of time and within a given area
“Element at risk (E)” includes the population, buildings, and civil engineering works,
economic activities, public services, utilities and infrastructures, etc., at
risk in a given area.
“Vulnerability (V)” is the exposure of a given element or set of elements at risk resulting
from the occurrence of a damaging phenomenon of a given magnitude.
“Risk (R)”is the expected degree of loss due to a particular natural phenomenon. It may
be expressed as the product of hazard (H), vulnerability (V), and element at risk (E)
In mapping malaria risk map by using shook (1999) model is the product of malaria
hazard areas, computing and reclassifying the population density map which is the
element at risk layer and vulnerability map that is produced by reclassifying land use/land
cover layer and distance from River Figure 3.9. Since Water body is one of the factors for
malarias breeding site, therefore distance from river were calculated by using buffering
tool in ArcGIS 10.1. And also GPS data taken in field for each health facilities. Then the
maximum and minimum distance from the boundary is taken. Which is the minimum
distance of health facilities are 2 km and the maximum distance from health center to the
administrative boundary is 62 km. then classification process is done using in between
the range of this two minimum and maximum distance from boundary is taken and
classified using ArcGIS 10.1. Weighted overlay analysis using multicriteria decision
technique were implemented to produce the Malaria risk map of the area. The overflow
of the methodology is shown in figure 3.9 and also the weight given by IDRISI is also
shown in table 3.4.

Exploring Geospatial and Socio economic factors contributing for malaria prevalence in Aysaita Woreda, Afar Regional State, Ethiopia
30 Idris Mahmud, 2013
Figure 3.9. Flow chart of Assessment of malaria risk map
Table 3.4. Pair-wise comparison of factor layers for malaria risk map
Layer Hazard Pop den Health LULC Weight (%)
Hazard 1 56%
Pop den 1/3 1 26%
Health 1/5 1/3 1 11%
LULC 1/7 1/5 1/3 1 7%
Malaria hazard map
Population density map
Distance from Health center map
Landuse/Landcover map
OVERLAY
MALARIA RISK MAP

Exploring Geospatial and Socio economic factors contributing for malaria prevalence in Aysaita Woreda, Afar Regional State, Ethiopia
31 Idris Mahmud, 2013
3.4 Data Analysis
3.4.1 Parameter for identifying Malaria Hazard area
Malaria is an environmental and climatic related disease affected by a variety of factors
such as topography, temperature, rainfall, land use. A malaria risk map was generated
based upon these environmental risk factors that allowed us to extrapolate malaria risk
throughout the study area. The aim of this study is for identification of areas at highest
risk of malaria epidemics based on environmental and climatic factors and the incidence
of previous malaria epidemics. Based on literature search, previous works, and interviews
with malaria experts; the following environmental factors that greatly influence on
malaria prevalence were identified.
3.4.1.1 Altitude
Altitude is one of an important determinant of malaria endemicity. It affects various
transmission factors which are epidemiologically significant. Probably the most
important of these factors is temperature, which affects longevity of vectors and the
process of parasite development. The relation of temperature and altitude is, when the
altitude increases the temperature decreases.
The altitude of the study area ranges from 270 up to 1378 meter above sea level. Most
part of the study area is characterized by flat lying topography which covers 81.3% of the
area when compare with temperature it is categorized as hottest area, the medium ranged
areas are covers 15.8% and the higher altitude of this study area covers only 2.9% of the
area which is above 600 meter above sea level.
The layer was shown in figure 3.10 below. Which shows the reclassified Altitude map in
to five classes and new values were assigned to each class and based on this
classification, 1, 2, 3, 4 and 5 values were given to elevation ranges of 270 – 380m, 380 –
451m, 451 – 600m, 600 – 925m and 925 – 1378m above sea level respectively and the
elevation of this study area are all suitable for malaria to survive according to FMOH.
The classification is done by default equally classified. Because of the change in altitude
will make variation in malaria prevalence even though with the same category.
Accordingly, the classes were labeled in the figure 3.10 as Very high, High, Moderate,
Low and Very Low according to their prevalence to malaria.

Exploring Geospatial and Socio economic factors contributing for malaria prevalence in Aysaita Woreda, Afar Regional State, Ethiopia
32 Idris Mahmud, 2013
Figure 3.10. Reclassified Altitude map
3.4.1.2 Slope
Since, Slope is one of the topographic parameters that can determine the existence of
mosquito larval habitat. Steeper slopes are slopes that allow the fast movement of water.
Hence, they restrain the development of stagnant aquatic bodies which can be conducive
for breeding of mosquito. Relative to steeper slopes, gentler slopes are slopes where
surface water movement is stagnant and this creates fertile situation for mosquito
breeding. Therefore, identifying gentler slopes can help to detect the relative importance
of areas for mosquito breeding.
The slope of the study Area was derived from SRTM data 30m and reclassified in to five
classes like the other parameters using natural break standard reclassification technique.

Exploring Geospatial and Socio economic factors contributing for malaria prevalence in Aysaita Woreda, Afar Regional State, Ethiopia
33 Idris Mahmud, 2013
The new classes (0-5°, 5-12°, 12-22°, 22-36°, 36-69°) in the reclassified slop layer shown
in figure 3.11 were ranked to 5, 4, 3, 2, and 1 and described as very high, high, moderate,
low, and very low respectively based on the relative degree of suitability of the slope
class for malaria incidence. This means that relatively, gentler slopes are better suitable
for malaria incidence and steeper slopes are less suitable.
Figure 3.11. Reclassified Slope map
3.4.1.3 Temperature
Temperature affects malaria transmission for two reasons: either the minimum
temperature is Solow that it prevents parasite and vector development or else the
temperature is too high resulting in increased mortality of the vector. A minimum
temperature of 16oC restricts parasite development and also prevents the development of

Exploring Geospatial and Socio economic factors contributing for malaria prevalence in Aysaita Woreda, Afar Regional State, Ethiopia
34 Idris Mahmud, 2013
the vector in its aquatic stages. At 17oC parasites develop but not rapidly enough to cause
an epidemic (Lindsay et al., 2004).
Temperature is also one of the main meteorological parameters associated with malaria
transmission, and is a determining factor that aids in determining the persistence of
breeding sites, the duration of the larval development, the adult mosquito survival rate,
the duration of the gonotrophic and sporogonic cycles. Most of the Studies have indicated
that P. falciparum cannot be transmitted when the average daily temperature is below
18oC; likewise P. vivax transmission is usually impossible if the average daily
temperature is below 16oC. An average daily temperature of above 30
oC is lethal to the
sporogonic stages of the parasite within the mosquito vector. An average daily
temperature of above 30oC is also unfavorable to the vectors, as adult longevity may be
reduced especially in arid environment (FMoH, 2004). And also in some studies is says
up to 32oC.
This study area has average temperature of from 24 up to 31oC which fulfills the standard
temperature in between 16oC to 32oC suitable for malaria prevalence (FMoH, 2004).
Temperature data is collected from meteorology agency of Ethiopia for about 12 years
and from seven stations. Inside study area there were only three stations therefore I face a
problem on interpolation process in ArcGIS10.1
The layer was reclassified in to five classes and new values were assigned to each class
and based on this classification, 5, 4, 3, 2 and 1 values were given to the area with
temperature below 24 – 26oC, 26 – 27
oC, 27 – 28
oC, 28 – 29
oC and 29 – 31
oC,
respectively. Hence, the classes were labeled in the figure 3.12 as very high, high,
moderate, low and very low based on the level of vulnerability of those areas to malaria
incidence.

Exploring Geospatial and Socio economic factors contributing for malaria prevalence in Aysaita Woreda, Afar Regional State, Ethiopia
35 Idris Mahmud, 2013
Figure 3.12. Temperature map
3.4.1.4 Rainfall
One of the variables used in this study is rainfall data. Its grids were interpolated based
on rainfall point data from rainfall stations and covering the whole Division using kriging
technique in ArcGIS 10.1. The rainfall data of the study area was collected from
Meteorological agency of Ethiopia. It includes seven stations three of them are found
inside Aysaita Woreda and the other four stations are found in the surrounding the study
area and the layer were created by Inverse Distance Weight (IDW). The layer was
reclassified based on the amount of rainfall within that woreda. The amount of rainfall of
the study area doesn’t fulfill the standard rainfall amount mentioned in most of the
studies. It was reclassified in to five classes and new values were assigned to each class

Exploring Geospatial and Socio economic factors contributing for malaria prevalence in Aysaita Woreda, Afar Regional State, Ethiopia
36 Idris Mahmud, 2013
and based on this classification, 5, 4, 3, 2 and 1 values were given to the mean annual
rainfall 12mm and 79mm, respectively. The amount of rainfall on this study area is very
low. This may not contribute for malaria prevalence when compare to other factors.
Hence, the classes were labeled in the figure 3.13 as Very high, High, moderate, low and
Very low based on the level of amount of rainfall on those areas to malaria incidence.
Figure 3.13. Reclassified Rainfall map
3.4.1.5 Distance from River
In this study area there are two different rivers pass through it namely awash and Logia
River. Awash River which crosses nine kebeles and logia river crosses only one kebele.
Distance was computed from every river. The computed distance was reclassified based
on the maximum distance that mosquitoes can fly. Different literatures indicate that

Exploring Geospatial and Socio economic factors contributing for malaria prevalence in Aysaita Woreda, Afar Regional State, Ethiopia
37 Idris Mahmud, 2013
mosquitoes have typical flight ranges up to 2 km depending upon species (Kaya, et al.,
2001). Therefore, for this study, similar to the distance calculated around wetlands, new
classes of 0-2km, 2 – 5km, 5 – 10km, 10 – 15km and above 15km were computed and
assigned values of 5, 4, 3, 2, and 1 respectively. Then, each class shown in figure 3.14,
beginning from the class with the highest value, was labeled as very high, high, moderate,
low, and very low based on the degree of vulnerability of the area to malaria.
Figure 3.14. Distance from river map
3.4.2 Socio-Economic Factors for Identifying Malaria Risk Areas Mapping which is based on natural conditions is not sufficient but socio-economic
factors, such as population distribution, health facility distribution and land use should
also be included. Because it is then that one can better site the area where there is high
risk of Malaria and can at the same time locate people at risk.

Exploring Geospatial and Socio economic factors contributing for malaria prevalence in Aysaita Woreda, Afar Regional State, Ethiopia
38 Idris Mahmud, 2013
3.4.2.1 Distance from Health Facilities Assessing the location of health facilities is important, because it is necessary not only to
map risky areas but also to uncover the potential needs and the location of existing Health
facilities so that allocation of the new facilities can be done effectively.
The map shown in figure 3.15 was done by calculating distance from each health facility
and by reclassifying the distances in to 5 classes based on the lowest easily accessible
distance set by WHO. According to WHO (2003), areas found within 2- 3 km radius
from a health facility is assumed to be less risky than areas found beyond this distance.
Hence, classes of distances; 0-2km, 2 – 5km, 5-10km, 10 – 15km and 15- 62km were
computed in figure 3.15. The classes were given values of 1, 2, 3, 4 and 5 and scaled as
Very low, Low, moderate, high and very high respectively based on the degree of
vulnerability to the risk of malaria.
Figure 3.15. Distance from Health facilities map

Exploring Geospatial and Socio economic factors contributing for malaria prevalence in Aysaita Woreda, Afar Regional State, Ethiopia
39 Idris Mahmud, 2013
3.4.2.2 Landuse/Landcover
Land use land cover of an area play an important role in the abundance of malaria insect
differs in space and time. The type of land use land cover especially type of vegetation
which surrounds the breeding sites basically supply sugar feeding for adult mosquitoes,
and provided ideal sites for resting.
In the study area, in order to identify aquatic habitats and land cover types that affect the
survivorship of anopheline mosquito, Landsat ETM+ satellite image of the year 2011 was
classified using a supervised classification method in ArcGIS 10.1 software. A total of
four land-cover classes were identified: Bare land, Agriculture, Bush and Shrubs and
Water body. Ground truth was conducted by direct field inspection of 40 points
randomly, which assesses the accuracy of landuse and land cover classification.
Moreover, the landuse/ land cover map in figure 3.16 was reclassified in to four sub-
groups in order of susceptibility and suitability for malaria risk. Thus, the reclassified
version in figure 3.16 implies 1 to 4 values, where 1 stands for highly prone landuse/land
cover and 4 for less prone landuse / land cover for malaria. The different types of the
LULC of the study area are bare land, Bush and Shrubs, Farm land and the water body
respectively (table 3.5).
Water body laying over an extended land surface for long period of time. This water body
includes the Awash River, the awra (logia) river and the lake gorgori. The Awash River
separates the study area halfway. And the awra (logia) river intersects in the south part of
the study area. The lake gorgori located in the east part of the study area which is
bordered with Afambo woreda and Djibouti. The overall coverage of the water body is
almost 5% of the study area.
Bare land includes a molten rock laying over an extended land surface as a result of
volcanoes and the soil. It is unfertile and does not support crop production. It is not
compact enough to support construction of houses for residential purpose. Currently this
area is not serving for any use type and it covers 67% of the area. Located mostly in the
North West and some are in the south part of the study area.
Bush and Shrubs are one of the LULC types which are widely distributed in the area.
Located in the west, east and some are to the south part of the study area. These are

Exploring Geospatial and Socio economic factors contributing for malaria prevalence in Aysaita Woreda, Afar Regional State, Ethiopia
40 Idris Mahmud, 2013
largely used by the local peoples for the production of charcoal which supplement their
livelihood especially during the dry season of the year. This bush and shrubs are
destroying the agricultural lands and also the settlement areas.
Farm land: land used for cultivation of crops from Awash River. It is scarcely distributed
and mainly used for the production of maize and cotton. Population of the area were
largely adapting themselves with crop production as their main livelihood in the near past
but recently they are adapting themselves for charcoal production, the livestock is
decreasing from time to time. This because of the high speed distribution of the bush and
shrubs and proportion of each land-use land-cover type of the study area is summerized
in table 3.5.
Table 3.5. Land use/Land cover class for the year 2011.
No. Landuse/Land cover Area ( km2 ) Area (%)
1. Bare land 1159.77 67
2. Bush and shrubs 294.27 17
3. Agricalture 190.41 11
4. Water body 86.55 5
One of the most common means of expressing classification accuracy is the preparation
of a classification error matrix. Accordingly, classification error matrix was prepared
using the image used for this study, ground truth during field survey (the data collected
by GPS) and the final classified LULC map. The result indicated that an overall
classification accuracy of 80% and overall kappa statistics of 0.72. Producer and user
accuracy ranges from 66.67 - 100 percent and 60.00 – 100 percent respectively as
described in table 3.6.

Exploring Geospatial and Socio economic factors contributing for malaria prevalence in Aysaita Woreda, Afar Regional State, Ethiopia
41 Idris Mahmud, 2013
Table 3.6. Accuracy Assessment for Land use/Land cover
Class Reference (Field data) Classified Number
correct Producers Accuracy
Users Accuracy
Bush and shrubs 4 5 3 75.00% 60.00%
Agriculture 6 5 4 66.67% 80.00%
Water body 2 2 2 100.00% 100.00%
Bare land 28 28 25 89.67% 87.25%
Total 40 40 34
Figure 3.16. Land use/Land cover map of the year 2011.

Exploring Geospatial and Socio economic factors contributing for malaria prevalence in Aysaita Woreda, Afar Regional State, Ethiopia
42 Idris Mahmud, 2013
3.4.2.3 Population Density
The population data used for this study area is the 2010’s population data which is
obtained from Health office of the woreda. As it is indicated in figure 3.17, areas colored
dark brown are areas of high population density with the range of 254 – 444 person per
km2. These areas are dense because they are areas of urban settlement and also
agricultural land. The areas are Aysaita town with two kebele and berga kebele. The
second dense areas is only one kebele which is keredura kebele bordered with the Dubti
woreda, having population density of 149 person per km2. The third denser areas are four
kebeles namely ramaytu, karbuda, hinale and handeg. Having with the range of 38 – 148
people per km2. Finally, low denser areas in which classified as low and very low class
found in the border part of the woreda in four sides. The areas are mostly covered by
rocky lands and soil which is shown in the figure 3.16 above, having the range of 14 – 38
people per km2.
Figure 3.17. Reclassified Population Density map

Exploring Geospatial and Socio economic factors contributing for malaria prevalence in Aysaita Woreda, Afar Regional State, Ethiopia
43 Idris Mahmud, 2013
Chapter Four 4. Results and Discussion
4.1 Malaria cases versus Temperature
Temperature is an important factor that determines the distribution of the mosquito.
There is almost parallel or a positive relationship between malaria case (patients came to
the health facilities in the woreda and confirmed that they are positive to malaria with
laboratory tests) (figure 4.1) and temperature from January to February, April to May and
from October to December. The negative different flow of chat was seen in months from
April to June, August and November and December. The temperature of the study area
increases continuously from January up to June and from July it continuously decreases
up to December. But even if the temperature decreases, the malaria case remains
increasing. This means that the seasonality of temperature should be combined with other
climatic variables especially with rainfall as most of the time malaria epidemics are
related to the seasonal pattern of rainfall in Ethiopia.
Temperature also increases transmission of malaria by increasing the frequency with
which the vector takes blood meals, which increases the growth rate of vector populations
through shortening of the generation time. However, as I have mentioned before, the
temperature should be combined with the availability of rainfall for this to be effective.
The following graphs illustrate the relationship between malaria incidence and
temperature of the study area. Table 4.1 shows the min and max temperature of the study
area from seven stations (1999-2010). And figure 4.1 shows the malaria case versus the
temperature.
Table 4.1. Malaria cases and Min and Max Temperature (1999-2010)
Jan Feb Mar Apr May Jun Jul Aug Seb Oct Nov Dec
Min Temperature(oC) 24.4 25.3 27.7 29.8 31.9 32.3 30.5 30.4 32.4 30.1 28.8 25.3
Max Temperature(oC) 28.7 30.1 31.8 34.9 37.1 37.9 36.7 34.4 33.9 31.9 31 29.4
Malaria cases 9304 11777 9282 8232 9568 9016 9579 9724 10900 11831 10384 9342

Exploring Geospatial and Socio economic factors contributing for malaria prevalence in Aysaita Woreda, Afar Regional State, Ethiopia
44 Idris Mahmud, 2013
Figure 4.1. Malaria cases versus Temperature of 1999-2010
4.2 Malaria cases versus Rainfall There is small positive relationship between rainfall and malaria case from January up to
February, June to July and October to November as shown in Figure 4.2. Almost for 6
months the increment and decrement patterns of malaria cases and the rainfall are the
same. However, the relationship becomes negative on March, April, May, August,
September and December. The highest malaria case is seen in February and October. The
lower seasonal variability of malaria epidemics might be due to the availability of
irrigation practices around Awash River. Irrigation structures in the area might have
provided suitable breeding sites for mosquitoes during the dry season. Since mosquito-
breeding sites are equally available both in the dry and rainy season, such a very high
increase in malaria prevalence was not observed during and after the rainy season. The
humid environment, which is created through irrigation during the dry season, might have
enhanced vector longevity and resulted in lower seasonal variation of malaria epidemics.
The malaria transmission cannot be explained only by the rainfall but by the lag time in
mosquito breeding and parasite life cycle inside the mosquito, which are dependent on air
temperature and humidity together with rainfall.
8000
8500
9000
9500
10000
10500
11000
11500
12000
12500
20
22
24
26
28
30
32
34
36
38
40
Jan Feb Mar Apr May Jun Jul Aug Seb Oct Nov Dec
Temp.MIN Temp.MAX Malaria case
Tem
pera
ture
in (o c
)
(Months)
Mal
aria
case
s

Exploring Geospatial and Socio economic factors contributing for malaria prevalence in Aysaita Woreda, Afar Regional State, Ethiopia
45 Idris Mahmud, 2013
Concerning to the relationship between rainfall and malaria epidemics of the study area,
the following graphs in table 4.2 and figure 4.2 shows the monthly average rainfall and
malaria cases of Aysaita woreda from one Hospital and eight Health centers for the year
between 1997 – 2002 E.C.
Table 4.2. Mean annual Rainfall versus Malaria cases
Jan Feb Mar Apr May Jun Jul Aug Seb Oct Nov Dec Rainfall(mm) 1.75 6.025 13.8 14.2 1.53 3.51 23.6 56.7 13.99 5.74 3.49 5.96 Malaria cases 9304 11777 9282 8232 9568 9016 9579 9724 10900 11831 10384 9342
Figure 4.2. Malaria cases and mean annual Rainfall of 199-2010
4.3 Identifying malaria Hazard areas Malaria hazard area is mapped by depending on environmental factors that create
favorable condition for the survival of the vector Anopheles mosquitoes. These variables
are including rainfall, temperature, altitude, distance from River and Slope, by overlaying
these factors that areas vulnerable to malaria were identified. The overlay analysis was
done using ArcGIS software, after each factor was given the appropriate weight. The
factors were ranked in Table 4.3, according to the degree of importance that they have for
the incidence of malaria in this research. This was done based on the previous studies, by
consulting the malaria expert of Aysaita woreda, and by using weighted linear
combination method in IDRISI software. Pair wise Comparison of the five parameters
8000850090009500100001050011000115001200012500
0
10
20
30
40
50
60
Jan Feb Mar Apr May Jun Jul Aug Seb Oct Nov Dec
Rainfall(mm) Malaria case
Rain
fall
in (m
m)
Mal
aria
case
s
(Months)

Exploring Geospatial and Socio economic factors contributing for malaria prevalence in Aysaita Woreda, Afar Regional State, Ethiopia
46 Idris Mahmud, 2013
was carried out to develop the pair wise comparison matrix. Accordingly, the above
weights of factors in table 4.3, was computed, Combined and analyzed in ArcGIS
environment using spatial analyst tool after each factor was given the appropriate weight
in IDRISI software.
Table 4.3. Derived factor maps and weight of malaria hazard
Assessment of malaria Hazard area
No. Factors Weight (%) Class Rank Degree of vulnerability
1 Rainfall 45%
12 - 19mm 1 Very low 19 - 27mm 2 Low 27 - 35mm 3 Moderate 35 - 43mm 4 High 43 - 55mm 5 Very high
2 Temperature 26%
25 - 26oC 1 Very low 26 - 27oC 2 Low 27 - 28oC 3 Moderate 28 - 29oC 4 High 29 - 30oC 5 Very high
3 Elevation 14%
270 - 380 ASL 1 Very high 380 - 451 ASL 2 High 451 - 600 ASL 3 Moderate 600 - 925 ASL 4 Low 925 - 1378 ASL 5 Very low
4 Slope 7%
0 - 6 o 1 Very high 6 - 16o 2 High 16 - 33o 3 Moderate 33 - 58o 4 Low 58 - 356o 5 Very low
5 Distance from river 8%
0 - 2km 1 Very high 2 - 5km 2 High 5 - 10km 3 Moderate 10 - 15km 4 Low 15 - 62 km 5 Very low

Exploring Geospatial and Socio economic factors contributing for malaria prevalence in Aysaita Woreda, Afar Regional State, Ethiopia
47 Idris Mahmud, 2013
After the overlay analysis of the five factors namely; Rainfall, Temperature, Elevation,
Distance from River and Slope done, the following malaria hazard map in figure 4.3 was
produced.
Figure 4.3. Malaria Hazard Map

Exploring Geospatial and Socio economic factors contributing for malaria prevalence in Aysaita Woreda, Afar Regional State, Ethiopia
48 Idris Mahmud, 2013
The malaria hazard map, in figure 4.3, illustrates that 18.83 km
2 very high, 787.68 km
2
high, 763.92 km2
moderate, 157.21 km2Low and 3.33 km2 Very low level of malaria
vulnerability, that are representing from the total area 1.1%, 45.5%, 44.1%, 9.1%and
0.2% of the study area respectively subject to very high, high, moderate, low and very
low level of malaria susceptibility. Hence, from these figures it is possible to conclude
that over 46.6%of the total areas are in high and very high malaria hazard, 44.1% of the
total areas are in Moderate malaria hazard and the remaining area was 9.3% as low
malaria Hazard area.
4.4 Identifying area of malaria at risk In fighting against Malaria, hazard mapping which is based on natural conditions is not
sufficient, but socio-economic factors, such as population density, distribution of health
facilities, and land use land cover should also be included. Because, it is only then that
one can cite the area where there’s high risk of malaria. The malaria hazard map,
Population distribution map, health facilities map, and land use land cover map were
multiplied and malaria risk indicator map which is shown in figure 4.4 was created. As I
have mentioned in the methodology part, the basis for the calculation of the map was the
risk computation model developed by shook (1999).
Risk = Hazard * Element at Risk * Vulnerability
As it is indicated above, the mapping of malaria risk includes hazard, element at risk, and
vulnerability. The malaria hazard layer was computed by overlaying the five selected
causative factors which includes Rainfall, Temperature, elevation, Distance from river
and slope the element at risk layer was developed by reclassifying population density
layer. Moreover, vulnerability layer was developed by reclassifying land use/ land cover
layer on the basis of the degree of susceptibility of each landuse/ land cover to malaria
and by computing and reclassifying distance from the existing health facilities layers. The
layers were prioritized according to their degree of influence. Pair wise comparison of the
four parameters was carried out to develop the following weights in Table 4.4.The
weights given for the factors in table 4.4, was computed, Combined and analyzed in

Exploring Geospatial and Socio economic factors contributing for malaria prevalence in Aysaita Woreda, Afar Regional State, Ethiopia
49 Idris Mahmud, 2013
ArcGIS environment using spatial analyst tool. The map in Figure 4.4 showing areas of
malaria risk was produced.
Table 4.4. Derived factor maps and weight of Malaria Risk
Assessment of malaria Risk area
No. Factors Weight (%) Class Rank Degree of
vulnerability
1 Hazard 56%
1 Very high
2 High
3 Moderate
4 Low
5 Very low
2 Population density 26%
14 - 18 1 Very low
18 - 38 2 Low
38 - 148 3 Moderate
148 - 254 4 High
254 - 444 5 Very high
3 Health Facility 11%
0 - 2km 1 Very high
2 - 5km 2 High
5 - 10km 3 Moderate
10 - 15km 4 Low
15 - 62km 5 Very low
4 Landuse/Landcover 7%
Water body 1 Very high
Agriculture 2 High
Bush and shrubs 3 Moderate
Bare land 4 Low

Exploring Geospatial and Socio economic factors contributing for malaria prevalence in Aysaita Woreda, Afar Regional State, Ethiopia
50 Idris Mahmud, 2013
After the overlay analysis of the four factors, the following malaria hazard map in figure
4.4 was produced.
Figure 4.4. Malaria Risk Map
In this study, to map malaria risk areas four factors were used as input factors namely;
Malaria Hazard, population density, distribution of health facilities and landuse/land
cover. As a result, the risk map shows 804 km2, 921.6 km2 and 5.4 km2of the total area is

Exploring Geospatial and Socio economic factors contributing for malaria prevalence in Aysaita Woreda, Afar Regional State, Ethiopia
51 Idris Mahmud, 2013
subject to High, Moderate and Low respectively (figure 4.4). That are representing in
percent from the total area 46.45%, 53.24% and 0.31% of the study area respectively.
Hence, it is possible to conclude that 99.69% of the study area is under epidemic area
(high and moderate). This seems due to the availability of favorable climatic condition to
the vector mosquito, the presence of water body around Awash River and the overflow of
Awash River during rainy season in high lands which will create the breed site. The slope
of the area is nearly level to gentle slope and the availability of large number of people
with lower health facility. Moreover, the existence of the green area might have provided
more shelter and sites for resting for adult mosquitoes, which extends their longevity and
density. Only 0.31% is in low epidemic area. This due to the areas located at higher
altitude and rocky land in the north part of the study area.
4.5 Comparing malaria Risk map with kebeles which are labeled as
Malarious by woreda health bureau In general, the whole woreda is in risk of malaria as labeled as malarious by the woreda
bureau (figure 4.5). Almost all of the kebeles in the study area are subject to high and
moderate risk of malaria. Among them Galifage, Ramaytu, Karbuda, Gelealo and
Mamule are almost fully in high malaria risk. Some part of Gehertu, Handeg, Ehayle and
hinale are subject to high risk of malaria moreover the remaining part of these Kebeles is
under moderate risk of malaria. This seems due to the availability of favorable climatic
condition to the vector mosquito, the presence of water body around Awash River and the
overflow of Awash River during rainy season in high lands which will create the breed
site, Additionally the degree of slope for these areas nearly level to gentle slope, and the
presence of large number of people in the area. Moreover, the existence of green area
might have provided food and more shelter for resting for adult mosquitoes, which
extends their longevity and density. It should be noted that the population of these at high
risk malarious kebeles are 20,453 people which is about 26% of the total population in
the Woreda. The low risk areas are found in some part of Gehertu Kebele and Aysaita
town. This seems due to the presence of high slope area, rocky land and no water body in
the area. These conditions together make uncomfortable situation for the vector malaria.

Exploring Geospatial and Socio economic factors contributing for malaria prevalence in Aysaita Woreda, Afar Regional State, Ethiopia
52 Idris Mahmud, 2013
Figure 4.5. Kebele wise malaria risk map
Malaria Risk Model Verification The validity of the model was checked against health facility based malaria case repot
which reflects the malaria risk zone of the area. Based on data collected from health
bureau is monthly health facility based report from 1997 up to 2002 Ethiopian calendar,
where out of nine health facility, five are on high risk zone also these five health facility
are reports high malaria case than others as shown in figure 4.6. And the rest of four

Exploring Geospatial and Socio economic factors contributing for malaria prevalence in Aysaita Woreda, Afar Regional State, Ethiopia
53 Idris Mahmud, 2013
health facilities are on moderate as shown in table 4.5. The Figure 4.7 shows that the
Comparism of the health facility reports with malarias risk area and figure 4.6 shows that
the line indicates the malaria case recorded in each Health facility and the color shows
the level of the risk.
Table 4.5. Comparison of Malaria cases data with risk model result.
Health center Easting Northing Malaria cases
Malaria risk model result
Galifage 753860 1288833 15752 High Ramaytu 755606 1283225 15445 High Kebele02 761435 1282764 10119 Moderate Kebele01 764761 1280389 11556 Moderate
Berga 768889 1275923 12672 Moderate Mamule 773810 1273436 13736 High Hamdeg 783528 1283448 13668 High
Ehaile 769418 1284357 13314 High Gehertu 768942 1300866 12477 Moderate
Figure 4.6. Comparison of Health center cases versus malaria risk
90001000011000120001300014000150001600017000
malaria case(Health facilities)
(Mal
aria
case
s)

Exploring Geospatial and Socio economic factors contributing for malaria prevalence in Aysaita Woreda, Afar Regional State, Ethiopia
54 Idris Mahmud, 2013
Figure 4.7. Comparison of Health center cases versus malaria risk.
Exploring Geospatial and Socio economic factors contributing for malaria prevalence in Aysaita Woreda, Afar Regional State, Ethiopia
55 Idris Mahmud, 2013
Chapter Five 5. Conclusion and Recommendation
5.1 Conclusion The main purpose of the study was achieved by identifying possible environmental and
socio-economic conditions that contribute for malaria spread in Aysaita Woreda.
Furthermore, the study produced mapping of malaria risk area which can be used as an
input for policy makers and other responsible bodies. Besides these groups, the experts in
the field will benefit more by acquiring readymade information which serves as a spring
board for national malaria eradication and prevention program.
The hazard map was produced depending upon the physical parameters which are
capable of providing fertile environmental situations for mosquito breeding. The study
focused on Rainfall, Temperature, elevation, slope and distance from rivers as the factors
of malaria incidence having 45%, 26%, 14%, 7% and 8% weights respectively in the
overlay analysis. The malaria incidence and transmission requires the environment with
lower elevation (higher temperature), occurrence of gentle slopes and availability of still
waters around rivers. Hence, from the result of the overlay analysis of the physical
parameters shows, from the total area 1.1%, 45.5%, 44.1%, 9.1% and 0.2% of the study
area subject to very high, high, moderate, low and very low level of malaria
susceptibility. It is possible to conclude that about 46.6% of the total areas are in high and
very high malaria hazard. In addition, Galifage, Ramaytu, Karbuda, Berga, Aysaita,
Keredura, Mamule and Gelealo kebeles were highly found to be under malaria hazard.
This is mainly due to the availability of aquatic bodies and irrigation practices in the
study area.
The risk computation model was used to achieve the final output (Malaria Risk map).
Similarly, after producing the hazard map, the malaria risk map was produced depending
upon the overlay analysis of malaria hazard map, element at risk (Population density) and
Vulnerability parameters like distance from health facility and Landuse/Land cover. The
factors had 56%, 26%, 11% and 7% of weights in the overlay analysis respectively. The
result indicated that 46.45%, 53.24% and 0.31% of the total area are subjected to High,
Moderate and Low respectively. Almost half of the area about 46.45% is under high risk
Exploring Geospatial and Socio economic factors contributing for malaria prevalence in Aysaita Woreda, Afar Regional State, Ethiopia
56 Idris Mahmud, 2013
of malaria. Including Galifage, Ramaytu, Karbuda, Mamule and Gelealo kebele. And half
of the total areas of some kebeles are at high malaria risk namely: Hinale, Handeg,
Ehayle and Gehertu kebele. This is not only due to the physical parameters but also the
existence of suitable landuse/land covers for mosquito breeding and also some fields
partially flooding, possibly due to some broken irrigation canals will occur due to the
high rainy season in the high lands, the kebeles found in moderate risk areas are 53.24%
of the total area, namely: 01, 02 and berga kebele. Hence, it is possible to conclude that
99.69% of the study area is under epidemic area (high and moderate). This shows that,
the final malaria risk map of the study area only 0.31% is in low epidemic area.
5.2 Recommendation The final malaria risk map of the study area shows, there is no area within Aysaita
Woreda with malaria free risk level. Since maps are considered as one of the very vital
input it is therefore, important to use them in every aspect of planning, implementation,
monitoring and evaluation of any development processes as well as malaria eradication
and prevention program in the Woreda. Therefore, Based on the finding of this study, the
following Recommendation were given as follows:-
My first recommendation will be the woreda must develop to use RS and GIS
technique to identify ecology of mosquito and other vector born disease. This
technique will help them to know the rate of the yearly status of malaria in the
woreda and will help the decision-makers to better allocate limited resources in
the fight against the disease.
To increase the health facilities in the woreda, health professionals and better
management, this is necessary for reduction and elimination of malaria from the
woreda and to give more training on malaria prevention and way of transmission.
Almost all people use traditional treatment for any disease.
Distribution of malaria nets, insecticide spraying and environmental measures
must be follow priority set by malaria risk map developed in this study.

Exploring Geospatial and Socio economic factors contributing for malaria prevalence in Aysaita Woreda, Afar Regional State, Ethiopia
57 Idris Mahmud, 2013
The identified environmental factors that are known very conducive for the
multiplication of the vectors such as clearing of Bushes and shrubs around the
house and laying rainfall water, keeping environmental sanitation by avoid old
vessels, tires, cans, pots. from the residential areas. These have to be done through
promoting voluntary participation of the community at large.

Exploring Geospatial and Socio economic factors contributing for malaria prevalence in Aysaita Woreda, Afar Regional State, Ethiopia
58 Idris Mahmud, 2013
Reference Abdlesemed Jamal (2012), Remote Sensing and Web Based GIS application for
malaria risk control, a case study of Abeshge woreda, Gurage Zone, Ethiopia.
Addis Ababa University.
Alen L. Melnick (2002) Introduction to Geographic Information Systems in Public
Health. An Aspen Publication, Mary Land, USA.
Aster tiruneh (2010). GIS and Remote Sensing Based Assessment of Malaria Risk
Mapping for Boricha Woreda, Sidama Zone, SNNP Region, Addis Ababa
university.
Boulos MNK, Roudsari AV, Carson ER. Health geomatics: An enabling suite of
technologies in health and healthcare. J Bio Informatics 2001; 34 : 195-219.
CDC. (2004). Centers for Disease Control and Prevention. Department of Health and
Human Services. [http://www.cdc.gov/malaria/biology/. On 27 app 2013,
09:38am.
Chin W, Contacos PG, Coatney RG, Kimbal HR, 1965. Naturally acquired quotidian-
type malaria in man transferable to monkeys. Science 149:865.
Coggeshall L.T. (1940) The occurrence of malaria antibodies in human serum
following induced infection with Plasmodium knowlesi. The Laboratories of
the International Health Division of the Rockefeller Foundation, New York.
Covell G. Malaria in Ethiopia. Journal of Tropical Medicine and Hygiene. 1957;60:7–
16. [Pub Med].
Federal democratic republic of Ethiopia, ministry of health. Malaria Prevention and
control Extension Package. September 2003.
Federal Ministry of Health (FMH): Malaria and Other Vector-borne Diseases Control
Unit. Addis Ababa, Ethiopia: Federal Ministry of Health of Ethiopia; 1999.
FMoH (2004). Source Malaria Diagnosis and Treatment Guidelines for Health
Workers in Ethiopia. 2nd Edition Addis Ababa, Ethiopia.
Ghebreyesus T, Berhane Y, Hailemariam D. Kloos H (editors) (2006):
“Epidemiology and Ecology of Health and Disease in Ethiopia”. Addis
Ababa, Ethiopia: Shama Books; 2006: 556-576.

Exploring Geospatial and Socio economic factors contributing for malaria prevalence in Aysaita Woreda, Afar Regional State, Ethiopia
59 Idris Mahmud, 2013
Gill CA. The rôle of meteorology in malaria. Indian Journal of Medical Research.
1920; 8:633–693.
Gilles, H.M. and Warrell, D.A. (1993). Bruce- Chewatt’s Essential malariology. 3rd
edition. Arnold. London.
Graves PM, Individual, household and environmental risk factors for malaria
infectionin Amhara, Oromia and SNNP regions of Ethiopia.(2009).
Grover-Kopec. K, Blumenthal. B, Ceccato. P, Tufa. D, Omumbo. A and Connor. J
(2006). Web- based climate information resources for malaria control in
Africa. Malaria Journal 5:38. http://www.unicef.org/ethiopia/malaria.html,
accessed online march 14/2013.
Jeefoo, P., Tripathi, N.K., Hara S., 2008. Analytical hierarchy process modeling for
malaria risk zonation in Kanchanaburi, Thailand. In: International Symposium
on Geoinformatics for Spatial Infrastructure Development in Earth and Allied
Sciences, 4–6 December, Vietnam.
Jenness, J., (2007). Some Thoughts on Analyzing Topographic Habitat
Characteristics. Jenness Enterprises 3020 N, Schevene Blvd. Flagstaff, AZ
86004 USA.
Konradsen, F.; Amerasinghe, F. P.; van der Hoek, W.; Amerasinghe, P. H. 2000.
Malaria in Sri Lanka: Current knowledge on transmission and control.
Colombo, Sri Lanka: International Water Management Institute.
Lindsay, S.W. and Bayoh, N. M. (2004). Mapping member of the Anopheles gambiae
complex using climatic data. Physiol. Entomol. 29: 204-209.
Malhotra M.S. and ArunaSrivastava (1995), Diagnostic Features of Malaria
Transmission in Nadida Using Remote Sensing and GIS.
McCutchan TF, Piper RC, Makler MT, 2008. Use of Malaria Rapid Diagnostic Test
to Identify Plasmodium knowlesi Infection. Emerging Infectious Diseases
14:11.
Munga, S., Minakawa, N., Zhou, G., Mushinzimana, E., Barrack, J., Githeko, K., and
Yan, G. (2006). Association between Land Cover and Habitat Productivity of
Malaria Vectors in Western Kenyan Highlands. American Journal of
Tropical Medicine and Hygiene 74:69-75.

Exploring Geospatial and Socio economic factors contributing for malaria prevalence in Aysaita Woreda, Afar Regional State, Ethiopia
60 Idris Mahmud, 2013
Praveen Kumar Rai, M.S. Nathawat Abhishek Mishra Department of Geography,
Banaras Hindu University, Varanasi. Role of GIS and GPS in Vector Born
Disease Mapping: A Case Study. Journal of GIS Trends, Vol 2, No 1 (2011).
Saaty TL: A scaling method for priorities in hierarchical structures. Journal of
Mathematical Psychology 1977, 15:234-281.
Shook, G (1997), An assessment of disaster risk and its management in Thailand,
Disasters 21(1): 77-88.
The President’s Malaria Initiative, Fifth Annual Report to Congress April 2011,
USAID.
The public health burden of Plasmodium falciparum malaria in Africa: Deriving the
numbers. By Robert W. Snow. Working Paper No. 11, Disease Control
Priorities Project. Bethesda, Maryland: Fogarty International Center, National
Institutes of Health. August 2003.
USAID, (2011). Malaria operational plan (MOP), President’s malaria initiative in
Ethiopia,
Vanessa moss and logia councilors, August 2009, a study on protection and
preservation of natural environment in afar region state of federal Democratic
Republic of Ethiopia. Page 5
WHO (2012). World Health organization, Generic risk assessment model for
insecticide-treated nets.
WHO (2012). World malaria report. WHO Global malaria program. Malaria -
prevention and control.
WHO (2012) fact sheet. Publication date: 2012, http://www.who.int/entity/malaria/
publications/world_malaria_report_2012/wmr2012_factsheet.pdf/ page
number - 1
WHO, Horn Africa initiative, Cross border review and planning meeting on malaria
control between Djibouti, Ethiopia and Somalia. 2003.
WHO, World malaria report 2012, accessed online march 14/2013. http://www.
who.int/mediacentre/news/releases/2012/malaria_20120424/en/index.html.

Exploring Geospatial and Socio economic factors contributing for malaria prevalence in Aysaita Woreda, Afar Regional State, Ethiopia
61 Idris Mahmud, 2013
Wim van der Hoek, Flemming K, Priyanie HA, Devika P, Piyaratne MK, Felix P A.,
2003. Towards a risk map of malaria for Sri Lanka: the importance of house
location relative to vector breeding sites .International Journal of
pidemiology,Volume 32, Issue 2: 280-285.
Yazoume Ye, Osman Sankoh, BocarKouyate and Rainer Sauerborn (2008)
Environmental Factors and Malaria Transmission Risk Modeling the Risk in a
Holoendemic Area of Burkina Faso. Ashgate Publishing Company, USA.

Exploring Geospatial and Socio economic factors contributing for malaria prevalence in Aysaita Woreda, Afar Regional State, Ethiopia
62 Idris Mahmud, 2013
Annex Annex 1. Health center based malaria report.
Annex 2. Health facility GPS data.
Annex 3. Meteorology data.
Annex 4. Satellite image 2011.
Annex 5. Ground truth data.
Annex 6. Picture of Aysaita.

Exploring Geospatial and Socio economic factors contributing for malaria prevalence in Aysaita Woreda, Afar Regional State, Ethiopia
63 Idris Mahmud, 2013
Annex 1. Health center based malaria report. Health center based report 1997 E.C
Month Galifage Ramaytu Kebele2 Kebele1 Berga Mamule Handeg Ehaile Gehertu Total Jul 271 234 134 156 154 213 225 204 172 1763 Aug 289 235 102 142 176 215 204 185 180 1728 Sep 176 194 89 97 76 132 126 172 142 1204 Oct 145 123 108 100 122 148 117 181 169 1213 Nov 247 264 158 195 218 161 185 227 249 1904 Dec 321 285 193 216 226 213 249 256 194 2153 Jan 302 243 148 169 183 272 251 261 205 2034 Feb 278 314 165 201 191 236 200 187 193 1965 Mar 371 342 182 220 263 215 289 256 165 2303 Apr 294 302 145 166 182 194 243 158 132 1816 May 241 192 156 180 195 212 226 146 128 1676 Jun 223 245 151 174 163 195 176 189 175 1691
Health center based report 1998 E.C Month Galifage Ramaytu Kebele2 Kebele1 Berga Mamule Handeg Ehaile Gehertu Total
Jul 199 176 123 132 150 144 153 120 123 1320 Aug 201 233 130 153 186 200 174 159 146 1582 Sep 221 203 156 169 188 214 191 134 125 1601 Oct 145 135 98 103 122 132 120 117 111 1083 Nov 254 229 155 182 195 221 189 206 253 1884 Dec 215 228 127 169 213 216 194 181 176 1719 Jan 327 304 184 202 210 250 238 276 213 2204 Feb 187 179 143 161 137 186 125 122 117 1357 Mar 206 216 131 156 152 194 188 196 173 1612 Apr 365 347 184 235 237 258 276 293 241 2436 May 278 297 168 191 192 237 223 197 210 1993 Jun 272 281 179 207 212 205 213 221 202 1992
Health center based report 1999 E.C Month Galifage Ramaytu Kebele2 Kebele1 Berga Mamule Handeg Ehaile Gehertu Total Jul 185 208 154 172 187 193 184 179 185 1647 Aug 210 194 154 181 193 205 197 199 175 1708 Sep 182 170 147 162 191 173 190 128 115 1458 Oct 171 163 102 128 154 127 141 186 169 1341 Nov 165 173 121 130 133 143 158 144 161 1328 Dec 124 136 98 103 121 129 120 120 114 1065 Jan 113 140 87 91 100 127 125 131 126 1040 Feb 185 173 105 115 134 156 172 168 143 1351 Mar 140 138 101 112 119 132 134 116 109 1101 Apr 197 207 123 158 164 178 192 182 162 1563 May 276 259 160 178 201 243 262 200 219 1998 Jun 123 132 85 94 102 125 116 122 105 1004

Exploring Geospatial and Socio economic factors contributing for malaria prevalence in Aysaita Woreda, Afar Regional State, Ethiopia
64 Idris Mahmud, 2013
Health center based report 2000 E.C Month Galifage Ramaytu Kebele2 Kebele1 Berga Mamule Handeg Ehaile Gehertu Total
Jul 172 183 124 156 158 185 191 148 179 1496 Aug 204 217 137 187 192 201 192 200 193 1723 Sep 192 209 143 185 191 169 219 143 185 1636 Oct 205 198 152 170 179 158 157 172 207 1598 Nov 230 211 156 187 195 192 200 212 201 1784 Dec 148 157 120 156 178 129 147 153 104 1292 Jan 205 211 167 146 155 163 124 136 148 1455 Feb 221 228 124 155 172 198 186 201 195 1680 Mar 149 186 149 134 160 161 130 162 124 1355 Apr 216 234 156 182 225 213 203 216 205 1850 May 178 183 132 125 124 153 174 156 143 1368 Jun 169 175 135 149 164 158 179 177 169 1475
Health center based report 2001 E.C Month Galifage Ramaytu Kebele2 Kebele1 Berga Mamule Handeg Ehaile Gehertu Total
Jul 206 213 143 162 181 195 179 191 183 1653 Aug 392 345 188 224 286 301 331 314 287 2668 Sep 186 207 155 160 182 190 187 177 154 1598 Oct 192 167 134 155 180 194 196 201 176 1595 Nov 201 172 123 127 152 133 159 162 144 1373 Dec 142 124 122 139 183 152 139 142 98 1241 Jan 127 131 120 143 125 172 166 116 114 1214 Feb 185 190 145 158 173 179 182 168 171 1551 Mar 278 253 152 191 225 251 216 241 221 2028 Apr 281 268 153 184 204 241 253 230 207 2021 May 202 194 155 167 183 192 188 175 169 1625 Jun 186 192 121 146 165 197 173 169 159 1508
Health center based report 2002 E.C Month Galifage Ramaytu Kebele2 Kebele1 Berga Mamule Handeg Ehaile Gehertu Total
Jul 191 203 126 156 147 162 136 151 153 1425 Aug 368 391 177 213 203 256 261 270 229 2368 Sep 215 223 169 172 189 212 206 209 190 1785 Oct 172 176 127 153 164 158 165 152 135 1402 Nov 148 127 118 129 142 165 138 174 154 1295 Dec 192 205 137 151 178 162 186 177 158 1546 Jan 215 189 124 158 167 205 214 163 197 1632 Feb 235 219 162 158 192 221 204 217 212 1820 Mar 322 295 163 172 201 257 275 266 250 2201 Apr 284 273 176 192 233 245 236 241 265 2145 May 234 207 153 163 185 233 207 215 227 1824 Jun 210 195 135 151 197 189 203 198 194 1672

Exploring Geospatial and Socio economic factors contributing for malaria prevalence in Aysaita Woreda, Afar Regional State, Ethiopia
65 Idris Mahmud, 2013
Annex 2. Health facility GPS data Health center Easting Northing
Galifage 753860 1288833
Ramaytu 755606 1283225
Kebele02 761435 1282764
Kebele01 764761 1280389
Berga 768889 1275923
Mamule 773810 1273436
Handeg 783528 1283448
Ehaile 769418 1284357
Gehertu 768942 1300866

Exploring Geospatial and Socio economic factors contributing for malaria prevalence in Aysaita Woreda, Afar Regional State, Ethiopia
66 Idris Mahmud, 2013
Annex 3. Meteorology data
Month Temp 1999 2000 2001 2002 2003 2004 2005 2006 2007 2008 2009 2010
Ays
aita
Tem
pera
ture
dat
a(19
99-2
010)
Jan MIN 19.9 19.3 19.4 21.0 21.0 22.0 20.5 20.7 32.0 32.6 31.4 32.6
MAX 33.2 32.1 31.6 32.9 33.4 33.1 32.9 33.0 21.0 20.3 20.0 20.6
Feb MIN 20.4 19.7 20.5 21.1 22.1 20.9 21.1 22.1 34.9 32.9 34.0 33.5
MAX 34.7 34.1 34.0 34.1 35.7 33.8 35.4 34.5 22.2 19.5 21.4 22.0
Mar MIN 23.0 22.6 22.8 23.7 23.9 22.2 24.4 23.3 37.1 36.7 36.5 36.2
MAX 35.5 36.3 35.8 36.9 36.7 36.4 37.2 37.0 23.4 20.0 23.0 23.4
Apr MIN 26.5 24.9 24.4 24.8 25.3 25.6 25.1 25.0 38.5 39.3 38.6 39.5
MAX 39.9 38.7 39.4 38.4 38.6 37.8 39.0 37.8 25.0 24.3 25.0 35.1
May MIN 28.5 27.5 24.5 27.2 27.4 26.5 27.6 27.2 41.5 41.4 41.4 41.5
MAX 42.3 41.7 42.1 42.3 41.9 41.9 40.7 41.4 28.1 26.9 26.8 28.7
Jun MIN 27.2 29.3 24.1 29.0 29.5 28.1 28.7 29.1 42.3 42.5 43.4 34.9
MAX 42.7 43.4 43.8 43.0 42.5 42.1 42.5 42.8 28.8 28.7 29.6 25.2
Jul MIN 22.3 27.0 27.4 29.9 28.3 28.5 28.8 27.9 39.3 41.4 41.2 24.4
MAX 40.4 41.5 41.3 42.8 41.2 41.2 32.4 40.8 26.0 28.0 28.2 37.2
Aug MIN 39.9 24.5 26.4 27.7 25.5 26.5 23.4 25.6 38.7 40.5 41.0 25.1
MAX 27.5 38.6 38.6 41.1 37.9 40.0 40.2 38.8 26.2 26.9 28.2 28.5
Seb MIN 38.4 26.9 26.1 27.3 27.9 26.6 24.8 27.1 39.4 40.4 41.1 42.3
MAX 24.7 39.0 38.7 40.0 39.2 39.3 38.4 38.8 27.1 27.5 27.5 27.2
Oct MIN 35.6 24.2 25.3 25.1 24.0 24.3 27.2 24.2 37.3 38.0 33.7 42.7
MAX 21.7 36.7 37.7 38.8 37.6 37.3 42.3 37.5 24.2 24.5 22.5 22.3
Nov MIN 33.9 22.8 21.4 22.9 22.8 22.3 29.0 22.5 34.7 34.3 38.6 40.4
MAX 20.5 34.1 34.7 36.9 35.1 35.2 38.5 34.8 22.3 22.5 27.4 30.4
Dec MIN 31.7 20.8 17.1 22.5 20.5 20.9 25.0 22.1 32.7 32.1 28.6 29.6
MAX 27.3 32.7 33.4 32.9 32.6 33.0 30.5 32.9 20.2 19.7 29.5 28.4

Exploring Geospatial and Socio economic factors contributing for malaria prevalence in Aysaita Woreda, Afar Regional State, Ethiopia
67 Idris Mahmud, 2013
Ays
aita
rain
fall
data
(199
9-20
10) Month 1999 2000 2001 2002 2003 2004 2005 2006 2007 2008 2009 2010 AVERAGE
Jan 0 0 0 3.8 0 3 0 0 1.2 0 13 0 1.75 Feb 0 0 0 0 45.6 0 0 1.2 0.3 0 0 25.2 6.03 Mar 36.6 0 15 5.1 0 38 31.2 15 7.5 0 0 18.1 13.88 Apr 0 37.1 1.2 20.7 40.5 13.2 21 17.6 6.8 13.2 0 0 14.3 May 0 0.4 2.7 4.8 0 0 0 0 0.2 6.5 0 3.8 1.53 Jun 0 0 0 0 7.3 3.2 25.3 0 0 0 0 6.3 3.51 Jul 8 37 39.8 0 18.1 12.4 23.6 54.6 23.7 13.4 23.06 Aug 18.4 105.6 43.1 32.4 117.4 22.8 132 36.4 31.3 27.9 56.73 Sep 31.9 8.1 24.8 3.2 2.8 27.5 2 24.3 9.9 5.4 13.99 Oct 30.7 15.7 0 0 0 0.4 0 3.4 1.5 5.74 Nov 0 30.8 0 0 0 0 0 0 0.6 3.49 Dec 0 2.8 0 15.2 23.4 1.6 16.6 0 0 0 5.96

Exploring Geospatial and Socio economic factors contributing for malaria prevalence in Aysaita Woreda, Afar Regional State, Ethiopia
68 Idris Mahmud, 2013
Annex 4. Ground truth data S.No. Easting Northing Class
1 753405 1307579 Bare Land 2 773475 1276919 Bare Land 3 748005 1289969 Bush and Shrubs 4 764475 1273889 Bare Land 5 784095 1284419 Bush and Shrubs 6 756765 1285619 Agriculture 7 760155 1295520 Bare Land 8 772005 1277400 Agriculture 9 757755 1284420 Agriculture
10 774165 1290570 Bare Land 11 782295 1234230 Bare Land 12 756255 1281660 Agriculture 13 770775 1296960 Bare Land 14 783075 1281810 Agriculture 15 769305 1290360 Bare Land 16 767685 1298940 Bare Land 17 759615 1305780 Bare Land 18 771285 1297950 Bare Land 19 767745 1306890 Bare Land 20 771075 1258260 Bare Land 21 788595 1280070 Water body 22 775185 1273440 Bush and Shrubs 23 754545 1305240 Bare Land 24 783675 1222020 Bare Land 25 751155 1309140 Bare Land 26 757815 1310760 Bare Land 27 763635 1289940 Bare Land 28 761175 1307340 Bare Land 29 753165 1291350 Bare Land 30 776685 1288620 Bare Land 31 764925 1309740 Bare Land 32 778305 1258650 Agriculture 33 784545 1288530 Water body 34 765315 1289160 Bare Land 35 764925 1275000 Bush and Shrubs 36 773475 1298940 Bare Land 37 761805 1300680 Bare Land 38 778575 1291440 Bare Land 39 761655 1304010 Bare Land 40 749565 1291980 Bare Land

Exploring Geospatial and Socio economic factors contributing for malaria prevalence in Aysaita Woreda, Afar Regional State, Ethiopia
69 Idris Mahmud, 2013
Annex 5. Satellite image of 2011

Exploring Geospatial and Socio economic factors contributing for malaria prevalence in Aysaita Woreda, Afar Regional State, Ethiopia
70 Idris Mahmud, 2013
Annex 6. Photos of Aysaita.
Plate 1. Sugar cane production in Aysaita woreda
Plate 2. Maize crop production around Awash River
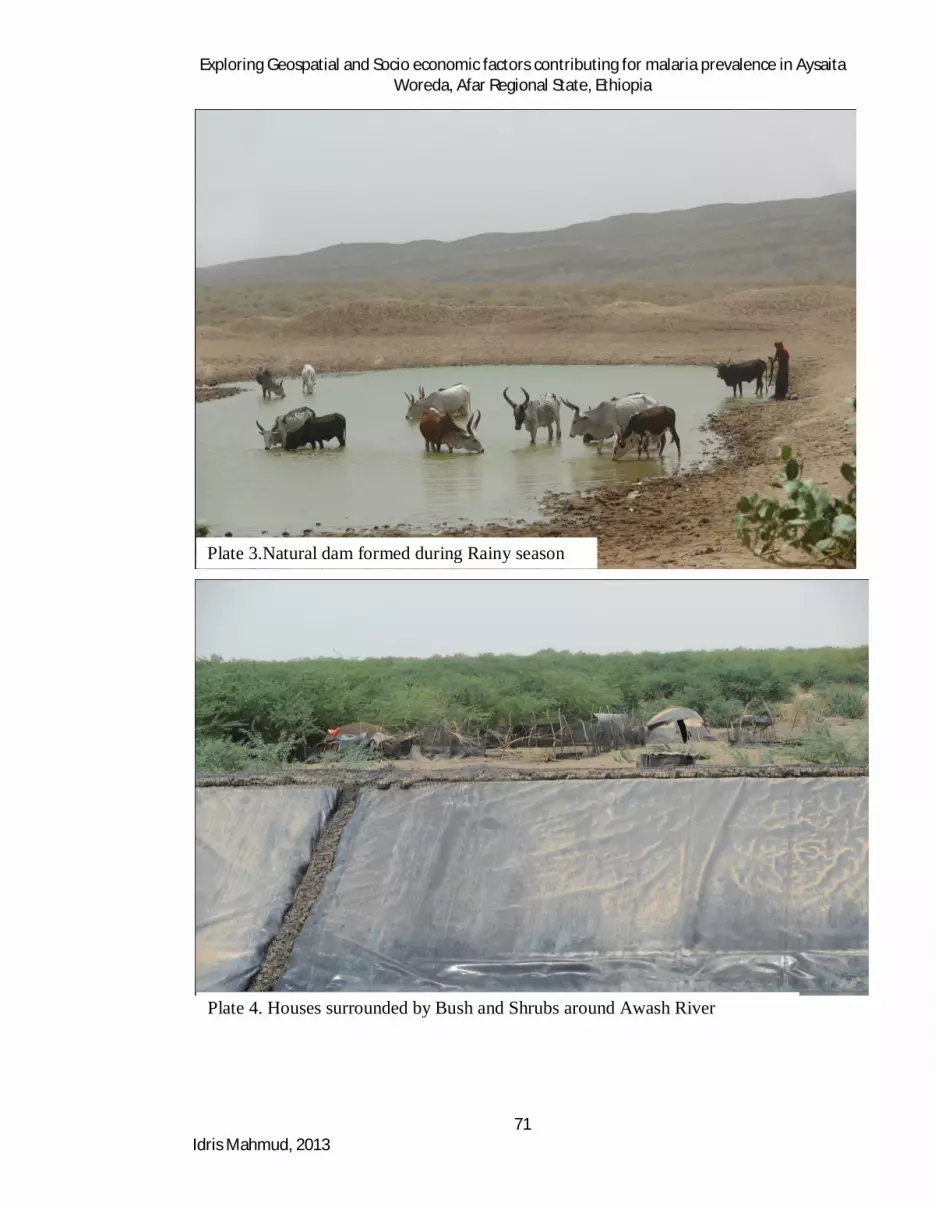
Exploring Geospatial and Socio economic factors contributing for malaria prevalence in Aysaita Woreda, Afar Regional State, Ethiopia
71 Idris Mahmud, 2013
Plate 3.Natural dam formed during Rainy season
Plate 4. Houses surrounded by Bush and Shrubs around Awash River

Exploring Geospatial and Socio economic factors contributing for malaria prevalence in Aysaita Woreda, Afar Regional State, Ethiopia
72 Idris Mahmud, 2013
Plate 5. The photo shows the reproduction site of mosquito around Awash River