Embed Size (px)
Citation preview
TanGeoMS: Tangible Geospatial Modeling System
Laura G. Tateosian, Member, IEEE, Helena Mitasova, Brendan A. Harmon,Brent Fogleman, Katherine Weaver, and Russel S. Harmon
Abstract—We present TanGeoMS, a tangible geospatial modeling visualization system that couples a laser scanner, projector, anda flexible physical three-dimensional model with a standard geospatial information system (GIS) to create a tangible user interfacefor terrain data. TanGeoMS projects an image of real-world data onto a physical terrain model. Users can alter the topography of themodel by modifying the clay surface or placing additional objects on the surface. The modified model is captured by an overhead laserscanner then imported into a GIS for analysis and simulation of real-world processes. The results are projected back onto the surfaceof the model providing feedback on the impact of the modifications on terrain parameters and simulated processes. Interaction with aphysical model is highly intuitive, allowing users to base initial design decisions on geospatial data, test the impact of these decisionsin GIS simulations, and use the feedback to improve their design. We demonstrate the system on three applications: investigatingrunoff management within a watershed, assessing the impact of storm surge on barrier islands, and exploring landscape rehabilitationin military training areas.
Index Terms—Visualization system, geographic/geospatial visualization, terrain visualization, tangible user interface, collaborativevisualization, human-computer interaction.
1 INTRODUCTION
Working with three-dimensional surfaces is a fundamental componentof geospatial data exploration, since the processes of interest occur onthe three-dimensional surface of the Earth. Topography is a key factorin understanding the geographic context in most planning and designdecisions. Historically, in the representation of the landscape, physicalthree-dimensional terrain models were often used to supplement mapsto provide a more intuitive understanding of the topography. Moderncomputing technology introduced three-dimensional computer model-ing and geospatial information systems (GIS) with sophisticated capa-bilities for working with three-dimensional virtual surfaces.
The advantages of virtual models include the ability to preciselyand yet dynamically represent the landscape. Scientific simulationslike watershed analysis, solar irradiation, and erosion modeling canbe processed using the data and then rendered on the virtual terrain.Since different datasets can be displayed and superimposed over vir-tual models, they have the potential to offer an enhanced understandingof landscape processes and support a much greater depth of informa-tion than traditional three-dimensional physical models.
Existing virtual models work well for analysis and visualizationof fixed data, but virtual models have some limitations for modelingchanges on surface landscapes. Computer-aided design (CAD) soft-ware can be used to precisely edit three-dimensional computer mod-els, allowing designers like planners and landscape architects to vi-sualize and test potential transformations of the landscape with math-ematical rigor. Yet virtual models are limited by their interface, bythe restrictive means of interaction, and by their translation througha two-dimensional display. The disjunction of visualizing a virtualthree-dimensional model and interacting with the model via a pointingdevice like a mouse hampers the user’s creativity. Furthermore, sincecomputer models can typically only be navigated and edited by a sin-
• Laura G. Tateosian is a Research Associate, Helena Mitasova is anAssociate Professor, and Brent Fogleman and Katherine Weaver aregraduate students with North Carolina State University, E-mail:[email protected].
• Brendan A. Harmon is a Candidate, M.Phil. Geography at University ofOxford, E-mail: [email protected].
• Russel S. Harmon is with the Army Research Office, E-mail:[email protected].
Manuscript received 31 March 2010; accepted 1 August 2010; posted online24 October 2010; mailed on 16 October 2010.For information on obtaining reprints of this article, please sendemail to: [email protected].
gle user at a time, they are not well-suited for group discussions andcollaborative decision-making.
An approach that draws on the benefits of both physical and vir-tual models is to provide a tangible user interface (TUI) for a virtualmodel. A tangible interface with the virtual model would allow a moreintuitive and immediate understanding of the terrain, a freer, more tac-tile mode to sculpt the terrain, and provide the potential for multipleusers to interact simultaneously. Like drawing a sketch but in three-dimensions, a tangible geospatial modeling system would allow de-signers great artistic and creative freedom to shape and interact witha modeled landscape while providing them with scientific tools forgeographic analysis to guide their decision-making, uniting art andscience, design and geography.
Early innovations in this direction arose in the context of architec-ture. Frazer and Anderson et al. employed object tracking devicesin model construction kits with tracking devices embedded in ob-jects such as building blocks [4] [1]. These systems demonstrated thevalue of physical affordances for spatial manipulation, though mod-eling was limited by the structure of the construction pieces. Masryet al. extended conventional CAD functionality to simulate a freehandsketching environment by constructing virtual volumes based on three-dimensional user sketches [9]. This approach exploits the human abil-ity to represent three-dimensional objects with drawings, though thisis still a level of abstraction beyond tangible modeling. Furthermore,sketching is usually a solitary activity, whereas, terrain modeling de-cisions usually require collaboration.
Humphreys and Hanrahan presented a collaborative working envi-ronment, emulating a conference room or studio, by seamlessly knit-ting displays from multiple projectors to create large tiled displays [5].Large-scale displays support group activities, enabling multiple usersto share a large number of materials. Another large-scale approach, alarge tabletop display, affords circulation around the materials. Arcin-iegas and Janssen used touch tables to support land planning negotia-tion forums [2]. Large display and touch tables support collaborationbecause of their size and physical configuration, but retain a level ofabstraction, as the data is still represented by pixels. Proponents of tan-gible user interfaces argue that digital interfaces should afford a seam-less extension of physical objects to capitalize on sophisticated humanskills for sensing and manipulating their physical environments andincrease their productivity by making digital tools easier to use [13][6].
Piper et al. maintained the collaborative advantages of a tabletopsystem for landscape analysis but reduced the level of abstraction byreplacing the touch screen with a clay physical terrain model on the
1605
1077-2626/10/$26.00 © 2010 IEEE Published by the IEEE Computer Society
IEEE TRANSACTIONS ON VISUALIZATION AND COMPUTER GRAPHICS, VOL. 16, NO. 6, NOVEMBER/DECEMBER 2010
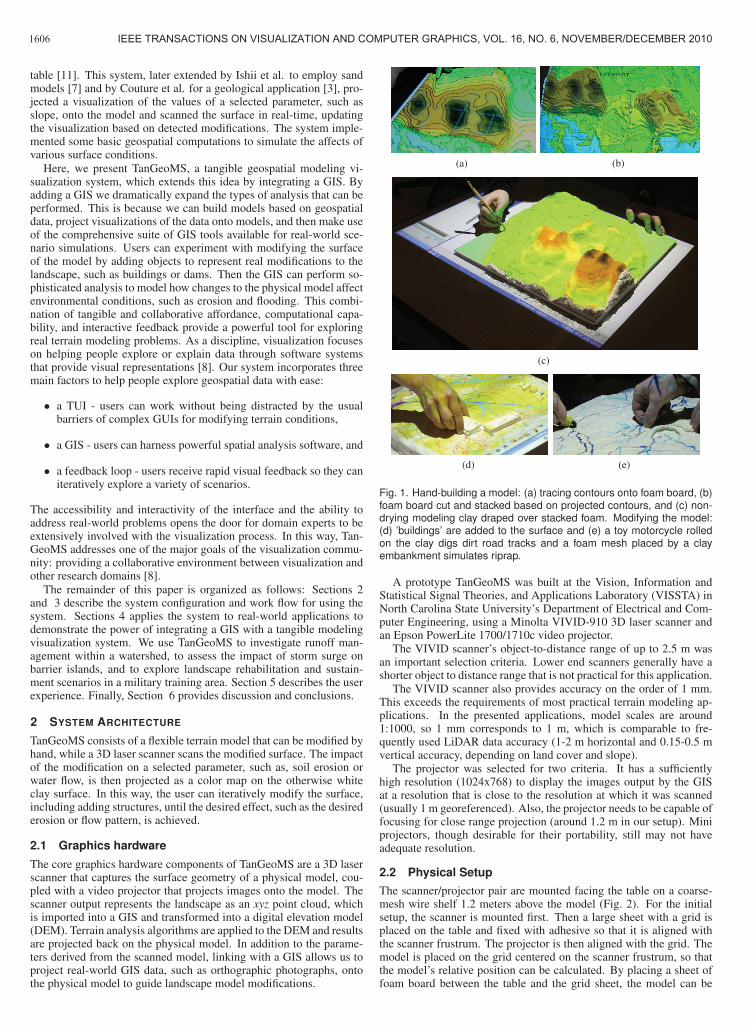
table [11]. This system, later extended by Ishii et al. to employ sandmodels [7] and by Couture et al. for a geological application [3], pro-jected a visualization of the values of a selected parameter, such asslope, onto the model and scanned the surface in real-time, updatingthe visualization based on detected modifications. The system imple-mented some basic geospatial computations to simulate the affects ofvarious surface conditions.
Here, we present TanGeoMS, a tangible geospatial modeling vi-sualization system, which extends this idea by integrating a GIS. Byadding a GIS we dramatically expand the types of analysis that can beperformed. This is because we can build models based on geospatialdata, project visualizations of the data onto models, and then make useof the comprehensive suite of GIS tools available for real-world sce-nario simulations. Users can experiment with modifying the surfaceof the model by adding objects to represent real modifications to thelandscape, such as buildings or dams. Then the GIS can perform so-phisticated analysis to model how changes to the physical model affectenvironmental conditions, such as erosion and flooding. This combi-nation of tangible and collaborative affordance, computational capa-bility, and interactive feedback provide a powerful tool for exploringreal terrain modeling problems. As a discipline, visualization focuseson helping people explore or explain data through software systemsthat provide visual representations [8]. Our system incorporates threemain factors to help people explore geospatial data with ease:
• a TUI - users can work without being distracted by the usualbarriers of complex GUIs for modifying terrain conditions,
• a GIS - users can harness powerful spatial analysis software, and
• a feedback loop - users receive rapid visual feedback so they caniteratively explore a variety of scenarios.
The accessibility and interactivity of the interface and the ability toaddress real-world problems opens the door for domain experts to beextensively involved with the visualization process. In this way, Tan-GeoMS addresses one of the major goals of the visualization commu-nity: providing a collaborative environment between visualization andother research domains [8].
The remainder of this paper is organized as follows: Sections 2and 3 describe the system configuration and work flow for using thesystem. Sections 4 applies the system to real-world applications todemonstrate the power of integrating a GIS with a tangible modelingvisualization system. We use TanGeoMS to investigate runoff man-agement within a watershed, to assess the impact of storm surge onbarrier islands, and to explore landscape rehabilitation and sustain-ment scenarios in a military training area. Section 5 describes the userexperience. Finally, Section 6 provides discussion and conclusions.
2 SYSTEM ARCHITECTURE
TanGeoMS consists of a flexible terrain model that can be modified byhand, while a 3D laser scanner scans the modified surface. The impactof the modification on a selected parameter, such as, soil erosion orwater flow, is then projected as a color map on the otherwise whiteclay surface. In this way, the user can iteratively modify the surface,including adding structures, until the desired effect, such as the desirederosion or flow pattern, is achieved.
2.1 Graphics hardware
The core graphics hardware components of TanGeoMS are a 3D laserscanner that captures the surface geometry of a physical model, cou-pled with a video projector that projects images onto the model. Thescanner output represents the landscape as an xyz point cloud, whichis imported into a GIS and transformed into a digital elevation model(DEM). Terrain analysis algorithms are applied to the DEM and resultsare projected back on the physical model. In addition to the parame-ters derived from the scanned model, linking with a GIS allows us toproject real-world GIS data, such as orthographic photographs, ontothe physical model to guide landscape model modifications.
(a) (b)
(c)
(d) (e)
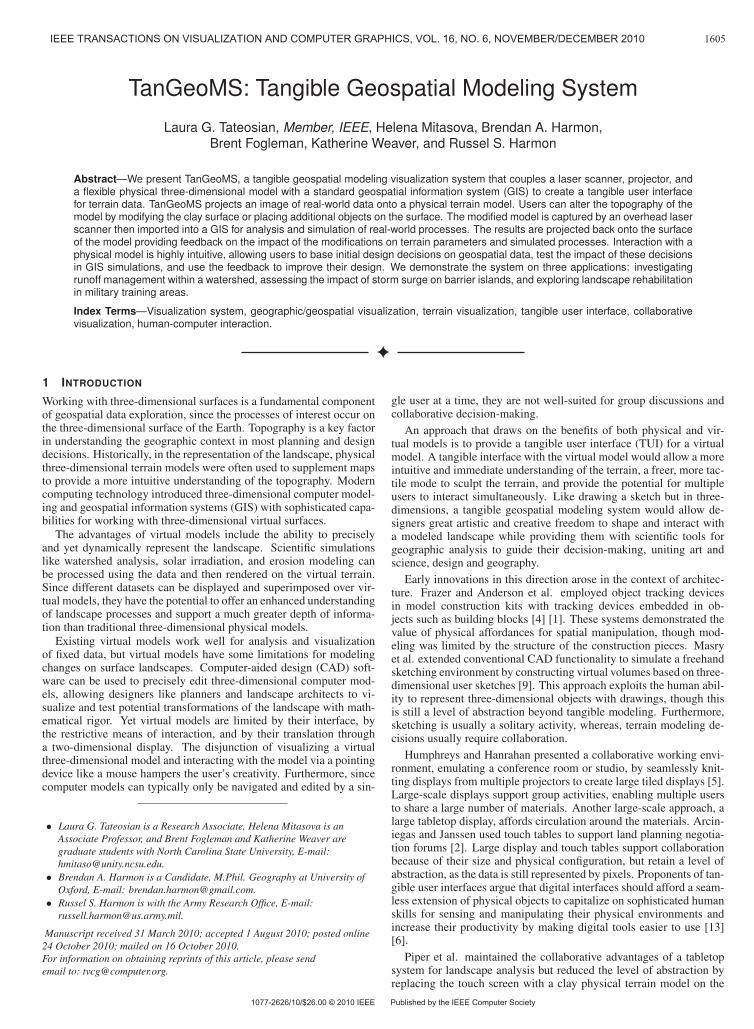
Fig. 1. Hand-building a model: (a) tracing contours onto foam board, (b)foam board cut and stacked based on projected contours, and (c) non-drying modeling clay draped over stacked foam. Modifying the model:(d) ’buildings’ are added to the surface and (e) a toy motorcycle rolledon the clay digs dirt road tracks and a foam mesh placed by a clayembankment simulates riprap.
A prototype TanGeoMS was built at the Vision, Information andStatistical Signal Theories, and Applications Laboratory (VISSTA) inNorth Carolina State University’s Department of Electrical and Com-puter Engineering, using a Minolta VIVID-910 3D laser scanner andan Epson PowerLite 1700/1710c video projector.
The VIVID scanner’s object-to-distance range of up to 2.5 m wasan important selection criteria. Lower end scanners generally have ashorter object to distance range that is not practical for this application.
The VIVID scanner also provides accuracy on the order of 1 mm.This exceeds the requirements of most practical terrain modeling ap-plications. In the presented applications, model scales are around1:1000, so 1 mm corresponds to 1 m, which is comparable to fre-quently used LiDAR data accuracy (1-2 m horizontal and 0.15-0.5 mvertical accuracy, depending on land cover and slope).
The projector was selected for two criteria. It has a sufficientlyhigh resolution (1024x768) to display the images output by the GISat a resolution that is close to the resolution at which it was scanned(usually 1 m georeferenced). Also, the projector needs to be capable offocusing for close range projection (around 1.2 m in our setup). Miniprojectors, though desirable for their portability, still may not haveadequate resolution.
2.2 Physical Setup
The scanner/projector pair are mounted facing the table on a coarse-mesh wire shelf 1.2 meters above the model (Fig. 2). For the initialsetup, the scanner is mounted first. Then a large sheet with a grid isplaced on the table and fixed with adhesive so that it is aligned withthe scanner frustrum. The projector is then aligned with the grid. Themodel is placed on the grid centered on the scanner frustrum, so thatthe model’s relative position can be calculated. By placing a sheet offoam board between the table and the grid sheet, the model can be
1606 IEEE TRANSACTIONS ON VISUALIZATION AND COMPUTER GRAPHICS, VOL. 16, NO. 6, NOVEMBER/DECEMBER 2010
pinned in position so that it remains fixed during hands-on interaction.The system is designed for flexibility - terrain analysis can be con-ducted on the workstation linked to the scanner and projector devicesor on any GIS-ready computing device. For example, users can bringa laptop, connect it to the system, and perform analysis on the laptop.Also, an additional projector mounted above the table can be used toprovide an optional large two-dimensional tabletop display to enablecollaboration or for a secondary three-dimensional data display.
Building the physical model of the landscape to be analyzed can beautomated with three-dimensional printers or two-dimensional cuttersor a model can be built by hand by tracing and cutting foam boardalong contours projected onto the foam, then stacking pieces to buildup the foam topology (Fig. 1). Covering resulting models in a layerof non-drying modeling clay creates a malleable surface. Spreading athin layer of plastic between the foam board and clay makes it easierto restore the model to its original state. The plastic sheet allows theclay to be removed and smoothed so that the model can be re-usedfor multiple studies. Automatic approaches may lead to more accu-rate models, but hand-built models are an inexpensive alternative thatprovide sufficient accuracy for most real-world applications.
laptop
3D scanner primaryprojector
physical model
secondaryprojector
optional display area
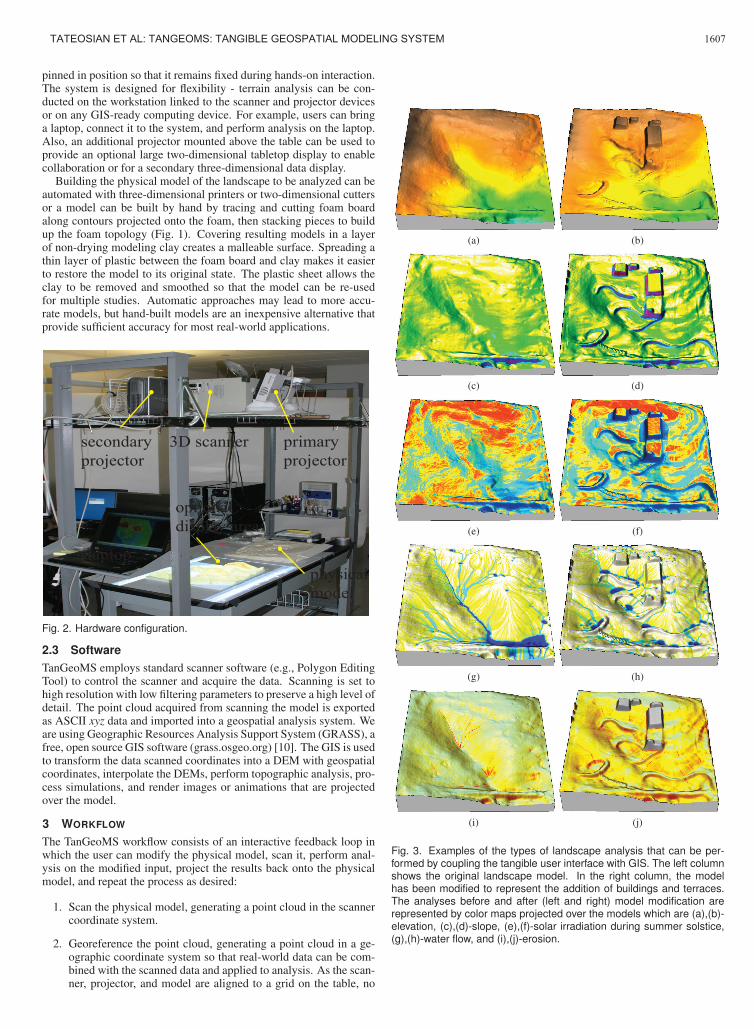
Fig. 2. Hardware configuration.
2.3 SoftwareTanGeoMS employs standard scanner software (e.g., Polygon EditingTool) to control the scanner and acquire the data. Scanning is set tohigh resolution with low filtering parameters to preserve a high level ofdetail. The point cloud acquired from scanning the model is exportedas ASCII xyz data and imported into a geospatial analysis system. Weare using Geographic Resources Analysis Support System (GRASS), afree, open source GIS software (grass.osgeo.org) [10]. The GIS is usedto transform the data scanned coordinates into a DEM with geospatialcoordinates, interpolate the DEMs, perform topographic analysis, pro-cess simulations, and render images or animations that are projectedover the model.
3 WORKFLOW
The TanGeoMS workflow consists of an interactive feedback loop inwhich the user can modify the physical model, scan it, perform anal-ysis on the modified input, project the results back onto the physicalmodel, and repeat the process as desired:
1. Scan the physical model, generating a point cloud in the scannercoordinate system.
2. Georeference the point cloud, generating a point cloud in a ge-ographic coordinate system so that real-world data can be com-bined with the scanned data and applied to analysis. As the scan-ner, projector, and model are aligned to a grid on the table, no
(a) (b)
(c) (d)
(e) (f)
(g) (h)
(i) (j)
Fig. 3. Examples of the types of landscape analysis that can be per-formed by coupling the tangible user interface with GIS. The left columnshows the original landscape model. In the right column, the modelhas been modified to represent the addition of buildings and terraces.The analyses before and after (left and right) model modification arerepresented by color maps projected over the models which are (a),(b)-elevation, (c),(d)-slope, (e),(f)-solar irradiation during summer solstice,(g),(h)-water flow, and (i),(j)-erosion.
1607TATEOSIAN ET AL: TANGEOMS: TANGIBLE GEOSPATIAL MODELING SYSTEM
rotation is needed; only translation and scaling are necessary.Assuming that the distortion due to projecting over varied to-pography is negligible, the following georeferencing approach isused:
Let N be the number of points in the point cloud, then scalethe model and shift the data, converting each of i ∈ 1, ...,Nscanner tuples, mi = [mix,miy,miz], to a geographic tuple gi =[gix,giy,giz] as follows:
gi = amTi +b, (1)
where the scaling vector, a = [ax,ay,az], is defined as
a j =g jmax −g jmin
m jmax −m jmin(2)
for j ∈ {x,y,z} and the shifting parameter, b, can be calculatedas
b = amT0 +g0 (3)
such that m0 are g0 are corresponding coordinates, such as thelower left corner of the model and the lower left corner of thegeographic region, respectively, to anchor the relationship.
Because there are variations in the elevation of the physicalmodel, some image distortion occurs as the projection intersectsthe surface at different elevations. Correction for distortion withpoint registration and higher-order equations could be necessaryfor models with more than 6 cm difference in elevation. In theapplications that we have explored, because of the scale used,the highest elevation of the model is less than 6 cm, even witha 3 times z exaggeration (6 cm corresponds to 24 m for scale1:1200); so these linear equations suffice.
3. Import the georeferenced data into GIS, generating a vector pointdata layer. This also creates a record of the change history, stor-ing the model state at each iteration so that change analysis canbe performed or a previous state can be restored.
4. Interpolate the vector points to create a digital surface model.
5. Compute derived parameters and perform geospatial analysis,deriving output such as a raster slope map, a raster water flowmap series, and a vector contour map. Calculated parameters in-clude slope, aspect, curvatures, flow path, and viewsheds. Anal-ysis can include any operation that a GIS can conduct on areal-world DEM. Processes that can be modeled include surfacerunoff, soil erosion and deposition, and solar irradiation.
6. Project user selected results of the analysis over the physicalmodel to provide feedback.
7. Modify the physical model and repeat steps 1-7 as desired. Mod-ifications to the physical model can include adding objects to thesurface or making modifications to the surface itself, since theclay surface is malleable. For example, users can experimentby adding objects, such as pieces of bubble wrap or styrofoam torepresent real modifications to the landscape like forests or build-ings or they can use clay tools to dig into or sculpt the landscape(Figs. 1 c, d, and e).
3.1 Design Decisions
TanGeoMS is distinguished from Illuminating Clay (IC) [11], the maininspiration for this system, by two important modifications: substan-tial increases in practicability and flexibility. To bring the system todomain experts, we needed be able to use real-world terrain data. ICprovided a proof of concept, with a scanning, modifying, re-scanning,and projecting, feedback loop, but its application was limited to hypo-thetical data. Terrain models for actual landscape analysis, however,need to be built from georeferenced data. Therefore, the most practical
approach to introduce real-world data was to integrate a GIS into thesystem.
Integrating with a GIS, makes it possible to run more complex anal-yses that combine parameters derived from real-world data with thosederived from scanning the physical model. For example, to model ero-sion, which depends on factors like slope steepness, vegetation type,and so forth, we can combine data from the model’s topography withland cover information from real remote sensing data. In certain cases,it is desirable to extract only the kind of information that is relevant toa specific question and to selectively display this information: for ex-ample, we can extract slopes that exceed a certain threshold. GIS havea wide variety of useful modeling tools, such as viewshed analysis andmap algebra (e.g., map algebra can be used to extract buildings placedon the model to assign different runoff values to these surfaces). Inaddition to enabling advanced analyses, the integration of a GIS intothe system allows users to run dynamic process simulations. This pro-vides feedback for users on how landscape modifications impact thebehavior of processes.
We chose to decouple the processing from the scanning, so that thesystem can be easily reconfigured, enabling a wide array of optionsfor users. By separating scanning from processing, we sacrificed real-time response capabilities for increased flexibility, allowing users tobring their own data and software tools to work with the system andintegrating georeferenced data for the GIS. Scanning is the only aspecttied to the core system. All other processing can be performed on anycomputational device the user chooses.
We also made significant improvements to the physical model.Early implementation of IC physical models layered a metal meshbase under the clay, which limited the intricacy of the resulting shapesand was difficult to modify. Sand models by Ishii et al. [7] increasedmalleability (though possibly at the cost of reproducibility). The in-corporation of the model is much more sophisticated in our system.First, actual geographic data can be used to build the model. Second,the model’s stratified structure allows users to remove a layer or makevery subtle changes to the model. Third, the model can more easily berestored to its original state (e.g., after cutting and removing part of alayer to represent a breach in a dune, that part of the model can easilybe replaced later if needed).
In summary, with TanGeoMS:
1. Analysis combining parameters derived from actual geographicdata and those from the physical model can be conducted.
2. More complex static analyses can be performed.
3. Dynamic simulations can be generated and displayed as anima-tions.
4. The scanning/feedback loop is not real-time.
5. Users can bring their own data and software tools.
6. The physical model itself is more flexible.
4 APPLICATIONS
Generally, the problems that can be explored with TanGeoMS arelinked to design tasks such as sustainable land management that in-volves storm water and erosion control, optimizing solar energy po-tential for new developments, and coastal protection. The three casestudies we present illustrate a runoff control application, coastal flood-ing impacts, and erosion.
4.1 Landscape Design
To demonstrate the capabilities of the system, we built a 1:1200 scaleclay model (with a scalar vertical exaggeration of three) of the land-scape surrounding the North Carolina State University Sediment andErosion Control Research and Education Facility (SECREF), based ongeoreferenced data stored in a GIS.
We projected various GIS-based landscape characterization layers,such as, orthophotography, soils, land cover, footprints of structures,
1608 IEEE TRANSACTIONS ON VISUALIZATION AND COMPUTER GRAPHICS, VOL. 16, NO. 6, NOVEMBER/DECEMBER 2010
(a) (b) (c)
(d) (e) (f)
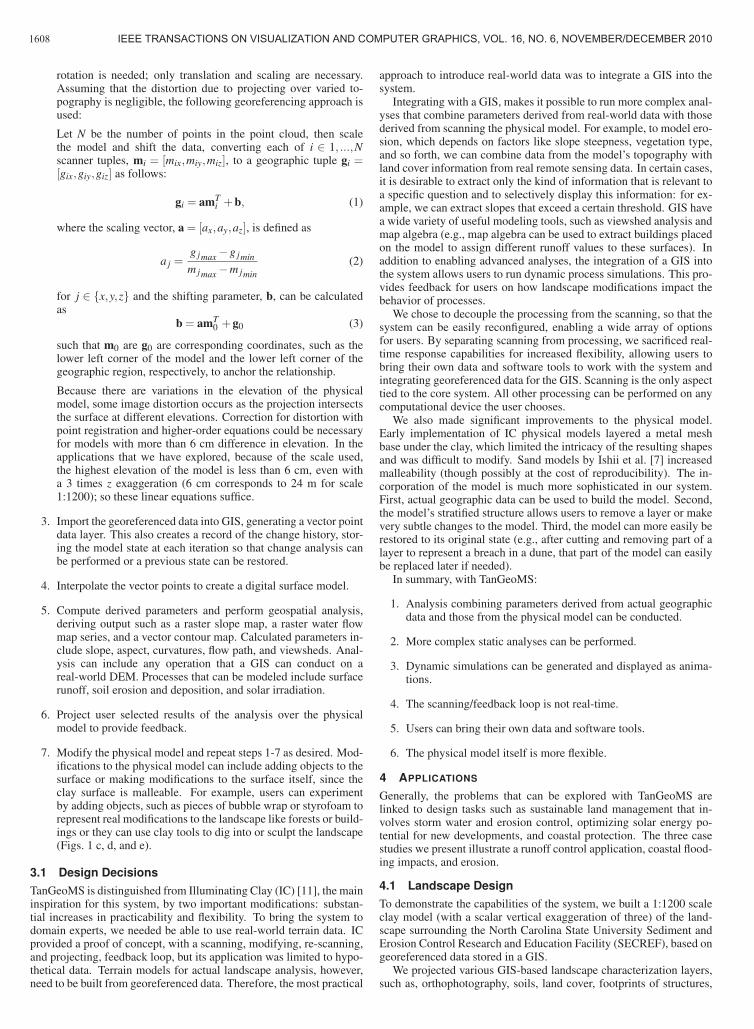
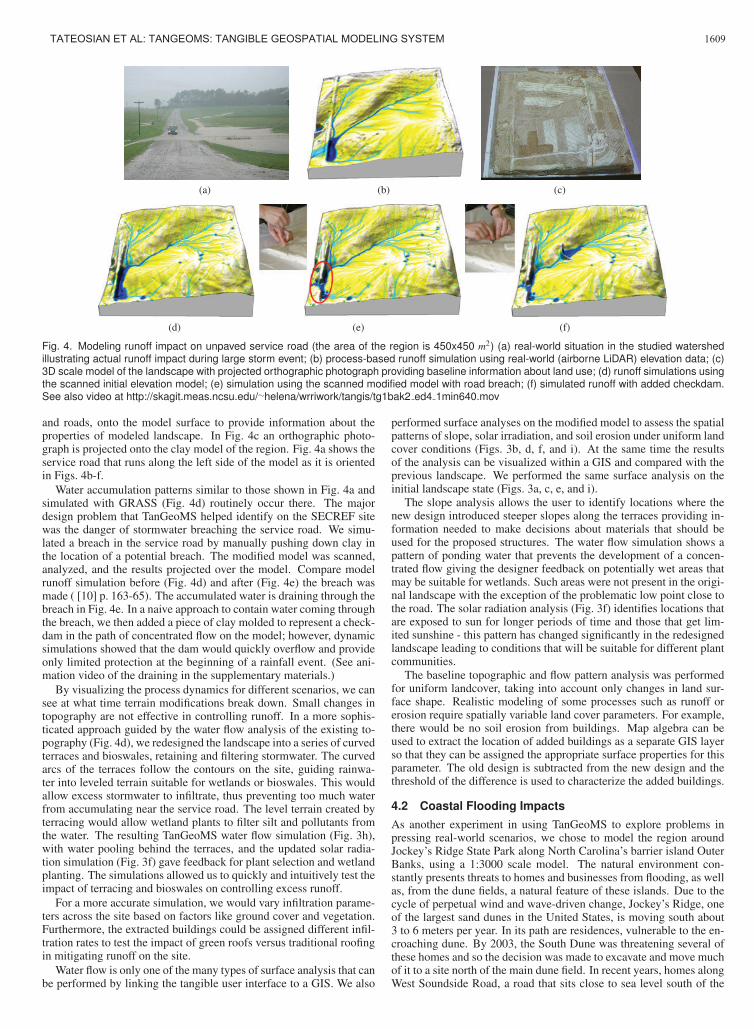
Fig. 4. Modeling runoff impact on unpaved service road (the area of the region is 450x450 m2) (a) real-world situation in the studied watershedillustrating actual runoff impact during large storm event; (b) process-based runoff simulation using real-world (airborne LiDAR) elevation data; (c)3D scale model of the landscape with projected orthographic photograph providing baseline information about land use; (d) runoff simulations usingthe scanned initial elevation model; (e) simulation using the scanned modified model with road breach; (f) simulated runoff with added checkdam.See also video at http://skagit.meas.ncsu.edu/∼helena/wrriwork/tangis/tg1bak2 ed4 1min640.mov
and roads, onto the model surface to provide information about theproperties of modeled landscape. In Fig. 4c an orthographic photo-graph is projected onto the clay model of the region. Fig. 4a shows theservice road that runs along the left side of the model as it is orientedin Figs. 4b-f.
Water accumulation patterns similar to those shown in Fig. 4a andsimulated with GRASS (Fig. 4d) routinely occur there. The majordesign problem that TanGeoMS helped identify on the SECREF sitewas the danger of stormwater breaching the service road. We simu-lated a breach in the service road by manually pushing down clay inthe location of a potential breach. The modified model was scanned,analyzed, and the results projected over the model. Compare modelrunoff simulation before (Fig. 4d) and after (Fig. 4e) the breach wasmade ( [10] p. 163-65). The accumulated water is draining through thebreach in Fig. 4e. In a naive approach to contain water coming throughthe breach, we then added a piece of clay molded to represent a check-dam in the path of concentrated flow on the model; however, dynamicsimulations showed that the dam would quickly overflow and provideonly limited protection at the beginning of a rainfall event. (See ani-mation video of the draining in the supplementary materials.)
By visualizing the process dynamics for different scenarios, we cansee at what time terrain modifications break down. Small changes intopography are not effective in controlling runoff. In a more sophis-ticated approach guided by the water flow analysis of the existing to-pography (Fig. 4d), we redesigned the landscape into a series of curvedterraces and bioswales, retaining and filtering stormwater. The curvedarcs of the terraces follow the contours on the site, guiding rainwa-ter into leveled terrain suitable for wetlands or bioswales. This wouldallow excess stormwater to infiltrate, thus preventing too much waterfrom accumulating near the service road. The level terrain created byterracing would allow wetland plants to filter silt and pollutants fromthe water. The resulting TanGeoMS water flow simulation (Fig. 3h),with water pooling behind the terraces, and the updated solar radia-tion simulation (Fig. 3f) gave feedback for plant selection and wetlandplanting. The simulations allowed us to quickly and intuitively test theimpact of terracing and bioswales on controlling excess runoff.
For a more accurate simulation, we would vary infiltration parame-ters across the site based on factors like ground cover and vegetation.Furthermore, the extracted buildings could be assigned different infil-tration rates to test the impact of green roofs versus traditional roofingin mitigating runoff on the site.
Water flow is only one of the many types of surface analysis that canbe performed by linking the tangible user interface to a GIS. We also
performed surface analyses on the modified model to assess the spatialpatterns of slope, solar irradiation, and soil erosion under uniform landcover conditions (Figs. 3b, d, f, and i). At the same time the resultsof the analysis can be visualized within a GIS and compared with theprevious landscape. We performed the same surface analysis on theinitial landscape state (Figs. 3a, c, e, and i).
The slope analysis allows the user to identify locations where thenew design introduced steeper slopes along the terraces providing in-formation needed to make decisions about materials that should beused for the proposed structures. The water flow simulation shows apattern of ponding water that prevents the development of a concen-trated flow giving the designer feedback on potentially wet areas thatmay be suitable for wetlands. Such areas were not present in the origi-nal landscape with the exception of the problematic low point close tothe road. The solar radiation analysis (Fig. 3f) identifies locations thatare exposed to sun for longer periods of time and those that get lim-ited sunshine - this pattern has changed significantly in the redesignedlandscape leading to conditions that will be suitable for different plantcommunities.
The baseline topographic and flow pattern analysis was performedfor uniform landcover, taking into account only changes in land sur-face shape. Realistic modeling of some processes such as runoff orerosion require spatially variable land cover parameters. For example,there would be no soil erosion from buildings. Map algebra can beused to extract the location of added buildings as a separate GIS layerso that they can be assigned the appropriate surface properties for thisparameter. The old design is subtracted from the new design and thethreshold of the difference is used to characterize the added buildings.
4.2 Coastal Flooding Impacts
As another experiment in using TanGeoMS to explore problems inpressing real-world scenarios, we chose to model the region aroundJockey’s Ridge State Park along North Carolina’s barrier island OuterBanks, using a 1:3000 scale model. The natural environment con-stantly presents threats to homes and businesses from flooding, as wellas, from the dune fields, a natural feature of these islands. Due to thecycle of perpetual wind and wave-driven change, Jockey’s Ridge, oneof the largest sand dunes in the United States, is moving south about3 to 6 meters per year. In its path are residences, vulnerable to the en-croaching dune. By 2003, the South Dune was threatening several ofthese homes and so the decision was made to excavate and move muchof it to a site north of the main dune field. In recent years, homes alongWest Soundside Road, a road that sits close to sea level south of the
1609TATEOSIAN ET AL: TANGEOMS: TANGIBLE GEOSPATIAL MODELING SYSTEM
Roanoke
Sound
Atlantic
Ocean
0 500m
21.6m
9.6
15.6
3.6
-2.3
(a)
20.8m
10.4
15.6
5.1
-0.1
breaches
(b)
20.8m
10.4
15.6
5.1
-0.1
(c)
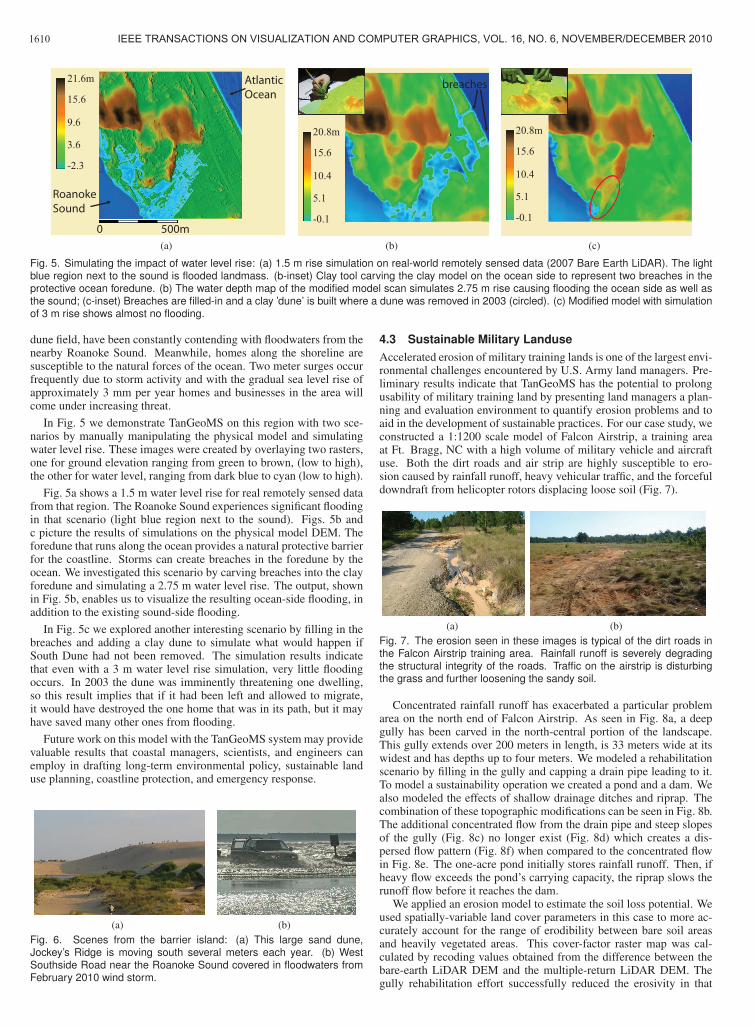
Fig. 5. Simulating the impact of water level rise: (a) 1.5 m rise simulation on real-world remotely sensed data (2007 Bare Earth LiDAR). The lightblue region next to the sound is flooded landmass. (b-inset) Clay tool carving the clay model on the ocean side to represent two breaches in theprotective ocean foredune. (b) The water depth map of the modified model scan simulates 2.75 m rise causing flooding the ocean side as well asthe sound; (c-inset) Breaches are filled-in and a clay ’dune’ is built where a dune was removed in 2003 (circled). (c) Modified model with simulationof 3 m rise shows almost no flooding.
dune field, have been constantly contending with floodwaters from thenearby Roanoke Sound. Meanwhile, homes along the shoreline aresusceptible to the natural forces of the ocean. Two meter surges occurfrequently due to storm activity and with the gradual sea level rise ofapproximately 3 mm per year homes and businesses in the area willcome under increasing threat.
In Fig. 5 we demonstrate TanGeoMS on this region with two sce-narios by manually manipulating the physical model and simulatingwater level rise. These images were created by overlaying two rasters,one for ground elevation ranging from green to brown, (low to high),the other for water level, ranging from dark blue to cyan (low to high).
Fig. 5a shows a 1.5 m water level rise for real remotely sensed datafrom that region. The Roanoke Sound experiences significant floodingin that scenario (light blue region next to the sound). Figs. 5b andc picture the results of simulations on the physical model DEM. Theforedune that runs along the ocean provides a natural protective barrierfor the coastline. Storms can create breaches in the foredune by theocean. We investigated this scenario by carving breaches into the clayforedune and simulating a 2.75 m water level rise. The output, shownin Fig. 5b, enables us to visualize the resulting ocean-side flooding, inaddition to the existing sound-side flooding.
In Fig. 5c we explored another interesting scenario by filling in thebreaches and adding a clay dune to simulate what would happen ifSouth Dune had not been removed. The simulation results indicatethat even with a 3 m water level rise simulation, very little floodingoccurs. In 2003 the dune was imminently threatening one dwelling,so this result implies that if it had been left and allowed to migrate,it would have destroyed the one home that was in its path, but it mayhave saved many other ones from flooding.
Future work on this model with the TanGeoMS system may providevaluable results that coastal managers, scientists, and engineers canemploy in drafting long-term environmental policy, sustainable landuse planning, coastline protection, and emergency response.
(a) (b)
Fig. 6. Scenes from the barrier island: (a) This large sand dune,Jockey’s Ridge is moving south several meters each year. (b) WestSouthside Road near the Roanoke Sound covered in floodwaters fromFebruary 2010 wind storm.
4.3 Sustainable Military LanduseAccelerated erosion of military training lands is one of the largest envi-ronmental challenges encountered by U.S. Army land managers. Pre-liminary results indicate that TanGeoMS has the potential to prolongusability of military training land by presenting land managers a plan-ning and evaluation environment to quantify erosion problems and toaid in the development of sustainable practices. For our case study, weconstructed a 1:1200 scale model of Falcon Airstrip, a training areaat Ft. Bragg, NC with a high volume of military vehicle and aircraftuse. Both the dirt roads and air strip are highly susceptible to ero-sion caused by rainfall runoff, heavy vehicular traffic, and the forcefuldowndraft from helicopter rotors displacing loose soil (Fig. 7).
(a) (b)
Fig. 7. The erosion seen in these images is typical of the dirt roads inthe Falcon Airstrip training area. Rainfall runoff is severely degradingthe structural integrity of the roads. Traffic on the airstrip is disturbingthe grass and further loosening the sandy soil.
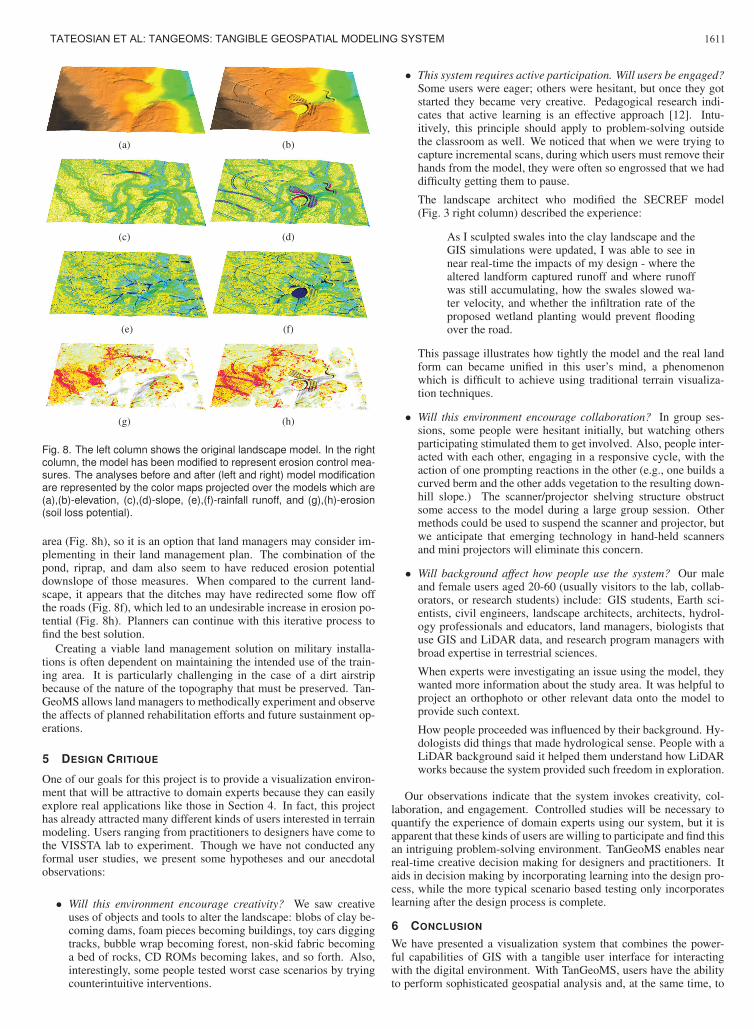
Concentrated rainfall runoff has exacerbated a particular problemarea on the north end of Falcon Airstrip. As seen in Fig. 8a, a deepgully has been carved in the north-central portion of the landscape.This gully extends over 200 meters in length, is 33 meters wide at itswidest and has depths up to four meters. We modeled a rehabilitationscenario by filling in the gully and capping a drain pipe leading to it.To model a sustainability operation we created a pond and a dam. Wealso modeled the effects of shallow drainage ditches and riprap. Thecombination of these topographic modifications can be seen in Fig. 8b.The additional concentrated flow from the drain pipe and steep slopesof the gully (Fig. 8c) no longer exist (Fig. 8d) which creates a dis-persed flow pattern (Fig. 8f) when compared to the concentrated flowin Fig. 8e. The one-acre pond initially stores rainfall runoff. Then, ifheavy flow exceeds the pond’s carrying capacity, the riprap slows therunoff flow before it reaches the dam.
We applied an erosion model to estimate the soil loss potential. Weused spatially-variable land cover parameters in this case to more ac-curately account for the range of erodibility between bare soil areasand heavily vegetated areas. This cover-factor raster map was cal-culated by recoding values obtained from the difference between thebare-earth LiDAR DEM and the multiple-return LiDAR DEM. Thegully rehabilitation effort successfully reduced the erosivity in that
1610 IEEE TRANSACTIONS ON VISUALIZATION AND COMPUTER GRAPHICS, VOL. 16, NO. 6, NOVEMBER/DECEMBER 2010
(a) (b)
(c) (d)
(e) (f)
(g) (h)
Fig. 8. The left column shows the original landscape model. In the rightcolumn, the model has been modified to represent erosion control mea-sures. The analyses before and after (left and right) model modificationare represented by the color maps projected over the models which are(a),(b)-elevation, (c),(d)-slope, (e),(f)-rainfall runoff, and (g),(h)-erosion(soil loss potential).
area (Fig. 8h), so it is an option that land managers may consider im-plementing in their land management plan. The combination of thepond, riprap, and dam also seem to have reduced erosion potentialdownslope of those measures. When compared to the current land-scape, it appears that the ditches may have redirected some flow offthe roads (Fig. 8f), which led to an undesirable increase in erosion po-tential (Fig. 8h). Planners can continue with this iterative process tofind the best solution.
Creating a viable land management solution on military installa-tions is often dependent on maintaining the intended use of the train-ing area. It is particularly challenging in the case of a dirt airstripbecause of the nature of the topography that must be preserved. Tan-GeoMS allows land managers to methodically experiment and observethe affects of planned rehabilitation efforts and future sustainment op-erations.
5 DESIGN CRITIQUE
One of our goals for this project is to provide a visualization environ-ment that will be attractive to domain experts because they can easilyexplore real applications like those in Section 4. In fact, this projecthas already attracted many different kinds of users interested in terrainmodeling. Users ranging from practitioners to designers have come tothe VISSTA lab to experiment. Though we have not conducted anyformal user studies, we present some hypotheses and our anecdotalobservations:
• Will this environment encourage creativity? We saw creativeuses of objects and tools to alter the landscape: blobs of clay be-coming dams, foam pieces becoming buildings, toy cars diggingtracks, bubble wrap becoming forest, non-skid fabric becominga bed of rocks, CD ROMs becoming lakes, and so forth. Also,interestingly, some people tested worst case scenarios by tryingcounterintuitive interventions.
• This system requires active participation. Will users be engaged?Some users were eager; others were hesitant, but once they gotstarted they became very creative. Pedagogical research indi-cates that active learning is an effective approach [12]. Intu-itively, this principle should apply to problem-solving outsidethe classroom as well. We noticed that when we were trying tocapture incremental scans, during which users must remove theirhands from the model, they were often so engrossed that we haddifficulty getting them to pause.
The landscape architect who modified the SECREF model(Fig. 3 right column) described the experience:
As I sculpted swales into the clay landscape and theGIS simulations were updated, I was able to see innear real-time the impacts of my design - where thealtered landform captured runoff and where runoffwas still accumulating, how the swales slowed wa-ter velocity, and whether the infiltration rate of theproposed wetland planting would prevent floodingover the road.
This passage illustrates how tightly the model and the real landform can became unified in this user’s mind, a phenomenonwhich is difficult to achieve using traditional terrain visualiza-tion techniques.
• Will this environment encourage collaboration? In group ses-sions, some people were hesitant initially, but watching othersparticipating stimulated them to get involved. Also, people inter-acted with each other, engaging in a responsive cycle, with theaction of one prompting reactions in the other (e.g., one builds acurved berm and the other adds vegetation to the resulting down-hill slope.) The scanner/projector shelving structure obstructsome access to the model during a large group session. Othermethods could be used to suspend the scanner and projector, butwe anticipate that emerging technology in hand-held scannersand mini projectors will eliminate this concern.
• Will background affect how people use the system? Our maleand female users aged 20-60 (usually visitors to the lab, collab-orators, or research students) include: GIS students, Earth sci-entists, civil engineers, landscape architects, architects, hydrol-ogy professionals and educators, land managers, biologists thatuse GIS and LiDAR data, and research program managers withbroad expertise in terrestrial sciences.
When experts were investigating an issue using the model, theywanted more information about the study area. It was helpful toproject an orthophoto or other relevant data onto the model toprovide such context.
How people proceeded was influenced by their background. Hy-dologists did things that made hydrological sense. People with aLiDAR background said it helped them understand how LiDARworks because the system provided such freedom in exploration.
Our observations indicate that the system invokes creativity, col-laboration, and engagement. Controlled studies will be necessary toquantify the experience of domain experts using our system, but it isapparent that these kinds of users are willing to participate and find thisan intriguing problem-solving environment. TanGeoMS enables nearreal-time creative decision making for designers and practitioners. Itaids in decision making by incorporating learning into the design pro-cess, while the more typical scenario based testing only incorporateslearning after the design process is complete.
6 CONCLUSION
We have presented a visualization system that combines the power-ful capabilities of GIS with a tangible user interface for interactingwith the digital environment. With TanGeoMS, users have the abilityto perform sophisticated geospatial analysis and, at the same time, to
1611TATEOSIAN ET AL: TANGEOMS: TANGIBLE GEOSPATIAL MODELING SYSTEM
intuitively interact with three-dimensional terrain models. The itera-tive feedback loop and flexible clay model guide landscape modifica-tions allowing the user to make landscape design decisions while tak-ing into consideration important environmental processes, like waterflow, solar irradiation, and soil erosion. Users are able to test numerousideas and visualize their impacts in an environment that facilitates col-laboration and creativity. While the internal data representations andcomputations are often complex, the tangible user interface for three-dimensional data helps to bridge the gap between a physical landscapeand a virtual model. By coupling the design process with analysesof the geographic context, landscape architects and planners can havea more sustainable and ecologically sensitive impact on the environ-ment.
TanGeoMS also has the potential to act as an effective educationaltool at different levels. In K-12 schools students can explore land-scape processes at age appropriate levels using models that they cancreate themselves from familiar materials. Installation of the systemin natural science museums would allow the public to actively inter-act with familiar scenarios like storm surge or runoff flooding, or soilerosion which would facilitate active learning for challenging geospa-tial terrain analysis concepts. Undergraduate and graduate studentscan explore the capabilities of different landscape process models anddevelop their own geospatial analysis and simulation tools. We havealso found the system useful for teaching methods and algorithms forprocessing point clouds representing landscape features with differentgeometries and improving our understanding of laser scanning materi-als with different optical properties. Both of these skills are importantfor working with real-world points clouds from airborne and ground-based laser scanners.
We envision numerous opportunities for improving the system tobroaden its applications. One of the current challenges is to improvethe speed of the system response to model modification that can cur-rently take between a few seconds for simple analysis, such as roughestimation of slope or flow directions, to several minutes for morecomplex hydrologic simulations. To achieve faster response we willfocus on streamlining the processing of data between scanning andGIS import and improving the computational efficiency of the simula-tion algorithms. TanGeoMS allows users to generate a large numberof model modifications in a very short time creating challenges formanaging the data that represents the models and the results of simu-lations, various improvements to the standard GIS GUI will be neededto allow users easy access to the results and their comparison.
The model scale is limited by the physical model scale at which wecan make and perceive changes. At a scale of 1:40000, for example,the system could model hilltop mining, but landscaping changes likewe made in our case studies would be too fine to make to the modelby hand at that scale. At 1:3000 things start to get so small, that manytypical man-made changes would not appear. 1:1200 is more realisticfor most man-made changes.
Given this constraint on scale, another limitation is the size of themodel that can be scanned with the current set-up (approximately600 mm x 480 mm), limiting the area that can be modeled to relativelysmall watersheds (25-100 ha). To study water flow within larger wa-tersheds where only a small area is being modified, we will investigatea multi-scale approach that will combine a lower resolution virtualmodel with a high resolution model of area where different designsare explored using TanGeoMS. Results of this type of multi-scale flowsimulation, when projected onto the solid model, will allow water flowinto the model area from the larger watershed represented by the lowerresolution, virtual model. This approach should address some of themodel size limitations.
We used simple color maps to visualize the simulation results inour case studies. More work is needed to introduce more sophisticatedtechniques. Different rules may apply to hue, luminance, and tex-ture usage when the image is being projected onto a three-dimensionalmodel. Also, intuition tells us that visualizations could take advan-tage of the topology and other features being visualized for us by thephysical model, freeing the projected pixels to represent additional in-formation for multi-variate visualization. For example, if we place
squares of foam board on the model to represent buildings, we may nolonger have to draw buildings in the image, but rather we could projecta glyph-based visualization using glyph color, size, and orientation torepresent other local attributes.
We presented three geospatial applications, runoff management ina small watershed, assessment of storm surge impacts on barrier is-lands, and exploration of landscape rehabilitation in military trainingareas. These represent just the first steps in employing the visualiza-tion approach that couples tangible models with GIS for real-worldapplications. Feedback from landscape architects, parks and militarylanduse planners has been very positive and we envision broadeningits accessibility with the development of smaller, more cost effectivescanning systems and projectors that are starting to appear on the mar-ket. With this trend, we believe that TanGeoMS can be a practicalvisualization and modeling tool for use by domain experts to explorenumerous design and land management decision-making applications.
ACKNOWLEDGMENTS
The authors wish to thank Dr. Krim from the Department of Electricaland Computer Engineering for collaboration in creating the VISSTALabratory. This work was supported in part by a grant from the USArmy Research Office.
REFERENCES
[1] D. Anderson, J. L. Frankel, J. Marks, A. Agarwala, P. Beardsley, J. K.Hodgins, D. Leigh, K. Ryall, E. Sullivan, and J. S. Yedidia. Tangibleinteraction + graphical interpretation: a new approach to 3d modeling. InIn Proceedings of ACM SIGGRAPH 2000, pages 393 – 402, July 2000.
[2] G. Arciniegas and R. Janssen. Using a touch table to support participa-tory land use planning. In In Anderssen, R.S., R.D. Braddock and L.T.H.Newham (eds) 18th World IMACS Congress and MODSIM09 Interna-tional Congress on Modelling and Simulation. Modelling and SimulationSociety of Australia and New Zealand and International Association forMathematics and Computers in Simulation, pages 2377–2383, 2009.
[3] N. Couture, G. Riviere, and P. Reuter. Geotui: a tangible user interfacefor geoscience. In TEI ’08: Proceedings of the 2nd international con-ference on Tangible and embedded interaction, pages 89–96, New York,NY, USA, 2008. ACM.
[4] J. Frazer. An Evolutionary Architecture. John Frazer and the ArchitecturelAssociation, 36 Bedford Square, London WC1B 3ES, 1995.
[5] G. Humphreys and P. Hanrahan. A distributed graphics system for largetiled displays. In VIS ’99: Proceedings of the conference on Visualiza-tion ’99, pages 215–223, Los Alamitos, CA, USA, 1999. IEEE ComputerSociety Press.
[6] H. Ishii. Tangible bits: beyond pixels. In TEI ’08: Proceedings of the 2ndinternational conference on Tangible and embedded interaction, pagesxv–xxv, New York, NY, USA, 2008. ACM.
[7] H. Ishii, C. Ratti, B. Piper, Y. Wang, A. Biderman, and E. Ben-Joseph.Bringing clay and sand into digital design — continuous tangible userinterfaces. BT Technology Journal, 22(4):287–299, 2004.
[8] C. Johnson, R. Moorhead, T. Munzner, H. Pfister, P. Rheingans, and T. S.Yoo. NIH/NSF visualization research challenges report. LOS ALAMI-TOS, CA: IEEE COMPUTING SOCIETY, 2006.
[9] K. D. J. Masry, M. and H. Lipson. A pen-based freehand sketching in-terface for progressive construction of 3d objects. Journal of Computersand Graphics, Special Issue on Pen-Based User Interfaces, 29(4):563–575, 2005.
[10] M. Neteler and H. Mitasova. Open Source GIS: A GRASS GIS Approach.The Kluwer international series in Engineering and Computer Science(SECS): Volume 689. Kluwer Academic Publishers, Boston, Dordrecht,London, 2002. ISBN: 1-4020-7088-8.
[11] B. Piper, C. Ratti, and H. Ishii. Illuminating clay: a 3-d tangible interfacefor landscape analysis. In CHI ’02: Proceedings of the SIGCHI confer-ence on Human factors in computing systems, pages 355–362, New York,NY, USA, 2002. ACM.
[12] M. Prince. Does active learning work? a review of the research. Journalof Engineering Education, 93(3):223–231, 2004.
[13] E. Sharlin, B. Watson, Y. Kitamura, F. Kishino, and Y. Itoh. On tangibleuser interfaces, humans and spatiality. Personal and Ubiquitous Comput-ing, 8(5):338–346, 2004.
1612 IEEE TRANSACTIONS ON VISUALIZATION AND COMPUTER GRAPHICS, VOL. 16, NO. 6, NOVEMBER/DECEMBER 2010


