Embed Size (px)
Citation preview
G
Y
Fd
MGG
a
ARRA
KMAFST
sRtipiTd
RC
H
1
1h
ARTICLE IN PRESS Model
PHRS-2469; No. of Pages 11
Pharmacological Research xxx (2012) xxx– xxx
Contents lists available at SciVerse ScienceDirect
Pharmacological Research
jo ur n al hom epage: www.elsev ier .com/ locate /yphrs
luorescently labeled macrolides as a tool for monitoring cellular and tissueistribution of azithromycin
ario Matijasic 1, Vesna Munic Kos ∗,2, Krunoslav Nujic 2, Snjezana Cuzic 2, Jasna Padovan2,oran Kragol2, Sulejman Alihodzic 2, Boris Mildner3, Donatella Verbanac1, Vesna Erakovic Haber2
laxoSmithKline Research Centre Zagreb Ltd., Prilaz baruna Filipovica 29, HR-10000 Zagreb, Croatia
r t i c l e i n f o
rticle history:eceived 21 February 2012eceived in revised form 2 June 2012ccepted 3 June 2012
eywords:acrolide
zithromycinluorescent derivateubcellular distributionissue distribution
a b s t r a c t
Exceptional therapeutic effects of macrolides in treating various infections and inflammatory conditionscan be significantly contributed to their unique pharmacokinetic properties. Macrolides accumulate incells and tissues, with concentrations usually 10 to more than 100 times higher of those measured inplasma. Intracellular distribution of macrolides has so far been examined using extensive subcellularfractionation techniques, radiolabeled compounds and conventional pharmacokinetic methods. In thisstudy we evaluated four fluorescently labeled macrolides on their applicability to monitor azithromycindistribution in vitro and in vivo. 9-Deoxo-9a-{3-[(7-nitro-2,1,3-benzoxadiazol-4-yl)amino]propyl}-9a-aza-9a-homoerythromycin A (9a-NBD-azithromycin) was selected as a compound with most similarcellular pharmacokinetics to azithromycin. 9a-NBD-azithromycin demonstrated antimicrobial proper-ties comparable to azithromycin, displayed the same biological activity profile in LPS-stimulated J774A.1murine macrophage cells and, even though it accumulated in cells almost 50% more than azithromycin,it showed same rate of retention. Identical to azithromycin, 9a-NBD-azithromycin was localized in lyso-somes of J774A.1 cells.
Two hours after 9a-NBD-azithromycin was administered intraperitonally to mice, a strong fluorescent
signal was located in kidneys and liver and slightly weaker in the spleen. In kidneys, the signal was con-centrated in tubuli, and glomeruli were negative. Patchy florescence in hepatocytes supports lysosomalcellular localization. Weaker staining of white pulp compared to red pulp of spleen is in agreement withlower accumulation of azithromycin in lymphocytes compared to other cell types present.We conclude that 9a-NBD-azithromycin can be used as a fluorescent analog of azithromycin to visualizeits distribution in in vitro systems, and is also suitable for in vivo studies.
Please cite this article in press as: Matijasic M, et al. Fluorescently labeled
azithromycin. Pharmacol Res (2012), http://dx.doi.org/10.1016/j.phrs.2012
Abbreviations: Azi, azithromycin; clari, clarithromycin; DMSO, dimethyl-ulphoxide; FITC, fluorescein isothiocyanate; GTTR, gentamicin labeled with Texased; IL-6, interleukin-6; LPS, lipopolysaccharide; MCP-1, macrophage chemotac-ic protein 1, CCL2; MIC, minimal inhibitory concentration; MIP-2, macrophagenflammatory protein 2, CXCL2; NBD, nitrobenzoxadiazol; ns, not significant; PBMC,eripheral blood mononuclear cells; PGE2, prostaglandin E2; PK, pharmacokinet-
cs; PMN, polymorphonuclear leukocyte; RANTES, regulated on activation, normal-cell expressed and secreted chemokine, CCL5; ROI, region of interest; SD, standardeviation; TNF�, tumor necrosis factor-alpha.∗ Corresponding author. Tel.: +385 1 8886323; fax: +385 1 8886443.
E-mail address: [email protected] (V. Munic Kos).1 Present address: School of Medicine, Center for Translational and Clinicalesearch, Department for Intercellular Communication, Salata 2, HR-10000 Zagreb,roatia.2 Present address: Galapagos Research Center Ltd., Prilaz baruna Filipovica 29,R-10000 Zagreb, Croatia.3 Present address: Faculty of Sciences, Department of Chemistry, Horvatovac
02a, HR-10000 Zagreb, Croatia.
043-6618/$ – see front matter © 2012 Elsevier Ltd. All rights reserved.ttp://dx.doi.org/10.1016/j.phrs.2012.06.001
© 2012 Elsevier Ltd. All rights reserved.
1. Introduction
Macrolides with 14- and 15-membered rings present awell established class of antimicrobial compounds widelyused in the clinic. Apart from their antimicrobial potency,some macrolides were also reported to show significant anti-inflammatory/immunomodulatory activity [1–5] and antiparasiticeffects [6]. A big part of their success as drugs is due to their distinctpharmacokinetic properties. Some macrolides highly accumulatein cells and tissues, with their concentrations in tissues often 10-to 100-fold higher than those found in plasma, depending on themacrolide and the tissue studied [7]. Azithromycin, an azalidemacrolide and one of the world’s best-selling antibiotics, demon-strates a particularly large volume of distribution, low clearanceand prolonged half life (t1/2) in blood, resulting in a more favorable
macrolides as a tool for monitoring cellular and tissue distribution of.06.001
dosing regimen [8,9].Macrolide subcellular distribution has so far been studied with
cell fractioning techniques and using a radiolabeled compound. Anautoradiographic in vitro study demonstrated that azithromycin

ARTICLE IN PRESSG Model
YPHRS-2469; No. of Pages 11
2 M. Matijasic et al. / Pharmacological Research xxx (2012) xxx– xxx
Fig. 1. Fluorescently labeled macrolides: 9a-FITC-azithromycin (9-deoxo-9a-{3-[(fluorescein-5-thiocarbamoyl)amino]propyl}-9a-aza-9a-homoerythromycin A), 9a-NBD-azithromycin (9-deoxo-9a-{3-[(7-nitro-2,1,3-benzoxadiazol-4-yl)amino]propyl}-9a-aza-9a-homoerythromycin A), 11-NBD-azithromycin (11-O-{3-[(7-nitro-2,1,3-benzo-x , 11-NO amine
wmlCifhadpa[ctoit
letntisiddfirAluma9wtuIa
adiazol-4-yl)amino]propyl}-9-deoxo-9a-aza-9a-methyl-9a-homoerythromycin A)-methyl-erythromycin A). N-ethyl-NBD (N-ethyl-7-nitro-2,1,3-benzoxadiazol-4-xperiments.
as most concentrated in cytoplasm and plasmalemma of poly-orphonuclear leukocytes (PMNs) and monocytes, while detailed
ocalization in cytoplasm was not determined at that time [10].ell fractionation reported 66% of cell associated azithromycin
n J774A.1 monocyte-macrophage cells was located in granularraction [11] and preferable association with granules of PMNsas also been documented for azithromycin and other macrolidentibiotics, i.e. erythromycin, roxithromycin, telithromycin andirithromycin [12,13]. This phenomenon is explained by weak basicroperties of macrolides causing protonation and entrapment incidic cellular compartments like lysosomes or azurophil granules14]. Tissue distribution of azithromycin has been reported fromonventional pharmacokinetic studies in which high total concen-rations were found in liver, spleen, kidney and lung [15]. In thenly reported microautoradiography study, azithromycin increasen infected tissue has been monitored and confirmed to occur dueo high accumulation in PMNs [16].
As a substitute for radiolabeled compounds, fluorescentlyabeled molecules have been used in pharmacology over past sev-ral decades. Fluorescently labeled antibiotics present a very usefulool for studying drug pharmacokinetics: elucidating the mecha-ism of drug uptake in cells and visualizing its distribution withinissues. Gentamicin labeled with Texas Red fluorescent dye (GTTR)s the most extensively used fluorescent antibiotic so far. GTTR wasuccessfully employed for studying gentamicin uptake and local-zation in sensory cells of the inner-ear in vitro [17,18] and cochlearistribution of gentamicin in vivo [19]. Also, GTTR was used toifferentiate the pharmacokinetic mechanism of gentamicin traf-cking in sensory cells [20,21] and in kidney cells in vivo [22], whichesult in different gentamicin toxicity toward these two organs.mong macrolide compounds, fluorescein isothiocyanate (FITC)
abeled and BODIPY labeled erythromycylamine were successfullysed as a substitute for radiolabeled erythromycin to monitoracrolide interactions with the ribosome [23–25]. Fluorescent
nalogs of geldanamycin, a specific inhibitor of heat shock protein0 (Hsp90) chaperone involved in oncogenic cell transformation,ere employed in development of new drugs for prevention of
Please cite this article in press as: Matijasic M, et al. Fluorescently labeled
azithromycin. Pharmacol Res (2012), http://dx.doi.org/10.1016/j.phrs.2012
umorogenesis [26,27]. Also, FITC-geldanamycin was successfullysed to study tumor cell mobility, both in vitro and in vivo [28].
n addition, there have been attempts in using nitrobenzoxadi-zol (NBD) labeled macrolide antibiotic nystatin to investigate
BD-clarithromycin (11-O-{3-[(7-nitro-2,1,3-benzoxadiazol-4-yl)amino]propyl}-6-e), a fluorescent moiety of NBD-conjugated macrolides, was also used in some
molecular arrangements of nystatin in membranes with differentsterol content [29].
In this study we have investigated the possibility to moni-tor cellular and tissue distribution of azithromycin by utilizingfluorescent macrolide conjugates. Since the introduction ofa fluorescent moiety has a significant impact on the size ofthe molecule, as well as on its 3D structure and physico-chemical properties, which were reported to be importantdeterminants of macrolide pharmacokinetics [30], fluores-cently labeled molecules were characterized and their cellularpharmacokinetic profiles compared to the parent molecule. 9-Deoxo-9a-{3-[(7-nitro-2,1,3-benzoxadiazol-4-yl)amino]propyl}-9a-aza-9a-homoerythromycin A (9a-NBD-azithromycin) wasidentified as the molecule with most similar cellular pharma-cokinetic properties to azithromycin. 9a-NBD-azithromycin wasfurther characterized and compared to azithromycin with respectto its biological activity, subcellular distribution as well as inin vivo tissue distribution. To our knowledge this is the firstreport to describe visualization of macrolide subcellular and tissuedistribution by using fluorescently labeled compound.
2. Materials and methods
2.1. Substances
Azithromycin was purchased from PLIVA and clarithromycinfrom US Pharmacopeia. Fluorescently labeled macrolides 9-deoxo-9a-{3-[(fluorescein-5-thiocarbamoyl)amino]propyl}-9a-aza-9a-homoerythromycin A (shortly: 9a-FITC-azithromycin), 9-deoxo-9a-{3-[(7-nitro-2,1,3-benzoxadiazol-4-yl)amino]propyl}-9a-aza-9a-homoerythromycin A (shortly: 9a-NBD-azithromycin),11-O-{3-[(7-nitro-2,1,3-benzoxadiazol-4-yl)amino]propyl}-9-deoxo-9a-aza-9a-methyl-9a-homoerythromycin A (shortly: 11-NBD-azithromycin) and 11-O-{3-[(7-nitro-2,1,3-benzoxadiazol-4-yl)amino]propyl}-6-O-methyl-erythromycin A (shortly:11-NBD-clarithromycin), as well as N-ethyl-7-nitro-2,1,3-benzoxadiazol-4-amine (shortly: N-ethyl-NBD) (Fig. 1) were
macrolides as a tool for monitoring cellular and tissue distribution of.06.001
synthesized internally in GlaxoSmithKline Research CentreZagreb. Chemical synthesis of 9a-NBD-azithromycin is shown inSupplementary Fig. 1. All compounds were dissolved in DMSO(Sigma) at the concentration of 20 mM.
ARTICLE IN PRESSG Model
YPHRS-2469; No. of Pages 11
M. Matijasic et al. / Pharmacological Research xxx (2012) xxx– xxx 3
F crolidb ressei
2
(g(
iIa
8S(
moTrbB
2
mM4A
mmteticpbiwiva
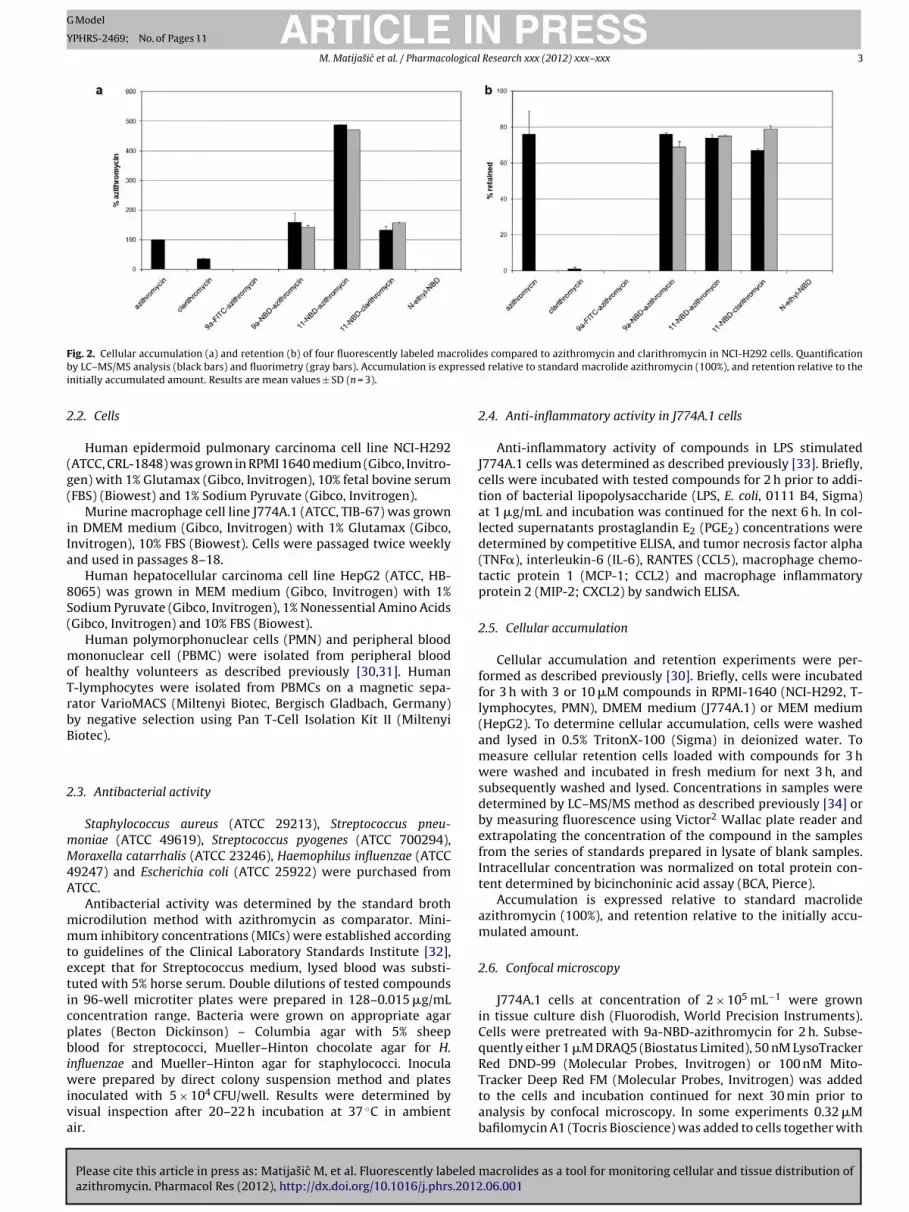
ig. 2. Cellular accumulation (a) and retention (b) of four fluorescently labeled may LC–MS/MS analysis (black bars) and fluorimetry (gray bars). Accumulation is exp
nitially accumulated amount. Results are mean values ± SD (n = 3).
.2. Cells
Human epidermoid pulmonary carcinoma cell line NCI-H292ATCC, CRL-1848) was grown in RPMI 1640 medium (Gibco, Invitro-en) with 1% Glutamax (Gibco, Invitrogen), 10% fetal bovine serumFBS) (Biowest) and 1% Sodium Pyruvate (Gibco, Invitrogen).
Murine macrophage cell line J774A.1 (ATCC, TIB-67) was grownn DMEM medium (Gibco, Invitrogen) with 1% Glutamax (Gibco,nvitrogen), 10% FBS (Biowest). Cells were passaged twice weeklynd used in passages 8–18.
Human hepatocellular carcinoma cell line HepG2 (ATCC, HB-065) was grown in MEM medium (Gibco, Invitrogen) with 1%odium Pyruvate (Gibco, Invitrogen), 1% Nonessential Amino AcidsGibco, Invitrogen) and 10% FBS (Biowest).
Human polymorphonuclear cells (PMN) and peripheral bloodononuclear cell (PBMC) were isolated from peripheral blood
f healthy volunteers as described previously [30,31]. Human-lymphocytes were isolated from PBMCs on a magnetic sepa-ator VarioMACS (Miltenyi Biotec, Bergisch Gladbach, Germany)y negative selection using Pan T-Cell Isolation Kit II (Miltenyiiotec).
.3. Antibacterial activity
Staphylococcus aureus (ATCC 29213), Streptococcus pneu-oniae (ATCC 49619), Streptococcus pyogenes (ATCC 700294),oraxella catarrhalis (ATCC 23246), Haemophilus influenzae (ATCC
9247) and Escherichia coli (ATCC 25922) were purchased fromTCC.
Antibacterial activity was determined by the standard brothicrodilution method with azithromycin as comparator. Mini-um inhibitory concentrations (MICs) were established according
o guidelines of the Clinical Laboratory Standards Institute [32],xcept that for Streptococcus medium, lysed blood was substi-uted with 5% horse serum. Double dilutions of tested compoundsn 96-well microtiter plates were prepared in 128–0.015 �g/mLoncentration range. Bacteria were grown on appropriate agarlates (Becton Dickinson) – Columbia agar with 5% sheeplood for streptococci, Mueller–Hinton chocolate agar for H.
nfluenzae and Mueller–Hinton agar for staphylococci. Inocula
Please cite this article in press as: Matijasic M, et al. Fluorescently labeled
azithromycin. Pharmacol Res (2012), http://dx.doi.org/10.1016/j.phrs.2012
ere prepared by direct colony suspension method and platesnoculated with 5 × 10⁴ CFU/well. Results were determined byisual inspection after 20–22 h incubation at 37 ◦C in ambientir.
es compared to azithromycin and clarithromycin in NCI-H292 cells. Quantificationd relative to standard macrolide azithromycin (100%), and retention relative to the
2.4. Anti-inflammatory activity in J774A.1 cells
Anti-inflammatory activity of compounds in LPS stimulatedJ774A.1 cells was determined as described previously [33]. Briefly,cells were incubated with tested compounds for 2 h prior to addi-tion of bacterial lipopolysaccharide (LPS, E. coli, 0111 B4, Sigma)at 1 �g/mL and incubation was continued for the next 6 h. In col-lected supernatants prostaglandin E2 (PGE2) concentrations weredetermined by competitive ELISA, and tumor necrosis factor alpha(TNF�), interleukin-6 (IL-6), RANTES (CCL5), macrophage chemo-tactic protein 1 (MCP-1; CCL2) and macrophage inflammatoryprotein 2 (MIP-2; CXCL2) by sandwich ELISA.
2.5. Cellular accumulation
Cellular accumulation and retention experiments were per-formed as described previously [30]. Briefly, cells were incubatedfor 3 h with 3 or 10 �M compounds in RPMI-1640 (NCI-H292, T-lymphocytes, PMN), DMEM medium (J774A.1) or MEM medium(HepG2). To determine cellular accumulation, cells were washedand lysed in 0.5% TritonX-100 (Sigma) in deionized water. Tomeasure cellular retention cells loaded with compounds for 3 hwere washed and incubated in fresh medium for next 3 h, andsubsequently washed and lysed. Concentrations in samples weredetermined by LC–MS/MS method as described previously [34] orby measuring fluorescence using Victor2 Wallac plate reader andextrapolating the concentration of the compound in the samplesfrom the series of standards prepared in lysate of blank samples.Intracellular concentration was normalized on total protein con-tent determined by bicinchoninic acid assay (BCA, Pierce).
Accumulation is expressed relative to standard macrolideazithromycin (100%), and retention relative to the initially accu-mulated amount.
2.6. Confocal microscopy
J774A.1 cells at concentration of 2 × 10⁵ mL−1 were grownin tissue culture dish (Fluorodish, World Precision Instruments).Cells were pretreated with 9a-NBD-azithromycin for 2 h. Subse-quently either 1 �M DRAQ5 (Biostatus Limited), 50 nM LysoTrackerRed DND-99 (Molecular Probes, Invitrogen) or 100 nM Mito-
macrolides as a tool for monitoring cellular and tissue distribution of.06.001
Tracker Deep Red FM (Molecular Probes, Invitrogen) was addedto the cells and incubation continued for next 30 min prior toanalysis by confocal microscopy. In some experiments 0.32 �Mbafilomycin A1 (Tocris Bioscience) was added to cells together with

ING Model
Y
4 logical
9ce
asTnfl
2
tmdoiwia
2
mtbEs6dwiHtEbC
2
i(wi
icmulws
2
FM
2
U
ARTICLEPHRS-2469; No. of Pages 11
M. Matijasic et al. / Pharmaco
a-NBD-azithromycin. After washing, the cells were examined withonfocal scanning microscope LSM510 META (Carl Zeiss) usingxcitation wavelengths of 488 nm, 543 nm and 633 nm.
Colocalization experiments were performed in multitrack modend Axiovision software (Carl Zeiss) was used for development ofcattergram graphs and calculation of colocalization coefficients.he colocalization coefficients range from 0 to 1, with 0 indicatingo colocalization and 1 indicating complete colocalization of twouorescent signals.
.7. Cell viability
Cell viability was determined by measuring the release ofhe cytosolic enzyme adenylate kinase as a marker of increased
embrane permeability in necrosis using Toxilight kit (Lonza) asescribed previously [33]. Resulting luminescence was measuredn Victor2 Wallac plate reader. None of the shown treatmentsnduced more than 1.2 fold increase in adenylate kinase release and
ere thus considered non-cytotoxic. For comparison lysing cellsn 0.5% TritonX-100 resulted in approximately 10-fold increase indenylate kinase signal over control.
.8. Microsomal stability
Intrinsic clearance (CLi) values were determined in murineicrosomes. Test compounds were incubated at final concentra-
ion of 1 �M at 37 ◦C for 60 min in 50 mM potassium phosphateuffer (pH 7.4) containing 0.5 mg microsomal protein/mL. 7-thoxycoumarin was used as positive control. The reaction wastarted by addition of co-factor (2.0 mM NADP, 20 mM glucose--phosphate, 2.0 mM MgCl2 and 4.0 U/mL glucose-6-phosphateehydrogenase). At 0, 10, 20, 30, 45 and 60 min an aliquot (50 �L)as taken, quenched with acetonitrile/methanol (2:1, v/v) contain-
ng internal standard (roxithromycin, 0.05 �g/mL) and analyzed byPLC-MS/MS. The intrinsic clearance (CLi) was determined from
he first order elimination constant by non-linear regression usingxcel (Microsoft Exel 2002), corrected for the volume of the incu-ation and assuming 52.5 mg microsomal protein/g liver. Values forLi were expressed as mL/min/g liver.
.9. Tissue distribution studies
The tissue distribution of 9a-NBD-azithromycin was evaluatedn male Balb/c mice obtained from Charles River LaboratoriesGermany). Animals were housed up to 3 per cage and suppliedith water and a commercial rodent diet ad libitum prior to study
nitiation.9a-NBD-azithromycin was administered in a dose of 20 mg/kg
ntraperitoneally in 5% DMSO, 2.5% citric acid (0.1 M), 92.5% methylellulose (0.5%), prepared freshly on the day of the study. Ani-als were sacrificed at 2 h post dose. Animals were anaesthetized
sing isoflurane and tissues (liver, kidney and spleen) were col-ected from treated and untreated animals. Blood samples (50 �L)
ere hemolyzed with an equal volume of analytical grade water. Allamples were stored in a freezer at −80 ◦C until LC–MS/MS analysis.
.10. Histological analysis
Tissues were frozen in liquid nitrogen, cut and fixed in acetone.luorescence was visualized using confocal microscope LSM510ETA.
Please cite this article in press as: Matijasic M, et al. Fluorescently labeled
azithromycin. Pharmacol Res (2012), http://dx.doi.org/10.1016/j.phrs.2012
.11. Compound quantification in tissues
Tissue samples were thawed, weighed and homogenized on anltrathurax homogenizer (10,500 rpm) in four equivalent volumes
PRESS Research xxx (2012) xxx– xxx
of analytical grade water. An aliquot of 100 �L of tissue homogenatewas transferred to a polypropylene tube and extracted by theaddition of three volumes of a mixture of acetonitrile/methanol(2:1) containing internal standard (roxithromycin 5 ng/mL). Sam-ples were refrigerated at 4 ◦C for 1 h, vortexed and centrifuged at4000 rpm for 15 min. Hemolyzed blood samples were extracted inthe same manner as aliquoted tissue homogenates. The compoundconcentration was determined on LC–MS/MS system consistingof API2000 mass spectrometer, coupled to an Agilent1100 SeriesBinary Pump, Vacuum Degasser and CTC Autosampler. Sampleswere delivered to the MS/MS on a Phenomenex Luna 3 �m C18(2)100Å 2 mm × 30 mm column, at a flow of 0.250 mL/min using agradient set-up and total run time of 6 min. The mobile phase con-sisted of 0.1% formic acid in water and acetonitrile containing 0.1%formic acid. Multiple reaction monitoring (955.7–797.8) was usedto obtain increased sensitivity.
2.12. Flow cytometry
PBMC were isolated from peripheral blood of healthy volun-teers as described previously. To determine cellular accumulation,PBMC were aliquoted to 1 × 10⁶ cells in polypropylene tubes andincubated for 3 h with 1 �M compounds in RPMI-1640 medium.To measure cellular retention, cells loaded with compounds for3 h were washed and incubated in fresh medium for next 3 h.Samples were subsequently washed 3x in wash/staining buffer(phosphate buffered saline (PBS) + 2% fetal bovine serum (FBS)) andstained with monoclonal mouse anti-human antibodies for 30 minat 4 ◦C: CD3 CyChrome (BD Biosciences), CD14 APC-eFluor780(eBioscience) and CD45 eFluor 450 (eBioscience). Samples werewashed twice, resuspended in 400 �L of wash/staining buffer andkept on ice until analysis by FACScan/CytekDev 8XDP flow cytome-ter using three lasers with 450 nm, 488 nm and 635 nm excitationwavelengths and FlowJo Collector’s software. FCS data files werefurther analyzed offline using FlowJo v7.6 software. Geometricmean fluorescence intensity values (MFI) were determined for lym-phocytes (CD3+/CD45+) and monocytes (CD14+/CD45+).
3. Results and discussion
3.1. Cellular accumulation and retention of fluorescently labeledmacrolides in NCI-H292 cells
In order to evaluate the similarity of newly synthesizedfluorescently labeled macrolides to azithromycin, compound accu-mulation and retention was measured in the NCI-H292 cell line.NCI-H292 cells were previously shown to be a well defined modelfor monitoring macrolide cellular pharmacokinetics [30]. Intracel-lular concentrations of compounds determined by LC–MS/MS werein accordance with results obtained by fluorimetry for four fluores-cent macrolides (Fig. 2) confirming the validity of the latter methodin this system.
Among 3 fluorescent derivatives of azithromycin, 9a-FITC-azithromycin did not show detectable accumulation by either ofthe analytical methods used. On the other hand, NBD labeled com-pounds showed high accumulation reaching 479% and 158% ofazithromycin for 11-NBD-azithromycin and 9a-NBD-azithromycin,respectively. Such a dramatic difference in accumulation betweenthese two compounds is in agreement with our previous studywith non-fluorescent substituents where azithromycin substitutedat position C(11) showed much higher accumulation compared
macrolides as a tool for monitoring cellular and tissue distribution of.06.001
to the same compound substituted at position N(9a) [30]. BothNBD-labeled azithromycin derivatives displayed high retention incells similar to azithromycin. Although quite close in values (100vs. 158 ± 32.7, mean values of 3 experiments ± SD) the difference

IN PRESSG Model
Y
logical Research xxx (2012) xxx– xxx 5
iwAm
pic(tchmSspfmm
saw
39
rbetwTcfl(fFdaodtd
mtc
3
rb
basaamhtpm
Table 1Antibacterial activity of azithromycin and 9a-NBD-azithromycin. Minimalinhibitory concentrations (MIC) in �g/mL are given. Results shown arerepresentative values of 3 experiments.
Azithromycin 9a-NBD-azithromycin
S. aureus 0.5 0.5S. pneumoniae 0.06 0.03S. pyogenes 0.06 0.03M. catarrhalis 0.125 1
ARTICLEPHRS-2469; No. of Pages 11
M. Matijasic et al. / Pharmaco
n accumulation between azithromycin and 9a-NBD-azithromycinas statistically significant with P < 0.01 according to one-wayNOVA and Bonferroni post test. Retention results for the twoolecules were not significantly different.Clarithromycin has a quite distinct cellular pharmacokinetic
rofile from azithromycin [30,35]. In this experiment, clar-thromycin reaches accumulation of 35% of azithromycin andompletely washes out after 3 h incubation in drug-free mediumretention 1% of initially accumulated amount). Interestingly,he fluorescently labeled clarithromycin derivative, 11-NBD-larithromycin, accumulates in cells up to 142% of azithromycin andas retention of 73% of the initial value, thus showing cellular phar-acokinetic profile far more like azithromycin than clarithromycin.
imilar behavior has already been noticed with non-fluorescentubstituents at C(11) position of clarithromycin further sup-orting the hypothesis that fluorescently labeled molecules stillollow the structure-property relationship inherent to non-labeled
acrolides [30]. As expected, the control compound lackingacrolide moiety, N-ethyl-NBD, did not accumulate in cells.Based on the results presented 9a-NBD-azithromycin was
elected as a fluorescent macrolide that most resembleszithromycin in cellular pharmacokinetic properties, and itas used in all subsequent studies.
.2. Cellular accumulation and retention ofa-NBD-azithromycin in T-lymphocytes and PMN
In the study by Stepanic et al. [30] accumulation of macrolideselative to azithromycin in various primary cells was found toe similar in all cell types studied. The lowest correlation, how-ver, was found for lymphocytes in comparison to all other cellypes. To check whether this fact has any impact on our results,e measured the accumulation of 9a-NBD-azithromycin in human
-lymphocytes, as well as in human polymorphonuclear leuko-ytes (PMN). Again, similar to NCI-H292 cell line, in T-lymphocytesuorescent analog accumulated 196 ± 32% of azithromycin valuemean value of 4 experiments ± SD) and was significantly differentrom azithromycin (P < 0.01, according to t-test) (Supplementaryig. 2A). Retention of 9a-NBD azithromycin was not significantlyifferent from azithromycins value (45 ± 11% vs. 48 ± 5%). Similarly,ccumulation of 9a-NBD-azithromycin in PMNs was 205 ± 65%f azithromycin (mean value of 3 experiments ± SD, significantlyifferent from azithromycin according to t-test, P < 0.05), and reten-ion was 76 ± 1% of initially accumulated amount (not significantlyifferent) (Supplementary Fig. 2B).
Obviously, 9a-NBD-azithromycin accumulates to approxi-ately the same extent in all cell types studied (1.5–2-fold more
han azithromycin), which makes it a reliable tool from pharma-okinetic perspective.
.3. Antibacterial activity of 9a-NBD-azitromycin
To further evaluate 9a-NBD-azithromycin as a fluorescent sur-ogate of azithromycin, in addition to cellular pharmacokinetics, itsiological activity was evaluated and compared to azithromycin.
Antibacterial activity of 9a-NBD-azithromycin was assessedy determining its minimal inhibitory concentrations (MICs) on
panel of standard Gram-positive and Gram-negative bacterialtrains (Table 1). The comparison of MIC values for 9a-NBD-zithromycin and azithromycin shows the identical antibacterialctivity of compounds on Gram-positive species (S. aureus, S. pneu-oniae, S. pyogenes). On the other hand, 9a-NBD-azithromycin
Please cite this article in press as: Matijasic M, et al. Fluorescently labeled
azithromycin. Pharmacol Res (2012), http://dx.doi.org/10.1016/j.phrs.2012
as slightly lower activity on Gram-negative species (M. cat-arhalis, H. influenzae, E. coli) than azithromycin. This effect couldrobably be attributed to the outer membrane of Gram-negativeicroorganisms, which presents a significant barrier for the entry
H. influenzae 1 8E. coli 2 16
of large hydrophobic molecules, such as bile salts or lipophilicantibiotics, into bacterial cell as well as promotes active effluxof such compounds by multidrug efflux pumps [36]. Apart frombeing larger than its parent molecule, 9a-NBD-azithromycin mostlikely possesses increased hydrophobic properties compared toazithromycin due to its fluorescent NBD moiety [37].
3.4. Accumulation and biological activity of9a-NBD-azithromycin in J774A.1 cells
Azithromycin is known to inhibit IL-6, PGE2, and RANTES pro-duction in J774A.1 murine monocyte-macrophage cell line uponLPS stimulation, and to have no effect on TNF�, MIP-1 and MCP-2production [33,38,39].
Similar to the results on NCI-H292 cells, in J774A.1 cells accu-mulation of 9a-NBD-azithromycin reached 163% of azithromycin(Fig. 3A), while their retention was not significantly different(Fig. 3B). Control compound lacking macrolide moiety, N-ethyl-NBD, did not accumulate in cells.
To compare the anti-inflammatory profiles of the two com-pounds in LPS-stimulated J774A.1 cells, a series of concentrationshave been tested (1.25–20 �M for 9a-NBD-azithromycin vs.5–80 �M for azithromycin). In LPS-stimulated J774A.1 cells9a-NBD-azithromycin exhibited the same activity profile likeazithomycin by inhibiting IL-6 (Fig. 3C), PGE2 (Fig. 3D) and RANTES(Fig. 3E) in dose-dependent manner, while having no significanteffect on TNF�, MIP-1 or MCP-2 production (data not shown). Thisfinding is in line with our previous study where macrolide anti-inflammatory activity in LPS-stimulated J774A.1 cells was found tobe dependent on its ability to accumulate in cells [33].
3.5. Subcellular distribution of 9a-NBD-azithromycin in J774A.1cells
Azithromycin accumulates in acidic compartments of the cell.This phenomenon is explained by the proton trapping mechanism,by which a weak base molecule gets protonated in cellular com-partments with low pH values and as such becomes much lessmembrane permeable than in its neutral form [14,40]. On theother hand, compounds with delocalized amine’s positive charge,like in structures with nitrogen atoms close to aromatic ringsand conjugated bonds, were reported to preferably accumulatein mitochondria [41,42]. Since similar structural moieties are alsopresent in NBD it is possible that conjugated molecule 9a-NBD-azithromycin may also be localized in mitochondria. Therefore,in our following experiments we investigated the subcellular dis-tribution of the selected fluorescent azithromycin derivative inlysosomes and mitochondria.
Using confocal microscopy it was shown that in living J774A.1
macrolides as a tool for monitoring cellular and tissue distribution of.06.001
cells 9a-NBD-azithromycin colocalizes with lysosomal stain Lyso-Tracker Red (Fig. 4A), whereas it does not accumulate inmitochondria as indicated by the lack of overlap with Mito-Tracker Red signal (Fig. 4B). N-ethyl-NBD, the fluorescent moiety of

Please cite this article in press as: Matijasic M, et al. Fluorescently labeled macrolides as a tool for monitoring cellular and tissue distribution ofazithromycin. Pharmacol Res (2012), http://dx.doi.org/10.1016/j.phrs.2012.06.001
ARTICLE IN PRESSG Model
YPHRS-2469; No. of Pages 11
6 M. Matijasic et al. / Pharmacological Research xxx (2012) xxx– xxx
Fig. 3. Cellular pharmacokinetics, and biological activity of azithromycin (black bars) and 9a-NBD-azithromycin (gray bars) in J774A.1 cells. For cellular accumulationexperiments (a), cells were incubated with 10 �M compounds for 3 h, intracellular concentration was determined by LC–MS/MS and expressed relative to azithromycin. Forretention experiments (b) drug loaded cells (10 �M, 3 h) were incubated in a drug free medium for additional 3 h, and amount remaining in cells was quantified by LC–MS/MSand expressed relative to the initially accumulated amount. For assessing biological activity, cells were incubated with compounds in denoted micromolar concentrationrange for 2 h, and stimulated with 1 �g/mL LPS for next 6 h. Concentrations of IL-6 (c), PGE2 (d) and RANTES (e), in supernatants were determined by ELISA and expressedrelative to LPS stimulated positive control samples (pos). Unstimulated samples are shown as negative control (neg). All data are mean values ± SD of three experiments(four for cellular accumulation) with *P < 0.05, **P < 0.01, ***P < 0.001 according to one-way ANOVA with Bonferroni post-test (in (b) t-test was applied).

ARTICLE IN PRESSG Model
YPHRS-2469; No. of Pages 11
M. Matijasic et al. / Pharmacological Research xxx (2012) xxx– xxx 7
F by cond ye Mis n.
9s
fwcernRtMcas
ig. 4. Subcellular distribution of 9a-NBD-azithromycin in J774A.1 cells examined
ye LysoTracker Red (a), and lack of colocalization with mitochondrial staining dignificantly (c). Scale bar = 10 �m. One representative experiment out of 3 is show
a-NBD-azithromycin, accumulates poorly in cells, with very faintignal dispersed throughout the cytoplasm (Fig. 4C).
The results were quantified using colocalization software bothor 9a-NBD-azithromycin and LysoTracker Red stained cells, asell as for 9a-NBD-azithromycin and MitoTracker Red stained
ells (Fig. 5). Regions of interest (ROI) were applied and pix-ls within these regions plotted in scattergram diagrams withespect to their signal intensities for both fluorescent chan-els. Most of the pixels in 9a-NBD-azithromycin/LysoTrackered stained cells show colocalized green and red signals, withhe calculated values of weighted colocalization coefficients of
Please cite this article in press as: Matijasic M, et al. Fluorescently labeled
azithromycin. Pharmacol Res (2012), http://dx.doi.org/10.1016/j.phrs.2012
CH1 = 0.85 ± 0.11 for green channel and MCH2 = 0.83 ± 0.10 for redhannel (Fig. 5A). In contrast, the majority of pixels in 9a-NBD-zithromycin/MitoTracker Red stained cells show only green or redignal. The weighted colocalization coefficients were calculated to
focal microscopy. Colocalization of 9a-NBD-azithromycin with lysosomal stainingtoTracker Red (b). Control compound, N-ethyl-NBD does not accumulate in cells
MCH1 = 0.18 ± 0.05 for green channel and MCH2 = 0.16 ± 0.09 for redchannel (Fig. 5B).
To examine the dependence of cellular accumulation of 9a-NBD-azithromycin on lysosomal pH, J774A.1 cells were co-treated withH-ATPase inhibitor bafilomycin A1. Inhibition of H-ATPase leads todisruption of lysosomal pH, as shown by the lack of LysoTrackerRed signal in cells (Fig. 6). It should be noted that Fig. 6 was takenunder the identical confocal microscopy conditions (laser intensi-ties, apertures and detector gain values) as Fig. 4. In bafilomycintreated cells, the 9a-NBD-azithroymcin signal was very weak andfound to be dispersed in cytoplasm. This result is in agreement with
macrolides as a tool for monitoring cellular and tissue distribution of.06.001
the impaired uptake of lysosomotropic compounds to lysosomalfractions of bafilomycin treated HL-60 cells [41] and rat hepato-cytes [43]. Also, accumulation of macrolides in PMN cytoplasts isconsiderably lower than in intact cells [13].

ARTICLE IN PRESSG Model
YPHRS-2469; No. of Pages 11
8 M. Matijasic et al. / Pharmacological Research xxx (2012) xxx– xxx
Fig. 5. Quantification of 9a-NBD-azithromycin localization in lysosomes and mitochondria. A representative cell was shown on the left with 9a-NBD-azithromycin signal ingreen color and LysoTracker Red (a) or MitoTracker Red (b) signal in red color. Scale bar = 5 �m. Regions of interest (ROI) were drawn and pixels from those regions shownin scattergram graphs. Each pixel in scattergram is allocated to a coordinative system based on its signal intensity values recorded for two fluorescent channels (Ch1 –9 nts arec contaf n valui
3
m(m
Fsc
a-NBD-azithromycin, Ch2 – LysoTracker or MitoTracker Red). Scattergram quadrahannel 2 only, 3 – pixels with signals from both channels, and unmarked quadrantor both fluorescent channels (MCh1 and MCh2) were calculated and shown as mean this figure legend, the reader is referred to the web version of the article.)
.6. Metabolic stability of 9a-NBD-azithromycin
Please cite this article in press as: Matijasic M, et al. Fluorescently labeled
azithromycin. Pharmacol Res (2012), http://dx.doi.org/10.1016/j.phrs.2012
The in vitro clearance (CLi) of 9a-NBD-azithromycin was deter-ined in mouse liver microsomes. The low CLi value obtained
<0.6 mL/min/g liver) suggests good metabolic stability in liverircosomes.
ig. 6. Effect of lysosomal pH disruption on subcellular distribution of 9a-NBD-azithromtained with LysoTracker Red and counterstained with DRAQ5 nuclear dye. Lack of LysoTonditions 9a-NBD-azithromycin signal is weak and dispersed in the cytoplasm. Scale ba
denoted as: 1 – pixels with signal from channel 1 only, 2 – pixels with signal fromins pixels with background signal intensities. Weighted colocalization coefficientses ± SD of 25 different cells and ROIs. (For interpretation of the references to color
3.7. In vivo distribution of 9a-NBD-azithromycin in mouse
macrolides as a tool for monitoring cellular and tissue distribution of.06.001
3.7.1. Quantification in tissuesSince azithromycin achieves very high concentrations in liver,
kidney and spleen [15], we selected these tissues to quantify thein vivo distribution of 9a-NBD-azithromycin in mice.
ycin. J774A.1 cells were incubated with 9a-NBD-azithromycin and bafilomycin A1,racker Red signal indicates disturbance of lysosomal pH by bafilomycin A1. In suchr = 10 �m. One representative experiment out of 3 is shown.
ARTICLE IN PRESSG Model
YPHRS-2469; No. of Pages 11
M. Matijasic et al. / Pharmacological Research xxx (2012) xxx– xxx 9
F after 2s a-NBDp
qtmtaswciohmtti
TCav
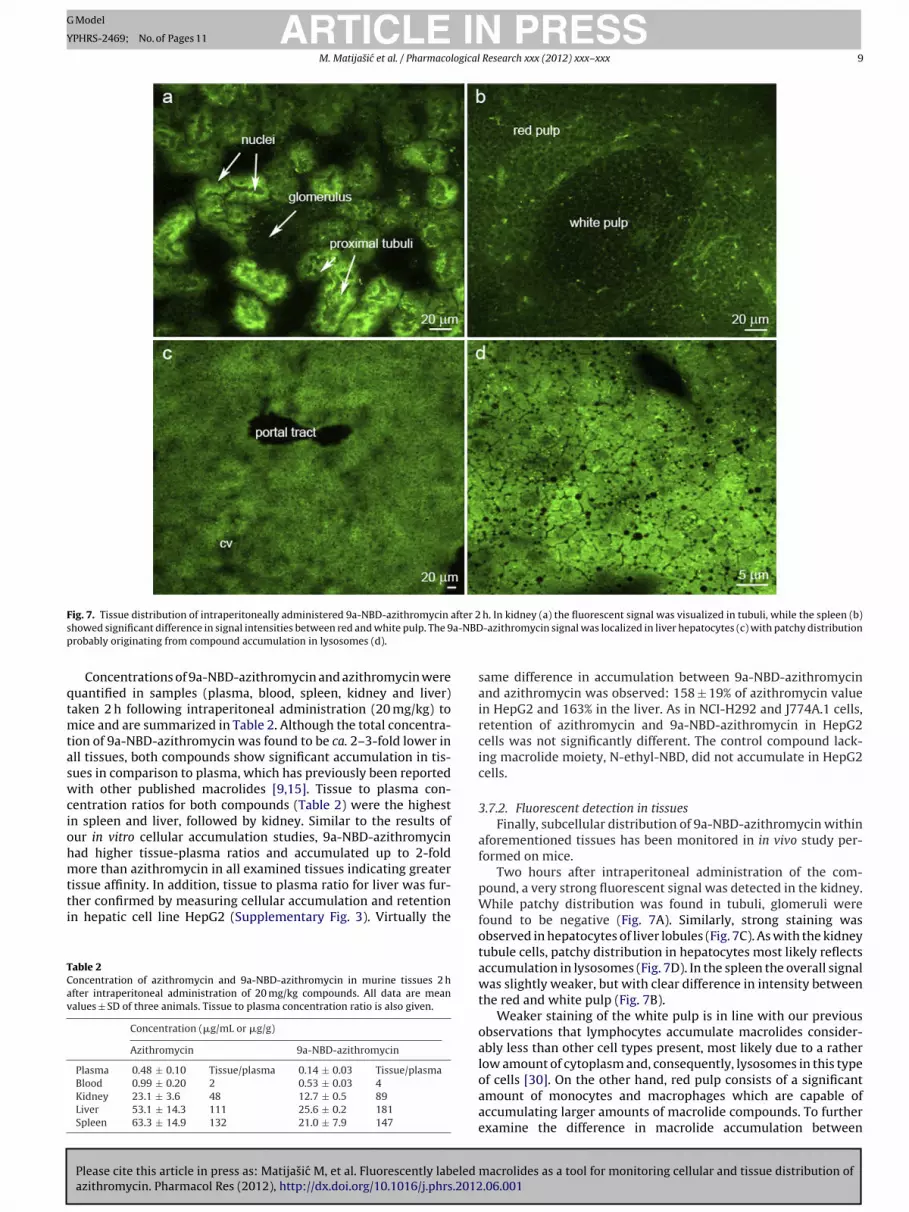
ig. 7. Tissue distribution of intraperitoneally administered 9a-NBD-azithromycin
howed significant difference in signal intensities between red and white pulp. The 9robably originating from compound accumulation in lysosomes (d).
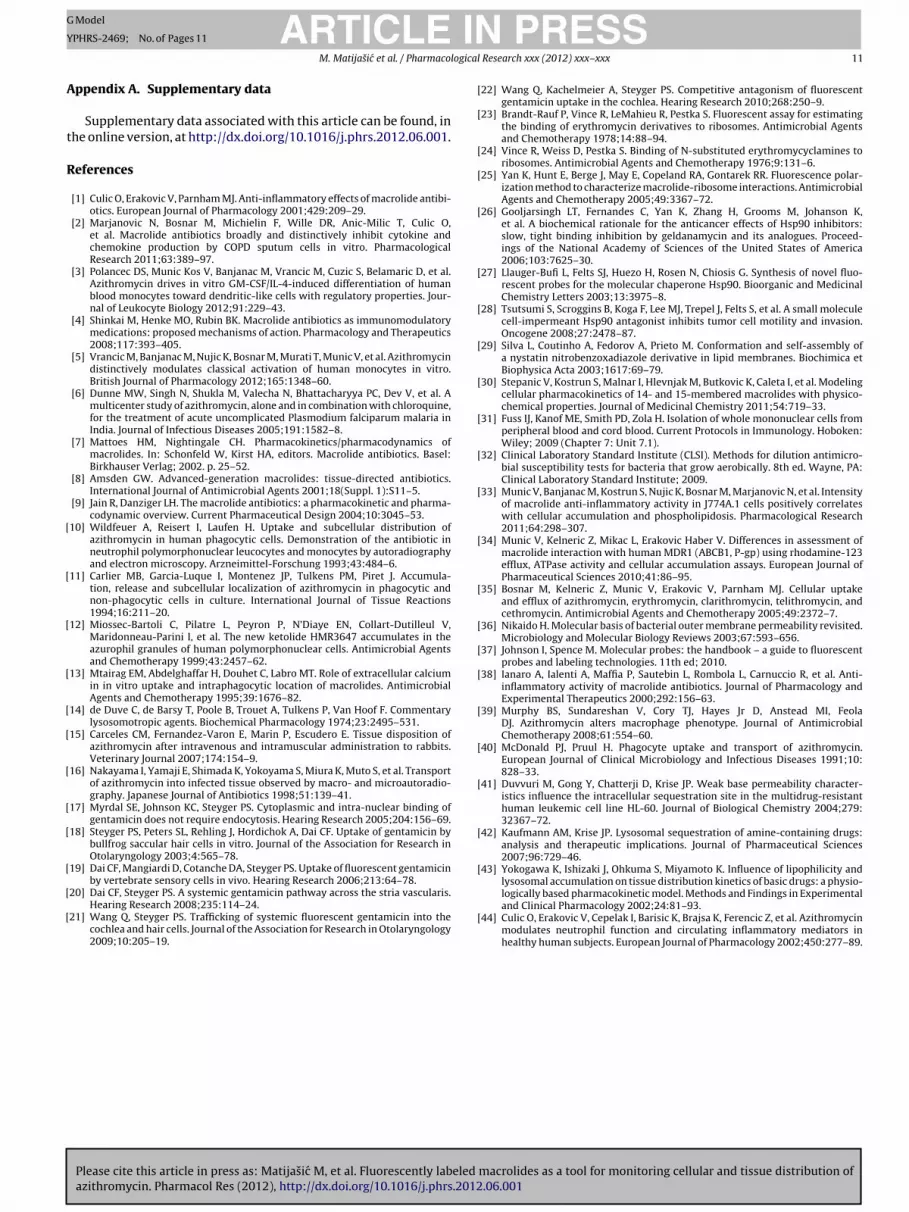
Concentrations of 9a-NBD-azithromycin and azithromycin wereuantified in samples (plasma, blood, spleen, kidney and liver)aken 2 h following intraperitoneal administration (20 mg/kg) to
ice and are summarized in Table 2. Although the total concentra-ion of 9a-NBD-azithromycin was found to be ca. 2–3-fold lower inll tissues, both compounds show significant accumulation in tis-ues in comparison to plasma, which has previously been reportedith other published macrolides [9,15]. Tissue to plasma con-
entration ratios for both compounds (Table 2) were the highestn spleen and liver, followed by kidney. Similar to the results ofur in vitro cellular accumulation studies, 9a-NBD-azithromycinad higher tissue-plasma ratios and accumulated up to 2-foldore than azithromycin in all examined tissues indicating greater
Please cite this article in press as: Matijasic M, et al. Fluorescently labeled
azithromycin. Pharmacol Res (2012), http://dx.doi.org/10.1016/j.phrs.2012
issue affinity. In addition, tissue to plasma ratio for liver was fur-her confirmed by measuring cellular accumulation and retentionn hepatic cell line HepG2 (Supplementary Fig. 3). Virtually the
able 2oncentration of azithromycin and 9a-NBD-azithromycin in murine tissues 2 hfter intraperitoneal administration of 20 mg/kg compounds. All data are meanalues ± SD of three animals. Tissue to plasma concentration ratio is also given.
Concentration (�g/mL or �g/g)
Azithromycin 9a-NBD-azithromycin
Plasma 0.48 ± 0.10 Tissue/plasma 0.14 ± 0.03 Tissue/plasmaBlood 0.99 ± 0.20 2 0.53 ± 0.03 4Kidney 23.1 ± 3.6 48 12.7 ± 0.5 89Liver 53.1 ± 14.3 111 25.6 ± 0.2 181Spleen 63.3 ± 14.9 132 21.0 ± 7.9 147
h. In kidney (a) the fluorescent signal was visualized in tubuli, while the spleen (b)-azithromycin signal was localized in liver hepatocytes (c) with patchy distribution
same difference in accumulation between 9a-NBD-azithromycinand azithromycin was observed: 158 ± 19% of azithromycin valuein HepG2 and 163% in the liver. As in NCI-H292 and J774A.1 cells,retention of azithromycin and 9a-NBD-azithromycin in HepG2cells was not significantly different. The control compound lack-ing macrolide moiety, N-ethyl-NBD, did not accumulate in HepG2cells.
3.7.2. Fluorescent detection in tissuesFinally, subcellular distribution of 9a-NBD-azithromycin within
aforementioned tissues has been monitored in in vivo study per-formed on mice.
Two hours after intraperitoneal administration of the com-pound, a very strong fluorescent signal was detected in the kidney.While patchy distribution was found in tubuli, glomeruli werefound to be negative (Fig. 7A). Similarly, strong staining wasobserved in hepatocytes of liver lobules (Fig. 7C). As with the kidneytubule cells, patchy distribution in hepatocytes most likely reflectsaccumulation in lysosomes (Fig. 7D). In the spleen the overall signalwas slightly weaker, but with clear difference in intensity betweenthe red and white pulp (Fig. 7B).
Weaker staining of the white pulp is in line with our previousobservations that lymphocytes accumulate macrolides consider-ably less than other cell types present, most likely due to a ratherlow amount of cytoplasm and, consequently, lysosomes in this type
macrolides as a tool for monitoring cellular and tissue distribution of.06.001
of cells [30]. On the other hand, red pulp consists of a significantamount of monocytes and macrophages which are capable ofaccumulating larger amounts of macrolide compounds. To furtherexamine the difference in macrolide accumulation between

ARTICLE IN PRESSG Model
YPHRS-2469; No. of Pages 11
10 M. Matijasic et al. / Pharmacological Research xxx (2012) xxx– xxx
Fig. 8. Cellular accumulation and retention of 9a-NBD-azithromycin in monocytes and lymphocytes. For cellular accumulation experiments (a), PBMCs were incubated with1 �M compounds for 3 h and analyzed on flow cytometer. Geometric mean fluorescence intensity (MFI) values were determined for monocytes (gray bars) and lymphocytes(black bars), and expressed as relative MFI fold increase over control sample for each cell population. For retention experiments (b) 9a-NBD-azithromycin loaded cells (1 �M,3 h) were incubated in a drug free medium for additional 3 h. The compound remaining in cells was quantified by flow cytometry and expressed relative to the initiallyaccumulated amount. Data are mean values ± SD of three experiments with *P < 0.05, **P < 0.01, ***P < 0.001 according to one-way ANOVA with Bonferroni post-test (in (b)t
lamiflliflb
iactcowdarpcwe
aipiw
cebitnwt
-test was applied).
ymphocytes and monocytes, cellular uptake of 9a-NBD-zithromycin was determined in human peripheral bloodononuclear cells (PBMC) using flow cytometry. After 3 h of
ncubation with the fluorescently labeled azithromycin, meanuorescence intensity of monocytes was 4-fold higher than that of
ymphocytes (Fig. 8A), supporting the conclusion of the differencen staining of white and red pulp of spleen. The retention ofuorescently labeled azithromycin did not differ significantlyetween two cell populations (Fig. 8B).
The results from the in vivo study confirm previous find-ngs obtained in in vitro systems, where it was observed thatzithromycin does not accumulate to an equal extent in all primaryell cultures studied [30]. Using a fluorescently labeled compound,he cellular distribution of azithromycin within various tissuesould be estimated as well as its subcellular localization in vari-us conditions or pharmacological interventions. As azithromycinas detected in human PMNs 28 days post conventional 3 × 500 mgose [44], presented fluorescently labeled macrolide (9a-NBD-zithromycin) may also be useful in finding other ‘macrolideeservoirs’ in the body participating in its distinct pharmacokineticrofile. Cells with the highest ability of concentrating macrolidesould be identified and their potential role in various diseaseshere macrolides like azithromycin show activity could then be
xamined in detail.With respect to the growing interest on anti-inflammatory
ctions of macrolides, fluorescent azithromycin could be utilizedn various processes of finding new macrolide targets. Similarly itsotential use in determining azithromycin penetration into various
ntracellular and extracellular microbes could also be evaluated, asell as the conditions affecting it.
Studies presented in this article have been limited to culturedells and freshly isolated primary cells or tissue segments. How-ver, in further studies fluorescent azithromycin analog could alsoe used as a tool for monitoring macrolide pharmacology in liv-
ng animals. Intravital studies employing two-photon microscopy
Please cite this article in press as: Matijasic M, et al. Fluorescently labeled
azithromycin. Pharmacol Res (2012), http://dx.doi.org/10.1016/j.phrs.2012
echniques could provide an insight into azithromycin pharmacoki-etics in vivo, enabling kinetic analyses and physiological studiesithin the organs of living animals with subcellular resolution. Fur-
hermore, fluorescent azithromycin could be combined with other
fluorophores and fluorescent probes thus allowing simultaneouscharacterization of multiple parameters within the same organ.
4. Conclusion
In this paper four fluorescently labeled macrolides were evalu-ated as possible fluorescent analogs of azithromycin to study its invitro and in vivo distribution. 9a-NBD-azithromycin was selected asa compound with the most similar cellular pharmacokinetic profileto azithromycin. The results show that 9a-NBD-azithromycin dis-plays almost identical biological activity properties (anti-microbialand anti-inflammatory) as azithromycin, and localizes in lysosomeswith its accumulation dependent on lysosomal pH as describedfor azithromycin. The in vivo pharmacokinetic study performedprovides evidence for comparable accumulation patterns of 9a-NBD-azithromycin and azithromycin in kidney, liver and spleen.Furthermore, 9a-NBD-azithromicin distribution was visualized byconfocal microscopy in various cell types within observed tissues:in tubules of kidneys, liver hepatocytes and red pulp of the spleen.
Based on all the presented findings, we conclude that 9a-NBD-azithromycin could be used as fluorescent analog of azithromycinfor monitoring azithromycin distribution within cells and tissues.To our knowledge this is the first report of employing fluorescentmacrolide in pharmacokinetic studies, and it opens new perspec-tives in the use of fluorescently labeled compounds to monitorpreferential cellular distribution of macrolides within tissues, aswell as their subcellular localization in various physiological andpathophysiological conditions, and in pharmacological interven-tions.
Acknowledgements
Authors wish to thank Marko Duksi and Visnja Poljak for thesynthesis of fluorescently labeled macrolides; and Mario Hlevn-jak, Slaven Crnkovic, Mihailo Banjanac, Branka Tavcar, Jovica Ralic,
macrolides as a tool for monitoring cellular and tissue distribution of.06.001
Genadij Razdorov, Denis Polancec, Maja Kosa Prtenjaca for partic-ipating in some experiments, as well as Ksenija Stajcer, BiserkaRagac, Marija Skalic and Srebrenka Kruzljak for an exceptional tech-nical assistance.
ING Model
Y
logical
A
t
R
[
[
[
[
[
[
[
[
[
[
[
[
[
[
[
[
[
[
[
[
[
[
[
[
[
[
[
[
[
[
[
[
[
[
ARTICLEPHRS-2469; No. of Pages 11
M. Matijasic et al. / Pharmaco
ppendix A. Supplementary data
Supplementary data associated with this article can be found, inhe online version, at http://dx.doi.org/10.1016/j.phrs.2012.06.001.
eferences
[1] Culic O, Erakovic V, Parnham MJ. Anti-inflammatory effects of macrolide antibi-otics. European Journal of Pharmacology 2001;429:209–29.
[2] Marjanovic N, Bosnar M, Michielin F, Wille DR, Anic-Milic T, Culic O,et al. Macrolide antibiotics broadly and distinctively inhibit cytokine andchemokine production by COPD sputum cells in vitro. PharmacologicalResearch 2011;63:389–97.
[3] Polancec DS, Munic Kos V, Banjanac M, Vrancic M, Cuzic S, Belamaric D, et al.Azithromycin drives in vitro GM-CSF/IL-4-induced differentiation of humanblood monocytes toward dendritic-like cells with regulatory properties. Jour-nal of Leukocyte Biology 2012;91:229–43.
[4] Shinkai M, Henke MO, Rubin BK. Macrolide antibiotics as immunomodulatorymedications: proposed mechanisms of action. Pharmacology and Therapeutics2008;117:393–405.
[5] Vrancic M, Banjanac M, Nujic K, Bosnar M, Murati T, Munic V, et al. Azithromycindistinctively modulates classical activation of human monocytes in vitro.British Journal of Pharmacology 2012;165:1348–60.
[6] Dunne MW, Singh N, Shukla M, Valecha N, Bhattacharyya PC, Dev V, et al. Amulticenter study of azithromycin, alone and in combination with chloroquine,for the treatment of acute uncomplicated Plasmodium falciparum malaria inIndia. Journal of Infectious Diseases 2005;191:1582–8.
[7] Mattoes HM, Nightingale CH. Pharmacokinetics/pharmacodynamics ofmacrolides. In: Schonfeld W, Kirst HA, editors. Macrolide antibiotics. Basel:Birkhauser Verlag; 2002. p. 25–52.
[8] Amsden GW. Advanced-generation macrolides: tissue-directed antibiotics.International Journal of Antimicrobial Agents 2001;18(Suppl. 1):S11–5.
[9] Jain R, Danziger LH. The macrolide antibiotics: a pharmacokinetic and pharma-codynamic overview. Current Pharmaceutical Design 2004;10:3045–53.
10] Wildfeuer A, Reisert I, Laufen H. Uptake and subcellular distribution ofazithromycin in human phagocytic cells. Demonstration of the antibiotic inneutrophil polymorphonuclear leucocytes and monocytes by autoradiographyand electron microscopy. Arzneimittel-Forschung 1993;43:484–6.
11] Carlier MB, Garcia-Luque I, Montenez JP, Tulkens PM, Piret J. Accumula-tion, release and subcellular localization of azithromycin in phagocytic andnon-phagocytic cells in culture. International Journal of Tissue Reactions1994;16:211–20.
12] Miossec-Bartoli C, Pilatre L, Peyron P, N’Diaye EN, Collart-Dutilleul V,Maridonneau-Parini I, et al. The new ketolide HMR3647 accumulates in theazurophil granules of human polymorphonuclear cells. Antimicrobial Agentsand Chemotherapy 1999;43:2457–62.
13] Mtairag EM, Abdelghaffar H, Douhet C, Labro MT. Role of extracellular calciumin in vitro uptake and intraphagocytic location of macrolides. AntimicrobialAgents and Chemotherapy 1995;39:1676–82.
14] de Duve C, de Barsy T, Poole B, Trouet A, Tulkens P, Van Hoof F. Commentarylysosomotropic agents. Biochemical Pharmacology 1974;23:2495–531.
15] Carceles CM, Fernandez-Varon E, Marin P, Escudero E. Tissue disposition ofazithromycin after intravenous and intramuscular administration to rabbits.Veterinary Journal 2007;174:154–9.
16] Nakayama I, Yamaji E, Shimada K, Yokoyama S, Miura K, Muto S, et al. Transportof azithromycin into infected tissue observed by macro- and microautoradio-graphy. Japanese Journal of Antibiotics 1998;51:139–41.
17] Myrdal SE, Johnson KC, Steyger PS. Cytoplasmic and intra-nuclear binding ofgentamicin does not require endocytosis. Hearing Research 2005;204:156–69.
18] Steyger PS, Peters SL, Rehling J, Hordichok A, Dai CF. Uptake of gentamicin bybullfrog saccular hair cells in vitro. Journal of the Association for Research inOtolaryngology 2003;4:565–78.
19] Dai CF, Mangiardi D, Cotanche DA, Steyger PS. Uptake of fluorescent gentamicinby vertebrate sensory cells in vivo. Hearing Research 2006;213:64–78.
Please cite this article in press as: Matijasic M, et al. Fluorescently labeled
azithromycin. Pharmacol Res (2012), http://dx.doi.org/10.1016/j.phrs.2012
20] Dai CF, Steyger PS. A systemic gentamicin pathway across the stria vascularis.Hearing Research 2008;235:114–24.
21] Wang Q, Steyger PS. Trafficking of systemic fluorescent gentamicin into thecochlea and hair cells. Journal of the Association for Research in Otolaryngology2009;10:205–19.
[
PRESS Research xxx (2012) xxx– xxx 11
22] Wang Q, Kachelmeier A, Steyger PS. Competitive antagonism of fluorescentgentamicin uptake in the cochlea. Hearing Research 2010;268:250–9.
23] Brandt-Rauf P, Vince R, LeMahieu R, Pestka S. Fluorescent assay for estimatingthe binding of erythromycin derivatives to ribosomes. Antimicrobial Agentsand Chemotherapy 1978;14:88–94.
24] Vince R, Weiss D, Pestka S. Binding of N-substituted erythromycyclamines toribosomes. Antimicrobial Agents and Chemotherapy 1976;9:131–6.
25] Yan K, Hunt E, Berge J, May E, Copeland RA, Gontarek RR. Fluorescence polar-ization method to characterize macrolide-ribosome interactions. AntimicrobialAgents and Chemotherapy 2005;49:3367–72.
26] Gooljarsingh LT, Fernandes C, Yan K, Zhang H, Grooms M, Johanson K,et al. A biochemical rationale for the anticancer effects of Hsp90 inhibitors:slow, tight binding inhibition by geldanamycin and its analogues. Proceed-ings of the National Academy of Sciences of the United States of America2006;103:7625–30.
27] Llauger-Bufi L, Felts SJ, Huezo H, Rosen N, Chiosis G. Synthesis of novel fluo-rescent probes for the molecular chaperone Hsp90. Bioorganic and MedicinalChemistry Letters 2003;13:3975–8.
28] Tsutsumi S, Scroggins B, Koga F, Lee MJ, Trepel J, Felts S, et al. A small moleculecell-impermeant Hsp90 antagonist inhibits tumor cell motility and invasion.Oncogene 2008;27:2478–87.
29] Silva L, Coutinho A, Fedorov A, Prieto M. Conformation and self-assembly ofa nystatin nitrobenzoxadiazole derivative in lipid membranes. Biochimica etBiophysica Acta 2003;1617:69–79.
30] Stepanic V, Kostrun S, Malnar I, Hlevnjak M, Butkovic K, Caleta I, et al. Modelingcellular pharmacokinetics of 14- and 15-membered macrolides with physico-chemical properties. Journal of Medicinal Chemistry 2011;54:719–33.
31] Fuss IJ, Kanof ME, Smith PD, Zola H. Isolation of whole mononuclear cells fromperipheral blood and cord blood. Current Protocols in Immunology. Hoboken:Wiley; 2009 (Chapter 7: Unit 7.1).
32] Clinical Laboratory Standard Institute (CLSI). Methods for dilution antimicro-bial susceptibility tests for bacteria that grow aerobically. 8th ed. Wayne, PA:Clinical Laboratory Standard Institute; 2009.
33] Munic V, Banjanac M, Kostrun S, Nujic K, Bosnar M, Marjanovic N, et al. Intensityof macrolide anti-inflammatory activity in J774A.1 cells positively correlateswith cellular accumulation and phospholipidosis. Pharmacological Research2011;64:298–307.
34] Munic V, Kelneric Z, Mikac L, Erakovic Haber V. Differences in assessment ofmacrolide interaction with human MDR1 (ABCB1, P-gp) using rhodamine-123efflux, ATPase activity and cellular accumulation assays. European Journal ofPharmaceutical Sciences 2010;41:86–95.
35] Bosnar M, Kelneric Z, Munic V, Erakovic V, Parnham MJ. Cellular uptakeand efflux of azithromycin, erythromycin, clarithromycin, telithromycin, andcethromycin. Antimicrobial Agents and Chemotherapy 2005;49:2372–7.
36] Nikaido H. Molecular basis of bacterial outer membrane permeability revisited.Microbiology and Molecular Biology Reviews 2003;67:593–656.
37] Johnson I, Spence M. Molecular probes: the handbook – a guide to fluorescentprobes and labeling technologies. 11th ed; 2010.
38] Ianaro A, Ialenti A, Maffia P, Sautebin L, Rombola L, Carnuccio R, et al. Anti-inflammatory activity of macrolide antibiotics. Journal of Pharmacology andExperimental Therapeutics 2000;292:156–63.
39] Murphy BS, Sundareshan V, Cory TJ, Hayes Jr D, Anstead MI, FeolaDJ. Azithromycin alters macrophage phenotype. Journal of AntimicrobialChemotherapy 2008;61:554–60.
40] McDonald PJ, Pruul H. Phagocyte uptake and transport of azithromycin.European Journal of Clinical Microbiology and Infectious Diseases 1991;10:828–33.
41] Duvvuri M, Gong Y, Chatterji D, Krise JP. Weak base permeability character-istics influence the intracellular sequestration site in the multidrug-resistanthuman leukemic cell line HL-60. Journal of Biological Chemistry 2004;279:32367–72.
42] Kaufmann AM, Krise JP. Lysosomal sequestration of amine-containing drugs:analysis and therapeutic implications. Journal of Pharmaceutical Sciences2007;96:729–46.
43] Yokogawa K, Ishizaki J, Ohkuma S, Miyamoto K. Influence of lipophilicity andlysosomal accumulation on tissue distribution kinetics of basic drugs: a physio-
macrolides as a tool for monitoring cellular and tissue distribution of.06.001
logically based pharmacokinetic model. Methods and Findings in Experimentaland Clinical Pharmacology 2002;24:81–93.
44] Culic O, Erakovic V, Cepelak I, Barisic K, Brajsa K, Ferencic Z, et al. Azithromycinmodulates neutrophil function and circulating inflammatory mediators inhealthy human subjects. European Journal of Pharmacology 2002;450:277–89.


