Embed Size (px)
Citation preview

K, Market Analys is
Getting Back to Work San Bernard ino County , Ca l i fo rn ia
San Bernardino Labor Market Report (Q3 2009)
Period Covered: July 2009 – September 2009
Au tho r s : Ba r r e t t L aMo the L add , Deanna Hamp ton , Ge r a r d Eue l l , J e f f Qu i nn & Dan DeMa i oNew ton
MGS Insights and Analysis The San Bernardino Labor Market Report (Q3 2009) is the first of four quarterly reports. The report contains information and analysis on hiring employers and job seekers in the San Bernardino area. The ultimate goal of the data is to facilitate key stakeholders in getting San Bernardino residents back to work. The report should assist in developing the most appropriate workforce programs, recruiting tactics, and business relationships.
Research Methodology The data used in producing this report comes from two sources: Monster Worldwide’s Talent Supply and Demand database of over 80 million U.S. resumes and WANTED Technologies aggregated job posting database for the period of April 2009 through September 2009, inclusive.
October 2009 ©2009 Monster Worldwide 1 of 23
Getting Back to Work San Bernardino Labor Market Research Quarter 3: July - Sept 2009
Cr i t ica l Ins ights
• Online job postings in San Bernardino County rose 9% from quarter two to quarter three.
• San Bernardino has sizable job postings and expanding opportunity in the healthcare area.
– Healthcare and Social Assistance is the second largest industry in terms of online job postings, representing 16% of total volume.
– The occupation in highest demand by employers is Health Diagnosing and Treating Practitioners (8%).
– The top four fastest growing occupations are health-related: Occupational and Physical Therapist Assistants and Aides; General Healthcare Support Occupations; Health Diagnosing and Treating Practitioners; and Health Technologists and Technicians.
• The occupation in highest demand by employers is Administrative and Support and Waste Management and Remediation (20%).
• The three largest decreases in occupation demand by employers are for blue collar (Metal and Plastic Workers, -15%) and white collar (Financial Clerks, -7%; Engineers, -4%) roles.
• The most common skill requirements in San Bernardino County job postings are for customer service and communications.
• While employers show the greatest demand for Bachelor’s degrees (36%) and High School degrees (34%), there is a deficit in the country for talent with this level of education.
• There is talent surplus for job seekers with an Associate’s degree or some College coursework (36%).
• There was a notable increase in roles for senior level candidates (those with 10+ years of experience or a Master’s Degree or higher) from quarter two to quarter three, though they represent less than 10% of job opportunities. This is a good indicator for strategic business growth.
• San Bernardino employers are seeking junior-level candidates, as they look to refill the workforce with low-cost employees; 76% of San Bernardino job postings desire a candidate with five years or less of work experience.
• Available talent for the region has fluctuated throughout 2009 along with confidence in the economy and seasonal swings; resume postings were down 15% in quarter two, but rose 3% in quarter three.
• The fastest growing industry for talent demand is Construction (+5%), while Professional, Scientific, and Technical (16%) and Manufacturing (11%) sectors show the greatest overall demand.
• Talent supply for the County is highest for Information and Record Clerks (12%), with General Sales and Related Workers (+61%) being the fastest growing occupation with talent availability.
• Office and Administrative Support is the only occupational segment with strong supply and demand. Sales and Related and Healthcare Practitioners/Technical both have talent deficits.
October 2009 ©2009 Monster Worldwide 2 of 23

Getting Back to Work San Bernardino Labor Market Research Quarter 3: July - Sept 2009
San Bernardino Talent Demand Analys is TALENT DEMAND Talent demand for San Bernardino County expanded from quarter two to quarter three 2009, as reflected by a 9% increase in job postings. This increase may be an early indication of green shoots for economic improvement, demonstrating employers increasing confidence and hiring.
Figure 1: Total Job Postings Source: Wanted Technologies
TALENT DEMAND BY INDUSTRY SECTOR Listed on the next page are the top twenty industries and their volume share of job postings for the second and third quarter of 2009, as well as the volume change from quarter-to-quarter. The greatest demand for the period was for the following industries: 1. Administrative and Support and Waste Management and Remediation Services (20%) 2. Health Care and Social Assistance (16%) 3. Educational Services (9%) 4. Public Administration (8%) 5. Retail Trade (8%) Demand for talent increased the greatest compared to the previous quarter (excluding those with under 100 jobs) in the following industries: 1. Utilities (415%) 2. Accommodation and Food Services (78%) 3. Health Care and Social Assistance (33%) 4. Administrative and Support and Waste Management and Remediation Services (32%) 5. Transportation and Warehousing (30%)
October 2009 ©2009 Monster Worldwide 3 of 23

Getting Back to Work San Bernardino Labor Market Research Quarter 3: July - Sept 2009 The slowest growing industries quarter-to-quarter include (excluding those with under 100 jobs): 1. Construction (-1%) 2. Public Administration (-1%) The most significant shifts in terms of the percentage share were: 1. A 2% increase in each Administrative and Support and Waste Management and
Remediation Services; Health Care and Social Assistance; and Accommodation and Food Services
2. A 1% drop in Public Administration and Information
Top 20 Industries: Job Postings Q2: April-June ’09 %
Q3: July-Sept ’09 %
Change Q2-Q3
Administrative and Support and Waste Management and Remediation Services 18% 20% 32% Health Care and Social Assistance 14% 16% 33% Educational Services 9% 9% 16% Public Administration 10% 8% -1% Retail Trade 8% 8% 20% Professional, Scientific, and Technical Services 7% 7% 11% Finance and Insurance 7% 7% 12% Manufacturing 6% 6% 14% Accommodation and Food Services 3% 5% 78% Wholesale Trade 4% 4% 26% Information 4% 3% 7% Other Services 2% 2% 19% Real Estate and Rental and Leasing 2% 2% 12% Transportation and Warehousing 1% 1% 30% Arts, Entertainment, and Recreation 1% 1% 5% Construction 1% 1% -1% Utilities 0.2% 1% 415% Agriculture, Forestry, Fishing and Hunting 0.1% 0.04% -47% Mining, Quarrying, and Oil and Gas Extraction 0.01% 0.04% 700% Management of Companies and Enterprises 0.1% 0.02% -56%
Figure 2: Top 20 Industries in Supply and Their Change Source: Wanted Technologies
Note: This industry data represents only 10% of all job postings tracked by WANTED; the
other 90% of postings had no industry indication.
October 2009 ©2009 Monster Worldwide 4 of 23

Getting Back to Work San Bernardino Labor Market Research Quarter 3: July - Sept 2009
TALENT DEMAND BY OCCUPATIONAL CATEGORIES Listed below is the percentage volume of job postings for the second and third quarter of 2009 for the twenty most popular occupations. The top 20 occupations account for more than 60% of postings in the San Bernardino area. There were two key changes of note from quarter to quarter: 1. A 2% expansion in Health Diagnosing and Treating Practitioners; and a 1% upward
shift in General Management Occupations; Retail Sales Workers; and Health Technologists and Technicians
2. A 1% share drop in Advertising, Marketing, Promotions, Public Relations, and Sales Managers; Business Operations Specialists; and Financial Specialists
Top 20 Occupations: Job Postings Q2: April-June ’09 %
Q3: July-Sept ’09 %
Health Diagnosing and Treating Practitioners 6% 8% Computer Specialists 7% 7% General Sales and Related Workers 5% 5% Entertainers and Performers, Sports and Related Workers 4% 4% General Management Occupations 3% 4% Sales Representatives, Services 4% 4% Advertising, Marketing, Promotions, PR, and Sales Managers 4% 3% Information and Record Clerks 3% 3% Secretaries and Administrative Assistants 3% 3% Operations Specialties Managers 3% 3% Financial Clerks 3% 3% Retail Sales Workers 2% 3% Business Operations Specialists 3% 2% Financial Specialists 3% 2% Supervisors, Sales Workers 2% 2% Sales Representatives, Wholesale and Manufacturing 2% 2% Art and Design Workers 2% 2% Health Technologists and Technicians 1% 2% Media and Communication Workers 2% 2% General Office and Administrative Support Workers 2% 2%
Figure 3: Top 20 Occupations in Supply Source: Wanted Technologies
October 2009 ©2009 Monster Worldwide 5 of 23

Getting Back to Work San Bernardino Labor Market Research Quarter 3: July - Sept 2009 The greatest increases in talent demand in San Bernardino were for the following occupations (for any occupation representing more than 1% of total volume):
1. Occupational and Physical Therapist Assistants and Aides (101%) 2. General Healthcare Support Occupations (57%) 3. Health Diagnosing and Treating Practitioners (50%) 4. Health Technologists and Technicians (34%) 5. Lawyers, Judges, and Related Workers (28%) 6. Supervisors, Food Preparation and Serving Workers (24%) 7. Supervisors, Office and Administrative Support Workers (19%) 8. Supervisors, Sales Workers (19%) 9. Cooks and Food Preparation Workers (19%) 10. Retail Sales Workers (17%) 11. General Management Occupations (17%) 12. Supervisors, Production Workers (14%) 13. Vehicle and Mobile Equipment Mechanics, Installers, and Repairers (14%) 14. Secretaries and Administrative Assistants (14%) 15. General Installation, Maintenance, and Repair Occupations (13%)
The greatest decreases in talent demand in San Bernardino were for the following occupations (for any occupation representing more than 1% of total volume):
1. Metal Workers and Plastic Workers (-15%) 2. Financial Clerks (-7%) 3. Engineers (-4%) 4. Media and Communication Equipment Workers (-2%) 5. General Protective Service Workers (-1%) 6. Building Cleaning and Pest Control Workers (-1%)
The table on the next page summarizes occupational growth and supply over the past two quarters.
October 2009 ©2009 Monster Worldwide 6 of 23

Getting Back to Work San Bernardino Labor Market Research Quarter 3: July - Sept 2009
Occupation Title Q2 %
Ttl Q3 %
Ttl Q2 - Q3 Change
Advertising, Marketing, Promotions, PR, and Sales Managers 4% 3% 7%
Art and Design Workers 2% 2% 8%
Building Cleaning and Pest Control Workers 1% 1% -1%
Business Operations Specialists 3% 2% 5%
Computer Specialists 7% 7% 8%
Construction Trades Workers 1% 1% 4%
Cooks and Food Preparation Workers 1% 1% 19%
Counselors, Social Workers, Community/Social Svc Specialists 1% 1% 3%
Engineers 2% 2% -4%
Entertainers and Performers, Sports and Related Workers 4% 4% 1%
Financial Clerks 3% 3% -7%
Financial Specialists 3% 2% 1%
Food and Beverage Serving Workers 1% 1% 9%
General Healthcare Support Occupations 1% 1% 57%
General Installation, Maintenance, and Repair Occupations 1% 1% 13%
General Management Occupations 3% 4% 17%
General Office and Administrative Support Workers 2% 2% 7%
General Personal Care and Service Workers 2% 2% 3%
General Production Occupations 1% 1% 3%
General Protective Service Workers 1% 1% -1%
General Sales and Related Workers 5% 5% 1%
Health Diagnosing and Treating Practitioners 6% 8% 50%
Health Technologists and Technicians 1% 2% 34%
Information and Record Clerks 3% 3% 6%
Lawyers, Judges, and Related Workers 1% 1% 28%
Material Moving Workers 1% 1% 9%
Material Record, Schedule, Dispatch, & Distribute Workers 1% 1% 13%
Media and Communication Equipment Workers 1% 1% -2%
Media and Communication Workers 2% 2% 9%
Metal Workers and Plastic Workers 1% 1% -15%
Motor Vehicle Operators 1% 1% 12%
Occupational and Physical Therapist Assistants and Aides 0% 1% 101%
Operations Specialties Managers 3% 3% 10%
Personal Appearance Workers 1% 1% 6%
Postsecondary Teachers 1% 1% 1%
Primary, Secondary, and Special Education School Teachers 2% 2% 11%
Retail Sales Workers 2% 3% 17%
Sales Representatives, Services 4% 4% 7%
Sales Representatives, Wholesale and Manufacturing 2% 2% 1%
Secretaries and Administrative Assistants 3% 3% 14%
Social Scientists and Related Workers 1% 1% 0%
Supervisors, Food Preparation and Serving Workers 1% 1% 24%
Supervisors, Office and Administrative Support Workers 1% 1% 19%
Supervisors, Production Workers 1% 1% 14%
Supervisors, Sales Workers 2% 2% 19%
Top Executives 1% 1% 5%
Vehicle/Mobile Equipment Mechanics, Installers, and Repairers 1% 1% 14%
Figure 4: San Bernardino Occupation Growth and Supply Source: Wanted
October 2009 ©2009 Monster Worldwide 7 of 23
Getting Back to Work San Bernardino Labor Market Research Quarter 3: July - Sept 2009
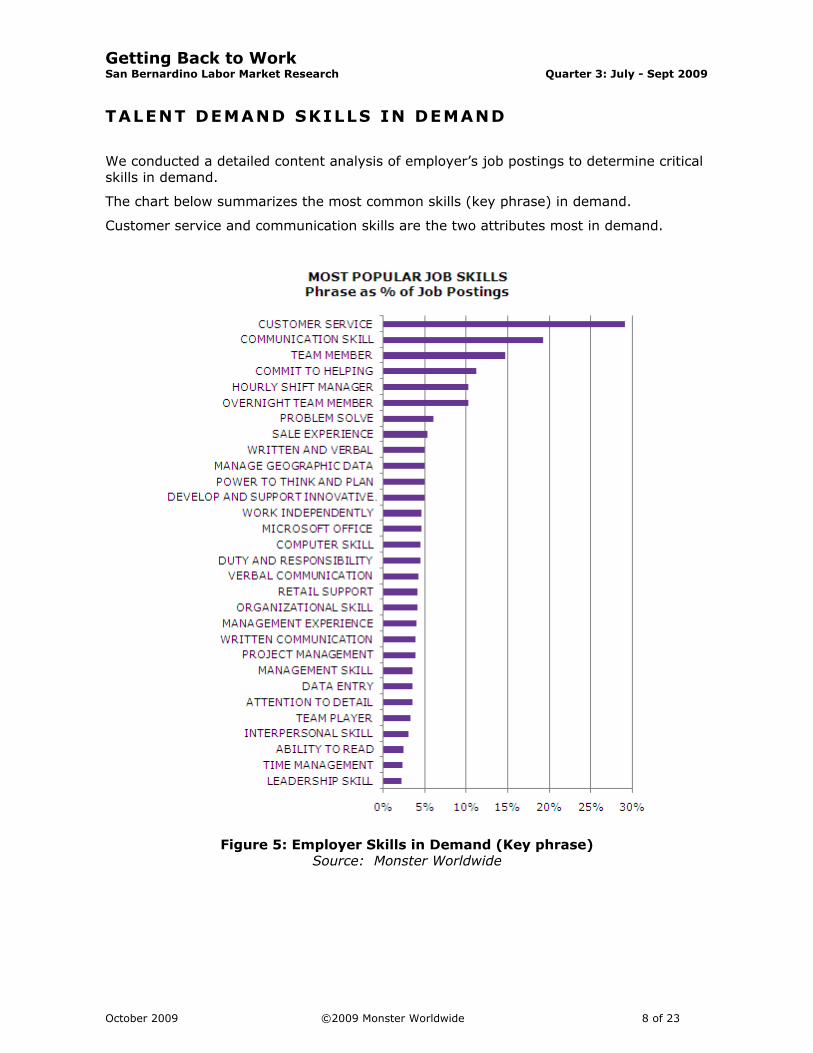
TALENT DEMAND SKILLS IN DEMAND
We conducted a detailed content analysis of employer’s job postings to determine critical skills in demand.
The chart below summarizes the most common skills (key phrase) in demand.
Customer service and communication skills are the two attributes most in demand.
Figure 5: Employer Skills in Demand (Key phrase) Source: Monster Worldwide
October 2009 ©2009 Monster Worldwide 8 of 23

Getting Back to Work San Bernardino Labor Market Research Quarter 3: July - Sept 2009
The chart below indicates the skill-related words in demand by employers.
Figure 6: Employer Skills in Demand (Single word) Source: Monster Worldwide
October 2009 ©2009 Monster Worldwide 9 of 23
Getting Back to Work San Bernardino Labor Market Research Quarter 3: July - Sept 2009
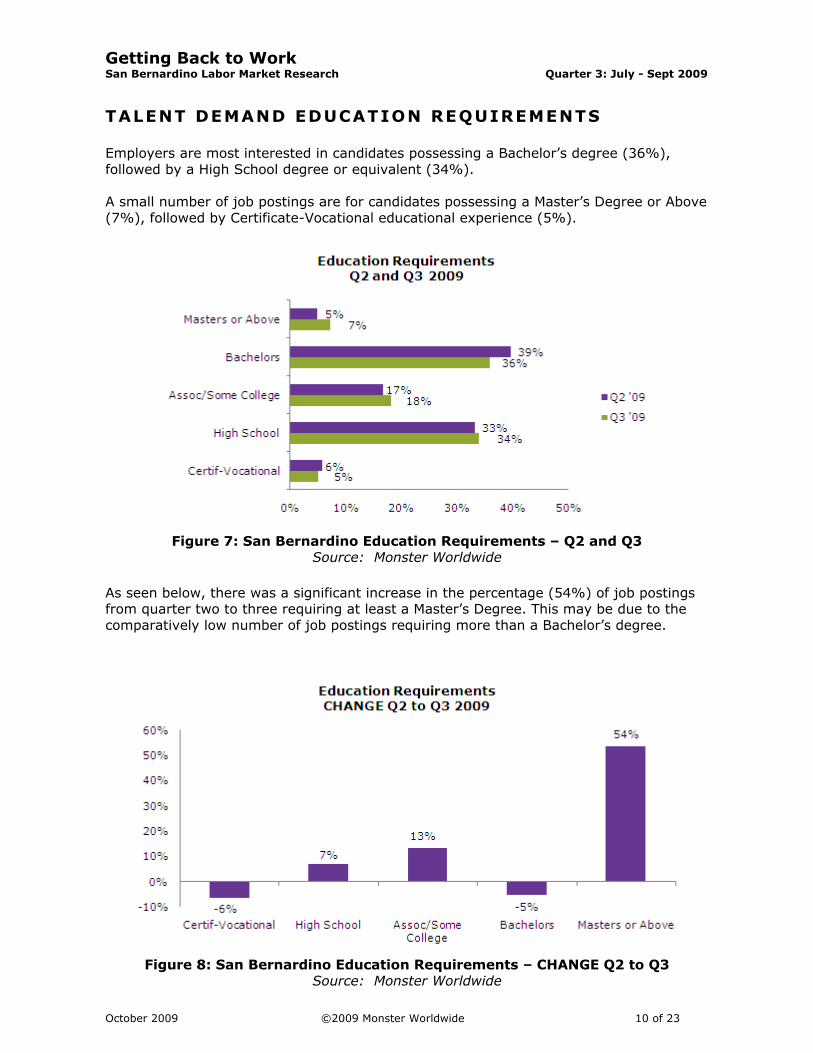
TALENT DEMAND EDUCATION REQUIREMENTS Employers are most interested in candidates possessing a Bachelor’s degree (36%), followed by a High School degree or equivalent (34%). A small number of job postings are for candidates possessing a Master’s Degree or Above (7%), followed by Certificate-Vocational educational experience (5%).
Figure 7: San Bernardino Education Requirements – Q2 and Q3 Source: Monster Worldwide
As seen below, there was a significant increase in the percentage (54%) of job postings from quarter two to three requiring at least a Master’s Degree. This may be due to the comparatively low number of job postings requiring more than a Bachelor’s degree.
Figure 8: San Bernardino Education Requirements – CHANGE Q2 to Q3 Source: Monster Worldwide
October 2009 ©2009 Monster Worldwide 10 of 23

Getting Back to Work San Bernardino Labor Market Research Quarter 3: July - Sept 2009
TALENT DEMAND EXPERIENCE REQUIREMENTS San Bernardino employers are seeking primarily entry and junior level candidates: 76% of job postings desire a candidate with five years or less of work experience. There was a notable drop in demand for seekers with 2 to 5 years of work experience and a corresponding increase in positions for candidates with less than two years of experience.
Figure 9: San Bernardino Experience Requirements – Q2 and Q3 Source: Monster Worldwide
From the previous quarter, there was a 25% increase in positions looking for 10+ years of work experience while there was a significant 23% decrease in demand for job seekers with 2 to 5 years of experience.
Figure 10: San Bernardino Education Requirements – CHANGE Q2 to Q3 Source: Monster Worldwide
October 2009 ©2009 Monster Worldwide 11 of 23

Getting Back to Work San Bernardino Labor Market Research Quarter 3: July - Sept 2009
San Bernardino Talent Supply Analys is Ta lent Avai labi l i ty In the past year, the number of new San Bernardino resumes on Monster has shown high volatility quarter by quarter. After falling 27% in the fourth quarter of 2008, resume postings increased 25% in the first quarter of 2009. Resume postings decreased in the second quarter, most likely due to summer seasonal slowdown. Resume postings increased by 3% in the third quarter.
Figure 11: Growth/Decline of New San Bernardino Resume Postings Source: Monster Worldwide
October 2009 ©2009 Monster Worldwide 12 of 23

Getting Back to Work San Bernardino Labor Market Research Quarter 3: July - Sept 2009
TALENT SUPPLY BY INDUSTRY SECTOR The table below summarizes the top twenty industries and their volume share of job seeker resumes posted for the second and third quarter of 2009, and the volume change from the second to third quarter. The two industries with the greatest talent availability were: 1. Professional, Scientific, and Technical Services (16%) 2. Manufacturing (11%) The three industries showing the greatest quarter-to-quarter growth in talent supply were: 1. Construction (5%) 2. Transportation and Warehousing (3%) 3. Agriculture, Forestry, Fishing, and Hunting (3%) The greatest decrease in talent supply quarter-to-quarter were in: 1. Management of Companies and Enterprises (-8%) 2. Professional, Scientific, and Technical Services (-5%) There was no change quarter-to-quarter in terms of the percentage share of each industry.
Top 20 Industries: New Resumes Q2: April-June ’09 %
Q3: July-Sept ’09 %
Change Q2-Q3
Professional, Scientific, and Technical Services 16% 16% -5% Manufacturing 11% 11% 0% Other Services 8% 8% 0% Finance and Insurance 8% 8% -2% Accommodation and Food Services 8% 8% 2% Information 8% 8% -3% Health Care and Social Assistance 6% 6% -3% Administrative, Support, Waste Management and Remediation Services 5% 5% 2% Construction 4% 4% 5% Arts, Entertainment, and Recreation 4% 4% 0% Retail Trade 4% 4% -1% Public Administration 3% 3% 2% Educational Services 3% 3% -3% Utilities 3% 3% -1% Real Estate and Rental and Leasing 2% 2% 0% Management of Companies and Enterprises 2% 2% -8% Transportation and Warehousing 2% 2% 3% Wholesale Trade 1% 1% -1% Mining, Quarrying, and Oil and Gas Extraction 1% 1% 2% Agriculture, Forestry, Fishing and Hunting 1% 1% 3%
Figure 12: Top 20 Industries in Demand and Their Change Source: Monster Worldwide
Note: Monster Job Seekers may target up to 10 Monster Industries per Resume
(See Appendix A for Monster Industry to NAICS crosswalk)
October 2009 ©2009 Monster Worldwide 13 of 23

Getting Back to Work San Bernardino Labor Market Research Quarter 3: July - Sept 2009
TALENT SUPPLY BY OCCUPATIONAL CATEGORIES The table below summarizes the top 20 occupations by talent supply for the second and third quarter of 2009. There were five shifts from quarter to quarter in terms of percentage share: A 1% expansion in Financial Specialists; General Sales and Related Workers; and
Supervisors, Office and Administrative Support A 1% drop in Computer Specialists and Top Executives
Top 20 Occupations: Talent Supply Growth Q2: April-June ’09 %
Q3: July-Sept ’09 %
Information and Record Clerks 12% 12% Secretaries and Administrative Assistants 6% 6% Operations Specialties Managers 6% 6% General Management 6% 6% General Office and Administrative Support Workers 5% 5% Computer Specialists 6% 5% Financial Specialists 4% 5% Top Executives 5% 4% Business Operations Specialists 4% 4% Advertising, Marketing, Promotions, PR, and Sales Managers 4% 4% Material Recording, Scheduling, Dispatching, and Distributing Workers 3% 3% Financial Clerks 3% 3% Retail Sales Workers 3% 3% Supervisors, Office and Administrative Support Workers 2% 3% Health Technologists and Technicians 2% 2% General Healthcare Support 2% 2% Engineers 2% 2% General Sales and Related Workers 1% 2% Supervisors, Production Workers 2% 2% Counselors, Social Workers, and Other Community and Social Service Specialists 2% 2%
Figure 13: Top 20 Occupations in Demand Source: Monster Worldwide
October 2009 ©2009 Monster Worldwide 14 of 23
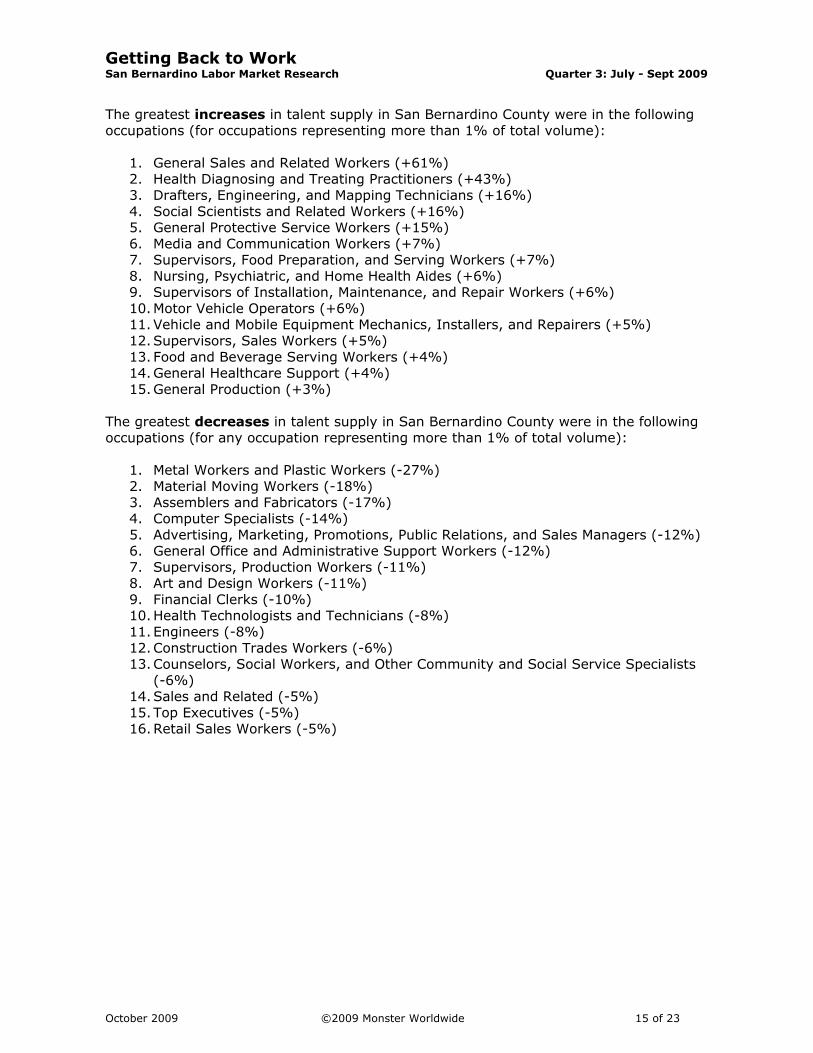
Getting Back to Work San Bernardino Labor Market Research Quarter 3: July - Sept 2009 The greatest increases in talent supply in San Bernardino County were in the following occupations (for occupations representing more than 1% of total volume):
1. General Sales and Related Workers (+61%) 2. Health Diagnosing and Treating Practitioners (+43%) 3. Drafters, Engineering, and Mapping Technicians (+16%) 4. Social Scientists and Related Workers (+16%) 5. General Protective Service Workers (+15%) 6. Media and Communication Workers (+7%) 7. Supervisors, Food Preparation, and Serving Workers (+7%) 8. Nursing, Psychiatric, and Home Health Aides (+6%) 9. Supervisors of Installation, Maintenance, and Repair Workers (+6%) 10. Motor Vehicle Operators (+6%) 11. Vehicle and Mobile Equipment Mechanics, Installers, and Repairers (+5%) 12. Supervisors, Sales Workers (+5%) 13. Food and Beverage Serving Workers (+4%) 14. General Healthcare Support (+4%) 15. General Production (+3%)
The greatest decreases in talent supply in San Bernardino County were in the following occupations (for any occupation representing more than 1% of total volume):
1. Metal Workers and Plastic Workers (-27%) 2. Material Moving Workers (-18%) 3. Assemblers and Fabricators (-17%) 4. Computer Specialists (-14%) 5. Advertising, Marketing, Promotions, Public Relations, and Sales Managers (-12%) 6. General Office and Administrative Support Workers (-12%) 7. Supervisors, Production Workers (-11%) 8. Art and Design Workers (-11%) 9. Financial Clerks (-10%) 10. Health Technologists and Technicians (-8%) 11. Engineers (-8%) 12. Construction Trades Workers (-6%) 13. Counselors, Social Workers, and Other Community and Social Service Specialists
(-6%) 14. Sales and Related (-5%) 15. Top Executives (-5%) 16. Retail Sales Workers (-5%)
October 2009 ©2009 Monster Worldwide 15 of 23

Getting Back to Work San Bernardino Labor Market Research Quarter 3: July - Sept 2009
The table below summarizes occupational growth and demand over the past two quarters.
Occupation Title Q2 % Total
Q3 % Total
Q2 to Q3 Change
Advertising, Marketing, Promotions, PR, and Sales Managers 4% 4% -12%
Art and Design Workers 2% 1% -11%
Assemblers and Fabricators 1% 1% -17%
Business Operations Specialists 4% 4% -3%
Computer Specialists 6% 5% -14%
Construction Trades Workers 1% 1% -6%
Counselors, Social Workers, and Community/Social Service Specialists 2% 2% -6%
Drafters, Engineering, and Mapping Technicians 1% 1% 16%
Electrical and Electronic Equipment Mechanics, Installers, and Repairers 1% 1% -2%
Engineers 2% 2% -8%
Financial Clerks 3% 3% -10%
Financial Specialists 4% 5% 0%
Food and Beverage Serving Workers 1% 1% 4%
General Healthcare Support 2% 2% 4%
General Installation, Maintenance, and Repair 1% 1% 0%
General Management 6% 6% -3%
General Office and Administrative Support Workers 5% 5% -12%
General Production 1% 1% 3%
General Protective Service Workers 1% 1% 15%
General Sales and Related Workers 1% 2% 61%
Health Diagnosing and Treating Practitioners 1% 1% 43%
Health Technologists and Technicians 2% 2% -8%
Information and Record Clerks 12% 12% -3%
Material Moving Workers 1% 1% -18%
Material Recording, Scheduling, Dispatching, and Distributing Workers 3% 3% 0%
Media and Communication Workers 1% 1% 7%
Metal Workers and Plastic Workers 1% 1% -27%
Motor Vehicle Operators 1% 2% 6%
Nursing, Psychiatric, and Home Health Aides 1% 1% 6%
Operations Specialties Managers 6% 6% -4%
Retail Sales Workers 3% 3% -5%
Sales and Related 1% 1% -5%
Sales Representatives, Services 1% 1% 2%
Secretaries and Administrative Assistants 6% 6% 1%
Social Scientists and Related Workers 1% 1% 16%
Supervisors of Installation, Maintenance, and Repair Workers 1% 1% 6%
Supervisors, Food Preparation and Serving Workers 1% 1% 7%
Supervisors, Office and Administrative Support Workers 2% 3% 3%
Supervisors, Production Workers 2% 2% -11%
Supervisors, Sales Workers 1% 1% 5%
Top Executives 5% 4% -5%
Vehicle and Mobile Equipment Mechanics, Installers, and Repairers 1% 1% 5%
Figure 14: San Bernardino Occupation Growth and Demand Source: Monster Worldwide
October 2009 ©2009 Monster Worldwide 16 of 23

Getting Back to Work San Bernardino Labor Market Research Quarter 3: July - Sept 2009
TALENT SUPPLY SKILLS AVAILABILITY We conducted a content analysis of job seekers’ resumes in the San Bernardino area to determine the top skills available for the region. Hard skills are technical requirements of a job or activities that are teachable, often requiring on-the-job training or more formal education such as that provided by a college or university.
SAN BERNARDINO COUNTY HARD SKILLS AVAILABILITY
1 Microsoft Excel 21 Network 2 Management 22 Microsoft Access 3 Customer Service 23 Data Entry 4 Type/Typing 24 Web 5 Microsoft Word 25 Project Management 6 Microsoft PowerPoint 26 Marketing 7 Sales 27 SQL 8 Microsoft Windows 28 C, C#, C++ 9 Microsoft Office 29 Operations
10 Microsoft Outlook 30 Operator 11 Cashier/Cash Handling 31 Server 12 Forklift 32 Medical 13 Internet 33 Visual Basic 14 Adobe 34 Inventory 15 Computer Skills 35 Programming 16 Software 36 Java 17 Design 37 Shipping 18 Bilingual 38 Adobe Photoshop 19 Accounting 39 SAP 20 Repair 40 Microsoft Project
Figure 15: Most Popular Hard Skills Source: Monster Worldwide
Soft skills tend to be very broad, representing personal attributes that enhance an individual’s job performance and career prospects.
MOST POPULAR SOFT SKILLS
1 Communication 2 Leadership 3 Organization 4 Training 5 Problem Solving 6 Teaming 7 Teaching 8 Writing 9 Creativity
10 Research 11 Time Management
Figure 16: Talent Availability Top Soft Skills Source: Monster Worldwide
October 2009 ©2009 Monster Worldwide 17 of 23

Getting Back to Work San Bernardino Labor Market Research Quarter 3: July - Sept 2009
TALENT AVAILABILITY EDUCATION The majority of San Bernardino’s job seekers possess an Associate’s degree and/or some college coursework (36%). From quarter two to quarter three, there was a 1% increase in High School candidates and a 1% drop in Associate/Some College degree candidates available.
Figure 17: San Bernardino Seeker Education Level – Q2 and Q3 Source: Monster Worldwide
There was a 6% increase in job seekers with Master’s degrees and higher.
Figure 18: San Bernardino Seeker Education Level – CHANGE Q2 to Q3
Source: Monster Worldwide
October 2009 ©2009 Monster Worldwide 18 of 23

Getting Back to Work San Bernardino Labor Market Research Quarter 3: July - Sept 2009 As shown in the chart below, there are several differences between the educational qualifications employers seek and talent level of those available. Employers are looking for candidates with Bachelor’s degrees in excess of the talent available (16% difference), as well as a higher percentage of High School graduates (8% difference). On the other hand, employers will find a greater population of candidates with an Associate’s degree/Some College experience (18% difference) and Certificate/Vocational experience (5% difference).
Figure 19: San Bernardino Seeker Education Level – Q3 Postings Vs Resumes
Source: Monster Worldwide
October 2009 ©2009 Monster Worldwide 19 of 23

Getting Back to Work San Bernardino Labor Market Research Quarter 3: July - Sept 2009
October 2009 ©2009 Monster Worldwide 20 of 23
Occupat ion Supply & Demand Analys is The Labor Performance Matrix below and on the next page compares San Bernardino’s job postings versus resume performance in targeted occupations. The size of the circles represents the supply, based on the ratio of resumes per job from July 2009 through September 2009. A large circle indicates a large pool of talent in comparison to the demand, and a smaller circle represents areas where the demand may outweigh the supply.
How to read the matrix:
• High Growth in jobs and talent
c
Not enough talent to meet
workforce alent
• Not enough jobs to match supply
High
HighLow
View
s P
er P
ostin
g
Resumes Per Posting
Talent Surplus
High Performance
Growth Areas
Talent Deficit
• Manage to ensure supply and demand meet quickly
• Continue with economi• Focus on economic
development or skills migration development
•
demand • Focus on
• High growth potential • Focus on economic
development coupled with workforce development
development and rapid tcreation or risk losing jobs
• Select key strategic industries to target
As seen on the next page in the San Bernardino analysis, the majority of occupations remain in the incubator zone. The County should continue to track performance in these areas to ensure that there is an adequate pipeline of both talent and demand as the economy begins to rebound. Computer and Mathematical and Business and Financial Operations talent is shifting towards a talent deficit and should be considered areas to watch. San Bernardino’s Office and Administrative Support sector is in the High Performance quadrant. This indicates that there is both a strong supply and demand for these positions. Sales and Related and Healthcare Practitioners/Technical are in the Talent Deficit zone. Their quadrants location and small circle size reveals the county should focus on workforce development and candidate recruitment in these two sectors in order to meet employer demand. The Management sector is straddling the High Performance and Talent Deficit line, showing there is only a slight shortage of talent to meet current demands. There are currently no occupations in the upper left Talent Surplus zone. This may pose a future risk if there is a need for transferable skills across occupational boundaries. With higher volumes of resumes per posting, Office and Administrative Support and Management could be most at risk for excess talent should the demand for these pools shift.

Getting Back to Work San Bernardino Labor Market Research Quarter 3: July - Sept 2009
The matrix below summarizes occupational supply and demand.
Figure 20: San Bernardino Labor Performance Matrix Source: Monster Worldwide
October 2009 ©2009 Monster Worldwide 21 of 23

Getting Back to Work San Bernardino Labor Market Research Quarter 3: July - Sept 2009
Act ions to Consider
Looking at the second and third quarter San Bernardino job posting and resume data, the following recommendations are made:
• Develop workforce programs in the healthcare sector. Recruiting has been strong in the healthcare space, in terms of overall percentage of opportunities and growth. Help recruiters with training programs and marketing support to continue to develop a strong pipeline of healthcare candidates.
• Increase the talent supply for entry level opportunities. The region could consider internships and cooperative work with higher education and community institutions to meet recruiters expanding need for entry level, lower cost employees. Further, work with businesses to provide ways for more experienced, unemployed individuals to start in entry level jobs that promise a quick opportunity for moving up in the organization.
• Enhance customer service and communication programs. The top skills noted in job postings were customer service and communication. These are basic skills that a majority of companies seek. Provide simple customer service and communication classes, online forums, and/or brochures to boost the quality and confidence of San Bernardino County job seekers.
• Provide management training resources. Four of the top 15 occupation job postings were for Supervisor roles (Food Preparation and Serving Workers; Office and Administrative Support Workers; Sales Workers; and Production Workers). Tips, for example, on how to best recruit managers, hire from within, and build a succession plan would be helpful, especially to local, small businesses.
• Drive construction as a top priority for the near term. As a result of economic stimulus funding, the fastest growth industry in the most recent quarter was Construction. Ensure construction contract jobs sponsored by the stimulus plan are well publicized and staffed with local qualified talent. Continue further infrastructure investment to maintain flow of construction jobs, keeping money flowing positively by both improving the county resources and providing jobs.
D isc la imer This report (the “Report”) and the data and information contained in this Report are provided as is by Monster Worldwide, Inc. (“Monster”). Information contained in this Report does not purport to be complete and is subject to various qualifications and based on various assumptions, not all of which may be set forth fully in this Report. Monster does not guarantee the accuracy, adequacy, completeness or availability of any information contained in this Report and is not responsible for any errors or omissions or for the results obtained from the use of such information. THERE ARE NO EXPRESS OR IMPLIED WARRANTIES, INCLUDING, BUT NOT LIMITED TO, WARRANTIES OF MERCHANTABILITY OR FITNESS FOR A PARTICULAR PURPOSE OR USE. In no event shall Monster be liable for any indirect, special, or consequential damages in connection with use of the information contained in this Report. © 2009 Monster Worldwide, Inc. All rights reserved. Any reproduction of this Report or redistribution of this information or any information contained in this Report except as provided in the Subscription Agreement regarding this Report is strictly prohibited.
October 2009 ©2009 Monster Worldwide 22 of 23

Getting Back to Work San Bernardino Labor Market Research Quarter 3: July - Sept 2009
October 2009 ©2009 Monster Worldwide 23 of 23
Appendix A: Monster Industry to NAICS Crosswalk NAICS code NAICS Monster Industry
11 Agriculture, Forestry, Fishing and Hunting Agriculture/Forestry/Fishing 21 Mining, Quarrying, and Oil and Gas Extraction Chemicals/Petro-Chemicals 21 Mining, Quarrying, and Oil and Gas Extraction Metals and Minerals 22 Utilities Energy and Utilities
23 Construction Construction - Industrial Facilities and Infrastructure
23 Construction Construction - Residential & Commercial/Office 31 Manufacturing Aerospace and Defense 31 Manufacturing Automotive and Parts Mfg
31 Manufacturing Electronics, Components, and Semiconductor Mfg
31 Manufacturing Manufacturing - Other 31 Manufacturing Marine Mfg & Services 31 Manufacturing Medical Devices and Supplies 31 Manufacturing Textile and Clothing Manufacturing 42 Wholesale Trade Wholesale Trade/Import-Export 44 Retail Trade Retail 48 Transportation and Warehousing Transport and Storage - Materials 51 Information Advertising and PR Services 51 Information Broadcasting, Music, and Film 51 Information Internet Services 51 Information Printing and Publishing 51 Information Telecommunications Services 52 Finance and Insurance Banking 52 Finance and Insurance Financial Services 52 Finance and Insurance Insurance 53 Real Estate and Rental and Leasing Real Estate and Property Management 53 Real Estate and Rental and Leasing Rental Services 54 Professional, Scientific, and Technical Services Accounting and Auditing Services 54 Professional, Scientific, and Technical Services Architectural and Design Services 54 Professional, Scientific, and Technical Services Biotechnology/Pharmaceuticals 54 Professional, Scientific, and Technical Services Business Services - Other 54 Professional, Scientific, and Technical Services Computer Hardware 54 Professional, Scientific, and Technical Services Computer Software 54 Professional, Scientific, and Technical Services Computer/IT Services 54 Professional, Scientific, and Technical Services Engineering Services 54 Professional, Scientific, and Technical Services Legal Services 55 Management of Companies and Enterprises Management Consulting Services
56 Administrative and Support and Waste Management and Remediation Services Staffing/Employment Agencies
56 Administrative and Support and Waste Management and Remediation Services Travel, Transportation and Tourism
56 Administrative and Support and Waste Management and Remediation Services Waste Management
61 Educational Services Education 62 Health Care and Social Assistance Healthcare Services 62 Health Care and Social Assistance Security and Surveillance 71 Arts, Entertainment, and Recreation Entertainment Venues and Theaters 71 Arts, Entertainment, and Recreation Performing and Fine Arts 71 Arts, Entertainment, and Recreation Sports and Physical Recreation 72 Accommodation and Food Services Food and Beverage Production 72 Accommodation and Food Services Hotels and Lodging 72 Accommodation and Food Services Restaurant/Food Services 81 Other Services All 81 Other Services Automotive Sales and Repair Services 81 Other Services Nonprofit Charitable Organizations 81 Other Services Other/Not Classified 81 Other Services Personal and Household Services 81 Other Services Personal Care and Cosmetics 92 Public Administration Government and Military


