Embed Size (px)
Citation preview
Graphene: a vision to the future of smart E-Textile application
Doctoral dissertation by
Milad Asadi Miankafshe
Year 2022

Graphene: a vision to the future of smart E-textile application Faculty of Textiles, Engineering, and Business (the Swedish School of Textiles) Department of Textile Technology University of Borås SE-501 90, Borås, Sweden Copyright © Milad Asadi Miankafshe, 2022 Printed in Sweden by Arkitektkopia AB ISBN 978-91-89271-64-7 (printed) ISBN 978-91-89271-65-4 (pdf) ISSN 0280-381X, Skrifter från Högskolan i Borås, nr. 128 Electronic version: http://urn.kb.se/resolve?urn=urn:nbn:se:hb:diva-27721
‘There is no power nor strength except by Allah’.
SVANENMÄRKET
Trycksak3041 0234
Abstract
Smart textile is a term referring to the textiles that could interact with their environment, receiving input and giving output based on their applications. Among smart textiles, electrically driven smart textiles (E-textiles) are being produced by various methods and materials integrated with textile substances. Graphene is one of these compounds that could be integrated into the polymer or integrated into the textile materials such as fibres. Therefore, other elements could be doped or immobilised on the graphene nanosheets for a wider range of applications, such as catalytic and electrocatalytic systems.
However, finding the most applicable and efficient method to integrate graphene into the textile fibres and further establishing a method for catalyst immobilisation are challenging and require focused research.
Therefore, this doctoral thesis focused on the innovative concept of integration of graphene and immobilisation of iron nanoparticles on it. Evidence from the systematic experiments was gathered for the case of dip-coating of polyester textiles with graphene oxide dispersion and enhancing the electrostatic bonding between fibres and graphene oxide nanosheets. In the second step, systematic experiments were gathered for the case of immobilisation of an inorganic catalyst (zerovalent iron) on textile supports. The goal of this thesis is to establish the feasibility of a mild and applicable method for textile material supports, which requires low temperature and mild pH, and further fabrication of heterogeneous catalytic and electrocatalytic systems for wastewater treatment. Polyester was chosen as the textile support material for graphene oxide coating and catalyst immobilisation due to its availability and cost-effectiveness.
The thesis has four distinct parts related to (a) Pre-surface-charge modification of the polyester for strong electrostatic bonding between polyester and graphene, (b) Design a continuous yarn coating system for mass production of graphene-coated conductive yarns, (c) Immobilisation of Fe0 on graphene-coated polyester textiles and optimising their feasibility in catalytic systems and (d) Design and prove the feasibility of knitting a fully textile-based reactor having two anodic and cathodic sections by using rGO-Fe0 yarns and stainless-steel multifilament yarns, respectively as a concept of electro-Fenton wastewater treatment.
Diverse analytical and instrumental techniques were used to monitor the surface modification of the polyester textiles and conductivity of the resulting textiles; moreover, the electromechanical and electrothermal properties of the graphene-modified textiles were examined. Further, the efficiency of catalyst immobilisation, physio-chemical properties of the immobilised catalyst, and their catalytical activities in dye removal from the water was studied. Results showed that surface charge modification of polyester fabric with both chitosan and hexadecylpyridinium chloride (HDPC) gives the most homogeneous graphene coating, resulting in high conductivity and very good fastness. Furthermore, results from scanning electron microscope (SEM), Differential scanning calorimetry (DSC), and UV/Visible spectrophotometry prove the success of immobilisation of zerovalent iron on the graphene-modified textiles.
II
The novelty of the research presented in this doctoral thesis is primarily attributed to the novelty of a hybrid graphene-catalyst immobilisation-grafting on polyester textile supports for wastewater treatment applications. The final concept of the thesis is to introduce the potential for assembling a fully textile-based reactor for Electro-Fenton wastewater treatments.
Keywords: graphene; graphene-coated e-textiles; catalyst immobilisation; hybrid graphene-catalyst multifunctional textiles; dye removal; e-textile; electro-Fenton; Fenton; wastewater treatment
III
Acknowledgments I would like to express my gratitude to Professor Nawar Kadi, who has always been supportive and helpful during my study. This thesis would not be completed without his help. My appreciation also goes to my dear friend, Dr Mohammad Neaz Morshed, for his contribution to this thesis work. In addition, I am thankful to Vijar Kumar for his kind co-supervision. I would also like to thank the knitting lab technicians (Kristian Rödby, Stefan Gustafsson, and Lars Brandin). I am so grateful to my love, Parandis; without her support, I would not have been able to finish this doctoral study. And finally, I would like to express my gratitude to my family for their support during my study.
June 2022
Milad Asadi Miankafshe
IV
List of appended publications
Peer-reviewed journal publications
Publication I
Miankafshe, Milad Asadi, Tariq Bashir, and Nils-Krister Persson. "The role and importance of surface modification of polyester fabrics by chitosan and hexadecylpyridinium chloride for the electrical and electro-thermal performance of graphene-modified smart textiles." New Journal of Chemistry 43.17 (2019): 6643-6658.
Publication II
Miankafshe, Milad Asadi, Tariq Bashir, and Nils-Krister Persson. "Electrostatic grafting of graphene onto polyamide 6, 6 yarns for use as conductive elements in smart textile applications." New Journal of Chemistry 44.18 (2020): 7591-7601.
Publication III
Morshed, M. N., Miankafshe, M. A., Persson, N. K., Behary, N., & Nierstrasz, V. A. (2020). Development of a multifunctional graphene/Fe-loaded polyester textile: robust electrical and catalytic properties. Dalton Transactions, 49(47), 17281-17300.
Publication IV
Miankafshe Milad Asadi, Vijay Kumar, Nawar Kadi. (2022)
Development of an industrial graphene/stainless steel, fully textile-based reactor for electrocatalysis: robust electrical and catalytic properties. (under editing)
V
Conference publications
Publication I
Miankafshe, Milad Asadi, Tariq Bashir, and Nils-Krister Persson. "The role and optimization of cationic agents for adhesion and electrical conductivity of graphene/coated textiles; Nanotexnology conference (ISFOE18), 2-5 July 2018, Thessaloniki, Greece.
Publication II
Milad Asadi Miankafshe, Tariq Bashir, Nils-Krister Persson. Grafen i Textilier, SIO Grafens resultatworkshop Svenskt Grafenforum, 16-17 October, Lund, Sweden
VI
Table of Contents Introduction ....................................................................................................................... 2
1. Background on E-textiles and use of graphene ................................................................. 2
1.2 Background on graphene oxide ........................................................................................... 3
Research gap .......................................................................................................................... 5
Research purposes ................................................................................................................. 5
Research questions ................................................................................................................ 6
1.2.1 Methods for reduction of graphene oxide to graphene .............................................. 7
Alcohol reducing agent reduction ..................................................................................... 7
Thermal reduction ............................................................................................................. 7
Chemical vapour deposition .............................................................................................. 7
Chemical reduction by a reducing agent ........................................................................... 7
1.2.2 Element doping of graphene ........................................................................................ 8
1.2.3 Graphene incorporation with textile ............................................................................ 8
1.2.4 Iron doping of graphene-coated textile ........................................................................ 9
1.3 Strategy chosen for this thesis ............................................................................................. 9
1.3.1 Dip-coating .................................................................................................................... 9
1.3.2 The role of reducing agent in electrical properties of reduced graphene oxide ........ 11
1.3.3 Thesis framework and outline .................................................................................... 12
1.4 Scope and limitation of the thesis ................................................................................ 14
State-of-the-art ................................................................................................................ 15
2.1. Surface charge modification of fabrics and yarns and graphene grafting ....................... 15
2.1.1 Preparation of textile surface for graphene grafting and iron immobilisation .......... 15
2.1.2 Surface charge modification ....................................................................................... 15
2.1.3 Methods of grafting functional polymers on polyester fibres for surface charge modification ......................................................................................................................... 16
Grafting of hyperbranched poly-(amidoamine) dendrimer (ethylenediamine core and tertiary amine branches dendrimer) on polyester non-woven ........................................... 17
Grafting of Chitosan on polyester yarns .............................................................................. 17
Grafting of polyethyleneimine (PEI) on polyester yarns...................................................... 18
Grafting of poly-(diallyldimethylammonium) chloride (PDDAC) on polyester yarns .......... 19
Grafting of hexadecylpyridinium chloride monohydrate (HDPC) on polyester yarns ......... 19
VII
2.2 State-of-the-art in graphene-modified textiles for the heating element and tactile sensors.................................................................................................................................................. 20
2.3 State-of-the-art in Graphene-modified textile support for catalyst immobilisation ........ 21
2.3.1 Inorganic catalyst immobilisation ............................................................................... 21
2.3.2 Technique of catalyst immobilisation on textiles ....................................................... 21
2.3.3 Main factors affecting the immobilisation of inorganic catalysts on textiles ............ 21
2.3.4 Challenges of inorganic immobilisation on textiles ............................................... 22
2.3.5 Catalytic system for wastewater treatment ............................................................... 22
2.3.6 Inorganic catalyst zerovalent iron particles (Fe0) ....................................................... 23
2.4 State-of-the-art in wastewater treatment......................................................................... 24
2.5 State-of-the-art in advanced catalytic systems for wastewater treatment ...................... 24
2.5.1 Electrocatalysts ........................................................................................................... 24
2.5.2 Electrocatalytic system for wastewater treatment .................................................... 25
2.5.3 Advanced oxidation process through Fenton’s and electro-Fenton reaction ............ 25
2.6 Main Factors affecting the electro-Fenton process ........................................................... 27
Presence of H2O2 .................................................................................................................. 27
The concentration of ferrous ions ....................................................................................... 27
Temperature ........................................................................................................................ 27
The pH of the solution ......................................................................................................... 28
Power density ...................................................................................................................... 28
Mass transfer ....................................................................................................................... 28
Electrode distance................................................................................................................ 28
Electrode arrangements ...................................................................................................... 29
2.6.1 Advantages and disadvantages of Electro-Fenton over convention Fenton reaction29
2.7 Strategies for thesis design ................................................................................................ 30
Material and methods ..................................................................................................... 31
3.1 Materials .................................................................................................................... 31
3.1.1 Chemicals .................................................................................................................... 31
3.1.2 Yarns ............................................................................................................................ 31
3.1.3 Polyester non-woven fabric ........................................................................................ 31
3.1.4 Polyester knitted fabric ............................................................................................... 32
3.2 Methods of material preparation ...................................................................................... 32
3.2.1 Preparation of polyester yarns ................................................................................... 32
3.2.2 Preparation of knitted polyester fabrics ..................................................................... 32
VIII
3.2.3 Preparation of polyester non-woven fabric for the Fenton process .......................... 32
3.3 Method of graphene grafting ............................................................................................ 34
3.3.1 Continuous yarn coating with graphene oxide ........................................................... 34
3.4 Method of catalysts immobilisation .................................................................................. 34
In situ immobilisation of zerovalent iron on polyester non-woven .................................... 34
3.5 Reactor designed in the electro-Fenton process ............................................................... 37
3.6 Methods for analysis and material characterisation ......................................................... 38
Sessile-drop goniometry ...................................................................................................... 38
Colour measurements.......................................................................................................... 38
Chemical Compositions ........................................................................................................ 38
Microscopic measurement .................................................................................................. 39
Thermogravimetric analysis (TGA) ....................................................................................... 39
Differential scanning calorimetry (DSC) ............................................................................... 39
Electrokinetic measurement ................................................................................................ 39
Electrical performance measurement ................................................................................. 40
Electro-mechanical performance of knitted graphene-modified fabrics ............................ 41
Electro-thermal performance of knitted graphene-modified fabrics ................................. 41
3.6.1 Methods for assessing catalytic pollutant removal .................................................... 41
Uv-visible (UV-VIS) spectroscopy ......................................................................................... 41
Chemical oxygen demand (COD) analysis ............................................................................ 42
Reusability ............................................................................................................................ 42
Particle size measurement ................................................................................................... 42
Cyclic voltammetry (CV) ....................................................................................................... 42
Results and Discussion ..................................................................................................... 44
4.1 The effect of cationic agents on performance of graphene-modified knitted polyester fabrics ....................................................................................................................................... 44
X-ray photoelectron spectroscopy (XPS) ............................................................................. 45
ATR-FTIR spectroscopy......................................................................................................... 47
Streaming potential measurements .................................................................................... 47
Sessile-drop goniometry ...................................................................................................... 49
Surface Morphology............................................................................................................. 50
The colour strength and estimation of dye concentration .................................................. 52
Manufacturing-based quality of modified fabrics ............................................................... 52
Electrical Conductivity.......................................................................................................... 53
IX
The electrothermal activity of the graphene-modified polyester knitted fabrics ............... 54
4.2 Characterisation of the coated yarn for tactile sensor applications ................................. 59
Surface Morphology............................................................................................................. 59
Tensile properties of the yarns ............................................................................................ 59
Electrical performance of the yarn ...................................................................................... 61
4.3 Non-woven polyester fabric and its catalytic properties .................................................. 63
Sessile droplet goniometry analysis..................................................................................... 63
Particle size distribution....................................................................................................... 64
Electrokinetic measurements (Zeta potential analysis) ...................................................... 64
The colour strength and the coating evenness analysis ...................................................... 65
ATR-FTIR spectroscopy analysis ........................................................................................... 66
Thermal analysis and decomposition of materials .............................................................. 68
X-ray photoelectron spectroscopy (XPS) analysis ................................................................ 69
4.3.2 Analysis of catalytic property of polyester non-woven fabrics .................................. 70
Colour removal..................................................................................................................... 70
Kinetics of colour removal using PET-rGO-Fe0 and PET-PAM-rGO-Fe0 ................................ 72
Toxicity reduction analysis ................................................................................................... 73
Analysis of recyclability-reusability ...................................................................................... 74
Effect of concentration of PET-rGO-Fe0 and PET-PAM-rGO-Fe0 on dye removal ................ 75
4.4 Fully textile-based reactor and its electro-Fenton performance ...................................... 76
4.4.1 Colour removal............................................................................................................ 76
4.4.2 Kinetic colour removal using the fully textile-based reactor ...................................... 76
Summary .......................................................................................................................... 78
General conclusion and future perspectives ................................................................... 78
X
List of Tables Table 1. Comparison of the reduction methods for GO production. ........................................ 7 Table 2. Comparison of the effect of reducing agents on surface resistance of cotton fabrics................................................................................................................................................... 11 Table 3. Publications and the focus in each manuscript. ........................................................ 12 Table 4. Physical characteristics of polyester non-woven membranes .................................. 31 Table 5. The composition of polyester yarn samples. ............................................................. 34 Table 6. Modification steps for the polyester non-woven fabric ............................................ 35 Table 7. The composition of samples. ..................................................................................... 44 Table 8. Atomic ratio of the surface chemical composition of samples. ................................ 46 Table 9. Reflectance (R), colour strength (K/S), and relative percentage difference (RPD) of colour strength for GO-modified and rGO-modified fabrics. .................................................. 52 Table 10. CIELab coordinates of GO-modified and rGO-modified fabrics. Colour differences (∆E) of a control and pre-treated samples in both CIE and CMC systems. L* is the coordinate response to brightness and darkness of the surface, a* coordinate response to green-red shade of colour, and b* coordinate response to yellow-blue shade of colour. ...................... 53 Table 11. Sheet resistance (Rsh) and maximum current (I) at a voltage of 30 V for control and rGO-modified samples. ............................................................................................................ 54 Table 12. The composition of polyester yarn samples. ........................................................... 59 Table 13. Tensile properties of the pristine, surface modified and functionalised polyester yarns. ........................................................................................................................................ 60 Table 14. Contact angle data from sessile droplet analysis ..................................................... 63 Table 15. CIELAB colour strength and the coating evenness measurement. .......................... 66 Table 16. DSC data from the second heating scan and cooling scan of the samples. ............. 69 Table 17. Atomic proportion (a.t%) of the surface chemical composition of the samples. .... 70 Table 18. A comparison of the reaction kinetics for the removal of crystal violet dyes using PET-GO, PET-rGO-Fe0 and PET-PAM-rGO-Fe0 ......................................................................... 73
XI
List of figures Figure 1. Schematic representation of Hummer’s method for oxidising (a) graphene to (b) graphene oxide. ......................................................................................................................... 4 Figure 2 A general scheme of the textile production processes from fibre to final product as smart textile in which graphene could be applied through the processes. ............................ 10 Figure 3. Schematic representation of reduction of (a) graphene oxide (GO) to (b) reduced graphene oxide (rGO) by Na2S2O4 as a reductant. ................................................................... 11 Figure 4. General theme of the thesis. .................................................................................... 13 Figure 5. Hydrolysis of polyester via sodium hydroxide 12%. ................................................. 15 Figure 6. (a) Denier reduction (alkalisation), (b) cationisation, (c) surface charge modification, and (d) chemical reduction of the GO coated fibre to rGO coated fibres. (e) schematic representation of the repulsion between non-treated polyester yarn and GO nano-sheets. (f) zeta potential of polyester, chitosan, and graphene oxide in different pH values. ................ 16 Figure 7. Chemical structure of hyperbranched poly-(amidoamine) dendrimer consists of ethylenediamine core and tertiary amine branches (PAMAM). ............................................. 17 Figure 8. Chemical structure of protonated chitosan. ............................................................ 18 Figure 9. Molecular structure of cationised branched polyethyleneimine (PEI). .................... 18 Figure 10. Molecular structure of poly-(diallyldimethylammonium) chloride (PDDAC). ........ 19 Figure 11. Molecular structure of hexadecylpyridinium chloride monohydrate (HDPC). ....... 19 Figure 12. Electro-Fenton reaction set-up. .............................................................................. 26 Figure 13. Illustration of the functionalisation process. (a) Alkalisation of the yarn, (b) surface charge modification, (c) coating with graphene oxide (GO), (d) thermal curing and (e) chemical reduction of GO-modified yarn to generate electrical conductivity. ...................................... 32 Figure 14. Schematic illustration of the modification process; (a) alkaline hydrolysis of PET membranes; (b) chemical grafting of hyperbranched poly-(amidoamine) (PAMAM) dendrimer. ............................................................................................................................... 33 Figure 15. Schematic representation of continuous yarn coating line. And a digital image of the in-house made set-up for yarn modification..................................................................... 34 Figure 16. Time-temperature scheme for the process of (a) alkalisation (denier reduction) of polyester yarns; (b) PAM-grafting; (c) incorporation of GO; (d) incorporation of Fe3+ (e) in situ immobilisation of rGO and Fe0. ............................................................................................... 35 Figure 17. Digital Images of the samples (a) PET, (b) PET-PAM-GO, (c) PET-PAM-rGO, (d) PET-PAM-rGO-Fe0............................................................................................................................ 36 Figure 18. (a) the fully textile-based reactor for electro-Fenton water treatment, (b) the knitting pattern designed by the CMS 330 software, and (c) the needle arrangement of the reactor. ..................................................................................................................................... 37 Figure 19. A 4-probe measurement of the electrical sheet resistance (Rsh) of the fabric....... 40 Figure 20. Build-up strain gauge powered by software for electromechanical measurements................................................................................................................................................... 41 Figure. 21 3-electrode set-up for electro-Fenton process....................................................... 43 Figure 22. the colloidal dyes segregated from the fabric into the solution during chemical reduction of a control sample (a), PDDAC-treated (b), HDPC-treated (c), PE-treated (d), and CS-treated sample (e). ............................................................................................................. 45
XII
Figure 23. (a) graphene oxide coated and (b) reduced graphene oxide coated knitted polyester fabric. ....................................................................................................................................... 45 Figure 24. Wide scan XPS spectra of (a) pristine polyester (PET), PET-PEI, PET-CS, PET-HDPC, and PET-PDDAC. (b) PET-GO and PET-rGO. ............................................................................. 46 Figure 25. ATR-FTIR spectra of a pristine fabric (PET), chitosan (8 g.L-1) treated fabric (PET-CS), graphene-coated fabric (PET-CS-GO), and reduced graphene-coated fabric (PET-CS-rGO)................................................................................................................................................... 48 Figure 26. Zeta potential (ζ) values determined for (a) PET-CS, PET-PDDAC, PET-PE, and PET-HDPC fabrics and (b) pristine PET fabric, PET fabric modified by graphene oxide (PET-GO), and a PET fabric modified by reduced graphene oxide (PET-rGO) in dependence on pH of an aqueous 10-3 mol/L KCL solution. ........................................................................................... 49 Figure 27. Image sequences of placing a deionised water droplet on (a) an unmodified polyester (PET), and (b) HDPC-modified polyester fabric (PET-HDPC) over time. .................. 50 Figure 28. Water contact angle of (a) pristine PET, (b) graphene oxide-modified polyester (PET-GO), (c) reduced graphene oxide-modified polyester fabric (PET-rGO), (d) reduced graphene oxide-HDPC modified polyester fabric (PET-HDPC-rGO), (e) reduced graphene oxide-PDDAC modified polyester fabric (PET-PDDAC-rGO), (f) reduced graphene oxide-PE modified polyester fabric (PET-PE-rGO), and (g) reduced graphene oxide-CS modified polyester fabric (PET-CS-rGO). ........................................................................................................................... 50 Figure 29. SEM images of (a) PET-GO sample (4.5kx Mag.), (b) PET-GO sample (20kx Mag.), (c) PET-CS-GO sample (4.5kx Mag.), (d) PET-CS-GO sample (20kx Mag.), (e) PET-HDPC-GO sample (20kx Mag.), (f) PET-HDPC-GO sample (150x.), (g) PET-PDDAC-GO sample (20kx Mag.), (h) PET-PDDAC-GO sample (800x Mag.). .............................................................................................. 51 Figure 30. SEM images of (a) PET-rGO sample (20kx Mag.), (b) PET-CS-rGO sample (20kx Mag.), (c) PET-HDPC-rGO sample (20kx Mag.), and (d) PET-PDDAC-rGO sample (20kx Mag). .......... 51 Figure 31. The steady-state temperature vs applied voltages profile of the samples. ........... 54 Figure 32. Temperature and current versus time profile of the (a) PET-HDPC-rGO by having a steady-state temperature of 115 at a constant voltage of 30V, (b) PET-CS-rGO with a steady-state temperature of 55 at a constant voltage of 25V, response times for both fabrics are less than 120 s. The current vs temperature profile of (c) PET-HDPC-rGO and (d) PET-CS-rGO during the electro-thermal activity with a function of I(T)= 6.7401 ln(T) + 37.899 and I(T)= 2.4788 ln(T) + 6.5443, respectively. ......................................................................................... 56 Figure 33. The measured resistance changes vs temperature profiles of (a) PET-HDPC-rGO with a function of R= -0.0004T+0.5083, and (b) PET-CS-rGO with a function of R= -0.0078T+2.3658. ...................................................................................................................... 57 Figure 34. Infrared images at a steady-state temperature of (a) PET-CS-rGO, and (b) PET-HDPC-rGO at an applied voltage of 30 V., reaching 63.9 and 110 for PET-CS-rGO and PET-HDPC-rGO correspondingly while having almost a homogeneous thermal expansion through the fabric surface. .................................................................................................................... 57 Figure 35 (a). DSC photographs of PET-HDPC-rGO, with a glass transition (Tg) of 76.49. (b) DSC photographs of a control polyester fabric (PET), a pre-alkalised polyester fabric coated by reduced graphene oxide (PET-ALK-rGO), and an HDPC surface-modified polyester fabric coated by reduced graphene oxide. Heat capacity profile of PET-HDPC-rGO. Melting temperature (Tm) of the polyester fabric with a value of 200 increases to 213 for a PET-
XIII
HDPC-rGO fabric. Heat capacity at constant pressure (Cp) of the same sample at 120 is 1.261 J.(g.)-1. ................................................................................................................................... 58 Figure 36. SEM images of (a) PET-GO, (b) PET-CS-GO (c) PET-HDPC-GO, (d) PET-rGO, (e) PET-CS-rGO, (f) PET-HDPC-rGO with 20kx magnification. .............................................................. 60 Figure 37. Stress-strain curves of a pristine polyester (PET), chitosan modified (PET-CS), graphene oxide modified (PET-CS-GO), and reduced graphene oxide modified (PET-CS-rGO) yarn. ......................................................................................................................................... 61 Figure 38 (a). Electrical resistance (kΩ.10cm-1) of the CS and HDPC modified polyester yarns. (b) 2-probe set up for electrical measurement. ...................................................................... 62 Figure 39. Particle size distribution of zerovalent iron nanoparticles; (a) PET-rGO- Fe0 and (b) PET-PAM-rGO- Fe0 ................................................................................................................... 64 Figure 40. Zeta-potential (ζ) values of non-wovens as a function of the pH values of the electrolyte solution (0.001M KCl). (PET refers to alkalised polyester) .................................... 65 Figure 41. The colour differences (ΔE) of CIE and CMC systems (Values less than 1 are the smallest colour differences than the human eye can detect) ................................................. 67 Figure 42. ATR-FTIR spectra of PET, PET-GO, PET-rGO-Fe0, PET-PAM, PET-PAM-rGO and PET-PAM-rGO-Fe0............................................................................................................................ 67 Figure 43. TGA and DTG curves of (a) PET-GO, (b) PET-rGO-Fe0, (c) PET-PAM-rGO, and (d) PET-PAM-rGO-Fe0. .......................................................................................................................... 68 Figure 44. Wide scan XPS spectra of (a) pristine PET, PET-PAM, PET-PAM-GO, and PET-PAM-rGO-Fe0 samples. ..................................................................................................................... 70 Figure 45. UV-visible spectroscopy of catalytic removal of crystal violet dyes using (a) PET-GO, (b) PET-PAM-GO, (c) PET-rGO-Fe0, and (d) PET-PAM-rGO-Fe0 [Conditions: Crystal violet = 50 mg. L-1, non-woven fabric = 700 mg. L-1, NaBH4 = 0.1 M, pH=5]. ......................................... 71 Figure 46. Evolution of (a) C/C0, (b) Ln(C/C0) and (c) the conversion (%) yield in time at room temperature for removal of crystal violet dyes using PET-GO (), PET- rGO-Fe0 () and PET-PAM-rGO-Fe0 () [Conditions: Crystal violet = 50 mg.L-1, nonwoven fabric = 700 mg.L-1, NaBH4 = 0.1 M, pH=5]. ............................................................................................................ 72 Figure 47. Recyclability and reusability of (a) PET-rGO-Fe0, (b) PET-PAM-rGO-Fe0 on catalytic removal of crystal violet dye [Conditions: Crystal violet = 50 mg.L-1, non-woven fabric = 700 mg.L-1, NaBH4 = 0.1 M, pH=5]. ............................................................................................... 74 Figure 48. Effect of catalyst concentration [0 mg.L-1(), 50 mg.L-1(♦), 100 mg.L-1(), 300 mg.L-1(), 500 mg.L-1(), 700 mg.L-1(), on the removal of crystal violet dyes (a) PET-rGO-Fe0 and (b) PET-PAM-rGO-Fe0. [Conditions: Crystal violet = 50 mg.L-1, NaBH4 = 0.1 M, pH=5]................................................................................................................................................... 75 Figure 49. UV-visible spectroscopy of catalytic removal of crystal violet dyes in electro-Fenton process. .................................................................................................................................... 76 Figure 50. Evolution of (a) C/C0, (b) ln(C/C0) and in time at room temperature for removal of crystal violet dyes using a GO-Fe0 / stainless steel textile reactor. ........................................ 77
2
Chapter 1
Introduction
Chapter outline
1. Background on E-textiles and use of graphene Textile is exceptional as a class of fabricated materials, interacting in almost any human social activity. Over the last two decades, studies pertaining to textile electronics started from initial research explorations and going up to the industrial area. It began with investigating the integration of conductive wires and circuits into textiles [1, 2].
The term “smart textiles” refers to a wide field of studies that extend the functionality of common fabrics. Smart textiles are defined as textile products that could interact with the environment or the user. Not all smart textiles are electrically driven. When electronics and textiles converge, it can be named e-textile [3].
The combination of textiles and other technology, such as electronics, could have a tremendous impact on society [4, 5]. However, the development of e-textiles runs the risk of stagnation if the prevalent paradigm of assembling the enabling technology with textiles results in bulky, heavy, non-compliant products with low comfort. An alternative to the classic integration of electronics into textiles is producing intrinsically conductive yarns.
Electroconductive textile fibres are currently attracting much attention for a range of applications from electrostatic discharge [6], supercapacitors [7], health monitoring and diagnostic systems [8], energy harvesting [9], environmental remediation system [10], photonic, luminescence [11], UV blocking [12], antibacterial [13, 14], insect repellent [15], colour change [16], electro-thermal heating elements such as seat heaters in vehicles [17] and electrically heated garments, [18-20]. Most of the research is based on electrically conductive polymers or metallic conductive mechanisms. The resulting threads are not good for knitting or weaving when it comes to wearable smart textiles.
Recently, e-textiles have been prepared using different methods, such as:
- The spinning of Nano-metallic filaments, such as stainless steel microfilaments with conventional staple fibres [21],
- Melt-spinning of conductive nanoparticles and carbon products with polymers [22], - Non-woven fabrics made of staple stainless steels, carbon fibres and polymers [23], - Carbon allomorphs such as graphene incorporation. [24].
Carbon allomorphs could be integrated with textiles for their electrical conductivity [25]. Among them, graphene, a two-dimensional nanosheet, is the object of intensive study [26-29]. It is because the two-dimensional shape of the graphene, which has a thickness of one or a few atoms of sp2-bonded carbon atoms, could have the minimum impact on the strength,
3
softness and comfortability of the resulting textiles. Graphene has the potential to create highly valuable electrically conductive textile systems with maintained pliability and psychological comfort of the textile. However, there is still a lack of continuous integration methods for further developing knitted and woven smart textiles and garments.
Using graphene is the most cost-effective and high-performance alternative for different applications, from the thermal heater to electro-Fenton wastewater treatment. For that, in this study, graphene has been chosen as the main conductive element to convert conventional textiles into E-textiles.
1.2 Background on graphene oxide Graphene is an interesting carbon allomorph for its electrical conductivity and mechanical and thermal properties. It has rich chemistry that can contribute to reactions as either a reducing agent as an electron donor or an oxidizer as an electron acceptor owning to its electronic structure, which results in both an electron affinity and an ionisation potential of 4.6 eV [30]. Another focus of studies on graphite is substitutional doping by replacing carbon with other elements. For instance, replacing carbon with boron and nitrogen results in p- and n-type graphite, respectively [31].
Extraordinary electronic properties in graphene are due to the high quality of its 2D crystal lattice [32, 33]. Specifically, small quantities are required to achieve electrical or electrothermal properties, and only a thin layer is required with potentially minimum impact on the thickness of the medium.
Graphene itself is known for its specific surface area (2620 m2g-1), excellent mechanical properties (Young’s modulus of 1 TPa), and high electrical conductivity (electron mobility of 2.5 × 105 cm2V-1s-1 at room temperature) and high thermal conductivity of (3000 W m K-1). Graphene could be prepared by either mechanical exfoliation of graphite or epitaxial chemical vapour deposition [34, 35].
Graphene oxide (GO) caught the attention of the scientific community after the discovery of graphene in 2004, because of its potential for use in various technological applications such as photocatalysis [28], field-effect transistors [34], transparent electrodes [36], batteries [27, 37] bio sensors [38], and smart textiles [39].
In 2006, Ruoff’s group was the first to establish a solution-based development for making single-layer graphene [40, 41]. The method is based on the chemical modification of graphite to produce a water-dispersible intermediary, graphite oxide (GO) [38].
The advantages of the GO method are its low-cost and large-scale production. The starting material is simple graphite, and by a simple Harsh oxidation Hummer’s method [42-44], it can easily be scaled up to produce chemically derived graphene dispersed in a liquid. Ruoff’s group has demonstrated free-standing films with extremely high tensile strength of up to ∼42 GPa [45, 46].
With this method, GO is produced by exfoliating graphite, resulting in highly oxygenated graphene with hydroxyl and epoxide functional groups on the surface and carboxyl and
4
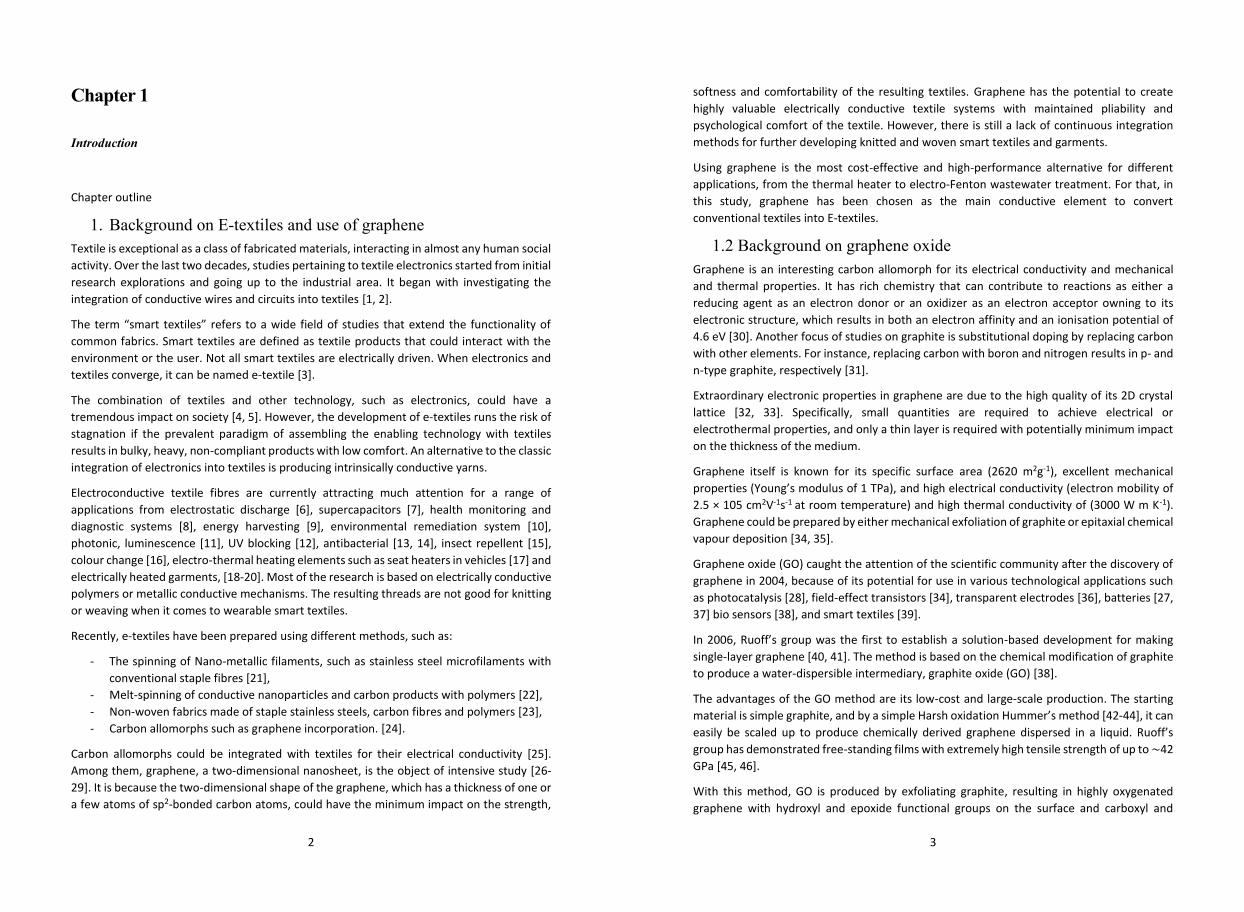
carbonyl groups at the edge of the sheets [47]. The Hummer’s method is the oxidation of graphene in which KMnO4 acts as an oxidation agent to introduce molecules of oxygen to the graphene surface.
Unlike graphene, GO is not conductive and is hydrophobic. However, the graphitic network could be substantially restored by either thermal annealing or through a chemical reduction process.
When it comes to textile, strong bonding between graphene oxide flakes and textile yarns is required, as there is evidence that textile materials need to have a standard washing and friction fastness.
There is a paucity of studies on enhancing the interaction and bonding between fibres and graphene oxide flakes. Among the different methods of preparing graphene or graphene oxide, preparing a dispersion of GO and thereafter dip-coating the textile with it could be the most reasonable and applicable method for the textile industry. For instant thermal annealing of GO on textile, media is not possible, as textile materials are sensitive to temperature and can be decomposed.
Still, dip-coating of textile with graphene oxide does not give us a high conductivity and high quality/fastness of the product. Thus, in the first step of this thesis, the focus is on surface charge modification of the textile to bring electrostatic attraction and bonding between textile fibres and GO. As a result, the conductivity of the textile materials will increase, and the electro-thermal textile heater could be prepared for different applications, such as military customs for cold environments and aeroplane heating systems.
Further, graphene could be doped with other elements to bring a particular property to the textile for a specific application. However, the doping method and condition need more investigation. For instance, if graphene-coated textile is doped with iron properly, it could be used in catalysis applications for wastewater treatment and dye removal of textile wastewater.
Figure 1. Schematic representation of Hummer’s method for oxidising (a) graphene to (b) graphene oxide.
5
If the conductivity of the GO/Fe is high enough, it could be used in electrocatalysis applications in combination with stainless steel fibres as well.
Nonetheless, the conductivity and fastness of the product are the main challenges and weaknesses of these textiles. Finding the most relevant process of incorporation of graphene and iron into textile is lacking. Thus, in this research, the focus is on designing an applicable process to produce high-quality GO-coated textile materials doped with iron for its catalytic and electrocatalytic applications.
Research gap
To the best of our knowledge, in previous studies conducted by other researchers, the electrostatic repulsion between fibres and graphene oxide (GO) has been neglected. Hence, it is essential to study the surface charge of the fibres and GO nanosheets and find an applicable method to improve the isoelectric point of the fibre and enhance the electrostatic attraction between fibres and GO. Moreover, it is essential to study the role of various cationic agents and their influence on the electrical conductivity of the fibre, the morphology of the coating and fastness of the resulting fibre.
Also, to the best of our knowledge, there is no research on producing a continuous graphene yarn coating system that provides conductive yarns which could be fed into knitting or weaving machines for further smart garment and device designing; this will result in having the same porosity and stretchability as a pristine fabric. Consequently, in this study, a continuous yarn coating system is designed to prepare graphene yarn bobbins for further knitting smart devices according to the needs, for instance, knitting a tactile sensor or a wastewater treatment reactor.
Graphene could be doped with other elements, such as iron to improve its performance or to add more functionality to the graphene. To the best of our knowledge, there is no applied research based on GO-Fe0 integration on textiles. In this study, an applicable method for doped graphene oxide on coated fibres and fabrics with iron is investigated and introduced to the system. This led us to prepare a catalyst for wastewater treatment in both Fenton and electro-Fenton processes.
And at the end of the study, a fully textile-based reactor is designed based on a combination of GO-Fe0 and stainless-steel yarns for further electrocatalyst wastewater treatment. In this research area, we focused on designing a reactor that could be produced on a large scale and be feasible in industrial wastewater treatment.
Research purposes
The first step of the study is to design an applicable method for dip-coating textiles with graphene oxide dispersion and previous improvements in the surface grafting of graphene through textiles, both in yarn and fabric medium. The plan was to apply various cationic agents to polyester yarns and fabrics and thereafter dip-coat these textiles with GO dispersion. Thus, it is essential to have the most effective coating conditions, including
6
temperature, time and pH. Further, the effect of each cationic agent on the surface morphology, fastness and electrical properties of the graphene layer is studied.
The second step of the study is to find an applicable method for doping graphene on textile mediums. There are various methods to dope graphene with other elements such as iron; however, when it comes to textiles, most available technologies are not applicable. This is mostly because they require high temperature or other harsh acidic or basic conditions that could deform or even decompose the textile materials. Hence, it is important to find and design an applicable procedure for doping the GO-modified textiles with iron zerovalent nanoparticles. The resulting Fe0 -PET fabrics could be used in a wide range of applications. However, this study focuses on providing a catalyst and an electrocatalyst for wastewater treatment.
Research questions
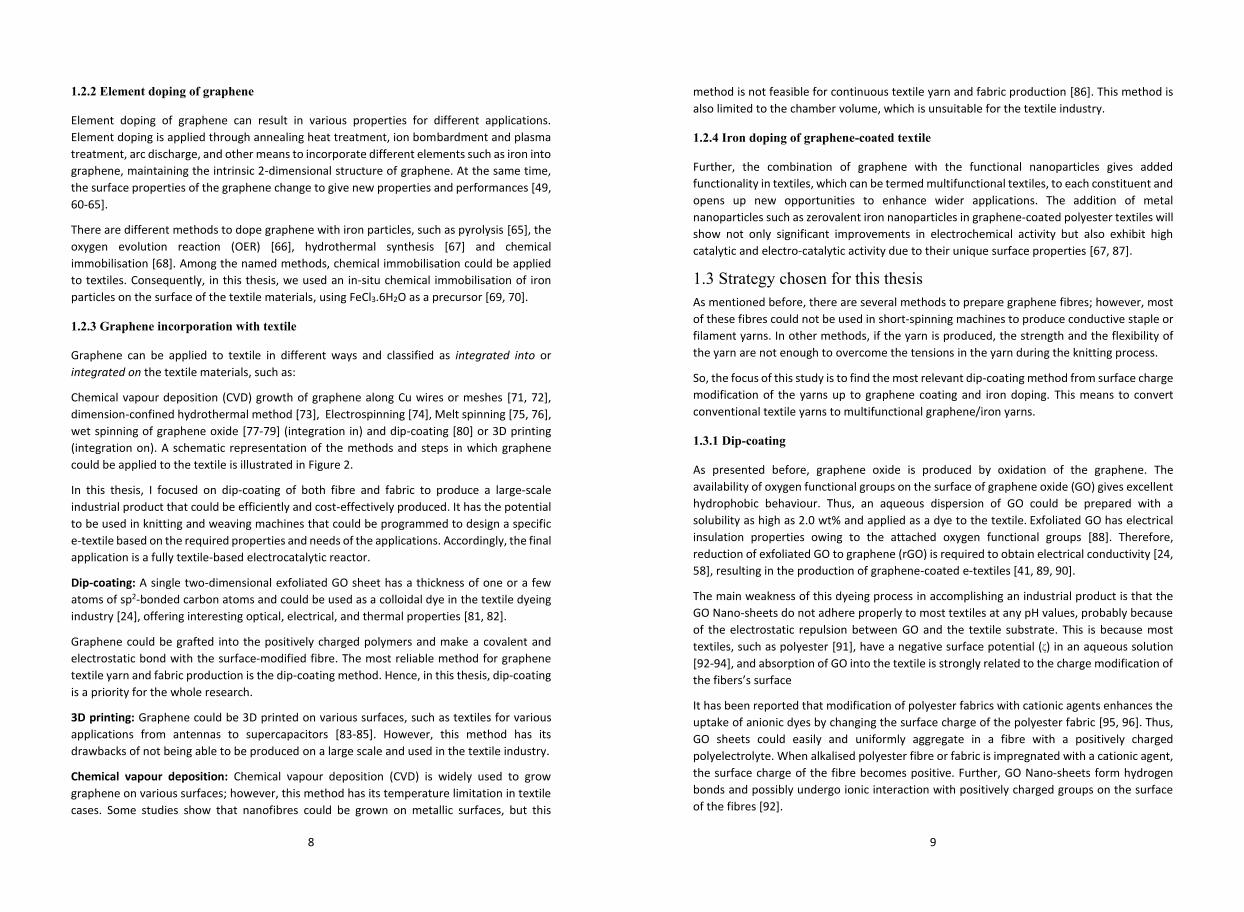
rq1
- How would the methods of pre-surface modification of the polyester textiles affect the surface morphology, electrical, electrothermal, electromechanical and washing fastness of the resulting e-textile? What is the relevant reducing agent to reduce graphene oxide or immobilise iron zerovalent on GO-coated textile materials for electrical performances?
rq2
- How can you design a continuous process for homogeneous yarn coating with graphene for knitting machines for e-textile application, and what are the process parameters to ensure the mass production of graphene-modified yarn?
- How can the knitted fabric based on coated yarn be used for electrocatalysis applications in wastewater treatments?
rq3
- Which method is the most appropriate and applicable method of grafting graphene with iron-on textile, considering the condition of application, such as low temperature and pH, to avoid the decomposition of the textile material?
7
1.2.1 Methods for reduction of graphene oxide to graphene
Graphene oxide (GO) could be reduced to graphene through different methods, such as thermal annealing, chemical reduction, and chemical vapour deposition [48, 49].
Alcohol reducing agent reduction
A mild reduction of GO could occur with alcohol. Furthermore, this method does not damage the edge morphology of the GO, resulting in highly conductive rGO Nano-sheets; ethanol vapour reduction could be used to reduce graphene [50]. However, this method requires a high temperature (more than 900 C), and it is not an applicable method for textile materials as the main substrate.
Thermal reduction
Thermal reduction of graphene could be prepared via the rapid heating of dry GO under inert gas and at high temperature [51, 52]. Like alcohol vapour reduction, thermal reduction requires a high temperature to reduce graphene into GO. Hence, this method is not usable in textile production.
Chemical vapour deposition
The growth of graphene on different metallic surfaces, such as copper, has been studied before [48, 53]. This method gives a large area of high-quality graphene Nanosheets; however, this method needs a high temperature (up to 1000 C), which is not applicable for textile materials.
Chemical reduction by a reducing agent
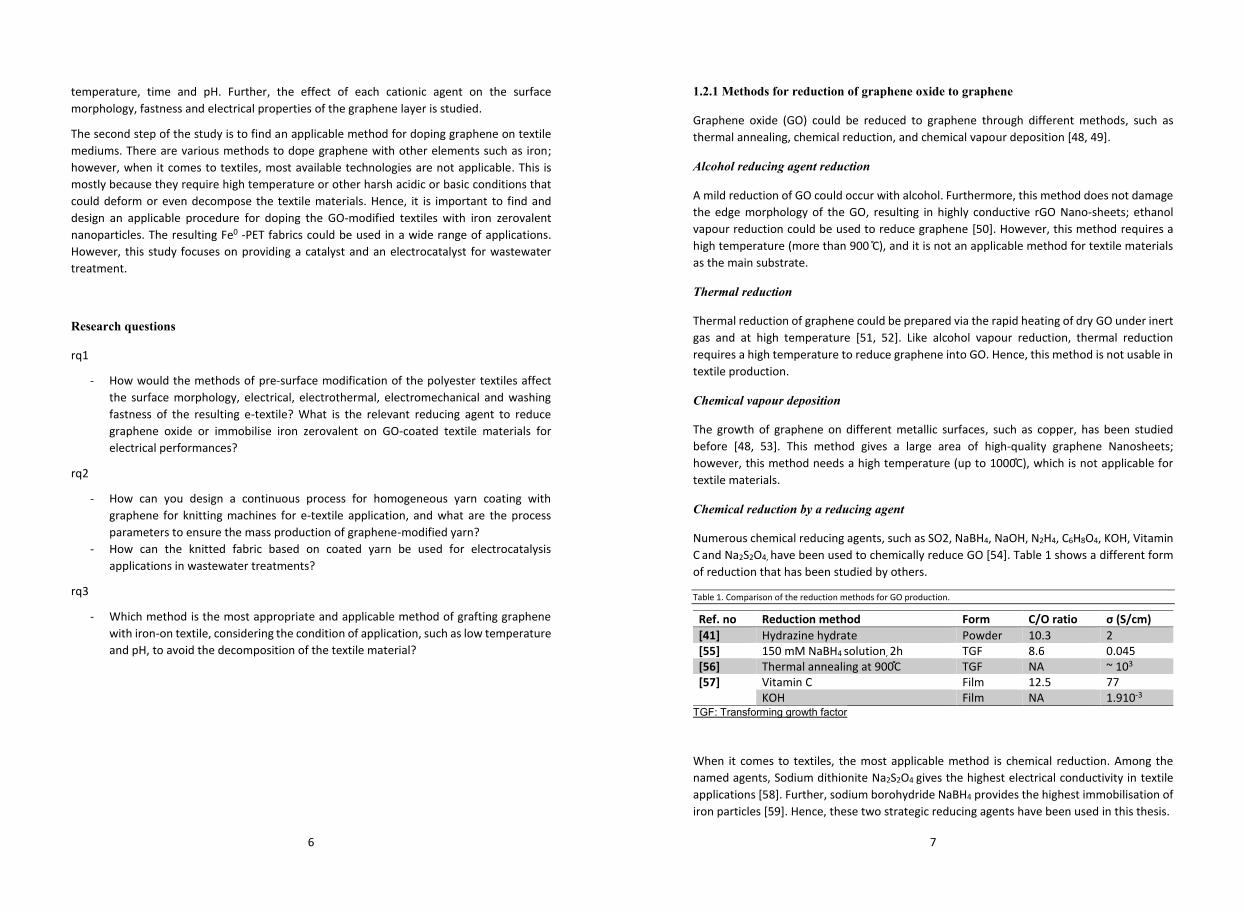
Numerous chemical reducing agents, such as SO2, NaBH4, NaOH, N2H4, C6H8O4, KOH, Vitamin C and Na2S2O4, have been used to chemically reduce GO [54]. Table 1 shows a different form of reduction that has been studied by others.
Table 1. Comparison of the reduction methods for GO production.
Ref. no Reduction method Form C/O ratio σ (S/cm) [41] Hydrazine hydrate Powder 10.3 2 [55] 150 mM NaBH4 solution, 2h TGF 8.6 0.045 [56] Thermal annealing at 900 C TGF NA ~ 103 [57] Vitamin C Film 12.5 77
KOH Film NA 1.910-3
TGF: Transforming growth factor
When it comes to textiles, the most applicable method is chemical reduction. Among the named agents, Sodium dithionite Na2S2O4 gives the highest electrical conductivity in textile applications [58]. Further, sodium borohydride NaBH4 provides the highest immobilisation of iron particles [59]. Hence, these two strategic reducing agents have been used in this thesis.
8
1.2.2 Element doping of graphene
Element doping of graphene can result in various properties for different applications. Element doping is applied through annealing heat treatment, ion bombardment and plasma treatment, arc discharge, and other means to incorporate different elements such as iron into graphene, maintaining the intrinsic 2-dimensional structure of graphene. At the same time, the surface properties of the graphene change to give new properties and performances [49, 60-65].
There are different methods to dope graphene with iron particles, such as pyrolysis [65], the oxygen evolution reaction (OER) [66], hydrothermal synthesis [67] and chemical immobilisation [68]. Among the named methods, chemical immobilisation could be applied to textiles. Consequently, in this thesis, we used an in-situ chemical immobilisation of iron particles on the surface of the textile materials, using FeCl3.6H2O as a precursor [69, 70].
1.2.3 Graphene incorporation with textile
Graphene can be applied to textile in different ways and classified as integrated into or integrated on the textile materials, such as:
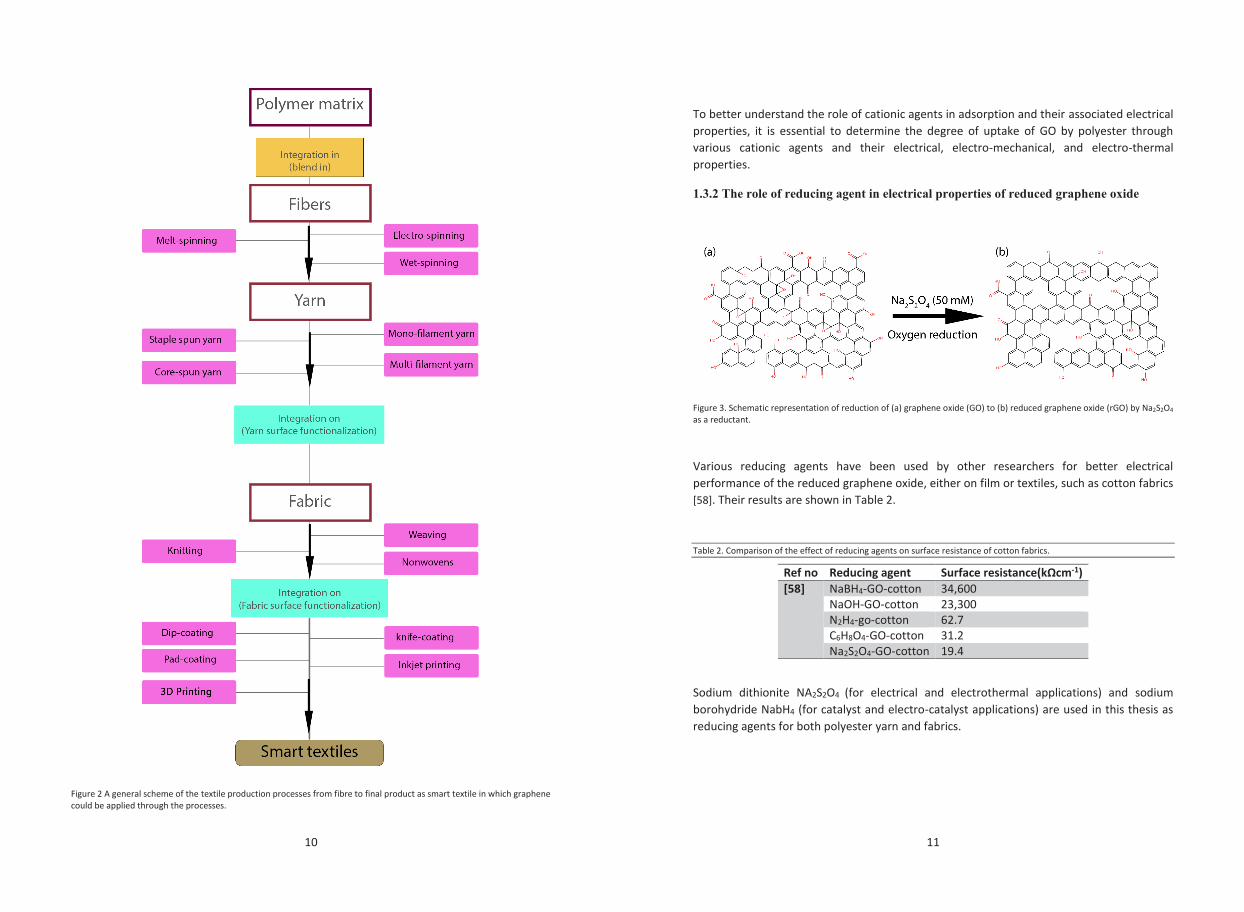
Chemical vapour deposition (CVD) growth of graphene along Cu wires or meshes [71, 72], dimension-confined hydrothermal method [73], Electrospinning [74], Melt spinning [75, 76], wet spinning of graphene oxide [77-79] (integration in) and dip-coating [80] or 3D printing (integration on). A schematic representation of the methods and steps in which graphene could be applied to the textile is illustrated in Figure 2.
In this thesis, I focused on dip-coating of both fibre and fabric to produce a large-scale industrial product that could be efficiently and cost-effectively produced. It has the potential to be used in knitting and weaving machines that could be programmed to design a specific e-textile based on the required properties and needs of the applications. Accordingly, the final application is a fully textile-based electrocatalytic reactor.
Dip-coating: A single two-dimensional exfoliated GO sheet has a thickness of one or a few atoms of sp2-bonded carbon atoms and could be used as a colloidal dye in the textile dyeing industry [24], offering interesting optical, electrical, and thermal properties [81, 82].
Graphene could be grafted into the positively charged polymers and make a covalent and electrostatic bond with the surface-modified fibre. The most reliable method for graphene textile yarn and fabric production is the dip-coating method. Hence, in this thesis, dip-coating is a priority for the whole research.
3D printing: Graphene could be 3D printed on various surfaces, such as textiles for various applications from antennas to supercapacitors [83-85]. However, this method has its drawbacks of not being able to be produced on a large scale and used in the textile industry.
Chemical vapour deposition: Chemical vapour deposition (CVD) is widely used to grow graphene on various surfaces; however, this method has its temperature limitation in textile cases. Some studies show that nanofibres could be grown on metallic surfaces, but this
9
method is not feasible for continuous textile yarn and fabric production [86]. This method is also limited to the chamber volume, which is unsuitable for the textile industry.
1.2.4 Iron doping of graphene-coated textile
Further, the combination of graphene with the functional nanoparticles gives added functionality in textiles, which can be termed multifunctional textiles, to each constituent and opens up new opportunities to enhance wider applications. The addition of metal nanoparticles such as zerovalent iron nanoparticles in graphene-coated polyester textiles will show not only significant improvements in electrochemical activity but also exhibit high catalytic and electro-catalytic activity due to their unique surface properties [67, 87].
1.3 Strategy chosen for this thesis As mentioned before, there are several methods to prepare graphene fibres; however, most of these fibres could not be used in short-spinning machines to produce conductive staple or filament yarns. In other methods, if the yarn is produced, the strength and the flexibility of the yarn are not enough to overcome the tensions in the yarn during the knitting process.
So, the focus of this study is to find the most relevant dip-coating method from surface charge modification of the yarns up to graphene coating and iron doping. This means to convert conventional textile yarns to multifunctional graphene/iron yarns.
1.3.1 Dip-coating
As presented before, graphene oxide is produced by oxidation of the graphene. The availability of oxygen functional groups on the surface of graphene oxide (GO) gives excellent hydrophobic behaviour. Thus, an aqueous dispersion of GO could be prepared with a solubility as high as 2.0 wt% and applied as a dye to the textile. Exfoliated GO has electrical insulation properties owing to the attached oxygen functional groups [88]. Therefore, reduction of exfoliated GO to graphene (rGO) is required to obtain electrical conductivity [24, 58], resulting in the production of graphene-coated e-textiles [41, 89, 90].
The main weakness of this dyeing process in accomplishing an industrial product is that the GO Nano-sheets do not adhere properly to most textiles at any pH values, probably because of the electrostatic repulsion between GO and the textile substrate. This is because most textiles, such as polyester [91], have a negative surface potential (ζ) in an aqueous solution [92-94], and absorption of GO into the textile is strongly related to the charge modification of the fibers’s surface
It has been reported that modification of polyester fabrics with cationic agents enhances the uptake of anionic dyes by changing the surface charge of the polyester fabric [95, 96]. Thus, GO sheets could easily and uniformly aggregate in a fibre with a positively charged polyelectrolyte. When alkalised polyester fibre or fabric is impregnated with a cationic agent, the surface charge of the fibre becomes positive. Further, GO Nano-sheets form hydrogen bonds and possibly undergo ionic interaction with positively charged groups on the surface of the fibres [92].
10
Figure 2 A general scheme of the textile production processes from fibre to final product as smart textile in which graphene could be applied through the processes.
11
To better understand the role of cationic agents in adsorption and their associated electrical properties, it is essential to determine the degree of uptake of GO by polyester through various cationic agents and their electrical, electro-mechanical, and electro-thermal properties.
1.3.2 The role of reducing agent in electrical properties of reduced graphene oxide
Figure 3. Schematic representation of reduction of (a) graphene oxide (GO) to (b) reduced graphene oxide (rGO) by Na2S2O4
as a reductant.
Various reducing agents have been used by other researchers for better electrical performance of the reduced graphene oxide, either on film or textiles, such as cotton fabrics [58]. Their results are shown in Table 2.
Table 2. Comparison of the effect of reducing agents on surface resistance of cotton fabrics.
Ref no Reducing agent Surface resistance(kΩcm-1) [58] NaBH4-GO-cotton 34,600
NaOH-GO-cotton 23,300 N2H4-go-cotton 62.7 C6H8O4-GO-cotton 31.2 Na2S2O4-GO-cotton 19.4
Sodium dithionite NA2S2O4 (for electrical and electrothermal applications) and sodium borohydride NabH4 (for catalyst and electro-catalyst applications) are used in this thesis as reducing agents for both polyester yarn and fabrics.
12
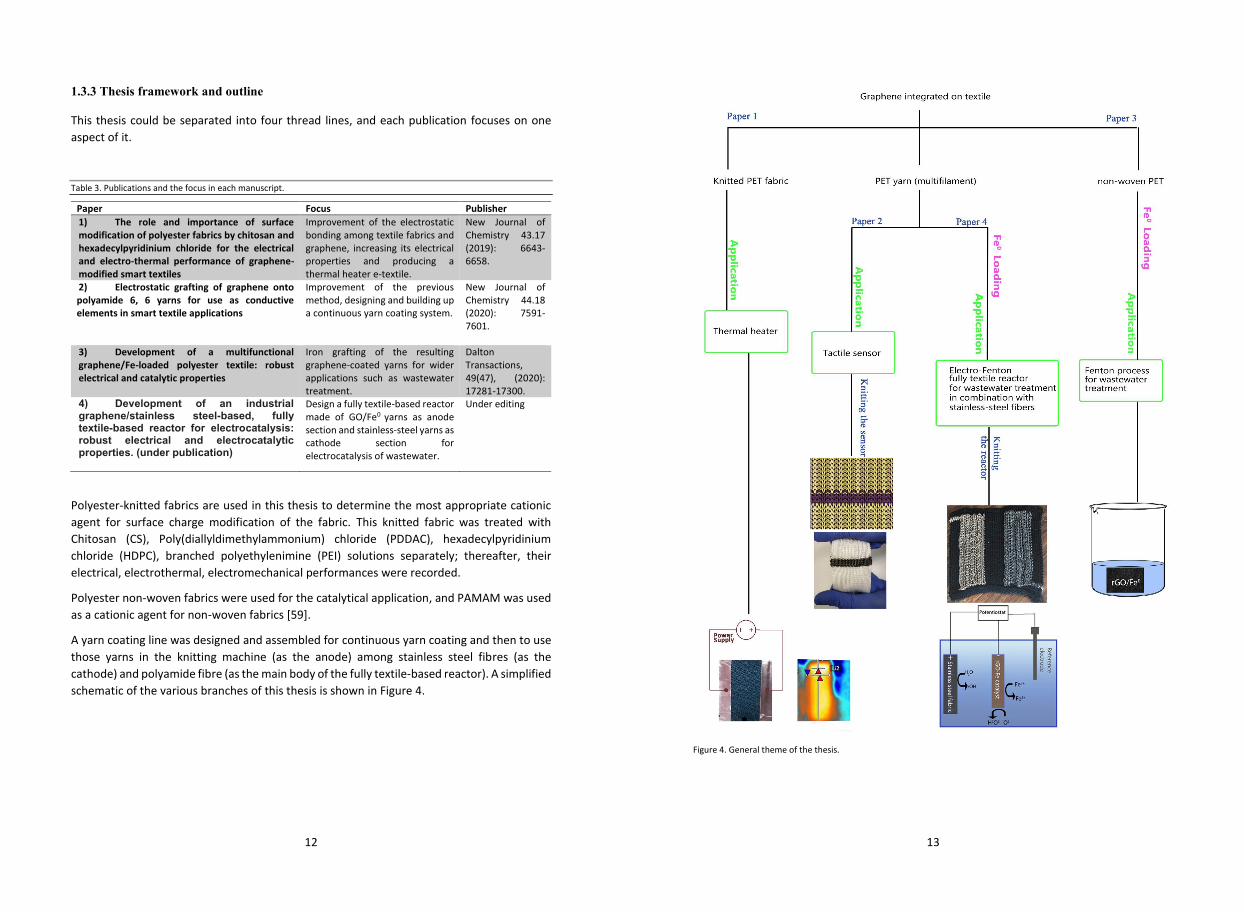
1.3.3 Thesis framework and outline
This thesis could be separated into four thread lines, and each publication focuses on one aspect of it.
Table 3. Publications and the focus in each manuscript.
Paper Focus Publisher 1) The role and importance of surface modification of polyester fabrics by chitosan and hexadecylpyridinium chloride for the electrical and electro-thermal performance of graphene-modified smart textiles
Improvement of the electrostatic bonding among textile fabrics and graphene, increasing its electrical properties and producing a thermal heater e-textile.
New Journal of Chemistry 43.17 (2019): 6643-6658.
2) Electrostatic grafting of graphene onto polyamide 6, 6 yarns for use as conductive elements in smart textile applications
Improvement of the previous method, designing and building up a continuous yarn coating system.
New Journal of Chemistry 44.18 (2020): 7591-7601.
3) Development of a multifunctional graphene/Fe-loaded polyester textile: robust electrical and catalytic properties
Iron grafting of the resulting graphene-coated yarns for wider applications such as wastewater treatment.
Dalton Transactions, 49(47), (2020): 17281-17300.
4) Development of an industrial graphene/stainless steel-based, fully textile-based reactor for electrocatalysis: robust electrical and electrocatalytic properties. (under publication)
Design a fully textile-based reactor made of GO/Fe0 yarns as anode section and stainless-steel yarns as cathode section for electrocatalysis of wastewater.
Under editing
Polyester-knitted fabrics are used in this thesis to determine the most appropriate cationic agent for surface charge modification of the fabric. This knitted fabric was treated with Chitosan (CS), Poly(diallyldimethylammonium) chloride (PDDAC), hexadecylpyridinium chloride (HDPC), branched polyethylenimine (PEI) solutions separately; thereafter, their electrical, electrothermal, electromechanical performances were recorded.
Polyester non-woven fabrics were used for the catalytical application, and PAMAM was used as a cationic agent for non-woven fabrics [59].
A yarn coating line was designed and assembled for continuous yarn coating and then to use those yarns in the knitting machine (as the anode) among stainless steel fibres (as the cathode) and polyamide fibre (as the main body of the fully textile-based reactor). A simplified schematic of the various branches of this thesis is shown in Figure 4.
13
Figure 4. General theme of the thesis.

14
1.4 Scope and limitation of the thesis
The modification of conventional textiles with graphene and further immobilisation of catalysts fall under the scope of a multidisciplinary field, requiring scientific and technical competencies in textile technology, material science, surface chemistry, electrochemistry, among others. The context of this thesis is on the scope of material science, surface chemistry and electrochemistry, with applications in smart garments (tactile sensor and heating garments) as well as environmental remediation.
The research perspective and conclusions are based on laboratory-based experimental data gathering and their respective analysis. The necessary interpretation of the scope and limitation of this thesis highlight the following matters: 1. Surface charge modification of conventional textiles for further graphene oxide coating and iron immobilisation falls under the scope of textile chemistry, material science and inorganic chemistry to some extent. 2. The study of electrocatalytic wastewater treatment falls under electrochemistry and surface chemistry to some extent. The related field of multifunctional or smart textiles in other applications is beyond the scope of this thesis.
All the results presented here are collected in laboratory-scale trials. Large-scale (industrial) production of such multifunctional smart textiles is outside the scope of this thesis. They require further development and optimisation.
15
Chapter 2 State-of-the-art
Chapter outline
2.1. Surface charge modification of fabrics and yarns and graphene grafting
2.1.1 Preparation of textile surface for graphene grafting and iron immobilisation
Polyester fibres are hydrophobic; thus, to bring some hydrophilic properties to the fibres, fibres could be treated with a basic solution that would break branches off the polyester chain and give extra oxygen functional groups to the fibre. This will result in a hydrophilic fibre.
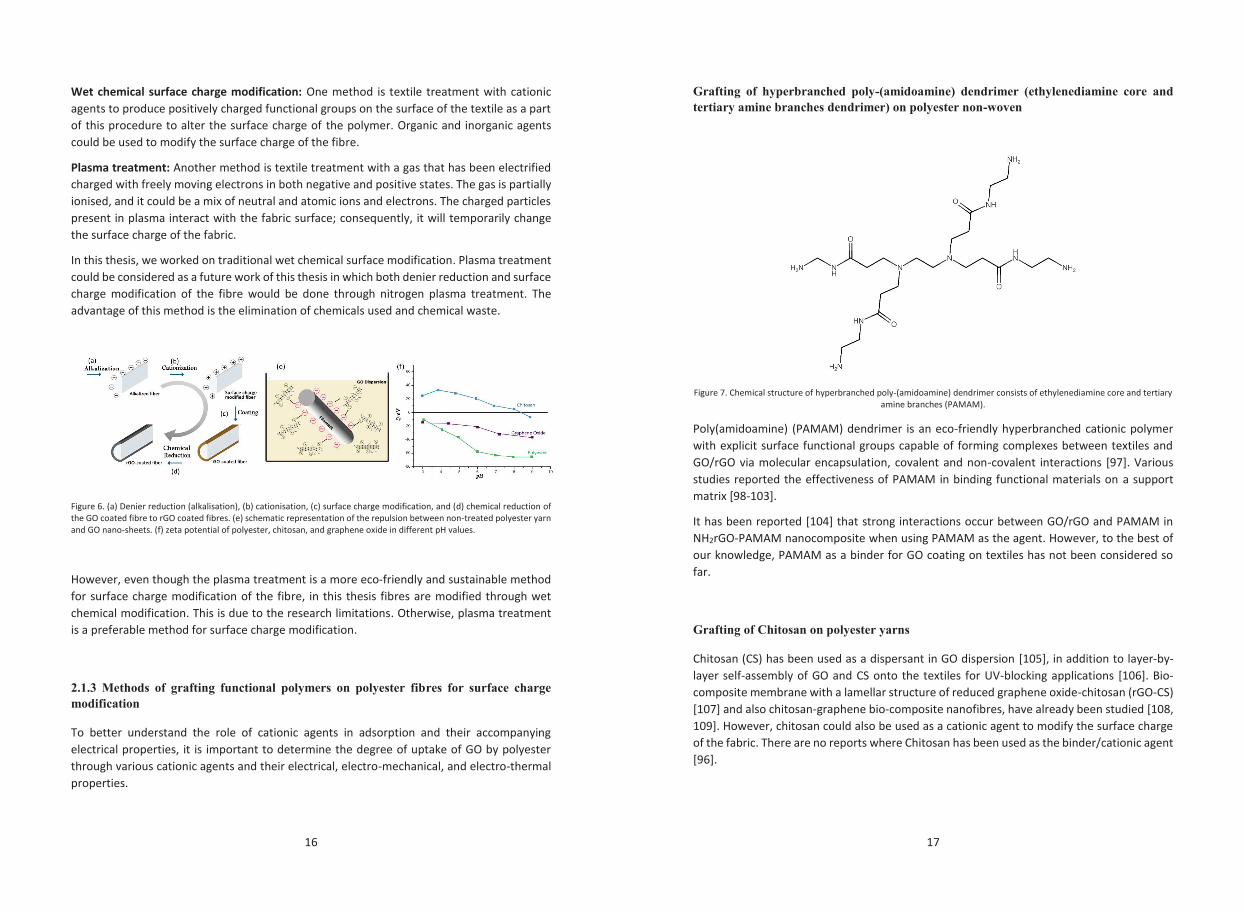
Alkalisation (Hydrolysis): Alkaline treatment is one of the simplest and most effective chemical treatments to remove impurities on the fibre surface and break the polymer chain. In the hydrolysis of polyester, esters are easily hydrolysed by reaction with dilute alkalis, such as sodium hydroxide. Polyesters are attacked by alkalis, and ester linkages are broken; furthermore, ethane-1,2-diol is formed together with the salt of the carboxylic acid.
Figure 5. Hydrolysis of polyester via sodium hydroxide 12%.
2.1.2 Surface charge modification
As mentioned before, graphene oxide has a negative surface charge in dispersion; further, to have a strong electrostatic bonding between the fibre and GO nanosheets, it is important to change the surface charge of the polyester (naturally negative) to positive. There are different methods for surface charge modification.
16
Wet chemical surface charge modification: One method is textile treatment with cationic agents to produce positively charged functional groups on the surface of the textile as a part of this procedure to alter the surface charge of the polymer. Organic and inorganic agents could be used to modify the surface charge of the fibre.
Plasma treatment: Another method is textile treatment with a gas that has been electrified charged with freely moving electrons in both negative and positive states. The gas is partially ionised, and it could be a mix of neutral and atomic ions and electrons. The charged particles present in plasma interact with the fabric surface; consequently, it will temporarily change the surface charge of the fabric.
In this thesis, we worked on traditional wet chemical surface modification. Plasma treatment could be considered as a future work of this thesis in which both denier reduction and surface charge modification of the fibre would be done through nitrogen plasma treatment. The advantage of this method is the elimination of chemicals used and chemical waste.
Figure 6. (a) Denier reduction (alkalisation), (b) cationisation, (c) surface charge modification, and (d) chemical reduction of the GO coated fibre to rGO coated fibres. (e) schematic representation of the repulsion between non-treated polyester yarn and GO nano-sheets. (f) zeta potential of polyester, chitosan, and graphene oxide in different pH values.
However, even though the plasma treatment is a more eco-friendly and sustainable method for surface charge modification of the fibre, in this thesis fibres are modified through wet chemical modification. This is due to the research limitations. Otherwise, plasma treatment is a preferable method for surface charge modification.
2.1.3 Methods of grafting functional polymers on polyester fibres for surface charge modification
To better understand the role of cationic agents in adsorption and their accompanying electrical properties, it is important to determine the degree of uptake of GO by polyester through various cationic agents and their electrical, electro-mechanical, and electro-thermal properties.
17
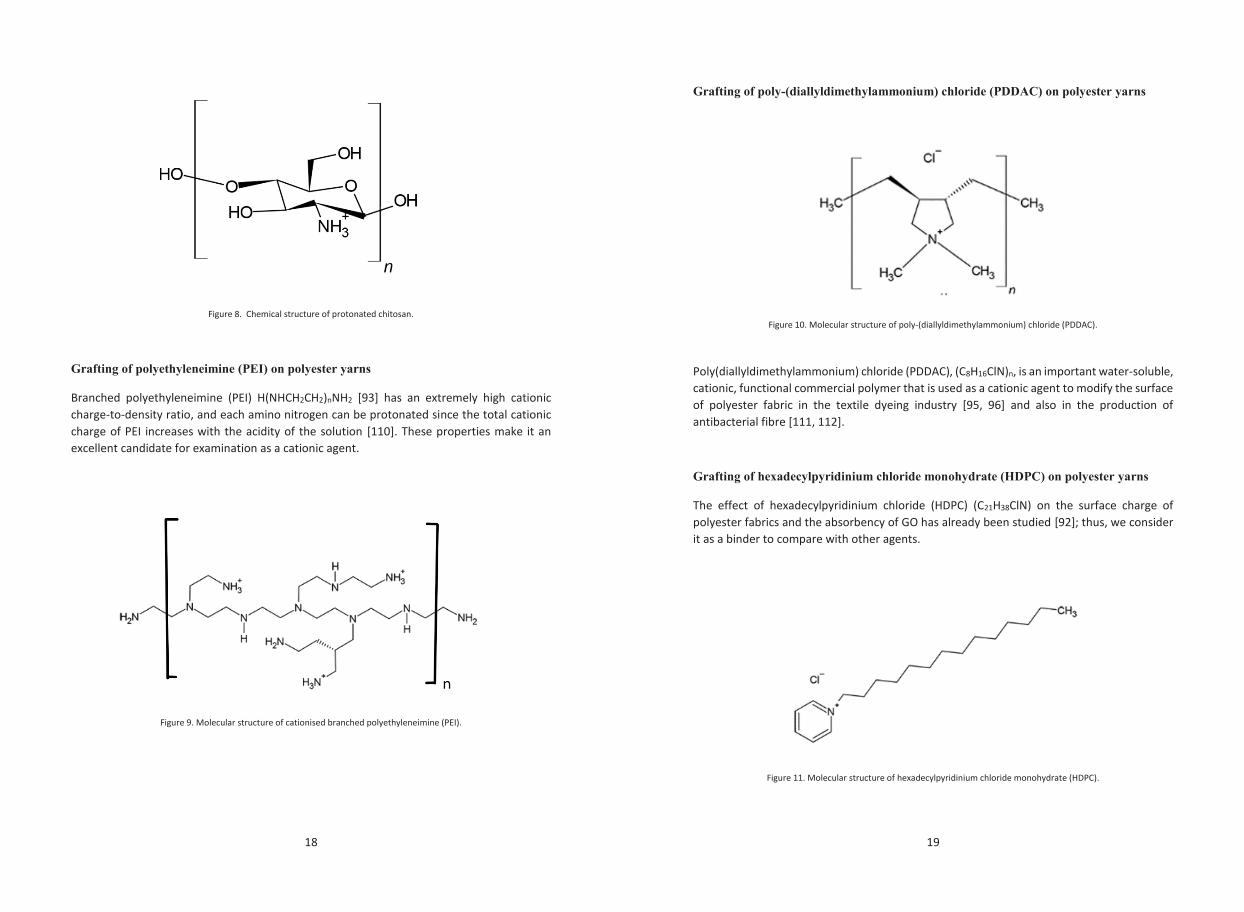
Grafting of hyperbranched poly-(amidoamine) dendrimer (ethylenediamine core and tertiary amine branches dendrimer) on polyester non-woven
Figure 7. Chemical structure of hyperbranched poly-(amidoamine) dendrimer consists of ethylenediamine core and tertiary
amine branches (PAMAM).
Poly(amidoamine) (PAMAM) dendrimer is an eco-friendly hyperbranched cationic polymer with explicit surface functional groups capable of forming complexes between textiles and GO/rGO via molecular encapsulation, covalent and non-covalent interactions [97]. Various studies reported the effectiveness of PAMAM in binding functional materials on a support matrix [98-103].
It has been reported [104] that strong interactions occur between GO/rGO and PAMAM in NH2rGO-PAMAM nanocomposite when using PAMAM as the agent. However, to the best of our knowledge, PAMAM as a binder for GO coating on textiles has not been considered so far.
Grafting of Chitosan on polyester yarns
Chitosan (CS) has been used as a dispersant in GO dispersion [105], in addition to layer-by-layer self-assembly of GO and CS onto the textiles for UV-blocking applications [106]. Bio-composite membrane with a lamellar structure of reduced graphene oxide-chitosan (rGO-CS) [107] and also chitosan-graphene bio-composite nanofibres, have already been studied [108, 109]. However, chitosan could also be used as a cationic agent to modify the surface charge of the fabric. There are no reports where Chitosan has been used as the binder/cationic agent [96].
18
Figure 8. Chemical structure of protonated chitosan.
Grafting of polyethyleneimine (PEI) on polyester yarns
Branched polyethyleneimine (PEI) H(NHCH2CH2)nNH2 [93] has an extremely high cationic charge-to-density ratio, and each amino nitrogen can be protonated since the total cationic charge of PEI increases with the acidity of the solution [110]. These properties make it an excellent candidate for examination as a cationic agent.
Figure 9. Molecular structure of cationised branched polyethyleneimine (PEI).
19
Grafting of poly-(diallyldimethylammonium) chloride (PDDAC) on polyester yarns
Figure 10. Molecular structure of poly-(diallyldimethylammonium) chloride (PDDAC).
Poly(diallyldimethylammonium) chloride (PDDAC), (C8H16ClN)n, is an important water-soluble, cationic, functional commercial polymer that is used as a cationic agent to modify the surface of polyester fabric in the textile dyeing industry [95, 96] and also in the production of antibacterial fibre [111, 112].
Grafting of hexadecylpyridinium chloride monohydrate (HDPC) on polyester yarns
The effect of hexadecylpyridinium chloride (HDPC) (C21H38ClN) on the surface charge of polyester fabrics and the absorbency of GO has already been studied [92]; thus, we consider it as a binder to compare with other agents.
Figure 11. Molecular structure of hexadecylpyridinium chloride monohydrate (HDPC).
20
2.2 State-of-the-art in graphene-modified textiles for the heating element and tactile sensors
Flexible heating elements are used for a wide range of applications, including seat heaters in vehicles [17]; thermal de-icing in aircraft and ice-prevention of the structural membrane, such as in wings [113, 114]; heated floor panels in aircraft for cabin temperature controlling [115]; and electrically heated garments [18-20].
Graphene has been used as a heating element in ink before, as in the case of conventional heating systems made from alloy or copper [116]. It has been reported that the film-like heater made from strips of a Fe–Cr–Al-based alloy, which is available in the market, has many disadvantages, including a complicated fabrication process, heavyweight, rigidity and low heating efficiency [116-119]. Graphene ink also has been used to replace the conventional heating elements, and printing graphene on textile is already reported [83, 84]. However, this method has its challenges and limitations. Using graphene dispersion as a dye and coating the fabric or fibre with graphene seems to be the most cost-effective, scalable and reliable method to focus on due to its various properties, including thermal, conductivity, lightweight and flexibility, among others [80].
Graphene can be used as continuous temperature sensing systems in constructions and industrial applications [120, 121] because of its negative temperature coefficient (NTC) properties [122].
Further, a textile-rGO coated sample could be used as a tactile sensor for both pressure sensing [123] and strain sensing applications [124-127]; in this thesis, we benefit from both graphene properties and knitted fabric stretchability to create a tactile sensor that could be used in different applications.
21
2.3 State-of-the-art in Graphene-modified textile support for catalyst immobilisation
2.3.1 Inorganic catalyst immobilisation
The immobilisation of inorganic catalysts has been studied and well-established by other researchers. Accordingly, the catalyst could be separated more easily from the resulting products, and it could be reused several times; this will lead to a decrease in the process cost. A variety of inorganic catalysts by immobilisation of different metals, such as palladium, tungsten, nickel, platinum, cobalt and carbon, have been well studied [128]. The tendency of metal particles to agglomerate during the synthesis and their thermodynamic instability are serious drawbacks [129]. Further, the difficulty of catalyst separation and its high cost and the remaining waste forced researchers to overcome these problems by immobilisation of the catalyst on a support medium. Designing a support medium for the conventional catalysts systems could be more expensive than the catalyst itself. Hence, a low-cost, scalable system is highly required.
Immobilisation of catalysts on textile supports is a common and cheap way compared to conventional systems [130]. Considering textile as the main support, large-scale and cheap catalytical systems could be produced and reused in wastewater treatment systems.
2.3.2 Technique of catalyst immobilisation on textiles
Immobilisation of inorganic catalysts on textiles could take place through physical or chemical adsorption and encapsulation [131, 132]. The methods could be classified as:
1. Solvent-based or chemical-based dip-coating of textile. In this method, an aqueous solution of the inorganic catalysts is used to immobilise the inorganic catalyst on the surface of the textiles via an interaction (covalent, electrostatic bonding) between the catalysts and the fibres [133, 134].
2. Physical coating through padding, printing or encapsulation. In these methods, inorganic catalysts are forced to confine inside the textile support materials such as non-woven fabrics.
2.3.3 Main factors affecting the immobilisation of inorganic catalysts on textiles
There are many key factors affecting the immobilisation process. Apart from environmental conditions, such as temperature, pH, and concentration of the catalysis, there are other major aspects, such as:
1. Diffusion of the catalyst into the textile support 2. Interaction and stability of the immobilised catalyst 3. Method of immobilisation
22
To have an optimal diffusion, the functional groups present on the textile surface, namely its isoelectric point of the material, play an important key for better binding between the textile and the catalysis. Many approaches have adopted the surface modification of the textile for further ionic exchange and crosslinking or covalent bonding among the textile medium and the catalysts.
2.3.4 Challenges of inorganic immobilisation on textiles
Catalytic and electrocatalytic systems are gradually becoming important for sustainable and green systems. Recyclability and reusability of the catalyst are essential parts of the immobilisation process; it could ensure the decrease in catalyst consumption, the final cost, and improve the sustainability of the system.
The catalytic immobilisation on textile has its own significant challenges. Here are some examples of the challenges in the field:
1. Harsh condition of the immobilisation: normally, immobilisation requires harsh conditions, such as high temperature or special pH. When it comes to textiles, however, there are some limitations in terms of temperature and the pH of the system. Thus, optimisation of the process for such a medium is required.
2. Leach of catalyst: even though the catalysis is bonded to the textile, reports show that a large number of the catalysts leach out of the textile during the usage; thus, improvement in the bonding is highly demanded.
3. A problematic confrontation of the catalyst may occur, causing disorientation of the catalyst and, as a result, blocking of catalyst sites.
4. Interaction between textile and catalyst change in inherent properties of the textile, such as the strength of the fibres.
2.3.5 Catalytic system for wastewater treatment
Numerous advanced and efficient technologies are being replaced with traditional ways of wastewater treatment, such as coagulation and flocculation. These methods include Fenton and Fenton like processes applying various sources of iron ions and hydrogen peroxide [135], ozonation of the wastewater by infusion of ozone into the water [136], wet air oxidation [137], catalytic reduction [138], enzyme [139] and sonochemical degradation [140] systems.
Among the named technologies, Fenton and Fenton-like systems as well as enzymatic systems, are the most promising processes for large-scale production and sustainability of the system.
23
2.3.6 Inorganic catalyst zerovalent iron particles (Fe0)
Iron is the 4th most common element on the earth (6.3%) and the most common and cost-effective transition metal [141]. Zerovalent iron particles (Fe0) are sub-micrometre particles of Fe metal [142]. The most common way to produce Fe0 is a chemical reduction of an iron precursor using sodium borohydride (NaBH4) as a reductant, as shown in the relation below:
Fe(H2O)3+ 6 + 3BH4- + 3H2O → Fe0 ↓+ 3B(OH)3 + 10.5 H2
Fe0 tends to donate electrons due to its negative, reductive potential [143] (𝐸𝐸𝑉𝑉0 = −0.44 𝑉𝑉),
and it rapidly oxidised in the presence of water and oxygen.
Fe0 + H2O → Fe2+ + H2 + 2OH-
2 Fe0 + 2H2O + O2 → 2Fe2+ + 4OH-
Fe0 could produce reactive radicals, such as sulfate and hydroxyl radicals, by competently catalysing common oxidants, such as H2O2, 𝑆𝑆𝑆𝑆5
2−, 𝑆𝑆2𝑆𝑆82−and O2 [144]. These radicals could be
used in wastewater treatment to recalcitrant organic pollutants [145].
24
2.4 State-of-the-art in wastewater treatment In recent years, due to the fast industrialisation and growth of the textile dyeing industry, different contaminants such as pathogenic bacteria, heavy metal ions, and other organic toxicants are released into water streams, causing serious threats to nature as well as human health. These toxins could be highly toxic, chemically stable, bio-accumulators and resist decomposing [146]. Among all industrial wastewater, colourants produced in the textile industry share a big part of pollutants that need to be considered [147]. Colourants which are widely used in industries, such as textile industry, printing, packaging and clinical purposes, could be highly toxic [148]. When these dyes are released into nature, they can increase the biochemical and chemical oxygen demand (BOD & COD), inhibit plant growth and photosynthesis and finally, enter the food chain.
These types of pollutants are typically named emerging contaminants (ECs). They are most likely resistant to conventional wastewater treatments, for example, physical, chemical and biological wastewater treatment such as flocculation, coagulation, adsorption aerobic and anaerobic biological systems and filtration, or a combination of both physical and chemical treatments [149, 150].
As an alternative, novel generation treatment methods based on catalytic mechanisms as well as advanced oxidation processes (AOPs) are introduced for pollutant removal in wastewater systems [151]. AOPs are defined by the generation of hydroxyl radicals (•OH) which are highly reactive (E0 = 2.8 V), and they are not the best option to remove pollutants from a medium such as water, soil and air [152].
2.5 State-of-the-art in advanced catalytic systems for wastewater treatment To replace traditional wastewater treatments such as flocculation, coagulation and so on, an advanced system is required. Numerous new technologies based on both catalytic and non-catalytic systems are introduced for a better sustainable green removal of complex Nano-pollutants and hazardous compounds. For instance, supercritical water oxidation above the mixture’s thermodynamic critical point [153], photocatalytic degradation by photocatalysts [154, 155], ozonation by infusion of ozone into the water [156], wet air oxidation [157], microwave degradation of wastewater through electromagnetic irradiation catalytic reduction [158], enzyme reduction systems [159], catalytic reduction [160], and the Fenton and Fenton-like systems using various sources of iron ions and H2O2 [135, 161], and electro-Fenton systems [162, 163].
2.5.1 Electrocatalysts
Catalytic reduction involves the usage of a solid catalyst and a reductant to degrade the wastewater pollutant through an electron-transfer reaction [164]. Numerous metallic
25
nanoparticles, such as gold, copper, nickel, cobalt and silver, are used for catalytic reduction of pollutants including phenols [165], pharmaceutical [166], pathogenic bacteria [167], and colourants [168] in wastewater.
Immobilisation of these elements on a solid support is a conventional way for it to be used in catalytic systems. It ensures better stability of the catalyst and easy recovery and replacement; it could produce by-products that are non-toxic or substantially less toxic compared to those traditional technologies.
Several factors affect the performance of a catalytic system (as they are described in section 2).
- Stability of the catalyst in the reduction system. - The concentration and ratio of the catalyst, reducing agent and pollutant. - The temperature of the solution, a gradual increase of the removal reaction to a
certain temperature point, has already been studied [169, 170]. - the pH of the system: as already reported [171], for a reduction to occur, the medium
should not be alkaline. However, the reduction increases significantly by reducing the pH and having a more acidic medium.
2.5.2 Electrocatalytic system for wastewater treatment
Among the AOPs, the electrochemical advanced oxidation processes (EAOPs) are a promising alternative to the traditional AOP processes, as they are environmentally clean and could continuously produce a large number of hydroxyl radicals (•OH) under the control of the applied potential [172, 173]. Hydroxyl radicals are produced in solution bulk through electrochemically assisted Fenton’s reaction, where hydrogen peroxide is produced in situ from a 2-electrode reduction of O2 on cathodes such as graphite-felt [174], following the reaction below:
O2 + 2H+ + 2e- → H2O2
Fe2+ + H2O2 → Fe3+ + OH- + •OH
2.5.3 Advanced oxidation process through Fenton’s and electro-Fenton reaction
One of the most reliable systems used in wastewater treatment is Fenton-like treatments. Fenton chemical reaction is one of the most efficient advanced oxidations processed (AOPs). Fenton reaction is a reaction between ferrous ions (Fe2+, Fe3+) and hydrogen peroxide (H2O2) that results in the formation of hydroxyl radicals, which is a strong oxidant (E0 = 2.8 V). This oxidant is capable of degrading organic pollutants in water [152, 175-177].
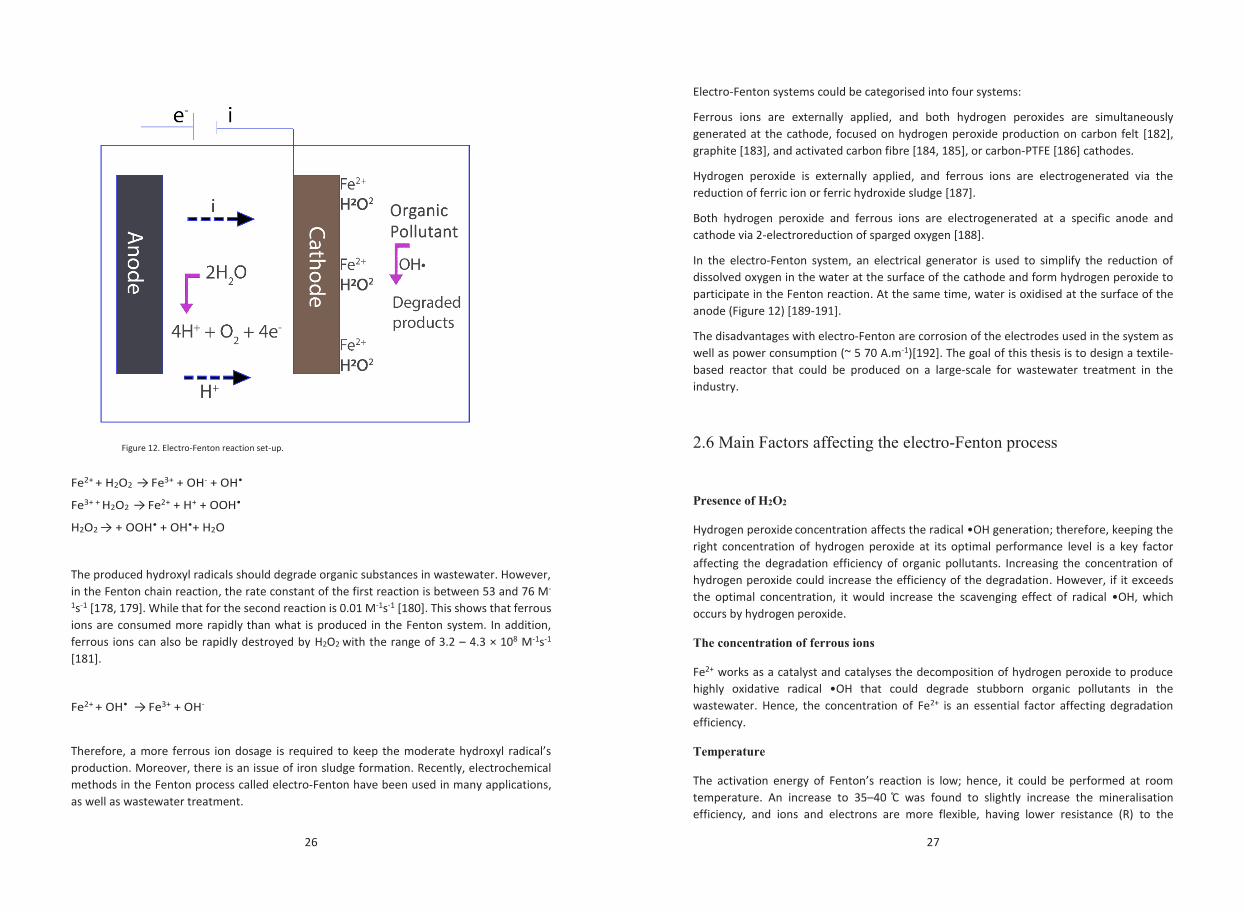
26
Fe2+ + H2O2 → Fe3+ + OH- + OH•
Fe3+ + H2O2 → Fe2+ + H+ + OOH•
H2O2 → + OOH• + OH•+ H2O
The produced hydroxyl radicals should degrade organic substances in wastewater. However, in the Fenton chain reaction, the rate constant of the first reaction is between 53 and 76 M-
1s-1 [178, 179]. While that for the second reaction is 0.01 M-1s-1 [180]. This shows that ferrous ions are consumed more rapidly than what is produced in the Fenton system. In addition, ferrous ions can also be rapidly destroyed by H2O2 with the range of 3.2 – 4.3 × 10⁸ M-1s-1
[181].
Fe2+ + OH• → Fe3+ + OH-
Therefore, a more ferrous ion dosage is required to keep the moderate hydroxyl radical’s production. Moreover, there is an issue of iron sludge formation. Recently, electrochemical methods in the Fenton process called electro-Fenton have been used in many applications, as well as wastewater treatment.
Figure 12. Electro-Fenton reaction set-up.
27
Electro-Fenton systems could be categorised into four systems:
Ferrous ions are externally applied, and both hydrogen peroxides are simultaneously generated at the cathode, focused on hydrogen peroxide production on carbon felt [182], graphite [183], and activated carbon fibre [184, 185], or carbon-PTFE [186] cathodes.
Hydrogen peroxide is externally applied, and ferrous ions are electrogenerated via the reduction of ferric ion or ferric hydroxide sludge [187].
Both hydrogen peroxide and ferrous ions are electrogenerated at a specific anode and cathode via 2-electroreduction of sparged oxygen [188].
In the electro-Fenton system, an electrical generator is used to simplify the reduction of dissolved oxygen in the water at the surface of the cathode and form hydrogen peroxide to participate in the Fenton reaction. At the same time, water is oxidised at the surface of the anode (Figure 12) [189-191].
The disadvantages with electro-Fenton are corrosion of the electrodes used in the system as well as power consumption (~ 5 70 A.m-1)[192]. The goal of this thesis is to design a textile-based reactor that could be produced on a large-scale for wastewater treatment in the industry.
2.6 Main Factors affecting the electro-Fenton process
Presence of H2O2
Hydrogen peroxide concentration affects the radical •OH generation; therefore, keeping the right concentration of hydrogen peroxide at its optimal performance level is a key factor affecting the degradation efficiency of organic pollutants. Increasing the concentration of hydrogen peroxide could increase the efficiency of the degradation. However, if it exceeds the optimal concentration, it would increase the scavenging effect of radical •OH, which occurs by hydrogen peroxide.
The concentration of ferrous ions
Fe2+ works as a catalyst and catalyses the decomposition of hydrogen peroxide to produce highly oxidative radical •OH that could degrade stubborn organic pollutants in the wastewater. Hence, the concentration of Fe2+ is an essential factor affecting degradation efficiency.
Temperature
The activation energy of Fenton’s reaction is low; hence, it could be performed at room temperature. An increase to 35–40 C was found to slightly increase the mineralisation efficiency, and ions and electrons are more flexible, having lower resistance (R) to the
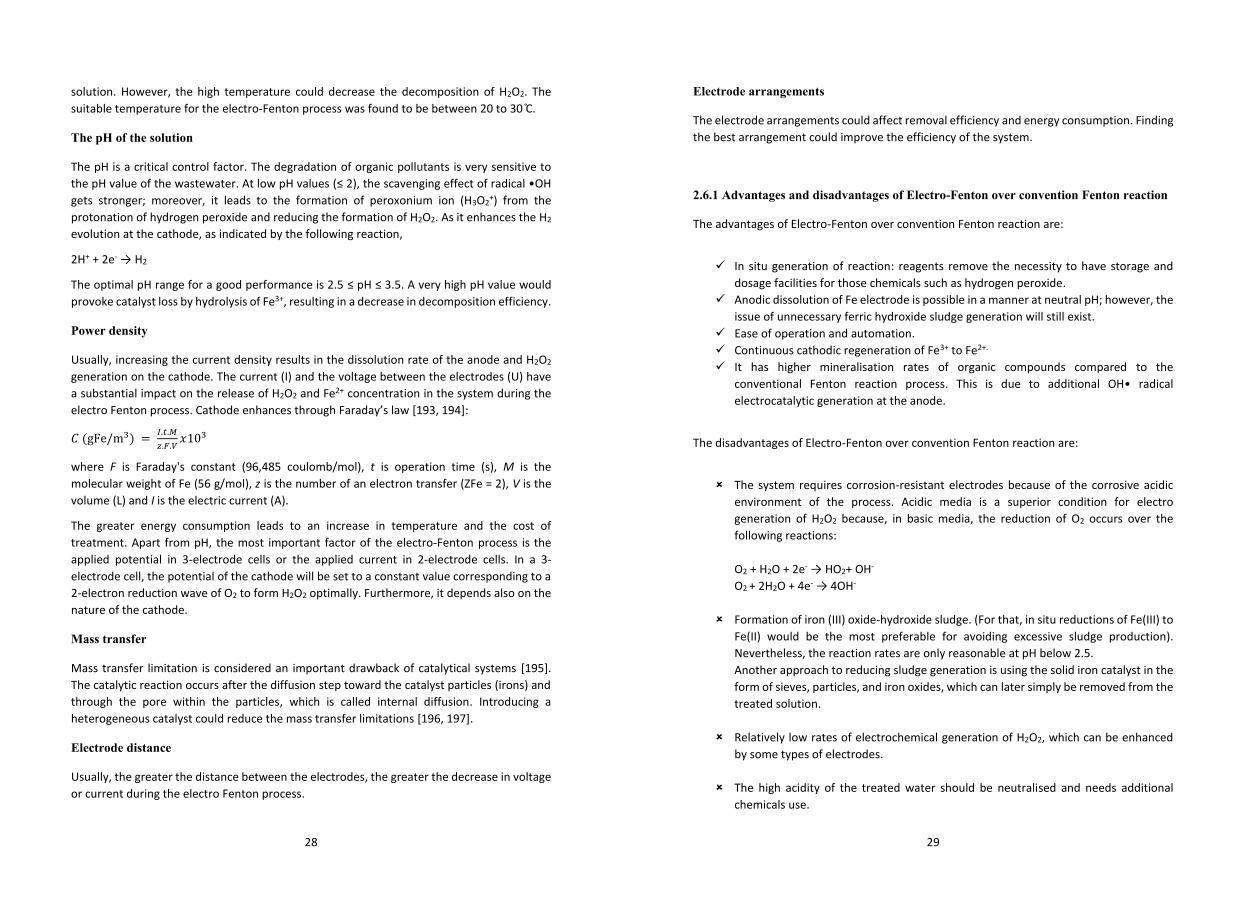
28
solution. However, the high temperature could decrease the decomposition of H2O2. The suitable temperature for the electro-Fenton process was found to be between 20 to 30 C.
The pH of the solution
The pH is a critical control factor. The degradation of organic pollutants is very sensitive to the pH value of the wastewater. At low pH values (≤ 2), the scavenging effect of radical •OH gets stronger; moreover, it leads to the formation of peroxonium ion (H3O2+) from the protonation of hydrogen peroxide and reducing the formation of H2O2. As it enhances the H2 evolution at the cathode, as indicated by the following reaction,
2H+ + 2e- → H2
The optimal pH range for a good performance is 2.5 ≤ pH ≤ 3.5. A very high pH value would provoke catalyst loss by hydrolysis of Fe3+, resulting in a decrease in decomposition efficiency.
Power density
Usually, increasing the current density results in the dissolution rate of the anode and H2O2 generation on the cathode. The current (I) and the voltage between the electrodes (U) have a substantial impact on the release of H2O2 and Fe2+ concentration in the system during the electro Fenton process. Cathode enhances through Faraday’s law [193, 194]:
𝐶𝐶 (gFe/m3) = 𝐼𝐼.𝑡𝑡.𝑀𝑀𝑧𝑧.𝐹𝐹.𝑉𝑉 𝑥𝑥103
where F is Faraday's constant (96,485 coulomb/mol), t is operation time (s), M is the molecular weight of Fe (56 g/mol), z is the number of an electron transfer (ZFe = 2), V is the volume (L) and I is the electric current (A).
The greater energy consumption leads to an increase in temperature and the cost of treatment. Apart from pH, the most important factor of the electro-Fenton process is the applied potential in 3-electrode cells or the applied current in 2-electrode cells. In a 3-electrode cell, the potential of the cathode will be set to a constant value corresponding to a 2-electron reduction wave of O2 to form H2O2 optimally. Furthermore, it depends also on the nature of the cathode.
Mass transfer
Mass transfer limitation is considered an important drawback of catalytical systems [195]. The catalytic reaction occurs after the diffusion step toward the catalyst particles (irons) and through the pore within the particles, which is called internal diffusion. Introducing a heterogeneous catalyst could reduce the mass transfer limitations [196, 197].
Electrode distance
Usually, the greater the distance between the electrodes, the greater the decrease in voltage or current during the electro Fenton process.
29
Electrode arrangements
The electrode arrangements could affect removal efficiency and energy consumption. Finding the best arrangement could improve the efficiency of the system.
2.6.1 Advantages and disadvantages of Electro-Fenton over convention Fenton reaction
The advantages of Electro-Fenton over convention Fenton reaction are:
In situ generation of reaction: reagents remove the necessity to have storage and
dosage facilities for those chemicals such as hydrogen peroxide. Anodic dissolution of Fe electrode is possible in a manner at neutral pH; however, the
issue of unnecessary ferric hydroxide sludge generation will still exist. Ease of operation and automation. Continuous cathodic regeneration of Fe3+ to Fe2+. It has higher mineralisation rates of organic compounds compared to the
conventional Fenton reaction process. This is due to additional OH• radical electrocatalytic generation at the anode.
The disadvantages of Electro-Fenton over convention Fenton reaction are:
The system requires corrosion-resistant electrodes because of the corrosive acidic
environment of the process. Acidic media is a superior condition for electro generation of H2O2 because, in basic media, the reduction of O2 occurs over the following reactions: O2 + H2O + 2e- → HO2+ OH- O2 + 2H2O + 4e- → 4OH-
Formation of iron (III) oxide-hydroxide sludge. (For that, in situ reductions of Fe(III) to
Fe(II) would be the most preferable for avoiding excessive sludge production). Nevertheless, the reaction rates are only reasonable at pH below 2.5. Another approach to reducing sludge generation is using the solid iron catalyst in the form of sieves, particles, and iron oxides, which can later simply be removed from the treated solution.
Relatively low rates of electrochemical generation of H2O2, which can be enhanced by some types of electrodes.
The high acidity of the treated water should be neutralised and needs additional chemicals use.
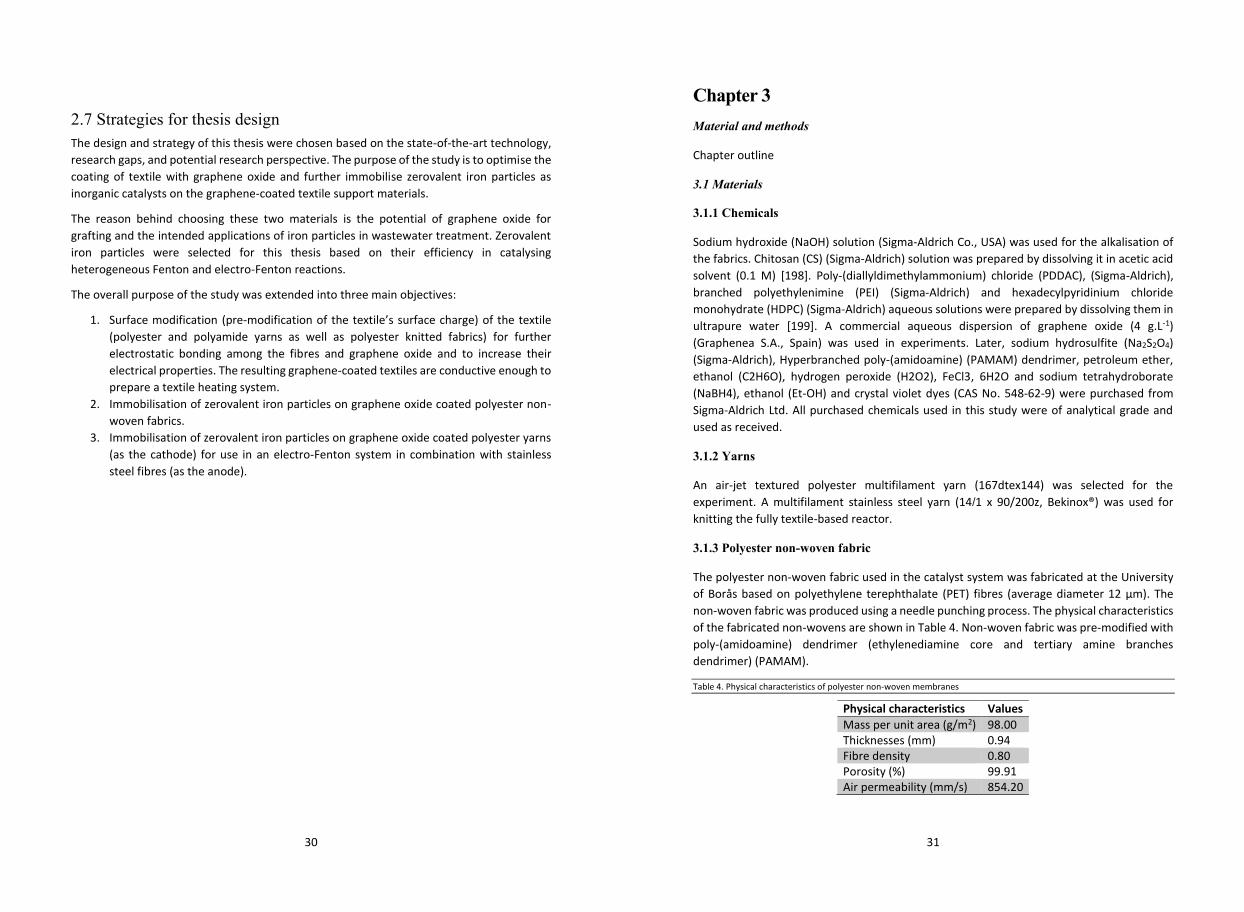
30
2.7 Strategies for thesis design The design and strategy of this thesis were chosen based on the state-of-the-art technology, research gaps, and potential research perspective. The purpose of the study is to optimise the coating of textile with graphene oxide and further immobilise zerovalent iron particles as inorganic catalysts on the graphene-coated textile support materials.
The reason behind choosing these two materials is the potential of graphene oxide for grafting and the intended applications of iron particles in wastewater treatment. Zerovalent iron particles were selected for this thesis based on their efficiency in catalysing heterogeneous Fenton and electro-Fenton reactions.
The overall purpose of the study was extended into three main objectives:
1. Surface modification (pre-modification of the textile’s surface charge) of the textile (polyester and polyamide yarns as well as polyester knitted fabrics) for further electrostatic bonding among the fibres and graphene oxide and to increase their electrical properties. The resulting graphene-coated textiles are conductive enough to prepare a textile heating system.
2. Immobilisation of zerovalent iron particles on graphene oxide coated polyester non-woven fabrics.
3. Immobilisation of zerovalent iron particles on graphene oxide coated polyester yarns (as the cathode) for use in an electro-Fenton system in combination with stainless steel fibres (as the anode).
31
Chapter 3 Material and methods
Chapter outline
3.1 Materials
3.1.1 Chemicals
Sodium hydroxide (NaOH) solution (Sigma-Aldrich Co., USA) was used for the alkalisation of the fabrics. Chitosan (CS) (Sigma-Aldrich) solution was prepared by dissolving it in acetic acid solvent (0.1 M) [198]. Poly-(diallyldimethylammonium) chloride (PDDAC), (Sigma-Aldrich), branched polyethylenimine (PEI) (Sigma-Aldrich) and hexadecylpyridinium chloride monohydrate (HDPC) (Sigma-Aldrich) aqueous solutions were prepared by dissolving them in ultrapure water [199]. A commercial aqueous dispersion of graphene oxide (4 g.L-1) (Graphenea S.A., Spain) was used in experiments. Later, sodium hydrosulfite (Na2S2O4) (Sigma-Aldrich), Hyperbranched poly-(amidoamine) (PAMAM) dendrimer, petroleum ether, ethanol (C2H6O), hydrogen peroxide (H2O2), FeCl3, 6H2O and sodium tetrahydroborate (NaBH4), ethanol (Et-OH) and crystal violet dyes (CAS No. 548-62-9) were purchased from Sigma-Aldrich Ltd. All purchased chemicals used in this study were of analytical grade and used as received.
3.1.2 Yarns
An air-jet textured polyester multifilament yarn (167dtex144) was selected for the experiment. A multifilament stainless steel yarn (14/1 x 90/200z, Bekinox®) was used for knitting the fully textile-based reactor.
3.1.3 Polyester non-woven fabric
The polyester non-woven fabric used in the catalyst system was fabricated at the University of Borås based on polyethylene terephthalate (PET) fibres (average diameter 12 μm). The non-woven fabric was produced using a needle punching process. The physical characteristics of the fabricated non-wovens are shown in Table 4. Non-woven fabric was pre-modified with poly-(amidoamine) dendrimer (ethylenediamine core and tertiary amine branches dendrimer) (PAMAM).
Table 4. Physical characteristics of polyester non-woven membranes
Physical characteristics Values Mass per unit area (g/m2) 98.00 Thicknesses (mm) 0.94 Fibre density 0.80 Porosity (%) 99.91 Air permeability (mm/s) 854.20
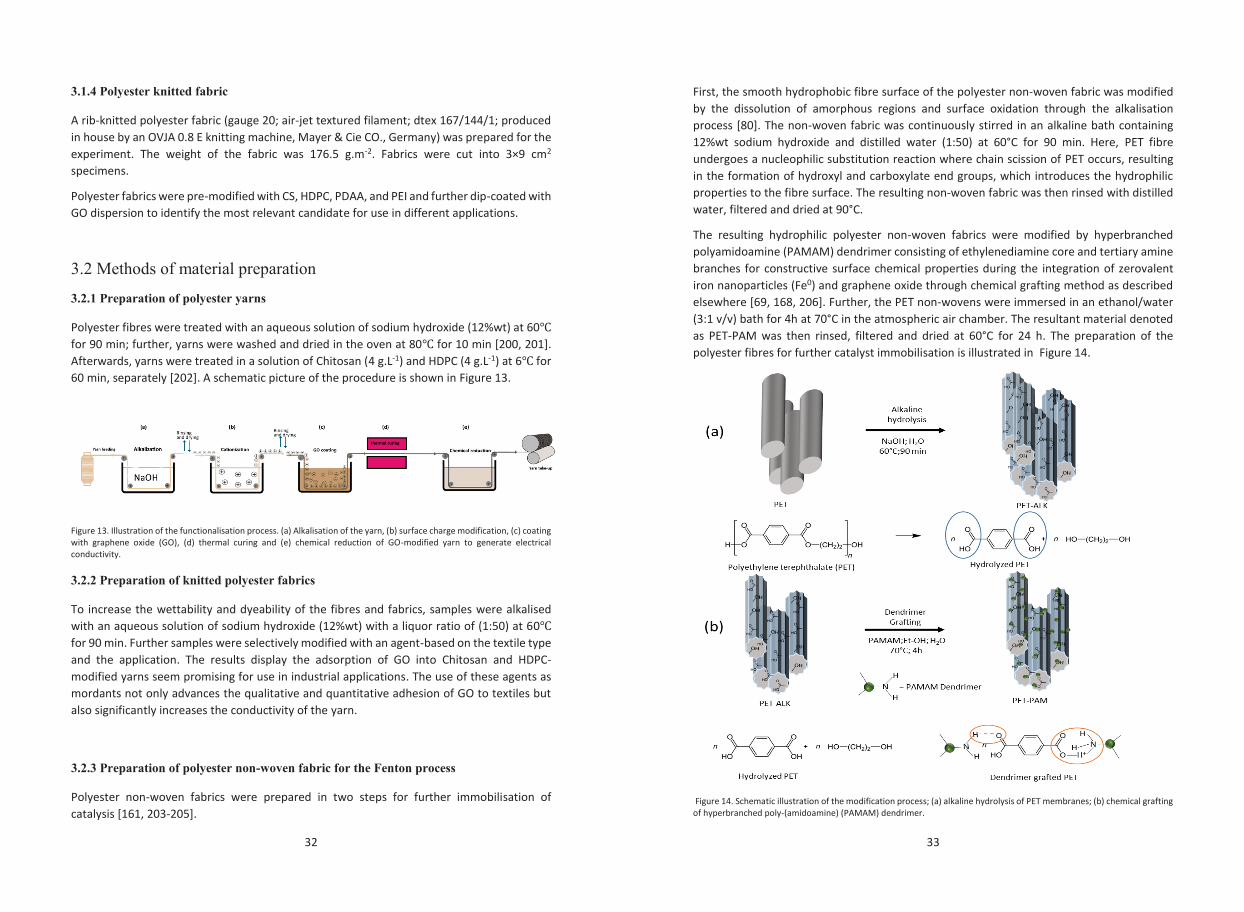
32
3.1.4 Polyester knitted fabric
A rib-knitted polyester fabric (gauge 20; air-jet textured filament; dtex 167/144/1; produced in house by an OVJA 0.8 E knitting machine, Mayer & Cie CO., Germany) was prepared for the experiment. The weight of the fabric was 176.5 g.m-2. Fabrics were cut into 3×9 cm2 specimens.
Polyester fabrics were pre-modified with CS, HDPC, PDAA, and PEI and further dip-coated with GO dispersion to identify the most relevant candidate for use in different applications.
3.2 Methods of material preparation
3.2.1 Preparation of polyester yarns
Polyester fibres were treated with an aqueous solution of sodium hydroxide (12%wt) at 60 for 90 min; further, yarns were washed and dried in the oven at 80 for 10 min [200, 201]. Afterwards, yarns were treated in a solution of Chitosan (4 g.L-1) and HDPC (4 g.L-1) at 6 for 60 min, separately [202]. A schematic picture of the procedure is shown in Figure 13.
Figure 13. Illustration of the functionalisation process. (a) Alkalisation of the yarn, (b) surface charge modification, (c) coating with graphene oxide (GO), (d) thermal curing and (e) chemical reduction of GO-modified yarn to generate electrical conductivity.
3.2.2 Preparation of knitted polyester fabrics
To increase the wettability and dyeability of the fibres and fabrics, samples were alkalised with an aqueous solution of sodium hydroxide (12%wt) with a liquor ratio of (1:50) at 60 for 90 min. Further samples were selectively modified with an agent-based on the textile type and the application. The results display the adsorption of GO into Chitosan and HDPC-modified yarns seem promising for use in industrial applications. The use of these agents as mordants not only advances the qualitative and quantitative adhesion of GO to textiles but also significantly increases the conductivity of the yarn.
3.2.3 Preparation of polyester non-woven fabric for the Fenton process
Polyester non-woven fabrics were prepared in two steps for further immobilisation of catalysis [161, 203-205].
33
First, the smooth hydrophobic fibre surface of the polyester non-woven fabric was modified by the dissolution of amorphous regions and surface oxidation through the alkalisation process [80]. The non-woven fabric was continuously stirred in an alkaline bath containing 12%wt sodium hydroxide and distilled water (1:50) at 60°C for 90 min. Here, PET fibre undergoes a nucleophilic substitution reaction where chain scission of PET occurs, resulting in the formation of hydroxyl and carboxylate end groups, which introduces the hydrophilic properties to the fibre surface. The resulting non-woven fabric was then rinsed with distilled water, filtered and dried at 90°C.
The resulting hydrophilic polyester non-woven fabrics were modified by hyperbranched polyamidoamine (PAMAM) dendrimer consisting of ethylenediamine core and tertiary amine branches for constructive surface chemical properties during the integration of zerovalent iron nanoparticles (Fe0) and graphene oxide through chemical grafting method as described elsewhere [69, 168, 206]. Further, the PET non-wovens were immersed in an ethanol/water (3:1 v/v) bath for 4h at 70°C in the atmospheric air chamber. The resultant material denoted as PET-PAM was then rinsed, filtered and dried at 60°C for 24 h. The preparation of the polyester fibres for further catalyst immobilisation is illustrated in Figure 14.
Figure 14. Schematic illustration of the modification process; (a) alkaline hydrolysis of PET membranes; (b) chemical grafting of hyperbranched poly-(amidoamine) (PAMAM) dendrimer.
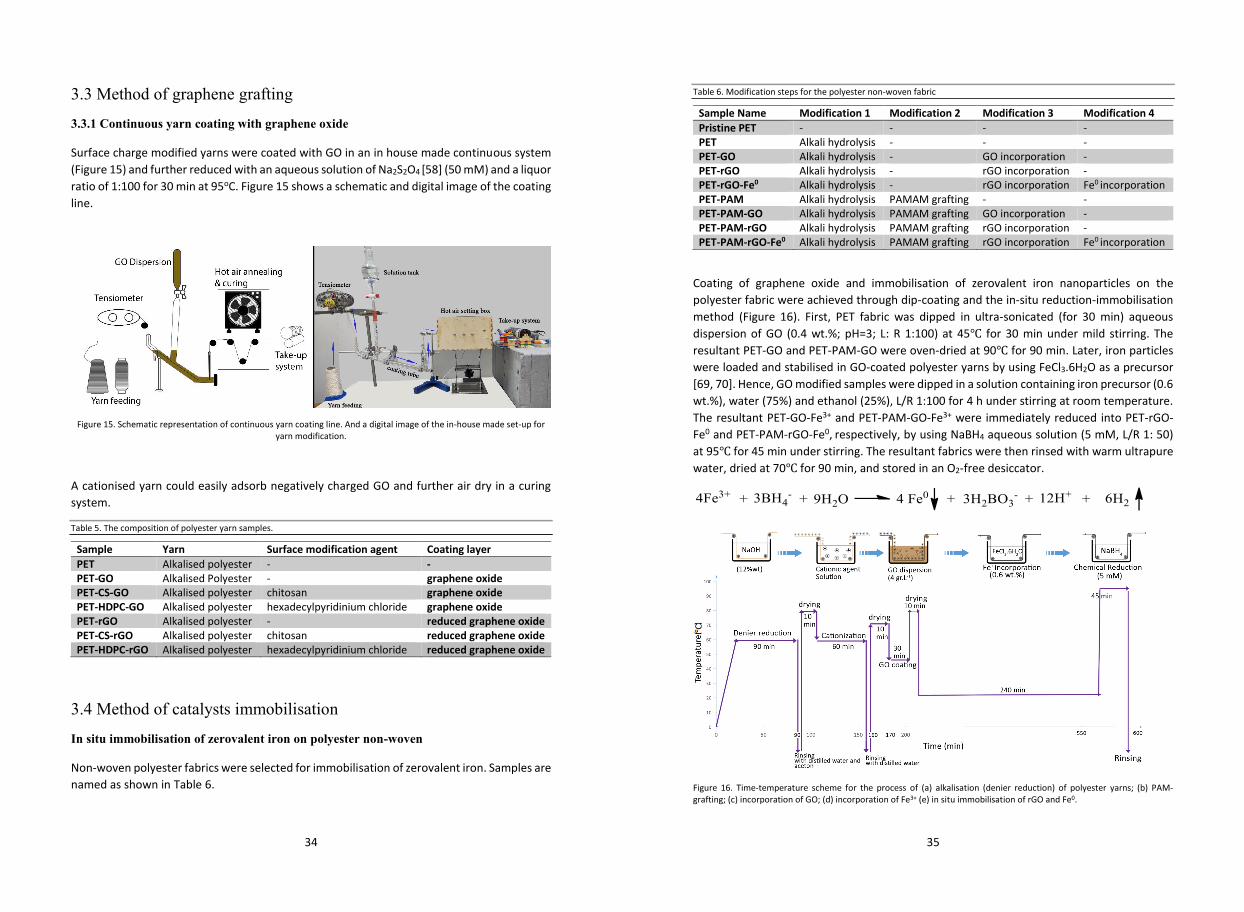
34
3.3 Method of graphene grafting
3.3.1 Continuous yarn coating with graphene oxide
Surface charge modified yarns were coated with GO in an in house made continuous system (Figure 15) and further reduced with an aqueous solution of Na2S2O4 [58] (50 mM) and a liquor ratio of 1:100 for 30 min at 95oC. Figure 15 shows a schematic and digital image of the coating line.
Figure 15. Schematic representation of continuous yarn coating line. And a digital image of the in-house made set-up for
yarn modification.
A cationised yarn could easily adsorb negatively charged GO and further air dry in a curing system.
Table 5. The composition of polyester yarn samples.
Sample Yarn Surface modification agent Coating layer PET Alkalised polyester - - PET-GO Alkalised Polyester - graphene oxide PET-CS-GO Alkalised polyester chitosan graphene oxide PET-HDPC-GO Alkalised polyester hexadecylpyridinium chloride graphene oxide PET-rGO Alkalised polyester - reduced graphene oxide PET-CS-rGO Alkalised polyester chitosan reduced graphene oxide PET-HDPC-rGO Alkalised polyester hexadecylpyridinium chloride reduced graphene oxide
3.4 Method of catalysts immobilisation
In situ immobilisation of zerovalent iron on polyester non-woven
Non-woven polyester fabrics were selected for immobilisation of zerovalent iron. Samples are named as shown in Table 6.
35
Table 6. Modification steps for the polyester non-woven fabric
Sample Name Modification 1 Modification 2 Modification 3 Modification 4 Pristine PET - - - - PET Alkali hydrolysis - - - PET-GO Alkali hydrolysis - GO incorporation - PET-rGO Alkali hydrolysis - rGO incorporation - PET-rGO-Fe0 Alkali hydrolysis - rGO incorporation Fe0 incorporation PET-PAM Alkali hydrolysis PAMAM grafting - - PET-PAM-GO Alkali hydrolysis PAMAM grafting GO incorporation - PET-PAM-rGO Alkali hydrolysis PAMAM grafting rGO incorporation - PET-PAM-rGO-Fe0 Alkali hydrolysis PAMAM grafting rGO incorporation Fe0 incorporation
Coating of graphene oxide and immobilisation of zerovalent iron nanoparticles on the polyester fabric were achieved through dip-coating and the in-situ reduction-immobilisation method (Figure 16). First, PET fabric was dipped in ultra-sonicated (for 30 min) aqueous dispersion of GO (0.4 wt.%; pH=3; L: R 1:100) at 45 for 30 min under mild stirring. The resultant PET-GO and PET-PAM-GO were oven-dried at 90 for 90 min. Later, iron particles were loaded and stabilised in GO-coated polyester yarns by using FeCl3.6H2O as a precursor [69, 70]. Hence, GO modified samples were dipped in a solution containing iron precursor (0.6 wt.%), water (75%) and ethanol (25%), L/R 1:100 for 4 h under stirring at room temperature. The resultant PET-GO-Fe3+ and PET-PAM-GO-Fe3+ were immediately reduced into PET-rGO-Fe0 and PET-PAM-rGO-Fe0, respectively, by using NaBH4 aqueous solution (5 mM, L/R 1: 50) at 95 for 45 min under stirring. The resultant fabrics were then rinsed with warm ultrapure water, dried at 70 for 90 min, and stored in an O2-free desiccator.
Figure 16. Time-temperature scheme for the process of (a) alkalisation (denier reduction) of polyester yarns; (b) PAM-grafting; (c) incorporation of GO; (d) incorporation of Fe3+ (e) in situ immobilisation of rGO and Fe0.
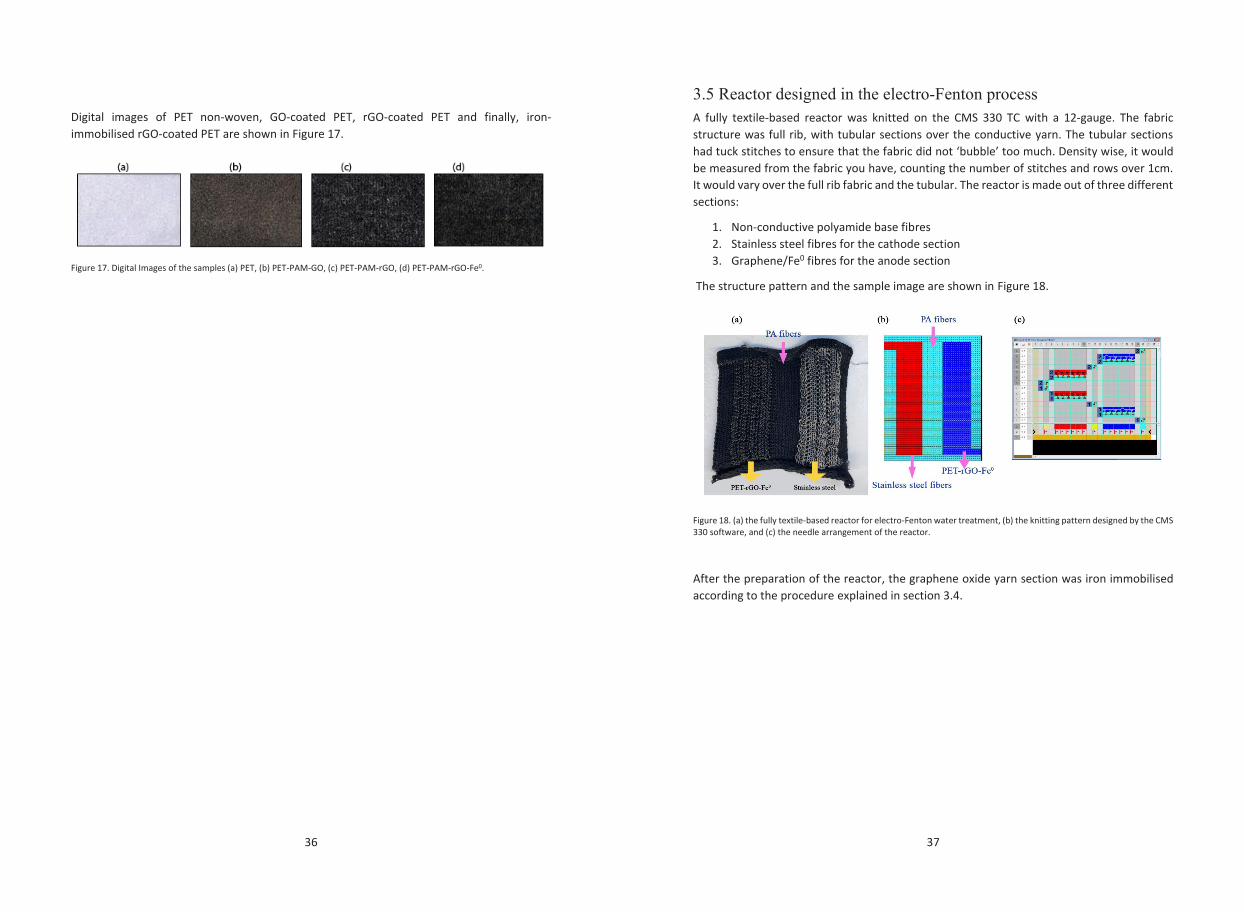
36
Digital images of PET non-woven, GO-coated PET, rGO-coated PET and finally, iron-immobilised rGO-coated PET are shown in Figure 17.
Figure 17. Digital Images of the samples (a) PET, (b) PET-PAM-GO, (c) PET-PAM-rGO, (d) PET-PAM-rGO-Fe0.
37
3.5 Reactor designed in the electro-Fenton process A fully textile-based reactor was knitted on the CMS 330 TC with a 12-gauge. The fabric structure was full rib, with tubular sections over the conductive yarn. The tubular sections had tuck stitches to ensure that the fabric did not ‘bubble’ too much. Density wise, it would be measured from the fabric you have, counting the number of stitches and rows over 1cm. It would vary over the full rib fabric and the tubular. The reactor is made out of three different sections:
1. Non-conductive polyamide base fibres 2. Stainless steel fibres for the cathode section 3. Graphene/Fe0 fibres for the anode section
The structure pattern and the sample image are shown in Figure 18.
Figure 18. (a) the fully textile-based reactor for electro-Fenton water treatment, (b) the knitting pattern designed by the CMS 330 software, and (c) the needle arrangement of the reactor.
After the preparation of the reactor, the graphene oxide yarn section was iron immobilised according to the procedure explained in section 3.4.
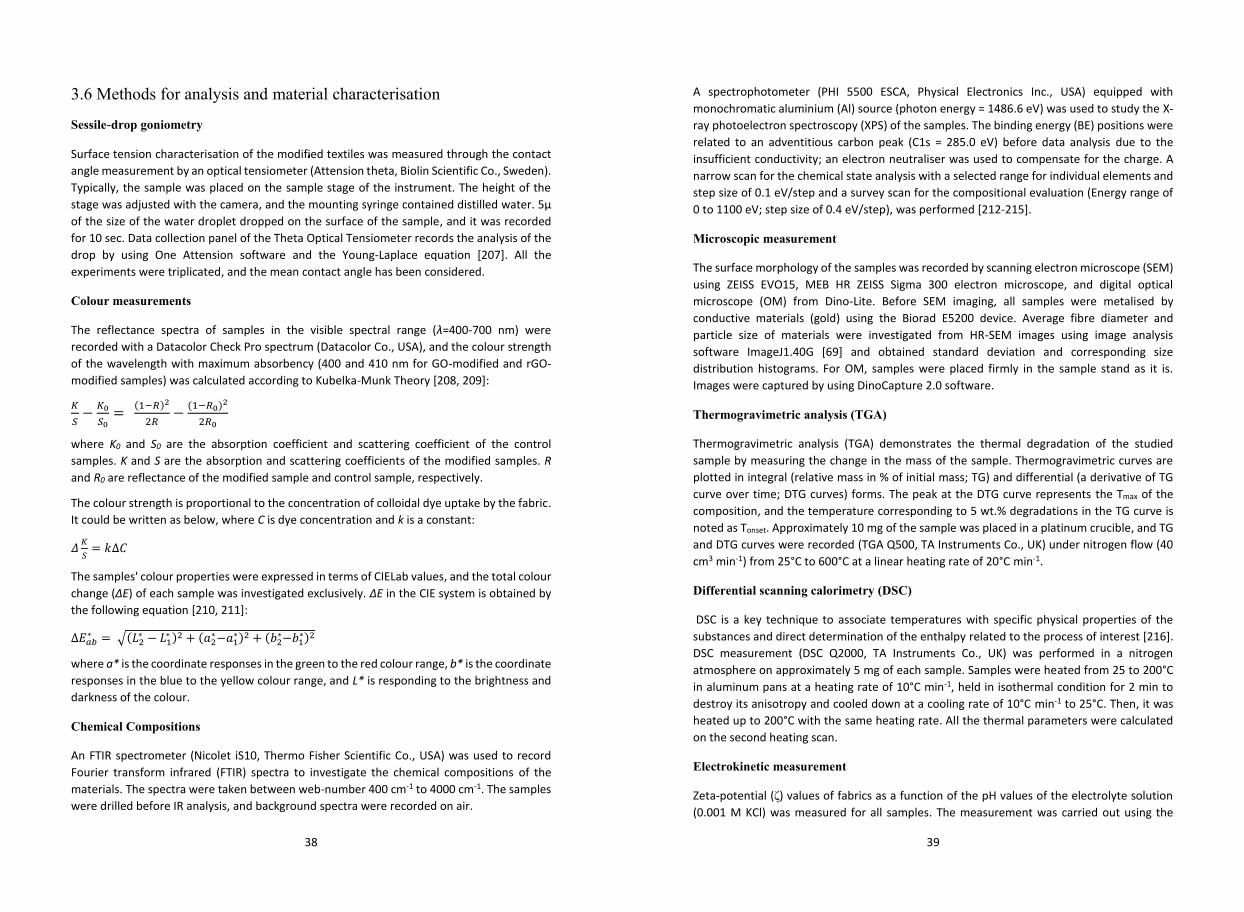
38
3.6 Methods for analysis and material characterisation
Sessile-drop goniometry
Surface tension characterisation of the modified textiles was measured through the contact angle measurement by an optical tensiometer (Attension theta, Biolin Scientific Co., Sweden). Typically, the sample was placed on the sample stage of the instrument. The height of the stage was adjusted with the camera, and the mounting syringe contained distilled water. 5μ of the size of the water droplet dropped on the surface of the sample, and it was recorded for 10 sec. Data collection panel of the Theta Optical Tensiometer records the analysis of the drop by using One Attension software and the Young-Laplace equation [207]. All the experiments were triplicated, and the mean contact angle has been considered.
Colour measurements
The reflectance spectra of samples in the visible spectral range (λ=400-700 nm) were recorded with a Datacolor Check Pro spectrum (Datacolor Co., USA), and the colour strength of the wavelength with maximum absorbency (400 and 410 nm for GO-modified and rGO-modified samples) was calculated according to Kubelka-Munk Theory [208, 209]:
𝐾𝐾𝑆𝑆 − 𝐾𝐾0
𝑆𝑆0= (1−𝑅𝑅)2
2𝑅𝑅 − (1−𝑅𝑅0)2
2𝑅𝑅0
where K0 and S0 are the absorption coefficient and scattering coefficient of the control samples. K and S are the absorption and scattering coefficients of the modified samples. R and R0 are reflectance of the modified sample and control sample, respectively.
The colour strength is proportional to the concentration of colloidal dye uptake by the fabric. It could be written as below, where C is dye concentration and k is a constant:
𝛥𝛥 𝐾𝐾𝑆𝑆 = 𝑘𝑘∆𝐶𝐶
The samples' colour properties were expressed in terms of CIELab values, and the total colour change (ΔE) of each sample was investigated exclusively. ΔE in the CIE system is obtained by the following equation [210, 211]:
∆𝐸𝐸𝑎𝑎𝑎𝑎∗ = √(𝐿𝐿2
∗ − 𝐿𝐿1∗ )2 + (𝑎𝑎2
∗−𝑎𝑎1∗)2 + (𝑏𝑏2
∗−𝑏𝑏1∗)2
where a* is the coordinate responses in the green to the red colour range, b* is the coordinate responses in the blue to the yellow colour range, and L* is responding to the brightness and darkness of the colour.
Chemical Compositions
An FTIR spectrometer (Nicolet iS10, Thermo Fisher Scientific Co., USA) was used to record Fourier transform infrared (FTIR) spectra to investigate the chemical compositions of the materials. The spectra were taken between web-number 400 cm-1 to 4000 cm-1. The samples were drilled before IR analysis, and background spectra were recorded on air.
39
A spectrophotometer (PHI 5500 ESCA, Physical Electronics Inc., USA) equipped with monochromatic aluminium (Al) source (photon energy = 1486.6 eV) was used to study the X-ray photoelectron spectroscopy (XPS) of the samples. The binding energy (BE) positions were related to an adventitious carbon peak (C1s = 285.0 eV) before data analysis due to the insufficient conductivity; an electron neutraliser was used to compensate for the charge. A narrow scan for the chemical state analysis with a selected range for individual elements and step size of 0.1 eV/step and a survey scan for the compositional evaluation (Energy range of 0 to 1100 eV; step size of 0.4 eV/step), was performed [212-215].
Microscopic measurement
The surface morphology of the samples was recorded by scanning electron microscope (SEM) using ZEISS EVO15, MEB HR ZEISS Sigma 300 electron microscope, and digital optical microscope (OM) from Dino-Lite. Before SEM imaging, all samples were metalised by conductive materials (gold) using the Biorad E5200 device. Average fibre diameter and particle size of materials were investigated from HR-SEM images using image analysis software ImageJ1.40G [69] and obtained standard deviation and corresponding size distribution histograms. For OM, samples were placed firmly in the sample stand as it is. Images were captured by using DinoCapture 2.0 software.
Thermogravimetric analysis (TGA)
Thermogravimetric analysis (TGA) demonstrates the thermal degradation of the studied sample by measuring the change in the mass of the sample. Thermogravimetric curves are plotted in integral (relative mass in % of initial mass; TG) and differential (a derivative of TG curve over time; DTG curves) forms. The peak at the DTG curve represents the Tmax of the composition, and the temperature corresponding to 5 wt.% degradations in the TG curve is noted as Tonset. Approximately 10 mg of the sample was placed in a platinum crucible, and TG and DTG curves were recorded (TGA Q500, TA Instruments Co., UK) under nitrogen flow (40 cm3 min-1) from 25°C to 600°C at a linear heating rate of 20°C min-1.
Differential scanning calorimetry (DSC)
DSC is a key technique to associate temperatures with specific physical properties of the substances and direct determination of the enthalpy related to the process of interest [216]. DSC measurement (DSC Q2000, TA Instruments Co., UK) was performed in a nitrogen atmosphere on approximately 5 mg of each sample. Samples were heated from 25 to 200°C in aluminum pans at a heating rate of 10°C min-1, held in isothermal condition for 2 min to destroy its anisotropy and cooled down at a cooling rate of 10°C min-1 to 25°C. Then, it was heated up to 200°C with the same heating rate. All the thermal parameters were calculated on the second heating scan.
Electrokinetic measurement
Zeta-potential (ζ) values of fabrics as a function of the pH values of the electrolyte solution (0.001 M KCl) was measured for all samples. The measurement was carried out using the
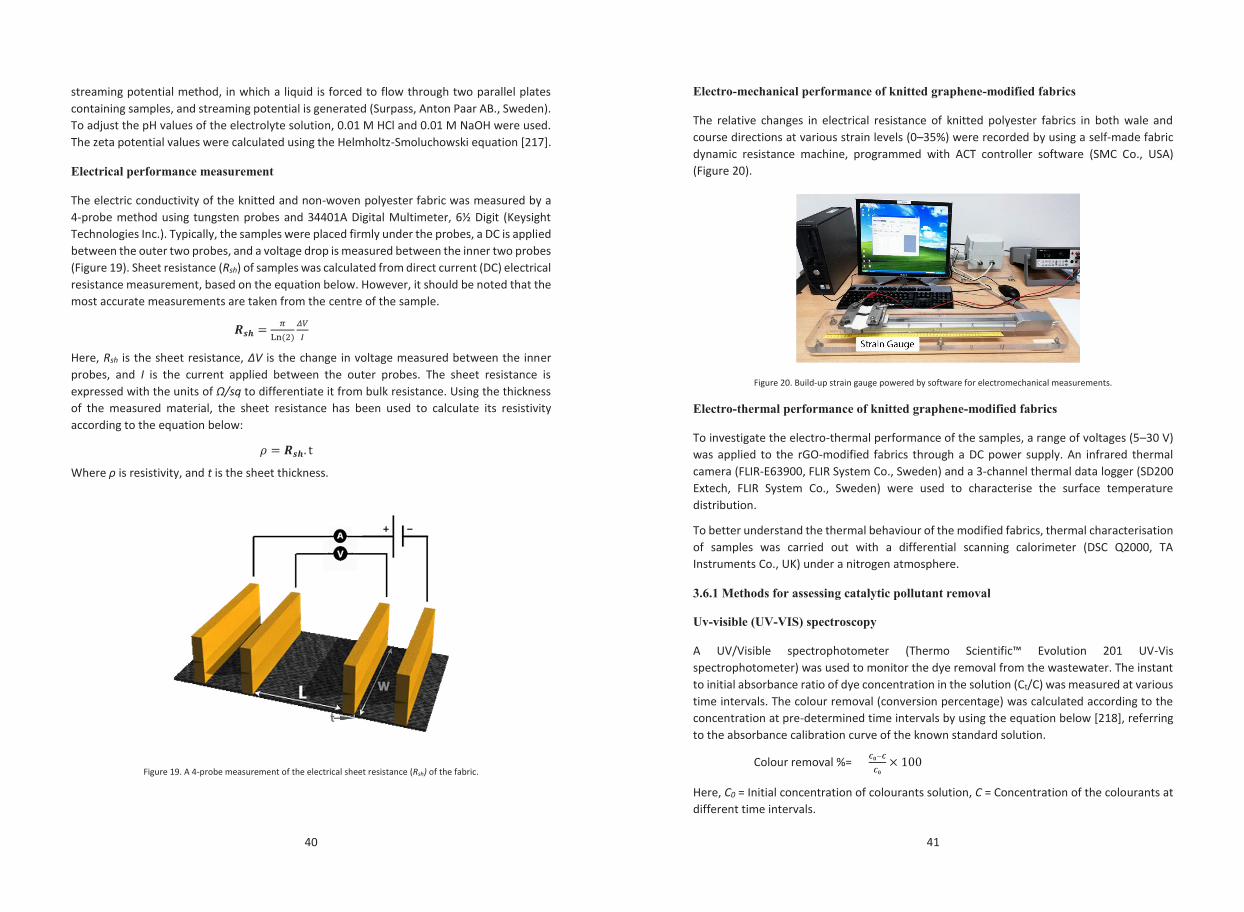
40
streaming potential method, in which a liquid is forced to flow through two parallel plates containing samples, and streaming potential is generated (Surpass, Anton Paar AB., Sweden). To adjust the pH values of the electrolyte solution, 0.01 M HCl and 0.01 M NaOH were used. The zeta potential values were calculated using the Helmholtz-Smoluchowski equation [217].
Electrical performance measurement
The electric conductivity of the knitted and non-woven polyester fabric was measured by a 4-probe method using tungsten probes and 34401A Digital Multimeter, 6½ Digit (Keysight Technologies Inc.). Typically, the samples were placed firmly under the probes, a DC is applied between the outer two probes, and a voltage drop is measured between the inner two probes (Figure 19). Sheet resistance (Rsh) of samples was calculated from direct current (DC) electrical resistance measurement, based on the equation below. However, it should be noted that the most accurate measurements are taken from the centre of the sample.
𝑹𝑹𝒔𝒔𝒔𝒔 =𝜋𝜋
Ln(2)𝛥𝛥𝛥𝛥𝐼𝐼
Here, Rsh is the sheet resistance, ΔV is the change in voltage measured between the inner probes, and I is the current applied between the outer probes. The sheet resistance is expressed with the units of Ω/sq to differentiate it from bulk resistance. Using the thickness of the measured material, the sheet resistance has been used to calculate its resistivity according to the equation below:
𝜌𝜌 = 𝑹𝑹𝒔𝒔𝒔𝒔. t
Where ρ is resistivity, and t is the sheet thickness.
Figure 19. A 4-probe measurement of the electrical sheet resistance (Rsh) of the fabric.
41
Electro-mechanical performance of knitted graphene-modified fabrics
The relative changes in electrical resistance of knitted polyester fabrics in both wale and course directions at various strain levels (0–35%) were recorded by using a self-made fabric dynamic resistance machine, programmed with ACT controller software (SMC Co., USA) (Figure 20).
Figure 20. Build-up strain gauge powered by software for electromechanical measurements.
Electro-thermal performance of knitted graphene-modified fabrics
To investigate the electro-thermal performance of the samples, a range of voltages (5–30 V) was applied to the rGO-modified fabrics through a DC power supply. An infrared thermal camera (FLIR-E63900, FLIR System Co., Sweden) and a 3-channel thermal data logger (SD200 Extech, FLIR System Co., Sweden) were used to characterise the surface temperature distribution.
To better understand the thermal behaviour of the modified fabrics, thermal characterisation of samples was carried out with a differential scanning calorimeter (DSC Q2000, TA Instruments Co., UK) under a nitrogen atmosphere.
3.6.1 Methods for assessing catalytic pollutant removal
Uv-visible (UV-VIS) spectroscopy
A UV/Visible spectrophotometer (Thermo Scientific™ Evolution 201 UV-Vis spectrophotometer) was used to monitor the dye removal from the wastewater. The instant to initial absorbance ratio of dye concentration in the solution (Ct/C) was measured at various time intervals. The colour removal (conversion percentage) was calculated according to the concentration at pre-determined time intervals by using the equation below [218], referring to the absorbance calibration curve of the known standard solution.
Colour removal %= 𝑪𝑪𝟎𝟎−𝑪𝑪
𝑪𝑪𝟎𝟎× 100
Here, C0 = Initial concentration of colourants solution, C = Concentration of the colourants at different time intervals.
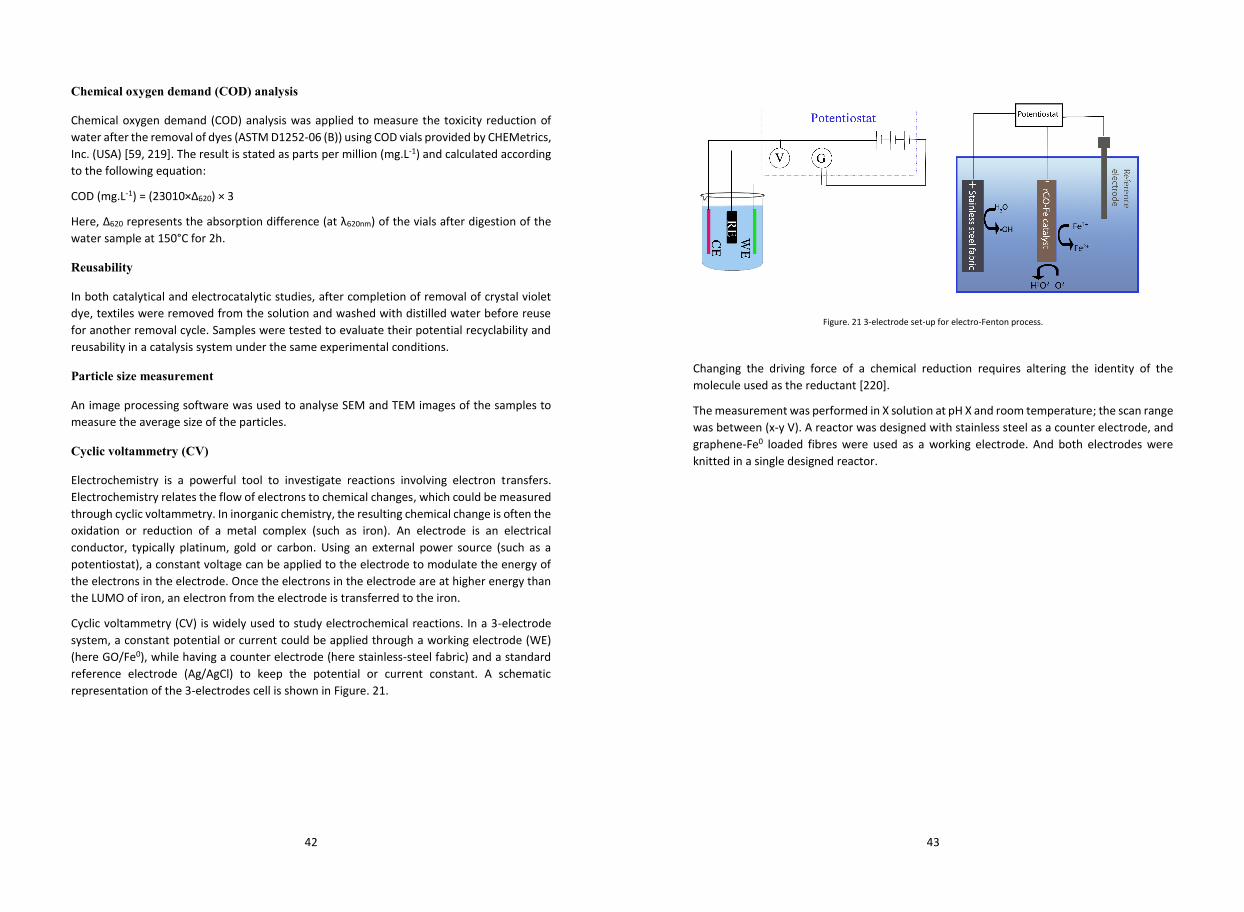
42
Chemical oxygen demand (COD) analysis
Chemical oxygen demand (COD) analysis was applied to measure the toxicity reduction of water after the removal of dyes (ASTM D1252-06 (B)) using COD vials provided by CHEMetrics, Inc. (USA) [59, 219]. The result is stated as parts per million (mg.L-1) and calculated according to the following equation:
COD (mg.L-1) = (23010×Δ620) × 3
Here, Δ620 represents the absorption difference (at λ620nm) of the vials after digestion of the water sample at 150°C for 2h.
Reusability
In both catalytical and electrocatalytic studies, after completion of removal of crystal violet dye, textiles were removed from the solution and washed with distilled water before reuse for another removal cycle. Samples were tested to evaluate their potential recyclability and reusability in a catalysis system under the same experimental conditions.
Particle size measurement
An image processing software was used to analyse SEM and TEM images of the samples to measure the average size of the particles.
Cyclic voltammetry (CV)
Electrochemistry is a powerful tool to investigate reactions involving electron transfers. Electrochemistry relates the flow of electrons to chemical changes, which could be measured through cyclic voltammetry. In inorganic chemistry, the resulting chemical change is often the oxidation or reduction of a metal complex (such as iron). An electrode is an electrical conductor, typically platinum, gold or carbon. Using an external power source (such as a potentiostat), a constant voltage can be applied to the electrode to modulate the energy of the electrons in the electrode. Once the electrons in the electrode are at higher energy than the LUMO of iron, an electron from the electrode is transferred to the iron.
Cyclic voltammetry (CV) is widely used to study electrochemical reactions. In a 3-electrode system, a constant potential or current could be applied through a working electrode (WE) (here GO/Fe0), while having a counter electrode (here stainless-steel fabric) and a standard reference electrode (Ag/AgCl) to keep the potential or current constant. A schematic representation of the 3-electrodes cell is shown in Figure. 21.
43
Figure. 21 3-electrode set-up for electro-Fenton process.
Changing the driving force of a chemical reduction requires altering the identity of the molecule used as the reductant [220].
The measurement was performed in X solution at pH X and room temperature; the scan range was between (x-y V). A reactor was designed with stainless steel as a counter electrode, and graphene-Fe0 loaded fibres were used as a working electrode. And both electrodes were knitted in a single designed reactor.
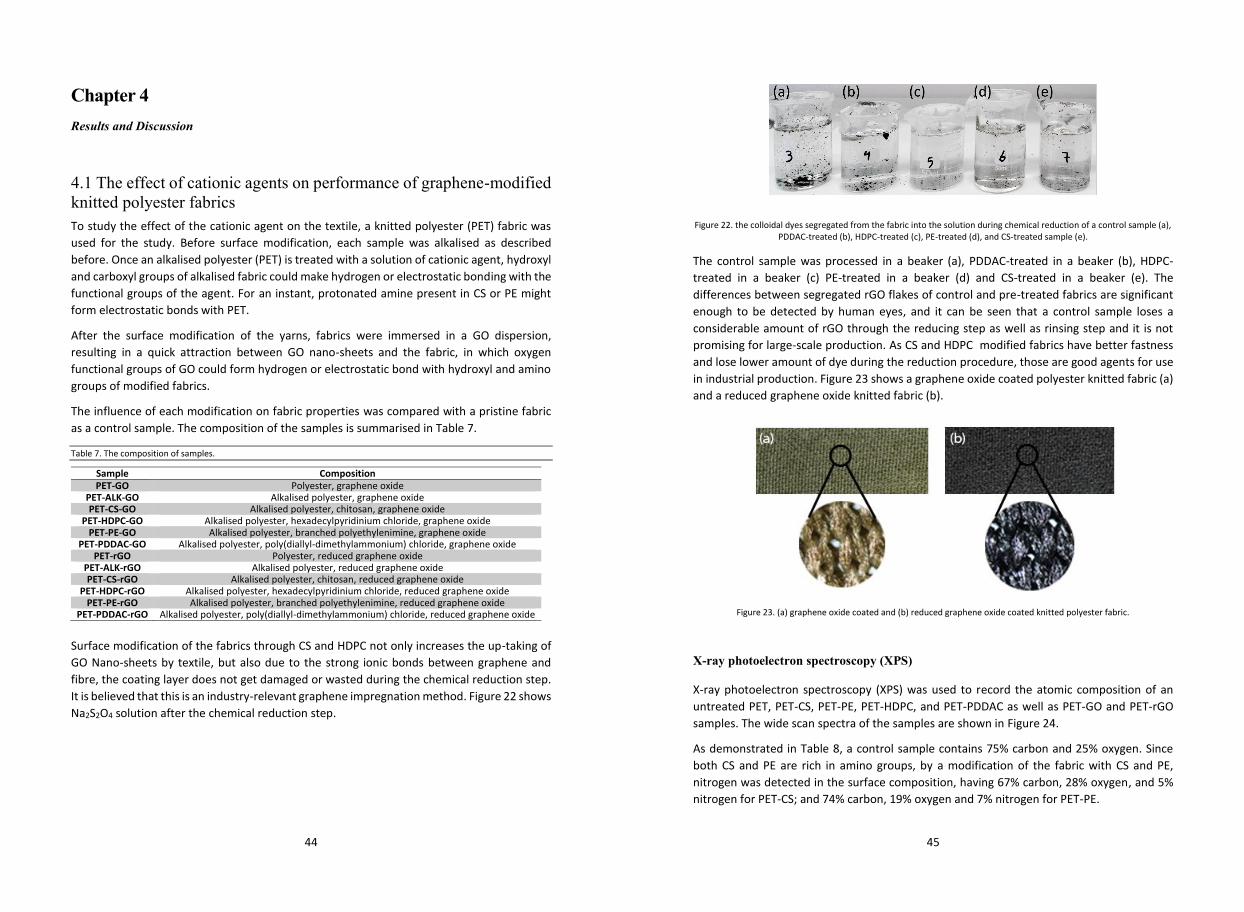
44
Chapter 4 Results and Discussion
4.1 The effect of cationic agents on performance of graphene-modified knitted polyester fabrics To study the effect of the cationic agent on the textile, a knitted polyester (PET) fabric was used for the study. Before surface modification, each sample was alkalised as described before. Once an alkalised polyester (PET) is treated with a solution of cationic agent, hydroxyl and carboxyl groups of alkalised fabric could make hydrogen or electrostatic bonding with the functional groups of the agent. For an instant, protonated amine present in CS or PE might form electrostatic bonds with PET.
After the surface modification of the yarns, fabrics were immersed in a GO dispersion, resulting in a quick attraction between GO nano-sheets and the fabric, in which oxygen functional groups of GO could form hydrogen or electrostatic bond with hydroxyl and amino groups of modified fabrics.
The influence of each modification on fabric properties was compared with a pristine fabric as a control sample. The composition of the samples is summarised in Table 7.
Table 7. The composition of samples.
Sample Composition PET-GO Polyester, graphene oxide
PET-ALK-GO Alkalised polyester, graphene oxide PET-CS-GO Alkalised polyester, chitosan, graphene oxide
PET-HDPC-GO Alkalised polyester, hexadecylpyridinium chloride, graphene oxide PET-PE-GO Alkalised polyester, branched polyethylenimine, graphene oxide
PET-PDDAC-GO Alkalised polyester, poly(diallyl-dimethylammonium) chloride, graphene oxide PET-rGO Polyester, reduced graphene oxide
PET-ALK-rGO Alkalised polyester, reduced graphene oxide PET-CS-rGO Alkalised polyester, chitosan, reduced graphene oxide
PET-HDPC-rGO Alkalised polyester, hexadecylpyridinium chloride, reduced graphene oxide PET-PE-rGO Alkalised polyester, branched polyethylenimine, reduced graphene oxide
PET-PDDAC-rGO Alkalised polyester, poly(diallyl-dimethylammonium) chloride, reduced graphene oxide
Surface modification of the fabrics through CS and HDPC not only increases the up-taking of GO Nano-sheets by textile, but also due to the strong ionic bonds between graphene and fibre, the coating layer does not get damaged or wasted during the chemical reduction step. It is believed that this is an industry-relevant graphene impregnation method. Figure 22 shows Na2S2O4 solution after the chemical reduction step.
45
Figure 22. the colloidal dyes segregated from the fabric into the solution during chemical reduction of a control sample (a), PDDAC-treated (b), HDPC-treated (c), PE-treated (d), and CS-treated sample (e).
The control sample was processed in a beaker (a), PDDAC-treated in a beaker (b), HDPC-treated in a beaker (c) PE-treated in a beaker (d) and CS-treated in a beaker (e). The differences between segregated rGO flakes of control and pre-treated fabrics are significant enough to be detected by human eyes, and it can be seen that a control sample loses a considerable amount of rGO through the reducing step as well as rinsing step and it is not promising for large-scale production. As CS and HDPC modified fabrics have better fastness and lose lower amount of dye during the reduction procedure, those are good agents for use in industrial production. Figure 23 shows a graphene oxide coated polyester knitted fabric (a) and a reduced graphene oxide knitted fabric (b).
Figure 23. (a) graphene oxide coated and (b) reduced graphene oxide coated knitted polyester fabric.
X-ray photoelectron spectroscopy (XPS)
X-ray photoelectron spectroscopy (XPS) was used to record the atomic composition of an untreated PET, PET-CS, PET-PE, PET-HDPC, and PET-PDDAC as well as PET-GO and PET-rGO samples. The wide scan spectra of the samples are shown in Figure 24.
As demonstrated in Table 8, a control sample contains 75% carbon and 25% oxygen. Since both CS and PE are rich in amino groups, by a modification of the fabric with CS and PE, nitrogen was detected in the surface composition, having 67% carbon, 28% oxygen, and 5% nitrogen for PET-CS; and 74% carbon, 19% oxygen and 7% nitrogen for PET-PE.
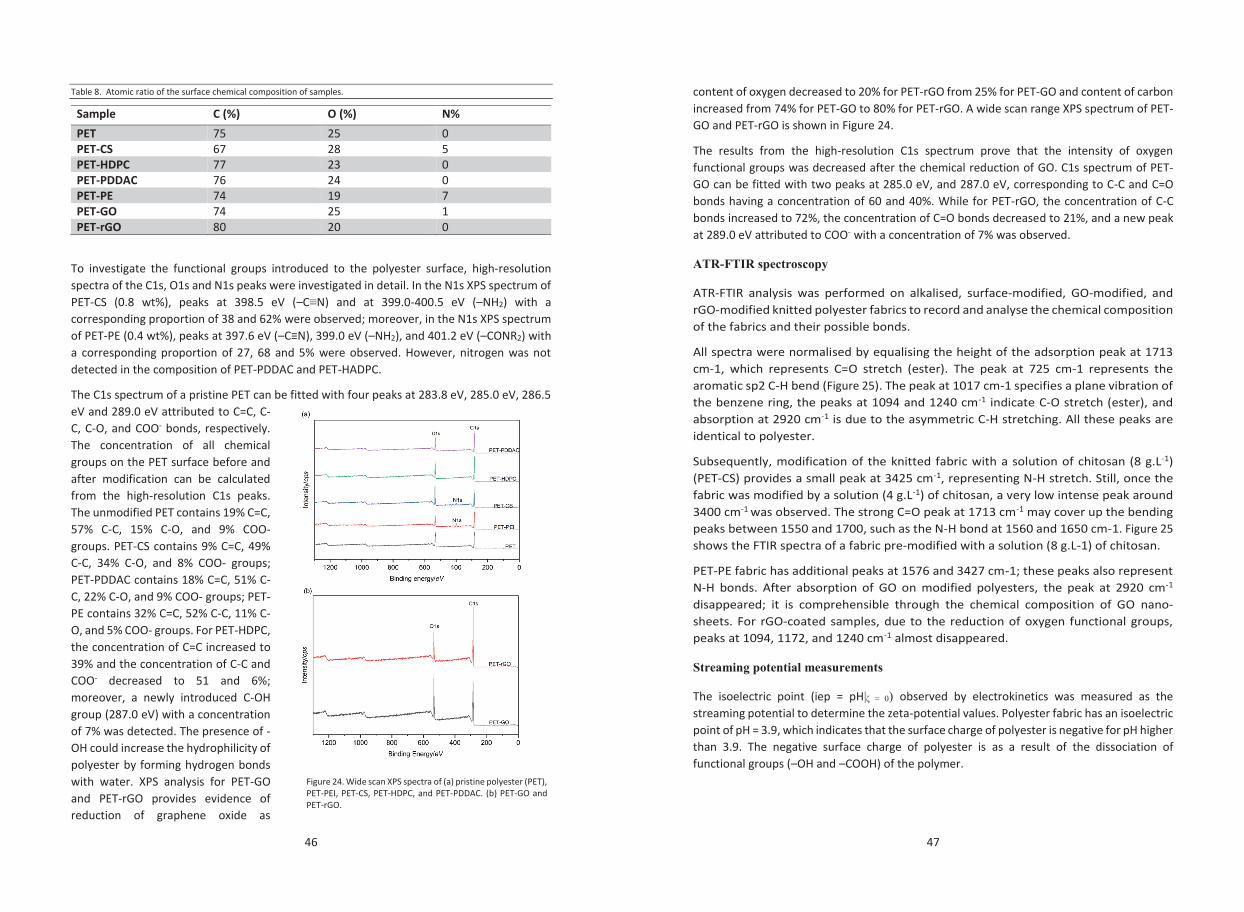
46
Table 8. Atomic ratio of the surface chemical composition of samples.
Sample C (%) O (%) N% PET 75 25 0 PET-CS 67 28 5 PET-HDPC 77 23 0 PET-PDDAC 76 24 0 PET-PE 74 19 7 PET-GO 74 25 1 PET-rGO 80 20 0
To investigate the functional groups introduced to the polyester surface, high-resolution spectra of the C1s, O1s and N1s peaks were investigated in detail. In the N1s XPS spectrum of PET-CS (0.8 wt%), peaks at 398.5 eV (–C≡N) and at 399.0-400.5 eV (–NH2) with a corresponding proportion of 38 and 62% were observed; moreover, in the N1s XPS spectrum of PET-PE (0.4 wt%), peaks at 397.6 eV (–C≡N), 399.0 eV (–NH2), and 401.2 eV (–CONR2) with a corresponding proportion of 27, 68 and 5% were observed. However, nitrogen was not detected in the composition of PET-PDDAC and PET-HADPC.
The C1s spectrum of a pristine PET can be fitted with four peaks at 283.8 eV, 285.0 eV, 286.5 eV and 289.0 eV attributed to C=C, C-C, C-O, and COO- bonds, respectively. The concentration of all chemical groups on the PET surface before and after modification can be calculated from the high-resolution C1s peaks. The unmodified PET contains 19% C=C, 57% C-C, 15% C-O, and 9% COO- groups. PET-CS contains 9% C=C, 49% C-C, 34% C-O, and 8% COO- groups; PET-PDDAC contains 18% C=C, 51% C-C, 22% C-O, and 9% COO- groups; PET-PE contains 32% C=C, 52% C-C, 11% C-O, and 5% COO- groups. For PET-HDPC, the concentration of C=C increased to 39% and the concentration of C-C and COO- decreased to 51 and 6%; moreover, a newly introduced C-OH group (287.0 eV) with a concentration of 7% was detected. The presence of -OH could increase the hydrophilicity of polyester by forming hydrogen bonds with water. XPS analysis for PET-GO and PET-rGO provides evidence of reduction of graphene oxide as
Figure 24. Wide scan XPS spectra of (a) pristine polyester (PET), PET-PEI, PET-CS, PET-HDPC, and PET-PDDAC. (b) PET-GO and PET-rGO.
47
content of oxygen decreased to 20% for PET-rGO from 25% for PET-GO and content of carbon increased from 74% for PET-GO to 80% for PET-rGO. A wide scan range XPS spectrum of PET-GO and PET-rGO is shown in Figure 24.
The results from the high-resolution C1s spectrum prove that the intensity of oxygen functional groups was decreased after the chemical reduction of GO. C1s spectrum of PET-GO can be fitted with two peaks at 285.0 eV, and 287.0 eV, corresponding to C-C and C=O bonds having a concentration of 60 and 40%. While for PET-rGO, the concentration of C-C bonds increased to 72%, the concentration of C=O bonds decreased to 21%, and a new peak at 289.0 eV attributed to COO- with a concentration of 7% was observed.
ATR-FTIR spectroscopy
ATR-FTIR analysis was performed on alkalised, surface-modified, GO-modified, and rGO-modified knitted polyester fabrics to record and analyse the chemical composition of the fabrics and their possible bonds.
All spectra were normalised by equalising the height of the adsorption peak at 1713 cm-1, which represents C=O stretch (ester). The peak at 725 cm-1 represents the aromatic sp2 C-H bend (Figure 25). The peak at 1017 cm-1 specifies a plane vibration of the benzene ring, the peaks at 1094 and 1240 cm-1 indicate C-O stretch (ester), and absorption at 2920 cm-1 is due to the asymmetric C-H stretching. All these peaks are identical to polyester.
Subsequently, modification of the knitted fabric with a solution of chitosan (8 g.L-1) (PET-CS) provides a small peak at 3425 cm-1, representing N-H stretch. Still, once the fabric was modified by a solution (4 g.L-1) of chitosan, a very low intense peak around 3400 cm-1 was observed. The strong C=O peak at 1713 cm-1 may cover up the bending peaks between 1550 and 1700, such as the N-H bond at 1560 and 1650 cm-1. Figure 25 shows the FTIR spectra of a fabric pre-modified with a solution (8 g.L-1) of chitosan.
PET-PE fabric has additional peaks at 1576 and 3427 cm-1; these peaks also represent N-H bonds. After absorption of GO on modified polyesters, the peak at 2920 cm-1 disappeared; it is comprehensible through the chemical composition of GO nano-sheets. For rGO-coated samples, due to the reduction of oxygen functional groups, peaks at 1094, 1172, and 1240 cm-1 almost disappeared.
Streaming potential measurements
The isoelectric point (iep = pH|ζ = 0) observed by electrokinetics was measured as the streaming potential to determine the zeta-potential values. Polyester fabric has an isoelectric point of pH = 3.9, which indicates that the surface charge of polyester is negative for pH higher than 3.9. The negative surface charge of polyester is as a result of the dissociation of functional groups (–OH and –COOH) of the polymer.
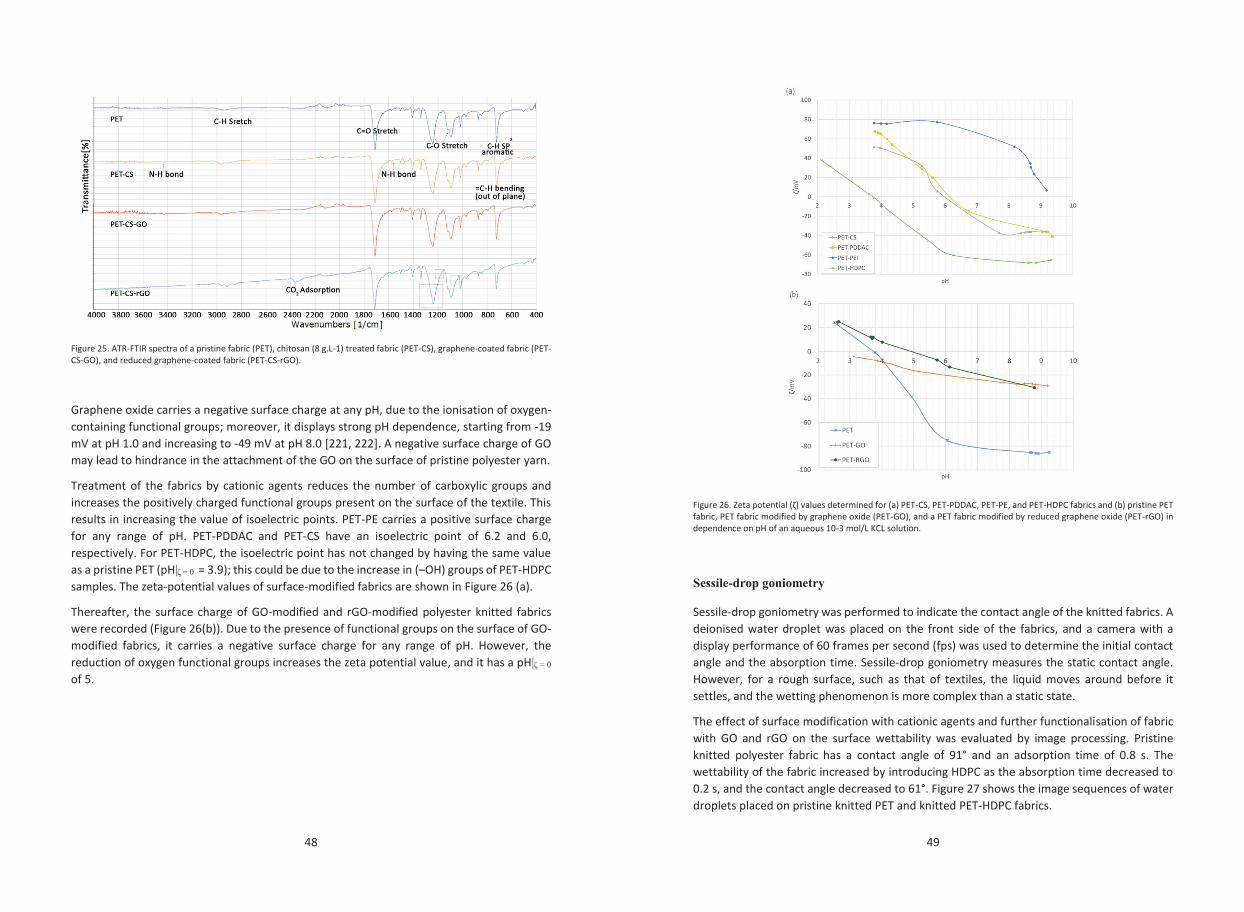
48
Figure 25. ATR-FTIR spectra of a pristine fabric (PET), chitosan (8 g.L-1) treated fabric (PET-CS), graphene-coated fabric (PET-CS-GO), and reduced graphene-coated fabric (PET-CS-rGO).
Graphene oxide carries a negative surface charge at any pH, due to the ionisation of oxygen-containing functional groups; moreover, it displays strong pH dependence, starting from -19 mV at pH 1.0 and increasing to -49 mV at pH 8.0 [221, 222]. A negative surface charge of GO may lead to hindrance in the attachment of the GO on the surface of pristine polyester yarn.
Treatment of the fabrics by cationic agents reduces the number of carboxylic groups and increases the positively charged functional groups present on the surface of the textile. This results in increasing the value of isoelectric points. PET-PE carries a positive surface charge for any range of pH. PET-PDDAC and PET-CS have an isoelectric point of 6.2 and 6.0, respectively. For PET-HDPC, the isoelectric point has not changed by having the same value as a pristine PET (pH|ζ = 0 = 3.9); this could be due to the increase in (–OH) groups of PET-HDPC samples. The zeta-potential values of surface-modified fabrics are shown in Figure 26 (a).
Thereafter, the surface charge of GO-modified and rGO-modified polyester knitted fabrics were recorded (Figure 26(b)). Due to the presence of functional groups on the surface of GO-modified fabrics, it carries a negative surface charge for any range of pH. However, the reduction of oxygen functional groups increases the zeta potential value, and it has a pH|ζ = 0 of 5.
49
Figure 26. Zeta potential (ζ) values determined for (a) PET-CS, PET-PDDAC, PET-PE, and PET-HDPC fabrics and (b) pristine PET fabric, PET fabric modified by graphene oxide (PET-GO), and a PET fabric modified by reduced graphene oxide (PET-rGO) in dependence on pH of an aqueous 10-3 mol/L KCL solution.
Sessile-drop goniometry
Sessile-drop goniometry was performed to indicate the contact angle of the knitted fabrics. A deionised water droplet was placed on the front side of the fabrics, and a camera with a display performance of 60 frames per second (fps) was used to determine the initial contact angle and the absorption time. Sessile-drop goniometry measures the static contact angle. However, for a rough surface, such as that of textiles, the liquid moves around before it settles, and the wetting phenomenon is more complex than a static state.
The effect of surface modification with cationic agents and further functionalisation of fabric with GO and rGO on the surface wettability was evaluated by image processing. Pristine knitted polyester fabric has a contact angle of 91° and an adsorption time of 0.8 s. The wettability of the fabric increased by introducing HDPC as the absorption time decreased to 0.2 s, and the contact angle decreased to 61°. Figure 27 shows the image sequences of water droplets placed on pristine knitted PET and knitted PET-HDPC fabrics.
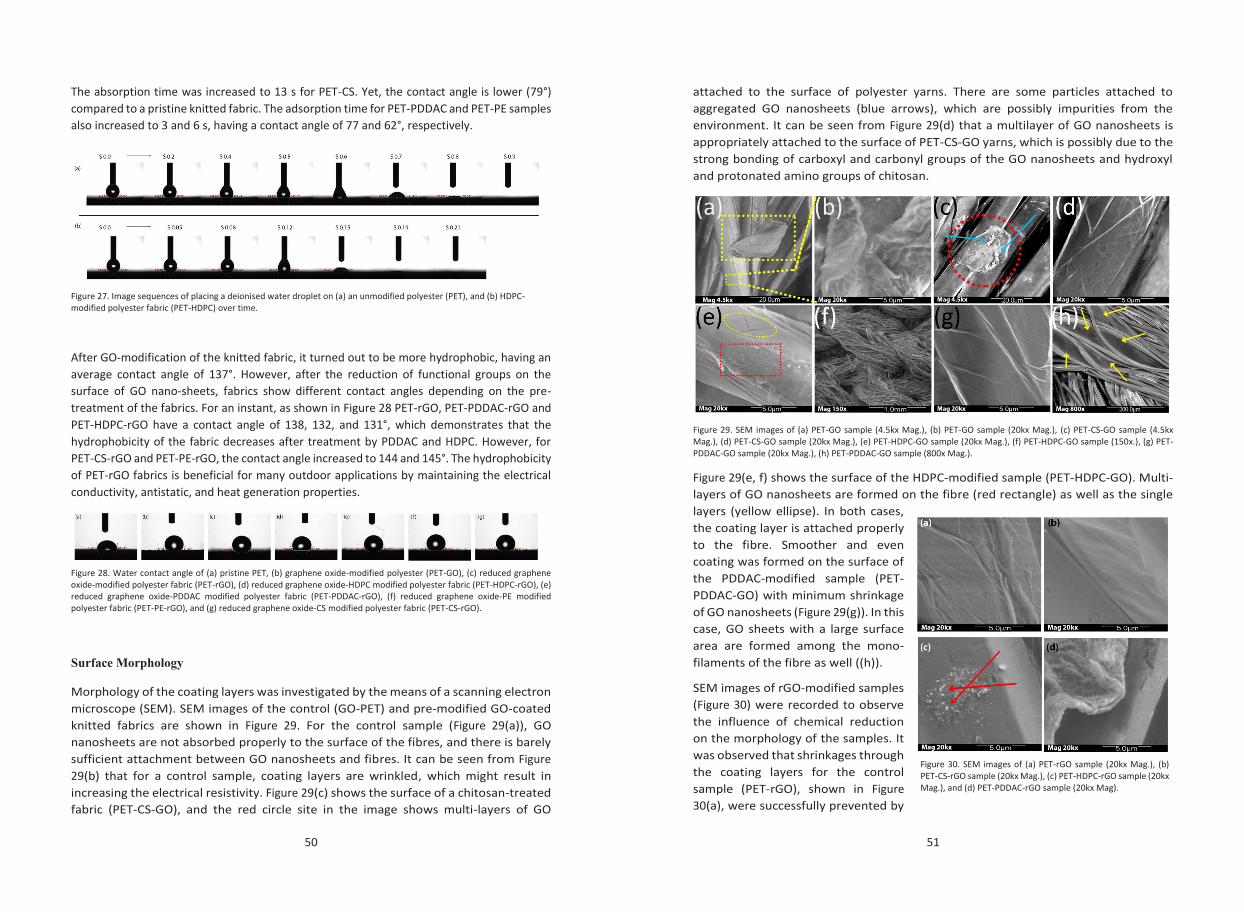
50
The absorption time was increased to 13 s for PET-CS. Yet, the contact angle is lower (79°) compared to a pristine knitted fabric. The adsorption time for PET-PDDAC and PET-PE samples also increased to 3 and 6 s, having a contact angle of 77 and 62°, respectively.
Figure 27. Image sequences of placing a deionised water droplet on (a) an unmodified polyester (PET), and (b) HDPC-modified polyester fabric (PET-HDPC) over time.
After GO-modification of the knitted fabric, it turned out to be more hydrophobic, having an average contact angle of 137°. However, after the reduction of functional groups on the surface of GO nano-sheets, fabrics show different contact angles depending on the pre-treatment of the fabrics. For an instant, as shown in Figure 28 PET-rGO, PET-PDDAC-rGO and PET-HDPC-rGO have a contact angle of 138, 132, and 131°, which demonstrates that the hydrophobicity of the fabric decreases after treatment by PDDAC and HDPC. However, for PET-CS-rGO and PET-PE-rGO, the contact angle increased to 144 and 145°. The hydrophobicity of PET-rGO fabrics is beneficial for many outdoor applications by maintaining the electrical conductivity, antistatic, and heat generation properties.
Figure 28. Water contact angle of (a) pristine PET, (b) graphene oxide-modified polyester (PET-GO), (c) reduced graphene oxide-modified polyester fabric (PET-rGO), (d) reduced graphene oxide-HDPC modified polyester fabric (PET-HDPC-rGO), (e) reduced graphene oxide-PDDAC modified polyester fabric (PET-PDDAC-rGO), (f) reduced graphene oxide-PE modified polyester fabric (PET-PE-rGO), and (g) reduced graphene oxide-CS modified polyester fabric (PET-CS-rGO).
Surface Morphology
Morphology of the coating layers was investigated by the means of a scanning electron microscope (SEM). SEM images of the control (GO-PET) and pre-modified GO-coated knitted fabrics are shown in Figure 29. For the control sample (Figure 29(a)), GO nanosheets are not absorbed properly to the surface of the fibres, and there is barely sufficient attachment between GO nanosheets and fibres. It can be seen from Figure 29(b) that for a control sample, coating layers are wrinkled, which might result in increasing the electrical resistivity. Figure 29(c) shows the surface of a chitosan-treated fabric (PET-CS-GO), and the red circle site in the image shows multi-layers of GO
51
attached to the surface of polyester yarns. There are some particles attached to aggregated GO nanosheets (blue arrows), which are possibly impurities from the environment. It can be seen from Figure 29(d) that a multilayer of GO nanosheets is appropriately attached to the surface of PET-CS-GO yarns, which is possibly due to the strong bonding of carboxyl and carbonyl groups of the GO nanosheets and hydroxyl and protonated amino groups of chitosan.
Figure 29. SEM images of (a) PET-GO sample (4.5kx Mag.), (b) PET-GO sample (20kx Mag.), (c) PET-CS-GO sample (4.5kx Mag.), (d) PET-CS-GO sample (20kx Mag.), (e) PET-HDPC-GO sample (20kx Mag.), (f) PET-HDPC-GO sample (150x.), (g) PET-PDDAC-GO sample (20kx Mag.), (h) PET-PDDAC-GO sample (800x Mag.).
Figure 29(e, f) shows the surface of the HDPC-modified sample (PET-HDPC-GO). Multi-layers of GO nanosheets are formed on the fibre (red rectangle) as well as the single layers (yellow ellipse). In both cases, the coating layer is attached properly to the fibre. Smoother and even coating was formed on the surface of the PDDAC-modified sample (PET-PDDAC-GO) with minimum shrinkage of GO nanosheets (Figure 29(g)). In this case, GO sheets with a large surface area are formed among the mono-filaments of the fibre as well ((h)).
SEM images of rGO-modified samples (Figure 30) were recorded to observe the influence of chemical reduction on the morphology of the samples. It was observed that shrinkages through the coating layers for the control sample (PET-rGO), shown in Figure 30(a), were successfully prevented by
Figure 30. SEM images of (a) PET-rGO sample (20kx Mag.), (b) PET-CS-rGO sample (20kx Mag.), (c) PET-HDPC-rGO sample (20kx Mag.), and (d) PET-PDDAC-rGO sample (20kx Mag).
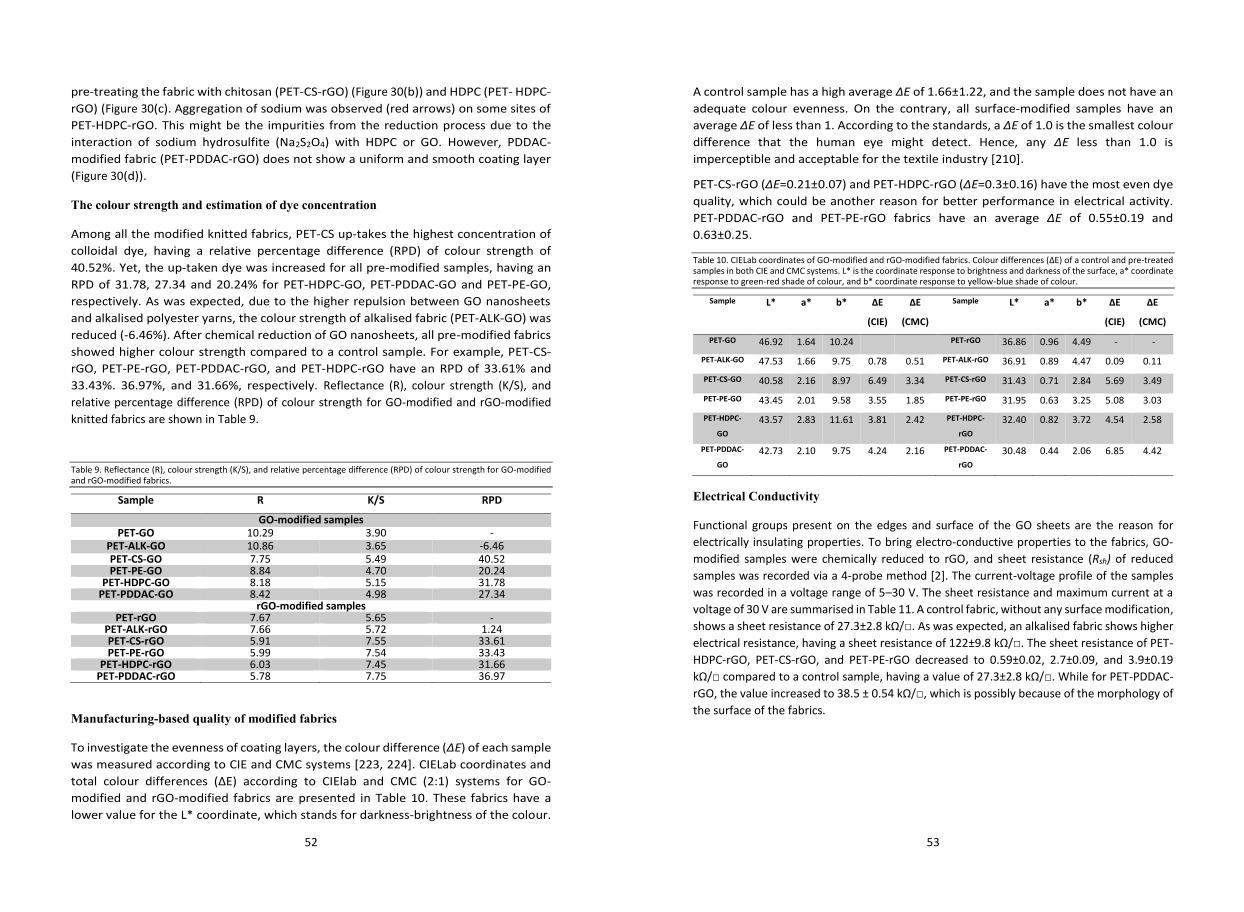
52
pre-treating the fabric with chitosan (PET-CS-rGO) (Figure 30(b)) and HDPC (PET- HDPC-rGO) (Figure 30(c). Aggregation of sodium was observed (red arrows) on some sites of PET-HDPC-rGO. This might be the impurities from the reduction process due to the interaction of sodium hydrosulfite (Na2S2O4) with HDPC or GO. However, PDDAC-modified fabric (PET-PDDAC-rGO) does not show a uniform and smooth coating layer (Figure 30(d)).
The colour strength and estimation of dye concentration
Among all the modified knitted fabrics, PET-CS up-takes the highest concentration of colloidal dye, having a relative percentage difference (RPD) of colour strength of 40.52%. Yet, the up-taken dye was increased for all pre-modified samples, having an RPD of 31.78, 27.34 and 20.24% for PET-HDPC-GO, PET-PDDAC-GO and PET-PE-GO, respectively. As was expected, due to the higher repulsion between GO nanosheets and alkalised polyester yarns, the colour strength of alkalised fabric (PET-ALK-GO) was reduced (-6.46%). After chemical reduction of GO nanosheets, all pre-modified fabrics showed higher colour strength compared to a control sample. For example, PET-CS-rGO, PET-PE-rGO, PET-PDDAC-rGO, and PET-HDPC-rGO have an RPD of 33.61% and 33.43%. 36.97%, and 31.66%, respectively. Reflectance (R), colour strength (K/S), and relative percentage difference (RPD) of colour strength for GO-modified and rGO-modified knitted fabrics are shown in Table 9.
Table 9. Reflectance (R), colour strength (K/S), and relative percentage difference (RPD) of colour strength for GO-modified and rGO-modified fabrics.
Sample R K/S RPD GO-modified samples
PET-GO 10.29 3.90 - PET-ALK-GO 10.86 3.65 -6.46 PET-CS-GO 7.75 5.49 40.52 PET-PE-GO 8.84 4.70 20.24
PET-HDPC-GO 8.18 5.15 31.78 PET-PDDAC-GO 8.42 4.98 27.34
rGO-modified samples PET-rGO 7.67 5.65 -
PET-ALK-rGO 7.66 5.72 1.24 PET-CS-rGO 5.91 7.55 33.61 PET-PE-rGO 5.99 7.54 33.43
PET-HDPC-rGO 6.03 7.45 31.66 PET-PDDAC-rGO 5.78 7.75 36.97
Manufacturing-based quality of modified fabrics
To investigate the evenness of coating layers, the colour difference (ΔE) of each sample was measured according to CIE and CMC systems [223, 224]. CIELab coordinates and total colour differences (ΔE) according to CIElab and CMC (2:1) systems for GO-modified and rGO-modified fabrics are presented in Table 10. These fabrics have a lower value for the L* coordinate, which stands for darkness-brightness of the colour.
53
A control sample has a high average ΔE of 1.66±1.22, and the sample does not have an adequate colour evenness. On the contrary, all surface-modified samples have an average ΔE of less than 1. According to the standards, a ΔE of 1.0 is the smallest colour difference that the human eye might detect. Hence, any ΔE less than 1.0 is imperceptible and acceptable for the textile industry [210].
PET-CS-rGO (ΔE=0.21±0.07) and PET-HDPC-rGO (ΔE=0.3±0.16) have the most even dye quality, which could be another reason for better performance in electrical activity. PET-PDDAC-rGO and PET-PE-rGO fabrics have an average ΔE of 0.55±0.19 and 0.63±0.25.
Table 10. CIELab coordinates of GO-modified and rGO-modified fabrics. Colour differences (∆E) of a control and pre-treated samples in both CIE and CMC systems. L* is the coordinate response to brightness and darkness of the surface, a* coordinate response to green-red shade of colour, and b* coordinate response to yellow-blue shade of colour.
Sample L* a* b* ∆E
(CIE)
∆E
(CMC)
Sample L* a* b* ∆E
(CIE)
∆E
(CMC) PET-GO 46.92 1.64 10.24 PET-rGO 36.86 0.96 4.49 - -
PET-ALK-GO 47.53 1.66 9.75 0.78 0.51 PET-ALK-rGO 36.91 0.89 4.47 0.09 0.11 PET-CS-GO 40.58 2.16 8.97 6.49 3.34 PET-CS-rGO 31.43 0.71 2.84 5.69 3.49 PET-PE-GO 43.45 2.01 9.58 3.55 1.85 PET-PE-rGO 31.95 0.63 3.25 5.08 3.03 PET-HDPC-
GO 43.57 2.83 11.61 3.81 2.42 PET-HDPC-
rGO 32.40 0.82 3.72 4.54 2.58
PET-PDDAC-
GO 42.73 2.10 9.75 4.24 2.16 PET-PDDAC-
rGO 30.48 0.44 2.06 6.85 4.42
Electrical Conductivity
Functional groups present on the edges and surface of the GO sheets are the reason for electrically insulating properties. To bring electro-conductive properties to the fabrics, GO-modified samples were chemically reduced to rGO, and sheet resistance (Rsh) of reduced samples was recorded via a 4-probe method [2]. The current-voltage profile of the samples was recorded in a voltage range of 5–30 V. The sheet resistance and maximum current at a voltage of 30 V are summarised in Table 11. A control fabric, without any surface modification, shows a sheet resistance of 27.3±2.8 kΩ/. As was expected, an alkalised fabric shows higher electrical resistance, having a sheet resistance of 122±9.8 kΩ/. The sheet resistance of PET-HDPC-rGO, PET-CS-rGO, and PET-PE-rGO decreased to 0.59±0.02, 2.7±0.09, and 3.9±0.19 kΩ/ compared to a control sample, having a value of 27.3±2.8 kΩ/. While for PET-PDDAC-rGO, the value increased to 38.5 ± 0.54 kΩ/, which is possibly because of the morphology of the surface of the fabrics.
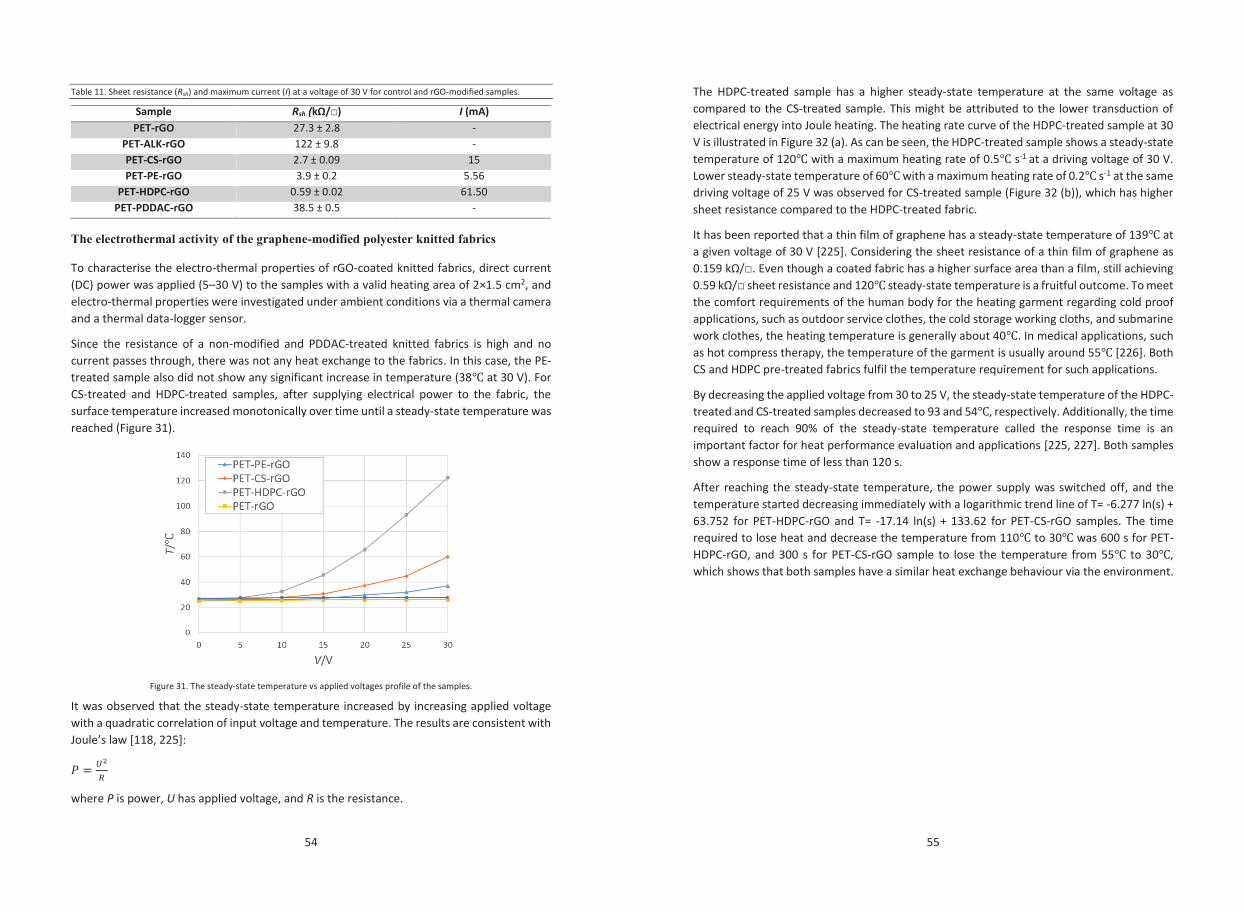
54
Table 11. Sheet resistance (Rsh) and maximum current (I) at a voltage of 30 V for control and rGO-modified samples.
Sample Rsh (kΩ/) I (mA) PET-rGO 27.3 ± 2.8 -
PET-ALK-rGO 122 ± 9.8 - PET-CS-rGO 2.7 ± 0.09 15 PET-PE-rGO 3.9 ± 0.2 5.56
PET-HDPC-rGO 0.59 ± 0.02 61.50 PET-PDDAC-rGO 38.5 ± 0.5 -
The electrothermal activity of the graphene-modified polyester knitted fabrics
To characterise the electro-thermal properties of rGO-coated knitted fabrics, direct current (DC) power was applied (5–30 V) to the samples with a valid heating area of 2×1.5 cm2, and electro-thermal properties were investigated under ambient conditions via a thermal camera and a thermal data-logger sensor.
Since the resistance of a non-modified and PDDAC-treated knitted fabrics is high and no current passes through, there was not any heat exchange to the fabrics. In this case, the PE-treated sample also did not show any significant increase in temperature (38 at 30 V). For CS-treated and HDPC-treated samples, after supplying electrical power to the fabric, the surface temperature increased monotonically over time until a steady-state temperature was reached (Figure 31).
Figure 31. The steady-state temperature vs applied voltages profile of the samples.
It was observed that the steady-state temperature increased by increasing applied voltage with a quadratic correlation of input voltage and temperature. The results are consistent with Joule’s law [118, 225]:
𝑃𝑃 = 𝑈𝑈2
𝑅𝑅
where P is power, U has applied voltage, and R is the resistance.
55
The HDPC-treated sample has a higher steady-state temperature at the same voltage as compared to the CS-treated sample. This might be attributed to the lower transduction of electrical energy into Joule heating. The heating rate curve of the HDPC-treated sample at 30 V is illustrated in Figure 32 (a). As can be seen, the HDPC-treated sample shows a steady-state temperature of 120 with a maximum heating rate of 0.5 s-1 at a driving voltage of 30 V. Lower steady-state temperature of 60 with a maximum heating rate of 0.2 s-1 at the same driving voltage of 25 V was observed for CS-treated sample (Figure 32 (b)), which has higher sheet resistance compared to the HDPC-treated fabric.
It has been reported that a thin film of graphene has a steady-state temperature of 139 at a given voltage of 30 V [225]. Considering the sheet resistance of a thin film of graphene as 0.159 kΩ/. Even though a coated fabric has a higher surface area than a film, still achieving 0.59 kΩ/ sheet resistance and 120 steady-state temperature is a fruitful outcome. To meet the comfort requirements of the human body for the heating garment regarding cold proof applications, such as outdoor service clothes, the cold storage working cloths, and submarine work clothes, the heating temperature is generally about 40. In medical applications, such as hot compress therapy, the temperature of the garment is usually around 55 [226]. Both CS and HDPC pre-treated fabrics fulfil the temperature requirement for such applications.
By decreasing the applied voltage from 30 to 25 V, the steady-state temperature of the HDPC-treated and CS-treated samples decreased to 93 and 54 respectively. Additionally, the time required to reach 90% of the steady-state temperature called the response time is an important factor for heat performance evaluation and applications [225, 227]. Both samples show a response time of less than 120 s.
After reaching the steady-state temperature, the power supply was switched off, and the temperature started decreasing immediately with a logarithmic trend line of T= -6.277 ln(s) + 63.752 for PET-HDPC-rGO and T= -17.14 ln(s) + 133.62 for PET-CS-rGO samples. The time required to lose heat and decrease the temperature from 110 to 30 was 600 s for PET-HDPC-rGO, and 300 s for PET-CS-rGO sample to lose the temperature from 55 to 30, which shows that both samples have a similar heat exchange behaviour via the environment.
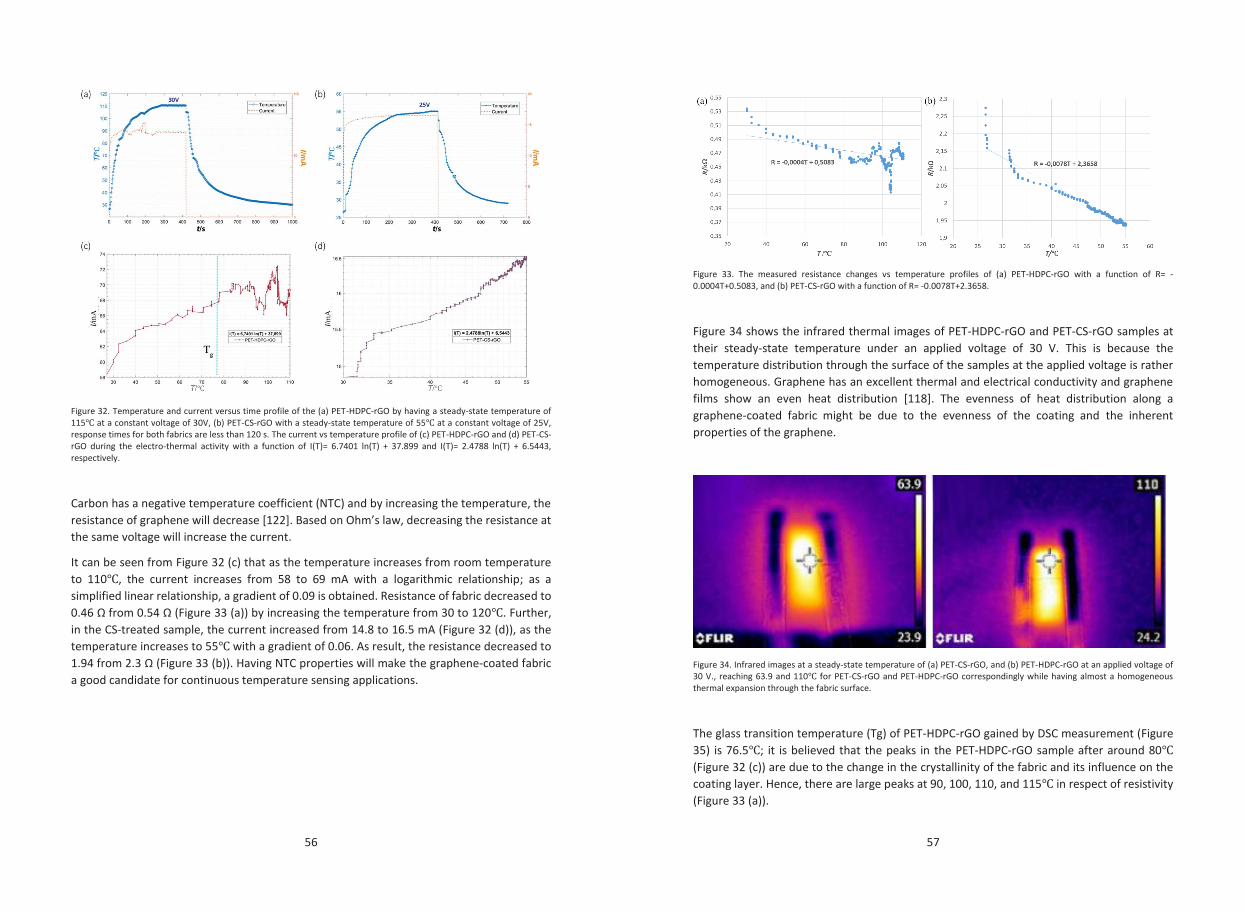
56
Figure 32. Temperature and current versus time profile of the (a) PET-HDPC-rGO by having a steady-state temperature of 115 at a constant voltage of 30V, (b) PET-CS-rGO with a steady-state temperature of 55 at a constant voltage of 25V, response times for both fabrics are less than 120 s. The current vs temperature profile of (c) PET-HDPC-rGO and (d) PET-CS-rGO during the electro-thermal activity with a function of I(T)= 6.7401 ln(T) + 37.899 and I(T)= 2.4788 ln(T) + 6.5443, respectively.
Carbon has a negative temperature coefficient (NTC) and by increasing the temperature, the resistance of graphene will decrease [122]. Based on Ohm’s law, decreasing the resistance at the same voltage will increase the current.
It can be seen from Figure 32 (c) that as the temperature increases from room temperature to 110, the current increases from 58 to 69 mA with a logarithmic relationship; as a simplified linear relationship, a gradient of 0.09 is obtained. Resistance of fabric decreased to 0.46 Ω from 0.54 Ω (Figure 33 (a)) by increasing the temperature from 30 to 120. Further, in the CS-treated sample, the current increased from 14.8 to 16.5 mA (Figure 32 (d)), as the temperature increases to 55 with a gradient of 0.06. As result, the resistance decreased to 1.94 from 2.3 Ω (Figure 33 (b)). Having NTC properties will make the graphene-coated fabric a good candidate for continuous temperature sensing applications.
57
Figure 33. The measured resistance changes vs temperature profiles of (a) PET-HDPC-rGO with a function of R= -0.0004T+0.5083, and (b) PET-CS-rGO with a function of R= -0.0078T+2.3658.
Figure 34 shows the infrared thermal images of PET-HDPC-rGO and PET-CS-rGO samples at their steady-state temperature under an applied voltage of 30 V. This is because the temperature distribution through the surface of the samples at the applied voltage is rather homogeneous. Graphene has an excellent thermal and electrical conductivity and graphene films show an even heat distribution [118]. The evenness of heat distribution along a graphene-coated fabric might be due to the evenness of the coating and the inherent properties of the graphene.
Figure 34. Infrared images at a steady-state temperature of (a) PET-CS-rGO, and (b) PET-HDPC-rGO at an applied voltage of 30 V., reaching 63.9 and 110 for PET-CS-rGO and PET-HDPC-rGO correspondingly while having almost a homogeneous thermal expansion through the fabric surface.
The glass transition temperature (Tg) of PET-HDPC-rGO gained by DSC measurement (Figure 35) is 76.5; it is believed that the peaks in the PET-HDPC-rGO sample after around 80 (Figure 32 (c)) are due to the change in the crystallinity of the fabric and its influence on the coating layer. Hence, there are large peaks at 90, 100, 110, and 115 in respect of resistivity (Figure 33 (a)).
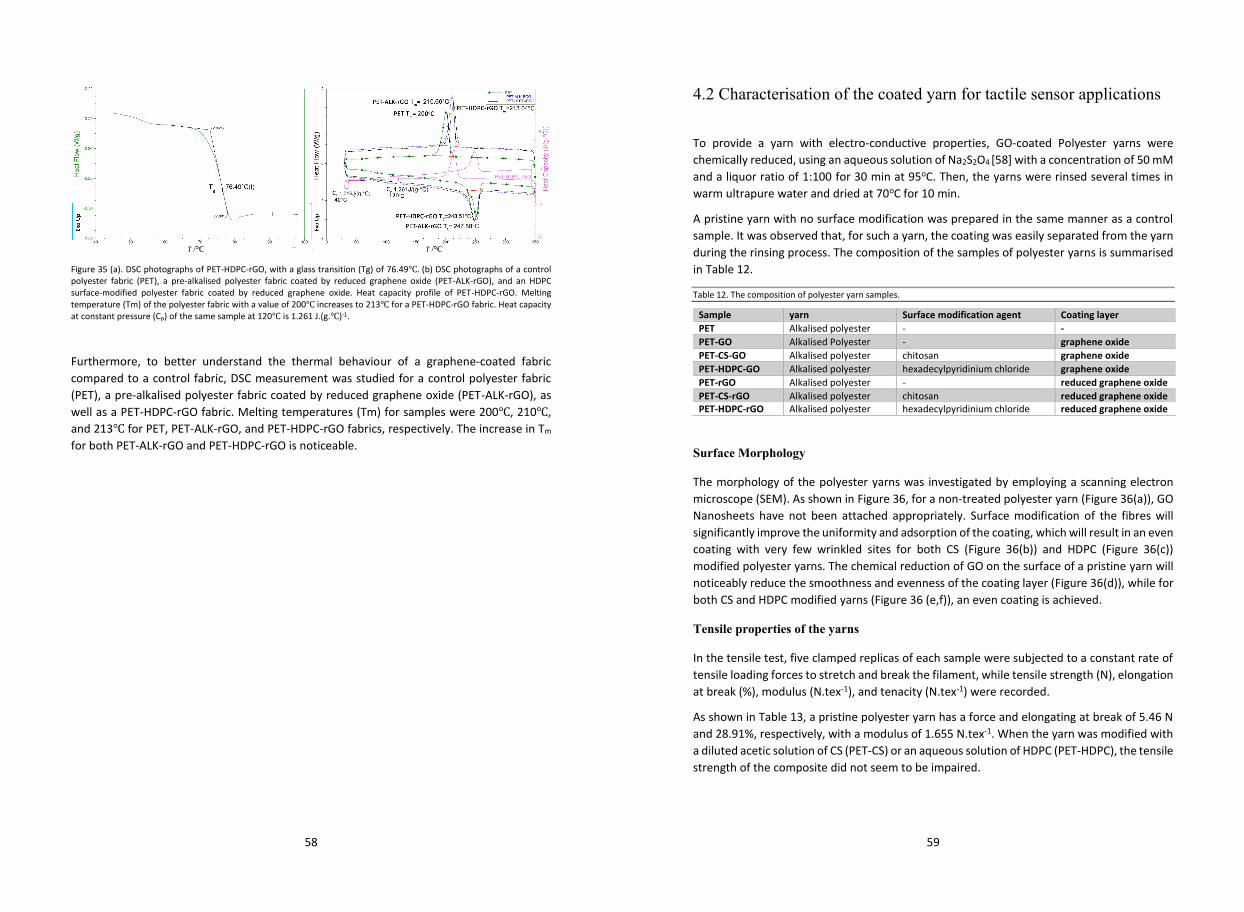
58
Figure 35 (a). DSC photographs of PET-HDPC-rGO, with a glass transition (Tg) of 76.49. (b) DSC photographs of a control polyester fabric (PET), a pre-alkalised polyester fabric coated by reduced graphene oxide (PET-ALK-rGO), and an HDPC surface-modified polyester fabric coated by reduced graphene oxide. Heat capacity profile of PET-HDPC-rGO. Melting temperature (Tm) of the polyester fabric with a value of 200 increases to 213 for a PET-HDPC-rGO fabric. Heat capacity at constant pressure (Cp) of the same sample at 120 is 1.261 J.(g.)-1.
Furthermore, to better understand the thermal behaviour of a graphene-coated fabric compared to a control fabric, DSC measurement was studied for a control polyester fabric (PET), a pre-alkalised polyester fabric coated by reduced graphene oxide (PET-ALK-rGO), as well as a PET-HDPC-rGO fabric. Melting temperatures (Tm) for samples were 200, 210, and 213 for PET, PET-ALK-rGO, and PET-HDPC-rGO fabrics, respectively. The increase in Tm for both PET-ALK-rGO and PET-HDPC-rGO is noticeable.
59
4.2 Characterisation of the coated yarn for tactile sensor applications
To provide a yarn with electro-conductive properties, GO-coated Polyester yarns were chemically reduced, using an aqueous solution of Na2S2O4 [58] with a concentration of 50 mM and a liquor ratio of 1:100 for 30 min at 95oC. Then, the yarns were rinsed several times in warm ultrapure water and dried at 70oC for 10 min.
A pristine yarn with no surface modification was prepared in the same manner as a control sample. It was observed that, for such a yarn, the coating was easily separated from the yarn during the rinsing process. The composition of the samples of polyester yarns is summarised in Table 12.
Table 12. The composition of polyester yarn samples.
Sample yarn Surface modification agent Coating layer PET Alkalised polyester - - PET-GO Alkalised Polyester - graphene oxide PET-CS-GO Alkalised polyester chitosan graphene oxide PET-HDPC-GO Alkalised polyester hexadecylpyridinium chloride graphene oxide PET-rGO Alkalised polyester - reduced graphene oxide PET-CS-rGO Alkalised polyester chitosan reduced graphene oxide PET-HDPC-rGO Alkalised polyester hexadecylpyridinium chloride reduced graphene oxide
Surface Morphology
The morphology of the polyester yarns was investigated by employing a scanning electron microscope (SEM). As shown in Figure 36, for a non-treated polyester yarn (Figure 36(a)), GO Nanosheets have not been attached appropriately. Surface modification of the fibres will significantly improve the uniformity and adsorption of the coating, which will result in an even coating with very few wrinkled sites for both CS (Figure 36(b)) and HDPC (Figure 36(c)) modified polyester yarns. The chemical reduction of GO on the surface of a pristine yarn will noticeably reduce the smoothness and evenness of the coating layer (Figure 36(d)), while for both CS and HDPC modified yarns (Figure 36 (e,f)), an even coating is achieved.
Tensile properties of the yarns
In the tensile test, five clamped replicas of each sample were subjected to a constant rate of tensile loading forces to stretch and break the filament, while tensile strength (N), elongation at break (%), modulus (N.tex-1), and tenacity (N.tex-1) were recorded.
As shown in Table 13, a pristine polyester yarn has a force and elongating at break of 5.46 N and 28.91%, respectively, with a modulus of 1.655 N.tex-1. When the yarn was modified with a diluted acetic solution of CS (PET-CS) or an aqueous solution of HDPC (PET-HDPC), the tensile strength of the composite did not seem to be impaired.
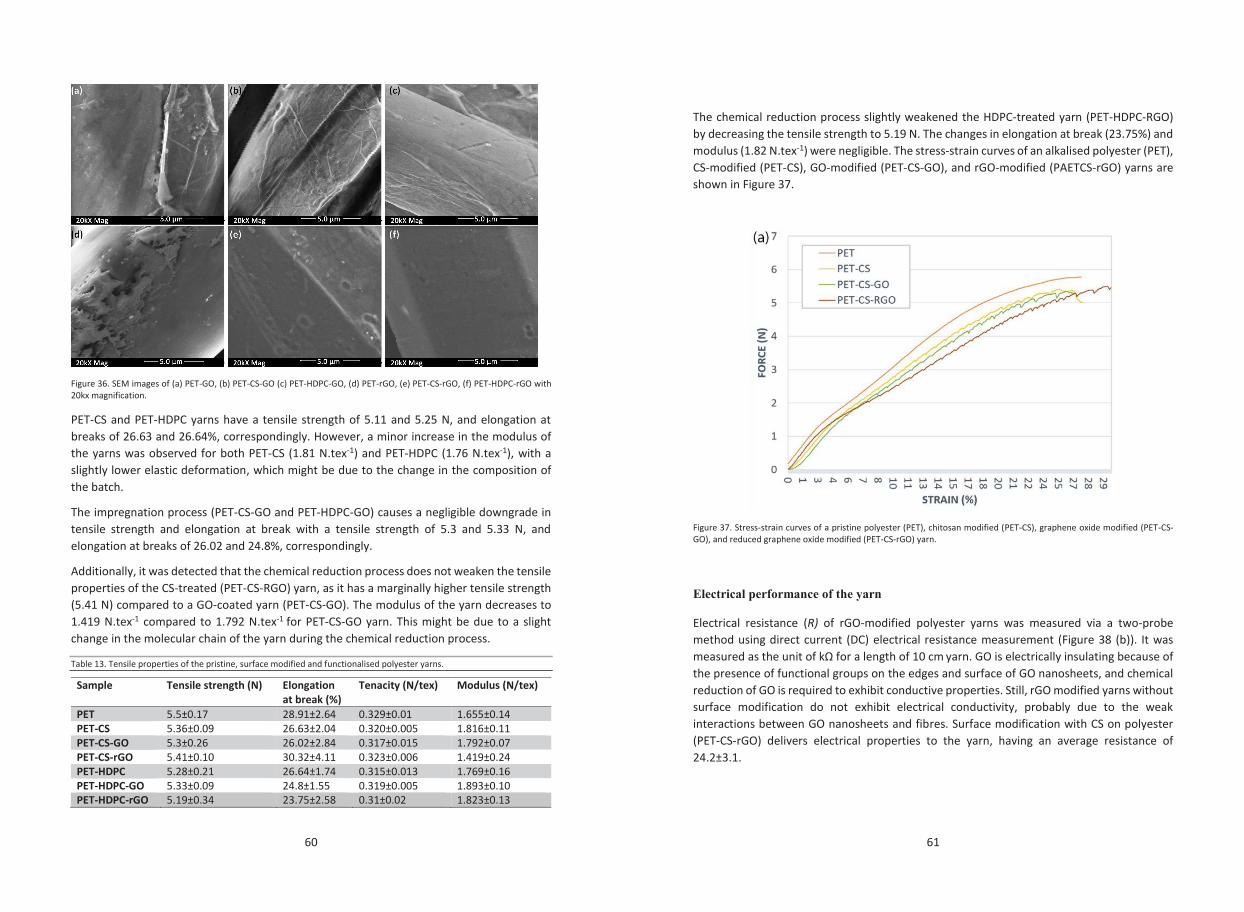
60
Figure 36. SEM images of (a) PET-GO, (b) PET-CS-GO (c) PET-HDPC-GO, (d) PET-rGO, (e) PET-CS-rGO, (f) PET-HDPC-rGO with 20kx magnification.
PET-CS and PET-HDPC yarns have a tensile strength of 5.11 and 5.25 N, and elongation at breaks of 26.63 and 26.64%, correspondingly. However, a minor increase in the modulus of the yarns was observed for both PET-CS (1.81 N.tex-1) and PET-HDPC (1.76 N.tex-1), with a slightly lower elastic deformation, which might be due to the change in the composition of the batch.
The impregnation process (PET-CS-GO and PET-HDPC-GO) causes a negligible downgrade in tensile strength and elongation at break with a tensile strength of 5.3 and 5.33 N, and elongation at breaks of 26.02 and 24.8%, correspondingly.
Additionally, it was detected that the chemical reduction process does not weaken the tensile properties of the CS-treated (PET-CS-RGO) yarn, as it has a marginally higher tensile strength (5.41 N) compared to a GO-coated yarn (PET-CS-GO). The modulus of the yarn decreases to 1.419 N.tex-1 compared to 1.792 N.tex-1 for PET-CS-GO yarn. This might be due to a slight change in the molecular chain of the yarn during the chemical reduction process.
Table 13. Tensile properties of the pristine, surface modified and functionalised polyester yarns.
Sample Tensile strength (N) Elongation at break (%)
Tenacity (N/tex) Modulus (N/tex)
PET 5.5±0.17 28.91±2.64 0.329±0.01 1.655±0.14 PET-CS 5.36±0.09 26.63±2.04 0.320±0.005 1.816±0.11 PET-CS-GO 5.3±0.26 26.02±2.84 0.317±0.015 1.792±0.07 PET-CS-rGO 5.41±0.10 30.32±4.11 0.323±0.006 1.419±0.24 PET-HDPC 5.28±0.21 26.64±1.74 0.315±0.013 1.769±0.16 PET-HDPC-GO 5.33±0.09 24.8±1.55 0.319±0.005 1.893±0.10 PET-HDPC-rGO 5.19±0.34 23.75±2.58 0.31±0.02 1.823±0.13
61
The chemical reduction process slightly weakened the HDPC-treated yarn (PET-HDPC-RGO) by decreasing the tensile strength to 5.19 N. The changes in elongation at break (23.75%) and modulus (1.82 N.tex-1) were negligible. The stress-strain curves of an alkalised polyester (PET), CS-modified (PET-CS), GO-modified (PET-CS-GO), and rGO-modified (PAETCS-rGO) yarns are shown in Figure 37.
Figure 37. Stress-strain curves of a pristine polyester (PET), chitosan modified (PET-CS), graphene oxide modified (PET-CS-GO), and reduced graphene oxide modified (PET-CS-rGO) yarn.
Electrical performance of the yarn
Electrical resistance (R) of rGO-modified polyester yarns was measured via a two-probe method using direct current (DC) electrical resistance measurement (Figure 38 (b)). It was measured as the unit of kΩ for a length of 10 cm yarn. GO is electrically insulating because of the presence of functional groups on the edges and surface of GO nanosheets, and chemical reduction of GO is required to exhibit conductive properties. Still, rGO modified yarns without surface modification do not exhibit electrical conductivity, probably due to the weak interactions between GO nanosheets and fibres. Surface modification with CS on polyester (PET-CS-rGO) delivers electrical properties to the yarn, having an average resistance of 24.2±3.1.
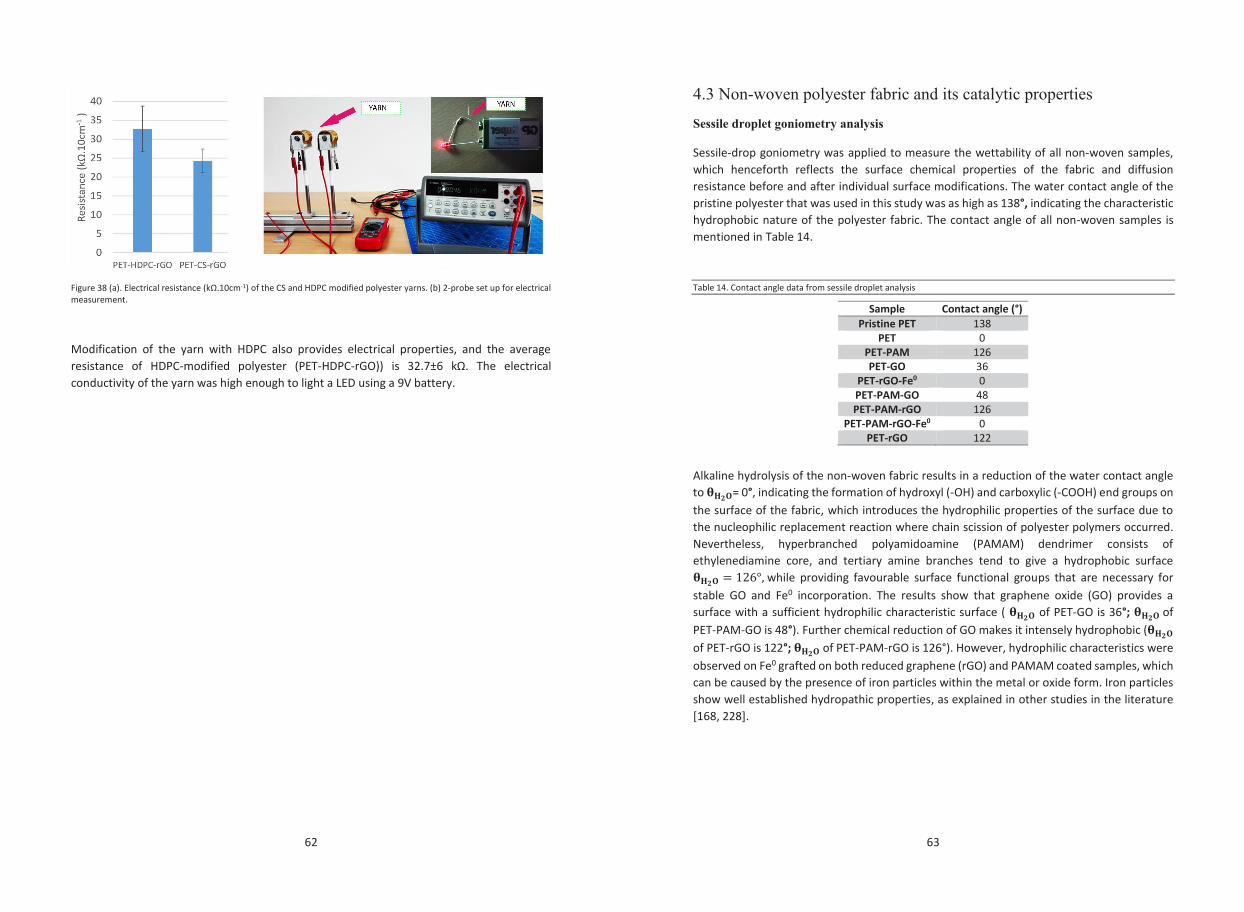
62
Figure 38 (a). Electrical resistance (kΩ.10cm-1) of the CS and HDPC modified polyester yarns. (b) 2-probe set up for electrical measurement.
Modification of the yarn with HDPC also provides electrical properties, and the average resistance of HDPC-modified polyester (PET-HDPC-rGO)) is 32.7±6 kΩ. The electrical conductivity of the yarn was high enough to light a LED using a 9V battery.
63
4.3 Non-woven polyester fabric and its catalytic properties
Sessile droplet goniometry analysis
Sessile-drop goniometry was applied to measure the wettability of all non-woven samples, which henceforth reflects the surface chemical properties of the fabric and diffusion resistance before and after individual surface modifications. The water contact angle of the pristine polyester that was used in this study was as high as 138°, indicating the characteristic hydrophobic nature of the polyester fabric. The contact angle of all non-woven samples is mentioned in Table 14.
Table 14. Contact angle data from sessile droplet analysis
Sample Contact angle (°) Pristine PET 138
PET 0 PET-PAM 126 PET-GO 36
PET-rGO-Fe0 0 PET-PAM-GO 48 PET-PAM-rGO 126
PET-PAM-rGO-Fe0 0 PET-rGO 122
Alkaline hydrolysis of the non-woven fabric results in a reduction of the water contact angle to 𝛉𝛉𝐇𝐇𝟐𝟐𝐎𝐎= 0°, indicating the formation of hydroxyl (-OH) and carboxylic (-COOH) end groups on the surface of the fabric, which introduces the hydrophilic properties of the surface due to the nucleophilic replacement reaction where chain scission of polyester polymers occurred. Nevertheless, hyperbranched polyamidoamine (PAMAM) dendrimer consists of ethylenediamine core, and tertiary amine branches tend to give a hydrophobic surface 𝛉𝛉𝐇𝐇𝟐𝟐𝐎𝐎 = 126°, while providing favourable surface functional groups that are necessary for stable GO and Fe0 incorporation. The results show that graphene oxide (GO) provides a surface with a sufficient hydrophilic characteristic surface ( 𝛉𝛉𝐇𝐇𝟐𝟐𝐎𝐎 of PET-GO is 36°; 𝛉𝛉𝐇𝐇𝟐𝟐𝐎𝐎 of PET-PAM-GO is 48°). Further chemical reduction of GO makes it intensely hydrophobic (𝛉𝛉𝐇𝐇𝟐𝟐𝐎𝐎 of PET-rGO is 122°; 𝛉𝛉𝐇𝐇𝟐𝟐𝐎𝐎 of PET-PAM-rGO is 126°). However, hydrophilic characteristics were observed on Fe0 grafted on both reduced graphene (rGO) and PAMAM coated samples, which can be caused by the presence of iron particles within the metal or oxide form. Iron particles show well established hydropathic properties, as explained in other studies in the literature [168, 228].
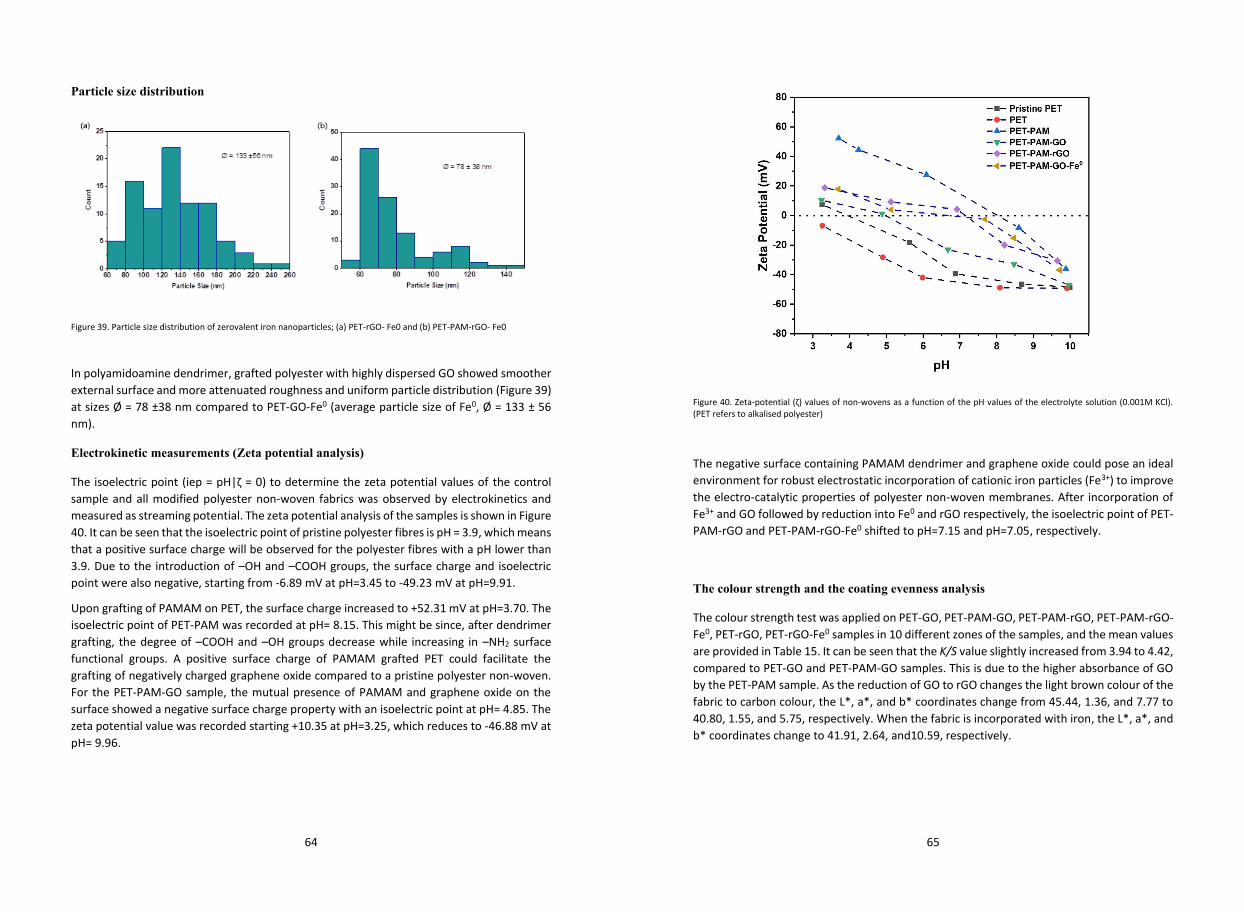
64
Particle size distribution
Figure 39. Particle size distribution of zerovalent iron nanoparticles; (a) PET-rGO- Fe0 and (b) PET-PAM-rGO- Fe0
In polyamidoamine dendrimer, grafted polyester with highly dispersed GO showed smoother external surface and more attenuated roughness and uniform particle distribution (Figure 39) at sizes Ø = 78 ±38 nm compared to PET-GO-Fe0 (average particle size of Fe0, Ø = 133 ± 56 nm).
Electrokinetic measurements (Zeta potential analysis)
The isoelectric point (iep = pH|ζ = 0) to determine the zeta potential values of the control sample and all modified polyester non-woven fabrics was observed by electrokinetics and measured as streaming potential. The zeta potential analysis of the samples is shown in Figure 40. It can be seen that the isoelectric point of pristine polyester fibres is pH = 3.9, which means that a positive surface charge will be observed for the polyester fibres with a pH lower than 3.9. Due to the introduction of –OH and –COOH groups, the surface charge and isoelectric point were also negative, starting from -6.89 mV at pH=3.45 to -49.23 mV at pH=9.91.
Upon grafting of PAMAM on PET, the surface charge increased to +52.31 mV at pH=3.70. The isoelectric point of PET-PAM was recorded at pH= 8.15. This might be since, after dendrimer grafting, the degree of –COOH and –OH groups decrease while increasing in –NH2 surface functional groups. A positive surface charge of PAMAM grafted PET could facilitate the grafting of negatively charged graphene oxide compared to a pristine polyester non-woven. For the PET-PAM-GO sample, the mutual presence of PAMAM and graphene oxide on the surface showed a negative surface charge property with an isoelectric point at pH= 4.85. The zeta potential value was recorded starting +10.35 at pH=3.25, which reduces to -46.88 mV at pH= 9.96.
65
Figure 40. Zeta-potential (ζ) values of non-wovens as a function of the pH values of the electrolyte solution (0.001M KCl). (PET refers to alkalised polyester)
The negative surface containing PAMAM dendrimer and graphene oxide could pose an ideal environment for robust electrostatic incorporation of cationic iron particles (Fe3+) to improve the electro-catalytic properties of polyester non-woven membranes. After incorporation of Fe3+ and GO followed by reduction into Fe0 and rGO respectively, the isoelectric point of PET-PAM-rGO and PET-PAM-rGO-Fe0 shifted to pH=7.15 and pH=7.05, respectively.
The colour strength and the coating evenness analysis
The colour strength test was applied on PET-GO, PET-PAM-GO, PET-PAM-rGO, PET-PAM-rGO-Fe0, PET-rGO, PET-rGO-Fe0 samples in 10 different zones of the samples, and the mean values are provided in Table 15. It can be seen that the K/S value slightly increased from 3.94 to 4.42, compared to PET-GO and PET-PAM-GO samples. This is due to the higher absorbance of GO by the PET-PAM sample. As the reduction of GO to rGO changes the light brown colour of the fabric to carbon colour, the L*, a*, and b* coordinates change from 45.44, 1.36, and 7.77 to 40.80, 1.55, and 5.75, respectively. When the fabric is incorporated with iron, the L*, a*, and b* coordinates change to 41.91, 2.64, and10.59, respectively.
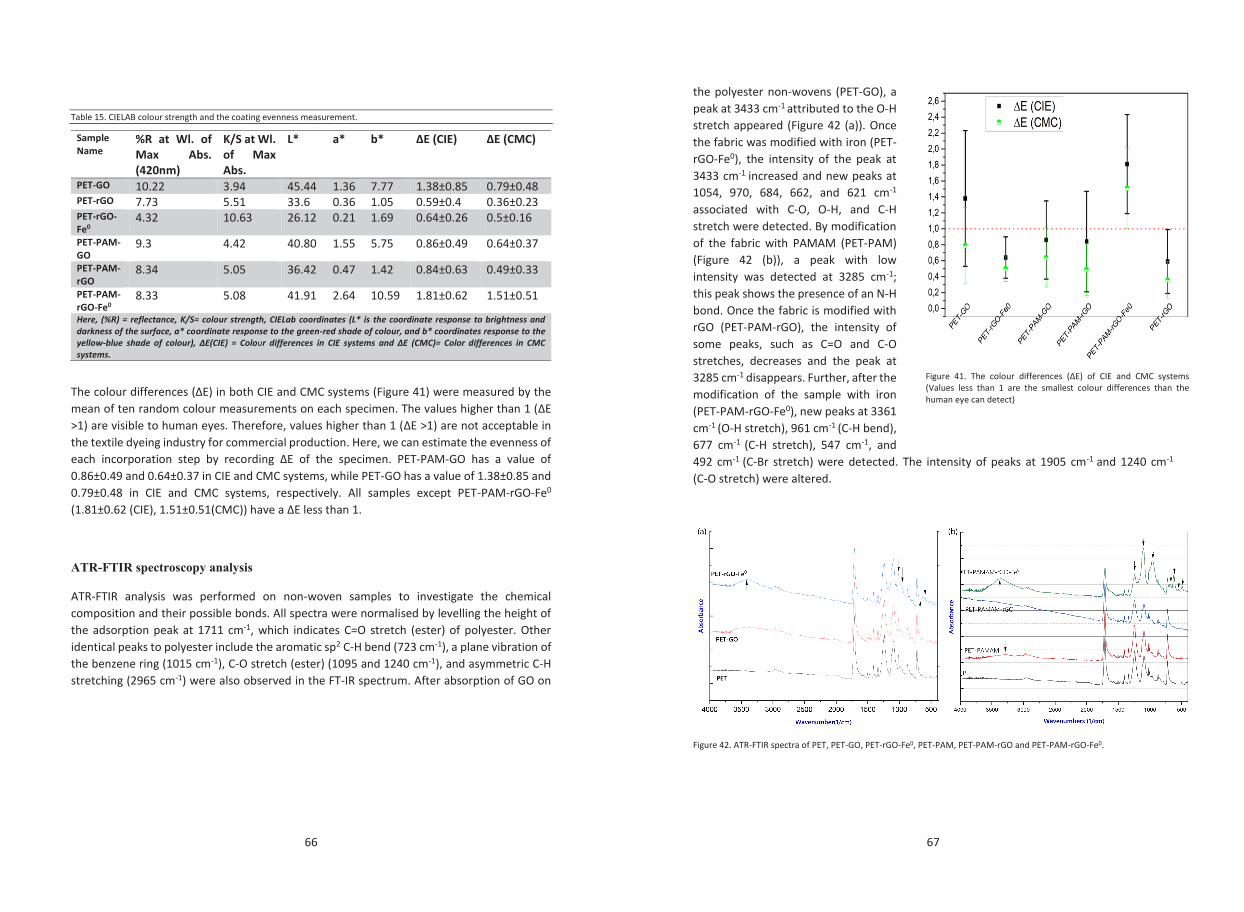
66
Table 15. CIELAB colour strength and the coating evenness measurement.
Sample Name
%R at Wl. of Max Abs. (420nm)
K/S at Wl. of Max Abs.
L* a* b* ∆E (CIE) ∆E (CMC)
PET-GO 10.22 3.94 45.44 1.36 7.77 1.38±0.85 0.79±0.48 PET-rGO 7.73 5.51 33.6 0.36 1.05 0.59±0.4 0.36±0.23 PET-rGO-Fe0
4.32 10.63 26.12 0.21 1.69 0.64±0.26 0.5±0.16
PET-PAM-GO
9.3 4.42 40.80 1.55 5.75 0.86±0.49 0.64±0.37
PET-PAM-rGO
8.34 5.05 36.42 0.47 1.42 0.84±0.63 0.49±0.33
PET-PAM-rGO-Fe0
8.33 5.08 41.91 2.64 10.59 1.81±0.62 1.51±0.51
Here, (%R) = reflectance, K/S= colour strength, CIELab coordinates (L* is the coordinate response to brightness and darkness of the surface, a* coordinate response to the green-red shade of colour, and b* coordinates response to the yellow-blue shade of colour), ∆E(CIE) = Colour differences in CIE systems and ∆E (CMC)= Color differences in CMC systems.
The colour differences (ΔE) in both CIE and CMC systems (Figure 41) were measured by the mean of ten random colour measurements on each specimen. The values higher than 1 (ΔE >1) are visible to human eyes. Therefore, values higher than 1 (ΔE >1) are not acceptable in the textile dyeing industry for commercial production. Here, we can estimate the evenness of each incorporation step by recording ΔE of the specimen. PET-PAM-GO has a value of 0.86±0.49 and 0.64±0.37 in CIE and CMC systems, while PET-GO has a value of 1.38±0.85 and 0.79±0.48 in CIE and CMC systems, respectively. All samples except PET-PAM-rGO-Fe0 (1.81±0.62 (CIE), 1.51±0.51(CMC)) have a ΔE less than 1.
ATR-FTIR spectroscopy analysis
ATR-FTIR analysis was performed on non-woven samples to investigate the chemical composition and their possible bonds. All spectra were normalised by levelling the height of the adsorption peak at 1711 cm-1, which indicates C=O stretch (ester) of polyester. Other identical peaks to polyester include the aromatic sp2 C-H bend (723 cm-1), a plane vibration of the benzene ring (1015 cm-1), C-O stretch (ester) (1095 and 1240 cm-1), and asymmetric C-H stretching (2965 cm-1) were also observed in the FT-IR spectrum. After absorption of GO on
67
the polyester non-wovens (PET-GO), a peak at 3433 cm-1 attributed to the O-H stretch appeared (Figure 42 (a)). Once the fabric was modified with iron (PET-rGO-Fe0), the intensity of the peak at 3433 cm-1 increased and new peaks at 1054, 970, 684, 662, and 621 cm-1 associated with C-O, O-H, and C-H stretch were detected. By modification of the fabric with PAMAM (PET-PAM) (Figure 42 (b)), a peak with low intensity was detected at 3285 cm-1; this peak shows the presence of an N-H bond. Once the fabric is modified with rGO (PET-PAM-rGO), the intensity of some peaks, such as C=O and C-O stretches, decreases and the peak at 3285 cm-1 disappears. Further, after the modification of the sample with iron (PET-PAM-rGO-Fe0), new peaks at 3361 cm-1 (O-H stretch), 961 cm-1 (C-H bend), 677 cm-1 (C-H stretch), 547 cm-1, and 492 cm-1 (C-Br stretch) were detected. The intensity of peaks at 1905 cm-1 and 1240 cm-1 (C-O stretch) were altered.
Figure 42. ATR-FTIR spectra of PET, PET-GO, PET-rGO-Fe0, PET-PAM, PET-PAM-rGO and PET-PAM-rGO-Fe0.
Figure 41. The colour differences (ΔE) of CIE and CMC systems (Values less than 1 are the smallest colour differences than the human eye can detect)
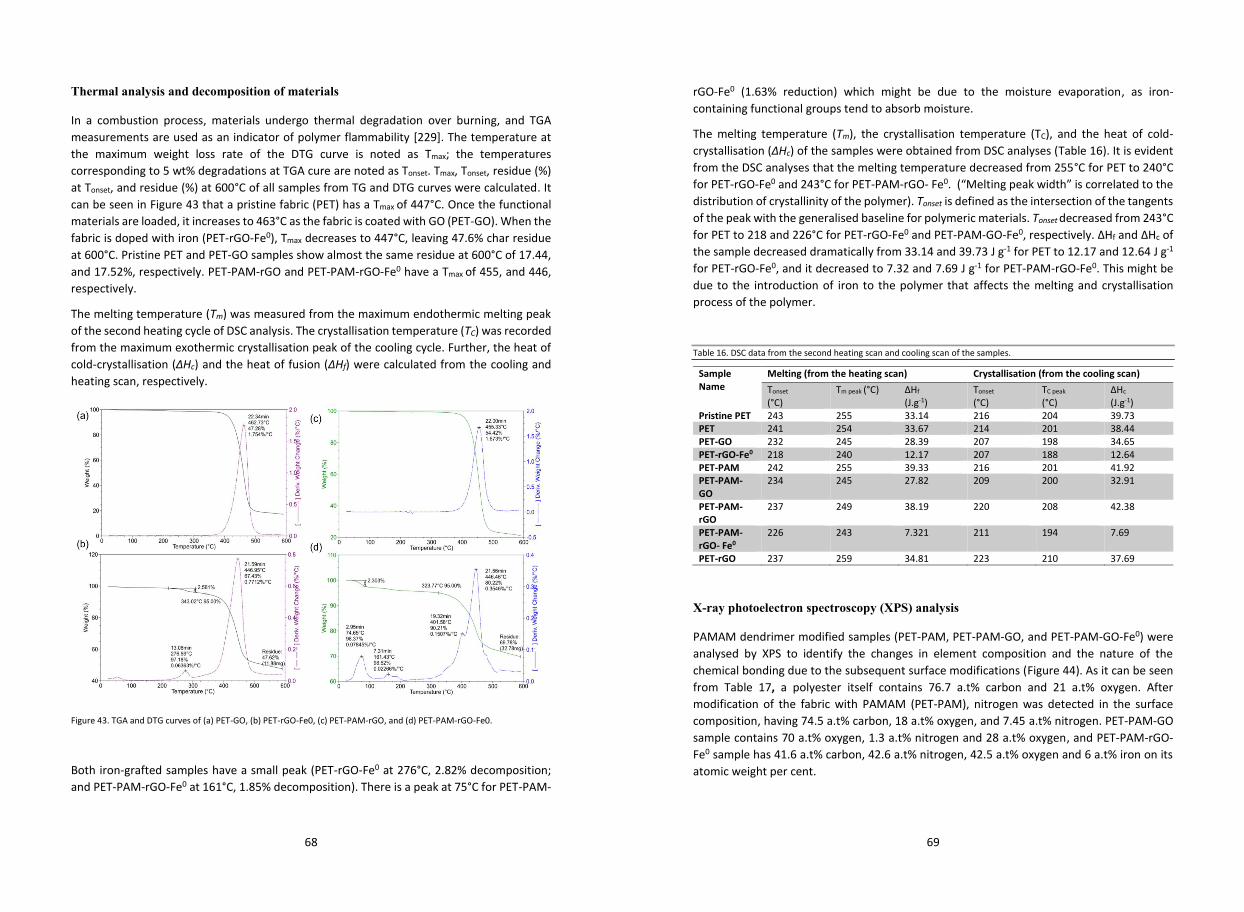
68
Thermal analysis and decomposition of materials
In a combustion process, materials undergo thermal degradation over burning, and TGA measurements are used as an indicator of polymer flammability [229]. The temperature at the maximum weight loss rate of the DTG curve is noted as Tmax; the temperatures corresponding to 5 wt% degradations at TGA cure are noted as Tonset. Tmax, Tonset, residue (%) at Tonset, and residue (%) at 600°C of all samples from TG and DTG curves were calculated. It can be seen in Figure 43 that a pristine fabric (PET) has a Tmax of 447°C. Once the functional materials are loaded, it increases to 463°C as the fabric is coated with GO (PET-GO). When the fabric is doped with iron (PET-rGO-Fe0), Tmax decreases to 447°C, leaving 47.6% char residue at 600°C. Pristine PET and PET-GO samples show almost the same residue at 600°C of 17.44, and 17.52%, respectively. PET-PAM-rGO and PET-PAM-rGO-Fe0 have a Tmax of 455, and 446, respectively.
The melting temperature (Tm) was measured from the maximum endothermic melting peak of the second heating cycle of DSC analysis. The crystallisation temperature (TC) was recorded from the maximum exothermic crystallisation peak of the cooling cycle. Further, the heat of cold-crystallisation (∆Hc) and the heat of fusion (∆Hf) were calculated from the cooling and heating scan, respectively.
Figure 43. TGA and DTG curves of (a) PET-GO, (b) PET-rGO-Fe0, (c) PET-PAM-rGO, and (d) PET-PAM-rGO-Fe0.
Both iron-grafted samples have a small peak (PET-rGO-Fe0 at 276°C, 2.82% decomposition; and PET-PAM-rGO-Fe0 at 161°C, 1.85% decomposition). There is a peak at 75°C for PET-PAM-
69
rGO-Fe0 (1.63% reduction) which might be due to the moisture evaporation, as iron-containing functional groups tend to absorb moisture.
The melting temperature (Tm), the crystallisation temperature (TC), and the heat of cold-crystallisation (∆Hc) of the samples were obtained from DSC analyses (Table 16). It is evident from the DSC analyses that the melting temperature decreased from 255°C for PET to 240°C for PET-rGO-Fe0 and 243°C for PET-PAM-rGO- Fe0. (“Melting peak width” is correlated to the distribution of crystallinity of the polymer). Tonset is defined as the intersection of the tangents of the peak with the generalised baseline for polymeric materials. Tonset decreased from 243°C for PET to 218 and 226°C for PET-rGO-Fe0 and PET-PAM-GO-Fe0, respectively. ∆Hf and ∆Hc of the sample decreased dramatically from 33.14 and 39.73 J g-1 for PET to 12.17 and 12.64 J g-1 for PET-rGO-Fe0, and it decreased to 7.32 and 7.69 J g-1 for PET-PAM-rGO-Fe0. This might be due to the introduction of iron to the polymer that affects the melting and crystallisation process of the polymer.
Table 16. DSC data from the second heating scan and cooling scan of the samples.
Sample Name
Melting (from the heating scan) Crystallisation (from the cooling scan) Tonset
(°C)
Tm peak (°C) ∆Hf
(J.g-1) Tonset
(°C)
TC peak
(°C)
∆Hc
(J.g-1)
Pristine PET 243 255 33.14 216 204 39.73 PET 241 254 33.67 214 201 38.44 PET-GO 232 245 28.39 207 198 34.65 PET-rGO-Fe0 218 240 12.17 207 188 12.64 PET-PAM 242 255 39.33 216 201 41.92 PET-PAM-GO
234 245 27.82 209 200 32.91
PET-PAM-rGO
237 249 38.19 220 208 42.38
PET-PAM-rGO- Fe0
226 243 7.321 211 194 7.69
PET-rGO 237 259 34.81 223 210 37.69
X-ray photoelectron spectroscopy (XPS) analysis
PAMAM dendrimer modified samples (PET-PAM, PET-PAM-GO, and PET-PAM-GO-Fe0) were analysed by XPS to identify the changes in element composition and the nature of the chemical bonding due to the subsequent surface modifications (Figure 44). As it can be seen from Table 17, a polyester itself contains 76.7 a.t% carbon and 21 a.t% oxygen. After modification of the fabric with PAMAM (PET-PAM), nitrogen was detected in the surface composition, having 74.5 a.t% carbon, 18 a.t% oxygen, and 7.45 a.t% nitrogen. PET-PAM-GO sample contains 70 a.t% oxygen, 1.3 a.t% nitrogen and 28 a.t% oxygen, and PET-PAM-rGO-Fe0 sample has 41.6 a.t% carbon, 42.6 a.t% nitrogen, 42.5 a.t% oxygen and 6 a.t% iron on its atomic weight per cent.
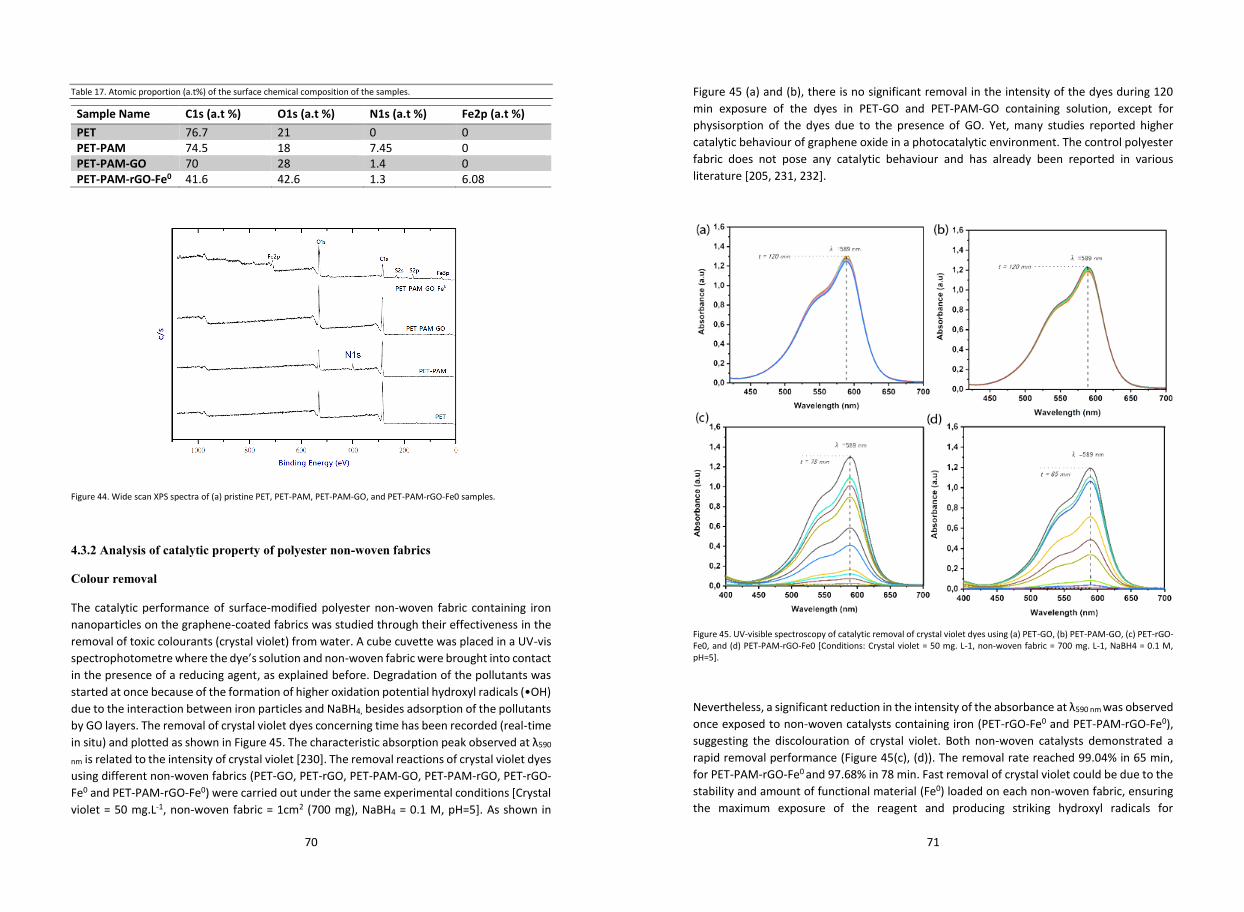
70
Table 17. Atomic proportion (a.t%) of the surface chemical composition of the samples.
Sample Name C1s (a.t %) O1s (a.t %) N1s (a.t %) Fe2p (a.t %) PET 76.7 21 0 0 PET-PAM 74.5 18 7.45 0 PET-PAM-GO 70 28 1.4 0 PET-PAM-rGO-Fe0 41.6 42.6 1.3 6.08
Figure 44. Wide scan XPS spectra of (a) pristine PET, PET-PAM, PET-PAM-GO, and PET-PAM-rGO-Fe0 samples.
4.3.2 Analysis of catalytic property of polyester non-woven fabrics
Colour removal
The catalytic performance of surface-modified polyester non-woven fabric containing iron nanoparticles on the graphene-coated fabrics was studied through their effectiveness in the removal of toxic colourants (crystal violet) from water. A cube cuvette was placed in a UV-vis spectrophotometre where the dye’s solution and non-woven fabric were brought into contact in the presence of a reducing agent, as explained before. Degradation of the pollutants was started at once because of the formation of higher oxidation potential hydroxyl radicals (•OH) due to the interaction between iron particles and NaBH4, besides adsorption of the pollutants by GO layers. The removal of crystal violet dyes concerning time has been recorded (real-time in situ) and plotted as shown in Figure 45. The characteristic absorption peak observed at λ590
nm is related to the intensity of crystal violet [230]. The removal reactions of crystal violet dyes using different non-woven fabrics (PET-GO, PET-rGO, PET-PAM-GO, PET-PAM-rGO, PET-rGO-Fe0 and PET-PAM-rGO-Fe0) were carried out under the same experimental conditions [Crystal violet = 50 mg.L-1, non-woven fabric = 1cm2 (700 mg), NaBH4 = 0.1 M, pH=5]. As shown in
71
Figure 45 (a) and (b), there is no significant removal in the intensity of the dyes during 120 min exposure of the dyes in PET-GO and PET-PAM-GO containing solution, except for physisorption of the dyes due to the presence of GO. Yet, many studies reported higher catalytic behaviour of graphene oxide in a photocatalytic environment. The control polyester fabric does not pose any catalytic behaviour and has already been reported in various literature [205, 231, 232].
Figure 45. UV-visible spectroscopy of catalytic removal of crystal violet dyes using (a) PET-GO, (b) PET-PAM-GO, (c) PET-rGO-Fe0, and (d) PET-PAM-rGO-Fe0 [Conditions: Crystal violet = 50 mg. L-1, non-woven fabric = 700 mg. L-1, NaBH4 = 0.1 M, pH=5].
Nevertheless, a significant reduction in the intensity of the absorbance at λ590 nm was observed
once exposed to non-woven catalysts containing iron (PET-rGO-Fe0 and PET-PAM-rGO-Fe0), suggesting the discolouration of crystal violet. Both non-woven catalysts demonstrated a rapid removal performance (Figure 45(c), (d)). The removal rate reached 99.04% in 65 min, for PET-PAM-rGO-Fe0 and 97.68% in 78 min. Fast removal of crystal violet could be due to the stability and amount of functional material (Fe0) loaded on each non-woven fabric, ensuring the maximum exposure of the reagent and producing striking hydroxyl radicals for
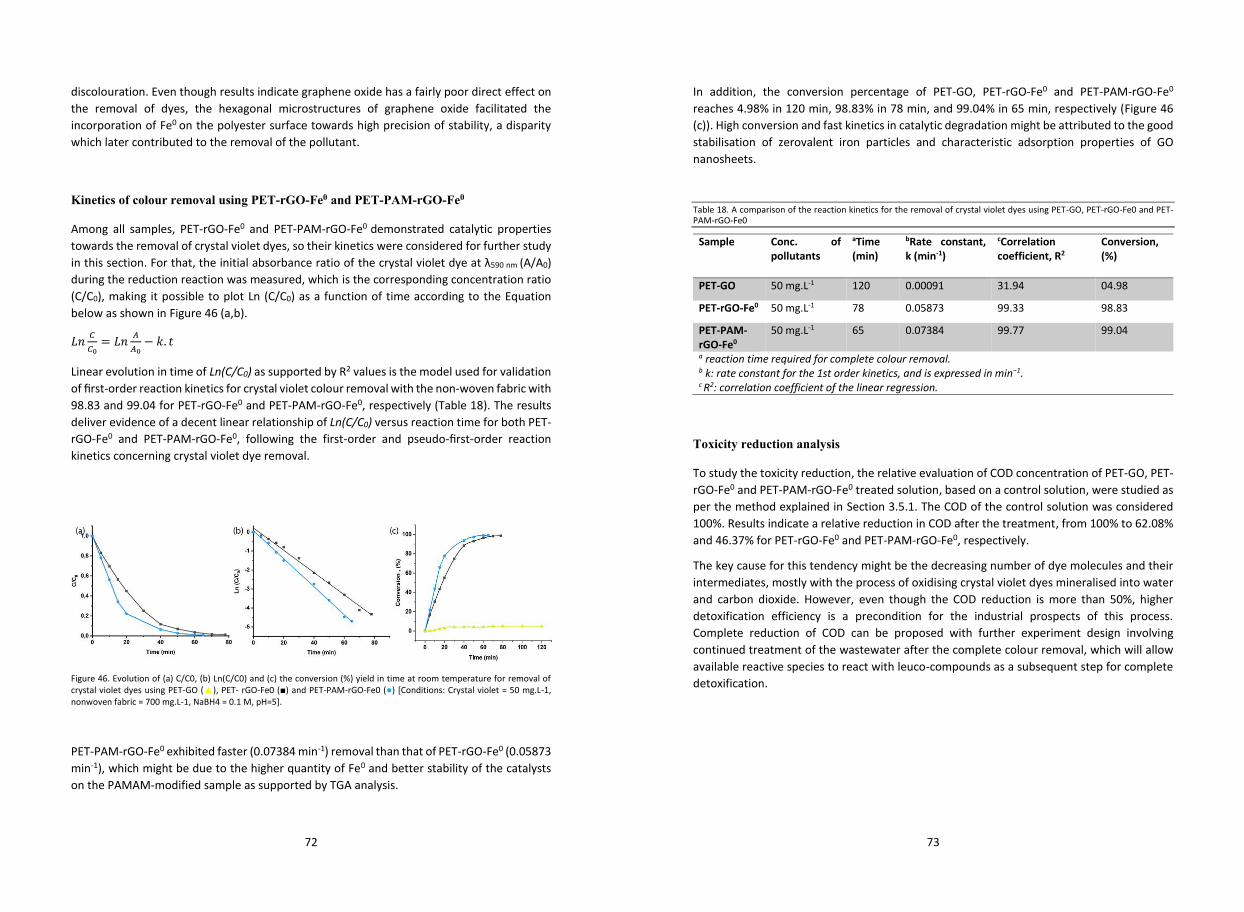
72
discolouration. Even though results indicate graphene oxide has a fairly poor direct effect on the removal of dyes, the hexagonal microstructures of graphene oxide facilitated the incorporation of Fe0 on the polyester surface towards high precision of stability, a disparity which later contributed to the removal of the pollutant.
Kinetics of colour removal using PET-rGO-Fe0 and PET-PAM-rGO-Fe0
Among all samples, PET-rGO-Fe0 and PET-PAM-rGO-Fe0 demonstrated catalytic properties towards the removal of crystal violet dyes, so their kinetics were considered for further study in this section. For that, the initial absorbance ratio of the crystal violet dye at λ590 nm (A/A0) during the reduction reaction was measured, which is the corresponding concentration ratio (C/C0), making it possible to plot Ln (C/C0) as a function of time according to the Equation below as shown in Figure 46 (a,b).
𝐿𝐿𝐿𝐿 𝐶𝐶𝐶𝐶0= 𝐿𝐿𝐿𝐿 𝐴𝐴
𝐴𝐴0− 𝑘𝑘. 𝑡𝑡
Linear evolution in time of Ln(C/C0) as supported by R2 values is the model used for validation of first-order reaction kinetics for crystal violet colour removal with the non-woven fabric with 98.83 and 99.04 for PET-rGO-Fe0 and PET-PAM-rGO-Fe0, respectively (Table 18). The results deliver evidence of a decent linear relationship of Ln(C/C0) versus reaction time for both PET-rGO-Fe0 and PET-PAM-rGO-Fe0, following the first-order and pseudo-first-order reaction kinetics concerning crystal violet dye removal.
Figure 46. Evolution of (a) C/C0, (b) Ln(C/C0) and (c) the conversion (%) yield in time at room temperature for removal of crystal violet dyes using PET-GO (), PET- rGO-Fe0 () and PET-PAM-rGO-Fe0 () [Conditions: Crystal violet = 50 mg.L-1, nonwoven fabric = 700 mg.L-1, NaBH4 = 0.1 M, pH=5].
PET-PAM-rGO-Fe0 exhibited faster (0.07384 min-1) removal than that of PET-rGO-Fe0 (0.05873 min-1), which might be due to the higher quantity of Fe0 and better stability of the catalysts on the PAMAM-modified sample as supported by TGA analysis.
73
In addition, the conversion percentage of PET-GO, PET-rGO-Fe0 and PET-PAM-rGO-Fe0 reaches 4.98% in 120 min, 98.83% in 78 min, and 99.04% in 65 min, respectively (Figure 46 (c)). High conversion and fast kinetics in catalytic degradation might be attributed to the good stabilisation of zerovalent iron particles and characteristic adsorption properties of GO nanosheets.
Table 18. A comparison of the reaction kinetics for the removal of crystal violet dyes using PET-GO, PET-rGO-Fe0 and PET-PAM-rGO-Fe0
Sample Conc. of pollutants
aTime (min)
bRate constant, k (min-1)
cCorrelation coefficient, R2
Conversion, (%)
PET-GO 50 mg.L-1 120 0.00091 31.94 04.98
PET-rGO-Fe0 50 mg.L-1 78 0.05873 99.33 98.83
PET-PAM-rGO-Fe0
50 mg.L-1 65 0.07384 99.77 99.04
a reaction time required for complete colour removal. b k: rate constant for the 1st order kinetics, and is expressed in min−1. c R2: correlation coefficient of the linear regression.
Toxicity reduction analysis
To study the toxicity reduction, the relative evaluation of COD concentration of PET-GO, PET-rGO-Fe0 and PET-PAM-rGO-Fe0 treated solution, based on a control solution, were studied as per the method explained in Section 3.5.1. The COD of the control solution was considered 100%. Results indicate a relative reduction in COD after the treatment, from 100% to 62.08% and 46.37% for PET-rGO-Fe0 and PET-PAM-rGO-Fe0, respectively.
The key cause for this tendency might be the decreasing number of dye molecules and their intermediates, mostly with the process of oxidising crystal violet dyes mineralised into water and carbon dioxide. However, even though the COD reduction is more than 50%, higher detoxification efficiency is a precondition for the industrial prospects of this process. Complete reduction of COD can be proposed with further experiment design involving continued treatment of the wastewater after the complete colour removal, which will allow available reactive species to react with leuco-compounds as a subsequent step for complete detoxification.
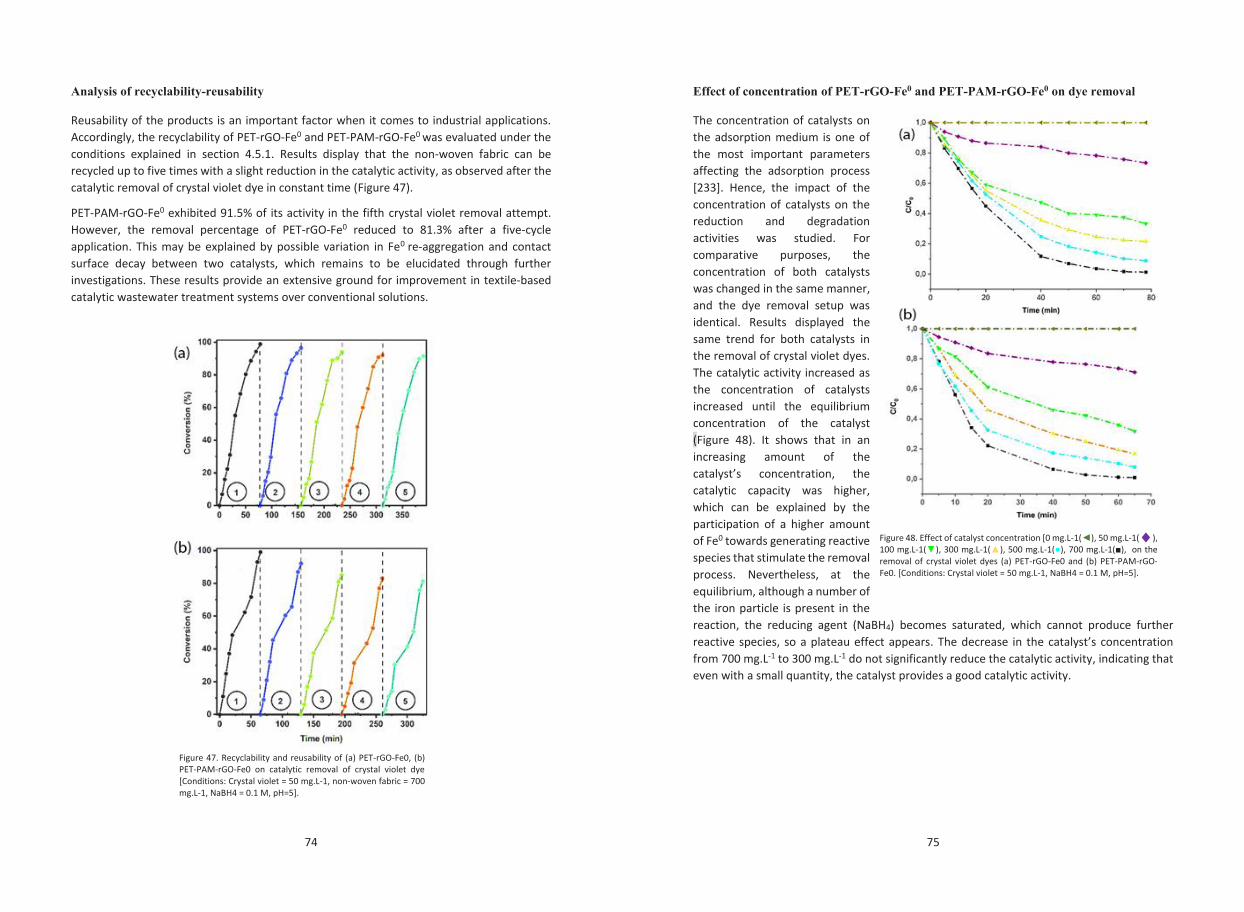
74
Analysis of recyclability-reusability
Reusability of the products is an important factor when it comes to industrial applications. Accordingly, the recyclability of PET-rGO-Fe0 and PET-PAM-rGO-Fe0 was evaluated under the conditions explained in section 4.5.1. Results display that the non-woven fabric can be recycled up to five times with a slight reduction in the catalytic activity, as observed after the catalytic removal of crystal violet dye in constant time (Figure 47).
PET-PAM-rGO-Fe0 exhibited 91.5% of its activity in the fifth crystal violet removal attempt. However, the removal percentage of PET-rGO-Fe0 reduced to 81.3% after a five-cycle application. This may be explained by possible variation in Fe0 re-aggregation and contact surface decay between two catalysts, which remains to be elucidated through further investigations. These results provide an extensive ground for improvement in textile-based catalytic wastewater treatment systems over conventional solutions.
Figure 47. Recyclability and reusability of (a) PET-rGO-Fe0, (b) PET-PAM-rGO-Fe0 on catalytic removal of crystal violet dye [Conditions: Crystal violet = 50 mg.L-1, non-woven fabric = 700 mg.L-1, NaBH4 = 0.1 M, pH=5].
75
Effect of concentration of PET-rGO-Fe0 and PET-PAM-rGO-Fe0 on dye removal
The concentration of catalysts on the adsorption medium is one of the most important parameters affecting the adsorption process [233]. Hence, the impact of the concentration of catalysts on the reduction and degradation activities was studied. For comparative purposes, the concentration of both catalysts was changed in the same manner, and the dye removal setup was identical. Results displayed the same trend for both catalysts in the removal of crystal violet dyes. The catalytic activity increased as the concentration of catalysts increased until the equilibrium concentration of the catalyst (Figure 48). It shows that in an increasing amount of the catalyst’s concentration, the catalytic capacity was higher, which can be explained by the participation of a higher amount of Fe0 towards generating reactive species that stimulate the removal process. Nevertheless, at the equilibrium, although a number of the iron particle is present in the reaction, the reducing agent (NaBH4) becomes saturated, which cannot produce further reactive species, so a plateau effect appears. The decrease in the catalyst’s concentration from 700 mg.L-1 to 300 mg.L-1 do not significantly reduce the catalytic activity, indicating that even with a small quantity, the catalyst provides a good catalytic activity.
Figure 48. Effect of catalyst concentration [0 mg.L-1(), 50 mg.L-1(♦), 100 mg.L-1(), 300 mg.L-1(), 500 mg.L-1(), 700 mg.L-1(), on the removal of crystal violet dyes (a) PET-rGO-Fe0 and (b) PET-PAM-rGO-Fe0. [Conditions: Crystal violet = 50 mg.L-1, NaBH4 = 0.1 M, pH=5].
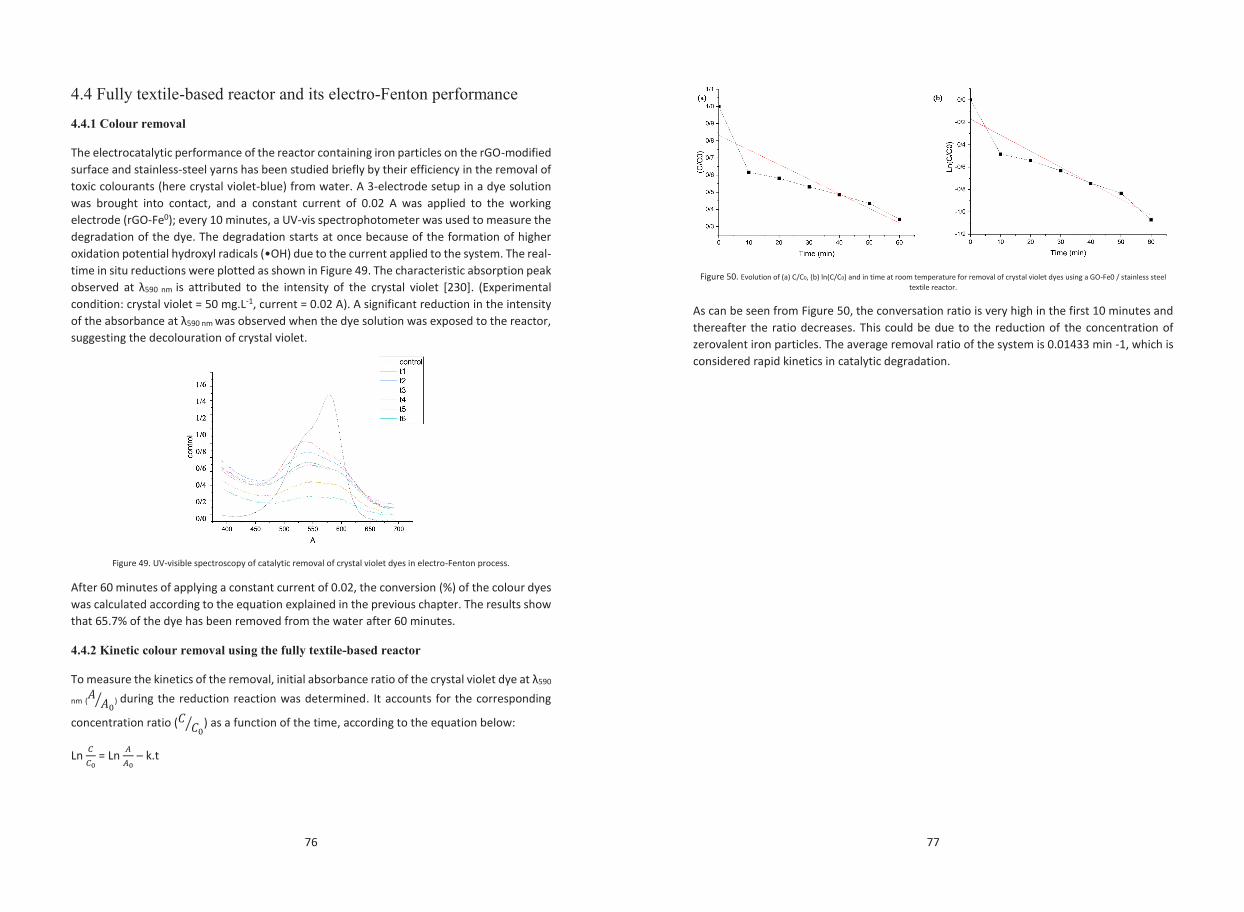
76
4.4 Fully textile-based reactor and its electro-Fenton performance
4.4.1 Colour removal
The electrocatalytic performance of the reactor containing iron particles on the rGO-modified surface and stainless-steel yarns has been studied briefly by their efficiency in the removal of toxic colourants (here crystal violet-blue) from water. A 3-electrode setup in a dye solution was brought into contact, and a constant current of 0.02 A was applied to the working electrode (rGO-Fe0); every 10 minutes, a UV-vis spectrophotometer was used to measure the degradation of the dye. The degradation starts at once because of the formation of higher oxidation potential hydroxyl radicals (•OH) due to the current applied to the system. The real-time in situ reductions were plotted as shown in Figure 49. The characteristic absorption peak observed at λ590 nm is attributed to the intensity of the crystal violet [230]. (Experimental condition: crystal violet = 50 mg.L-1, current = 0.02 A). A significant reduction in the intensity of the absorbance at λ590 nm was observed when the dye solution was exposed to the reactor, suggesting the decolouration of crystal violet.
Figure 49. UV-visible spectroscopy of catalytic removal of crystal violet dyes in electro-Fenton process.
After 60 minutes of applying a constant current of 0.02, the conversion (%) of the colour dyes was calculated according to the equation explained in the previous chapter. The results show that 65.7% of the dye has been removed from the water after 60 minutes.
4.4.2 Kinetic colour removal using the fully textile-based reactor
To measure the kinetics of the removal, initial absorbance ratio of the crystal violet dye at λ590
nm (𝐴𝐴 𝐴𝐴0⁄ ) during the reduction reaction was determined. It accounts for the corresponding
concentration ratio (𝐶𝐶 𝐶𝐶0⁄ ) as a function of the time, according to the equation below:
Ln 𝐶𝐶𝐶𝐶0 = Ln 𝐴𝐴𝐴𝐴0 – k.t
77
Figure 50. Evolution of (a) C/C0, (b) ln(C/C0) and in time at room temperature for removal of crystal violet dyes using a GO-Fe0 / stainless steel
textile reactor.
As can be seen from Figure 50, the conversation ratio is very high in the first 10 minutes and thereafter the ratio decreases. This could be due to the reduction of the concentration of zerovalent iron particles. The average removal ratio of the system is 0.01433 min -1, which is considered rapid kinetics in catalytic degradation.
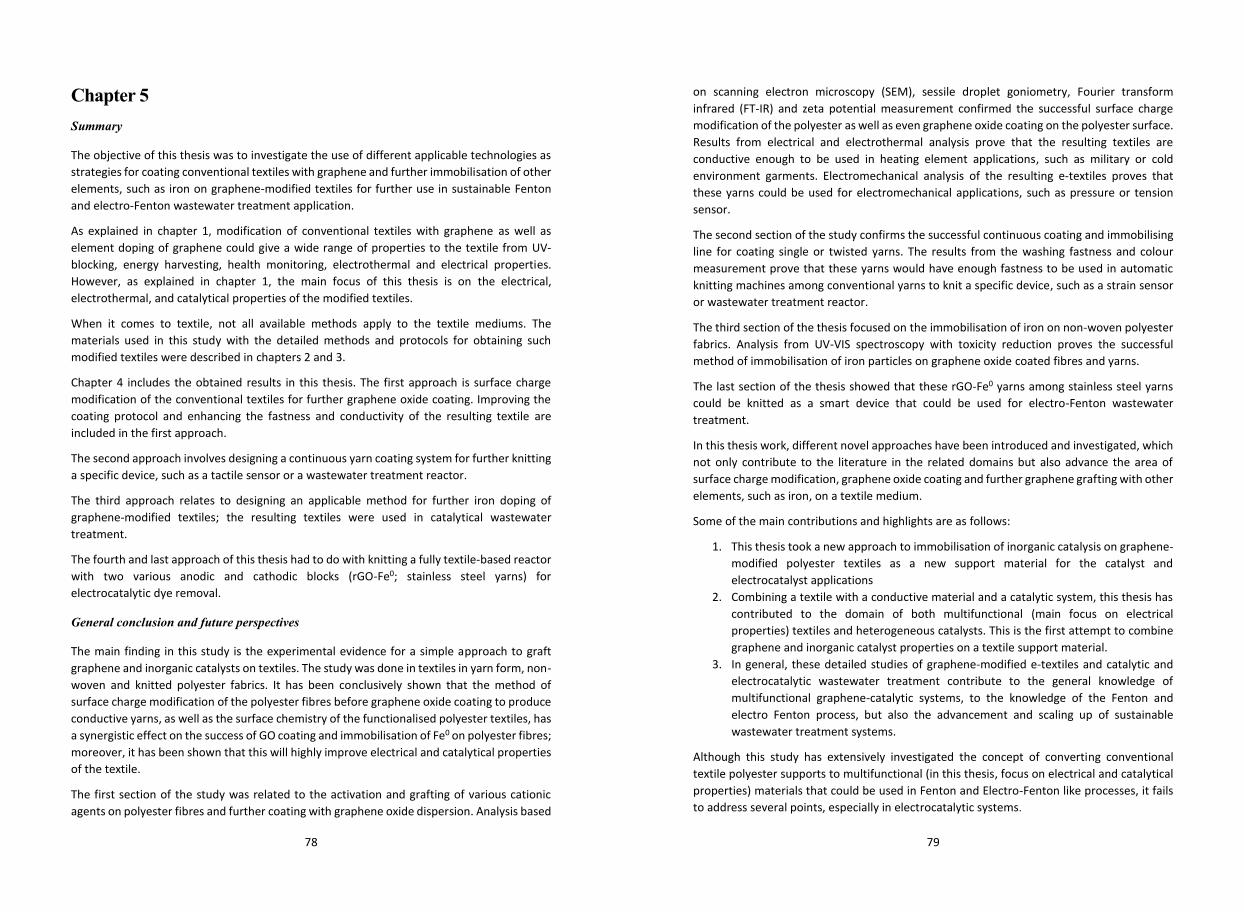
78
Chapter 5 Summary
The objective of this thesis was to investigate the use of different applicable technologies as strategies for coating conventional textiles with graphene and further immobilisation of other elements, such as iron on graphene-modified textiles for further use in sustainable Fenton and electro-Fenton wastewater treatment application.
As explained in chapter 1, modification of conventional textiles with graphene as well as element doping of graphene could give a wide range of properties to the textile from UV-blocking, energy harvesting, health monitoring, electrothermal and electrical properties. However, as explained in chapter 1, the main focus of this thesis is on the electrical, electrothermal, and catalytical properties of the modified textiles.
When it comes to textile, not all available methods apply to the textile mediums. The materials used in this study with the detailed methods and protocols for obtaining such modified textiles were described in chapters 2 and 3.
Chapter 4 includes the obtained results in this thesis. The first approach is surface charge modification of the conventional textiles for further graphene oxide coating. Improving the coating protocol and enhancing the fastness and conductivity of the resulting textile are included in the first approach.
The second approach involves designing a continuous yarn coating system for further knitting a specific device, such as a tactile sensor or a wastewater treatment reactor.
The third approach relates to designing an applicable method for further iron doping of graphene-modified textiles; the resulting textiles were used in catalytical wastewater treatment.
The fourth and last approach of this thesis had to do with knitting a fully textile-based reactor with two various anodic and cathodic blocks (rGO-Fe0; stainless steel yarns) for electrocatalytic dye removal.
General conclusion and future perspectives
The main finding in this study is the experimental evidence for a simple approach to graft graphene and inorganic catalysts on textiles. The study was done in textiles in yarn form, non-woven and knitted polyester fabrics. It has been conclusively shown that the method of surface charge modification of the polyester fibres before graphene oxide coating to produce conductive yarns, as well as the surface chemistry of the functionalised polyester textiles, has a synergistic effect on the success of GO coating and immobilisation of Fe0 on polyester fibres; moreover, it has been shown that this will highly improve electrical and catalytical properties of the textile.
The first section of the study was related to the activation and grafting of various cationic agents on polyester fibres and further coating with graphene oxide dispersion. Analysis based
79
on scanning electron microscopy (SEM), sessile droplet goniometry, Fourier transform infrared (FT-IR) and zeta potential measurement confirmed the successful surface charge modification of the polyester as well as even graphene oxide coating on the polyester surface. Results from electrical and electrothermal analysis prove that the resulting textiles are conductive enough to be used in heating element applications, such as military or cold environment garments. Electromechanical analysis of the resulting e-textiles proves that these yarns could be used for electromechanical applications, such as pressure or tension sensor.
The second section of the study confirms the successful continuous coating and immobilising line for coating single or twisted yarns. The results from the washing fastness and colour measurement prove that these yarns would have enough fastness to be used in automatic knitting machines among conventional yarns to knit a specific device, such as a strain sensor or wastewater treatment reactor.
The third section of the thesis focused on the immobilisation of iron on non-woven polyester fabrics. Analysis from UV-VIS spectroscopy with toxicity reduction proves the successful method of immobilisation of iron particles on graphene oxide coated fibres and yarns.
The last section of the thesis showed that these rGO-Fe0 yarns among stainless steel yarns could be knitted as a smart device that could be used for electro-Fenton wastewater treatment.
In this thesis work, different novel approaches have been introduced and investigated, which not only contribute to the literature in the related domains but also advance the area of surface charge modification, graphene oxide coating and further graphene grafting with other elements, such as iron, on a textile medium.
Some of the main contributions and highlights are as follows:
1. This thesis took a new approach to immobilisation of inorganic catalysis on graphene-modified polyester textiles as a new support material for the catalyst and electrocatalyst applications
2. Combining a textile with a conductive material and a catalytic system, this thesis has contributed to the domain of both multifunctional (main focus on electrical properties) textiles and heterogeneous catalysts. This is the first attempt to combine graphene and inorganic catalyst properties on a textile support material.
3. In general, these detailed studies of graphene-modified e-textiles and catalytic and electrocatalytic wastewater treatment contribute to the general knowledge of multifunctional graphene-catalytic systems, to the knowledge of the Fenton and electro Fenton process, but also the advancement and scaling up of sustainable wastewater treatment systems.
Although this study has extensively investigated the concept of converting conventional textile polyester supports to multifunctional (in this thesis, focus on electrical and catalytical properties) materials that could be used in Fenton and Electro-Fenton like processes, it fails to address several points, especially in electrocatalytic systems.
80
One of the most important plans is to replace both alkalisation and chemical surface charge modification with plasma technology, in which textiles could be nitrogen plasma treated before graphene oxide coating. This leads to a more sustainable and green method, as there is no need for chemicals, solvents and water consumption.
In this thesis, the study of toxicity reduction analysis for the electro-Fenton reactor is lacking. The reusability and recyclability of the resulting reactor also remain unanswered.
Further research in the field of electro-Fenton wastewater treatment using textile support, scaling it up and enhancing the concentration of the catalyst have endless ideas and possibilities that could be at the core of further studies.
81
REFERENCES
1. Schneegass, S. and Amft, O. Smart textiles. 2017: Springer. 2. Guo, L. et al. Smart Textiles and their Applications. 2016. Woodhead Publishing Limited,
Cambridge. 3. Stoppa, M. and Chiolerio, A. Wearable electronics and smart textiles: A critical review. Sensors,
2014. 14(7): p. 11957-11992. 4. Persson, N.K. et al. Actuating Textiles: Next Generation of Smart Textiles. Advanced Materials
Technologies, 2018. 3(10): p. 1700397. 5. Schwarz, A. et al. A roadmap on smart textiles. Textile Progress, 2010. 42(2): p. 99-180. 6. Cheng, K.B., Ueng, T.H. and Dixon, G. Electrostatic discharge properties of stainless
steel/polyester woven fabrics. Textile Research Journal, 2001. 71(8): p. 732-738. 7. Huang, Y. et al. From industrially weavable and knittable highly conductive yarns to large
wearable energy storage textiles. ACS Nano, 2015. 9(5): p. 4766-4775. 8. Lymberis, A. and De Rossi, D.E. Wearable ehealth systems for personalised health
management: state of the art and future challenges. Vol. 108. 2004: IOS Press. 9. Chai, Z. et al. Tailorable and wearable textile devices for solar energy harvesting and
simultaneous storage. ACS Nano, 2016. 10(10): p. 9201-9207. 10. Pervez, M.N. et al. Low-temperature synthesis of novel polyvinylalcohol (PVA) nanofibrous
membranes for catalytic dye degradation. Journal of Cleaner Production, 2020. 262: p. 121301.
11. Iyer, S.N. et al. Study of photoluminescence property on cellulosic fabric using multifunctional biomaterials riboflavin and its derivative Flavin mononucleotide. Scientific Reports, 2019. 9(1): p. 1-16.
12. Morshed, M.N. et al. Sonochemical fabrication of nanocryatalline titanium dioxide (TiO2) in cotton fiber for durable ultraviolet resistance. Journal of Natural Fibers, 2020. 17(1): p. 41-54.
13. Vieillard, J. et al. CuO nanosheets modified with amine and thiol grafting for high catalytic and antibacterial activities. Industrial & Engineering Chemistry Research, 2019. 58(24): p. 10179-10189.
14. Hebeish, A. et al. Preparation of durable insect repellent cotton fabric: Limonene as insecticide. Carbohydrate Polymers, 2008. 74(2): p. 268-273.
15. Agnihotri, A. et al. Insect-repellent textiles using green and sustainable approaches, in The Impact and Prospects of Green Chemistry for Textile Technology. 2019, Elsevier. p. 307-325.
16. Sadi, M.S. et al. Direct screen printing of single-faced conductive cotton fabrics for strain sensing, electrical heating and color changing. Cellulose, 2019. 26(10): p. 6179-6188.
17. Wittkowski, T. Electrically conductive textiles for occupant sensing and/or heating applications. 2014, Google Patents.
18. Craddick, J.E. Electrothermal garment. 1921, Google Patents. 19. Park, S. and Jayaraman, S. Smart textiles: Wearable electronic systems. MRS Bulletin, 2003.
28(8): p. 585-591. 20. Li, L. et al. Wearable electronic design: electrothermal properties of conductive knitted fabrics.
Textile Research Journal, 2014. 84(5): p. 477-487. 21. Hwang, P.-W. et al. Electromagnetic shielding effectiveness and functions of stainless
steel/bamboo charcoal conductive fabrics. Journal of Industrial Textiles, 2014. 44(3): p. 477-494.
22. Kumar, S. et al. Fibers from polypropylene/nano carbon fiber composites. Polymer, 2002. 43(5): p. 1701-1703.
23. Ozen, M.S. et al. Investigation of the Electromagnetic Shielding Effectiveness of Needle Punched Nonwoven Fabrics Produced from Stainless Steel and Carbon Fibres. Fibres & Textiles in Eastern Europe, 2018.
82
24. Fugetsu, B. et al. Graphene oxide as dyestuffs for the creation of electrically conductive fabrics. Carbon, 2010. 48(12): p. 3340-3345.
25. Morgan, P. Carbon fibers and their composites. 2005: CRC Press. 26. Zhou, Y. et al. Polyurethane-based solid-solid phase change materials with in situ reduced
graphene oxide for light-thermal energy conversion and storage. Chemical Engineering Journal, 2018. 338: p. 117-125.
27. Kucinskis, G., Bajars, G. and Kleperis, J. Graphene in lithium ion battery cathode materials: A review. Journal of Power Sources, 2013. 240: p. 66-79.
28. Li, X. et al. Graphene in photocatalysis: a review. Small, 2016. 12(48): p. 6640-6696. 29. Ke, Q. and Wang, J. Graphene-based materials for supercapacitor electrodes–A review. Journal
of Materiomics, 2016. 2(1): p. 37-54. 30. Enoki, T., Suzuki, M. and Endo, M. Graphite intercalation compounds and applications. 2003:
Oxford University Press. 31. Kaner, R. et al. Boron-carbon-nitrogen materials of graphite-like structure. Materials Research
Bulletin, 1987. 22(3): p. 399-404. 32. Novoselov, K.S. et al. Two-dimensional gas of massless Dirac fermions in graphene. Nature,
2005. 438(7065): p. 197-200. 33. Morozov, S. et al. Giant intrinsic carrier mobilities in graphene and its bilayer. Physical Review
Letters, 2008. 100(1): p. 016602. 34. Novoselov, K.S. et al. Electric field effect in atomically thin carbon films. Science, 2004.
306(5696): p. 666-669. 35. Berger, C. et al. Electronic confinement and coherence in patterned epitaxial graphene.
Science, 2006. 312(5777): p. 1191-1196. 36. Kim, K.S. et al. Large-scale pattern growth of graphene films for stretchable transparent
electrodes. Nature, 2009. 457(7230): p. 706-710. 37. Li, X. et al. Chemically derived, ultrasmooth graphene nanoribbon semiconductors. Science,
2008. 319(5867): p. 1229-1232. 38. Choi, W. et al. Synthesis of graphene and its applications: a review. Critical Reviews in Solid
State and Materials Sciences, 2010. 35(1): p. 52-71. 39. Geim, A.K. and Novoselov, K.S. The rise of graphene, in Nanoscience and technology: a
collection of reviews from nature journals. 2010, World Scientific. p. 11-19. 40. Stankovich, S. et al. Graphene-based composite materials. Nature, 2006. 442(7100): p. 282-
286. 41. Stankovich, S. et al. Synthesis of graphene-based nanosheets via chemical reduction of
exfoliated graphite oxide. Carbon, 2007. 45(7): p. 1558-1565. 42. Hummers Jr, W.S. and Offeman, R.E. Preparation of graphitic oxide. Journal of the American
Chemical Society, 1958. 80(6): p. 1339-1339. 43. Hirata, M. et al. Thin-film particles of graphite oxide 1:: High-yield synthesis and flexibility of
the particles. Carbon, 2004. 42(14): p. 2929-2937. 44. Park, S. and Ruoff, R.S. Chemical methods for the production of graphenes. Nature
Nanotechnology, 2009. 4(4): p. 217. 45. Stankovich, S. et al. Systematic post-assembly modification of graphene oxide paper with
primary alkylamines. Chemistry of Materials, 2010. 22(14): p. 4153-4157. 46. Dikin, D.A. et al. Preparation and characterization of graphene oxide paper. Nature, 2007.
448(7152): p. 457-460. 47. Lerf, A. et al. Structure of graphite oxide revisited. The Journal of Physical Chemistry B, 1998.
102(23): p. 4477-4482. 48. Pei, S. and Cheng, H.-M. The reduction of graphene oxide. Carbon, 2012. 50(9): p. 3210-3228. 49. Yu, W. et al. Progress in the functional modification of graphene/graphene oxide: A review.
RSC Advances, 2020. 10(26): p. 15328-15345.
83
50. Su, C.-Y. et al. Highly efficient restoration of graphitic structure in graphene oxide using alcohol vapors. ACS Nano, 2010. 4(9): p. 5285-5292.
51. Kim, H., Abdala, A.A. and Macosko, C.W. Graphene/polymer nanocomposites. Macromolecules, 2010. 43(16): p. 6515-6530.
52. Huh, S.H. Thermal reduction of graphene oxide. Physics and Applications of Graphene-Experiments, 2011. 19: p. 73-90.
53. Chang, S.-J. et al. Graphene growth from reduced graphene oxide by chemical vapour deposition: seeded growth accompanied by restoration. Scientific Reports, 2016. 6(1): p. 1-9.
54. Chua, C.K. and Pumera, M. Chemical reduction of graphene oxide: a synthetic chemistry viewpoint. Chemical Society Reviews, 2014. 43(1): p. 291-312.
55. Shin, H.J. et al. Efficient reduction of graphite oxide by sodium borohydride and its effect on electrical conductance. Advanced Functional Materials, 2009. 19(12): p. 1987-1992.
56. Becerril, H.A. et al. Evaluation of solution-processed reduced graphene oxide films as transparent conductors. ACS Nano, 2008. 2(3): p. 463-470.
57. Fernández-Merino, M.J. et al. Vitamin C is an ideal substitute for hydrazine in the reduction of graphene oxide suspensions. The Journal of Physical Chemistry C, 2010. 114(14): p. 6426-6432.
58. Shateri-Khalilabad, M. and Yazdanshenas, M.E. Fabricating electroconductive cotton textiles using graphene. Carbohydrate Polymers, 2013. 96(1): p. 190-195.
59. Nabil, B. et al. Development of new multifunctional filter based nonwovens for organics pollutants reduction and detoxification: High catalytic and antibacterial activities. Chemical Engineering Journal, 2019. 356: p. 702-716.
60. Bai, H. et al. Non-covalent functionalization of graphene sheets by sulfonated polyaniline. Chemical Communications, 2009(13): p. 1667-1669.
61. Wang, X. and Shi, G. An introduction to the chemistry of graphene. Physical Chemistry Chemical Physics, 2015. 17(43): p. 28484-28504.
62. Duan, X. et al. Effects of nitrogen-, boron-, and phosphorus-doping or codoping on metal-free graphene catalysis. Catalysis Today, 2015. 249: p. 184-191.
63. Song, Y. et al. Iron (III) Chloride doping of CVD graphene. Nanotechnology, 2014. 25(39): p. 395701.
64. Zhou, T. et al. Increased activity of nitrogen-doped graphene-like carbon sheets modified by iron doping for oxygen reduction. Journal of Colloid and Interface Science, 2019. 536: p. 42-52.
65. Sibul, R. et al. Iron-and nitrogen-doped graphene-based catalysts for fuel cell applications. ChemElectroChem, 2020. 7(7): p. 1739-1747.
66. Li, J. et al. Electronic modulation of nickel phosphide by iron doping and its assembly on a graphene framework for efficient electrocatalytic water oxidation. Journal of Alloys and Compounds, 2020. 824: p. 153913.
67. Liu, H. et al. Easy one-step hydrothermal synthesis of nitrogen-doped reduced graphene oxide/iron oxide hybrid as efficient supercapacitor material. Journal of Solid State Electrochemistry, 2015. 19(1): p. 135-144.
68. Hsu, K.-I. et al. Immobilization of iron hydroxide/oxide on reduced graphene oxide: peroxidase-like activity and selective detection of sulfide ions. RSC Advances, 2014. 4(71): p. 37705-37713.
69. Deb, H. et al. Design and development of TiO 2-Fe 0 nanoparticle-immobilized nanofibrous mat for photocatalytic degradation of hazardous water pollutants. Journal of Materials Science: Materials in Electronics, 2019. 30(5): p. 4842-4854.
70. Morshed, M.N. et al. Stabilization of zero valent iron (Fe0) on plasma/dendrimer functionalized polyester fabrics for Fenton-like removal of hazardous water pollutants. Chemical Engineering Journal, 2019. 374: p. 658-673.
71. Hu, C. et al. Spontaneous reduction and assembly of graphene oxide into three-dimensional graphene network on arbitrary conductive substrates. Scientific Reports, 2013. 3: p. 2065.
84
72. Li, X. et al. Directly drawing self-assembled, porous, and monolithic graphene fiber from chemical vapor deposition grown graphene film and its electrochemical properties. Langmuir, 2011. 27(19): p. 12164-12171.
73. Dong, Z. et al. Facile fabrication of light, flexible and multifunctional graphene fibers. Advanced Materials, 2012. 24(14): p. 1856-1861.
74. Mishra, R.K. et al. Electrospinning of graphene-oxide onto screen printed electrodes for heavy metal biosensor. Sensors and Actuators B: Chemical, 2017. 247: p. 366-373.
75. Weise, B. et al. Melt-and wet-spinning of graphene-polymer nano-composite fibres for multifunctional textile applications. Materials Today: Proceedings, 2017. 4: p. S135-S145.
76. Xu, Z. and Gao, C. In situ polymerization approach to graphene-reinforced nylon-6 composites. Macromolecules, 2010. 43(16): p. 6716-6723.
77. Xu, Z. and Gao, C. Graphene chiral liquid crystals and macroscopic assembled fibres. Nature Communications, 2011. 2: p. 571.
78. Xu, Z. et al. Strong, conductive, lightweight, neat graphene aerogel fibers with aligned pores. Acs Nano, 2012. 6(8): p. 7103-7113.
79. Jalili, R. et al. Scalable one‐step wet‐spinning of graphene fibers and yarns from liquid crystalline dispersions of graphene oxide: towards multifunctional textiles. Advanced Functional Materials, 2013. 23(43): p. 5345-5354.
80. Miankafshe, M.A., Bashir, T. and Persson, N.-K. The role and importance of surface modification of polyester fabrics by chitosan and hexadecylpyridinium chloride for the electrical and electro-thermal performance of graphene-modified smart textiles. New Journal of Chemistry, 2019. 43(17): p. 6643-6658.
81. Stoller, M.D. et al. Graphene-based ultracapacitors. Nano letters, 2008. 8(10): p. 3498-3502. 82. Suk, J.W. et al. Mechanical properties of monolayer graphene oxide. ACS Nano, 2010. 4(11): p.
6557-6564. 83. He, H. et al. 3D-printed graphene antennas and interconnections for textile RFID tags:
fabrication and reliability towards humidity. International Journal of Antennas and Propagation, 2017. 2017.
84. He, H. et al. 3D-printed graphene and stretchable antennas for wearable RFID applications. in 2017 International Symposium on Antennas and Propagation (ISAP). 2017. IEEE.
85. Xu, X. et al. Screen printed graphene electrodes on textile for wearable electrocardiogram monitoring. Applied Physics A, 2019. 125(10): p. 1-7.
86. Neves, A. et al. Transparent conductive graphene textile fibers. Scientific Reports, 2015. 5(1): p. 1-7.
87. Ojha, K., Anjaneyulu, O. and Ganguli, A.K. Graphene-based hybrid materials: synthetic approaches and properties. Current Science, 2014: p. 397-418.
88. Stankovich, S. et al. Stable aqueous dispersions of graphitic nanoplatelets via the reduction of exfoliated graphite oxide in the presence of poly (sodium 4-styrenesulfonate). Journal of Materials Chemistry, 2006. 16(2): p. 155-158.
89. Bourlinos, A.B. et al. Graphite oxide: chemical reduction to graphite and surface modification with primary aliphatic amines and amino acids. Langmuir, 2003. 19(15): p. 6050-6055.
90. Lotya, M. et al. Liquid phase production of graphene by exfoliation of graphite in surfactant/water solutions. Journal of the American Chemical Society, 2009. 131(10): p. 3611-3620.
91. Grancaric, A.M., Tarbuk, A. and Pusic, T. Electrokinetic properties of textile fabrics. Coloration Technology, 2005. 121(4): p. 221-227.
92. Moleon, J.A. et al. Effect of N-cetylpyridinium chloride in adsorption of graphene oxide onto polyester. Dyes and Pigments, 2015. 122: p. 310-316.
93. Bao, H. et al. Immobilization of trypsin in the layer-by-layer coating of graphene oxide and chitosan on in-channel glass fiber for microfluidic proteolysis. Analyst, 2011. 136(24): p. 5190-5196.
85
94. Sahito, I.A. et al. Integrating high electrical conductivity and photocatalytic activity in cotton fabric by cationizing for enriched coating of negatively charged graphene oxide. Carbohydrate Polymers, 2015. 130: p. 299-306.
95. Salem, T. et al. Modification of plasma pre-treated PET fabrics with poly-DADMAC and its surface activity towards acid dyes. Progress in Organic Coatings, 2011. 72(1-2): p. 168-174.
96. Oliveria, F.R. et al. Dyeing of cotton and polyester blended fabric previously cationized with synthetic and natural polyelectrolytes. Procedia Engineering, 2017. 200: p. 309-316.
97. Perinotto, A.C. et al. Dendrimer-assisted immobilization of alcohol dehydrogenase in nanostructured films for biosensing: Ethanol detection using electrical capacitance measurements. Thin Solid Films, 2008. 516(24): p. 9002-9005.
98. Xu, L. et al. Biosensor Based on Self‐Assembling Glucose Oxidase and Dendrimer‐Encapsulated Pt Nanoparticles on Carbon Nanotubes for Glucose Detection. Electroanalysis: An International Journal Devoted to Fundamental and Practical Aspects of Electroanalysis, 2007. 19(6): p. 717-722.
99. Wang, S. et al. Polyamidoamine dendrimer as a spacer for the immobilization of glucose oxidase in capillary enzyme microreactor. Analytical biochemistry, 2010. 405(2): p. 230-235.
100. Svobodova, L., Šnejdárková, M. and Hianik, T. Properties of glucose biosensors based on dendrimer layers. Effect of enzyme immobilization. Analytical and Bioanalytical Chemistry, 2002. 373(8): p. 735-741.
101. Wan, D. et al. A novel mesoporous nanocarrier: Integrating hollow magnetic fibrous silica with PAMAM into a single nanocomposite for enzyme immobilization. Microporous and Mesoporous Materials, 2019. 280: p. 46-56.
102. Jiang, J. et al. Enzyme immobilized on polyamidoamine-coated magnetic microspheres for α-glucosidase inhibitors screening from Radix Paeoniae Rubra extracts accompanied with molecular modeling. Talanta, 2019. 195: p. 127-136.
103. Morshed, M.N. et al. Stabilization of zero valent iron (Fe0) on plasma/dendrimer functionalized polyester fabrics for Fenton-like removal of hazardous water pollutant. Chemical Engineering Journal, 2019.
104. Omar, N.A.S. et al. Sensitive Detection of Dengue Virus Type 2 E-Proteins Signals Using Self-Assembled Monolayers/Reduced Graphene Oxide-PAMAM Dendrimer Thin Film-SPR Optical Sensor. Scientific Reports, 2020. 10(1): p. 1-15.
105. Tian, M. et al. Robust ultraviolet blocking cotton fabric modified with chitosan/graphene nanocomposites. Materials Letters, 2015. 145: p. 340-343.
106. Tian, M. et al. Ultraviolet protection cotton fabric achieved via layer-by-layer self-assembly of graphene oxide and chitosan. Applied Surface Science, 2016. 377: p. 141-148.
107. Hung, W.-S. et al. Fabrication of hydrothermally reduced graphene oxide/chitosan composite membranes with a lamellar structure on methanol dehydration. Carbon, 2017. 117: p. 112-119.
108. Kuilla, T. et al. Recent advances in graphene based polymer composites. Progress in Polymer Science, 2010. 35(11): p. 1350-1375.
109. Liu, Y. et al. Facile preparation and characterization of poly (vinyl alcohol)/chitosan/graphene oxide biocomposite nanofibers. Journal of Industrial and Engineering Chemistry, 2014. 20(6): p. 4415-4420.
110. Boussif, O. et al. A versatile vector for gene and oligonucleotide transfer into cells in culture and in vivo: polyethylenimine. Proceedings of the National Academy of Sciences, 1995. 92(16): p. 7297-7301.
111. Fischer, D. et al. Poly (diallyldimethylammonium chlorides) and their N-methyl-N-vinylacetamide copolymer-based DNA-polyplexes: role of molecular weight and charge density in complex formation, stability, and in vitro activity. International Journal of Pharmaceutics, 2004. 280(1-2): p. 253-269.
86
112. Krajcik, R. et al. Functionalization of carbon nanotubes enables non-covalent binding and intracellular delivery of small interfering RNA for efficient knock-down of genes. Biochemical and Biophysical Research Communications, 2008. 369(2): p. 595-602.
113. Giamati, M.J. Variable power density heating using stranded resistance wire. 1995, Google Patents.
114. Ely, R.S. and Ketcham, I.M. Flexible electric heater for deicing airfoils. 1950, Google Patents. 115. Schramm, K.C. Aircraft heated floor panel. 2004, Google Patents. 116. Kim, J.H. et al. Heat generation properties of Ga doped ZnO thin films prepared by rf-
magnetron sputtering for transparent heaters. Thin Solid Films, 2008. 516(7): p. 1330-1333. 117. Kang, T.J. et al. Thickness-dependent thermal resistance of a transparent glass heater with a
single-walled carbon nanotube coating. Carbon, 2011. 49(4): p. 1087-1093. 118. Sui, D. et al. Flexible and transparent electrothermal film heaters based on graphene materials.
Small, 2011. 7(22): p. 3186-3192. 119. Anagnostopoulos, G. et al. An Evaluation of Graphene as a Multi-Functional Heating Element
for Biomedical Applications. Journal of Biomedical Nanotechnology, 2018. 14(1): p. 86-97. 120. Kochman, E. and Kochman, D. Textile heater with continuous temperature sensing and hot
spot detection. 2004, Google Patents. 121. Ohgushi, K., Hijiri, M. and Kitazawa, Z. Fibrous heating element. 1991, Google Patents. 122. Fang, X.-Y. et al. Temperature-and thickness-dependent electrical conductivity of few-layer
graphene and graphene nanosheets. Physics Letters A, 2015. 379(37): p. 2245-2251. 123. Lou, C. et al. A graphene-based flexible pressure sensor with applications to plantar pressure
measurement and gait analysis. Materials, 2017. 10(9): p. 1068. 124. Hu, X. et al. Conductive graphene-based E-textile for highly sensitive, breathable, and water-
resistant multimodal gesture-distinguishable sensors. Journal of Materials Chemistry A, 2020. 8(29): p. 14778-14787.
125. Wang, C. et al. Tactile sensors for advanced intelligent systems. Advanced Intelligent Systems, 2019. 1(8): p. 1900090.
126. Xu, M. et al. Transparent and flexible tactile sensors based on graphene films designed for smart panels. Journal of Materials Science, 2018. 53(13): p. 9589-9597.
127. Miao, P. et al. Graphene nanostructure-based tactile sensors for electronic skin applications. Nano-Micro Letters, 2019. 11(1): p. 1-37.
128. Shi, F. and Cui, X. Catalytic amination for N-alkyl amine synthesis. 2018: Academic Press. 129. Fraile, J.M., García, J.I. and Mayoral, J.A. Recent advances in the immobilization of chiral
catalysts containing bis (oxazolines) and related ligands. Coordination Chemistry Reviews, 2008. 252(5-7): p. 624-646.
130. Zhang, H. and Zhu, H. Preparation of Fe-doped TiO2 nanoparticles immobilized on polyamide fabric. Applied Surface Science, 2012. 258(24): p. 10034-10041.
131. Zhao, X. et al. Immobilizing catalysts on porous materials. Materials Today, 2006. 9(3): p. 32-39.
132. Fan, J. and Gao, Y. Nanoparticle-supported catalysts and catalytic reactions–a mini-review. Journal of Experimental Nanoscience, 2006. 1(4): p. 457-475.
133. Xiao, S. et al. Polyelectrolyte multilayer-assisted immobilization of zero-valent iron nanoparticles onto polymer nanofibers for potential environmental applications. ACS Applied Materials & Interfaces, 2009. 1(12): p. 2848-2855.
134. Crane, R.A. and Scott, T.B. Nanoscale zero-valent iron: future prospects for an emerging water treatment technology. Journal of Hazardous Materials, 2012. 211: p. 112-125.
135. Jiang, C. et al. A new insight into Fenton and Fenton-like processes for water treatment. Journal of Hazardous Materials, 2010. 174(1-3): p. 813-817.
136. Zhang, Z. et al. Microwave degradation of methyl orange dye in aqueous solution in the presence of nano-TiO2-supported activated carbon (supported-TiO2/AC/MW). Journal of Hazardous Materials, 2012. 209: p. 271-277.
87
137. Zhou, L. et al. Phenolic compounds removal by wet air oxidation based processes. Frontiers of Environmental Science & Engineering, 2018. 12(1): p. 1-20.
138. Chang, Y.-C. and Chen, D.-H. Catalytic reduction of 4-nitrophenol by magnetically recoverable Au nanocatalyst. Journal of Hazardous Materials, 2009. 165(1-3): p. 664-669.
139. Joshni, T.C. and Subramaniam, K. Enzymatic degradation of azo dyes-a review. International Journal of Environmental Sciences, 2011. 1(6): p. 1250-1260.
140. Sanchez-Prado, L. et al. Sonochemical degradation of triclosan in water and wastewater. Ultrasonics Sonochemistry, 2008. 15(5): p. 689-694.
141. Frey, P.A. and Reed, G.H. The ubiquity of iron. 2012, ACS Publications. 142. Xiang, W. et al. An insight in magnetic field enhanced zero-valent iron/H 2 O 2 Fenton-like
systems: Critical role and evolution of the pristine iron oxides layer. Scientific Reports, 2016. 6(1): p. 1-11.
143. Zhang, Y. et al. A new insight on the core–shell structure of zerovalent iron nanoparticles and its application for Pb (II) sequestration. Journal of Hazardous Materials, 2013. 263: p. 685-693.
144. Neyens, E. and Baeyens, J. A review of classic Fenton’s peroxidation as an advanced oxidation technique. Journal of Hazardous Materials, 2003. 98(1-3): p. 33-50.
145. Wu, Y., et al., Zero-valent iron-based technologies for removal of heavy metal (loid) s and organic pollutants from the aquatic environment: recent advances and perspectives. Journal of Cleaner Production, 2020: p. 123478.
146. Singh, C., Goyal, A. and Singhal, S. Nickel-doped cobalt ferrite nanoparticles: efficient catalysts for the reduction of nitroaromatic compounds and photo-oxidative degradation of toxic dyes. Nanoscale, 2014. 6(14): p. 7959-7970.
147. Carvalho, R.N. et al. Development of the first watch list under the environmental quality standards directive. JRC Science Hub, 2015.
148. Wang, Z. et al. Textile dyeing wastewater treatment. Advances in treating textile effluent, 2011. 5: p. 91-116.
149. Bernes, C. Persistent organic pollutants. 1998. 150. Gaur, N., Narasimhulu, K. and PydiSetty, Y. Recent advances in the bio-remediation of
persistent organic pollutants and its effect on environment. Journal of Cleaner Production, 2018. 198: p. 1602-1631.
151. Khurana, P., Thatai, S. and Kumar, D. Destruction of recalcitrant nanomaterials contaminants in industrial wastewater, in Emerging and Nanomaterial Contaminants in Wastewater. 2019, Elsevier. p. 137-158.
152. Cheng, M. et al. Hydroxyl radicals based advanced oxidation processes (AOPs) for remediation of soils contaminated with organic compounds: a review. Chemical Engineering Journal, 2016. 284: p. 582-598.
153. Söǧüt, O.Ö. and Akgün, M. Treatment of dyehouse waste‐water by supercritical water oxidation: a case study. Journal of Chemical Technology & Biotechnology, 2010. 85(5): p. 640-647.
154. Umar, M. and Aziz, H.A. Photocatalytic degradation of organic pollutants in water. Organic Pollutants-monitoring, Risk and Treatment, 2013. 8: p. 196-197.
155. Devi, L.G. and Kavitha, R. A review on non metal ion doped titania for the photocatalytic degradation of organic pollutants under UV/solar light: Role of photogenerated charge carrier dynamics in enhancing the activity. Applied Catalysis B: Environmental, 2013. 140: p. 559-587.
156. Wang, J. and Chen, H. Catalytic ozonation for water and wastewater treatment: recent advances and perspective. Science of the Total Environment, 2020. 704: p. 135249.
157. Pruden, B. and Le, H. Wet air oxidation of soluble components in waste water. The Canadian Journal of Chemical Engineering, 1976. 54(4): p. 319-325.
158. Xue, C. et al. Current status of applying microwave-associated catalysis for the degradation of organics in aqueous phase–a review. Journal of Environmental Sciences, 2019. 81: p. 119-135.
88
159. Naghdi, M. et al. Removal of pharmaceutical compounds in water and wastewater using fungal oxidoreductase enzymes. Environmental Pollution, 2018. 234: p. 190-213.
160. Ismail, M. et al. Catalytic reduction of picric acid, nitrophenols and organic azo dyes via green synthesized plant supported Ag nanoparticles. Journal of Molecular Liquids, 2018. 268: p. 87-101.
161. Morshed, M.N. et al. Development of a multifunctional graphene/Fe-loaded polyester textile: robust electrical and catalytic properties. Dalton Transactions, 2020. 49(47): p. 17281-17300.
162. Birjandi, N. et al. Electricity generation through degradation of organic matters in medicinal herbs wastewater using bio-electro-Fenton system. Journal of Environmental Management, 2016. 180: p. 390-400.
163. Kahoush, M. et al. Bio-Fenton and Bio-electro-Fenton as sustainable methods for degrading organic pollutants in wastewater. Process Biochemistry, 2018. 64: p. 237-247.
164. Hu, M. et al. Catalytic reduction for water treatment. Frontiers of Environmental Science & Engineering, 2018. 12(1): p. 1-18.
165. Bouazizi, N. et al. Copper oxide coated polyester fabrics with enhanced catalytic properties towards the reduction of 4-nitrophenol. Journal of Materials Science: Materials in Electronics, 2018. 29(13): p. 10802-10813.
166. Reddy, P.M. et al. Catalytic reduction of pralidoxime in pharmaceuticals by macrocyclic Ni (II) compounds derived from orthophthalaldehyde. Spectrochimica Acta Part A: Molecular and Biomolecular Spectroscopy, 2008. 70(3): p. 704-712.
167. Nabil, B. et al. Polyfunctional cotton fabrics with catalytic activity and antibacterial capacity. Chemical Engineering Journal, 2018. 351: p. 328-339.
168. Bouazizi, N. et al. Entrapment and stabilization of iron nanoparticles within APTES modified graphene oxide sheets for catalytic activity improvement. Journal of Alloys and Compounds, 2019. 771: p. 1090-1102.
169. Gupta, V.K. et al. A novel magnetic Fe@ Au core–shell nanoparticles anchored graphene oxide recyclable nanocatalyst for the reduction of nitrophenol compounds. Water Research, 2014. 48: p. 210-217.
170. Thawarkar, S.R. et al. Kinetic investigation for the catalytic reduction of nitrophenol using ionic liquid stabilized gold nanoparticles. RSC Advances, 2018. 8(67): p. 38384-38390.
171. Liu, B. et al. Insight into catalytic mechanisms for the reduction of nitrophenol via heterojunctions of gold nanoclusters on 2D boron nitride nanosheets. ChemNanoMat, 2019. 5(6): p. 784-791.
172. Brillas, E., Sirés, I. and Oturan, M.A. Electro-Fenton process and related electrochemical technologies based on Fenton’s reaction chemistry. Chemical Reviews, 2009. 109(12): p. 6570-6631.
173. Panizza, M. and G. Cerisola, Direct and mediated anodic oxidation of organic pollutants. Chemical Reviews, 2009. 109(12): p. 6541-6569.
174. Sires, I. et al. Electro-Fenton degradation of antimicrobials triclosan and triclocarban. Electrochimica Acta, 2007. 52(17): p. 5493-5503.
175. Fenton, H.J.H. LXXIII.—Oxidation of tartaric acid in presence of iron. Journal of the Chemical Society, Transactions, 1894. 65: p. 899-910.
176. Vasquez-Medrano, R., Prato-Garcia, D. and Vedrenne, M. Ferrioxalate-mediated processes, in Advanced Oxidation Processes for Waste Water Treatment. 2018, Elsevier. p. 89-113.
177. Deng, Y. and Zhao, R. Advanced oxidation processes (AOPs) in wastewater treatment. Current Pollution Reports, 2015. 1(3): p. 167-176.
178. Su, S. et al. Degradation of amoxicillin in aqueous solution using sulphate radicals under ultrasound irradiation. Ultrasonics Sonochemistry, 2012. 19(3): p. 469-474.
179. Rastogi, A., Al-Abed, S.R. and Dionysiou, D.D. Effect of inorganic, synthetic and naturally occurring chelating agents on Fe (II) mediated advanced oxidation of chlorophenols. Water Research, 2009. 43(3): p. 684-694.
89
180. Rastogi, A., Al-Abed, S.R. and Dionysiou, D.D. Sulfate radical-based ferrous–peroxymonosulfate oxidative system for PCBs degradation in aqueous and sediment systems. Applied catalysis B: environmental, 2009. 85(3-4): p. 171-179.
181. Wu, J., Zhang, H. and Qiu, J. Degradation of Acid Orange 7 in aqueous solution by a novel electro/Fe2+/peroxydisulfate process. Journal of Hazardous Materials, 2012. 215: p. 138-145.
182. Lin, H., Wu, J. and Zhang, H. Degradation of clofibric acid in aqueous solution by an EC/Fe3+/PMS process. Chemical Engineering Journal, 2014. 244: p. 514-521.
183. Zhang, H., Wu, X. and Li, X. Oxidation and coagulation removal of COD from landfill leachate by Fered–Fenton process. Chemical Engineering Journal, 2012. 210: p. 188-194.
184. Wahba, N., El Asmar, M. and El Sadr, M. Iodometric method for determination of persulfates. Analytical Chemistry, 1959. 31(11): p. 1870-1871.
185. Chiu, K.-L. and Ng, D.H. Synthesis and characterization of cotton-made activated carbon fiber and its adsorption of methylene blue in water treatment. Biomass and Bioenergy, 2012. 46: p. 102-110.
186. Zarei, M. et al. Peroxi-coagulation degradation of CI Basic Yellow 2 based on carbon-PTFE and carbon nanotube-PTFE electrodes as cathode. Electrochimica Acta, 2009. 54(26): p. 6651-6660.
187. Wang, Y. and Chu, W. Photo-assisted degradation of 2, 4, 5-trichlorophenol by Electro-Fe (II)/Oxone® process using a sacrificial iron anode: Performance optimization and reaction mechanism. Chemical Engineering Journal, 2013. 215: p. 643-650.
188. Zhang, H. et al. Removal of COD from landfill leachate by an electro/Fe2+/peroxydisulfate process. Chemical Engineering Journal, 2014. 250: p. 76-82.
189. Lin, H. Removal of organic pollutants from water by electro-Fenton and electro-Fenton like processes. 2015, Université Paris-Est.
190. Jiang, C.-C. and Zhang, J.-F. Progress and prospect in electro-Fenton process for wastewater treatment. Journal of Zhejiang University-SCIENCE A, 2007. 8(7): p. 1118-1125.
191. Nidheesh, P. and Gandhimathi, R. Trends in electro-Fenton process for water and wastewater treatment: an overview. Desalination, 2012. 299: p. 1-15.
192. He, H. and Zhou, Z. Electro-Fenton process for water and wastewater treatment. Critical Reviews in Environmental Science and Technology, 2017. 47(21): p. 2100-2131.
193. Martínez-Huitle, C.A., Rodrigo, M.A. and Scialdone, O. Electrochemical water and wastewater treatment. 2018: Butterworth-Heinemann.
194. Sillanpää, M. and Shestakova, M. Electrochemical water treatment methods: Fundamentals, methods and full scale applications. 2017: Butterworth-Heinemann.
195. Poza-Nogueiras, V. et al. Current advances and trends in electro-Fenton process using heterogeneous catalysts–a review. Chemosphere, 2018. 201: p. 399-416.
196. Mohammadi, H., Bina, B. and Ebrahimi, A. A novel three-dimensional electro-Fenton system and its application for degradation of anti-inflammatory pharmaceuticals: modeling and degradation pathways. Process Safety and Environmental Protection, 2018. 117: p. 200-213.
197. Meijide, J. et al. Heterogeneous Electro-Fenton as “Green” Technology for Pharmaceutical Removal: A Review. Catalysts, 2021. 11(1): p. 85.
198. Rinaudo, M., Pavlov, G. and Desbrieres, J. Influence of acetic acid concentration on the solubilization of chitosan. Polymer, 1999. 40(25): p. 7029-7032.
199. Jayakrishnan, A. and Shah, D.O. Phase‐transfer‐catalyzed free‐radical polymerization: Kinetics of polymerization of methyl methacrylate using ammonium peroxydisulfate/hexadecyl pyridinium chloride in ethyl acetate/water. Journal of Polymer Science: Polymer Chemistry Edition, 1983. 21(11): p. 3201-3208.
200. Sanders, E.M. and Zeronian, S.H. An analysis of the moisture‐related properties of hydrolyzed polyester. Journal of Applied Polymer Science, 1982. 27(11): p. 4477-4491.
201. Olson, L.M. and Wentz, M. Moisture Related Properties of Hydrolyzed Polyester Fabrics. Textile Chemist & Colorist, 1984. 16(2).
90
202. Miankafshe, M.A., Bashir, T. and Persson, N.-K. Electrostatic grafting of graphene onto polyamide 6, 6 yarns for use as conductive elements in smart textile applications. New Journal of Chemistry, 2020. 44(18): p. 7591-7601.
203. Takke, V. et al. Studies on the atmospheric air–plasma treatment of PET (polyethylene terephtalate) woven fabrics: effect of process parameters and of aging. Journal of Applied Polymer Science, 2009. 114(1): p. 348-357.
204. Morshed, M.N. et al. Iron-loaded amine/thiol functionalized polyester fibers with high catalytic activities: Comparative study. Dalton Transactions, 2019. 48: p. 8384-8399.
205. Morshed, M.N. et al. Iron-loaded amine/thiol functionalized polyester fibers with high catalytic activities: a comparative study. Dalton Transactions, 2019. 48(23): p. 8384-8399.
206. Xiao, S. et al. Excellent copper (II) removal using zero-valent iron nanoparticle-immobilized hybrid electrospun polymer nanofibrous mats. Colloids and Surfaces A: Physicochemical and Engineering Aspects, 2011. 381(1-3): p. 48-54.
207. Wege, H.A. et al. Dynamic contact angle and spreading rate measurements for the characterization of the effect of dentin surface treatments. Journal of Colloid and Interface Science, 2003. 263(1): p. 162-169.
208. Trotman, E.R. Dyeing and chemical technology of textile fibres. 1984. 209. Mirabella, F.M. Modern techniques in applied molecular spectroscopy. Vol. 14. 1998: John
Wiley & Sons. 210. Green, P. and MacDonald, L. Colour engineering: achieving device independent colour. Vol. 30.
2011: John Wiley & Sons. 211. Schanda, J. Colorimetry: understanding the CIE system. 2007: John Wiley & Sons. 212. Moulder, J.F. Handbook of X-ray photoelectron spectroscopy. Physical electronics, 1995: p.
230-232. 213. Okpalugo, T.I.T. et al. High resolution XPS characterization of chemical functionalised MWCNTs
and SWCNTs. Carbon, 2005. 43(1): p. 153-161. 214. Yang, L. et al. A new carboxyl-copper-organic framework and its excellent selective
absorbability for proteins. Journal of Solid State Chemistry, 2014. 218: p. 64-70. 215. Guo, X. et al. XPS analysis for cubic boron nitride crystal synthesized under high pressure and
high temperature using Li3N as catalysis. Applied Surface Science, 2014. 321: p. 94-97. 216. Höhne, G., Hemminger, W.F. and Flammersheim, H.J. Differential scanning calorimetry. 2013:
Springer Science & Business Media. 217. Hunter, R.J. Zeta Potential in Colloid Science: Principles and Applications (New York:
Academic). 1981. 218. Deb, H. et al. Immobilization of cationic titanium dioxide (TiO 2+) on electrospun nanofibrous
mat: synthesis, characterization, and potential environmental application. Fibers and Polymers, 2018. 19(8): p. 1715-1725.
219. Morshed, M.N. et al. Stabilization of zero valent iron (Fe0) on plasma/dendrimer functionalized polyester fabrics for Fenton-like removal of hazardous water pollutant. Chemical Engineering Journal, 2019. 374: p. 658-673.
220. Connelly, N.G. and Geiger, W.E. Chemical redox agents for organometallic chemistry. Chemical Reviews, 1996. 96(2): p. 877-910.
221. Li, D. et al. Processable aqueous dispersions of graphene nanosheets. Nature nanotechnology, 2008. 3(2): p. 101-105.
222. He, H. and Riedl, T. Klinowski, Solid-state NMR studies of the structure of graphite oxide, Thejournal ofPhysical Chemistry. 100 (51)(1996) 19954-19958. A Lerf, H. He, M. Forster,]. Klinowski, Structure of graphite oxide revisited. The Journal of Physical Chemistry B, 1998. 102(23): p. 4477-4482.
223. Heggie, D., Wardman, R.H. and Luo, M.R. A comparison of the colour differences computed using the CIE94, CMC (l: c) and BFD (l: c) formulae. Journal of the Society of Dyers and Colourists, 1996. 112(10): p. 264-269.
91
224. Luo, M.R. and Rigg, B. Uniform Colour Space Based on the CMC (l: c) Colour‐difference Formula. Journal of the Society of Dyers and Colourists, 1986. 102(5‐6): p. 164-171.
225. Li, C. et al. Flexible graphene electrothermal films made from electrochemically exfoliated graphite. Journal of Materials Science, 2016. 51(2): p. 1043-1051.
226. Yang, H. Research on application of carbon fiber heating material in clothing. in IOP Conference Series: Earth and Environmental Science. 2017. IOP Publishing.
227. Wang, X., Zhi, L. and Müllen, K. Transparent, conductive graphene electrodes for dye-sensitized solar cells. Nano Letters, 2008. 8(1): p. 323-327.
228. Sun, Y.-P. et al. Characterization of zero-valent iron nanoparticles. Advances in Colloid and Interface Science, 2006. 120(1-3): p. 47-56.
229. Cullis, C.F. and Hirschler, M.M. The significance of thermoanalytical measurements in the assessment of polymer flammability. Polymer, 1983. 24(7): p. 834-840.
230. Mittal, A. et al. Adsorption of hazardous dye crystal violet from wastewater by waste materials. Journal of Colloid and Interface Science, 2010. 343(2): p. 463-473.
231. Harifi, T. and Montazer, M. In situ synthesis of iron oxide nanoparticles on polyester fabric utilizing color, magnetic, antibacterial and sono-Fenton catalytic properties. Journal of Materials Chemistry B, 2014. 2(3): p. 272-282.
232. Sudrajat, H. and Babel, S. A new, cost-effective solar photoactive system N-ZnO@ polyester fabric for degradation of recalcitrant compound in a continuous flow reactor. Materials Research Bulletin, 2016. 83: p. 369-378.
233. Wawrzkiewicz, M. et al. Adsorptive removal of acid, reactive and direct dyes from aqueous solutions and wastewater using mixed silica–alumina oxide. Powder Technology, 2015. 278: p. 306-315.

Paper I
This journal is©The Royal Society of Chemistry and the Centre National de la Recherche Scientifique 2019 New J. Chem., 2019, 43, 6643--6658 | 6643
Cite this: New J. Chem., 2019,
43, 6643
The role and importance of surface modificationof polyester fabrics by chitosan andhexadecylpyridinium chloride for the electricaland electro-thermal performance of graphene-modified smart textiles
Milad Asadi Miankafshe, *ab Tariq Bashir ac and Nils-Krister Perssonab
Graphene has the potential to create highly valuable electrical conductive textile systems with
maintained pliability and psychological comfort. There have already been numerous studies regarding
electrically functionalized graphene-coated textiles. However, processing development is far from being
exhausted. Here we have studied electro-thermal textiles based on the most common fibers, polyester,
and an industry-relevant graphene impregnation method by introducing surface pre-modification of
fabrics for graphene-modified textile processing. For this purpose, polyester fabrics were treated with
four different cationic agents and impregnated with graphene oxide (GO) colloidal particles. Then, direct
chemical reduction of GO to an electrically conductive graphene oxide (rGO) was performed. A pristine
fabric modified by rGO showed a high resistance of 27.3 kO &1 without any electro-thermal activity,
whilst chitosan-treated (CS) and hexadecylpyridinium chloride-treated (HDPC) fabrics had resistance
values of 2.7 and 0.59 kO &1 respectively, and excellent heat propagation with a good temperature
distribution. The steady-state temperature of CS-treated and HDPC-treated fabrics increased from
28 1C and 33 1C to 60 1C and 120 1C, respectively, as the voltage applied increased from 10 V to 30 V.
These rGO-modified fabrics also have excellent electro-mechanical performance, and are good
candidates for flexible strain sensor applications.
Introduction
Flexible electro-thermal heating elements have been used for awide range of applications—for example, electrically heatedgarments,1–3 seat heaters in vehicles,4 thermal de-icing in aircraftand ice-prevention of structural membranes such as in wings,5,6
heated floor panels in aircrafts to control the cabin temperature,7
and continuous temperature sensing systems in constructionand industrial applications.8,9
These systems are mostly based on integration of metallicwires and textile fibers. Recently, textiles with electrical proper-ties (known as e-textiles) for use in many smart applications andin heating elements, have been prepared by different methods,e.g. deposition of conjugated polymers onto textiles by chemicalvapor deposition,10 spinning of nano-metallic filaments such as
stainless steel microfilaments with conventional staple fibers,11
melt-spinning of nanoparticles and carbon products withpolymers,12 preparation of non-woven fabrics made of staplestainless steels, carbon fibers and polymers,13 and dip-coatingof conventional textiles with graphene.14
Among these, graphene is an excellent choice for e-textiles.A single two-dimensional exfoliated graphene oxide (GO) sheethas a thickness of one or a few atoms of sp2-bonded carbonatoms and could be used as a colloidal dye in the textile dyeingindustry,14 offering interesting optical, electrical, and thermalproperties.15,16
GO is produced by exfoliating graphite through a simpleHarsh oxidation by Hummers’ method,17–19 resulting in highlyoxygenated graphene with hydroxyl and epoxide functionalgroups on the surface, and carboxyl and carbonyl groups at theedge of the sheets.20 The availability of oxygen functional groupson the structure of GO gives excellent hydrophilic behavior andpossible chemical bonding with textiles. Thus, an aqueousdispersion of GO could be prepared with a solubility as highas 2.0 wt% and applied as a dye to the textile. Exfoliated GOhas electrical insulation properties owing to the attached
a The Swedish School of Textile, Polymeric E-textiles, University of Borås,
SE-501 90 Borås, Sweden. E-mail: [email protected]; Tel: +46723993664b Smart Textiles, University of Borås, SE-501 90 Borås, Swedenc Swedish Centre for Resource Recovery, University of Borås,
SE-501 90 Borås, Sweden
Received 26th October 2018,Accepted 2nd April 2019
DOI: 10.1039/c8nj05445b
rsc.li/njc
NJC
PAPER
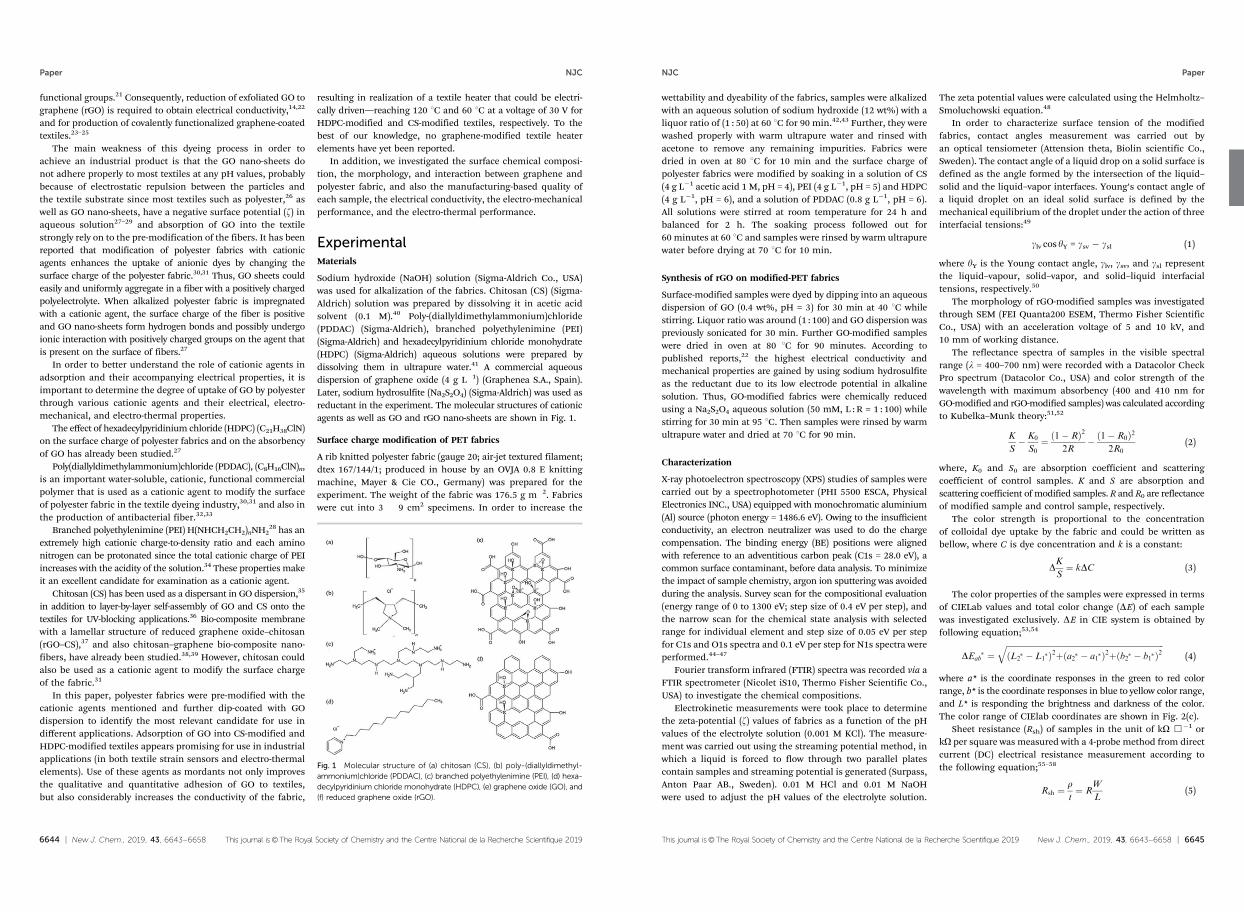
6644 | New J. Chem., 2019, 43, 6643--6658 This journal is©The Royal Society of Chemistry and the Centre National de la Recherche Scientifique 2019
functional groups.21 Consequently, reduction of exfoliated GO tographene (rGO) is required to obtain electrical conductivity,14,22
and for production of covalently functionalized graphene-coatedtextiles.23–25
The main weakness of this dyeing process in order toachieve an industrial product is that the GO nano-sheets donot adhere properly to most textiles at any pH values, probablybecause of electrostatic repulsion between the particles andthe textile substrate since most textiles such as polyester,26 aswell as GO nano-sheets, have a negative surface potential (z) inaqueous solution27–29 and absorption of GO into the textilestrongly rely on to the pre-modification of the fibers. It has beenreported that modification of polyester fabrics with cationicagents enhances the uptake of anionic dyes by changing thesurface charge of the polyester fabric.30,31 Thus, GO sheets couldeasily and uniformly aggregate in a fiber with a positively chargedpolyelectrolyte. When alkalized polyester fabric is impregnatedwith a cationic agent, the surface charge of the fiber is positiveand GO nano-sheets form hydrogen bonds and possibly undergoionic interaction with positively charged groups on the agent thatis present on the surface of fibers.27
In order to better understand the role of cationic agents inadsorption and their accompanying electrical properties, it isimportant to determine the degree of uptake of GO by polyesterthrough various cationic agents and their electrical, electro-mechanical, and electro-thermal properties.
The effect of hexadecylpyridinium chloride (HDPC) (C21H38ClN)on the surface charge of polyester fabrics and on the absorbencyof GO has already been studied.27
Poly(diallyldimethylammonium)chloride (PDDAC), (C8H16ClN)n,is an important water-soluble, cationic, functional commercialpolymer that is used as a cationic agent to modify the surfaceof polyester fabric in the textile dyeing industry,30,31 and also inthe production of antibacterial fiber.32,33
Branched polyethylenimine (PEI) H(NHCH2CH2)nNH228 has an
extremely high cationic charge-to-density ratio and each aminonitrogen can be protonated since the total cationic charge of PEIincreases with the acidity of the solution.34 These properties makeit an excellent candidate for examination as a cationic agent.
Chitosan (CS) has been used as a dispersant in GO dispersion,35
in addition to layer-by-layer self-assembly of GO and CS onto thetextiles for UV-blocking applications.36 Bio-composite membranewith a lamellar structure of reduced graphene oxide–chitosan(rGO–CS),37 and also chitosan–graphene bio-composite nano-fibers, have already been studied.38,39 However, chitosan couldalso be used as a cationic agent to modify the surface chargeof the fabric.31
In this paper, polyester fabrics were pre-modified with thecationic agents mentioned and further dip-coated with GOdispersion to identify the most relevant candidate for use indifferent applications. Adsorption of GO into CS-modified andHDPC-modified textiles appears promising for use in industrialapplications (in both textile strain sensors and electro-thermalelements). Use of these agents as mordants not only improvesthe qualitative and quantitative adhesion of GO to textiles,but also considerably increases the conductivity of the fabric,
resulting in realization of a textile heater that could be electri-cally driven—reaching 120 1C and 60 1C at a voltage of 30 V forHDPC-modified and CS-modified textiles, respectively. To thebest of our knowledge, no graphene-modified textile heaterelements have yet been reported.
In addition, we investigated the surface chemical composi-tion, the morphology, and interaction between graphene andpolyester fabric, and also the manufacturing-based quality ofeach sample, the electrical conductivity, the electro-mechanicalperformance, and the electro-thermal performance.
ExperimentalMaterials
Sodium hydroxide (NaOH) solution (Sigma-Aldrich Co., USA)was used for alkalization of the fabrics. Chitosan (CS) (Sigma-Aldrich) solution was prepared by dissolving it in acetic acidsolvent (0.1 M).40 Poly-(diallyldimethylammonium)chloride(PDDAC) (Sigma-Aldrich), branched polyethylenimine (PEI)(Sigma-Aldrich) and hexadecylpyridinium chloride monohydrate(HDPC) (Sigma-Aldrich) aqueous solutions were prepared bydissolving them in ultrapure water.41 A commercial aqueousdispersion of graphene oxide (4 g L1) (Graphenea S.A., Spain).Later, sodium hydrosulfite (Na2S2O4) (Sigma-Aldrich) was used asreductant in the experiment. The molecular structures of cationicagents as well as GO and rGO nano-sheets are shown in Fig. 1.
Surface charge modification of PET fabrics
A rib knitted polyester fabric (gauge 20; air-jet textured filament;dtex 167/144/1; produced in house by an OVJA 0.8 E knittingmachine, Mayer & Cie CO., Germany) was prepared for theexperiment. The weight of the fabric was 176.5 g m2. Fabricswere cut into 3 9 cm2 specimens. In order to increase the
Fig. 1 Molecular structure of (a) chitosan (CS), (b) poly-(diallyldimethyl-ammonium)chloride (PDDAC), (c) branched polyethylenimine (PEI), (d) hexa-decylpyridinium chloride monohydrate (HDPC), (e) graphene oxide (GO), and(f) reduced graphene oxide (rGO).
Paper NJC
This journal is©The Royal Society of Chemistry and the Centre National de la Recherche Scientifique 2019 New J. Chem., 2019, 43, 6643--6658 | 6645
wettability and dyeability of the fabrics, samples were alkalizedwith an aqueous solution of sodium hydroxide (12 wt%) with aliquor ratio of (1 : 50) at 60 1C for 90 min.42,43 Further, they werewashed properly with warm ultrapure water and rinsed withacetone to remove any remaining impurities. Fabrics weredried in oven at 80 1C for 10 min and the surface charge ofpolyester fabrics were modified by soaking in a solution of CS(4 g L1 acetic acid 1 M, pH = 4), PEI (4 g L1, pH = 5) and HDPC(4 g L1, pH = 6), and a solution of PDDAC (0.8 g L1, pH = 6).All solutions were stirred at room temperature for 24 h andbalanced for 2 h. The soaking process followed out for60 minutes at 60 1C and samples were rinsed by warm ultrapurewater before drying at 70 1C for 10 min.
Synthesis of rGO on modified-PET fabrics
Surface-modified samples were dyed by dipping into an aqueousdispersion of GO (0.4 wt%, pH = 3) for 30 min at 40 1C whilestirring. Liquor ratio was around (1 : 100) and GO dispersion waspreviously sonicated for 30 min. Further GO-modified sampleswere dried in oven at 80 1C for 90 minutes. According topublished reports,22 the highest electrical conductivity andmechanical properties are gained by using sodium hydrosulfiteas the reductant due to its low electrode potential in alkalinesolution. Thus, GO-modified fabrics were chemically reducedusing a Na2S2O4 aqueous solution (50 mM, L : R = 1 : 100) whilestirring for 30 min at 95 1C. Then samples were rinsed by warmultrapure water and dried at 70 1C for 90 min.
Characterization
X-ray photoelectron spectroscopy (XPS) studies of samples werecarried out by a spectrophotometer (PHI 5500 ESCA, PhysicalElectronics INC., USA) equipped with monochromatic aluminium(Al) source (photon energy = 1486.6 eV). Owing to the insufficientconductivity, an electron neutralizer was used to do the chargecompensation. The binding energy (BE) positions were alignedwith reference to an adventitious carbon peak (C1s = 28.0 eV), acommon surface contaminant, before data analysis. To minimizethe impact of sample chemistry, argon ion sputtering was avoidedduring the analysis. Survey scan for the compositional evaluation(energy range of 0 to 1300 eV; step size of 0.4 eV per step), andthe narrow scan for the chemical state analysis with selectedrange for individual element and step size of 0.05 eV per stepfor C1s and O1s spectra and 0.1 eV per step for N1s spectra wereperformed.44–47
Fourier transform infrared (FTIR) spectra was recorded via aFTIR spectrometer (Nicolet iS10, Thermo Fisher Scientific Co.,USA) to investigate the chemical compositions.
Electrokinetic measurements were took place to determinethe zeta-potential (z) values of fabrics as a function of the pHvalues of the electrolyte solution (0.001 M KCl). The measure-ment was carried out using the streaming potential method, inwhich a liquid is forced to flow through two parallel platescontain samples and streaming potential is generated (Surpass,Anton Paar AB., Sweden). 0.01 M HCl and 0.01 M NaOHwere used to adjust the pH values of the electrolyte solution.
The zeta potential values were calculated using the Helmholtz–Smoluchowski equation.48
In order to characterize surface tension of the modifiedfabrics, contact angles measurement was carried out byan optical tensiometer (Attension theta, Biolin scientific Co.,Sweden). The contact angle of a liquid drop on a solid surface isdefined as the angle formed by the intersection of the liquid–solid and the liquid–vapor interfaces. Young’s contact angle ofa liquid droplet on an ideal solid surface is defined by themechanical equilibrium of the droplet under the action of threeinterfacial tensions:49
glv cos yY = gsv gsl (1)
where yY is the Young contact angle, glv, gsv, and gsl representthe liquid–vapour, solid–vapor, and solid–liquid interfacialtensions, respectively.50
The morphology of rGO-modified samples was investigatedthrough SEM (FEI Quanta200 ESEM, Thermo Fisher ScientificCo., USA) with an acceleration voltage of 5 and 10 kV, and10 mm of working distance.
The reflectance spectra of samples in the visible spectralrange (l = 400–700 nm) were recorded with a Datacolor CheckPro spectrum (Datacolor Co., USA) and color strength of thewavelength with maximum absorbency (400 and 410 nm forGO-modified and rGO-modified samples) was calculated accordingto Kubelka–Munk theory:51,52
K
S K0
S0¼ 1 Rð Þ2
2R ð1 R0Þ2
2R0(2)
where, K0 and S0 are absorption coefficient and scatteringcoefficient of control samples. K and S are absorption andscattering coefficient of modified samples. R and R0 are reflectanceof modified sample and control sample, respectively.
The color strength is proportional to the concentrationof colloidal dye uptake by the fabric and could be written asbellow, where C is dye concentration and k is a constant:
DK
S¼ kDC (3)
The color properties of the samples were expressed in termsof CIELab values and total color change (DE) of each samplewas investigated exclusively. DE in CIE system is obtained byfollowing equation;53,54
DEab ¼
ffiffiffiffiffiffiffiffiffiffiffiffiffiffiffiffiffiffiffiffiffiffiffiffiffiffiffiffiffiffiffiffiffiffiffiffiffiffiffiffiffiffiffiffiffiffiffiffiffiffiffiffiffiffiffiffiffiffiffiffiffiffiffiffiffiffiffiffiffiffiffiffiffiffiffiffiffiffiffiL2
L1ð Þ2þ a2 a1ð Þ2þ b2 b1ð Þ2
q(4)
where a* is the coordinate responses in the green to red colorrange, b* is the coordinate responses in blue to yellow color range,and L* is responding the brightness and darkness of the color.The color range of CIElab coordinates are shown in Fig. 2(c).
Sheet resistance (Rsh) of samples in the unit of kO &1 orkO per square was measured with a 4-probe method from directcurrent (DC) electrical resistance measurement according tothe following equation;55–58
Rsh ¼ rt¼ R
W
L(5)
NJC Paper
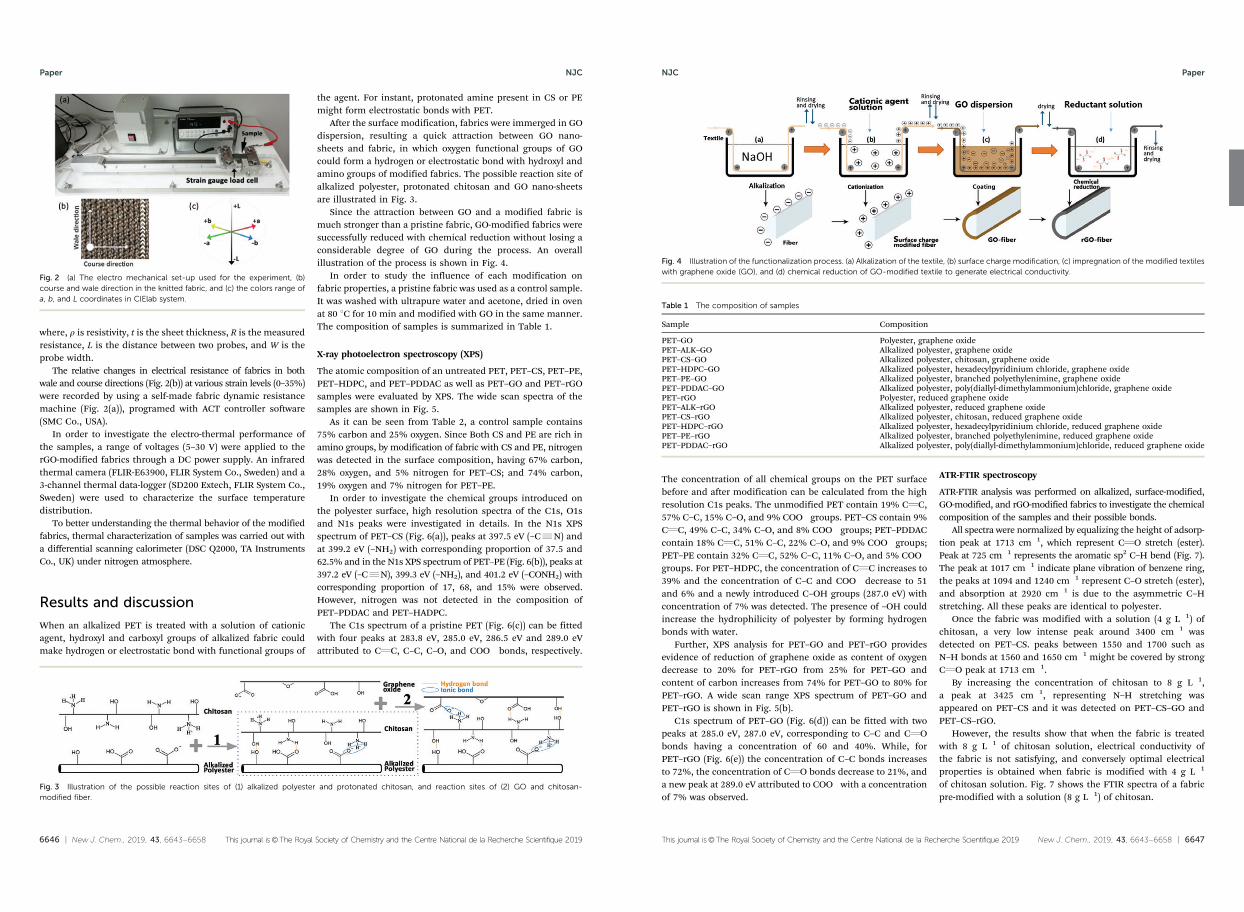
6646 | New J. Chem., 2019, 43, 6643--6658 This journal is©The Royal Society of Chemistry and the Centre National de la Recherche Scientifique 2019
where, r is resistivity, t is the sheet thickness, R is the measuredresistance, L is the distance between two probes, and W is theprobe width.
The relative changes in electrical resistance of fabrics in bothwale and course directions (Fig. 2(b)) at various strain levels (0–35%)were recorded by using a self-made fabric dynamic resistancemachine (Fig. 2(a)), programed with ACT controller software(SMC Co., USA).
In order to investigate the electro-thermal performance ofthe samples, a range of voltages (5–30 V) were applied to therGO-modified fabrics through a DC power supply. An infraredthermal camera (FLIR-E63900, FLIR System Co., Sweden) and a3-channel thermal data-logger (SD200 Extech, FLIR System Co.,Sweden) were used to characterize the surface temperaturedistribution.
To better understanding the thermal behavior of the modifiedfabrics, thermal characterization of samples was carried out witha differential scanning calorimeter (DSC Q2000, TA InstrumentsCo., UK) under nitrogen atmosphere.
Results and discussion
When an alkalized PET is treated with a solution of cationicagent, hydroxyl and carboxyl groups of alkalized fabric couldmake hydrogen or electrostatic bond with functional groups of
the agent. For instant, protonated amine present in CS or PEmight form electrostatic bonds with PET.
After the surface modification, fabrics were immerged in GOdispersion, resulting a quick attraction between GO nano-sheets and fabric, in which oxygen functional groups of GOcould form a hydrogen or electrostatic bond with hydroxyl andamino groups of modified fabrics. The possible reaction site ofalkalized polyester, protonated chitosan and GO nano-sheetsare illustrated in Fig. 3.
Since the attraction between GO and a modified fabric ismuch stronger than a pristine fabric, GO-modified fabrics weresuccessfully reduced with chemical reduction without losing aconsiderable degree of GO during the process. An overallillustration of the process is shown in Fig. 4.
In order to study the influence of each modification onfabric properties, a pristine fabric was used as a control sample.It was washed with ultrapure water and acetone, dried in ovenat 80 1C for 10 min and modified with GO in the same manner.The composition of samples is summarized in Table 1.
X-ray photoelectron spectroscopy (XPS)
The atomic composition of an untreated PET, PET–CS, PET–PE,PET–HDPC, and PET–PDDAC as well as PET–GO and PET–rGOsamples were evaluated by XPS. The wide scan spectra of thesamples are shown in Fig. 5.
As it can be seen from Table 2, a control sample contains75% carbon and 25% oxygen. Since Both CS and PE are rich inamino groups, by modification of fabric with CS and PE, nitrogenwas detected in the surface composition, having 67% carbon,28% oxygen, and 5% nitrogen for PET–CS; and 74% carbon,19% oxygen and 7% nitrogen for PET–PE.
In order to investigate the chemical groups introduced onthe polyester surface, high resolution spectra of the C1s, O1sand N1s peaks were investigated in details. In the N1s XPSspectrum of PET–CS (Fig. 6(a)), peaks at 397.5 eV (–CRN) andat 399.2 eV (–NH2) with corresponding proportion of 37.5 and62.5% and in the N1s XPS spectrum of PET–PE (Fig. 6(b)), peaks at397.2 eV (–CRN), 399.3 eV (–NH2), and 401.2 eV (–CONH2) withcorresponding proportion of 17, 68, and 15% were observed.However, nitrogen was not detected in the composition ofPET–PDDAC and PET–HADPC.
The C1s spectrum of a pristine PET (Fig. 6(c)) can be fittedwith four peaks at 283.8 eV, 285.0 eV, 286.5 eV and 289.0 eVattributed to CQC, C–C, C–O, and COO bonds, respectively.
Fig. 2 (a) The electro mechanical set-up used for the experiment, (b)course and wale direction in the knitted fabric, and (c) the colors range ofa, b, and L coordinates in CIElab system.
Fig. 3 Illustration of the possible reaction sites of (1) alkalized polyester and protonated chitosan, and reaction sites of (2) GO and chitosan-modified fiber.
Paper NJC
This journal is©The Royal Society of Chemistry and the Centre National de la Recherche Scientifique 2019 New J. Chem., 2019, 43, 6643--6658 | 6647
The concentration of all chemical groups on the PET surfacebefore and after modification can be calculated from the highresolution C1s peaks. The unmodified PET contain 19% CQC,57% C–C, 15% C–O, and 9% COO groups. PET–CS contain 9%CQC, 49% C–C, 34% C–O, and 8% COO groups; PET–PDDACcontain 18% CQC, 51% C–C, 22% C–O, and 9% COO groups;PET–PE contain 32% CQC, 52% C–C, 11% C–O, and 5% COO
groups. For PET–HDPC, the concentration of CQC increases to39% and the concentration of C–C and COO decrease to 51and 6% and a newly introduced C–OH groups (287.0 eV) withconcentration of 7% was detected. The presence of –OH couldincrease the hydrophilicity of polyester by forming hydrogenbonds with water.
Further, XPS analysis for PET–GO and PET–rGO providesevidence of reduction of graphene oxide as content of oxygendecrease to 20% for PET–rGO from 25% for PET–GO andcontent of carbon increases from 74% for PET–GO to 80% forPET–rGO. A wide scan range XPS spectrum of PET–GO andPET–rGO is shown in Fig. 5(b).
C1s spectrum of PET–GO (Fig. 6(d)) can be fitted with twopeaks at 285.0 eV, 287.0 eV, corresponding to C–C and CQObonds having a concentration of 60 and 40%. While, forPET–rGO (Fig. 6(e)) the concentration of C–C bonds increasesto 72%, the concentration of CQO bonds decrease to 21%, anda new peak at 289.0 eV attributed to COO with a concentrationof 7% was observed.
ATR-FTIR spectroscopy
ATR-FTIR analysis was performed on alkalized, surface-modified,GO-modified, and rGO-modified fabrics to investigate the chemicalcomposition of the samples and their possible bonds.
All spectra were normalized by equalizing the height of adsorp-tion peak at 1713 cm1, which represent CQO stretch (ester).Peak at 725 cm1 represents the aromatic sp2 C–H bend (Fig. 7).The peak at 1017 cm1 indicate plane vibration of benzene ring,the peaks at 1094 and 1240 cm1 represent C–O stretch (ester),and absorption at 2920 cm1 is due to the asymmetric C–Hstretching. All these peaks are identical to polyester.
Once the fabric was modified with a solution (4 g L1) ofchitosan, a very low intense peak around 3400 cm1 wasdetected on PET–CS. peaks between 1550 and 1700 such asN–H bonds at 1560 and 1650 cm1 might be covered by strongCQO peak at 1713 cm1.
By increasing the concentration of chitosan to 8 g L1,a peak at 3425 cm1, representing N–H stretching wasappeared on PET–CS and it was detected on PET–CS–GO andPET–CS–rGO.
However, the results show that when the fabric is treatedwith 8 g L1 of chitosan solution, electrical conductivity ofthe fabric is not satisfying, and conversely optimal electricalproperties is obtained when fabric is modified with 4 g L1
of chitosan solution. Fig. 7 shows the FTIR spectra of a fabricpre-modified with a solution (8 g L1) of chitosan.
Fig. 4 Illustration of the functionalization process. (a) Alkalization of the textile, (b) surface charge modification, (c) impregnation of the modified textileswith graphene oxide (GO), and (d) chemical reduction of GO-modified textile to generate electrical conductivity.
Table 1 The composition of samples
Sample Composition
PET–GO Polyester, graphene oxidePET–ALK–GO Alkalized polyester, graphene oxidePET–CS–GO Alkalized polyester, chitosan, graphene oxidePET–HDPC–GO Alkalized polyester, hexadecylpyridinium chloride, graphene oxidePET–PE–GO Alkalized polyester, branched polyethylenimine, graphene oxidePET–PDDAC–GO Alkalized polyester, poly(diallyl-dimethylammonium)chloride, graphene oxidePET–rGO Polyester, reduced graphene oxidePET–ALK–rGO Alkalized polyester, reduced graphene oxidePET–CS–rGO Alkalized polyester, chitosan, reduced graphene oxidePET–HDPC–rGO Alkalized polyester, hexadecylpyridinium chloride, reduced graphene oxidePET–PE–rGO Alkalized polyester, branched polyethylenimine, reduced graphene oxidePET–PDDAC–rGO Alkalized polyester, poly(diallyl-dimethylammonium)chloride, reduced graphene oxide
NJC Paper
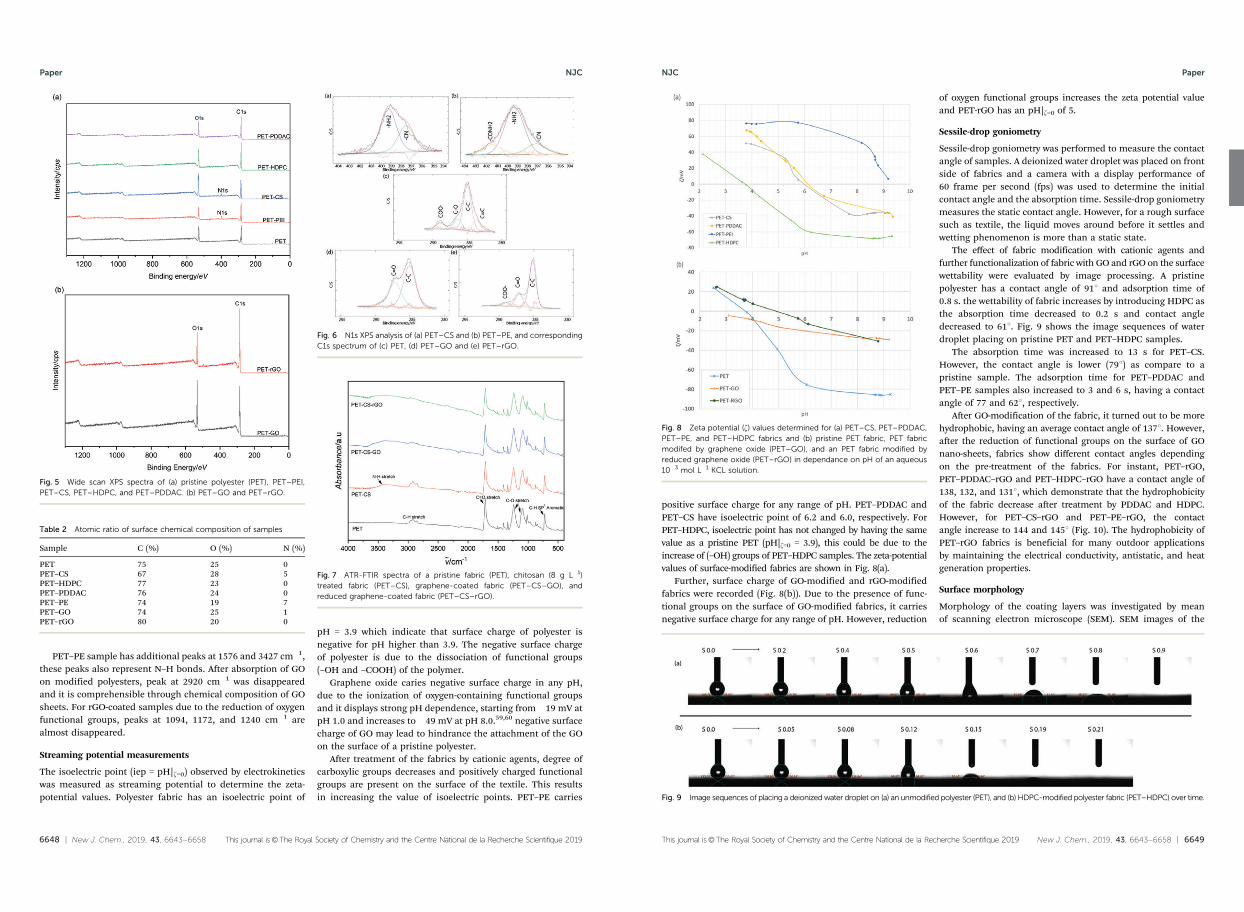
6648 | New J. Chem., 2019, 43, 6643--6658 This journal is©The Royal Society of Chemistry and the Centre National de la Recherche Scientifique 2019
PET–PE sample has additional peaks at 1576 and 3427 cm1,these peaks also represent N–H bonds. After absorption of GOon modified polyesters, peak at 2920 cm1 was disappearedand it is comprehensible through chemical composition of GOsheets. For rGO-coated samples due to the reduction of oxygenfunctional groups, peaks at 1094, 1172, and 1240 cm1 arealmost disappeared.
Streaming potential measurements
The isoelectric point (iep = pH|z=0) observed by electrokineticswas measured as streaming potential to determine the zeta-potential values. Polyester fabric has an isoelectric point of
pH = 3.9 which indicate that surface charge of polyester isnegative for pH higher than 3.9. The negative surface chargeof polyester is due to the dissociation of functional groups(–OH and –COOH) of the polymer.
Graphene oxide caries negative surface charge in any pH,due to the ionization of oxygen-containing functional groupsand it displays strong pH dependence, starting from 19 mV atpH 1.0 and increases to 49 mV at pH 8.0.59,60 negative surfacecharge of GO may lead to hindrance the attachment of the GOon the surface of a pristine polyester.
After treatment of the fabrics by cationic agents, degree ofcarboxylic groups decreases and positively charged functionalgroups are present on the surface of the textile. This resultsin increasing the value of isoelectric points. PET–PE carries
Fig. 5 Wide scan XPS spectra of (a) pristine polyester (PET), PET–PEI,PET–CS, PET–HDPC, and PET–PDDAC. (b) PET–GO and PET–rGO.
Table 2 Atomic ratio of surface chemical composition of samples
Sample C (%) O (%) N (%)
PET 75 25 0PET–CS 67 28 5PET–HDPC 77 23 0PET–PDDAC 76 24 0PET–PE 74 19 7PET–GO 74 25 1PET–rGO 80 20 0
Fig. 6 N1s XPS analysis of (a) PET–CS and (b) PET–PE, and correspondingC1s spectrum of (c) PET, (d) PET–GO and (e) PET–rGO.
Fig. 7 ATR-FTIR spectra of a pristine fabric (PET), chitosan (8 g L1)treated fabric (PET–CS), graphene-coated fabric (PET–CS–GO), andreduced graphene-coated fabric (PET–CS–rGO).
Paper NJC
This journal is©The Royal Society of Chemistry and the Centre National de la Recherche Scientifique 2019 New J. Chem., 2019, 43, 6643--6658 | 6649
positive surface charge for any range of pH. PET–PDDAC andPET–CS have isoelectric point of 6.2 and 6.0, respectively. ForPET–HDPC, isoelectric point has not changed by having the samevalue as a pristine PET (pH|z=0 = 3.9), this could be due to theincrease of (–OH) groups of PET–HDPC samples. The zeta-potentialvalues of surface-modified fabrics are shown in Fig. 8(a).
Further, surface charge of GO-modified and rGO-modifiedfabrics were recorded (Fig. 8(b)). Due to the presence of func-tional groups on the surface of GO-modified fabrics, it carriesnegative surface charge for any range of pH. However, reduction
of oxygen functional groups increases the zeta potential valueand PET-rGO has an pH|z=0 of 5.
Sessile-drop goniometry
Sessile-drop goniometry was performed to measure the contactangle of samples. A deionized water droplet was placed on frontside of fabrics and a camera with a display performance of60 frame per second (fps) was used to determine the initialcontact angle and the absorption time. Sessile-drop goniometrymeasures the static contact angle. However, for a rough surfacesuch as textile, the liquid moves around before it settles andwetting phenomenon is more than a static state.
The effect of fabric modification with cationic agents andfurther functionalization of fabric with GO and rGO on the surfacewettability were evaluated by image processing. A pristinepolyester has a contact angle of 911 and adsorption time of0.8 s. the wettability of fabric increases by introducing HDPC asthe absorption time decreased to 0.2 s and contact angledecreased to 611. Fig. 9 shows the image sequences of waterdroplet placing on pristine PET and PET–HDPC samples.
The absorption time was increased to 13 s for PET–CS.However, the contact angle is lower (791) as compare to apristine sample. The adsorption time for PET–PDDAC andPET–PE samples also increased to 3 and 6 s, having a contactangle of 77 and 621, respectively.
After GO-modification of the fabric, it turned out to be morehydrophobic, having an average contact angle of 1371. However,after the reduction of functional groups on the surface of GOnano-sheets, fabrics show different contact angles dependingon the pre-treatment of the fabrics. For instant, PET–rGO,PET–PDDAC–rGO and PET–HDPC–rGO have a contact angle of138, 132, and 1311, which demonstrate that the hydrophobicityof the fabric decrease after treatment by PDDAC and HDPC.However, for PET–CS–rGO and PET–PE–rGO, the contactangle increase to 144 and 1451 (Fig. 10). The hydrophobicity ofPET–rGO fabrics is beneficial for many outdoor applicationsby maintaining the electrical conductivity, antistatic, and heatgeneration properties.
Surface morphology
Morphology of the coating layers was investigated by meanof scanning electron microscope (SEM). SEM images of the
Fig. 8 Zeta potential (z) values determined for (a) PET–CS, PET–PDDAC,PET–PE, and PET–HDPC fabrics and (b) pristine PET fabric, PET fabricmodifed by graphene oxide (PET–GO), and an PET fabric modified byreduced graphene oxide (PET–rGO) in dependance on pH of an aqueous103 mol L1 KCL solution.
Fig. 9 Image sequences of placing a deionizedwater droplet on (a) an unmodified polyester (PET), and (b) HDPC-modified polyester fabric (PET–HDPC) over time.
NJC Paper
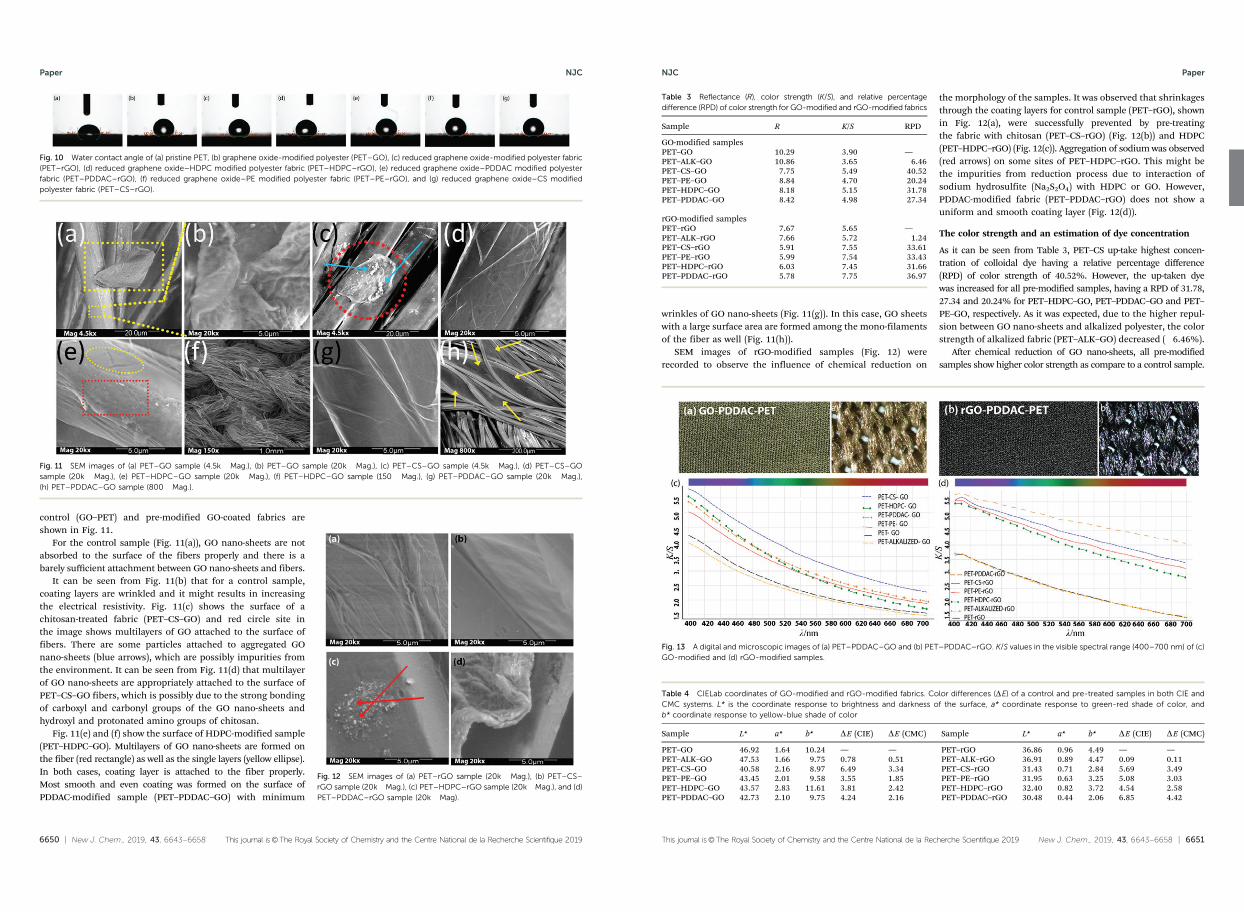
6650 | New J. Chem., 2019, 43, 6643--6658 This journal is©The Royal Society of Chemistry and the Centre National de la Recherche Scientifique 2019
control (GO–PET) and pre-modified GO-coated fabrics areshown in Fig. 11.
For the control sample (Fig. 11(a)), GO nano-sheets are notabsorbed to the surface of the fibers properly and there is abarely sufficient attachment between GO nano-sheets and fibers.
It can be seen from Fig. 11(b) that for a control sample,coating layers are wrinkled and it might results in increasingthe electrical resistivity. Fig. 11(c) shows the surface of achitosan-treated fabric (PET–CS–GO) and red circle site inthe image shows multilayers of GO attached to the surface offibers. There are some particles attached to aggregated GOnano-sheets (blue arrows), which are possibly impurities fromthe environment. It can be seen from Fig. 11(d) that multilayerof GO nano-sheets are appropriately attached to the surface ofPET–CS–GO fibers, which is possibly due to the strong bondingof carboxyl and carbonyl groups of the GO nano-sheets andhydroxyl and protonated amino groups of chitosan.
Fig. 11(e) and (f) show the surface of HDPC-modified sample(PET–HDPC–GO). Multilayers of GO nano-sheets are formed onthe fiber (red rectangle) as well as the single layers (yellow ellipse).In both cases, coating layer is attached to the fiber properly.Most smooth and even coating was formed on the surface ofPDDAC-modified sample (PET–PDDAC–GO) with minimum
Fig. 10 Water contact angle of (a) pristine PET, (b) graphene oxide-modified polyester (PET–GO), (c) reduced graphene oxide-modified polyester fabric(PET–rGO), (d) reduced graphene oxide–HDPC modified polyester fabric (PET–HDPC–rGO), (e) reduced graphene oxide–PDDAC modified polyesterfabric (PET–PDDAC–rGO), (f) reduced graphene oxide–PE modified polyester fabric (PET–PE–rGO), and (g) reduced graphene oxide–CS modifiedpolyester fabric (PET–CS–rGO).
Fig. 11 SEM images of (a) PET–GO sample (4.5k Mag.), (b) PET–GO sample (20k Mag.), (c) PET–CS–GO sample (4.5k Mag.), (d) PET–CS–GOsample (20k Mag.), (e) PET–HDPC–GO sample (20k Mag.), (f) PET–HDPC–GO sample (150 Mag.), (g) PET–PDDAC–GO sample (20k Mag.),(h) PET–PDDAC–GO sample (800 Mag.).
Fig. 12 SEM images of (a) PET–rGO sample (20k Mag.), (b) PET–CS–rGO sample (20kMag.), (c) PET–HDPC–rGO sample (20kMag.), and (d)PET–PDDAC–rGO sample (20k Mag).
Paper NJC
This journal is©The Royal Society of Chemistry and the Centre National de la Recherche Scientifique 2019 New J. Chem., 2019, 43, 6643--6658 | 6651
wrinkles of GO nano-sheets (Fig. 11(g)). In this case, GO sheetswith a large surface area are formed among the mono-filamentsof the fiber as well (Fig. 11(h)).
SEM images of rGO-modified samples (Fig. 12) wererecorded to observe the influence of chemical reduction on
the morphology of the samples. It was observed that shrinkagesthrough the coating layers for control sample (PET–rGO), shownin Fig. 12(a), were successfully prevented by pre-treatingthe fabric with chitosan (PET–CS–rGO) (Fig. 12(b)) and HDPC(PET–HDPC–rGO) (Fig. 12(c)). Aggregation of sodiumwas observed(red arrows) on some sites of PET–HDPC–rGO. This might bethe impurities from reduction process due to interaction ofsodium hydrosulfite (Na2S2O4) with HDPC or GO. However,PDDAC-modified fabric (PET–PDDAC–rGO) does not show auniform and smooth coating layer (Fig. 12(d)).
The color strength and an estimation of dye concentration
As it can be seen from Table 3, PET–CS up-take highest concen-tration of colloidal dye having a relative percentage difference(RPD) of color strength of 40.52%. However, the up-taken dyewas increased for all pre-modified samples, having a RPD of 31.78,27.34 and 20.24% for PET–HDPC–GO, PET–PDDAC–GO and PET–PE–GO, respectively. As it was expected, due to the higher repul-sion between GO nano-sheets and alkalized polyester, the colorstrength of alkalized fabric (PET–ALK–GO) decreased (6.46%).
After chemical reduction of GO nano-sheets, all pre-modifiedsamples show higher color strength as compare to a control sample.
Table 3 Reflectance (R), color strength (K/S), and relative percentagedifference (RPD) of color strength for GO-modified and rGO-modified fabrics
Sample R K/S RPD
GO-modified samplesPET–GO 10.29 3.90 —PET–ALK–GO 10.86 3.65 6.46PET–CS–GO 7.75 5.49 40.52PET–PE–GO 8.84 4.70 20.24PET–HDPC–GO 8.18 5.15 31.78PET–PDDAC–GO 8.42 4.98 27.34
rGO-modified samplesPET–rGO 7.67 5.65 —PET–ALK–rGO 7.66 5.72 1.24PET–CS–rGO 5.91 7.55 33.61PET–PE–rGO 5.99 7.54 33.43PET–HDPC–rGO 6.03 7.45 31.66PET–PDDAC–rGO 5.78 7.75 36.97
Fig. 13 A digital and microscopic images of (a) PET–PDDAC–GO and (b) PET–PDDAC–rGO. K/S values in the visible spectral range (400–700 nm) of (c)GO-modified and (d) rGO-modified samples.
Table 4 CIELab coordinates of GO-modified and rGO-modified fabrics. Color differences (DE) of a control and pre-treated samples in both CIE andCMC systems. L* is the coordinate response to brightness and darkness of the surface, a* coordinate response to green-red shade of color, andb* coordinate response to yellow-blue shade of color
Sample L* a* b* DE (CIE) DE (CMC) Sample L* a* b* DE (CIE) DE (CMC)
PET–GO 46.92 1.64 10.24 — — PET–rGO 36.86 0.96 4.49 — —PET–ALK–GO 47.53 1.66 9.75 0.78 0.51 PET–ALK–rGO 36.91 0.89 4.47 0.09 0.11PET–CS–GO 40.58 2.16 8.97 6.49 3.34 PET–CS–rGO 31.43 0.71 2.84 5.69 3.49PET–PE–GO 43.45 2.01 9.58 3.55 1.85 PET–PE–rGO 31.95 0.63 3.25 5.08 3.03PET–HDPC–GO 43.57 2.83 11.61 3.81 2.42 PET–HDPC–rGO 32.40 0.82 3.72 4.54 2.58PET–PDDAC–GO 42.73 2.10 9.75 4.24 2.16 PET–PDDAC–rGO 30.48 0.44 2.06 6.85 4.42
NJC Paper
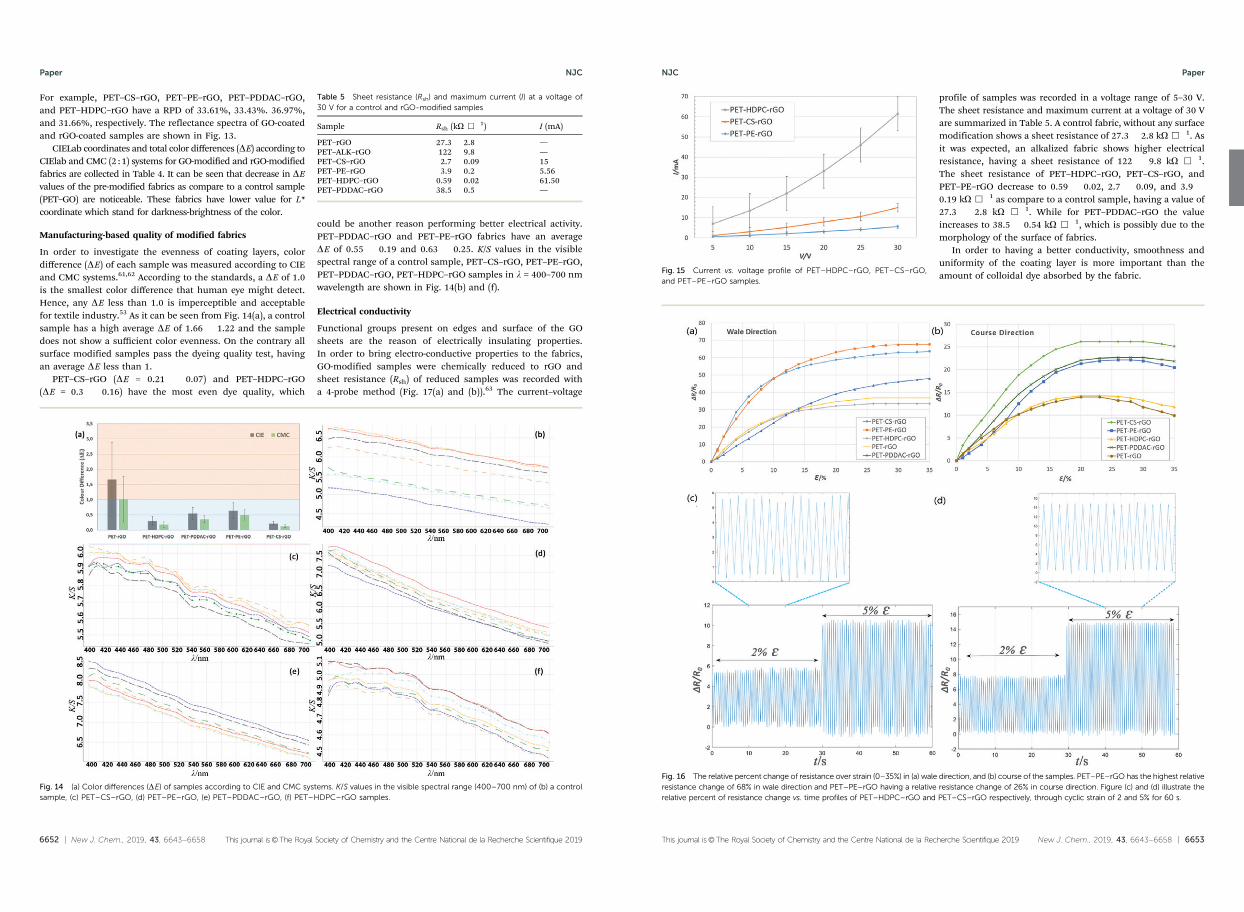
6652 | New J. Chem., 2019, 43, 6643--6658 This journal is©The Royal Society of Chemistry and the Centre National de la Recherche Scientifique 2019
For example, PET–CS–rGO, PET–PE–rGO, PET–PDDAC–rGO,and PET–HDPC–rGO have a RPD of 33.61%, 33.43%. 36.97%,and 31.66%, respectively. The reflectance spectra of GO-coatedand rGO-coated samples are shown in Fig. 13.
CIELab coordinates and total color differences (DE) according toCIElab and CMC (2 :1) systems for GO-modified and rGO-modifiedfabrics are collected in Table 4. It can be seen that decrease in DEvalues of the pre-modified fabrics as compare to a control sample(PET–GO) are noticeable. These fabrics have lower value for L*coordinate which stand for darkness-brightness of the color.
Manufacturing-based quality of modified fabrics
In order to investigate the evenness of coating layers, colordifference (DE) of each sample was measured according to CIEand CMC systems.61,62 According to the standards, a DE of 1.0is the smallest color difference that human eye might detect.Hence, any DE less than 1.0 is imperceptible and acceptablefor textile industry.53 As it can be seen from Fig. 14(a), a controlsample has a high average DE of 1.66 1.22 and the sampledoes not show a sufficient color evenness. On the contrary allsurface modified samples pass the dyeing quality test, havingan average DE less than 1.
PET–CS–rGO (DE = 0.21 0.07) and PET–HDPC–rGO(DE = 0.3 0.16) have the most even dye quality, which
could be another reason performing better electrical activity.PET–PDDAC–rGO and PET–PE–rGO fabrics have an averageDE of 0.55 0.19 and 0.63 0.25. K/S values in the visiblespectral range of a control sample, PET–CS–rGO, PET–PE–rGO,PET–PDDAC–rGO, PET–HDPC–rGO samples in l = 400–700 nmwavelength are shown in Fig. 14(b) and (f).
Electrical conductivity
Functional groups present on edges and surface of the GOsheets are the reason of electrically insulating properties.In order to bring electro-conductive properties to the fabrics,GO-modified samples were chemically reduced to rGO andsheet resistance (Rsh) of reduced samples was recorded witha 4-probe method (Fig. 17(a) and (b)).63 The current–voltage
Fig. 14 (a) Color differences (DE) of samples according to CIE and CMC systems. K/S values in the visible spectral range (400–700 nm) of (b) a controlsample, (c) PET–CS–rGO, (d) PET–PE–rGO, (e) PET–PDDAC–rGO, (f) PET–HDPC–rGO samples.
Table 5 Sheet resistance (Rsh) and maximum current (I) at a voltage of30 V for a control and rGO-modified samples
Sample Rsh (kO &1) I (mA)
PET–rGO 27.3 2.8 —PET–ALK–rGO 122 9.8 —PET–CS–rGO 2.7 0.09 15PET–PE–rGO 3.9 0.2 5.56PET–HDPC–rGO 0.59 0.02 61.50PET–PDDAC–rGO 38.5 0.5 —
Paper NJC
This journal is©The Royal Society of Chemistry and the Centre National de la Recherche Scientifique 2019 New J. Chem., 2019, 43, 6643--6658 | 6653
profile of samples was recorded in a voltage range of 5–30 V.The sheet resistance and maximum current at a voltage of 30 Vare summarized in Table 5. A control fabric, without any surfacemodification shows a sheet resistance of 27.3 2.8 kO &1. Asit was expected, an alkalized fabric shows higher electricalresistance, having a sheet resistance of 122 9.8 kO &1.The sheet resistance of PET–HDPC–rGO, PET–CS–rGO, andPET–PE–rGO decrease to 0.59 0.02, 2.7 0.09, and 3.9 0.19 kO &1 as compare to a control sample, having a value of27.3 2.8 kO &1. While for PET–PDDAC–rGO the valueincreases to 38.5 0.54 kO &1, which is possibly due to themorphology of the surface of fabrics.
In order to having a better conductivity, smoothness anduniformity of the coating layer is more important than theamount of colloidal dye absorbed by the fabric.
Fig. 15 Current vs. voltage profile of PET–HDPC–rGO, PET–CS–rGO,and PET–PE–rGO samples.
Fig. 16 The relative percent change of resistance over strain (0–35%) in (a) wale direction, and (b) course of the samples. PET–PE–rGO has the highest relativeresistance change of 68% in wale direction and PET–PE–rGO having a relative resistance change of 26% in course direction. Figure (c) and (d) illustrate therelative percent of resistance change vs. time profiles of PET–HDPC–rGO and PET–CS–rGO respectively, through cyclic strain of 2 and 5% for 60 s.
NJC Paper
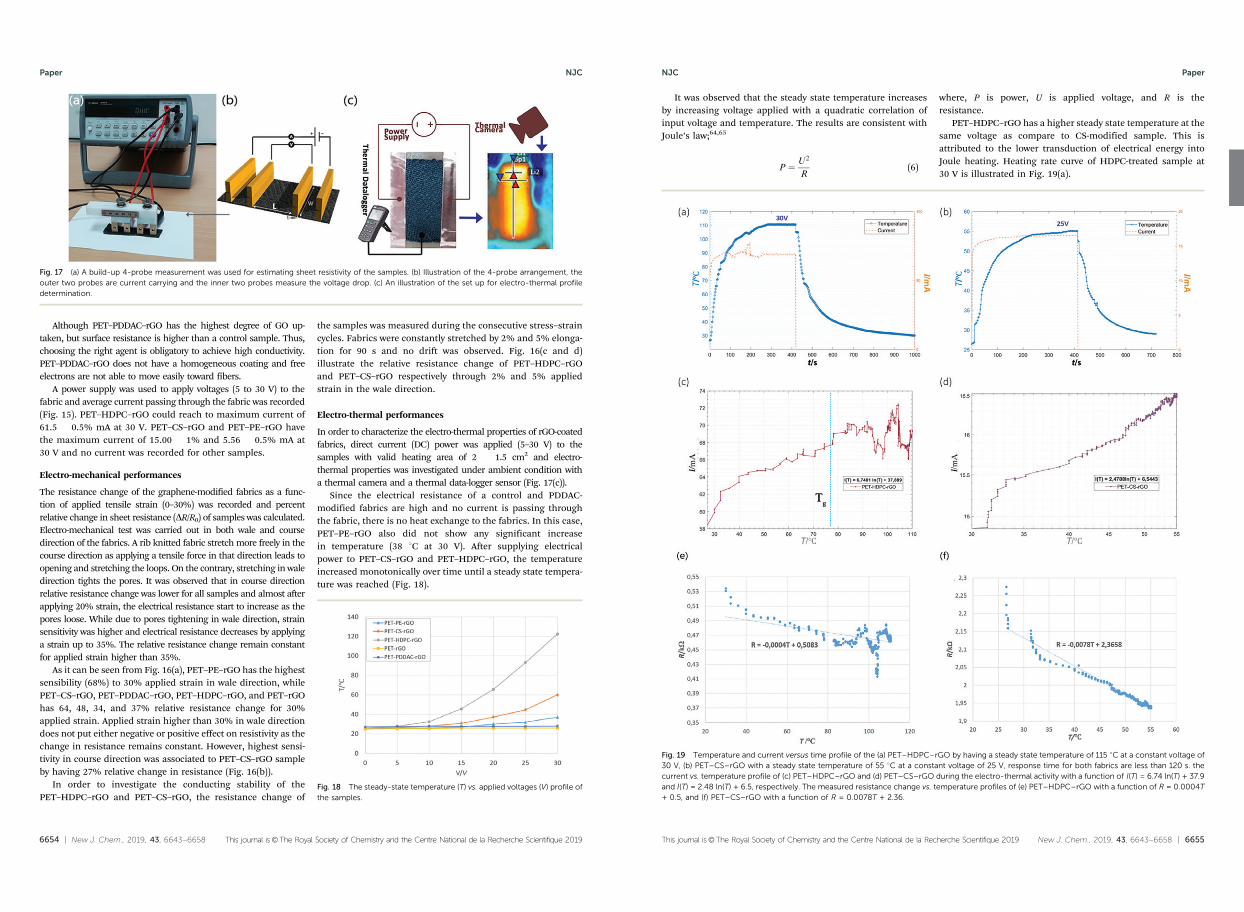
6654 | New J. Chem., 2019, 43, 6643--6658 This journal is©The Royal Society of Chemistry and the Centre National de la Recherche Scientifique 2019
Although PET–PDDAC–rGO has the highest degree of GO up-taken, but surface resistance is higher than a control sample. Thus,choosing the right agent is obligatory to achieve high conductivity.PET–PDDAC–rGO does not have a homogeneous coating and freeelectrons are not able to move easily toward fibers.
A power supply was used to apply voltages (5 to 30 V) to thefabric and average current passing through the fabric was recorded(Fig. 15). PET–HDPC–rGO could reach to maximum current of61.5 0.5% mA at 30 V. PET–CS–rGO and PET–PE–rGO havethe maximum current of 15.00 1% and 5.56 0.5% mA at30 V and no current was recorded for other samples.
Electro-mechanical performances
The resistance change of the graphene-modified fabrics as a func-tion of applied tensile strain (0–30%) was recorded and percentrelative change in sheet resistance (DR/R0) of samples was calculated.Electro-mechanical test was carried out in both wale and coursedirection of the fabrics. A rib knitted fabric stretchmore freely in thecourse direction as applying a tensile force in that direction leads toopening and stretching the loops. On the contrary, stretching in waledirection tights the pores. It was observed that in course directionrelative resistance change was lower for all samples and almost afterapplying 20% strain, the electrical resistance start to increase as thepores loose. While due to pores tightening in wale direction, strainsensitivity was higher and electrical resistance decreases by applyinga strain up to 35%. The relative resistance change remain constantfor applied strain higher than 35%.
As it can be seen from Fig. 16(a), PET–PE–rGO has the highestsensibility (68%) to 30% applied strain in wale direction, whilePET–CS–rGO, PET–PDDAC–rGO, PET–HDPC–rGO, and PET–rGOhas 64, 48, 34, and 37% relative resistance change for 30%applied strain. Applied strain higher than 30% in wale directiondoes not put either negative or positive effect on resistivity as thechange in resistance remains constant. However, highest sensi-tivity in course direction was associated to PET–CS–rGO sampleby having 27% relative change in resistance (Fig. 16(b)).
In order to investigate the conducting stability of thePET–HDPC–rGO and PET–CS–rGO, the resistance change of
the samples was measured during the consecutive stress–straincycles. Fabrics were constantly stretched by 2% and 5% elonga-tion for 90 s and no drift was observed. Fig. 16(c and d)illustrate the relative resistance change of PET–HDPC–rGOand PET–CS–rGO respectively through 2% and 5% appliedstrain in the wale direction.
Electro-thermal performances
In order to characterize the electro-thermal properties of rGO-coatedfabrics, direct current (DC) power was applied (5–30 V) to thesamples with valid heating area of 2 1.5 cm2 and electro-thermal properties was investigated under ambient condition witha thermal camera and a thermal data-logger sensor (Fig. 17(c)).
Since the electrical resistance of a control and PDDAC-modified fabrics are high and no current is passing throughthe fabric, there is no heat exchange to the fabrics. In this case,PET–PE–rGO also did not show any significant increasein temperature (38 1C at 30 V). After supplying electricalpower to PET–CS–rGO and PET–HDPC–rGO, the temperatureincreased monotonically over time until a steady state tempera-ture was reached (Fig. 18).
Fig. 17 (a) A build-up 4-probe measurement was used for estimating sheet resistivity of the samples. (b) Illustration of the 4-probe arrangement, theouter two probes are current carrying and the inner two probes measure the voltage drop. (c) An illustration of the set up for electro-thermal profiledetermination.
Fig. 18 The steady-state temperature (T) vs. applied voltages (V) profile ofthe samples.
Paper NJC
This journal is©The Royal Society of Chemistry and the Centre National de la Recherche Scientifique 2019 New J. Chem., 2019, 43, 6643--6658 | 6655
It was observed that the steady state temperature increasesby increasing voltage applied with a quadratic correlation ofinput voltage and temperature. The results are consistent withJoule’s law;64,65
P ¼ U2
R(6)
where, P is power, U is applied voltage, and R is theresistance.
PET–HDPC–rGO has a higher steady state temperature at thesame voltage as compare to CS-modified sample. This isattributed to the lower transduction of electrical energy intoJoule heating. Heating rate curve of HDPC-treated sample at30 V is illustrated in Fig. 19(a).
Fig. 19 Temperature and current versus time profile of the (a) PET–HDPC–rGO by having a steady state temperature of 115 1C at a constant voltage of30 V, (b) PET–CS–rGO with a steady state temperature of 55 1C at a constant voltage of 25 V, response time for both fabrics are less than 120 s. thecurrent vs. temperature profile of (c) PET–HDPC–rGO and (d) PET–CS–rGO during the electro-thermal activity with a function of I(T) = 6.74 ln(T) + 37.9and I(T) = 2.48 ln(T) + 6.5, respectively. The measured resistance change vs. temperature profiles of (e) PET–HDPC–rGO with a function of R = 0.0004T+ 0.5, and (f) PET–CS–rGO with a function of R = 0.0078T + 2.36.
NJC Paper
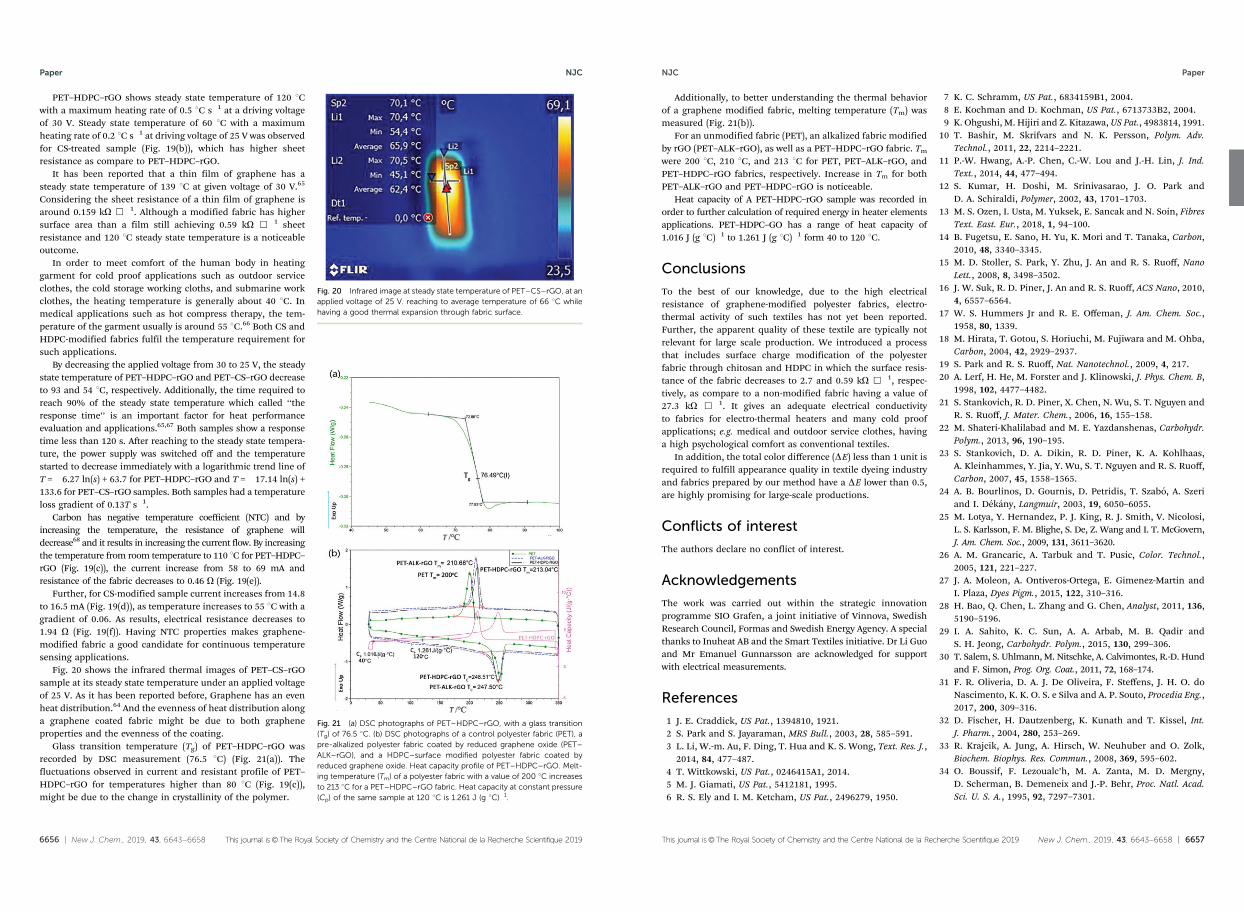
6656 | New J. Chem., 2019, 43, 6643--6658 This journal is©The Royal Society of Chemistry and the Centre National de la Recherche Scientifique 2019
PET–HDPC–rGO shows steady state temperature of 120 1Cwith a maximum heating rate of 0.5 1C s1 at a driving voltageof 30 V. Steady state temperature of 60 1C with a maximumheating rate of 0.2 1C s1 at driving voltage of 25 V was observedfor CS-treated sample (Fig. 19(b)), which has higher sheetresistance as compare to PET–HDPC–rGO.
It has been reported that a thin film of graphene has asteady state temperature of 139 1C at given voltage of 30 V.65
Considering the sheet resistance of a thin film of graphene isaround 0.159 kO &1. Although a modified fabric has highersurface area than a film still achieving 0.59 kO &1 sheetresistance and 120 1C steady state temperature is a noticeableoutcome.
In order to meet comfort of the human body in heatinggarment for cold proof applications such as outdoor serviceclothes, the cold storage working cloths, and submarine workclothes, the heating temperature is generally about 40 1C. Inmedical applications such as hot compress therapy, the tem-perature of the garment usually is around 55 1C.66 Both CS andHDPC-modified fabrics fulfil the temperature requirement forsuch applications.
By decreasing the applied voltage from 30 to 25 V, the steadystate temperature of PET–HDPC–rGO and PET–CS–rGO decreaseto 93 and 54 1C, respectively. Additionally, the time required toreach 90% of the steady state temperature which called ‘‘theresponse time’’ is an important factor for heat performanceevaluation and applications.65,67 Both samples show a responsetime less than 120 s. After reaching to the steady state tempera-ture, the power supply was switched off and the temperaturestarted to decrease immediately with a logarithmic trend line ofT = 6.27 ln(s) + 63.7 for PET–HDPC–rGO and T = 17.14 ln(s) +133.6 for PET–CS–rGO samples. Both samples had a temperatureloss gradient of 0.13T s1.
Carbon has negative temperature coefficient (NTC) and byincreasing the temperature, the resistance of graphene willdecrease68 and it results in increasing the current flow. By increasingthe temperature from room temperature to 110 1C for PET–HDPC–rGO (Fig. 19(c)), the current increase from 58 to 69 mA andresistance of the fabric decreases to 0.46 O (Fig. 19(e)).
Further, for CS-modified sample current increases from 14.8to 16.5 mA (Fig. 19(d)), as temperature increases to 55 1C with agradient of 0.06. As results, electrical resistance decreases to1.94 O (Fig. 19(f)). Having NTC properties makes graphene-modified fabric a good candidate for continuous temperaturesensing applications.
Fig. 20 shows the infrared thermal images of PET–CS–rGOsample at its steady state temperature under an applied voltageof 25 V. As it has been reported before, Graphene has an evenheat distribution.64 And the evenness of heat distribution alonga graphene coated fabric might be due to both grapheneproperties and the evenness of the coating.
Glass transition temperature (Tg) of PET–HDPC–rGO wasrecorded by DSC measurement (76.5 1C) (Fig. 21(a)). Thefluctuations observed in current and resistant profile of PET–HDPC–rGO for temperatures higher than 80 1C (Fig. 19(c)),might be due to the change in crystallinity of the polymer.
Fig. 20 Infrared image at steady state temperature of PET–CS–rGO, at anapplied voltage of 25 V. reaching to average temperature of 66 1C whilehaving a good thermal expansion through fabric surface.
Fig. 21 (a) DSC photographs of PET–HDPC–rGO, with a glass transition(Tg) of 76.5 1C. (b) DSC photographs of a control polyester fabric (PET), apre-alkalized polyester fabric coated by reduced graphene oxide (PET–ALK–rGO), and a HDPC–surface modified polyester fabric coated byreduced graphene oxide. Heat capacity profile of PET–HDPC–rGO. Melt-ing temperature (Tm) of a polyester fabric with a value of 200 1C increasesto 213 1C for a PET–HDPC–rGO fabric. Heat capacity at constant pressure(Cp) of the same sample at 120 1C is 1.261 J (g 1C)1.
Paper NJC
This journal is©The Royal Society of Chemistry and the Centre National de la Recherche Scientifique 2019 New J. Chem., 2019, 43, 6643--6658 | 6657
Additionally, to better understanding the thermal behaviorof a graphene modified fabric, melting temperature (Tm) wasmeasured (Fig. 21(b)).
For an unmodified fabric (PET), an alkalized fabric modifiedby rGO (PET–ALK–rGO), as well as a PET–HDPC–rGO fabric. Tmwere 200 1C, 210 1C, and 213 1C for PET, PET–ALK–rGO, andPET–HDPC–rGO fabrics, respectively. Increase in Tm for bothPET–ALK–rGO and PET–HDPC–rGO is noticeable.
Heat capacity of A PET–HDPC–rGO sample was recorded inorder to further calculation of required energy in heater elementsapplications. PET–HDPC–GO has a range of heat capacity of1.016 J (g 1C)1 to 1.261 J (g 1C)1 form 40 to 120 1C.
Conclusions
To the best of our knowledge, due to the high electricalresistance of graphene-modified polyester fabrics, electro-thermal activity of such textiles has not yet been reported.Further, the apparent quality of these textile are typically notrelevant for large scale production. We introduced a processthat includes surface charge modification of the polyesterfabric through chitosan and HDPC in which the surface resis-tance of the fabric decreases to 2.7 and 0.59 kO &1, respec-tively, as compare to a non-modified fabric having a value of27.3 kO &1. It gives an adequate electrical conductivityto fabrics for electro-thermal heaters and many cold proofapplications; e.g. medical and outdoor service clothes, havinga high psychological comfort as conventional textiles.
In addition, the total color difference (DE) less than 1 unit isrequired to fulfill appearance quality in textile dyeing industryand fabrics prepared by our method have a DE lower than 0.5,are highly promising for large-scale productions.
Conflicts of interest
The authors declare no conflict of interest.
Acknowledgements
The work was carried out within the strategic innovationprogramme SIO Grafen, a joint initiative of Vinnova, SwedishResearch Council, Formas and Swedish Energy Agency. A specialthanks to Inuheat AB and the Smart Textiles initiative. Dr Li Guoand Mr Emanuel Gunnarsson are acknowledged for supportwith electrical measurements.
References
1 J. E. Craddick, US Pat., 1394810, 1921.2 S. Park and S. Jayaraman, MRS Bull., 2003, 28, 585–591.3 L. Li, W.-m. Au, F. Ding, T. Hua and K. S. Wong, Text. Res. J.,
2014, 84, 477–487.4 T. Wittkowski, US Pat., 0246415A1, 2014.5 M. J. Giamati, US Pat., 5412181, 1995.6 R. S. Ely and I. M. Ketcham, US Pat., 2496279, 1950.
7 K. C. Schramm, US Pat., 6834159B1, 2004.8 E. Kochman and D. Kochman, US Pat., 6713733B2, 2004.9 K. Ohgushi, M. Hijiri and Z. Kitazawa, US Pat., 4983814, 1991.10 T. Bashir, M. Skrifvars and N. K. Persson, Polym. Adv.
Technol., 2011, 22, 2214–2221.11 P.-W. Hwang, A.-P. Chen, C.-W. Lou and J.-H. Lin, J. Ind.
Text., 2014, 44, 477–494.12 S. Kumar, H. Doshi, M. Srinivasarao, J. O. Park and
D. A. Schiraldi, Polymer, 2002, 43, 1701–1703.13 M. S. Ozen, I. Usta, M. Yuksek, E. Sancak and N. Soin, Fibres
Text. East. Eur., 2018, 1, 94–100.14 B. Fugetsu, E. Sano, H. Yu, K. Mori and T. Tanaka, Carbon,
2010, 48, 3340–3345.15 M. D. Stoller, S. Park, Y. Zhu, J. An and R. S. Ruoff, Nano
Lett., 2008, 8, 3498–3502.16 J. W. Suk, R. D. Piner, J. An and R. S. Ruoff, ACS Nano, 2010,
4, 6557–6564.17 W. S. Hummers Jr and R. E. Offeman, J. Am. Chem. Soc.,
1958, 80, 1339.18 M. Hirata, T. Gotou, S. Horiuchi, M. Fujiwara and M. Ohba,
Carbon, 2004, 42, 2929–2937.19 S. Park and R. S. Ruoff, Nat. Nanotechnol., 2009, 4, 217.20 A. Lerf, H. He, M. Forster and J. Klinowski, J. Phys. Chem. B,
1998, 102, 4477–4482.21 S. Stankovich, R. D. Piner, X. Chen, N. Wu, S. T. Nguyen and
R. S. Ruoff, J. Mater. Chem., 2006, 16, 155–158.22 M. Shateri-Khalilabad and M. E. Yazdanshenas, Carbohydr.
Polym., 2013, 96, 190–195.23 S. Stankovich, D. A. Dikin, R. D. Piner, K. A. Kohlhaas,
A. Kleinhammes, Y. Jia, Y. Wu, S. T. Nguyen and R. S. Ruoff,Carbon, 2007, 45, 1558–1565.
24 A. B. Bourlinos, D. Gournis, D. Petridis, T. Szabo, A. Szeriand I. Dekany, Langmuir, 2003, 19, 6050–6055.
25 M. Lotya, Y. Hernandez, P. J. King, R. J. Smith, V. Nicolosi,L. S. Karlsson, F. M. Blighe, S. De, Z. Wang and I. T. McGovern,J. Am. Chem. Soc., 2009, 131, 3611–3620.
26 A. M. Grancaric, A. Tarbuk and T. Pusic, Color. Technol.,2005, 121, 221–227.
27 J. A. Moleon, A. Ontiveros-Ortega, E. Gimenez-Martin andI. Plaza, Dyes Pigm., 2015, 122, 310–316.
28 H. Bao, Q. Chen, L. Zhang and G. Chen, Analyst, 2011, 136,5190–5196.
29 I. A. Sahito, K. C. Sun, A. A. Arbab, M. B. Qadir andS. H. Jeong, Carbohydr. Polym., 2015, 130, 299–306.
30 T. Salem, S. Uhlmann,M. Nitschke, A. Calvimontes, R.-D. Hundand F. Simon, Prog. Org. Coat., 2011, 72, 168–174.
31 F. R. Oliveria, D. A. J. De Oliveira, F. Steffens, J. H. O. doNascimento, K. K. O. S. e Silva and A. P. Souto, Procedia Eng.,2017, 200, 309–316.
32 D. Fischer, H. Dautzenberg, K. Kunath and T. Kissel, Int.J. Pharm., 2004, 280, 253–269.
33 R. Krajcik, A. Jung, A. Hirsch, W. Neuhuber and O. Zolk,Biochem. Biophys. Res. Commun., 2008, 369, 595–602.
34 O. Boussif, F. Lezoualc’h, M. A. Zanta, M. D. Mergny,D. Scherman, B. Demeneix and J.-P. Behr, Proc. Natl. Acad.Sci. U. S. A., 1995, 92, 7297–7301.
NJC Paper
6658 | New J. Chem., 2019, 43, 6643--6658 This journal is©The Royal Society of Chemistry and the Centre National de la Recherche Scientifique 2019
35 M. Tian, X. Tang, L. Qu, S. Zhu, X. Guo and G. Han, Mater.Lett., 2015, 145, 340–343.
36 M. Tian, X. Hu, L. Qu, M. Du, S. Zhu, Y. Sun and G. Han,Appl. Surf. Sci., 2016, 377, 141–148.
37 W.-S. Hung, S.-M. Chang, R. L. G. Lecaros, Y.-L. Ji, Q.-F. An,C.-C. Hu, K.-R. Lee and J.-Y. Lai, Carbon, 2017, 117, 112–119.
38 T. Kuilla, S. Bhadra, D. Yao, N. H. Kim, S. Bose and J. H. Lee,Prog. Polym. Sci., 2010, 35, 1350–1375.
39 Y. Liu, M. Park, H. K. Shin, B. Pant, J. Choi, Y. W. Park,J. Y. Lee, S.-J. Park and H.-Y. Kim, J. Ind. Eng. Chem., 2014,20, 4415–4420.
40 M. Rinaudo, G. Pavlov and J. Desbrieres, Polymer, 1999, 40,7029–7032.
41 A. Jayakrishnan and D. O. Shah, J. Polym. Sci., Polym. Chem.Ed., 1983, 21, 3201–3208.
42 E. M. Sanders and S. H. Zeronian, J. Appl. Polym. Sci., 1982,27, 4477–4491.
43 L. M. Olson and M. Wentz, Text. Chem. Color., 1984, 16, 48.44 J. F. Moulder, Physical electronics, 1995, 230–232.45 T. I. T. Okpalugo, P. Papakonstantinou, H. Murphy,
J. McLaughlin and N. M. D. Brown, Carbon, 2005, 43, 153–161.46 L. Yang, L. Xin, W. Gu, J. Tian, S. Liao, P. Du, Y. Tong,
Y. Zhang, R. Lv and J. Wang, J. Solid State Chem., 2014, 218,64–70.
47 X. Guo, B. Xu, W. Zhang, Z. Cai and Z. Wen, Appl. Surf. Sci.,2014, 321, 94–97.
48 R. J. Hunter, Zeta potential in colloid science: principles andapplications, Academic press, 1981, pp. 22–24.
49 T. Young, Philos. Trans. R. Soc. London, 1805, 95, 65–87.50 T. Young, Philos. Trans. R. Soc. London, 1805, 95, 65–87.51 E. R. Trotman and E. Russell, Dying and chemical technology
of textile fibers, Edward Arnold, London, 6th edn, 1984,pp. 109–135.
52 F. M. Mirabella, Modern techniques in applied molecularspectroscopy, John Wiley & Sons, 1998.
53 P. Green and L. MacDonald, Colour engineering: achievingdevice independent colour, John Wiley & Sons, 2011.
54 J. Schanda, Colorimetry: understanding the CIE system, JohnWiley & Sons, 2007.
55 F. M. Smits, Bell Syst. Tech. J., 1958, 37, 711–718.56 I. Miccoli, F. Edler, H. Pfnur and C. Tegenkamp, J. Phys.:
Condens. Matter, 2015, 27, 223201.57 M. Tokarska and K. Gniotek, J. Text. Inst., 2015, 106,
9–18.58 L. Guo, T. Bashir, E. Bresky and N. K. Persson, Smart Textiles
and their Applications, Elsevier, 2016, pp. 657–693.59 D. Li, M. B. Muller, S. Gilje, R. B. Kaner and G. G. Wallace,
Nat. Nanotechnol., 2008, 3, 101–105.60 H. He and T. Riedl, J. Phys. Chem. B, 1998, 102, 4477–4482.61 D. Heggie, R. H. Wardman and M. R. Luo, J. Soc. Dyers
Colour., 1996, 112, 264–269.62 M. R. Luo and B. Rigg, J. Soc. Dyers Colour., 1986, 102,
164–171.63 L. Guo, T. Bashir, E. Bresky, N. K. Persson and V. Koncar,
Smart textiles and their applications, Woodhead PublishingLimited, Cambridge, 2016.
64 D. Sui, Y. Huang, L. Huang, J. Liang, Y. Ma and Y. Chen,Small, 2011, 7, 3186–3192.
65 C. Li, Y.-T. Xu, B. Zhao, L. Jiang, S.-G. Chen, J.-B. Xu,X.-Z. Fu, R. Sun and C.-P. Wong, J. Mater. Sci., 2016, 51,1043–1051.
66 H. Dai, H. Yang and J. Yin, Climate Dynamics, 2017, 49,1513–1529.
67 X. Wang, L. Zhi and K. Mullen, Nano Lett., 2008, 8, 323–327.68 X.-Y. Fang, X.-X. Yu, H.-M. Zheng, H.-B. Jin, L. Wang and
M.-S. Cao, Phys. Lett. A, 2015, 379, 2245–2251.
Paper NJC
Paper II
This journal is©The Royal Society of Chemistry and the Centre National de la Recherche Scientifique 2020 New J. Chem.
Cite this:DOI: 10.1039/c9nj06437k
Electrostatic grafting of graphene onto polyamide6,6 yarns for use as conductive elements in smarttextile applications
Milad Asadi Miankafshe, *ab Tariq Bashirac and Nils-Krister Perssonab
Electrostatic graphene-grafted conductive yarns were prepared based on a scalable manufacturing
method using conventional polyamide 6,6 (PA 6,6) multifilament yarns, common in the textile industry.
Graphene oxide (GO) shows negative surface charge at any pH and PA 6,6 has an isoelectric point (IEP
= pH|z=0) of 3.6. When GO and a polymer have the same charge sign, the resulting electrostatic
interaction is repulsive and an electrostatic attraction does not arise until the polymer backbone has an
oppositely charged sign compared to the GO nanosheets. To achieve this, yarns were modified with
protonated chitosan (CS) followed by dip-coating with GO, resulting in electrostatic grafting of oxygen
functional groups of GO onto amino groups of CS polymer chains. This coating process provides
durable electrically conductive yarns (3 102 to 4 102 S m1) with an excellent fastness to washing.
It leads to the realization of graphene-grafted yarns as building elements of smart textiles, obtaining
metal-free textile sensors. These yarns are capable of supplying power to an LED light using a 9 V
battery and are expected to be an excellent candidate for feeding V-bed flat-knitting, Jacquard
and raschel knitting machines. To achieve this, a wearable tactile sensor was designed and prepared
using a flat-knitting machine and the sensor was characterized through electrical, mechanical, and
electromechanical measurements.
Introduction
As textiles are a unique class of fabricated materials, involved inalmost every human social activity, smart textiles i.e. thecombination of textiles and any other enabling technology suchas electronics, often regarded as the key factor for obtainingsmartness, are forecast to have a tremendous impact onsociety.1,2 However, the development of smart textiles runsthe risk of stagnation if the prevalent paradigm of mountingthe enabling technology on the surface of textiles (what hasbeen called the integration on approach3) prevails, as it resultsin bulky, heavy, and non-compliant products with low comfort,which are based on inefficient production and require manynon-automatic processes which need manual steps.
Instead, an alternative approach for achieving smartness isinteresting. In what has been denoted as the integration inapproach,3 the very yarns, or a subset thereof, are conductiveand when weaved in, or knitted in, simultaneously add to the
structural cohesion as well as the function. Ultimately, thegoal is to maintain textile comfort, smoothness, pliability,washability, and production infrastructure while maintaininglow production costs.
Electroconductive fibers are currently attractingmuch attentionfor a range of applications from electrostatic discharge4–6 to healthmonitoring and diagnostic systems,7–14 supercapacitors15–19 andenergy harvesting threads.20–23 Many of these are based on elec-trically conductive polymers or metallic conductive mechanisms.An interesting alternative is fibres based on any of the carbonallomorphs for electrical conductivity.24 Among these, graphene –a system of two-dimensional nanosheets with a thickness of one ora few atoms of sp2-bonded carbon atoms – is presently the objectof intensive study.25–35 This is due to the fact that (a) only smallamounts are needed to achieve any effect (electrical or otherwise),and that (b) a thin layer with potentially minimal impact on thethickness of already small structures is often enough.
Graphene with electrical functionality could be introducedat many levels in the textile hierarchy (Fig. 1). Integrationof graphene on the fabrics occurs via different methods suchas dip-coating,36–39 pad-coating,40–42 knife-coating,43–45 inkjetprinting46–48 and more. Among the mentioned methods, dip-coating is a cost-effective, easy to handle and readily scalableprocess. However, a drawback of dip-coating knitted and woven
a The Swedish School of Textile, Polymeric E-textiles, University of Borås,
SE-501 90 Borås, Sweden. E-mail: [email protected]; Tel: +46 729339664b Smart Textiles, University of Borås, SE-501 90 Borås, Swedenc Swedish Centre for Resource Recovery, University of Borås, SE-501 90 Borås,
Sweden
Received 29th December 2019,Accepted 10th April 2020
DOI: 10.1039/c9nj06437k
rsc.li/njc
NJC
PAPER
Publ
ishe
d on
13
Apr
il 20
20. D
ownl
oade
d by
Lin
kopi
ngs u
nive
rsite
tsbi
blio
tek
on 5
/7/2
020
2:57
:37
PM.
View Article OnlineView Journal
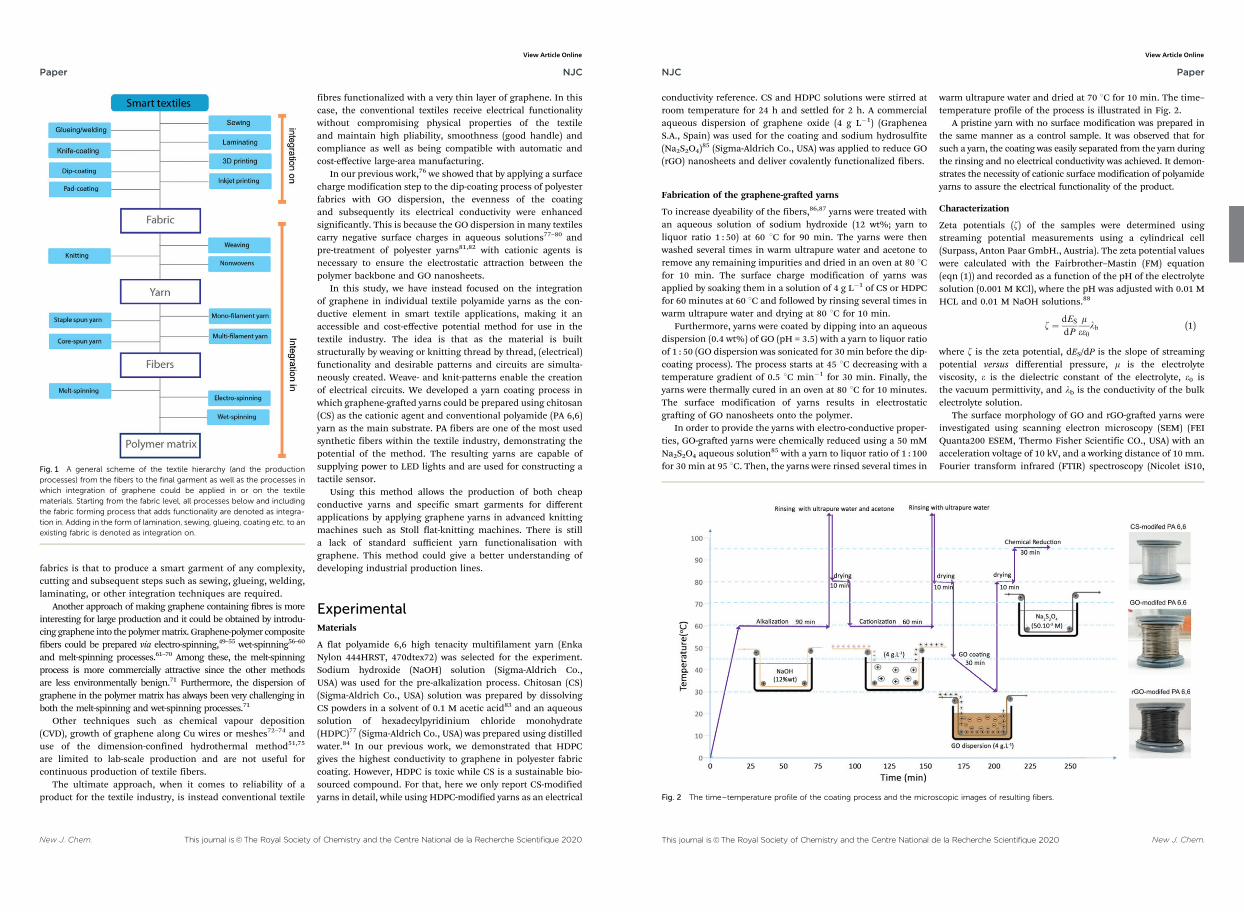
New J. Chem. This journal is©The Royal Society of Chemistry and the Centre National de la Recherche Scientifique 2020
fabrics is that to produce a smart garment of any complexity,cutting and subsequent steps such as sewing, glueing, welding,laminating, or other integration techniques are required.
Another approach of making graphene containing fibres is moreinteresting for large production and it could be obtained by introdu-cing graphene into the polymermatrix. Graphene-polymer compositefibers could be prepared via electro-spinning,49–55 wet-spinning56–60
and melt-spinning processes.61–70 Among these, the melt-spinningprocess is more commercially attractive since the other methodsare less environmentally benign.71 Furthermore, the dispersion ofgraphene in the polymer matrix has always been very challenging inboth the melt-spinning and wet-spinning processes.71
Other techniques such as chemical vapour deposition(CVD), growth of graphene along Cu wires or meshes72–74 anduse of the dimension-confined hydrothermal method51,75
are limited to lab-scale production and are not useful forcontinuous production of textile fibers.
The ultimate approach, when it comes to reliability of aproduct for the textile industry, is instead conventional textile
fibres functionalized with a very thin layer of graphene. In thiscase, the conventional textiles receive electrical functionalitywithout compromising physical properties of the textileand maintain high pliability, smoothness (good handle) andcompliance as well as being compatible with automatic andcost-effective large-area manufacturing.
In our previous work,76 we showed that by applying a surfacecharge modification step to the dip-coating process of polyesterfabrics with GO dispersion, the evenness of the coatingand subsequently its electrical conductivity were enhancedsignificantly. This is because the GO dispersion in many textilescarry negative surface charges in aqueous solutions77–80 andpre-treatment of polyester yarns81,82 with cationic agents isnecessary to ensure the electrostatic attraction between thepolymer backbone and GO nanosheets.
In this study, we have instead focused on the integrationof graphene in individual textile polyamide yarns as the con-ductive element in smart textile applications, making it anaccessible and cost-effective potential method for use in thetextile industry. The idea is that as the material is builtstructurally by weaving or knitting thread by thread, (electrical)functionality and desirable patterns and circuits are simulta-neously created. Weave- and knit-patterns enable the creationof electrical circuits. We developed a yarn coating process inwhich graphene-grafted yarns could be prepared using chitosan(CS) as the cationic agent and conventional polyamide (PA 6,6)yarn as the main substrate. PA fibers are one of the most usedsynthetic fibers within the textile industry, demonstrating thepotential of the method. The resulting yarns are capable ofsupplying power to LED lights and are used for constructing atactile sensor.
Using this method allows the production of both cheapconductive yarns and specific smart garments for differentapplications by applying graphene yarns in advanced knittingmachines such as Stoll flat-knitting machines. There is stilla lack of standard sufficient yarn functionalisation withgraphene. This method could give a better understanding ofdeveloping industrial production lines.
ExperimentalMaterials
A flat polyamide 6,6 high tenacity multifilament yarn (EnkaNylon 444HRST, 470dtex72) was selected for the experiment.Sodium hydroxide (NaOH) solution (Sigma-Aldrich Co.,USA) was used for the pre-alkalization process. Chitosan (CS)(Sigma-Aldrich Co., USA) solution was prepared by dissolvingCS powders in a solvent of 0.1 M acetic acid83 and an aqueoussolution of hexadecylpyridinium chloride monohydrate(HDPC)77 (Sigma-Aldrich Co., USA) was prepared using distilledwater.84 In our previous work, we demonstrated that HDPCgives the highest conductivity to graphene in polyester fabriccoating. However, HDPC is toxic while CS is a sustainable bio-sourced compound. For that, here we only report CS-modifiedyarns in detail, while using HDPC-modified yarns as an electrical
Fig. 1 A general scheme of the textile hierarchy (and the productionprocesses) from the fibers to the final garment as well as the processes inwhich integration of graphene could be applied in or on the textilematerials. Starting from the fabric level, all processes below and includingthe fabric forming process that adds functionality are denoted as integra-tion in. Adding in the form of lamination, sewing, glueing, coating etc. to anexisting fabric is denoted as integration on.
Paper NJC
Publ
ishe
d on
13
Apr
il 20
20. D
ownl
oade
d by
Lin
kopi
ngs u
nive
rsite
tsbi
blio
tek
on 5
/7/2
020
2:57
:37
PM.
View Article Online
This journal is©The Royal Society of Chemistry and the Centre National de la Recherche Scientifique 2020 New J. Chem.
conductivity reference. CS and HDPC solutions were stirred atroom temperature for 24 h and settled for 2 h. A commercialaqueous dispersion of graphene oxide (4 g L1) (GrapheneaS.A., Spain) was used for the coating and sodium hydrosulfite(Na2S2O4)
85 (Sigma-Aldrich Co., USA) was applied to reduce GO(rGO) nanosheets and deliver covalently functionalized fibers.
Fabrication of the graphene-grafted yarns
To increase dyeability of the fibers,86,87 yarns were treated withan aqueous solution of sodium hydroxide (12 wt%; yarn toliquor ratio 1 : 50) at 60 1C for 90 min. The yarns were thenwashed several times in warm ultrapure water and acetone toremove any remaining impurities and dried in an oven at 80 1Cfor 10 min. The surface charge modification of yarns wasapplied by soaking them in a solution of 4 g L1 of CS or HDPCfor 60 minutes at 60 1C and followed by rinsing several times inwarm ultrapure water and drying at 80 1C for 10 min.
Furthermore, yarns were coated by dipping into an aqueousdispersion (0.4 wt%) of GO (pH = 3.5) with a yarn to liquor ratioof 1 : 50 (GO dispersion was sonicated for 30 min before the dip-coating process). The process starts at 45 1C decreasing with atemperature gradient of 0.5 1C min1 for 30 min. Finally, theyarns were thermally cured in an oven at 80 1C for 10 minutes.The surface modification of yarns results in electrostaticgrafting of GO nanosheets onto the polymer.
In order to provide the yarns with electro-conductive proper-ties, GO-grafted yarns were chemically reduced using a 50 mMNa2S2O4 aqueous solution
85 with a yarn to liquor ratio of 1 : 100for 30 min at 95 1C. Then, the yarns were rinsed several times in
warm ultrapure water and dried at 70 1C for 10 min. The time–temperature profile of the process is illustrated in Fig. 2.
A pristine yarn with no surface modification was prepared inthe same manner as a control sample. It was observed that forsuch a yarn, the coating was easily separated from the yarn duringthe rinsing and no electrical conductivity was achieved. It demon-strates the necessity of cationic surface modification of polyamideyarns to assure the electrical functionality of the product.
Characterization
Zeta potentials (z) of the samples were determined usingstreaming potential measurements using a cylindrical cell(Surpass, Anton Paar GmbH., Austria). The zeta potential valueswere calculated with the Fairbrother–Mastin (FM) equation(eqn (1)) and recorded as a function of the pH of the electrolytesolution (0.001 M KCl), where the pH was adjusted with 0.01 MHCL and 0.01 M NaOH solutions.88
z ¼ dES
dP
mee0
lb (1)
where z is the zeta potential, dES/dP is the slope of streamingpotential versus differential pressure, m is the electrolyteviscosity, e is the dielectric constant of the electrolyte, e0 isthe vacuum permittivity, and lb is the conductivity of the bulkelectrolyte solution.
The surface morphology of GO and rGO-grafted yarns wereinvestigated using scanning electron microscopy (SEM) (FEIQuanta200 ESEM, Thermo Fisher Scientific CO., USA) with anacceleration voltage of 10 kV, and a working distance of 10 mm.Fourier transform infrared (FTIR) spectroscopy (Nicolet iS10,
Fig. 2 The time–temperature profile of the coating process and the microscopic images of resulting fibers.
NJC Paper
Publ
ishe
d on
13
Apr
il 20
20. D
ownl
oade
d by
Lin
kopi
ngs u
nive
rsite
tsbi
blio
tek
on 5
/7/2
020
2:57
:37
PM.
View Article Online
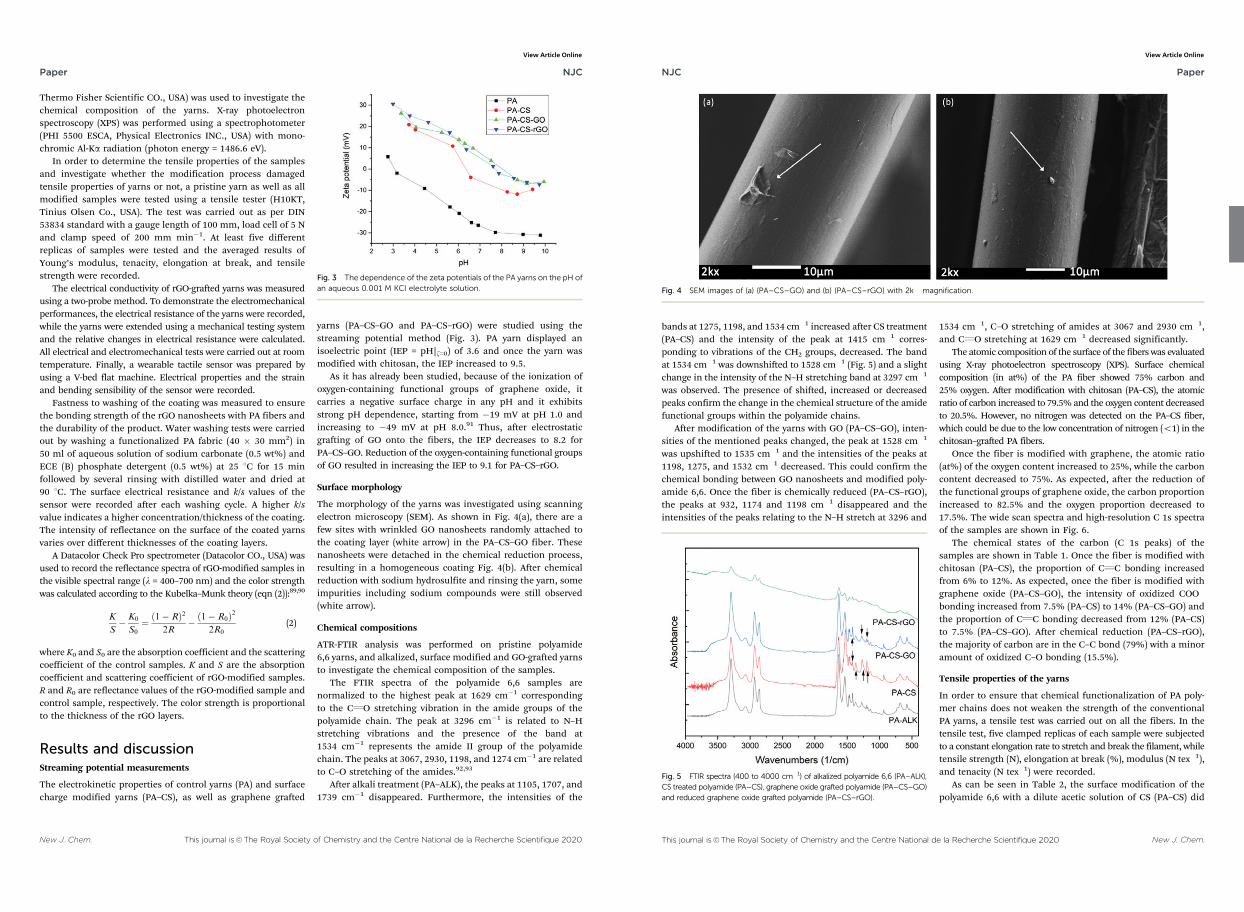
New J. Chem. This journal is©The Royal Society of Chemistry and the Centre National de la Recherche Scientifique 2020
Thermo Fisher Scientific CO., USA) was used to investigate thechemical composition of the yarns. X-ray photoelectronspectroscopy (XPS) was performed using a spectrophotometer(PHI 5500 ESCA, Physical Electronics INC., USA) with mono-chromic Al-Ka radiation (photon energy = 1486.6 eV).
In order to determine the tensile properties of the samplesand investigate whether the modification process damagedtensile properties of yarns or not, a pristine yarn as well as allmodified samples were tested using a tensile tester (H10KT,Tinius Olsen Co., USA). The test was carried out as per DIN53834 standard with a gauge length of 100 mm, load cell of 5 Nand clamp speed of 200 mm min1. At least five differentreplicas of samples were tested and the averaged results ofYoung’s modulus, tenacity, elongation at break, and tensilestrength were recorded.
The electrical conductivity of rGO-grafted yarns was measuredusing a two-probe method. To demonstrate the electromechanicalperformances, the electrical resistance of the yarns were recorded,while the yarns were extended using a mechanical testing systemand the relative changes in electrical resistance were calculated.All electrical and electromechanical tests were carried out at roomtemperature. Finally, a wearable tactile sensor was prepared byusing a V-bed flat machine. Electrical properties and the strainand bending sensibility of the sensor were recorded.
Fastness to washing of the coating was measured to ensurethe bonding strength of the rGO nanosheets with PA fibers andthe durability of the product. Water washing tests were carriedout by washing a functionalized PA fabric (40 30 mm2) in50 ml of aqueous solution of sodium carbonate (0.5 wt%) andECE (B) phosphate detergent (0.5 wt%) at 25 1C for 15 minfollowed by several rinsing with distilled water and dried at90 1C. The surface electrical resistance and k/s values of thesensor were recorded after each washing cycle. A higher k/svalue indicates a higher concentration/thickness of the coating.The intensity of reflectance on the surface of the coated yarnsvaries over different thicknesses of the coating layers.
A Datacolor Check Pro spectrometer (Datacolor CO., USA) wasused to record the reflectance spectra of rGO-modified samples inthe visible spectral range (l = 400–700 nm) and the color strengthwas calculated according to the Kubelka–Munk theory (eqn (2)):89,90
K
S K0
S0¼ ð1 RÞ2
2R 1 R0ð Þ2
2R0(2)
where K0 and S0 are the absorption coefficient and the scatteringcoefficient of the control samples. K and S are the absorptioncoefficient and scattering coefficient of rGO-modified samples.R and R0 are reflectance values of the rGO-modified sample andcontrol sample, respectively. The color strength is proportionalto the thickness of the rGO layers.
Results and discussionStreaming potential measurements
The electrokinetic properties of control yarns (PA) and surfacecharge modified yarns (PA–CS), as well as graphene grafted
yarns (PA–CS–GO and PA–CS–rGO) were studied using thestreaming potential method (Fig. 3). PA yarn displayed anisoelectric point (IEP = pH|z=0) of 3.6 and once the yarn wasmodified with chitosan, the IEP increased to 9.5.
As it has already been studied, because of the ionization ofoxygen-containing functional groups of graphene oxide, itcarries a negative surface charge in any pH and it exhibitsstrong pH dependence, starting from 19 mV at pH 1.0 andincreasing to 49 mV at pH 8.0.91 Thus, after electrostaticgrafting of GO onto the fibers, the IEP decreases to 8.2 forPA–CS–GO. Reduction of the oxygen-containing functional groupsof GO resulted in increasing the IEP to 9.1 for PA–CS–rGO.
Surface morphology
The morphology of the yarns was investigated using scanningelectron microscopy (SEM). As shown in Fig. 4(a), there are afew sites with wrinkled GO nanosheets randomly attached tothe coating layer (white arrow) in the PA–CS–GO fiber. Thesenanosheets were detached in the chemical reduction process,resulting in a homogeneous coating Fig. 4(b). After chemicalreduction with sodium hydrosulfite and rinsing the yarn, someimpurities including sodium compounds were still observed(white arrow).
Chemical compositions
ATR-FTIR analysis was performed on pristine polyamide6,6 yarns, and alkalized, surface modified and GO-grafted yarnsto investigate the chemical composition of the samples.
The FTIR spectra of the polyamide 6,6 samples arenormalized to the highest peak at 1629 cm1 correspondingto the CQO stretching vibration in the amide groups of thepolyamide chain. The peak at 3296 cm1 is related to N–Hstretching vibrations and the presence of the band at1534 cm1 represents the amide II group of the polyamidechain. The peaks at 3067, 2930, 1198, and 1274 cm1 are relatedto C–O stretching of the amides.92,93
After alkali treatment (PA–ALK), the peaks at 1105, 1707, and1739 cm1 disappeared. Furthermore, the intensities of the
Fig. 3 The dependence of the zeta potentials of the PA yarns on the pH ofan aqueous 0.001 M KCl electrolyte solution.
Paper NJC
Publ
ishe
d on
13
Apr
il 20
20. D
ownl
oade
d by
Lin
kopi
ngs u
nive
rsite
tsbi
blio
tek
on 5
/7/2
020
2:57
:37
PM.
View Article Online
This journal is©The Royal Society of Chemistry and the Centre National de la Recherche Scientifique 2020 New J. Chem.
bands at 1275, 1198, and 1534 cm1 increased after CS treatment(PA–CS) and the intensity of the peak at 1415 cm1 corres-ponding to vibrations of the CH2 groups, decreased. The bandat 1534 cm1 was downshifted to 1528 cm1 (Fig. 5) and a slightchange in the intensity of the N–H stretching band at 3297 cm1
was observed. The presence of shifted, increased or decreasedpeaks confirm the change in the chemical structure of the amidefunctional groups within the polyamide chains.
After modification of the yarns with GO (PA–CS–GO), inten-sities of the mentioned peaks changed, the peak at 1528 cm1
was upshifted to 1535 cm1 and the intensities of the peaks at1198, 1275, and 1532 cm1 decreased. This could confirm thechemical bonding between GO nanosheets and modified poly-amide 6,6. Once the fiber is chemically reduced (PA–CS–rGO),the peaks at 932, 1174 and 1198 cm1 disappeared and theintensities of the peaks relating to the N–H stretch at 3296 and
1534 cm1, C–O stretching of amides at 3067 and 2930 cm1,and CQO stretching at 1629 cm1 decreased significantly.
The atomic composition of the surface of the fibers was evaluatedusing X-ray photoelectron spectroscopy (XPS). Surface chemicalcomposition (in at%) of the PA fiber showed 75% carbon and25% oxygen. After modification with chitosan (PA–CS), the atomicratio of carbon increased to 79.5% and the oxygen content decreasedto 20.5%. However, no nitrogen was detected on the PA–CS fiber,which could be due to the low concentration of nitrogen (o1) in thechitosan–grafted PA fibers.
Once the fiber is modified with graphene, the atomic ratio(at%) of the oxygen content increased to 25%, while the carboncontent decreased to 75%. As expected, after the reduction ofthe functional groups of graphene oxide, the carbon proportionincreased to 82.5% and the oxygen proportion decreased to17.5%. The wide scan spectra and high-resolution C 1s spectraof the samples are shown in Fig. 6.
The chemical states of the carbon (C 1s peaks) of thesamples are shown in Table 1. Once the fiber is modified withchitosan (PA–CS), the proportion of CQC bonding increasedfrom 6% to 12%. As expected, once the fiber is modified withgraphene oxide (PA–CS–GO), the intensity of oxidized COO
bonding increased from 7.5% (PA–CS) to 14% (PA–CS–GO) andthe proportion of CQC bonding decreased from 12% (PA–CS)to 7.5% (PA–CS–GO). After chemical reduction (PA–CS–rGO),the majority of carbon are in the C–C bond (79%) with a minoramount of oxidized C–O bonding (15.5%).
Tensile properties of the yarns
In order to ensure that chemical functionalization of PA poly-mer chains does not weaken the strength of the conventionalPA yarns, a tensile test was carried out on all the fibers. In thetensile test, five clamped replicas of each sample were subjectedto a constant elongation rate to stretch and break the filament, whiletensile strength (N), elongation at break (%), modulus (N tex1),and tenacity (N tex1) were recorded.
As can be seen in Table 2, the surface modification of thepolyamide 6,6 with a dilute acetic solution of CS (PA–CS) did
Fig. 4 SEM images of (a) (PA–CS–GO) and (b) (PA–CS–rGO) with 2k magnification.
Fig. 5 FTIR spectra (400 to 4000 cm1) of alkalized polyamide 6,6 (PA–ALK),CS treated polyamide (PA–CS), graphene oxide grafted polyamide (PA–CS–GO)and reduced graphene oxide grafted polyamide (PA–CS–rGO).
NJC Paper
Publ
ishe
d on
13
Apr
il 20
20. D
ownl
oade
d by
Lin
kopi
ngs u
nive
rsite
tsbi
blio
tek
on 5
/7/2
020
2:57
:37
PM.
View Article Online
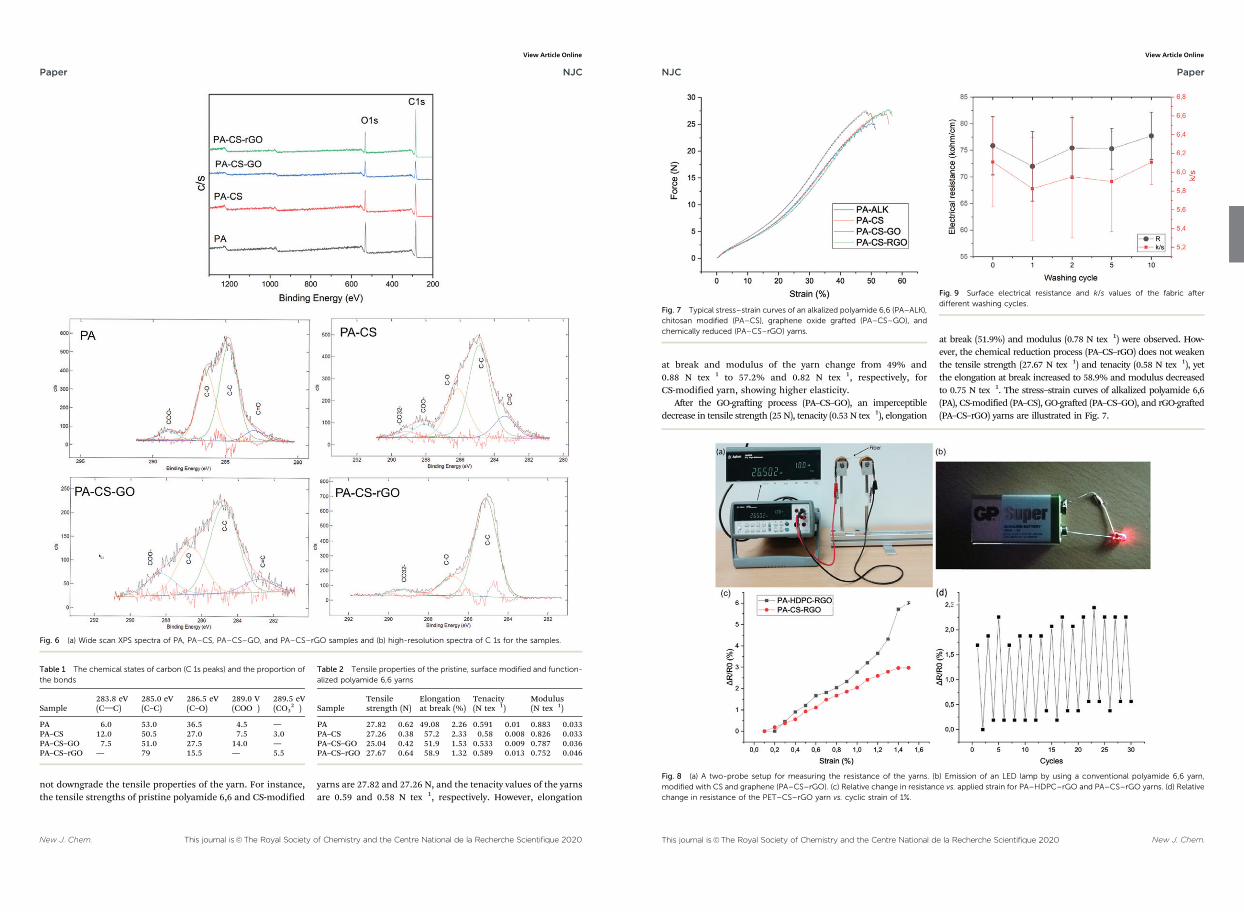
New J. Chem. This journal is©The Royal Society of Chemistry and the Centre National de la Recherche Scientifique 2020
not downgrade the tensile properties of the yarn. For instance,the tensile strengths of pristine polyamide 6,6 and CS-modified
yarns are 27.82 and 27.26 N, and the tenacity values of the yarnsare 0.59 and 0.58 N tex1, respectively. However, elongation
Fig. 6 (a) Wide scan XPS spectra of PA, PA–CS, PA–CS–GO, and PA–CS–rGO samples and (b) high-resolution spectra of C 1s for the samples.
Table 1 The chemical states of carbon (C 1s peaks) and the proportion ofthe bonds
Sample283.8 eV(CQC)
285.0 eV(C–C)
286.5 eV(C–O)
289.0 V(COO)
289.5 eV(CO3
2)
PA 6.0 53.0 36.5 4.5 —PA–CS 12.0 50.5 27.0 7.5 3.0PA–CS–GO 7.5 51.0 27.5 14.0 —PA–CS–rGO — 79 15.5 — 5.5
Table 2 Tensile properties of the pristine, surface modified and function-alized polyamide 6,6 yarns
SampleTensilestrength (N)
Elongationat break (%)
Tenacity(N tex1)
Modulus(N tex1)
PA 27.82 0.62 49.08 2.26 0.591 0.01 0.883 0.033PA–CS 27.26 0.38 57.2 2.33 0.58 0.008 0.826 0.033PA–CS–GO 25.04 0.42 51.9 1.53 0.533 0.009 0.787 0.036PA–CS–rGO 27.67 0.64 58.9 1.32 0.589 0.013 0.752 0.046
Paper NJC
Publ
ishe
d on
13
Apr
il 20
20. D
ownl
oade
d by
Lin
kopi
ngs u
nive
rsite
tsbi
blio
tek
on 5
/7/2
020
2:57
:37
PM.
View Article Online
This journal is©The Royal Society of Chemistry and the Centre National de la Recherche Scientifique 2020 New J. Chem.
at break and modulus of the yarn change from 49% and0.88 N tex1 to 57.2% and 0.82 N tex1, respectively, forCS-modified yarn, showing higher elasticity.
After the GO-grafting process (PA–CS–GO), an imperceptibledecrease in tensile strength (25 N), tenacity (0.53 N tex1), elongation
at break (51.9%) and modulus (0.78 N tex1) were observed. How-ever, the chemical reduction process (PA–CS–rGO) does not weakenthe tensile strength (27.67 N tex1) and tenacity (0.58 N tex1), yetthe elongation at break increased to 58.9% and modulus decreasedto 0.75 N tex1. The stress–strain curves of alkalized polyamide 6,6(PA), CS-modified (PA–CS), GO-grafted (PA–CS–GO), and rGO-grafted(PA–CS–rGO) yarns are illustrated in Fig. 7.
Fig. 7 Typical stress–strain curves of an alkalized polyamide 6,6 (PA–ALK),chitosan modified (PA–CS), graphene oxide grafted (PA–CS–GO), andchemically reduced (PA–CS–rGO) yarns.
Fig. 8 (a) A two-probe setup for measuring the resistance of the yarns. (b) Emission of an LED lamp by using a conventional polyamide 6,6 yarn,modified with CS and graphene (PA–CS–rGO). (c) Relative change in resistance vs. applied strain for PA–HDPC–rGO and PA–CS–rGO yarns. (d) Relativechange in resistance of the PET–CS–rGO yarn vs. cyclic strain of 1%.
Fig. 9 Surface electrical resistance and k/s values of the fabric afterdifferent washing cycles.
NJC Paper
Publ
ishe
d on
13
Apr
il 20
20. D
ownl
oade
d by
Lin
kopi
ngs u
nive
rsite
tsbi
blio
tek
on 5
/7/2
020
2:57
:37
PM.
View Article Online
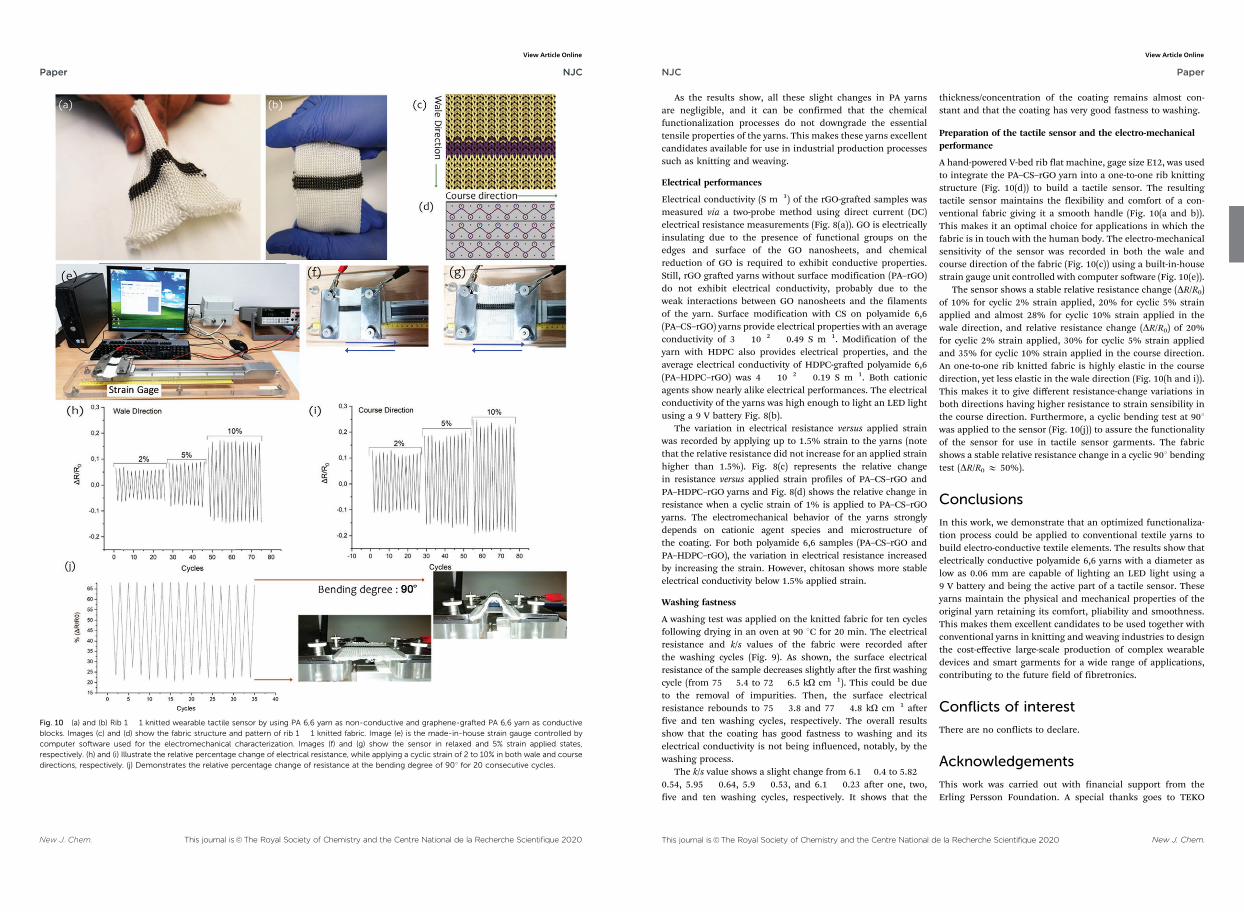
New J. Chem. This journal is©The Royal Society of Chemistry and the Centre National de la Recherche Scientifique 2020
Fig. 10 (a) and (b) Rib 1 1 knitted wearable tactile sensor by using PA 6,6 yarn as non-conductive and graphene-grafted PA 6,6 yarn as conductiveblocks. Images (c) and (d) show the fabric structure and pattern of rib 1 1 knitted fabric. Image (e) is the made-in-house strain gauge controlled bycomputer software used for the electromechanical characterization. Images (f) and (g) show the sensor in relaxed and 5% strain applied states,respectively. (h) and (i) Illustrate the relative percentage change of electrical resistance, while applying a cyclic strain of 2 to 10% in both wale and coursedirections, respectively. (j) Demonstrates the relative percentage change of resistance at the bending degree of 901 for 20 consecutive cycles.
Paper NJC
Publ
ishe
d on
13
Apr
il 20
20. D
ownl
oade
d by
Lin
kopi
ngs u
nive
rsite
tsbi
blio
tek
on 5
/7/2
020
2:57
:37
PM.
View Article Online
This journal is©The Royal Society of Chemistry and the Centre National de la Recherche Scientifique 2020 New J. Chem.
As the results show, all these slight changes in PA yarnsare negligible, and it can be confirmed that the chemicalfunctionalization processes do not downgrade the essentialtensile properties of the yarns. This makes these yarns excellentcandidates available for use in industrial production processessuch as knitting and weaving.
Electrical performances
Electrical conductivity (S m1) of the rGO-grafted samples wasmeasured via a two-probe method using direct current (DC)electrical resistance measurements (Fig. 8(a)). GO is electricallyinsulating due to the presence of functional groups on theedges and surface of the GO nanosheets, and chemicalreduction of GO is required to exhibit conductive properties.Still, rGO grafted yarns without surface modification (PA–rGO)do not exhibit electrical conductivity, probably due to theweak interactions between GO nanosheets and the filamentsof the yarn. Surface modification with CS on polyamide 6,6(PA–CS–rGO) yarns provide electrical properties with an averageconductivity of 3 102 0.49 S m1. Modification of theyarn with HDPC also provides electrical properties, and theaverage electrical conductivity of HDPC-grafted polyamide 6,6(PA–HDPC–rGO) was 4 102 0.19 S m1. Both cationicagents show nearly alike electrical performances. The electricalconductivity of the yarns was high enough to light an LED lightusing a 9 V battery Fig. 8(b).
The variation in electrical resistance versus applied strainwas recorded by applying up to 1.5% strain to the yarns (notethat the relative resistance did not increase for an applied strainhigher than 1.5%). Fig. 8(c) represents the relative changein resistance versus applied strain profiles of PA–CS–rGO andPA–HDPC–rGO yarns and Fig. 8(d) shows the relative change inresistance when a cyclic strain of 1% is applied to PA–CS–rGOyarns. The electromechanical behavior of the yarns stronglydepends on cationic agent species and microstructure ofthe coating. For both polyamide 6,6 samples (PA–CS–rGO andPA–HDPC–rGO), the variation in electrical resistance increasedby increasing the strain. However, chitosan shows more stableelectrical conductivity below 1.5% applied strain.
Washing fastness
A washing test was applied on the knitted fabric for ten cyclesfollowing drying in an oven at 90 1C for 20 min. The electricalresistance and k/s values of the fabric were recorded afterthe washing cycles (Fig. 9). As shown, the surface electricalresistance of the sample decreases slightly after the first washingcycle (from 75 5.4 to 72 6.5 kO cm1). This could be dueto the removal of impurities. Then, the surface electricalresistance rebounds to 75 3.8 and 77 4.8 kO cm1 afterfive and ten washing cycles, respectively. The overall resultsshow that the coating has good fastness to washing and itselectrical conductivity is not being influenced, notably, by thewashing process.
The k/s value shows a slight change from 6.1 0.4 to 5.82 0.54, 5.95 0.64, 5.9 0.53, and 6.1 0.23 after one, two,five and ten washing cycles, respectively. It shows that the
thickness/concentration of the coating remains almost con-stant and that the coating has very good fastness to washing.
Preparation of the tactile sensor and the electro-mechanicalperformance
A hand-powered V-bed rib flat machine, gage size E12, was usedto integrate the PA–CS–rGO yarn into a one-to-one rib knittingstructure (Fig. 10(d)) to build a tactile sensor. The resultingtactile sensor maintains the flexibility and comfort of a con-ventional fabric giving it a smooth handle (Fig. 10(a and b)).This makes it an optimal choice for applications in which thefabric is in touch with the human body. The electro-mechanicalsensitivity of the sensor was recorded in both the wale andcourse direction of the fabric (Fig. 10(c)) using a built-in-housestrain gauge unit controlled with computer software (Fig. 10(e)).
The sensor shows a stable relative resistance change (DR/R0)of 10% for cyclic 2% strain applied, 20% for cyclic 5% strainapplied and almost 28% for cyclic 10% strain applied in thewale direction, and relative resistance change (DR/R0) of 20%for cyclic 2% strain applied, 30% for cyclic 5% strain appliedand 35% for cyclic 10% strain applied in the course direction.An one-to-one rib knitted fabric is highly elastic in the coursedirection, yet less elastic in the wale direction (Fig. 10(h and i)).This makes it to give different resistance-change variations inboth directions having higher resistance to strain sensibility inthe course direction. Furthermore, a cyclic bending test at 901was applied to the sensor (Fig. 10(j)) to assure the functionalityof the sensor for use in tactile sensor garments. The fabricshows a stable relative resistance change in a cyclic 901 bendingtest (DR/R0 E 50%).
Conclusions
In this work, we demonstrate that an optimized functionaliza-tion process could be applied to conventional textile yarns tobuild electro-conductive textile elements. The results show thatelectrically conductive polyamide 6,6 yarns with a diameter aslow as 0.06 mm are capable of lighting an LED light using a9 V battery and being the active part of a tactile sensor. Theseyarns maintain the physical and mechanical properties of theoriginal yarn retaining its comfort, pliability and smoothness.This makes them excellent candidates to be used together withconventional yarns in knitting and weaving industries to designthe cost-effective large-scale production of complex wearabledevices and smart garments for a wide range of applications,contributing to the future field of fibretronics.
Conflicts of interest
There are no conflicts to declare.
Acknowledgements
This work was carried out with financial support from theErling Persson Foundation. A special thanks goes to TEKO
NJC Paper
Publ
ishe
d on
13
Apr
il 20
20. D
ownl
oade
d by
Lin
kopi
ngs u
nive
rsite
tsbi
blio
tek
on 5
/7/2
020
2:57
:37
PM.
View Article Online
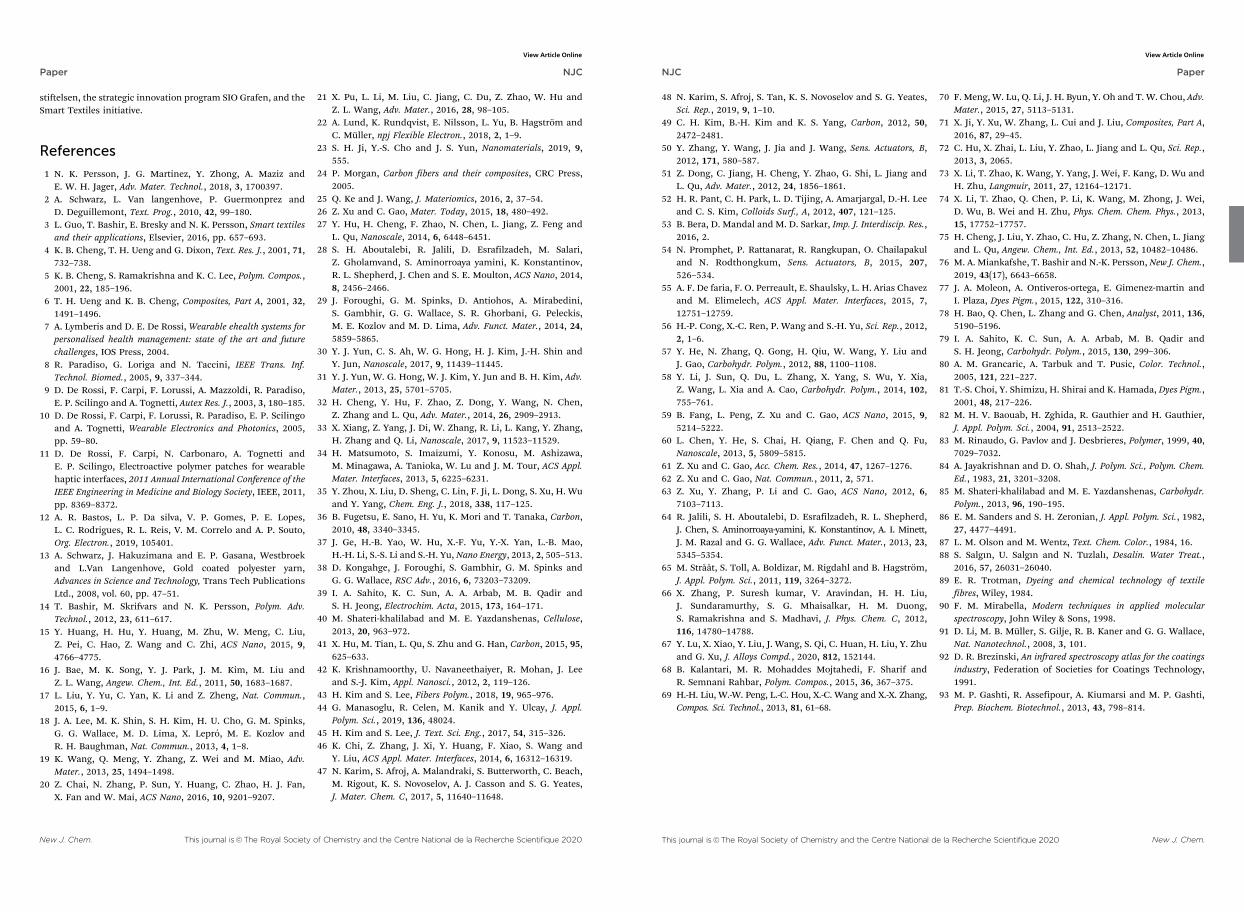
New J. Chem. This journal is©The Royal Society of Chemistry and the Centre National de la Recherche Scientifique 2020
stiftelsen, the strategic innovation program SIO Grafen, and theSmart Textiles initiative.
References
1 N. K. Persson, J. G. Martinez, Y. Zhong, A. Maziz andE. W. H. Jager, Adv. Mater. Technol., 2018, 3, 1700397.
2 A. Schwarz, L. Van langenhove, P. Guermonprez andD. Deguillemont, Text. Prog., 2010, 42, 99–180.
3 L. Guo, T. Bashir, E. Bresky and N. K. Persson, Smart textilesand their applications, Elsevier, 2016, pp. 657–693.
4 K. B. Cheng, T. H. Ueng and G. Dixon, Text. Res. J., 2001, 71,732–738.
5 K. B. Cheng, S. Ramakrishna and K. C. Lee, Polym. Compos.,2001, 22, 185–196.
6 T. H. Ueng and K. B. Cheng, Composites, Part A, 2001, 32,1491–1496.
7 A. Lymberis and D. E. De Rossi, Wearable ehealth systems forpersonalised health management: state of the art and futurechallenges, IOS Press, 2004.
8 R. Paradiso, G. Loriga and N. Taccini, IEEE Trans. Inf.Technol. Biomed., 2005, 9, 337–344.
9 D. De Rossi, F. Carpi, F. Lorussi, A. Mazzoldi, R. Paradiso,E. P. Scilingo and A. Tognetti, Autex Res. J., 2003, 3, 180–185.
10 D. De Rossi, F. Carpi, F. Lorussi, R. Paradiso, E. P. Scilingoand A. Tognetti, Wearable Electronics and Photonics, 2005,pp. 59–80.
11 D. De Rossi, F. Carpi, N. Carbonaro, A. Tognetti andE. P. Scilingo, Electroactive polymer patches for wearablehaptic interfaces, 2011 Annual International Conference of theIEEE Engineering in Medicine and Biology Society, IEEE, 2011,pp. 8369–8372.
12 A. R. Bastos, L. P. Da silva, V. P. Gomes, P. E. Lopes,L. C. Rodrigues, R. L. Reis, V. M. Correlo and A. P. Souto,Org. Electron., 2019, 105401.
13 A. Schwarz, J. Hakuzimana and E. P. Gasana, Westbroekand L.Van Langenhove, Gold coated polyester yarn,Advances in Science and Technology, Trans Tech PublicationsLtd., 2008, vol. 60, pp. 47–51.
14 T. Bashir, M. Skrifvars and N. K. Persson, Polym. Adv.Technol., 2012, 23, 611–617.
15 Y. Huang, H. Hu, Y. Huang, M. Zhu, W. Meng, C. Liu,Z. Pei, C. Hao, Z. Wang and C. Zhi, ACS Nano, 2015, 9,4766–4775.
16 J. Bae, M. K. Song, Y. J. Park, J. M. Kim, M. Liu andZ. L. Wang, Angew. Chem., Int. Ed., 2011, 50, 1683–1687.
17 L. Liu, Y. Yu, C. Yan, K. Li and Z. Zheng, Nat. Commun.,2015, 6, 1–9.
18 J. A. Lee, M. K. Shin, S. H. Kim, H. U. Cho, G. M. Spinks,G. G. Wallace, M. D. Lima, X. Lepro, M. E. Kozlov andR. H. Baughman, Nat. Commun., 2013, 4, 1–8.
19 K. Wang, Q. Meng, Y. Zhang, Z. Wei and M. Miao, Adv.Mater., 2013, 25, 1494–1498.
20 Z. Chai, N. Zhang, P. Sun, Y. Huang, C. Zhao, H. J. Fan,X. Fan and W. Mai, ACS Nano, 2016, 10, 9201–9207.
21 X. Pu, L. Li, M. Liu, C. Jiang, C. Du, Z. Zhao, W. Hu andZ. L. Wang, Adv. Mater., 2016, 28, 98–105.
22 A. Lund, K. Rundqvist, E. Nilsson, L. Yu, B. Hagstrom andC. Muller, npj Flexible Electron., 2018, 2, 1–9.
23 S. H. Ji, Y.-S. Cho and J. S. Yun, Nanomaterials, 2019, 9,555.
24 P. Morgan, Carbon fibers and their composites, CRC Press,2005.
25 Q. Ke and J. Wang, J. Materiomics, 2016, 2, 37–54.26 Z. Xu and C. Gao, Mater. Today, 2015, 18, 480–492.27 Y. Hu, H. Cheng, F. Zhao, N. Chen, L. Jiang, Z. Feng and
L. Qu, Nanoscale, 2014, 6, 6448–6451.28 S. H. Aboutalebi, R. Jalili, D. Esrafilzadeh, M. Salari,
Z. Gholamvand, S. Aminorroaya yamini, K. Konstantinov,R. L. Shepherd, J. Chen and S. E. Moulton, ACS Nano, 2014,8, 2456–2466.
29 J. Foroughi, G. M. Spinks, D. Antiohos, A. Mirabedini,S. Gambhir, G. G. Wallace, S. R. Ghorbani, G. Peleckis,M. E. Kozlov and M. D. Lima, Adv. Funct. Mater., 2014, 24,5859–5865.
30 Y. J. Yun, C. S. Ah, W. G. Hong, H. J. Kim, J.-H. Shin andY. Jun, Nanoscale, 2017, 9, 11439–11445.
31 Y. J. Yun, W. G. Hong, W. J. Kim, Y. Jun and B. H. Kim, Adv.Mater., 2013, 25, 5701–5705.
32 H. Cheng, Y. Hu, F. Zhao, Z. Dong, Y. Wang, N. Chen,Z. Zhang and L. Qu, Adv. Mater., 2014, 26, 2909–2913.
33 X. Xiang, Z. Yang, J. Di, W. Zhang, R. Li, L. Kang, Y. Zhang,H. Zhang and Q. Li, Nanoscale, 2017, 9, 11523–11529.
34 H. Matsumoto, S. Imaizumi, Y. Konosu, M. Ashizawa,M. Minagawa, A. Tanioka, W. Lu and J. M. Tour, ACS Appl.Mater. Interfaces, 2013, 5, 6225–6231.
35 Y. Zhou, X. Liu, D. Sheng, C. Lin, F. Ji, L. Dong, S. Xu, H. Wuand Y. Yang, Chem. Eng. J., 2018, 338, 117–125.
36 B. Fugetsu, E. Sano, H. Yu, K. Mori and T. Tanaka, Carbon,2010, 48, 3340–3345.
37 J. Ge, H.-B. Yao, W. Hu, X.-F. Yu, Y.-X. Yan, L.-B. Mao,H.-H. Li, S.-S. Li and S.-H. Yu, Nano Energy, 2013, 2, 505–513.
38 D. Kongahge, J. Foroughi, S. Gambhir, G. M. Spinks andG. G. Wallace, RSC Adv., 2016, 6, 73203–73209.
39 I. A. Sahito, K. C. Sun, A. A. Arbab, M. B. Qadir andS. H. Jeong, Electrochim. Acta, 2015, 173, 164–171.
40 M. Shateri-khalilabad and M. E. Yazdanshenas, Cellulose,2013, 20, 963–972.
41 X. Hu, M. Tian, L. Qu, S. Zhu and G. Han, Carbon, 2015, 95,625–633.
42 K. Krishnamoorthy, U. Navaneethaiyer, R. Mohan, J. Leeand S.-J. Kim, Appl. Nanosci., 2012, 2, 119–126.
43 H. Kim and S. Lee, Fibers Polym., 2018, 19, 965–976.44 G. Manasoglu, R. Celen, M. Kanik and Y. Ulcay, J. Appl.
Polym. Sci., 2019, 136, 48024.45 H. Kim and S. Lee, J. Text. Sci. Eng., 2017, 54, 315–326.46 K. Chi, Z. Zhang, J. Xi, Y. Huang, F. Xiao, S. Wang and
Y. Liu, ACS Appl. Mater. Interfaces, 2014, 6, 16312–16319.47 N. Karim, S. Afroj, A. Malandraki, S. Butterworth, C. Beach,
M. Rigout, K. S. Novoselov, A. J. Casson and S. G. Yeates,J. Mater. Chem. C, 2017, 5, 11640–11648.
Paper NJC
Publ
ishe
d on
13
Apr
il 20
20. D
ownl
oade
d by
Lin
kopi
ngs u
nive
rsite
tsbi
blio
tek
on 5
/7/2
020
2:57
:37
PM.
View Article Online
This journal is©The Royal Society of Chemistry and the Centre National de la Recherche Scientifique 2020 New J. Chem.
48 N. Karim, S. Afroj, S. Tan, K. S. Novoselov and S. G. Yeates,Sci. Rep., 2019, 9, 1–10.
49 C. H. Kim, B.-H. Kim and K. S. Yang, Carbon, 2012, 50,2472–2481.
50 Y. Zhang, Y. Wang, J. Jia and J. Wang, Sens. Actuators, B,2012, 171, 580–587.
51 Z. Dong, C. Jiang, H. Cheng, Y. Zhao, G. Shi, L. Jiang andL. Qu, Adv. Mater., 2012, 24, 1856–1861.
52 H. R. Pant, C. H. Park, L. D. Tijing, A. Amarjargal, D.-H. Leeand C. S. Kim, Colloids Surf., A, 2012, 407, 121–125.
53 B. Bera, D. Mandal and M. D. Sarkar, Imp. J. Interdiscip. Res.,2016, 2.
54 N. Promphet, P. Rattanarat, R. Rangkupan, O. Chailapakuland N. Rodthongkum, Sens. Actuators, B, 2015, 207,526–534.
55 A. F. De faria, F. O. Perreault, E. Shaulsky, L. H. Arias Chavezand M. Elimelech, ACS Appl. Mater. Interfaces, 2015, 7,12751–12759.
56 H.-P. Cong, X.-C. Ren, P. Wang and S.-H. Yu, Sci. Rep., 2012,2, 1–6.
57 Y. He, N. Zhang, Q. Gong, H. Qiu, W. Wang, Y. Liu andJ. Gao, Carbohydr. Polym., 2012, 88, 1100–1108.
58 Y. Li, J. Sun, Q. Du, L. Zhang, X. Yang, S. Wu, Y. Xia,Z. Wang, L. Xia and A. Cao, Carbohydr. Polym., 2014, 102,755–761.
59 B. Fang, L. Peng, Z. Xu and C. Gao, ACS Nano, 2015, 9,5214–5222.
60 L. Chen, Y. He, S. Chai, H. Qiang, F. Chen and Q. Fu,Nanoscale, 2013, 5, 5809–5815.
61 Z. Xu and C. Gao, Acc. Chem. Res., 2014, 47, 1267–1276.62 Z. Xu and C. Gao, Nat. Commun., 2011, 2, 571.63 Z. Xu, Y. Zhang, P. Li and C. Gao, ACS Nano, 2012, 6,
7103–7113.64 R. Jalili, S. H. Aboutalebi, D. Esrafilzadeh, R. L. Shepherd,
J. Chen, S. Aminorroaya-yamini, K. Konstantinov, A. I. Minett,J. M. Razal and G. G. Wallace, Adv. Funct. Mater., 2013, 23,5345–5354.
65 M. Strååt, S. Toll, A. Boldizar, M. Rigdahl and B. Hagstrom,J. Appl. Polym. Sci., 2011, 119, 3264–3272.
66 X. Zhang, P. Suresh kumar, V. Aravindan, H. H. Liu,J. Sundaramurthy, S. G. Mhaisalkar, H. M. Duong,S. Ramakrishna and S. Madhavi, J. Phys. Chem. C, 2012,116, 14780–14788.
67 Y. Lu, X. Xiao, Y. Liu, J. Wang, S. Qi, C. Huan, H. Liu, Y. Zhuand G. Xu, J. Alloys Compd., 2020, 812, 152144.
68 B. Kalantari, M. R. Mohaddes Mojtahedi, F. Sharif andR. Semnani Rahbar, Polym. Compos., 2015, 36, 367–375.
69 H.-H. Liu, W.-W. Peng, L.-C. Hou, X.-C. Wang and X.-X. Zhang,Compos. Sci. Technol., 2013, 81, 61–68.
70 F. Meng, W. Lu, Q. Li, J. H. Byun, Y. Oh and T. W. Chou, Adv.Mater., 2015, 27, 5113–5131.
71 X. Ji, Y. Xu, W. Zhang, L. Cui and J. Liu, Composites, Part A,2016, 87, 29–45.
72 C. Hu, X. Zhai, L. Liu, Y. Zhao, L. Jiang and L. Qu, Sci. Rep.,2013, 3, 2065.
73 X. Li, T. Zhao, K. Wang, Y. Yang, J. Wei, F. Kang, D. Wu andH. Zhu, Langmuir, 2011, 27, 12164–12171.
74 X. Li, T. Zhao, Q. Chen, P. Li, K. Wang, M. Zhong, J. Wei,D. Wu, B. Wei and H. Zhu, Phys. Chem. Chem. Phys., 2013,15, 17752–17757.
75 H. Cheng, J. Liu, Y. Zhao, C. Hu, Z. Zhang, N. Chen, L. Jiangand L. Qu, Angew. Chem., Int. Ed., 2013, 52, 10482–10486.
76 M. A. Miankafshe, T. Bashir and N.-K. Persson, New J. Chem.,2019, 43(17), 6643–6658.
77 J. A. Moleon, A. Ontiveros-ortega, E. Gimenez-martin andI. Plaza, Dyes Pigm., 2015, 122, 310–316.
78 H. Bao, Q. Chen, L. Zhang and G. Chen, Analyst, 2011, 136,5190–5196.
79 I. A. Sahito, K. C. Sun, A. A. Arbab, M. B. Qadir andS. H. Jeong, Carbohydr. Polym., 2015, 130, 299–306.
80 A. M. Grancaric, A. Tarbuk and T. Pusic, Color. Technol.,2005, 121, 221–227.
81 T.-S. Choi, Y. Shimizu, H. Shirai and K. Hamada, Dyes Pigm.,2001, 48, 217–226.
82 M. H. V. Baouab, H. Zghida, R. Gauthier and H. Gauthier,J. Appl. Polym. Sci., 2004, 91, 2513–2522.
83 M. Rinaudo, G. Pavlov and J. Desbrieres, Polymer, 1999, 40,7029–7032.
84 A. Jayakrishnan and D. O. Shah, J. Polym. Sci., Polym. Chem.Ed., 1983, 21, 3201–3208.
85 M. Shateri-khalilabad and M. E. Yazdanshenas, Carbohydr.Polym., 2013, 96, 190–195.
86 E. M. Sanders and S. H. Zeronian, J. Appl. Polym. Sci., 1982,27, 4477–4491.
87 L. M. Olson and M. Wentz, Text. Chem. Color., 1984, 16.88 S. Salgın, U. Salgın and N. Tuzlalı, Desalin. Water Treat.,
2016, 57, 26031–26040.89 E. R. Trotman, Dyeing and chemical technology of textile
fibres, Wiley, 1984.90 F. M. Mirabella, Modern techniques in applied molecular
spectroscopy, John Wiley & Sons, 1998.91 D. Li, M. B. Muller, S. Gilje, R. B. Kaner and G. G. Wallace,
Nat. Nanotechnol., 2008, 3, 101.92 D. R. Brezinski, An infrared spectroscopy atlas for the coatings
industry, Federation of Societies for Coatings Technology,1991.
93 M. P. Gashti, R. Assefipour, A. Kiumarsi and M. P. Gashti,Prep. Biochem. Biotechnol., 2013, 43, 798–814.
NJC Paper
Publ
ishe
d on
13
Apr
il 20
20. D
ownl
oade
d by
Lin
kopi
ngs u
nive
rsite
tsbi
blio
tek
on 5
/7/2
020
2:57
:37
PM.
View Article Online

Paper III
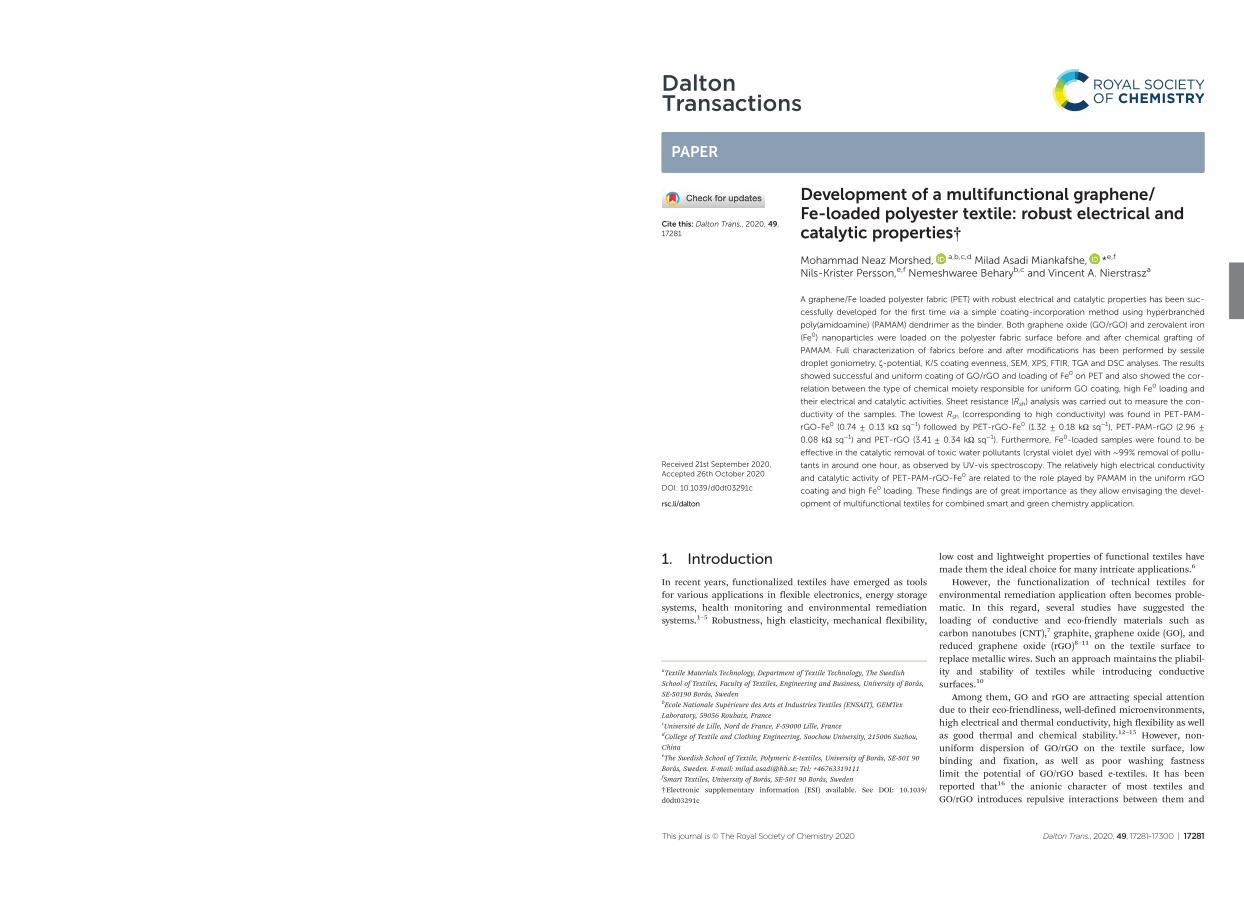
DaltonTransactions
PAPER
Cite this: Dalton Trans., 2020, 49,17281
Received 21st September 2020,Accepted 26th October 2020
DOI: 10.1039/d0dt03291c
rsc.li/dalton
Development of a multifunctional graphene/Fe-loaded polyester textile: robust electrical andcatalytic properties†
Mohammad Neaz Morshed, a,b,c,d Milad Asadi Miankafshe, *e,f
Nils-Krister Persson,e,f Nemeshwaree Beharyb,c and Vincent A. Nierstrasza
A graphene/Fe loaded polyester fabric (PET) with robust electrical and catalytic properties has been suc-
cessfully developed for the first time via a simple coating-incorporation method using hyperbranched
poly(amidoamine) (PAMAM) dendrimer as the binder. Both graphene oxide (GO/rGO) and zerovalent iron
(Fe0) nanoparticles were loaded on the polyester fabric surface before and after chemical grafting of
PAMAM. Full characterization of fabrics before and after modifications has been performed by sessile
droplet goniometry, ζ-potential, K/S coating evenness, SEM, XPS, FTIR, TGA and DSC analyses. The results
showed successful and uniform coating of GO/rGO and loading of Fe0 on PET and also showed the cor-
relation between the type of chemical moiety responsible for uniform GO coating, high Fe0 loading and
their electrical and catalytic activities. Sheet resistance (Rsh) analysis was carried out to measure the con-
ductivity of the samples. The lowest Rsh (corresponding to high conductivity) was found in PET-PAM-
rGO-Fe0 (0.74 ± 0.13 kΩ sq−1) followed by PET-rGO-Fe0 (1.32 ± 0.18 kΩ sq−1), PET-PAM-rGO (2.96 ±
0.08 kΩ sq−1) and PET-rGO (3.41 ± 0.34 kΩ sq−1). Furthermore, Fe0-loaded samples were found to be
effective in the catalytic removal of toxic water pollutants (crystal violet dye) with ∼99% removal of pollu-
tants in around one hour, as observed by UV-vis spectroscopy. The relatively high electrical conductivity
and catalytic activity of PET-PAM-rGO-Fe0 are related to the role played by PAMAM in the uniform rGO
coating and high Fe0 loading. These findings are of great importance as they allow envisaging the devel-
opment of multifunctional textiles for combined smart and green chemistry application.
1. Introduction
In recent years, functionalized textiles have emerged as toolsfor various applications in flexible electronics, energy storagesystems, health monitoring and environmental remediationsystems.1–5 Robustness, high elasticity, mechanical flexibility,
low cost and lightweight properties of functional textiles havemade them the ideal choice for many intricate applications.6
However, the functionalization of technical textiles forenvironmental remediation application often becomes proble-matic. In this regard, several studies have suggested theloading of conductive and eco-friendly materials such ascarbon nanotubes (CNT),7 graphite, graphene oxide (GO), andreduced graphene oxide (rGO)8–11 on the textile surface toreplace metallic wires. Such an approach maintains the pliabil-ity and stability of textiles while introducing conductivesurfaces.10
Among them, GO and rGO are attracting special attentiondue to their eco-friendliness, well-defined microenvironments,high electrical and thermal conductivity, high flexibility as wellas good thermal and chemical stability.12–15 However, non-uniform dispersion of GO/rGO on the textile surface, lowbinding and fixation, as well as poor washing fastnesslimit the potential of GO/rGO based e-textiles. It has beenreported that16 the anionic character of most textiles andGO/rGO introduces repulsive interactions between them and
†Electronic supplementary information (ESI) available. See DOI: 10.1039/d0dt03291c
aTextile Materials Technology, Department of Textile Technology, The Swedish
School of Textiles, Faculty of Textiles, Engineering and Business, University of Borås,
SE-50190 Borås, SwedenbEcole Nationale Supérieure des Arts et Industries Textiles (ENSAIT), GEMTex
Laboratory, 59056 Roubaix, FrancecUniversité de Lille, Nord de France, F-59000 Lille, FrancedCollege of Textile and Clothing Engineering, Soochow University, 215006 Suzhou,
ChinaeThe Swedish School of Textile, Polymeric E-textiles, University of Borås, SE-501 90
Borås, Sweden. E-mail: [email protected]; Tel: +46763319111fSmart Textiles, University of Borås, SE-501 90 Borås, Sweden
This journal is © The Royal Society of Chemistry 2020 Dalton Trans., 2020, 49, 17281–17300 | 17281
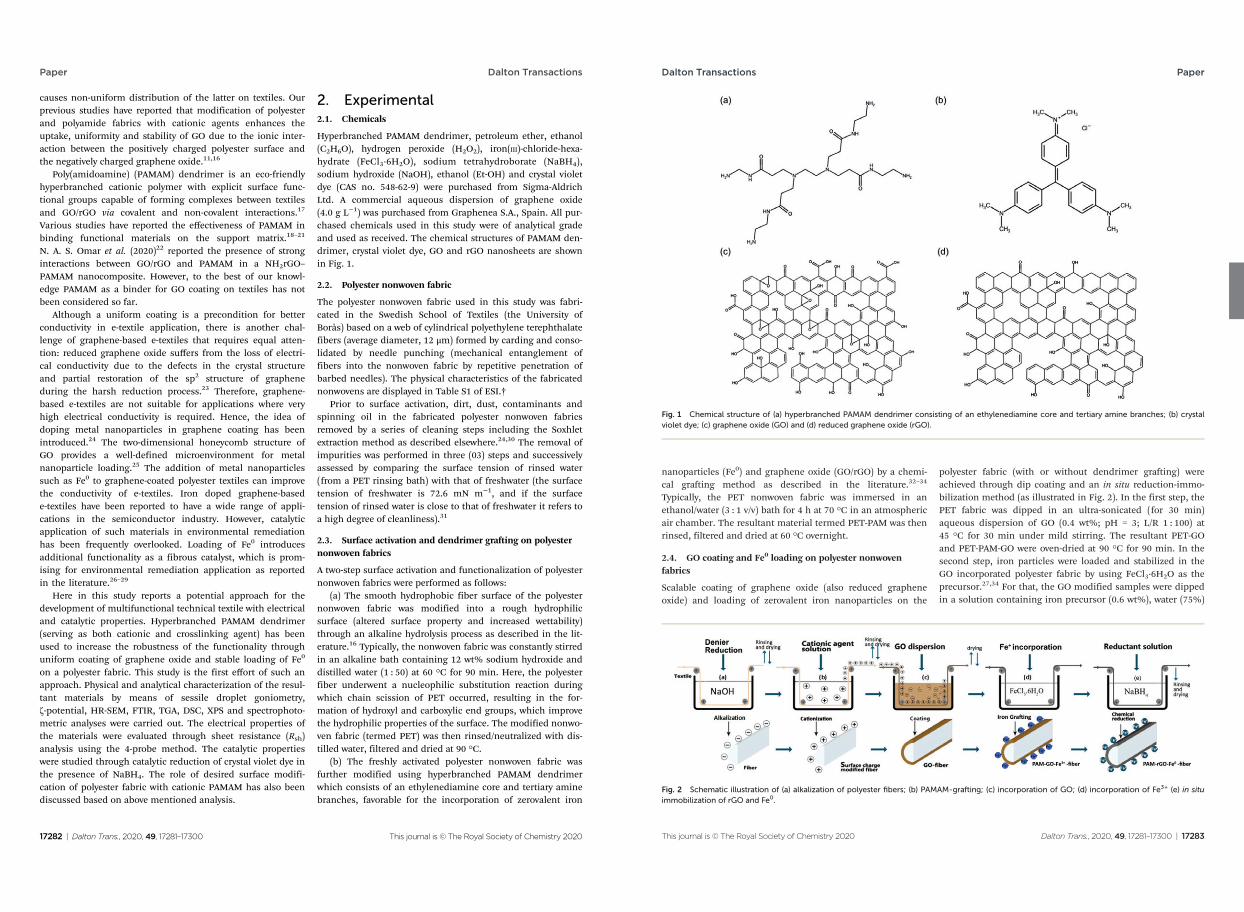
causes non-uniform distribution of the latter on textiles. Ourprevious studies have reported that modification of polyesterand polyamide fabrics with cationic agents enhances theuptake, uniformity and stability of GO due to the ionic inter-action between the positively charged polyester surface andthe negatively charged graphene oxide.11,16
Poly(amidoamine) (PAMAM) dendrimer is an eco-friendlyhyperbranched cationic polymer with explicit surface func-tional groups capable of forming complexes between textilesand GO/rGO via covalent and non-covalent interactions.17
Various studies have reported the effectiveness of PAMAM inbinding functional materials on the support matrix.18–21
N. A. S. Omar et al. (2020)22 reported the presence of stronginteractions between GO/rGO and PAMAM in a NH2rGO–PAMAM nanocomposite. However, to the best of our knowl-edge PAMAM as a binder for GO coating on textiles has notbeen considered so far.
Although a uniform coating is a precondition for betterconductivity in e-textile application, there is another chal-lenge of graphene-based e-textiles that requires equal atten-tion: reduced graphene oxide suffers from the loss of electri-cal conductivity due to the defects in the crystal structureand partial restoration of the sp2 structure of grapheneduring the harsh reduction process.23 Therefore, graphene-based e-textiles are not suitable for applications where veryhigh electrical conductivity is required. Hence, the idea ofdoping metal nanoparticles in graphene coating has beenintroduced.24 The two-dimensional honeycomb structure ofGO provides a well-defined microenvironment for metalnanoparticle loading.25 The addition of metal nanoparticlessuch as Fe0 to graphene-coated polyester textiles can improvethe conductivity of e-textiles. Iron doped graphene-basede-textiles have been reported to have a wide range of appli-cations in the semiconductor industry. However, catalyticapplication of such materials in environmental remediationhas been frequently overlooked. Loading of Fe0 introducesadditional functionality as a fibrous catalyst, which is prom-ising for environmental remediation application as reportedin the literature.26–29
Here in this study reports a potential approach for thedevelopment of multifunctional technical textile with electricaland catalytic properties. Hyperbranched PAMAM dendrimer(serving as both cationic and crosslinking agent) has beenused to increase the robustness of the functionality throughuniform coating of graphene oxide and stable loading of Fe0
on a polyester fabric. This study is the first effort of such anapproach. Physical and analytical characterization of the resul-tant materials by means of sessile droplet goniometry,ζ-potential, HR-SEM, FTIR, TGA, DSC, XPS and spectrophoto-metric analyses were carried out. The electrical properties ofthe materials were evaluated through sheet resistance (Rsh)analysis using the 4-probe method. The catalytic propertieswere studied through catalytic reduction of crystal violet dye inthe presence of NaBH4. The role of desired surface modifi-cation of polyester fabric with cationic PAMAM has also beendiscussed based on above mentioned analysis.
2. Experimental2.1. Chemicals
Hyperbranched PAMAM dendrimer, petroleum ether, ethanol(C2H6O), hydrogen peroxide (H2O2), iron(III)-chloride-hexa-hydrate (FeCl3·6H2O), sodium tetrahydroborate (NaBH4),sodium hydroxide (NaOH), ethanol (Et-OH) and crystal violetdye (CAS no. 548-62-9) were purchased from Sigma-AldrichLtd. A commercial aqueous dispersion of graphene oxide(4.0 g L−1) was purchased from Graphenea S.A., Spain. All pur-chased chemicals used in this study were of analytical gradeand used as received. The chemical structures of PAMAM den-drimer, crystal violet dye, GO and rGO nanosheets are shownin Fig. 1.
2.2. Polyester nonwoven fabric
The polyester nonwoven fabric used in this study was fabri-cated in the Swedish School of Textiles (the University ofBorås) based on a web of cylindrical polyethylene terephthalatefibers (average diameter, 12 μm) formed by carding and conso-lidated by needle punching (mechanical entanglement offibers into the nonwoven fabric by repetitive penetration ofbarbed needles). The physical characteristics of the fabricatednonwovens are displayed in Table S1 of ESI.†
Prior to surface activation, dirt, dust, contaminants andspinning oil in the fabricated polyester nonwoven fabricsremoved by a series of cleaning steps including the Soxhletextraction method as described elsewhere.24,30 The removal ofimpurities was performed in three (03) steps and successivelyassessed by comparing the surface tension of rinsed water(from a PET rinsing bath) with that of freshwater (the surfacetension of freshwater is 72.6 mN m−1, and if the surfacetension of rinsed water is close to that of freshwater it refers toa high degree of cleanliness).31
2.3. Surface activation and dendrimer grafting on polyesternonwoven fabrics
A two-step surface activation and functionalization of polyesternonwoven fabrics were performed as follows:
(a) The smooth hydrophobic fiber surface of the polyesternonwoven fabric was modified into a rough hydrophilicsurface (altered surface property and increased wettability)through an alkaline hydrolysis process as described in the lit-erature.16 Typically, the nonwoven fabric was constantly stirredin an alkaline bath containing 12 wt% sodium hydroxide anddistilled water (1 : 50) at 60 °C for 90 min. Here, the polyesterfiber underwent a nucleophilic substitution reaction duringwhich chain scission of PET occurred, resulting in the for-mation of hydroxyl and carboxylic end groups, which improvethe hydrophilic properties of the surface. The modified nonwo-ven fabric (termed PET) was then rinsed/neutralized with dis-tilled water, filtered and dried at 90 °C.
(b) The freshly activated polyester nonwoven fabric wasfurther modified using hyperbranched PAMAM dendrimerwhich consists of an ethylenediamine core and tertiary aminebranches, favorable for the incorporation of zerovalent iron
Paper Dalton Transactions
17282 | Dalton Trans., 2020, 49, 17281–17300 This journal is © The Royal Society of Chemistry 2020
nanoparticles (Fe0) and graphene oxide (GO/rGO) by a chemi-cal grafting method as described in the literature.32–34
Typically, the PET nonwoven fabric was immersed in anethanol/water (3 : 1 v/v) bath for 4 h at 70 °C in an atmosphericair chamber. The resultant material termed PET-PAM was thenrinsed, filtered and dried at 60 °C overnight.
2.4. GO coating and Fe0 loading on polyester nonwovenfabrics
Scalable coating of graphene oxide (also reduced grapheneoxide) and loading of zerovalent iron nanoparticles on the
polyester fabric (with or without dendrimer grafting) wereachieved through dip coating and an in situ reduction-immo-bilization method (as illustrated in Fig. 2). In the first step, thePET fabric was dipped in an ultra-sonicated (for 30 min)aqueous dispersion of GO (0.4 wt%; pH = 3; L/R 1 : 100) at45 °C for 30 min under mild stirring. The resultant PET-GOand PET-PAM-GO were oven-dried at 90 °C for 90 min. In thesecond step, iron particles were loaded and stabilized in theGO incorporated polyester fabric by using FeCl3·6H2O as theprecursor.27,34 For that, the GO modified samples were dippedin a solution containing iron precursor (0.6 wt%), water (75%)
Fig. 2 Schematic illustration of (a) alkalization of polyester fibers; (b) PAMAM-grafting; (c) incorporation of GO; (d) incorporation of Fe3+ (e) in situimmobilization of rGO and Fe0.
Fig. 1 Chemical structure of (a) hyperbranched PAMAM dendrimer consisting of an ethylenediamine core and tertiary amine branches; (b) crystalviolet dye; (c) graphene oxide (GO) and (d) reduced graphene oxide (rGO).
Dalton Transactions Paper
This journal is © The Royal Society of Chemistry 2020 Dalton Trans., 2020, 49, 17281–17300 | 17283
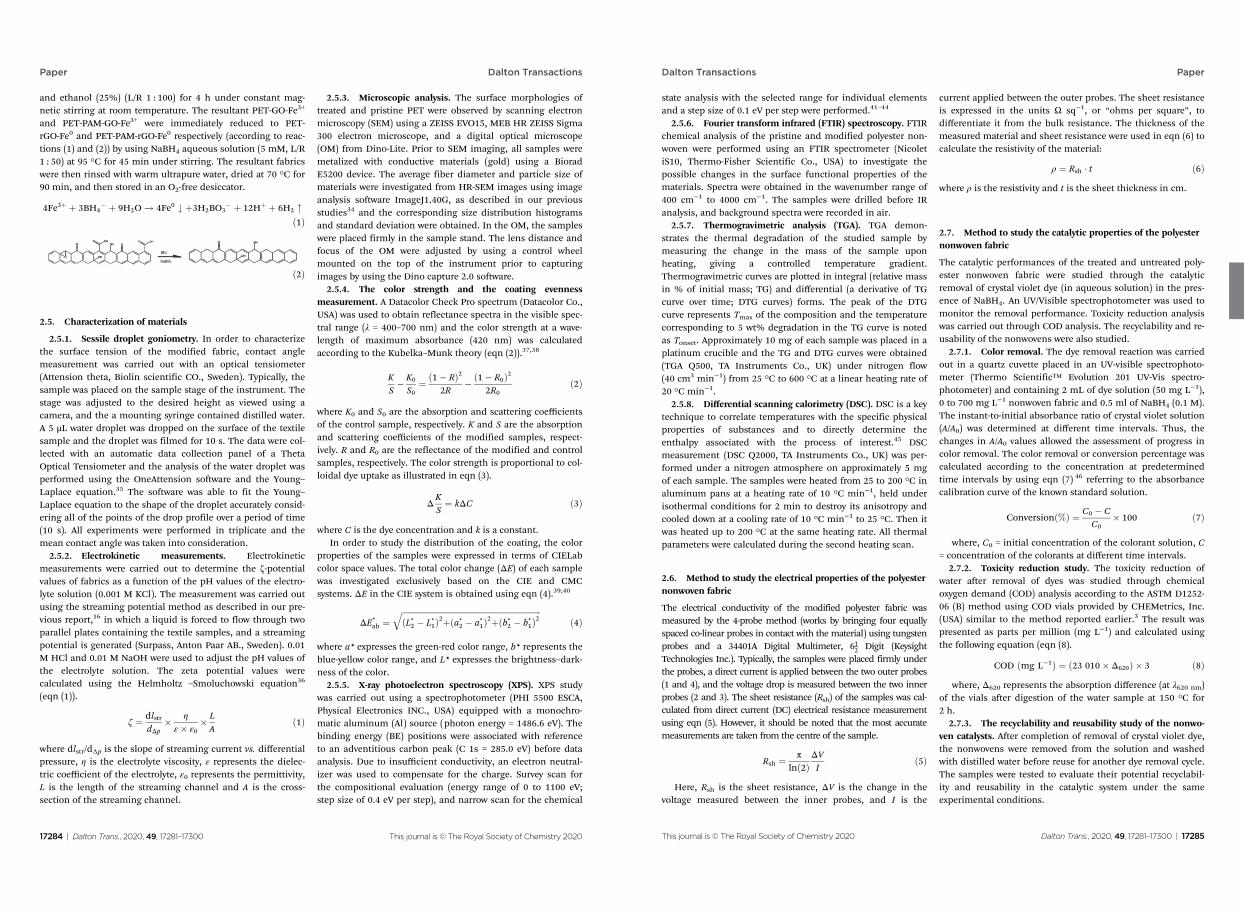
and ethanol (25%) (L/R 1 : 100) for 4 h under constant mag-netic stirring at room temperature. The resultant PET-GO-Fe3+
and PET-PAM-GO-Fe3+ were immediately reduced to PET-rGO-Fe0 and PET-PAM-rGO-Fe0 respectively (according to reac-tions (1) and (2)) by using NaBH4 aqueous solution (5 mM, L/R1 : 50) at 95 °C for 45 min under stirring. The resultant fabricswere then rinsed with warm ultrapure water, dried at 70 °C for90 min, and then stored in an O2-free desiccator.
4Fe3þ þ 3BH4 þ 9H2O ! 4Fe0 # þ3H2BO3
þ 12Hþ þ 6H2 "ð1Þ
ð2Þ
2.5. Characterization of materials
2.5.1. Sessile droplet goniometry. In order to characterizethe surface tension of the modified fabric, contact anglemeasurement was carried out with an optical tensiometer(Attension theta, Biolin scientific CO., Sweden). Typically, thesample was placed on the sample stage of the instrument. Thestage was adjusted to the desired height as viewed using acamera, and the a mounting syringe contained distilled water.A 5 μL water droplet was dropped on the surface of the textilesample and the droplet was filmed for 10 s. The data were col-lected with an automatic data collection panel of a ThetaOptical Tensiometer and the analysis of the water droplet wasperformed using the OneAttension software and the Young–Laplace equation.35 The software was able to fit the Young–Laplace equation to the shape of the droplet accurately consid-ering all of the points of the drop profile over a period of time(10 s). All experiments were performed in triplicate and themean contact angle was taken into consideration.
2.5.2. Electrokinetic measurements. Electrokineticmeasurements were carried out to determine the ζ-potentialvalues of fabrics as a function of the pH values of the electro-lyte solution (0.001 M KCl). The measurement was carried outusing the streaming potential method as described in our pre-vious report,16 in which a liquid is forced to flow through twoparallel plates containing the textile samples, and a streamingpotential is generated (Surpass, Anton Paar AB., Sweden). 0.01M HCl and 0.01 M NaOH were used to adjust the pH values ofthe electrolyte solution. The zeta potential values werecalculated using the Helmholtz –Smoluchowski equation36
(eqn (1)).
ζ ¼ dlstrdΔp
η
ε ε0 LA
ð1Þ
where dlstr/dΔp is the slope of streaming current vs. differentialpressure, η is the electrolyte viscosity, ε represents the dielec-tric coefficient of the electrolyte, ε0 represents the permittivity,L is the length of the streaming channel and A is the cross-section of the streaming channel.
2.5.3. Microscopic analysis. The surface morphologies oftreated and pristine PET were observed by scanning electronmicroscopy (SEM) using a ZEISS EVO15, MEB HR ZEISS Sigma300 electron microscope, and a digital optical microscope(OM) from Dino-Lite. Prior to SEM imaging, all samples weremetalized with conductive materials (gold) using a BioradE5200 device. The average fiber diameter and particle size ofmaterials were investigated from HR-SEM images using imageanalysis software ImageJ1.40G, as described in our previousstudies34 and the corresponding size distribution histogramsand standard deviation were obtained. In the OM, the sampleswere placed firmly in the sample stand. The lens distance andfocus of the OM were adjusted by using a control wheelmounted on the top of the instrument prior to capturingimages by using the Dino capture 2.0 software.
2.5.4. The color strength and the coating evennessmeasurement. A Datacolor Check Pro spectrum (Datacolor Co.,USA) was used to obtain reflectance spectra in the visible spec-tral range (λ = 400–700 nm) and the color strength at a wave-length of maximum absorbance (420 nm) was calculatedaccording to the Kubelka–Munk theory (eqn (2)).37,38
KS K0
S0¼ 1 Rð Þ2
2R 1 R0ð Þ2
2R0ð2Þ
where K0 and S0 are the absorption and scattering coefficientsof the control sample, respectively. K and S are the absorptionand scattering coefficients of the modified samples, respect-ively. R and R0 are the reflectance of the modified and controlsamples, respectively. The color strength is proportional to col-loidal dye uptake as illustrated in eqn (3).
ΔKS¼ kΔC ð3Þ
where C is the dye concentration and k is a constant.In order to study the distribution of the coating, the color
properties of the samples were expressed in terms of CIELabcolor space values. The total color change (ΔE) of each samplewas investigated exclusively based on the CIE and CMCsystems. ΔE in the CIE system is obtained using eqn (4).39,40
ΔE*ab ¼
ffiffiffiffiffiffiffiffiffiffiffiffiffiffiffiffiffiffiffiffiffiffiffiffiffiffiffiffiffiffiffiffiffiffiffiffiffiffiffiffiffiffiffiffiffiffiffiffiffiffiffiffiffiffiffiffiffiffiffiffiffiffiffiffiffiffiffiffiffiffiL*2 L*1ð Þ2þ a*2 a*1ð Þ2þ b*2 b*1ð Þ2
qð4Þ
where a* expresses the green-red color range, b* represents theblue-yellow color range, and L* expresses the brightness–dark-ness of the color.
2.5.5. X-ray photoelectron spectroscopy (XPS). XPS studywas carried out using a spectrophotometer (PHI 5500 ESCA,Physical Electronics INC., USA) equipped with a monochro-matic aluminum (Al) source (photon energy = 1486.6 eV). Thebinding energy (BE) positions were associated with referenceto an adventitious carbon peak (C 1s = 285.0 eV) before dataanalysis. Due to insufficient conductivity, an electron neutral-izer was used to compensate for the charge. Survey scan forthe compositional evaluation (energy range of 0 to 1100 eV;step size of 0.4 eV per step), and narrow scan for the chemical
Paper Dalton Transactions
17284 | Dalton Trans., 2020, 49, 17281–17300 This journal is © The Royal Society of Chemistry 2020
state analysis with the selected range for individual elementsand a step size of 0.1 eV per step were performed.41–44
2.5.6. Fourier transform infrared (FTIR) spectroscopy. FTIRchemical analysis of the pristine and modified polyester non-woven were performed using an FTIR spectrometer (NicoletiS10, Thermo-Fisher Scientific Co., USA) to investigate thepossible changes in the surface functional properties of thematerials. Spectra were obtained in the wavenumber range of400 cm−1 to 4000 cm−1. The samples were drilled before IRanalysis, and background spectra were recorded in air.
2.5.7. Thermogravimetric analysis (TGA). TGA demon-strates the thermal degradation of the studied sample bymeasuring the change in the mass of the sample uponheating, giving a controlled temperature gradient.Thermogravimetric curves are plotted in integral (relative massin % of initial mass; TG) and differential (a derivative of TGcurve over time; DTG curves) forms. The peak of the DTGcurve represents Tmax of the composition and the temperaturecorresponding to 5 wt% degradation in the TG curve is notedas Tonset. Approximately 10 mg of each sample was placed in aplatinum crucible and the TG and DTG curves were obtained(TGA Q500, TA Instruments Co., UK) under nitrogen flow(40 cm3 min−1) from 25 °C to 600 °C at a linear heating rate of20 °C min−1.
2.5.8. Differential scanning calorimetry (DSC). DSC is a keytechnique to correlate temperatures with the specific physicalproperties of substances and to directly determine theenthalpy associated with the process of interest.45 DSCmeasurement (DSC Q2000, TA Instruments Co., UK) was per-formed under a nitrogen atmosphere on approximately 5 mgof each sample. The samples were heated from 25 to 200 °C inaluminum pans at a heating rate of 10 °C min−1, held underisothermal conditions for 2 min to destroy its anisotropy andcooled down at a cooling rate of 10 °C min−1 to 25 °C. Then itwas heated up to 200 °C at the same heating rate. All thermalparameters were calculated during the second heating scan.
2.6. Method to study the electrical properties of the polyesternonwoven fabric
The electrical conductivity of the modified polyester fabric wasmeasured by the 4-probe method (works by bringing four equallyspaced co-linear probes in contact with the material) using tungstenprobes and a 34401A Digital Multimeter, 612 Digit (KeysightTechnologies Inc.). Typically, the samples were placed firmly underthe probes, a direct current is applied between the two outer probes(1 and 4), and the voltage drop is measured between the two innerprobes (2 and 3). The sheet resistance (Rsh) of the samples was cal-culated from direct current (DC) electrical resistance measurementusing eqn (5). However, it should be noted that the most accuratemeasurements are taken from the centre of the sample.
Rsh ¼ πln 2ð Þ
ΔVI
ð5Þ
Here, Rsh is the sheet resistance, ΔV is the change in thevoltage measured between the inner probes, and I is the
current applied between the outer probes. The sheet resistanceis expressed in the units Ω sq−1, or “ohms per square”, todifferentiate it from the bulk resistance. The thickness of themeasured material and sheet resistance were used in eqn (6) tocalculate the resistivity of the material:
ρ ¼ Rsh t ð6Þ
where ρ is the resistivity and t is the sheet thickness in cm.
2.7. Method to study the catalytic properties of the polyesternonwoven fabric
The catalytic performances of the treated and untreated poly-ester nonwoven fabric were studied through the catalyticremoval of crystal violet dye (in aqueous solution) in the pres-ence of NaBH4. An UV/Visible spectrophotometer was used tomonitor the removal performance. Toxicity reduction analysiswas carried out through COD analysis. The recyclability and re-usability of the nonwovens were also studied.
2.7.1. Color removal. The dye removal reaction was carriedout in a quartz cuvette placed in an UV-visible spectrophoto-meter (Thermo Scientific™ Evolution 201 UV-Vis spectro-photometer) and containing 2 mL of dye solution (50 mg L−1),0 to 700 mg L−1 nonwoven fabric and 0.5 ml of NaBH4 (0.1 M).The instant-to-initial absorbance ratio of crystal violet solution(A/A0) was determined at different time intervals. Thus, thechanges in A/A0 values allowed the assessment of progress incolor removal. The color removal or conversion percentage wascalculated according to the concentration at predeterminedtime intervals by using eqn (7) 46 referring to the absorbancecalibration curve of the known standard solution.
Conversionð%Þ ¼ C0 CC0
100 ð7Þ
where, C0 = initial concentration of the colorant solution, C= concentration of the colorants at different time intervals.
2.7.2. Toxicity reduction study. The toxicity reduction ofwater after removal of dyes was studied through chemicaloxygen demand (COD) analysis according to the ASTM D1252-06 (B) method using COD vials provided by CHEMetrics, Inc.(USA) similar to the method reported earlier.3 The result waspresented as parts per million (mg L−1) and calculated usingthe following equation (eqn (8).
COD ðmg L1Þ ¼ ð23 010 Δ620Þ 3 ð8Þ
where, Δ620 represents the absorption difference (at λ620 nm)of the vials after digestion of the water sample at 150 °C for2 h.
2.7.3. The recyclability and reusability study of the nonwo-ven catalysts. After completion of removal of crystal violet dye,the nonwovens were removed from the solution and washedwith distilled water before reuse for another dye removal cycle.The samples were tested to evaluate their potential recyclabil-ity and reusability in the catalytic system under the sameexperimental conditions.
Dalton Transactions Paper
This journal is © The Royal Society of Chemistry 2020 Dalton Trans., 2020, 49, 17281–17300 | 17285
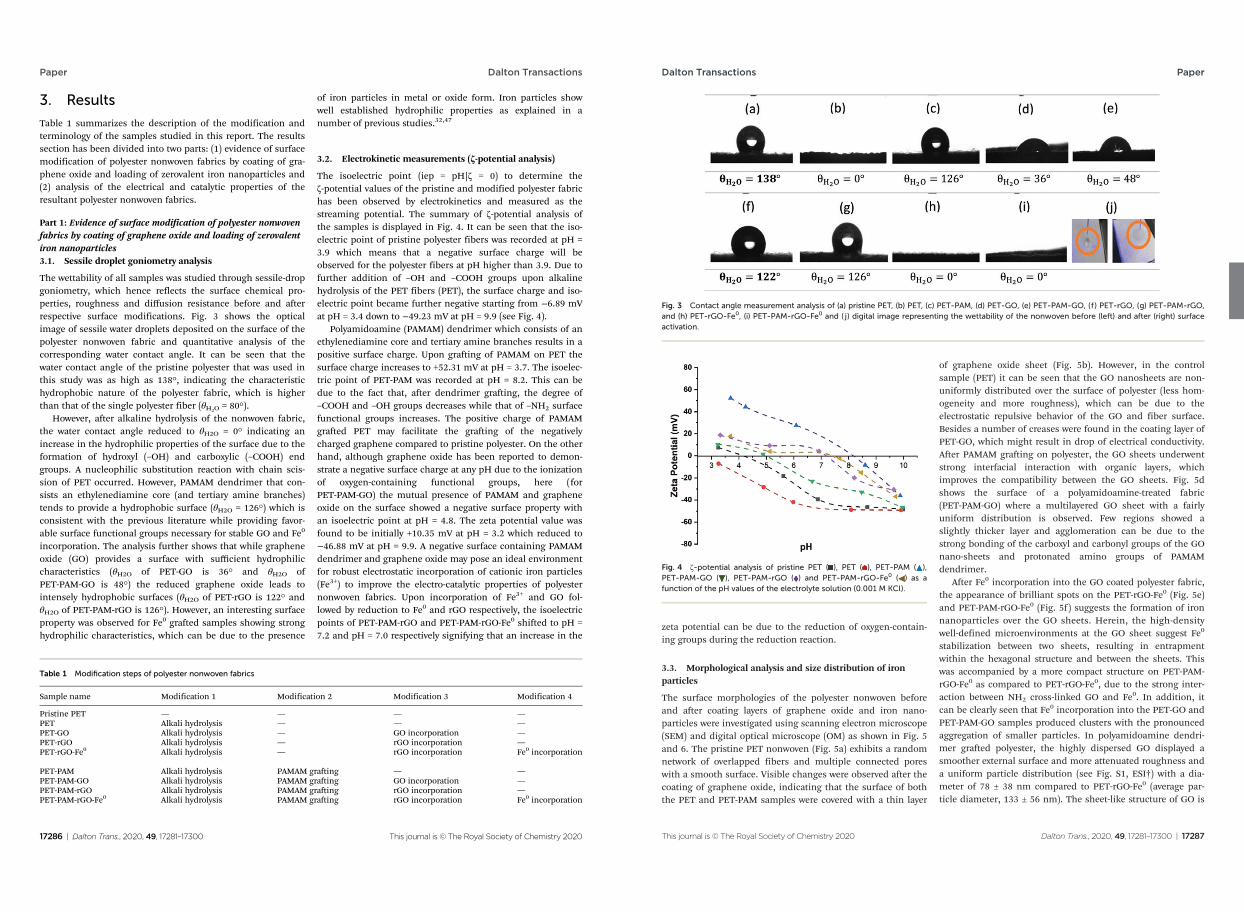
3. Results
Table 1 summarizes the description of the modification andterminology of the samples studied in this report. The resultssection has been divided into two parts: (1) evidence of surfacemodification of polyester nonwoven fabrics by coating of gra-phene oxide and loading of zerovalent iron nanoparticles and(2) analysis of the electrical and catalytic properties of theresultant polyester nonwoven fabrics.
Part 1: Evidence of surface modification of polyester nonwovenfabrics by coating of graphene oxide and loading of zerovalentiron nanoparticles3.1. Sessile droplet goniometry analysis
The wettability of all samples was studied through sessile-dropgoniometry, which hence reflects the surface chemical pro-perties, roughness and diffusion resistance before and afterrespective surface modifications. Fig. 3 shows the opticalimage of sessile water droplets deposited on the surface of thepolyester nonwoven fabric and quantitative analysis of thecorresponding water contact angle. It can be seen that thewater contact angle of the pristine polyester that was used inthis study was as high as 138°, indicating the characteristichydrophobic nature of the polyester fabric, which is higherthan that of the single polyester fiber (θH2O = 80°).
However, after alkaline hydrolysis of the nonwoven fabric,the water contact angle reduced to θH2O = 0° indicating anincrease in the hydrophilic properties of the surface due to theformation of hydroxyl (–OH) and carboxylic (–COOH) endgroups. A nucleophilic substitution reaction with chain scis-sion of PET occurred. However, PAMAM dendrimer that con-sists an ethylenediamine core (and tertiary amine branches)tends to provide a hydrophobic surface (θH2O = 126°) which isconsistent with the previous literature while providing favor-able surface functional groups necessary for stable GO and Fe0
incorporation. The analysis further shows that while grapheneoxide (GO) provides a surface with sufficient hydrophiliccharacteristics (θH2O of PET-GO is 36° and θH2O ofPET-PAM-GO is 48°) the reduced graphene oxide leads tointensely hydrophobic surfaces (θH2O of PET-rGO is 122° andθH2O of PET-PAM-rGO is 126°). However, an interesting surfaceproperty was observed for Fe0 grafted samples showing stronghydrophilic characteristics, which can be due to the presence
of iron particles in metal or oxide form. Iron particles showwell established hydrophilic properties as explained in anumber of previous studies.32,47
3.2. Electrokinetic measurements (ζ-potential analysis)
The isoelectric point (iep = pH|ζ = 0) to determine theζ-potential values of the pristine and modified polyester fabrichas been observed by electrokinetics and measured as thestreaming potential. The summary of ζ-potential analysis ofthe samples is displayed in Fig. 4. It can be seen that the iso-electric point of pristine polyester fibers was recorded at pH =3.9 which means that a negative surface charge will beobserved for the polyester fibers at pH higher than 3.9. Due tofurther addition of –OH and –COOH groups upon alkalinehydrolysis of the PET fibers (PET), the surface charge and iso-electric point became further negative starting from −6.89 mVat pH = 3.4 down to −49.23 mV at pH = 9.9 (see Fig. 4).
Polyamidoamine (PAMAM) dendrimer which consists of anethylenediamine core and tertiary amine branches results in apositive surface charge. Upon grafting of PAMAM on PET thesurface charge increases to +52.31 mV at pH = 3.7. The isoelec-tric point of PET-PAM was recorded at pH = 8.2. This can bedue to the fact that, after dendrimer grafting, the degree of–COOH and –OH groups decreases while that of –NH2 surfacefunctional groups increases. The positive charge of PAMAMgrafted PET may facilitate the grafting of the negativelycharged graphene compared to pristine polyester. On the otherhand, although graphene oxide has been reported to demon-strate a negative surface charge at any pH due to the ionizationof oxygen-containing functional groups, here (forPET-PAM-GO) the mutual presence of PAMAM and grapheneoxide on the surface showed a negative surface property withan isoelectric point at pH = 4.8. The zeta potential value wasfound to be initially +10.35 mV at pH = 3.2 which reduced to−46.88 mV at pH = 9.9. A negative surface containing PAMAMdendrimer and graphene oxide may pose an ideal environmentfor robust electrostatic incorporation of cationic iron particles(Fe3+) to improve the electro-catalytic properties of polyesternonwoven fabrics. Upon incorporation of Fe3+ and GO fol-lowed by reduction to Fe0 and rGO respectively, the isoelectricpoints of PET-PAM-rGO and PET-PAM-rGO-Fe0 shifted to pH =7.2 and pH = 7.0 respectively signifying that an increase in the
Table 1 Modification steps of polyester nonwoven fabrics
Sample name Modification 1 Modification 2 Modification 3 Modification 4
Pristine PET — — — —PET Alkali hydrolysis — — —PET-GO Alkali hydrolysis — GO incorporation —PET-rGO Alkali hydrolysis — rGO incorporation —PET-rGO-Fe0 Alkali hydrolysis — rGO incorporation Fe0 incorporation
PET-PAM Alkali hydrolysis PAMAM grafting — —PET-PAM-GO Alkali hydrolysis PAMAM grafting GO incorporation —PET-PAM-rGO Alkali hydrolysis PAMAM grafting rGO incorporation —PET-PAM-rGO-Fe0 Alkali hydrolysis PAMAM grafting rGO incorporation Fe0 incorporation
Paper Dalton Transactions
17286 | Dalton Trans., 2020, 49, 17281–17300 This journal is © The Royal Society of Chemistry 2020
zeta potential can be due to the reduction of oxygen-contain-ing groups during the reduction reaction.
3.3. Morphological analysis and size distribution of ironparticles
The surface morphologies of the polyester nonwoven beforeand after coating layers of graphene oxide and iron nano-particles were investigated using scanning electron microscope(SEM) and digital optical microscope (OM) as shown in Fig. 5and 6. The pristine PET nonwoven (Fig. 5a) exhibits a randomnetwork of overlapped fibers and multiple connected poreswith a smooth surface. Visible changes were observed after thecoating of graphene oxide, indicating that the surface of boththe PET and PET-PAM samples were covered with a thin layer
of graphene oxide sheet (Fig. 5b). However, in the controlsample (PET) it can be seen that the GO nanosheets are non-uniformly distributed over the surface of polyester (less hom-ogeneity and more roughness), which can be due to theelectrostatic repulsive behavior of the GO and fiber surface.Besides a number of creases were found in the coating layer ofPET-GO, which might result in drop of electrical conductivity.After PAMAM grafting on polyester, the GO sheets underwentstrong interfacial interaction with organic layers, whichimproves the compatibility between the GO sheets. Fig. 5dshows the surface of a polyamidoamine-treated fabric(PET-PAM-GO) where a multilayered GO sheet with a fairlyuniform distribution is observed. Few regions showed aslightly thicker layer and agglomeration can be due to thestrong bonding of the carboxyl and carbonyl groups of the GOnano-sheets and protonated amino groups of PAMAMdendrimer.
After Fe0 incorporation into the GO coated polyester fabric,the appearance of brilliant spots on the PET-rGO-Fe0 (Fig. 5e)and PET-PAM-rGO-Fe0 (Fig. 5f) suggests the formation of ironnanoparticles over the GO sheets. Herein, the high-densitywell-defined microenvironments at the GO sheet suggest Fe0
stabilization between two sheets, resulting in entrapmentwithin the hexagonal structure and between the sheets. Thiswas accompanied by a more compact structure on PET-PAM-rGO-Fe0 as compared to PET-rGO-Fe0, due to the strong inter-action between NH2 cross-linked GO and Fe0. In addition, itcan be clearly seen that Fe0 incorporation into the PET-GO andPET-PAM-GO samples produced clusters with the pronouncedaggregation of smaller particles. In polyamidoamine dendri-mer grafted polyester, the highly dispersed GO displayed asmoother external surface and more attenuated roughness anda uniform particle distribution (see Fig. S1, ESI†) with a dia-meter of 78 ± 38 nm compared to PET-rGO-Fe0 (average par-ticle diameter, 133 ± 56 nm). The sheet-like structure of GO is
Fig. 3 Contact angle measurement analysis of (a) pristine PET, (b) PET, (c) PET-PAM, (d) PET-GO, (e) PET-PAM-GO, (f ) PET-rGO, (g) PET-PAM-rGO,and (h) PET-rGO-Fe0, (i) PET-PAM-rGO-Fe0 and ( j) digital image representing the wettability of the nonwoven before (left) and after (right) surfaceactivation.
Fig. 4 ζ-potential analysis of pristine PET ( ), PET ( ), PET-PAM ( ),PET-PAM-GO ( ), PET-PAM-rGO ( ) and PET-PAM-rGO-Fe0 ( ) as afunction of the pH values of the electrolyte solution (0.001 M KCl).
Dalton Transactions Paper
This journal is © The Royal Society of Chemistry 2020 Dalton Trans., 2020, 49, 17281–17300 | 17287
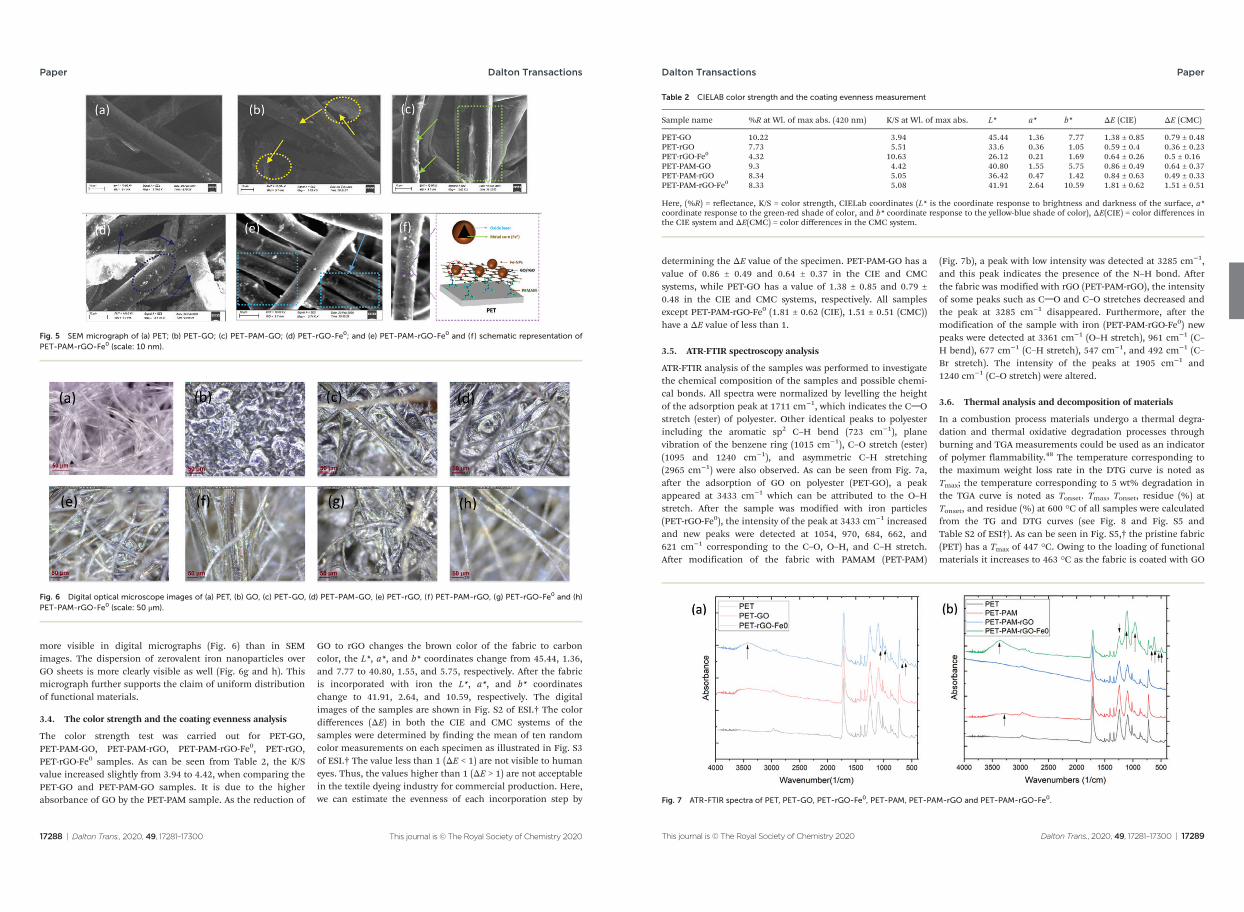
more visible in digital micrographs (Fig. 6) than in SEMimages. The dispersion of zerovalent iron nanoparticles overGO sheets is more clearly visible as well (Fig. 6g and h). Thismicrograph further supports the claim of uniform distributionof functional materials.
3.4. The color strength and the coating evenness analysis
The color strength test was carried out for PET-GO,PET-PAM-GO, PET-PAM-rGO, PET-PAM-rGO-Fe0, PET-rGO,PET-rGO-Fe0 samples. As can be seen from Table 2, the K/Svalue increased slightly from 3.94 to 4.42, when comparing thePET-GO and PET-PAM-GO samples. It is due to the higherabsorbance of GO by the PET-PAM sample. As the reduction of
GO to rGO changes the brown color of the fabric to carboncolor, the L*, a*, and b* coordinates change from 45.44, 1.36,and 7.77 to 40.80, 1.55, and 5.75, respectively. After the fabricis incorporated with iron the L*, a*, and b* coordinateschange to 41.91, 2.64, and 10.59, respectively. The digitalimages of the samples are shown in Fig. S2 of ESI.† The colordifferences (ΔE) in both the CIE and CMC systems of thesamples were determined by finding the mean of ten randomcolor measurements on each specimen as illustrated in Fig. S3of ESI.† The value less than 1 (ΔE < 1) are not visible to humaneyes. Thus, the values higher than 1 (ΔE > 1) are not acceptablein the textile dyeing industry for commercial production. Here,we can estimate the evenness of each incorporation step by
Fig. 5 SEM micrograph of (a) PET; (b) PET-GO; (c) PET-PAM-GO; (d) PET-rGO-Fe0; and (e) PET-PAM-rGO-Fe0 and (f ) schematic representation ofPET-PAM-rGO-Fe0 (scale: 10 nm).
Fig. 6 Digital optical microscope images of (a) PET, (b) GO, (c) PET-GO, (d) PET-PAM-GO, (e) PET-rGO, (f ) PET-PAM-rGO, (g) PET-rGO-Fe0 and (h)PET-PAM-rGO-Fe0 (scale: 50 μm).
Paper Dalton Transactions
17288 | Dalton Trans., 2020, 49, 17281–17300 This journal is © The Royal Society of Chemistry 2020
determining the ΔE value of the specimen. PET-PAM-GO has avalue of 0.86 ± 0.49 and 0.64 ± 0.37 in the CIE and CMCsystems, while PET-GO has a value of 1.38 ± 0.85 and 0.79 ±0.48 in the CIE and CMC systems, respectively. All samplesexcept PET-PAM-rGO-Fe0 (1.81 ± 0.62 (CIE), 1.51 ± 0.51 (CMC))have a ΔE value of less than 1.
3.5. ATR-FTIR spectroscopy analysis
ATR-FTIR analysis of the samples was performed to investigatethe chemical composition of the samples and possible chemi-cal bonds. All spectra were normalized by levelling the heightof the adsorption peak at 1711 cm−1, which indicates the CvOstretch (ester) of polyester. Other identical peaks to polyesterincluding the aromatic sp2 C–H bend (723 cm−1), planevibration of the benzene ring (1015 cm−1), C–O stretch (ester)(1095 and 1240 cm−1), and asymmetric C–H stretching(2965 cm−1) were also observed. As can be seen from Fig. 7a,after the adsorption of GO on polyester (PET-GO), a peakappeared at 3433 cm−1 which can be attributed to the O–Hstretch. After the sample was modified with iron particles(PET-rGO-Fe0), the intensity of the peak at 3433 cm−1 increasedand new peaks were detected at 1054, 970, 684, 662, and621 cm−1 corresponding to the C–O, O–H, and C–H stretch.After modification of the fabric with PAMAM (PET-PAM)
(Fig. 7b), a peak with low intensity was detected at 3285 cm−1,and this peak indicates the presence of the N–H bond. Afterthe fabric was modified with rGO (PET-PAM-rGO), the intensityof some peaks such as CvO and C–O stretches decreased andthe peak at 3285 cm−1 disappeared. Furthermore, after themodification of the sample with iron (PET-PAM-rGO-Fe0) newpeaks were detected at 3361 cm−1 (O–H stretch), 961 cm−1 (C–H bend), 677 cm−1 (C–H stretch), 547 cm−1, and 492 cm−1 (C–Br stretch). The intensity of the peaks at 1905 cm−1 and1240 cm−1 (C–O stretch) were altered.
3.6. Thermal analysis and decomposition of materials
In a combustion process materials undergo a thermal degra-dation and thermal oxidative degradation processes throughburning and TGA measurements could be used as an indicatorof polymer flammability.48 The temperature corresponding tothe maximum weight loss rate in the DTG curve is noted asTmax; the temperature corresponding to 5 wt% degradation inthe TGA curve is noted as Tonset. Tmax, Tonset, residue (%) atTonset, and residue (%) at 600 °C of all samples were calculatedfrom the TG and DTG curves (see Fig. 8 and Fig. S5 andTable S2 of ESI†). As can be seen in Fig. S5,† the pristine fabric(PET) has a Tmax of 447 °C. Owing to the loading of functionalmaterials it increases to 463 °C as the fabric is coated with GO
Table 2 CIELAB color strength and the coating evenness measurement
Sample name %R at Wl. of max abs. (420 nm) K/S at Wl. of max abs. L* a* b* ΔE (CIE) ΔE (CMC)
PET-GO 10.22 3.94 45.44 1.36 7.77 1.38 ± 0.85 0.79 ± 0.48PET-rGO 7.73 5.51 33.6 0.36 1.05 0.59 ± 0.4 0.36 ± 0.23PET-rGO-Fe0 4.32 10.63 26.12 0.21 1.69 0.64 ± 0.26 0.5 ± 0.16PET-PAM-GO 9.3 4.42 40.80 1.55 5.75 0.86 ± 0.49 0.64 ± 0.37PET-PAM-rGO 8.34 5.05 36.42 0.47 1.42 0.84 ± 0.63 0.49 ± 0.33PET-PAM-rGO-Fe0 8.33 5.08 41.91 2.64 10.59 1.81 ± 0.62 1.51 ± 0.51
Here, (%R) = reflectance, K/S = color strength, CIELab coordinates (L* is the coordinate response to brightness and darkness of the surface, a*coordinate response to the green-red shade of color, and b* coordinate response to the yellow-blue shade of color), ΔE(CIE) = color differences inthe CIE system and ΔE(CMC) = color differences in the CMC system.
Fig. 7 ATR-FTIR spectra of PET, PET-GO, PET-rGO-Fe0, PET-PAM, PET-PAM-rGO and PET-PAM-rGO-Fe0.
Dalton Transactions Paper
This journal is © The Royal Society of Chemistry 2020 Dalton Trans., 2020, 49, 17281–17300 | 17289
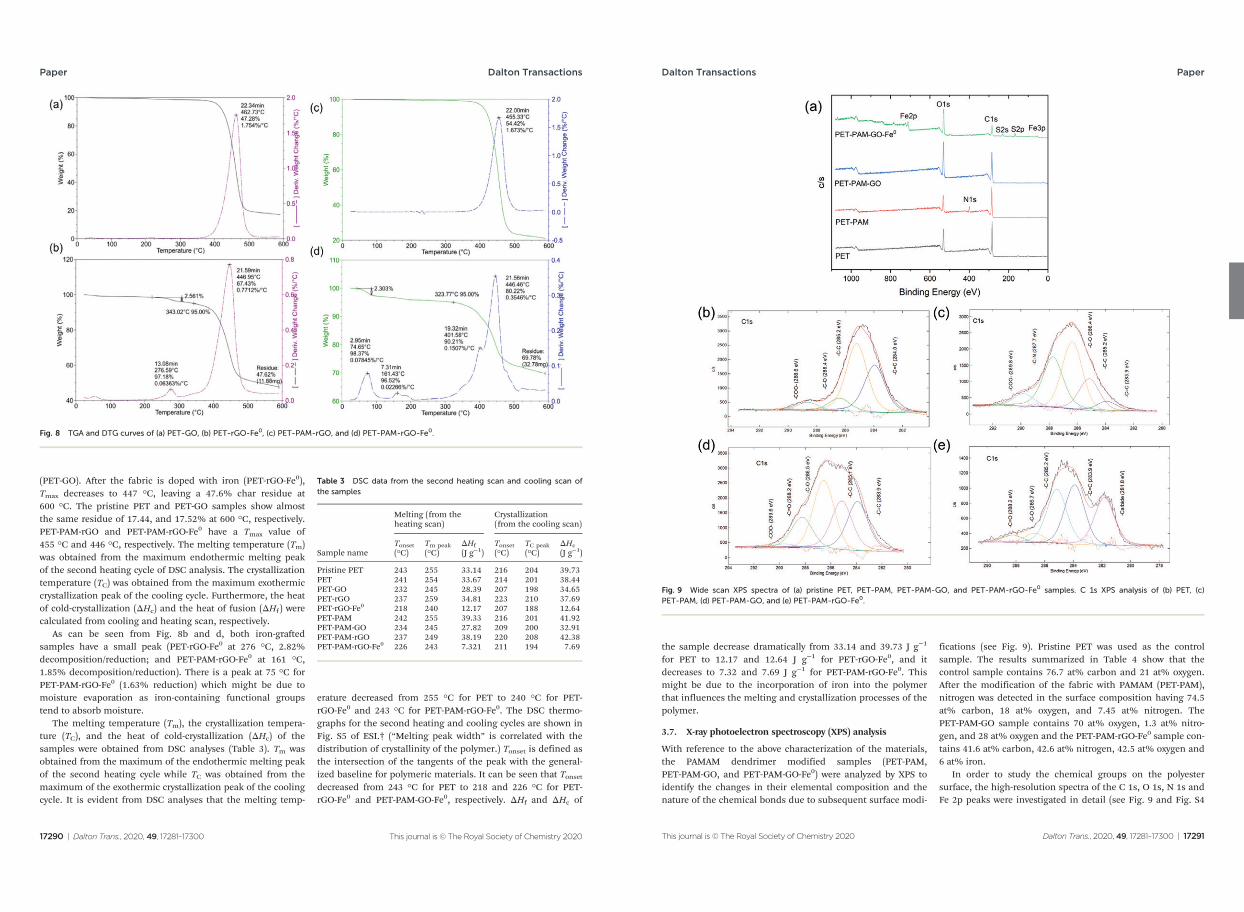
(PET-GO). After the fabric is doped with iron (PET-rGO-Fe0),Tmax decreases to 447 °C, leaving a 47.6% char residue at600 °C. The pristine PET and PET-GO samples show almostthe same residue of 17.44, and 17.52% at 600 °C, respectively.PET-PAM-rGO and PET-PAM-rGO-Fe0 have a Tmax value of455 °C and 446 °C, respectively. The melting temperature (Tm)was obtained from the maximum endothermic melting peakof the second heating cycle of DSC analysis. The crystallizationtemperature (TC) was obtained from the maximum exothermiccrystallization peak of the cooling cycle. Furthermore, the heatof cold-crystallization (ΔHc) and the heat of fusion (ΔHf ) werecalculated from cooling and heating scan, respectively.
As can be seen from Fig. 8b and d, both iron-graftedsamples have a small peak (PET-rGO-Fe0 at 276 °C, 2.82%decomposition/reduction; and PET-PAM-rGO-Fe0 at 161 °C,1.85% decomposition/reduction). There is a peak at 75 °C forPET-PAM-rGO-Fe0 (1.63% reduction) which might be due tomoisture evaporation as iron-containing functional groupstend to absorb moisture.
The melting temperature (Tm), the crystallization tempera-ture (TC), and the heat of cold-crystallization (ΔHc) of thesamples were obtained from DSC analyses (Table 3). Tm wasobtained from the maximum of the endothermic melting peakof the second heating cycle while TC was obtained from themaximum of the exothermic crystallization peak of the coolingcycle. It is evident from DSC analyses that the melting temp-
erature decreased from 255 °C for PET to 240 °C for PET-rGO-Fe0 and 243 °C for PET-PAM-rGO-Fe0. The DSC thermo-graphs for the second heating and cooling cycles are shown inFig. S5 of ESI.† (“Melting peak width” is correlated with thedistribution of crystallinity of the polymer.) Tonset is defined asthe intersection of the tangents of the peak with the general-ized baseline for polymeric materials. It can be seen that Tonsetdecreased from 243 °C for PET to 218 and 226 °C for PET-rGO-Fe0 and PET-PAM-GO-Fe0, respectively. ΔHf and ΔHc of
Fig. 8 TGA and DTG curves of (a) PET-GO, (b) PET-rGO-Fe0, (c) PET-PAM-rGO, and (d) PET-PAM-rGO-Fe0.
Table 3 DSC data from the second heating scan and cooling scan ofthe samples
Sample name
Melting (from theheating scan)
Crystallization(from the cooling scan)
Tonset(°C)
Tm peak(°C)
ΔHf(J g−1)
Tonset(°C)
TC peak(°C)
ΔHc(J g−1)
Pristine PET 243 255 33.14 216 204 39.73PET 241 254 33.67 214 201 38.44PET-GO 232 245 28.39 207 198 34.65PET-rGO 237 259 34.81 223 210 37.69PET-rGO-Fe0 218 240 12.17 207 188 12.64PET-PAM 242 255 39.33 216 201 41.92PET-PAM-GO 234 245 27.82 209 200 32.91PET-PAM-rGO 237 249 38.19 220 208 42.38PET-PAM-rGO-Fe0 226 243 7.321 211 194 7.69
Paper Dalton Transactions
17290 | Dalton Trans., 2020, 49, 17281–17300 This journal is © The Royal Society of Chemistry 2020
the sample decrease dramatically from 33.14 and 39.73 J g−1
for PET to 12.17 and 12.64 J g−1 for PET-rGO-Fe0, and itdecreases to 7.32 and 7.69 J g−1 for PET-PAM-rGO-Fe0. Thismight be due to the incorporation of iron into the polymerthat influences the melting and crystallization processes of thepolymer.
3.7. X-ray photoelectron spectroscopy (XPS) analysis
With reference to the above characterization of the materials,the PAMAM dendrimer modified samples (PET-PAM,PET-PAM-GO, and PET-PAM-GO-Fe0) were analyzed by XPS toidentify the changes in their elemental composition and thenature of the chemical bonds due to subsequent surface modi-
fications (see Fig. 9). Pristine PET was used as the controlsample. The results summarized in Table 4 show that thecontrol sample contains 76.7 at% carbon and 21 at% oxygen.After the modification of the fabric with PAMAM (PET-PAM),nitrogen was detected in the surface composition having 74.5at% carbon, 18 at% oxygen, and 7.45 at% nitrogen. ThePET-PAM-GO sample contains 70 at% oxygen, 1.3 at% nitro-gen, and 28 at% oxygen and the PET-PAM-rGO-Fe0 sample con-tains 41.6 at% carbon, 42.6 at% nitrogen, 42.5 at% oxygen and6 at% iron.
In order to study the chemical groups on the polyestersurface, the high-resolution spectra of the C 1s, O 1s, N 1s andFe 2p peaks were investigated in detail (see Fig. 9 and Fig. S4
Fig. 9 Wide scan XPS spectra of (a) pristine PET, PET-PAM, PET-PAM-GO, and PET-PAM-rGO-Fe0 samples. C 1s XPS analysis of (b) PET, (c)PET-PAM, (d) PET-PAM-GO, and (e) PET-PAM-rGO-Fe0.
Dalton Transactions Paper
This journal is © The Royal Society of Chemistry 2020 Dalton Trans., 2020, 49, 17281–17300 | 17291
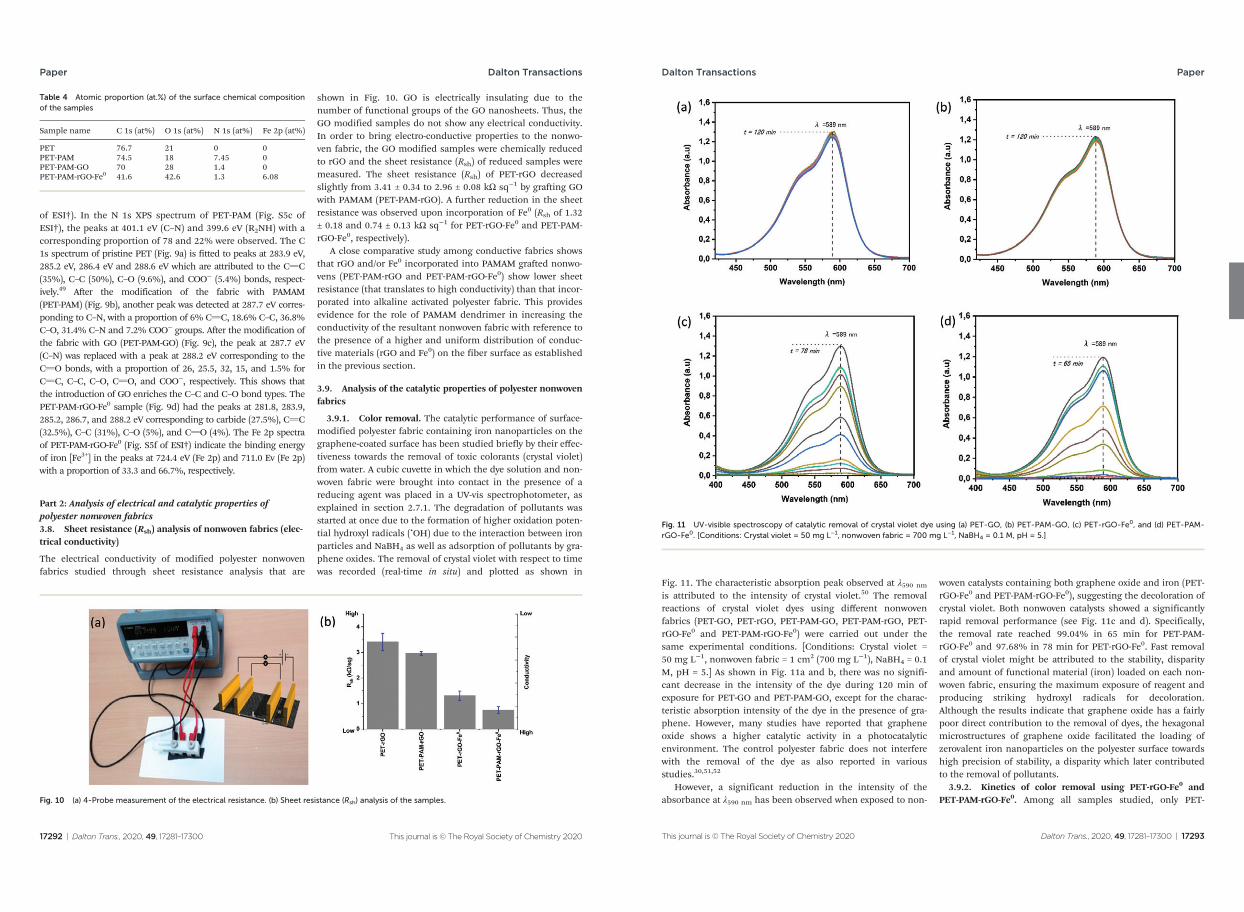
of ESI†). In the N 1s XPS spectrum of PET-PAM (Fig. S5c ofESI†), the peaks at 401.1 eV (C–N) and 399.6 eV (R2NH) with acorresponding proportion of 78 and 22% were observed. The C1s spectrum of pristine PET (Fig. 9a) is fitted to peaks at 283.9 eV,285.2 eV, 286.4 eV and 288.6 eV which are attributed to the CvC(35%), C–C (50%), C–O (9.6%), and COO− (5.4%) bonds, respect-ively.49 After the modification of the fabric with PAMAM(PET-PAM) (Fig. 9b), another peak was detected at 287.7 eV corres-ponding to C–N, with a proportion of 6% CvC, 18.6% C–C, 36.8%C–O, 31.4% C–N and 7.2% COO− groups. After the modification ofthe fabric with GO (PET-PAM-GO) (Fig. 9c), the peak at 287.7 eV(C–N) was replaced with a peak at 288.2 eV corresponding to theCvO bonds, with a proportion of 26, 25.5, 32, 15, and 1.5% forCvC, C–C, C–O, CvO, and COO−, respectively. This shows thatthe introduction of GO enriches the C–C and C–O bond types. ThePET-PAM-rGO-Fe0 sample (Fig. 9d) had the peaks at 281.8, 283.9,285.2, 286.7, and 288.2 eV corresponding to carbide (27.5%), CvC(32.5%), C–C (31%), C–O (5%), and CvO (4%). The Fe 2p spectraof PET-PAM-rGO-Fe0 (Fig. S5f of ESI†) indicate the binding energyof iron [Fe3+] in the peaks at 724.4 eV (Fe 2p) and 711.0 Ev (Fe 2p)with a proportion of 33.3 and 66.7%, respectively.
Part 2: Analysis of electrical and catalytic properties ofpolyester nonwoven fabrics3.8. Sheet resistance (Rsh) analysis of nonwoven fabrics (elec-trical conductivity)
The electrical conductivity of modified polyester nonwovenfabrics studied through sheet resistance analysis that are
shown in Fig. 10. GO is electrically insulating due to thenumber of functional groups of the GO nanosheets. Thus, theGO modified samples do not show any electrical conductivity.In order to bring electro-conductive properties to the nonwo-ven fabric, the GO modified samples were chemically reducedto rGO and the sheet resistance (Rsh) of reduced samples weremeasured. The sheet resistance (Rsh) of PET-rGO decreasedslightly from 3.41 ± 0.34 to 2.96 ± 0.08 kΩ sq−1 by grafting GOwith PAMAM (PET-PAM-rGO). A further reduction in the sheetresistance was observed upon incorporation of Fe0 (Rsh of 1.32± 0.18 and 0.74 ± 0.13 kΩ sq−1 for PET-rGO-Fe0 and PET-PAM-rGO-Fe0, respectively).
A close comparative study among conductive fabrics showsthat rGO and/or Fe0 incorporated into PAMAM grafted nonwo-vens (PET-PAM-rGO and PET-PAM-rGO-Fe0) show lower sheetresistance (that translates to high conductivity) than that incor-porated into alkaline activated polyester fabric. This providesevidence for the role of PAMAM dendrimer in increasing theconductivity of the resultant nonwoven fabric with reference tothe presence of a higher and uniform distribution of conduc-tive materials (rGO and Fe0) on the fiber surface as establishedin the previous section.
3.9. Analysis of the catalytic properties of polyester nonwovenfabrics
3.9.1. Color removal. The catalytic performance of surface-modified polyester fabric containing iron nanoparticles on thegraphene-coated surface has been studied briefly by their effec-tiveness towards the removal of toxic colorants (crystal violet)from water. A cubic cuvette in which the dye solution and non-woven fabric were brought into contact in the presence of areducing agent was placed in a UV-vis spectrophotometer, asexplained in section 2.7.1. The degradation of pollutants wasstarted at once due to the formation of higher oxidation poten-tial hydroxyl radicals (•OH) due to the interaction between ironparticles and NaBH4 as well as adsorption of pollutants by gra-phene oxides. The removal of crystal violet with respect to timewas recorded (real-time in situ) and plotted as shown in
Table 4 Atomic proportion (at.%) of the surface chemical compositionof the samples
Sample name C 1s (at%) O 1s (at%) N 1s (at%) Fe 2p (at%)
PET 76.7 21 0 0PET-PAM 74.5 18 7.45 0PET-PAM-GO 70 28 1.4 0PET-PAM-rGO-Fe0 41.6 42.6 1.3 6.08
Fig. 10 (a) 4-Probe measurement of the electrical resistance. (b) Sheet resistance (Rsh) analysis of the samples.
Paper Dalton Transactions
17292 | Dalton Trans., 2020, 49, 17281–17300 This journal is © The Royal Society of Chemistry 2020
Fig. 11. The characteristic absorption peak observed at λ590 nm
is attributed to the intensity of crystal violet.50 The removalreactions of crystal violet dyes using different nonwovenfabrics (PET-GO, PET-rGO, PET-PAM-GO, PET-PAM-rGO, PET-rGO-Fe0 and PET-PAM-rGO-Fe0) were carried out under thesame experimental conditions. [Conditions: Crystal violet =50 mg L−1, nonwoven fabric = 1 cm2 (700 mg L−1), NaBH4 = 0.1M, pH = 5.] As shown in Fig. 11a and b, there was no signifi-cant decrease in the intensity of the dye during 120 min ofexposure for PET-GO and PET-PAM-GO, except for the charac-teristic absorption intensity of the dye in the presence of gra-phene. However, many studies have reported that grapheneoxide shows a higher catalytic activity in a photocatalyticenvironment. The control polyester fabric does not interferewith the removal of the dye as also reported in variousstudies.30,51,52
However, a significant reduction in the intensity of theabsorbance at λ590 nm has been observed when exposed to non-
woven catalysts containing both graphene oxide and iron (PET-rGO-Fe0 and PET-PAM-rGO-Fe0), suggesting the decoloration ofcrystal violet. Both nonwoven catalysts showed a significantlyrapid removal performance (see Fig. 11c and d). Specifically,the removal rate reached 99.04% in 65 min for PET-PAM-rGO-Fe0 and 97.68% in 78 min for PET-rGO-Fe0. Fast removalof crystal violet might be attributed to the stability, disparityand amount of functional material (iron) loaded on each non-woven fabric, ensuring the maximum exposure of reagent andproducing striking hydroxyl radicals for decoloration.Although the results indicate that graphene oxide has a fairlypoor direct contribution to the removal of dyes, the hexagonalmicrostructures of graphene oxide facilitated the loading ofzerovalent iron nanoparticles on the polyester surface towardshigh precision of stability, a disparity which later contributedto the removal of pollutants.
3.9.2. Kinetics of color removal using PET-rGO-Fe0 andPET-PAM-rGO-Fe0. Among all samples studied, only PET-
Fig. 11 UV-visible spectroscopy of catalytic removal of crystal violet dye using (a) PET-GO, (b) PET-PAM-GO, (c) PET-rGO-Fe0, and (d) PET-PAM-rGO-Fe0. [Conditions: Crystal violet = 50 mg L−1, nonwoven fabric = 700 mg L−1, NaBH4 = 0.1 M, pH = 5.]
Dalton Transactions Paper
This journal is © The Royal Society of Chemistry 2020 Dalton Trans., 2020, 49, 17281–17300 | 17293
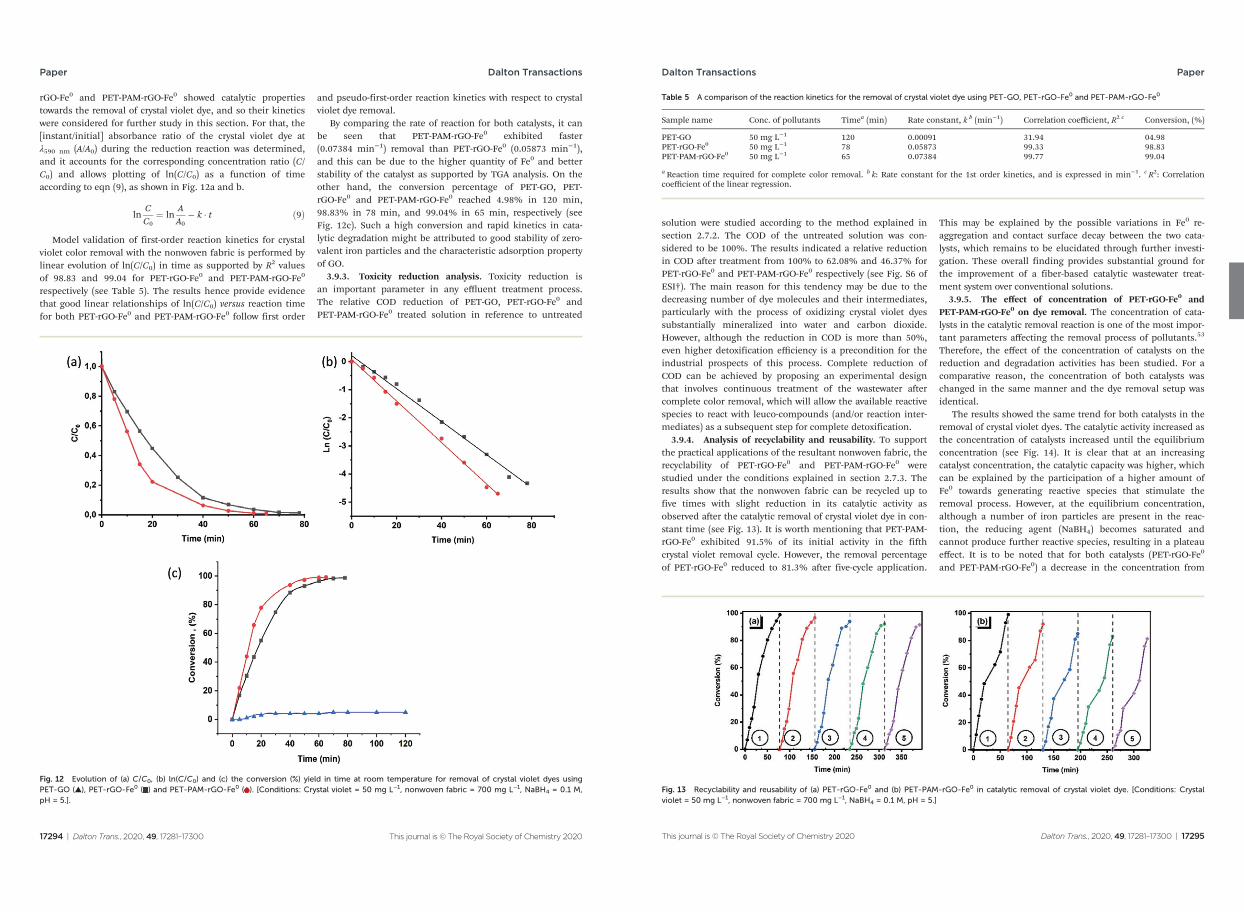
rGO-Fe0 and PET-PAM-rGO-Fe0 showed catalytic propertiestowards the removal of crystal violet dye, and so their kineticswere considered for further study in this section. For that, the[instant/initial] absorbance ratio of the crystal violet dye atλ590 nm (A/A0) during the reduction reaction was determined,and it accounts for the corresponding concentration ratio (C/C0) and allows plotting of ln(C/C0) as a function of timeaccording to eqn (9), as shown in Fig. 12a and b.
lnCC0
¼ lnAA0
k t ð9Þ
Model validation of first-order reaction kinetics for crystalviolet color removal with the nonwoven fabric is performed bylinear evolution of ln(C/C0) in time as supported by R2 valuesof 98.83 and 99.04 for PET-rGO-Fe0 and PET-PAM-rGO-Fe0
respectively (see Table 5). The results hence provide evidencethat good linear relationships of ln(C/C0) versus reaction timefor both PET-rGO-Fe0 and PET-PAM-rGO-Fe0 follow first order
and pseudo-first-order reaction kinetics with respect to crystalviolet dye removal.
By comparing the rate of reaction for both catalysts, it canbe seen that PET-PAM-rGO-Fe0 exhibited faster(0.07384 min−1) removal than PET-rGO-Fe0 (0.05873 min−1),and this can be due to the higher quantity of Fe0 and betterstability of the catalyst as supported by TGA analysis. On theother hand, the conversion percentage of PET-GO, PET-rGO-Fe0 and PET-PAM-rGO-Fe0 reached 4.98% in 120 min,98.83% in 78 min, and 99.04% in 65 min, respectively (seeFig. 12c). Such a high conversion and rapid kinetics in cata-lytic degradation might be attributed to good stability of zero-valent iron particles and the characteristic adsorption propertyof GO.
3.9.3. Toxicity reduction analysis. Toxicity reduction isan important parameter in any effluent treatment process.The relative COD reduction of PET-GO, PET-rGO-Fe0 andPET-PAM-rGO-Fe0 treated solution in reference to untreated
Fig. 12 Evolution of (a) C/C0, (b) ln(C/C0) and (c) the conversion (%) yield in time at room temperature for removal of crystal violet dyes usingPET-GO (), PET-rGO-Fe0 ( ) and PET-PAM-rGO-Fe0 ( ). [Conditions: Crystal violet = 50 mg L−1, nonwoven fabric = 700 mg L−1, NaBH4 = 0.1 M,pH = 5.].
Paper Dalton Transactions
17294 | Dalton Trans., 2020, 49, 17281–17300 This journal is © The Royal Society of Chemistry 2020
solution were studied according to the method explained insection 2.7.2. The COD of the untreated solution was con-sidered to be 100%. The results indicated a relative reductionin COD after treatment from 100% to 62.08% and 46.37% forPET-rGO-Fe0 and PET-PAM-rGO-Fe0 respectively (see Fig. S6 ofESI†). The main reason for this tendency may be due to thedecreasing number of dye molecules and their intermediates,particularly with the process of oxidizing crystal violet dyessubstantially mineralized into water and carbon dioxide.However, although the reduction in COD is more than 50%,even higher detoxification efficiency is a precondition for theindustrial prospects of this process. Complete reduction ofCOD can be achieved by proposing an experimental designthat involves continuous treatment of the wastewater aftercomplete color removal, which will allow the available reactivespecies to react with leuco-compounds (and/or reaction inter-mediates) as a subsequent step for complete detoxification.
3.9.4. Analysis of recyclability and reusability. To supportthe practical applications of the resultant nonwoven fabric, therecyclability of PET-rGO-Fe0 and PET-PAM-rGO-Fe0 werestudied under the conditions explained in section 2.7.3. Theresults show that the nonwoven fabric can be recycled up tofive times with slight reduction in its catalytic activity asobserved after the catalytic removal of crystal violet dye in con-stant time (see Fig. 13). It is worth mentioning that PET-PAM-rGO-Fe0 exhibited 91.5% of its initial activity in the fifthcrystal violet removal cycle. However, the removal percentageof PET-rGO-Fe0 reduced to 81.3% after five-cycle application.
This may be explained by the possible variations in Fe0 re-aggregation and contact surface decay between the two cata-lysts, which remains to be elucidated through further investi-gation. These overall finding provides substantial ground forthe improvement of a fiber-based catalytic wastewater treat-ment system over conventional solutions.
3.9.5. The effect of concentration of PET-rGO-Fe0 andPET-PAM-rGO-Fe0 on dye removal. The concentration of cata-lysts in the catalytic removal reaction is one of the most impor-tant parameters affecting the removal process of pollutants.53
Therefore, the effect of the concentration of catalysts on thereduction and degradation activities has been studied. For acomparative reason, the concentration of both catalysts waschanged in the same manner and the dye removal setup wasidentical.
The results showed the same trend for both catalysts in theremoval of crystal violet dyes. The catalytic activity increased asthe concentration of catalysts increased until the equilibriumconcentration (see Fig. 14). It is clear that at an increasingcatalyst concentration, the catalytic capacity was higher, whichcan be explained by the participation of a higher amount ofFe0 towards generating reactive species that stimulate theremoval process. However, at the equilibrium concentration,although a number of iron particles are present in the reac-tion, the reducing agent (NaBH4) becomes saturated andcannot produce further reactive species, resulting in a plateaueffect. It is to be noted that for both catalysts (PET-rGO-Fe0
and PET-PAM-rGO-Fe0) a decrease in the concentration from
Table 5 A comparison of the reaction kinetics for the removal of crystal violet dye using PET-GO, PET-rGO-Fe0 and PET-PAM-rGO-Fe0
Sample name Conc. of pollutants Timea (min) Rate constant, k b (min−1) Correlation coefficient, R2 c Conversion, (%)
PET-GO 50 mg L−1 120 0.00091 31.94 04.98PET-rGO-Fe0 50 mg L−1 78 0.05873 99.33 98.83PET-PAM-rGO-Fe0 50 mg L−1 65 0.07384 99.77 99.04
a Reaction time required for complete color removal. b k: Rate constant for the 1st order kinetics, and is expressed in min−1. c R2: Correlationcoefficient of the linear regression.
Fig. 13 Recyclability and reusability of (a) PET-rGO-Fe0 and (b) PET-PAM-rGO-Fe0 in catalytic removal of crystal violet dye. [Conditions: Crystalviolet = 50 mg L−1, nonwoven fabric = 700 mg L−1, NaBH4 = 0.1 M, pH = 5.]
Dalton Transactions Paper
This journal is © The Royal Society of Chemistry 2020 Dalton Trans., 2020, 49, 17281–17300 | 17295
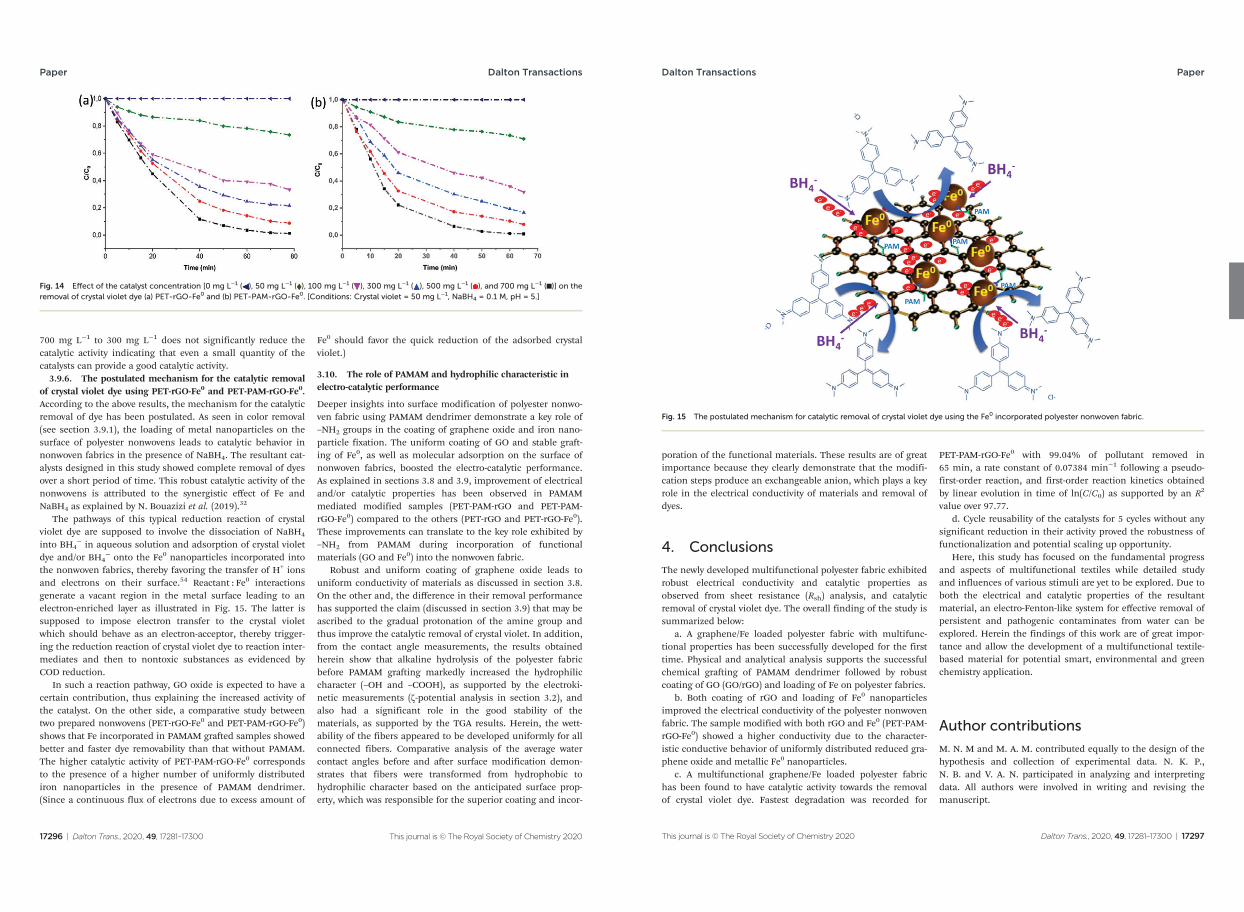
700 mg L−1 to 300 mg L−1 does not significantly reduce thecatalytic activity indicating that even a small quantity of thecatalysts can provide a good catalytic activity.
3.9.6. The postulated mechanism for the catalytic removalof crystal violet dye using PET-rGO-Fe0 and PET-PAM-rGO-Fe0.According to the above results, the mechanism for the catalyticremoval of dye has been postulated. As seen in color removal(see section 3.9.1), the loading of metal nanoparticles on thesurface of polyester nonwovens leads to catalytic behavior innonwoven fabrics in the presence of NaBH4. The resultant cat-alysts designed in this study showed complete removal of dyesover a short period of time. This robust catalytic activity of thenonwovens is attributed to the synergistic effect of Fe andNaBH4 as explained by N. Bouazizi et al. (2019).32
The pathways of this typical reduction reaction of crystalviolet dye are supposed to involve the dissociation of NaBH4
into BH4− in aqueous solution and adsorption of crystal violet
dye and/or BH4− onto the Fe0 nanoparticles incorporated into
the nonwoven fabrics, thereby favoring the transfer of H+ ionsand electrons on their surface.54 Reactant : Fe0 interactionsgenerate a vacant region in the metal surface leading to anelectron-enriched layer as illustrated in Fig. 15. The latter issupposed to impose electron transfer to the crystal violetwhich should behave as an electron-acceptor, thereby trigger-ing the reduction reaction of crystal violet dye to reaction inter-mediates and then to nontoxic substances as evidenced byCOD reduction.
In such a reaction pathway, GO oxide is expected to have acertain contribution, thus explaining the increased activity ofthe catalyst. On the other side, a comparative study betweentwo prepared nonwovens (PET-rGO-Fe0 and PET-PAM-rGO-Fe0)shows that Fe incorporated in PAMAM grafted samples showedbetter and faster dye removability than that without PAMAM.The higher catalytic activity of PET-PAM-rGO-Fe0 correspondsto the presence of a higher number of uniformly distributediron nanoparticles in the presence of PAMAM dendrimer.(Since a continuous flux of electrons due to excess amount of
Fe0 should favor the quick reduction of the adsorbed crystalviolet.)
3.10. The role of PAMAM and hydrophilic characteristic inelectro-catalytic performance
Deeper insights into surface modification of polyester nonwo-ven fabric using PAMAM dendrimer demonstrate a key role of–NH2 groups in the coating of graphene oxide and iron nano-particle fixation. The uniform coating of GO and stable graft-ing of Fe0, as well as molecular adsorption on the surface ofnonwoven fabrics, boosted the electro-catalytic performance.As explained in sections 3.8 and 3.9, improvement of electricaland/or catalytic properties has been observed in PAMAMmediated modified samples (PET-PAM-rGO and PET-PAM-rGO-Fe0) compared to the others (PET-rGO and PET-rGO-Fe0).These improvements can translate to the key role exhibited by–NH2 from PAMAM during incorporation of functionalmaterials (GO and Fe0) into the nonwoven fabric.
Robust and uniform coating of graphene oxide leads touniform conductivity of materials as discussed in section 3.8.On the other and, the difference in their removal performancehas supported the claim (discussed in section 3.9) that may beascribed to the gradual protonation of the amine group andthus improve the catalytic removal of crystal violet. In addition,from the contact angle measurements, the results obtainedherein show that alkaline hydrolysis of the polyester fabricbefore PAMAM grafting markedly increased the hydrophiliccharacter (–OH and –COOH), as supported by the electroki-netic measurements (ζ-potential analysis in section 3.2), andalso had a significant role in the good stability of thematerials, as supported by the TGA results. Herein, the wett-ability of the fibers appeared to be developed uniformly for allconnected fibers. Comparative analysis of the average watercontact angles before and after surface modification demon-strates that fibers were transformed from hydrophobic tohydrophilic character based on the anticipated surface prop-erty, which was responsible for the superior coating and incor-
Fig. 14 Effect of the catalyst concentration [0 mg L−1 ( ), 50 mg L−1 ( ), 100 mg L−1 ( ), 300 mg L−1 ( ), 500 mg L−1 ( ), and 700 mg L−1 ()] on theremoval of crystal violet dye (a) PET-rGO-Fe0 and (b) PET-PAM-rGO-Fe0. [Conditions: Crystal violet = 50 mg L−1, NaBH4 = 0.1 M, pH = 5.]
Paper Dalton Transactions
17296 | Dalton Trans., 2020, 49, 17281–17300 This journal is © The Royal Society of Chemistry 2020
poration of the functional materials. These results are of greatimportance because they clearly demonstrate that the modifi-cation steps produce an exchangeable anion, which plays a keyrole in the electrical conductivity of materials and removal ofdyes.
4. Conclusions
The newly developed multifunctional polyester fabric exhibitedrobust electrical conductivity and catalytic properties asobserved from sheet resistance (Rsh) analysis, and catalyticremoval of crystal violet dye. The overall finding of the study issummarized below:
a. A graphene/Fe loaded polyester fabric with multifunc-tional properties has been successfully developed for the firsttime. Physical and analytical analysis supports the successfulchemical grafting of PAMAM dendrimer followed by robustcoating of GO (GO/rGO) and loading of Fe on polyester fabrics.
b. Both coating of rGO and loading of Fe0 nanoparticlesimproved the electrical conductivity of the polyester nonwovenfabric. The sample modified with both rGO and Fe0 (PET-PAM-rGO-Fe0) showed a higher conductivity due to the character-istic conductive behavior of uniformly distributed reduced gra-phene oxide and metallic Fe0 nanoparticles.
c. A multifunctional graphene/Fe loaded polyester fabrichas been found to have catalytic activity towards the removalof crystal violet dye. Fastest degradation was recorded for
PET-PAM-rGO-Fe0 with 99.04% of pollutant removed in65 min, a rate constant of 0.07384 min−1 following a pseudo-first-order reaction, and first-order reaction kinetics obtainedby linear evolution in time of ln(C/C0) as supported by an R2
value over 97.77.d. Cycle reusability of the catalysts for 5 cycles without any
significant reduction in their activity proved the robustness offunctionalization and potential scaling up opportunity.
Here, this study has focused on the fundamental progressand aspects of multifunctional textiles while detailed studyand influences of various stimuli are yet to be explored. Due toboth the electrical and catalytic properties of the resultantmaterial, an electro-Fenton-like system for effective removal ofpersistent and pathogenic contaminates from water can beexplored. Herein the findings of this work are of great impor-tance and allow the development of a multifunctional textile-based material for potential smart, environmental and greenchemistry application.
Author contributions
M. N. M and M. A. M. contributed equally to the design of thehypothesis and collection of experimental data. N. K. P.,N. B. and V. A. N. participated in analyzing and interpretingdata. All authors were involved in writing and revising themanuscript.
Fig. 15 The postulated mechanism for catalytic removal of crystal violet dye using the Fe0 incorporated polyester nonwoven fabric.
Dalton Transactions Paper
This journal is © The Royal Society of Chemistry 2020 Dalton Trans., 2020, 49, 17281–17300 | 17297
Conflicts of interest
The authors declare no conflict of interest.
Acknowledgements
This work has been carried out in the framework of ErasmusMundus Joint Doctorate Project—Sustainable Managementand Design for Textiles (SMDTex), which is financed by theEuropean Commission (Grant No. 532704-EM-5-2017-1-FR-ERA). Special thanks to the Erling Persson Foundation andthe Smart Textiles initiative. The authors would like to thankHaike Hilke from the Department of Textile Technology at theUniversity of Borås, Sweden for her support during experi-mental works.
References
1 M. Stoppa and A. Chiolerio, Wearable electronics andsmart textiles: a critical review, Sensors, 2014, 14, 11957–11992.
2 W. Zeng, L. Shu, Q. Li, S. Chen, F. Wang and X. M. Tao,Fiber–based wearable electronics: a review of materials,fabrication, devices, and applications, Adv. Mater., 2014,26, 5310–5336.
3 B. Nabil, M. N. Morshed, B. Nemeshwaree, C. Christine,V. Julien, T. Olivier and A. Abdelkrim, Development of newmultifunctional filter based nonwovens for organics pollu-tants reduction and detoxification: High catalytic and anti-bacterial activities, Chem. Eng. J., 2019, 356, 702–716.
4 B. Nabil, C. Christine, V. Julien and A. Abdelkrim,Polyfunctional cotton fabrics with catalytic activity andantibacterial capacity, Chem. Eng. J., 2018, 351, 328–339.
5 M. N. Pervez, G. K. Stylios, Y. Liang, F. Ouyang and Y. Cai,Low-temperature synthesis of novel polyvinylalcohol (PVA)nanofibrous membranes for catalytic dye degradation,J. Cleaner Prod., 2020, 121301.
6 Q. Li, Y. Wang, S. Jiang, T. Li, X. Ding, X. Tao and X. Wang,Investigation into tensile hysteresis of polyurethane-con-taining textile substrates for coated strain sensors, Mater.Des., 2020, 188, 108451.
7 G. Cai, M. Yang, J. Pan, D. Cheng, Z. Xia, X. Wang andB. Tang, Large-scale production of highly stretchable CNT/cotton/spandex composite yarn for wearable applications,ACS Appl. Mater. Interfaces, 2018, 10, 32726–32735.
8 N. Karim, S. Afroj, A. Malandraki, S. Butterworth, C. Beach,M. Rigout, K. S. Novoselov, A. J. Casson and S. G. Yeates,All inkjet-printed graphene-based conductive patterns forwearable e-textile applications, J. Mater. Chem. C, 2017, 5,11640–11648.
9 X. Hu, T. Huang, Z. Liu, G. Wang, D. Chen, Q. Guo,S. Yang, Z. Jin, J.-M. Lee and G. Ding, Conductive gra-phene-based E-textile for highly sensitive, breathable, and
water-resistant multimodal gesture-distinguishablesensors, J. Mater. Chem. A, 2020, 8, 14778–14787.
10 M. A. Shathi, C. Minzhi, N. A. Khoso, T. Rahman andB. Bidhan, Graphene coated textile based highly flexibleand washable sports bra for human health monitoring,Mater. Des., 2020, 108792.
11 M. A. Miankafshe, T. Bashir and N.-K. Persson,Electrostatic grafting of graphene onto polyamide 6, 6yarns for use as conductive elements in smart textile appli-cations, New J. Chem., 2020, 44, 7591–7601.
12 K. S. Novoselov, A. K. Geim, S. V. Morozov, D. Jiang,Y. Zhang, S. V. Dubonos, I. V. Grigorieva and A. A. Firsov,Electric field effect in atomically thin carbon films, Science,2004, 306, 666–669.
13 Y. Zhang, Y.-W. Tan, H. L. Stormer andP. Kim, Experimental observation of the quantum Halleffect and Berry’s phase in graphene, Nature, 2005, 438,201–204.
14 A. K. Geim and K. S. Novoselov, The rise of graphene, inNanoscience and technology: a collection of reviews fromnature journals, World Scientific, 2010, pp. 11–19.
15 K. Nomura and A. H. MacDonald, Quantum transport ofmassless Dirac fermions, Phys. Rev. Lett., 2007, 98, 076602.
16 M. A. Miankafshe, T. Bashir and N.-K. Persson, The roleand importance of surface modification of polyester fabricsby chitosan and hexadecylpyridinium chloride for the elec-trical and electro-thermal performance of graphene-modi-fied smart textiles, New J. Chem., 2019, 43, 6643–6658.
17 A. C. Perinotto, L. Caseli, C. O. Hayasaka, A. Riul Jr.,O. N. Oliveira Jr. and V. Zucolotto, Dendrimer-assistedimmobilization of alcohol dehydrogenase in nano-structured films for biosensing: Ethanol detection usingelectrical capacitance measurements, Thin Solid Films,2008, 516, 9002–9005.
18 P. Bhattacharya, M. I. Nandasiri, D. Lv, A. M. Schwarz,J. T. Darsell, W. A. Henderson, D. A. Tomalia, J. Liu,J.-G. Zhang and J. Xiao, Polyamidoamine dendrimer-basedbinders for high-loading lithium–sulfur battery cathodes,Nano Energy, 2016, 19, 176–186.
19 G. Li, S. Yu, W. Xue, D. Ma and W. Zhang, Chitosan-graft-PAMAM loading nitric oxide for efficient antibacterialapplication, Chem. Eng. J., 2018, 347, 923–931.
20 Y. Peng, R. Yao and W. Yang, A poly (amidoamine) nano-particle cross-linked two-dimensional metal–organic frame-work nanosheet membrane for water purification, Chem.Commun., 2019, 55, 3935–3938.
21 M. N. Morshed, N. Behary, N. Bouazizi, J. Guan, G. Chenand V. Nierstrasz, Surface modification of polyester fabricusing plasma-dendrimer for robust immobilization ofglucose oxidase enzyme, Sci. Rep., 2019, 9, 1–16.
22 N. A. S. Omar, Y. W. Fen, J. Abdullah, Y. M. Kamil,W. M. E. M. M. Daniyal, A. R. Sadrolhosseini andM. A. Mahdi, Sensitive Detection of Dengue Virus Type 2E-Proteins Signals Using Self-Assembled Monolayers/Reduced Graphene Oxide-PAMAM Dendrimer Thin Film-SPR Optical Sensor, Sci. Rep., 2020, 10, 1–15.
Paper Dalton Transactions
17298 | Dalton Trans., 2020, 49, 17281–17300 This journal is © The Royal Society of Chemistry 2020
23 S. Pei and H.-M. Cheng, The reduction of graphene oxide,Carbon, 2012, 50, 3210–3228.
24 J.-P. Jegal, K.-C. Kim, M. S. Kim and K.-B. Kim, A lithiumiron phosphate/nitrogen-doped reduced graphene oxidenanocomposite as a cathode material for high-powerlithium ion batteries, J. Mater. Chem. A, 2014, 2, 9594–9599.
25 D. R. Dreyer, S. Park, C. W. Bielawski and R. S. Ruoff, Thechemistry of graphene oxide, Chem. Soc. Rev., 2010, 39,228–240.
26 X.-Q. Li, D. W. Elliott and W.-X. Zhang, Zero-valent ironnanoparticles for abatement of environmental pollutants:materials and engineering aspects, Crit. Rev. Solid StateMater. Sci., 2006, 31, 111–122.
27 M. N. Morshed, N. Bouazizi, N. Behary, J. Guan andV. Nierstrasz, Stabilization of zero valent iron (Fe0) onplasma/dendrimer functionalized polyester fabrics forFenton-like removal of hazardous water pollutants, Chem.Eng. J., 2019, 374, 658–673.
28 C. D. Raman and S. Kanmani, Textile dye degradationusing nano zero valent iron: a review, J. Environ. Manage.,2016, 177, 341–355.
29 M. N. Morshed, M. N. Pervez, N. Behary, N. Bouazizi,J. Guan and V. A. Nierstrasz, Statistical modeling andoptimization of heterogeneous Fenton-like removal oforganic pollutant using fibrous catalysts: a full factorialdesign, Sci. Rep., 2020, 10, 1–14.
30 M. N. Morshed, N. Bouazizi, N. Behary, J. Vieillard,O. Thoumire, V. Nierstrasz and A. Azzouz, Iron-loadedamine/thiol functionalized polyester fibers with high cata-lytic activities: a comparative study, Dalton Trans., 2019, 48,8384–8399.
31 A. Mohamed, B. Nemeshwaree, M. Brigitte, P. Anne,B. Kalim, D. Pascal, M. Anne-Sophie and F. Rénato, Activityof enzymes immobilized on plasma treated polyester,J. Mol. Catal. B: Enzym., 2016, 134, 261–272.
32 N. Bouazizi, J. Vieillard, R. Bargougui, N. Couvrat,O. Thoumire, S. Morin, G. Ladam, N. Mofaddel, N. Brunand A. Azzouz, Entrapment and stabilization of iron nano-particles within APTES modified graphene oxide sheets forcatalytic activity improvement, J. Alloys Compd., 2019, 771,1090–1102.
33 S. Xiao, H. Ma, M. Shen, S. Wang, Q. Huang and X. Shi,Excellent copper(II) removal using zero-valent iron nano-particle-immobilized hybrid electrospun polymer nanofi-brous mats, Colloids Surf., A, 2011, 381, 48–54.
34 H. Deb, M. N. Morshed, S. Xiao, S. Al Azad, Z. Cai andA. Ahmed, Design and development of TiO2-Fe0 nano-particle-immobilized nanofibrous mat for photocatalyticdegradation of hazardous water pollutants, J. Mater. Sci.:Mater. Electron., 2019, 30, 4842–4854.
35 H. A. Wege, J. A. Aguilar, M. Á. Rodríguez-Valverde,M. Toledano, R. Osorio and M. Á. Cabrerizo-Vílchez,Dynamic contact angle and spreading rate measurementsfor the characterization of the effect of dentin surface treat-ments, J. Colloid Interface Sci., 2003, 263, 162–169.
36 A. Sze, D. Erickson, L. Ren and D. Li, Zeta-potentialmeasurement using the Smoluchowski equation and theslope of the current–time relationship in electroosmoticflow, J. Colloid Interface Sci., 2003, 261, 402–410.
37 E. R. Trotman, Dyeing and chemical technology of textilefibres, 1984.
38 F. M. Mirabella, Modern techniques in applied molecularspectroscopy, John Wiley & Sons, 1998.
39 P. Green and L. MacDonald, Colour engineering: achievingdevice independent colour, John Wiley & Sons, 2011.
40 J. Schanda, Colorimetry: understanding the CIE system, JohnWiley & Sons, 2007.
41 J. F. Moulder, Handbook of X-ray photoelectron spectroscopy,Physical Electronics, 1995, pp. 230–232.
42 T. I. T. Okpalugo, P. Papakonstantinou, H. Murphy,J. McLaughlin and N. M. D. Brown, High resolution XPScharacterization of chemical functionalised MWCNTs andSWCNTs, Carbon, 2005, 43, 153–161.
43 L. Yang, L. Xin, W. Gu, J. Tian, S. Liao, P. Du, Y. Tong,Y. Zhang, R. Lv and J. Wang, A new carboxyl-copper-organicframework and its excellent selective absorbability for pro-teins, J. Solid State Chem., 2014, 218, 64–70.
44 X. Guo, B. Xu, W. Zhang, Z. Cai and Z. Wen, XPS analysisfor cubic boron nitride crystal synthesized under highpressure and high temperature using Li3N as catalysis,Appl. Surf. Sci., 2014, 321, 94–97.
45 G. Höhne, W. F. Hemminger and H. J. Flammersheim,Differential scanning calorimetry, Springer Science &Business Media, 2013.
46 H. Deb, S. Xiao, M. N. Morshed and S. Al Azad,Immobilization of Cationic Titanium Dioxide (TiO2
+) onElectrospun Nanofibrous Mat: Synthesis, Characterization,and Potential Environmental Application, Fibers Polym.,2018, 19, 1715–1725.
47 Y.-P. Sun, X.-Q. Li, J. Cao, W.-X. Zhang and H. P. Wang,Characterization of zero-valent iron nanoparticles, Adv.Colloid Interface Sci., 2006, 120, 47–56.
48 C. F. Cullis and M. M. Hirschler, The significance of ther-moanalytical measurements in the assessment of polymerflammability, Polymer, 1983, 24, 834–840.
49 C. Zhang and K. Fang, Surface modification of polyesterfabrics for inkjet printing with atmospheric-pressure air/Arplasma, Surf. Coat. Technol., 2009, 203, 2058–2063.
50 A. Mittal, J. Mittal, A. Malviya, D. Kaur and V. K. Gupta,Adsorption of hazardous dye crystal violet from wastewaterby waste materials, J. Colloid Interface Sci., 2010, 343, 463–473.
51 T. Harifi and M. Montazer, In situ synthesis of iron oxidenanoparticles on polyester fabric utilizing color, magnetic,antibacterial and sono-Fenton catalytic properties, J. Mater.Chem. B, 2014, 2, 272–282.
52 H. Sudrajat and S. Babel, A new, cost-effective solar photo-active system N-ZnO@ polyester fabric for degradation ofrecalcitrant compound in a continuous flow reactor, Mater.Res. Bull., 2016, 83, 369–378.
Dalton Transactions Paper
This journal is © The Royal Society of Chemistry 2020 Dalton Trans., 2020, 49, 17281–17300 | 17299
53 M. Wawrzkiewicz, M. Wiśniewska, V. M. Gun’ko andV. I. Zarko, Adsorptive removal of acid, reactive and directdyes from aqueous solutions and wastewater using mixedsilica–alumina oxide, Powder Technol., 2015, 278, 306–315.
54 S. Wunder, F. Polzer, Y. Lu, Y. Mei and M. Ballauff, Kineticanalysis of catalytic reduction of 4-nitrophenol by metallicnanoparticles immobilized in spherical polyelectrolytebrushes, J. Phys. Chem. C, 2010, 114, 8814–8820.
Paper Dalton Transactions
17300 | Dalton Trans., 2020, 49, 17281–17300 This journal is © The Royal Society of Chemistry 2020