Embed Size (px)
Citation preview
V. Di Cocco et alii, Roma, Italia, 1-3 Luglio 2013; ISBN 978-88-95940-47-2
9
Graphite nodule morphology evolution as an indicator of DCI macroscopic damage level
Vittorio Di Cocco, Francesco Iacoviello, Alessandra Rossi Università di Cassino e del Lazio Meridionale, DiCeM, via G. Di Biasio 43, 03043 Cassino (FR), Italy [email protected] Daniela Iacoviello Sapienza Università di Roma, Dipartimento di Ingegneria Informatica, Automatica e Gestionale Antonio Ruberti, Italy
ABSTRACT. Ductile cast irons (DCI) mechanical properties are strongly influenced both by the matrix and by the graphite elements morphological peculiarities. These elements cannot be merely considered as “microvoids embedded in a metal matrix”, but their presence implies a modification of the damaging micromechanisms, depending on the metal matrix microstructure. In this work, a ferritic DCI has been considered. Tensile tests have been performed on notched tensile specimen: quantitative image analysis approach has been applied in order to analyze the possibility to consider the graphite nodules as indicators of the damaging level evolution. SOMMARIO. Le proprietà meccaniche delle ghise sferoidali (DCI) sono fortemente influenzate sia dalle caratteristiche della matrice che dalle peculiarità morfologiche degli elementi di grafite. Questi elementi non possono essere solo considerati come “microvuoti immersi in una matrice metallica”, ma la loro presenza implica una modifica dei micromeccanismi di danneggiamento, in funzione della microstruttura della matrice metallica. In questo lavoro è stata considerata una ghisa sferoidale a matrice metallica. Sono state effettuate delle prove di trazione utilizzando dei provini intagliati e, mediante l’analisi di immagine quantitativa, è stata analizzata la possibilità di considerare i noduli di grafite come degli indicatori dell’evoluzione del danneggiamento. KEYWORDS. Ductile cast irons; Damaging micromechanisms; Quantitative Image Analysis. INTRODUCTION
lassic approach to the internal damage in DCI has been often focused on voids nucleation and growth due to the matrix-graphite nodules debonding [1-5]. As a consequence of this approach, numerous analytical laws have been proposed to describe a single void growth, depending on the void geometries and matrix behaviour. Focusing on
ferritic DCIs [3], no damage at graphite nodule interface was observed in the elastic stage of the load-displacement curve. Corresponding to the plastic deformation stage, slip lines were observed emanating from the equator of the nodules, indicating a local plastic deformation of the matrix. Decohesions at the pole cap of the nodules were observed when the macroscopic yield stress was reached. The increase of macroscopic plastic deformation induced void growth in the stress direction, thus forming ellipsoidal cavities inside which nearly undeformed nodules were embedded, and failure occurred by shear instabilities linking adjacent voids. More recently experimental results allowed to identify a more complex damaging micromechanism [6-10], with the graphite nodules that do not merely play the role of “debonding initiation point”, but are characterized by an internal
C
V. Di Cocco et alii, Convegno Nazionale IGF XXII, Roma, Italia, 1-3 Luglio 2013, 9-15
10
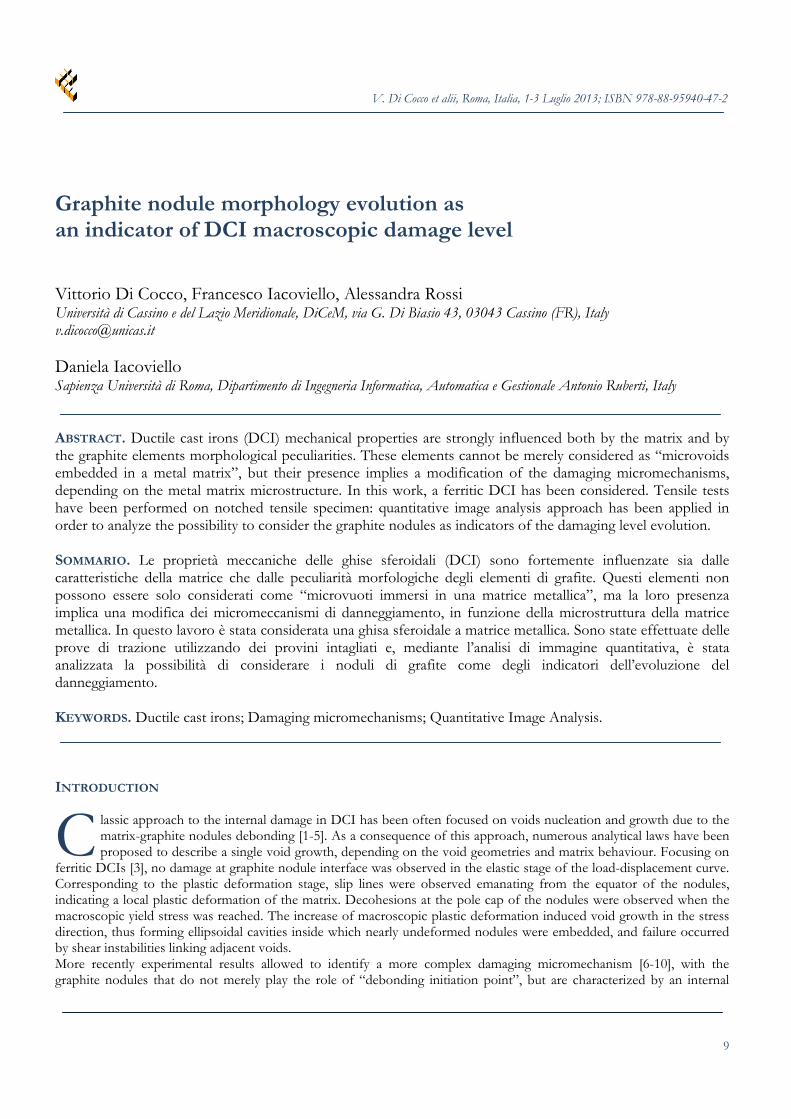
mechanical properties gradient [11] and show an internal damage development that increase with the increase of the applied macroscopical deformation (Fig. 1). The nodules influence on the damaging micromechanisms is dependent on the matrix microstructure [6]. According to these experimental results, an “onion like” mechanism is often observed, with a sort of “internal debonding”. Furthermore, also the initiation and propagation of internal cracks is observed, sometimes corresponding to the nodule center (as in Fig. 1). Evidences of ferritic matrix plastic deformation (e.g., slip lines) are observed only after the cracks initiation inside the graphite nodule. According to the experimental results, it is possible that these mechanisms are due to the presence of an internal gradient of mechanical properties inside the graphite nodules.
Figure 1: Damage evolution in a ferritic DCI. Role played by the graphite nodules (bold arrows show the loading direction). Considering the paper published by I. Hervas et alii [12], where the compression behaviour of a DCI has been investigated for different specimens morphologies, and the aspect ratio of graphite nodules during the deformation was successfully considered as a convenient metallurgical parameter to describe the local material strain and its evolution during the compression test, in this work an analogous approach has been followed to investigate if low magnification observations of the graphite nodules shape evolution during a tensile test are able to characterize the local deformation conditions. Low magnification observations coupled with the quantitative image analysis approach have been performed on a notched tensile mini specimens, observing the specimens lateral surface during the test by means of a scanning electron microscope (SEM) and a Digital Microscope (DM). Image analysis techniques [13] may help in quantifying the deformation; the extensive use of image analysis in material science dates back to about ten years and depending on the quality of the data different procedures may be applied [14, 15]. The aim is to determine automatic procedure to quantify the elements of interest in the data and their modification if a stress is applied. INVESTIGATED MATERIAL AND EXPERIMENTAL PROCEDURES
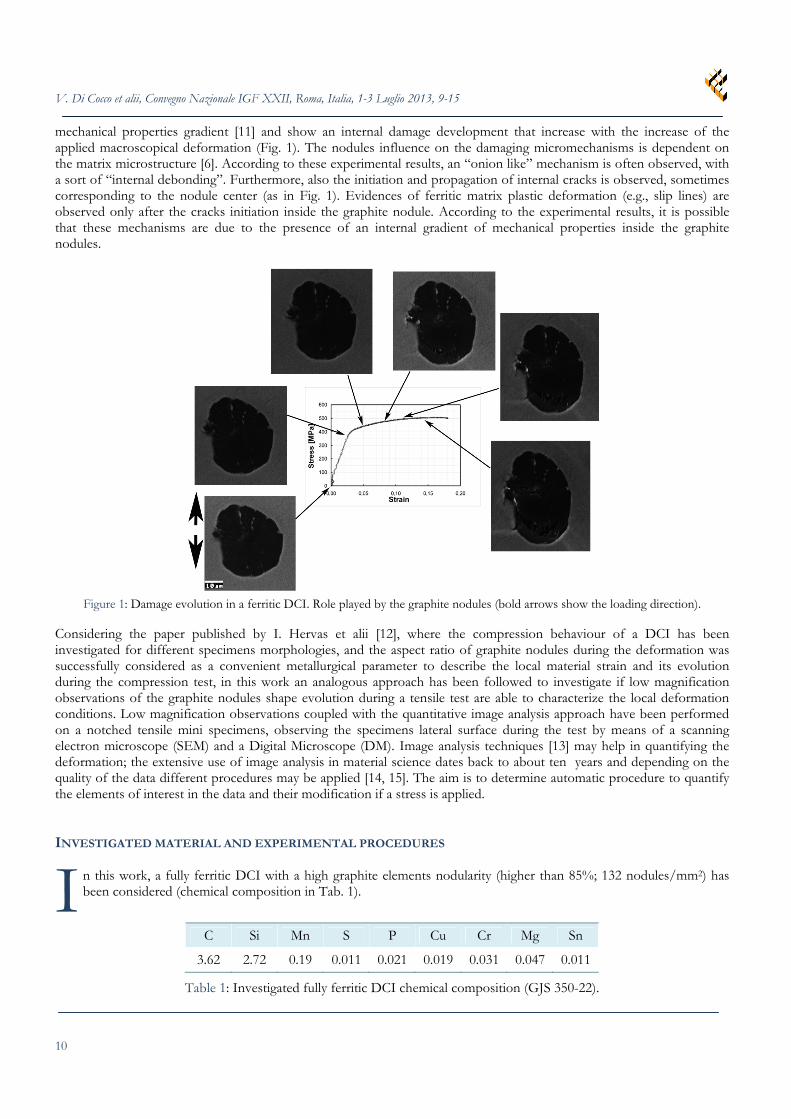
n this work, a fully ferritic DCI with a high graphite elements nodularity (higher than 85%; 132 nodules/mm2) has been considered (chemical composition in Tab. 1).
C Si Mn S P Cu Cr Mg Sn
3.62 2.72 0.19 0.011 0.021 0.019 0.031 0.047 0.011
Table 1: Investigated fully ferritic DCI chemical composition (GJS 350-22).
I
V. Di Cocco et alii, Roma, Italia, 1-3 Luglio 2013; ISBN 978-88-95940-47-2
11
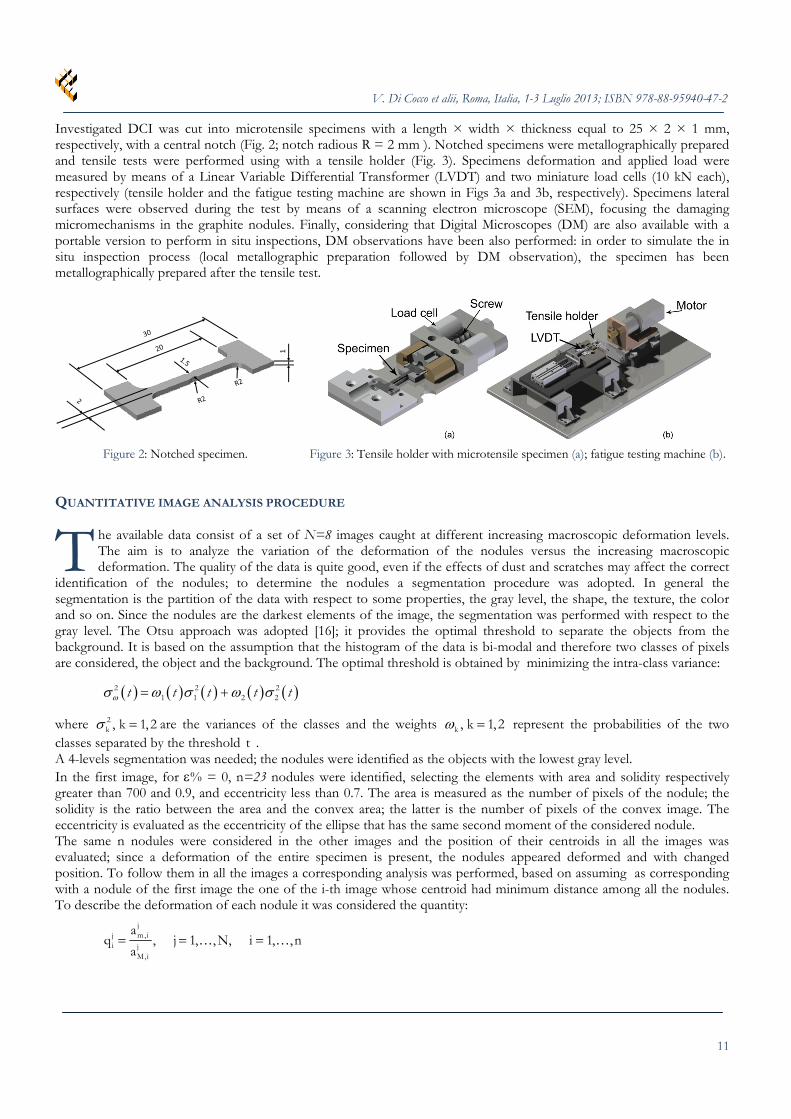
Investigated DCI was cut into microtensile specimens with a length × width × thickness equal to 25 × 2 × 1 mm, respectively, with a central notch (Fig. 2; notch radious R = 2 mm ). Notched specimens were metallographically prepared and tensile tests were performed using with a tensile holder (Fig. 3). Specimens deformation and applied load were measured by means of a Linear Variable Differential Transformer (LVDT) and two miniature load cells (10 kN each), respectively (tensile holder and the fatigue testing machine are shown in Figs 3a and 3b, respectively). Specimens lateral surfaces were observed during the test by means of a scanning electron microscope (SEM), focusing the damaging micromechanisms in the graphite nodules. Finally, considering that Digital Microscopes (DM) are also available with a portable version to perform in situ inspections, DM observations have been also performed: in order to simulate the in situ inspection process (local metallographic preparation followed by DM observation), the specimen has been metallographically prepared after the tensile test.
1
Figure 2: Notched specimen.
Figure 3: Tensile holder with microtensile specimen (a); fatigue testing machine (b).
QUANTITATIVE IMAGE ANALYSIS PROCEDURE
he available data consist of a set of N=8 images caught at different increasing macroscopic deformation levels. The aim is to analyze the variation of the deformation of the nodules versus the increasing macroscopic deformation. The quality of the data is quite good, even if the effects of dust and scratches may affect the correct
identification of the nodules; to determine the nodules a segmentation procedure was adopted. In general the segmentation is the partition of the data with respect to some properties, the gray level, the shape, the texture, the color and so on. Since the nodules are the darkest elements of the image, the segmentation was performed with respect to the gray level. The Otsu approach was adopted [16]; it provides the optimal threshold to separate the objects from the background. It is based on the assumption that the histogram of the data is bi-modal and therefore two classes of pixels are considered, the object and the background. The optimal threshold is obtained by minimizing the intra-class variance:
2 2 21 1 2 2 t t t t t
where 2k , k 1, 2 are the variances of the classes and the weights k , k 1,2 represent the probabilities of the two
classes separated by the threshold t . A 4-levels segmentation was needed; the nodules were identified as the objects with the lowest gray level. In the first image, for % = 0, n=23 nodules were identified, selecting the elements with area and solidity respectively greater than 700 and 0.9, and eccentricity less than 0.7. The area is measured as the number of pixels of the nodule; the solidity is the ratio between the area and the convex area; the latter is the number of pixels of the convex image. The eccentricity is evaluated as the eccentricity of the ellipse that has the same second moment of the considered nodule. The same n nodules were considered in the other images and the position of their centroids in all the images was evaluated; since a deformation of the entire specimen is present, the nodules appeared deformed and with changed position. To follow them in all the images a corresponding analysis was performed, based on assuming as corresponding with a nodule of the first image the one of the i-th image whose centroid had minimum distance among all the nodules. To describe the deformation of each nodule it was considered the quantity:
jm,ij
i jM,i
aq , j 1, ,N, i 1, ,n
a
T

V. Di Cocco et alii, Convegno Nazionale IGF XXII, Roma, Italia, 1-3 Luglio 2013, 9-15
12
where jm,ia and j
M,ia are respectively the minor and major axis of the i-th nodule in the j-th image. Of course the quantity jiq ranges between zero and one, being the latter the case of a round nodule and the former corresponding to an object
very crushed. The evaluation of the deformation j
iq of each of the n nodules of the N-1 images was normalized with respect to the same
quantity 1iq evaluated in the first image:
j 1i ij
i 1i
q qQ , j 1, ,N 1, i 1, ,n
q
This normalized quantity is about 0 when the deformation with respect to the nodule of the first image is not significant, and it increases with the deformation. EXPERIMENTAL RESULTS AND COMMENTS
ow magnification SEM observations of the notched specimen lateral surface are shown in Fig. 4, considering different crosshead displacement values.
0.0 mm
1.0 mm 1.5 2.0 mm
2.5 mm 4.0 mm 3.5 mm 4.0 mm
Figure 4: Notched specimen deformation for different crosshead displacement values (SEM lateral surface observation). According to the procedure described in the Quantitative image analysis procedure paragraph, 23 nodules were considered to analyze their shape evolution with the increase of the crosshead displacement. Considering the notched shape of the
L
V. Di Cocco et alii, Roma, Italia, 1-3 Luglio 2013; ISBN 978-88-95940-47-2
13
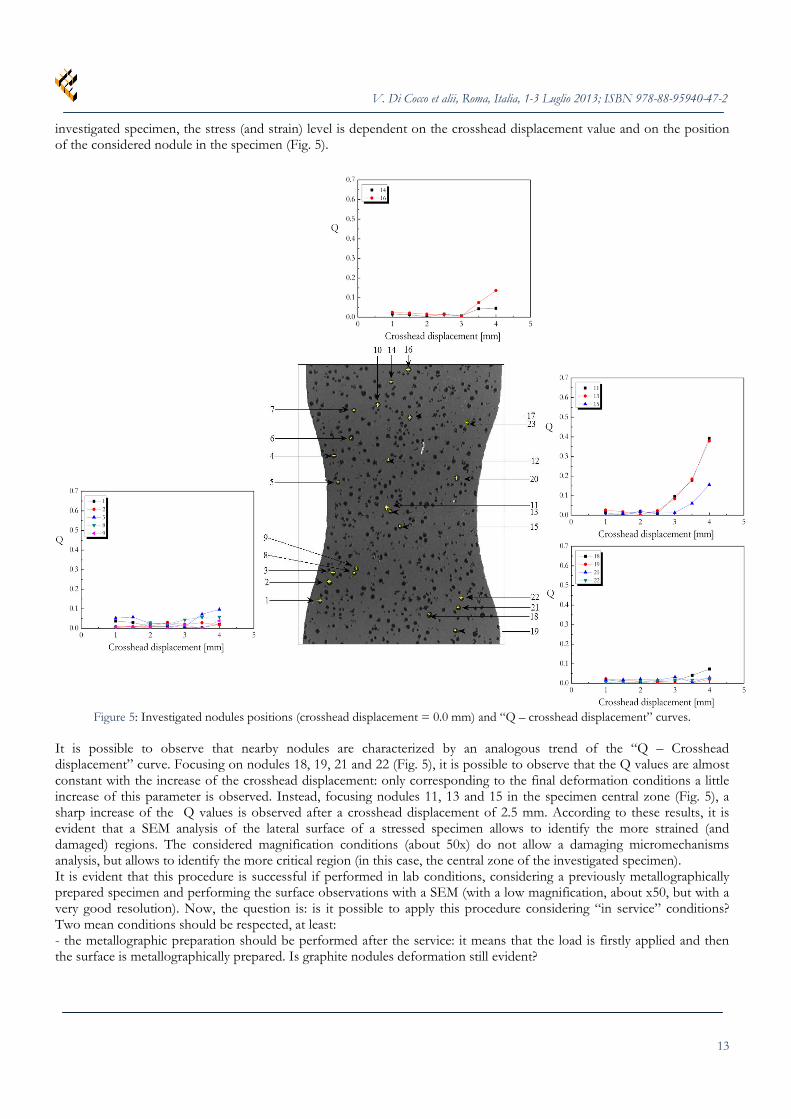
investigated specimen, the stress (and strain) level is dependent on the crosshead displacement value and on the position of the considered nodule in the specimen (Fig. 5).
Figure 5: Investigated nodules positions (crosshead displacement = 0.0 mm) and “Q – crosshead displacement” curves.
It is possible to observe that nearby nodules are characterized by an analogous trend of the “Q – Crosshead displacement” curve. Focusing on nodules 18, 19, 21 and 22 (Fig. 5), it is possible to observe that the Q values are almost constant with the increase of the crosshead displacement: only corresponding to the final deformation conditions a little increase of this parameter is observed. Instead, focusing nodules 11, 13 and 15 in the specimen central zone (Fig. 5), a sharp increase of the Q values is observed after a crosshead displacement of 2.5 mm. According to these results, it is evident that a SEM analysis of the lateral surface of a stressed specimen allows to identify the more strained (and damaged) regions. The considered magnification conditions (about 50x) do not allow a damaging micromechanisms analysis, but allows to identify the more critical region (in this case, the central zone of the investigated specimen). It is evident that this procedure is successful if performed in lab conditions, considering a previously metallographically prepared specimen and performing the surface observations with a SEM (with a low magnification, about x50, but with a very good resolution). Now, the question is: is it possible to apply this procedure considering “in service” conditions? Two mean conditions should be respected, at least: - the metallographic preparation should be performed after the service: it means that the load is firstly applied and then the surface is metallographically prepared. Is graphite nodules deformation still evident?
V. Di Cocco et alii, Convegno Nazionale IGF XXII, Roma, Italia, 1-3 Luglio 2013, 9-15
14
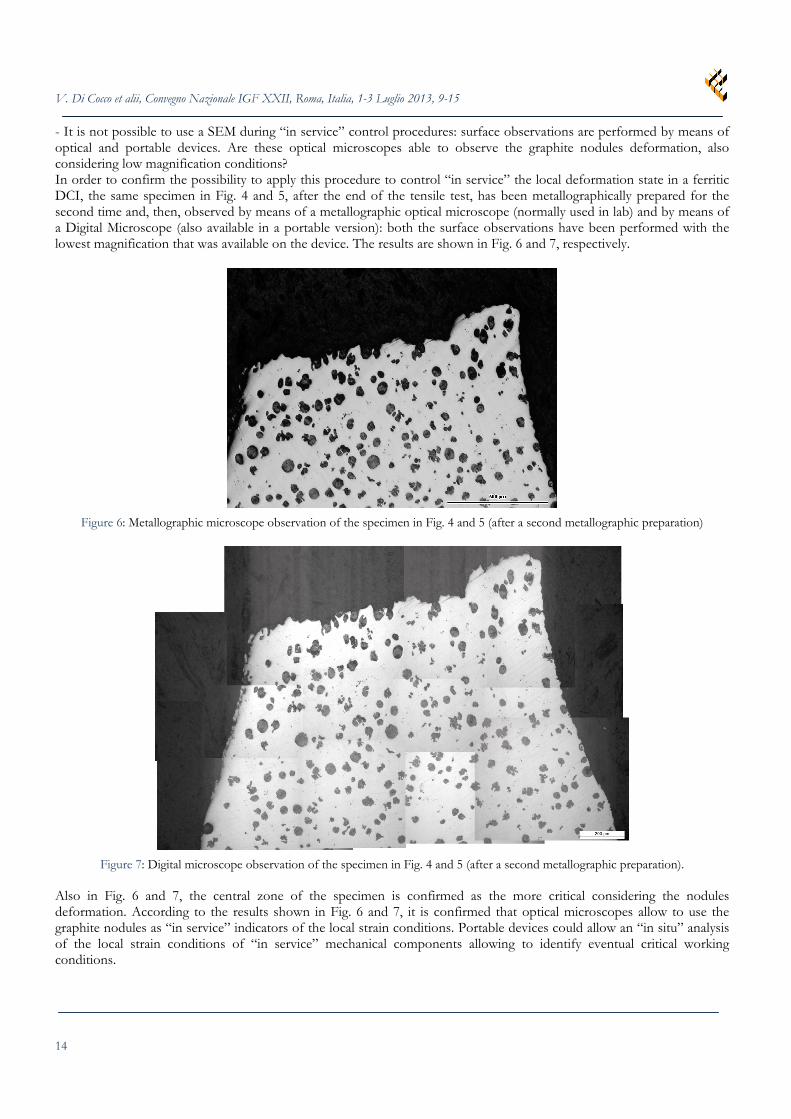
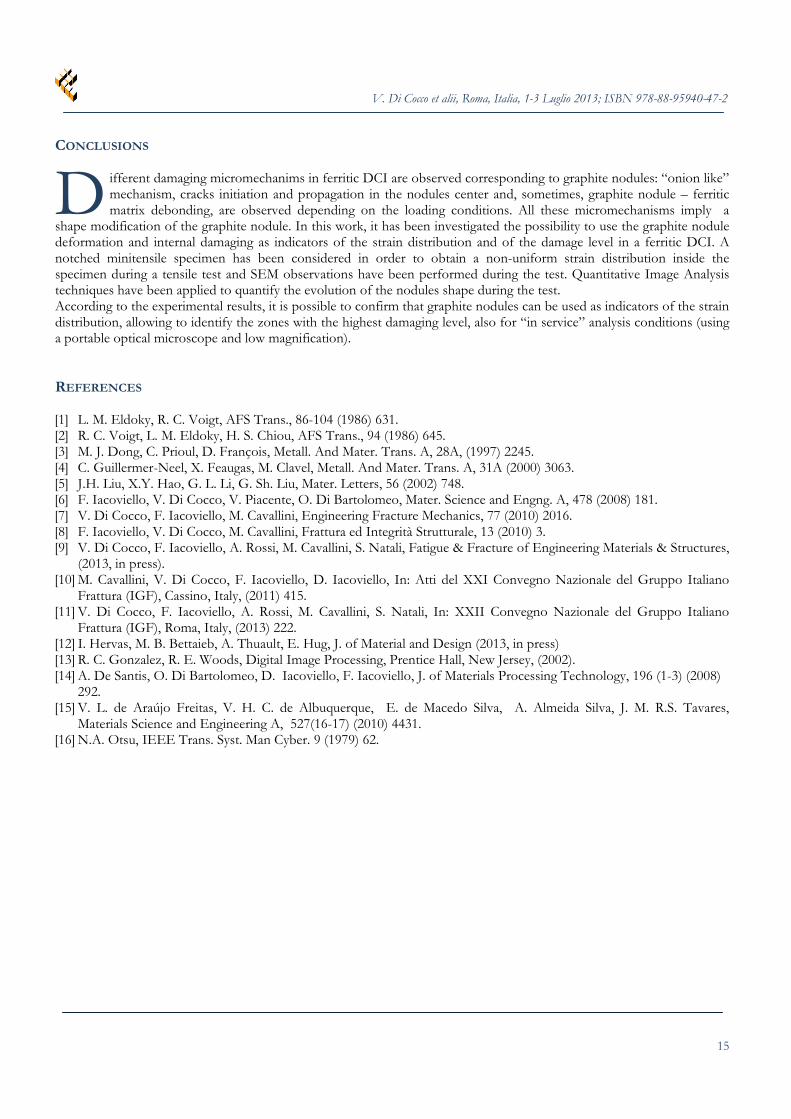
- It is not possible to use a SEM during “in service” control procedures: surface observations are performed by means of optical and portable devices. Are these optical microscopes able to observe the graphite nodules deformation, also considering low magnification conditions? In order to confirm the possibility to apply this procedure to control “in service” the local deformation state in a ferritic DCI, the same specimen in Fig. 4 and 5, after the end of the tensile test, has been metallographically prepared for the second time and, then, observed by means of a metallographic optical microscope (normally used in lab) and by means of a Digital Microscope (also available in a portable version): both the surface observations have been performed with the lowest magnification that was available on the device. The results are shown in Fig. 6 and 7, respectively.
Figure 6: Metallographic microscope observation of the specimen in Fig. 4 and 5 (after a second metallographic preparation)
Figure 7: Digital microscope observation of the specimen in Fig. 4 and 5 (after a second metallographic preparation).
Also in Fig. 6 and 7, the central zone of the specimen is confirmed as the more critical considering the nodules deformation. According to the results shown in Fig. 6 and 7, it is confirmed that optical microscopes allow to use the graphite nodules as “in service” indicators of the local strain conditions. Portable devices could allow an “in situ” analysis of the local strain conditions of “in service” mechanical components allowing to identify eventual critical working conditions.
V. Di Cocco et alii, Roma, Italia, 1-3 Luglio 2013; ISBN 978-88-95940-47-2
15
CONCLUSIONS
ifferent damaging micromechanims in ferritic DCI are observed corresponding to graphite nodules: “onion like” mechanism, cracks initiation and propagation in the nodules center and, sometimes, graphite nodule – ferritic matrix debonding, are observed depending on the loading conditions. All these micromechanisms imply a
shape modification of the graphite nodule. In this work, it has been investigated the possibility to use the graphite nodule deformation and internal damaging as indicators of the strain distribution and of the damage level in a ferritic DCI. A notched minitensile specimen has been considered in order to obtain a non-uniform strain distribution inside the specimen during a tensile test and SEM observations have been performed during the test. Quantitative Image Analysis techniques have been applied to quantify the evolution of the nodules shape during the test. According to the experimental results, it is possible to confirm that graphite nodules can be used as indicators of the strain distribution, allowing to identify the zones with the highest damaging level, also for “in service” analysis conditions (using a portable optical microscope and low magnification). REFERENCES [1] L. M. Eldoky, R. C. Voigt, AFS Trans., 86-104 (1986) 631. [2] R. C. Voigt, L. M. Eldoky, H. S. Chiou, AFS Trans., 94 (1986) 645. [3] M. J. Dong, C. Prioul, D. François, Metall. And Mater. Trans. A, 28A, (1997) 2245. [4] C. Guillermer-Neel, X. Feaugas, M. Clavel, Metall. And Mater. Trans. A, 31A (2000) 3063. [5] J.H. Liu, X.Y. Hao, G. L. Li, G. Sh. Liu, Mater. Letters, 56 (2002) 748. [6] F. Iacoviello, V. Di Cocco, V. Piacente, O. Di Bartolomeo, Mater. Science and Engng. A, 478 (2008) 181. [7] V. Di Cocco, F. Iacoviello, M. Cavallini, Engineering Fracture Mechanics, 77 (2010) 2016. [8] F. Iacoviello, V. Di Cocco, M. Cavallini, Frattura ed Integrità Strutturale, 13 (2010) 3. [9] V. Di Cocco, F. Iacoviello, A. Rossi, M. Cavallini, S. Natali, Fatigue & Fracture of Engineering Materials & Structures,
(2013, in press). [10] M. Cavallini, V. Di Cocco, F. Iacoviello, D. Iacoviello, In: Atti del XXI Convegno Nazionale del Gruppo Italiano
Frattura (IGF), Cassino, Italy, (2011) 415. [11] V. Di Cocco, F. Iacoviello, A. Rossi, M. Cavallini, S. Natali, In: XXII Convegno Nazionale del Gruppo Italiano
Frattura (IGF), Roma, Italy, (2013) 222. [12] I. Hervas, M. B. Bettaieb, A. Thuault, E. Hug, J. of Material and Design (2013, in press) [13] R. C. Gonzalez, R. E. Woods, Digital Image Processing, Prentice Hall, New Jersey, (2002). [14] A. De Santis, O. Di Bartolomeo, D. Iacoviello, F. Iacoviello, J. of Materials Processing Technology, 196 (1-3) (2008)
292. [15] V. L. de Araújo Freitas, V. H. C. de Albuquerque, E. de Macedo Silva, A. Almeida Silva, J. M. R.S. Tavares,
Materials Science and Engineering A, 527(16-17) (2010) 4431. [16] N.A. Otsu, IEEE Trans. Syst. Man Cyber. 9 (1979) 62.
D