Embed Size (px)
Citation preview

RESEARCH ARTICLE
High-Resolution Harmonics UltrasoundImaging for Non-Invasive Characterization ofWound Healing in a Pre-Clinical Swine ModelSurya C. Gnyawali1☯, Kasturi G. Barki1☯, Shomita S. Mathew-Steiner1, Sriteja Dixith1,Daniel Vanzant1, Jayne Kim3, Jennifer L. Dickerson1, Soma Datta1, Heather Powell3,4,Sashwati Roy1, Valerie Bergdall2, Chandan K. Sen1*
1 Comprehensive Wound Center, Davis Heart and Lung Research Institute, Centers for RegenerativeMedicine and Cell Based Therapies, The Ohio State University, Columbus, Ohio, United States of America,2 Veterinary Preventive Medicine, The Ohio State University, Columbus, Ohio, United States of America,3 Department of Biomedical Engineering, The Ohio State University, Columbus, Ohio, United States ofAmerica, 4 Department of Materials Science and Engineering, The Ohio State University, Columbus, Ohio,United States of America
☯ These authors contributed equally to this work.* [email protected]
AbstractThis work represents the first study employing non-invasive high-resolution harmonic ultra-
sound imaging to longitudinally characterize skin wound healing. Burn wounds (day 0-42),
on the dorsum of a domestic Yorkshire white pig were studied non-invasively using tandem
digital planimetry, laser speckle imaging and dual mode (B and Doppler) ultrasound imag-
ing. Wound depth, as measured by B-mode imaging, progressively increased until day 21
and decreased thereafter. Initially, blood flow at the wound edge increased up to day 14 and
subsequently regressed to baseline levels by day 21, when the wound was more than 90%
closed. Coinciding with regression of blood flow at the wound edge, there was an increase
in blood flow in the wound bed. This was observed to regress by day 42. Such changes in
wound angiogenesis were corroborated histologically. Gated Doppler imaging quantitated
the pulse pressure of the primary feeder artery supplying the wound site. This pulse pres-
sure markedly increased with a bimodal pattern following wounding connecting it to the in-
duction of wound angiogenesis. Finally, ultrasound elastography measured tissue stiffness
and visualized growth of new tissue over time. These studies have elegantly captured the
physiological sequence of events during the process of wound healing, much of which is an-
ticipated based on certain dynamics in play, to provide the framework for future studies on
molecular mechanisms driving these processes. We conclude that the tandem use of non-
invasive imaging technologies has the power to provide unprecedented insight into the dy-
namics of the healing skin tissue.
PLOS ONE | DOI:10.1371/journal.pone.0122327 March 23, 2015 1 / 19
OPEN ACCESS
Citation: Gnyawali SC, Barki KG, Mathew-SteinerSS, Dixith S, Vanzant D, Kim J, et al. (2015) High-Resolution Harmonics Ultrasound Imaging for Non-Invasive Characterization of Wound Healing in a Pre-Clinical Swine Model. PLoS ONE 10(3): e0122327.doi:10.1371/journal.pone.0122327
Academic Editor: Paul McNeil, Medical College ofGeorgia, UNITED STATES
Received: September 13, 2014
Accepted: February 10, 2015
Published: March 23, 2015
Copyright: © 2015 Gnyawali et al. This is an openaccess article distributed under the terms of theCreative Commons Attribution License, which permitsunrestricted use, distribution, and reproduction in anymedium, provided the original author and source arecredited.
Data Availability Statement: All relevant data arewithin the paper and its supporting information files.
Funding: Grants from the National Institutes ofHealth (NIH - www.nih.gov) include the following:National Institute of Nursing Research NR013898(CS); National Institute of General Medical SciencesGM077185 (CS), GM069589 (CS), GM108014 (CS);Grant from U.S. Department of Defense (DoD www.defense.gov): DoD W81XWH-11-2-0142 (CS). Thefunders had no role in study design, data collectionand analysis, decision to publish, or preparation ofthe manuscript.

IntroductionChronic wounds are major burdens on patients and health care support systems. Every yearin the United States, conservative estimates put the number of cases of chronic wounds atmore than 6.5 million with a cost burden of over 50 billion dollars [1,2]. Measurement ofwound depth, angiogenesis and scar formation are important for the proper assessment andmanagement of the healing wound in the patient [3]. Currently, these measurements requirerepeated biopsies that necessitate the removal of a portion of the wound to assess biomechan-ics, morphology and biochemical properties. The invasiveness of this current standard in clin-ical assessment of wounds perturbs the wound healing process and is also an added burden onthe patient. Tissue characterization parameters involving non-invasive methods have been ap-plied to pathological studies of various organs such as the breast, heart and liver [3–6]. How-ever, the diagnostic applications of non-invasive methods involving ultrasonic measurementshave not been widely applied to studies involving the skin, particularly in the context ofwound healing [7].
In this study we have assessed the applications of a combination of advanced ultrasoundbased measurements along with laser speckle perfusion imaging to capture the sequence ofevents as related to the physiological processes of healing in an acute burn wound. We expectthat the same measurements could also be applied to capture differences in the physiology ofchronic wounds. Laser speckle perfusion imaging (LSI) is a technique that visualizes tissueblood perfusion in the microcirculation in real time. The LSI system provides dynamic re-sponse and spatial resolution in the instrument, providing both real-time graphs and video re-cordings of the area of interest. Dedicated application software enhances the collection andpost-processing of images. The speckled patterns (dark and bright areas) generated reflect thedegree of movement in any particular area [8,9]. Speckle patterns blur in the region where par-ticles in the blood are in motion. Blurred areas in motion give rise to contrast over the areasoutside blood vessels without motion. The blurred micro vessels are color-coded to generateperfusion maps. It is therefore a powerful approach for blood perfusion imaging.
Ultrasonic techniques have been used to quantify physical parameters of biological tissuethrough measurements of acoustic propagation properties such as velocity, attenuation, ab-sorption and scattering [5]. The basic principle of ultrasound imaging is the use of high fre-quency sound waves to generate images of internal organs and tissues via a pulse-echosequence. Modern ultrasound systems have numerous and diverse applications including vas-cular imaging, visualizing 3D structures in motion and measuring the stiffness of tissues. Theultrasound transducer generates pulses that pass through tissue and reflect back producingechoes. The echoes of reflected and scattered ultrasound waves from tissue boundaries andwithin tissues respectively result in a B-mode image. The amplitude of the echo relates tobrightness of the image [10]. Diagnostic ultrasound techniques typically have noise artifactsand clutter representing undesirable echoes from tissue interfaces. However, ultrasonic imag-ing of tissue using harmonics has been shown to reduce clutter and markedly improve imagequality. Confining the imaging to the harmonic range eliminates much of the near-field arti-facts associated with typical ultrasound imaging.
Elastography, also known as elasticity imaging, stiffness imaging or strain imaging, is a dy-namic technique that uses ultrasound to non-invasively assess the mechanical stiffness of tissueby measuring tissue distortion in response to external stretch [11,12]. The transducer is used toapply mechanical stress on the tissue by alternative compression and decompression of the skin,and this stress, measured as axial displacement of tissue, is displayed as an elastogram. The elas-togram is represented as a color map with a range of colors from red (soft/high strain) to green(intermediate/equal strain) to blue (hard/no strain). This data can also be semi-quantitated
Ultrasound Imaging of Wounds
PLOS ONE | DOI:10.1371/journal.pone.0122327 March 23, 2015 2 / 19
Competing Interests: The authors have declaredthat no competing interests exist.

using a visual scoring system based on the colors or using strain-ratio measurements usuallyprovided in the elastography software [13]. Color Doppler based detection and analysis of bloodflow velocity for high resolution imaging of tissues such as the skin is another unique feature.There are many advantages to using harmonic ultrasonic techniques for analysis of the skin incontrast to deeper organs. Due to the low depth of penetration required, lower frequencies canbe used, permitting higher spatial resolution of the sample being analyzed. In skin, higher spatialresolution allows the differentiation of the epidermis, dermis and subcutaneous fat and the mus-cle layer. This technique has been demonstrated to be a rapid, accurate and non-invasive diag-nostic tool in animal models [14].
In the current study, we explored the application of a combination of the ultrasound imag-ing system with laser speckle perfusion measurements to non-invasively monitor the processof wound healing, including measurements of tissue elasticity and microcirculation. Our intentwas to validate such findings against invasive histological and biomechanical data and there-fore we adopted a pre-clinical swine model which is known to be powerful in representing thehuman cutaneous wound [14–17].
Materials and Methods
Swine Skin Full Thickness Burn ModelAnimal wounding and maintenance procedures were performed as reported previously [17].Briefly, six domestic Yorkshire white swine (70–80 lbs.) were used in this study for measure-ments using a set of six burn wounds each. The pig was sedated by Telazol (Fort Dodge AnimalHealth, Fort Dodge, IA) and anesthetized using isoflurane (3–4%). The dorsal region wasshaved and skin was surgically prepared with alternating 2% chlorhexidine and 70% alcohol(Butler Schein, Columbus, OH) scrubs. Under such aseptic conditions, six 1”×1” burn wounds(three on each side of the dorsal spinal area) were made using a burn wound device heated upto 150°C and applied for 60 seconds under standardized pressure conditions [17]. Woundswere dressed with Tegaderm (3M, St. Paul, MN) after burning. Tegaderm dressings were heldin place using V.A.C. drape (Owens & Minor, Mechanicsville, VA) and then wrapped withVetrap and Elastikon (3M, St. Paul, MN). The animal received a single intramuscular injectionof buprenorphine (0.3 mg/ml) during recovery from anesthesia and a transdermal fentanylpatch (100 μg/h) was applied to the inner surface of the pinnae. The pig was fed Mazuri labora-tory swine chow (non-antibiotic) ad libitum, fasted overnight before the procedures, andhoused individually in our animal facilities (University Laboratory Animal Resources, OhioState University). The pig was maintained on 12h light—dark cycles and was euthanized afterthe completion of experiments on day 42. Laser speckle perfusion images, digital images, andultrasound images were acquired from the pig pre-burn, immediately post-burn, and on days3, 7, 14, 21, 28, 35, and 42 post-burn. Wound tissue from the left side of the mid-dorsum wascollected on day 14 post-burn and wounds from the right side were collected on day 42 forimmuno-histochemical assessments. In addition, tissue was collected for tensile strength mea-surements on day 42 post burn. Following the completion of the experiments, the animals wereeuthanized using concentrated KCl (1–2 mmol/kg) (as per IACUC policy:http://orrp.osu.edu/files/2013/07/045-01-Use-of-Pharmaceutical-and-Non-Pharmaceutical-Compounds.pdf)given intravenously (IV) while the animal was held under general anesthesia. This method ofeuthanasia is in compliance with the AVMA Guidelines and in accordance with OSU-IACUCpolicy on Euthanasia.
Ultrasound Imaging of Wounds
PLOS ONE | DOI:10.1371/journal.pone.0122327 March 23, 2015 3 / 19

Ethics statementAll experiments were approved by The Ohio State University Institutional Laboratory AnimalCare and Use Committee (Protocol Number: 2008A0012-R2). This study was carried out instrict accordance with the recommendations in the Guide for the Care and Use of LaboratoryAnimals of the National Institutes of Health. All procedures were performed under 3–4% iso-flurane anesthesia and all efforts were made to minimize suffering.
BiopsiesOn the designated days (days 14 and 42 post-burn), swine were anesthetized as described inthe burn method, the bandages were gently removed, followed by collection of full thicknesswound-edge tissue biopsies using an 8 mm sterile biopsy punch for tissue analyses [17]. Twofull thickness excisional biopsies across the whole burn wound length and comparable normalskin strips were collected on days 3, 7 (immuno-histochemistry only), 14 and 42 post-burn forhistology, immuno-histochemistry, elasticity and tensile strength measurements. Buprino-phine analgesia was provided at the time of biopsy collection, and wound sites re-bandaged asdescribed earlier.
HistologyFormalin-fixed, paraffin-embedded or optimum cutting temperature (OCT)-embedded frozenwound-edge specimens were sectioned (10 μm) [14–17]. The paraffin sections were deparaffi-nized and stained with hematoxylin & eosin (H&E) or Massons trichrome stain using standardprocedures. Immuno-histochemical staining of paraffin or frozen sections was performedusing the following antibodies: von Willebrand factor (vWF) (Dako North America Inc., Car-pinteria, CA), keratin-14 (K14) (Covance Inc., New Jersey), Collagen IV (Acris Antibodies, SanDiego, CA) after heat-induced epitope retrieval when necessary. Fluorescence detection andcounterstaining were performed with Alexa Fluor 488 or 568 secondary antibody (1:200, LifeTechnologies, Grand Island, NY).
MicroscopyMosaic images were collected using a Zeiss Axiovert 200 inverted fluorescence microscope sup-ported by an AxioCam digital camera, a motorized stage, and guided by Axiovision software(Zeiss, Thornwood, NY). Each mosaic image was generated by combining a minimum of ~100images. Images were created by merging serial scans of thick tissue sections (20 μm) [14–17].
Wound PlanimetryWounds were photographed using a Canon S110 digital camera, with electro-focus and a5.2–26.0 mm lens. A ruler was captured in the photographs near the wound border for scaleadjustments. The photos were uploaded to the ImageJ software to calculate the wound area.The ruler photographed on the image was used to calibrate the scale then freehand tracingaround the wound was performed [14–17].
Ex vivo Tensile Strength and Dynamic Mechanical PropertiesMeasurementTo measure the strength of the healed tissue and skin; biopsies (2” × 0.08”) were collected fromthe dorsum of the pig on day 14 and day 42 post-burn. The wound sites were positioned centrallywithin the skin biopsies as described previously [18]. Tissue specimens were mounted into thegrips in to a mechanical tester (TestResources, Shakopee, MN, USA). MTestWr Version 1.3.6
Ultrasound Imaging of Wounds
PLOS ONE | DOI:10.1371/journal.pone.0122327 March 23, 2015 4 / 19

software (TestResources, Shakopee, MN) was used. All skin samples were tested to failure at astrain rate of 1.3mm/s (0.05 in/s) (n = 4 per time point). To examine the dynamic mechanicalproperties of the healing wounds at days 14 and 42 post burning cyclic tensile tests were per-formed. Specimens were made as above and cyclically strained at 0.05 in/sec following a sinewave with a maximum strain of 10% and a minimum strain of 0% for a total of 20 cycles(n = 3 per time point). The resultant hysteresis in the load vs. position plots were quantified andaverage energy dissipation reported which is inversely related to skin elasticity. The total areawithin the curve between cycle 1 and cycle 20 (hysteresis) was calculated by the Trapezoid Ruleusing MATLAB R2014b (MathWorks, Natick, MA, USA). Average energy dissipation (mJ/mm2)for each time point was presented in comparison to normal pig skin from the same animal.
Ultrasound Data Acquisition and AnalysisB-mode Image Acquisition and Processing. Video clips of the axial view of the wound
area were recorded using a linear array probe with a frequency range of 3–18 MHz (Noblus ul-trasound imaging system, Hitachi-Aloka Medical Corporation, Chiyoda-ku, Japan). A 6.5mHz frequency was used for all the measurements described in this work. Initial adjustmentswere made to optimize the instrument before imaging was performed. Images/videos were re-corded while gently sliding the probe head across the wound surface. Central time frames werechosen from the recorded video to measure the wound depth using the ‘measure’ feature in thesoftware. Normal skin images were used to measure baseline skin thickness. The skin-adiposeborder being the brightest was used as an anatomical landmark to measure the wound depthand skin thickness. Wound depth was measured by choosing a frame that represents thewound center and applying the in-built software to obtain values depicted in the graph.
Color Doppler Flow Imaging. The tissue Doppler color flow imaging (CFI) feature of themachine was used to acquire video clips with color coded images representing blood flow. Thistechnique is capable of detecting arteries and measuring maximum flow rate in the skin andwound regions on B-mode. Application of a pseudo-color to the images allows the identifica-tion of the direction of flow—forward (red) and backward (blue). Noise caused by motion wasminimized by reducing pressure applied while scanning and adjusting the gain. Proper orienta-tion and rotation of the probe enabled detection of cross-sectional and longitudinal blood ves-sels across the wound tissue. The identification of vessels by pulse wave Doppler velocitymeasurement was based on the sensitivity and specificity of the probes to detect the mostprominent signal in the wound vicinity. We used the following parameters to maintain consis-tency of the results obtained: 1) Depth as basis for vessel identification: Measurements weremade upto a 12 mm depth from the skin surface and maintained for all time points. 2) Mea-surement taken: Specific side of the wound was chosen for the detection of feeder vessels andkept consistent for every time point measured. 3) Size of the vessel detected: Using the lengthmeasurement tool the size of the vessels detected was measured and size matched vessels wereused for the flow measurement.
Pulse Wave Doppler Velocity Measurement. The pulse wave color Doppler feature ofthe machine generated the blood flow velocity from the color flow images. Real-time velocityprofiles were recorded and used to measure systole (profile peaks) and diastole (profiletroughs) values. Vessel diameters were measured to identify similar blood vessels in the de-sired area for all time points to maintain consistency. Velocity was calculated from three peaksand troughs and the mean and standard deviation was calculated. Using the modified Ber-noulli equation [19],
P ¼ 1
2rðV2
s � V2d Þ
Ultrasound Imaging of Wounds
PLOS ONE | DOI:10.1371/journal.pone.0122327 March 23, 2015 5 / 19

Where ρ is the density of blood, Vs is the velocity at systole and Vd is the velocity at diastole,the pulse pressure of the feeder artery was calculated.
Elastography and Tissue Stiffness Mapping. Tissue Doppler elastography imaging (TDI)allowed the non-invasive mapping of tissue stiffness [20]. Elastography images show a colormap representing the range of tissue elasticity within the strain curve of ± 0.5 limited by the ul-trasound software. Blue represents tissues with least compressibility and red represents tissueswith most compressibility indicating hard to soft tissue, respectively. TDI was used to obtainmaps of normal, healing and scar tissues over time. Elastography is a qualitative measurementof hardness of tissue and is assessed visually by color coding. Numeric quantification was be-yond the scope of this software.
Scar Thickness Measurement. Tissue that was visualized as dark blue by TDI (indicatinghardness) was determined to be scar tissue. Scar thickness was measured using the depth mea-surement feature of the software on the color elastography [21].
Laser Speckle Perfusion Imaging and ProcessingColor coded perfusion maps were acquired at all time points and average perfusion was calcu-lated using PimSoft v1.4 software (Perimed Inc., Sweden). The wound edge and wound bed tis-sue regions were chosen as region of interests (ROI). From the real-time graphs obtained,time-of-interest (TOI) was chosen to include lower peak regions and to exclude motion relatedartifacts. Mean and standard deviation of perfusion data were obtained from the selected TOIperfusion data.
StatisticsData are reported as mean ± standard deviation of three wounds. Difference between meanswas tested using Students t-test or analysis of variance as appropriate.
Results
Digital image planimetry and ultrasound B-mode imaging helps visualizethe progress of wound healing on a real-time basisWound surface area was calculated using digital image planimetry. Digital images taken imme-diately following burn injury on the dorsum of the pig are shown in Fig. 1B (day 0) and S1 Fig.These wounds were imaged on days 3–42 and representative images are shown in Fig. 1B. Vi-sual observations of the wound area show that there was an initial expansion of the wound areauntil day 7, followed by significant reduction between days 14 to 42 (Fig. 1B, dotted rectanglesmark the area of the wound). This is shown quantitatively in Fig. 1C. The Noblus ultrasoundscanner was used in tandem with a 5–18 MHz, 4 cm x 1cm linear array probe. The B-mode im-aging feature was used to obtain cross-sectional images of the skin for longitudinal assessmentof burn wounds in pigs for the first time (Fig. 1B and S1 Video). Baseline measurements of theskin (Fig. 1B, pre) allowed clear visualization and differentiation of the skin, adipose tissue andmuscle layers. Immediately following the burn, these layers are no longer distinguishable(Fig. 1B, day 0). Images from day 3 to day 42 show a steady progress in the healing of thewound with an appreciable restoration of the different layers to that of baseline at day 42(Fig. 1B, d3—d42). The lack of biomechanical properties of the underlying skin results in aconcave appearance in B-mode starting at d14. The images obtained were then used to calcu-late wound depth which is quantitatively represented in Fig. 1D. The data shows that wounddepth increased until day 14 (8.1mm) followed by a steady decrease as the healing progressedupto the end of the study. Interestingly, on days 21–42, there appears to be a cavitation visible
Ultrasound Imaging of Wounds
PLOS ONE | DOI:10.1371/journal.pone.0122327 March 23, 2015 6 / 19

in the healing skin layers (outlined with a white hashed line in these images), with a narrow topand a broader base region that would not be otherwise visualized by standard methods. Thiscavitation area was visualized in wounds from all pigs used in the study (representative imagesfrom n = 1 pig shown) with differences in size and shape as may be expected due to biologicalvariations. From the measured wound depth and wound area, wound volume was calculated.The results show that there was a regression of the wound after three weeks (Fig. 1E).
Histological characterization of wound healingFormalin-fixed paraffin sections were de-paraffinized and stained with hematoxylin and eosin(Fig. 2A). OCT embedded frozen sections were fixed and stained for a marker of epithelial
Fig 1. Digital image planimetry and ultrasound B-mode imaging helps visualize the progress of wound healing on a real-time basis. (A) Digitalimages showing a time course of wound healing starting at day 0 (immediately post-burn) and ending at day 42. Hashed line box of size 1”×1” was drawn ond0 wounds to show the actual wound size. (B) Ultrasound based axial B-mode images from the time course of the study are shown. Included is a baselineimage from the normal skin pre-burn (pre). The hashed lines indicated in the images—pre d14, represent the distance of the subcutaneous tissue from theepidermal layer. The lines in images d21- d42 outline the cavitation area visualized by this imaging. (C) Image planimetry data was plotted over the timecourse of the study.Data are mean ± SD, n = 3 pigs. (Scale bar = 1cm). (D) Wound depth quantification was performed based on the B-mode images for alltime points and represented graphically. Pre-burn images were used to measure baseline skin thickness. (E) Using the area and depth measurements,wound volume was calculated and represented graphically. Data presented as mean ± SD. (Scale bar = 1 cm).
doi:10.1371/journal.pone.0122327.g001
Ultrasound Imaging of Wounds
PLOS ONE | DOI:10.1371/journal.pone.0122327 March 23, 2015 7 / 19

cells (keratin—14) (K14; Fig. 2B). H & E and K14 (green) stained sections of normal skin andwounds from day 14 and 42 are shown in Fig. 2. On day 14 post burn, the epithelium was stillin the process of being reformed and appears incomplete compared to normal skin (Fig. 2A,compare normal skin and day 14 panels). Shown in the zoomed in image is the area in thehealing wound where epithelialization has started and a characteristic epithelial tongue (ET) is
Fig 2. Histological characterization of wound healing. (A) Shown are representative images (left panels)from formalin-fixed paraffin-embedded biopsy tissue sections (10 μm) of normal and wounded skin (days 14 and42) that were immunostained using hematoxylin (blue) and eosin (red). Zoomed in images (right panels) ofareas in each sections are also shown for better visualization of the epithelial layer of the skin. (Scalebar = 4 mm (left panels) or 500 μm (right panels)). (B) OCT embedded frozen wound biopsies were sectioned(10 μm) and stained using anti—keratin-14 (green) and DAPI (blue). Shown are representative images (leftpanels) of the stained tissue sections from normal skin and wounded skin (days 14 and 42). Also shown arezoomed in images (right panels) of areas in each section for better visualization of K14 stained epithelial layer ofthe skin. ET = epithelial tongue. (Scale bar = 1000 μm (left panels) or 200 μm (right panels)).
doi:10.1371/journal.pone.0122327.g002
Ultrasound Imaging of Wounds
PLOS ONE | DOI:10.1371/journal.pone.0122327 March 23, 2015 8 / 19

visible (indicated in Fig. 2A, B). This is further corroborated by the partial K14 staining insections from day 14 wounds, where the epithelium appears to be still in the process of beingformed. Also shown in these sections are DAPI stained nuclei in blue (Fig. 2B, comparenormal skin and day 14 panels). Images from day 42 post burn show almost complete re-epithelialization of the wound by H&E (Fig. 2A, day 42 panels) and K14 staining (Fig. 2B, day42 panels) indicating normal healing of the wound. However, despite re-epithelialization at 6weeks post burn, the healing skin is still in the process of remodeling as evidenced by histologi-cal differences compared to normal skin.
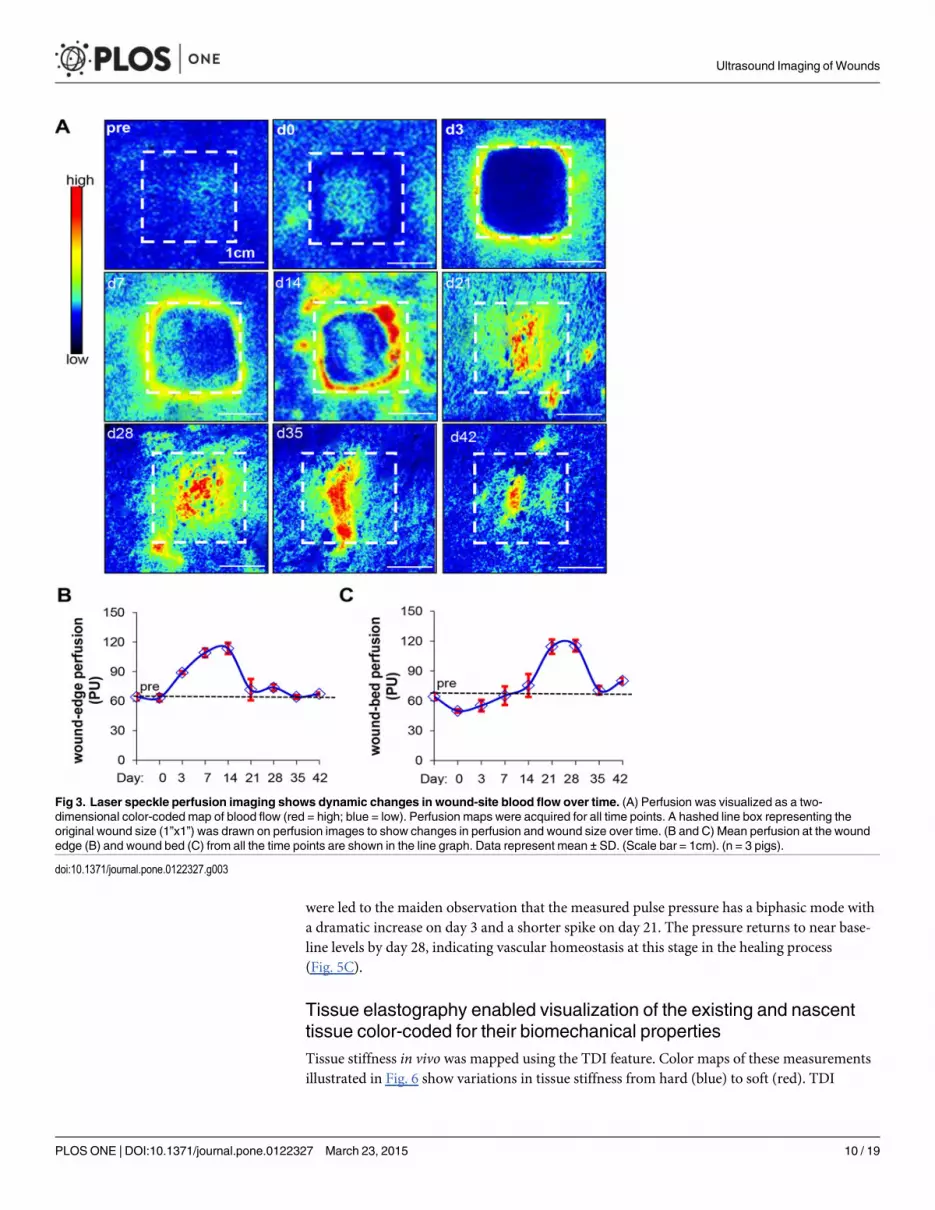
Laser speckle perfusion imaging shows dynamic changes in wound-siteblood flow over timeThe laser speckle perfusion method was used to functionally assess vascularization in the heal-ing wound. Measurements taken immediately before and after the burn show low baseline lev-els of perfusion in the wound area (indicated by the box). The perfusion maps in Fig. 3A showthe temporal changes in vascularization along the wound edge (indicated by white hashed line)and wound bed through the time of study. On day 3, vasodilation of existing vessels at the pe-riphery of the wound results in detectable perfusion that remains elevated and interestingly, ap-pear to be confined to the edge of the wound until day 14. From d7–14, neovascularizationdominates at the wound edge. Following this, concurrent with the increased perfusion in thewound bed, there is a regression of perfusion along the wound edge at day 21. Finally, by day42, there is sharp regression of perfusion throughout the wound. This is quantitatively repre-sented in the graphs shown in Fig. 3B and C indicating dynamic changes in the microcircula-tion in response to the healing process of the wound.
VonWillebrand's factor and Collagen IV staining corroborate tissueperfusion imaging observationsVonWillebrand’s factor (vWF) is produced by endothelial cells and is a marker for vascularstructures [22–24]. Collagen IV (ColIV) is deposited by endothelial cells and plays a critical rolein angiogenesis [25,26]. These two markers were used in this study to visualize wound tissue vas-cularization on days 3, 7, 14 and 42 post burn (Fig. 4A & B). On day 3, ColIV and vWF stainedstructures were not visible in the wound edge or bed sections indicating that vasodilation from ex-isting vessels near the wound edge rather than neoangiogenesis may be responsible for perfusiondetected by laser speckle studies (Fig. 3). On days 7 and 14 post-burn, concurrent with the onsetof angiogenesis near the wound edge, ColIV and vWF stained structures were visible in woundedge sections (Fig. 4A & B). At day 42, vWF-positive and ColIV-positive vascular structures withpatent lumen were visible at both the wound bed and edge (Fig. 4A & B, day 42 panels).
Ultrasound measurement of pulse pressure indicates enhanced bloodflow via feeder artery supplying the edge of the woundTo further investigate wound-edge angiogenesis, color Doppler flow imaging (CFI) was per-formed using harmonics ultrasound technique at the wound edge. Blood vessels were identifiedusing CFI mode. The systole and diastole velocity profiles of feeder vessels to the wound sitewere obtained using pulse wave Doppler technique (representative images in Fig. 5A and S2Video). Quantitation of the systolic and diastolic flow velocity are represented in the graph inFig. 5B and showed that blood flow in the vessels at wound edge increased after day 3 post-burn and returned to normal values by day 42. Bernoulli’s modified hemodynamics equation(see materials and methods) was used to calculate arterial pulse pressure [19]. Interestingly, we
Ultrasound Imaging of Wounds
PLOS ONE | DOI:10.1371/journal.pone.0122327 March 23, 2015 9 / 19
were led to the maiden observation that the measured pulse pressure has a biphasic mode witha dramatic increase on day 3 and a shorter spike on day 21. The pressure returns to near base-line levels by day 28, indicating vascular homeostasis at this stage in the healing process(Fig. 5C).
Tissue elastography enabled visualization of the existing and nascenttissue color-coded for their biomechanical propertiesTissue stiffness in vivo was mapped using the TDI feature. Color maps of these measurementsillustrated in Fig. 6 show variations in tissue stiffness from hard (blue) to soft (red). TDI
Fig 3. Laser speckle perfusion imaging shows dynamic changes in wound-site blood flow over time. (A) Perfusion was visualized as a two-dimensional color-coded map of blood flow (red = high; blue = low). Perfusion maps were acquired for all time points. A hashed line box representing theoriginal wound size (1”x1”) was drawn on perfusion images to show changes in perfusion and wound size over time. (B and C) Mean perfusion at the woundedge (B) and wound bed (C) from all the time points are shown in the line graph. Data represent mean ± SD. (Scale bar = 1cm). (n = 3 pigs).
doi:10.1371/journal.pone.0122327.g003
Ultrasound Imaging of Wounds
PLOS ONE | DOI:10.1371/journal.pone.0122327 March 23, 2015 10 / 19

Fig 4. vonWillebrand’s Factor and Collagen IV staining corroborate tissue perfusion imagingobservations.OCT embedded frozen wound biopsies were sectioned (10 μm) and stained using anti-ColIV(green), anti-vWF (red) and DAPI (blue). Shown are representative images of the stained tissue sections fromthe edge and bed of the wound on days 3, 7, 14 and 42. (Scale bar = 500 μm)
doi:10.1371/journal.pone.0122327.g004
Ultrasound Imaging of Wounds
PLOS ONE | DOI:10.1371/journal.pone.0122327 March 23, 2015 11 / 19

measurements taken immediately before and after the burn (pre and day 0 respectively) indi-cate a very stiff outer layer (skin) and softer inner layers (adipose) (Fig. 6A). Starting at day 3post-burn and up to day 14, corresponding with the increased wound depth, there is a decreasein the stiffness of the skin as indicated by the lighter blue and green areas in the top layers ofthe healing wound. From days 21 to 42, there was a progressive increase in the stiffness of theskin layers (dark blue areas). Interestingly, the cavitation visualized using B-mode imaging(Fig. 1B) was more apparent in the elastography images (marked with asterisks). Histologicalanalysis of d42 wound indicated a lower abundance of mature collagen fibers compared to nor-mal skin (Fig. 6B). An invasive measurement involving energy dissipation, which is inversely
Fig 5. Ultrasoundmeasurement of pulse pressure indicates enhanced blood flow via feeder vessels supplying the edge of the wound. (A) Velocityprofile images of arterial wound-edge blood flow as measured by pulse wave Doppler flow are shown. Profiles of diastole (peaks) and systole (troughs) asindicated by arrows. (B) Flow velocities measured using the caliper feature of the software (cm/s) were plotted over time in the graph. (n = 3 pigs) (C) Meanarterial pulse pressure (mm Hg) of vessels feeding the wound area were calculated using Bernoulli’s modified hemodynamics equation and representedgraphically (n = 3 pigs). Data represent mean ± SD.
doi:10.1371/journal.pone.0122327.g005
Ultrasound Imaging of Wounds
PLOS ONE | DOI:10.1371/journal.pone.0122327 March 23, 2015 12 / 19

related to elasticity, was calculated during cyclic tensile testing. This showed a 4-fold increasein energy dissipation (decreased elasticity) from day 14 to day 42 post burn wound (average atd14 = 0.12 mJ/mm2, average at d42 = 0.48mJ/mm2). Energy dissipation from normal pig skinwas significantly higher with an average of 0.71 mJ/mm2 (data not shown). Additionally, usingelastography imaging, scar thickness was visualized and measured starting at day 35 (Fig. 6C).
Fig 6. Tissue elastography enabled visualization of the existing and nascent tissue color-coded for their biomechanical properties. Skin hardnessand elasticity of the wound was mapped over time as the wound heals. (A) Shown are color maps of the elasticity of the wound tissue over time. Asterisks(d21—d42 images) mark the presence of cavitation area. (n = 3 pigs). (B) Shown are representative images of formalin-fixed paraffin-embedded biopsytissue sections (5 μm) of normal and wounded skin (Day 42) that were stained using Massons trichromemethod. Staining results in blue-black nuclei, bluecollagen and light red/pink cytoplasm. Epidermal cells appear red. Scale bar = 4mm. (C) Quantification of the thickness of the scar from day 35 and 42 areshown graphically. (D-F) The strength of the healing burn wounds were assessed using a TestResources mechanical tester. All skin samples were tested tofailure at a strain rate of 0.05 in/sec. Load versus position for each group (normal skin, d14 and d42) is plotted; (n = 3 pigs); (Scale bar = 1cm).
doi:10.1371/journal.pone.0122327.g006
Ultrasound Imaging of Wounds
PLOS ONE | DOI:10.1371/journal.pone.0122327 March 23, 2015 13 / 19

Measurements of the thickness of the scar using inbuilt software showed a decrease in sizefrom days 35 and 42. Finally, tensile testing of the wound on days 14 and 42 was performedand showed that there was a decrease in failure properties of the healing skin compared to nor-mal skin (Fig. 6D-F). Failure results also showed that the strength of the wound showed no sig-nificant improvement between 14 and 42 days of healing with an average maximum load atfailure 61.3 ± 10.9 lbs. and 54.14 ± 5.5 lbs., respectively (Fig. 6E,F). While no significant differ-ences in wound strength or stiffness in tension were observed between days 14 and 42 postburn, a larger number of delamination events, evidenced by the shoulders in the load-positioncurve, were present at day 14 likely indicative of an immature basement membrane formationbetween the epidermis and dermis (Fig. 6E).
DiscussionThis work establishes that high resolution harmonics ultrasound imaging in tandem with laserspeckle flowmetry imaging is a powerful approach to longitudinally study functional woundhealing non-invasively. Harmonics ultrasound imaging afforded the ability to perform highresolution, live imaging of skin and skin-associated tissues with the added advantage of study-ing gated feeder vessels supplying the wound site. The technologies implemented in this workallowed the monitoring and assessment of a cutaneous wound in all three dimensions affordingthe opportunity to scale depth. Ultrasound based B-mode imaging along with elastographymeasured the changes in anatomical structure as discriminated by their acoustic properties.Previous attempts to estimate wound depth have been riddled with technical challenges pri-marily because of the approach utilized [27,28]. The design of linear array probe taken togetherwith the versatility of the post-processing software used in the current study provided reliablequantitation and visualization of the heterogenous wound tissue as a function of healing time.In the current experimental model of burn wounding, it took 6 weeks for the injured skin to ap-proach baseline anatomical profile with clear presence of scar tissue. This observation is consis-tent with the established notion that scar tissue may take several months or years to remodel[29–33]. Indeed, a tight match between the ultrasound and histological images validates thesuitability of the 6.5 MHz probe in weighing out resolution versus field of view. This probe set-ting should be adjusted such that higher frequency may be preferred for smaller wounds. Im-ages shown in the current work have been subjected to the handicap of low frequency probe tomake sure that the findings are relevant to clinically presented wound sizes.
In the skin, pathologies are commonly associated with changes in tissue stiffness. The abilityto map elastic properties of the repairing skin enabled visualization of soft tissue growth withina week of injury. Commonly used for breast examination [34,35], this work provides first re-port on strain imaging and shear wave elastography of the healing wound. Measurement of thehysteresis of the load-position curve provided energy dissipation values and an invasive mea-surement of the elasticity of the tissue which indicated that the skin in the healing wound ismore pliable or elastic at d14 compared to d42. However, even at d42, the elastic properties ofthe skin have not yet returned to normal skin values. Caution must be taken when comparingmechanical data from these different testing modalities, however, as they probe different vol-umes of the tissue and probe the tissue using different forces (tension versus compression etc.).Elastography also enabled the visualization and quantification of post-closure scar tissue. Theresults are in tight agreement with histological findings. During the first two weeks after injury,it is visible that the subcutaneous tissue is depressed by an expanding presence of granulationtissue which serves as the site of inflammation. One week thereafter, the granulation tissueshrinks making room for the subcutaneous tissue to return to its prior position. At the sametime, appearance of the leading edge from both sides is evident. Upon closure in the 6th week
Ultrasound Imaging of Wounds
PLOS ONE | DOI:10.1371/journal.pone.0122327 March 23, 2015 14 / 19

after injury, the skin and subcutaneous adipose tissues re-position in a way that closely resem-bles but does not exactly match the baseline skin image. The cavitation noted on the closedwound represents the scar tissue as validated histologically. It is possible that this cavitationarea in the wound might represent a region where extracellular matrix remodeling is still oc-curring, therefore having lower collagen density. This is corroborated by the lower abundanceof mature collagen fibers in d42 wounds compared to normal skin. This could compromise thebiomechanical properties or elasticity of the wound, making it brittle and compromising itsload bearing capacity. In the context of findings related to post-closure tensile strength, the im-plications of this observation are that the cavitation area may be a vulnerable point in thewound and likely to be more prone to wound recurrence.
The ultrasound transducer used in the current study is capable of Doppler color flow imag-ing. While this technology platform is commonly used for diagnostic echocardiography[36,37], this work provides first evidence on functional blood flow parameters in gated periph-eral feeder artery supplying the wound site. In isolation, angiogenic factors or endothelial cellproliferation is not sufficient to induce angiogenesis. It is well documented that hemodynamicfactors play a key role in driving inducible angiogenesis. Importantly, these biomechanicalforces have to work synergistically with chemical factors in order to drive the proper establish-ment of vascular supply. A combination of biomechanical stimulation (e.g. shear stress, cir-cumferential stretch and mechanotransduction) [38–44] and chemical stimulation (e.g.angiogenic proteins and growth factors) [45–50] orchestrate various aspects of neo-vasculari-zation including the proliferation of cells (endothelial, smooth muscle and fibroblasts), regula-tion of permeability, stabilization of vessels and the production of the extracellular matrix(ECM). Modulation of simply one or the other of these regulatory arms may be insufficient totrigger functional angiogenesis to the full extent possible. This is evidenced from reports ofgene therapies targeting the vascular endothelial growth factor (VEGF) that have failed in clini-cal trials [51,52] possibly because they target only one aspect of the above mentioned combina-torial regulatory process. Because of technological limitations currently there is no functionalevidence in the literature as to how wound angiogenesis is related to changes in blood flow ve-locity of the primary feeder artery that supplies the wound site. While pulse velocity is com-monly used to assess arterial wall stiffness, it is also a key determinant of local hemodynamicperformance. Higher pulse velocity can only be generated by healthy arteries and will propelblood flow within the given vessel resulting in higher sheer stress which in turn is likely todrive wound angiogenesis. As expected, pulse velocity was recorded as being low, comparableto that of homeostatic baseline skin, immediately post-injury. Hypothetically one of the earliestdrivers of wound angiogenesis is a sharp elevation of pulse velocity in the primary feeder arterythat supplies the wound site. This remarkable change is noted on day 3 at the inflammatoryphase as blood borne immune cells accumulate at the wound site. The mechanisms underlyingthis escalation remain unknown. During the course of the next two weeks of the healing pro-cess there appears to be a correction of pulse velocity wherein the velocity is still 5-fold of thebaseline but has declined by about a third of where it was during the peak on day 3. This obser-vation leads to the speculation that the noted rise in pulse velocity after wounding is notcompletely dependent on cells abundant during the inflammatory phase. As evident histologi-cally with this wound model, the inflammatory phase has been largely resolved by the end ofthe second week. Of outstanding interest is the observation that as pulse velocity declines fromday 3 to day 14, the system engages in a second boost of pulse velocity resulting in a bimodalpeak as reported. This tight dual control of the arterial pulse velocity points towards an extraor-dinary significance of arterial hemodynamics in wound angiogenesis.
Laser speckle imaging has previously been used for the assessment of spatio-temporal he-modynamic changes during excisional wound healing [53,54]. We were able to visualize
Ultrasound Imaging of Wounds
PLOS ONE | DOI:10.1371/journal.pone.0122327 March 23, 2015 15 / 19

perfusion changes in the entire wound area as healing progressed and these were validatedwith histological analyses. Perfusion is visibly increased along the wound edge during earlystages of wound healing, co-inciding with the inflammatory phase of wound healing, whichthen proceeds to the wound bed as healing progresses. ColIV has been implicated as an earlymarker of neoangiogenesis in recent studies on rat gastric walls [55]. ColIV is detected earlierduring wound healing than vWF. As tissue remodeling occurs (d42), perfusion in the woundedge regresses and returns to baseline levels comparable to that of the surrounding normal skin[56,57]. Remarkably, it appears that it takes over a month for angiogenesis induced at woundedge (d3) to resolve (d42) and approach baseline levels. Although similar spatial changes inperfusion have been previously noted in short term studies on excisional wound healing[53,54], this study is the first to longitudinally follow the spatio-temporal changes in blood per-fusion over a period of six weeks.
In conclusion, we demonstrate that harmonic ultrasound in tandem with laser speckletechnologies represent a powerful approach for the non-invasive longitudinal assessment ofthe cutaneous wound healing process with higher resolution and accuracy. This approach hasthe power to comprehensively query wound depth and tunneling issues that are of criticalclinical significance. The utility of these powerful tools in visualizing and characterizingwound healing multi-dimensionally, without the need for invasive measures is an incompara-ble advantage for both clinical as well as research applications. Visualization of the longitudi-nal cutaneous wound healing process through the lens of the above-mentioned technologiesprovide the opportunity to appreciate mechanistic underpinnings that are otherwise not evi-dent. Changes in the pulse velocity pattern in the primary feeder artery supplying the woundsite, is one such example. In summary, this work establishes that high-resolution harmonicsultrasound imaging is a powerful approach for the non-invasive characterization of cutaneouswound healing.
Supporting InformationS1 Fig. Digital images of 1”x1” burn wounds applied to the dorsum of pig.(TIF)
S1 Video. Ultrasound B-mode imaging showing normal and wound areas on day 14 post-burn.(WMV)
S2 Video. Color Doppler flow imaging of a feeder vessel showing measurement of systolicand diastolic pressures.(WMV)
AcknowledgmentsThe authors thank Matthew Joseph and Elizabeth Schwab for assistance with the performanceof the experiments on the porcine model.
Author ContributionsConceived and designed the experiments: SR VB CKS. Performed the experiments: SG KGBJD S. Dixit S. Datta DV JK HP. Analyzed the data: SG KGB S. Dixit DV SSMS SR CKS. Wrotethe paper: SSMS SG KGB SR CKS.
Ultrasound Imaging of Wounds
PLOS ONE | DOI:10.1371/journal.pone.0122327 March 23, 2015 16 / 19

References1. Brigham PA, McLoughlin E. Burn incidence and medical care use in the United States: estimates,
trends, and data sources. J Burn Care Rehabil. 1996; 17: 95–107. PMID: 8675512
2. Sen CK, Gordillo GM, Roy S, Kirsner R, Lambert L, Hunt TK, et al. Human skin wounds: a major andsnowballing threat to public health and the economy. Wound Repair Regen. 2009; 17: 763–771. doi:10.1111/j.1524-475X.2009.00543.x PMID: 19903300
3. Monstrey S, Hoeksema H, Verbelen J, Pirayesh A, Blondeel P. Assessment of burn depth and burnwound healing potential. Burns. 2008; 34: 761–769. doi: 10.1016/j.burns.2008.01.009 PMID:18511202
4. Davis SC, Pogue BW, Springett R, Leussler C, Mazurkewitz P, Tuttle SP, et al. Magnetic resonance-coupled fluorescence tomography scanner for molecular imaging of tissue. Rev Sci Instrum. 2008; 79:064302. doi: 10.1063/1.2919131 PMID: 18601421
5. D'Astous FT, Foster FS. Frequency dependence of ultrasound attenuation and backscatter in breasttissue. Ultrasound Med Biol. 1986; 12: 795–808. PMID: 3541334
6. Manduca A, Oliphant TE, Dresner MA, Mahowald JL, Kruse SA, Amromin E, et al. Magnetic resonanceelastography: non-invasive mapping of tissue elasticity. Med Image Anal. 2001; 5: 237–254. PMID:11731304
7. Peeters W, Anthonissen M, Deliaert A, Van der Hulst R, Van den Kerckhove E. A comparison betweenlaser-doppler imaging and colorimetry in the assessment of scarring: "a pilot study". Skin Res Technol.2012; 18: 188–191. doi: 10.1111/j.1600-0846.2011.00552.x PMID: 22092605
8. Limbourg A, Korff T, Napp LC, Schaper W, Drexler H, Limbourg FP. Evaluation of postnatal arteriogen-esis and angiogenesis in a mouse model of hind-limb ischemia. Nat Protoc. 2009; 4: 1737–1746. doi:10.1038/nprot.2009.185 PMID: 19893509
9. Forrester KR, Tulip J, Leonard C, Stewart C, Bray RC. A laser speckle imaging technique for measuringtissue perfusion. IEEE Trans Biomed Eng. 2004; 51: 2074–2084. PMID: 15536909
10. Martin K. Introduction to B-mode imaging. In: Hoskins P, Martin K., Thrush A., editor. Diagnostic Ultra-sound-Physics and Equipment. 2nd ed. Cambridge, UK: Cambridge University Press; 2010.
11. Krouskop TA, Wheeler TM, Kallel F, Garra BS, Hall T. Elastic moduli of breast and prostate tissuesunder compression. Ultrason Imaging. 1998; 20: 260–274. PMID: 10197347
12. Coutts L, Bamber J, Miller N. Multi-directional in vivo tensile skin stiffness measurement for the designof a reproducible tensile strain elastography protocol. Skin Res Technol. 2013; 19: e37–44. doi: 10.1111/j.1600-0846.2011.00604.x PMID: 22309091
13. Gennisson JL, Deffieux T, Fink M, Tanter M. Ultrasound elastography: principles and techniques.Diagn Interv Imaging. 2013; 94: 487–495. doi: 10.1016/j.diii.2013.01.022 PMID: 23619292
14. Elgharably H, Roy S, Khanna S, Abas M, Dasghatak P, Das A, et al. A modified collagen gel enhanceshealing outcome in a preclinical swine model of excisional wounds. Wound Repair Regen. 2013; 21:473–481. doi: 10.1111/wrr.12039 PMID: 23607796
15. Roy S, Biswas S, Khanna S, Gordillo G, Bergdall V, Green J, et al. Characterization of a preclinicalmodel of chronic ischemic wound. Physiol Genomics. 2009; 37: 211–224. doi: 10.1152/physiolgenomics.90362.2008 PMID: 19293328
16. Roy S, Driggs J, Elgharably H, Biswas S, Findley M, Khanna S, et al. Platelet-rich fibrin matrix improveswound angiogenesis via inducing endothelial cell proliferation. Wound Repair Regen. 2011; 19: 753–766. doi: 10.1111/j.1524-475X.2011.00740.x PMID: 22092846
17. Roy S, Elgharably H, Sinha M, Ganesh K, Chaney S, Mann E, et al. Mixed-species biofilm compro-mises wound healing by disrupting epidermal barrier function. J Pathol. 2014; 233: 331–343. doi: 10.1002/path.4360 PMID: 24771509
18. Christoforidis JB, Wang J, Jiang A, Willard J, Pratt C, Abdel-Rasoul M, et al. The effect of intravitrealbevacizumab and ranibizumab on cutaneous tensile strength during wound healing. Clin Ophthalmol.2013; 7: 185–191. doi: 10.2147/OPTH.S40537 PMID: 23378736
19. Badeer HS. Elementary hemodynamic principles based on modified Bernoulli's equation. Physiologist.1985; 28: 41–46. PMID: 3983247
20. Maurice RL, Daronat M, Ohayon J, Stoyanova E, Foster FS, Cloutier G. Non-invasive high-frequencyvascular ultrasound elastography. Phys Med Biol. 2005; 50: 1611–1628. PMID: 15798347
21. Lau JC, Li-Tsang CW, Zheng YP. Application of tissue ultrasound palpation system (TUPS) in objectivescar evaluation. Burns. 2005; 31: 445–452. PMID: 15896506
22. Jaffe EA, Hoyer LW, Nachman RL. Synthesis of vonWillebrand factor by cultured human endothelialcells. Proc Natl Acad Sci U S A. 1974; 71: 1906–1909. PMID: 4209883
Ultrasound Imaging of Wounds
PLOS ONE | DOI:10.1371/journal.pone.0122327 March 23, 2015 17 / 19

23. Yamamoto K, de Waard V, Fearns C, Loskutoff DJ. Tissue distribution and regulation of murine vonWillebrand factor gene expression in vivo. Blood. 1998; 92: 2791–2801. PMID: 9763564
24. Muller AM, Skrzynski C, Skipka G, Muller KM. Expression of vonWillebrand factor by human pulmo-nary endothelial cells in vivo. Respiration. 2002; 69: 526–533. PMID: 12457006
25. Madri JA. Extracellular matrix modulation of vascular cell behaviour. Transpl Immunol. 1997; 5: 179–183. PMID: 9402683
26. Maragoudakis ME, Missirlis E, Karakiulakis GD, Sarmonica M, Bastakis M, Tsopanoglou N. Basementmembrane biosynthesis as a target for developing inhibitors of angiogenesis with anti-tumor properties.Kidney Int. 1993; 43: 147–150. PMID: 7679456
27. Davis KE, Constantine FC, Macaslan EC, Bills JD, Noble DL, Lavery LA. Validation of a laser-assistedwound measurement device for measuring wound volume. J Diabetes Sci Technol. 2013; 7: 1161–1166. PMID: 24124941
28. Little C, McDonald J, Jenkins MG, McCarron P. An overview of techniques used to measure woundarea and volume. J Wound Care. 2009; 18: 250–253. PMID: 19661849
29. Witte MB, Barbul A. General principles of wound healing. Surg Clin North Am. 1997; 77: 509–528.PMID: 9194878
30. Hunt TK, Hopf H, Hussain Z. Physiology of wound healing. Adv Skin Wound Care. 2000; 13: 6–11.PMID: 11074996
31. Velnar T, Bailey T, Smrkolj V. The wound healing process: an overview of the cellular and molecularmechanisms. J Int Med Res. 2009; 37: 1528–1542. PMID: 19930861
32. Broughton G 2nd, Janis JE, Attinger CE. The basic science of wound healing. Plast Reconstr Surg.2006; 117: 12S–34S. PMID: 16799372
33. Ramasastry SS. Acute wounds. Clin Plast Surg. 2005; 32: 195–208. PMID: 15814117
34. Berg WA, Cosgrove DO, Dore CJ, Schafer FK, SvenssonWE, Hooley RJ, et al. Shear-wave elastogra-phy improves the specificity of breast US: the BE1 multinational study of 939 masses. Radiology. 2012;262: 435–449. doi: 10.1148/radiol.11110640 PMID: 22282182
35. Cosgrove DO, BergWA, Dore CJ, Skyba DM, Henry JP, Gay J, et al. Shear wave elastography forbreast masses is highly reproducible. Eur Radiol. 2012; 22: 1023–1032. doi: 10.1007/s00330-011-2340-y PMID: 22210408
36. Ommen SR, Nishimura RA, Appleton CP, Miller FA, Oh JK, Redfield MM, et al. Clinical utility of Dopplerechocardiography and tissue Doppler imaging in the estimation of left ventricular filling pressures: Acomparative simultaneous Doppler-catheterization study. Circulation. 2000; 102: 1788–1794. PMID:11023933
37. Ommen SR, Nishimura RA, Hurrell DG, Klarich KW. Assessment of right atrial pressure with 2-dimensional and Doppler echocardiography: a simultaneous catheterization and echocardiographicstudy. Mayo Clin Proc. 2000; 75: 24–29. PMID: 10630753
38. Lehoux S, Castier Y, Tedgui A. Molecular mechanisms of the vascular responses to haemodynamicforces. J Intern Med. 2006; 259: 381–392. PMID: 16594906
39. Hoefer IE, den Adel B, DaemenMJ. Biomechanical factors as triggers of vascular growth. CardiovascRes. 2013; 99: 276–283. doi: 10.1093/cvr/cvt089 PMID: 23580605
40. Boerckel JD, Uhrig BA, Willett NJ, Huebsch N, Guldberg RE. Mechanical regulation of vascular growthand tissue regeneration in vivo. Proc Natl Acad Sci U S A. 2011; 108: E674–680. doi: 10.1073/pnas.1107019108 PMID: 21876139
41. Mulvany MJ, Aalkjaer C. Structure and function of small arteries. Physiol Rev. 1990; 70: 921–961.PMID: 2217559
42. Pourageaud F, De Mey JG. Structural properties of rat mesenteric small arteries after 4-wk exposure toelevated or reduced blood flow. Am J Physiol. 1997; 273: H1699–1706. PMID: 9362233
43. Ingber DE, Folkman J. How does extracellular matrix control capillary morphogenesis? Cell. 1989; 58:803–805. PMID: 2673531
44. Ingber DE, Folkman J. Mechanochemical switching between growth and differentiation during fibroblastgrowth factor-stimulated angiogenesis in vitro: role of extracellular matrix. J Cell Biol. 1989; 109: 317–330. PMID: 2473081
45. Resnick N, Gimbrone MA Jr. Hemodynamic forces are complex regulators of endothelial gene expres-sion. FASEB J. 1995; 9: 874–882. PMID: 7615157
46. Rubanyi GM, Freay AD, Kauser K, Johns A, Harder DR. Mechanoreception by the endothelium: media-tors and mechanisms of pressure- and flow-induced vascular responses. Blood Vessels. 1990; 27:246–257. PMID: 2242445
Ultrasound Imaging of Wounds
PLOS ONE | DOI:10.1371/journal.pone.0122327 March 23, 2015 18 / 19

47. Carmeliet P. Angiogenesis in life, disease and medicine. Nature. 2005; 438: 932–936. PMID:16355210
48. Battegay EJ. Angiogenesis: mechanistic insights, neovascular diseases, and therapeutic prospects.J Mol Med (Berl). 1995; 73: 333–346. PMID: 8520966
49. Schott RJ, Morrow LA. Growth factors and angiogenesis. Cardiovasc Res. 1993; 27: 1155–1161.PMID: 7504584
50. Adams RH, Alitalo K. Molecular regulation of angiogenesis and lymphangiogenesis. Nat Rev Mol CellBiol 2007; 8: 464–478. PMID: 17522591
51. Stewart DJ, Kutryk MJ, Fitchett D, Freeman M, Camack N, Su Y, et al. VEGF gene therapy fails to im-prove perfusion of ischemic myocardium in patients with advanced coronary disease: results of theNORTHERN trial. Mol Ther. 2009; 17: 1109–1115. doi: 10.1038/mt.2009.70 PMID: 19352324
52. Gupta R, Tongers J, Losordo DW. Human studies of angiogenic gene therapy. Circ Res. 2009; 105:724–736. doi: 10.1161/CIRCRESAHA.109.200386 PMID: 19815827
53. Rege A, Thakor NV, Rhie K, Pathak AP. In vivo laser speckle imaging reveals microvascular remodel-ing and hemodynamic changes during wound healing angiogenesis. Angiogenesis. 2012; 15: 87–98.doi: 10.1007/s10456-011-9245-x PMID: 22198198
54. Stewart CJ, Gallant-Behm CL, Forrester K, Tulip J, Hart DA, Bray RC. Kinetics of blood flow duringhealing of excisional full-thickness skin wounds in pigs as monitored by laser speckle perfusion imag-ing. Skin Res Technol. 2006; 12: 247–253. PMID: 17026655
55. Fonseca J, Martins-dos-Santos J, Oliveira P, Laranjeira N, Aguas A, Castelo-Branco N. Noise-inducedgastric lesions: a light and electron microscopy study of the rat gastric wall exposed to low frequencynoise. Arq Gastroenterol. 2012; 49: 82–88. PMID: 22481691
56. Gurtner GC, Werner S, Barrandon Y, Longaker MT. Wound repair and regeneration. Nature 2008; 453:314–321. doi: 10.1038/nature07039 PMID: 18480812
57. Swift ME, Kleinman HK, DiPietro LA. Impaired wound repair and delayed angiogenesis in aged mice.Lab Invest. 1999; 79: 1479–1487. PMID: 10616199
Ultrasound Imaging of Wounds
PLOS ONE | DOI:10.1371/journal.pone.0122327 March 23, 2015 19 / 19


