Embed Size (px)
Citation preview
這份刊物的 PDF 版本的文字是從印刷版掃描而成,再利用光學字符識別軟
件轉換成電子格式。由於原印刷版本已印製並保存多年,光學字符識別技
術未必能準確地識別某些文字或數字。因此,搜索或複製此 PDF 檔案內的
文字時應加以注意。 The text of this PDF publication was scanned from its printed version and then converted to electronic text using Optical Character Recognition (OCR) software. Because of the age and condition of the original printed copy, the OCR may not recognise certain characters or figures accurately. Caution should therefore be taken when searching or copying text from this PDF publication.
EXCHANGE RATE
All figures quoted are in Hong Kong dollars.
The official rate for conversion to U.S. dollars was HK$5.085=U.S.$1.00 until 25th November, 1974.
The Hong Kong dollar floated on 26th November, 1974.
PRINTED AND PUBLISHED DY D. R . RICK , GoVERNMENT PRINTER AT THE GOVERNMENT PRESS, JAVA ROAD, HONG KONO
Hong Kong
Monthly Digest of Statistics
November, 1978
Census and Statistics Department, Hong Kong ·
-- )
CONTENTS
Sections/tables Page
Part I
ii
SECTION 1: CLIMATE
1.1 1.2
Summary of meteorological observations Extract of meteorological observations for Hong Kong during November 1978
SECTION 2: VITAL STATISTICS
2.1 2.2 2.3
Statistics of registered births and marriages Statistics of registered deaths Deaths by cause
SECTION 3: EMPLOYMENT, WAGES, ACCIDENTS AND LABOUR STOPPAGES
3.1
3.2
3.3 3.4 3.5 3.6
Number of establishments and persons engaged, analysed by International Standard Industrial Classification .
Number of establishments and persons engaged, analysed by employment size by International Standard Industrial Classification
Employment in Government service by purpose Indexes of average daily wages for workers in selected industries and services Reported accidents by cause Stoppages of work by industry .
SECTION 4: PRODUCTION
4.1 4.2 4.3 4.4 4.5
Mining production Electricity consumption and distribution Gas consumption and distribution Cement production Textile production
SECTION 5: EXTERNAL TRADE
1 1
2 2 3
4-6
7 8 9
10 11
12 12 13 13
14-15
5.1 External trade 16 5.2 Imports by areas 16 5.3 Domestic exports by areas 17 5.4 Re-exports by areas . 17 5.5 Merchandise trade with major trading partners 18 5.6 Imports by commodity sections of Standard International Trade Classification
(Revised 2) I 8 5.7 Domestic exports by commodity sections of Standard International Trade Classifica-
tion (Revised 2) I 9 5.8 Re-exports by commodity sections of Standard International Trade Classification
(Revised 2) 19 5.9 Domestic exports of principal commodities 20 5.10 Trade index numbers 20 5.11 Trade index numbers for domestic exports 21 5.12 Trade index numbers for imports 22
SECTION 6: FOOD SUPPLIES
6.1 6.2
Rice . Other foodstuffs
23 23
Hong Kong Monthly Digest of Statistics November 1978
Sections/tables
SECTION 7: TRANSPORT AND COMMUNICATIONS 7.1 Movements of aircraft and airborne passengers 7.2 Ocean-going vessels entered and cleared . 7.3 River steamers, hydrofoil vessels, junks and launches entered and cleared. 7.4 Kowloon-Canton Railway (British Section) traffic statistics 7.5 Total tonnage of commercial cargo carried by different means of transport 7.6 Commercial cargo carried by vessels of all types 7.7 Containers carried by ocean-going vessels. 7.8 Public transport: passenger journeys by undertaking 7.9 Public transport: passenger journeys by area 7.10 Traffic accidents and casualties . 7.11 Motor vehicles registered . 7.12 Telephone services statistics
SECTION 8: 8.1 8.2 8.3 8.4 8.5 8.6
PRICES AND PRICE INDEXES Average retail prices of selected foodstuffs Average wholesale prices of selected foodstuffs . Consumer Price Index (A) Consumer Price Index (B) Hang Seng Consumer Price Index Consumer Price Indexes (A) and (B): averages for the period of 12 months
SECTION 9: MONEY, BANKING AND FINANCE 9.1 Money supply . 9 .2 Banking statistics: liabilities and assets 9.3 Analysis of bank loans and advances 9.4 Interest rates paid by principal banks 9.5 Interest rates charged and bank cheques cleared 9.6 Exchange rates in Hong Kong dollars and the effective exchange rate index for the
Hong Kong dollar . 9.7 Exchange rates in Hong Kong dollars and the effective exchange rate index for the
Page
24 24-25
26 26 27 27 28 28 29 29 30 31
32 33 33 34 34 35
36 36 37 38 38
39
Hong Kong dollar in November 1978 . 40 9.8 Revenue and expenditure of the Hong Kong Government 41 9.9 Value of stock exchange turnover 41 9.10 Index of share prices 42 9.11 Index of share prices and value of stock exchange turnover in November 1978 42 9.12 Commodity exchange turnover . 43 9.13 Closing quotations of commodity futures and commodity exchange turnover in
November 1978 43 9.14 Instruments registered in the Land Office . 44 9 .15 Local and foreign companies registered and dissolved 45
SECTION 10: HOUSING, BUILDING AND CONSTRUCTION 10.1 Existing private living quarters in urban areas . 46 10.2 Public housing . 46 10.3 New building projects with consent to commence work 47 10.4 Completed buildings certified for occupation 47 10.5 Usable floor area of completed new buildings . 48 10.6 Number and cost of completed buildings by cost of construction 48 10. 7 Completed buildings certified for occupation by type of building, cost of construction
and area during November 1978 49
Hong Kong Monthly Digest of Statistics November 1978 iii
Sections/tables
SECTION 11: TRA YELLING AND TOURISM 11.1 Arrivals of passengers by air, sea and land 11.2 Departures of passengers by air, sea and land 11.3 Incoming tourists to Hong Kong by country of residence .
SECTION 12: SOCIAL STATISTICS
12.1 Crime statistics . 12.2 Infectious diseases notified: cases and deaths
SECTION 13: MISCELLANEOUS
Page
50
50
51
52-53 54
13.1 Petroleum products: releases from petroleum companies by type 55 13.2 Petroleum products: releases from petroleum companies, duty free and duty paid 5? 13.3 Fire services statistics 56 13.4 Water supplies . 57
Part II (appears in July issue only)
SECTION 14: POPULATION
14.1 Total population 14.2 Estimated population by age group at mid-1979 14.3 Estimated mid-year population and growth rates, 1969-1979
Part ill (appears in January issue only)
SECTION 15: POPULATION
15.1 Estimated population and growth rates, 1968-1978
SECTION 16: SOCIAL STATISTICS
16.1 Education statistics .
Part IV (appears in January, April, July and October issues only)
SECTION 17: SPECIAL REVIEW
Part V Explanatory notes I-II
iv Hong Kong Monthly Digest of Statistics November 1978
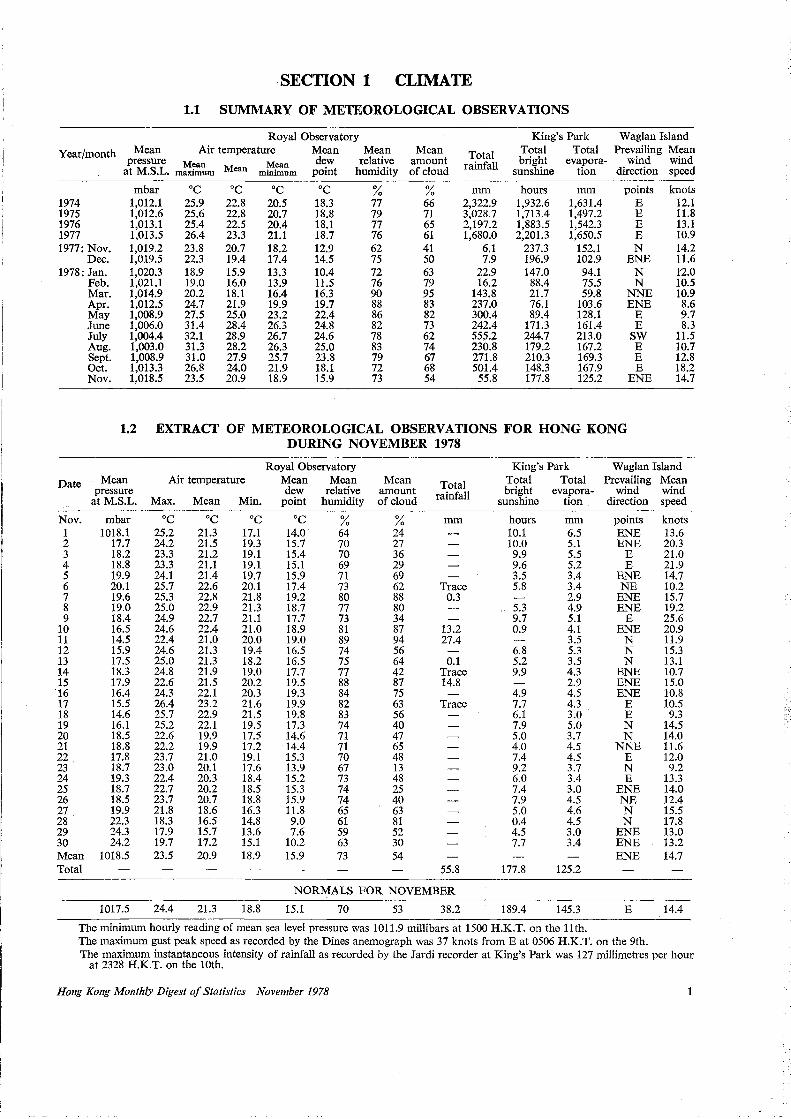
SECTION 1 CLIMATE
1.1 SUMMARY OF METEOROLOGICAL OBSERVATIONS
Year/month
1974 1975 1976 1977 1977: Nov.
Dec. 1978: Jan.
Feb. Mar. Apr. May June July Aug. Sept. Oct. Nov.
Royal Observatory Mean Air temperature Mean Mean
pressure Mean Mean dew relative at M.S.L. maximum Mean minimum point humidity
mbar 1,012.1 1,012.6 1,013.1 1,013.5 1,019.2 1,019.5 1,020.3 1,021.l 1,014.9 1,012.5 1,008.9 1,006.0 1,004.4 1,003.0 1,008.9 1,013.3 l,018.5
cc 25.9 25.6 25.4 26.4 23.8 22.3 18.9 19.0 20.2 24.7 27.5 31.4 32.1 31.3 31.0 26.8 23.5
cc 22.8 22.8 22.5 23.3 20.7 19.4 15.9 16.0 18.1 21.9 25.0 28.4 28.9 28.2 27.9 24.0 20.9
cc 20.5 20.7 20.4 21.1 18.2 17.4 13.3 13.9 16.4 19.9 23.2 26.3 26.7 26.3 25.7 21.9 18.9
cc 18.3 18.8 18.1 18.7 12.9 14.5 10.4 11.5 16.3 19.7 22.4 24.8 24.6 25.0 23.8 18.1 15.9
% 77 79 77 76 62 75 72 76 90 88 86 82 78 83 79 72 73
Mean amount of cloud
% 66 71 65 61 41 50 63 79 95 83 82 73 62 74 67 68 54
Total rainfall
mm 2,322.9 3,028.7 2,197.2 1,680.0
6.1 7.9
22.9 16.2
143.8 237.0 300.4 242.4 555.2 230.8 271.8 501.4
55.8
King's Park Waglan Island Total Total Prevailing Mean bright evapora- wind wind
sunshine tion direction speed
hours 1,932.6 1,713.4 1,883.5 2,201.3
237.3 196.9 147.0
88.4 21.7 76.l 89.4
171.3 244.7 179.2 210.3 148.3 177.8
mm 1,631.4 1,497.2 1,542.3 1,650.5
152.1 102.9 94.1 75.5 59.8
103.6 128.1 161.4 213.0 167.2 169.3 167.9 125.2
points E E E E N
ENE N N
NNE ENE
E E
SW E E E
ENE
knots 12.1 11.8 13.1 10.9 14.2 11.6 1'2.0 10.5 10.9
8.6 9.7 8.3
11.5 10.7 12.8 18.2 14.7
1.2 EXTRACT OF METEOROLOGICAL OBSERVATIONS FOR HONG KONG DURING NOVEMBER 1978
Date
Nov. 1 2 3 4 5 6 7 8 9
10 11 12 13 14 15 16 17 18 19 20 21 22 23 24 25 26 27 28 29 30 Mean Total
Mean pressure
at M.S.L.
mbar 1018.l
17.7 18.2 18.8 19.9 20.1 19.6 19.0 18.4 16.5 14.5 15.9 17.5 18.3 17.9 16.4 15.5 14.6 16.1 18.5 18.8 17.8 18.7 19.3 18.7 18.5 19.9 22.3 24.3 24.2
1018.5
1017.5
Royal Observatory Air temperature Mean Mean
dew relative Max. Mean Min. point humidity
cc 25.2 24.2 23.3 23.3 24.1 25.7 25.3 25.0 24.9 24.6 22.4 24.6 25.0 24.8 22.6 24.3 26.4 25.7 25.2 22.6 22.2 23.7 23.0 22.4 22.7 23.7 21.8 18.3 17.9 19.7 23.5
cc 21.3 21.5 21.2 21.1 21.4 22.6 22.8 22.9 22.7 22.4 21.0 21.3 21.3 21.9 21.5 22.l 23.2 22.9 22.1 19.9 19.9 21.0 20.l 20.3 20.2 20.7 18.6 16.5 15.7 17.2 20.9
cc 17.1 19.3 19.1 19.l 19.7 20.1 21.8 21.3 21.1 21.0 20.0 19.4 18.2 19.0 20.2 20.3 21.6 21.5 19.5 17.5 17.2 19.1 17.6 18.4 18.5 18.8 16.3 14.8 13.6 15.1 18.9
cc 14.0 15.7 15.4 15.1 15.9 17.4 19.2 18.7 17.7 18.9 19.0 16.5 16.5 17.7 19.5 19.3 19.9 19.8 17.3 14.6 14.4 15.3 13.9 15.2 15.3 15.9 11.8 9.0 7.6
10.2 15.9
% 64 70 70 69 71 73 80 77 73 81 89 74 75 77 88 84 82 83 74 71 71 70 67 73 74 74 65 61 59 63 73
Mean amount of cloud
% 24 27 36 29 69 62 88 80 34 87 94 56 64 42 87 75 63 56 40 47 65 48 13 48 25 40 63 81 52 30 54
Total rainfall
mm
Trace 0.3
13.2 27.4
0.1 Trace 14.8
Trace
55.8
NORMALS FOR NOVEMBER
24.4 21.3 18.8 15.l 70 53 38.2
King's Park Total Total bright evapora-
sunshine tion
hours 10.1 10.0 9.9 9.6 3.5 5.8
5.3 9.7 0.9
6.8 5.2 9.9
4.9 7.7 6.1 7.9 5.0 4.0 7.4 9.2 6.0 7.4 7.9 5.0 0.4 4.5 7.7
177.8
189.4
mm 6.5 5.1 5.5 5.2 3.4 3.4 2.9 4.9 5.1 4.1 3.5 5.3 3.5 4.3 2.9 4.5 4.3 3.0 5.0 3.7 4.5 4.5 3.7 3.4 3.0 4.5 4.6 4.5 3.0 3.4
125.2
145.3
The minimum hourly reading of mean sea level pressure was 1011.9 millibars at 1500 H.K.T. on the llth.
Waglan Island Prevailing Mean
wind wind direction speed
points ENE ENE
E E
ENE NE
ENE ENE
E ENE
N N N
ENE ENE ENE
E E N N
NNE E N E
ENE NE N N
ENE ENE ENE
E
knots 13.6 20.3 21.0 21.9 14.7 10.2 15.7 19.2 25.6 20.9 11.9 15.3 13.1 10.7 15.0 10.8 10.5 9.3
14.5 14.0 11.6 12.0 9.2
13.3 14.0 12.4 15.5 17.8 13.0 13.2 14.7
14.4
The maximum gust peak speed as recorded by the Dines anemograph was 37 knots from Eat 0506 H.K.T. on the 9th. The maximum instantaneous intensity of rainfall as recorded by the Jardi recorder at King's Park was 127 millimetres per hour
at 2328 H.K.T. on the lOth.
Hong Kong Monthly Digest of Statistics November 1978
Year/month
1974 1975
1976
1977
1977: Nov.
Dec.
1978: Jan.
Feb.
Mar.
Apr. May
June
July
Aug.
Sept.
Oct.
Nov.
Year/month
1974
1975
1976
1977
1977: Nov.
Dec.
1978: Jan.
2
Feb.
Mar.
Apr.
May
June
July
Aug.
Sept.
Oct.
Nov.
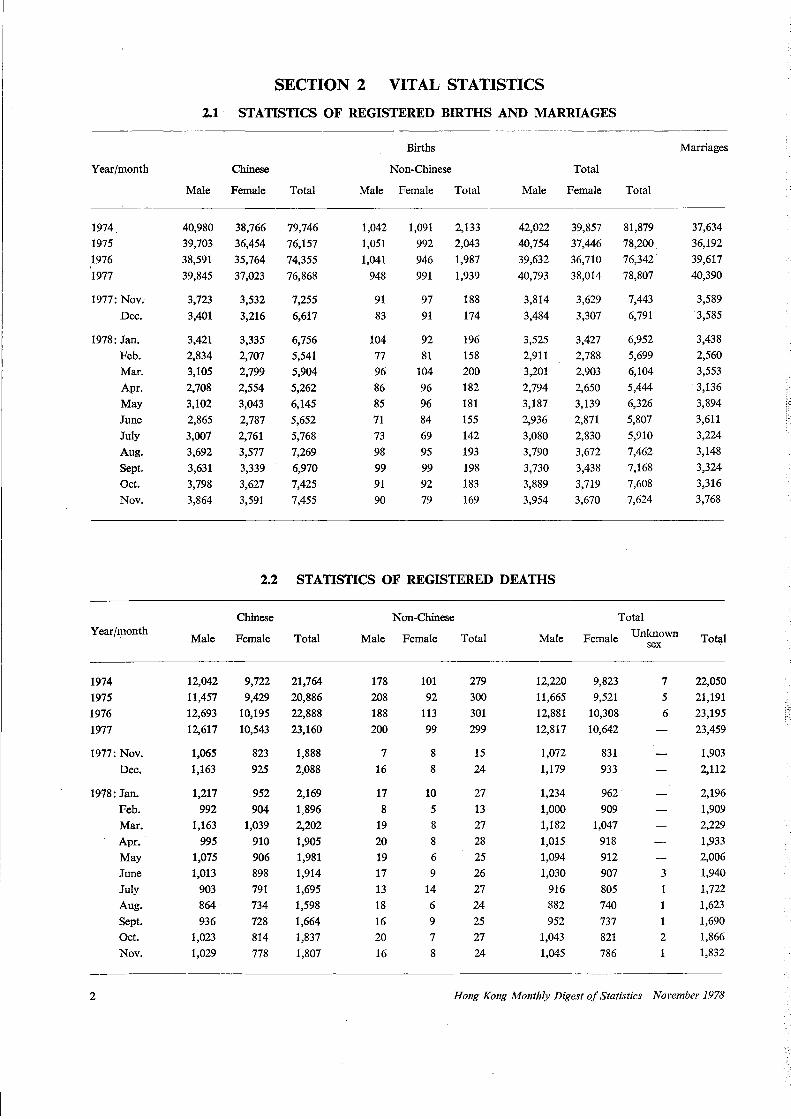
SECTION 2 VITAL STATISTICS
2.1 STATISTICS OF REGISTERED BIRTHS AND MARRIAGES
Chinese
Male Female Total
40,980 38,766 79,746
39,703 36,454 76,157
38,591 35,764 74,355
39,845 37,023 76,868
3,723 3,532 7,255
3,401 3,216 6,617
3,421 3,335 6,756 2,834 2,707 5,541
3,105 2,799 5,904
2, 708 2,554 5,262
3,102 3,043 6,145
2,865 2,787 5,652
3,007 2,761 5,768
3,692 3,577 7,269
3,631 3,339 6,970
3, 798 3,627 7,425
3,864 3,591 7,455
Births
Non-Chinese
Male Female Total
1,042
1,051
1,041
948
91
83
104
77 96
86
85
71
73
98
99 91
90
1,091
992
946
991
97
91
92
81
104
96
96
84
69
95
99
92
79
2,133
2,043
1,987
1,939
188
174
196
158
200
182
181
155
142
193
198
183
169
Total
Male Female
42,022
40,754
39,632
40,793
3,814
3,484
3,525 2,911
3,201
2,794
3,187
2,936
3,080
3,790
3,730
3,889
3,954
39,857
37,446
36,710
38,014
3,629
3,307
3,427
2,788 2,903
2,650
3,139
2,871
2,830
3,672
3,438
3,719
3,670
2.2 STATISTICS OF REGISTERED DEATHS
Total
81,879
78,200
76,342
78,807
7,443
6,791
6,952
5,699
6,104
5,444 6,326
5,807
5,910
7,462
7,168
7,608
7,624
Chinese
Female
Non-Chinese Total
Male Total
12,042 9,722 21,764
11,457 9,429 20,886
12,693 10,195 22,888
12,617 10,543 23,160
1,065
1,163
1,217
992 1,163
995
1,075 1,013
903
864
936
1,023
1,029
823
925
952
904 1,039
910
906 898
791
734
728
814
778
1,888
2,088
2,169
1,896
2,202
1,905
1,981 1,914
1,695
1,598
1,664 1,837
1,807
Male
178
208
188
200
7
16
17
8
19
20
19 17
13
18
16 20
16
Female
101
92
113
99
8
8
10
5 8
8
6
9
14
6
9
7
8
Total
279
300
301
299
15
24
27
13 27
28
25
26
27
24
25
27
24
Male Female
12,220 9,823
11,665 9,521
12,881 10,308
12,817 10,642
1,072
1,179
1,234
1,000 1,182
1,015
1,094
1,030
916 882
952 1,043
1,045
831
933
962
909 1,047
918
912
907
805
740
737
821
786
Unknown sex
7
5
6
3
1
2
1
Marriages
37,634
36,192
39,617
40,390
3,589
3,585
3,438
2,560
3,553
3,136 3,894
3,611 3,224
3,148
3,324
3,316 3,768
Total
22,050
21,191
23,195
23,459
1,903
2,112
2,196
1,909
2,229
1,933
2,006
1,940
1,722
1,623
1,690
1,866 1,832
Hong Kong Monthly Digest of Statistics November 1978
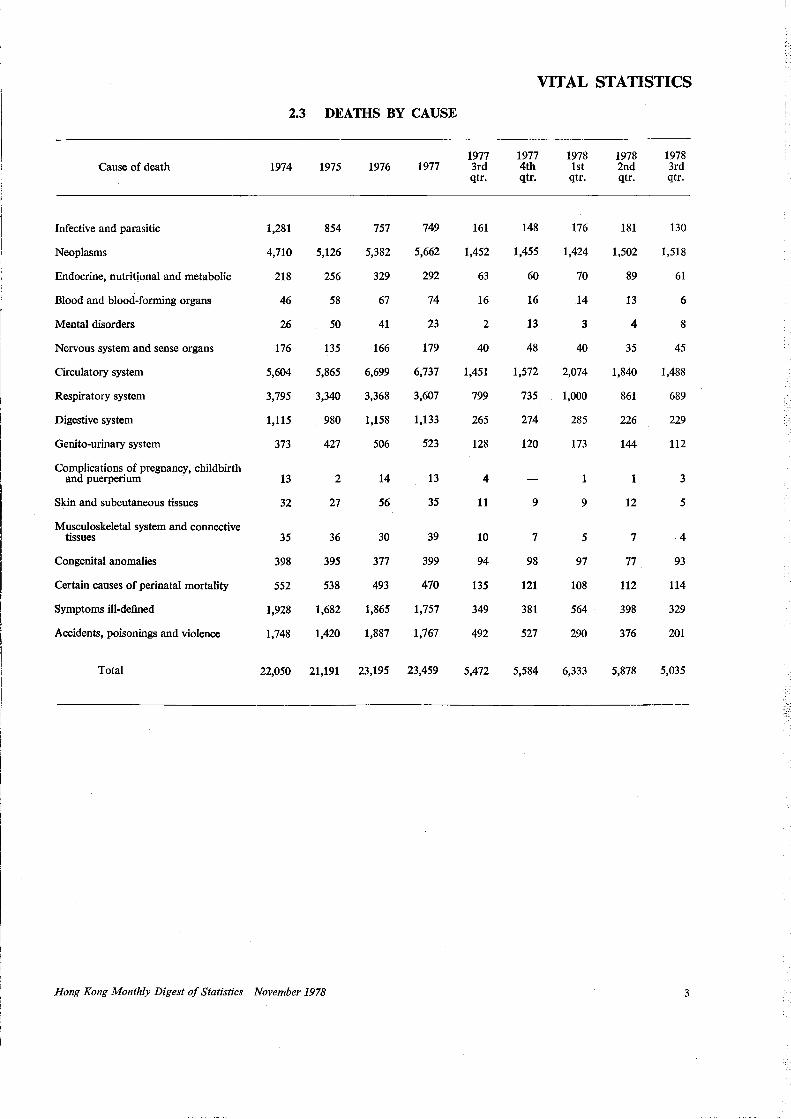
VITAL STATISTICS
2.3 DEATHS BY CAUSE
1977 1977 1978 1978 1978 Cause of death 1974 1975 1976 1977 3rd 4th lst 2nd 3rd
qtr. qtr. qtr. qtr. qtr.
Infective and parasitic 1,281 854 757 749 161 148 176 181 130
Neoplasms 4,710 5,126 5,382 5,662 1,452 1,455 1,424 1,502 1,518
Endocrine, nutritional and metabolic 218 256 329 292 63 60 70 89 61
Blood and blood-forming organs 46 58 67 74 16 16 14 13 6
Mental disorders 26 50 41 23 2 13 3 4 8
Nervous system and sense organs 176 135 166 179 40 48 40 35 45
Circulatory system 5,604 5,865 6,699 6,737 1,451 1,572 2,074 1,840 1,488
Respiratory system 3,795 3,340 3,368 3,607 799 735 1,000 861 689
Digestive system 1,115 980 1,158 1,133 265 274 285 226 229
Genito-urinary system 373 427 506 523 128 120 173 144 112
Complications of pregnancy, childbirth and puerperium 13 2 14 13 4 1 1 3
Skin and subcutaneous tissues 32 27 56 35 11 9 9 12 5
Musculoskeletal system and connective tissues 35 36 30 39 10 7 5 7 4
Congenital anomalies 398 395 377 399 94 98 97 77 93
Certain causes of perinatal mortality 552 538 493 470 135 121 108 112 114
Symptoms ill-defined 1,928 1,682 1,865 1,757 349 381 564 398 329
Accidents, poisonings and violence 1,748 1,420 1,887 1,767 492 527 290 376 201
Total 22,050 21,191 23,195 23,459 5,472 5,584 6,333 5,878 5,035
Hong Kong Monthly Digest of Statistics November 1978 3
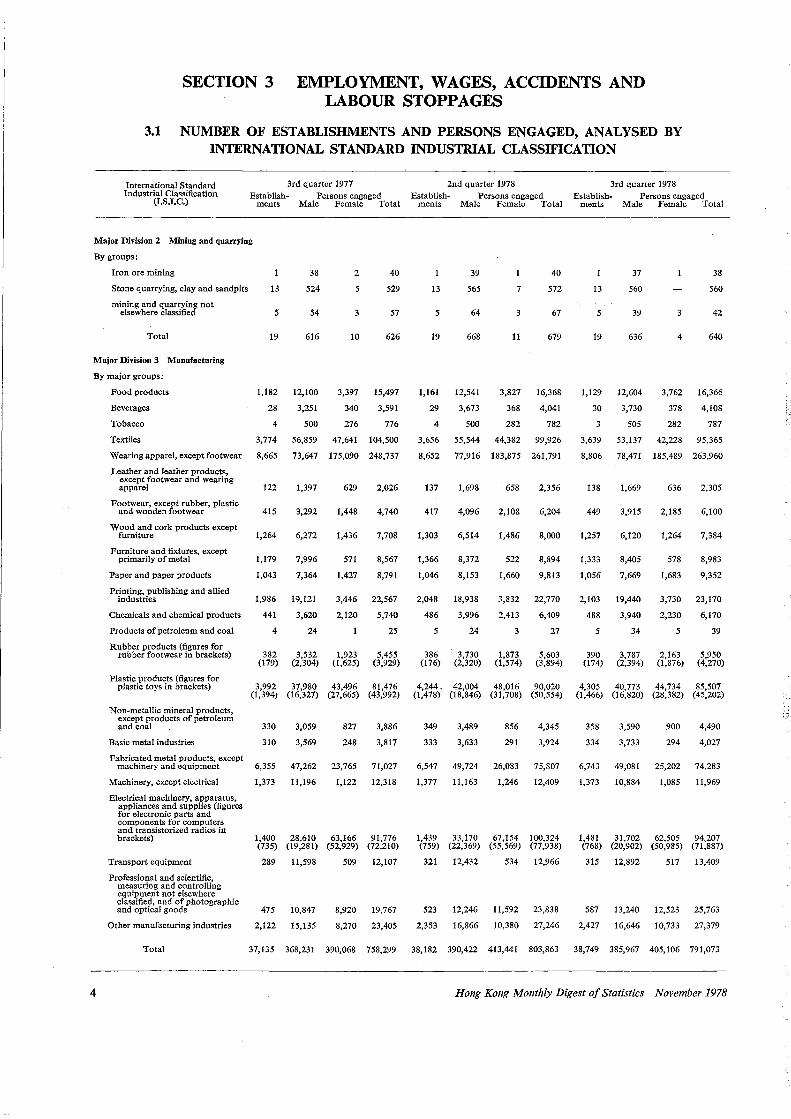
SECTION 3 EMPLOY1\.1ENT, WAGES, ACCIDENTS AND LABOUR STOPPAGES
3.1 NUMBER OF ESTABLISHMENTS AND PERSONS ENGAGED, ANALYSED BY INTERNATIONAL STANDARD INDUSTRIAL CLASSIFICATION
International Standard Industrial Classification
(I.S.I.C.)
3rd quarter 1977 2nd quarter 1978 3rd quarter 1978 Establish- Persons engaged Establish- Persons engaged Establish- Persons engaged
ments Male Female Total ments Male Female Total ments Male Female Total
Major Division 2 Mining and quarrying
By groups:
Iron ore mining
Stone quarrying, clay and sandpits
mining and quarrying not elsewhere classified
Total
13
5
19
38
524
54
616
2
5
3
10
40
529
57
626
13
5
19
39
565
64
668
7
3
11
40
572
67
679
13
5
19
37
560
39
636
3
4
38
560
42
640
Major Division 3 Manufacturing
By major groups:
4
Food products
Beverages
Tobacco
1,182 12,100
28 3,251
4 500
3,397 15,497
340 3,591
276 776
Textiles 3,774 56,859 47,641 104,500
Wearing apparel, except footwear 8,665 73,647 175,090 248,737
Leather and leather products, except footwear and wearing apparel
Footwear, except rubber, plastic and wooden footwear ·
Wood and cork products except furniture
Furniture and fixtures, except primarily of metal
Paper and paper products
Printing, publishing and allied industries
Chemicals and chemical products
Products of petroleum and coal
Rubber products (figures for rubber footwear in brackets)
122
415
1,264
1,179
1,043
1,986
441
4
382 (179)
1,397
3,292
6,272
7,996
7,364
19,121
3,620
24
3,532 (2,304)
629 2,026
1,448 4,740
1,436 7,708
571 8,567
1,427 8,791
3,446 22,567
2,120 5,740
1 25
1,923 5,455 (1,625) (3,929)
1,161 12,541 3,827 16,368
29 3,673 368 4,041
4 500 282 782
3,656 55,544 44,382 99,926
8,652 77,916 183,875 261,791
137
417
1,303
1,366
1,046
2,048
486
5
386 (176)
1,698
4,096
6,514
8,372
8,153
18,938
3,996
24
3,730 (2,320)
658
2,108
1,486
522
1,660
3,832
2,413
3
1,873 (1,574)
2,356
6,204
8,000
8,894
9,813
22,770
6,409
27
5,603 (3,894)
1,129 12,604 3,762 16,366
30 3,730 378 4,108
505 282 787
3,639 53,137 42,228 95,365
8,806 78,471 185,489 263,960
138
449
1,257
1,333
1,056
2,103
488
5
390 (174)
1,669
3,915
6,120
8,405
7,669
19,440
3,940
34
3,787 (2,394)
636 2,305
2,185 6,100
1,264 7,384
578 8,983
1,683 9,352
3,730 23,170
2,230 6,170
5 39
2,163 5,950 (1,876) (4,270)
Plastic products (figures for plastic toys in brackets) 3,992 37,980 43,496 81,476 4,244- 42,004 48,016 90,020 4,305 40,773 44,734 85,507
(1,394) (16,327) (27,665) (43,992) (1,478) (18,846) (31,708) (50,554) (1,466) (16,820) (28,382) (45,202)
Non-metallic mineral products, except products of petroleum and coal
Basic metal industries
Fabricated metal products, except
330
310
3,059
3,569
827
248
3,886
3,817
machinery and equipment 6,355 47,262 23,765 71,027
12,318 Machinery, except electrical 1,373 11,196 1,122
Electrical machinery, apparatus, appliances and supplies (figures for electronic parts and components for computers and transistorized radios in brackets) 1,400 28,610 63,166 91,776
(735) (19,281) (52,929) (72,210)
Transport equipment 289 11,598 509 12,107
Professional and scientific, measuring and controlling equipment not elsewhere classified, and of photographic and optical goods 475 10,847 8,920 19, 767
Other manufacturing industries 2,122 15,135 8,270 23,405
349
333
6,547
1,377
3,489
3,633
856
291
49,724 26,083
11,163 1,246
4,345
3,924
75,807
12,409
1,439 33,170 67,154 100,324 (759) (22,369) (55,569) (77,938)
321 12,432 534 12,966
523 12,246 11,592 23,838
2,353 16,866 10,380 27,246
358
334
6,743
1,373
3,590
3,733
49,081
10,884
900
294
4,490
4,027
25,202 74,283
1,085 11,969
1,481 31,702 62,505 94,207 (768) (20,902) (50,985) (71,887)
315 12,892 517 13,409
587 13,240 12,523 25,763
2,427 16,646 10,733 27,379
Total 37,135 368,231 390,068 758,299 38,182 390,422 413,441 803,863 38,749 385,967 405,106 791,073
Hong Kong Monthly Digest of Statistics November 1978
International Standard Industrial Classification
(I.S.I.C.)
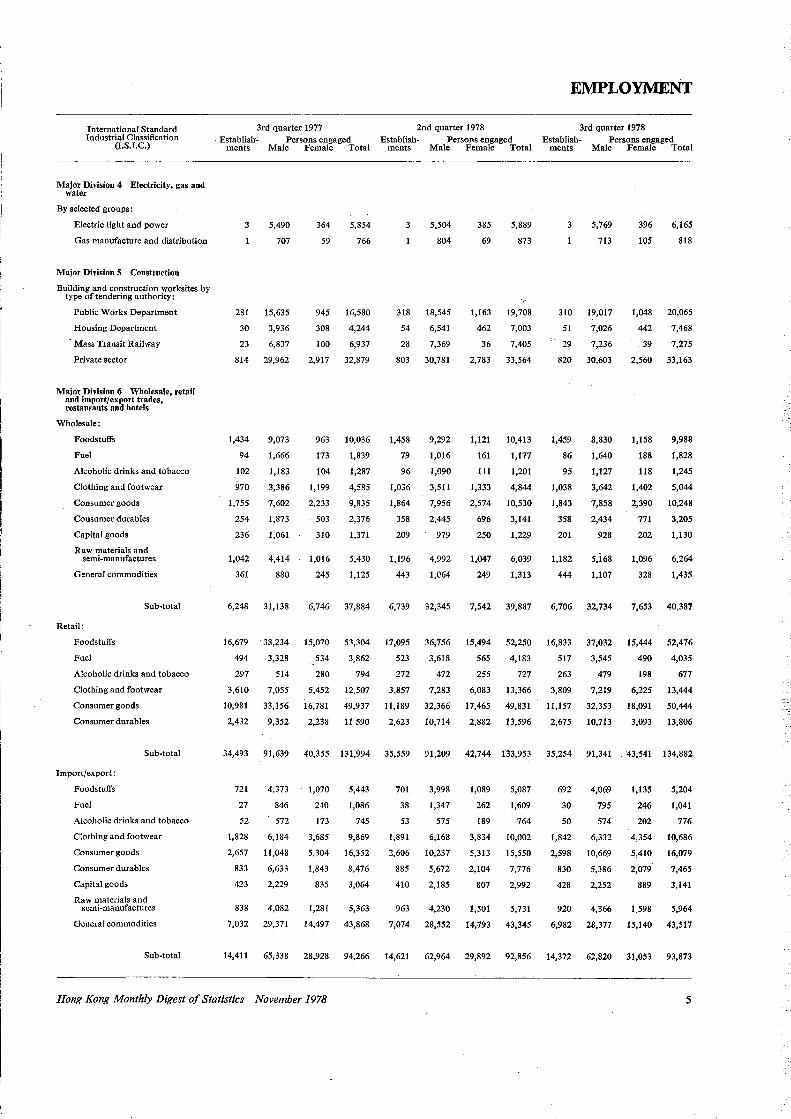
Major Division 4 Electricity, gas and water
By selected groups:
Electric light and power
Gas manufacture and distribution
Major Division 5 Construction
Building and construction worksites by type of tendering authority:
Public Works Department
Housing Department
Mass Transit Railway
Private sector
Major Division 6 Wholesale, retail and import/export trades, restaurants and hotels
Wholesale:
Foodstuffs
Fuel
Alcoholic drinks and tobacco
Clothing and footwear
Consumer goods
Consumer durables
Capital goods
Raw materials and semi-manufactures
General commodities
Retail:
Foodstuffs
Fuel
Sub-total
Alcoholic drinks and tobacco
Clothing and footwear
Consumer goods
Consumer durables
Import/export:
Foodstuffs
Fuel
Sub-total
Alcoholic drinks and tobacco
Clothing and footwear
Consumer goods
Consumer durables
Capital goods
Raw :rilaterials and semi-manufactures
General commodities
Sub-total
EMPLOYMENT
3rd quarter 1977 2nd quarter 1978 3rd quarter 1978 Establishc Persons engaged Establish- Persons engaged Establish- Persons engaged
ments Male Female Total ments Male Female Total ments Male Female Total
3 5,490
707
281 15,635
30 3,936
23 6,837
814 29,962
1,434
94
102
970
1,755
254
236
1,042
361
6,248
9,073
1,666
1,183
3,386
7,602
1,873
1,061
4,414
880
31,138
364
59
5,854
766
945 16,580
308 4,244
100 6,937
2,917 32,879
963
173
104
1,199
2,233
503
310
1,016
245
6,746
10,036
1,839
1,287
4,585
9,835
2,376
1,371
5,430
1,125
37,884
5,504
804
318 18,545
54 6,541
28 7,369
803 30,781
1,458
79
96
1,036
1,864
358
209
1,196
443
6,739
9,292
1,016
1,090
3,511
7,956
2,445
979
4,992
1,064
32,345
385
69
5,889
873
1,163 19,708
462 7,003
36 7,405
2, 783 33,564
1,121
161
111
1,333
2,574
696
250
1,047
249
7,542
10,413
1,177
1,201
4,844
10,530
3,141
1,229
6,039
1,313
39,887
3 5,769
713
310 19,017
51 7,026
29 7,236
820 30,603
1,459
86
95
1,038
1,843
358
201
1,182
444
6,706
8,830
1,640
1,127
3,642
7,858
2,434
928
5,i68
1,107
32,734
396
105
6,165
818
1,048 20,065
442 7,468
39 7,275
2,560 33, 163
1,158
188
118
1,402
2,390
771
202
1,096
328
7,653
9,988
1,828
1,245
5,044
10,248
3,205
1,130
6,264
1,435
40,387
16,679 38,234 15,070 53,304 17,095 36,756 15,494 52,250 16,833 37,032 15,444 52,476
494 3,328 534 3,862 523 3,618 565 4,183 517 3,545 490 4,035
297 514 280 794 272 472 255 727 263 479 198 677
3,610 7,055 5,452 12,507 3,857 7,283 6,083 13,366 3,809 7,219 6,225 13,444
10,981 33,156 16,781 49,937 11,189 32,366 17,465 49,831 11,157 32,353 18,091 50,444
2,432 9,352 2,238 11 590 2,623 10, 714 2,882 13,596 2,675 10,713 3,093 13,806
34,493 91,639 40,355 131,994 35,559 91,209 42,744 133,953 35,254 91,341 43,541 134,882
721 4,373
27 846
52 572
1,828 6,184
2,657 11,048
833 6,633
423 2,229
838 4,082
7,032 29,371
14,411 65,338
1,070
240
173
3,685
5,304
1,843
835
1,281
14,497
28,928
5,443
1,086
745
9,869
16,352
8,476
3,064
5,363
43,868
94,266
701
38
53
1,891
2,606
885
410
963
7,074
14,621
3,998
1,347
575
6,168
10,237
5,672
2,185
4,230
28,552
62,964
1,089
262
189
3,834
5,313
2,104
807
1,501
14,793
29,892
5,087
1,609
764
10,002
15,550
7,776
2,992
5,731
43,345
92,856
692
30
50
1,842
2,598
830
428
920
6,982
14,372
4,069
795
574
6,332
10,669
5,386
2,252
4,366
28,377
62,820
1,135
246
202
4,354
5,410
2,079
889
1,598
15,140
31,053
5,204
1,041
776
10,686
16,079
7,465
3,141
5,964
43,517
93,873
Hong Kong Monthly Digest of Statistics November 1978 5
EMPLOYMENT
International Standard Industrial Classification
(l.S.I.C.)
3rd quarter 1977 2nd quarter 1978 3rd quarter 1978 Establish- Persons engaged Establish- Persons engaged Establish- Persons engaged
ments Male Female Total ments Male Female Total ments Male Female Total
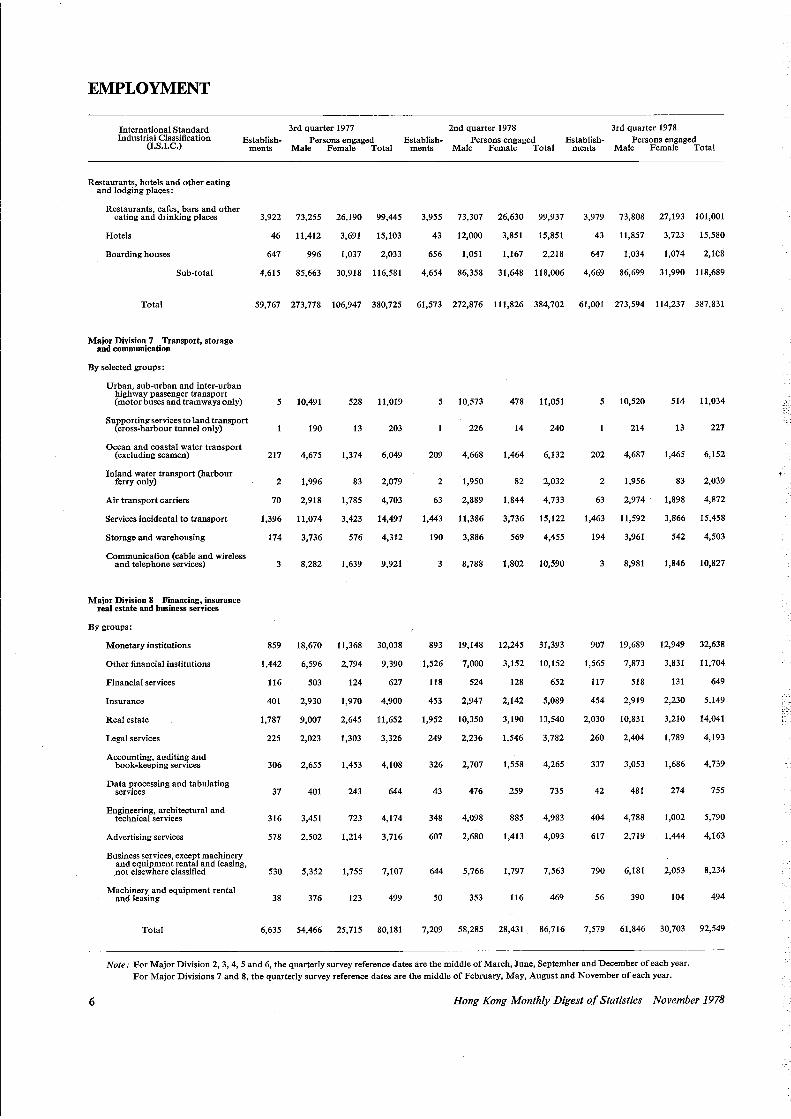
Restaurants, hotels and other eating and lodging places :
Restaurants, cafes, bars and other eating and drinking places 3,922 73,255 26,190 99,445 3,955 73,307 26,630 99,937 3,979 73,808 27,193 101,001
Hotels 46 11,412 3,691 15,103 43 12,000 3,851 15,851 43 11,857 3,723 15,580
Boarding houses 647 996 1,037 2,033 656 1,051 1,167 2,218 647 1,034 1,074 2,108
Sub-total 4,615 85,663 30,918 116,581 4,654 86,358 31,648 118,006 4,669 86,699 31,990 118,689
Total 59,767 273,778 106,947 380,725 61,573 272,876 111,826 384,702 61,001 273,594 114,237 387,831
Major Division 7 Transport, storage and communication
By selected groups:
Urban, sub-urban and inter-urban highway passenger transport (motor buses and tramways only)
Supporting services to land transport (cross-harbour tunnel only)
Ocean and coastal water transport (excluding seamen)
Inland water transport (harbour ferry only)
Air transport carriers
Services incidental to transport
Storage and warehousing
Communication (cable and wireless and telephone services)
Major Division 8 Financing, insurance real estate and business services
By groups:
Monetary institutions
Other financial institutions
Financial services
Insurance
Real estate
5 10,491 528 11,019
190 13 203
217 4,675 1,374 6,049
2 1,996 83 2,079
70 2,918 1,785 4,703
1,396 11,074 3,423 14,497
174 3,736 576 4,312
8,282 1,639 9,921
859 18,670 11,368 30,038
1,442 6,596 2,794 9,390
116 503 124 627
401
1,787
2,930
9,007
1,970 4,900
2,645 11,652
Legal services 225 2,023 1,303 3,326
Accounting, auditing and book-keeping services 306 2,655 1,453 4,108
Data processing and tabulating services 37 401 243 644
Engineering, architectural and technical services 316 3,451 723- 4,174
Advertising services 578 2,502 1,214 3,716
Business services, except machinery and equipment rental and leasing, _not elsewhere classified 530 5,352 1,755 7,107
Machinery and equipment rental and leasing 38 376 123 499
Total 6,635 54,466 25,715 80,181
5 10,573
226
209 4,668
2 1,950
63 2,889
1,443 11,386
190 3,886
3
893
1,526
118
8,788
19,148
7,000
524
453 2,947
1,952 10,350
478 11,051
14 240
1,464 6,132
82 2,032
1,844 4,733
3,736 15,122
569 4,455
1,802 10,590
12,245 31,393
3,152 10,152
128 652
2,142 5,089
3, 190 13,540
249 2,236 1,546 3, 782
326 2, 707 1,558 4,265
43 476 259 735
348 4,098 885 4,983
607 2,680 1,413 4,093
644 5,766 1,797 7,563
50 353 116 469
7,209 58,285 28,431 86,716
5 10,520 514 11,034
214 13 227
202 4,687 1,465 6,152
2 1,956 83 2,039
63 2,974 1,898 4,872
1,463 11,592 3,866 15.458
194 3,961 542 4,503
8,981 1,846 10,827
907 19,689 12,949 32,638
1,565 7,873 3,831 11,704
117 518 131 649
454 2,919 2,230 5,149
2,030 10,831 3,210 14,041
260 2,404 1,789 4,193
337 3,053 1,686 4, 739
42 481 274 755
404 4,788 1,002 5,790
617 2,719 1,444 4,163
790 6,181 2,053 8,234
56 390 104 494
7,579 61,846 30,703 92,549
Note: For Major Division 2, 3, 4, 5 and 6, the quarterly survey reference dates are the middle of March, June, September and December of each year. For Major Divisions 7 and 8, the quarterly survey reference dates are the middle of February, May, August and November of each year.
6 Hong Kong Monthly Digest of Statistics November 1978
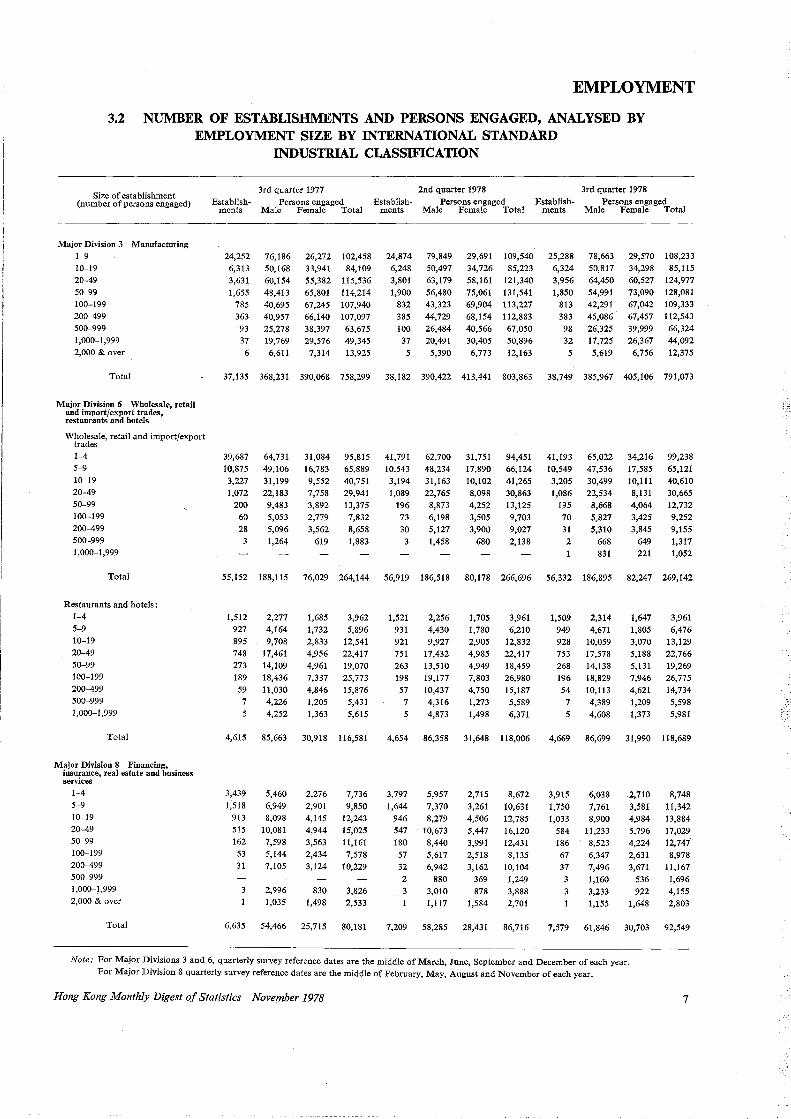
EMPLOYMENT
3.2 NUMBER OF ESTABLISHMENTS AND PERSONS ENGAGED, ANALYSED BY EMPLOYMENT SIZE BY INTERNATIONAL STANDARD
INDUSTRIAL CLASSIFICATION
Size of establishment (number of persons engaged)
Major Division 3 Manufacturing 1-9 10-19 20-49 50-99 100-199 200-499 500-999 1,000-1,999 2,000 & over
Total
Major Division 6 Wholesale, retail and import/export trades, restaurants and hotels
Wholesale, retail and import/export trades 1-4 5-9 10--19 20-49
- 50-99 100-199 200-499 500-999 1,000--1,999
Total
Restaurants and hotels : 1-4 5-9 10-19 20-49 50--99 100-199 200-499 500-999 1,000-1,999
Total
Major Division 8 Financing, insurance, real estate and business services
1-4
5-9 10-19 20--49 50-99 100-199 200-499 500-999 1,000--1,999 2,000 & over
Total
3rd quarter 1977 2nd quarter 1978 3rd quarter 1978 Establish- Persons engaged Establish- Persons engaged Establish- Persons engaged
ments Male Female Total ments Male Female Total ments Male Female Total
24,252 6,313 3,631 1,655
785 363 93 37
6
76,186 50,168 60,154 48,413 40,695 40,957 25,278 19,769 6,611
26,272 102,458 33,941 55,382 65,801 67,245 66,140 38,397 29,576
7,314
84,109 115,536 114,214 107,940 107,097 63,675 49,345 13,925
24,874 6,248
3,801 1,900
832 385 100
37 5
79,849 50,497 63,179 56,480 43,323 44,729 26,484 20,491
5,390
29,691 109,540 34, 726 85,223 58,161 121,340
75,061 131,541 69,904 113,227 68,154 40,566 30,405 6,773
112,883 67,050 50,896 12,163
25,288 6,324
3,956 1,850
813 383 98 32 5
78,663 50,817 64,450 54,991 42,291 45,086 26,325 17,725 5,619
29,570 108,233 34,298 85,115 60,527 124,977 73,090 128,081 67,042 109,333 67,457 39,999 26,367
6,756
112,543 66,324 44,092 12,375
37,135 368,231 390,068 758,299 38,182 390,422 413,441 803,863 38,749 385,967 405,106 791,073
39,687 10,875
3,227 1,072
200 60 28
3
64,731 49,106 31,199 22,183
9,483 5,053 5,096 1,264
31,084 16,783 9,552 7,758 3,892 2,779 3,562
619
95,815 65,889 40,751
29,941 13,375 7,832 8,658 1,883
41,791 10,543
3,194 1,089
196 73 30 3
62,700 48,234 31,163 22,765 8,873 6,198 5,127 1,458
31,751 17,890 10,102 8,098 4,252 3,505 3,900
680
94,451 66,124 41,265 30,863 13,125 9,703 9,027 2,138
41,193 10,549 3,205 1,086
195
70 31 2
65,022 47,536 30,499 22,534 8,668 5,827 5,310
668 831
34,216 17,585 10,111 8,131 4,064 3,425 3,845
649 221
99,238 65,121 40,610 30,665 12,732 9,252 9,155 1,317 1,052
55,152 188,115 76,029 264,144 56,919 186,518 80,178 266,696 56,332 186,895 82,247 269,142
1,512 927 895 748 273 189
59 7
5
2,277 4,164 9,708
17,461 14,109 18,436 11,030 4,226 4,252
1,685 1,732 2,833 4,956 4,961
7,337 4,846 1,205 1,363
3,962 5,896
12,541 22,417 19,070 25,773 15,876 5,431 5,615
4,615 85,663 30,918 116,581
3,439 1,518
913 515
162 53 31
5,460 6,949 8,098
10,081 7,598 5,144 7,105
2,996 1,035
2,276 2,901 4,145 4,944 3,563 2,434 3,124
830 1,498
7,736
9,850 12,243 15,025 11,161 7,578
10,229
3,826 2,533
6,635 54,466 25,715 80,181
1,521 931 921 751 263 198 57
7
5
2,256 4,430 9,927
17,432 13,510 19,177 10,437 4,316 4,873
1,705 1,780 2,905 4,985 4,949 7,803 4,750 1,273 1,498
3,961 6,210
12,832 22,417 18,459 26,980 15,187 5,589 6,371
4,654 86,358 31,648 118,006
3,797 1,644
946 547 180 57 32 2
5,957
7,370 8,279
10,673 8,440 5,617 6,942
880 3,010 1,117
2,715
3,261 4,506 5,447
3,991 2,518 3,162
369 878
1,584
8,672 10,631 12,785 16,120 12,431
8,135 10,104 1,249 3,888 2,701
7,209 58,285 28,431 86,716
1,509 949 928 753 268 196 54
7 5
2,314 4,671
10,059 17,578 14,138 18,829
10,113 4,389 4,608
1,647 1,805 3,070 5,188 5,131 7,946 4,621 1,209 1,373
3,961 6,476
13,129 22,766 19,269 26,775 14,734
5,598 5,981
4,669 86,699 31,990 118,689
3,915
1,750 1,033
584 186 67 37 3
3
1
6,038
7,761 8,900
11,233 8,523 6,347 7,496 1,160 3,233 1,155
2,710 3,581 4,984 5,796 4,224 2,631 3,671
536 922
1,648
8,748 11,342 13,884 17,029 12,747<
8,978 11,167 1,696 4,155 2,803
7,579 61,846 30,703 92,549
Note: For Major Divisions 3 and 6, quarterly survey reference dates are the middle of March, June, September and December of each year. For Major Division 8 quarterly survey reference dates are the middle of February, May, August and November of each year.
Hong Kong Monthly Digest of Statistics November 1978 7
EMPLOYMENT
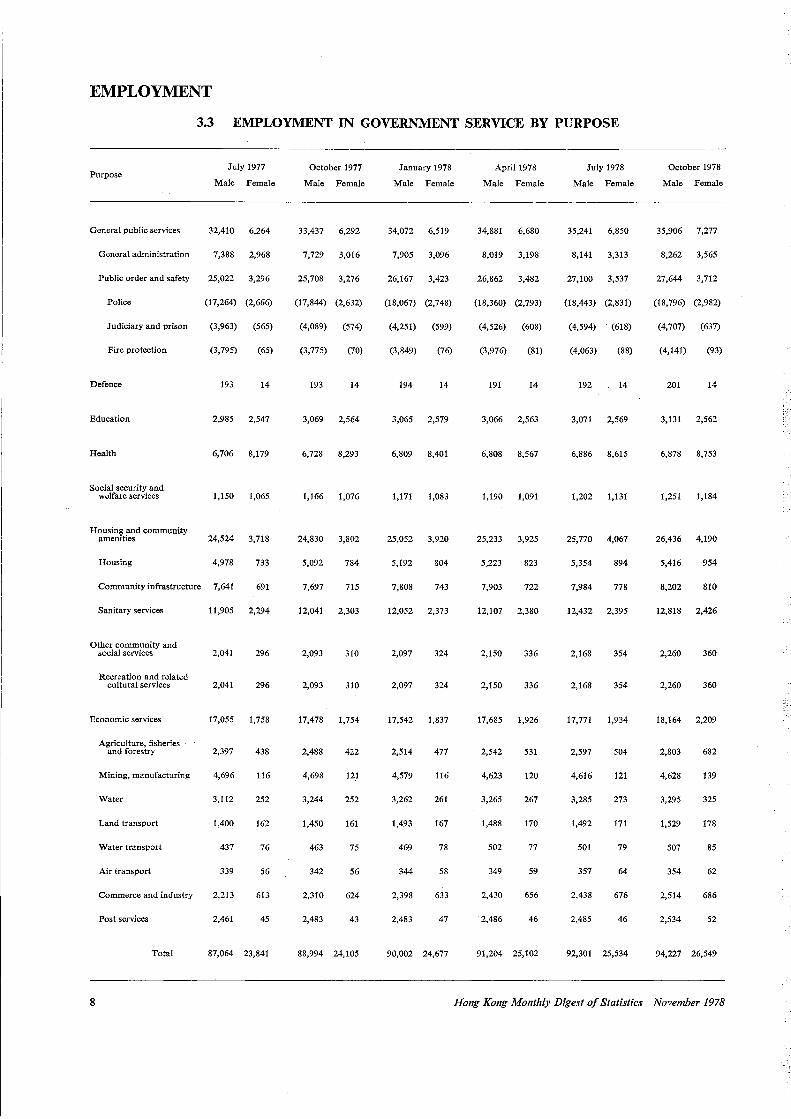
3.3 EMPLOYMENT IN GOVERNMENT SERVICE BY PURPOSE
Purpose July 1977
Male Female
General public services 32,410 6,264
General administration 7,388 2,968
Public order and safety 25,022 3,296
Police (17,264) (2,666)
Judiciary and prison (3,963) (565)
Fire protection (3,795) (65)
Defence 193 14
Education 2,985 2,547
Health 6,706 8,179
Social security and welfare services 1,150 1,065
Housing and community amenities 24,524 3, 718
Housing 4,978 733
Community infrastructure 7,641 691
Sanitary services 11,905 2,294
Other community and social services 2,041 296
Recreation and related cultural services 2,041 296
Economic services 17,055 1,758
Agriculture, fisheries and forestry 2,397 438
Mining, manufacturing 4,696 116
Water 3, 112 252
Land transport 1,400 162
Water transport 437 76
Air transport 339 56
Commerce and industry 2,213 613
Post services 2,461 45
Total 87,064 23,841
8
October 1977
Male Female
33,437 6,292
7,729 3,016
25,708 3,276
(17,844) (2,632)
(4,089) (574)
(3,775) (70)
193 14
3,069 2,564
6,728 8,293
1,166 1,076
24,830 3,802
5,092 784
7,697 715
12,041 2,303
2,093 310
2,093 310
17,478 1,754
2,488 422
4,698 121
3,244 252
1,450 161
463 75
342 56
2,310 624
2,483 43
88,994 24,105
January 1978
Male Female
34,072 6,519
7,905 3,096
26,167 3,423
(18,067) (2,748)
(4,251) (599)
(3,849) (76)
194 14
3,065 2,579
6,809 8,401
1,171 1,083
25,052 3,920
5,192 804
7,808 743
12,052 2,373
2,097 324
2,097 324
17,542 1,837
2,514 477
4,579 116
3,262 261
1,493 167
469 78
344 58
2,398 633
2,483 47
90,002 24,677
April 1978
Male Female
34,881 6,680
8,019 3,198
26,862 3,482
(18,360) (2, 793)
(4,526) (608)
(3,976) (81)
191 14
3,066 2,563
6,808 8,567
1,190 1,091
25,233 3,925
5,223 823
7,903 722
12,107 2,380
2,150 336
2,150 336
17,685 1,926
2,542 531
4,623 120
3,265 267
1,488 170
502 77
349 59
2,430 656
2,486 46
91,204 25,102
July 1978
Male Female
35,241 6,850
8,141 3,313
27,100 3,537
(18,443) (2,831)
(4,594) (618)
(4,063) (88)
192 14
3,071 2,569
6,886 8,615
1,202 1,131
25, 770 4,067
5,354 894
7,984 778
12,432 2,395
2,168 354
2,168 354
17, 771 1,934
2,597 504
4,616 121
3,285 273
1,492 171
501 79
357 64
2,438 676
2,485 46
92,301 25,534
October 1978
Male Female
35,906 7 ,277
8,262 3,565
27,644 3,712
(18,796) (2,982)
(4,707) (637)
(4,141) (93)
201 14
3,131 2,562
6,878 8,753
1,251 1,184
26,436 4,190
5,416 954
8,202 810
12,818 2,426
2,260 360
2,260 360
18,164 2,209
2,803 682
4,628 139
3,295 325
1,529 178
507 85
354 62
2,514 686
2,534 52
94,227 26,549
Hong Kong Monthly Digest of Statistics November 1978
WAGES
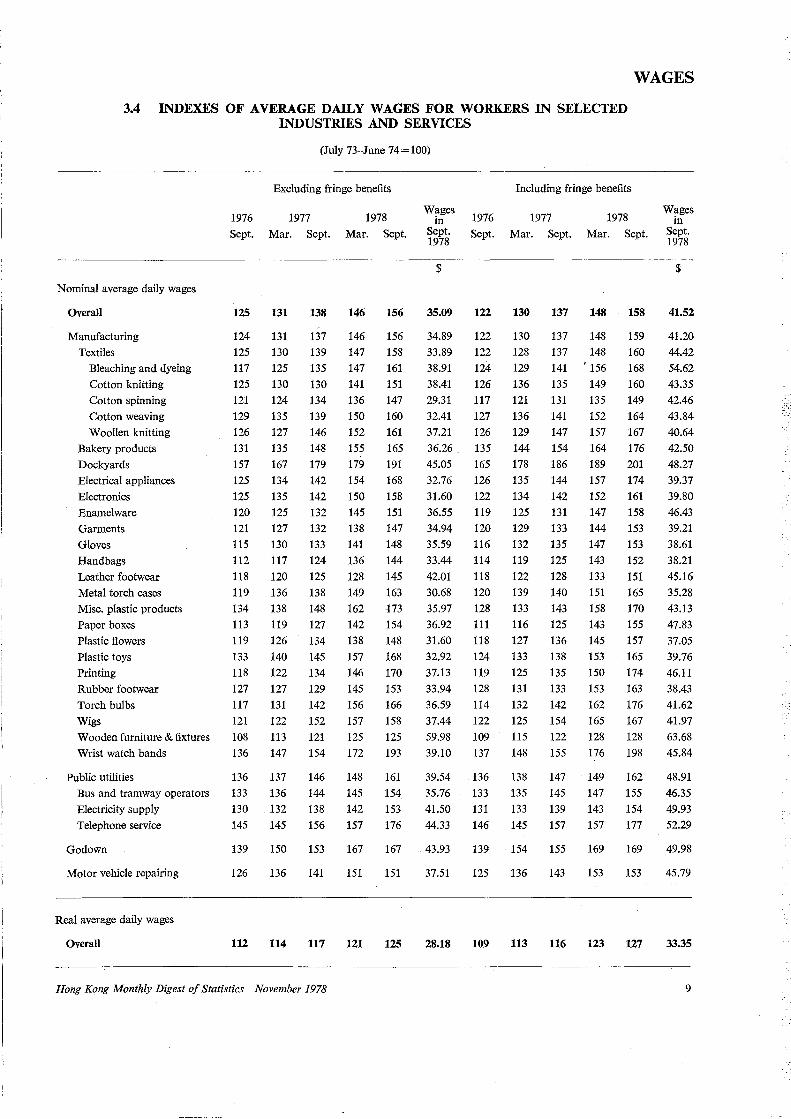
3.4 INDEXES OF AVERAGE DAILY WAGES FOR WORKERS IN SELECTED INDUSTRIES AND SERVICES
Nominal average daily wages
Overall
Manufacturing
Textiles
Bleaching and dyeing
Cotton knitting
Cotton spinning
Cotton weaving
Woollen knitting
Bakery products
Dockyards
Electrical appliances
Electronics
Enamelware
Garments
Gloves
Handbags
Leather footwear
Metal torch cases
Misc. plastic products
Paper boxes
Plastic flowers
Plastic toys
Printing
Rubber footwear
Torch bulbs
Wigs
Wooden furniture & fixtures
Wrist watch bands
Public utilities
Bus and tramway operators
Electricity supply
Telephone service
Godown
Motor vehicle repairing
Real average daily wages
Overall
(July 73-June 74=100)
Excluding fringe benefits
1976 1977
Sept. Mar. Sept.
125 131
124 131
125 130
117 125
125 130
121 124
129 135
126 127
131 135
157 167
125 134
125 135
120 125
121 127
115 130
112 117
118 120
119 136
134 138
113 119
119 126
133 140
118 122
127 127
117 131
121 122
108 113
136 147
136 137
133 136
130 . 132
145 145
139 150
126 136
112 114
138
137
139
135
130
134
139
146
148
179
142
142
132
132
133
124
125
138
148
127
134
145
134
129
142
152
121
154
146
144
138
156
153
141
117
1978
Mar. Sept.
146
146
147
147
141
136
150
152
155
179
154
150
145
138
141
136
128
149
162
142
138
157
146
145
156
157
125
172
148
145
142
157
167
151
121
156
156
158
161
151
147
160
161
165
191
168
158
151
147
148
144
145
163
173
154
148
168
170
153
166
158
125
193
161
154
153
176
167
151
125
Wages in
Sept. 1978
$
1976
Sept.
35.09 122
34.89 122
33.89 122
38.91 124
38.41 126
29.31 117
32.41 127
37.21 126
36.26. 135
45.05 165
32.76 126
31.60 122
36.55 119
34.94 120
35.59 116
33.44 114
42.01 118
30.68 120
35.97 128
36.92 111
31.60 118
32.92 124
37.13 119
33.94 128
36.59 114
37.44 122
59.98 109
39.10 137
39.54 136
35.76 133
41.50 131
44.33 146
43.93 139
37.51 125
28.18 109
Hong Kong Monthly Digest of Statistics November 1978
Including fringe benefits
1977 1978
Mar. Sept. Mar. Sept.
130 137 148 158
130 137 148 159
128 137 148 160
129 141 ' 156 168
136 135 149 160
121 131 135 149
136 141 152 164
129 147 157 167
144 154 164 176
178 186 189 201
135 144 157 174
134 142 152 161
125 131 147 158
129 133 144 153
132 135 147 153
119 125 143 152
122 128 133 151
139 140 151 165
133 143 158 170
116 125 143 155
127 136 145 157
133 138 153 165
125 135 150 174
131 133 153 163
132 142 162 176
125 154 165 167
115 122 128 128
148 155 176 198
138 147 149 162
135 145 147 155
133 139 143 154
145 157 157 177
154 155 169 169
136 143 153 153
113 116 123 127
Wages in
Sept. 1978
$
41.52
41.20
44.42
54.62
43.35
42.46
43.84
40.64
42.50
48.27
39.37
39.80
46.43
39.21
38.61
38.21
45.16
35.28
43.13
47.83
37.05
39.76
46.11
38.43
41.62
41.97
63.68
45.84
48.91
46.35
49.93
52.29
49.98
45.79
33.35
9
ACCIDENTS
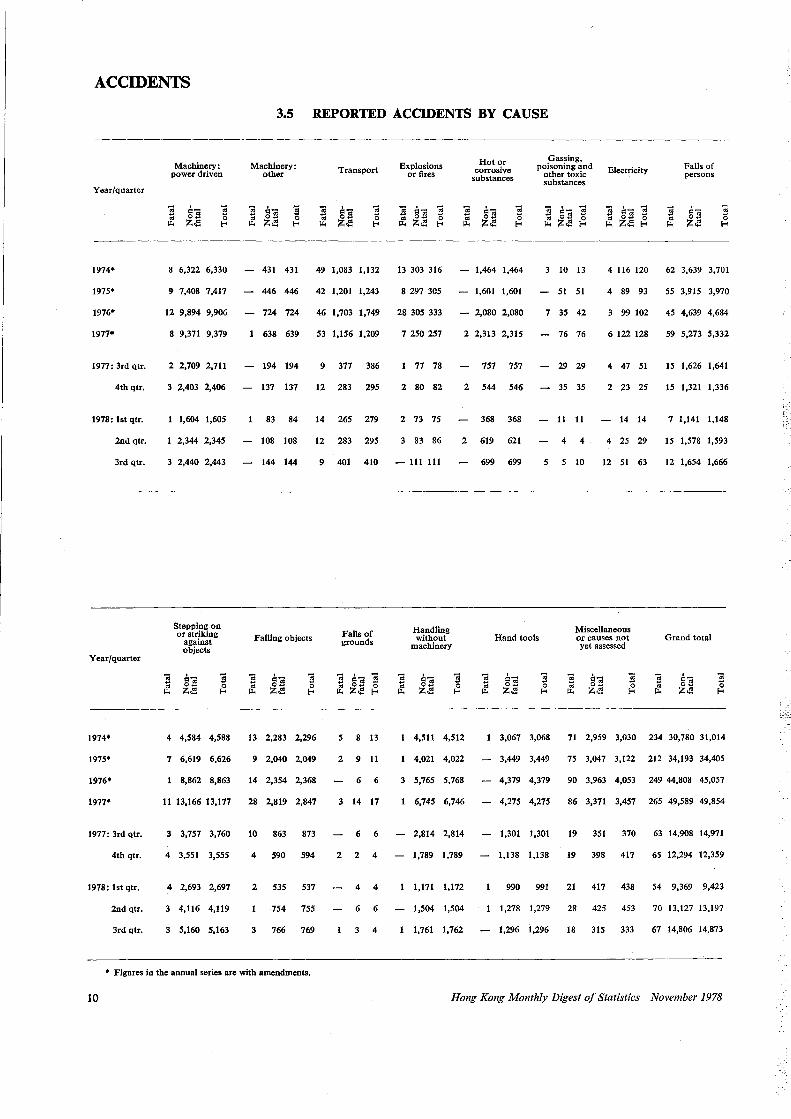
3.5 REPORTED ACCIDENTS BY CAUSE
Year/quarter
1974•
1975•
1976•
1977•
1977: 3rd qtr.
4th qtr.
1978: lst qtr.
2nd qtr.
3rd qtr.
Year/quarter
1974•
1975•
1976•
1977•
1977: 3rd qtr.
4th qtr.
1978: lst qtr.
2nd qtr.
3rd qtr.
Machinery: power driven
8 6,322 6,330
9 7,408 7,417
12 9,894 9,906
8 9,371 9,379
2 2,709 2,711
3 2,403 2,406
1 1,604 1,605
1 2,344 2,345
3 2,440 2,443
Stepping on or striking
against objects
4 4,584 4,588
7 6,619 6,626
8,862 8,863
11 13,166 13,177
3 3,757 3,760
4 3,551 3,555
4 2,693 2,697
3 4,116 4,119
5,160 5,163
Machinery: other Transport
431 431 49 1,083 1,132
446 446 42 1,201 1,243
724 724 46 1,703 1,749
638 639 53 1,156 1,209
194 194 9 377 386
137 137 12 283 295
83 84 14 265 279
108 108 12 283 295
144 144
Falling objects
13 2,283 2,296
9 2,040 2,049
14 2,354 2,368
28 2,819 2,847
10 863 873
4 590 594
2 535 537
754 755
3 766 769
9 401 410
Falls of grounds
5 8 13
2 9 11
6 6
3 14 17
6 6
2 2 4
4 4
6 6
3 4
• Figures in the annual series are with amendments.
10
Explosions or fires
13 303 316
8 297 305
28 305 333
Hot or corrosive
substances
1,464 1,464
1,601 1,601
2,080 2,080
Gassing, poisoning and
other toxic substances
3 10 13
51 51
7 35 42
Electricity
4 116 120
4 89 93
3 99 102
Falls of persons
62 3,639 3,701
55 3,915 3,970
45 4,639 4,684
7 250 257 2 2,313 2,315 76 76 6 122 128 59 5,273 5,332
77 78 757 757 29 29 4 47 51 15 1,626 1,641
2 80 82 2 544 546 35 35 2 23 25 15 1,321 1,336
2 73 75 368 368 II II 14 14 7 1,141 1,148
83 86 2 619 621 4 4 4 25 29 15 1,578 1,593
- 111 111 699 699 5 5 10 12 51 63 12 1,654 1,666
Handling without
machinery
4,511 4,512
4,021 4,022
3 5,765 5,768
6,745 6,746
2,814 2,814
1,789 1,789
1,171 1,172
1,504 1,504
1,761 1,762
Hand tools
3,067 3,068
3,449 3,449
4,379 4,379
4,275 4,275
1,301 1,301
1,138 1,138
990 991
1,278 1,279
1,296 1,296
Miscellaneous or causes not yet assessed
Grand total
71 2,959 3,030 234 30,780 31,014
75 3,047 3,122 212 34,193 34,405
90 3,963 4,053 249 44,808 45,057
86 3,371 3,457 265 49,589 49,854
19 351 370 63 14,908 14,971
19 398 417 65 12,294 12,359
21 417 438 54 9,369 9,423
28 425 453 70 13,127 13,197
18 315 333 67 14,806 14,873
Hong Kong Monthly Digest of Statistics November 1978
,. I.
INDUSTRIAL WORK STOPPAGES
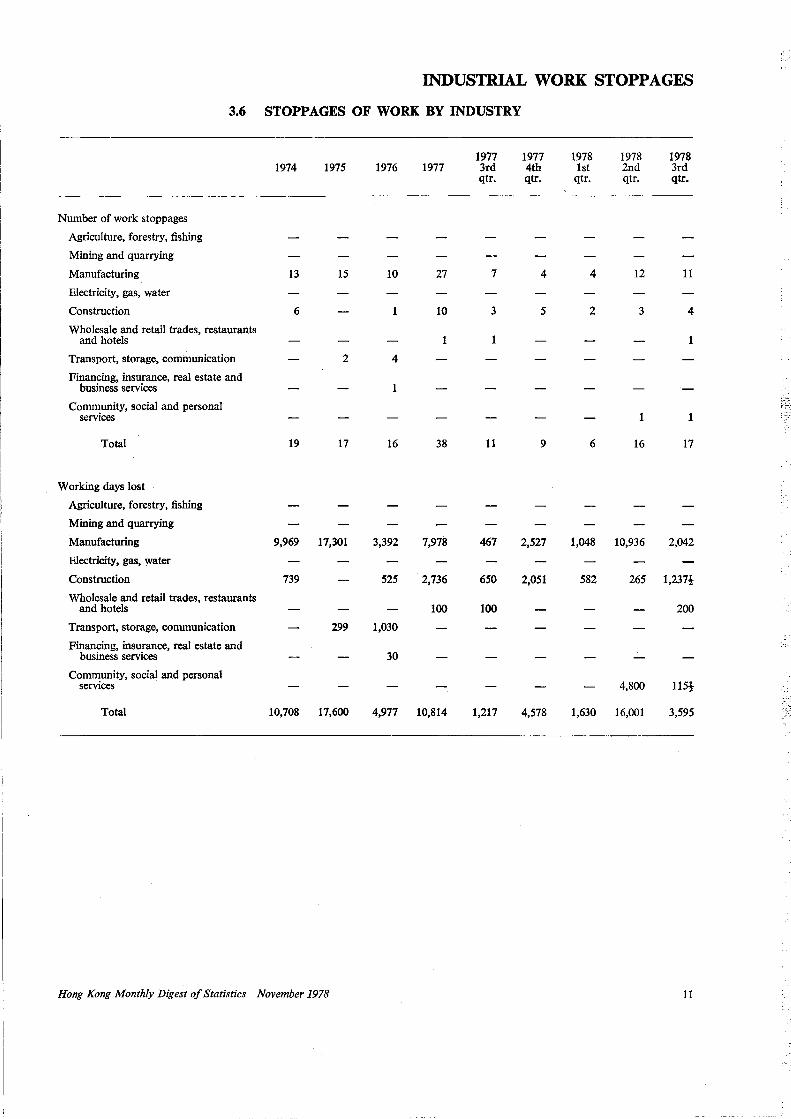
3.6 STOPPAGES OF WORK BY INDUSTRY
1977 1977 1978 1978 1978 1974 1975 1976 1977 3rd 4th lst 2nd 3rd
qtr. qtr. qtr. qtr. qtr.
Number of work stoppages
Agriculture, forestry, fishing
Mining and quarrying
Manufacturing 13 15 10 27 7 4 4 12 11
Electricity, gas, water
Construction 6 10 3 5 2 3 4
Wholesale and retail trades, restaurants and hotels 1 1
Transport, storage, comtnunication 2 4
Financing, insurance, real estate and business services 1
Community, social and personal services 1 1
Total 19 17 16 38 11 9 6 16 17
Working days lost
_Agriculture, forestry, fishing
Mining and quarrying
Manufacturing 9,969 17,301 3,392 7,978 467 2,527 1,048 10,936 2,042
Electricity, gas, water
Construction 739 525 2,736 650 2,051 582 265 1,237!
Wholesale and retail trades, restaurants and hotels 100 100 200
Transport, storage, communication 299 1,030
Financing, insurance, real estate and business services 30
Community, social and personal services 4,800 115t
- . Total 10,708 17,600 4,977 10,814 1,217 4,578 1,630 16,001 3,595
Hong Kong Monthly Digest of Statistics November 1978 11
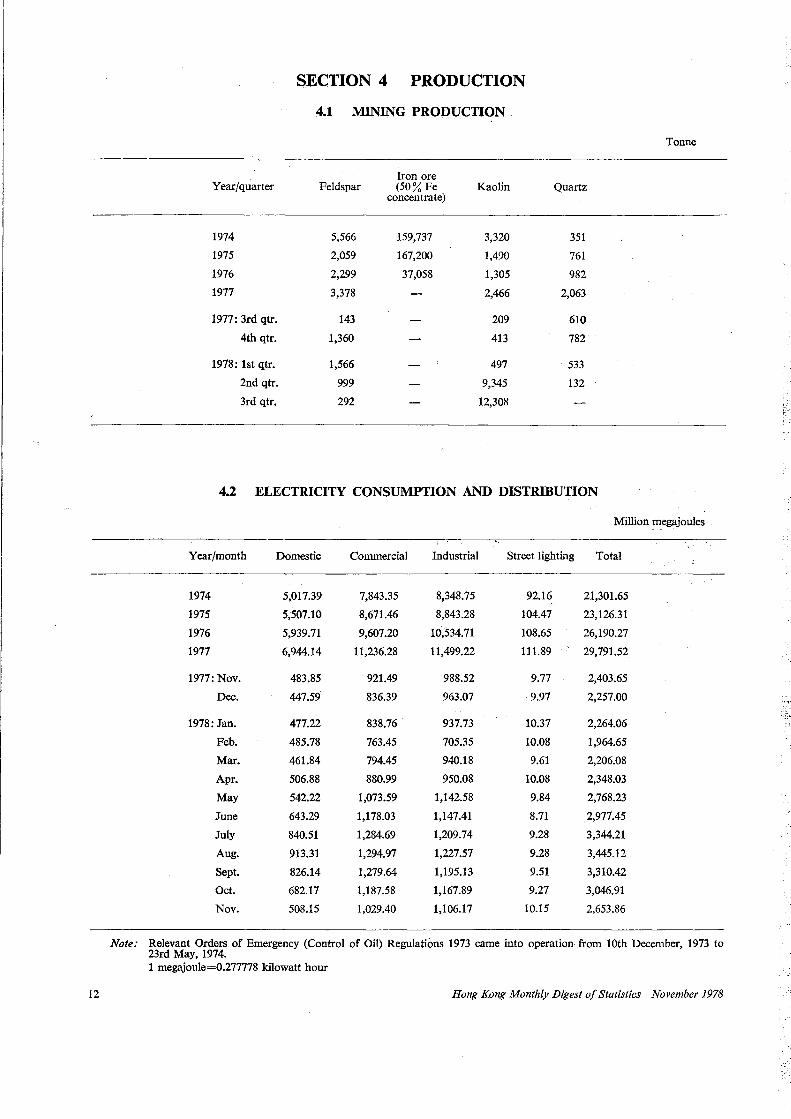
SECTION 4 PRODUCTION
4.1 MINING PRODUCTION
Tonne
Iron ore Year/quarter Feldspar (50% Fe Kaolin Quartz
concentrate)
1974 5,566 159,737 3,320 351
1975 2,059 167,200 1,490 761
1976 2,299 37,058 1,305 982
1977 3,378 2,466 2,063
1977: 3rd qtr. 143 209 610
4th qtr. 1,360 413 782
1978: lst qtr. 1,566 497 533
2nd qtr. 999 9,345 132
3rd qtr. 292 12,308
4.2 ELECTRICITY CONSUMPTION AND DISTRIBUTION
Million megajoules
Year/month Domestic Commercial Industrial Street lighting Total
1974 5,017.39 7,843.35 8,348.75 92.16 21,301.65
1975 5;507.10 8,671.46 8,843.28 104.47 23,126.31
1976 5,939.71 9,607.20 10,534.71 108.65 26,190.27
1977 6,944.14 11,236.28 11,499.22 111.89 29,791.52
1977: Nov. 483.85 921.49 988.52 9.77 2,403.65
Dec. 447.59 836.39 963.07 9.97 2,257.00
1978: Jan. 477.22 838.76 937.73 10.37 2,264.06
Feb. 485.78 763.45 705.35 10.08 1,964.65
Mar. 461.84 794.45 940.18 9.61 2,206.08
Apr. 506.88 880.99 950.08 10.08 2,348.03
May 542.22 1,073.59 1,142.58 9.84 2,768.23
June 643.29 1,178.03 1,147.41 8.71 2,977.45
July 840.51 1,284.69 1,209.74 9.28 3,344.21
Aug. 913.31 1,294.97 1,227.57 9.28 3,445.12
Sept. 826.14 1,279.64 1,195.13 9.51 3,310.42
Oct. 682.17 1,187.58 1,167.89 9.27 3,046.91
Nov. 508.15 1,029.40 1,106.17 10.15 2,653.86
Note: Relevant Orders of Emergency (Control of Oil) Regulations 1973 came into operation from lOth December, 1973 to 23rd May, 1974. 1 megajoule=0.277778 kilowatt hour
12 Hong Kong Monthly Digest of Statistics November 1978
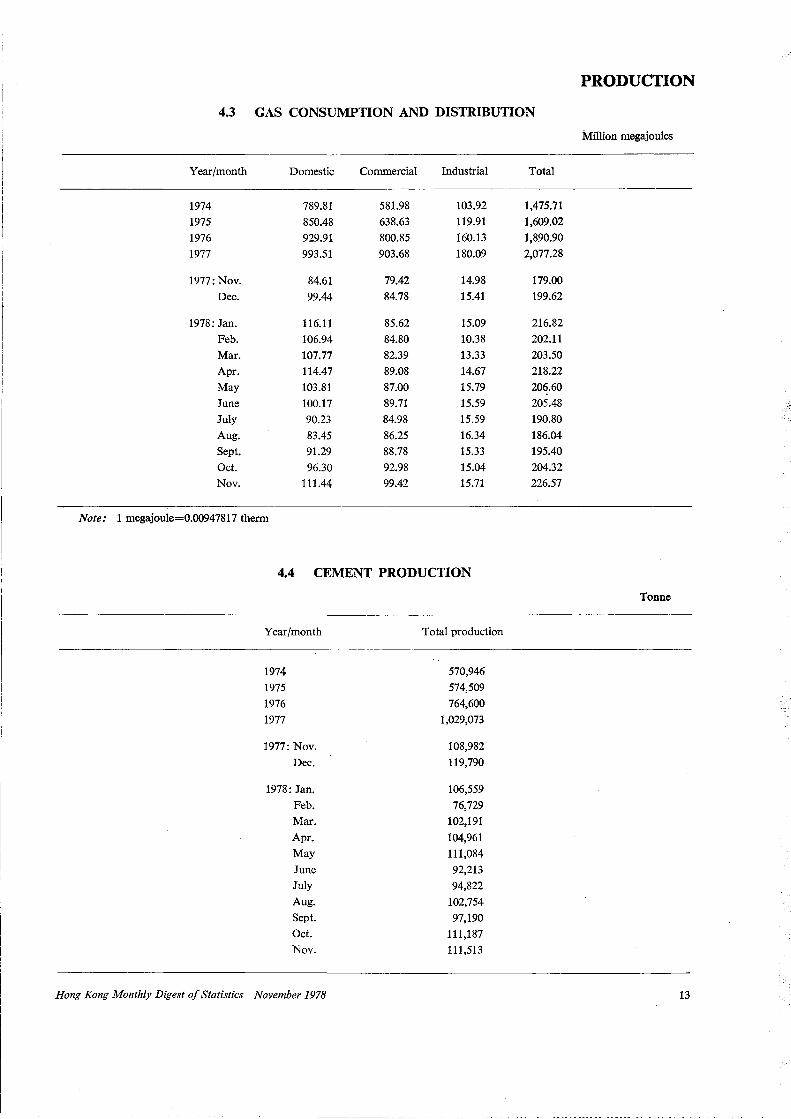
4.3 GAS CONSUMPTION AND DISTRIBUTION
Year/month Domestic Commercial Industrial
1974 789.81 581.98 103.92
1975 850.48 638.63 119.91
1976 929.91 800.85 160.13
1977 993.51 903.68 180.09
1977: Nov. 84.61 79.42 14.98
Dec. 99.44 84.78 15.41
1978: Jan. 116.11 85.62 15.09
Feb. 106.94 84.80 10.38
Mar. 107.77 82.39 13.33
Apr. 114.47 89.08 14.67
May 103.81 87.00 15.79
June 100.17 89.71 15.59
July 90.23 84.98 15.59
Aug. 83.45 86.25 16.34
Sept. 91.29 88.78 15.33
Oct. 96.30 92.98 15.04
Nov. lll.44 99.42 15.71
Note: 1 megajoule=0.00947817 therm
4.4 CEMENT PRODUCTION
Year/month
1974
1975
1976
1977
1977: Nov.
Dec.
1978: Jan.
Feb.
Mar.
Apr.
May
June
July
Aug.
Sept.
Oct.
Nov.
Hong Kong Monthly Digest of Statistics November 1978
Total production
570,946
574,509
764,600
1,029,073
108,982
119,790
106,559
76,729
102,191
104,961
111,084
92,213
94,822
102,754
97,190
111,187
111,513
Total
1,475.71
1,609.02
1,890.90
2,077.28
179.00
199.62
216.82
202.11
203.50
218.22
206.60
205.48
190.80
186.04
195.40
204.32
226.57
PRODUCTION
Million megajoules
Tonne
13
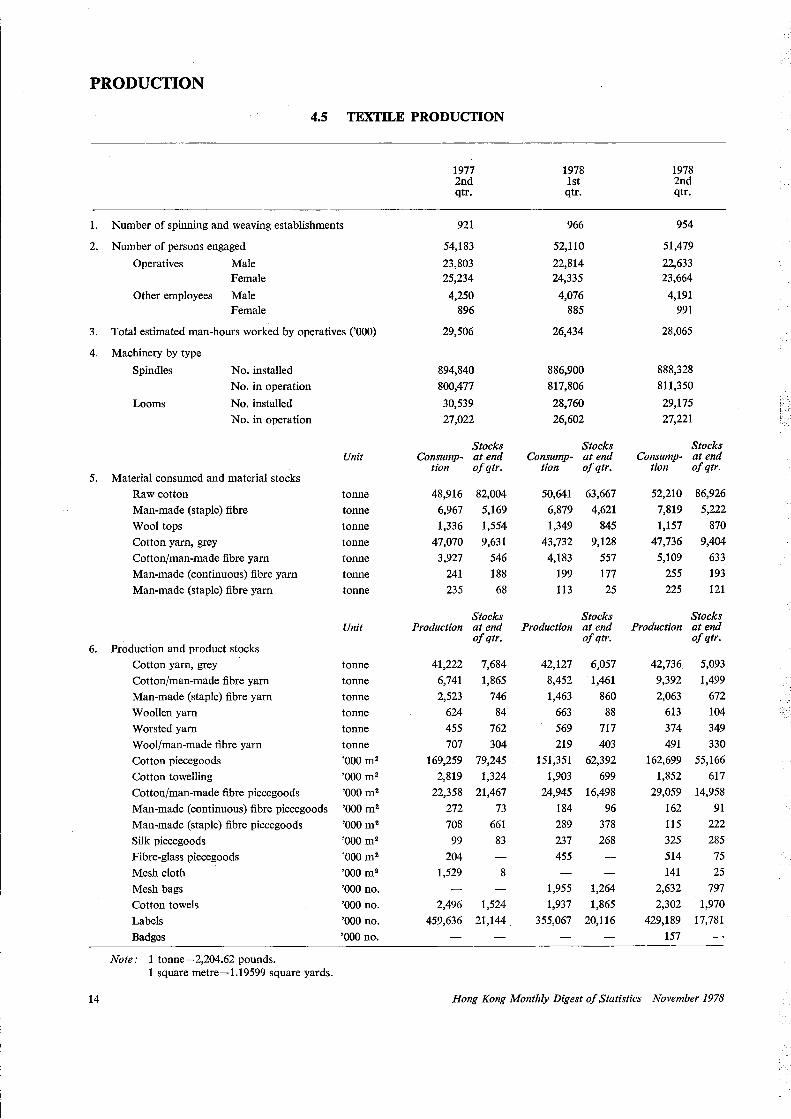
PRODUCTION
4.5 TEXTILE PRODUCTION
1977 1978 1978 2nd lst 2nd qtr. qtr. qtr.
1. Number of spinning and weaving establishments 921 966 954
2. Number of persons engaged 54,183 52,110 51,479
Operatives Male 23,803 22,814 22,633 Female 25,234 24,335 23,664
Other employees Male 4,250 4,076 4,191 Female 896 885 991
3. Total estimated man-hours worked by operatives ('OOO) 29,506 26,434 28,065
4. Machinery by type
Spindles No. installed 894,840 886,900 888,328
No. in operation 800,477 817,806 811,350
Looms No. installed 30,539 28,760 29,175
No. in operation 27,022 26,602 27,221
Stocks Stocks Stocks Unit Consump- at end Consump- at end Consump- at end
tion of qtr. tion of qtr. tion of qtr. 5. Material consumed and material stocks
Raw cotton tonne 48,916 82,004 50,641 63,667 52,210 86,926
Man-made (staple) fibre tonne 6,967 5,169 6,879 4,621 7,819 5,222
Wool tops tonne 1,336 1,554 1,349 845 1,157 870
Cotton yarn, grey tonne 47,070 9,631 43,732 9,128 47,736 9,404
Cotton/man-made fibre yarn tonne 3,927 546 4,183 557 5,109 633
Man-made (continuous) fibre yarn tonne 241 188 199 177 255 193
Man-made (staple) fibre yarn tonne 235 68 113 25 225 121
Stocks Stocks Stocks Unit Production at end Production at end Production at end
of qtr. of qtr. of qtr. 6. Production and product stocks
Cotton yarn, grey tonne 41,222 7,684 42,127 6,057 42,736 5,093
Cotton/man-made fibre yarn tonne 6,741 1,865 8,452 1,461 9,392 1,499
Man-made (staple) fibre yarn tonne 2,523 746 1,463 860 2,063 672
Woollen yarn tonne 624 84 663 88 613 104
Worsted yarn tonne 455 762 569 717 374 349
Wool/man-made fibre yarn tonne 707 304 219 403 491 330
Cotton piecegoods 'OOO m 2 169,259 79,245 151,351 62,392 162,699 55,166
Cotton towelling 'OOO m• 2,819 1,324 1,903 699 1,852 617
Cotton/man-made fibre piecegoods 'OOO m2 22,358 21,467 24,945 16,498 29,059 14,958
Man-made (continuous) fibre piecegoods 'OOO m2 272 73 184 96 162 91
Man-made (staple) fibre piecegoods 'OOO m 2 708 661 289 378 115 222
Silk piecegoods 'OOO m2 99 83 237 268 325 285
Fibre-glass piecegoods 'OOO m 2 204 455 514 75
Mesh cloth 'OOO m 2 1,529 8 141 25
Mesh bags 'OOO no. 1,955 1,264 2,632 797
Cotton towels 'OOO no. 2,496 1,524 1,937 1,865 2,302 1,970
Labels 'OOO no. 459,636 21,144 355,067 20,116 429,189 17,781
Badges 'OOO no. 157
Note: 1 tonne=2,204.62 pounds. 1 square metre=l.19599 square yards.
14 Hong Kong Monthly Digest of Statistics November 1978
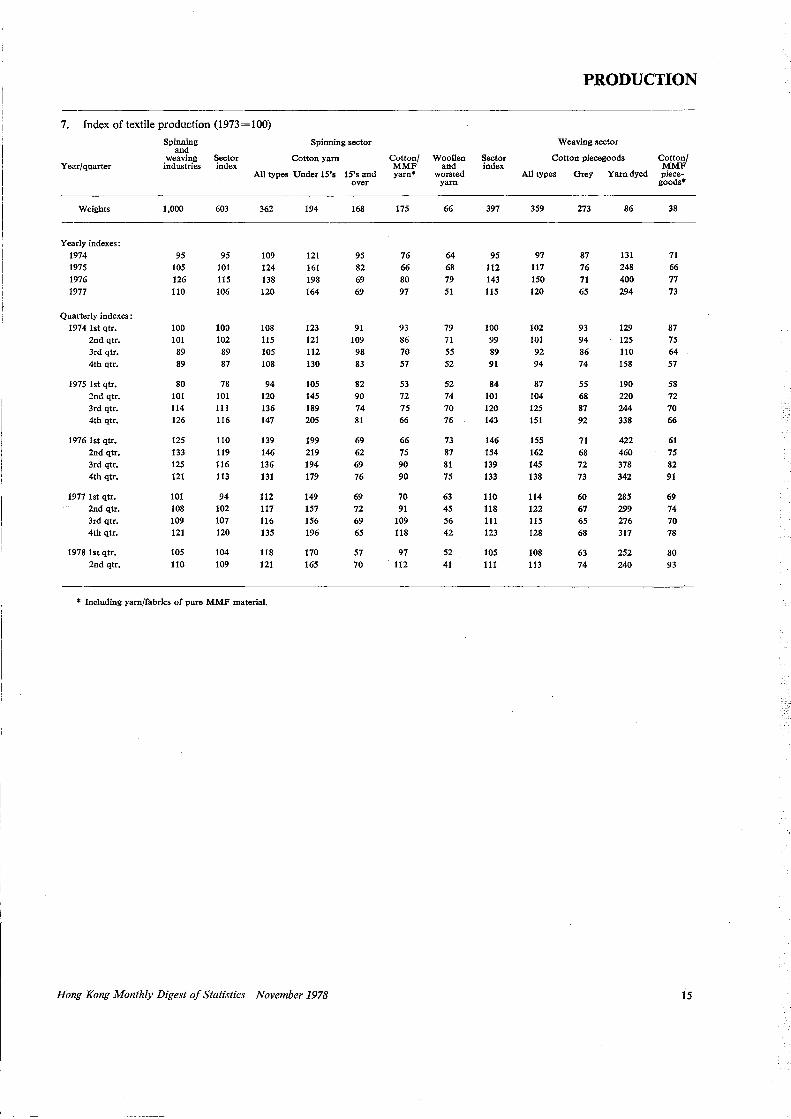
7. Index of textile production (1973=100)
Spinning
Year/quarter
and weaving
industries Sector index
Spinning sector
Cotton yam
All types Under 15's 15's and
Weights
Yearly indexes: 1974 1975 1976 1977
Quarterly indexes : 1974 lst qtr.
2nd qtr. 3rd qtr. 4th qtr.
1975 lst qtr. 2nd qtr. 3rd qtr. 4th qtr.
1976 lst qtr. 2nd qtr. 3rd qtr. 4th qtr.
1977 lst qtr. 2nd qtr. 3rd qtr. 4th qtr.
1978 ht qtr. 2nd qtr.
1,000
95 105 126 110
100 101
89 89
80 101 114 126
125 133 125 121
101 108 109 121
105 110
603
95 101 115 106
100 102
89 87
78 101 111 116
110 119 116 113
94 102 107 120
104 109
362
109 124 138 120
108 115 105 108
94 120 136 147
139 146 136 131
112 117 116 135
118 121
• Including yam/fabrics of pure MMF material.
194
121 161 198 164
123 121 112 130
105 145 189 205
199 219 194 179
149 157 156 196
170 165
Hong Kong Monthly Digest of Statistics November 1978
over
168
95 82 69 69
91 109 98 83
82 90 74 81
69 62 69 76
69 72 69 65
57 70
Cotton/ MMF yarn*
175
76 66 80 97
93 86 70 57
53 72 75 66
66 75 90 90
70 91
109 118
97 112
Woollen and
worsted yarn
66
64 68 79 51
79 71 55 52
52 74 70 76
73 87 81 75
63 45 56 42
52 41
Sector index
397
95 112 143 115
100 99 89 91
84 101 120 143
146 154 139 133
110 118 Ill 123
105 111
PRODUCTION
Weaving sector
Cotton piecegoods
All types Grey Yam dyed
359
97 117 150 120
102 101 92 94
87 104 125 151
155 162 145 138
114 122 115 128
108 113
273
87 76 71 65
93 94 86 74
55 68 87 92
71 68 72 73
60 67 65 68
63 74
86
131 248 400 294
129 125 110 158
190 220 244 338
422 460 378 342
285 299 276 317
252 240
Cotton/ MMF piece
goods•
38
71 66 77 73
87 75 64 57
58 72 70 66
61 75 82 91
69 74 70 78
80 93
15
Year/month
1974
1975
1976
1977
1977: Oct.
Nov.
Dec.
1978: Jan.
Feb.
Mar.
Apr.
May
June
July
Aug.
Sept.
Oct.
SECTION 5 EXTERNAL TRADE
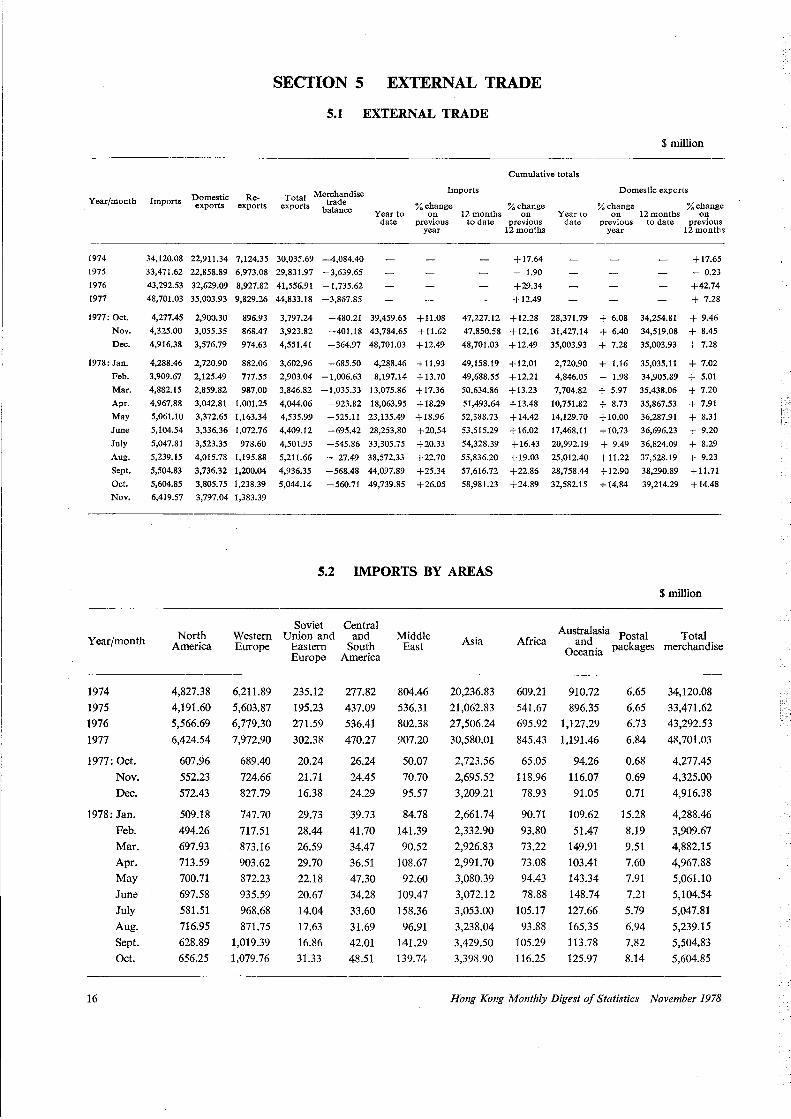
5.1 EXTERNAL TRADE
$million
Cumulative totals
Domestic Re-Imports Domestic exports
Imports exports exports Total Merchandise
exports b~l~~~e % change % change % change % change Year to
date on 12 months on Year to
date on 12 months on
previous to date previous previous to date previous year 12 months year 12 months
34,120.08 22,911.34 7,124.35 30,035.69 -4,084.40
33,471.62 22,858.89 6,973.08 29,831.97 -3,639.65
43,292.53 32,629.09 8,927.82 41,556.91 -1,735.62
48,701.03 35,003.93 9,829.26 44,833.18 -3,867.85
4,277.45 2,900.30 896.93 3,797.24 -480.21 39,459.65 +11.08
4,325.00 3,055.35 868.47 3,923.82 -401.18 43,784.65 + 11.62
4,916.38 3,576.79 974.63 4,551.41 -364.97 48,701.03 + 12.49
4,288.46 2, 720.90 882.06
3,909.67 2,125.49 777.55
4,882.15 2,859.82 987.00
4,967.88 3,042.81 1,001.25
5,061.10 3,372.65 1,163.34
5,104.54 3,336.36 1,072.76
5,047.81
5,239.15
5,504.83
5,604.85
3,523.35 978.60
4,015.78 1,195.88
3,736.32 1,200.04
3,805.75 1,238.39
3,602.96 -685.50 4,288.46 + 11.93
2,903.04 -1,006.63 8,197.14 + 13.70
3,846.82 -1,035.33 13,075.86 +17.36
4,044.06 -923.82 18,063.95 + 18.29
4,535.99 -525.11 23,135.49 + 18.96
4,409.12 -695.42 28,253.80 +20.54
4,501.95
5,211.66
4,936.35
5,044.14
-545.86 33,305.75 +20.33
- 27.49 38,572.33 +22.70
-568.48 44,097.89 +25.34
-560.71 49,739.85 +26.05
+17.64
- 1.90
+29.34
+12.49
+17.65
- 0.23
+42.74
+ 7.28
47,227.12 + 12.28 28,371.79 + 6.08 34,254.81 + 9.46
47,850.58 + 12.16 31,427.14 + 6.40 34,519.08 + 8.45
48,701.03 + 12.49 35,003.93 + 7.28 35,003.93 + 7.28
49,158.19 + 12.Ql
49,688.55 + 12.21
50,634.86 + 13.23
51,493.64 + 13.48
52,388.73 + 14.42
53,515.29 + 16.02
2, 720.90 + 1.16
4,846.05 - 1.98
7,704.82 + 5.97
10,751.82 + 8.73
14,129.70 +10.00
17,468.11 + 10.73
35,035.11 + 7.02
34,905.89 + 5.01
35,438.06 + 7.20
35,867.53 + 7.91
36,287.91 + 8.31
36,696.23 + 9.20
54,328.39 + 16.43 20,992.19 + 9.49 36,824.09 + 8.29
55,836.20 + 19.03 25,012.40 + 11.22 37 ,528.19 + 9.23
57,616.72 +22.86 28,758.44 +12.90 38,290.89 +11.71
58,981.23 +24.89 32,582.15 +14.84 39,214.29 +14.48
Nov. 6,419.57 3,797.04 1,383.39
Year/month
1974
1975
1976
1977
1977: Oct.
Nov.
Dec.
1978: Jan.
16
Feb. Mar.
Apr.
May
June
July
Aug.
Sept.
Oct.
North America
4,827.38
4,191.60
5,566.69
6,424.54
607.96
552.23
572.43
509.18
494.26
697.93
713.59
700.71
697.58
581.51
716.95
628.89
656.25
Western Europe
6,211.89
5,603.87
6,779.30
7,972.90
689.40
724.66
827.79
747.70
717.51
873.16
903.62
872.23
935.59
968.68
871.75
1,019.39
1,079.76
5.2 IMPORTS BY AREAS
Soviet Union and
Eastern Europe
235.12
195.23
271.59
302.38
20.24
21.71
16.38
29.73
28.44
26.59
29.70
22.18
20.67
14.04
17.63
16.86
31.33
Central and
South America
277.82
437.09
536.41
470.27
26.24
24.45
24.29
39.73
41.70
34.47
36.51
47.30
34.28
33.60
31.69
42.01
48.51
Middle East
804.46
536.31
802.38
907.20
50.07
70.70
95.57
84.78
141.39
90.52
108.67
92.60
109.47
158.36
96.91
141.29
139.74
Asia
20,236.83
21,062.83
27,506.24
30,580.01
2,723.56
2,695.52
3,209.21
2,661.74
2,332.90
2,926.83
2,991.70
3,080.39
3,072.12
3,053.00
3,238.04
3,429.50
3,398.90
$million
Australasia Postal Total Africa and
Oceania packages merchandise
609.21
541.67
695.92
845.43
65.05
118.96
78.93
90.71
93.80
73.22
73.08
94.43
78.88
105.17
93.88
105.29
116.25
910.72
896.35
1,127.29
1,191.46
94.26
116.07
91.05
109.62
51.47
149.91
103.41
143.34
148.74
127.66
165.35
113.78
125.97
6.65
6.65
6.73
6.84
0.68
0.69
0.71
15.28
8.19
9.51
7.60
7.91
7.21
5.79
6.94
7.82
8.14
34,120.08
33,471.62
43,292.53
48,701.03
4,277.45
4,325.00
4,916.38
4,288.46
3,909.67
4,882.15
4,967.88
5,061.10
5,104.54
5,047.81
5,239.15
5,504.83
5,604.85
Hong Kong Monthly Digest of Statistics November 1978
EXTERNAL TRADE
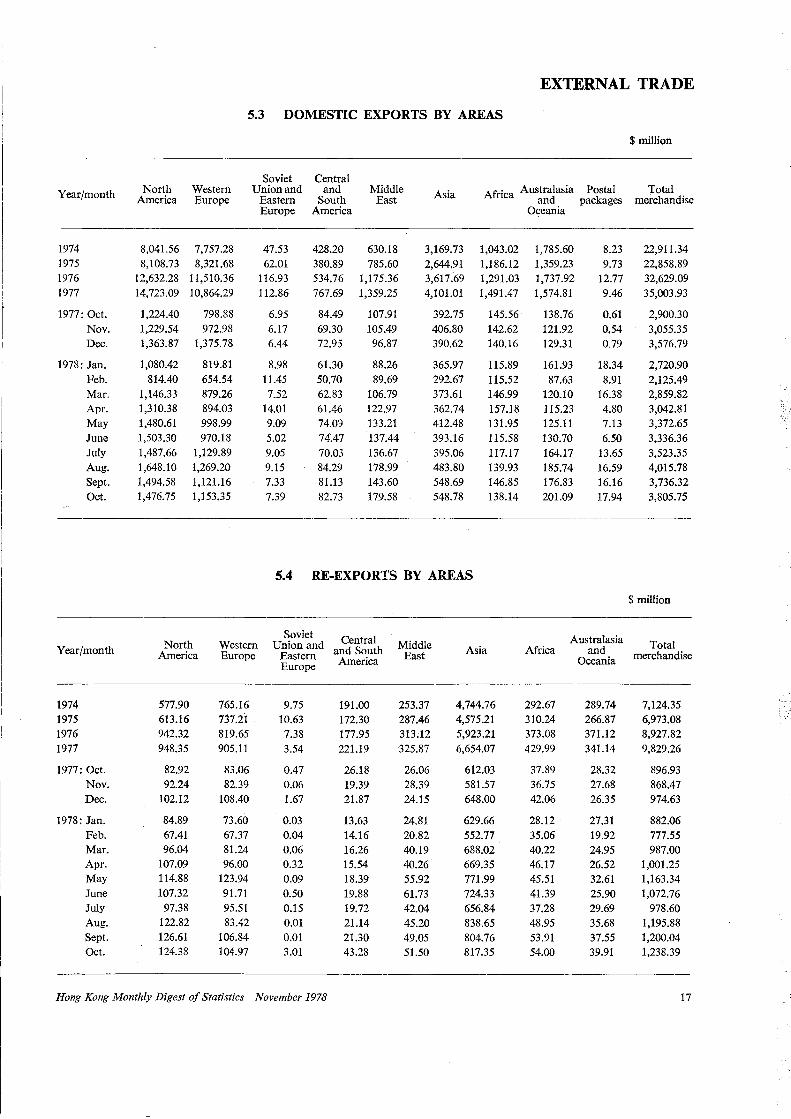
5.3 DOMESTIC EXPORTS BY AREAS
$million
Year/month North America
Western Europe
Soviet Union and
Eastern Europe
Central and
South America
Middle East Asia Africa Australasia Postal
and packages Total
merchandise
1974 1975 1976 1977
1977: Oct. Nov. Dec.
1978: Jan. Feb. Mar. Apr. May June July Aug. Sept. Oct.
Year/month
1974 1975 1976 1977
1977: Oct. Nov. Dec.
1978: Jan. Feb. Mar. Apr. May June July Aug. Sept. Oct.
8,041.56 8,108.73
12,632.28 14,723.09
1,224.40 1,229.54 1,363.87
1,080.42 814.40
1, 146.33 1,310.38 1,480.61 1,503.30 1,487.66 1,648.10 1,494.58 1,476.75
7,757.28 8,321.68
11,510.36 10,864.29
798.88 972.98
1,375.78
819.81 654.54 879.26 894.03 998.99 970.18
1,129.89 1,269.20 1,121.16 1,153.35
North America
Western Europe
577.90 613.16 942.32 948.35
82.92 92.24
102.12
84.89 67.41 96.04
107.09 114.88 107.32
97.38 122.82 126.61 124.38
765.16 737.21 819.65 905.11
83.06 82.39
108.40
73.60 67.37 81.24 96.00
123.94 91.71 95.51 83.42
106.84 104.97
47.53 62.01
116.93 112.86
428.20 380.89 534.76 767.69
630.18 785.60
1,175.36 1,359.25
3,169.73 2,644.91 3,617.69 4,101.01
1,043.02 1,186.12 1,291.03 1,491.47
6.95 6.17 6.44
8.98 11.45 7.52
14.01 9.09 5.02 9.05 9.15 7.33 7.39
84.49 69.30 72.95
61.30 50.70 62.83 61.46 74.09 74A7 70.03 84.29 81.13 82.73
107.91 105.49 96.87
88.26 89.69
106.79 122.97 133.21 137.44 136.67 178.99 143.60 179.58
392.75 406.80 390.62
365.97 292.67 373.61 362.74 412.48 393.16 395.06 483.80 548.69 548.78
145.56 142.62 140.16
115.89 115.52 146.99 157.18 131.95 115.58 117.17 139.93 146.85 138.14
5.4 RE-EXPORTS BY AREAS
Soviet Union and Central
Eastern and South America Europe
9.75 10.63 7.38 3.54
0.47 0.06 1.67
0.03 0.04 0.06 0.32 0.09 0.50 0.15 0.01 0.01 3.01
191.00 172.30 177.95 221.19
26.18 19.39 21.87
13.63 14.16 16.26 15.54 18.39 19.88 19.72 21.14 21.30 43.28
Middle East
253.37 287.46 313.12 325.87
26.06 28.39 24.15
24.81 20.82 40.19 40.26 55.92 61.73 42.04 45.20 49.05 51.50
Asia
4,744.76 4,575.21 5,923.21 6,654.07
612.03 581.57 648.00
629.66 552.77 688.02 669.35 771.99 724.33 656.84 838.65 804.76 817.35
Hong Kong Monthly Digest of Statistics November 1978
Oceania
1,785.60 1,359.23 1,737.92 1,574.81
138.76 121.92 129.31
161.93 87.63
120.10 115.23 125.11 130.70 164.17 185.74 176.83 201.09
8.23 9.73
12.77 9.46
0.61 0.54 0.79
18.34 8.91
16.38 4.80 7.13 6.50
13.65 16.59 16.16 17.94
Africa Australasia
and Oceania
292.67 310.24 373.08 429.99
37.89 36.75 42.06
28.12 35.06 40.22 46.17 45.51 41.39 37.28 48.95 53.91 54.00
289.74 266.87 371.12 341.14
28.32 27.68 26.35
27.31 19.92 24.95 26.52 32.61 25.90 29.69 35.68 37.55 39.91
22,911.34 22,858.89 32,629.09 35,003.93
2,900.30 3,055.35 3,576.79
2,720.90 2,125.49 2,859.82 3,042.81 3,372.65 3,336.36 3,523.35 4,015.78 3,736.32 3,805.75
$million
Total merchandise
7,124.35 6,973.08 8,927.82 9,829.26
896.93 868.47 974.63
882.06 777.55 987.00
1,001.25 1,163.34 1,072.76
978.60 1,195.88 1,200.04 1,238.39
17
EXTERNAL TRADE
Year/month
1974 1975 1976 1977
1977: Oct. Nov. Dec.
1978: Jan. Feb. Mar. Apr. May June July Aug. Sept. Oct.
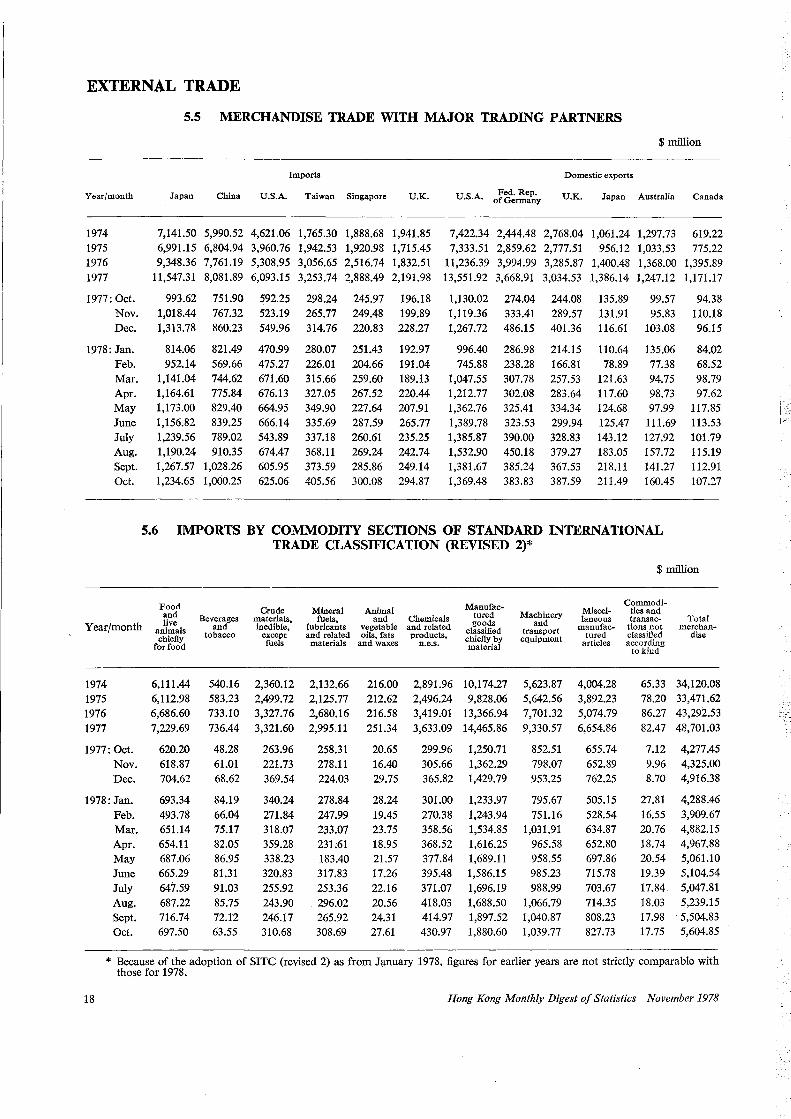
5.5 MERCHANDISE TRADE WITH MAJOR TRADING PARTNERS
Imports
Japan China U.S.A. Taiwan Singapore U.K.
7,141.50 5,990.52 4,621.06 1,765.30 1,888.68 1,941.85 6,991.15 6,804.94 3,960.76 1,942.53 1,920.98 1,715.45 9,348.36 7,761.19 5,308.95 3,056.65 2,516.74 1,832.51
11,547.31 8,081.89 6,093.15 3,253.74 2,888.49 2,191.98
993.62 751.90 1,018.44 767.32 1,313.78 860.23
814.06 821.49 952.14 569.66
1,141.04 744.62 1,164.61 775.84 1,173.00 829.40 1,156.82 839.25 1,239.56 789.02 1,190.24 910.35 1,267.57 1,028.26 1,234.65 1,000.25
592.25 523.19 549.96
470.99 475.27 671.60 676.13 664.95 666.14 543.89 674.47 605.95 625.06
298.24 245.97 265.77 249.48 314.76 220.83
280.07 251.43 226.01 204.66 315.66 259.60 327.05 267.52 349.90 227.64 335.69 287.59 337.18 260.61 368.11 269.24 373.59 285.86 405.56 300.08
196.18 199.89 228.27
192.97 191.04 189.13 220.44 207.91 265.77 235.25 242.74 249.14 294.87
U.S.A. Fed. Rep. of Germany
Domestic exports
U.K. Japan
$million
Australia Canada
7,422.34 2,444.48 2,768.04 1,061.24 1,297.73 619.22 7,333.51 2,859.62 2,777.51 956.12 1,033.53 775.22
11,236.39 3,994.99 3,285.87 1,400.48 1,368.00 1,395.89 13,551.92 3,668.91 3,034.53 1,386.14 1,247.12 1,171.17
1,130.02 1,119.36 1,267.72
996.40 745.88
1,047.55 1,212.77 1,362.76 1,389.78 1,385.87 1,532.90 1,381.67 1,369.48
274.04 333.41 486.15
286.98 238.28 307.78 302.08 325.41 323.53 390.00 450.18 385.24 383.83
244.08 289.57 401.36
214.15 166.81 257.53 283.64 334.34 299.94 328.83 379.27 367.53 387.59
135.89 131.91 116.61
110.64 78.89
121.63 117.60 124.68 125.47 143.12 183.05 218.11 211.49
99.57 95.83
103.08
135.06 77.38 94.75 98.73 97.99
111.69 127.92 157.72 141.27 160.45
94.38 110.18 96.15
84.02 68.52 98.79 97.62
117.85 113.53 101.79 115.19 112.91 107.27
5.6 IMPORTS BY COMMODITY SECTIONS OF STANDARD INTERNATIONAL TRADE CLASSIFICATION (REVISED 2)*
$million
Animal and Chemicals
Year/month
Food and live
animals chiefly
for food
Beverages and
tobacco
Crude materials. inedible,
except fuels
Mineral fuels,
lubricants and related
materials
vegetable and related oils, fats products,
Mannfactured goods
classified chiefly by material
Machinery and
transport equipment
Miscellaneous
manufac-tured
articles
Commodities and transac
tions not classified according
Total merchan
dise
1974 1975 1976 1977
1977: Oct. Nov. Dec.
1978: Jan. Feb. Mar. Apr. May June July Aug. Sept. Oct.
6,111.44 6,112.98 6,686.60 7,229.69
620.20 618.87 704.62
693.34 493.78 651.14 654.11 687.06 665.29 647.59 687.22 716.74 697.50
540.16 583.23 733.10 736.44
48.28 61.01 68.62
84.19 66.04 75.17 82.05 86.95 81.31 91.03 85.75 72.12 63.55
2,360.12 2,499.72 3,327.76 3,321.60
263.96 221.73 369.54
340.24 271.84 318.07 359.28 338.23 320.83 255.92 243.90 246.17 310.68
2,132.66 2,125.77 2,680.16 2,995.11
258.31 278.11 224.03
278.84 247.99 233.07 231:61 183.40 317.83 253.36 296.02 265.92 308.69
and waxes n.e.s.
216.00 212.62 216.58 251.34
20.65 16.40 29.75
28.24 19.45 23.75 18.95 21.57 17.26 22.16 20.56 24.31 27.61
2,891.96 2,496.24 3,419.01 3,633.09
299.96 305.66 365.82
301.00 270.38 358.56 368.52 377.84 395.48 371.07 418.03 414.97 430.97
10,174.27 9,828.06
13,366.94 14,465.86
1,250.71 1,362.29 1,429.79
1,233.97 1,243.94 1,534.85 1,616.25 1,689.11 1,586.15 1,696.19 1,688.50 1,897.52 1,880.60
5,623.87 5,642.56 7,701.32 9,330.57
852.51 798.07 953.25
795.67 751.16
1,031.91 965.58 958.55 985.23 988.99
1,066.79 1,040.87 1,039.77
4,004.28 3,892.23 5,074.79 6,654.86
655.74 652.89 762.25
505.15 528.54 634.87 652.80 697.86 715.78 703.67 714.35 808.23 827.73
to kind
65.33 78.20 86.27 82.47
7.12 9.96 8.70
27.81 16.55 20.76 18.74 20.54 19.39 17.84 18.03 17.98 17.75
34,120.08 33,471.62 43,292.53 48,701.03
4,277.45 4,325.00 4,916.38
4,288.46 3,909.67 4,882.15 4,967.88 5,061.10 5,104.54 5,047.81 5,239.15 5,504.83 5,604.85
* Because of the adoption of SITC (revised 2) as from January 1978, figures for earlier years are not strictly comparable with those for 1978.
18 Hong Kong Monthly Digest of Statistics November 1978
EXTERNAL TRADE
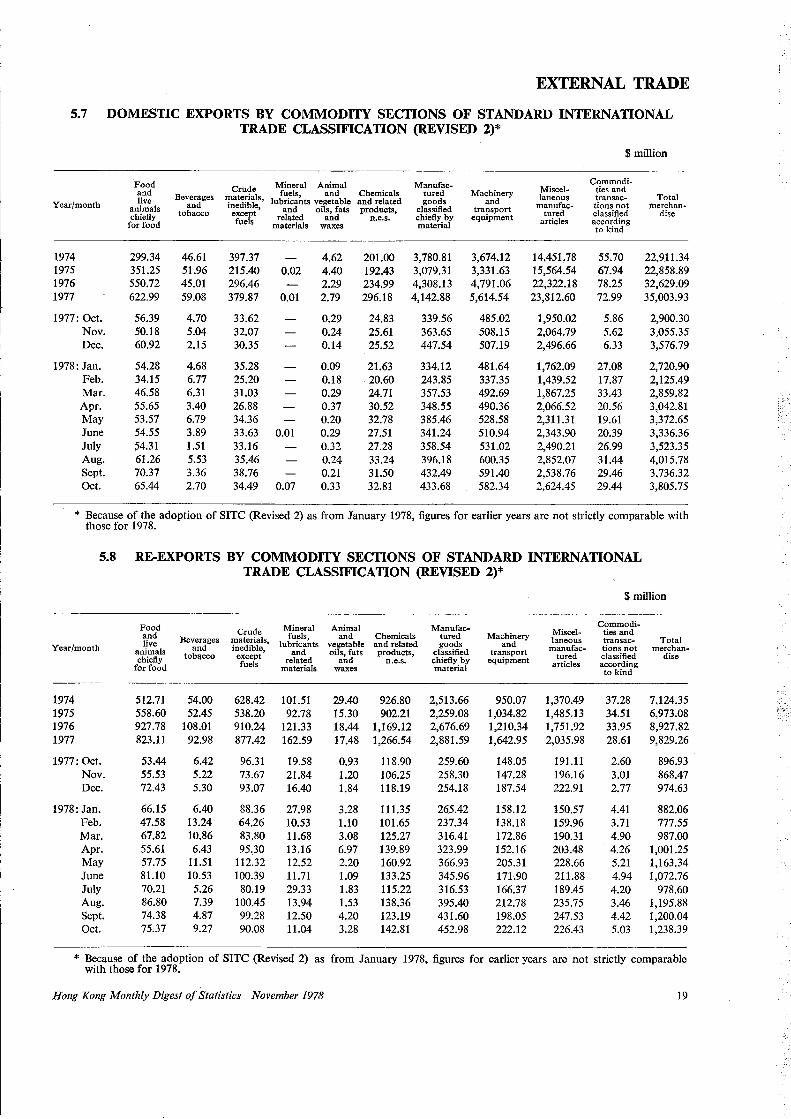
5.7 DOMESTIC EXPORTS BY COMMODITY SECTIONS OF STANDARD INTERNATIONAL TRADE CLASSIFICATION (REVISED 2)*
$million
Food Mineral Animal Manufac- Commodi-and Crude fuels, and Chemicals tu red Machinery Miscel- ties and
Beverages materials, laneous transac- Total Year/month live and inedible, lubricants vegetable and related goods and manufac- tions not tnerchan-animals tobacco except and oils, fats products, classified transport tured classified dise chiefly
fuels related and n.e.s. chiefly by equipment articles according for food materials waxes material to kind
1974 299.34 46.61 397.37 4.62 201.00 3,780.81 3,674.12 14,451.78 55.70 22,911.34 1975 351.25 51.96 215.40 0.02 4.40 192.43 3,079.31 3,331.63 15,564.54 67.94 22,858.89 1976 550.72 45.01 296.46 2.29 234.99 4,308.13 4,791.06 22,322.18 78.25 32,629.09 1977 622.99 59.08 379.87 0.01 2.79 296.18 4,142.88 5,614.54 23,812.60 72.99 35,003.93
1977: Oct. 56.39 4.70 33.62 0.29 24.83 339.56 485.02 1,950.02 5.86 2,900.30 Nov. 50.18 5.04 32.07 0.24 25.61 363.65 508.15 2,064.79 5.62 3,055.35 Dec. 60.92 2.15 30.35 0.14 25.52 447.54 507.19 2,496.66 6.33 3,576.79
1978: Jan. 54.28 4.68 35.28 0.09 21.63 334.12 481.64 1,762.09 27.08 2,720.90 Feb. 34.15 6.77 25.20 0.18 20.60 243.85 337.35 1,439.52 17.87 2,125.49 Mar. 46.58 6.31 31.03 0.29 24.71 357.53 492.69 1,867.25 33.43 2,859.82 Apr. 55.65 3.40 26.88 0.37 30.52 348.55 490.36 2,066.52 20.56 3,042.81 May 53.57 6.79 34.36 0.20 32.78 385.46 528.58 2,311.31 19.61 3,372.65 June 54.55 3.89 33.63 0.01 0.29 27.51 341.24 510.94 2,343.90 20.39 3,336.36 July 54.31 1.51 33.16 0.32 27.28 358.54 531.02 2,490.21 26.99 3,523.35 Aug. 61.26 5.53 35.46 0.24 33.24 396.18 600.35 2,852.07 31.44 4,015.78 Sept. 70.37 3.36 38.76 0.21 31.50 432.49 591.40 2,538.76 29.46 3,736.32 Oct. 65.44 2.70 34.49 0.07 0.33 32.81 433.68 582.34 2,624.45 29.44 3,805.75
* Because of the adoption of SITC (Revised 2) as from January 1978, figures for earlier years are not strictly comparable with those for 1978.
5.8 RE-EXPORTS BY COMMODITY SECTIONS OF STANDARD INTERNATIONAL TRADE CLASSIFICATION (REVISED 2)*
$million
Food Mineral Animal Manufac- Commodi-and Crude fuels, and Chemicals tured Machinery Miscel- ties and
Beverages materials, laneous transac- Total Year/month live and inedible, lubricants vegetable and related goods and manufac- tions not merchan-animals tobacco except and oils, fats products, classified transport tured classified dise chiefly fuels related and n.e.s. chiefly by equipment articles according for food materials waxes material to kind
1974 512.71 54.00 628.42 101.51 29.40 926.80 2,513.66 950.07 1,370.49 37.28 7,124.35 1975 558.60 52.45 538.20 92.78 15.30 902.21 2,259.08 1,034.82 1,485.13 34.51 6,973.08 1976 927.78 108.01 910.24 121.33 18.44 1,169.12 2,676.69 1,210.34 1,751.92 33.95 8,927.82 1977 823.11 92.98 877.42 162.59 17.48 1,266.54 2,881.59 1,642.95 2,035.98 28.61 9,829.26
1977: Oct. 53.44 6.42 96.31 19.58 0.93 118.90 259.60 148.05 191.11 2.60 896.93 Nov. 55.53 5.22 73.67 21.84 1.20 106.25 258.30 147.28 196.16 3.01 868.47 Dec. 72.43 5.30 93.07 16.40 1.84 118.19 254.18 187.54 222.91 2.77 974.63
1978: Jan. 66.15 6.40 88.36 27.98 3.28 111.35 265.42 158.12 150.57 4.41 882.06 Feb. 47.58 13.24 64.26 10.53 1.10 101.65 237.34 138.18 159.96 3.71 777.55 Mar. 67.82 10.86 83.80 11.68 3.08 125.27 316.41 172.86 190.31 4.90 987.00 Apr. 55.61 6.43 95.30 13.16 6.97 139.89 323.99 152.16 203.48 4.26 1,001.25 May 57.75 11.51 112.32 12.52 2.20 160.92 366.93 205.31 228.66 5.21 1,163.34 June 81.10 10.53 100.39 11.71 1.09 133.25 345.96 171.90 211.88 4.94 1,072.76 July 70.21 5.26 80.19 29.33 1.83 115.22 316.53 166.37 189.45 4.20 978.60 Aug. 86.80 7.39 100.45 13.94 1.53 138.36 395.40 212.78 235.75 3.46 1,195.88 Sept. 74.38 4.87 99.28 12.50 4.20 123.19 431.60 198.05 247.53 4.42 1,200.04 Oct. 75.37 9.27 90.08 11.04 3.28 142.81 452.98 222.12 226.43 5.03 1,238.39
* Because of the adoption of SITC (Revised 2) as with those for 1978.
from January 1978, figures for earlier years are not strictly comparable
Hong Kong Monthly Digest of Statistics November 1978 19
EXTERNAL TRADE
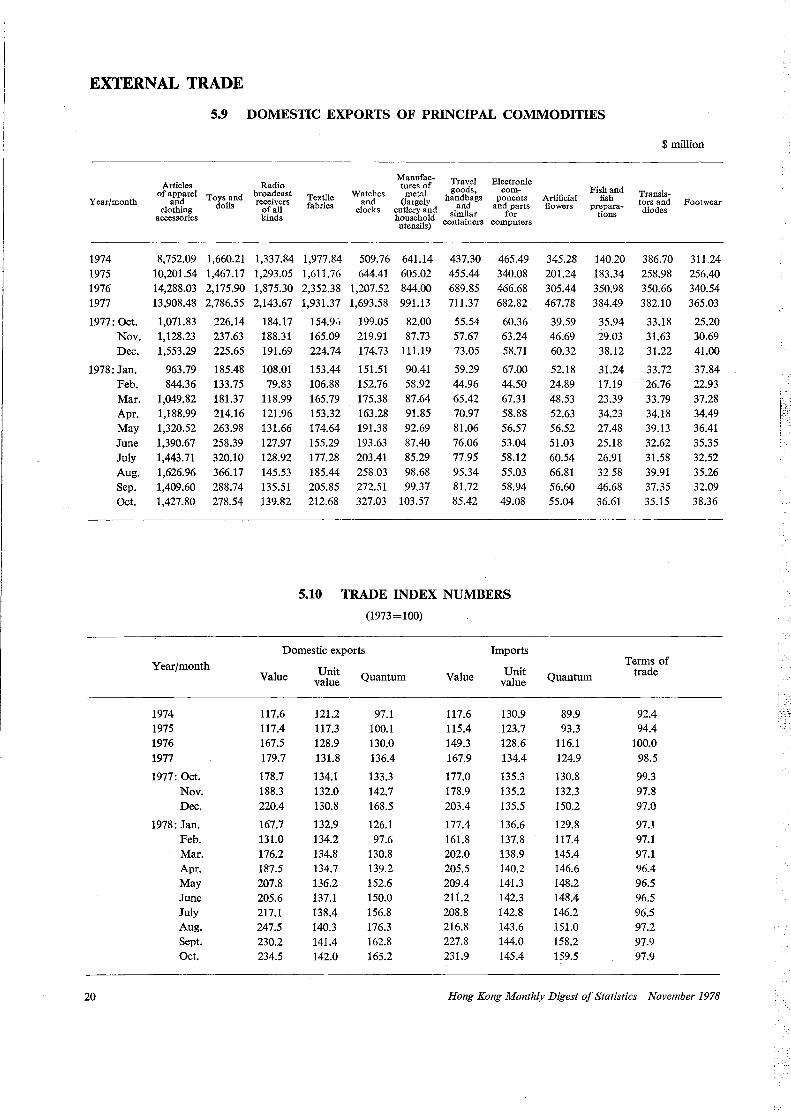
5.9 DOMESTIC EXPORTS OF PRINCIPAL COMMODITIES
Year/month
1974 1975 1976 1977
1977: Oct. Nov. Dec.
1978: Jan.
20
Feb. Mar. Apr. May June July Aug. Sep. Oct.
Articles of a,.I';'J'rel Toys and clothing dolls
accessories
8,752.09 10,201.54 14,288.03 13,908.48
1,071.83 1,128.23 1,553.29
963.79 844.36
1,049.82 1,188.99 1,320.52 1,390.67 1,443.71 1,626.96 1,409.60 1,427.80
1,660.21 1,467.17 2,175.90 2,786.55
226.14 237.63 225.65
185.48 133.75 181.37 214.16 263.98 258.39 320.10 366.17 288.74 278.54
Year/month
1974 1975 1976 1977
1977: Oct. Nov. Dec.
1978: Jan. Feb. Mar. Apr. May June July Aug. Sept. Oct.
Radio broadcast receivers
of all kinds
1,337.84 l,293.05 1,875.30 2,143.67
184.17 188.31 191.69
108.01 79.83
118.99 121.96 131.66 127.97 128.92 145.53 135.51 139.82
Textile fabrics
1,977.84 1,611.76 2,352.38 1,931.37
154.95 165.09 224.74
153.44 106.88 165.79 153.32 174.64 155.29 177.28 185.44 205.85 212.68
Watches and
clocks
Manufactures of
metal (largely
cutlery and household
utensils)
509.76 641.14 644.41 605.02
1,207.52 844.00 1,693.58 991.13
199.05 82.00 219.91 87.73 174.73 111.19
151.51 90.41 152.76 58.92 175.38 87.64 163.28 91.85 191.38 92.69 193.63 87.40 203.41 85.29 258.03 98.68 272.51 99.37 327.03 103.57
Travel goods,
handbags and
similar containers
437.30 455.44 689.85 711.37
55.54 57.67 73.05
59.29 44.96 65.42 70.97 81.06 76.06 77.95 95.34 81.72 85.42
Electronic com
ponents and parts
for computers
465.49 340.08 466.68 682.82
60.36 63.24 58.71
67.00 44.50 67.31 58.88 56.57 53.04 58.12 55.03 58.94 49.08
5.10 TRADE INDEX NUMBERS
(1973=100)
Domestic exports Imports
Unit value Value
117.6 117.4 167.5 179.7
178.7 188.3 220.4
167.7 131.0 176.2 187.5 207.8 205.6 217.1 247.5 230.2 234.5
Unit value
121.2 117.3 128.9 131.8
134.1 132.0 130.8
132.9 134.2 134.8 134.7 136.2 137.1 138.4 140.3 141.4 142.0
Quantum
97.1 100.1 130.0 136.4
133.3 142.7 168.5
126.1 97.6
130.8 139.2 152.6 150.0 156.8 176.3 162.8 165.2
Value
117.6 115.4 149.3 167.9
177.0 178.9 203.4
177.4 161.8 202.0 205.5 209.4 211.2 208.8 216.8 227.8 231.9
130.9 123.7 128.6 134.4
135.3 135.2 135.5
136.6 137.8 138.9 140.2 141.3 142.3 142.8 143.6 144.0 145.4
Artificial flowers
345.28 201.24 305.44 467.78
39.59 46.69 60.32
52.18 24.89 48.53 52.63 56.52 51.03 60.54 66.81 56.60 55.04
Fish and fish
preparations
140.20 183.34 350.98 384.49
35.94 29.03 38.12
31.24 17.19 23.39 34.23 27.48 25.18 26.91 32.58 46.68 36.61
$million
Transistors and diodes
386.70 258.98 350.66 382.10
33.18 31.63 31.22
33.72 26.76 33.79 34.18 39.13 32.62 31.58 39.91 37.35 35.15
Footwear
311.24 256.40 340.54 365.03
25.20 30.69 41.00
37.84 22.93 37.28 34.49 36.41 35.35 32.52 35.26 32.09 38.36
Quantum
Terms of trade
89.9 93.3
116.1 124.9
130.8 132.3 150.2
129.8 117.4 145.4 146.6 148.2 148.4 146.2 151.0 158.2 159.5
92.4 94.4
100.0 98.5
99.3 97.8 97.0
97.1 97.1 97.1 96.4 96.5 96.5 96.5 97.2 97.9 97.9
Hong Kong Monthly Digest of Statistics November 1978
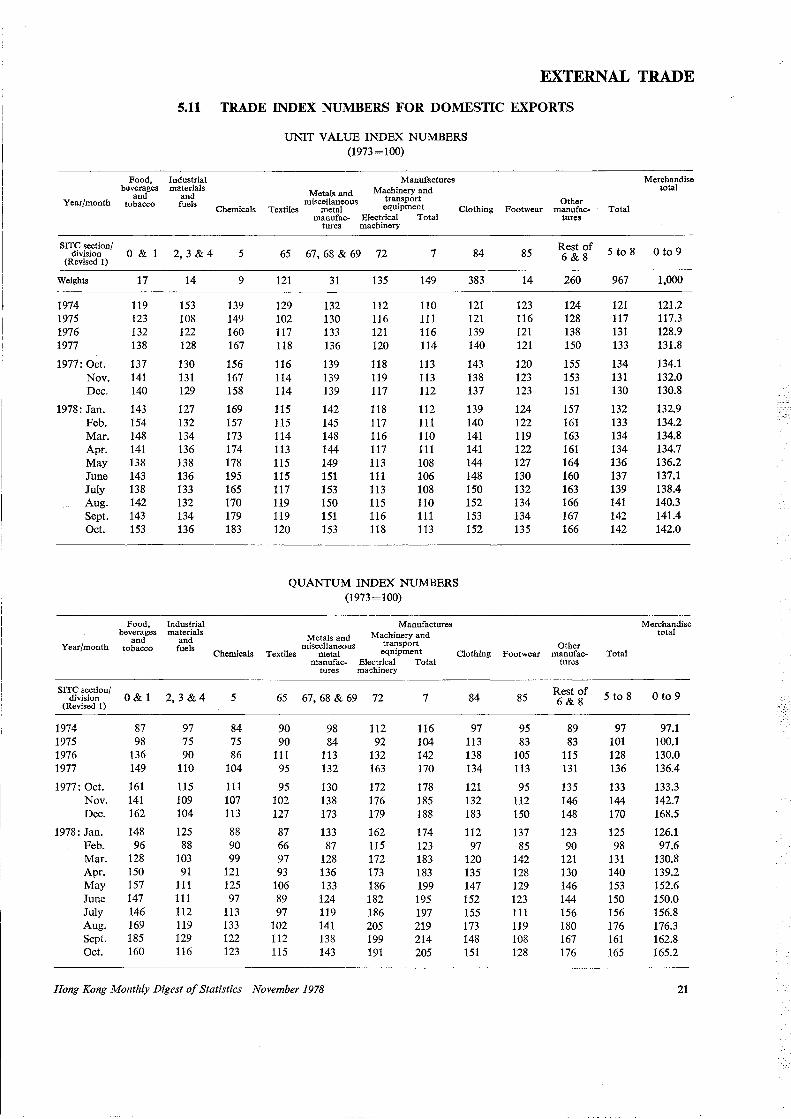
EXTERNAL TRADE
5.11 TRADE INDEX NUMBERS FOR DOMESTIC EXPORTS
UNIT VALUE INDEX NUMBERS (1973=100)
Food, Industrial Manufactures Merchandise beverages materials
Metals and Machinery and total and and
Year/month tobacco fuels miscellaneous transport Other Chemicals Textiles metal equipment Clothing Footwear manufac- Total
1nanufac- Electrical Total tures tures machinery
SITC section/ 0 & 1 2, 3 &4 5 65 67, 68 & 69 72 7 84 85 Rest of 5 to 8 0 to 9 division 6&8 (Revised I)
Weights 17 14 9 121 31 135 149 383 14 260 967 1,000
1974 119 153 139 129 132 112 110 121 123 124 121 121.2 1975 123 108 149 102 130 116 111 121 116 128 117 117.3 1976 132 122 160 117 133 121 116 139 121 138 131 128.9 1977 138 128 167 118 136 120 114 140 121 150 133 131.8
1977: Oct. 137 130 156 116 139 118 113 143 120 155 134 134.1 Nov. 141 131 167 114 139 119 113 138 123 153 131 132.0 Dec. 140 129 158 114 139 117 112 137 123 151 130 130.8
1978: Jan. 143 127 169 115 142 118 112 139 124 157 132 132.9 Feb. 154 132 157 115 145 117 111 140 122 161 133 134.2 Mar. 148 134 173 114 148 116 110 141 119 163 134 134.8 Apr. 141 136 174 113 144 117 111 141 122 161 134 134.7 May 138 138 178 115 149 113 108 144 127 164 136 136.2 June 143 136 195 115 151 111 106 148 130 160 137 137.1 July 138 133 165 117 153 113 108 150 132 163 139 138.4 Aug. 142 132 170 119 150 115 110 152 134 166 141 140.3 Sept. 143 134 179 119 151 116 111 153 134 167 142 141.4 Oct. 153 136 183 120 153 118 113 152 135 166 142 142.0
QUANTUM INDEX NUMBERS (1973=100)
Food, Industrial Manufactures Merchandise beverages materials
Metals and Machinery and total and and
Year/month tobacco fuels miscellaneous transport Other Chemicals Textiles metal equipment Clothing Footwear manufac .. Total
manufac- Electrical Total tures tures machinery
SITC section/ O&l 2, 3 &4 5 65 67, 68 & 69 72 7 84 85 Rest of 5 to 8 0 to 9 division 6&8 (Revised I)
1974 87 97 84 90 98 112 116 97 95 89 97 97.1 1975 98 75 75 90 84 92 104 113 83 83 101 100.1 1976 136 90 86 111 113 132 142 138 105 115 128 130.0 1977 149 110 104 95 132 163 170 134 113 131 136 136.4
1977: Oct. 161 115 111 95 130 172 178 121 95 135 133 133.3 Nov. 141 109 107 102 138 176 185 132 112 146 144 142.7 Dec. 162 104 113 127 173 179 188 183 150 148 170 168.5
1978: Jan. 148 125 88 87 133 162 174 112 137 123 125 126.1 Feb. 96 88 90 66 87 115 123 97 85 90 98 97.6 Mar. 128 103 99 97 128 172 183 120 142 121 131 130.8 Apr. 150 91 121 93 136 173 183 135 128 130 140 139.2 May 157 111 125 106 133 186 199 147 129 146 153 152.6 June 147 111 97 89 124 182 195 152 123 144 150 150.0 July 146 112 113 97 119 186 197 155 111 156 156 156.8 Aug. 169 119 133 102 141 205 219 173 119 180 176 176.3 Sept. 185 129 122 112 138 199 214 148 108 167 161 162.8 Oct. 160 116 123 115 143 191 205 151 128 176 165 165.2
Hong Kong Monthly Digest of Statistics November 1978 21
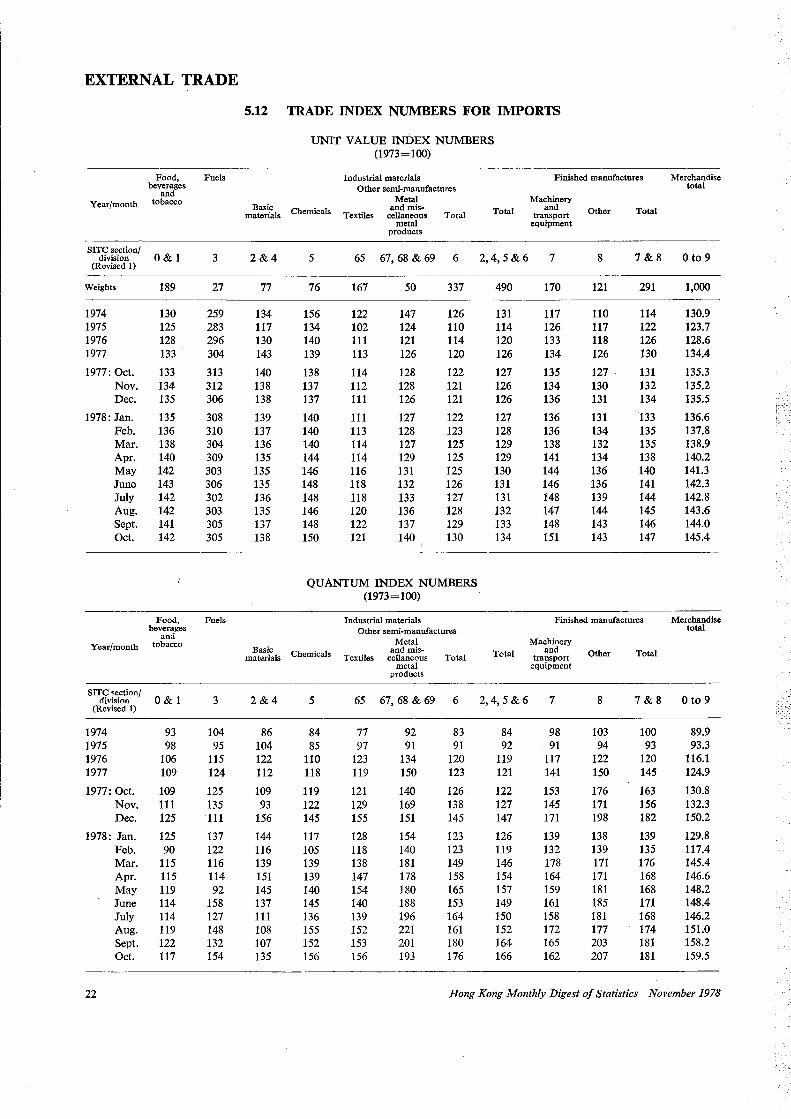
EXTERNAL TRADE
5.12 TRADE INDEX NUMBERS FOR IMPORTS
UNIT VALUE INDEX NUMBERS (1973=100)
Food, Fuels Industrial materials Finished manufactures Merchandise beverages Other semi-manufactures total
and Metal Machinery
Year/month tobacco Basic Chemicals and mls- Total and Other Total materials Textiles cellaneous Total transport
metal equipment products
SITC section/ 0&1 3 2&4 5 65 67, 68 & 69 6 2,4, 5 & 6 7 8 7&8 0 to 9 division
(Revised I)
Weights 189 27 77 76 167 50 337 490 170 121 291 1,000
1974 130 259 134 156 122 147 126 131 117 110 114 130.9 1975 125 283 117 134 102 124 110 114 126 117 122 123.7 1976 128 296 130 140 111 121 114 120 133 118 126 128.6 1977 133 304 143 139 113 126 120 126 134 126 130 134.4
1977: Oct. 133 313 140 138 114 128 122 127 135 127 131 135.3 Nov. 134 312 138 137 112 128 121 126 134 130 132 135.2 Dec. 135 306 138 137 111 126 121 126 136 131 134 135.5
1978: Jan. 135 308 139 140 111 127 122 127 136 131 133 136.6 Feb. 136 310 137 140 113 128 123 128 136 134 135 137.8 Mar. 138 304 136 140 114 127 125 129 138 132 135 138.9 Apr. 140 309 135 144 114 129 125 129 141 134 138 140.2 May 142 303 135 146 116 131 125 130 144 136 140 141.3 June 143 306 135 148 118 132 126 131 146 136 141 142.3 July 142 302 136 148 118 133 127 131 148 139 144 142.8 Aug. 142 303 135 146 120 136 128 132 147 144 145 143.6 Sept. 141 305 137 148 122 137 129 133 148 143 146 144.0 Oct. 142 305 138 150 121 140 130 134 151 143 147 145.4
QUANTUM INDEX NUMBERS (1973=100)
Food, Fuels Industrial materials Finished manufactures Merchandise beverages Other semi-manufactures total
and Year/month tobacco Metal Machinery
Basic Chemicals and mis- Total and Other Total materials Textiles ce1laneous Total transport metal equipment
products
SITC section/ 0&1 3 2&4 5 65 67, 68 & 69 6 2,4, 5&6 7 8 7&8 0 to 9 division
(Revised I)
1974 93 104 86 84 77 92 83 84 98 103 100 89.9 1975 98 95 104 85 97 91 91 92 91 94 93 93.3 1976 106 115 122 110 123 134 120 119 117 122 120 116.1 1977 109 124 112 118 119 150 123 121 141 150 145 124.9
1977: Oct. 109 125 109 119 121 140 126 122 153 176 163 130.8 Nov. 111 135 93 122 129 169 138 127 145 171 156 132.3 Dec. 125 111 156 145 155 151 145 147 171 198 182 150.2
1978: Jan. 125 137 144 117 128 154 123 126 139 138 139 129.8 Feb. 90 122 116 105 118 140 123 119 132 139 135 117.4 Mar. 115 116 139 139 138 181 149 146 178 171 176 145.4 Apr. 115 114 151 139 147 178 158 154 164 171 168 146.6 May 119 92 145 140 154 180 165 157 159 181 168 148.2 June 114 158 137 145 140 188 153 149 161 185 171 148.4 July 114 127 111 136 139 196 164 150 158 181 168 146.2 Aug. 119 148 108 155 152 221 161 152 172 177 174 151.0 Sept. 122 132 107 152 153 201 180 164 165 203 181 158.2 Oct. 117 154 135 156 156 193 176 166 162 207 181 159.5
22 Hong Kong Monthly Digest of Statistics November 1978
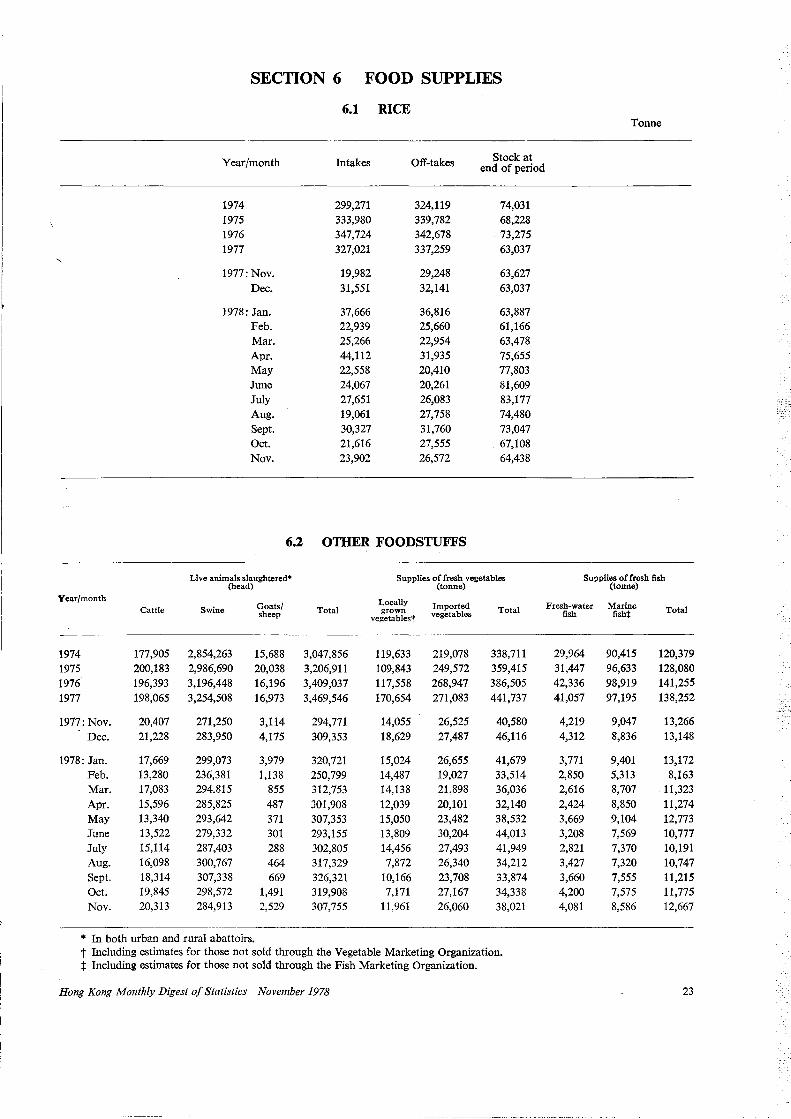
SECTION 6 FOOD SUPPLIES
6.1 RICE Tonne
Year/month Intakes Off-takes Stock at end of period
1974 299,271 324,119 74,031 1975 333,980 339,782 68,228 1976 347,724 342,678 73,275 1977 327,021 337,259 63,037
1977: Nov. 19,982 29,248 63,627 Dec. 31,551 32,141 63,037
1978: Jan. 37,666 36,816 63,887 Feb. 22,939 25,660 61,166 Mar. 25,266 22,954 63,478 Apr. 44,112 31,935 75,655 May 22,558 20,410 77,803 June 24,067 20,261 81,609 July 27,651 26,083 83,177 Aug. 19,061 27,758 74,480 Sept. 30,327 31,760 73,047 Oct. 21,616 27,555 67,108 Nov. 23,902 26,572 64,438
6.2 OTHER FOODSTUFFS
Live animals slaughtered* Supplies of fresh vegetables Supplies offresh fish (head) (tonne) (tonne)
Year/month Locally Imported Fresh-water Marine Cattle Swine Goats/ Total grown Total Total sheep vegetablest vegetables fish fish:j:
1974 177,905 2,854,263 15,688 3,047,856 119,633 219,078 338,711 29,964 90,415 120,379 1975 200,183 2,986,690 20,038 3,206,911 109,843 249,572 359,415 31,447 96,633 128,080 1976 196,393 3,196,448 16,196 3,409,037 117,558 268,947 386,505 42,336 98,919 141,255
1977 198,065 3,254,508 16,973 3,469,546 170,654 271,083 441,737 41,057 97,195 138,252
1977: Nov. 20,407 271,250 3,114 294,771 14,055 26,525 40,580 4,219 9,047 13,266
Dec. 21,228 283,950 4,175 309,353 18,629 27,487 46,116 4,312 8,836 13,148
1978: Jan. 17,669 299,073 3,979 320,721 15,024 26,655 41,679 3,771 9,401 13,172 Feb. 13,280 236,381 1,138 250,799 14,487 19,027 33,514 2,850 5,313 8,163 Mar. 17,083 294.815 855 312,753 14,138 21,898 36,036 2,616 8,707 11,323 Apr. 15,596 285,825 487 301,908 12,039 20,101 32,140 2,424 8,850 11,274 May 13,340 293,642 371 307,353 15,050 23,482 38,532 3,669 9,104 12,773 June 13,522 279,332 301 293,155 13,809 30,204 44,013 3,208 7,569 10,777 July 15,114 287,403 288 302,805 14,456 27,493 41,949 2,821 7,370 10,191 Aug. 16,098 300,767 464 317,329 7,872 26,340 34,212 3,427 7,320 10,747 Sept. 18,314 307,338 669 326,321 10,166 23,708 33,874 3,660 7,555 11,215 Oct. 19,845 298,572 1,491 319,908 7,171 27,167 34,338 4,200 7,575 11,775 Nov. 20,313 284,913 2,529 307,755 11,961 26,060 38,021 4,081 8,586 12,667
* In both urban and rural abattoirs. t Including estimates for those not sold through the Vegetable Marketing Organization. t Including estimates for those not sold through the Fish Marketing Organization.
Hong Kong Monthly Digest of Statistics November 1978 23
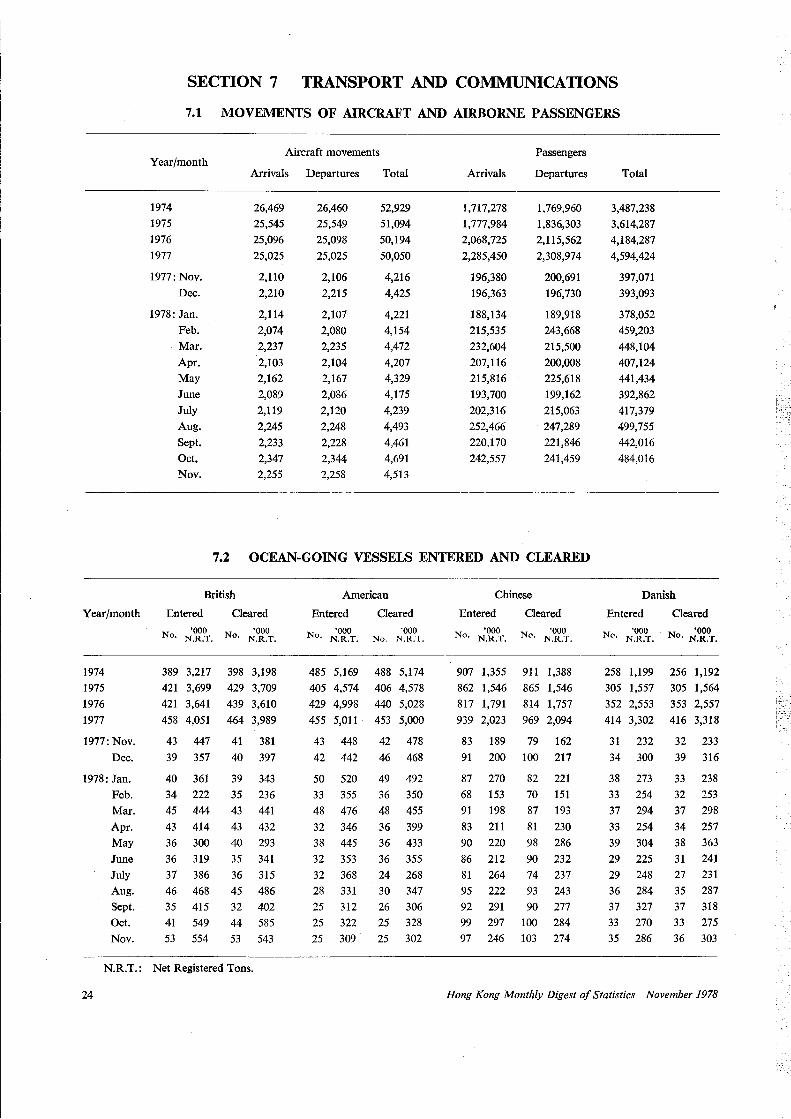
Year/month
1974 1975
1976
1977
1977: Nov.
Dec.
1978: Jan.
Feb. Mar.
Apr. May
June
July Aug.
Sept.
Oct.
Nov.
SECTION 7 TRANSPORT AND COMMUNICATIONS
7.1 MOVEMENTS OF AIRCRAFT AND AIRBORNE PASSENGERS
Year/month
1974
1975
1976
1977
1977: Nov.
Dec.
1978: Jan.
Feb.
Mar.
Apr. May
June
July
Aug.
Sept.
Oct.
Nov.
Aircraft movements
Arrivals Departures
26,469
25,545
25,096
25,025
2,110
2,210
2,114
2,074
2,237
2,103
2,162
2,089
2,119
2,245
2,233 2,347
2,255
26,460
25,549
25,098
25,025
2,106
2,215
2,107
2,080 2,235
2,104
2,167
2,086
2,120
2,248
2,228
2,344 2,258
Total
52,929
51,094
50,194
50,050
4,216
4,425
4,221
4,154 4,472
4,207 4,329
4,175
4,239
4,493
4,461 4,691
4,513
Arrivals
1,717,278
1,777,984
2,068,725
2,285,450
196,380
196,363
188,134 215,535
232,604
207,116 215,816
193,700
202,316
252,466
220.170
242,557
Passengers
Departures
1,769,960
1,836,303
2,115,562
2,308,974
200,691
196,730
189,918 243,668
215,500
200,008
225,618
199,162
215,063
247,289
221,846
241,459
7.2 OCEAN-GOING VESSELS ENTERED AND CLEARED
British
Entered Geared
'OOO '000 No. N.R.T. No. N.R.T.
389 3,217 421 3,699
421 3,641
458 4,051
43 447
39 357
40 361 34 222
45 444
43 414
36 300
36 319
37 386
46 468
35 415
41 549 53 554
398 3,198
429 3,709
439 3,610
464 3,989
41 381
40 397
39 343
35 236
43 441
43 432
40 293
35 341
36 315
45 486
32 402
44 585
53 543
American
Entered Geared
'OOO 'OOO No. N.R.T. No. N.R.T.
485 5,169
405 4,574
429 4,998
455 5,011
43 448
42 442
50 520
33 355
48 476
32 346
38 445
32 353
32 368
28 331
25 312
25 322
25 309
488 5,174
406 4,578
440 5,028
453 5,000
42 478
46 468
49 492
36 350
48 455
36 399
36 433
36 355
24 268
30 347
26 306 25 328
25 302
Chinese
Entered Cleared
'OOO 'OOO No. N.R.T. No. N.R.T.
907 1,355
862 1,546
817 1,791
939 2,023
83 189
91 200
87 270
68 153
91 198
83 211
90 220
86 212
81 264
95 222
92 291 99 297
97 246
911 1,388
865 1,546
814 1,757
969 2,094
79 162
100 217
82 221
70 151
87 193
81 230
98 286
90 232
74 237
93 243
90 277 100 284
103 274
Total
3,487,238 3,614,287
4,184,287
4,594,424
397,071
393,093
378,052 459,203
448,104
407,124
441,434
392,862
417,379 499,755
442,016
484,016
Danish
Entered Oeared
'OOO 'OOO No. N.R.T. No. N.R.T.
258 1,199
305 1,557
352 2,553
414 3,302
31 232
34 300
38 273
33 254
37 294
33 254
39 304
29 225
29 248 36 284
37 327
33 270
35 286
256 1,192
305 1,564
353 2,557
416 3,318
32 233
39 316
33 238
32 253
37 298
34 257
38 363
31 241
27 231
35 287
37 318
33 275
36 303
N.R.T.: Net Registered Tons.
24 Hong Kong Monthly Digest of Statistics November 1978
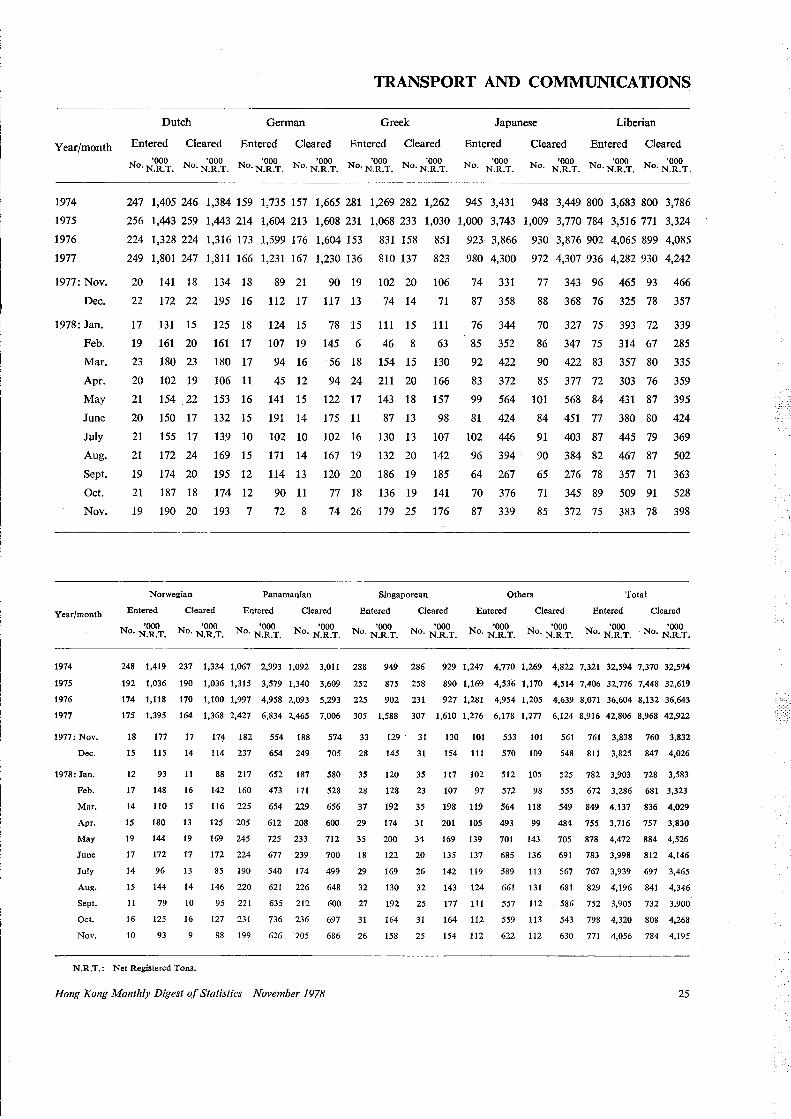
TRANSPORT AND COMMUNICATIONS
Dutch German Greek Japanese Liberian
Year/month Entered Cleared Entered Cleared Entered Cleared Entered Cleared Entered Cleared
'OOO 'OOO 'OOO 'OOO 'OOO 'OOO 'OOO 'OOO 'OOO 'OOO No. N.R.T. No. N.R.T. No. N.R.T. No. N.R.T. No. N.R.T. No. N.R.T. No. N.R.T. No. N.R.T. No. N.R.T. No. N.R.T.
1974 247 1,405 246 1,384 159 1,735 157 1,665 281 1,269 282 1,262 945 3,431 948 3,449 800 3,683 800 3,786
1975 256 1,443 259 1,443 214 1,604 213 1,608 231 1,068 233 1,030 1,000 3,743 1,009 3,770 784 3,516 771 3,324
1976 224 1,328 224 1,316 173 1,599 176 1,604 153 831 158 851 923 3,866 930 3,876 902 4,065 899 4,085
1977 249 1,801 247 1,811 166 1,231 167 1,230 136 810 137 823 980 4,300 972 4,307 936 4,282 930 4,242
1977: Nov.
Dec.
1978: Jan.
Feb.
Mar.
Apr.
May
June
July
Aug.
Sept.
Oct.
Nov.
Year/month
20 141 18
22 172 22
17 131 15
19 161 20
23 180 23
20 102 19
21 154 .22
20 150 17
21 155 17
21 172 24
19 174 20
21 187 18
19 190 20
Norwegian
134 18
195 16
125 18
161 17
180 17
106 11
153 16
132 15
139 10
169 15
195 12
174 12
193 7
89 21
112 17
124 15
107 19
94 16
45 12
141 15
191 14
102 10
171 14
114 13
90 11
72 8
Panamanian
90 19
117 13
78 15
145 6
56 18
94 24
122 17
175 11
102 16
167 19
120 20
77 18
74 26
102 20
74 14
111 15
46 8
154 15
211 20
143 18
87 13
130 13
132 20
186 19
136 19
179 25
Singaporean
106
71
111
63
130
166
157
98
107
142
185
141
176
Entered Cleared Entered Cleared Entered Cleared
74 331 77
87 358 88
76 344 70
85 352 86
92 422 90
83 372 85
99 564 101
81 424 84
102 446 91
96 394 . 90
64 267 65
70 376 71
87 339 85
Others
343 96
368 76
327 75
347 75
422 83
377 72
568 84
451 77
403 87
384 82
276 78
345 89
372 75
465 93 466
325 78 357
393 72 339
314 67 285
357 80 335
303 76 359
431 87 395
380 80 424
445 79 369
467 87 502
357 71 363
509 91 528
383 78 398
Total
Entered Cleared Entered Cleared
'OOO '000 'OOO 'OOO '000 '000 '000 '000 'OOO 'OOO ~~~~~~~-~~~~~~~~~~~~~
1974 248 1,419 237 1,334 1,067 2,993 1,092 3,011 288 949 286 929 1,247 4,770 1,269 4,822 7,321 32,594 7,370 32,594
1975 192 1,036 190 1,036 1,315 3,579 1,340 3,609 252 875 258 890 1,169 4,536 1,170 4,514 7,406 32,776 7,448 32,619
1976 174 1,118 170 1,100 1,997 4,958 2,093 5,293 225 902 231 927 1,281 4,954 1,205 4,639 8,071 36,604 8,132 36,643
1977 175 1,395 164 1,368 2,427 6,834 2,465 7,006 305 1,588 307 1,610 1,276 6,178 1,277 6,124 8,916 42,806 8,968 42,922
1977: Nov. 18 177 17 114 182 554 188 574 33 129 . 31 130 101 533 101 561 761 3,838 760 3,832
Dec. 15 115 14 114 237 654 249 705 28 145 31 154 111 570 109 548 811 3,825 847 4,026
1978: Jan. 12 93 11 88 217 652 187 580 35 120 35 117 102 512 105 525 782 3,903 728 3,583
Feb. 17 148 16 142 160 473 171 528 28 128 23 107 97 572 98 555 672 3,286 681 3,323
Mar. 14 110 15 116 225 654 229 656 37 192 35 198 119 564 118 549 849 4,137 836 4,029
Apr.
May
June
180
144
172
96
144
13
19
17
13
14
10
16
125 205
169 245
172 224
85 190
146 220
95 221
127 231
612 208
725 233
677 239
540 174
621 226
635 212
736 236
600
712
700
499
648
600
697
29
35
18
29
32
27
31
174
200
122
169
130
192
164
31
34
20
26
32
25
31
201
169
135
142
143
177
164
105
139
137
119
124
111
112
493
701
685
589
661
557
559
99
143
136
113
131
112
113
484 755 3,716
705 878 4,472
691 783 3,998
567 767 3,939
681 829 4,196
586 752 3,905
543 798 4,320
757 3,830
884 4,526
812 4,146
697 3,465
841 4,346
732 3,900
808 4,268
July
Aug.
Sept.
Oct.
Nov.
15
19
17
14
15
11
16
10
79
125
93 9 88 199 626 205 686 26 158 25 154 112 622 112 630 771 4,056 784 4,195
N.R.T.: Net Registered Tons.
Hong Kong Monthly Digest of Statistics November 1978 25
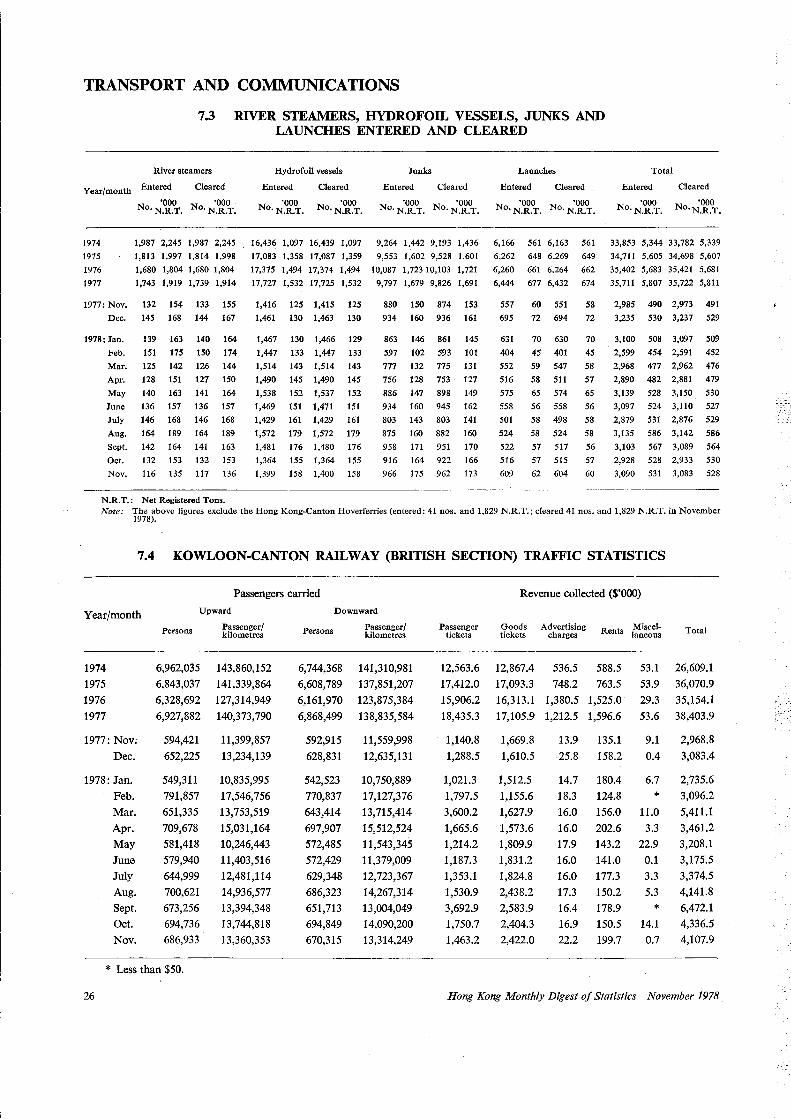
TRANSPORT AND COMMUNICATIONS
7.3 RIVER STEAMERS, HYDROFOIL VESSELS, JUNKS AND LAUNCHES ENTERED AND CLEARED
River steamers Hydrofoil vessels Junks Launches Total
Year/month Entered Cleared Entered Cleared Entered Cleared Entered Cleared Entered Cleared
'OOO 'OOO No. N.R.T. No. N.R.T. No. r:.~'.!r. No. r:.~'.!r. No. r:.~'.!r. No. ~~?T. No. r:.~'.!r. No. r:.~.~- 'OOO 'OOO
No.N.R.T. No.N.R.T.
1974
1975
1976
1977
1,987 2,245 1,987 2,245
1,813 1,997 1,814 1,998
1,680 1,804 1,680 1,804
1,743 1,919 1,739 1,914
1977: Nov. 132 154 133 155
Dec. 145 168 144 167
1978: Jan.
Feb.
Mar.
Apr.
May
June
July
Aug.
Sept.
Oct.
Nov.
139 163 140 164
151 175 150 174
125 142 126 144
128 151 127 150
140 163 141 164
136 157 136 157
146 168 146 168
164 189 164 189
142 164 141 163
132 153 132 153
116 135 117 136
N.R.T.: Net Registered Tons.
16,436 1,097 16,439 1,097 9,264 1,442 9,193 1,436
17,083 1,358 17,087 1,359 9,553 1,602 9,528 1,601
17,375 1,494 17,374 1,494 10,087 1,723 10,103 1,721
17,727 1,532 17,725 1,532 9,797 1,679 9,826 1,691
1,416 125 1,415 125
1,461 130 1,463 130
1,467
1,447
1,514
1,490
1,538
1,469
1,429
1,572
1,481
1,364
1,399
130 1,466
133 1,447
143 1,514
145 1,490
152 1,537
151 1,471
161 1,429
179 1,572
176 1,480
155 1,364
158 1,400
129
133
143
145
152
151
161
179
176
155
158
880 150 874 153
934 160 936 161
863
597
777
756
886
934
803
875
958
916
966
146 861
102 593
132 775
128 753
147 898
160 945
143 803
160 882
171 951
164 922
175 962
145
IOI
131
127
149
162
141
160
170
166
173
6,166 561 6,163 561
6,262 648 6,269 649
6,260 661 6.264 662
6,444 677 6,432 674
33,853 5,344 33,782 5,339
34,711 5,605 34,698 5,607
35,402 5,683 35,421 5,681
35,711 5,807 35,722 5,811
557 60 551 58 2,985 490 2,973 491
695 72 694 72 3,235 530 3,237 529
631
404
552
516
575
558
501
524
522
516
609
70
45
59
58
65
56
58
58
57
57
62
630
401
547
Sil
574
558
498
524
517
515
604
70
45
58
57
65
56
58
58
56
57
60
3,100
2,599
2,968
2,890
3,139
3,097
2,879
3,135
3,103
2,928
3,090
508 3,097
454 2,591
477 2,962
482 2,881
528 3,150
524 3,110
531 2,876
586 3,142
567 3,089
528 2,933
531 3,083
509
452
476
479
530
527
529
586
564
530
528
Note: The above figures exclude the Hong Kong-Canton Hoverferries (entered: 41 nos. and 1,829 N.R.T.; cleared 41 nos. and 1,829 N.R.T. in November 1978).
7.4 KOWLOON-CANTON RAILWAY (BRITISH SECTION) TRAFFIC STATISTICS
Passengers carried
Year/month
1974
1975
1976
1977
1977: Nov;
Dec.
1978: Jan.
Feb.
Mar.
Apr.
May
June
July
Aug.
Sept.
Oct.
Nov.
Persons
Upward
Passenger/ kilometres
6,962,035 143,860,152
6,843,037 141,339,864
6,328,692 127,314,949
6,927,882 140,373,790
594,421
652,225
549,311
791,857
651,335
709,678
581,418
579,940
644,999
700,621
673,256
694,736
686,933
11,399,857
13,234,139
10,835,995
17,546,756
13,753,519
15,031,164
10,246,443
11,403,516
12,481,114
14,936,577
13,394,348
13,744,818
13,360,353
* Less than $50.
26
Downward
Persons Passenger/ kilometres
6,744,368 141,310,981
6,608,789 137,851,207
6,161,970 123,875,384
6,868,499 138,835,584
592,915
628,831
542,523
770,837
643,414
697,907
572,485
572,429
629,348
686,323
651,713
694,849
670,315
11,559,998
12,635,131
10,750,889
17,127,376
13,715,414
15,512,524
11,543,345
11,379,009
12,723,367
14,267,314
13,004,049
14,090,200
13,314,249
Passenger tickets
12,563.6
17,412.0
15,906.2
18,435.3
1,140.8
1,288.5
1,021.3
1,797.5
3,600.2
1,665.6
1,214.2
1,187.3
1,353.1
1,530.9
3,692.9
1,750.7
1,463.2
Revenue collected (S'OOO)
Goods Advertising Rents 1Maniesce0 u18-tickets charges Total
12,867.4 536.5 588.5 53.1 . 26,609.1
17,093.3 748.2 763.5 53.9 36,070.9
16,313.1 1,380.5 1,525.0
17,105.9 1,212.5 1,596.6
29.3 35,154.1
1,669.8
1,610.5
1,512.5
1,155.6
1,627.9
1,573.6
1,809.9
1,831.2
1,824.8
2,438.2
2,583.9
2,404.3
2,422.0
53.6 38,403.9
13.9 135.1 9.1
25.8 158.2 0.4
14.7 180.4 6.7
18.3 124.8 * 16.0 156.0 11.0
16.0 202.6 3.3
17.9 143.2 22.9
16.0 141.0 0.1
16.0 177.3 3.3
17.3 150.2 5.3
16.4 178.9 * 16.9 150.5 14.1
22.2 199.7 0.7
2,968.8
3,083.4
2,735.6
3,096.2
5,411.1
3,461.2
3,208.1
3,175.5
3,374.5
4,141.8
6,472.1
4,336.5
4,107.9
Hong Kong Monthly Digest of Statistics November 1978
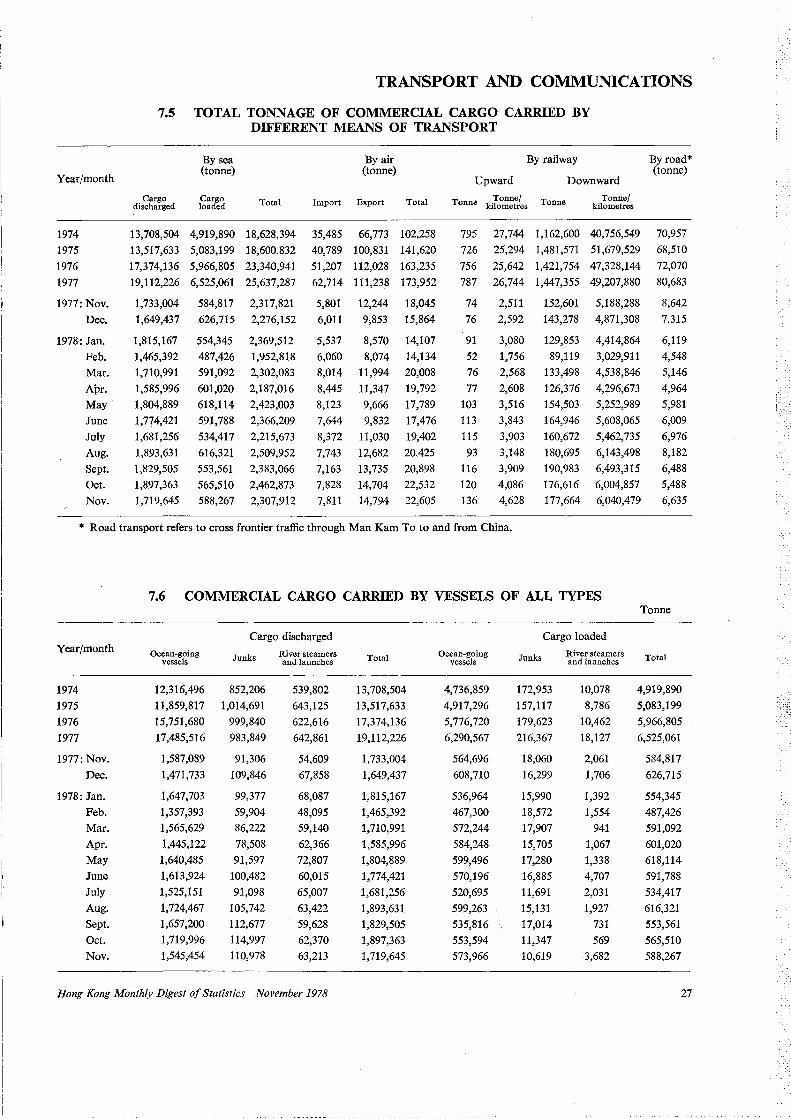
Year/month
1974
1975
1976
1977
1977: Nov.
Dec.
1978: Jan.
Feb.
Mar.
Apr. May
June
July
Aug.
Sept.
Oct.
Nov.
TRANSPORT AND COMMUNICATIONS
7.5 TOTAL TONNAGE OF COMMERCIAL CARGO CARRIED BY DIFFERENT MEANS OF TRANSPORT
Cargo discharged
By sea (tonne)
Cargo loaded Total
13,708,504 4,919,890 18,628,394
13,517,633 5,083,199 18,600,832
17,374,136
19,112,226
1,733,004
1,649,437
1,815,167
1,465,392
1,710,991
1,585,996
1,804,889
1,774,421
1,681,256
1,893,631
1,829,505
1,897,363
1,719,645
5,966,805
6,525,061
584,817
626,715
23,340,941
25,637,287
2,317,821
2,276,152
554,345 2,369,512
487,426 1,952,818 591,092 2,302,083
601,020 2,187,016
618,114 2,423,003
591,788 2,366,209
534,417 2,215,673
616,321 2,509,952
553,561 2,383,066
565,510 2,462,873
588,267 2,307,912
Import
By air (tonne)
Export Total
35,485 66,773 102,258
40,789 100,831 141,620
51,207 112,028 163,235
62,714 111,238 173,952
5,801 12,244 18,045
6,011 9;853 15,864
5,537 6,060
8,014
8,445
8,123
7,644
8,372
7,743
7,163 7,828
7,811
8,570 14,107
8,074 14,134 11,994 20,008
11,347 19,792
9,666 17,789
9,832 17,476
11,030 19,402
12,682 20A25
13,735 20,898
14,704 22,532
14,794 22,605
By railway
Upward Downward
Tonne
795
726
756 787
74
76
91
52
76
77
103
113
115
93
116
120
136
Tonne/ kilometres Tonne Tonne/
kilometres
27,744 1,162,600 40,756,549
25,294 1,481,571 51,679,529
25,642 1,421, 754 47,328,144
26,744 1,447,355 49,207,880
2,511 152,601 5,188,288
2,592 143,278 4,871,308
3,080
1,756 2,568
2,608
3,516
3,843
3,903
3,148
3,909
4,086 4,628
129,853 4,414,864
89,119 3,029,911 133,498 4,538,846
126,376 4,296,673
154,503 5,252,989
164,946 5,608,065
160,672 5,462,735
180,695 6,143,498
190,983 6,493,315
176,616 6,004,857 177,664 6,040,479
Byroad* (tonne)
70,957
68,510
72,070
80,683
8,642
7,315
6,119
4,548 5,146
4,964
5,981
6,009
6,976
8,182
6,488
5,488
6,635
* Road transport refers to cross frontier traffic through Man Kam To to and from China.
7.6 COMMERCIAL CARGO CARRIED BY VESSELS OF ALL TYPES
Year/month
1974
1975
1976
1977
1977: Nov. Dec.
1978: Jan.
Feb.
Mar.
Apr. May
June July
Aug.
Sept.
Oct.
Nov.
Ocean-going vessels
12,316,496 11,859,817
15,751,680
17,485,516
1,587,089
1,471,733
1,647,703
1,357,393 1,565,629
1,445,122
1,640,485 1,613,924
1,525,151
1,724,467
1,657,200
1,719,996
1,545,454
Cargo discharged
Junks
852,206
1,014,691
999,840
983,849
91,306
109,846
99,377
59,904 86,222
78,508
91,597
100,482
91,098
105,742
112,677
114,997 110,978
River steamers and launches
539,802
643,125
622,616
642,861
54,609 67,858
68,087
48,095
59,140
62,366
72,807
60,015
65,007
63,422 59,628
62,370 63,213
Hong Kong Monthly Digest of Statistics November 1978
Total
13,708,504
13,517,633
17,374,136
19,112,226
1,733,004
1,649,437
1,815,167 1,465,392
1,710,991
1,585,996
1,804,889
1,774,421
1,681,256 1,893,631
1,829,505
1,897,363
1,719,645
Ocean-going vessels
4,736,859
4,917,296
5,776,720
6,290,567
564,696
608,710
536,964
467,300
572,244
584,248
599,496
570,196
520,695
599,263 I
535,816 553,594
573,966
Cargo loaded
Junks
172,953
157,117 179,623
216,367
18,060
16,299
15,990
18,572
17,907
15,705 17,280
16,885 11,691
15,131
17,014 11,347
10,619
River steamers and launches
10,o78
8,786
10,462
18,127
2,061
1,706
1,392
1,554
941
1,067
1,338
4,707 2,031
1,927
731 569
3,682
Tonne
Total
4,919,890 5,083,199
5,966,805
6,525,061
584,817
626,715
554,345
487,426 591,092
601,020
618,114
591,788
534,417
616,321
553,561
565,510
588,267
27
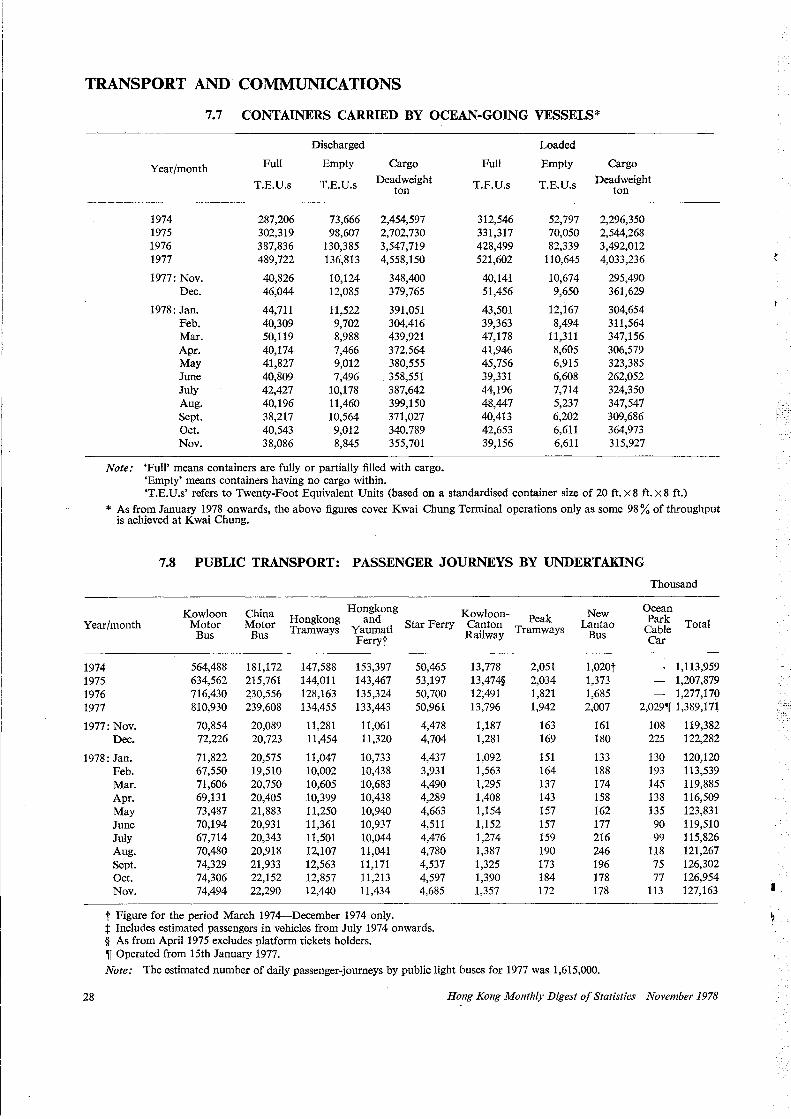
TRANSPORT AND COMMUNICATIONS
7.7 CONTAINERS CARRIED BY OCEAN-GOING VESSELS*
Discharged Loaded
Year/month Full Empty Cargo Full Empty Cargo
T.E.U.s T.E.U.s Dead weight T.E.U.s T.E.U.s Dead weight ton ton
1974 287,206 73,666 2,454,597 312,546 52,797 2,296,350 1975 302,319 98,607 2,702,730 331,317 70,050 2,544,268 1976 387,836 130,385 3,547,719 428,499 82,339 3,492,012 1977 489,722 136,813 4,558,150 521,602 110,645 4,033,236
1977: Nov. 40,826 10,124 348,400 40,141 10,674 295,490 Dec. 46,044 12,085 379,765 51,456 9,650 361,629
1978: Jan. 44,711 11,522 391,051 43,501 12,167 304,654 Feb. 40,309 9,702 304,416 39,363 8,494 311,564 Mar. 50,119 8,988 439,921 47,178 11,311 347,156 Apr. 40,174 7,466 372,564 41,946 8,605 306,579 May 41,827 9,012 380,555 45,756 6,915 323,385 June 40,809 7,496 358,551 39,331 6,608 262,052 July 42,427 10,178 387,642 44,196 7,714 324,350 Aug. 40,196 11,460 399,150 48,447 5,237 347,547 Sept. 38,217 10,564 371,027 40,413 6,202 309,686 Oct. 40,543 9,012 340,789 42,653 6,611 364,973 Nov. 38,086 8,845 355,701 39,156 6,611 315,927
Note: 'Full' means containers are fully or partially filled with cargo. 'Empty' means containers having no cargo within. 'T.E.U.s' refers to Twenty-Foot Equivalent Units (based on a standardised container size of 20 ft. x 8 ft. x 8 ft.)
* As from January 1978 onwards, the above figures cover Kwai Chung Terminal operations only as some 98 % of throughput is achieved at Kwai Chung.
7.8 PUBLIC TRANSPORT: PASSENGER JOURNEYS BY UNDERTAKING
Kowloon China Hongkong
Year/month Motor Motor Hongkong and Star Ferry Bus Bus Tramways Yaumati
Ferryt
1974 564,488 181,172 147,588 153,397 50,465 1975 634,562 215,761 144,011 143,467 53,197 1976 716,430 230,556 128,163 135,324 50,700 1977 810,930 239,608 134,455 133,443 50,961
1977: Nov. 70,854 20,089 11,281 11,061 4,478 Dec. 72,226 20,723 11,454 11,320 4,704
1978: Jan. 71,822 20,575 11,047 10,733 4,437 Feb. 67,550 19,510 10,002 10,438 3,931 Mar. 71,606 20,750 10,605 10,683 4,490 Apr. 69,131 20,405 10,399 10,438 4,289 May 73,487 21,883 11,250 10,940 4,663 June 70,194 20,931 11,361 10,937 4,511 July 67,714 20,343 11,501 10,044 4,476 Aug. 70,480 20,918 12,107 11,041 4,780 Sept. 74,329 21,933 12,563 11,171 4,537 Oct. 74,306 22,152 12,857 11,213 4,597 Nov. 74,494 22,290 12,440 11,434 4,685
t Figure for the period March 1974-December 1974 only. t Includes estimated passengers in vehicles from July 1974 onwards. § As from April 1975 excludes platform tickets holders. 'If Operated from 15th January 1977.
Kowloon- New Canton Peak Lantao Railway Tramways Bus
13,778 2,051 1,020t 13,474§ 2,034 1,373 12,491 1,821 1,685 13,796 1,942 2,007
1,187 163 161 1,281 169 180
1,092 151 133 1,563 164 188 1,295 137 174 1,408 143 158 1,154 157 162 1,152 157 177 1,274 159 216 1,387 190 246 1,325 173 196 1,390 184 178 1,357 172 178
Note: The estimated number of daily passenger-journeys by public light buses for 1977 was 1,615,000.
Thousand
Ocean Park Total Cable Car
1,113,959 1,207,879 1,277,170
2,029'1[ 1,389,171
108 119,382 225 122,282
130 120,120 193 113,539 145 119,885 138 116,509 135 123,831 90 119,510 99 115,826
118 121,267 75 126,302 77 126,954
113 127,163
28 Hong Kong Monthly Digest of Statistics November 1978
I
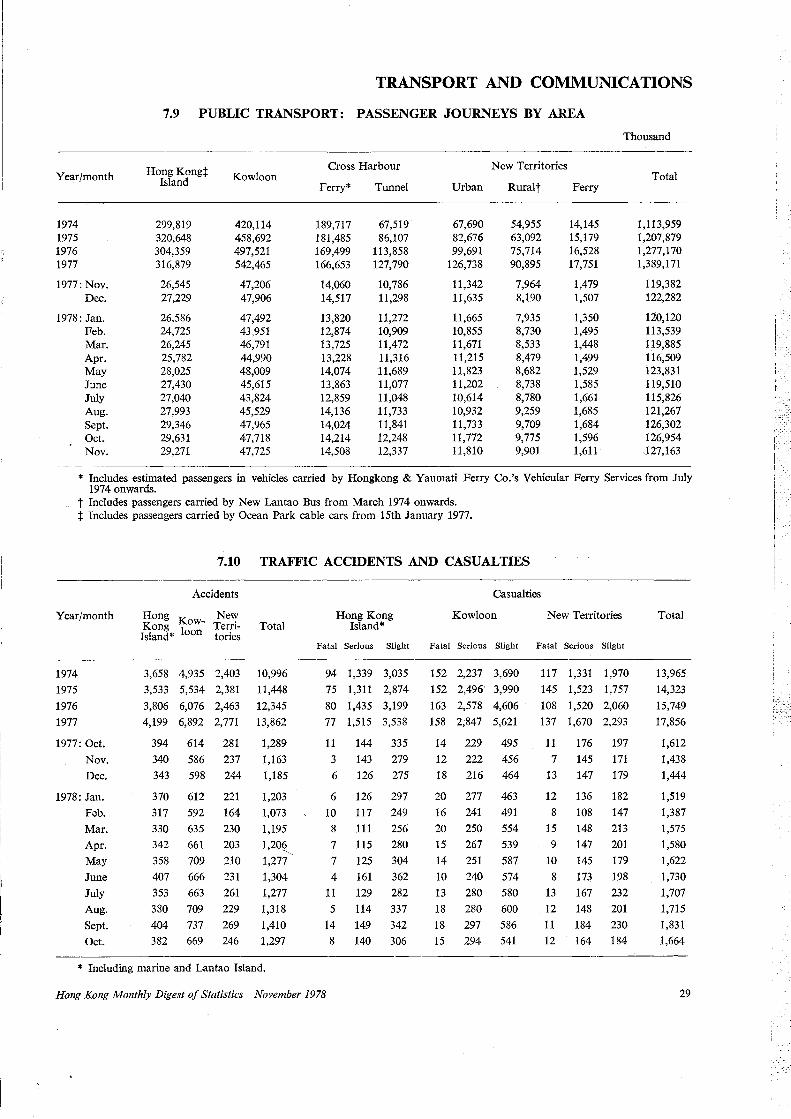
TRANSPORT AND COMMUNICATIONS
7.9 PUBLIC TRANSPORT: PASSENGER JOURNEYS BY AREA
Thousand
Year/month
1974 1975 1976 1977
1977: Nov. Dec.
1978: Jan. Feb. Mar. Apr. May June July Aug. Sept. Oct. Nov.
HongKongt Island
299,819 320,648 304,359 316,879
26,545 27,229
26,586 24,725 26,245 25,782 28,025 27,430 27,040 27,993 29,346 29,631 29,271
Kowloon
420,114 458,692 497,521 542,465
47,206 47,906
47,492 43,951 46,791 44,990 48,009 45,615 43,824 45,529 47,965 47,718 47,725
Cross Harbour
Ferry*
189,717 181,485 169,499 166,653
14,060 14,517
13,820 12,874 13,725 13,228 14,074 13,863 12,859 14,136 14,024 14,214 14,508
Tunnel
67,519 86,107
113,858 127,790
10,786 11,298
11,272 10,909 11,472 11,316 11,689 11,077 11,048 11,733 11,841 12,248 12,337
New Territories
Urban Ruralt Ferry
67,690 82,676 99,691
126,738
11,342 11,635
11,665 10,855 11,671 11,215 11,823 11,202 10,614 10,932 11,733 11,772 11,810
54,955 63,092 75,714 90,895
7,964 8,190
7,935 8,730 8,533 8,479 8,682 8,738 8,780 9,259 9,709 9,775 9,901
14,145 15,179 16,528 17,751
1,479 1,507
1,350 1,495 1,448 1,499 1,529 1,585 1,661 1,685 1,684 1,596 1,611
Total
1,113,959 1,207,879 1,277,170 1,389,171
119,382 122,282
120,120 113,539 119,885 116,509 123,831 119,510 115,826 121,267 126,302 126,954 127,163
* Includes estimated passengers in vehicles carried by Hongkong & Yaumati Ferry Co.'s Vehicular Ferry Services from July 1974 onwards.
t Includes passengers carried by New Lantao Bus from March 1974 onwards. t Includes passengers carried by Ocean Park cable cars from 15th January 1977.
7.10 TRAFFIC ACCIDENTS AND CASUALTIES
Accidents Casualties
Year/month
1974 1975
1976
1977
1977: Oct.
Nov.
Dec.
1978: Jan.
Feb.
Mar. Apr. May
June
July Aug.
Sept.
Oct.
Hong New Kong Kow- Terri- Total Island* loon tories
3,658 4,935 2,403 10,996
3,533 5,534 2,381 11,448
3,806 6,076 2,463 12,345
4,199 6,892 2,771 13,862
394 614 281
340 586 237
343 598 244
370 612 221
317 592 164
330 635 230 342 661 203
358 709 210 407 666 231
353 663 261
380 709 229
404 737 269 382 669 246
1,289
1,163
1,185
1,203
1,073
1,195
1,20~
1,277
1,304
1,277 1,318
1,410
1,297
* Including marine and Lantao Island.
Hong Kong Island*
Kowloon New Territories
Fatal Serious Slight Fatal Serious Slight Fatal Serious Slight
94 1,339 3,035 152 2,237 3,690
75 1,311 2,874 152 2,496 3,990
80 1,435 3,199 163 2,578 4,606
77 1,515 3,538 158 2,847 5,621
11 144 335 14 229 495
3 143 279 12 222 456
6 126 275 18 216 464
6 126 297 20 277 463
10 117 249 16 241 491
8 111 256 20 250 554 7 115 280 15 267 539
7 125 304 14 251 587
4 161 362 10 240 574
11 129 282 13 280 580
5 114 337 18 280 600
14 149 342 18 297 586
8 140 306 15 294 541
117 1,331 1,970
145 1,523 1,757
108 1,520 2,060
137 1,670 2,293
11 176 197
7 145 171
13 147 179
12 136 182
8 108 147
15 148 213
9 147 201
10 145 179
8 173 198
13 167 232
12 148 201
11 184 230
12 164 184
Hong Kong Monthly Digest of Statistics November 1978
Total
13,965
14,323
15,749
17,856
1,612
1,438
1,444
1,519
1,387
1,575
1,580
1,622
1,730 1,707
1,715
1,831
1,664
29
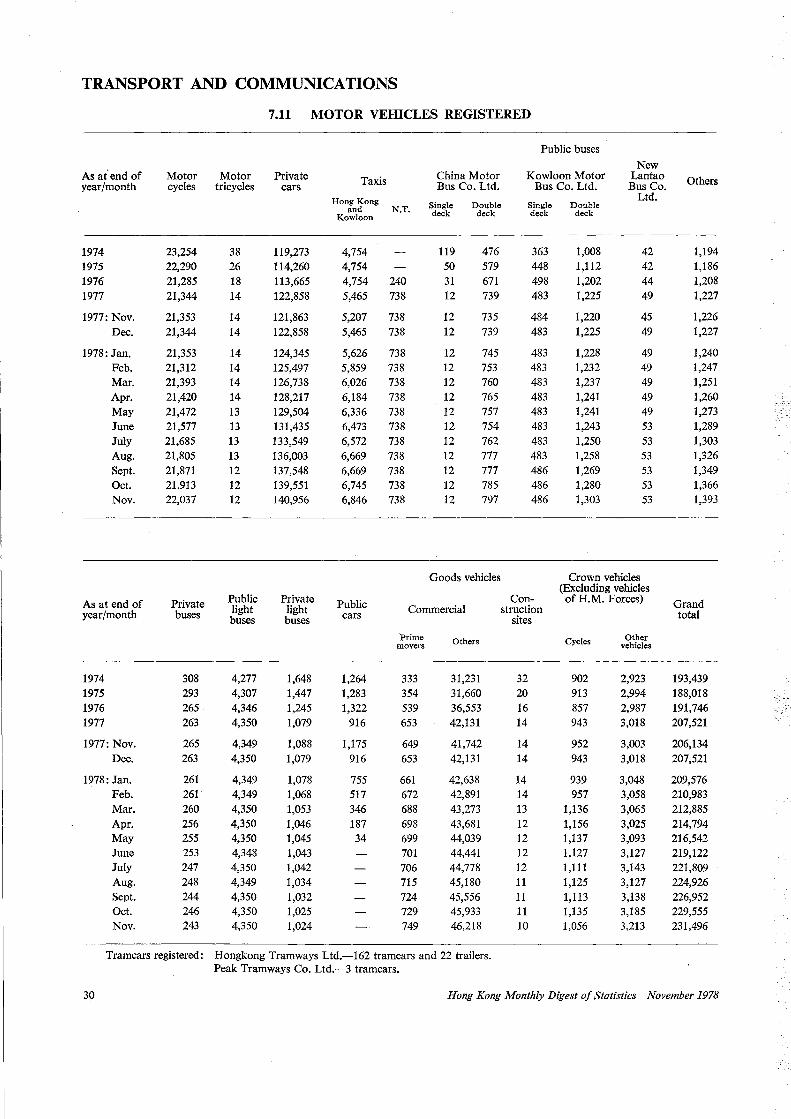
TRANSPORT AND COMMUNICATIONS
7.11 MOTOR VEIIlCLES REGISTERED
Public buses
New As at' end of Motor Motor Private Taxis China Motor Kowloon Motor Lantao Others year/month cycles tricycles cars Bus Co. Ltd. Bus Co. Ltd. Bus Co.
Hong Kong Ltd. Single Double Single Double and N.T. deck deck deck deck Kowloon
1974 23,254 38 119,273 4,754 119 476 363 1,008 42 1,194 1975 22,290 26 114,260 4,754 50 579 448 1,112 42 1,186 1976 21,285 18 113,665 4,754 240 31 671 498 1,202 44 1,208 1977 21,344 14 122,858 5,465 738 12 739 483 1,225 49 1,227
1977: Nov. 21,353 14 121,863 5,207 738 12 735 484 1,220 45 1,226 Dec. 21,344 14 122,858 5,465 738 12 739 483 1,225 49 1,227
1978: Jan. 21,353 14 124,345 5,626 738 12 745 483 1,228 49 1,240 Feb. 21,312 14 125,497 5,859 738 12 753 483 1,232 49 1,247 Mar. 21,393 14 126,738 6,026 738 12 760 483 1,237 49 1,251 Apr. 21,420 14 128,217 6,184 738 12 765 483 1,241 49 1,260 May 21,472 13 129,504 6,336 738 12 757 483 1,241 49 1,273 June 21,577 13 131,435 6,473 738 12 754 483 1,243 53 1,289 July 21,685 13 133,549 6,572 738 12 762 483 1,250 53 1,303 Aug. 21,805 13 136,003 6,669 738 12 777 483 1,258 53 1,326 Sept. 21,871 12 137,548 6,669 738 12 777 486 1,269 53 1,349 Oct. 21,913 12 139,551 6,745 738 12 785 486 1,280 53 1,366 Nov. 22,037 12 140,956 6,846 738 12 797 486 1,303 53 1,393
Goods vehicles Crown vehicles (Excluding vehicles
As at end of Private Public Private Public Con- of H.M. Forces) Grand year/month buses light light cars Commercial struction total buses buses sites
Prime Others Cycles Other movers vehicles
1974 308 4,277 1,648 1,264 333 31,231 32 902 2,923 193,439 1975 293 4,307 1,447 1,283 354 31,660 20 913 2,994 188,018 1976 265 4,346 1,245 1,322 539 36,553 16 857 2,987 191,746 1977 263 4,350 1,079 916 653 42,131 14 943 3,018 207,521
1977: Nov. 265 4,349 1,088 1,175 649 41,742 14 952 3,003 206,134 Dec. 263 4,350 1,079 916 653 42,131 14 943 3,018 207,521
1978: Jan. 261 4,349 1,078 755 661 42,638 14 939 3,048 209,576 Feb. 261 4,349 1,068 517 672 42,891 14 957 3,058 210,983 Mar. 260 4,350 1,053 346 688 43,273 13 1,136 3,065 212,885 Apr. 256 4,350 1,046 187 698 43,681 12 1,156 3,025 214,794 May 255 4,350 1,045 34 699 44,039 12 1,137 3,093 216,542 June 253 4,348 1,043 701 44,441 12 1,127 3,127 219,122 July 247 4,350 1,042 706 44,778 12 1,111 3,143 221,809 Aug. 248 4,349 1,034 715 45,180 11 1,125 3,127 224,926 Sept. 244 4,350 1,032 724 45,556 11 1,113 3,138 226,952 Oct. 246 4,350 1,025 729 45,933 11 1,135 3,185 229,555 Nov. 243 4,350 1,024 749 46,218 10 1,056 3,213 231,496
Tramcars registered: Hongkong Tramways Ltd.-162 tramcars and 22 trailers. Peak Tramways Co. Ltd.-3 tramcars.
30 Hong Kong Monthly Digest of Statistics November 1978
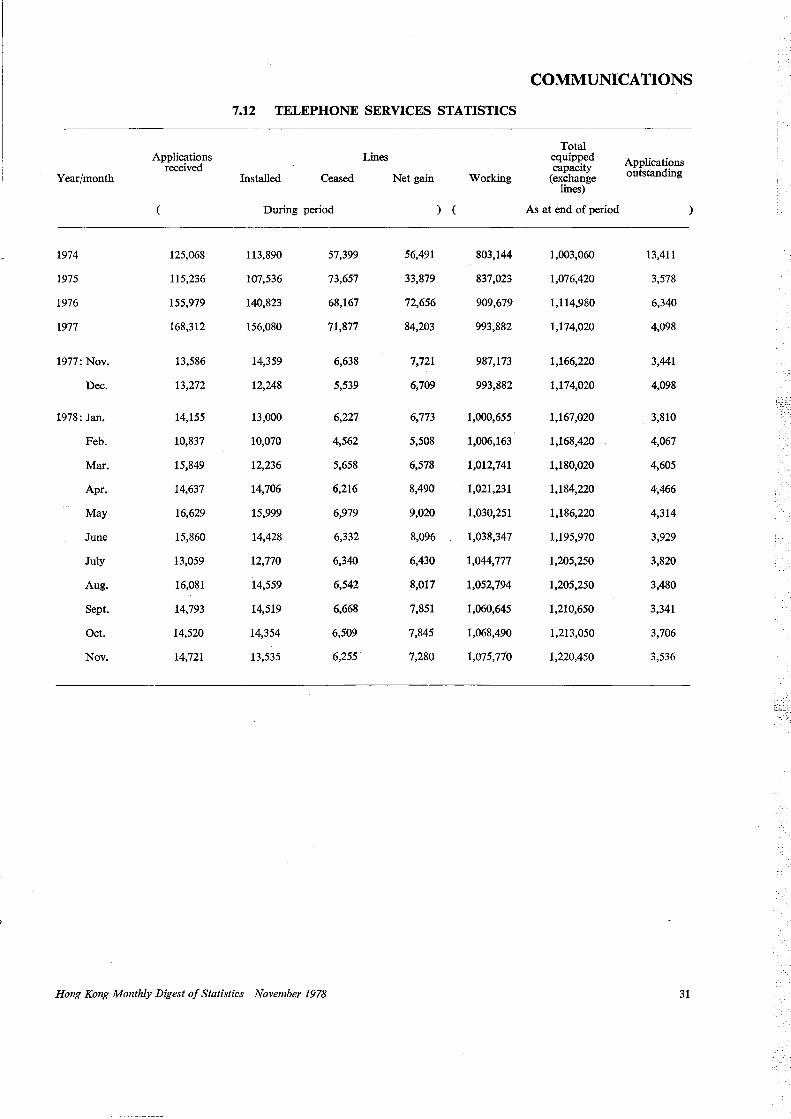
COMMUNICATIONS
7.12 TELEPHONE SERVICES STATISTICS
Total Applications Lines equipped Applications received capacity
Year/month Installed Ceased Net gain Working (exchange outstanding
lines)
During period As at end of period
1974 125,068 113,890 57,399 56,491 803,144 1,003,060 13,411
1975 115,236 107,536 73,657 33,879 837,023 1,076,420 3,578
1976 155,979 140,823 68,167 72,656 909,679 1,114,980 6,340
1977 168,312 156,080 71,877 84,203 993,882 1,174,020 4,098
1977: Nov. 13,586 14,359 6,638 7,721 987,173 1,166,220 3,441
Dec. 13,272 12,248 5,539 6,709 993,882 1,174,020 4,098
1978: Jan. 14,155 13,000 6,227 6,773 1,000,655 1,167,020 3,810
Feb. 10,837 10,070 4,562 5,508 1,006,163 1,168,420 4,067
Mar. 15,849 12,236 5,658 6,578 1,012,741 1,180,020 4,605
Apr. 14,637 14,706 6,216 8,490 1,021,231 1,184,220 4,466
May 16,629 15,999 6,979 9,020 1,030,251 1,186,220 4,314
June 15,860 14,428 6,332 8,096 1,038,347 1,195,970 3,929
July 13,059 12,770 6,340 6,430 1,044,777 1,205,250 3,820
Aug. 16,081 14,559 6,542 8,017 1,052,794 1,205,250 3,480
Sept. 14,793 14,519 6,668 7,851 1,060,645 1,210,650 3,341
Oct. 14,520 14,354 6,509 7,845 1,068,490 1,213,050 3,706
Nov. 14,721 13,535 6,255 7,280 1,075,770 1,220,450 3,536
Hong Kong Monthly Digest of Statistics November 1978 31
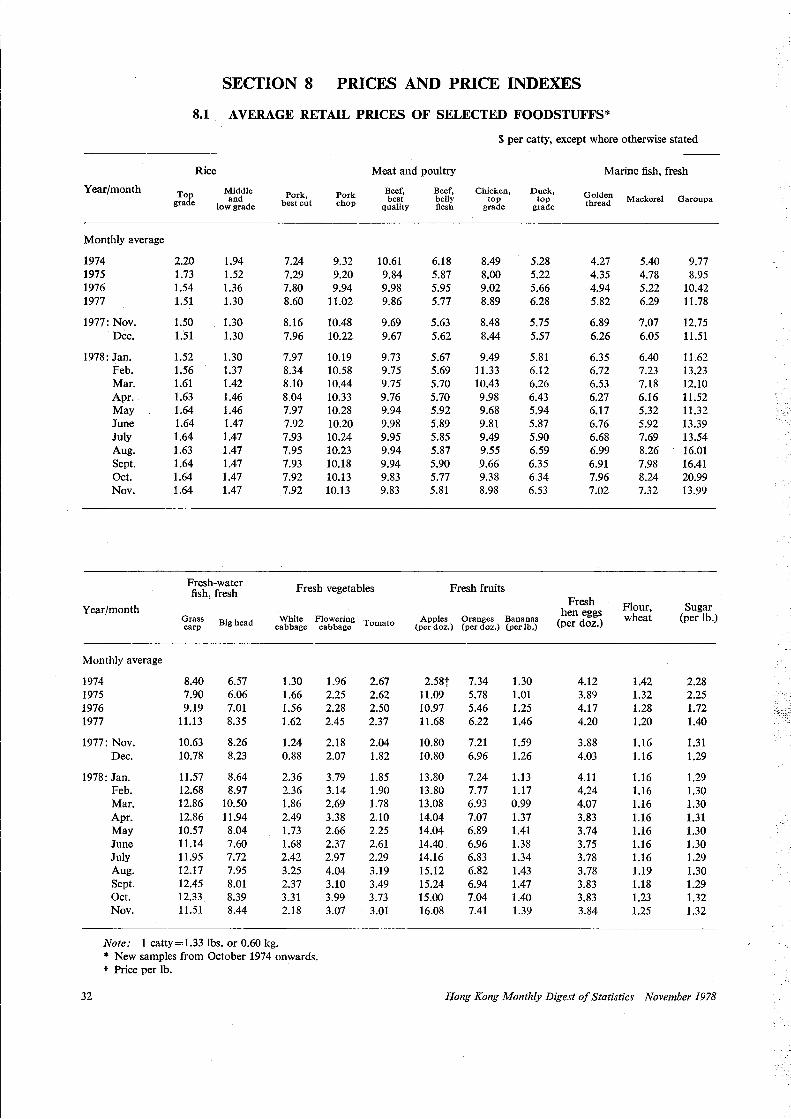
SECTION 8 PRICES AND PRICE INDEXES
8.1 AVERAGE RETAIL PRICES OF SELECTED FOODSTUFFS*
$ per catty, except where otherwise stated
Rice Meat and poultry Marine fish, fresh
Year/month Top Middle Pork, Pork Beef, Beef, Chicken, Duck, Golden grade and best cut chop best belly top top thread Mackerel Garoupa
low grade quality flesh grade grade
Monthly average
1974 2.20 1.94 7.24 9.32 10.61 6.18 8.49 5.28 4.27 5.40 9.77 1975 1.73 1.52 7.29 9.20 9.84 5.87 8.00 5.22 4.35 4.78 8.95 1976 1.54 1.36 7.80 9.94 9.98 5.95 9.02 5.66 4.94 5.22 10.42 1977 1.51 1.30 8.60 11.02 9.86 5.77 8.89 6.28 5.82 6.29 11.78
1977: Nov. 1.50 1.30 8.16 10.48 9.69 5.63 8.48 5.75 6.89 7.07 12.75 Dec. 1.51 1.30 7.96 10.22 9.67 5.62 8.44 5.57 6.26 6.05 11.51
1978: Jan. 1.52 1.30 7.97 10.19 9.73 5.67 9.49 5.81 6.35 6.40 11.62 Feb. 1.56 1.37 8.34 10.58 9.75 5.69 11.33 6.12 6.72 7.23 13.23 Mar. 1.61 1.42 8.10 10.44 9.75 5.70 10.43 6.26 6.53 7.18 12.10 Apr .. 1.63 1.46 8.04 10.33 9.76 5.70 9.98 6.43 6.27 6.16 11.52 May 1.64 1.46 7.97 10.28 9.94 5.92 9.68 5.94 6.17 5.32 11.32 June 1.64 1.47 7.92 10.20 9.98 5.89 9.81 5.87 6.76 5.92 13.39 July 1.64 1.47 7.93 10.24 9.95 5.85 9.49 5.90 6.68 7.69 13.54 Aug. 1.63 1.47 7.95 10.23 9.94 5.87 9.55 6.59 6.99 8.26 16.01 Sept. 1.64 1.47 7.93 10.18 9.94 5.90 9.66 6.35 6.91 7.98 16.41 Oct. 1.64 1.47 7.92 10.13 9.83 5.77 9.38 6.34 7.96 8.24 20.99 Nov. 1.64 1.47 7.92 10.13 9.83 5.81 8.98 6.53 7.02 7.32 13.99
Fresh-water Fresh vegetables Fresh fruits fish, fresh Fresh
Year/month hen eggs Flour, Sugar Grass Bighead White Flowering· T m to Apples Oranges Bananas (per doz.) wheat (per lb.) carp cabbage cabbage 0 a (per doz.) (per doz.) (per lb.)
Monthly average
1974 8.40 6.57 1.30 1.96 2.67 2.58t 7.34 1.30 4.12 1.42 2.28 1975 7.90 6.06 1.66 2.25 2.62 11.09 5.78 1.01 3.89 1.32 2.25 1976 9.19 7.01 1.56 2.28 2.50 10.97 5.46 1.25 4.17 1.28 1.72 1977 11.13 8.35 1.62 2.45 2.37 11.68 6.22 1.46 4.20 1.20 1.40
1977: Nov. 10.63 8.26 1.24 2.18 2.04 10.80 7.21 1.59 3.88 1.16 1.31 Dec. 10.78 8.23 0.88 2.07 1.82 10.80 6.96 1.26 4.03 1.16 1.29
1978: Jan. 11.57 8.64 2.36 3.79 1.85 13.80 7.24 1.13 4.11 1.16 1.29 Feb. 12.68 8.97 2.36 3.14 1.90 13.80 7.77 1.17 4.24 1.16 1.30 Mar. 12.86 10.50 1.86 2.69 1.78 13.08 6.93 0.99 4.07 1.16 1.30 Apr. 12.86 11.94 2.49 3.38 2.10 14.04 7.07 1.37 3.83 1.16 1.31 May 10.57 8.04 1.73 2.66 2.25 14.04 6.89 1.41 3.74 1.16 1.30 June 11.14 7.60 1.68 2.37 2.61 14.40 6.96 1.38 3.75 1.16 1.30 July 11.95 7.72 2.42 2.97 2.29 14.16 6.83 1.34 3.78 1.16 1.29 Aug. 12.17 7.95 3.25 4.04 3.19 15.12 6.82 1.43 3.78 1.19 1.30 Sept. 12.45 8.01 2.37 3.10 3.49 15.24 6.94 1.47 3.83 1.18 1.29 Oct. 12.33 8.39 3.31 3.99 3.73 15.00 7.04 1.40 3.83 1.23 1.32 Nov. 11.51 8.44 2.18 3.07 3.01 16.08 7.41 1.39 3.84 1.25 1.32
Note: 1 catty=l.33 lbs. or 0.60 kg. * New samples from October 1974 onwards. t Price per lb.
32 Hong Kong Monthly Digest of Statistics November 1978
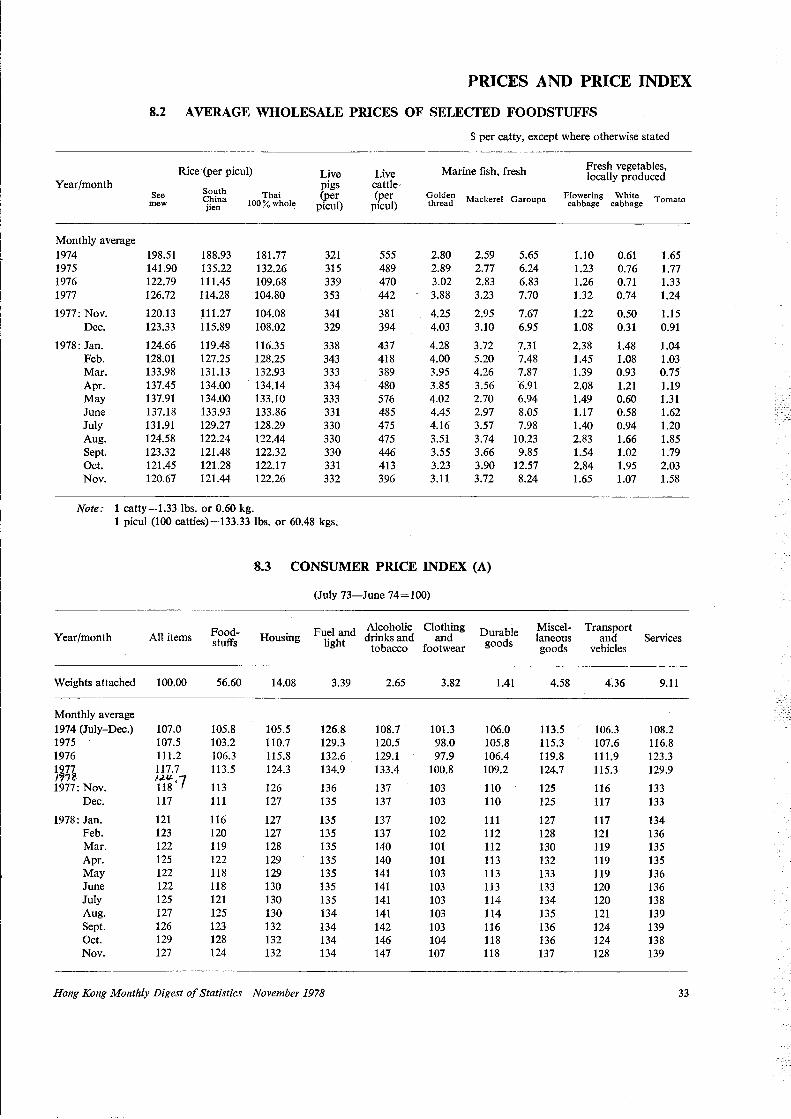
PRICES AND PRICE INDEX
8.2 AVERAGE WHOLESALE PRICES OF SELECTED FOODSTUFFS
$per catty, except where otherwise stated
Rice (per picul) Live Live Marine fish, fresh Fresh vegetables, locally produced
Year/month South
pigs cattle See China Thai (per (per Golden Mackerel Garoupa Flowering White Tomato mew jien 100% whole pi cul) picul) thread cabbage cabb~ge
Monthly average 1974 198.51 188.93 181.77 321 555 2.80 2.59 5.65 1.10 0.61 1.65 1975 141.90 135.22 132.26 315 489 2.89 2.77 6.24 1.23 0.76 1.77 1976 122.79 111.45 109.68 339 470 3.02 2.83 6.83 1.26 0.71 1.33 1977 126.72 114.28 104.80 353 442 3.88 3.23 7.70 1.32 0.74 1.24
1977: Nov. 120.13 111.27 104.08 341 381 4.25 2.95 7.67 1.22 0.50 1.15 Dec. 123.33 115.89 108.02 329 394 4.03 3.10 6.95 1.08 0.31 0.91
1978: Jan. 124.66 119.48 116.35 338 437 4.28 3.72 7.31 2.38 1.48 1.04 Feb. 128.01 127.25 128.25 343 418 4.00 5.20 7.48 1.45 1.08 1.03 Mar. 133.98 131.13 132.93 333 389 3.95 4.26 7.87 1.39 0.93 0.75 Apr. 137.45 134.00 134.14 334 480 3.85 3.56 6.91 2.08 1.21 1.19 May 137.91 134.00 133.10 333 576 4.02 2.70 6.94 1.49 0.60 1.31 June 137.18 133.93 133.86 331 485 4.45 2.97 8.05 1.17 0.58 1.62 July 131.91 129.27 128.29 330 475 4.16 3.57 7.98 1.40 0.94 1.20 Aug. 124.58 122.24 122.44 330 475 3.51 3.74 10.23 2.83 1.66 1.85 Sept. 123.32 121.48 122.32 330 446 3.55 3.66 9.85 1.54 1.02 1.79 Oct. 121.45 121.28 122.17 331 413 3.23 3.90 12.57 2.84 1.95 2.03 Nov. 120.67 121.44 122.26 332 396 3.11 3.72 8.24 1.65 1.07 1.58
Note: 1 catty=l.33 lbs. or 0.60 kg. 1 picul (100 catties)=133.33 lbs. or 60.48 kgs.
8.3 CONSUMER PRICE INDEX (A)
(July 73-June 74= 100)
Food- Fuel and Alcoholic Clothing Durable Miscel- Transport Year/month All items stuffs Housing light drinks and and goods laneous and Services
tobacco footwear goods vehicles
Weights attached 100.00 56.60 14.08 3.39 2.65 3.82 1.41 4.58 4.36 9.11
Monthly average 1974 (July-Dec.) 107.0 105.8 105.5 126.8 108.7 101.3 106.0 113.5 106.3 108.2 1975 107.5 103.2 110.7 129.3 120.5 98.0 105.8 115.3. 107.6 116.8 1976 111.2 106.3 115.8 132.6 129.l 97.9 106.4 119.8 111.9 123.3
}~n 117.7 113.5 124.3 134.9 133.4 100.8 109.2 124.7 115.3 129.9
1977: Nov. 't:t:1 113 126 136 137 103 110 125 116 133 Dec. 117 111 127 135 137 103 110 125 117 133
1978: Jan. 121 116 127 135 137 102 111 127 117 134 Feb. 123 120 127 135 137 102 112 128 121 136 Mar. 122 119 128 135 140 101 112 130 119 135 Apr. 125 122 129 135 140 101 113 132 119 135 May 122 118 129 135 141 103 113 133 119 136 June 122 118 130 135 141 103 113 133 120 136 July 125 121 130 135 141 103 114 134 120 138 Aug. 127 125 130 134 141 103 114 135 121 139 Sept. 126 123 132 134 142 103 116 136 124 139 Oct. 129 128 132 134 146 104 118 136 124 138 Nov. 127 124 132 134 147 107 118 137 128 139
Hong Kong Monthly Digest of Statistics November 1978 33
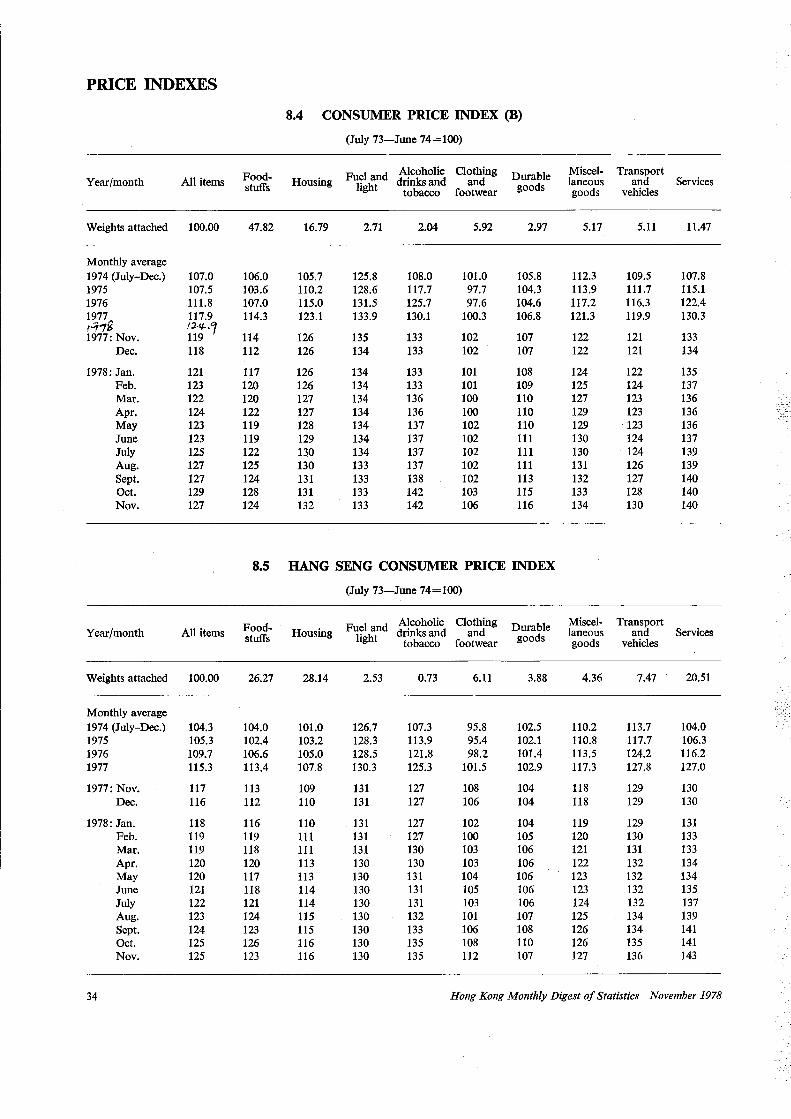
PRICE INDEXES
8.4 CONSUMER PRICE INDEX (B)
(July 73-June 74=100)
Food- Fuel and Alcoholic Clothing Durable Miscel- Transport Year/month All items stuffs Housing light drinks and and goods laneous and Services
tobacco footwear goods vehicles
Weights attached 100.00 47.82 16.79 2.71 2.04 5.92 2.97 5.17 5.11 11.47
Monthly average 1974 (July-Dec.) 107.0 106.0 105.7 125.8 108.0 101.0 105.8 112.3 109.5 107.8 1975 107.5 103.6 110.2 128.6 117.7 97.7 104.3 113.9 111.7 115.1 1976 111.8 107.0 115.0 131.5 125.7 97.6 104.6 117.2 116.3 122.4 1977 117.9 114.3 123.l 133.9 130.1 100.3 106.8 121.3 119.9 130.3 ,q..,g l'JA/,..1 1977: Nov. 119 114 126 135 133 102 107 122 121 133
Dec. 118 112 126 134 133 102 107 122 121 134
1978: Jan. 121 117 126 134 133 101 108 124 122 135 Feb. 123 120 126 134 133 101 109 125 124 137 Mar. 122 120 127 134 136 100 110 127 123 136 Apr. 124 122 127 134 136 100 110 129 123 136 May 123 119 128 134 137 102 110 129 123 136 June 123 119 129 134 137 102 111 130 124 137 July 125 122 130 134 137 102 111 130 124 139 Aug. 127 125 130 133 137 102 111 131 126 139 Sept. 127 124 131 133 138 102 113 132 127 140 Oct. 129 128 131 133 142 103 115 133 128 140 Nov. 127 124 132 133 142 106 116 134 130 140
8.5 HANG SENG CONSUMER PRICE INDEX
(July 73-June 74=100)
Food- Fuel and Alcoholic Clothing Durable Miscel- Transport Year/month All items stuffs Housing light drinks and and goods laneous and Services
tobacco footwear goods vehicles
Weights attached 100.00 26.27 28.14 2.53 0.73 6.11 3.88 4.36 7.47 20.51
Monthly average 1974 (July-Dec.) 104.3 104.0 101.0 126.7 107.3 95.8 102.5 110.2 113.7 104.0 1975 105.3 102.4 103.2 128.3 113.9 95.4 102.1 110.8 117.7 106.3 1976 109.7 106.6 105.0 128.5 121.8 98.2 101.4 113.5 124.2 116.2 1977 115.3 113.4 107.8 130.3 125.3 101.5 102.9 117.3 127.8 127.0
1977: Nov. 117 113 109 131 127 108 104 118 129 130 Dec. 116 112 110 131 127 106 104 118 129 130
1978: Jan. 118 116 110 131 127 102 104 119 129 131 Feb. 119 119 111 131 127 100 105 120 130 133 Mar. 119 118 111 131 130 103 106 121 131 133 Apr. 120 120 113 130 130 103 106 122 132 134 May 120 117 113 130 131 104 106 123 132 134 June 121 118 114 130 131 105 106 123 132 135 July 122 121 114 130 131 103 106 124 132 137 Aug. 123 124 115 130 132 101 107 125 134 139 Sept. 124 123 115 130 133 106 108 126 134 141 Oct. 125 126 116 130 135 108 110 126 135 141 Nov. 125 123 116 130 135 112 107 127 136 143
34 Hong Kong Monthly Digest of Statistics November 1978
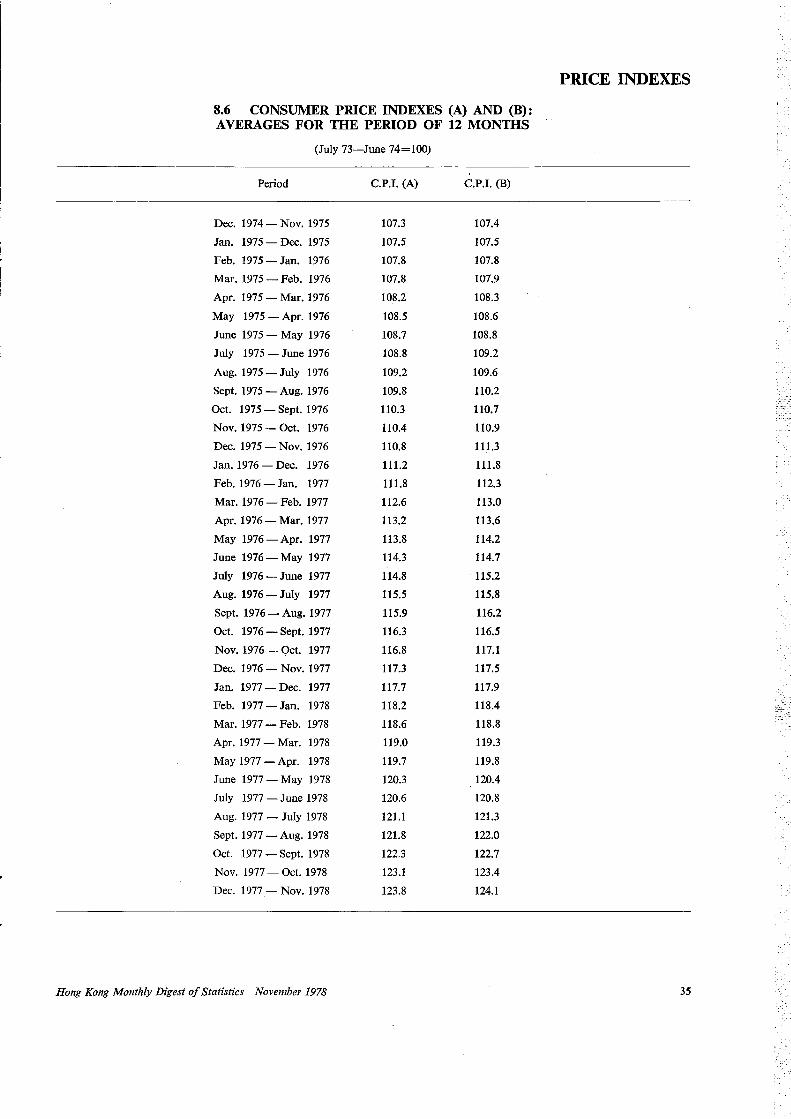
PRICE INDEXES
8.6 CONSUMER PRICE INDEXES (A) AND (B): AVERAGES FOR THE PERIOD OF 12 MONTHS
(July 73-June 74=100)
Period C.P.I. (A) C.P.I. (B)
Dec. 1974 - Nov. 1975 107.3 107.4
Jan. 1975 - Dec. 1975 107.5 107.5
Feb. 1975 - Jan. 1976 107.8 107.8
Mar. 1975 - Feb. 1976 107.8 107.9
Apr. 1975 - Mar. 1976 108.2 108.3
May 1975 - Apr. 1976 108.5 108.6
June 1975 - May 1976 108.7 108.8
July 1975 - June 1976 108.8 109.2
Aug. 1975 - July 1976 109.2 109.6
Sept. 1975 - Aug. 1976 109.8 110.2
Oct. 1975 - Sept. 1976 110.3 110.7
Nov. 1975 - Oct. 1976 110.4 110.9
Dec. 1975 - Nov. 1976 110.8 111.3
Jan. 1976 - Dec. 1976 111.2 111.8
Feb. 1976 - Jan. 1977 111.8 112.3
Mar. 1976 - Feb. 1977 112.6 113.0
Apr. 1976 - Mar. 1977 113.2 113.6
May 1976 - Apr. 1977 113.8 114.2
June 1976 - May 1977 114.3 114.7
July 1976 - June 1977 114.8 115.2
Aug. 1976 - July 1977 115.5 115.8
Sept. 1976 - Aug. 1977 115.9 116.2
Oct. 1976 - Sept. 1977 116.3 116.5
Nov. 1976 - Oct. 1977 116.8 117.1
Dec. 1976 - Nov. 1977 117.3 117.5
Jan. 1977 - Dec. 1977 117.7 117.9
Feb. 1977 - Jan. 1978 118.2 118.4
Mar. 1977 - Feb. 1978 118.6 118.8
Apr. 1977 - Mar. 1978 119.0 119.3
May 1977 - Apr. 1978 119.7 119.8
June 1977 - May 1978 120.3 120.4
July 1977 - June 1978 120.6 120.8
Aug. 1977 - July 1978 121.1 121.3
Sept. 1977 -Aug. 1978 121.8 122.0
Oct. 1977 - Sept. 1978 122.3 122.7
Nov. 1977 - Oct. 1978 123.1 123.4
Dec. 1977 - Nov. 1978 123.8 124.1
Hong Kong Monthly Digest of Statistics November 1978 35
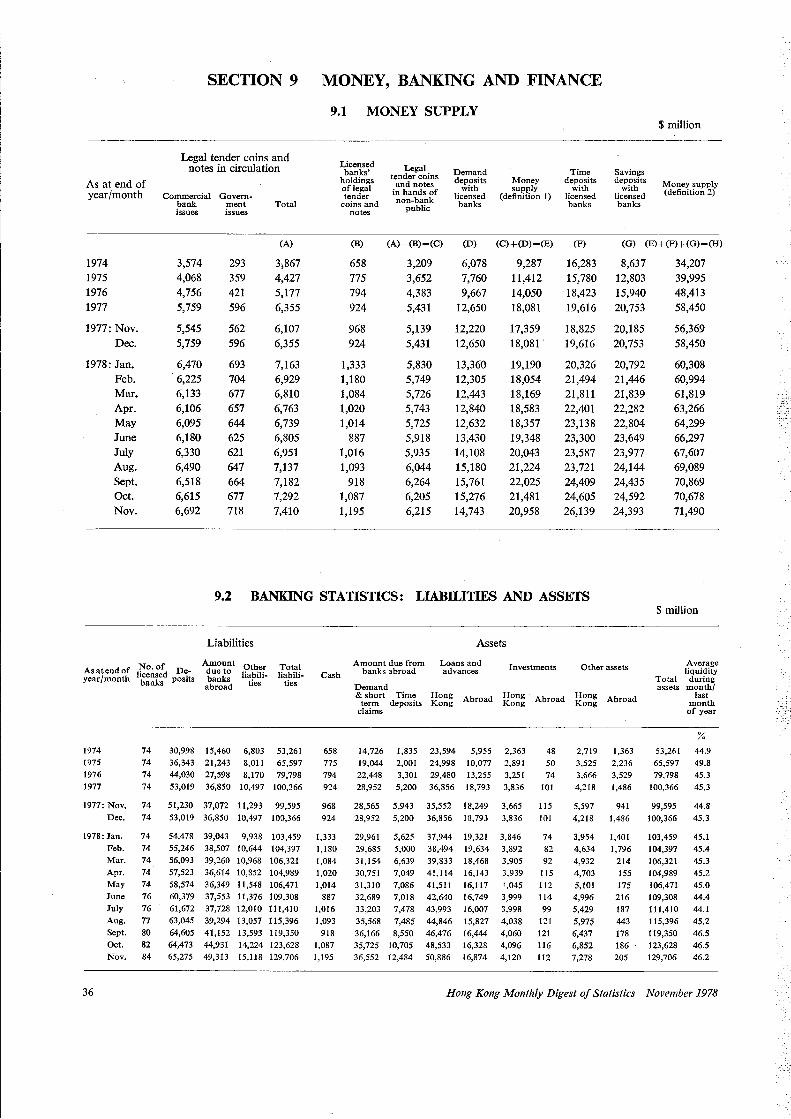
As at end of year/month
1974 1975 1976 1977
1977: Nov. Dec.
1978: Jan. Feb. Mar. Apr. May June July Aug. Sept. Oct. Nov.
SECTION 9
Legal tender coins and notes in circulation
Commercial Govern-bank ment Total issues issues
3,574 4,068 4,756 5,759
5,545 5,759
6,470 6,225 6,133 6,106 6,095 6,180 6,330 6,490 6,518 6,615 6,692
293 359 421 596
562 596
693 704 677 657 644 625 621 647 664 677 718
(A)
3,867 4,427 5,177 6,355
6,107 6,355
7,163 6,929 6,810 6,763 6,739 6,805 6,951 7,137 7,182 7,292 7,410
MONEY, BANKING AND FINANCE
9.1 MONEY SUPPLY
Licensed banks'
holdings of legal tender
coins and notes
(B)
658 775 794 924
968 924
1,333 1,180 1,084 1,020 1,014
887 1,016 1,093
918 1,087 1,195
Legal tender coins
and notes in hands of non-bank
public
(A)-(B)=(C)
3,209 3,652 4,383 5,431
5,139 5,431
5,830 5,749 5,726 5,743 5,725 5,918 5,935 6,044 6,264 6,205 6,215
Demand deposits
with licensed banks
(D)
6,078 7,760 9,667
12,650
12,220 12,650
13,360 12,305 12,443 12,840 12,632 13,430 14,108 15,180 15,761 15,276 14,743
Money supply
(definition 1)
(C)+(D)=(B)
9,287 11,412 14,050 18,081
17,359 18,081
19,190 18,054 18,169 18,583 18,357 19,348 20,043 21,224 22,025 21,481 20,958
Time deposits
with licensed banks
(F)
16,283 15,780 18,423 19,616
18,825 19,616
20,326 21,494 21,811 22,401 23,138 23,300 23,587 23,721 24,409 24,605 26,139
Savings deposits
with licensed banks
$million
Money supply (definition 2)
(G) (E)+(F)+(G)=(H)
8,637 12,803 15,940 20,753
20,185 20,753
20,792 21,446 21,839 22,282 22,804 23,649 23,977 24,144 24,435 24,592 24,393
34,207 39,995 48,413 58,450
56,369 58,450
60,308 60,994 61,819 63,266 64,299 66,297 67,607 69,089 70,869 70,678 71,490
9.2 BANKING STATISTICS: LIABILITIES AND ASSETS
Liabilities
Asatendof ~o.of Deyear/month 1b=~k~d posits
Amount Other
i~~~~ liabili-abroad ties
Total liabili
ties
1974 1975
74 30,998 15,460 6,803 53,261 74 36,343 21,243 8,011 65,597
1976 74 44,030 27,598 8,170 79,798
1977 74 53,019 36,850 10,497 100,366
1977: Nov. 74 51,230 37,072 11,293 99,595 Dec. 74 53,019 36,850 10,497 100,366
1978: Jan.
36
Feb. Mar. Apr. May
June July Aug. Sept.
Oct. Nov.
74 74 74 74 74 76 76 77 80 82 84
54,478 39,043 9,938 103,459 55,246 38,507 10,644 104,397 56,093 39,260 10,968 106,321 57,523 36,614 10,852 104,989 58,574 36,349 11,548 106,471 60,379 37,553 11,376 109,308 61,672 37,728 12,010 111,410 63,045 39,294 13,057 115,396 64,605 41,152 13,593 119,350 64,473 44,931 14,224 123,628 65,275 49,313 15,118 129,706
$million
Assets
Amount due from Loans and banks abroad advances Cash
Investments Other assets
Demand & short Time Hong Abroad
term deposits Kong Hong d Hong Kong Abroa Kong Abroad
Average liquidity
Total during assets month/
last month of year
658 775
claims
14,726 1,835 23,594 5,955 2,363 19,044 2,001 24,998 10,077 2,891
48 50
794 22,448 3,301 29,480 13,255 3,251 74
924 28,952 5,200 36,856 18,793 3,836 101
968 28,565 5,943 35,552 18,249 3,665 115 924 28,952 5,200 36,856 18,793 3,836 101
1,333 1,180 1,084 1,020 1,014
887 1,016 1,093
918 1,087 1,195
29,961 5,625 29,685 5,000 31,154 6,639 30,751 7,049 31,310 7,086 32,689 7,018 33,203 7,478 35,568 7,485 36,166 8,550 35,725 10,705 36,552 12,484
37,944 19,321 38,494 19,634 39,833 18,468 41, l 14 16,143
41,511 16,117 42,640 16,749 43,993 16,007 44,846 15,827 46,476 16,444 48,533 16,328 50,886 16,874
3,846 3,892 3,905 3,939
',045 3,999 3,998 4,038 4,060 4,096 4,120
74 82 92
115 112 114
99 121
121 116 112
2,719 1,363 53,261 44.9 3,525 2,236 65,597 49.8 3,666 3,529 79,798 45.3 4,218 1,486 100,366 45.3
5,597 941 99,595 44.8 4,218 1,486 100,366 45.3
3,954 4,634 4,932 4,703 5,101 4,996 5,429 5,975 6,437 6,852 7,278
1,401 1,796
214 155 175
216 187 443 178 186 .
205
103,459 104,397 106,321 104,989 106,471 109,308 111,410 115,396 119,350 123,628 129,706
45.1 45.4 45.3 45.2 45.0 44.4 44.1 45.2 46.5 46.5 46.2
Hong Kong Monthly Digest of Statistics November 1978
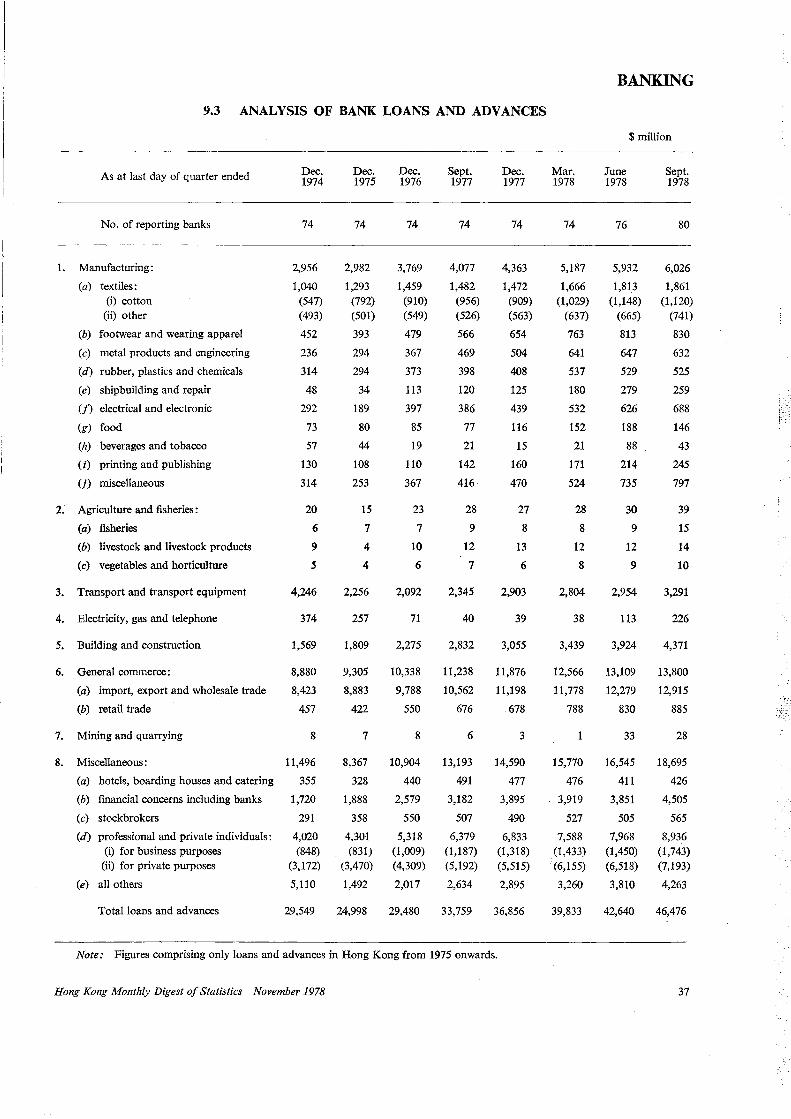
9.3 ANALYSIS OF BANK LOANS AND ADVANCES
As at last day of quarter ended
No. of reporting banks
1. Manufacturing:
(a) textiles : (i) cotton
(ii) other
(b) footwear and wearing apparel
(c) metal products and engineering
(d) rubber, plastics and chemicals
(e) shipbuilding and repair
(f) electrical and electronic
(g) food
(h) beverages and tobacco
(i) printing and publishing
(j) miscellaneous
2. Agriculture and fisheries:
(a) fisheries
(b) livestock and livestock products
(c) vegetables and horticulture
3. Transport and transport equipment
4. Electricity, gas and telephone
5. Building and construction
6. General commerce:
(a) import, export and wholesale trade
(b) retail trade
7. Mining and quarrying
8. Miscellaneous:
(a) hotels, boarding houses and catering
(b) financial concerns including banks
(c) stockbrokers
(d) professional and private individuals: (i) for business purposes
(ii) for private purposes
(e) all others
Total loans and advances
Dec. 1974
74
2,956
1,040 (547) (493)
452
236
314
48
292
73
57
130
314
20
6
9
s
4,246
374
1,569
8,880
8,423
457
8
11,496
355
1,720
291
4,020 (848)
(3,172)
5,110
29,549
Dec. 1975
74
2,982
1,293 (792) (501)
393
294
294
34
189
80
44
108
253
15
7
4
4
2,256
257
1,809
9,305
8,883
422
7
8,367
328
1,888
358
4,301 (831)
(3,470)
1,492
24,998
Dec. 1976
74
3,769
1,459 (910) (549)
479
367
373
113
397
85
19
110
367
23
7
10
6
2,092
71
2,275
10,338
9,788
550
8
10,904
440
2,579
550
5,318 (1,009) (4,309)
2,017
29,480
Sept. 1977
74
4,077
1,482 (956) (526)
566
469
398
120
386
77
21
142
416
28
9
12
7
2,345
40
2,832
11,238
10,562
676
6
13,193
491
3,182
507
6,379 (1,187) (5,192)
2,634
33,759
Dec. 1977
74
4,363
1,472 (909) (563)
654
504
408
125
439
116
15
160
470
27
8
13
6
2,903
39
3,055
11,876
11,198
678
3
14,590
477
3,895
490
6,833 (1,318) (5,515)
2,895
36,856
Note: Figures comprising only loans and advances in Hong Kong from 1975 onwards.
Hong Kong Monthly Digest of Statistics November 1978
Mar. 1978
74
5,187
1,666 (1,029)
(637)
763
641
537
180
532
152
21
171
524
28
8
12
8
2,804
38
3,439
12,566
11,778
788
1
15,770
476
3,919
527
7,588 (1,433) (6,155)
3,260
39,833
BANIHNG
$million
June 1978
76
5,932
1,813 (1,148)
(665)
813
647
529
279
626
188
88
214
735
30
9
12
9
2,954
113
3,924
13,109
12,279
830
33
16,545
411
3,851
505
7,968 (1,450) (6,518)
3,810
42,640
Sept. 1978
80
6,026
1,861 (1,120)
(741)
830
632
525
259
688
146
43
245
797
39
15
14
10
3,291
226
4,371
13,800
12,915
885
28
18,695
426
4,505
565
8,936 (1,743) (7,193)
4,263
46,476
37
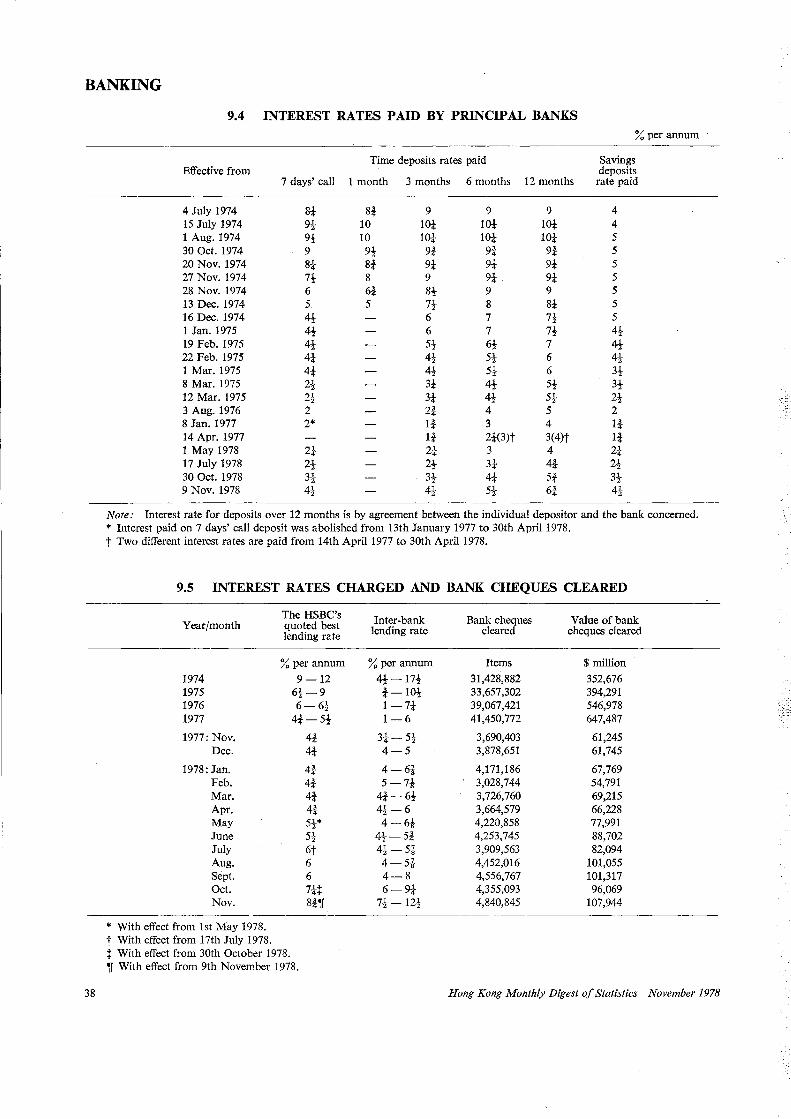
BANKING
3S
9.4 INTEREST RATES PAID BY PRINCIPAL BANKS % per annum
Time deposits rates paid Savings Effective from deposits
7 days' call 1 month 3 months 6 months 12 months rate paid
4 July 1974 St St 9 9 9 4 IS July 1974 9t 10 lot lot lot 4 1Aug.1974 9t 10 lot lot lot s 30 Oct. 1974 9 9t 9i 9t 9-! s 20 Nov. 1974 St St 9-!- 9t 9-!- s 27 Nov. 1974 7t 8 9 9t 9t s 2S Nov. 1974 6 6t 8! 9 9 s 13 Dec. 1974 s s 7t s st s 16 Dec. 1974 4! 6 7 7t s 1 Jan. 197S 4! 6 7 7t 4t 19 Feb. 197S 4! St 6t 7 4! 22 Feb. 197S 4-l: 4! St 6 4! 1Mar.197S 4-! 4! St 6 3t S Mar. 197S 2t 3t 4! St 3t 12 Mar. 197S 2t 3-! 4! St 2t 3 Aug. 1976 2 2t 4 s 2 S Jan. 1977 2* It 3 4 It 14 Apr. 1977 It 2t(3)t 3(4)t It 1May1978 2t 2t 3 4 2-l 17 July 197S 2t 2t 3t 4t 2t 30 Oct. 197S 3t 3t 4t St 3t 9 Nov. 1978 4! 4t st 6-! 4t
Note: Interest rate for deposits over 12 months is by agreement between the individual depositor and the bank concerned. * Interest paid on 7 days' call deposit was abolished from 13th January 1977 to 30th April 197S. t Two different interest rates are paid from 14th April 1977 to 30th April 197S.
9.5 INTEREST RATES CHARGED AND BANK CHEQUES CLEARED
Year/month
1974 197S 1976 1977
1977: Nov. Dec.
197S: Jan. Feb. Mar. Apr. May June July Aug. Sept. Oct. Nov.
* With effect from lst May 1978. t With effect from 17th July 197S.
The HSBC's quoted best lending rate
% per annum
9-12 6t-9 6-6t
4t-St
4-! 4t
4-! 4t 4i 4t S1-* 2
St 6t 6 6 7H Si'if
t With effect from 30th October 1978. 'if With effect from 9th November 197S.
Inter-bank Bank cheques Value of bank lending rate cleared cheques cleared
% per annum Items $million
4!-17t 31,42S,SS2 3S2,676 i-lOt 33,6S7,302 394,291 1-7-! 39,067,421 S46,97S 1-6 41,4S0,772 647,4S7
3t-St 3,690,403 61,24S 4-S 3,S7S,6Sl 61,74S
4-6~ 4,171,1S6 67,769 S-7t 3,02S,744 S4,791
4t-6t 3,726,760 69,21S 4t-6 3,664,S79 66,22S 4-6t 4,220,SSS 77,991
4t-St 4,2S3,745 S8,702 4!-Si 3,909,S63 S2,094 4-Si 4,4S2,016 101,0SS 4-S 4,SS6,767 101,317 6-9t 4,3SS,093 96,069
7-}-12t 4,S40,S4S 107,944
Hong Kong Monthly Digest of Statistics November 1978
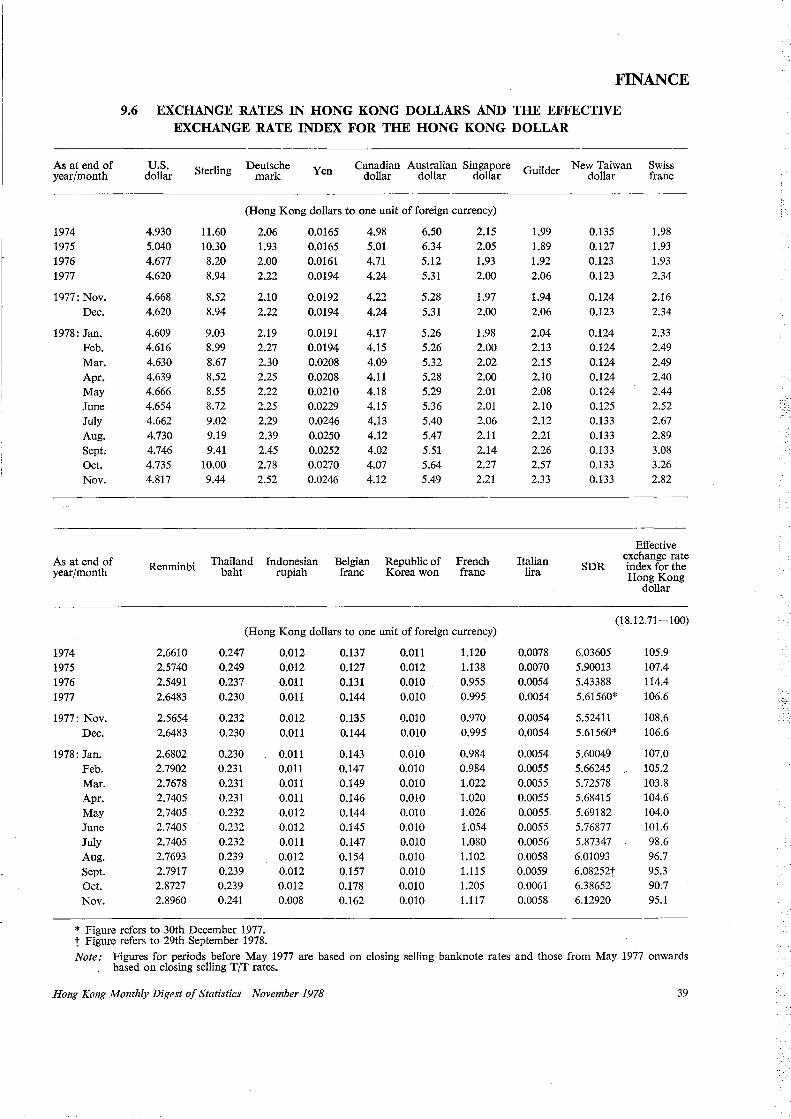
As at end of year/month
1974 1975 1976 1977
1977: Nov. Dec.
1978: Jan. Feb. Mar. Apr. May June July Aug. Sept, Oct. Nov.
As at end of year/month
1974 1975 1976 1977
1977: Nov. Dec.
1978: Jan. Feb. Mar. Apr. May June July Aug. Sept. Oct. Nov.
FINANCE
9.6 EXCHANGE RATES IN HONG KONG DOLLARS AND THE EFFECTIVE EXCHANGE RATE INDEX FOR THE HONG KONG DOLLAR
U.S. dollar
4.930 5.040 4.677 4.620
4.668 4.620
4.609 4.616 4.630 4.639 4.666 4.654 4.662 4.730 4.746 4.735 4.817
Renminbi
2.6610 2.5740 2.5491 2.6483
2.5654 2.6483
2.6802 2.7902 2.7678 2.7405 2.7405 2.7405 2.7405 2.7693 2.7917 2.8727 2.8960
Sterling Deutsche mark Yen Canadian Australian Singapore Guilder New Taiwan
dollar dollar dollar dol!ar Swiss franc
11.60 10.30 8.20 8.94
8.52 8.94
9.03 8.99 8.67 8.52 8.55 8.72 9.02 9.19 9.41
10.00 9.44
(Hong Kong dollars to one unit of foreign currency)
2.06 1.93 2.00 2.22
2.10 2.22
2.19 2.27 2.30 2.25 2.22 2.25 2.29 2.39 2.45 2.78 2.52
0.0165 0.0165 0.0161 0.0194
0.0192 0.0194
0.0191 0.0194 0.0208 0.0208 0.0210 0.0229 0.0246 0.0250 0.0252 0.0270 0.0246
4.98 5.01 4.71 4.24
4.22 4.24
4.17 4.15 4.09 4.11 4.18 4.15 4.13 4.12 4.02 4.07 4.12
6.50 6.34 5.12 5.31
5.28 5.31
5.26 5.26 5.32 5.28 5.29 5.36 5.40 5.47 5.51 5.64 5.49
2.15 2.05 1.93 2.00
1.97 2.00
1.98 2.00 2.02 2.00 2.01 2.01 2.06 2.11 2.14 2.27 2.21
Thailand Indonesian Belgian Republic of French baht rupiah franc Korea won franc
(Hong Kong dollars to one unit of foreign currency)
0.247 0.249 0.237 0.230
0.232 0.230
0.230 0.231 0.231 0.231 0.232 0.232 0.232 0.239 0.239 0.239 0.241
0.012 0.012 0.011 0.011
0.012 0.011
0.011 0.011 0.011 0.011 0.012 0.012 0.011 0.012 0.012 0.012 0.008
0.137 0.127 0.131 0.144
0.135 0.144
0.143 0.147 0.149 0.146 0.144 0.145 0.147 0.154 0.157 0.178 0.162
0.011 0.012 0.010 0.010
0.010 0.010
0.010 0.010 0.010 0.010 0.010 0.010 0.010 0.010 0.010 0.010 0.010
1.120 1.138 0.955 0.995
0.970 0.995
0.984 0.984 1.022 1.020 1.026 1.054 1.080 1.102 1.115 1.205 1.117
1.99 1.89 1.92 2.06
1.94 2.06
2.04 2.13 2.15 2.10 2.08 2.10 2.12 2.21 2.26 2.57 2.33
Italian lira
0.0078 0.0070 0.0054 0.0054
0.0054 0.0054
0.0054 0.0055 0.0055 0.0055 0.0055 0.0055 0.0056 0.0058 0.0059 0.0061 o.0058
0.135 0.127 0.123 0.123
0.124 0.123
0.124 0.124 0.124 0.124 0.124 0.125 0.133 0.133 0.133 0.133 0.133
SDR
1.98 1.93 1.93 2.34
2.16 2.34
2.33 2.49 2.49 2.40 2.44 2.52 2.67 2.89 3.08 3.26 2.82
Effective exchange rate index for the Hong Kong
dollar
(18.12.71 =100)
6.03605 105.9 5.90013 107.4 5.43388 114.4 5.61560* 106.6
5.52411 108.6 5.61560* 106.6
5.60049 107.0 5.66245 , 105.2 5.72578 103.8 5.68415 104.6 5.69182 104.0 5.76877 101.6 5.87347 98.6 6.01093 96.7 6.08252t 95.3 6.38652 90.7 6.12920 95.1
* Figure refers to 30th December 1977. t Figure refers to 29th September 1978. Note: Figures for periods before May 1977 are based on closing selling banknote rates and those from May 1977 onwards
, based on closing selling T/T rates.
Hong Kong Monthly Digest of Statistics November 1978 39
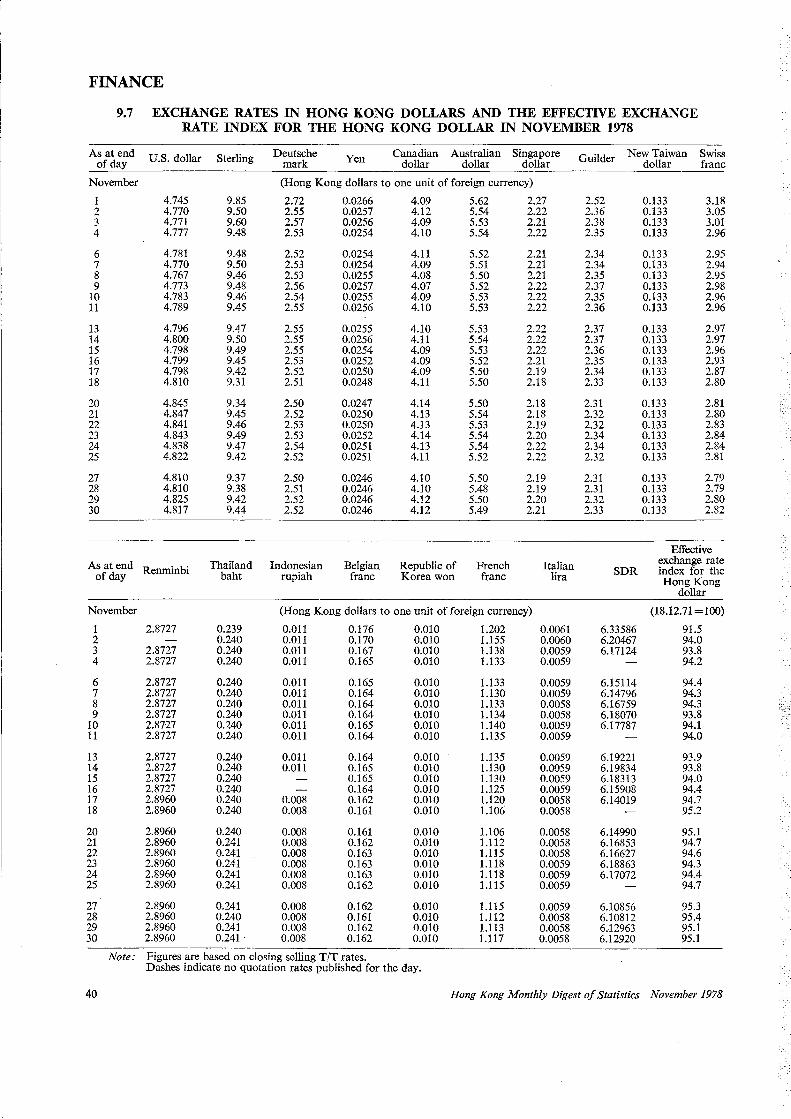
FINANCE
9.7 EXCHANGE RATES IN HONG KONG DOLLARS AND THE EFFECTIVE EXCHANGE RATE INDEX FOR THE HONG KONG DOLLAR IN NOVEMBER 1978
As at end U.S. dollar Sterling Deutsche Yen Canadian Australian Singapore Guilder New Taiwan Swiss of day mark dollar dollar dollar dollar franc
November (Hong Kong dollars to one unit of foreign currency)
1 4.745 9.85 2.72 0.0266 4.09 5.62 2.27 2.52 0.133 3.18 2 4.770 9.50 2.55 0.0257 4.12 5.54 2.22 2.36 0.133 3.05 3 4.771 9.60 2.57 0.0256 4.09 5.53 2.21 2.38 0.133 3.01 4 4.777 9.48 2.53 0.0254 4.10 5.54 2.22 2.35 0.133 2.96
6 4.781 9.48 2.52 0.0254 4.11 5.52 . 2.21 2.34 0.133 2.95 7 4.770 9.50 2.53 0.0254 4.09 5.51 2.21 2.34 0.133 2.94 8 4.767 9.46 2.53 0.0255 4.08 5.50 2.21 2.35 0.133 2.95 9 4.773 9.48 2.56 0.0257 4.07 5.52 2.22 2.37 0.133 2.98
10 4.783 9.46 2.54 0.0255 4.09 5.53 2.22 2.35 0.133 2.96 11 4.789 9.45 2.55 0.0256 4.10 5.53 2.22 2.36 0.133 2.96
13 4.796 9.47 2.55 0.0255 4.10 5.53 2.22 2.37 0.133 2.97 14 4.800 9.50 2.55 0.0256 4.11 5.54 2.22 2.37 0.133 2.97 15 4.798 9.49 2.55 0.0254 4.09 5.53 2.22 2.36 0.133 2.96 16 4.799 9.45 2.53 0.0252 4.09 5.52 2.21 2.35 0.133 2.93 17 4.798 9.42 2.52 0.0250 4.09 5.50 2.19 2.34 0.133 2.87 18 4.810 9.31 2.51 0.0248 4.11 5.50 2.18 2.33 0.133 2.80
20 4.845 9.34 2.50 0.0247 4.14 5.50 2.18 2.31 0.133 2.81 21 4.847 9.45 2.52 0.0250 4.13 5.54 2.18 2.32 0.133 2.80 22 4.841 9.46 2.53 0.0250 4.13 5.53 2.19 2.32 0.133 2.83 23 4.843 9.49 2.53 0.0252 4.14 5.54 2.20 2.34 0.133 2.84 24 4.838 9.47 2.54 0.0251 4.13 5.54 2.22 2.34 0.133 2.84 25 4.822 9.42 2.52 0.0251 4.11 5.52 2.22 2.32 0.133 2.81
27 4.810 9.37 2.50 0.0246 4.10 5.50 2.19 2.31 0.133 2.79 28 4.810 9.38 2.51 0.0246 4.10 5.48 2.19 2.31 0.133 2.79 29 4.825 9.42 2.52 0.0246 4.12 5.50 2.20 2.32 0.133 2.80 30 4.817 9.44 2.52 0.0246 4.12 5.49 2.21 2.33 0.133 2.82
Effective
As at end Thailand Indonesian Belgian Republic of French Italian exchange rate Renminbi SDR index for the of day baht rupiah franc Korea won franc lira Hong Kong
dollar
November (Hong Kong dollars to one unit of foreign currency) (18.12.71 =100)
1 2.8727 0.239 0.011 0.176 0.010 1.202 0.0061 6.33586 91.5 2 0.240 0.011 0.170 0.010 1.155 0.0060 6.20467 94.0 3 2.8727 0.240 0.011 0.167 0.010 1.138 0.0059 6.17124 93.8 4 2.8727 0.240 0.011 0.165 0.010 1.133 0.0059 94.2
6 2.8727 0.240 0.011 0.165 0.010 1.133 0.0059 6.15114 94.4 7 2.8727 0.240 0.011 0.164 0.010 1.130 0.0059 6.14796 94.3 8 2.8727 0.240 0.011 0.164 0.010 1.133 0.0058 6.16759 94.3 9 2.8727 0.240 0.011 0.164 0.010 1.134 0.0058 6.18070 93.8
10 2.8727 0.240 0.011 0.165 0.010 1.140 0.0059 6.17787 94.1 11 2.8727 0.240 0.011 0.164 0.010 1.135 0.0059 94.0
13 2.8727 0.240 0.011 0.164 0.010 1.135 0.0059 6.19221 93.9 14 2.8727 0.240 0.011 0.165 0.010 1.130 0.0059 6.19834 93.8 15 2.8727 0.240 0.165 0.010 1.130 0.0059 6.18313 94.0 16 2.8727 0.240 0.164 0.010 1.125 0.0059 6.15908 94.4 17 2.8960 0.240 0.008 0.162 0.010 1.120 0.0058 6.14019 94.7 18 2.8960 0.240 0.008 0.161 0.010 1.106 0.0058 95.2
20 2.8960 0.240 0.008 0.161 0.010 1.106 0.0058 6.14990 95.1 21 2.8960 0.241 0.008 0.162 0.010 1.112 0.0058 6.16853 94.7 22 2.8960 0.241 0.008 0.163 0.010 1.115 0.0058 6.16627 94.6 23 2.8960 0.241 0.008 0.163 0.010 1.118 0.0059 6.18863 94.3 24 2.8960 0.241 0.008 0.163 0.010 1.118 0.0059 6.17072 94.4 25 2.8960 0.241 0.008 0.162 0.010 1.115 0.0059 94.7
27 2.8960 0.241 0.008 0.162 0.010 1.115 0.0059 6.10856 95.3 28 2.8960 0.240 0.008 0.161 0.010 1.112 0.0058 6.10812 95.4 29 2.8960 0.241 0.008 0.162 0.010 1.113 0.0058 6.12963 95.1 30 2.8960 0.241 0.008 0.162 0.010 1.117 0.0058 6.12920 95.1
Note: Figures are based on closing selling T /T rates. Dashes indicate no quotation rates published for the day.
40 Hong Kong Monthly Digest of Statistics November 1978
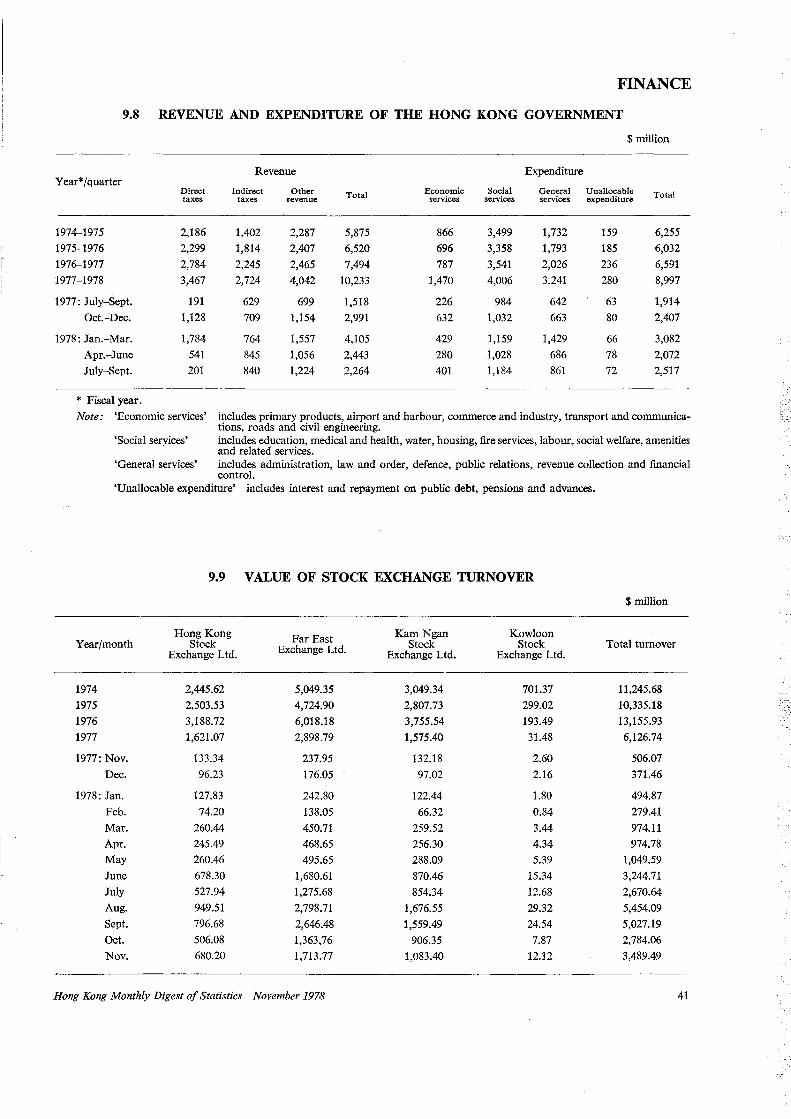
FINANCE
9.8 REVENUE AND EXPENDITURE OF THE HONG KONG GOVERNMENT
$million
Revenue Expenditure Year* /quarter
Direct Indirect Other Total Economic Social General Unallocable Total taxes taxes revenue services services services expenditure
1974-1975 2,186 1,402 2,287 5,875 866 3,499 1,732 159 6,255
1975-1976 2,299 1,814 2,407 6,520 696 3,358 1,793 185 6,032
1976-1977 2,784 2,245 2,465 7,494 787 3,541 2,026 236 6,591
1977-1978 3,467 2,724 4,042 10,233 1,470 4,006 3,241 280 8,997
1977: July-Sept. 191 629 699 1,518 226 984 642 63 1,914
Oct.-Dec. 1,128 709 1,154 2,991 632 1,032 663 80 2,407
1978: Jan.-Mar. 1,784 764 1,557 4,105 429 1,159 1,429 66 3,082
Apr.-June 541 845 1,056 2,443 280 1,028 686 78 2,072
July-Sept. 201 840 1,224 2,264 401 1,184 861 72 2,517
* Fiscal year. Note: 'Economic services' includes primary products, airport and harbour, commerce and industry, transport and communica
tions, roads and civil engineering. 'Social seryices' includes education, medical and health, water, housing, fire services, labour, social welfare, amenities
and related services. 'General services' includes administration, law and order, defence, public relations, revenue collection and financial
control. 'Unallocable expenditure' includes interest and repayment on public debt, pensions and advances.
9.9 VALUE OF STOCK EXCHANGE TURNOVER
$million
Hong Kong Far East Kam Ngan Kowloon Year/month Stock Exchange Ltd. Stock Stock Total turnover
Exchange Ltd. Exchange Ltd. Exchange Ltd.
1974 2,445.62 5,049.35 3,049.34 701.37 11,245.68
1975 2,503.53 4,724.90 2,807.73 299.02 10,335.18
1976 3,188.72 6,018.18 3,755.54 193.49 13,155.93
1977 1,621.07 2,898.79 1,575.40 31.48 6,126.74
1977: Nov. 133.34 237.95 132.18 2.60 506.07
Dec. 96.23 176.05 97.02 2.16 371.46
1978: Jan. 127.83 242.80 122.44 1.80 494.87
Feb. 74.20 138.05 66.32 0.84 279.41
Mar. 260.44 450.71 259.52 3.44 974.11
Apr. 245.49 468.65 256.30 4.34 974.78
May 260.46 495.65 288.09 5.39 1,049.59
June 678.30 1,680.61 870.46 15.34 3,244.71
July 527.94 1,275.68 854.34 12.68 2,670.64
Aug. 949.51 2,798.71 1,676.55 29.32 5,454.09
Sept. 796.68 2,646.48 1,559.49 24.54 5,027.19
Oct. 506.08 1,363,76 906.35 7.87 2,784.06
Nov. 680.20 1,713.77 1,083.40 12.12 3,489.49
Hong Kong Monthly Digest of Statistics November 1978 41
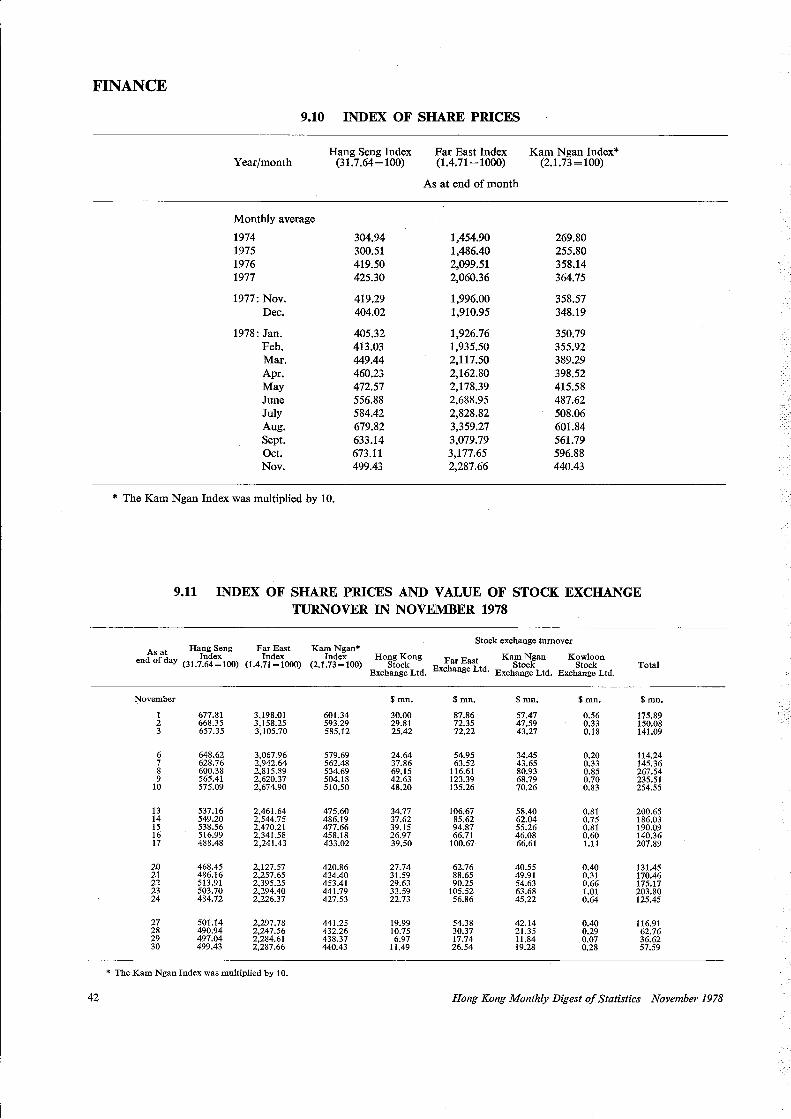
FINANCE
42
9.10 INDEX OF SHARE PRICES
Year/month
Monthly average
1974 1975 1976 1977
1977: Nov. Dec.
1978: Jan. Feb. Mar. Apr. May June July Aug. Sept. Oct. Nov.
Hang Seng Index (31.7.64=100)
304.94 300.51 419.50 425.30
419.29 404.02
405.32 413.03 449.44 460.23 472.57 556.88 584.42 679.82 633.14 673.11 499.43
* The Kam Ngan Index was multiplied by 10.
Far East Index (1.4. 71 = 1000)
As at end of month
1,454.90 1,486.40 2,099.51 2,060.36
1,996.00 1,910.95
1,926.76 1,935.50 2,117.50 2,162.80 2,178.39 2,688.95 2,828.82 3,359.27 3,079.79 3,177.65 2,287.66
Kam Ngan Index* (2.l.73=100)
269.80 255.80 358.14 364.75
358.57 348.19
350.79 355.92 389.29 398.52 415.58 487.62 508.06 601.84 561.79 596.88 440.43
9.11 INDEX OF SHARE PRICES AND VALUE OF STOCK EXCHANGE TURNOVER IN NOVEMBER 1978
Stock exchange turnover
As at Hal':,~~;ng Ft~d~~st Kah.cfe~an* Hong Kong K N K I end of day (31.7.64=100) (l.4.71=1000) (2.l.73=100) Stock Far East a~ocfan S~~kn Total
November
1 2 3
6 7 8 9
10
13 14 15 16 17
20 21 22 23 24
27 28 29 30
677.81 668.35 657.35
648.62 628.76 600.38 565.41 575.09
537.16 549.20 538.56 516.99 488.48
468.45 486.16 513.91 503.70 484.72
501.14 490.94 497.04 499.43
3,198.01 3,158.25 3,105.70
3,067.96 2,942.64 2,815.89 2,620.37 2,674.90
2,461.64 2,544.75 2,470.21 2,341.58 2,241.43
2,127.57 2,257.65 2,395.25 2,294.40 2,226.37
2,297.78 2,247.56 2,284.61 2,287.66
* The Kam Ngan Index was multiplied by 10.
601.34 593.29 585.12
579.69 562.48 534.69 504.18 510.50
475.60 486.19 477.66 458.18 433.02
420.86 434.40 453.41 441.79 427.53
441.25 432.26 438.37 440.43
Exchange Ltd. Exchange Ltd. Exchange Ltd. Exchange Ltd.
$mn.
30.00 29.81 25.42
24.64 37.86 69.15 42.63 48.20
34.77 37.62 39.15 26.97 39.50
27.74 31.59 29.63 33.59 22.73
19.99 10.75 6.97
11.49
$mn.
87.86 72.35 72.22
54.95 63.52
116.61 123.39 135.26
106.67 85.62 94.87 66.71
100.67
62.76 88.65 90.25
105.52 56.86
54.38 30.37 17.74 26.54
$mn.
57.47 47.59 43.27
34.45 43.65 80.93 68.79 70.26
58.40 62.04 55.26 46.08 66.61
40.55 49.91 54.63 63.68 45.22
42.14 21.35 11.84 19.28
$mn.
0.56 0.33 0.18
0.20 0.33 0.85 0.70 0.83
0.81 0.75 0.81 0.60 1.11
0.40 0.31 0.66 I.OJ 0.64
0.40 0.29 0.07 0.28
$mn.
175.89 150.08 141.09
114.24 145.36 267.54 235.51 254.55
200.65 186.03 190.09 140.36 207.89
131.45 170.46 175.17 203.80 125.45
116.91 62.76 36.62 57.59
Hong Kong Monthly Digest of Statistics November 1978
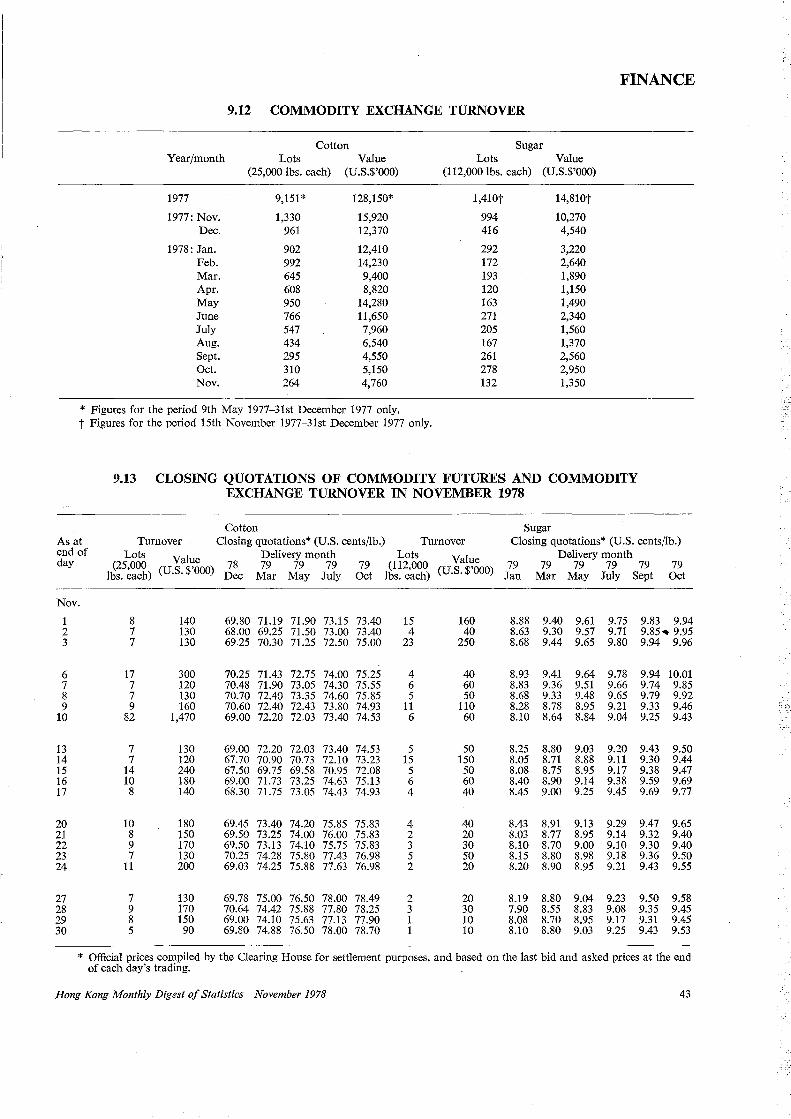
FINANCE
9.12 COMMODITY EXCHANGE TURNOVER
Cotton Sugar Year/month Lots Value Lots Value
(25,000 lbs. each) (U.S.$'000) (112,000 lbs. each) (U.S.$'000)
1977 9,151* 128,150* 1,410t 14,810t
1977: Nov. 1,330 15,920 994 10,270 Dec. 961 12,370 416 4,540
1978: Jan. 902 12,410 292 3,220 Feb. 992 14,230 172 2,640 Mar. 645 9,400 193 1,890 Apr. 608 8,820 120 1,150 May 950 14,280 163 1,490 June 766 11,650 271 2,340 July 547 7,960 205 1,560 Aug. 434 6,540 167 1,370 Sept. 295 4,550 261 2,560 Oct. 310 5,150 278 2,950 Nov. 264 4,760 132 1,350
* Figures for the period 9th May 1977-31st December 1977 only. t Figures for the period 15th November 1977-3lst December 1977 only.
9.13 CLOSING QUOTATIONS OF COMMODITY FUTURES AND COMMODITY EXCHANGE TURNOVER IN NOVEMBER 1978
As at end of day
Nov.
1 2 3
6 7 8 9
10
13 14 15 16 17
20 21 22 23 24
27 28 29 30
Cotton Turnover Closing quotations* (U.S. cents/lb.) Turnover
Lots 1 Delivery month (25,000 Va 1-!e 78 79 79 79 79
lbs. each) (U.S. $ OOO) Dec Mar May July Oct
8 7 7
17 7 7 9
82
7 7
14 10 8
10 8 9 7
11
7 9 8 5
140 130 130
300 120 130 160
1,470
130 120 240 180 140
180 150 170 130 200
130 170 150 90
69.80 71.19 71.90 73.15 73.40 68.00 69.25 71.50 73.00 73.40 69.25 70.30 71.25 72.50 75.00
70.25 71.43 72.75 74.00 75.25 70.48 71.90 73.05 74.30 75.55 70.70 72.40 73.35 74.60 75.85 70.60 72.40 72.43 73.80 74.93 69.00 72.20 72.03 73.40 74.53
69.00 72.20 72.03 73.40 74.53 67.70 70.90 70.73 72.10 73.23 67.50 69.75 69.58 70.95 72.08 69.00 71.73 73.25 74.63 75.13 68.30 71.75 73.05 74.43 74.93
69.45 73.40 74.20 75.85 75.83 69.50 73.25 74.00 76.00 75.83 69.50 73.13 74.10 75.75 75.83 70.25 74.28 75.80 77.43 76.98 69.03 74.25 75.88 77.63 76.98
69.78 75.00 76.50 78.00 78.49 70.64 74.42 75.88 77.80 78.25 69.00 74.10 75.63 77.13 77.90 69.80 74.88 76.50 78.00 78.70
Lots V 1 (112 OOO a ue lbs. ~ach) (U.S. $'OOO)
15 4
23
4 6 5
11 6
5 15 5 6 4
4 2 3 5 2
2 3 1 1
160 40
250
40 60 50
110 60
50 150 50 60 40
40 20 30 50 20
20 30 10 10
Sugar Closing quotations* (U.S. cents/lb.)
Delivery month 79 79 79 79 79 79 Jan Mar May July Sept Oct
8.88 9.40 9.61 9.75 9.83 9.94 8.63 9.30 9.57 9.71 9.8h 9.95 8.68 9.44 9.65 9.80 9.94 9.96
8.93 9.41 9.64 9.78 9.94 10.01 8.83 9.36 9.51 9.66 9.74 9.85 8.68 9.33 9.48 9.65 9.79 9.92 8.28 8.78 8.95 9.21 9.33 9.46 8.10 8.64 8.84 9.04 9.25 9.43
8.25 8.80 8.05 8.71 8.08 8.75 8.40 8.90 8.45 9.00
9.03 9.20 9.43 9.50 8.88 9.11 9.30 9.44 8.95 9.17 9.38 9.47 9.14 9.38 9.59 9.69 9.25 9.45 9.69 9.77
8.43 8.91 9.13 9.29 9.47 9.65 8.03 8.77 8.95 9.14 9.32 9.40 8.10 8.70 9.00 9.10 9.30 9.40 8.15 8.80 8.98 9.18 9.36 9.50 8.20 8.90 8.95 9.21 9.43 9.55
8.19 8.80 9.04 9.23 9.50 9.58 7.90 8.55 8.83 9.08 9.35 9.45 8.08 8.70 8.95 9.17 9.31 9.45 8.10 8.80 9.03 9.25 9.43 9.53
* Official prices compiled by the Clearing House for settlement purposes, and based on the last bid and asked prices at the end of each day's trading.
Hong Kong Monthly Digest of Statistics November 1978 43
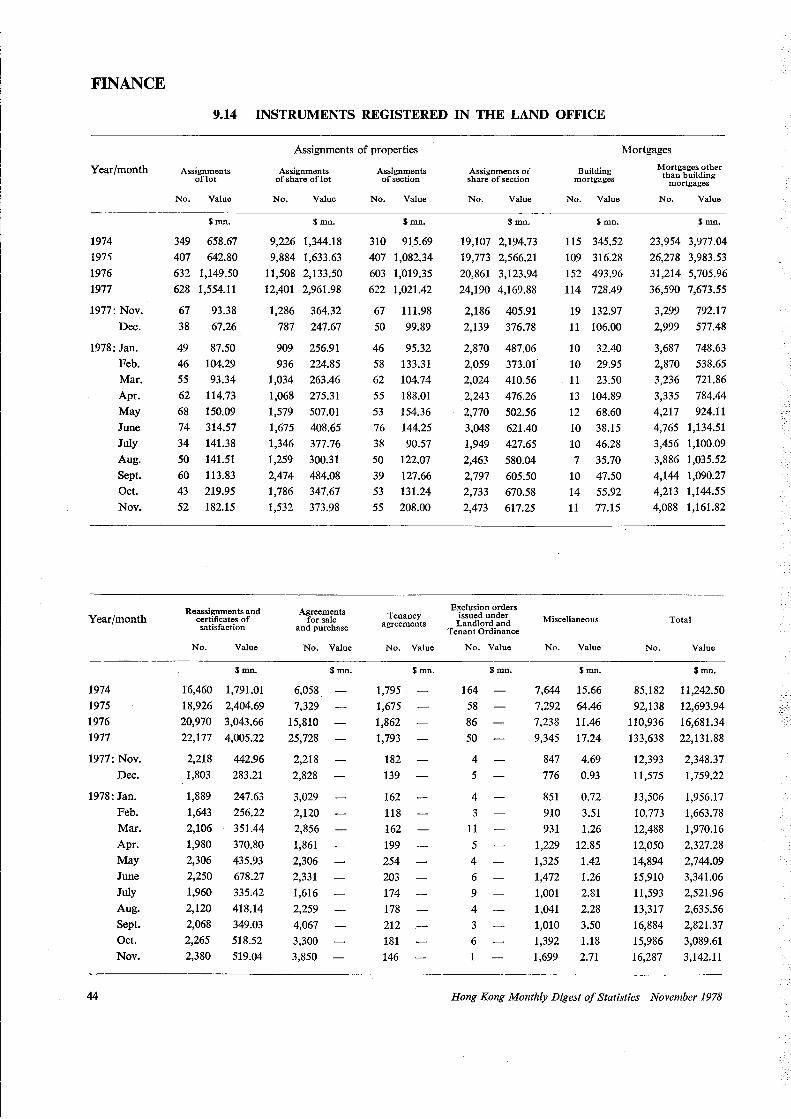
FINANCE
Year/month
1974
1975
1976
1977
1977: Nov.
Dec.
1978: Jan. Feb.
Mar.
Apr.
May
June
July
Aug.
Sept.
Oct.
Nov.
Year/month
1974
1975
1976
1977
1977: Nov.
Dec.
1978: Jan.
44
Feb.
Mar.
Apr.
May
June
July
Aug.
Sept.
Oct.
Nov.
9.14 INSTRUMENTS REGISTERED IN THE LAND OFFICE
Assignments oflot
No. Value
$mn.
349 658.67
407 642.80
632 1,149.50
628 1,554.11
67
38
93.38
67.26
49 87.50
46 104.29
55 93.34
62 114.73
68 150.09
74 314.57
34 141.38
50 141.51
60 113.83
43 219.95
52 182.15
Reassignments and certificates of satisfaction
No. Value
$mn.
16,460 1,791.01
18,926 2,404.69
20,970 3,043.66
22,177 4,005.22
2,218
1,803
1,889
1,643
2,106
1,980
2,306
2,250
1,960
2,120
2,068
2,265
2,380
442.96
283.21
247.63
256.22
351.44
370.80
435.93
678.27
335.42
418.14
349.03
518.52
519.04
Assignments of properties
Assignments of share oflot
No. Value
$mn.
9,226 1,344.18
9,884 1,633.63
11,508 2,133.50
12,401 2,961.98
1,286 364.32
787 247.67
909
936
1,034
1,068
1,579
1,675
1,346
1,259
2,474
1,786
1,532
256.91
224.85
263.46
275.31
507.01
408.65
377.76
300.31
484.08
347.67
373.98
Agreements for sale
and purchase
No. Value
6,058
7,329
15,810
25,728
2,218
2,828
3,029
2,120
2,856
1,861
2,306
2,331
1,616
2,259
4,067
3,300
3,850
$mn.
Assignments of section
No. Value
$mn.
310 915.69
407 1,082.34
603 1,019.35
622 1,021.42
67 111.98
50 99.89
46 95.32
58 133.31
62 104.74
55 188.01
53 154.36
76 144.25
38 90.57
50 122.07
39 127.66
53 131.24
55 208.00
Tenancy agreements
No. Value
1,795
1,675
1,862
1,793
182
139
162
118
162
199
254
203
174
178
212
181
146
$mn.
Mortgages
Assignments or' share of section
No. Value
$mn.
19,107 2,194.73
19,773 2,566.21
20,861 3,123.94
24,190 4,169.88
2,186 405.91
2,139 376.78
2,870
2,059
2,024
2,243
2,770
3,048
1,949
2,463
2,797
2,733
2,473
487.06 373.01·
410.56
476.26
502.56
621.40
427.65
580.04
605.50
670.58
617.25
Exclusion orders issued under Landlord and
Tenant Ordinance
No. Value
$mn.
Building mortgages
No. Value
$mn.
115 345.52
109 316.28
152 493.96
114 728.49
19 132.97
11 106.00
10 32.40
10 29.95
11 23.50
13 104.89
12 68.60
10 38.15
10 46.28
7 35.70
10 47.50
14 55.92
11 77.15
Miscellaneous
No. Value
$mn.
164
58
86
50
7,644 15.66
4
5
4
3
11
5
4
6
9
4
3 6
7,292 64.46
7,238 11.46
9,345 17.24
847 4.69
776 0.93
851 0.72
910 3.51
931 1.26
1,229 12.85
1,325 1.42
1,472 1.26
1,001 2.81
1,041 2.28
1,010 3.50
1,392 1.18
1,699 2.71
Mortgages other than building
mortgages
No. Value
$mn.
23,954 3,977.04
26,278 3,983.53
31,214 5,705.96
36,590 7,673.55
3,299 792.17
2,999 577.48
3,687 748.63
2,870 538.65
3,236 721.86
3,335 784.44
4,217 924.11
4,765 1,134.51
3,456 1,100.09
3,886 1,035.52
4,144 1,090.27
4,213 1,144.55
4,088 1,161.82
Total
No. Value
Smn.
85,182 11,242.50
92,138 12,693.94
110,936 16,681.34
133,638 22,131.88
12,393
11,575
13,506
10,773
12,488
12,050
14,894
15,910
11,593
13,317
16,884
15,986
16,287
2,348.37
1,759.22
1,956.17
1,663.78
1,970.16
2,327.28
2,744.09
3,341.06
2,521.96
2,635.56
2,821.37
3,089.61
3,142.11
Hong Kong Monthly Digest of Statistics November 1978
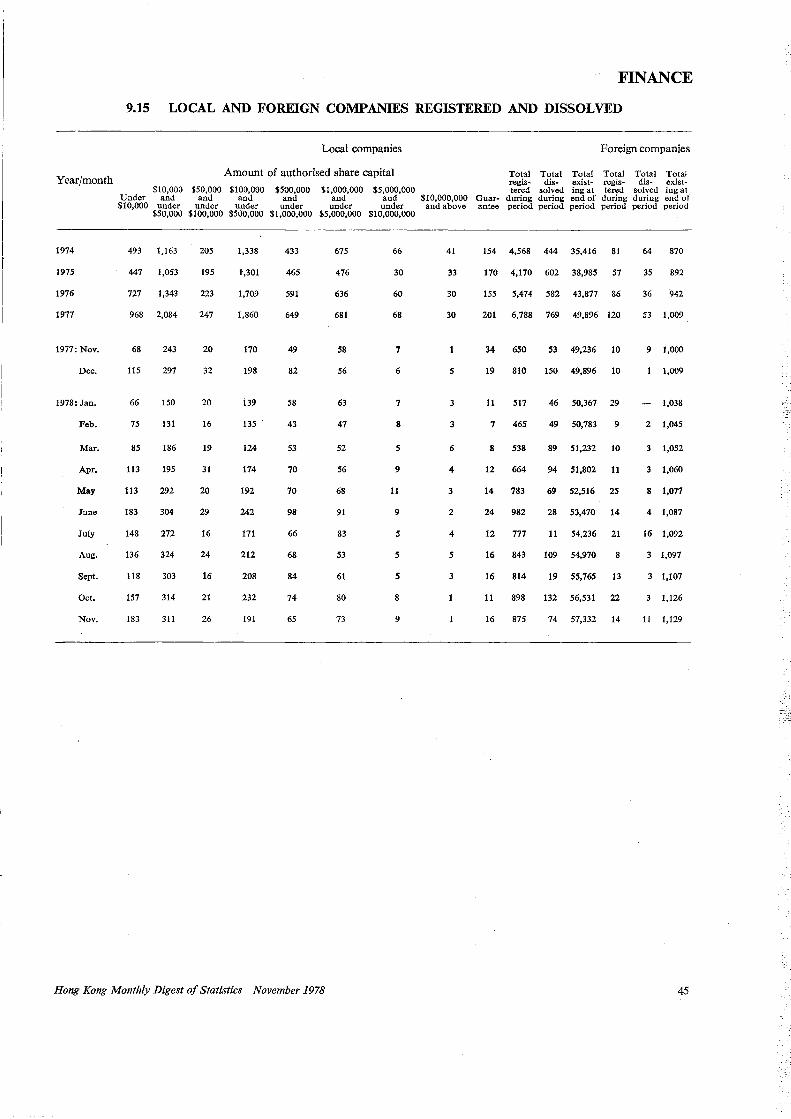
FINANCE
9.15 LOCAL AND FOREIGN COMPANIES REGISTERED AND DISSOLVED
Local companies
Year/month Amount of authorised share capital
$10,000 $50,000 $100,000 $500,000 $1,000,000 $5,000,000 Under and and and and and and
$10,000 under under under under under under $50,000 $100,000 $500,000 $1,000,000 $5,000,000 $10,000,000
1974 493 1,163 205 1,338 433 675 66
1975 447 1,053 195 1,301 465 476 30
1976 727 1,343 223 1,709 591 636 60
1977 968 2,084 247 1,860 649 681 68
1977: Nov. 68 243 20 170 49 58 7
Dec. 115 297 32 198 82 56 6
1978: Jan. 66 150 20 139 58 63 7
Feb. 75 131 16 135 43 47 8
Mar. 85 186 19 124 53 52 5
Apr. 113 195 31 174 70 56 9
May 113 292 20 192 70 68 11
June 183 304 29 242 98 91 9
July 148 272 16 171 66 83 5
Aug. 136 324 24 212 68 53 5
Sept. 118 303 16 208 84 61 5
Oct. 157 314 21 232 74 80 8
Nov. 183 311 26 191 65 73 9
Hong Kong Monthly Digest of Statistics November 1978
Foreign companies
Total Total Total Total Total Total regis- dis- exist- regis- dis- existtered solved ing at tered solved ing at
$10,000,000 Guarand above antee
during during end of during during end of period period period period period period
41 154 4,568 444 35,416 81 64 870
33 170 4,170 602 38,985 57 35 892
30 155 5,474 582 43,877 86 36 942
30 201 6,788 769 49,896 120 53 1,009
34 650 53 49,236 10 9 1,000
5 19 810 150 49,896 10 1,009
3 11 517 46 50,367 29 1,038
3 7 465 49 50,783 9 2 1,045
6 8 538 89 51,232 10 3 1,052
4 12 664 94 51,802 11 3 1,060
3 14 783 69 52,516 25 8 1,077
2 24 982 28 53,470 14 4 1,087
4 12 777 11 54,236 21 16 1,092
5 16 843 109 54,970 8 3 1,097
16 814 19 55,765 13 1,107
11 898 132 56,531 22 3 1,126
16 875 74 57,332 14 11 1,129
45
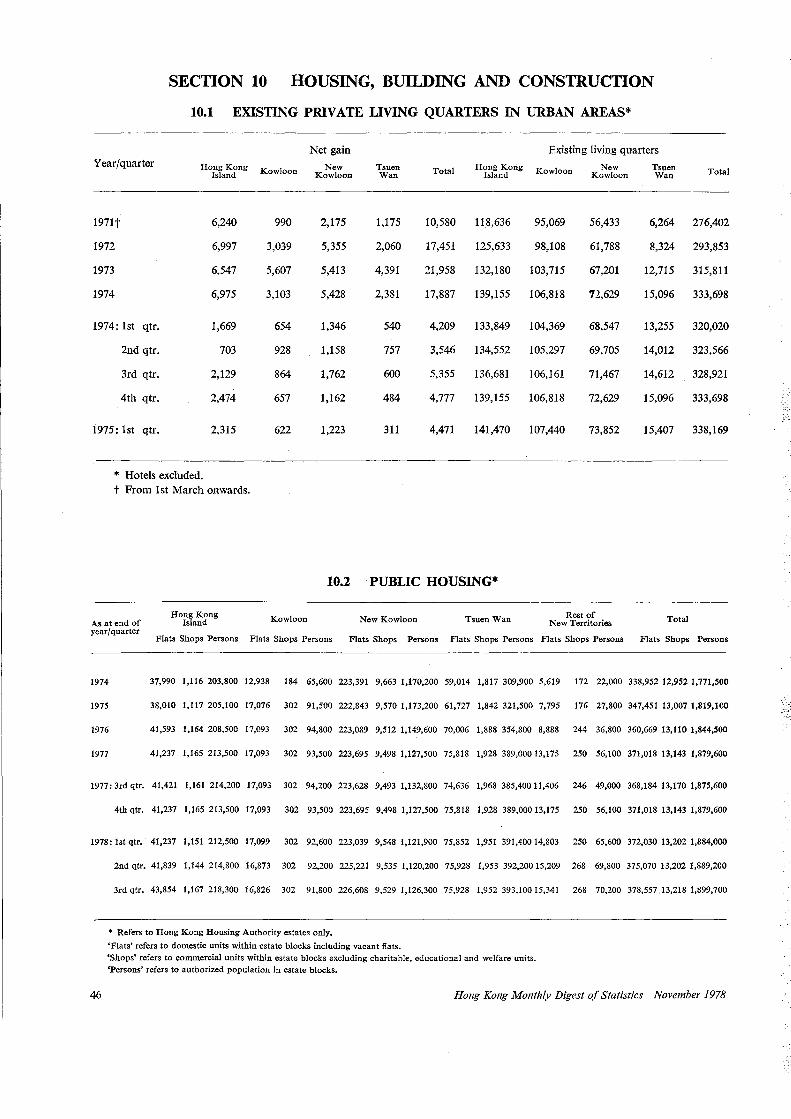
SECTION 10 HOUSING, BUILDING AND CONSTRUCTION
10.1 EXISTING PRIVATE LIVING QUARTERS IN URBAN AREAS*
Net gain Existing living quarters Year/quarter Hong Kong New Tsuen Hong Kong New Tsuen
Island Kowloon Kowloon Wan Total Island Kowloon Kowloon Wan Total
1971t 6,240 990 2,175 1,175 10,580 118,636 95,069 56,433 6,264 276,402
1972 6,997 3,039 5,355 2,060 17,451 125,633 98,108 61,788 8,324 293,853
1973 6,547 5,607 5,413 4,391 21,958 132,180 103,715 67,201 12,715 315,811
1974 6,975 3,103 5,428 2,381 17,887 139,155 106,818 72,629 15,096 333,698
1974: lst qtr. 1,669 654 1,346 540 4,209 133,849 104,369 68,547 13,255 320,020
2nd qtr. 703 928 1,158 757 3,546 134,552 105,297 69,705 14,012 323,566
3rd qtr. 2,129 864 1,762 600 5,355 136,681 106,161 71,467 14,612 328,921
4th qtr. 2,474 657 1,162 484 4,777 139,155 106,818 72,629 15,096 333,698
1975: lst qtr. 2,315 622 1,223 311 4,471 141,470 107,440 73,852 15,407 338,169
* Hotels excluded. t From lst March onwards.
10.2 PUBLIC HOUSING*
Hong Kong Kowloon New Kowloon Tsuen Wan Rest of Total As at end of Island New Territories year/quarter
Flats Shops Persons Flats Shops Persons Flats Shops Persons Flats Shops Persons Flats Shops Persons Flats Shops Persons
1974 37,990 1,116 203,800 12,938 184 65,600 223,391 9,663 1,170,200 59,014 1,817 309,900 5,619 172 22,000 338,952 12,952 1,771,500
1975 38,010 1,117 205,100 17,076 302 91,500 222,843 9,570 1,173,200 61,727 1,842 321,500 1,195 176 27,800 347,451 13,007 1,819,100
1976 41,593 1,164 208,500 17,093 302 94,800 223,089 9,512 1,149,600 70,006 1,888 354,800 8,888 244 36,800 360,669 13,110 1,844,500
1977 41,237 1,165 213,500 17,093 302 93,500 223,695 9,498 1,127,500 75,818 1,928 389,000 13,175 250 56,100 371,018 13,143 1,879,600
1977: 3rd qtr. 41,421 1,161 214,200 17,093 302 94,200 223,628 9,493 1,132,800 74,636 1,968 385,400 11,406 246 49,000 368,184 13,170 1,875,600
4th qtr. 41,237 1,165 213,500 17,093 302 93,500 223,695 9,498 1,127,500 75,818 1,928 389,000 13,175 250 56,100 371,018 13,143 1,879,600
1978: lst qtr. 41,237 1,151 212,500 17,099 302 92,600 223,039 9,548 1,121,900 75,852 1,951 391,400 14,803 250 65,600 372,030 13,202 1,884,000
2nd qtr. 41,839 1,144 214,800 16,873 302 92,200 225,221 9,535 1,120,200 75,928 1,953 392,200 15,209 268 69,800 375,070 13,202 1,889,200
3rd qtr. 43,854 1,167 218,300 16,826 302 91,800 226,608 9,529 1,126,300 75,928 1,952 393,100 15,341 268 70,200 378,557' 13,218 1,899,700
46
• Refers to Hong Kong Housing Authority estates only.
'Flats' refers to domestic units within estate blocks inclnding vacant flats. 'Shops' refers to commercial units within estate blocks excluding charitable, educational and welfare units. 'Persons' refers to authorized population in estate blocks.
Hong Kong Month(v Digest of Statistics November 1978
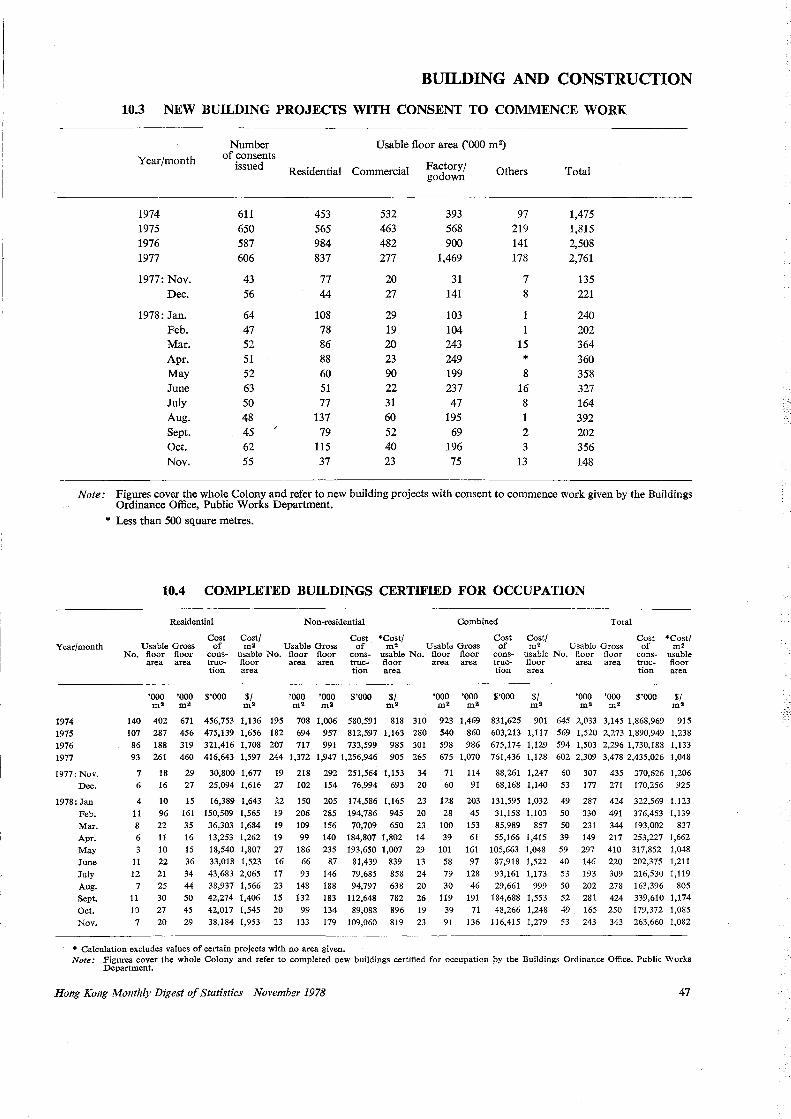
BUILDING AND CONSTRUCTION
10.3 NEW BUILDING PROJECTS Willi CONSENT TO COMMENCE WORK
Year/month
1974 1975 1976 1977
1977: Nov. Dec.
1978: Jan. Feb. Mar. Apr. May
June July Aug.
Sept. Oct. Nov.
Number of consents
issued
611 650 587 606
43 56
64 47 52 51 52 63 50 48 45 62
55
Usable floor area ('OOO m 2)
Residential Commercial
453 565 984 837
77 44
108 78 86 88 60 51 77
137 79
115 37
532 463 482 277
20
27
29 19 20 23 90 22 31
60 52 40 23
Factory/ go down
393 568
900 1,469
31 141
103 104 243 249 199 237 47
195
69 196
75
Others
97 219 141 178
7 8
1 15
* 8
16 8
2 3
13
Total
1,475 1,815 2,508 2,761
135 221
240 202 364
360 358 327 164 392 202 356 148
Note: Figures cover the whole Colony and refer to new building projects with consent to commence work given by the Buildings Ordinance Office, Public Works Department.
Year/month
1974 1975 1976 1977
1977: Nov. Dec.
1978: Jan Feb. Mar. Apr. May June July Aug. Sept.
Oct. Nov.
* Less than 500 square metres.
10.4 COMPLETED BUILDINGS CERTIFIBD FOR OCCUPATION
Residential Non-residential Combined Total
Cost Cost/ Cost *Cost/ Cost Cost/ Cost *Cost/ Usable Gross
No. floor floor area area
of cons .. truction
m• Usable Gross of construetion
m• Usable Gross of construetion
m• Usable Gross of construetion
m• usable floor area
usable No. floor floor floor area area area
usable No. floor floor floor area area area
usable No. floor floor floor area area area
'OOO 'OOO $'000 $/ '000 'OOO $'000 $/ 'OOO 'OOO $'000 $/ 'OOO 'OOO $'000 $/ m2 m2 m2 m2 m2 m2
140 402 107 287 86 188 93 261
7 18 6 16
4
11 8 6 3
11 12
7 11 10
7
10 96 22 11 10 22 21 25 30 27 20
671 456,753 1,136 195 708 1,006 580,591 818 310 456 475,139 1,656 182 694 957 812,597 1,163 280 319 321,416 1,708 207 717. 991 733,599 985 301 460 416,643 1,597 244 1,372 1,947 1,256,946 905 265
29 30,800 1,677 19 218 292 251,564 1,153 34 27 25,094 1,616 27 102 154 76,994 693 20
15 16,389 1,643
161 150,509 1,565 35 36,303 1,684 16 13,253 1,262 15 18,540 1,807 36 33,018 1,523 34 43,683 2,065 44 38,937 1,566 so 42,274 1,406 45 42,017 1,545
29 38,184 1,953
22
19 19 19 27 16 17 23 15 20 23
150
206 109 99
186 66 93
148 132
99 133
205 174,586 1,165 23 285 194, 786 945 20 156 70,709 650 23 140 184,807 1,802 14 235 193,650 1,007 29
87 81,439 839 13 146 79,685 858 24 188 94,797 638 20 183 112,648 782 26 134 89,088 896 19 179 109,060 819 23
m2 m2 m2 m2 m2 m2
923 1,469 831,625 901 645 2,033 3,145 1,868,969 915 540 860 603,213 1,117 569 1,520 2,273 1,890,949 1,238 598 986 675,174 1,129 594 1,503 2,296 1,730,188 1,133 675 1,070 761,436 1,128 602 2,309 3,478 2,435,026 1,048
71 60
128
28 100 39
101 58 79 30
119 39 91
114 91
88,261 1,247 60 68,168 1,140 53
307 435 370,626 1,206 177 271 170,256 925
203 131,595 1,032 45 31,158 1,103
153 85,989 857 61 55,166 1,415
161 105,663 1,048 97 87,918 1,522
128 93,161 1,173 46 29,661 999
191 184,688 1,553 71 48,266 1,248
136 116,415 1,279
49 287 424 322,569 1,123 50 330 491 376,453 1,139 50 231 344 193,002 837 39 149 217 253,227 1,662 59 297 410 317,852 1,048 40 146 220 202,375 1,211 53 193 309 216,530 1,119 50 202 278 163,396 805 52 281 424 339,610 1,174 49 165 250 179,372 1,085 53 243 343 263,660 1,082
* Calculation excludes values of certain projects with no area given. Note: Figures cover the whole Colony and refer to completed new buildings certified for occupation by the Buildings Ordinance Office. Public Works
Department.
Hong Kong Monthly Digest of Statistics November 1978 47
,. ,_.
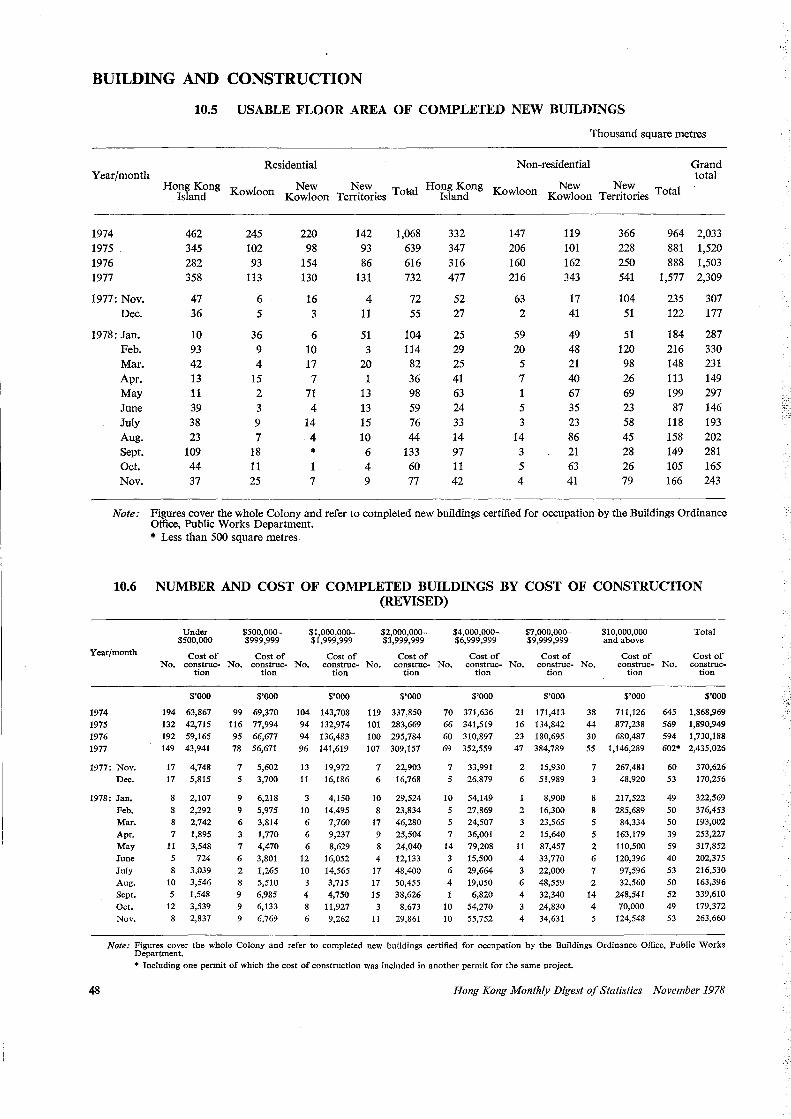
BUILDING AND CONSTRUCTION
Year/month
1974 1975 1976 1977
1977: Nov. Dec.
1978: Jan. Feb. Mar. Apr. May June July Aug. Sept. Oct. Nov.
10.5 USABLE FLOOR AREA OF COMPLETED NEW BUILDINGS
Residential
Thousand square metres
Non-residential Grand total
Hong Kong K 1 New New Hong Kong 1 New New T t 1 Island ow oon Kowloon Territories Total Island Kow oon Kowloon Territories 0 a
462 345 282 358
47 36
10 93 42 13 11 39 38 23
109 44 37
245 102 93
113
6 5
36 9 4
15 2 3 9 7
18 11 25
220 98
154 130
16 3
6 10 17 7
71 4
14 4
* 1 7
142 93 86
131
4 11
51 3
20 1
13 13 15 10 6 4 9
1,068 639 616 732
72 55
104 114
82 36 98 59 76 44
133 60 77
332 347 316 477
52 27
25 29 25 41 63 24 33 14 97 11 42
147 206 160 216
63 2
59 20
5 7 1 5 3
14 3 5 4
119 101 162 343
17 41
49 48 21 40 67 35 23 86 21 63 41
366 228 250 541
104 51
51 120 98 26 69 23 58 45 28 26 79
964 2,033 881 1,520 888 1,503
1,577 2,309
235 307 122 177
184 216 148 113 199 87
118 158 149 105 166
287 330 231 149 297 146 193 202 281 165 243
Note: Figures cover the whole Colony and refer to completed new buildings certified for occupation by the Buildings Ordinance Office, Public Works Department. * Less than 500 square metres.
10.6 NUMBER AND COST OF COMPLETED BUILDINGS BY COST OF CONSTRUCTION (REVISED)
Year/month
1974 1975 1976 1977
1977: Nov. Dec.
1978: Jan.
Feb. Mar. Apr. May June July Aug. Sept,
Oct. Nov.
Under $500,000
Cost of
$500,000-$999,999
$1,000,000-$1,999,999
$2,000,000-$3,999,999
$4,000,000-$6,999,999
$7,000,000-$9,999,999
$10,000,000 and above
Total
No. construe- No. tion
Cost of construe- No.
tion
Cost of construe- No.
tion
Cost of construe .. No.
tion
Cost of construe- No.
tion
Cost of construe-- No.
tion
Cost of construe- No.
tion
Cost of construc
tion
$'000
194 63,867 132 42,715 192 59,165 149 43,941
17 4,748 17 5,815
8 2,107 8 2,292 8 2,742 7 1,895
11 3,548 5 724
3,039 10 3,546 5 1,548
12 3,539 2,837
$'000
99 69,370 116 77,994 95 66,677 78 56,671
7 5,602 5 3,700
9 6,218
9 5,975 6 3,814 3 1,770 7 4,470 6 3,801 2 1,265 8 5,510 9 6,985 9 6,133 9 6,769
$'000
104 143,708 94 132,974 94 136,483 96 141,619
13 19,972 11 16,186
3 4,150 10 14,495
6 7,760 6 9,237 6 8,629
12 16,052 10 14,565
3,715 4 4,750 8 11,927 6 9,262
$'000
119 337,850 101 283,669 100 295,784 107 309,157
7 22,903 6 16,768
10 29,524 8 23,834
17 46,280 9 25,504
24,040
4 12,133 17 48,400 17 50,455 15 38,626
3 8,673 11 29,861
$'000
70 371,636 66 341,519 60 310,897 69 352,559
7 33,991 5 26,879
10 54,149 5 27,869 5 24,507 7 36,001
14 79,208 15,500
6 29,664 4 19,050
6,820 10 54,270 10 55,752
$'000
21 171,413 16 134,842 23 180,695 47 384,789
2 15,930 6 51,989
8,900 2 16,300 3 23,565 2 15,640
11 87,457 4 33,770 3 22,000 6 48,559 4 32,340 3 24,830 4 34,631
$'000
38 711,126 44 877,238 30 680,487 55 1,146,289
7 3
8
8 5
5 2 6 7
2 14 4 5
267,481 48,920
217,522 285,689
84,334 163,179 110,500 120,396 97,596 32,560
248,541 70,000
124,548
$'000
645 1,868,969 569 1,890,949 594 1,730,188 602* 2,435,026
60 53
49
50 50 39 59 40 53 50 52 49 53
370,626 170,256
322,569 376,453 193,002 253,227 317,852 202,375 216,530 163,396 339,610 179,372 263,660
Note: Figures cover the whole Colony and refer to completed new buildings certified for occupation by the Buildings Ordinance Office, Public Works Department. • Including one permit of which the cost of construction was included in another permit for the same project.
48 Hong Kong Monthly Digest of Statistics November 1978
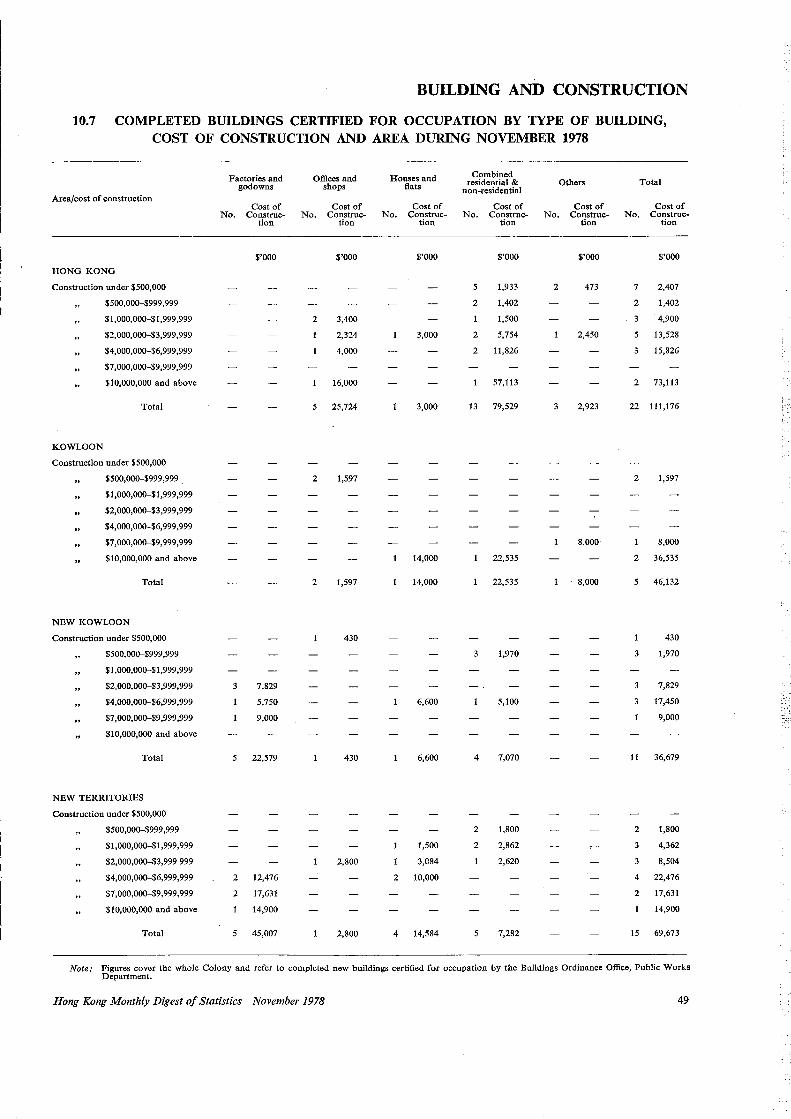
BUILDING AND CONSTRUCTION
10.7 COMPLETED BUILDINGS CERTIFIED FOR OCCUPATION BY TYPE OF BUILDING, COST OF CONSTRUCTION AND AREA DURING NOVEMBER 1978
Factories and Offices and Houses and Combined residential & Others Total godowns shops flats non-residential
Area/cost of construction Cost of Cost of Cost of Cost of Cost of Cost of
No. Construe- No. Construe- No. Construe- No. Construe- No. Construe- No. Construe-tion tion tion tion tion tion
$'000 $'000 $'000 $'000 $'000 $'000
HONG KONG
Construction under $500,000 5 1,933 2 473 7 2,407
$500,000-$999,999 2 1,402 2 1,402
$1,000,000-$1,999 ,999 2 3,400 1,500 4,900
$2,000,000-$3,999,999 2,324 3,000 2 5,754 2,450 5 13,528
$4,000,000-$6,999,999 4,000 2 11,826 15,826
$7,000,000-$9,999,999
$10,000,000 and above 16,000 57,113 2 73,113
Total 5 25,724 3,000 13 79,529 2,923 22 111,176
KOWLOON
Construction under $500,000
$500,000-$999,999 2 1,597 2 1,597
$1,000,000-$1,999,999
$2,000,000-$3,999,999
$4,000,000-$6,999,999
$7 ,000,000-$9,999,999 8,000 8,000
$10,000,000 and above 14,000 22,535 2 36,535
Total 2 1,597 14,000 22,535 8,000 5 46,132
NEW KOWLOON
Construction under $500,000 430 430
$500,000-$999,999 1,970 3 1,970
$1,000,000-$1,999,999
$2,000,000-$3,999,999 7,829 7,829
$4,000,000-$6,999,999 5,750 6,600 5,100 17,450
$7,000,000-$9,999,999 9,000 9,000
$10,000,000 and above
Total 5 22,579 430 6,600 4 7,070 11 36,679
NEW TERRITORIES
Construction under $500,000
$500,000-$999,999 2 1,800 2 1,800
$1,000,000-$1,999,999 1,500 2 2,862 4,362
$2,000,000-$3,999 999 2,800 3,084 2,620 8,504
$4,000,000-$6,999,999 2 12,476 2 10,000 4 22,476
$7,000,000-$9,999,999 2 17,631 2 17,631
$10,000,000 and above 14,900 14,900
Total 5 45,007 2,800 4 14,584 5 7,282 15 69,673
Note: Figures cover the whole Colony and refer to completed new buildings certified for occupation by the Buildings Ordinance Office, Public Works Department.
Hong Kong Monthly Digest of Statistics November 1978 49
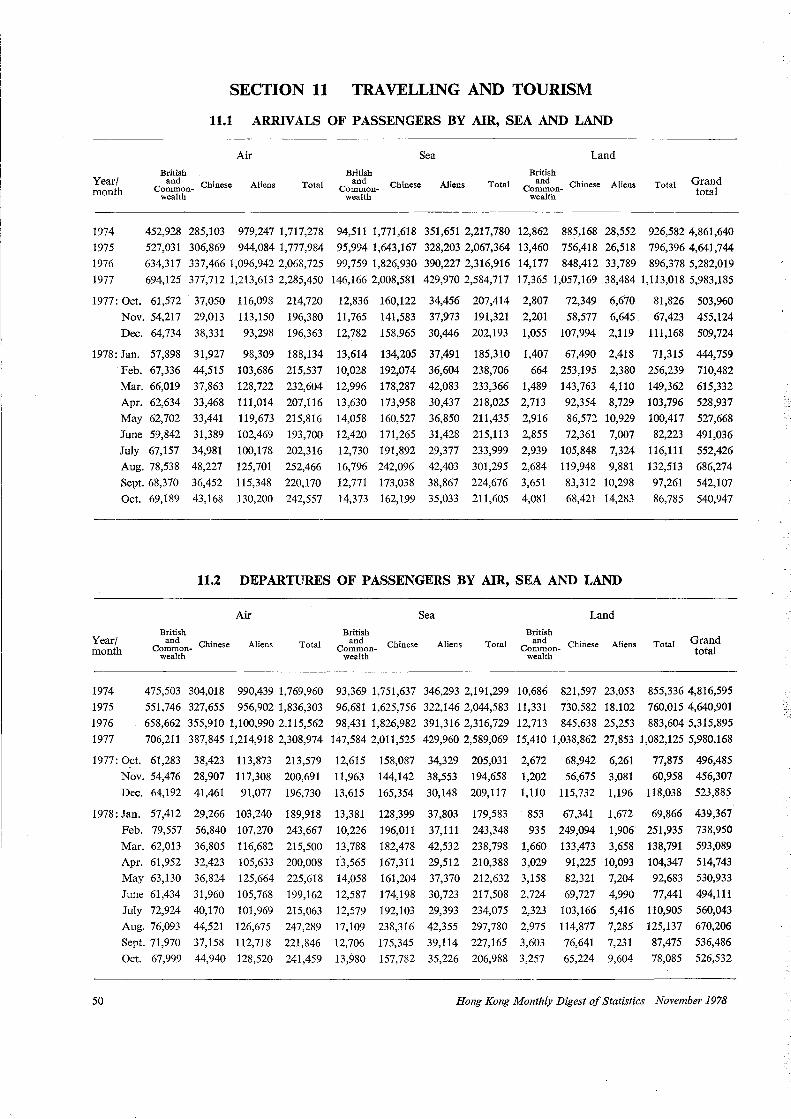
SECTION 11 TRA YELLING AND TOURISM
11.1 ARRIVALS OF PASSENGERS BY AIR, SEA AND LAND
Air Sea Land
British Year/ month
British .
co::i~on- Chinese wealth
Aliens Total British
and Common
wealth Chinese Aliens Total co!.1:on- Chinese Aliens
wealth Total Grand
total
1974 452,928 285,103 979,247 1,717,278 94,511 1,771,618 351,651 2,217,780 12,862 885,168 28,552 926,582 4,861,640
1975 527,031 306,869 944,084 1,777,984 95,994 1,643,167 328,203 2,067,364 13,460 756,418 26,518 796,396 4,641,744
1976 634,317 337,466 1,096,942 2,068,725 99,759 1,826,930 390,227 2,316,916 14,177 848,412 33,789 896,378 5,282,019
1977 694,125 377,712 1,213,613 2,285,450 146,166 2,008,581 429,970 2,584,717 17,365 1,057,169 38,484 1,113,018 5,983,185
1977: Oct. 61,572 . 37,050 116,098 214,720 12,836 160,122 34,456 207,414 2,807 72,349 6,670 81,826 503,960
Nov. 54,217 29,013 113,150 196,380 11,765 141,583 37,973 191,321 2,201 58,577 6,645 67,423 455,124
Dec. 64,734 38,331 93,298 196,363 12,782 158,965 30,446 202,193 1,055 107,994 2,119 111,168 509,724
1978: Jan. 57,898 31,927 98,309 188,134 13,614 134,205 37,491 185,310 1,407 67,490 2,418 71,315 444,759
Feb. 67,336 44,515 103,686 215,537 10,028 192,074 36,604 238,706 664 253,195 2,380 256,239 710,482
Mar. 66,019 37,863 128,722 232,604 12,996 178,287 42,083 233,366 1,489 143,763 4,110 149,362 615,332
Apr. 62,634 33,468 111,014 207,116 13,630 173,958 30,437 218,025 2,713 92,354 8,729 103,796 528,937
May 62,702 33,441 119,673 215,816 14,058 160,527 36,850 211,435 2,916 86,572 10,929 100,417 527,668
June 59,842 31,389 102,469 193,700 12,420 171,265 31,428 215,113 2,855 72,361 7,007 82,223 491,036
July 67,157 34,981 100,178 202,316 12,730 191,892 29,377 233,999 2,939 105,848 7,324 116,111 552,426
Aug. 78,538 48,227 125,701 252,466 16,796 242,096 42,403 301,295 2,684 119,948 9,881 132,513 686,274
Sept. 68,370 36,452 115,348 220,170 12,771 173,038 38,867 224,676 3,651 83,312 10,298 97,261 542,107
Oct. 69,189 43,168 130,200 242,557 14,373 162,199 35,033 211,605 4,081 68,421 14,283 86,785 540,947
11.2 DEPARTURES OF PASSENGERS BY AIR, SEA AND LAND
Air Sea Land
British British Year/ month co:i~on- Chinese
wealth Aliens Total
British and
Commonwealth
Chinese Aliens Total co:'~on- Chinese Aliens wealth
Total Grand total
1974
1975
1976
1977
475,503 304,018 990,439 1,769,960 93,369 1,751,637 346,293 2,191,299 10,686 821,597 23,053 855,336 4,816,595
551,746 327,655 956,902 1,836,303 96,681 1,625,756 322,146 2,044,583 11,331 730,582 18,102 760,015 4,640,901
658,662 355,910 1,100,990 2,115,562 98,431 1,826,982 391,316 2,316,729 12,713 845,638 25,253 883,604 5,315,895
706,211 387,845 1,214,918 2,308,974 147,584 2,011,525 429,960 2,589,069 15,410 1,038,862 27,853 1,082,125 5,980,168
1977: O_ct. 61,283 38,423 113,873 213,579 12,615 158,087 34,329 205,031 2,672 68,942 6,261 77,875 496,485
Nov. 54,476 28,907 117,308 200,691 11,963 144,142 38,553 194,658 1,202 56,675 3,081 60,958 456,307
Dec. 64,192 41,461 91,077 196,730 13,615 165,354 30,148 209,117 1,110 115,732 1,196 118,038 523,885
1978: Jan. 57,412 29,266 103,240 189,918 13,381 128,399 37,803 179,583 853 67,341 1,672 69,866 439,367
50
Feb. 79,557 56,840 107,270 243,667 10,226 196,011 37,111 243,348 935 249,094 1,906 251,935 738,950
Mar. 62,013 36,805 116,682 215,500 13,788 182,478 42,532 238,798 1,660 133,473 3,658 138,791 593,089
Apr. 61,952 32,423 105,633 200,008 13,565 167,311 29,512 210,388 3,029 91,225 10,093 104,347 514,743
May 63,130 36,824 125,664 225,618 14,058 161,204 37,370 212,632 3,158 82,321 7,204 92,683 530,933
June 61,434 31,960 105,768 199,162 12,587 174,198 30,723 217,508 2,724 69,727 4,990 77,441 494,111
July 72,924 40,170 101,969 215,063 12,579 192,103 29,393 234,075 2,323 103,166 5,416 110,905 560,043
Aug. 76,093 44,521 126,675 247,289 17,109 238,316 42,355 297,780 2,975 114,877 7,285 125,137 670,206
Sept. 71,970 37,158 112,718 221,846 12,706 175,345 39,114 227,165 3,603 76,641 7,231 87,475 536,486
Oct. 67,999 44,940 128,520 241,459 13,980 157,782 35,226 206,988 3,257 65,224 9,604 78,085 526,532
Hong Kong Monthly Digest of Statistics November 1978
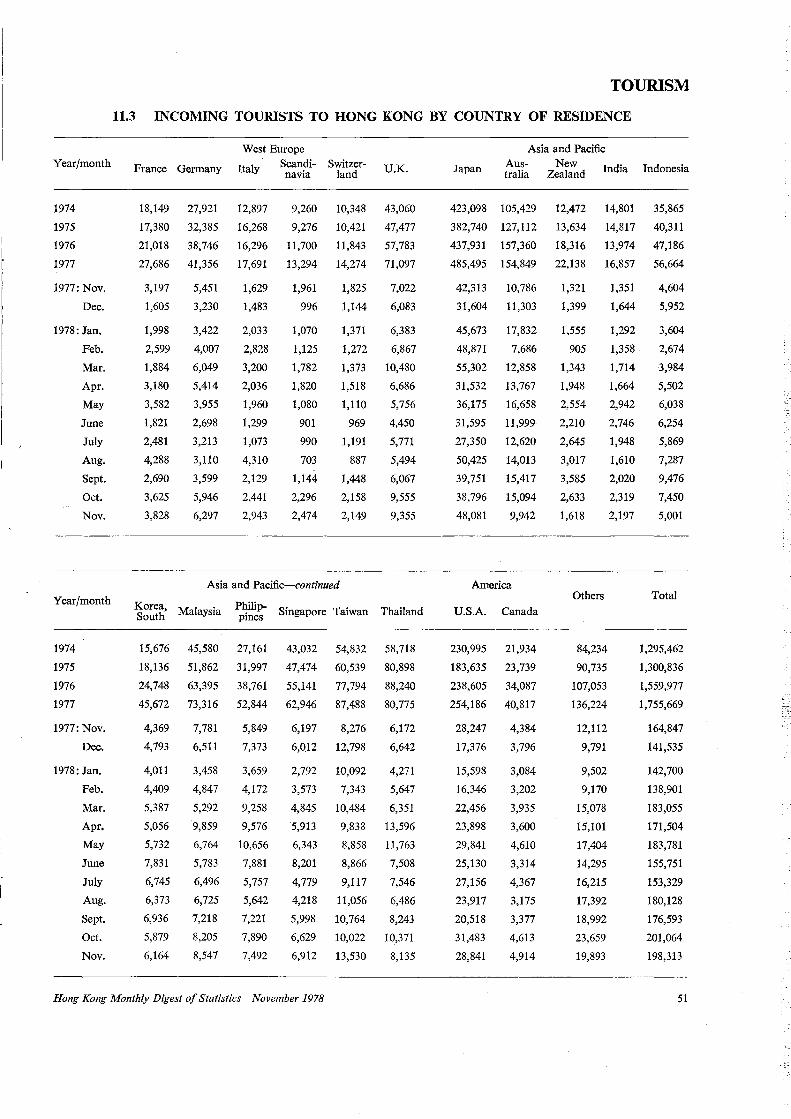
TOURISM
11.3 INCOMING TOURISTS TO HONG KONG BY COUNTRY OF RESIDENCE
Year/month
1974
1975
1976
1977
1977: Nov.
Dec.
1978: Jan.
Feb.
Mar.
Apr.
May
June
July
Aug.
Sept.
Oct.
Nov.
Year/month
1974
1975
1976
1977
1977: Nov.
Dec.
1978: Jan.
Feb.
Mar.
Apr.
May
June
July
Aug.
Sept.
Oct.
Nov.
France Germany
18,149 27,921
17,380 32,385
21,018 38,746
27,686 41,356
3,197
1,605
1,998
2,599
1,884
3,180
3,582
1,821
2,481
4,288
2,690
3,625
3,828
5,451
3,230
3,422
4,007
6,049
5,414
3,955
2,698
3,213
3,110
3,599
5,946
6,297
West Europe Italy Scandi- Switzer-
navia land U.K.
12,897
16,268
16,296
17,691
1,629
1,483
2,033
2,828
3,200
2,036
1,960
1,299
1,073
4,310
2,129
2,441
2,943
9,260
9,276
11,700
13,294
1,961
996
1,070
1,125
1,782
1,820
1,080
901
990
703
1,144
2,296
2,474
10,348 43,060
10,421 47,477
11,843 57,783
14,274 71,097
1,825
1,144
1,371
1,272
1,373
1,518
1,110
969
1,191
887
1,448
2,158
2,149
7,022
6,083
6,383
6,867
10,480
6,686
5,756
4,450
5,771
5,494
6,067
9,555
9,355
Asia and Pacific-continued
Korea, South
15,676
18,136
Malaysia
45,580
51,862
Philippines
27,161
31,997
Singapore Taiwan
43,032
47,474
54,832
60,539
Thailand
58,718
80,898
24,748 63,395 38,761 55,141 77,794 88,240
45,672 73,316 52,844 62,946 87,488 80,775
4,369
4,793
4,011
4,409
5,387
5,056
5,732
7,831
6,745
6,373
6,936
5,879
6,164
7,781
6,511
3,458
4,847
5,292
9,859
6,764
5,783
6,496
6,725
7,218
8,205
8,547
5,849
7,373
3,659
4,172
9,258
9,576
10,656
7,881
5,757
5,642
7,221
7,890
7,492
6,197
6,012
2,792
3,573
4,845
5,913
6,343
8,201
4,779
4,218
5,998
6,629
6,912
8,276
12,798
10,092
7,343
10,484
9,838
8,858
8,866
9,117
11,056
10,764
10,022
13,530
6,172
6,642
4,271
5,647
6,351
13,596
11,763
7,508
7,546
6,486
8,243
10,371
8,135
Hong Kong Monthly Digest of Statistics November 1978
Asia and Pacific
Japan Australia
423,098 105,429
382,740 127,112
437,931 157,360
485,495 154,849
42,313 10,786
31,604 11,303
45,673
48,871
55,302
31,532
36,175
31,595
27,350
50,425
39,751
38,796
48,081
17,832
7,686
12,858
13,767
16,658
11,999
12,620
14,013
15,417
15,094
9,942
America
U.S.A.
230,995
183,635
Canada
21,934
23,739
238,605 34,087
254,186 40,817
28,247
17,376
15,598
16,346
22,456
23,898
29;841
25,130
27,156
23,917
20,518
31,483
28,841
4,384
3,796
3,084
3,202
3,935
3,600
4,610
3,314
4,367
3,175
3,377
4,613
4,914
New Zealand India Indonesia
12,472
13,634
18,316
22,138
14,801 35,865
14,817 40,311
13,974 47,186
16,857 56,664
1,321
1,399
1,555
905
1,343
1,948
2,554
2,210
2,645
3,017
3,585
2,633
1,618
Others
84,234
90,735
107,053
136,224
12,112
9,791
9,502
9,170
15,078
15,101
17,404
14,295
16,215
17,392
18,992
23,659
19,893
1,351
1,644
1,292
1,358
1,714
l,664
2,942
2,746
1,948
1,610
2,020
2,319
2,197
4,604
5,952
3,604
2,674
3,984
5,502
6,038
6,254
5,869
7,287
9,476
7,450
5,001
Total
1,295,462
1,300,836
1,559,977
1,755,669
164,847
141,535
142,700
138,901
183,055
171,504
183,781
155,751
153,329
180,128
176,593
201,064
198,313
51
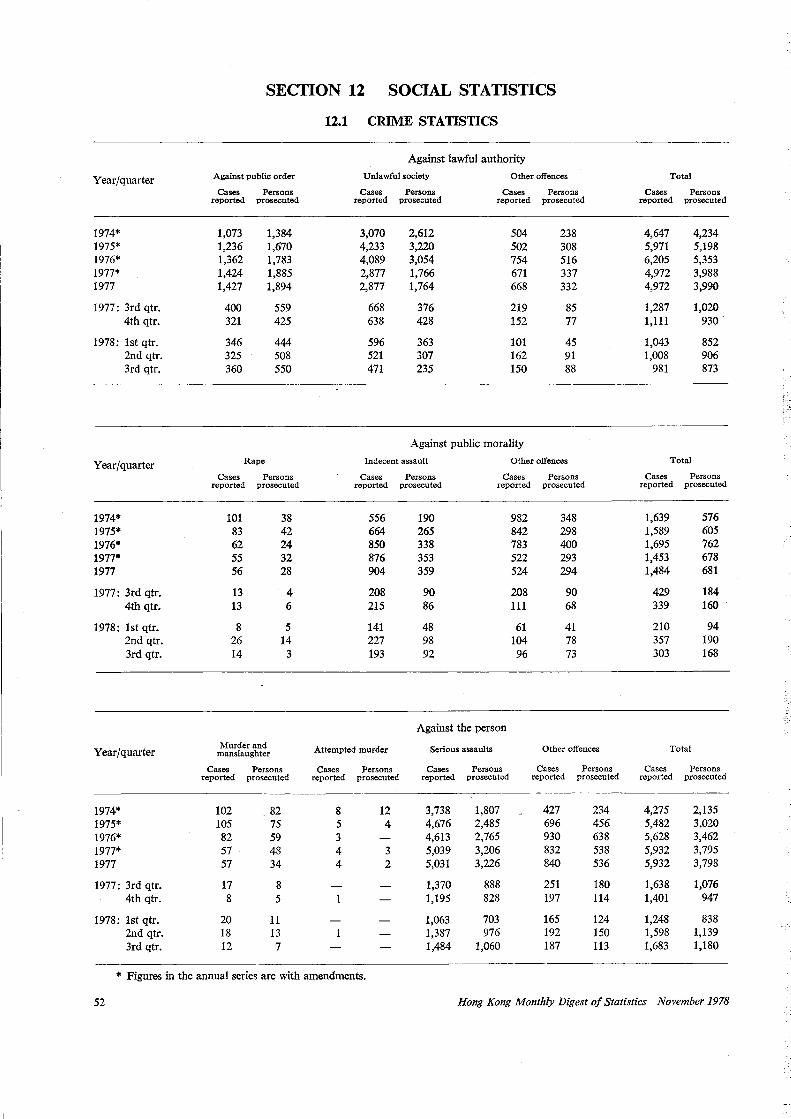
SECTION 12 SOCIAL STATISTICS
12.1 CRIME STATISTICS
Against lawful authority
Year/quarter Against public order Unlawful society Other offences Total
Cases Persons Cases Persons Cases Persons Cases Persons reported prosecuted reported prosecuted reported prosecuted reported prosecuted
1974* 1,073 1,384 3,070 2,612 504 238 4,647 4,234 1975* 1,236 1,670 4,233 3,220 502 308 5,971 5,198 1976* 1,362 1,783 4,089 3,054 754 516 6,205 5,353 1977* 1,424 1,885 2,877 1,766 671 337 4,972 3,988 1977 1,427 1,894 2,877 1,764 668 332 4,972 3,990
1977: 3rd qtr. 400 559 668 376 219 85 1,287 1,020 4th qtr. 321 425 638 428 152 77 1,111 930
1978: lst qtr. 346 444 596 363 101 45 1,043 852 2nd qtr. 325 508 521 307 162 91 1,008 906 3rd qtr. 360 550 471 235 150 88 981 873
.. r·~: 1--:
Against public morality
Year/quarter Rape Indecent assault Other offences Total
Cases Persons Cases Persons Cases Persons Cases Persons reported prosecuted reported prosecuted reported prosecuted reported prosecuted
1974* 101 38 556 190 982 348 1,639 576 1975* 83 42 664 265 842 298 1,589 605 1976* 62 24 850 338 783 400 1,695 762 1977* 55 32 876 353 522 293 1,453 678 1977 56 28 904 359 524 294 1,484 681
1977: 3rd qtr. 13 4 208 90 208 90 429 184 4th qtr. 13 6 215 86 111 68 339 160
1978: lst qtr. 8 5 141 48 61 41 210 94 2nd qtr. 26 14 227 98 104 78 357 190 3rd qtr. 14 3 193 92 96 73 303 168
.·:-,
Against the person
Year/quarter Murder and Attempted murder Serious assaults Other offences Total manslaughter
Cases Persons Cases Persons Cases Persons Cases Persons Cases Persons reported prosecuted reported prosecuted reported prosecuted reported prosecuted reported prosecuted
1974* 102 82 8 12 3,738 1,807 427 234 4,275 2,135 1975* 105 75 5 4 4,676 2,485 696 456 5,482 3,020 1976* 82 59 3 4,613 2,765 930 638 5,628 3,462 1977* 57 48 4 3 5,039 3,206 832 538 5,932 3,795 1977 57 34 4 2 5,031 3,226 840 536 5,932 3,798
1977: 3rd qtr. 17 8 1,370 888 251 180 1,638 1,076 4th qtr. 8 5 1,195 828 197 114 1,401 947
1978: lst qtr. 20 11 1,063 703 165 124 1,248 838 2nd qtr. 18 13 1,387 976 192 150 1,598 1,139 3rd qtr. 12 7 1,484 1,060 187 113 1,683 1,180
* Figures in the annual series are with amendments.
52 Hong Kong Monthly Digest of Statistics November 1978
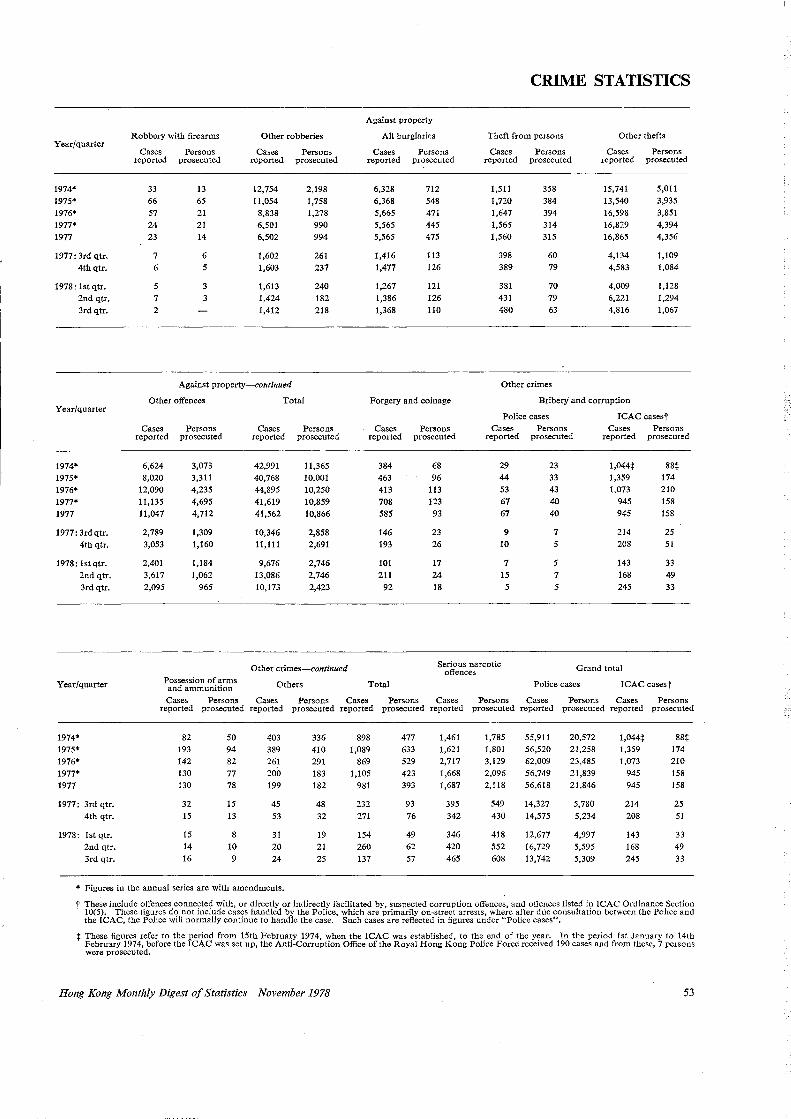
Year/quarter
1974* 1975* 1976* 1977* 1977
1977: 3rd qtr. 4th qtr.
1978: lst qtr. 2nd qtr. 3rd qtr.
Year/quarter
1974* 1975* 1976* 1977* 1977
1977: 3rd qtr. 4th qtr.
1978: lst qtr. 2nd qtr. 3rd qtr.
Year/quarter
Robbery with firearms
Cases Persons reported prosecuted
33 13 66 65 57 21 24 21 23 14
7 6 6 5
5
7 3
2
Other robberies
Cases reported
12,754 11,054
8,838 6,501 6,502
1,602 1,603
l,613 1,424 1,412
Persons prosecuted
2,198 1,758 l,278
990 994
261 237
240 182 218
Against property-continued
Other offences
Cases Persons reported prosecuted
6,624 8,020
12,090 11,135 11,047
2,789 3,053
2,401 3,617 2,095
3,073 3,311 4,235 4,695 4,712
l,309 l,160
1,184 1,062
965
Possession of arms and ammunition
Total
Cases Persons reported prosecuted
42,991 40,768 44,895 41,619 41,562
10,346 11,111
9,676 13,086 10,173
11,365 10,001 10,250 10,859 10,866
2,858 2,691
2,746 2,746 2,423
Other crimes-continued
Others
Against property
All burglarie.s
Cases Persons reported prosecuted
6,328 712 6,368 548 5,665 471 5,565 445 5,565 475
1,416 113 1,477 126
1,267 121 1,386 126 1,368 110
Forgery and coinage
Cases Persons reported prosecuted
384 463 413 708 585
146 193
101 211
92
68 96
113 123
93
23 26
17 24
18
CRIME STATISTICS
Theft from persons
Cases reported
1,511 l,720 1,647 1,565 1,560
398 389
381 431 480
Persons prosecuted
358 384 394 314 315
60 79
70 79 63
Other crimes
Other thefts
Cases reported
15,741 13,540 16,598 16,829 16,865
4,134 4,583
4,009 6,221 4,816
Persons prosecuted
5,011 3,935 3,851 4,394 4,356
l,109 1,084
1,128 1,294 1,067
Bribery and corruption
Police cases Cases Persons
reported prosecuted
29
44 53 67 67
9 10
7 15 5
23 33
43 40 40
7 5
5 7 5
ICAC casest Cases Persons
reported prosecuted
1,044+ l,359 1,073
945 945
214 208
143 168 245
88+ 174 210 158 158
25 51
33 49 33
Serious narcotic offences Grand total
Total Police cases ICAC casest
Cases Persons Cases Persons Cases Persons Cases Persons Cases Persons Cases Persons reported prosecuted reported prosecuted reported prosecuted reported prosecuted reported prosecuted reported prosecuted
1974* 1975* 1976* 1977* 1977
1977: 3rd qtr. 4th qtr.
1978: lst qtr. 2nd qtr. 3rd qtr.
82 193 142 130 130
32 15
15 14 16
50 94 82
77 78
15 13
8 10
9
403 389 261 200
199
45 53
31 20 24
* Figures in the annual series are with amendments.
336 410 291 183 182
48 32
19 21 25
898 l,089
869 l,105
981
232 271
154 260 137
477 633 529 423 393
93 76
49 62 57
1,461 1,621 2,717 1,668 l,687
395 342
346 420 465
1,785 l,801 3,129 2,096 2,118
549 430
418 552 608
55,911 56,520 62,009 56,749 56,618
14,327 14,575
12,677 16,729 13,742
20,572 21,258 23,485 21,839 21,846
5,780 5,234
4,997 5,595
5,309
1,044+ 1,359 l,073
945 945
214 208
143 168 245
88+ 174 210 158 158
25
51
33
49 33
t These include offences connected with, or directly or indirectly facilitated by, suspected corruption offences, and offences listed in ICAC Ordinance Section 10(5). These figures do not include cases handled by the Police, which are primarily on-street arrests, where after due consultation between the Police and the ICAC, the Police will normally continue to handle the case. Such cases are reflected in figures under "Police cases".
+ These figures refer to the period from l5th February 1974, when the ICAC was established, to the end of the year. Jn the period Jst January to 14th February 1974, before the ICAC was set up, the Anti-Corruption Office of the Royal Hong Kong Police Force received 190 cases and from these, 7 persons were prosecuted.
Hong Kong Monthly Digest of Statistics November 1978 53
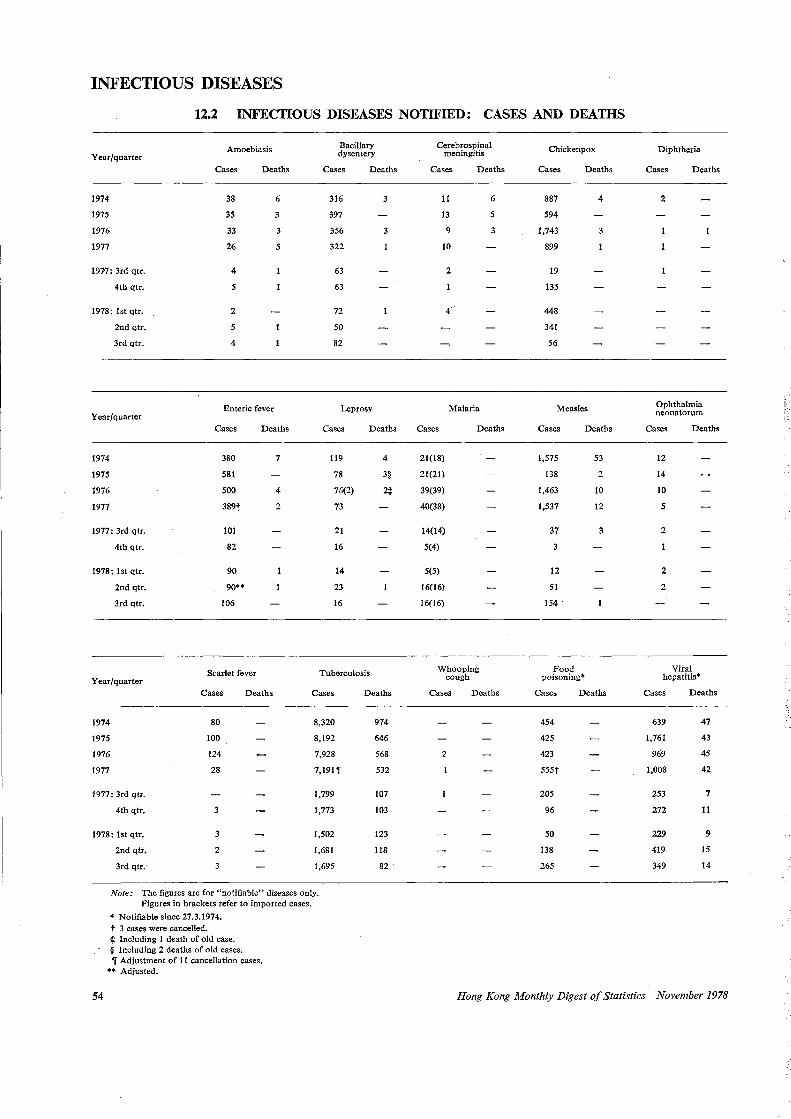
INFECTIOUS DISEASES
12.2 INFECTIOUS DISEASES NOTIFIED: CASES AND DEATHS
Amoebiasis Bacillary Year/quarter dysentery
Cases Deaths Cases Deaths
1974 38 6 316 3
1975 35 397
1976 33 3 356 3
1977 26 5 322
197'7: 3rd qtr. 4 63
4th qtr. 5 63
1978: lst qtr. 2 72
2nd qtr. 5 50
3rd qtr. 4 82
Enteric fever Leprosy Year/quarter
Cases Deaths Cases Death•
1974 380 7 119 4
1975 581 78 3§
1976 500 4 76(2) 2:j:
1977 389t 2 73
1977: 3rd qtr. IOI 21
4th qtr. 82 16
1978: lst qtr. 90 14
2nd qtr. 90** 23
3rd qtr. 106 16
Scarlet fever Tuberculosis Year/quarter
Cases Deaths Cases Deaths
1974 80 8,320 974
1975 100 8,192 646
1976 124 7,928 568
1977 28 7,191 ir 532
1977: 3rd qtr. 1,799 107
4th qtr. 3 1,773 103
1978: lst qtr. 3 1,502 123
2nd qtr. 2 1,681 118
3rd qtr. 1,695 82
Note: The :figures are for "notifiable" diseases only.
54
Figures in brackets refer to imported cases.
* Notifiable since 27.3.1974. t 3 cases were cancelled. t Including I death of old case. § Including 2 deaths of old cases. if Adjustment of 11 cancellation cases.
** Adjusted.
Cerebrospinal Chickenpox Diphtheria meningitis
Cases Deaths Cases Deaths Cases Deaths
11 6 887 4 2
13 5 594
9 1,743 3
10 899
2 19
135
4 448
341
56
Malaria Measles Ophthahnia neonatorum
Cases Deaths Cases Deaths Cases Deaths
21(18) 1,575 53 12
21(21) 138 2 14
39(39) 1,463 10 10
40(38) 1,537 12 5
14(14) 37 3 2
5(4) 3
5(5) 12 2
16(16) 51 2
16(16) 154 .
Whooping Food Viral cough poisoning* hepatitis*
Cases Deaths Cases Deaths Cases Deaths
454 639 47
425 1,761 43
2 423 969 45
555t 1,008 42
205 253 7
96 272 11
50 229 9
138 419 15
265 349 14
Hong Kong Monthly Digest of Statistics November 1978
,_ ..
· ..
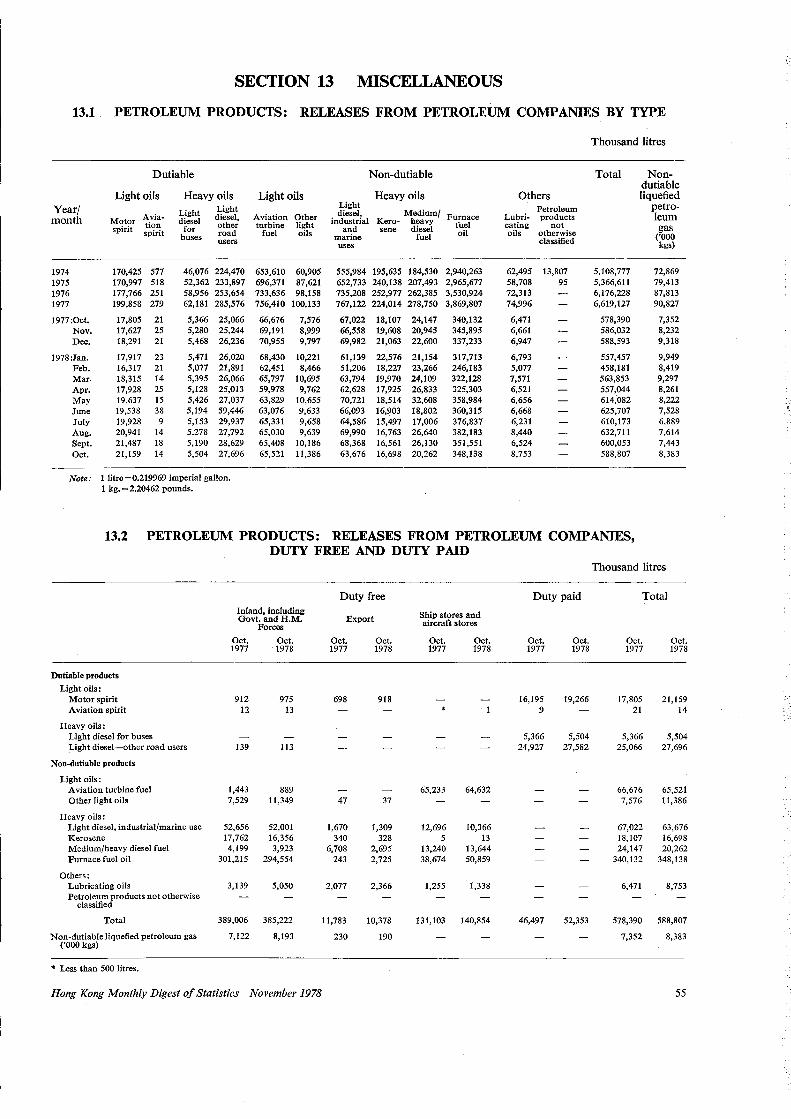
SECTION 13 MISCELLANEOUS
13.1. PETROLEUM PRODUCTS: RELEASES FROM PETROLEUM COMPANIES BY TYPE
Thousand litres
Dutiable Non-dutiable Total Non-dutiable
Light oils Heavy oils Light oils Heavy oils Others liquefied Year/ Light Light Petroleum petro-month A via- Light diesel, Aviation Other diesel, Medium/ Furnace Lubri- products leum Motor tion diesel other turbine light industrial Kero- heavy fuel eating not spirit spirit for road fuel oils and sene diesel oil oils otherwise gas
buses users marine fuel classified ('OOO uses kgs)
1974 170,425 577 46,076 224,470 653,610 60,905 555,984 195,635 184,530 2,940,263 62,495 13,807 5,108,777 72,869 1975 170,997 518 52,362 233,897 696,371 87,621 652,733 240,138 207,493 2,965,677 58,708 95 5,366,611 79,413 1976 177,766 251 58,956 253,654 733,636 98,158 735,208 252,977 262,385 3,530,924 72,313 6,176,228 87,813 1977 199,858 279 62,181 285,576 756,410 100,133 767,122 224,014 278,750 3,869,807 74,996 6,619,127 90,827
1977:0ct. 17,805 21 5,366 25,066 66,676 7,576 67,022 18,107 24,147 340,132 6,471 578,390 7,352 Nov. 17,627 25 5,280 25,244 69,191 8,999 66,558 19,608 20,945 345,895 6,661 586,032 8,232 Dec. 18,291 21 5,468 26,236 70,955 9,797 69,982 21,063 22,600 337,233 6,947 588,593 9,318
1978:Jan. 17,917 23 5,471 26,020 68,430 10,221 61,139 22,576 21,154 317,713 6,793 557,457 9,949 Feb. 16,317 21 5,077 21,891 62,451 8,466 51,206 18,227 23,266 246,183 5,077 458,181 8,419 Mar. 18,315 14 5,395 26,066 65,797 10,695 63,794 19,970 24,109 322,128 7,571 563,853 9,297 Apr. 17,928 25 5,128 25,013 59,978 9,762 62,628 17,925 26,833 325,303 6,521 557,044 8,261 May 19,637 15 5,426 27,037 63,829 10,655 70,721 18,514 32,608 358,984 6,656 614,082 8,222 June 19,538 38 5,194 59,446 63,076 9,633 66,093 16,903 18,802 360,315 6,668 625,707 7,528 July 19,928 9 5,153 29,937 65,331 9,658 64,586 15,497 17,006 376,837 6,231 610,173 6,889 Aug. 20,941 14 5.278 27,792 65,030 9,639 69,990 16,763 26,640 382,183 8,440 632,711 7,614 Sept. 21,487 18 5,190 28,629 65,408 10,186 68,368 16,561 26,130 351,551 6,524 600,053 7,443 Oct. 21,159 14 5,504 27,696 65,521 11,386 63,676 16,698 20,262 348,138 8,753 588,807 8,383
Note: 1 litre=0.219969 imperial gallon. 1 kg. = 2.20462 pounds.
13.2 PETROLEUM PRODUCTS: RELEASES FROM PETROLEUM COMPANIES, DUTY FREE AND DUTY PAID
Thousand litres
Duty free Duty paid Total Inland, including Ship stores and Govt. and H.M. Export aircraft stores Forces
Oct. Oct. Oct. Oct. Oct. Oct. Oct. Oct. Oct. Oct. 1977 . 1978 1977 1978 1977 1978 1977 1978 1977 1978
Dutiable products
Light oils: Motor spirit 912 975 698 918 16,195 19,266 17,805 21,159 Aviation spirit 12 13 9 21 14 r. ~,
Heavy oils: Light diesel for buses 5,366 5,504 5,366 5,504 Light diesel-other road users 139 113 24,927 27,582 25,066 27,696
Non-dutiable products
Light oils: Aviation turbine fuel 1,443 889 65,233 64,632 66,676 65,521 Other light oils 7,529 11,349 47 37 7,576 11,386
Heavy oils: Light diesel, industrial/marine use 52,656 52,001 1,670 1,309 12,696 10,366 67,022 63,676 Kerosene 17,762 16,356 340 328 5 13 18,107 16,698 Medium/heavy diesel fuel 4,199 3,923 6,708 2,695 13,240 13,644 24,147 20,262 Furnace fuel oil 301,215 294,554 243 2,725 38,674 50,859 340,132 348,138
Others: Lubricating oils 3,139 5,050 2,077 2,366 1,255 1,338 6,471 8,753 Petroleum products not otherwise
classified
Total 389,006 385,222 11,783 10,378 131,103 140,854 46,497 52,353 578,390 588,807
Non-dutiable liquefied petroleum gas 7,122 8,193 230 190 7,352 8,383 ('OOO kgs)
* Less than 500 litres.
Hong Kong Monthly Digest of Statistics November 1978 55
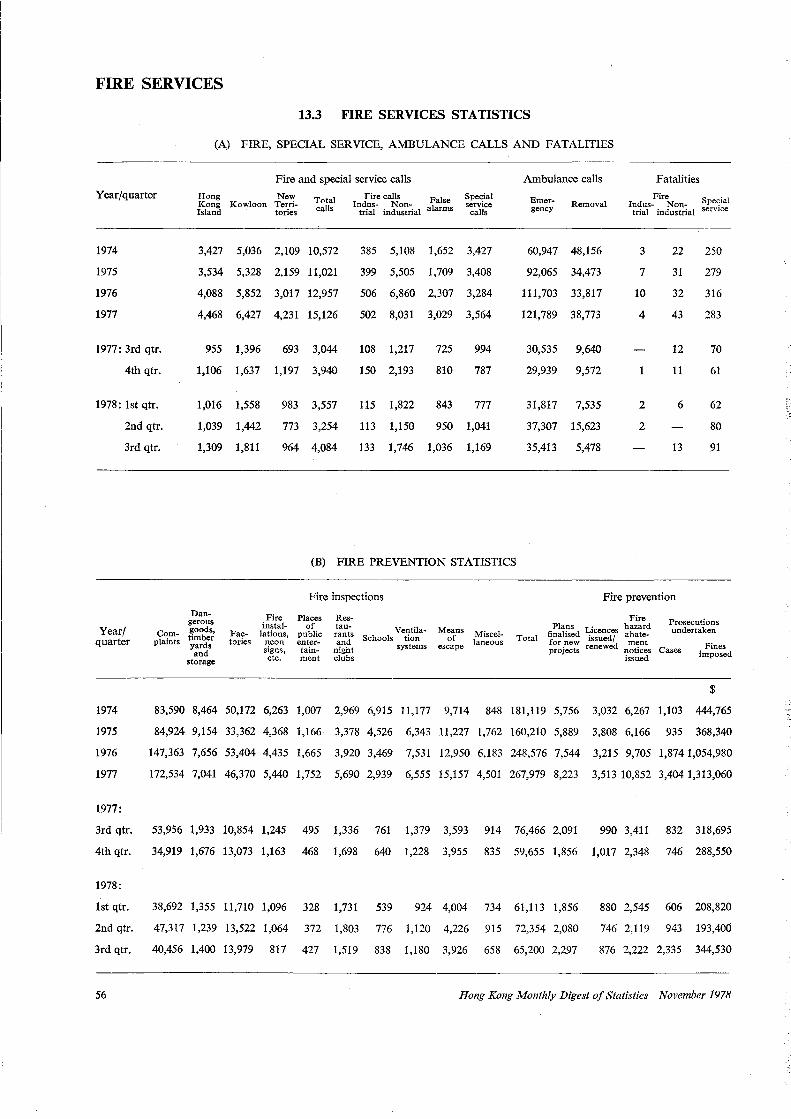
FIRE SERVICES
Year/quarter
1974
1975
1976
1977
1977: 3rd qtr.
4th qtr.
1978: lst qtr.
2nd qtr.
3rd qtr.
Year/ quarter
Complaints
13.3 FIRE SERVICES STATISTICS
(A) FIRE, SPECIAL SERVICE, AMBULANCE CALLS AND FATALITIES
Fire and special service calls
Hong Kong Island
New Kowloon Terri
tories Total calls
1nl.l;: ca~on- False trial industrial alarms
Special service
calls
3,427 5,036 2,109 10,572
3,534 5,328 2,159 11,021
4,088 5,852 3,017 12,957
4,468 6,427 4,231 15,126
955 1,396 693 3,044
1,106 1,637 1,197 3,940
1,016 1,558
1,039 1,442
1,309 1,811
983 3,557
773 3,254
964 4,084
385 5,108 1,652 3,427
399 5,505 1,709 3,408
506 6,860 2,307 3,284
502 8,031 3,029 3,564
108 1,217
150 2,193
115 1,822
725
810
843
994
787
777
113 1,150 950 1,041
133 1,746 1,036 1,169
(B) FIRE PREVENTION STATISTICS
Dangerous goods, timber yards and
storage
Factories
Fire instal
lations, neon signs, etc.
Fire inspections
Places of
public entertainment
Restaurants and
night clubs
VentilaSchools tion
systems
Means of
escape
Miscellaneous
Ambulance calls Fatalities
Emergency Removal lndus-FirNon- Spe~ial
trial industrial service
60,947 48,156
92,065 34,473
111,703 33,817
121,789 38,773
30,535 9,640
29,939 9,572
31,817 7,535
37,307 15,623
35,413 5,478
3
7
10
4
2
2
22
31
32
43
12
11
6
13
250
279
316
283
70
61
62
80
91
Fire prevention
Total
Fire Pla!'s Licences hazard
finahsed issued/ abate· for new renewed ment projects notices
issued
Prosecutions undertaken
Cases Fines imposed
$
1974 83,590 8,464 50,172 6,263 1,007 2,969 6,915 11,177 9,714 848 181,119 5,756 3,032 6,267 1,103 444,765
1975 84,924 9,154 33,362 4,368 1,166 3,378 4,526 6,343 11,227 1,762 160,210 5,889 3,808 6,166 935 368,340
1976 147,363 7,656 53,404 4,435 1,665 3,920 3,469 7,531 12,950 6,183 248,576 7,544 3,215 9,705 1,874 1,054,980
1977 172,534 7,041 46,370 5,440 1,752 5,690 2,939 6,555 15,157 4,501 267,979 8,223 3,513 10,852 3,404 1,313,060
1977:
3rd qtr.
4th qtr.
1978:
lst qtr.
53,956 1,933 10,854 1,245 495 1,336 761 1,379 3,593 914 76,466 2,091 990 3,411 832 318,695
34,919 1,676 13,073 1,163 468 1,698 640 1,228 3,955 835 59,655 1,856 1,017 2,348 746 288,550
38,692 1,355 11,710 1,096 328 1,731 539 924 4,004 734 61,113 1,856 880 2,545 606 208,820
2nd qtr. 47,317 1,239 13,522 1,064 372 1,803 776 1,120 4,226 915 72,354 2,080 746 2,119 943 193,400
3rd qtr. 40,456 1,400 13,979 817 427 1,519 838 1,180 3,926 658 65,200 2,297 876 2,222 2,335 344,530
56 Hong Kong Monthly Digest of Statistics November 1978
r.
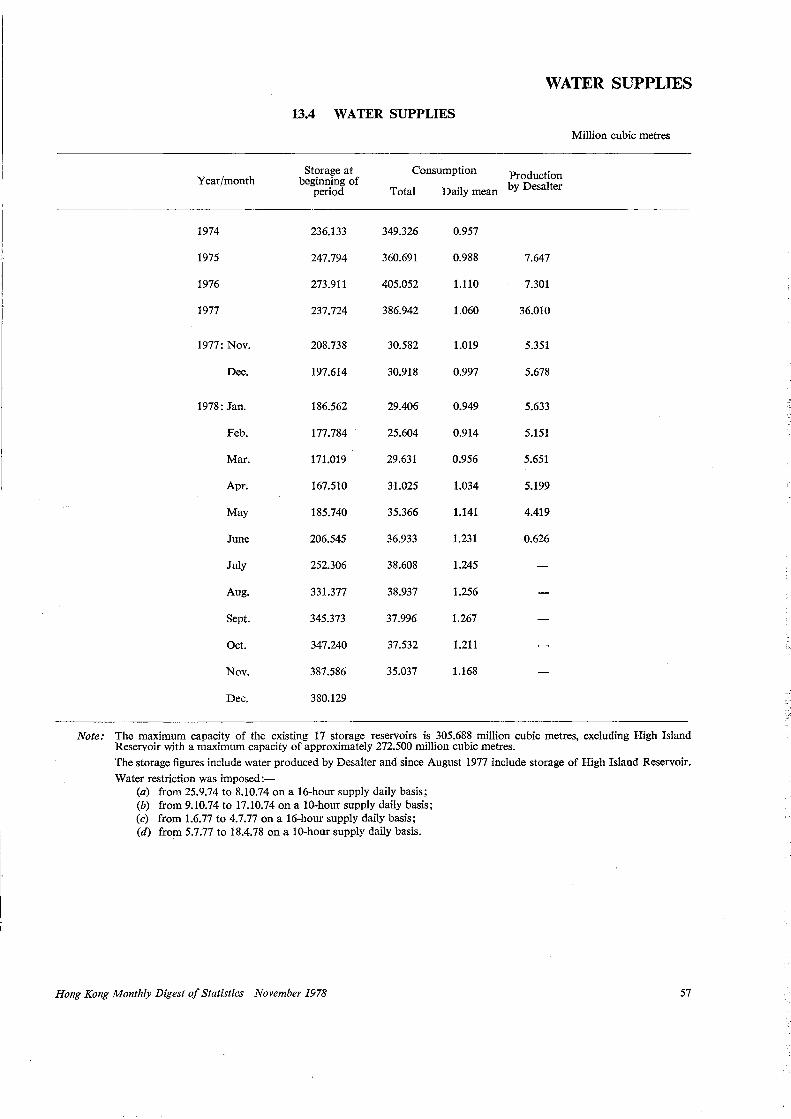
WATER SUPPLIES
13.4 WATER SUPPLIES
Million cubic metres
Storage at Consumption Production Year/month beginning of by Desalter period Total Daily mean
1974 236.133 349.326 0.957
1975 247.794 360.691 0.988 7.647
1976 273.911 405.052 1.110 7.301
1977 237.724 386.942 1.060 36.010
1977: Nov. 208.738 30.582 1.019 5.351
Dec. 197.614 30.918 0.997 5.678
1978: Jan. 186.562 29.406 0.949 5.633
Feb. 177.784 25.604 0.914 5.151
Mar. 171.019 29.631 0.956 5.651
Apr. 167.510 31.025 1.034 5.199
May 185.740 35.366 1.141 4.419
June 206.545 36.933 1.231 0.626
July 252.306 38.608 1.245
Aug. 331.377 38.937 1.256
Sept. 345.373 37.996 1.267
Oct. 347.240 37.532 1.211
Nov. 387.586 35.037 1.168
Dec. 380.129
Note: The maximum capacity of the existing 17 storage reservoirs is 305.688 million cubic metres, excluding High Island Reservoir with a maximum capacity of approximately 272.500 million cubic metres.
The storage figures include water produced by Desalter and since August 1977 include storage of High Island Reservoir.
Water restriction was imposed:-(a) from 25.9.74 to 8.10.74 on a 16-hour supply daily basis; (b) from 9.10.74 to 17.10.74 on a 10-hour supply daily basis; (c) from 1.6.77 to 4.7.77 on a 16-hour supply daily basis; (d) from 5.7.77 to 18.4.78 on a 10-hour supply daily basis.
Hong Kong Monthly Digest of Statistics November 1978 57
,-1
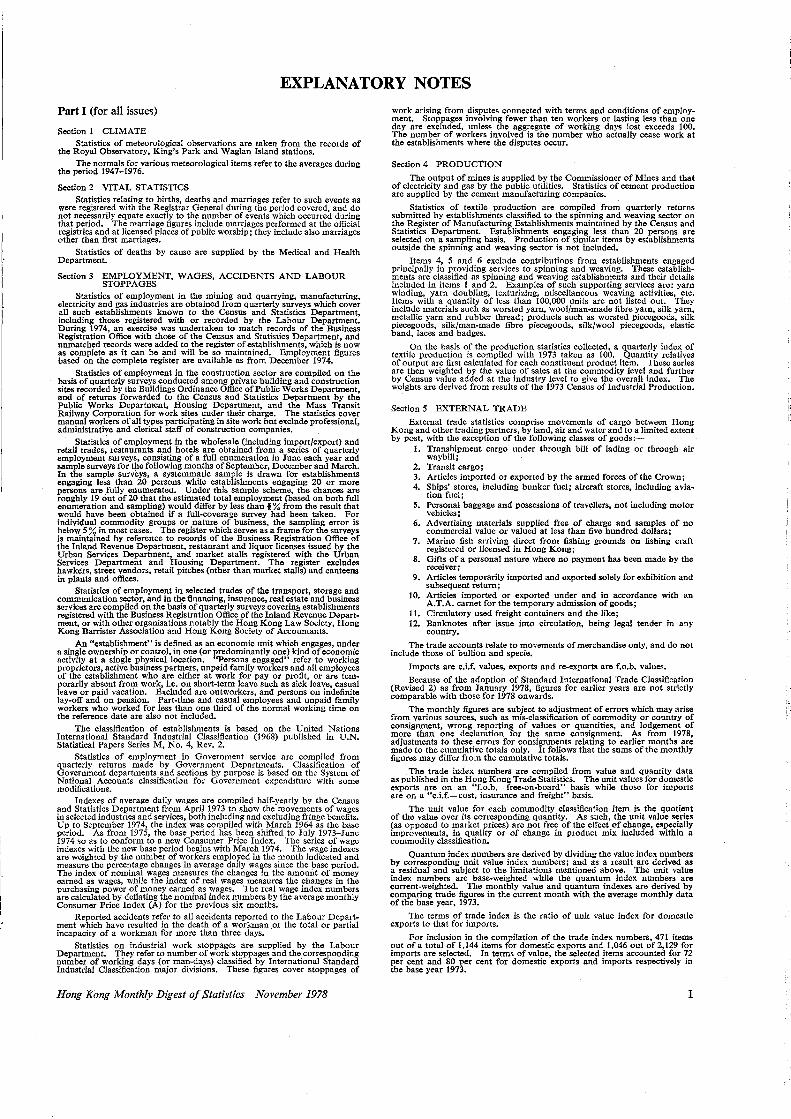
EXPLANATORY NOTES
Part I (for all issues)
Section 1 CLIMATE Statistics of meteorological observations are taken from the records of
the Royal Observatory, King's Park and Waglan Island stations. The normals for various meteorological items refer to the averages during
the period 1947-1976.
Section 2 VITAL STATISTICS Statistics relating to births, deaths and marriages refer to such events as
were registered with the Registrar General during the period covered, and do not necessarily equate exactly to the number of events which occurred during that period. The marriage figures include marriages performed at the official registries and at licensed places of public worship; they include also marriages other than first marriages.
Statistics of deaths by cause are supplied by the Medical and Health Department.
Section 3 EMPLOYMENT, WAGES, ACCIDENTS AND LABOUR STOPPAGES
Statistics of employment in the mining and quarrying, manufacturing, electricity and gas industries are obtained from quarterly surveys which cover all such establishments known to the Census and Statistics Department, including those registered with or recorded by the La hour Department. During 1974, an exercise was undertaken to match records of the Business Registration Office with those of the Census and Statistics Department, and unmatched records were added to the register of establishments, which is now as complete as it can be and will be so maintained. Employment figures based on the complete register are available as from December 1974.
Statistics of employment in the construction sector are compiled on the basis of quarterly surveys conducted among private building and construction sites recorded by the Buildings Ordinance Office of Public Works Department, and of returns forwarded to the Census and Statistics Department by the Public Works Department, Housing Department, and the Mass Transit Railway Corporation for work sites under their charge. The statistics cover manual workers of all types participating in site work but exclude professional, administrative and clerical staff of construction companies.
Statistics of employment in the wholesale (including import/export) and retail trades, restaurants and hotels are obtained from a series of quarterly employment surveys, consisting of a full enumeration in June each year and sample surveys for the following months of September, December and March. In the sample surveys, a systemmatic sample is drawn for establishments engaging less than 20 persons while establishments engaging 20 or more persons are fully enumerated. Under this sample scheme, the chances are roughly 19 out of 20 that the estimated total employment (based on both full ennmeration and sampling) would differ by less than i % from the result that would have been obtained if a full-coverage survey had been taken. For individual commodity groups or nature of business, the sampling error is below 5 % in most cases. The register which serves as a frame for the surveys is maintained by reference to records of the Business Registration Office of the Inland Revenue Department, restaurant and liquor licenses issued by the Urban Services Department, and market stalls registered with the Urban Services Department and Housing Department. The register excludes hawkers, street vendors, retail pitches (other than market stalls) and canteens in plants and offices.
Statistics of employment in selected trades of the transport, storage and communication sector, and in the financing, insurance, real estate and business services are compiled on the basis of quarterly surveys coverini. establishments registered with the Business Registration Office of the Inland Revenue Department, or with other organisations notably the Hong Kong Law Society, Hong Kong Barrister Association and Hong Kong Society of Accountants.
An "establishment'' is defined as an economic unit which engages, under a single ownership or control, in one (or predominantly one) kind of economic activity at a single physical location. "Persons engaged" refer to working proprietors, active business partners, unpaid family workers and all employees of the establishment who are either at work for pay or profit, or are temporarily absent from work, i.e. on short-term leave such as sick leave, casual leave or paid vacation. EJtcluded are outworkers, and persons on indefinite lay-off and on pension. Part-time and casual employees and unpaid family workers who worked for less than one third of the normal working time on the reference date are also not included.
The classification of establishments is based on the United Nations International Standard Industrial Classification (1968) published in U.N. Statistical Papers Series M, No. 4, Rev. 2.
Statistics of employment in Government service are compiled from quarterly returns made by Government Departments. Classification of Government departments and sections by purpose is based on the System of National Accounts classification for Government expenditure with some modifications.
Indexes of average daily wages are compiled half-yearly by the Census and Statistics Department from April 1973 to show the movements of wages in selected industries and services, both including and excluding fringe benefits. Up to September 1974, the index was compiled with March 1964 as the base period. As from 1975, the base period has been shifted to July 1973-June 1974 so as to conform to a new Consumer Price Index. The series of wage indexes with the new base period begins with March 1974. The wage indexes are weighted by the nuinber of workers employed in the month indicated and measure the percentage changes in average daily wages since the base period. The index of nominal wages measures the changes in the amount of money earned as wages, while the index of real wages measures the changes in the purchasing power of money earned as wages. The real wage index numbers are calculated by deflating the nominal index numbers by the average monthly Consumer Price Index (A) for the previous six months.
Reported accidents refer to all accidents reported to the Labour Department which have resulted in the death of a workman _or the total or partial incapacity of a workman for more than three days.
Statistics on industrial work stoppages are supplied by the Labour Department. They refer to number of work stoppages and the corresponding number of working days (or man-days) classified by International Standard Industrial Classification major divisions. These figures cover stoppages of
Hong Kong Monthly Digest of Statistics November 1978
work arising from disputes connected with terms and conditions of employment. Stoppages involving fewer than ten workers or lasting less than one day are excluded, unless the aggregate of working days lost exceeds 100. The number of workers involved is the number who actually cease work at the establishments where the disputes occur.
Section 4 PRODUCTION
The output of mines is supplied by the Commissioner of Mines and that of electricity and gas by the public utilities. Statistics of cement production are supplied by the cement manufacturing companies.
Statistics of textile production are compiled from quarterly returns submitted by establishments classified to the spinning and weaving sector on the Register of Manufacturing Establishments maintained by the Census and Statistics Department. Establishments engaging less than 20 persons are selected on a sampling basis. Production of similar items by establishments outside the spinning and weaving sector is not included.
Items 4, 5 and 6 exclude contributions from establishments engaged principally in providing services to spinning and weaving. These establishments are classified as spinning and weaving establishments and their details included in items 1 and 2. Examples of such supporting services are: yarn winding, yarn doubling, texturizing, miscellaneous weaving activities, etc. Items with a quantity of less than 100,000 units are not listed out. They include materials such as worsted yarn, wool/man-made fibre yarn, silk yarn, metallic yarn and rubber thread; products such as worsted piecegoods, silk piecegoods, silk/man-made fibre piecegoods, silk/wool piecegoods, elastic band, laces and badges.
On the basis of the production statistics collected, a quarterly index of textile production is compiled with 1973 taken as 100. Quantity relatives of output are first calculated for each constituent product item. These series are then weighted by the value of sales at the commodity level and further by Census value added at the industry level to give the overall index. The weights are derived from results of the 1973 Census of Industrial Production.
Section 5 EXTERNAL TRADE
External trade statistics comprise movements of cargo between Hong Kong and other trading partners, by land, air and water and to a limited extent by post, with the exception of the following classes of goods:-
1. Transhipment cargo under through bill of lading or through air waybill;
2. Transit cargo; 3. Articles imported or exported by the armed forces of the Crown; 4. Ships' stores, including bunker fuel; aircraft stores, including avia ..
tion fuel; 5. Personal baggage and possessions of travellers, not including motor
vehicles; 6. Advertising materials supplied free of charge and samples of no
commercial value or valued at less than five hundred dollars; 7. Marine fish arriving direct from fishing grounds on fishing craft
registered or licensed in Hong Kong; 8. Gifts of a personal nature where no payment has been made by the
receiver; 9. Articles temporarily imported and exported solely for exhibition a_nd
subsequent return; 10. Articles imported or exported under and in accordance with an
A.T.A. carnet for the temporary admission of goods; 11. Circulatory used freight containers and the like; 12. Banknotes after issue into circulation, being legal tender in any
country.
The trade accounts relate to movements of merchandise only, and do not include those of bullion and specie.
Imports are c.i.f. values, exports and re-exports are f.o.b. values.
Because of the adoption of Standard International Trade Classification (Revised 2) as from January 1978, figures for earlier years are not strictly comparable with those for 1978 onwards.
The monthly fignres are subject to adjustment of errors which may arise from various sources, such as mis-classification of commodity or country of consignment, wrong reporting of values or quantities, and lodgement of more than one declaration for the same consignment. As from 1978, adjustments to these errors for consignments relating to earlier months are made to the cumulative totals only. It follows that the sums of the monthly figures may differ from the cumulative totals.
The trade index numbers are compiled from value and quantity data as published in the Hong Kong Trade Statistics. The unit values for domestic ex.ports are on an "f.o.b.-free-on-board" basis while those for imports are on a Hc.i.f.---cost, insurance and freight0 basis.
The unit value for each commodity classification item is the quotient of the value over its corresponding quantity. As such, the unit value series (as opposed to market prices) are not free of the effect of change, especially improvements, in quality or of change in product mix included within a commodity classification.
Quantum index numbers are derived by dividing the value index numbers by corresponding unit value index numbers; and as a result are derived as a residual and subject to the limitations mentioned above. The unit value index numbers are base-weighted while the quantum index numbers are current-weighted. The monthly value and quantum indexes are derived by comparing trade fignres in the current month with the average monthly data of the base year, 1973.
The terms of trade index is the ratio of unit value index for domestic exports to that for imports.
For inclusion in the compilation of the trade index numbers, 471 items out of a total of 1,144 items for domestic exports and 1,046 out of 2,129 for imports are selected. In terms of value, the selected items accounted for 72 per cent and 80 per cent for domestic exports and imports respectively in the base year 1973.
I
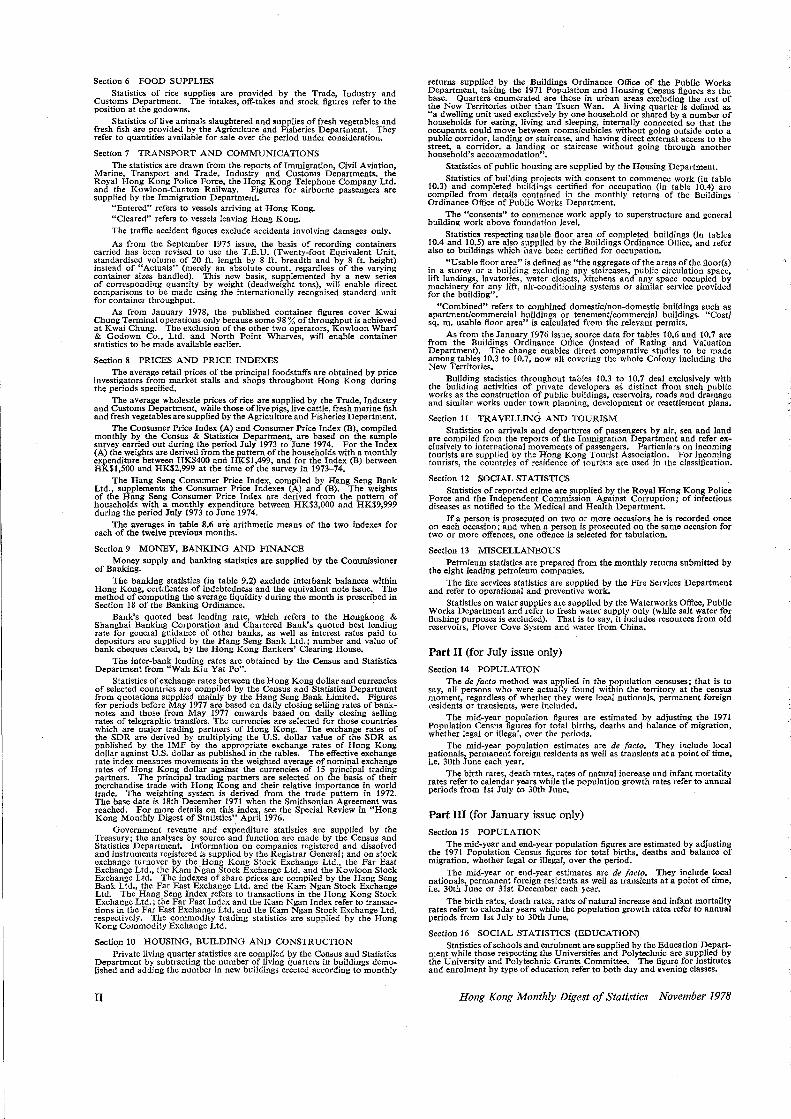
Section 6 FOOD SUPPLIES Statistics of rice supplies are provided by the Trade, Industry and
Customs Department. The intakes, off-takes and stock figures refer to the position at the godowns.
Statistics of Ii ve animals slaughtered and supplies of fresh vegetables and fresh fish are provided by the Agriculture and Fisheries Department. They refer to quantities available for sa]e over the period under consideration.
Section 7 TRANSPORT AND COMMUNICATIONS The statistics are drawn from the reports of Immigration, Civil Aviation,
Marine, Transport and Trade, Industry and Customs Departments. the Royal Hong Kong Police Force, the Hong Kong Telephone Company Ltd. and the Kowloon-Canton Railway. Figures for airborne passengers are supplied by the Immigration Department.
"Enteredn refers to vessels arriving at Hong Kong. "Cleared" refers to vessels leaving Hong Kong. The traffic accident figures exclude accidents involving damages only.
As from the September 1975 issue, the basis of recording containers carried has been revised to use the T.E. U. (Twenty-foot Equivalent Unit, standardised volume of 20 ft. length by 8 ft. breadth and by 8 ft. height) instead of "Actuals" (mere1y an absolute count, regardle.ss of the varying container sizes handled). This new basis, supplemented by a new series of corresponding quantity by weight (deadweight tons), will enable direct comparisons to be made using the internationally recognised standard unit for container throughput.
As from January 1978, the published container figures cover Kwai Chung Terminal operations only because some 98 % of throughput is achieved at Kwai Chung. The exclusion of the other two operators, Kowloon Wharf & Godown Co., Ltd. and North Point Wharves, will enable container statistics to be made available earlier.
Section 8 PRICES AND PRICE INDEXES The average retail prices of the principal foodstuffs are obtained by price
investigators from market stalls and shops throughout Hong Kong during the periods specified.
The average wholesale prices of rice are supplied by the Trade, Industry and Customs Department, while those of live pigs, live cattle, fresh marine fish and fresh vegetables are supplied by the Agriculture and Fisheries Department.
The Consumer Price Index (A) and Consumer Price Index (B), compiled monthly by the Census & Statistics Department, are based on the sample survey carried out during the period July 1973 to June 1974. For the Index (A) the weights are derived from the pattern of the households with a monthly expenditure between HK$400 and HK$1,499, and for the Index (BJ between HK$1,500 and HK$2,999 at the time of the survey in 1973-74.
The Hang Seng Consumer Price Index, compiled by Hang Seng Bank Ltd., supplements the Consumer Price Indexes (A) and (B). The weights of the Hang Seng Consumer Price Index are derived from the pattern of households with a monthly expenditure between HK$3,000 and HK$9,999 during the period July 1973 to June 1974.
The averages in table 8.6 are arithmetic means of the two indexes for each of the twelve previous months.
Section 9 MONEY, BANKING AND FINANCE Money supply and banking statistics are supplied by the Commissioner
of Banking. The banking statistics (in table 9.2) exclude interbank balances within
Hong Kong, certificates of indebtedness and the equivalent note issue. The method of computing the average liquidity during the month is prescribed in Section 18 of the Banking Ordinance. ·
Bank's quoted best lending rate, which refers to the Hongkong & Shanghai Banking Corporation and Chartered Bank's quoted best lending rate for general guidance of other banks, as well as interest rates paid to depositors are supplied by the Hang Seng Bank Ltd.; number and value of bank cheques cleared, by the Hong Kong Bankers' Clearing House.
The inter-bank lending rates are obtained by the Census and Statistics Department from "Wah Kiu Yat Po".
Statistics of exchange rates between the Hong Kong dollar and currencies of selected countries are compiled by the Census and Statistics Department from qu.otations supplied mainly by the Hang Seng Bank Limited. Figures for periods before May 1977 are based on daily closing selling rates of banknotes and those from May 1977 onwards based on daily closing selling rates of telegraphic transfers. The currencies are selected for those countries which are major trading partners of Hong Kong. The exchange rates of the SDR are derived by multiplying the U.S. dollar value of the SDR as published by the IMF by the appropriate exchange rates of Hong Kong dollar against U.S. dollar as published in the tables. The effective exchange rate index measures movements in the weighted average of nominal exchange rates of Hong Kong dollar against the currencies of 15 principal trading partners. The principal trading partners are selected on the basis of their merchandise trade with Hong Kong and their relative importance in world trade. The weighting system is derived from the trade pattern in 1972. The base date is 18th December 1971 when the Smithsonian Agreement was reached. For more details on this index, see the Special Review in "Hong Kong Monthly Digest of Statistics" April 1976.
Government revenue and exPenditure statistic5 are supplied by the Treasury; the analyses by source and function are made by the Census and Statistics Department. Information on companies registered and dissolved and instruments registered is supplied by the Registrar Genera]; and on stock exchange turnover by the Hong Kong Stock Exchange Ltd., the Far East Exchange Ltd., the Kam Ngan Stock Exchange Ltd. and the Kowloon Stock Exchange Ltd. The indexes of share prices are compiled by the Hang Seng Bank Ltd., the Far East Exchange Ltd. and the Kam Ngan Stock Exchange Ltd. The Hang Seng Index refers to transactions in the Hong Kong Stock Exchange Ltd.; the Far East Index and the Kam Ngan Index refer to transactions in the Far East Exchange Ltd. and the Kam Ngan Stock Exchange Ltd. respectively. The commodity trading statistiCs are supplied by the Hong Kong Commodity Exchange Ltd.
Section JO HOUSING, BUILDING AND CONSTRUCTION Private living quarter statistics are compiled by the Census and Statistics
Department by subtracting the number of living quarters in buildings demolished and adding the number in new buildings erected according to monthly
II
returns supplied by the Buildings Ordinance Office of the Public Works Department, taking the 1971 Population and Housing Census figures as the base. Quarters enumerated are those in urban areas excluding the rest of the New Territories other than Tsuen Wan. A living quarter is defined as "a dwelling unit used exclusively by one household or shared by a number of households for eating, living and sleeping, internally connected so that the occupants could move between rooms/cubicles without going outside onto a public corridor, landing or staircase, and having direct externaJ access to the street, a corridor, a landing or staircase without going through another household's accommodation".
Statistics of public housing are supplied by the Housing Department. Statistics of building projects with consent to commence work (in table
10.3) and completed buildings certified for occupation (in table 10.4) are compiled from details contained in the monthly returns of the Buildings Ordinance Office of Public Works Department.
The "consents" to commence work apply to superstructure and general building work above foundation level.
Statistics respecting usable floor area of completed buildings (in tables 10.4 and I 0.5) are also supplied by the Buildings Ordinance Office, and refer also to buildings which have been certified for occupation.
nu sable floor area" is defined as "the aggregate of the areas of the floor(s) in a storey or a building excluding any staircases, public circulation space, lift landings, lavatories, water closets, kitchens and any space occupied by machinery for any lift: air-conditioning systems or similar service provided for the building".
"Combined" refers to combined domestic/non-domestic buildings such as apartment/commercial buildings or tenement/commercial buildings. "Cost/ sq. m. usable floor area" is calculated from the relevant permits.
As from the January 1976 issue, source data for tables 10.6 and 10.7 are from the Buildings Ordinance Office (instead of Rating and Valuation Department). The change enables direct comparative studies to be made among tables 10.3 to l 0. 7, now all covering the whole Colony including the New Territories.
Building statistics throughout tables 10.3 to 10.7 deal exclusively with the building activities of private developers as distinct from such public works as the construction of public bui1dings, reservoirs, roads and drainage and similar works under town planning, development or resettlement plans.
Section 11 TRA YELLING AND TOURISM Statistics on arrivals and departures of passengers by air, sea and land
are compiled from the reports of the Immigration Department and refer exclusively to international movements of passengers. Particulars on incoming tourists are suppJ;ed by the Hong Kong Tourist Association. For incoming tourists, the countries of residence of tourists are used in the classification.
Section 12 SOCIAL STATISTICS Statistics of reported crime are supplied by the Royal Hong Kong Police
Force and the Independent Commission Against Corruption; of infectious diseases as notified to the Medical and Health Department.
If a person is prosecuted on two or more occasions he is recorded once on each occasion; and when a person is prosecuted on the same occasion for two or more offences, one offence is selected for tabu1ation.
Section 13 MISCELLANEOUS Petroleum statistics are prepared from the monthly returns submitted by
the eight leading petroleum companies. The fire services statistics are supplied by the Fire Services Department
and refer to operational and preventive work. Statistics on water supplies are supplied by the Waterworks Office, Public
Works Department and refer to fresh water supply only (while salt water for flushing purposes is excluded). That is to say, it includes resources from old reservoirs, PJover Cove System and water from China.
Part II (for July issue only)
Section 14 POPULATION The de facto method was applied in the population censuses; that is to
say all persons who were actually found within the territory at the census mo~ent, regardless of whether they were local nationals, permanent foreign residents or transients, were included.
The mid-year population figures are estimated by adjusting the 1971 Population Census figures for total births, deaths and balance of migration, whether legal or illegal, over the periods.
The mid-year population estimates are de facto. They include local nationals, permanent foreign residents as well as transients at a point of time, i.e. 30th June each year.
The birth rates, death rates, rates of natural increase and infant mortality rates refer to calendar years while the population growth rates refer to annual periods from lst July to 30th June.
Part III (for January issue only)
Section 15 POPULATION The mid-year and end-year population figures are estimated by adjusting
the 1971 Population Census figures for total births, deaths and balance of migration, whether legal or illegal, over the period.
The mid-year or end-year estimates are de facto. They include local nationals, permanent foreign residents as well as transients at a point of time, i.e. 30th June or 3lst December each year.
The birth rates, death rates, rates of natural increase and infant mortality rates refer to calendar years while the population growth rates refer to annual periods from lst July to 30th June.
Section 16 SOCIAL STATISTICS (EDUCATION) Statistics of schools and enrolment are supplied by the Education Depart
ment while those respecting the Universities and Polytechnic are supplied by the University and Polytechnic Grants Committee. The figure for institutes and enrolment by type of education refer to both day and evening classes.
Hong Kong Monthly Digest of Statistics November 1978
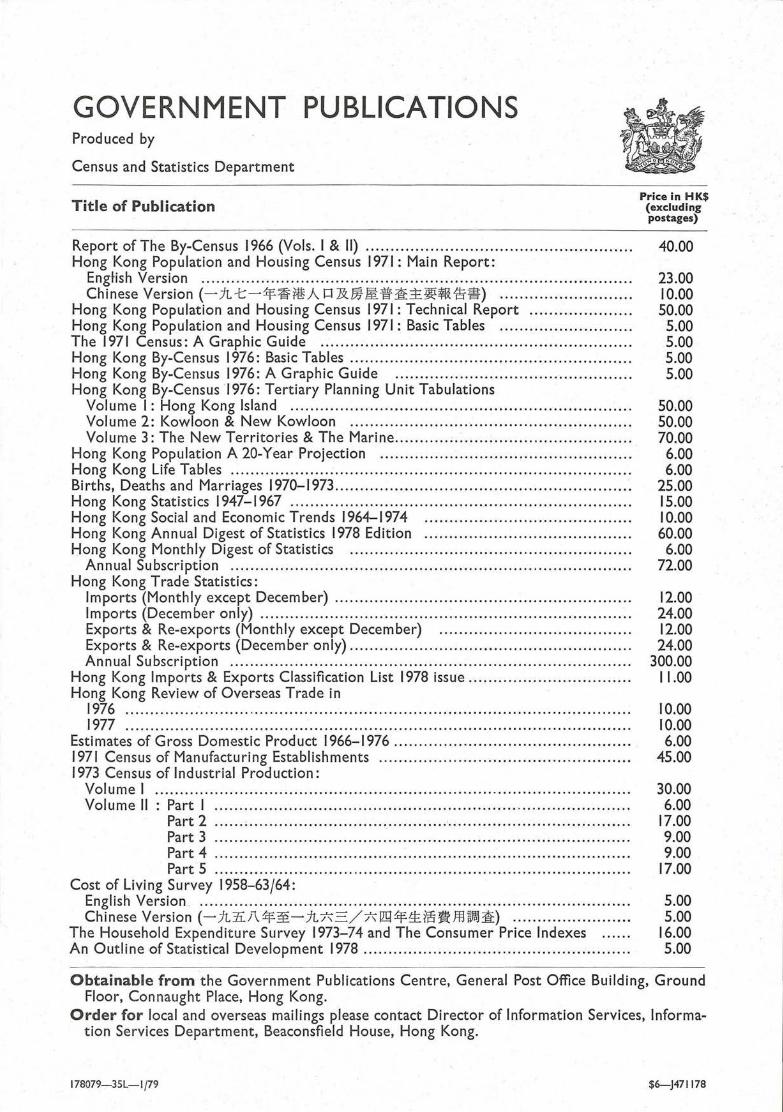
GOVERNMENT PUBLICATIONS Produced by
Census and Statistics Department
Title of Publication
Report of The By-Census 1966 (Vols. I & 11) ..................................................... . Hong Kong Population and Housing Census 1971: Main Report:
Engtish Version ...................................................................................... . Chinese Version (-JL--t:-~11H~A r::r&m~1ff3!t±~¥1H!r•) .......................... .
Hong Kong Population and Housing Census 1971: Technical Report ................... .. Hong Kong Population and Housing Census 1971: Basic Tables .......................... . The 1971 Census: A Graphic Guide .............................................................. . Hong Kong By-Census 1976: Basic Tables ........................................................ . Hong Kong By-Census 1976: A Graphic Guide ............................................... . Hong Kong By-Census 1976: Tertiary Planning Unit Tabulations
Volume I: Hong Kong Island .................................................................... . Volume 2: Kowloon & New Kowloon ........................................................ . Volume 3: The New Territories & The Marine .............................................. ..
Hong Kong Population A 20-Year Projection ................................................. .. Hong Kong Life Tables .......... ...................................................................... . Births, Deaths and Marriages 1970-1973 ....... ........................................ ...... .... .. . Hong Kong Statistics 1947-1967 .................................................................... . Hong Kong Social and Economic Trends 1964-1974 ....................................... .. . Hong Kong Annual Digest of Statistics 1978 Edition ......................................... . Hong Kong Monthly Digest of Statistics ................... .. ....... ................... ...... ... .
Annual Subscription ................................................................................ . Hong Kong Trade Statistics:
Imports (Monthly except December) ........................................................... . Imports (December only) .......................................................................... . Exports & Re-exports (Monthly except December) ...................................... . Exports & Re-exports (December only) ...... .. ... ............... ......... ............... .. ... .. Annual Subscription ...................... ...................... ...... ...... ......... ...... .... ..... .
Hong Kong Im ports & Exports Classification List 1978 issue ................................ . Hong Kong Review of Overseas Trade in
1976 ..................................................................................................... . 1977 ..................................................................................................... .
Estimates of Gross Domestic Product 1966-1976 ............................................... . 1971 Census of Manufacturing Establishments .................................................. . 1973 Census of Industrial Production:
Volume I ............................................................................................... . Volume II : Part I ................................................................................... .
Part 2 ...... ~ ........................................ · .................................... . Part 3 ................................................................................... . Part 4 ................................................................................... . Part 5 ................................................................................... .
Cost of Living Survey 1958-63/64: English Version . ....................................................... .............................. . . Chinese Version (-iLil.i\~~-JLn= /n lill~~il§JtfflW!;j31t) ....................... .
The Household Expenditure Survey 1973-74 and The Consumer Price Indexes .... .. An Outline of Statistical Development 1978 ............................................ ........ ..
Price in HK$ (excluding postages)
40.00
23.00 10.00 50.00 5.00 5.00 5.00 5.00
50.00 50.00 70.00
6.00 6.00
25.00 15.00 10.00 60.00 6.00
72.00
12.00 24.00 12.00 24.00
300.00 11.00
10.00 10.00 6.00
45.00
30.00 6.00
17.00 9.00 9.00
17.00
5.00 5.00
16.00 5.00
Obtainable from the Government Publications Centre, General Post Office Building, Ground Floor, Connaught Place, Hong Kong.
Order for local and overseas mailings please contact Director of Information Services, Information Services Department, Beaconsfield House, Hong Kong.
178079-35L-1/79 $6-J471178


![CSR Report 2015 [Digest]](https://img.pdfslide.net/doc/110x75/63257519cedd78c2b50c99c4/csr-report-2015-digest.jpg)