Embed Size (px)
Citation preview

1
How Skills Do and Could Determine Labour Incomes in the Public Sector: the Case of Bulgaria
Ralitsa Simeonova-Ganeva,
Sofia University “St. Kliment Ohridski”
Nataliya Panayotova,
AEAF, Ministry of Finance
9 October 2009

2
Outline
Stylized facts
Research questions
Brief review of literature
Data
Logical framework
Results and conclusions
3
Stylized facts
The Government is actively involved in setting the
wage levels
Official statistics – NSI, Annual Data from the
Regular Enterprises’ Survey
Economic Activity Share of employees in the economy
2002, 2006
growth 2002-2006
Average wage growth
2002-2006
Public administration 5.0%, 5.9%
38.7%
34.5%
Education 10.3%, 8.4%
-3.4%
40.7%
Health 6.9%, 5.6%
-3.8%
53.2%
Total economy growth for the period 2002-2006
Employment growth
17.7%
Wage growth
40%

4
Stylized facts (2)
More detailed official statistics – NSI, Data from
the Structure of Earnings Survey in 2002 and 2006
The educational status of the employees in the public
sector is relatively higher than the total-economy average in 2002 and even more in 2006.
However, the average wage of the most educated employees in the public sector increases slower than the total-economy average for the period 2002 - 2006.

5
Average wage and share of employees holding Bachelor, Master or PhD degree by economic activity, 2002 and 2006
0
10
20
30
40
50
60
70
80
Tota
l econom
y
Min
ing
Manufa
ctu
ring
Ele
ctr
icity
Constr
uction
Whole
sale
and
reta
il t
rade
Hote
ls a
nd
resta
ura
nts
Tra
nsport
and
com
unic
ation
Fin
ancia
l
inte
rmedia
tion
Real esta
te
Public
adm
inis
tration
Education
Health
Oth
ers
0
200
400
600
800
1000
1200
Average wage (BGN), 2002, right scale
Average wage (BGN), 2006, right scale
Share of employees holding Bachelor, Master, or PhD degree (%), 2002
Share of employees holding Bachelor, Master, or PhD degree (%), 2006

6
Deviation of average years of education and accumulated human capital (measured on the basis of labour incomes) from total-economy average by economic activity (%)

7
Deviation of average years of education and accumulated human capital (measured on the basis of labour incomes) from total-economy average by economic activity (%)
2006
-60
-30
0
30
60
90
120
150
Fin
ance
Min
nin
g
Public
adm
inis
tration
Health
Tra
nsport
and
com
munic
ations
Real esta
te
Education
Tra
de
Energ
y
Manufa
ctu
ring
Constr
uction
Hote
ls
-10
-5
0
5
10
15
20
25
Accumulated HC Years of education

8
Research questions
The variance of wages among workers with
the same level of education is significant
If qualified labour in public sector is
underestimated, then why not public
employees change their employer?
Do public wages conform prevailing wage
standard or do they differ from wages for
private sector jobs?
How Do and How Could Skills Determine
Labour Incomes in the Public Sector?
9
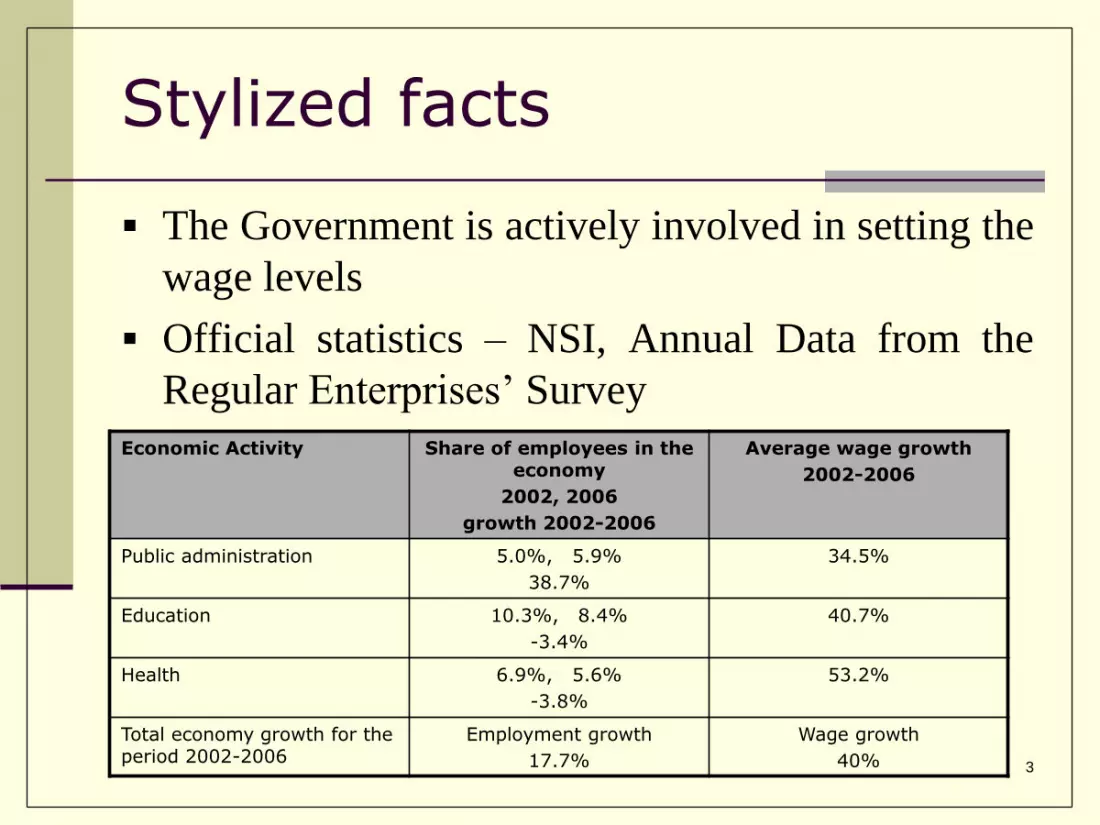
Brief review of literature
Rise in earnings disparity: Wheeler(2005),Blau and Kahn(1996)
Cross-sectional wage variance across skill groups: Vinay and Robin(2002)
Determinants of wage differentials: Acemoglu(2002), Freeman(2002), Abowd, Kramarz and Margolis(1999), Krueger and Summers(1988), Gosling and Lemieux(2001), Brown and Medoff(2003)
Public sector employment and wage inequality: Fuller(2005)
Labour mobility and mobility costs: Lee and Wolpin(2006)

10
Data:
The present study utilizes data from the Structure of Earnings Survey held in 2002 and 2006 by the National Statistical Institute, covering 148 942 and 176 276 employees respectively
Income determinants explored: age, gender, occupation, education, experience, wage, size of enterprise
11
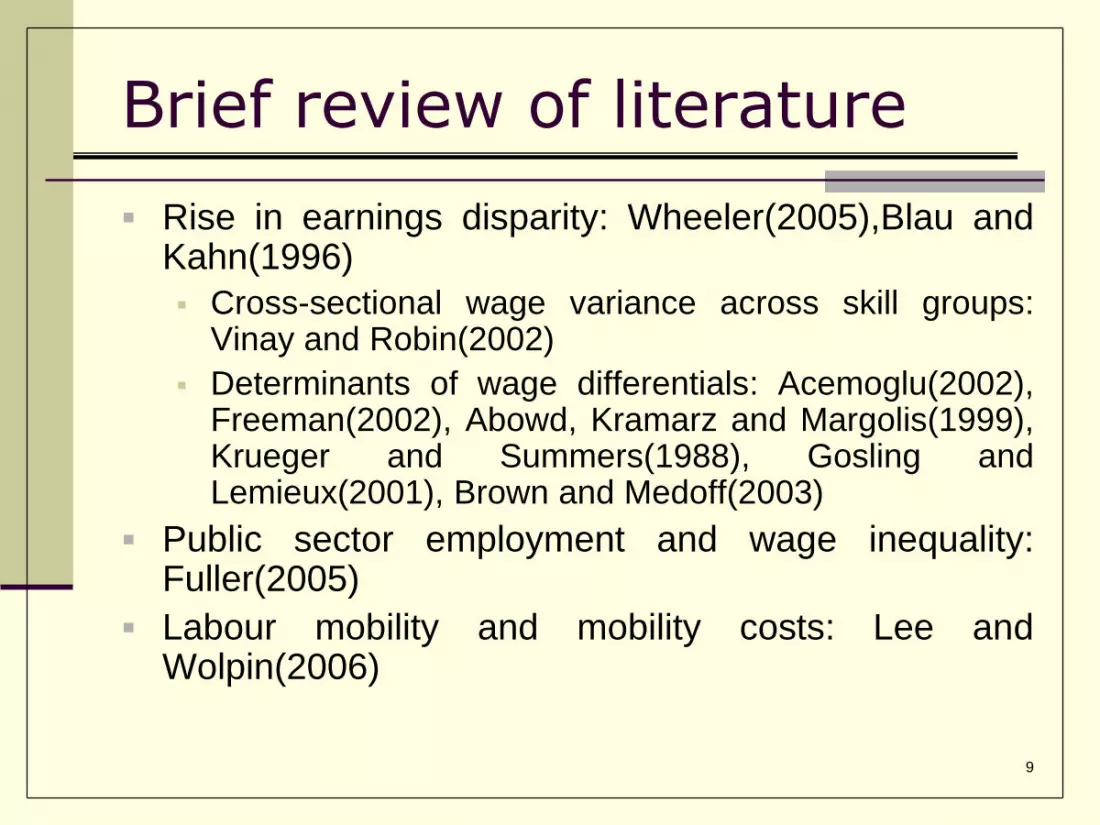
Logical framework
1. Identification of the most competitive economic activity in terms of nexus between incomes and education
this is done by the preliminary statistical analysis
the analysis led to identification of the economic activity Finance as the most competitive
2. Estimation of returns to skills in each economic activity using Mincerian equations
3. Calculation of potential labour incomes in the public sector using the most competitive activity as a benchmark for returns to skills
using estimated Mincerian equation for the benchmark activity
4. Calculation of wage gaps by level of education and occupation
calculating what the income of each employee in the public sector would have been if he/she was working in the Finance sector considering his/her educational attainment, occupational level and years of experience

12
Wage gaps by educational and occupational level in
public administration sector
Wage gaps by level of education, 2002
-26%12%
43%41%
76%
83%
49%
0
200
400
600
800
1000
Primary Basic Secondary Vocational 2-years of
colleage
Bachelor or
Master
PhD degree
Actual wage (BGN) Potential wage (BGN)
Wage gaps by level of occupation, 2002
77%
66%
57%
78%24%
6%5%
13%
0
200
400
600
800
E lementary
occupations
P lant and
machine
operators and
assemblers
C raft and
related trade
workers
Skilled
agricultural
and fishing
workers
Service
workers , shop
and market
sales workers
C lerks P rofess ionals Legis lators ,
senior offic ials
and managers
Actual wage (BGN) Potential wage (BGN)
Wage gaps by level of education, 2006
10%
93%
124%
83%
77%60%
0
300
600
900
1200
1500
1800
Primary Basic Secondary 2-years of
colleage
Bachelor or
Master
PhD degree
Actual wage (BGN) Potential wage (BGN)
Wage gaps by level of occupation, 2006
77%
2%
-5%14%
42%
159%
73%
138%
93%
0
300
600
900
1200
1500
1800
E lementary
occupations
P lant and
machine
operators and
assemblers
C raft and
related trade
workers
Skilled
agricultural
and fishing
workers
Service
workers , shop
and market
sales workers
C lerks Technic ians
and
assoc iated
profess ionals
P rofess ionals Legis lators ,
senior
offic ials and
managers
Actual wage (BGN) Potential wage (BGN)

13
Wage gaps by educational and occupational level in
education sector
Wage gaps by level of education, 2002
-44% 6%23%
32%40%
22%
17%
0
200
400
600
800
Primary Basic Secondary Vocational 2-years of
colleage
Bachelor or
Master
PhD degree
Actual wage (BGN) Potential wage (BGN)
Wage gaps by level of occupation, 2002
22%
38%
31%
45%1%
-5%-7%
-10%
0
150
300
450
600
E lementary
occupations
P lant and
machine
operators and
assemblers
C raft and
related trade
workers
Skilled
agricultural
and fishing
workers
Service
workers , shop
and market
sales workers
C lerks P rofess ionals Legis lators ,
senior offic ials
and managers
Actual wage (BGN) Potential wage (BGN)
Wage gaps by level of education, 2006
21%
93%
79%
43%
-4%-32%
0
300
600
900
1200
Primary Basic Secondary 2-years of
colleage
Bachelor or
Master
PhD degree
Actual wage (BGN) Potential wage (BGN)
Wage gaps by level of occupation, 2006
68%
-20%-7%
8%34%
69%
72%
72%
88%
0
300
600
900
1200
E lementary
occupations
P lant and
machine
operators and
assemblers
C raft and
related trade
workers
Skilled
agricultural
and fishing
workers
Service
workers , shop
and market
sales workers
C lerks Technic ians
and
assoc iated
profess ionals
P rofess ionals Legis lators ,
senior
offic ials and
managers
Actual wage (BGN) Potential wage (BGN)

14
Wage gaps by educational and occupational level in
health sector
Wage gaps by level of education, 2002
-18% 23%
60%76%
113%
99%
50%
0
200
400
600
800
Primary Basic Secondary Vocational 2-years of
colleage
Bachelor or
Master
PhD degree
Actual wage (BGN) Potential wage (BGN)
Wage gaps by level of occupation, 2002
102%
91%
77%
88%32%
26%11%
24%
0
150
300
450
600
750
900
E lementary
occupations
P lant and
machine
operators and
assemblers
C raft and
related trade
workers
Skilled
agricultural
and fishing
workers
Service
workers , shop
and market
sales workers
C lerks P rofess ionals Legis lators ,
senior offic ials
and managers
Actual wage (BGN) Potential wage (BGN)
Wage gaps by level of education, 2006
16%
26%
55%
31%
20%-21%
0
300
600
900
1200
Primary Basic Secondary 2-years of
colleage
Bachelor or
Master
PhD degree
Actual wage (BGN) Potential wage (BGN)
Wage gaps by level of occupation, 2006
32%
-26%-12%
2% 32%41%
36%
53%
23%
0
300
600
900
1200
E lementary
occupations
P lant and
machine
operators and
assemblers
C raft and
related trade
workers
Skilled
agricultural
and fishing
workers
Service
workers , shop
and market
sales workers
C lerks Technic ians
and
assoc iated
profess ionals
P rofess ionals Legis lators ,
senior
offic ials and
managers
Actual wage (BGN) Potential wage (BGN)

15
If qualified labour in public sector is significantly
underestimated, then would public employees change
their employer?
Conclusions

16
Conclusions (2)
What could happen in the public sector if no major changes occur on the labour market:
Scenario 1: Policy makers decide to decrease labour incomes (by quitting payment of regular bonuses)
The wage gaps will increase and most qualified employees in the public sector will have strong incentive to leave their current jobs
Scenario 2: Policy makers choose to freeze labour incomes (by not changing both wages and bonuses)
Highly qualified employees may move to private sector, if mobility costs are reasonable and expected income in the private sector is substantially higher
Scenario 3: Policy makers decide to increase labour incomes (by efficient reforms in the public sector and restructuring)
Highly qualified employees will stay in the public sector and new qualified labour could be attracted from the private sector, or from abroad
This could lead to possible increase in gender pay gaps of not considered in advance in policy measures!
What could happen in the public sector if major changes occur on the labour market:
Labour decisions of public sector employees will be driven by the dynamics of the wage gaps as well as future expansion or decline in employment in other sectors or the economy as a whole
Outcome in this case could not be determined as of today but they will definitely depend on these wage gaps

17
Thank you!
Whole paper is available upon request.