Embed Size (px)
Citation preview
Executive Summary
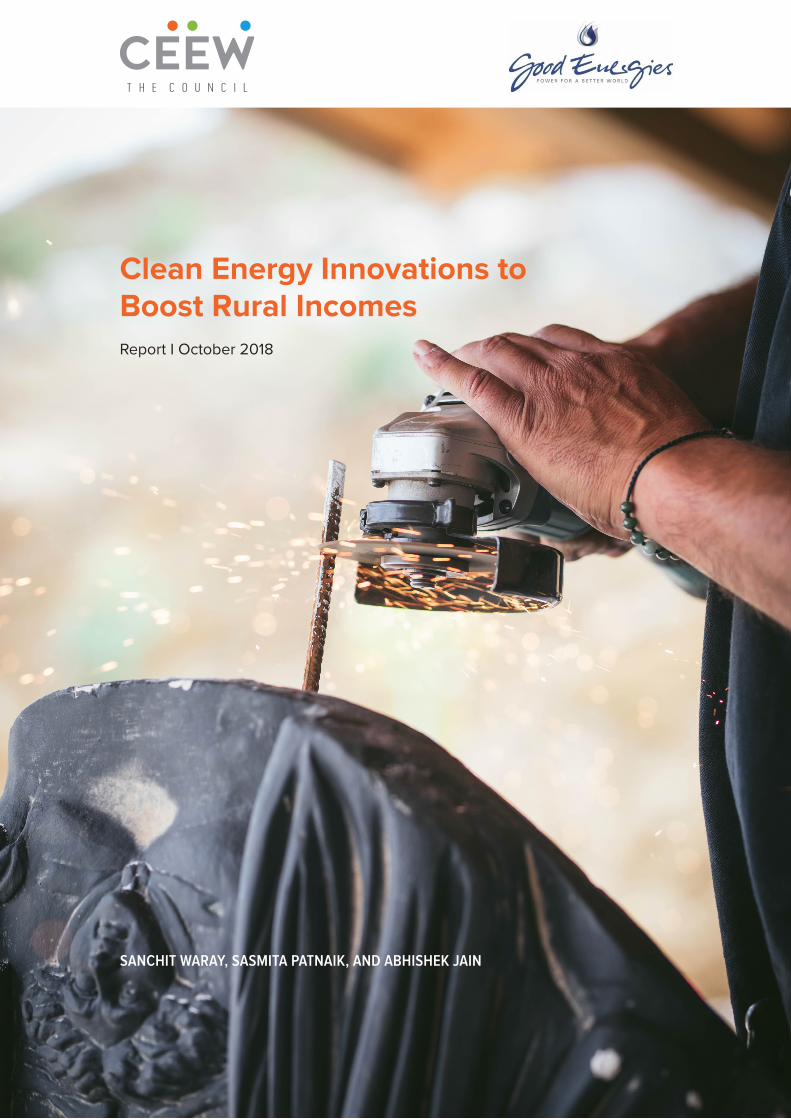
Clean Energy Innovations to Boost Rural Incomes
SANCHIT WARAY, SASMITA PATNAIK, AND ABHISHEK JAIN
Report I October 2018
Clean Energy Innovations to Boost Rural Incomes
Egg incubators used for hatching eggs in rural poultry farms.
Executive Summary
SANCHIT WARAY, SASMITA PATNAIK, AND ABHISHEK JAIN
CEEW ReportOctober 2018
ceew.in
Clean Energy Innovations to Boost Rural Incomes
Clean Energy Innovations to Boost Rural Incomes
Copyright © 2018 Council on Energy, Environment and Water (CEEW)
Open access. Some rights reserved. This report is licensed under the Creative Commons Attribution-Noncommercial 4.0. International (CC BY-NC 4.0) license. To view the full license, visit: www.creativecommons.org/licenses/by-nc/4.0/legalcode
Citation: Sanchit Waray, Sasmita Patnaik, and Abhishek Jain (2018) 'Clean Energy Innovations to Boost Rural Incomes', October.
Disclaimer: The views expressed in this publication are those of the authors and do not necessarily reflect the views and policies of the Council on Energy, Environment and Water or Good Energies Foundation.
Peer reviewers: S. N. Srinivas, CEO, Clean Energy Access Network (CLEAN); Vivek Shastry, Program Manager and Huda Jaffer, Lead Designer, SELCO Foundation; Ananth Aravamudan, Senior Advisor and Energy Sector Lead, Villgro Innovations Foundation; Caspar Priesemann, Energy Access Advisor, Deutsche Gesellschaft fuer Internationale Zusammenarbeit (GIZ); and Shikha Bhasin, Programme Lead, Council on Energy, Environment and Water (CEEW).
Publication team: Alina Sen (CEEW), Mihir Shah (CEEW), Chitralekha Manohar, Twig Designs, and Friends Digital.
Cover image: Unsplash/ Nathalie Jolie.
Acknowledgements: The authors of this report would like to thank Good Energies Foundation for providing financial support for this study. We would like to thank our advisory group members for their constant guidance and support throughout the project: Jessica Seddon, Ashok Jhunjhunwala, Ananth Aravamudan, Harish Hande, and Kannan Lakshminarayan. We would also like to thank Praanjal Agarwal of TERI University for his contribution to the research during his internship. We are extremely thankful to our reviewers, who provided valuable insights in shaping the publication. Finally, we would like to thank the entire team at The Council for their support and inputs at various stages of the study.
Organisations: The Council on Energy, Environment and Water (http://ceew.in/) is one of South Asia’s leading not-for-profit policy research institutions. The Council uses data, integrated analysis, and strategic outreach to explain-and change-the use, reuse, and misuse of resources. It prides itself on the independence of its high-quality research, develops partnerships with public and private institutions, and engages with the wider public. In 2018, CEEW has once again been featured across nine categories in the ‘2017 Global Go To Think Tank Index Report’. It has also been consistently ranked among the world’s top climate change think tanks. Follow us on Twitter @CEEWIndia for the latest updates.
Good Energies Foundation is a Swiss-based private foundation. It was established in 2007 as an integral part of Good Energies Inc., a private equity company specialised in investing in the renewable energy and energy-efficiency industries. The foundation’s goal is to help prevent climate change and mitigate its harm, especially to people who live in poverty. It focuses on two levers that reverse climate change: clean energy and forest protection. The foundation invests in early-stage market solutions and funds efforts to bring successful approaches to scale.
Council on Energy, Environment and Water (CEEW)Sanskrit Bhawan, A-10, Qutab Institutional Area Aruna Asaf Ali Marg, New Delhi - 110067, India
Executive Summary
About CEEW
The Council on Energy, Environment and Water (CEEW) is one of South Asia’s leading not-for-profit policy research institutions. The Council uses data, integrated analysis, and strategic outreach to explain - and change - the use, reuse, and misuse of resources. The Council addresses pressing global challenges through an integrated and internationally focused approach. It prides itself on the independence of its high-quality research, develops partnerships with public and private institutions, and engages with wider public.
In 2018, CEEW once again featured extensively across nine categories in the ‘2017 Global Go To Think Tank Index Report’, including being ranked as South Asia’s top think tank (14th globally) with an annual operating budget of less than USD 5 million for the fifth year in a row. In 2016, CEEW was also ranked 2nd in India, 4th outside Europe and North America, and 20th globally out of 240 think tanks as per the ICCG Climate Think Tank’s standardised rankings. In 2013 and 2014, CEEW was rated as India’s top climate change think-tank as per the ICCG standardised rankings.
In over eight years of operations, The Council has engaged in 200 research projects, published well over 130 peer-reviewed books, policy reports and papers, advised governments around the world nearly 500 times, engaged with industry to encourage investments in clean technologies and improve efficiency in resource use, promoted bilateral and multilateral initiatives between governments on more than 60 occasions, helped state governments with water and irrigation reforms, and organised nearly 250 seminars and conferences.
The Council’s major projects on energy policy include India’s largest energy access survey (ACCESS); thefirst independent assessment of India’s solar mission; the Clean Energy Access Network (CLEAN) of hundreds of decentralised clean energy firms; India’s green industrial policy; the $125 million India-U.S. Joint Clean Energy R&D Centers; developing the strategy for and supporting activities related to the International Solar Alliance; modelling long-term energy scenarios; energy subsidies reform; energy storage technologies; India’s 2030 renewable energy roadmap; clean energy subsidies (for the Rio+20 Summit); clean energy innovations for rural economy; community energy; and renewable energy jobs, finance and skills.
The Council’s major projects on climate, environment, and resource security include advising and contributing to climate negotiations (COP-23) in Bonn, especially on the formulating guidelines of the Paris Agreement rule-book; pathways for achieving INDCs and mid-century strategies for decarbonisation; assessing global climate risks; heat-health action plans for Indian cities; assessing India’s adaptation gap; low-carbon rural development; environmental clearances; modelling HFC emissions; business case for phasing down HFCs; assessing India’s critical minerals; geoengineering governance; climate finance; nuclear power and low-carbon pathways; electric rail transport; monitoring air quality; business case for energy efficiency and emissions reductions; India’s first report on global governance, submitted to the National Security Adviser; foreign policy implications for resource security; India’s power sector reforms; resource nexus, and strategic industries and technologies; and Maharashtra-Guangdong partnership on sustainability.
The Council’s major projects on water governance and security include the 584-page National Water Resources Framework Study for India’s 12th Five Year Plan; irrigation reform for Bihar; Swachh Bharat; supporting India’s National Water Mission; collective action for water security; mapping India’s traditional water bodies; modelling water-energy nexus; circular economy of water; participatory irrigation management in South Asia; domestic water conflicts; modelling decision making at the basin-level; rainwater harvesting; and multi-stakeholder initiatives for urban water management.

Clean Energy Innovations to Boost Rural Incomes
Executive Summary
About the Authors
SANCHIT WARAY I [email protected] I @pancakepoet
SASMITA PATNAIK I [email protected] I @sasmitapnaik
ABHISHEK JAIN I [email protected] I @ajainme
Sanchit Waray is a Programme Associate in the Energy Access team at the Council on Energy, Environment and Water (CEEW). He has over five years of experience in researching technology and policy aspects of innovation ecosystems, renewable energy systems, sustainable materials, and chemicals, among others. Prior to joining The Council, he was an entrepreneur and had also worked with Saint-Gobain and Battelle. Sanchit received a Master of Science in Energy Science, Technology, and Policy at Carnegie Mellon University and a Bachelor of Technology in Polymer and Surface Engineering from Institute of Chemical Technology (formerly UDCT), Mumbai.
Sasmita Patnaik is a Programme Lead in the Energy Access team at The Council. She has over five years of research and consulting experience in rural development, sustainability, and social entrepreneurship. Her work in sustainability involved the assessment of sustainability policies and practices of industries around biodiversity and land use, health and safety, and carbon emissions. Sasmita is a Felix scholar, and holds an M.Sc. in Development Studies from School of Oriental and African Studies (SOAS) and a Post-Graduate Diploma in Rural Management from Xavier Institute of Management, Bhubaneswar (XIMB).
Abhishek Jain is a Senior Programme Lead at CEEW. He leads the Energy Access focus area at The Council. His research focuses on energy provision and use for households, community, and productive applications, fossil fuel subsidy reform, and circular economy. With close to seven years of professional experience, Abhishek has worked on multiple issues at the confluence of energy, economics, and environment. He holds an M.Phil. from University of Cambridge and an engineering degree from IIT Roorkee.

Clean Energy Innovations to Boost Rural Incomes
Image: Sasmita Patnaik/CEEW
Executive Summary
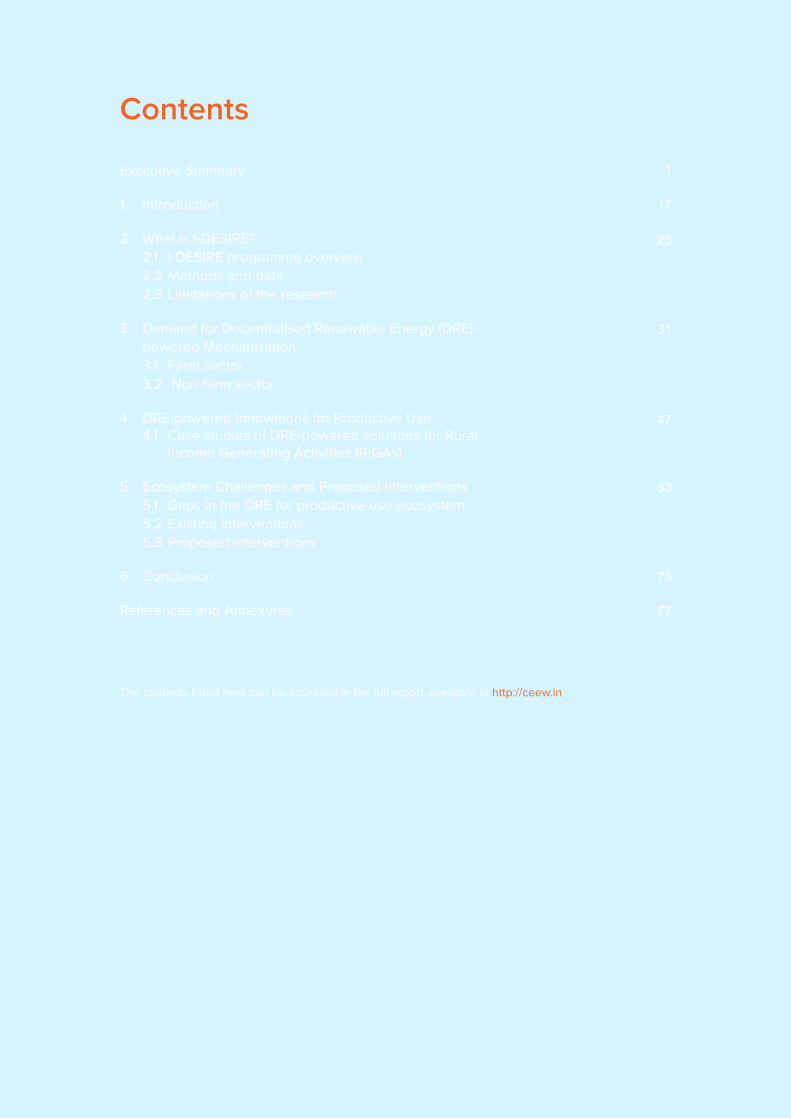
Contents
Executive Summary
1. Introduction
2. What is I-DESIRE? 2.1 I-DESIRE programme overview 2.2 Methods and data 2.3 Limitations of the research
3. Demand for Decentralised Renewable Energy (DRE)-powered Mechanisation
3.1 Farm sector 3.2 Non-farm sector
4. DRE-powered Innovations for Productive Use 4.1 Case studies of DRE-powered solutions for Rural
Income Generating Activities (RIGAs)
5. Ecosystem Challenges and Proposed Interventions 5.1 Gaps in the DRE for productive-use ecosystem 5.2 Existing interventions 5.3 Proposed interventions
6. Conclusion
References and Annexures
1
17
23
31
47
53
73
77
The contents listed here can be accessed in the full report, available at http://ceew.in
Clean Energy Innovations to Boost Rural Incomes
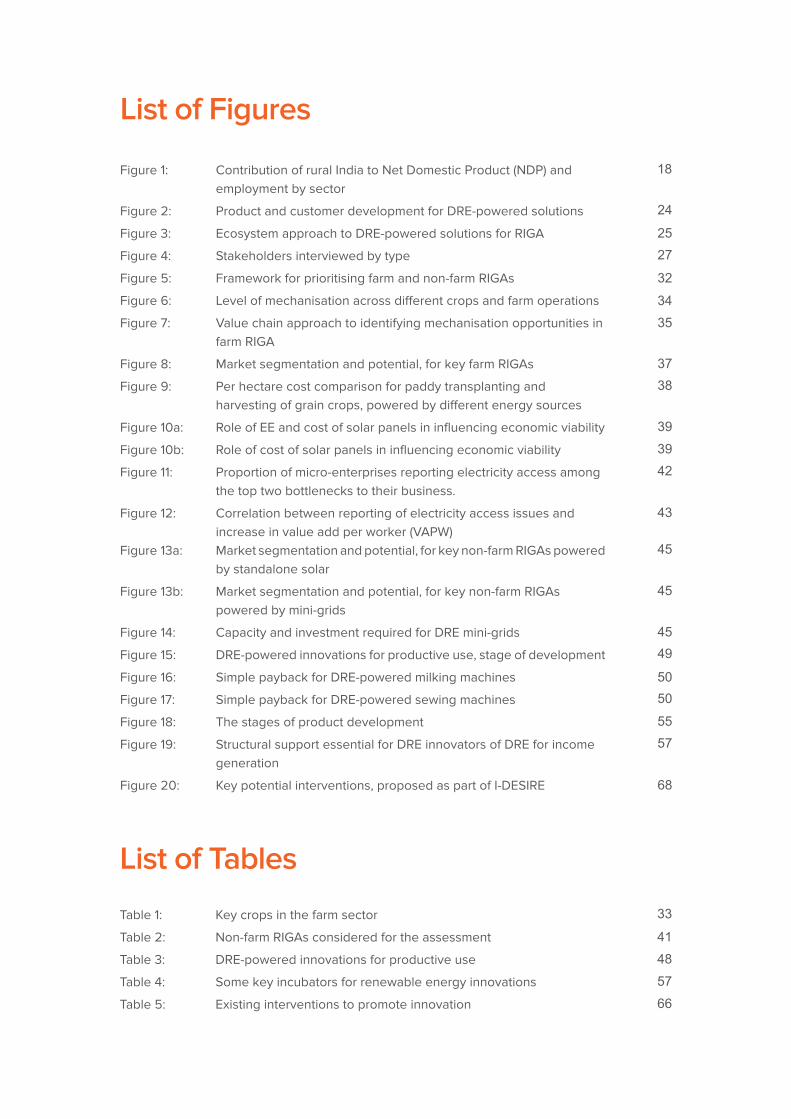
Figure 1: Contribution of rural India to Net Domestic Product (NDP) and employment by sector
Figure 2: Product and customer development for DRE-powered solutions
Figure 3: Ecosystem approach to DRE-powered solutions for RIGA
Figure 4: Stakeholders interviewed by type
Figure 5: Framework for prioritising farm and non-farm RIGAs
Figure 6: Level of mechanisation across different crops and farm operations
Figure 7: Value chain approach to identifying mechanisation opportunities in farm RIGA
Figure 8: Market segmentation and potential, for key farm RIGAs
Figure 9: Per hectare cost comparison for paddy transplanting and harvesting of grain crops, powered by different energy sources
Figure 10a: Role of EE and cost of solar panels in influencing economic viability
Figure 10b: Role of cost of solar panels in influencing economic viability
Figure 11: Proportion of micro-enterprises reporting electricity access among the top two bottlenecks to their business.
Figure 12: Correlation between reporting of electricity access issues and increase in value add per worker (VAPW)Figure 13a: Market segmentation and potential, for key non-farm RIGAs powered by standalone solar
Figure 13b: Market segmentation and potential, for key non-farm RIGAs powered by mini-grids
Figure 14: Capacity and investment required for DRE mini-grids
Figure 15: DRE-powered innovations for productive use, stage of development
Figure 16: Simple payback for DRE-powered milking machines
Figure 17: Simple payback for DRE-powered sewing machines
Figure 18: The stages of product development
Figure 19: Structural support essential for DRE innovators of DRE for income generation
Figure 20: Key potential interventions, proposed as part of I-DESIRE
Table 1: Key crops in the farm sector
Table 2: Non-farm RIGAs considered for the assessment
Table 3: DRE-powered innovations for productive use
Table 4: Some key incubators for renewable energy innovations
Table 5: Existing interventions to promote innovation
List of Tables
33
41485766
List of Figures
18
24
2527
323435
3738
393942
43
45
45
4549
5050
5557
68
Executive Summary
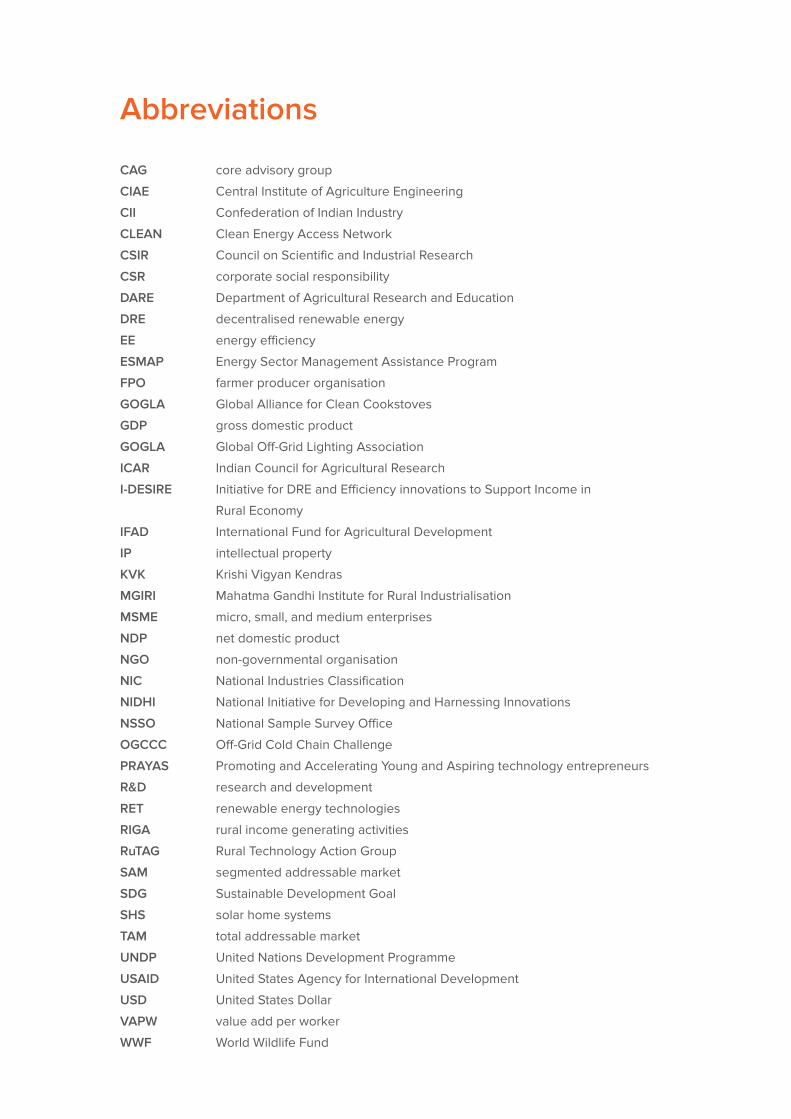
Abbreviations
CAG core advisory group
CIAE Central Institute of Agriculture Engineering
CII Confederation of Indian Industry
CLEAN Clean Energy Access Network
CSIR Council on Scientific and Industrial Research
CSR corporate social responsibility
DARE Department of Agricultural Research and Education
DRE decentralised renewable energy
EE energy efficiency
ESMAP Energy Sector Management Assistance Program
FPO farmer producer organisation
GOGLA Global Alliance for Clean Cookstoves
GDP gross domestic product
GOGLA Global Off-Grid Lighting Association
ICAR Indian Council for Agricultural Research
I-DESIRE Initiative for DRE and Efficiency innovations to Support Income in
Rural Economy
IFAD International Fund for Agricultural Development
IP intellectual property
KVK Krishi Vigyan Kendras
MGIRI Mahatma Gandhi Institute for Rural Industrialisation
MSME micro, small, and medium enterprises
NDP net domestic product
NGO non-governmental organisation
NIC National Industries Classification
NIDHI National Initiative for Developing and Harnessing Innovations
NSSO National Sample Survey Office
OGCCC Off-Grid Cold Chain Challenge
PRAYAS Promoting and Accelerating Young and Aspiring technology entrepreneurs
R&D research and development
RET renewable energy technologies
RIGA rural income generating activities
RuTAG Rural Technology Action Group
SAM segmented addressable market
SDG Sustainable Development Goal
SHS solar home systems
TAM total addressable market
UNDP United Nations Development Programme
USAID United States Agency for International Development
USD United States Dollar
VAPW value add per worker
WWF World Wildlife Fund
Clean Energy Innovations to Boost Rural Incomes
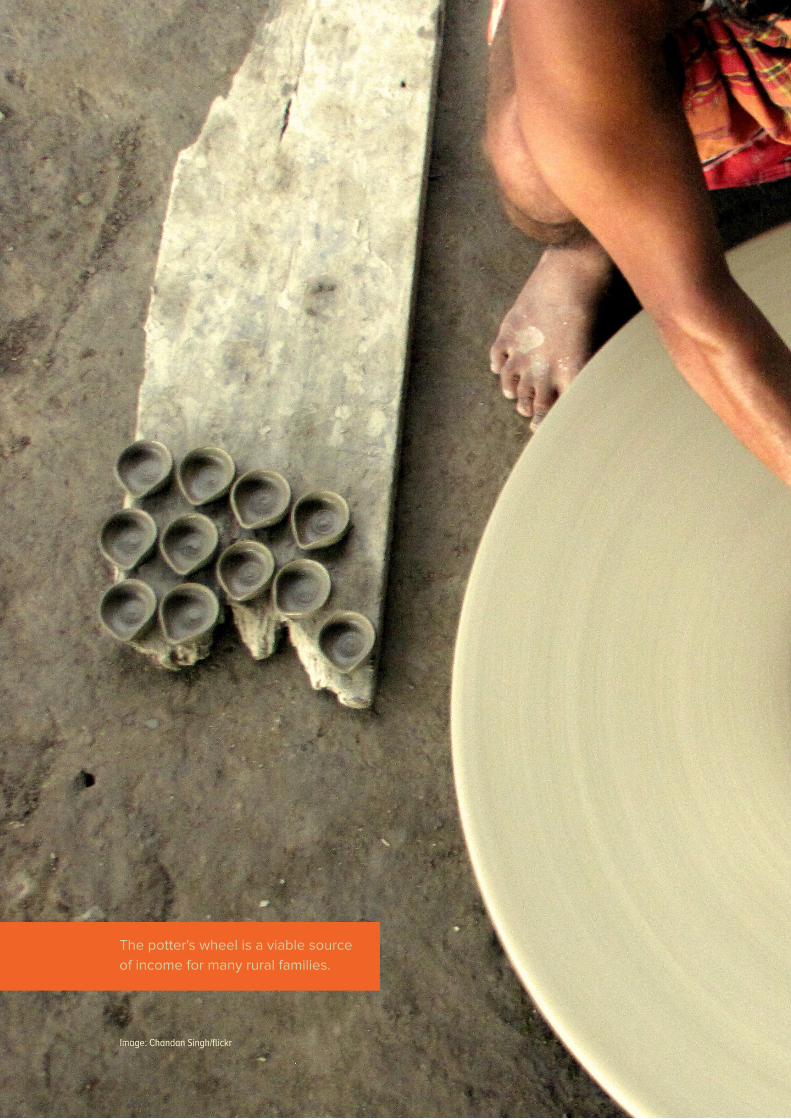
Image: Chandan Singh/flickr
The potter's wheel is a viable source of income for many rural families.

Executive Summary
Executive Summary
Clean Energy Innovations to Boost Rural Incomes2
Access to energy has historically been a critical input to economic development. In the current context, access to modern forms of energy is considered indispensable for alleviating
poverty, increasing employment, promoting economic growth, and providing social services. Recognising the role of energy in furthering human development, access to energy is listed among the United Nations’ 17 Sustainable Development Goals (SDGs). For India, access to modern forms of energy is inextricably tied to economic development.
Energy access in India
While India is home to 18 per cent of the world’s population, it uses only six per cent of the world’s primary energy. Within India, there is a significant divide between energy consumption in rural and urban India. As of 2015, an estimated 240 million people in India did not have access to electricity, and many more suffered from irregular and poor access. The situation appears even more dire when one considers the case of rural India. Of those without electricity, almost 92 per cent lived in rural areas.
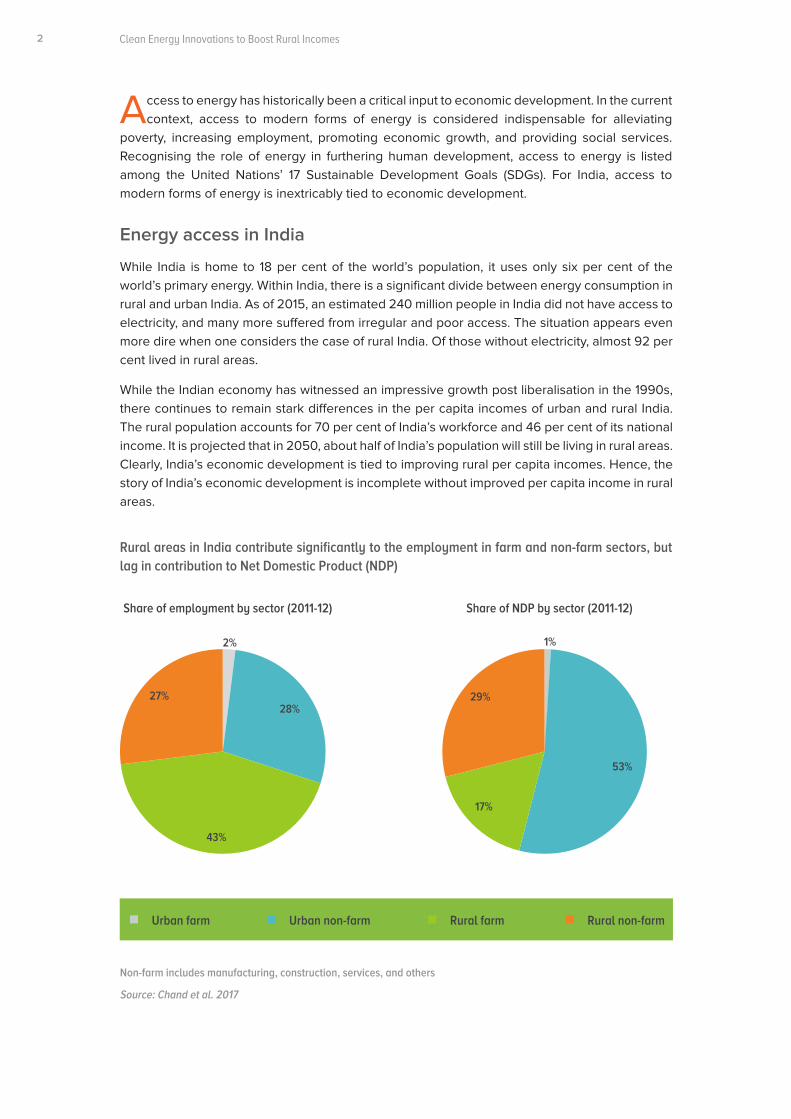
While the Indian economy has witnessed an impressive growth post liberalisation in the 1990s, there continues to remain stark differences in the per capita incomes of urban and rural India. The rural population accounts for 70 per cent of India’s workforce and 46 per cent of its national income. It is projected that in 2050, about half of India’s population will still be living in rural areas. Clearly, India’s economic development is tied to improving rural per capita incomes. Hence, the story of India’s economic development is incomplete without improved per capita income in rural areas.
Rural areas in India contribute significantly to the employment in farm and non-farm sectors, but lag in contribution to Net Domestic Product (NDP)
Non-farm includes manufacturing, construction, services, and others
Share of employment by sector (2011-12) Share of NDP by sector (2011-12)
Source: Chand et al. 2017
2% 1%
28%
53%
43%
17%
27% 29%
Urban farm Rural farmUrban non-farm Rural non-farm
Executive Summary 3
Energy access and rural economy
The rural economy is broadly divided into two sectors: those whose primary income comes from agriculture (the farm sector), and those whose livelihoods depend on work other than agriculture (the non-farm sector). Agriculture accounts for only 17 per cent of India’s GDP, but it constitutes the livelihood of more than 40 per cent of India’s 1.3 billion population. The ever-increasing demand for food has put productivity pressure on agriculture, leading to increased mechanisation in the farm sector. While the average farm power availability in India has increased from about 0.30 kW/ha in 1960-61 to about 2.02 kW/ha in 2013-14, it is still far lower than in countries like China (about 6 kW/ha). Overall farm mechanisation in India stands at about 40 to 45 per cent, which presents a stark contrast to countries such as the United States (95 per cent) and Brazil (75 per cent). Lack of energy access remains a significant impediment to improving agricultural productivity and incomes in India.
While agriculture has remained the primary source of income for most of rural India, non-farm employment has grown from 15 per cent in the early 1970s to more than 35 per cent in 2011-12. Further, as productivity improves in the farm sector, people moving away from agriculture will seek employment opportunities in the non-farm sector. This will increase the need to expand and support livelihood opportunities in the non-farm sector. However, this sector is also facing energy access challenges. Based on National Sample Survey of unincorporated non-agricultural enterprises 2015-16, we found that in over 100 districts in India, more than 50 per cent of micro-enterprises mentioned lack of reliable electricity as one of their top two challenges. According to the World Bank Enterprise Survey (Word Bank Group 2014), over 55 per cent of Indian manufacturing and service sector firms (small, medium, and large) are affected by electricity supply interruptions an average of 14 times a month.
Both the farm and non-farm sectors in India are under-served by existing electricity sources and are primarily complemented by diesel. This gap presents an opportunity for decentralised renewable energy (DRE) and energy efficiency (EE) innovations. The Indian government’s electrification plans, which predominantly focus on household electrification, need to be complemented in two ways: (i) product innovations for livelihood applications, which can use electricity efficiently and effectively; (ii) DRE-powered innovations that can bridge gaps in the centralised electricity supply system and which can power income-generating activities in rural areas. These innovations are already beginning to transform lives among population deprived of reliable energy access by increasing productivity and product value, reducing input costs, and reducing drudgery. DRE-powered solutions such as sewing machines, milk-chillers, milking machines, motorised pottery wheels, weaving machines, and solar pesticide sprayers are already introduced in rural areas.
To understand whether, where, and how such clean energy innovations can support incomes in rural areas, we carried out a three-part research study with the following objectives.
Research objectives IN OVER 100 DISTRICTS
IN INDIA, MORE THAN
50 PER CENT OF MICRO-
ENTERPRISES MENTIONED
LACK OF RELIABLE
ELECTRICITY AS ONE
OF THEIR TOP TWO
CHALLENGES
Characterising and sizing the demand for clean energy innovations in livelihood applications, for both the farm and non-farm sectors;
Understanding the status of such innovations in terms of their overall number, stage of development, numbers deployed on the ground, and the challenges being faced in scaling up;
Clean Energy Innovations to Boost Rural Incomes4
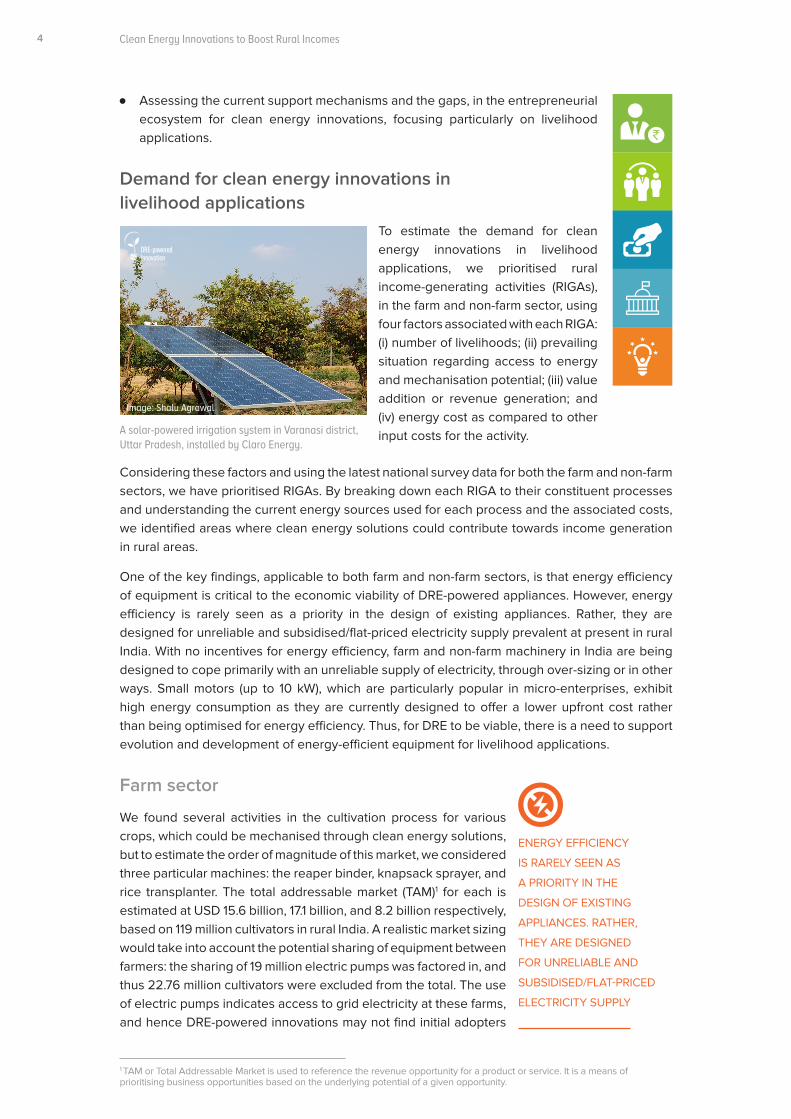
To estimate the demand for clean energy innovations in livelihood applications, we prioritised rural income-generating activities (RIGAs), in the farm and non-farm sector, using four factors associated with each RIGA: (i) number of livelihoods; (ii) prevailing situation regarding access to energy and mechanisation potential; (iii) value addition or revenue generation; and (iv) energy cost as compared to other input costs for the activity.
Considering these factors and using the latest national survey data for both the farm and non-farm sectors, we have prioritised RIGAs. By breaking down each RIGA to their constituent processes and understanding the current energy sources used for each process and the associated costs, we identified areas where clean energy solutions could contribute towards income generation in rural areas.
One of the key findings, applicable to both farm and non-farm sectors, is that energy efficiency of equipment is critical to the economic viability of DRE-powered appliances. However, energy efficiency is rarely seen as a priority in the design of existing appliances. Rather, they are designed for unreliable and subsidised/flat-priced electricity supply prevalent at present in rural India. With no incentives for energy efficiency, farm and non-farm machinery in India are being designed to cope primarily with an unreliable supply of electricity, through over-sizing or in other ways. Small motors (up to 10 kW), which are particularly popular in micro-enterprises, exhibit high energy consumption as they are currently designed to offer a lower upfront cost rather than being optimised for energy efficiency. Thus, for DRE to be viable, there is a need to support evolution and development of energy-efficient equipment for livelihood applications.
Farm sector
We found several activities in the cultivation process for various crops, which could be mechanised through clean energy solutions, but to estimate the order of magnitude of this market, we considered three particular machines: the reaper binder, knapsack sprayer, and rice transplanter. The total addressable market (TAM)1 for each is estimated at USD 15.6 billion, 17.1 billion, and 8.2 billion respectively, based on 119 million cultivators in rural India. A realistic market sizing would take into account the potential sharing of equipment between farmers: the sharing of 19 million electric pumps was factored in, and thus 22.76 million cultivators were excluded from the total. The use of electric pumps indicates access to grid electricity at these farms, and hence DRE-powered innovations may not find initial adopters
1 TAM or Total Addressable Market is used to reference the revenue opportunity for a product or service. It is a means of prioritising business opportunities based on the underlying potential of a given opportunity.
A solar-powered irrigation system in Varanasi district, Uttar Pradesh, installed by Claro Energy.
ENERGY EFFICIENCY
IS RARELY SEEN AS
A PRIORITY IN THE
DESIGN OF EXISTING
APPLIANCES. RATHER,
THEY ARE DESIGNED
FOR UNRELIABLE AND
SUBSIDISED/FLAT-PRICED
ELECTRICITY SUPPLY
Demand for clean energy innovations inlivelihood applications
Image: Shalu Agrawal
Assessing the current support mechanisms and the gaps, in the entrepreneurial ecosystem for clean energy innovations, focusing particularly on livelihood applications.
Executive Summary 5
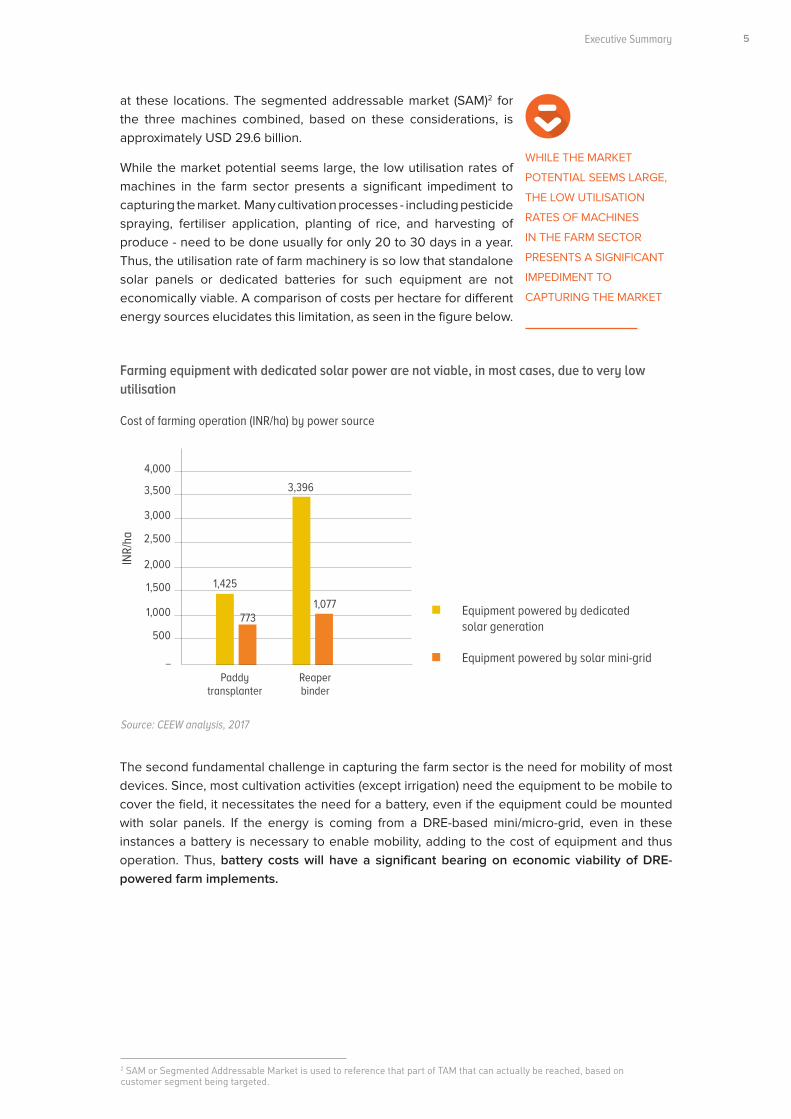
at these locations. The segmented addressable market (SAM)2 for the three machines combined, based on these considerations, is approximately USD 29.6 billion.
While the market potential seems large, the low utilisation rates of machines in the farm sector presents a significant impediment to capturing the market. Many cultivation processes - including pesticide spraying, fertiliser application, planting of rice, and harvesting of produce - need to be done usually for only 20 to 30 days in a year. Thus, the utilisation rate of farm machinery is so low that standalone solar panels or dedicated batteries for such equipment are not economically viable. A comparison of costs per hectare for different energy sources elucidates this limitation, as seen in the figure below.
2 SAM or Segmented Addressable Market is used to reference that part of TAM that can actually be reached, based on customer segment being targeted.
Farming equipment with dedicated solar power are not viable, in most cases, due to very low utilisation
Source: CEEW analysis, 2017
Cost of farming operation (INR/ha) by power source
Equipment powered by dedicated solar generation
Equipment powered by solar mini-grid
Paddy transplanter
Reaper binder
_
1,000
500
1,500
2,000
2,500
3,000
3,500
4,000
1,425
3,396
1,077 773
WHILE THE MARKET
POTENTIAL SEEMS LARGE,
THE LOW UTILISATION
RATES OF MACHINES
IN THE FARM SECTOR
PRESENTS A SIGNIFICANT
IMPEDIMENT TO
CAPTURING THE MARKET
The second fundamental challenge in capturing the farm sector is the need for mobility of most devices. Since, most cultivation activities (except irrigation) need the equipment to be mobile to cover the field, it necessitates the need for a battery, even if the equipment could be mounted with solar panels. If the energy is coming from a DRE-based mini/micro-grid, even in these instances a battery is necessary to enable mobility, adding to the cost of equipment and thus operation. Thus, battery costs will have a significant bearing on economic viability of DRE-powered farm implements.
INR/
ha
Clean Energy Innovations to Boost Rural Incomes6
Non-farm sector
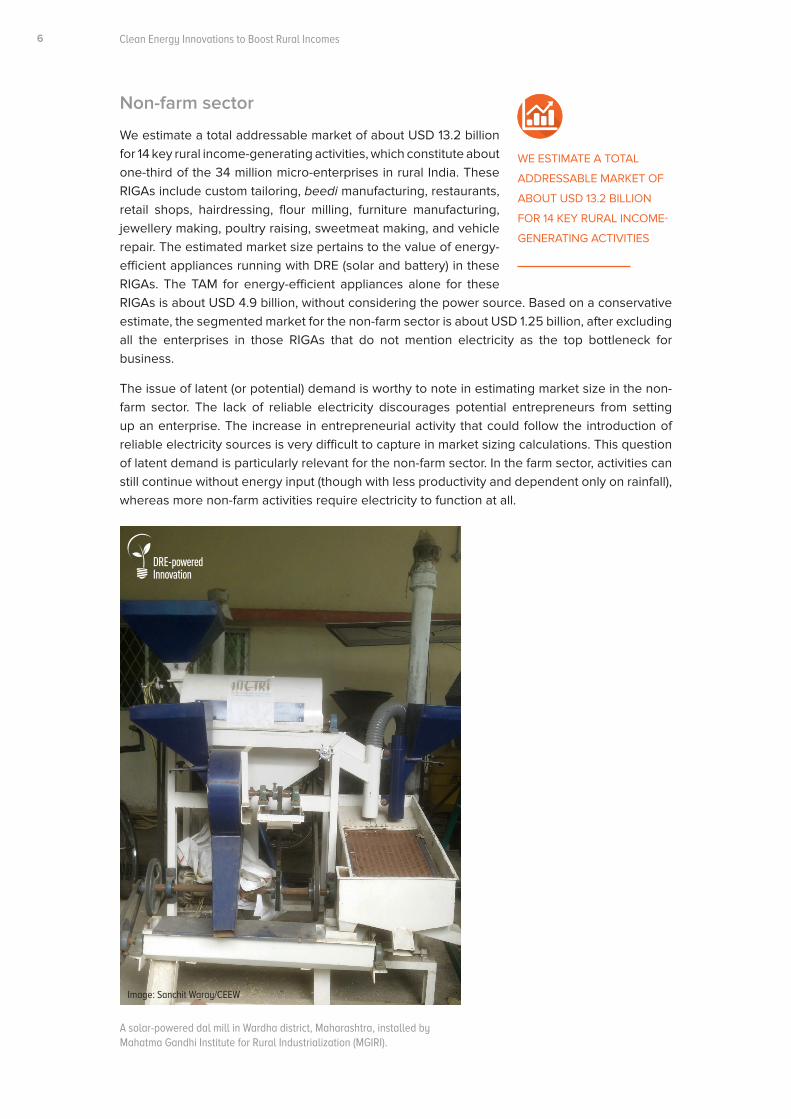
We estimate a total addressable market of about USD 13.2 billion for 14 key rural income-generating activities, which constitute about one-third of the 34 million micro-enterprises in rural India. These RIGAs include custom tailoring, beedi manufacturing, restaurants, retail shops, hairdressing, flour milling, furniture manufacturing, jewellery making, poultry raising, sweetmeat making, and vehicle repair. The estimated market size pertains to the value of energy-efficient appliances running with DRE (solar and battery) in these RIGAs. The TAM for energy-efficient appliances alone for these RIGAs is about USD 4.9 billion, without considering the power source. Based on a conservative estimate, the segmented market for the non-farm sector is about USD 1.25 billion, after excluding all the enterprises in those RIGAs that do not mention electricity as the top bottleneck for business.
The issue of latent (or potential) demand is worthy to note in estimating market size in the non-farm sector. The lack of reliable electricity discourages potential entrepreneurs from setting up an enterprise. The increase in entrepreneurial activity that could follow the introduction of reliable electricity sources is very difficult to capture in market sizing calculations. This question of latent demand is particularly relevant for the non-farm sector. In the farm sector, activities can still continue without energy input (though with less productivity and dependent only on rainfall), whereas more non-farm activities require electricity to function at all.
WE ESTIMATE A TOTAL
ADDRESSABLE MARKET OF
ABOUT USD 13.2 BILLION
FOR 14 KEY RURAL INCOME-
GENERATING ACTIVITIES
A solar-powered dal mill in Wardha district, Maharashtra, installed by Mahatma Gandhi Institute for Rural Industrialization (MGIRI).
Image: Sanchit Waray/CEEW
Executive Summary 7
Current status of clean energy innovations for livelihood applications
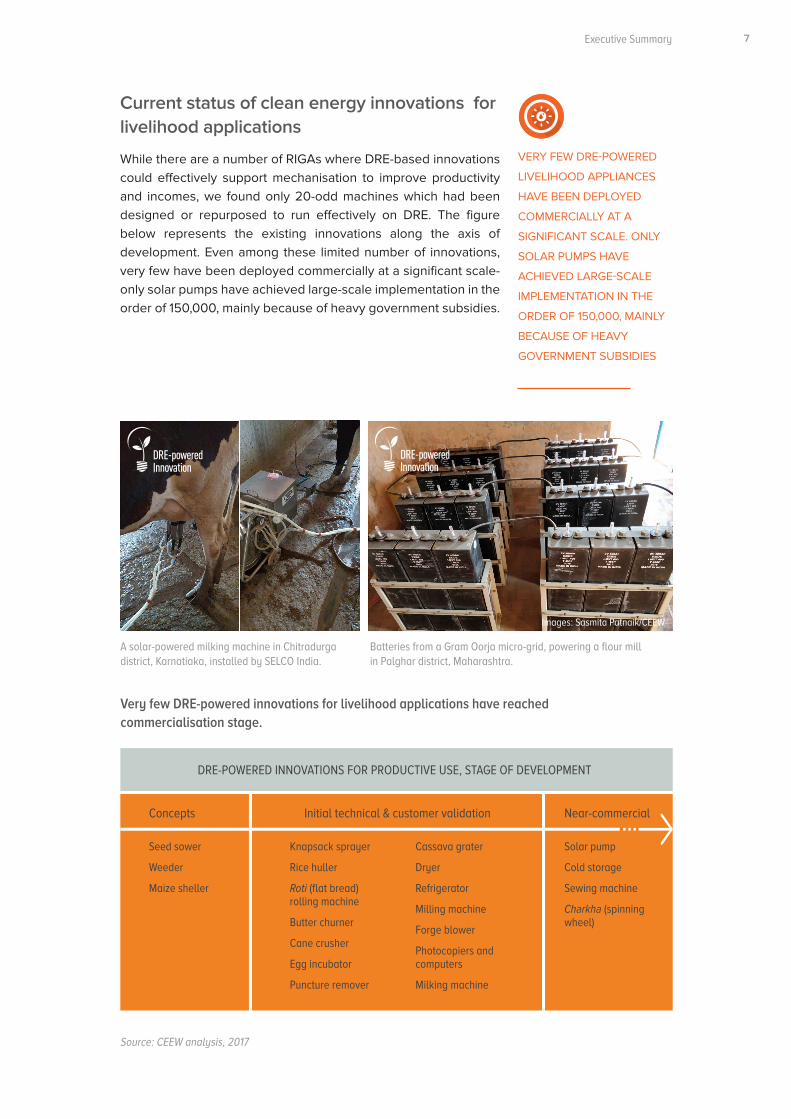
While there are a number of RIGAs where DRE-based innovations could effectively support mechanisation to improve productivity and incomes, we found only 20-odd machines which had been designed or repurposed to run effectively on DRE. The figure below represents the existing innovations along the axis of development. Even among these limited number of innovations, very few have been deployed commercially at a significant scale-only solar pumps have achieved large-scale implementation in the order of 150,000, mainly because of heavy government subsidies.
DRE-POWERED INNOVATIONS FOR PRODUCTIVE USE, STAGE OF DEVELOPMENT
Seed sower
Weeder
Maize sheller
Knapsack sprayer
Rice huller
Roti (flat bread) rolling machine
Butter churner
Cane crusher
Egg incubator
Puncture remover
Cassava grater
Dryer
Refrigerator
Milling machine
Forge blower
Photocopiers and computers
Milking machine
Solar pump
Cold storage
Sewing machine
Charkha (spinning wheel)
Concepts Initial technical & customer validation Near-commercial
VERY FEW DRE-POWERED
LIVELIHOOD APPLIANCES
HAVE BEEN DEPLOYED
COMMERCIALLY AT A
SIGNIFICANT SCALE. ONLY
SOLAR PUMPS HAVE
ACHIEVED LARGE-SCALE
IMPLEMENTATION IN THE
ORDER OF 150,000, MAINLY
BECAUSE OF HEAVY
GOVERNMENT SUBSIDIES
Very few DRE-powered innovations for livelihood applications have reached commercialisation stage.
Batteries from a Gram Oorja micro-grid, powering a flour mill in Palghar district, Maharashtra.
Images: Sasmita Patnaik/CEEW
A solar-powered milking machine in Chitradurga district, Karnatiaka, installed by SELCO India.
Source: CEEW analysis, 2017
Clean Energy Innovations to Boost Rural Incomes8
94Stakeholders
Source: CEEW analysis, 2017
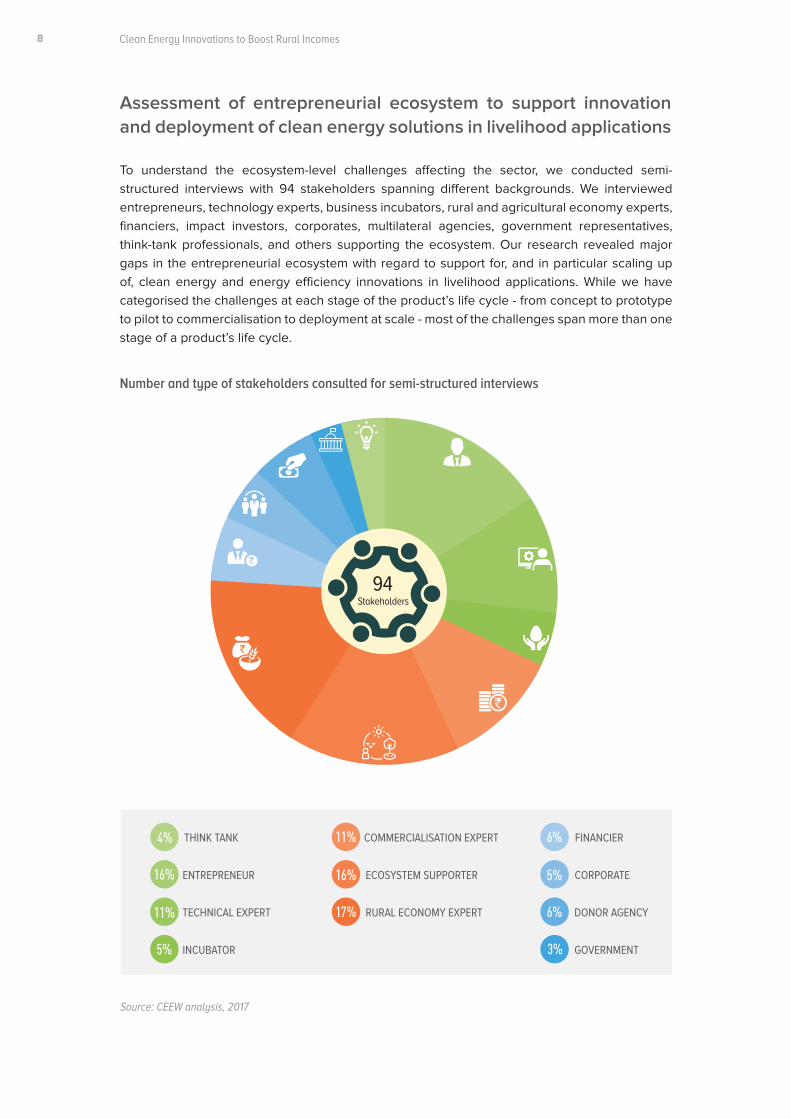
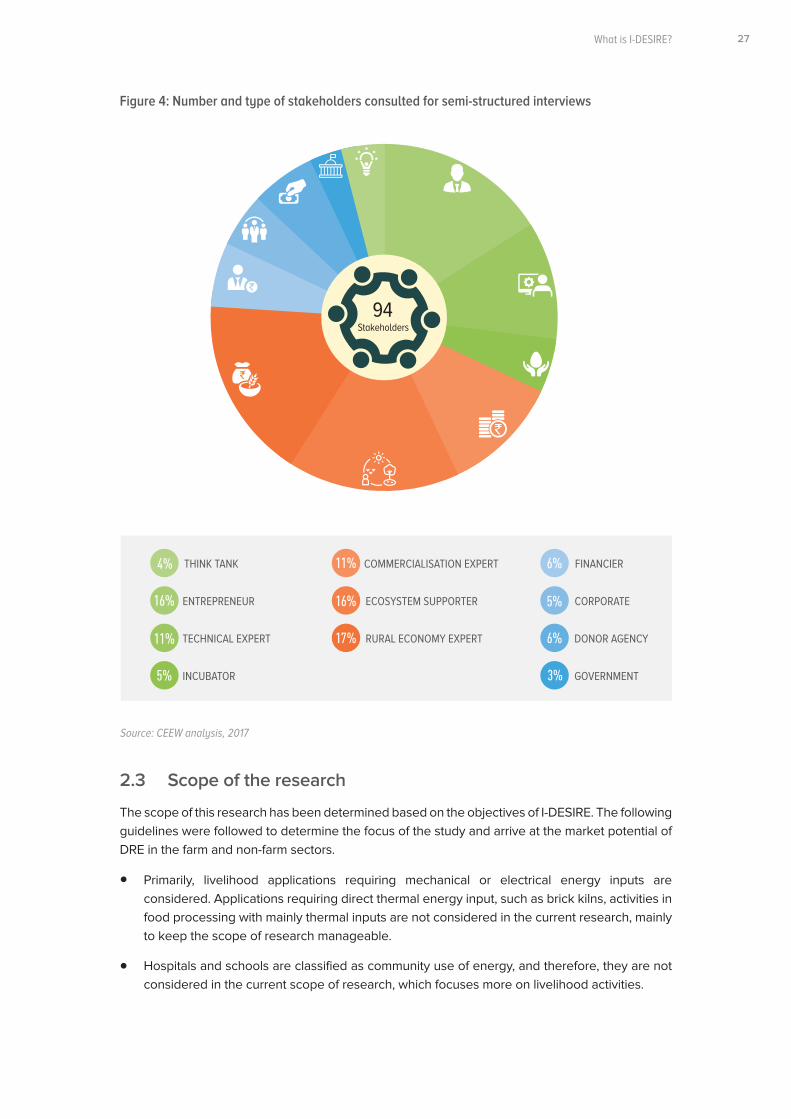
To understand the ecosystem-level challenges affecting the sector, we conducted semi-structured interviews with 94 stakeholders spanning different backgrounds. We interviewed entrepreneurs, technology experts, business incubators, rural and agricultural economy experts, financiers, impact investors, corporates, multilateral agencies, government representatives, think-tank professionals, and others supporting the ecosystem. Our research revealed major gaps in the entrepreneurial ecosystem with regard to support for, and in particular scaling up of, clean energy and energy efficiency innovations in livelihood applications. While we have categorised the challenges at each stage of the product’s life cycle - from concept to prototype to pilot to commercialisation to deployment at scale - most of the challenges span more than one stage of a product’s life cycle.
Number and type of stakeholders consulted for semi-structured interviews
Assessment of entrepreneurial ecosystem to support innovation and deployment of clean energy solutions in livelihood applications
ENTREPRENEUR
TECHNICAL EXPERT
INCUBATOR
COMMERCIALISATION EXPERT
ECOSYSTEM SUPPORTER
RURAL ECONOMY EXPERT
FINANCIER
CORPORATE
DONOR AGENCY
GOVERNMENT
THINK TANK
Executive Summary 9
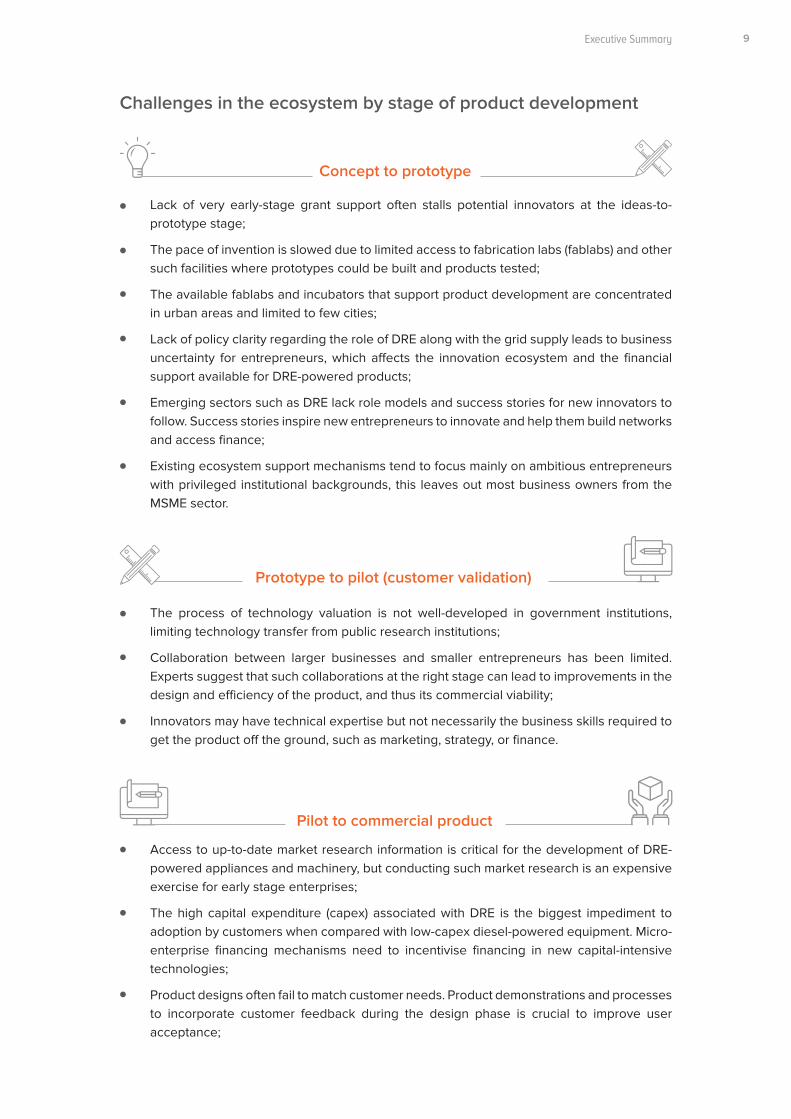
Challenges in the ecosystem by stage of product development
Prototype to pilot (customer validation)
Concept to prototype
Pilot to commercial product
Lack of very early-stage grant support often stalls potential innovators at the ideas-to-prototype stage;
The pace of invention is slowed due to limited access to fabrication labs (fablabs) and other such facilities where prototypes could be built and products tested;
The available fablabs and incubators that support product development are concentrated in urban areas and limited to few cities;
Lack of policy clarity regarding the role of DRE along with the grid supply leads to business uncertainty for entrepreneurs, which affects the innovation ecosystem and the financial support available for DRE-powered products;
Emerging sectors such as DRE lack role models and success stories for new innovators to follow. Success stories inspire new entrepreneurs to innovate and help them build networks and access finance;
Existing ecosystem support mechanisms tend to focus mainly on ambitious entrepreneurs with privileged institutional backgrounds, this leaves out most business owners from the MSME sector.
The process of technology valuation is not well-developed in government institutions, limiting technology transfer from public research institutions;
Collaboration between larger businesses and smaller entrepreneurs has been limited. Experts suggest that such collaborations at the right stage can lead to improvements in the design and efficiency of the product, and thus its commercial viability;
Innovators may have technical expertise but not necessarily the business skills required to get the product off the ground, such as marketing, strategy, or finance.
Access to up-to-date market research information is critical for the development of DRE-powered appliances and machinery, but conducting such market research is an expensive exercise for early stage enterprises;
The high capital expenditure (capex) associated with DRE is the biggest impediment to adoption by customers when compared with low-capex diesel-powered equipment. Micro-enterprise financing mechanisms need to incentivise financing in new capital-intensive technologies;
Product designs often fail to match customer needs. Product demonstrations and processes to incorporate customer feedback during the design phase is crucial to improve user acceptance;
Clean Energy Innovations to Boost Rural Incomes10
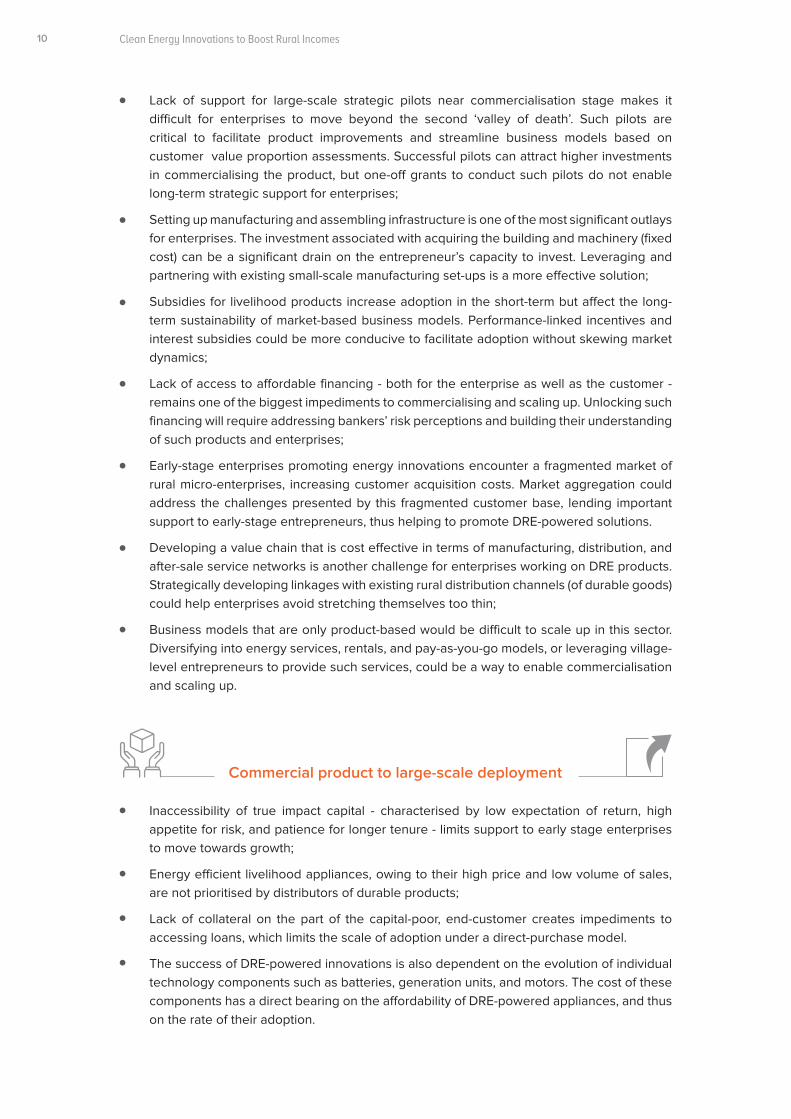
Commercial product to large-scale deployment
Inaccessibility of true impact capital - characterised by low expectation of return, high appetite for risk, and patience for longer tenure - limits support to early stage enterprises to move towards growth;
Energy efficient livelihood appliances, owing to their high price and low volume of sales, are not prioritised by distributors of durable products;
Lack of collateral on the part of the capital-poor, end-customer creates impediments to accessing loans, which limits the scale of adoption under a direct-purchase model.
The success of DRE-powered innovations is also dependent on the evolution of individual technology components such as batteries, generation units, and motors. The cost of these components has a direct bearing on the affordability of DRE-powered appliances, and thus on the rate of their adoption.
Lack of support for large-scale strategic pilots near commercialisation stage makes it difficult for enterprises to move beyond the second ‘valley of death’. Such pilots are critical to facilitate product improvements and streamline business models based on customer value proportion assessments. Successful pilots can attract higher investments in commercialising the product, but one-off grants to conduct such pilots do not enable long-term strategic support for enterprises;
Setting up manufacturing and assembling infrastructure is one of the most significant outlays for enterprises. The investment associated with acquiring the building and machinery (fixed cost) can be a significant drain on the entrepreneur’s capacity to invest. Leveraging and partnering with existing small-scale manufacturing set-ups is a more effective solution;
Subsidies for livelihood products increase adoption in the short-term but affect the long-term sustainability of market-based business models. Performance-linked incentives and interest subsidies could be more conducive to facilitate adoption without skewing market dynamics;
Lack of access to affordable financing - both for the enterprise as well as the customer - remains one of the biggest impediments to commercialising and scaling up. Unlocking such financing will require addressing bankers’ risk perceptions and building their understanding of such products and enterprises;
Early-stage enterprises promoting energy innovations encounter a fragmented market of rural micro-enterprises, increasing customer acquisition costs. Market aggregation could address the challenges presented by this fragmented customer base, lending important support to early-stage entrepreneurs, thus helping to promote DRE-powered solutions.
Developing a value chain that is cost effective in terms of manufacturing, distribution, and after-sale service networks is another challenge for enterprises working on DRE products. Strategically developing linkages with existing rural distribution channels (of durable goods) could help enterprises avoid stretching themselves too thin;
Business models that are only product-based would be difficult to scale up in this sector. Diversifying into energy services, rentals, and pay-as-you-go models, or leveraging village-level entrepreneurs to provide such services, could be a way to enable commercialisation and scaling up.
Executive Summary 11
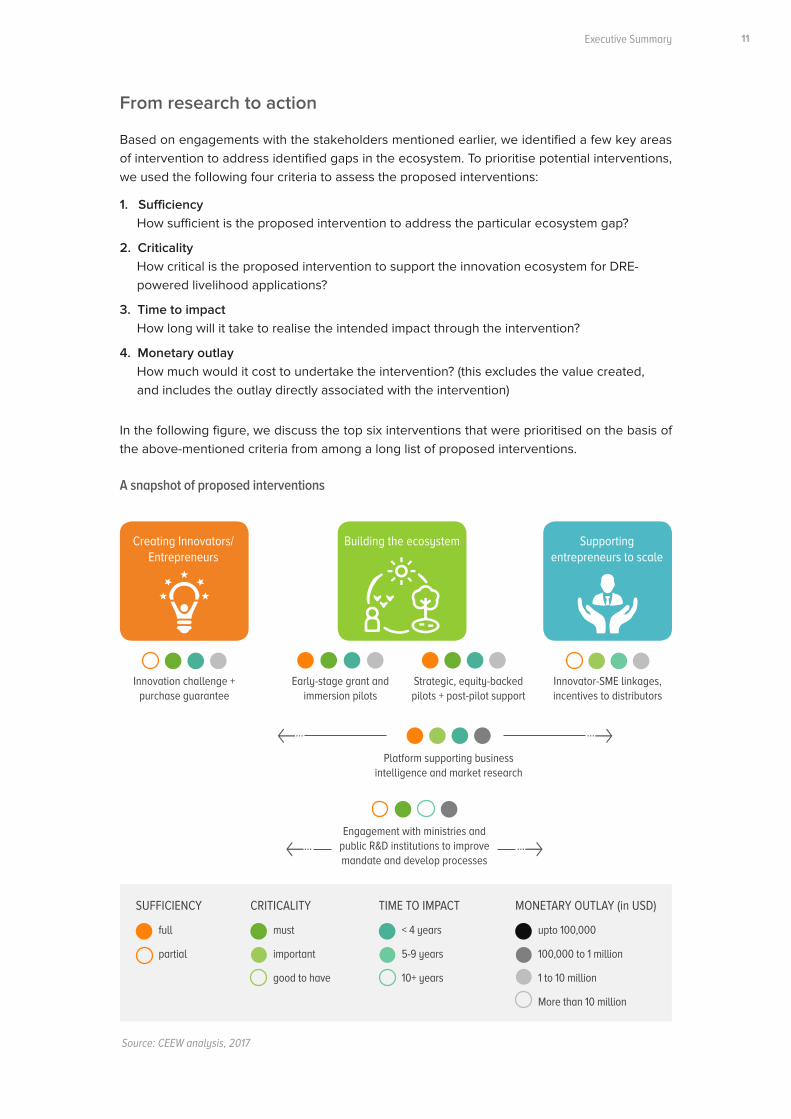
Based on engagements with the stakeholders mentioned earlier, we identified a few key areas of intervention to address identified gaps in the ecosystem. To prioritise potential interventions, we used the following four criteria to assess the proposed interventions:
In the following figure, we discuss the top six interventions that were prioritised on the basis of the above-mentioned criteria from among a long list of proposed interventions.
A snapshot of proposed interventions
SUFFICIENCY
full
partial
Innovation challenge + purchase guarantee
Platform supporting business intelligence and market research
Engagement with ministries and public R&D institutions to improve mandate and develop processes
Early-stage grant and immersion pilots
Strategic, equity-backed pilots + post-pilot support
Innovator-SME linkages, incentives to distributors
must
important
good to have
< 4 years
5-9 years
10+ years
upto 100,000
100,000 to 1 million
1 to 10 million
More than 10 million
CRITICALITY TIME TO IMPACT MONETARY OUTLAY (in USD)
Creating Innovators/ Entrepreneurs
Building the ecosystem Supporting entrepreneurs to scale
Source: CEEW analysis, 2017
From research to action
1. Sufficiency How sufficient is the proposed intervention to address the particular ecosystem gap?
2. Criticality How critical is the proposed intervention to support the innovation ecosystem for DRE- powered livelihood applications?
3. Time to impact How long will it take to realise the intended impact through the intervention?
4. Monetary outlay How much would it cost to undertake the intervention? (this excludes the value created, and includes the outlay directly associated with the intervention)
Clean Energy Innovations to Boost Rural Incomes12
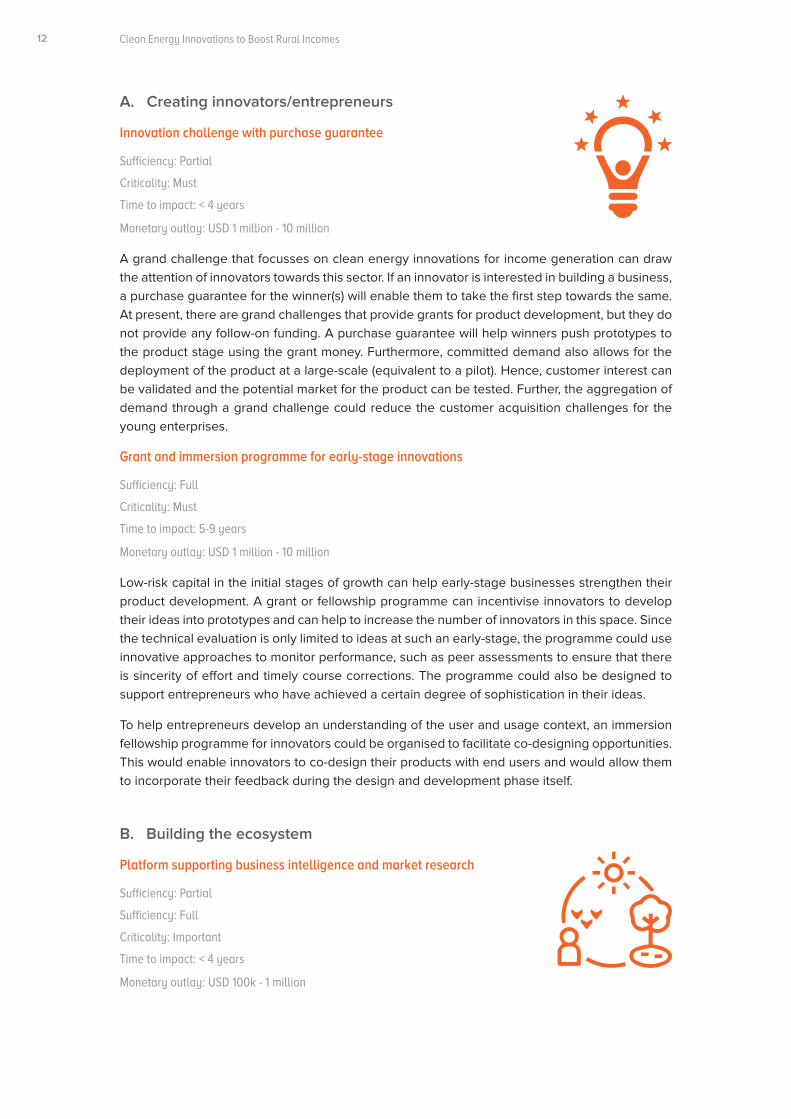
A. Creating innovators/entrepreneurs
Innovation challenge with purchase guarantee
Sufficiency: Partial
Criticality: Must
Time to impact: < 4 years
Monetary outlay: USD 1 million - 10 million
A grand challenge that focusses on clean energy innovations for income generation can draw the attention of innovators towards this sector. If an innovator is interested in building a business, a purchase guarantee for the winner(s) will enable them to take the first step towards the same. At present, there are grand challenges that provide grants for product development, but they do not provide any follow-on funding. A purchase guarantee will help winners push prototypes to the product stage using the grant money. Furthermore, committed demand also allows for the deployment of the product at a large-scale (equivalent to a pilot). Hence, customer interest can be validated and the potential market for the product can be tested. Further, the aggregation of demand through a grand challenge could reduce the customer acquisition challenges for the young enterprises.
Grant and immersion programme for early-stage innovations
Sufficiency: Full
Criticality: Must
Time to impact: 5-9 years
Monetary outlay: USD 1 million - 10 million
Low-risk capital in the initial stages of growth can help early-stage businesses strengthen their product development. A grant or fellowship programme can incentivise innovators to develop their ideas into prototypes and can help to increase the number of innovators in this space. Since the technical evaluation is only limited to ideas at such an early-stage, the programme could use innovative approaches to monitor performance, such as peer assessments to ensure that there is sincerity of effort and timely course corrections. The programme could also be designed to support entrepreneurs who have achieved a certain degree of sophistication in their ideas.
To help entrepreneurs develop an understanding of the user and usage context, an immersion fellowship programme for innovators could be organised to facilitate co-designing opportunities. This would enable innovators to co-design their products with end users and would allow them to incorporate their feedback during the design and development phase itself.
B. Building the ecosystem
Platform supporting business intelligence and market research
Sufficiency: Partial
Sufficiency: Full
Criticality: Important
Time to impact: < 4 years
Monetary outlay: USD 100k - 1 million
Executive Summary 13
Access to data on markets and consumer segmentation allows enterprises to better understand their customers’ needs, target markets, and optimise their communication and distribution. Access to affordable and timely information on markets has been cited as a key challenge by several entrepreneurs. To overcome this challenge, a platform that aggregates various market research and durable product consulting companies to provide pro bono or low bono services to early-stage enterprises in the sector would be useful. The value proposition for market research companies is that it allows them to build their profile, provides them opportunities to understand rural markets and consumers better, and creates potential long-term business opportunities. Companies such as EY, Bain, and Accenture have already been undertaking such initiatives to support non-profits and social enterprises. However, there is a need to create a niche platform for the rural livelihoods space in order to better tap into the resources of international and domestic companies. Further, this kind of collaborative platform would need donor support to develop an open access database of critical market information.
Engagement with ministries and public R&D institutes to modify mandates and develop processes for tech transfer
Sufficiency: Partial
Criticality: Must
Time to impact: 5-9 years
Monetary outlay: USD 100k - 1 million
As discussed earlier, there have been credible innovations to empower agriculture and other non-farm activities through public institutions such as Mahatma Gandhi Institute of Rural Industrialisation and Central Institute of Agricultural Engineering. However, public institutions lack a clear mandate, sufficient focus, and effective operational processes to enable technology transfer. There is a need to strategically engage with these institutions and respective ministries to bring to their attention the importance of technology transfer. In addition, it is necessary to aid in the development of guidelines to enable the same. This would require long-term and persistent engagement over years to first bring attention to the cause, push institutional mandates, and then lay out operational mechanisms to enable greater and faster technology transfer. Ultimately, this could have a significant impact in bringing affordable innovations to end customers.
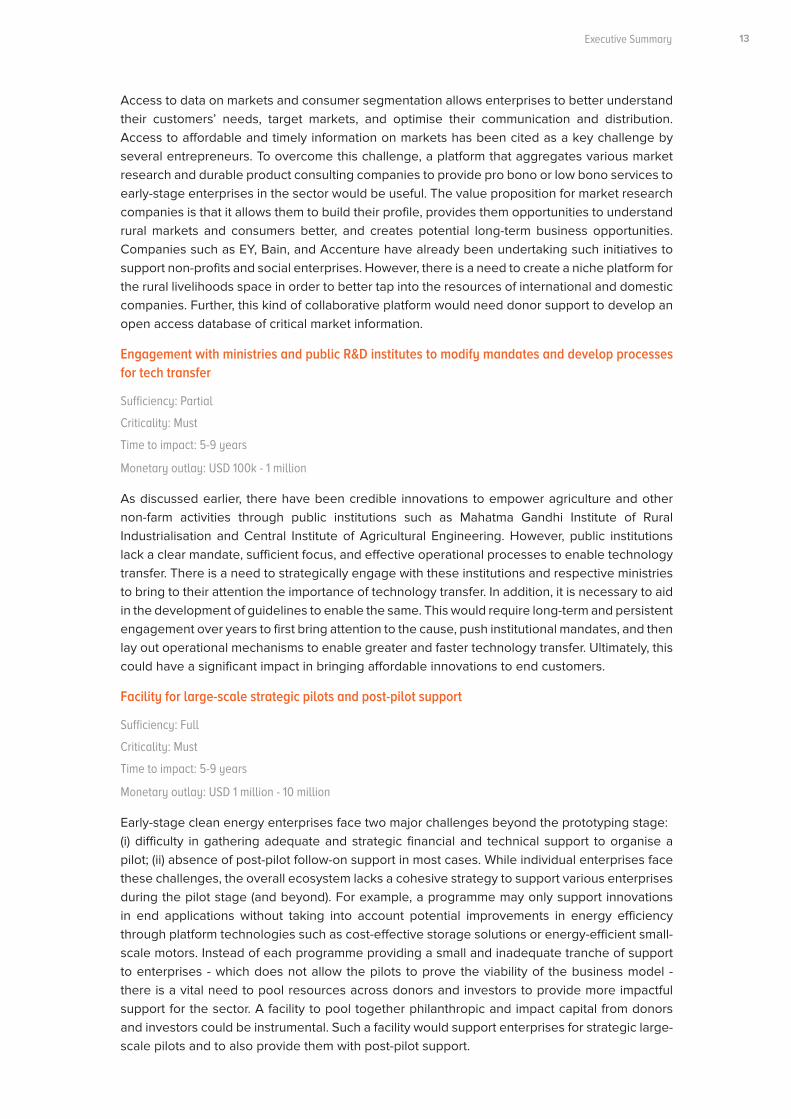
Facility for large-scale strategic pilots and post-pilot support
Sufficiency: Full
Criticality: Must
Time to impact: 5-9 years
Monetary outlay: USD 1 million - 10 million
Early-stage clean energy enterprises face two major challenges beyond the prototyping stage: (i) difficulty in gathering adequate and strategic financial and technical support to organise a pilot; (ii) absence of post-pilot follow-on support in most cases. While individual enterprises face these challenges, the overall ecosystem lacks a cohesive strategy to support various enterprises during the pilot stage (and beyond). For example, a programme may only support innovations in end applications without taking into account potential improvements in energy efficiency through platform technologies such as cost-effective storage solutions or energy-efficient small-scale motors. Instead of each programme providing a small and inadequate tranche of support to enterprises - which does not allow the pilots to prove the viability of the business model - there is a vital need to pool resources across donors and investors to provide more impactful support for the sector. A facility to pool together philanthropic and impact capital from donors and investors could be instrumental. Such a facility would support enterprises for strategic large-scale pilots and to also provide them with post-pilot support.
Clean Energy Innovations to Boost Rural Incomes14
The facility could provide post-pilot support for access to networks for follow-on funding, identifying go-to-market strategies, establishing distribution channels, demand aggregation, etc. Several enterprises import a large portion of their products or components from other countries as the costs are lower and production is more convenient. Over the course of the post-pilot period, aggregation efforts could create a network of MSMEs to manufacture and scale products locally. The facility could build such a network in order to reduce the steep learning curve for each enterprise and to collectively optimise the match between the product and the MSME. The collaborative facility could also support enterprises through its core funding and could even act as an enabling platform for donors and investors to support enterprises directly.
C. Supporting entrepreneurs to scale
Strengthening the distribution network for DRE-powered products
Sufficiency: Partial
Criticality: Important
Time to impact: 5-9 years
Monetary outlay: USD 1 million - 10 million
A strong distribution network is essential to promote and scale DRE-powered products. It could also be leveraged to provide timely after-sales services, which is imperative for sustaining the market for a product. A facility, of the kind discussed above, could support enterprises’ post-pilot efforts to establish distribution networks, and could also support market aggregators and last-mile distributors. Further, guarantee mechanisms to buy back unsold stock from distributors or finance the interest amounts of their working capital loans could be explored to encourage distributors to stock DRE-powered products in the early phases of market adoption. Options such as buyback could also improve the risk appetite of small- and medium-sized distributors. Currently, most large distributors control the access to credit for rural retailers. However, by easing credit levels for retailers and distributors, the interruption of their cash flow could be prevented, strengthening the distribution network for DRE-powered innovations.
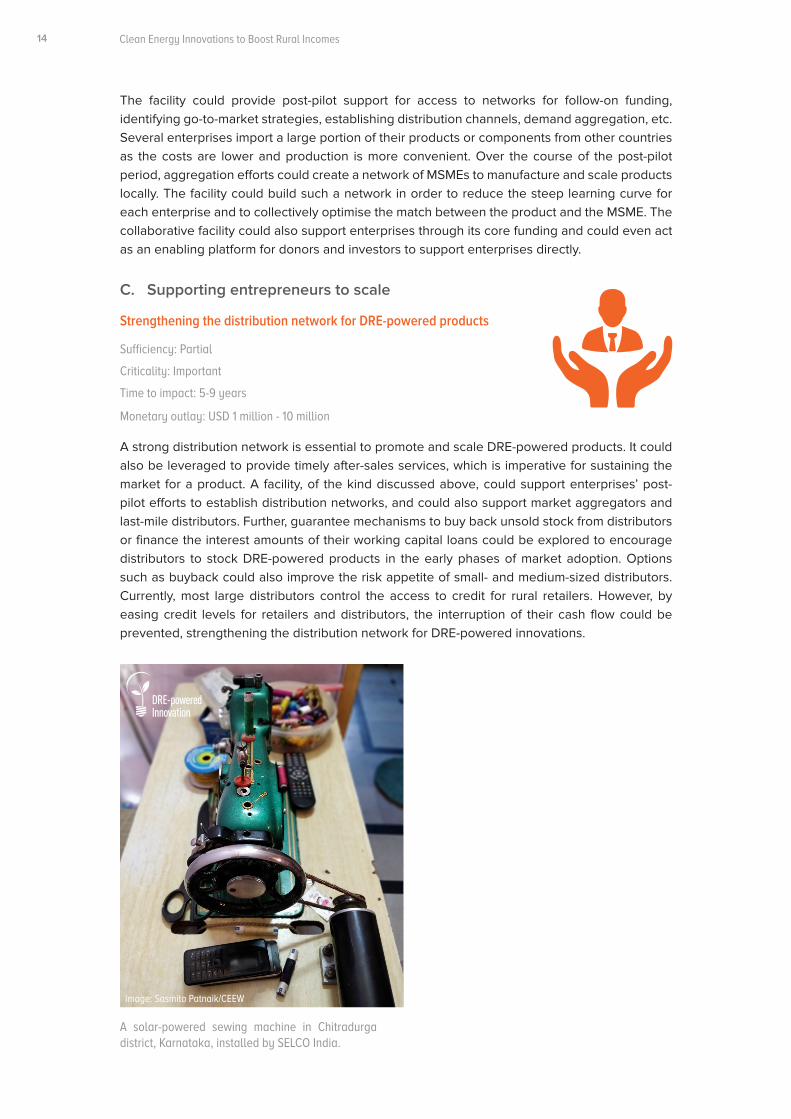
Image: Sasmita Patnaik/CEEW
A solar-powered sewing machine in Chitradurga district, Karnataka, installed by SELCO India.
Executive Summary 15
Conclusion
Acknowledging the energy access barriers for the farm and non-farm sectors in India, The Council aims to move beyond research and support the ecosystem in scaling clean energy solutions to improve livelihood opportunities in rural areas. We envision clean energy to be a catalyst for nurturing income-generating activities through enhanced mechanisation in rural areas. As we move forward, we plan to partner with ecosystem supporters: philanthropic organisations, impact investors, incubators, corporates, and the public sector. We hope to leverage our respective capabilities to provide an enabling environment for many more innovations to get realised, many more products to get commercialised, and many more solutions to get deployed on the ground, to support rural livelihoods.
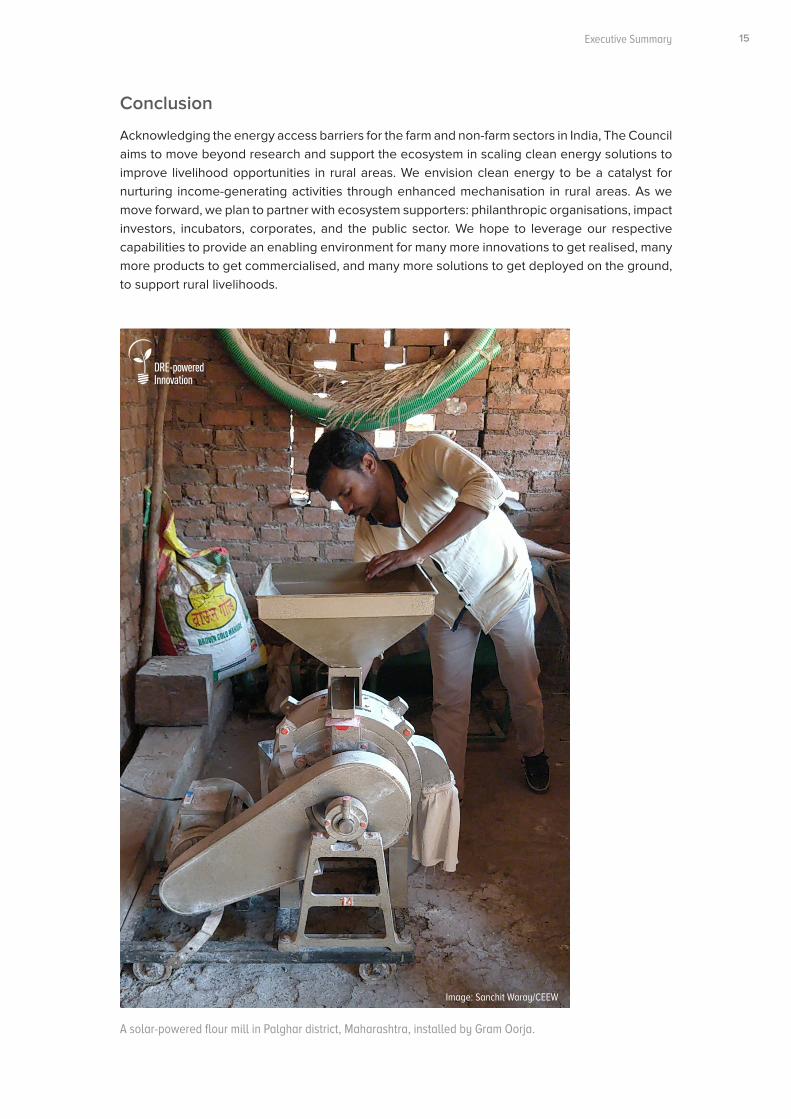
A solar-powered flour mill in Palghar district, Maharashtra, installed by Gram Oorja.
Image: Sanchit Waray/CEEW
Clean Energy Innovations to Boost Rural Incomes
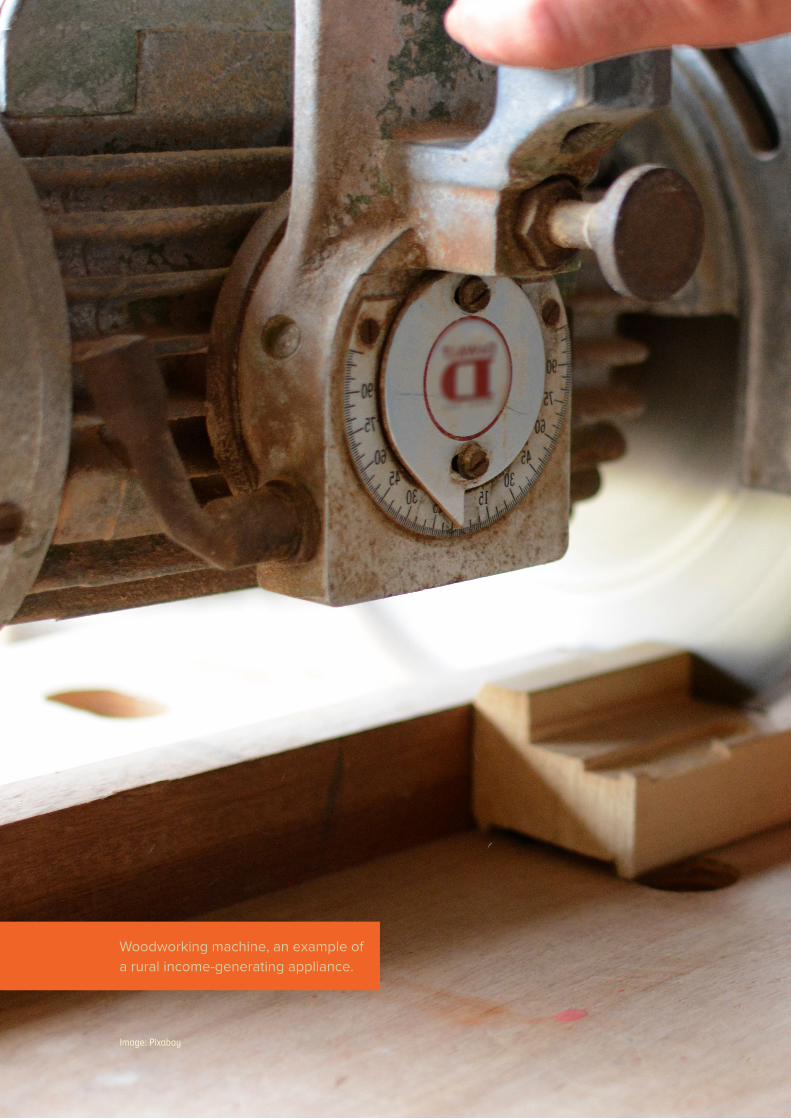
Image: Pixabay
Woodworking machine, an example of a rural income-generating appliance.

Executive Summary
1. Introduction
Clean Energy Innovations to Boost Rural Incomes18
Access to energy has historically been crucial for economic development. Today, access to modern forms of energy is considered indispensable for alleviating poverty, increasing
employment, accelerating economic growth, and providing social services (IIASA 2012). Because of its importance for furthering human development, access to energy was included among the United Nations’ 17 Sustainable Development Goals (SDGs) in 2015.
While India is home to 18 per cent of the world’s population, it uses only six per cent of the world’s primary energy. As of 2015, an estimated 240 million people in India did not have access to electricity, and many more suffered from irregular and poor access. The situation appears even more dire when one considers the case of rural India. Of those without electricity, almost 92 per cent lived in rural areas.
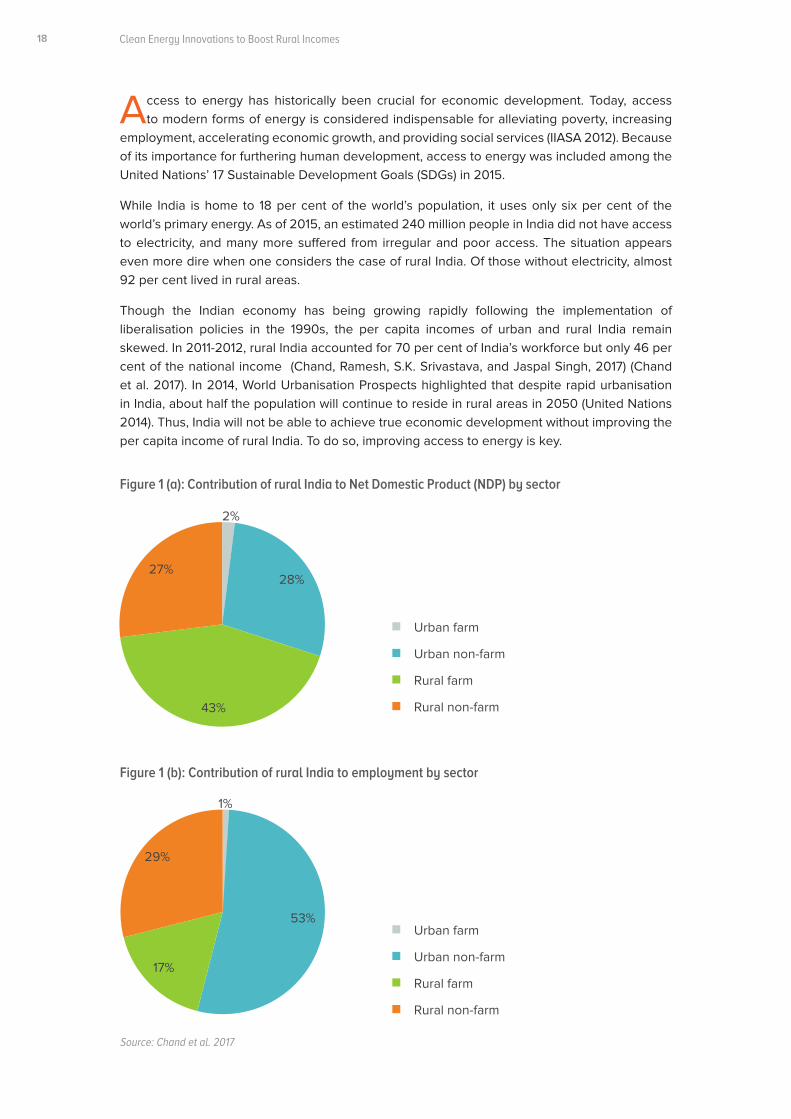
Though the Indian economy has being growing rapidly following the implementation of liberalisation policies in the 1990s, the per capita incomes of urban and rural India remain skewed. In 2011-2012, rural India accounted for 70 per cent of India’s workforce but only 46 per cent of the national income (Chand, Ramesh, S.K. Srivastava, and Jaspal Singh, 2017) (Chand et al. 2017). In 2014, World Urbanisation Prospects highlighted that despite rapid urbanisation in India, about half the population will continue to reside in rural areas in 2050 (United Nations 2014). Thus, India will not be able to achieve true economic development without improving the per capita income of rural India. To do so, improving access to energy is key.
Figure 1 (a): Contribution of rural India to Net Domestic Product (NDP) by sector
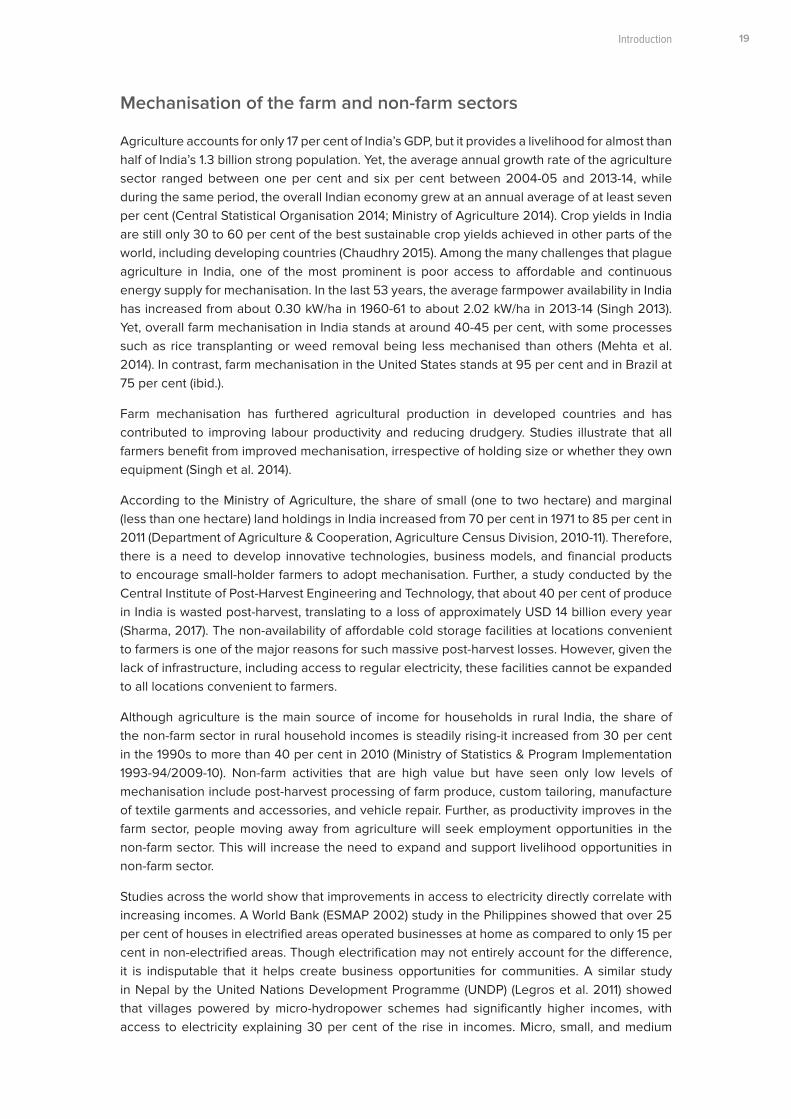
Figure 1 (b): Contribution of rural India to employment by sector
Source: Chand et al. 2017
2%
1%
28%
53%
43%
17%
27%
29%
Urban farm
Rural farm
Urban non-farm
Rural non-farm
Urban farm
Rural farm
Urban non-farm
Rural non-farm
Executive Summary 19
Mechanisation of the farm and non-farm sectors
Agriculture accounts for only 17 per cent of India’s GDP, but it provides a livelihood for almost than half of India’s 1.3 billion strong population. Yet, the average annual growth rate of the agriculture sector ranged between one per cent and six per cent between 2004-05 and 2013-14, while during the same period, the overall Indian economy grew at an annual average of at least seven per cent (Central Statistical Organisation 2014; Ministry of Agriculture 2014). Crop yields in India are still only 30 to 60 per cent of the best sustainable crop yields achieved in other parts of the world, including developing countries (Chaudhry 2015). Among the many challenges that plague agriculture in India, one of the most prominent is poor access to affordable and continuous energy supply for mechanisation. In the last 53 years, the average farmpower availability in India has increased from about 0.30 kW/ha in 1960-61 to about 2.02 kW/ha in 2013-14 (Singh 2013). Yet, overall farm mechanisation in India stands at around 40-45 per cent, with some processes such as rice transplanting or weed removal being less mechanised than others (Mehta et al. 2014). In contrast, farm mechanisation in the United States stands at 95 per cent and in Brazil at 75 per cent (ibid.).
Farm mechanisation has furthered agricultural production in developed countries and has contributed to improving labour productivity and reducing drudgery. Studies illustrate that all farmers benefit from improved mechanisation, irrespective of holding size or whether they own equipment (Singh et al. 2014).
According to the Ministry of Agriculture, the share of small (one to two hectare) and marginal (less than one hectare) land holdings in India increased from 70 per cent in 1971 to 85 per cent in 2011 (Department of Agriculture & Cooperation, Agriculture Census Division, 2010-11). Therefore, there is a need to develop innovative technologies, business models, and financial products to encourage small-holder farmers to adopt mechanisation. Further, a study conducted by the Central Institute of Post-Harvest Engineering and Technology, that about 40 per cent of produce in India is wasted post-harvest, translating to a loss of approximately USD 14 billion every year (Sharma, 2017). The non-availability of affordable cold storage facilities at locations convenient to farmers is one of the major reasons for such massive post-harvest losses. However, given the lack of infrastructure, including access to regular electricity, these facilities cannot be expanded to all locations convenient to farmers.
Although agriculture is the main source of income for households in rural India, the share of the non-farm sector in rural household incomes is steadily rising-it increased from 30 per cent in the 1990s to more than 40 per cent in 2010 (Ministry of Statistics & Program Implementation 1993-94/2009-10). Non-farm activities that are high value but have seen only low levels of mechanisation include post-harvest processing of farm produce, custom tailoring, manufacture of textile garments and accessories, and vehicle repair. Further, as productivity improves in the farm sector, people moving away from agriculture will seek employment opportunities in the non-farm sector. This will increase the need to expand and support livelihood opportunities in non-farm sector.
Studies across the world show that improvements in access to electricity directly correlate with increasing incomes. A World Bank (ESMAP 2002) study in the Philippines showed that over 25 per cent of houses in electrified areas operated businesses at home as compared to only 15 per cent in non-electrified areas. Though electrification may not entirely account for the difference, it is indisputable that it helps create business opportunities for communities. A similar study in Nepal by the United Nations Development Programme (UNDP) (Legros et al. 2011) showed that villages powered by micro-hydropower schemes had significantly higher incomes, with access to electricity explaining 30 per cent of the rise in incomes. Micro, small, and medium
Introduction
Clean Energy Innovations to Boost Rural Incomes
enterprises (MSMEs) in the service sector in rural Uganda that use solar home systems (SHS) work for approximately one hour longer, attract more customers, and earn monthly profits that are approximately 8 USD higher than a comparable group of businesses in an unelectrified region (Harsdorff and Bamanyaki 2009).
According to the World Bank’s 2014 Enterprise Surveys, over 55 per cent of small, medium, and large manufacturing and service sector firms in India are affected by electricity supply interruptions an average of 14 times a month. The survey also suggests that Indian firms lose about four per cent in annual sales due to such interruptions, and that over 21 per cent of firms consider the lack of regular electricity supply a major constraint (World Bank, 2014). Workflow interruptions, and the damage caused to sensitive electrical equipment by power fluctuations, not only limit the productivity of enterprises, but they also hinder the establishing of new enterprises. In the largest energy access survey to date, conducted across six states of India in 2015 by CEEW, only 39 per cent of rural businesses using electricity indicated that they were satisfied with their current electricity supply. Of the businesses not using electricity, about 52 per cent mentioned that access to electricity can contribute to an increase in income (Jain et al. 2015). Our analysis on National Sample Survey Office (NSSO) 73rd round survey of unincorporated non-farm enterprises indicates that owners of 4.4 million enterprises in rural India complained of erratic power supply as one of the top bottlenecks affecting their business (Ministry of Statistics & Programme Implementation 2015-16).
Opportunities for improving mechanisation in rural India through affordable and reliable sources of renewable energy
Decentralised renewable energy (DRE) could bridge gaps in access to energy and increase overall mechanisation. There is growing evidence that DRE-powered innovations can contribute to driving agricultural mechanisation in India. One such estimate showed that replacing five million diesel pumps with solar pumps could result in savings of nearly 18 GW of installed capacity, 23 TWh of electricity, 10 billion litres of diesel, and 26 million tonnes of carbon dioxide emissions (Indian Council on Agricultural Research 2017). Other examples include solar-powered cold storage units and solar-powered sprayers, though these studies examined a relatively small scale of deployment. If rural businesses can effectively leverage existing market linkages to purchase small and innovative machines powered by DRE, this can help improve productivity and lower the operational costs associated with post-harvest processes such as rice milling, flour milling, dal milling, and oil extraction from oilseeds, among others.
Both the farm and non-farm sectors in India are underserved by existing energy sources and hence present enormous potential for the productive use of DRE. Existing distributed generation assets and new DRE capacity can both be leveraged to unlock significant untapped economic opportunities in rural India, such as home-based enterprises and more efficient post-harvest processing. While the government’s electrification policy and schemes primarily focus on household electrification (Ministry of Power 2017), this needs to expanded to cover interventions that can boost rural economic activities. Rural lives that have been deprived of equitable energy access are already being transformed by the improved productivity, enhanced product value, reduced inputs cost, and reduced drudgery of innovations such as solar-powered sewing machines, milk-chillers, milking machines, pottery wheels, weaving machines, solar pesticide sprayers, and biomass-based co-generation, among others. Organisations such as SELCO Foundation have been pioneers in innovating, incubating, and commercialising DRE-powered appliances for productive use. However, the product and customer development ecosystem for DRE is still evolving, and to find a large user base, it must overcome significant technical, financial, and policy challenges. Customers - farmer and entrepreneurs - encounter numerous challenges
20
Executive Summary 21Introduction
that prevent or delay adoption, such as cash flow problems, high capital costs, lack of familiarity with new technologies, low asset utilisation, and lack of after-sales support. For distributors, there is limited incentive to stock DRE-related products considering weak demand due to these impediments, or because of a lack of awareness on the part of customers. For entrepreneurs involved in the production or distribution of DRE-powered products, the market remains large but highly fragmented, making it difficult for them to capture the same. For innovators, production of new technologies is hampered by the lack of user feedback. Entrepreneurs, financiers, policymakers, and other ecosystem supporters need to leverage synergies to overcome the challenges in achieving their goal of transforming livelihoods in rural India.
This report explores the potential of DRE and energy efficiency (EE) innovations to improve rural electricity access. It maps the existing challenges in the entrepreneurial ecosystem and outlines potential interventions.
Chapter 2 provides an overview of the study and outlines its research methodology and limitations.
Chapter 3 undertakes a demand-side analysis of DRE-powered electricity access for increasing mechanisation in the farm and non-farm sector. This chapter provides information on the economic viability and market potential of DRE for powering key farm and non-farm rural income-generating activities (RIGAs).
Chapter 4 maps existing DRE-powered livelihood applications, from the concept stage to their commercial availability. Through case studies, this chapter presents four innovations that have seen some uptake and that have helped supplement incomes in rural India.
Chapter 5 highlights the challenges inherent to the ecosystem as experienced by stakeholders. This chapter analyses these challenges across all stages of the product ecosystem and elaborates on potential interventions that could partially or sufficiently address some of these challenges.
Clean Energy Innovations to Boost Rural Incomes18
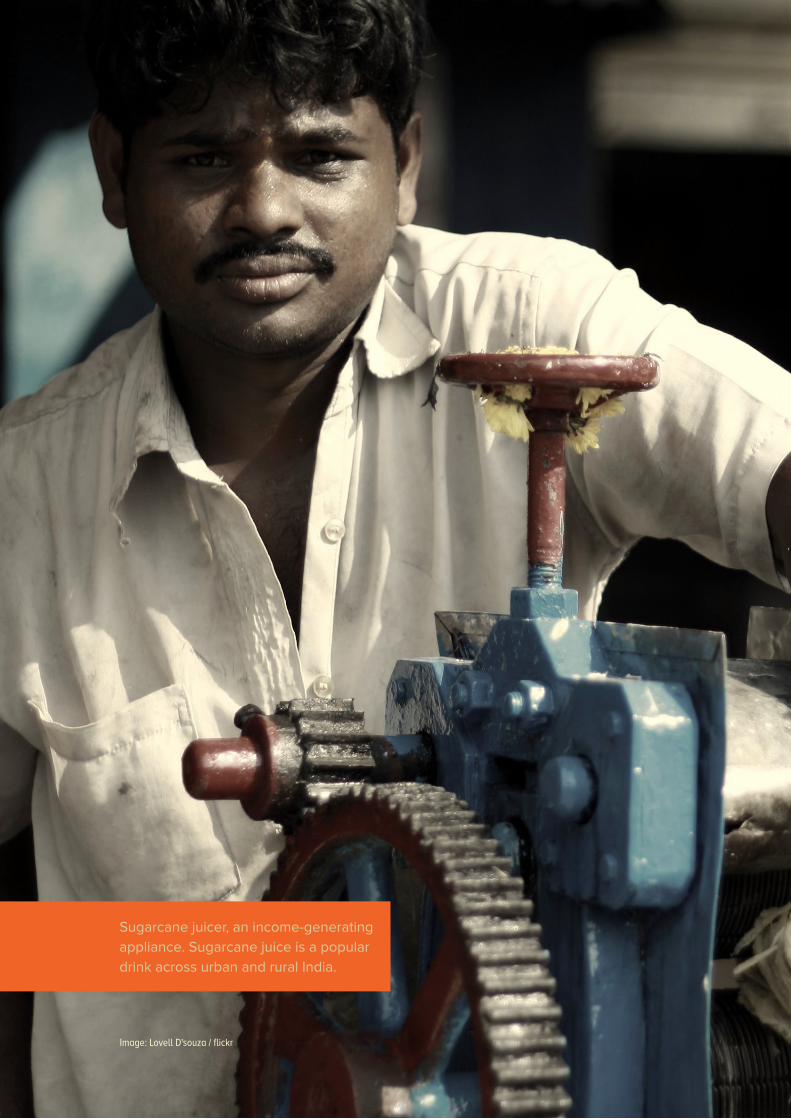
Image: Lovell D'souza / flickr
Sugarcane juicer, an income-generating appliance. Sugarcane juice is a popular drink across urban and rural India.
Executive Summary 23Introduction
2. What is I-DESIRE?
Clean Energy Innovations to Boost Rural Incomes24
Negligible use of DRE for income generating activities in rural areas
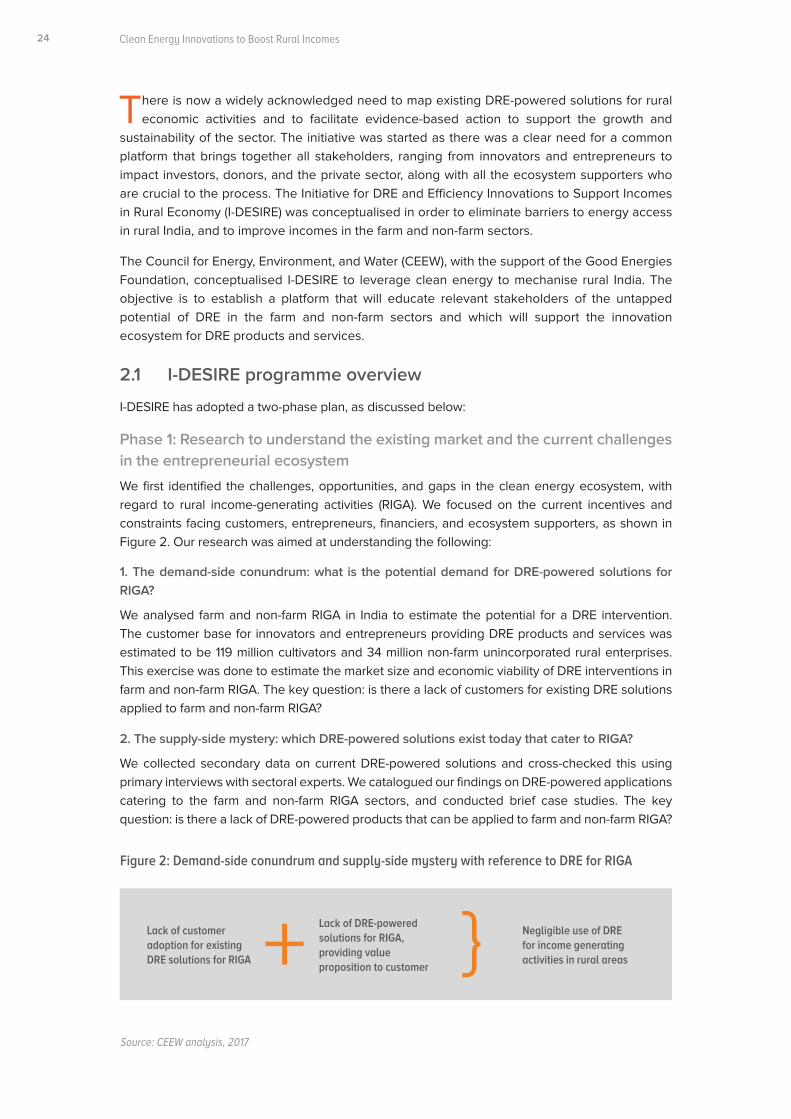
There is now a widely acknowledged need to map existing DRE-powered solutions for rural economic activities and to facilitate evidence-based action to support the growth and
sustainability of the sector. The initiative was started as there was a clear need for a common platform that brings together all stakeholders, ranging from innovators and entrepreneurs to impact investors, donors, and the private sector, along with all the ecosystem supporters who are crucial to the process. The Initiative for DRE and Efficiency Innovations to Support Incomes in Rural Economy (I-DESIRE) was conceptualised in order to eliminate barriers to energy access in rural India, and to improve incomes in the farm and non-farm sectors.
The Council for Energy, Environment, and Water (CEEW), with the support of the Good Energies Foundation, conceptualised I-DESIRE to leverage clean energy to mechanise rural India. The objective is to establish a platform that will educate relevant stakeholders of the untapped potential of DRE in the farm and non-farm sectors and which will support the innovation ecosystem for DRE products and services.
2.1 I-DESIRE programme overview
I-DESIRE has adopted a two-phase plan, as discussed below:
Phase 1: Research to understand the existing market and the current challenges in the entrepreneurial ecosystem
We first identified the challenges, opportunities, and gaps in the clean energy ecosystem, with regard to rural income-generating activities (RIGA). We focused on the current incentives and constraints facing customers, entrepreneurs, financiers, and ecosystem supporters, as shown in Figure 2. Our research was aimed at understanding the following:
1. The demand-side conundrum: what is the potential demand for DRE-powered solutions for RIGA?
We analysed farm and non-farm RIGA in India to estimate the potential for a DRE intervention. The customer base for innovators and entrepreneurs providing DRE products and services was estimated to be 119 million cultivators and 34 million non-farm unincorporated rural enterprises. This exercise was done to estimate the market size and economic viability of DRE interventions in farm and non-farm RIGA. The key question: is there a lack of customers for existing DRE solutions applied to farm and non-farm RIGA?
2. The supply-side mystery: which DRE-powered solutions exist today that cater to RIGA?
We collected secondary data on current DRE-powered solutions and cross-checked this using primary interviews with sectoral experts. We catalogued our findings on DRE-powered applications catering to the farm and non-farm RIGA sectors, and conducted brief case studies. The key question: is there a lack of DRE-powered products that can be applied to farm and non-farm RIGA?
Figure 2: Demand-side conundrum and supply-side mystery with reference to DRE for RIGA
Source: CEEW analysis, 2017
Lack of customer adoption for existing DRE solutions for RIGA
Lack of DRE-powered solutions for RIGA, providing value proposition to customer
Executive Summary 25What is I-DESIRE?
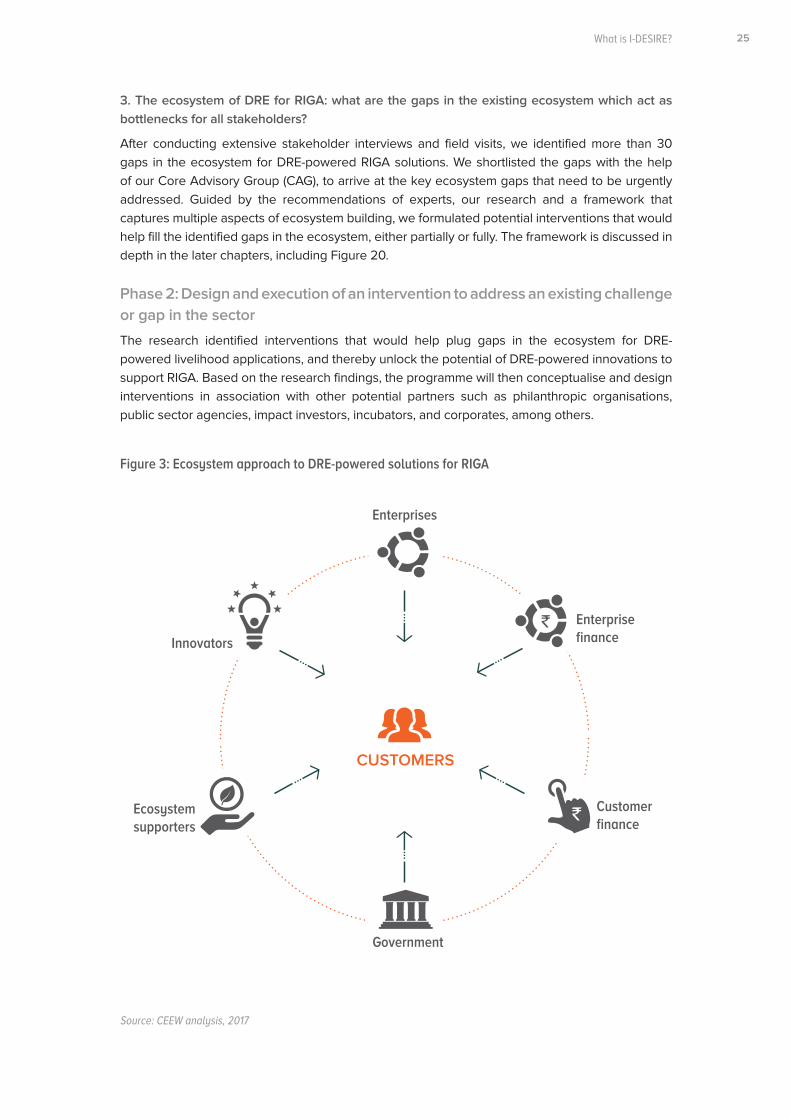
3. The ecosystem of DRE for RIGA: what are the gaps in the existing ecosystem which act as bottlenecks for all stakeholders?
After conducting extensive stakeholder interviews and field visits, we identified more than 30 gaps in the ecosystem for DRE-powered RIGA solutions. We shortlisted the gaps with the help of our Core Advisory Group (CAG), to arrive at the key ecosystem gaps that need to be urgently addressed. Guided by the recommendations of experts, our research and a framework that captures multiple aspects of ecosystem building, we formulated potential interventions that would help fill the identified gaps in the ecosystem, either partially or fully. The framework is discussed in depth in the later chapters, including Figure 20.
Phase 2: Design and execution of an intervention to address an existing challenge or gap in the sector
The research identified interventions that would help plug gaps in the ecosystem for DRE-powered livelihood applications, and thereby unlock the potential of DRE-powered innovations to support RIGA. Based on the research findings, the programme will then conceptualise and design interventions in association with other potential partners such as philanthropic organisations, public sector agencies, impact investors, incubators, and corporates, among others.
Figure 3: Ecosystem approach to DRE-powered solutions for RIGA
Source: CEEW analysis, 2017
Innovators
Government
Enterprises
Enterprise finance
Ecosystem supporters
CUSTOMERS
Customer finance
Clean Energy Innovations to Boost Rural Incomes26
2.2 Methods and data
A comprehensive literature review, which included both qualitative and quantitative methods of data collection and analysis, informed the research.
The subsequent points highlight the data sources, methods used, and their purpose in specific aspects of the research:
1. Demand-side: Publicly available data was used to shortlist key farm and non-farm RIGA, and therefore estimate the market potential for DRE-powered livelihood appliances. This data was sourced from i) National Sample Survey: Operational Characteristics of Unincorporated Non-agricultural Enterprises 2010-11 (Ministry of Statistics & P.I., 2010-11); ii) National Sample Survey: Key Indicators of Unincorporated Non-agricultural Enterprises (Excluding Construction) in India 2015-16 (Ministry of Statistics and P.I., 2015-16); iii) Directorate of Economics and Statistics: Ministry of Agriculture; iv) Statewise estimates of Value of Output from Agriculture and Allied Activities (Ministry of Statistics & P.I., 2013); and v) Agriculture Census (Input Survey) 2010-11 (Department of Agriculture & Cooperation, Agriculture Census Division, 2010-11).
2. Supply-side: Survey of literature, including journal publications, internet searches using selective terms, and snow-balling interviews with innovators to identify and collate a list of DRE-powered livelihood appliances in India.
3. Primary interviews were held with stakeholders, including investors, multilateral and bilateral agencies, corporations, DRE and rural economy sector experts, entrepreneurs, representatives from incubators and accelerators, farmer producer organisations (FPOs), scientists, innovators from public R&D institutions, and various ecosystem supporters including NGOs. A semi-structured interview guide was used to identify and understand ecosystem challenges pertaining to product and customer development.
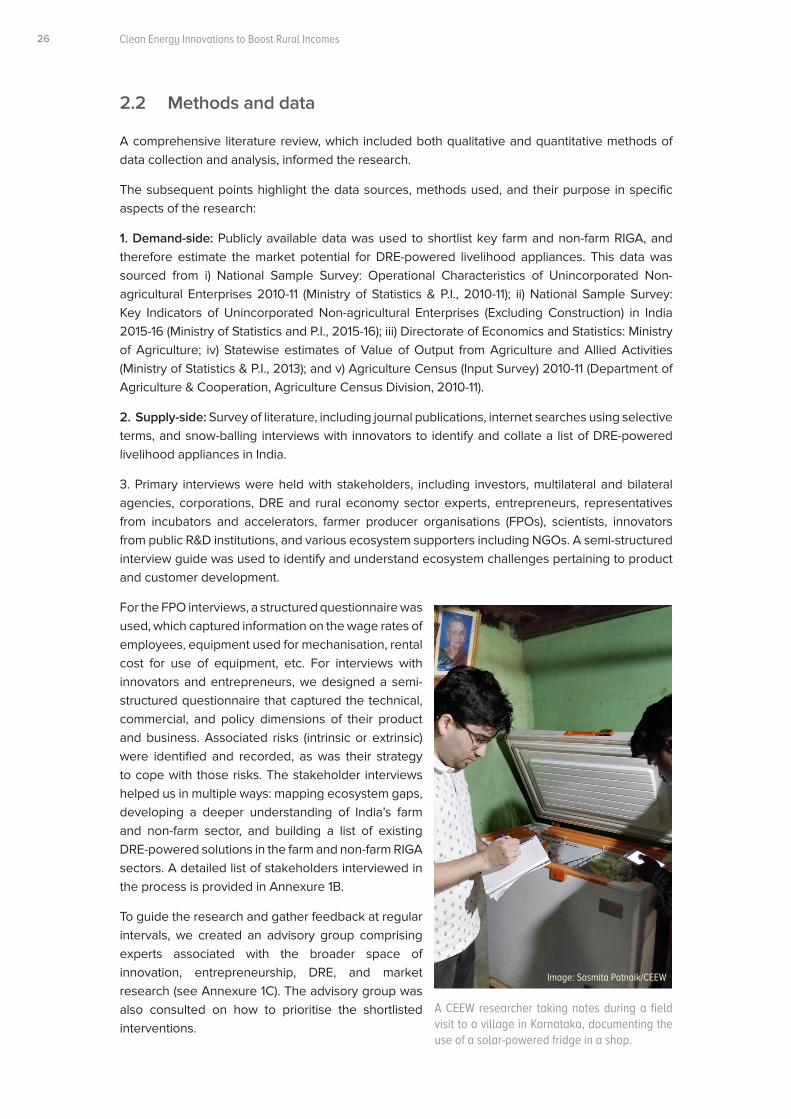
For the FPO interviews, a structured questionnaire was used, which captured information on the wage rates of employees, equipment used for mechanisation, rental cost for use of equipment, etc. For interviews with innovators and entrepreneurs, we designed a semi-structured questionnaire that captured the technical, commercial, and policy dimensions of their product and business. Associated risks (intrinsic or extrinsic) were identified and recorded, as was their strategy to cope with those risks. The stakeholder interviews helped us in multiple ways: mapping ecosystem gaps, developing a deeper understanding of India’s farm and non-farm sector, and building a list of existing DRE-powered solutions in the farm and non-farm RIGA sectors. A detailed list of stakeholders interviewed in the process is provided in Annexure 1B.
To guide the research and gather feedback at regular intervals, we created an advisory group comprising experts associated with the broader space of innovation, entrepreneurship, DRE, and market research (see Annexure 1C). The advisory group was also consulted on how to prioritise the shortlisted interventions.
A CEEW researcher taking notes during a field visit to a village in Karnataka, documenting the use of a solar-powered fridge in a shop.
Executive Summary 27What is I-DESIRE?
94Stakeholders
Source: CEEW analysis, 2017
Figure 4: Number and type of stakeholders consulted for semi-structured interviews
ENTREPRENEUR
TECHNICAL EXPERT
INCUBATOR
COMMERCIALISATION EXPERT
ECOSYSTEM SUPPORTER
RURAL ECONOMY EXPERT
FINANCIER
CORPORATE
DONOR AGENCY
GOVERNMENT
THINK TANK
2.3 Scope of the research
The scope of this research has been determined based on the objectives of I-DESIRE. The following guidelines were followed to determine the focus of the study and arrive at the market potential of DRE in the farm and non-farm sectors.
Primarily, livelihood applications requiring mechanical or electrical energy inputs are considered. Applications requiring direct thermal energy input, such as brick kilns, activities in food processing with mainly thermal inputs are not considered in the current research, mainly to keep the scope of research manageable.
Hospitals and schools are classified as community use of energy, and therefore, they are not considered in the current scope of research, which focuses more on livelihood activities.
Clean Energy Innovations to Boost Rural Incomes28
Livestock businesses such as dairy, poultry, and pig farms do not feature as part of the framework, since they heavily comprise of processing and manufacturing activities, which are considered to be non-farm activities under National Industrial Classification 2008.
When considering the gaps in the DRE ecosystem, only concept-level gaps are considered. Implementation-level gaps explaining effectiveness of existing initiatives are not assessed in the research.
Livelihood activities primarily in rural areas are considered, as per the classification of rural sector by Ministry of Statistics and Programme Implementation.
One aspect of further research, which is not in the scope of current study, is the issue of latent demand. Improved electricity access can potentially lead to an increase in productivity and incomes along with a reduction in costs for the farmer or rural enterprise. However, access to reliable power in rural areas could lead to evolution of new forms of business and industry that do not exist in those areas today. Such incremental market (or latent demand) is not estimated as part of the demand estimation.
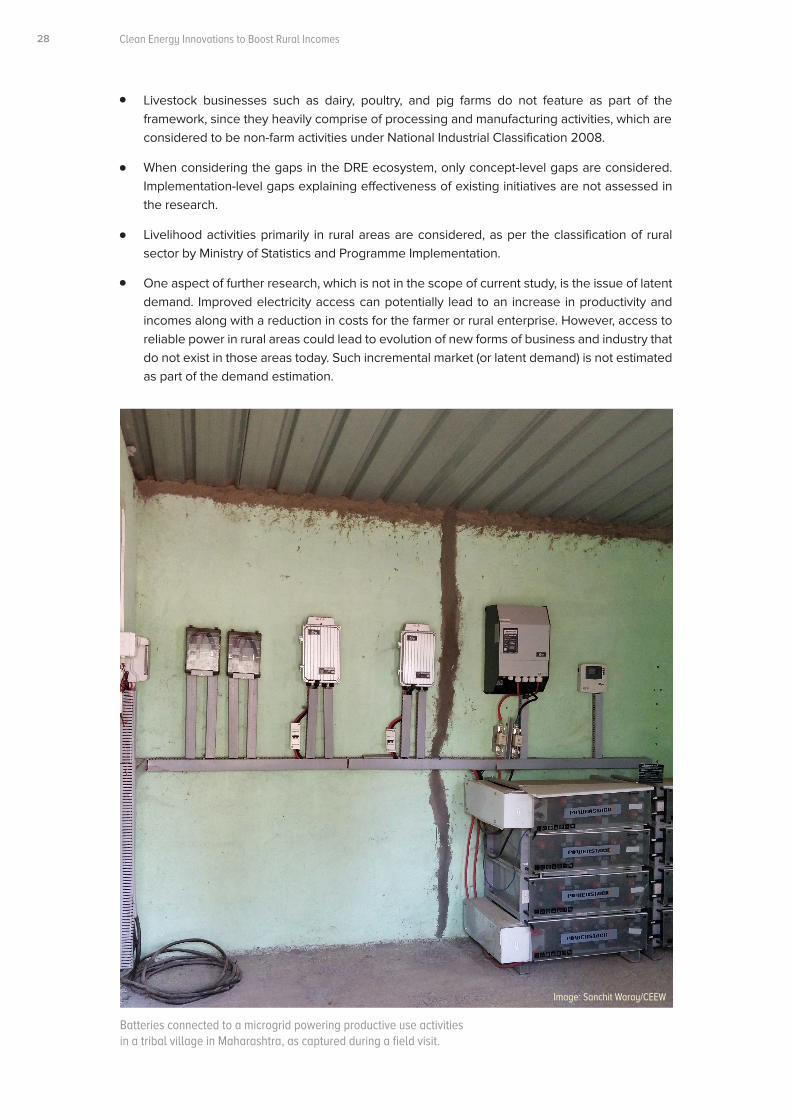
Batteries connected to a microgrid powering productive use activities in a tribal village in Maharashtra, as captured during a field visit.
Image: Sanchit Waray/CEEW
Executive Summary 28 29
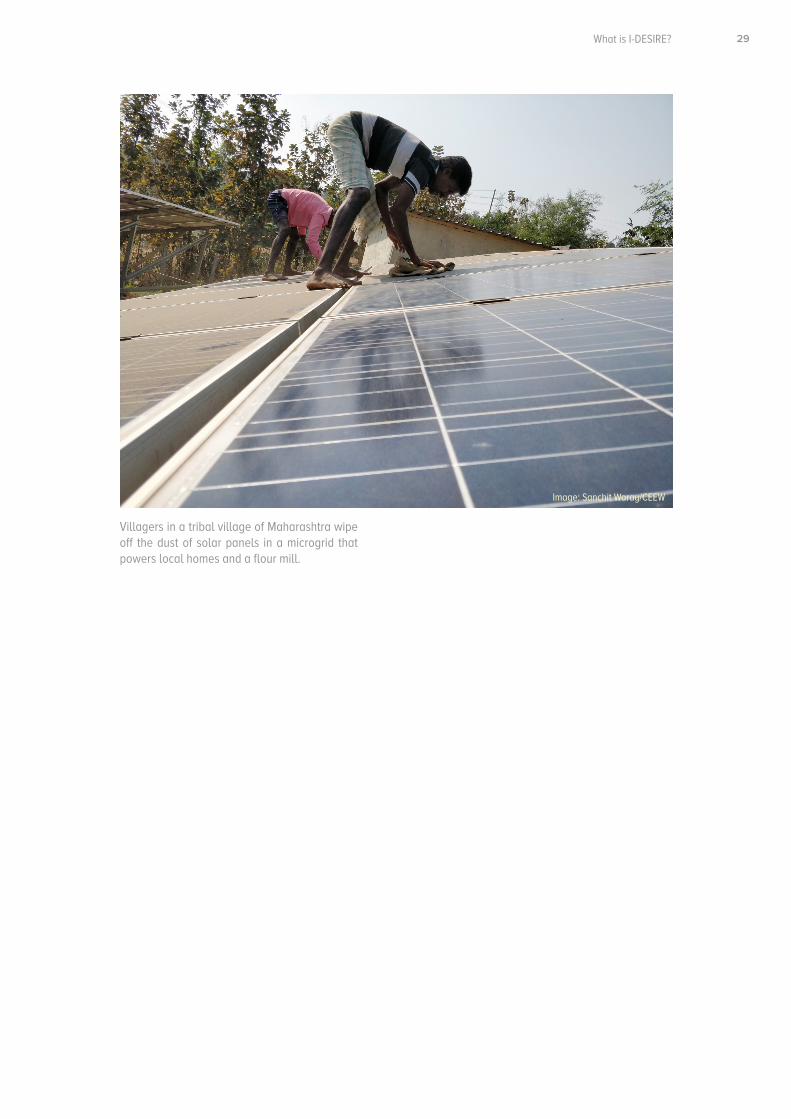
Villagers in a tribal village of Maharashtra wipe off the dust of solar panels in a microgrid that powers local homes and a flour mill.
What is I-DESIRE?
Image: Sanchit Waray/CEEW
Clean Energy Innovations to Boost Rural Incomes18
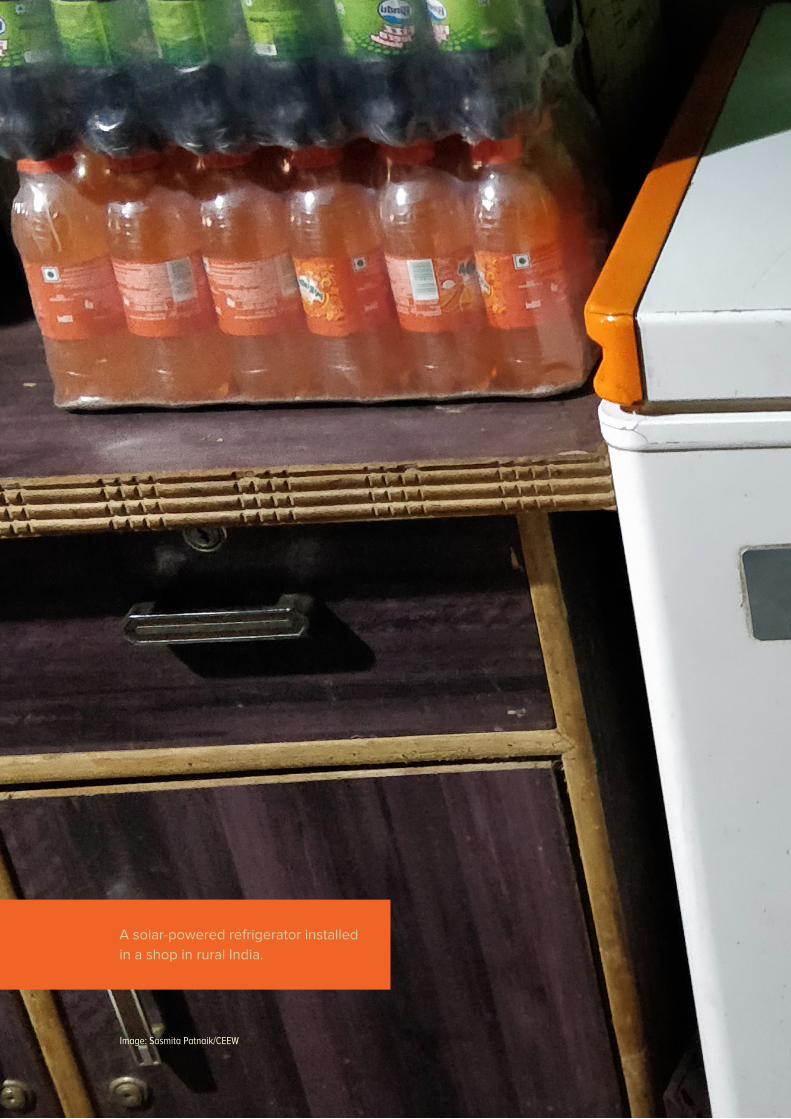
Image: Sasmita Patnaik/CEEW
A solar-powered refrigerator installed in a shop in rural India.
Executive Summary 23Introduction
3. Demand for DRE-powered Mechanisation
Clean Energy Innovations to Boost Rural Incomes32
Economists and policymakers broadly classify the rural economy into two sectors, the farm and non-farm. While the farm sector accounts for 64 per cent of all livelihoods in rural
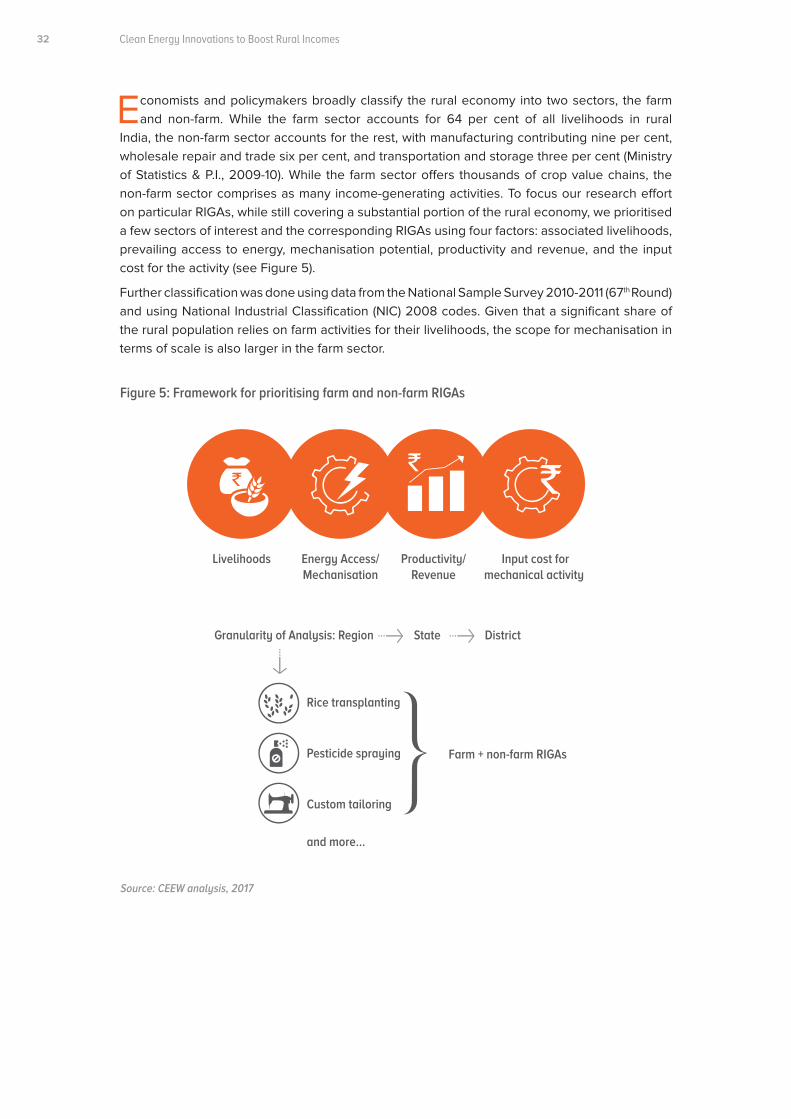
India, the non-farm sector accounts for the rest, with manufacturing contributing nine per cent, wholesale repair and trade six per cent, and transportation and storage three per cent (Ministry of Statistics & P.I., 2009-10). While the farm sector offers thousands of crop value chains, the non-farm sector comprises as many income-generating activities. To focus our research effort on particular RIGAs, while still covering a substantial portion of the rural economy, we prioritised a few sectors of interest and the corresponding RIGAs using four factors: associated livelihoods, prevailing access to energy, mechanisation potential, productivity and revenue, and the input cost for the activity (see Figure 5).
Further classification was done using data from the National Sample Survey 2010-2011 (67th Round) and using National Industrial Classification (NIC) 2008 codes. Given that a significant share of the rural population relies on farm activities for their livelihoods, the scope for mechanisation in terms of scale is also larger in the farm sector.
Figure 5: Framework for prioritising farm and non-farm RIGAs
Livelihoods Energy Access/Mechanisation
Productivity/Revenue
Input cost for mechanical activity
Granularity of Analysis: Region
Rice transplanting
Farm + non-farm RIGAsPesticide spraying
Custom tailoring
and more...
State District
Source: CEEW analysis, 2017
Executive Summary 33Demand for DRE-powered Mechanisation
3.1 Farm sector
3.1.1 Methodology
For the farm sector, we shortlisted 10 crops using three indicators with predetermined weights, to create a composite score for each crop.
1. Number of operational landholdings cultivating the crop (50 per cent),
2. Value of farm produce per hectare (25 per cent),
3. Ratio of human and animal labour expenses to machine-use expenses (25 per cent).
We assigned weights to these parameters, prioritising scale (determined by the number of farmers cultivating a crop) over the other two parameters. Equal weight was given to the average value of the crop and the mechanisation potential (determined by the ratio of human and animal labour expenses to machine-use expenses). While the former is determined by the economic value of the crop, the latter is determined by the market potential for DRE-powered energy-efficient appliances in the sector.
After multiplying the weighted ratios with the values obtained, the key crops were shortlisted using percentile ranks. A detailed explanation of the normalisation methodology is provided in Annexure 2.
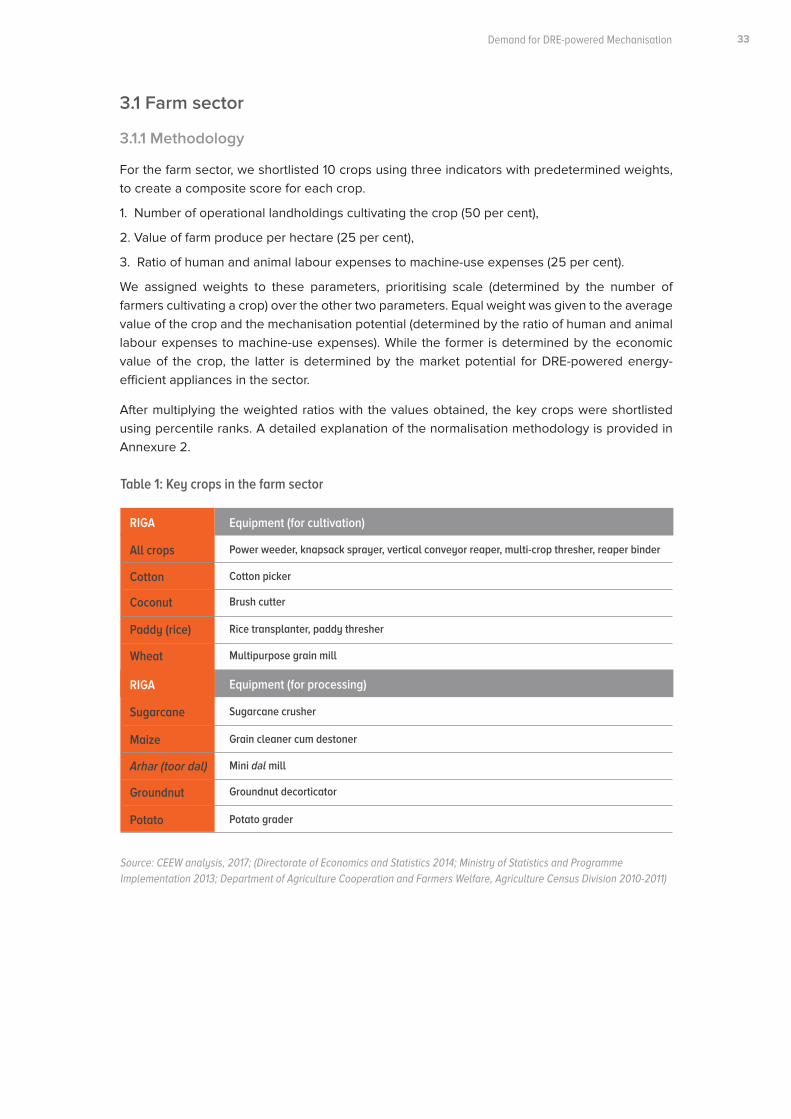
Table 1: Key crops in the farm sector
Source: CEEW analysis, 2017; (Directorate of Economics and Statistics 2014; Ministry of Statistics and Programme Implementation 2013; Department of Agriculture Cooperation and Farmers Welfare, Agriculture Census Division 2010-2011)
RIGA
RIGA
All crops
Sugarcane
Power weeder, knapsack sprayer, vertical conveyor reaper, multi-crop thresher, reaper binder
Sugarcane crusher
Cotton picker
Grain cleaner cum destoner
Brush cutter
Mini dal mill
Multipurpose grain mill
Potato grader
Rice transplanter, paddy thresher
Groundnut decorticator
Cotton
Maize
Coconut
Arhar (toor dal)
Paddy (rice)
Groundnut
Wheat
Potato
Equipment (for cultivation)
Equipment (for processing)
Clean Energy Innovations to Boost Rural Incomes34
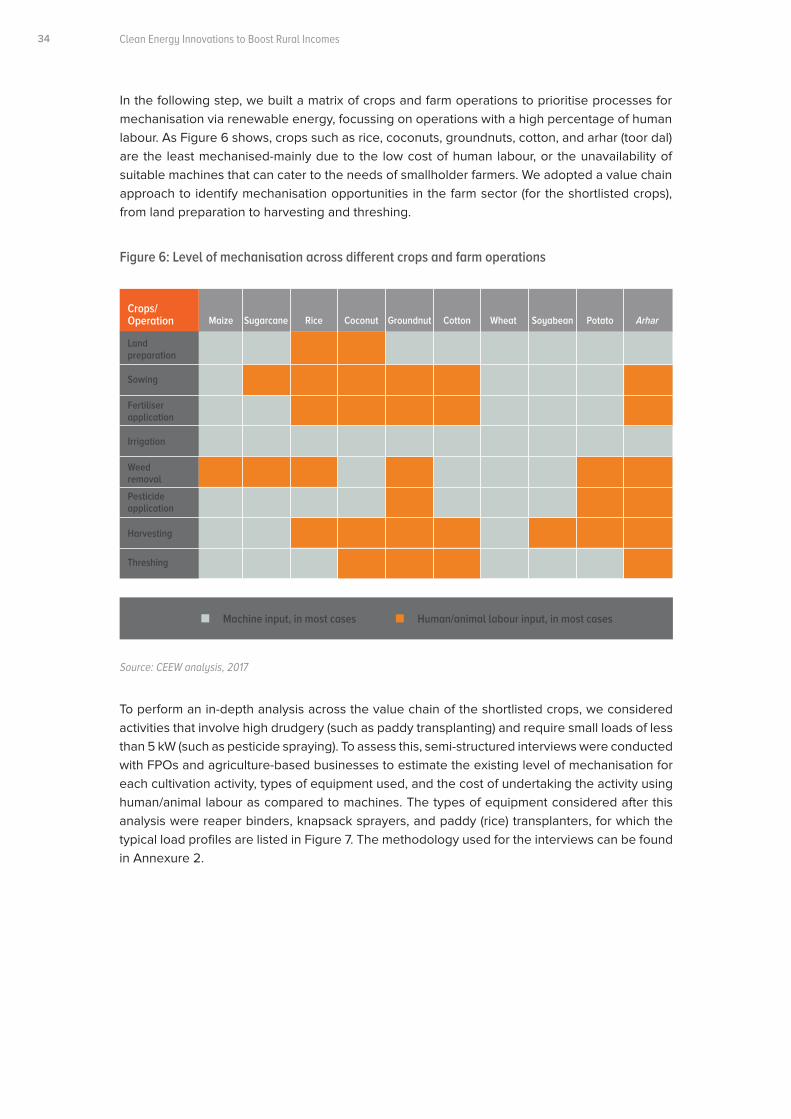
In the following step, we built a matrix of crops and farm operations to prioritise processes for mechanisation via renewable energy, focussing on operations with a high percentage of human labour. As Figure 6 shows, crops such as rice, coconuts, groundnuts, cotton, and arhar (toor dal) are the least mechanised-mainly due to the low cost of human labour, or the unavailability of suitable machines that can cater to the needs of smallholder farmers. We adopted a value chain approach to identify mechanisation opportunities in the farm sector (for the shortlisted crops), from land preparation to harvesting and threshing.
To perform an in-depth analysis across the value chain of the shortlisted crops, we considered activities that involve high drudgery (such as paddy transplanting) and require small loads of less than 5 kW (such as pesticide spraying). To assess this, semi-structured interviews were conducted with FPOs and agriculture-based businesses to estimate the existing level of mechanisation for each cultivation activity, types of equipment used, and the cost of undertaking the activity using human/animal labour as compared to machines. The types of equipment considered after this analysis were reaper binders, knapsack sprayers, and paddy (rice) transplanters, for which the typical load profiles are listed in Figure 7. The methodology used for the interviews can be found in Annexure 2.
Figure 6: Level of mechanisation across different crops and farm operations
Source: CEEW analysis, 2017
Crops/Operation
Land preparation
Harvesting
Pesticide application
Sowing
Threshing
Fertiliser application
Irrigation
Weed removal
Maize Sugarcane Rice Coconut Groundnut Cotton Wheat Soyabean Potato Arhar
Machine input, in most cases Human/animal labour input, in most cases
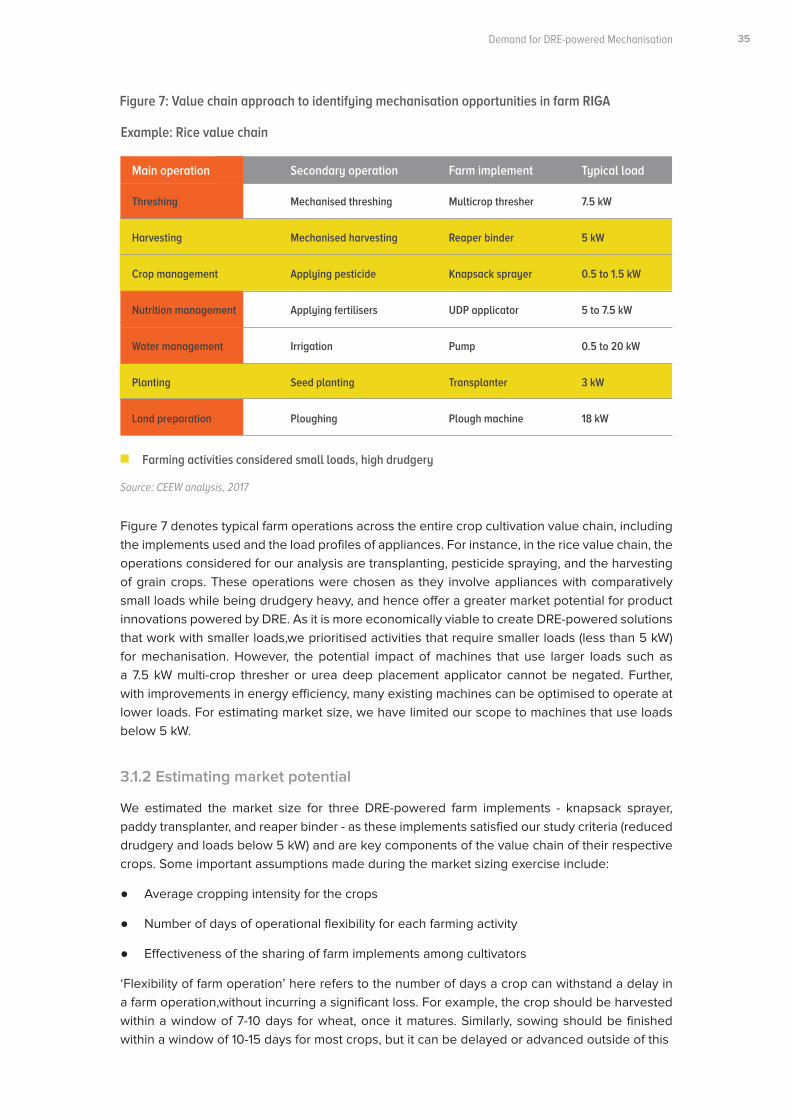
Executive Summary 35Demand for DRE-powered Mechanisation
Figure 7 denotes typical farm operations across the entire crop cultivation value chain, including the implements used and the load profiles of appliances. For instance, in the rice value chain, the operations considered for our analysis are transplanting, pesticide spraying, and the harvesting of grain crops. These operations were chosen as they involve appliances with comparatively small loads while being drudgery heavy, and hence offer a greater market potential for product innovations powered by DRE. As it is more economically viable to create DRE-powered solutions that work with smaller loads,we prioritised activities that require smaller loads (less than 5 kW) for mechanisation. However, the potential impact of machines that use larger loads such as a 7.5 kW multi-crop thresher or urea deep placement applicator cannot be negated. Further, with improvements in energy efficiency, many existing machines can be optimised to operate at lower loads. For estimating market size, we have limited our scope to machines that use loads below 5 kW.
3.1.2 Estimating market potential
We estimated the market size for three DRE-powered farm implements - knapsack sprayer, paddy transplanter, and reaper binder - as these implements satisfied our study criteria (reduced drudgery and loads below 5 kW) and are key components of the value chain of their respective crops. Some important assumptions made during the market sizing exercise include:
● Average cropping intensity for the crops
● Number of days of operational flexibility for each farming activity
● Effectiveness of the sharing of farm implements among cultivators
‘Flexibility of farm operation’ here refers to the number of days a crop can withstand a delay in a farm operation,without incurring a significant loss. For example, the crop should be harvested within a window of 7-10 days for wheat, once it matures. Similarly, sowing should be finished within a window of 10-15 days for most crops, but it can be delayed or advanced outside of this
Figure 7: Value chain approach to identifying mechanisation opportunities in farm RIGA
Example: Rice value chain
Source: CEEW analysis, 2017
Threshing
Harvesting
Crop management
Nutrition management
Water management
Planting
Land preparation
Farming activities considered small loads, high drudgery
Main operation
Mechanised threshing
Mechanised harvesting
Applying pesticide
Applying fertilisers
Irrigation
Seed planting
Ploughing
Secondary operation
Multicrop thresher
Reaper binder
Knapsack sprayer
UDP applicator
Pump
Transplanter
Plough machine
Farm implement
7.5 kW
5 kW
0.5 to 1.5 kW
5 to 7.5 kW
0.5 to 20 kW
3 kW
18 kW
Typical load
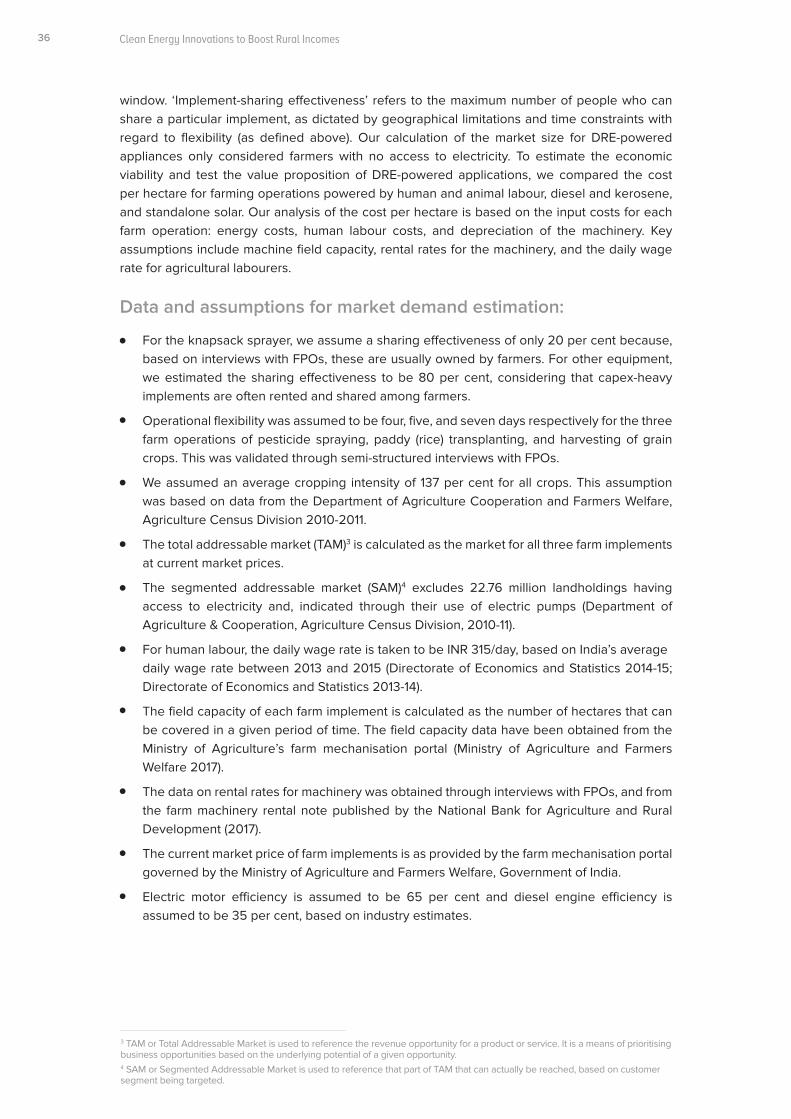
Clean Energy Innovations to Boost Rural Incomes
window. ‘Implement-sharing effectiveness’ refers to the maximum number of people who can share a particular implement, as dictated by geographical limitations and time constraints with regard to flexibility (as defined above). Our calculation of the market size for DRE-powered appliances only considered farmers with no access to electricity. To estimate the economic viability and test the value proposition of DRE-powered applications, we compared the cost per hectare for farming operations powered by human and animal labour, diesel and kerosene, and standalone solar. Our analysis of the cost per hectare is based on the input costs for each farm operation: energy costs, human labour costs, and depreciation of the machinery. Key assumptions include machine field capacity, rental rates for the machinery, and the daily wage rate for agricultural labourers.
Data and assumptions for market demand estimation:
3 TAM or Total Addressable Market is used to reference the revenue opportunity for a product or service. It is a means of prioritising business opportunities based on the underlying potential of a given opportunity.4 SAM or Segmented Addressable Market is used to reference that part of TAM that can actually be reached, based on customer segment being targeted.
36
For the knapsack sprayer, we assume a sharing effectiveness of only 20 per cent because, based on interviews with FPOs, these are usually owned by farmers. For other equipment, we estimated the sharing effectiveness to be 80 per cent, considering that capex-heavy implements are often rented and shared among farmers.
Operational flexibility was assumed to be four, five, and seven days respectively for the three farm operations of pesticide spraying, paddy (rice) transplanting, and harvesting of grain crops. This was validated through semi-structured interviews with FPOs.
We assumed an average cropping intensity of 137 per cent for all crops. This assumption was based on data from the Department of Agriculture Cooperation and Farmers Welfare, Agriculture Census Division 2010-2011.
The total addressable market (TAM)3 is calculated as the market for all three farm implements at current market prices.
The segmented addressable market (SAM)4 excludes 22.76 million landholdings having access to electricity and, indicated through their use of electric pumps (Department of Agriculture & Cooperation, Agriculture Census Division, 2010-11).
For human labour, the daily wage rate is taken to be INR 315/day, based on India’s average daily wage rate between 2013 and 2015 (Directorate of Economics and Statistics 2014-15; Directorate of Economics and Statistics 2013-14).
The field capacity of each farm implement is calculated as the number of hectares that can be covered in a given period of time. The field capacity data have been obtained from the Ministry of Agriculture’s farm mechanisation portal (Ministry of Agriculture and Farmers Welfare 2017).
The data on rental rates for machinery was obtained through interviews with FPOs, and from the farm machinery rental note published by the National Bank for Agriculture and Rural Development (2017).
The current market price of farm implements is as provided by the farm mechanisation portal governed by the Ministry of Agriculture and Farmers Welfare, Government of India.
Electric motor efficiency is assumed to be 65 per cent and diesel engine efficiency is assumed to be 35 per cent, based on industry estimates.
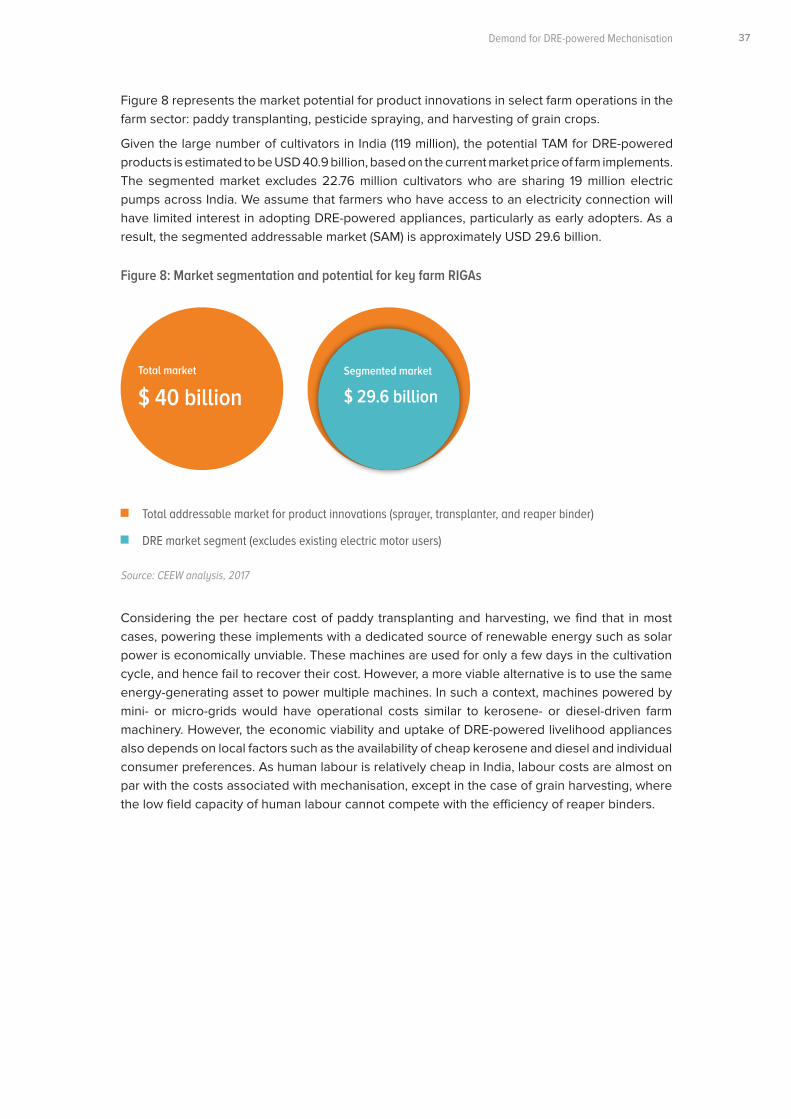
Executive Summary
Considering the per hectare cost of paddy transplanting and harvesting, we find that in most cases, powering these implements with a dedicated source of renewable energy such as solar power is economically unviable. These machines are used for only a few days in the cultivation cycle, and hence fail to recover their cost. However, a more viable alternative is to use the same energy-generating asset to power multiple machines. In such a context, machines powered by mini- or micro-grids would have operational costs similar to kerosene- or diesel-driven farm machinery. However, the economic viability and uptake of DRE-powered livelihood appliances also depends on local factors such as the availability of cheap kerosene and diesel and individual consumer preferences. As human labour is relatively cheap in India, labour costs are almost on par with the costs associated with mechanisation, except in the case of grain harvesting, where the low field capacity of human labour cannot compete with the efficiency of reaper binders.
Figure 8: Market segmentation and potential for key farm RIGAs
Source: CEEW analysis, 2017
Total addressable market for product innovations (sprayer, transplanter, and reaper binder)
DRE market segment (excludes existing electric motor users)
Figure 8 represents the market potential for product innovations in select farm operations in the farm sector: paddy transplanting, pesticide spraying, and harvesting of grain crops.
Given the large number of cultivators in India (119 million), the potential TAM for DRE-powered products is estimated to be USD 40.9 billion, based on the current market price of farm implements. The segmented market excludes 22.76 million cultivators who are sharing 19 million electric pumps across India. We assume that farmers who have access to an electricity connection will have limited interest in adopting DRE-powered appliances, particularly as early adopters. As a result, the segmented addressable market (SAM) is approximately USD 29.6 billion.
37Demand for DRE-powered Mechanisation
Total market
$ 40 billionSegmented market
$ 29.6 billion
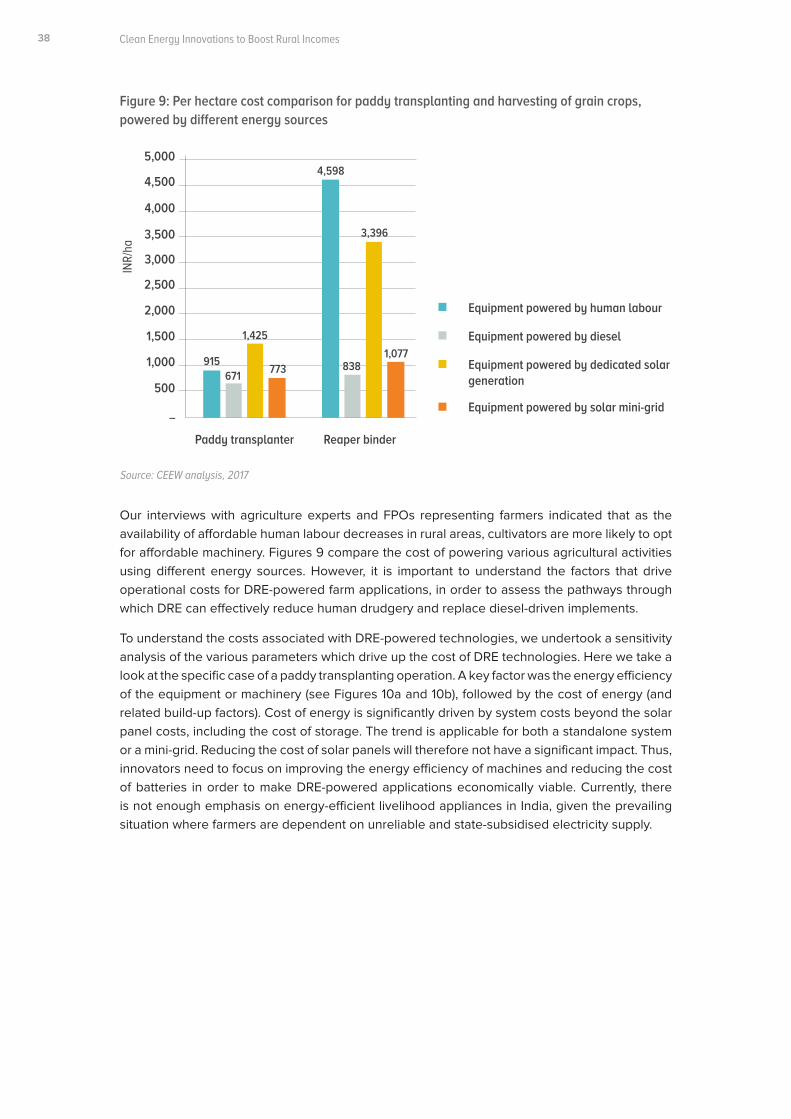
Clean Energy Innovations to Boost Rural Incomes
Figure 9: Per hectare cost comparison for paddy transplanting and harvesting of grain crops, powered by different energy sources
Source: CEEW analysis, 2017
Our interviews with agriculture experts and FPOs representing farmers indicated that as the availability of affordable human labour decreases in rural areas, cultivators are more likely to opt for affordable machinery. Figures 9 compare the cost of powering various agricultural activities using different energy sources. However, it is important to understand the factors that drive operational costs for DRE-powered farm applications, in order to assess the pathways through which DRE can effectively reduce human drudgery and replace diesel-driven implements.
To understand the costs associated with DRE-powered technologies, we undertook a sensitivity analysis of the various parameters which drive up the cost of DRE technologies. Here we take a look at the specific case of a paddy transplanting operation. A key factor was the energy efficiency of the equipment or machinery (see Figures 10a and 10b), followed by the cost of energy (and related build-up factors). Cost of energy is significantly driven by system costs beyond the solar panel costs, including the cost of storage. The trend is applicable for both a standalone system or a mini-grid. Reducing the cost of solar panels will therefore not have a significant impact. Thus, innovators need to focus on improving the energy efficiency of machines and reducing the cost of batteries in order to make DRE-powered applications economically viable. Currently, there is not enough emphasis on energy-efficient livelihood appliances in India, given the prevailing situation where farmers are dependent on unreliable and state-subsidised electricity supply.
Equipment powered by human labour
Equipment powered by diesel
Equipment powered by dedicated solar generation
Equipment powered by solar mini-grid
Paddy transplanter Reaper binder
_
1,000
500
915671
773 838
4,598
1,425
3,396
1,077
1,500
2,000
2,500
3,000
3,500
4,000
4,500
5,000
38
INR/
ha
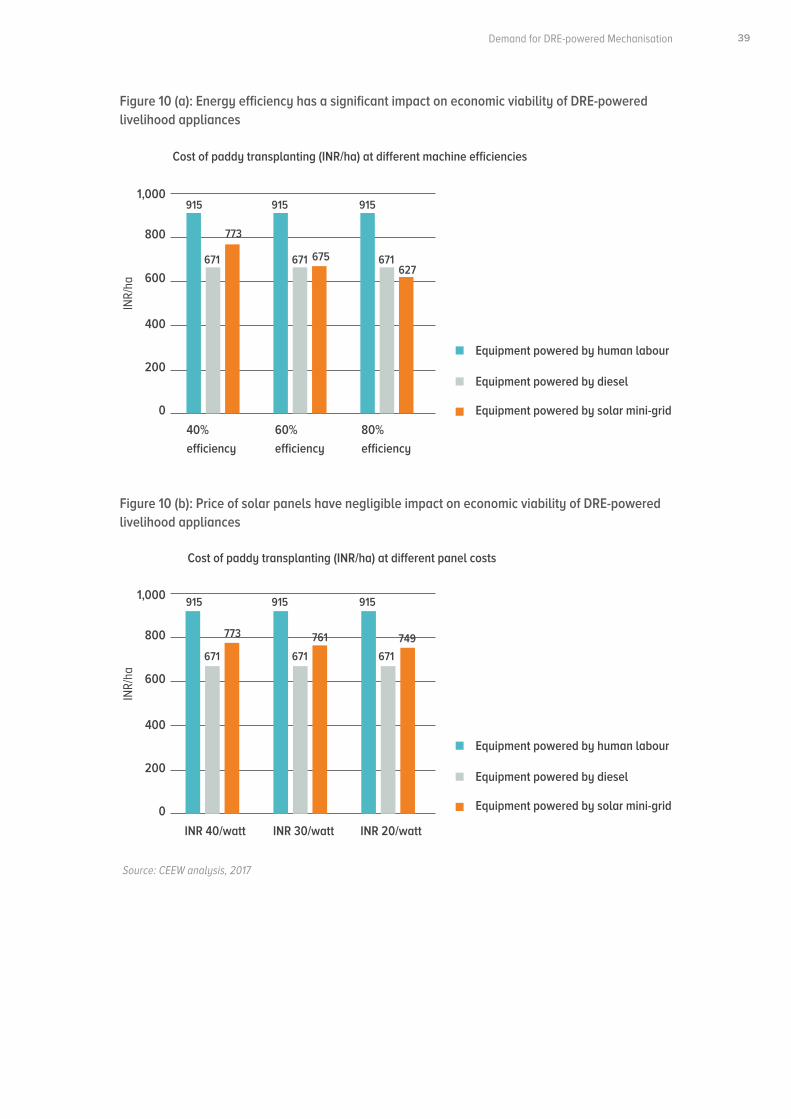
Executive Summary
Figure 10 (a): Energy efficiency has a significant impact on economic viability of DRE-powered livelihood appliances
Figure 10 (b): Price of solar panels have negligible impact on economic viability of DRE-powered livelihood appliances
Source: CEEW analysis, 2017
Cost of paddy transplanting (INR/ha) at different machine efficiencies
Cost of paddy transplanting (INR/ha) at different panel costs
40%
efficiency
INR 40/watt
60%
efficiency
INR 30/watt
80%
efficiency
INR 20/watt
0
0
200
200
400
400
600
600
800
915
915
671
671
773
773
675
761
627
749
671
671
671
671
915
915
915
915
800
1,000
1,000
Equipment powered by human labour
Equipment powered by human labour
Equipment powered by diesel
Equipment powered by diesel
Equipment powered by solar mini-grid
Equipment powered by solar mini-grid
39Demand for DRE-powered Mechanisation
INR/
haIN
R/ha
Clean Energy Innovations to Boost Rural Incomes
3.2 Non-farm sector
The non-farm sector forms the backbone of India in terms of its contribution to household incomes and the rural GDP. Though its provides lesser employment in rural areas compared to the farm sector, its share has grown significantly - from 15 per cent in the early 1970s to more than 35 per cent in 2011-12 (Chand, Srivastava, and Singh 2017). Thus, it is important to focus on the issues impacting India’s non-farm sector in particular, on the lack of opportunity caused by inadequate access to electricity.
3.2.1 Selection of top non-farm RIGAs
To analyse the non-farm sector in India, we used the data from National Sample Survey 2015-2016 (73rd Round) of Unincorporated Non-Agricultural Enterprises (Excluding Construction) (Ministry of Statistics and P.I., 2015-16). This dataset comprises information on 34 million unincorporated non-farm rural enterprises - one of the latest and most comprehensive survey datasets on rural non-farm livelihoods in India. Using this dataset, we shortlisted the top RIGAs based on the following factors:
1. Number of enterprises engaged in a RIGA (50 per cent),
2. Gross value added (GVA) per worker (25 per cent),
3. Ratio of emoluments (i.e. labour costs) to electricity and fuel expenses (15 per cent),
4. Proportion of enterprises reporting electricity access as a key bottleneck (10 per cent).
Similar to our analysis of the farm sector, scale (the number of enterprises engaged in a RIGA) was given the highest weightage, as interventions that targeted the most widely practised RIGAs would have an impact on the largest number of people and their livelihoods. GVA per worker received the second-highest weightage, reflecting the potentially higher gains that can be realised with improved productivity. The ratio of emoluments to electricity and fuel expenses is used as a proxy to estimate the level of mechanisation in the RIGA. Lastly, we considered the proportion of non-farm enterprises in each RIGA which explicitly stated access to electricity as one of their top two bottlenecks.
We estimated the composite score for each RIGA by calculating the weighted average sum of the normalised score across each parameter. (A detailed explanation of the normalisation methodology is provided in Annexure 2.) Finally, we selected for further analysis the 12 RIGAs with the highest overall score (see Table 2).
In addition to the RIGAs shortlisted using the above framework, we also included post-harvest processing as a key non-farm RIGA in our analysis. We chose to do so because (i) some of these RIGAs (and their equipment) are related to the crops we have considered in the farm sector; (ii) value chain losses from 'farm to fork' in India are estimated to be INR 92,000 crores annually (Ministry of Food Processing Industries 2016); (iii) since the feedstock for these activities is produced in rural areas, greater value addition in rural areas before goods are transported to consumer markets would improve rural incomes.
40
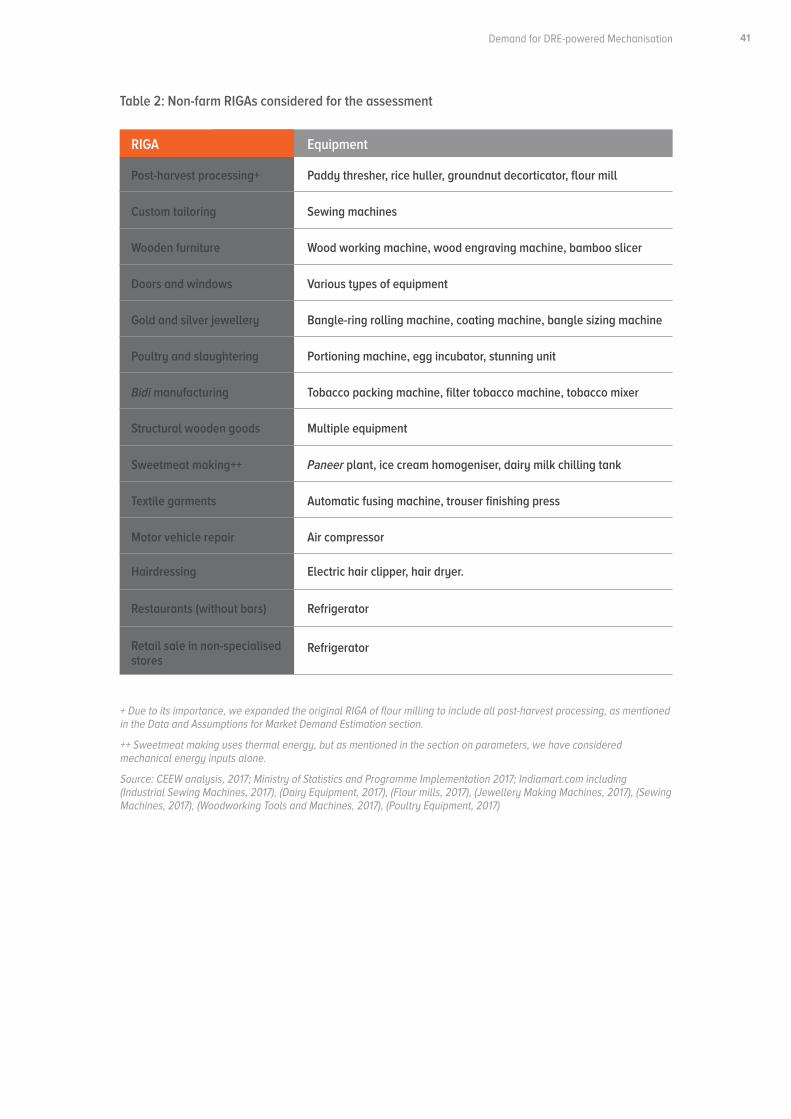
Executive Summary
Table 2: Non-farm RIGAs considered for the assessment
+ Due to its importance, we expanded the original RIGA of flour milling to include all post-harvest processing, as mentioned in the Data and Assumptions for Market Demand Estimation section.
++ Sweetmeat making uses thermal energy, but as mentioned in the section on parameters, we have considered mechanical energy inputs alone.
Source: CEEW analysis, 2017; Ministry of Statistics and Programme Implementation 2017; Indiamart.com including (Industrial Sewing Machines, 2017), (Dairy Equipment, 2017), (Flour mills, 2017), (Jewellery Making Machines, 2017), (Sewing Machines, 2017), (Woodworking Tools and Machines, 2017), (Poultry Equipment, 2017)
Post-harvest processing+
Custom tailoring
Wooden furniture
Doors and windows
Gold and silver jewellery
Poultry and slaughtering
Bidi manufacturing
Structural wooden goods
Sweetmeat making++
Textile garments
Motor vehicle repair
Hairdressing
Restaurants (without bars)
Retail sale in non-specialised stores
RIGA
Paddy thresher, rice huller, groundnut decorticator, flour mill
Sewing machines
Wood working machine, wood engraving machine, bamboo slicer
Various types of equipment
Bangle-ring rolling machine, coating machine, bangle sizing machine
Portioning machine, egg incubator, stunning unit
Tobacco packing machine, filter tobacco machine, tobacco mixer
Multiple equipment
Paneer plant, ice cream homogeniser, dairy milk chilling tank
Automatic fusing machine, trouser finishing press
Air compressor
Electric hair clipper, hair dryer.
Refrigerator
Refrigerator
Equipment
41Demand for DRE-powered Mechanisation
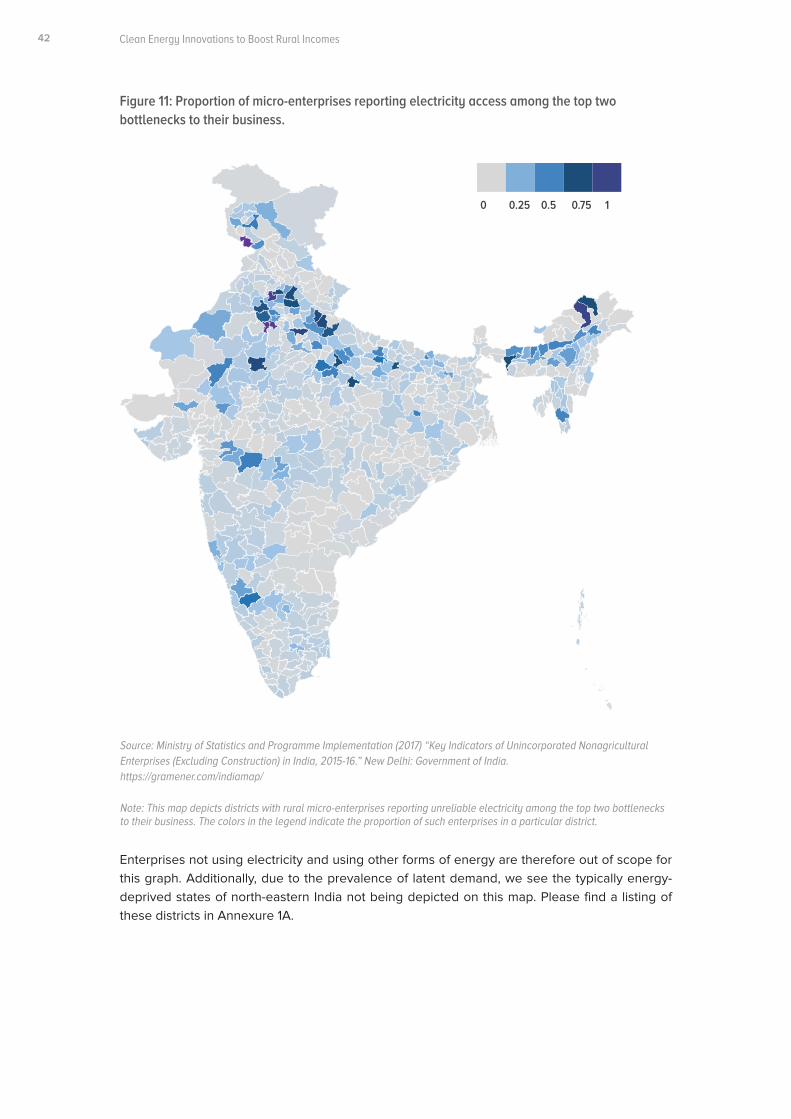
Clean Energy Innovations to Boost Rural Incomes
Figure 11: Proportion of micro-enterprises reporting electricity access among the top two bottlenecks to their business.
0 0.25 0.5 0.75 1
Note: This map depicts districts with rural micro-enterprises reporting unreliable electricity among the top two bottlenecks to their business. The colors in the legend indicate the proportion of such enterprises in a particular district.
Enterprises not using electricity and using other forms of energy are therefore out of scope for this graph. Additionally, due to the prevalence of latent demand, we see the typically energy-deprived states of north-eastern India not being depicted on this map. Please find a listing of these districts in Annexure 1A.
Source: Ministry of Statistics and Programme Implementation (2017) “Key Indicators of Unincorporated NonagriculturalEnterprises (Excluding Construction) in India, 2015-16.” New Delhi: Government of India.https://gramener.com/indiamap/
42
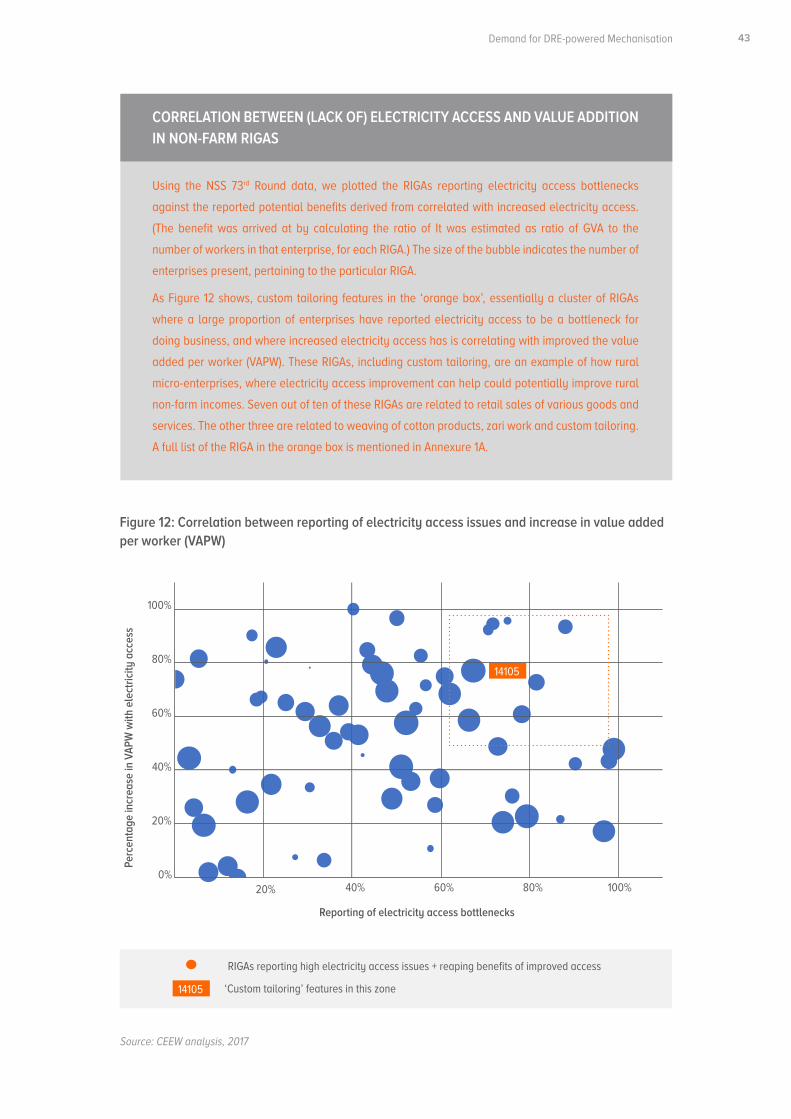
Executive Summary
Figure 12: Correlation between reporting of electricity access issues and increase in value added per worker (VAPW)
CORRELATION BETWEEN (LACK OF) ELECTRICITY ACCESS AND VALUE ADDITION IN NON-FARM RIGAS
Using the NSS 73rd Round data, we plotted the RIGAs reporting electricity access bottlenecks
against the reported potential benefits derived from correlated with increased electricity access.
(The benefit was arrived at by calculating the ratio of It was estimated as ratio of GVA to the
number of workers in that enterprise, for each RIGA.) The size of the bubble indicates the number of
enterprises present, pertaining to the particular RIGA.
As Figure 12 shows, custom tailoring features in the ‘orange box’, essentially a cluster of RIGAs
where a large proportion of enterprises have reported electricity access to be a bottleneck for
doing business, and where increased electricity access has is correlating with improved the value
added per worker (VAPW). These RIGAs, including custom tailoring, are an example of how rural
micro-enterprises, where electricity access improvement can help could potentially improve rural
non-farm incomes. Seven out of ten of these RIGAs are related to retail sales of various goods and
services. The other three are related to weaving of cotton products, zari work and custom tailoring.
A full list of the RIGA in the orange box is mentioned in Annexure 1A.
Source: CEEW analysis, 2017
Reporting of electricity access bottlenecks
0%
20%
20%
40%
40%
60%
60%
80%
80%
100%
100%
RIGAs reporting high electricity access issues + reaping benefits of improved access
‘Custom tailoring’ features in this zone
14105
14105
43Demand for DRE-powered Mechanisation
Perc
enta
ge in
crea
se in
VAP
W w
ith e
lect
ricity
acc
ess
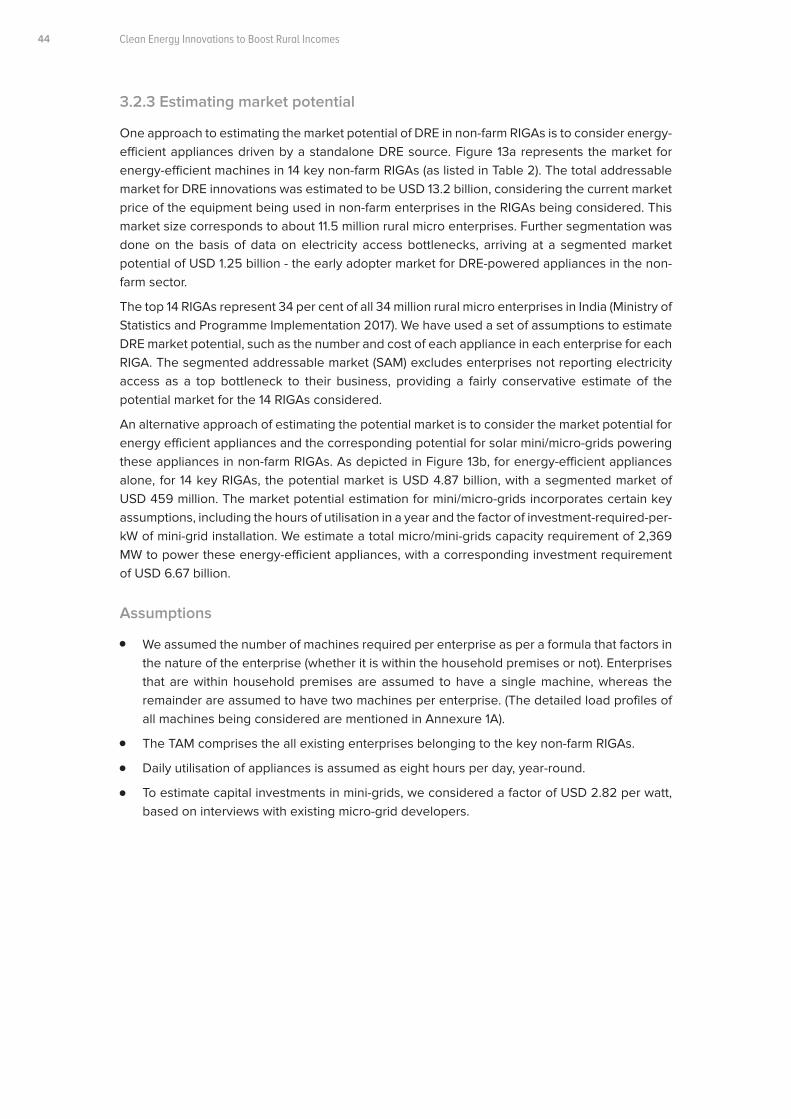
Clean Energy Innovations to Boost Rural Incomes
3.2.3 Estimating market potential
One approach to estimating the market potential of DRE in non-farm RIGAs is to consider energy-efficient appliances driven by a standalone DRE source. Figure 13a represents the market for energy-efficient machines in 14 key non-farm RIGAs (as listed in Table 2). The total addressable market for DRE innovations was estimated to be USD 13.2 billion, considering the current market price of the equipment being used in non-farm enterprises in the RIGAs being considered. This market size corresponds to about 11.5 million rural micro enterprises. Further segmentation was done on the basis of data on electricity access bottlenecks, arriving at a segmented market potential of USD 1.25 billion - the early adopter market for DRE-powered appliances in the non-farm sector.
The top 14 RIGAs represent 34 per cent of all 34 million rural micro enterprises in India (Ministry of Statistics and Programme Implementation 2017). We have used a set of assumptions to estimate DRE market potential, such as the number and cost of each appliance in each enterprise for each RIGA. The segmented addressable market (SAM) excludes enterprises not reporting electricity access as a top bottleneck to their business, providing a fairly conservative estimate of the potential market for the 14 RIGAs considered.
An alternative approach of estimating the potential market is to consider the market potential for energy efficient appliances and the corresponding potential for solar mini/micro-grids powering these appliances in non-farm RIGAs. As depicted in Figure 13b, for energy-efficient appliances alone, for 14 key RIGAs, the potential market is USD 4.87 billion, with a segmented market of USD 459 million. The market potential estimation for mini/micro-grids incorporates certain key assumptions, including the hours of utilisation in a year and the factor of investment-required-per-kW of mini-grid installation. We estimate a total micro/mini-grids capacity requirement of 2,369 MW to power these energy-efficient appliances, with a corresponding investment requirement of USD 6.67 billion.
Assumptions
44
We assumed the number of machines required per enterprise as per a formula that factors in the nature of the enterprise (whether it is within the household premises or not). Enterprises that are within household premises are assumed to have a single machine, whereas the remainder are assumed to have two machines per enterprise. (The detailed load profiles of all machines being considered are mentioned in Annexure 1A).
The TAM comprises the all existing enterprises belonging to the key non-farm RIGAs.
Daily utilisation of appliances is assumed as eight hours per day, year-round.
To estimate capital investments in mini-grids, we considered a factor of USD 2.82 per watt, based on interviews with existing micro-grid developers.
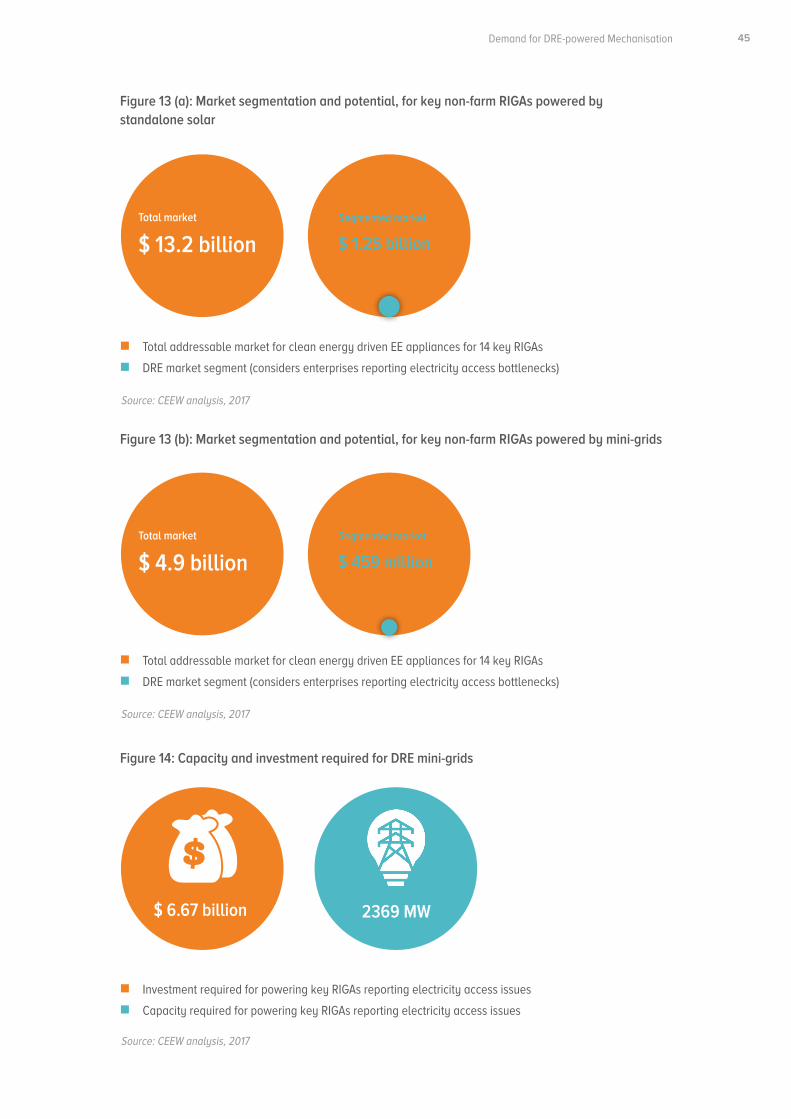
Executive Summary
Figure 13 (a): Market segmentation and potential, for key non-farm RIGAs powered by standalone solar
Figure 13 (b): Market segmentation and potential, for key non-farm RIGAs powered by mini-grids
Figure 14: Capacity and investment required for DRE mini-grids
Source: CEEW analysis, 2017
Source: CEEW analysis, 2017
Source: CEEW analysis, 2017
Total addressable market for clean energy driven EE appliances for 14 key RIGAs
Total addressable market for clean energy driven EE appliances for 14 key RIGAs
Investment required for powering key RIGAs reporting electricity access issues
DRE market segment (considers enterprises reporting electricity access bottlenecks)
DRE market segment (considers enterprises reporting electricity access bottlenecks)
Capacity required for powering key RIGAs reporting electricity access issues
Total market
$ 13.2 billion
Total market
$ 4.9 billionSegmented market
$ 459 million
Segmented market
$ 1.25 billion
$$ 6.67 billion 2369 MW
45Demand for DRE-powered Mechanisation
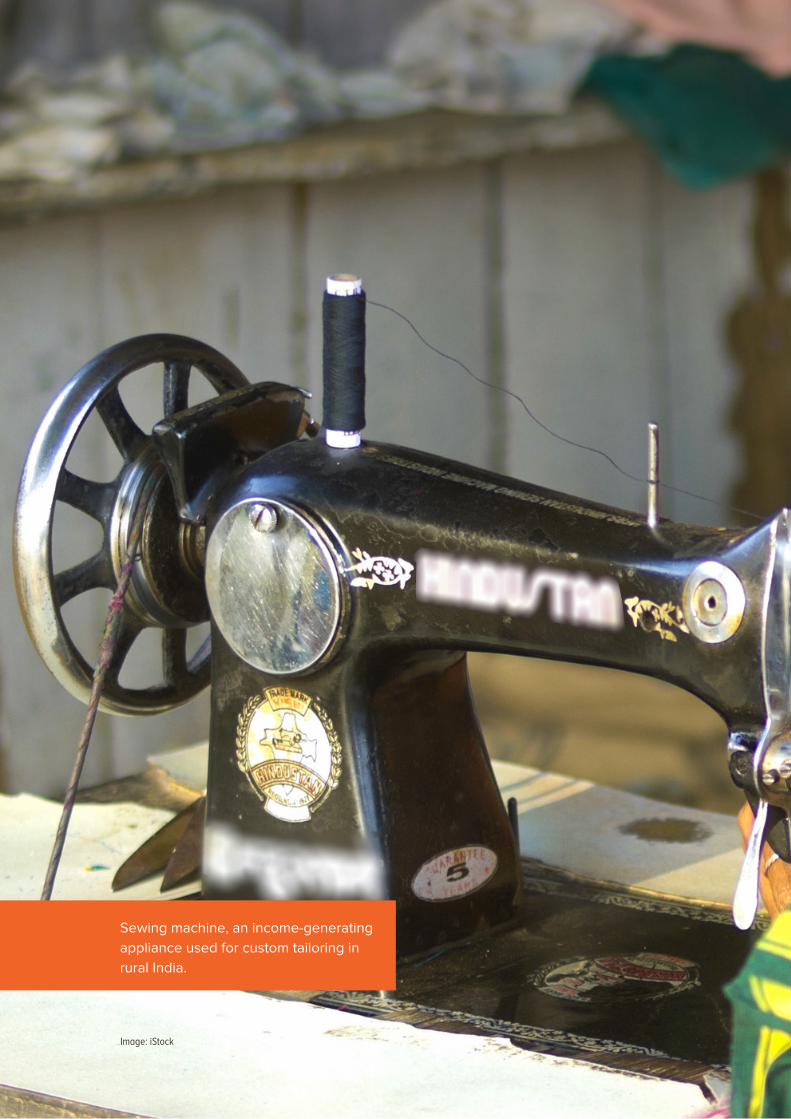
Clean Energy Innovations to Boost Rural Incomes
Image: iStock
Sewing machine, an income-generating appliance used for custom tailoring in rural India.
Executive Summary
4. DRE-powered Innovations for Productive Use
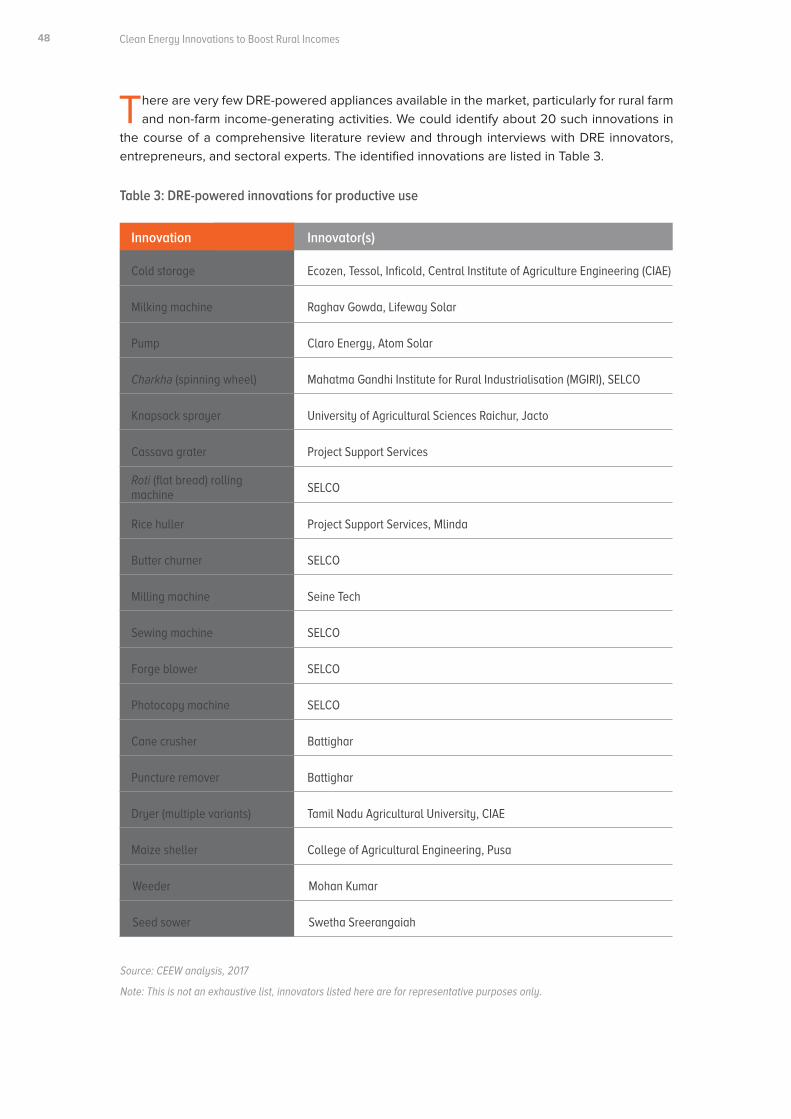
Clean Energy Innovations to Boost Rural Incomes
There are very few DRE-powered appliances available in the market, particularly for rural farm and non-farm income-generating activities. We could identify about 20 such innovations in
the course of a comprehensive literature review and through interviews with DRE innovators, entrepreneurs, and sectoral experts. The identified innovations are listed in Table 3.
Table 3: DRE-powered innovations for productive use
Source: CEEW analysis, 2017
Note: This is not an exhaustive list, innovators listed here are for representative purposes only.
Cold storage
Milking machine
Pump
Charkha (spinning wheel)
Knapsack sprayer
Cassava grater
Roti (flat bread) rolling machine
Rice huller
Butter churner
Milling machine
Sewing machine
Forge blower
Photocopy machine
Cane crusher
Puncture remover
Dryer (multiple variants)
Maize sheller
Weeder
Seed sower
Innovation
Ecozen, Tessol, Inficold, Central Institute of Agriculture Engineering (CIAE)
Raghav Gowda, Lifeway Solar
Claro Energy, Atom Solar
Mahatma Gandhi Institute for Rural Industrialisation (MGIRI), SELCO
University of Agricultural Sciences Raichur, Jacto
Project Support Services
SELCO
Project Support Services, Mlinda
SELCO
Seine Tech
SELCO
SELCO
SELCO
Battighar
Battighar
Tamil Nadu Agricultural University, CIAE
College of Agricultural Engineering, Pusa
Mohan Kumar
Swetha Sreerangaiah
Innovator(s)
48
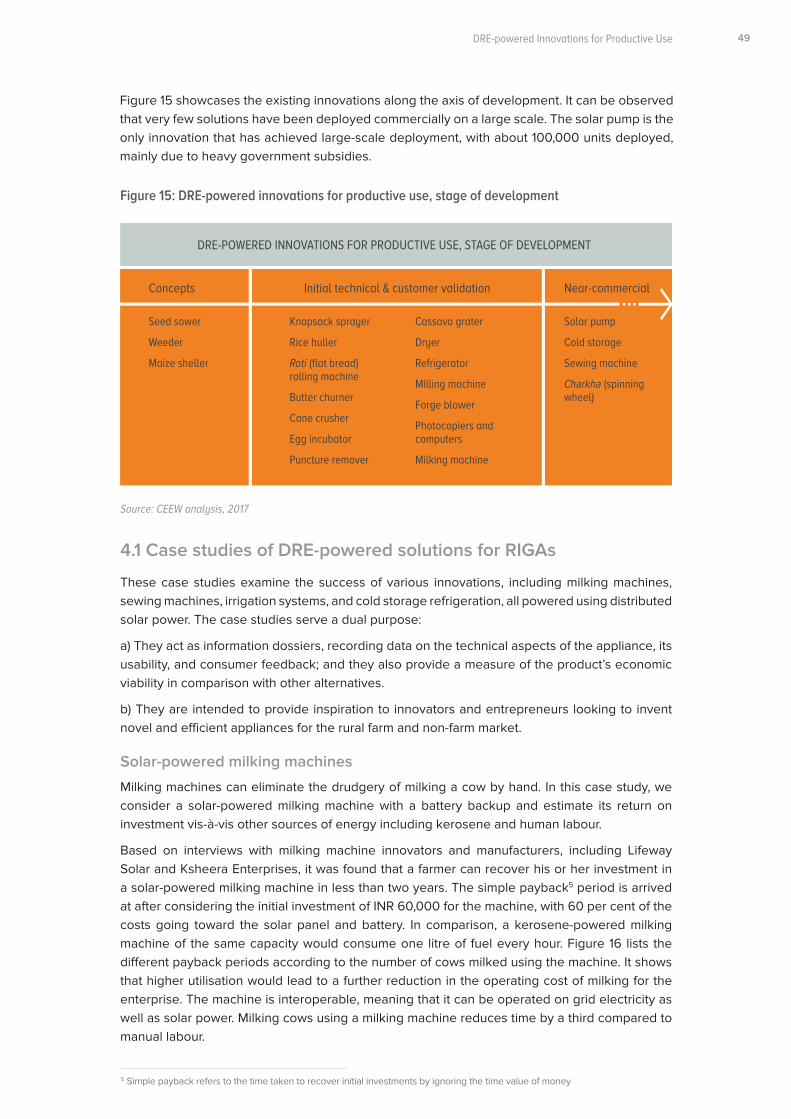
Executive Summary
Figure 15 showcases the existing innovations along the axis of development. It can be observed that very few solutions have been deployed commercially on a large scale. The solar pump is the only innovation that has achieved large-scale deployment, with about 100,000 units deployed, mainly due to heavy government subsidies.
4.1 Case studies of DRE-powered solutions for RIGAs
These case studies examine the success of various innovations, including milking machines, sewing machines, irrigation systems, and cold storage refrigeration, all powered using distributed solar power. The case studies serve a dual purpose:
a) They act as information dossiers, recording data on the technical aspects of the appliance, its usability, and consumer feedback; and they also provide a measure of the product’s economic viability in comparison with other alternatives.
b) They are intended to provide inspiration to innovators and entrepreneurs looking to invent novel and efficient appliances for the rural farm and non-farm market.
Solar-powered milking machines
Milking machines can eliminate the drudgery of milking a cow by hand. In this case study, we consider a solar-powered milking machine with a battery backup and estimate its return on investment vis-à-vis other sources of energy including kerosene and human labour.
Based on interviews with milking machine innovators and manufacturers, including Lifeway Solar and Ksheera Enterprises, it was found that a farmer can recover his or her investment in a solar-powered milking machine in less than two years. The simple payback5 period is arrived at after considering the initial investment of INR 60,000 for the machine, with 60 per cent of the costs going toward the solar panel and battery. In comparison, a kerosene-powered milking machine of the same capacity would consume one litre of fuel every hour. Figure 16 lists the different payback periods according to the number of cows milked using the machine. It shows that higher utilisation would lead to a further reduction in the operating cost of milking for the enterprise. The machine is interoperable, meaning that it can be operated on grid electricity as well as solar power. Milking cows using a milking machine reduces time by a third compared to manual labour.
5 Simple payback refers to the time taken to recover initial investments by ignoring the time value of money
Figure 15: DRE-powered innovations for productive use, stage of development
Source: CEEW analysis, 2017
DRE-POWERED INNOVATIONS FOR PRODUCTIVE USE, STAGE OF DEVELOPMENT
Seed sower
Weeder
Maize sheller
Knapsack sprayer
Rice huller
Roti (flat bread) rolling machine
Butter churner
Cane crusher
Egg incubator
Puncture remover
Cassava grater
Dryer
Refrigerator
Milling machine
Forge blower
Photocopiers and computers
Milking machine
Solar pump
Cold storage
Sewing machine
Charkha (spinning wheel)
Concepts Initial technical & customer validation Near-commercial
49DRE-powered Innovations for Productive Use
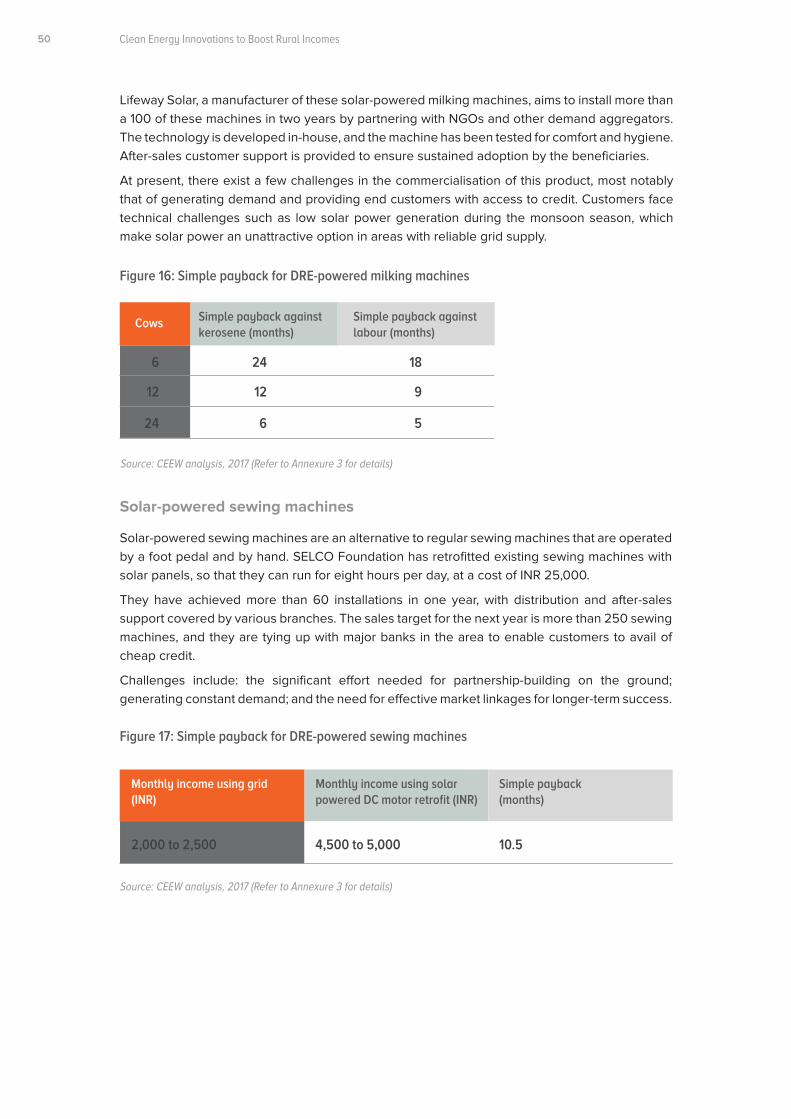
Clean Energy Innovations to Boost Rural Incomes
Solar-powered sewing machines
Solar-powered sewing machines are an alternative to regular sewing machines that are operated by a foot pedal and by hand. SELCO Foundation has retrofitted existing sewing machines with solar panels, so that they can run for eight hours per day, at a cost of INR 25,000.
They have achieved more than 60 installations in one year, with distribution and after-sales support covered by various branches. The sales target for the next year is more than 250 sewing machines, and they are tying up with major banks in the area to enable customers to avail of cheap credit.
Challenges include: the significant effort needed for partnership-building on the ground; generating constant demand; and the need for effective market linkages for longer-term success.
Lifeway Solar, a manufacturer of these solar-powered milking machines, aims to install more than a 100 of these machines in two years by partnering with NGOs and other demand aggregators. The technology is developed in-house, and the machine has been tested for comfort and hygiene. After-sales customer support is provided to ensure sustained adoption by the beneficiaries.
At present, there exist a few challenges in the commercialisation of this product, most notably that of generating demand and providing end customers with access to credit. Customers face technical challenges such as low solar power generation during the monsoon season, which make solar power an unattractive option in areas with reliable grid supply.
Figure 16: Simple payback for DRE-powered milking machines
Figure 17: Simple payback for DRE-powered sewing machines
Source: CEEW analysis, 2017 (Refer to Annexure 3 for details)
Source: CEEW analysis, 2017 (Refer to Annexure 3 for details)
6
2,000 to 2,500
12
24
Cows
Monthly income using grid (INR)
24
4,500 to 5,000
18
10.5
12 9
6 5
Simple payback against kerosene (months)
Monthly income using solar powered DC motor retrofit (INR)
Simple payback against labour (months)
Simple payback (months)
50
Executive Summary
Solar-powered irrigation systems (SPIS)
Solar-powered irrigation systems have achieved a relatively higher penetration among farmers compared to other DRE-powered innovations. India is the world’s leading country in terms of solar pumps deployment with a current deployment of 150,000 (as of December 2017). Individual solar pump prices range from INR 85,000 to INR 100,000 per horsepower, whereas a conventional pump of a similar size can be purchased for ten times less. However, the operating cost of solar pumps is low, and several studies conclude that from a lifecycle cost perspective, solar pumps are better for farmers than diesel pumps (Agrawal and Jain, 2015).
Some studies have looked at various deployment approaches for SPIS and concluded that multiple business models and novel financial instruments need to be tested in different geographies to arrive at the most cost-optimal and sustainable SPIS solution for every region (Raymond & Jain, 2017). For instance, models such as pumping-as-a-service would allow farmers to overcome the upfront cost. Financial instruments such as interest rate subvention could prove to be more useful in accelerating rapid deployment of pumps as opposed to capital subsidy on upfront cost. Another study in Uttar Pradesh shed light on farmers’ perspectives on renting vs owning farming technology, current irrigation practices, solar-based irrigation systems, and sources of financing (Jain and Shahidi 2018). For the enterprises in the sector, one of the biggest challenges is to develop and validate innovative business models without reliance on subsidy, which could compete with subsidised grid electricity.
Solar-powered cold storage
Several companies such as Tessol, Inficold, and Ecozen have made forays into the cold storage business with varying scales of deployment over different geographies. Farmers are mostly using cold storage systems for storing milk and horticultural produce - horticulture includes produce such as potatoes, mangoes, and baby corn, mainly catering to large retailers such as Walmart and Reliance Fresh, or the export market. These units are mainly being used by aggregators of produce, including online retailers, small wholesalers, and FPOs.
The addition of solar increases the cost of cold storage by at least 4 times, which is probably the biggest deterrent to deployment and the adoption of solar-powered cold storage. So far, mostly farmers with strong market linkages have been able to afford these solutions. Like solar pumps, cold storage solutions are also supported by subsidies from various ministries. For instance, the Ministry of Food Processing Industries offers support through open ended credit linked schemes, while the Ministry of New and Renewable Energy provides capital subsidy on the product.
Enterprises in this sector agree that there is a need for longer, more strategic pilot projects to establish the market for DRE-powered cold storage. These pilots need to focus on proving business models by considering factors such as appropriate sizing of the cold storage based on farmers’ need, extent of asset sharing, adequate market linkages & demand, willingness to pay from farmers, novel financial instruments for end-user financing, and conducive policy mechanisms that promote end-to-end cold chains.
FOR THE ENTERPRISES IN
THE SECTOR, ONE OF THE
BIGGEST CHALLENGES IS
TO DEVELOP AND VALIDATE
INNOVATIVE BUSINESS
MODELS WITHOUT
RELIANCE ON SUBSIDY,
WHICH COULD COMPETE
WITH SUBSIDISED GRID
ELECTRICITY
51DRE-powered Innovations for Productive Use
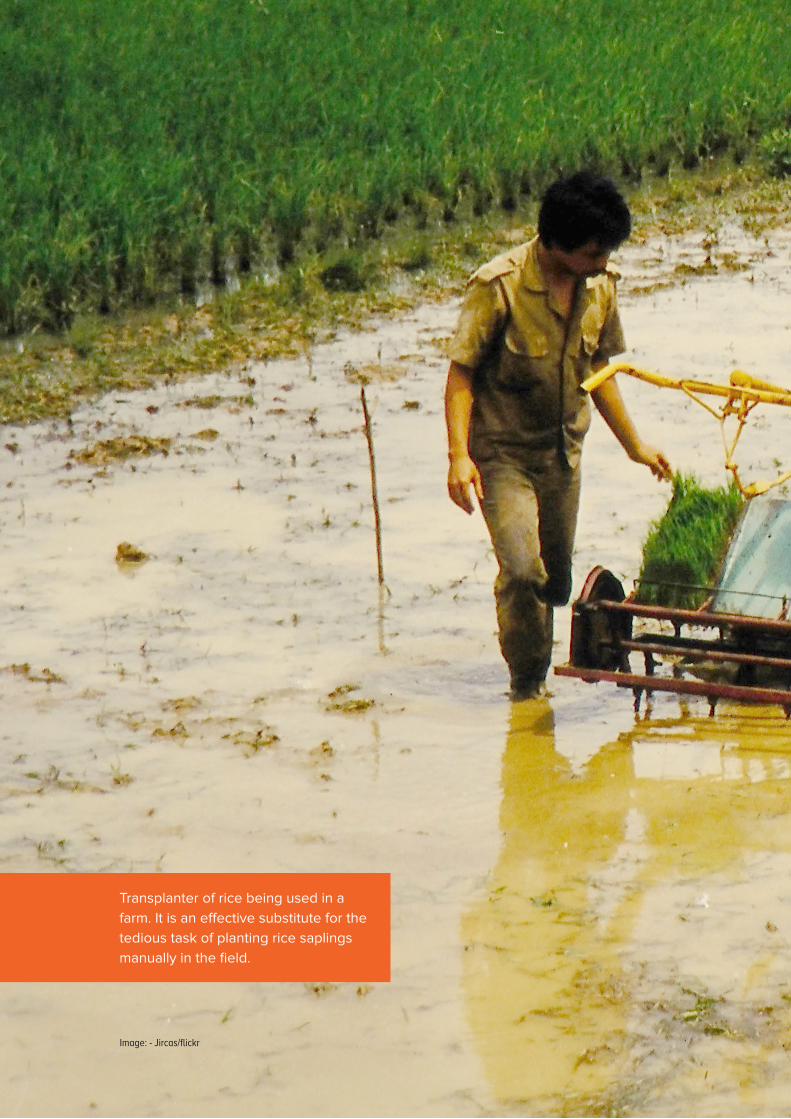
Clean Energy Innovations to Boost Rural Incomes
Image: - Jircas/flickr
Transplanter of rice being used in a farm. It is an effective substitute for the tedious task of planting rice saplings manually in the field.
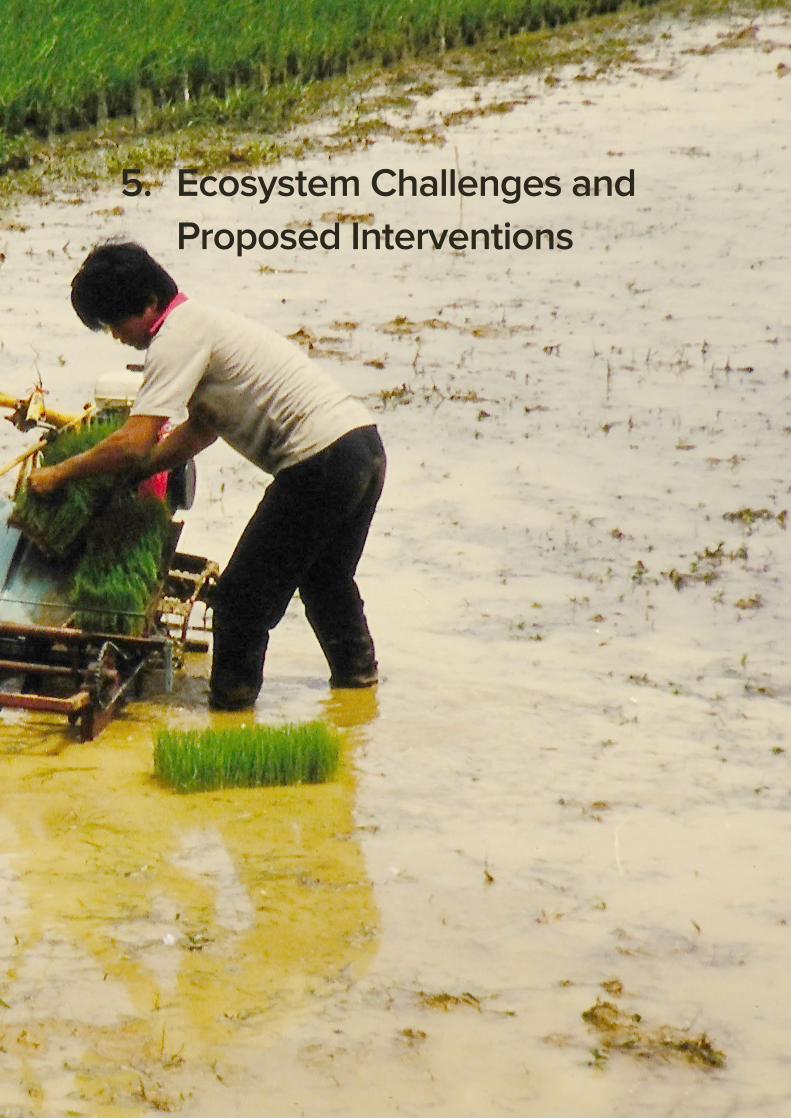
Executive Summary
5. Ecosystem Challenges and Proposed Interventions
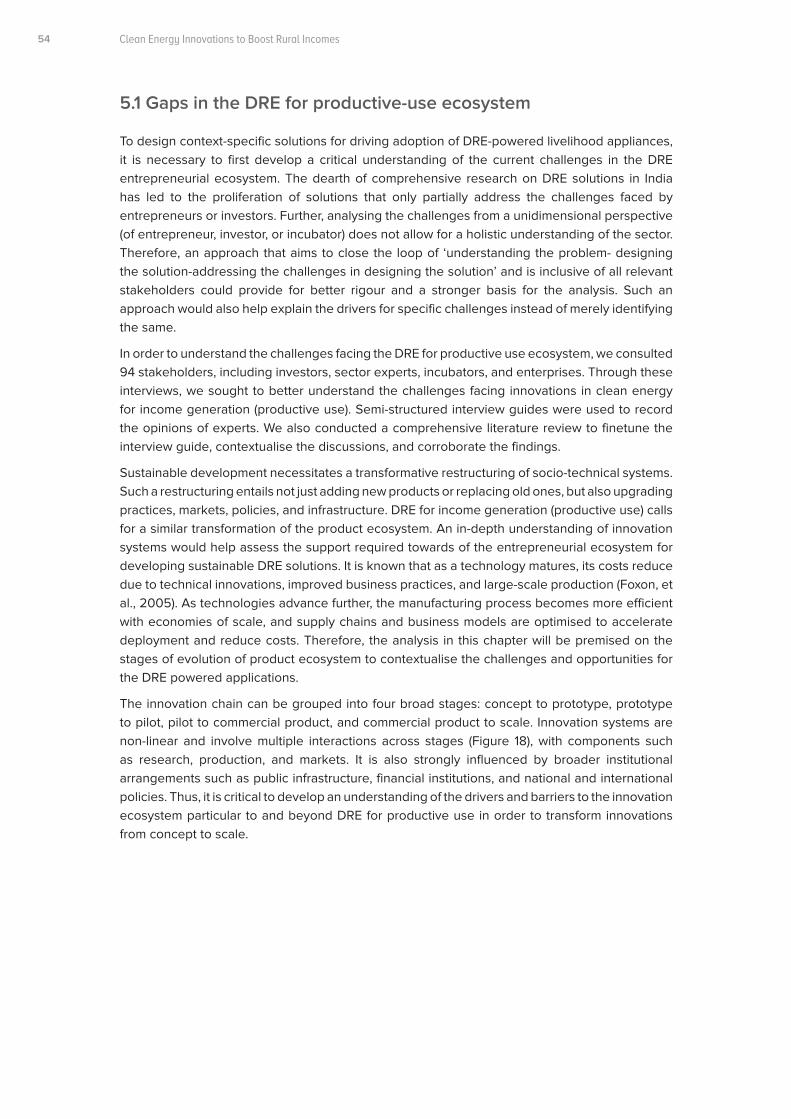
Clean Energy Innovations to Boost Rural Incomes
5.1 Gaps in the DRE for productive-use ecosystem
To design context-specific solutions for driving adoption of DRE-powered livelihood appliances, it is necessary to first develop a critical understanding of the current challenges in the DRE entrepreneurial ecosystem. The dearth of comprehensive research on DRE solutions in India has led to the proliferation of solutions that only partially address the challenges faced by entrepreneurs or investors. Further, analysing the challenges from a unidimensional perspective (of entrepreneur, investor, or incubator) does not allow for a holistic understanding of the sector. Therefore, an approach that aims to close the loop of ‘understanding the problem- designing the solution-addressing the challenges in designing the solution’ and is inclusive of all relevant stakeholders could provide for better rigour and a stronger basis for the analysis. Such an approach would also help explain the drivers for specific challenges instead of merely identifying the same.
In order to understand the challenges facing the DRE for productive use ecosystem, we consulted 94 stakeholders, including investors, sector experts, incubators, and enterprises. Through these interviews, we sought to better understand the challenges facing innovations in clean energy for income generation (productive use). Semi-structured interview guides were used to record the opinions of experts. We also conducted a comprehensive literature review to finetune the interview guide, contextualise the discussions, and corroborate the findings.
Sustainable development necessitates a transformative restructuring of socio-technical systems. Such a restructuring entails not just adding new products or replacing old ones, but also upgrading practices, markets, policies, and infrastructure. DRE for income generation (productive use) calls for a similar transformation of the product ecosystem. An in-depth understanding of innovation systems would help assess the support required towards of the entrepreneurial ecosystem for developing sustainable DRE solutions. It is known that as a technology matures, its costs reduce due to technical innovations, improved business practices, and large-scale production (Foxon, et al., 2005). As technologies advance further, the manufacturing process becomes more efficient with economies of scale, and supply chains and business models are optimised to accelerate deployment and reduce costs. Therefore, the analysis in this chapter will be premised on the stages of evolution of product ecosystem to contextualise the challenges and opportunities for the DRE powered applications.
The innovation chain can be grouped into four broad stages: concept to prototype, prototype to pilot, pilot to commercial product, and commercial product to scale. Innovation systems are non-linear and involve multiple interactions across stages (Figure 18), with components such as research, production, and markets. It is also strongly influenced by broader institutional arrangements such as public infrastructure, financial institutions, and national and international policies. Thus, it is critical to develop an understanding of the drivers and barriers to the innovation ecosystem particular to and beyond DRE for productive use in order to transform innovations from concept to scale.
54
Executive Summary
5.1.1 Concept to prototype
Biggest challenges
Lack of high-risk capital, limited support infrastructure, poor incentives for increasing energy efficiency, lack of policy clarity, and a dearth of role models.
The lack of financial support in the pre-incubation stages for the development of ideas into prototypes is a big deterrent for innovators. Given the high-risk nature of the product development process, there is a dire need for capital grants from philanthropic and public funds. Incubators such as the Centre for Innovation Incubation and Entrepreneurship and Villgro provide support to entrepreneurs from the development stage to formulating marketing strategies. However, very few clean energy entrepreneurs are supported by these incubators given their mandate to support entrepreneurs across sectors. This is because of a preference for entrepreneurs working in established sectors over an underdeveloped sector such as DRE for productive use. Also, the longer gestation period (especially compared to software and internet products) for the realisation of a DRE-powered innovation into a prototype puts off prospective early-stage investors.
Figure 18: The stages of product development
Source: CEEW analysis, 2017
The Department of Science and Technology, Government of India, has set up the National
Initiative for Developing and Harnessing Innovations (NIDHI) for nurturing an innovation-driven
entrepreneurial ecosystem for social development. In order to ameliorate the profound lack of
support for early-stage prototyping in India, NIDHI launched a programme in 2016 - PRomoting
and Accelerating Young and ASpiring technology entrepreneurs (PRAYAS) - which looks to support
young innovators in turning their ideas into proof-of-concepts. The programme is sector-agnostic.
Every year, ten innovators are supported with a grant of INR 10 lakhs (USD 15,600) to develop
a prototype of their idea. Our interviews indicate that the key challenge for entrepreneurs is
transforming quality products into affordable, economically viable solutions, in order to secure
follow-on funding from private investors, including venture capitalists. Further, the long gestation
period for product development results in fewer entrepreneurs entering this space.
Concept to prototype
Prototype to pilot
Pilot to commercial product
Commercial product to scale
55Ecosystem Challenges and Proposed Interventions
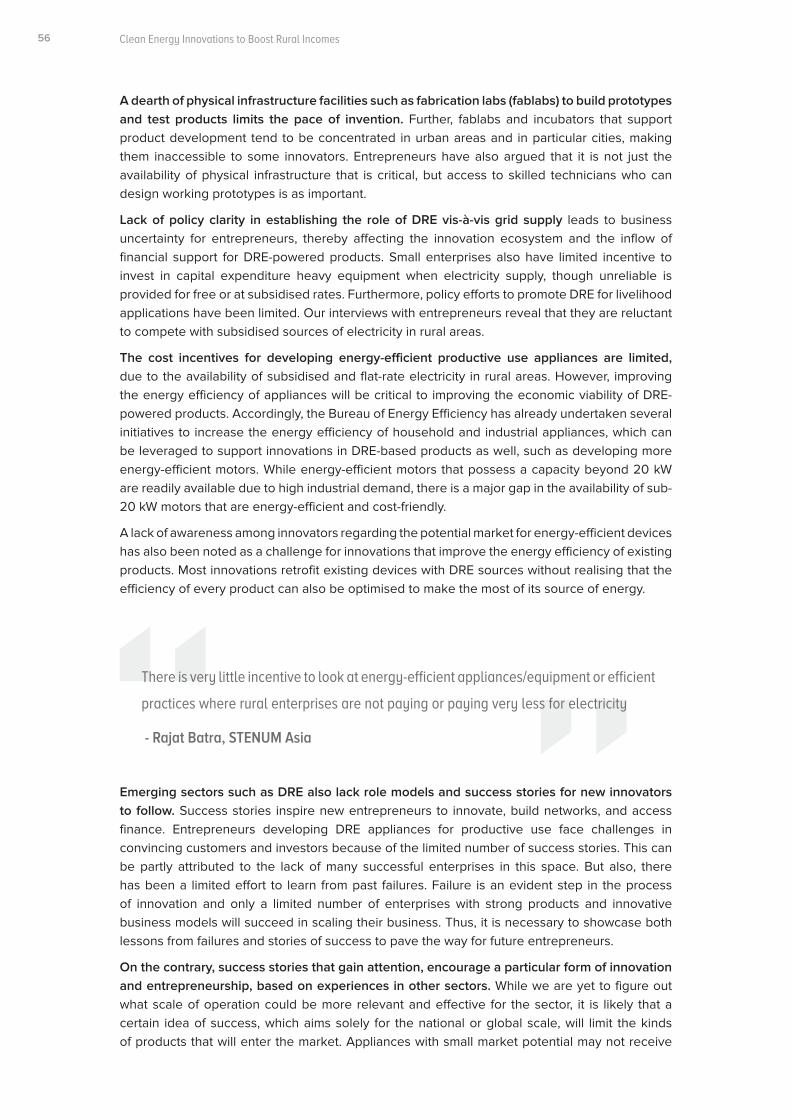
Clean Energy Innovations to Boost Rural Incomes
A dearth of physical infrastructure facilities such as fabrication labs (fablabs) to build prototypes and test products limits the pace of invention. Further, fablabs and incubators that support product development tend to be concentrated in urban areas and in particular cities, making them inaccessible to some innovators. Entrepreneurs have also argued that it is not just the availability of physical infrastructure that is critical, but access to skilled technicians who can design working prototypes is as important.
Lack of policy clarity in establishing the role of DRE vis-à-vis grid supply leads to business uncertainty for entrepreneurs, thereby affecting the innovation ecosystem and the inflow of financial support for DRE-powered products. Small enterprises also have limited incentive to invest in capital expenditure heavy equipment when electricity supply, though unreliable is provided for free or at subsidised rates. Furthermore, policy efforts to promote DRE for livelihood applications have been limited. Our interviews with entrepreneurs reveal that they are reluctant to compete with subsidised sources of electricity in rural areas.
The cost incentives for developing energy-efficient productive use appliances are limited, due to the availability of subsidised and flat-rate electricity in rural areas. However, improving the energy efficiency of appliances will be critical to improving the economic viability of DRE-powered products. Accordingly, the Bureau of Energy Efficiency has already undertaken several initiatives to increase the energy efficiency of household and industrial appliances, which can be leveraged to support innovations in DRE-based products as well, such as developing more energy-efficient motors. While energy-efficient motors that possess a capacity beyond 20 kW are readily available due to high industrial demand, there is a major gap in the availability of sub-20 kW motors that are energy-efficient and cost-friendly.
A lack of awareness among innovators regarding the potential market for energy-efficient devices has also been noted as a challenge for innovations that improve the energy efficiency of existing products. Most innovations retrofit existing devices with DRE sources without realising that the efficiency of every product can also be optimised to make the most of its source of energy.
Emerging sectors such as DRE also lack role models and success stories for new innovators to follow. Success stories inspire new entrepreneurs to innovate, build networks, and access finance. Entrepreneurs developing DRE appliances for productive use face challenges in convincing customers and investors because of the limited number of success stories. This can be partly attributed to the lack of many successful enterprises in this space. But also, there has been a limited effort to learn from past failures. Failure is an evident step in the process of innovation and only a limited number of enterprises with strong products and innovative business models will succeed in scaling their business. Thus, it is necessary to showcase both lessons from failures and stories of success to pave the way for future entrepreneurs.
On the contrary, success stories that gain attention, encourage a particular form of innovation and entrepreneurship, based on experiences in other sectors. While we are yet to figure out what scale of operation could be more relevant and effective for the sector, it is likely that a certain idea of success, which aims solely for the national or global scale, will limit the kinds of products that will enter the market. Appliances with small market potential may not receive
There is very little incentive to look at energy-efficient appliances/equipment or efficient
practices where rural enterprises are not paying or paying very less for electricity
- Rajat Batra, STENUM Asia
56
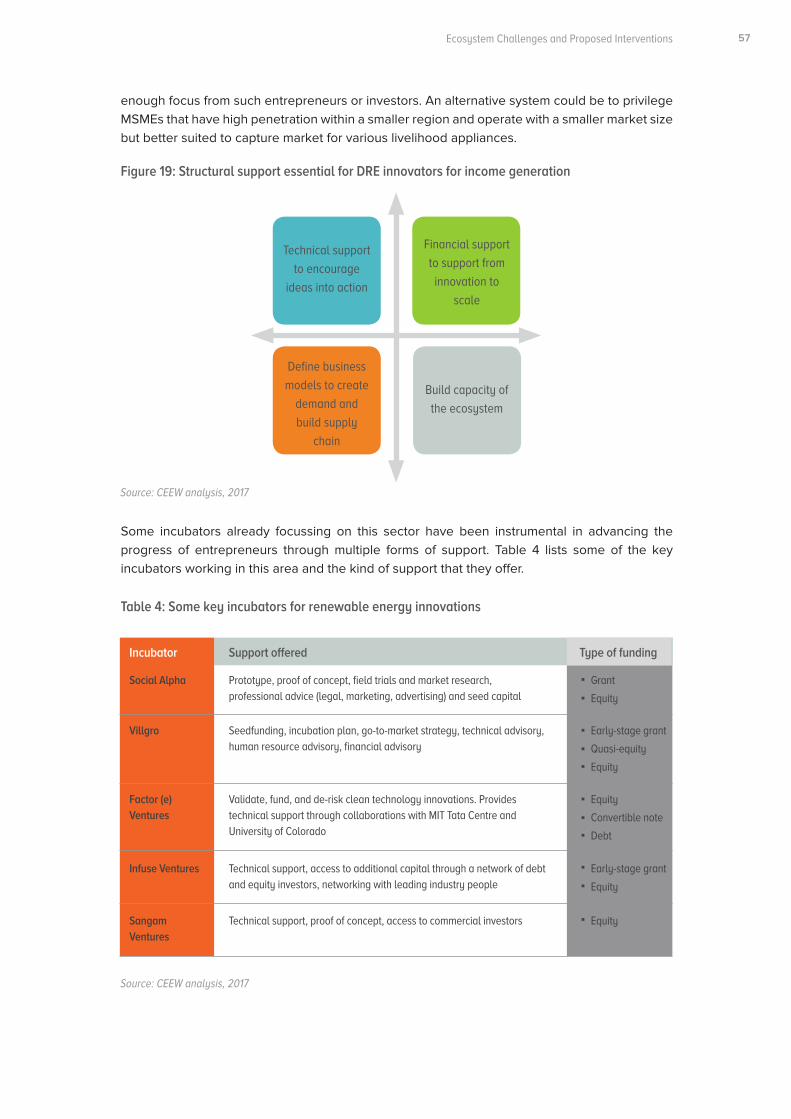
Executive Summary
enough focus from such entrepreneurs or investors. An alternative system could be to privilege MSMEs that have high penetration within a smaller region and operate with a smaller market size but better suited to capture market for various livelihood appliances.
Some incubators already focussing on this sector have been instrumental in advancing the progress of entrepreneurs through multiple forms of support. Table 4 lists some of the key incubators working in this area and the kind of support that they offer.
Figure 19: Structural support essential for DRE innovators for income generation
Table 4: Some key incubators for renewable energy innovations
Source: CEEW analysis, 2017
Source: CEEW analysis, 2017
Technical support
to encourage
ideas into action
Define business
models to create
demand and
build supply
chain
Build capacity of
the ecosystem
Financial support
to support from
innovation to
scale
Incubator Type of funding
Social Alpha Grant
Equity
Early-stage grant
Quasi-equity
Equity
Equity
Convertible note
Debt
Early-stage grant
Equity
Equity
Infuse Ventures
Prototype, proof of concept, field trials and market research, professional advice (legal, marketing, advertising) and seed capital
Technical support, access to additional capital through a network of debt and equity investors, networking with leading industry people
Seedfunding, incubation plan, go-to-market strategy, technical advisory, human resource advisory, financial advisory
Technical support, proof of concept, access to commercial investors
Validate, fund, and de-risk clean technology innovations. Provides technical support through collaborations with MIT Tata Centre and University of Colorado
Villgro
Sangam Ventures
Factor (e) Ventures
Support offered
57Ecosystem Challenges and Proposed Interventions
Clean Energy Innovations to Boost Rural Incomes
5.1.2 Prototype to pilot
Biggest challenges
Lack of adequate knowledge of valuation of technology, lack of industry collaboration, lack of skilled professionals.
Entrepreneurs and government institutions lack adequate knowledge of valuation of new products and enterprises. This limits their ability to assess the market potential of an innovation and attract capital from financiers. Early-stage entrepreneurs may not have the skills nor the knowledge to value their innovations appropriately. Valuation is a challenge for many technical institutions in India, when it comes to setting a price for the transfer of technology. Government institutions such as the Rural Technology Action Group (RuTAG), Mahatma Gandhi Institute for Rural Industrialisation (MGIRI), and Central Institute of Agriculture Engineering (CIAE) have developed several innovative products that can help farmers and small businesses to mechanise their operations through renewable energy. However, these institutions face difficulties in commercialising their products on account of two reasons: 1) the lack of a strong mandate and an effective mechanism for technology transfer; 2) lack of guidelines to evaluate potential innovations for technology transfer. These institutions lack the professional capacity to estimate the market potential of a product and to adequately value it. Further, these institutions lack a definitive mandate to facilitate the smooth transfer of technology from innovation to commercialisation. Although Kisan Vigyan Kendras (KVKs) are designed to be the frontline points of contact of agricultural universities and can facilitate the dissemination of viable technology, they lack the ability to estimate the market potential of a product.
Very recently, the International Fund for Agricultural Development (IFAD) proposed a collaboration with the Indian Council for Agricultural Research (ICAR) to scale up the commercialisation of selected renewable energy technologies (RETs) in agriculture for marginal and small farm holders. ICAR was interested in taking existing RET prototypes developed by their institutes and having farmers test them under IFAD-supported projects so that they can be deployed at scale at a later stage. Such collaborations would allow government institutions to get a better sense of the market demand for their innovations and will also enable them to estimate their market potential. Farmers’ willingness to adopt and pay for these products could provide a basis to assess the potential demand of similar products in future.
Collaborations with industry has been limited, especially for smaller entrepreneurs. Experts have suggested that collaborating with the manufacturing sector can help in improving the design and efficiency of products, making them more commercially viable. Collaborations between industry associations and innovators and entrepreneurs can also help in building more sustainable business models by allowing for a more accurate estimation of the market potential of the product, as well as by guiding research on the willingness of consumers to pay for these products. However, for entrepreneurs in this space, access to collaborations with industry has been limited. Some notable examples include a partnership between Crompton Greaves with the energy technology company Cygni. The collaboration was incubated at IIT-Madras and aimed to deploy energy-efficient fans compatible with solar home systems. Another example is an MoU signed between the Confederation of Indian Industry and the Council on Scientific and Industrial Research (CSIR) for the commercialisation of more than 640 technology processes and products available with 38 labs across India, under the aegis of CSIR (The Hindu Business Line, 2017).
Innovators are not always skilled at all pertinent business functions. While innovators have the technical expertise, many are not adept at skills such as marketing, strategy, or finance. Incubators do provide support for innovators-turned-entrepreneurs to learn some of these skills. However, in the long run, entrepreneurs must have a strong team with diverse skills to run their
58
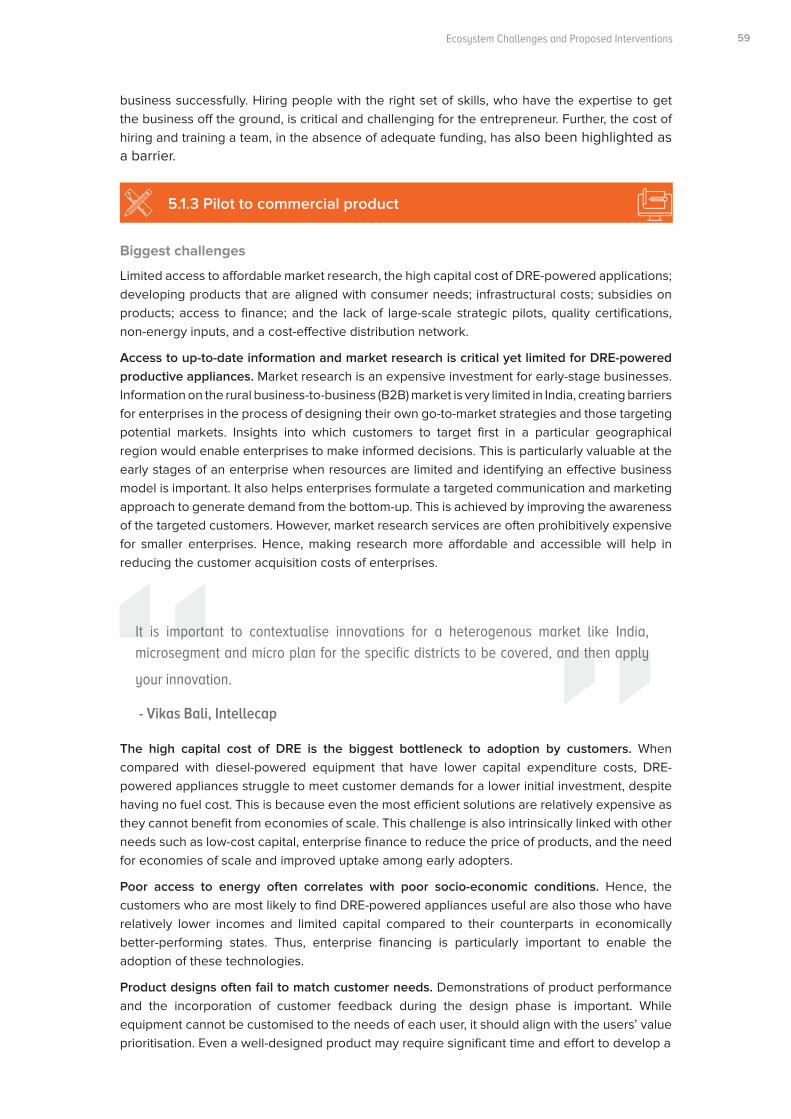
Executive Summary
It is important to contextualise innovations for a heterogenous market like India, microsegment and micro plan for the specific districts to be covered, and then apply
your innovation.
- Vikas Bali, Intellecap
5.1.3 Pilot to commercial product
Biggest challenges
Limited access to affordable market research, the high capital cost of DRE-powered applications; developing products that are aligned with consumer needs; infrastructural costs; subsidies on products; access to finance; and the lack of large-scale strategic pilots, quality certifications, non-energy inputs, and a cost-effective distribution network.
Access to up-to-date information and market research is critical yet limited for DRE-powered productive appliances. Market research is an expensive investment for early-stage businesses. Information on the rural business-to-business (B2B) market is very limited in India, creating barriers for enterprises in the process of designing their own go-to-market strategies and those targeting potential markets. Insights into which customers to target first in a particular geographical region would enable enterprises to make informed decisions. This is particularly valuable at the early stages of an enterprise when resources are limited and identifying an effective business model is important. It also helps enterprises formulate a targeted communication and marketing approach to generate demand from the bottom-up. This is achieved by improving the awareness of the targeted customers. However, market research services are often prohibitively expensive for smaller enterprises. Hence, making research more affordable and accessible will help in reducing the customer acquisition costs of enterprises.
The high capital cost of DRE is the biggest bottleneck to adoption by customers. When compared with diesel-powered equipment that have lower capital expenditure costs, DRE-powered appliances struggle to meet customer demands for a lower initial investment, despite having no fuel cost. This is because even the most efficient solutions are relatively expensive as they cannot benefit from economies of scale. This challenge is also intrinsically linked with other needs such as low-cost capital, enterprise finance to reduce the price of products, and the need for economies of scale and improved uptake among early adopters.
Poor access to energy often correlates with poor socio-economic conditions. Hence, the customers who are most likely to find DRE-powered appliances useful are also those who have relatively lower incomes and limited capital compared to their counterparts in economically better-performing states. Thus, enterprise financing is particularly important to enable the adoption of these technologies.
Product designs often fail to match customer needs. Demonstrations of product performance and the incorporation of customer feedback during the design phase is important. While equipment cannot be customised to the needs of each user, it should align with the users’ value prioritisation. Even a well-designed product may require significant time and effort to develop a
business successfully. Hiring people with the right set of skills, who have the expertise to get the business off the ground, is critical and challenging for the entrepreneur. Further, the cost of hiring and training a team, in the absence of adequate funding, has also been highlighted as a barrier.
59Ecosystem Challenges and Proposed Interventions
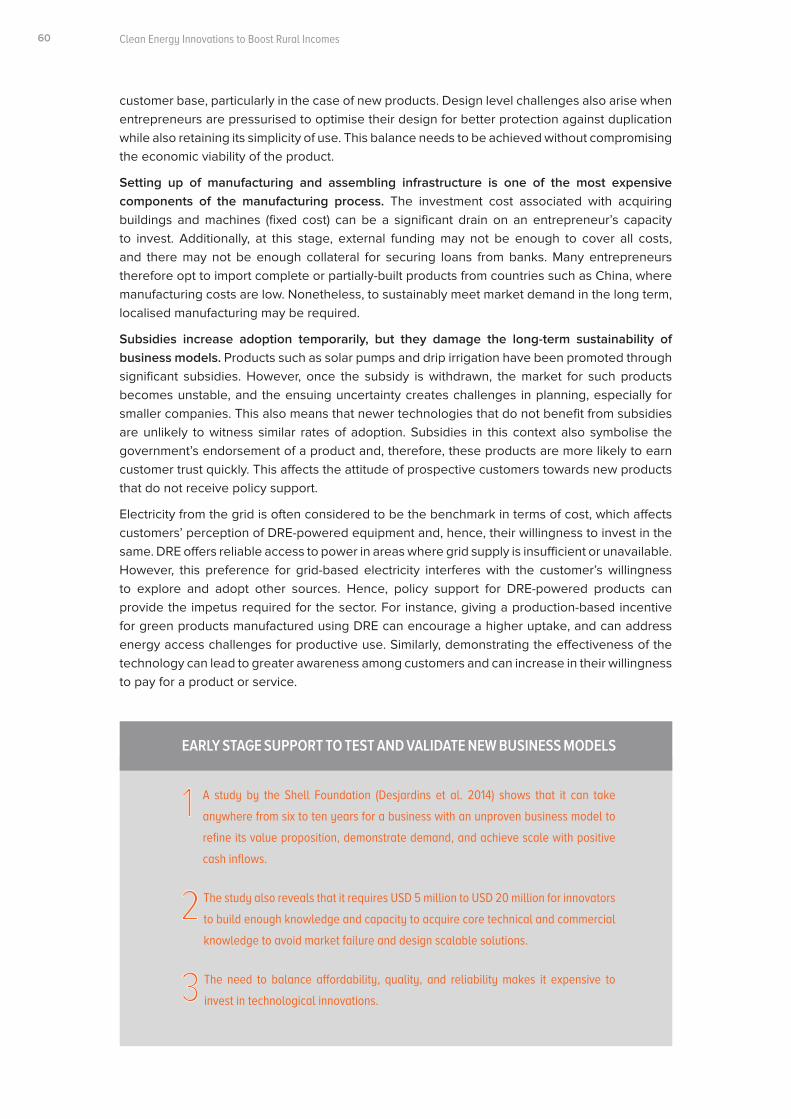
Clean Energy Innovations to Boost Rural Incomes
customer base, particularly in the case of new products. Design level challenges also arise when entrepreneurs are pressurised to optimise their design for better protection against duplication while also retaining its simplicity of use. This balance needs to be achieved without compromising the economic viability of the product.
Setting up of manufacturing and assembling infrastructure is one of the most expensive components of the manufacturing process. The investment cost associated with acquiring buildings and machines (fixed cost) can be a significant drain on an entrepreneur’s capacity to invest. Additionally, at this stage, external funding may not be enough to cover all costs, and there may not be enough collateral for securing loans from banks. Many entrepreneurs therefore opt to import complete or partially-built products from countries such as China, where manufacturing costs are low. Nonetheless, to sustainably meet market demand in the long term, localised manufacturing may be required.
Subsidies increase adoption temporarily, but they damage the long-term sustainability of business models. Products such as solar pumps and drip irrigation have been promoted through significant subsidies. However, once the subsidy is withdrawn, the market for such products becomes unstable, and the ensuing uncertainty creates challenges in planning, especially for smaller companies. This also means that newer technologies that do not benefit from subsidies are unlikely to witness similar rates of adoption. Subsidies in this context also symbolise the government’s endorsement of a product and, therefore, these products are more likely to earn customer trust quickly. This affects the attitude of prospective customers towards new products that do not receive policy support.
Electricity from the grid is often considered to be the benchmark in terms of cost, which affects customers’ perception of DRE-powered equipment and, hence, their willingness to invest in the same. DRE offers reliable access to power in areas where grid supply is insufficient or unavailable. However, this preference for grid-based electricity interferes with the customer’s willingness to explore and adopt other sources. Hence, policy support for DRE-powered products can provide the impetus required for the sector. For instance, giving a production-based incentive for green products manufactured using DRE can encourage a higher uptake, and can address energy access challenges for productive use. Similarly, demonstrating the effectiveness of the technology can lead to greater awareness among customers and can increase in their willingness to pay for a product or service.
EARLY STAGE SUPPORT TO TEST AND VALIDATE NEW BUSINESS MODELS
A study by the Shell Foundation (Desjardins et al. 2014) shows that it can take
anywhere from six to ten years for a business with an unproven business model to
refine its value proposition, demonstrate demand, and achieve scale with positive
cash inflows.
The study also reveals that it requires USD 5 million to USD 20 million for innovators
to build enough knowledge and capacity to acquire core technical and commercial
knowledge to avoid market failure and design scalable solutions.
The need to balance affordability, quality, and reliability makes it expensive to
invest in technological innovations.
60
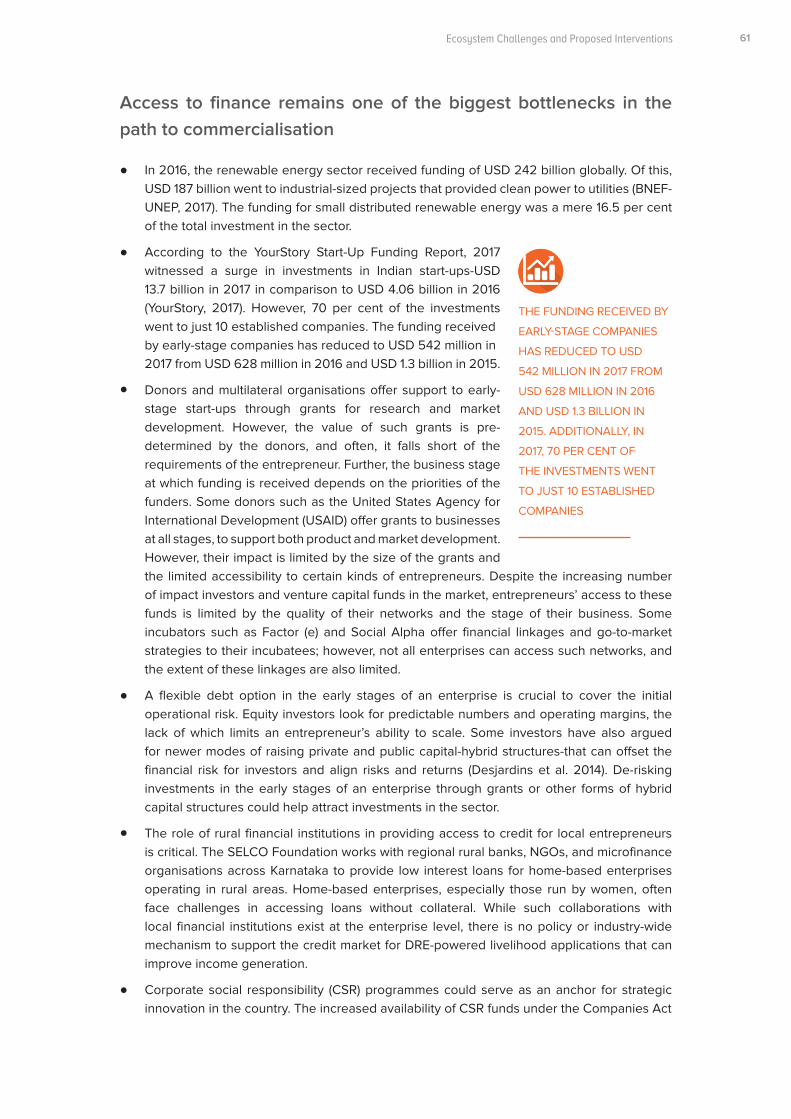
Executive Summary
In 2016, the renewable energy sector received funding of USD 242 billion globally. Of this, USD 187 billion went to industrial-sized projects that provided clean power to utilities (BNEF-UNEP, 2017). The funding for small distributed renewable energy was a mere 16.5 per cent of the total investment in the sector.
According to the YourStory Start-Up Funding Report, 2017 witnessed a surge in investments in Indian start-ups-USD 13.7 billion in 2017 in comparison to USD 4.06 billion in 2016 (YourStory, 2017). However, 70 per cent of the investments went to just 10 established companies. The funding received by early-stage companies has reduced to USD 542 million in 2017 from USD 628 million in 2016 and USD 1.3 billion in 2015.
Donors and multilateral organisations offer support to early-stage start-ups through grants for research and market development. However, the value of such grants is pre-determined by the donors, and often, it falls short of the requirements of the entrepreneur. Further, the business stage at which funding is received depends on the priorities of the funders. Some donors such as the United States Agency for International Development (USAID) offer grants to businesses at all stages, to support both product and market development. However, their impact is limited by the size of the grants and the limited accessibility to certain kinds of entrepreneurs. Despite the increasing number of impact investors and venture capital funds in the market, entrepreneurs’ access to these funds is limited by the quality of their networks and the stage of their business. Some incubators such as Factor (e) and Social Alpha offer financial linkages and go-to-market strategies to their incubatees; however, not all enterprises can access such networks, and the extent of these linkages are also limited.
A flexible debt option in the early stages of an enterprise is crucial to cover the initial operational risk. Equity investors look for predictable numbers and operating margins, the lack of which limits an entrepreneur’s ability to scale. Some investors have also argued for newer modes of raising private and public capital-hybrid structures-that can offset the financial risk for investors and align risks and returns (Desjardins et al. 2014). De-risking investments in the early stages of an enterprise through grants or other forms of hybrid capital structures could help attract investments in the sector.
The role of rural financial institutions in providing access to credit for local entrepreneurs is critical. The SELCO Foundation works with regional rural banks, NGOs, and microfinance organisations across Karnataka to provide low interest loans for home-based enterprises operating in rural areas. Home-based enterprises, especially those run by women, often face challenges in accessing loans without collateral. While such collaborations with local financial institutions exist at the enterprise level, there is no policy or industry-wide mechanism to support the credit market for DRE-powered livelihood applications that can improve income generation.
Corporate social responsibility (CSR) programmes could serve as an anchor for strategic innovation in the country. The increased availability of CSR funds under the Companies Act
THE FUNDING RECEIVED BY
EARLY-STAGE COMPANIES
HAS REDUCED TO USD
542 MILLION IN 2017 FROM
USD 628 MILLION IN 2016
AND USD 1.3 BILLION IN
2015. ADDITIONALLY, IN
2017, 70 PER CENT OF
THE INVESTMENTS WENT
TO JUST 10 ESTABLISHED
COMPANIES
61Ecosystem Challenges and Proposed Interventions
Access to finance remains one of the biggest bottlenecks in the path to commercialisation
Clean Energy Innovations to Boost Rural Incomes
Grant/soft funding is key to getting started with innovative and high-risk business ideas
in the clean tech space. At a later stage when a company is ready to raise Rs 5-10 crore
(corresponding to a company valuation of at least Rs 25 crore) then it would get more
attention among commercial and institutional investors for follow-on funding
– Premnath Venugopalan, NCL Venture Centre
Demonstrative pilots can be hugely impactful, it will encourage few early adopters to
come forward
– Lakshminarayan Kannan, Microspin, Skillveri, Vortex Engineering
2013 can be leveraged to promote investments in development innovations. However, very few organisations use their CSR funds to support this cause. As of 2017, Indian companies spent only 6 per cent of their CSR funds on clean energy (Tenneti & Parekh, 2017). Only 39 per cent of the top 100 companies with a CSR budget spent money on programmes that focused on product-based solutions for generating clean energy. Further, states with relatively low energy gaps have a higher proportion of companies implementing an access to energy programmes through CSR, while states which need interventions the most, such as Bihar, remain a nascent space for CSR programmes. Typically, CSR funds are tied to specific causes, and CSR programmes are expected to meet conventional parameters of project efficiency. Hence, CSR programmes are not adequately focused on promoting innovations in DRE owing to their complexity, experimentality, and long gestation periods.
The need for funding is not limited to first generation or first-time entrepreneurs alone, but also extends to established entrepreneurs who are pursuing small-scale ventures in the energy or other sectors. Given the risks associated with starting a new business, especially one that is product-based, access to low-risk capital can prove to be a key factor in encouraging existing businesses with a stable supply chain to consider investing in this space.
The lack of a large-scale strategic pilot impedes the honing of the product and the streamlining of the business model. Strategic pilots can validate the techno-economic feasibility of a product and the willingness of customers to pay for it. Further, large pilots can demonstrate the viability of the product to customers and can improve customer awareness, as has been well-noted by entrepreneurs. However, even though successful pilots can help attract higher investments in commercialising the product, a lack of funding to conduct such pilots is itself a deterrent during product development. New businesses and products tend to require more time to set up pilots than conventional businesses. This is owing to a lack of precedents in the product and the business model. New products also require innovations in business processes, such as financing, distribution models, etc. (Allen et al. 2012). This makes access to patient and low-risk capital essential for success. At present, most pilots are funded through grants, given that there are such high risks and uncertainties involved. However, donors and public institutions that support these pilots through grants rarely have a strategy in place to support enterprises beyond organising pilots. This strands enterprises and leaves them to figure out the next steps for themselves. Hence, there is a need for a new kind of investment that can weather high risks and is patient with respect to returns. Blended finance, defined as the strategic use of development finance and philanthropic funds, could play an important role in mobilising private capital flows to emerging markets.
62
Executive Summary
The de-fragmented rural microenterprises market presents customer acquisition challenges for early-stage DRE product enterprises. Market aggregation could address the challenges presented by a de-fragmented customer base, and in turn reduce early-stage enterprises’ difficulties in acquiring customers. However, at present, there are no market aggregators operational in this sector. As a result, existing institutions such as farmer producer organisations (FPOs) and NGOs would have to act as market aggregators to develop the initial market. Organisations like Tata Trusts have been aggregating the demand for productive use applications in their areas of intervention. In each region covered by the trust, there has been an initiative framed, according to local conditions. However, the sustainability of this business model is uncertain as the aggregation depends on donor funding and state support, with minimal customer contributions. Further, enterprises become dependent on the subsidy model as opposed to developing their own business and financial models.
Developing cost-effective distribution value chains and after-sale service networks is another challenge for DRE product-based enterprises. Larger corporates and SME players working in the durable goods industry have established distribution networks. Hence, new enterprises can tackle this challenge by learning from the experiences of other SMEs, collaborating with them, and piggy-backing on the distribution channels of larger corporates through strategic collaborations. Further, innovative distribution channels (existing or new) may help accelerate growth. For instance, Dharma Life is a social enterprise that provides last-mile distribution services for products such as cookstoves and solar lamps, by building a network of rural entrepreneurs. Frontier Markets is another company that has established innovative distribution models for its energy products with strong after-sales service networks by focussing on women entrepreneurs.
The economics of a business is determined by both energy and non-energy inputs, this influences the buyer’s willingness and/or ability to invest in DRE-powered productive applications. The potential customers for DRE for productive use are businesses and farm holders. This influences the dynamics that are at play. For the buyer, an investment in DRE has to make business sense and should recover its initial costs within a short period. If the scale of the business is small, and the investment required is high, the motivation to purchase the product is low. The decision to invest is not merely a factor of the current energy costs. Nonetheless, business models such as for hire, pay-as-go, or service-based payments can alleviate the burden of upfront costs and improve uptake. EM3 Agri Services offers farming-as-service to about 8,000 farmers in Madhya Pradesh, Rajasthan, and Uttar Pradesh. It is able to do this by enabling a pay-for-use mechanism for all mechanisation equipment from land preparation to post-harvest management. In 2017, the company raised Series B funding from the Global Innovation Foundation (GIF), which proves the merit of its business model (Pani, 2017).
The lack of quality certifications and benchmarking processes for products has also had an impact on the quality of the products that enter the market. Sub-standard products could potentially put off customers, leading to a distrust of the entire product category. Thus, it may be useful to have quality certifications in order to identify good-quality products, particularly to aid the decision-making of financing institutions providing end customer financing.
5.1.4 Commercial product to scale
Biggest challenges
Lack of consumer finance, prohibitive cost of ecosystem building, lack of follow-on funding, lack of distribution network, lack of skilled technicians, and dependence on the economic viability of components.
Low utilisation rates make many standalone DRE-powered products unviable. Given that
63Ecosystem Challenges and Proposed Interventions
Clean Energy Innovations to Boost Rural Incomes
standalone DRE-powered products require high capital investments, the utilisation rate of the asset is a key determinant of its economic viability. Higher the utilisation, the more attractive is the economic value proposition for the end customer. Low utilisation rates particularly affect the farm sector, as for most cultivation activities, a certain machine is only used for a few days in a year. In such cases, energising various appliances using the same power generation source could help improve economic viability. Other possibilities include improving asset utilisation through enterprise-based or FPO-based rental models that provide farmers with the necessary equipment for a period of time for a fee. Considering that this allows many farmers to share the same equipment, it can significantly improve the utilisation rate in comparison to individual ownership.
In 2012, USAID, along with several partner stakeholders, launched Powering Agriculture,
a global competition to support clean energy innovations that can improve agricultural
productivity and stimulate low carbon economic growth. It provides grants between
USD 500,000 to USD 2,000,000 to enterprises to design, pilot, or deploy clean energy
innovations in the agricultural value chain. The competition has seen numerous applicants
from Africa and Asia. Most businesses supported under the programme are in the early
stages. In the future, USAID aims to provide follow-on funding after a certain scale has been
achieved. However, access to this programme is limited to a certain pool of entrepreneurs
who can leverage their network and communication capabilities to make an effective pitch.
It is prohibitive expensive for early-stage enterprises to invest in the collective needs of the ecosystem, which impedes their ability to scale. To address this challenge, collaborative networks that pool together resources to create the required infrastructure are necessary. Global and national platforms such as Global Off-Grid Lighting Association (GOGLA) or Global Alliance for Clean Cookstoves (GACC) have brought together relevant stakeholders (both government and non-government) and funds to develop the ecosystem for all early-stage enterprises. Whether it is establishing distribution channels, addressing policy uncertainty, or leveraging existing government networks, a platform that integrates all the relevant voices will enable the designing of a coherent strategy to address the challenges faced by entrepreneurs in this sector. In India, the Clean Energy Access Network (CLEAN) is a platform that attempts to address the collective challenges of DRE enterprises with respect to finance, policy, skills, and technology. Such platforms can also be leveraged to generate awareness of DRE innovations for productive use.
Lack of patient follow-on funding after pilots that offer longer repayment tenures and low interest rates affect the ability of enterprises to scale. Acquiring customers for DRE-powered products is expensive and time-consuming, owing to the high upfront costs associated with procuring the product and the lack of awareness of the technology. In such a situation, the relatively low upfront cost of conventional products skews customer preferences towards the same. For instance, the cost of a solar loom is INR 1.6 lakhs (USD 2500), as opposed to INR 60,000 (USD 940) for a conventional power loom.6 While in terms of operation, there may not be any differences between the two, the solar loom could improve revenues and reduce input cost, owing to the improved productivity from having better access to electricity. This needs to be communicated effectively to customers to help them make informed decisions while making their purchase. Therefore, conventional repayment cycles and interest rates make it economically unviable for enterprises to sustain in the market long enough to build a customer base and communicate the benefits of DRE-powered appliances to prospective customers.
6 Primary interview with stakeholders.
64
Executive Summary
Technical and commercial skilling of manpower for functions such as distribution and after-sales services is an additional challenge for entrepreneurs. Almost all the entrepreneurs we interviewed cited the lack of trained personnel as a major impediment for the upscaling of business. Training additional manpower is expensive and, most new enterprises struggle to meet this cost. Entrepreneurs also mentioned that as soon as workers gained new skills, they migrated to nearby towns and cities, seeking better remuneration. Rural skilling centres can help meet this demand and aid in building a strong network of on-ground professionals. Strong incentive structures will also be essential to retain skilled staff members. As per government estimates from 2014, around 7 million workers are skilled annually (Ministry of Skill Development and Entrepreneurship, 2015). The National Policy for Skill Development and Entrepreneurship can be leveraged to create skilled professionals for this space.
Energy-efficient livelihood appliances, owing to their high prices and low sales volumes, are not prioritised by durable products distributors. Distributors tend to stock fast-moving products to reduce their working capital requirements. As a result, DRE products are rarely stocked, which in turn affects their uptake and customer awareness. However, the solution is to not only strengthen the distribution network, but to adopt an integrated approach that will build customer awareness and makes the product accessible and affordable for customers. Some organisations, such as Dharma Life and Frontier Markets, have even tried to build alternate rural supply chains for renewable energy products. However, most of their products are still limited to household use, and they are yet to focus on livelihood applications.
The capital-starved end consumer’s lack of collateral creates barriers in accessing loans, which limits adoption under the direct purchase model. Access to finance for the end consumer is critical for the realisation of demand. New financial models such as group lending could help improve access to finance for DRE. Equipment rental models can also help address this challenge to a great extent, provided that an adequate number of entrepreneurs are able leverage capital to set up custom hiring centres. In our interviews, organisations7 had mentioned that customers would be interested in owning an asset, but only if the payback period is two years or less.
The success of DRE-powered innovations is also dependent on the viability of individual components such as batteries. The cost of storage comprises about 45 per cent of the total cost of a motorised machine (e.g., flour mill).8 For most livelihood appliances, a battery is essential (unless powered through mini-grid/grid), though the capacity requirements differ significantly based on the appliance. However, the high cost of storage increases the cost of the overall product, thereby reducing the demand for the product. Inficold provides cold storage services to farmers. While the cost of an 800 cubic feet cold storage unit is INR 10-12 lakhs (USD 15,600- 18,700), an additional investment of INR 9-10 lakhs (USD 14,000-15,600) is required to make it solar compatible. Hence, most cold storage units operated by the company are powered by electricity from the grid. In addition, only farmers that cater to export markets are willing to pay for cold storage, due to the direct value addition. This limits the customer base of the enterprise.
Energy is opportunity. So, what would happen if you could provide 24x7 power to villages
in rural India? Imagine how that could transform lives, businesses, rural economies!
– Paul Needham, Simpa Networks
7 Cold storage services.8 Primary interview with entrepreneurs.
65Ecosystem Challenges and Proposed Interventions
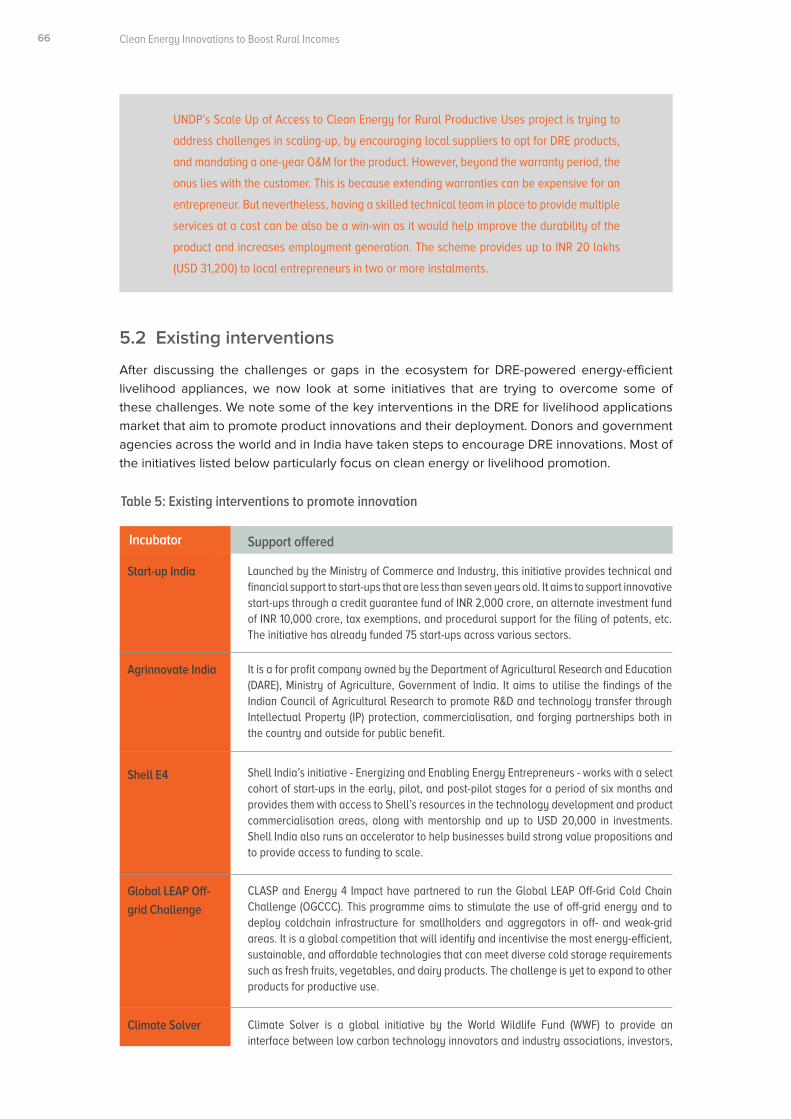
Clean Energy Innovations to Boost Rural Incomes
UNDP’s Scale Up of Access to Clean Energy for Rural Productive Uses project is trying to
address challenges in scaling-up, by encouraging local suppliers to opt for DRE products,
and mandating a one-year O&M for the product. However, beyond the warranty period, the
onus lies with the customer. This is because extending warranties can be expensive for an
entrepreneur. But nevertheless, having a skilled technical team in place to provide multiple
services at a cost can be also be a win-win as it would help improve the durability of the
product and increases employment generation. The scheme provides up to INR 20 lakhs
(USD 31,200) to local entrepreneurs in two or more instalments.
5.2 Existing interventions
After discussing the challenges or gaps in the ecosystem for DRE-powered energy-efficient livelihood appliances, we now look at some initiatives that are trying to overcome some of these challenges. We note some of the key interventions in the DRE for livelihood applications market that aim to promote product innovations and their deployment. Donors and government agencies across the world and in India have taken steps to encourage DRE innovations. Most of the initiatives listed below particularly focus on clean energy or livelihood promotion.
Table 5: Existing interventions to promote innovation
Incubator
Start-up India
Agrinnovate India
Shell E4
Global LEAP Off-
grid Challenge
Climate Solver
Launched by the Ministry of Commerce and Industry, this initiative provides technical and financial support to start-ups that are less than seven years old. It aims to support innovative start-ups through a credit guarantee fund of INR 2,000 crore, an alternate investment fund of INR 10,000 crore, tax exemptions, and procedural support for the filing of patents, etc. The initiative has already funded 75 start-ups across various sectors.
It is a for profit company owned by the Department of Agricultural Research and Education (DARE), Ministry of Agriculture, Government of India. It aims to utilise the findings of the Indian Council of Agricultural Research to promote R&D and technology transfer through Intellectual Property (IP) protection, commercialisation, and forging partnerships both in the country and outside for public benefit.
Shell India’s initiative - Energizing and Enabling Energy Entrepreneurs - works with a select cohort of start-ups in the early, pilot, and post-pilot stages for a period of six months and provides them with access to Shell’s resources in the technology development and product commercialisation areas, along with mentorship and up to USD 20,000 in investments. Shell India also runs an accelerator to help businesses build strong value propositions and to provide access to funding to scale.
CLASP and Energy 4 Impact have partnered to run the Global LEAP Off-Grid Cold Chain Challenge (OGCCC). This programme aims to stimulate the use of off-grid energy and to deploy coldchain infrastructure for smallholders and aggregators in off- and weak-grid areas. It is a global competition that will identify and incentivise the most energy-efficient, sustainable, and affordable technologies that can meet diverse cold storage requirements such as fresh fruits, vegetables, and dairy products. The challenge is yet to expand to other products for productive use.
Climate Solver is a global initiative by the World Wildlife Fund (WWF) to provide an interface between low carbon technology innovators and industry associations, investors,
Support offered
66
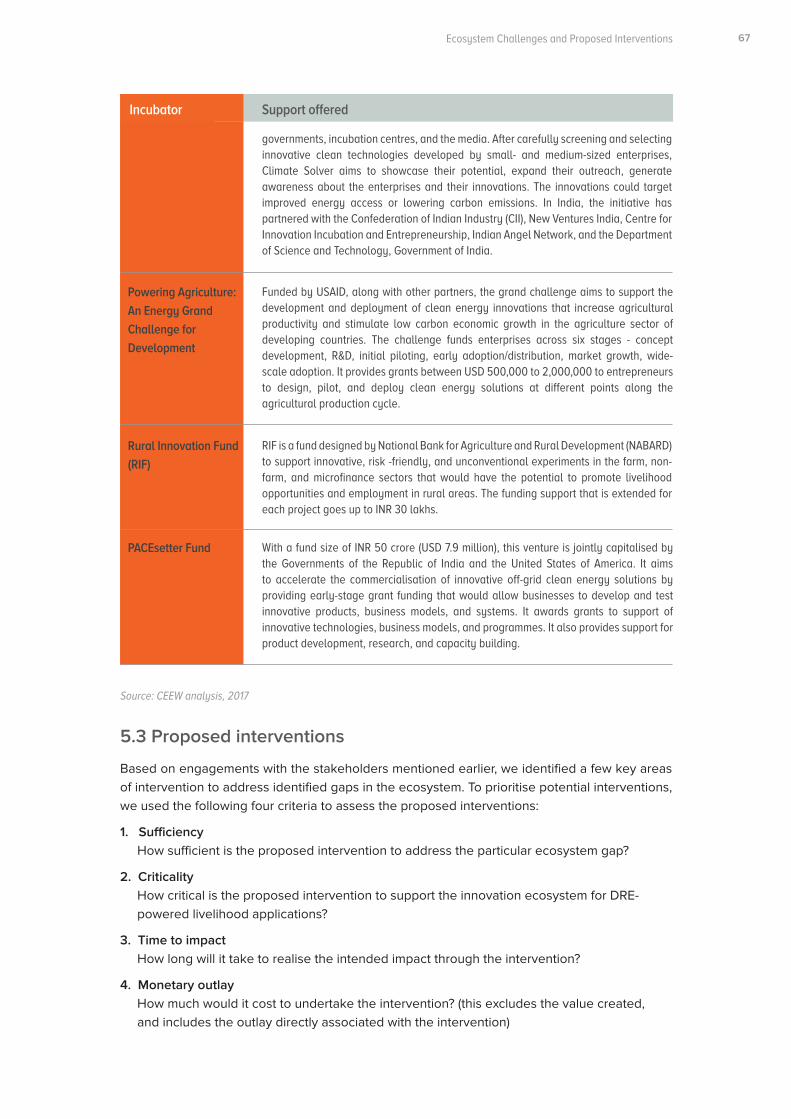
Executive Summary
5.3 Proposed interventions
Based on engagements with the stakeholders mentioned earlier, we identified a few key areas of intervention to address identified gaps in the ecosystem. To prioritise potential interventions, we used the following four criteria to assess the proposed interventions:
1. Sufficiency How sufficient is the proposed intervention to address the particular ecosystem gap?
2. Criticality How critical is the proposed intervention to support the innovation ecosystem for DRE- powered livelihood applications?
3. Time to impact How long will it take to realise the intended impact through the intervention?
4. Monetary outlay How much would it cost to undertake the intervention? (this excludes the value created, and includes the outlay directly associated with the intervention)
Source: CEEW analysis, 2017
Incubator
Powering Agriculture:
An Energy Grand
Challenge for
Development
governments, incubation centres, and the media. After carefully screening and selecting innovative clean technologies developed by small- and medium-sized enterprises, Climate Solver aims to showcase their potential, expand their outreach, generate awareness about the enterprises and their innovations. The innovations could target improved energy access or lowering carbon emissions. In India, the initiative has partnered with the Confederation of Indian Industry (CII), New Ventures India, Centre for Innovation Incubation and Entrepreneurship, Indian Angel Network, and the Department of Science and Technology, Government of India.
Funded by USAID, along with other partners, the grand challenge aims to support the development and deployment of clean energy innovations that increase agricultural productivity and stimulate low carbon economic growth in the agriculture sector of developing countries. The challenge funds enterprises across six stages - concept development, R&D, initial piloting, early adoption/distribution, market growth, wide-scale adoption. It provides grants between USD 500,000 to 2,000,000 to entrepreneurs to design, pilot, and deploy clean energy solutions at different points along the agricultural production cycle.
Support offered
Rural Innovation Fund
(RIF)
PACEsetter Fund
RIF is a fund designed by National Bank for Agriculture and Rural Development (NABARD) to support innovative, risk -friendly, and unconventional experiments in the farm, non-farm, and microfinance sectors that would have the potential to promote livelihood opportunities and employment in rural areas. The funding support that is extended for each project goes up to INR 30 lakhs.
With a fund size of INR 50 crore (USD 7.9 million), this venture is jointly capitalised by the Governments of the Republic of India and the United States of America. It aims to accelerate the commercialisation of innovative off-grid clean energy solutions by providing early-stage grant funding that would allow businesses to develop and test innovative products, business models, and systems. It awards grants to support of innovative technologies, business models, and programmes. It also provides support for product development, research, and capacity building.
67Ecosystem Challenges and Proposed Interventions
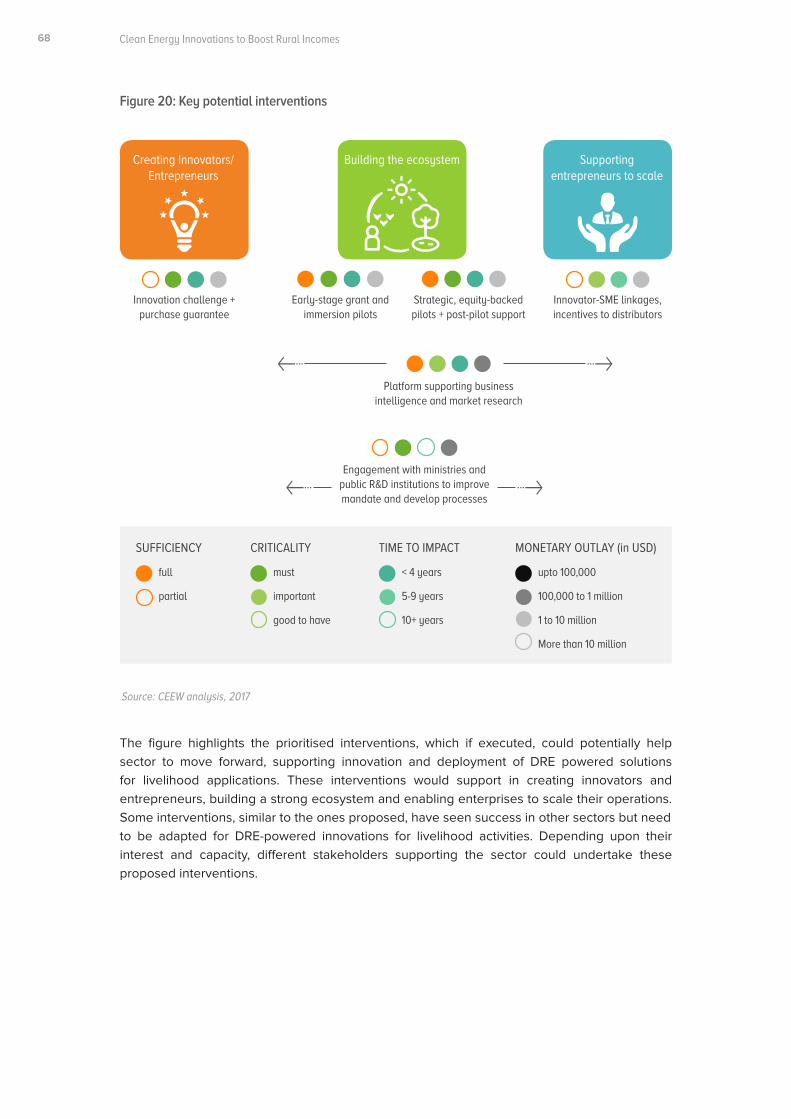
Clean Energy Innovations to Boost Rural Incomes
Figure 20: Key potential interventions
SUFFICIENCY
full
partial
Innovation challenge + purchase guarantee
Platform supporting business intelligence and market research
Engagement with ministries and public R&D institutions to improve mandate and develop processes
Early-stage grant and immersion pilots
Strategic, equity-backed pilots + post-pilot support
Innovator-SME linkages, incentives to distributors
must
important
good to have
< 4 years
5-9 years
10+ years
upto 100,000
100,000 to 1 million
1 to 10 million
More than 10 million
CRITICALITY TIME TO IMPACT MONETARY OUTLAY (in USD)
Creating Innovators/ Entrepreneurs
Building the ecosystem Supporting entrepreneurs to scale
Source: CEEW analysis, 2017
The figure highlights the prioritised interventions, which if executed, could potentially help sector to move forward, supporting innovation and deployment of DRE powered solutions for livelihood applications. These interventions would support in creating innovators and entrepreneurs, building a strong ecosystem and enabling enterprises to scale their operations. Some interventions, similar to the ones proposed, have seen success in other sectors but needto be adapted for DRE-powered innovations for livelihood activities. Depending upon their interest and capacity, different stakeholders supporting the sector could undertake these proposed interventions.
68
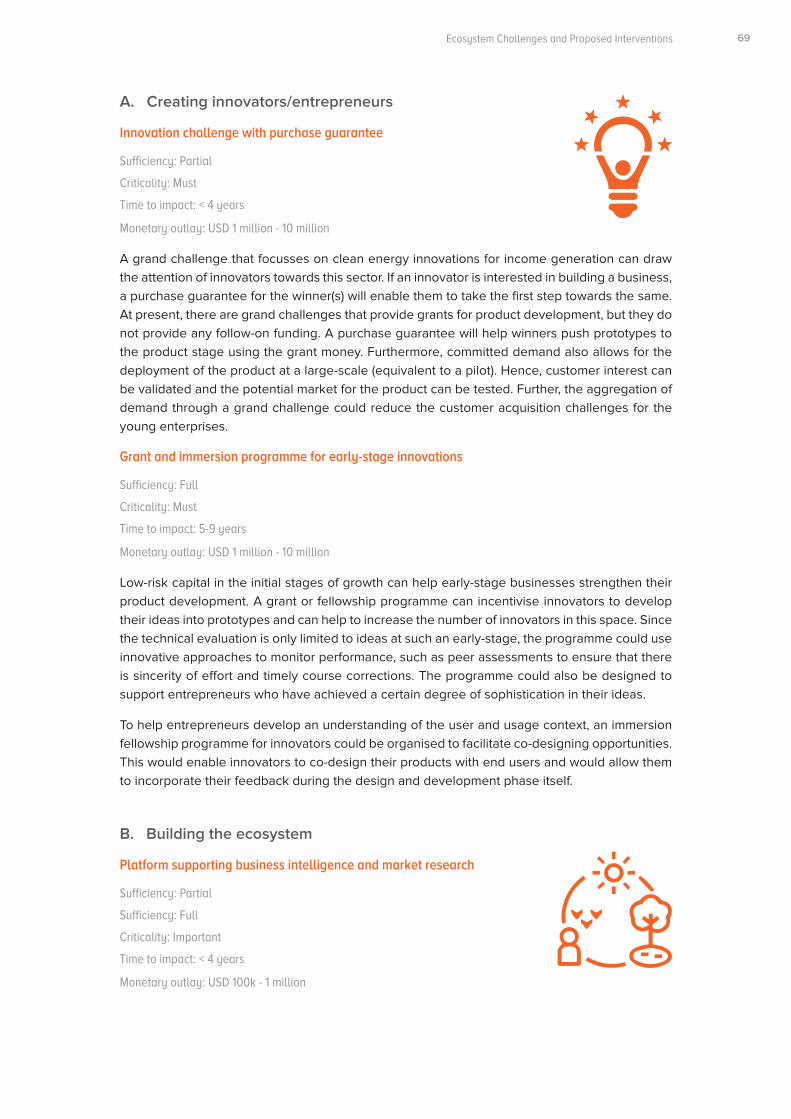
Executive Summary
A. Creating innovators/entrepreneurs
Innovation challenge with purchase guarantee
Sufficiency: Partial
Criticality: Must
Time to impact: < 4 years
Monetary outlay: USD 1 million - 10 million
A grand challenge that focusses on clean energy innovations for income generation can draw the attention of innovators towards this sector. If an innovator is interested in building a business, a purchase guarantee for the winner(s) will enable them to take the first step towards the same. At present, there are grand challenges that provide grants for product development, but they do not provide any follow-on funding. A purchase guarantee will help winners push prototypes to the product stage using the grant money. Furthermore, committed demand also allows for the deployment of the product at a large-scale (equivalent to a pilot). Hence, customer interest can be validated and the potential market for the product can be tested. Further, the aggregation of demand through a grand challenge could reduce the customer acquisition challenges for the young enterprises.
Grant and immersion programme for early-stage innovations
Sufficiency: Full
Criticality: Must
Time to impact: 5-9 years
Monetary outlay: USD 1 million - 10 million
Low-risk capital in the initial stages of growth can help early-stage businesses strengthen their product development. A grant or fellowship programme can incentivise innovators to develop their ideas into prototypes and can help to increase the number of innovators in this space. Since the technical evaluation is only limited to ideas at such an early-stage, the programme could use innovative approaches to monitor performance, such as peer assessments to ensure that there is sincerity of effort and timely course corrections. The programme could also be designed to support entrepreneurs who have achieved a certain degree of sophistication in their ideas.
To help entrepreneurs develop an understanding of the user and usage context, an immersion fellowship programme for innovators could be organised to facilitate co-designing opportunities. This would enable innovators to co-design their products with end users and would allow them to incorporate their feedback during the design and development phase itself.
B. Building the ecosystem
Platform supporting business intelligence and market research
Sufficiency: Partial
Sufficiency: Full
Criticality: Important
Time to impact: < 4 years
Monetary outlay: USD 100k - 1 million
69Ecosystem Challenges and Proposed Interventions
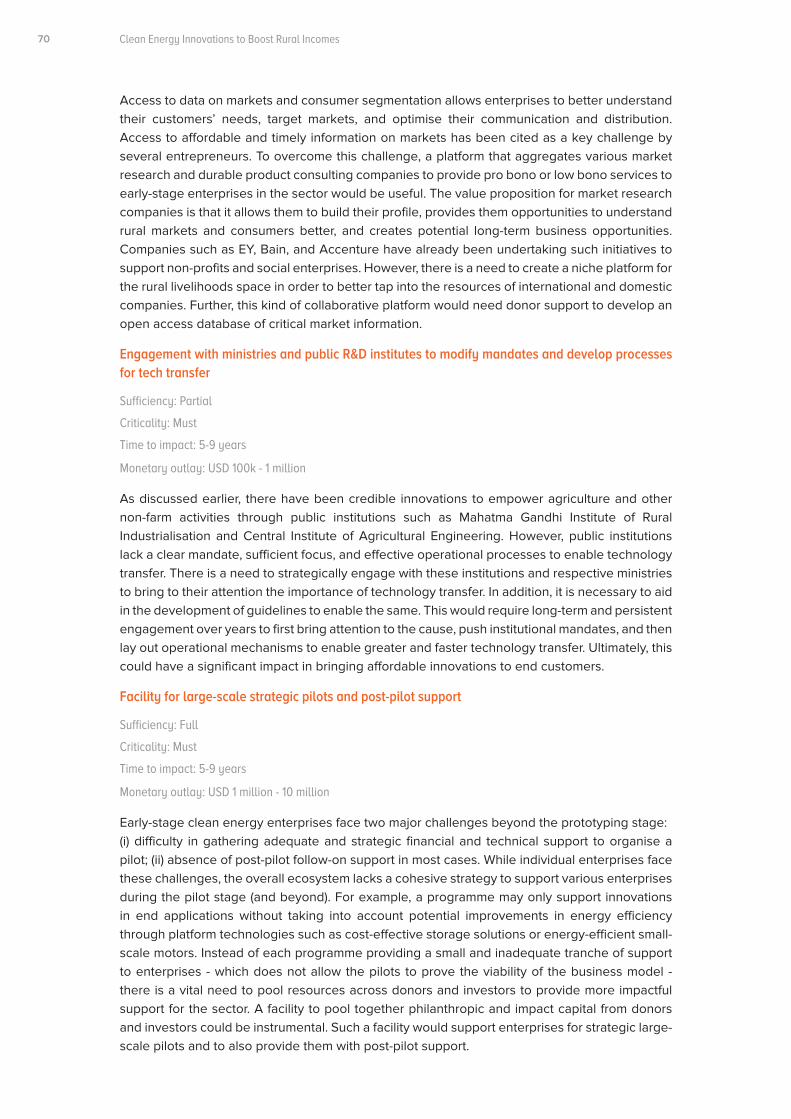
Clean Energy Innovations to Boost Rural Incomes
Access to data on markets and consumer segmentation allows enterprises to better understand their customers’ needs, target markets, and optimise their communication and distribution. Access to affordable and timely information on markets has been cited as a key challenge by several entrepreneurs. To overcome this challenge, a platform that aggregates various market research and durable product consulting companies to provide pro bono or low bono services to early-stage enterprises in the sector would be useful. The value proposition for market research companies is that it allows them to build their profile, provides them opportunities to understand rural markets and consumers better, and creates potential long-term business opportunities. Companies such as EY, Bain, and Accenture have already been undertaking such initiatives to support non-profits and social enterprises. However, there is a need to create a niche platform for the rural livelihoods space in order to better tap into the resources of international and domestic companies. Further, this kind of collaborative platform would need donor support to develop an open access database of critical market information.
Engagement with ministries and public R&D institutes to modify mandates and develop processes for tech transfer
Sufficiency: Partial
Criticality: Must
Time to impact: 5-9 years
Monetary outlay: USD 100k - 1 million
As discussed earlier, there have been credible innovations to empower agriculture and other non-farm activities through public institutions such as Mahatma Gandhi Institute of Rural Industrialisation and Central Institute of Agricultural Engineering. However, public institutions lack a clear mandate, sufficient focus, and effective operational processes to enable technology transfer. There is a need to strategically engage with these institutions and respective ministries to bring to their attention the importance of technology transfer. In addition, it is necessary to aid in the development of guidelines to enable the same. This would require long-term and persistent engagement over years to first bring attention to the cause, push institutional mandates, and then lay out operational mechanisms to enable greater and faster technology transfer. Ultimately, this could have a significant impact in bringing affordable innovations to end customers.
Facility for large-scale strategic pilots and post-pilot support
Sufficiency: Full
Criticality: Must
Time to impact: 5-9 years
Monetary outlay: USD 1 million - 10 million
Early-stage clean energy enterprises face two major challenges beyond the prototyping stage: (i) difficulty in gathering adequate and strategic financial and technical support to organise a pilot; (ii) absence of post-pilot follow-on support in most cases. While individual enterprises face these challenges, the overall ecosystem lacks a cohesive strategy to support various enterprises during the pilot stage (and beyond). For example, a programme may only support innovations in end applications without taking into account potential improvements in energy efficiency through platform technologies such as cost-effective storage solutions or energy-efficient small-scale motors. Instead of each programme providing a small and inadequate tranche of support to enterprises - which does not allow the pilots to prove the viability of the business model - there is a vital need to pool resources across donors and investors to provide more impactful support for the sector. A facility to pool together philanthropic and impact capital from donors and investors could be instrumental. Such a facility would support enterprises for strategic large-scale pilots and to also provide them with post-pilot support.
70
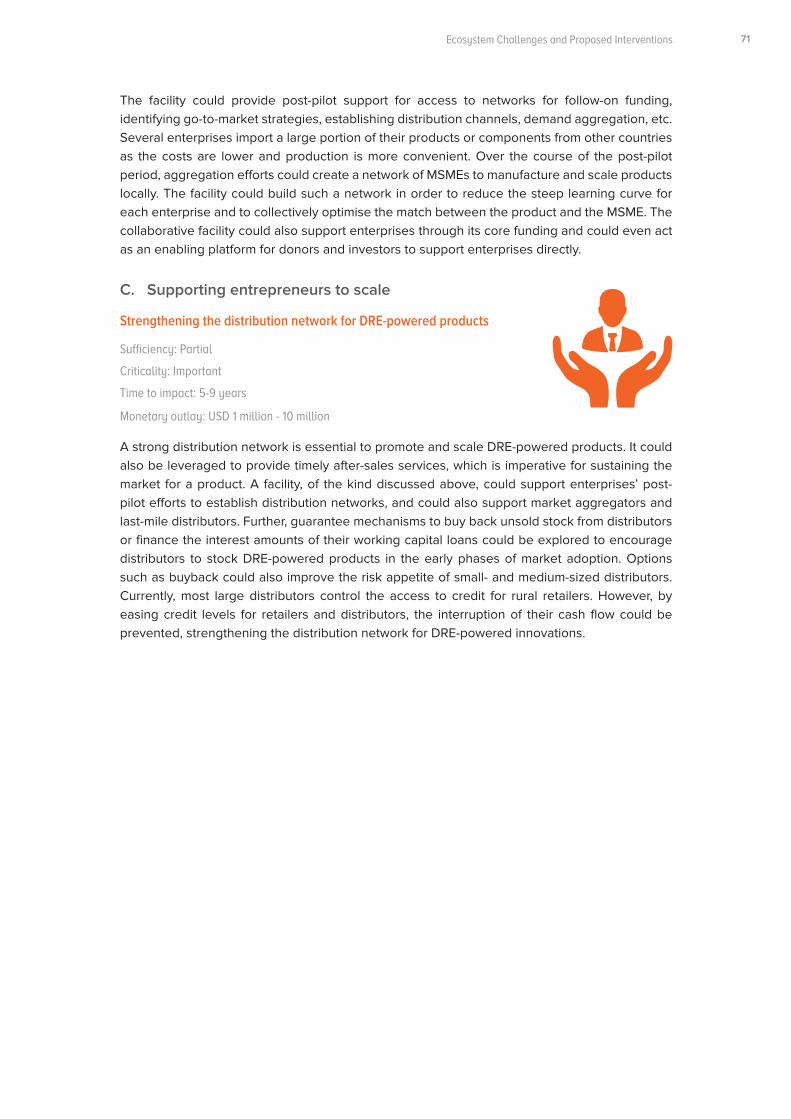
Executive Summary
The facility could provide post-pilot support for access to networks for follow-on funding, identifying go-to-market strategies, establishing distribution channels, demand aggregation, etc. Several enterprises import a large portion of their products or components from other countries as the costs are lower and production is more convenient. Over the course of the post-pilot period, aggregation efforts could create a network of MSMEs to manufacture and scale products locally. The facility could build such a network in order to reduce the steep learning curve for each enterprise and to collectively optimise the match between the product and the MSME. The collaborative facility could also support enterprises through its core funding and could even act as an enabling platform for donors and investors to support enterprises directly.
C. Supporting entrepreneurs to scale
Strengthening the distribution network for DRE-powered products
Sufficiency: Partial
Criticality: Important
Time to impact: 5-9 years
Monetary outlay: USD 1 million - 10 million
A strong distribution network is essential to promote and scale DRE-powered products. It could also be leveraged to provide timely after-sales services, which is imperative for sustaining the market for a product. A facility, of the kind discussed above, could support enterprises’ post-pilot efforts to establish distribution networks, and could also support market aggregators and last-mile distributors. Further, guarantee mechanisms to buy back unsold stock from distributors or finance the interest amounts of their working capital loans could be explored to encourage distributors to stock DRE-powered products in the early phases of market adoption. Options such as buyback could also improve the risk appetite of small- and medium-sized distributors. Currently, most large distributors control the access to credit for rural retailers. However, by easing credit levels for retailers and distributors, the interruption of their cash flow could be prevented, strengthening the distribution network for DRE-powered innovations.
71Ecosystem Challenges and Proposed Interventions
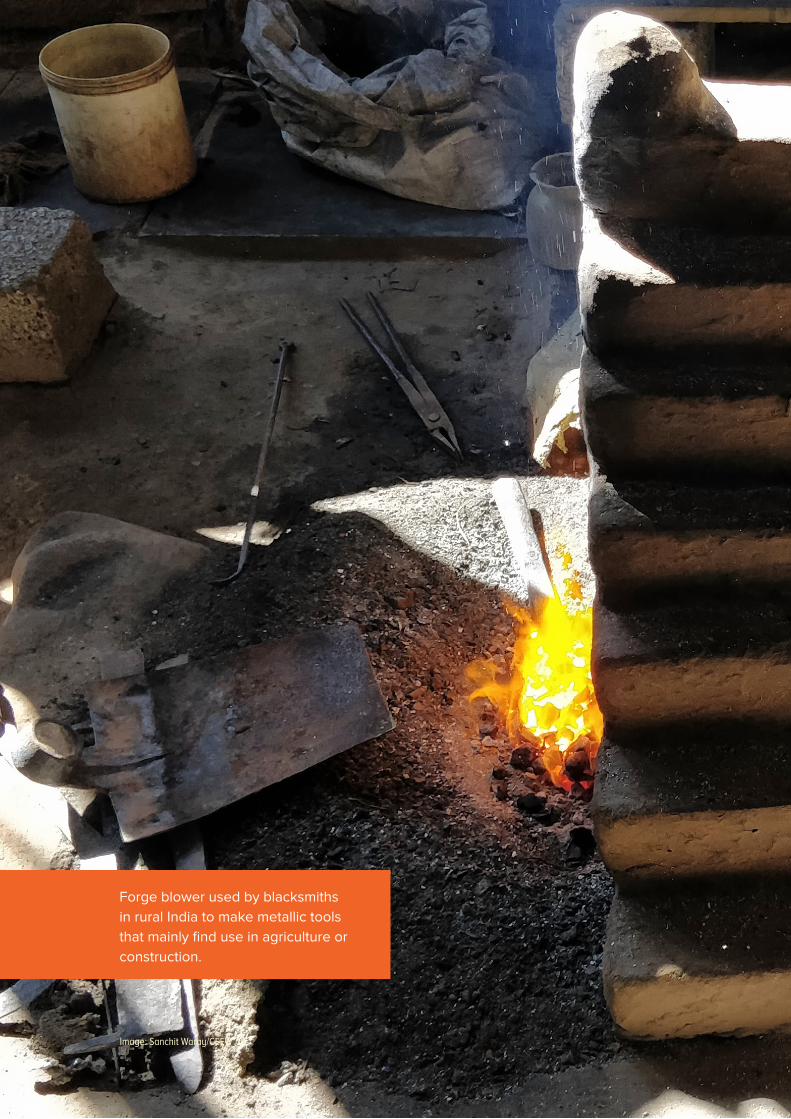
Clean Energy Innovations to Boost Rural Incomes
Image: Sanchit Waray/CEEW
Forge blower used by blacksmiths in rural India to make metallic tools that mainly find use in agriculture or construction.
Executive Summary
6. Conclusion
Clean Energy Innovations to Boost Rural Incomes
DRE and energy efficiency innovations can play a pivotal role in replacing existing fossil-fuel-based sources of energy, reducing human and animal drudgery, and contributing to an
increase in rural net incomes, thereby making India’s villages ‘smarter’. Potential DRE solutions to power RIGAs would require technological as well as business model innovations, coupled with access to patient capital investment. This section summarises the key insights from the study, and the interventions needed to promote the mass adoption of DRE-powered livelihood applications.
Improving the asset utilisation and economic viability of DRE by complementing
and sharing loads.
One way of improving the utilisation rate of solar energy applications on farms is to also use it to power non-farm productive activities, such as dal or gram mills, parboiling units, rice puffing machines, multipurpose grain mills, or pedal-cum-power-operated wheat cleaners. Load sharing can be done directly between two parties or can be moderated through a third party (e.g., an energy services company). The benefit the farmer accrues from selling additional electricity will depend on the local price of electricity and the revenues that can accrue from the additional productive work. Given the seasonality of the energy demand for agricultural activities, seasonal productive uses of energy (such as post-harvest processing) can help improve asset utilisation and facilitate better incomes for farmers. Energy products and services need to be modified accordingly to meet consumer expectations of quality, reliability, and affordability.
Concerted focus on the product innovation ecosystem will be necessary to
develop sustainable markets that cater to all stakeholders.
While there are some innovations that cater to the needs of the farm and non-farm sectors, they are inadequate to mechanise rural India sufficiently to improve incomes and reduce drudgery. There exist more than 200 farm and non-farm RIGAs, and each RIGA has a value chain comprising several processes, while there are only a handful of DRE-powered innovations. The few innovations that do exist are still at an early, pre-commercial stage, with limited revenues and markets.
Markets where energy supply is inadequate to meet market requirements, where fossil fuels are being used, where human and animal drudgery limit productivity and undermine quality of life, or where energy is being used inefficiently thus driving up the price, are potential markets for DRE-powered solutions.
Product innovation in the sector is insufficient and inadequately supported. A product innovation ecosystem is needed to support product development from concept to commercialisation. For a vibrant innovation ecosystem, there need to be design labs, prototyping facilities, incubators and accelerators, angel investors and early-stage venture capital, low-cost manufacturing hubs, and identification of early adopter customers. While some of these services already exist, others are yet to be established. New business models and financial innovations need to be tested and validated to make DRE-powered products economically competitive. There are lessons to be learned on how to create, cultivate, and capture a novel market, from innovation hubs such as Shenzhen and Silicon Valley, as well as Oxbridge and Israel.
Customer development and demand creation will be critical to the success of
the product despite an enabled product ecosystem
Industry interviews and a literature review show that there is a dearth of product innovations in DRE-powered livelihood applications. However, product innovations alone would not guarantee
74
Executive Summary
adoption on the ground. One of the most vital reasons for poor technology adoption is an inadequate understanding of human behaviour, and the failure to acknowledge its importance for the adoption of new products and business models. Unlike conventional products where customers realise the value proposition of the product, a customer base needs to be developed for DRE products by analysing unmet needs that may indicate potential demand. Access to information on customers’ needs, perceptions, and willingness to pay is crucial. To that end, consumer research, design experts catering to consumer utility, and strategic pilots to evaluate consumers’ needs and willingness to pay are all essential. Endeavours to design a holistic innovation ecosystem will need to address all these essential aspects of product and consumer development simultaneously.
DRE for productive use can be the catalyst for improving household energy
consumption and supporting a better quality of life
Access to energy does not translate into human development unless it is followed by an increase in energy use in line with a higher standard of living (Nordhaus, Trembath and Devi 2016). With the Saubhagya Scheme, the Government of India aims to universalise household electrification, but this will not be enough to increase energy use among rural populations (Ranjan 2018). While establishing energy supply is a first step, affordable energy services need to be made available to encourage a transition to higher energy use. Rural incomes can rise through the increased use of distributed renewable energy powered innovative, energy-efficient products. Higher incomes will not only facilitate the further expansion of productive activities, but it will also improve the affordability of energy for households, thus leading to an increase in energy consumption. I-DESIRE’s focus on DRE for livelihood activities would also have the additional benefit of improved and affordable energy consumption among rural households.
75Conclusion

Clean Energy Innovations to Boost Rural Incomes36
Executive Summary
References
Allen, Sarah, Anar Bhatt, Usha Ganesh, and Nisha Kumar Kulkarni (2012) “On the Path to Sustainability and
Scale - A Study of India's Social Enterprise Landscape,” Intellecap, April. Mumbai: Intellecap.
Central Statistical Organisation (2014) “State-wise Growth Rate of Agriculture & Allied Sector in India: 1996-
97 to 2013-14,” Ministry of Agriculture, 22 December. Available at http://planningcommission.nic.in/data/
datatable/data_2312/DatabookDec2014%2060.pdf.
Chand, Ramesh, S.K. Srivastava, and Jaspal Singh (2017) “Changing Structure of Rural Economy of India -
Implications for Employment and Growth,” NITI Aayog. New Delhi: Government of India. Available at http://
niti.gov.in/writereaddata/files/document_publication/Rural_Economy_DP_final.pdf.
Chaudhry, Siraj (2015) “3 Ways to Boost Indian Agriculture,”, World Economic Forum, 3 November. Available
at https://www.weforum.org/agenda/2015/11/3-ways-to-boost-indian-agriculture/; accessed 23 June 2018.
“CSIR, CII to Collaborate on Technology Development,” (2017) The Hindu BusinessLine, 6 May. Available
at http://www.thehindubusinessline.com/news/science/csir-cii-to-collaborate-on-technology-development/
article9684382.ece.
Department of Agriculture Cooperation and Farmers Welfare, Agriculture Census Division (2010-11) “All
India Report on Agriculture Census 2010-2011,” New Delhi: Government of India.
Desjardins, Simon, Richard Gomes, Pradeep Pursnani, and Chris West (2014) “Accelerating Access to
Energy,” Shell Foundation. Available at https://www.shellfoundation.org/ShellFoundation.org_new/media/
Shell-Foundation-Reports/Access_to_Energy_Report_2014.pdf; accessed on 29 June 2018.
Directorate of Economics and Statistics (2013-14) “Agricultural Wages in India 2013-2014,” Department of
Agriculture, CooperationandFarmersWelfare. New Delhi: Government of India.
Directorate of Economics and Statistics (2014) “Estimates of Cost of Cultivation/Production and Related
Data,” Department of Agriculture, Cooperation and Farmers Welfare. New Delhi: Government of India.
Directorate of Economics and Statistics (2014-15) “Agricultural Wages in India 2014-2015,” Department of
Agriculture, Cooperation and Farmers Welfare New Delhi: Government of India.
Energy Sector Management Assistance Program (2002) “Rural Electrification and Development in the
Philippines: Measuring the Social and Economic Benefits,” World Bank/ESMAP. Washington, D.C.: World
Bank.
Foxon, T.J., R. Gross, A. Chase, J. Howes, A. Arnall, and D. Anderson (2005) “UK Innovation Systems for
New and Renewable Energy Technologies: Drivers, Barriers and System Failures,” Energy Policy 33.pp
2123-2137.
Harsdorff, M, and P. Bamanyaki (2009) “Impact Assessment of the Solar Electrification of Micro Enterprises,
Households and the Development of the Rural Solar Market,” Promotion of Renewable Energy and Energy
Efficiency Programme. Kampala: GTZ - Deutsche Gesellschaft fürTechnischeZusammenarbeit. Available at
https://energypedia.info/images/d/d4/Impact_assessment_shs_preeep_uganda_2009.pdf; accessed 23
June 2018.
Indian Council on Agricultural Research (2015) “Four Decades of R&D: All India Coordinated Research
Project on Post-Harvest Engineering and Technology,” ICAR. New Delhi: Government of India. Available
at https://aicrp.icar.gov.in/phet/wp-content/uploads/2017/02/Four-Decay_3rd-dec.-2015_PHET_Dixit.pdf;
accessed on 28 June 2018.
77
Clean Energy Innovations to Boost Rural Incomes
Indian Council on Agricultural Research (2017) “Consultation Workshop on Integrating Renewable Energy
Technologies for Smallholder Agriculture in India,” ICAR, 3 August. New Delhi.
“India's Per Capita Energy Consumption to Double in Next 6-7 Years,” (2017) The Hindu Business Line
12 October. Available at http://www.thehindubusinessline.com/economy/indias-per-capita-energy-
consumption-to-double-in-next-67-years/article9901708.ece; accessed 8 January 2018.
International Energy Agency (2015) “India Energy Outlook,” World Energy Outlook 2015. Paris: International
Energy Agency, pp 425-572. Available at https://www.iea.org/publications/freepublications/publication/
WEO2015.pdf; accessed 23 June 2018.
International Institute for Applied Systems Analysis (2012) “Energy, Poverty, and Development,” in Thomas
B. Johansson, Anand Patwardhan, Nebojsa Nakicenovic, and Luis Gomez-Echeverri (eds), Global Energy
Assessment. Cambridge, UK: Cambridge University Press, pp 151–190. Available at http://www.iiasa.ac.at/
web/home/research/Flagship-Projects/Global-Energy-Assessment/GEA-Summary-web.pdf; accessed 23
June 2018.
Jain, Abhishek, Sudatta Ray, Karthik Ganesan, Michael Aklin, Chao-yo Cheng, andJohannes Urpelainen
(2015) “Access to Clean Cooking Energy and Electricity: Survey of States,” CEEW Report, September. New
Delhi: Council on Energy, Environment and Water.
Agrawal, S. and Jain, A. (2015) ‘Solar Pumps for Sustainable Irrigation: A Budget Neutral Opportunity’. New
Delhi: Council on Energy, Environment and Water.
Jain, Abhishek, and Shahidi, Tauseef (2018) “Adopting Solar for Irrigation: Farmers' Perspectives from Uttar
Pradesh,” CEEW Report, January. New Delhi: Council on Energy, Environment and Water. Available at
http://ceew.in/pdf/CEEW%20-%20Adopting%20Solar%20for%20Irrigation%20(SPIS)%20-%20Farmers'%20
Perspectives%20from%20UP%20Report%2017Jan18.pdf; accessed 26 June 2018.
Legros, Gwénaëlle, Kamal Rijal, and BaharehSeyedi (2011) “Decentralized Energy Access and the Millennium
Development Goals: An Assessment of the Development Benefits of Micro Hydropower in Rural Nepal,”
Alternative Energy Promotion Centre. New York: United Nations Development Programme. Available at
http://www.undp.org/content/dam/undp/library/Environment%20and%20Energy/Sustainable%20Energy/
UNDP-Decentralized-Energy-Access-and-MDGs-book.pdf; accessed 23 June 2018.
Lundvall, B.A. (1992) National Systems of Innovation: Towards a Theory of Innovation and Interactive
Learning. London: Pinter Publishers.
McCrone, Angus, Ulf Moslener, Francoise d’Estais, and Christine Grünin (eds) (2017) “Global Trends
in Renewable Energy Investment 2017,” Frankfurt School-UNEP Collaborating Centre for Climate and
Sustainable Energy Finance. Frankfurt: FS-UNEP Centre. Available at http://fs-unep-centre.org/publications/
global-trends-renewable-energy-investment-2017; accessed 29 June 2018.
Mehta, C.R., N.S Chandel, and T Senthilkumar (2014) “Status, Challenges and Strategies for Farm
Mechanization in India,” Agricultural Mechanisation in Asia, Africa, and Latin America 45(4): 43-50.
Ministry of Agriculture and Farmers Welfare (2017) “National Portal on Mechanization and Technology,”
Mechanization & Technology Division, Department of Agriculture, Cooperation and Farmers Welfare, 11
December. New Delhi: Government of India. Available athttp://farmech.dac.gov.in/.
Ministry of Food Processing Industries (2016) “Wastage of Agricultural Produce,” Press Information Bureau,
9 August. Available at http://pib.nic.in/newsite/PrintRelease.aspx?relid=148566.
78
Executive Summary
Ministry of Power (2017) “Guidelines for Pradhan Mantri Sahaj Nijli Har Ghar Yojana,” Government of
India, 20 October. Available at https://powermin.nic.in/sites/default/files/webform/notices/Guidelines_of_
SAUBHAGYA.pdf;Accessed22April 2018.
Ministry of Skill Development and Entrepreneurship (2015) “National Policy for Skill Development and
Entrepreneurship 2015,” Ministry of Skill Development and Entrepreneurship. New Delhi: Government of
India. Available at http://www.skilldevelopment.gov.in/assets/images/Skill%20India/policy%20booklet-%20
Final.pdf; accessed 29 June 2018.
Ministry of Statistics and Programme Implementation (1993-94) “NSS: Employment and Unemployment
Situation Among Social Groups in India.” New Delhi: Government of India.
Ministry of Statistics and Programme Implementation (2009-10) “NSS: Employment and Unemployment
Situation among Social Groups in India.” New Delhi: Government of India.
Ministry of Statistics and ProgrammeImplementation (2010-11) “Operational Characteristics of Unincorporated
Non-Agricultural Enterprises in India.” New Delhi: Government of India.
Ministry of Statistics and Programme Implementation (2013) “Statewise Estimates of Value of
OutputfromAgriculture andAllied Activities.” New Delhi: GovernmentofIndia.
Ministry of Statistics and Programme Implementation (2017) “Key Indicators of Unincorporated Non-
agricultural Enterprises (Excluding Construction) in India, 2015-16.” New Delhi: Government of India.
Nair, Radhika P (2017) “The YourStory 2017 Startup Funding Report—$13.7 Billion Invested Across 820
Deals,” YourStory, 23 December. Available at https://yourstory.com/2017/12/2017-startup-funding-report/
National Bank for Agriculture and Rural Development (2017) “Agricultural Machinery Custom Hiring
Centres: Model Scheme,” NABARD. Available at http://agritech.tnau.ac.in/banking/nabard_pdf/Farm%20
mechanization/3.Custom_Hiring_Centre.pdf
National Food Security Mission (2017) “Crop Calendar of NFSM Crops,” NFSM. New Delhi: Government of
India. Available at http://nfsm.gov.in/nfmis/RPT/CalenderReport.aspx.
National Renewable Energy Laboratory (2017) NREL PV Watts Calculator, U.S. Department of Energy.
Available at http://pvwatts.nrel.gov.
Nordhaus, Ted, Alex Trembath, and Shaiyra Devi (2016) “Energy for Human Development,” Breakthrough
Institute, November 16. Available at https://thebreakthrough.org/index.php/issues/human-development/
energy-for-human-development.
Office of the Registrar General & Census Commissioner, India (2011) Census Data Online. New Delhi:
Government of India. Available at http://censusindia.gov.in/2011-common/censusdataonline.html
Pani, Priyanka (2017) “EM3 AgriServices raises $10 mn series B funding,” The Hindu BusinessLine, 9
August. Available at http://www.thehindubusinessline.com/info-tech/em3-agriservices-raises-10-mn-series-
b-funding/article9808365.ece; accessed 20 December 2017.
Ramesh Chand, S.K. Srivastava, and Jaspal Singh (2017) “Changing Structure of Rural Economy of India,
Implications for Employment and Growth,” NITI Aayog. New Delhi: Government of India.
Ranjan, Manya (2018) “Energy Access: a Cautionary Tale,” The Economic Times: Energyworld, 8 January.
Available at https://www.google.com/url?hl=en-GB&q=https://energy.economictimes.indiatimes.com/
energy-speak/energy-access-a-cautionary-tale/2801&source=gmail&ust=1515477092317000&usg=AFQjC
NFm6a46EUwScdgA9NWQ1ki8Ljmvag; accessed 8 January 2018.
Raymond, Anne, and Jain, Abhishek (2018) “Solar For Irrigation: A Comparative Assessment
79References
Clean Energy Innovations to Boost Rural Incomes
Of Deployment Strategies,” CEEW, January. New Delhi: Council on Energy, Environment, and Water.
Singh, Gajendra (2013) “Agricultural Mechanization in India,” in Josef Kienzle, John E. Ashburner, and Brian
G. Sims (eds), Mechanization for Rural Development: A Review of Patterns and Progress From Around the
World, Integrated Crop Management 20. Rome: FAO, pp 99-119. Available at http://www.fao.org/docrep/018/
i3259e/i3259e.pdf
Singh, Surendra, R.S. Singh, and S.P. Singh (2014) “Farm Power Availability on Indian Farms.” Agricultural
Engineering Today 28(4): 44-52.
Tenneti, Sandhya, and Anushree Parekh (2017) “CSR in Clean Energy - What Are India's Top Companies Up
To?” Samhita Social Ventures, November. Mumbai. Available at https://drive.google.com/file/d/1AIpUTAWT
0r2YAbGTssAQadnHDTdqfscg/view.
United Nations (2014) World Urbanization Prospects 2014 Revision, New York: United Nations Department
of Economic and Social Affairs. Available at https://esa.un.org/unpd/wup/publications/files/wup2014-
highlights.pdf
World Bank (2014), World Bank Enterprise Surveys, Available at : http://www.enterprisesurveys.org/data/
exploreeconomies/2014/india
80
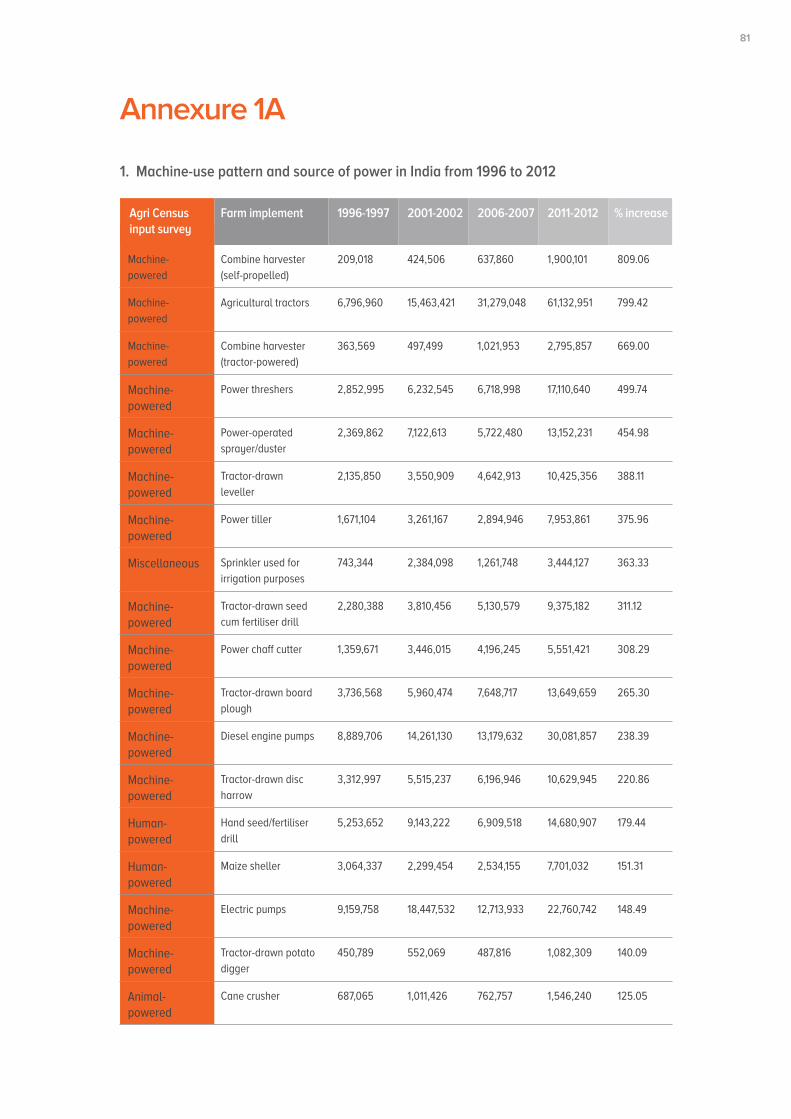
Executive Summary
Annexure 1A
1. Machine-use pattern and source of power in India from 1996 to 2012
Agri Census input survey
Machine- powered
Machine- powered
Machine- powered
Machine- powered
Machine- powered
Machine- powered
Machine- powered
Human-powered
Machine- powered
Machine- powered
Machine- powered
Machine- powered
Miscellaneous
Machine- powered
Machine- powered
Human-powered
Machine- powered
Animal-powered
Combine harvester (self-propelled)
Combine harvester (tractor-powered)
Power-operated sprayer/duster
Power tiller
Tractor-drawn seed cum fertiliser drill
Tractor-drawn board plough
Tractor-drawn disc harrow
Maize sheller
Tractor-drawn potato digger
Agricultural tractors
Power threshers
Tractor-drawn leveller
Sprinkler used for irrigation purposes
Power chaff cutter
Diesel engine pumps
Hand seed/fertiliser drill
Electric pumps
Cane crusher
209,018
363,569
2,369,862
1,671,104
2,280,388
3,736,568
3,312,997
3,064,337
450,789
6,796,960
2,852,995
2,135,850
743,344
1,359,671
8,889,706
5,253,652
9,159,758
687,065
424,506
497,499
7,122,613
3,261,167
3,810,456
5,960,474
5,515,237
2,299,454
552,069
15,463,421
6,232,545
3,550,909
2,384,098
3,446,015
14,261,130
9,143,222
18,447,532
1,011,426
637,860
1,021,953
5,722,480
2,894,946
5,130,579
7,648,717
6,196,946
2,534,155
487,816
31,279,048
6,718,998
4,642,913
1,261,748
4,196,245
13,179,632
6,909,518
12,713,933
762,757
1,900,101
2,795,857
13,152,231
7,953,861
9,375,182
13,649,659
10,629,945
7,701,032
1,082,309
61,132,951
17,110,640
10,425,356
3,444,127
5,551,421
30,081,857
14,680,907
22,760,742
1,546,240
809.06
669.00
454.98
375.96
311.12
265.30
220.86
151.31
140.09
799.42
499.74
388.11
363.33
308.29
238.39
179.44
148.49
125.05
Farm implement 1996-1997 2001-2002 2006-2007 2011-2012 % increase
81
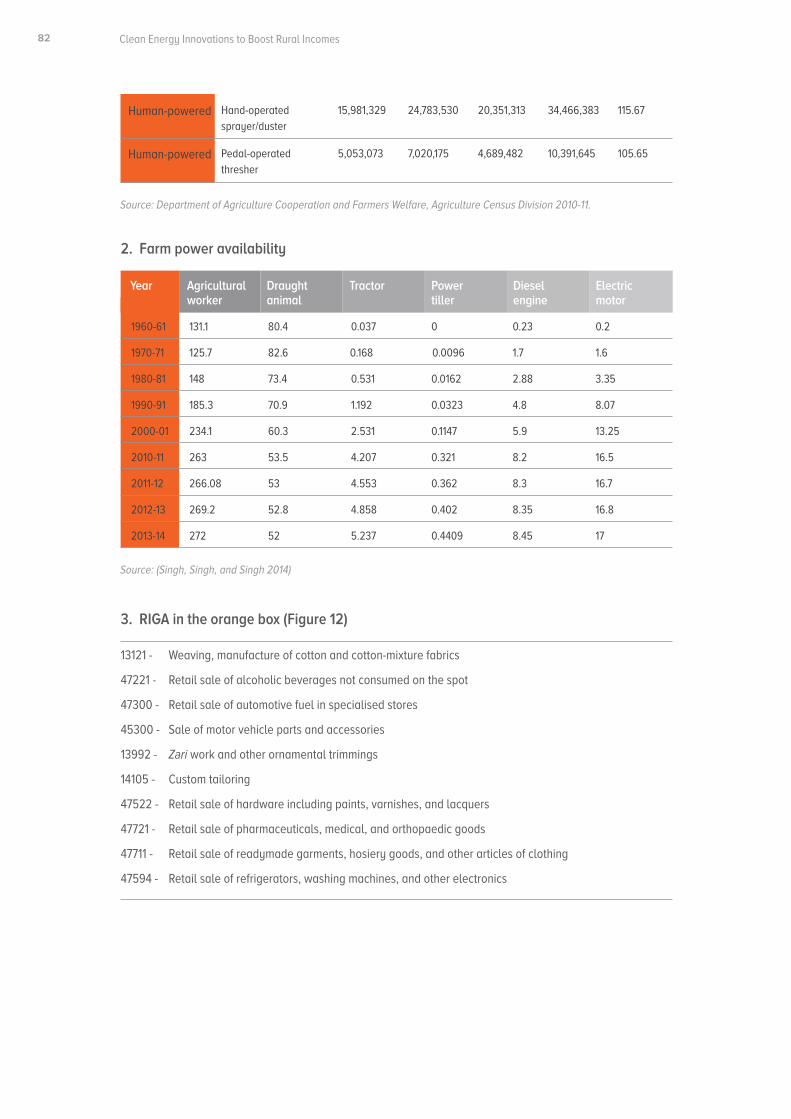
Clean Energy Innovations to Boost Rural Incomes
2. Farm power availability
3. RIGA in the orange box (Figure 12)
1960-61 131.1 80.4 0.037 0 0.23 0.2
1970-71 125.7 82.6 0.168 0.0096 1.7 1.6
1980-81 148 73.4 0.531 0.0162 2.88 3.35
1990-91 185.3 70.9 1.192 0.0323 4.8 8.07
2000-01 234.1 60.3 2.531 0.1147 5.9 13.25
2010-11 263 53.5 4.207 0.321 8.2 16.5
2011-12 266.08 53 4.553 0.362 8.3 16.7
2012-13 269.2 52.8 4.858 0.402 8.35 16.8
2013-14 272 52 5.237 0.4409 8.45 17
13121 - Weaving, manufacture of cotton and cotton-mixture fabrics
47221 - Retail sale of alcoholic beverages not consumed on the spot
47300 - Retail sale of automotive fuel in specialised stores
45300 - Sale of motor vehicle parts and accessories
13992 - Zari work and other ornamental trimmings
14105 - Custom tailoring
47522 - Retail sale of hardware including paints, varnishes, and lacquers
47721 - Retail sale of pharmaceuticals, medical, and orthopaedic goods
47711 - Retail sale of readymade garments, hosiery goods, and other articles of clothing
47594 - Retail sale of refrigerators, washing machines, and other electronics
Source: (Singh, Singh, and Singh 2014)
Source: Department of Agriculture Cooperation and Farmers Welfare, Agriculture Census Division 2010-11.
Human-powered
Human-powered
Hand-operated sprayer/duster
Pedal-operated thresher
15,981,329
5,053,073
24,783,530
7,020,175
20,351,313
4,689,482
34,466,383
10,391,645
115.67
105.65
Year Agricultural worker
Draught animal
Tractor Power tiller
Diesel engine
Electric motor
82
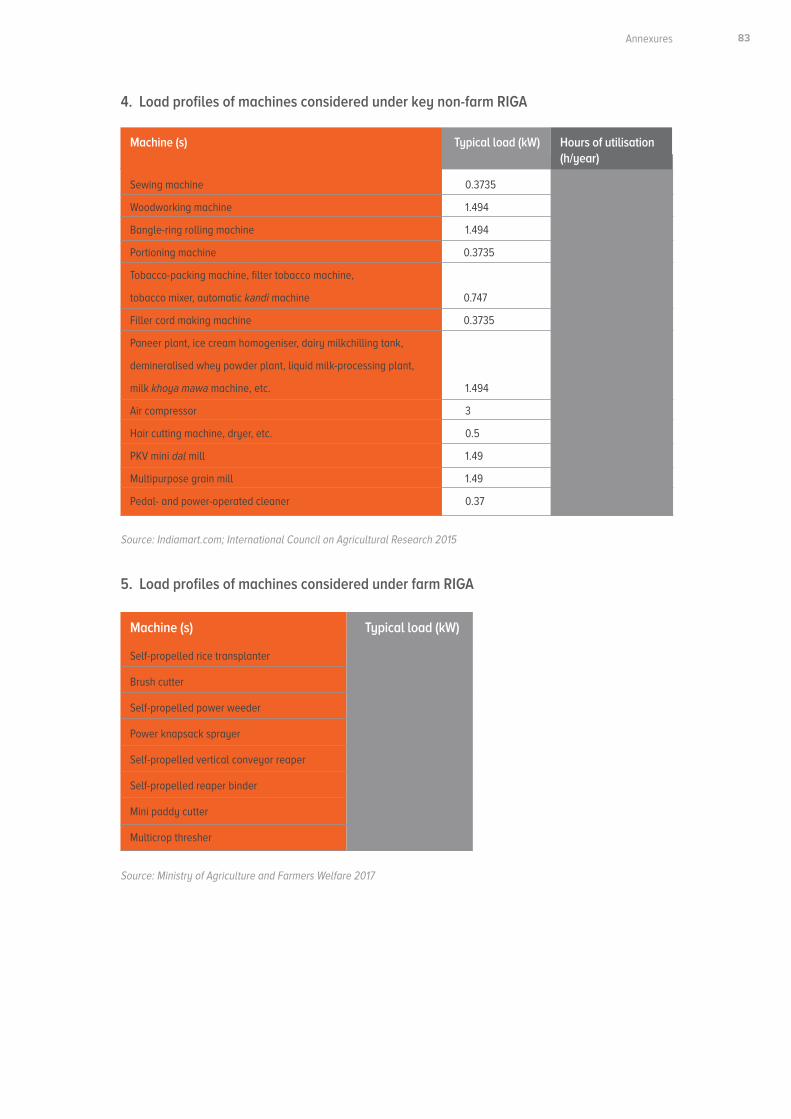
Executive Summary
5. Load profiles of machines considered under farm RIGA
4. Load profiles of machines considered under key non-farm RIGA
Sewing machine 0.3735 2,891
Woodworking machine 1.494 2,891
Bangle-ring rolling machine 1.494 2,891
Portioning machine 0.3735 2,891
Tobacco-packing machine, filter tobacco machine,
tobacco mixer, automatic kandi machine 0.747 2,891
Filler cord making machine 0.3735 2,891
Paneer plant, ice cream homogeniser, dairy milkchilling tank,
demineralised whey powder plant, liquid milk-processing plant,
milk khoya mawa machine, etc. 1.494 2,891
Air compressor 3 2,891
Hair cutting machine, dryer, etc. 0.5 2,891
PKV mini dal mill 1.49 1,944
Multipurpose grain mill 1.49 1,944
Pedal- and power-operated cleaner 0.37 1,944
Source: Ministry of Agriculture and Farmers Welfare 2017
Source: Indiamart.com; International Council on Agricultural Research 2015
Machine (s)
Machine (s)
Hours of utilisation (h/year)
Typical load (kW)
Typical load (kW)
Self-propelled rice transplanter 3.28
Brush cutter 0.75
Self-propelled power weeder 2.25
Power knapsack sprayer 0.52
Self-propelled vertical conveyor reaper 3.75
Self-propelled reaper binder 5.1
Mini paddy cutter 1.48
Multicrop thresher 5.59
83Annexures
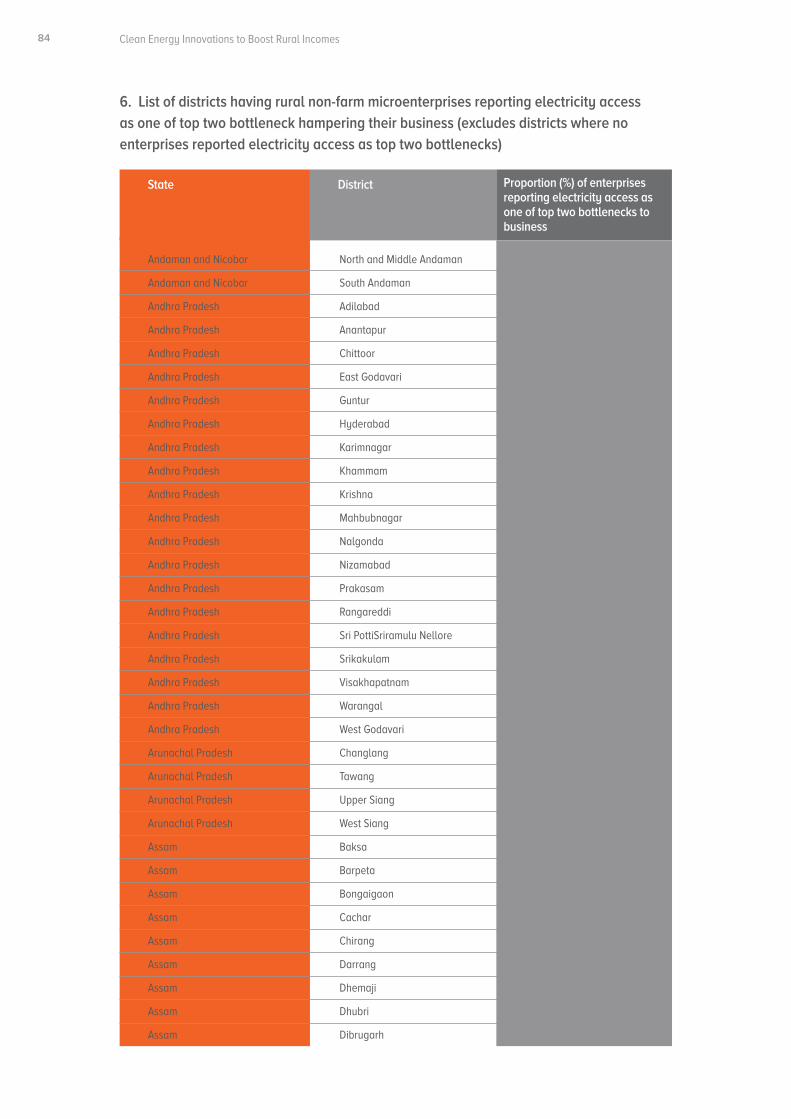
Clean Energy Innovations to Boost Rural Incomes
Andaman and Nicobar North and Middle Andaman 2
Andaman and Nicobar South Andaman 10
Andhra Pradesh Adilabad 2
Andhra Pradesh Anantapur 3
Andhra Pradesh Chittoor 7
Andhra Pradesh East Godavari 4
Andhra Pradesh Guntur 1
Andhra Pradesh Hyderabad 1
Andhra Pradesh Karimnagar 6
Andhra Pradesh Khammam 5
Andhra Pradesh Krishna 3
Andhra Pradesh Mahbubnagar 3
Andhra Pradesh Nalgonda 2
Andhra Pradesh Nizamabad 1
Andhra Pradesh Prakasam 1
Andhra Pradesh Rangareddi 2
Andhra Pradesh Sri PottiSriramulu Nellore 5
Andhra Pradesh Srikakulam 3
Andhra Pradesh Visakhapatnam 4
Andhra Pradesh Warangal 1
Andhra Pradesh West Godavari 3
Arunachal Pradesh Changlang 3
Arunachal Pradesh Tawang 20
Arunachal Pradesh Upper Siang 52
Arunachal Pradesh West Siang 67
Assam Baksa 7
Assam Barpeta 29
Assam Bongaigaon 33
Assam Cachar 16
Assam Chirang 25
Assam Darrang 36
Assam Dhemaji 11
Assam Dhubri 50
Assam Dibrugarh 37
6. List of districts having rural non-farm microenterprises reporting electricity accessas one of top two bottleneck hampering their business (excludes districts where noenterprises reported electricity access as top two bottlenecks)
State District Proportion (%) of enterprises reporting electricity access as one of top two bottlenecks to business
84

Executive Summary
Assam Dima Hasao 53
Assam Goalpara 20
Assam Golaghat 26
Assam Hailakandi 20
Assam Jorhat 19
Assam Kamrup 31
Assam Kamrup Metropolitan 62
Assam KarbiAnglong 32
Assam Karimganj 20
Assam Kokrajhar 35
Assam Lakhimpur 35
Assam Morigaon 6
Assam Nagaon 19
Assam Nalbari 37
Assam Sivasagar 40
Assam Sonitpur 37
Assam Tinsukia 8
Assam Udalguri 38
Bihar Araria 8
Bihar Arwal 1
Bihar Aurangabad 2
Bihar Banka 25
Bihar Begusarai 10
Bihar Bhagalpur 15
Bihar Bhojpur 13
Bihar Buxar 27
Bihar Dharbanga 1
Bihar Gaya 10
Bihar Gopalganj 12
Bihar Jehanabad 5
Bihar Kaimur (Bhabua) 8
Bihar Katihar 32
Bihar Khagaria 14
Bihar Kishanganj 2
Bihar Lakhisarai 1
Bihar Madhopura 8
Bihar Munger 20
Bihar Muzaffarpur 10
Bihar Nalanda 7
Bihar Nawada 17
85Annexures
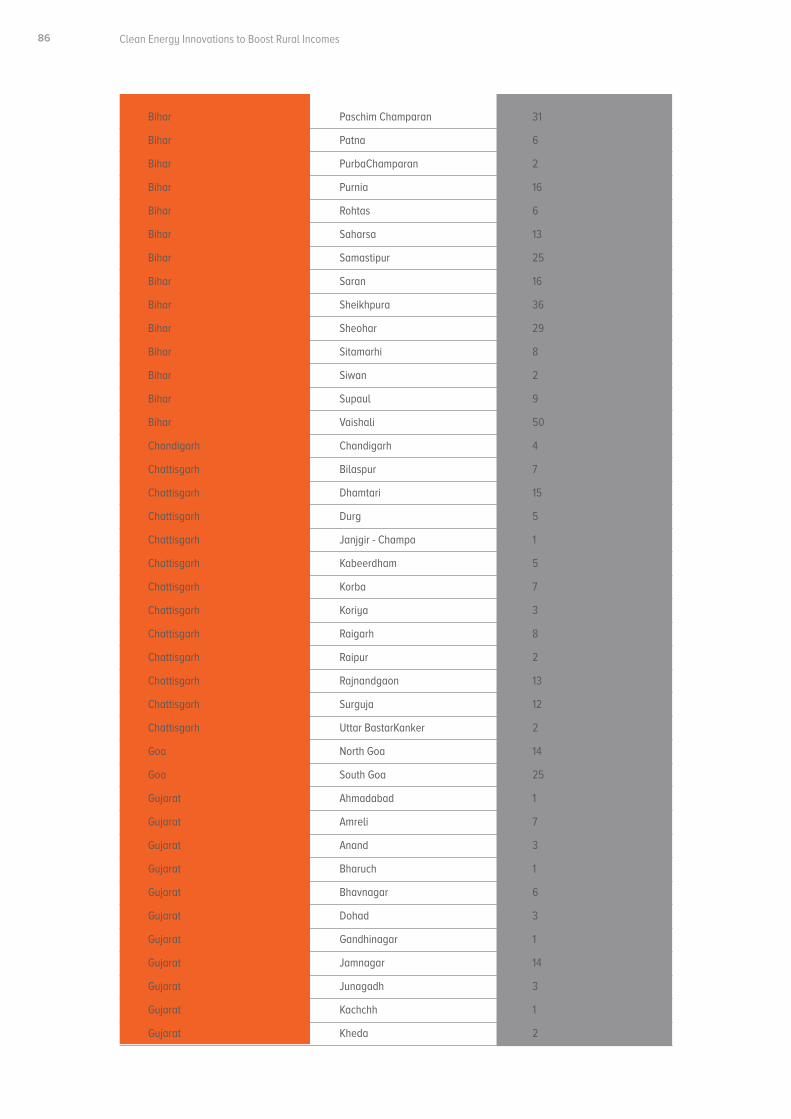
Clean Energy Innovations to Boost Rural Incomes86
Bihar Paschim Champaran 31
Bihar Patna 6
Bihar PurbaChamparan 2
Bihar Purnia 16
Bihar Rohtas 6
Bihar Saharsa 13
Bihar Samastipur 25
Bihar Saran 16
Bihar Sheikhpura 36
Bihar Sheohar 29
Bihar Sitamarhi 8
Bihar Siwan 2
Bihar Supaul 9
Bihar Vaishali 50
Chandigarh Chandigarh 4
Chattisgarh Bilaspur 7
Chattisgarh Dhamtari 15
Chattisgarh Durg 5
Chattisgarh Janjgir - Champa 1
Chattisgarh Kabeerdham 5
Chattisgarh Korba 7
Chattisgarh Koriya 3
Chattisgarh Raigarh 8
Chattisgarh Raipur 2
Chattisgarh Rajnandgaon 13
Chattisgarh Surguja 12
Chattisgarh Uttar BastarKanker 2
Goa North Goa 14
Goa South Goa 25
Gujarat Ahmadabad 1
Gujarat Amreli 7
Gujarat Anand 3
Gujarat Bharuch 1
Gujarat Bhavnagar 6
Gujarat Dohad 3
Gujarat Gandhinagar 1
Gujarat Jamnagar 14
Gujarat Junagadh 3
Gujarat Kachchh 1
Gujarat Kheda 2
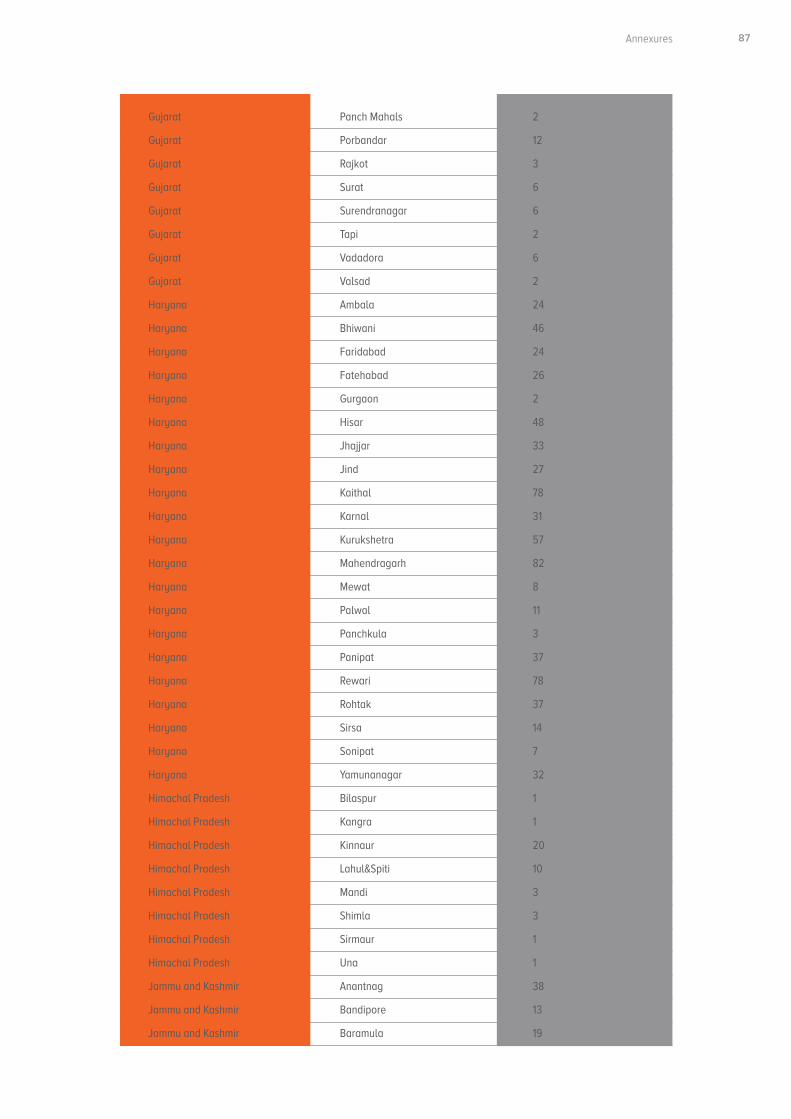
Executive Summary 87Annexures
Gujarat Panch Mahals 2
Gujarat Porbandar 12
Gujarat Rajkot 3
Gujarat Surat 6
Gujarat Surendranagar 6
Gujarat Tapi 2
Gujarat Vadadora 6
Gujarat Valsad 2
Haryana Ambala 24
Haryana Bhiwani 46
Haryana Faridabad 24
Haryana Fatehabad 26
Haryana Gurgaon 2
Haryana Hisar 48
Haryana Jhajjar 33
Haryana Jind 27
Haryana Kaithal 78
Haryana Karnal 31
Haryana Kurukshetra 57
Haryana Mahendragarh 82
Haryana Mewat 8
Haryana Palwal 11
Haryana Panchkula 3
Haryana Panipat 37
Haryana Rewari 78
Haryana Rohtak 37
Haryana Sirsa 14
Haryana Sonipat 7
Haryana Yamunanagar 32
Himachal Pradesh Bilaspur 1
Himachal Pradesh Kangra 1
Himachal Pradesh Kinnaur 20
Himachal Pradesh Lahul&Spiti 10
Himachal Pradesh Mandi 3
Himachal Pradesh Shimla 3
Himachal Pradesh Sirmaur 1
Himachal Pradesh Una 1
Jammu and Kashmir Anantnag 38
Jammu and Kashmir Bandipore 13
Jammu and Kashmir Baramula 19
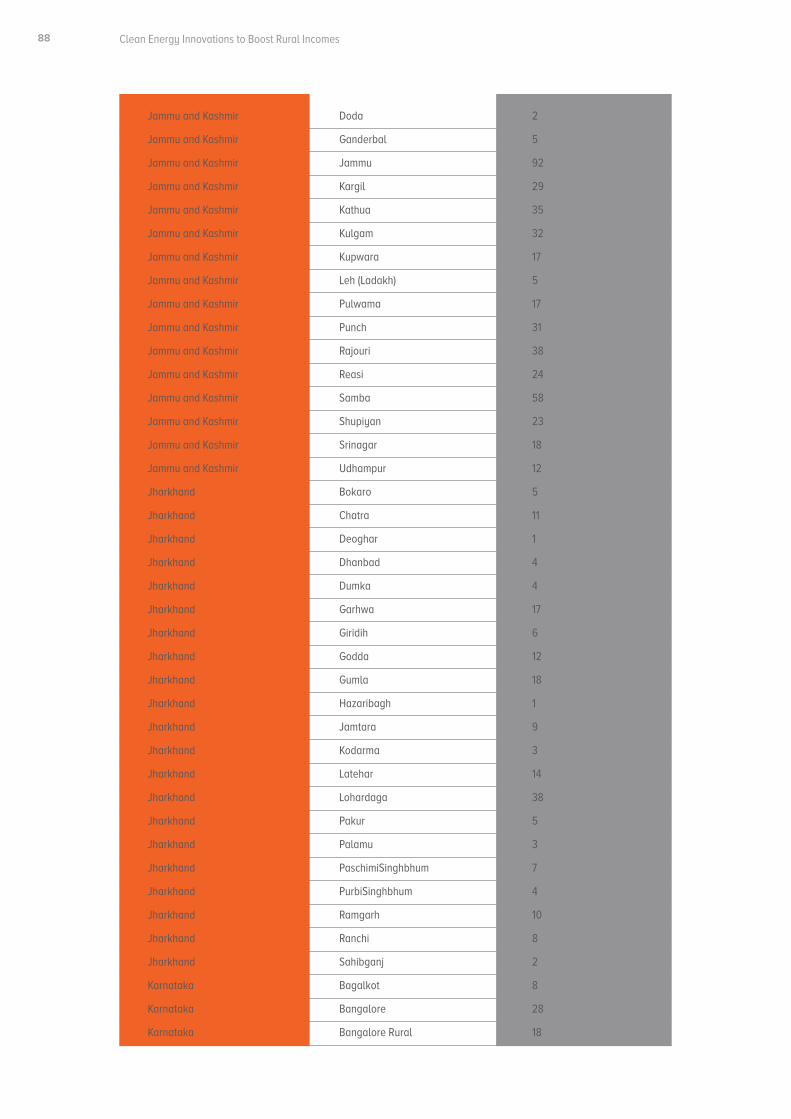
Clean Energy Innovations to Boost Rural Incomes88
Jammu and Kashmir Doda 2
Jammu and Kashmir Ganderbal 5
Jammu and Kashmir Jammu 92
Jammu and Kashmir Kargil 29
Jammu and Kashmir Kathua 35
Jammu and Kashmir Kulgam 32
Jammu and Kashmir Kupwara 17
Jammu and Kashmir Leh (Ladakh) 5
Jammu and Kashmir Pulwama 17
Jammu and Kashmir Punch 31
Jammu and Kashmir Rajouri 38
Jammu and Kashmir Reasi 24
Jammu and Kashmir Samba 58
Jammu and Kashmir Shupiyan 23
Jammu and Kashmir Srinagar 18
Jammu and Kashmir Udhampur 12
Jharkhand Bokaro 5
Jharkhand Chatra 11
Jharkhand Deoghar 1
Jharkhand Dhanbad 4
Jharkhand Dumka 4
Jharkhand Garhwa 17
Jharkhand Giridih 6
Jharkhand Godda 12
Jharkhand Gumla 18
Jharkhand Hazaribagh 1
Jharkhand Jamtara 9
Jharkhand Kodarma 3
Jharkhand Latehar 14
Jharkhand Lohardaga 38
Jharkhand Pakur 5
Jharkhand Palamu 3
Jharkhand PaschimiSinghbhum 7
Jharkhand PurbiSinghbhum 4
Jharkhand Ramgarh 10
Jharkhand Ranchi 8
Jharkhand Sahibganj 2
Karnataka Bagalkot 8
Karnataka Bangalore 28
Karnataka Bangalore Rural 18
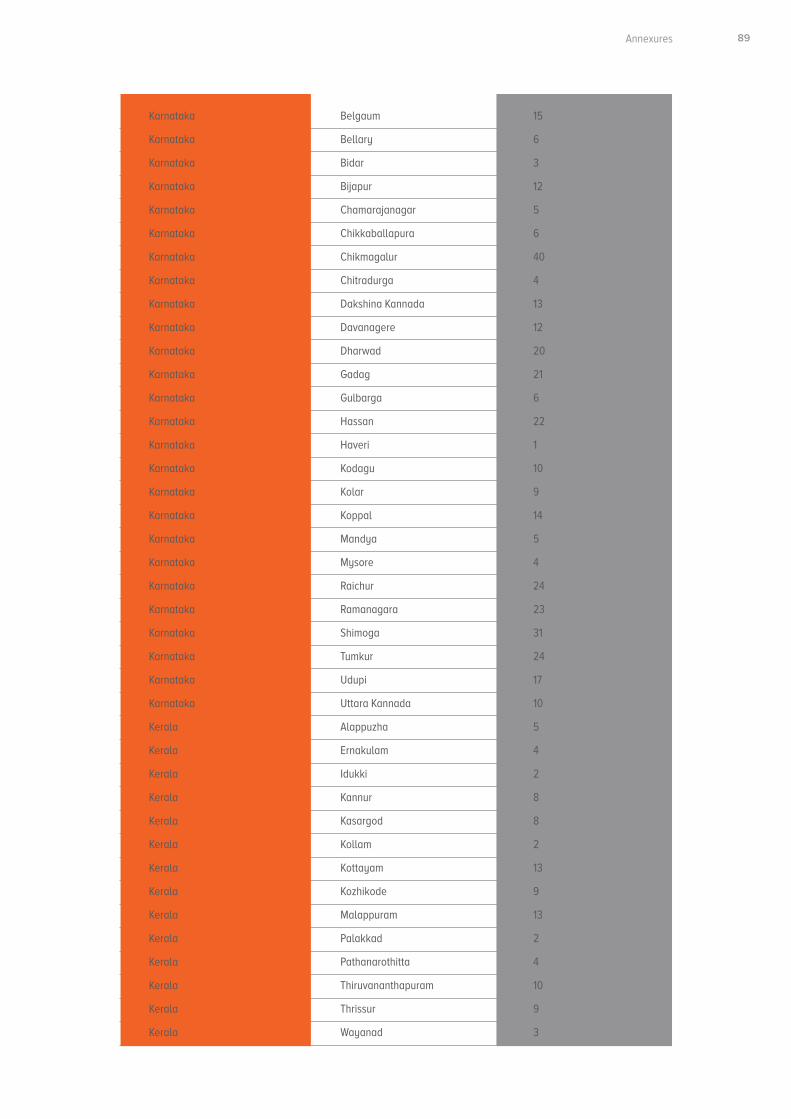
Executive Summary 89Annexures
Karnataka Belgaum 15
Karnataka Bellary 6
Karnataka Bidar 3
Karnataka Bijapur 12
Karnataka Chamarajanagar 5
Karnataka Chikkaballapura 6
Karnataka Chikmagalur 40
Karnataka Chitradurga 4
Karnataka Dakshina Kannada 13
Karnataka Davanagere 12
Karnataka Dharwad 20
Karnataka Gadag 21
Karnataka Gulbarga 6
Karnataka Hassan 22
Karnataka Haveri 1
Karnataka Kodagu 10
Karnataka Kolar 9
Karnataka Koppal 14
Karnataka Mandya 5
Karnataka Mysore 4
Karnataka Raichur 24
Karnataka Ramanagara 23
Karnataka Shimoga 31
Karnataka Tumkur 24
Karnataka Udupi 17
Karnataka Uttara Kannada 10
Kerala Alappuzha 5
Kerala Ernakulam 4
Kerala Idukki 2
Kerala Kannur 8
Kerala Kasargod 8
Kerala Kollam 2
Kerala Kottayam 13
Kerala Kozhikode 9
Kerala Malappuram 13
Kerala Palakkad 2
Kerala Pathanarothitta 4
Kerala Thiruvananthapuram 10
Kerala Thrissur 9
Kerala Wayanad 3
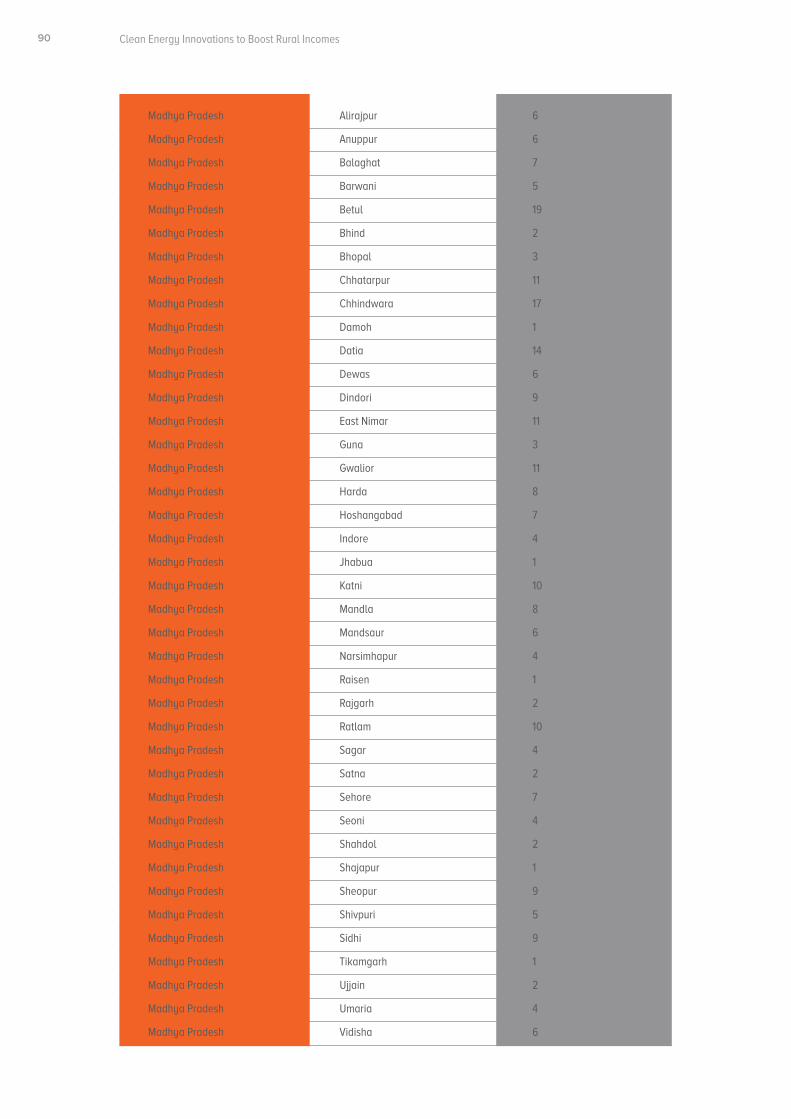
Clean Energy Innovations to Boost Rural Incomes90
Madhya Pradesh Alirajpur 6
Madhya Pradesh Anuppur 6
Madhya Pradesh Balaghat 7
Madhya Pradesh Barwani 5
Madhya Pradesh Betul 19
Madhya Pradesh Bhind 2
Madhya Pradesh Bhopal 3
Madhya Pradesh Chhatarpur 11
Madhya Pradesh Chhindwara 17
Madhya Pradesh Damoh 1
Madhya Pradesh Datia 14
Madhya Pradesh Dewas 6
Madhya Pradesh Dindori 9
Madhya Pradesh East Nimar 11
Madhya Pradesh Guna 3
Madhya Pradesh Gwalior 11
Madhya Pradesh Harda 8
Madhya Pradesh Hoshangabad 7
Madhya Pradesh Indore 4
Madhya Pradesh Jhabua 1
Madhya Pradesh Katni 10
Madhya Pradesh Mandla 8
Madhya Pradesh Mandsaur 6
Madhya Pradesh Narsimhapur 4
Madhya Pradesh Raisen 1
Madhya Pradesh Rajgarh 2
Madhya Pradesh Ratlam 10
Madhya Pradesh Sagar 4
Madhya Pradesh Satna 2
Madhya Pradesh Sehore 7
Madhya Pradesh Seoni 4
Madhya Pradesh Shahdol 2
Madhya Pradesh Shajapur 1
Madhya Pradesh Sheopur 9
Madhya Pradesh Shivpuri 5
Madhya Pradesh Sidhi 9
Madhya Pradesh Tikamgarh 1
Madhya Pradesh Ujjain 2
Madhya Pradesh Umaria 4
Madhya Pradesh Vidisha 6
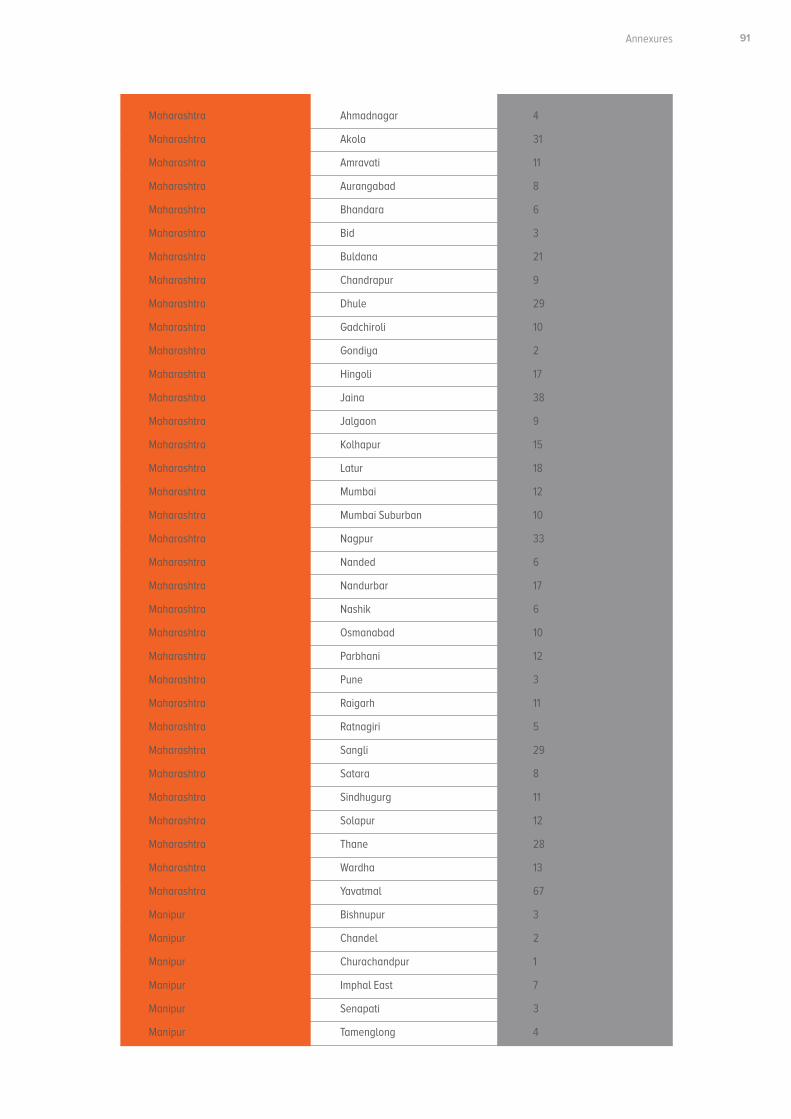
Executive Summary 91Annexures
Maharashtra Ahmadnagar 4
Maharashtra Akola 31
Maharashtra Amravati 11
Maharashtra Aurangabad 8
Maharashtra Bhandara 6
Maharashtra Bid 3
Maharashtra Buldana 21
Maharashtra Chandrapur 9
Maharashtra Dhule 29
Maharashtra Gadchiroli 10
Maharashtra Gondiya 2
Maharashtra Hingoli 17
Maharashtra Jaina 38
Maharashtra Jalgaon 9
Maharashtra Kolhapur 15
Maharashtra Latur 18
Maharashtra Mumbai 12
Maharashtra Mumbai Suburban 10
Maharashtra Nagpur 33
Maharashtra Nanded 6
Maharashtra Nandurbar 17
Maharashtra Nashik 6
Maharashtra Osmanabad 10
Maharashtra Parbhani 12
Maharashtra Pune 3
Maharashtra Raigarh 11
Maharashtra Ratnagiri 5
Maharashtra Sangli 29
Maharashtra Satara 8
Maharashtra Sindhugurg 11
Maharashtra Solapur 12
Maharashtra Thane 28
Maharashtra Wardha 13
Maharashtra Yavatmal 67
Manipur Bishnupur 3
Manipur Chandel 2
Manipur Churachandpur 1
Manipur Imphal East 7
Manipur Senapati 3
Manipur Tamenglong 4

Clean Energy Innovations to Boost Rural Incomes92
Manipur Ukhrul 18
Meghalaya East Garo Hills 4
Meghalaya East Khasi Hills 5
Meghalaya Jaintia Hills 1
Meghalaya Ri Bhoi 3
Meghalaya West Garo Hills 10
Mizoram Aizawl 19
Mizoram Champhai 4
Mizoram Kolasib 13
Mizoram Lawngtlai 7
Mizoram Lunglei 37
Mizoram Mamit 7
Mizoram Saiha 14
Mizoram Serchhip 17
Nagaland Dimapur 24
Nagaland Kohima 15
Nagaland Longleng 7
Nagaland Mokokchung 6
Nagaland Mon 7
Nagaland Peren 53
Nagaland Phek 3
Nagaland Tuensang 2
Nagaland Wokha 7
Nagaland Zunheboto 5
Orissa Anugul 3
Orissa Balangir 1
Orissa Baleshwar 17
Orissa Bargarh 1
Orissa Baudh 5
Orissa Bhadrak 6
Orissa Cuttack 9
Orissa Dhenkanal 1
Orissa Gajapati 7
Orissa Ganjam 9
Orissa Jagatsinghapur 1
Orissa Jajapur 11
Orissa Jharsuguda 5
Orissa Kalahandi 8
Orissa Kandhamal 7
Orissa Kendrapara 5
Executive Summary 93Annexures
Orissa Kendujhar 10
Orissa Khordha 2
Orissa Koraput 10
Orissa Malkangiri 18
Orissa Mayurbhanj 7
Orissa Nabarangapur 5
Orissa Nayagarh 2
Orissa Nuapada 14
Orissa Puri 2
Orissa Rayagada 16
Orissa Subarnapur 2
Orissa Sundargarh 3
Puducherry Pondicherry 2
Punjab Amritsar 3
Punjab Barnala 9
Punjab Bathinda 12
Punjab Faridkot 14
Punjab Fatehgarh Sahib 15
Punjab Firozpur 1
Punjab Gurdaspur 5
Punjab Hoshiarpur 5
Punjab Jalandhar 12
Punjab Kapurthala 5
Punjab Ludhiana 1
Punjab Mansa 12
Punjab Moga 16
Punjab Muktsar 8
Punjab Patiala 8
Punjab Rupnagar 11
Punjab SAS Nagar 21
Punjab SBS Nagar 2
Punjab Sangrur 9
Punjab Tarn Taran 3
Rajasthan Ajmer 16
Rajasthan Alwar 5
Rajasthan Banswara 17
Rajasthan Baran 14
Rajasthan Barmer 1
Rajasthan Bharatpur 4
Rajasthan Bhilwara 19
Clean Energy Innovations to Boost Rural Incomes94
Rajasthan Bikaner 30
Rajasthan Bundi 14
Rajasthan Chittaurgarh 15
Rajasthan Churu 4
Rajasthan Dausa 21
Rajasthan Dhaulpur 6
Rajasthan Dungarpur 33
Rajasthan Ganganagar 8
Rajasthan Hanumangarh 13
Rajasthan Jaipur 19
Rajasthan Jaisalmer 21
Rajasthan Jalor 3
Rajasthan Jhalawar 4
Rajasthan Jhunhjunun 4
Rajasthan Jodhpur 3
Rajasthan Karauli 10
Rajasthan Kota 20
Rajasthan Nagaru 14
Rajasthan Pali 11
Rajasthan Pratapgarh 10
Rajasthan Rajsamand 14
Rajasthan Sawai Madhopur 11
Rajasthan Sikar 20
Rajasthan Sirohi 20
Rajasthan Tonk 57
Rajasthan Udaipur 23
Sikkim South District 2
Sikkim West District 7
Tamil Nadu Ariyalur 8
Tamil Nadu Chennai 7
Tamil Nadu Coimbatore 8
Tamil Nadu Cuddalore 9
Tamil Nadu Dharmapuri 8
Tamil Nadu Dingugul 5
Tamil Nadu Erode 1
Tamil Nadu Kancheepuram 13
Tamil Nadu Kanniyakumari 27
Tamil Nadu Karur 4
Tamil Nadu Krishnagiri 8
Tamil Nadu Madurai 16
Executive Summary 95Annexures
Tamil Nadu Nagapattinam 8
Tamil Nadu Namakkal 7
Tamil Nadu Perambalur 6
Tamil Nadu Pudukkottai 12
Tamil Nadu Ramanathapuram 15
Tamil Nadu Salem 6
Tamil Nadu Sivagangai 13
Tamil Nadu The Nilgiris 2
Tamil Nadu Theni 3
Tamil Nadu Thiruvallur 12
Tamil Nadu Thiruvarur 6
Tamil Nadu Thoothukkudi 13
Tamil Nadu Tiruchinappalli 10
Tamil Nadu Tirunelveli 6
Tamil Nadu Tiruppur 9
Tamil Nadu Tiruvannamalai 5
Tamil Nadu Vellore 5
Tamil Nadu Viluppuram 4
Tripura Dhalai 3
Tripura North Tripura 4
Tripura South Tripura 1
Tripura West Tripura 7
Uttar Pradesh Agra 29
Uttar Pradesh Aligarh 62
Uttar Pradesh Allahabad 10
Uttar Pradesh Ambedkar Nagar 40
Uttar Pradesh Azamgarh 23
Uttar Pradesh Baghpat 14
Uttar Pradesh Bahraich 3
Uttar Pradesh Ballia 13
Uttar Pradesh Balrampur 7
Uttar Pradesh Banda 16
Uttar Pradesh Bara Banki 17
Uttar Pradesh Bareilly 54
Uttar Pradesh Basti 37
Uttar Pradesh Bijnor 18
Uttar Pradesh Budaun 35
Uttar Pradesh Bulandshahr 22
Uttar Pradesh Chandraili 10
Uttar Pradesh Chitrakoot 50
Clean Energy Innovations to Boost Rural Incomes96
Uttar Pradesh Deoria 12
Uttar Pradesh Etah 16
Uttar Pradesh Etawah 3
Uttar Pradesh Faizabad 25
Uttar Pradesh Farrukhabad 26
Uttar Pradesh Fatehpur 8
Uttar Pradesh Firozabad 7
Uttar Pradesh GBN Faridabad 3
Uttar Pradesh Ghaziabad 3
Uttar Pradesh Ghazipur 7
Uttar Pradesh Gonda 38
Uttar Pradesh Gorakhpur 21
Uttar Pradesh Hamirpur 40
Uttar Pradesh Hardoi 29
Uttar Pradesh Jalaun 21
Uttar Pradesh Jaunpur 14
Uttar Pradesh Jhansi 3
Uttar Pradesh Jyotiba Nagar 19
Uttar Pradesh Kannauj 52
Uttar Pradesh Kanpur Nagar 21
Uttar Pradesh Kanshiram Nagar 11
Uttar Pradesh Kaushambi 9
Uttar Pradesh Kheri 7
Uttar Pradesh Kushinagar 35
Uttar Pradesh Lalitpur 17
Uttar Pradesh Lucknow 12
Uttar Pradesh Mahamaya Nagar 16
Uttar Pradesh Mahoba 36
Uttar Pradesh Mahraganj 29
Uttar Pradesh Mainpuri 48
Uttar Pradesh Mathura 31
Uttar Pradesh Mau 9
Uttar Pradesh Meerut 32
Uttar Pradesh Mirzapur 49
Uttar Pradesh Muzaffarnagar 15
Uttar Pradesh Phule 22
Uttar Pradesh Pilibhit 56
Uttar Pradesh Pratapgarh 55
Uttar Pradesh Rae Bareli 18
Uttar Pradesh Rampur 17
Executive Summary 97Annexures
Uttar Pradesh SKN 48
Uttar Pradesh SRNB 5
Uttar Pradesh Saharanpur 1
Uttar Pradesh Shahjahanpur 9
Uttar Pradesh Shrawasti 11
Uttar Pradesh Siddharthnagar 8
Uttar Pradesh Sitapur 36
Uttar Pradesh Sonbhadra 18
Uttar Pradesh Sultanpur 60
Uttar Pradesh Unnao 75
Uttar Pradesh Varanasi 33
Uttarakhand Bageshwar 14
Uttarakhand Champawat 16
Uttarakhand Dehradun 9
Uttarakhand Garhwal 2
Uttarakhand Hardwar 16
Uttarakhand Nainital 6
Uttarakhand Pithoragarh 2
Uttarakhand Rudraprayag 2
Uttarakhand Tehri Garhwal 1
Uttarakhand Udham Singh Nagar 5
Uttarakhand Uttarakshi 1
West Bengal Bankura 12
West Bengal Barddhaman 1
West Bengal Birbhum 11
West Bengal Dakshin Dinajpur 1
West Bengal Darjiling 8
West Bengal Haora 5
West Bengal Hugli 4
West Bengal Jalpaiguri 1
West Bengal Koch Bihar 4
West Bengal Kolkata 5
West Bengal Maldah 11
West Bengal Murshidabad 4
West Bengal Nadia 5
West Bengal North Twenty Four Parganas 6
West Bengal Paschim Medinipur 9
West Bengal PurbaMedinipur 2
West Bengal Puruliya 7
West Bengal South Twenty Four Parganas 1
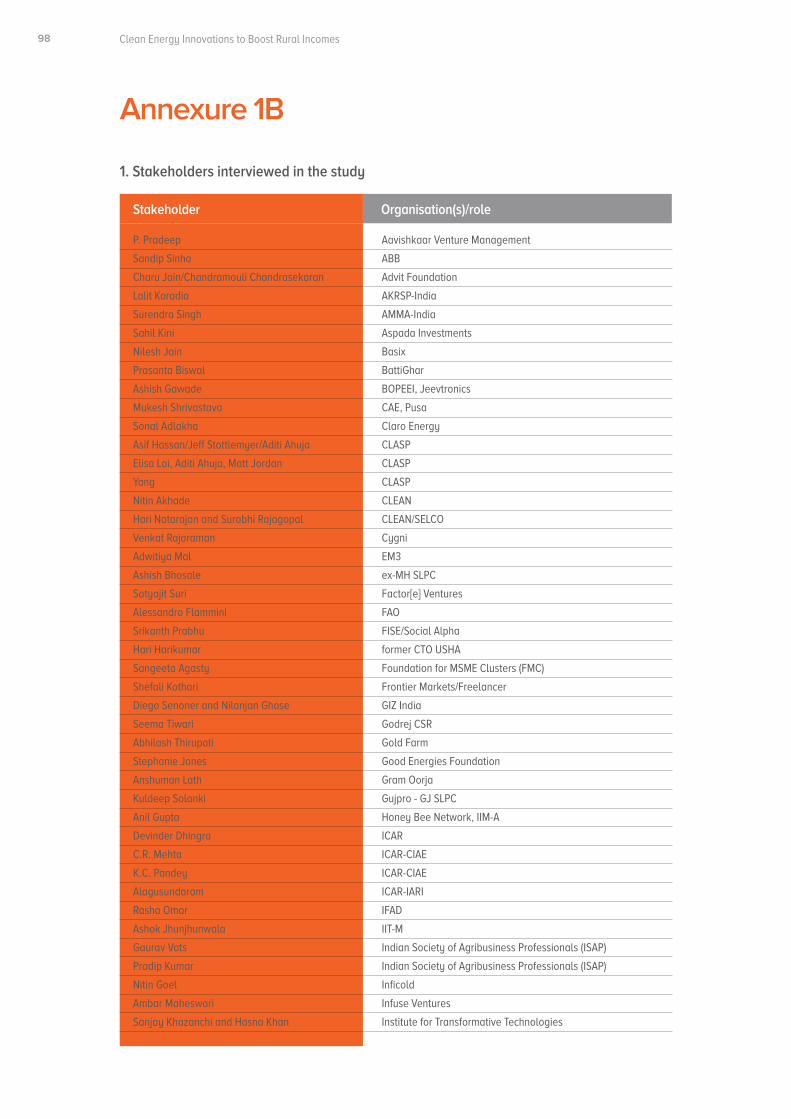
Clean Energy Innovations to Boost Rural Incomes
Annexure 1B
P. Pradeep Aavishkaar Venture Management
Sandip Sinha ABB
Charu Jain/Chandramouli Chandrasekaran Advit Foundation
Lalit Koradia AKRSP-India
Surendra Singh AMMA-India
Sahil Kini Aspada Investments
Nilesh Jain Basix
Prasanta Biswal BattiGhar
Ashish Gawade BOPEEI, Jeevtronics
Mukesh Shrivastava CAE, Pusa
Sonal Adlakha Claro Energy
Asif Hassan/Jeff Stottlemyer/Aditi Ahuja CLASP
Elisa Lai, Aditi Ahuja, Matt Jordan CLASP
Yang CLASP
Nitin Akhade CLEAN
Hari Natarajan and Surabhi Rajagopal CLEAN/SELCO
Venkat Rajaraman Cygni
Adwitiya Mal EM3
Ashish Bhosale ex-MH SLPC
Satyajit Suri Factor[e] Ventures
Alessandro Flammini FAO
Srikanth Prabhu FISE/Social Alpha
Hari Harikumar former CTO USHA
Sangeeta Agasty Foundation for MSME Clusters (FMC)
Shefali Kothari Frontier Markets/Freelancer
Diego Senoner and Nilanjan Ghose GIZ India
Seema Tiwari Godrej CSR
Abhilash Thirupati Gold Farm
Stephanie Jones Good Energies Foundation
Anshuman Lath Gram Oorja
Kuldeep Solanki Gujpro - GJ SLPC
Anil Gupta Honey Bee Network, IIM-A
Devinder Dhingra ICAR
C.R. Mehta ICAR-CIAE
K.C. Pandey ICAR-CIAE
Alagusundaram ICAR-IARI
Rasha Omar IFAD
Ashok Jhunjhunwala IIT-M
Gaurav Vats Indian Society of Agribusiness Professionals (ISAP)
Pradip Kumar Indian Society of Agribusiness Professionals (ISAP)
Nitin Goel Inficold
Ambar Maheswari Infuse Ventures
Sanjay Khazanchi and Hasna Khan Institute for Transformative Technologies
1. Stakeholders interviewed in the study
Stakeholder Organisation(s)/role
98
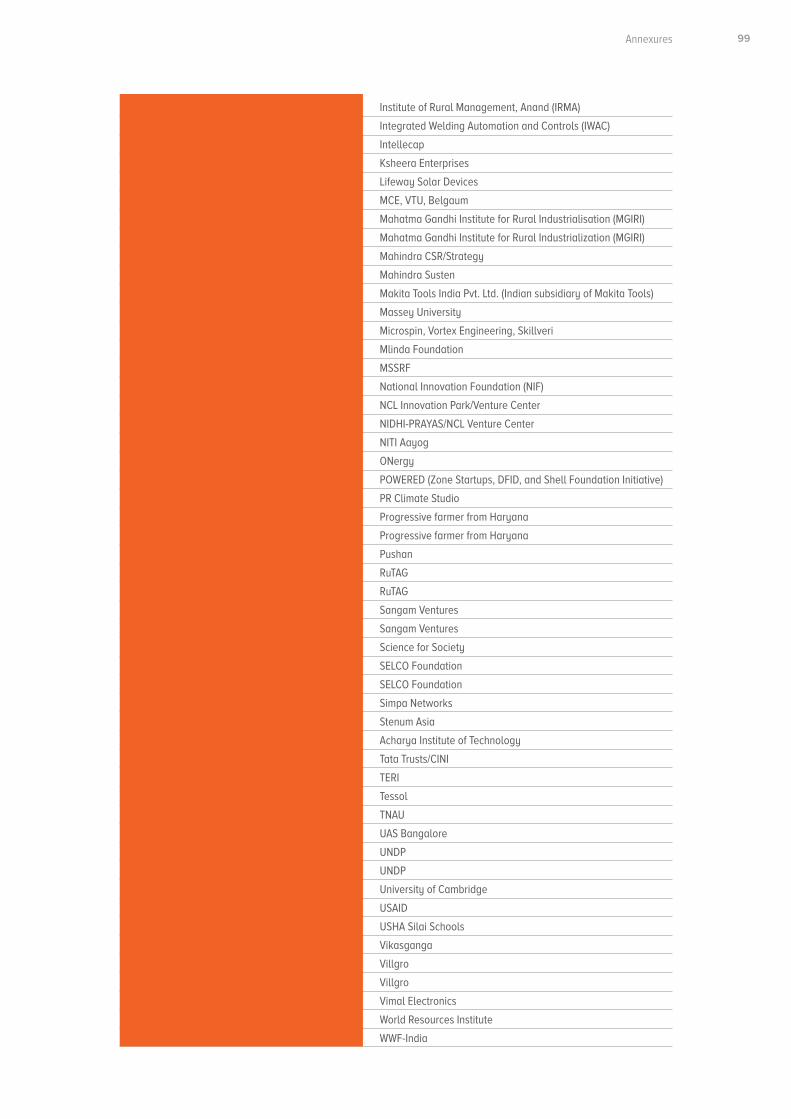
Executive Summary
Shambu Prasad Institute of Rural Management, Anand (IRMA)
S. Murthy Sreedhara Integrated Welding Automation and Controls (IWAC)
Vikas Bali Intellecap
Raghav Gowda Ksheera Enterprises
Georgekutty Kariyanappally Lifeway Solar Devices
S. Mohankumar MCE, VTU, Belgaum
P.B. Kale Mahatma Gandhi Institute for Rural Industrialisation (MGIRI)
Deep Varma Mahatma Gandhi Institute for Rural Industrialization (MGIRI)
Anirban Ghosh Mahindra CSR/Strategy
Amit and Pratik Shitole Mahindra Susten
Sunil Kumar Tiwari Makita Tools India Pvt. Ltd. (Indian subsidiary of Makita Tools)
Ralph Sims Massey University
Kannan Lakshminarayan Microspin, Vortex Engineering, Skillveri
Vijay Bhaskar Mlinda Foundation
Manjula Menon MSSRF
Tushar Garg National Innovation Foundation (NIF)
Premnath Venugopalan NCL Innovation Park/Venture Center
Piyush Joshi NIDHI-PRAYAS/NCL Venture Center
Mudit Narain NITI Aayog
Antara Dey Bhowmik ONergy
Kainat Ahmed POWERED (Zone Startups, DFID, and Shell Foundation Initiative)
Pratap Raju PR Climate Studio
Dinesh Kumar Progressive farmer from Haryana
Prashant Katar Progressive farmer from Haryana
Susmita Bhattacharjee Pushan
Ketaki Bapat RuTAG
Sabyasachi Chatterjee RuTAG
Karthik Chandrasekhar Sangam Ventures
Starlene Sharma Sangam Ventures
Vaibhav Tidke Science for Society
Harish Hande SELCO Foundation
Niraj Sabnani SELCO Foundation
Paul Needham Simpa Networks
Rajat Batra Stenum Asia
Swetha S Acharya Institute of Technology
Ganesh Neelam Tata Trusts/CINI
Debajit Palit/Bigsna Gill TERI
Rajat Gupta Tessol
D. Suresh Kumar TNAU
K.B. Umesh UAS Bangalore
Durlav Dhadumia UNDP
S.N. Srinivas UNDP
Shailaja Fennel University of Cambridge
Augusta Abrahamse USAID
Priya Somaiya USHA Silai Schools
Ranjit Bobade Vikasganga
P.R. Ganapathy Villgro
Ananth Aravamudan Villgro
Mukesh Parmar Vimal Electronics
Jessica Seddon World Resources Institute
T.S. Panwar WWF-India
Annexures 99
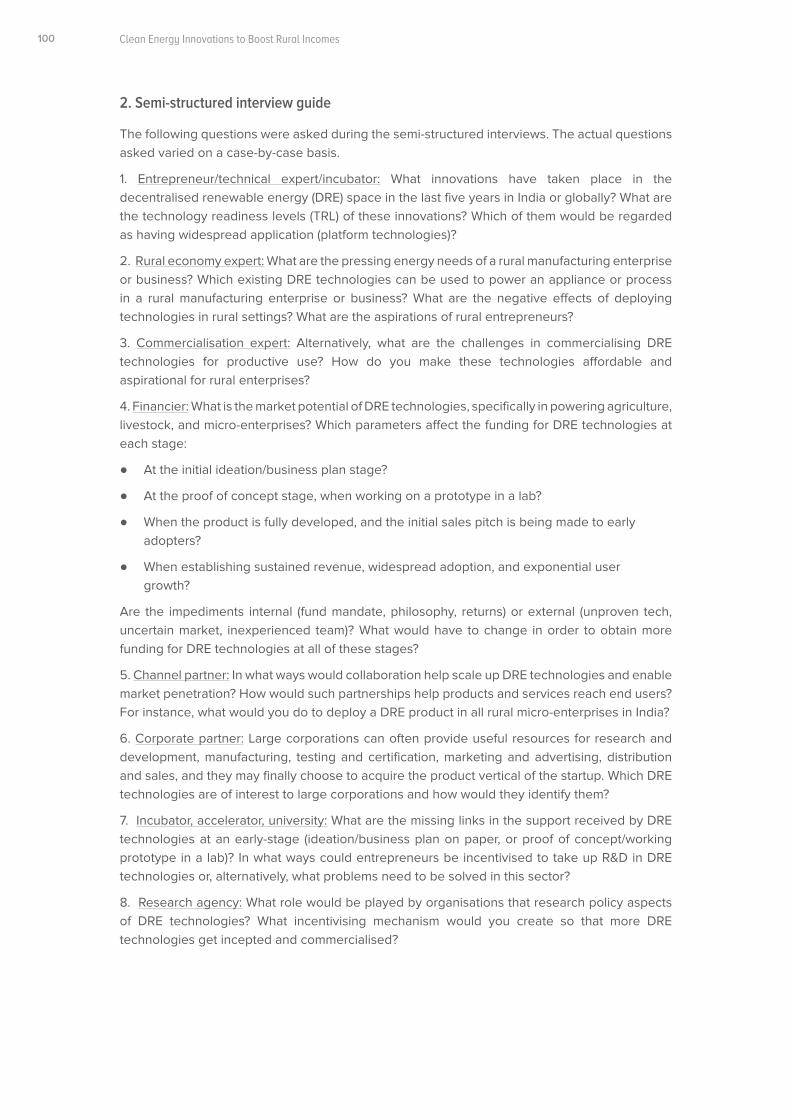
Clean Energy Innovations to Boost Rural Incomes
2. Semi-structured interview guide
The following questions were asked during the semi-structured interviews. The actual questions asked varied on a case-by-case basis.
1. Entrepreneur/technical expert/incubator: What innovations have taken place in the decentralised renewable energy (DRE) space in the last five years in India or globally? What are the technology readiness levels (TRL) of these innovations? Which of them would be regarded as having widespread application (platform technologies)?
2. Rural economy expert: What are the pressing energy needs of a rural manufacturing enterprise or business? Which existing DRE technologies can be used to power an appliance or process in a rural manufacturing enterprise or business? What are the negative effects of deploying technologies in rural settings? What are the aspirations of rural entrepreneurs?
3. Commercialisation expert: Alternatively, what are the challenges in commercialising DRE technologies for productive use? How do you make these technologies affordable and aspirational for rural enterprises?
4. Financier: What is the market potential of DRE technologies, specifically in powering agriculture, livestock, and micro-enterprises? Which parameters affect the funding for DRE technologies at each stage:
● At the initial ideation/business plan stage?
● At the proof of concept stage, when working on a prototype in a lab?
● When the product is fully developed, and the initial sales pitch is being made to early adopters?
● When establishing sustained revenue, widespread adoption, and exponential user growth?
Are the impediments internal (fund mandate, philosophy, returns) or external (unproven tech, uncertain market, inexperienced team)? What would have to change in order to obtain more funding for DRE technologies at all of these stages?
5. Channel partner: In what ways would collaboration help scale up DRE technologies and enable market penetration? How would such partnerships help products and services reach end users? For instance, what would you do to deploy a DRE product in all rural micro-enterprises in India?
6. Corporate partner: Large corporations can often provide useful resources for research and development, manufacturing, testing and certification, marketing and advertising, distribution and sales, and they may finally choose to acquire the product vertical of the startup. Which DRE technologies are of interest to large corporations and how would they identify them?
7. Incubator, accelerator, university: What are the missing links in the support received by DRE technologies at an early-stage (ideation/business plan on paper, or proof of concept/working prototype in a lab)? In what ways could entrepreneurs be incentivised to take up R&D in DRE technologies or, alternatively, what problems need to be solved in this sector?
8. Research agency: What role would be played by organisations that research policy aspects of DRE technologies? What incentivising mechanism would you create so that more DRE technologies get incepted and commercialised?
100
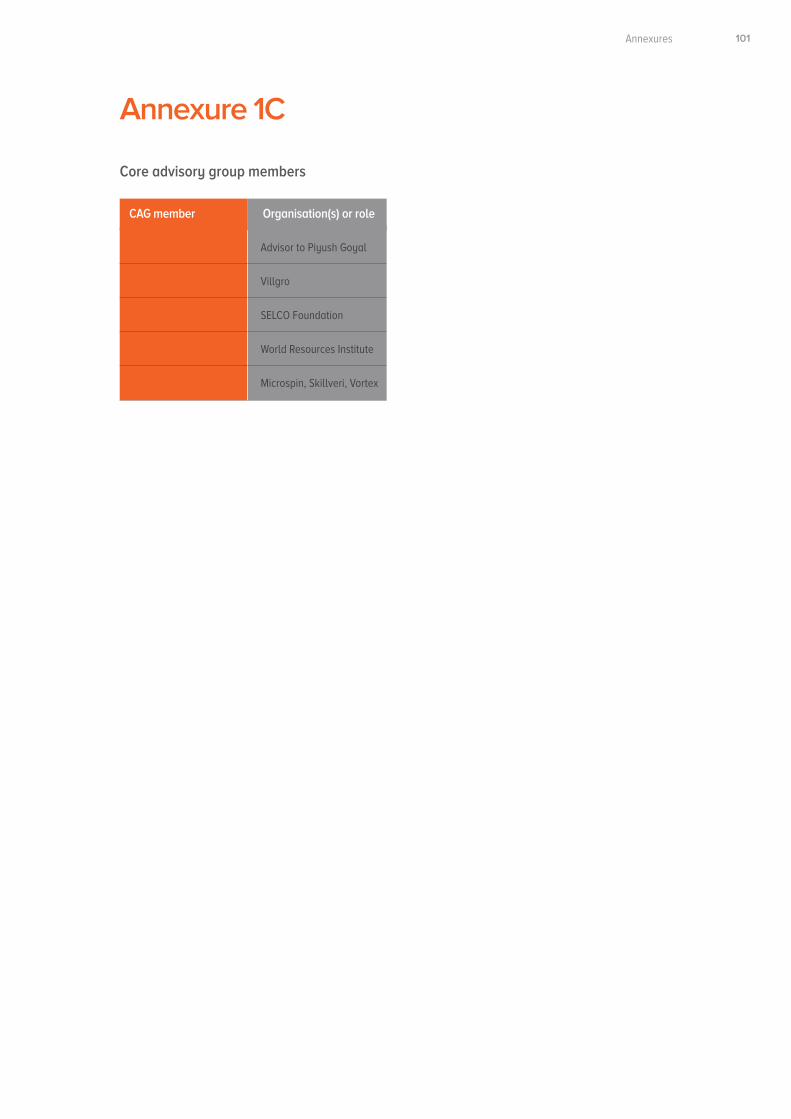
Executive Summary
Annexure 1C
Core advisory group members
Ashok Jhunjhunwala Advisor to Piyush Goyal
Ananth Aravamudan Villgro
Harish Hande SELCO Foundation
Jessica Seddon World Resources Institute
Kannan Lakshminarayan Microspin, Skillveri, Vortex
CAG member Organisation(s) or role
Annexures 101
Clean Energy Innovations to Boost Rural Incomes
Annexure 2
For data collection, ten crops were chosen on the basis of a number of cultivatorsrepresentative of the number of livelihoods supported, the value of produce, and ratio of total labour cost to machine-operational cost. The ten crops were:
1. Wheat
2. Rice
3. Cotton
4. Coconuts
5. Sugarcane
6. Soybeans
7. Maize
8. Arhar (toor) dal
9. Groundnuts
10. Potatoes
The normalisation methodology used for selecting the top crops in the farm sector and the top RIGA in the non-farm sector was percentile rank, which was applied to the weighted sum of the respective indicators being considered. We did not apply a Z-score normalisation because the data was not a normal distribution, whereas our calculations showed the existence of an outlier effect for at least one indicator, because of which the min-max method of normalisation was deemed unusable.
Three states were chosen on the basis of the gross cropped area for these select crops: Tamil Nadu for coconuts, maize, rice, and sugarcane; Gujarat for cotton; Madhya Pradesh for soybeans and potatoes; Uttar Pradesh for wheat, groundnuts, and arhar. The stakeholders for the study were:
● Small Farmers’ Agribusiness Consortium (SFAC)
● State Level Producer Company (SLPC)
● Farmer Producer Organisations (FPO)
According to SFAC, as of July 2017, 741 FPOs existed, out of which 318 were of interest because they were associated with the selected crops. Data was collected through telephonic conversations, with the best data obtained from organisations experienced in cultivating specific crops. A semi-structured questionnaire was prepared to collect information from FPOs on the different steps involved in the cultivation of the selected crops, and the extent and types of farm mechanisation involved. The semi-structured interviews posed questions related to:
1. Methodology for collection of data on mechanisation across crops
The area and the district to which an FPO belongs, the number of farmers being served by the organisation, and the area of land holdings
The major crops grown in the region, and the cropping cycle (including the different cultivation steps)
The level of mechanisation and how labour intensive the cultivation process is, along with the cost of operation and energy for each crop
102
Executive Summary
The input costs for different power sources (animal, human, diesel, and electricity), as well as field capacities and hours of usage for all the equipment used with each power source.
The availability of different power sources, hiring costs, wage rates (in the case of human labour), and costs of animal labour, and the different challenges related to the usage of each.
The quantity harvested in one cycle, post-harvest technologies, the availability of market or the produce, the availability of packaging, cold storage, and transportation to markets.
Farmers’ perspectives on the kind of machines they need which are not available, the challenges in employing agricultural labour, farmers’ opinions on the adoption and diffusion of technology, the lack of adoption of machines, the availability of non-tractor machinery, ecosystem challenges like the effect of various government policies and schemes, the availability of financing schemes, the role of clean energy, farmers’ understanding of clean energy solutions, and any best practices taken up by farmers that improved production.
The specifics of product/prototype/innovation and what problems they are addressing in the farm space
Challenges faced during product development, and how to tackle those challenges
Assess the customer base, revenues, business model, target markets, and sectors in which the enterprise has a presence - questions were included which focused on products, prototypes, and innovations
Challenges faced during customer development, and steps taken to address those challenges
Challenges faced in the search for seed funding, and the availability of financial schemes to support the setting up of business models in the farm sector
Competition in the market, if information is available, and the related selling price
External and ecosystem-level risks that may impact the company’s growth or the growth of the sector, and what measures are taken to address these risks
The internal risks that can be foreseen, and what measures can be taken to prepare for them
The ecosystem support that is expected in order to help establish the model in the market
A separate questionnaire was designed to interview DRE entrepreneurs, farm machinery manufacturers, financiers, venture capitalists and seed funders, ecosystem supporters such as government bodies and solar engineering agencies, as well as providers of engineering, procurement, and construction (EPC) solution. The questionnaire covered the following areas:
A literature review of various reported and published materials was conducted to find entrepreneurs who offered DRE-powered innovations in the farm sector. Through an extensive online search, the contact details for these entrepreneurs and other stakeholders were gathered, and semi-structured interviews were conducted with them. A snowball sampling strategy was also used to get new respondents from the stakeholders' list. Around 20 DRE-powered innovations were captured from various sources. Various data points were gathered, such as materials used, power and load profiles, production or operational capacity, the capacity of the solar panels, storage options, inverter capacity, electricity/diesel consumption, and the price of the product.
2. Methodology for data collection for existing DRE-powered livelihood applications
Annexures 103
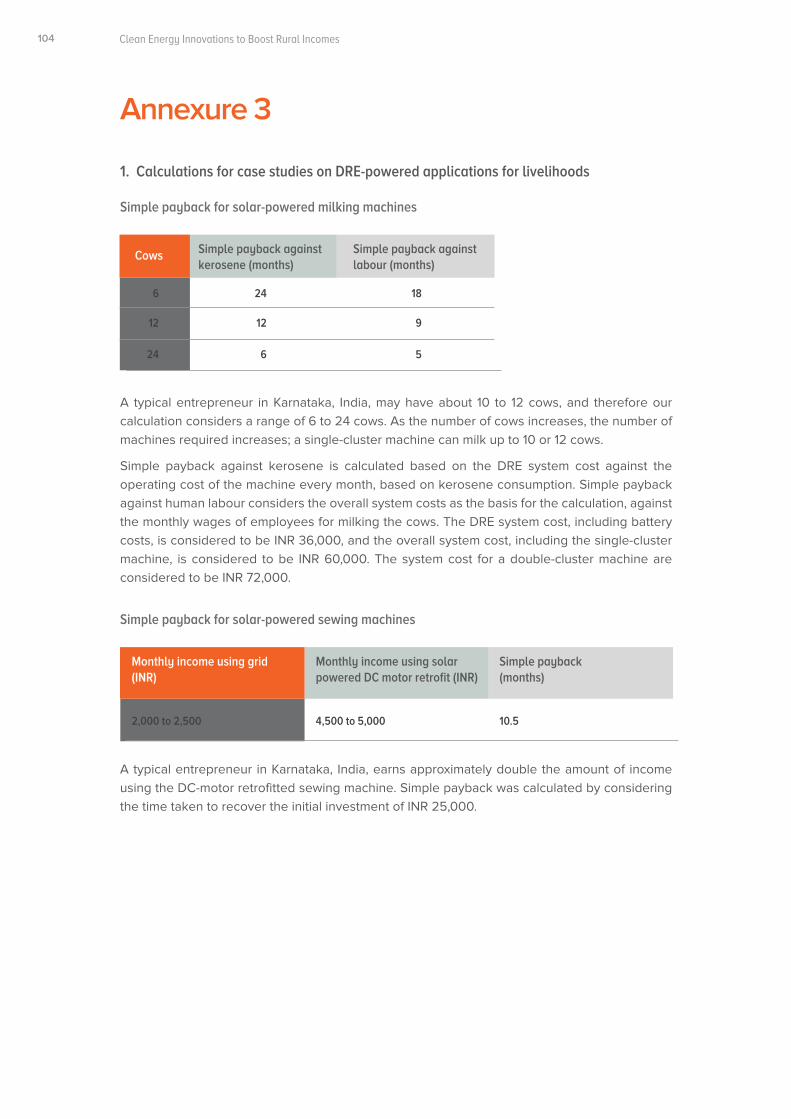
Clean Energy Innovations to Boost Rural Incomes
Annexure 3
A typical entrepreneur in Karnataka, India, may have about 10 to 12 cows, and therefore our calculation considers a range of 6 to 24 cows. As the number of cows increases, the number of machines required increases; a single-cluster machine can milk up to 10 or 12 cows.
Simple payback against kerosene is calculated based on the DRE system cost against the operating cost of the machine every month, based on kerosene consumption. Simple payback against human labour considers the overall system costs as the basis for the calculation, against the monthly wages of employees for milking the cows. The DRE system cost, including battery costs, is considered to be INR 36,000, and the overall system cost, including the single-cluster machine, is considered to be INR 60,000. The system cost for a double-cluster machine are considered to be INR 72,000.
A typical entrepreneur in Karnataka, India, earns approximately double the amount of income using the DC-motor retrofitted sewing machine. Simple payback was calculated by considering the time taken to recover the initial investment of INR 25,000.
1. Calculations for case studies on DRE-powered applications for livelihoods
Simple payback for solar-powered milking machines
Simple payback for solar-powered sewing machines
6
12
24
Cows
24 18
12 9
6 5
Simple payback against kerosene (months)
Simple payback against labour (months)
2,000 to 2,500
Monthly income using grid (INR)
4,500 to 5,000 10.5
Monthly income using solar powered DC motor retrofit (INR)
Simple payback (months)
104
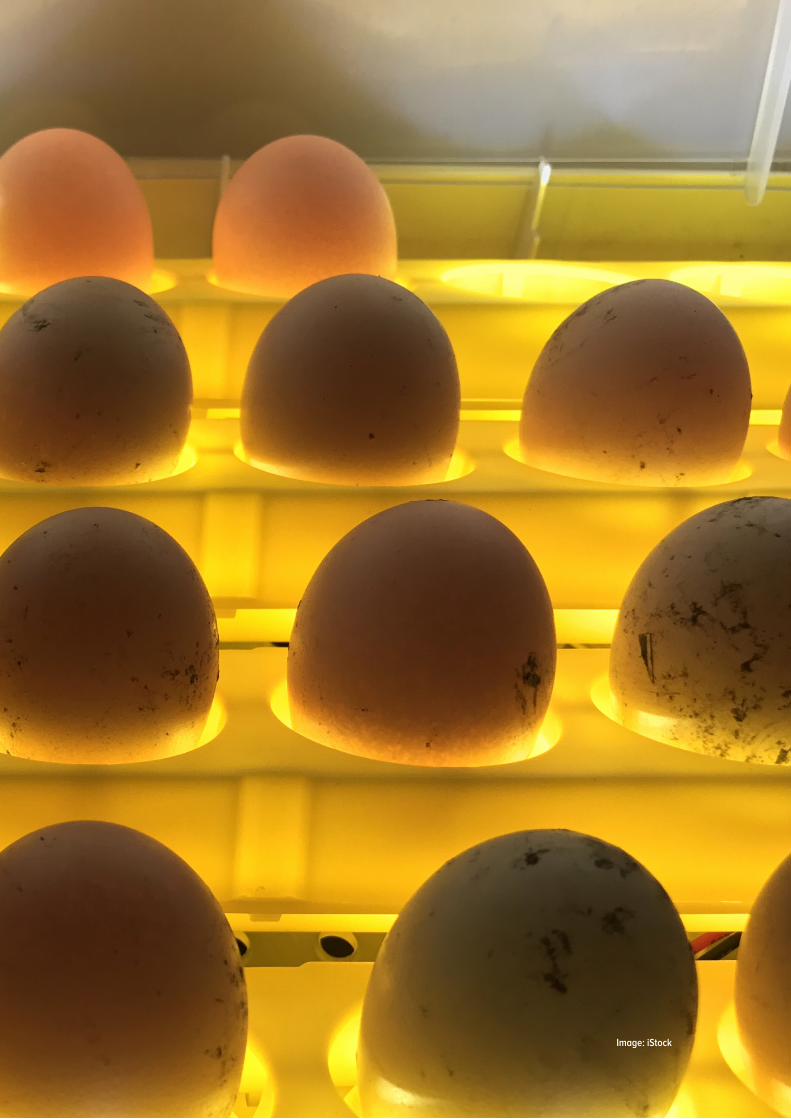
Executive Summary
Image: iStock
Clean Energy Innovations to Boost Rural Incomes
Council on Energy, Environment and Water (CEEW)
Sanskrit Bhawan, A-10, Qutab Institutional AreaAruna Asaf Ali Marg, New Delhi - 110067, IndiaT: +91 (0) 11 [email protected] | ceew.in | @CEEWIndia
Image: Pixabay