Embed Size (px)
Citation preview

ISPRS Int. J. Geo-Inf. 2015, 4, 942-956; doi:10.3390/ijgi4020942OPEN ACCESS
ISPRS International Journal of
Geo-InformationISSN 2220-9964
www.mdpi.com/journal/ijgiArticle
Integrating Free and Open Source Solutions into GeospatialScience EducationVaclav Petras 1,2,*, Anna Petrasova 1,2, Brendan Harmon 2,3, Ross K. Meentemeyer 2,4
and Helena Mitasova 1,2
1 Department of Marine, Earth, and Atmospheric Sciences, North Carolina State University,2800 Faucette Drive, Raleigh, NC 27695, USA; E-Mails: [email protected] (A.P.);[email protected] (H.M.)
2 Center for Geospatial Analytics, North Carolina State University, 2800 Faucette Drive, Raleigh,NC 27695, USA; E-Mails: [email protected] (B.H.); [email protected] (R.K.M.)
3 Department of Landscape Architecture, North Carolina State University, 50 Pullen Road, Raleigh,NC 27695, USA
4 Department of Forestry and Environmental Resources, North Carolina State University,2800 Faucette Drive, Raleigh, NC 27695, USA
* Author to whom correspondence should be addressed; E-Mail: [email protected] [email protected]; Tel.: +1-919-578-4957
Academic Editors: Barend Kobben, Serena Coetzee and Wolfgang Kainz
Received: 12 February 2015 / Accepted: 21 May 2015 / Published: 1 June 2015
Abstract: While free and open source software becomes increasingly important ingeospatial research and industry, open science perspectives are generally less reflected inuniversities’ educational programs. We present an example of how free and open sourcesoftware can be incorporated into geospatial education to promote open and reproduciblescience. Since 2008 graduate students at North Carolina State University have theopportunity to take a course on geospatial modeling and analysis that is taught with bothproprietary and free and open source software. In this course, students perform geospatialtasks simultaneously in the proprietary package ArcGIS and the free and open sourcepackage GRASS GIS. By ensuring that students learn to distinguish between geospatialconcepts and software specifics, students become more flexible and stronger spatial thinkerswhen choosing solutions for their independent work in the future. We also discuss waysto continually update and improve our publicly available teaching materials for reuse byteachers, self-learners and other members of the GIS community. Only when free and

ISPRS Int. J. Geo-Inf. 2015, 4 943
open source software is fully integrated into geospatial education, we will be able toencourage a culture of openness and, thus, enable greater reproducibility in research anddevelopment applications.
Keywords: online course; GRASS GIS; ArcGIS; FOSS; geospatial modeling; visualization
1. Introduction
Reproducibility is a fundamental requirement of science. Scientists need access to all tools usedin published research to fully reproduce and verify results and conclusions. If the software used in aresearch study is a “black box” and the code and algorithms cannot be scrutinized, then the results willnot be verifiable and reproducible in the long run. Therefore, in science, the use of free and open sourcesoftware has been considered a high priority (and often stated as mandatory by funding agencies), asit is fully transparent [1,2] and more accessible for institutions, individual students and scientists thanproprietary software [3].
The emerging field of open science calls for greater transparency and free sharing of knowledge,methods, data and code, so that science is accessible to all. By requiring open source software, dataand access [4], open science approaches ensure that scientists have access to the same methods, dataand code used in a published study. Open science perspectives, such as open access and open data, arebeing increasingly adopted in research, but free and open source software is surprisingly less reflected inuniversities’ educational programs, despite its wide adoption in industry [5,6].
Open software, open data, open standards and open education are the key components of the openGIS framework proposed by Sui [7]. There is great demand for open geospatial education, as spatialthinking and GIS concepts can be applied across disciplines. The popularity of massive open onlinecourses (MOOC) is growing [8], including those focused on open geospatial education [9] and free andopen source geospatial software [10]. Open education concepts, such as accessible teaching materialsand the usage of free and open source software, are not limited to online courses and have also beenapplied to traditional on-campus education [11]. Several educators have suggested that open educationconcepts should be applied throughout the geospatial curriculum [12].
The application of geospatial concepts should be emphasized in education more than software-specifictasks. If students understand not only the implementation, but also the underlying science andtechnology, then they will be able to do better research and develop more flexible solutions. However,students who learn and use particular software packages as part of their classes inevitably mix generalconcepts with software-specific implementation. Teaching a diverse set of software packages may helpto untangle the general concepts of geospatial analytics from software-specific features and issues. Freeand open source software readily allows students to compare how scientific tools are implemented indifferent software packages; it is harder to make such comparisons when using proprietary software,because the source code and algorithms are concealed [13]. Moreover, easy access enables students toexplore new technologies without requiring the university or their instructors to provide the software.
ISPRS Int. J. Geo-Inf. 2015, 4 944
This is especially beneficial for project-based classes and independent studies where students solvereal-world problems in which unique or custom capabilities are required.
Throughout this paper, we use the term free and open source software (FOSS) in which “free” standsfor software freedom as defined by Stallman [14] and “open source” stands for a type of developmentmodel [15]. Proprietary software refers to software developed and licensed by a particular softwarevendor. It is sometimes referred to as commercial or enterprise software, which is incorrect, becauseboth proprietary software and FOSS can be used commercially and in enterprise settings.
In this paper, we begin with an overview of newly-developed educational concepts and theassociated online resources for courses in geospatial analytics at North Carolina State University(NCSU). These courses combine FOSS GIS and proprietary GIS to emphasize general conceptsand techniques in geospatial science [16]. The NCSU OSGeo Research and Education Laboratory(OSGeoREL), established in 2012 as the founding member of the world-wide GeoForAll initiativein North America [17], provides the infrastructure to update and redesign teaching materials, expandcourses and incorporate the latest visualization and collaborative technologies in classes.
In Section 2, we describe the design of our courses, including the technical solution for our teachingmaterials used by both on-campus and distance education students. Section 3 describes several examplesof these courses. We conclude with a discussion of our experience offering open science education, andwe outline future directions for moving the field forward.
2. Approach to Course Design and Implementation
The general concept for integrating FOSS into geospatial information science and technology (GIST)education was inspired by common real-world situations when GIST professionals need to combinevarious software tools and techniques to solve complex problems. This approach was used to developgraduate level geospatial science courses serving Master of Science (MS) and PhD students in the NCSUGIST program, as well as the students from a broad range of disciplines, such as natural resourcesmanagement, Earth systems (marine, Earth and atmospheric sciences), landscape architecture, civilengineering and anthropology. The courses are designed for students with very diverse sets of skillsand backgrounds and can be taken on-campus or through the NCSU distance education program.
2.1. General Course Design
The courses have three standard components: lectures, in-class assignments with homework anda project. The lectures are software independent (to the extent possible) and focus on concepts,methods and algorithms. Each lecture is accompanied by a hands-on assignment to demonstrate theimplementation of the concepts presented in the lectures in two software packages: the FOSS packageGRASS GIS and the proprietary package ArcGIS. This teaching model gives students the opportunityto improve their knowledge of software that they already know (as most students taking the courses arealready familiar with ArcGIS) and, at the same time, challenges them with different software that uses asimilar, but not identical approach and solves some of the tasks using different algorithms. Our goal is toensure that students can more easily distinguish between GIS concepts and the specifics of GIS software,
ISPRS Int. J. Geo-Inf. 2015, 4 945
become true experts in GIS, rather than a particular software, and become more flexible when choosingsolutions for their independent work in the future.
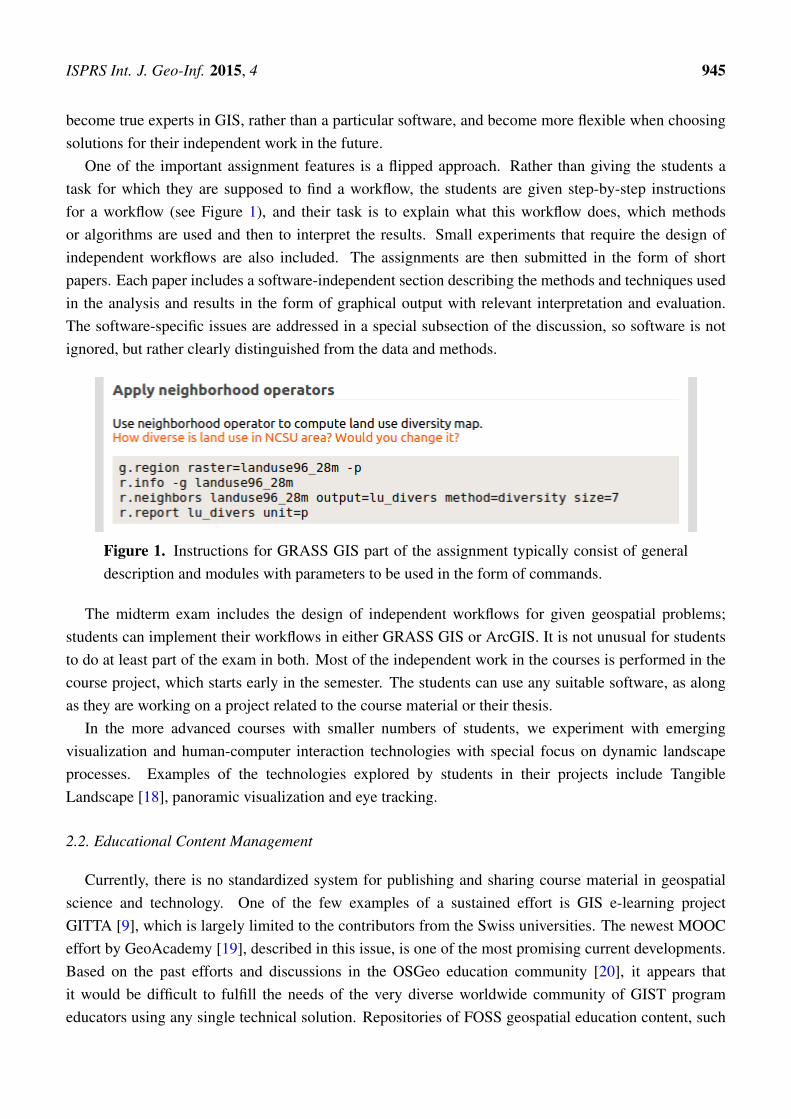
One of the important assignment features is a flipped approach. Rather than giving the students atask for which they are supposed to find a workflow, the students are given step-by-step instructionsfor a workflow (see Figure 1), and their task is to explain what this workflow does, which methodsor algorithms are used and then to interpret the results. Small experiments that require the design ofindependent workflows are also included. The assignments are then submitted in the form of shortpapers. Each paper includes a software-independent section describing the methods and techniques usedin the analysis and results in the form of graphical output with relevant interpretation and evaluation.The software-specific issues are addressed in a special subsection of the discussion, so software is notignored, but rather clearly distinguished from the data and methods.
Figure 1. Instructions for GRASS GIS part of the assignment typically consist of generaldescription and modules with parameters to be used in the form of commands.
The midterm exam includes the design of independent workflows for given geospatial problems;students can implement their workflows in either GRASS GIS or ArcGIS. It is not unusual for studentsto do at least part of the exam in both. Most of the independent work in the courses is performed in thecourse project, which starts early in the semester. The students can use any suitable software, as alongas they are working on a project related to the course material or their thesis.
In the more advanced courses with smaller numbers of students, we experiment with emergingvisualization and human-computer interaction technologies with special focus on dynamic landscapeprocesses. Examples of the technologies explored by students in their projects include TangibleLandscape [18], panoramic visualization and eye tracking.
2.2. Educational Content Management
Currently, there is no standardized system for publishing and sharing course material in geospatialscience and technology. One of the few examples of a sustained effort is GIS e-learning projectGITTA [9], which is largely limited to the contributors from the Swiss universities. The newest MOOCeffort by GeoAcademy [19], described in this issue, is one of the most promising current developments.Based on the past efforts and discussions in the OSGeo education community [20], it appears thatit would be difficult to fulfill the needs of the very diverse worldwide community of GIST programeducators using any single technical solution. Repositories of FOSS geospatial education content, such

ISPRS Int. J. Geo-Inf. 2015, 4 946
as ELOGeo [21] or the OSGeo Educational Content Inventory [22], provide many valuable contributions,but without collaborative and versioning infrastructure, the material becomes obsolete relatively quickly.
Thus, in order to share and collaboratively develop educational content, standardized formats andcollaborative environments are important. Often, more than one instructor and their teaching assistantswork on the course material. Thus, managing the content in a revision control system, a practicewidely adopted for software development by FOSS projects, offers several advantages. It facilitatescollaboration, includes a full history of changes and inherently supports the reuse of the materials, eitherby the author (for example, for a different course with customized modifications) or by others in thecommunity if the repository is public.
The easiest way to share source material for courses with others is through revision control hostingservices such as GitHub, GitLab or Bitbucket. These web-based tools together with desktop graphicaltools make revision control systems accessible for users who are not familiar with using revision controltools in the command line. We use Git as a revision control system, because it allows us to work offlineand to easily switch hosting providers for remote repositories. We use a remote repository hosted atGitHub because collaboration is a priority for us and GitHub is well established in the FOSS community.It is important to say that with Git vendor lock to any particular hosting service is minimal due to thefact that everything is also stored locally.
2.3. Teaching Material for Assignments
The common revision control systems are designed to work best with text files, and thus, the formatsshould be text-based, not binary. The text files are independent from specific text editors; therefore,they can be changed by anyone, anytime, even if the original software used to create them no longerexists. Text files are also easy to modify using scripts.
We have considered several formats for text documents, i.e., markup languages, including LaTeX,DocBook, reStructuredText, Markdown and Textile (see the Appendix for a more complete discussionon format selection). After careful evaluation of these options, we decided to keep our teaching materialsas a set of HTML files. This allows us to publish our material as a website and to take full advantage ofHTML capabilities, such as CSS classes. The fact that our old course materials were already in HTMLalso contributed to this decision and made the transition easier. Eventually, our goal is to use the HTML5standard, although not all of our pages have the correct HTML5 semantics yet.
The assignments are managed in individual files, which include only the assignment text componentof the HTML documents. The sections of the HTML documents that are common to all pages(e.g., navigation) are kept separately, and we use scripts in Bash and Python to create a complete HTMLdocument. The script builds a static website, which does not require any server-side application, so itcan be published anywhere. We use a dedicated university server for courses, but the static pages can bepublished also using solutions, such as GitHub pages or websites on Bitbucket.
Our solution with custom scripts requires several steps to produce the web pages, but for the simplepages for which we are aiming, the amount of work and complexity is very low. More importantly, thescripting allows us to add new features. For example, we have developed a script that extracts examplesfrom GRASS GIS assignments, which are then converted into a script executable in GRASS GIS. The

ISPRS Int. J. Geo-Inf. 2015, 4 947
script allows us to efficiently test all examples in assignments for each new release of GRASS GIS. Thisproved helpful when several module parameter names were changed just before the release of GRASSGIS 7. We also use the scripts to ensure that everything published on the website is also stored in arepository, i.e., the script for publishing checks that proper revision control commands were executed.Custom scripting allows us to accommodate different formats, such as reStructuredText, in the future.
Using HTML for both source and published material gives us the opportunity to use moresophisticated HTML formatting and JavaScript for interactivity. For example, in one of our tutorials,we show students how to do the same operation in the GRASS GIS command line, using the PythonAPI or the graphical user interface. The page then consists of a general text description followed by anexample box with tabs to switch between the different methods (Figure 2). This shows students severalpossible ways to interact with the software and may help them to transition between these approaches.For example, students can learn how to develop a Python script from a series of commands. The samemethod could be applied to provide instructions for different software packages.
(a) (b)
Figure 2. GRASS GIS tutorial using tabs with instructions for (a) scriptinglanguages and (b) a graphical user interface. Examples are available athttp://ncsu-osgeorel.github.io/grass-temporal-workshop/.
2.4. Teaching Material for Lectures
The choice of format and technology for lecture materials is not straightforward; it depends onthe focus of the lectures, as well as personal preferences. Besides the standard desktop presentationtools, HTML5-based presentations and various cloud-based presentation services are being used morefrequently. Our lectures were originally prepared in the PPTX format using PowerPoint and are availableas presentation slides, as well as a screencast of the presentation accompanied by audio. The currentformat for slides has serious limitations in terms of updates and collaborative development, and thus,several options have been considered for redesigning the lecture material (see the discussion of differentformats and tools, such as LibreOffice, LaTeX and HTML5, in Appendix 5).
We decided to use HTML5-based presentations, since they are plain text files and HTML5 supportsdynamic and interactive content, including animated pictures, video files, automatically highlightedcode, equations (through MathJax) and even embedding websites. HTML5 presentations, such as

ISPRS Int. J. Geo-Inf. 2015, 4 948
Reveal.js, lack the ability to freely position elements on a slide or add decorations, such as arrowsconnecting text and pictures, in a simple way. Today, however, lecturers can take advantage of touchscreens and use a stylus to draw directly on the slides to make their presentations more engagingfor students. Based on these considerations, we are currently experimenting with the open sourcepresentation framework Reveal.js to see whether it is suitable for our lectures. We created a set oftemplates for different slide layouts, so that only a basic knowledge of HTML is needed to createpresentations with images and text in different positions.
2.5. Licensing
When sharing teaching materials, the choice of license is critical, since choosing an inappropriatelicense or not stating the license at all prevents others from using the material. There are standardizedlicenses that support sharing; Creative Commons (CC) licenses are the most used ones. Amongthe CC licenses, the best for sharing open education teaching materials are the Creative CommonsAttribution-ShareAlike (CC BY-SA) and the Creative Commons Attribution (CC BY). The otherCC licenses, such as the Creative Commons Attribution-NonCommercial-NoDerivs (CC BY-NC-ND),do not allow modification or commercial use and, thus, conflict with the values of FOSS, such as thefreedom of reuse. We share both the material and the source files under the CC BY-SA license.
3. Course Implementation
The core components of the presented approach have been used to develop three courses focused ongeospatial analysis, modeling and design.
3.1. GIS/MEA582: Geospatial Modeling and Analysis
The first course based on this concept, Geospatial Analysis and Modeling, was offered in 2008 andstarted as an on-campus special topics course with a small enrollment of 10 students. The distanceeducation section was added in 2009, and today, the number of students has grown to around 50 persemester. It is one of two choices for a mandatory, core course in the GIST MS program and serves asan elective in several MS and PhD programs across NCSU colleges.
While the course topics are relatively stable, the teaching material is very dynamic, with assignmentsupdated every semester based on the latest software releases. The topics covered include thedigital representation and analysis of geospatial phenomena represented by continuous fields with aspecial focus on cost surfaces, terrain modeling, geomorphometry, watershed analysis and introductoryGIS-based modeling of landscape processes. Perspective 3D visualizations and working with LiDARdata are an integral part of the course material. Figures 3 and 4 show examples of students’ course work.
The take-home midterm exam consists of theoretical and practical sections. In the practical part,students develop their own workflow using ArcGIS, GRASS GIS or both to solve a given task. Projecttopics are typically chosen by students depending on their interests or masters theses research and,include, for example, the estimation of solar radiation and energy potential, coastal applications related

ISPRS Int. J. Geo-Inf. 2015, 4 949
to beach erosion or sea level rise, hazard mapping, designing trails using cost surfaces and, also,occasionally, free and open source software development or testing.
(a) (b)
(c) (d)
Figure 3. Images from the Geospatial Modeling and Analysis course assignment reports.Working with LiDAR data: (a) bare ground and first return surface cross-section in GRASSGIS; (b) multiple return point cloud visualized in ArcGIS. Modeling landscape processes:(c) erosion-deposition map draped over an elevation model visualized in GRASS GIS;(d) erosion-deposition map displayed over shaded relief in ArcGIS.
(a) (b)
Figure 4. Images from the Geospatial Modeling and Analysis course exam and a projectpaper: (a) least cost path analysis done in GRASS GIS for the midterm exam; (b) fire spreadmodeling done in GRASS GIS for a final project.
On-campus sections are offered in a collaborative classroom with groups of students clustered aroundtables equipped with a computer with a large screen. Most students, however, use their own laptops,

ISPRS Int. J. Geo-Inf. 2015, 4 950
running GRASS GIS on different operating systems, including Microsoft Windows, Mac OS X andvarious Linux distributions. FOSS enables students to continue using the software installed on theircomputers, even after they have finished their university studies.
The online course material includes lecture slides with audio and associated assignment workflowsused by both distance education and on-campus students. The course website with all of the assignmentswas redesigned to improve navigation, readability and management of content. Students can interactwith the instructor and teaching assistants through a private forum set up for the course, and theyget feedback on their assignment reports and their project progress. The course is available athttp://courses.ncsu.edu/gis582/common/.
3.2. GIS595/MEA592: Multidimensional Geospatial Modeling
The second, more advanced course is aimed at PhD students and highly skilled MS students.The focus is on working with 3D rasters, time series, dynamic models and simulations and multiplereturn LiDAR data. This course has a stronger focus on the advanced applications of free and opensource GIS and GRASS GIS in particular. Programming (scripting) skills are useful, but not required.The first half of the course is led by the instructor, and the second half is led by students who have toprepare both a lecture and a working assignment on a topic of their choice while making sure that theother students in the class can successfully complete the assignment. Based on the students’ interests,the topics change each year. In Figures 5 and 6a, students present their data and analysis in the HuntLibrary Teaching and Visualization Lab and develop applications for the Tangible Landscape system.The course is available at http://courses.ncsu.edu/mea592/common/GIST_MEA592004.html.
Figure 5. Students in the Multidimensional Geospatial Modeling course visualizing a digitalelevation model of an area affected by mountaintop mining in the Hunt Library Teaching andVisualization Lab.
3.3. LAR582: GIS for Designers
This course, GIS for Designers, aims to teach landscape architecture students how to use GIS asan integral part of the creative design process, rather than simply as an analytical tool. Studentslearn how to generate and develop the seed of a design in GIS as part of an iterative design process.They use conceptual and logical models to structure and generate designs, linking creative abstraction,computational exploration, structured decision-making and expression. As part of an iterative design

ISPRS Int. J. Geo-Inf. 2015, 4 951
process, students learn workflows linking 3D GIS, 3D modeling and rapid prototyping, i.e., 3D printing,computer numeric controlled (CNC) fabrication and laser cutting.
Topics for this course include terrain modeling, hydrological modeling, map overlay analysis, trailrouting using least cost paths, 3D visualization and rapid prototyping. All topics are taught in bothArcGIS and GRASS GIS.
In a series of charrettes (i.e., design workshops), students plan and design a trail network for LakeRaleigh Woods, a landscape on NCSU’s Centennial Campus, using GIS and 3D modeling (Figure 6b,c).In the charrettes, student teams model environmental impacts and risks, identify potential trail routesand then develop a series of trail scenarios. Each team designs scenarios for differing and potentiallyconflicting stakeholder objectives, such as accessibility, aesthetics and conservation. For each scenario,they compute a trail network using map overlay analysis, iterative least cost path analysis and networkanalysis using either ArcGIS, GRASS GIS or the Tangible Landscape system, which uses GRASS GISin the background. For their final review, students present their designs to a jury in the Teaching andVisualization Lab in Hunt Library using blended projectors, stereoscopic 3D and CNC routed models(Figure 7). The course is available at http://courses.ncsu.edu/lar582/common/.
(a) (b) (c)
Figure 6. Students working on projects with Tangible Landscape: (a) (top) sculpting a sandmodel; (a) (bottom) simulating storm surge on the Outer Banks of NC; (b) designing a parkon the North Carolina State University (NCSU) campus; (c) and exploring various optionsfor the design of a trail.
Figure 7. Landscape architecture students presenting their design for a trail system in theHunt Library Teaching and Visualization Lab.
4. Future Directions
The integration of FOSS into geospatial education is largely driven by its suitability for science andits future potential in geospatial disciplines [12], following the success of FOSS in software engineeringand business [5,23].

ISPRS Int. J. Geo-Inf. 2015, 4 952
Students enrolling in our courses have very diverse backgrounds, often with limited programmingskills when entering our GIST programs. Although the MS GIST curriculum includes the GeospatialProgramming course, more programming experience is needed to introduce students to more advancedlearning opportunities, including dynamic modeling and analysis techniques and to benefit from FOSSby examining or modifying source code [12,24]. The opportunity to study source code is an advantageoften overlooked outside the computer science domain, yet important for geospatial science.
In our courses, we plan to introduce more opportunities for students to take advantage of the“open source” aspect of FOSS. Geospatial science, like any other science, requires an understandingof underlying processes, as well as the ability to verify results. To understand underlying processes, wecontinue to emphasize the importance of learning algorithms and how they are implemented in software;only with FOSS will this frontier in geospatial science education be reached. For example, to helpstudents gain an understanding of the manner in which geospatial algorithms are implemented, we willask students to find and study the segments of code in GRASS GIS that underlie the geospatial analysesdiscussed in a lecture, such as computing slope and aspect or bilinear interpolation between raster cells.We are also experimenting with ways to encourage students to connect equations and algorithms withthe code, another benefit to education that is only possible with open source systems.
We are exploring the possibility of using a web-based tool that would allow students to interactivelyexplore algorithm behavior as they study the teaching materials provided. The interactive tool would belinked with our teaching materials, standard user manual and, most importantly, the source code. WithGRASS GIS as the back-end of analyses, online analyses and those done on students’ computers wouldmatch the linked source code. If we limit the functionality of the tool, there will be no need to manageaccess rights for students, and we can keep the access open for everybody.
Another advantage of using open science and FOSS in education is the opportunity to interact withmembers of the community and to influence the FOSS development. Although we would like to seeindividual students getting involved in the community, we think that the direct involvement of theinstructors is more important. The instructors can provide students with insights into the open sourcedevelopment process, how the community supports users and encourage student participation in thecommunity later on. We, as instructors, have benefited from interaction with GRASS GIS developers,and the GRASS GIS project has been enhanced by our feedback and contributions.
Finally, we are planning a new course solely dedicated to the important role FOSS plays in scienceand how open science perspectives can lead to new geospatial solutions in research and decision making.Such training is essential for preparing next generation students for successful careers in open scienceand leaders across many fields.
5. Conclusions
We have demonstrated how free and open source software can be integrated into geospatial educationto encourage a culture of openness, clearly differentiate between science and software and enablegreater reproducibility in science. By using multiple software packages with different computationalapproaches, students can learn to decouple science and software and, thus, come to understand both theunderlying concepts and their implementation. By understanding the concepts and their implementation,

ISPRS Int. J. Geo-Inf. 2015, 4 953
students will become better scientists, who are able to generate, reproduce, critique and improve researchand analysis. Furthermore, by learning to switch between computational tools, students may learn to bemore flexible in developing strategies for research or analysis.
The method and tools we are using for the teaching materials are available to all, as all thedependencies are free and open source and the overall requirements are kept to minimum. The materialscan be, if desired, easily combined with other more complicated solutions based on similar principles.Teaching materials are shared under a CC BY-SA license at https://github.com/ncsu-osgeorel.
Acknowledgments
We acknowledge the GRASS GIS developers and users, as well as the communities for the freeand open source software used in the work presented in this paper, including, but not limited to, Git,Reveal.js, Python and Ubuntu. This paper was written using LaTeX and Overleaf.
Author Contributions
Helena Mitasova developed the courses GIS/MEA582 Geospatial Modeling and Analysis andMEA592 Multidimensional Geospatial Modeling in the Masters of Geospatial Information Science andTechnology (MGIST) program at NC State University. Brendan Harmon developed the course LAR582GIS for Designers. Vaclav Petras and Anna Petrasova developed the system to build the course webpages, created the layout and style and updated GIS/MEA582 course material to the new solution. RossK. Meentemeyer directs the MGIST program at the Center for Geospatial Analytics at NC State. Allauthors participated in writing the paper.
Appendix
Comparison of File Formats
In this section we compare different file formats and tools we have considered when selecting solutionfor our teaching materials. First we discuss the assignment instructions and then the presentation slides.We evaluated the options keeping in mind that we want the assignment instructions to be managed inrevision control system and to be published as web pages. We require the solution to depend only onFOSS, to be vendor-independent and accessible to anybody thanks to zero license cost.
1. Document Format for Assignments
HTML is one popular option, mainly because you can directly publish teaching materials onlinewithout any conversion needed. The known disadvantage of HTML is that it is not as easy to writeby hand as lightweight markup languages. However, at least basic knowledge of HTML is typicallyexpected from anyone in geospatial community. Unfortunately, for creating a well designed web sitemore advanced knowledge of HTML, CSS and also perhaps JavaScript is necessary, unless usinggraphical HTML editors which is not applicable because it usually excludes the possibility of editingfiles by hand without any particular software.

ISPRS Int. J. Geo-Inf. 2015, 4 954
LaTeX is excellent, often used tool for desktop publishing and high-quality typography with thetypical output format being PDF and PS. LaTeX provides means to be customized, to manipulate separatefiles, to typeset math expressions and to ensure consistent styles. However LaTeX is rarely used forcreating HTML web pages.
XML formats such as DocBook provide a highly structured and flexible way of storing documentsbut writing XML by hand is too cumbersome. This applies also to eLML used by GITTA project whichunlike DocBook is specialized for education purposes.
Many projects, including geospatial free and open source ones, write documentation in lightweightmarkup languages, such as reStructuredText in case of QGIS, OSGeoLive and GeoAcademy.reStructuredText is a feature rich language which is being standardized by Python community. Sphinxand Pandoc tools are often used to create websites from reStructuredText documents. Markdown isanother widely used and supported lightweight markup, used for example by GitHub, Stack Exchangewebsite or Doxygen documentation tool. Comparing to reStructuredText it is often considered simplerbut it is not standardized because each implementation adds some additional features, specific to atool or use case; there is for example feature-rich Pandoc’s Markdown or GitHub flavored Markdown.Other lightweight markups, for example AsciiDoc or Textile, lack the wide acceptance which bothreStructuredText and Markdown have.
Wiki systems such as MediaWiki use lightweight markup languages and store different revisions of adocument. However, they require the same setup as other content management systems and the sourcedocuments are inside the system, so they are more difficult to share. On the other hand, there are somewiki systems which do not have such disadvantages. Zim, a desktop wiki, stores the documents as textfiles which can be easily managed using revision control system. One can edit the files graphically inZim wiki application or as plain text files in any text editor and Zim wiki can export the content asa website.
2. Slides Format for Lecture Presentations
Although students in our courses take advantage of cloud-based solutions like Google Sites formanaging their homework, we excluded Google Slides and similar services, since we would haveminimal control over the files especially in the long run. Using free and open source desktop presentationsoftware packages such as LibreOffice and OpenOffice in combination with OpenDocument format isoften a good choice, because they support multimedia and they are simple to use in the sense that theirusers do not have to know any markup language. However, as discussed earlier, the binary format is notsuitable for revision control systems.
Therefore we are more interested in presentations designed in plain text, for example in LaTeX orHTML5. LaTeX PDF presentations are easy and fast to prepare thanks to specialized packages suchas Beamer and are especially useful for materials with many equations or source code. Unfortunately,the missing support for GIF animations and other multimedia is a big obstacle for using it in our courses.Students especially in the geospatial field are used to a lot of visuals and dynamic content in the lectureswhich LaTeX and PDF can’t easily provide.

ISPRS Int. J. Geo-Inf. 2015, 4 955
We decided to explore more HTML5-based presentations such as Reveal.js framework since they arealmost as easy to prepare as LaTeX ones and although they typically lack sophisticated typography ofLaTeX presentations.
Using lightweight markup language for presentations does not seems suitable for us because ofnumber of visualizations we want to include and this usually requires finer control over inclusion ofimages and videos than lightweight markup languages usually offer. However, HTML5 presentationframework Reveal.js offers the possibility to write text in Markdown.
Conflicts of Interest
The authors declare no conflict of interest.
References
1. Rocchini, D.; Neteler, M. Let the four freedoms paradigm apply to ecology. Trends Ecol. Evol.2012, 27, 310–311.
2. Steiniger, S.; Hay, G.J. Free and open source geographic information tools for landscape ecology.Ecol. Inform. 2009, 4, 183–195.
3. Lees, J.M. Open and free: Software and scientific reproducibility. Seismol. Res. Lett. 2012,83, 751–752.
4. Rey, S.J. Open regional science. Ann. Reg. Sci. 2014, 52, 825–837.5. Noyes, K. Open Source Software is Now a Norm in Businesses. Available online:
http://www.pcworld.com/article/228136/open_source_software_now_a_norm_in_businesses.html(accessed on 15 January 2015).
6. Yves de Montcheuil, T. Open Source has Become Mainstream but Still Drives Innovation.Available online: http://www.zdnet.com/article/open-source-has-become-mainstream-but-still-drives-innovation (accessed on 30 January 2015).
7. Sui, D. Opportunities and impediments for open GIS. Trans. GIS 2014, 18, 1–24.8. Pappano, L. The Year of the MOOC. Available online: www.nytimes.com/2012/11/04/education/
edlife/massive-open-online-courses-are-multiplying-at-a-rapid-pace.html (accessed on 15January 2015).
9. Weibel, R.; Bleisch, S.; Fisler, J. How open source can help achieving sustainability of e-learningcontent: The GITTA experience. In Proceedings of the 2012 Open Source Geospatial Research &Education Symposium, Yverdon-les-Bains, Switzerland, 24–26 October 2012.
10. Davis, P. Establishing a US National FOSS4G academy. In Proceedings of the 2012Open Source Geospatial Research & Education Symposium, Yverdon-les-Bains, Switzerland,24–26 October 2012.
11. Rey, S.J. Open source spatial analysis: Lessons for research and education from PySAL.In Proceedings of the 2012 Open Source Geospatial Research & Education Symposium,Yverdon-les-Bains, Switzerland, 24–26 October 2012.
12. Ertz, O.; Rey, S.J.; Joost, S. The open source dynamics in geospatial research and education.J. Spat. Inf. Sci. 2014, 8, 67–71.

ISPRS Int. J. Geo-Inf. 2015, 4 956
13. Branger, F.; Jankowfsky, S.; Vannier, O.; Viallet, P.; Debionne, S.; Braud, I. Use of open-sourceGIS for the pre-processing of distributed hydrological models. In Geospatial Free and Open SourceSoftware in the 21st Century; Springer: Berlin, Heidelberg, Germany, 2012; pp. 35–48.
14. Stallman, R. The GNU manifesto. Dr. Dobb’s J. Softw. Tools 1985, 10, 30–35.15. Raymond, E. The cathedral and the bazaar. Knowl. Technol. Policy 1999, 12, 23–49.16. Mitasova, H.; Landa, M.; Shukunobe, M. Building open source geospatial education at
research universities: Where we are and what is holding us back. In Proceedings of the 2012Open Source Geospatial Research & Education Symposium, Yverdon-les-Bains, Switzerland,24–26 October 2012.
17. Mitasova, H.; Schweik, C. Open source geospatial education and research. GIM Int. 2013,27, 25–29.
18. Petrasova, A.; Harmon, B.; Petras, V.; Mitasova, H. GIS-Based environmental modeling withtangible interaction and dynamic visualization. In Proceedings of the 7th International Congress onEnvironmental Modelling and Software, San Diego, CA, USA, 15–19 June 2014.
19. Davis, P. Educating 21st century geospatial technology industry workers with open source software.ISPRS Int. J. Geo-Inf. 2015, under review.
20. OSGeo-Edu Mailing List Subscribers. Our Proposed Educational Content and ManagementStandard. Available online: http://lists.osgeo.org/pipermail/edu_discuss/2008-January/thread.html(accessed on 30 January 2015).
21. E-Learning for the Open Geospatial Community (ELOGeo). Available online: http://elogeo.nottingham.ac.uk/xmlui/ (accessed on 30 December 2013).
22. OSGeo Community. OSGeo Educational Content Inventory. Open Source Geospatial Foundation.Available online: http://www.osgeo.org/educational_content (accessed on 30 January 2015).
23. Deutscher, M. Vast Majority of Software Developers Now Use Open Source, Forrester Reports.Available online: http://siliconangle.com/blog/2014/10/30/vast-majority-of-software-developers-now-use-open-source-forrester-reports/ (accessed on 16 January 2015).
24. Morin, A.; Urban, J.; Adams, P.; Foster, I.; Sali, A.; Baker, D.; Sliz, P. Shining light into blackboxes. Science 2012, 336, 159–160.
c© 2015 by the authors; licensee MDPI, Basel, Switzerland. This article is an open access articledistributed under the terms and conditions of the Creative Commons Attribution license(http://creativecommons.org/licenses/by/4.0/).


