Embed Size (px)
Citation preview
Grant agreement No: 325348
LECTURE. Sources of hydrogen ignition and prevention measures
Compiled by S. Tretsiakova-McNally; reviewed by D. Makarov
2
Contents Introduction ............................................................................................................................................ 3
Objectives of the lecture ......................................................................................................................... 3
An overview of hydrogen ignition incidents and mechanisms ............................................................... 3
Ignition and reverse Joule-Thomson effect ............................................................................................ 5
Minimum Ignition Energy (MIE) .............................................................................................................. 5
Triboelectricity ........................................................................................................................................ 7
Auto-ignition temperature ...................................................................................................................... 7
Types of ignition sources and mechanisms of ignition ........................................................................... 7
Electrostatic discharge ignition ........................................................................................................... 9
A spark from an isolated conductor ................................................................................................ 9
A brush discharge .......................................................................................................................... 10
A corona discharge ........................................................................................................................ 10
Mechanical ignition ........................................................................................................................... 10
Ignition by a hot surface ................................................................................................................... 11
Adiabatic compression ignition ......................................................................................................... 12
Diffusion mechanism of spontaneous ignition ..................................................................................... 12
Spontaneous ignition of a sudden releases ...................................................................................... 13
Physical mechanism .......................................................................................................................... 15
An instantaneous opening ............................................................................................................ 15
Effect of a valve opening rate ....................................................................................................... 16
Transition to a sustained fire ........................................................................................................ 17
Effect of a flame separation by vortex .......................................................................................... 19
Spontaneous ignition in a T-shaped PRD .......................................................................................... 20
Experimental set-up ...................................................................................................................... 20
Effect of a storage pressure on the spontaneous ignition in a T-shaped channel ....................... 21
Prevention of hydrogen ignition ........................................................................................................... 25
Ex-zone classification ........................................................................................................................ 25
Electrostatic spark ignition prevention ............................................................................................. 27
Control of thermal and mechanical sources of ignition .................................................................... 28
Summary ............................................................................................................................................... 29
References ............................................................................................................................................ 29
3
Introduction This lecture will provide First Responders with the information on the possible sources of hydrogen
ignition and the related mechanisms, including diffusion mechanism of spontaneous ignition during a
sudden release of hydrogen. It covers the main characteristics related to the ignition of hydrogen-
oxidiser mixture: minimum ignition energy, its dependence on hydrogen concentration in the mixture,
auto-ignition temperature, and effect of triboelectricity. This lecture also describes the methods used
for the prevention of hydrogen ignition through careful evaluation of the possibility of ignition and
elimination of ignition sources.
The work carried out by Astbury and Hawksworth (2007) gives an analysis of the statistics of hydrogen
ignition incidents and proposes some mechanisms [1]. They include: electrostatic charge generation,
mechanical ignition, reverse Joule-Thompson effect, diffusion ignition, sudden adiabatic compression,
and hot surface ignition. These mechanisms will be discussed below. In addition, the work carried out
at HySAFER centre (UU) on spontaneous ignition of a sudden release also presented in this lecture.
The ignition prevention measures and control of the ignition sources are covered as well.
Objectives of the lecture By the end of this lecture a First Responder/a trainee will be able to:
Recognise different types of ignition sources;
Identify mechanisms of hydrogen ignition depending of the ignition source;
Describe why the Joule-Thomson effect is unlikely source of hydrogen ignition;
Compare the values of minimum ignition energy (MIE) and auto-ignition temperature of
hydrogen with those for other common fuels;
Define the dependence of MIE on hydrogen content in the mixture;
Explain the effect of triboelectricity on hydrogen ignition;
Evaluate stages of spontaneous ignition of a sudden hydrogen release;
Recognise the means to control hydrogen ignition sources;
Classify electrical equipment depending on the Ex-zone;
State the main prevention measures for hydrogen ignition.
An overview of hydrogen ignition incidents and mechanisms In 2007 Astbury and Hawksworth published a paper analysing the statistics of hydrogen ignition
incidents and the associated mechanisms [1]. The authors discovered that there have been reports of
high pressure hydrogen leaks igniting for no obvious reasons, and several ignition mechanisms have
been proposed. It was underlined that although many leaks have been ignited, there are also reported
leaks where no ignition has occurred. For the cases where ignitions occurred without any obvious
ignition sources the mechanisms suggested are rather speculative, lacking a rigorous scientific
analysis. This work identified the knowledge gaps of the exact ignition mechanism for a hydrogen
release. The mechanisms, which have been considered by Astbury and Hawksworth (2007) include:
electrostatic charge generation, mechanical ignition, reverse Joule-Thompson effect, diffusion
ignition, sudden adiabatic compression, and hot surface ignition [1]. These mechanisms will be
discussed below in the present lecture.
4
By analysing the Major Hazard Incident Database Service of the Health and Safety Executive1 (UK)
Astbury and Hawksworth (2007) revealed 81 incidents involving releases of hydrogen [1]. Of those, a
delay between a release and ignition was reported only for 4 cases. The authors assumed that in other
cases hydrogen was ignited immediately. In 11 cases, the source of ignition was identified, but in the
remainder, i.e. in 86.3% of incidents, the source of ignition was not clear. As for non-hydrogen
releases, 1.5% of them did not ignite, and 65.5% of ignition sources were not identified. This does
prove the suggestion that there is a difference in propensity for ignition between hydrogen and non-
hydrogen gases when released.
The following incidents/accidents have been reviewed by Astbury and Hawksworth (2007) among the
others. From work undertaken by Nusselt in Germany several spontaneous ignitions of hydrogen at
2.1 MPa being discharged to atmosphere had been reported. The storage cylinders had been noted
for having quantities of iron oxide (i.e. rust) in them even though they were apparently dry, and it was
thought first that there was potential for electrostatic charging to occur. However, the experiments
on discharging hydrogen into an open funnel fitted with a long pipe showed no ignitions, except when
the funnel was obstructed by an iron cap. The mechanism was not understood, so further trials were
undertaken. Only when the tests were carried out in the dark a corona discharge was observed. When
hydrogen leaked out of a flange and the pipe was tapped to stir up dust the corona discharge
increased. An ignition occurred after the tapping. Further work showed that when sharpened copper
wires were used to promote corona discharges, the ignition happened when the point was bent away
from the gas direction, whereas no ignition occurred when the wire was pointing in the direction of
flow [1].
Another incident reported by Astbury and Hawksworth (2007) refers to a cylinder of hydrogen being
connected to a piece of laboratory apparatus. A laboratory technician cracked the valve open to clear
any dirt out of the connection, and when he did so, the escaping gas ignited immediately. Bond (1991)
attributed this ignition to the phenomenon of diffusion ignition. Whilst no pressure of gas is quoted
in this incident, it can be assumed that the pressure would have been the typical full cylinder pressure
of 23 MPa [3].
Reider et al. (1965) tested a release of a large quantity of hydrogen in order to determine the sound
pressure levels. Gaseous hydrogen was released at an initial pressure of 23.6 MPa and an initial rate
of 54.4 kg/s, for a period of 10 s. The gas was transferred through a 200 mm nominal bore pipe and a
150 mm bore ball valve to a cylindrical vessel fitted with a convergent–divergent nozzle venting to
atmosphere. In the test run where the gas was not deliberately ignited, after 10 s, the 150 mm
diameter valve was closed, and 3 s after starting to close the valve, ignition occurred. The three
potential ignition mechanisms examined were: electrification of the gas, electrification of particles in
the gas, and metal particles abrading a metal bar welded across the mouth of the nozzle. Of these, the
first was discounted as pure gases are known to have negligible electrostatic charging. The second
mechanism was considered, but the system had been thoroughly cleaned and blown down prior to
the test. Yet, the velocity of the gas being discharged, at 1216 m/s, was far higher during the run than
had been used before, so this potential mechanism could not be discounted. The third mechanism
was considered as a possibility as the discharge velocity was high thus possibly dislodging particles
1 In this database hydrogen releases, which simply dispersed and did not involve fire, explosion, or other major hazard, are not recorded.
Thus, the non-ignition being reported as zero is not necessarily an indication that all hydrogen releases were ignited.
5
and impacting them on the bar. This mechanism too could not be discounted. However, after the
ignition it was found that the bar had been torn loose at one end, and this may have presented a
possible ignition source, which had not been foreseen [4].
The “unexpected” spontaneous ignition of hydrogen release in large-scale experiments was reported
as well by Chaineaux et al. (1991) [5], Groethe et al. (2005) [6].
Ignition and reverse Joule-Thomson effect While the sudden releases of many gases such as methane, propane and nitrogen lead to a decrease
in temperature, for hydrogen, on the contrary, the temperature increases when it expands at constant
enthalpy into surroundings. This is due to the fact that hydrogen has a Joule-Thomson inversion
temperature, i.e. the temperature above which the Joule-Thomson coefficient becomes negative and
the isenthalpic gas expansion leads to warming instead of cooling. Some literature sources state that
this makes hydrogen more susceptible to ignition following its sudden release from a pressurised
vessel. However, Astbury and Hawksworth (2007) [1] have disregarded the Joule-Thomson effect as a
potential mechanism of ignition in considered experiments. They made this conclusion using data by
Michels et al. (1963) that the Joule-Thomson coefficient for hydrogen, estimated for expansion from
pressure 250 MPa and initial temperature 150oC down to 100 MPa, does not exceed 0.53 K [7]. Thus,
the ignition through this mechanism is highly unlikely at the pressures in most of the incidents
discussed above.
Minimum Ignition Energy (MIE) Minimum Ignition Energy (MIE) of flammable gases and vapours is the minimum value of the electric
energy, stored in the discharge circuit with as small a loss in the leads as possible, which (upon
discharge across a spark gap) just ignites the quiescent mixture in the most ignitable composition. A
weak spark caused by the discharge of a static electricity from a human body may be sufficient to
ignite any of the fuels discussed in this lecture [2].
For a given mixture composition the following parameters of the discharge circuit must be varied to
get the optimum conditions: capacitance, inductivity, charging voltage, shape and dimensions of the
electrodes as well as the distance between the electrodes [8]. In addition to the mixture composition
MIE depends on other factors such as the initial pressure and temperature. Since most ignition sources
generate more than 10 mJ, practically all common fuels would be ignited in the mixture with air if their
concentration exceeds the lower flammability limit (LFL). The ignition sources capable of forming
shocks, for example high-energy spark discharges and high explosives, can directly initiate detonation.
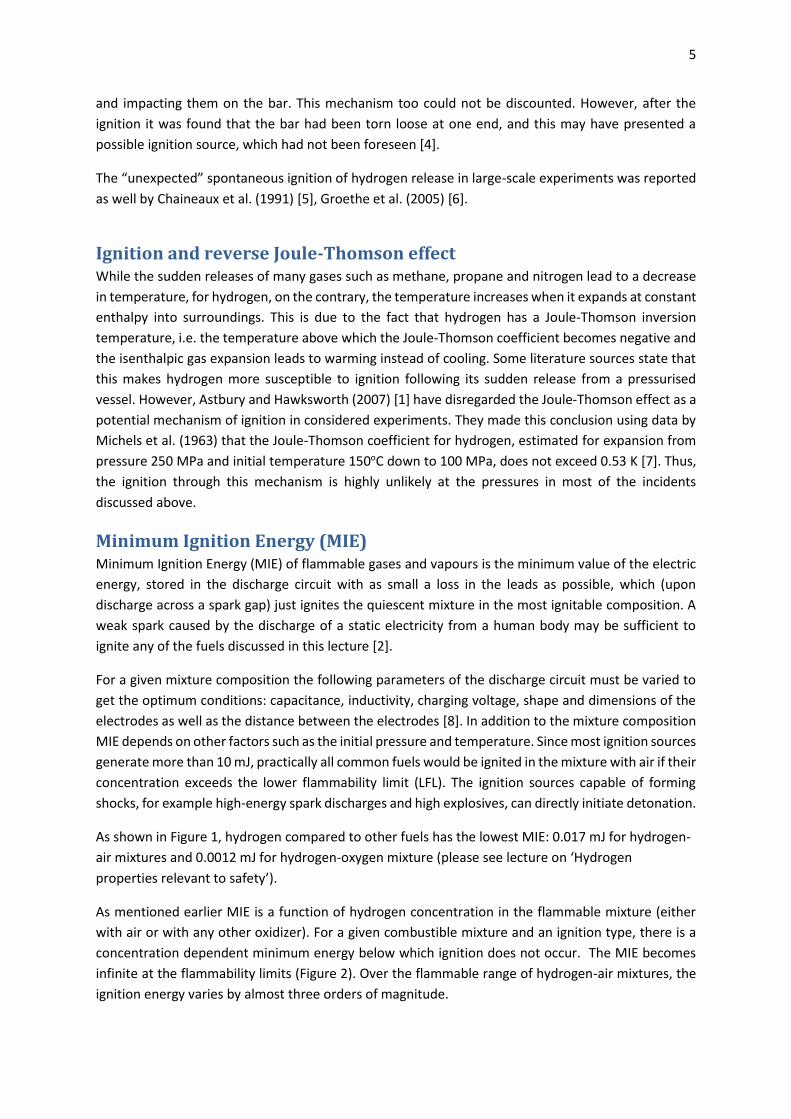
As shown in Figure 1, hydrogen compared to other fuels has the lowest MIE: 0.017 mJ for hydrogen-
air mixtures and 0.0012 mJ for hydrogen-oxygen mixture (please see lecture on ‘Hydrogen
properties relevant to safety’).
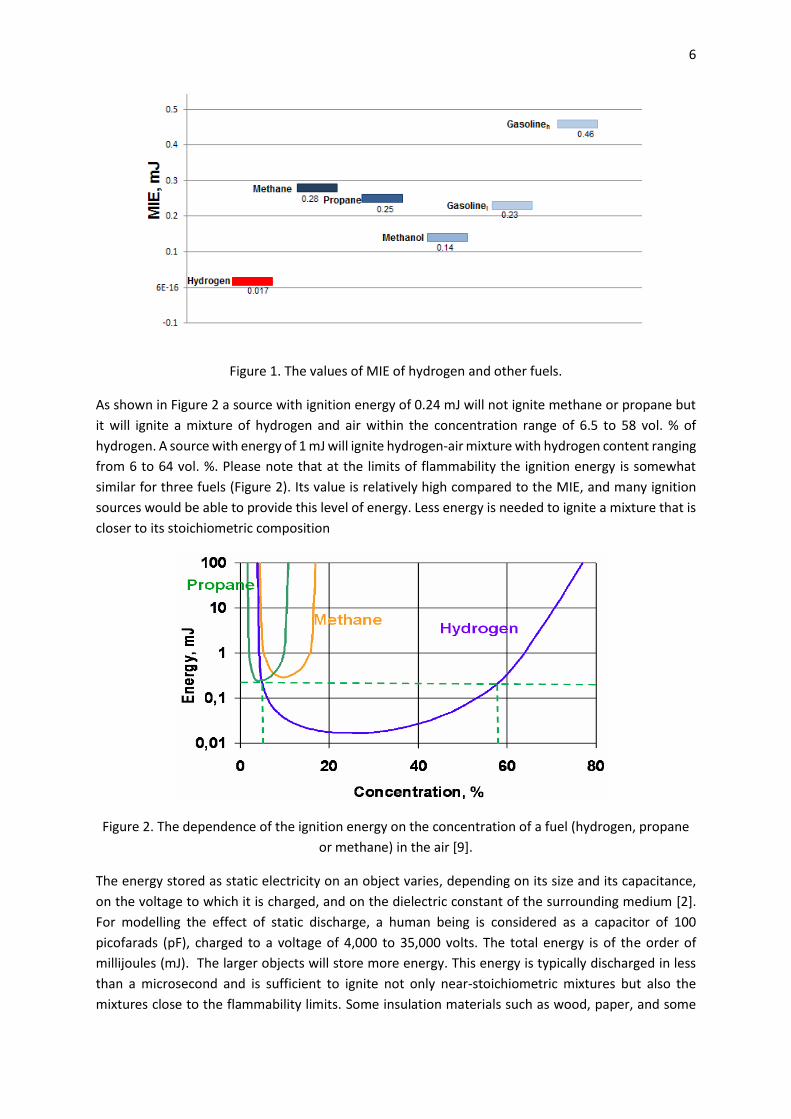
As mentioned earlier MIE is a function of hydrogen concentration in the flammable mixture (either
with air or with any other oxidizer). For a given combustible mixture and an ignition type, there is a
concentration dependent minimum energy below which ignition does not occur. The MIE becomes
infinite at the flammability limits (Figure 2). Over the flammable range of hydrogen-air mixtures, the
ignition energy varies by almost three orders of magnitude.
6
Figure 1. The values of MIE of hydrogen and other fuels.
As shown in Figure 2 a source with ignition energy of 0.24 mJ will not ignite methane or propane but
it will ignite a mixture of hydrogen and air within the concentration range of 6.5 to 58 vol. % of
hydrogen. A source with energy of 1 mJ will ignite hydrogen-air mixture with hydrogen content ranging
from 6 to 64 vol. %. Please note that at the limits of flammability the ignition energy is somewhat
similar for three fuels (Figure 2). Its value is relatively high compared to the MIE, and many ignition
sources would be able to provide this level of energy. Less energy is needed to ignite a mixture that is
closer to its stoichiometric composition
Figure 2. The dependence of the ignition energy on the concentration of a fuel (hydrogen, propane
or methane) in the air [9].
The energy stored as static electricity on an object varies, depending on its size and its capacitance,
on the voltage to which it is charged, and on the dielectric constant of the surrounding medium [2].
For modelling the effect of static discharge, a human being is considered as a capacitor of 100
picofarads (pF), charged to a voltage of 4,000 to 35,000 volts. The total energy is of the order of
millijoules (mJ). The larger objects will store more energy. This energy is typically discharged in less
than a microsecond and is sufficient to ignite not only near-stoichiometric mixtures but also the
mixtures close to the flammability limits. Some insulation materials such as wood, paper, and some
7
fabrics will typically form a conductive layer that can prevent static build-up by absorbing water from
the air in environments where the relative humidity is greater than 50% [10].
Triboelectricity Hydrogen is an electrical insulator in both gaseous and liquid phases. The flow or agitation of hydrogen
gas or liquid may generate charges of static electricity similar to all non-conductive liquids or gases.
For this reason, all hydrogen conveying equipment must be thoroughly grounded. Only above some
critical “breakdown” voltage, where ionization occurs, and it does become an electrical conductor
[11]. When high velocity hydrogen flow accompanies high-pressure vessel blow-down this property
can potentially be responsible for the generation of static electrical charge of present in piping
particulates by triboelectricity, which is a type of contact electrification in which certain materials
become electrically charged after they come into contact with another different material and are then
separated [2]. The probability of hydrogen ignition by this mechanism increases with increase of the
blow-down time (i.e. time needed to empty a storage tank) with the same other conditions.
Auto-ignition temperature The auto-ignition temperature is the minimum temperature required to initiate a combustion reaction
of a fuel-oxidiser mixture in the absence of any external source of ignition [2].
The standard auto-ignition temperature of hydrogen in air is above 510 oC [11]. It is relatively high
compared to hydrocarbons with long molecules. However, this auto-ignition temperature can be
reduced by catalytic surfaces such as platinum. The objects at temperatures ranging from 500 to
580 oC can ignite either hydrogen-air or hydrogen-oxygen mixtures at atmospheric pressure. The
substantially cooler objects at about 320 oC can cause hydrogen ignition under prolonged contact at
less than atmospheric pressure [12]. Hot air jet ignition temperature is 670oC [13].
Types of ignition sources and mechanisms of ignition As discussed above it is sometimes difficult to define the exact origin of ignition. Due to the low values
of the MIE it is often difficult to establish what caused hydrogen to ignite and what was the mechanism
of ignition. The list of possible ignition sources is shown below.
Electrical sources:
Electric sparks (e.g. from electrical equipment)
Static discharges (e.g. in ungrounded particulate filters)
Electric arc (switches, electric motors, portable phones, pagers and radios).
Lightning discharge (e.g. lightning strikes near the vent stack)
Electrical charge generated by equipment operation (compressors, generators, vehicles and
other construction equipment)
Electrical short circuits or other electrical equipment
Electrified particulates
Mechanical sources:
8
Mechanical sparks (from rapidly closing valves)
Mechanical impact and/or friction
Metal fracture
Mechanical vibration and repeated flexing
Thermal sources:
Hot surfaces (e.g. heating equipment)
Open flames
Hot jets
Exhausts (e.g. combustion engines and exhaust stacks)
Explosive charges (e.g. charges used in construction, fireworks or pyrotechnic devices)
Catalysts, explosives and reactive chemical materials
Shock waves and/or fragments
Reflected or repeated acoustic and shock waves
Other sources:
Ionizing radiation (radioactivity)
Electromagnetic radiation
Ultrasonic radiation
Light (laser/flash)
Adiabatic compression (pressure increase)
From the analysis carried out by Astbury and Hawksworth it was concluded that a single mechanism
is not able to explain all of the recorded incidents [1]. Two or more potential mechanisms may work
together. It is known that the MIE of gases and vapours decreases as the temperature increases [14],
thus the expanding hydrogen would increase its temperature due to the reverse Joule–Thomson
effect, and hence its ignition energy would reduce. Similarly, if particles were to be abraded from the
walls of any flow path, the required energy for ignition from a corona discharge would be lower, so it
is likely that less corona charging current would be required to ignite the hydrogen [2].
In several incidents, there is a suggestion in the reports that electrostatic effects may have been
responsible. In particular, one of incidents involved only a fine stream of mercury, with no other
potential ignition sources inside the closed system. The potential for drops and bursting bubbles to
generate electrostatic charges has been proposed by Blanchard [15], and the ability of such charges
to ignite sensitive atmospheres has been illustrated by Pratt [16].
It is generally recognised that pure gases do not become electrostatically charged under normal
conditions [2], but this refers generally to low velocities and pressures. When gases are released at
very high pressures, the flow becomes sonic and the propensity of electrostatic charging occurring is
not known. It is known that pure gases tend not to charge, but particles within the gas stream are
known to become electrostatically charged [2].
9
The discharge path in many practical cases would probably be convoluted and not in a straight line.
This would require the hydrogen to discharge through bends, which would potentially allow materials
on the surface of the discharge path, e.g. piping, to be eroded and form particles which could become
electrostatically charged [2].
Electrostatic discharge ignition There are three main types of electrostatic discharge: spark, brush, and corona [1]. A spark discharge
is a single plasma channel between a high potential conductor and an earthed conductor. A brush
discharge is a discharge between a charged insulator and a conducting earthed point. A corona
discharge is a silent, usually continuous, discharge with a current but without a plasma channel.
A spark from an isolated conductor
The energy from a spark discharge from an isolated conductor is calculated as
𝐸 = 𝐶𝑉22⁄ (1),
where C is a capacitance of the item, and V is a potential (voltage). For example, a person has a
capacitance C of about 100 pF, depending on the body size, the area of their feet, and the design and
thickness of the soles of the footwear [1]. Taking the typical MIE of 0.29 mJ (E) for hydrocarbon-air
mixtures, for example for propane-air, the voltage required to produce a spark of a sufficient energy
to ignite the atmosphere can be calculated as:
C
EV
2 (2)
Substitution gives V=2408 V. For the air, the dielectric strength is about 30 kV/cm. So, the gap between
the charged conductor and the earthed point required for breakdown to occur would be about
2400/30=0.08 cm, 0.8 mm or 800 micrometers.
People typically cannot feel an electrostatic shock of less than about 1 mJ, so they would be unaware
of the potential to ignite a hydrocarbon-air mixture [1]. The gap, over which the spark passes from a
person to earth, is rarely of a form which has pointed electrodes. Typically a finger has a tip radius of
about 6 mm. Therefore, a finger-tip approaching a flat earthed metal surface, though having a gap of
800 micrometers, would actually present a large, almost flat area, around the point at which the spark
passes. This would tend to quench any ignition. This phenomenon of a spark not igniting a flammable
mixture between two parallel plates is discussed by Metzler (1952) with relation to the prediction of
MIE [17]. The quenching of flames by parallel surfaces in close proximity has also been investigated
by Potter (1960), who found that hydrocarbons have quenching distances of 2-3 mm [18].
Thus, theoretically, any ignition would not propagate from the plasma channel of the spark at such a
“low” voltage of 2400 V. With breakdown strength of 30 kV/cm, and a gap of 2 mm which would just
allow the flame to propagate in hydrocarbon-air mixture, a potential of 6 kV would be required for a
spark to occur [1].
If hydrogen is now considered, the corresponding voltages and gaps are much lower compared to
hydrocarbons [1]. The dielectric strength of hydrogen atmospheres is only 17.5 kV/cm [19]. Its
quenching gap is only 0.64 mm [10]. The variation of dielectric strength with concentration of
hydrogen in air mixtures is unknown, but as a simple case, it could be assumed to be linear within a
specified narrow concentration range, so the theoretical dielectric strength of about stoichiometric
10
mixture of 30 vol. % of hydrogen in air would be (0.3x17.5 + 0.7x30) = 26.25 kV. With a quenching
distance of 0.64 mm and a dielectric strength of 26.25 kV/cm the breakdown potential would
correspond to a voltage of 26.25x0.064=1.68 kV, which corresponds to a stored energy of 0.5x[100x10-
12]x[1.68x103]2 = 1.41x10⁻⁴ J, i.e. 0.141 mJ. This is more than sufficient to ignite the stoichiometric
hydrogen-air mixture that requires only 0.017 mJ [2].
Thus, whilst electrostatic charging of those who refuel their vehicles with petrol rarely gives rise to
ignitions, it is significant that the voltage required for hydrogen to be ignited is below 2 kV. This voltage
can be generated easily on people, without them being aware of it, standing on an insulating surface,
so there is a potential for personnel to ignite hydrogen leaks very easily, without any apparent ignition
source being present [1].
A brush discharge
A brush discharge is characterised by many individual plasma channels, combining at the conductor.
As the charged surface is a non-conductor, a capacitance and, hence, the energy cannot be
determined. The work published by Gibson and Harper (1988) introduced the term ‘incendivity’ or
equivalent energy, which is, when the brush discharge has the ability to ignite an atmosphere with the
same minimum ignition energy as a spark, will just ignite the flammable atmosphere [20]. Typical
equivalent energies were found to be about 4mJ for brush discharges from flat polyethylene sheets.
However, Ackroyd and Newton (2003) found that some more modern plastics, and thin plastic
coatings on earthed metal, had higher equivalent energies [21].
A corona discharge
A corona discharge can ignite hydrogen-air mixture without there being a discrete spark or a single
discharge event [1]. The voltage required for a corona depends on a tip-radius [8]. Cross and Jean
(1987) give an equation to determine the voltage required for a corona to start from a point given its
tip-radius [22]. The prevention of ignition of hydrogen deliberately vented to atmosphere has been
applied before by using a polished toroidal ring at the end of the vent to ensure that the effective tip
radius is large. In practice, corrosion and dirt deposits are effectively small radius protrusions, so
anything which affects the polished finish could create small radius protrusions which would still have
an effect [1]. Studies undertaken many years ago on hydrogen vents showed that ignition was rare
during fine weather, but was more frequent during thunderstorms, sleet, falling snow, and on cold
frosty nights [1].
Mechanical ignition The key properties of burning metal particles or sparks that are relevant to their ability to cause
ignition of a flammable mixtures include:
Size
Material
Velocity
Temperature
Number
Combustion rate and time
11
There are metal-to-metal contact pressure and relative velocity threshold for spark production during
impact, rubbing or grinding. Above the threshold metal particles are lost from the weaker of two
materials. Generally, the particles are only produced when the relative velocity between the two
surfaces exceeds 1 m/s [8].
Ignition by a hot surface This phenomenon, common for the most of flammable gas/vapour-air mixtures, in that providing the
surroundings are at a high enough temperature, the rate of oxidation generates more heat than is
being lost to the surroundings, so allowing the oxidation chain-reaction to progress [2]. This is the
usual method of determining the auto-ignition temperatures, and the value obtained is dependent on
the apparatus used. It is known that the higher the temperature the shorter is ignition delay time. The
lowest temperatures for ignition are associated with large volumes and surface areas [8]. Hot surface
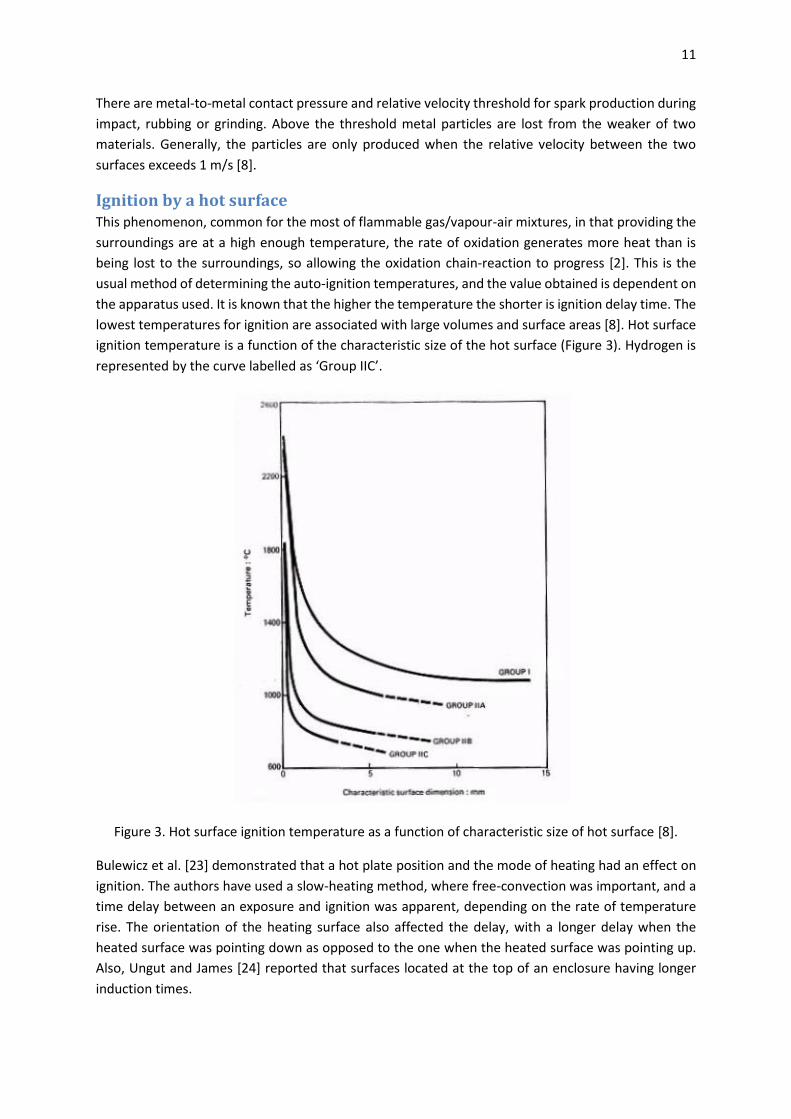
ignition temperature is a function of the characteristic size of the hot surface (Figure 3). Hydrogen is
represented by the curve labelled as ‘Group IIC’.
Figure 3. Hot surface ignition temperature as a function of characteristic size of hot surface [8].
Bulewicz et al. [23] demonstrated that a hot plate position and the mode of heating had an effect on
ignition. The authors have used a slow-heating method, where free-convection was important, and a
time delay between an exposure and ignition was apparent, depending on the rate of temperature
rise. The orientation of the heating surface also affected the delay, with a longer delay when the
heated surface was pointing down as opposed to the one when the heated surface was pointing up.
Also, Ungut and James [24] reported that surfaces located at the top of an enclosure having longer
induction times.
12
A catalytic surface (e.g. Pt-platinum) has a dramatic effect on the ignition temperature: ignitions are
reported at temperatures as low as 70 oC (please note that standard auto-ignition temperature is
510 oC [8].
Adiabatic compression ignition The ideal gas, when compressing it at constant entropy, would increase the pressure due to the
compression in accordance with the relationship PVγ=const. It can be shown with use of the equation
of state for the ideal gas that the following relationship TVγ-1=const is valid as well. For example, for
the compression ratio V1/V2=28 at the initial temperature of 293.15 K (γ=1.39) this theoretical
relationship would increase the temperature to T2=T1(V1/V2)γ−1=1075.2 K, i.e. the temperature rise of
782 K. However, in the experiments conducted by Pan et al. [25], the measured temperature realised
by the compression ratio of 28 times was only 149 K. Based on this, Astbury and Hawksworth [1]
concluded that isentropic compression is unlikely to occur in practice.
However, the work carried out by Cain [26] indicates that the compression ignition of hydrogen-
oxygen-helium mixtures occurs at a relatively constant temperature of 1050 K, at pressure rise ratios
of 35-70 starting at 300 K at atmospheric pressure. Reverse calculation indicates that a temperature
rise from 300 to 1050 K would require a pressure rise ratio of P2/P1=(T1/T2)γ /(γ−1) =
(1050/300)(1.39/0.39)=86.9. Thus, adiabatic compression mechanism requires pressure rise ratio greater
than that measured by Cain [26], suggesting that there is another ignition mechanism present [1].
Diffusion mechanism of spontaneous ignition The phenomenon of diffusion ignition has been postulated by Wolanski and Wojcicki [27], who
demonstrated that ignition occurred when high pressure hydrogen was admitted to a shock tube filled
with air or oxygen. They found that ignition could be achieved even if the temperature was below the
auto-ignition temperature of the hydrogen [27].
Wolanski and Wojcicki calculated that the gas composed of hydrogen and nitrogen (3:1 mixture),
would ignite in air if the shock wave exceeded a Mach number of 2.8 at a temperature of 575 K [27].
A shock wave of this Mach number would be produced by an upstream pressure of 3.9 MPa. They also
calculated that the ignition would occur at a lower Mach number of only 1.7, corresponding to an
upstream pressure of 1.3 MPa, when the shock wave was reflected by an obstacle [27].
There is no indication whether the auto-ignition temperature was measured by Wolanski and Wojcicki
(1972) at the expected final pressure in the shock tube, or at atmospheric pressure [27]. Although
their shock tube experiments produced ignition, the initial temperature was rather high at 575 K (302 oC), requiring an increase of only 110 K to reach their auto-ignition temperature of hydrogen. This
means that more research on this mechanism is needed.
In 2007 Astbury and Hawksworth suggested that the diffusion ignition mechanism is only likely if the
initial temperature is high [1]. However, they continued that when the valves on cylinders were briefly
opened directly into the atmosphere, presumably to clear any debris from the cylinder, the ignition
had occurred. The diffusion ignition effect appears to be reproducible in a shock tubes or similar closed
equipment. Wolanski and Wojcicki (1972) appear to have only carried out work using a hydrogen-
nitrogen mixture [27]. Since 2007 more work, both experimental and numerical has been performed,
on the diffusion mechanism. This is reported partially in the following section of the lecture
13
Spontaneous ignition of a sudden releases Many attempts have been made to explain spontaneous ignition of a sudden release over the last
decades, starting from the pioneering study by Wolanski and Wojcicki (1972) on the so-called
“diffusion ignition mechanism” [27]. The experimental data gave critical conditions of this
phenomenon. Unfortunately, they cannot provide a detailed insight into the dynamics of the process.
For example, the exact location of the initial ignition spots and a chemical reaction progression within
tubing downstream a rupture disk or valve can hardly be identified by experimental means at high
pressures [2].
It is an agreed opinion that the probability of hydrogen spontaneous ignition at a sudden release from
high-pressure equipment is relatively high if mitigation measures are not in place. However, there are
no references in codes and standards with regards to a spontaneous ignition problem or on a specific
engineering design to avoid or promote it for piping, storage and use of high-pressure systems
handling compressed hydrogen [2]. Control of spontaneous ignition of high-pressure hydrogen release
is one of the challenges in hydrogen safety, for which a little fundamental explanation exists.
Experimental proof of spontaneous ignition by the diffusion mechanism for the releases from high
pressure equipment to the atmosphere through a tube was obtained in a “controlled laboratory
environment” by: Dryer et al. [28], Golub et al. [29, 30], Pinto et al. [31] and Mogi et al. [32]. In these
experiments hydrogen at elevated pressures was separated from the air in a pipe at atmospheric
pressure by a flat burst disk. To facilitate spontaneous ignition various extension tubes and
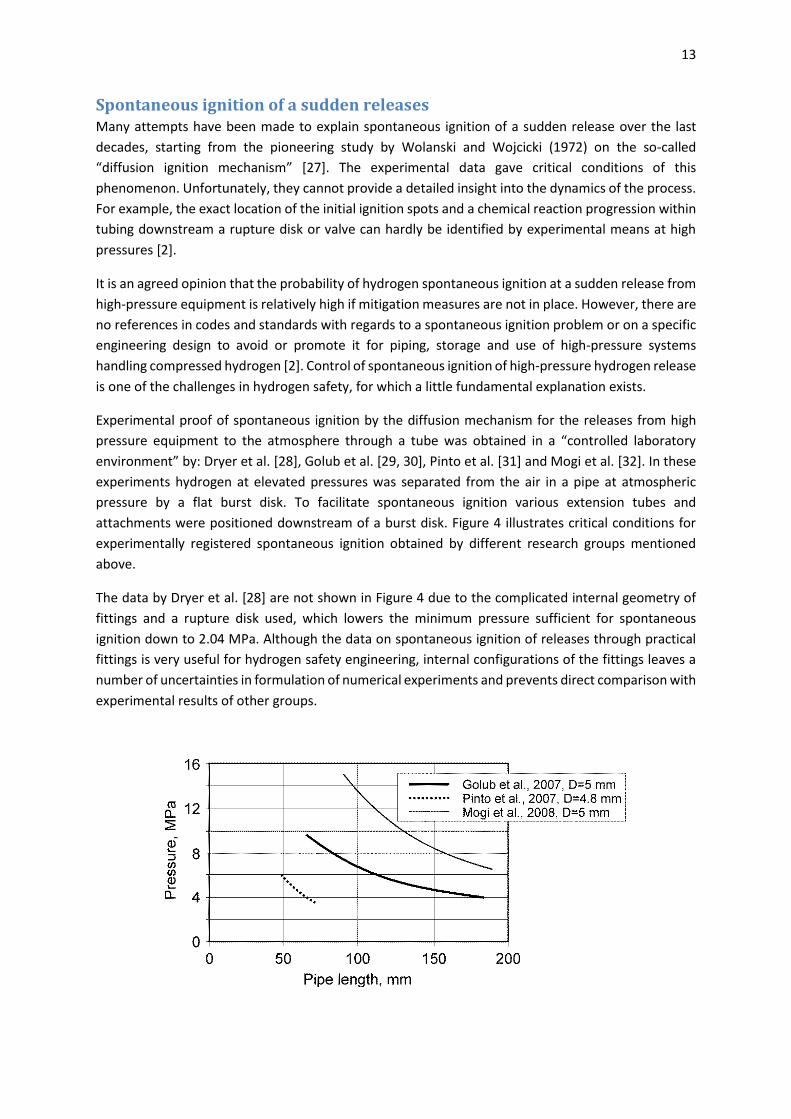
attachments were positioned downstream of a burst disk. Figure 4 illustrates critical conditions for
experimentally registered spontaneous ignition obtained by different research groups mentioned
above.
The data by Dryer et al. [28] are not shown in Figure 4 due to the complicated internal geometry of
fittings and a rupture disk used, which lowers the minimum pressure sufficient for spontaneous
ignition down to 2.04 MPa. Although the data on spontaneous ignition of releases through practical
fittings is very useful for hydrogen safety engineering, internal configurations of the fittings leaves a
number of uncertainties in formulation of numerical experiments and prevents direct comparison with
experimental results of other groups.
14
Figure 4. Hydrogen ‘ignition’ pressure as a function of a pipe length in series of tests with flat
burst disks [2].
Experimental results agree with a general trend of the decrease of the critical (limit) pressure with the
increase of a pipe length. However, the critical conditions of spontaneous ignition vary substantially
due to difference in test arrangements. Sensitivity of spontaneous ignition to different not yet fully
understood factors poses a number of issues to be studied.
Figure 4 shows an essential difference in critical conditions for spontaneous ignition obtained in
different studies. It can be seen, for example that for hydrogen storage pressure of 6 MPa in
experiments carried out by Pinto et al. [31] the 50 mm pipe length is sufficient to provide spontaneous
ignition. However, at the same storage pressure and practically with the same internal diameter the
channel length sufficient to provide spontaneous ignition in the experiments performed by Golub et
al. [29, 30] is 110 mm, and in the tests by Mogi et al. [32] the minimum length increases by four times
to 200 mm. How these differences can be explained?
First of all, Golub et al. [29, 30] registered the onset of spontaneous ignition by monitoring the shock
propagation and location of radiation from chemical reaction inside the pipe. Hence, critical conditions
for spontaneous ignition in their experiments represent the distance from the rupture disk to the
location where ignition was captured by a radiation gauge.
Mogi et al. [32] judged the occurrence of spontaneous ignition by optical observation of the area near
the pipe exit to atmosphere. They showed that in some experiments spontaneous ignition did occur,
but combustion was blown out by the flow. Unfortunately, no critical conditions for such releases
were reported. Nevertheless, this fact confirms that not all spontaneously ignited releases transit into
sustained jet fires. This is one likely reason for the shift of the critical curve in Mogi et al. experiments
[32] compared to those by Golub et al. [29, 30]. However, the most probable reason explaining the
shift of Mogi et al. data to higher pressures for the same pipe length was suggested in [2]. Indeed, in
the experiments by Mogi et al. the internal surface of the pipe between the diaphragm (rupture disk)
and the exit to atmosphere was washed away by the aqueous Na2CO3 solution (1%) in order to allow
visualization of the flame via the reaction of sodium. This solution could have interfered with boundary
layer flow and chemistry of hydrogen combustion and draw away some heat from the process. Thus,
the process happened later along the tube for the same initial pressure.
The experimental procedure applied by Pinto et al. [31] was different as hydrogen was compressed
just before the burst disk rupture using a piston combined with the shock tube. Nitrogen gas was
injected into the high pressure section of the shock tube upstream of the piston to push it towards
hydrogen gas in order to generate high pressure of hydrogen to burst the disk. This compression
obviously caused heating of hydrogen in high-pressure chamber and the release was not at the
ambient temperature, but somewhat higher. But since, neither the temperature measurements in
high-pressure chamber, nor information of the time, during which hydrogen was compressed, are
available, it is difficult to estimate accurately the initial hydrogen temperature.
The results of the experiments performed by Pinto et al. [31] are in full compliance with those by
Bazhenova et al. [33], who stated that the increase of initial hydrogen temperature stimulates the
spontaneous ignition to occur earlier and under lower initial pressures. The higher initial temperature
of hydrogen is the most likely reason for a shorter tube required for spontaneous ignition in the
15
experiments by Pinto et al. [31] for the chosen pressure compared to the experiments by Golub et al.
[29, 30] and Mogi et al. [32].
The way how the burst disk ruptures is probably the most important factor for spontaneous ignition
as this affects the hydrogen-air mixing [28]. In the experiments discussed by Golub et al. [29, 30] burst
disks were incised in the form of the cross to facilitate sharp “petal” opening at predetermined
pressure, whereas in the experiments by others a wider stochastic burst disk rupture pressure
distribution was observed. Stochastic nature of an in-house made burst disk rupture produces
variations in a structure and strength of the shock wave generated, even at constant burst pressure,
and obviously can affect the repeatability of experimental data. Very good repeatability of the
experiments is stated by Golub et al. [29, 30] both in the measured pressure behind the generated
shock wave, and the minimum initial pressure, which would provide spontaneous ignition at fixed tube
length.
Pinto et al. [31] compared the results for smooth and screwed tubes. It was found that the same initial
pressure, causing spontaneous ignition in a smooth tube, fails to cause an ignition in the case of a
screwed tube. This observation, however, conflicts with the opinion of Dryer et al. [28], who found
that the experiments with several tubes mated together produced an ignition, whilst a single tube (no
mating unions) did not, for the same initial pressure, the internal diameter and the overall tube length.
These observations underline that the interaction of developing boundary layer with the roughness of
the walls in the tube section, downstream of the burst disk, can either promote or delay spontaneous
ignition [2].
Dryer et al. [28] reported that spontaneous ignition events are statistically distributed in a narrow
pressure range between 2.04 and 2.21 MPa, with zero probability for membrane failure at pressures
less than 2.04 MPa and with certain inflammation for failure at pressures above 2.21 MPa.
The experimental study by Golub et al. [34] argues on a possibility of spontaneous ignition in a T-
shaped channel for initial hydrogen pressure in the range of 1.2-2.9 MPa. Dryer et al. [28] speculate
on the importance of the initial stage of a membrane rupture on the mixing and subsequent
spontaneous ignition process. They concluded that at low pressures, the chemical ignition time
becomes the limiting factor, while at high pressures the mixing time to achieve significant flammable
mixture volume limits the process. There is a need to clarify the physics of the spontaneous ignition in
order to control it appropriately.
Physical mechanism
An instantaneous opening
The mechanism of spontaneous ignition by the diffusion mechanism is illustrated in Figure 5. For the
simplicity, the simulations were performed for the case of an instantaneous opening of a burst disk
separating hydrogen and air at the same initial temperature but at different initial pressures (hydrogen
at 9.6 MPa and air at 0.1 MPa) [8].
16
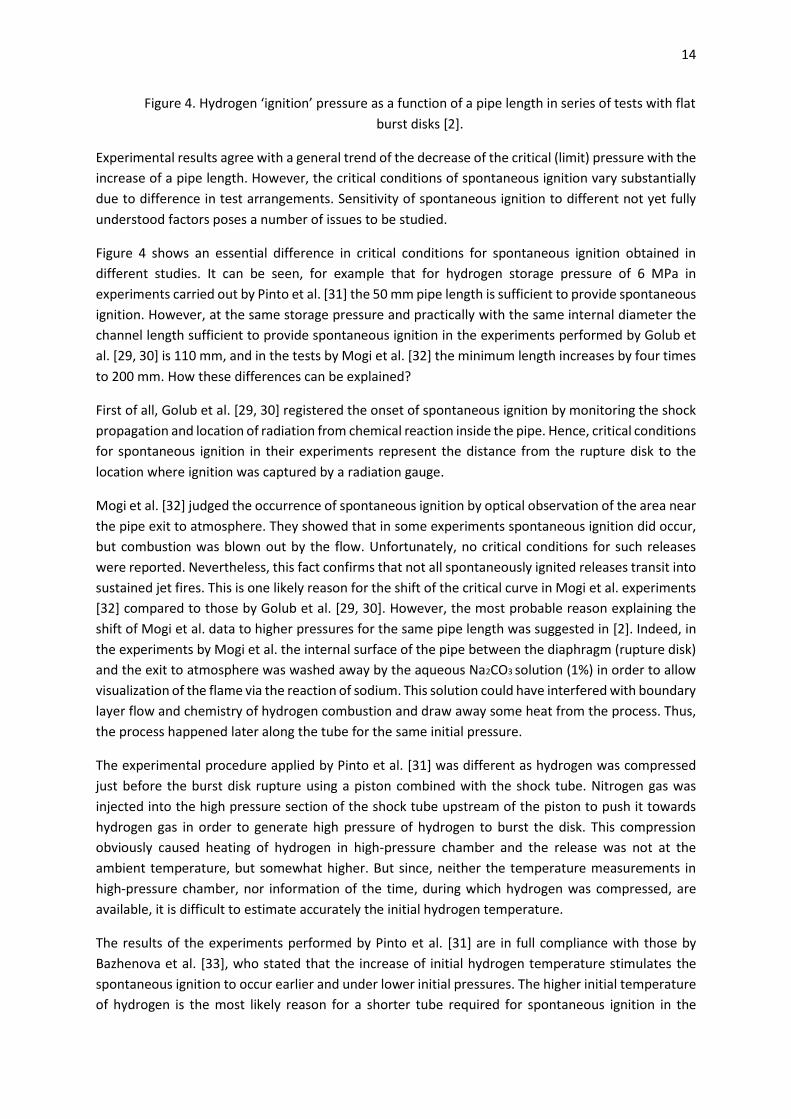
Figure 5. The dynamics of spontaneous ignition: temperature (left) and hydrogen mole fraction
(right) [35].
Figure 5 shows the dynamics of temperature (left) and hydrogen mole fraction (right) during the first
56 μs after the rupture disk instant opening (non-inertial rupture disk). At the initial moment (t=0) the
“rupture disk” boundary, separating high-pressure hydrogen and atmospheric air, located at x=0, is
instantaneously removed and a shock wave propagates into the air, heating it up due to the
compression. The shock wave is followed by a contact surface separating cold hydrogen and heated
air. It is seen that the thickness of the heated air layer between the shock front and the contact surface
increases in time [2].
The shock wave propagates along the tube as a plane wave without any curvature outside the
boundary layer. The shape of the contact surface changes from plane to slightly convex in the
beginning due to the non-slip conditions at the pipe walls. The highest temperature is observed in the
boundary layer due to velocity decrease (stagnation conditions). Owing to a counter diffusion of
hydrogen and air at the contact surface with a consequent heat diffusion from hot air to cold hydrogen
through the contact surface, the spontaneous ignition occurs when critical conditions for chemical
reaction are reached. The chemical reaction propagates in the direction from the wall to the tube axis
as the contact surface propagates downstream. After 45 μs from the start of the process at distance
20 mm from the non-inertial “rupture disk” location the combustion occupies the whole cross-section
area of the pipe. The initiation of the chemical reactions in the boundary layer accelerates the
propagation of the reaction front along the wall compared to the axial part leading to change of the
convex shape of the contact surface in the most of the tube cross-section to a slightly concave form
[2].
Effect of a valve opening rate
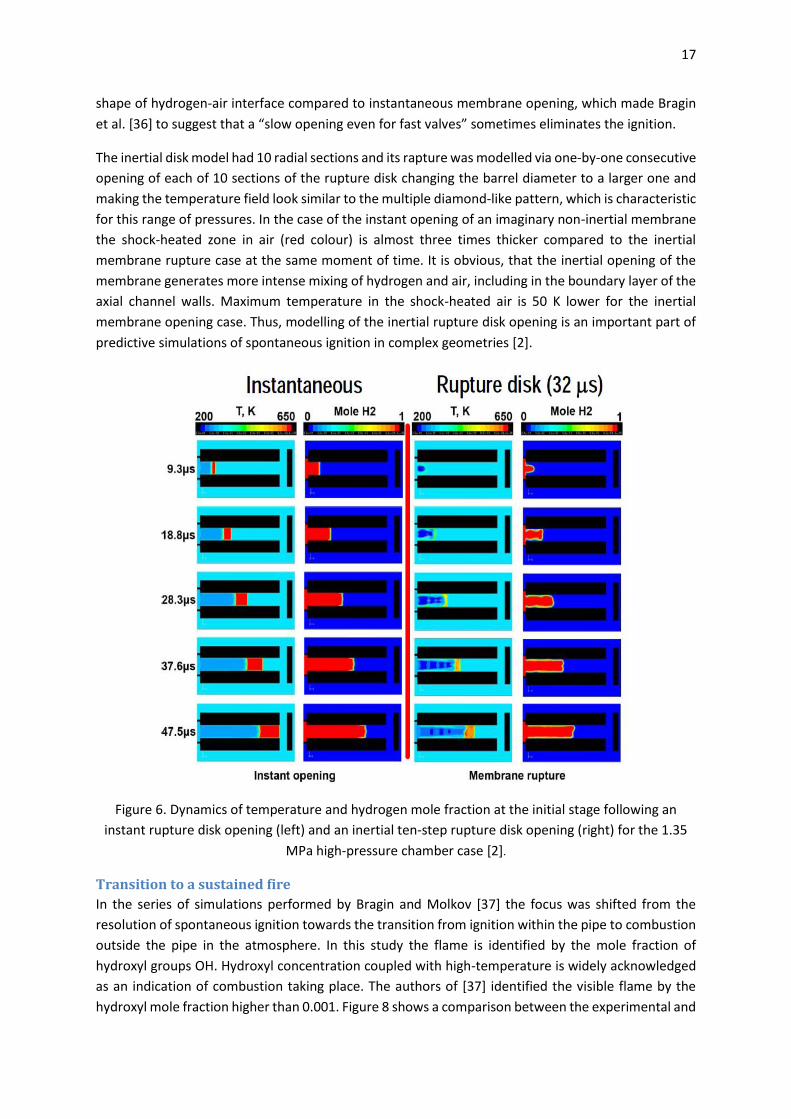
Figure 6 shows the dynamics of temperature and hydrogen mole fraction at an initial stage of
hydrogen release into the air in a mock PRD with an instant opening (left) and with an inertial opening
(right) of the rupture disk for initial pressure of 1.35 MPa in the high-pressure chamber [36]. The
inertial rupture disk opening is accompanied by a formation of an under-expanded jet from an
increasing with time open area of the disk. A barrel-like structure can be seen for the case of inertial
membrane opening (Figure 6, right). Inertial disk rapture results in lower temperature and different
17
shape of hydrogen-air interface compared to instantaneous membrane opening, which made Bragin
et al. [36] to suggest that a “slow opening even for fast valves” sometimes eliminates the ignition.
The inertial disk model had 10 radial sections and its rapture was modelled via one-by-one consecutive
opening of each of 10 sections of the rupture disk changing the barrel diameter to a larger one and
making the temperature field look similar to the multiple diamond-like pattern, which is characteristic
for this range of pressures. In the case of the instant opening of an imaginary non-inertial membrane
the shock-heated zone in air (red colour) is almost three times thicker compared to the inertial
membrane rupture case at the same moment of time. It is obvious, that the inertial opening of the
membrane generates more intense mixing of hydrogen and air, including in the boundary layer of the
axial channel walls. Maximum temperature in the shock-heated air is 50 K lower for the inertial
membrane opening case. Thus, modelling of the inertial rupture disk opening is an important part of
predictive simulations of spontaneous ignition in complex geometries [2].
Figure 6. Dynamics of temperature and hydrogen mole fraction at the initial stage following an
instant rupture disk opening (left) and an inertial ten-step rupture disk opening (right) for the 1.35
MPa high-pressure chamber case [2].
Transition to a sustained fire
In the series of simulations performed by Bragin and Molkov [37] the focus was shifted from the
resolution of spontaneous ignition towards the transition from ignition within the pipe to combustion
outside the pipe in the atmosphere. In this study the flame is identified by the mole fraction of
hydroxyl groups OH. Hydroxyl concentration coupled with high-temperature is widely acknowledged
as an indication of combustion taking place. The authors of [37] identified the visible flame by the
hydroxyl mole fraction higher than 0.001. Figure 8 shows a comparison between the experimental and
18
simulated snapshots. Numerical flame propagation can be referenced to experimental dimensions by
vertical lines, which are positioned 10 mm apart.
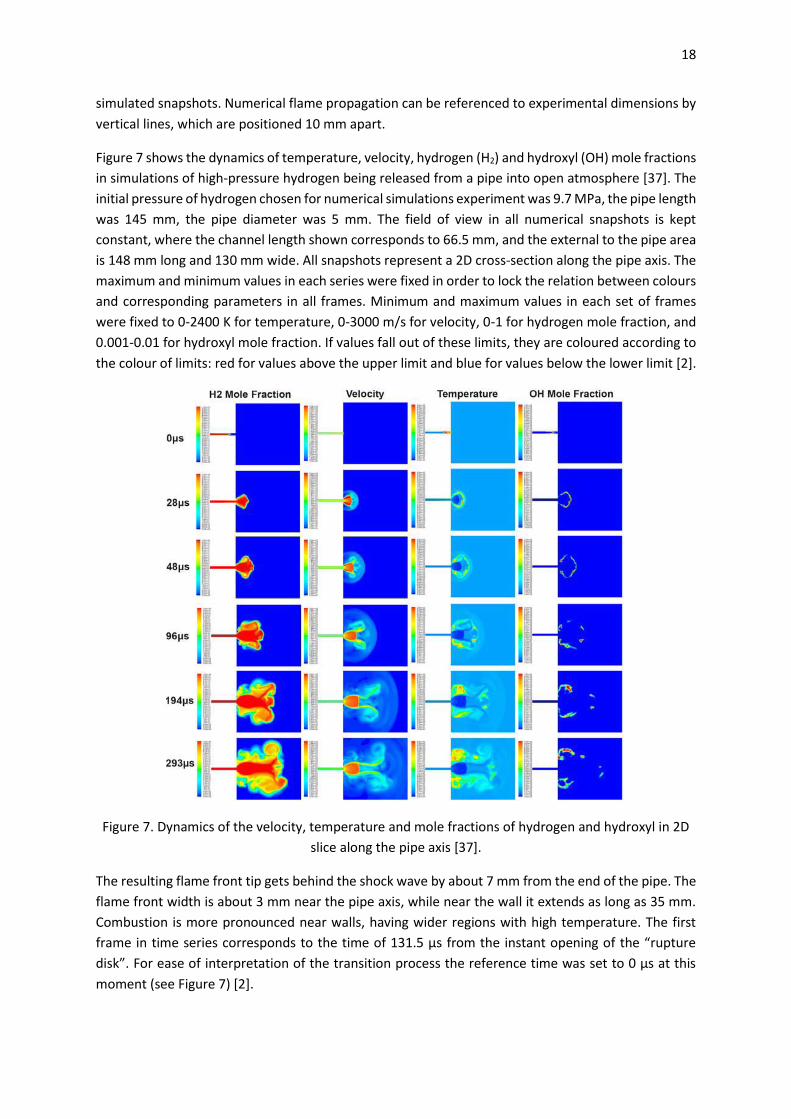
Figure 7 shows the dynamics of temperature, velocity, hydrogen (H2) and hydroxyl (OH) mole fractions
in simulations of high-pressure hydrogen being released from a pipe into open atmosphere [37]. The
initial pressure of hydrogen chosen for numerical simulations experiment was 9.7 MPa, the pipe length
was 145 mm, the pipe diameter was 5 mm. The field of view in all numerical snapshots is kept
constant, where the channel length shown corresponds to 66.5 mm, and the external to the pipe area
is 148 mm long and 130 mm wide. All snapshots represent a 2D cross-section along the pipe axis. The
maximum and minimum values in each series were fixed in order to lock the relation between colours
and corresponding parameters in all frames. Minimum and maximum values in each set of frames
were fixed to 0-2400 K for temperature, 0-3000 m/s for velocity, 0-1 for hydrogen mole fraction, and
0.001-0.01 for hydroxyl mole fraction. If values fall out of these limits, they are coloured according to
the colour of limits: red for values above the upper limit and blue for values below the lower limit [2].
Figure 7. Dynamics of the velocity, temperature and mole fractions of hydrogen and hydroxyl in 2D
slice along the pipe axis [37].
The resulting flame front tip gets behind the shock wave by about 7 mm from the end of the pipe. The
flame front width is about 3 mm near the pipe axis, while near the wall it extends as long as 35 mm.
Combustion is more pronounced near walls, having wider regions with high temperature. The first
frame in time series corresponds to the time of 131.5 μs from the instant opening of the “rupture
disk”. For ease of interpretation of the transition process the reference time was set to 0 μs at this
moment (see Figure 7) [2].
19
Figure 7 shows that as the shock wave emerges from the pipe exit it diffracts and transforms from a
plane to a hemispherical form. The shock propagates outwards and quickly loses its strength. It is
followed by the flame front pushed by the expanding hydrogen. Once hydrogen leaves the tube, the
expansion starts and the flame front follows the expansion. The formation of Mach disk commences
shortly after (see “28 μs” frame in Figure 7) and the expansion of hydrogen is held back, increasing
the separation distance between the leading shock and the contact surface. Sudden deceleration of
hydrogen stimulates turbulent mixing and the contact surface becomes turbulent [37].
Effect of a flame separation by vortex
In parallel to the Mach disk formation, the outer annular flow at the Mach disk’s periphery forms.
Owing to viscous forces this supersonic annular flow generates a large-scale vortex, which turns the
flow back towards the pipe exit. The formation of vortex breaks the combusting gas into two parts:
downstream and upstream parts – see Figure 7, 48 μs, mole fraction of OH radical (which serves as
combustion reaction indicator) and comparison with experimental snapshots in Figure 8 below.
Meanwhile, the shock barrel is not yet stabilized. Upstream combustion region is pushed back by the
vortex tip (96 μs), while downstream combustion region in the vicinity of jet axis is forced out. As the
vortex straightens, the supply of hydrogen to the recirculation area dies out and reduction of flow
velocity allows necessary induction time for intensification of combustion. It can be seen that
combustion affects the gas dynamic evolution of the jet and results in non-axis-symmetrical to some
extent flow beyond the Mach disk (194 μs). Shock barrel is stabilized around 200 μs. The annular
vortex increases in size, widening the distance from the axis where hydrogen is present. By the time
of the last frame in Figure 7 (293 μs) the downstream from vortex combustion is fully ceased (no OH
radicals), while the upstream combustion in the recirculation zone is sustained.
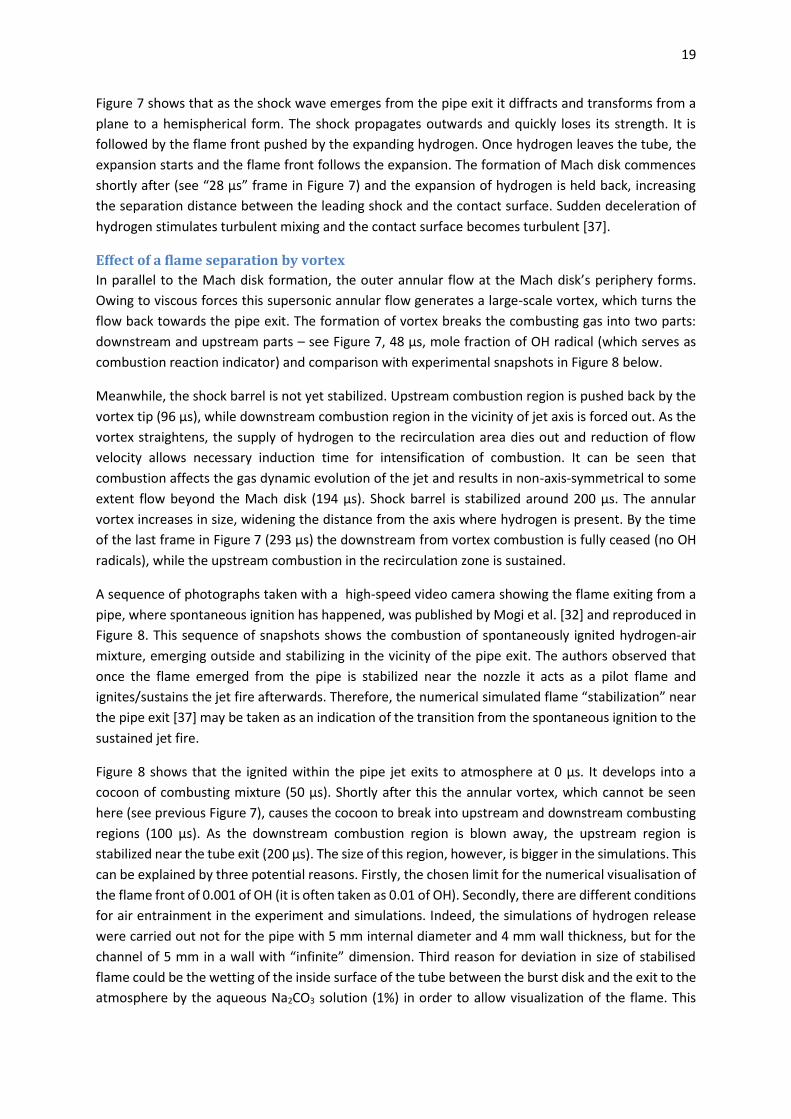
A sequence of photographs taken with a high-speed video camera showing the flame exiting from a
pipe, where spontaneous ignition has happened, was published by Mogi et al. [32] and reproduced in
Figure 8. This sequence of snapshots shows the combustion of spontaneously ignited hydrogen-air
mixture, emerging outside and stabilizing in the vicinity of the pipe exit. The authors observed that
once the flame emerged from the pipe is stabilized near the nozzle it acts as a pilot flame and
ignites/sustains the jet fire afterwards. Therefore, the numerical simulated flame “stabilization” near
the pipe exit [37] may be taken as an indication of the transition from the spontaneous ignition to the
sustained jet fire.
Figure 8 shows that the ignited within the pipe jet exits to atmosphere at 0 μs. It develops into a
cocoon of combusting mixture (50 μs). Shortly after this the annular vortex, which cannot be seen
here (see previous Figure 7), causes the cocoon to break into upstream and downstream combusting
regions (100 μs). As the downstream combustion region is blown away, the upstream region is
stabilized near the tube exit (200 μs). The size of this region, however, is bigger in the simulations. This
can be explained by three potential reasons. Firstly, the chosen limit for the numerical visualisation of
the flame front of 0.001 of OH (it is often taken as 0.01 of OH). Secondly, there are different conditions
for air entrainment in the experiment and simulations. Indeed, the simulations of hydrogen release
were carried out not for the pipe with 5 mm internal diameter and 4 mm wall thickness, but for the
channel of 5 mm in a wall with “infinite” dimension. Third reason for deviation in size of stabilised
flame could be the wetting of the inside surface of the tube between the burst disk and the exit to the
atmosphere by the aqueous Na2CO3 solution (1%) in order to allow visualization of the flame. This
20
solution could have interfered with heat transfer and chemistry of hydrogen combustion and
decreases the visible flame size [2].
Figure 8. High-speed video camera experimental photographs (top) [32] and numerical 3D snapshots
(bottom) [37].
It is assumed, following the experimental observations and numerical simulations, that the transition
to the sustained jet flame is largely dependent on the initial jet formation stage, where developing
annular vortex pushes combusting mixture upstream into the recirculation zone. Once the flame is
stabilised near the pipe exit, it can act as a pilot flame to jet fire later on [2].
Spontaneous ignition in a T-shaped PRD
Experimental set-up
The geometry of the experimental set up, including a T-shaped channel mimicking a PRD, is taken from
Golub et al. [34] and is shown in Figure 9. The high pressure system consists of a 210 mm long tube
with the internal diameter (ID) of 16 mm followed by a 280 mm long tube with the ID= 10 mm, at the
end of which a flat rupture disk, made of copper or aluminium with cuts facilitating failure, is located
followed by a mock-up PRD (T-shaped channel) open to the atmosphere.
The PRD has a 48 mm long axial channel of 6.5 mm ID with a flat end, and two radial channels on
opposite sides of the axial channel to vent hydrogen to the atmosphere. Each radial channel has
6.25 mm length and 4 mm ID (distance from the end connected to the atmosphere of one radial
channel to the end of another one is 19 mm). Radial channels are flushed with the axial channel end
wall and positioned so that the edge of each radial channel touches tangentially the flat end wall of
the axial channel. The rupture disk opening was estimated by Golub et al. [34] as about ten
microseconds, thus creating conditions for better mixing of hydrogen with the air during the opening
as compared to a unrealistic instant opening. To register the spontaneous ignition a light sensor was
installed along the axis of radial channels of the PRD. Temperature behind the shock wave reflected
from the flat end wall was estimated by the authors as more than twice higher than the temperature
behind the incident shock wave. Golub et al. [34] stated that when the initial pressure in high pressure
chamber did not exceed 1.2 MPa the light sensor did not record any signal, and when pressure was
2.9 MPa the ignition was registered.
21
Figure 9. The geometry and computational domain: 1 and 2 – high pressure tubes, 3 – a mock-up
PRD (T-shaped channel), 4 – burst disk, 5 – external computational domain.
Effect of a storage pressure on the spontaneous ignition in a T-shaped channel
Simulation results for 1.35 MPa (no spontaneous ignition)
Figure 10 demonstrates a flow pattern and provides an insight into the process of hydrogen release
from a storage at pressure 1.35 MPa through a T-shaped channel mimicking PRD device, as a result of
which no ignition was observed.
The first snapshot denoted ‘60 μs’ shows a contact surface between hydrogen at near room
temperature (in light-blue colour) and the air heated by the pressure wave (in green-yellow) within
the horizontal axial channel. The contact surface is inside the axial channel at this moment and it is
disturbed by the Rayleigh-Taylor instability. Close to the flat end of the axial channel there is a volume
of air heated further by the reflected shock (in red colour). New areas of the heated air (in red) in
radial channels are seen in the next snapshot ‘63 μs’ along with the increasing volume of the hot air
at the axial channel end. These new areas are probably due to the second reflection from a wall of the
radial channel that is opposite to the flat end of the axial channel. At the time of 67 μs “cold” hydrogen
starts to exit the axial channel and flows along one side of the radial channel. The hot air temperature
in front of hydrogen is reduced (see the snapshots from ‘67 μs’ to ‘77 μs’). There is a drop in the heated
air temperature when the hot air exits the radial channel to the atmosphere. The reflected shock is
weak at a storage pressure of 1.35 MPa and the hot air in flow following the reflected pressure wave
cannot enter the axial channel (only to small extent at the axial channel axis). At the time equal to 77
μs hydrogen starts exiting to the atmosphere and its temperature drops further down during this
expansion (dark-blue colour) [8].
22
Figure 10. Temperature dynamics of a hydrogen release into the T-shaped channel at a storage
pressure of 1.35 MPa - no ignition (yellow – air heated by the shock wave; red – air heated by the
reflected shock wave; light-blue in the pipe - flowing hydrogen; dark-blue – hydrogen cooled during
expansion to the atmosphere) [8].
Simulation results for 2.9 MPa (ignition) and for 2.43 MPa
Temperature and hydroxyls mole fraction profiles in the axial cross-section for the case with the initial
pressure of 2.9 MPa in the high-pressure chamber are presented in Figure 11. Figure 12 shows the
temperature and hydroxyls mole fraction profiles in the axial cross-section for the case with the initial
hydrogen pressure of 2.43 MPa in the high-pressure chamber.
At initial stage of hydrogen release the highest temperature is achieved at the location of the leading
shock reflection on the flat end of the axial channel, see snapshots for 62 µs and 63 µs in Figure 11.
However it is clear that the ignition is not possible in this location since hydrogen is not supplied to
this area yet. Once the hydrogen flow diffracts around the edge from the axial channel into the radial
channels, it starts mixing with the air heated by shocks. This provides the necessary “fire triangle”
conditions (i.e. fuel-oxidiser-high temperature) for the ignition of the hydrogen-air mixture. It can be
seen that the chemical reaction is initiated in case of both 2.9 MPa (Figure 11) and 2.43 MPa (Figure
12) storage pressure in the radial channel in a location close to the upstream wall and indicated by
non-zero hydroxyl mole fraction starting to grow from 63 µs and 67 µs respectively.
Large high temperature regions can be observed for the storage pressure of 2.9 MPa (Figure 11)
compared to the pressure of 2.43 MPa (Figure 12). The difference becomes obvious when combusting
mixture is pushed outside. At the pressure of 2.9 MPa a semi-spherical cocoon of a heated to critical
23
conditions flammable hydrogen-air mixture is formed outside the PRD being followed by the
expanding hydrogen. The combustion is initiated in a number of spots within the cocoon (as indicated
on the snapshots of temperature and OH mole fraction at 79 μs). The concentration of hydrogen in
these spots, outside the PRD, just before the ignition, is in the range between 29 and 36 vol. % (not
shown in the Figure). Thus, a conclusion can be drawn that the ignition by the diffusion mechanism
takes place in the most reacting near-stoichiometric hydrogen-air mixtures [8].
Figure 11. Temperature (top) and hydroxyls mole fraction (bottom) for 2.9 MPa hydrogen storage
pressure.
At the storage pressure of 2.43 MPa (Figure 12) the combustion is rather weak compared to the case
of 2.9 MPa pressure, and the reacting mixture is dragged with the adjacent hydrogen flow, which leads
to the elongation of combusting regions. Upon the exit from the radial channels of the PRD, the flow
undergoes an expansion and high-temperature regions disappear, thus ceasing the reaction and OH
concentration, including the cooling role of the expanding pure hydrogen jet on the flammable
mixture [8].
24
Figure 12. Temperature (top) and hydroxyl mole fraction (bottom) for 2.43 MPa hydrogen storage
pressure.
The whole process, from the combustion initiation to the self-extinction (i.e. disappearance of high
temperature and OH mole fractions region, Figure 12), takes a bit longer than 10 μs. This time is
sufficient to register the chemical reaction by a light sensor in the experiments. This explains the
uncertainty in the interpretation of the experimental observations by Golub et al. [34]. Indeed, at the
pressure of 2.9 MPa the combustion is quite pronounced, but at the pressure of 2.43 MPa the spot of
spontaneous ignition is weak and it disappears due the self-extinction. However, the light sensors still
registered a signal during the spontaneous ignition. Thus, in full compliance with the experimental
observation the simulations confirmed the spontaneous ignition at the storage pressure of 2.43 MPa
(which is not sustained) [8].
Figures 11 and 12 demonstrate that the process is asymmetrical, i.e. the ignition in the upper radial
channel is weaker than in the lower channel. At the pressure of 2.9 MPa the ignition survives the
expansion from only the lower radial channel, while the upper part is extinguished. This is sought due
to the asymmetrical opening of the rupture disk in the simulations. The results support the previous
25
conclusion about the sensitivity of the spontaneous ignition to the burst disk rupture process that
should be investigated further along with the effects of other factors such as the air humidity, etc. [8].
More detailed information on the spontaneous ignition in a T-shaped PRD can be found in [2].
Prevention of hydrogen ignition The ignition sources must be eliminated or isolated in appropriate way and the operations on FCH
facilities should be conducted as if unforeseen ignition sources could occur. Grounding (earthing)
methods should be in place to minimize the risk of static discharge and the potential for lightning
strikes in outdoor environments. Materials selected for the use in hydrogen environments should be
evaluated for their ability to discharge static electricity. Insulation materials such as wood, paper, and
some fabrics will typically form a conductive layer that can prevent static build-up by absorbing water
from the air in environments where the relative humidity is greater than 50%. Recommended
practices for grounding methods to prevent static discharges can be found in various national and
international standards that cover the installation of electrical equipment in hazardous environments.
Electrical equipment selected for use in hydrogen environments can also be a source of sparks or heat
generation, and care should be taken to follow the appropriate national and International Electrical
Standards for installation.
There are several ways to eliminate or at least to reduce the risk of ignition. Health and Safety
Executive (UK) compiled the list of the following preventive measures [38]:
Use of adequate electrical equipment (i.e. the equipment classified for the zone in which it is
located). Mechanical equipment should be selected in a similar manner.
Earthing all the equipment with a facility.
Elimination of the surfaces with temperature above the auto-ignition temperature of
flammable materials being stored/used.
Provision of lightning protection.
Correct selection of vehicles/internal combustion engines that can work in zoned areas.
Correct selection of equipment to avoid high intensity electromagnetic radiation sources,
e.g. limitations of the power input to fibre-optic systems, avoidance of high intensity lasers
or sources of infrared radiation.
Prohibition of smoking/use of matches or lighters.
Control over the use of regular vehicles.
Control over the activities that create the intermittent hazardous areas, e.g. tanker loading/
unloading.
Control of maintenance activities that may cause sparks/hot surfaces/naked flames through
a permit to work scheme.
Precautions to control the risk from pyrophoric scale, usually associated with the formation
of iron sulphide inside the process equipment.
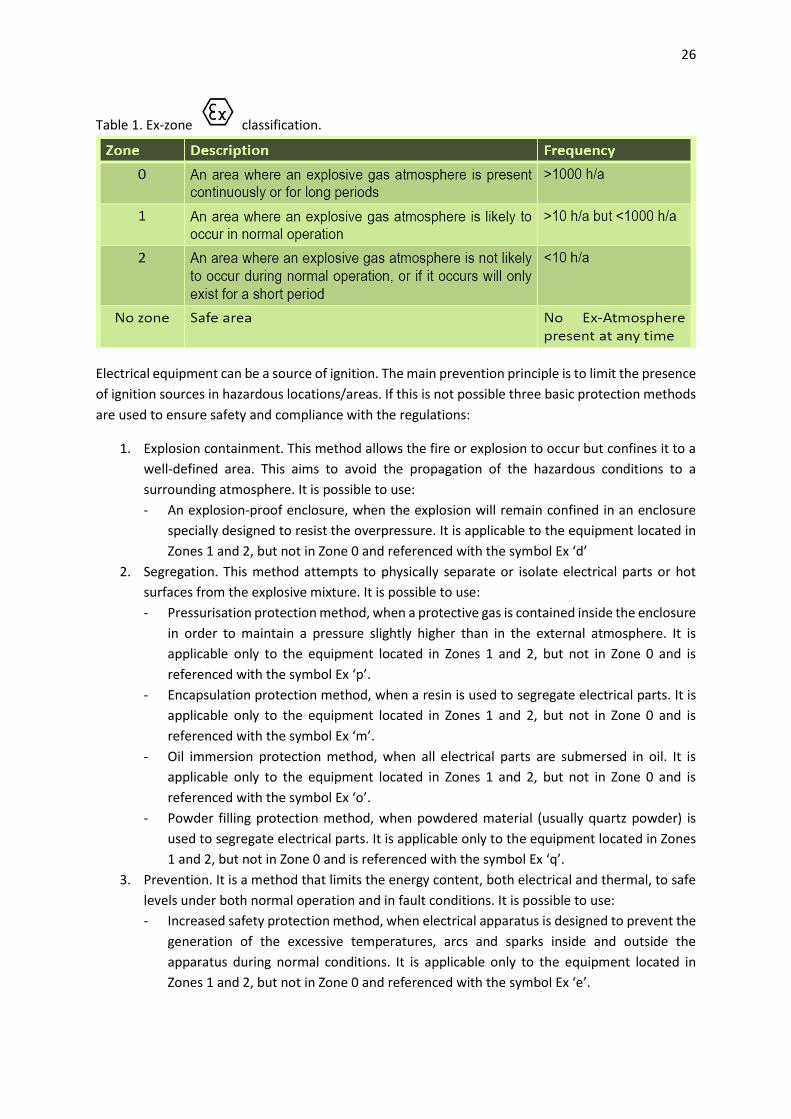
Ex-zone classification The description of equipment ex-zone classification and the frequency of leaks (in hrs per annum) are
indicated in Table 1.The equipment used in Zone 0 has to be intrinsically safe. The equipment has to
be certified by a notified body in order to get the marking. Regular maintenance is required to ensure
the equipment remains intrinsically safe.
26
Table 1. Ex-zone classification.
Electrical equipment can be a source of ignition. The main prevention principle is to limit the presence
of ignition sources in hazardous locations/areas. If this is not possible three basic protection methods
are used to ensure safety and compliance with the regulations:
1. Explosion containment. This method allows the fire or explosion to occur but confines it to a
well-defined area. This aims to avoid the propagation of the hazardous conditions to a
surrounding atmosphere. It is possible to use:
- An explosion-proof enclosure, when the explosion will remain confined in an enclosure
specially designed to resist the overpressure. It is applicable to the equipment located in
Zones 1 and 2, but not in Zone 0 and referenced with the symbol Ex ‘d’
2. Segregation. This method attempts to physically separate or isolate electrical parts or hot
surfaces from the explosive mixture. It is possible to use:
- Pressurisation protection method, when a protective gas is contained inside the enclosure
in order to maintain a pressure slightly higher than in the external atmosphere. It is
applicable only to the equipment located in Zones 1 and 2, but not in Zone 0 and is
referenced with the symbol Ex ‘p’.
- Encapsulation protection method, when a resin is used to segregate electrical parts. It is
applicable only to the equipment located in Zones 1 and 2, but not in Zone 0 and is
referenced with the symbol Ex ‘m’.
- Oil immersion protection method, when all electrical parts are submersed in oil. It is
applicable only to the equipment located in Zones 1 and 2, but not in Zone 0 and is
referenced with the symbol Ex ‘o’.
- Powder filling protection method, when powdered material (usually quartz powder) is
used to segregate electrical parts. It is applicable only to the equipment located in Zones
1 and 2, but not in Zone 0 and is referenced with the symbol Ex ‘q’.
3. Prevention. It is a method that limits the energy content, both electrical and thermal, to safe
levels under both normal operation and in fault conditions. It is possible to use:
- Increased safety protection method, when electrical apparatus is designed to prevent the
generation of the excessive temperatures, arcs and sparks inside and outside the
apparatus during normal conditions. It is applicable only to the equipment located in
Zones 1 and 2, but not in Zone 0 and referenced with the symbol Ex ‘e’.
27
- Intrinsic safety protection method. There is a limitation in the energy stored in an
electrical circuit making it incapable of generating arcs, sparks or thermal effects that are
able to ignite an explosion of hydrogen-air mixture, both during normal operation and in
specific fault conditions. The kind of protection labelled as Ex ‘ia’ is applicable to the
equipment located in Zones 0, 1 and 2, while the one labelled as Ex ‘ib’ – only to the
equipment in Zones 1 and 2, but not in Zone 0 [39].
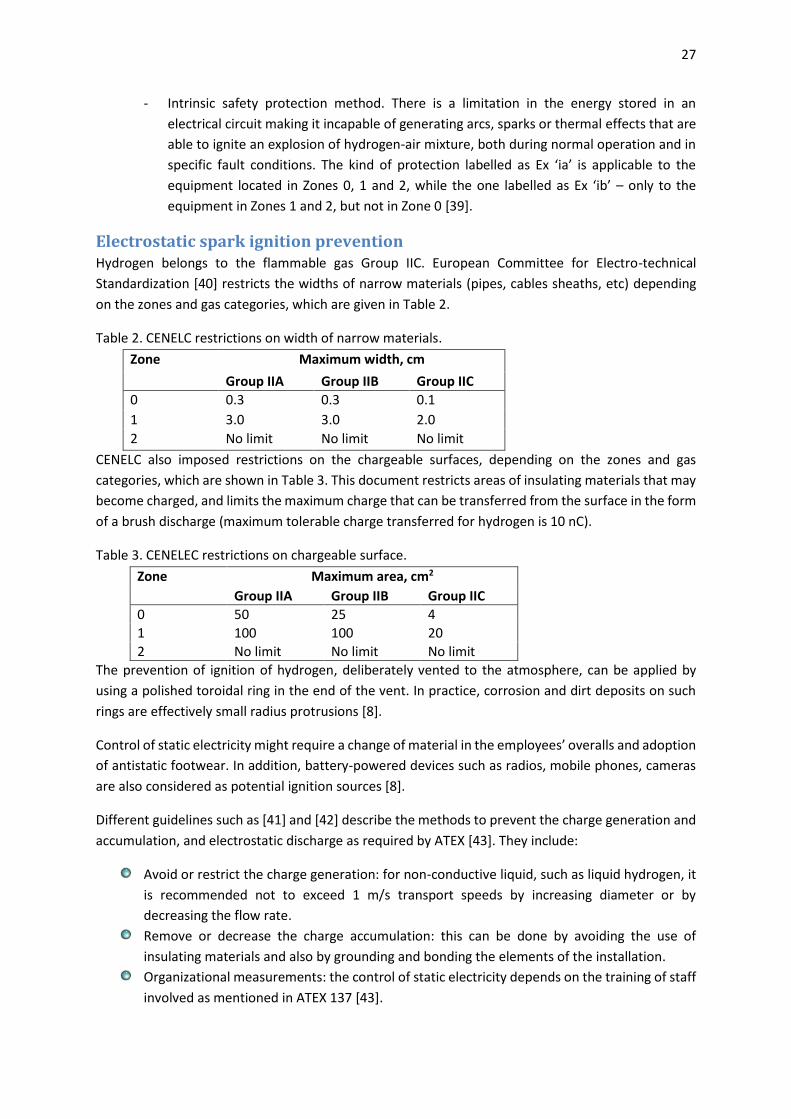
Electrostatic spark ignition prevention Hydrogen belongs to the flammable gas Group IIC. European Committee for Electro-technical
Standardization [40] restricts the widths of narrow materials (pipes, cables sheaths, etc) depending
on the zones and gas categories, which are given in Table 2.
Table 2. CENELC restrictions on width of narrow materials.
Zone Maximum width, cm
Group IIA Group IIB Group IIC
0 0.3 0.3 0.1
1 3.0 3.0 2.0
2 No limit No limit No limit
CENELC also imposed restrictions on the chargeable surfaces, depending on the zones and gas
categories, which are shown in Table 3. This document restricts areas of insulating materials that may
become charged, and limits the maximum charge that can be transferred from the surface in the form
of a brush discharge (maximum tolerable charge transferred for hydrogen is 10 nC).
Table 3. CENELEC restrictions on chargeable surface.
Zone Maximum area, cm2
Group IIA Group IIB Group IIC
0 50 25 4
1 100 100 20
2 No limit No limit No limit
The prevention of ignition of hydrogen, deliberately vented to the atmosphere, can be applied by
using a polished toroidal ring in the end of the vent. In practice, corrosion and dirt deposits on such
rings are effectively small radius protrusions [8].
Control of static electricity might require a change of material in the employees’ overalls and adoption
of antistatic footwear. In addition, battery-powered devices such as radios, mobile phones, cameras
are also considered as potential ignition sources [8].
Different guidelines such as [41] and [42] describe the methods to prevent the charge generation and
accumulation, and electrostatic discharge as required by ATEX [43]. They include:
Avoid or restrict the charge generation: for non-conductive liquid, such as liquid hydrogen, it
is recommended not to exceed 1 m/s transport speeds by increasing diameter or by
decreasing the flow rate.
Remove or decrease the charge accumulation: this can be done by avoiding the use of
insulating materials and also by grounding and bonding the elements of the installation.
Organizational measurements: the control of static electricity depends on the training of staff
involved as mentioned in ATEX 137 [43].
28
Control of thermal and mechanical sources of ignition Ignition of hydrogen-air mixture can be caused by a hot surface. For hydrogen, the temperature of hot
surfaces or hot spots shall not exceed 585 oC even for a few mm2 according to the experiments
conducted within the European project MECHEX (please note that hydrogen auto-ignition
temperature, 510 oC, is still lower than specified above).
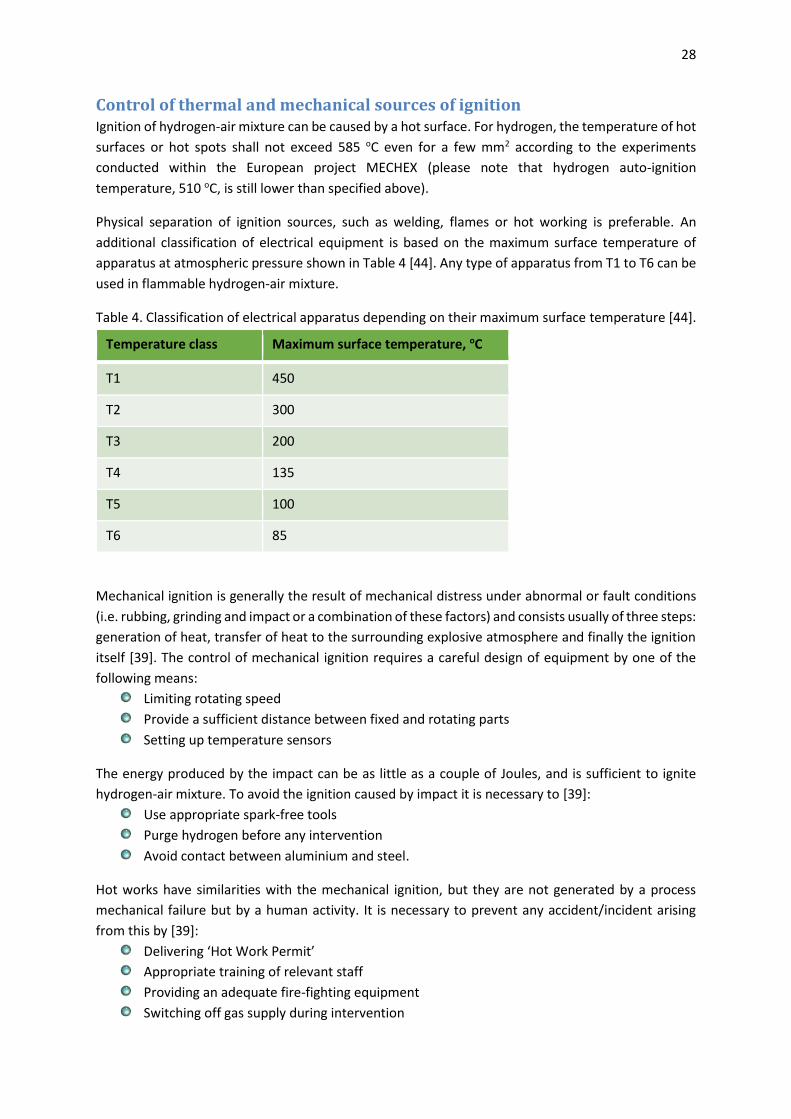
Physical separation of ignition sources, such as welding, flames or hot working is preferable. An
additional classification of electrical equipment is based on the maximum surface temperature of
apparatus at atmospheric pressure shown in Table 4 [44]. Any type of apparatus from T1 to T6 can be
used in flammable hydrogen-air mixture.
Table 4. Classification of electrical apparatus depending on their maximum surface temperature [44].
Temperature class Maximum surface temperature, oC
T1 450
T2 300
T3 200
T4 135
T5 100
T6 85
Mechanical ignition is generally the result of mechanical distress under abnormal or fault conditions
(i.e. rubbing, grinding and impact or a combination of these factors) and consists usually of three steps:
generation of heat, transfer of heat to the surrounding explosive atmosphere and finally the ignition
itself [39]. The control of mechanical ignition requires a careful design of equipment by one of the
following means:
Limiting rotating speed
Provide a sufficient distance between fixed and rotating parts
Setting up temperature sensors
The energy produced by the impact can be as little as a couple of Joules, and is sufficient to ignite
hydrogen-air mixture. To avoid the ignition caused by impact it is necessary to [39]:
Use appropriate spark-free tools
Purge hydrogen before any intervention
Avoid contact between aluminium and steel.
Hot works have similarities with the mechanical ignition, but they are not generated by a process
mechanical failure but by a human activity. It is necessary to prevent any accident/incident arising
from this by [39]:
Delivering ‘Hot Work Permit’
Appropriate training of relevant staff
Providing an adequate fire-fighting equipment
Switching off gas supply during intervention
29
Purging equipment prior to intervention.
Summary Hydrogen ignites easily due to the lowest value of the MIE amongst the known fuels. It is often difficult
to establish the exact source of hydrogen ignition and to determine its specific mechanism. Current
lecture gave an overview of hydrogen ignition incidents and mechanisms. The main ignition
parameters such as MIE and auto-ignition temperature were revisited here. The lecture detailed the
main types of ignition sources and explained the most common hydrogen ignition mechanisms. A
particular attention was paid to the phenomenon of spontaneous ignition during a sudden hydrogen
release and factors affecting it. The measures to prevent the potential hydrogen ignition and control
the ignition sources are also discussed in detail in this lecture.
References 1. Astbury, GR and Hawksworth, SJ (2007). Spontaneous ignition of hydrogen leaks: a review of
postulated mechanisms. International Journal of Hydrogen Energy. Vol. 32, pp. 2178-2185.
2. Molkov, V (2012). Fundamentals of hydrogen safety engineering, Part I and Part II. Available
from: www.bookboon.com, free download e-book.
3. Bond, J (1991). Sources of ignition: flammability characteristics of chemicals and products.
Oxford: Butterworth Heinemann.
4. Reider, R, Otway, HJ and Knight HT (1965). An unconfined large volume hydrogen/air
explosion. Pyrodynamics. Vol. 2, pp. 249-261.
5. Chaineaux, J, Mavrothalassitis, G and Pineau, J (1991). Modelization and validation of the
discharge in air of a vessel pressurized by flammable gas. Progress in Astronautics and
Aeronautics. Vol. 134, pp. 104-137.
6. Groethe, M, Merilo, E, Colton, J, Chiba, S, Sato, Y and Iwabuchi, H (2005). Large-scale
hydrogen deflagrations and detonations, Proceedings of the1st International Conference on
Hydrogen Safety, 8-10 September 2005, Pisa, Paper 120105.
7. Michels, A, de Graaf, W and Wolkers GJ (1963). Thermodynamic properties of hydrogen and
deuterium between 175◦C and 150◦C and at pressures up to 2500 atmospheres (Part A).
Applied Science Research. Vol. 12, pp. 9–32.
8. HyFacts Project. Chapter IM. Hydrogen ignition mechanisms. Prevention and mitigation of
ignition. Available from: http://hyfacts.eu/category/education-training/ [accessed on
04.01.16].
9. Schmidchen, U (2009). Hydrogen safety facts and myths. 3rd International Short Course and
Advanced Research Workshop “Progress in Hydrogen Safety”, Belfast, 27th April-1st May 2009,
Northern Ireland, UK.
10. ISO/TR 15916 (2004). Basic considerations for the safety of hydrogen systems. International
Organization for Standardization. ISO Technical Committee 197 Hydrogen Technologies.
International Organization for Standardization, Geneva.
11. BRHS, Biennial Report on Hydrogen Safety (2009). The European network of excellence
“Safety of hydrogen as an energy carrier” (NoE HySafe). Available from: www.hysafe.org
[accessed on 13.05.14].
30
12. Baratov, AN, Korolchenko, AY and Kravchuk, GN (Eds.) (1990). Fire and explosion hazards of
substances and materials. Moscow: Khimia. 496 p., ISBN 5-7245-0603-3 part 1, ISBN 5-7245-
0408-1 part 2 (in Russian).
13. NASA (1997). Safety standard for hydrogen and hydrogen systems. Guidelines for hydrogen
system design, materials selection, operations, storage, and transportation. Technical report
NSS 1740.16, Office of safety and mission assurance, Washington. Available from:
http://www.hq.nasa.gov/office/codeq/doctree/canceled/871916.pdf was cancelled on July
25 2005 [accessed 13.05.14].
14. Moorehouse, J, Williams, A and Maddison TE (1974). An investigation of the minimum ignition
energies of some C1 to C7 hydrocarbons. Combustion and Flame. Vol. 23, pp. 203-213.
15. Blanchard, DC (1963). Electrification of the atmosphere by particles from bubbles in the sea.
Progress in Oceanography. Vol. 1, pp. 71–202.
16. Pratt, TH (1993). Electrostatic ignitions in enriched oxygen atmospheres: a case history.
Process Safety Progress. Vol. 12, pp. 203-205.
17. Metzler, AJ (1952). Minimum ignition energies of six pure hydrocarbon fuels. NACA Report RM
E52 F27.
18. Potter, AE (1960). Flame quenching. Progress in Combustion Science and Technology. Vol. 1,
pp. 145–181.
19. Cassutt, L, Biron, D and Vonnegut B (1962). Electrostatic hazards associated with the transfer
and storage of liquid hydrogen. Advances in Cryogenic Engineering. Vol. 7, pp. 327–35.
20. Gibson, N and Harper, DJ (1988). Parameters for assessing electrostatic risk from non-
conductors - a discussion. Journal of Electrostatics. Vol. 21, pp. 27–36.
21. Ackroyd, GP and Newton, SG (2003). An investigation of the electrostatic ignition risks
associated with a plastic coated metal. Journal of Electrostatics. Vol. 59, pp. 143–51.
22. Cross, S and Jean, A (1987). Electrostatics principles, problems and applications. Bristol: Adam
Hilger.
23. Bulewicz, EM, et al. (1977). Zaplon mieszaniny wodorowo-tlenowej od gor¸acej powierzchni
[The ignition of hydrogen–oxygen mixtures from a hot surface]. Archiwum Termodynamiki i
Spalania. Vol. 8(1), pp. 85–93.
24. Ungut, A and James, H (2001). Autoignition of gaseous fuel-air mixtures near a hot surface.
Institution of Chemical Engineers Symposium Series. Vol. 148, pp. 487–502.
25. Pan, L, Fisher, SA, Jayanti, S and Hewitt, GF (1995). Measurement and prediction of
temperature rise following sudden compression in a high-pressure pipeline. Transactions of
the Institution of Chemical Engineers. Vol. 73 (Part B), pp. 18–20.
26. Cain, TM (1997). Autoignition of hydrogen at high pressure. Combustion and Flame. Vol.
111, pp. 124–32.
27. Wolanski, P and Wojcicki, S (1972). Investigation into the mechanism of the diffusion ignition
of a combustible gas flowing into an oxidizing atmosphere. Proceedings of the Combustion
Institute. Vol. 14, pp. 1217-1223.
28. Dryer, FL, Chaos, M, Zhao, Z, Stein, JN, Alpert JY and Homer, CJ (2007). Spontaneous ignition
of pressurized releases of hydrogen and natural gas into air. Combustion Science and
Technology. Vol. 179, pp. 663-694.
29. Golub, VV, Baklanov, DI, Bazhenova, TV, Bragin, MV, Golovastov, SV, Ivanov, MF and Volodin,
VV (2007). Hydrogen auto-ignition during accidental or technical opening of high pressure
tank. Journal of Loss Prevention in the Process Industries. Vol. 20(4-6), pp. 439-446.
31
30. Golub, VV, Baklanov, DI, Golovastov, SV, Ivanov, MF, Laskin, IN, Saveliev, AS, Semin, NV and
Volodin, VV (2008). Mechanisms of high-pressure hydrogen gas self-ignition in tubes. Journal
of Loss Prevention in the Process Industries. Vol. 21(2), pp. 185-198.
31. Pinto, D, Aizawa, K, Liu, YF, Sato, H, Hayashi, AK and Tsuboi, N (2007). Auto-ignition of high
pressure hydrogen release. Proceedings of the 21st International Colloquium on the Dynamics
of Explosions and Reactive Systems, 23-27 July 2007, Poitiers, France.
32. Mogi, T, Kim, D, Shiina, H and Horiguchi, S (2008). Self-ignition and explosion during discharge
of high-pressure hydrogen. Journal of Loss Prevention in the Process Industries. Vol. 21(2), pp.
199-204.
33. Bazhenova, TV, Bragin, MV, Golub, VV and Ivanov, MF (2006). Self-ignition of a fuel gas upon
pulsed efflux into an oxidative medium. Technical Physics Letters. Vol. 32(3), pp. 269-271.
34. Golub, VV, Volodin, VV, Baklanov, DI, Golovastov, SV and Lenkevich, DA (2010). In: Physics of
Extreme States of Matter, ISBN 978-5-901675-96-0, Chernogolovka, 2010, pp.110-113.
35. Bragin, MV and Molkov, VV (2011). Physics of spontaneous ignition of high-pressure
hydrogen release and transition to jet fire. International Journal of Hydrogen Energy. Vol.
36(3), pp. 2589-2596.
36. Bragin, MV, Makarov, DV and Molkov, VV (2011). Proceedings of the 4th International
Conference on Hydrogen Safety, 12-14 September 2011, San Francisco, USA.
37. Bragin, M and Molkov, V (2009). Physics of spontaneous ignition of high-pressure hydrogen
release and transition to jet fire, Proceedings of the 3rd International Conference on Hydrogen
Safety, 16-18 September 2009, Ajaccio, France.
38. Health and Safety Executive (2012). Hazardous Area Classification and Control of Ignition
Sources. Available from: http://www.hse.gov.uk/comah/sragtech/techmeasareaclas.htm
[accessed 04.01.16].
39. Saffers, JB (2010). Principles of hydrogen safety engineering. PhD thesis. University of Ulster.
40. CENELEC (2003). Electrostatics – Code of practice for the avoidance of hazards due to static
electricity, PD CLC/TR 50404:2003.
41. NFPA (2000). Recommended Practice on Static Electricity. 77.
42. British Standards Institution. Electrostatics (2003). Code of practice for the avoidance of
hazards due to static electricity. PD CLC/TR 50404: 2003.
43. European Parliament and European Council, Directive 1999/92/EC of the European Parliament
and Council of 16 December 1999 on the minimum requirements for improving safety and
health protection of workers potentially at risk from explosive atmospheres (15th individual
Directive within the meaning of Article 16(1) of Directive 89/391/EEC). 1999/92/EC (2000).
44. IEC, Electrical apparatus for explosive gas atmospheres – Part 0: General requirements.
EN60079-0 (2006).