Embed Size (px)
Citation preview
Acta Theriologica 35 (3-4): 357-363, 1990.
PL ISSN OOOI _705I
FRAGM ENTA THERIOLOGICA
Live-trapping vs. snap-trapping of deer mice:
a comparison of methods
Carlos GALINDO-LEAL
Galindo-Leal c. 199o.^Livetrapping vs. snap-trapping of deer nrice: a comparison ofmethods. Acta theriol^ 35: 35'7 363.
. In this study I compared live-trapping and snap-trapping as means to assess abundance31d population trends ol dee¡ mice Piioml scus manicutáius (-Wagner, 1845) in the southe¡nYukon. I also investigated the presence of "trap-shy" indiviiualíwhich máy i"riti¿rt" ifr"central assumption oÍ mark-recapture and enümerátion methods. iive-trappine was vervefficient. for this population ol dter mice. Snap-trapping the two previouily li-ve-trappeápopulations showed that ll oh and, 12aA of the iirdiviáiall were not tagged. These untaggedindividuals could be either "trap-shy" or new recruits. Both snap-trapp"iig and live-traplTngprovided_simiiar estimates ol population size and trend. Howevir, the sei and age stliiturErevealed by each method were very different. An important incidental result wa"s that bothminimum number alive and Jolly-Seber estimates wére ve.y similar.
Pgqa_r_t1r_en! of Toology, University ol British Columbia, 2204 Main Mall, Vancouver,V6T-IW5, Canada; and Instituto de Ecologia A. C., A. p. 18-845, 01300 D.F.. Mexico
Key v'ords: live-trapping, snap-trapping, peromyscus maniculatus
Introduction
Many studies on populations of small mammals have used either live-trapping orsnap-trapping to estimate population density. In general, live-trapping has been usedto gather detailed demographic information and population trends. In contrast,snap-trapping has been used to carry out broad surveys of distribution and abundanceof small mammals. Snap-trapping has also been used to gather information onlong-term trends in population abundance (Montgomery l987). Few studies however,have compared both methods in the same location and time.
ln live-trapping studies the enumeration method has been preferred because manyof the assumptions of mark and recapture methods are not fulfilled in naturalpopulations (Hilborn et al. 1976). From a number of papers that examin ed Peromyscuspopulations, Montgomery ( 1 9 B 7) found that only B oA uttlizedcapture-mark-recapturemethods whereas 6l %o used minimum number alive to estimate abundance. Recently,probabilistic models of population estimation, such as Jolly-Seber, have been stronglyrecommended for small mammal studies since they are iess biased than enumerationtechniques (Nichols and Pollock 1983. Montgomery 1987). Enumeration estimates, inturn, are inappropriate fbr interspecific comparisons because diflerent species havediflerent capture probabilities (Nichois 1986). However, Boonstra (1985) foun<l thatboth Jolly-Seber and the total enumeration techniques provided similar values forpopulation size of Microtus pennsylvanicus. Krebs et at. (1986) concluded that
Irsu]
358 C. Galindo-Leal
enumeration methods may remain useful when populations are low and recaptures
infrequent.The central assumption of the enumeration method is that all resident individuals
are trapped. In turn, mark-recapture methods assume equal catchabiiity among
individuals. Two kinds of animals may render these assumptions untenable:
individuals that never enter traps and individuals that become "trap-shy" after being
caught. To fulfil1 these assumptions, many researchers using enumeration rely on
intensive prebaiting and trapping. In mark-recapture studies there are several methods
to assess heterogeniity in capture probability (Montgomery l987). However, these are
only concerned with the second kind of individuals, those that become trap-shy after
being trapped.The purpose of this study was twofold: First, to investigate the presence of
trap-shy individuals which may invalidate a central assumption of mark-recapture and
enumeration methods. Second, to compare live-trapping and snap-trapping to assess
population density and trends.
Study area and methods
The study was carried out in boreal forest at the south corner of Kluane Lake, Yukon Territory,
Canada (61'N, 138'W), from May to September 1983. The forest was dominated by white sptuce Picea
glauca.Balsampoplar Populus balsamifera and trembling aspen (P. tremuloides) occurred in small patches.
The common species in the understory were soapberry (Sheperdia canadensís), willow (Salrx glauca),licorice
root (Hedysarum borealis) and bearberry (Arctostaphylos rubra, A. uva-ursi).
To investigate the presence of trap-shy individuals, two live-trapping grids (A and B) were trapped
from May to September. Each grid contained 42 Longworth live-traps, spaced at I 0 m intervals tn a 6 x'7
pattern (0.42ha). Traps were prebaited with whole oats for 5 days and then set for two nights at least every
second week. All captured individuals of deer motse Peromyscus manicularzs (Wagner, 1845) were
ear-ragged with f,rngerling flsh tags. The live-trapping program ended on September I lth, 1983. Population
estimates were obtained by both enumeration (MNA) and Jolly-Seber (J-S) techniques to be compared with
numbers collected from snap-trapping. On September 13th, two days following completion of live-trapping
each live-trap was replaced by two Museum Special snap-traps. These 84 snap-traps were baited with peanut
butter and set also lor two consecutive nightsTo compare live-trapping and snap-trapping as indices of population size and trends, two
snap-trapping grids (X and Y) were also sampled from May to September. Each grid had 49 stations with two
Museum Special snap-traps per station. The stations were spaced at 10 m intervals. The size of each grid was
0.49 ha. Grids were located between 500 and 1000 m apart from live-trapping grids. No tagged individuals
were caught in snap-trapping grids. Traps were baited with peanut butter and set for three nights every 10
days. Grids X and Y were compared with two live trapping grids (B and G). Grid A was not used here
because it was an experimental grid (Galindo and Krebs 1987).
Results
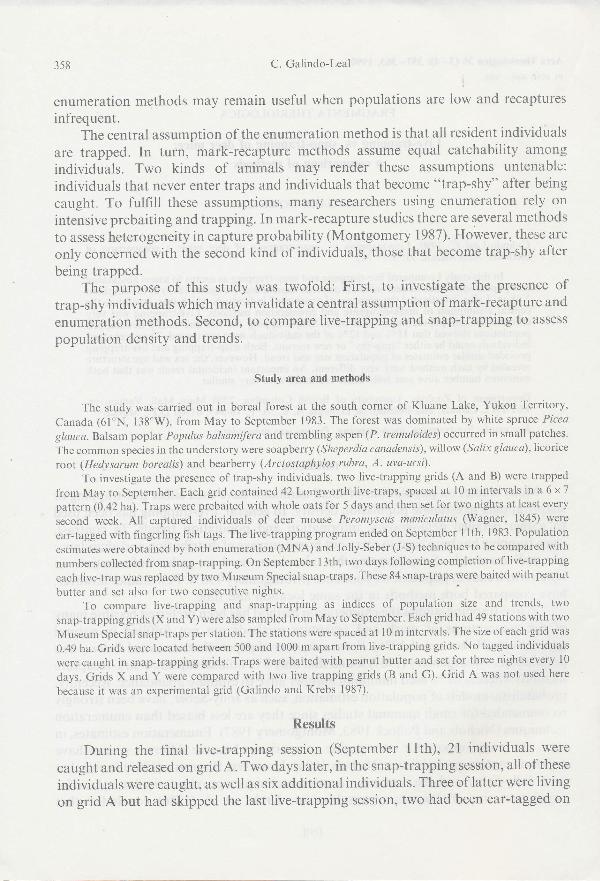
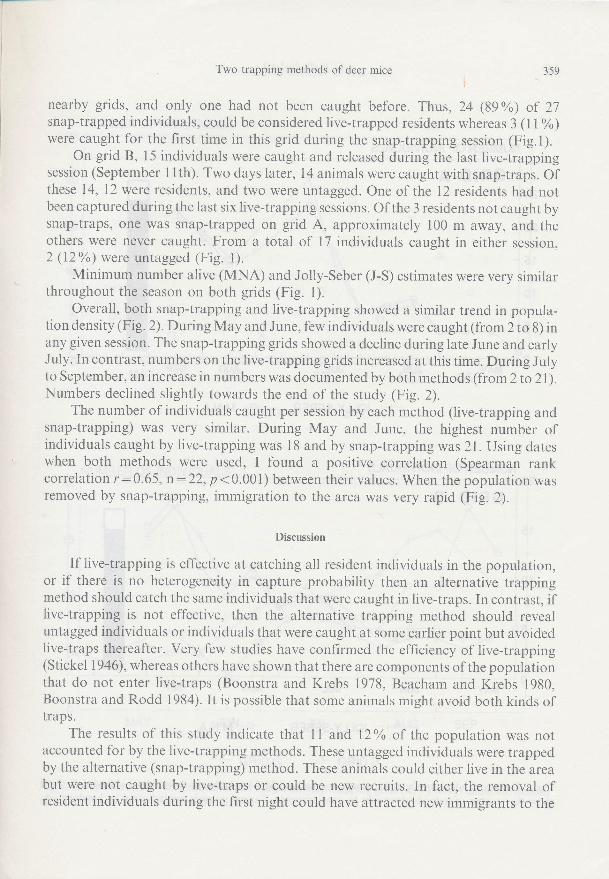
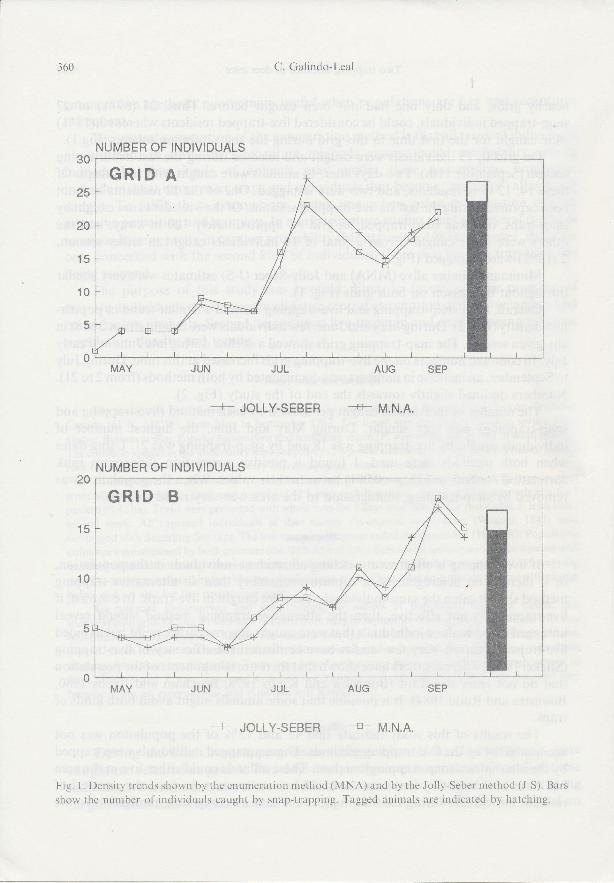
During the final live-trapping session (September llth), 21 individuals were
caught and released on grid A. Two days later, in the snap-trapping session, all of these
individuals were caught, as well as six additional individuals. Three of latter were living
on grid A but had skipped the last live-trapping session, two had been ear-tagged on
Two trapping methods of deer mice
nearby grids, and only one had not been caught before. Thus, 24 (89%) of 21snap-trapped individuals, could be considered live-trapped residents whereas 3 (11%)were caught for the first time in this grid during the snap-trapping session (Fig.1).
On grid B, l5 individuals were caught and released during the last live-trappingsession (September l lth). Two days later, 14 animals were caught with snap-traps. Ofthese 14, 12 were residents, and two were untagged. One of the 12 residents had notbeen captured during the last six live-trapping sessions. Of the 3 residents not caught bysnap-traps, one was snap-trapped on grid A, approximately 100 m away, and theothers were never caught. From a total of 17 individuals caught in either session,2 (12%) were untagged (Fig. l).
Minimum number alive (MNA) and Jolly-Seber (J-S) estimates were very similarthroughout the season on both grids (Fig. l).
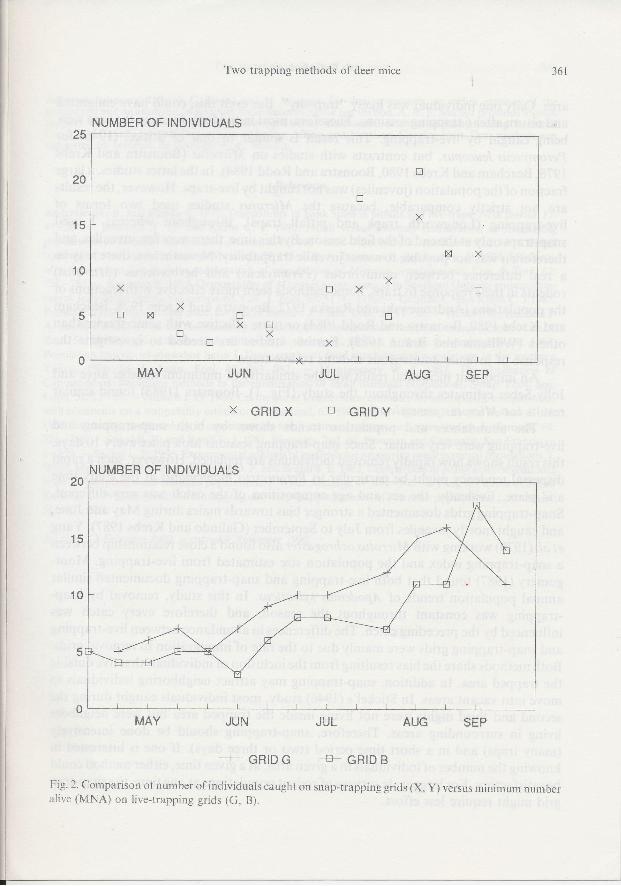
Overall, both snap-trapping and live-trapping showed a similar trend in popula-tion density (Fig.2). During May and June, few individuals were caught (from2to 8) inany given session. The snap-trapping grids showed a decline during late June and earlyJuly. In contrast, numbers on the live-trapping grids increased at this time. During Julyto September, an increase in numbers was documented by both methods (from 2to2l).Numbers declined slightly towards the end of the study (Fig. 2).
The number of individuals caught per session by each method (live-trapping andsnap-trapping) was very similar. During May and June, the highest number ofindividuals caught by live-trapping was l8 and by snap-trapping was 21. Using dateswhen both methods were used, I found a positive correlation (Spearman rankcorrelation r:0.65, n:22,p < 0.001) between their values. when the population wasremoved by snap-trapping, immigration to the area was very rapid (Fig. 2).
Discussion
If live-trapping is elfective at catching all resident individuals in the population,or if there is no heterogeneity in capture probability then an alternative trappingmethod should catch the same individuals that were caught in live-traps. In contrast, iflive-trapping is not effective, then the alternative trapping method should revealuntagged individuals or individuals that were caught at some earlier point but avoidedlive-traps thereafter. Very lew studies have confirmed the efficiency of live-trapping(Stickel 1946), whereas others have shown that there are components of the populationthat do not enter live-traps (Boonstra and Krebs 1978, Beacham and Krebs 1980.Boonstra and Rodd 1984). It is possible that some animals might avoid both kinds oftraps.
The results of this study indicate that 11 and 1206 of the population was notaccounted for by the live-trapping methods. These untagged individuals were trappedby the alternative (snap-trapping) method. These animals could either live in the areabut were not caught by live-traps or could be new recruits. In fact, the removal ofresident individuals during the first night could have attracted new immigrants to the
359
NUMBER OF INDIVIDUALS
GRID A
360 C. Galindo-Leal
JUL
__]- JOLLY-SEBER
JUN JUL
]' JOLLY-SEBER
30
25
20
15
10
5
0AUG
--€- M.N.A.
AUG
---B- M.N.A.
SEP
Fig. l. Density trends shown by the enun.reration method (MNA) and by the Jolly-Seber method (J-S). Bars
show the number ol individuals caught by snap-trapping. Tagged animals are indicated by hatching.
NUMBER OF INDIVIDUALS
GRID B
Two trapping methods of deer mice
25
20
15
10
5
oMAY JUN SEP
X GRID X GRID Y
MAY SEP
-.-J- GRID G __€- GRID B
Fig. 2. Comparison of number of individuals caught on snap-trapping grids (X, Y) versus minimum numberalive (MNA) on live-trapping grids (G, B).
361
JUL
tr
NUMBER OF INDIVIDUALS
X
X!EnXtr!X
X
AX
Xtrx!tr
X
NUMBER OF INDIVIDUALS

362 C. Galindo-Leal
area. Only one individual was likely "trap-shy". But even this, could have emigrated
and return after |trapping sessions. Therefore, most individuals living in the area were
being caught by live-trapping. This result is similar to that of Stickel (1946) forperimyscis leucopus, but contrasts with studies on Microtus (Boonstra and Krebs
1978, Beacham and Krebs 1980, Boonstra and Rodd 1984). In the latter studies, a large
fraction of the population fiuveniles) was not caught by live-traps. However, the results
are not strictiy comparable, because the Microtus studies used two forms oflive-trapping (Longworth traps and pitfall traps), throughout whereas I used
snap-tráps only at the end of the field season. By this time, there were few juveniles, and
theiefore it was not possible to assess juvenile trappability. Nevertheless, there may be
a real difference between omnivorous (Peromyscus) and herbivorous (Microtus)
rodents in their response to traps. Some methods seem more effective with fractions ofthe populations (Andrzejewski and Rajska 1972,Boonstra and Krebs 1978, Beacham
anlKiebs 1980, Boonstra and Rodd 1984) or more effective with some species than
others (Williams and Braun 1983). Further studies are needed to investigate the
response of juvenile omnivorous rodents to live-traps.
An important incidental result was the similarity of minimum number alive and
Jolly-Seber estimates throughout the study (Fig. 1). Boonstra (1985) found similar
results for Microtus pennsylvanicus.
The abundances and population trends shown by both snap-trapping and
live-trapping were very similar. Since snap-trapping sessions took place every 10 days,
this result shows how rapidly removed individuals are replaced. However, such a rapid
dispersal tendency might be particular to Peromyscus maniculatus at the study time
aná place. Evidently, the sex and age composition of the catch was very different.
Snap-ltupping grids documented a stronger bias towards males during May and June,
and caught mostly juveniles from July to September (Galindo and Krebs 1987). Yang
et at. (1970)working witt_ Microtus ochrogaster also found a close relationship between
a snap-trapping index and the population size estimated from live-trapping. Mont-go-.iy (1987) found that both live-trapping and snap-trapping dopumented similar
ánnual population trends of Apodemus sylvaticus. In this study, removal by snap-
-trapping was constant throughout the season, and therefore every catch was
influénced by the preceding catch. The differences in abundance between live*trapping
and snap-trapping grids were mainly due to the rate of immigration to removal grids.
Both méthods share the bias resulting from the inclusion of individuals that live outside
the trapped area. In addition, snap-trapping may attract neighboring individuals to
move into vacant areas. In Stickel's (1946) study, most individuals caught during the
second and third ilights were not living inside the trapped area but were neighbors
living in surrounding areas. Therefore, snap-trapping should be done intensively
(many traps) and in a short time period (two or three days). If one is interested in
knowing tñe number of individuals in a given area, a|a given time, either method could
be satisfactory. For large scale surveys of rodent populations at one time, the snap-trap
grid might require less effort.
Two trapping methods of deer mice
Acknowledgements: I thank C. Krebs and L. Jamieson for their comments on earlier versions of themanuscript and an ano.ny^mous reviewer for comments on the last version. A. n. E. sinclair proviáJfosisii"slPport. lhe tieldwork fbr this study was supported by the Natural Sciences and Eneineeri"e ñéi;;óhCouncil of Canada and the Departmént_of Indian Affairs and Northein ó;.1;p;."r:ó;;;';;.ly;;ñ;.supported by Instituto de Ecolbgia A. C. Mexico.
References
Andrzejewski R. and Rajska E. 1972. Trappability of bank voles in pitfails and live-traps. Acta theriol. 17:41 56. - Beacham T. D. and Krebs C. J. 1980. Pitfall versus live-trap .nrrrn..u1ion of fluctuatingpopulations of Microtus townsendií. J. Mammal. 61:486 499. Boonstra R. and Krebs C. J. 197g. pitfalltrappingof Microtus tob,nsendii. J.Mamma1. 59: 136- 148.
-Boonstra R. and Rodd F. H. 19g4. Efficiency
of pitlalls versus live traps in enumeration of populations of¡Microtus pennsylvanicus. Can. J. Zool. 6):758-765. - Boonstra R. 1985. Demography of Mícrotus pennsylvanícus insouthern Ontario: enumerationversus Jolly-Seber estimation compared. Can. J . Zool. 63: 117 4 - I 180. - Galindo C. and Krebs C. J.l9g7.Population regulation in deer mice: the role of females. J. Anim. Ecol. 56: 1l - 23. - Hilborn R., Redfield J.A' and Krebs C. J. 1976. On the reliability of enumeration for mark and recapture census of voles. Can. J.zool. 54: l0l9-1024. - Krebs c. J., Gilbert B. S., Boutin S., Sinclair A. R. E. and Smith J. N. M. 1986.Population biology of snowshoe hares I. Demography of food supplemented populations in the southernYukon, 1976-84. J. Anim. Ecol. 55: 963-982. - Montgomery w. I. 1987. The application ofCapture-Mark-Recapture methods to the enumeration of small mammal populations. Symp. Zool. Soc.Lond. 58: 25 - 57 . - Nichols J. D. 1986. On the use of enumeration estimates fár interspecific iomparisons,with comments on a trappability estimator. J. Mammal. 67:590-593.
- Nichols J. D. and pollock K. H.1983. Estimation methodology in contemporary small mammal capture-recapture studies. J. Mammal. 64:253-260.
- Sokal R. R. and Rohlf F. J. 1981. Biometry. 2nd. ed. Freeman and Company. San Francisco:1 - 859. - Stickel L- F- 1946. Experimental analysis of methods for measuring small mammal populations. J.Wildl. Mgmt. l0: 150- 159' - Williams D. F. and Braun S. E. 1983. Comparison of pitfall aná conventionaltraps for sampling small mammal populations. J. Wildl. Manage. 47:841-845.
-yang K., Krebs C. J. andKeller B. L. 1970. Sequential live-trapping and snap-trapping studies of Microtus populations. J. Mammal.51:517 526.
Received 12 February 1990, acceptedg November 1990.
363
Acta Theriologica 35 (3-4):364-368, 1990.
PL ISSN OOOI 7051
Changes in numbers of Myotis daubentoni (Kuhl, 1819)
in autumn shelters and the effect of disturbance
Crzegorz LESIÑSKI
Lesiúski G. 1990. Changes in numbers of M¡:otis tluubentoni (Kuhl,l819) in auturnn sheltersand the ellect ol disturbance. Acta theriol. 35: 364 368.
Undergrounds of 2 forts in Central Poland were inhabited by Myotís daubentoni at thebeginning oi August. From the hall ol September the majority ol individuals remained inlethargy.The maiimum numbers were reached in the end of October (in 1984 70 individuals,in 1985 52 individuals). Studied forts are only autumn shelters for the majority of individuals,not proper hibernacula. It was lound that the process of bat ringing resulted laster leavingundérgrounds. Disturbance with the lrequency once per two weeks changed natural dynamicsin lower degree thar-r more frequent controls.
Department ol Vertebrate Ecology, lnstitute ol Ecology, Polish Academy of Sciences,Dziekanów LeÉny n. Warsaw, 05-092 l-omianki, Poland
KeJ, v'ords'. autumn shelters, M1'of ís dauben¡o¡rl, disturbance, Poland
lntroduction
Myotis daubentoni (Kuhl, l8l9) hibernates in the highest numbers in underg-rounds of Central and Eastern Europe (Strelkov 1971, Haitlinger 1976, Bogdanowicz1983, Degn 1987). It prefers large undergrounds (Bagrowska-Urbaúczyk and Urbaú-czyk 1983) and only occasionally has been found in small cellars (Masing 1982). Thedata relating to the changes in numbers of M. daubentoniinundergrounds were shown
in many works but the term of inhabiting the shelters and its variability in localpopulations and different parts of a continent have been still not exactly determined. Itwas observed that in some winter shelters the maximum numbers of this species falledon autumn months (Strelkov 1971, Lesiúski 1986), and the number of individualsgradually decreased later, during winter being rather low.
The aim of this work is to determine the changes in numbers of M. daubentoni inlate summer and autumn in undergrounds of Central Poland and if it is modif,red bydisturbance.
Study area and methods
The study was carried out in 2 lorts (Janowo. Strubiny) belonging to the outer parf ol the Modlinlorrress (Central Poland), studied previously during hibernation period (Lesiriski 1986). Some resnlts were
published in preliminarl, paper (Lesiiski I 989). The forts are located in agricultural landscape on the border
of spall viliage. 0.5 I km appart lrom the small wood, 5 km2 in size. They dilfer mainly in size, shape and
distribution ol corridors. number of entrances err'. In majority of colridors, permanent air circulationprecludes statrle thern-ral conditions (many entrances).
f:o¿l