Embed Size (px)
Citation preview


MALAYSIAN CONSTRUCTION RESEARCH JOURNAL (MCRJ)
SPECIAL ISSUE Vol. 12 | No. 1 | 2021
RISM INTERNATIONAL RESEARCH CONFERENCE 2020
The Malaysian Construction Research Journal is indexed in
Scopus Elsevier
eISSN No.: 2590 – 4140
Construction Research Institute of Malaysia (CREAM) Level 29, Sunway Putra Tower,
No. 100, Jalan Putra, 50350 Kuala Lumpur
MALAYSIA

i MCRJ Special Issue Vol. 12 | No. 1 | 2021
Contents
Introduction iii
Editorial Advisory Board iv
Editorial v
DEVELOPMENT OF BIM CAPABILITIES MODEL FOR MALAYSIA AIRPORT
PROJECT MANAGEMENT Samsuri Abdul Hamid and Nurshuhada Zainon
1
BUILDING INFORMATION MODELING – UTILIZATION IN QS CONSULTANT
FIRMS AND COMPETENCY REQUIREMENTS OF QS GRADUATES Nurulhuda Hashim, Yap Foong Mei, Myzatul Aishah Kamarazaly, Shirley Chin Ai Ling,
Azrina Md Yaakop and Loo Seong King
23
STRATEGIC PROCESS PROTOCOL FOR BUILDING INFORMATION
MODELING (BIM) CONTRACT ADMINISTRATION IN MALAYSIA –
A CONCEPT PAPER Sharifah Nur Aina Syed Alwee, Hafez Salleh and Umi Kalsum Zulkifli
37
THE CONCEPT OF TELECOMMUTING LIFESTYLE IN THE CONSTRUCTION
INDUSTRY: QUANTITY SURVEYOR’ PERSPECTIVES
Azrina Md Yaakob, M.H. Nur Firzana, Myzatul Aishah Kamarazaly and Nurulhuda Hashim,
Loo Seong King and Shirley Chin Ai Ling
53
BIBLIOMETRIC ANALYSIS OF CONSTRUCTION DISPUTE Olaolu Titus Olalekan, Hamizah Liyana Binti Tajul Ariffin, Kherun Nita Ali, Faraziera Mohd
Raslim and Mardiana Binti Mohamad
64
BUILDING DEFECTS AND RESTORATION TECHNIQUES OF HERITAGE
BUILDINGS IN MALAYSIA Mohd Adib Ramli, Myzatul Aishah Kamarazaly, Lim Xiao Shi, Filzani Illia Ibrahim, Mohamed
Rizal Mohamed and Kam Kenn Jhun
76
LOCATION OF THE ELDERLY EVACUEES AND ITS EFFECT ON TIME AND
DISTANCE IN MULTI-STOREY HOUSING Nurul Liyana Hanapi, Sabarinah Sheikh Ahmad, Azli Abd Razak and Norhati Ibrahim
90
DOES FENG SHUI FACTORS INFLUENCED THE DECISION OF MALAYSIAN
IN HOUSING SELECTION? Myzatul Aishah Kamarazaly,Cheah Man Yee, Nurulhuda Hashim, Azrina Md Yaakob, Loo Seong King
and Noorul Iffa Mohd Nayan
101
GOVERNING HOUSING AFFORDABILITY PROBLEMS AMONG YOUNGER
WORKING HOUSEHOLDS Zafirah Al Sadat Zyed, Peter Aning Tedong, Wan Nor Azriyati Wan Abd Aziz and
Noor Rosly Hanif
118
ii MCRJ Special Issue Vol. 12 | No. 1 | 2021
STRESS LEVELS AND COPING STRATEGIES: CASE STUDY ON QUANTITY
SURVEYING STUDENTS IN PRIVATE UNIVERSITY
Myzatul Aishah Kamarazaly, Teow Kah Yan, Mohd Adib Ramli, Azrina Md Yaakob,
Soon Lam Tatt and Habizah Sheikh Ilmi
129
ENVIRONMENTALLY SUSTAINABLE CONCERN TOWARD AFFORDABLE
HOUSING Noraliza Basrah, Rohayu Ab Majid, Norbaya Ab Rahim and Noor Hazwani Alias
149
FACTORS AND IMPACTS ON THE ACCURACY OF COST PLANNING:
PRE-CONTRACT STAGE Shirley Chin Ai Ling, Loh Wen Jun, NurulHuda Hashim, Myzatul Aishah Hj Kamarazaly Azrina
Md Yaakob and Loo Seong King
159
PROPOSING BIM-RELATED CLAUSES IN STANDARD FORM OF
MALAYSIAN CONSTRUCTION CONTRACTS Nurshuhada Zainon and Leong Vicky
171
A STUDY OF GIRDER BRIDGE AESTHETICS Chu Sheng Ding, Hafez Salleh and Mei Ye Kho
188
ENVIRONMENTAL SUSTAINABILITY IN MALAYSIAN HERITAGE BUILDING
CONSERVATION: REVIEW OF HERITAGE LEGISLATION AND POLICY Noor Suzaini M. Zaid, Mohd Izzat Ghazali, Nur Farhana Azmi, Putri Nabila Kamarulzaman,
and Farid Wajdi Akashah
203
CONSTRUCTION QUANTIFICATION SKILLS: A PRELIMINARY
INVESTIGATION OF THE KEY FACTORS AND THEMES Norhafizah Yusop, Mohmad Mohd Derus and Ismail Samsuddin
219
DEVELOPING A FRAMEWORK FOR SUCCESSFUL HANDOVER OF PRIVATE
FINANCE INITIATIVE (PFI) PROJECTS IN MALAYSIA Erni Juwita Abd Manan and Umi Kalsum Zolkafli @Zulkifly
229
EXPLORING THE QUANTITY SURVEYING SERVICES FROM THE
EMPLOYERS’ AND GRADUATES’ PERSPECTIVE
Habizah Sheikh Ilmi, Soon Lam Tatt, Darren Tan Quan Wen, Myzatul Aishah Kamarazaly
and Shirley Chin Ai Ling
246
EXPLORING THE ADAPTIVE REUSE CONCEPT AND BENEFITS IN
MANAGING PUBLIC BUILDING QUARTERS IN MALAYSIA
Mohamad Izzat Bin Zulkanain, Mastura Jaafar and Nuzaihan Aras Agus Salim
258
E-TENTERING : IMPROVEMENT MODEL IN MALAYSIA CONSTRUCTION
INDUSTRY PUBLIC SECTOR
Umi Kalsum Zolkafli@Zulkifly, Lee Hong Ming and Siti Nor Azniza Ahmad Sekak
271

iii MCRJ Special Issue Vol. 12 | No. 1 | 2021
Introduction
Welcome to this special issue in Malaysian Construction Research Journal (MCRJ) for
the RISM International Research Conference 2020 (RISM-IRC2020). This conference has
been successfully jointly organised by the Royal Institution of Surveyors Malaysia (RISM)
and University of Malaya.
This special issue consists of 20 selected papers reviewed by conference scientific
committee and international expert reviewers. The conference main theme is “Exceed the
Exceeding” which comprises of the following sub-theme; Digital Construction, Quality
Safety and Productivity, Environmental Sustainability, Practice and Professionalism,
Engineering Technology, Construction Management, Facilities Management; and Teaching
and Learning in Built Environment.
This publication has contributed in the area Building Information Modeling (BIM) where it will
drive the adoption of Industry Revolution 4.0 within the construction industry. Focus is given
in the BIM protocal and contract related matters where it is hope that industy players will
aware about legality of the data in BIM and also the contractual process involved in adopting
BIM in a projects. Besides that, attention also being given to the affordable houses where
paper presented mainly highlighted about the problem, policy and issues rise by the young
buyers. It is also hope that this will enhance greater knowledge growth, improves efficiency
and improved the current demands of affordable houses in Malaysia. The quantity surveying
practices especially in the area of private finance initiative and e tendering has been revisited
to improve further the existing practices in Malaysia. Teaching and learning practices
highlighted to enhance the effectiveness teaching methodologies and thus producing a
specific skills and competency in the construction industry.

iv MCRJ Special Issue Vol. 12 | No. 1 | 2021
Editorial Advisory Board
Zuhairi Abd. Hamid, Prof., Ir, Dr., Honorary Editorial Board Construction Industry Development Board Malaysia (CIDB) Haji Razuki Haji Ibrahim Editor Construction Research Institute of Malaysia (CREAM) Rohaizi Mohd. Jusoh, Dato’, Ir, Editor Construction Research Institute of Malaysia (CREAM) Norhanim Zakaria, Assoc., Prof., Dr., Editor Universiti of Malaya (UM) Umi Kalsum Zolkafli@Zulkifly, Sr, Dr., Co-Editor Universiti of Malaya (UM) Eric Khoo Sui Lai, Sr, Co-Editor Royal Institution of Surveyors Malaysia (RISM) Azlan Shah Ali, Prof., Dr., Sr, Ts, Universiti of Malaya (UM) Chen Wang, Prof., Dr., Huaqiao University, Xiamen, China Nor Marina Rosli, Ms., University Tunku Abdul Rahman (UTAR) Lim Yoke Mui, Assoc., Prof., Dr., Universiti Sains Malaysia (USM) Faraziera Mohd Raslim, Dr., Universiti Sains Malaysia (USM) Hamizah Liyana Tajul Ariffin, Dr., Universiti Teknologi Malaysia (UTM) Nadzirah Hj. Zainordin, Ts, Sr, SEGi University Zulkiflee Abd Samad, Dr., Sr, Universiti of Malaya (UM) Amirul Ramli, Mr., Linton University College
Mohd Farhan Mohd Nasir SEGi University Loo Siaw Chuing, Dr., Universiti of Malaya (UM) Shahela Mamter, Sr, Universiti Teknologi MARA, Shah Alam (UiTM) Asmah Alia Mohamad Bohari, Dr., Universiti Teknologi MARA, Sarawak (UiTM) Lilawati Abd Wahab, Dr., Universiti Teknologi MARA, Perak (UiTM) Siti Nur Alia Roslan, Sr, Gs, Dr., Infrastructure University Kuala Lumpur (IUKL) Yuhanis Abd Talib, Dr., Universiti Teknologi MARA, Perak (UiTM) Roziha Che Harun, Asst., Prof., Dr., International Islamic University Malaysia (IIUM) Nurshuhada Zainon, Dr., Universiti of Malaya (UM) Kan Fock Kui, Dr., University College of Technology Sarawak (UCTS) Lew Yoke Lian, Dr., Universiti Tunku Abdul Rahman (UTAR)
Secretariat Special Issue Nurulhuda Mat Kilau Construction Research Institute of Malaysia (CREAM) Tengku Mohd Hafizi Raja Ahmad Construction Research Institute of Malaysia (CREAM) Intan Diyana Musa Construction Research Institute of Malaysia (CREAM) Natasha Dzulkalnine, Dr., Construction Research Institute of Malaysia (CREAM)

v MCRJ Special Issue Vol. 12 | No. 1 | 2021
Editorial
Welcome from the Editors
Welcome to the Malaysian Construction Research Journal (MCRJ) special issue. This
journal provides a forum for dissemination of research activity broadly in the built
environment. The RISM-IRC2020 is an outreach platform for surveying postgraduates and
researchers with the aim to serve as an open dialogue avenue in the region on contemporary
surveying and built environment issues. The conference presents the best of current systems
research and practice, emphasizing innovation and quantified experience. It is aimed to
emerge this platform as the foremost world-wide gathering of academic researchers, Ph.D.
and graduate students, top research thinks tanks and industry technology developers. It would
also be the best opportunities for linkages, networking and talent scout for research
institutions and industry around the globe.
This is the second year for the RISM QS Division organising the conference. Previously,
it was successfully brought together researchers in one venue to not only present breakthrough
research in future technologies but to also promote practicality and applications and an intra-
and inter-field exchange of ideas. Since we received an overwhelming participation, the
publication has been divided into two. One publication has been published in the year 2020
and the 2nd publication is published in the year 2021.
We are very happy to have a team of excellent scientific committee and editorial board
members from the national and international league covering in depth the related topics. The
abstract of the twenty (20) articles are as follow;
Samsuri Abdul Hamid and Nurshuhada Zainon, have proposed a BIM capabilities
model for the airport project as a project management tool in order to educate and promote
BIM in airport infrastructure development in Malaysia. A questionnaire survey was designed
to identify the importance level of each variables and the significant relationship between the
BIM capabilities and the project management process groups. Subsequently, a model was
developed based on 33 significant BIM capabilities which were arranged according to the
importance level within the respective project management process groups. Through the
proposed model, it could assist project stakeholders in understanding the BIM capabilities;
available opportunities as well as benefits related to engaging BIM in airport project
management processes.
Nurulhuda Hashim et al., have found that BIM allows Quantity Surveying (QS)
consultants to visualize the building in 3D and obtain accurate quantity in a shorter time. In
order to achieve the BIM work outputs, Quantity Surveyors (QSs) need to be equipped with
some competencies related to BIM. QS graduates are expected to have basic level of BIM
skills and employers would also like to see other technical competencies in today’s QS
graduates.
Sharifah Nur Aina Syed Alwee et al., have proposed a conceptual framework on the
strategic process protocol for BIM contract administration in Malaysia. It reviewed the current
literature and suggested the adoption of qualitative research as the strategy for the primary
data collection. The proposed exploratory study aims to analyse the contractual issues and

vi MCRJ Special Issue Vol. 12 | No. 1 | 2021
find solutions for improving the existing implementation. Findings from the literature
conceptualise the importance of having the right contractual practice as one of the
improvement pillars in BIM adoption. It is hoped that the study will contribute to a new
knowledge of BIM contract administration in project management and construction studies,
increase the awareness on the contractual rights and responsibilities amongst the BIM
stakeholders, thus, to enhance the utilisation of BIM as the catalyst for digital construction.
Azrina Md Yaakob et al., have identified specific factors that can affect telecommuting
acceptance and further examine the level of impact these factors have in influencing the QS’s
readiness in the adoption of telecommuting. A data from a survey of registered QSs under the
Board of Quantity Surveyors Malaysia has been analysed. The results reveal that Attitude,
Work-life Balance, Nature of Work, Efficiency, Empowerment and Information Technology
have a positive effect on telecommuting acceptance. Empowerment and Nature of Work have
contributed most to telecommuting acceptance. The study contributes to the identification,
conceptualisation and measurement can allow firms to consider QSs participation into a
modern workplace when firms adopt telecommuting. It also helps to identify barriers of
telecommuting intention among QS employees.
Olaolu Titus Olalekan et al., have showed the similarities in both databases in the
construction dispute subject area. However, the high publications in Scopus indicate that Web
of Science has low publications in the area of social sciences, art and humanities. Furthermore,
the retrieved publications from both databases were analyzed using VOSviewer. The result
shows that most of the publications focused more on managing already existing dispute by
litigation, arbitration, and Alternative Dispute Resolution (ADR) and a lack in the area of
dispute prevention methods.
Mohd Adib Ramli et al., have discussed a building defects and restoration techniques of
heritage buildings in Malaysia. Malaysia, being endowed with heritage a building that
signifies a sense of livelihood to the nation, should not take these as the only retort. Permanent
shortage of heritage buildings and their continuous disappearance calls for a need to preserve
heritage through restoration. Restoration preserves the past and plan for the future.
Restoration also prevents further decay, damage and defects to the existing building. As
restoration works are known to have unique challenges due to their high uncertainties and
complexities, the need to understand the factors that affects the restoration process becomes
more prominent. To provide more clarity and certainty, the common building defects in local
heritage buildings have to be identified and its respective current restoration techniques have
to be evaluated.
Nurul Liyana Hanapi et al., have analysed the location of the elderly evacuees and its
effect on time and distance in multi-storey housing. Method applied in this study is through
computer simulation using Pathfinder software. Nine cases are tested where every case runs
a two set of scenarios between randomly placed elders and lowered floor elders to see the
differences. Results shows, when the elders are located at the lower floor are significantly
reduced the total time and distance travelled by the elders. By positioning the elders at the
lower floor area will not affecting other evacuees evacuate the building as others time and
distance are much similar the other scenarios. Future studies can consider elders with other
limited physical capability or depending on an assistant as this study only focuses those elders
who are able to evacuate by themselves.

vii MCRJ Special Issue Vol. 12 | No. 1 | 2021
Myzatul Aishah Kamarazaly et al., has investigated the influence of Feng Shui factors
on the landed residential housing selection among Malaysians. Feng Shui theory is thought
of “harmony between heaven, earth and people” and described as “the Chinese art of
placement and design”. The findings revealed that most of the Malaysian Chinese and Indians
would consider Feng Shui factor when choosing a premise. However, although only less than
half of the Malaysian Malays would consider Feng Shui, but it reflected that they are getting
more concerns and familiar with Feng Shui concepts. The facing direction of a house is the
major issue among Malaysians. Result revealed that a house near to or directly facing the
hospital, a cemetery and tall buildings would be unfavourable and would have impact on their
house buying intentions.
Zafirah Al Sadat Zyed et al., have examined examine the problems of housing
affordability among younger working households (YWH) in terms of governing housing
affordability. The selected respondents were interviewed at least 30 minutes based on the
semi-structured interview questions. The findings revealed that the state identified one of the
housing affordability problems among YWH is influence by house price. In addition, there is
less opportunity for YWH to purchase a house in urban area. Apart from that, lack of financial
literacy among YWH is due to the upbringing of YWH from well off parents.
Myzatul Aishah Kamarazaly et al., have investigated the stress levels and coping
strategies amongst quantity surveying students in private university. If the student is unable
to deal with the circumstances appropriately, it will cause stress. Coping mechanism plays an
important role in reducing and overcoming the stress experienced by an individual. Different
type of coping strategies can influence individual experience stress differently. This study
aims to find out the stressors that contribute to Quantity Surveying students in a private
university, students’ coping strategies and the stress level of students by using Perceived
Stress Scale. The result of this study indicated that majority of the Quantity Surveying
students are having moderate level of stress and academic factors is the main source of stress
to students.
Noraliza Basrah et al., have explored the environment criteria applied in sustainable
affordable housing (SAH), which influence a household’s quality of life. This paper presents
findings from the survey distributed to residents of affordable housing in Klang Valley area
and 21 environment criteria were analyzed by using SPSS through chi-square test. Hence, 19
environment aspects were identified as significant criteria to affordable sustainable housing.
Shirley Chin Ai Ling et al., have focused on assessing the factors and impacts on the
accuracy of cost planning in the construction industry during pre-contract stage to ensure the
project is completed within budget. The findings revealed that the most significant factors
that affecting the accuracy of cost planning is highly dependent on the level of estimator
experience and information available when preparing the cost planning. In addition, the
respondents agreed that in accuracy of cost estimate would cause the cost overrun in the
project development. Hence, the findings have successfully identified that by develop a
historical database of completed projects will definitely improve an accuracy of cost estimate.
Nurshuhada Zainon and Leong Vicky, have proposed an implementation of BIM for
the existing clauses of Malaysian standard form of contracts. This research started with a
comparative analysis of contractual obligations that influences BIM-based project in Malaysia

viii MCRJ Special Issue Vol. 12 | No. 1 | 2021
and the BIM conditions of international contract, by considering BIM International Standards
BS EN ISO 19650-1 and 2 as a baseline. After the preliminary proposed conditions are
developed, experts’ interview was conducted to enrich and validate the findings by implying
thematic analysis. The findings are hoped to assist stakeholders including clients,
architectures, quantity surveyors, engineers understand their liability and scope of work
clearer in BIM process. At the same time, to allow smooth process, to reduce the risk and cost
of projects, as well as, to avoid disputes.
Chu Sheng Ding et al., have ranked different girder bridge design alternatives based on
their contribution towards the aesthetics of girder bridge design. Twenty-four (24) consulting
engineers and contractors in Sarawak, Malaysia were asked to rate various girder bridge
components design alternatives in term of their importance in enhancing the aesthetics of
girder bridge design based on 5-point Likert Scale. The results were analyzed using Relative
Importance Index (RII) method. Based on the results, the design alternatives that contributed
the most to the girder bridge aesthetics are V-shaped pier (RII 0.975), New Jersey parapet
with steel railing (RII 0.933), and box girder (RII 0.900).
Noor Suzaini M. Zaid et al., have revealed that the Malaysian heritage conversation
legislation is lacking integration between the environmental sustainability element, in
comparison to social and economic elements of sustainable development. The three existing
heritage conservation legislation in Malaysia has no integration towards the carrying capacity
element of environmental sustainability principle, while only has indirect integration for eco-
system integrity. Future policy makers should seriously take this environmental disregard
within Malaysian heritage conservation legislation into account.
Norhafizah Yusop et al., have investigated the key factors and themes that are related to
construction quantification performance of the quantity-surveying learners. The data for the
study was collected through a semi-structured interview conducted on 25 participants
comprising of consultant quantity surveyors registered with the Board of Quantity Surveyors
Malaysia (BQSM). Based on the thematic analysis, four (4)-core inquiry topics (themes) were
identified, namely construction quantification proficiency, construction quantification
difficulties, academic performance and information technology or software intervention. The
findings also showed that the key factors and themes greatly influenced the performance of
the learners. This study provides an overview of issues related to quantification skills and
performance development amongst learners in the quantity-surveying field.
Erni Juwita Abd Manan and Umi Kalsum Zolkafli @Zulkifly, have investigated on
the problems that affect the handing over stage for PFI projects in Malaysia. Based on the
analysis, the problems identified are delay, defect, commissioning, incomplete as-built
documentation, incomplete O&M documentation, financial issues, unclear project brief,
incompliance to client requirement, drawing discrepancies, project control and monitoring
failure, collaboration issues and human-related issues. The solutions for problems that affect
handover of PFI Projects in Malaysia are also identified which mainly are planning, control,
monitoring, competent/experienced team and the stakeholder management.
Mohamad Izzat Bin Zulkanain et al., have explored the adaptive reuse concept and
benefits in managing public building quarters in Malaysia. This paper provides literature
review on the concept of adaptive reuse and its benefits by using a Systematic Literature

ix MCRJ Special Issue Vol. 12 | No. 1 | 2021
Review (SLR) approach. As stated by previous scholars, the concept of adaptive reuse is
explained throughout this paper and the identified benefits of adaptive reuse are in term of
environmental, social and cultural, economic, promoting innovation and time saving. Such
benefits may be applicable to support adaptive reuse towards public quarters (teachers’
quarters) as it may revitalise and lengthen the lifecycle of the building.
Umi Kalsum Zolkafli @Zulkifly et al., have proposed an improvement model for public
sector construction e-Tendering system by achieving objectives of identifying barriers and
solutions for improving usage of National e-Tendering system. Public sector procurement
department is the target respondents where their opinions on barriers and solutions for
improving usage of National e-Tendering system is collected through quantitative which is
questionnaires. This research found that the top three barriers for improving usage of National
e-Tendering system are ‘resistance to change in users’, ‘securities concern’ and ‘incomplete
technical coverage on whole e-Tendering process’.
Habizah Sheikh Ilmi et al., have identified the traditional and present roles of quantity
surveyors and find out the threats to quantity surveyors’ profession in the future. A
quantitative method is used through the survey questionnaires to gather data and information
from the quantity surveying practitioner and graduates. The research outcome showed that
the quantity surveying profession and the graduates are still relevant and stay competitive in
the industry.

1
MCRJ Special Issue Vol. 12 | No. 1 | 2021
DEVELOPMENT OF BIM CAPABILITIES MODEL FOR MALAYSIA AIRPORT PROJECT MANAGEMENT Samsuri Abdul Hamid1 and Nurshuhada Zainon2 1Diplomatic Administrative Officer, Development Division, Ministry of Housing and Local Government, Putrajaya, Malaysia. 2Department of Quantity Surveying, Faculty of Built Environment, University of Malaya, Kuala Lumpur, Malaysia.
Abstract Building Information Modelling (BIM) adoption in the Malaysian construction industry are driven by the Ministry of Works. However, transportation construction projects are complex and high-risk, which in common circumstances, these kinds of projects are categorized under Transportation Ministry’s portfolio and are self-executed by them. As the consequences, the transportation projects are slower in coping with the use of BIM technology. As such, airport infrastructure construction is currently still using conventional project management practices without adaptation of BIM technology although a period of about eleven years has elapsed since BIM was implemented in public-sector projects. The capabilities of BIM technology in managing airport infrastructure development projects have yet to be explored. Therefore, this research aims to propose a BIM capabilities model for the airport project as a project management tool in order to educate and promote BIM in airport infrastructure development in Malaysia. A questionnaire survey was designed to identify the importance level of each variables and the significant relationship between the BIM capabilities and the project management process groups. Subsequently, a model was developed based on 33 significant BIM capabilities, which were arranged according to the importance level within the respective project management process groups. Through the proposed model, it could assist project stakeholders in understanding the BIM capabilities, available opportunities as well as benefits related to engaging BIM in airport project management processes. Keywords: Building Information Modelling (BIM); capabilities; airport; project management;
transportation project.
INTRODUCTION
The construction industry is generally known as one of the most challenging industries in
many countries. Among all, airport projects are especially complex because they involve such
a wide variety of stakeholders and revenue sources. Airport developments also are typically
very large in scope, use large amounts of space as well as support vast infrastructure and
numerous facilities, much like a small city (Wells & Young, 2004). It normally involves a
long timeline from planning to completion, increasing the likelihood of design and other
changes along the way, even it is always having a well-planned and intricate system where
many experienced professionals have worked hard to ensure that all details are considered
(Huang et al., 2018).
Malaysia is facing 70% of airport projects by the Ministry of Transport (MOT) was not
completed within the original contract period and had to be given an extension of time (data
was extracted from Sistem Pemantauan Projek II; one of the Electronic-Government
applications under the Multimedia Super Corridor (MSC) flagship to monitors Federal
Government development projects under the 5-year Malaysia Plan). However, the industry is
broadly criticized for low productivity and insufficient innovation (Redwood et al., 2017).

2
MCRJ Special Issue Vol. 12 | No. 1 | 2021
In the Malaysia context, the business of construction and operation of the airports are
carried out by two different entities. The construction of airport infrastructures is managed by
the Government meanwhile the operation and maintenance of the airport are currently run by
the private sector, the Malaysia Airports Holdings Berhad (MAHB). MAHB is a privatized
company which operates and manages all the airports in Malaysia except for Kerteh Airport
in Terengganu and the Senai Airport in Johor (Karim et al., 2003). According to the Operating
Agreement (OA) entered between the Government of Malaysia through the MOT and MAHB,
the responsibility for providing airport-related infrastructure facilities is born and financed
directly from the Government except for the KLIA2 project (Karim et al., 2003). Therefore,
MOT is responsible to manage airport construction from the initiation up to closure processes.
This is including proposing and obtaining project allocation and approvals from Economic
Planning Unit (EPU), project procurement, contractors and consultants’ appointment,
supervising and monitoring project performance until the completion of the projects. Then,
the infrastructure of the airports is handed over to MAHB for operations, maintenance and
assets management. Tladi (2012) argued that designers, owners, and end-users who involve
in the building process, normally have very little communication between end-users and the
other two groups (designers and owners). This leads to designers and owners making
decisions for the end-users and this may result in scope changes, facilities that do not suit the
end-users, resulting in facilities that are not easy to operate and maintain.
The wide uptake of BIM in the development sector around the world is believed to deliver
a great impact on the existing construction project management models (Karim et al., 2003).
Many nations around the globe have rolled out technology advantages in the project lifecycle.
This situation leads to initiatives in facilitating BIM adoption in the construction industry via
regulations, to support the development and adoption of BIM and modern methods and to
implement competency and learning management system (CIDB, 2016). However, the mega
infrastructure size, combined with complex operational challenges that makes the
construction of airports fertile ground for BIM technology. For the case of construction of
complex and high-risk projects such as airport and railway infrastructures, the implementation
of these projects is categorized under MOT’s portfolio and most the projects are self-executed
by the ministry through their Development Division, not by Public Work Department (PWD).
As the consequences, the projects under the control of MOT are likely to go far beyond the
use of BIM technology.
It is desirable that a study which looks at the capabilities of BIM's utilization in public-
sector projects, particularly in airport infrastructure development, can be made. Therefore,
this study aims to propose a BIM capabilities model for airport project management. It
reviews the significant capabilities of BIM technology as a construction project management
tool for the purpose of assessing project status and its contribution to airport projects.
LITERATURE REVIEW
Airport Construction Project
Airport project are considered as large-scale and complex projects due to its difficulty in
design, operate and manage (Alnasseri, 2015). In fact, airport facilities serve multiple users,
needs certain facilities to operate and function. The airport components have two main
categories: airside and landside areas (Wells & Young, 2004). The airside is dealing with

3
MCRJ Special Issue Vol. 12 | No. 1 | 2021
aircraft operations, and the landside is related to passenger operations (Adrem et al., 2006).
The airport components are planned and designed in a way that guarantees the relationship
between the relevant activity and the exact flow from one point to the other.
The airport's own features that are vulnerable to various risks require it to be carefully
planned and constructed and in accordance with all established international standards and
procedures. Basically, airport projects have much in common with any other conventional
building, except for airside areas. However, based on the study conducted by Alnasseri (2015)
have made a several comparison analyses and revealed the unique characteristics of an airport
as shown in the figure below:
Airside Safety Rules and
Regulations Many Stakeholders High Level of Details
Security Elements Personnel badges, license for
vehicle on airside, certified drivers, security check points often distance from site by the
specific country’s security agency.
Airport Different Activities and Functions
Several key functions need to be considered by several
stakeholders which lead to many construction requirements.
Function Examples:
Terminal Coordination
Commercial
Traffic Coordination
Customs and Security
Design
Ministries
High Complex Projects Clients are tempted to set-up design and specification before engaging a contractor. The client assumes the risk and not take advantage of the
contractor’s technical know-how and experience.
Insurance Policies Potential damage, flammable fuel
Prepared for Big Events
Airport Regulations Must be followed by various
stakeholders involved on airside activities
Time Extremely Crucial World Cup, Olympic & Paralympics
Game, Pilgrimage
Commercial Factors Airports often 24/7, major
operations in low traffic period High Level of Impact
Expansion Projects Common, new materials conform
with existing one. Identifying installation connection points.
Economic Trade, Tourism
Development Transportation, Infrastructure
Figure 1. Characteristics of Airport Construction (Alnaserri, 2015).
Large-scale complex projects such as airports will certainly involve many stakeholders
starting from the initial stage of planning, construction and even airport operations. The
integrated process related with the airport’s project will not only involves the infrastructure,
but also must be look at the handling multiple facilities, end-users and service providers in
order to provide safe and secure air travel services. In general, stakeholders involved in airport
projects in Malaysia can be categorized under few groups such as following:
• Airport Owners: Government entity that owns the infrastructures of the airports –
MOT.
• Airport Operator: the private entity that runs the airports – MAHB.
• Aviation Authorities: Government entity that provides regulations, rules and other
instructions related to airport’s activities – Civil Aviation Authority of Malaysia
(CAAM).
• Airlines: private companies that provide air transportation services.
• Local Authorities: local state governments or private organisations with certain
authorities (e.g.: Environmental Protection Department, Tenaga Nasional Berhad etc.)
• Contractors and Consultants: a firm that undertakes a contract to provide materials,
labour or services to build the infrastructures.

4
MCRJ Special Issue Vol. 12 | No. 1 | 2021
Project Management Process Groups
In order to assess the capabilities of BIM technology in airport project management point
of view, it should first figure out what "right" or "best" project management practices are. The
response to this inquiry is open-ended and beyond the scope of this study. Rather, this study
looked towards "A Guide to the Project Management Body of Knowledge" (PMBOK) 6th
Edition, 2017 by Project Management Institute (PMI) as a project management standard
represent a substantial investment of expertise, advancement exertion, wide-based accord, and
far-reaching acknowledgment of project management best practices.
According to PMBOK 6th Edition, the project management process groups are describing
how a project is taken from brief through to delivery (PMI, 2017). The project management
process groups are as illustrates in figure below:
Figure 2. Project Management Process Groups (PMI, 2017).
BIM and Airport Construction Projects
BIM is described as the process of gathering input f rom team members through complex
multiphase process to model the components (Viscuso et al., 2020). BIM is a tool that will be
adopted during the process of construction to produce an exceptional perspective of the
building process and to handle 3-dimensional (3D) models of a facility's structural and
operational features (Galiano-Garrigos et al., 2017).
In Malaysia, since the beginning of 2000, the adoption of BIM was driven primarily by
the private sector (Zainon et al., 2016). However, BIM began to be widely used when PWD
produced the BIM Standard Manual and Guideline in 2007 to be used in public-sector projects
(Latiffi et al., 2014). Even though, to date, there is no reported study presents BIM adoption
in airport construction project. It is still using conventional project management practices
without adaptation of BIM technology although a period of about thirteen years has elapsed
since BIM was implemented in public-sector projects.
Preliminary Mapping Matrix of BIM Capabilities
As Eastman et al. (2008) summarised based on the 10 case studies, no single project has
yet realized all or even a majority of BIM's potential benefits and the BIM implementation
varies from one organization to another. For the implementation of aviation sector projects in
Malaysia, the researcher has identified a total of 21 variables of BIM's capabilities for the
airport’s project as well as the relevant benefits. This study had preliminary mapped all these

5
MCRJ Special Issue Vol. 12 | No. 1 | 2021
21 variables of BIM's capabilities into each of the project management processes by using the
Matrix Method of Literature Review Analysis. When each of these variables is grouped
according to Project Management Groups respectively, a total of 44 variables were identified
as capable to contribute to the airport’s project. The results of these 44 variables as well as
the benefits are shown in the table below.
Table 1. Preliminary Mapping Matrix for BIM Capabilities.
PM PROCESS BIM CAPABILITY DESCRIPTION BENEFITS
INIT
IAT
ION
Existing Condition Modeling
Assist clients in producing a comprehensive feasibility study report especially for upgrading and expansion of an existing airport
Feasibility study
Cost Estimation Assist the Government to obtain more reliable cost estimates for project listings under Malaysia Plan and budget screening sessions
Budget Screening
Phase Planning
Assist stakeholders to more easily understand the project phasing as well as provide multiple choice of conceptual designs through Modeling and visualization
Conceptual design
visualisations
PL
AN
NIN
G
Existing Condition Modeling
Planning on passenger flow will be more organized and clearer through an animated model, especially for live and busy airports
Passenger flow Modeling
Cost Estimation
The exact cost estimate is very important at this stage to undergo a compulsory Value Management session for Government projects worth RM50 million and above as well as for the tender purposes
Value Management
Phase Planning
For a non-technical person, Phase Planning through a developed model would give a better understanding of project milestones and construction plans
Project milestones/
Construction plans
Programming The developed BIM model allows the project team to analyse space by having strategic plan visualisations of standards and regulations.
Strategic plan visualisations
Site Analysis Guides with producing a strategic development planning in making decisions on selecting suitable sites for airport development
Strategic development
planning
Design Review
Through this ability, BIM is able to provide immediate information on specific space such as commercial property fit-out design required by airports stakeholders
Commercial property fit-out
design
EX
EC
UT
ION
Existing Condition Modeling
Provides accurate information about the actual situation and works on the site
Accurate representation of
work
Cost Estimation
This function can be integrated with the 4D analysis (schedule) for budget track purposes so that all dealings involving costs throughout the construction will be well managed
Track budgets
Phase Planning Among the disadvantages of conventional phase planning weaknesses is the increase in waste on job sites, which can be improved by using BIM
Decreased waste on job sites
Programming Efficient and accurate assessment of design performance regarding spatial requirements
Design performance
Design Authoring The same design will be used by all parties who can access directly to that design
Design transparency
Design Review No more traditional construction mock-ups
Eliminate traditional mock-
ups

6
MCRJ Special Issue Vol. 12 | No. 1 | 2021
PM PROCESS BIM CAPABILITY DESCRIPTION BENEFITS
Structural Analysis Comprehensive structural analysis through various forms of analysis will optimize the design
Comprehensive structural analysis
Sustainability Evaluation
Sustainability evaluation can be made more comprehensively when all needs can be calculated, simulated and presented via energy Modeling
Energy Modeling
Code Validation Avoid any design processes that do not comply with international standards and requirements from local authorities
Efficient design process
3D Coordination
Clash detection will be able to improve project performance by avoiding clashes of all disciplines under construction which may lead to cost implications
Clash detection
Site Utilization Planning
Site usage layout can make construction management work efficiently like organizing material transfers, temporary facilities and working area demarcation (especially in the airside area)
Site usage layout
Construction System Design
Reduce the risk of misunderstandings and different interpretations (language barriers) when engaging in the construction of complex buildings from various project backgrounds
Reduce language barriers
Digital Fabrication It assists the manufacturer to have complete information for fabrication with minimal waste, reduce the error and the delay of production.
Minimal fabrication ambiguities
3D Control and Planning
It will integrate layouts with certain live coordinates (such as GPS) that can increase efficiency as well as reduce layout errors
Decrease layout errors
Record Modeling The capability of the record model to link to the contract with historical data will minimize facility turnover dispute
Minimize facility turnover dispute
CO
NT
RO
L &
MO
NIT
OR
ING
Existing Condition Modeling
Verify project status with quantity information for progress monitoring and reporting
Progress reporting
Cost Estimation
Information about Variation Order is essential to be monitored throughout construction for owners to get updated on the project's overall cost control status
Cost control
Phase Planning
Controlling procurement issues such as monitoring to avoid delaying essential equipment or materials delivery to the site and impacting the project as a whole
Avoid procurement
issues
Design Authoring Transparent design information that can be accessed by all stakeholders will be able to control and improve the design quality
Quality control
Design Review Design evaluation will assess the effectiveness in meeting the requirements of airport stakeholders as stipulated in the contract
Design evaluation
Structural Analysis
Increasing consistency throughout the entire project with a single building information model is used for both the analysis and the documentation phases
Increase consistency
Sustainability Evaluation
Optimized building performance by improved energy performance management
Energy performance management
Code Validation
Specific code compliance such as Federal Aviation Administration (FAA) and International Civil Aviation Organisation (ICAO), Annex 14
Specific code compliance

7
MCRJ Special Issue Vol. 12 | No. 1 | 2021
PM PROCESS BIM CAPABILITY DESCRIPTION BENEFITS
3D Coordination Will ensure that the as built drawings are accurate and as per what has been built
As-built documentation
Site Utilization Planning
During the construction works, the usage of the space as well as site organisation will be easily updated
Space usage update
3D Control and Planning
Integrate with real-time technologies as a control points, produce accurate information as data received directly from the model
Reduce rework
Record Modeling Client requirement assessment to as designed Client
requirement assessment
CL
OS
UR
E
Existing Condition Modeling
Visualize current and future facility status and plans
Future facility plans
Cost Estimation Reduce the operating expenditure cost by precisely quantify the life-cycle cost of the buildings
Life-cycle cost calculation
Record Modeling
The information contain in the model will improve documentation and facilitate any future uses, e.g., environmental assessment documentation for extension of runway on reclamation area
Environmental assessment
documentation
Maintenance Scheduling
Reduce corrective maintenance and repairs by the airport operator
Reduce corrective
maintenance
Building System Analysis
Ensure building is operating to specified design and sustainable standards
Sustainable standards operation
Asset Management Integrated assets information Integrated assets
information
Space Management Provides guidance for the preparation of airport master plans from small general aviation to large commercial service facilities
Airport master plans
Disaster Planning and Management
Provide immediate access to the airport facilities for emergency in real-time (such as Airport Fire and Rescue Service (AFRS), police, etc.)
Real-time emergency
access
METHODOLOGY
Data Collection
The early phase of the research began with reviewing literature reviews of published
articles, reports and texts to scope the relevant parameters to the research. The best project
management practice, PMBOK 6th Edition, 2017 guided by PMI, was chosen to be used in
this research and every single process in the Project Management Process Groups was
described. The BIM's capabilities in the construction industry, as well as their benefits in the
airport's project, were identified. This step was vital since the subject of discussion was
relatively new and the application of BIM technology in airport project management in
Malaysia was never being explored. In order to identify the BIM capabilities variables that
suit for an airport project in Malaysia, this study used Mendeley Data software owned by
Elsevier as a database using several keywords such as airport, BIM, project management and
BIM capabilities. As a result, 21 variables of BIM's capabilities that suit for the airport
projects in Malaysia had been identified and supported by related refereed paper, published
academic journal articles, books, reports, and reliable sources.

8
MCRJ Special Issue Vol. 12 | No. 1 | 2021
In the next stage, a preliminary mapping was conducted to categorize the 21 variables
according to the Project Management Process Groups by using the Matrix Method of
Literature Review Analysis. This method of analysis was characterized as a conceptual
framework in a table or grid format, consisting of various rectangular symbols arranged in
rows and columns to form a symbolic set which, when used together as a set, allows a
researcher to conclude the non-obvious relationship that exists between entries on the table
(Klopper et al., 2007). The goal of this analysis was to identify the patterns in the each of BIM
Capabilities as well as the Project Management Process Groups and used these patterns to
address the issue.
The final mapping process has then been verified through inputs from the primary data
of the questionnaires survey and statistical analysis. The questionnaire had 3 main sections.
Section A is to determine the demography of the respondents, Section B focused on the
respondents’ opinions about the BIM capabilities as well as its benefits in the respective
Project Management Process Groups, and Section C determined the impact of using BIM
towards overall project performance.
The targeted respondents were construction players who have BIM knowledge. The
questionnaires were randomly distributed to officials from MOT, PWD, MAHB, airport
regulators, CIDB, consultants and contractors. Among them are the specialized from BIM
Unit under the Integrated Asset Management Division (PWD) and MyBIM Malaysia. For
that, a total of eight sub-questions consist of general and technical aspects of BIM were given
to the respondents. The respondents with scores ranging from 0-60% were categorized as
‘lack of BIM knowledge’ while respondents with scores ranging from 61% - 100% were those
who categorized as ‘with BIM knowledge’. This method has been adopted to ensure only
respondents who are eligible to be selected for analysis (Alston & Bowles, 2003).
The sample size for this study was calculated using G-Power software and a total of 138
samples were required. Total of 425 sets of questionnaire surveys were distributed using an
online survey and self-administered survey. The online surveys consist of the URL link
generated from a platform known as Google Form was sent out and distributed via email.
Respondents were given two months to complete the survey before the link is closed. The
self-administered survey was sent out by-hand and collected at the respondent’s office. The
researcher received a total response of 73 sets of answered questionnaires from Google Form
and another 112 sets of surveys from the collection at the respondent’s office. Thus, the total
numbers of completed questionnaire surveys were 185 sets out of 425 which resulted in 44%
of response rate.
Data Analysis
The Relative Importance Index (RII) was used to rank the variables using the ‘mean
score’ method derive from the frequency value of the questionnaire findings by establishing
the relative importance and relevance of the respondent’s opinions respectively (Johnson &
LeBreton, 2004). Then, a Spearman Rank Correlation Coefficient will be conducted to
support the findings from the relative importance analysis by producing a mathematical value
that shows the direction and strength of the relationship (descriptive) and to test the significant
relationship between the variables (inferential). This correlation analysis was used since the
variables for BIM capabilities were in the form of categorical data (Bin et al., 2019). Results

9
MCRJ Special Issue Vol. 12 | No. 1 | 2021
from this analysis were interpreted by the strength value of correlation coefficients (rs) and
were categorized into a weak, moderate or strong relationship based on the Cohen’s Statistical
Analysis. Pearson Product Moment Correlation was also conducted in order to support the
model by giving the indication to the airport’s stakeholders regarding the ability of BIM usage
at every project management process to contribute to the improvement of overall project
performance.
Model verification was essential parts of the model development process if models to be
accepted (Charles, 2005). Hence, this model has been presented to the Head of BIM Unit,
PWD as an expert and BIM practitioner. The purpose of this model verification was to get an
expert opinion on the usability of this model in the field. According to Charles (2005), the
goal of model verification is to make the model useful in the sense that the model addresses
the right issues, provides accurate information about the system being modelled, and to makes
the model used.
ANALYSIS AND FINDINGS
Respondents’ Demographic
From the total of 185 respondents, 79% (147 respondents) were able to score 61% and
above and belong to the ‘With BIM Knowledge’ group. Meanwhile, 21% (38 respondents)
scored 60% and below. Only respondents in the category of ‘With BIM Knowledge’ were
analysed.
A total of 59% (109 respondents) were a public sector which the largest type of
organization in this study. Most of the public sector respondents were largely contributed by
PWD officials. The second largest type of organization was the private sector such as
contractors/consultants or any player in the construction industry. 48 respondents were
involved which contributes 26% of the total respondents. Thirdly, 15% or 28 respondents are
from airport operator, MAHB. Only officials from Planning and Development, MAHB
division are suitable to participate in this survey since the study requires respondents who
have a background in the construction industry. This is the reason for the small number of
respondents from this organization.
The largest number of respondents came from engineering sector (51%), followed by
managerial sector (32%), quantity surveying sector (8%), site supervisions sector (5%),
architectural sector (3%) and others (0.7%).
The range of 6-10 years of experience in the construction industry was the majority (59
respondents) in this survey, while the smallest group was from the respondents with less than
1 years’ experience (17 respondents). A total of 38 respondents in the category of "lack of
BIM knowledge", 14 numbers were contributed by respondents with experience of 1 year and
below. This is followed by an experience of 1-5 years as the second largest contributor. The
number of respondents in this category is seen decreasing in tandem with the increase of
experience in the construction industry. Of the 185 respondents, 108 respondents (58%) were
less experienced in the airport's project. This makes 42% of the total are those who have more
than 1-year experience in the airport's project. From the total 147 respondents selected in the
"With BIM Knowledge" category, only 36% (53 respondents) were contributed by those who
had experience in the airport's project.

10
MCRJ Special Issue Vol. 12 | No. 1 | 2021
The Significance of BIM Capabilities in Airport Project Management
The RII was calculated for each BIM capabilities in every project management process.
Having observed the most likely important BIM capabilities based on frequencies, the index
value of the RII was also presented as Severity Index (SI) to indicate the ranking in the form
of percentage. There were quite a few studies related to the construction industry has used the
variables ranking as part of the data analysis method (Doloi et al., 2011; Yang & Wei, 2010;
Odeh & Battaineh, 2002). The value of RII is between 0 to 1 (for SI, the value will be between
0 to 100%), and the closer to 1 the value gets, the more important it is perceived to be (Umar
et al., 2012).
Therefore, the researcher has set the condition that only BIM capabilities with RII value
of more than 0.75 (SI values of 75% and above) can be regarded as “important” and will be
mapped into the model, while BIM capabilities with RII value of lower than 0.75 are
considered as “less important” for it is to be included in the model. This action is necessary
to ensure that only BIM capabilities that are truly eligible will be included in the model
(Syazwina, 2017). The results are shown in the following tables.
Table 2. Results on the BIM Capabilities Ranked According to RII and SI.
Code BIM Capabilities RII SI (%) Rank
INITIATION
A1 Existing Condition Modeling 0.7959 79.59 1
A3 Phase Planning 0.7850 78.50 2
A2 Cost estimation 0.7483 74.83 3
PLANNING
B2 Cost estimation 0.7959 79.59 1
B4 Programming 0.7918 79.18 2
B3 Phase Planning 0.7878 78.78 3
B5 Site Analysis 0.7864 78.64 4
B6 Design Reviews 0.7864 78.64 5
B1 Existing Condition Modeling 0.7837 78.37 6
EXECUTION
C10 3D Coordination 0.8544 85.44 1
C6 Design Reviews 0.8449 84.49 2
C1 Existing Condition Modeling 0.8000 80.00 3
C14 3D Control Planning 0.7946 79.46 4
C4 Programming 0.7810 78.10 5
C2 Cost estimation 0.7796 77.96 6
C5 Design Authoring 0.7755 77.55 7
C15 Record Model 0.7755 77.55 8
C9 Code Validation 0.7619 76.19 9
C3 Phase Planning 0.7592 75.92 10
C11 Site Utilization Planning 0.7497 74.97 11
C12 Construction System Design 0.7483 74.83 12
C7 Structural Analysis 0.7388 73.88 13
C13 Digital Fabrication 0.7374 73.74 14
C8 Sustainability Evaluation 0.7306 73.06 15
CONTROL & MONITORING
D5 Design Reviews 0.8231 82.31 1
D9 3D Coordination 0.7946 79.46 2

11
MCRJ Special Issue Vol. 12 | No. 1 | 2021
Code BIM Capabilities RII SI (%) Rank
D2 Cost estimation 0.7918 79.18 3
D1 Existing Condition Modeling 0.7823 78.23 4
D11 3D Control Planning 0.7823 78.23 5
D4 Design Authoring 0.7782 77.82 6
D12 Record Model 0.7687 76.87 7
D6 Structural Analysis 0.7537 75.37 8
D10 Site Utilization Planning 0.7510 75.10 9
D8 Code Validation 0.7456 74.56 10
D3 Phase Planning 0.7361 73.61 11
D7 Sustainability Evaluation 0.7320 73.20 12
CLOSURE
E4 Maintenance Scheduling 0.8327 83.27 1
E6 Asset Management 0.8272 82.72 2
E2 Cost estimation 0.8204 82.04 3
E1 Existing Condition Modeling 0.7837 78.37 4
E7 Space Management 0.7810 78.10 5
E3 Record Model 0.7728 77.28 6
E5 Building System Analysis 0.7497 74.97 7
E8 Disaster Planning & Management 0.7197 71.97 8
The Spearman’s Rho Correlation test was essential to this study in order to support the
results from the above analysis in terms of significance relationship. A hypothesis test of the
“significance of the correlation coefficient” is performed to decide whether the relationship
between the two variables (BIM capabilities and project management process) is strong
enough to use to model the relationship. The strength of the relationship will be determined
by the value of Correlation Coefficient (rs). The results of the Spearman’s Rho Correlation
test for Initiation until Closure process are as shown in the following table. It shows that the
value of ρ for each variable was ρ = 0.00 (smaller than α = 0.05). Therefore, the decision from
this analysis was to reject the Hypothesis Null (Ho). Results revealed a significant relationship
between each BIM Capabilities and Project Management Process.
Table 3. Results on Spearman’s Rho Correlation Test.
INITIATION
Variables rs ρ
Existing Condition Modeling [1] .778** .000
Phase planning [2] .718** .000
PLANNING
Cost estimation [1] .760** .000
Programming [2] .715** .000
Phase planning [3] .794** .000
Site analysis [4] .649** .000
Design Reviews [5] .771** .000
Existing Condition Modeling [6] .640** .000
EXECUTION
3D Coordination [1] .546** .000
Design Reviews [2] .506** .000
Existing Condition Modeling [3] .596** .000
3D Control Planning [4] .652** .000
Programming [5] .674** .000

12
MCRJ Special Issue Vol. 12 | No. 1 | 2021
INITIATION
Variables rs ρ
Cost estimation [6] .575** .000
Design Authoring [7] .711** .000
Record Model [8] .708** .000
Code Validation [9] .744** .000
Phase planning [10] .653** .000
CONTROL & MONITORING
Design Reviews [1] .757** .000
3D Coordination [2] .649** .000
Cost estimation [3] .696** .000
Existing Condition Modeling [4] .757** .000
3D Control Planning [5] .791** .000
Design Authoring [6] .712** .000
Record Model [7] .733** .000
Structural analysis [8] .654** .000
Site Utilization Planning [9] .782** .000
CLOSURE
Maintenance Scheduling [1] .598** .000
Asset Management [2] .769** .000
Cost estimation [3] .664** .000
Existing Condition Modeling [4] .766** .000
Space Management [5] .725** .000
Record Model [6] .759** .000
Development of BIM Capabilities Model
To support the model and show the relationship between each of the project management
process (Independent Variables) towards the overall project performance (Dependent
Variables), Pearson Correlation Coefficients test was carried out since both variables are
intervals and the data were normally distributed. The researcher had considered that any score
of Skewness within the range of ± 2.5 is acceptable to meet the normality requirements as it
is approaching the normal graph (George & Mallery, 2010).
Table 4. Pearson Correlation Coefficients between Project Management Process and
Overall Project Performance.
Variables R Ρ
Initiation .641** 0.000
Planning .764** 0.000
Execution .783** 0.000
Control & Monitoring .777** 0.000
Closure .763** 0.000
The table above shows the results on Pearson Correlation Coefficients between project
management process and overall project performance. The ρ value for each variable is smaller
than α (0.005), proving that there is a significant relationship between the project management
process and the overall project performance. The strongest strength value (0.783) was in the
Execution process. Followed by Control & Monitoring (0.777), Planning (0.76), Closure
(0.763) and Initiation (0.641). The result shows that respondents are of the view that BIM's
use ability are the most during the Execution process to contribute to the better overall project

13
MCRJ Special Issue Vol. 12 | No. 1 | 2021
performance. Although the strength value in the Initiation process is the lowest, it does not
indicate that BIM is not important at this process to contribute to the better project
performance. It is interpreted as BIM's application at this stage are less used in contributing
to the overall project performance compared to the usage of BIM in other project management
processes.
Based on these results, the preliminary mapping matrix was updated. The process of the
development of BIM capabilities model has achieved the essential requirements through the
inclusive analysis implemented above. In order to provide clear and transparent illustrations
on the BIM capabilities for airports project management in a way that all related stakeholders
involve can simply understand, the researcher has proposed the model as shown in Figure 3.
This model has also been presented and verified by an expert BIM practitioner.
DISCUSSION
Generally, all BIM capabilities identified from the literature review are related and
involved in the stated project management processes. However, the production of a model
requires only the significant variables in the context of Malaysia’s construction industry to be
included. From the data of the questionnaires survey, RII was used to compile each BIM
capabilities according to the importance level from the perspective of the airport's project.
The researcher decided to issue variables which had the results of “less important” to ensure
that the model to be produced is concise but complete with significant information the
stakeholder’s needs.
It should be reminded that this removal does not mean that the previously identified
variables are not usable at all in that project management process. As mentioned in literature
review, there is no single project has yet realized all or even most of the BIM's capability and
the BIM implementation varies from one organization to another (Eastman et al., 2008). On
the contrary, it should be interpreted that, the unselected variables were less important by the
respondents in a way of giving an impact on the activities involved within that project
management process in airport’s construction project. Hence, through the RII test, the selected
variables of BIM capabilities have been verified as important (Somiah et al., 2015).
This study requires another test to verify the relationship. The most appropriate statistical
analysis is to use the Spearman’s Rank Correlation Coefficient since the variables for BIM
capabilities was in the form of categorical data and not numerical (Bin, Ruodu & Yuming,
2019). The results of Spearman’s Rank Correlation Coefficient show that the ρ value of each
variable is lower than the value of α (0.05). Results revealed a significant relationship between
each BIM capabilities (IV) and their respective project management process (DV).
It is not statistically appropriate to translate correlation coefficient values through the
Spearman Rank Correlation Coefficient as to indicate the importance level of BIM's capability
in the relevant project management process. The reason was the importance level of BIM's
capability has been verified through RII test. For this study, the Spearman Rank Correlation
Coefficient used to examine whether there is a significant relationship between the variables
based on the hypothesis constructed to support the output of preliminary mapping and RII
decisions. According to Ambaum (2010), "Significance level" is a misleading term that many
researchers do not fully understand. In normal English, "significant" means important, while

14
MCRJ Special Issue Vol. 12 | No. 1 | 2021
in Statistics "significant" means probably true (not due to chance). A research finding may
be true without being important. When statisticians say a result is "highly significant" they
mean it is very probably true. They do not (necessarily) mean it is highly important (Ambaum,
2010). The value of the correlation coefficient strength should be interpreted as representing
respondents' opinions on the BIM capabilities utilization’s level at the relevant project
management process. The higher the value of the correlation coefficient, that variable can be
very probably true to be utilized more frequently in that project management process.
Initiation Phase
Existing Condition Modeling scored the highest rank in the Initiation process. Existing
Condition Modeling is where the designers build up a 3D model of the current conditions
nearby, once the model is developed it can be questioned for data. This data is most helpful
for the development of new airport, redevelopment, expansion of main terminal buildings as
well as the extension of the runway in which the existing condition data are essential.
Furthermore, it can improve the proficiency and precision of existing conditions
documentation, gives documentation of condition to future uses as well as assist clients in
producing a comprehensive feasibility study report (McCuen & Pittenger, 2016). Phase
Planning will be used 4D model to adequately strategize phased occupancy in an airport
terminal expansion, redevelopment, extension of the runway and so on, or to demonstrate the
development arrangement and space prerequisites on the airport facilities (Gatwick Airport,
2014). Dynamic phasing plans of occupancy with conceptual design visualizations can
provide several choices of designs to the stakeholders.
Through the RII method, Cost Estimation at the Initiation process was considered as “less
important”. It is wrong to interpret that the cost estimation activity is not important at this
stage since budget screening were amongst the most important activities at the Initiation
process. As stated in the literature review, at this point, MOT will make a joint evaluation
session with the central agency to get the approval of the ceiling project cost under Malaysia's
Plan.
However, based on the results obtained, it should be noted that respondents are of the
view that there was no need for assistance from BIM application at this stage to produce an
accurate cost estimation since the client’s needs only a simple derivation for a project ceiling
cost. Furthermore, at this earliest stage, without any detailed technical input as there is no bill
of quantities, contract documents, nor contractors yet to be appointed, the client practice on
estimating ceiling cost was only based on the precedence airport construction budget. The
more accurate 5D analysis related to costs will be needed in the following process of project
management where that cost will be the basis of the tendering process and actual project costs
(Talebi, 2014).
Planning Phase
Six BIM capabilities have been identified in the literature review involved in the Planning
process. Through the RII test, all six capabilities are found to have a high index which means
the respondents are of the view that at this process, BIM has a lot of important capabilities to
be used and can contribute to achieving more organized project planning. In some completed
construction projects, 40% - 90% reduction of rework during construction was reported by
using BIM prior to the actual start of work (Fischer & Kunz, 2004).

15
MCRJ Special Issue Vol. 12 | No. 1 | 2021
The highest index position was recorded by BIM's ability in doing cost estimation. As
indicated by Sabol (2008), BIM with Cost Estimation capabilities (5D analysis) integrates all
the information with cost data such as quantities, schedules and prices and form a basis to be
used in the procurement phase, which happened in this Project Management Process. BIM
are capable to increase the exactness of the cost estimation process by improving data
accessibility (Sabol, 2008). With 5D examination, the items in a 3D configuration are
connected to value records for various materials. The benefits of having BIM at this stage will
also provide an easier exploration of different design options and concepts especially during
the Value Management session and assists the Ministry in making appropriate financial
planning.
The following BIM capabilities in Planning process was Phase Planning. For a non-
technical person, Phase Planning through a developed model would give a clearer picture of
the project milestones and easier for them to understand the phasing of the construction plans.
A 4D model is utilized to effectively plan the phased occupancy or to show the construction
sequence (Messner, 2011) especially for the airport terminal redevelopment and upgrading
works.
As stated in the literature review, Site Analysis is used to calculate decision making and
determine if potential sites meet the required criteria according to project requirements,
technical factors, and financial factors to produce a strategic development planning. Design
Reviews will give the opportunities to the project team to get immediate response on the
requirements, the commercial property fit-out design or space aesthetics (Rydén, 2013). The
results of this study also support the literature review that strategic planning for the passenger
flow Modeling especially for live and busy airports can be produced through BIM capabilities
of Existing Condition Modeling.
Execution Phase
According to Aranda et al. (2009), the capabilities of BIM to reduce a lot of rework
activities is the biggest contribution during construction. Usually, during the execution of the
project, lack of understanding in design, language barriers, coordination problems at site that
involves many disciplines, is one of the top causes of incompatibility. Failure to manage these
issues will result in too many Requests for information (RFIs) which come together with the
increase in cost and time than the initially planned budgets (Khemlani, 2006). BIM
capabilities of 3D Coordination occupy the top list in the Execution process, acts as an
unparalleled tool for coordination and clash detection between components of various
disciplines. After clash reporting, resolutions are applied on to the model to generate a
practically clash free model. Once the model is deemed clash free, the shop drawings and
various information are extracted and the model is made available to different stakeholders
for a better understanding of how execution is to be carried out (Azhar et al., 2007).
The 3D model with the accurate information of the current conditions of the physical
characteristics and obstacle surfaces (Existing Condition Modeling capability) within the
airport boundary will facilitate the constructors to comply with the airport’s standards set by
Annex 14 (ICAO, 2013).

16
MCRJ Special Issue Vol. 12 | No. 1 | 2021
The most important first step of any field layout is establishing control. Control is the
alignment of at least two points in the virtual world with the corresponding points in the
physical world. When control is acquired, all future points can be shot and collected relative
to those control points. BIM with the 3D Control Planning capability will be able to reduce
the numbers of errors in the layout by integrate it with the real-time (satellite) technology.
Spatial programming in Execution process is to consistently evaluate the progress of the
designs related to space as required by the airport operator as the end-user for terminal
building's requirements such as the segregation between international and domestic area,
departure and arrival, etc., throughout each of the design phases and throughout construction.
The BIM capabilities of spatial Programming ensures that the project is meeting the gross
square footage set by the airport regulator. Budget and schedule overruns are a big number of
construction projects. Within a virtual design and construction working environment, BIM
can be described as a convenient tool that takes advantage of improved team coordination and
visualization tools to associate detailed time and cost values with each component of a 5D
building model. BIM developed cost estimate are capable of tracks budget and schedule
monitoring throughout the project (Jrade & Lessard, 2015).
Design authoring is one of the essential BIM capabilities. Using a 3D model enable
transparency of design and improve communication for all stakeholders. Subsequently, a
decision can be made much faster and earlier in the Execution process before the exploration
costs too much time and money.
By the end of the construction phase, BIM Record Modeling will describe what has
actually been built with geometries and specifications branded (proprietary) wherever
appropriate (and as far as this is practical), and assembly drawings showing actual dimensions
and details rather than those in the contractual construction, that will definitely minimize
facility turnover dispute.
A local authority has a general duty to enforce the building regulations in its area.
Notwithstanding the possibility of enforcement action, if the local authority or approved
inspector considers that building work carried out does not comply with the building
regulations and it is not rectified, no completion/final certificate will be issued. Code
Validation could be used to make sure all necessary code is complying and reduce risks.
Phase Planning is an ongoing effort to manage the progress of a construction project and
react accordingly to the situation on the ground. By including schedule data, the model can
be used for 4D visualization (time is the fourth dimension). 4D models include planning data
such as the start and end date of a component and their criticality or slack. As a result, using
BIM for 4D visualization provides an intuitive interface for the project team and other
stakeholders to visualize the assembling of a building over time. Hence, during the Execution
process, project productivity can be increased and waste on job sites can be minimized.
Controlling and Monitoring Phase
Despite our efforts to plan exceptionally well, things may change or happen that cause
our projects to derail. Therefore, effective control and monitoring process in overall project
management is essential. It is during this process that we keep abreast of project progress, the

17
MCRJ Special Issue Vol. 12 | No. 1 | 2021
quality of our efforts, identifying deviations, determining necessary corrective action and
implementing those corrective actions (PMI, 2017). Every stakeholder has different needs and
goals. Therefore, it is important to understand how their needs and goals can impact and
influence the direction of the project.
Airport’s project is widely recognized as an information-intensive and complex industry
(Wells & Young, 2004). The proliferation towards multi-participant has heightened the need
for an effective and efficient evaluation and monitoring by stakeholders. A persistent problem
in construction has been in documenting changes, which occur in the field, and preparing the
as-built drawings (Memon et al., 2006). BIM with 3D Coordination is capable to produce
more accurate as-built drawings and offers a potential solution.
Variation Order (VO) or changes in scope are very likely in many construction projects.
Those changes can be of different nature and may include additional works, changing material
specifications, changing working conditions, design changes before, during and even after
work execution. It is essential for the entire project team to know exactly what the scope of
work and the requirements are (Eastman et al., 2008). BIM capabilities of Cost Estimation
during Control & Monitoring Process can provide cost information that the project team needs
to control during the project implementation. By doing this, it can also avoid scope creep and
the project will be properly managed and organized.
Existing Condition Modeling during Control & Monitoring Process can verify project
status with quantity information whether the project activities are implemented according to
plans, and whether the means of observation are used in a correct and efficient manner. The
system will supply project management with a continuous flow of information throughout the
project for monitoring and reporting.
Design Authoring in Control & Monitoring process used 3D software to ensure that the
building’s design is compliance with the requirements and was included the key important
criteria that were translated from the developed model. Design Authoring connects 3D model
with a powerful database of properties, quantities, means, and methods so that the project will
have better control over the quality of the design, cost, and schedule.
A 3D As-Built Model is a combination of 3D models from various project disciplines that
when merged represent an accurate picture of the constructed facility and its assets. A Record
Model is a step further; as 3D As-Built Model that has information embedded into the model
geometry such as warranty, Ownership & Maintenance manuals, training videos, etc.
Structure in the civil point of view is very important to be in proper design and detailing
so that maximum benefit can be achieved by the people. For example, a hangar is a place
where the aircraft can be taken care, proper management and enhancement in the
manufacturing parts can be made. Hence, hangars should be designed keeping in mind the
future point of view. BIM can provide a single building information model for both the
analysis and the documentation phases, contributing to better coordination between the
Structural Analysis results and the overall design, increasing consistency throughout the entire
project.

18
MCRJ Special Issue Vol. 12 | No. 1 | 2021
BIM capabilities of Site Utilization Planning will provide a proper decision-making
process for determining the location of temporary facilities (i.e., lay down areas, unloading
areas, material paths, staging areas, personnel paths, storage areas, prefabrication areas etc.)
within the boundary of airport construction site, identifying spatial relationships and
developing best alternative solutions so that the efficiency of the construction process is
improved over the project life cycle (Whitman, 2014).
Closure Phase
Maintenance Scheduling scored the highest rank of BIM capabilities during the Closure
process. As stated in the literature review, Maintenance Scheduling is a procedure to ensure
information on the use of building structures (passenger loading bridges, hangars, etc.) and
equipment in the building (generator set, instrument landing system, etc.) are maintained in
an efficient and well-organized manner (McCuen & Pittenger, 2016). This BIM's capability
will be able to reduce corrective maintenance by airport operator (MAHB) as well as
emergency maintenance repairs such as potholes on the runway and the track maintenance
history.
Asset Management through BIM technology is connected to a record model to
proficiently help in the operation and maintenance of airport’s facility, comprising of the
physical building, surrounding environment and equipment which capable for monitoring the
performance in the most cost-effective manner.
Airports, as well as other governmental entities, usually are required to take the lowest
bid when procuring assets. This approach tends not to take into consideration the life-cycle
costs, such as the operation and maintenance (O&M) costs, which can result in higher than
anticipated costs from the O&M budget. Taking a life-cycle approach, the capability of BIM
to provide the 5D analysis (Cost estimation) can precisely quantify modelled materials of life-
cycle cost and ensure more fiscally responsible use of funds.
Instead of having information and benefits in a set of as-built plans, Existing Condition
Modeling provide more data about the property is captured, resulting in more detailed plans.
Whether it is for greenfield airport or an upgrading project, by providing the most detailed
view possible of a particular structure and property such as the locations of electrical and data
outlets, ductwork, and sprinkler lines, the Existing Condition Modeling during the Closure
Process will be able to visualize current and future facility status and plans.
Space Management will provide guidance for the preparation of airport master plans that
range in size and function from small general aviation to large commercial service facilities
and planning airport facilities that accommodate general aviation aircraft. The guidance is
designed to help airport practitioners plan flexible and cost-effective facilities that are
responsive to industry needs. The record model contains information relating to the main
architectural, structural, and MEP elements. Extra data including documentation of
environment, equipment and space planning system will be fundamental when MOT and
MAHB expect to use in the future (McCuen & Pittenger).

19
MCRJ Special Issue Vol. 12 | No. 1 | 2021
Development of BIM Capabilities Model
The model was presented in clockwise representation to reflect a life cycle, starting from
the process of Initiation, Planning, Execution, Control & Monitoring and Closure. This model
had been presented to the Head of BIM Unit, PWD as an expert and BIM practitioner. The
goal of model verification is to make the model useful in the sense that the model addresses
the right issues, provides accurate information about the system being modelled, and to makes
the model used. As such, the final BIM capabilities Model for Airport’s Project Management
that has been confirmed and verified was shown in the figure below. This model will be able
to facilitate stakeholders in understanding BIM capabilities and giving added value to the
management of airports project in Malaysia.
Figure 3. BIM Capabilities Model for Airport Project Management.
CONCLUSION
This study is expected to produce the significant BIM's capabilities model for airport
project management, which can be used as a platform to increase the understanding and
knowledge about BIM, to create awareness among airport stakeholders, especially MOT and
also to the other local construction industry players by promoting the potential capabilities of
BIM technology in airport projects. By exploring the potential of BIM’s adoption in this
sector, it is not only can benefit in terms of project management practices, but a transformed
in ways of managing airport projects will enable the government to strengthen its fiscal
position by both enhancing revenue and reducing cost of capital expenditure. Most likely, the
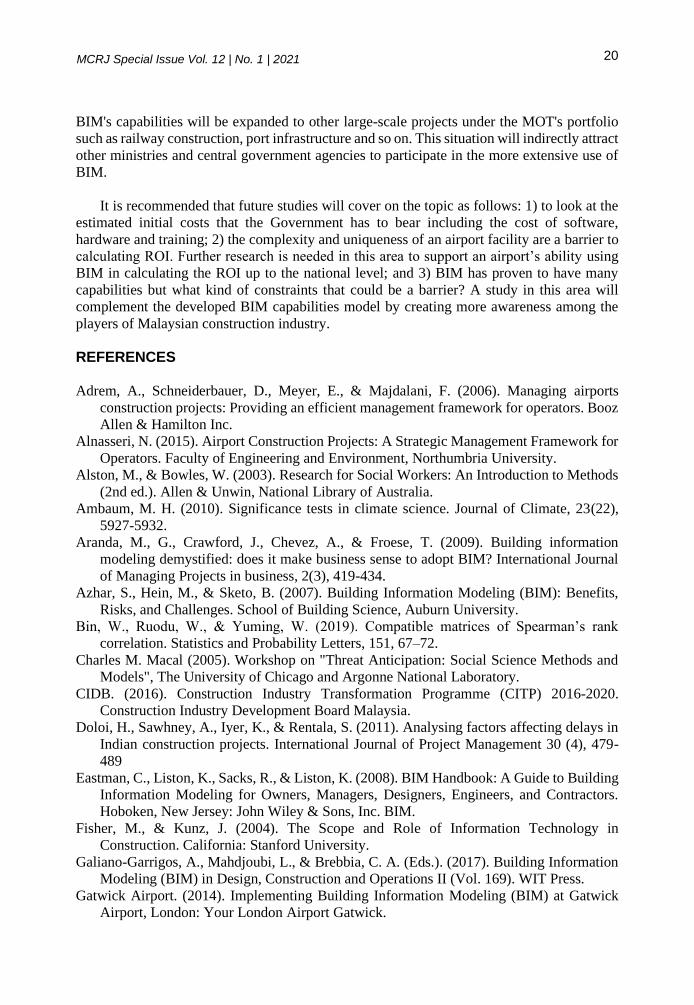
20
MCRJ Special Issue Vol. 12 | No. 1 | 2021
BIM's capabilities will be expanded to other large-scale projects under the MOT's portfolio
such as railway construction, port infrastructure and so on. This situation will indirectly attract
other ministries and central government agencies to participate in the more extensive use of
BIM.
It is recommended that future studies will cover on the topic as follows: 1) to look at the
estimated initial costs that the Government has to bear including the cost of software,
hardware and training; 2) the complexity and uniqueness of an airport facility are a barrier to
calculating ROI. Further research is needed in this area to support an airport’s ability using
BIM in calculating the ROI up to the national level; and 3) BIM has proven to have many
capabilities but what kind of constraints that could be a barrier? A study in this area will
complement the developed BIM capabilities model by creating more awareness among the
players of Malaysian construction industry.
REFERENCES
Adrem, A., Schneiderbauer, D., Meyer, E., & Majdalani, F. (2006). Managing airports
construction projects: Providing an efficient management framework for operators. Booz
Allen & Hamilton Inc.
Alnasseri, N. (2015). Airport Construction Projects: A Strategic Management Framework for
Operators. Faculty of Engineering and Environment, Northumbria University.
Alston, M., & Bowles, W. (2003). Research for Social Workers: An Introduction to Methods
(2nd ed.). Allen & Unwin, National Library of Australia.
Ambaum, M. H. (2010). Significance tests in climate science. Journal of Climate, 23(22),
5927-5932.
Aranda, M., G., Crawford, J., Chevez, A., & Froese, T. (2009). Building information
modeling demystified: does it make business sense to adopt BIM? International Journal
of Managing Projects in business, 2(3), 419-434.
Azhar, S., Hein, M., & Sketo, B. (2007). Building Information Modeling (BIM): Benefits,
Risks, and Challenges. School of Building Science, Auburn University.
Bin, W., Ruodu, W., & Yuming, W. (2019). Compatible matrices of Spearman’s rank
correlation. Statistics and Probability Letters, 151, 67–72.
Charles M. Macal (2005). Workshop on "Threat Anticipation: Social Science Methods and
Models", The University of Chicago and Argonne National Laboratory.
CIDB. (2016). Construction Industry Transformation Programme (CITP) 2016-2020.
Construction Industry Development Board Malaysia.
Doloi, H., Sawhney, A., Iyer, K., & Rentala, S. (2011). Analysing factors affecting delays in
Indian construction projects. International Journal of Project Management 30 (4), 479-
489
Eastman, C., Liston, K., Sacks, R., & Liston, K. (2008). BIM Handbook: A Guide to Building
Information Modeling for Owners, Managers, Designers, Engineers, and Contractors.
Hoboken, New Jersey: John Wiley & Sons, Inc. BIM.
Fisher, M., & Kunz, J. (2004). The Scope and Role of Information Technology in
Construction. California: Stanford University.
Galiano-Garrigos, A., Mahdjoubi, L., & Brebbia, C. A. (Eds.). (2017). Building Information
Modeling (BIM) in Design, Construction and Operations II (Vol. 169). WIT Press.
Gatwick Airport. (2014). Implementing Building Information Modeling (BIM) at Gatwick
Airport, London: Your London Airport Gatwick.

21
MCRJ Special Issue Vol. 12 | No. 1 | 2021
George, D., & Mallery, M. (2010). Using SPSS for Windows step by step: a simple guide and
reference.
Huang, W.-J., Xiao, H., & Wang, S. (2018). Airports as liminal space. Annals of Tourism
Research, 70(November 2017), 1–13.
ICAO. (2013). International Standards and Recommended Practices Chapter 1. Definitions,
(Cc), 1–260.
Johnson, J. W., & LeBreton, J. M. (2004). History and use of relative importance indices in
organizational research. Organizational Research Methods, 7(3), 238–257.
Jrade, A., & Lessard, J. (2015). An Integrated BIM System to Track the Time and Cost of
Construction Projects: A Case Study. Journal of Construction Engineering, 2015, 1–10.
Karim, M. R., Parikesit, D., Narupiti, S., & Kushari, B. (2003). Airport Development in
Southeast Asia – Case Study of Malaysia and Thailand. Journal of the Eastern Asia
Society for Transportation Studies, 5(January), 484–498.
Khemlani, L. (2006). Use of BIM By Facility Owners: An ‘Expositions’ Meeting. Aecbytes
Building the Future.
Klopper, R., Lubbe, S., & Rugbeer, H. (2007). The Matrix Method of literature review.
Alternation, 14(1), 262–276.
Latiffi, A. A., Brahim, J., Mohd, S., & Fathi, S. F. (2014). The Malaysian Government's
Initiatives in using Building Information Modeling (BIM) in Construction Projects.
Sustainable Solutions in Structural Engineering and Construction, (Cream), 767–772.
McCuen, T. L., & Pittenger, D. M. (2016). Building Information Modeling for Airports.
Transportation Research Board. The National Academies of Sciences, Engineering,
Medicine.
Memon, Z. A., Zaimi, M., Majid, A., Yusoff, N. I., & Mustaffar, M. (2006). Systematic
Approach for Developing As-built Schedule for Construction Project. Jurnal
Kejuruteraan, 135–146.
Messner, J. (2011). National BIM Standard-United States®: The Development, Application,
and Vision.
Odeh, A. M., & Battaineh, H. T. (2002). Causes of construction delay: traditional contracts.
International Journal of Project Management 20 (1), 67-73.
PMI. (2017). A Guide to The Project Management Body of Knowledge (PMBOK) (6th ed.).
Newtown Square, Pennsylvania: Project Management Institute, Inc.
Redwood, J., Thelning, S., Elmualim, A., & Pullen, S. (2017). The Proliferation of ICT and
Digital Technology Systems and their Influence on the Dynamic Capabilities of
Construction Firms. Procedia Engineering, 180, 804–811.
Rydén, J. (2013). BIM in Project Management. Retrieved from https://lup.lub.lu.se/student-
papers/search/publication/3990825
Sabol, L. (2008). Challenges in Cost Estimating with Building Information Modeling.
Washington DC: Design and Construction Strategies.
Somiah, M. K., Osei-Poku, G., & Aidoo, I. (2015). Relative Importance Analysis of Factors
Influencing Unauthorized Siting of Residential Buildings in the Sekondi-Takoradi
Metropolis of Ghana. Journal of Building Construction and Planning Research, 03(03),
117–126.
Syazwina, F. (2017). Unmanned Aerial Vehicle (UAV) Capabilities in Construction Project
Management Life Cycle, Kuala Lumpur: University of Malaya.
Talebi, S. (2014). Rethinking the project Development Process Through the Use of BIM. 2nd
BIM International Conference on Challenges to Overcome, 1–19.

22
MCRJ Special Issue Vol. 12 | No. 1 | 2021
Tladi, K. (2012). Evaluating the Facility Manager’s Role in Project Design. University of the
Witwatersrand, Johannesburg.
Umar, A. A., Khamidi, M. F., Idrus, A., & Wan Abdullah Zawawi, N. (2012). Assessing the
Perceptions of Regional Stakeholders on Benefits of PFI for Infrastructure Provision.
Paper presented at the 2nd International Conference on Business and Economics Research
Phnom Penh, Cambodia.
Viscuso, S., Talamo, C., Zanelli, A., & Arlati, E. (2020). BIM Management Guidelines of the
Construction Process for General Contractors. In Digital Transformation of the Design,
Construction and Management Processes of the Built Environment (pp. 189-199).
Springer, Cham.
Wells, A. T., & Young, S. (2004). Airport Planning & Management, 5th Edition.
Whitman, J. B. (2014). Construction Site Utilization Planning Best Practices, 1–191.
Yang, J.-B., & Wei, P.-R. (2010). Causes of Delay in the Planning and Design Phases for
Construction Projects. Journal of Architectural Engineering, 80- 83.
Zainon, N., Mohd-Rahim, F. A., & Salleh, H. (2016). The Rise of BIM in Malaysia and Its
Impact on Quantity Surveying Practices. MATEC Web of Conferences, 66, 00060.

23
MCRJ Special Issue Vol. 12 | No. 1 | 2021
BUILDING INFORMATION MODELING – UTILIZATION IN QS CONSULTANT FIRMS AND COMPETENCY REQUIREMENTS OF QS GRADUATES Nurulhuda Hashim, Yap Foong Mei, Myzatul Aishah Kamarazaly, Shirley Chin Ai Ling, Azrina Md Yaakop and Loo Seong King School of Architecture, Building & Design (SABD), Taylor’s University, Subang Jaya, Malaysia.
Abstract At different phases of a facility, BIM allows collaboration by different professionals in a project team to insert, extract, update and modify information. Quantity Surveying (QS) consultants are using BIM due to its’ efficient and effective quantity take-off feature especially in Glodon TAS and Glodon TRB as these BIM software are using the standard of measurement method 2 (SMM2). In this study, the utilization of BIM in QS consultant firms and the competency required of QS graduates specifically in BIM were identified and analysed through qualitative method by interviewing few QS consultant employers. The findings of this thesis showed that BIM allows QS consultants to visualize the building in 3D and obtain accurate quantity in a shorter time. In order to achieve the BIM work outputs, Quantity Surveyors (QSs) need to be equipped with some competencies related to BIM. QS graduates were expected to have basic level of BIM skills and employers would also like to see other technical competencies in today’s QS graduates. Keywords: Building Information Modeling (BIM); Quantity Surveyor (QSs); Utilization of BIM;
competency.
INTRODUCTION
Since it was first introduced about 15 years ago, BIM has revolutionized the construction
industry by allowing industry players to collaborate closely not only with each other but with
the building being designed. This BIM capability has helped boost the extensiveness and
intensiveness of their actions that has led to a much more comprehensive management of the
whole life value of a building asset. With such features, members working with BIM can
coordinate and integrate their work and harness on the combined efforts of individuals,
technology, and method (Furneaux & Kivit, 2008). Olanrewajuna and Anahve (2015). This
further explained how QSs need to handle price management, acquisition, and written
agreement problems within the supply chain and marketplace. Moreover, QSs also monitor
and update initial estimates and manage the contractual obligations of respective parties as
construction work progresses which usually will be plagued with many variations and
contractual claims. BIM’s auto computation feature helps to provide dependable and correct
quantities and price estimation updates which reduces human errors (Ashworth, Hogg, &
Higgs, 2013). Ashworth and Hogg (2007) identified that economic, legal, technological and
managerial are the major QSs’ talents required. These talents allow QSs to forecast, analyse,
plan, control and account a construction project (RICS, 1971). Many other studies done in
recent years show that information technology competency is the most significant skill to a
QSs. Therefore, the employer would like to employ graduates with technical skills,
information skills, and interpersonal skills which can be learned at academic institutions
(Chan et al., 2002).
According to CIDB report 2016, the BIM adoption rate in QS firm is only 12%. This
finding highlights the crucial role of QS fresh graduates to prepare themselves with learning

24
MCRJ Special Issue Vol. 12 | No. 1 | 2021
BIM in their degree course before they begin employment because BIM competency will be
one of the competencies employers hope to see (CIDB Malaysia, 2017). Incompetency and
ineffective collaboration within BIM team have caused the low adoption of BIM in Malaysia
(Ali et al., 2016). In the research study by Ismail, Adnan and Bakhary (2019), among 202
QSs, only 23.3% have implemented BIM software, 68.3% were aware of BIM usage but have
not implemented and another 9.4% are not aware of BIM. Through that, they concluded low
adoption of BIM and its slow development in Malaysia can lead to low awareness level among
construction players.
This research aims to help the current QS graduates prepare for the skills and
competencies that are required by employers in QS consultant firms. BIM is also becoming
more popular in Malaysia and it is expected that more QSs will want to implement BIM in
their consultant firm especially in the next 5 years. Data for this research will be collected
through qualitative method. The employers from QS consultant firms will be invited for an
interview and their perspectives on the extent of BIM utilization in QS consultant firms and
the competency requirement of QS graduates will be collected too. The objectives of this
research are:
i. To identify the utilization of BIM in Quantity Surveying consultant firms.
ii. To identify the required competency of QS graduates in QS consultant firms specially
in BIM competency.
OVERVIEW OF BIM
Analysis of BIM
BIM is a well-known Modeling technology that can produce, communicate and analyse
digital information throughout a project life cycle (CIDB, 2014). Based on the Cambridge
Centre for Housing and Planning Research, project members can collaborate, share data and
make decisions in a construction project (Goubau, 2019). At different phases of a facility, the
different team players can import, extract, update and change the information of building by
using BIM (Azhar et al., 2015). Hardin (2009) stated that BIM improves the collaborative-
process of architectural and structural work. BIM can be integrated with other “third party
software” for simulation such as light analysis (Eastman et al., 2011).
Functions of BIM
At the pre-design stage, BIM enables ease of communication and collaboration with the
client's demands for space allocation. BIM eases project feasibility study and develop more
reliable cost plan in providing maximum value for clients.
During the tender document stage, QSs are mandated to manage the financial and
contractual documents and they can collect data through documentation and statistic assigned
to the information via BIM. This helps reduce errors in estimation and further facilitates by
having standard data feature, so the users can search and extract data straightaway from the
Modeling (Azhar et al., 2015). The QSs can detect clashes during quantity take-off when
several models are integrated into one main BIM model. Besides that, Bill of Quantities (BQ)
can be generated via BIM as it is using standard method of measurement.

25
MCRJ Special Issue Vol. 12 | No. 1 | 2021
In the design phase, BIM improves the efficiency and effectiveness of project-related
decision making by obtaining critical information related to design and geometry. QSs can
visualize the different project details and thus it is easy to detect and resolve the problems of
the project. BIM can easily detect the clashes and make a change on the design immediately.
3D Modeling allows users to add detail that makes the model to closely mimic the completed
structure (Zainon et al., 2016).
During the construction phase, information on building quality (specifications), project
agenda and project value are available concurrently with the implementation of BIM. Thus,
QSs can make necessary changes to the initial cost estimate plan and construction planning
(Zainon et al., 2016).
Benefits of BIM
According to McKinsey’s report, 75% of consultant firms gained some benefits like
shorter construction periods and lower material costs after adopting BIM (Agarwal et al.,
2016). Laiserin (2002) mentioned that high quality of work, great speed and productivity and
low cost of a development project can be achieved by implementing BIM. The BIM feature
of visualization reduces information loss especially when the project is required to be passed
to another team because it allows the project team members to communicate through and
gather detailed information to/from the BIM model (Eastman, 2009). Besides that, with BIM,
design and documentation can proceed concurrently and this leads to greater speed. The BIM
feature of 5D can automatically (with minimal manual input) generate BQ which helps to get
rid of the long and troublesome traditional taking off method and so minimize human errors.
Not only that, but QSs can also easily identify and relate how the total project cost are broken
down into each building element or space as BIM improves the identification of the quantity
relationship versus locations and costs. BIM enables the project team to efficiently execute
value management with integrated cost estimation during the design phase.
BIM Competencies
Individual BIM competencies are when an individual who apply his/her traits,
professional expertise and technical skills in construction works with the implementation of
BIM (Succar et al., 2012). BIM competencies can be gained through tertiary education, part-
time working, and seminar organized by professionals. Taiebat and Ku (2010) declare
individuals with a deep conceptual knowledge of BIM are more appreciated by employers as
compared to those with only BIM application skills.
Based on the explanation of Hussin and Omran (2009), QSs are responsible to plan and
control project costs and decide on the procedures of management and some related technical
materials and equipment. Therefore, they must have at least the basic managerial and technical
competency. Role of a QS is critical as the QS must perform cost planning, controlling and
analysing, value management, conceptual studies, and lastly cost evaluation as well as handle
the information in a project team which includes developer, architect, contractor, and others.
Thus, administration, operation, and functional competency are critical competencies to a QS.
Besides that, RICS (2018) has also defined employability skills through the Assessment
of Professional Competences (APC) pathway of competencies domain and categorized into

26
MCRJ Special Issue Vol. 12 | No. 1 | 2021
mandatory, core and optional. In mandatory competencies, there are ethics, rules of conduct
and professionalism, client care, communication and negotiation as well as diversity,
inclusion and teamworking. While contract practice, construction technology and
environmental services, procurement and tendering, quantification and costing of
construction works are under the category of core competencies. BIM management, contract
administration, risk management and due diligent are categorised as optional competency.
Different employer would have different opinions on the competency required of QS fresh
graduate, depending on the needs of QS works.
Competency Level
Individual Competency Index (ICI) is a performance model to measure the competency
level and promoted by Benner (Dwivedi et al., 2011).
Table 1. ICT Competency Level Level Description
Level 1 (Basic) An understanding of fundamentals and some initial practical application
Level 2 (Intermediate) A solid conceptual understanding and some practical application
Level 3 (Advanced) Significant conceptual knowledge and practical experience in performing a competency to a consistently high standard
Level 4 (Expert) Extensive knowledge, refined skill and prolonged experience in performing a defined competency at the highest standard
RESEARCH METHODOLOGY
Sampling and Limitation
Qualitative method (interview) was adopted as the research technique in this research. By
having an interview, the researcher can find out in more details the extent of BIM utilization
in QS consultant firms and the competency that employers expect from the fresh graduates.
The sampling techniques were a mix of judgment and snowball selection. Content analysis
was chosen to determine the existence of certain phrases or concepts within the answer given
by the respondents. Evaluation of content is divided into two general categories: abstract and
relational evaluation. This study used data display, codes identify, information reduction,
code count frequency and related categories. This is a manual analysis to be grasped in order
to contribute to qualitative analysis of code. The participants that were chosen were
specifically selected according to the following criteria:
• QS working in a QS Consultant firm
• Employer (Principal/Owner) of QS consultant firm
• QS who implement BIM in a consultant firm
• Minimum 5 years of experience
• QS firms that engage interns and fresh graduates
Demographic Profile
The respondents identified have more than 7 years’ working experience and they were
from QS consultant firms. Therefore, they can share their experiences on their implementation
of BIM and perspectives on employability requirements. All the respondents have
implemented BIM for at least 5 years. Respondents' profile is the analysis in Table 2.

27
MCRJ Special Issue Vol. 12 | No. 1 | 2021
Table 2. Demographic Profile Respondent
No. Years of
Experience Type of Projects
Value of Project (RM)
Years of BIM Experience
R1 8 Commercial, Residential, Industrial 200 million – 350 million
6
R2 30 Commercial, Residential 100 thousand – 200 million
8
R3 23 Commercial, Residential, Industrial, Infrastructure, Public Work
10 million – 400 million
6
R4 20 Commercial, Residential 10 million – 300 million
5
Research Framework
Table 3. Dependent and Independent Variables
Independent Variables Dependent Variables
• BIM Software • Utilization of BIM in QS Consultant Firm
• BIM Functions
• BIM Benefits
• BIM Competencies • Competency Requirement of QS Graduates
ANALYSES OF BIM UTILIZATION
Analysis on The Utilization of BIM In Consultant Firm
Respondents who have contributed their experience to the utilization of BIM in their
consultant firm via semi-structured interviews are categorized as in Table 3.
Table 4. Coding for Objective 1
Category Themes Subthemes
BIM Utilisation 1. Reason of using BIM a. Future construction industry b. Measurement
2. Construction Stages a. Every stage b. Tender documentation stage
3. BIM software a. Glodon TAS b. Glodon TRB c. Revit
4. Functions of BIM a. Modeling b. Coordination c. Clash analysis d. Quantity takes off e. BQ preparation f. Tendering process
5. Benefits of BIM a. Time saving b. Accuracy c. 3D representation
6. Ways to monitor BIM works a. Cloud based software b. Bulk check
Reason for Using BIM
R1 explained that he started implementing BIM due to future construction industry. He
believes BIM has a significant impact on the construction industry. The other respondents
(R2, R3, and R4) started using BIM because Glodon approached them and BIM can do
measurement very fast.

28
MCRJ Special Issue Vol. 12 | No. 1 | 2021
Figure 1. Reason for Using BIM
All respondents except R3 utilize BIM in every stage while R3 mentioned they use BIM
for BQ preparation in tender documentation stage only. R2 uses BIM in the beginning and
slowly develops to the BQ. R4 stated that they use BIM in the pre-tender stage because they
can amend the cost estimation based on the changes of drawings and don't need to rush
through when producing BQ. While R1 stated the reason for using BIM in the construction
stage is BIM allows them to know more details about the building such as maintenance period,
service centre and cost of maintenance.
Type of BIM Software
Respondents (R2, R3, and R4) use Glodon TAS and TRB for measuring the architectural,
structural and reinforcement bar. R4 mentioned BIM is more effective than measuring
manually. This software allows quick quantity take-off. R1 is using Revit which allows
architects, engineers, QSs, and clients to bring their concept to life. Revit offers a brilliant
model-based technique to plan, design and construct infrastructure and buildings. R1 uses
Glodon TAS and TRB in the past. The difference between these BIM is a Revit model can
integrate with other software for simulation or different analyses.
Figure 2. Types of BIM Software
Functions of BIM
R1 used BIM for different purposes compared to other respondents. R1's focus is
modeling, coordination and clashes analysis because they are responsible to measure
mechanical and electrical work. Other respondents are mainly using BIM for the preparation
of BQ and quantity take-off. Glodon can generate BQ using a standard method of
measurement so it greatly helps the QS consultant in measurement.

29
MCRJ Special Issue Vol. 12 | No. 1 | 2021
Figure 3. Functions of BIM
Benefits of Using BIM
R1, R3, and R4 state BIM can speed up the production of BQ and other documents. Apart
from R3, the other respondents agreed that BIM produces accurate data, to the extent that R2
is confident to meet his client and can give assurance to the clients on the accuracy of quantity.
Next, R2 and R3 highlighted another benefit of BIM is the 3D representation of measurement.
It helps in bulk checking and able to capture 90% of the building.
Figure 4. Benefits of BIM
Ways to Monitor BIM Works
By monitoring the quality of BIM works, R1 stated that he uses a cloud-based software
called Autodesk 360. He mentioned it is important to keep, share and manage the information
of BIM. As for the other respondents, their usual practice is doing a bulk check after finishing
modeling in BIM, to ensure quantities are correct and accurate.
Figure 5. Ways to Monitor BIM Works
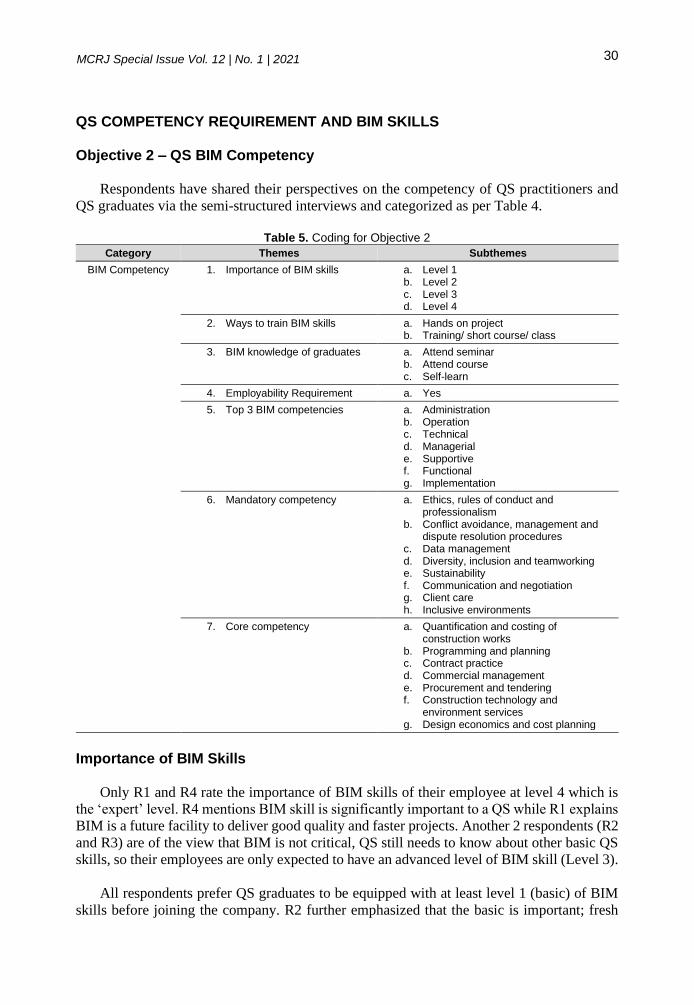
30
MCRJ Special Issue Vol. 12 | No. 1 | 2021
QS COMPETENCY REQUIREMENT AND BIM SKILLS
Objective 2 – QS BIM Competency
Respondents have shared their perspectives on the competency of QS practitioners and
QS graduates via the semi-structured interviews and categorized as per Table 4.
Table 5. Coding for Objective 2
Category Themes Subthemes
BIM Competency 1. Importance of BIM skills a. Level 1 b. Level 2 c. Level 3 d. Level 4
2. Ways to train BIM skills a. Hands on project b. Training/ short course/ class
3. BIM knowledge of graduates a. Attend seminar b. Attend course c. Self-learn
4. Employability Requirement a. Yes
5. Top 3 BIM competencies a. Administration b. Operation c. Technical d. Managerial e. Supportive f. Functional g. Implementation
6. Mandatory competency a. Ethics, rules of conduct and professionalism
b. Conflict avoidance, management and dispute resolution procedures
c. Data management d. Diversity, inclusion and teamworking e. Sustainability f. Communication and negotiation g. Client care h. Inclusive environments
7. Core competency a. Quantification and costing of construction works
b. Programming and planning c. Contract practice d. Commercial management e. Procurement and tendering f. Construction technology and
environment services g. Design economics and cost planning
Importance of BIM Skills
Only R1 and R4 rate the importance of BIM skills of their employee at level 4 which is
the ‘expert’ level. R4 mentions BIM skill is significantly important to a QS while R1 explains
BIM is a future facility to deliver good quality and faster projects. Another 2 respondents (R2
and R3) are of the view that BIM is not critical, QS still needs to know about other basic QS
skills, so their employees are only expected to have an advanced level of BIM skill (Level 3).
All respondents prefer QS graduates to be equipped with at least level 1 (basic) of BIM
skills before joining the company. R2 further emphasized that the basic is important; fresh

31
MCRJ Special Issue Vol. 12 | No. 1 | 2021
graduates must know how to use BIM software and what they can do with BIM. R1 mentioned
this because due to the advancement in technology, fresh graduates need to keep improving
and learn new things. If not, they will be outdated.
Figure 6. Importance of BIM Skills
Ways to Train BIM Skills
R1, R3, and R4 will train the new employees who lack of BIM skills by giving them some
projects, to use BIM from basic like structural and architectural. Besides that, except for R1,
other respondents are willing to send their employees for short courses organized by Glodon.
Figure 7. Ways to Train BIM Skills
BIM Knowledge of Graduates
When BIM has an update, the respondents except R2 will send their new employees to
the courses provided by BIM like Glodon. R1 mentioned he allocates funds for employees’
development. Besides that, R2 and R3 will assign experienced employees in their firm to take
charge of BIM updates. He or she will be responsible to learn the new features of BIM and
communicate issues on BIM usage with the BIM expert to reduce miscommunication.
Furthermore, R1 suggested that he would also send his new employees to a seminar organized
by Building Smart, PAM or others if he thinks it is suitable and useful, so they will be updated
with the new technology, features, and knowledge.
All 4 respondents mentioned they will consider employing fresh graduates with very basic
BIM knowledge. R2 explained he appreciates the fact that we cannot learn everything in
school/university as most learning process will be from the industry, thus why he will give
them an opportunity. While R3 stated that it is important that fresh graduates are willing to
learn and have a coachable attitude.

32
MCRJ Special Issue Vol. 12 | No. 1 | 2021
Figure 8. BIM Knowledge of QS Graduates
Competencies Requirement of QS Graduates
R1 and R2 pick administration because QS needs to be very organized. QS must deal with
client, architects, contractors, and others, and he/she must manage the massive amount of
information produced by them. R1 and R4 think the operation is important because QS needs
to deal with contractors. Next, all respondents except R2 choose technical competency
because they expect the graduates' foundation of measurement must be good and whether the
graduates are competent to use BIM. While R2 would like to see managerial competence in
graduates because QS needs to be familiar with the price and able to generate costs quickly
by using BIM. R3 mentioned supportive competency is important as in how the graduates
deal with people. Furthermore, R2 and R3 think functional is one of the important
competencies they expect from the graduates. The ability to do a quick estimate during the
meeting with the designer. R4 expects graduates to have implementation competency because
the application of knowledge into work progress is very important.
Figure 9. Competencies Requirement of QS Graduates
QS Graduates Mandatory Competency Requirements
R1 prefers graduates with a good attitude and willingness to learn. However, he thinks
these mandatory competencies are the basis of a QS, so he said level 1 is enough. R2
mentioned ethics is very important (level 2) because a QS needs to be firm in their dealings
as well as honest. He added that communication is what the graduates are lacking now, they
are unable to communicate and deliver the message, idea or right information clearly and he
sometimes has difficulties in understanding them. R3 rated ethics, rules of conduct and
professionalism at the highest (level 4) compared to other competencies because honesty is
very critical when graduates start working. Besides that, he also rated diversity, inclusion and

33
MCRJ Special Issue Vol. 12 | No. 1 | 2021
teamwork, communication and negotiation, client care and inclusive environment at level 3.
R3 added he is not looking for independent people but a team player, so team working is very
important. R4 mentioned ethics, rules of conduct and professionalism are as important as
client care because they are employing graduates for the long term. Thus, the graduates must
act professional and secure the job given by the client to protect the reputation of their
company. R4 prefers graduates with an intermediate level of communication and negotiation.
Figure 10. Scale of Mandatory Competency of QS Graduates
R1 explained that he is not expecting the graduates to have other competencies besides
quantification and costing of construction work and programming planning because he started
working without those competencies, so he rates this at level 2. R2 mentioned graduates
should have an intermediate level of understanding contract. He ranks these competencies
level 2 because the graduates can learn it along when they start working.
From the figure 10 above, R3 is stricter with the core competency of graduates. He ranked
the contract practice, commercial management, and procurement and tendering at level 3 and
quantification and costing of construction works and construction technology and
environmental services at level 4. Similar to R2, R4 does not expect a high scale level of
competency from the graduates as he is willing to guide the graduates along the journey of
working so he gives a rank of level 2 for the competencies he thinks a graduate should have,
which are quantification and costing, contract practice, construction technology, and
environmental services and also design economics and cost planning.
QS Graduates Core Competency Requirements
For the core competency aspect, all respondents agreed that BIM skill requirement is only
at level 1 as they understand graduates would not have learnt the full outline of BIM in
university. Other than R1, other respondents have chosen contract administration as one of
the optional competencies. R2 and R4 rate the requirement for this competency at level 1 but
R3 is level 2. Although graduates need to produce contract documents, R2 and R4 explained
that graduates probably do not have many opportunities to prepare contract documents during
their internship, so they only expect the graduates to know the production of contract
documents theoretically.
Due diligence of a graduate is important to R3 and he justified a graduate need to do
double-checking when they finish the work. As QS work will be very hectic with
measurement especially before tendering, so the graduates must be responsible for their work.

34
MCRJ Special Issue Vol. 12 | No. 1 | 2021
R4 however expects graduates to have a basic understanding of construction and financial
risk and thus he picks risk management (level 1).
Figure 11. Scale of Core Competency of QS Graduates
FINDINGS AND CONTRIBUTION OF THE STUDY
Based on the input collected, all respondents started using BIM because of its’ efficient
and effective quantity take-off feature which can be used at every stage of construction.
Currently they are using Glodon TAS and TRB only because it is the only BIM that comply
with standard of measurement method 2 (SMM2). BIM allows QSs to visualize the building
in 3D and obtain accurate quantity in a shorter time. However, human errors do happen
sometimes, so they always do manual bulk checks to monitor the quality of BIM work output.
As all respondents have at least five years of BIM-related working experience and their
employees are expected to have level 3 or 4 of BIM skills. However, they are willing to hire
QS graduates with basic BIM skills. For the graduates, they are willing to train them by
attending short courses provided by BIM and giving hands-on project experience. Each
employer has different perspectives on the BIM competency of a QS due to their diverse
working experience. However, the result shows most of the employers expect the QS
graduates to have technical competency especially on using BIM software because they are
no longer doing measurement manually. The findings also show that ethics, rules of conduct,
professionalism, communication, and negotiation skills have higher ranking in mandatory
competency. The employers wish to hire QS graduates who are able to communicate, explain
and discuss their BIM works to the client. Quantification and costing of construction work
and contract practice is still the necessary core competencies of QS graduates as all the
respondents give a scale of 2.
In conclusion, currently, consultant firms mainly use BIM for quantity take-off and BQ
preparation. Malaysian construction industry has yet to take full advantage of BIM
capabilities which is expected to increase soon. By understanding the required BIM
competency of a QS, it helps the graduates to prepare themselves for future employment.
Future studies can be carried out by identifying the utilization of BIM in contractor firms
because it is noticeable that the BIM adoption rate in contractor firm in lower. BIM can be
very useful in contractor firms for clash analysis, coordination and facility management. It
will be interesting to know the reasons why contractors in Malaysia have not implemented
BIM widely in their organizations.

35
MCRJ Special Issue Vol. 12 | No. 1 | 2021
REFERENCES
Ali, K. N., Keat, Q. J., & Enegbuma, W. I. (2016) Building Information Modeling (BIM)
educational framework for quantity surveying students: the Malaysian
perspective. Journal of Information Technology in Construction, 21. pp. 140-151. ISSN
1874-4753
Ashworth, A. and Hogg, K., (2007). Willis’s practice and procedure for the quantity surveyor.
12th ed. UK: Blackwell Publishing
Ashworth, A., Hogg, K., & Higgs, C. (2013). Willis's Practice and Procedure for the Quantity
Surveyor. Hoboken, NJ: John Wiley & Sons.
Azhar, S. A., Khalfan, M., & Maqsood, T. (2015). Building information Modeling (BIM):
now and beyond. Construction Economics and Building, 12(4), 15-28.
Chan, E. H., Chan, M. W., Scott, D., & Chan, A. T. (2002). Educating the 21st Century
Construction Professionals. Journal of Professional Issues in Engineering Education and
Practice, 128(1), 44-51
CIDB (2016). BIM Training retrieved from http://www.bimcenter.com.my/.
CIDB Malaysia. (2017). Malaysia Building Information Modeling Report 2016. Kuala
Lumpur: Lembaga Pembangunan Industri Pembinaan Malaysia. Retrieved from
http://www.cidb.gov.my/images/content/penerbitan-IBS/BIM-REPORT.pdf
CIDB. (2014). Building Information Modeling Roadmap for Malaysia’s Construction
Industry, Workshop Report (Series 2). Construction Industry Development Board
Malaysia (CIDB), (2), 1–21
Dwivedi, Y. K., Wade, M. R., & Schneberger, S. L. (2011). Information Systems Theory:
Explaining and Predicting Our Digital Society. Berlin, Germany: Springer Science &
Business Media.
Eastman, C., Teicholz, P., Sacks, R. & Liston, K. (2011). BIM Handbook: A Guide to
Building Information Modeling for Owners, Managers, Designers, Engineers, And
Contractors Second Edition. New Jersey: John Wiley & Sons, Inc.
Furneaux, C., & Kivit, R. (2008). BIM: Implications for Government. CRC for Construction
Innovation. Brisbane Australia. Net Pty Ltd., pp. 10-31.
Goubau, T. (2019, July 5). What is BIM? What are its Benefits to the Construction Industry?
Retrieved from https://www.aproplan.com/blog/quality-management-plan-
construction/what-is-bim-what-are-its-benefits-to-the-construction-industry.
Hardin B. (2009). BIM and Construction Management: Proven Tools, Methods, and
Workflows. Indianapolis, Indiana: Wiley Publishing Inc.
Hussin, A. A., Omran. (2009). Roles of professionals in construction industry. The
International Conference on Economics and Administration, Faculty of Administration
and Business, University of Bucharest, Romania. Retrieved
http://www.itchannel.ro/faa/248_pdfsam_ICEA_FAA_2009.pdf
Ismail, N. A. A., Adnan, H., & Bakhary, N. A. (2019). Building Information Modeling (BIM)
Adoption by Quantity Surveyors: A Preliminary Survey from Malaysia. IOP Conference
Series: Earth and Environmental Science, 267, 052041. doi: 10.1088/1755-
1315/267/5/052041Nkado, R. and Meyer, T. (2001) ‘Competencies of professional
quantity surveyors: South African perspective’, Construction Management and
Economics, 19, 481-491
Laiserin, J. 2002. Comparing Pommes and Naranjas [online], [cited 13 November 2010].
Available from Internet: http://www.laiserin.com

36
MCRJ Special Issue Vol. 12 | No. 1 | 2021
Olanrewaju, A., & Anahve, P. J. (2015). Duties and Responsibilities of Quantity Surveyors
in the Procurement of Building Services Engineering. Procedia Engineering, 123, 352-
360.
RICS (1971) The future role of Quantity Surveyors, London: Royal Institution of Chartered
Surveyors
Succar, B., Sher, W., & Williams, A. (2012). Measuring BIM performance: Five
metrics. Architectural Engineering and Design Management, 8(2), 120-142.
Taiebat, M. & Ku, K., (2010). April. Industry's Expectations of Construction School
Graduates' BIM Skills. In Proceedings of ASC conference, Boston
Zainon, N., Mohd-Rahim, F. A., & Salleh, H. (2016). The Rise of BIM in Malaysia And Its
Impact Towards Quantity Surveying Practices. MATEC Web of Conferences, 66, 00060.

37
MCRJ Special Issue Vol. 12 | No. 1 | 2021
STRATEGIC PROCESS PROTOCOL FOR BUILDING INFORMATION MODELING (BIM) CONTRACT ADMINISTRATION IN MALAYSIA – A CONCEPT PAPER Sharifah Nur Aina Syed Alwee2, Hafez Salleh1 and Umi Kalsum Zulkifli1
1Project Management, Procurement & Economic Research Group, Centre for Building, Construction & Tropical Architecture (BuCTA), Faculty of Built Environment, University of Malaya, Kuala Lumpur, Malaysia. 2Centre of Studies for Quantity Surveying, Faculty of Architecture, Planning and Surveying, Universiti Teknologi MARA, Shah Alam, Selangor, Malaysia.
Abstract Building Information Modeling (BIM) in this age of digital construction is very well established as a technology to solve and encourage building stakeholders to address issues in the construction industry such as the disintegration of construction processes, weak project management, and issues relating to the project execution, such as delays and cost overruns. Nevertheless, many scholars have found that one of the main barriers in BIM adoption is the unresolved legal and contractual issues. Until today, the contractual requirements for BIM implementation is still unsettled to overcome interoperability issues in BIM processes, ownership of BIM data and models, unclear payment mechanism and the most crucial is the non-availability of BIM provisions in the standard forms of contract. This paper aims to propose a conceptual framework on the strategic process protocol for BIM contract administration in Malaysia. It reviewed the current literature and suggested the adoption of qualitative research as the strategy for the primary data collection. The proposed exploratory study aims to analyse the contractual issues and find solutions for improving the existing implementation. Findings from the literature conceptualise the importance of having the right contractual practice as one of the improvement pillars in BIM adoption. It is hoped that the study will contribute to a new knowledge of BIM contract administration in project management and construction studies, increase the awareness on the contractual rights and responsibilities amongst the BIM stakeholders, thus to enhance the utilisation of BIM as the catalyst for digital construction. Keywords: Building Information Modeling (BIM); contractual issues; contract administration;
process protocol; BIM-based construction projects.
INTRODUCTION
Under the Eleventh Malaysia Plan (11th MP), transformation in the construction industry
is one of the key areas that has been identified as the main driver to accelerate the national
economic momentum. The Construction Industry Transformation Programme (CITP), covers
duration from the year 2016 until 2020, aims to empower and strengthen the construction
industry via a few strategic Thrusts under the 11th MP. Nevertheless, there are still certain
obstacles that are crucial to be highlighted. According to the Construction Industry
Development Board (CIDB), issues of ineffectiveness and low productivity of the
construction industry are still occurring. These are due to the limited adoption of technologies
and practices (CIDB, 2017). Modern technology, such as information and communications
technology (ICT) need to be embraced and utilised successfully. One of the ways to do it is
by using Building Information Modeling (BIM), which is widely known as an advanced ICT
that can improve the efficiency, productivity and quality of construction developments
(CIDB, 2017). With the use of BIM in construction projects, the virtual creation of model can
increase the accuracy of design and construction process (Balali et al., 2020). Hence, the
construction industry can embrace the digital era of the 4th Industrial Revolution together with
the other innovations in digital construction, such as the Internet of Things (IoT), Augmented
Reality (AR)/Virtual Reality (VR), drones, 3D construction printings and many more.

38
MCRJ Special Issue Vol. 12 | No. 1 | 2021
One of the critical components that ought to be tackled in advance should be the
contractual and procurement aspects of BIM implementation. Currently, the existing
contractual documents available in BIM-based construction projects are still lacking in terms
of demonstrating the precise requirements to support BIM collaborative process and
information sharing (Abdirad, 2015; Winfield & Rock, 2018). In Malaysia, a few scholars
have also criticised the same situation (Abd. Jamil & Fathi, 2019; Kamal Hasni et al., 2019;
Teoh et al., 2018). It is discovered that very limited references are currently available to solve
unclarities that occurred from the use of BIM data as well as the uneven contractual risks
associated with the supply chain process in the local context. Hence, based on a
comprehensive literature review, this study aims to propose the conceptual framework for the
strategic process protocol as an instrument to improve the contract administration of BIM-
based construction projects in Malaysia. In deriving this aim, a few objectives have been
determined. Firstly, to explore the current practice of BIM in the construction industry,
secondly to outline the existing BIM contractual protocols and requirements used in the
industry, thirdly to highlight the contractual issues arise from BIM implementation, and
finally to describe the established process protocol practices in the construction industry.
BUILDING INFORMATION MODELING (BIM) IN THE CONSTRUCTION INDUSTRY
In recent years, the definition of BIM has been emerged into a modernised terminology
to reflect the evolution involved in the construction industry. BIM can be described as "a verb
or adjective phrase to describe tools, processes, and technologies that are facilitated by digital,
machine-readable, documentation about a building, its performance, it is planning, its
construction, and later its operation” (Sacks et al., 2018). BIM combines three main pillars,
namely process, technology and policy (Haron et al., 2015). As a tool that can change the
traditional ways of doing things, BIM integrates human and technology within construction
processes throughout the lifespan of construction projects. It can ensure the project goals and
objectives be delivered successfully. However, the right knowledge of doing BIM is very
crucial to gain those benefits. It is pertinent to mention that the implementation of BIM
demands a high order of thinking in terms of the way construction business can work.
Therefore, to utilise BIM technology into construction practice, the players must not only
master the software applications (Sacks et al., 2018; Yaakob et al., 2014). The knowledge on
how to recreate the work sequences, consistent training programmes to upskill the
competency levels and the capability to fulfill all responsibilities assigned are the most
significant traits that they should be able to equip from time to time.
In the global arena, various standards have been established to support the utilisation of
BIM processes such as BIM Guide Series (US), ISO 19650 (UK), Senate Properties’ BIM
Requirements for Architectural Design (Finland), NATSPEC National BIM Guide
(Australia), BIM Standards Manual and Project Specification (Hong Kong), Singapore BIM
Guide and many more. In the year 2016, the Public Work Department (PWD) and CIDB have
taken similar action by releasing a few Malaysian standards such as CIDB BIM Guide, PWD
BIM Guidelines, Standards and Manual Working Process with the mission to ease the BIM
implementation for public sectors construction projects. The use of Level 2 BIM for public
projects is mandatorily required, where the contract values exceeding RM100 Million (Kamal
Hasni et al., 2019; Roslan et al., 2019). Nevertheless, until today, there are still many local
players who reluctant to adopt BIM. It is reported that only 10 percent of construction players
in Malaysia who adopted BIM in their construction projects (Mamter et al., 2017). In fact,

39
MCRJ Special Issue Vol. 12 | No. 1 | 2021
many scholars have criticised that the level of BIM adoption in Malaysia is still at its infancy
stage (Kamal Hasni et al., 2019; Teoh et al., 2018). In a national report produced by the CIDB
(CIDB, 2017), one of their findings disclosed that 45% of the respondents from various
construction backgrounds with the knowledge of BIM show that only 17% of them have
experience using BIM. From this population, 12.8% (which is the highest result) have 1 to 5
years of experience implementing BIM. These shreds of evidence suggest that BIM in the
Malaysian construction industry is still in embracing stage. Many local construction players
are still relying on traditional approaches when developing construction projects. Hence, this
will reflect the status-quo of the industry’s performance, such as poor coordination throughout
the supply-chain and isolation of professionals based on their skills and expertise.
Construction players that are disconnected and work in isolation ways will result in
inefficiencies of managing the project, which can lead to various conflicts and disputes
between them (Ariffin et al., 2017). For these reasons, BIM working procedures such as
protocols and contractual requirements have been established from time to time to facilitate
the construction players to do the right BIM processes.
BIM PROTOCOLS AND CONTRACTUAL REQUIREMENTS
It is important to know some of the existing BIM contractual guidelines that are available
worldwide. The function of these documents is mainly to facilitate the BIM players, especially
to the contracting parties, on how they should fulfill their contractual obligations while
managing BIM-based projects. These documents can be described as follows:
• Time and Cost Management Contract, Chartered Institute of Building (CIOB) 2015,
UK
• JCT Design and Build Contract 2016 (integrated with CIC BIM Protocol), UK
• BIM and JCT Contracts 2019 - Practical Note (integrated with CIC BIM Protocol),
UK
• New Engineering Contract (NEC4) Engineering and Construction Contracts 2018
(integrated with CIC BIM Protocol), UK
• CIC BIM Protocol,2nd Edition 2018, UK
• AIA Doc G201 2013, US
• AIA Doc G202 2013, UK
• AIA Doc E203 2013, US
• Consensus DOCS – 301 BIM Addendum 2008, US
• BIM Particular Conditions, Version 2 2015, Singapore
• JKR BIM Requirements for Design and Build Projects 2016, Malaysia.
Figure 1 outlines some of the provisions in the JKR BIM Requirement (Malaysia) and
CIC BIM Protocol (UK). These two references were discussed in this section to demonstrate
the similarities and differences of the risk allocation for BIM implementation. The common
elements between these two guidelines emphasised the needs for delivering the project based
on specific levels of development (LOD), standardisation on the types of software and data
format, employer’s information requirements (EIR) and the requirement for the contractor to
propose their BIM execution plan (BEP) for tendering and post-contract purposes.
Nevertheless, provisions such as the remedies for breach of BIM data security, time and cost
compensation, management of changes or variation orders, termination of contract and

40
MCRJ Special Issue Vol. 12 | No. 1 | 2021
resolution of conflicts are not explicitly stated particularly in the BIM JKR Requirement,
which means there are some considerations still lacking in the existing contractual guideline.
It is pertinent to mention that the higher integration process in BIM may create more risks to
the project implementation. Therefore, parties involved with BIM must know the right
allocation of risks and responsibilities to overcome these difficulties.
Figure 1. BIM Provisions in the JKR BIM Requirement and the CIC BIM Protocol
In Figure 2 below, it can be discovered that the administration of the contract for BIM is
separated into three main phases, which are the pre-construction stage, construction and post-
construction stage (Chong et al., 2017). It comprises the whole life cycle of BIM contractual
integration, whereby the roles and responsibilities should be allocated clearly amongst the
BIM project team. Furthermore, the right contractual languages should be used in drafting
BIM requirements for the contract administration. Eastman, as quoted in Manderson et al.
(2015), specifies that the language of the first level should cover all technical specifications
to standardise the use of BIM for project execution and the language of the second levels
should show the highest level of process definition and protocols which can then be included
in the BIM contract documents. Without the clarity and adequacy in drafting the BIM
contractual guidelines, it will impact more contractual issues, particularly during the
collaboration processes.
CONTRACTUAL ISSUES IN BIM IMPLEMENTATION
The contractual issue can be defined as a problem that incurred between two or more
parties due to the unfulfillment of obligation in their existing agreement (Abdullah Habib,
2017). Currently, the construction contracts are still relying on traditional contractual
practices; hence many obstacles were found when the construction sequences have to be
integrated with the digitalised coordination works and modernised technology. This can be
associated with the procurement and contractual issues of BIM implementation.

41
MCRJ Special Issue Vol. 12 | No. 1 | 2021
Figure 2. The Contract Administration Aspects of BIM-Based Construction Projects
(Adapted from Chong et al., 2017)
Fragmented Procurement System
The traditional procurement system in Malaysian public projects has several limitations
(Ariffin et al., 2017). One of them can be associated with the segregations of design,
construction and the Facility Management (FM) stage. Hence, alternative procurement routes
have been innovated from time to time to overcome these limitations. Integrated Project
Delivery (IPD) has emerged in recent years as a new project delivery method that has a vast
potential to revolutionise the delivery of BIM-based projects. It is also known as the relational
contract comprised procurement (Abd. Jamil & Fathi, 2018) whereby all construction parties
are abided to comply with their employment agreement under a single multi-party contract.
Nevertheless, only a limited number of projects are using this integrative method. Some of
the challenges with IPD are due to the unresolved legal and contractual issues and
organisational problems (Ghassemi & Becerik-Gerber, 2011), such as ambiguous descriptions
of the roles and responsibilities of various parties involved with the contract.
Therefore, many practitioners are now reversing to explore the parts of BIM within the
existing procurement methods (Aibinu & Papadonikolaki, 2016; Holzer, 2015), such as
Traditional and Design and Build. However, more specific research should be conducted to
study the potentialities (Ariffin et al., 2017). Although some of the conventional procurement
methods inhibit cooperation an integration (Jowett et al., 2018), but many prospects and
opportunities can be enhanced from Design and Build processes starting from the pre until
the post-construction stage of BIM employment (Abd. Jamil & Fathi, 2019; Jowett et al.,

42
MCRJ Special Issue Vol. 12 | No. 1 | 2021
2018). Hence, more strategies and endeavors are required to improve the current atmosphere
of existing procurement frameworks.
Legal and Contractual Barriers in BIM
It is important to note that, somehow, the usage of BIM can carry more threats in
achieving mutual collaboration. There is a belief that a higher level of BIM maturity, will
create more emerging issues due to the intricate arrangement of collaborations amongst the
project participants (Abdirad, 2015). In BIM adoption, the contractual issues are very much
related to the unclear project roles and responsibilities, copyright and insurance coverage due
to the multi-party involvements (Porwal & Hewage, 2013). These will rise into the
professional liability due to errors and corruptions while transferring data into the BIM
models (Abd. Jamil & Fathi, 2019; Ghaffarianhoseini et al., 2017; Teoh et al., 2018).
Moreover, improper financial strategies may also lead to unclear financial sharings such as
fees, payments, rewards and penalties (Abd. Jamil & Fathi, 2018; Fan et al., 2018; Jiang et
al., 2018; Kamal Hasni et al., 2019). Hence, the identified barriers could lead to dispute and
conflict, but the dispute settlement mechanism is still missing until today (Mat Ya’acob et al.,
2018). These challenges occurred due to the more complex procedures that the parties need
to collaborate. The higher integration process in BIM may create more risks to the project
implementation. Therefore, the parties involved must know the right allocation of risks and
responsibilities to overcome these difficulties.
Contractual Impediments in the Project Implementation Process
It can be figured out that some of the construction practitioners who adopt BIM in their
construction projects have a lack of understanding to integrate the work practices with BIM
contractual requirements. Even though the client requires BIM Execution Plan (BEP) as a part
of the BIM contracting documents, still, in reality, the actual progress on-site failed to capture
the same planning as described earlier in the BEP (Abd. Jamil & Fathi, 2019). The BIM
documents remain theoretic and not being adopted into real practice (Abd. Jamil & Fathi,
2018). In more recent discovery, it is revealed that there is an ambiguity of the validation
process for FM data management during the handover stage for the operation and maintenance
of a BIM project (Abd. Jamil & Fathi, 2020). Thus, these evidences show that inconsistencies
in the interpretation of BIM documents make the parties to the contract fall within the
"agreement to agree" principles (Winfield & Rock, 2018). It means that the parties agreed to
make a contract, but they do not know the rights and obligations that they should execute
when they entered into the BIM agreement.
Lack of BIM Requirements in the Contract Document
The function of BIM requirements is to impose the rights and responsibilities in achieving
the project success. Nevertheless, there is a claim that the existing legal and contractual
frameworks are “too unsettled” (Porwal & Hewage, 2013) and rather obstruct than support
the uses of BIM (Holzer, 2015). This circumstance can lead to constructability issues that can
lessen the esteem from the utilisation of BIM. Currently, there is an absence of appropriate
BIM contracting documents, particularly in the Malaysian construction industry (Abd. Jamil
& Fathi, 2018; Kamal Hasni et al., 2019; Teoh et al., 2018). The available contracting systems
that put conventional forms of collaboration will only lead to un-unified contract strategies

43
MCRJ Special Issue Vol. 12 | No. 1 | 2021
(Eschenbruch & Bodden, 2018). Therefore, these problems remained long-standing
challenges for the construction industry. The legal and contractual barriers in BIM are mainly
occurred from the non-standardised contracting system and due to the lack of clarity in
determining the right content for BIM processes, particularly on the project roles and their
contractual responsibilities.
The contractual hurdles with the current implementation of BIM may be summed up as a
result of the fragmentation of the current procurement system, legal and contractual barriers
which hamper the adoption process, poor understanding of BIM project players, and lack of
contractual framework standards to serve as a guideline for BIM contracts. As mentioned
before, until recently, no standard forms were incorporating BIM provisions in the Malaysian
construction contracts. The identified contractual barriers somehow must be resolved to
improve the BIM implementation in our country. A new way of managing the contract
administration is therefore needed since BIM adoption involves a few phases of development
and these will be described further in the next section.
PROCESS PROTOCOL FOR BIM-BASED CONTRACT ADMINISTRATION
The above discussions have discussed some of the theoretical backgrounds related to BIM
and its contractual implications. This section focuses more on the existing process protocols
that have been established in the construction industry. The evolution of process protocol
starts from the introduction of RIBA Plan of Work in the year 1993 and the Generic Design
and Construction Process Protocol (GDCPPP) by the University of Salford, UK in the year
1998 (Al-Ahbabi, 2014; Kagioglou et al., 1998). The main purpose of innovating this
mapping process is to solve many flaws related to communication, coordination, and
disintegration of development processes within the UK construction industry.
For almost three decades, various researches from the Western and Eastern countries have
adopted the principles of process protocol, and integrated them into various construction
management areas such as studies conducted by (Al-Ahbabi, 2014; Goulding & Alshawi,
2002; Hijazi et al., 2018; Khalfan, 2006; Mzyece et al., 2019; Nyando & van Breda Strasheim,
2012; Russell et al., 2018; Thomson et al., 2008; Zerjav & Ceric, 2009). The main principles
of the process protocol can be described as the followings (Al-Ahbabi, 2014; Kagioglou et
al., 1998):-
i. Processes are assembled to represent the whole project view until the operation and
maintenance stage of construction projects
ii. The “stage-gate” approach will be integrated whereby before the next phase can
proceed, it needs to undergo the review and validation process
iii. The activities are mutually interrelated
iv. Each stakeholder needs to get involved via tasks and responsibilities assigned to them
v. Effective coordination is developed from the initial stages to encourage multi-
functional team members
vi. In each phase, the feedback will be reported for future improvements.
The more recent researches have innovated the process protocol concepts with BIM
adoption by integrating the use of Construction, Design and Management (CDM) regulations
with BIM processes (Mzyece et al., 2019) and the roles of IPD processes to enhance the high-

44
MCRJ Special Issue Vol. 12 | No. 1 | 2021
level collaborations for projects implementing BIM (Al-Ahbabi, 2014). As a result, this tool
has been treated as a solution to construction management. It proves the importance of
transparency, particularly in defining the roles and responsibilities of construction
stakeholders. Besides, the check and balance of each activity can be done effectively through
the reviews and validation processes throughout the development phases.
Table 1. Differences Between the Existing Process Protocol & Proposed Process Protocol
Scope IPD BIM Process Protocol (Al-Ahbabi, 2014) Proposed Strategic Process Protocol
Phase Seven Phases involved:
• Phase 0: Strategy Setting
• Phase 1: Project Requirements
• Phase 2: Integrated Procurement
• Phase 3: BIM-based tender
• Phase 4: Integrated Design
• Phase 5: Construction
• Phase 6: Operate (FM)
Five Phases to be proposed:
• LOD 100: Concept
• LOD 200: Design Development
• LOD 300: Documentation
• LOD 400: Construction
• LOD 500: FM
Sub-phases Involved 11 departments (all stakeholders throughout the BIM supply chain)
The BIM players/concerned parties that involved throughout the building life cycle (to be identified)
Processes Procurement processes for Integrated Project Delivery
Contract administration processes (to be identified)
Outcome Improve collaboration via Integrated Project Delivery (IPD) throughout the supply chain of BIM-based construction projects
Improve the contract administration processes throughout the supply chain of BIM-based construction projects
One of the main findings in the research conducted by Al-Ahbabi (2014) revealed that
the contracts and legal frameworks seem to be the main hurdle to create a healthy
collaborative environment in BIM implementation. The study has also suggested a few
recommendations for further explorations, such as a new contractual instrument should be
developed to overcome the issue of poor collaboration in BIM adoption. Furthermore, an
innovative multi-party contract with clear collaboration objectives must be reformed by
emphasising the rewards and risks sharing amongst the BIM project actors. Hence, this
research aims to incorporate the principles that are commonly used in the process protocol
frameworks. Table 1 above demonstrates the differences between previous research (Al-
Ahbabi, 2014) and the proposed study. Concentration will be made on the development
phases, sub-phases and processes involved in the proposed process protocol. The next part
explains the methodology used for the literature findings as well as to propose the strategies
for main data collection.
METHODOLOGY
This paper is part of on-going research, and a review of the related articles has been
conducted from the year 2002 until 2020. Specific keywords such as “Building Information
Modeling (BIM),” “BIM,” “contractual issues,” “contract administration” and “process
protocol” were searched in the online databases such as Scopus, Web of Science, Emerald,
Science Direct and a few other relevant databases. Relevant theses and secondary data from
the existing BIM standard forms and protocols are referred too (Refer Table 2). Hence, the
information presented in this paper was primarily based on the literature review and the
findings obtained were engaged to formulate the conceptual framework of the proposed
process protocol.

45
MCRJ Special Issue Vol. 12 | No. 1 | 2021
Table 2. Summary of Inclusion Criteria for Literature Review
Eligibility
Criteria Inclusion
Timeline 2002 - 2020
Outline databases Scopus, Web of Science, Emerald, Science Direct, and others
Document types Journal articles, conference paper (indexed), government report, standard forms of contract, protocols, and theses
Language English
Industry Construction
Figure 3 describes the research methodology to be employed in the proposed empirical
study, whereby they can be differentiated in terms of the philosophical level, research
approaches and data level. Qualitative research adopted due to the nature of the proposed
study deal with the ‘reality’ behind the situations (Saunders et al., 2009), to be more specific,
on the current practice of the contract administration processes in construction projects
implementing BIM.
Figure 3. Proposed Research Methodology
The primary objective of applying this qualitative research in the main study is to collect
as much as possible on the participants' views. Then the meanings will be constructed and
interpreted to make sense of what else that can be done to improve the current situations
(Creswell & Creswell, 2018). The multiple-embedded case study is the approach that will be
employed, whereby four to six numbers of case studies are sufficient to get compelling results
from the main data collection (Yin, 2018). The purposive sampling technique will be used to
identify the number of informants based on certain specific criteria, such as the years of
experience with BIM-based projects and the knowledge about the contract administration
process. Feedbacks from the BIM practitioners will be collected through face-to-face
interviews to discover the challenges that they have been facing while managing the BIM-
based construction projects. The inspection from BIM documents will help to assess the level
of compliance on the BIM contractual requirements. Hence, the phenomena in the real BIM-

46
MCRJ Special Issue Vol. 12 | No. 1 | 2021
based construction projects will be observed to investigate the actual issues faced and to
identify the contractual solutions for further enhancements. Figure 4 illustrates the unit and
sub-units of the proposed study. The units are determined based on the research questions
after the extensive literature review has been conducted (Abdullah Habib, 2017). The unit of
study is the BIM-based construction projects, and the sub-units consist of the BIM usage in
the contract administration process, contractual issues and the solutions.
Figure 4. Unit of Study and the Sub-Units
The overall research design of the proposed study is demonstrated in Figure 5. It is
pertinent to mention that there will be another research approach for the data collection, which
is the comparative study of the existing BIM standard forms, protocols and addendums from
international practice. These document analyses are considered important in formulating the
contractual solutions from the BIM contractual issues. Besides, this approach is commonly
adopted in legal and contract studies. Data collected from the empirical study will then be
analysed by using cross-case analysis and thematic analysis. ATLAS ti.8 software will be
used to expedite the qualitative analyses of this study.
FINDINGS
The research area requires further investigation concerning the right contractual processes
that should be embedded in the contract documents for any construction projects
implementing BIM. There are still many missing parts that need to be improvised to solve the
ambiguities and inadequacy issues, as highlighted above. The full potential of BIM demands
a high level of collaboration that can integrate the client, contractor, designers, and suppliers
differently from the non-BIM environments that they used to work before.
Referring to Table 3, it can be summarised that previous local researchers have discovered
the alignment of procurement method, contractual challenges and BIM functionalities (Abd.
Jamil & Fathi, 2018), new BIM provisions to modify the existing standard forms of contract
(Teoh et al., 2018), contractual considerations for Level Two (2) BIM utilisation in Malaysia
(Kamal Hasni et al., 2019) and many more. This motivates the need for an alternative
approach whereby the proposed research will adopt the existing process protocol principles
and takes into account the recommendations suggested by Manderson et al. (2015) and
Englund & Grönlund (2018), to explore the contractual issues from the real BIM-based
projects. Some modifications will be added to the proposed contractual process, roles and
responsibilities and the LOD stages involve, which the contents will be investigated
extensively during the primary data collection.

47
MCRJ Special Issue Vol. 12 | No. 1 | 2021
Figure 5. The Research Design for the Proposed Study
From the preliminary reviews, the conceptual framework for this research is proposed
(refer to Figure 6). The first construct focuses on the BIM usage in the contract administration
processes. The second construct concentrates on the contractual issues in BIM and the third
one investigates the existing BIM contractual frameworks to know the strength and their
weaknesses. Finally, the existing process protocol frameworks are evaluated to know the
suitability of the process protocol principles with the proposed study. This research
conceptualises:
• Five phases of BIM (LOD 100 until LOD 500)
• Subphases on the roles of the concerned parties (BIM players)
• Contract administration process within the LOD phases and subphases (contractual
responsibilities
These elements form the basis of developing the strategic process protocol framework of
BIM contract administration in Malaysia. From the past studies (Al-Ahbabi, 2014; Goulding
& Alshawi, 2002; Hijazi et al., 2018; Khalfan, 2006; Mzyece et al., 2019; Nyando & van
Breda Strasheim, 2012; Russell et al., 2018; Thomson et al., 2008; Zerjav & Ceric, 2009), the
process protocol not only capable of showing high-level processes within the context of areas
that have been explored. It can also add more value to the BIM supply chain by showing the
interrelationships amongst the stakeholder involved throughout the building life cycle. The
above findings disclosed that the integration of process protocol principles with the context
of BIM contract administration particularly in Malaysia remained unknown. Hence, this study
could lead to a good prospect to overcome the inadequacy of the roles and responsibilities of
BIM contract administration, within the various phases of design and construction process.

48
MCRJ Special Issue Vol. 12 | No. 1 | 2021
Table 3. Malaysian Researches on the Challenges and Contractual Issues of BIM
Author Year Findings Contributions
Abd. Jamil & Fathi
2018
Design and Build procurement method as the most appropriate to be used for BIM projects due to the transparency of flow besides integration with contract administration can be catered until FM stage.
Proposed an integrative contractual framework by aligning the BIM functionalities, procurement method and contractual provisions for BIM-based construction projects.
Ng et al.
2018
Main barriers of BIM implementation in Malaysia are due to the mindset and thinking of construction players. However, many initiatives have been done to promote and create awareness to all stakeholders in our country.
Some insights about the benefits and challenges of BIM in the current practice by the Malaysian construction players.
Yaakob et al.
2016
Some of the CSFs for the Malaysian construction industry to adopt BIM are the interoperability of BIM data, collaboration and standardise BIM processes as guidelines for the construction stakeholders.
The set of CSFs identified are the foundation for the successful delivery of BIM-based projects in Malaysia.
Kamal Hasni et al.
2019
Implementation of BIM is still limited to Level 0 and 1, which is more focusing on design stage only. Many limitations have been disclosed to support Level Two BIM in Malaysia.
Identified the contractual considerations for Level 2 BIM implementation in Malaysia.
Teoh et al.
2018
The infancy stage of BIM in Malaysia shows the need for modification in the existing standard forms of contract. The overall findings demonstrate an initial framework for the inclusion of new BIM clauses for the current construction contracts.
Identified new provisions for BIM to be incorporated into the existing standard forms of contract (CIDB and PWD).
Mat Ya’acob et al.
2018
The legal risks in BIM are the contributory factors to the slow adoption of BIM in Malaysia. The research disclosed that no clear standard and policy, as well as the unspecified BIM provisions in the standard forms, were some of the critical barriers that lead to uneven risk allocations in BIM implementation.
The study identifies risk factors in BIM project for risk response strategy to guide the construction stakeholders in identifying, assessing and evaluating the risk response process.
Abd. Jamil & Fathi
2019
From the content analysis, the study proposed some amendments for construction contracts based on the risks and barriers in BIM which have been discovered from the literature reviews and the case study.
The study disclosed a new approach to integrate BIM with contracting considerations, namely intellectual property right, risk allocations, professional liability and cloud-based computing infrastructure.
CONCLUSION
The fears on the legal and contractual issues in BIM were due to its complexity during
the project's implementation. Reviews have shown that little efforts have been employed in
identifying the roles and functions of each BIM player with the spirit of collaboration. The
traditional contractual structure involves the client and contractor as the parties to the contract.
However, in BIM organisation, collaboration can only be achieved if the allocation of risks is
defined appropriately to all stakeholders involved. It can be summarised that the procurement
and contracting system in Malaysia is still lack of integration to support BIM processes from
LOD 100 until LOD 500. The application of the BIM requires an unconventional procurement
arrangement, a contract form, new contractual terms and conditions, and business alignment
that differs from the traditional contracting process. Furthermore, new solutions need to be

49
MCRJ Special Issue Vol. 12 | No. 1 | 2021
done to enhance the transparency and accountability of information management. This
information is crucial to be incorporated into the BIM contract documents. Hence, there is an
urgency for a new contract reformation in the existing structure of the construction contracts.
Other than that, a new contractual instrument must be developed for further refinement to the
current BIM practice. The flow of information in BIM needs to be evaluated to promote
integrity and reliability. Therefore, additional requirements must be made in the existing BIM
contractual documents to allocate the risks and responsibilities not only for digital modeling
but also on the part of the contractual obligations.
Figure 6. Conceptual Framework of the Proposed Study
From the past literature, it can be seen that the way to overcome the contractual barriers
in BIM is by changing the current contract terms, formulating new BIM clauses to be amended
in current standard forms, or developing new BIM protocols that can be complemented in the
existing standard forms. This study further indicates that another development, which is by
incorporating the principles of the process protocol into the administration of BIM contract,
could lead to a framework that can help to standardise the processing and management of
digital data with the EIR or BEP contractual obligations. This study is expected to facilitate
the transformation of construction contracts for the future Malaysian construction industry.
ACKNOWLEDGEMENT
This work was supported by the Ministry of Higher Education (MOHE), Universiti
Teknologi MARA (UiTM) and University of Malaya (UM), Malaysia.
REFERENCES
Abd. Jamil, A.H. and Fathi, M. S. (2018) Contractual Challenges for BIM-based Construction
Projects: A Systematic Review. Built Environment Project and Asset Management, 8(4):
372–385.

50
MCRJ Special Issue Vol. 12 | No. 1 | 2021
Abd. Jamil, A. H. and Fathi, M. S. (2019) Contractual Issues for Building Information
Modeling (BIM)-based Construction Projects: An Exploratory Case Study. IOP
Conference Series: Materials Science and Engineering, 513(1): 1-8.
Abd. Jamil, A. H. and Fathi, M. S. (2020) Enhancing BIM-based Information Interoperability:
Dispute Resolution From Legal and Contractual Perspectives. Journal of Construction
Engineering and Management, 146(7): 1–11.
Abdirad, H. (2015) Advancing in Building Information Modeling (BIM) Contracting: Trends
in The AEC/FM Industry. Birth and Life of the Integrated Building - Proceedings of the
AEI Conference 2015 (AEI 2015), 1–12.
Abdullah Habib, S. N. H. (2017). Critical Success Factors and Contractual Risks for Private
Finance 2 (PF2) Projects Implementing Building Information Modeling (BIM). Ph.D.
Thesis, University of Salford. 351 pp.
Aibinu, A. and Papadonikolaki, E. (2016). BIM Implementation and Project Coordination in
Design-Build Procurement. Proceedings of the 32nd Annual ARCOM Conference
(ARCOM 2016). 15–24.
Al-Ahbabi, M. S. (2014). Process Protocol for The Implementation of Integrated Project
Delivery in The UAE: A Client Perspective. Ph.D. Thesis, University of Salford. 313 pp.
Ariffin, H. L. T., Cun, K. C., Raslim, F. M. and Mustaffa, N. E. (2017). Factors Concerning
Procurement Selection in Building Information Modeling (BIM) Projects. International
Conference on Research and Innovation in Information Systems (ICRIIS 2017), 1-6.
Balali, V., Zalavadia, A. and Heydarian, A. (2020). Real-Time Interaction and Cost
Estimating Within Immersive Virtual Environments. Journal of Construction
Engineering and Management, 146(2): 1–10.
Chong, H. Y., Fan, S. L., Sutrisna, M., Hsieh, S. H. and Tsai, C. M. (2017). Preliminary
Contractual Framework for BIM-enabled Projects. Journal of Construction Engineering
and Management, 143(7): 04017025 1–8.
CIDB. (2017). Malaysia Building Information Modeling (BIM) Report 2016. Construction
Industry Development Board (CIDB), Malaysia.
Creswell, J. W. and Creswell, D. J. (2018). Research Design: Qualitative, Quantitative, and
Mixed Methods Approaches. California: SAGE Publication (Fifth Edition), 371 pp.
Englund, E. and Grönlund, M. (2018). Current Legal Problems and Risks with BIM in The
Swedish AEC Industry. MSc. Thesis, Royal Institute of Technology. 65 pp.
Eschenbruch, K. and Bodden, J. L. (2018). Integrating BIM in Construction Contracts.
Building Information Modeling: Technology Foundations and Industry Practice. Springer
International Publishing, 303–313.
Fan, S. L., Lee, C. Y., Chong, H. Y. and Skibniewski, M. J. (2018). A Critical Review of
Legal Issues and Solutions Associated with Building Information Modeling.
Technological and Economic Development of Economy, 24(5): 2098-2130.
Ghaffarianhoseini, A., Tookey, J., Ghaffarianhoseini, A., Naismith, N., Azhar, S., Efimova,
O. and Raahemifar, K. (2017). Building Information Modeling (BIM) Uptake: Clear
Benefits, Understanding Its Implementation, Risks and Challenges. Renewable and
Sustainable Energy Reviews, 75(October 2015): 1046–1053.
Ghassemi, R. and Becerik-Gerber, B. (2011). Transitioning to Integrated Project Delivery:
Potential Barriers and Lessons Learned. Lean Construction Journal, 32–52.
Goulding, J. S. and Alshawi, M. (2002). Generic and Specific IT Training: A Process Protocol
Model for Construction. Construction Management and Economics, 20(6): 493–505.

51
MCRJ Special Issue Vol. 12 | No. 1 | 2021
Haron, A. T., Marshall-Ponting, A. J., Zakaria, Z., Nawi, M. N. M., Hamid, Z. A. and Kamar,
K. A. M. (2015). An Industrial Report on The Malaysian Building Information Modeling
(BIM) Taskforce: Issues and Recommendations. Malaysian Construction Research
Journal, 17(1): 21–36.
Hijazi, I., Isikdag, U., Abunemeh, M., Li, X., Hashash, M., El Meouche, R. and Cansiz, S.
(2018). Mapping The Processes of Donor-Funded Construction Projects. Sustainability,
10(7): 1–25.
Holzer, D. (2015). BIM for Procurement - Procuring for BIM. Living and Learning: Research
for a Better Built Environment: 49th International Conference of the Architectural
Science Association, 237-246.
Jiang, Y., Ma, P. and Zhang, S. (2018). Contractual Governance of BIM-enabled Projects:
Where Are We? International Journal of Architecture, Engineering and Construction,
7(1): 1–10.
Jowett, B. R., Hattab, M. A. and Kassem, M. (2018). Demystifying Collaboration in BIM-
based Projects under Design-Build Procurement: Clash Detection As A Use Value.
Contemporary Strategies and Approaches in 3-D Information Modeling, 158–190.
Kagioglou, M., Cooper, R., Aouad, G., Sexton, M., Hinks, J. and Sheath, D. (1998). Cross-
Industry Learning: The Development of A Generic Design And Construction Process
Based on Stage/Gate New Product Development Processes Found in The Manufacturing
Industry. Engineering Design Conference, Vol 98: 595–602.
Kamal Hasni, M. I. ., Ismail, Z. and Hashim, N. (2019). Contractual Aspects in The Utilisation
of Level Two Building Information Modeling (BIM) Within Malaysian Public
Construction Projects. International Conference on Built Environment and Engineering
(IConBEE 2018). 1-7.
Khalfan, M. M. A. (2006). Managing Sustainability Within Construction Projects. Journal of
Environmental Assessment Policy and Management, 8(1): 41–60.
Mamter, S., Abdul-Aziz, A. R. and Mamat, M. E. (2017). Stimulating A Sustainable
Construction Through Holistic BIM Adoption: The Root Causes of Recurring Low BIM
Adoption in Malaysia. IOP Conference Series: Materials Science and Engineering,
216(1): 1-6.
Manderson, A., Jefferies, M. and Brewer, G. (2015). Building Information Modeling and
Standardised Construction Contracts: A Content Analysis of The GC21 Contract.
Construction Economics and Building (Vol. 15, Issue 3): 72-84.
Mat Ya’acob, I. A., Mohd Rahim, F. A. and Zainon, N. (2018). Risk in Implementing Building
Information Modeling (BIM) In Malaysia Construction Industry: A Review.
International Conference in Computer and Electrical Engineering (ICCEE 2018), 1–9.
Mirarchi, C., Spagnolo, S. L., Daniotti, B. and Pavan, A. (2020). Structuring General
Information Specifications for Contracts in Accordance with the UNI 11337: 2017
Standard. In Digital Transformation of the Design, Construction and Management
Processes of the Built Environment. Switzerland: Springer Open, 103-112.
Mzyece, D., Ndekugri, I. E. and Ankrah, N. A. (2019). Building Information Modeling (BIM)
and The CDM Regulations Interoperability Framework. Engineering, Construction and
Architectural Management, 26(11): 2682–2704.
Nyando, C. K. and Strasheim, J. A.V. B. (2012). Assessing Labour-based Construction Works
Management Processes. Proceedings of Institution of Civil Engineers: Management,
Procurement and Law, 165(4), 239–251.
Porwal, A. and Hewage, K. N. (2013). Building Information Modeling (BIM) Partnering
Framework for Public Construction Projects. Automation in Construction, 31: 204–214.

52
MCRJ Special Issue Vol. 12 | No. 1 | 2021
Roslan, A. F., Hamid, Z. A., Zain, M. Z. M., Kilau, N. M., Dzulkalnine, N. and Hussain, A.
H. (2019). Building Information Modeling (BIM) Stage 2 Implementation Strategy for
The Construction Industry in Malaysia. Malaysian Construction Research Journal,
6(Special issue 1): 153–161.
Russell, R., Ormerod, M. and Newton, R. (2018). The Development of A Design and
Construction Process Protocol to Support The Home Modification Process Delivered By
Occupational Therapists. Journal of Aging Research, Volume 201:1–13.
Sacks, R., Eastman, C., Lee, G. and Teicholz, P. (2018). BIM Handbook: A Guide To
Building Information Modeling For Owners, Designers, Engineers, Contractors And
Facility Managers. New Jersey: John Wiley & Sons, Inc. (Third Edition). 397 pp.
Saunders, M., Lewis, P. and Thornhill, A. (2009). Research Methods For Business Students.
London: Prentice Hall (Fifth Edition).
Teoh, M. J., Ishak, S. S. M. and Rashid, Z. Z. A. (2018). Overview of The Legal Aspects and
Contract Requirements of The BIM Practice in Malaysian Construction industry. MATEC
Web of Conferences. 1-8.
Thomson, C. S., El-Haram, M. A., Hardcastle, C. and Horner, E. M. (2008). Developing an
Urban Sustainabilty Assessment Protocol Reflecting the Project Lifecycle. Proceedings
of the 24th Annual ARCOM Conference (ARCOM 2008).1155–1164.
Winfield, M. and Rock, S. (2018). The Winfield Rock Report: Overcoming The Legal and
Contractual Barriers of BIM. BIM-Legal, 34(6), 426–477.
Yaakob, M., Nawi, M. N. M., Ibrahim, A. and Hanafi, M. H. (2014). A Propose Study of
Developing Building Information Modeling (BIM) Framework in The Malaysian
Construction Industry. Proceeding of Knowledge Management International Conference
(Kmice 2014), 744–748.
Yin, R. K. (2018). Case Study Research and Applications: Design and Methods. Los Angeles:
SAGE Publications, Inc. (Sixth Edition), 414 pp.
Zerjav, V. and Ceric, A. (2009). Structuring Communication Within Construction Projects:
A Communication Breakdown Structure. Association of Researchers in Construction
Management (ARCOM 2009). 907–916.

53
MCRJ Special Issue Vol. 12 | No. 1 | 2021
THE CONCEPT OF TELECOMMUTING LIFESTYLE IN THE CONSTRUCTION INDUSTRY: QUANTITY SURVEYOR’ PERSPECTIVES Azrina Md Yaakob, M. H. Nur Firzana, Myzatul Aishah Kamarazaly, Nurulhuda Hashim, Loo Seong King and Shirley Chin Ai Ling School of Architecture, Building & Design, Taylor’s University, Subang Jaya, MALAYSIA.
Abstract Green businesses and smart growth have inspired construction firms to promote telecommuting. The innovation of the construction industry provides the nation with sustainability through telecommuting that is technologically appropriate, environmentally adaptive and create a conducive healthy lifestyle of working. Despite many benefits of telecommuting, not many QS employees are willing to adopt telecommuting. Past research has shown that little is known about the factors and barriers of telecommuting intention among QS employees. The purpose of this study is to identify specific factors that can affect telecommuting acceptance and further examine the level of impact these factors have in influencing the QS’s readiness in the adoption of telecommuting. A data from a survey of registered QSs under the Board of Quantity Surveyors Malaysia has been analysed. The results reveal that Attitude, Work-life Balance, Nature of Work, Efficiency, Empowerment and Information Technology have a positive effect on telecommuting acceptance. Empowerment and Nature of Work have contributed most to telecommuting acceptance. The study contributes to the identification, conceptualisation and measurement can allow firms to consider QSs participation into a modern workplace when firms adopt telecommuting. It also helps to identify barriers of telecommuting intention among QS employees. Keywords: Telecommuting; teleworking; telecommuting lifestyle; Quantity Surveyors; green
business; sustainability; flexible work; smart working.
INTRODUCTION
Smart working emerged due to the availability of technological artifacts that has increased
immensely within the past decade (Calvo-Porral and Pesqueira-Sanchez, 2019). The adoption
of smart working implies that Millennials and Gen-Z can choose when and where to work
(Errichiello and Pianese, 2019). Telecommuting can be defined as a practice in which an
organisational employee can work remotely at a location combining the use of computers and
wireless communication technologies without the geographical and organizational boundaries
of the traditional, centralized workplace (Yap and Tng, 1990; Olszewski and Lam, 1993).
The concept of telecommuting has been associated with potential growth in leading
various industries to work from home since the 1970s (Nilles et al., 1976). From international
findings, it is quite a common workstyle for companies to allow friendly telecommuting
between their employees and has shown many possible advantages that might bring additional
benefits such as a better work-life balance, increase in productivity, time and energy
efficiency, increase in employees’ self-reliance, potential networking opportunities as well as
global competitiveness.
Telecommuting has been made feasible because of the advancement of technology
devices and computer networking systems resulted in fundamental changes in the method of
practice in all businesses and industries (Lim, 2000). Telecommuting potential can enhance
the performance of professional consultants and reduce the time for data processing. It also

54
MCRJ Special Issue Vol. 12 | No. 1 | 2021
helps to improve communications for effective decision-making and coordination among
construction participants while enhancing construction productivity as claimed by Liston et
al. (2000), Peansupap & Walker (2005).
QS organisations have to ditch the organisation’s operating business culture and should
be wise to rethink of the design structure on the employment practice and look into other
alternatives by changing the flexibility of the work patterns and developing new effective
management strategies with the adoption of somewhat unconventional work methods to
maintain a competitive advantage and enhancing profitability.
THE ISSUE Even with the recognition and awareness of the work method in being the next powerful
force driving the telecommuting phenomenon considering it “the next workplace revolution”,
there are still gaps between integrating telecommuting in the construction firms (Karia and
Asaari, 2016). It is undoubtedly achievable that QS work can be done and carried out within
the four walls of a space that one calls home instead of an office.
Majority of QS firms in Malaysia are using computers to produce most of their work in
the office preparing works in pre-contract stage until the post-contract stage. Software’s in
the current market helps increase productivity, time and cost-efficiency. About more than half
of construction professionals in Malaysia (68.4%) had taken time off work due to
occupational stress due to exposed of high workload intake with long working hours and most
often multitasking to complete construction projects (Zawawi, A., et al., 2013). Work-related
stress may lead to extreme cases of physical disorders, mental and behaviour deviation
(Jaapar, Said and Bari, 2015). Currently, this is the case of employees’ work-related stress
that produces a substantial impact on employee performance and subsequently discourages
the performance of QS firms.
The nature of telecommuting implementation is that it empowers QS firms to enhance the
organizational happiness index. For instance, about 24% of employees from countries abroad
that have already implemented telecommuting as a form of work practice more likely to feel
happy and productive in their roles when they telecommute once a month than those who
don't or can't work remotely (OWL Labs & TINYpulse, 2019). Turnover rate at 25% lower
of those who work in the traditional office space.
Telecommuting has not been adopted into the construction industry as the concept is still
at the infancy stage in the Malaysian work culture. The lack of research background and
knowledge concerning this problem is yet to be addressed. This contemporary study
acknowledges the urgency of knowledge for a new telecommuting model in the era of rapidly
expanding technology and dynamic environments that will boost employee and QS firms’
performance.
RESEARCH OBJECTIVES
The essence of this research is to achieve the following objective that is to identify the
contextual factors of telecommuting that affect quantity surveyor’s willingness to adopt
telecommuting. and evaluate the level of impact these factors have in influencing the quantity

55
MCRJ Special Issue Vol. 12 | No. 1 | 2021
surveyor’s willingness in the adoption of telecommuting as well as the barriers preventing the
implementation of telecommuting intention among quantity surveying employees.
LITERATURE REVIEW
Global Finding
A future QS firm counts on smart workers, where rivalry and digitalisation awaken
uncertainty and vulnerability. An increasing number of telecommuting implementations has
been realised worldwide, particularly in the United States, the Netherlands, Japan, Korea,
Australia, France and Italy (Errichiello and Pianese, 2019). A past study done by Anell and
Hartmann (2007) showed the acceptance of telecommuting in different parts of Asia.
Singapore and Hong Kong were easier to introduce the concept because both countries have
a wide concentration of employment with exposure towards western work practices.
However, some companies from countries such as Thailand and Taiwan struggled to
implement due to cultural resistance and lack of demand from employees.
A progressive country like Japan viewed telecommuting to be an obstacle and not viable
during the late 1980s (Higa and Wijayanayake, 1998) but gained fame between notable
Japanese companies when it became part of the Prime Minister, Shinzo Abe’s strategy to
modernise the way working arrangements are viewed (Mainichi Japan, 2016). Japan’s
government was ready to proceed further in promoting the practice to create career
opportunities by considering the use of flexible time systems to make it pleasant for staff
members with disabilities and low rates of employment among women (Jiji, 2018). It is duly
noted, the ministry hopes telecommuting can be introduced to change the mindset of
employees that work can be achieved outside of the office and perhaps enrich a healthier work
style option because of the country’s strong work ethic and decrease traffic congestion during
rush hours (Kyodo, 2018).
Over the coming years and the shift of perspectives, recent rise of telecommuting
originating from countries such as South America, Asia, and the Middle East lead the race in
telecommuting. Globally, at least one in five workers spend a part of their job telecommuting.
Western countries have also come up with their ways to combat stress and worker’s burden
in the office due to skepticism. Comparing countries such as India and Indonesia, who are the
current frontrunners of the telecommuting movement, followed by Mexico and Argentina as
opposed to countries in the European Union (EU), who devised their own plans for workers
by developing strong paid leave programs. These programs include maternal and paternal
paid time off and mandatory vacation. They also have some the lowest work hours in the
world, with Norway and Denmark standardizing a 33-hour work week while one country
quietly leading the race in flexible work hours is Netherlands, clocking in at a total of 29 hours
per week. In Belgium, the government have created a program called “career breaks” or
sabbaticals allowing Belgian employees a one-year work hiatus during their working lifetime.
German employees are given subsidy from the government while Germany reimburses
employees for lost wages during the reduced work hours to keep the unemployment rate down
during their time off (Reale, 2015).

56
MCRJ Special Issue Vol. 12 | No. 1 | 2021
Local Finding
The telecommuting research in Malaysia is scant and immature. Therefore, the findings
cannot be generalized (Karia and Asaari, 2016). The study of telecommuting is a very recent
idea and the trend is not entirely accepted within the nation. Regardless of how most of the
global perception has put interest into it and the Malaysian government acknowledges the
many benefits that can be obtained from the style of work, the concept still remains unpopular
amongst local companies due to the scarce published academic research on the success of
telecommuting in Malaysia and the lack of guidance and support for the type of work
arrangements (Ndubisi, 2005; Saludin, Karia and Hassan, 2013; Peros Khan et al., 2018).
Only a handful of renowned multinational corporation have implemented the work concept
such as Cadbury, Pepsi, Dow Chemical, Royal Dutch Shell, Nestle, IBM, Intel, CIMB Group,
KPMG Group, Telekom Malaysia, Petronas, Maybank, Intel, Johnson & Johnson etc. (Anell
and Hartman, 2007; TalentCorp, 2016). The companies listed range from various industries
mainly those from oil and gas, finance, ICT and service sectors. (Nordin, Mohd Baidzowi and
Razak (2016); Peros Khan et al. (2018).
Telecommuting and Construction Industry
The construction industry sector is widely considered to play a vital role in enhancing
economic growth and providing development towards a country by generating a range of
employment and job opportunities to the society at large. Malaysia is one of the many
developing countries that is regarded one of the most successful non-western countries to
achieve a very smooth transition to be an emerging self-sufficient industrialised nation by the
year 2020.
Typically, construction firms work in a highly competitive environment with a
comparatively small profit margins with projects to be completed within a given timeline on
a constrained budget. To guarantee that a project is finished on time and accordance with
specifications, construction professionals and specialists have heavier workload. (Wong, Teo
and Cheung, 2010). Employees tend to spend more hours at the office than the typical 8 hours
a day to satisfy the completion of tasks is done on time while working extra overtime more
days than the other. It has drawn attention that the combination of long hours and tight
deadlines bring physical and emotional complications giving negative work impact,
unavoidable for most modern working culture towards employees such as occupational stress,
high absenteeism, job dissatisfaction, increase turnovers and lack of self-care towards the
wellbeing. (Sheikh Ilmi and Rogber, 2013). Jaapar et al. (2015) conducted a study on
workplace stress management, highlighted stressors of interpersonal, work and organisational
context were faced the highest by QS professionals in Hong Kong as compared to among
other construction professionals resulting in the lowest work productivity and must be dealt
appropriately.
Research Framework and Methodology
The absence of telework theory has been highlighted (Nakrošienė et al., 2019). Based on
early study, employees consider telecommuting as the means of increasing their work-life
balance since it enhances the opportunity to take care of family members. To theoretically
explain telecommuting acceptance, this study identifies the telecommuting factors based on

57
MCRJ Special Issue Vol. 12 | No. 1 | 2021
the study of Nur Firzana (2019). The study operationalises factors connecting to willingness
of telecommuting as Attitude (Jacowski, 2010; Hassan and Nuruddin, 2011), Work-life
Balance (Nordin et al., 2016; Munusamy, 2016 and Peros Khan et al., 2018), Nature of Work
(Ndubisi et al., 2005), Efficiency (Munusamy, 2016), Empowerment (Munusamy, 2016), and
Information Technology (Ndubisi et al., 2005; Ruiller et al., 2019).
Figure 1 depicted the conceptual framework of the study. It suggests the novel
telecommuting model that fosters employees’ willingness to opt for telecommuting.
Specifically, the model explains the positive effects of certain telecommuting factors on
telecommuting acceptance. It allows organisations to promote smart working for smart
workers. It has a huge potential in enhancing employee’s work-life balance (Lee and Ma,
2019).
Figure 1. Research Framework of Telecommuting Acceptance
Attitude is regarded as high level of self-discipline, time management skills together with
having a clear and concise communication skill that possessed by employees to carry out
telecommuting (Jacowski, 2010; Hassan and Nuruddin, 2011).
Work-life balance is regarded as the measurement property of improvements in health &
wellbeing and lower occupational stress/burnouts occurring (Nordin et al., 2016; Munusamy,
2016 and Peros Khan et al., 2018). Furthermore, having more time to care for personal duties.
E.g., household chores, sick parents or caring family members is studied to be a proper
measurement.
Nature of work is regarded as employees operating in different construction stages in
small groups, not necessarily obliged to undertake every stage of a project along with QS
employees who operate within small groups that are in charge of every element of a project
from inception to completion can both efficiently arrange to telecommute. (Ndubisi et al.,
2005).
Efficiency is regarded as avoiding time and energy wasted in traffic, particularly during
rush hours and the cost saved on long journeys to the workplace were a suitable measure in
calculating the properties of measurement (Munusamy, 2016).
Empowerment is regarded as a mind-set change from the upper management is utmost
crucial to determine the changes. Telecommuting is a new work culture that can offer a
competitive edge for QS firms to survive and should be introduced gradually, demands from
employees to arrange to telecommute as a flexible work method, the trust from employer

58
MCRJ Special Issue Vol. 12 | No. 1 | 2021
gives a sense of empowerment towards employees telecommuting and the generational shift
and equality in retaining and recruiting staffs can help turnovers. E.g., young people
(Generation Z), women and older retired employees (Munusamy, 2016).
Information technology is operationalized as employee efficiency in IT (e.g., literate and
knowledge on IT usage or common IT applications and tools) (Ruiller et al., 2019).
Instrument and Measures
The study was designed to gather personal particulars from the participants to get to know
the respondents and their place of work. The telecommuting factors, measured using Nur
Firzana (2019), comprise of Attitude, Work-life Balance, Nature of Work, Efficiency,
Empowerment, and Information Technology using a five-point Likert scale ranging from 1-
strongly disagree to 5-strongly agree, close format and multiple-choice questions. The survey
was pre-tested to detect any possible shortcomings in the questionnaire, the pilot test was
conducted to a group of quantity surveyors at a RISM talk (northern branch). The sample data
was analysed using statistical software, SPSS to test the reliability of the questionnaire.
Sampling and Data Collection
The research sample contains 244 registered QS firms throughout Kuala Lumpur from
the Boards of Quantity Surveyors Malaysia which has a comprehensive list of 373. The
convenience sampling technique was utilised in this study due to the issue of privacy and
confidentiality in obtaining information’s on the registered QS individuals. A set of
questionnaires was distributed to the firms via email.
The majority of respondents (83%) fully recognise the concept of telecommuting and
most would likely to consider and accept the telecommuting lifestyle (68.1%). A profile of
respondents is presented in Table 1.
Table 1. QS Employees’ Profile
Demographic Category Frequency (%)
Gender Male 22 46.8
Female 25 53.2
Age of Respondent < 30 years old 35 74.5
31-40 years old 9 19.1
41-50 years old 2 4.3
50 years old > 1 2.1
Current Position as a QS Provisional QS 31 66.0
Professional QS 5 10.6
Consultant QS 6 12.8
Others 5 10.6
Years of working experience as a QS
< 10 years 42 89.4
11-20 years 3 6.4
21-30 years 1 2.1
30 years > 1 2.1
Years of working experience with the current firm
< 5 years 38 80.9
6-10 years 7 14.9
11-20 years 2 4.3

59
MCRJ Special Issue Vol. 12 | No. 1 | 2021
RESULTS
The sample respondents are satisfactory for the development of this research. The IBM
SPSS Statistic software version 23 was employed for various analysis in calculating the
results.
Reliability Analysis, Mean and Standard Deviation
The measurement model of the study was assessed by conducting several statistical
approaches: reliability, mean and standard deviation (Table 2 & 3). The results satisfy the
assumption of the research objective.
• The reliability analysis is used to test the consistency of the instrument by using the
Cronbach Alpha statistics. The result of items for each factor are above 0.7, indicating
all the six factors and telecommuting acceptance are reliable.
• The mean extracted is above 3.0 indicating the value are high and with consideration
of the factors, most QS’s agree efficiency, attitude and information technology are
given the highest priority for the inclination to opt for telecommuting acceptance.
Table 2. Results of Reliability Test
Factor Cronbach’s Alpha if items are
deleted Cronbach’s Alpha
Attitude 0.792
ATT01 ATT02
0.662 0.662
Work-life Balance 0.803
WLB02 0.671
WLB03 0.671
Nature of work 0.803
NOW02 0.583
NOW03 0.583
Efficiency 0.976
EFF03 0.954
EFF04 0.954
Empowerment 0.795
EMP01 0.780
EMP02 0.730
EMP03 0.795
EMP04 0.752
EMP05 0.722
Information Technology 0.764
IT01 0.626
IT02 0.626

60
MCRJ Special Issue Vol. 12 | No. 1 | 2021
Table 3. Results of Mean and Standard Deviation Test
Factor Mean Standard Deviation
EFF 4.55 0.678
ATT 4.44 0.577
IT 4.33 0.503
EMP 3.99 0.494
WLB 3.93 0.787
NOW 3.02 0.807
Correlation and Regression Analysis
Correlation analysis was used to know how strong the factors are associated to
telecommuting factor. The result indicates the coefficient value is significant (0.00) against
the factors of telecommuting and telecommuting acceptance (Table 4). The results suggested
that Attitude, Work-life Balance, Nature of Work, Efficiency, Empowerment and Information
Technology are positively related with telecommuting acceptance.
Multiple regression was made to identifying R-square (R2) by measuring the magnitude
of the coefficient to see, which has the most effect (Table 5). The current research model
explains that 47.1 per cent of the variance in telecommuting acceptance, indicating the
telecommuting factors have determined most of the variance in willingness to opt for
telecommuting. Thus, implies that the greater the extent of these factors, the higher the
telecommuting acceptance. Interestingly, the essential factors of telecommuting in explaining
variance in telecommuting acceptance are Nature of Work and Empowerment.
Barriers of telecommuting was identified with the use of the highest-ranking mean to the
lowest mean. The top 5 barriers are:
1. Documents are private & confidential and must be remained within the company;
Mean: 4.2.
2. Complications of incorporating data from the firm’s computer software i.e.,
Buildsoft, Binalink, Masterbill etc. into own PC’s; Mean: 4.19.
3. Rigid organisational system prevents the management change to a newer concept;
Mean: 4.09.
4. Quantity Surveying requires high level of coordination between employees; Mean:
4.06.
5. Only full-time employees from the company are allowed to telecommute with an
agreement the employer feels they are prepared; Mean: 4.02.
Table 4. Results of Correlation Test
Factor Coefficient Significance
ATT .207*** 0.678
WLB .300*** 0.577
NOW .432*** 0.503
EFF .164*** 0.494
EMP .646*** 0.787
IT .388*** 0.807
(**) Correlation is significant at the 0.01 level (2-tailed). (*) Correlation is significant at the 0.05 level (2-tailed). NS Not significant

61
MCRJ Special Issue Vol. 12 | No. 1 | 2021
Table 5. Results of Regression Test
Model Unstandardised Coefficients Standardised Coefficients
t Sig.
b Std. error Beta
(Constant) -.076 1.007 -.076 .940
ATT -.089 .187 -.067 -.476 .637
WLB -.007 .127 -.008 -.059 .953
NOW .209 .120 .221 1.737 .090
EFF .003 .141 .002 .018 .985
EMP .986 .284 .637 3.471 .001
IT -.079 .263 -.052 -.300 .766
DISCUSSION
QS firms must leverage on the potential value of their talented employees and knowledge
resource tools for global competitiveness and survival. The future potential working
environment is being rendered to be more versatile and digital, both of which will further
encourage future quantity surveyors to opt for telecommuting. QS firms must build an
innovative business model by telecommuting in order to empower their competitiveness in
terms of cost-saving, environmental concerns, flexibility and lifestyle. Unfortunately, not
many QS firms implement telecommuting due to lack of knowledge on the potential values
and benefits of telecommuting. Nevertheless, due to a number of telecommuting barriers, QS
companies have underestimated these implications of telecommuting on their growth and
performance.
First, the findings confirm the constructs and measurements for telecommuting factors
and telecommuting acceptance. As far as authors are aware, such constructs are a novel
representation of a new contribution to the field, thus expanding the telecommuting and
construction work of literature and research. Explicitly, the study confirms the telecommuting
factors are namely Attitude, Work-life Balance, Nature of Work, Efficiency, Empowerment
and Information Technology.
Second, the significant positive relationship between telecommuting factors and
telecommuting acceptance justifies that quantity surveyors adopt telecommuting due to
Attitude, Work-life Balance, Nature of Work, Efficiency, Empowerment and Information
Technology factors, suggesting that the higher the quantity surveyors concern on these
telecommuting factors, the higher the telecommuting acceptance. These findings provide
empirical evidence and extend previous studies (Pigini and Staffolani, 2019; Gimenez-Nadal
et al., 2019) that uphold telecommuting factors are related to telecommuting acceptance. This
evidence implies that such factors empower quantity surveyors to opt for telecommuting.
Third, QS firms need to reduce their barriers or bring to their knowledge because of the
privacy and confidentiality, complications of incorporating data and the rigid mindset of the
organisation prevent telecommuting to be accepted. These barriers are examples that show
employees are considering to telecommute but are unlikely to opt within the organisation in
the near future. Strategic challenges for QS firms are to exploit its innovation capability to
source a competitive advantage and lead organisations to venture in shifting efforts toward
virtual office orientation.

62
MCRJ Special Issue Vol. 12 | No. 1 | 2021
Finally, the paper provides insight in understanding for managers to effectively attracting
quantity surveyors for telecommuting. Managers should focus more on developing strategies
in the six factors of telecommuting for enhancing telecommuting implementation. For QS
firm competitiveness and sustainability empowerment and nature of QS work are the most
important factors for QS firms to implement telecommuting. Further, the research provides
QS firms with the telecommuting acceptance model leading to the appropriate direction and
understanding the factors that generate QS firm’s growth and performance. QS firms should
consider such six factors of telecommuting to capitalize and retain their valuable knowledge
resources as a source of competitive advantage. Additionally, QS firms should align their
strategic human resources with the future era of Industry 4.0. QS firm should be proactive in
adopting telecommuting for its future organisation. The relationship between employers and
employees needs to be enhanced, especially in the design structure of an employment practice
that can be seen to be rigid and unalterable. The aspects to be improved is by changing the
flexibility of the work patterns (Nordback et al., 2017) and developing new effective
management strategies by expanding the worker’s skills.
CONCLUSION
This paper unveils the novel and key findings of telecommuting factors and
telecommuting acceptance. The findings conclude the essential results suggested that the
research model has significant power to explain Malaysian quantity surveyor telecommuting
acceptance, it would be great to discover different factor and how this impact would be in a
different context such as time, industry and country. The future study should identify more
factors that might have different results from this study and might explain more on
telecommuting acceptance. It would be interesting to search if or how this study would impact
on the large sample and population.
REFERENCES
Calvo-Porral, C. and Pesqueira-Sanchez, R. (2019), "Generational differences in technology
behaviour: comparing millennials and Generation X", Kybernetes, Vol. 49 No. 11, pp.
2755-2772. https://doi.org/10.1108/K-09-2019-0598
Errichiello, L. and Pianese, T. (2019), "Toward a theory on workplaces for smart
workers", Facilities, Vol. 38 No. 3/4, pp. 298-315. https://doi.org/10.1108/F-11-2018-
0137
Giménez-Nadal, J.I., Molina, J.A. and Velilla, J. (2019), "Work time and well-being for
workers at home: evidence from the American Time Use Survey", International Journal
of Manpower, Vol. 41 No. 2, pp. 184-206. https://doi.org/10.1108/IJM-04-2018-0134
Hassan, H., & Nuruddin, A. R. (2011). Working from Home Concept for Quantity Surveying
Employment. The Quantity Surveying International Convention 2011, 127–135.
Higa, K., & Wijayanayake, J. (1998). Telework in Japan: Perceptions and implementation.
In Proceedings of the Hawaii International Conference on System Sciences (Vol. 4, pp.
169–177). Institute of Electrical and Electronics Engineers Computer
Society. https://doi.org/10.1109/hicss.1998.655272
Jaapar, A., Said, N., and Bari, N. A. A. (2015). Workplace Stress Management Model for
Malaysian Quantity Surveyors. Australian Journal of Basic and Applied Sciences, 9
(April), 211–214.

63
MCRJ Special Issue Vol. 12 | No. 1 | 2021
Joshi, A., Kale, S., Chandel, S., & Pal, D. (2015). Likert Scale: Explored and
Explained. British Journal of Applied Science & Technology, 7(4), 396–403
https://doi.org/10.9734/bjast/2015/14975
Karia, N., & Asaari, M. H. (2016). Innovation capability: The impact of teleworking on
sustainable competitive advantage. International Journal of Technology, Policy and
Management,16(2), 181 https://doi.org/10.1504/ijtpm.2016.076318
Karin Anell Danielle Hartmann, A., & Harrington, B. (2007). Flexible Work Arrangements
in Asia. Boston College Global Workforce Roundtable. Retrieved from
https://www.bc.edu/content/dam/files/centers/cwf/research/publications/researchreports/
Flexible%20Work%20Arrangements%20in%20Asia
Lee, T. T., & Ma, X. (2019). Identity and border setting: a quantitative study of homeworkers
in China. Social Transformations in Chinese Socities. Vol. 15. No. 2, 2019. pp. 94-113.
https://doi.org/10.1108/STICS-12-2018-0018
Lim, V.K.G. and Teo, T.S.H. (2000), "To work or not to work at home‐An empirical
investigation of factors affecting attitudes towards teleworking", Journal of Managerial
Psychology, Vol. 15 No. 6, pp. 560-586. https://doi.org/10.1108/02683940010373392
Liston, K.M., Fischer, M.A. and Kunz, J.C. (2000) Designing and Evaluating Visualization
Techniques for Construction Planning, Proc. of the 8th International Conference on
Computing in Civil and Building Engineering (ICCCBE-VIII), Stanford University,
Stanford, CA, 1293-300.
Nakrošienė, A., Bučiūnienė, I., and Goštautaitė, B. (2019) Working from home:
characteristics and outcomes of telework. International Journal of Manpower. Vol. 40.
No. 2, 2019. pp. 87-101. https://doi.org/10.1108/IJM-07-2017-0172
Ndubisi, N. O., & Kahraman, C. (2005). Teleworking adoption decision-making processes:
Multinational and Malaysian firms comparison. Journal of Enterprise Information
Management, 18(2), 150–168. https://doi.org/10.1108/17410390510579891
Nilles, J. M., Carlson, F. R., Gray, P., & Hanneman, G. (1974). Telecommunications-
transportation tradeoffs. Final Report, 1 Jul. 1973-31 Dec. 1974 University of Southern
California, Los Angeles.
Nordback, E.S., Myers, K.K. and McPhee, R.D. (2017). “Workplace flexibility and
communication flows: a structurational view”, Journal of Applied Communication
Research, Vol. 45 No. 4, pp. 397-412. https://doi.org/10.1080/00909882.2017.1355560
Nordin., N. N., Fateha, M., Baidzowi, M., & Razak, R. A. (2016). Understanding the Work
At Home Concept, Its Benefits and Challenges Towards Employee. e-Proceeding of the
Social Sciences Research (ICSSR 2016), 109–118.
Nur Firzana, M. H. (2019). The Concept of Telecommuting Lifestyle in the Construction
Industry: Quantity Surveyor’s Perspective. Unpublished Undergraduate Thesis. School
of Architecture, Building & Design. Taylor’s University, Selangor.
Owl Labs. (2017). State of Remote Work 2017. Retrieved from https://www.owllabs.com/
state-of-remote-work-2017

64
MCRJ Special Issue Vol. 12 | No. 1 | 2021
BIBLIOMETRIC ANALYSIS OF CONSTRUCTION DISPUTE
Olaolu Titus Olalekan1, Hamizah Liyana Binti Tajul Ariffin1, Kherun Nita Ali1, Faraziera Mohd Raslim2 and Mardiana Binti Mohamad3 1Department of Quantity Surveying, Faculty of Built Environment and Surveying, Universiti Teknologi Malaysia, Johor, Malaysia. 2School of Housing, Building and Planning Universiti Sains Malaysia Gelagor, Pulai Pinang, Malaysia. 3Jabatan Kejuruteraan Awan Politeknik, Kuching, Sarawak, Malaysia.
Abstract Construction dispute is common all over the world. Moreover, it has been identified as the cause of the deficiency and low performance of the construction industry. Therefore, the continued occurrence of this dispute calls for more research. A bibliometric analysis was carried out to identify the trend in the construction dispute research area and a total number of 1026 of publications from Scopus and 457 publications from Web of Science were retrieved. The result shows similarities in both databases in the construction dispute subject area. However, the high publications in Scopus indicates that Web of Science has low publications in the area of social sciences, art and humanities. Furthermore, the retrieved publication from both databases were analyzed using VOSviewer. The result shows that most of the publications focused more on managing already existing dispute by litigation, arbitration, and Alternative Dispute Resolution (ADR) and a lack in the area of dispute prevention methods. Keywords: dispute; ADR; BIM; bibliometric analysis.
INTRODUCTION
Construction dispute seems to be common all over the world and when not resolved in a
timely and effective manner, it becomes very expensive, adversarial and affects project
performance. Construction project involves coming together of many participants namely:
employer, consultants, contractors and suppliers, the involvement of many parties with
individuals seeking their own interest and benefits may lead to dispute (Hansen, 2019).
Moreover, complex project is mostly executed over a long period, in an uncertain and
complex environment (Mashwama et al., 2016). This result in complex activities with
complex dispute, therefore, dispute appears to be an inevitable phenomenon in the
Architectural, Engineering, Construction, and Operation industry. Besides its prevalence, it
seems to damage both business and professional relationships (Chaphalkar et al., 2015), waste
and consume project resources (Hayati et al., 2019). Likewise, a dispute has been linked with
high transaction cost with an overall increase in total project cost (Bean et al., 2019).
Consequently, the project environment can be described as highly competitive, multifaceted
and unpredictable. Thus, maintaining a non-adversarial environment seems elusive and
unattainable.
Many literature reviews have been proposed recently in the construction dispute subject
area. Saleh (2019) works on new approach to mediating construction dispute. Treacy et al.
(2016) works on identifying critical factors causing construction disputes in small to medium
enterprises (SMEs) in Ireland during the recession period from 2007 to 2013. Chan (2015)
review the Statutory Adjudication’ regime, and its attempts to preserve cash-flow during a
project by resolving payment disputes in an expeditious and provisional manner. Daradkeh
(2016) studied dispute settlement mechanisms for construction. Charehzehi et al. (2015)
works on incorporating conflict philosophy management in relation to BIM to develop a
conceptual framework for conflict management before escalating to dispute.

65
MCRJ Special Issue Vol. 12 | No. 1 | 2021
A considerable number of reviews in the construction dispute subject area adopted
narrative literature review and focused on a specific predetermined aspect as explained above.
However, this approach has been criticized to offer no broad background. Likewise, the
selection of the articles is built on random selection and may not fully represent the state of
existing knowledge in the selected subject area of research (Linnenluecke et al., 2019).
Consequently, this current review aims at identifying main themes and clusters in the
construction dispute subject area without focusing on a predetermined aspect. This is
important to determine the state of existing knowledge in the selected subject area and to
ascertain the area that is lacking. This review adopts a bibliometric analysis to achieve its aim.
The method uses a replicable, scientific and transparent process, that is detailed and mitigates
bias through extensive literature searches of published and unpublished studies and by
providing an audit trail of the reviewer’s decisions, procedures, and conclusion.
Having said above, this review proposes to carry out a holistic review of construction
dispute publications against random selection and define subfields that constitute a major area
in construction dispute and area that is lacking.
METHODOLOGY
Literature Search
This review adopted bibliometric analysis systems to achieve the predefined objectives
of identifying the main category in dispute research in order to determine areas in which more
research is still required. Bibliometric analysis is a statistical analysis procedure that aims at
quantifying and addressing the intellectual structure of the research field. This procedure
commences from a mathematical and statistical analysis of pattern that appears in the
publication and use of documents. Moreover, the system adopts a visualization technique to
display the result of different analyses (Cobo et al., 2011). Bibliometric mapping is used in
this review to identify the knowledge domain and research trends in construction dispute
based on the existing literature.
Data Acquisition
In this review, data acquisition of existing literature is important as it decides the scientific
articles from which inference will be drawn. Consequently, the database and searching
procedure were carefully selected. Scopus and Web of Science (WOS) was selected as a
literature database for the following reasons: (1) They are comprehensive, organized and
robust in term of scientific research (De Castro E Silva Neto et al., 2016). (2) They are the
most frequently used and largely accepted source for bibliometric studies (Marsilio et al.,
2011). Subsequently, a total number of 1026 of publications and 457 publications comprise
of articles, conference papers, book chapters, and books were retrieved from Scopus and WOS
database between the selected span period of 2014 – 2019. The following keyword was used
for the search “Dispute” AND TOPICS “Construction” OR “Building”.
Bibliometric Analysis
To develop an overall understanding of the knowledge domain and research trend in
construction dispute. The search started with 1026 publications from Scopus and 457
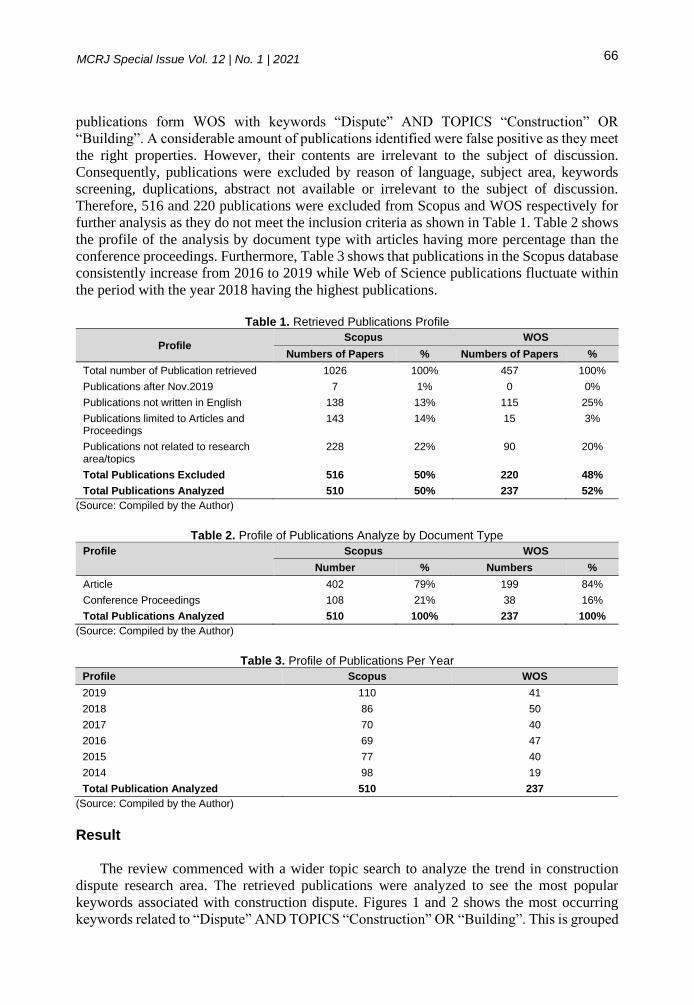
66
MCRJ Special Issue Vol. 12 | No. 1 | 2021
publications form WOS with keywords “Dispute” AND TOPICS “Construction” OR
“Building”. A considerable amount of publications identified were false positive as they meet
the right properties. However, their contents are irrelevant to the subject of discussion.
Consequently, publications were excluded by reason of language, subject area, keywords
screening, duplications, abstract not available or irrelevant to the subject of discussion.
Therefore, 516 and 220 publications were excluded from Scopus and WOS respectively for
further analysis as they do not meet the inclusion criteria as shown in Table 1. Table 2 shows
the profile of the analysis by document type with articles having more percentage than the
conference proceedings. Furthermore, Table 3 shows that publications in the Scopus database
consistently increase from 2016 to 2019 while Web of Science publications fluctuate within
the period with the year 2018 having the highest publications.
Table 1. Retrieved Publications Profile
Profile Scopus WOS
Numbers of Papers % Numbers of Papers %
Total number of Publication retrieved 1026 100% 457 100%
Publications after Nov.2019 7 1% 0 0%
Publications not written in English 138 13% 115 25%
Publications limited to Articles and Proceedings
143 14% 15 3%
Publications not related to research area/topics
228 22% 90 20%
Total Publications Excluded 516 50% 220 48%
Total Publications Analyzed 510 50% 237 52%
(Source: Compiled by the Author)
Table 2. Profile of Publications Analyze by Document Type
Profile Scopus WOS
Number % Numbers %
Article 402 79% 199 84%
Conference Proceedings 108 21% 38 16%
Total Publications Analyzed 510 100% 237 100%
(Source: Compiled by the Author)
Table 3. Profile of Publications Per Year
(Source: Compiled by the Author)
Result
The review commenced with a wider topic search to analyze the trend in construction
dispute research area. The retrieved publications were analyzed to see the most popular
keywords associated with construction dispute. Figures 1 and 2 shows the most occurring
keywords related to “Dispute” AND TOPICS “Construction” OR “Building”. This is grouped
Profile Scopus WOS
2019 110 41
2018 86 50
2017 70 40
2016 69 47
2015 77 40
2014 98 19
Total Publication Analyzed 510 237

67
MCRJ Special Issue Vol. 12 | No. 1 | 2021
into different clusters as shown in Tables 4 and 5. The item label size represents the number
of publications in which the keyword was found. A bigger label size suggests that more
publications contain this keyword while different colours represent different groups of
keywords that can be clustered by the clustering technique of VOSviewer. VOSviewer is a
free “software tool for constructing and visualizing bibliometric networks. These networks
may, for instance, include journals, researchers, or individual publications, and they can be
constructed based on citation, bibliographic coupling, co-citation, or co-authorship relations.
VOSviewer also offers text mining functionality that can be used to construct and visualize
co-occurrence networks of important terms extracted from a body of scientific literature”(Van
Eck and Waltman, 2010).
Figure 1. Most Commonly Co-Occurring Keyword Search Related to “Dispute” AND TOPICS
“Construction” OR “Building” from the Scopus Database
Figure 2. Most Commonly Co-Occurring Keyword Search Related to “Dispute” AND TOPICS
“Construction” OR “Building” from the Web of Science Database

68
MCRJ Special Issue Vol. 12 | No. 1 | 2021
Table 4. Clusters of Keywords Co-Occurred With “Dispute” and Topics “Construction” Or “Building” in Scopus
(Source: Compiled by the Author)
Table 5. Clusters of Keywords Co-Occurred With “Dispute” and Topics “Construction” Or “Building in
Web of Science
(Source: Compiled by the Author)
Furthermore, to get the co-occurrence of the keywords, a threshold of a minimum number
of at least 5 occurrences was set. Co-occurrence defines the closeness of keywords in the title,
abstract or keywords list in the retrieved publications. This is used to discover the connection
in order to identify the research topics. The links indicate the strength of their occurrence. Out
of 1572 keywords in Scopus, 33 keywords met the threshold in Scopus while out of 711
keywords in WOS, 18 keywords met the threshold. For each keyword that meets the
threshold, the total link strength of the co-occurrence links with other keywords was
generated.
Table 6 and 7 shows the co-occurrence of the search keyword “Dispute” AND TOPICS
“Construction” OR “Building” in Scopus and WOS. For example, the search keyword co-
occurred with dispute resolutions 25 times in Scopus and 19 times in WOS. Likewise, Table
8 and 9 shows the total link strength of the search keyword with its linked keywords. The
keywords that have a higher link strength with linked keyword reveals how strongly and
significantly they are networked together. For example, dispute resolution is significantly
connected to the search keyword both in Scopus and WOS.
Table 6. Total Link Strength with Keywords Search “Dispute” and Topics “Construction” Or “Building”
in Web of Science
ID Label Cluster Links Total Link Occur. Avg. Pub. Year
236 Dispute resolution 1 12 23 19 2017
138 Construction 3 12 24 18 2017
229 Dispute 3 8 21 17 2017
154 Construction disputes 4 8 11 13 2016
30 Arbitration 1 11 21 11 2017
546 Project management 1 6 7 11 2017
129 Conflict 3 7 13 9 2016
21 Alternative Dispute Resolution 2 5 6 8 1764
6 Adjudication 4 6 9 7 2016
Clusters Keywords
1 Construction industry, Disputes, Claims, Construction project, Construction projects and Delay analysis.
2 Dispute resolution, Construction disputes, Adjudication and Mediation. 3 Dispute, Conflict, Claim, and Contract management
4 Project management, Construction Management, Disputes and arbitration, Contracting
5 Arbitration, Litigation, Alternative Dispute Resolution and Negotiation
6 Construction, Contract and Law
7 Risk, Contract law and Risk management
Clusters Keywords
1 Arbitration, Construction management, Construction projects, Dispute resolution, Negotiation and Project management
2 ADR, Alternative Dispute Resolution, Construction industry and Disputes
3 Conflict, Construction, Contract and Dispute

69
MCRJ Special Issue Vol. 12 | No. 1 | 2021
ID Label Cluster Links Total Link Occur. Avg. Pub. Year
9 ADR 2 7 8 7 2016
156 Construction industry 2 6 9 7 1727
167 Construction projects 1 6 6 7 2017
432 Mediation 4 9 11 7 2016
159 Construction management 1 6 9 6 2017
417 Litigation 4 9 13 6 2017
236 Dispute resolution 1 12 23 19 2017
461 Negotiation 1 8 10 6 2016
174 Contract 3 6 10 5 2015
244 Disputes 2 6 7 5 1612
(Source: Compiled by the Author)
Table 7. Total Link Strength with Keywords Search “Dispute” and Topics “Construction” Or “Building”
in Scopus
(Source: Compiled by the Author)
DISCUSSION
The keyword search shows that there is similarity in the retrieved publications from
Scopus and WOS. This indicates that both databases have a considerable amount of
publications in the area of construction dispute. However, Scopus has more publications than
ID Label Cluster Links Total Link Occur. Avg.Pub. Year
458 Dispute resolution 2 17 29 25 2017
277 Construction 6 17 28 24 2017
450 Dispute 3 14 34 21 2017
295 Construction industry 1 9 12 17 2016
465 Disputes 1 13 19 16 2017
1127 Project management 4 9 12 14 2017
268 Conflict 3 9 12 11 2016
200 Claims 1 12 18 10 2017
56 Arbitration 5 14 20 10 2017
330 Contract 6 13 21 10 2017
1240 Risk 7 8 10 10 2017
293 Construction disputes 2 6 8 9 2016
309 Construction project 1 7 7 8 2016
313 Construction projects 1 5 5 8 2018
196 Claim 3 5 12 8 2017
299 Construction Management 4 8 9 8 2017
852 Litigation 5 11 17 8 2017
337 Contract management 3 7 9 7 2017
40 Alternative Dispute Resolution 5 7 10 7 2017
336 Contract law 7 7 10 7 2015
22 Adjudication 2 8 12 6 2015
466 Disputes & arbitration 4 2 3 6 2015
1249 Risk management 7 4 4 6 2018
413 Delay analysis 1 3 3 5 2018
889 Mediation 2 5 7 5 2015
339 Contracting 4 3 4 5 2015
970 Negotiation 5 10 12 5 2016
815 Law 6 3 3 5 2017

70
MCRJ Special Issue Vol. 12 | No. 1 | 2021
WOS. This is similar to the submission of Mongeon and Paul-Hus (2016) which states that
journal coverage of Web of Science in the area of social sciences, art and humanity is
relatively low when compared to Scopus. Furthermore, keywords co-occurrence and clusters
shows that the keywords focus on the issues in the construction industry like conflicts, claim,
dispute which is epidemic and prevalent in the industry (Akinradewo and Oladinrin, 2018).
Likewise, the clusters also reveal that their resolution and management is more by litigation,
arbitrations and different alternative dispute resolution methods like negotiation and
mediation. The search keyword co-occurred more with keywords that relate to the resolution
and management of existing dispute and no keyword with dispute prevention or avoidance.
Therefore, it can be concluded that there is a lack of research in the area of dispute prevention.
This is similar to the findings of Charehzehi et al. (2015).
Table 8. Total Link Strength with Keywords Search “Dispute” and Topics “Construction” Or “Building in
Web of Science
(Source: Compiled by the Author)
Table 9. Total Link Strength with Keywords Search “Dispute” and Topics “Construction” Or “Building in
Scopus
Keywords Total Link Strength
Construction 24
Dispute resolution 23
Arbitration 21
Keywords Total Link Strength
Dispute 34
Dispute resolution 29
Construction 28
Contract 21
Arbitration 20
Disputes 19
Claims 18
Litigation 17
Construction industry 12
Project management 12
Conflict 12
Claim 12
Adjudication 12
Negotiation 12
Risk 10
Alternative Dispute Resolution 10
Contract law 10
Construction Management 9
Contract management 9
Construction disputes 8
Construction project 7
Mediation 7
Construction projects 5
Risk management 4
Contracting 4
Disputes & arbitration 3
Delay analysis 3
Law 3

71
MCRJ Special Issue Vol. 12 | No. 1 | 2021
Keywords Total Link Strength
Dispute 21
Conflict 13
Litigation 13
Construction disputes 11
Mediation 11
Contract 10
Negotiation 10
Adjudication 9
Construction industry 9
Construction management 9
ADR 8
Disputes 7
Project management 7
Alternative Dispute Resolution 6
Construction projects 6
(Source: Compiled by the Author)
Generally, dispute management falls into two categories. The first approach addresses
already existing dispute using Alternative Dispute Resolution (ADR) methods. This seems to
be more popular due to its advantage of cost-effectiveness and short period which alleviate
the shortcoming of litigation and arbitration. (Idowu et al., 2015). Likewise based on the
global construction dispute report from Arcadis (Arcadis, 2018), ADR is highlighted as the
most prevalent method of resolving disputes. However, researchers like Jelodar, Yiu, and
Wilkinson, (2015) suggested that opportunism and poor handling of dispute in the ADR
methods are the ultimate trigger of dispute. Likewise, Yiu (2014) opined that mistrust impedes
the success of mediation while Cheung and Chow (2014) highlighted the withdrawal of
negotiators as one of the failing synopsis of negotiation. Moreover, Li and Cheung (2016)
suggested that the possibility of bias on the part of the disputant and neutral third party may
cause unexpected hindrance to the ADR method. Likewise, based on the finding of this
review which show that dispute resolution is significantly related to the search keywords, the
global construction dispute report by Arcadis from year 2010 to 2018 (Arcadis, 2016; 2017;
2018) which highlighted that there is increase both in the value of dispute and time taken to
resolve them. It can be opined that despite the numerous advantages of ADR, it also seems to
be the reason for the prevalence of dispute in the industry. This is because it appears not to
meet up with the expected result. Akinradewo (2017) after the assessment of the dispute
resolution system suggested the need for a dispute prevention strategy rather than settlement.
likewise, Alaloul et al. (2019) having considered the advantages and disadvantages of
different ADR methods highlighted that there seems to be difficulty in selecting best suit ADR
method to meets parties need and manage a dispute since the selection is done before the
occurrence of dispute when it is included in the contract. Likewise, Hayati, Latief and Santos
(2018) affirmed the need for an integrated claim system to prevent and minimize
dispute.Thus, the need to adopt a model that can prevent disputes prior to their occurrence
becomes more important.
The second approach is based on the idea that prevention is better than cure. It uses
prevention and avoidance techniques before the occurrence of disputes but with the
expectation that disputes may occur. This involved, effective planning to minimize the area
of likely conflict and preventing them from escalating to formal dispute. One of the new

72
MCRJ Special Issue Vol. 12 | No. 1 | 2021
concepts that allow effective planning and optimization of the construction process in the
construction industry is Building Information Modeling (BIM). It is an approach that fosters
the virtual design and collaborative working environment prior to physical construction.
Moreover, it has the capacity to control conflict causes before the occurrence of disputes
(Sacks et al., 2018).
The benefits that can be accrued from using BIM on any given project run through its
entire life cycle. At the pre-construction stage, the virtual design and construction enabled by
BIM give every party a clear understanding of the project right from the inception. Every
member of the team can have virtual assess, evaluate and ask for clarifications. Therefore,
information is made available in the right format and at the right time. As a result, the right
use & sharing of information, decision making, client satisfaction and project performance at
the completion of the project can be guaranteed. (Onungwa et al., 2017). Similarly, the BIM
process coordinates the building system to ensure that potential conflicts in locations and
relationships of components are resolved at the planning stage. Clash detention enables the
team to work in a collaborative way and instill commitment toward project success. BIM
model capture explore coordinates and maintain consistent data through planning, design,
construction and operation phase. Thus, it provides great insight for constructability issues
and rework is reduced drastically (Autodesk, 2016). At the Construction stage, with the BIM
model, accurate documentation can be generated, distributed among the team member in a
coordinated and efficient way. The quick understanding of the model enables the end-user to
understand the intention of the designer. Consequently, eliminates unnecessary redesign and
reduce request for information (Kymmell, 2008). Likewise, with the BIM model, completed
works can be tagged. Subsequently, completed quantities and valuation of work done can be
done automatically. Moreover, quantities take-off errors are minimized, time and resources
are saved. The benefit of BIM at the pre-construction stage influenced project outcome at the
construction stage. This is because conflicts, redesign, construction delay and disruption,
change order & rework collaboration issues, health & safety issues, fabrication & offsite
manufacturing issues are avoided (Wei and Mydin, 2017). The availability of facility
information for maintenance purposes made available by the BIM model makes the transition
from the construction phase to the operation stage seamless (Kelly et al., 2013).
Consequently, it can be concluded that this area is still lacking as the keyword does not
co-occur with BIM. This does not mean that there is no publication on BIM and dispute, but
it indicates that their occurrence is insignificant in the subject area of construction dispute.
Therefore, to fill this deficiency of applying BIM to prevent construction dispute, the industry
should explore this area further.
CONCLUSION
In this review, a bibliometric analysis of construction dispute was carried out to identify
the research trend in the subject area. A total number of 1026 publications from Scopus and
457 publications from WOS with keywords “Dispute” AND TOPICS “Construction” OR
“Building is retrieved and analyzed using the VOSviewer. The result shows similarities in the
retrieved publications from Scopus and WOS. However, Scopus seems to have more
publication than WOS. Furthermore, the retrieved publications revealed that the research
trend is towards dispute resolution as keywords co-occurred with themes in this area.
Likewise, it shows that the resolution is more on managing already existing dispute by the

73
MCRJ Special Issue Vol. 12 | No. 1 | 2021
use of different Alternative Dispute Resolution (ADR) methods and significant lack in the
area of dispute prevention. However, it is discussed that despite the numerous advantages of
ADR it seems to be reasons for the increasing dispute. Subsequently, a dispute prevention
method seems preferable rather than the management of already existing dispute. One of the
dispute prevention methods is BIM which uses virtual design and a collaborative working
environment prior to physical construction. Moreover, it has the capacity to control conflict
causes before the occurrence of disputes. Therefore, it is concluded that more research should
focus on the application of BIM in preventing construction dispute. This is part of an ongoing
Ph.D. research work that aims at investigating the role of BIM in minimizing dispute
occurrence in the construction industry.
REFERENCES
Akinradewo, F. O., & Oladinrin, O. T. (2018). A quantitative study of the magnitude of
construction claims in construction projects in Nigeria. Journal of Project Management
and Innovation , 8(18), 1872-1885.
Akinradewo, O. F. (2017). Assessment of Dispute Resolution in the Construction Industry in
Lagos State Nigeria, Journal of Construction Management. 8(18), 22–27.
Alaloul, W. S., Hasaniyah, M. W., & Tayeh, B. A. (2019). A Comprehensive Review of
Disputes Prevention and Resolution in Construction Projects. MATEC Web of
Conferences, 270 (February), 05012.
Arcadis. (2016). Global Construction Disputes Report 2016 : Don’t Get left Behind.
Arcadis. (2017). Global Construction Disputes Report" Avoiding the Same Pitfalls.
Arcadis. (2018). Global Construction Dispute Report : Does the Construction Industry Learn
from its Mistakes.
Autodesk. (2016). The Value of BIM for Owners : Save Time and Money During the Building
Lifecycle.
Bean, T. K., Mustapa, F. D., & Mustapa, M. (2019). Unbundling Transaction Cost
Components in Building Information Modeling Adoption Procurement. International
Journal of Recent Technology and Engineering, 8(2 Special), 333–338.
Chan, A. (2015). Briefing: Statutory adjudication for construction disputes: An overview.
Proceedings of Institution of Civil Engineers: Management, Procurement and Law,
168(6), 255–258.
Chaphalkar, N. B., Iyer, K. C., & Patil, S. K. (2015). Prediction of Outcome of Construction
Dispute Claims Using Multilayer Perceptron Neural Network Model. International
Journal of Project Management, 33(8), 1827–1835.
Charehzehi, A., Yusof, A. M., Chai, C., & Chong, H.-Y. (2015). Conceptualizing Building
Information Modeling: n Construction Conflict Management. Proceedings of the 26th
International Business Information Management Association Conference - Innovation
Management and Sustainable Economic Competitive Advantage: From Regional
Development to Global Growth, IBIMA 2015, 1337–1358.
Cheung, S. O., & Chow, P. T. (2014). Withdrawal as a form of construction dispute
negotiation failure. In Construction Dispute Research: Conceptualisation, Avoidance and
Resolution (Vol. 9783319044).
Cobo, M. J., López-Herrera, A. G., Herrera-Viedma, E., & Herrera, F. (2011). Science
Mapping Software Tools: Review, Analysis, And Cooperative Study Among Tools.
Journal of the American Society for Information Science and Technology, 62(7), 1382–
1402.

74
MCRJ Special Issue Vol. 12 | No. 1 | 2021
Daradkeh, L. (2016). Solution By Negotiation and Determination by Arbitration in Arab
World Construction Disputes: Comparative Study Between FIDIC Rules of 1987 and
FIDIC Rules of 1999. Arab Law Quarterly, 30(4), 395–409.
De Castro E Silva Neto, D., Cruz, C. O., Rodrigues, F., & Silva, P. (2016). Bibliometric
Analysis of PPP and PFI Literature: Overview of 25 Years of Research. Journal of
Construction Engineering and Management.
Hansen, S. (2019). Challenging Arbitral Awards in the Construction Industry: Case Study of
Infrastructure Disputes. Journal of Legal Affairs and Dispute Resolution in Engineering
and Construction, 11(1).
Hayati, K., Latief, Y., & Ahmad Jaka, S. (2019). Risk Response Analysis for Construction
Dispute Resolution on Litigation. AIP Conference Proceedings, 2059.
Hayati, K., Latief, Y., & Santos, A. J. (2018). Development of Prototype Claims Management
System to Minimize Dispute in Infrastructure Projects with Design Build Contract.
International Journal of Civil Engineering and Technology, 9(7), 1370–1377.
Idowu, F. O., Ogunbiyi, O. E., & Hungbo, A. A. (2015). An Evaluation of the Use of ADR in
The Nigerian Public Construction Project Disputes. International Journal of Sustainable
Construction Engineering & Technology, 6(1), 16–28.
Jelodar, M. B., Yiu, T. W., & Wilkinson, S. (2015). Dispute Manifestation and Relationship
Quality in Practice. Journal of Legal Affairs and Dispute Resolution in Engineering and
Construction, 8(1), C4515003.
Kelly, G., Serginson, M., Lockley, S., Dawood, N., & Kassem, M. (2013). BIM for Facility
Management : A Review and a case Study Investigating the Value and Chanllenges.
(October), 30–31.
Kymmell, W. (2008). Building Information Modeling : Planning and Managing Construction
Projects with 4D CAD and Simulations (McGraw-Hill Construction Series) : Planning
and Managing Construction Projects with 4D CAD and Simulations. McGraw-Hill
Publishing.
Li, K., & Cheung, S. O. (2016). The potential of bias in multi-tier construction dispute
resolution processes. Proceedings of the 32nd Annual ARCOM Conference, ARCOM
2016, 197–205.
Linnenluecke, M. K., Marrone, M., & Singh, A. K. (2019). Conducting systematic literature
reviews and bibliometric analyses. Australian Journal of Management.
Marsilio, M., Cappellaro, G., & Cuccurullo, C. (2011). The Intellectual Structure Of Research
Into PPPs. Public Management Review.
Mashwama, X. N., Aigbavboa, C., & Thwala, D. (2016). Investigation of Construction
Stakeholders’ Perception on the Effects & Cost of Construction Dispute in
Swaziland. Procedia Engineering, 164, 196–205.
Mongeon, P., & Paul-Hus, A. (2016). The journal coverage of Web of Science and Scopus: a
comparative analysis. Scientometrics, 106(1), 213–228.
Onungwa, I. O., Uduma-Olugu, N., & Igwe, J. M. (2017). Building Information Modeling as
a Construction Management Tool in Nigeria. WIT Transactions on the Built Environment,
169, 25–33.
Sacks, R., Eastman, C., Lee, G., & Teicholz, P. (2018). BIM handbook: a Guide to Building
Information Modeling for Owners, Designers, Engineers, Contractors, and
FacilityMmanagers.
Saleh, A. M. (2019). New Approach to Mediating Construction Disputes. Journal of Legal
Affairs and Dispute Resolution in Engineering and Construction, 11(4).

75
MCRJ Special Issue Vol. 12 | No. 1 | 2021
Treacy, D., Spillane, J. P., & Tansey, P. (2016). Construction Disputes In Small To Medium
Enterprise’s in Ireland During Recession: Identification of Critical Factors. International
Journal of Law in the Built Environment, 8(1), 21–41.
Van Eck, N. J., & Waltman, L. (2010). Software Survey: VOSviewer, A Computer Program
for Bibliometric Mapping. Scientometrics.
Wei, A. N., & Mydin, A. O. (2017). Potential and Benefits of Building Information Mod-
eling ( BIM ) During Pre-Construction , Construction and Post Construction Stage. (1),
429–438.
Yiu, T. W. (2014). The efficacy of trust-building tactics in construction dispute mediation. In
Construction Dispute Research: Conceptualisation, Avoidance and Resolution (Vol.
9783319044).

76
MCRJ Special Issue Vol. 12 | No. 1 | 2021
BUILDING DEFECTS AND RESTORATION TECHNIQUES OF HERITAGE BUILDINGS IN MALAYSIA Mohd Adib Ramli, Myzatul Aishah Kamarazaly, Lim Xiao Shi, Filzani Illia Ibrahim, Mohamed Rizal Mohamed and Kam Kenn Jhun School of Architecture, Building and Design, Taylor’s University, Subang Jaya, Malaysia.
Abstract A considerable amount of existing building stocks will become redundant as the buildings’ performances decline while demolition and abandonment will rise upon, but this comes with a cost. Malaysia, being endowed with abundant collection of heritage buildings that signifies a sense of livelihood to the nation, should not take these as the only retort. Permanent shortage of heritage buildings and their continuous disappearance calls for a need to preserve these heritages through restoration. Restoration preserves the past and plans for the future. Restoration also prevents further decay, damage and defects to the existing building. As restoration works are known to have unique challenges due to their high uncertainties and complexities, the need to understand the factors that affects the restoration process becomes more prominent. To provide more clarity and certainty, the common building defects in local heritage buildings have to be identified and the current restoration techniques have to be evaluated. Keywords: Deterioration; heritage buildings; restoration; building defects; techniques.
INTRODUCTION
Boeri, Gabrielli and Longo (2011) summarized that old building stocks of poor quality
and construction processes led to an urgent need of restoration. Gradual deterioration of
building leaves building owners no option but to result to restoration for its continual usage
(Ball, 2002; Flourentzou and Roulet, 2002). Ahmad and Rahman (2010) said that heritage
buildings are vulnerable to deterioration due to climatic conditions and moisture. Lack of
repair information and constant developmental pressure leads to the demolition of potential
pre-war buildings as a sacrifice for new development (Hanafi et al., 2018). A growing concern
over the heritage conservation in Malaysia can be observed as a strong public uproar was
witnessed with the government’s decision to demolish the old buildings of the Bukit Bintang
Girls’ School and Bok House (Hamid, 2001). Syed Zainol (1995) as cited by Salleh (2011)
stated that according to the heritage building inventory study done by the National Museum,
there are more than 35,000 pre-war buildings built during the British colonial period. The
effort to prevent further deterioration of the buildings can be achieved by conservation,
through the process of restoration (Zolkafli et al., 2015). Harun (2011) defined restoration as
a process of accurately recovering the details and forms of any building structure as well as
its settings, as how it appeared at some period in time, through the removal of the latter work
and the replacement of the missing original work.
PROBLEM STATEMENT
Heritage restoration remains an anathema to most of the building professions and building
owners, preferring the choice of demolition or new building to repairing or modifying the
existing. The lack of knowledgeable consultants and contractors in this field contributed to
the demolition approach, as they are more familiar working with the conventional methods
(Tan et al., 2016). Roy and Kalidindi (2017) agreed that challenges are unique especially for

77
MCRJ Special Issue Vol. 12 | No. 1 | 2021
heritage restoration projects due to their high uncertainties and complexities. Tan et al. (2016)
added that there is still lack of heritage conservation literature focusing on the technical
application and building survey approach. Harun (2011) concluded that the main challenges
of conservation practice are due to the lack of technical experts in conservation techniques,
lack of conservation guidelines and technical manuals, and poor conservation plans. Salleh
(2011) revealed that the key challenges relied upon the economic development pressure, lack
of knowledge and expertise, ineffective enforcement and poor public awareness. Askari and
Dola (2009) also stressed that lack of technical knowledge in the repairing of historic building
posed as a threat. To redress these knowledge shortfalls, there is a need to understand more
on the current practice of restoration techniques to fill the gap from the challenges concluded
in the studies from Askari and Dola (2009); Harun (2011); Salleh (2011); and Tan et al. (2016)
who consolidated that there is still a lack of technical understanding in the restoration
techniques. Common building defects and the factors affecting the restoration process will
also be determined to answer the uncertainties lingering in the study by Roy and Kalidindi
(2017) to promote increased uptakes of successful restoration projects.
RESEARCH OBJECTIVES
The study aimed to achieve the following objectives:
a) To identify the common building defects in local heritage buildings.
b) To determine the factors affecting the restoration of local heritage buildings.
c) To evaluate the current practice of restoration techniques on local heritage buildings.
LITERATURE REVIEW
Restoration of Heritage Buildings in Malaysia
Restoration of architectural heritage is a multidisciplinary approach as heritage structures
are known to be meticulously designed and constructed building structures (Sandbhor and
Botre, 2013). As explained and summarized by Harun (2011), under the National Heritage
Act 2005 (NHA), heritage is understood as any heritage object, heritage site, underwater
cultural heritage or living person being declared as National Heritage. Sandbhor and Botre
(2013) defined building restoration as a process of appropriately revealing the state of a
historic building by looking in the past and recovering through various measures as a respect
to its heritage value. Lakhani and Sharma (2018) agreed that the restoration and reintegration
of features and details should be based upon respect of archaeological evidence and original
design, documents and materials.
Common Building Defects in Heritage Buildings
Cracks in Concrete and Brick Wall
Alauddin, Ishak and Azim (2018) mentioned that cracks occur due to pressure of either
excessive dead load, live load or wind load to the building elements. A temporary load or lack
of support could also result to cracks (Bakri and Mydin, 2013; Kian, 2001). Bakri and Mydin
(2013) mentioned that vertical and angled cracks occurred due to overloading or settlement
and heaving whereas horizontal cracks happened due to lateral pressure. Construction

78
MCRJ Special Issue Vol. 12 | No. 1 | 2021
materials, whether concrete, mortar or bricks, tend to crack as they age due to the expansion
and contraction process, also known as moisture movement (Alauddin et al., 2018; Chitte and
Sonawane, 2018). Cracks tend to occur more frequently with the increase in age of a building
as the strength of components gradually decreases and the frame starts to experience
dilapidation (Alauddin et al., 2018).
Timber Defect
Taylor (2000) as cited by Bakri and Mydin (2013) mentioned that timber is a durable
material and would be able to last indefinitely as deterioration does not occur spontaneously.
Moisture problem like fungi and biological attack from termites are the most common
problem found in decayed historic timber building (Mustafa et al., 2011; Zolkafli et al., 2015).
Ahmad (2004) and Mansor et al. (2012) both mentioned that insect or termite attacks pose a
serious threat to damp and digestible timber located in feet of rafters, bearing ends of trusses
or beams, and timbers built into or placed against damp brick walls. Areas of minimal air
flow, low ventilation and high moisture environment promotes the survival of termites (Bakri
and Mydin, 2013; Mansor et al., 2012).
Dampness and Salt Attack
Dampness in building is one of the most damaging failures that could lead to several other
defects or issues (Ahmad and Rahman, 2010; Othman et al., 2015). Othman et al. (2015)
mentioned that Malaysia being a tropical country has high humidity of about 80 percent
throughout the year and rainfall of more than 2500mm, indicating that our country is heavily
exposed to moisture issue that deteriorates buildings at a faster rate and affects its
functionality. Commonly, visible sign of rising dampness can be seen as high as 5 to 7 feet
above the ground on plastered wall surfaces (Ahmad and Rahman, 2005). Aw and Mydin
(2017) agreed that heritage buildings are more prone to rising dampness issue due to the
absence of damp proof course when the buildings were built around early 1900s. Ahmad and
Rahman (2010) elaborated that rising dampness issues could be aggravated with a
combination of high-water table and poor drainage system. Crumbling plaster, peeling of
paint and powdery salt residue are visible signs of rising dampness (Ahmad and Rahman,
2010; Aw and Mydin, 2017). Aw and Mydin (2017) mentioned that rising dampness and salt
crystallization is an interrelated process. Such damage, also known as salt attack or salt decay,
is generally a damage caused by salt phase transitions due to moisture transfer (Delgado et
al., 2016).
Defective Plaster and Paint
Staining, a visible discoloration produced by foreign substances that penetrated through
the masonry in building either occur due to air pollution or bio-growth (Sabri and Suleiman,
2014; Talib et al., 2014). Chalking or powdering of the paint surface, on the other hand,
happens when resin in the paint film has weakened slowly (Sabri and Suleiman, 2014).
Alauddin et al. (2018) added that the amount of constant rain, sun and wind received could
easily turn the paint surfaces chalky and blistered or wrinkled. The use of cement plaster that
has low vapour exchange will trap moisture inside the masonry wall which lead to peeling,
crumbling and falling off of paint after several years (Bakri and Mydin, 2013; Sabri and
Suleiman, 2014). Sabri and Suleiman (2014) further added that the use of non-breathable

79
MCRJ Special Issue Vol. 12 | No. 1 | 2021
chemical paint would also contribute to the peeling of paint as such incompatible material
prohibits the breathing of the wall. Bakri and Mydin (2013) and Talib et al. (2014) agreed to
this, where they mentioned that improper surface preparation would deteriorate the wall due
to bad evaporation process.
Factors Affecting Restoration of Existing Heritage Building
Monetary Factors
When decision to take on any restoration project is made, the availability of labour is
imperative especially for skilled craftsmen (Rahmat, 2008). Due to the nature of restoration
work is geared towards craftwork, the works are characterized to use small hand tools rather
than heavy engineering that normally use heavy machineries. According to Rahmat (2008), it
is exceptionally difficult to find skilled craftsmen who execute fine plaster work and wood
carving in Malaysia as most of them are old. This is further agreed by Zolkafli et al. (2015)
that mentioned only a handful of specialists are available and knowledgeable in restoration
works.
The cost per unit of material procured is usually higher in restoration projects as they are
purchased in smaller quantities where the suppliers are unlikely to provide bulk discount
(Rahmat, 2008). Particularly when there is a stringent need to use the authentic construction
materials (Hein and Houck, 2008; Rahmat, 2008) or the building owner is adamant and
unlikely to compromise with replacement that may result in undesirable aesthetic (Rahmat,
2008), difficulty of matching new construction materials with original ones might arise. When
prolonged, delay in design and project duration could occur (Ali, 2014; Hein and Houck,
2008). Hence, Mustafa et al. (2011) mentioned that when there is insufficient source of
materials, replacement through imitation of similar design or material character that blends in
with its other original elements should be applied.
Zou et al. (2016) emphasized on the difficulty and constraint in the transportation of
materials and equipment to site as compared to new construction. As existing building
structures are often situated where there are restricted road traffic controls and close proximity
to nearby existing buildings, careful equipment selection and construction scheduling is
imperative. As suggested by Rahmat (2008) one of the solutions is to construct high-level
cantilevered platforms above roads that is adjacent to the building, though such temporary
structure requires approval from the local authority due to safety reasons.
Regulatory Factors
In regard to the building regulation, restoration design is affected by complex legislation
(Ali, 2014; Ali and Zakaria, 2012) and statutory requirements (Gorse and Highfield, 2009).
Ali and Zakaria (2012) simplified that it is not necessary to obtain approval from the Town
Planning Department of the local council when the refurbishment work does not involve
addition to the building height or area, change of use, change of façade and anything that does
not come in conflict with the local plan. This is in accordance with Act 172 (1976) Clause 19
of the Malaysia Town and Country Planning Act. Statutory requirement includes plan
approval from respective local authorities (Ali and Zakaria, 2012). Ali and Zakaria (2012)
also commented that it is likely that such Act together with the Uniform Building By-Law

80
MCRJ Special Issue Vol. 12 | No. 1 | 2021
(UBBL) 1984 are not considered to be extensively applicable in refurbishment projects except
for the fire department requirement.
The existing façade of an existing structure needs to be retained, which is also due to the
regulatory constraint. Gorse and Highfield (2009) agreed that façade retention is important as
it holds certain historic value. These façade walls, which often are load-bearing walls, provide
structural support to many internal elements such as floor slabs and roofs. Gorse and Highfield
(2009) further emphasized that there is a need for practical arrangement of temporary support
structure externally so it would not obstruct the surrounding and posed any danger to the
nearby passer-by, which was also subject to permit from the local authorities.
Grants and incentives offered in countries like Australia and United Kingdom promote
the uptake of restoration projects (Wilkinson et al., 2009). In Malaysia building context, albeit
not many, the Habitat Seed Fund was introduced in Penang under the effort of the local
authorities.
Design Information
Insufficient and inaccurate information on existing building system, whether from
incomplete or missing as-built drawings, reports or other available documentation may pose
a challenge to the project team and complicate the design process (Zou et al., 2016). It
compounds to the project uncertainty and resulting in greater amount of assumption,
especially on the hidden items, such as electrical and piping cables (Ali, 2010; 2014). Ryan
and Mansfield (2001) as mentioned by Ali (2010) highlighted that due to lack of clarity of
design information, higher provisional and contingency sum needs to be allocated and more
variation order is expected to be issued later. Roy and Kalidindi (2017) found out that the
building structure itself has many unforeseen conditions that are often only discovered once
the work has started. It was also common for structural components that were initially thought
strong and stable, which were later discovered that it needs replacement (Rahmat, 2008).
Restoration Techniques for Building Defects in Heritage Builidngs
Restore Cracks in Concrete and Brick Wall
For minor cracks on surfaces, Chitte and Sonawane (2018) suggested that surface filling
method is the simplest technique to repair micro-cracks lesser than 0.2mm. They further
explained that brush polymer and elastomeric sealant could be applied to prevent moisture
content. Stitching is another method to repair cracks (Chitte and Sonawane, 2018; Doshi et
al., 2018). According to Chitte and Sonawane (2018), stitching involves drilling holes on both
sides of the cracked structure followed by anchoring a U-shaped metal unit with short legs,
often known as staples, that spans the crack. Rajabather (2016) mentioned that epoxy injection
is another economical method for repairing cracks in concrete but Doshi et al. (2018) argued
that the cost of epoxy concrete is prohibitive. Surface should be kept clean and free from dust
before establishing entry and venting of ports along the crack, followed by sealing of cracks,
injecting the epoxy and letting it to be absorbed before removing any excess using a rubber
squeeze (Chitte and Sonawane, 2018; Rajabather, 2016).

81
MCRJ Special Issue Vol. 12 | No. 1 | 2021
Restore Timber Defect
Walker (2017) said that though it is considered the most disruptive part, structurally
weakened and compromised timber due to woodworm infestation or dry rot and wet rot
outbreak must be removed and replaced by a new sound timber. For decayed timber structure
that bears into the wall, there are chances that only the ends need to be replaced by splicing
in new sections using bolts or steel plates. Another way as suggested by Mustafa et al. (2011)
is to use synthetic resin adhesive to fill missing areas and secured failed or weak connections
with special brackets, angled irons or stirrups. Ahmad (2004) and Ridout (2004) both
mentioned that the use of pressure-spraying insecticides could also prevent the growth of
insect attack. Preventive measures through removal of the source of problem, which is
moisture, is equally important. Hence, simple care such as repairing leaking rainwater system
and ventilating spaces well are ways to prevent or reduce chances of timber decay (Walker,
2017).
Remove Moisture and Salt Content
Tan et al. (2016) mentioned that chemical injection method is widely recommended to
seal off the ground water from rising through capillary action. According to Ahmad and
Rahman (2010), the chemical injection method is the cheapest way to provide a damp-proof
course to the masonry walls. In their study, such treatment shall be done prior to salt
desalination treatment, whereby holes will be drilled on wall and silicone-based chemical will
be injected either by gravity flow or by pumping until it becomes saturated and forms a
moisture barrier. Undersetting, which is the replacement of existing bricks with vent bricks,
saw slotting and making good leaked plumbing systems are good methods to treat dampness,
as concluded by a study done by Asomoah et al. (2017). The cocoon method, or the process
of poulticing, involves the application of a damp-absorbent material, often a pharmaceutical
fiber mixed with distilled water, that will draw salts from the applied surface after leaving it
for several weeks to dry (Ahmad and Rahman, 2010). Another method is the sacrificial
plastering that allows moisture and salt to be removed through its high sorptivity
characteristics before it is substituted with other restoration plaster (Franzoni, 2014).
Restore Defective Plaster and Paint
Sabri and Suleiman (2014) noted that lime is widely encouraged as it allows natural
ground moisture to travel up the wall and evaporates through the lime plaster. Talib et al.
(2014) mentioned that the George Town World Heritage Incorporate (GTWHI) had
recommended three layers of lime plaster with the ratio of 3:1 (sand:lime) and additional
material like brick dust pozzolan added to increase the durability of plaster. As paint served
as the first layer of protection against weather and deterioration, lime-based paint or lime
wash is highly encouraged as they are vapour permeable material that will aid in controlling
condensation within the building and maintaining the hydrostatic pressure (Talib et al., 2014).
Tan (2015) further added that modern wall finishes are not suitable to be used on traditional
lime plaster as water will build up and eventually the paint will experience blister, inflicting
damage to the structural wall.

82
MCRJ Special Issue Vol. 12 | No. 1 | 2021
RESEARCH METHODOLOGY
Case Study Research Technique
Starman (2013) defined qualitative research as an interpretative paradigm where it
emphasized on the subjective experiences of a subject matter. According to Sturman (1997)
as cited by Starman (2013), a case study is generally an exploration of an individual, a group
or a phenomenon and it comprises of a comprehensive description of any investigated case or
subject matter and its analysis. A single case study, though vulnerable in nature, provides in-
depth understanding of a unique and one of a kind study (Gustafsson, 2017). For multiple
case studies, each case will be studied and analysed individually and is then compared and
evaluated against the other cases and are utilised to augur similar results in studies or to augur
contrasting results for expected outcomes (Starman, 2013). Hence, as the research objectives
requires in-depth exploration and explanation with descriptive data, a multiple case study
approach is deemed the most appropriate and suitable method for this study as it deploys a
wider range of interpretative practice.
Data Analysis Method
Comparative analysis synthesizes the similarities, dissimilarities and patterns across two
or more cases that shared a common goal or focus (Goodrick, 2014). For the study, two
common characteristics of the case studies are identified which is the heritage recognition and
the period of the said heritage building’s last restoration which is within 5 years, namely 2015
– 2019 and data would be interpreted qualitatively whilst looking at the causality between the
variables. Content analysis makes valid inferences verbally or visually to analyse and gain
more knowledge and exposure of relevant studied objectives as cited by Bengtsson (2016).
Content analysis as a flexible way of analysing text data is suited for this study as it enables
descriptive data obtained from the relevant parties in each case study to be replicated into
valid inferences.
Scope of Case Study
The scope of case studies was limited to heritage buildings that have undergone recent
restoration, which is within the last 5 years as shown in Table 1. Although the selected cases
are from different states in Malaysia, yet all the buildings are gazetted and gained its heritage
recognition.
Table 1. Basic Information of the Selected Case Studies of Local Heritage Buildings in Malaysia
Case Studies Penang Grocers
Association Rumah Tangsi Cheah Kongsi
Sultan Alaeddin Royal Mosque
Coding CS1 CS2 CS3 CS4
Age of building 82 114 146 114
Location Penang Kuala Lumpur Penang Selangor
Heritage recognition
Classified as Category II (Heritage
shophouse) in the buffer zone under Special Area Plan
Gazetted as National Heritage Building in 2012 under National Heritage Act 2005
Classified as Category I (Heritage religious) in the core zone under Special
Area Plan
Gazetted as National Heritage
Site in 2008 under National
Heritage Act 2005
Last restoration year
2019 2017 2015 2018

83
MCRJ Special Issue Vol. 12 | No. 1 | 2021
Conceptual Framework
Figure 1. Conceptual Framework
RESULTS AND DISCUSSIONS
Summary of Key Findings for Objective 1
Table 2. Comparison of Common Building Defects in Local Heritage Buildings
Coded Case Studies
CS1 CS2 CS3 CS4
Cracks in concrete and brick wall
Minor cracks Minor cracks and major crack due to poor workmanship
Minor cracks Minor cracks and major crack due to settlement
Timber defects Termite attacks at roof and ceiling battens
Termite attacks at staircase area
Damped timber battens due to moisture seepage
Termite attack
REASONS
Lack of restoration technical expert, high
uncertainty, and higher restoration cost
IMPACT
Loses important heritage buildings and
assets
OPPORTUNITY
Preserve heritage buildings through restoration by identifying the restoration techniques practised to provide alternatives for different common building defects
Comparison of successfully restored local heritage buildings
Cheah Kongsi Sultan Alaeddin Royal Mosque
Rumah Tangsi
OBJECTIVE OF STUDY
1. To identify the common building defects in local heritage buildings. 2. To determine the factors affecting the restoration of local heritage buildings.
3. To evaluate the current practice of restoration techniques on local heritage buildings.
ISSUE
Many heritage buildings in Malaysia are left unrestored, dilapidated and abandoned
COMMON BUILDING
DEFECTS
1. Cracks
2. Timber defect
3. Dampness and salt attack
4. Defective plaster and paint
FACTORS AFFECTING
RESTORATION
1. Monetary
2. Regulatory
3. Design information
RESTORATION TECHNIQUES PRACTISED
1. Restore cracks
2. Restore timber defect
3. Remove moisture and salt content
4. Restore defective plaster and paint
Penang Grocers Association

84
MCRJ Special Issue Vol. 12 | No. 1 | 2021
Coded Case Studies
CS1 CS2 CS3 CS4
Dampness and salt attack
No rising dampness detected
Rising dampness due to entry of ground water
Rising dampness due to entry of ground water
Rising dampness due to entry of ground water
Defective plaster and paint
Powdery surface and peeling of paint
Powdery surface and peeling of paint
Powdery surface and peeling of paint
Powdery surface and peeling of paint
From the case studies, it was found that major cracks in brick wall usually occur not due
to excessive loading, but settlement or movement of soil and the cracks are worsened due to
poor workmanship of connecting the newly built brick wall with the existing old ones. As old
buildings were constructed mainly of timber structure apart from brick walls, therefore termite
attack that is common in Malaysia can be seen in most of the case studies. The most
prominent termite attacks are at the roof area, typically where the timber roof battens are
embedded to the damp brick wall. It was also proven from CS2, CS3 and CS4 that rising
dampness and salt attack happened hand-in-hand. Plaster and paint on wall surfaces tend to
wear off and peel easily and the condition worsen when the breathability of the wall is
obstructed with cement plastering. In Penang, lime plastering has to be used for plastering
work but in other states where it is not a necessity, cement plaster that is less tedious is more
preferred, but such building material does not aid in the breathability of the brick wall
especially in old buildings. Moisture coming from rising dampness pose as another threat to
heritage buildings and can deteriorate the condition if not removed or reduced.
Summary of Key Findings for Objective 2
Regulation, labour and building materials are the factors that have the greatest impact on
restoration above others. Due to regulation, demolition of heritage buildings is prohibited,
however there are many restrictions for the restoration work, for example the restoration of
traditional architectural elements. Regardless of the type or usage of building, majority of
them has traditional architectural elements that carries certain value. Restoration of such work
requires highly skilled craftsmen yet scarcity of labour affects the restoration process.
Training is vital to ensure that such heritage legacy is continued or there will be a need to
depend on foreign skilled craftsmen which would incur additional costs. Similarly, matching
building materials will need to be procured or if they are unavailable, a substitute that shares
a certain nature or characteristics has to be identified.
Cost of building materials are often higher due to limited salvage sources and often
procured in small quantities. Due to unavailability of materials and disagreement to use
certain materials within the project team, delay in project completion may occur and hence,
it is one important factor to be considered. Although not all the case studies had space
constraint due to being a stand-alone building like CS2, CS3 and CS4, however, due to its
location transportation of materials and loading issue within high traffic places was still a
concern. Demolition was also not an option due to regulatory reasons, and therefore the façade
as well as other parts of the building have to be retained as much as possible.
From another point of view, encouragement from the Government plays a vital role in the
success of a restoration work. This can be seen in CS1 and CS3 where the fund and financial
support from the local authority pushed the restoration to its success and in CS2 although the

85
MCRJ Special Issue Vol. 12 | No. 1 | 2021
fund amount was not identified, the local authority was involved in the project. In Penang
where there is a more holistic plan to rejuvenate their heritage zones, restoration works are
done in a more orderly manner. Likewise, some improvements can be observed in Kuala
Lumpur as local authorities are putting in efforts to restore more heritage buildings. However,
in other states like Selangor, restoration is done mainly on the building owner’s willingness
and initiative.
Uncertainty is still a challenge in any restoration project, but it can be reduced by
obtaining previously recorded information or through site measurement. Proper recording of
work provides more certainty to the subsequent team that carries out the restoration work,
either minor or major. However, late discovery of defects also needs to be considered as the
defects of some elements can only be detected upon inspection and hence, such factor should
be noted when considering a restoration project. Hence, it is noticeable that although the
factors act independently but they are actually inter-related and affecting one another.
Summary of Key Findings for Objective 3
Table 3. Comparison of Restoration Techniques in Local Heritage Buildings
Coded Case Studies
CS1 CS2 CS3 CS4
Restore cracks in concrete and brick wall
Surface filling and crack stitching
Surface filling and manual stitching
Surface filling Surface filling and Helifax bar stitching
Restore timber defect
Full removal and replacement of timber
Partial removal and replacement of timber
Full removal and replacement of timber
Full removal and replacement of timber
Remove moisture and salt content
Suggested cocoon method
Chemical injection Suggested steel plate method
Chemical injection
Restore defective plaster and paint
Lime plaster with lime wash
Sacrificial plaster and lime plaster and breathable paint
Sacrificial plaster and lime plaster with lime wash
Sacrificial plaster and lime plaster and breathable paint
For all case studies, surface filling was the only method to repair minor cracks. Whereas
for major cracks, there were several methods that have been practiced including using (1) wall
stitching with reinforcement and wire mesh, (2) manual stitching by replacement of defect
bricks with new bricks, and (3) Helifax bars; steel bars that resembles U-shape to tie bricks
together. It is also noteworthy to mention that when there is an additional work such as
building new brick wall, the connection method to the existing brick wall has to be critically
considered as settlement or movement may occur over time and will result in large,
threatening major cracks.
For timber defects, partial and full replacement were the commonly practiced method. It
is important to mention that if partial replacement is practiced, all affected parts have to be
fully removed or the damage left in timber would further deteriorate and spread to the newly
attached timber pieces. It is also suggested to use anti-termite layers as additional protection
for timber, which have been practiced in CS2 and CS4. Timber structures are durable by
nature and only under unfavorable conditions such as moisture that it would deteriorate.
Hence, removal of the source of moisture is vital besides improvement on the building
ventilation.

86
MCRJ Special Issue Vol. 12 | No. 1 | 2021
For rising dampness and salt attack issues, several older methods such as steel plate and
cocoon method were being practiced. However, the chemical barrier method was preferred in
CS2 and CS4 as it is more effective and long lasting. Yet the effect is only better when paired
up with proper removal of moisture from brick wall such as the sacrificial method through
weak lime plastering, which was practiced in three case studies. For wall surfaces, building
materials like lime plaster and lime wash can provide and promote breathability and reduce
moisture issue in brick wall. However due to its tedious work, some practitioners may
substitute it with water-based paint, unless it is required by the local authority.
CONCLUSION
Based on the collected and analysed data, the common building defects across all local
heritage buildings were almost similar where most of them experienced termite attack,
moisture and slight settlement, all due to the age of building, durability of building materials
and climate condition in Malaysia. The factors affecting restoration varies according to
project however, there were a few common factors to be considered. The factors are scarcity
and the need to employ skilled craftsmen, the source and procurement of matching building
materials, and discovery of defects only upon building inspection when work had
commenced. These are partly regulated by the Government or the policy of the said heritage
building. Various restoration techniques were also summarized such as the three variations in
brick wall stitching for major cracks, partial removal of defected timber, full removal and
replacement of defected timber and strengthening with anti-termite protection layer. Moisture
is the source of most of the defects in building including salt attack and peeling of paint.
Chemical injection can be identified as one of the most practiced methods to curb rising
dampness, combined with the sacrificial plastering method. Lime plaster and lime wash or
water-based paint are best to promote the breathability of wall.
With all things considered, local heritage buildings have to be preserved and protected
through restoration to prevent their permanent shortage and continuous disappearance. When
a restoration work is being taken up, there are many factors to be considered before a decision
is made in order to achieve balance in construction time, quality and cost of the project.
Understanding the common building defects and knowing the current practice of restoration
techniques would give more certainty and leads to a more successful restoration works.
REFERENCES
Ahmad, A. G. (2004). Understanding Common Building Defects. Majalah Akitek, 19–21.
Ahmad, A. & Rahman, H. F. (2005). Restoration and Refurbishment of Old City Hall, George
Town, Penang, Malaysia. Proceedings of 2005 International Conference on Construction
and Real Estate Management, 2, 1356–1361.
Ahmad, A. G. and Rahman, H. F. (2010). Treatment of Salt Attack and Rising Damp in
Heritage Buildings in Penang, Malaysia. Journal of Construct ion in Developing
Countries, 15 (1), 93–113.
Alauddin, K., Ishak, M. F. and Azim, M. (2018). The Critical Defects of Heritage Mosque in
Perak, Malaysia. Proceedings on Architectuure 2017 (ICRP-AVAN). Indonesia.
Ali, A. S. (2010). Design Information in Managing Refurbishment Projects in Malaysia.
International Journal of Physical Sciences, 5(6), 768–773.

87
MCRJ Special Issue Vol. 12 | No. 1 | 2021
Ali, A. S. (2014). Complexity in Managing Refurbishment Design Process: Malaysian
Experience. MATEC Web of Conferences, 15, 1–5.
Ali, A. S., & Zakaria, R. (2012). Complexity of Statutory Requirements: Case Study of
Refurbishment Projects in Malaysia. Journal of Building Performance, 3(1), 49-54.
Askari, A. H. & Dola, K. (2009). Influence of Building Façade Visual Elements on Its
Historical Image: Case of Kuala Lumpur City, Malaysia. Journal of Design and Built
Environment (5), 49–59.
Asomoah, R. O., Ankrah, J. S., Bannor, P. and Ofei-Nyako, K. (2017). Construction Practices
Contributing to Rising Damp in Kumasi Metropolitan and Ejisu Municipal Assemblies in
Ghana. Journal of Construction Engineering, 2017, 1–6.
Aw, Nien Wei and Othuman Mydin, Md Azree (2017). Appraisal of Salt Crystallisation and
Rising Damp Problems in Building. Analele Universităţii "Eftimie Murgu" Reşiţa, XXIV
(1). 418-428.
Bakri, N. N. O. and Mydin, Md. A. O. (2013). General Building Defects: Causes, Symptoms
and Remedial Work. European Journal of Technology and Design, 3 (1), 4–17.
Ball, R. M. (2002). Re-use Potential and Vacant Industrial Premises: Revisiting the
Regeneration Issue in Stoke-on-Trent. Journal of Property Research, 19(2), 93–110.
Bengtsson, M. (2016). How to Plan and Perform a Qualitative Study Using Content Analysis.
NursingPlus Open, 2, 8–14.
Boeri, A., Gabrielli, L., and Longo, D. (2011). Evaluation and Feasibility Study of Retrofitting
Interventions on Social Housing in Italy. Procedia Engineering, 21, 1161–1168.
Chitte, C. J. and Sonawane, Y. N. (2018). Study on Causes and Prevention of Cracks in
Building. International Journal for Research in Applied Sciences & Engineering
Technology, 6 (3), 453–461.
Delgado, J. M. P. Q., Guimaraes, A. S., Freitas, V. P., Antepara, I., Koci, V. and Cerny, R.
(2016). Salt Damage and Rising Damp Treatment in Building Structures. Advance in
Materials Science and Engineering, 2016, 1-13.
Doshi, S., Patel, D. B., Patel, K.B., Patel, K. B. and Mavani, P. D. (2018). Methodology for
Prevention and Repair of Cracks in Building. Global Research and Development Journal
for Engineering, 3 (3), 52–58.
Flourentzou, F., and Roulet, C. A. (2002). Elaboration of Retrofit Scenarios. Energy and
Buildings, 34(2), 185–192.
Franzoni, E. (2014). Rising Damp Removal From Historical Masonries: A Still Open
Challenge. Construction and Building Materials, 54, 123 – 136.
Gorse, C. and Highfield, D. (2009). Refurbishment and Upgrading of Buildings. 2nd Edition.
New York: Spon Press, 272 pp.
Goodrick, D. (2014). Comparative Case Studies, Methodological Briefs: Impact Evaluation
9. Florence: UNICEF Office of Research, 17 pp.
Gustafsson, J. (2017). Single Case Studies vs. Multiple Case Studies: A Comparative Study.
Retrieved from http://www.diva-
portal.org/smash/get/diva2:1064378/FULLTEXT01.pdf
Hanafi, M. H., Umar, M. U., Razak, A. A., Rashid, Z. Z. A., Noriman, N. Z. and Dahham, O.
S. (2018). Common Defect of Colonial Buildings in Malaysia. International Conference
on Materials Engineering and Science, 454 (1–9).
Harun, S. N. (2011). Heritage Building Conservation in Malaysia: Experience and
Challenges. Procedia Engineering 20, 41–53.

88
MCRJ Special Issue Vol. 12 | No. 1 | 2021
Hein, M. F., and Houck, K. D. (2008). Construction Challenges of Adaptive Reuse of
Historical Buildings in Europe. International Journal of Construction Education and
Research, 4(2), 115–131.
Kian, P.S. (2001). A Review of Factors Affecting Building Defects in Singapore. Dimensi
Teknik Sipil, 3 (2), 64–68.
Lakhani, R. and Sharma, R. K. (2018). Strategies for the Restoration of Heritage Buildings:
Material Issues. BHAGVAN-A SEARCH, India. Retrieved from https://www.researchgate.
net/publication/329446459_Strategies_for_the_Restoration_of_Heritage_Buildings_Ma
terial_Issues
Mansor, R., Mydin, A.O., Ismail, M., & Harun, W.M. (2012). Categorization of General
Problems and Defects in Historical Building. Analele Universităţii "Eftimie Murgu"
Reşiţa: Fascicola I, Inginerie, 127-136.
Mustafa, N. K. F., Johar, S., Ahmad, A. G., Zulkarnan, S. H., Rahman, M. Y. A. and Che-
Ani, A. I. (2011). Conservation and Repair Works for Traditional Timber Mosque in
Malaysia: A Review on Techniques. International Journal of Social, Behavioral,
Educational, Economic, Business and Industrial Engineering, 5 (1), 663–668.
Othman, N. L., Jaafar, M., Harun, W. M. W., and Ibrahim, F. (2015). A Case Study on
Moisture Problems and Building Defects. Procedia–Social and Behavioral Sciences, 170,
27–36.
Rahmat, I. (2008) Managing Refurbishment Projects. Shah Alam, Selangor Darul Ehsan,
Malaysia: University Publication Centre (UPENA).
Rajabather, A. (2016). Investigation of Cracks in Buildings. Forensic Structural
Engineering. India. Retrieved from
https://www.researchgate.net/publication/319630328_INVESTIGATION_OF_CRACK
S_IN_ BUILDINGS
Ridout, B. (1998). The Treatment of Timber Decay Into the 21st Century. Journal of
Architectural Conservation, 4(3), 7–21.
Roy, D. and Kalidindi, S. N. (2017). Critical Challenges in Management of Heritage
Conservation Projects in India. Journal of Cultural Heritage Management and
Sustainable Development, 7 (3), 290–307.
Sabri, A. A. M. and Suleiman, M. Z. (2014). Study of the Use of Lime Plaster on Heritage
Buildings’ in Malaysia: A Case Study in George Town, Penang. MATEC Web of
Conferences, 17, 1–6.
Salleh, N. H. (2011). Architectural Heritage Conservation in Malaysia: Experience and
Challenges. Procedia Engineering, 20 (2011), 41-53.
Sandbhor, S. and Botre, R. (2013). A Systematic Approach Towards Restoration of Heritage
Buildings – A Case Study. International Journal of Research in Engineering and
Technology, 2 (3), 229–238.
Starman, A. B. (2013). The Case Study as a Type of Qualitative Research. Journal of
Contemporary Educational Studies, 1, 28–43.
Talib, R., Ahmad, A.G., Sabri, A. and Suleiman, M.Z. (2014). Classification of Factor
Affecting External Wall Defects Focusing on Lime Material of Heritage Buildings in
Penang, Malaysia. Journal of Emerging Trends in Engineering and Applied Sciences
(JETEAS) 5(5), 295–299.
Tan, Y. W. (2015). Penang Shophouses: A Handbook of Features and Materials. Penang:
Phoenix Press Sdn Bhd, 93 pp.
Tan, S. Y., Olanrewaju, A. and Lee, L. T. (2016). Maintenance of Heritage Building: A Case
Study from Ipoh, Malaysia. MATEC Web of Conferences, 47, 1–6.

89
MCRJ Special Issue Vol. 12 | No. 1 | 2021
Walker, R. (2017). Wood Treatment and Timber Preservation. Retrieved from
https://www.petercox.com/blog/cpd-wood-treatment-timber-preservation/
Wilkinson, S. J., Reed, R. G., and James, K. (2009). Using Building Adaptation to Deliver
Sustainability in Australia. Structural Survey, 27(1), 46–61.
Zolkafli, U. K., Yahya, Z., Zakaria, N., Akashah, F. W. and Ali, A. S. (2015). Restoration of
Historical Timber Building: A Malaysian Case Study. Structural Survey, 34 (4/5), 309–
321.
Zou, P., Alam, M., Sanjayan, J., Wilson, J., Stewart, R., Sahin, O., Ellis-Jones, D. (2016).
Managing Risks in Complex Building Retrofit Projects for Energy and Water Efficiency.
International Conference on Innovative Production and Construction (IPC 2016).
Australia, 1-16.
90
MCRJ Special Issue Vol. 12 | No. 1 | 2021
LOCATION OF ELDERLY EVACUEES AND ITS EFFECT ON EVACUATION TIME AND DISTANCE IN MULTI-STOREY HOUSING Nurul Liyana Hanapi1, Sabarinah Sheikh Ahmad1, Azli Abd Razak2 and Norhati Ibrahim1 1Center of Building and Resilient Development, Faculty of Engineering and Built Environment, SEGi University, Selangor, Malaysia. 2Faculty of Architecture, Planning and Surveying, University Teknologi MARA (UiTM), Selangor, Malaysia. 3Faculty of Mechanical Engineering, University Teknologi MARA (UiTM), Selangor, Malaysia.
Abstract Increases in the number of elderly populations have raised some concerns on their safety during emergency situations. The elderlies’ limited physical capability increases the chances of injuries or even casualties during evacuations. As buildings are normally designed as vertical structures, descending staircases becomes a major issue with the elders. This paper aims to analyse the location of elderly evacuees and its effect on time and distance of evacuation in multi-storey housing. The method applied in this study is a computer simulation using the Pathfinder software. Nine cases were tested where every case ran two sets of scenarios between randomly placed elders and elders placed on lower floors to see the difference. The results show that when elderlies are located at lower floors, the total time and distance travelled by them are significantly reduced. Positioning elders at lower floors also does not affect the other evacuees evacuating the building as their evacuation time and distance are similar in all scenarios. Future studies can consider studying the evacuation strategy of elders with limited physical capability or those depending on assistance as this study only focused on elders who are able to evacuate by themselves. Keywords: Elderly; evacuation; multi-storey; public housing; evacuation time; travel distance.
INTRODUCTION
The main factor contributing to the high number of injuries is the decline in physical
strength as people age (Shalahim et al., 2015). This physical decline contributes to the risk of
falling, thus increasing the risk of casualties during emergencies. Not only that, elderlies’ slow
speed of movement is also believed to be associated with age-related physiological conditions
that increase the elderlies’ vulnerability during emergency situations (Enderlin et al., 2015;
Hadjistavropoulos et al., 2017; Ismail et al., 2015; Kholshevnikov et al., 2012). The law
enforced in Malaysia such as UBBL 1984 does not put much emphasis on the safety of
elderlies as they are often considered as disabled, but a majority of elderly residents can still
perform their daily activities without the help of other people. Only a small percentage of
elderlies fall under the disabled category and are mainly those who are either very old or
dependent on mobility aids.
To ensure that the safety of elderlies is considered, this study needs to find out if the safety
features provided in buildings are proportionate with the number of occupants. Designers play
an important role in designing a safe environment for occupants. With proper planning, fast
evacuation processes are possible (Craighead & Craighead, 2009; Oven & Cakici, 2009;
Wagner & Agrawal, 2014). Some designers might only adhere to the minimum requirements
set by the authorities with minimal consideration of the actual phenomenon happening during
an emergency situation. This is mainly due to cost constraints that limit the choices one
designer has. Not only the increased number of elderlies has become a concern, but the

91
MCRJ Special Issue Vol. 12 | No. 1 | 2021
increasing number of occupants should also be considered as it could increase the total
evacuation time. With increments in the number of populations, evacuation times may be
longer than actually intended (Lawson, 2011; Lei et al., 2012; Wang et al., 2015; Xu et al.,
2013).
Almost all buildings are bounded with safety requirements set by the authorities. During
the design stage, the passenger evacuation capacity is calculated based on the requirements
set by the authorities that consist of ventilation, exit, and staircase design. Although the fire
safety design procedure has been implemented in buildings, the insufficient number of egress
could create bottleneck issues (Jiang et al., 2014; Lawson, 2011; Zhang, 2017). Consideration
regarding the increasing number of elderly occupants with low speed and movement is also
believed to trigger bottleneck and stagnation issues. Designers should provide adequate egress
choices for evacuation based on the number of occupants in a building. However, increases
in the number of occupants and guidelines that only cater to the speed of people might result
in insufficiency in terms of escape route design.
It is difficult to address this issue, especially for buildings built based on the typical layout
set by the authorities. Physical adjustments are quite impossible for existing buildings. Thus,
one of the possible approaches to solve this issue is to test the effect of positioning elderly
occupants at different locations in the building in order to calculate their evacuation time and
distance.
LITERATURE REVIEW
Risk of Falling amongst Elderlies
As ageing typically leads to anthropometric decline, it is believed to influence the ability
of elderly evacuees to evacuate safely (Shalahim et al., 2015). Fall risk among elderly
evacuees has become a huge topic since the predicted increment of the population of elderly
evacuees has become a major public health concern. Since then, the number of researches on
similar areas have increased, signifying that awareness towards fall risk among elderly
evacuees have improved (Hatamabadi et al., 2016; Leszczyńska et al., 2016; Marques-Vieira
et al., 2016; Thaweewannakij et al., 2016; Yang et al., 2016). The trend of determining and
understanding fall risk factors has been researched on for years – nonetheless, it was only
recently that studies start to incorporate strategies to minimise fall risk while foreseeing
challenges faced due to falls.
Considering that even in normal situations, elderly evacuees are highly exposed to the
risk of falling, an emergency situation hence exposes this group to a bigger risk of morbidity
and casualties. Many studies conducted mostly gave focus to the risk of falling among elderly
evacuees in normal conditions. This thus presents a gap in the knowledge on the fall risk
elderly evacuees are exposed to upon panic or emergency situations. Since elderly evacuees
are prone to falling, the main concern is on their safety when in crowd stampedes which has
high crowd density (and is often associated with panic behaviour that is believed to be able to
cause great danger).
Thus, it is important for the study to find ways to mitigate the risk of falling during
emergencies. Reducing the amount of energy and effort needed to evacuate might be
beneficial as elderlies are known to have limited physical capabilities.

92
MCRJ Special Issue Vol. 12 | No. 1 | 2021
Speed of Elderly Occupants
The main issue faced by elderly evacuees during any evacuation process is their slower
speed of movement compared to others which is believed to be associated with age-related
physiological conditions (Enderlin et al., 2015; Hadjistavropoulos et al., 2011; Hairi et al.,
2009; Hanapi et al., 2017; Kholshevnikov et al., 2012). Some studies suggest that the slow
walking speed is related to the fear of falling; as a result, elderly evacuees restrict their
physical activity and movements, causing their physical condition to further deteriorate
(Landers et al., 2011).
Apart from slow walking speeds, the ability of elderly evacuees to react quickly or start
moving is also a huge issue as a shift from one foot to the other can be difficult
(Kholshevnikov et al., 2012). Sudden changes in the direction or presence of obstacles such
as narrow passages also amplify the tendency for this group of people to slow down, resulting
in a speed drop or a halt (Kholshevnikov et al., 2012). A study by Kloshevnikov et al. (2012)
conducted through observation of movement of elderly evacuees concluded that elderly
evacuees do have prolonged pre-movement time, low movement speed and low endurance.
It can be concluded that as people age, their physical capability declines. The fear of
falling also results in a decrease in walking speed. As the population of elderly evacuees
grows bigger, evacuation is expected to become prolonged due to their slow walking speed
as well as slow reaction to sudden changes. During an emergency, evacuees must be prepared
for sudden movements and changes of plan due to surrounding factors; this may further cause
difficulty for elderly evacuees.
METHODOLOGY
A computer simulation tool was used to conduct a simulation study on human behaviour
in multi-storey buildings. The model is used based on the typical layout of public residential
buildings built in Malaysia. In the simulation study, evacuees consisted of varied ratios and
percentages of elderly evacuees and adult occupants. The simulation study was conducted to
analyse the effect of elderly evacuees’ position in the building on the overall evacuation time
and distance. It was conducted in such a way to observe the foreseeable issues of an ever-
increasing population and the growing number of elderly occupants in buildings.
Simulation Setup
The base case model used in this study is a linear building layout configuration for public
buildings. The building was tested using the agent-based approach as elderly evacuees and
adult evacuees with various walking speeds were included in this simulation study. The
simulation was carried out using Pathfinder, an evacuation software, to evaluate the speed and
movement of evacuees.
The building model which was first drawn using AutoCAD and Sketchup was imported
to PathFinder. Figure 1 is the base case layout plan of public buildings imported into the
PathFinder software.

93
MCRJ Special Issue Vol. 12 | No. 1 | 2021
Figure 1. Building Plan of Simulation Study Using the Typical Layout of Public Residential Buildings
in Malaysia
Setting up Agent Evacuees
The first stage of setting up the agents is to determine their speeds. The speeds are
determined based on the range of speed for both male and female elders and normal adults
listed in IMO MSC/Circ 1238.
Table 1. Walking Speed Range of Elderly and Adult Evacuees
Speed (m/s) Evacuee Categories
Adults Elderly
Minimum Speed 0.71 0.56
Maximum Speed 1.85 1.4
Anthropometrically, the agents were set as 40cm X 40cm which is the typical surface
occupied by a person in a crowd situation. The characteristic of occupants remains the same
with the consideration of elderly evacuees’ capability to evacuate without any assistance. All
other settings that contribute to the behaviour of occupants were set by default following the
NFPA requirements for simulation studies.
Differentiation in Case Scenarios
It was hard to determine the location of elderly evacuees in multi-storey residential
buildings since their distribution is random; hence, the data collected might vary slightly,
although the difference may be minimal. In this section, data pertaining to elders being
randomly placed and placed on lower levels were compared. To determine the number of
elders to be located on the lower floors (the floor level is determined based on the number of
elderly evacuees where it is limited to 2 elderly evacuees in one unit of house), the percentage
of elderly evacuees and the assumption of maximum two elders in one household were
referred to. This thus decided the number of elders and floors to be involved. Cases a, b and
c can be categorised to have lower occupancy rates with 4 people per household, while cases
d, e and f can be grouped as having medium occupancy rates with 5 people per household,
and cases g, h and j can be grouped as having high occupancy rates with 6 people per
household. Cases a, d and g had the same percentage of elderly evacuees at 7%; cases b, e
and h involved 10% of elderly evacuees, while 15% elderly evacuees participated in cases c,
f and j. Comparison of data was made based on certain criteria. The first criterion was the
comparison between two elderly evacuees’ placement scenarios (randomly placed and placed
on lower floors).

94
MCRJ Special Issue Vol. 12 | No. 1 | 2021
Table 2. Number of Occupancy Based on Different Case Scenarios
No
Number of occupants
Low Occupancy 1478
Medium Occupancy 1700
High Occupancy 2100
Case 1 X
Case 2 X
Case 3 X
Case 4 X
Case 5 X
Case 6 X
Case 7 X
Case 8 X
Case 9 X
Table 3. Number of Elderly Evacuees Based on Different Case Scenarios
No Number of elderly evacuees (percentage)
7% 10% 15%
Case 1 100
Case 2 143
Case 3 214
Case 4 119
Case 5 170
Case 6 255
Case 7 143
Case 8 204
Case 9 306
Every case was simulated twice with different scenarios. The first scenario was where all
the elderlies were randomly placed, while the second scenarios was where the elderlies were
placed at the lower floors. The simulation was tested using the same base case but
differentiated based on the colours in the graph. Elderly evacuees placed randomly were
marked with colour blue, whereas elderly evacuees placed at lower floor levels were marked
with orange. When comparisons were made between adults and elderly evacuees in every
case, adults were represented by the colour red with a dash line (simulation where elderly
evacuees were randomly placed) and green dash line (simulation when elderly evacuees were
placed at lower levels). Determining the maximum level of elderly evacuees was done based
on the number of elderly evacuees and the placement of maximum 2 elders in one unit. The
comparison conducted next was related to the number of occupancies and the effect of elderly
evacuees’ percentage on time and duration. Finally, a comparison was also made based on the
different results obtained from the elderly evacuees and adults involved in every case. The
discussion covers the most distinct results from the data.
RESULTS AND DISCUSSION
Computer simulation is an experimental tool that helps studies gather a multitude of data
based on input. This current paper used the tool to experiment with evacuation time and
distance in relation to several variables chosen for this study on public multi-storey buildings
in Malaysia. The simulation studied the effect of dissimilar initial position of elderly evacuees
during evacuation. To do this, elderly occupants were randomly place at every floor and the

95
MCRJ Special Issue Vol. 12 | No. 1 | 2021
evacuation results were compared with elderly occupants placed at lower floors. In both
scenarios, placement was limited to 2 elders per unit. The two set of studies (randomly placed
and placement on lower floors) were used in every case. Each case represented different
occupancy rates and presence of elderly occupants.
Maximum Evacuation Time of All Occupants
Figure 2 represents the maximum evacuation time taken in all nine (9) cases (case a – j).
Based on the overall layout, the results show that placing elderly evacuees on lower floors
(refer orange line) reduces the maximum evacuation time. Figure 4.37 also shows although
there is a decrease in time, although the gap is slight. In comparison, results for cases with
randomly placed elders (refer blue line) show consistent increments in maximum evacuation
time as the occupancy and percentage of elderly evacuees were increased.
Figure 2. Maximum Evacuation Time Based on the Location of the Elderly Evacuees
Results obtained from having elderly evacuees placed randomly and on lower levels were
different; having elders placed on lower levels resulted in slightly shorter evacuation times
compared with situations with randomly placed elders. In short, the placement of elderly
evacuees on lower floors is proven to reduce evacuation time.
In case 9, elderlies placed on lower floors recorded a higher maximum evacuation time
of 489.2 seconds compared to the randomly placed elders (with 482.3 seconds maximum
evacuation time). In case b, elderly evacuees located on lower floors (low occupancy and 10%
of elderly evacuees) recorded the lowest evacuation time of 354 seconds.
Comparison between Maximum Evacuation Time of Elderly and Adults
Figure 3 shows a comparison between the maximum time taken by elderly and adult
evacuees in two situations where the elderly evacuees were either randomly placed or placed
on lower floors. Placing elderly evacuees on lower floors ensured that all of them could
evacuate much quicker than the rest; with random placement, they take almost the same time
taken by adults.
350
400
450
500
case 1 case 2 case 3 case 4 case 5 case 6 case 7 case 8 case 9
tim
e (
second)
Cases
Randomly Placed Lowered floor

96
MCRJ Special Issue Vol. 12 | No. 1 | 2021
Figure 3. Comparison Between Maximum Evacuation Time of Elderly Evacuees and Adults based on
Location of Elderly Evacuees
It was also found that adults in the two situations evacuated within almost the same time,
asserting that the location of elderly evacuees did not affect the adults’ evacuation time.
Looking at the orange line which represents elderly evacuees located on lower levels, it can
be seen that the elderly evacuees evacuated faster when the occupancy was at the lowest (refer
cases a, d and g). As the number of elderly evacuees increased, the duration of evacuation
also increased. These results are based on the last person safely evacuated from the building.
The average time needed for every group of people involved is discussed in the next figure.
Maximum Travel Distance
Figure 4. Maximum Travel Distance Based on the Location of Elderly Evacuees
Time is crucial when it comes to saving lives during an emergency event. The longer the
evacuation time is, the more lives are exposed to the risk of casualties. Although time is an
important factor in evacuation, distance is also important as it determines the efficiency of an
evacuation process. So, in this section, distance is considered through a comparison of various
cases, scenarios and groups of people (elderly and adult evacuees). Figure 4 shows the travel
distance of evacuees in nine (9) cases with two (2) scenarios. The graph shows that results
vary for the two (2) scenarios between elders placed randomly and those placed on lower
floors.
50
100
150
200
250
300
350
400
450
500
case 1 case 2 case 3 case 4 case 5 case 6 case 7 case 8 case 9
tim
e (
second)
Cases
Randomly Placed (elderly) Lowered floor (elderly)
Randomly Placed (adults) Lowered floor (adults)
200
220
240
260
280
300
case 1 case 2 case 3 case 4 case 5 case 6 case 7 case 8 case 9
dis
tance (
mete
r)
Cases
Randomly Placed Lowered floor

97
MCRJ Special Issue Vol. 12 | No. 1 | 2021
This thereby shows that the location of elderly evacuees does not significantly determine
the maximum evacuation distance as the results were based on the last person exiting the
building which the programme was unable to determine whether it was an elder or adult.
Based on the results, low and medium occupancy levels recorded similar results in terms of
travel distance. However, as occupancy increased (>2000 people), evacuees tend to walk
further. This might be due to stagnation at exits, forcing evacuees to find other alternative
escape routes. The percentage of elderly evacuees was also not a big determining factor for
the maximum travel distance as the results are inconsistent (contain both high and low values).
Comparison between Maximum Travel Distance of Elderly and Adult Evacuees
Figure 5. Comparison Between Maximum Travel Distance of Elderly and Adult Evacuees Based on
Location of Elderly Evacuees
Figure 5 shows a comparison between the maximum distance taken by elderly and adult
evacuees in the nine (9) cases. From the graph, it can be seen that placing elderly evacuees on
the lower floors reduced their travel distance. Nevertheless, once occupancy reached and went
above 2000 people and the percentage of elderly evacuees became 15% (refer to case 9), the
maximum travel distance for elderly evacuees also increased. When elderly evacuees were
randomly placed, the maximum distance travelled by elderly evacuees was found to be in a
similar range with the maximum distance travelled by adults in the two scenarios.
Referring to the orange line which represents elderly evacuees being placed on lower
floors, only small increments in distance were shown when going from the low to the medium
occupancy level; when occupancy was high, the distance also increased. At high occupancy,
scenarios containing 7% and 10% of elders placed on lower floors obtained the same results,
while scenarios with 15% elderly evacuees resulted in a bigger distance, almost reaching the
average distance travelled by adults in the scenarios with randomly placed elders. It can
therefore be concluded from the data that placing elderly evacuees on lower levels reduces
the maximum travel distance of elderly evacuees. This is however only limited to scenarios
with lower and medium occupancy levels. Once occupancy reaches and goes above 2000,
high stagnation might occur, forcing evacuees to travel further. While being able to reduce
the distance travelled by elderly evacuees, adults’ travel distance was found to be in the same
range with other scenarios.
50
100
150
200
250
300
case 1 case 2 case 3 case 4 case 5 case 6 case 7 case 8 case 9
dis
tance (
mete
r)
Cases
Randomly Placed (elderly) Lowered floor (elderly)
Randomly Placed (adults) Lowered floor (adults)

98
MCRJ Special Issue Vol. 12 | No. 1 | 2021
CONCLUSION
It can be summarised that there were only slight differences in the total evacuation time
between cases with randomly placed elderly evacuees and with those placed on lower floors.
Nonetheless, on average, the duration for all evacuees to safely evacuate the building remains
the same. All in all, the placement of elderly evacuees is not significant enough to affect
evacuation time.
Looking at the travel distance of evacuees, their maximum travel distances had varied in
the two scenarios, indicating that the placement of elderly evacuees did not contribute to the
maximum travel distance. On average, placing elderly evacuees on lower floors did result in
a shorter travel distance, but it increases as the number of elderly evacuees and level of
occupancy reached the maximum.
When comparing both elderly evacuees and adult occupants, the data were observed to
vary. The maximum travel time of elderly evacuees was tremendously reduced when they
were placed on lower floors. When the elderly evacuees were randomly placed in other
scenarios, the maximum time they took was the same as adults. Although adults were able to
exit much quicker than the elderly evacuees, both groups produced similar average evacuation
times.
While the elderly evacuees were found to walk shorter distances when placed on the lower
levels, their maximum distance was found to increase profoundly when their percentage
reached 15% and when the occupancy level went beyond 2000. The results also show the
same pattern in the average distance travelled by elderly evacuees. From the data, adults were
shown to travel more than the elderly evacuees.
As a conclusion, placing elderly residents on lower levels allows the elderly evacuees to
evacuate much faster by taking short travel distances without affecting adult evacuees. This
can be implemented into the evacuation strategies of existing buildings to prevent casualty
among vulnerable residents.
ACKNOWLEDGEMENT
This paper is funded by the Ministry of Education under the MyBrain15 Scholarship.
Special thanks to Thunderhead Engineering (Pathfinder) for providing free licensed software.
REFERENCES
Craighead, G., & Craighead, G. (2009). Chapter 3 – Security and Fire Life Safety Threats. In
High-Rise Security and Fire Life Safety (pp. 61–184). https://doi.org/10.1016/B978-1-
85617-555-5.00003-1
Enderlin, C., Rooker, J., Ball, S., Hippensteel, D., Alderman, J., Fisher, S. J., … Jordan, K.
(2015). Summary of factors contributing to falls in older adults and nursing implications.
Geriatric Nursing (New York, N.Y.), 36(5), 397–406. https://doi.org/10.1016/j.gerinurse.
2015.08.006

99
MCRJ Special Issue Vol. 12 | No. 1 | 2021
Hadjistavropoulos, T., Delbaere, K., & Fitzgerald, T. (2011). Reconceptualizing the Role of
Fear of Falling and Balance Confidence in Fall Risk. Journal of Aging and Health, 23(1),
3–23. https://doi.org/10.1177/0898264310378039
Hairi, N. N., Hiong, T. G., Bulgiba, A., & Mudla, I. (2009). Physical Function in Older
People. 3–29.
Hanapi, N. L., Ahmad, S. S., Ibrahim, N., Razak, A. A., & Ali, N. M. (2017). Suitability of
Escape Route Design for Elderly Residents of Public Multi-storey Residential Building.
Pertanika Journal of Social Science and Humanities, 25, 251–258.
Hatamabadi, H. R., Sum, S., Tabatabaey, A., & Sabbaghi, M. (2016). Emergency department
management of falls in the elderly: A clinical audit and suggestions for improvement.
International Emergency Nursing, 24, 2–8. https://doi.org/10.1016/j.ienj.2015.05.001
Ismail, N., Hairi, F., Wan Yuen, C., Hairi, N. N., Peramalah, D., & Bulgiba, A. (2015). The
Physical Activity Scale for the Elderly (PASE): Validity and Reliability Among
Community-Dwelling Older Adults in Malaysia. Asia-Pacific Journal of Public Health.
https://doi.org/10.1177/1010539515590179
Jiang, Z., Zhang, P., Shang, R., & Tian, X. (2014). Investigation and Simulation on Human
Evacuation Behaviour in Large Hospital Building in Shenyang. Procedia Engineering,
71, 101–106. https://doi.org/10.1016/j.proeng.2014.04.014
Kholshevnikov, V., Samoshin, D., & Istratov, R. (2012). The problems of elderly people safe
evacuation from senior citizen health care buildings in case of fire.
Landers, M. R., Durand, C., Powell, D. S., Dibble, L. E., & Young, D. L. (2011). Development
of a scale to assess avoidance behavior due to a fear of falling: the Fear of Falling
Avoidance Behavior Questionnaire. Physical Therapy, 91(8), 1253–1265.
https://doi.org/10.2522/ptj.20100304
Lawson, G. (2011). Predicting human behaviour in emergencies. Retrieved from
http://etheses.nottingham.ac.uk/2027/
Lei, W., Li, A., Gao, R., Hao, X., & Deng, B. (2012). Simulation of pedestrian crowds’
evacuation in a huge transit terminal subway station. Physica A: Statistical Mechanics
and Its Applications, 391(22), 5355–5365. https://doi.org/10.1016/j.physa.2012.06.033
Leszczyńska, A., Daniszewska, B., Pruszyńska, M., Przedborska, A., Hadała, M., &
Raczkowski, J. W. (2016). Effects of a health improvement programme on quality of life
in elderly people after falls. Polish Annals of Medicine.
https://doi.org/10.1016/j.poamed.2016.01.008
Marques-Vieira, C. M. A., Sousa, L. M. M., Severino, S., Sousa, L., & Caldeira, S. (2016).
Cross-cultural validation of the falls efficacy scale international in elderly: Systematic
literature review. Journal of Clinical Gerontology and Geriatrics.
https://doi.org/10.1016/j.jcgg.2015.12.002
Oven, V. A., & Cakici, N. (2009). Modeling the evacuation of a high-rise office building in
Istanbul. Fire Safety Journal, 44(1), 1–15. https://doi.org/10.1016/j.firesaf.2008.02.005
Shalahim M.S.N., Dawal M.S.Z., & Case, K. (2015). The relationship between anthropometry
and hand grip strength among elderly Malaysians. International Journal of Industrial
Ergonomics, 50, 17-25
Thaweewannakij, T., Suwannarat, P., Mato, L., & Amatachaya, S. (2016). Functional ability
and health status of community-dwelling late age elderly people with and without a
history of falls. Hong Kong Physiotherapy Journal, 34, 1–9.
https://doi.org/10.1016/j.hkpj.2015.08.001

100
MCRJ Special Issue Vol. 12 | No. 1 | 2021
Wagner, N., & Agrawal, V. (2014). An agent-based simulation system for concert venue
crowd evacuation modeling in the presence of a fire disaster. Expert Systems with
Applications, 41(6), 2807–2815. https://doi.org/10.1016/j.eswa.2013.10.013
Wang, J., Zhang, L., Shi, Q., Yang, P., & Hu, X. (2015). Modeling and simulating for
congestion pedestrian evacuation with panic. Physica A: Statistical Mechanics and Its
Applications. https://doi.org/10.1016/j.physa.2015.01.057
Xu, J. Bin, Zhang, C., Zhao, J. F., Chen, Q. Q., & Wu, J. B. (2013). The Study on Influence
Factors of the Mechanical Smoke Evacuation System in Atrium Buildings. Procedia
Engineering, 52, 508–513. https://doi.org/10.1016/j.proeng.2013.02.176
Yang, L., Ren, Y., & Zhang, W. (2016). 3D Depth Image Analysis for Indoor Fall Detection
of Elderly People. Digital Communications and Networks, 2(1), 24–34.
https://doi.org/10.1016/j.dcan.2015.12.001
Zhang, X. (2017). Study on rapid evacuation in high-rise buildings. Engineering Science and
Technology, an International Journal. https://doi.org/10.1016/j.jestch.2017.04.007

101
MCRJ Special Issue Vol. 12 | No. 1 | 2021
DOES FENG SHUI FACTORS INFLUENCED THE DECISION OF MALAYSIAN IN HOUSING SELECTION Myzatul Aishah Kamarazaly, Cheah Man Yee, Nurulhuda Hashim, Azrina Md Yaakob, Loo Seong King and Noorul Iffa Mohd Nayan Taylor’s University, Lakeside Campus, Subang Jaya, Malaysia. School of Pre-University Studies, Taylor’s College, Subang Jaya, Malaysia.
Abstract The paper seeks to investigate the influence of Feng Shui factors on the landed residential housing selection among Malaysians. Feng Shui theory is thought of “harmony between heaven, earth and people” and described as “the Chinese art of placement and design”. The aim of Feng Shui concepts towards architecture is to create a harmonised built environment for people to live in and acts as a guideline in selecting favourable sites. Feng Shui in Malaysia lately are widely recognized by everyone. Prospective buyers believe that Feng Shui arrangements can affect the housing price, luck and fortune of occupant. Therefore, the goal of this is threefold: (1) to identify the Feng Shui principles incorporated into housing design; (2) to determine whether the Feng Shui principles affect the decision in housing selection among Malaysians; and (3) to prioritise the Feng Shui design factors in housing selection among Malaysians. A survey questionnaire is developed based on the 24 key criteria in the Feng Shui design framework and tested on a sample of 158 Malaysians from Kuala Lumpur. The findings revealed that most of the Malaysian Chinese and Indians would consider Feng Shui factor when choosing a premise. However, although only less than half of the Malaysian Malays would consider Feng Shui, but it reflected that they are getting more concerns and familiar with Feng Shui concepts. The facing direction of a house is the major issue among Malaysians. Result revealed that a house near to or directly facing the hospital, a cemetery and tall buildings would be unfavourable and would have impact on their house buying intentions. The findings are useful for property developers in their future development, and as a reference for investors and homebuyers. Keywords: Feng Shui; building design; housing selection; Malaysia.
INTRODUCTION
Feng Shui is an old Chinese practice that has accumulated more than 5,000 years of
history, knowledge and experience related to the built environment. It is originated from early
Chinese in choosing tomb dwellers of an ideal site (Li, 2014). Nowadays, the practice of Feng
Shui become an important guideline for many homebuyers in making decision including
selecting an auspicious site for living (Erdogan & Erdogan, 2014). Besides, many people
choose to arrange their living environment according to Feng Shui precepts (Sia et al., 2018).
Around year 1966 to 1976, after the Chinese Cultural Revolution, the practice of Feng Shui
has spread throughout the world as millions of people in all countries practice it, including
Malaysia (Sally Painter, n.d.).
One of the important things in our lives is buying a house (Chang & Lin, 2015). There
are many factors should be considered when purchasing a residential property (Sia et al.,
2018). According to Ge and Mak (2013), Feng Shui is one of the important factors to be
considered for purchasing real property. Many believes that good Feng Shui residential
property has a better value and is easier to sell (Geh & Osmadi, 2015). Ge and Mak (2013,
pg.85) also stated that architects and building professionals are beginning to recognise Feng
Shui as a philosophy connected ecologically and architecturally. Further, in Malaysia, many
developers consult a Feng Shui Master on site selection and design of their housing

102
MCRJ Special Issue Vol. 12 | No. 1 | 2021
developments (Fengshui Republic Academy and Consultation, 2017). They believe that a
Feng Shui Master can help them or save them from offending the surrounding (Sia et al.,
2018).
The public, especially the Chinese, are concerned in choosing the right premises with a
good direction in which they believe they will be fortunate in their lives. In addition, the public
often believe it will generate good fortune for their next generation by choosing the right
orientation for tombstone. These beliefs that occur in the community have initiating more
Feng Shui Courses to be conducted in recent years. The School of Design of one renowned
local college in Malaysia, held a special seminar entitled “Applying Feng Shui in Design for
Art of Living” by Grand Master Yap Cheng Hai (“Welcome to Yap Cheng Hai Academy -
Media Centre,” n.d.). This scenario has shown that the principles of Feng Shui are getting
significant in Malaysia.
In Malaysia, there are three major ethnic groups, namely, Malays, Chinese and Indians.
Malaysian Chinese are mostly familiar with the Feng Shui concept because the beliefs and
practice of Feng Shui is deeply rooted among the Chinese. However, in this modern era,
practicing Feng Shui among Malaysians has become a trend. Malays and Indians are likely
more familiar with the ideas of Feng Shui. The Feng Shui concept or principle has become an
important consideration for Malaysians in making decisions including choosing locations for
dwelling, design of both interior and exterior of the buildings, and etc (Nur Zalikha Mohd
Amar & Zulhabri Ismail, 2012).
OVERVIEW OF FENG SHUI
Definition of Feng Shui
The earliest name of Feng Shui in Chinese is kan yu. Kan represent heaven, and yu
represent earth (Chen, 2007). Feng Shui, or “wind water”, represent a traditional Chinese
worldwide regarding the interaction of humans and nature. However, Lip stated Feng Shui is
known as Chinese geomancy (Engr et al., 2006). Besides, Wind and Water are related with
great environment and wellbeing in Chinese Culture (Ge & Mak, 2013). “Feng Shui” mainly
focuses on the comprehensive evaluation of the climate, geology, geomorphology, ecology
and landscape and other architectural environmental elements including the general guideline
of some techniques and various taboos in the construction when ancient people selected
building sites (Sun, 2012). It shows the concerns on the harmonious positioning of dwellings
for the living and grave for the dead, with special regard for the proposed site’s manifestation
of chi or the life’s “breadth” (Chen, 2007). In other words, Feng Shui is “the art of living in
harmony with the land, and deriving the greatest benefit, peace and prosperity from being in
the right place at the right time” (Skinner, 1982). Therefore, the main goal of Feng Shui is to
stay harmony with the nature and able to provide positive effects that can bring fortune,
success and zest for living comfort (Liang & Osmadi, 2015).
Factors to be considered when purchasing a house
Purchasing a house is one of the most important things in our lives. It becomes a major
decision, requiring a huge amount of money, and it binds for some 20 to 30 years if one was
to buy a house by hire purchase (Engr et al., 2006). However, there are various factors affect

103
MCRJ Special Issue Vol. 12 | No. 1 | 2021
the consumer decision making when it comes to purchasing a residential property. Besides
the normal factors such as location, house features, environment, financial, etc. In Asia, Feng
Shui is also a significant consideration factor on the housing price and decision making in
purchasing a house (Chang & Lin, 2015).
However, Feng Shui is quite subjective. There are various views and opinions on Feng
Shui in society based on previous research. There are two common views: one is that people
believe it to be strongly true and trust that living in Feng Shui’s house would become health
or fortunate; on the other hand, people do not believe Feng Shui, treat Feng Shui with disdain
and think it as superstition and nonsense (Li, 2014).
According to the Fortin et al. (2014) there is a superstition effect in the housing market.
For example, houses address with unlucky number – “4” were sold at lower price in real estate
market. However, it should be known as the effect of Feng Shui. As Feng Shui said the
number of “4” brings the meaning of death. Thus, Feng Shui is not a superstition or belief or
religion but a philosophy (Erdogan & Erdogan, 2014). To clarify it, the reasons are (Li, 2014):
(i) Feng Shui is a tendency theory in which for humans to avoid from danger and tend
to get auspiciousness. The theory of Feng Shui provides a set of rules, views and
approaches that will have a positive impact on an individual or his/ her life by
following them.
(ii) Feng Shui is a philosophical system that takes the living environment. Each sub-
system in the environment is an element that restrict each other, depends on each
other and mutually transforms. Feng Shui theory’s function is to grasp and coordinate
the relationship between systems to achieve the most harmonious state.
INFLUENCE OF FENG SHUI FACTORS IN HOUSING SELECTION
Feng Shui affects housing price
For many Malaysians, owning a residential property is a primary goal, according to Tan
(2014). As pointed out by Ge and Mak (2013), Feng Shui is one of the important factors to be
considered for purchasing real property. If the property has good Feng Shui, most Chinese
families may be willing to spend more on a property compared with a house with bad Feng
Shui elements (Ge & Mak, 2013). For instance, research investigations carried out by Bond
(2008), the results indicated that Feng Shui has various positive effect on unit price. Further,
Bond (2008) stated that the prices of Feng Shui designed units sell for 7.7% more than those
units not designed with Feng Shui principles (Liang & Osmadi, 2015). Besides, it shows that
the design of a unit without applying the Feng Shui principles sell for 6.2% less than similarly
located unites which are designed in accordance with concept of Feng Shui in the analysis
conducted by Bond (2008). Geh and Osmandi (2015) pointed out there are few factors that
affect the selling market, such as an inauspicious Feng Shui location, land, internal
arrangement and the number of units. Therefore, the Feng Shui principles in housing design
and housing selection has a great impact towards not only the buyer decision but also
developers and architects (Sia et al., 2018).

104
MCRJ Special Issue Vol. 12 | No. 1 | 2021
Consumers’ Expected Outcome
According to Sia et al. (2018), people usually buy residential properties for two purposes,
namely for dwelling and investment. Besides, Hei and Dastane (2017) observes that
individuals are motivated to own a residential property by factors such as expected outcome.
Based on the findings by Hei and Dastane (2017), Tan (2014) and Chyi (2013), it can conclude
the consumers’ expected outcome of owning a residential property into three categories of
consideration and these three expected outcomes which are similarly with Feng Shui concept
(Table 1). Thus, the influence of Feng Shui in buyer’s decision in selecting a house is
understandable (Engr et al., 2006).
Table 1. Consumers’ Expected Outcome and The Feng Shui Concept
Consumer’s Expected Outcome Similarities Feng Shui Concept
House value will be enhanced by future growth
Growth Potential Positive effect on unit price
Houses sell well at any time Resale Value Most homebuyers would choose houses with good Feng Shui
House located at convenience place and comfortable to live
Convenience and Comfortable
Feng Shui can help in choosing an auspicious location where people live and achieve the greatest amount of peace, security, benefit.
(Source: Hei & Dastane, 2017; Tan, 2014; Chyi, 2013; Engr, Mal, Chiong & Shui, 2006)
Trends of Practising Feng Shui
Feng Shui practice is now a trend in Malaysia (Liang & Osmadi, 2015). Feng Shui serves
as an important reference for many homebuyers in decision making, including the choice of
residential areas, office, burial sites, the placement of buildings and the design of interior and
exterior buildings (Sia et al., 2018). In Malaysia, each ethnic group has its own beliefs and
they are taken into consideration of these beliefs into their practices even in building design
and selection of house, for example, Indian- Vasthu Sastra, Malay- Tajul Muluk and Chinese-
Feng Shui.
Nowadays, however, Muslim are likely more familiar with the idea of Feng Shui and
Vasthu Sastra. For instance, Feng Shui does not encourage their believers to build or buy a
house at the T-junction because it may cause dangerous for the house’s occupants (Liang &
Osmadi, 2015). This could be deemed as the Islamic elements within the Feng Shui as Islam
also concerned about the safety of the followers. Therefore, the author also claims that in his
matter there is something similar and significant to Islam. It is just about locating and
presenting the source in a contemporary and relevant context (Nur Zalikha Mohd Amar &
Zulhabri Ismail, 2012).
For other religions, when it comes to design a house, there is also Vasthu Sastra whereby
it is almost the same concept with the Feng Shui that came from Chinese beliefs (Saran &
Shirodkar, 2017). Saran and Shirodkar (2017) has conducted a research based on the Vasthu
Shastra and Feng Shui the ancient sciences and their fusion in context of Indian architecture.
The result indicated that there is no difference between both ancient art and are aimed at
creating harmonious energy fields inside the building. Bearing different names, they may have
differences in terms of applications as a result of cultural and geographical backgrounds, but
all of them have the same principles (Low Lay Phon, 2007). Both beliefs are usually
emphasized on the tips of home décor and home buying for their believers. In summary, Feng
Shui has influence on Malaysia’s Chinese, Malays and Indians.

105
MCRJ Special Issue Vol. 12 | No. 1 | 2021
FENG SHUI DESIGN CRITERIA IN HOUSING
House, as well as other spaces, should have a good outdoor Feng Shui. Many homebuyers
pay more money for a good view and especially for places where the water is seen (Wu et.al,
2012). Most of the development projects in Asia are assessed according to Feng Shui before
the initiation of construction process. They would allocate some of their budget for Feng Shui
consultancy and determine the ideal directions, the best layout, locations of doors, corridor,
and rooms; the best function for every area; the best place for every person, ideal colours and
furniture layout. Taylor et al. (2011) developed a Feng Shui design framework consisting of
24 criteria grouped in four design modules, namely surrounding environment, external layout,
internal layout and interior arrangement (Figure 1). The design framework consists of Feng
Shui design criteria that are favourable and unfavourable. It appears from a literature review
that prospective home buyers would buy houses with auspicious Feng Shui factors that would
bring good fortune and luck. They would avoid buying houses that would bring ill luck and
misfortune with inauspicious Feng Shui factors.
Figure 1. Feng Shui Criteria Grouped in Four Design Modules
Surrounding Environment Design Module
The seven criteria in the surrounding environment module and 28 related Feng Shui
factors are shown in Table 2.
Table 2. Feng Shui Factors for Surrounding Environment Module
Surrounding Environment
Feng Shui Factors Feng Shui Viewpoint
References
Topography On the top of a hill or elevated ground Unfavourable (Engr et al., 2006)
Located at the low-lying area that is landlocked by surrounding hills
Unfavourable (Geh & Osmandi, 2015)
Land that house sit higher in front and lower at back
Unfavourable (Geh & Osmandi, 2015); (Sia et al., 2018)

106
MCRJ Special Issue Vol. 12 | No. 1 | 2021
Surrounding Environment
Feng Shui Factors Feng Shui Viewpoint
References
Front of Site Facing cemetery Unfavourable (Webster, 2005, pg. 32);
Facing hospital Unfavourable (Sia et al., 2018);
Facing gap between two tall buildings Unfavourable (Geh & Osmandi, 2015)
T-junction or Y- junction Unfavourable (Sia et al., 2018)
Directly facing a transmission tower Unfavourable (Engr et al., 2006)
Directly facing a lamp post Unfavourable (Engr et al., 2006)
Directly facing an electric pole Unfavourable (Engr et al., 2006)
Directly facing the chimney of a factory Unfavourable (Engr et al., 2006)
Directly facing a tall building Unfavourable (Engr et al., 2006)
Facing a funeral Parlour Unfavourable (Engr et al., 2006)
Facing a transmission tower Unfavourable (Webster, 2005, pg. 28)
Directly facing a tree Unfavourable (Shen, 2001, pg.104)
Rear of Site With a river at the back Unfavourable (Sia et al., 2018)
Mountain behind the site Favourable (Xu, 1997)
Sides of Site Beside electric substation Unfavourable (Too, 1994, pg.40)
Near to transmission lines Unfavourable (Shen, 2001, pg.159)
Besides an area of heavy industry Unfavourable (Shen, 2001, pg.161)
With a large water tank nearby Unfavourable (Too, 1994, pg.40)
With sewerage treatment plant nearby Unfavourable (Engr et al., 2006)
Street location At dead end or cul-de-sac Unfavourable (Geh & Osmandi, 2015)
At a T-junction Unfavourable (Shen, 2001, pg.90)
At an interchange Unfavourable (Webster, 2005)
Water View Sea View Favourable (Bond, 2008)
Wind direction Lack of wind to the site Unfavourable (Wu et al., 2012)
Strong wind to the site Unfavourable (Wu et al., 2012)
External Layout Design Module
There are six criteria in the external layout module and 12 related Feng Shui factors as
shown in Table 3.
Table 3. Feng Shui Factors for External Layout Module
External Layout Feng Shui Factors Feng Shui Viewpoint
References
Shape of site Land with irregular shape Unfavourable (Geh & Osmandi, 2015)
Entrance Main entrance in the centre of the house Favourable (Ng, 2016)
Main door at the left side of the building Unfavourable (Webster, 2005)
Solid wood front entrance door Favourable (Bond, 2008)
With main door facing gate Unfavourable (Engr et al., 2006)
Shape of Building
It is an L-shaped house Unfavourable (Shen, 2001, pg.98)
It is a U-shaped house Unfavourable (Shen, 2001, pg.98)
It is a regular-shaped house Favourable (Sia et al., 2018)
Orientation Oriented South Favourable (Sia & Lu, 2006)
Trees Dead tree trunks Unfavourable (Too, 1994)
Pond Location of fishpond on left side of house Favourable (Sia et al., 2018)
Round-shape fishpond Favourable (Sia et al., 2018)

107
MCRJ Special Issue Vol. 12 | No. 1 | 2021
Internal Layout Design Module
The six criteria in the internal layout module and 14 related Feng Shui factors are shown
in Table 4.
Table 4. Feng Shui Factors for Internal Layout Module
Internal Layout Feng Shui Factors Feng Shui Viewpoint
References
Layout Split level, with living room and dining room at different levels
Unfavourable (Shen, 2001, pg.69)
Doors Different sizes of doors Unfavourable (Sia et al., 2018)
Main door and back door in a straight line Unfavourable (Engr et al., 2006)
Smaller main door Unfavourable (Geh & Osmandi, 2015)
Two doors facing each other Unfavourable (Geh & Osmandi, 2015)
Toilet with glass door Unfavourable (Geh & Osmandi, 2015)
Window Windows should not be aligned with doors Unfavourable (Ng, 2016)
Shape of rooms Regular shape Favourable (Sia et al., 2018)
Staircase Spiral Staircase Unfavourable (Shen, 2001, pg.106)
Straight Staircase Unfavourable (Geh & Osmandi, 2015)
Closed riser Staircase Unfavourable (Sia et al., 2018)
Staircase facing main door of house Unfavourable (Engr et al., 2006)
Ceiling Ceiling of dining designed with openings or windows
Unfavourable (Sia & Lu, 2006)
House with mirror ceiling Unfavourable (Geh & Osmandi, 2015)
Interior Arrangement Design Module
There are five criteria in the interior arrangement module and 8 related Feng Shui factors
as shown in Table 5.
Table 5. Feng Shui Factors for Interior Arrangement Module
Interior Arrangement
Feng Shui Factors Feng Shui Viewpoint
References
Door openings Door opens inward Favourable (Sia et al., 2018)
Right-handed door Favourable (Sia et al., 2018)
Bedroom Bedroom door aligned with bathroom door Unfavourable (Shen, 2001, pg.69)
Located at the end of the corridor Unfavourable (Sia et al., 2018)
Kitchen Kitchen door facing bedroom door Unfavourable (Engr et al., 2006)
Located at the back half of the house Favourable (Sia et al., 2018)
Living Room Well lit Favourable (Ng, 2016); (Sia et al., 2018)
Bathroom Directly above the main door of the house Unfavourable (Engr et al., 2006)
GAPS IN THE LITERATURE AND THE RESEARCH OBJECTIVES
While past studies have identified the impacts of Feng Shui factors based on only Chinese
perspectives, the factors unfortunately are not prioritised and in terms of their degree of
influence in housing selection based on differences in ethnicity. Housing developers would
benefit from the prioritisation mainly because it would enable them to consider consumer
preferences towards the trend of applying Feng Shui principles in housing design and building

108
MCRJ Special Issue Vol. 12 | No. 1 | 2021
site selection. Furthermore, housing investors and individual could use this as a guidance in
decision-making process while purchasing a property. This study aims to contribute to filling
this gap. The specific objectives of the study are as follows: (1) to determine whether the Feng
Shui factors affect the decision in housing selection among Malaysians and (2) to prioritize
the Feng Shui design factors in housing selection among Malaysians.
RESEARCH METHOD
Sampling and Population
This study was limited to the views expressed by Malaysian in Kuala Lumpur area. The
focus was on homebuyers or property investors and homeowners with potential to purchase a
house for personal residence or investment. The reason of the chosen population is to achieve
the aim – to determine the extent of the influence of Feng Shui factors on Malaysian decision
in purchasing or choosing a house / property. According to Jabatan Perangkaan Malaysia
(2019), the total population of Malaysian in Kuala Lumpur is 1,780,700 in 2019. Based on
Krejcie & Morgan’s (1970) sample size formula, a minimum of 384 responses are needed. A
random sampling method was adopted for this research study. A total of 384 sets of
questionnaire survey were distributed to the probable respondents in Kuala Lumpur area, via
face to face, mail, e-mail and other social media ways. Out of 384 questionnaires were
distributed, only 170 completed questionnaires were returned before the deadline of this
survey. As a result, only 158 responses were found usable and completed. This shown a 41%
of response rate. The remaining 226 questionnaires were either left incomplete or responses
from respondents failed to meet the criteria of this survey.
Data analysis
Content and multi-attribute methods were used in this study. Content analysis served the
purpose of cross tabulation and frequency counts which according to Zikmund (1997), this is
adequate to meet pertinent research objectives. On the other hand, the multi-attribute analysis
was used to analyse the ratings of respondents with the aim to establish mean rating point for
each group of respondents. This analytical technique involves computation of mean rating
and relative importance index (RII) under each attribute under a subset (Chang and Ive, 2002).
Conceptual Framework
Figure 2. Conceptual Framework

109
MCRJ Special Issue Vol. 12 | No. 1 | 2021
A conceptual framework (Figure 2) was developed for this study to show the relationship
between the four independent variable and one dependent variable. The purpose of building
this framework is to test whether the four variables are having positive impacts towards the
dependent variable or affecting the Malaysians’ decision-making when choosing a landed
residential house.
RESULTS AND DISCUSSIONS
Key Results in Relation to Objective 1: To Determine Whether the Feng Shui Factors Affect the Decision in Housing Selection
The 1st objective of the study is to determine whether the Feng Shui factors affect the
decision in housing selection among Malaysians. Figure 3 shows that Chinese and Indian
homebuyers were affected by the Feng Shui principles, both of which are more than 50%
(67% and 55%, respectively). On the contrary, less than half of the Malay respondents (39%)
have taken into consideration on the Feng Shui factors during housing selection. 69% of
Malays respondents has less consideration on Feng Shui factors solely due to different
religious beliefs and they are more concern on the price of the house/ property while making
their selection. This finding accords with similar results by Razak et al (2013), stated financial
consideration especially house price is the most crucial factor for most Malaysian while
choosing or purchasing their property.
Figure 3. The Influences of Feng Shui Factors in Housing Selection Among Malaysians
Out of 39% of Malays respondents who have considered Feng Shui factors in their
housing selection, 3% of them perceived Feng Shui factors could improve their life, such as
enhance health, career, education, relationship, prosperity, etc. This aligns with the findings
by Engr et al. (2006), that Feng Shui can help in determining a comfortable location that
benefits one’s health, career, wealth, luck and family. 9% of them agrees that Feng Shui
factors could help to obtain comfortable living and it will affect the housing price. According
to Sandy (2008), Feng Shui factors have impact on the housing prices – 7.7% more than
comparable units not designed with Feng Shui.
67% of Chinese respondents has taken into consideration of Feng Shui factors in their
housing. This result is consistent with the findings by Sia, Yew and Siew (2018) stating that
the influence of Feng Shui is still pervasive among Malaysian Chinese. Results indicated that

110
MCRJ Special Issue Vol. 12 | No. 1 | 2021
35% perceived Feng Shui will affect the housing price; 17% perceived Feng Shui as a factor
that could help improve life, career and relationship and 15% considered Feng Shui as an
avenue to obtain comfortable living space and auspicious sites to get lucky life (Madeddu and
Zhang, 2017). These results are also aligned with Chang and Lin’s (2015) findings that Feng
Shui is a significant consideration factor on the housing price and decision making in
purchasing a house. According to Engr, Mal, Chiong and Shui (2006), Feng Shui principles
and practice have been deeply rooted among Chinese, hence most of the Chinese would have
some degree of knowledge on Feng Shui. This is evident from the results of this study with
30% of Malaysian Chinese had knowledge on Feng Shui through their religious beliefs where
Feng Shui has been practiced over 3,000 years of history.
55% of Indian respondents have considered Feng Shui during housing selection as Feng
Shui application can help them obtain a comfortable living space. Feng Shui is conceptually
similar to its Indian counterpart “Vastu Shastra” which both methods seek to harmonize the
stream of the life energy through the house and to create a harmony with the earth in order to
obtain a comfortable living space (“Feng Shui | Chi (Energy) | Architecture Ideas,” n.d.).
Results show that 55% of the Indian respondents utilize the concept of Feng Shui in housing
selection. Only 45% of Indians are not considering Feng Shui due to less interest and
knowledge in Feng Shui. This result is aligned with Gautam Rana’s (2019) study stating that
many Chinese homebuyers are guided by the Feng Shui principles while Indian homebuyers
are guided by Vasthu Shastra; hence most Indian prefers to follow their own religion beliefs
(Vasthu Shastra Hindu System).
Key results in relation to Objective 2: Prioritize the Feng Shui design factors in housing selection among Malaysians.
Feng Shui Design Factors for Surrounding Environment Module
Table 6 presents the top 3 ranking Feng Shui design factors for surrounding environment
module among Malaysians. The findings showed that Malaysians were very concerned about
the Feng Shui aspect of a house facing a hospital, which was rated by all the group of
respondents in the top 3 list. Chinese respondents ranked the highest with Important Index
(II) of 4.10, among the three ethnicity groups. In Feng Shui theory, a house that is located
near to or facing a hospital is known as inauspicious features as it can negatively affect the
health of the people living nearby and may cause depression. In addition, this research finding
agrees with the Feng Shui study conducted by Liang and Osmadi (2015), as the design factor
for a hospital-facing home is ranked in top 5 ranking that has the potential to affect house
purchasers.
Nevertheless, the factor of a house facing cemetery or tomb is also very much concerned
by the Malaysians, ranked 1st for Malaysian Chinese (II=4.15) and 2nd for Malaysian Malays
(II= 2.714). In Feng Shui theory, a house located near or facing a gravesite has poor Feng
Shui as it could have an impact on future investment due to the difficulty of disposing of it at
a good resale price (Liang & Osmadi, 2015). Results also showed that Indians and Malays
respondents are also concerned with the design features of a house facing a gap between two
tall buildings. The occupants may experience the feelings of oppression with such
unfavourable feature (David Daniel Kennedy, 2011). In short, it has showed that Malaysians
have the same perception towards the Feng Shui factors during the selection of a house.
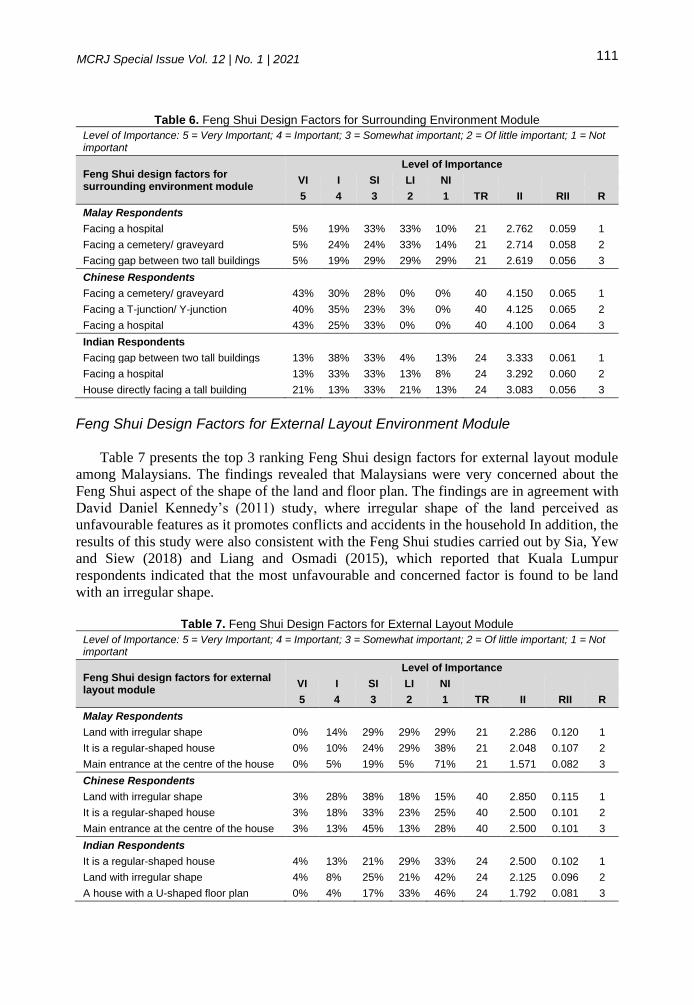
111
MCRJ Special Issue Vol. 12 | No. 1 | 2021
Table 6. Feng Shui Design Factors for Surrounding Environment Module
Level of Importance: 5 = Very Important; 4 = Important; 3 = Somewhat important; 2 = Of little important; 1 = Not important
Feng Shui design factors for surrounding environment module
Level of Importance
VI I SI LI NI
5 4 3 2 1 TR II RII R
Malay Respondents
Facing a hospital 5% 19% 33% 33% 10% 21 2.762 0.059 1
Facing a cemetery/ graveyard 5% 24% 24% 33% 14% 21 2.714 0.058 2
Facing gap between two tall buildings 5% 19% 29% 29% 29% 21 2.619 0.056 3
Chinese Respondents
Facing a cemetery/ graveyard 43% 30% 28% 0% 0% 40 4.150 0.065 1
Facing a T-junction/ Y-junction 40% 35% 23% 3% 0% 40 4.125 0.065 2
Facing a hospital 43% 25% 33% 0% 0% 40 4.100 0.064 3
Indian Respondents
Facing gap between two tall buildings 13% 38% 33% 4% 13% 24 3.333 0.061 1
Facing a hospital 13% 33% 33% 13% 8% 24 3.292 0.060 2
House directly facing a tall building 21% 13% 33% 21% 13% 24 3.083 0.056 3
Feng Shui Design Factors for External Layout Environment Module
Table 7 presents the top 3 ranking Feng Shui design factors for external layout module
among Malaysians. The findings revealed that Malaysians were very concerned about the
Feng Shui aspect of the shape of the land and floor plan. The findings are in agreement with
David Daniel Kennedy’s (2011) study, where irregular shape of the land perceived as
unfavourable features as it promotes conflicts and accidents in the household In addition, the
results of this study were also consistent with the Feng Shui studies carried out by Sia, Yew
and Siew (2018) and Liang and Osmadi (2015), which reported that Kuala Lumpur
respondents indicated that the most unfavourable and concerned factor is found to be land
with an irregular shape.
Table 7. Feng Shui Design Factors for External Layout Module
Level of Importance: 5 = Very Important; 4 = Important; 3 = Somewhat important; 2 = Of little important; 1 = Not important
Feng Shui design factors for external layout module
Level of Importance
VI I SI LI NI
5 4 3 2 1 TR II RII R
Malay Respondents
Land with irregular shape 0% 14% 29% 29% 29% 21 2.286 0.120 1
It is a regular-shaped house 0% 10% 24% 29% 38% 21 2.048 0.107 2
Main entrance at the centre of the house 0% 5% 19% 5% 71% 21 1.571 0.082 3
Chinese Respondents
Land with irregular shape 3% 28% 38% 18% 15% 40 2.850 0.115 1
It is a regular-shaped house 3% 18% 33% 23% 25% 40 2.500 0.101 2
Main entrance at the centre of the house 3% 13% 45% 13% 28% 40 2.500 0.101 3
Indian Respondents
It is a regular-shaped house 4% 13% 21% 29% 33% 24 2.500 0.102 1
Land with irregular shape 4% 8% 25% 21% 42% 24 2.125 0.096 2
A house with a U-shaped floor plan 0% 4% 17% 33% 46% 24 1.792 0.081 3

112
MCRJ Special Issue Vol. 12 | No. 1 | 2021
The overall top 3 ranking factors ranked by the Chinese respondents is similar with the
result obtained from Malay respondents. A house with a regular floor plan is considered an
auspicious feature and represents a solid, even and stable existence. The findings of Sia, Yew
and Siew (2018) and Liang and Osmadi (2015) on their Feng Shui studies have also
highlighted that regular shape as favourable for external layout of a property and is also one
of Kuala Lumpur respondents’ main concerns. It has shown that the perception of Kuala
Lumpur respondents remains the same as the shape of floor plan can influence their decision
to choose a house. Besides, the position of main entrance factor was also crucial for Malays
and Chinese respondents. This result also coincides with the findings of Engr, Mal, Chiong
and Shui (2006), stated that 92% of the prospective homebuyers would consider the main
door position factor because it would affect the Feng Shui of the building and their decision
making.
Feng Shui Design Factors for Internal Layout Environment Module
Table 8 shows that Malaysians have a common perception towards the Feng Shui aspect
such as a house with different door sizes, house with a smaller main door, a regular-shaped
of rooms and the alignment of the main door and back door. In Feng Shui theory, a house
consists of different door size is considered as bad Feng Shui as it would affect the flow of
Chi around the house. David (2011) pointed out, the larger door devours the smaller door,
which may lead to disagreements and disputes between the occupants. This feature is
considered as the unfavourable Feng Shui which has impact on the decision-making of the
Malaysians in the selection of the house. However, according to a study conducted by the
Liang and Osmadi (2015), different size of door factor is not crucial for internal layout
category.
Table 8. Feng Shui Design Factors for Internal Layout Module
Level of Importance: 5 = Very Important; 4 = Important; 3 = Somewhat important; 2 = Of little important; 1 = Not important
Feng Shui design factors for internal layout module
Level of Importance
VI I SI LI NI
5 4 3 2 1 TR II RII R
Malay Respondents
House with different sizes of doors 5% 14% 43% 29% 10% 21 2.762 0.120 1
House with smaller main door 5% 14% 43% 19% 19% 21 2.667 0.115 2
Regular-shaped of rooms 0% 5% 29% 29% 38% 21 2.000 0.087 3
Chinese Respondents
House with smaller main door 33% 35% 8% 10% 15% 40 3.600 0.114 1
House with different sizes of doors 33% 33% 10% 8% 18% 40 3.550 0.113 2
House with main door and back door in a straight line
25% 35% 8% 10% 23% 40 3.300 0.105 3
Indian Respondents
House with different sizes of doors 21% 29% 17% 17% 17% 24 3.208 0.114 1
House with smaller main door 13% 38% 13% 25% 13% 24 3.125 0.111 2
House with main door and back door in a straight line
0% 13% 21% 33% 33% 24 2.125 0.075 3
Regular-shaped of rooms 0% 13% 25% 15% 38% 24 2.125 0.075 3
House with smaller main door is more preferred by most Malaysians. In Feng Shui terms,
the main door should slightly bigger, which represents active and open. Even in the design

113
MCRJ Special Issue Vol. 12 | No. 1 | 2021
field, the smaller main door will make the house improper ratio. The results shown were
consistent with the findings of Liang and Osmadi (2015) and Sia, Yew and Siew (2018) that
smaller main door factor is considered as unfavourable and concerned factor for respondents
from Kuala Lumpur. The Chinese and Indian respondents perceived that it is important to
have backdoor in line with the front door. Feng Shui explained that the main door and the
back door in a straight line may resulting in a significant loss of household income, wealth,
health, and more (David Daniel Kennedy, 2011). The findings of a Feng Shui study done by
Sia, Yew and Siew (2018) also indicated that this factor had a significant impact on the
selection of house purchases among respondents.
Feng Shui Design Factors for Interior Arrangement Module
Table 9 shows that Malaysians have almost the same perception towards the Feng Shui
aspect in terms of house with door opens inward, house with right-handed door and house
with well-lit living room. The factor of door open inward was perceived to be important factor
for all ethnic groups. The door opens inwards is favourable in Feng Shui principles. This
allowing the people entering the room feel control. If a door opens out, we are required to
interrupt our forward flow and take a step backward before continuing forward (David Daniel
Kennedy, 2011). Thus, when Malaysians is looking for a house, the door opening factor will
be highly considered.
Table 9. Feng Shui Design Factors for Interior Arrangement Module
Level of Importance: 5 = Very Important; 4 = Important; 3 = Somewhat important; 2 = Of little important; 1 = Not important
Feng Shui design factors for external layout module
Level of Importance
VI I SI LI NI
5 4 3 2 1 TR II RII R
Malay Respondents
House with a door open inward 0% 0% 43% 5% 52% 21 1.905 0.151 1
House with right-handed door 0% 0% 38% 10% 52% 21 1.857 0.147 2
House with well-lit living room 0% 0% 33% 10% 57% 21 1.762 0.140 3
Chinese Respondents
House with a door open inward 3% 33% 35% 20% 10% 40 2.975 0.065 1
House with right-handed door 5% 30% 28% 25% 13% 40 2.900 0.065 2
Bathroom directly above the main door of the house
8% 18% 28% 28% 20% 40 2.650 0.064 3
Indian Respondents
House with a door open inward 0% 4% 25% 42% 29% 24 2.042 0.144 1
Bedroom located at the end of the corridor
4% 8% 13% 25% 50% 24 1.917 0.135 2
House with well-lit living room 0% 4% 21% 21% 54% 24 1.750 0.124 3
As for the factor of house with right-handed door was concerned by Malays and Chinese
and was voted as rank 2 respectively. The result of the study is similar with the Feng Shui
viewpoints as the right-handed door is considered favourable in Feng Shui. A right-handed
door will swing open to the right and allow us to proceed smoothly into the room. If the door
is a left-handed door that opens to the left and we have grabbed the knob with our right hand,
suddenly find that our right arm is in front of you, blocking us from easily entering the space
(David Daniel Kennedy, 2011). According Sia, Yew and Siew (2018), the most unfavourable
Feng Shui factor for interior arrangement is a bedroom located at the end of the corridor,
whereas well-lit living rooms were found to be favourable for interior arrangement.

114
MCRJ Special Issue Vol. 12 | No. 1 | 2021
Overall Comparison for Four Feng Shui Design Modules
The comparison between the Feng Shui designs modules are shown in Table 10. Results
showed that Malaysians have the same perception towards Feng Shui design factors and the
most important Feng Shui factor is the surrounding environment module. This is evident II
value of each ethnicity - Malay group (2.123), Chinese group (2.902) and Indian group
(2.487).
Table 10. Comparison Between Four Feng Shui Design Module Among Malaysians
Feng Shui Design Modules Malay Chinese Indian
Average Mean Value
1 Surrounding Environment 2.123 2.902 2.487
2 External Layout 1.365 1.771 1.570
3 Internal Layout 1.650 2.254 2.012
4 Interior Arrangement 1.577 2.263 1.771
CONCLUSION
This research aimed at determining the influence of Feng Shui factors on Malaysian
decision-making on housing selection and prioritising the Feng Shui design factors of each
design module. The findings for objective 1 show that the influence of Feng Shui is still
widespread among the Chinese of Malaysia. Most Malaysian Chinese still consider Feng Shui
to be one of the criteria for purchasing a house, other than the price of housing and location
of property. This finding is consistent with previous study of other researchers (Engr, Mal,
Chiong & Shui, 2006; Sia et al., 2018; Liang & Osmadi, 2015). However, this study also
found that other than the Malaysian Chinese, there are 55% of Malaysian Indians also took
into consideration the Feng Shui factor when choosing a house. The reason of Indian
respondents considered Feng Shui during housing selection as Feng Shui application can help
them obtain a comfortable living space. The goal of Feng Shui and Indian Vasthu Shastra are
the same, the methodology is different and cannot be compared, but application of both can
seek harmony and comfortable living space (Saran & Shirodkar, 2017).
On the contrary, less than half of the Malay respondents (39%) considered Feng Shui to
be a factor in choosing a house. Having said that, these findings also revealed that not only
Malaysian Chinese would consider the application of Feng Shui, but also part of the
Malaysian Malays. This result agrees with the previous study conducted by Nur Zalikha
Mohd Amar and Zulhabri Ismail (2012), saying that Muslim nowadays are more familiar
with the idea of Feng Shui. Overall, although the application of Feng Shui originates from
China and has been practiced by Chinese for more 5,000 years ago, it has begun to be widely
recognized by the public due to the popularity and benefits of Feng Shui.
For objective 2, even though Chinese, Malays and Indians are different ethnicities and
have their own religious beliefs, the results of this study have revealed that they have same
perception on the influence of Feng Shui design factors of a house on their house purchase
intentions. Overall results showed that Malaysian the most concerned Feng Shui design
factors among Malaysians fall within the surrounding environment category. The facing
direction of a house is the major issue among Malaysians. They perceived that a house near
to or directly facing the hospital, a cemetery and tall buildings would be unfavourable and
115
MCRJ Special Issue Vol. 12 | No. 1 | 2021
would have impact on their house buying intentions. In overall, the surrounding environment
factor is one of the significant factors that Malaysian homebuyers should consider when
buying house and this is supported by many previous studies on Feng Shui (Chang & Lin,
2015; Hsieh, Yung-Jin, 2005).
Apart from the surrounding environment category, the findings show that there is no
significant difference between Malaysian Chinese, Malays and Indians perceptions of the
other three design modules. The results are as follows: (i) for Feng Shui external layout
factors, 3 significant factors are irregular shaped land, regular-shaped house and the main
entrance must be at the centre of the house; (ii) for Internal layout design module, 3 important
factors are: house with different door sizes, smaller main door, regular shape of rooms and
the alignment of the main door and back door and (iii) for Interior arrangement design
module, the 3 essential factors are: house with door open inward, house with right-handed
door, well-lit living room and the bathroom and bedroom layout.
IMPLICATION AND CONTRIBUTION OF THE STUDY
This research contributes to the understanding and application of Feng Shui design
factors as well as the perception of Malaysian homebuyers in choosing landed residential
building. The findings of this study make it possible for the housing developer to act as a
guideline and understand the consumer preferences for the trend of applying Feng Shui
principles in housing design. As with this research outcome, the housing developer can
identify and apply an appropriate Feng Shui concept and design according to the different
ethnicity customer perspective before undertaking new housing development project. The
favourable factors of Feng Shui in the surrounding environment, external layout, internal
layout and interior arrangement should therefore be highly considered by the housing
developer in order to achieve a competitive advantage and to maintain the level of consumer’s
satisfaction. This paper also able to increase the level of Feng Shui knowledge and awareness
of the construction industry of the importance of having concept of Feng Shui in housing
design. The findings of this study are also relevant to the property investors, as the results
can help them in determining which house has a good Feng Shui and the value of the house
will be enhanced by future growth.
REFERENCES
Bond, S. 2008. “The Impact of Feng Shui on Residential Property Prices in Western
Cultures.” International Journal of Housing Markets and Analysis 1 (1): 81–101.
Chang, C.-P., & Lin, C.-M. (2015). The Influence of Wai Sha Feng Shui Factors on the
Housing Price and House Buyers. Asian Journal of Humanities and Social Studies, 3(3),
239–243. Retrieved from https://www.ajouronline.com/index.php/AJHSS/article/view/
2816/1442
Chang, C. and Ive, G. (2002). Rethinking the multi-attribute utility approach-based
procurement route selection technique. Construction Management & Economics, 20 (3),
pp.275-284.
Chen, G.-M. (2007). The Impact of Feng Shui on Chinese Communication. China Media
Research, 3(4), 102–109. https://doi.org/ENDO:22:2:143 [pii]\r10.1385/ENDO:22:2:143
Chyi, L. L. (2013). Housing in Malaysia as a portfolio investment. International Journal of
Housing Markets and Analysis, 1(4), 352-361.

116
MCRJ Special Issue Vol. 12 | No. 1 | 2021
David Daniel Kennedy. (2011). Feng Shui for Dummies.pdf. Retrieved June 18, 2019, from
Wiley Publishing Inc. website: https://docslide.net/documents/feng-shui-for-
dummiespdf.html
Engr, B., Mal, S., Chiong, L. L., & Shui, F. (2006). Feng Shui and Buying House. (December),
22–27.
Erdogan, E., & Erdogan, H. A. (2014). Feng Shui Paradigm as Philosophy of Sustainable
Design. International Scholarly and Scientific Research & Innovation, 8(10), 3185–3190.
Feng Shui | Chi (Energy) | Architecture Ideas. (n.d.). Retrieved July 26, 2019, from
http://architectureideas.info/2010/07/feng-shui-chi-energy/
Fengshui Republic Academy and Consultation. (2017). Fengshui Republic Academy and
Consultation. Retrieved May 14, 2019, from http://fengshui-republic.com/
Fortin, N. M., Hill, A. J., & Huang, J. (2014). Superstition in the Housing Market. Economic
Inquiry, 52(3), 974-993.
Ge, X. I. N. J., & Mak, M. Y. (2013). Purchasing Family Homes : Feng Shui versus
Sustainability. CIB World Building Congress, Brisbane, Australia.
Geh, C. L., & Osmadi, A. (2015). The significance of feng shui in house buying selection
among Malaysians. Jurnal Teknologi, 75(9), 15–19.
Hsieh, Yung-Jin (2005). MasterHsieh Yung Jin’s Advanced Fengshui Guide Book-Outer
Negative Energy. Taiwan Taipei: Both Techart Co., Ltd.
Krejcie, R.V., & Morgan, D.W. (1970). Determining Sample Size for Research Activities.
Educational and Psychological Measurement, 30, 607-610
Li, H. (2014). Analysis of the Application of Traditional “ Feng Shui ” Theory in Modern
Home Space. Studies in Sociology of Science, 5(3), 105–109.
https://doi.org/10.3968/5072
Liang, G. C., & Osmadi, A. (2015). The Significance of Feng Shui in House Buying Selection
Among Malaysians. Jurnal Teknologi, 75(9), 15–19.
https://doi.org/10.11113/jt.v75.5218
Low Lay Phon. (2007). Geomancy Meet Ends on High Note - Community | The Star Online.
Retrieved March 16, 2019, from The Star Online website:
https://www.thestar.com.my/news/community/2007/07/25/geomancy-meet-ends-on-
high-note/
Madeddu, M. and Zhang, X. (2017). Harmonious Spaces: The Influence of Feng Shui on
Urban Form and Design. Journal of Urban Design, 22(6), 709-725.
https://doi.org/10/1080/13574809.2017.1336061
Mak, M. Y. (n.d.). Sustainable Design and Feng Shui : A Case Study of an Office Building in
Sydney. Image (Rochester, N.Y.), 83–96.
Mak, M. Y., & Ng, S. T. (2008). Feng shui: An alternative framework for complexity in
design. Architectural Engineering and Design Management, 4(1), 58–72.
Mak, M. Y., & So, A. T. (2015). Scientific feng shui for the built environment: Theories and
application. Hong Kong: City University of Hong Kong Press.
Ng, E. Y. L. (2016). Urban feng shui: Design guidelines for multifamily residential in
Honolulu (Doctoral dissertation). Retrieved from
https://search.proquest.com.newdc.oum.edu.my/
Nur Zalikha Mohd Amar, Zulhabri Ismail, H. S. (2012). Guidelines for Internal Arrangement
of Islamic House. 189–194.
Portal Rasmi Jabatan Perangkaan Malaysia. (n.d.). Retrieved from
https://www.dosm.gov.my/v1/index.php?r=column/cone&menu_id=Nk1JZnJBMm1Td
mRFS0xaTXZnanIrQT09

117
MCRJ Special Issue Vol. 12 | No. 1 | 2021
Razak, I., Ibrahim, R., Hoo, J., Osman, I., & Alias, Z. (2013). Purchasing Intention towards
Real Estate Development in Setia Alam, Shah Alam: Evidence from Malaysia.
International Journal of Business, Humanities and Technology, 3(6), 66-75.
Sally Painter, T. H. (n.d.). Fascinating Feng Shui History | LoveToKnow. Retrieved June 17,
2019, from https://feng-shui.lovetoknow.com/Feng_Shui_History
Saran, S., & Shirodkar, A. D. (2017). Vastu Shastra And Feng Shui The Ancient Sciences and
Their Fusion in Context of Indian Architecture. 6(11), 136–144.
Shen, Z. S. (2001). Feng shui – harmonising your inner and outer space. London: Dorling
Kindersley.
Sandy, B. (2008). The Impact of Feng Shui on Residential Property Prices in Western
Cultures. International Journal of Housing Markets and Analysis. 1(1): 81-101
Sia, M. K., & Lu, L. C. (2006). Feng shui and buying house. Jurutera, 00, 20–27.
Sia, M. K., Yew, V. W. C., & Siew, C. L. (2018). Influence of Feng Shui Factors on House
Buying Intention of Malaysian Chinese. Architectural Engineering and Design
Management, 14(6), 427–439. https://doi.org/10.1080/17452007.2018.1466684
Skinner, S. (1982). The living earth manual of feng shui. London: Graham Brash.
Sun, J. Y. (2012). On the basis of traditional Chinese Feng Shui theory. Research on Modern
Home Design, 9.
Tan, T. H., 2014. Determinates of homeownership in Malaysia. Habitat International.
Taylor, P., Mak, M. Y., & Ng, S. T. (2011). Architectural Engineering and Design complexity
in design Feng shui : an alternative framework for complexity in design. (June 2013), 37–
41. https://doi.org/10.3763/aedm.2008.S307
Too, L. (1994). Practical applications of feng shui. Kuala Lumpur: Konsep Books.
Vastu seeks to harmonize the home with nature. (n.d.). Retrieved February 3, 2020, from
https://www.mercurynews.com/2019/08/02/real-deal-vastu-seeks-to-harmonize-the-
home-with-nature/
Webster, R. (2005). Feng shui for beginners – successful living by design. Petaling Jaya:
Golden Books
Welcome to Yap Cheng Hai Academy - Media Centre. (n.d.). Retrieved February 3, 2020,
from https://www.ychacademy.com/events-231105.shtml
Wu, W. Y., Yau, O. H. M., & Lu, H. Y. (2012). Feng shui principles in residential housing
selection. Psychology and Marketing, 29(7), 502–518.
Xu, P. (1997). Feng-shui as clue: Identifying prehistoric landscape setting patterns in the
American southwest. Landscape Journal, 16, 174–190.
Zikmund, W.G. (2007). Business Research Methods (4th ed.). New York: The Dryden Press.

118
MCRJ Special Issue Vol. 12 | No. 1 | 2021
GOVERNING HOUSING AFFORDABILITY PROBLEMS AMONG YOUNGER WORKING HOUSEHOLDS Zafirah Al Sadat Zyed1, Peter Aning Tedong2, Wan Nor Azriyati Wan Abd Aziz1 and Noor Rosly Hanif1 1Department of Real Estate, Faculty of Built Environment, Universiti Malaya. 2Department of Urban and Regional Planning, Faculty of Built Environment, Universiti Malaya.
Abstract Housing affordability problems bring an impact especially to the income capability of new entrants in the housing purchasing market. These new entrants are predominantly younger working households (YWH) who are at the lower end of the income distribution as they are in the early stages of their working career. The problem of providing affordable housing is not new. However, the provision of affordable housing to close the gap in the market for YWH is a problem. The aim of this study is to examine the problems of housing affordability among YWH in terms of governing housing affordability. The selected respondents were interviewed at least 30 minutes based on the semi-structured interview questions. The findings revealed that the state identified one of the housing affordability problems among YWH is influence by house price. In addition, there is less opportunity for YWH to purchase a house in urban area. Apart from that, lack of financial literacy among YWH is due to the upbringing of YWH from well off parents. Keywords: housing affordability; young household; housing problems; affordable housing; housing
policy.
INTRODUCTION
Homeownership is every household dream. What stands in between a household and
purchasing a house, among others, is their affordability to own a house. Housing affordability
is defined in many terms by many researchers. However, the root definition of housing
affordability is the income capability to cover the cost of purchasing a house (Wilcox, 2003;
Stone, 2006; Burke, 2007; Wilcox, 2007; Wan et al., 2010). Housing affordability is also
commonly used as an indicator of household’s ability to own a house (Norazmawati, 2012).
According to Wilcox, housing affordability is traditionally defined by the rules of access to
mortgage finance which may pose as a problem in housing affordability issues (Wilcox,
2003). More so, housing affordability is not a feature of housing but a feature of housing
service in relation to consumer capacity and desire to buy a house (Suhaida et al., 2011).
Additionally, housing market also influence housing affordability because the price for
housing services may exceed the market average (Thalmann, 2003). Furthermore, with the
decrease of housing affordability; there will be an exertion of stress in the society (Gan and
Hill, 2009). This scenario affects households who does not have the capacity to purchase a
house and are eventually forced to pay higher rents. This may lead to housing affordability
problems to affect vulnerable groups. Vulnerable groups are commonly perceived as low-
income households. However, due to several factors including urbanisation, the prospective
of basic needs especially in housing pose to be difficult for middle income households as well.
Even more, there are two factors that the society are concern over, first, housing is the single
largest expenditure item in their budget and second, the increase in housing prices and rents
(Quigley and Raphael, 2004).

119
MCRJ Special Issue Vol. 12 | No. 1 | 2021
A house is argued as a very valuable asset and has much wider economy, social, cultural,
and personal significance (Kajimo and Evans, 2006). To this significance, the housing
affordability problems garnered towards ensuring affordable housing supply is available to
YWH in the housing market. Davidson and Malloy argued that affordable housing can be
many things such as a fundamental right, a critical source of shelter and a contested locus of
community (Davidson and Malloy, 2009). Most commonly, affordable housing is associated
with low-income households who are not able to enter the homeownership market without
any state assistance due to the definition of it is a critical source of shelter (Agus, 2002; Byrne
and Diamond, 2007; O'Mahony, 2009). The housing affordability problem occurs when the
household income is not enough to cover the cost of purchasing the house due to expensive
house price in the housing market.
Housing affordability problems bring an impact especially towards the income capability
of new entrants in the housing purchasing market. These new entrants are predominantly
younger working households (YWH) who are in the lower end of the income distribution as
they are in the early stages of their working career. With decent qualifications and
employment, YWH are considered a member of middle-income households. In a UK study,
YWH are identified to be between 20 to 39 years old (Wilcox, 2003; 2007; 2008). The age of
YWH is considered as the breadth of first-time home buyers. This group is argued that they
are classified in an Intermediate Housing Market (IHM) which is where households who are
not eligible for housing benefits but cannot buy at the lowest decile of house price level in the
housing market. The restriction to access the housing market is led to indications of housing
affordability problems among YWH (Wilcox, 2003).
In Malaysia, the government holds a responsibility in providing houses for low-income
households while other income households depend on the private sector for housing (Tan,
2011). Additionally, the private sector has concentrated on high end homes because of the
substantial increase in house and land prices. Due to this, it becomes difficult for YWH to
find houses that they could afford of their choice in urban areas. Even so, the houses that are
considered affordable are located away from the city centre and will incur additional
transportation cost. This is particularly felt in Greater Kuala Lumpur (GKL). Lower classes
(urban poor) have low-cost housing while the YWH who are members of the middle-income
class have set their sights on affordable homes which are something that the market has yet
to fulfil (Abdul Rahman, 2013). Therefore, YWH are neglected by the state. These salaried
workers, who have their money deducted monthly and still have to pay more at the end of the
year and worse, are not qualified for aid.
Article 25(1) of the Universal Declaration of Human Rights states that “everyone has a
right to a standard of living adequate for the health and wellbeing of himself and his family,
including food, clothing, housing and medical care and necessary social services, and the right
to security in the event of unemployment, sickness, disability, widowhood, old age or other
lack of livelihood in circumstances beyond his control.” The right to housing in this context
shows that regardless of households’ income group, everyone should have the opportunity
towards adequate housing. This means that the expense of housing should not crowd other
expenditure, and everyone should live adequately with other non-shelter necessities such as
food and clothing as well. If one agrees that every individual has the right to housing, then it
proclaims towards it is the state’s duty to ensure that every individual should enjoy the right
(Buang, 2010). The main aim of this study is to examine the problems of housing affordability
among YWH in terms of governing housing affordability.

120
MCRJ Special Issue Vol. 12 | No. 1 | 2021
HOUSING AFFORDABILITY PROBLEMS
Housing affordability has become a pressing issue due to certain factors such as growing
population, speculation in house prices, economic growth, and inadequate housing supply
(Mak et al., 2007). Thalmann (2003) argued there are two potential affordability problems
which are, if income minus the cost of standard housing consumption is no less than standard
non-housing expenditure and if the cost of standard housing consumption does not exceed a
given share of income. However, there are other problems in a different perspective as well.
This persistent affordability problem focused on the accessibility restriction of potential
homeowners in the private housing market (Mak et al., 2007). The restriction to access the
housing market is led to indications of housing affordability problems (Wilcox, 2003). Ortalo-
Magné and Rady (1999) observed co-movements of housing prices and owner occupancy
rates can be explained as an equilibrium response to income and credit market shocks. They
argued that in the period of rapid gross domestic product growth followed by the deregulation
of the mortgage market resulted into repeat home buyers were larger than those of first-time
buyer properties. In relation to this, Green and Hendershott (1996) discussed that the
movement of baby boomers into adulthood impacted the ratio of household formation to
population growth rises. This led to the understanding of YWH as off springs of the baby
boomers and are the first-time buyer properties in this context. In contradiction, with easier
access to credit loan, YWH can become homeowners because they can borrow a higher
proportion of the house price.
Distribution of income plays an important role as well especially in securing housing loan.
From income growth, there are potential of increasing savings rate and because of this
decrease in interest rates would not increase home ownership rate. In general, income is
personal and subjective towards a household. There is evidence of education influence the
category of houses; either, low-cost houses, medium cost houses or high-cost houses
(Norazmawati, 2012). However, Alexiu et al. (2010) argued that education and housing is not
connected in a linear or direct correlation, even though, education effects on life quality in
many social fields and is strongly related to socio-economic status. He further concluded that
good housing does not relate to educational credentials but economic success. Even though,
there is no certain relation between education and housing conditions, in terms of housing
choice, the norms of attaining good education are associated to a better employment with a
higher income. Thus, it is perceived that YWH can afford good houses.
Andrew et al. (2006) argued that young households choose to remain in their parental
home. They concluded that household characteristics that influenced the probability of
transition to homeownership are permanent income and higher education level beyond high
school level. Higher volatility of house prices slows down the transition to home ownership
among YWH (Lee, 2009). Even more, the tenure choice to own a house weighs on
homeownership benefits. The evolution of the real estate market is described as a result of
sudden liberalization of prices and rents together with a surge of demand from foreign
investors and many major development projects of international standard (Tan, 2011; Mak et
al., 2007). Balancing the demand and supply of housing and the foreign investors’ entrants to
the local housing market is important. This is to prevent households from being shut out from
their own local housing market. Apart from that, the impact of influx of foreign investors
increases living standards and forced households to live with their family and colleagues (Mak
et al., 2007). Due to this, YWH are influenced by the increasing living standards and their
income could not sustain their expenses and thus experience housing affordability problem.

121
MCRJ Special Issue Vol. 12 | No. 1 | 2021
STATE INTERVENTION IN HOUSING AFFORDABILITY PROBLEMS
The trend of migration rate from rural to urban areas has increased from 11% in 1957 to
73.6% in 2016 (Department of Statistics, 2017). With demand increasing and affordable
housing supply decreasing, the house price increases and is perceived to be unaffordable for
YWH. The need for state intervention is crucial to rebalance the housing policy that assists
the current housing scenario. In the National Housing Policy (2011), there is an added focus
on middle income households in the housing sector. With previous emphasis on low-income
households, the new recognition of middle-income households in the National Housing Policy
(NHP) has highlight that middle-income household has encountered problems in purchasing
a house. This is crucial in urban housing areas where the inclination of house prices and
household income seems to have a wider gap with each other. The problem of urban housing
area resulted from the urbanisation where households in rural areas migrated to urban areas
for better opportunities in the job sector and to have better living standards.
Conversely, the state has intervened through the NHP, 1Malaysia People Housing
Scheme and My First Home Scheme. The National Housing Policy still holds the state to the
responsibility to assist the housing welfare of the low-income households. However, in the
NHP that was introduced in 2011, there is a statement on encouraging private developers to
develop more affordable housing for not only the low-income household but also the middle-
income household. Additionally, the intervention of the state in this sense is only in terms of
words of encouragement with no incentives as indicated in the NHP.
Furthermore, the subsidised housing scheme, 1Malaysia People Housing Scheme
(PR1MA) focus is on providing affordable housing for the middle-income households and
there are eligible for the housing scheme. The applicants for the housing scheme must earn
RM 2,500 to RM 7,500 monthly of individual household income or combine household
incomes and the house must be owner occupied with a 10-year moratorium. In addition, the
My First Home Scheme (MFHS) focus is to assist young households below 35 years old to
enter homeownership. MFHS aims to relieve YWH in terms of housing loan for house price
between RM 100,000 to RM 400,000. Similar, PR1MA, MFHS also has eligibility criteria for
applicants to apply and require the applicants to reside in the house purchased through MFHS.
Although the state has introduced various housing schemes to assist YWH to purchase a
house, the housing policy and schemes is insufficient to address the housing affordability
problems among YWH.
Malaysia is a country that practice democracy. The federal government is formed and
administered by the winning party in elections that are held every five years. Specifically, the
type of ruling in Malaysia is federal parliamentary democracy with a constitutional monarch
(Hai, 2002). Housing affordability is one of the key factors that can describe the socio-
economic stability and development of a country (Suhaida et al., 2011). It is aimed to ensure
housing provided is affordable for all income groups. However, the objectives set by the
National Housing Policy (NHP) are still far in the process of achieving it. The state has missed
on the social changes between the first generation of middle class and the second generation
of middle class. The second generation of middle class is the younger working households
today. The change in the social structure, especially in social behaviour must redirect the
housing policy approach. The role of state is loosely put together in providing affordable
homes for YWH.

122
MCRJ Special Issue Vol. 12 | No. 1 | 2021
METHODOLOGY
The case study is YWH who are currently working in Greater KL, Malaysia. Greater KL
is chosen as the location of the case study due to the rapid growth of urbanisation. Kuala
Lumpur, Putrajaya and parts of Selangor collectively are Greater KL and have 100% of
urbanisation except for Selangor that has achieved 91.4% of urbanisation. Furthermore,
house prices in Greater KL are more expensive as compared to other locations. The
relationship of Greater KL with YWH is significant in this study as it depicts living hardships
in urban areas that has caused housing affordability problems among YWH.
The selected respondents must be willing to spend at least 30 minutes to be interviewed
based on the semi-structured interview questions. As for the selection of representatives, the
respondents chosen are based on who the state decided is best to represent them in this case.
It should be noted that, the respondents for this in-depth interview are from the state and its
affiliations who are stakeholder providing access to affordable housing and has a position of
executive level. In qualitative studies, there is no minimum of respondents if there are more
than 2 respondents (Patton, 2001; Fossey et al., 2002). This study interviewed seven
respondents (n=7). Therefore, the in-depth interviews are fitting and eliminate the element of
bias.
This study analysed qualitative data through narrative data analysis. The first step in
analysing the data is getting to know the data. The field notes and a few digital recordings
(only a few respondents allowed digital recording) are transcribed into texts. The text is read
and re-read to consider the quality of the data and proceed accordingly. The second step is
focusing the analysis. The purpose of the evaluation is to gain insights from the state’s
perspective on housing affordability problems among YWH. The focus of analysis is by
question. The data is organised by questions to look across all the answers from the
respondents to identify consistencies and differences. The third step is categorising the
information. The crux of qualitative analysis is to bring meaning to the words by identifying
themes or patterns and organising them into coherent categories (Taylor-Powell and Renner,
2003).
The coding generation included “expensive house price”, “limited housing choice”,
“financial literacy” and many others. These coding were guided by the semi-structure
interview. The field notes are labelled paragraph-by-paragraph and page-by-page basis.
Coding categories were transferred to coded and categorised computer tables that included
information such as source and quotes. Furthermore, the fourth step is to identify patterns and
connections within and between categories. This is done through the relative importance of
the categories and counts the number of times the themes are identified. This will reveal the
general patterns of the data. Apart from that, the relationship between and within categories
are also sought to reveal connections of the categories. Lastly, the final step is interpretation
where the themes and connections will explain the findings where it attaches the meaning and
significance of the analysis.
FINDINGS AND DISCUSSIONS
It is argued that YWH will eventually decide to purchase their first house within the
opportunities in the housing market (Hitlin and Elder Jr., 2006). Due to this, housing

123
MCRJ Special Issue Vol. 12 | No. 1 | 2021
affordability problems is important for the state to recognise. The findings of the study are
divided into three (3) main themes and five (5) sub-themes. Based on the findings, the three
main themes of housing affordability problems in the perspective of state are unaffordable
house price in urban areas for YWH to purchase, insufficient household income among YWH
to purchase a house in the housing market and limited housing choice in the housing market.
The sub-themes will be explained further within the three main themes.
Main Theme I – Unaffordable House Price
Table 1. Unaffordable House Price
Main Theme I Sub-theme
Unaffordable house price in urban areas for YWH to purchase
• To assist developers to provide houses at affordable price, tax incentives should be given by the state
• Affordable houses are available to purchase in the housing market but far from city centre
The findings show that majority of the respondents agreed that house prices are perceived
to be unaffordable for YWH as land prices are also expensive (refer Table 1.0). Apart from
that, majority of the respondents also agreed that there is a factor of speculation of house
prices among property investors in the housing market that attributed to the high house prices,
especially in the urban areas. These findings agreed with Tan (2011) and Mak et al. (2007)
on how property investors might have speculated house price hence increasing house price to
unaffordable prices. One of the respondents who agreed to this added;
“These problems faced by younger working households are due to several factors.
One of the factors is speculation. There are speculators or probably investors who are
adding to their assets… […] investment in housing is lucrative… another factor is
high cost of living... Such places like Subang Jaya, there are an elite group with high
income and have marked the place as a high-cost area… apart from that, the price of
land is expensive. Due to this, there is insufficient land to build affordable houses.
Additionally, when there is high demand, the house prices will increase”
Expensive land price contributes to the housing affordability problem because it becomes
a factor to increase house price. Apart from that, the findings concur with Abdul Rahman
(2013) that one of the factors of increasing land price is due to scarcity of land especially in
urban areas. Additionally, this has caused housing developers to build houses on the outskirts
of urban areas. One of the respondents explained;
“What kind of houses can they buy with RM900? If it’s in an urban area, you cannot
run away from an apartment. An apartment that’s RM900 a month, house price is
around RM 250,000…”
In addition, the lack of incentives to build affordable housing for YWH from the state
also contributed to this problem. One of the respondents explained that in the United States
there is a tax credit that instead big developers paying taxes to the state, they will build
affordable houses. Majority of the respondents felt that there should be more intervention
from the state instead of just through regulation similar with previous research by Agus
(2002). Furthermore, a further study on providing affordable houses should be done before a
policy on affordable housing is enacted as lands are valuable and a thorough study should

124
MCRJ Special Issue Vol. 12 | No. 1 | 2021
prevent a waste of resources from an unfit housing policy. The respondents also felt that the
government must go beyond policy and be responsible and be more serious in this matter. The
structure of the state responsible in housing is crucial and is stressed in this context.
The imposition of cross subsidies in the form of quotas and discounts from the
government are very much welcomed to assist YWH in housing. Even more, financial
institutions should also be investigated as well as argued by one of the respondents;
“We have to look into financial institutions as well. Even though they offer housing
loan until you are 60 years old, the interest rate is high. And this high interest rate is
what burdens the young households the most.”
However, it is also important to note that from the findings, there are also respondents
that disagreed house prices are expensive in the housing market for YWH to purchase. The
argument was that the perception that all houses are not affordable to YWH is incorrect as
there are houses available in the market, but they could afford but could not because they do
not know how to budget their income. Due to this, the next main theme from the findings is
insufficient household income.
Main Theme II – Insufficient Household Income
Table 2. Insufficient Household Income
Main Theme II Sub-theme
Insufficient household income among YWH to purchase a house in the private housing market
Insufficient household income could be due to lack of financial literacy
The findings also show that one of the housing affordability problems among YWH
insufficient household income due to lack of financial literacy especially in housing finance
(refer Table 2.0). The respondents all agreed that the issue of weak financial literacy among
YWH is attributed to saving money for the housing deposit and most of YWH are privileged
with comfortable basic needs from their parents as what has been asserted by Green and
Hendershott (1996); Alexiu et al. (2010) and Andrew et al. (2006). This can be elaborated
further by one of the respondents;
“The issue with young households is the housing deposit. If they are working in the
private sector, their annual bonus will probably help them with the deposit and as for
those working in the public sector, the 10% deposit will be difficult to save with their
monthly salary but they have an option to use government housing loans. But other
costs to enter homeownership are a burden too. And this requires a big amount of
money. Todays’ generation is different because their priorities lie with buying a car
first. Because they need to be mobile, it is their challenge in today and because of all
this their priorities are not the same with the previous generations.”
In addition, one of the respondents added that saving for housing deposit might be
difficult as YWH are not aware of other housing costs as well such as legal fees, stamp duty,
moving costs, among others. Furthermore, getting the best mortgage package and a decent
interest rate requires a good set of financial skills as well. The respondents stated that even
though financial institutions offer mortgage loan up to 60 years old, the interest rate that is

125
MCRJ Special Issue Vol. 12 | No. 1 | 2021
imposed is considerably high. Similar to Thalmann (2003), the findings suggest that getting
caught in a high interest rate loan for a long period of time is going to burden YWH more
than helping them with their finance.
The majority of respondents suggested that YWH should get their financial priorities
straight and purchasing a house should be their number one priority as it is a basic need. Even
with no direct correlation between education and housing (Alexiu et al., 2010); financial
literacy could bring a different result for housing. According to Andrew et al. (2006), a
permanent income will influence a higher probability to homeownership. Perhaps, the
insufficient of income could also indicate instability of income as well. Therefore, financial
literacy could assist the financial path to homeownership.
The respondents also felt that it is the state’s responsibility to create the awareness of
financial literacy among YWH in order to tackle the issue of housing affordability problem.
One of the respondents stressed that “the government has to tackle and ensure how to
regularise their (YWH) income and the government has to teach how to spend and budget
their income effectively.” Moreover, this is important to highlight as one of the housing
affordability problems among YWH because there are also limited choices of affordable
housing in the housing market (Tan, 2011; Mak et al., 2007).
Main Theme III – Limited Housing Choice
Table 3. Limited Housing Choice
Based on the findings, it is argued that there is limited housing choice in the housing
market as YWH who are considered to be in the middle income group could not purchase in
low cost housing but could not afford also in the housing market (Abdul Rahman, 2013). As
housing affordability is a feature of housing service in relation to consumer capacity and
desire to buy a house (Suhaida et al., 2011), majority of the respondents highlighted that if
YWH cannot afford to purchase house in the housing market, they should save their money
first and rent until they can afford to purchase a house. Furthermore, because YWH does not
have many housing choices in the market, the respondents argued that there should be some
control of the market by the state. One of the respondents argued;
“Younger working households today have limited choices in houses. They are over-
qualified to apply for low-cost houses and could not afford to purchase high cost
houses. The housing market is not favourable to them and the government does not
control the housing market, it is a free market. From the perspective of housing
developer when the land has higher potential the market is favourable to build high-
cost houses and there is a demand for it. Due to this, the government has to step in.”
Therefore, it is crucial for the state to intervene in the housing market to ensure that
housing is equitable to every households and to not only limit state intervention in housing
for low-income households (Agus, 2002). Additionally, affordable housing supply is in poor
Main Theme III Sub-theme
Limited housing choice in the housing market
i. State should impose a control mechanism in the market to ensure there are affordable housing choices for YWH
ii. If house price is expensive, YWH should look into the rental market

126
MCRJ Special Issue Vol. 12 | No. 1 | 2021
location with limited access to public transportation. Construed to this note, most respondents
shared similar views on limited options for houses in urban areas and suggest YWH should
look elsewhere if they want to become homeowners. However, one of the respondents argued
that with lack of knowledge and information on buying a house, YWH will faced even deeper
difficulties when they have bought a house that is not to what they are looking for just for the
sake of buying a house. Hence, YWH seems to prefer to stay in their parental home similar
to a research by Andrew et al. (2006).
Other than that, the respondents believed that the government should provide land for free
to build affordable houses. If the responsibility is to be borne by the developer and the
government is just on the regulation bench, the role of the government is questionable and
unfair. If the land is given for free, the concept and idea of an affordable housing hub can be
proposed.
However, one of the respondents felt strongly that the rental market should be the option
for YWH;
“What I think now, actually because of housing policy that everybody must own a
house. But in reality, young households cannot afford to own house. They should go
for rental market. They should rent first. If say you are buying a house, the 20 to 30
years you are paying is double. You have to think about quit rent, maintenance and
so forth. So, for the young, rental market has to be there. And how to make it more
affordable… rental market is a must when they go into the market. We should not
burden them. They have just started working and have to pay 30% of their income.
Even though house prices are increasing, you have to look into your own
affordability.”
From this observation by majority of the respondents, it is important for the state to
intervene in the housing market especially in the housing demand. All the respondents agreed
that there is a need to address the housing demand of YWH in order to overcome the housing
affordability problems among YWH. In National Housing Policy (2011), this has been
addressed but it was only the encouraged and is given support to build affordable houses
rather than an initiative and incentives to provide affordable houses similarly to low-cost
houses. In addition, there should be a long-term affordable housing system that allows the
state to take control of the segmented market.
RECOMMENDATIONS
Having established the housing affordability problems faced by YWH, the state identified
similar problems with YWH. The housing affordability problems such as expensive house
price, lack of financial literacy match from the perceptions of YWH and limited housing
choice in the market. However, the state perceived such problems can resolve. The state
argued that affordable houses are available in the private housing market. It is YWH
behaviour that has led to them facing housing affordability problems. Conversely, there are
weaknesses in state intervention in addressing this problem if YWH has no opportunity in
enjoying their housing rights (Tan, 2011).
State intervention is important because without the support of a strong structure, YWH
will eventually be known as the homeless generation. All the respondents agreed that

127
MCRJ Special Issue Vol. 12 | No. 1 | 2021
prioritising on what they spend with their monthly income is very important. It can be
concluded that, the recommendations to the state are to enact strict laws and regulations to
ensure the housing market segment of affordable housing and some control from the state in
this housing market segment. Additionally, there is a need to include financial literacy in the
state’s mechanism to address the housing affordability problems among YWH.
CONCLUSION
The majority of the state representatives recognised that house prices are unaffordable for
YWH. Even more, there are limited housing choices for YWH to purchase in the housing
market. Although, the findings revealed that there is no reluctance from the state
representatives to build affordable houses in contrast to the inclination of private housing
developers to build high-cost houses. However, there were also views on the absence of
financial literacy among YWH that led to the housing affordability problems. In addition, the
reluctance of YWH to purchase available affordable houses and their spending behaviour are
among the housing affordability problems.
State involvement through housing policy and housing schemes imposed on the private
sector has been relatively limited and inadequate. Insufficient household income, increasing
house prices, expensive land prices, increasing building cost and other factors affect supply
of house in the private housing market may be outside the realms of the state authority.
However, in this context, it is instructive for the state to consider a more authoritative
approach. Arguably, attempts to extend this approach by considering alternative tenure such
as rental and additions of housing schemes that will witness better outcomes in achieving the
goal of the National Housing Policy.
REFERENCES
Abdul Rahman, E. (2013). Responding to the Globalization and the State: Negotiations and
Contestation by the Middle Class in Malaysia. In C. Tazreiter & S. Y. Tham (Eds.),
Globalization and Social Transformation in the Asia-Pacific: The Australian and
Malaysian Experience: Palgrave Macmillan.
Agus, M. R. (2002). The role of state and market in the Malaysian housing sector. Journal of
Housing and the Built Environment, 17(1):49-67.
Alexiu, T. M., Ungureanu, D., and Dorobantu, A. (2010). Impact of education in terms of
housing opportunities. Procedia - Social and Behavioural Sciences, 2(2):1321-1325.
Andrew, M., Haurin, D., and Munasib, A. (2006). Explaining the route to owner-occupation:
A transatlantic comparison. Journal of Housing Economics, 15(3):189-216.
Buang, S. (2010). The Affordability Challenge. News Straits Times.
Burke, T. (2007). Experiencing the Housing Affordability Problem: Blocked Aspirations,
Trade-offs and Financial Hardships. Financial Review Housing Congress.
Byrne, J. P., and Diamond, M. (2007). Affordable Housing, Land Tenure, and Urban Policy:
The Matrix Revealed. Fordham Urb. LJ, 34, 527.
Davidson, N. M., and Malloy, R. P. (2009). Affordable housing and public-private
partnerships. Ashgate Publishing, Ltd.
Department of Statistics. (2010). Population Distribution and Basic Demographic
Characteristics Report. Retrieved from Kuala Lumpur
Department of Statistics. (2017). Migration Survey Report Malaysia 2016. Retrieved from
Malaysia.

128
MCRJ Special Issue Vol. 12 | No. 1 | 2021
Fossey, E., Harvey, C., McDermott, F., and Davidson, L. (2002). Understanding and
evaluating qualitative research. Australian and New Zealand Journal of Psychiatry,
36(1):717-732.
Gan, Q., and Hill, R. J. (2009). Measuring housing affordability: Looking beyond the median.
Journal of Housing Economics, 18(2009):115-125.
Green, R., and Hendershott, P. H. (1996). Age, housing demand, and real house prices.
Regional Science and Urban Economics, 26(5):465-480.
Hai, L. H. (2002). Electoral Politics in Malaysia: ‘managing’ Elections in a Plural Society.
Electoral Politics in Southeast and East Asia, 101-148.
Hitlin, S., and Elder Jr, G. H. (2006). Agency: An Empirical Model of an Abstract Concept.
Advances in Life Course Research, 11:33-67.
Kajimo, K., and Evans, K. (2006). The role of the banks in the provision of low-income
housing in South Africa. International Journal of Strategic Property Management,
10(1):23-38.
Lee, C. L. (2009). Housing price volatility and its determinants. International Journal of
Housing Markets and Analysis, 2(3):293-308.
Mak, S. W. K., Choy, L. H. T., and Ho, W. K. O. (2007). Privatization, housing conditions
and affordability in the People's Republic of China. Habitat International, 31(2):177-192.
National Housing Policy. (2011). Kuala Lumpur.
Norazmawati, M. S. (2012). Homeownership of low-cost house in Melaka, Malaysia.
Advances in Applied Science Research, 3(5):3387-3389.
O'Mahony, L. F. (2009). Homeownership, Debt and Default: The Affective Value of Home
and the Challenge of Affordability. In N. M. Davidson & R. P. Malloy (Eds.), Affordable
housing and public-private partnerships. Ashgate Publishing, Ltd
Ortalo-Magné, F., and Rady, S. (1999). Boom in, bust out: Young households and the housing
price cycle. European Economic Review, 43(4-6):755-766.
Patton, M. Q. (2001). Qualitative research & evaluation methods: Thousand Oaks, CA: Sage.
Quigley, J. M., and Raphael, S. (2004). Is housing unaffordable? why isn't it more affordable?
Journal of Economic Perspectives, 18(1):129-152.
Suhaida, M. S., Tawil, N. M., Hamzah, N., Che-Ani, A. I., Basri, H., and Yuzainee, M. Y.
(2011). Housing Affordability: A Conceptual Overview for House Price Index. Procedia
Engineering, 20(0):346-353.
Stone, M. (2006). What is housing affordability? The case for the residual income approach.
Housing policy debate, 17(1):151-184.
Tan, T.-H. (2011). Meeting first-time buyers’ housing needs and preferences in greater Kuala
Lumpur. Cities. 29(6):389-396.
Taylor-Powell, E., and Renner, M. (2003). Analysing qualitative data: University of
Wisconsin--Extension, Cooperative Extension.
Thalmann, P. (2003). ‘House poor' or simply `poor'? Journal of Housing Economics,
12(4):291-317.
Wan, N. A., Hanif, N. R., and Singaravello, K. (2010). Housing affordability issues for middle
income households: The Malaysian perspective. Paper presented at the 22nd
International Housing Research Conference, Istanbul.
Wilcox, S. (2003). Can work - Can't buy. Retrieved from UK
Wilcox, S. (2007). Can't Buy: Can Rent. Retrieved from UK
Wilcox, S. (2008). Can’t Supply: Can’t Buy. Retrieved from York

129
MCRJ Special Issue Vol. 12 | No. 1 | 2021
STRESS LEVELS AND COPING STRATEGIES: CASE STUDY ON QUANTITY SURVEYING STUDENTS IN PRIVATE UNIVERSITY Myzatul Aishah Kamarazaly, Teow Kah Yan, Mohd Adib Ramli, Azrina Md Yaakob, Soon Lam Tatt and Habizah Sheikh Ilmi School of Architecture, Building & Design, Taylor’s University, Subang Jaya, Malaysia.
Abstract Stress is the body’s reaction to any change that required an arrangement and adoption. The feeling of stress is a part of university students’ life. Students exposed to challenges every day. If the student is unable to deal with the circumstances appropriately, it will cause stress. Coping mechanism plays an important role in reducing and overcoming the stress experienced by an individual. Different type of coping strategies can influence individual experience stress differently. This study aims to find out the stressors that contribute to Quantity Surveying students in a private university, students’ coping strategies and the stress level of students by using Perceived Stress Scale. A quantitative method is used in gathering and analyzing the data. The result of this study indicated that majority of the Quantity Surveying students are having moderate level of stress and academic factors is the main source of stress to students. Keywords: Stress level; coping strategies; university students.
INTRODUCTION
University life is a fascinating and remarkable experiences in a youth’s life. However,
stress almost becomes part of students’ life and students are constantly exposed to challenges
in daily life. Hence, it will cause stress to students if they cannot cope with the stress properly.
There are two type of stress, which is eustress and distress. Smith (2019) defines eustress as
a positive stress which can drive us a desire to overcome the challenges. Distress can be
defined as undesirable emotions which often make us see the difficult as a threat instead of
challenge.
Students nowadays face many difficulties that parents may not have had to experience
during their time (Kumar & Bhukar, 2013). Students need to handle their busy lives, school
and work and allocate time with family and friends at the same time. Students often feel stress
because they cannot manage their time wisely and effectively.
The level of stress can be range as low stress, moderate stress and high stress depending
on the individual. The score of stress of students came from these three main categories which
are personal factors, academic factors and environmental factors. Personal factors vary from
person to person that results in a different set of behaviours, perceptions and attitudes (Essel
& Owusu, 2017). Shaikh et al. (2004) revealed that the most impactful stressors were came
from academic factors. Environmental factors such as fear, future worries will also contribute
stress to students.
Coping mechanism helps in overcoming and reducing the stress of an individual (Ganesan
et al., 2019). Managing stress during university can be considered as a challenging task for a
student. However, an appropriate coping strategy for a student will allow student to have a
better campus life experience. Positive coping strategies can be helpful in a long time while
negative coping strategies only helpful for a short period.

130
MCRJ Special Issue Vol. 12 | No. 1 | 2021
The research aims to analyze the stress level and coping strategies of Quantity Surveying
students in Taylor’s University. The objectives are: 1) To analyze the stress level of Quantity
Surveying students in Taylor’s University. 2) To identify and priorities the stressors that
contribute to Quantity Surveying students’ stress level in Taylor’s University. 3) To suggest
the coping strategies to overcome Quantity Surveying students’ stress level in Taylor’s
University.
Society should put more concern and cannot disregard the issue of students’ stress in
Malaysia because high stress level can cause students to suffer from mental health problem
and the worst-case scenario is student commit suicide. Student suicides case in Malaysia are
on the rise over the years. “Private university” (2019) and Theleaders-Online (2019) reported
on two different suicide cases in a private university within one week. The first suicide took
place on May 6, while the second occurred on May 14.
There were also little to no research conducted on the stress level among Quantity
Surveying students as majority of the previous studies were focusing on medical students and
engineering students. The difference in study environment would influence the outcome of
the measures of these variables. Therefore, this study will fill in the gap by analyzing the
stress level, stressors and coping strategies among the Quantity Surveying students in Taylor’s
University.
OVERVIEW ON STRESS LEVEL
Stress is the body’s reaction to any change that required an arrangement and adoption.
Stress can be interpreted as a feeling of mental pressure and tension (Shahsavarani, Abadi &
Kalkhoran, 2015). Elias, Ping, & Abdullah (2011) pointed out that students experienced
moderate stress level and academic stress is student’s main source of stress. The stress level
amongst the final year students is higher than other students (Elias et al., 2011; Ganesan et
al., 2019). In Ganesan’s study, the parameter used is Perceived Stress Scale. It is a classic and
most widely used psychological instrument for measuring the stress levels. The parameter
helped to understand how different situations affect feelings and perceived stress. The
questions were designed to test how unpredictable, uncontrollable and overloaded
respondents find their lives.
Factors Affecting Students’ Stress Level
The source of students’ stress derived from the following three main categories: personal
factors, academic factors and environmental factors. Identifying the stressor that causes a
student to feel stress is the first step towards helping the student to overcome it.
Personal Factors
Essel & Owusu (2017) highlighted that personal factors vary among individual as each
individual has own perceptions, behaviours and attitudes. Examples of personal factors as a
source of stress includes the following:

131
MCRJ Special Issue Vol. 12 | No. 1 | 2021
• Time management - Stress levels can be decreased among students who managed
their time well (Misra, & McKean, 2000 as cited in Al Khatib, 2014). In general, a
person feels stressed when they cannot finish their work on time.
• Financial difficulties - Students’ life becomes very challenging and stress when they
need to take care of their studies and handle financial problems at the same time (Essel
& Owusu, 2017).
• Combining jobs with studies - Students with jobs are finding themselves with higher
stress levels as it might be too difficult to handle in balancing the different areas of
their lives (Essel & Owusu, 2017). They felt difficult in balancing their lives because
they need to take responsibilities for both and commit to their studies and work at the
same time.
• Physical causes of stress - This can be referred to lack of sleeping hours and unhealthy
eating habits. Students often sacrifice sleep to complete their assignments which will
also cause them to fell stress.
• Low self-esteem - Scott (2019) revealed that self-esteem impacts on happiness level
and can make life more or less stressful. More specifically, low self-esteem generates
more negative thoughts to a person and decrease the happiness level.
Academic Factors
Academic stress is basically derived from the demands of studying which considered as
the main cause of stress or tension (MacGeorge, Samter, & Gilihan, 2005 as cited in Calaguas,
2012). Examples of academic factors as a source of stress includes the following:
• Examination - Students often feel stress while preparing for exam because they
worry, they might fail, think the preparation is not enough (Roussos, 2018).
• Excessive course workload - An excessive course workload will stress up students in
the sense that when students have to do more than they can handle.
• Procrastination - Shokeen (2018) stating that the students who tend to procrastination
are prone to stress and has negative impacts on students which cause them to a low
level of academic achievement. Indeed, a last-minute work always comes with
anxiety and sleeping problem.
• Frustration due to misunderstanding – Essel & Owusu (2017) highlighted that this
frustration causes students being stressed up because they worried about their
performance in exams as they hardly understand what the lecturers teach in the class.
• Competition among students - Rose (2011) stating that grading system increase
students stress and interferes with deep learning.
Environmental Factors
The examples of environmental factors as a source of stress studied in this research
includes:
• Placed in unfamiliar situations - Students become disturbed and worried when they
find themselves in unfamiliar situations and will stress them up (Essel & Owusu,
2017).

132
MCRJ Special Issue Vol. 12 | No. 1 | 2021
• Transportation - Commuter students rarely spend time outside of the classroom on
campus as they direct go home after attending classes. Forbus, Newvold, & Mehta’s
2009 (as quoted in Johari, 2013) discovered that commuter students are said to be
presented with stressful events more frequently as they have less involvement in
campus life.
• Family problems - Family should be a place where we can relase our stress and be
relaxed. However, on contrary, poor family relations can incur greater amount of
stress to students instead of helping them (Pfeiffer, 2001).
• Unrealistic expectation - Wrosch et al. (2007), as cited in Jerrim (2014) discovered
that unrealistic expectations can cause students to feel stress and anxiety. Sometimes,
high expectations from parents and lecturers are often too high to become unrealistic
expectations which are beyond the students' capabilities and may not handle it (Lam,
2017).
• Future anxiety – It is right to worry about future, however, excessive worrying will
only lead to stress. Berland (2017) highlighted that many students worry about not
graduating on time, anxiety for their employment and scared they are unable to get a
job in their degree field.
Coping Strategies
Stress coping mechanism is about developing the appropriate reaction to stressful events
and improve an individual’s adjustment instead of escaping and avoiding the stressful events
(Yikealo et al., 2018). Not all coping strategies are constructive, some could result in more
complicated or difficult conditions. Hence, dealing with stress during university are
considered quite difficult for some students.
Positive Coping Skills
Pariat et al. (2014) described that positive coping mechanisms relieves stress and was
found to be beneficial in the long run. Yusoff (2010), as summarized by Ganesan et al. (2019)
also highlighted that students can reduce their stress level by using the correct and effective
coping strategies.
• Social support – Study proved that people who are having stressful situations produce
less stress hormone, compared to those who are handling things solo (Lougheed,
Koval, & Hollenstein, 2016). In short, facing a problem alone is more difficult to
handle then facing the problem with support.
• Exercise – Plante, Coscarelli, & Ford (2001) revealed that exercise produced positive
impact on calmness and energy. Kim, & McKenzie (2014) highlighted that exercise
helps in decision making because exercise release positive emotion and lead to better
concentration on problem, hence enhancing the problem-focused skill.
• Meditate/ Pray – It is expected to reduce stress-related symptoms by meditating or
praying as it can be practiced independently and serve as a buffer against ongoing
stress.
• Positive thinking - According to StressHack (2015), research carried out by Steptoe,
Dockray, & Wardle (2009) has highlighted an individual with positive mood has a
lower level of stress hormone cortisol. In other words, an individual with positive
thoughts has a higher problem-oriented coping skill when dealing with stress.

133
MCRJ Special Issue Vol. 12 | No. 1 | 2021
• Involving in leisure related activities – The leisure related activities discussed in this
study include reading, listening to music, watching television program and playing
video games. All these activities are proved to be helping in reducing stress if the
students manage it well.
Negative Coping Skills
Everley et al. (2002) as cited in Pariat et al. (2014) indicated that negative coping
strategies may release stress for a short time, however, studies showed that negative coping
skills are deemed to be destructive and cause an individual to suffer physical and mental
health.
• Alcohol/ Smoking – Both alcohol and smoking can help in releasing stress in short
term. However, it can lead to negative situations such as long-term heavy drinking
and smoking where the person keeps drinking or smoking to deal with the stress.
• Compulsive spending – Kalhour & Ng (2015) highlighted that individual will feel the
short-term fulfillment when they are buying things and Kelly (2018) stated that stress
can be relieved in a short time by buying things. However, this coping mechanism
only temporary relief stress as they may feel guilty or disappointed after they make a
purchase.
• Under eating/ overeating – Many studies showed that many people will under- or
overeating when they deal with stress, which will cause the imbalance dietary pattern
to the person. It is a way of not concentration on the problems and stress when a
person is under- or overeating.
• Avoiding or procrastinating the problem – Greene (2013) and Johnson (2013) agreed
that the problems tend to increase growth and may appear much larger than they are
when we keep ignoring the problems.
• Oversleeping – Healthyplace.com Staff Writer (2014) revealed that an individual may
have pushed his problems or struggles aside by sleeping, but once his wake up, his
problems are still there. Other than not solving the problem, oversleeping will also
cause some medical problems, including diabetes, heart disease (DerSarkissian,
2018).
RESEARCH METHODOLOGY
Research Framework
Figure 1. Research Framework

134
MCRJ Special Issue Vol. 12 | No. 1 | 2021
Research framework (Figure 1) is used to limit the scope of the relevant data to be
analyzed in this research. Framework 1 is achieved by using a survey instrument namely
Perceived Stress Scale and framework 2 is achieved by self-constructed questions.
Research Technique
The research technique used in this study is quantitative method as the results achieved
from this method are statistical, logical, unbiased and it is suitable to collect larger samples.
Descriptive method is being used as it only associated between variables. The data was
collected from the primary source. A questionnaire was prepared by using Google Form and
was sent to the class representatives of each semester in Quantity Surveying school to collect
data. By sending them the questionnaire, each class representatives were able to send out the
questionnaire to their classmates.
A survey instrument namely Perceived Stress Scale was used in this study to identify
students’ stress level, which is to achieve objective 1. In order to achieve objective 2, this
survey consists of 15 items divided into 3 categories which is personal factors, academic
factors and environmental factors. Furthermore, a section consists of 10 items were asked in
this survey to understand the coping strategies that used by students. Likert scale of 5 point is
used in this study with the option of “Never”, “Almost never”, “Sometimes”, “Fairly often”,
“Very often”. Other than closed-ended question, some sections have provided an open-ended
question stated "Others (please state)" which allow respondents to indicate any response that
are not provided in the category.
The population for this study comprised all Bachelor of Quantity Surveying students in
Taylor’s University. The sampling design used in this study is stratified random sampling. This
sampling design is chosen because the students are divided into certain groups based on their
semester and each student in each semester have the same opportunity of being selected in
taking part in this study. The required sample size for this study is 189 whereas only 154
participants completed the surveys within the given time frame. Therefore, the response rate
for this survey is 81.48%. All data were analyzed by descriptive analysis and rank the data
based on the mean.
DATA ANALYSIS AND KEY FINDINGS
Stress Levels of Quantity Surveying Students’ in Taylor’s University
The levels of stress were measured by using Perceived Stress Scale parameter. It is the
most widely used psychological instrument in terms of measuring the stress level. Individual
scores on the Perceived Stress Scale can range from 0-40, score ranging from 0-13 would be
considered low stress, ranging from 14-26 would be considered moderate stress and ranging
from 27-40 would be considered high stress.
Table 1. Stress Level of Quantity Surveying Students in Taylor’s University
Stress level of Quantity Surveying students in Taylor’s University
High Stress
Moderate Stress
Low Stress
Frequency of stress level of students 35 110 9
Percentage of stress level of students 23% 71% 6%
Rank 2 1 3

135
MCRJ Special Issue Vol. 12 | No. 1 | 2021
The table showed that majority of the Quantity Surveying students experienced moderate
stress level, which is 110 students (71%) out of total 154 students. This result was consistent
with the earlier study by Elias et al. (2011) which was carried out in University Putra Malaysia
saying that most of the students were having moderate vulnerability to stress as well. This
finding showed 35 students (23%) tend to be experience high level of stress and only 9
students (6%) experience low level of stress. This finding has similar statement as Ganesan
et al. (2019) which carried out in University Malaysia Sarawak highlighted that many of the
students are having moderate stress level followed by high stress level then low stress level.
Situations That Affect Students’ Feelings and Perceived Stress
Table 2 showed the results of each questions in the Perceived Stress Scale parameter.
There have total 10 questions in this test. Based on the table above, the questions can be
separated into two parts, which Question 1 to Question 6 is more towards to negative
situations whereas Question 7 to Question 10 is tile to positive situations. The results clearly
showed that Question 1 to Question 6 was ranked for the top six. In other words, the Quantity
Surveying students in Taylor’s University experience negative situations more often than
positive situations. It is not surprising that students are vulnerable to stressful life conditions
and experience negative situation more frequently as it is not easy when persuade higher
professional education in a highly competitive environment (Kumar, & Bhukar, 2013).
Table 2. The Situation That Affects Students’ Stress
Frequencies of occurrence: 5 = Very Often; 4 = Fairly Often; 3 = Sometimes; 2 = Almost Never; 1 = Never
Stress Level of QS Students in Taylor’s University
Frequency (%)
5 4 3 2 1 TR Mean RII Rank
Perceived Stress Scale (PSS)
1 How often have you felt nervous and “stressed”?
21 34 31 13 1 154 3.604 0.111 1
2 How often have you been upset because of something that happen unexpectedly?
11 41 29 17 2 154 3.422 0.105 2
3 How often have you felt difficulties were piling up so high that you could not overcome then?
14 35 31 18 3 154 3.409 0.105 3
4 How often have you felt you were unable to control the important things in your life?
16 33 28 20 3 154 3.377 0.104 4
5 How often have you found that you could not cope with all the things that you had to do?
10 29 39 21 1 154 3.279 0.101 5
6 How often have you been angered because of things that were outside your control?
12 31 32 19 5 154 3.273 0.101 6
7 How often have you felt confident about your ability to handle your personal problems?
8 36 34 17 5 154 3.260 0.100 7
8 How often have you been able to control irritations in your life?
5 30 41 20 4 154 3.123 0.096 8
9 How often have you felt that things were going your way?
5 32 32 25 6 154 3.032 0.093 9
10 How often have you felt that you were on top of things?
1 19 44 27 8 154 2.773 0.085 10
32.552 1.000
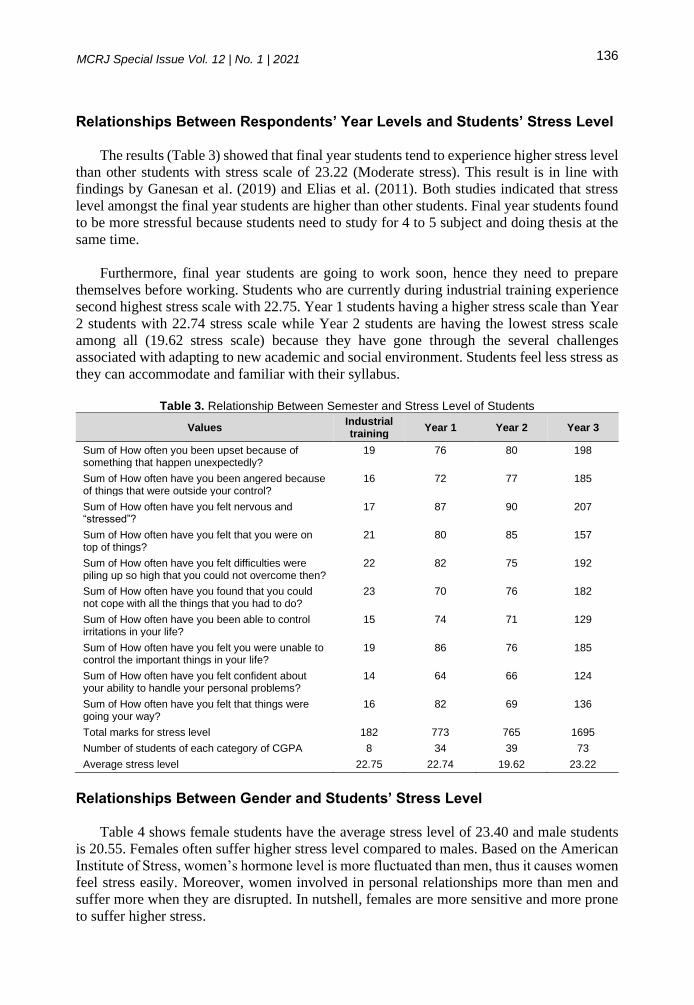
136
MCRJ Special Issue Vol. 12 | No. 1 | 2021
Relationships Between Respondents’ Year Levels and Students’ Stress Level
The results (Table 3) showed that final year students tend to experience higher stress level
than other students with stress scale of 23.22 (Moderate stress). This result is in line with
findings by Ganesan et al. (2019) and Elias et al. (2011). Both studies indicated that stress
level amongst the final year students are higher than other students. Final year students found
to be more stressful because students need to study for 4 to 5 subject and doing thesis at the
same time.
Furthermore, final year students are going to work soon, hence they need to prepare
themselves before working. Students who are currently during industrial training experience
second highest stress scale with 22.75. Year 1 students having a higher stress scale than Year
2 students with 22.74 stress scale while Year 2 students are having the lowest stress scale
among all (19.62 stress scale) because they have gone through the several challenges
associated with adapting to new academic and social environment. Students feel less stress as
they can accommodate and familiar with their syllabus.
Table 3. Relationship Between Semester and Stress Level of Students
Values Industrial training
Year 1 Year 2 Year 3
Sum of How often you been upset because of something that happen unexpectedly?
19 76 80 198
Sum of How often have you been angered because of things that were outside your control?
16 72 77 185
Sum of How often have you felt nervous and “stressed”?
17 87 90 207
Sum of How often have you felt that you were on top of things?
21 80 85 157
Sum of How often have you felt difficulties were piling up so high that you could not overcome then?
22 82 75 192
Sum of How often have you found that you could not cope with all the things that you had to do?
23 70 76 182
Sum of How often have you been able to control irritations in your life?
15 74 71 129
Sum of How often have you felt you were unable to control the important things in your life?
19 86 76 185
Sum of How often have you felt confident about your ability to handle your personal problems?
14 64 66 124
Sum of How often have you felt that things were going your way?
16 82 69 136
Total marks for stress level 182 773 765 1695
Number of students of each category of CGPA 8 34 39 73
Average stress level 22.75 22.74 19.62 23.22
Relationships Between Gender and Students’ Stress Level
Table 4 shows female students have the average stress level of 23.40 and male students
is 20.55. Females often suffer higher stress level compared to males. Based on the American
Institute of Stress, women’s hormone level is more fluctuated than men, thus it causes women
feel stress easily. Moreover, women involved in personal relationships more than men and
suffer more when they are disrupted. In nutshell, females are more sensitive and more prone
to suffer higher stress.

137
MCRJ Special Issue Vol. 12 | No. 1 | 2021
Table 4. Relationship Between Gender and Stress Level of Students
Values Female Male
Sum of How often you been upset because of something that happen unexpectedly?
227 146
Sum of How often have you felt you were unable to control the important things in your life?
214 152
Sum of How often have you felt nervous and “stressed”? 250 151
Sum of How often have you felt confident about your ability to handle your personal problems?
164 104
Sum of How often have you felt that things were going your way? 180 123
Sum of How often have you found that you could not cope with all the things that you had to do?
209 142
Sum of How often have you been able to control irritations in your life? 178 111
Sum of How often have you felt that you were on top of things? 204 139
Sum of How often have you been angered because of things that were outside your control?
206 144
Sum of How often have you felt difficulties were piling up so high that you could not overcome then?
227 144
Total marks for stress level 2059 1356
Number of female and male students 88 66
Average stress level 23.40 20.55
Relationship Between Academic Achievement and Stress Level of Students
The result revealed that students with lower CGPA are tend to have higher stress level
compared to others. Students with CGPA below 2.00 score 29.50 in stress scale which is high
level of stress according to the calculation of Perceived Stress Scale. The second highest of
stress scale is from students who score CGPA 2.00-2.50 with the stress scale of 23.00
(moderate stress). This finding was in line with a study carried out by Oketch-Oboth, &
Odiemo (2018) saying that the poorer the academic performance, the higher the stress level
students suffer. Students with lower CGPA feel stress as they worry they are unable to
improve their performance in the future and they might have to deal with many personal
issues. This will lead them to have insufficient time to study.
Table 5. Relationship Between Academic Achievement and Stress Level of Students
Values 2.00-2.50
2.50-3.00
3.00-3.50
3.50-4.00
Below 2.00
Sum of How often you been upset because of something that happen unexpectedly?
6 74 166 121 6
Sum of How often have you felt you were unable to control the important things in your life?
5 80 158 116 7
Sum of How often have you felt nervous and “stressed”?
5 82 171 137 6
Sum of How often have you felt confident about your ability to handle your personal problems?
3 66 107 85 7
Sum of How often have you felt that things were going your way?
5 77 113 102 6
Sum of How often have you found that you could not cope with all the things that you had to do?
5 69 155 117 5
Sum of How often have you been able to control irritations in your life?
3 65 119 97 5
Sum of How often have you felt that you were on top of things?
5 81 135 116 6

138
MCRJ Special Issue Vol. 12 | No. 1 | 2021
Values 2.00-2.50
2.50-3.00
3.00-3.50
3.50-4.00
Below 2.00
Sum of How often have you been angered because of things that were outside your control?
5 83 160 118 5
Sum of How often have you felt difficulties were piling up so high that you could not overcome then?
4 71 158 111 6
Total marks for stress level 46 748 1442 1120 59
Number of students of each category of CGPA 2 34 67 49 2
Average stress level 23.00 22.00 21.52 22.86 29.50
Stressors That Contribute to Quantity Surveying Students’ Stress Level in Taylor’s University
Personal Factors
The result showed that the most contributed stressor in personal factor is time
management. It is not surprising that students felt poor time management has the most impact
on their stress as Al Khatib (2014) and Adams, & Blair (2019) both agreed that it is quite
challenging for students to balance both their studies and external life. Poor time management
led to poor sleep patterns and increased levels of stress. The following impactful stressor is
low self-esteem (Ranked at 2nd) and physical source of stress (Ranked at 3rd) with mean
score of 3.273 and 3.208 respectively. The two factors that were less impact to students’ stress
level is financial difficulties and combining job with studies. It is expected these two factors
were ranked at bottom two because majority of Quantity Surveying students in Taylor’s
University rely on their families for paying the tuition fees and involved in external funding
like scholarship and PTPTN loan based on respondents’ demographic profile.
Table 6. Personal Factor That Contributes to Students’ Stress Level
Frequencies of occurrence: 5 = Very Often; 4 = Fairly Often; 3 = Sometimes; 2 = Almost Never; 1 = Never
Stressors that contribute to QS students’ stress level in Taylor’s University
Frequency
5 4 3 2 1 TR Mean RII Rank
A PERSONAL FACTOR
1. Time management (E.g., Too much to do and not enough time to do it or wasting time on activities that are not priority)
32 50 46 21 5 154 3.539 0.229 1
2. Low self-esteem (E.g., Often see difficult events as a threat instead of as a challenge.)
25 36 59 24 10 154 3.273 0.211 2
3. Physical source of stress (E.g., Adopt unhealthy eating habits and sacrifice sleep for extensive studying)
25 45 37 31 16 154 3.208 0.207 3
4. Financial difficulties (E.g., Settle financial problems first before shift focus to studies)
17 27 44 42 24 154 2.812 0.182 4
5. Combining job with studies (E.g., Struggle with balancing and prioritizing the areas between work and school life)
17 33 30 26 48 154 2.643 0.171 5
15.474 1.000
3.095

139
MCRJ Special Issue Vol. 12 | No. 1 | 2021
Academic Factors
Table 7 shows how frequently the students feel stress due to academic factors. The results
show that Quantity Surveying students in Taylor’s University rated examinations in the first
place as the most impactful academic factor to their stress levels with mean score of 3.929.
Quantity Surveying students are required to have final examination which weight 50% of their
total results for almost every subject and some subject might have mid-term test which weight
20%. Therefore, students often used a lot of times in studying and sometimes may sacrifice
sleep to study. Roussos (2018) mentioned that students who do not have proper sleep before
examination tend to experience higher stress levels.
Procrastination was ranked at 2nd with a mean score of 3.688. In this question, the
procrastination is referring to students always delay in preparing for exams and submitting
assignments. According to Table 6 which stated time management contributes the most to
students’ stress level among personal factors. In other words, students with poor time
management skills are prone to procrastinate in studying which eventually will lead them tend
to be more stress. Other than the factor that listed above, there were one feedback from student
in terms on academic stressors. The statement sounds quite well reasoned and rational as
students feel stress since students are unable to know their coursework mark for every subject.
In other words, students are unable to know how they did for the assignment and where can
they improve in future. In the event if students want to refer the assignment in the future, they
didn’t even know which part is correct, which part is not.
Table 7. Academic Factor That Contributes to Students’ Stress Level
Frequencies of occurrence: 5 = Very Often; 4 = Fairly Often; 3 = Sometimes; 2 = Almost Never; 1 = Never
Stressors that contribute to QS students’ stress level in Taylor’s University
Frequency
5 4 3 2 1 TR Mean RII Rank
B ACADEMIC FACTOR
6. Examination (E.g., Worry about performance is not adequate to the expectations and think the preparation is not enough.)
50 61 32 4 7 154 3.929 0.225 1
7. Procrastination (E.g., Delay in preparing and submitting your assignments and preparing for examinations.)
49 42 34 24 5 154 3.688 0.212 2
8. Frustration due to misunderstandings (E.g., Easily get frustrated when you do not understand what is being taught by the lecturers in the class.)
34 44 41 30 5 154 3.468 0.199 3
9. Excessive course workload (E.g., Have to do more than what you can handle, get frustrated and unable to focus on studies.)
27 45 53 25 5 154 3.429 0.197 4
10. Competition with other students (E.g., Academic competition among classmates often make you feel stress)
17 41 29 45 22 154 2.909 0.167 5
17.422 1.000
3.484
Other stressors stated by respondents
Stress due to assignments given by lecturers and then they didn’t even bother to give our coursework mark on the end of the semester. They left us hanging without knowing how we did for the assignments

140
MCRJ Special Issue Vol. 12 | No. 1 | 2021
Table 8 shows that students with CGPA below 2.00 suffer academic stressors more
frequently than other students with average mean score of 3.70. Students with CGPA 2.00-
2.50 also experience higher frequency to academic stressors with average mean score of 3.60.
Excessive academic stress will cause anxiety, depression to students and lead to poor
academic performance to students (Yikealo et al., 2018).
Table 8. Relationship Between Academic Achievement and Academic Stressors
Values 2.00-2.50
2.50-3.00
3.00-3.50
3.50-4.00
Below 2.00
Sum of Competition with other students 5 97 200 139 7
Sum of Excessive course workload 6 112 227 176 7
Sum of Examination 10 126 266 195 8
Sum of Procrastination 6 117 258 179 8
Sum of Frustration due to misunderstandings 9 107 229 182 7
Total frequency for academic factors 36 559 1180 871 37
Number of students of each category of CGPA 2 34 67 49 2
Average mean 3.60 3.29 3.52 3.56 3.70
Environmental Factors
Based on Table 9, factor that ranked at the first place is future anxiety. This result was in
line with a study carried by Mazumdar et al. (2012), as cited by Yavuzaslan, Barişçil & Farkas
(2016), highlighted the main source of stress to university students is worries about the future.
This situation happened for some reasons such as student’s worry of not graduating on time,
anxiety for their employment and afraid that they are unable to get a degree related field job
(Berland, 2017). Furthermore, there was a feedback regarding environmental factor stating
that students feel stress when the impractical learning and outdated information learned in the
class was unable to help in contributing to the society. Other than getting high expectations
from parents and lecturers, students feel stress when they have set a high expectation for
themselves.
Table 9. Environmental Factor That Contributes to Students’ Stress Level
Frequencies of occurrence: 5 = Very Often; 4 = Fairly Often; 3 = Sometimes; 2 = Almost Never; 1 = Never
Stressors that contribute to QS students’ stress level in Taylor’s University
Frequency
5 4 3 2 1 TR Mean RII Rank
C ENVIRONMENTAL FACTOR
1. Future anxiety (E.g., Worry about future or work-related fears)
38 48 34 23 11 154 3.513 0.243 1
2. Placed in unfamiliar situation (E.g., Involved in these kinds of situation such as group assignment assigned by lecturer)
18 48 47 28 13 154 3.195 0.221 2
3. Unrealistic expectations (E.g., Ambitious educational goals, high expectation from parents and lecturers)
16 43 40 41 14 154 3.039 0.210 3
4. Transportation (E.g., Delay or crowding in public transport/ traffic jam/ find parking in campus)
13 23 36 40 42 154 2.513 0.174 4

141
MCRJ Special Issue Vol. 12 | No. 1 | 2021
5. Family problem at home (E.g., Lack of respect in relationship, family, financial problems and different in opinions)
8 23 18 47 58 154 2.195 0.152 5
14.455 1.000
2.891
Other stressors stated by respondents 1. High expectation from myself 2. Portion of impractical learning which doesn’t fully contribute to the society, some sources/ information are outdated
Table 10 reveals the mean score and ranking for the three main constructs that
contributing to students’ stress level. The three main constructs are personal factor, academic
factor and environmental factor. The most impactful factor contributes to Quantity Surveying
students’ stress level in Taylor’s University is academic factor with mean score of 3.484
followed by personal factor (Ranked at 2nd) and environmental factor (Ranked at 3rd) with
mean score of 3.095 and 2.891 respectively. This result was in accordance with the study
carried out by Elias et al. (2011) which revealed that academic stress was the most
significance stressors which cause students to feel stress. Other than that, the result was in
line with study conducted by Ong, Bessie & Cheong (2009) as cited in Elias et al. (2011),
revealed academic stressors were ranked at the first to the students’ stressor list. Students
spend most of time in studying, learning, completing assignments and preparing for
examinations, thus it is not surprising that academic factor was ranked at the 1st place by the
students.
Table 10. Table for Comparison Between Personal Factor, Academic Factor and Environmental Factor
Type of main factor that contribute to QS students’ stress level in Taylor’s University
Total Mean Number of
factors Mean Rank
1 Personal factors 15.474 5 3.095 2
2 Academic factors 17.422 5 3.484 1
3 Environmental factors 14.455 5 2.891 3
Coping Strategies for Quantity Surveying Students’ Stress Levels
Positive Coping Skills
Table 11 shows the results for positive coping skills. The most frequently used positive
coping skill is students involved in leisure activities in order to release stress with an average
mean score of 3.864. The term leisure activities in this study include reading, listening to
music, watching television program and playing video games. This coping mechanism was
ranked at the first place because students can do different leisure activities based on their
preference. Besides, these coping strategies has been scientifically proved that it can reduce
our stress significantly. The less frequent adopted method is students meditate or pray when
they are having stress with an average mean score of 2.701. This coping skill was ranked at
the last because it is not common in Malaysia, especially young adults do not have the patience
to sit down and relax to meditate or pray.

142
MCRJ Special Issue Vol. 12 | No. 1 | 2021
Table 11. Average Mean and Average Relatively Importance Index for Positive Coping Skills to Overcome Quantity Surveying Students’ Stress Level
Coping strategies to overcome QS students’ stress level
Mean Remark RII Rank Average
Mean Average
RII Rank
POSITIVE COPING SKILLS
Involving in leisure related activities
1. I find an outlet to express my emotions such as playing some music, playing video games, watching dramas.
4.013 Fairly Often
0.121 1
3.864 0.117 1
2. I seek out more leisure activities to occupy my time and thoughts.
3.714 Fairly Often
0.112 2
Positive thinking
3. I outline a few strategies to resolve the issue and choose the one seems to be the best.
3.214 Some times
0.097 6
3.458 0.105 2
4. I remind myself to focus on the good things in my life instead of the bad.
3.701 Fairly Often
0.112 3
Social support
5. I seek out emotional support from my family and friends.
3.279 Some times
0.999 5
3.386 0.102 3 6. I try to find people who can offer me information or otherwise help me with any problems.
3.494 Fairly Often
0.106 4
Exercise
7. I use physical activity as a way to get rid of the pent-up energy.
3.123 Some times
0.094 8
3.133 0.094 4 8. Exercise helps me in handling stress as it can help in distracting from my daily worries.
3.143 Some times
0.095 7
Meditate/ Pray
9. I take a deep breath or exercise other relaxation techniques such as mediate.
2.929 Some times
0.089 9
2.701 0.082 5 10. I found out prayer to be a source of
peace and release stress when I am having troubles and problems.
2.474 Almost Never
0.075 10
33.084 1.000
Negative Coping Skills
Table 12 shows the results for negative coping skills. Most of the items can be grouped
together and get mean score and mean relatively important index. However, researcher is
unable to group under-eating and overeating together and alcohol and smoking because it is
totally different. The most frequently used negative coping skill is students avoid or
procrastinate the problem with an average mean score of 3.334. It has been proved by
Badarudin (2018) stating that people will procrastinate when it comes to solving the problem
which causes them to feel stress. According to Common Sense Media, young adults spend an
average of nine hours a day online. Hence, it is not surprising that students usually
procrastinating the problem by wasting more time on scrolling social media, watching
television and playing video games. The less frequent adopted method is students use heavy
alcohol or smoke a lot when they are having stress. There were 91 and 122 students choose
‘Never’ in the rating scale of 1. In short, majority of the students never use alcohol or smoke
to release their stress. It is a good sign as these two methods does not cease the problem and
it only increase a person’s alcohol and smoke dependence.

143
MCRJ Special Issue Vol. 12 | No. 1 | 2021
Table 12. Average Mean and Average Relatively Importance Index for Negative Coping Skills to Overcome Quantity Surveying Students’ Stress Level
Coping strategies to overcome QS students’ stress level
Mean Remark RII Rank Average
Mean Average
RII Rank
NEGATIVE COPING SKILLS
Avoiding or procrastinating the problem
1 My thoughts about the situation prevent me from concentrating on another important task.
3.455 Fairly Often
0.302 1
3.334
0.292
1
2 I deny that there is a problem at all and find myself wasting more time on leisure activities such as scrolling social media, watching television, plying video games.
3.214 Some times
0.281 3
Oversleeping
3 I just stay in bed in sloth mode because I can’t deal with my problems.
3.123 Some times
0.273 4 3.185
0.279
2
4 I sleep a lot when I feel stressed and escaping from reality.
3.247 Some times
0.284 2
Compulsive spending
5 My mind will be taken from the undesirable and stress environment when I engage in compulsive spending.
2.604 Some times
0.228 5 2.526
0.221
3
6 I release stress by shopping because I can feel the short-term fulfillment at the moment when I am buying things.
2.448 Almost Never
0.214 7
Under eating/ Overeating
7 I usually do not have the appetite to eat because I can’t deal with my problems.
2.227 Almost Never
0.195 8 - - 5
8 I start overeating as it is one of a way of not concentrating on the problems and stress.
2.494 Almost Never
0.218 6 - - 4
Alcohol/ Smoking
9 I use heavy alcohol to get my mind off my real problems.
1.851 Almost Never
0.162 9 - - 6
10 I smoke a lot when I am in an undesirable and stressful environment.
1.571 Never 0.138 10 - - 7
11.422 1.000
Developing Stress Level Test on Times
Based on the research findings, this study has developed a stress level test application to
be incorporated on TIMeS (Taylor’s University official portal). Each student has to take the
test during mid semester and also at the end of the semester. The purpose of this test is to
evaluate the stress level of Quantity Surveying students. With the outcome of this test, the
lecturers would be able to guide those students with high stress level and would be able to
help them in studies. Moreover, in the stress level test, a section will be dedicated for students

144
MCRJ Special Issue Vol. 12 | No. 1 | 2021
to rank the subjects in accordance with the stress level felt. With this ranking, lecturers can
reach out for the students in need. Figure 2 is the banner regarding stress level test to be shown
in TMeS. The banner will be incorporated in interface of TIMeS as shown in Figure 3. Steps
to take to test stress level:
1. Click on the banner illustrated in TIMeS
2. Answer the questions to test stress level as shown in Figure 2.
3. Rank the subject in accordance with the stress level felt as shown in Figure 3.
4. The result of the stress level will be calculated and shown as Figure 4.
Figure 2. Banner Illustrated in TIMeS
Figure 3. Example of Banner Illustrated in TIMeS
Figure 4. Example of Result Shown After the Test
The stress level test incorporated in TIMeS will consists of 2 sections. The first section
includes all the questions in Perceived Stress Scale as shown in Figure 5. The score of the test
can range from 0-40, scoring ranging from 0-13 would be considered low stress, ranging from
14-26 would be considered moderate stress and ranging from 27-40 would be considered high
stress. With the outcome of this test, the lecturers would be able to guide those students with
high stress level and would be able to help them in studies. Section 2 will be dedicated for
students to rank the modules in accordance with the stress level felt. All the modules for each
semester will be listed out to let students to rank as shown in Figure 6. With this ranking,
lecturers can reach out for the students in need.

145
MCRJ Special Issue Vol. 12 | No. 1 | 2021
Figure 5. Questions to Test Student Strress Level in TIMeS
Figure 6. Modules for Each Semester That Students Will Rank (Sample for Semester 1 Modules)
CONCLUSION AND RECOMMENDATION
Perceived Stress Scale parameter was used in this study in order to analyze the stress level
of Quantity Surveying students in Taylor’s University. Throughout the survey, results showed
that 71% of students are having moderate stress, 23% having high stress and only 6% having
low stress. Students are required to handle their personal life and study life during their
university life, thus it has incurred moderate level of stress to students.
Based on the questions in parameter, the results showed that students experience negative
situations more often than positive situations in their life. In nutshell, students have to deal
with many things, and this has cause them unable to control the things in their lives and felt
stressed. Other than stress level, the study also found out some relationship between
respondent’s demographic and students’ stress level. The results revealed that Year 3 students
suffer the highest stress level among the all. Besides, female students tend to experience
higher stress level than male students. Students with lower CGPA (below 2.00) experience
higher stress level than other students.
The most impactful personal stressors to students are having problem in time management
followed by low self-esteem, physical source of stress, financial difficulties and combining
job with studies. Majority of the respondents do not involve in work while they were
persuading a degree as they finance their tuition fees from parents, PTPTN loan and
scholarship.

146
MCRJ Special Issue Vol. 12 | No. 1 | 2021
Moreover, examination was ranked as the most impactful academic stressors to students’
stress level followed by procrastination, frustration due to misunderstandings, excessive
course workload and competition with other students. This study also found out the
relationship between academic achievement and academic stressors which stating that the
students with CGPA below 2.00 suffer academic stressors more frequently compared to
others.
For the environmental stressors, factor that contribute the most to students’ stress level is
future anxiety followed by placing in unfamiliar situation, unrealistic expectations,
transportation and family problem. Future anxiety happened quite frequently in students’ life
as university life is considered last part of student’s life and they are going to society once
they graduate. Students are least prone to family problems as majority of the students are
staying away from family while persuading their degree.
Among the three main stressors, academic stressors were contributed the most to students’
stress level, followed by personal stressors and environmental stressors. Academic issues
often make students stress because students need to allocate most of the time in studying,
learning, completing assignments and preparing for exams.
The study also indicated that the most preferred coping strategies to deal with stress were
involving in leisure related activities followed by thinking positively, getting social support
from family and friends, exercise and meditate or pray.
The study showed that students also deal with their stress by non-productive coping. The
most adopted negative coping skill is avoiding or procrastinating the problem followed by
oversleeping, compulsive spending, and under-easting or overeating and the least adopted
way were smoking and drinking alcohol. Therefore, students are suggested to involve in
leisure activities, think positive and getting support from family and friends to release stress.
As for recommendation, the university’s counselling programs should be strengthened.
Extracurricular activities and education programs are recommended to increase in a university
to help students to cope their stress better.
Most of the previous studies on students’ stress level were conducted in quantitative data.
Therefore, qualitative research method is recommended for future study to obtain in-depth
results and comprehensive opinions. In addition, future study may also investigate on how
universities could collaborate to help minimize students’ stress level.
REFERENCES
Adams, R. V., & Blair, E. (2019). Impact of Time Management Behaviors on Undergraduate
Engineering Students’ Performance. SAGE Open, 9(1). doi:10.1177/2158244018824506
Al Khatib, A. S. (2014). Time Management and Its Relation to Students’ Stress, Gender and
Academic Achievement among Sample of Students at Al Ain University of Science and
Technology, UAE. International Journal of Business and Social Research, 4(5), 47–57.
Retrieved from https://www.thejournalofbusiness.org/index.php/site/index
Badarudin, N. (2018, April 24). Don't let stress beat you. New Straits Times. Retrieved from
https://www.nst.com.my/lifestyle/heal/2018/04/361001/dont-let-stress-beat-you

147
MCRJ Special Issue Vol. 12 | No. 1 | 2021
Berland, M. (2017). How to Overcome College Stress and Fear of the Future. Retrieved from
https://www.hercampus.com/school/valdosta/how-overcome-college-stress-and-fear-
future
Calaguas, G. M. (2012). Survey of college academic stressors: Development of a new measure.
Journal of Human Sciences, 9(1), 441–457. Retrieved from https://www.j-
humansciences.com/ojs/index.php/IJHS/article/view/1811
DerSarkissian, C. (2018). Oversleeping Side Effects: Is Too Much Sleep Harmful? Retrieved
from https://www.webmd.com/sleep-disorders/guide/physical-side-effects-
oversleeping#3
Elias, H., Ping, W. S., & Abdullah, M. C. (2011). Stress and academic achievement among
undergraduate students in Universiti Putra Malaysia. Procedia - Social and Behavioral
Sciences, 29(2011), 646–655. doi:10.1016/j.sbspro.2011.11.288
Essel, G., & Owusu, P. (2017). Causes of students ’ stress , its effects on their academic success
, and stress management by students. Journal of Musculoskeletal Pain, 2(2), 82. Retrieved
from Theseus database.
Ganesan, Y., Talwar, P., Fauzan, N., & Oon, Y. B. (2019). A Study on Stress Level and Coping
Strategies among Undergraduate Students. Journal of Cognitive Sciences and Human
Development, 3(2), 37–47. doi:10.33736/jcshd.787.2018
Greene, L. A. (2013). Best and Worst Ways to Cope With Stress. Retrieved from
https://www.health.com/health/gallery/0,,20765943,00.html?slide=77310#77310
Jerrim, J. (2014). The Unrealistic Educational Expectations of High School Pupils: Is America
Exceptional? The Sociological Quarterly, 55(1), 196-231. doi:10.1111/tsq.12049
Johari, N. M. (2013). Stress and Coping Strategies among Commuter and Non-commuter
Students. ResearchGate. doi:10.13140/RG.2.2.19157.83688
Johnson, B. (2013). Walk in the Face of Your Fears. Retrieved from
https://newviewpsychology.com.au/facing-fears/
Kalhour, M., & Ng, J. C. Y. (2015). Compulsive Buying Behavior As a Way To Cope. Journal
of International Management Studies, 15(2), 7–14. doi: 10.18374/jims-15-2.1
Kelly, O. (2018). Understanding Compulsive Shopping Disorder. Retrieved from
https://www.verywellmind.com/what-is-compulsive-shopping-disorder-2510592
Kim, J. H., & McKenzie, L. A. (2014). The Impacts of Physical Exercise on Stress Coping and
Well-Being in University Students in the Context of Leisure. Health, 6(19), 2570–2580.
doi:10.4236/health.2014.619296
Kumar, S., & J. P. Bhukar. (2013). Stress level and coping strategies of college students.
Journal of Physical Education and Sports Management, 4(1), 5–11.
doi:10.5897/JPESM12.001
Lam, M. T. (2017). Stress Caused by Unrealistic Expectations. Retrieved from
https://buhk.me/2017/02/19/stress/
Lougheed, J. P., Koval, P., & Hollenstein, T. (2016). Sharing the burden: The interpersonal
regulation of emotional arousal in mother−daughter dyads. Emotion, 16(1), 83–93.
doi:10.1037/emo0000105
Oketch-Oboth, J. W. B., & Odiemo, L. O. (2018). The Relationship Between Levels of Stress
and Academic Performance Among University of Nairobi Students. International Journal
of Learning and Development, 8(4). doi:10.5296/ijld.v8i4.13840
Pariat, L., Rynjah, A., Joplin, & Kharjana, M. G. (2014). Stress Levels of College Students:
Interrelationship between Stressors and Coping Strategies. IOSR Journal of Humanities
and Social Science, 19(8), 40–46. doi:10.9790/0837-19834046

148
MCRJ Special Issue Vol. 12 | No. 1 | 2021
Pfeiffer, D. (2001). Academic And Environmental Stress Among Undergraduate And Graduate
College Students: A Literature Review (Master’s thesis, University of Wisconsin-Stout,
Wisconsin, United States). Retrieved from
http://www2.uwstout.edu/content/lib/thesis/2001/2001pfeifferd.pdf
Plante, T. G., Coscarelli, L., & Ford, M. (2001). Does Exercising with Another Enhance the
Stress-Reducing Benefits of Exercise? International Journal of Stress Management, 8(3),
201–213. doi:10.1023/A:1011339025532
Private university reels from two students suicides in space of a week. (2019, May 15). New
Straits Times. Retrieved from https://www.nst.com.my/news/nation/2019/05/488510/
private-university-reels-two-student-suicides-space-week
Rose, L. M. (2011). Norm-referenced grading in the age of carnegie: why criteria-referenced
grading is more consistent with current trends in legal education and how legal writing can
lead the way. Journal of the Legal Writing Institute, 17, 123-159. Retrieved from
https://papers.ssrn.com/sol3/papers.cfm?abstract_id=1933242
Roussos, C. (2018). What Are the Causes of Exam Stress? Retrieved from
https://www.theclassroom.com/causes-exam-stress-7414016.html
Scott, E. (2019). Why and How to Raise Your Self Esteem for Stress Relief. Retrieved from
https://www.verywellmind.com/why-an-how-to-raise-your-self-esteem-for-stress-relief-
3144820
Shahsavarani, A. M., Abadi, E. A. M., & Kalkhoran, M. H. (2015). Stress : Facts and Theories
through Literature Review. International Journal of Medical Reviews, 2(2), 230-241.
Retrieved from
www.ijmedrev.com/article_68654_37adc02e9432adfa017b8d6095cb6760.pdf
Shaikh, B. T., Kahloon, A., Kazmi, M., Khalid, H., Nawaz, K., Khan, N. A., & Khan, S. (2004).
Students, Stress and Coping Strategies: A case of Pakistani Medical School. Education for
Health, 17(3), 346–353. doi:10.1080/13576280400002585
Shokeen, A. (2018). Procrastination, Stress and Academic Achievement among the B. Ed.
Students. An International Journal of Education and Applied Social Sciences, 9(1), 125–
129. doi:10.30954/2230-7311.2018.04.17
Smith, J. T. (2019). What is Eustress and How Is It Different than Stress? Retrieved from
https://positivepsychology.com/what-is-eustress/
Steptoe, A., Dockray, S., & Wardle, J. (2009). Positive Affect and Psychobiological Processes
Relevant to Health. Journal of Personality, 77(6), 1747–1776. doi:10.1111/j.1467-
6494.2009.00599
Theleaders-Online. (2019, May 21). Suicide: University addressing mental health issues
among students. The Leaders Online. Retrieved from https://theleaders-
online.com/suicide-university-addressing-mental-health-issues-among-students-staff/
Healthyplace.com Staff Writer. (2014). Sleeping Away Troubles Does Not Get Rid of Your
Depression. Retrieved from https://www.healthyplace.com/other-info/mental-health-
newsletter/sleeping-away-troubles-does-not-get-rid-of-your-depression
Yavuzaslan, A., Barişçil, A., & Farkas, M. F. (2016). Stress and Future Career Aspirations
among University Students in Turkey. International Journal of Social Sciences and
Humanity Studies, 8(1), 233-250. Retrieved from DergiPark database.
Yikealo, D., Yemane, B., & Karvinen, I. (2018). The Level of Academic and Environmental
Stress among College Students: A Case in the College of Education. Open Journal of
Social Sciences, 6, 40–57. doi:10.4236/jss.2018.61100

149
MCRJ Special Issue Vol. 12 | No. 1 | 2021
ENVIRONMENTALLY SUSTAINABLE CONCERNS TOWARD AFFORDABLE HOUSING Noraliza Basrah, Rohayu Ab Majid, Norbaya Ab Rahim and Noor Hazwani Alias Centre of Studies for Estate Management, Faculty of Architecture, Planning and Surveying, Universiti Teknologi MARA, Shah Alam, Malaysia.
Abstract Sustainable affordable housing refers to the good long-term investment with emerging concerns in maintaining the environment surrounding that can support human living, provision of the basic shelter needs as well as protecting and preserving nature for future generations. Alongside the Sustainable Development Goals 2030, the government indicated providing enough shelter, access to health facilities and all the basic amenities which are the bases for improving the Quality of Life (QOL). However, due to rapid urbanization rate, it affects directly to the delivery of sustainable affordable housing. The environmental sustainability of affordable housing has drawn much attention over the years since it is a fundamental aspect of accomplishing sustainable development. This paper aims to explore the environment criteria applied in sustainable affordable housing (SAH) which influence a household’s quality of life. This paper presents findings from the survey distributed to residents of affordable housing in Klang Valley area and 21 environment criteria were analyzed by using SPSS through chi-square test. Hence, 19 environment aspects were identified as significant criteria to affordable sustainable housing. Keywords: Sustainable Affordable Housing (SAH); environmental sustainability; Quality of Life
(QOL).
INTRODUCTION
Housing is one of the basic needs and fundamental to the survival, health and welfare of
human beings. Therefore, housing provision on affordable scheme has become a big agenda
by Malaysia government in ensuring all Malaysian citizens to be able to buy their own
residential units. That basic need of the house must be met at an affordable price. Additionally,
affordable housing needs to be offered at an affordable price including every element of
sustainability that drives different tastes and choices among the house buyers. Housing
supposedly embodies many aspects like safety, location, comfort and important concerns to
human being’s quality of life and health. However, the real challenge in housing industry
nowadays for undeveloped and developed countries is the citizen cannot afford the basic need
of shelter (Harrisa and Arkub, 2007). Worst case scenario, there are situation whereby the
low-income earners are paying high rental for poor quality housing (Bakhtyar et al., 2013).
Cohen (2005) confirmed the threats that these problems pose to the health and well-being of
such communities.
UNCHS (1996) estimated that more than 100 million homeless and about one billion
people inadequately housed throughout the world and supported by the statistic also from
UNCHS in 2003 highlighted that about 924 million people which is 31.6% from the world’s
population were already living in slum. The good quality and design of residential buildings
with the access to services and recreation can give direct effect towards quality of life,
promotion of healthy living and cohesiveness of society (Colesca and Alpopi, 2011). Rozana
(2007) opined that sustainable housing development involves more than just provision of
amenities and infrastructures, but it concerns on planning and designing of healthy and
sustainable living environments that offer communities to live in peace, creativity and

150
MCRJ Special Issue Vol. 12 | No. 1 | 2021
security. In accordance with the slogan of 1Malaysia, the government was very committed to
establish the sufficient, quality and affordable house to own or rent based on the citizen need
(Zainol, 2011).
Despite the various efforts and initiatives from government to ensure decent and
affordable homes to citizens, yet it is a big challenge due to the rapid urbanization and
population growth (UN-Habitat, 2012). Idrus & Ho (2008) stated that the well-organised and
systematic urban services programmes of affordable housing scheme can improve the quality
of life for sustainable improvement and promoting social integration. In sustainable
development, the concerns include the protection and preservation of environmental resources
such as land, water, vegetation and landscapes since it will affect the human’s economic,
physical and social balance. The main question that needs to be addressed is to discover the
fundamental environmental criteria in sustainable affordable housing that need to be
considered as decent and quality homes to communities.
This paper reports the investigation on the housing affordability context from exploring
the relationship of the sustainable development dimensions on environmental concerns. In
this exploration, the environment criteria implied in affordable sustainable housing were
measured and evaluated using the data generated from the research findings. The most
significant environmental criteria for the sustainable affordable housing (SAH) development
were established from the results.
LITERATURE REVIEW
Housing Affordability
Affordability is the ability of a person in providing something, which is usually referred
to his ability in financial terms (Norazmawati, 2007). There are a few different perspective
and measurement to define the meaning of affordability. It must involve the balancing
between present and future needs, Community planning and Development of United State
(2010). Disney (2007) agreed that a house can be considered as affordable housing if the
expenditure or cost is not more than 30% of a household’s income. While AHURI (2012)
indicates the housing cost usually include expenditure on rent or mortgage payments, property
taxes household insurance, repairs and maintenance where these are the responsibility of the
resident.
Numerous studies have identified many factors associated with demand for affordable
housing scheme, such as interest rates, income levels, construction cost, land supply, and
housing prices. Since an affordable housing is a long-term investment, it should provide added
value to its owners in terms of comfort, quality and lifespan (Jenkins et al., 2007). To sum up,
‘housing affordability’ refers to the capacity of households to meet housing cost while
maintaining the ability to meet other basic costs of living (AHURI, 2004).
Sustainable Housing Development
Most author indicated that sustainability and affordability are often discussed mutually
and recognized as being important and related to one another (CLG 2007; HM Governmnet
2005; Maliene et al., 2008). From Brundtland report (WCED, 1987) and the 1992 Rio Earth

151
MCRJ Special Issue Vol. 12 | No. 1 | 2021
Summit that described that sustainable development means “meeting the needs of the present
without compromising the ability of future generations to meet their own needs.” The term
“sustainable” directly implied to green environment and eco-friendly. According to Klunder
(2004), the sustainable housing can be defined as affordable, quality and a house with energy
efficient and positive psychological impacts. Mitlin and Satterthwaite (1996) indicated
sustainable housing as: “shelter that is healthy, safe, affordable and secure within a
neighbourhood with provision of piped water, sanitation, drainage, transport, healthcare,
education and child development. In addition, it is also a home protected from any
environmental hazards, including chemical pollution. It is also vital to meet needs related to
people’s choice and control, including homes and neighbours which they value and where
their social and cultural priorities are met.”
Additionally, Madu and Kuei (2012), UN-Habitat (2012), Ibem and Azuh (2011) agreed
that the concept of sustainable development has three (3) dimensions which are economic,
social and environment. Chiu (2002) indicated that sustainable development aims at
delivering a house environment that can enhance the quality of life, people satisfaction,
flexibility to cater for user changes in the future, provides the desirables natural and support
the social environment that maximize the use of resources. The principles applied in
sustainable housing, including concern for people by ensuring that they live in a healthy,
productive and in harmony with nature (Nazirah, 2005).
Environmental Sustainability
The protection and preservation of environmental resources suchlike water, tree, land and
landscapes are among the most concerned elements in developing a sustainable affordable
housing project which can affect the human’s economic, physical and social wellbeing
(AHURI, 2012). There are many factors that influence the environmental performance of a
building. These include features of its architecture and design, aspect, location, the
construction materials and processes used, opportunities for rainwater harvesting and
recycling, and the presence of on-site renewable energy sources (AHURI, 2012).
The UN-HABITAT (2012) generally described three types of the relationships between
housing and the environment such as:
1. drawing of the different environmental resources, for instance building materials,
water, energy and land in the course of housing design, construction and operation
2. direct ecological impacts on local areas towards air and water pollution, waste and
damage of natural ecosystems resulting from residential activities in human
settlements; and
3. the coverage of houses and their occupants to various environmental hazards (e.g., air
and water pollution, lack of sanitation), due to natural factors (e.g., landslides, vector-
borne diseases such as malaria), or due to the combination of natural and human-made
factors (e.g., climate change).
The environmental sustainability of affordable housing involves three criteria, such as [1]
the protection of various environment hazards, [2] land conservation and proper planning as
well as [3] the energy and environmental resources efficiency with the measurement of the
indicators shown below in Table 1.

152
MCRJ Special Issue Vol. 12 | No. 1 | 2021
Table 1. Environmental Sustainable Criteria
Environmental Sustainability Theme
Measurement of Theme Literature Sources
Protection from various environment
hazards
Reduced Carbon footprint/emission UN Habitat (2008), Golubchikov (2009)
Environmental hazard mitigation UN Habitat (2012), Golubchikov (2009)
Pollution UN Habitat (2008)
Land Conservation and proper planning
Transportation network Burton (2000), Jenks et al. (1996), Williams et al. (2000), Gray et al. (2010), Pandey (2012)
Waste Management Burak (2006), UN Habitat (2008), Sharloy et al. (2008), Vij D. (2012)
Water management or drainage system UN Habitat (2012), Pitts (2004), Halliday (2008), Krieger and Higgins (2002)
Sustainable Design and ‘green’ areas Oktay (2001), Pitts (2004)
Efficient Space Planning / use Golubchikov (2009)
Lighting and solar orientation Kilbert (2005), Halliday (2008)
Ventilation, climatic adaptions and active shading
Kilbert (2005), NSW Government (2002)
Energy and environmental
resources efficiently use
Sustainable Building Material UN Habitat (2008), UN Habitat (2012), Kilbert (2005), Smith (2005), NSW Government (2002), Chen et al. (2005)
Lighting and solar orientation Kilbert (2005), Halliday (2008)
Ventilation, climatic adaptions and active shading
Kilbert (2005), NSW Government (2002)
Carbon emission Dave (2011), Turok (2012), Hossain (2000)
RESEARCH METHODOLOGY
Systematic Literature Review
From the literature review, the listing of environmental sustainability criteria for
sustainable affordable housing (SAH) was established (refer to Table 2). The establishment
of the environment criteria used as the questionnaire survey items that distributed among 297
residents of affordable housing in Klang Valley area, Malaysia by direct approach and email
to the potential buyer of affordable housing.
Table 2. Environmental Sustainability Criteria for Sustainable Affordable Housing (SAH)
Environmental Sustainability Theme
Environmental Sustainability Measurement
Environmental Sustainability Criteria Ref no.
Protection of various environment hazards
Environmental hazard mitigation
To lower the rate of environment hazard risk E9
Pollution To reduce the noise exposure from outside To prevent the air pollution To reduce the water pollution
E6 E7 E8
Land Conservation and proper planning
Transportation network To provide a good transportation route (eg: access to public transport, taxis, bus) To offer the alternative transportation modes (eg: public bus, LRT, and other transport facilities) To create a good traffic circulation pattern To avoid traffic congestion in housing scheme
E1
E18
E20 E21

153
MCRJ Special Issue Vol. 12 | No. 1 | 2021
Environmental Sustainability Theme
Environmental Sustainability Measurement
Environmental Sustainability Criteria Ref no.
Waste Management To build an efficient waste management structure
E5
Water management & drainage system
To promote the water saving sanitary and plumbing appliances
E14
Sustainable design & ‘green’ areas
To protect the natural habitat using proper landscape To offer an effective land use planning of natural resources (eg: water bodies, trees and bushes)
E15
E17
Efficient Space Planning / use
To offer a privacy in housing surrounding To provide pedestrianized area, jogging track, or cycling track for public use
E10 E19
Energy and environmental resources efficiency
Sustainable Building Material
To promote the use of eco-friendly and recyclable materials To meets local climatic and environmental conditions through appropriate design and building material use
E2
E12
Lighting and solar orientation
To provide a natural lighting access into the house
E3
Ventilation, thermal and shading
To create a better ventilation system in the house To provide a good thermal comfort for resident
E4
E16
Carbon emission To apply renewable resources into the house (eg: wind, solar) To increase the installation of energy saving appliances
E11
E13
Questionnaire Survey
This study involves primary data, where the questionnaire was distributed to the
respondents in determining which environment criteria need to be emphasized in the
affordable housing development. The listing below has been labelled with E1 until E21 (Refer
Table 3.) Table 3 depicts the environmental sustainability criteria set in the questionnaire for
the respondents to consider. Descriptive analysis has been applied on research data involving
21 environment criteria and 6 respondent profiles, such as age, job status, marital status,
employment sector, house purchase status and the monthly income. However, the income
level will be selected to perform chi square test with 21 environment criteria as the profile
related to affordability. Therefore, the significant attributes will be selected as the significant
environment criteria which could be applied in sustainable affordable housing scheme.
Table 3. Environmental Sustainability Criteria and References
References No
Environmental Sustainability Criteria
E1 To provide a good transportation route (eg: access to public transport, taxis, bus)
E2 To promote the use of eco-friendly and recyclable materials
E3 To provide a natural lighting access into the house
E4 To create a better ventilation system in the house
E5 To build an efficient waste management structure
E6 To reduce the noise exposure from outside
E7 To prevent the air pollution
E8 To reduce the water pollution

154
MCRJ Special Issue Vol. 12 | No. 1 | 2021
References No
Environmental Sustainability Criteria
E9 To lower the rate of environment hazard risk
E10 To offer a privacy in housing surrounding
E11 To apply renewable resources into the house (eg: wind, solar)
E12 To meets local climatic and environmental conditions through appropriate design and building material use
E13 To increase the installation of energy saving appliances
E14 To promote the water saving sanitary and plumbing appliances
E15 To protect the natural habitat through proper landscape
E16 To provide a good thermal comfort for resident
E17 To offer an effective land use planning of natural resources (eg: water bodies, trees and bushes)
E18 To offer the alternative transportation modes (eg: public bus, LRT, and other transport facilities)
E19 To provide pedestrianized area, jogging track, or cycling track for public use
E20 To create a good traffic circulation pattern
E21 To avoid traffic congestion in housing scheme
RESULT AND DISCUSSION
Table 4 shows the proportion of respondent sector occupation percentage according to
monthly income profile. The majority of respondents (60.3%) earn income between RM2000
and RM5000 per month which is compatible with the requirement of affordable housing range
price.
Table 4. Information for Selected Respondent Profile
Respondent Profile
Categories
Occupation Sector
Government (%)
Private (%)
Self-employment (%)
Total
Monthly income
below <RM 1,999 0.8 1.9 4.2 6.9
RM 2,000 - RM 2,999 5.0 11.1 3.1 19.1
RM 3,000 - RM 3,999 8.4 8.0 3.8 20.2
RM 4,000 - RM 4,999 9.5 8.8 2.7 21.0
RM 5,000 - RM 5,999 3.8 5.3 3.4 12.6
RM 6,000 - RM 6,999 1.1 3.8 2.3 7.3
RM 7,000 - RM 7,999 2.3 1.9 0.8 5.0
RM 8,000 - RM 8,999 1.1 0.4 0.4 1.9
RM 9,000 - RM 9,999 0.0 0.8 0.4 1.1
exceed> RM 10,000 0.0 0.8 4.2 5.0
Through the chi square test, twenty-one (21) environment criteria have been analysed
with the monthly income profile and 19 environment criteria were significant with monthly
income except E14 (0.186) and E15 (0.084) (Refer to Table 5).
Table 5. The Significant of Environment Criteria
Ref no. Asymp. Sig. (2-sided)
Monthly Income
E1 .000
E2 .000
E3 .000
E4 .000

155
MCRJ Special Issue Vol. 12 | No. 1 | 2021
Ref no. Asymp. Sig. (2-sided)
Monthly Income
E5 .000
E6 .000
E7 .012
E8 .000
E9 .000
E10 .000
E11 .002
E12 .023
E13 .021
E14 .186
E15 .084
E16 .005
E17 .000
E18 .000
E19 .004
E20 .000
E21 .001
Table 6 show the ranking order of significant environmental criteria for affordable
housing based on the chi-square value. The top five environmental criteria within the highest
ranking of significance are E18 [To offer the alternative transportation modes (e.g., public
bus, LRT, and other transport facilities)], E1 [To provide a good transportation route (e.g.,
access to public transport, taxis, bus)], E8 [To reduce the water pollution], E17 [to offer an
effective land use planning of natural resources] and E20 [to create a good traffic circulation
pattern].
Table 6. Ranking Order of Significance
Ranking order Ref. No Pearson chi-square value vs
monthly income Ranking of Significance
1 E18 93.342a
Highest (80-130)
2 E1 90.081a
3 E8 87.926a
4 E17 85.751a
5 E20 85.481a
6 E3 84.662a
7 E4 83.821a
8 E10 79.253a
Medium (50-79)
9 E9 79.130a
10 E5 78.810a
11 E2 75.706a
12 E6 71.401a
13 E21 68.366a
14 E11 64.445a
15 E19 62.301a
16 E16 61.542a
17 E7 57.862a
18 E13 55.151a
19 E12 54.914a

156
MCRJ Special Issue Vol. 12 | No. 1 | 2021
20 E15 48.185a Lowest (not significant) 21 E14 43.374a
Figure 1 illustrates the correlation value inherent to the significant environment criteria
over the respondent profile. Based on the result above, E18 (93.3) and E1 (90.0) shows profile
records high correlation value with income profile. The lowest correlation record is at 48.1
and 43.3 which is E15 and E14 respectively.
Figure 1. The Percentage of Pearson Chi-Square Value of Environment Criteria
CONCLUSION
Issues relating to sustainable affordable housing stems from the rapid growth of
urbanization rate, poor quality of design, high demand on affordable housing, house price
bubble, and lack of affordable accommodation to suit varied household types will affect the
delivering a good quality of housing. In achieving the goal of sustainable communities in
affordable housing, these issues should be addressed. This paper identified the important
environmental sustainability criteria to be considered before developing an affordable housing
project. At a broader level, local authorities may also consider these criteria to regenerate
existing affordable housing communities to make environmentally sustainable. In general, the
application of environmental sustainability criteria to the affordable housing development is
very important to balance the economic, environmental and social wellbeing of the
population.
There are 19 environmental sustainability criteria identified and recorded as more than
50% of significance value. The outcome reveals that affordable housing scheme should
emphasize all 19 environment aspects that are being studied. Among the most important
aspects that need to be highlight are offering the alternative transportation modes, provide a
good transportation route and create a good traffic circulation pattern. Besides that, concerns
for unpolluted water resources and effective land use planning of the natural resources are
also paramount.
90%75%
84%83%
78%71%
57%87%
79%79%
64%54%55%
43%48%
61%85%
93%62%
85%68%
0% 10% 20% 30% 40% 50% 60% 70% 80% 90% 100%
E1
E3
E5
E7
E9
E11
E13
E15
E17
E19
E21
SIGNIFICANT VALUE OVER INCOME
RE
FE
RE
NC
E N
O

157
MCRJ Special Issue Vol. 12 | No. 1 | 2021
Hence the emphasis of the significant environmental sustainability criteria is necessary to
ensure the important items are applied into the affordable housing project scheme to achieve
the sustainable affordable housing that benefit communities in present and future time. It is
hoped, sustainable affordable housing of the future will significantly contribute to the quality
of life for the urban communities in a sustainable way.
ACKNOWLEDGEMENT
The authors gratefully acknowledge the help of the Universiti Teknologi MARA, Shah
Alam of Selangor in providing the research grant of Bestari Fund (046/2017) to undertake
this research. The authors also thankful to the centre of postgraduate studies, Faculty of
Architecture, Planning and Surveying, Universiti Teknologi MARA (UiTM), Shah Alam,
Selangor and the respondents of this research.
REFERENCES
Andrews (1998). Trends in the Supply of Affordable Housing. Meeting America’s Housing
Needs (MAHD): A Habitat 11 Follow-up Project.
Australian Housing and Research Institute (AHURI) (2004). Measuring housing affordability.
AHURI Research and Policy Bulletin, Issue 45
Bakhtyar, B., Zaharim A., Sopian K., and Moghimi S. (2013). Housing for Poor People: A
Review on Low Cost Housing Process,WESEAS, Issue 2 vol. 9.
Chiu, R. (2002), Social equity in housing in the Hong Kong special administrative region: A
social sustainability perspective. Sustainable Development
CLG (Communities and Local Government). 2007. Strategic Housing Market Assessments:
Practice Guidance Version 2. London: CLG.
Cohen, B. (2005). Urbanization in developing countries: Current trends, future projections,
and key challenges for sustainability. Technology in Society, 28(1-2), 63-80.
Colesia, S. E. and Alpopi, C. (2011). The quality of Bucharest’s green spaces. Theoretical and
Empirical Researches. Urban Management, 6(4), 45-59.
Disney, J. (2007) ‘Affordable Housing in Australia: Some Key Problems and Priorities for
Action’, Paper presented at the National Forum on Affordable Housing, 19 Apr 2007,
AHURI, Melbourne
Eziyi O. Ibem & Dominic E. Azuh (2011), Framework for Evaluating the Sustainability of
Public Housing Programmes in Developing Countries, Covenant University, Ota
Harrisa, R. and Arkub, G. (2007). The rise of housing in international development: The
effects of economic discourse. Habitat International, 31, 11.
HM Government. 2005. Securing the future: delivering UK sustainable development strategy.
London: The Stationery Office. http://www.davislangdon.com/upload/images/
publications/USA/Morris%20Article.pdf
Idrus, N. and Ho, C. S. (2008). Affordable & Quality Housing Through the Low Cost Housing
Provision in Malaysia: Paper presented at the Paper presented to Seminar of Sustainable
development and Governance at Department of Civil Engineering, and Architecture,
Toyohashi University of Technology.
Jenkins P, Smith, H., PingWwang, Y., (2007). Planning and Housing in the rapidly
Urbanizing World. In: Housing, Planning and Design Series, London
Klunder, G. (2004), The Search for the most Eco-Efficient Strategies Building Construction:
Dutch Lessions. Journal of Housing and the Built Environment. Pp111-126.

158
MCRJ Special Issue Vol. 12 | No. 1 | 2021
Madu, C. N. & Kuei, C.-H. (2012). Handbook of sustainability management, 5 Toh Tuck
Link, Singapore 596224, World Scientific Publishing Company
Maliene, V.; Howe, J. and Malys, N., (2008). Sustainable communities: affordable housing
and socio-economic relations. Local Economy, 23(4), 267-276.
Mitlin, D and Satterthwaite, D. (1996), “Sustainable development and cities” C. Pugh (ed.)
Sustainability, the Environment and Urbanisation, London
Norazmawati, M.S. (2007). Kemampuan Pemilikan Rumah Kos Rendah di Kuala Lumpur.
Thesis Ph.D, Universiti Sains Malaysia, Pulau Pinang.
Rozana, Z. (2007). Sustainable Housing for Residential-Industrial Neoghbourhood in
Malaysia. Thesis PhD, Queensland University of Technology.
UNCHS, (1996), Report of the United Nations Conference on Human Settlements (Habitat
II) (Istanbul, 3-14 June 1996)
UN-HABITAT (2003). United Nations Centre of Human Settlements Programme. The
Challenge of Slums: Global Report on Human Settlements 2003. London: Earthscan
UN-Habitat. (2012). Sustainable Housing For Sustainable Cities: A Policy Framework for
Developing Countries. Nairobi.
WCED (1987). Our Common Future: Report of the World Commission on Environment and
Development. Oslo: United Nations World Commission on Environment and
Development.
World Commission on Environment and Development, (1987). Our Common Future. Oxford:
Oxford University Press.
Zainol Ariffin, A.F. (2011). Penyediaan Rumah yang mencukupi, berkualiti dan mampu
dimiliki. Utusan Malaysia. Dicapai pada Mac 20, 2011, dari http://www.utusan.com.my

159
MCRJ Special Issue Vol. 12 | No. 1 | 2021
FACTORS AND IMPACTS ON THE ACCURACY OF COST PLANNING: PRE-CONTRACT STAGE Shirley Chin Ai Ling, Loh Wen Jun, NurulHuda Hashim, Myzatul Aishah Hj Kamarazaly, Azrina Md Yaakob and Loo Seong King
School of Architecture, Building and Design, Taylor’s University, Subang Jaya, Malaysia.
Abstract Construction is an important sector that contributes greatly to the economic growth of a nation. Clients have always been looking towards a successful development without satisfaction due to the project experiencing delay and cost overrun. Therefore, it is essential that projects can complete within the allocated budget. Proper cost planning practices should ensure the construction costs (initial and final), and subsequent cost control to prevent unpleasant consequences of cost overruns. Hence, cost planning required an extensive knowledge and expertise in order to achieve client’s satisfactions and budget. However, there is always some uncertainty when estimating the cost of construction, but accuracy can be improved if the estimate is performed by an experienced professional. Therefore, this study focused on assessing the factors and impacts on the accuracy of cost planning in the construction industry during the pre-contract stage to ensure the project is completed within budget. The collection of data is carried out through survey questionnaires among Quantity Surveyors to obtain their feedback and opinions which are related to the factors and impacts on the accuracy of cost planning in a construction project. The findings revealed that the most significant factors that affect the accuracy of cost planning is highly dependent on the level of estimator experience and information available when preparing the cost planning. In addition, the respondents agreed that in accuracy of cost estimate will cause the cost overrun in the project development. Hence, the findings have successfully identified that by developing a historical database of completed projects will definitely improve the accuracy of cost estimate. Keywords: construction industry, cost planning, accuracy, pre-contract stage.
INTRODUCTION
Leibing (2018) stated the construction industry gives an extraordinary effect to the
nation's economy. The construction industry is one of the most important sectors as it
contributes around 6-9% of the Gross Domestic Product (GDP) to the financial advancement
of a nation (Chitkara, 2016). In view of Giang (2012), the construction industry is viewed as
a standout amongst the most responsive and dynamic areas.
Boussabaine (2013) expressed that the cost planning process utilizes various techniques
by the Quantity Surveyor (QS) or building financial expert. Cost planning covers cost control
from brief until completion stage in a construction project to achieve client’s budget. Cost
planning ensures that clients will recognize the foreseen final expenses of the building in the
beginning stage of the project (Smith et al., 2007).
According to Knipe et al. (2017), viable cost advice allows developers to make decisions
on the financial of a project. Furthermore, cost planning provides cost advice to assist
designers to control the design within budget. However, Ramabodu and Verster (2007)
uncovered that most building projects were not being kept within cost target including cost
disparity, cost surpassing financial capacity, inadequacies in the design and absence of close
cost checking of design factors in the pre-contract stage which could affect the accuracy in
the preparation of cost planning.

160
MCRJ Special Issue Vol. 12 | No. 1 | 2021
Furthermore, Ernest et al. (2017) described that inadequate preparation of a cost plan may
lead to cost overrun and the project abandoned. Besides, Laryea (2010) expressed the failure
of cost consultants to give quality and dependable cost estimates consistently is due to the
absence of adequate cost planning in the development. Cost estimating process is an important
element within the project life cycle. Comprehensive information, expanded knowledge,
considerable expertise, and continuous improvement are needed to obtain accurate cost
estimation.
Therefore, this research seeks to: (1) identify the factors affecting the accuracy of the cost
plan in a construction project, (2) identify the impacts on the implementation of the cost plan
through the pre-contract stage, and (3) determine the solutions to improve the accuracy of cost
plan in the development project.
LITERATURE REVIEW
Overview of Concept of Cost Planning
These days, the construction industry regularly is expected to decrease or control the
expense of project and completion within the period of the project to lower cost. The
accomplishment of the development industry relies upon how the developer controls the
expense of construction projects. Hence, cost planning is useful to control the estimated cost
of a project within budget during the design and construction phase. In this way, it is
fundamental that successful cost advice can convey to the client to settle on a great choice
while planning dependent on professional expertise (Knipe and Nwachukwu, 2017).
Figure 1. Outline of the Process Involved During the Cost Planning Stage
Remedial action
Stage A: Inception Stage
Stage B: Outline Proposals
Stage C: Cost Reporting
Stage/ Final Proposal Stage
Determine project finance and client's capacity
Preparing feasibility report
Establish cost limit and cost target
Detailed cost plan Outline design
Elemental cost target
Bills of quantities Pre-tender estimate Detailed design
Cost checking
Design proposal
161
MCRJ Special Issue Vol. 12 | No. 1 | 2021
Factors Affecting the Accuracy of Cost Planning in A Construction Project
Experience Related Factors
Oosthuizen & Berry (2018) identified individuals as a significant basic achievement
factor for Consultant Quantity Surveyor firms. To provide service in a timely, accurate and
reliable manner, the people working in this firm are required to have cost data, experience and
capability.
Cunningham (2015) report titled "Cost Control in the Pre-Contract Stage of a Building
Project" expressed that to complete legitimate cost planning and cost control on a
development, it is important to choose a cost expert to carry out the estimation. This expertise
ought to be designated at the earliest conceivable stage and ought to be expert in every aspect
of cost advice and ought to have understanding on the proposed development of a comparable
size, nature and unpredictability.
Information Related Factors
Odeyinka et al. (2013) mentioned that the lower the degree of accessible information at
the beginning stage of a development, the higher the degree of risks and unreliability. The
accessible information that is not sufficient at the early undertaking of a project may cause
the Quantity Surveyor to make their own assumptions as respects the detail design of a
development, which might eventuate as the design, arranging, and development advance
(Adnan et al., 2013).
Design Related Factors
Cunningham (2015) expressed that the procedure of cost planning and control intends to
convey the most ideal design solutions as indicated by the allocated budget expenditure. Cost
planning allows alterations, choices and adjustment on design to be reflected on a general cost
structure and accomplish an overall effective design. Incomplete design information and
design for cost planning during the pre-contract stage led to the inaccuracy of cost estimation.
The fundamental of cost planning in the pre-contract stage is to help designers accomplish
a fair and prudent design solution that reflects cost effectiveness in terms of quality and
financial capacity based on client priority. It guarantees that the tender figure is close as could
be expected inside satisfactory range to the tender estimate (Pott, 2017).
Time Related Factors
Cunningham (2013) report titled "Factors Affecting the Cost of Building Work' expressed
that the client is concerned to complete the building as soon as possible once the decision to
build had been made. At the early development stage, clients are attentive to know the total
expense of undertaking a project. However, cost estimation at the pre-tender stage could
prompt inaccuracy since they are often arranged at a tight schedule and frequently missing
the concluding project scope. The inadequate sufficient time assigned for cost planning
frequently leads to a poor execution of the cost estimate (Morrison, 2011).

162
MCRJ Special Issue Vol. 12 | No. 1 | 2021
Cost Related Factors
Kirkham (2017) mentioned that the cost planning process commonly pursues the outline
design and detail design process. The initial cost estimate derived by using the 'ballpark' figure
so that the client is able to obtain financial commitment in an early stage. Cost estimate is
prepared based on the cost data obtained from previous projects and benchmarking with
various projects for cost comparison between various elements. The cost data can be obtained
from building cost information services (BCIS) though Royal Institution Chartered Surveyor
(2013). This will permit cost planning to make a cost comparison with others similar types of
projects and cost control on how much cost has been spent for each element in order to meet
the client requirements.
Impacts Towards the Accuracy of Cost Planning in A Construction Project
According to various studies by Frimpong (2010), Zhu and Lin (2013), construction
projects have been facing cost overruns which lead to an extraordinary financial misfortune
or even project disappointment in case of non-contingency (Smith & Jaggar, 2007).
According to Ostrowski (2018) cited in Ernest et al. (2017), cost planning assists
designers to achieve balanced and economical design solutions in terms of better quality,
buildability and project complete within budget. However, ineffective cost planning will
cause the consultant's team to review design again and may result in time consuming and cost
overrun. As Chan and Suen (2007) observed that inadequate cost planning practices has led
to over budget in projects and causes delay of payment in the construction projects.
A report of Cunningham (2015) highlighted that cost control is to convey a high level of
cost certainty in different phases of a project in order to complete within budget. Ernest et al
(2017) stated “the adoption of effective cost planning practices is lacking to the extent that
construction projects are often abandoned because poor cost planning practices lead to cost
overruns”.
Solutions to Improve Accuracy of Cost Planning in A Construction Project
Matipa et al. (2017) expressed that the requirement for successful cost planning has turned
out to be progressively significant after worldwide financial subsidence. With comprehension
of cost viability being a significant component in a successful construction project, cost
planning becomes the most fundamental procedure to accomplish value for money. This
conveys fulfilment to client and contractor subsequently controlling expense in terms of
financial capacity and improving productivity respectively. To accomplish accuracy of cost
planning, solutions for the issues are fundamental to improve the quality of cost planning in
construction projects.
These are the suggestions from various researchers (such as Enshassi et al., 2013), where
they mentioned that in each development project shall reflect in cost management procedure
and to mitigate from continuous budget overwhelms. These are the basic criteria to regularly
practice in their project. (1) Conduct frequent meetings to improve relationship between
clients and consultants, (2) Quantity surveyors should be properly trained or experienced, (3)
Provide sufficient time for designing and cost planning to produce high quality Bills of

163
MCRJ Special Issue Vol. 12 | No. 1 | 2021
Quantities (BQ) and tender documents, (4) Adopt effective lines of communications among
project consultants in order to develop a better pre-contract cost planning process and (5)
Client and consultants are advised to keep records for all cost information and build up a
historical data of completed project.
RESEARCH METHODOLOGY
In this research, a quantitative approach was used through survey questionnaires to
determine the feedback and opinions from the Consultant Quantity Surveyors’ perspective in
Malaysia. The opinion and feedback of Quantity Surveyors is important to identify the causes
and impacts of affecting the accuracy of cost plans in a construction project. Hence, survey
research was used to obtain Quantity Surveyors’ opinions on the level of accuracy of cost
estimation and their suggestion to improve accuracy of cost plan in the construction project
is essential.
Research Approach
The questionnaires were structured to be open-ended questions and close-ended
questions. The questionnaire was divided into four sections. Section A comprises the
respondents background which include experiences, type and project size involved. Section
B is to identify the important factors affecting the accuracy of cost planning. Section C is used
to identify the impacts towards accuracy of cost planning. Section D is to determine the
possible solutions to improve the accuracy of cost planning.
Table 1. Factors Affecting Cost Planning
Factors no. Factors
Factors related to experience
F1 F2 F3
Expertise of cost consultants Experience and ability of estimator Experience of project team involvement on construction, issuing of detail drawings and specifications
Factors related to information
F4 F5 F6
Availability of price data Incomplete project information Accuracy of cost information
Factors related to design
F7 F8 F9
Incomplete design during tendering stage Availability of sufficient design information Design changes
Factors related to time
F10 F11 F12
Time available Client priority on construction time frame Time allowed prepare pre-tender estimate
Factors related to cost
F13 F14 F15
Poor cost databases Source of cost data in estimating stage Suitability of cost data
(Source: Odusami et al., 2008; Alumbugu 2014; Olawale, 2010; Ernest Kissi et al., 2016)
15 factors were identified as the most important factors affecting the accuracy of cost
planning. These factors were used to form structured questionnaires in order to quantify the
data and determine the most important variables that affect the accuracy of cost planning.

164
MCRJ Special Issue Vol. 12 | No. 1 | 2021
Table 1 shows the factors affecting cost planning. The operational measures of these
factors are categorized into five groups as follows:
1. Factors related to experience
2. Factors related to information
3. Factors related to design
4. Factors related to time
5. Factors related to cost
Conceptual Framework
A conceptual framework (Figure 2) was developed for this study to show the relationship
between the independent variable (factors affecting the accuracy of cost planning) and
dependent variable (impacts towards the accuracy of cost planning). The purpose of the
framework is to analyse whether the variables have positive impacts towards the dependent
variable or affect the accuracy of cost planning during the pre-contract stage.
Figure 2. Conceptual Framework
Sampling and Population
This study was limited to the views expressed by Malaysian in the Kuala Lumpur area.
The focus was on Consultant Quantity Surveyors Firm. In total, 364 emails were sent out and
distributed to the Consultant Quantity Surveyor firms. The questionnaire was developed using
Google Form and delivered through email to all respondents. However, some of the
questionnaires were unable to reach the targeted respondents due to the outdated and invalid
email address provided by the Board of Quantity Surveyor Malaysia.
The relative sample size was obtained based on the formula as follows:
S = X2NP (1 - P) / d2 (N - 1) + X2P (1 - P)

165
MCRJ Special Issue Vol. 12 | No. 1 | 2021
Where S = required sample size; X2 = 3.841 is obtained from the table value of chi-square
for 1 degree of freedom at desired confidence level; N = population size; P = population
proportion, always fixed at (0.50) as this would provide maximum sample size; D = degree
of accuracy expressed as a proportion at (0.05).
The sampling size of this research study obtained is 187 from the calculated formula and
43 replies from the Quantity Surveyors firm had been successfully collected which
contributed to a 23% response rate and within the acceptable range based on the sampling
size obtained as the targeted population focused in the Kuala Lumpur area. The remaining
144 questionnaires were either left incomplete or responses from respondents failed to meet
the criteria of this survey. Although several soft reminders have been notified to the
respondents.
Data Analysis
Frequency Distribution and Relative Importance Index (RII) methods were used in this
study. The frequency distribution method was used to summarize the data collected from
respondents who gave different variables of answers in the questionnaires. The variable will
be analyzed in the form of bar chart and tabulation to show the number and percentage of
frequency according to the total number of respondents. The relative importance index (RII)
was used to describe the respondents’ attitude towards the factors and impacts on the accuracy
of cost planning. Researchers (such as Elhag, Enshassi (2013)) used RII to quantify the factors
and impacts which have an effect on the level of accuracy. Hence, RII is used to analyze and
obtain the result through the rating of scale to place the answers in positions with rank.
DATA PRESENTATION, ANALYSIS AND DISCUSSION
Key Findings for Objective 1: Factors Affecting the Accuracy of Cost Planning in A Construction Project
Table 2 shown below has summarized the most noteworthy factors affecting the accuracy
of cost planning from each of the distinctive sorts of factor classification.
Table 2. Factors Affecting the Accuracy of Cost Planning in A Construction Project
Factors affecting accuracy of cost planning RII Rank
Experience and skill level of estimator 0.874 1
Accuracy and reliability of cost information 0.851 2
Availability of sufficient design information 0.819 3
Time available 0.781 5
Suitability of cost data 0.800 4
Results show that the most significant factor is the experience and skill level of the
estimator with an RII score of 0.874. This is the most significant factor that affects the
accuracy of cost planning. From Consultant QS’ perspectives, it emphasizes that experience
related factors have significant implications towards the accuracy of cost planning.
The second most important factor is the accuracy and reliability of cost information with
RII score of 0.851. This demonstrates that cost information is important as the Client would

166
MCRJ Special Issue Vol. 12 | No. 1 | 2021
obtain the financial commitment based on the cost plan issued by Quantity Surveyor in the
early stage to provide an accurate cost estimate.
The third most significant factor is the availability of sufficient design information with
RII score at 0.819. This shows that the completeness of design details and design
discrepancies during the pre-contract stage could affect the accuracy of cost estimate and to
accomplish value for money based on the client brief.
Suitability of cost information was the fourth significant factor with an RII score of 0.800.
This indicates that cost data of the previous completed project could be easily obtained for
cost comparisons in estimating future projects to improve the accuracy of cost planning.
Time available for designing and cost planning are less important factors with an RII
score of 0.781. This indicates that the factors related to time have less influence in the
preparation of cost estimates in the early stage.
Key Findings for Objective 2: Impacts on Implementation of Cost Planning in Construction Project
Table 3. Impacts on Implementation of Cost Planning in Construction Project
The Table 3 shows that 44% responded that the impact towards the accuracy of cost
planning will cause over budget to overall project, 21% agreed that the cost estimate cannot
achieve balance and cost-effective design solutions, whereas 19% responded that the project
will delay if the budget is exceeded, 14% responded that ineffective cost planning result in
reviewing design to achieve cost target and 12% only agreed that the project will be
abandonment.
The respondent mostly agreed that poor accuracy of cost planning may result in budget
overrun and clients may not have sufficient funds to complete the overrun project. Besides, it
will cause clients to overspend the budget and will give the impact on the client's revenue.
According to previous studies as discussed in the literature review, Frimpong et al. (2010),
Zhu and Lin (2013) had stated that construction projects have been facing cost overruns.

167
MCRJ Special Issue Vol. 12 | No. 1 | 2021
Although these become common in construction projects, they lead to an extraordinary
financial misfortune or even project disappointment in case of non-contingency.
Unable to achieve balance and cost-effective design solutions is the second major impact
in this finding because respondents agreed that drawing and design needs to be amended to
meet the budget. According to Ostrowski (2018) cited in Ernest et al (2017), cost planning
assists designers to achieve balanced and economical design solutions that are cost effective
to the required quality, function and within budget. The essence of cost planning is to assist
designers to achieve a balanced and economical design solution in order to meet the value for
money to overall development.
Delay in project is third ranked impact towards the accuracy of cost planning.
Respondents agreed that poor accuracy of cost planning will impact the client's financial cash
flow resulting in the delay of progress when no sufficient budget is allowed to pay for the
main contractor, sub trade and supplier. Chan and Suen (2007) stated that inadequate cost
planning exercises have led to over budget and delay payment in the construction industry.
Ineffective cost planning results in reviewing design to achieve cost targets is the fourth
major impact of cost planning because respondents agreed that poor cost planning could lead
to budget bursts and clients do not have much capital to sustain. Besides, ineffective and poor
cost planning serve no purpose for cost effective design and lead to the failure in completing
the project. Pott (2016) stated that majority clients must work within tight financial capability
if the budget or cost plan is inaccurate.
According to the findings, poor cost planning resulting in project abandonment is less
likely to occur as it depends on how realistic the budget is and how flexible the client is
towards meeting the budget or cost plan. Respondents agreed that without proper cost
planning the client will face cash flow issues and hence, it may cause the organization to put
on hold or to halt the project.
Key Findings for Objective 3: Solution to Improve the Accuracy of Cost Planning in A Construction Project
Table 4. Solution to Improve the Accuracy of Cost Planning in A Construction Project
Solution to improve the accuracy of cost planning RII Rank
Conduct frequent meeting to improve relationship between client and consultant 0.684 5
Quantity surveyors should be properly trained or experienced 0.781 4
Provide sufficient time for designing and cost planning 0.828 2
Adopt effective communication among project consultants 0.809 3
Record all cost data to develop a historical database of completed project 0.847 1
Detail drawing to prepare cost estimate 0.809 3
Based on the Table 4, results show that to develop a historical database of completed
projects is the most significant solution in order to improve accuracy of cost planning (RII
0.847). Respondents have mentioned that it is better to have more than three similar projects
for cost comparison to get a more accurate cost plan in future projects. Hence, the record of
all the cost data is relatively important and it can be obtained from building cost information
services (BCIS) though Royal Institution Chartered Surveyor (2013).

168
MCRJ Special Issue Vol. 12 | No. 1 | 2021
Besides, providing sufficient time for designing and cost planning is the second
significant solution (RII 0.828) as respondents highlighted that time constraint will affect the
quality of the works and the reliability of the overall cost. In addition, the Consultant Teams
may make an error and reduce the productivity if they are working overtime in order to meet
the dateline. Thus, the time management between the Consultant Teams and the Client are
relatively important in order to achieve a quality and reliability of cost planning.
Obtaining detail drawing to prepare a cost estimate is third ranked (RII 0.809) from the
finding. Respondents agreed cost planning should be prepared based on full information
available during the preliminary stage. Hence, Quantity Surveyors are not required to make
any unnecessary assumptions when preparing the cost estimate.
Adopt effective communications among project consultants is also ranked as third (RII
0.809) as the direct communication among consultant teams could eliminate discrepancies
and design errors. Therefore, it is essential that all the project consultants’ team are required
to provide regular updates to notify the status of the project as well as its performance
capacity.
Quantity Surveyors should be properly trained or experienced (RII 0.781) in order to
produce an accuracy of the budget. With experience in cost management of projects and
professional industry practices, the Quantity Surveyor must have principal knowledge in
terms of technical, business, regulatory and legal matters in order to capture the cost in the
budget. Hence, the competencies of the Quantity Surveyor in measuring and managing the
cost estimation is essential in construction projects.
Conducting frequent meetings to improve the relationship between client and consultant
(RII, 0.684) is the least important solution to increase accuracy of cost planning. Most of the
time, the timeline given is not sufficient for the consultant teams to conduct the meetings
regularly, thus they have to make an assumption and clarification upon the submission of
budget.
DISCUSSION
This research aims to identify the approaches to improve the accuracy in preparing cost
planning in the construction industry, Malaysia. Literature research has been conducted to
gather the information for objective 1 on the factors influencing the accuracy of cost planning.
The findings showed that the top 3 significant factors affecting the accuracy of cost planning
are experience and skill level of estimator, accuracy, reliability of cost information and
availability of sufficient design information to produce an accurate and precise estimate.
The findings for objective 2 showed that the top 3 significant impacts towards accuracy
are project over budget, cannot achieve cost-effective design and project delay which is
relatively important as it will influence the cost overrun in development projects. In practice,
the cost overrun becomes a significant issue in development projects. Inadequate estimating
invariably leads to misallocation of scarce resources and eventually overspending on the
client’s budget.
169
MCRJ Special Issue Vol. 12 | No. 1 | 2021
For objective 3, the top 3 solutions to improve the accuracy of cost planning are: (1)
record all cost data to develop a historical database of completed projects, (2) provide
sufficient time for designing and cost planning and (3) adopt effective communications. It has
been shown that the most effective solution is the cost data. Quantity surveyors are advisable
to keep records for all cost information and build up a historical data of finished projects. This
data ought to be the primary source of data that will be utilized in forecasting the cost of future
projects. Besides, the client shall provide sufficient time to the consultant's team as it will
influence the quality of documents and the accuracy of the cost planning.
CONLUSION
In essence, this research contributes the approaches to improve on the accuracy of cost
planning in the construction industry, Malaysia. The outcome of the findings served as a
guidance for the practitioners to implement it especially the Quantity Surveyors are preparing
the cost planning. The findings of this study give more consideration in the cost planning
process in order to achieve the accuracy and the precise estimate.
REFERENCES
Adnan Enshassi, Elhag, Liu and Zhu, Factors Affecting the Accuracy of Pre-Tender Cost
Estimates in the Gaza Strip. Journal of Construction in Developing Countries, 18(1), 73–
94, 2013
Alumbugu, Azman and Shane, "Factors affecting the accuracy of cost estimate: case of
Jordan", Engineering, Construction and Architectural Management, Vol. 25 Issue: 1,
pp.113-131, 2018.
Aibinu, A.A. and Pasco, T. (2008). The accuracy of pre-tender building cost estimates in
Australia. Construction Management and Economics, 26(12): 1257–1269. Akintoye, A.
(2000).
Boussabaine, Assessment of the Factors Affecting Accuracy of Pre-tender Cost Estimate in
Kaduna State, Nigeria. IOSR Journal of Environmental Science, Toxicology and Food
Technology (IOSR-JESTFT). Volume 8, Issue 5 Ver. IV, PP 19-27, 2013
Chitkara, Analysis of Causes of Delay and Time Performance in Construction Projects
Journal of Mechanical and Civil Engineering (IOSR-JMCE) e-ISSN: 2278-1684, p-
ISSN: 2320-334X, Volume 13, Issue 5 Ver. III (Sep. - Oct. 2016), PP 116-121
Cunningham, Cost Control during the Pre-Contract Stage of a Building Project – An
Introduction. Report prepared for Dublin Institute of Technology, 2015.
Cunningham, Factors Affecting the Cost of Building Work - An Overview. Dublin Institute
of Technology, 2013. Report prepared for Dublin Institute of Technology, 2013
Cunningham, What Causes Cost Overruns on Building Projects? An Overview. Review.
Report prepared for Dublin Institute of Technology, 2017
Eliufoo, Ernest Kissi, Kirkham and Matipa, Exploring cost planning practices by Ghanaian
construction professionals. Int. J. Project Organisation and Management, Vol. 9, No. 1,
2017
Frimpong, Cost Performance for Building Construction Projects In Klang Valley. Journal of
Building Performance. Volume 1 Issue 1 2010
Giang, Role of the construction industry in economic development of Turkmenistan. Energy
Education Science and Technology Part A: Energy Science and Research. 29. 883-890,
2012

170
MCRJ Special Issue Vol. 12 | No. 1 | 2021
Knipe and Nwachukwu, Exploring cost planning practices by Ghanaian construction
professionals. International Journal of Project Organisation and Management. Vol. 9,
No. 1, 2017
Laryea, Achieving design-stage elemental cost planning accuracy: Case study of New
Zealand. International Journal of Social, Behavioral, Educational, Economic, Business
and Industrial Engineering, 11(1), 115-120, 2010
Leibing and Olawale, Factors Affecting Effective Implementation of Cost Management
Process in Construction Industry. International Research Journal of Engineering and
Technology (IRJET). Volume: 05 Issue: 05 (May 2018)
Marjuki, Evaluating the Budgetary Reliability of Design Stage Elemental Cost Plan in
Building Procurement: A New Zealand Study. Department of Civil & Environmental
Engineering, Faculty of Engineering, 2016
Morrison, The Accuracy of Pre-Tender Cost Estimates Of Consultant Quantity Surveyors In
Nigeria. Department of Building, University of Uyo, Uyo, Nigeria, 2011
Odeyinka, Accuracy in Design Stage Cost Estimating Through Risk Contingency Analysis:
A Theoretical Exploration. Construction Research Congress 2014 ©ASCE 2014
Odusami and Qnukwube, Factors Affecting the Accuracy of Pre-Tender Cost Estimates in the
Gaza Strip. Journal of Construction in Developing Countries, 18(1), 73–94, 2013
Oosthuizen & Berry, The Accuracy of Pre-Tender Cost Estimates Of Consultant Quantity
Surveyors In Nigeria. Department of Building, University of Uyo, Uyo, Nigeria.
Ostrowski, An Evaluation of Pre-Contract Cost Planning Process for Building Projects in
Tanzania. International Journal of Innovative Research and Development, ISSN 2278 –
0211, 2018
Pott, Accuracy in Design Stage Elemental Cost Planning: An Analysis of New Zealand Data.
Department of Civil and Environmental Engineering, The University of Auckland, New
Zealand, 2017
Ramabodu, Verster, Chan and Suen, Critical Barriers to the Practice of Effective Cost
Planning in the Ghanaian Construction Industry. Department of Building Technology,
Kwame Nkrumah University of Science and Technology, Kumasi, Ghana, 2016
Smith, J., & Jaggar. D. (2007). Building Cost Planning for the Design Team (2nd ed.). Oxford:
Elsevier.

171
MCRJ Special Issue Vol. 12 | No. 1 | 2021
PROPOSING BIM-RELATED CLAUSES IN STANDARD FORM OF MALAYSIAN CONSTRUCTION CONTRACTS Nurshuhada Zainon and Leong Vicky Department of Quantity Surveying, Faculty of Built Environment, University of Malaya, Kuala Lumpur, Malaysia.
Abstract Building Information Modeling (BIM) is becoming mandatory for use on procured public sector works in many parts of the world. This serious effort of BIM implementation means that the contract documents for the contractor and through the supply chain and professional consultants will need to consider the specific implications of BIM. Therefore, a standard of approach of BIM and building contracts is essential to allow the process to work as it should and avoid disputes. Especially in Malaysia, there is still an absence of a standard form of contract for BIM. Therefore, this research aims to propose an implementation of BIM for the existing clauses of Malaysian standard form of contracts. This research started with a comparative analysis of contractual obligations that influences BIM-based project in Malaysia and the BIM conditions of international contract, by considering BIM International Standards BS EN ISO 19650-1 and 2 as a baseline. After the preliminary proposed conditions are developed, experts’ interview was conducted to enrich and validate the findings by implying thematic analysis. The respondents were among the prominent BIM implementers and Quantity Surveyors in Malaysia, which was selected using snowball sampling method. Finally, the modified conditions area proposed according to the suitability of existing clauses on PWD Form of Contract 203A and PAM Form of Contract 2018. The findings are hoped to assist stakeholders including clients, architectures, quantity surveyors, engineers understand their liability and scope of work clearer in BIM process. At the same time, to allow smooth process, to reduce the risk and cost of projects, as well as, to avoid disputes. Keywords: Building Information Modeling (BIM); contract; construction management; law; standard
form.
INTRODUCTION
Building information Modeling (BIM) is an encouraging development in the architecture,
engineering, construction, and operations industry due to its data-rich digital representation
of building components. As adoption of BIM is growing in the industry, implementation of
BIM in existing contracts has become concerns of the industry. A survey was found that 67%
of the respondents felt the existing form of contract used in the industry now, are not suitable
for implementation of the BIM system due to lack of and 50% agreed that the contract still
lack of express term related to BIM (Winfield, 2016).
In Malaysia, the most common and widely used condition of contracts in Malaysia
construction industry are PWD 203A and PAM form of contract. Both of these standard forms
are still absence with standard approach covered the liabilities required in BIM-based
projects. The discrepancy between the perceptions and contractual liability causes
misunderstanding and unwanted disputes when adopting BIM system in a project. There are
potential inconsistencies, confusion and gaps in liability due to lack of express terms dealing
with process and risk allocation of BIM (Winfield, 2016). This leads to more time and money
needed to generate an accepted condition between the parties. For an example, the first
reported BIM case was in 2017; a case that caused by the misunderstanding or unclear contract
term is Trant Engineering v Mott Macdonald. Both parties had suffered a large sum of legal
fees and affected their commercial relationship when the case was brought up to the Supreme

172
MCRJ Special Issue Vol. 12 | No. 1 | 2021
Court in the United Kingdom (UK). This can be avoided if both parties have a clear contract
terms that described their rights and duties in the contract before interpretation of the term
and right needed to be done by the courts and lead to considerable cost (Sinclair, 2018).
There are many aspects of legal issues related to BIM, namely responsibility and roles of
stakeholders, storage and security of the data, interoperability, protection of intellectual
property, professional liability, copyright, ownership issue, confidentiality, allocation of risk
and archiving and disposal of information (Manderson, 2015). New country-specific form of
contracts would be required to cover the various relationships, that is consultant and
employer, contract and sub-contractor which are affected by working method of BIM (Udom,
2018). This paper aims to propose BIM-related clauses for the existing Malaysia standard
forms of contract considering common BIM legal issues. To achieve the aim, the delineated
objectives are to identify the BIM related issues through a comparative analysis of
international and local BIM documents, and finally proposing BIM-related clauses for an
improvement of existing form of contract for Malaysia construction industry.
LITERATURE REVIEW
Building Information Modeling (BIM)
BIM is described as the process of gathering input from team members through complex
multiphase process to model the components (Viscuso et al., 2020). BIM is a tool that will be
adopted during the process of construction to produce an exceptional perspective of the
building process and to handle 3-dimensional (3D) models of a facility's structural and
operational features (Galiano-Garrigos et al., 2017). These models are then stored in databases
used by the various stakeholders involved in the project and can be constantly revised to make
sure that owners, architects, design teams, suppliers and building managers are able to work
with similar data. The method of visualisation of model would mean that project stakeholders
can improve their understanding on the project's approaches and alternatives available and
provides a reliable basis for informed decision-making throughout the lifetime of the project,
from design and construction to its operation and eventually demolition.
In any BIM-based construction projects, BIM Execution Plan (BEP) is now an essential
element, especially for particularly large or complex projects with a number of different
parties in collaboration. The plan can principally be used to help ensure that all parties are on
the same page when it comes to collaborating and taking the project forward. It should show
an overall plan of execution, keeping the big picture clear and in focus.
Barnes (2019) outlines information that should be included in the BEP, including how the
data in the actual BIM files should be generated, managed, documented and shared. It should
include elements such as agreed roles and responsibilities within the BIM process, a strategy
for key deliverables, and a guide to vital project milestones. Project Implementation Plans
(PIPs) and Task Information Delivery Plans (TIDPs) can be components of the overall
implementation plan, which demonstrates when information will be prepared, who is
responsible for doing what, and which protocols and procedures they will use. The BEP
should also include practical working procedure details such as file name conventions and the
software that will be used, as well as a common set of annotations, abbreviations, and symbols
to be used in the BIM process.

173
MCRJ Special Issue Vol. 12 | No. 1 | 2021
However, BEP is not a set of standards to be issues by one party which everyone must
comply. It is often poorly compiled and lack the information necessary for them to be properly
useful. As a consequence, BEP is often not been expressed on the contract but is treated as a
guideline for the project team to follow.
Legal Issues of Adopting BIM in Construction Contract
BIM raises a number of specific legal and contract issues aside from organisation, people
and technology issues. The issues are largely from the creation and use of BIM model, share
risk and liability for those responsible of the model during the whole construction lifecycle.
Intellectual Property Rights (IPR)
As various parties will contribute to the BIM model, a BIM protocol should make sure
every contributor guarantee that they hold the IPR over the contributions they have made
(Stepanenko et al., 2019). Generally, IPR is recognised by the intellectual property law for
every distinctive contribution and this should be included in the BIM protocol.
Model Reliance Risk
Conventionally, the risks of reliance are managed by the project designers. However,
according to Jamil & Fathi (2018), the process of BIM allows direct model access to various
parties, i.e., those who will make decisions and resources allocation based on the information
contained in the models.
Model Management
Model manager processes a single model containing all information from the various
components is compiled. He should be responsible to ensure the model presents organised
information which can be shared and accessed during all phases of project and building’s life
cycle. Udom (2018) highlighted among the issues are model access, software matrix, roles
for model manager and how to replace the manager, and responsibility to bear the costs of
these when anything arising from this role.
BIM Management
BIM management mission is to integrate the objects issued by the different BIM
contributors into a single digital model and then to manage their interfaces to ensure the
overall consistency of the model, with respect to delivery schedules and final parameters
desired by the client. It shall include liability on missing information, problematic design and
discrepancies in the models (Mäki & Kerosuo, 2015).
Risks Allocation
Extraordinary liability issues may be created by the technology on which BIM is based.
Therefore, the liability related to software and technology issues between consultants who
opted these technologies and have expertise on those technologies, and the client or owner of
the BIM process should be carefully mapped out. The parties should consider obtaining

174
MCRJ Special Issue Vol. 12 | No. 1 | 2021
insurance coverage to protect them from the liability for errors in their contribution to the
model (Jiang et al., 2018). This shall include the delay, the extension of time and costs arising
from BIM errors. On top of it, a BIM contingency fund suggested to be created according to
the proportion of contributions from each party (Chang, 2018). The fund could be used to
cover the unforeseen costs that arise during the BIM process that applicable by the project
participants.
METHODOLOGY
Data Collection
The research began with an extensive literature based on Gough, Oliver & Thomas
(2017)’s approach, which involving clarifying the research questions, determining and
describing the related research, evaluating the reports of research systematically, concluding
the finding into a logical and coherent statement (synthesis), and establishing the distinctness
that can be made from the research. In this research, this method is used as primary research
to answer some specific question, i.e., legal issues arose by BIM projects, strategies that taken
by other countries to resolve the legal issues, the concerned issues by the industry regarding
the contract of BIM projects. The literature searches were conducted by using independent
databases such as Web of Science, Scopus, ScienceDirect and Wiley Online Library. The
search was set to English language and restricted to papers published between 2015 to 2020
to get the last five years of studies under keywords: BIM legal issues, BIM contracts, BIM
disputes, BIM roles and responsibilities, BIM liability and BIM risks.
In the next stage, a comparative study was conducted assessing prominent addendums
and BIM guides, internationally and locally. On top of these, Malaysia standard form of
contracts were also assessed looking into gaps on BIM-related clauses based on the common
legal issues identified in the earlier stage.
Subsequently, a preliminary addendum was developed to address BIM legal issues. This
preliminary addendum was presented to the experts through semi-structured interview
sessions. The purpose of conducting this activity was to get suggestions and verification from
the local experts.
The targeted respondents involved were BIM manager, Quantity Surveyors, contract
managers, and BIM-based project contractors who were able to express their experience and
viewpoints on BIM and legal issues that faced by the industry. They were identified through
a snowball sampling due to an absent of population database in determining the targeted
respondents. A few targeted respondents were listed before conducting the interviews
sessions. Then, contact information of the targeted respondents were obtained from the
company’s official websites. Then, invitation to participate in the study were sent via email
to each of them. Interviews were conducted with those providing positive responses. The
respondent was then requested to recommend another potential respondent that meet the
criteria. The steps to contact the recommended respondent were repeated as described. A total
of 5 face-to-face interviews were conducted. The sessions were recorded, and the audible data
was then transcribed.

175
MCRJ Special Issue Vol. 12 | No. 1 | 2021
Data Analysis
Data were analysed using a thematic analysis. Transcribed data was assessed to identify
the general ideas collected from all the respondents according to themes. The themes were
then coded to group similar information, subsequently the information was tabulated in a table
form. Finally, the findings were verified by the same respondents through electronic mail.
ANALYSIS AND DISCUSSION
Contractual Provisions for BIM-based Projects
The important purposes of the contract are to clearly state the obligations and right of the
parties that involved in the contracts, and also to distribute the risk between the parties that
involved (Eggink, 2020). In Malaysia, two most widely used standard form of contracts are
PWD 203A by the Malaysian Public Works Department (PWD) and PAM form of contract
by the Malaysian Institute of Architects (PAM). PWD 203A is a form of contract based on
bills of quantities for public sector or government projects in civil engineering and building
contracts (Zakaria, 2013). On the other hand, the PAM contract is widely used in private
sector institutional, commercial, housing and other projects of building (Rajoo, 2009). Both
of these, unfortunately, have no contractual provisions BIM.
Internationally, the Chartered Institute of Building’s Complex Projects Contract 2013
(CPC 2013) is the first standard form of construction contract to include BIM clauses in its
provisions and appendices that was designed for international construction and building
projects (Gibbs et al., 2015). This form of contract is suitable for various procurement
methods with the option of proposing special conditions for respective project (Pickavance,
2014). CPC 2013 is accustomed on programming, resource data and keeping the record to
recommend the best practice (CIOB, 2011). The contract introduces new roles, which are time
manager and data security manager (Gibbs et al., 2015). This contract is applicable for both
BIM and conventional projects and it is included BIM in the clauses and appendices with the
support of BIM protocol.
Whereas United States of America has developed a BIM specific contract initiative as an
addendum to be attached with an existing agreement. The AIA Document E203-Building
Information Modeling Protocol Exhibit is legally binding document to solve legal issues that
are related to BIM (AIA, 2018).
In Singapore, BIM Particular Conditions were introduced as an attachment to the
construction contracts when applying BIM to a project (Corenet, 2018). The first version of
BIM Particular Conditions was published as Appendix E in the Singapore BIM Guide Version
1.0 originally. Then, it was updates and revised into BIM Particular Conditions Version 2.0
and being released on August 2015.
The table below shows the main difference between the three addendums; BIM Particular
Condition Version 2.0, CPC 2013, and AIA Document E203 in covering the issues for
intellectual property rights, model reliance risk, model management, BIM management and
risk allocation.

176
MCRJ Special Issue Vol. 12 | No. 1 | 2021
Table 1. Comparison Between International Documents
Particulars
Addendums
BIM PARTICULAR CONDITIONS VERSION 2.0
CPC 2013 AIA DOCUMENT
E203
Country Singapore UK USA
Year 2015 2013 2013
Intellectual Property Rights
Creator
Licensence & Sub-License N/A
Model Reliance Risk
Model Author is not liable for use of model beyond the Level of Details (LOD) Specified
N/A
Model Author is not liable for use of model beyond the Level of Details (LOD) Specified
Model Management
N/A N/A Archives & Milestones
BIM Management
Every Party is liable to reduce discrepancy & BIM manager facilitate resolution of discrepancy
Designer shall be liable for the integrity of the model
Architect is liable for the discrepancy
Risk Allocation
Every Party is liable to reduce discrepancy & BIM manager facilitate resolution of discrepancy
External Party being employed to create the required information at the cost of the contractor if contractor fail to produce required information
N/A
Each party is not liable for any corruption/ Unintended Amendment/ Modification or Alteration
N/A N/A
Note: N/A = Not Available
All the addendums highlighted that the copyright and ownership of the 3D BIM model
shall remain under the model author after the project. While additional from the BIM
Particular Conditions Version 2.0 and CPC stated that the project team member will grant the
employer a non-exclusive license, the employer shall grant the sub-license to other project
team member for them to access to the BIM model during the construction period. However,
this is not mentioned in the AIA Document E203.
Secondly, for model reliance risk, BIM Particular Conditions Version 2.0 and AIA
Document E203 proposed that the model author is not liable for use of model by any project
team member during the construction period beyond the Level of Details specified in the BIM
Execution Plan or agreement. While this is not included in CPC 2013.
Only one addendum mentioned about the model management in it, i.e., AIA Document
E203. AIA Document E203 stated that all the progress shall be kept as record without
alterations when every milestone of the project is met. Any Changes made on the identified
milestones by any project team members, it shall be indicated. These are known as the archive
section in this document.
The addendum has indicated the person should be liable when discrepancy happened
respectively. BIM Particular Conditions Version 2.0 stated that every Party is liable to reduce
discrepancy and the BIM manager facilitate resolution of discrepancy. CPC 2013 at the
designer shall be liable for the integrity of the model which is similar to the AIA Document
E203 stated that the Architect is liable for the discrepancy happened during construction
period.

177
MCRJ Special Issue Vol. 12 | No. 1 | 2021
The last main issues that compared among the documents is risk allocation. In BIM
Particular Conditions Version 2.0 of Singapore, it stated that Each party is not liable for any
corruption/ unintended amendment, modification or alteration. However, this is not
mentioned in other addendums. While CPC 2013 has proposed that external Party being
employed to create the required information at the cost of the contractor if contractor fail to
produce required information. This is not mentioned in the other document as well. However,
none of the condition as above is mentioned in the AIA Document E203.
BIM Guides and Protocols
In most of the developed countries which have successfully implemented BIM practice
in the construction industry, have enacted a BIM guideline to define the requirements, rules
and regulation (Jo et al., 2018).
A new set of International Standards ISO19650 has just been published to enable BIM to
flourish across projects and borders, benefitting the industry as a whole. It was developed on
the basis of the tried-and-tested British standard BS 1192 and publicly available specification
ISO19650, which have already been shown to help users save up to 22 % in construction costs
(Naden, 2019).
In UK, the CIC BIM Protocol was published in 2013 functions as a legal agreement
(McPartland, 2018). There are two appendices featured in this Protocol which the Appendix
1 contains the model production and delivery table to employer required BIM models at every
stage of the project and the Appendix 2 includes all the information management standards
details that required in the projects (Construction Industry Council, 2018). On top of it, the
Protocol also covers rights of client and the contracted party, responsibilities, liabilities and
limitations, copyright, expected deliverables and collaborative practices and the use of
ISO19650 for information management (McPartland, 2018).
Malaysia has two BIM guides, published by the PWD and by the Construction Industry
Development Board (CIDB). The PWD’s document is known as JKR BIM Standard and
Guidelines made for public projects that adopt BIM process. The purpose of the document is
to provide understanding, knowledge and useful information for every party involved in BIM-
based project to increase the competency of each officer and to add on value on the system of
project delivery. On the other hand, the CIDB’s BIM Guide that comes in 5 series are more
generic. The series cover awareness, readiness, adoption, BEP, and project guide.
The table below shows the main difference between the three guidelines and protocol
(CIC BIM Protocol 2013, Malaysia CIDB BIM Guide, ISO19650 and JKR BIM Guidelines)
in covering the issues for intellectual property rights, model reliance risk, model management,
BIM management and risk allocation.
All the guidelines and protocol highlighted that the copyright and ownership of the 3D
BIM model shall remain under the model author after the project except JKR BIM guidelines.
Additional from the CIC Protocol 2013 stated that the project team member will grant the
employer a non-exclusive license. However, Malaysia CIDB BIM Guide stated that the
intellectual property right shall be fully transferred to the client upon full payment which is
opposed to the other two documents.

178
MCRJ Special Issue Vol. 12 | No. 1 | 2021
Table 2. Comparison Between International Guides
Particulars
Guidelines and Protocol
ISO19650 CIC BIM Protocol JKR BIM Standard
& Guideline CIDB BIM Guide
Country UK UK Malaysia Malaysia
Year 2013 2013 2014 2017
Intellectual Property Rights
Copyright & ownership remains under creator.
Copyright & ownership remains under creator
N/A Intellectual Property Right transferred to the client upon full payment.
N/A
License and sub-license are to be granted
N/A N/A
Model Reliance Risk
N/A N/A N/A N/A
Model Management
Model archives & milestones
N/A N/A N/A
BIM Management
N/A
Project Team Manager shall be liable for Model Produced.
N/A N/A
When there is deviation, model should be updated in 24 hours/ 48 hours
N/A
N/A N/A
Risk Allocation
N/A
Each Party is not liable for any corruption/ Unintended Amendment/ Modification or Alteration
N/A N/A
Note: N/A = Not Available
Secondly, for model reliance risk, none of the documents cover for this legal issue. Only
one of guidelines mentioned about the model management in it, i.e., ISO19650 stated that all
the progress shall be kept as record without alterations when every milestone of the project is
met. Any Changes made on the identified milestones by any project team members, it shall
be indicated. These are known as the archive section in this document.
The only guideline has indicated the person should be liable when discrepancy is CIC
Protocol 2013. CIC Protocol 2013 stated that the Project Team Manager shall be liable for
Model Produced when there is discrepancy. While ISO19650 stated that when there is
deviation, model should be updated in 24 hours or 48 hours.
CIC BIM Protocol stated that each Party is not liable for any corruption or Unintended
Amendment or Modification or Alteration. While the other documents do not mention about
risk allocation.
BIM Legal Issues and Related Clauses of Local Standard Form of Contracts
Two prominent standard form of contacts in Malaysia construction industry were
assessed, namely PWD 203A and PAM 2018 form of contract. Issues regarding Level of
Details (LOD) of BIM model could possibly related to Clause 6.1 of PWD 203A. It states that

179
MCRJ Special Issue Vol. 12 | No. 1 | 2021
contractor is responsible to construct and complete the works with goods, materials and
workmanship of standards according with best industry practice. On the other hand, PAM
2018 states under Clause 6.5, that contractor is responsible to take required actions, if the
Architect finds any materials, goods or workmanship is not comply with the contract.
However, the responsibility for the development of the BIM model is not mentioned should
be taken by any party in both contracts.
For the model management issue, Clause 8.1(c) of PWD 203A states that it is the duty of
a Superintendent Officer (SO) to provide contractor with further drawings, details, levels and
other information to ensure that the contract can finish the job in time. On the other hand,
PAM 2018 states that it is the duty of the architect to provide the contractor with further
drawings, details, levels and other information to ensure that the contract can finish the job in
time. However, both contracts do not state that the BIM model should be managed by which
party in these clauses.
Issues related to risks allocation are stated under Clause 8.2(b) of PWD 203A and Clause
1.3 of PAM 2018. The public contract states that it is the responsibility of contractor if there
is any discrepancies and divergence in contract documents and following documents. While
the later contract allocates the responsibility to the contractor and rectification should be done
with architect or engineer. As BIM model have more than one participant during the process,
everyone contributes to the model. The liability for inaccurate contribution to BIM model
should be who’s responsible is not mentioned in these clauses.
The BIM model ownership issues is related to Clause 8.1(e) of PWD 203A and Clause
3.10 of PAM 2018. Both of these contract’s state that drawings, details, specifications,
unpriced copy of Summary of Tender, Provisional Bills of Quantities to the client. Both
documents do not mention about the data of BIM model, and under these clauses, it could be
possibility suggest that the BIM model is belong to the client.
Clause 64.2 of PWD 203A and 7.0 of PAM 2018 are related to Intellectual Property
Rights. Contractors should be responsible for any claim from the client if the equipment
supplied infringes the copyright, patent or registered design under PWD 203A. In contrast,
PAM 2018 allows contractor to compensate to the client if the contractor infringed any
intellectual property of the client. Both contracts do not state the right of the contractor as
contractor is also one of the contributors to the BIM model.
Comparison of BIM Legal Issues Coverage
Table below shows the comparison of BIM legal issues coverage by the International
Addendums, Standards & Guidelines and Existing Standard form of Contract in Malaysia. It
summarizes that none of the addendums or guidelines available managed to cover all the
common legal aspects which are intellectual property right, model reliance risk, model
management, risk allocation and BIM management. Singapore BIM Particulars 2.0 and AIA
E203 cover the most which is four aspects, followed by CPC 2013, CIC BIM protocol and
ISO19650 which only cover 3 aspects and Malaysia standard form of contracts cover the least
legal aspect.

180
MCRJ Special Issue Vol. 12 | No. 1 | 2021
Table 3. Comparison of BIM Legal Issues Coverage
BIM Legal Issues
Addendums Guidelines Malaysia Contract
Sin
ga
po
re
CP
C
AIA
CIC
ISO
CID
B
JK
R
PA
M
PW
D
Intellectual Property Right / / / / / /
Model Reliance Risk / /
Model Management / /
BIM Management / / / / /
Risk Allocation / / /
Considerations for BIM Legal Issues in Standard Form of Contracts
Based on the semi-structured interviews that were conducted with experts in Malaysia,
there are several considerations need to be considered in drafting BIM-related clauses.
Standardisation of the terms are agreed by all respondents important to avoid
misinterpretation among international or local construction players involved in a BIM-based
project as. Alternatively, if different terminologies being used, the definition of terms are
crucial to ensure all parties involved have a common understanding.
The LOD each element shall vary according to the project. Therefore, all respondents
agreed that LOD is not suitable to be mentioned in a standard form of contract, however, LOD
should be described in a BEP and legally binding.
Half of the respondents were in consensus to suggest details on BIM dimension are stated
clearly in the addendum. This will lead to a clearer BIM project objectives and dispute on the
deliverables could possibly be reduced by stating the BIM dimension of the deliverable in the
addendum. Another point of views, BIM dimensions should be stated in the condition of
tendering or described in BEP and should not legally binding due to various standard
definitions regarding this matter.
Majority of the respondents highlighted that the copyright and ownership of the model
should be owned by client as the model is included in the payment done by client to the model
modeler. Furthermore, this can ease the data and facilities management during the operation
and maintenance phase. Additionally, one respondent suggested that an agreement between
the modeler should clearly state the BIM ownership transfer during the handover.
All the respondents suggested that the client should be responsible for the cost of the
license granted for accessing to the BIM model in a BIM project, and the number of licenses
granted to access the model shall be priced in the Bill of Quantities.
There were two respondents stated it is needed for a data security manager to be included
in a BIM-based project. However, majority of the respondents were not in consensus due to
limited job scope carried by a dapta security manager. As an alternative, it should be a part of
the BIM manager’s responsibility or under the construction organisation’s management.

181
MCRJ Special Issue Vol. 12 | No. 1 | 2021
All respondents in agreement to suggest that discrepancy of the BIM model should be
under the responsibility of the Architect who plays as the main BIM modeler, which should
also coordinate data inputs during construction phase. Architect could transfer the
responsibility to a BIM Manager.
Preliminary Addendum: Analysis for Contents Improvement
The improvements of the addendums are done based on the comments given by the
respondents during the interview sessions.
Table 4. Improvement Made on the Preliminary Addendum
Particulars Preliminary Addendum
Improvement Finalised
Part 1: Definitions Comprises of 18 definitions
Reduce Redundant Information & repeated terms.
Comprises of 10 definitions
Part 2: BIM Team Roles and Responsibility
BIM Manager BIM Coordinated
Reduce confusing by excluding BIM process from construction process
Removed
Part 3: Model management
5 clauses proposed Clarified on the liabilities Clause 3.3 and 3.4
Part 4: Model Reliance Risk
3 clauses proposed N/A Remain unchanged
Part 5: Risk Allocation 4 clauses proposed N/A Remain unchanged
Part 6: Intellectual Property
6 clauses proposed Amended to suit the practice in Malaysia
5 clauses
Part 7: Extension to existing clause in PWD203A and PAM 2018
Not exist To enhance the understanding on deliverables
4 clauses proposed for PAM 2018 and 2 Clauses proposed for PWD 203A
Part 1: Definition
The first section in the first draft of the addendum comprises of 18 terms with definitions.
They are 1.1 Building Information Modeling (BIM), 1.2 BIM Guide,1.3 BIM Execution Plan,
1.4 BIM Manager, 1.5 BIM Coordinator, 1.6 BIM Modeller, 1.7 Contribution, 1.8
Information Model, 1.9 Project Information Model, 1.10 Asset Information Model, 1.11
Design Intent Model, 1.12 Author, 1.13 Employer, 1.14 Principal Agreement, 1.15 Common
Data Environment (CDE), 1.16 Archive, 1.17 Information Exchange and 1.18 Level of
Definition. The definition of these 18 terms is referring to the ISO19650, BIM Particular
Conditions Version 2.0 Singapore and CIDB BIM Guide Malaysia.
However, at the finalised version of the addendum, 8 clauses were removed. Respondents
agreed that the BIM process should not be mixed up with the construction process. Term 1.5
BIM Modeller and 1.6 BIM Modeller are roles that only involve in the BIM process but not
the construction process, therefore, it should not be included in the addendums for
construction contract.
The term which is 1.13 were removed from part 1 of the addendum to reduce repeated
information. According to respondents, the “employer” is defined in the standard form of
contract PWD 203A 2010 and PAM 2018, therefore any term “employer” that appears in the
addendums shall be referred to the main contracts. If the same term were defined again in the
addendum with different definition, it might contradict to the main contract and hence arise

182
MCRJ Special Issue Vol. 12 | No. 1 | 2021
dispute and misunderstanding between the users of the contract. In any event, the addendum
should not prevail, therefore, repeated information which may contradict to the main contract
shall be removed.
Lastly, term 1.18 is removed from the addendum as well due as there is still lack of
standard which is followed by everyone in the construction industry. Therefore, one of the
respondents suggested that it should not be defined with any standard which can defined the
term clearly as a support. The details of term 1.18 shall be included in the BEP instead of the
construction contract. As the definition of the term may be customised due to different
understanding by the client or BIM consultant. Therefore, it is not suitable to be included in
an addendum to be attached to the standard form of contract.
In a conclusion, the finalised version of addendums contained of 10 terms with definition
respectively to reduce confusion of the user and repeated information.
Part 2: BIM Team Roles and Responsibility
The second section contains the roles of BIM team members with 2 main clauses and 14
sub-clauses. Clause 2.1 explained about the roles of a BIM manager with 8 sub-clauses in
detail and clause 2.2 explained about the roles of the BIM coordinator in detail with 6-sub
clauses.
As the addendum is made for construction contract, therefore role of the BIM team should
not be included in the addendums. The roles of the BIM shall be included in the contract of
BIM process or the BEP. Therefore, it was removed from the addendums to reduce the
confusion of the contract user on construction process and BIM process.
Part 3: Model Management
There are total number of 5 clauses explain about how to leave an audit trail for the model
modification, the mechanism of correcting the 3D BIM model, who shall be responsible for
the discrepancy happened and clash checking. Amendment was done on clause 3.3, where in
the first draft of the addendums, it stated that when discrepancy is found between the latest
versions of a model by any party, the party should inform the BIM manager. This clause is
found contradict to the clause 1.4 of PAM 2018. In clause 1.4 of PAM 2018, it stated that the
contractor found any discrepancy between the contract documents, he shall notify the
Architect by written notice. There were disputes where, if there is discrepancy, who shall be
referred to.
The main contract which is the standard form of contract, PWD 203A and PAM 2018
shall take precedent. Therefore, the addendum was modified to suit the main contract where
the BIM manager is replaced with the Architect/SO to avoid conflict between the construction
contract with the addendums.
Clause 3.4 which described about the requirement of clash checking should be done
during the construction period. This clause is enhanced by stated the party who should be
responsible for it. Contractor shall be responsible to carry out the clash checking during the
construction period. Therefore, the party to carry out clash checking where specified in this
clause.

183
MCRJ Special Issue Vol. 12 | No. 1 | 2021
Part 4: Model Reliance Risk
There are 3 clauses proposed under this part describing about model reliance risk. All the
respondents agreed that the clauses are suitable to be included in the addendum and there were
not changes shall be made onto these clauses. No comment was given by the respondents for
the clauses.
Part 5: Risk Allocation
There are 5 clauses proposed under this part describing about model risk allocation. All
the respondents agreed that the clauses are suitable to be included in the addendum and there
were not changes shall be made onto these clauses. No comment was given by the respondents
for the clauses.
Part 6: Intellectual Property
There are 6 clauses proposed under this part describing about intellectual property right
in the first draft of the addendum. In the finalised version of the addendum, there is only 5
clauses left. The clauses are removed and amended to suit the practice of Malaysian
construction industry. Majority of the respondents highlighted that the copyright and
ownership of the model should be owned by client for same reasons. According to the
respondents, the copyright and ownership should fully transfer to the client for suitability of
practice Malaysia to reduce dispute. They stated that normally payment of client has included
the ownership and copyright of the BIM model in Malaysia. Therefore, the copyright and
ownership should be owned by client in Malaysia.
The respondents also emphasized that full transfer of copyright and ownership to the
client up to full payment can ease the facilities management process after the construction.
Client does not need consent from the model author for using the model to conduct facility
management in the future. Therefore, clause 6.1 was amended and clause 6.6 was removed so
that the ownership and the copyright of the model will be fully transferred to the client upon
full payment was made as the original version stated that the ownership and copyright of the
model shall remain under the model author and consent is needed from the model author if
the client wish to use the model after the project.
Part 7: Extension to Existing Clause in PWD 203A and PAM
This section does not exist in the first draft of the addendum. It is suggested given by one
of the respondents for enhancing the understanding of the contract user on the deliverables of
the project. To differentiate between a conventional construction project and project that
adopted BIM tool, the keyword is 3D parametric tool. Therefore, extension to the existing
clauses in the standard form of contract, PWD 203A and PAM 2018 to emphasize all the
information like, variations orders, progress payment and design shall be submitted with 3D
parametric model. This section is added so that the consultant and the contractor can utilised
the BIM model rather than just taking it as an extra works. According to the suggested
respondent, the phenomenon in the construction industry is the designs are prepared in both
2D and 3D form separately just to fulfil the requirement of the client to have a 3D model of
design at the end of the project. However, the 3D model is delivered separately, they do not

184
MCRJ Special Issue Vol. 12 | No. 1 | 2021
utilise the model for the construction project. Therefore, the 3D parametric model was
emphasized in the related clauses in the existing contract hopefully will encourage the contract
to utilise the BIM model.
PROPOSED ADDENDUM FOR MALAYSIA STANDARD FORM OF CONTRACTS
Table below presents the proposed addendum that is possibly suitable for Malaysia
standard form of contracts, PWD 203A and PAM 2018.
Table 5. Proposed Addendum for PWD203A and PAM2018
1.0 Definitions
1.1 Building Information Modeling (BIM) means the process of designing, constructing or operating a building or infrastructure asset using the electronic object-oriented information.
1.2 BIM Guide refers to the guide that is specified in the Principal Agreement for BIM. If it is not stated, the BIM Guidebook 4 that published by Construction Industry Development Board (CIDB) shall be used.
1.3 BIM Execution Plan means the plan that explaining about the how to carry out the information Modeling aspects of a project.
1.4 BIM Manager refers to the agent of Architect or the contractor appointed by the Employer in accordance with Clause 2 to be BIM Manager.
1.5 Contribution means the data, design, expression or information that a party in the project created, prepared or shared with other Parties for use in or in connection with a model.
1.6 Information Model means model comprising of documentation, non-graphical information and graphical information.
1.7 Model Author refers to the originator of model files, drawings or documents. 1.8 Principle Agreement means the agreement or main building contracts which the parties have entering for the
Project. 1.9 Common Data Environment (CDE) means the single source of information for the Project which may be a
project server, an extranet or other suitable tool, used to collect, manage and disseminate all related project documents for multi-disciplined teams.
1.10 Archive means the component of CDE that is inactive which provide a history of project information transfers, sharing, change orders and knowledge retention.
2.0 Model Management
2.1 All progress should be kept as record without alterations when every milestone of the project is met. (Archive Section)
2.2 Any changes made on the identified milestones by any project team members, it should be indicated. 2.3 When discrepancy is found between the latest versions of a model by any party, the party should inform the
Architect/SO. 2.4 Clash checking shall be carried out by the contractor continuously throughout the whole process of
construction as the model are always updated as constructed information to make sure it is complied with the contract.
2.5 When defects or deviation from the constructions occurs, the model shall be updated within the period in accordance with the contract, to ensure that impact on the following trades can be detected and to make appropriate decision.
3.0 Model Reliance Risk
3.1 Project team member may only rely on the completeness and accuracy of the information model up to level details as required by the contract.
3.2 Any project team member uses the BIM model that exceed the level of details as required in the contract at own risk, creator of the model is not responsible for it.
3.3 If any project team member transmits the BIM model without authorization, reliance on the model at own risk.
4.0 Risks Allocation
4.1 Every project team member shall be responsible to minimize risk of claims and inform to the Architect/S.O. if any error, inconsistencies or omissions.
4.2 Model author is not liable for any expenses or damages arise from its contribution for usage of model beyond as stated in the BEP.
4.3 No party is responsible for any corruption or any unintended amendments, modification or alteration of the electronic data in any BIM model after the BIM model had transmitted by that party which comply with requirements in the agreement or BEP.
4.4 No party is responsible to the employer for modification or amendment to any transmission, copying or use of the materials by the employer, other party who is given authorization for transmitting the data without giving notice.

185
MCRJ Special Issue Vol. 12 | No. 1 | 2021
5.0 Intellectual Property Rights
5.1 The copyright and the ownership of the information or BIM model shall fully transfer to the client upon full payment.
5.2 Model Author agreed to indemnify the project team members that given authorization to use the BIM model against claim from third party for infringement or alleged infringement of the copyright that consisted in the Contribution of the Model Author.
5.3 Project Team Member will grant the Employer a non-exclusive licence (to grant sub-licence to other project team members) to transmit, copy and use the Materials and any proprietary work contained in the materials for the permitted purpose.
5.4 Non-payment for the license may cause the license to be suspended or revoked. 5.5 The license does not grant the right to modify or amend the materials without Project Team Member’s
Consent; to reproduce the work contained in the Materials.
Please refer to the clauses for the project based on the standard form of contract used.
6.0 Extension to the Existing Clause in PAM 2018.
6.1 As accordance to clause 1.3, 1.4 and 4.2 of PAM 2018, the information that will be produced must be in 3D parametric model.
6.2 As accordance to clause 3.1(d), 3.4 and 3.10 of PAM 2018, All submissions drawing must produce from the 3D model.
6.3 As accordance to clause 11.5, justification of claim for Variation Order (VO) shall base on 3D model within the 5D methodology.
6.4 As accordance to clause 30.1, justification of payment shall base on 3D model within the 5D methodology.
7.0 Extension to the Existing Clause in PWD 203A.
7.1 As accordance to clause 10.0(f), 10.0(h) and 22.0 of PWD 203A 2010, the information that will be produced must be in 3D parametric model.
7.2 As accordance to clause 24.1, justification of claim for Variation Order (VO) shall base on 3D model within the 5D methodology.
CONCLUSION
This research concludes that implementation of BIM in Malaysia is still in early stage and
not many from the construction industry is aware about this and ready for the implementation
of BIM. The factors that contribute to this phenomenon are identified by exploring the
challenges faced to develop a comprehensive construction contract for Malaysia construction
industry were discussed. However, the research figured out the 5 common legal issues that
should be took into considerations while drafting a contract for a BIM project. The applicable
BIM condition from the addendums is acted as a reference while drafting the addendum to be
attached to the PWD 203A and PAM 2018 with consideration of suitability for construction
industry in Malaysia. The proposed addendum hopes to cover the possible events during BIM-
based project.
In academic point of view, findings from this research helps the quantity surveyors
understand better about the elements should be included in a construction contract for BIM
project. The loopholes of the existing standard form of contract to be used for BIM project
was also explained. Practically, the research will guide the construction players with the
knowledge of legal issues that shall be concerned while drafting contract for a BIM-based
project. Hoping this can save more time and resources of them while drafting contract for
BIM projects with the understanding of scope and liabilities involved.
REFERENCES
AIA. (2018). E203-2013 Building Information Modeling and Digital Data Exhibit. AIA.
https://www.aiacontracts.org/
Barnes, P. (2019). BIM in Principle and in Practice. Ice Publishing.

186
MCRJ Special Issue Vol. 12 | No. 1 | 2021
Chang, C. Y. (2018, November). Incentivizing Collaborative BIM-enabled Projects: A
Synthesis of Agency and Behavioural Approaches. Project Management Institute.
CIOB (2011). Guide to Good Practice in the Management of Time in Complex Projects. The
Chartered Institution of Building.
Construction Industry Council (2018), Building Information Modeling (BIM) Protocol
Second Edition: Standard Protocol for use in projects using Building Information,
retrieved from http://cic.org.uk/admin/resources/bim-protocol-2nd-edition-2.pdf.
Corenet (2018). Singapore BIM Guide Version 2.0. Corenet by Singapore Government.
Retrieved from https://www.corenet.gov.sg/general/bim-guides/singapore-bim-guide-
version-20.aspx
Eggink, E. (2020). A Practical Guide to Engineering, Procurement and Construction
Contracts. Taylor & Francis.
Galiano-Garrigos, A., Mahdjoubi, L., & Brebbia, C. A. (Eds.). (2017). Building Information
Modeling (BIM) in Design, Construction and Operations II (Vol. 169). WIT Press.
Gibbs, D. J., Emmitt, S., Lord, W., & Ruikar, K. (2015). BIM and construction contracts–
CPC 2013’s approach. Proceedings of the Institution of Civil Engineers-Management,
Procurement and Law, 168(6), 285-293.
Gough, D., Oliver, S., & Thomas, J. (2017). An Introduction to Systematic Reviews. London:
SAGE Publications Ltd.
Jamil, A. H. A., & Fathi, M. S. (2018). Contractual challenges for BIM-based construction
projects: a systematic review. Built Environment Project and Asset Management.
Jiang, Y. X., Ma, P., & Zhang, S. B. (2018). Contractual governance of BIM-enabled projects:
Where are we. International Journal of Architecture, Engineering and Construction, 7(1),
1-10.
Jo, T. M., Ishak, S. S. M., & Rashid, Z. Z. A. (2018). Overview of the Legal Aspects and
Contract Requirements of the BIM Practice in Malaysian Construction Industry. In
MATEC Web of Conferences (Vol. 203, p. 02011). EDP Sciences.
Maki, T., & Kerosuo, H. (2015). Site managers’ daily work and the uses of building
information Modeling in construction site management. Construction management and
economics, 33(3), 163-175.
Manderson, A. (2015). Building Information Modeling and Standardised Construction
Contracts: A Content Analysis of the GC21 Contract. Construction Economics and
Building, 13.
McPartland, R (2018, December 19). What is the CIC BIM Protocol? NBS. Retrieved from
https://www.thenbs.com/knowledge/what-is-the-cic-bim-protocol
Naden, C (2019), Better Building With New International Standards For BIM, News: ISO,
retrieved from https://www.iso.org/news/ref2364.html
Pickavance (2014). The CIOB Complex Projects Contract. Society of Construction Law,
Hinckley, UK, D165. Retrieved from http://www.scl.org.uk/files/D165-pickavance.pdf
Rajoo, S (2009) The PAM 2006 Form of Building Contract: An Overview. SRAC. Retrieved
from http://sundrarajoo.com/2009/10/07/the-pam-2006-form-of-building-contract-an-
overview/
Sinclair, D. S. (2018). The First Reported UK BIM Case: Trant v Mott MacDonald. Fenwick
Elliott Annual Review 2017/2018.
Stepanenko, O., Tatarnikov, V., & Cherdakova, L. (2019, November). Legal protection of
BIM products. In IOP Conference Series: Materials Science and Engineering (Vol. 667,
No. 1, p. 012099). IOP Publishing.

187
MCRJ Special Issue Vol. 12 | No. 1 | 2021
Udom, K. (2018, December 16). BIM: mapping out the legal issues. NBS. Retrieved from
https://www.thenbs.com/knowledge/bim-mapping-out-the-legal-issues.
Viscuso, S., Talamo, C., Zanelli, A., & Arlati, E. (2020). BIM Management Guidelines of the
Construction Process for General Contractors. In Digital Transformation of the Design,
Construction and Management Processes of the Built Environment (pp. 189-199).
Springer, Cham.
Winfield, M. (2016, January 11). BIM Contracts Are Leaving Liability Gaps: A Ticking Time
Bomb? CIOB. Retrieved from http://www.bimplus.co.uk/management/bim-contracts-
leav3ng-liability-gap2s-tick7ing/
Zakaria, Z. B. (2013). An Overview of Comparison between Construction Contracts in
Malaysia: The Roles and Responsibilities of Contract Administrator Achieving Final
Account Closing Success. Paper presented at the International Conference on Education
and Educational Technologies.

188
MCRJ Special Issue Vol. 12 | No. 1 | 2021
A STUDY OF GIRDER BRIDGE AESTHETICS
Chu Sheng Ding1, Hafez Salleh2 and Mei Ye Kho2 1Quantity Surveying Department, School of Built Environment, University College of Technology Sarawak, Sarawak, Malaysia. 2Centre for Building, Construction & Tropical (BuCTA), Faculty of Built Environment, University of Malaya, Malaysia.
Abstract There are numerous research on the constructability concept since its introduction in late 1970. However, there are limited studies to study the constructability concept from the aesthetics point of view. For bridge designs, many researchers and designers commented that aesthetics is an important design consideration. Design that is aesthetically appealing should be one important principle under the big umbrella of the constructability concept. This study ranked different girder bridge design alternatives based on their contribution towards the aesthetics of girder bridge design. Twenty-four (24) consulting engineers and contractors in Sarawak, Malaysia were invited to rate various girder bridge components design alternatives in term of their importance in enhancing the aesthetics of girder bridge design based on 5-point Likert Scale. The collected data was analyzed using Relative Importance Index (RII) method. Based on the results, the design alternatives that contributed the most to the girder bridge aesthetics are V-shaped pier (RII 0.975), New Jersey parapet with steel railing (RII 0.933), and box girder (RII 0.900). The results of the present study can provide guidelines to engineers when designing girder bridges. The new knowledge can be considered together with other constructability principles so that girder bridges designed by engineers are not only construct-able but also aesthetically appealing.
Keywords: Constructability; bridge aesthetics.
INTRODUCTION
Applicable to both building and infrastructure projects, implementing constructability
principles at the early design stage can help to enhance the project performance. Some benefits
of “constructability” include reduced project duration & cost (Jadidoleslami et al., 2018)
reduced changes (Saghatforoush et al., 2010), better design (Khan, 2018), improved
construction efficiency (Sanjaya et al., 2019), and reduced project risk (Sopic et al., 2019).
There are numerous research on the constructability concept since its introduction in late
1970. However, there are limited studies to study the constructability concept from the
aesthetics point of view. For bridge designs, many researchers and designers commented that
aesthetics is an important consideration. “Constructability” is a comprehensive project
management concept therefore the aesthetics of a design should be covered under the big
umbrella of this concept. This paper aims to rank different girder bridge design alternatives
based on their contribution towards the aesthetics of girder bridge design. Only long river-
crossing girder bridge which is longer that 1 kilometer is considered for this study. The
research process and findings are explained in this paper.
LITERATURE REVIEW
Definitions of “constructability”
There are many definitions of “constructability”. Basically, constructability is a project
management concept to be considered and adopted before and throughout the project delivery
stages so that optimum project outcome can be achieved. Apart from that, constructability can

189
MCRJ Special Issue Vol. 12 | No. 1 | 2021
be extended to incorporate maintainability and operability concerns (Saghatforoush et al.,
2012). Constructability is also referred to as buildability and these two terms are sometimes
used interchangeably. However, constructability is found to encompass wider project
management scope compared to buildability (Alinaitwe et al., 2014). Some definitions of
constructability are as shown in Table 1.
Table 1. Definitions of Constructability
Definition
The optimum use of construction knowledge and experience in the conceptual planning, detailed engineering, procurement and field operations phases to achieve the overall project objectives
Construction Industry Institute (CII), 1986
The integration of construction knowledge in the project delivery process and balancing the various project and environmental constraints to achieve project goals and building performance at an optimal level
Construction Industry Institute (CII) Australia, 1996
The optimum use of construction knowledge and experience by the owner, engineer, contractor and construction manager in the conceptual planning, detailed engineering, procurement and field operations phases to achieve the overall project objectives
Nima et al., 1999
The standardization of primary structural elements to balance multi-objective design goals Horn, 2015
Constructability is one of the project management methods to evaluate the whole construction process. It is defined as a concept with relative, not absolute, value to increase optimization capacity of resources, such as workforce, time, cost, quality and working environment conditions
Jadidoleslami et al., 2018
Constructability is a project management technique for reviewing construction processes from start to finish during the pre-construction phase. It will identify obstacles before a project is actually built to reduce or prevent error, delays and cost overrun
Ansyorie, 2019
Constructability Principles
There are various principles introduced by various institutions or researchers over the past
decades. Some of the most frequently mentioned constructability principles are shown in
Table 2.
Table 2. Constructability Principles
Principles
Project elements should be standardized Nima et al., 2001; Mydin et al., 2011; Building and Construction Authority (BCA), 2017
Considering the accessibility of construction personnel, materials and equipment
CII Australia, 1996; Oludare and Oluseye, 2016; Sanjaya et al., 2019
Design simplification and conducting design review Zin and Hassan, 2006; Mydin et al., 2011; BCA, 2017
Design should facilitate construction during adverse weather conditions
Yitmen and Akyel, 2005; Wong, 2007; Alinaitwe et al., 2014
Individuals with current construction knowledge should achieve the early construction planning
CII Australia, 1996; Oludare and Oluseye, 2016; Sopic et al., 2019
The capability of modularization and preassemblies for project elements should be taken into consideration
Nima et al., 2001; Zin and Hassan, 2006; BCA, 2017
Considering storage requirement at the jobsite Zin and Hassan, 2006; Wong, 2007; Alinaitwe et al., 2014
Designing for the skills and resources available CII Australia, 1996; Oludare and Oluseye, 2016; Sanjaya et al., 2019
Considering suitability of designed materials Construction Industry Research and Information Association (CIRIA), 1983; Zin and Hassan, 2006; Alinaitwe et al., 2014

190
MCRJ Special Issue Vol. 12 | No. 1 | 2021
Although aesthetics is not included as one of the constructability principles by previous
researchers, it is an important factor to be considered when designing a bridge. Gottemoeller
(2014) opined that “for the same reason engineers would not build a bridge that is unsafe,
they should not build one that is ugly”. When designing a bridge, engineers should consider
“the concept that best integrates efficiency, economy, and elegance while achieving the design
vision” (American Association of State Highway and Transportation Officials (AASHTO),
2010). Baker and Puckett (2013) mentioned that bridge aesthetics “needs a priority boost”
and it can be considered without infringing other factors like constructability, economy and
safety. Tang (2018) thought that aesthetics should be an integral part of bridge design instead
of additional consideration. He mentioned that bridge aesthetics and structural configuration
should be considered together when designing a bridge. Chakradeo (2018) also stated that for
bridge design, the aesthetics principles and structural principles are linked and cannot be
separated.
A recent research conducted by Ding, Hafez and Kho (2019) had identified 54
constructability principles for girder bridge construction. Aesthetics was included as one of
the principles as recommended by a few bridge experts during the pilot survey. Questionnaire
survey was adopted for the consulting engineers and contractors to rate the 54 constructability
principles in term of their importance or impact in enhancing the constructability of river-
crossing girder bridge projects based on 5-point Likert scale. The result was analyzed using
factor analysis and the 54 principles were consolidated into 11 critical constructability
principles. Out of the 11 critical principles, “Design complements the surrounding
environment and is aesthetically appealing” is one of them. Against this background, the
researchers of this paper decided to explore further to study the girder bridge design from the
aesthetics perspective.
For this study, “aesthetics” is defined as “the study of qualities of beauty of an object and
of their perception through our senses” (Barker and Puckett, 2013).
River-Crossing Girder Bridge
Figure 1 shows a typical river-crossing girder bridge design. Girder bridge is probably
the most common and simplest form of bridge design (Sharma and Sharma, 2015; Bharil,
2016; Lin and Yoda, 2017). The most common form of girders are box girder and I-beam
girders (Sharma and Sharma, 2015). The major components of a girder bridge include:
11. Foundation
12. Abutment
13. Wing wall
14. Pier
15. Girder
16. Bridge deck
17. Wearing surface
18. Approach slab
19. Expansion joint
20. Bearing
21. Drainage system
22. Railing/parapet wall
For each of the major component above, there are different design alternatives. Take
abutment for example, there are gravity abutment, counterfort abutment, stub & semi stub
abutment, full height abutment, spill-through abutment, pile bent abutment and Mechanically
Stabilized Earth (MSE) abutment. As for the pier, there are wall pier, hammerhead pier, rigid
frame pier, single column pier, pile bent pier and V-shaped pier.

191
MCRJ Special Issue Vol. 12 | No. 1 | 2021
Figure 1. Typical River-Crossing Girder Bridge Components
RESEARCH METHODOLOGY
The present research adopted quantitative research method. Comprehensive literature
review was conducted to identify various alternatives of each bridge component. The
complete list of all alternatives was shown to 5 bridge construction experts for discussion.
Based on their comments, some missing alternatives were included and some unsuitable
alternatives were excluded. Thereafter, a complete list was compiled in questionnaire format.
Although the format is in questionnaire form, the researchers adopted structured interview. A
structured interview is “an interview that has a set of predefined questions and the questions
would be asked in the same order for all respondents” (Zhang and Wildemuth, 2009). It is
also called as ‘quantitative research interviews’ because it is used to collect quantifiable data
(Saunders et al., 2016). Under this method, the interviewer will meet the respondents and ask
questions face to face (Saunders et al., 2016). This method was adopted because the
researchers wished to give further explanations on the design alternatives if needed. During
the structured interviews, the interviewees were asked to rate each of the design alternative in
term of its contribution towards bridge aesthetics based on 5-point Likert scale. Number 5
symbolizes very high contribution whereas Number 1 symbolizes very low contribution.
The respondents for this research were consulting engineers (public & private sectors)
and contractors in Sarawak, Malaysia who have more than 10 years experiences in bridge
construction. Most contractors included in this survey were contractors for the Pan Borneo
project. The sampling method adopted was purposive sampling method because the present
study required information from interviewees with unique characteristics (Pajo, 2018). Only
consulting engineers and contractors who have experiences in designing and/or constructing
bridges were selected. According to Sekaran and Bougie (2016), purposive sampling method
is a good choice to collect information from the persons who possess the necessary
information.

192
MCRJ Special Issue Vol. 12 | No. 1 | 2021
As for the rankings of various bridge components design alternatives, the responses
collected were analyzed using RII method. RII method can be used to rank different variables
(Choudhry et al., 2017; Rooshdi et al., 2018; Olugboyega, 2018). According to Jarkas and
Bitar (2012), “the rank of each group was established by quantifying the average value of the
importance indices for all factors within; the higher the average value, the stronger the effect
of the group”. The following formula was used to calculate the RII (Olugboyega, 2018):
RII = ∑𝑤
𝐴𝑁=
5𝑛5+ 4𝑛4+3𝑛3+2𝑛2+1𝑛1
5𝑁 (1)
Where:
W = The weight given to each design alternative by the respondent, ranging from 0 to 5.
A = The highest weight (5 in this case).
N = Total number of respondents.
n1 = Number of respondents for “very low contribution”.
n2 – n4 = Number of respondents for intermediate level between very low and very high contribution.
n5 = Number of respondents for “very high contribution”.
The RII ranges from 0 to 1. Higher RII symbolizes more contribution towards girder
bridge aesthetics.
RESULTS AND DISCUSSIONS
Number of Interviewees
There were 24 interviewees for the present study (Figure 2). More inputs were collected
from the consulting engineers (public sector) and contractors. There were only 5 private
sectors consulting engineers to participate in the survey. Only engineers and contractors in
Sarawak were interviewed.
Figure 2. Number of the Interviewees for the Structured Interview Survey
Geographical Location of the Interviewees
The geographical location of the interviewees are shown in Figure 3. Most of the data
were collected from Kuching, Sarawak.

193
MCRJ Special Issue Vol. 12 | No. 1 | 2021
Figure 3. Geographical Location of the Interviewees
RII and Rankings of Girder Bridge Design Alternatives
Table 3. Ranking of Foundation Design Alternatives
1. Foundation RII Ranking
Spun pile 0.242 /
Pipe pile 0.242 /
H pile 0.242 /
Bored pile 0.242 /
Caisson method 0.242 /
Foundation constructed using cofferdam 0.242 /
Table 4. Ranking of Abutment Design Alternatives
2. Abutment RII Ranking
Full height abutment 0.758 1
Spill-through abutment 0.717 2
MSE abutment 0.700 3
Stub abutment 0.692 4
Semi stub abutment 0.617 5
Gravity abutment 0.533 6
Counterfort abutment 0.483 7
Pile bent abutment 0.342 8
Table 5. Ranking of Wing Wall Design Alternatives
3. Wing Wall RII Ranking
Flared wing wall cantilever 0.667 1
Flared wing wall independent 0.667 1
U type wing wall cantilever 0.600 2
U type wing wall independent 0.600 2
In-line wing wall cantilever 0.425 3
In-line wing wall independent 0.425 3
Table 6. Ranking of Pier Design Alternatives
4. Pier RII Ranking
V-shaped pier 0.975 1
Hammerhead pier 0.842 2
Single column pier 0.667 3
Rigid frame pier 0.558 4
Wall pier 0.533 5
Pile bent pier 0.275 6

194
MCRJ Special Issue Vol. 12 | No. 1 | 2021
Table 7. Ranking of Girder Design Alternatives
5. Girder RII Ranking
Box girder 0.900 1
U girder (concrete) 0.758 2
U girder (steel) 0.650 3
I girder (concrete) 0.608 4
T beam 0.583 5
I girder (steel) 0.492 6
Concrete encased steel beam 0.467 7
Table 8. Ranking of Bridge Deck Design Alternatives
6. Bridge Deck RII Ranking
Concrete deck 0.400 1
Effideck 0.350 2
Fibre reinforced polymer deck 0.350 3
Exordemic deck 0.342 4
Top flange of box girder / T girder as deck 0.333 5
Steel trough deck 0.333 5
Steel orthotropic deck 0.333 5
Open grid deck 0.333 5
Grid reinforced concrete deck 0.333 5
Table 9. Ranking of Wearing Surface Design Alternatives
7. Wearing Surface RII Ranking
Polymer modified asphalt 0.592 1
Open graded asphalt 0.575 2
Dense graded asphalt 0.575 2
Stone mastic asphalt 0.575 2
Latex modified concrete 0.575 2
Unmodified concrete 0.558 3
Integrated wearing surface (top part of bridge deck as wearing surface) 0.558 3
Table 10. Ranking of Approach Slab Design Alternatives
8. Approach Slab RII Ranking
Concrete slab on sleeper slab 0.400 1
Concrete slab on sleeper slab + piles under sleeper slab 0.350 2
Concrete slab on geogrid 0.350 3
Concrete slab on driven piles 0.342 4
Table 11. Ranking of Expansion Joint Design Alternatives
9. Expansion Joint RII Ranking
Modular joint 0.817 1
Steel finger joint 0.742 2
Elastomeric strip joint 0.708 3
Bolt down joint 0.617 4
Sliding steel plate 0.408 5
Compression seal joint 0.408 5
No expansion joint 0.367 6
Butt joint 0.358 7
Asphaltic joint 0.358 7
Poured sealant joint 0.325 8

195
MCRJ Special Issue Vol. 12 | No. 1 | 2021
Table 12. Ranking of Bearing Design Alternatives
10. Bearing RII Ranking
Pot beaing 0.742 1
Spherical bearing 0.717 2
Disc bearing 0.708 3
Steel reinforced elastomeric 0.633 4
Elastomeric sliding bearing 0.600 5
No bearing 0.517 6
Rubber bearing 0.308 7
Pin bearing 0.308 7
Rocker bearing 0.308 7
Roller bearing 0.300 8
Table 13. Ranking of Deck Drainage Design Alternatives
11. Deck Drainage RII Ranking
Concrete curb 0.825 1
Combination inlets (concrete curb + grate) 0.808 2
Composite material curb (i.e. Envirodeck) 0.717 3
Slotted inlet 0.692 4
Trench inlet 0.592 5
Grate inlet 0.442 6
Ductile steel curb 0.392 7
Table 14. Ranking of Railing Design Alternatives
12. Railing / Parapet RII Ranking
New Jersey parapet with steel railing 0.933 1
Concrete railing 0.783 2
Standard curb with steel railing 0.550 3
Steel railing 0.500 4
DISCUSSION
Giving the RII and rankings, the results are self-explanatory. Foundation of bridge
contributes the least to the bridge aesthetics and there is no ranking because it cannot be seen
once driven into the ground or water. The approach slab and bridge deck also have lesser
contribution because cannot be seen once the construction is completed. So, there is no clear
distinction between the alternatives. The results also shows that there is no preference for
asphaltic or concrete wearing surface.
Some of the bridge designs allow the wing wall to be exposed after completion. Most
interviewees preferred the flared wing wall and U type wing wall. For expansion joints, the
modular, steel fingers and elastomeric strip joints were preferred by the interviewees.
Although modular joint contributes more to aesthetics and it is useful to accommodate large
movement, the initial cost can be more expensive. Some interviewees reported that the
“fingers” of steel fingers joint may be broken or bent after some time due to traffic impact.
Therefore, the durability of the joints selected must be taken into account while considering
the design aesthetics.

196
MCRJ Special Issue Vol. 12 | No. 1 | 2021
As for the bearing type, pot, spherical and disc bearings were preferred. Although
spherical bearing ranked the 2nd, its use in Sarawak is still limited. It is because the engineers
normally selected pot and disc bearings as they can accommodate large movement and require
less maintenance. The superiority of spherical bearing over pot and disc bearing is subject to
further research. Besides, even though there is a trend for the designers to go for integrated
structure design (means no expansion joints and bearings) for some bridges, the interviewees
commented that this does not contribute to enhance the bridge aesthetics. According to them,
appropriate joints and bearings also served as “decorations” apart from their main functions.
Furthermore, integrated structures are more suitable for shorter span.
For abutment designs, the interviewees preferred full height abutment and spill-through
abutment because they look more spectacular. However, they commented that these
abutments are costly to be constructed and the compaction of the backfilled materials can be
difficult. MSE abutment ranked the 3rd because the facing units /cladding (Figure 4) can be
designed to cover the earth thus enhancing the aesthetics. In practice, most of the long river-
crossing girder bridges in Sarawak adopted stub abutment design because it is easier to
construct and is less expensive compared to taller abutments like full height and spill-through
types. In this regard, the researchers found that to enhance aesthetics would require more
construction cost and time. However, better aesthetics should not be automatically linked to
additional cost and time (AASHTO, 2010). The wisdom of engineers is needed to find the
balancing point between aesthetics and construction cost.
Figure 4. MSE Abutment
For deck drainage design, the interviewees preferred traditional concrete curb and
combination inlets. In practice, many steel grate inlets are adopted as deck drainage system.
This design should be avoided because it contributed less (RII 0.422) to enhancing bridge
aesthetics.
The design alternatives that contributed the most to the girder bridge aesthetics are V-
shaped pier (RII 0.975), New Jersey parapet with steel railing (0.933), and box girder (RII
0.900). This indicates that the engineers can put in more efforts in designing aesthetically
appealing piers, parapet wall and girders as there are very obvious components that are
exposed to the public. New Jersey parapet with steel railing and box girder are commonly
adopted in Sarawak. Apart from New Jersey parapet with steel railing, concrete parapet is

197
MCRJ Special Issue Vol. 12 | No. 1 | 2021
also commonly used. However, the existing concrete parapet walls are mostly of the identical
plain concrete design (less decoration). The researchers found that the concrete parapet
designs should be varied (e.g., Figure 13) to enhance aesthetics and to ensure uniqueness of
each bridge.
V-shaped pier is yet to be constructed in Sarawak. The researchers think that the biggest
barriers to adopting V-shaped pier are its complex design and difficult construction process
due to its steep slope and shape variation. The construction cost is also higher than other pier
types. Besides, wall pier is commonly constructed in Sarawak but it is only ranked as number
5 (RII 0.533). It is recommended that other pier designs should be considered by engineers to
diversify the bridge design.
Engineers play important roles in ensuring the aesthetics of bridge designs. Ignoring
aesthetics is irresponsible (AASHTO, 2010). According to Tang (2018), aesthetics is “one
basic requirement of a successful bridge” and “a bridge that is safe, functional…and beautiful
will provide both comfort and convenience.”
The results of the present research can provide guidelines to the engineers at the design
stage to enhance the aesthetics of girder bridge designs. When the bridge aesthetics is
enhanced, general public can enjoy using bridges that are visually pleasing and be proud of
them. Furthermore, similar research can be conducted by academicians to study the aesthetics
of other types of bridge designs such as arch bridge, suspension bridge, and cable stayed
bridge.
LIMITATION OF THE PRESENT STUDY
There are limited sample size. Only 24 interviewees (including consulting engineers and
contractors) were interviewed. Samples were collected within Sarawak, from Kuching, Miri,
Sibu, Bintulu, Sarikei, and Limbang. The result should not be generalized beyond this scope.
The main subject of this study is longer river-crossing girder bridge which is more than 1
kilometer span. Other bridge types like highway bridge, arch bridge, truss bridge, suspension
bridges were not considered. Besides, the study only focused on the aesthetics aspect of bridge
designs. Other design factors such as suitability of design, sustainability, resources
availability and structural configuration were not considered.
CONCLUSION
Structured interviews were conducted to allow the consulting engineers and contractors
to rate different girder bridge components design alternatives in term of their importance in
enhancing the aesthetics of girder bridge projects based on 5-point Likert scale. The responses
of the survey were analyzed using RII method. The design alternatives for each component
were ranked based on RII. Based on the results, the design alternatives that contributed the
most to the girder bridge aesthetics are V-shaped pier, New Jersey parapet with steel railing,
and box girder. The present study is the first in Sarawak to study the aesthetics of girder bridge
design alternatives. Aesthetics should be one factor to be considered by the engineers when
designing bridges. Through this study, it is anticipated to create awareness among the
engineers to consider bridge design aesthetics from the early project stage instead of
considered it as a “last touch” or an “add on”. Aesthetics should be taken into account together
with other constructability principles such as standardization, resources utilization, suitability

198
MCRJ Special Issue Vol. 12 | No. 1 | 2021
of design, and waste minimization so that bridges designed by engineers are not only
construct-able but also aesthetically appealing.
FUTURE DIRECTION
There is a trend for the constructability research to shift from the exploration of theoretical
concept to the development of quantitative assessment tools. The present study is part of the
effort of the researchers in developing a conceptual quantitative constructability assessment
model for girder bridge construction. Apart from aesthetics, other constructability principles
including time and cost savings, resources utilization, sustainable construction, simple design,
effective designs, and improved construction safety will be integrated to develop the said
model. It is also recommended that more quantitative constructability assessment models for
infrastructure projects can be developed as the existing models are mostly designed for
building projects only.
PICTURES OF BRIDGE COMPONENTS
Due to the limitation of space, only the pictures of some design alternatives are provided.
The explanations and pictures of all design alternatives can be found from online sources.
Figure 5. Independent and Cantilever Wing Wall (Adapted from University of Ljubljana, 2015).
Figure 6. Wing Wall Types (Adapted from Minnesota Department of Transportation, 2016).

199
MCRJ Special Issue Vol. 12 | No. 1 | 2021
Figure 7. Concrete Curb Inlet (Adapted from Department of Irrigation and Drainage (DID), 2012).
Figure 8. Combination Inlet (Concrete Curb + Grate) (Adapted from DID, 2012).
Figure 9. Grate Inlet (Adapted from DID, 2012).
Figure 10. Composite Material Curb (Adapted from Pipeline & Drainage Systems PLC, 2019).
Figure 11. Standard Curb with Steel Railing.

200
MCRJ Special Issue Vol. 12 | No. 1 | 2021
Figure 12. New Jersey Parapet with Steel Railing.
Figure 13. Different Designs of Concrete Railing (Adapted from Texas Department of Transportation
(TxDOT), 2019).
ACKNOWLEDGMENT
The work described in this paper was fully supported by University College of
Technology Sarawak (UCTS) research grant (UCTS/RESEARCH/2/2019/05).
REFERENCES
Alinaitwe, H., Nyamutale, W., and Tindiwensi, D. (2014) Design Phase Constructability
Improvement Strategies for Highway Projects in Uganda. Journal of Construction in
Developing Countries, 19(1):127–140.
American Association of State Highway and Transportation Officials (AASHTO). (2010)
Bridge Aesthetics Sourcebook: Practical Ideas for Short- and Medium- span Bridges,
WA: AASHTO.
Ansyorie, M. M. A. (2019) Concepts of Constructability for Project Construction in
Indonesia. IOP Conference Series: Materials Science and Engineering, 669:1-8.
Barker, R. M., and Puckett, J. A. (2013) Design of Highway Bridges: An LRFD Approach,
NJ: John Wiley and Sons, Inc.
Bharil, R. K. (2016) Girder. In A. Pipinato (Ed.). Innovative Bridge Design Handbook:
Construction, Rehabilitation and Maintenance, UK: Butterworth Heinemann.
Bridge Grid Flooring Manufacturers Association. (2010) Corrosion protection options for
grid reinforced voncrete decks. Retrieved from: http://www.
bgfma.org/Newsletter/HTML/TECHnews1.html
Building and Construction Authority (BCA). (2017). Code of Practice on Buildability,
Singapore: BCA, 2017.

201
MCRJ Special Issue Vol. 12 | No. 1 | 2021
Chakradeo, R. C. (2018) Understanding the Principle of Aesthetics In Bridges with Reference
to the Structural Principles. International Journal of Engineering Research, 7(3):289-
292.
Choudhry, R. M., Gabriel, H. F., Khan, M. K., and Azhar, S. (2017) Causes of Discrepancies
Between Design and Construction in the Pakistan Construction Industry. Journal of
Construction in Developing Countries, 22(2):1–18.
Construction Industry Institute (CII). (1986) Constructability: A Primer. Texas: CII.
Construction Industry Institute (CII) Australia. (1996) Constructability Manual. Brisbane: CII
Australia.
Construction Industry Research and Information Association (CIRIA). (1983) Buildability:
An Assessment, London: CIRIA.
Department of Irrigation and Drainage (DID). (2012) Urban stormwater management manual
for Malaysia, Kuala Lumpur: DID.
Ding, C. S., Hafez, S., and Kho, M. Y. (2019) Critical Constructability Principles for Girder
Bridge Construction in Malaysia. International Journal of Sustainable Construction
Engineering and Technology, 10(2):41-51.
Gottemoeller, F. (2014) Bridge Aesthetics: Achieving Structural Art in Bridge Design, in
BridgeEngineering Handbook, Fundamentals. Florida: CRC Press.
Horn, A. (2015). Integrating Constructability Into Conceptual Structural Design and
Optimization. Master’s dissertation, Massachusetts Institute of Technology.
Jadidoleslami, S., Saghatforoush, E., Heravi, A., and Preece, C. (2018) Evaluating the
Existing Barriers in Implementing Constructability. Civil Engineering Journal,
4(12):2864-2875.
Jarkas, A. M., and Bitar, C. G. (2012) Factors Affecting Construction Labor Productivity in
Kuwait. Journal of Construction Engineering and Management, 138(7):811-820.
Khan, S. (2018) Constructability: A Tool for Project Management. FL: CRC Press.
Lin, W. W., and Yoda, T. (2017) Bridge Engineering: Classifications, Design Loading, and
Analysis Methods, UK: Butterworth-Heinemann.
Minnesota Department of Transportation. (2016) LRFD Bridge Design Manual. Minnesota:
MnDOT.
Mydin, S. H., Zin, R. M., Majid, M. Z. A., Zahidi, M., and Memon, A. H. (2011) Buildability
Attributes at Design Phase in Malaysian Building Construction. International Journal of
Sustainable Construction Engineering Technology, 2(1):24-43.
Nima, M. A., Abdul-Kadir, M. R., and Jaafar, M. S. (1999) Evaluation of the Engineer's
Personnel's Role in Enhancing the Project Constructability. Facilities, 17(11):423-430.
Nima, M. A., Abdul-Kadir, M. R., Jaafar, M. S., and Alghulamp, R. G. (2001)
Constructability Implementation: A Survey in the Malaysian Construction Industry.
Construction Management and Economics, 19:819-829.
Oludare, O. S., and Oluseye, O. (2016) Constructability Concepts and Enhancement
Capabilities of Construction Site Team Members in Obafemi Awolowo University, Ile-
Ife, Nigeria. Civil and Environmental Research, 8(3):13-19.
Olugboyega, O. (2018) Specific Roles of Builders in Building Information Modelling
Processes. Journal of Construction in Developing Countries, 23(2):27–42.
Pajo, B. (2018) Introduction to Research Methods: A Hands-on Approach. California: SAGE
Publications, Inc.
Pipeline & Drainage Systems PLC. (2019) Envirodeck. Retrieved from:
https://www.pdsenviro.com/ media/1078/envirodeck.pdf

202
MCRJ Special Issue Vol. 12 | No. 1 | 2021
Rooshdi, R. R. R. M., Majid, M. Z. A., Sahamir, S. R., and Ismail, N. A. A. (2018) Relative
Importance Index of Sustainable Design and Construction Activities Criteria for Green
Highway. Chemical Engineering Transactions, 63:151-156.
Saghatforoush, E., Hassim, S., Jaafar, M. S., and Trigunarsyah, B. (2010) Critical
Constructability Activities in Building Projects. Proceedings of 6th International Project
Management Conference. Iran, 1-12.
Saghatforoush, E., Trigunarsyah, B., and Too, E. (2012) Assessment of Operability and
Maintainability Success Factors in Provision of Extended Constructability Principles.
Proceedings of the 9th International Congress on Civil Engineering. Iran, 1-10.
Sanjaya, P. A., Joni, I. G. P., and Frederika, A. (2019) The Role of Contractor in Improving
Buidability in Construction Projects in Bali. MATEC Web of Conferences, 276:1-6.
Saunders, M., Lewis, P., and Thornhill, A. (2016) Research Methods for Business Students,
Essex: Pearson Education Limited.
Sekaran, U., and Bougie, R. (2016) Research Methods for Business: A Skill-building
Approach, West Sussex: John Wiley & Sons Ltd.
Sharma, R., and Sharma, D. K. (2015) A Review on Bridge Construction Technology.
International Journal of Computer Technology and Electronics Engineering, 5(2):1-10.
Sopic, M., Vukomanovic, M., and Car-Pusic, D. (2019) Risk and Opportunities of Taking
Different Procurement Routes in Construction Projects in Croatia. Proceedings of 14th
Organization, Technology & Management in Construction Conference. Croatia, 23-42.
Tang, M. C. (2018) Forms and Aesthetics of Bridges. Engineering, 4(2):267-276.
Texas Department of Transportation (TxDOT). (2019) Bridge Railing Manual. Texas:
TxDOT.
Wang, L. (2014) Abutments. In W. F. Chen & L. Duan (Eds.). Bridge Engineering Handbook:
Substructure Design. Florida: CRC Press.
Wong, W. H. (2007) Developing and Implementing an Empirical System for Scoring
Buildability of Designs in the Hong Kong Construction Industry. PhD thesis, The Hong
Kong Polytechnic University.
Yitmen, I., and Akyel, S.(2005) Challenges of Best Practices for Constructability
Implementation. North Cyprus Construction Industry. Northern Cyprus: Publisher
unknown.
Zhang, Y., and Wildemuth, B. M. (2009) Unstructured interviews. In B. M. Wildemuth (Ed.).
Application of Social Research Methods to Questions in Information and Library Science.
Connecticut: Library Unlimited.
Zin, R. M., and Hassan, S. H. (2006) Design Phase Constructability Concepts for Highway
Construction. Proceedings of the International Conference on Construction Industry.
Indonesia, 1-11.
203
MCRJ Special Issue Vol. 12 | No. 1 | 2021
ENVIRONMENTAL SUSTAINABILITY IN MALAYSIAN HERITAGE BUILDING CONSERVATION: REVIEW OF HERITAGE LEGISLATION AND POLICY
Noor Suzaini M. Zaid2, Mohd Izzat Ghazali3, Nur Farhana Azmi1, Putri Nabila Kamarulzaman3, and Farid Wajdi Akashah1 1Center for Building, Construction and Tropical Architecture (BuCTA), Faculty of Built Environment, Universiti Malaya, Malaysia. 2Center for Sustainable Urban Planning and Real Estate (SUPRE), Faculty of Built Environment, Universiti Malaya, Malaysia. 3Department of Building Surveying, Faculty of Built Environment, Universiti Malaya, Malaysia.
Abstract Heritage building is a tangible part of cultural heritage, a physical artefact of significant value from past generations that need to be maintained and preserved for the benefit of future generations. This paper investigates the importance and relevance of triple-bottom line elements of sustainable development (social, economic and environment) integration within heritage conservation legislation and policy. A comparative review of current Malaysian and international heritage legislation and policy was made to identify existing gaps in improving the integration of sustainability elements into current heritage legislation. The Malaysian heritage legislation is extensively benchmarked against the UNESCO Operational Guidelines for the Implementation of the World Heritage Convention, the United Kingdom Building Regulations and Historic Buildings 2004, the Australian Burra Charter, the United States National Historic Preservation Act 1966, the Japanese Law for the Protection of Cultural Property 1950, the Singaporean Preservation of Monuments Act 1971, and the Indonesian Cagar Budaya. The review analysis revealed that the Malaysian heritage conversation legislation is lacking integration between the environmental sustainability element, in comparison to social and economic elements of sustainable development. With over 170 buildings currently registered in the Malaysian National Heritage Council heritage list, these issues should be taken into consideration when planning the next heritage conservation procedure. The three existing heritage conservation legislation in Malaysia has no integration towards the carrying capacity element of environmental sustainability principle, while only has indirect integration for eco-system integrity. This environmental disregard within Malaysian heritage conservation legislation should be seriously taken into account by future policy makers. Keywords: Heritage conservation; triple-bottom line; sustainable development; legislation; policy
review.
INTRODUCTION
Globally, heritage buildings are considered as an important asset as they carry past history
and culture of a nation (Essays, 2018). Similar in Malaysia, heritage buildings are categorised
as an important asset which carries important values and lesson from the past. There are
several variations of how heritage building is defined; one of the most referred definition
globally is from The United Nations Educational, Scientific and Cultural Organisation
(UNESCO). UNESCO, an organisation responsible in coordinating and managing the World
Heritage list, defines heritage building as a tangible cultural heritage, a physical artefact that
carries significant values from the past generations of a society, which are maintained and
preserved for the benefit of future generations (UNESCO, 1972). In Malaysian context,
heritage building is defined as “monument” which have significant values in term of history,
art or science in its elements or structures (The Commissioner of Law Revision, 2005).
Preserving these heritage assets is important to ensure the future generation can learn the
204
MCRJ Special Issue Vol. 12 | No. 1 | 2021
significant value contained in those assets toward the development of modern world.
Conservation of heritage building benefits the society in terms of economic, cultural and
social (Bullen and Love, 2010).
However, there have been issues concerning the viability of the sustainability of these
historical structures. In the United Kingdom and Europe region, the main sustainability
concern in historical buildings is the reduction of Carbon Dioxide (CO2) emission which in
result this issue has become an integral part in the region major political, economic and social
agenda (Godwin, 2011). Hence, these heritage buildings need to fully adapt with this change
of sustainability concern in ensuring them not to be an asset which considered as sustainably
obsolete (Cassar, 2009). Sustainability can be defined as the principle of reducing the resource
consumption in achieving the present needs for a sustainable future (Godwin, 2011). In order
to achieve sustainability, the fundamental triple-bottom line need to be considered when
planning an action which are environmental, economic and social (Adams, 2006).
The practice of conserving and refurbishing an old heritage building to cater new use and
prolong its life are in line with the ideology of sustainability. Through the conservation of
heritage building, it mitigates the consumption of energy required for demolition, waste
disposal and construction of new building, and at the same time promoting sustainable
development through the conservation of the existing building embodied energy (Sodangi et
al., 2009). With application of sustainability principle in heritage building conservation, we
can sustainably pass these valuable assets onto future generation. However, the main
challenge in achieving sustainable heritage conservation is how to obtain it without sacrificing
the building’s valuable architectural or historical significance (Godwin, 2011).
In new development projects, the main approach in achieving sustainability is through
the integration of sustainable principle in decision making. This is achieved through
consideration of environmental, social and economic impact during the decision making
(Dernbach and Mintz, 2011). From a study conducted by Ashford and Hall (2011), through
the integration of sustainability requirement into development legislation, it will cause a surge
of innovation and approach created by the developer (Ashford and Hall, 2011). This proves
the effectiveness of legislation usage as the governing tool for sustainability which could also
be adopted in the heritage conservation legislation. Therefore, there is a need to efficiently
integrate sustainability principles into the existing heritage conservation legislation.
Consequently, with over 170 buildings that are currently registered in the Malaysian
National Heritage Council heritage list (National Heritage Council, 2015), issues of
sustainability integration should be taken into consideration when planning for the upcoming
heritage conservation procedure.
INTERNATIONAL HERITAGE CONSERVATION LEGISLATION AND POLICIES
Internationally there are several conservation policies developed to ensure the survival of
heritage value and also the retention of its originality. These international conservation
legislation and policies can be used as reference in improving Malaysian conservation
legislation and policy with regards to sustainability aspect. One of the common international
policies used in Malaysia is the UNESCO Operational Guidelines for the Implementation of
the World Heritage Convention. Malaysia has several sites listed under UNESCO World

205
MCRJ Special Issue Vol. 12 | No. 1 | 2021
Heritage Convention which is located in Malacca, Penang, Perak and Sarawak (UNESCO,
2017). In this section of literature analysis, the international legislation and policies that will
be analysed are the UNESCO, Operational Guidelines for the Implementation of the World
Heritage Convention; the United Kingdom Building Regulations and Historic Buildings
2004; the Australian Burra Charter, the United States National Historic Preservation Act
1966, the Japanese Law for the Protection of Cultural Property 1950, the Singaporean
Preservation of Monuments Act 1971, and the Indonesian Cagar Budaya.
Each of these selected legislation and policies represents the different region where it is
based and drafted on. The distribution of legislation and policy are, the Building Regulations
and Historic Buildings 2004 representing the European region, the Burra Carter represents
the Oceania region, the Law for the Protection of Cultural Property 1950 representing the
Asian region while the Preservation of Monuments Act 1971 and Cagar Budaya further
representing the South-east Asian region. The UNESCO Operational Guidelines for
Implementation of the World Heritage Convention on the other hand is representing the
document which is being implemented internationally. The idea behind this is to identify the
variation of the sustainability principle integration approach throughout different region.
UNESCO, Operational Guidelines for the Implementation of the World Heritage Conservation
The Operational Guidelines for the Implementation of the World Heritage Convention is
a Non-Governmental Organisation (NGO) document, which functions to encourage the
convention to protect the world heritage. It acts as a supporting document for the 1972 World
Heritage Convention document (UNESCO, 2016). In general, the document consists of
identification of world heritage list, procedure for protecting and conserving the world
heritage properties, international funding for conservation work through world heritage fund
and mobilization of support for the convention.
Part 1.G of the document listed out the advisory bodies for the committee which is
ICCROM (International Centre for the Study of the Preservation and Restoration of Cultural
Property), ICOMOS (International Council on Monuments and Sites), and IUCN
(International Union for Conservation of Nature) (UNESCO, 2016). All these advisory bodies
provide advice on their field of expertise on the implementation of the World Heritage with
IUCN being the responsible advisory body for sustainability. This is one of the approaches
that can be considered in the research in incorporating sustainable principle in Malaysian
heritage conservation.
The process of declaration for world heritage property is defined in Part 2.D of the
document in which, ten (10) criteria are laid out for building to be considered for World
Heritage property (UNESCO, 2016). These ten (10) criteria emphasize on sustaining social
element in term of cultural identity, and environmental element which is biodiversity and
ecosystem integrity. This highlights that, sustainable element of a heritage building can be
monitored from the selection stage. Hence this can be taken into consideration as one of the
approaches which can be adopted in incorporating sustainable principle in Malaysian heritage
conservation.

206
MCRJ Special Issue Vol. 12 | No. 1 | 2021
Part 2.F of this document highlights the importance of protection and management of
World Heritage properties. It emphasises on ensuring that the property Outstanding Universal
Value is sustained or enhanced over time. In the operational guideline, it mentions that any
World Heritage properties can be adapted for ecologically and culturally sustainable and
which in result can contribute to improve the life quality of the communities. However, it is
highlighted that any changes to the building shall not damage the Outstanding Universal
Value of the property. This section of document highlights that it is possible to adapt a heritage
building into a sustainable building without sacrificing its Outstanding Universal Value.
In summary, the UNESCO, Operational Guidelines for the Implementation of the World
Heritage Convention provides several good approach examples for the integration of
sustainability element into the heritage conservation. Some of the interesting integration
approaches are the usage of requirement criteria for heritage status declaration and the
appointment of expertise advisory agencies.
English Heritage, Building Regulations and Historic Buildings 2004
The English Heritage, Building Regulations and Historic Buildings 2004 acts as a guide
for mitigating issues and conflicts between energy conservation policies and the revised
Building Regulations and policies in terms of conservation of the historic property. The
document highlights the aim of English Heritage organisation which to conserve the usage of
fuel and power through adaption without compromising the special interest, character and
appearance of heritage building buildings which is in line with the aim of this research. The
document emphasises on the organisation’s measure in developing methods to be adopted in
applying the Building regulation to heritage. This highlights the viability of using legislation
as tool in enhancing the sustainability of heritage building.
In the document, it highlights the principles of repair and alteration for heritage buildings
in relation to Part L of Building regulation 2000. It discusses on the method of identifying the
special elements of the building, provides guidance on repairing and altering the heritage
building with minimum intervention to comply with Part L of Building Regulation 2000. In
relation to adapting the building into lower energy use and low greenhouse gas emission, the
document acts as a guide in achieving this approach but at the same time retains the heritage
value of the building. This highlights the possibilities of adopting environmental sustainability
into heritage conservation through managing the building environmental impact.
In summary, the English Heritage, Building Regulations and Historic Buildings 2004
provides a good example for heritage conservation environmental sustainability integration
approach which is through the requirement for carbon emission reduction in heritage building.
ICOMOS, the Burra Charter: The Australia ICOMOS Charter for Places of Cultural Significance Australia
The Australia ICOMOS Burra Charter, 2013 is one of the most significant document on
heritage conservation in Australia for the past thirty years (Heritage Perth, 2011). The Burra
Charter functions as a guidance for the conservation and management practice of heritage
property. In general, the document emphasises on defining the heritage property, and the
principle, processes and practices in managing and conserving the heritage property.

207
MCRJ Special Issue Vol. 12 | No. 1 | 2021
The Burra Charter set out several principles throughout the document which act as
guidance for the conservation and management of heritage properties. The first principle
emphasises on defining the value of keeping the heritage properties. The second principle
highlights the importance of identifying the important elements of property which carry the
significant cultural value to the heritage property. This important element can exist in many
forms such as the properties fabric, location, contents, function, associated documents, and
meaning to the properties’ users. The third principle focuses on the importance of
understanding the cultural significant in understanding the heritage properties. This principle
highlights the significance of the data gathering and analysing process in making decisions
during the conservation and management process of the properties. The last principle focuses
on the importance of documenting the decision and changes that has been made to the heritage
properties.
In general, the Burra Charter provides several possible approaches that can be used in
managing the social sustainability of a heritage building. The document approach emphasises
on retaining the cultural identity criteria through ensuring that any decisions that have been
made regarding the future of a heritage place are based on the understanding of the property,
its cultural significance and its values to people, and ensuring that the significant property
fabric and the site are being properly taken care of. Hence the document is a good reference
document for the integration approach for social sustainability.
National Historic Preservation Act 1966, Unites States of America
The National Historic Preservation Act (NHPA) was introduced in 1966 with the
intention of protecting the United States of America historical and archaeological sites from
the surge of federal development. The NHPA acts as a policy which supports and encourages
the preservation of nation heritage property. The policy emphasises on urging the
consideration from the federal agencies toward their development impact on the historic
properties. Through NHPA, a multifaceted preservation scheme is set out in achieving the
policy at the state and federal levels.
The first part of NHPA emphasises in managing the National Register of Historic Places,
an inventory of gazetted heritage properties. The act emphasises in authorising the Secretary
of Interior on updating and maintaining the inventory. Several criteria and procedures are
listed out in determining the eligibility of a property to be listed. The criteria emphasise on
the significant value of the properties toward the American history, architecture, archaeology,
engineering and culture.
The second part of NHPA focuses on heritage preservation program. This section
encourages the state to prepare a preservation program which can be submitted for the
secretary approval. A State Historic Preservation Officer (SHPO) will be designated to
administrate the program. The SHPO is responsible in identifying and inventories the historic
properties of the states which the SHPO are designated to. SHPO is also responsible in
preparing and implementing a heritage preservation plan and to provide information,
education and technical assistance to the public. In relation with the amendment in 1992, the
SHPO being equally responsible to rural heritage properties such as the Indian tribe. This
amendment is made to manage the social sustainability of the diverse tribe in the United State
of America. The roles of SHPO may differ from state to state to further efficiently manage
this diversity of heritage background.
208
MCRJ Special Issue Vol. 12 | No. 1 | 2021
In the third part NHPA, the act also emphasises on managing the economic sustainability
of the preservation program. Any program that has been authorized for grant will be supported
by the Historic Preservation Fund which its function is to provide finance for sustaining the
heritage preservation projects. The historic Preservation funds also provide financial
assistance to individuals which their properties are listed in the National Register. The
financial assistance is provided for two categories of grant; which are on emphasis on
providing essential financial support for administration of the preservation program and
emphasis on providing the financial assistance for the "bricks and mortar" preservation or
rehabilitation of historic properties.
The last part of NHPA emphasises on the establishment of Advisory Council on Historic
Preservation. The council are consisted of 20 mixed private and public sector members which
will employ professional staffs trained in many aspects of preservation. The council acts as
an advisor to the President and Congress on historic preservation matters, reviewing and
improving the policies and programs of Federal agencies, conduct training and educational
programs, and to encourage public interest in preservation.
Law for the Protection of Cultural Property 1950, Japan
The enactment of Japan’s Law for the Protection of Cultural Property 1950 is to
encourage the preserving and utilising the nation’s heritage property. The law focuses to
enhance the importance of cultural quality of the nation. With Meiji Restoration in 1968, The
National government of Japan has further promoted the importance of these by-Law since
(Tadanao, 2006). The law has several parts which emphasise on identification and
classification of heritage property, management and conservation process of the heritage
property.
The first part of the law emphasises in defining the heritage properties and designating
role of responsible person for the listed heritage properties. The document has laid out several
requirements and procedures in managing the designation of responsible present to manage
and conserve the heritage properties. This section also encourages the responsible person to
care and open the properties for the public to enhance the awareness of conserving their
cultural heritage which improves the social sustainability.
The second part of the law emphasises on identifying and registering the heritage
properties. The document has laid out criteria in identifying the properties which can be
classified into several group such as tangible and intangible cultural properties, monument,
and groups of historic building. Interestingly most of the designated tangible cultural
properties are properties which are classified as religious facilities (Tadanao, 2006).
Interestingly also in this part, there is a section which allow removing the listed properties.
Article 31 focuses on the requirement for annulment of a property from heritage property
registry (Agency for Cultural Affairs, 2007). This part of law also emphasises on managing
the conservation of heritage property. Under this section, the law provides assistance for the
finance for heritage property conservation work through providences of heritage conservation
material subsidy which is covered in article 35.
The last part of the law emphasises on the involvement of public with the heritage
property conservation. In part of the law encourages to open the access of the property for
209
MCRJ Special Issue Vol. 12 | No. 1 | 2021
public viewing. This section emphasises on the designating the role and responsibility of the
property owner or management body in giving access for the public to view the heritage
properties. The main purpose of the open for public viewing is to enhance the awareness and
educate the public on the importance of conserving the heritage property.
In general, Law for the Protection of Cultural Property 1950 provides several possible
approaches that can be used in managing the social sustainability of a heritage building
through retaining cultural identity, sharing, participation, and accessibility criteria.
The Preservation of Monuments Act 1971, Singapore
Enacted in 1971, The Preservation of Monuments Act emphasises on preserving and
managing Singapore’s historical monuments. The act consists of six (6) parts which in general
focuses on managing the roles and responsibilities of Preservation of Monuments Board,
defining the function of preservation order, managing maintenance of monuments, and
enforcing penalties regarding to heritage monument (Secretariat, 2008).
In part two (2) of the document, Article 2 defines that the board is responsible in
identifying the heritage monument where historical, cultural, traditional, archaeological,
architectural, artistic or symbolic significance and national importance are highlighted as the
criteria in considering a heritage monument. All these criteria emphasise on retaining the
cultural identity. Part four (4) of the Act emphasise on provision for monument preservation
where the function of preservation order is defined. Under preservation order, the monument
owner shall be responsible to preserve the facilitate access and provides proper management
of the monument.
In summary, the Preservation of Monuments Act focuses on social sustainability where
the criteria such as retaining cultural identity, empowerment and accessibility are being
managed throughout the document.
Cagar Budaya 2010, Indonesia
Cagar Budaya was introduced by the Indonesian Government in 2010 to enhance the
conservation and management of cultural heritage in Indonesia. The document covers on the
issues of managing the heritage categorization, heritage register and multidisciplinary
approach in heritage conservation work (Fitri et al., 2016). Chapter two (2) of the document
highlights sustainability as one of nine (9) principle which the cultural conservation
preservation shall be based (People’s Consultative Assembly, 2010).
Chapter three (3), part one (1) of the document emphasises on defining the criteria of
cultural conservation where four main criteria are laid out for the identification of heritage
properties. In general, all of these laid out criteria were emphasised to retain the cultural
identity. The documents also manage the criteria in preserving the heritage properties. Under
chapter seven (7), part one (1) of the document highlights that any cultural conservation
procedure made must be based on a feasibility study which is academically, technically and
administratively reliable (People’s Consultative Assembly, 2010). It also mentions that any
procedure which may bring negative impact to the environment shall be preceded with
environmental impact analysis. Under the same chapter, Part three (3) emphasises on the

210
MCRJ Special Issue Vol. 12 | No. 1 | 2021
development for heritage conservation. In this section, it highlights the development of
heritage conservation shall be carried out by considering the utilization, safety, maintenance
and the significant values of the properties. Overall, Cagar Budaya is a very interesting
document as it provides some possible approach for the integration of sustainability principle
into heritage conservation.
MALAYSIAN NATIONAL HERITAGE ACT 2005
National Heritage Act 2005 (Act 645) was created to manage the conservation and
preservation of all heritage properties in Malaysia. In general, Act 645 focuses on managing
the national heritage assets, council, fund and listing. Act 645 consists of 16 parts.
In the document, process of declaration for heritage property is defined; this is highlighted
under section 67(2), where nine criteria (refer Table 1) are laid out for potential heritage
building to be considered for National Heritage property declaration (The Commissioner of
Law Revision, 2005). From these nine criteria, it can be concluded that National Heritage Act
2005 has direct implication of social sustainability where it emphasises in sustaining the
cultural identity.
Table 1. Criteria for National Heritage Property Declaration
National Heritage Property Declaration criteria
i. The historical importance, association with or relationship to Malaysian history;
ii. The good design or aesthetic characteristics;
iii. The scientific or technical innovations or achievements;
iv. The social or cultural associations;
v. The potential to educate, illustrate or provide further scientific investigation in relation to Malaysian cultural heritage;
vi. The importance in exhibiting a richness, diversity or unusual integration of features;
vii. The rarity or uniqueness of the natural heritage, tangible or intangible cultural heritage or underwater cultural heritage;
viii. The representative nature of a site or object as part of a class or type of a site or object; and any other matter which is relevant to the determination of cultural heritage significance.
(Source: Adopted from The Commissioner of Law Revision, 2005)
Part 5 of the Act focuses on receiving and managing the world heritage fund. From the
document, once a building is listed as National Heritage property, the building owner can
request for heritage fund in funding the maintenance and conservation work of the building
(The Commissioner of Law Revision, 2005). This indicates the direct implication of economic
sustainability where the issue of accessing to the resources in fulfilling the needs is being
mitigated.
This act also highlights the importance of preserving and conserving the heritage. The
document focuses on retaining old buildings and tries to mitigate issues of heritage building
demolition through the introduction of fines. This highlights the indirect implication of
environmental sustainability in term of reduction of carbon expenditure and waste emission.
Referring to past researches, the demolition and constructing new building yield more carbon
expenditure and waste emission than preserving the building (Forster et al., 2011).

211
MCRJ Special Issue Vol. 12 | No. 1 | 2021
Malacca Enactment No.6 of 1998
The Malacca enactment No. 6 of 1998 in general focuses on managing heritage property,
council and fund. This enactment highlights the allowance for local government to obtain its
revenue from taxes, rates, fees and fines from the rate payers within conservation area to fund
the conservation work (Ismail, 2012). This also indicates the direct implication of economic
sustainability where the issues of accessing to the resources in fulfilling needs are being
mitigated. It also highlights the people responsible in managing the conservation of old
building. The enactment also emphasises on the preservation or conservation of declared
heritage building by the responsible person, which will be inspected at all reasonable times
by an officer authorised by the Local Authority.
The enactment ensures the identity of the conservation town is retained through no
allowance of new building to be built within the historic town and no allowance for old
building demolition (Ismail, 2012). The height of the new building around the conservation
area is also controlled in the enactment to ensure the retention of identity of the area (Ismail,
2012). This part highlights the indirect implication of environment sustainability through
reduction of demolition and construction carbon and waste expenditure and direct implication
of social sustainability in term of cultural identity.
Penang State Heritage Enactment 2011
Penang State Heritage Enactment 2011 is an adaptation of Act 645 for state use. It is
created to manage the conservation and preservation of all heritage properties in Penang.
Similar to Act 645, this enactment in general focuses on managing the national heritage assets,
council, fund and listing.
In the document, the declaration of heritage property is defined. This is highlighted under
section 29(2), where six criteria (refer Table 2) are laid out for potential heritage building to
be considered for State Heritage property declaration (Penang State Authority, 2011). The six
criteria reflect the direct implication of social sustainability where its emphasis on sustaining
the cultural identity.
Table 2. Criteria for Penang Heritage Property Declaration
Penang Heritage Property Declaration criteria
i. The state heritage importance;
ii. The good design or aesthetic characteristics;
iii. The scientific or technical innovations or achievements;
iv. The social or cultural associations;
v. The potential to educate, illustrate or provide further scientific investigation in relation to Penang state cultural heritage;
(Source: Adopted from Penang State Authority, 2011)
Under section 36(1), the act highlights that the owner of heritage site can request for loan
or grant from the commissioner to fund the maintenance and conservation work of the
property (Penang State Authority, 2011). This indicates the direct implication of economic
sustainability where the issues of accessing to the resources in fulfilling needs are being
mitigated.

212
MCRJ Special Issue Vol. 12 | No. 1 | 2021
This document also highlights the importance of preserving and conserving the heritage
building. The document emphasises on retaining old buildings. This highlights the indirect
implication of environmental sustainability in term of reduction of carbon expenditure and
waste emission. Referring to past researches, the demolition and constructing new building
yield more carbon expenditure and waste emission than preserving the building (Forster et
al., 2011).
RESEARCH APPROACH ON HERITAGE CONSERVATION LEGISLATION AND POLICY
This paper reviews existing Malaysian heritage building conservation policies and
legislations and its integration of the triple-bottom line principle of sustainability and are
benchmarked against other international policies and legislation. This paper aims to inform
the development of a guideline for integrating sustainability principle in the adaptation,
conservation and restoration of heritage building in Malaysia.
This paper focuses on analysing current available local and international heritage
conservation legislation and policies, and to explore the current integration of the legislation
and policies towards sustainability aspects of environment, economic and social. These
legislation and policies will be analysed in terms of sustainability which is based on the sub
criteria of each sustainability element (refer Table 3). These criteria are adopted from Agenda
21 document which highlights the economic, social and environment criteria for “Sustainable
development” concept (Kahn, 1995).
Table 3. The Principle of Sustainable Development
Element Criteria
Economic Sustainability Growth Development Productivity
Trickle Down
Social Sustainability Equity Empowerment Accessibility Participation
Sharing Cultural Identity
Institutional Stability
Environmental Sustainability Eco-System Integrity Carrying Capacity
Biodiversity
(Source: Adopted from Kahn, 1995)
The analysis will identify the integration of criteria for each sustainable principle
throughout the legislation. Each of the requirement in the section of legislation will be
analysed for any means of sustainability criteria integration. The document will then be
categorised into direct integration, indirect integration or no integration. This categorisation
will be made for all criteria of the sustainability element. The analysis will determine the
criteria of each sustainable principle throughout the legislation:
• A direct integrated document shall consist of legislation section where the mean of its
requirement directly manages the sustainability criteria such as the cultural identity.

213
MCRJ Special Issue Vol. 12 | No. 1 | 2021
These requirements need to be directly emphasised the importance of managing the
sustainability criteria in the heritage conservation.
• Indirect document on the other hand categorises the document which consist of
legislation section where from the impact of complying with the requirement of the
legislation, it will be resulting in the sustainable criteria benefits such as the low
environmental impact.
This method of legislation and policy analysis was adapted from study made by Sarnacki,
Bonafede (Kantor Management Consultants, 2015) which analysed the integration of
environmental into other sector policies and legislation. The purpose of this categorisation is
to assist in further understanding and benchmarking the current implementation of
sustainability principle in the international and Malaysian legislation and policy.
HERITAGE LEGISLATION AND POLICY INTEGRATION TO SUSTAINABLE DEVELOPMENT
Derived from the reviews made, it is identified that all of the studied international heritage
legislations have already emphasised on the sustainability principle integration. Throughout
all regions, it can be identified that the integration of social and economic sustainability
criteria is having some direct integration into the legislation. It is identified that the economic
criteria of cost, productivity and growth are the criteria emphasised in directly integrating the
economic sustainability in heritage building. On the social sustainability integration, the
criteria that being emphasised in the direct integration measure are institutional stability,
cultural identity, sharing, participation, accessibility, accessibility, and equity (refer Table 4).
In terms of environmental sustainability criteria, most of the legislations have indirect
environmental integration criteria in their documents. However, the Indonesian, United
Kingdom and UNESCO documents greater emphasis on direct integration of environmental
sustainability criteria into their document. The importance of these documents’ analysis, other
than benchmarking, is an approach method that can be derived and considered in improving
the integration of sustainability principle into the current Malaysian heritage legislation.
Malaysian Heritage Conservation Legislation and Policy
In summary, all of the studied Malaysian heritage legislations have already emphasised
on the sustainability principle integration. It is identified that the integration of the social and
economic sustainability criteria is mostly directly integrated into the legislation. It is identified
that the economic criteria of cost and productivity are the criteria that being emphasised in
directly integrating the economic sustainability in heritage building.
With regards to the social sustainability integration, the criteria emphasised in the direct
integration measure are institutional stability, cultural identity, empowerment, sharing,
accessibility, accessibility, and equity. In term of environmental sustainability criteria, most
of the legislations are indirectly integrating the sustainable criteria into the document. The
importance of this analysis is to identify the current performance of the legislation in term of
sustainability integration and to benchmark against the international counterpart in order for
approach method to be derived in improving the integration of sustainability principle into
the current Malaysian heritage legislation.

214
MCRJ Special Issue Vol. 12 | No. 1 | 2021
Table 4. International Heritage Legislation and Policies Against Sustainability Criteria
Document Coverage
Sustainability Element
Economic Social Environment
Gro
wth
Develo
pm
en
t
Pro
du
cti
vit
y
Tri
ckle
Do
wn
Eq
uit
y
Em
po
werm
en
t
Accessib
ilit
y
Part
icip
ati
on
Sh
ari
ng
Cu
ltu
ral Id
en
tity
Ins
titu
tio
na
l S
tab
ilit
y
Eco
-Syste
m
Inte
gri
ty
Carr
yin
g
Cap
acit
y
Bio
div
ers
ity
UNESCO, Operational Guidelines for the Implementation of the World Heritage Convention 2016
International ● ● ● x ● o ● ● ● ● ● ● ● ●
English Heritage, Building Regulations and Historic Buildings 2004
United Kingdom ● o ● x x o o ● ● ● ● ● ● x
ICOMOS, the Burra Charter: The Australia ICOMOS Charter for Places of Cultural Significance 2013
Australia ● o ● x ● o o ● ● ● ● o x o
National Historic Preservation Act 1966
United States of America ● o ● x ● ● ● ● ● ● ● o x o
Law for the Protection of Cultural Property 1950
Japan ● o ● x ● ● ● ● ● ● ● o x o
The Preservation of Monuments Act 1971
Singapore o x ● x o ● ● ● ● ● ● o x x
Cagar Budaya 2010 Indonesia ● ● ● x ● ● o ● ● ● o o ● x
National Heritage Act 2005 (Act 645) Department of National
Heritage o o ● o ● ● ● o ● ● ● o x ●
Malacca Enactment no.6 of 1998
Historic Malacca City Council
o o ● o ● ● ● o ● ● ● o x x
Penang State Heritage Enactment 2011
Penang Island City Council
o o ● o ● ● ● o ● ● ● o x ●
Indicator:
● Direct Integration o Indirect Integration x No Integration
(Source: UNESCO, 2016; Heritage Perth, 2011; Agency for Cultural Affairs, 2007; People’s Consultative Assembly, 2010; Ismail, 2012; Penang State Authority, 2011; English Heritage, 2004; The Law Revision Commissioner, 2011; Office of the Law Revision Council, 2016)

215
MCRJ Special Issue Vol. 12 | No. 1 | 2021
SUSTAINABILITY GAP IN MALAYSIAN AND INTERNATIONAL LEGISLATION AND POLICY
The summaries of Malaysian and International heritage legislation in Table 4, are
benchmarked to identify the existing gap in terms of sustainability aspect. The focus in
analysing existing sustainability gap is to identify approach method which can be adopted
into the current Malaysia legislation and policies to improve the integration of sustainability
principle.
Economic Sustainability Gap
From the benchmarking against International legislation and policies, in terms of
economic sustainability, the current Malaysian heritage policies are integrating the economic
element on par with the international counterpart. The current Malaysian legislation and
policy are integrating the economic sustainability with a direct approach despite having
different approach methods in each document. Despite the differences, the ideology behind
these approaches are similar which is to provide the owner or the managing parties of the
heritage properties with ways of obtaining resources in managing the property. This approach
ideology can also be identified throughout all of these benchmarked International documents.
For example, the UNESCO document is using the approach of providing access to World
Heritage Fund resources to the managing parties of the listed world heritage site (UNESCO,
2016). This approach is similar with the National Heritage Act approach which provides
access for the managing parties to the National Heritage Fund (The Commissioner of Law
Revision, 2005).
However, a small gap can be identified when these documents are being benchmarked in
terms of development and growth criteria. When being compared to the Indonesian document,
the current Malaysian document fall short in terms of managing the heritage properties
development. In the Indonesian document, the Cagar Budaya, under chapter seven (7), there
is a specific section which emphasises on managing the development of the heritage
properties (People’s Consultative Assembly, 2010). This section aims to encourage the
development of the heritage properties but at the same time retains the significant values of
the properties. This is the area which can be looked into in order to improve the current
Malaysian heritage sustainability.
Overall, the current Malaysian heritage legislation adopts similar approach in integrating
economic sustainable element. However, the sustainable performance of the current heritage
legislation can be further improved in terms of development criteria aspect.
Social Sustainability Gap
In terms of integrating social aspect of sustainability, the Malaysian legislation and
policies are performing similarly with the international counterpart. Throughout the
document, the issues of social are directly integrated and managed. Different from the
economic approach, all of the analysed Malaysian heritage legislation and policy are having
similar emphasis in sustaining the social pillar of sustainability. The approach used in most
documents emphasise on sustaining the cultural identity, equity, accessibility and sharing.

216
MCRJ Special Issue Vol. 12 | No. 1 | 2021
Despite performing similarly with the international counterpart, there are minor
sustainable gap that exists in the current Malaysian heritage legislation. Currently, the
Malaysian documents are lacking in terms of managing participation criteria for the social
sustainability. In the UNESCO document, they integrate the participation criteria of social
sustainable by encouraging the involvement of society with the heritage conservation project.
Methods such as organising educational and information programmes which emphasise in
strengthening appreciation and respect by the peoples for the cultural and natural heritage are
used as an approach in managing the social sustainability (UNESCO, 2016).
Overall, the current Malaysian legislations, which are the National Heritage Act 2005,
Malacca Enactment No. 6 of 1998, Control of Rent (Repeal) Act 1997, Penang State Heritage
Enactment 2011 are performing on par with the international counterpart in term of
integrating social sustainable element. However, the current legislations can still be improved
through integrating the participation criteria of the social element.
Environmental Sustainability Gap
A few notable differences of sustainable integration approach can be found when
benchmarking the current Malaysian legislations and policies against some of the
international counterpart in terms of environmental aspects. From analysing the Malaysian
heritage legislations, the result indicates that the current document mostly indirectly integrates
the environmentally sustainable element. Most of the integration comes through the impact
of implementing several requirement or specification of legislation and regulation which
resulting reduction of waste emission. For example, through controlling the disposal of old
buildings (The Commissioner of Law Revision, 2005; Penang State Authority, 2011) it assists
in reducing the waste emission.
There is currently no direct integration of environmental sustainability criteria in the
current Malaysian document. However, compared to the European based international
legislation policy, there are some sustainability gaps exist. Most of the analysed European
document has opted to use a direct integration approach in managing the environmental
sustainability element. The UNESCO Operational Guidelines for the Implementation of the
World Heritage Convention, 2016 has a section which requires the integration of sustainable
development principles into the management system. Other than that, the document also
encourages the usage of heritage properties toward more ecologically and culturally
sustainable purpose (UNESCO, 2016). Besides, the document also listed out selected advisory
bodies for sustainability. In United Kingdom, the direct approach method used are through
integrating the requirement of energy used and greenhouse gas emissions reduction measure
in their building regulation (English Heritage, 2004). Besides that, the current Indonesian
heritage legislation has also directly integrated environmentally sustainable elements in term
of reducing the environmental impact. Under chapter seven (7), the document integrate the
environmental criteria trough the requirement for environmental impact analysis before
making any decision making (People's Consultative Assembly, 2010).
Overall, the current Malaysian heritage legislations are lacking in the integration of the
environmentally sustainable element. Through the identified sustainable gap,
environmentally sustainable measure which is adopted from the international counterpart can
be used to improve that current performance of Malaysian heritage legislations. The measures

217
MCRJ Special Issue Vol. 12 | No. 1 | 2021
such as requirement for carbon emission reduction and environmental impact analysis can be
adopted in improving the current Malaysian heritage legislation.
CONCLUSION
The findings and analysis indicate that existing Malaysian heritage conservation
legislations are socially and economically sustainable, rather than environmentally focused.
This is mainly due to the nature and ideology of heritage conservation which is to preserve
the cultural significant of the heritage properties for the future generations, which in result
benefits the social and economic sustainability. Some minor improvement can be made in
further improving the integration participation criteria and development criteria.
Subsequently, improvements need to be done in integrating the environmentally sustainable
criteria in the Malaysian heritage conservation legislations.
From the analysis, it was identified that integration of carbon reduction requirement as a
suitable environmental integration in improving existing Malaysian Heritage conservation
legislation. For the economic sustainability, the allowance for heritage assets to be developed
with the consideration of the utilisation, maintenance and significant values of the properties
are identified as suitable approach in integrating the development criteria directly into the
heritage. As for social integration, organising educational and information programmes that
emphasise in strengthening appreciation and respect by the people for cultural and natural
heritage can be adopted to improve the current Malaysian heritage legislation.
ACKNOWLEDGEMENT
The authors gratefully acknowledge the financial support of the Fundamental Research
Grant Scheme (FRGS), grant no FP027-2017A established by the Ministry of Education
Malaysia (MoHE).
REFERENCES
Adams, W. M. (2006) The Future of Sustainability: Re-thinking Environment and
Development in the Twenty-first Century. IUCN Renowned Thinkers Meeting 2006 22
May 2006. Retrieved 2017, 10 December, from
http://cmsdata.iucn.org/downloads/iucn_future_of_sustanability.pdf.
Agency for Cultural Affairs. (2007) Law for the Protection of Cultural Property 1950. Japan:
Ministry of Education, Culture, Sports, Science and Technology.
Ashford, N. A. and Hall, R. P. (2011) The Importance of Regulation-Induced Innovation for
Sustainable Development. Sustainability, 3:270-292.
Bullen, P. A. and Love, P. E. D. (2010) The rhetoric of adaptive reuse or reality of demolition:
Views from the field. Cities, 27(4):215-224.
Cassar, M. (2009) Sustainable Heritage: Challenges and Strategies for the Twenty-First
Century. APT Bulletin: The Journal of Preservation Technology, 40(1):3-11.
Dernbach, J. C. and Mintz, J. A. (2011) Environmental Law and Sustainability: An
Introduction. Sustainability. Sustainability, 3:531-540.
English Heritage. (2004) Building Regulations and Historic Buildings. United Kingdom:
English Heritage.

218
MCRJ Special Issue Vol. 12 | No. 1 | 2021
Essays, U. (2018) Heritage Conservation Is Important for Identifying Environmental Sciences
Essay. Retrieved 2017, from https://www.ukessays.com/essays/environmental-
sciences/heritage-conservation-is-important-for-identifying-environmental-sciences-
essay.php?cref=1.
Fitri, I., Ahmad, Y. and Ratna. (2016) Cultural Heritage and Its Legal Protection in Indonesia
Since the Dutch East Indies Government Period. Advances in Social Science, Education
and Humanities Research (ASSEHR), 81:127-134.
Forster, A. M., Carter, K., Banfill, P. F. G. and Kayan, B. (2011) Green maintenance for
historic masonry buildings: An emerging concept. Building Research and Information,
39(6):654-664.
Godwin, P. J. (2011) Building Conservation and Sustainability in the United Kingdom.
Procedia Engineering, 20:12-21.
Heritage Perth. (2011) The Burra Charter. Retrieved 2017, 16 September, from
https://heritageperth.com.au/your-heritage/the-burra-charter/.
Ismail, W. H. W. (2012) Sustainability of Buildings in Historic City of Malacca in Faculty of
Built Environment. Malaysia: University Teknologi Malaysia.
Kahn, M. (1995) Concepts, definitions, and key issues in sustainable development: the
outlook for the future. Proceedings of the 1995 International Sustainable Development
Research Conference. Manchester, England.
Kantor Management Consultants. (2015) Environmental Integration into Other Sector
Policies and Legislation in The Eastern Partnership Countries. European Commission, 9
pp.
National Heritage Council. (2015) Building. Retrieved 2017, 28 March, from
http://www.heritage.gov.my/en/heritage-registration/heritage-list/site/building.
Office of the Law Revision Council. (2016) The National Historic Preservation Act, in 54.
United States of America.
Penang State Authority. (2011) Penang State Heritage Enactment. Penang: Penang State
Authority.
People’s Consultative Assembly. (2010) Cagar Budaya. Indonesia: R.o.I. Government.
Secretariat, L. C. (2008) Built heritage conservation policy in Singapore. R.A.L.S. Division.
Sodangi, M., Khamidi, M. F. and Idrus, A. (2009) Towards Sustainable Heritage Building
Conservation in Malaysia. Journal of Applied Sciences & Environmental Sustainability,
1(1):54-61.
Tadanao, Y. (2006) The Protection of Cultural Properties in Japan: Characteristics and
Problems. Retrieved 2017, 20 October, from
http://www.nara.accu.or.jp/elearning/2006/cultural.pdf.
The Commissioner of Law Revision, M. (2005) National Heritage Act 2005 (Act 645). Kuala
Lumpur: National Printing Department.
The Law Revision Commissioner. (2011) Preservation of Monument Act, in Chapter 239.
Singapore: T.P.o.M. Board.
UNESCO. (1972) Convention Concerning the Protection of the World Cultural and Natural
Heritage. Paris: UNESCO.
UNESCO. (2016) Operational Guidelines for the Implementation of the World Heritage
Convention. S.A.C.O. United Nations Educational.
UNESCO. (2017) World Heritage List. Retrieved 2017, 24 May, from
http://whc.unesco.org/en/list/

219
MCRJ Special Issue Vol. 12 | No. 1 | 2021
CONSTRUCTION QUANTIFICATION SKILLS: A PRELIMINARY INVESTIGATION OF THE KEY FACTORS AND THEMES Norhafizah Yusop1, Mohmad Mohd Derus1 and Ismail Samsuddin2 1Department of Quantity Surveying, Faculty of Architecture, Planning and Surveying, Universiti Teknologi MARA, Seri Iskandar Campus, Seri Iskandar, Perak, Malaysia. 2Department of Architecture, Faculty of Architecture, Planning and Surveying, Universiti Teknologi MARA, Seri Iskandar Campus, Seri Iskandar, Perak, Malaysia.
Abstract Construction quantification skills are crucial to producing an accurate Bill of Quantities. Therefore, the study investigates the key factors and themes related to the quantity surveying learners' construction quantification performance. In this qualitative research, the data collected through a semi-structured interview conducted on 25 participants comprising of consultant quantity surveyors registered with the Board of Quantity Surveyors Malaysia (BQSM). Based on the thematic analysis, four (4) core inquiry topics (themes) identified, such as construction quantification proficiency, construction quantification difficulties, academic performance and information technology or software intervention. The findings also showed that the key factors and themes greatly influenced the performance of the learners. This study provides an overview of quantification skills and performance development among learners in the quantity surveying field. Keywords: Construction quantification; difficulties; performance; proficiency; intervention.
INTRODUCTION
Due to awareness of the importance of construction quantification skills, the present study
attempts to determine several key factors and core inquiry topics (themes) related to the
construction quantification skills. These themes have been identified from the semi-structured
interview known as contributors to the quality standards and skill gaps of construction
quantification skills amongst learners (Hodgson et al., 2008; Peddle, 2000). On top of that,
this study also reviews related core variables (key factors) reported in previous studies
associated with the construction quantification learning and performance framework studies
to confirm the validity of variables obtained from the interviews. Based on the sub-themes
(i.e., first and second theme) generated from the semi-structured interviews, the preliminary
investigation would also be crucial to produce meaningful outcomes at the end of the thematic
analysis procedures.
RESEARCH BACKGROUND
One of the most significant course outcomes of the construction quantification subject is
to benchmark against the students' construction quantification proficiency standard.
Therefore, possessing a highly proficient level in the construction quantification skill is
crucial for every Quantity Surveyor (QS) to master as it is the essential skill required in the
preparation of Bills of Quantities (BQ) for any construction works (Fortune & Skitmore,
1993; Fortune & Skitmore, 1994).
Correspondingly, as reported in the previous research, construction quantification
proficiency standards have been identified as the learners' core requirements in the quantity

220
MCRJ Special Issue Vol. 12 | No. 1 | 2021
surveying field (McDonnell, 2010). Thus, to tackle the learners' and graduates' proficiency
issues, the focus must be on improving the core abilities that influence learners' construction
quantification capability. According to Osman et al. (2015), it is advantageous to have the
ability to understand thoroughly the complex ideas shown in the drawings as it could greatly
assist the learners to perform well in construction quantification tasks (Osman et al., 2015).
Therefore, a valuable framework and a thorough plan to improve learning outcomes and
performance relationship are undeniably crucial. The learners need to be well-equipped with
the critical factors of construction quantification skills influences during the learning process
(See Table 1).
Table 1. Construction Quantification Skills Influences
Key Factors Author
• Basic taking-off skills
• In-depth training
• Completed QS tasks within the time frame
• Basic quantification tasks
• Good skills (reading and interpreting drawings)
• Creative thinking
• Imagine a picture (taking-off problems)
• Good skills (visualisation)
Fortune and Skitmore (1993) Fortune and Skilmore (1994) Greene (2001) Hodgson et al. (2008) Klosters (2014) Kymmel (2008) McDonnell (2010) Oladotun and Edosa (2016) Osman et al. (2015) Zakaria et al. (2006)
• Completed QS tasks within the time frame but had many errors
• Carrying out quantification tasks under the supervision and failed to perform independently
• Always completed taking-off task beyond the time frame
• Struggled with problems involving drawings
• Struggled to convert the two dimensional (2D) drawing into a three dimensional (3D) drawing
• Struggled to interpret drawings within a short time
• Struggled to visualise the 3D view in mind
• Struggled to read 2D drawings
Chong et al. (2012) Hodgson et al. (2008) Lay (1998) Smith (2004) Peddle (2000)
• Well-trained in QS core skills
• Ability to imagine a picture
• Able to sketch (to solve a taking-off problem)
• Able to indicate essential label aspects of the drawing
• Able to understand (the 2D and 3D view looks when rotated from their initial states)
• Able to understand how an object would appear, drawn or represented
Ali et al. (2012) Basham and Kotrlik (2008) Fortune and Skitmore (1994) Golledge and Stimson (1997) Marunić and Glažar (2014) McGee (1979) Oladotun and Edosa (2016) Olkun (2003) Park and Yoon (2012) Velez et al. (2005) Wang, Chang and Li (2007) Zakaria et al. (2006)
• Well-trained to the latest computer and Information Technology (IT) techniques
• Well-equipped with computerised drawing skills, planning and programming techniques
Ali et al. (2012) Cheng (2008) Fogg (2007) Hassan et al. (2011) Hodgson et al. (2008)
RESEARCH METHODOLOGY
This study adopted a qualitative method for the data collection approach, using a semi-
structured interview (open-ended questions). In line with the previous qualitative research
approach, this study comprises three processes: content analysis (literature review), selection
of participants, and a semi-structured interview. The content analysis explores the associated

221
MCRJ Special Issue Vol. 12 | No. 1 | 2021
construction quantification learning key factors and performance framework studies
discussed in previous studies and identified problems encountered amongst the QS learners.
For data collection approach in a qualitative method, the sample's information power,
such as the saturation concept will be critical to achieving the study's aim (Malterud et al.,
2016). The same concept adopted in this research. At the beginning of the data collection
process, a total of 364 consultants QS registered with the BQSM (as of December 2018)
invited to participate in the study via an official letter to individual QS consultant. A follow-
up phone call regarding the invitation letter's acceptance was the further action taken to
confirm the participation agreement (Drabble et al., 2016). The consultants were selected
based on their broad experience and knowledge in the field of quantity surveying. The
invitation period was allowed for two months to allow ample time for the QS consultants to
decide whether or not to participate in the study. Further follow-up was decided not to be
made beyond the above period as the participants for this study were determined based on
their willingness to participate.
The interviews session was via either face-to-face or telephone calls, based on the
participants' choice. To ensure the participants understand the research context clearly, the
researcher allocates 30 minutes for each participant to review the semi-structured interview
questions before the session begins. The interview lasted for 1 – 2 hours for each participant.
Participants' approval obtained before recording the interview session with an electronic
recorder. The interview session guided by 22 open-ended questions related to the key factors
contributing to the construction quantification skills in quantity surveying and relevant
practices.
The semi-structured interview questions that have been asked to the respondents were
related to the critical skills of learners or graduates in the QS profession, critical technical
subjects that influence the QS skills preparedness when performing construction
quantification task, construction quantification skills of learners or staff who recently
graduated in QS field (proficiency levels), challenges and difficulties encountered in
construction quantification work, challenges to thoroughly understand the construction
drawings, deficiencies of the 2D drawings, effectiveness of the 3D drawings, examples of
technical subjects that need to be emphasised during learning to improve the construction
quantification skills, importance of draughtsmanship subject (construction drawings),
importance of imagination ability, differences between learners or graduates with high and
low visualisation, examples of difficulties faced by the learners and graduates, importance of
software application in the QS work profession, employers' expectations and last but not least
the suggestions, ideas or initiatives to improve the construction quantification skills of
learners or graduates (quality standards).
During the interview session, the participants not restricted to answer the listed questions
as they were allowed to suggest potential ideas on improving the academic achievement and
anticipated skill requirements among the quantity surveying learners or graduates. Further to
ease the communication process and valuable data flow, the session was conducted using the
participant preferred language (Nederhof, 1985).
Table 1 summarised the details of critical factors (learners' performance criteria) obtained
during the content analysis procedures (literature review) to accomplish the research purpose.

222
MCRJ Special Issue Vol. 12 | No. 1 | 2021
Data obtained through the semi-structured interview were analysed using a thematic analysis
procedure, which examined the data to identify common themes such as topics, ideas and
patterns of repeatedly meaning from the participants' articulation.
FINDINGS AND DISCUSSION
The study aimed to investigate the key factors and themes contributing to the quantity
surveying learners' construction quantification performance. After two months, 25 QS
consultants who agreed to participate gave a response rate of 6.9%. Even though the data
obtained from a small number of participants, the qualitative method's uniqueness allows the
researcher to obtain comprehensive information on the investigated issues (Malterud et al.,
2016). In this study, the study's information obtained for this study was from a small number
of 25 QS professionals via semi-structured interviews.
Table 2 below shows the key factors and themes obtained through a thematic analysis of
the interview recordings. The study findings disclosed several key factors and themes
contributing to the construction quantification skills in the quantity surveying profession.
Firstly, the findings listed in general on several key quotes (sub-themes) associated with the
research aim. Secondly, the significant factors classified into sub-themes categories based on
the similarity of meanings (sub-themes). Finally, the analysis further highlighted several
crucial points and relevant core inquiry topics (themes) of an observable outcome during
coding, clustering and labelling process.
During the thematic analysis phases, it is essential to fully understand how the sub-themes
and themes fit into the construction quantification learning outcome. Additionally, it is vital
to fully understand each variable's relationship effect to construction quantification learning
and performance criteria before finalising the most meaningful core inquiry topics (themes).
In this particular research, the preliminary survey findings highlighted four significant themes
related to construction quantification matters: proficiency, difficulties, academic
performance, and software intervention (See Table 2).
Proficiency
Construction quantification proficiency (core knowledge) was the first key theme
contributing to the construction quantification skills in quantity surveying and relevant
practices. These include abilities to rotate 2D objects in mind, perform taking-off in a timely
and independent manner. The participants had highlighted the importance of the taking-off
skill, in-depth training, excellent skills and abilities in interpreting construction drawings. The
learner should also possess high imagination and spatial visualisation ability (SVA) to
understand 2D drawings. A study on the e-learning approach to quantity surveying in
Australia reported quite a similar finding (Hodgson et al., 2008).
Difficulties
Construction quantification difficulties relate to the lack of ability to perform a given task.
This core factor emerged second key theme contributing to the construction quantification
skills in quantity surveying (Hodgson et al., 2008). The difficulties experienced by many
learners, graduates, or junior QS hovers around the incapability to complete a given task

223
MCRJ Special Issue Vol. 12 | No. 1 | 2021
promptly. Many admitted this as a result of the difficulty in understanding of 2D drawings.
The participants emphasised in the interview on the minimum knowledge and skill the
learners need to acquire because of less experience among novice learners would lead to lack
of skills, minimum knowledge, limited ability and inevitably failed to perform the task
efficiently. The current study findings support that of study in Australia (Hodgson et al.,
2008).
Academic Performance
Academic performance differences amongst learners emerged the third key theme that
contributes to the construction quantification skills in quantity surveying and relevant
practices. These include the individual learners' ability to understand 2D drawings, draw
pictures or diagrams to help perform the taking-off task. The participants opined that quantity
surveying learners should have exposed to 3D drawings, such as isometric views or other
relevant animations, and outstanding ability such as visualisation skills including other QS
core skills.
The current study findings comparable to the previous study findings in a classroom
setting of an English education approach (Hinchion, 2016). Additionally, according to
Wasserman and Wasserman (2016), personal experience and knowledge can be considered
value indicators and must be well emphasised.
Software Intervention
Current Information Technology (IT) or software intervention emerged the fourth key
theme that contributes to the construction quantification skills in quantity surveying and
relevant practices. According to Hassan et al. (2011), Information Technology (IT)
competencies are skills abilities in the employers' expectation list. To meet construction
industry expectations, they are always targeting outstanding graduates who can perform well
to survive in this challenging industry.
Moreover, according to Hodgson et al. (2008), Information Technology (IT) and software
intervention are complements for conventional approaches as they could assist learners'
limitations of 2D drawings problem. The interview participants agreed that the latest
computer and Information Technology (IT) techniques such as computerised drawing skills,
planning, and programming techniques are very efficient in supporting the current educational
setting. Besides known as additional support tools in the current learning approach, most
employers believed that Information Technology (IT) intervention could improve the learners'
skills, especially for learners with significant learning difficulties. As a result, using IT
nowadays is also known as a value-added for increasing the quality standard of the learners'
skills to meet the industry and the employer's needs.
Table 2. Key Factors and Core Inquiry (Thematic Analysis Results)
Sub-themes (first) Sub-themes (second) Themes
• Well-equipped with the necessary taking-off skills required by junior QS (A).
• Well-equipped with the necessary taking-off skills required by junior QS (A).
Proficiency
• Well-trained in QS core skills (ability to prepare bills of quantities, drafts construction contracts, estimates and final account (B).
• Well-equipped with in-depth training of construction quantification skills (D).

224
MCRJ Special Issue Vol. 12 | No. 1 | 2021
Sub-themes (first) Sub-themes (second) Themes
• Well-trained in the latest computer and IT techniques (C).
• Capable of completing QS tasks within the time frame but with fewer errors (F).
• Well-equipped with in-depth training of construction quantification skills (D).
• Capable of carrying out basic construction quantification tasks without supervision (Independent) (H).
• Well-equipped with computerised drawing skills, planning and programming techniques (E).
• Always possess good skills in sketching, reading and translating drawings (K).
• Capable of completing QS tasks within the time frame but with fewer errors (F).
• Always good at expressing ideas and creative thinking to solve a taking-off problem (P).
• Capable of completing QS tasks within the time frame but with many errors (G).
• Able to imagine a picture related to a taking-off problem in mind (R).
• Capable of carrying out basic construction quantification tasks without supervision (Independent) (H).
• Having good visualisation skills is essential to a QS (Z).
• Capable of carrying out basic construction quantification tasks under supervision (Taking-off) (J).
• Capable of completing QS tasks within the time frame but with many errors (G).
Difficulties
• Always possess good skills in sketching, reading and translating drawings (K).
• Capable of carrying out basic construction quantification tasks under supervision (Taking-off) (J).
• Capable of carrying out basic construction quantification tasks under supervision (Taking off) but failed to perform independently (Dependent) (L).
• Capable of carrying out basic construction quantification tasks under supervision (Taking off) but failed to perform independently (Dependent) (L).
• Always complete taking-off task beyond the time frame and with many errors (M).
• Always complete taking-off task beyond the time frame and with many errors (M).
• Always had trouble with the SVA, problems involving drawings (N).
• Always had trouble with the SVA, problems involving drawings (N).
• Always good at expressing ideas and creative thinking to solve a taking-off problem (P).
• When working on a 2D picture or drawing problem in taking-off class, graduates always find it hard to convert the drawing into a 3D view in mind and struggle to draw the 3D picture (U).
• Able to imagine a picture related to the problem (Q).
• Fresh graduates have difficulties reading and translating drawings within a short time due to lack of experience (V).
• Able to imagine a picture related to a taking-off problem in mind (R).
• Most fresh graduates had trouble visualising the (3D) view in mind due to lack of experience (W).
• Can draw pictures to solve a taking-off problem (S).
• Most recent graduates had trouble understanding and interpreting orthographic (2D) drawings due to lack of experience and imagination skills (X).
• Able to indicate essential label aspects of the drawing such as length, width, height or angles (T).
• Well-trained in QS core skills (ability to prepare bills of quantities, drafts construction contracts, estimates and final account (B).
Academic Performance
• When working on a 2D picture or drawing problem in taking-off class, graduates always find it hard to convert the drawing into a 3D view in mind and struggle to draw the 3D picture (U).
• Able to imagine a picture related to the problem (Q).
• Can draw pictures to solve a taking-off problem (S).
• Fresh graduates have difficulties reading and translating drawings within a short time due to lack of experience (V).
• Able to indicate essential label aspects of the drawing such as length, width, height or angles (T).

225
MCRJ Special Issue Vol. 12 | No. 1 | 2021
Sub-themes (first) Sub-themes (second) Themes
• Most fresh graduates had trouble visualising the (3D) view in mind due to lack of experience (W).
• Having the capability of viewing and sketching the 3D helped them gain a better understanding (Y).
• Most recent graduates had trouble understanding and interpreting orthographic (2D) drawings due to lack of experience and imagination skills (X).
• Well-trained in the latest computer and IT techniques (C).
Software Intervention
• Having the capability of viewing and sketching the 3D helped them gain a better understanding (Y).
• Well-equipped with computerised drawing skills, planning and programming techniques (E).
• Having good visualisation skills is essential to a QS (Z).
During this early familiarisation phase, getting known the thematic analysis findings is
very crucial. Specifically, the process would help group the key factors, sub-themes and
themes (See Table 2). In other words, it is useful towards clarifying the actual representation
ability of learners, especially when it comes to visualising and calculating the approximate
cost of the whole project from the construction drawings (construction quantification
performance). Figure 1 below summarises core inquiry topics (themes) generated from the
thematic analysis of the interview data which confirmed the research variables.
Figure 1. Construction Quantification Skills (Themes)
CONCLUSION
Based on a thematic analysis of a semi-structured interview data conducted amongst
consultant QS registered with the BQSM, the study disclosed several related vital factors and
themes of construction quantification skills and performance influences. The participants
indicated their concern towards skill gaps that influenced the learners' skills in construction
quantification. In particular, they claimed that the skill gaps occur where learners did not
possess adequate prior experience, knowledge, or specialised skills to meet the industry and
the employer's needs.
Construction Quantification
Skills
Academic Performance
Difficulties
Software Intervention
Proficiency

226
MCRJ Special Issue Vol. 12 | No. 1 | 2021
In the first place, the key factors described in several sub-themes (first sub-themes and
second sub-themes) that may be essential towards generating more ideas and grounds for the
purpose and further direction of the present study designed to fill and discuss. Finally, four
themes disclosed from the thematic analysis, namely construction quantification proficiency,
difficulties, academic performance and Information Technology (IT) or software intervention.
In summary, QS learners' skills and performance in construction quantification seem to
influence the highlighted key factors and learners' criteria. Additionally, most of the
participants agreed that the key factors would provide a valuable framework for improving
learning outcomes and performance relationship. The current study noted that the findings of
the core themes obtained from the thematic analysis in this research were generally in tandem
with the previous authors' key factors. Therefore, in ensuring learners' quality standards, the
findings offered a crucial contribution towards giving initial indications regarding learners'
quantification skills.
ACKNOWLEDGEMENTS
The authors would like to thank the Universiti Teknologi MARA for supporting this
research under Geran Khas Insentif Penyeliaan Perak (GKIPP). The authors also would like
to express the deepest gratitude to all the research participants for their time and valuable
information.
REFERENCES
Ali, D. F., Noordin, M. K., Nasir, A. N. M. & Nordin, M. S. (2012) Visualisation Skills
Among Engineering Student: Pilot Study. Journal of Engineering Education, 1(1): 36-
40.
Basham, K. L., & Kotrlik, J. W. (2008) The Effects of 3-Dimensional CADD Modeling on
the Development of the Spatial Ability of Technology Education Students. Journal of
Technology Education, 20(1): 32-47.
Cheng, E. (2008) An Investigation into the Curriculum of the Construction-Related Associate
Degree in Hong Kong. AACE International Transactions, Dev 07: 1-13.
Chong, B. L., Lee, W. P., & Lim, C. C. (2012) The Roles of Graduate Quantity Surveyors in
the Malaysian Construction Industry. International Proceedings of Economics
Development & Research (IPEDR 2012). Singapore, 37: 17–20.
Drabble, L., Trocki, K. F., Salcedo, B., Walker, P. C., & Korcha, R. A. (2016) Conducting
Qualitative Interviews by Telephone: Lessons Learned From A Study of Alcohol Use
among Sexual Minority and Heterosexual Women. Journal of Qualitative Social
Work, 15(1): 118-133.
Fogg, J. (2007) Dedicated Software for the QS: Prospects for the Future. Proceedings of the
Quantity Surveying International Convention. Crowne Mutiara Plaza Hotel, 4-5
September, Malaysia, 323-326.
Fortune, C., & Skitmore, M. (1993) The Identification and Classification of the Skills
Required for the Collection and Transfer of Design Information. Proceeding Economics
Evaluation and Built Environment, Vol 1: Knowledge-Based Systems in Planning and
Construction, The International Council for Building Research Studies and
Documentation CIB W-55 and 95. Portugal, 75-85.

227
MCRJ Special Issue Vol. 12 | No. 1 | 2021
Fortune, C., & Skitmore, M. (1994) Quantification Skills in the Construction Industry.
Journal of Construction Management and Economics, 12(1): 79–88.
Golledge, R. G., & Stimson, R. J. (1997) Spatial Behaviour. A Geographic Perspective. New
York: The Guilford Press, 157 pp.
Greene, M. (2001) Variations on a Blue Guitar. New York: Teachers College Press.
Hassan, F., Ismail, Z., Zaini, A. A., Hassan, S., & Maisham, M. (2011) An Evaluation of the
Competencies, Skills and Knowledge of Quantity Surveying Graduates in Consultant
Quantity Surveying Firms in Malaysia. Proceeding of 2011 IEEE Colloquium on
Humanities, Science and Engineering (CHUSER 2011). Penang Malaysia, 228-232.
Hinchion, C. (2016) Embodied and Aesthetic Education Approaches in the English
Classroom. Journal of English in Education, 50(2): 182-198.
Hodgson, G., Sher, W., & Mak, M. (2008) An E-Learning Approach to Quantity Surveying
Measurement. Journal of Building Resilience, 1639-1649.
Klosters, D. (2014) Matching Skills and Labour Market Needs: Building Social Partnerships
for Better Skills and Better Jobs. World Economic Forum Global Agenda Council on
Employment. Switzerland, 1-28.
Kymmel, W. (2008) Building Information Modeling. Planning and Managing Construction
Projects with 4D CAD and Simulations. New York: McGrawHill, 270 pp.
Lay, R. (1998) The Agenda for Change: 1998 Presidential Address. London: RICS.
Malterud, K., Siersma, V. D., & Guassora, A. D. (2016) Sample Size in Qualitative Interview
Studies: Guided by Information Power. Journal of Qualitative Health Research, 26(13):
1753-1760.
Marunić, G., & Glažar, V. (2014) Improvement and Assessment of Spatial Ability in
Engineering Education. Journal of Engineering Review, 34(2): 139-150.
McDonnell, F. P. (2010) The Relevance of Teaching Traditional Measurement Techniques to
Undergraduate Quantity Surveying Students. Journal for Education in the Built
Environment, 1–15.
McGee, M. G. (1979) Human Spatial Abilities: Psychometric Studies and Environmental,
Genetic, Hormonal, and Neurological Influences. Psychological Bulletin, 86(5): 889-918.
Nederhof, A. J. (1985) Methods of Coping with Social Desirability Bias: A review. European
Journal of Social Psychology, 15(3): 263-280.
Oladotun, A. J., & Edosa, O. M. (2016) The Needs for Professionalism and Competency in
the Construction Industry. International Journal of Built Environment and Sustainability,
3(3): 184-190.
Olkun, S. (2003) Making Connections: Improving Spatial Abilities with Engineering
Drawing Activities. International Journal of Mathematics Teaching and Learning, 3(1):
1-10.
Osman, J., Mazlina, S., Khuzzan, S., & Razaksapian, A. (2015) Building Information
Modeling: Proposed Adoption Model for Quantity Surveying Firms. Proceeding of
International Conference on Information Technology & Society (IC-ITS). Malaysia, 151-
165.
Park, S. S., & Yoon, S. Y. (2012) Assessing Korean Middle School Students' Spatial Ability:
The Relationship with Mathematics, Gender, and Grade. Journal of Research in
Mathematical Education, 16(2): 91-106.
Peddle M. T. (2000) Frustration at the Factory: Employer Perceptions of Workforce
Deficiencies and Training Trends. Journal of Regional Analysis & Policy, 30: 23–40.

228
MCRJ Special Issue Vol. 12 | No. 1 | 2021
Smith, P. V. (2004) Trends in the Australian Quantity Surveying Profession 1995-2003.
World Congress on Cost Engineering, Project Management and Quantity Surveying,
AACE American Association of Cost Engineers. International Cost Engineering Council.
Australia, 19(1): 1-15.
Velez, M. C., Silver, D., & Tremaine, M. (2005) Understanding Visualisation through Spatial
Ability Differences. Proceedings of IEEE Visualization 2005 Conference. Minneapolis,
511-518.
Wang, H. C., Chang, C. Y., & Li, T. Y. (2007) The Comparative Efficacy of 2D-Versus 3D-
Based Media Design for Influencing Spatial Visualisation Skills. Journal of Computers
in Human Behavior, 23(4): 1943-1957.
Wasserman, T., & Wasserman, L. D. (2016) How We Learn: Models of Learning and
Cognition. Depathologizing Psychopathology. Switzerland: Springer Cham, 13-21 pp.
Zakaria, N., Munaaim, M. C., & Khan, S. I. (2006) Malaysian Quantity Surveying Education
Framework. Proceedings of Built Environment Annual Conference (BEECON 2006).
United Kingdom (UK), 1-19.

229
MCRJ Special Issue Vol. 12 | No. 1 | 2021
DEVELOPING A FRAMEWORK FOR SUCCESSFUL HANDOVER OF PRIVATE FINANCE INITIATIVE (PFI) PROJECTS IN MALAYSIA Erni Juwita Abd Manan and Umi Kalsum Zolkafli @Zulkifly Department of Quantity Surveying, Faculty of Built Environment, University Malaya, Kuala Lumpur, Malaysia.
Abstract Private Finance Initiative (PFI) is known as one of the Public-Private Partnership (PPP) model in Malaysia, and it has a significant part in Malaysia’s Development Plan. However, the PFI projects’ success is related to the successful handover to its operational stage. This study defines the handing over and delivery stage as receiving the certificate of acceptance from the owner or client. It is the final crucial phase to complete the whole life cycle of the PFI project. However, given its importance, there are no existing studies that elaborate further on the problems that affect the handing over the stage in PFI projects. Therefore, this study investigates these problems in Malaysia’s context, including incomplete O&M documentation, financial issues, unclear project briefs, incompliance to client requirements, and drawing discrepancies. The solutions for these problems that affect the handover of PFI projects were then identified consisting of planning, control, monitoring, the level of competency and experience of team members and the stakeholder management. The research also looks at project control and monitoring failure, collaboration issues and human-related matters. A framework for a more successful handover of PFI projects in Malaysia is then proposed. Through this framework, this study’s contribution will minimize the numbers of delaying handing over of PFI project towards its operational stage. At the same time, it provides valuable information for the government, public and private sectors alike, on the key factors that need to be highlighted for a more successful handover of the PFI projects. Keywords: Private Finance Initiative (PFI), handover, delay, defect, and commissioning.
INTRODUCTION
Over the past few decades, the Public-Private Partnership (PPP) has been marketed as an
option method of procurement to deliver public services in many countries. The scheme refers
to the correlation between the public and private sectors, with various obligations and tasks,
to deliver public services (Ahmadabadi & Heravi, 2019). In previous studies, Ismail and
Azzahra Haris (2014) informed that PPP involves the transfer of responsibilities or liability
(from the public sector to private sector) for the finance, design, building, and operation of
public sector assets, such as infrastructure, buildings, equipment, and other associated
facilities. It is typically based on an agreed concession period (typically 25 to 30 years). In
return, the public sector pays rental charges to private companies in the form of a lease through
the concession period (Rahman, Memon, & Zulkiffli, 2014a). On a recent study, Hashim,
Che-Ani and Ismail (2017a) suggested that the Public-Private Partnership (PPP) or Private
Finance Initiative (PFI) is a method of procurement of the projects that had been successfully
executed and applied by numerous countries around the world.
LITERATURE REVIEW
With the recent achievement, PPP has become more common in Malaysia. The Malaysian
government has introduced a prominent form of PPP, which is recognized as a Private Finance
Initiative (PFI) under the Ninth Malaysia Plan (2006-2010) (Ismail et al., 2014). PPP under

230
MCRJ Special Issue Vol. 12 | No. 1 | 2021
the Ninth Malaysia Plan emphasized reforming at the execution process and improving the
feasibility via the suitable risk’s allocation between the public and private. Simultaneously,
the Tenth Malaysia Plan (10th MP, 2011–2015), continued these objectives under its Five
Strategic Thrusts (Abdullah, Sufian, Asenova & J. Bailey, 2014). Under the 10th Malaysia
Plan, PPP’s model would include a long-term lease of land with commercial potential and the
outright sale and joint venture possibility (Khairuddin, 2014). Meanwhile, concurrent with
the Eleventh Malaysia Plan (2016-2020), a high value is allocated to infrastructure
development that utilizes PPP. Therefore, the Private Finance Initiative (PFI) as one of the
Public-Private Partnership (PPP) model in Malaysia had a significant part in Malaysia’s
Development Plan. The methods used for the implementation of PPP projects include Built
Operate-Transfer (BOT), Build-Operate-Own (BOO), Build-Lease-Maintain Transfer
(BLMT), Build-Lease-Transfer (BLT) contract management, land swap, and corporatization.
However, in Malaysia, the PPP method is implemented under the Build-Lease-Maintain
Transfer (BLMT), Built Build-Lease-Transfer (BLT), and Build-Lease-Maintain Operator
Transfer (BLMOT) (Khaderi et al., 2019).
There are several successfully executed PFI projects in the past decade in Malaysia.
However, there are still unsuccessful cases, mostly at its operational stage that this study will
address. Among other considerations, the handing over of the PFI project to its operation stage
is an important phase for completing the entire life cycle of the PFI project. The handing over
and delivery stage in this study is defined as the stage of receiving the certificate of acceptance
from the owner or client. Unkovski (2016) stated that the completion certificate refers to the
certificate issued by the independent certifier (or by authority based on the construction,
engineering and inspection engineer’s reports). It is considered as the contractual evidence
that the construction phase is complete. This independent party appointed by the client will
check the completeness of works, verifying the start and update of the operating stage and
issuing the acceptance certificate for the completed phase. Without this certificate, the PFI
project is considered to be halfway complete and could not perform as required. If this occurs,
the private partner suffers several negative impacts from the late completion of the
construction phase that then impacts operational commencement. Therefore, determining the
problems that may contribute to the unsuccessful or delayed delivery of the PFI projects
towards its operational stage are critical and needed to be identified.
On PFI aspects as part of the PPP model, past works of literature discovered were
primarily focused on PPP as the central interest of studies. Likewise, de Castro e Silva Neto,
Cruz, Rodrigues and Silva (2016) had conducted studies overviewing 25 years of research on
PPP and PFI literature. Their findings have shown that previous studies are mainly
concentrated on analyzing contract performance and benefit, risk-sharing, and contract
design. The latest study on the PPP (whereby PFI is part of it) for the past decades by Cui,
Liu, Hope and Wang (2018), also had described and categorized the research topics into the
following groups: financial package and PPP application, procurement and contract
management, governance and regulation, economic viability and VFM, risk management
success factors, and performance management. Most of the past studies are indicated to be
more inclined towards identifying critical success factors (CSF) and the risk issues of the
overall execution of the PFI.
Therefore, this study recognized the literature gap as the lack of critical research on the
problems affecting the handing over PFI projects, specifically in Malaysia. This fact is
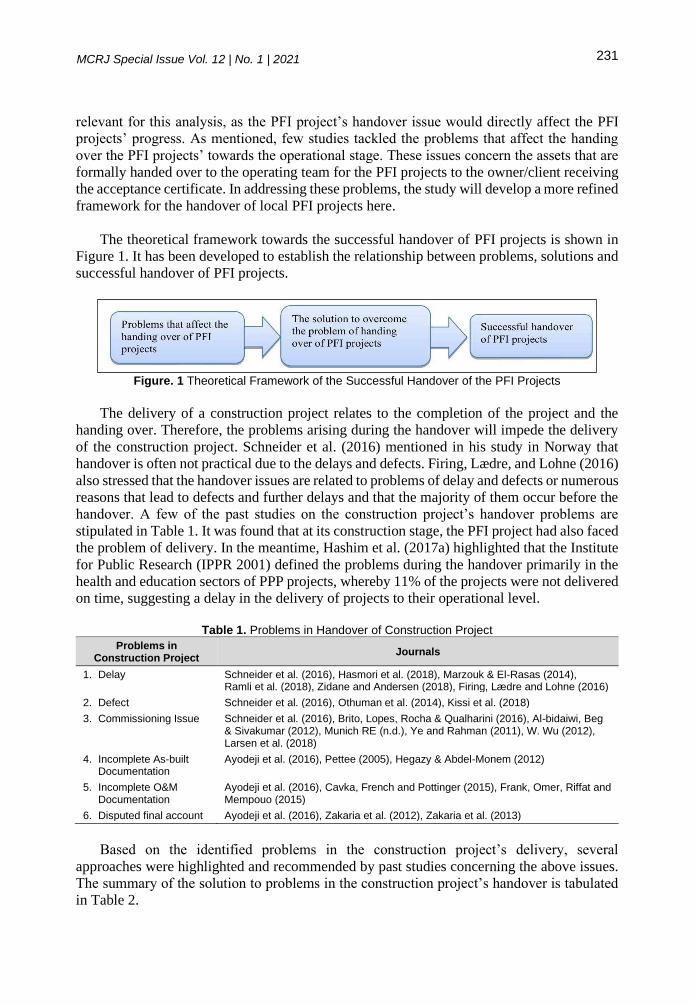
231
MCRJ Special Issue Vol. 12 | No. 1 | 2021
relevant for this analysis, as the PFI project’s handover issue would directly affect the PFI
projects’ progress. As mentioned, few studies tackled the problems that affect the handing
over the PFI projects’ towards the operational stage. These issues concern the assets that are
formally handed over to the operating team for the PFI projects to the owner/client receiving
the acceptance certificate. In addressing these problems, the study will develop a more refined
framework for the handover of local PFI projects here.
The theoretical framework towards the successful handover of PFI projects is shown in
Figure 1. It has been developed to establish the relationship between problems, solutions and
successful handover of PFI projects.
Figure. 1 Theoretical Framework of the Successful Handover of the PFI Projects
The delivery of a construction project relates to the completion of the project and the
handing over. Therefore, the problems arising during the handover will impede the delivery
of the construction project. Schneider et al. (2016) mentioned in his study in Norway that
handover is often not practical due to the delays and defects. Firing, Lædre, and Lohne (2016)
also stressed that the handover issues are related to problems of delay and defects or numerous
reasons that lead to defects and further delays and that the majority of them occur before the
handover. A few of the past studies on the construction project’s handover problems are
stipulated in Table 1. It was found that at its construction stage, the PFI project had also faced
the problem of delivery. In the meantime, Hashim et al. (2017a) highlighted that the Institute
for Public Research (IPPR 2001) defined the problems during the handover primarily in the
health and education sectors of PPP projects, whereby 11% of the projects were not delivered
on time, suggesting a delay in the delivery of projects to their operational level.
Table 1. Problems in Handover of Construction Project
Problems in Construction Project
Journals
1. Delay Schneider et al. (2016), Hasmori et al. (2018), Marzouk & El-Rasas (2014), Ramli et al. (2018), Zidane and Andersen (2018), Firing, Lædre and Lohne (2016)
2. Defect Schneider et al. (2016), Othuman et al. (2014), Kissi et al. (2018)
3. Commissioning Issue Schneider et al. (2016), Brito, Lopes, Rocha & Qualharini (2016), Al-bidaiwi, Beg & Sivakumar (2012), Munich RE (n.d.), Ye and Rahman (2011), W. Wu (2012), Larsen et al. (2018)
4. Incomplete As-built Documentation
Ayodeji et al. (2016), Pettee (2005), Hegazy & Abdel-Monem (2012)
5. Incomplete O&M Documentation
Ayodeji et al. (2016), Cavka, French and Pottinger (2015), Frank, Omer, Riffat and Mempouo (2015)
6. Disputed final account Ayodeji et al. (2016), Zakaria et al. (2012), Zakaria et al. (2013)
Based on the identified problems in the construction project’s delivery, several
approaches were highlighted and recommended by past studies concerning the above issues.
The summary of the solution to problems in the construction project’s handover is tabulated
in Table 2.
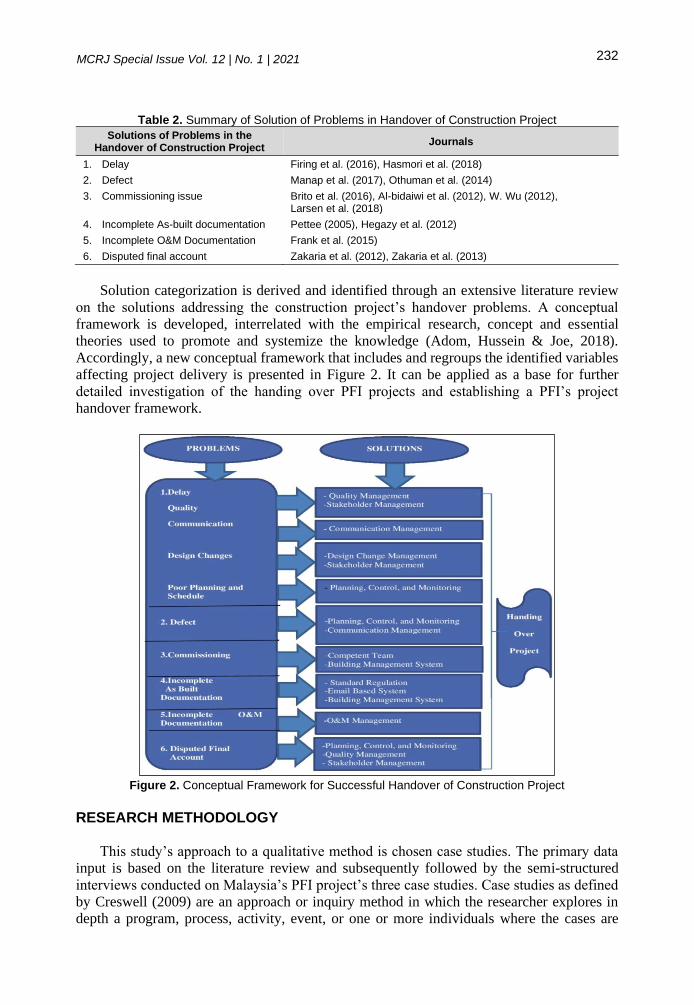
232
MCRJ Special Issue Vol. 12 | No. 1 | 2021
Table 2. Summary of Solution of Problems in Handover of Construction Project
Solutions of Problems in the Handover of Construction Project
Journals
1. Delay Firing et al. (2016), Hasmori et al. (2018)
2. Defect Manap et al. (2017), Othuman et al. (2014)
3. Commissioning issue Brito et al. (2016), Al-bidaiwi et al. (2012), W. Wu (2012), Larsen et al. (2018)
4. Incomplete As-built documentation Pettee (2005), Hegazy et al. (2012)
5. Incomplete O&M Documentation Frank et al. (2015)
6. Disputed final account Zakaria et al. (2012), Zakaria et al. (2013)
Solution categorization is derived and identified through an extensive literature review
on the solutions addressing the construction project’s handover problems. A conceptual
framework is developed, interrelated with the empirical research, concept and essential
theories used to promote and systemize the knowledge (Adom, Hussein & Joe, 2018).
Accordingly, a new conceptual framework that includes and regroups the identified variables
affecting project delivery is presented in Figure 2. It can be applied as a base for further
detailed investigation of the handing over PFI projects and establishing a PFI’s project
handover framework.
Figure 2. Conceptual Framework for Successful Handover of Construction Project
RESEARCH METHODOLOGY
This study’s approach to a qualitative method is chosen case studies. The primary data
input is based on the literature review and subsequently followed by the semi-structured
interviews conducted on Malaysia’s PFI project’s three case studies. Case studies as defined
by Creswell (2009) are an approach or inquiry method in which the researcher explores in
depth a program, process, activity, event, or one or more individuals where the cases are

233
MCRJ Special Issue Vol. 12 | No. 1 | 2021
bound by time and activity. Researchers gathered detailed data by applying various data
collection procedures over a sustained period. On the other hand, to enhance this research’s
validity, the multiple case studies had been selected for this research to make better
comparison and observation. Likewise, Yin (2014) stated that the researcher could examine
the differences within and between cases in a multiple case study method. Therefore, three
local cases studies of PFI projects were selected. These three case studies’ choices is based
on the successful and unsuccessful handover of the PFI project; receiving the certificate of
acceptance from the client/public sector/government.
For the trustworthiness in qualitative research, the informants’ feedback was applied to
confirm the research’s validity in this study. This method is also known as respondent
validation or participant validation, whereby it is used to assess the trustworthiness, verify
and validate the qualitative findings (Birt, Scott, Cavers, Campbell & Walter, 2016). The in-
depth interviews were carried out with the respondents who came from different
organizations. The respondents include consultants, client/end-user, contractor and
concessionaire. All respondents verified the data’s accuracy when they analyzed the results
from each case study. The research instrument is developed for the semi-structured interview
is divided into two parts. Section A aims to get feedback from the respondents regarding the
problem of the handover of the PFI project in Malaysia. Meanwhile, section B seeks input
from the respondents on solutions to Malaysia’s PFI project handover issues.
In this study, the mock interviews or the pilot test of the qualitative interview, as
suggested by Dikko (2016), were conducted in December 2018. The mock interview was
conducted based on the research interview questions to conclude the construct and content
validity of the selected data collection method. The expert checking for validation via the pilot
test of interview questions was conducted with two potential project participants, who had the
same criteria selection; minimum three years of experience in PFI projects, and a high position
in a construction-related company. The interviews were conducted within a one-hour time
frame. Subsequently, upon the pilot test interview, the interview questionnaire was reviewed,
refined, and rephrased accordingly to achieve the research objectives. Therefore, the
interviews’ result becomes the baseline for the upcoming interview sessions with the other
respondents.
Based on the respondents’ numbers, the purposive sampling is chosen for this study and
three selected projects for case studies were analyzed. The consultants, main contractors,
client, and the concessionaire company were invited for the semi-structured interview,
conducted in January 2019 to March 2019.
ANALYSIS AND DISCUSSION
The summary of the project information for the case studies are stipulated in Table 3. The
semi-structured interviews were conducted with the project participants from different
companies; consultant, contractor, concessionaire and the client from every case study
chosen. For easy referencing, coding is given for the company and the respondents. All the
interviews were recorded with permission and were transcribed verbatim. The interview’s
transcripts will be extracted and tabulated into one table form, divided into ‘Respondent’,
‘Interview Text’, ‘Interpretation of the Underlying Meaning’, and ‘Descriptive Code. The raw
data collected from the interviews are then categorized into codes.

234
MCRJ Special Issue Vol. 12 | No. 1 | 2021
Table 3. Project Information for Case Studies
Project
Development & Construction of Centre for Foundation
Studies for 5,000 Students at Dengkil via PFI
(CASE STUDY A)
Development & Construction of
Training Institute via PFI
(CASE STUDY B)
Development & Construction of Centre for Foundation Studies
at Gambang via PFI (CASE STUDY C)
Location Dengkil Selangor Nilai, Negeri Sembilan Gambang, Pahang
Owner Government Government Government
Commencement Date
26-Nov-12 1-Jul-13 16 Jan 2013
Completion Date (COA)
25-Nov-15 22-Jul-16 1 Dec 2018
On-Time Yes Yes No (Delay Handover)- 2 years
The Problem That Affects the Successful Handover of PFI Projects in Malaysia
Table 4 summarizes the descriptive code for identifying the problem affecting the
successful handover of PFI projects in Malaysia. It is noticed that most of the respondents
believe that the delay, defects detected and commissioning are the main problems that affect
these handovers. The main contractors and concessionaire company from the three case
studies shared the same opinions that the incomplete As-built documentation and the O&M
documentation will not affect the handover. However, the concession agreement hinged on it
did not require these documents mentioned above before issuing the certificate of acceptance.
Therefore, the consultants and the client still view that these documents are essential for them
and the O&M team usage at the operation stage. Likewise, the documents’ incomplete
submission will be a problem to the end-user or client if it has only been handed over after
the issuance of the certificate of acceptance.
It was also found that the collaboration issues are the main problems for the three case
studies as it relates to other problems such as the unclear project brief, different interpretation,
and coordination issues between the client and the concessionaire. Sizeable respondents
concluded that the disputed final account is not viable to the PFI project for all the case
studies. Besides, the project’s nature does not allow any extension of time (EOT) or the
variation cost due to work variation. Since there is no final commercial account that influences
the PFI project’s delivery, the impact of the disputed final account will only happen between
the concessionaire and the main contractors.

235
MCRJ Special Issue Vol. 12 | No. 1 | 2021
Table 4. Summary of Descriptive Codes/Themes on the Problems That Affect the Handover of PFI project
Respondents Code
Descriptive Codes IVCA IVCB IVCC IVCD IVCE IVCF IVCG IVCH IVCI IVCJ IVCK IVCL Total %
P1 - Delay ü ü ü ü ü ü ü ü ü ü ü ü 12 100
P2 - Defect ü ü ü ü ü ü ü ü ü ü ü 11 92
P3 - Commissioning ü ü ü ü ü ü ü ü ü ü ü ü 12 100
P4 - Incomplete as built documentation
ü ü ü ü ü ü 6 50
P5 - Incomplete O&M documentation ü ü ü ü ü ü 6 50
P6 - Disputed Final Account 0 0
P7 - Financial Issues ü ü ü ü 4 33
P8 - Unclear Project Brief ü ü ü ü ü ü ü ü ü ü 10 83
P9 - Incompliance to Client Requirement
ü ü ü ü ü 5 42
P10 - Drawing Discrepancies ü ü 2 17
P11 - Planning, Control and Monitoring Failure
ü ü ü ü ü ü 6 50
P12 - Collaboration Issues ü ü ü ü ü ü ü ü ü 9 75
P13 - Human Related Issues ü ü ü 3 25

236
MCRJ Special Issue Vol. 12 | No. 1 | 2021
Table 4 shows eight (8) variables that achieved more than 50% feedback from the
respondents. The variables are as follows:
Delay
Based on the results, all the respondents agreed that delay is the main problem that may
obstruct the PFI project’s handover. This result parallels the study conducted in Norway, that
delay will affect the handover’s effectiveness (Schneider et al., 2016). The main factor that
causes a delay in the PFI project may be due to the defects similarly shared by the three cases
studies especially highlighted during a joint inspection between the client and concessionaire.
Typically, the contractor needs time to rectify the detected issues before the second inspection
could be carried out. Delay also happened caused by the lack of monitoring from the
concessionaire’s project team, especially regarding site management and supervision.
Commissioning Issues
All the case studies and the respondents ranked the commissioning as a significant
problem. Saidin Khaderi, Adnan, Yih Chong & Bakhary (2015) mentioned that the
commissioning risk is part of the risk identification in Malaysia’s PFI projects. However,
there are no specific studies on commissioning issues related to the handover of identified PFI
projects. Furthermore, the risk mentioned as the unsatisfactory performance in the
commissioning stage will indeed influence the client not accepting the facility at that stage
for handover to proceed.
The interview findings suggest that commissioning related to contractors’ negligence in
delivering good workmanship and good performance impaired the system’s functioning. In
case-study C, all equipment, particularly the M&E system, must be re-tested and re-run once
the re-inspection has been carried out. When the time gap between the joint inspections is
longer than standard construction period timeline, the recommissioning will fail due to the
system not working for some time, especially if the M&E system is not maintained properly.
Therefore, commissioning issues can be considered a continuous and prolonged problem if it
is not appropriately handled until the handover process is completed.
Defect
From the findings, 92% of respondents informed that defects are the second problem that
mainly affect the PFI projects’ handover. This statement is supported by Hashim et al. (2017a)
in his study that, construction defects perceived as a significant contributing factor that could
distract the handing over the process and operational phase. The defect’s origin is due to the
different interpretation of defects from the concessionaire and client. Moreover, there is a
defect due to the poor workmanship from the contractors. These two defect categories are
identified in case study C, whereby nearly 4000 defects detected from the first joint inspection
(JI) were due to the mentioned factors.
Furthermore, based on the interview findings, the PFI defect is categorized into two types
of non-conformance (NCR): the major NCR, and minor NCR. The major NCR includes the
functioning, security, and safety mechanism in the PFI project. All the non-conformance work
that was inspected during the joint inspection between the client /end-user and the

237
MCRJ Special Issue Vol. 12 | No. 1 | 2021
concessionaire project team did not comply with those factors as mentioned. This major non-
conformance shall be treated as a significant defect which needs to be rectified before the
handover. Moreover, the issue is that the defect’s identification is subjective based on
different interpretations between the concessionaire /his project team and the client /end-user.
These issues occurred for both case study B and C. Hence, it is crucial to have an acceptable
mechanism agreed by both parties to categorize the major NCR and minor NCR to avoid
disputes or argument on the defect issues.
Unclear Project Brief
From the analysis, almost 83 % of the respondents highlighted their concern regarding
unclear project brief as one of the main problems discussed as potential PFI handover failures.
Likewise, Carrillo, Robinson, Foale, Anumba & Bouchlaghem (2008) opined that inadequate
client brief/requirements at the procurement stage had become a unique PFI issue. Therefore,
enhancing the project brief at the early stage will eliminate the problems during the handover.
Moreover, communication is suggested as the critical channel for resolving the issues during
that early stage. It is essential that discussion with the end-user and well-maintained
coordination among the team to be conducted regularly. As a result, liaison with the client
and the authorities to comply with the standard criteria and eventually integrated into the
project brief must be practiced. One of the useful mechanisms implemented in one of the PFI
projects is noticed in case study A where it established the Value Management (VM) lab at
the early stage of the project to conclude the final project brief as to avoid technical issues
and other identified risks.
Collaboration Issues
75 % of the respondents claimed that collaboration issues have to be taken cared of to
mitigate risks. In the case study A, the respondents stressed the significance of the
collaboration to the project success. This result agrees with Ismail et al. (2018) findings that
Private Finance Initiative (PFI) is a collaboration between private and public sector in
procuring public infrastructure projects that begins with conceptual designs until the
operational phase. Therefore, the collaboration issues such as coordination issues, relationship
matters, lack of involvement of end-user, and miscommunication should be avoided from the
beginning of the project. Consequently, the effective coordination and integration are crucial
and necessary from the early stage, execution stage, and handover until the PFI project’s
operation stage. However, in case study C, this linear progression was not evidently practiced;
hence it eventually created problems during the handover process.
Incomplete As-Built Documentation
50% of the respondents agreed that the incomplete As-built documentation, including
drawings, will affect the PFI project’s handover. Likewise, Ayodeji et al. (2016) mentioned
the incomplete As-built documents are associated with the construction projects’ handover.
Nevertheless, there are no studies that have related the incomplete As-built documentation in
the PFI projects. Furthermore, the findings have shown that there are different opinions from
different respondents. For example, in case study C, the concessionaire will only require to
hand over the documents after receiving the client’s certificate of acceptance. The complete
submission of the As-built drawings is required and is part of handover criteria imposed by
the PFI projects’ client nowadays.

238
MCRJ Special Issue Vol. 12 | No. 1 | 2021
Incomplete O&M Documentation
Even though Ayodeji et al. (2016) informed that incomplete submission of O&M would
be affecting the handover of construction projects, but in the perspective of PFI model
structure, the facility shall be maintained by the same concessionaire for a time-period as per
stipulated in the concessionaire agreement. Therefore, it is purely the liability of the facility
management team in the concessionaire company to obtain the complete O&M
documentation for their usage purpose later. The availability charges may be reduced due to
any hiccup during the operation and maintenance period. That is why half of the respondents
do not recognize that incomplete O&M documentation may affect the PFI projects’ handover.
Moreover, there are no evident studies relating it to affect the handover of the PFI projects in
Malaysia.
Planning, Control, and Monitoring Failure
Trangkanont & Charoenngam (2014) mentioned that the poor project control, monitoring
and project management were among the failure factors for the PPP projects handover.
However, most past studies did not specifically highlight these problems that impact the PFI
projects’ handover stage. Moreover, based on interview findings, the issues of financial
monitoring failure, the revised work programme, financial control failure, and the authorities’
schedule not being monitored had been highlighted in case study A. Only with effective
project management, control, and monitoring could the project mission objectives be achieved
within the specified time, budgeted cost, and pre-defined quality specifications.
Solutions for Problems that Affect Handover of PFI Projects in Malaysia
Table 5 indicates the display for summarizing the descriptive codes for the solutions of
problems that affect the PFI project’s handover. The respondents emphasized that ‘planning
and monitoring’ and ‘competent and experienced team’ are the most influential problem-
solving theme in the problems that affect the PFI project’s handover. 92% of respondents
reported that stakeholder management offers a solution to most of the PFI project’s handover
issues. Most of the issues such as the unclear project brief, the incompliance of client
requirement and drawing discrepancies, collaboration problems could be resolved by the close
relationship between stakeholder management and the entire project team. 42% of
respondents proposed quality management to solve the problems of handover related to the
defect issues. Only 33 % of the respondents stated that financial management is the solution
for financial issues – the respondents were mainly from the contractor and concessionaire
company side. Finally, human actions, such as management skills, responsible and competent
leadership, would be the solution to the issue of handover relating to project monitoring and
controlling failure.

239
MCRJ Special Issue Vol. 12 | No. 1 | 2021
Table 5. Summary of Descriptive Codes/ Themes on the Solution for Problems That Affect the Handover of PFI Project
Respondents Code
Descriptive Codes IVCA IVCB IVCC IVCD IVCE IVCF IVCG IVCH IVCI IVCJ IVCK IVCL Total %
S1 - Planning, Control and Monitoring
✓ ✓ ✓ ✓ ✓ ✓ ✓ ✓ ✓ ✓ ✓ ✓ 12 100
S2 - Quality Management ✓
✓
✓ ✓
✓ 5 42
S3 - Competent Team / Experience Team
✓ ✓ ✓ ✓ ✓ ✓ ✓ ✓ ✓ ✓ ✓ ✓ 12 100
S4 - Stakeholder Management ✓ ✓ ✓ ✓ ✓ ✓ ✓ ✓ ✓ ✓
✓ 11 92
S5 - Human Behaviour/Skills ✓ ✓
✓
3 25
S6 - Financial Management ✓ ✓ ✓
✓ 4 33

240
MCRJ Special Issue Vol. 12 | No. 1 | 2021
Planning, Control, and Monitoring
All the respondents agreed that planning and monitoring are the best solutions for the
main problems that occurred. This result agreed with Alinaitwe & Ayesiga (2013) that vital
monitoring and evaluation teams for the projects implemented were among the success factors
of implementing PFI in the construction industry. Previous studies have discussed the project
management method to be applied, such as the development of an EPS (Enterprise Project
Structure), and the creation of a WBS (Work Breakdown Structure) (Viradia, P. & Prakash
Rao B. 2018). Nevertheless, none of the respondents explicitly mentioned the form of project
management tools to be introduced.
Competent Team / Experienced Team
All the respondents agreed that competent and experienced team members are also
possible solutions for handover issues. The related problems are often identified defects,
commissioning issues, and planning and monitoring failure. The study’s result parallels with
Yong & Mustaffa (2013) that stipulates that all involved members in the project should be
competent and have relevant experience in their area of expertise. From the interview
findings, the selection of the contractor is the core figure in the PFI projects. For example, in
case study A and B, the projects achieved delivery on-time due to the experienced team
involved in the PFI projects, whom both have the PFI management team from the client-side.
Stakeholder Management
The problem solving on the collaboration issues, unclear project brief, project control
monitoring failure, incompliance to client requirement and drawing discrepancies are among
the issues found regarding stakeholder management. The problems can be seen developed
from the planning stage, design stage and the construction stage. As suggested by El-Gohary,
Osman & El-Diraby (2006), the PPP projects’ stakeholder management would influence the
project success related to the successful handover of the PFI project to its operational stage.
When comparing case study, A & B with case study C, the lack of involvement of the end-
user and the client mostly occurs in case study C. As a result, there was no regular
engagement, such as meetings, and coordination between the stakeholders, especially
concessionaire and the client that greatly affected the due progress.
Development of Successful Handover Framework of PFI Project in Malaysia
Based on the above analysis, findings to the problems and its solution, the framework for
a successful handover of the PFI project is developed, as shown in Figure 4. This study
discovered new additional problems for the handover of the PFI project in Malaysia. These
problems are collaboration issues, unclear project brief, planning, control and monitoring
failure, financial issues, incompliance to client requirement, human-related matters and
drawing discrepancies. On the solution part, the result proposes a further focus on project
planning, better control and monitoring, quality management, competent team or experience
team, human behavior and skill factors, financial management, and better stakeholder
management. These identified areas have to be improved to see significant progress in the
handover issues of PFI projects. The only similarity with the traditional construction project’s
solution is quality management, stakeholder management, project planning control,
monitoring, and competent team.

241
MCRJ Special Issue Vol. 12 | No. 1 | 2021
CONCLUSION
The present study showed that the problems concerning the successful handover of the
PFI project in Malaysia are recognized from the early stage of the project’s implementation,
even before the concessionaire agreement had been signed. The issues typically persist until
the handover stage. The primary problems identified are delay, commissioning, defect,
unclear project brief, collaboration issues, the incomplete As-built documentation, O&M
documentation and planning, control and monitoring failure.
However, the result showed that the leading solutions to overcome these problems
potentially is planning, control and monitoring, establishing a more competent and
experienced team and better stakeholder management. From the analysis, the framework
consolidates the problems and solutions for a successful handover of the Private Finance
Initiative (PFI) projects in Malaysia is shown in Figure 4. The framework gives useful
information on the critical factors that need to be adequately managed for the government,
public and private sectors in ensuring the successful handover of the PFI projects.
Figure 4. Framework for Successful Handover of PFI Project in Malaysia

242
MCRJ Special Issue Vol. 12 | No. 1 | 2021
On the other hand, academically, the study also provides new knowledge and learning
area on the handover issues, especially the problems and the solutions for PFI project
handover. Several new suggestions can be adopted for future implementation of the PFI
project, such as the pre-qualification of the concessionaire company, third party supervision,
monitoring, and the Value Management lab. Further research and studies on problem and
solution can be explored based on Malaysia’s other PPP model. The result can be compared
whether the same problems arise and solutions for better handover process of Malaysia’s PFI
projects apply to the other type of PPP models. Furthermore, to achieve a more profound
knowledge of the underlying problems and solutions, future research focused on each theme
of problems and solutions in PPP or PFI projects locally or worldwide can be investigated
further.
REFERENCES
Abdullah, N., Sufian, A., Asenova, D., & J. Bailey, S. (2014). PPP/PFI in Malaysian
Development Plans: Purpose, Structure, Implementation, Financing and Risk Transfer. In
Proceedings of 5th Asia-Pacific Business Research Conference (pp. 1-14). KUALA
LUMPUR.
Adom, D., Hussein, E., & Joe, A. (2018). Theoretical and Conceptual Framework: Mandatory
Ingredients of a Quality Research. International Journal of Scientific Research, 7(1), 438-
441.
Ahmadabadi, A., & Heravi, G. (2019). The effect of critical success factors on project success
in Public-Private Partnership projects: A case study of highway projects in Iran. Transport
Policy, 73, 152-161. doi: 10.1016/j.tranpol.2018.07.004
Al-bidaiwi, M., Beg, M., & Sivakumar, K. (2012). Deal with Start-Up and Commissioning
Threats and Challenges at an Early Stage of the Project for a Successful Handover and
Project Completion. In SPE International Production and Operations Conference &
Exhibition (pp. 1-10). Doha: society of petroleum engineer. Retrieved from
https://doi.org/10.2118/156098-MS
Alinaitwe, H., & Ayesiga, R. (2013). Success Factors for the Implementation of Public–
Private Partnerships in the Construction Industry in Uganda. Journal Of Construction In
Developing Countries, 18(2), 1-14.
Ayodeji Emmanue, O., Samuel O, O., & Abel Adetoye, A. (2016). Factors Affecting
Construction Project Handover and Feedback Mechanism. In Procs. of the Joint
International Conference (JIC) on 21st Century Human Habitat: Issues, Sustainability and
Development, 2 (pp. 841-850). Nigeria: Joint International Conference.
Birt, L., Scott, S., Cavers, D., Campbell, C., & Walter, F. (2016). Member Checking.
Qualitative Health Research, 26(13), 1802-1811. doi: 10.1177/1049732316654870
Brito, M., Lopes, R., Rocha, L., & Qualharini, E. (2016). Beyond Buildability: Operability
and Commissioning of Industrial Facilities. Procedia - Social And Behavioral Sciences,
226, 67-74. doi: 10.1016/j.sbspro.2016.06.163
Carrillo, P., Robinson, H., Foale, P., Anumba, C., & Bouchlaghem, D. (2008). Participation,
Barriers, and Opportunities in PFI: The United Kingdom Experience. Journal Of
Management In Engineering, 24(3), 138-145. doi: 10.1061/(asce)0742-597x
(2008)24:3(138)
Cavka, H., French, S., & Pottinger, R. (2015). Evaluation of Organisational Context and
Requirements for Leveraging Building Information Models to Support Handover and
Operations & Maintenance. In 5th International/11th Construction Specialty Conference

243
MCRJ Special Issue Vol. 12 | No. 1 | 2021
(pp. 251-1-251-11). Vancouver: British columbia.
Creswell, J. W. (2009). Research design: Qualitative, quantitative, and mixed methods
approaches (3rd edition). Thousand Oaks, CA: Sage.
Cui, C., Liu, Y., Hope, A., & Wang, J. (2018). Review of studies on the public–private
partnerships (PPP) for infrastructure projects. International Journal Of Project
de Castro e Silva Neto, D., Cruz, C., Rodrigues, F., & Silva, P. (2016). Bibliometric Analysis
of PPP and PFI Literature: Overview of 25 Years of Research. Journal Of Construction
Engineering And Management, 142(10), 06016002. doi: 10.1061/(asce)co.1943-
7862.0001163
Dikko, M. (2016). Establishing Construct Validity and Reliability: Pilot Testing of a
Qualitative Interview for Research in Takaful (Islamic Insurance). The Qualitative
Report, 21(3), 521-528
El-Gohary, N., Osman, H., & El-Diraby, T. (2006). Stakeholder management for public
private partnerships. International Journal Of Project Management, 24(7), 595-604. doi:
10.1016/j.ijproman.2006.07.009
Firing, M., Lædre, O., & Lohne, J. (2016). Main Challenges Found in the Handover of a
Shopping Centre in Norway. Procedia - Social And Behavioral Sciences, 226, 100-107.
doi: 10.1016/j.sbspro.2016.06.167
Frank, O., Omer, S., Riffat, S., & Mempouo, B. (2015). The indispensability of good
operation & maintenance (O&M) manuals in the operation and maintenance of low
carbon buildings. Sustainable Cities And Society, 14, e1-e9. doi:
10.1016/j.scs.2014.06.002
Hashim, H., Che-Ani, A. I., & Ismail, K. (2017a). A polemic on defects liability in public
private partnership (PPP) project. Journal of Engineering Science and Technology,
12(Special Issue), 212-220.
Hashim, h., Che-Ani, A., & Ismail, K. (2017b). Review of issues and challenges for public
private partnership (PPP) project performance in Malaysia. In The 2nd International
Conference on Applied Science and Technology 2017 (pp. 020051-1 - 020051-7).
KUALA LUMPUR: American Institute of Physics.
Hasmori, M., Said, I., Deraman, R., Abas, N., Nagapan, S., & Ismail, M. et al. (2018).
Significant Factors of Construction Delays Among Contractors in Klang Valley and its
Mitigation. International Journal Of Integrated Engineering, 10(2), 32-36. doi:
10.30880/ijie.2018.10.02.007
Hegazy, T., & Abdel-Monem, M. (2012). Email-based system for documenting construction
as-built details. Automation In Construction, 24, 130-137. doi:
10.1016/j.autcon.2012.02.014
Hwang, B., Zhao, X., & Gay, M. (2013). Public private partnership projects in Singapore:
Factors, critical risks and preferred risk allocation from the perspective of contractors.
International Journal Of Project Management, 31(3), 424-433. doi:
10.1016/j.ijproman.2012.08.003
Ismail, S., & Azzahra Haris, F. (2014). Rationales for public private partnership (PPP)
implementation in Malaysia. Journal of Financial Management of Property and
Construction, 19(3), 188–201. https://doi.org/10.1108/JFMPC-04-2014-0006
Ismail, K., Talib, Y., Salleh, N., & Japri, A. (2018). Critical Success Factors in Operation
Phase of Private Finance Initiative (PFI) Projects. International Journal Of Academic
Research In Business And Social Sciences, 8(1). doi: 10.6007/ijarbss/v8-i1/3894

244
MCRJ Special Issue Vol. 12 | No. 1 | 2021
Khaderi, S., Abd Shukor, A., Bakri, A., & Mahbub, R. (2019). Public Infrastructure Project
Tendering Through Public Private Partnerships (PPP) – A Literature Review. MATEC
Web Of Conferences, 266, 01015. doi: 10.1051/matecconf/201926601015
Khairuddin, A. R. (2014). Public-Private Partnership and its Significance for Malaysia.
Commonwealth Governance and Growth, 54–57.
Kissi, E., Sadick, M., & Diatuo K. J., O. (2018). Challenges Facing Public Works
Departments in Construction Project Delivery Within Metropolitan Municipal and
District Assemblies In Ghana. UDS International Journal Of Development [UDSIJD],
5(1), 129-143.
Larsen, J., Lindhard, S., Brunoe, T., & Jensen, K. (2018). The Relation between Pre-planning,
Commissioning and Enhanced Project Performance. Construction Economics And
Building, 18(2), 1-14. doi: 10.5130/ajceb.v18i2.5762.
Manap, N., Goh, Y., & Syahrom, N. (2017). Compulsory of Malaysia’s Quality Assessment
System in Construction (QLASSIC). IOP Conference Series: Earth And Environmental
Science, 109, 012008. doi: 10.1088/1755-1315/109/1/012008
Marzouk, M., & El-Rasas, T. (2014). Analyzing delay causes in Egyptian construction
projects. Journal Of Advanced Research, 5(1), 49-55. doi: 10.1016/j.jare.2012.11.005
Munich RE. Machinery and equipment damage during first start-up, testing and
commissioning (pp. 1-11). London.
Othuman Mydin, M., Othman, N., & Sani, N. (2014). A Prospective Study on Building
Quality: Relationship between Workmanship Quality and Common Building Defects of
Low-cost Construction Projects. MATEC Web Of Conferences, 17, 01001. doi:
10.1051/matecconf/20141701001
Pettee, S. (2005). As-builts – Problems & Proposed Solutions (pp. 1-19).
Rahman, I. A., Memon, A. H., & Zulkiffli, N. S. M. (2014a). PPP Procurement Methods in
Malaysian Construction Industry Ismail. Igarss 2014, 10(1), 1–5.
https://doi.org/10.1007/s13398-014-0173-7.2
Rahman, I. A., Memon, A. H., & Zulkiffli, N. S. M. (2014b). Failure reasons of PPP
infrastructure projects: Case study of Kuala Lumpur LRT project. Life Science Journal,
11(7), 238–246.
Ramli, M., Malek, M., Hanipah, M., Lin, C., Mahamad Sukri, M., & Zawawi, M. et al. (2018).
Study of factors influencing construction delays at rural area in Malaysia. Journal Of
Physics: Conference Series, 1049, 012017. doi: 10.1088/1742-6596/1049/1/012017
Saidin Khaderi, S., Adnan, H., Yih Chong, H., & Bakhary, N. (2015). Risk Management in
Private Finance Initiative (PFI) Projects in Malaysia. MAGNT Research Report (, 3(5),
27-36.
Schneider, K., Lædre, O., & Lohne, J. (2016). Challenges Found in Handover of Commercial
Buildings. Procedia - Social And Behavioral Sciences, 226, 310-317. doi:
10.1016/j.sbspro.2016.06.193
Trangkanont, S., & Charoenngam, C. (2014). Critical failure factors of public-private
partnership low-cost housing program in Thailand. Engineering, Construction And
Architectural Management, 21(4), 421-443. doi: 10.1108/ecam-04-2012-0038
Unkovski, I. (2016). APMG PPP Guide (p. 45). Washington: World Bank Publications.
Viradia, P., & Prakash Rao, B. (2018). Planning, scheduling and delay analysis of a building.
International Journal of Civil Engineering and Technology, 9(5), 665-671.
W. Wu, R. I. (2012). BIM-Enabled Building Commissioning and Handover W. Wu1 and R.
R.A. Issa2 1. 237 Computing in Civil Engineering, (912), 237–244.

245
MCRJ Special Issue Vol. 12 | No. 1 | 2021
Yin, R. (2014). Case study research: design and methods (5th ed.). London: Sage Publication.
Yong, Y., & Mustaffa, N. (2013). Critical success factors for Malaysian construction projects:
an empirical assessment. Construction Management And Economics, 31(9), 959-978. doi:
10.1080/01446193.2013.828843
Zakaria, Z., Ismail, S., & Yusof, A. (2012). Cause and Impact of Dispute and Delay the
Closing of Final Account in Malaysia Construction Industry. Journal Of Southeast Asian
Research, 2012, 1-12. doi: 10.5171/2012.975385
Zakaria, Z., Ismail, S., & Yusof, A. (2013). Fundamental Variables of Final Account Closing
Success in Construction Projects in Malaysia. International Journal of Economics and
Management Engineering, 7(10), 2761–2766.
Zidane, Y., & Andersen, B. (2018). The top 10 universal delay factors in construction projects.
International Journal Of Managing Projects In Business, 11(3), 650-672. doi:
10.1108/ijmpb-05-2017-0052

246
MCRJ Special Issue Vol. 12 | No. 1 | 2021
EXPLORING THE QUANTITY SURVEYING SERVICES FROM THE EMPLOYERS’ AND GRADUATES’ PERSPECTIVE Habizah Sheikh Ilmi, Soon Lam Tatt, Darren Tan Quan Wen, Myzatul Aishah Kamarazaly and Shirley Chin Ai Ling School of Architecture, Building and Design, Taylor’s University, Malaysia.
Abstract A quantity surveyor is a professional working within the construction industry that is concerned with construction economics. The quantity surveyor profession in Malaysia has evolved due to client’s additional needs and requirements. Quantity surveyors not only are requested to perform traditional professional services but are also asking for the demanding services such as productivity improvement, project management, arbitration, risk management, construction financial practice and feasibility study in today’s changing construction industry. Therefore, this paper will identify the traditional and present roles of quantity surveyors and find out the threats to quantity surveyors’ profession in the future. A quantitative method is used through the survey questionnaires to gather data and information from the quantity surveying practitioner and graduates. The research outcome showed that the quantity surveying profession and the graduates are still relevant and stay competitive in the industry. Keywords: Core competencies, graduates, profession, quantity surveyor, services.
INTRODUCTION
Quantity surveyors are the professionals that play an important role in the construction
industry along with the architects, engineers, developers, building proprietors, government
bodies and agencies and contractors. Roles of quantity surveyors include cost management,
cost planning, project procurement, feasibility studies, contract administration and asset
financial management (Shafiei and Said, 2008). As the time passes, it has constantly changed
the way of construction business is handled. This change has pushed the quantity surveyors
evolving over time to survive and remain viable in their respective field. In order for the
profession to survive and evolve with the environment, they depend on the extent of
competencies and knowledge (Sonson, 2014, Cartlidge, 2018). A lot of firms are becoming
more of a business advisor than a traditional quantity surveyor (Heaton, 2015). Moreover,
with technology changing, the quantity surveying profession is going to evolve, while
bringing more challenges than ever before (Wong et al., 2014). Thus, evolving as a new breed
of quantity surveyors in the modern market, they are currently facing a few problems such as
the implementation of Building Information Modeling (BIM) as it will bring a huge impact
towards the productivity and quality of the projects. Ineffective data interoperability, slacking
of software adaptabilities, unavailable skilled staffs and project inexperience are the examples
of technical issues that limited the BIM implementation (Chien et al., 2014). Apart from the
usual barriers which constrain change, an additional factor restraining BIM adoption is an
inherent conflict of interest within the construction industry. This may be a major deterrent to
innovation as it straddles professional boundaries (Olatunji, Sher & Gu., 2010).
ISSUES
According to Rahmani (2010), the changing and shifting scene in the requirements of
clients indicated that the clients had their dissatisfaction with the services provided by

247
MCRJ Special Issue Vol. 12 | No. 1 | 2021
construction professionals generally and their continual disappointment with the result that
they received. Hence, up to this day, it is very important to refine the services of quantity
surveyors for them to play a pro-active and competent role during the progress cycle of
projects (Brummer, 2004 cited by Ofori, 2012).
Graduate quantity surveyors acquire their competencies from university education and
internship training. However, there is no benchmark for the level of competencies acquired
by the graduate through their education as implied by Shafiei & Said (2008). Through the
absence of benchmark, there is a mismatch of expectation of quantity surveyor graduate
competencies by construction industry and the competencies acquired by graduate in
university. This has led to dissatisfaction by the industry toward the graduate competencies
(Perera et al., 2011).
There is always a strong emphasis to understand the clients’ needs on evolving quantity
surveying profession. Therefore, getting feedback from the fresh graduates will be as
important as well as from the industry to fully grasp what quantity surveying graduates learnt
during their educational period and to see what is lacking from the industry needs. Therefore,
getting feedback from both parties are important to understand the needs and to create a
solution. This research will identify the competencies of quantity surveying graduates to adapt
the changing needs of the construction industry and the threats to quantity surveying'
profession in the future.
LITERATURE REVIEW
Changing Roles of Quantity Surveyors
Competency is described as an action, behaviour or outcome of a person who can transfer
the skills and knowledge to act effectively in a job or situation (Klieme et al., 2008). A
quantity surveying is a profession for persons who are trained and qualified to provide reliable
advice and assist in handling problems arising in the industry (Frei & Mbachu, 2009).
According to Male (1990), valuation and measurement are the key competencies which are
important for proper cost management in construction projects. Nkado & Meyer (2001) stated
that quantity surveying competencies reside in financial and contractual control of the project
and proposed to develop their interpersonal skills. Dada & Jagboro (2015) identified the
competencies of quantity surveyor include built environment, property economics, technical
skills and many more.
Nowadays as technologies and environment continues to advance, transforming various
profession as well as removing certain job where it could easily be taken over by technology.
According to Frei and Mbachu (2009), quantity surveyors are not different from any other
professional jobs, as it also faces a risk of receiving more threats than opportunity. The threats
can be the major drawback for a quantity surveying and possibly change the role or completely
remove the profession.
As quantity surveyors are constantly being faced with challenges and new opportunities,
thereby it is essential for them to continuously enhance the competencies in order to stay
competent in the competitive industry. They are to adapt quickly with the environment or else
the threats will be imminent. It can be implied that the graduate quantity surveyors need to
248
MCRJ Special Issue Vol. 12 | No. 1 | 2021
develop their skills to diversify into different nature of organizations. By diversifying their
roles, it would help the graduates to be more marketable. However, the graduates should not
neglect the traditional service as it still plays an importance in the industry despite not being
as important as previously.
New Procurement and Contract Management
A noticeable revolution in the competencies for quantity surveyors are the client which
are seeking for ways to manage contracts (Potts, 2008). Frei et al. (2013) discussed the that
new forms of procurement have been designed to counter the traditional procurement as
client’s requirement varies. Frei and Mbachu (2009) believe cost plus contract, design and
build contracts and turnkey gives a great benefit to the value and it should be used as a basic
knowledge by the quantity surveyor. New contract management and new procurement forms
such measured term contracts, design management, cost management, cost plus and project
delivery partners were developed over the past decades for the benefits of quick contract
management and price knowledge.
Even so, different procurement methods require different types of knowledge (El
Wardani, 2006). Therefore, the quantity surveyors are encouraged to understand well with
different types of procurement method to advise the client on the best options available.
Different procurement has different effects on the time and cost. The suitable procurement
method will help in concentrating on the work at hand by different contracting parties
(Verster, 2006).
Building Information Technology and Building Integration Modeling
Technologies have overtaken the way how many things are done, as a result the
development of BIM and automatically generated quantities, are considered a potential threat
in terms of the quantity surveyor’s technical role (Smith, 2004 and Frei & Mbachu, 2009). As
described by Ali et al. (2016), all construction professionals will require for developing and
expanding their skill in BIM sooner or later as BIM systems will be at the focus of future
virtual projects and information management system. Therefore, BIM qualifications and
knowledge will be as important to the professionals to be a key player in the industry (Matipa
et al., 2013).
However, there are firms who believed that the implementation of BIM is not a
considerable threat to the profession but the BIM integration in the industry is the greatest
problem (Wong, 2004). Although, computer usage has increased during the construction
periods, but there was never a common ground of software used by different firms, as such
an integration recommended by using Building Integration Modeling (BIM). Hence, it is a
challenge for the quantity surveyors to acquire as much knowledge and familiarize themselves
to different types of BIM software for cost estimation and measurement.
Resistant to Change
The construction sector diverse in both engineering and design aspect. However, the
utilization of Information Technology (IT) has been lacking in comparison with other
industries. It was observed that quantity surveying experience in term of information

249
MCRJ Special Issue Vol. 12 | No. 1 | 2021
technology (IT) applications was relatively low as compared with other developed countries.
The construction industry is perhaps conservative in term of IT application, where the industry
has a common approach of “wait and see” (Shen et al., 2003). The quantity surveying
profession is perhaps still seen as a traditional role and not view as IT capable (Smith, 2004).
The current industry still focuses on the quantity surveyors’ traditional role and not improving
their services as extra time and cost required to gain those knowledges.
Competition of Other Professions
The construction industry market is always in constant competitive state. Smith (2004)
mentioned that cost management is not the only exclusive service. Other professions can carry
out this service as well and may be providing better quality over it. Frei and Mbachu (2009)
also agreed to the current competition from other professions such as accountants, lawyers,
property managers, value management consultants and many more, which could provide
similar services as a quantity surveyor can be viewed as one of the threats. Due to various
professional service requirements, the clients have an increasing need for a profession which
can provide all the required services that a modern construction requires.
As viewed by Smith (2004) that there are some firms prioritizing their quantity surveying
competencies and expertise on the profession and proceeding on developing this skill. As a
matter of fact, firms need to be more flexible and willing to change their standard work
practices than to stick with the traditional ways. Not only do the firms must be flexible but
quantity surveyor should adapt to the work pattern changes (Dada and Jagboro, 2012). Smith
(2004) also agreed that diversification is needed for the quantity surveying profession. By
diversifying their scope, the quantity surveyors are able to fulfil clients and industry’s
requirement. Quantity surveying can be diversified into various area such as investment
appraisal, project planning, project management, contractual dispute resolution, etc. as
explained by Fanous (2012) cited by Nnadi et al. (2016).
Quality of Graduates
Over the past years, the industrial practitioners have expressed their opinion on the
graduates. The employers believe the graduates should be adapting to technical skill task.
Practitioners often expressing their opinion about intellectual calibre of quantity surveying
graduates is laudable, but the level of technical skill is distressing as expressed by Wilkinson
and Hoxley (2005). They were disappointed by the graduate performance specifically with
the core skills of measurement and construction knowledge (Smith, 2004). Furthermore, the
graduates were found not interested in the traditional measurement role, which result a decline
in core competencies and skills. According to Smith (2004), even some quantity surveyors
have trouble functioning in their traditional services.
Zou and Darvish (2006) stated that in order to help graduate obtain various attributes
expressed by the employers, the graduates should be placed on a more practical assignment
with activities that provide hands on work that have real life relevance. This is to allow the
graduates to gain useful experience. For example, the graduates should be assigned to various
group-work opportunities to allow everyone to develop the teamwork attribute which will
come in handy in their professional career. Universities should also allow the students to be
exposed with the industry, including site visits and experience guest lecturers to give talks.

250
MCRJ Special Issue Vol. 12 | No. 1 | 2021
Education, Training, Mentorship, Continuing Professional Development (CPD) and Research
The Royal Institution of Chartered Surveyors (RICS) have set out a minimum
requirement that members must undergo a minimum of 20 hours of Continuing Professional
Development (CPD) training each year by recording it online (RICS, 2018). This is currently
seen as a potential process to allow quantity surveyors to have a certain amount of
professionalism. The CPD’s benefit is to enhance their professional practice through genuine
continuation of education and learning (Lester, 1999). Anyhow, CPD does not only satisfy
their professional body’s requirements, but to ensure integrity with colleagues and employers,
improve job performance, widen the horizon in term to perform in the current and future role
to enable promotion and progression (King, 2004). Verster (2009) suggested there should be
a model for maturity which includes education, training, mentorship, continuing professional
development (CPD) and research and allows to bridge the gap between formal education
providers and providers of the quantity surveying and construction management service to the
industry.
RESEARCH METHODOLOGY
This paper aims to investigate consultant quantity surveyors and graduates’ perception
towards the change in services that the quantity surveyors are required to perform. Therefore,
a survey-based investigation which is one of the quantitative methods are preferred in the
assessment. It is considered the most suitable method in this study as it can obtain a large
amount of data and permits analysis in statistical form. A questionnaire survey is a standout
amongst the best techniques to obtain countless data to accomplish better outcomes, as
recommended by Minato (2003). The questionnaire is known as a technique which question
people on a point to portraying their feedback as mentioned by Jackson (2011).
Questionnaires are sent through website or email, enabling to reach further region.
The data collected are from survey which are distributed to practitioners of quantity
surveying firms, fresh graduates and/or final year students from private university. Targeted
population were consultancy firms in the Klang Valley and 3 private university fresh
graduates and the students in their final years. The selection of fresh graduates with one year
working experience are selected as they are still aware of the latest curriculum of the
programme structure provided by their respective universities to give their insights whether
their knowledge acquired during their studies shall complement the services or skills expected
by the employers. Whilst, the final year students’ opinion can still be counted as well as they
have already received some exposure of industrial training experience during their internship
and their awareness of the latest quantity surveying programme structure provided. According
to the BQSM website there are 237 consultancy firm in Klang Valley. For the 3-private
universities, there are a total of 199 final year students and/or graduates.
The respondents are required to rate the level of importance by a five- point Likert scale
for the types of services performed by the quantity surveyors and the threats faced by them.
This is to capture the relative importance index (RII) from data collected (Rooshdi, 2018). As
mentioned by Gliem et al. (2003), the RII value of 0.6 to 0.8 is still consider acceptable but
0.8 and above are highly preferable.

251
MCRJ Special Issue Vol. 12 | No. 1 | 2021
FINDINGS
A sum of 237 and 199 survey were dispatched to the focused population of quantity
surveying firms in Klang Valley and the graduates of quantity surveying programmes from
three private universities. Only 41 responses from the consultants and 43 responses from the
graduates were received.
Table 1. Type of Services Provided by Quantity Surveyors
Type of Services Practitioner Graduate
RII Rank RII Rank
Traditional Services
Contract administration 0.873 1 0.819 4
Tendering 0.854 2 0.860 2
Bills of Quantities 0.849 3 0.879 1
Estimating/Cost planning 0.844 4 0.856 3
Builders Quantities (refer to builder/ contractors)
0.834 5 0.814 5
Procurement 0.815 6 0.819 4
Specification preparation 0.727 7 0.786 7
Non- Traditional Services
Project management 0.776 1 0.795 4
Cost benefit analysis 0.756 2 0.809 2
Feasibility study 0.741 3 0.756 8
Construction Planning 0.722 4 0.791 5
Arbitration/mediation 0.707 5 0.740 9
Value management 0.693 6 0.814 1
Quality management 0.688 7 0.763 7
Post Occupancy Evaluation 0.688 7 0.716 11
Lifecycle Costs 0.683 8 0.800 3
Due diligence reports 0.683 8 0.712 12
Facilities management 0.663 9 0.712 12
Risk management 0.663 9 0.786 6
Expert witness 0.659 10 0.716 11
Insurance valuation 0.629 11 0.721 10
Tax advice 0.605 12 0.684 13
Premises Audits 0.600 13 0.712 12
Other Fields
Infrastructure works 0.790 1 0.781 1
Civil works 0.780 2 0.730 2
Transport 0.654 3 0.660 4
Manufacturing 0.644 4 0.702 3
Ship Building 0.590 5 0.609 8
Petrochemical 0.585 6 0.619 6
Marine works 0.576 7 0.637 5
Mining 0.566 8 0.614 7
Aeronautical 0.551 9 0.619 6
Based on Table 1, the services which are important to both consultants and graduates are
displayed. Among the three categories, the is a clear picture that shows the importance of
traditional services as it has the highest rank compared to the other services. Among the seven
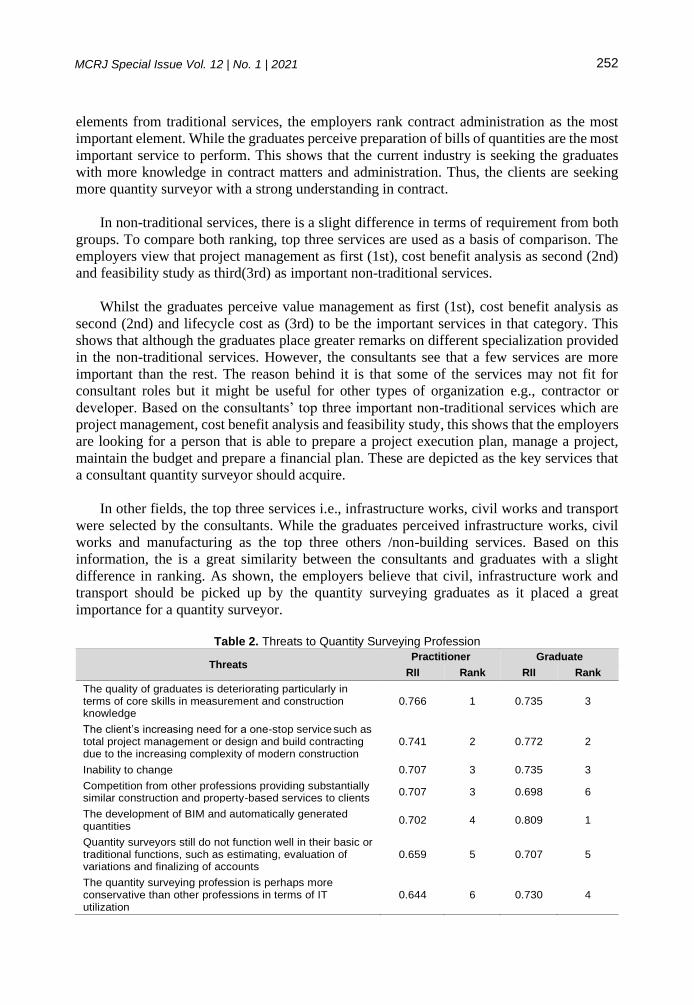
252
MCRJ Special Issue Vol. 12 | No. 1 | 2021
elements from traditional services, the employers rank contract administration as the most
important element. While the graduates perceive preparation of bills of quantities are the most
important service to perform. This shows that the current industry is seeking the graduates
with more knowledge in contract matters and administration. Thus, the clients are seeking
more quantity surveyor with a strong understanding in contract.
In non-traditional services, there is a slight difference in terms of requirement from both
groups. To compare both ranking, top three services are used as a basis of comparison. The
employers view that project management as first (1st), cost benefit analysis as second (2nd)
and feasibility study as third(3rd) as important non-traditional services.
Whilst the graduates perceive value management as first (1st), cost benefit analysis as
second (2nd) and lifecycle cost as (3rd) to be the important services in that category. This
shows that although the graduates place greater remarks on different specialization provided
in the non-traditional services. However, the consultants see that a few services are more
important than the rest. The reason behind it is that some of the services may not fit for
consultant roles but it might be useful for other types of organization e.g., contractor or
developer. Based on the consultants’ top three important non-traditional services which are
project management, cost benefit analysis and feasibility study, this shows that the employers
are looking for a person that is able to prepare a project execution plan, manage a project,
maintain the budget and prepare a financial plan. These are depicted as the key services that
a consultant quantity surveyor should acquire.
In other fields, the top three services i.e., infrastructure works, civil works and transport
were selected by the consultants. While the graduates perceived infrastructure works, civil
works and manufacturing as the top three others /non-building services. Based on this
information, the is a great similarity between the consultants and graduates with a slight
difference in ranking. As shown, the employers believe that civil, infrastructure work and
transport should be picked up by the quantity surveying graduates as it placed a great
importance for a quantity surveyor.
Table 2. Threats to Quantity Surveying Profession
Threats Practitioner Graduate
RII Rank RII Rank
The quality of graduates is deteriorating particularly in terms of core skills in measurement and construction knowledge
0.766 1 0.735 3
The client’s increasing need for a one-stop service such as total project management or design and build contracting due to the increasing complexity of modern construction
0.741 2 0.772 2
Inability to change 0.707 3 0.735 3
Competition from other professions providing substantially similar construction and property-based services to clients
0.707 3 0.698 6
The development of BIM and automatically generated quantities
0.702 4 0.809 1
Quantity surveyors still do not function well in their basic or traditional functions, such as estimating, evaluation of variations and finalizing of accounts
0.659 5 0.707 5
The quantity surveying profession is perhaps more conservative than other professions in terms of IT utilization
0.644 6 0.730 4

253
MCRJ Special Issue Vol. 12 | No. 1 | 2021
Table 2 below shows the threats that could potentially affect the profession. The
employers believe that the top threat that is affecting the profession is the graduate’s qualities
in terms of their core skills, client’s need of one stop services, the inability to enhance their
skills or services and other profession able to provide similar function. As seen by the
employers, this top threat revolves around the issues of graduate showing less promising
capability in terms of knowledge as well as unable to take the initiative to improve themselves.
The second threat is where the clients looking for better control of the contract, which are
associated with the price and contract management offered by quantity surveyors. If the
graduates do not improve themselves, there could be a risk of other profession taking the role
of a quantity surveyor.
The graduates seem to have a different ranking on the threats impose to the profession
but with some slight resemblance by choosing the development of BIM to be the most
important threat, followed by the client’s increasing need for a one- stop service, the
deteriorating graduates in terms of core skills and knowledge and the inability to change.
Based on the data collected, the graduates have the similar awareness with the employers. The
only difference is that the graduates placed the development of BIM and automatically
generated quantities to be the most threatening aspect that a quantity surveyor will face in this
generation. The reason behind it is the emphasis on BIM that has been highly advertised and
established in Malaysia, which placed a huge demand on several projects (Latiffi et al., 2013).
This creates a demand on graduate quantity surveyors to obtain such knowledge to remain
viable in the market. By considering the threat and understand the cause of it, this will assist
the graduates to prevent it and to counteract the threats. This indeed helps the graduates to
stay employable in the industry.
The results have shown that the current industry’s requirement and expectation from the
graduates from the employer’s view, the traditional services are the most essential in the
quantity surveying profession. The graduates must have these fundamental knowledges to
equip themselves before entering the industry. Their knowledge and skills can be enhanced
during their internship, given a reasonable period of industrial training experience. This can
be a good solution to solve the quality of graduates which is deteriorating particularly in terms
of measurement skills. The quality of graduates would affect the number of employments
secured by the employers in the future.
The respondents were also asked to give their feedbacks on the expectations of quantity
surveying services by the clients and ways of improving the performance of graduate quantity
surveyors. Based on the consultants/employers’ perspective, they believe that a quantity
surveyor should have sufficient skills and expertise in the profession. A quantity surveyor
should adapt to the changing environment to remain viable. To ensure high-quality
performance of the workforce can be attained through the process of education, training,
research, training and Continuing Profession Development (CPD). It can be deduced that the
employers seem to be selecting the methods that requires graduates to be adaptable to change,
while still having enough professional expertise and skills and good knowledge in information
technology (IT).
Even though, the quantity surveyor is the key role and service in the construction industry,
this role or service can also be performed by other profession. Therefore, to prevent such
event to happen, the quantity surveyors are recommended to have acquired the following
skills:

254
MCRJ Special Issue Vol. 12 | No. 1 | 2021
• Apart from fundamental knowledge, hard and soft skills, a right attitude is always very
important. With the right attitude, a person can continue to learn, survive, adapt,
improve and move on. Without this, the person shall be often stagnant at the same
spot.
• The quantity surveyors must not only be competent in the basic roles such as
measurement and building economics, but should be also knowledgeable in other
aspects, namely contracts, construction law, sustainability and be familiar with the
roles of other profession in the construction industry.
• They need to improve their skills in terms of information technology or any new
software system to enhance their services. This is to gain additional bonus to remain
valuable in the industry.
• The quantity surveyors today must be able to multitask. This is to fulfil the needs of
the clients as well as be ready to provide proper advice.
• As from the graduate’s perspective, the quantity surveying graduates should excel in
their basic skills and continuously learn and explore to cover a wider scope in the
industry. They understand the needs to improve themselves to stay competent and
choose the method that will benefit themselves the most. The graduate’s opinion has
been summarized as follow:
• BIM allows quantities to be extracted efficiently, it should be perceived as a tool for
quantity surveyors rather than a replacement. The construction industry cannot
progress if the graduates have inadequate knowledge on software application.
• Quantity surveyor shall have enough professional expertise and skills in the core
competencies and continue to develop this expertise and quantity surveyor adaptability
in the changing market.
• Willing to adapt and learn the varieties. This profession can be only strong when you
have multi knowledge and discipline in many different aspects.
• Modules should be more focused on the actual site or industry experience. This is to
improve more hands-on work rather than purely theory subject.
• Diversified role of Quantity Surveyors.
Referring to the summary from both employers and graduates’ point of view, their fear
especially on the comment that quantity surveyors could be replaced by others fear may not
seem to be something new. This may not happen in the actual practice since architects and
engineers cannot take over the scope of works of professional quantity surveyors easily.
Different professions have different strength and specialization. Similarly, to the quantity
surveyors, multitasking can be an issue. The quantity surveyor may take over some of the
scope of work of others such as legal, public relation and project monitoring. However, there
will still be restriction imposed if quantity surveyor wants to cross over the other professional
boundaries, for example, the design which is practiced by architects and engineers for years
cannot be easily obtained without a proper professional qualification.
Despite of a huge number of comments from the respondents about the requirement to
improve information technology skills during their studies in the universities. In fact, the
graduates only received just fundamental knowledge whilst the industries use a lot of
diversified software where it would take years to master the software used in the industry. It
should not be neglected that the universities must play a big part in providing a proper and up
to date course for information technology to ensure their students are well equipped with the

255
MCRJ Special Issue Vol. 12 | No. 1 | 2021
basic knowledge to hasten their learning curve. Gradually, the graduates should be more
proactive to gain additional specialized knowledge and experience in using the specialized
software provided in their daily works.
CONCLUSION
To wrap up the whole study, the research has investigated the issue identified with the
quantity surveyor services, the threats and the techniques to improve graduate competencies.
The study is able to recognize the abilities required from quantity surveyors to remain relevant
in the current industry. This research can also help university to evaluate the quantity
surveying course structure. As a suggestion to industry is that employers should be more
supportive to provide opportunity to the graduate to allow them to improve themselves. This
way, the graduate can continuously improve their knowledge and expertise. While the
university should work together with industry players to provide real simulation or case
studies, sites, actual insight of projects to allow the students to gain useful experience
knowledge instead of merely theory. Therefore, creating a suitable syllabus is necessary for
students to learn and remain relevant after graduating.
REFERENCES
Ali, K. N., Mustaffa, N. E., Keat, Q. J., & Enegbuma, W. I. (2016). Building information
Modeling (BIM) educational framework for quantity surveying students: The Malaysian
perspective. Journal of Information Technology in Construction (ITcon), 21(9), 140-151.
Cartlidge, D. (2018). New aspects of quantity surveying practice. London: Routledge.
https://doi.org/10.1201/9781315561707
Chien, K.F., Wu, Z.H. & Huang, S.C. (2014). Identifying and assessing critical risk factors
for BIM projects. Empirical Study. Automation in Construction, 15 pp 1-15.
Gliem, J.A & Gliem, R.R (2003). Critical success factors, opportunities and threats of the cost
management profession: the case of Australasian quantity surveying firms. International
Journal of Project Organisation and Management 7, 5(1-2), pp 4-24.
Heaton, A. (2015). The changing face of quantity surveyors, online, retrieved from
https://sourceable.net/the-changing-face-of-quantity-surveying/
Dada, J. O., & Jagboro, G. O. (2015). Core skills requirement and competencies expected of
quantity surveyors: perspectives from quantity surveyors, allied professionals and clients
in Nigeria. Construction Economics and Building, 12(4), 78-90.
El Wardani, M. A., Messner, J. I., & Horman, M. J. (2006). Comparing procurement methods
for design-build projects. Journal of Construction Engineering and Management, 132(3),
230-238.
Frei, M., & Mbachu, J. (2009). The future of quantity surveying in New Zealand: Likely
changes, threats and opportunities. 13th Pacific Association of Quantity Surveyors
Congress.
Frei, M., Mbachu, J., & Phipps, R. (2013). Critical success factors, opportunities and threats
of the cost management profession: the case of Australasian quantity surveying firms.
International Journal of Project Organisation and Management 7, 5(1-2), 4-24.
Jackson, S. L. (2015). Research methods and statistics: A critical thinking approach. Cengage
Learning. (p.17).
King, H. (2004). Continuing Professional Development in Higher Education: what do
academics do?. Planet, 13(1), 26-29.

256
MCRJ Special Issue Vol. 12 | No. 1 | 2021
Klieme, E., Hartig, J., & Rauch, D. (2008). The concept of competence in educational
contexts. Assessment of competencies in educational contexts, 3-22.
Latiffi, A. A., Mohd, S., Kasim, N., & Fathi, M. S. (2013). Building information modeling
(BIM) application in Malaysian construction industry. International Journal of
Construction Engineering and Management, 2(4A), 1-6.
Lester, S. (1999). Professional bodies, CPD and informal learning: the case of conservation.
Continuing professional development, 2(4), 110-121.;
Male, S. (1990). Professional authority, power and emerging forms of ‘profession’in quantity
surveying. Construction Management and Economics, 8(2), 191-204.
Minato, T. (2003). Design documents quality in the Japanese construction industry: factors
influencing and impacts on construction process. International Journal of Project
Management, 21(7), 537-546.
Nkado, R., & Meyer, T. (2001). Competencies of professional quantity surveyors: a South
African perspective. Construction Management and Economics, 19(5), 481-491.
Nnadi, E. O. E., Okeke, F. N., & Alintah-Abel, U. (2016). Marketing Quantity Surveying
Profession in South-Eastern Nigeria. IOSR Journal of Mechanical and Civil Engineering
(IOSR-JMCE) e-ISSN, 2278-1684.
Ofori, G. (2012). Role of leadership in transforming the profession of quantity surveying.
Construction Economics and Building, 9(1), 37-44.
Olatunji, O. A., Sher, W., & Gu, N. (2010). Building information modeling and quantity
surveying practice. Emirates Journal for Engineering Research, 15(1), 67-70.
Perera, S., Pearson, J., & Ekundayo, D. (2011). Mapping RICS quantity surveying
competencies to curricula of RICS accredited programmes, online, retrieved from
https://www.academia.edu/901024/ Mapping_RICS_quantity_surveying competencies
to curricula of RICS accredited programmes.
Potts, K. (2008). Change in the quantity surveying profession. 2008). Collaborative
Relationships in Construction: developing frameworks and networks, 42-58.
Rahmani, F. (2010). Importance of Quantity Surveyors for public sector organisations in
the prevaling recession, online, retrieved from http://www.academia.edu/466357/
Importance_of_Quantity_Surveyors_for_public_sector organisations in the prevaling
recession.
Rooshdi, R.R.M, Majid, M.Z.A, Sahamir, S.R. & Ismail, N.A.A (2018). Relative importance
index of sustainable design and construction activities criteria for green highway. In
Chemical Engineering Transactions (pp.151-156). Italian Association of Chemical
Engineering-AIDIC.
Royal Institution of Chartered Surveyors (RICS). TARGETpostgrad, online, retrieved from
(2018, October 10) https://targetpostgrad.com/subjects/built- environment/royal-
institution-of-chartered-surveyors-rics
Shafiei, M. W., & Said, I. (2008). The competency requirements for quantity surveyors:
Enhancing continuous professional development. Sri Lankan Journal of Human Resource
Management, Vol. 2, No. 1.
Shen, Q., Li, H., Shen, L., Drew, D., & Chung, J. (2003). Benchmarking the use of
information technology by the quantity surveying profession. Benchmarking: An
International Journal, 10(6), 581-596.
Smith, P. V. (2004). Trends in the Australian Quantity Surveying Profession 1995- 2003. In
World Congress on Cost Engineering, Project Management and Quantity Surveying,
AACE American Association of Cost Engineers. International Cost Engineering Council.

257
MCRJ Special Issue Vol. 12 | No. 1 | 2021
Sonson, S. J., & Kulatunga, U. (2014). Quantity surveying role and environmental influences
in Saint Lucia. In Proceedings of the International Conference on Construction in a
Changing World, CIB International Conference (pp. 4-7).
Verster, J. J. P. (2006). Managing cost, contracts, communication and claims: A Quantity
Surveying perspective on future opportunities. In Proceedings of 1st ICEC & IPMA
Global Congress on Project Management, 5th World congress on Cost Engineering,
Project Management and Quantity Surveying (pp. 23-26).
Verster, J. J. P., van Zyl, C. H., & Kotzé, B. G (2009). The Quantity Surveyor And
Construction Manager: Structure, Maturity And The Pillars Of Development.
Wilkinson, S., & Hoxley, M. (2005). The impact of RICS education reform on building
surveying. Structural Survey, 23(5), 359-370.
Wong, K. D. A. (2004). A Case Study Of The ISO 13567 CAD Layering Standard For
Automated Quantity Measurement In Hong Kong.
Wong, P. F., Salleh, H., & Rahim, F. A. (2014). The relationship of building information
modeling (BIM) capability in quantity surveying practice and project performance.
International Journal of Civil, Architectural, Structural and Construction Engineering,
8(10), 990-994R.
Zou P. X., & Darvish, H. (2006). Group assignments and teamwork skills development in
postgraduate construction management studies. Architectural Engineering and Design
Management, 2(3), 203-215.

258
MCRJ Special Issue Vol. 12 | No. 1 | 2021
EXPLORING THE ADAPTIVE REUSE CONCEPT AND BENEFITS IN MANAGING PUBLIC BUILDING QUARTERS IN MALAYSIA Mohamad Izzat Zulkanain, Mastura Jaafar and Nuzaihan Aras Agus Salim School of Housing, Building and Planning, Universiti Sains Malaysia, Minden, Penang, Malaysia.
Abstract Government building quarters are crucial solution to provide sufficient dwelling and to improve civil servant public service quality. Since independent, the government has provided each ministry with certain allocation of fund to build their own quarters. Ministry of Education has been given certain allocation to build residential quarters to facilitate teachers throughout Malaysia, unfortunately several quarters especially those are located in rural area are not being fully utilized and the condition of the abandoned teachers’ quarters is in terrible condition. To overcome the problem, adaptive reuse method is purposed. Adaptive reuse is one of the methods to achieve sustainability in the built environment as Malaysia is targeting to be a modern country by 2020. But still, there are a few arguments when it comes to adaptive reuse such as, lack of knowledge and exposure regarding the concept and benefits of adaptive reuse. This paper will provide literature review on the concept of adaptive reuse and its benefits by using a Systematic Literature Review (SLR) approach. As stated by previous scholars, the concept of adaptive reuse is explained throughout this paper and the identified benefits of adaptive reuse are in term of environmental, social and cultural, economic, promoting innovation and time saving. Such benefits may be applicable to support adaptive reuse towards public quarters (teachers’ quarters) as it may revitalise and lengthen the lifecycle of the building. Keywords: Adaptive reuse; teachers’ quarters; concept; benefits; civil servant; systematic literature
review.
INTRODUCTION
Civil servant is an important stakeholder in the implementation of public
service. National Transformation Agenda targeted Malaysia to become a high-income
developed nation by the year 2020, where the Public Service Department was given the
mandate to lead the transformation of the public service. In ensuring the effective service of
public servant, their basic necessity should be taken care of. One of basic need provided by
the government is housing quarters. This facility has been provided by a federal government
to assist them in reducing the burden of civil servant (Borham, 2013). Malaysia Five Years
Development Plan has been used as a tool of medium-term economic policy-making in
Malaysia whereby it been used to help government mobilize available economic resources to
achieve specific socio-economic goals. Since then, the Malaysian government has been
focusing on providing the best facilities especially housing for government servant and among
of the beneficiary of this facilities are teachers in Malaysia. In the Ninth Malaysia Plan (2006-
2010) the Government has allocated RM690 million for teachers' accommodation or housing
quarters and half of this allocation is for teachers' housing quarters in rural areas (Malaysia
Economic Planning Unit, 2006).
However, many of government quarters left unoccupied. For example, in terms of
teacher’s quarters, according to Ministry of Education, there are 50,257 units teachers’
quarters throughout Malaysia, from the number 33,893 units are occupied while the rest
16,364 units are unoccupied. Among the 16,364 units, 10,062 units are in a dreadful condition

259
MCRJ Special Issue Vol. 12 | No. 1 | 2021
and it is located in rural area (BERNAMA, 2019). This trend has certainly caused the
government unsustainable losses on both of the productivity and financial sides of land use
(Borham, 2013). Besides this, government still need to allocate certain amount of money to
maintain the building. In 2018, Finance Minister Lim Guan Eng stated RM400 million have
been allocated for the maintenance and repair of government quarters for civil servants,
especially the police, army and teachers, to live more comfortably (BERNAMA, 2018).
Generally, as a developing country, Malaysia has a large stock of existing buildings and
most of these buildings were not maintained well includes government quarters. As an impact
it may shorten the lifespan of the building making them to be in poor conditions and
invaluable (Mohamed & Alauddin, 2016). Borham, (2013) in his research identified most of
the quarters including teachers’ quarters left in unoccupied are located outside of the city,
which is located at Kerian district, Perak. The research shows that 43.3% of the government
quarters units in numerous grades are deserted in rural area.
As an option to overcome this problem, adaptive reuse method is used for achieving
sustainability. Adaptive reuse is defined as maximizing building life with changing original
building usage (Kincaid, 2002; Vivian & Jane, 2019). Adaptive reuse is the act of finding a
new utilization for a building. It is often described as a procedure by which structurally sound
older buildings are developed for economically permanent new uses (Conejos, Langston &
Smith, 2013). It is an alternative to demolition and replacement of buildings since it requires
less energy and waste. It also provides social benefits by revitalizing familiar landmarks and
giving them a new life (Misirlisoy & Gunce, 2016).
There are few statements given by minister on the alternative use of government
buildings. A recent statement from The Youth and Sports Minister Syed Saddiq Abdul
Rahman proposed to state governments that abandoned government quarters should be
converted into transit or rental homes and open to the public, particularly young Malaysians.
This initiative may help those with problems buying their own property with current economy
(Ben, 2018). Also, a supportive statement from Deputy Prime Minister Datuk Seri Dr Wan
Azizah Wan Ismail, government buildings or vacant teacher quarters can be used as temporary
shelters for flood victims across the country. “In the future if there are many places
(government buildings and teachers' quarters) that are unoccupied, it can be utilized (as
temporary accommodation) so that it does not interfere with the learning of students in
schools” she said (Shaarani & Shaiful, 2019).
PROBLEM STATEMENT
Adaptive reuse is closely related to property that has been abandon or vacant. Property
abandonment has generally not been addressed as a problem; it has been viewed as a
symptom, and not a cause, of urban disinvestment. Hence, since the 1940s, cities have
attempted to stimulate demand for housing, commercial property and office space, through
massive demolition programs, public improvements, and subsidized developments that they
hope will stimulate reinvestment in a neighbourhood or downtown district (Accordino &
Johnson, 2000).
Then, the common argument when it comes to adaptive reuse are, “Lack of awareness on
adaptive reuse opportunities and benefits”; “Believe that the demolition is the only

260
MCRJ Special Issue Vol. 12 | No. 1 | 2021
alternative”, “Adaptive reuse cost is high”; “Social unwillingness for changing day to day
activities related to properties that have potential for adaptive reuse”; and “Notion that the
preservation of buildings is more traditional” (De Silva, Perera & Rodrigo, 2019). As an
alternative, adaptive reuse is suggested to overcome the symptom, and a clear understanding
on how adaptive reuse works must be established.
Adaptive reuse is one of the sustainable methods to conserve building. There are a lot of
previous project regarding adaptive reuse, but those projects mostly focused on heritage or
historical building. (Mısırlısoy & Günçe, 2016, Wilson, 2010). There is lack of study
regarding adaptive reuse towards public building especially teachers’ quarters.
Moreover, social and cultural benefits of adaptive reuse were given less attention when
considering adaptive reuse method, possibly because such benefits are difficult to measure. It
is widely recognized that historical buildings contribute to the sense of place which people
have to maintain for a considerable period of time (Bullen and Love, 2011). Hence, in this
paper, further explanation of adaptive reuse benefit on social and culture will be elaborated.
There is general agreement among researchers that adaptation can make an important
contribution to the sustainability of existing buildings (Kurul, 2007). The change to the reuse
and adaptation of buildings is a trend that has been clearly recognized by Bullen (2007),
Gallant and Blickle (2005), and Bon and Hutchinson (2000). In parallel of Malaysia vision to
become a developed nation by 2020, certain criteria that need to be achieved are to have the
sustainability in construction and efficient use of resources.
RESEARCH QUESTIONS
Having the above research problem, as a preliminary step in exploring the use of adaptive
reuse concept in ensuring the sustainability of government quarters in Malaysia, this paper
hopes to answer the below research questions:
1. What is the adaptive reuse concept?
2. What are the benefit of adapting this concept?
METHODOLOGY
This section describes the framework for carrying out this study. This combines all
methods, requirements for qualifications, references and review. For the design of the study,
content analysis of the articles was carried out to identify the concept and benefits of adaptive
reuse. Selected studies that showed the concept and benefits of adaptive reuse were selected
for the analysis.
The articles were searched under the terms "adaptive reuse", "concept", "benefits", and
"advantages". This study only considered materials from previous published research. Those
published studies were identified through searches of electronic databases accessible through
the authors’ university library system. The literature review process started by looking into
primary and secondary sources. The primary literature sources included refereed journals,
refereed conferences, dissertations/theses, occasional papers and government reports.
Secondary sources included textbooks, trade journals, newspapers and magazines.

261
MCRJ Special Issue Vol. 12 | No. 1 | 2021
The five top journals that were reviewed in the search are: i) Science Direct; ii) Emerald
Group Publishing; iii) Google Scholar; iv) Springer Link; v) Elsevier. These top five journals
were selected as they frequently publish scientific scholarly papers in multiple fields and they
have been ranked highly by several researchers (Mohamed & Alauddin, 2016).
DATA ANALYSIS
The selected documents were then reviewed and studied. At first, the abstract of the
papers was studied and then the full documents to comprehend and interpret the substance for
this paper. In order to identify the concept of adaptive reuse, related papers that provide
understanding towards the idea of adaptive reuse were taken to be abstracted. Then, for the
advantages of adaptive reuse, the shortlisted papers were then reviewed as shown in (Table
1). The selected research papers that consist of benefits of adaptive reuse covered from various
parts of region such as South Korea, Sri Lanka, United States, China, United Kingdom and
Australia.
Table 1. Benefit of Adaptive Reuse
Scholars Region
Benefits of Adaptive Reuse
Environmental Social and
Cultural Economic
Promoting Innovation
Time Saving
Yoon & Lee (2019) South Korea ✓ ✓
De Silva, Perera & Rodrigo (2019)
Sri Lanka ✓ ✓ ✓
Myers (2018) United States ✓ ✓ ✓
Hang & Chen (2017) China ✓ ✓
Manewa, Siriwardena, Ross & Madanayake (2016)
United Kingdom
✓ ✓ ✓
Conejos, Langston & Smith (2011)
Australia ✓ ✓ ✓
Bullen (2007) Australia ✓ ✓ ✓
Australia’s Department of the Environment and Heritage (2004)
Australia ✓ ✓ ✓ ✓
Many researchers have explored on the benefit of adopting adaptive reuse strategy in
building such as De Silva et al. (2019), Manewa et al. (2016), Conejos et al. (2011) and Bullen
(2007). These researchers identified the benefit in terms of social and cultural, economic and
environmental.
Besides the three common advantages, Myers (2018) add time saving as the new
advantage of adaptive reuse for industrial buildings. Another view from Australia Department
of the Environment and Heritage (2004), identified the benefits of adaptive reuse of heritage
and historical buildings in terms of the environment, social, economic and promoting
innovation.
While Yoon and Lee (2019) and Hang and Chen (2017) believe the benefits of adaptive
reuse are in term of social and cultural and economic. Thus, the below section will elaborate
more on the concept and the benefits of adaptive reuse in terms of environment, social,
economic and promoting innovation and time saving.

262
MCRJ Special Issue Vol. 12 | No. 1 | 2021
FINDING AND DISCUSSION
The concept of adaptive reuse existed around the Roman times. Due to a long historical
background, adaptive reuse has been proposed, particularly in some parts of the world such
as Europe (Stratton, 2000). Adaptive reuse inspiration comes from several other terms that
are interchangeably used such as preservation, conservation, rehabilitation, renovation and
recycling. Adaptive reuse is described as optimizing building life with changing original use
of the building (Kincaid, 2002). Adaptive reuse is intended for buildings that have failed
economically or socially and have been abandoned previously.
In architecture, adaptive reuse means ‘the change process or state that suits a new
environment or circumstance, or the subsequent change’ (Abdulhameed, Mamat & Zakaria,
2019). In addition, Yildirim (2012) views it as an effective adaptive modification of existing
buildings to fit newly proposed purposes and coexist in an area other than the original. It is
the act or process of keeping something alive by either modernization (rehabilitation to the
original function) or complete conversion to a new function or even a mixture between the
two. Brooker & Stone (2008) link the need for the conversion of buildings or sites in relation
to new sustainable development trends. In different situation, buildings need to change its
original function to fit into contemporary social needs.
Adaptive reuse is the process of adapting old structures, renovating a building or site to
include elements enabling specific uses to occupy a space originally intended for a different
purpose (Douglas, 2006). It is the act or process of allowing a property to be used compatibly
by repairing, altering and adding while preserving those portions or features that convey the
economic, cultural or architectural values. This could be simply to keep an existing building
component or to completely renovate the entire building. The new way of thinking about
adaptive reuse is to reduce consumption, recycle and reuse what was produced and be
environmentally responsive (McDonough, 1998).
Adaptive reuse strategies assist the promotion of development of sustainable built
environment (Conejos, Langston & Smith, 2011). On the other hand, architectural
conservation ensures economic, cultural and social benefits to urban communities. Therefore,
the role of architectural conservation has changed from preservation to being part of urban
regeneration and sustainability (Ariffin et al., 2017; Bullen & Love, 2011). Adaptive reuse is
an alternative to demolition and replacement of buildings since it requires less energy and
waste. It also provides social benefits by revitalizing familiar landmarks and giving them a
new life (Conejos, Langston & Smith, 2011). Giving new life into heritage buildings ensures
environmental and social benefits to the communities and helps to retain our national heritage
(Shen & Langston, 2010).
Adaptive reuse strategies are preferable to demolition if the objectives of environmental
sustainability and reduced energy consumption are also to be met (van der Flier & Thomsen,
2006). The central issues are that a static internal environment that cannot be easily adapted
is wasteful in terms of sustainability and not warranted in terms of the needs of the occupants.
The more flexible a building is the quicker and easier to adapt, which represents a saving in
the time and productivity lost during “office churn” (Wilson & Boehland, 2008). Adaptive re-
use also offers a more efficient and effective process of dealing with buildings than
demolition. This is because it is deemed to be safer as it reduces the amount of disturbance

263
MCRJ Special Issue Vol. 12 | No. 1 | 2021
due to hazardous materials, contaminated ground and the risk of falling materials and dust.
Site work is also more convenient because the existing building presents a work enclosure
that reduces downtime from inclement weather. There are numerous researches by scholars
that have identify the benefits of adaptive reuse towards different types of building such as
heritage, historical, commercial, industrial and residential.
BENEFITS OF ADAPTIVE REUSE
Environmental
Demolition of buildings is not environmentally friendly (Itard and Klunder, 2007). Bullen
(2007) and Johnstone (1995) consider adaptive reuse as quite sustainable as it consumes less
material, energy and transport compared to new building construction which causing less
environmental pollution. According to Binder (2007), there is a considerable amount of
embodied energy in the existing building stock. One of the main environmental benefits of
reusing buildings is the retention of the original building’s “embodied energy”. The
Commonwealth Scientific and Industrial Research Organisation (CSIRO) defines embodied
energy as the energy consumed by all the processes associated with the production of a
building, from the acquisition of natural resources to product delivery, including mining,
manufacturing of materials and equipment, transport and administrative functions. By
reusing buildings, their embodied energy is retained, making the project much more
environmentally sustainable than entirely new construction (Australia Department of the
Environment and Heritage, 2004).
Referring to Australia Department of the Environment and Heritage (2004), new
buildings have much higher embodied energy costs than buildings that are adaptively reused.
In 2001, new building accounted for about 40 per cent of annual energy and raw materials
consumption, 25 per cent of wood harvest, 16 per cent of fresh water supplies, 44 per cent of
landfill, 45 per cent of carbon dioxide production and up to half of the total greenhouse
emissions from industrialised countries. The Australian Greenhouse Office notes that the
reuse of building materials usually involves a saving of approximately 95 percent of embodied
energy that would otherwise be wasted. In this context the reuse of heritage buildings makes
good sense.
According to Australia Department of the Environment and Heritage (2004), adaptive
reuse of buildings has a major role to play in the sustainable development of communities.
When adaptive reuse involves historic buildings, environmental benefits are more significant,
as these buildings offer so much to the landscape, identity and amenity of where the
communities belong to De Silva et al. (2017) have found that adaptive reuse ensures
cleanliness and the good appearance of a city which provide environmental benefits.
In other hand, adaptive reuse may have benefits towards the architecture environment. As
stated by Myers (2018), in some cases of adaptive reuse by business company, old buildings
can provide aesthetic appeal and promote certain qualities that help define a company’s brand
and culture. Companies can use the space to represent their work and brand or image of their
firm. The property may contain attractive features that can no longer be duplicated. For
instance, older buildings often have charming architectural characteristics and touches that
new buildings eschew for economic reasons.

264
MCRJ Special Issue Vol. 12 | No. 1 | 2021
In different condition, research done by Zainudin, Haron, Bachek & Jusoh in 2016
regarding the Traditional Malay Houses in Malaysia. The structure of Traditional Malay
Houses is considered as vernacular architecture, built and designed by the locals with
thoughtful considerations and appreciation for nature. There are various beneficial features in
technical and environmental contexts of a Traditional Malay Houses that should be
investigated further and applied in the present-day built environment. By applying adaptive
reuse method, the architecture value of the structure can be preserved.
Elliott (2018) in his research regarding adaptive reuse of commercial building stated that
creative office space is all the rage in the commercial office world, with adaptive reuse offices
being a prominent part of that newly popular office class. Such office space, often found in
unique parts of cities that have long been abandoned or underutilized, appeals to a younger
talent pool because of its novelty. These spaces, which can include old manufacturing
facilities and warehouses, are also viewed as environmentally responsible because no new
ground is disturbed by their development.
Social and Culture
Keeping and reusing historic buildings has long-term benefits for the communities that
value them. When done well, adaptive reuse can restore and maintain the heritage
significance of a building and help to ensure its survival. Rather than falling into disrepair
through neglect or being rendered unrecognisable, heritage buildings that are sympathetically
recycled can continue to be used and appreciated (Australia Department of the Environment
and Heritage, 2004).
Adaptive Reuse provides specific opportunities for the public to perceive and attract new
born spaces to the value of historic buildings (Abdulhameed, Mamat & Zakaria, 2019). In the
context of local government planning, heritage has merged with more general quality-of-life
concerns in recent years. Communities increasingly recognise that future generations will
benefit from the protection of certain places and areas, including heritage places. Human
lifestyle is enhanced not just from the retention of heritage buildings, but from their adaptation
into accessible and useable places. The reuse of heritage buildings in established residential
areas can provide the community with new housing and commercial property opportunities
(Australia Department of the Environment and Heritage, 2004).
In Australia, the greater Sydney region, for example, a number of large publicly owned
sites containing heritage buildings are being redeveloped including the former Parramatta,
Lidcombe, and Rozelle Hospitals. Location, access and public transport availability will
always attract developers, and the size of the sites, and variety of buildings available for reuse
mean that a good mix of dwelling types can be offered, with broad appeal to buyers as a result.
Town planners and councils that recognise and promote the benefits of adaptive reuse of
heritage buildings, then, will be contributing to the liveability and sustainability of the
communities (Australia Department of the Environment and Heritage, 2004).
Bullen (2007) believes that adaptive reuse deserves broader recognition as it is a form of
urban regeneration that can help future generations to reap benefits by protecting buildings
(Australia Department of the Environment and Heritage, 2005). Adaptation is a successful
alternative to the retention of embodied cultural and social capital of important buildings

265
MCRJ Special Issue Vol. 12 | No. 1 | 2021
(Bullen, 2007; Bromley et al., 2005). According to Langston (2008), Bullen (2007), Remoy
and Wilkinson (2012), adaptive reuse prevents the promotion of antisocial activities in cities.
Investments on adaptive reuse can significantly boost the living standards of people living in
neglected areas and communities (Ball, 2002; Langston et al., 2007; Langston and Shen,
2007).
Mayer (2018) stated when a vacant building is revitalized, it serves as a tipping point to
stimulate a hub of growth and activity. Existing buildings are part of the fabric of a city and
reflect the history and culture of the neighbourhood. As such, older buildings can have a large
impact on the vitality of that city. This has been the case in many parts of Denver. In the River
North District, for example, the adaptive reuse of warehouse and industrial buildings has
transformed these buildings into restaurants and co-working spaces. In fact, the city of Denver
and private parties alike have been investing heavily in the RiNo district, which is
experiencing a major revival and now is considered one of Denver’s most desirable
neighbourhoods. In addition, adaptive reuse projects like the Rackhouse Pub’s brewery,
distillery, and cidery collaboration are emerging in the formerly industrial LoHi area.
Economic
According to Australia Department of the Environment and Heritage (2004), there are
several financial savings and returns to be made from adaptive reuse of historic buildings.
Embodied energy savings from not demolishing a building will only increase with the
predicted rise of energy costs in the future. While there is no definitive research on the market
appeal of reused heritage buildings, they have anecdotally been popular because of their
originality and historic authenticity. Many researchers also believe that demolishing and
rebuilding is more expensive and less practical than converting old buildings to new uses
(Ariffin, Zahari, Radzi and Kutut, 2017; Bullen, 2007).
Shipley et al. (2006) indicate that the average cost saving expected from adaptive reuse
is approximately 10-12 per cent. According to past research, it is often less costly to adapt a
building than to construct a totally new building (Ball, 2002; Bullen, 2007; Campbell, 1996;
Douglas, 2006; Highfield, 2000; Shipley et al., 2006). A study on high density residential
properties in Hong Kong has revealed that there has been a 9.8 per cent increase in property
values after the refurbishment of the properties (Chau et al., 2003). Developing countries can
use adaptive reuse to improve their economies. Adaptive reuse provides a sense of belonging
to the people (De Silva et al., 2017).
Myers in 2018 stated that saving money is one way that stakeholder can improve when
using adaptive reuse. Stakeholder can lower their equity requirements by purchasing a
building for less than the replacement cost would be. Even if the property is not available for
sale, the lease rate can be quite affordable given that the property may appear to be obsolete.
According to De Silva et al. (2017), adaptive reuse generates revenue through commercial
initiatives, avoids demolition costs and other related costs, attracts tourists and encourages
companies to move into adapted buildings to demonstrate their passions and identities.

266
MCRJ Special Issue Vol. 12 | No. 1 | 2021
Promoting Innovation
The definition of innovation has been an area of interest both for researchers and for
different industries (Popa, Preda & Boldia, 2010). In general literature, innovation is referred
to as research and development practices and implementing high technology aspects, but
innovation in building and construction can take different forms from design to procurement,
contracting, financial arrangement or even softer aspects such as teamwork and leadership
(Maghsoudi, Duffield & Wilson, 2016).
The adaptation of heritage buildings presents a genuine challenge to architects and
designers to find innovative solutions. As development pressures increase in the cities, more
heritage buildings are being reused, producing some excellent examples of creative designs
that retain heritage significance (Australia Department of the Environment and Heritage,
2004).
For instance, the Traditional Malay House have its own unique modularity and ingenious
construction method, it is possible for a Traditional Malay House to be dismantled, relocated
and reconstructed in a new environment. By applying adaptive reuse method, the study is
promoting innovation focusing on exploring Building Infromation Modeling (BIM) usage to
analyse the building performance of a typical TMH. (Zainudin, Haron, Bachek & Jusoh,
2016).
Time Saving
Lee in 2006 stated by using adaptive reuse mode, developers save time and money rather
than starting from scratch. Supporting the statement, Myers (2018) says if the client is dealing
with a short timeline, reusing a building may be not only the best option, but also the only
option. The zoning and site plan approval process for a new development can be lengthy and
only begins once a site has shortened the wait for occupancy significantly, as adaptive reuse
does not require the same lengthy approval process.
According to Misirlisoy and Gunce in 2016, adaptive reuse occurred in the past precisely
because demolition and construction of new buildings will take more time than reusing the
existing building. Supporting the point, reuse of existing building is pragmatic because it
provides faster build time compared to demolition and new development with the population
growth and increasing urbanization trend. (Wikilson and Remoy, 2017).
Moreover, there are advantages of adaptive reuse when the building is in good structural
condition and easily adapted to its new programme. These include the potential for less
construction time depending on the extent of the work done (Ijla & Broström, 2015).
While Lin (1995) stated construction time is a function of the required work range.
However, it may be more expedient to reuse an old building than new construction-through
fast-track construction, staged or continuous occupancy, and early marketing. New building
often takes longer to recover costs.

267
MCRJ Special Issue Vol. 12 | No. 1 | 2021
CONCLUSION AND RECOMMENDATION
Since independent, the provision of government quarters has become a priority of the
government in the Five Years National Plans. The Malaysian government has been focused
on housing for government staff quarters during the first until the fifth Malaysia plan (1981-
1985). As a developing country, Malaysia has a large stock of existing buildings and most of
these buildings were not conserved well and most of them were in poor conditions and
invaluable (Mohamed & Alauddin, 2016). To address the problem, adaptive reuse of existing
buildings is seen as an important strategy for achieving sustainability because of Malaysia
intends to be a developed country by 2020 and the criteria that need to be achieved are to have
the construction of sustainable and inclusive, and efficient use of resources. This method will
have a positive impact towards the construction industry in Malaysia.
From the perspective of Malaysia, development schemes for historic cities revolves
around the idea of introducing new modern development to historic areas, revitalization of
the areas and refurbishment of historic buildings, which are often referred to as the tools for
the improvement schemes of the cities. This is where adaptive reuse plays its role to ensure
sustainability of these buildings. A deep understanding towards the concept of adaptive reuse
must be done to make sure the proper adaptive reuse method is applied towards the building.
Most of previous studies apply adaptive reuse towards historical or heritage building but less
to other type of building such as commercial, industrial, residential, even to public building.
As recommendation, adaptive reuse should be applicable to all types of vacant building as it
gives benefits towards the environment, economic, social and culture, promoting innovation
and saving times.
ACKNOWLEDGMENT
I would like to acknowledge the Ministry of Education, Malaysia for the funding via
Fundamental Research Grant Scheme (FRGS)-Grant No: 203.PPBGN.6711653.
REFERENCES
AB Ariffin, MSM Zahari, SM Radzi, & Kutut, M. (2017). Adaptive reuse of historical
buildings and local residents' actual visitation. Journal of Tourism, Hospitality & Culinary
Arts, 9(2), 35-46.
Abdulhameed, N., Mamat, M. J., & Zakaria, S. A. (2019). Adaptive reuse approaches of
Shophouses at Cannon Street in George Town, Penang. IOP Conference Series:
Materials Science and Engineering, Volume 636(Issue 1). https://doi.org/10.1088/1757-
899X/636/1/012014
Accordino, J., & Johnson, G. T. (2000). Addressing the vacant and abandoned property
problem. Journal of Urban Affairs, 22(3), 301-315.
Australia Department of the Environment and Heritage, (2004), Adaptive Reuse: Preserving
our past, building our future [Booklet], Australian Government, Canberra.
Australia Department of the Environment and Heritage, (2005), Adaptive Reuse. Department
of the Environment and Heritage, Australian Government, Canberra.
Ben, T. (2018, 10 November). Syed Saddiq moots turning disused quarters into homes for
rent. Malay Mail. Retrieved November 1, 2019, from https://www.malaymail.com/news/

268
MCRJ Special Issue Vol. 12 | No. 1 | 2021
malaysia/2018/11/10/syed-saddiq-moots-turning-disused-quarters-into-homes-for-
rent/1692047
BERNAMA. (2018, 02 November). Budget 2019: RM1bil fund for first house purchase. The
Star Online. Retrieved November 1, 2019, from https://www.thestar.com.my/news/
nation/2018/11/02/budget-2019-rm1bil-fund-for-first-house-purchase
BERNAMA. (2019, 25 August). Isu kuarters guru terbiar akan ditangani. Berita Harian
Online. Retrieved November 1, 2019, from https://www.bharian.com.my/berita/nasional/
2019/08/599939/isu-kuarters-guru-terbiar-akan-ditangani
Binder, M. (2007), “Adaptive reuse and sustainable design: a holistic approach for abandoned
industrial buildings”, Master of Architecture, The School of Architecture and Interior
Design, University of Cincinnati, OH, available at: http://internationalinventjournals.org/
journals/IIJASS (accessed 09 December 2019).
Boehland, J (2003) Future-Proofing Your Building: Designing for Flexibility and Adaptive
Reuse. Environmental Building News, 12(2), 1-14.
Bon, R. a., & Hutchinson, K. (2000). Sustainable construction: some economic challenges.
Building Research and Information, 28(5/6), 310-314.
Borham, M. S. (2013), Kuarters Kerajaan Di Daerah Kerian Yang Tidak Berpenghuni:
Faktor Dan Penyelesaian, http://eprints.utm.my/id/eprint/48233/, retrieved 20 October
2019.
Bromley, R. D. F., Tallon, A. R., & Thomas, C. J. (2005). City Centre Regeneration through
Residential Development: Contributing to Sustainability. 42(13), 2407–2429.
Brooker, G., & Stone, S. (2008). Basics interior architecture 02: Context & environment (Vol.
2). United Kingdom: Ava Publishing.
Bullen, P. A. (2007). Adaptive reuse and sustainability of commercial buildings. Facilities,
25(1–2), 20–31. https://doi.org/10.1108/02632770710716911
Bullen, P. and Love, P. (2011), "Adaptive reuse of heritage buildings", Structural Survey,
Vol. 29 No. 5, pp. 411-421. https://doi.org/10.1108/02630801111182439
Conejos, S., Langston, C., & Smith, J. (2011). Improving the implementation of adaptive
reuse strategies for historic buildings. In Le vie dei mercanti S.A.V.E.HERITAGE.
Safeguard of Architectural, Visual, Environmental Heritage., 1–10.
Conejos, S., Langston, C., & Smith, J. (2013). Adapt STAR model: A climate-friendly
strategy to promote built environment sustainability. Habitat Int., 37, 95-103.
De Silva, G.D.R., Perera, B.A.K.S. and Rodrigo, M.N.N. (2017), “Embracing adaptive reuse
of buildings: The case of Sri Lanka”, In 6th World Construction Symposium –What’s New
and What ’s Next in the Built Environment Sustainable Agenda? Ceylon Institute of
Builders, Colombo, Sri Lanka, pp.178-187.
De Silva, G.D.R., Perera, B.A.K.S. and Rodrigo, M.N.N. (2019), Adaptive reuse of buildings :
the case of Sri Lanka. 24(1), 79–96. https://doi.org/10.1108/JFMPC-11-2017-0044
Douglas J. 2006. Building adaptation. Edinburgh (United Kingdom): Heriot-Watt University.
Economic Planning Unit. (2006). The Ninth Malaysia Plan 2006–2010. The Economic
Planning Unit, Prime Minister Department, 1–559. Retrieved from
http://www.pmo.gov.my/dokumenattached/RMK/RM9_E.pdf
Elliott, M. L. (2018). Practical concerns with adaptive re-use office projects. National Real
Estate Investor, Retrieved from https://search.proquest.com/docview/2126958499?
accountid=14645
Gallant, B. T., & Blickle, F. W. (2005). Managing redevelopment of brownfields with major
structures. Environmental Practice, 7(2), 97-107.

269
MCRJ Special Issue Vol. 12 | No. 1 | 2021
Hong, Y., & Chen, F. (2017). Evaluating the adaptive reuse potential of buildings in
conservation areas. Facilities.
Ijla, A., & Broström, T. (2015). The sustainable viability of adaptive reuse of historic
buildings: The experiences of two world heritage old cities; Bethlehem in Palestine and
Visby in Sweden. International Invention Journal of Arts and Social Sciences, 2(4), 52-
66.
Kincaid D. (2002). Adapting buildings for changing uses: guidelines for change of use
refurbishment. London: Spon Press.
Kurul, E. (2007). A qualitative approach to exploring adaptive re-use processes. Facilities
25(13/14): 554-570
Langston, C., & Shen, L. Y. (2007). Application of the adaptive reuse potential model in Hong
Kong: A case study of Lui Seng Chun. International Journal of Strategic Property
Management, 11(4), 193–207. https://doi.org/10.1080/1648715X.2007.9637569
Lee, E. (2006). Bringing obsolete buildings back to life. Njbiz, 19(50), 3. Retrieved from
https://search.proquest.com/docview/228578997?accountid=14645
Lin, X. (1995). A Proper Way for Chinese Architectural. (Master’s Thesis, University of
Arizona) Retrieved 05 December 2019, from https://arizona.openrepository.com/arizona/
bitstream/10150/596974/1/azu_td_arc_001_sip1_w.pdf
Maghsoudi, S., Duffield, C., & Wilson, D. (2016). A practical tool for evaluation of
innovation outcomes in building projects. International Journal of Innovation
Science, 8(4), 350-387. doi:http://dx.doi.org/10.1108/IJIS-07-2016-0019
Manewa, A., Siriwardena, M., Ross, A., Madanayake, U., Manewa, A., Siriwardena, M., …
Management, A. (2016). Adaptable buildings for sustainable built environment", Built
Environment Project and Asset Management, Vol. 6 Iss 2 pp. 139 - 158
McDonough W. (1998). The next industrial revolution. Retrieved December 05, 2019, from
https://www.theatlantic.com/magazine/archive/1998/10/the-next-industrial-
revolution/304695/
Mohamed, N. K., Alauddin. (2016). The Criteria For Decision Making In Adaptive Reuse
Towards Sustainable Development. Paper presented at the The 4th International Building
Control Conference.
Mısırlısoy, D., & Günçe, K (2016). Adaptive reuse strategies for heritage buildings: A holistic
approach. Sustainable Cities and Society, 26, 91-98. doi: 10.1016/j.scs.2016.05.017.
Myers, R. (2018). Adaptive reuse: Good for the environment and good for business. Design
Cost Data, 62(5), 16. Retrieved from https://search.proquest.com/docview/2216253673?
accountid=14645
Popa, I. L., Preda, G., & Boldea, M. (2010). A Theoretical Approach Of The Concept Of
Innovation. Cluj-Napoca: Babes Bolyai University. Retrieved from
https://search.proquest.com/docview/1431391247?accountid=14645
Shaarani, I. and Shaiful, S. A. P. (2019, 30 October). Pertimbang kuarters guru kosong jadi
PPS. My Metro. Retrieved November 1, 2019, from https://www.hmetro.com.my/
mutakhir/2019/10/512160/pertimbang-kuarters-guru-kosong-jadi-pps-metrotv
Shen, L. and Langston, C. (2010), "Adaptive reuse potential: An examination of differences
between urban and non‐urban projects", Facilities, Vol. 28 No. 1/2, pp. 6-
16. https://doi.org/10.1108/02632771011011369
Stratton M. 2000. Industrial building conservation and regeneration. London (United
Kingdom): E & Fn Spon.

270
MCRJ Special Issue Vol. 12 | No. 1 | 2021
Thomsen, A., and K. van der Flier, 2006. XXXIV IAHS, World Congress on Housing,
Sustainable Housing Design, September 20-23 2006: Life Cycle of Dwellings; a
Conceptual Model Based on Dutch Practice. IAHS: Naples.
Van Bueren, E., & De Jong, J. (2007). Establishing sustainability: policy successes and
failures Introduction: performance in terms of sustainability. 35, 543–556.
https://doi.org/10.1080/09613210701203874
Velthuis, K., & D.H.R. Spennemann. (2007). The Future of Defunct Religious Buildings:
Dutch Approaches to Their Adaptive Re-use. Cultural Trends 16(1): 43-66.
Wilkinson, S. J., & Remoy, H. (2017). Adaptive reuse of Sydney offices and sustainability.
Sustainable Buildings.
Yildirim, M. (2012). Assessment of the decision-making process for re-use of a historical
asset: The example of Diyarbakir Hasan Pasha Khan, Turkey. Journal of cultural
heritage, 13(4), 379-388.
Vivian W. Y. Tam & Jane J. L. Hao (2019) Adaptive reuse in sustainable
development, International Journal of Construction Management, 19:6, 509-
521, DOI: 10.1080/15623599.2018.1459154
Yoon, J., & Lee, J. (2019). Adaptive reuse of apartments as heritage assets in the seoul station
urban regeneration area. Sustainability, 11(11) doi:http://dx.doi.org/10.3390/su11113124
Zainudin, H., Haron, N. A., Bachek, S. H., & Jusoh, A. (2016). Utilization of building
information modeling (BIM) in planning an adaptive reuse project of a traditional malay
house (TMH). Piscataway: The Institute of Electrical and Electronics Engineers, Inc.
(IEEE). Retrieved from https://search.proquest.com/docview/1873459205?
accountid=14645.

271
MCRJ Special Issue Vol. 12 | No. 1 | 2021
E-TENDERING: IMPROVEMENT MODEL IN MALAYSIA PUBLIC SECTOR’S CONSTRUCTION INDUSTRY Umi Kalsum Zolkafli @Zulkifly1, Lee Hong Ming1 and Siti Nor Azniza Ahmad Sekak2
1Department of Quantity Surveying, Faculty of Built Environment, University of Malaya, Kuala Lumpur, Malaysia. 2Centre of Studies for Quantity Surveying, Faculty of Architecture, Planning and Surveying Universiti Teknologi MARA, Shah Alam, Malaysia.
Abstract Industry 4.0 ushered the rapid development of the Internet of Things (IoT) within the diverse industry. The construction industry in Malaysia is also entering the era of Industry 4.0. Besides the trending of Building Information Modeling (BIM) adoption, the e-Tendering application is also an essential part of the Construction Industry 4.0. E-tendering is an electronic facilitated solution involving a whole tendering process. However, the e-Tendering System usage here is still relatively low, especially in the implementation strategy. Therefore, to catch up to the global Industry 4.0 steps, the usage of Malaysia's public sector e-Tendering system is needed for improvement. Therefore, this research aims to propose an improved model for the public sector construction e-Tendering system by identifying the barriers and solutions for improving the National e-Tendering System usage. The public sector procurement department is the target respondents whose opinions on the barriers and solutions for improving the National e-Tendering System usage are accounted for through quantitative measurement, a questionnaire survey. This research found that the top three barriers for improving the National e-Tendering System usage are 'resistance to change in users,' 'securities concern' and 'incomplete technical coverage on the whole e-Tendering process.' Furthermore, this research also justified the primary and secondary solutions to overcome each barrier. Based on the findings, the National e-Tendering framework improvement model is proposed. This model may assist the public sector in planning the upgrading of the existing National e-Tendering System in the future. Keywords: e-Tendering; NeTI; National e-Tendering system usage improvement model.
INTRODUCTION
In conjunction with the development of Industry 4.0, the construction industry is driving
towards the world of digitalization. The movement of business mode from traditional methods
towards modern ways to aid information technology creates high working efficiency (Herbst,
Knolmayer, & Mendling, 2012). As the great contributors to Malaysian Gross Domestic
Product (GDP) currently at 4 percent, the construction industry is expected to contribute 5.5
percent to the Malaysian GDP up to 2020 (CITP, 2015). Therefore, the construction industry
must follow the steps of industrial digitalization trends to improve current performances. One
of the crucial processes in construction is the procurement method. The procurement method's
efficiency will affect the particular construction project performance (Ogunsanmi, 2013 and
Ghadamsi, 2012). Based on this inevitable development, this paper will focus on the digital
transformation in the tendering process.
E-Tendering is estimated to cut down the cost for preparing paper-based documentation,
simplify information and data entry process, as well as to ensure fairer assessment between
tenderers (RICS, 2011). Previous research pointed out that e-procurement in construction
leverage the tenderer’s proposal from the perspective of financial and technical value (Trkman
& McCormack, 2010). According to Elias, Mahidin, & Shiratuddin (2005), e-Tendering can
save over 90% of paper usage with online document viewing and save space for physical

272
MCRJ Special Issue Vol. 12 | No. 1 | 2021
document storage. Besides, tendering lead-time can be reduced by over 80% when the tender
can be obtained online. Besides, e-Tendering reduces by over 80% of tedious data entry and
compilation.
In sight of the slow adoption of the e-procurement system launched by the Malaysian
government in 1999, the Construction Industry Development Board (CIDB) initiated a
triggering program called National e-Tendering Initiatives (NeTI). It was specially formulated
for the construction industry procurement purpose transition towards digitality. It links all the
tendering process into an electronic platform, aiming to reduce unnecessary tendering error
and speed up the tendering process. Four phases of e-Tendering implementation are adopted
in NeTI, namely 'Tender Advertisement,' 'Registration and Purchase Tender,' 'Pricing and
Upload BQ (Bill of Quantities’) and ‘Open Tender Box’ to encourage participants of
construction players towards e-Tendering transition. However, despite all these benefits
brought by the e-Tendering System, they are still reluctant to change and adapt to the digital
process due to too many years of using the traditional manual tendering method that assured
a sense of security and comfortability among themselves (Betts et al., 2006). A study showed
that there are only 57% of Malaysia's construction members, having experiences with e-
Tendering (Tan & Ren, 2016).
According to the trending of BIM usage in the global construction industry, there is no
doubt that the current e-procurement framework is far from adequate to accommodate the
integrated data in the BIM-based projects (He, Li, Wu, & Ning, 2018). The concept and idea
phase of an e-commerce platform specially designed for BIM in digitalized construction is
starting to emerge ( Grilo & Jardim, 2013; Grilo & Jardim, 2011; Ren, Skibniewski, & Jiang,
2012). If the Malaysian construction industry did not completely implement the e-Tendering
framework, the opportunity to deal with potential BIM-based e-procurement would be limited
due to not utilizing the e-commerce platform. From the above issues, it can be concluded that
the existing traditional tendering process is inefficient, and there is a need for Malaysia’s
construction industry to fully adopt e-Tendering in replacement of the common tendering
practice. Therefore, the objectives that have been counted to achieve the above aim are:
i. To identify barriers in improving the use of the current e-Tendering System for
Malaysia's public construction sector.
ii. To establish a solution for the identified barriers to enhancing the current e-Tendering
System's use by the Malaysian public construction sector.
iii. To develop an improved model that would significantly progress the usage of the
existing e-Tendering System.
E-TENDERING
Tendering is defined as preparing and submitting a conforming offer to execute work in
return for a price estimated or known as bid. For later acceptance, thorough evaluation and
assessment. The tendering process typically involves preparing tender documents,
advertisement or invitation of tender, tenders submission by tenderers, evaluation of tenders,
tenders awards, and followed by contract management and execution (Patilp, Waghmarep,
Gawande3, & Patil, 2016). E-Tendering is defined as an electronic facilitated solution
involving a tendering process that completely covers project requirement advertisement until
placing of contract, and even to contract execution (Eadie, Perera, & Heaney, 2010; Tindsley

273
MCRJ Special Issue Vol. 12 | No. 1 | 2021
& Stephenson, 2008).
E-Tendering operates on a web services platform that allows access of tenderers and
clients via login and password to exchange information involving upload and download of
tendering documents. This common platform provides accessibility for all the tenderers on
designated levels of information, enabling similar information flows for all tenderers. A
secure online area is designed for each tenderer to submit their tenders during the submission
of a tender proposal. The accessibility of the submitted tender documents usually is reachable
by the client's side after the tender submission deadline or tender closing date by using
controlled access features (RICS, 2011). Based on the literature definition of e-Tendering, the
whole process involves electronic application starting from the tender preparation until the
tender award stages. Therefore, centered on the Malaysia Government Procurement Regime
by the Minister of Finance, a table is formed to show the mapping between the components
of the e-Tendering.
Table 1. E-Tendering System Components and Functions
Tendering System Component E-Tendering General System Function
Tenderer Registration Pre-registration
Issuance of ID and Username for registered tenderers
Tender Preparation The client prepares a tender document with basic requirements and details for tending
Upload the tender documents to Client Tendering System
Tender Advertisement Advertisement of tender on website and newspaper
Tenderer access the tender advertisement
Tender Submission Tenderer registers for the tender purchase
Tenderer downloads the tender documents
Tenderer submits the tender proposal through upload to the online Tendering System
Tender Closing and Tender Aggregation Tender online submission valve closed
The principals open the tender proposal
Tender Evaluation The proposal is assessed
The most qualified proposal is awarded the tender
Tender Award The signing of the formal agreement between both parties
(Source: Ministry of Finance Malaysia, 2016; Mohd, Baharom, Darus, Saip, & Marzuki, 2017)
Existing National e-Tendering System
In 2004, a memorandum of understanding was signed between the Construction Industry
Development Board (CIDB) and the Public Works Department (PWD), establishing a
National E-tendering System that would become the revolution flagship of Malaysia's
construction industry tendering process. It is clearly stated in the memorandum that the roles
of CIDB will be on the development, implementation, operation, and maintenance of the
National E-Tender System. This initiative aims to create greater corporate governance in the
tendering process of the construction industry. To achieve the goals for all construction works
submitted to the government, e-Tendering, tendering knowledge management, tender
appointment, and selection of services are involved (Azizan, 2012).
According to Tan & Ren (2016), the NeTI implementation was planned in four phases.
Phase 1 is the Online Tender Box that enables uploading the BQ, drawings, and other tender

274
MCRJ Special Issue Vol. 12 | No. 1 | 2021
documents by the clients. Phase 2 is the Online Viewing of Tender Documents, which permits
tender documents uploaded by the applicant to be accessed by the interested tenderer if an
Internet connection is available. Phase 3 is the Online Buying of Tender Documents that
process the Electronic Bills Presentment and Payment (EBPP) system for tender document
purchases by tender via the e-tender system. Finally, Phase 4 is Virtual Tender Box. A virtual
tender box allows the tenderer to submit their proposal online without manually submitting
the proposal at the nearest tender box location.
Despite the practical implementation phases proposed by NeTI, the proposal does not
seem to match up with the government e-Tendering framework's current operation. By
comparing the e-Tendering System available on CIDB, PWD, and Ministry of Works (KKR),
each e-Tendering system component's current application is summarized as follows.
Table 2. National e-Tendering System Components
(Source: Ministry of Finance Malaysia, (2016); Mohd et al., (2017); Construction Industry Development Board, (2018); Public Works Department, (2018); Ministry of Works, (2018))
Tendering System Component
E-Tendering General System Function
Current Application
Tenderer Registration
Pre-registration Tenderer can register at the Ministry of Work e-Vendor website http://evendor.kkr.gov.my/portal/index.php
Issuance of ID and Username for registered tenderers
Once successful registration, ID and username will be given for login purposes afterward.
Tender Preparation The client prepares a tender document with basic requirements and details for tending.
The related government agencies prepare the tender documents but never upload them to the Tendering System, not even the simple specification and instruction to the tenderer, stated in Phase 2 of the National e-Tender system implementation.
Upload the tender documents to Client Tendering System
Tender Advertisement
Advertisement of tender on website and newspaper
Tender advertisement syncs with three other leading construction portals: the Ministry of Work website (MoW), Public Work Department (PWD) website, and CIDB e-tender website.
Tenderer access the tender advertisement
Tender advertisement accessibility is opened to the public viewing the e-tender websites.
Tender Submission Tenderer registers for the tender purchase
Tender purchase only available manually for both MoW / PWD and CIDB e-tender sites.
Tenderer downloads the tender documents.
Tenderer submits the tender proposal through upload to the online Tendering System.
Submission of the tender proposal still needs to go through manual submission to the tender box at the specified venue.
Tender Closing and Tender Aggregation
Tender online submission valve closed. E-Tender notice on the website does show the tender closing date and highlights the warning of "late tender submission will not be accepted."
Tender Evaluation The principals open the tender proposal.
These processes still adhered to the traditional tendering process but not through online web services or automated mechanisms.
The proposal is assessed.
Tender Award The most qualified proposal is awarded the tender.
The signing of the formal agreement between both parties

275
MCRJ Special Issue Vol. 12 | No. 1 | 2021
Table 3. Barriers for Public Sector to Improve Usage of National e-Tendering System
Barriers Description Reference
High Initial Cost The first key barrier to the e-Tendering application is the high initial cost, including integrated e-Tendering platform invention, maintenance, and services. The government may need to invest a lot in purchasing IT software and hardware but cannot see substantial benefits. Besides, costly ultra-speed internet service is needed for the e-Tendering process to be complete, especially during tender submission.
(Eadie, 2010; Khalil & Waly, 2015; Nasrun et al., 2017, 2016; Tan & Ren, 2016)
Lack of Government Policies and Standard
There are insufficient government policies and legislation promoting the existing e-Tendering system application. For example, the current tendering advertisement, including those on the existing sector e-Tendering website, requests the tenderer to purchase hardcopy tender at specific locations. No e-Tendering mandating policies is set up for the application in public sector projects.
(Construction Industry Developement Board, 2018; Jabatan Kerja Raya, 2018; Kementerian Kerja Raya, 2018; Nasrun et al., 2016; Norzaidi, Mohammad & Mohamed, 2013)
Securities Concern
E-Tendering users are mostly concerned regarding security issues such as data integrity where the tender documents uploaded may become inaccurate, missing parts, or data corrupted after reassembly. Accessibility authorization is another concern where the e-Tendering platform operator's integrity may tamper with documents without permission. Document potential confidential and security issues hinder the application of e-Tendering because tenderers worry about data leakage such as tender sum exposure.
(Eadie, 2010; Kajewski, 2014; Kaliannan, Raman, & Dorasamy, 2009; Khalil & Waly, 2015; Tan & Ren, 2016)
Legal Issues When switching from the conventional tendering process to the digital submission, the enforceability of electronic contracts and electronic signatures is still one of the e-Tender users' objections. In addition, in some previous studies on e-Tendering implantation challenges, problems with proof of intent and knowledge clarity of the tenderer are listed. Moreover, where conflicts should arise, there are no applicable legal cases on the subject of e-Tendering; therefore, time-consuming and onerous regulatory processes will occur.
(Eadie, Heaney, & Carlisle, 2007; IDC, 2015; Khalil & Waly, 2015; Tan & Ren, 2016)
Resistance to Change
People typically adhere to established ways of doing things that have served them well for years, are familiar with, and appear to perceive that there is no need for improvement, hence disregarding the advantages of e-Tendering. The lack of top management pressure and motivation confirms the reluctance to consider e-Tendering. Moreover, the benefits of e-Tendering exacerbate employee’s resistance to change as it would potentially challenge their job security.
(Choen & Lou, 2015; Eadie, 2010; Khalil & Waly, 2015; Oyediran & Akintola, 2011; Tan & Ren, 2016)
Incomplete Technical Coverage on whole E-Tendering process
Potential corruption of documents and data could occur due to myriad issues such as the possibility of failure of the e-Tendering portal, poor telecommunications infrastructure, irregular power supply, inadequate broadband coverage, internal and external system interoperability, especially during tender submission. The new e-Tendering System, from tender advertisements to tender awards, does not cover the entire tendering process.
(Eadie, 2010; Nasrun et al., 2017, 2016; Oyediran & Akintola, 2011; Tan & Ren, 2016)
The disbelief of Reliability on E-Tendering Efficiency
E-Tendering users commonly feel that it is more time-consuming than the established traditional tendering. It will need additional training time to adopt it that requires additional works with no incentives. Apart from the perception of no business benefits gained, a lack of benchmark model in adopting the e-Tendering System as a consistent reference and its quantifiable measurement of success discourages the uptake of the e-Tendering System.
(Choen & Lou, 2015; Eadie, 2010; Kaliannan et al., 2009; Khalil & Waly, 2015; Nasrun et al., 2017, 2016; Tan & Ren, 2016)
By looking at the current application of the e-Tendering System in the construction
industry, it is believed that Malaysia lags way behind compared to the UK, China, and

276
MCRJ Special Issue Vol. 12 | No. 1 | 2021
Australia (M. Inzofu, 2016). Therefore, the barriers that hinder the improvement of the e-
Tendering system usage in the public sector construction industry in Malaysia, summarized
through a literature review as in Table 3.
The solution to Address Public Sector Problems to Enhance the Use of the Current National E-Tendering System
After reading through the recommendation of solutions on each barrier in improving the
National e-Tendering System usage, the proposed solutions are tabulated in Table 4.
Table 4. Solution to Overcome Challenges
No Barriers Solution Reference
B1 High initial cost Value management adoption in developing complete e-Tender System
(Institute of Value Management Australia, 2018; Malaysia Institute of Value Management, 2018)
Phasing budget in e-Tendering promotion activities
(Panda & Sahu, 2011; Yusoff, Abas, Islam, & Muhd Yusuf, 2011)
B2 Lack of Government Policies and Standard
Establish staging compulsory policy based on project size
(Alyahya & Panuwatwanich, 2017; Arasa & Achuora, 2012; Tan & Ren, 2016)
Establish Incentive-based policy (Igari, 2014; Iosifidis, Gao, Huang, & Tassiulas, 2014)
B3 Securities Concern Instigate an enhanced security policy and standard.
(Bakari, Tarimo, Yngström, & Magnusson, 2005)
Perform regular security and system "health checks."
(dos Santos Moreira, Fondazzi Martimiano, dos Santos Brandão, & Bernardes, 2008)
B4 Legal Issues Enforce the existing electronic commerce Acts
(Act, 2012; Ayub, 2007; Deka, Zain, & Mahanti, n.d.; HJ Ahmad & Othman, 2009)
Training and education (Arasa & Achuora, 2012; Choen & Lou, 2015; Kajewski et al., 2001; Tan & Ren, 2016)
B5 Resistance to Change Training and education (Arasa & Achuora, 2012; Choen & Lou, 2015; Kajewski et al., 2001; Tan & Ren, 2016)
Staging compulsory enforcement policy based on project size
(Alyahya & Panuwatwanich, 2017; Arasa & Achuora, 2012; Tan & Ren, 2016)(Bin Zakaria, Z, Mohamed Ali, N, Tarmizi Haron, A, Marshall-Ponting, AJ and Abd Hamid & Title, 2015; Nov & Ye, 2010; Talke & Heidenreich, 2014)
B6 Incomplete Technical Coverage on whole E-Tendering process
Cooperation between CIDB and third-party e-tender service provider for the system upgrade
(Arasa & Achuora, 2012)
Hire a third-party e-tender service provider to perform a system upgrade
B7 The disbelief of Reliability on E-Tendering Efficiency
Introduce quantifiable measure of success
(Gardenal, 2013; Kauppi, Jones, Ronchi, Raaij, & Brandon-jones, 2013; Vaidya, Guy Callender, Sajeev, & Gao, 2004)
Training and education (Arasa & Achuora, 2012; Choen & Lou, 2015; Kajewski et al., 2001; Tan & Ren, 2016)

277
MCRJ Special Issue Vol. 12 | No. 1 | 2021
Table 5. Description for Each Variable in Solution to Overcome Barriers on Improving Usage of Existing e-Tendering System
Solution Description
B1-Solution1 Apply a value management approach in upgrading the existing National e-Tendering System to focus more on functionality and securities of the System.
B1-Solution2 Design a series of National e-Tendering promotional activities such as training, discussion forums and implement them in phases with the budget allocated for each phase.
B2-Solution1 Establish E-Tendering application compulsory policies on public sector projects starting from large sum projects then gradually enforce to smaller sum projects.
B2-Solution2 Establish an Incentive-based policy. For example, tenderer who use the National e-Tendering System will get a certain amount of discount on the price for purchasing tender document.
B3-Solution1 Instigate an enhanced security policy and standard that includes system authorization rights.
B3-Solution2 Perform regular security and system “health checks."
B4-Solution1 Enforce the existing Acts regarding electronic commerce.
B4-Solution2 Training and education on legal tenderer’s legal rights.
B5-Solution1 Staging training and education for the contractors based on the Contractor grade.
B5-Solution2 Establish E-Tendering application compulsory policies on public sector projects starting from large sum projects and then gradually enforce smaller sum projects.
B6-Solution1 Look for an experienced e-procurement portal service provider to cooperate with the CIDB e-construct team to develop a complete E-Tendering System that extensively covers from tender advertisement till tender awards stage.
B6-Solution2 Hire a third-party e-tender service provider to perform regular system upgrades.
B7-Solution1 Introduce E-procurement Performance Measurement Model (EPPMM) on the contractor that uses the public E-Tendering System to evaluate the impact of E-Tendering usage on organizational benefits to prove the efficacy of the E-Tendering framework.
B7-Solution2 Establish discussion forums and training for different construction players to highlight the advantages of the e-Tendering System.
RESEARCH METHODOLOGY
The two main methods used for this research are primary data collection and secondary
data collection. This particular research's primary data collection is a questionnaire survey,
while the secondary data collection is a literature review. The primary literature was sourced
from the incredible amount of data and information from the internet. However, to avoid
discrepancies, the research hinged foremost to the data collected through the questionnaire
survey's primary method. The questionnaire has three (3) sections, where every question in
each section is close-ended. The sections are; Section 1 – Demographic Information, Section
2 – National e-Tendering System Usage Improvement Barriers, and Section 3 – Solution to
Overcome Barriers on Improving Usage of existing e-Tendering System.
The research is carried out at Klang Valley, a state in Selangor, from September 2018 to
May 2019. The targeted respondents are the e-Tendering practitioners from the contract or
procurement department in Malaysia's public construction sectors. Therefore, the respondents
are selected from the official websites where all the information about targeted respondents
are shown from these industrial players; the Construction Industry Development Board
(CIDB), Kementerian Perumahan dan Kerajaan Tempatan (KPKT), Public Works
Department (PWD), Ministry of Energy, Science, Technology, Environment and Climate
Change (MESTECC), Ministry of Agriculture (MOA), Ministry of Defence (MOD), Ministry
of Education (MOE), Ministry of Tourism, Arts and Culture (MOTAC), Ministry of Works
(MOW) and Kementerian Pembangunan Luar Bandar (KPLB). In order to obtain accurate

278
MCRJ Special Issue Vol. 12 | No. 1 | 2021
data and results, some criteria of the respondents are outlined as follows: (1) The respondents
must be from contract or procurement departments that possess e –Tendering System, (2) The
respondents must have at least one-year experience in e-Tendering System, and (3) The
respondents should be the members of CIDB e-Construct Services as they are the developer
of the National e-Tendering System. The total population identified is 363, a significant
sampling size where Krejcie and Morgan (1970) recommended the sample size of 186.
Simple random sampling was adopted for this research.
Meanwhile, three hundred and one (301) questionnaires were sent to the targeted
respondents via email and hand distribution. The questionnaires were distributed to more than
the total number of samples necessary to ensure a high response rate. Compared to the sample
size required, the response rate is 55.37%, which is equivalent to 103 returned questionnaires.
The results obtained from the questionnaire survey were collected and analyzed using the
Statistical Package for Social Science (SPSS) version 25.0. The descriptive analysis and
Inferential Analysis were chosen to analyze the results.
ANALYSIS AND DISCUSSION
The result of the research will be presented following the objectives that have been
decided during the early stage of the research.
Barriers for Public Sector to Improve Usage of National e-Tendering System
This section contains several questions concerning the respondents' opinion on several
obstacles to the improvement of the current national e-Tendering System, to identify the
importance of these obstacles to the success of e-Tendering. The respondents were requested
to rate those barriers based on the level of agreement, from strongly disagree to strongly agree,
by using the Likert scale (1-5). The outcome of this section's descriptive analysis is clarified
in the table below, where the results can be used to assess the ranking of the public sectors'
barriers to improving their usage of the National e-Tendering framework.
As shown in Table 6, the “resistance to change” variable occupied the 1st ranking with
the highest mean value of 4.1845. The "resistance to change" describes that people are often
clinging to old ways of actions with which they are familiar. Apart from that, the lack of
organizational help and worries about replacing jobs with more easily applicable electronic
tools also contribute to the factor. Respondents opined that the above concern is the biggest
challenge to transition towards the National e-Tendering System usage. The result is followed
by "securities concern" and "incomplete technical coverage" by a mean value of 3.5728 and
3.2524, respectively. Securities Issue indicates that the data's disruption and the confidential
degree of the data impeded the e-Tendering System's implementation.
In contrast, the incomplete technical coverage of the entire e-Tendering process clarified
that the electronic operation's inadequate technical explanations also reduced the optimum
use of the e-Tendering System. Based on the results, respondents believe that these barriers
contribute more to improving the use of e-Tendering Systems. The fourth ranking, which is
"high initial cost," with a mean value of 3.2427, has a minor difference of about 0.01 mean
values from the third-ranking variable. On the other hand, the three barriers with a relatively
lower mean value, which are "disbelief of reliability on e-Tendering effectiveness," "legal
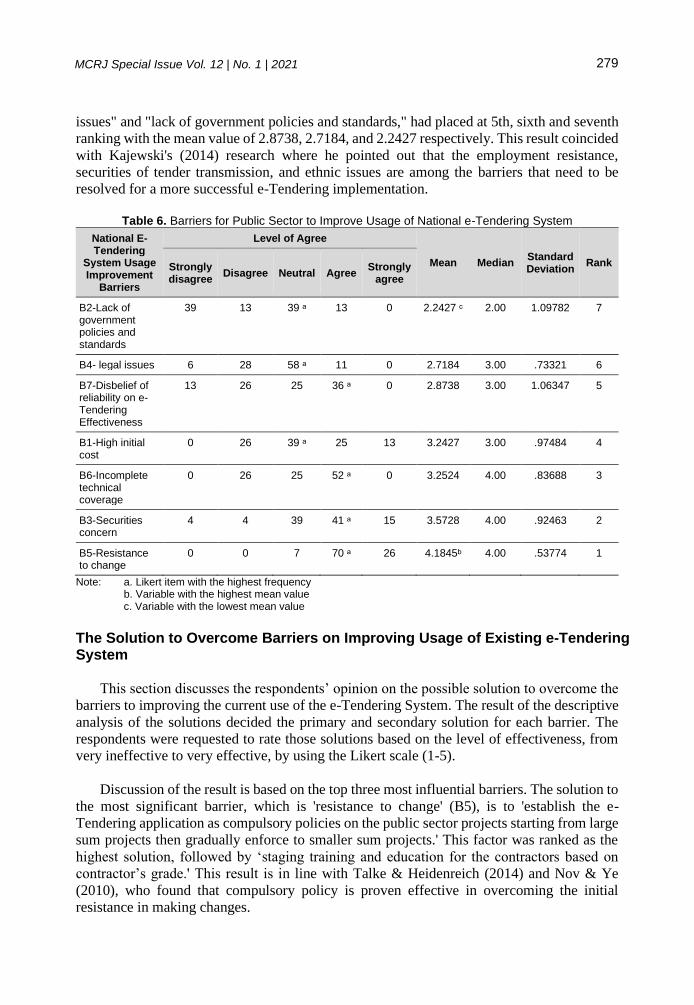
279
MCRJ Special Issue Vol. 12 | No. 1 | 2021
issues" and "lack of government policies and standards," had placed at 5th, sixth and seventh
ranking with the mean value of 2.8738, 2.7184, and 2.2427 respectively. This result coincided
with Kajewski's (2014) research where he pointed out that the employment resistance,
securities of tender transmission, and ethnic issues are among the barriers that need to be
resolved for a more successful e-Tendering implementation.
Table 6. Barriers for Public Sector to Improve Usage of National e-Tendering System
National E-Tendering
System Usage Improvement
Barriers
Level of Agree
Mean Median Standard Deviation
Rank Strongly disagree
Disagree Neutral Agree Strongly
agree
B2-Lack of government policies and standards
39 13 39 ᵃ 13 0 2.2427 ᶜ 2.00 1.09782 7
B4- legal issues 6 28 58 ᵃ 11 0 2.7184 3.00 .73321 6
B7-Disbelief of reliability on e-Tendering Effectiveness
13 26 25 36 ᵃ 0 2.8738 3.00 1.06347 5
B1-High initial cost
0 26 39 ᵃ 25 13 3.2427 3.00 .97484 4
B6-Incomplete technical coverage
0 26 25 52 ᵃ 0 3.2524 4.00 .83688 3
B3-Securities concern
4 4 39 41 ᵃ 15 3.5728 4.00 .92463 2
B5-Resistance to change
0 0 7 70 ᵃ 26 4.1845ᵇ 4.00 .53774 1
Note: a. Likert item with the highest frequency b. Variable with the highest mean value c. Variable with the lowest mean value
The Solution to Overcome Barriers on Improving Usage of Existing e-Tendering System
This section discusses the respondents’ opinion on the possible solution to overcome the
barriers to improving the current use of the e-Tendering System. The result of the descriptive
analysis of the solutions decided the primary and secondary solution for each barrier. The
respondents were requested to rate those solutions based on the level of effectiveness, from
very ineffective to very effective, by using the Likert scale (1-5).
Discussion of the result is based on the top three most influential barriers. The solution to
the most significant barrier, which is 'resistance to change' (B5), is to 'establish the e-
Tendering application as compulsory policies on the public sector projects starting from large
sum projects then gradually enforce to smaller sum projects.' This factor was ranked as the
highest solution, followed by ‘staging training and education for the contractors based on
contractor’s grade.' This result is in line with Talke & Heidenreich (2014) and Nov & Ye
(2010), who found that compulsory policy is proven effective in overcoming the initial
resistance in making changes.
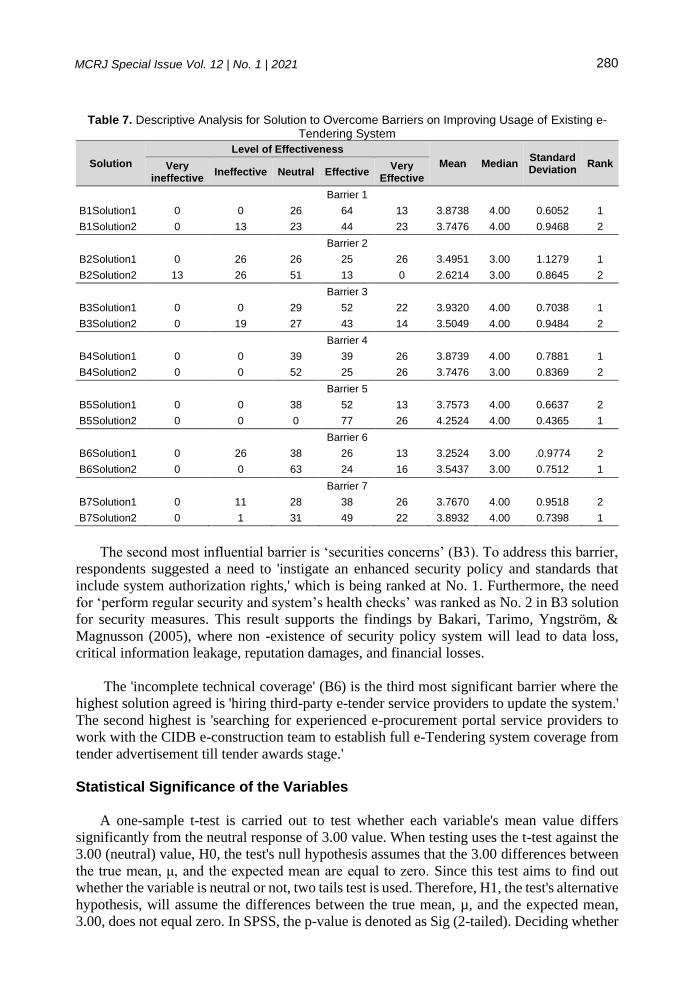
280
MCRJ Special Issue Vol. 12 | No. 1 | 2021
Table 7. Descriptive Analysis for Solution to Overcome Barriers on Improving Usage of Existing e-Tendering System
Solution
Level of Effectiveness
Mean Median Standard Deviation
Rank Very ineffective
Ineffective Neutral Effective Very
Effective
Barrier 1
B1Solution1 0 0 26 64 13 3.8738 4.00 0.6052 1
B1Solution2 0 13 23 44 23 3.7476 4.00 0.9468 2
Barrier 2
B2Solution1 0 26 26 25 26 3.4951 3.00 1.1279 1
B2Solution2 13 26 51 13 0 2.6214 3.00 0.8645 2
Barrier 3
B3Solution1 0 0 29 52 22 3.9320 4.00 0.7038 1
B3Solution2 0 19 27 43 14 3.5049 4.00 0.9484 2
Barrier 4
B4Solution1 0 0 39 39 26 3.8739 4.00 0.7881 1
B4Solution2 0 0 52 25 26 3.7476 3.00 0.8369 2
Barrier 5
B5Solution1 0 0 38 52 13 3.7573 4.00 0.6637 2
B5Solution2 0 0 0 77 26 4.2524 4.00 0.4365 1
Barrier 6
B6Solution1 0 26 38 26 13 3.2524 3.00 .0.9774 2
B6Solution2 0 0 63 24 16 3.5437 3.00 0.7512 1
Barrier 7
B7Solution1 0 11 28 38 26 3.7670 4.00 0.9518 2
B7Solution2 0 1 31 49 22 3.8932 4.00 0.7398 1
The second most influential barrier is ‘securities concerns’ (B3). To address this barrier,
respondents suggested a need to 'instigate an enhanced security policy and standards that
include system authorization rights,' which is being ranked at No. 1. Furthermore, the need
for ‘perform regular security and system’s health checks’ was ranked as No. 2 in B3 solution
for security measures. This result supports the findings by Bakari, Tarimo, Yngström, &
Magnusson (2005), where non -existence of security policy system will lead to data loss,
critical information leakage, reputation damages, and financial losses.
The 'incomplete technical coverage' (B6) is the third most significant barrier where the
highest solution agreed is 'hiring third-party e-tender service providers to update the system.'
The second highest is 'searching for experienced e-procurement portal service providers to
work with the CIDB e-construction team to establish full e-Tendering system coverage from
tender advertisement till tender awards stage.'
Statistical Significance of the Variables
A one-sample t-test is carried out to test whether each variable's mean value differs
significantly from the neutral response of 3.00 value. When testing uses the t-test against the
3.00 (neutral) value, H0, the test's null hypothesis assumes that the 3.00 differences between
the true mean, μ, and the expected mean are equal to zero. Since this test aims to find out
whether the variable is neutral or not, two tails test is used. Therefore, H1, the test's alternative
hypothesis, will assume the differences between the true mean, µ, and the expected mean,
3.00, does not equal zero. In SPSS, the p-value is denoted as Sig (2-tailed). Deciding whether
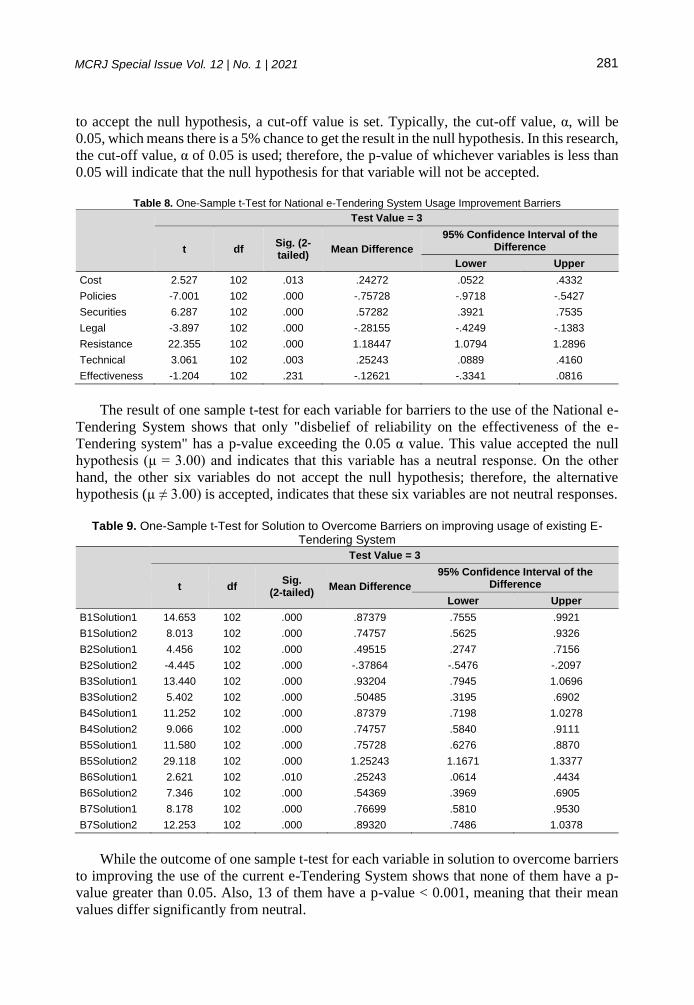
281
MCRJ Special Issue Vol. 12 | No. 1 | 2021
to accept the null hypothesis, a cut-off value is set. Typically, the cut-off value, α, will be
0.05, which means there is a 5% chance to get the result in the null hypothesis. In this research,
the cut-off value, α of 0.05 is used; therefore, the p-value of whichever variables is less than
0.05 will indicate that the null hypothesis for that variable will not be accepted.
Table 8. One-Sample t-Test for National e-Tendering System Usage Improvement Barriers
Test Value = 3
t df Sig. (2-tailed)
Mean Difference
95% Confidence Interval of the Difference
Lower Upper
Cost 2.527 102 .013 .24272 .0522 .4332
Policies -7.001 102 .000 -.75728 -.9718 -.5427
Securities 6.287 102 .000 .57282 .3921 .7535
Legal -3.897 102 .000 -.28155 -.4249 -.1383
Resistance 22.355 102 .000 1.18447 1.0794 1.2896
Technical 3.061 102 .003 .25243 .0889 .4160
Effectiveness -1.204 102 .231 -.12621 -.3341 .0816
The result of one sample t-test for each variable for barriers to the use of the National e-
Tendering System shows that only "disbelief of reliability on the effectiveness of the e-
Tendering system" has a p-value exceeding the 0.05 α value. This value accepted the null
hypothesis (μ = 3.00) and indicates that this variable has a neutral response. On the other
hand, the other six variables do not accept the null hypothesis; therefore, the alternative
hypothesis (µ ≠ 3.00) is accepted, indicates that these six variables are not neutral responses.
Table 9. One-Sample t-Test for Solution to Overcome Barriers on improving usage of existing E-
Tendering System
Test Value = 3
t df Sig.
(2-tailed) Mean Difference
95% Confidence Interval of the Difference
Lower Upper
B1Solution1 14.653 102 .000 .87379 .7555 .9921
B1Solution2 8.013 102 .000 .74757 .5625 .9326
B2Solution1 4.456 102 .000 .49515 .2747 .7156
B2Solution2 -4.445 102 .000 -.37864 -.5476 -.2097
B3Solution1 13.440 102 .000 .93204 .7945 1.0696
B3Solution2 5.402 102 .000 .50485 .3195 .6902
B4Solution1 11.252 102 .000 .87379 .7198 1.0278
B4Solution2 9.066 102 .000 .74757 .5840 .9111
B5Solution1 11.580 102 .000 .75728 .6276 .8870
B5Solution2 29.118 102 .000 1.25243 1.1671 1.3377
B6Solution1 2.621 102 .010 .25243 .0614 .4434
B6Solution2 7.346 102 .000 .54369 .3969 .6905
B7Solution1 8.178 102 .000 .76699 .5810 .9530
B7Solution2 12.253 102 .000 .89320 .7486 1.0378
While the outcome of one sample t-test for each variable in solution to overcome barriers
to improving the use of the current e-Tendering System shows that none of them have a p-
value greater than 0.05. Also, 13 of them have a p-value < 0.001, meaning that their mean
values differ significantly from neutral.

282
MCRJ Special Issue Vol. 12 | No. 1 | 2021
Development of Usage Improvement Model for Existing National e-Tendering System
Figure 1. Final Usage Improvement Model for Existing National e-Tendering System
CONCLUSION
In conclusion, in tandem with the development of Industry 4.0, the construction industry
is progressing towards the world of digitalization. The movement of business mode from
traditional methods towards modern ways to aid information technology creates higher
working efficiency. Therefore, the efficacy of the procurement process will impact the success
of the specific construction project. Nonetheless, in terms of the purpose and implementation,
the e-Tendering System available in Malaysia's public construction sector is still relatively
limited. There is a need to expand the National e-Tendering System's use while preparing the
industry to comply with Industry 4.0 and to meet future BIM procurement requirements. This
study explored the most recent opinions on the existing barriers and solutions to the
development of the National e-Tendering System usage in the construction sector from the
public sector's point of view. The improvement model proposed in this research will enable
the public sector to prepare for the current national e-Tendering System upgrading for
optimum usage in the future. Finally, this research can inform Malaysia's construction
industry on the importance of improving e-Tendering use, particularly in the period of
Industry 4.0.

283
MCRJ Special Issue Vol. 12 | No. 1 | 2021
REFERENCES
Act, electronic commerce. (2012). Act 658 electronic commerce act 2006, (November).
Alyahya, M., & Panuwatwanich, K. (2017). Implementing e-Tendering to Improve the
Efficiency of Public Construction Contract in Saudi Arabia, (January 2018).
Arasa, R. M., & Achuora, J. O. (2012). Antecedents to Successful Adoption of e- Procurement
in Textile and Apparel Firms in, 3(10), 1–10.
Ayub, Z. A. (2007). Malaysian Electronic Commerce Act 2006 and EU Directives : Consumer
Protection Perspectives, 3, 68–76.
Azizan, A. Z. (2012). E-Tender Application And Its Implementation To Malaysian
Construction Industry, pp.1-13. Retrieved from
http://eprints.uthm.edu.my/2770/1/Saiful_HAdi_Mastor.pdf
Bakari, J. K., Tarimo, C. N., Yngström, L., & Magnusson, C. (2005). State of ICT security
management in the institutions of higher learning in developing countries: Tanzania case
study. Proceedings - 5th IEEE International Conference on Advanced Learning
Technologies, ICALT 2005, 2005, 1007–1011. https://doi.org/10.1109/ICALT.2005.243
Betts, M., Black, P., Christensen, S., Dawson, E., Du, R., Duncan, W., … Nieto, J. G. (2006).
Towards secure and legal E-tendering. Electronic Journal of Information Technology in
Construction, 11(April), 89–102.
Bin Zakaria, Z, Mohamed Ali, N, Tarmizi Haron, A, Marshall-Ponting, AJ and Abd Hamid,
Z., & Title. (2015). Exploring the Adoption of Building Information Modeling (Bim) in
the Malaysian Construction Industry: a Qualitative Approach. International Journal of
Research in Engineering and Technology, 02(08), 384–395.
https://doi.org/10.15623/ijret.2013.0208060
Choen, E., & Lou, W. (2015). Critical success factors for e-tendering Implementation in
construction collaborative environments : people and process issues, (May).
CITP. (2015). Construction Industry Transformation Programme. Construction Industry
Development Board (CIDB) Malaysia. Retrieved from http://www.citp.my/2017/wp-
content/uploads/0.-CITP-eBook-complete.pdf
Construction Industry Developement Board. (2018). e-tender. Retrieved December 20, 2018,
from http://eiklan.cidb.gov.my/
Deka, G. C., Zain, J. M., & Mahanti, P. (n.d.). ICT ’ s role in e-Governance in India and
Malaysia : A Review.
dos Santos Moreira, E., Fondazzi Martimiano, L. A., dos Santos Brandão, A. J., & Bernardes,
M. C. (2008). Ontologies for information security management and governance.
Information Management and Computer Security, 16(2), 150–165.
https://doi.org/10.1108/09685220810879627
Eadie, R. (2010). A Cross Discipline Comparison Of Rankings For E-Procurement Drivers
And Barriers Within Uk Construction Organisations, 15(March), 217–233.
Eadie, R., Heaney, G., & Carlisle, J. (2007). Drivers And Barriers To Public Sector E-
Procurement Within Northern Ireland’s Construction Industry, 12(January), 103–120.
Eadie, R., Perera, S., & Heaney, G. (2010). Identification of e-procurement drivers and
barriers for UK construction organisations and ranking of these from the perspective of
quantity surveyors. Electronic Journal of Information Technology in Construction,
15(January), 23–43.
Elias, E. M., Mahidin, N., & Shiratuddin, N. (2005). E-Tendering System for Construction
Projects, 313–319.

284
MCRJ Special Issue Vol. 12 | No. 1 | 2021
Gardenal, F. (2013). A model to measure e-procurement impacts on organizational
performance. Journal of Public Procurment, 13(2), 215–242.
https://doi.org/doi.org/10.1108/JOPP-13-02-2013-B003
Ghadamsi, A. (2012). The influence of procurement methods on project performance : A
conceptual framework, 860–871.
Grilo, Antonio, & Jardim-Goncalves, R. (2013). Cloud-Marketplaces: Distributed e-
procurement for the AEC sector. Advanced Engineering Informatics, 27(2), 160–172.
https://doi.org/10.1016/j.aei.2012.10.004
Grilo, António, & Jardim-Goncalves, R. (2011). Challenging electronic procurement in the
AEC sector: A BIM-based integrated perspective. Automation in Construction, 20(2),
107–114. https://doi.org/10.1016/j.autcon.2010.09.008
He, D., Li, Z., Wu, C., & Ning, X. (2018). An E-Commerce Platform for Industrialized
Construction Procurement Based on BIM and Linked Data. Sustainability, 10(8), 2613.
https://doi.org/10.3390/su10082613
Herbst, H., Knolmayer, G., & Mendling, J. (2012). E-Commerce and Web Technologies. (C.
Huemer & P. Lops, Eds.), Methods and associated tools for the information systems life
cycle (Vol. 123). Berlin, Heidelberg: Springer Berlin Heidelberg.
https://doi.org/10.1007/978-3-642-32273-0
HJ Ahmad, M., & Othman, R. (2009). Implementation Of Electronic Government In Malays
I A : The Status And Potential For Better Service To The Public. Public Sector Ict
Management Review.
IDC. (2015). Promoting E-Government Procurement ( E-GP ) The Strategy and Role of the
World Bank in the Europe and Central Asia ( ECA ) Countries, (February).
Igari, N. (2014). How to successfully promote ICT usage: A comparative analysis of Denmark
and Japan. Telematics and Informatics, 31(1), 115–125.
https://doi.org/10.1016/j.tele.2012.10.001
Institute of Value Management Austrialia. (2018). What is Value Management. Retrieved
March 4, 2019, from https://ivma.org.au/
Iosifidis, G., Gao, L., Huang, J., & Tassiulas, L. (2014). Incentive mechanisms for user-
provided networks. IEEE Communications Magazine, 52(9), 20–27.
https://doi.org/10.1109/MCOM.2014.6894448
Jabatan Kerja Raya. (2018). e-tender. Retrieved December 20, 2018, from
https://www.jkr.gov.my/ckub/b_admin/t_list.asp
Kajewski, S. L. (2014). e-Tendering: Benefits, Challenges and Recommendations for
Practice, (June).
Kajewski, S., Tilley, P., Crawford, J., Csiro, T. R., Chen, S., Lenard, D., … Weippert, A.
(2001). Electronic Tendering : An Industry Perspective.
Kaliannan, M., Raman, M., & Dorasamy, M. (2009). E-Procurement Adoption in the
Malaysian Public Sector : Organizational Perspectives E-Procurement Adoption in the
Malaysian Public Sector : Organizational Perspectives, (May 2014).
https://doi.org/10.1109/EDOCW.2009.5331999
Kauppi, K., Jones, A. B., Ronchi, S., Raaij, E. M. Van, & Brandon-jones, A. (2013). Tools
without skills Exploring the moderating effect of absorptive. International Journal of
Operations & Production Management, 33(7), 828–857. https://doi.org/10.1108/IJOPM-
12-2011-0445
Kementerian Kerja Raya. (2018). e-tender. Retrieved December 20, 2018, from
http://www.kkr.gov.my/ms/tender/iklan-kontraktor?page=1

285
MCRJ Special Issue Vol. 12 | No. 1 | 2021
Khalil, C. A., & Waly, A. F. (2015). Challenges And Obstacles Facing Tenderers Adopting
E- Tendering In The Public Sector Of The Construction Industry In Egypt, (Ebrd 2013),
1–10.
Krejcie, R.V, & Morgan, D. (1970). Activities, 607-610
M. INZOFU, K. (2016). Challenges To Implementation Of Electronic Procurement In The
Construction Sector. KCA University. Retrieved from
http://41.89.49.13:8080/xmlui/bitstream/handle/123456789/1168/Inzofu-Challenges To
Implementation Of Electronic Procurement In The Construction
Sector.pdf?sequence=1&isAllowed=y
Malaysia Institute of Value Management. (2018). National Value Management Guide.
Retrieved March 3, 2019, from www.ivmm.org.my
Ministry of Finance Malaysia. (2016). Malaysia’s Government Procurement Regime.
Retrieved from http://www.treasury.gov.my/index.php/en/business/company-
registration-information/item/1093-tender-process
Mohd, H., Baharom, F., Darus, N. M., Saip, M. A., & Marzuki, Z. (2017). A Secured Model
of E-Tendering Using Unified Modeling Language Approach, 6(2), 190–195.
Nasrun, M., Nawi, M., Deraman, R., Bamgbade, J. A., & Zulhumadi, F. (2017). E-
Procurement in Malaysian Construction Industry : Benefits and Challenges in
Implementation, 6(1), 209–213.
Nasrun, M., Nawi, M., Roslan, S., Salleh, N. A., & Zulhumadi, F. (2016). The Benefits and
Challenges of E-procurement Implementation : A Case Study of Malaysian Company, 6,
329–332.
Norzaidi, M. D., Mohammad, N., & Mohamed, I. S. (2013). Factors Influencing The Usage
Of E-Procurement Among Contractor Companies In Malaysia, (March 2016).
Nov, O., & Ye, C. (2010). Brief Communication A New Short Proof of Naranan ’ s Theorem
, Explaining Lotka ’ s Law and Zipf ’ s Law. Journal of the American Society for
Information Science, 1(6), 2581–2583. https://doi.org/10.1002/asi
Ogunsanmi, O. (2013). Effects of Procurement Related Factors on Construction Project
Performance in Nigeria. Ethiopian Journal of Environmental Studies and Management,
6(2), 197–208. https://doi.org/10.4314/ejesm.v6i2.12
Oyediran, O. S., & Akintola, A. A. (2011). A Survey Of The State Of The Art Of E-Tendering
In Nigeria, 16(March), 557–576.
Panda, P., & Sahu, G. . (2011). E-procurement implementation. IUP Journal of Supply Chain
Management, VIII(No.2), 34–67.
Patilp, T. C., Waghmarep, A. P., Gawande3, P. S., & Patil, Y. (2016). Tender and Bidding
Process in Construction Projects. IJISET -International Journal of Innovative Science,
Engineering & Technology, 3(3), 492–498. Retrieved from www.ijiset.com
Ren, Y., Skibniewski, M. J., & Jiang, S. (2012). Building information modeling integrated
with electronic commerce material procurement and supplier performance management
system. Journal of Civil Engineering and Management, 18(5), 642–654.
https://doi.org/10.3846/13923730.2012.719835
RICS. (2011). RICS releases 2nd edition eTendering guidance note. Structural Survey, 29(2),
ss.2011.11029bae.011. Retrieved from https://www.rics.org/globalassets/rics-
website/media/upholding-professional-standards/sector-standards/construction/black-
book/etendering-2nd-edition-rics.pdf
Talke, K., & Heidenreich, S. (2014). How to overcome pro-change bias: Incorporating passive
and active innovation resistance in innovation decision models. Journal of Product
Innovation Management, 31(5), 894–907. https://doi.org/10.1111/jpim.12130

286
MCRJ Special Issue Vol. 12 | No. 1 | 2021
Tan, J., & Ren, J. (2016). Application of E-tendering in Malaysian Construction Industry.
INTI Journal Special Edition.
Tindsley, G., & Stephenson, P. (2008). E-Tendering Process Within Construction : A UK
Perspective, 13(October), 273–278.
Trkman, P., & McCormack, K. (2010). Estimating the Benefits and Risks of Implementing
E-Procurement. IEEE Transactions on Engineering Management, 57(2), 338–349.
https://doi.org/10.1109/TEM.2009.2033046
Vaidya, K., Guy Callender, Sajeev, A. S. M., & Gao, J. (2004). Towards a Model for
Measuring the Performance of e- Procurement Initiatives in the Australian Public Sector :
A Balanced Scorecard Approach. In Australian Electronic Governance Conference (pp.
1–31).
Yusoff, W. S., Abas, Z., Islam, M. A., & Muhd Yusuf, D. H. (2011). Electronic Government
Procurement Adoption Behavior amongst Malaysian SMEs. International Business
Research, 4(1), 100–111.