Embed Size (px)
Citation preview
doi:10.1182/blood-2006-01-011007Prepublished online August 31, 2006;
Maria-Carolina Pintao, J P McCoy, Jr, Edgar G Rizzatti and Neal S YoungYong-Gang Yao, Yoji Ogasawara, Sachiko Kajigaya, Jeffrey J Molldrem, Roberto P Falcao, patientsMitochondrial DNA sequence variation in single cells from leukemia
(4217 articles)Neoplasia � (149 articles)Genomics �
Articles on similar topics can be found in the following Blood collections
http://bloodjournal.hematologylibrary.org/site/misc/rights.xhtml#repub_requestsInformation about reproducing this article in parts or in its entirety may be found online at:
http://bloodjournal.hematologylibrary.org/site/misc/rights.xhtml#reprintsInformation about ordering reprints may be found online at:
http://bloodjournal.hematologylibrary.org/site/subscriptions/index.xhtmlInformation about subscriptions and ASH membership may be found online at:
digital object identifier (DOIs) and date of initial publication. theindexed by PubMed from initial publication. Citations to Advance online articles must include
final publication). Advance online articles are citable and establish publication priority; they areappeared in the paper journal (edited, typeset versions may be posted when available prior to Advance online articles have been peer reviewed and accepted for publication but have not yet
Copyright 2011 by The American Society of Hematology; all rights reserved.20036.the American Society of Hematology, 2021 L St, NW, Suite 900, Washington DC Blood (print ISSN 0006-4971, online ISSN 1528-0020), is published weekly by
For personal use only. by guest on June 8, 2013. bloodjournal.hematologylibrary.orgFrom
1
Mitochondrial DNA sequence variation in single cells from leukemia
patients
Yong-Gang Yao1, Yoji Ogasawara1, Sachiko Kajigaya1, Jeffrey J. Molldrem2, Roberto P.
Falcão3, Maria-Carolina Pintão3, J. Philip McCoy, Jr1, Edgar Gil Rizzatti3, and Neal S.
Young1
From the Hematology Branch and Flow Cytometry Core Facility, National Heart Lung
and Blood Institute, National Institutes of Health, Bethesda, MD 1; Department of Blood
and Marrow Transplantation, University of Texas M.D. Anderson Cancer Center,
Houston, TX 2; and Division of Hematology, University of Sao Paulo at Ribeirao Preto
Medical School, Ribeirao Preto, Brazil 3
Running title: mtDNA heterogeneity in leukemia
Word counts: Abstract 199 words; Text 4125 words
Scientific heading: Neoplasia
Corresponding author:
Dr. Yong-Gang Yao
National Heart, Lung, and Blood Institute, NIH
Bldg 10 CRC, Rm 3E-5216, 10 Center Drive, Bethesda, MD, 20892-1202
Fax: +1 301 496 8396; Tel: 301-451-7151
E-mail: [email protected] or [email protected]
Or
Dr. Neal S. Young
National Heart, Lung, and Blood Institute, NIH
Bldg 10 CRC, Rm 3E-5140, 10 Center Drive, Bethesda, MD, 20892-1202
Fax: +1 301 496 8396; E-mail: [email protected]
Blood First Edition Paper, prepublished online August 31, 2006; DOI 10.1182/blood-2006-01-011007
Copyright © 2006 American Society of Hematology
For personal use only. by guest on June 8, 2013. bloodjournal.hematologylibrary.orgFrom
2
Abstract
A high frequency of mtDNA somatic mutation has been observed in many tumors
as well as in aging tissues. In this study, we analyzed mtDNA control region sequence
variation in 3534 single normal cells and individual blasts from 18 leukemia patients and
10 healthy donors, to address the mutation process in leukemic cells. We found
significant differences in mtDNA sequence, as represented by the number of haplotypes
and the mean number of cells with each nonaggregate haplotype in a population of cells,
in patients compared to controls. Patients with similar clinical leukemia types,
particularly AML, did not show a uniform pattern of sequence variation in single blasts.
Some relapsed patients presented a complex shift of major haplotypes in single cells.
Four patients showed high frequencies of cells containing mutations 189, 260, 16150, and
16488, respectively, as a result of clonal expansion, and could be considered as potential
markers for their respective disease progression. To our knowledge, this is the first large-
scale study of mtDNA variation in single malignant cells. Our results suggest that the
somatic mutation process in leukemia is complex, leading to diverse levels of genetic
alterations due to either intrinsic aspects of leukemia pathophysiology and/or
chemotherapy effects.
For personal use only. by guest on June 8, 2013. bloodjournal.hematologylibrary.orgFrom
3
Introduction
Since the recent discovery of a high frequency of mtDNA somatic mutations in
cancer, 1,2 a putative role of mtDNA has been sought in tumorigenesis. Two recent
studies showed a potential role for pathogenic mtDNA mutations in the promotion of
tumor by increasing reactive oxygen species (ROS) 3 and preventing apoptosis 4. There is
a proposal for adding cancer to the list of mitochondrial diseases. 3 Despite the enormous
number of mtDNA somatic mutations identified in cancer cells, 5,6 not yet fully resolved
is the questions of how mutations arise and become fixed in tumors, and whether the
mutation rate is accelerated or slowed at different stages of malignant progression. A
selective mechanism leading to a replicative advantage has been suggested to explain an
apparently high rate of somatic mutation in tumors, 1,2 but later studies and computer
modeling indicated that random processes are sufficient to explain the high frequency of
homoplasmic somatic mutations in both tumors and aging tissues. 7-11
Several laboratories have reported unexpectedly large number of somatic
mutations in leukemia. Ivanova et al. 12 compared the restriction endonuclease digestion
pattern of mtDNA in acute lymphoblastic leukemia (ALL) patients and normal controls.
Carew et al. 13 determined mtDNA mutations in six short fragments from the control and
coding regions in chronic lymphocytic leukemia (CLL) patients with and without prior
chemotherapy. Grist et al. 14 analyzed partial control region sequence variation in acute
myeloid leukaemia (AML) and ALL patients. He et al. 15 sequenced the entire mtDNA
genome in both normal and leukemic cells from each of the 24 patients. Finally, Linnartz
et al. 16 analyzed the mtDNA alterations in 10 cases of acute leukemia evolving from
For personal use only. by guest on June 8, 2013. bloodjournal.hematologylibrary.orgFrom
4
myelodysplastic syndrome. There are also reports of change of mtDNA copy number in
leukemic cells. 11,15,17,18 None of these studies has traced somatic mutations in leukemia at
the single cell level.
We have recently described age-dependent accumulation of mtDNA mutations in
single hematopoietic cells from the bone marrow and peripheral blood (PB) of healthy
donors 19-21 and compared the mutation spectra of differentiated blood cells from the
same donors by using an optimized method for analyzing mtDNA variation in single flow
cytometry-sorted cells. 21 In the present study, we employed single cell analysis to detect
low-frequency individual somatic mutations that are not well represented in bulk tissue in
order to quantify a somatic mutation process in leukemia, as well as, to determine
whether mtDNA could be used as a marker for monitoring disease progression. We
analyzed mtDNA control region sequence variation among single cells obtained from
leukemia patients and normal controls. Our results indicate that the mutation process in
leukemia is complex, leading to diverse levels of genetic sequence alterations due to
either intrinsic aspects of leukemia pathophysiology and/or chemotherapy effects. Shifts
in major mtDNA haplotypes in single cells can be observed during different stages of
leukemia in some individual patients.
Materials and Methods
Patients
A total of 18 leukemia patients were recruited in this study with informed consent
under protocols approved by the Institutional Review Boards of the National Heart, Lung,
For personal use only. by guest on June 8, 2013. bloodjournal.hematologylibrary.orgFrom
5
and Blood Institute (NHLBI, Bethesda), M.D. Anderson Cancer Center, and University
of Sao Paulo at Ribeirao Preto Medical School (online supplementary Table 1).
Peripheral blood (PB) from 10 patients (UPN1-3, UPN16-22) was collected at the M.D.
Anderson Cancer Center and was transferred to Bethesda. Leukemic blasts, mononuclear
cells, and granulocytes from PB were separated by Ficoll density gradient centrifugation
upon arrival and were frozen in liquid nitrogen. Frozen PB cells of eight acute myeloid
leukemia patients from Brazil were shipped to Bethesda on dry ice. We also obtained PB
sample from patient OAM at the time of relapse. The recently available data of mtDNA
variation in single PB hematopoietic cells from five healthy donors, 21 together with data
from PB CD34+ single cells from five newly analyzed healthy volunteers in the current
study, served as normal controls.
Single cell sorting
We sorted for blasts in each patient according to specific cell surface markers for
the malignant cell population as determined in a clinical laboratory during diagnostic
evaluation (online supplementary Table 1). For some patients, we also sorted “normal”
cells, such as granulocytes, and used them as controls. We failed to successfully sort the
blast cells of patient UPN22 due to poor survival after shipping, freezing, and thawing,
and possibly also chemotherapy effects, and for this case we only analyzed CD34+ cells
and granulocytes. We followed the staining procedures for each antibody provided by the
manufacture (BD Bioscience, San Jose, CA) and the procedures described in our recent
publication. 21 Briefly, 1 × 10⁶ cells suspended in 100 µL PBS containing 0.5% bovine
serum albumin (BSA) were incubated with respective antibodies [anti-CD34
For personal use only. by guest on June 8, 2013. bloodjournal.hematologylibrary.orgFrom
6
phycoerythrin (PE)-conjugated monoclonal antibody; anti-CD33 allophycocyanin (APC)-
conjugated monoclonal antibody or anti-CD33 PE-conjugated monoclonal antibody; anti-
CD13 PE-conjugated monoclonal antibody; anti-CD5 fluorescein isothiocyanate (FITC)-
conjugated monoclonal antibody] or a combination of two antibodies (online
supplementary Table 1) for 30 min at 4°C. Cells were then washed and resuspended in
600 µL of PBS supplemented with 0.5% BSA.
Cell sorting was performed on a MoFlo Cytometer (Dako-Cytomation, Ft Collins,
CO), using 100 milliwatts of the 488 nm line of an argon laser (I-90, Coherent Inc, Palo
Alto, CA) for excitation. Forward scatter was the triggering parameter. Single cell
deposition was accomplished using the CyClone automated cloner (Dako-Cytomation) in
the 0.5 single drop mode with gating based on forward scatter and fluorescence. Single
blasts, CD34+ cells, and granulocytes were sorted into each well of a 96-well plate
containing 50 µL of lysis buffer (10 mmol/L Tris-HCl [pH 8.0], 50 mmol/L KCl, 100
µg/mL Proteinase K, 1% Triton X-100). The whole plate was then incubated at 56°C for
15 min to liberate total DNA. Proteinase K in the lysate was inactivated by incubation at
96°C for 6 min.
DNA amplification and sequencing
To generate sufficient template from single cells for sequencing of the entire
mtDNA control region sequence, two-step nested PCR amplification was employed using
the outer and inner primer pairs and conditions as described in our recent studies. 19-21 In
brief, the first PCR was performed in 30 µL of reaction mixture containing 400 µM of
each dNTP, 1 units of TaKaRa LA TaqTM , which has proof reading activity (Takara Bio.
For personal use only. by guest on June 8, 2013. bloodjournal.hematologylibrary.orgFrom
7
Inc.), 0.5 µM of each forward and reverse outer primer (L15594: 5’ -
CGCCTACACAATTCTCCGATC -3’ and H901: 5’- ACTTGGGTTAATCGTGTGACC
-3’), and 5 µL of cell lysates. The amplification was run on the GeneAmp PCR system
9700 (Applied Biosystems, Foster City, CA) with the following cycles: one cycle of 94°C
for 3 minute; then 35 cycles of 94°C for 30 sec, 52°C for 40 sec and 72°C for 1 minute
with a 5 sec increase per cycle; and ending with a full extension cycle of 72°C for 10
minutes. The second PCR was performed in 50 µL of reaction mixture containing 400
µM of each dNTP, 2 units of TaKaRa LA TaqTM, 0.5 µM of each forward and reverse
inner primers (L15990: 5’ – TTAACTCCACCATTAGCACC -3’ and H650: 5’ –
GAAAGGCTAGGACCAAACCTA -3’), and 5 µL of first PCR product under the same
amplification condition as the 1st PCR but with an extension time of 90 sec at 72°C per
cycle. Second PCR products were purified using the QIA quick PCR purification kit
(Qiagen, Valencia, CA) and were directly sequenced by using BigDye Terminator v3.1
Cycle Sequencing Kit on a 3100 DNA sequencer (Applied Biosystems) according to the
manufacturer’s manual. We used the second PCR primers and the following primers to
overlap sequence the entire mtDNA control region: L15996, 5’-
CTCCACCATTAGCACCCAAAGC -3’; L16209, 5’- CCCCATGCTTACAAGCAAGT-
3’; L16517, 5’ - CATCTGGTTCCTACTTCAGG -3’; H26, 5’-
GCATGGAGAGCTCCCGTGAGTGG-3’; L29, 5’ -
GGTCTATCACCCTATTAACCAC-3’; L332, 5’- CCCGCTTCTGGCCACAGCAC-3’.
Sequence analyses
For personal use only. by guest on June 8, 2013. bloodjournal.hematologylibrary.orgFrom
8
Sequences were aligned by SeqMan program in DNAstar package (DNASTAR
Inc.) and were proof-read by eyes. A mutation was scored relative to the revised
Cambridge Reference Sequence (rCRS). 22 Cells showing sequence difference at all the
variable sites of the donor’s consensus sequence, which suggest external mtDNA
contamination, were discarded. Due to the limits of sequencing, mutation heteroplasmy
(co-existence of wild-type and the mutant allele) was scored when a mutant allele was
present at >10% level chromatography (Figure 1). The length mutations of C-tract in
region 16184-16193 due to 16189T>C mutation was not scored in single cells, as most of
them were heteroplasmic of multiple polyC-tracts and could not be conservatively
counted according to sequencing chromatographs. We scored the length mutation of C-
tract in region 303-309 in the second hypervariable segment (HVS-II) of control region
by direct counting of the base shift of T at site 310. The length mutation of the AC repeat
in region 515-524 in the third hypervariable segement (HVS-III) was also based on the
sequencing chromatographs.
Measurement of the number and size of mtDNA haplotypes in single cell
populations
We employed two parameters to quantify the difference of the subclones marked
by respective mtDNA haplotypes in healthy donors and leukemia patients. First, we
determined the number of haplotypes identified in a population of cells from each
sample: this index reflects the total number of mutations that have occurred within a
given number of cells, which in turn reflects time over which the subclone has developed
and the net mutation rate per unit time. Second, we calculated the mean number of cells
For personal use only. by guest on June 8, 2013. bloodjournal.hematologylibrary.orgFrom
9
bearing each nonaggregate haplotypes: this parameter relects the mean size of the
subclones marked by the nonaggregate haplotypes, which correlates with factors such as
the time that each mutation occurred, genetic drift, and the magnitude of selection or
clonal expansion of the subclones harboring a particular nonaggregate haplotype. Both
parameters have some limitations, but direct comparison of the leukemia and control
samples based on either parameter should reveal differences between the two groups and
may be correlated with distinct biological processes.
The unpaired t test was used to compare differences between normal controls and
patients by using Prism 4 (GraphPad Software, Inc.). F test was used to compare
variances between the two groups; if variances were significantly different, unpaired t-
test with Welch’s correction was employed to quantify the difference between the two
groups. A value of P < 0.05 was regarded as statistically significant.
Results and Discussion
Data quality control
As has been reemphasized recently in a critical paper, 5 analysis of mtDNA from
minute amounts of DNA derived from minimal amounts of tissue makes contamination
and PCR errors particularly problematic. Previous reports of somatic mutations in cancer
tissues have not been free of laborotary error and misinterpretation of flawed data.5 In
the current study, we were especially attentive to systematic errors that might introduce
artifacts and we sought to maintain stringent quality control. First, a high fidelity Taq
polymerase with proof reading activity (with a relative error rate of 0.16 as compared to
For personal use only. by guest on June 8, 2013. bloodjournal.hematologylibrary.orgFrom
10
regular Taq polymerase, according to the manufacturer), and negative controls were
employed during the amplification. Second, single nucleotide mutations were verified by
independent amplification and sequencing using the first PCR product as template.
While recognizing that such a confirmation is not entirely independent because it does
not utilize the original cell lysate, comprison of triplicates of independent amplifications
derived from the original lysates followd by sequencing did indicate that 85%-90% of
mutations could be consistently reproduced from single CD34+ cells. 21 In the current
study, we compared substitutions among triplicates of independent amplifications for
single cells from donor 6 (see online supplementary Table 3 for a consensus result of the
triplicate). Several differences were observed: the cell harboring mutation 16172 T>Y
appeared as 16172T>C and 151T>C in one replicate; cell harboring mutation 16240G>R
had one more mutation 106G>R in one replicate; mutations 16267C>C/A, 16039G>R,
and 412G>R were observed in two of the three independent amplifications. Nucleotide
substitutions in the other five cells could be confirmed in all the triplicates. The mutations
that presented with marginal levels of heteroplasmy, < about 20% as observed in the
chromatographs, were not always reproducible. Finally, a phylogenetic approach that was
described in previous studies 5,23,24 was used for data quality control.
Aggregate mtDNA sequence and haplogroup status
We determined the aggregate mtDNA sequences of each patient and normal
control by taking the consensus sequence of the single cells, and assigned each mtDNA
to the nominated haplogroup system of world human mtDNA phylogeny. 25-29 The
resulting classification of each mtDNA revealed that six leukemia patients had
For personal use only. by guest on June 8, 2013. bloodjournal.hematologylibrary.orgFrom
11
matrilineal origin of native Americans (haplogroups A2 and D1 25). Three patients and
two healthy donors had matrilineal origin of Africans (haplogroups L2a, L3f, and L0a1
28). One healthy donor and one patient were of east Asian matrilineal origin (haplogroups
M7a and B4b 27). The remaining cases and controls were with European matrilineal
origin 26 (Online supplementary Table 2).
We tentatively grouped the samples according to mtDNA haplogroup background
and compared the mutation level in a population of cells among samples with the same
haplogroup status. Although the numbers of patients and controls were small, we did not
observe any obvious correlation between halpogroup background and mtDNA variation
in single cells (Table 1).
MtDNA variation in leukemic blasts versus normal cells from patients and healthy
donors
As the nuclear genetic background of each patient and healthy donor was
different, comparison of mtDNA variation of “normal” single cells and single blasts from
the same patient would be desirable. However, in our recent analysis of mtDNA
mutation spectra of CD34+, T, B cells, and granulocytes from the same healthy donors,
we found varied level of mtDNA alterations among the four cell types from the same
individual, with generally greater variation among granulocytes. 21 Therefore, we
anticipated that such a comparison of “normal” cells and leukemic blasts from the same
patient might be confounded by the higher level of mtDNA alterations in
polymorpohonuclear cells.
For personal use only. by guest on June 8, 2013. bloodjournal.hematologylibrary.orgFrom
12
Consistent with the pattern in normal donors, we found marked variance of
mtDNA variation in different cell types from the same patient. For example, we observed
more haplotypes among blasts (22 haplotypes in 94 blast cells) of acute promyelocytic
leukemia (APML) UPN19 than in the same patient's presumably normal CD34+ cells (10
haplotypes in 96 cells). Granulocytes from this patient contained even more mutations
(23 haplotypes in 79 granulocytes). In another three patients (UPN20-22), in which
analyses of both granulocytes and blast cells (or CD34+ cells) were conducted, we found
a similar trend of greater variation in granulocytes (Table 1). Thus, it appears that somatic
mutations might accumulate at different rates and/or mechanisms in differentiated cells
and progenitor cells from the same individual.
We next obtained the PB CD34+ cells from the healthy donors as controls for
comparison with blasts in patients (Table 1 and online supplementary Tables 3 and 4).
MtDNA variation in single blast cells and CD34+ cells for each subject, as represented
by the number of haplotypes and the mean number of cells bearing each nonaggregate
haplotype, varied substantially among the patients compared with controls (Table 1 and
Figure 2). The overall difference in the number of haplotypes/100 cells between the
patient and control groups was statistically significant (P = 0.02 < 0.05, two tailed
unpaired t-test); the leukemia group harboring fewer haplotypes than in controls. Among
the AML patients who were sampled at the time of diagnosis and prior to any treatment,
particularly subtype M1, we did not observe a uniform pattern of mtDNA variation in
blast cells (Table 1 and Figure 2). AML patients who had previously undergone medical
treatment, including the relapsed AML patients and the AML patients in which leukemia
was secondary to chemotherapy or evolved from another hematologic disease, did not
For personal use only. by guest on June 8, 2013. bloodjournal.hematologylibrary.orgFrom
13
generally show a higher level of variation compared to de novo leukemia patients (for
both parameters, P > 0.05; two-tailed unpaired t-test). Based on the pattern of mtDNA
variation in single cells, AML appeared heterogeneous despite its character as a clonal
disease.
MtDNA marker for leukemia progression and clonal proliferation
Rapid expansion and other neoplastic features of blast cells in leukemia could
affect the mutation process in mtDNA and be detectable during progression. These
changes therefore might be utilized as markers for tracking individual clones. The C-tract
alteration in region 303-309 in HVS-II has been identified as a major target for mtDNA
alterations in cancer 30 and related to premalignant lesions of the head and neck as a
marker 31. In contrast, our data indicates that this C-tract alteration is also a “hot spot” for
somatic mutation in single cells in normal individuals (Ogasawara et al. 21 and this study).
The heteroplasmy of certain point mutations has been found to vary during diagnosis,
remission, and relapse stages of the same leukemia patient 15,16. In the present study,
besides the C-tract alteration, which occurred in 12 of 18 leukemia patients and in nine of
the 10 controls (albeit with different frequency in each sample), we also observed
mtDNA substitution with different levels of heteroplasmy in many single cells from each
of the five patients UPN2 (260G>R), UPN17 (189A>R), UPN22 (16320C>Y), DC
(16150C>Y), and OAM (16488C>C/A). In patient UPN20, 12.9% (11/85) of blasts was
distinguished by different levels of heteroplasmy of a dinucleotide AC repeat insertion at
region 515-524 relative to its aggregate sequence (note that the aggregate sequence of
UPN20 only had four AC repeats in region 515-524, as compared with the rCRS22).
For personal use only. by guest on June 8, 2013. bloodjournal.hematologylibrary.orgFrom
14
These different levels of heteroplasmy of certain mutation in different single cells from
the same individual, as exemplified by mutations at sites 189 and 16150 in patients
UPN17 and DC, respectively, in Figure 1, were obviously resulted from clonal expansion
and genetic drift due to the rapid proliferation of the blasts, which may ultimately result
in a shift of the predominant allele in single cells. Coding region mutations may also exist
in leukemic blasts and present similar heteroplasmy pattern as observed here but
sequencing was restricted to the control region in the present study. Potential damage to
DNA in single blasts may also contribute to observed heteroplasmy owing to random
statistical effects.
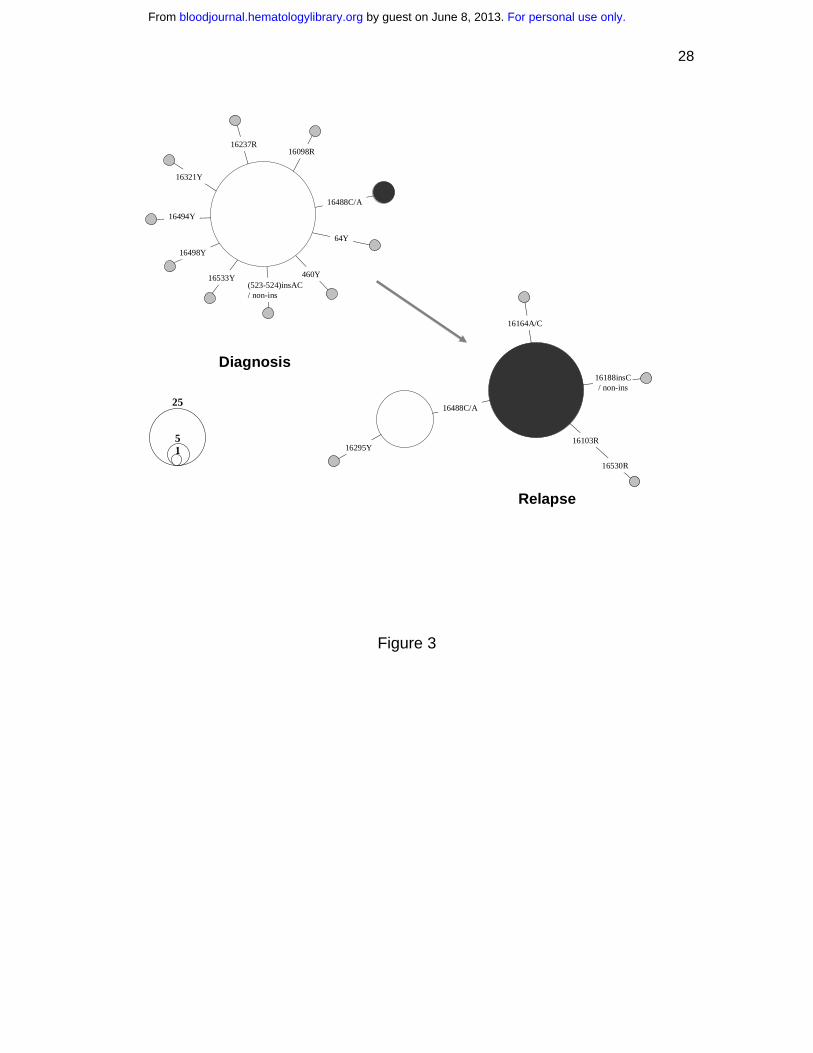
The comparison of the mtDNA mutation pattern in single blasts of one AML
patient, OAM, at diagnosis and relapse provided direct evidence of the dynamics of
different leukemic clones during disease progression. At first diagnosis in September
2002, only five of 92 blasts harbored a mtDNA haplotype, defined by the presence of an
extra rare C to A transversion at site 16488 in a heteroplasmic status. However, 76.1% of
single blasts (70/92) were found to bear this mutation at relapse in May 2005, suggesting
its origin from the residual blast clone harboring mutation 16488C>C/A (Figure 3). This
clone was apparently selected and then expanded after treatment. Although we were
unable to analyze samples at different stages for all leukemia patients in the current
study, this analysis of mtDNA sequence variation in single blasts suggests the feasibility
of applying mtDNA somatic mutation to trace the progression of leukemia in individual
cells. The feasibility of such an approach depends on the probability that cells which
result from clonal expansion harbor the sentinel mutation; in most cases, however, there
For personal use only. by guest on June 8, 2013. bloodjournal.hematologylibrary.orgFrom
15
was little evidence for specific mutation markers for each leukemia patient or for
different leukemia (sub)types.
MtDNA mutation process in leukemia
Somatic mutations accumulated in tumors and aging tissues. 1,2,5-11,19-21,32-34
Among the models proposed, random genetic drift provides the simplest explanation for
this process and has been supported by mathematic simulations. 7-11 Determining mtDNA
variation in single cells could further test this hypothesis. Rapid clonal expansion of
blasts (from a few founders) at an early stage of disease, together with altered
intracellular mtDNA copy number in tumor cells, 11,17,18 should enhance random drift and
result in a pattern of a generally lower amount of mtDNA variation in patients’ blast cells
compared with controls. However, our analysis for mtDNA variation in single cells from
leukemia patients revealed an unexpectedly complex pattern: the extent of mtDNA
alteration varied greatly among the patients analyzed and was not generally increased in
the later stages of leukemia or after medical treatment (Tables 1 and online
supplementary Table 3). Some leukemia patients at diagnosis presented levels of mtDNA
alterations comparable to controls. Our previous studies had shown that mtDNA
sequence is relatively homogenous in CD34 cells from cord blood and much more
heterogeneous in CD34 cells from middle-aged adults.19 We thus anticipated
homogeneity among acute leukemic blasts, which could be assumed to have arisen over a
much shorter time period from limited number of founders. The observed complex
pattern in leukemia patients, although on average showing fewer mutations than that in
controls, suggests that mutations appear at a relatively high rate in leukemic cell mtDNA
For personal use only. by guest on June 8, 2013. bloodjournal.hematologylibrary.orgFrom
16
and that homoplasmy (uniformity of sequence within an individual cell) and clonal
expansion (expression of the fixed mtDNA mutation in a substantial proportion of
progeny) can be achieved over months rather than requiring decades.
Among those patients that presented high level of mtDNA variation, we also
observed different levels of heteroplasmy for certain mutation, such as variant at site
16150 in patient DC (Figure 1), which reflects the effect of random drift and clonal
proliferation. In such cases, drift may play an active role in the fixation of mutations. The
observed mtDNA variation pattern in these leukemia patients may reflect dynamic and/or
counterbalanced processes of cumulative mutation induction by mutagens and mutation
loss by genetic drift during clonal expansion, as well as effects of cytotoxic drug
treatment. The mutation pattern observed in patient UPN22 may be an example: we
observed several mutations with different levels of heteroplasmy, such as a length
mutation in C-tract in HVS-II and variants C16320T and T195C in the majority of single
cells that had a consensus sequence 16222-16519-263-319, whereas several cells bore the
consensus sequence 16239-16519-263. The latter consensus sequence type was present at
different frequency in CD34+ cells (4.6%, 3/65) and granulocytes (11.4%, 8/70) (online
supplementary Table 3). It is possible that one of the two mtDNA consensus sequence
types arose during chemotherapy. Grist et al. 14 also reported a shifting pattern of mtDNA
types in a number of their leukemia patients and depicted a complex hypothetical
evolutionary pathway for mtDNA haplotypes during diagnosis, remission, and relapse of
one acute leukemia patient in their figure 1. In Carew et al.’s 13 study, chronic
lymphocytic leukemia patients with chemotherapy had many heteroplasmic mutations in
the short ND1 fragment (532bp) and in other regions analyzed. These results favor an
For personal use only. by guest on June 8, 2013. bloodjournal.hematologylibrary.orgFrom
17
increased rate of mtDNA mutation during and after chemotherapy in some patients.
Notable also is the presence of three mutations in the two consensus sequence types in
UPN22, without evidence of intermediary types with single or double mutations; this
patient had received a platelet transfusion proximate to sample acquisition, and
contamination by donor blood cells cannot be excluded, as has been reported in a patient
with ALL. 35 In any case, mutations at sites 16320 and 195 and other mutations that
steped from the consensus sequence 16222-16519-263-319 in the majority of single cells
in patient UPN22 were obviously the product of a quick mutation process.
About 60% of mutations (not including the length mutation in the C-tract and the
dinucleotide AC repeat in HVS-III) which were observed in single cells from leukemia
patients are not listed on MITOMAP (www.mitomap.org) as reported polymorphisms;
this database is derived mainly from population genetics, medical and forensic studies.
The percentage of such “novel” mutations was also very high (up to 55%) among the
single cells from normal donors (this study and Ogasawara et al.21). Most of these
mutations also are not in the list of phantom mutation hotspots that were detected in a
massive screening of >5000 sequencing electropherograms, 36 and thus are unlikely be
reading errors of sequencing chromatographs. Why these nucleotide changes have only
occurred as somatic mutations and are not fixed in human populations as a germ-line
substitution remains an open question. When we quantitated absolute numbers of
mutations irrespective of their frequency, some mutations, such as 42T>Y, 146T>Y,
185G>R, 204T>Y, 378C>Y, 571C>Y, 16068T>Y, 16131T>Y, 16189T>Y, 16222C>Y,
16390G>R, and 16565C>Y, were present in single cells from three or more individuals.
Among them, mutations 146, 185, 204, and 16189 have been scored as mutation hot spots
For personal use only. by guest on June 8, 2013. bloodjournal.hematologylibrary.orgFrom
18
in human mtDNA control region that was based on population data. 23,24,37,38 It thus
seems that somatic mutation events in single hematopoietic cells are also prone to occur
at well characterized mutational hotspots, as has been observed in patients with primary
tumors of the central nervous system. 33 Our observed mtDNA mutation spectrum of
single cells from the normal and leukemic hematopoietic system also differs from the
patterns that were described in aging tissues 39-41, Alzheimer's disease brain 42,
cardiomyocytes 43, and neurons and glia 44, suggesting tissue specificity and adding
further complexity to our view of the mutation process in leukemia.
Acknowledgements
We thank Ms Leigh Samsel for technical assistance and Dr. Rodrigo Calado for help in
obtaining the samples. We are also grateful to the two anonymous reviewers for valuable
comments.
Reference
1. Polyak K, Li Y, Zhu H, et al. Somatic mutations of the mitochondrial genome in human colorectal tumours. Nat Genet. 1998;20:291-293. 2. Fliss MS, Usadel H, Caballero OL, et al. Facile detection of mitochondrial DNA mutations in tumors and bodily fluids. Science. 2000;287:2017-2019. 3. Petros JA, Baumann AK, Ruiz-Pesini E, et al. mtDNA mutations increase tumorigenicity in prostate cancer. Proc Natl Acad Sci U S A. 2005;102:719-724. 4. Shidara Y, Yamagata K, Kanamori T, et al. Positive contribution of pathogenic mutations in the mitochondrial genome to the promotion of cancer by prevention from apoptosis. Cancer Res. 2005;65:1655-1663. 5. Salas A, Yao Y-G, Macaulay V, Vega A, Carracedo Á, Bandelt H-J. A Critical Reassessment of the Role of Mitochondria in Tumorigenesis. PLoS Med. 2005;2:e296. 6. Salas A, Yao Y-G, Bandelt H-J. Mitochondria: more than mitochondrial DNA in cancer — Author's reply. PLoS Med. 2006;3:e166. 7. Chinnery PF, Samuels DC, Elson J, Turnbull DM. Accumulation of mitochondrial DNA mutations in ageing, cancer, and mitochondrial disease: is there a common mechanism? Lancet. 2002;360:1323-1325.
For personal use only. by guest on June 8, 2013. bloodjournal.hematologylibrary.orgFrom
19
8. Elson JL, Samuels DC, Turnbull DM, Chinnery PF. Random intracellular drift explains the clonal expansion of mitochondrial DNA mutations with age. Am J Hum Genet. 2001;68:802-806. 9. Coller HA, Khrapko K, Bodyak ND, Nekhaeva E, Herrero-Jimenez P, Thilly WG. High frequency of homoplasmic mitochondrial DNA mutations in human tumors can be explained without selection. Nat Genet. 2001;28:147-150. 10. Taylor RW, Barron MJ, Borthwick GM, et al. Mitochondrial DNA mutations in human colonic crypt stem cells. J Clin Invest. 2003;112:1351-1360. 11. Jones JB, Song JJ, Hempen PM, Parmigiani G, Hruban RH, Kern SE. Detection of mitochondrial DNA mutations in pancreatic cancer offers a "mass"-ive advantage over detection of nuclear DNA mutations. Cancer Res. 2001;61:1299-1304. 12. Ivanova R, Lepage V, Loste MN, et al. Mitochondrial DNA sequence variation in human leukemic cells. Int J Cancer. 1998;76:495-498. 13. Carew JS, Zhou Y, Albitar M, Carew JD, Keating MJ, Huang P. Mitochondrial DNA mutations in primary leukemia cells after chemotherapy: clinical significance and therapeutic implications. Leukemia. 2003;17:1437-1447. 14. Grist SA, Lu XJ, Morley AA. Mitochondrial mutations in acute leukaemia. Leukemia. 2004;18:1313-1316. 15. He L, Luo L, Proctor SJ, et al. Somatic mitochondrial DNA mutations in adult-onset leukaemia. Leukemia. 2003;17:2487-2491. 16. Linnartz B, Anglmayer R, Zanssen S. Comprehensive scanning of somatic mitochondrial DNA alterations in acute leukemia developing from myelodysplastic syndromes. Cancer Res. 2004;64:1966-1971. 17. Boultwood J, Fidler C, Mills KI, et al. Amplification of mitochondrial DNA in acute myeloid leukaemia. Br J Haematol. 1996;95:426-431. 18. Jia L, Liu KZ, Newland AC, Mantsch HH, Kelsey SM. Pgp-positive leukaemic cells have increased mtDNA but no increased rate of proliferation. Br J Haematol. 1999;107:861-869. 19. Shin MG, Kajigaya S, McCoy JP, Jr., Levin BC, Young NS. Marked mitochondrial DNA sequence heterogeneity in single CD34+ cell clones from normal adult bone marrow. Blood. 2004;103:553-561. 20. Shin MG, Kajigaya S, Tarnowka M, McCoy JP, Jr., Levin BC, Young NS. Mitochondrial DNA sequence heterogeneity in circulating normal human CD34 cells and granulocytes. Blood. 2004;103:4466-4477. 21. Ogasawara Y, Nakayama K, Tarnowka M, et al. Mitochondrial DNA spectra in single CD34+ cells, T-cells, B-cells and granulocytes. Blood. 2005;106:3271-3284. 22. Andrews RM, Kubacka I, Chinnery PF, Lightowlers RN, Turnbull DM, Howell N. Reanalysis and revision of the Cambridge reference sequence for human mitochondrial DNA. Nat Genet. 1999;23:147. 23. Yao YG, Bravi CM, Bandelt HJ. A call for mtDNA data quality control in forensic science. Forensic Sci Int. 2004;141:1-6. 24. Bandelt HJ, Quintana-Murci L, Salas A, Macaulay V. The fingerprint of phantom mutations in mitochondrial DNA data. Am J Hum Genet. 2002;71:1150-1160. 25. Bandelt HJ, Herrnstadt C, Yao YG, et al. Identification of Native American founder mtDNAs through the analysis of complete mtDNA sequences: some caveats. Ann Hum Genet. 2003;67:512-524.
For personal use only. by guest on June 8, 2013. bloodjournal.hematologylibrary.orgFrom
20
26. Palanichamy MG, Sun C, Agrawal S, et al. Phylogeny of mitochondrial DNA macrohaplogroup N in India, based on complete sequencing: implications for the peopling of South Asia. Am J Hum Genet. 2004;75:966-978. 27. Kong QP, Yao YG, Sun C, Bandelt HJ, Zhu CL, Zhang YP. Phylogeny of east Asian mitochondrial DNA lineages inferred from complete sequences. Am J Hum Genet. 2003;73:671-676. 28. Salas A, Richards M, Lareu MV, et al. The African diaspora: mitochondrial DNA and the Atlantic slave trade. Am J Hum Genet. 2004;74:454-465. 29. Reidla M, Kivisild T, Metspalu E, et al. Origin and diffusion of mtDNA haplogroup X. Am J Hum Genet. 2003;73:1178-1190. 30. Sanchez-Cespedes M, Parrella P, Nomoto S, et al. Identification of a mononucleotide repeat as a major target for mitochondrial DNA alterations in human tumors. Cancer Res. 2001;61:7015-7019. 31. Ha PK, Tong BC, Westra WH, et al. Mitochondrial C-tract alteration in premalignant lesions of the head and neck: a marker for progression and clonal proliferation. Clin Cancer Res. 2002;8:2260-2265. 32. Gattermann N. Mitochondrial DNA mutations in the hematopoietic system. Leukemia. 2004;18:18-22. 33. Vega A, Salas A, Gamborino E, Sobrido MJ, Macaulay V, Carracedo A. mtDNA mutations in tumors of the central nervous system reflect the neutral evolution of mtDNA in populations. Oncogene. 2004;23:1314-1320. 34. Greaves LC, Preston SL, Tadrous PJ, et al. Mitochondrial DNA mutations are established in human colonic stem cells, and mutated clones expand by crypt fission. Proc Natl Acad Sci U S A. 2006;103:714-719. 35. Meierhofer D, Ebner S, Mayr JA, Jones ND, Kofler B, Sperl W. Platelet transfusion can mimic somatic mtDNA mutations. Leukemia. 2006;20:362-363. 36. Brandstätter A, Sanger T, Lutz-Bonengel S, et al. Phantom mutation hotspots in human mitochondrial DNA. Electrophoresis. 2005;26:3414-3429. 37. Malyarchuk BA, Rogozin IB, Berikov VB, Derenko MV. Analysis of phylogenetically reconstructed mutational spectra in human mitochondrial DNA control region. Hum Genet. 2002;111:46-53. 38. Stoneking M. Hypervariable sites in the mtDNA control region are mutational hotspots. Am J Hum Genet. 2000;67:1029-1032. 39. Michikawa Y, Mazzucchelli F, Bresolin N, Scarlato G, Attardi G. Aging-dependent large accumulation of point mutations in the human mtDNA control region for replication. Science. 1999;286:774-779. 40. Wang Y, Michikawa Y, Mallidis C, et al. Muscle-specific mutations accumulate with aging in critical human mtDNA control sites for replication. Proc Natl Acad Sci U S A. 2001;98:4022-4027. 41. Zhang J, Asin-Cayuela J, Fish J, et al. Strikingly higher frequency in centenarians and twins of mtDNA mutation causing remodeling of replication origin in leukocytes. Proc Natl Acad Sci U S A. 2003;100:1116-1121. 42. Coskun PE, Beal MF, Wallace DC. Alzheimer's brains harbor somatic mtDNA control-region mutations that suppress mitochondrial transcription and replication. Proc Natl Acad Sci U S A. 2004;101:10726-10731.
For personal use only. by guest on June 8, 2013. bloodjournal.hematologylibrary.orgFrom

21
43. Nekhaeva E, Bodyak ND, Kraytsberg Y, et al. Clonally expanded mtDNA point mutations are abundant in individual cells of human tissues. Proc Natl Acad Sci U S A. 2002;99:5521-5526. 44. Cantuti-Castelvetri I, Lin MT, Zheng K, et al. Somatic mitochondrial DNA mutations in single neurons and glia. Neurobiol Aging. 2005;26:1343-1355.
For personal use only. by guest on June 8, 2013. bloodjournal.hematologylibrary.orgFrom
22
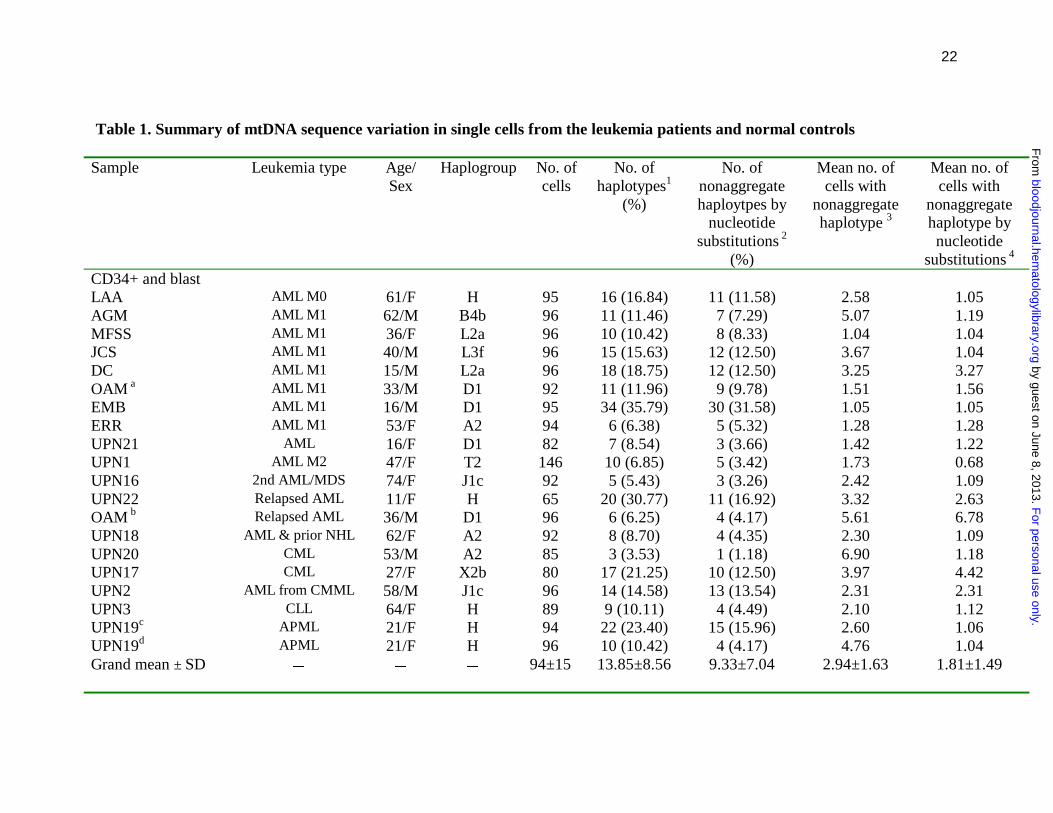
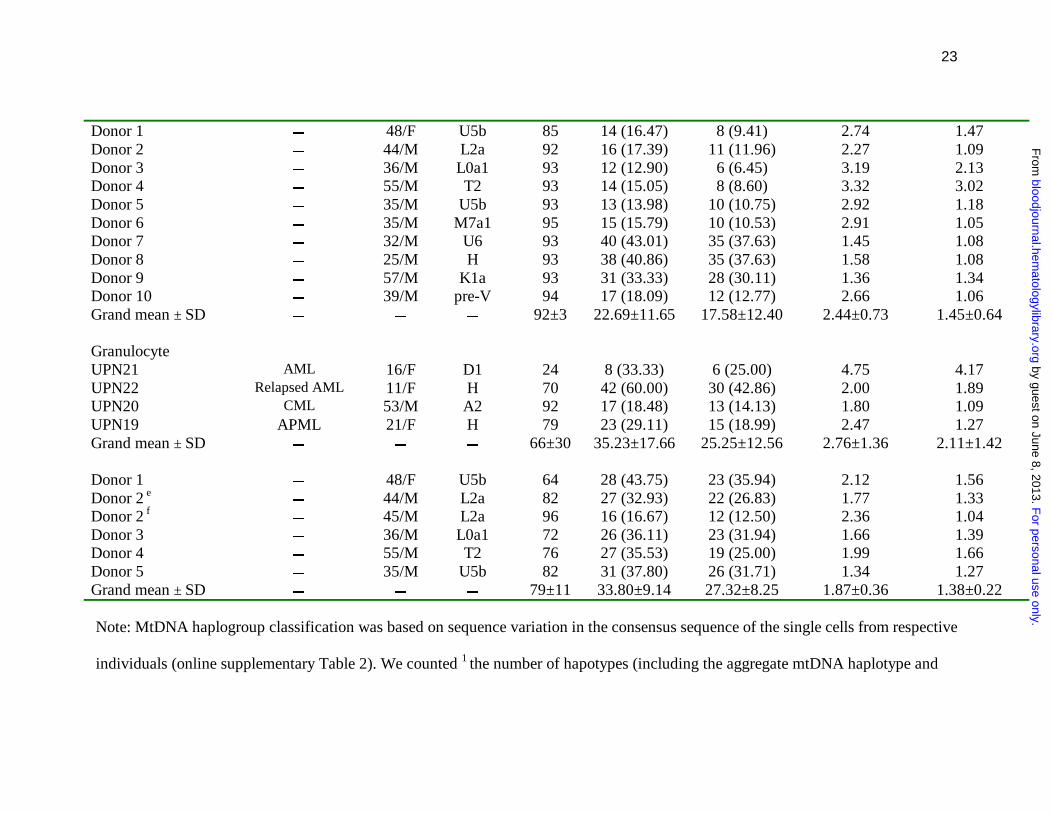
Table 1. Summary of mtDNA sequence variation in single cells from the leukemia patients and normal controls
Sample Leukemia type Age/ Sex
Haplogroup No. of cells
No. of haplotypes1
(%)
No. of nonaggregate haploytpes by
nucleotide substitutions 2
(%)
Mean no. of cells with
nonaggregate haplotype 3
Mean no. of cells with
nonaggregate haplotype by nucleotide
substitutions 4 CD34+ and blast LAA AML M0 61/F H 95 16 (16.84) 11 (11.58) 2.58 1.05 AGM AML M1 62/M B4b 96 11 (11.46) 7 (7.29) 5.07 1.19 MFSS AML M1 36/F L2a 96 10 (10.42) 8 (8.33) 1.04 1.04 JCS AML M1 40/M L3f 96 15 (15.63) 12 (12.50) 3.67 1.04 DC AML M1 15/M L2a 96 18 (18.75) 12 (12.50) 3.25 3.27 OAM a AML M1 33/M D1 92 11 (11.96) 9 (9.78) 1.51 1.56 EMB AML M1 16/M D1 95 34 (35.79) 30 (31.58) 1.05 1.05 ERR AML M1 53/F A2 94 6 (6.38) 5 (5.32) 1.28 1.28 UPN21 AML 16/F D1 82 7 (8.54) 3 (3.66) 1.42 1.22 UPN1 AML M2 47/F T2 146 10 (6.85) 5 (3.42) 1.73 0.68 UPN16 2nd AML/MDS 74/F J1c 92 5 (5.43) 3 (3.26) 2.42 1.09 UPN22 Relapsed AML 11/F H 65 20 (30.77) 11 (16.92) 3.32 2.63 OAM b Relapsed AML 36/M D1 96 6 (6.25) 4 (4.17) 5.61 6.78 UPN18 AML & prior NHL 62/F A2 92 8 (8.70) 4 (4.35) 2.30 1.09 UPN20 CML 53/M A2 85 3 (3.53) 1 (1.18) 6.90 1.18 UPN17 CML 27/F X2b 80 17 (21.25) 10 (12.50) 3.97 4.42 UPN2 AML from CMML 58/M J1c 96 14 (14.58) 13 (13.54) 2.31 2.31 UPN3 CLL 64/F H 89 9 (10.11) 4 (4.49) 2.10 1.12 UPN19c APML 21/F H 94 22 (23.40) 15 (15.96) 2.60 1.06 UPN19d APML 21/F H 96 10 (10.42) 4 (4.17) 4.76 1.04 Grand mean ± SD � � � 94±15 13.85±8.56 9.33±7.04 2.94±1.63 1.81±1.49
F
or personal use only. by guest on June 8, 2013.
bloodjournal.hematologylibrary.org
From
23
Donor 1 � 48/F U5b 85 14 (16.47) 8 (9.41) 2.74 1.47 Donor 2 � 44/M L2a 92 16 (17.39) 11 (11.96) 2.27 1.09 Donor 3 � 36/M L0a1 93 12 (12.90) 6 (6.45) 3.19 2.13 Donor 4 � 55/M T2 93 14 (15.05) 8 (8.60) 3.32 3.02 Donor 5 � 35/M U5b 93 13 (13.98) 10 (10.75) 2.92 1.18 Donor 6 � 35/M M7a1 95 15 (15.79) 10 (10.53) 2.91 1.05 Donor 7 � 32/M U6 93 40 (43.01) 35 (37.63) 1.45 1.08 Donor 8 � 25/M H 93 38 (40.86) 35 (37.63) 1.58 1.08 Donor 9 � 57/M K1a 93 31 (33.33) 28 (30.11) 1.36 1.34 Donor 10 � 39/M pre-V 94 17 (18.09) 12 (12.77) 2.66 1.06 Grand mean ± SD � � � 92±3 22.69±11.65 17.58±12.40 2.44±0.73 1.45±0.64 Granulocyte UPN21 AML 16/F D1 24 8 (33.33) 6 (25.00) 4.75 4.17 UPN22 Relapsed AML 11/F H 70 42 (60.00) 30 (42.86) 2.00 1.89 UPN20 CML 53/M A2 92 17 (18.48) 13 (14.13) 1.80 1.09 UPN19 APML 21/F H 79 23 (29.11) 15 (18.99) 2.47 1.27 Grand mean ± SD � � � 66±30 35.23±17.66 25.25±12.56 2.76±1.36 2.11±1.42 Donor 1 � 48/F U5b 64 28 (43.75) 23 (35.94) 2.12 1.56 Donor 2 e � 44/M L2a 82 27 (32.93) 22 (26.83) 1.77 1.33 Donor 2 f � 45/M L2a 96 16 (16.67) 12 (12.50) 2.36 1.04 Donor 3 � 36/M L0a1 72 26 (36.11) 23 (31.94) 1.66 1.39 Donor 4 � 55/M T2 76 27 (35.53) 19 (25.00) 1.99 1.66 Donor 5 � 35/M U5b 82 31 (37.80) 26 (31.71) 1.34 1.27 Grand mean ± SD � � � 79±11 33.80±9.14 27.32±8.25 1.87±0.36 1.38±0.22 Note: MtDNA haplogroup classification was based on sequence variation in the consensus sequence of the single cells from respective
individuals (online supplementary Table 2). We counted 1 the number of hapotypes (including the aggregate mtDNA haplotype and
F
or personal use only. by guest on June 8, 2013.
bloodjournal.hematologylibrary.org
From
24
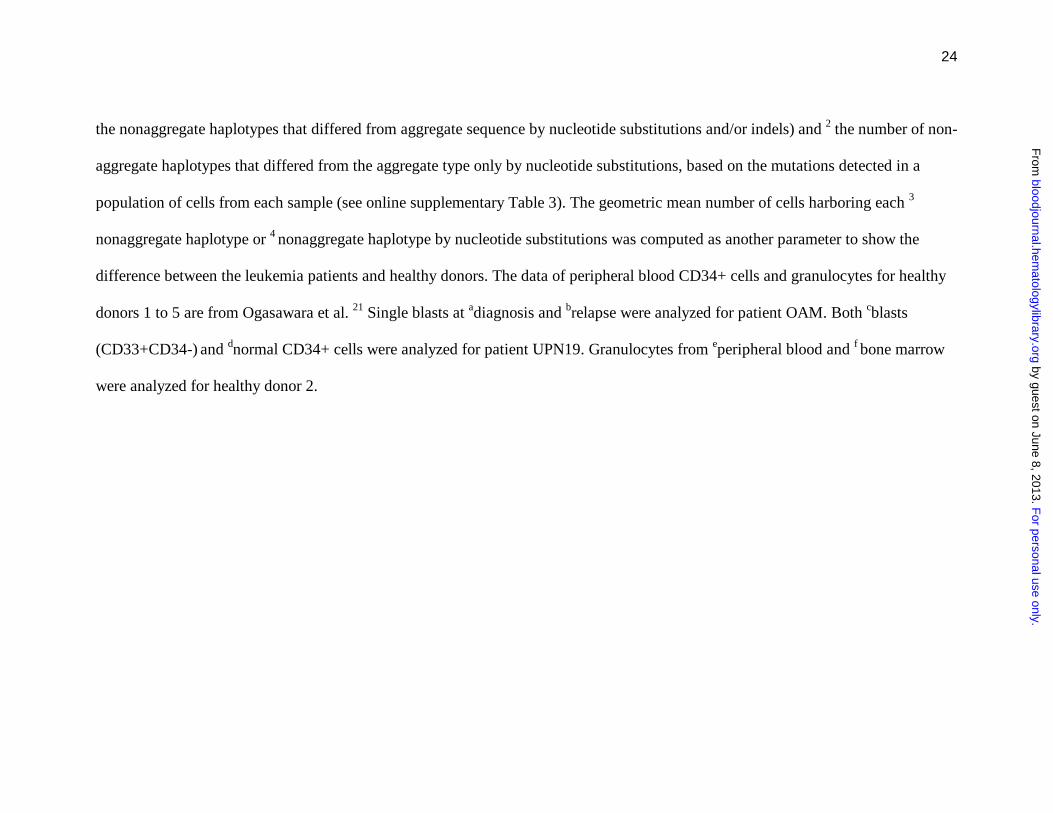
the nonaggregate haplotypes that differed from aggregate sequence by nucleotide substitutions and/or indels) and 2 the number of non-
aggregate haplotypes that differed from the aggregate type only by nucleotide substitutions, based on the mutations detected in a
population of cells from each sample (see online supplementary Table 3). The geometric mean number of cells harboring each 3
nonaggregate haplotype or 4 nonaggregate haplotype by nucleotide substitutions was computed as another parameter to show the
difference between the leukemia patients and healthy donors. The data of peripheral blood CD34+ cells and granulocytes for healthy
donors 1 to 5 are from Ogasawara et al. 21 Single blasts at adiagnosis and brelapse were analyzed for patient OAM. Both cblasts
(CD33+CD34-) and dnormal CD34+ cells were analyzed for patient UPN19. Granulocytes from eperipheral blood and f bone marrow
were analyzed for healthy donor 2.
F
or personal use only. by guest on June 8, 2013.
bloodjournal.hematologylibrary.org
From
25
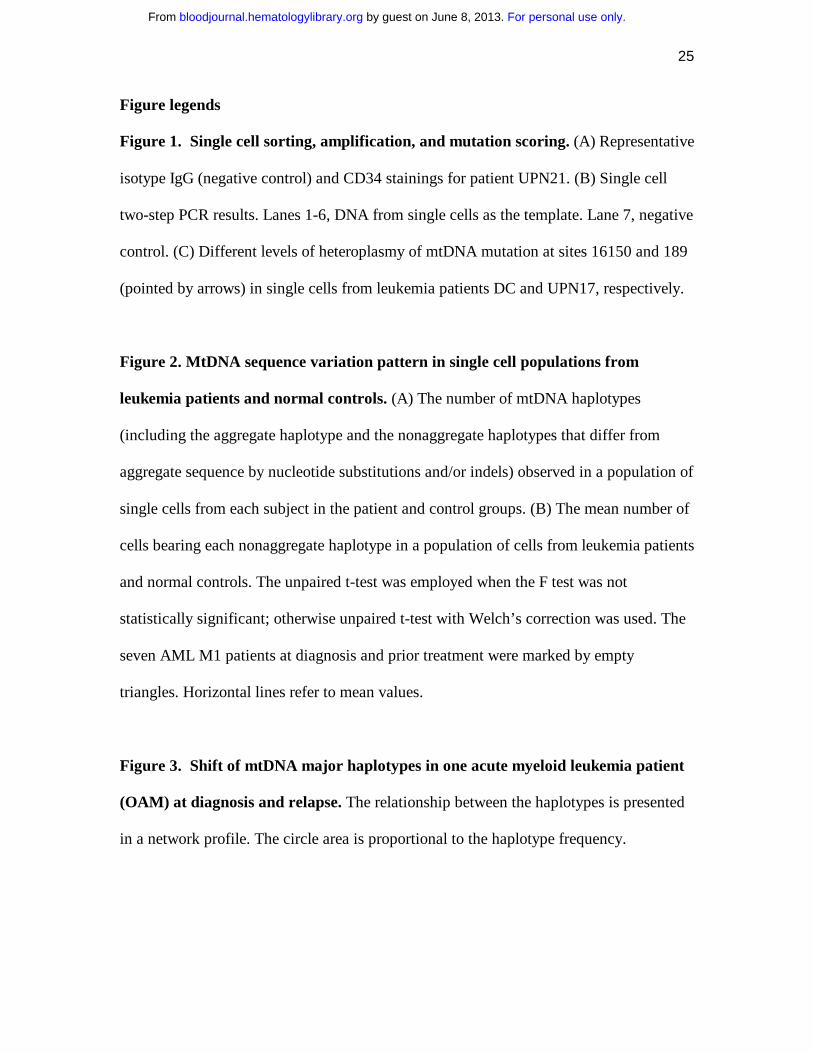
Figure legends
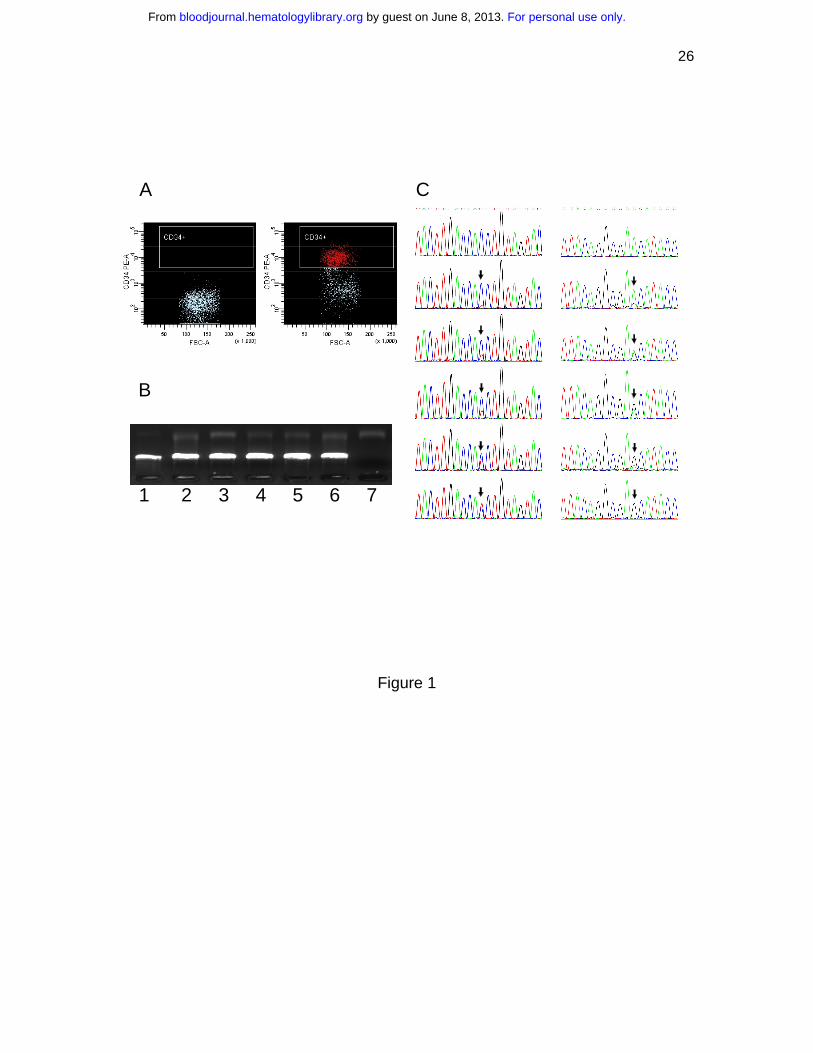
Figure 1. Single cell sorting, amplification, and mutation scoring. (A) Representative
isotype IgG (negative control) and CD34 stainings for patient UPN21. (B) Single cell
two-step PCR results. Lanes 1-6, DNA from single cells as the template. Lane 7, negative
control. (C) Different levels of heteroplasmy of mtDNA mutation at sites 16150 and 189
(pointed by arrows) in single cells from leukemia patients DC and UPN17, respectively.
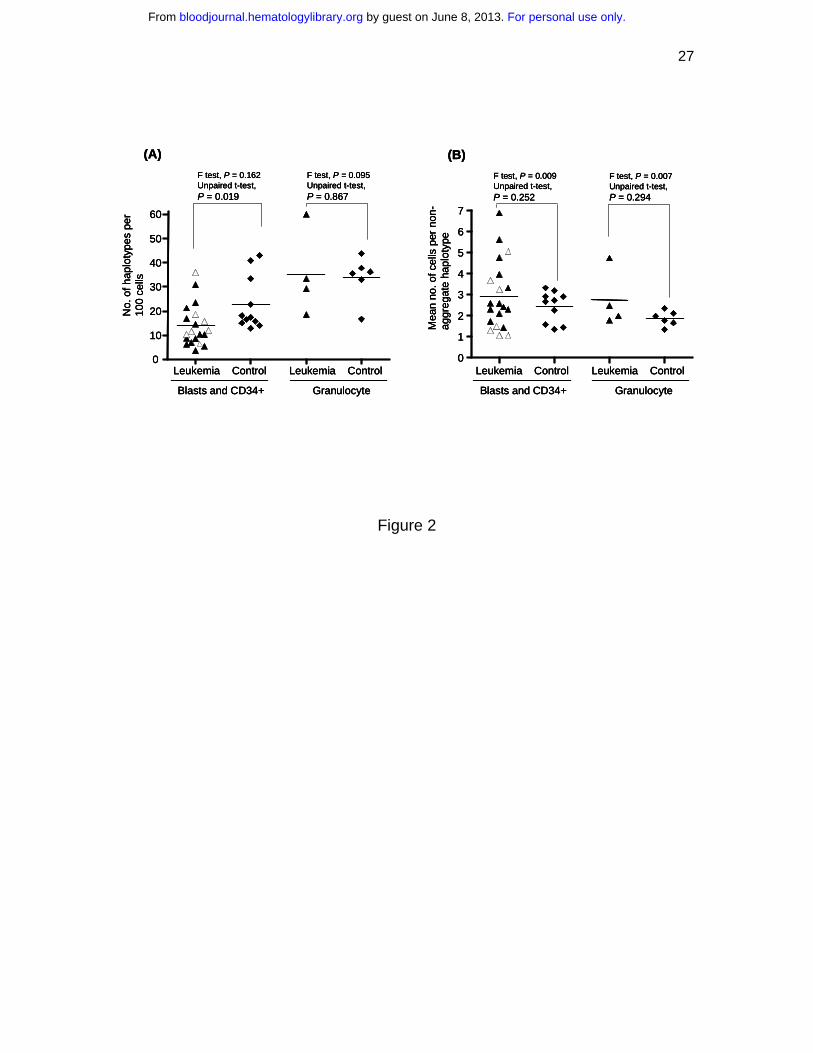
Figure 2. MtDNA sequence variation pattern in single cell populations from
leukemia patients and normal controls. (A) The number of mtDNA haplotypes
(including the aggregate haplotype and the nonaggregate haplotypes that differ from
aggregate sequence by nucleotide substitutions and/or indels) observed in a population of
single cells from each subject in the patient and control groups. (B) The mean number of
cells bearing each nonaggregate haplotype in a population of cells from leukemia patients
and normal controls. The unpaired t-test was employed when the F test was not
statistically significant; otherwise unpaired t-test with Welch’s correction was used. The
seven AML M1 patients at diagnosis and prior treatment were marked by empty
triangles. Horizontal lines refer to mean values.
Figure 3. Shift of mtDNA major haplotypes in one acute myeloid leukemia patient
(OAM) at diagnosis and relapse. The relationship between the haplotypes is presented
in a network profile. The circle area is proportional to the haplotype frequency.
For personal use only. by guest on June 8, 2013. bloodjournal.hematologylibrary.orgFrom
26
Figure 1
A
B
1 2 3 4 5 6 7
C
For personal use only. by guest on June 8, 2013. bloodjournal.hematologylibrary.orgFrom
27
Figure 2
(A)
Leukemia Control0
10
20
30
40
50
60
No.
of h
aplo
type
spe
r 10
0 ce
lls
Leukemia Control
Blasts and CD34+ Granulocyte
F test, P = 0.162Unpaired t-test, P = 0.019
F test, P = 0.095Unpaired t-test, P = 0.867
0
1
2
3
4
5
6
7
(B)
Leukemia Control Leukemia Control
Blasts and CD34+ Granulocyte
F test, P = 0.009Unpaired t-test, P = 0.252
F test, P = 0.007Unpaired t-test, P = 0.294
Mea
n no
. of c
ells
per
non
-ag
greg
ate
hapl
otyp
e
(A)
Leukemia Control0
10
20
30
40
50
60
No.
of h
aplo
type
spe
r 10
0 ce
lls
Leukemia Control
Blasts and CD34+ Granulocyte
F test, P = 0.162Unpaired t-test, P = 0.019
F test, P = 0.095Unpaired t-test, P = 0.867
(A)
Leukemia Control0
10
20
30
40
50
60
No.
of h
aplo
type
spe
r 10
0 ce
lls
Leukemia Control
Blasts and CD34+ Granulocyte
F test, P = 0.162Unpaired t-test, P = 0.019
F test, P = 0.095Unpaired t-test, P = 0.867
0
1
2
3
4
5
6
7
(B)
Leukemia Control Leukemia Control
Blasts and CD34+ Granulocyte
F test, P = 0.009Unpaired t-test, P = 0.252
F test, P = 0.007Unpaired t-test, P = 0.294
Mea
n no
. of c
ells
per
non
-ag
greg
ate
hapl
otyp
e
0
1
2
3
4
5
6
7
(B)
Leukemia Control Leukemia Control
Blasts and CD34+ Granulocyte
F test, P = 0.009Unpaired t-test, P = 0.252
F test, P = 0.007Unpaired t-test, P = 0.294
Mea
n no
. of c
ells
per
non
-ag
greg
ate
hapl
otyp
e
For personal use only. by guest on June 8, 2013. bloodjournal.hematologylibrary.orgFrom
28
Figure 3
16488C/A
16498Y
16494Y
16321Y
16237R16098R
16533Y
64Y
460Y(523-524)insAC/ non-ins
16488C/A
16164A/C
16295Y16103R
16530R
16188insC/ non-ins
51
25
Diagnosis
Relapse
For personal use only. by guest on June 8, 2013. bloodjournal.hematologylibrary.orgFrom


