Embed Size (px)
Citation preview
Modeling and analyzing the Proton Exchange
Membrane of Fuel Cell (PEMFC) in
Matlab/SIMULINK environment
Ahmad Fuad Abdul Aziz Universiti Teknologi Malaysia
UTM Skudai, 81310 Johor Ahmad Saudi Samosir
Universiti Teknologi Malaysia UTM Skudai, 81310 Johor Malaysia
Khurram Kamal UniversitiTeknologi Malaysia
UTM Skudai, 81310 JohorMalaysia
Abstract-This paper presents and studies the mathematical
model of proton exchange membrane of fuel cell (PEMFC) using
Matlab/SIMULINK software. The paper consists of the
calculation of cell voltage, the double layer charging effect,
dynamic response and thermodynamic response. This model is
used to analyze the fuel cell behavior and the characteristic of
output values at different parameters. Two characteristics
involved in this paper which are transient and steady-state
condition where the results are presented in graphical
representation. The parameters for this model in this paper are
based on Ballard-Mark-V fuel cell. The maximum power
produced by the fuel cell is 3757 watt at load current of 261.4 Amps.
Keywords-component;simulink, fuel cell, modelling,
LINTRODUCTION
The price of natural resources in the global market is increasing year by year. Natural resources like oil, coal and natural gas are being consumed massively by human beings thus resulting in a rapid decrease in availability of these resources. On the other hand, this massive consumption is resulting in serious environmental pollution thus causing greenhouse effect. In the past ten years, the major focus of research is on renewable sources of energy. PEMFC (proton exchange membrane fuel cell) is drawing the attention of researchers as one of the most promising technology in the future. Due to high efficiency, high stability, low energy consumption and being environmental friendly, efforts are being made to commercialize this technology. Several companies such as Ballard and Toshiba Corporation are carrying out research to commercialize the fuel cell technology [1].
Although the PEMFC technology has many advantages as compared to other competent technologies, there are also some disadvantages of PEMFC technology such as high maintenance
978-1-4577-0657-8/111$26.00 © 2011 IEEE 238
Itnran Amin Centre for Renewable Energy Research
SZABIST Karachi, Pakistan
[email protected] Senthan Mathavan
UniversitiTeknologi Malaysia UTM Skudai, 81310 JohorMalaysia
cost and high price per unit have made this technology difficult to commercialize. However, efforts are being made in order to produce low cost and high performance fuel cells[2-5].
This paper uses MATLAB/Simulink to design a PEMFC model and to study its performance. It helps to estimate the maximum power produced by single stack fuel cell, prevent the fuel cell from defect due to excessive heat and predict the result before executing the experiment. The model is explained in detail later in this paper. This PEMFC model is based on BALLARD MARK V Fuel cell parameter and the parameters are varied to determine the characteristic of PEMFC.
o�I----------------------'�X Fuel In --+
J
H'O
H2
Gas Flow Channel
Polymer Electrolyte Membrane
H+ -.
Anode H2O Cathode +-----Electrode Electrode
t. CatalystJ it I Layers : 2 .
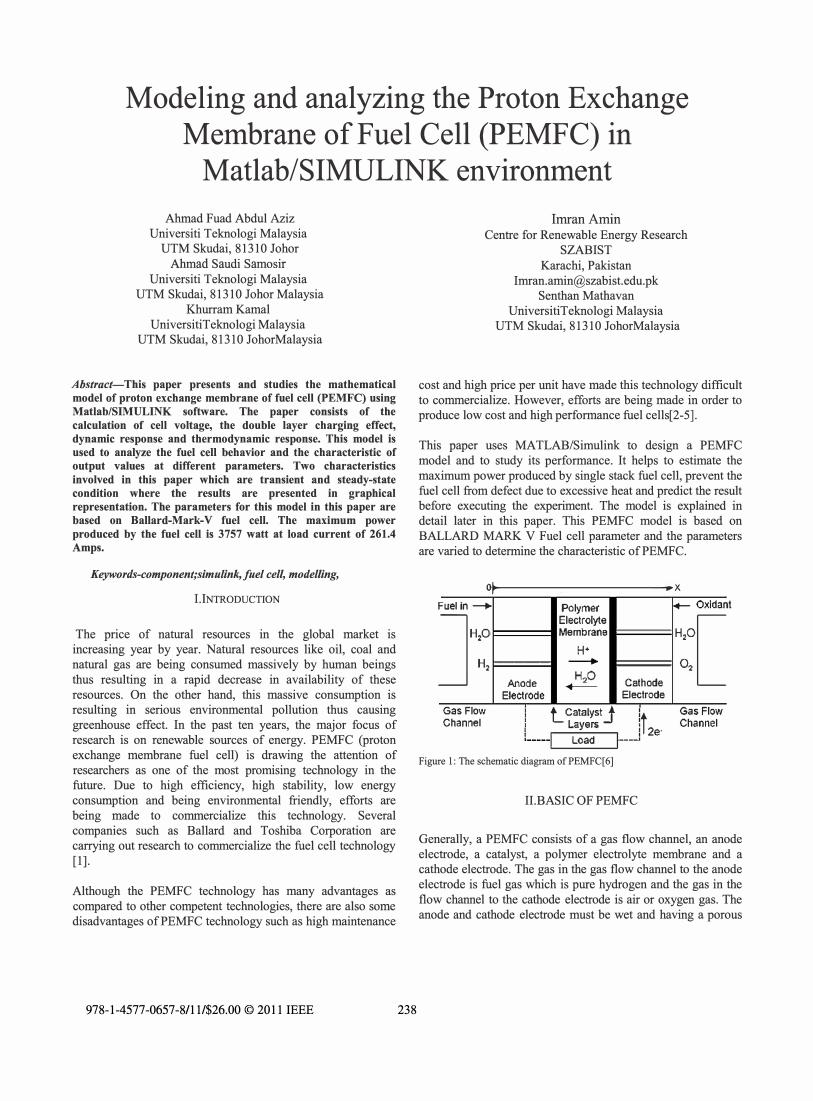
1-----1 Load 1 ____ 1 e Figure 1: The schematic diagram of PEMFC[6]
II.BASIC OF PEMFC
+- Oxlda nt
HP[
O2
Gas Flow Channel
Generally, a PEMFC consists of a gas flow channel, an anode electrode, a catalyst, a polymer electrolyte membrane and a cathode electrode. The gas in the gas flow channel to the anode electrode is fuel gas which is pure hydrogen and the gas in the flow channel to the cathode electrode is air or oxygen gas. The anode and cathode electrode must be wet and having a porous
electrode structure. This structure is necessary since it helps the reactant gases to dissolve inside the electrode [1]. Therefore, it can increase the performance of fuel cell. The catalyst layers that exist between electrode polymer membranes are thin platinum plates. These catalyst layers are used to help the hydrogen element to split into proton and electron and to prevent the hydrogen and oxygen reacted directly through the membrane. At the cathode electrode, the reaction between hydrogen and oxygen occurred. This reaction produces water and heat as byproducts. The chemical reaction is shown below:
Anode reaction: H2-+2H++2e- eq. (1) Cathode reaction: 1I20,+2W+2e--+H,O+Heat eq. (2) Overall Reaction: H,+lj20,-)H,O+Heat eq. (3)
The chemical process inside PEMFC is explained below:
v
� 1.0
0."
A. Hydrogen molecules enter the anode.
B. Hydrogen elements react with the catalyst and split into protons and electrons.
C. The electrolytes allow the protons to pass through to the cathode.
D. The electrons are directed to external circuit (electrical load) to create electrical current.
E. Oxygen molecules enter the cathode.
F. Oxygen and protons will combine with electrons producing water and heat. First, confIrm that you have the correct template for your paper size. This template has been tailored for output on the A4 paper size. If you are using US letter-sized paper, please close this file and download the file for "MSW USltr format".
III.PEMFC PERFORMANCE
o�----------------------------------. J
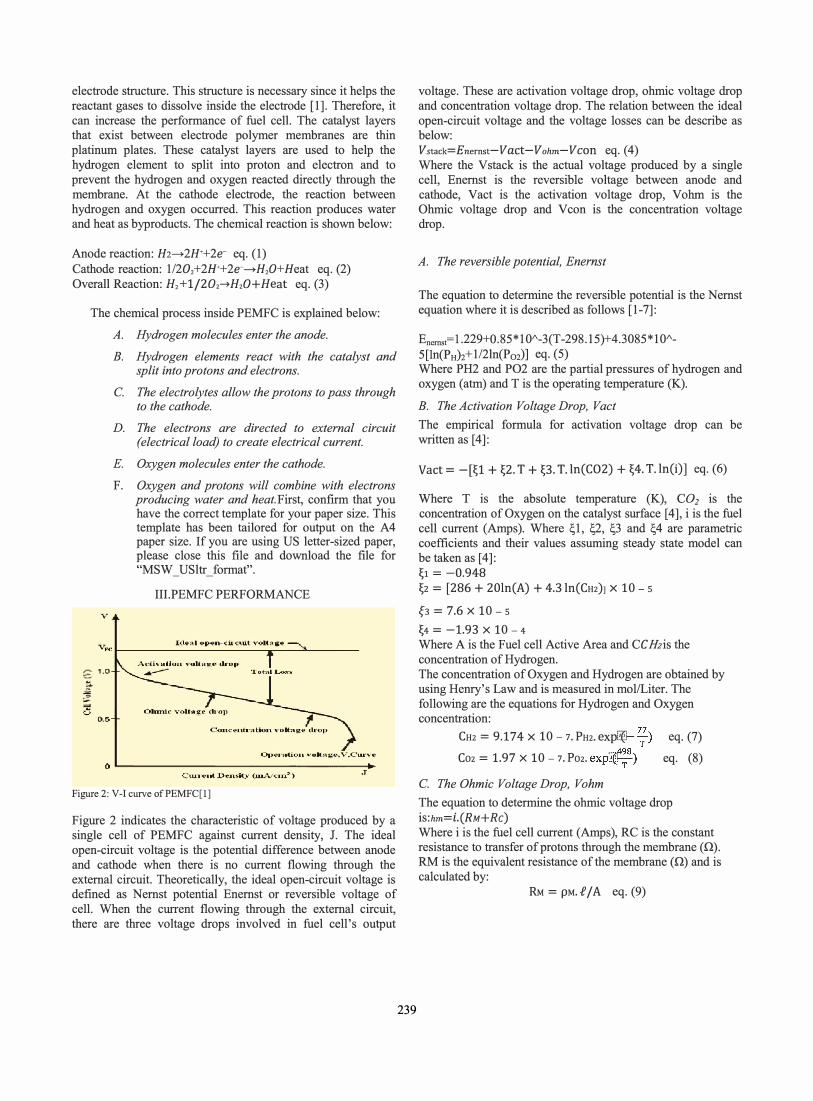
Figure 2: V-I curve of PEMFC[I]
Figure 2 indicates the characteristic of voltage produced by a single cell of PEMFC against current density, J. The ideal open-circuit voltage is the potential difference between anode and cathode when there is no current flowing through the external circuit. Theoretically, the ideal open-circuit voltage is defIned as Nernst potential Enernst or reversible voltage of cell. When the current flowing through the external circuit, there are three voltage drops involved in fuel cell's output
239
voltage. These are activation voltage drop, ohmic voltage drop and concentration voltage drop. The relation between the ideal open-circuit voltage and the voltage losses can be describe as below: Vstack=Enernst-Vact-Vohm-Vcon eq. (4) Where the Vstack is the actual voltage produced by a single cell, Enernst is the reversible voltage between anode and cathode, Vact is the activation voltage drop, Vohm is the Ohmic voltage drop and Vcon is the concentration voltage drop.
A. The reversible potential, Enernst
The equation to determine the reversible potential is the Nernst equation where it is described as follows [1-7]:
Enemst=I.229+O.85* 1 0"-3(T -298.15)+4.3085*10"-5 [In(PH)2+ 1I2ln(P02)] eq. (5) Where PH2 and P02 are the partial pressures of hydrogen and oxygen (atm) and T is the operating temperature (K).
B. The Activation Voltage Drop, Vact
The empirical formula for activation voltage drop can be written as [4]:
Vact = -[�1 + �2. T + �3. T.ln(C02) + �4. T.ln(i)] eq. (6)
Where T is the absolute temperature (K), CO2 is the concentration of Oxygen on the catalyst surface [4], i is the fuel cell current (Amps). Where �1, �, �3 and �4 are parametric coefficients and their values assuming steady state model can be taken as [4]: �1 = -0.948 �2 = [286 + 20ln(A) + 4.3ln(CHZ)] x 10 - 5
(3 = 7.6 x 10 - 5
�4 = -1.93 x 10 - 4 Where A is the Fuel cell Active Area and CC Hzis the concentration of Hydrogen. The concentration of Oxygen and Hydrogen are obtained by using Henry's Law and is measured in mol/Liter. The following are the equations for Hydrogen and Oxygen concentration:
CH2 = 9.174 x 10 -7. PH2.exp:�l-7;) eq. (7) .. 7.fI-98) C02 = 1.97 x 10 -7. P02. eXpi!�S-
C. The Ohmic Voltage Drop, Vohm
eq. (8)
The equation to determine the ohmic voltage drop is:hm= i.(RM+Rc) Where i is the fuel cell current (Amps), RC is the constant resistance to transfer of protons through the membrane (n). RM is the equivalent resistance of the membrane (n) and is calculated by:
RM = pM.fjA eq. (9)
Where: isthe specific resistivity of the membrane for the electron flow (O.cm), i is the thickness of the membrane (cm) and A is the cell active area (cm2). For the specific resistivity of commonly used Nafion membrane, PM can be obtained through this equation [3]:
_ [181.6[1+0.03·GJ+O.062·(�)(*rll
pM - fi) ( 303) eq. (10) [A-O.634-3'\A lexp[{�.18. T-T 1
Where i is the fuel cell current (Amps), A is the cell active area (cm
2), T is the absolute temperature (K) and parameter
coefficient A. is the water membrane content. This parameter A. is an adjustable parameter with a range from 14 to 23. If the parameter A. is equal to 14, the membrane is under the ideal condition of 100% relative humidity. Practically, the membrane is under oversaturated condition and the value of the parameter A. in this condition is equal to 22 and 23 [4, 5].
D. Concentration voltage drop, Vcon This voltage drop can described as:
Veon = -BB . ln!ifll _ ...L) Imax eq. (11)
Where J is the current density of fuel cell and Jmax is the maximum current density of fuel cell. The unit of J is A/cm
2 B is the parametric coefficient and its value depends
on the cell and its operation state.
E. Dynamic response
The dynamic response in fuel cell's performance is due to the double-layer charging effect. The existence of two different surface charge layers at both electrodes and the electrolyte that acts for storage of electrical charge affect the activation and concentration voltage drop. This situation can be considered as capacitive effect. When the sudden change of cell current occurs in the fuel cell, the voltage output is varied in delay time. The dynamic response relationship can be obtained as:
I Vd dVd/dt = (-dl ) - (-Cdl) eq. (12)
C Ra
Where CdIis the double layer charge, whereas, Vd and Ra can be expressed as follows:
Vd = Vact + Vcon eq. (13)
Ra = (Vact + Vcon )/i eq. (14)
Where Vact is the activation voltage drop (Volts), Vcon is the concentration voltage drop (Volts), i is the fuel cell current (Amps) and Ra is the equivalent resistance (0).
240
F. Thermodynamic response
The operating temperature of fuel cell is necessary in order to calculate the reactant gas diffusion, the Nemst equation, and all the voltage drops. The operation temperature is directly proportional with cell current. Therefore, the thermodynamic response has been introduced in this paper. The differential equation of transient temperature is given as [6, 7]:
mC(�;) = iCE - Veell) - bA(T - Tref) eq. (15)
Where mC is the product of mass and the average specific heat of the cell body (JIK), i is the fuel cell current (Amps), E is the reversible voltage (Volts), Vcell is the output voltage for single cell (Volts), hA is the total heat transfer coefficient for the surface of fuel cell (W IK), T and Tref are the absolute temperature (K). The reference temperature is the room temperature (296.5K).
G. Reactant gasses diffosion in the electrode
The saturated vapor pressure, psat H20, is function of the operating temperature of the PEMFC and written to be:
loglOpsat H20 = 2.95 X 10" - 2(T -273.15) -9.18 x 10" -s(T -273.15)"2 + 1.44 X 10" - 7(T -273.15)"3 -2.18 eq. (16)
The partial pressure of hydrogen and oxygen are [7]:
PH2 = 0.5 psat H20[Pa /PH20s expi!fr-6S3]) -1] eq. (17) T1.334 P02 =
psat H20[ Pc
C.192,) -1] eq. (18) psat H20exp TTTI4
Where psat H20 is the saturated vapor pressure (atm), T is the absolute temperature (K), Pc is the partial pressure at the cathode and Pa is the partial pressure at the anode.
IV. SIMULINK BLOCK DIAGRAM
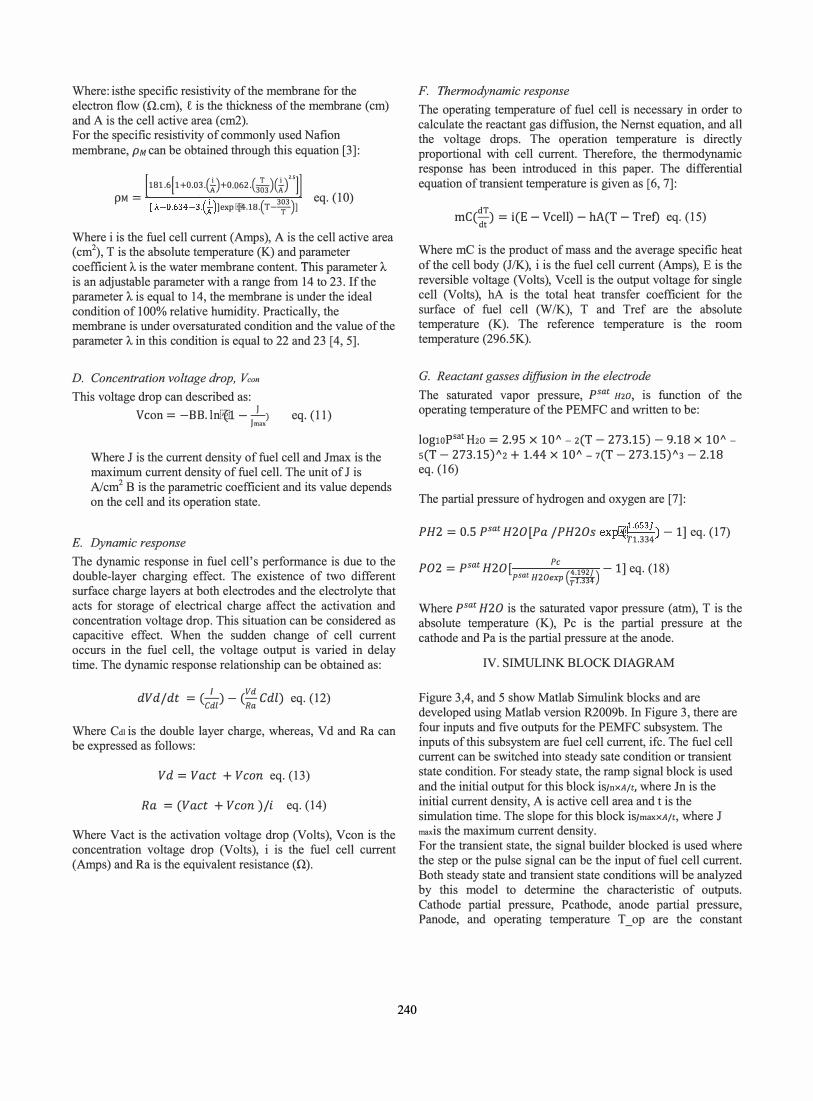
Figure 3,4, and 5 show Matlab Simulink blocks and are developed using Matlab version R2009b. In Figure 3, there are four inputs and five outputs for the PEMFC subsystem. The inputs of this subsystem are fuel cell current, ifc. The fuel cell current can be switched into steady sate condition or transient state condition. For steady state, the ramp signal block is used and the initial output for this block is]nxA/t, where In is the initial current density, A is active cell area and t is the simulation time. The slope for this block is]rnaxxA/t, where J maxis the maximum current density. For the transient state, the signal builder blocked is used where the step or the pulse signal can be the input of fuel cell current. Both steady state and transient state conditions will be analyzed by this model to determine the characteristic of outputs. Cathode partial pressure, Pcathode, anode partial pressure, Panode, and operating temperature T _ op are the constant
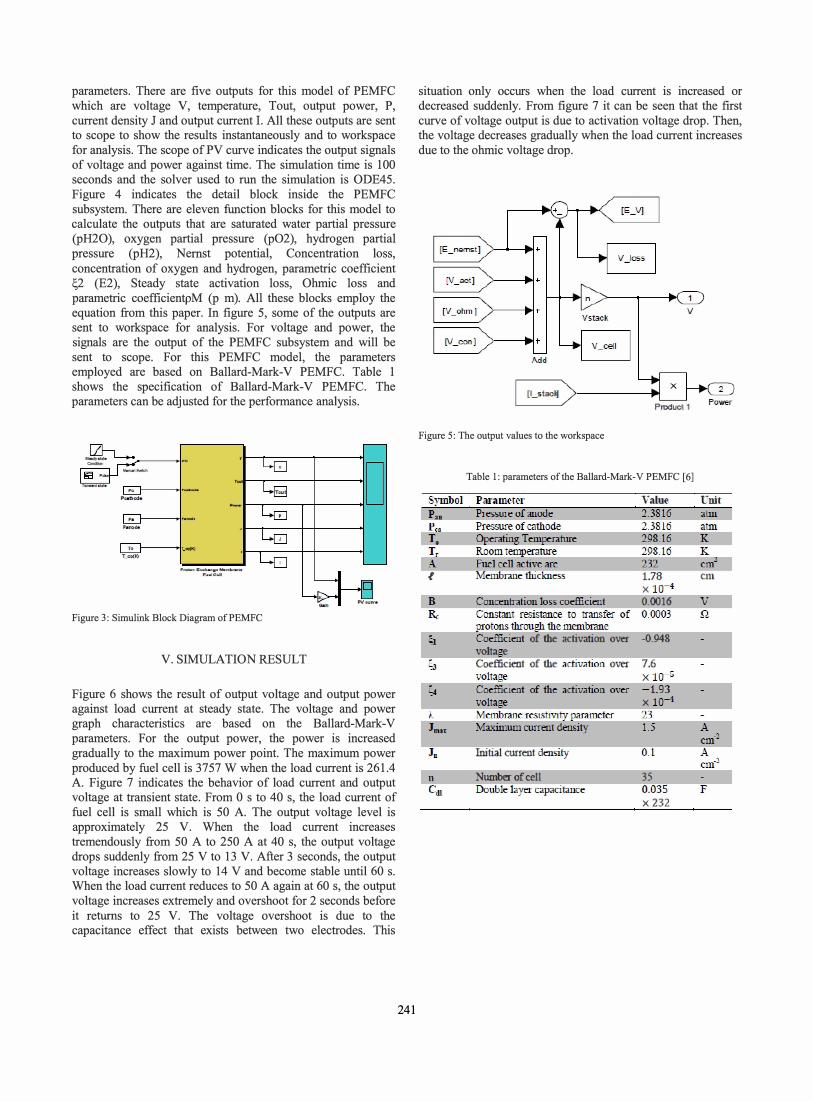
parameters. There are five outputs for this model of PEMFC which are voltage V, temperature, Tout, output power, P, current density J and output current 1. All these outputs are sent to scope to show the results instantaneously and to workspace for analysis. The scope of PV curve indicates the output signals of voltage and power against time. The simulation time is 100 seconds and the solver used to run the simulation is ODE45. Figure 4 indicates the detail block inside the PEMFC subsystem. There are eleven function blocks for this model to calculate the outputs that are saturated water partial pressure (pH20), oxygen partial pressure (P02), hydrogen partial pressure (pH2), Nemst potential, Concentration loss, concentration of oxygen and hydrogen, parametric coefficient �2 (E2), Steady state activation loss, Ohmic loss and parametric coefficientpM (p m). All these blocks employ the equation from this paper. In figure 5, some of the outputs are sent to workspace for analysis. For voltage and power, the signals are the output of the PEMFC subsystem and will be sent to scope. For this PEMFC model, the parameters employed are based on Ballard-Mark-V PEMFC. Table 1 shows the specification of Ballard-Mark-V PEMFC. The parameters can be adjusted for the performance analysis.
Figure 3: Simulink Block Diagram of PEMFC
V. SIMULATION RESULT
Figure 6 shows the result of output voltage and output power against load current at steady state. The voltage and power graph characteristics are based on the Ballard-Mark-V parameters. For the output power, the power is increased gradually to the maximum power point. The maximum power produced by fuel cell is 3757 W when the load current is 261.4 A. Figure 7 indicates the behavior of load current and output voltage at transient state. From 0 s to 40 s, the load current of fuel cell is small which is 50 A. The output voltage level is approximately 25 V. When the load current increases tremendously from 50 A to 250 A at 40 s, the output voltage drops suddenly from 25 V to 13 V. After 3 seconds, the output voltage increases slowly to 14 V and become stable until 60 s. When the load current reduces to 50 A again at 60 s, the output voltage increases extremely and overshoot for 2 seconds before it returns to 25 V. The voltage overshoot is due to the capacitance effect that exists between two electrodes. This
241
situation only occurs when the load current is increased or decreased suddenly. From figure 7 it can be seen that the first curve of voltage output is due to activation voltage drop. Then, the voltage decreases gradually when the load current increases due to the ohmic voltage drop.
v
iI_st""� )-------.; Produc, 1
Figure 5: The output values to the workspace
Table I: parameters of the Ballard-Mark-V PEMFC [6]
Symbol Parameter Value Unit
I 1.78 em x 10-4
B Concentration loss coefficient 0.0016 0.0003 Constant resist.:mce to transfer of
protons throu tile mell1brane "'-::-Sl- --'Coefficient of the activation over :0.948
volta e Coefficient of tile activation over 7.6
v Q
voltage x 1 0-5 �� - - --C� oe�ffi�c�ien-t�of�th-e-a-ctI� ·va�ti� on-o-.�--�-�1�.9�3� - - �
J.u
Ini rial current density
n NlUIIber of cell Cd! Double layer c.apacitaoce
x 10-4 23 1.S
0. 1
35 0.035 x 232
F
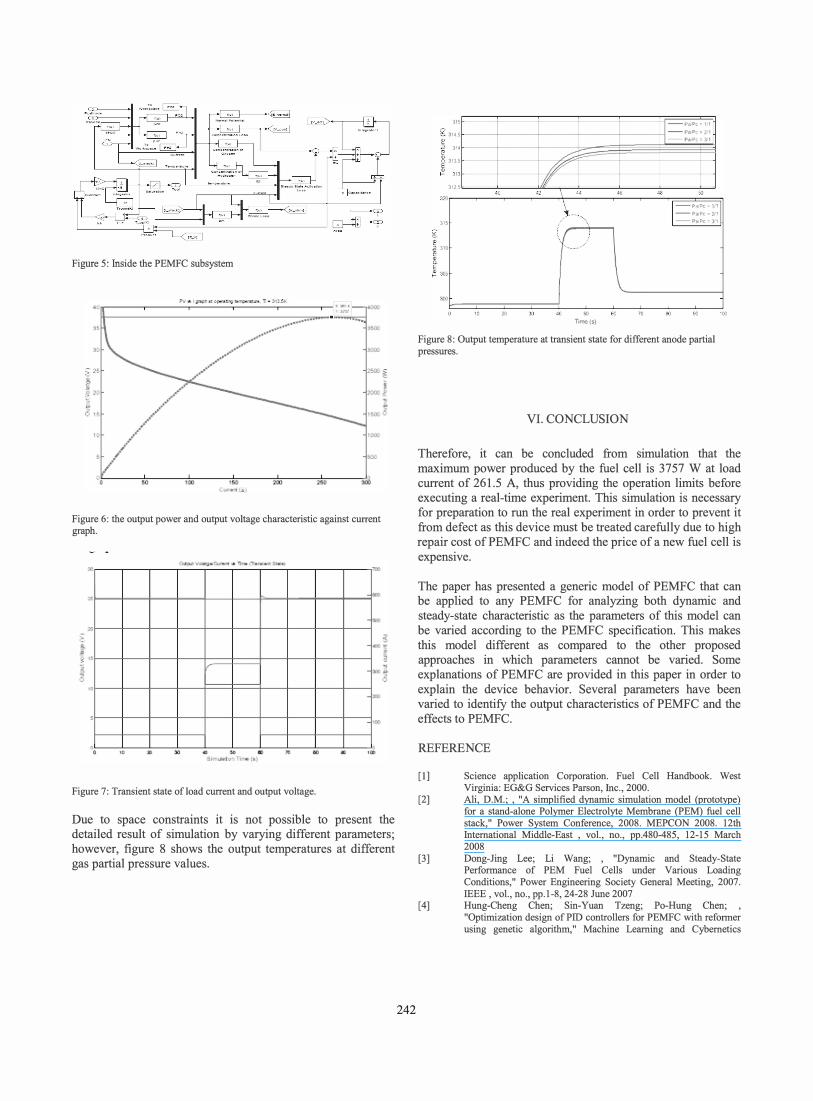
Figure 5: Inside the PEMFC subsystem
00 . ., L ... , •• �I
Figure 6: the output power and output voltage characteristic against current graph.
-�--+---�--�---+--�----r---+---�--�--�
j , .. lOD�
�+-�-+�==F=��-+��
.0 '" .. 50 lJoIlu'
10 ,.
Figure 7: Transient state of load current and output voltage.
.. .CX>
Due to space constraints it is not possible to present the detailed result of simulation by varying different parameters; however, figure 8 shows the output temperatures at different gas partial pressure values.
242
'15 3145
, .. t 3135
,r "J � 3125
,.
" " \ ..
(8 S
0
320
"
J05
JOO 0 '0 '" JO 4() '"
Tlme(s)
+ �
•• ..
\ 60 TO
1 Pa''P, � , 1 -Pa,Pe �1 -Pa,'P,-J,l
'"
I p,'p, • "
-P&'PC-21 -Pa'Pc- l l
'" 90 100
Figure 8: Output temperature at transient state for different anode partial pressures.
VI. CONCLUSION
Therefore, it can be concluded from simulation that the maximum power produced by the fuel cell is 3757 W at load current of 261.5 A, thus providing the operation limits before executing a real-time experiment. This simulation is necessary for preparation to run the real experiment in order to prevent it from defect as this device must be treated carefully due to high repair cost of PEMFC and indeed the price of a new fuel cell is expensive.
The paper has presented a generic model of PEMFC that can be applied to any PEMFC for analyzing both dynamic and steady-state characteristic as the parameters of this model can be varied according to the PEMFC specification. This makes this model different as compared to the other proposed approaches in which parameters cannot be varied. Some explanations of PEMFC are provided in this paper in order to explain the device behavior. Several parameters have been varied to identify the output characteristics of PEMFC and the effects to PEMFC.
REFERENCE
[1]
[2]
[3]
[4]
Science application Corporation. Fuel Cell Handbook. West Virginia: EG&G Services Parson, Inc., 2000. Ali, D.M.; , "A simplified dynamic simulation model (prototype) for a stand-alone Polymer Electrolyte Membrane (PEM) fuel cell stack," Power System Conference, 2008. MEPCON 2008. 12th International Middle-East , voL, no., pp.480-485, 12-15 March 2008 Dong-Jing Lee; Li Wang; , "Dynamic and Steady-State Performance of PEM Fuel Cells under Various Loading Conditions," Power Engineering Society General Meeting, 2007. IEEE , voL, no., pp.l-8, 24-28 June 2007 Hung-Cheng Chen; Sin-Yuan Tzeng; Po-Hung Chen; , "Optimization design of PID controllers for PEMFC with reformer
using genetic algorithm," Machine Learning and Cybernetics

(ICMLC), 2010 International Conference on , vol.6, no., pp.2990-2995,11-14 July 2010
[5] Mo Zhijun; Zhu Xinjian; Cao Guangyi; , "Design and simulation of fuzzy controller for PEMFCs," Industrial Technology, 2005. ICIT 2005. IEEE International Conference on , vol., no., pp.220-224, 14-17 Dec. 2005
[6] Chien-Hsing Lee, Jian-Ting Yang, Modeling of the Ballard-MarkV proton exchange membrane fuel cell with power converters for applications in autonomous underwater vehicles, Journal of Power Sources, Volume 196, Issue 8, 15 April 2011, Pages 3810-3823, ISSN 0378-7753, DOl: 1O.1016/j.jpowsour.2010.12.049.
[7] Yancheng Xiao; Agbossou, K.; , "Interface Design and Software Development for PEM Fuel Cell Modeling Based on Matlab/Simulink Environment," Software Engineering, 2009.WCSE '09. WRI World Congress on , vol.4, no., pp.318-322, 19-21 May 2009
243


