Embed Size (px)
Citation preview
Modeling Hard-Disk Power Consumption
John Zedlewski∗ Sumeet Sobti∗ Nitin Garg∗ Fengzhou Zheng∗
Arvind Krishnamurthy† Randolph Wang∗
Abstract
Excessive power consumption is a major barrierto the market acceptance of hard disks in mobileelectronic devices. Studying and reducing powerconsumption, however, often involves running time-intensive disk traces on real hardware with spe-cialized power-monitoring equipment. This paperpresents Dempsey, a disk simulation environmentthat includes accurate modeling of disk power con-sumption. It includes tools to automatically ex-tract performance and power consumption param-eters from a given disk drive, without needing de-tailed specifications from the manufacturer. Thetools use stimulus-based measurements to extractthese parameters. Dempsey is experimentally vali-dated for two mobile hard disks, namely, the 1 GBIBM Microdrive and the 5 GB Toshiba Type II PCCard HDD. In the worst observed case, Dempsey’sestimate of power consumption differs from the mea-sured consumption by 7.5%. This demonstratesthat disk power consumption can be simulated bothefficiently and accurately.
1 Introduction
Many mobile electronic devices, such as MP3players, digital cameras and personal digital as-sistants, exhibit an almost insatiable demand forstorage capacity. These devices have traditionallyrelied on compact flash memory, which is reason-ably fast and power-efficient, but also expensive andcapacity-limited. Recent advances in magnetic disktechnology have made possible the development ofhigh capacity, small form-factor disk drives that arecompatible with traditional mobile interfaces, suchas PCMCIA and CF+ Type II slots.∗Department of Computer Science, Princeton University.
Email: [email protected], {sobti, nitin, zheng, ry-wang}@cs.princeton.edu.†Department of Computer Science, Yale University.
Email: [email protected] work is supported in part by IBM. Wang is sup-
ported by NSF Career Award CCR-9984790 and Krishna-murthy is supported by NSF Career Award CCR-9985304.
Unfortunately, one important hurdle continuesto block the widespread acceptance of these minia-ture hard disks in mobile devices: power consump-tion. Recent studies have demonstrated that a smallform-factor disk, such as the IBM Microdrive, mayconsume 5-10 times more power than its flash mem-ory counterparts [26]. In the context of a note-book computer with a powerful lithium-ion battery,these levels of energy consumption are quite bear-able, and the storage subsystem in such computersis rarely responsible for more than 10-30% of theoverall power drain [4]. In an MP3 player runningon AAA batteries, on the other hand, every Joule iscritical. Thus, effective power management of harddisks, especially the mobile ones, is becoming in-creasingly important.
Research in effective disk power managementcan be a frustrating process, as meaningful disktraces take days to run, and researchers need ac-cess to expensive power-monitoring equipment. Inthis scenario, simulation quite naturally seems likean attractive approach to follow. Simulation soft-ware has already been demonstrated to be able tomodel disk performance, both efficiently and accu-rately [6, 19, 20]. In this paper, we present Dempsey(Disk Energy Modeling and Performance SimulationEnvironment), a tool that seeks to bring a similarlevel of accuracy and convenience to energy-awarestorage system designs.
Dempsey extends the well-tested DiskSim sim-ulator [6] to model power consumption in addi-tion to performance characteristics of hard disks.It includes a set of tools to extract the necessarypower consumption parameters from a given disk.Dempsey uses stimulus-based measurements to de-rive all the required performance and power con-sumption parameters. Thus, no detailed specifica-tions from the manufacturer are necessary. Thisenables it to handle disks with the IDE interface,which in general lacks commands to determine spe-cific internal parameters of the disk. This abilityto handle IDE disks is significant, since IDE is thedominant standard for mobile disks today.
Dempsey is experimentally validated for the
1 GB IBM Microdrive and the 5 GB Toshiba Type IIPC Card HDD using a variety of synthetic and real-world traces. For the IBM Microdrive, Dempsey’sestimate of power consumption differs from the mea-sured consumption by 7.5% in the worst observedcase. In the average case, however, the error isonly 1.8%. The corresponding errors for the ToshibaHDD are 6.9% and 3.6% respectively. On a mod-ern desktop machine, Dempsey is able to simulatetraces at a rate of more than 8000 disk-requests persecond.
Section 2 provides an overview of relevant exist-ing work in the fields of disk performance modelingand disk power management. Details of Dempsey’sdesign and implementation, including the perfor-mance and power modeling components, are givenin Section 3. In Section 4, experimental results arepresented, which validate the simulator for the tworepresentative disks. Section 5 presents the conclu-sions.
2 Related Work
Dempsey attempts to connect two research fields:disk performance modeling and disk power manage-ment. We survey some related work in these twofields.
2.1 Disk Performance Modeling
Ruemmler and Wilkes present a thorough in-troduction to disk performance modeling [19], andconvincingly demonstrate the need for sophisticateddisk-simulation techniques. They suggest the use ofthe “demerit figure” as a measure of a simulator’saccuracy. The demerit is defined as the root meansquare of the horizontal difference between the sim-ulated and real response-time distribution curves fora given trace. They show how demerit figures of aslow as 3% can be achieved by simulating the diskbehavior in extreme detail. Similar simulation tech-niques are used in [12, 15, 22].
DiskSim [6], developed by Ganger, Worthingtonand Patt, is a general-purpose simulator that goesbeyond the techniques of Ruemmler and Wilkes.The DiskSim software requires a large set of param-eters to characterize a disk drive. These parame-ters include nearly a hundred behavioral details andoverhead timings, in addition to detailed disk ge-ometry information and a large table of seek times.Much of this complexity stems from DiskSim’s goalof simulating the widest possible range of disks. Thesource code for DiskSim is publicly available, and it
has been used as the basis for Dempsey’s implemen-tation.
Several recent projects have attempted to auto-mate the process of extracting these large numberof disk performance parameters. Many of these relyon a combination of two kinds of techniques [24],namely interrogative extraction and empirical ex-traction. Interrogative extraction makes use of low-level commands in the disk interface to extract infor-mation about geometry and other static propertiesof the disk. Such techniques have successfully beenused with many SCSI disk drives [20, 24]. Interroga-tive extraction, however, is not sufficient for severalreasons. First, a given disk drive may not supportall interrogative commands. Second, the informa-tion returned by such commands may be inaccurate,in which case it is only usable as a hint. Empiricalextraction observes the behavior of a given disk ona set of carefully-chosen synthetic workloads, andextracts the parameter values from these observa-tions. Since empirical extraction does not dependon specific commands in the disk interface, it is moregenerally applicable [2, 21].
Dempsey mainly uses empirical extraction tech-niques to extract the relevant performance andpower parameters from a given disk. This makesDempsey relatively general-purpose and suitable fordisks with the IDE interface. The extraction tech-niques for the performance parameters are quitesimilar to those described in existing work, like DIX-Trac [20]. To these, we add techniques for extractingpower parameters.
2.2 Disk Power Management
Most research in disk power management has fo-cused on the behavior of the disk during periods ofinactivity, i.e., idle periods. Specifically, the ques-tion is when the disk should be put to sleep tominimize power consumption with little impact onperformance. Many papers have analyzed the im-pact of aggressively spinning down disks when thetime since last I/O request exceeds some thresh-old [4, 14, 23]. Algorithms for dynamically vary-ing the spin-down threshold in response to chang-ing user behavior and priorities have also been pro-posed [3, 7, 10, 13]. IBM’s storage systems divi-sion has developed an adaptive power managementalgorithm [1] called ABLE (Adaptive Battery LifeExtender). ABLE has been incorporated in IBM2.5-inch Travelstar drives and IBM Microdrives.
The simulators employed in these projects aresimpler. Greenawalt uses an analytical model thatassumes that requests arrive according to a Poisson
distribution [8]. Helmbold et. al. [10] model powerin terms of seconds of activity, rather than usingJoules. This simplification relies on two implicit as-sumptions. One is that a disk has only two distinctpower levels: active and idle. The second is that anactive disk always consumes power at the same rate.Douglis et. al. [4] use a disk simulator that uses afixed, average response time for all requests, exceptfor those that lie within a small neighborhood of theprevious request. This is quite similar to the modelthat Reummler and Wilkes show to have a demeritof 35% [19].
These earlier simplified simulations are valuablein studying disk spin-up and spin-down policies.One common assumption shared by these studiesis a given disk I/O access pattern generated by agiven file system. Researchers, however, have re-cently begun to investigate how to influence the diskI/O access pattern to reduce energy consumption,sometimes by changing the file system itself. Zhenget. al. [26], for example, analyze the effect of variousfile system attributes, like data layout policy, bursti-ness, background data reorganization algorithms,etc., on disk energy consumption. Even when theuser issues the same sequence of system calls, thedisk I/O requests issued by a log-structured file sys-tem, for example, can be very different from thosegenerated by an update-in-place file system, in theirlocality and burstiness characteristics. A simulatorthat lacks a level of sophistication that is compara-ble to that seen in DiskSim, among other disadvan-tages, may err in its timing estimate of individualI/O requests, which may translate into inaccuraciesin its energy estimate. Papathanasiou and Scott [16]explore file-system level techniques for increasingthe burstiness of disk accesses. Heath et. al. [9]and Weissel et. al. [23] attempt to achieve similargoals by making applications more “energy-aware”.We believe that an accurate and efficient disk powermodeling tool like Dempsey can be very useful inprojects of this kind. We also expect Dempsey tobe useful for systems like ECOSystem [25] where ac-curate on-line estimates of energy consumption areneeded outside a laboratory setting.
3 Dempsey
Dempsey extends the DiskSim simulator witha component to model disk power consumption.The power modeling component is relatively simple,adding fewer than 200 non-comment source lines ofcode to the existing DiskSim software. Given datafiles describing the performance and power charac-
teristics of a disk, the simulator can take an inputtrace file and quickly return an estimate (in Joules)of the energy that would be consumed by executingthe given trace on the specified disk. The simulatoralso produces the standard DiskSim output, whichdescribes performance and response time character-istics.
Dempsey includes tools that automatically ex-tract the required performance and power param-eters of a given disk. In all, these tools containabout 2500 source lines of code in C++, Pythonand bash shell scripts. These tools use the empiri-cal extraction technique to extract disk parameters.Specifically, the behavior of the disk on a set ofcarefully-selected synthetic workloads is observed,and parameter values are extracted from these ob-servations. The performance characterization toolsare similar, in nature, to those used in the DIXTracproject [20], so they will be described only in brief inSection 3.2. The power modeling component, how-ever, is described in detail in Section 3.3.
3.1 Measurement Infrastructure
To compute the parameters required for powersimulation, the characterization tools need to mea-sure actual power consumption for a variety of syn-thetic traces. For this, the tools need to inter-face with a multimeter or a voltmeter. Clearly, itwould be preferable to eliminate this need for spe-cial equipment, but other observable indicators ofpower consumption, such as battery life, etc., sim-ply do not provide the speed and accuracy necessaryfor a detailed understanding of power usage. It isalso important, however, to note that the simula-tion component of Dempsey does not require spe-cial equipment. Once a disk’s power consumptionhas been characterized, researchers can use the re-sulting power parameters to model the disk drivewithout needing to carry out any tests with specialequipment. This section describes Dempsey’s hard-ware and software infrastructure.
3.1.1 Hardware
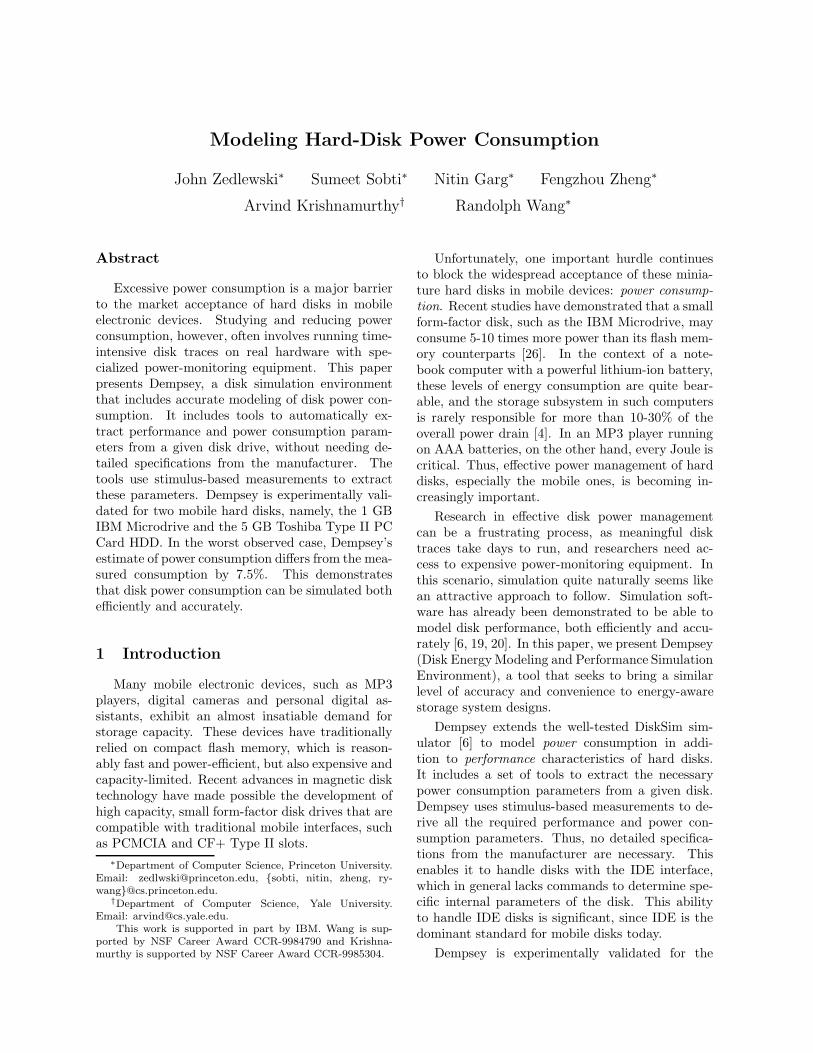
To gather power statistics, we have fashioned a PCcard sleeve as pictured in Figure 1, with a schematicdiagram in Figure 2. The power measurement sleeveconsists of a PC card extender attached to a shuntresistor in series with the card’s power supply. Fol-lowing the general approach taken in [5, 11], wemeasure the voltage across the shunt resistor. Thecard extender connects to a PCMCIA-compatibledisk drive, such as an IBM Microdrive. The card
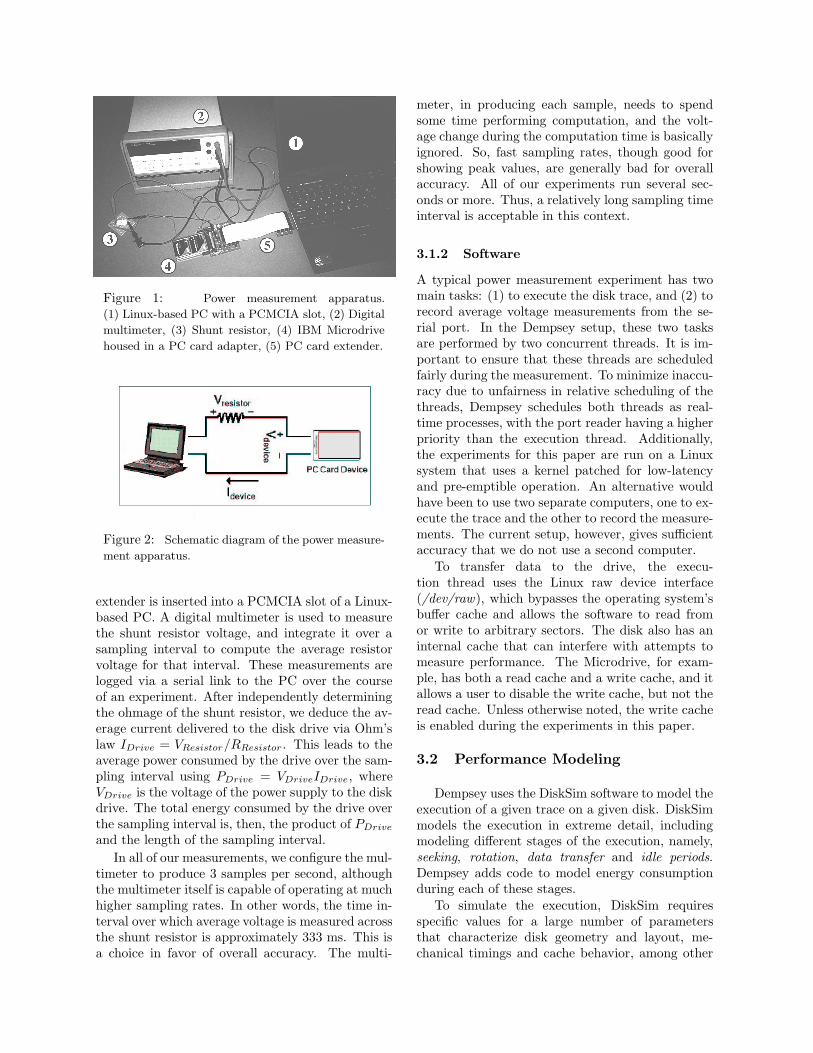
Figure 1: Power measurement apparatus.(1) Linux-based PC with a PCMCIA slot, (2) Digitalmultimeter, (3) Shunt resistor, (4) IBM Microdrivehoused in a PC card adapter, (5) PC card extender.
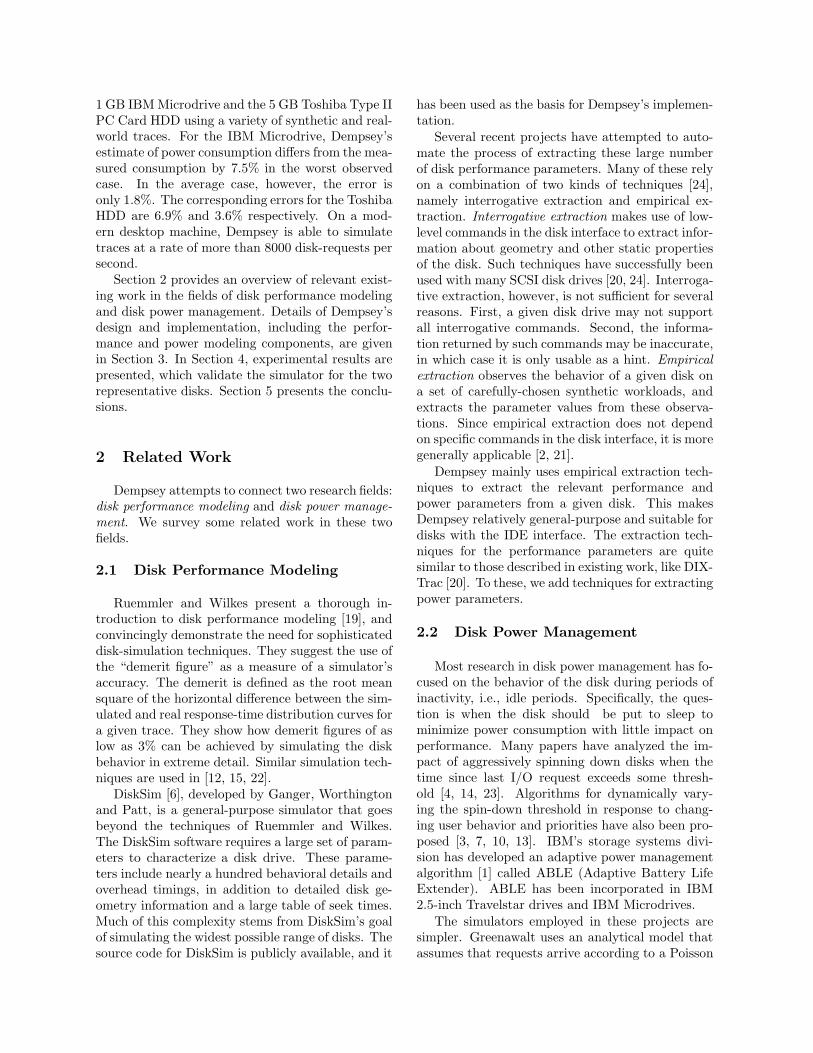
Figure 2: Schematic diagram of the power measure-ment apparatus.
extender is inserted into a PCMCIA slot of a Linux-based PC. A digital multimeter is used to measurethe shunt resistor voltage, and integrate it over asampling interval to compute the average resistorvoltage for that interval. These measurements arelogged via a serial link to the PC over the courseof an experiment. After independently determiningthe ohmage of the shunt resistor, we deduce the av-erage current delivered to the disk drive via Ohm’slaw IDrive = VResistor/RResistor . This leads to theaverage power consumed by the drive over the sam-pling interval using PDrive = VDriveIDrive, whereVDrive is the voltage of the power supply to the diskdrive. The total energy consumed by the drive overthe sampling interval is, then, the product of PDriveand the length of the sampling interval.
In all of our measurements, we configure the mul-timeter to produce 3 samples per second, althoughthe multimeter itself is capable of operating at muchhigher sampling rates. In other words, the time in-terval over which average voltage is measured acrossthe shunt resistor is approximately 333 ms. This isa choice in favor of overall accuracy. The multi-
meter, in producing each sample, needs to spendsome time performing computation, and the volt-age change during the computation time is basicallyignored. So, fast sampling rates, though good forshowing peak values, are generally bad for overallaccuracy. All of our experiments run several sec-onds or more. Thus, a relatively long sampling timeinterval is acceptable in this context.
3.1.2 Software
A typical power measurement experiment has twomain tasks: (1) to execute the disk trace, and (2) torecord average voltage measurements from the se-rial port. In the Dempsey setup, these two tasksare performed by two concurrent threads. It is im-portant to ensure that these threads are scheduledfairly during the measurement. To minimize inaccu-racy due to unfairness in relative scheduling of thethreads, Dempsey schedules both threads as real-time processes, with the port reader having a higherpriority than the execution thread. Additionally,the experiments for this paper are run on a Linuxsystem that uses a kernel patched for low-latencyand pre-emptible operation. An alternative wouldhave been to use two separate computers, one to ex-ecute the trace and the other to record the measure-ments. The current setup, however, gives sufficientaccuracy that we do not use a second computer.
To transfer data to the drive, the execu-tion thread uses the Linux raw device interface(/dev/raw), which bypasses the operating system’sbuffer cache and allows the software to read fromor write to arbitrary sectors. The disk also has aninternal cache that can interfere with attempts tomeasure performance. The Microdrive, for exam-ple, has both a read cache and a write cache, and itallows a user to disable the write cache, but not theread cache. Unless otherwise noted, the write cacheis enabled during the experiments in this paper.
3.2 Performance Modeling
Dempsey uses the DiskSim software to model theexecution of a given trace on a given disk. DiskSimmodels the execution in extreme detail, includingmodeling different stages of the execution, namely,seeking, rotation, data transfer and idle periods.Dempsey adds code to model energy consumptionduring each of these stages.
To simulate the execution, DiskSim requiresspecific values for a large number of parametersthat characterize disk geometry and layout, me-chanical timings and cache behavior, among other
things. Dempsey includes performance characteri-zation tools to automatically extract these parame-ters from a given disk.
Typically, the first step in such characterizationis the extraction of detailed information about diskgeometry and physical layout of data blocks on thedisk. For this, many previous efforts, includingDIXTrac [20], have relied on low-level commandsin the disk interface that reveal the mapping fromlogical block addresses (LBAs) to physical locationson the disk. The SCSI interface, for example, hasthe “Translate” option in its “SEND DIAGNOS-TIC” and “RECEIVE DIAGNOSTIC” commandsto translate a given LBA to the corresponding phys-ical location.
Dempsey chooses not to rely on such transla-tion commands, since not all disks support suchcommands. Also, even if a disk does support suchcommands, the information returned may not beentirely correct and reliable. For example, theIBM Microdrive, which supports the IDE inter-face, does include a “Translate Sector” commandto translate a given LBA to the correspondingcylinder/head/sector (CHS) combination. Unfortu-nately, this CHS address does not represent the truephysical location of the corresponding sector on thedisk. Dempsey uses empirical extraction techniquesto extract the geometry information, which is thenused in the extraction of all other relevant parame-ters through empirical extraction techniques similarto those used in [20].
3.2.1 Extracting Disk Layout
The most important feature of the mapping be-tween LBAs and their corresponding physical lo-cations on a given disk drive is the drive’s zoningstrategy. Zoning refers to the technique of dividinga drive’s surface into several groups (or zones) oftracks, such that all tracks within a given zone havean equal number of sectors. Tracks in different zonesmay have different numbers of sectors. This allowsmore sectors on the outermost tracks, which arelonger than the innermost tracks. Because LBA tophysical-location mappings are generally sequential,an accurate description of a disk’s zones is nearlyequivalent to a description of a drive’s layout, pro-vided that the drive’s geometry has not been sub-stantially affected by defects and that the numberof heads is known.
Finding tracks. A fundamental buildingblock of the zone discovery algorithm is theSame Track(L) function. Same Track returns arange of LBAs that includes all LBAs on the same
track as LBA L. Let Seek Time(L1, L2) denotethe time taken for a seek from LBA L1 to LBAL2. (A function to compute Seek Time can be im-plemented using the SEEK command directly, sothat it bypasses issues of caching and rotational la-tency.) The Same Track function begins by com-puting Seek Time(L, L). This represents the timenecessary to perform a zero-distance seek, essen-tially equivalent to the bus and command processingoverhead. Any seek of non-zero distance will takesubstantially longer. The Same Track function canthen compute Seek Time(L, Lk) for a series of Lkvalues. If the Seek Time value is more than twice ofthe minimal seek time (this factor of two is an arbi-trary threshold that proves to work well in practice),then it is inferred that Lk does not lie on the sametrack as L. Same Track can then use binary searchto discover the upper and lower boundaries of thedesired track.
From tracks to zones. Note that using theSame Track function, it is trivial to determine thenumber of sectors on the track on which a givenLBA lies. Let Num Sectors(L) denote the numberof sectors on the track on which L lies. Rememberthat a zone is defined to be a set of consecutivetracks, all of which have the same number of sectors.Let Same Zone(L) be a function that returns therange of LBAs that lie in the same zone as LBAL. Same Zone can easily be implemented using theNum Sectors function and binary search.
Starting with the disk’s first LBA and repeat-edly applying Same Zone function until the disk’sfinal LBA is reached, Dempsey is able to generate acomplete map of the disk’s zones.
Disk heads. The boundaries, which record thenumber of blocks per track and the starting andending LBAs of each zone, are still not enoughinformation to map an LBA to a physical cylin-der/head/sector address. On a disk with multipleheads, each cylinder logically contains tracks spreadacross several different data surfaces. Therefore,if a zone has Sz total sectors and St sectors pertrack, the zone contains Sz
(St×H) cylinders, where His the number of heads on the disk. Clearly, then,Dempsey must know the number of physical headson the disk in order to understand its geometry.
The current version of Dempsey relies on themanufacturer’s specifications to determine the num-ber of disk heads in a drive, although techniquesfor experimentally determining this number are alsoknown [20].
3.2.2 Extracting Other Parameters
Other performance parameters, like the seek curve,the rotation speed and the cache parameters, areextracted using techniques similar to those used inthe DIXTrac project. Therefore, these techniquesare not described here in any detail.
As noted in [20], some disk drives that incorpo-rate adaptive caching techniques (where the organi-zation of the on-disk cache changes in response tochanging disk access patterns) are not very accu-rately modeled by DiskSim. Both the IBM Micro-drive and the Toshiba HDD are observed to havean adaptive cache. Thus, following [20], Dempseyuses average values for many cache parameters inthe parameter files.
3.3 Power Modeling
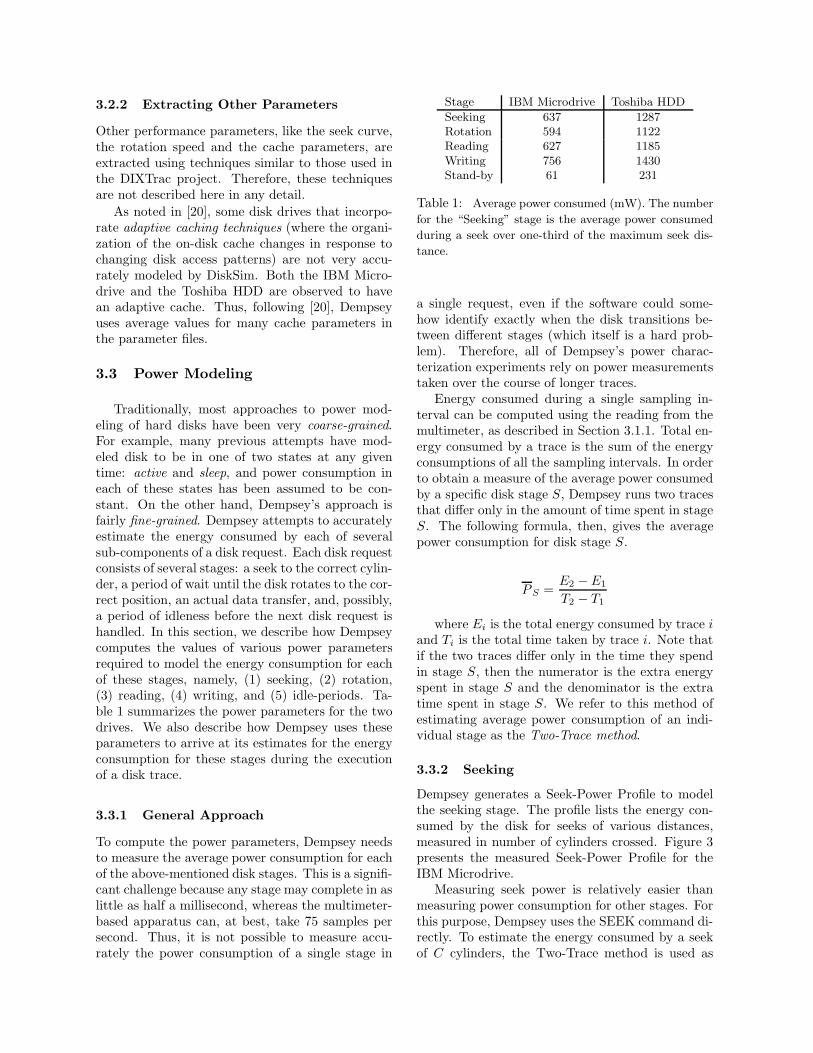
Traditionally, most approaches to power mod-eling of hard disks have been very coarse-grained.For example, many previous attempts have mod-eled disk to be in one of two states at any giventime: active and sleep, and power consumption ineach of these states has been assumed to be con-stant. On the other hand, Dempsey’s approach isfairly fine-grained. Dempsey attempts to accuratelyestimate the energy consumed by each of severalsub-components of a disk request. Each disk requestconsists of several stages: a seek to the correct cylin-der, a period of wait until the disk rotates to the cor-rect position, an actual data transfer, and, possibly,a period of idleness before the next disk request ishandled. In this section, we describe how Dempseycomputes the values of various power parametersrequired to model the energy consumption for eachof these stages, namely, (1) seeking, (2) rotation,(3) reading, (4) writing, and (5) idle-periods. Ta-ble 1 summarizes the power parameters for the twodrives. We also describe how Dempsey uses theseparameters to arrive at its estimates for the energyconsumption for these stages during the executionof a disk trace.
3.3.1 General Approach
To compute the power parameters, Dempsey needsto measure the average power consumption for eachof the above-mentioned disk stages. This is a signifi-cant challenge because any stage may complete in aslittle as half a millisecond, whereas the multimeter-based apparatus can, at best, take 75 samples persecond. Thus, it is not possible to measure accu-rately the power consumption of a single stage in
Stage IBM Microdrive Toshiba HDDSeeking 637 1287Rotation 594 1122Reading 627 1185Writing 756 1430Stand-by 61 231
Table 1: Average power consumed (mW). The numberfor the “Seeking” stage is the average power consumedduring a seek over one-third of the maximum seek dis-tance.
a single request, even if the software could some-how identify exactly when the disk transitions be-tween different stages (which itself is a hard prob-lem). Therefore, all of Dempsey’s power charac-terization experiments rely on power measurementstaken over the course of longer traces.
Energy consumed during a single sampling in-terval can be computed using the reading from themultimeter, as described in Section 3.1.1. Total en-ergy consumed by a trace is the sum of the energyconsumptions of all the sampling intervals. In orderto obtain a measure of the average power consumedby a specific disk stage S, Dempsey runs two tracesthat differ only in the amount of time spent in stageS. The following formula, then, gives the averagepower consumption for disk stage S.
PS =E2 −E1
T2 − T1
where Ei is the total energy consumed by trace iand Ti is the total time taken by trace i. Note thatif the two traces differ only in the time they spendin stage S, then the numerator is the extra energyspent in stage S and the denominator is the extratime spent in stage S. We refer to this method ofestimating average power consumption of an indi-vidual stage as the Two-Trace method.
3.3.2 Seeking
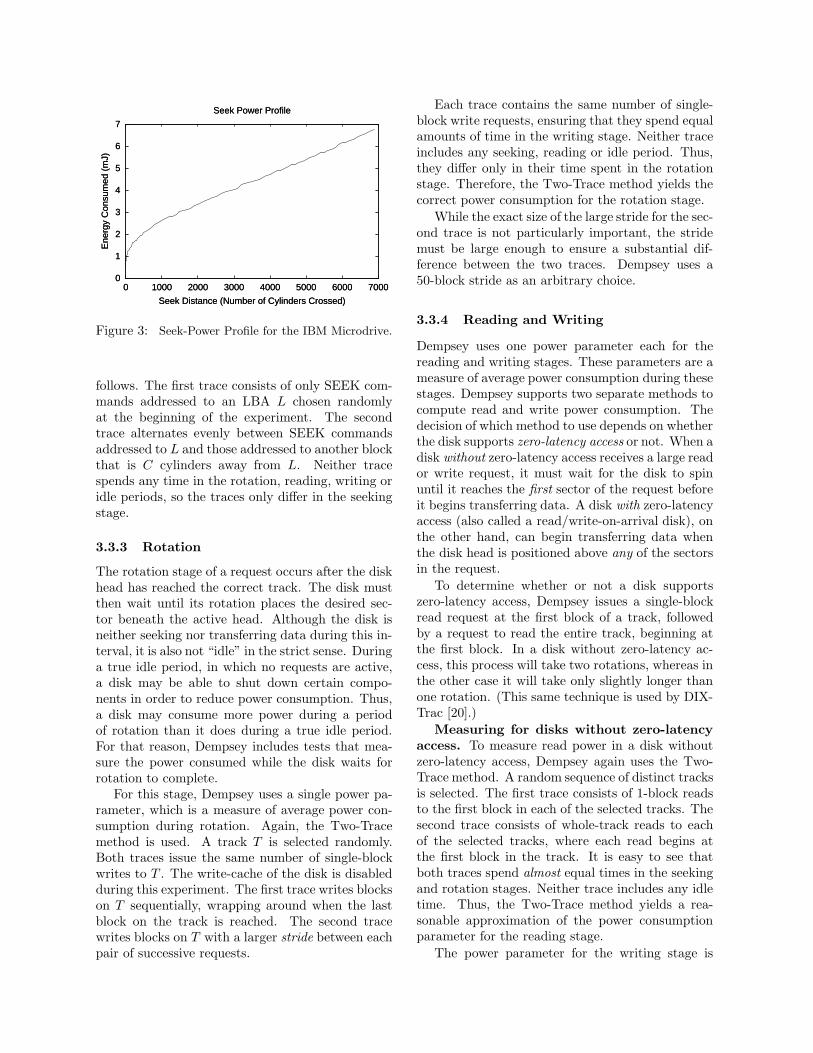
Dempsey generates a Seek-Power Profile to modelthe seeking stage. The profile lists the energy con-sumed by the disk for seeks of various distances,measured in number of cylinders crossed. Figure 3presents the measured Seek-Power Profile for theIBM Microdrive.
Measuring seek power is relatively easier thanmeasuring power consumption for other stages. Forthis purpose, Dempsey uses the SEEK command di-rectly. To estimate the energy consumed by a seekof C cylinders, the Two-Trace method is used as
0
1
2
3
4
5
6
7
0 1000 2000 3000 4000 5000 6000 7000
Ene
rgy
Con
sum
ed (
mJ)
Seek Distance (Number of Cylinders Crossed)
Seek Power Profile
0
1
2
3
4
5
6
7
0 1000 2000 3000 4000 5000 6000 7000
Ene
rgy
Con
sum
ed (
mJ)
Seek Distance (Number of Cylinders Crossed)
Seek Power Profile
Figure 3: Seek-Power Profile for the IBM Microdrive.
follows. The first trace consists of only SEEK com-mands addressed to an LBA L chosen randomlyat the beginning of the experiment. The secondtrace alternates evenly between SEEK commandsaddressed to L and those addressed to another blockthat is C cylinders away from L. Neither tracespends any time in the rotation, reading, writing oridle periods, so the traces only differ in the seekingstage.
3.3.3 Rotation
The rotation stage of a request occurs after the diskhead has reached the correct track. The disk mustthen wait until its rotation places the desired sec-tor beneath the active head. Although the disk isneither seeking nor transferring data during this in-terval, it is also not “idle” in the strict sense. Duringa true idle period, in which no requests are active,a disk may be able to shut down certain compo-nents in order to reduce power consumption. Thus,a disk may consume more power during a periodof rotation than it does during a true idle period.For that reason, Dempsey includes tests that mea-sure the power consumed while the disk waits forrotation to complete.
For this stage, Dempsey uses a single power pa-rameter, which is a measure of average power con-sumption during rotation. Again, the Two-Tracemethod is used. A track T is selected randomly.Both traces issue the same number of single-blockwrites to T . The write-cache of the disk is disabledduring this experiment. The first trace writes blockson T sequentially, wrapping around when the lastblock on the track is reached. The second tracewrites blocks on T with a larger stride between eachpair of successive requests.
Each trace contains the same number of single-block write requests, ensuring that they spend equalamounts of time in the writing stage. Neither traceincludes any seeking, reading or idle period. Thus,they differ only in their time spent in the rotationstage. Therefore, the Two-Trace method yields thecorrect power consumption for the rotation stage.
While the exact size of the large stride for the sec-ond trace is not particularly important, the stridemust be large enough to ensure a substantial dif-ference between the two traces. Dempsey uses a50-block stride as an arbitrary choice.
3.3.4 Reading and Writing
Dempsey uses one power parameter each for thereading and writing stages. These parameters are ameasure of average power consumption during thesestages. Dempsey supports two separate methods tocompute read and write power consumption. Thedecision of which method to use depends on whetherthe disk supports zero-latency access or not. When adisk without zero-latency access receives a large reador write request, it must wait for the disk to spinuntil it reaches the first sector of the request beforeit begins transferring data. A disk with zero-latencyaccess (also called a read/write-on-arrival disk), onthe other hand, can begin transferring data whenthe disk head is positioned above any of the sectorsin the request.
To determine whether or not a disk supportszero-latency access, Dempsey issues a single-blockread request at the first block of a track, followedby a request to read the entire track, beginning atthe first block. In a disk without zero-latency ac-cess, this process will take two rotations, whereas inthe other case it will take only slightly longer thanone rotation. (This same technique is used by DIX-Trac [20].)
Measuring for disks without zero-latencyaccess. To measure read power in a disk withoutzero-latency access, Dempsey again uses the Two-Trace method. A random sequence of distinct tracksis selected. The first trace consists of 1-block readsto the first block in each of the selected tracks. Thesecond trace consists of whole-track reads to eachof the selected tracks, where each read begins atthe first block in the track. It is easy to see thatboth traces spend almost equal times in the seekingand rotation stages. Neither trace includes any idletime. Thus, the Two-Trace method yields a rea-sonable approximation of the power consumptionparameter for the reading stage.
The power parameter for the writing stage is
computed in the same manner, with the write cacheof the disk disabled.
Measuring for disks with zero-latency ac-cess. It is easy to observe that the traces used abovecan not be used in this case, because here the twotraces will differ significantly in the time they spendin the rotation stage.
To make it work for disks with zero-latency ac-cess, we need to change the first trace slightly. Herethe first trace, instead of issuing 1-block read com-mands, issues SEEK commands to each of the tracksin the selected sequence. The second trace issueswhole-track reads as in the previous case. It is easyto verify that these two traces, when executed ona zero-latency disk, will differ only in the readingstage. Thus, the Two-Trace method can be ap-plied to obtain the average power consumption ofthe reading stage. Note that the traces that workin this case do not work for the previous case, be-cause they will differ significantly in the time theyspend in the rotation stage when executed on a diskwithout zero-latency access.
3.3.5 Idle Periods
The behavior of a hard disk during idle periods issubstantially more complex than during the disk-stages described above. Typically, several powermodes are defined where performance is traded-offfor savings in power consumption. For example,many disks have four modes of operation: active,idle, standby and sleep. The active-mode is theonly mode in which the disk can satisfy requests.The active-mode has the highest power consump-tion, followed by the idle-mode, the standby-modeand the sleep-mode in that order. The intentionis to let the disk operate in one of the low powermodes when there is no disk activity, but transition-ing from one power mode to another usually incurstime and energy overheads. Thus, power manage-ment usually has implications for power and perfor-mance (response times, in particular).
Modeling a disk’s power management scheme canbe decomposed into two tasks. First, the energy andperformance overheads associated with mode transi-tions need to be measured. Second, the power simu-lator requires a model of when the mode transitionsoccur.
To measure the cost of mode transitions,Dempsey issues a series of traces to generate anIdle-Period Energy Profile. Each trace has a largenumber of I/O operations that are separated byan idle period of constant length. By varying thelength of idle periods across traces, Dempsey gen-
erates a series of tuples of the form (t, E, T ). Atuple (t, E, T ) records the fact that an idle periodof length t consumes energy E, and introduces de-lay T in the response time for the following request.The Idle-Period Energy Profile can be used to de-termine accurately the modes used by the powermanagement scheme, the overheads incurred duringmode transitions, and the power consumed by thedisk in different modes.
The task of developing a model for when the disktransitions between modes is more complex. Tradi-tionally, disks have used fixed waiting thresholds totransition from higher power to lower power modes.For such disks, the Idle-Period Energy Profile is suf-ficient to predict when mode transitions would oc-cur. The fixed thresholds for mode transitions canbe inferred from the Idle-Period Energy Profile, andDempsey provides a default mechanism for deter-mining such fixed thresholds.
Newer disks, however, are moving toward moresophisticated mechanisms for managing their oper-ation. For example, the IBM Microdrive employsthe Adaptive Battery Life Extender (ABLE) tech-nology, which, in addition to defining many morepower modes, adaptively manages transitions be-tween those modes. ABLE continuously monitorsdisk-request pattern and maintains statistics on therecent history of disk requests. Instead of fixed wait-ing thresholds, ABLE’s decisions on when and howto make power-mode transitions are determined byits predictions about the current request-burst, thecurrent level of internal disk-activity (prefetching,write-behind, etc.), the desired performance-leveland the energy costs associated with the transitions.
Ideally, one would like to use the exact ABLEalgorithms when modeling the IBM Microdrive inDempsey, but since these algorithms are not avail-able publicly, we use the fixed-threshold model withthe following straightforward implementation. Theestimate for the energy consumed during a givenidle period of length t is computed by looking upthe appropriate tuple in the energy profile. If no tu-ple is found for length t, then interpolation is usedto arrive at an estimate. The time overhead is fedback into the performance modeling component ofDempsey so as to keep the response-time estimatesaccurate.
3.4 Simulation
Dempsey inherits the performance simulationmodule from DiskSim, which models the disk in ex-treme detail. To obtain an estimate of total en-ergy consumption for a given trace, the simulator
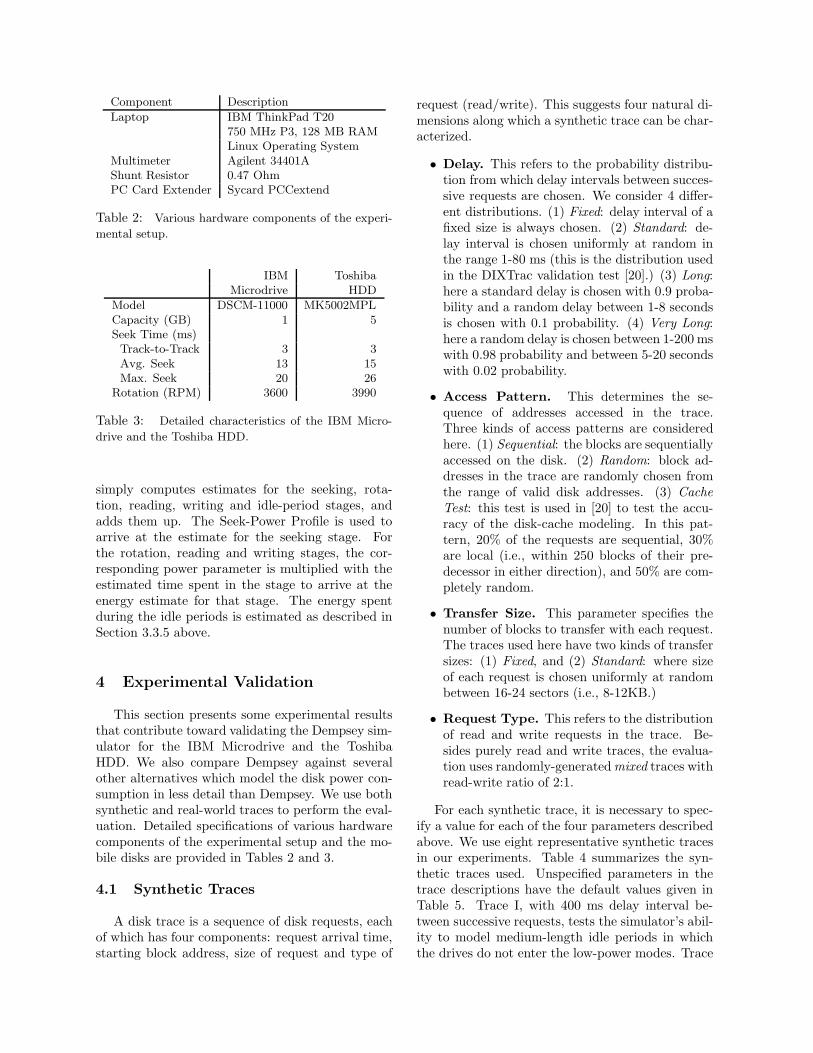
Component DescriptionLaptop IBM ThinkPad T20
750 MHz P3, 128 MB RAMLinux Operating System
Multimeter Agilent 34401AShunt Resistor 0.47 OhmPC Card Extender Sycard PCCextend
Table 2: Various hardware components of the experi-mental setup.
IBM ToshibaMicrodrive HDD
Model DSCM-11000 MK5002MPLCapacity (GB) 1 5Seek Time (ms)
Track-to-Track 3 3Avg. Seek 13 15Max. Seek 20 26
Rotation (RPM) 3600 3990
Table 3: Detailed characteristics of the IBM Micro-drive and the Toshiba HDD.
simply computes estimates for the seeking, rota-tion, reading, writing and idle-period stages, andadds them up. The Seek-Power Profile is used toarrive at the estimate for the seeking stage. Forthe rotation, reading and writing stages, the cor-responding power parameter is multiplied with theestimated time spent in the stage to arrive at theenergy estimate for that stage. The energy spentduring the idle periods is estimated as described inSection 3.3.5 above.
4 Experimental Validation
This section presents some experimental resultsthat contribute toward validating the Dempsey sim-ulator for the IBM Microdrive and the ToshibaHDD. We also compare Dempsey against severalother alternatives which model the disk power con-sumption in less detail than Dempsey. We use bothsynthetic and real-world traces to perform the eval-uation. Detailed specifications of various hardwarecomponents of the experimental setup and the mo-bile disks are provided in Tables 2 and 3.
4.1 Synthetic Traces
A disk trace is a sequence of disk requests, eachof which has four components: request arrival time,starting block address, size of request and type of
request (read/write). This suggests four natural di-mensions along which a synthetic trace can be char-acterized.
• Delay. This refers to the probability distribu-tion from which delay intervals between succes-sive requests are chosen. We consider 4 differ-ent distributions. (1) Fixed: delay interval of afixed size is always chosen. (2) Standard: de-lay interval is chosen uniformly at random inthe range 1-80 ms (this is the distribution usedin the DIXTrac validation test [20].) (3) Long:here a standard delay is chosen with 0.9 proba-bility and a random delay between 1-8 secondsis chosen with 0.1 probability. (4) Very Long:here a random delay is chosen between 1-200 mswith 0.98 probability and between 5-20 secondswith 0.02 probability.
• Access Pattern. This determines the se-quence of addresses accessed in the trace.Three kinds of access patterns are consideredhere. (1) Sequential: the blocks are sequentiallyaccessed on the disk. (2) Random: block ad-dresses in the trace are randomly chosen fromthe range of valid disk addresses. (3) CacheTest: this test is used in [20] to test the accu-racy of the disk-cache modeling. In this pat-tern, 20% of the requests are sequential, 30%are local (i.e., within 250 blocks of their pre-decessor in either direction), and 50% are com-pletely random.
• Transfer Size. This parameter specifies thenumber of blocks to transfer with each request.The traces used here have two kinds of transfersizes: (1) Fixed, and (2) Standard: where sizeof each request is chosen uniformly at randombetween 16-24 sectors (i.e., 8-12KB.)
• Request Type. This refers to the distributionof read and write requests in the trace. Be-sides purely read and write traces, the evalua-tion uses randomly-generated mixed traces withread-write ratio of 2:1.
For each synthetic trace, it is necessary to spec-ify a value for each of the four parameters describedabove. We use eight representative synthetic tracesin our experiments. Table 4 summarizes the syn-thetic traces used. Unspecified parameters in thetrace descriptions have the default values given inTable 5. Trace I, with 400 ms delay interval be-tween successive requests, tests the simulator’s abil-ity to model medium-length idle periods in whichthe drives do not enter the low-power modes. Trace
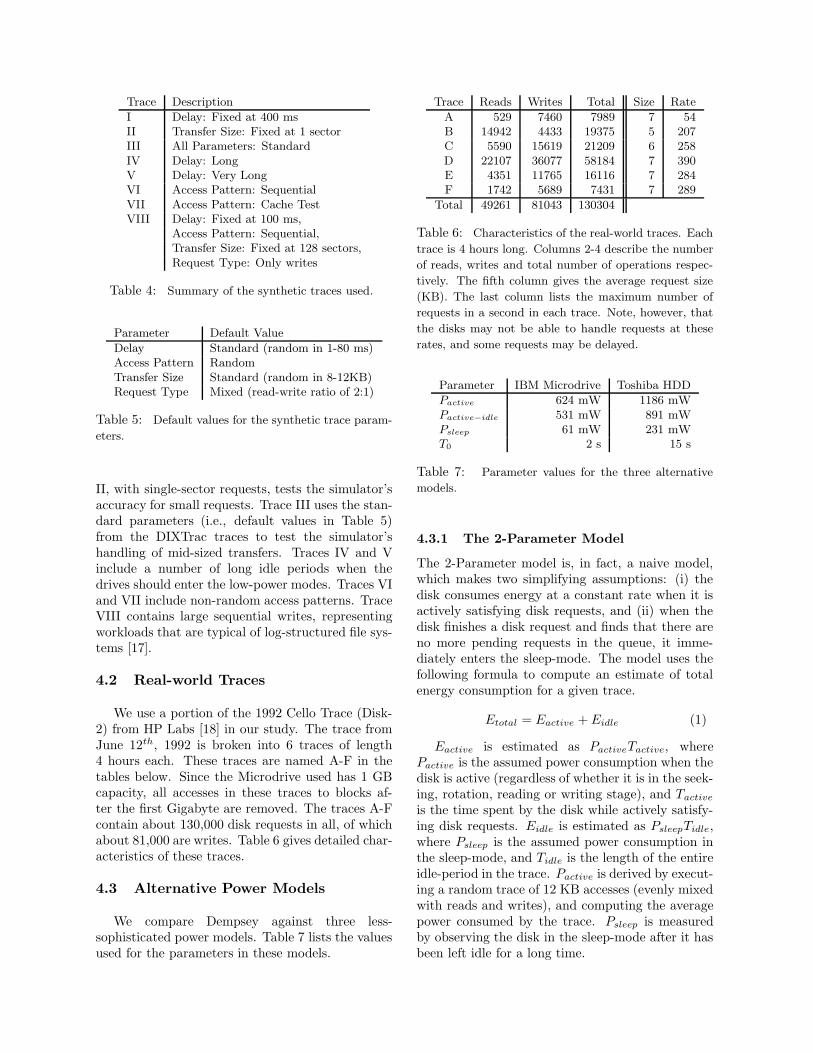
Trace DescriptionI Delay: Fixed at 400 msII Transfer Size: Fixed at 1 sectorIII All Parameters: StandardIV Delay: LongV Delay: Very LongVI Access Pattern: SequentialVII Access Pattern: Cache TestVIII Delay: Fixed at 100 ms,
Access Pattern: Sequential,Transfer Size: Fixed at 128 sectors,Request Type: Only writes
Table 4: Summary of the synthetic traces used.
Parameter Default ValueDelay Standard (random in 1-80 ms)Access Pattern RandomTransfer Size Standard (random in 8-12KB)Request Type Mixed (read-write ratio of 2:1)
Table 5: Default values for the synthetic trace param-eters.
II, with single-sector requests, tests the simulator’saccuracy for small requests. Trace III uses the stan-dard parameters (i.e., default values in Table 5)from the DIXTrac traces to test the simulator’shandling of mid-sized transfers. Traces IV and Vinclude a number of long idle periods when thedrives should enter the low-power modes. Traces VIand VII include non-random access patterns. TraceVIII contains large sequential writes, representingworkloads that are typical of log-structured file sys-tems [17].
4.2 Real-world Traces
We use a portion of the 1992 Cello Trace (Disk-2) from HP Labs [18] in our study. The trace fromJune 12th, 1992 is broken into 6 traces of length4 hours each. These traces are named A-F in thetables below. Since the Microdrive used has 1 GBcapacity, all accesses in these traces to blocks af-ter the first Gigabyte are removed. The traces A-Fcontain about 130,000 disk requests in all, of whichabout 81,000 are writes. Table 6 gives detailed char-acteristics of these traces.
4.3 Alternative Power Models
We compare Dempsey against three less-sophisticated power models. Table 7 lists the valuesused for the parameters in these models.
Trace Reads Writes Total Size RateA 529 7460 7989 7 54B 14942 4433 19375 5 207C 5590 15619 21209 6 258D 22107 36077 58184 7 390E 4351 11765 16116 7 284F 1742 5689 7431 7 289
Total 49261 81043 130304
Table 6: Characteristics of the real-world traces. Eachtrace is 4 hours long. Columns 2-4 describe the numberof reads, writes and total number of operations respec-tively. The fifth column gives the average request size(KB). The last column lists the maximum number ofrequests in a second in each trace. Note, however, thatthe disks may not be able to handle requests at theserates, and some requests may be delayed.
Parameter IBM Microdrive Toshiba HDDPactive 624 mW 1186 mWPactive−idle 531 mW 891 mWPsleep 61 mW 231 mWT0 2 s 15 s
Table 7: Parameter values for the three alternativemodels.
4.3.1 The 2-Parameter Model
The 2-Parameter model is, in fact, a naive model,which makes two simplifying assumptions: (i) thedisk consumes energy at a constant rate when it isactively satisfying disk requests, and (ii) when thedisk finishes a disk request and finds that there areno more pending requests in the queue, it imme-diately enters the sleep-mode. The model uses thefollowing formula to compute an estimate of totalenergy consumption for a given trace.
Etotal = Eactive +Eidle (1)
Eactive is estimated as PactiveTactive, wherePactive is the assumed power consumption when thedisk is active (regardless of whether it is in the seek-ing, rotation, reading or writing stage), and Tactiveis the time spent by the disk while actively satisfy-ing disk requests. Eidle is estimated as PsleepTidle,where Psleep is the assumed power consumption inthe sleep-mode, and Tidle is the length of the entireidle-period in the trace. Pactive is derived by execut-ing a random trace of 12 KB accesses (evenly mixedwith reads and writes), and computing the averagepower consumed by the trace. Psleep is measuredby observing the disk in the sleep-mode after it hasbeen left idle for a long time.
4.3.2 The 3-Parameter Model
The 3-Parameter model improves upon the 2-Parameter model by further refining the modelingof idle periods. As in the 2-Parameter model, equa-tion (1) is used to estimate the total energy con-sumption, and Eactive is estimated as PactiveTactive.The behavior during the idle periods, however, ismodeled as follows. The model assumes that thedisk enters an intermediate power-mode, called the“active-idle” mode, as soon as it finishes a disk re-quest and finds no more pending requests in thequeue. The transition from the active-idle-modeto the sleep-mode, however, is governed by a fixedwaiting threshold T0. For an idle-period of length Lwith L ≤ T0, the energy consumption is estimatedas Pactive−idleL. For an idle-period of length L withL > T0, the energy consumption is estimated asPactive−idleT0 + Psleep(L− T0). Note that the timeor energy overheads of the mode transitions are notmodeled. Pactive−idle is measured by observing thedisk immediately after a disk request has finished.
4.3.3 The Coarse-Dempsey Model
The Coarse-Dempsey model is a hybrid between the3-Parameter model and Dempsey. As before, it usesequation (1) to estimate total energy consumption.Eactive is estimated as in the 3-Parameter model,whereas Eidle is estimated as in Dempsey. There-fore, this model uses the complete Idle-Period En-ergy Profile of the disk, which also models the timeand energy overheads of mode transitions.
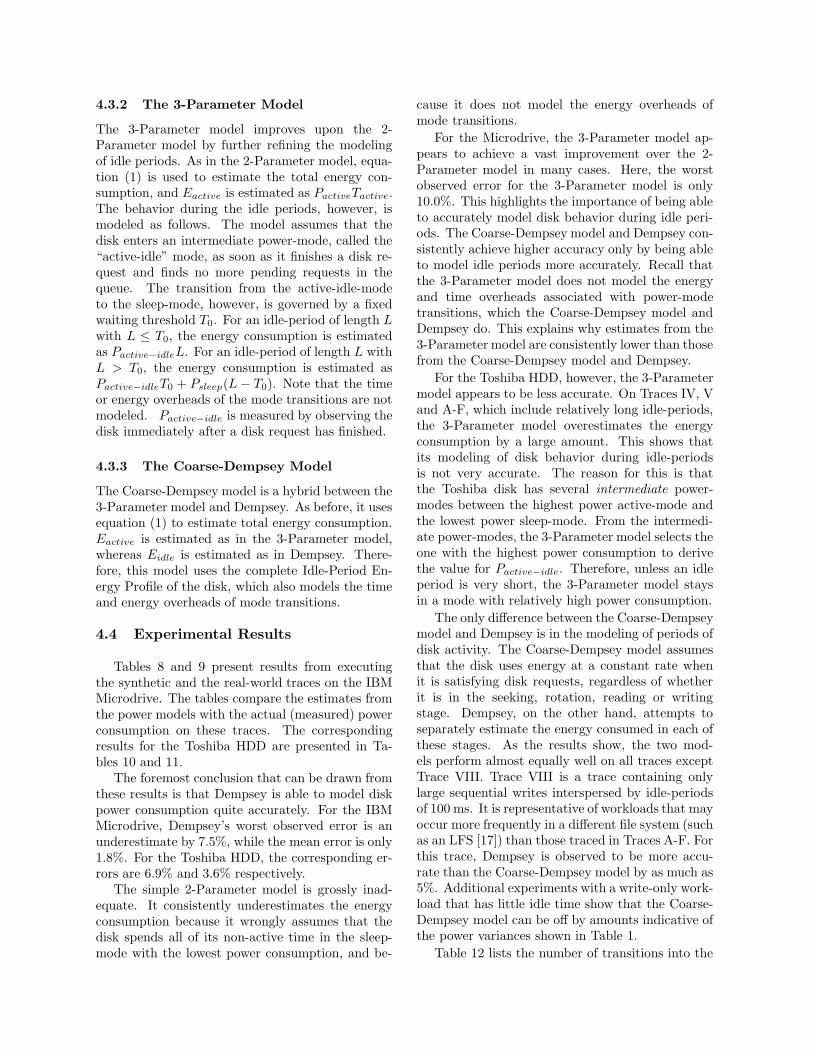
4.4 Experimental Results
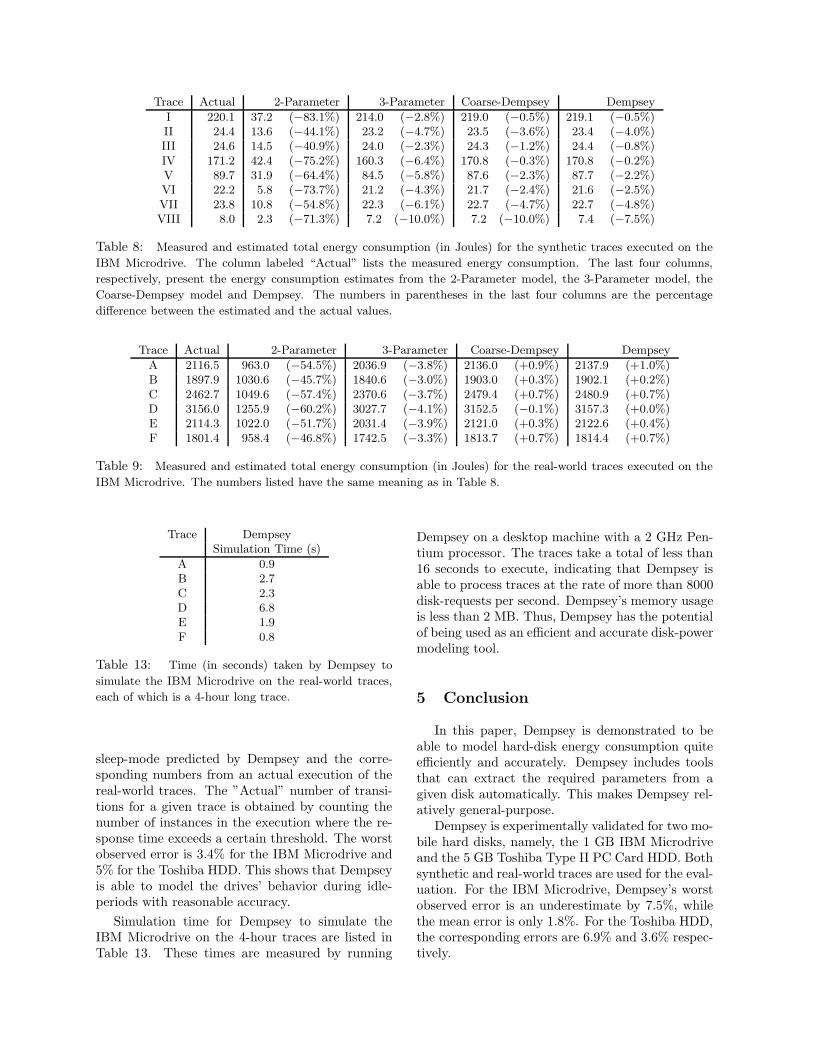
Tables 8 and 9 present results from executingthe synthetic and the real-world traces on the IBMMicrodrive. The tables compare the estimates fromthe power models with the actual (measured) powerconsumption on these traces. The correspondingresults for the Toshiba HDD are presented in Ta-bles 10 and 11.
The foremost conclusion that can be drawn fromthese results is that Dempsey is able to model diskpower consumption quite accurately. For the IBMMicrodrive, Dempsey’s worst observed error is anunderestimate by 7.5%, while the mean error is only1.8%. For the Toshiba HDD, the corresponding er-rors are 6.9% and 3.6% respectively.
The simple 2-Parameter model is grossly inad-equate. It consistently underestimates the energyconsumption because it wrongly assumes that thedisk spends all of its non-active time in the sleep-mode with the lowest power consumption, and be-
cause it does not model the energy overheads ofmode transitions.
For the Microdrive, the 3-Parameter model ap-pears to achieve a vast improvement over the 2-Parameter model in many cases. Here, the worstobserved error for the 3-Parameter model is only10.0%. This highlights the importance of being ableto accurately model disk behavior during idle peri-ods. The Coarse-Dempsey model and Dempsey con-sistently achieve higher accuracy only by being ableto model idle periods more accurately. Recall thatthe 3-Parameter model does not model the energyand time overheads associated with power-modetransitions, which the Coarse-Dempsey model andDempsey do. This explains why estimates from the3-Parameter model are consistently lower than thosefrom the Coarse-Dempsey model and Dempsey.
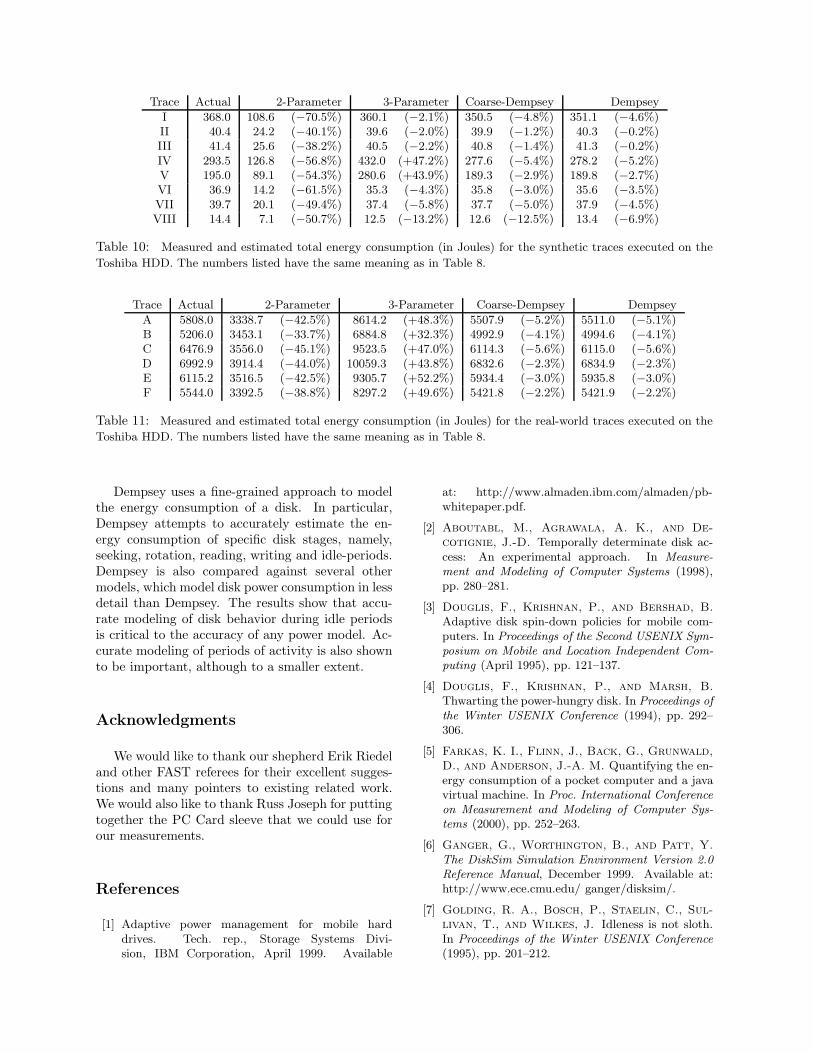
For the Toshiba HDD, however, the 3-Parametermodel appears to be less accurate. On Traces IV, Vand A-F, which include relatively long idle-periods,the 3-Parameter model overestimates the energyconsumption by a large amount. This shows thatits modeling of disk behavior during idle-periodsis not very accurate. The reason for this is thatthe Toshiba disk has several intermediate power-modes between the highest power active-mode andthe lowest power sleep-mode. From the intermedi-ate power-modes, the 3-Parameter model selects theone with the highest power consumption to derivethe value for Pactive−idle. Therefore, unless an idleperiod is very short, the 3-Parameter model staysin a mode with relatively high power consumption.
The only difference between the Coarse-Dempseymodel and Dempsey is in the modeling of periods ofdisk activity. The Coarse-Dempsey model assumesthat the disk uses energy at a constant rate whenit is satisfying disk requests, regardless of whetherit is in the seeking, rotation, reading or writingstage. Dempsey, on the other hand, attempts toseparately estimate the energy consumed in each ofthese stages. As the results show, the two mod-els perform almost equally well on all traces exceptTrace VIII. Trace VIII is a trace containing onlylarge sequential writes interspersed by idle-periodsof 100 ms. It is representative of workloads that mayoccur more frequently in a different file system (suchas an LFS [17]) than those traced in Traces A-F. Forthis trace, Dempsey is observed to be more accu-rate than the Coarse-Dempsey model by as much as5%. Additional experiments with a write-only work-load that has little idle time show that the Coarse-Dempsey model can be off by amounts indicative ofthe power variances shown in Table 1.
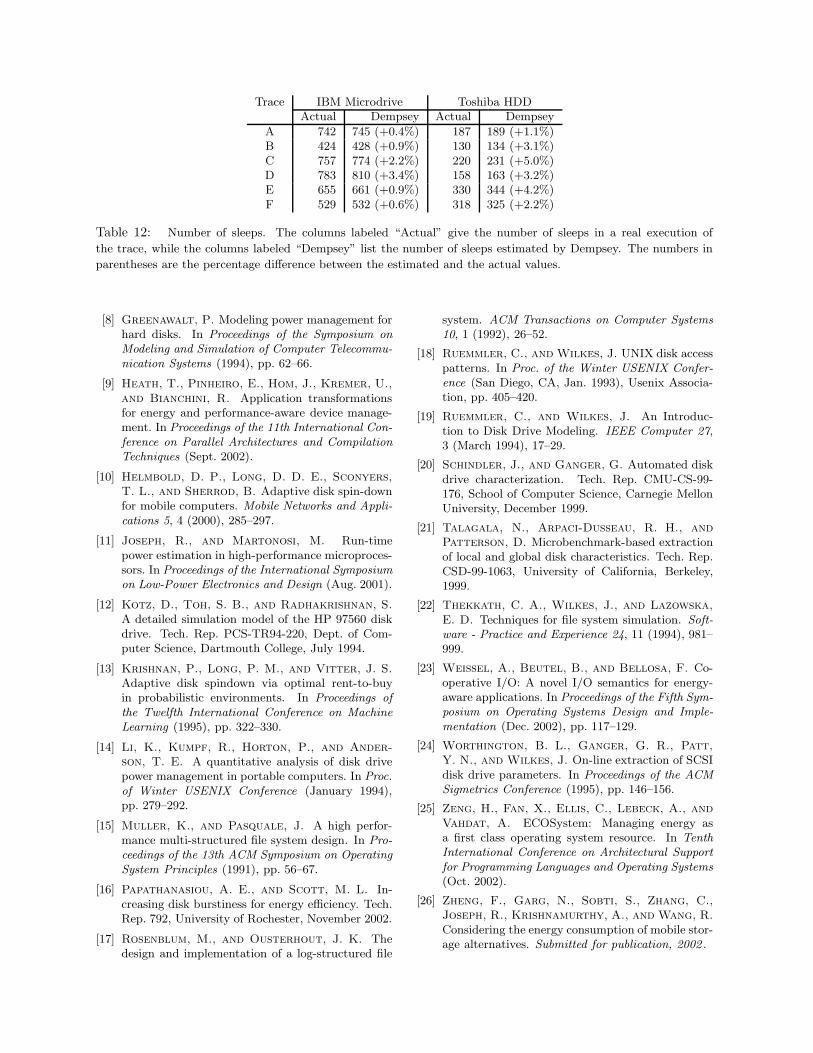
Table 12 lists the number of transitions into the
Trace Actual 2-Parameter 3-Parameter Coarse-Dempsey DempseyI 220.1 37.2 (−83.1%) 214.0 (−2.8%) 219.0 (−0.5%) 219.1 (−0.5%)II 24.4 13.6 (−44.1%) 23.2 (−4.7%) 23.5 (−3.6%) 23.4 (−4.0%)III 24.6 14.5 (−40.9%) 24.0 (−2.3%) 24.3 (−1.2%) 24.4 (−0.8%)IV 171.2 42.4 (−75.2%) 160.3 (−6.4%) 170.8 (−0.3%) 170.8 (−0.2%)V 89.7 31.9 (−64.4%) 84.5 (−5.8%) 87.6 (−2.3%) 87.7 (−2.2%)VI 22.2 5.8 (−73.7%) 21.2 (−4.3%) 21.7 (−2.4%) 21.6 (−2.5%)VII 23.8 10.8 (−54.8%) 22.3 (−6.1%) 22.7 (−4.7%) 22.7 (−4.8%)VIII 8.0 2.3 (−71.3%) 7.2 (−10.0%) 7.2 (−10.0%) 7.4 (−7.5%)
Table 8: Measured and estimated total energy consumption (in Joules) for the synthetic traces executed on theIBM Microdrive. The column labeled “Actual” lists the measured energy consumption. The last four columns,respectively, present the energy consumption estimates from the 2-Parameter model, the 3-Parameter model, theCoarse-Dempsey model and Dempsey. The numbers in parentheses in the last four columns are the percentagedifference between the estimated and the actual values.
Trace Actual 2-Parameter 3-Parameter Coarse-Dempsey DempseyA 2116.5 963.0 (−54.5%) 2036.9 (−3.8%) 2136.0 (+0.9%) 2137.9 (+1.0%)B 1897.9 1030.6 (−45.7%) 1840.6 (−3.0%) 1903.0 (+0.3%) 1902.1 (+0.2%)C 2462.7 1049.6 (−57.4%) 2370.6 (−3.7%) 2479.4 (+0.7%) 2480.9 (+0.7%)D 3156.0 1255.9 (−60.2%) 3027.7 (−4.1%) 3152.5 (−0.1%) 3157.3 (+0.0%)E 2114.3 1022.0 (−51.7%) 2031.4 (−3.9%) 2121.0 (+0.3%) 2122.6 (+0.4%)F 1801.4 958.4 (−46.8%) 1742.5 (−3.3%) 1813.7 (+0.7%) 1814.4 (+0.7%)
Table 9: Measured and estimated total energy consumption (in Joules) for the real-world traces executed on theIBM Microdrive. The numbers listed have the same meaning as in Table 8.
Trace DempseySimulation Time (s)
A 0.9B 2.7C 2.3D 6.8E 1.9F 0.8
Table 13: Time (in seconds) taken by Dempsey tosimulate the IBM Microdrive on the real-world traces,each of which is a 4-hour long trace.
sleep-mode predicted by Dempsey and the corre-sponding numbers from an actual execution of thereal-world traces. The ”Actual” number of transi-tions for a given trace is obtained by counting thenumber of instances in the execution where the re-sponse time exceeds a certain threshold. The worstobserved error is 3.4% for the IBM Microdrive and5% for the Toshiba HDD. This shows that Dempseyis able to model the drives’ behavior during idle-periods with reasonable accuracy.
Simulation time for Dempsey to simulate theIBM Microdrive on the 4-hour traces are listed inTable 13. These times are measured by running
Dempsey on a desktop machine with a 2 GHz Pen-tium processor. The traces take a total of less than16 seconds to execute, indicating that Dempsey isable to process traces at the rate of more than 8000disk-requests per second. Dempsey’s memory usageis less than 2 MB. Thus, Dempsey has the potentialof being used as an efficient and accurate disk-powermodeling tool.
5 Conclusion
In this paper, Dempsey is demonstrated to beable to model hard-disk energy consumption quiteefficiently and accurately. Dempsey includes toolsthat can extract the required parameters from agiven disk automatically. This makes Dempsey rel-atively general-purpose.
Dempsey is experimentally validated for two mo-bile hard disks, namely, the 1 GB IBM Microdriveand the 5 GB Toshiba Type II PC Card HDD. Bothsynthetic and real-world traces are used for the eval-uation. For the IBM Microdrive, Dempsey’s worstobserved error is an underestimate by 7.5%, whilethe mean error is only 1.8%. For the Toshiba HDD,the corresponding errors are 6.9% and 3.6% respec-tively.
Trace Actual 2-Parameter 3-Parameter Coarse-Dempsey DempseyI 368.0 108.6 (−70.5%) 360.1 (−2.1%) 350.5 (−4.8%) 351.1 (−4.6%)II 40.4 24.2 (−40.1%) 39.6 (−2.0%) 39.9 (−1.2%) 40.3 (−0.2%)III 41.4 25.6 (−38.2%) 40.5 (−2.2%) 40.8 (−1.4%) 41.3 (−0.2%)IV 293.5 126.8 (−56.8%) 432.0 (+47.2%) 277.6 (−5.4%) 278.2 (−5.2%)V 195.0 89.1 (−54.3%) 280.6 (+43.9%) 189.3 (−2.9%) 189.8 (−2.7%)VI 36.9 14.2 (−61.5%) 35.3 (−4.3%) 35.8 (−3.0%) 35.6 (−3.5%)VII 39.7 20.1 (−49.4%) 37.4 (−5.8%) 37.7 (−5.0%) 37.9 (−4.5%)VIII 14.4 7.1 (−50.7%) 12.5 (−13.2%) 12.6 (−12.5%) 13.4 (−6.9%)
Table 10: Measured and estimated total energy consumption (in Joules) for the synthetic traces executed on theToshiba HDD. The numbers listed have the same meaning as in Table 8.
Trace Actual 2-Parameter 3-Parameter Coarse-Dempsey DempseyA 5808.0 3338.7 (−42.5%) 8614.2 (+48.3%) 5507.9 (−5.2%) 5511.0 (−5.1%)B 5206.0 3453.1 (−33.7%) 6884.8 (+32.3%) 4992.9 (−4.1%) 4994.6 (−4.1%)C 6476.9 3556.0 (−45.1%) 9523.5 (+47.0%) 6114.3 (−5.6%) 6115.0 (−5.6%)D 6992.9 3914.4 (−44.0%) 10059.3 (+43.8%) 6832.6 (−2.3%) 6834.9 (−2.3%)E 6115.2 3516.5 (−42.5%) 9305.7 (+52.2%) 5934.4 (−3.0%) 5935.8 (−3.0%)F 5544.0 3392.5 (−38.8%) 8297.2 (+49.6%) 5421.8 (−2.2%) 5421.9 (−2.2%)
Table 11: Measured and estimated total energy consumption (in Joules) for the real-world traces executed on theToshiba HDD. The numbers listed have the same meaning as in Table 8.
Dempsey uses a fine-grained approach to modelthe energy consumption of a disk. In particular,Dempsey attempts to accurately estimate the en-ergy consumption of specific disk stages, namely,seeking, rotation, reading, writing and idle-periods.Dempsey is also compared against several othermodels, which model disk power consumption in lessdetail than Dempsey. The results show that accu-rate modeling of disk behavior during idle periodsis critical to the accuracy of any power model. Ac-curate modeling of periods of activity is also shownto be important, although to a smaller extent.
Acknowledgments
We would like to thank our shepherd Erik Riedeland other FAST referees for their excellent sugges-tions and many pointers to existing related work.We would also like to thank Russ Joseph for puttingtogether the PC Card sleeve that we could use forour measurements.
References
[1] Adaptive power management for mobile harddrives. Tech. rep., Storage Systems Divi-sion, IBM Corporation, April 1999. Available
at: http://www.almaden.ibm.com/almaden/pb-whitepaper.pdf.
[2] Aboutabl, M., Agrawala, A. K., and De-cotignie, J.-D. Temporally determinate disk ac-cess: An experimental approach. In Measure-ment and Modeling of Computer Systems (1998),pp. 280–281.
[3] Douglis, F., Krishnan, P., and Bershad, B.Adaptive disk spin-down policies for mobile com-puters. In Proceedings of the Second USENIX Sym-posium on Mobile and Location Independent Com-puting (April 1995), pp. 121–137.
[4] Douglis, F., Krishnan, P., and Marsh, B.Thwarting the power-hungry disk. In Proceedings ofthe Winter USENIX Conference (1994), pp. 292–306.
[5] Farkas, K. I., Flinn, J., Back, G., Grunwald,D., and Anderson, J.-A. M. Quantifying the en-ergy consumption of a pocket computer and a javavirtual machine. In Proc. International Conferenceon Measurement and Modeling of Computer Sys-tems (2000), pp. 252–263.
[6] Ganger, G., Worthington, B., and Patt, Y.The DiskSim Simulation Environment Version 2.0Reference Manual, December 1999. Available at:http://www.ece.cmu.edu/ ganger/disksim/.
[7] Golding, R. A., Bosch, P., Staelin, C., Sul-livan, T., and Wilkes, J. Idleness is not sloth.In Proceedings of the Winter USENIX Conference(1995), pp. 201–212.
Trace IBM Microdrive Toshiba HDDActual Dempsey Actual Dempsey
A 742 745 (+0.4%) 187 189 (+1.1%)B 424 428 (+0.9%) 130 134 (+3.1%)C 757 774 (+2.2%) 220 231 (+5.0%)D 783 810 (+3.4%) 158 163 (+3.2%)E 655 661 (+0.9%) 330 344 (+4.2%)F 529 532 (+0.6%) 318 325 (+2.2%)
Table 12: Number of sleeps. The columns labeled “Actual” give the number of sleeps in a real execution ofthe trace, while the columns labeled “Dempsey” list the number of sleeps estimated by Dempsey. The numbers inparentheses are the percentage difference between the estimated and the actual values.
[8] Greenawalt, P. Modeling power management forhard disks. In Proceedings of the Symposium onModeling and Simulation of Computer Telecommu-nication Systems (1994), pp. 62–66.
[9] Heath, T., Pinheiro, E., Hom, J., Kremer, U.,and Bianchini, R. Application transformationsfor energy and performance-aware device manage-ment. In Proceedings of the 11th International Con-ference on Parallel Architectures and CompilationTechniques (Sept. 2002).
[10] Helmbold, D. P., Long, D. D. E., Sconyers,T. L., and Sherrod, B. Adaptive disk spin-downfor mobile computers. Mobile Networks and Appli-cations 5, 4 (2000), 285–297.
[11] Joseph, R., and Martonosi, M. Run-timepower estimation in high-performance microproces-sors. In Proceedings of the International Symposiumon Low-Power Electronics and Design (Aug. 2001).
[12] Kotz, D., Toh, S. B., and Radhakrishnan, S.A detailed simulation model of the HP 97560 diskdrive. Tech. Rep. PCS-TR94-220, Dept. of Com-puter Science, Dartmouth College, July 1994.
[13] Krishnan, P., Long, P. M., and Vitter, J. S.Adaptive disk spindown via optimal rent-to-buyin probabilistic environments. In Proceedings ofthe Twelfth International Conference on MachineLearning (1995), pp. 322–330.
[14] Li, K., Kumpf, R., Horton, P., and Ander-son, T. E. A quantitative analysis of disk drivepower management in portable computers. In Proc.of Winter USENIX Conference (January 1994),pp. 279–292.
[15] Muller, K., and Pasquale, J. A high perfor-mance multi-structured file system design. In Pro-ceedings of the 13th ACM Symposium on OperatingSystem Principles (1991), pp. 56–67.
[16] Papathanasiou, A. E., and Scott, M. L. In-creasing disk burstiness for energy efficiency. Tech.Rep. 792, University of Rochester, November 2002.
[17] Rosenblum, M., and Ousterhout, J. K. Thedesign and implementation of a log-structured file
system. ACM Transactions on Computer Systems10, 1 (1992), 26–52.
[18] Ruemmler, C., and Wilkes, J. UNIX disk accesspatterns. In Proc. of the Winter USENIX Confer-ence (San Diego, CA, Jan. 1993), Usenix Associa-tion, pp. 405–420.
[19] Ruemmler, C., and Wilkes, J. An Introduc-tion to Disk Drive Modeling. IEEE Computer 27,3 (March 1994), 17–29.
[20] Schindler, J., and Ganger, G. Automated diskdrive characterization. Tech. Rep. CMU-CS-99-176, School of Computer Science, Carnegie MellonUniversity, December 1999.
[21] Talagala, N., Arpaci-Dusseau, R. H., andPatterson, D. Microbenchmark-based extractionof local and global disk characteristics. Tech. Rep.CSD-99-1063, University of California, Berkeley,1999.
[22] Thekkath, C. A., Wilkes, J., and Lazowska,E. D. Techniques for file system simulation. Soft-ware - Practice and Experience 24, 11 (1994), 981–999.
[23] Weissel, A., Beutel, B., and Bellosa, F. Co-operative I/O: A novel I/O semantics for energy-aware applications. In Proceedings of the Fifth Sym-posium on Operating Systems Design and Imple-mentation (Dec. 2002), pp. 117–129.
[24] Worthington, B. L., Ganger, G. R., Patt,Y. N., and Wilkes, J. On-line extraction of SCSIdisk drive parameters. In Proceedings of the ACMSigmetrics Conference (1995), pp. 146–156.
[25] Zeng, H., Fan, X., Ellis, C., Lebeck, A., andVahdat, A. ECOSystem: Managing energy asa first class operating system resource. In TenthInternational Conference on Architectural Supportfor Programming Languages and Operating Systems(Oct. 2002).
[26] Zheng, F., Garg, N., Sobti, S., Zhang, C.,Joseph, R., Krishnamurthy, A., and Wang, R.Considering the energy consumption of mobile stor-age alternatives. Submitted for publication, 2002 .


