Embed Size (px)
Citation preview

1
. To: Assembly Judiciary Committee From: Nevada Attorneys for Criminal Justice Date: March 27, 2017 Re: Assembly Bill 237 Support for Assembly Bill 237 Nevada Attorneys for Criminal Justice supports Assembly Bill 237, making life without the possibility of parole the most severe punishment available under Nevada law. Basis for Support Assembly Bill 237 would replace the death penalty with life without the possibility of parole. Put differently, Assembly Bill 237 replaces death by execution with death by incarceration. Because history has proven that Nevada’s death penalty serves no practical purpose and cannot be repaired, Nevada Attorneys for Criminal Justice supports Assembly Bill 237. The death penalty does not serve any penological purpose: Criminal punishment is meant to serve four purposes: deterrence of crime, incapacitation of offenders, retribution, or rehabilitation.1 For consideration of Assembly Bill 237, two of these purposes are unaffected. Life without the possibility of parole and the death penalty are equally effective in incapacitating offenders. Life without the possibility of parole and the death penalty are also equally effective in rehabilitating offenders—which is to say, neither punishment aspires to rehabilitation. Thus incapacitation and rehabilitation do not justify the death penalty. Neither do deterrence nor retribution. No evidence supports the idea that the death penalty deters: In 2012 the National Research Council, an arm of the National Academy of Sciences, conducted a study to determine if any researchers had shown a relationship between the death penalty and deterrence.2 They concluded that, even after substantial attempts to show such a link, no deterrent effect could be proven.3 In contrast, research does show that would-be offenders are deterred from crime if they know there is a large probability of being apprehended.4 In this regard, the cost of the death penalty is very important: money spent on the death penalty—which has no proven relationship with deterrence—is money that could be spent on more efficient law enforcement, or adding officers—
President Lance Hendron Vice President – South T. Augustus Claus Vice President – North Marty Wiener Secretary Augustus Claus Treasurer Maizie Pusich Past President Amy Coffee Board of Directors Paola Armeni Robert Arroyo Susan Burke Peter Cleary Scott Coffee David Fischer Franny Forsman Stephanie Kice John Malone Ivette Amelburu Maningo Joel Mann Michael Pescetta Marc Picker Randall Pike Maizie Pusich Lisa Rasmussen David Schieck Lori Teicher Rene Valladares Marty Wiener Emeritus Dan Albregts Howard Brooks Walter Fey Dominic Gentile Alzora Jackson Phil Kohn Tom Pitaro Cal Potter Jonell Thomas John Watkins Karen Winckler Richard Wright Mace Yampolsky
N A C J Nevada Attorneys for Criminal Justice

2
which does have proven deterrent results.5 The death penalty is ineffective for retribution: Victims are not served by the death penalty. Researchers recently compared the physical, psychological, and behavioral health of two groups of victims: some in Texas, where the maximum punishment is the death penalty, and some in Minnesota, where the maximum punishment is life without release.6 The study concluded that closure and predictability of the process were the most important factors for victim well-being.7 Because Minnesota did not have the death penalty, its process ended within a couple of years; in contrast, in Texas, the process was long and unpredictable.8 Thus, the study concluded that victims were better served by a system where life without the possibility of parole is the ultimate punishment. The same holds true in Nevada, where a person sentenced to death is four times more likely to have that sentence overturned than they are to be executed.9 The death penalty is broken beyond repair: Since the United States Supreme Court brought back the death penalty in 1976, Nevada has tinkered with the process and procedures of imposing death. Roughly forty years of tinkering have not created a fair death penalty. Executions in Nevada are rare: since 1976, only twelve people have been executed; only one of these was involuntary; the last execution in Nevada was more than a decade ago.10 Executions will only get rarer as more and more prosecutors conclude that the death penalty is not worth the time, expense, or problems.11 In Nevada, simply seeking the death penalty makes a homicide substantially more expensive to prosecute: the recent legislative audit concluded seeking the death penalty cost, on average, half a million dollars more.12 Finally, the drugs Nevada previously used in executions are unavailable, with no indication that they will become available.13 This lack of drugs means that Nevada prosecutors continue to waste tax dollars pursuing a death sentence without the means of actually being able to carry it out. Imposition of the death penalty remains unfair: Another problem is the impact of the death penalty on veterans: the post-traumatic stress disorder caused by their service is often intimately connected to the crime committed.14 Despite this, veterans receive death sentences without any understanding of this connection, or recognition of the veteran’s service to this country.15 The death penalty is also disproportionately influenced by two factors that have nothing to do with the heinousness of the offense: race and geography. Nevada’s death row is disproportionately African-American.16 Clark County’s prolific death practice has placed more people on death row than all but five counties of the more than 3,000 counties in the United States.17 Nationally, Clark County is an outlier jurisdiction.18 Implicit bias infects administration of the death penalty, particularly in selecting jurors: Scholars are still coming to terms with how much implicit bias (in addition to explicit bias) affects our justice system.19 Implicit bias poses a serious problem for the continued use of the death penalty.20 Consider death qualification: the process under which potential jurors are struck if they are unwilling to impose the death penalty.21 Those who are willing to consider the death penalty are “death qualified.” These jurors, it turns out, have greater implicit racial bias than their non-death-qualified counterparts.22 Death qualification, which only occurs in death penalty cases, infects these cases with racial bias. This is only one example of a major flaw within death penalty schemes; these flaws render the death penalty unfair.
3
It is time to abolish the death penalty: Nevada Attorneys for Criminal Justice believes that this legislature has the opportunity to end a practice that has long outlived its usefulness. The death penalty is not effective for deterrence or retribution. And the death penalty is not fair. In discussing why he voted to abolish the death penalty, Justice Thurgood Marshall wrote:
No nation in the recorded history of man has a greater tradition of revering justice and fair treatment for all its citizens in times of turmoil, confusion, and tension than ours. This is a country which stands tallest in troubled times, a country that clings to fundamental principles, cherishes its constitutional heritage, and rejects simple solutions that compromise the values that lie at the roots of our democratic system.23
As this body considers Assembly Bill 237, Nevada Attorneys for Criminal Justice requests that the Committee consider whether the death penalty is consistent with the values that underlie our democratic system. Whether a punishment, divorced from penological purpose, inflicted under the shadow of racial bias, is a punishment consistent with fundamental principles of justice. The death penalty is not. And for these reasons, we support passage of this bill. Very truly yours,
Randolph M. Fiedler Randolph M. Fiedler NACJ Legislative Committee
1 See Glossip v. Gross, 135 S. Ct. 2726, 2767 (2015) (Breyer, J., dissenting); see also Ewing v. California, 538 U.S. 11, 25 (2003). 2 National Research Council, Deterrence and the Death Penalty (2012) (attached as Exhibit A). 3 Id. at 2. 4 Daniel S. Nagin, Deterrence in the Twenty-First Century, 42 Crime & Just. 199, 201-02 (2013) (attached as Exhibit B). 5 See State of Nevada Legislative Auditor, Performance Audit: Fiscal Costs of the Death Penalty, LA14-25, at 10 (Nov. 17, 2014) [hereinafter Performance Audit] (noting that the average cost difference between death penalty and non-death penalty cases is $532,000). 6 Marilyn Peterson Armour & Mark S. Umbreit, Assessing the Impact of the Ultimate Penal Sanction on Homicide Survivors: A Two State Comparison, 96 Marq. L. Rev. 1, 3 (Fall 2012) (attached as Exhibit C) 7 Id. at 97. 8 Id. at 98. 9 See, e.g., James S. Liebman, Jeffrey Fagan, & Valerie West, A Broken System, at 74 (June 12, 2000) (indicating 68% error rate in Nevada’s death penalty cases from 1973-1995), available at http://www2.law.columbia.edu/instructionalservices/liebman/liebman_final.pdf 10 See Guy Rocha, An Outline of Capital Punishment in Nevada, Nevada State Library, Archives and Public Records, available at http://nsla.nv.gov/Archives/Capital_Punishment/ 11 The Editorial Board, A Wiser Generation of Prosecutors, N.Y. Times, Feb. 6, 2017, available at https://www.nytimes.com/2017/02/06/opinion/a-wiser-generation-of-prosecutors.html?_r=0; Frances Robles and Alan Blinder, Florida Prosecutor Takes a Bold Stand Against the Death Penalty, N.Y.

4
Times, March 16, 2017, available at https://www.nytimes.com/2017/03/16/us/orlando-prosecutor-will-no-longer-seek-death-penalty.html?_r=1 12 Performance Audit, supra n.5, at 10. 13 Sean Whaley, Nevada’s New $860,000 execution chamber is finished but gathering dust, Las Vegas Rev. J. (Nov. 27, 2016) (noting that not a single pharmaceutical company responded to the bid for additional drugs) available at http://www.reviewjournal.com/crime/nevada-s-new-860000-execution-chamber-finished-gathering-dust 14 See Richard C. Dieter, Death Penalty Information Center, Battle Scars: Military Veterans and the Death Penalty, at 25 (Veteran’s Day 2015) [hereinafter Battle Scars] (“his case fits the characteristics of many other veterans who have been sentenced to death: evidence of mental illness, probably caused by or exacerbated by PTSD or other military-related trauma; a bizarre and horrendous crime, followed by the vet’s fatalistic admittance of what he did; and finally a harsh denial of mercy, despite the mitigating evidence of military service and the toll that it might have taken.”) (attached as Exhibit D); see also Iulia Filip, Should Veterans With PTSD Be Exempt From the Death Penalty, The Atlantic (Jan. 30, 2015), available at https://www.theatlantic.com/national/archive/2015/01/should-veterans-with-ptsd-be-exempt-from-the-death-penalty/384940/ ; James P. Cullen, David R. Irvine, and Stephen N. Xenakis, Vets suffering from PTSD need our help: Column, USA Today (Nov. 11, 2015) available at http://www.usatoday.com/story/opinion/2015/11/11/vets-suffering-ptsd-need-our-help-death-row-column/75520218/; Richard A. Serrano, Why are 10% of prisoners on death row veterans, some with PTSD?, L.A. Times (Nov. 9, 2015) available at http://www.latimes.com/nation/la-na-veterans-death-penalty-20151109-story.html 15 See Battle Scars, supra n.14 at 4. 16 See Performance Audit, supra n.5, at 84-86. 17 Richard C. Dieter, Death Penalty Information Center, The 2% Death Penalty: How a Minority of Counties Produce Most Death Cases At Enormous Costs to All, at 8 (October 2013). 18 Id. 19 Justin D. Levinson, Robert J. Smith & Danielle M. Young, Devaluing Death: An Empical Study of Implicit Racial Bias on Jury Eligible Citizens in Six Death Penalty States 89 N.Y.U. L. Rev. 513, 545 (May 2014) [hereinafter Devaluing Death] (attached as Exhibit E); see also McCarty v. State, 371 P.3d 1002, 1006, 132 Nev. Adv. Op. 20 (2016). 20 Edwin Grimsley, What Wrongful Convictions Teach Us About Racial Inequality, The Innocence Project (Sept. 26, 2012), available at https://www.innocenceproject.org/what-wrongful-convictions-teach-us-about-racial-inequality/ 21 See, e.g., Lockhart v. McCree, 476 U.S. 162 (1986). 22 Devaluing Death, supra n.9, at 559. 23 Furman v. Georgia, 408 U.S. 238, 370 (1972) (Marshall, J., concurring).

Exhibit A: National Research Council, Deterrence and the Death
Penalty (2012)

Visit the National Academies Press online and register for...
Instant access to free PDF downloads of titles from the
Distribution, posting, or copying of this PDF is strictly prohibited without written permission of the National Academies Press. Unless otherwise indicated, all materials in this PDF are copyrighted by the National Academy of Sciences. Request reprint permission for this book
Copyright © National Academy of Sciences. All rights reserved.
10% off print titles
Custom notification of new releases in your field of interest
Special offers and discounts
NATIONAL ACADEMY OF SCIENCES
NATIONAL ACADEMY OF ENGINEERING
INSTITUTE OF MEDICINE
NATIONAL RESEARCH COUNCIL
This PDF is available from The National Academies Press at http://www.nap.edu/catalog.php?record_id=13363
ISBN978-0-309-25416-8
144 pages6 x 9PAPERBACK (2012)
Deterrence and the Death Penalty
Daniel S. Nagin and John V. Pepper, editors; Committee on Deterrence and the Death Penalty; Committee on Law and Justice; Division on Behavioral and Social Sciences and Education; National Research Council
Copyright © National Academy of Sciences. All rights reserved.
Deterrence and the Death Penalty
DETERRENCEAND THE
DEATH PENALTY
Committee on Deterrence and the Death Penalty
Daniel S. Nagin and John V. Pepper, Editors
Committee on Law and Justice
Division of Behavioral and Social Sciences and Education

Copyright © National Academy of Sciences. All rights reserved.
Deterrence and the Death Penalty
THE NATIONAL ACADEMIES PRESS • 500 Fifth Street, NW • Washington, DC 20001
NOTICE: The project that is the subject of this report was approved by the Govern-ing Board of the National Research Council, whose members are drawn from the councils of the National Academy of Sciences, the National Academy of Engineer-ing, and the Institute of Medicine. The members of the committee responsible for the report were chosen for their special competences and with regard for appropri-ate balance.
This study was supported by Grant Number 2010-IJ-CX-0018 from the National Institute of Justice, Grant Number TRF09-01115 from the Tides Foundation, and the Proteus Action League (grant not numbered). Any opinions, findings, conclu-sions, or recommendations expressed in this publication are those of the author(s) and do not necessarily reflect the views of the organizations or agencies that pro-vided support for the project.
International Standard Book Number-13: 978-0-309-25416-8International Standard Book Number-10: 0-309-25416-7
Additional copies of this report are available from the National Academies Press, 500 Fifth Street, NW, Keck 360, Washington, DC 20001; (800) 624-6242 or (202) 334-3313; http://www.nap.edu.
Copyright 2012 by the National Academy of Sciences. All rights reserved.
Printed in the United States of America
Suggested citation: National Research Council. (2012). Deterrence and the Death Penalty. Committee on Deterrence and the Death Penalty, Daniel S. Nagin and John V. Pepper, Eds. Committee on Law and Justice, Division of Behavioral and Social Sciences and Education. Washington, DC: The National Academies Press.

Copyright © National Academy of Sciences. All rights reserved.
Deterrence and the Death Penalty
The National Academy of Sciences is a private, nonprofit, self-perpetuating society of distinguished scholars engaged in scientific and engineering research, dedicated to the furtherance of science and technology and to their use for the general welfare. Upon the authority of the charter granted to it by the Congress in 1863, the Acad-emy has a mandate that requires it to advise the federal government on scientific and technical matters. Dr. Ralph J. Cicerone is president of the National Academy of Sciences.
The National Academy of Engineering was established in 1964, under the charter of the National Academy of Sciences, as a parallel organization of outstanding en-gineers. It is autonomous in its administration and in the selection of its members, sharing with the National Academy of Sciences the responsibility for advising the federal government. The National Academy of Engineering also sponsors engineer-ing programs aimed at meeting national needs, encourages education and research, and recognizes the superior achievements of engineers. Dr. Charles M. Vest is presi-dent of the National Academy of Engineering.
The Institute of Medicine was established in 1970 by the National Academy of Sciences to secure the services of eminent members of appropriate professions in the examination of policy matters pertaining to the health of the public. The Insti-tute acts under the responsibility given to the National Academy of Sciences by its congressional charter to be an adviser to the federal government and, upon its own initiative, to identify issues of medical care, research, and education. Dr. Harvey V. Fineberg is president of the Institute of Medicine.
The National Research Council was organized by the National Academy of Sci-ences in 1916 to associate the broad community of science and technology with the Academy’s purposes of furthering knowledge and advising the federal government. Functioning in accordance with general policies determined by the Academy, the Council has become the principal operating agency of both the National Academy of Sciences and the National Academy of Engineering in providing services to the government, the public, and the scientific and engineering communities. The Council is administered jointly by both Academies and the Institute of Medicine. Dr. Ralph J. Cicerone and Dr. Charles M. Vest are chair and vice chair, respectively, of the National Research Council.
www.national-academies.org

Copyright © National Academy of Sciences. All rights reserved.
Deterrence and the Death Penalty

Copyright © National Academy of Sciences. All rights reserved.
Deterrence and the Death Penalty
v
COMMITTEE ON DETERRENCE AND THE DEATH PENALTY
DANIEL S. NAGIN (Chair), H. John Heinz III College, Carnegie Mellon University
KERWIN K. CHARLES, Harris School of Public Policy Studies, University of Chicago
PHILIP J. COOK, Sanford School of Public Policy, Duke University STEVEN N. DURLAUF, Department of Economics, University of
Wisconsin–Madison AMELIA M. HAVILAND, H. John Heinz III College, Carnegie Mellon
University GERARD E. LYNCH, U.S. Court of Appeals for the Second Circuit CHARLES F. MANSKI, Department of Economics, Northwestern
University JAMES Q. WILSON, School of Public Policy, Pepperdine University, and
Clough Center for the Study of Constitutional Democracy, Boston College
JANE L. ROSS, Study DirectorJOHN V. PEPPER, Consultant KEIKO ONO, Senior Program AssociateCAROL HAYES, Christine Mirzayan FellowBARBARA BOYD, Administrative Associate

Copyright © National Academy of Sciences. All rights reserved.
Deterrence and the Death Penalty
vi
COMMITTEE ON LAW AND JUSTICE 2012
JEREMY TRAVIS (Chair), John Jay College of Criminal Justice, City University of New York
CARL C. BELL, Community Mental Health Council, Inc., Chicago, IL JOHN J. DONOHUE, III, Stanford Law School, Stanford UniversityMARK A.R. KLEIMAN, Department of Public Policy, University of
California, Los AngelesGARY LAFREE, Department of Criminology and Criminal Justice,
University of Maryland JANET L. LAURITSEN, Department of Criminology and Criminal
Justice, University of Missouri-St. Louis GLENN C. LOURY, Department of Economics, Brown UniversityCHARLES F. MANSKI, Department of Economics, Northwestern
University TERRIE E. MOFFITT, Department of Psychology and Neuroscience,
Duke University DANIEL S. NAGIN, H. John Heinz III College, Carnegie Mellon
UniversityRUTH D. PETERSON, Criminal Justice Research Center, Ohio State
University ANNE MORRISON PIEHL, Department of Economics and Program in
Criminal Justice, Rutgers UniversityDANIEL B. PRIETO, Public Sector Strategy & Innovation, IBM Global
Business Services, Washington, DCROBERT J. SAMPSON, Department of Sociology, Harvard University DAVID WEISBURD, Department of Criminology, Law and Society,
George Mason University CATHY SPATZ WIDOM, Psychology Department, John Jay College of
Criminal Justice, City University of New YorkPAUL K. WORMELI, Integrated Justice Information Systems,
Ashburn, VA
JANE L. ROSS, DirectorBARBARA BOYD, Administrative Associate

Copyright © National Academy of Sciences. All rights reserved.
Deterrence and the Death Penalty
vii
IN MEMORIAM
James Q. Wilson 1931-2012
“I’ve tried to follow the facts wherever they land.”
This report is dedicated to James Q. Wilson for his long service to the National Research Council,
his influential career of scholarship and public service, and his unblinking commitment to the principle that science requires us to interpret the evidence as it is, not as we want it to be.

Copyright © National Academy of Sciences. All rights reserved.
Deterrence and the Death Penalty

Copyright © National Academy of Sciences. All rights reserved.
Deterrence and the Death Penalty
ix
Preface
More than three decades ago, in Deterrence and Incapacitation: Estimating the Effects of Criminal Sanctions on Crime Rates, the National Research Council (NRC) (1978, p. 9) concluded
that “available studies provide no useful evidence on the deterrent effect of capital punishment.” That report was issued 2 years after the Supreme Court decision in Gregg v. Georgia ended a 4-year moratorium on execu-tion in the United States. In the 35 years since the publication of that report, especially in recent years, a considerable number of post-Gregg studies have attempted to estimate the effect of the legal status or the actual implemen-tation of the death penalty on homicide rates. Those studies have reached widely varying conclusions.
Against this background, the NRC formed the Committee on Deter-rence and the Death Penalty to address whether the available evidence provides a reasonable basis for drawing conclusions about the magnitude of the effect of capital punishment on homicide rates. At a workshop on April 28-29, 2011, workshop papers commissioned by the committee (which will be published in a special issue of the Journal of Quantitative Criminology) were presented and discussed by their authors: Robert J. Apel, University at Albany, State University of New York; Aaron Chalfin, University of Califor-nia, Berkeley; Chao Fu, University of Wisconsin–Madison; Justin McCrary, University of California, Berkeley; Salvador Navarro, University of Western Ontario, Ontario, Canada; John V. Pepper, University of Virginia; and Steven Raphael, University of California, Berkeley. The workshop also included comments on the presentations by Jeffrey Grogger, University of Chicago; Guido Imbens, Harvard University; Kenneth C. Land, Duke

Copyright © National Academy of Sciences. All rights reserved.
Deterrence and the Death Penalty
x PREFACE
University; Christopher Sims, Princeton University; and Justin Wolfers, University of Pennsylvania.
The committee appreciates the contributions of these presenters and those who commented on them to the development of its report. In ad-dition, John V. Pepper provided invaluable assistance to the committee throughout its deliberations. The work of staff members from the Com-mittee on Law and Justice of the NRC facilitated the committee’s work in many ways. Thanks are due to Jane L. Ross, study director; Keiko Ono, senior program associate; Carol Hayes, Christine Mirzayan fellow; and Barbara Boyd, administrative coordinator.
Many individuals at the NRC assisted the committee. We thank Kirsten Sampson-Snyder, who shepherded the report through the NRC review pro-cess, Eugenia Grohman, who edited the draft report, and Yvonne Wise, for processing the report through final production.
This report has been reviewed in draft form by individuals chosen for their diverse perspectives and technical expertise, in accordance with pro-cedures approved by the NRC’s Report Review Committee. The purpose of this independent review is to provide candid and critical comments that will assist the institution in making its published report as sound as possible and to ensure that the report meets institutional standards for objectivity, evidence, and responsiveness to the study charge. The review comments and draft manuscript remain confidential to protect the integrity of the deliberative process. We thank the following individuals for their review of this report: John Donohue, III, Stanford Law School, Stanford University; Andrew Gelman, Department of Statistics and Department of Political Sci-ence, Columbia University; Kenneth C. Land, Department of Sociology, Duke University; Candice Odgers, School of Social Ecology, University of California, Irvine; Ricardo Reis, Department of Economics, Columbia Uni-versity; Greg Ridgeway, RAND Safety and Justice Program, RAND Center on Quality Policing, RAND Corporation; Robert J. Sampson, Department of Sociology, Harvard University; Dick Thornburgh, Counsel, K&L Gates, LLP, and former Attorney General of the United States; Petra E. Todd, Department of Economics, University of Pennsylvania; and Michael Tonry, School of Law, University of Minnesota, Minneapolis.
Although the reviewers listed above have provided many constructive comments and suggestions, they were not asked to endorse the conclusions or recommendations nor did they see the final draft of the report before its release. The review of this report was overseen by Gary LaFree, National Consortium for the Study of Terrorism and Responses to Terrorism, Univer-sity of Maryland, and John T. Monahan, University of Virginia Law School. Appointed by the NRC, they were responsible for making certain that an independent examination of this report was carried out in accordance with institutional procedures and that all review comments were carefully con-

Copyright © National Academy of Sciences. All rights reserved.
Deterrence and the Death Penalty
PREFACE xi
sidered. Responsibility for the final content of this report rests entirely with the authoring committee and the institution.
This report is dedicated to James Q. Wilson. Jim was a valued member of this and many other NRC committees on which he served over his long and influential career. Jim’s contributions to scholarship and public service will stand as enduring testimony to the power of his intellect. He was a quiet but forceful proponent for balanced and clear-minded assessment of the evidence. I first met Jim in my role as a staff member of the 1978 NRC committee that resulted in report Deterrence and Incapacitation: Estimat-ing the Effect of Criminal Sanctions on Crime Rates. I was deeply impressed by the clarity of his thought and gift for communication. He served as a role model for me ever since. I was thus especially honored that he agreed to serve on this committee, which was greatly aided by his constructive participation throughout our deliberations.
Daniel S. Nagin, ChairCommittee on Deterrence and the Death Penalty

Copyright © National Academy of Sciences. All rights reserved.
Deterrence and the Death Penalty

Copyright © National Academy of Sciences. All rights reserved.
Deterrence and the Death Penalty
xiii
Contents
SUMMARY 1 Shortcomings in Existing Research, 4 Specification of the Sanction Regime for Homicide, 4 Potential Murderers’ Perceptions of and Responses to Capital Punishment, 5 Strong and Unverifiable Assumptions, 6 Next Steps for Research, 7 References, 8
1 INTRODUCTION 9 The Current Debate, 9 Committee Charge and Scope of Work, 11 References, 14
2 CAPITAL PUNISHMENT IN THE POST-GREGG ERA 15 Executions and Death Sentences Over Time, 15 Use of the Death Penalty, 20 References, 26 3 DETERMINING THE DETERRENT EFFECT OF
CAPITAL PUNISHMENT: KEY ISSUES 27 Concepts of Deterrence, 28 Sanction Regimes, 32
Copyright © National Academy of Sciences. All rights reserved.
Deterrence and the Death Penalty
xiv CONTENTS
Data Issues, 36 Variations in Murder Rates, 37 Reciprocal Effects Between Homicide Rates and Sanction Regimes, 41 Summary, 43 References, 44
4 PANEL STUDIES 47 Panel Studies Reviewed, 48 Methods Used: Overview, 48 The Studies, Their Characteristics, and the Effects Found, 49 Specifying the Expected Cost of Committing a Capital
Homicide: f(Zit), 54 Model Assumptions, 63 Benefits of Random Assignment, 64 Fixed Effect Regression Model, 65 Instrumental Variables, 66 Homogeneity, 68 Conclusion, 70 References, 71
5 TIME-SERIES STUDIES 75 Basic Conceptual Issues, 76 Execution Event Studies, 76 Studies of Deviations from Fitted Trends, 78 Vector Autoregressions, 82 Evidence Under Existing Criminal Sanction Regimes, 82 Granger Causality and Causality as Treatment Response, 86 Choice of Variables in VAR Studies, 88 Inferences Under Alternative Sanction Regimes, 89 Event Studies, 90 Time-Series Regressions, 92 Cross-Polity Comparisons, 94 Conclusions, 97 References, 99
6 CHALLENGES TO IDENTIFYING DETERRENT EFFECTS 101 Data on Sanction Regimes, 104 Perceptions of Sanction Risks, 105 Measurement of Perceptions, 107 Inference on Perceptions from Homicide Rates Following Executions, 110

Copyright © National Academy of Sciences. All rights reserved.
Deterrence and the Death Penalty
CONTENTS xv
Identifying Effects: Feedbacks and Unobserved Confounders, 111 Feedback Effects, 111 Omitted Variables, 112 The Equilibrium Effect, 113 Addressing Model Uncertainty with Weaker Assumptions, 115 Model Averaging, 116 Partial Identification, 119 References, 121
Appendix: Biographical Sketches of Committee Members and Staff 125

Copyright © National Academy of Sciences. All rights reserved.
Deterrence and the Death Penalty
Copyright © National Academy of Sciences. All rights reserved.
Deterrence and the Death Penalty
1
Summary
In 1976, the Supreme Court decision in Gregg v. Georgia (428 U.S. 153) ended the 4-year moratorium on executions that had resulted from its 1972 decision in Furman v. Georgia (408 U.S. 238). In the immediate
aftermath of Gregg, an earlier report of the National Research Council (NRC) reviewed the evidence relating to the deterrent effect of the death penalty that had been gathered through the mid-1970s. That review was highly critical of the earlier research and concluded (National Research Council, 1978, p. 9) that “available studies provide no useful evidence on the deterrent effect of capital punishment.”
During the 35 years since Gregg, and particularly in the past decade, many additional studies have renewed the attempt to estimate the effect of capital punishment on homicide rates. Most researchers have used post-Gregg data from the United States to examine the statistical association between homicide rates and the legal status, the actual implementation of the death penalty, or both. The studies have reached widely varying, even contradictory, conclusions. Some studies conclude that executions save large numbers of lives; others conclude that executions actually increase homicides; and still others conclude that executions have no effect on homicide rate. Commentary on the scientific validity of the findings has sometimes been acrimonious. The Committee on Deterrence and the Death Penalty was convened against this backdrop of conflicting claims about the effect of capital punishment on homicide rates. The committee addressed three main questions laid out in its charge:

Copyright © National Academy of Sciences. All rights reserved.
Deterrence and the Death Penalty
2 DETERRENCE AND THE DEATH PENALTY
1. Does the available evidence provide a reasonable basis for drawing conclusions about the magnitude of capital punishment’s effect on homicide rates?
2. Are there differences among the extant analyses that provide a ba-sis for resolving the differences in findings? Are the differences in findings due to inherent limitations in the data? Are there existing statistical methods and/or theoretical perspectives that have yet to be applied that can better address the deterrence question? Are the limitations of existing evidence reflective of a lack of information about the social, economic, and political underpinnings of homi-cide rates and/or the administration of capital punishment that first must be resolved before the deterrent effect of capital punishment can be determined?
3. Do potential remedies to shortcomings in the evidence on the de-terrent effect of capital punishment have broader applicability for research on the deterrent effect of noncapital sanctions?
CONCLUSION AND RECOMMENDATION: The committee con-cludes that research to date on the effect of capital punishment on ho-micide is not informative about whether capital punishment decreases, increases, or has no effect on homicide rates. Therefore, the committee recommends that these studies not be used to inform deliberations requiring judgments about the effect of the death penalty on homicide. Consequently, claims that research demonstrates that capital punish-ment decreases or increases the homicide rate by a specified amount or has no effect on the homicide rate should not influence policy judg-ments about capital punishment.
The committee was disappointed to reach the conclusion that research conducted in the 30 years since the earlier NRC report has not sufficiently advanced knowledge to allow a conclusion, however qualified, about the ef-fect of the death penalty on homicide rates. Yet this is our conclusion. Some studies play the useful role, either intentionally or not, of demonstrating the fragility of claims to have or not to have found deterrent effects. However, even these studies suffer from two intrinsic shortcomings that severely limit what can be learned from them about the effect of the death penalty—as it has actually been administered in the United States in the past 35 years—on the death penalty.
Properly understood, the relevant question about the deterrent effect of capital punishment is the differential or marginal deterrent effect of execu-tion over the deterrent effect of other available or commonly used penalties, specifically, a lengthy prison sentence or one of life without the possibility of

Copyright © National Academy of Sciences. All rights reserved.
Deterrence and the Death Penalty
SUMMARY 3
parole. One major deficiency in all the existing studies is that none specify the noncapital sanction components of the sanction regime for the punish-ment of homicide. Another major deficiency is the use of incomplete or implausible models of potential murderers’ perceptions of and response to the capital punishment component of a sanction regime. Without this basic information, it is impossible to draw credible findings about the effect of the death penalty on homicide.
Commentary on research findings often pits studies claiming to find statistically significant deterrent effects against those finding no statistically significant effects, with the latter studies sometimes interpreted as imply-ing that there is no deterrent effect. A fundamental point of logic about hypothesis testing is that failure to reject a null hypothesis does not imply that the null hypothesis is correct.
Our mandate was not to assess whether competing hypotheses about the existence of marginal deterrence from capital punishment are plausible, but simply to assess whether the empirical studies that we have reviewed provide scientifically valid evidence. In its deliberations and in this report, the committee has made a concerted effort not to approach this question with a prior assumption about deterrence. Having reviewed the research that purports to provide useful evidence for or against the hypothesis that the death penalty affects homicide rates, we conclude that it does not pro-vide such evidence.
A lack of evidence is not evidence for or against the hypothesis. Hence, the committee does not construe its conclusion that the existing studies are uninformative as favoring one side or the other side in the long-standing debate about deterrence and the death penalty. The committee also empha-sizes that deterrence is but one of many considerations relevant to rendering a judgment on whether the death penalty is good public policy.
Even though the scholarly evidence on the deterrent effect of capital punishment is too weak to guide decisions, this does not mean that people should have no views on capital punishment. Judgment about whether there is a deterrent effect is still relevant to policy, but that judgment should not be justified based on evidence from existing research on capital punishment’s effect on homicide. Just as important, the committee did not investigate the moral arguments for or against capital punishment or the empirical evidence on whether capital punishment is administered in a nondiscriminatory and consistent fashion. Nor did it investigate whether the risk of mistaken execution is acceptably small or how the cost of ad-ministering the death penalty compares to other sanction alternatives. All of these issues are relevant to making a judgment about whether the death penalty is good public policy.
Our charge was also limited to assessing the evidence on the deterrent effect of the death penalty on murder, not the deterrent effect of noncapital
Copyright © National Academy of Sciences. All rights reserved.
Deterrence and the Death Penalty
4 DETERRENCE AND THE DEATH PENALTY
sanctions on crime more generally. Our negative conclusion on the infor-mativeness of the evidence on the former issue should not be construed as extending to the latter issue because the committee did not review the very large body of evidence on the deterrent effect of noncapital sanctions.
SHORTCOMINGS IN EXISTING RESEARCH
The post-Gregg studies are usefully divided into two categories based on the type of data analyzed. One category, which we call panel data stud-ies, analyzes sets of states or counties measured over time, usually from about 1970 to 2000. These studies relate homicide rates to variations over time and across states or counties in the legal status of capital punishment and/or the frequency of executions. The second category, which we call time-series studies, generally studies only a single geographic unit. The geo-graphic unit may be as large as a nation or as small as a city. These studies usually examine whether there are short-term changes in homicide rates in that geographic unit in the aftermath of an execution.
As noted above, research on the effect of capital punishment on ho-micide suffers from two fundamental flaws that make them uninformative about the effect of capital punishment on homicide rates: they do not specify the noncapital sanction components of the sanction regime for the punishment of homicide, and they use incomplete or implausible models of potential murderers’ perceptions of and response to the capital punishment component of a sanction regime. In addition, the existing studies use strong and unverifiable assumptions to identify the effects of capital punishment on homicides.
Specification of the Sanction Regime for Homicide
The sanction regime for homicide comprises both the capital and non-capital sanctioning options that are available for its punishment and the policies governing the administration of these options. The relevant ques-tion regarding the deterrent effect of capital punishment is the differential deterrent effect of execution in comparison with the deterrent effect of other available or commonly used penalties. We emphasize “differential” because it is important to recognize that even in states that make the most intense use of capital punishment, most convicted murderers are not sentenced to death but to a lengthy prison sentence—often life without the possibility of parole.
None of the studies that we reviewed (both those using a panel ap-proach and those using time-series approaches) accounted for the severity of noncapital sanctions in their analyses. As discussed in Chapters 4 and 6, there are sound reasons to expect that the severity of the noncapital sanc-

Copyright © National Academy of Sciences. All rights reserved.
Deterrence and the Death Penalty
SUMMARY 5
tions for homicide varies systematically with the availability of capital pun-ishment, the intensity of use of capital punishment, or both. For example, the political culture of a state may affect the frequency of the use of capital punishment and also the severity of noncapital sanctions for homicide. Thus, any effect that these noncapital sanctions have on the homicide rate may contaminate any estimated effect of capital punishment.
Potential Murderers’ Perceptions of and Responses to Capital Punishment
A by-product of the absence of consideration of the noncapital com-ponent of the sanction regime is that no studies consider how the capital and noncapital components of a regime combine in affecting the behavior of potential murderers. Only the capital component of the sanction regime has been studied, and this in itself shows both a serious conceptual flaw and a serious data flaw in the entire body of research.
Several factors make the attempts by the panel studies to specify the capital component of state sanctions regimes uninterpretable. First, the findings are very sensitive to the way the risk of execution is specified. Sec-ond, there is no logical basis for resolving disagreements about how this risk should be measured.
Much of the panel research simply assumes that potential murderers respond to the objective risk of execution. There are significant complexities in computing this risk even for a well-informed researcher, let alone for a potential murderer. Among these complexities are that only 15 percent of people who have been sentenced to death since 1976 have actually been executed and a large fraction of death sentences are subsequently reversed. None of the measures that are used in the research have been shown to be a better measure of the risk of execution than any others. Thus, even if one assumes that a potential murderer’s perceived risk corresponds to the actual risk, there is no basis for arbitrating the competing claims about what is the “right” risk measure.
The committee is also skeptical that potential murderers can possibly estimate the objective risk, whatever it is. Hence, there is good reason to be-lieve that perceived risk deviates from the objective risk. The research does not address how potential murderers’ perceptions of capital punishment—and, more generally, noncapital sanction risks—are formed.
The time-series studies come in many forms—studies of a single ex-ecution event, studies of many events, and studies with a cross-polity dimension—but a common feature of the studies is that none of them at-tempts to specify even the capital component of the overall sanction regime. This is a crucial shortcoming and is exemplified in the time-series analyses that examine the association between deviations of number of executions from a fitted trend line and deviations of homicides from a fitted trend line.
Copyright © National Academy of Sciences. All rights reserved.
Deterrence and the Death Penalty
6 DETERRENCE AND THE DEATH PENALTY
For potential murderers to possibly be responsive to deviations from the execution trend line, they have to be attentive to it. The studies are silent on two key questions: (1) Why are potential murderers attentive to the trend line in the number of executions? (2) Why do they respond to deviations from the trend line?
If time-series analyses find that homicide rates are not responsive to such deviations, it may be that potential murderers are responding to the trend line in executions but not to deviations from it. For example, a ris-ing trend in the number of executions might be perceived as signaling a toughening of the sanction regime, which might deter potential murderers. Alternatively, if a time-series analysis finds that homicide rates are respon-sive to such deviations, the question is why? One possibility is that potential murderers interpret the deviations as new information about the intensity of the application of capital punishment—that is, they perceive a change in the part of the sanction regime relating to application of capital punish-ment. If so, a deviation from the execution trend line may cause potential murderers to alter their perceptions of the future course of the trend line, which in turn may change their behavior.
Yet, even accepting this idea, a basic question persists. Why should the trend lines fit by researchers coincide with the perceptions of potential mur-derers about trends in executions? Because there are no studies that include empirical analyses on the question of how potential murderers perceive the risk of sanctions, there is no basis for assuming that the trend line specified by researchers corresponds to the trend line (if any) that is perceived by potential murderers. If researchers and potential murderers do not perceive trends the same way, then time-series analyses do not correctly identify what potential murderers perceive as deviations. Because of this basic flaw in the research, the committee has no basis for assessing whether the find-ings of time-series studies reflect a real effect of executions on homicides or are artifacts of models that incorrectly specify how deviations from a trend line cause potential murderers to update their forecasts of the future course of executions.
Strong and Unverifiable Assumptions
To obtain a single estimate that specifies the effect of capital punish-ment on homicide, researchers invariably rely on a range of strong and unverified assumptions. In part (as discussed above), this reflects the lack of basic information on the relevant sanction regimes for homicide and the as-sociated perceptions of risk. None of the studies accounts for the noncapital component of the sanction regime, and potential murderers’ risk percep-tions are assumed to depend on observable frequencies of arrest, conviction, and execution. The ad hoc choices of alternative models of risk perceptions

Copyright © National Academy of Sciences. All rights reserved.
Deterrence and the Death Penalty
SUMMARY 7
lead to very different inferences on the effects of capital punishment, and none of them is inherently any more justifiable than any other.
Additional data and research on sanction regimes and risk perceptions may serve to reduce this form of model uncertainty. However, even if these uncertainties are fully reconciled, a more fundamental problem is that the outcomes of counterfactual sanction policies are unobservable. That is, there is no way to determine what would have occurred if a given state had a different sanction regime. In light of this observational problem, the available data cannot reveal the effect of capital punishment itself since the policy-relevant question is whether capital punishment deters homicides relative to other sanction regimes. That is, the data alone cannot reveal what the homicide rate in a state without (with) a capital punishment re-gime would have been had the state (not) had such a regime.
The standard procedure in capital punishment research has been to impose sufficiently strong assumptions to yield definitive findings on deter-rence. For example, a common assumption is that sanctions are random across states or years, as they would be if sanctions had been randomly as-signed in an experiment. Another common assumption is that the response of criminality to sanctions is homogeneous across states and years. Some studies use instrumental variables to identify deterrent effects, but this requires yet other assumptions. The use of strong assumptions hides the problem that the study of deterrence is plagued by model uncertainty and that many of the assumptions used in the research lack credibility.
NEXT STEPS FOR RESEARCH
The earlier NRC committee concluded that it was “skeptical that the death penalty [as practiced in the United States] can ever be subjected to the kind of statistical analysis that would validly establish the presence or ab-sence of a deterrent effect” (National Research Council, 1978, p. 62). The present committee is not so pessimistic and offers several recommendations for addressing the shortcomings in research to date on capital punishment. They include
1. collection of the data required for a more complete specification of both the capital and noncapital components of the sanction regime for murder;
2. research on how potential murderers perceive the sanction regime for murder; and
3. use of methods that makes less strong and more credible assump-tions to identify or bound the effect of capital punishment on homicides.

Copyright © National Academy of Sciences. All rights reserved.
Deterrence and the Death Penalty
8 DETERRENCE AND THE DEATH PENALTY
In addition, the committee suggests research on how the presence of capital punishment in a sanctions regime affects the administration of the regime and how the homicide rate affects the statutory definition of the sanction regime and its administration.
The committee does not expect that advances in new data on sanction regimes and obtaining knowledge of sanctions risk perceptions will come quickly or easily. However, data collection on the noncapital component of the sanction regime need not be entirely complete to be useful. Moreover, even if research on perceptions of the risk of capital punishment cannot resolve all major issues, some progress would be an important step forward.
The ultimate success of the research may depend on the specific ques-tion that is addressed. Questions of interest include
• if or how the legal status of the death penalty affects homicide rates,
• if or how the intensity of use of the death penalty affects homicide rates, and
• iforhowexecutionsaffecthomicideratesintheshortrun.
Some but not all of these questions may be informed by successful applica-tion of the committee’s suggested lines of research.
Although evaluation of research on the deterrent effect of noncapital sanctions was not part of the committee’s charge, we note that the methods and approaches used to study capital and noncapital sanction effects on crime overlap. We were charged with making suggestions for advancing research on the latter issue. Thus, the research and data collection sugges-tions above are framed in the broader context of research on the effect on crime rates of both capital and noncapital sanctions.
We think this aspect of our charge is particularly important. Although capital punishment is a highly contentious public policy issue, policies on prison sanctions and their enforcement are the most important components of the nation’s response to crime. Thus, even if the research agenda we outline is not ultimately successful in illuminating some aspects of the ef-fect of capital punishment on homicide, advancing knowledge on the crime prevention effects of noncapital sanctions and their enforcement can make major contributions to important policy issues.
REFERENCE
National Research Council. (1978). Deterrence and Incapacitation: Estimating the Effects of Criminal Sanctions on Crime Rates. Panel on Research on Deterrent and Incapacitative Effects. A. Blumstein, J. Cohen, and D. Nagin (Eds.), Committee on Research on Law Enforcement and Criminal Justice. Assembly of Behavioral and Social Sciences.Washing-ton, DC: National Academy Press.

Copyright © National Academy of Sciences. All rights reserved.
Deterrence and the Death Penalty
1
Introduction
In 1976 the Supreme Court decision Gregg v. Georgia (428 U.S. 153) ended the 4-year moratorium on executions that had resulted from its 1972 decision in Furman v. Georgia (408 U.S. 238). In Furman the
Court had ruled that the death penalty, as then administered in the United States, constituted cruel and unusual punishment in violation of the Eighth Amendment to the Constitution. Then, in Gregg, it had ruled that the death penalty is not, in all circumstances, cruel and unusual punishment, thereby opening the way for states to revise their capital punishment statutes to conform to the requirements of Gregg.
In the immediate aftermath of Gregg, a National Research Council report reviewed the evidence relating to the deterrent effect of the death penalty that had been published through the mid-1970s. That review was highly critical of the available research, concluding (1978, p. 9):
The flaws in the earlier analyses finding no effect and the sensitivity of the more recent analysis to minor variations in model specification and the serious temporal instability of the results lead the panel to conclude that available studies provide no useful evidence on the deterrent effect of capital punishment.
THE CURRENT DEBATE
During the 35 years since Gregg, and particularly in the past decade, many studies have renewed the attempt to estimate the effect of capital punishment on homicide rates. Most researchers have used post-Gregg data from the United States to examine the statistical association between
9
Copyright © National Academy of Sciences. All rights reserved.
Deterrence and the Death Penalty
10 DETERRENCE AND THE DEATH PENALTY
homicide rates and the legal status or the actual implementation of the death penalty.
The studies have reached widely varying, even contradictory, conclu-sions, and commentary on the findings has sometimes been acrimonious. Some researchers have concluded that deterrent effects are large and robust across datasets and model specifications. For example, Dezhbakhsh, Rubin, and Shepherd (2003, p. 344) concluded that:
Our results suggest that capital punishment has a strong deterrent effect; each execution results, on average, in eighteen fewer murders with a mar-gin of error of plus or minus ten. Tests show that results are not driven by tougher sentencing laws and are robust to many alternative specifications.
Similarly, Mocan and Gittings (2003, p. 453) stated the following:
The results show that each additional execution decreases homicides by about five, and each additional commutation increases homicides by the same amount, while an additional removal from death row generates one additional murder.
In 2004 testimony before Congress, Shepherd (2004, p. 1) summarized this line of evidence on the deterrent effect of capital punishment as follows:
Recent research on the relationship between capital punishment and crime has created a strong consensus among economists that capital punishment deters crime.
However, the claims that the evidence shows a substantial deterrent effect have been vigorously challenged. Kovandzic, Vieraitis, and Boots (2009, p. 803) concluded that:
Employing well-known econometric procedures for panel data analysis, our results provide no empirical support for the argument that the exis-tence or application of the death penalty deters prospective offenders from committing homicide . . . policymakers should refrain from justifying its use by claiming that it is a deterrent to homicide and should consider less costly, more effective ways of addressing crime.
Others do not go so far as to claim that there is no deterrent effect, but instead argue that the findings supporting a deterrent effect are fragile, not robust. Donohue and Wolfers (2005, p. 794) reanalyzed several of the data sets used by the authors who claimed to have found robust deterrent effects and concluded that:
We find that the existing evidence for deterrence is surprisingly fragile, and even small changes in specifications yield dramatically different re-

Copyright © National Academy of Sciences. All rights reserved.
Deterrence and the Death Penalty
INTRODUCTION 11
sults. Our key insight is that the death penalty—at least as it has been implemented in the United States since Gregg ended the moratorium on executions—is applied so rarely that the number of homicides it can plausibly have caused or deterred cannot be reliably disentangled from the large year-to year changes in the homicide rate caused by other factors.
Berk (2005, p. 328) reached a similar conclusion:
. . . the results raise serious questions about whether anything useful about the deterrent value of the death penalty can ever be learned from an obser-vational study with the data that are likely to be available.
Not surprisingly, the criticisms of the research claiming to have found deterrent effects have generated defenses of the research findings and the methodologies used, as well as counterclaims about the deficiencies in the methods used by the critics. For instance, in response to the Kovandzic, Vieraitis, and Boots (2009) claim of no deterrent effect, Rubin (2009, p. 858) argued that:
the weight of the evidence as well as the theoretical predictions both argue for deterrence, and econometrically flawed studies such as this article are insufficient to overthrow this presumption.
In response to Donohue and Wolfers (2005, 2009), Zimmerman (2009, p. 396) argued that:
This paper shows that many of D&W’s [Donohue and Wolfers] criticisms of Zimmerman’s original work do not hold up under scrutiny, and other authors have also rebutted D&W’s criticisms of their research.
Beyond disagreement about whether the research evidence shows a deterrent effect of capital punishment, some researchers claim to have found a brutalization effect from state-sanctioned executions such that capital punishment actually increases homicide rates (see, e.g., Cochran and Chamlin, 2000; Thomson, 1999). Evidence in support of a brutalization effect is mostly the work of sociologists, but it is notable that in her latter work Shepherd also concluded that brutalization effects may be present (Shepherd, 2005).
COMMITTEE CHARGE AND SCOPE OF WORK
The Committee on Deterrence and the Death Penalty was organized against this backdrop of conflicting claims about the effect of capital pun-ishment on homicide rates, with the following charge:

Copyright © National Academy of Sciences. All rights reserved.
Deterrence and the Death Penalty
12 DETERRENCE AND THE DEATH PENALTY
This study will assess the evidence on the deterrent effect of the death penalty—whether the threat of execution prevents homicides. The focus will be on studies completed since an earlier National Research Council assessment (National Research Council, 1978). A major objective of this study is to evaluate underlying reasons for the differing conclusions in more recent empirical studies about the effects of the legal status and ac-tual practice of the death penalty on criminal homicide rates. The commit-tee will develop a report about what can be concluded from these studies and also draw conclusions about the potential for future work to improve upon the quality of existing evidence.
Issues and questions to be examined include the following:
1. Does the available evidence provide a reasonable basis for drawing conclusions about the magnitude of capital punishment’s effect on homicide rates?
2. Are there differences among the extant analyses that provide a ba-sis for resolving the differences in findings? Are the differences in findings due to inherent limitations in the data? Are there existing statistical methods and/or theoretical perspectives that have yet to be applied that can better address the deterrence question? Are the limitations of existing evidence reflective of a lack of information about the social, economic, and political underpinnings of homi-cide rates and/or the administration of capital punishment that first must be resolved before the deterrent effect of capital punishment can be determined?
3. Do potential remedies to shortcomings in the evidence on the de-terrent effect of capital punishment have broader applicability for research on the deterrent effect of noncapital sanctions?
In addressing those questions, we focused on the studies that have been undertaken since the earlier assessment (National Research Council, 1978). That assessment has stood largely unchallenged: none of the recent work, whatever its conclusion regarding deterrence, relies on the earlier studies criticized in that report or attempts to rehabilitate the value of those studies.
It is important to make clear what is not in the committee’s charge. Deterrence is but one of many considerations relevant to deciding whether the death penalty is good public policy. Not all supporters of capital pun-ishment base their argument on deterrent effects, and not all opponents would be affected by persuasive evidence of such effects. The case for capital punishment is sometimes based on normative retributive arguments that the death penalty is the only appropriate and proportional response to especially heinous crimes; the case against it is sometimes based on

Copyright © National Academy of Sciences. All rights reserved.
Deterrence and the Death Penalty
INTRODUCTION 13
similarly normative claims that the sanctity of human life precludes state-sanctioned killings, regardless of any possible social benefits of capital punishment. Separate from normative considerations, deterrence is not the only empirical issue relevant to the debate over capital punishment. Other considerations include whether capital punishment can be administered in a nondiscriminatory and consistent fashion, whether the risk of a mistaken execution of an innocent person is acceptably small, and the cost of admin-istering the death penalty in comparison with other sanction alternatives.
Although there is empirical evidence on the issues of discrimination, mistakes, and cost, the charge to the committee does not include these questions. Nor have we been charged with rendering an overall judgment on whether capital punishment is good public policy. We have been tasked only with assessing the scientific quality of the post-Gregg evidence on the deterrent effect of capital punishment and making recommendations for improving the scientific quality and policy relevance of future research.
In including recommendations for future research, the study’s statement of task recognized that potential remedies to shortcomings in the evidence on the deterrent effect of capital punishment on homicide might also be used in the study of the crime prevention effects of noncapital sanctions. Thus, this report also offers recommendations for improving the scientific quality and policy relevance of that research.
The post-Gregg studies can be divided into two types on the basis of the type of data analyzed. Panel data studies analyze sets of states or coun-ties measured over time, usually from about 1970 to 2000. These studies relate homicide rates over time and the jurisdictions covered to the legal status of capital punishment or the frequency of executions or both. Time-series studies generally cover only a single geographic unit, which may be as large as a nation or as small as a city. These studies usually examine whether there are short-term changes in homicide rates in that geographic unit in the aftermath of an execution. We review and critique these two types of studies separately because their design and statistical methods are quite different.
Assessing the deterrent effect of the death penalty is much more than a question of interest to social science research. It is a matter of importance to U.S. society at large, and we expect that a potentially broad audience will want to understand how the committee reached its conclusions. Yet the research that the committee has had to appraise is a body of formal empirical work that makes use of highly technical concepts and techniques. The committee has been mindful of the importance of reaching as broad an audience as possible while meeting the fundamental requirement that the report be scientifically grounded. With this in mind, Chapters 1, 2, and 3 (as well as the summary) have been written for a broad, largely policy audience, largely avoiding technical language. In contrast, Chapters 4 and

Copyright © National Academy of Sciences. All rights reserved.
Deterrence and the Death Penalty
14 DETERRENCE AND THE DEATH PENALTY
5 include some exposition and analyses that are aimed for the researchers in the field.
Chapter 2 summarizes homicide rates and the legal status and practice of execution in the United States from 1950 to the present. Chapter 3 pro-vides an overview of the possible mechanisms by which the legal status and practice of execution might affect homicide rates and also provides a non-technical primer on some of the key challenges to making valid inferences about the deterrent effect of the death penalty. Chapters 4 and 5 review and assess the panel and time-series studies, respectively. Chapter 6 elaborates on the theoretical and statistical challenges to drawing valid conclusions about the deterrent effect of the death penalty, and presents our conclusions and recommendations for future research.
REFERENCES
Berk, R. (2005). New claims about executions and general deterrence: Déjà vu all over again? Journal of Empirical Legal Studies, 2(2), 303-330.
Cochran, J.K., and Chamlin, M.B. (2000). Deterrence and brutalization: The dual effects of executions. Justice Quarterly, 17(4), 685-706.
Dezhbakhsh, H., Rubin, P.H., and Shepherd, J.M. (2003). Does capital punishment have a deterrent effect? New evidence from postmoratorium panel data. American Law and Economics Review, 5(2), 344-376.
Donohue, J.J., and Wolfers, J. (2005). Uses and abuses of empirical evidence in the death penalty debate. Stanford Law Review, 58(3), 791-845.
Donohue, J.J., and Wolfers, J. (2009). Estimating the impact of the death penalty on murder. American Law and Economics Review, 11(2), 249-309.
Kovandzic, T.V., Vieraitis, L.M., and Boots, D.P. (2009). Does the death penalty save lives? Criminology & Public Policy, 8(4), 803-843.
Mocan, H.N., and Gittings, R.K. (2003). Getting off death row: Commuted sentences and the deterrent effect of capital punishment. Journal of Law & Economics, 46(2), 453-478.
National Research Council. (1978). Deterrence and Incapacitation: Estimating the Effects of Criminal Sanctions on Crime Rates. Panel on Research on Deterrent and Incapacitative Effects, A. Blumstein, J. Cohen, and D. Nagin (Eds.). Committee on Research on Law Enforcement and Criminal Justice. Assembly of Behavioral and Social Sciences. Wash-ington, DC: National Academy Press.
Rubin, P.H. (2009). Don’t scrap the death penalty. Criminology & Public Policy, 8(4), 853-859.Shepherd, J.M. (2004). Testimony on Crime and Deterrence: Hearing on H.R. 2934, the
Terrorist Penalties Enhancement Act of 2003. Subcommittee on Crime, Terrorism, and Homeland Security, House Judiciary Committee. Available: http://judiciary.house.gov/legacy/shepherd042104.pdf [January 2012].
Shepherd, J.M. (2005). Deterrence versus brutalization: Capital punishment’s differing impacts among states. Michigan Law Review, 104(2), 203-255.
Thomson, E. (1999). Effects of an execution on homicides in California. Homicide Studies, 3(2), 129-150.
Zimmerman, P.R. (2009). Statistical variability and the deterrent effect of the death penalty. American Law and Economics Review, 11(2), 370-398.

Copyright © National Academy of Sciences. All rights reserved.
Deterrence and the Death Penalty
2
Capital Punishment in the Post-Gregg Era
The resurgence in the use of the death penalty in the aftermath of Gregg, which followed the de facto moratorium of the 1960s and early 1970s, created the empirical basis for the post-Gregg capital
punishment deterrence studies. This chapter provides an empirical summary of the legal status and use of capital punishment during this period.
EXECUTIONS AND DEATH SENTENCES OVER TIME
Figure 2-1 shows executions in the United States from 1930 through 2010. As can be seen, executions were more common prior to World War II than in the postwar era. Executions peaked at 199 in 1935. Following the war, executions steadily declined, from 153 in 1947 to 0 in the late 1960s. From 1967 to the Furman decision in 1972, there were no executions even though they were legally permissible. (The Furman rendered executions legally impossible from 1972 through 1976.) Following the Gregg decision in 1976, the number of executions rose rather steadily to the 1999 peak of 98. It then began falling again: by 2005, the number of executions had nearly halved to 53. Since 2005 the number of executions has remained stable at about 50 per year. From 1976 to 2010, a total of 1,234 people were executed.
Also relevant to the evidence on deterrence is the number of death sen-tences imposed: Figure 2-2 shows the number of those sentences, as well as the number of executions, for the post-Gregg period. In 1977, the first full year following the Gregg decision, 137 death sentences were imposed. Thereafter, death sentences rose to an annual peak of about 300 in the late
15

Copyright © National Academy of Sciences. All rights reserved.
Deterrence and the Death Penalty
16 DETERRENCE AND THE DEATH PENALTY
0
50
100
150
200
250
1930 1950 1970 1990 2010
Ann
ual N
umbe
r of
Exe
cutio
ns in
the
Uni
ted
Sta
tes
Year
R02175Figure 2-1
vectors, editable
FIGURE 2-1 Annual number of executions in the United States from 1930 to 2010. SOURCE: Bureau of Justice Statistics (2010, Figure 2).
0
50
100
150
200
250
300
350
1976 1981 1986 1991 1996 2001 2006
ExecutionsDeath Sentences
Year
Num
ber
R02175Figure 2-2
vectors, editable
2009
FIGURE 2-2 Annual number of death sentences and executions in the United States from 1976 to 2009.SOURCE: Bureau of Justice Statistics (2010, Tables 13, 19).

Copyright © National Academy of Sciences. All rights reserved.
Deterrence and the Death Penalty
CAPITAL PUNISHMENT IN THE POST-GREGG ERA 17
1990s. Since then there has been a steady decline, to 112 in 2009. Figure 2-2 makes clear that far more death sentences are imposed than are carried out.
When a defendant is convicted and sentenced to death, theoretically what follows is an execution. An execution, however, does not follow a death sentence very swiftly or at all for a variety of reasons. The Bureau of Justice Statistics reports that only 15 percent of people sentenced to death between 1973 and 2009 had been executed by the end of 2009. Of these cases, 46 percent ended in alternate ways, including reversed convictions, commuted sentences, or the death of the inmate. Thus, 39 percent of the in-mates sentenced to death during the 36-year period were still on death row in December 2009. These inmates, on average, had been under a death sen-tence for more than 12 years. Because of the smaller number of executions than death sentences every year, the death row population has increased steadily over this period. The number of prisoners facing a death sentence was a little over 400 in 1977 (the first full year after reinstatement); by 2009 it was close to 3,200 (Bureau of Justice Statistics, 2010, Table 18).
These national-level data conceal large differences across states in the use of the death penalty. During the post-Gregg era, the death penalty was not legal in all states, and in some states it was only legal for part of the period. Also, among states authorizing the death penalty, in at least some cases there were very large differences in the extent of the legal authority for capital punishment and the frequency with which that authority was used. Notably, these variations across states and over time in the legal authority to impose the death penalty and the frequency with which that authority was exercised created the empirical basis for the deterrence studies reviewed in this report.
Table 2-1 shows the legal authority for a death sentence by state from 1976 to 2009. A geographically and otherwise diverse group of 10 states never authorized the use of the death penalty during this period: Alaska, Hawaii, Iowa, Maine, Michigan, Minnesota, North Dakota, Vermont, Wisconsin, and West Virginia. Of the other 40 states, 29 provided that au-thority for the whole period. The remaining 11 states experienced changes in death penalty authority from 1976 to 2009:
• Two states—North Carolina and Wyoming—transitioned in 1977, immediately after the Gregg decision.
• Four states—Kansas, New Hampshire, Oregon, and South Dakota—transitioned from non–death penalty to death penalty status after 1977.
• Two states—New Mexico and Rhode Island—transitioned from death penalty to non–death penalty status after 1977.

Copyright © National Academy of Sciences. All rights reserved.
Deterrence and the Death Penalty
18 DETERRENCE AND THE DEATH PENALTY
TABLE 2-1 Legal Status of Execution in the Post-Gregg Era
State Legal Authority for Death Penalty 1976-2009
Alabama Yes
Alaska No
Arizona Yes
Arkansas Yes
California Yes
Colorado Yes
Connecticut Yes
Delaware Yes
Florida Yes
Georgia Yes
Hawaii No
Idaho Yes
Illinois Yes
Indiana Yes
Iowa No
Kansas No, 1976-1992; Yes, 1993-2009
Kentucky Yes
Louisiana Yes
Maine No
Maryland Yes
Massachusetts No, 1977-1979; Yes, 1980-1983; No, 1984-2009
Michigan No
Minnesota No
Mississippi Yes
Missouri Yes
Montana Yes
Nebraska Yes
Nevada Yes
New Hampshire No, 1976-1989; Yes, 1990-2009
New Jersey No, 1976-1981; Yes, 1982-2005; No, 2006-2009
New Mexico Yes, 1976-2007; No, 2008-2009
New York No, 1976-1994; Yes, 1995-2006; No, 2007-2009
North Carolina No, 1976; Yes, 1977-2009
North Dakota No
Ohio Yes
Oklahoma Yes
Oregon No, 1976-1977; Yes, 1978-2009
Pennsylvania Yes
Rhode Island Yes, 1976-1983; No, 1984-2009
South Carolina Yes

Copyright © National Academy of Sciences. All rights reserved.
Deterrence and the Death Penalty
CAPITAL PUNISHMENT IN THE POST-GREGG ERA 19
State Legal Authority for Death Penalty 1976-2009
South Dakota No, 1976-1978; Yes, 1979-2009
Tennessee Yes
Texas Yes
Utah Yes
Vermont No
Virginia Yes
Washington Yes
West Virginia No
Wisconsin No
Wyoming No, 1976; Yes, 1977-2009
SOURCES: Data from Bureau of Justice Statistics (2010), Rogers (2002), and Death Penalty Information Center (2010b).
TABLE 2-1 Continued
• Three states—Massachusetts, New Jersey, and New York—transitioned from a non–death penalty to a death penalty status and back to a non–death penalty status over the period.
Thus, from 1976 to 2009 there were 14 transitions in death penalty status among the 50 states. This fact has important implications for estimating the deterrent effect of providing the legal authority for the death penalty independent of the frequency of its use. This issue is discussed at length in Chapter 5.
There is considerable variation among states that authorize the death penalty regarding the types of cases in which death is an allowable punish-ment. While deterrence studies often focus on homicide rates, there are no states in which the death penalty is available for all intentional homicides. First, not all intentional homicides are murders: many prosecutions that begin as homicide cases are mitigated to the lesser crime of manslaughter, for which capital punishment is never available. Second, even in most states that authorize the death penalty, capital punishment is only available for the relatively narrow category of “first-degree” murders, typically those committed with “premeditation” or those committed during the course of serious felonies. Finally, even those guilty of first-degree murder can only be sentenced to death if the jury finds one or more specified aggravating circumstances. These specified circumstances vary somewhat from state to state, but typically include such factors as the murder of a police of-ficer or witness, murder for hire, murder by a sentenced prisoner, multiple murders or killings that caused a serious risk of death to many people, and

Copyright © National Academy of Sciences. All rights reserved.
Deterrence and the Death Penalty
20 DETERRENCE AND THE DEATH PENALTY
murders that are especially “heinous, atrocious, or cruel,” which is gener-ally interpreted to mean killings that inflicted torture or extreme degrees of physical or psychological pain on the victim beyond that inherent in the act of killing.
The research reviewed in this report is not always clear in its use of such terms as “homicide” and “murder.” Homicide is a generic term mean-ing the killing of one human being by another (as distinct from suicide or accidental death). Some homicides (e.g., killings in legitimate self-defense or executions pursuant to judicial judgment) are not criminal at all. Criminal homicides are subdivided into various categories of crime (e.g., murder, manslaughter, negligent homicide), depending on whether the person caus-ing death intended to do so or was merely reckless or negligent and on other circumstances surrounding the killing, and these categories are often further subdivided into degrees (e.g., murder in the first degree). Capital punish-ment is typically only available for the most serious instances of murder.
Most of the studies we reviewed examine the association between capital punishment and the combined number or rate of all types of non-negligent homicides. Unless the specific context dictates otherwise, we use the term “homicide” in describing the findings from the research. When discussing the effect of capital punishment in a broader or more conceptual sense, we use the term “murder,” since the conduct that the death penalty typically aims to deter is unjustified intentional killing, which often (but not always) falls into that legal category.
We recognize that neither of these usages is entirely precise as a reflec-tion of legal categories, but the legal complexity (and diversity across the states) of the legal categories, and the general tendency of the social science literature to ignore these distinctions altogether, leave us with no entirely satisfactory alternative.
USE OF THE DEATH PENALTY
As we discuss in Chapter 3, there are no data on the fraction of mur-ders that are eligible for capital punishment, and studies of this issue have reached varying conclusions. One nationwide study (Fagan, Zimring, and Geller, 2006) concluded that about 25 percent of homicides are capital eligible; in contrast, a Missouri study estimated that more than 70 per-cent of all intentional homicides were at least theoretically capital eligible (Barnes, Sloss, and Thaman, 2009). However, these kinds of studies are inherently problematic. In the absence of an authoritative adjudication, the “facts” of any given homicide can only be gleaned from police reports and other accounts that do not necessarily reliably describe the facts that could be proven sufficiently in a court of law to support a finding of capital eligibility.

Copyright © National Academy of Sciences. All rights reserved.
Deterrence and the Death Penalty
CAPITAL PUNISHMENT IN THE POST-GREGG ERA 21
Whatever the percentage of homicides that could hypothetically be charged as capital, the percentage that are so charged, even at a very early stage of the criminal process, is much smaller, and the number in which a capital verdict is handed down, or a defendant actually executed, is minute in comparison to the homicide rate. Cook (2009) reports that in North Carolina for the fiscal years 2005 and 2006, 26.5 percent of murder ar-raignments (N = 1,034) were initially charged as capital offenses, and of those that were capitally prosecuted 4 percent were ultimately sentenced to death.
The Cook study also illustrates that, even if a case is initially treated by prosecutors as capital eligible, it is very unlikely to result in a death sentence. There were many reasons for the precipitous drop-off in capital cases between arraignment and sentencing. A small fraction of cases were dismissed or found not guilty at trial. More commonly, defendants pleaded guilty and received a noncapital sentence in return for the plea. In jury trials, some individuals were found guilty of manslaughter or second-, not first-, degree murder, and among those found guilty of first-degree murder most juries did not recommend the death penalty.
Table 2-2 shows summary statistics on the frequency of executions and death sentences from 1973 to 2009 for the 40 states with active death penalty laws during at least part of the period. We focus on this time period because it is the one used in most panel studies of deterrence. The table shows that executions were very concentrated in a few states. Texas ac-counted for 37.6 percent of executions from 1973 to 2009; Florida, Texas, and Virginia together accounted for 52.2 percent. This concentration is only partly attributable to more frequent imposition of the death penalty by the courts in those states. Other large states, such as California and Pennsylva-nia, impose relatively large numbers of death sentences. However, the rate at which death sentences are actually carried out varies greatly across states. The last column in Table 2-2 is the ratio of total executions to total death sentences. In California and Pennsylvania, it is only 1.4 percent and 0.8 percent, respectively, compared with 7.0 percent in Florida, 43.0 percent in Texas, and 70.0 percent in Virginia.
Table 2-2 makes clear that in many states death sentences will either never be carried out or will only be carried out after a very long delay. This fact is important for considering the deterrent effect of the death penalty be-cause the longer the delay the more the death penalty resembles a sentence of life without parole, the next most severe sanction to execution. It also complicates the assessment of what features of a capital punishment regime should be tested for an effect on homicide rates: the legal status of capital punishment as a potential sanction, the rate of capital sentences, the rate of executions, or the time to execution. We return to this point in Chapter 3.
Table 2-3 provides perspective on the frequency of executions and

Copyright © National Academy of Sciences. All rights reserved.
Deterrence and the Death Penalty
22 DETERRENCE AND THE DEATH PENALTY
TABLE 2-2 Number of Death Sentences and Executions by Jurisdiction, 1973-2009
Death Sentences ExecutionsExecutions perDeath Sentence
Federal 65 3 0.0462Alabama 412 44 0.1068Arizona 286 23 0.0804Arkansas 110 27 0.2455California 927 13 0.0140Colorado 21 1 0.0476Connecticut 13 1 0.0769Delaware 56 14 0.2500Florida 977 68 0.0696Georgia 320 46 0.1438Idaho 42 1 0.0238Illinois 307 12 0.0391Indiana 100 20 0.2000Kansas 12 0 0Kentucky 81 3 0.0370Louisiana 238 27 0.1134Maryland 53 5 0.0943Massachusetts 4 0 0Mississippi 190 10 0.0526Missouri 182 67 0.3681Montana 15 3 0.2000Nebraska 32 3 0.0938Nevada 147 12 0.0816New Hampshire 1 0 0New Jersey 52 0 0New Mexico 28 1 0.0357New York 10 0 0North Carolina 528 43 0.0814Ohio 401 33 0.0823Oklahoma 350 91 0.2600Oregon 58 2 0.0345Pennsylvania 399 3 0.0075Rhode Island 2 0 0South Carolina 203 42 0.2069South Dakota 5 1 0.2000Tennessee 221 6 0.0271Texas 1,040 447 0.4298Utah 27 6 0.2222Virginia 150 105 0.7000Washington 38 4 0.1053Wyoming 12 1 0.0833TOTAL 8,115 1,188
SOURCE: Bureau of Justice Statistics (2010, Table 20).
Copyright © National Academy of Sciences. All rights reserved.
Deterrence and the Death Penalty
CAPITAL PUNISHMENT IN THE POST-GREGG ERA 23
death sentences relative to the frequency of homicides in the states that provided the authority for capital punishment for all or part of the period from 1990 to 1999, the post-Gregg decade in which the most executions occurred. The final two columns in the table report the ratios of total death sentences and total executions, respectively, to the total homicides for the period. The statistics make clear that relative to total homicides, death sentences are rare and executions ever rarer. Among states with more than 500 homicides, Oklahoma had the highest ratio of death sentences to homi-cides, 4.9 percent. Those ratios for Texas and Virginia, the two states that most frequently impose the death penalty were 2.1 percent and 1.4 percent, respectively. The ratio of executions to homicides was even smaller. Among states with more than 500 homicides, the rate never exceeds 1 percent ex-cept in Virginia.
The data in Table 2-3 highlight two important challenges to inferring the deterrent effect of the death penalty. Because the fraction of murders resulting in a death sentence is small and the fraction that results in execu-tions even smaller, absolute differences in these fractions between the high and low use states are correspondingly small. It is these small absolute differences that typically form the basis for statistical inferences about the deterrent effect of the death penalty in the panel-type studies. The second problem results from the relative infrequency of homicide in small states. Eight states in Table 2-3 averaged fewer than 50 homicides per year for the 1990-1999 period. Overall, in absolute terms, the numbers of death sentences and executions has been very small. It is these rare events that are the basis for trying to determine what would-be murderers calculate to infer the risk of execution.
The infrequency of executions has been interpreted to mean that there is insufficient variation in the data to detect the effect of capital punishment (see, e.g., Donohue and Wolfers, 2005, p. 794). However, the problem is not that a deterrent effect cannot be estimated from the data: as shown in Table 4-1, there is no shortage of statistically significant results that are re-ported. Rather, the problem is that the inferences drawn from those data on the impact of the death penalty rest heavily on unsupported assumptions. Although many methodological approaches have been used in the research and analyses, the challenge is to identify credible and informative assump-tions that can be combined with the data to draw valid inferences on the deterrent effect of capital sanctions. These issues are discussed further in Chapter 4 on panel studies.
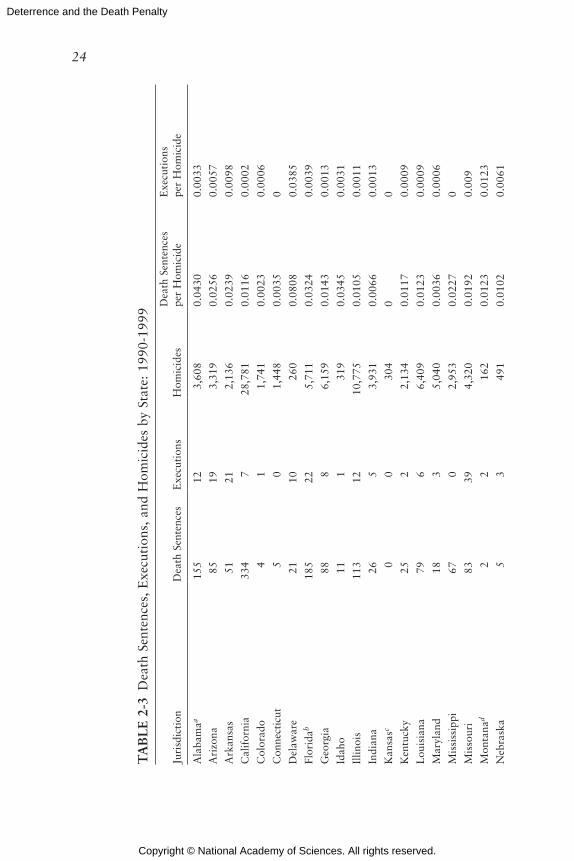
Copyright © National Academy of Sciences. All rights reserved.
Deterrence and the Death Penalty
24
TA
BL
E 2
-3 D
eath
Sen
tenc
es,
Exe
cuti
ons,
and
Hom
icid
es b
y St
ate:
199
0-19
99
Juri
sdic
tion
Dea
th S
ente
nces
Exe
cuti
ons
Hom
icid
esD
eath
Sen
tenc
es
per
Hom
icid
eE
xecu
tion
s
per
Hom
icid
e
Ala
bam
aa 15
512
3,60
80.
0430
0.00
33
Ari
zona
85
193,
319
0.02
560.
0057
Ark
ansa
s 51
212,
136
0.02
390.
0098
Cal
ifor
nia
334
728
,781
0.01
160.
0002
Col
orad
o 4
11,
741
0.00
230.
0006
Con
nect
icut
5
01,
448
0.00
350
Del
awar
e 21
1026
00.
0808
0.03
85
Flor
idab
185
225,
711
0.03
240.
0039
Geo
rgia
88
86,
159
0.01
430.
0013
Idah
o 11
131
90.
0345
0.00
31
Illin
ois
113
1210
,775
0.01
050.
0011
Indi
ana
265
3,93
10.
0066
0.00
13
Kan
sasc
00
304
00
Ken
tuck
y 25
22,
134
0.01
170.
0009
Lou
isia
na
796
6,40
90.
0123
0.00
09
Mar
ylan
d 18
35,
040
0.00
360.
0006
Mis
siss
ippi
67
02,
953
0.02
270
Mis
sour
i 83
394,
320
0.01
920.
009
Mon
tana
d 2
216
20.
0123
0.01
23
Neb
rask
a 5
349
10.
0102
0.00
61
New
Ham
pshi
ree
00
174
00
New
Jer
sey
200
3,31
30.
006
0N
ew M
exic
o 5
01,
450
0.00
340
New
Yor
k 5
015
,227
0.00
030
Nor
th C
arol
ina
237
116,
123
0.03
870.
0018
Ohi
o 12
71
5,33
70.
0238
0.00
02
Okl
ahom
a 10
919
2,22
60.
049
0.00
85
Ore
gon
322
1,12
90.
0283
0.00
18
Penn
sylv
ania
15
13
6,41
00.
0236
0.00
05
Sout
h C
arol
ina
6321
3,00
70.
021
0.00
7
Sout
h D
akot
a 4
011
00.
0364
0
Tenn
esse
e 57
04,
492
0.01
270
Texa
s 34
316
216
,120
0.02
130.
01
Uta
h 5
351
80.
0097
0.00
58
Vir
gini
a 62
634,
562
0.01
360.
0138
Was
hing
ton
183
2,20
30.
0082
0.00
14
Wyo
min
g 1
114
10.
0071
0.00
71
NO
TE
: Ta
ble
incl
udes
onl
y st
ates
wit
h th
e le
gal
auth
orit
y fo
r us
e of
the
dea
th p
enal
ty f
or s
ome
part
of
this
per
iod.
a A
laba
ma
data
inc
lude
onl
y 19
90-1
998
beca
use
hom
icid
e ra
tes
wer
e no
t av
aila
ble
for
1999
.
b Flo
rida
dat
a in
clud
e on
ly 1
990
and
1992
-199
6 be
caus
e ho
mic
ide
rate
s w
ere
not
avai
labl
e fo
r 19
91 a
nd 1
997-
1999
.
c Kan
sas
data
inc
lude
onl
y 19
91-1
992
beca
use
hom
icid
e ra
tes
wer
e no
t av
aila
ble
for
1993
-199
9.
d Mon
tana
dat
a in
clud
e on
ly 1
991,
199
2, a
nd 1
995
beca
use
hom
icid
e ra
tes
wer
e no
t av
aila
ble
for
1993
and
199
4.
e New
Ham
pshi
re d
ata
incl
ude
only
199
0-19
96 a
nd 1
998-
1999
bec
ause
hom
icid
e ra
tes
wer
e no
t av
aila
ble
for
1997
.SO
UR
CE
S: D
ata
on e
xecu
tion
s fr
om E
spy
and
Smyk
la (
2004
), d
ata
on d
eath
sen
tenc
es f
rom
Dea
th P
enal
ty I
nfor
mat
ion
Cen
ter
(201
0a),
dat
a on
ho
mic
ides
fro
m B
urea
u of
Jus
tice
Sta
tist
ics
(200
9).

Copyright © National Academy of Sciences. All rights reserved.
Deterrence and the Death Penalty
25
TA
BL
E 2
-3 D
eath
Sen
tenc
es,
Exe
cuti
ons,
and
Hom
icid
es b
y St
ate:
199
0-19
99
Juri
sdic
tion
Dea
th S
ente
nces
Exe
cuti
ons
Hom
icid
esD
eath
Sen
tenc
es
per
Hom
icid
eE
xecu
tion
s
per
Hom
icid
e
Ala
bam
aa 15
512
3,60
80.
0430
0.00
33
Ari
zona
85
193,
319
0.02
560.
0057
Ark
ansa
s 51
212,
136
0.02
390.
0098
Cal
ifor
nia
334
728
,781
0.01
160.
0002
Col
orad
o 4
11,
741
0.00
230.
0006
Con
nect
icut
5
01,
448
0.00
350
Del
awar
e 21
1026
00.
0808
0.03
85
Flor
idab
185
225,
711
0.03
240.
0039
Geo
rgia
88
86,
159
0.01
430.
0013
Idah
o 11
131
90.
0345
0.00
31
Illin
ois
113
1210
,775
0.01
050.
0011
Indi
ana
265
3,93
10.
0066
0.00
13
Kan
sasc
00
304
00
Ken
tuck
y 25
22,
134
0.01
170.
0009
Lou
isia
na
796
6,40
90.
0123
0.00
09
Mar
ylan
d 18
35,
040
0.00
360.
0006
Mis
siss
ippi
67
02,
953
0.02
270
Mis
sour
i 83
394,
320
0.01
920.
009
Mon
tana
d 2
216
20.
0123
0.01
23
Neb
rask
a 5
349
10.
0102
0.00
61
New
Ham
pshi
ree
00
174
00
New
Jer
sey
200
3,31
30.
006
0N
ew M
exic
o 5
01,
450
0.00
340
New
Yor
k 5
015
,227
0.00
030
Nor
th C
arol
ina
237
116,
123
0.03
870.
0018
Ohi
o 12
71
5,33
70.
0238
0.00
02
Okl
ahom
a 10
919
2,22
60.
049
0.00
85
Ore
gon
322
1,12
90.
0283
0.00
18
Penn
sylv
ania
15
13
6,41
00.
0236
0.00
05
Sout
h C
arol
ina
6321
3,00
70.
021
0.00
7
Sout
h D
akot
a 4
011
00.
0364
0
Tenn
esse
e 57
04,
492
0.01
270
Texa
s 34
316
216
,120
0.02
130.
01
Uta
h 5
351
80.
0097
0.00
58
Vir
gini
a 62
634,
562
0.01
360.
0138
Was
hing
ton
183
2,20
30.
0082
0.00
14
Wyo
min
g 1
114
10.
0071
0.00
71
NO
TE
: Ta
ble
incl
udes
onl
y st
ates
wit
h th
e le
gal
auth
orit
y fo
r us
e of
the
dea
th p
enal
ty f
or s
ome
part
of
this
per
iod.
a A
laba
ma
data
inc
lude
onl
y 19
90-1
998
beca
use
hom
icid
e ra
tes
wer
e no
t av
aila
ble
for
1999
.
b Flo
rida
dat
a in
clud
e on
ly 1
990
and
1992
-199
6 be
caus
e ho
mic
ide
rate
s w
ere
not
avai
labl
e fo
r 19
91 a
nd 1
997-
1999
.
c Kan
sas
data
inc
lude
onl
y 19
91-1
992
beca
use
hom
icid
e ra
tes
wer
e no
t av
aila
ble
for
1993
-199
9.
d Mon
tana
dat
a in
clud
e on
ly 1
991,
199
2, a
nd 1
995
beca
use
hom
icid
e ra
tes
wer
e no
t av
aila
ble
for
1993
and
199
4.
e New
Ham
pshi
re d
ata
incl
ude
only
199
0-19
96 a
nd 1
998-
1999
bec
ause
hom
icid
e ra
tes
wer
e no
t av
aila
ble
for
1997
.SO
UR
CE
S: D
ata
on e
xecu
tion
s fr
om E
spy
and
Smyk
la (
2004
), d
ata
on d
eath
sen
tenc
es f
rom
Dea
th P
enal
ty I
nfor
mat
ion
Cen
ter
(201
0a),
dat
a on
ho
mic
ides
fro
m B
urea
u of
Jus
tice
Sta
tist
ics
(200
9).

Copyright © National Academy of Sciences. All rights reserved.
Deterrence and the Death Penalty
26 DETERRENCE AND THE DEATH PENALTY
REFERENCES
Barnes, K., Sloss, D., and Thaman, S. (2009). Place matters (most): An empirical study of pros-ecutorial decision-making in death-eligible cases. Arizona Law Review, 51(2), 305-379.
Bureau of Justice Statistics. (2009). Homicide—State Level Trends in One Variable. Available: http://bjs.ojp.usdoj.gov/dataonline/Search/Homicide/State/TrendsinOneVar.cfm [January 2011].
Bureau of Justice Statistics. (2010). Capital Punishment, 2009—Statistical Tables. U.S. De-partment of Justice. Available: http://bjs.ojp.usdoj.gov/index.cfm?ty=pbdetail&iid=2215 [December 2011].
Cook, P.J. (2009). Potential savings from abolition of the death penalty in North Carolina. American Law and Economics Review, 11(2), 498-529.
Death Penalty Information Center. (2010a). Death Sentences in the United States from 1977 by State and by Year. Available: http://www.deathpenaltyinfo.org/death-sentences-united-states-1977-2008 [September 2011].
Death Penalty Information Center. (2010b). State by State Database. Available: http://www.deathpenaltyinfo.org/state_by_state [January 2011].
Donohue, J.J., and Wolfers, J. (2005). Uses and abuses of empirical evidence in the death penalty debate. Stanford Law Review, 58(3), 791-845.
Espy, M.W., and Smykla, J.O. (2004). Executions in the United States, 1608-2002: The Espy File. Available: http://www.deathpenaltyinfo.org/executions-us-1608-2002-espy-file [De-cember 2011].
Fagan, J., Zimring, F.E., and Geller, A. (2006). Capital punishment and capital murder: Market share and the deterrent effects of the death penalty. Texas Law Review, 84(7), 1803-1867.
Rogers, A. (2002). “Success-at long last”: The abolition of the death penalty in Massachusetts, 1928-1984. Boston College Third World Law Journal, 22(2), 281-354.

Copyright © National Academy of Sciences. All rights reserved.
Deterrence and the Death Penalty
3
Determining the Deterrent Effect of Capital Punishment: Key Issues
Many people have strongly held views on the deterrent effect of the death penalty. To some a deterrent effect is self-evident—who would not at least take pause before committing murder when
the potential consequence may be forfeiting one’s own life? To others it is equally self-evident that there is no deterrent effect due to the rarity of the imposition of the death penalty and the emotionally charged circumstances of most murders. Both views may have some merit, as the deterrent effect of the death penalty may vary across persons and circumstances. This chapter provides an overview of the difficulties of empirical analysis of the potential deterrent effect. The difficulties arise both from conceptual issues about how the death penalty might deter and from statistical issues that must be successfully overcome to measure the size of that effect, if any.
To argue for the deterrent effect of the death penalty in such ways as “because the death penalty increases the price of murder, there will be less of it” is to gloss over critical elements of understanding how it might work. The magnitude of the deterrent effect of the death penalty, including the possibility of no effect, will depend both on the scope of the legal author-ity for its use and on the way that legal authority is actually administered. It might also depend on such factors as the publicity given to executions, which are beyond the direct control of the criminal justice system.
One reflection of this complexity is that research on the deterrent ef-fect of capital punishment in the post-Gregg era has itself examined diverse issues. Some studies have attempted to assess whether the legal status of capital punishment is related to the homicide rate. And some of these stud-ies have addressed whether statewide homicide rates are associated with
27

Copyright © National Academy of Sciences. All rights reserved.
Deterrence and the Death Penalty
28 DETERRENCE AND THE DEATH PENALTY
whether capital punishment is a legally permissible sanction. Other studies have examined whether homicide rates are associated with moratoriums on executions ordered by governors or courts. There is also a distinct set of studies that have examined whether the frequency of and publicity given to actual executions are related to homicide rates. One part of this research has examined whether execution events seem to affect homicide rates; an-other part has examined whether homicide rates are associated with various measures of the probability of being executed for homicide.
Our overview of key challenges to making an empirical assessment of the effect of capital punishment on homicide rates is necessarily selective. There is an enormous research literature on the mechanisms by which legal sanctions, of which the death penalty is but one, might affect crime rates. There is also a very large research literature on the econometric and statistical methods used to estimate the effect of the death penalty on ho-micide rates. We focus on those issues that are particularly important to the reviews and critiques of the panel and time-series literatures in Chapters 4 and 5, respectively. These issues include data limitations, factors beyond the death penalty that contribute to large differences in murder rates across place and over time, possible feedback effects by which homicide rates might affect the administration of the death penalty, how sanction risks are perceived, and the concept of a sanction regime.
There is also a literature that examines the argument that executions may actually exacerbate homicide rates through a brutalization effect. This argument has been studied using the same statistical tools as deterrence, although the mechanism being studied is different. With one exception, all of these are time-series studies, and we review them in Chapter 5.
CONCEPTS OF DETERRENCE
Going back at least 200 years to the legal philosophers Cesare Beccaria in Italy and Jeremy Bentham in England, scholars have speculated on the deterrent effect of official sanctions. At its most basic level, deterrence is typi-cally understood as operating within a theory of choice in which would-be offenders balance the benefits and costs of crime. In the context of murder, the benefits may be tangible, such as pecuniary gain or silencing a potential witness, but they may also involve intangibles, such as defending one’s honor, expressing outrage, demonstrating dominance, or simply seeking thrills. The potential costs of crime are comparably varied. Crime can entail personal risk if the victim resists (see, e.g., Cook, 1986). It may also invoke pangs of conscience or shame (see, e.g., Braithwaite, 1989).
In this report we are mainly concerned with the response of would-be offenders to the sanction costs that may result from the commission of mur-der. Such sanction costs will typically include lengthy imprisonment. Properly

Copyright © National Academy of Sciences. All rights reserved.
Deterrence and the Death Penalty
DETERMINING THE DETERRENT EFFECT OF CAPITAL PUNISHMENT 29
understood, the relevant question regarding the deterrent effect of capital punishment is the differential or marginal deterrent effect of execution over the deterrent effect of other available or commonly used penalties. We em-phasize “differential” because it is important to recognize that the alternative to capital punishment is not no punishment or a minor punishment such as probation. Instead, it is a lengthy prison sentence—often life without the possibility of parole.
The theory of deterrence is predicated on the idea that if state-imposed sanction costs are sufficiently severe, certain, and swift, criminal activity will be discouraged. Concerning the severity dimension, a necessary condition for state-sanctioned executions to deter crime is that, at least for some, capital punishment is deemed an even worse fate than the possibility of a lifetime of imprisonment.1 Severity alone, however, cannot deter. There must also be some possibility that the sanction will be incurred if the crime is committed. For that to happen, the offender must be apprehended, charged, successfully prosecuted, and sentenced by the judiciary. As discussed in Chapter 2, none of these successive stages in processing through the criminal justice system is certain. Thus, another key concept in deterrence theory is the certainty of punishment. Many of the studies of the deterrent effect of capital punishment attempt to estimate whether homicide rates seem to be affected by variation in various measures of the likelihood of execution beyond the likelihood of apprehension and conviction.
Across the social science disciplines, the concepts of certainty and severity have been made operational in deterrence research in very different ways. In Becker’s (1968) seminal economic formulation of criminal decision making, individual perceptions of certainty and severity are assumed to correspond to reality. The decision to commit a crime is also assumed to correspond with a precisely formulated set of axioms that define rational decision making. In contrast, among criminologists, models of criminal decision making are less mathematically formalized and place great emphasis on the role of percep-tions. These models also explicitly acknowledge that perceptions of certainty and severity may diverge substantially from reality and are probably heavily influenced by experience with the criminal justice system (Cook, 1980; Nagin, 1998). More recent theorizing about criminal decision making also incorpo-rates insights from behavioral economics on biases in risk perceptions to bet-ter model the linkage between sanction risk perceptions and reality (Durlauf and Nagin, 2011; Kleiman, 2009; Pogarsky, 2009). For example, prospect
1 Another way sanctions may prevent crime is by making it physically impossible for the offender to commit another crime. Execution achieves this end by the death of the offender. Note, however, that a death sentence will not, on the margin, be more effective in preventing crime (outside a prison) than the incapacitation that accompanies a sentence of life imprison-ment without parole.
Copyright © National Academy of Sciences. All rights reserved.
Deterrence and the Death Penalty
30 DETERRENCE AND THE DEATH PENALTY
theory (Kahneman and Tversky, 1979) predicts that low probability events, such as execution, are either overweighted compared to models based on objective probabilities or not considered at all. While each of these perspec-tives on the deterrence process shares a common view that criminal decision making involves a balancing of costs and benefits, the conceptualization of how this balancing occurs varies greatly across theories. Most importantly for our purposes, the different models are based on different conceptions of how sanction risks are perceived and affect behavior.
A less studied dimension of the classical formulation of deterrence is the concept of celerity—the speed with which a sanction is imposed. In the case of the death penalty, celerity may be a particularly important dimension of the classical formulation. According to the Bureau of Justice Statistics (2010), the average time to execution for the executions that occurred between 1984 and 2009 was 10 years. This statistic, however, pertains only to the small minor-ity of persons sentenced to death who have actually been executed. Only 15 percent of death sentences imposed since 1976 have been carried out. Thus, some individuals have been on death row for decades and indeed may die by other causes before they can be executed. Indeed, according to the Bureau of Justice Statistics (2010, Table 11) there have already been 416 such deaths (1973-2009) among death row inmates. For these offenders, their sentence was, in fact, equivalent to a life sentence.
The studies we review do little to reveal the underlying mechanisms that generate the associations that are estimated between the death penalty and the homicide rate. Indeed, it is possible that these associations reflect social pro-cesses that are distinct from deterrence in the narrow sense discussed above. For example, Andenæs (1974) and Packer (1968) speculate that independent of the sanctions prescribed in the criminal laws, the laws themselves may reduce the incidence of the prohibited acts by moral education and related social processes. Thus, providing the legal authority for the use of the death penalty for a special class of murders might prevent murders of that type by making clear that these types of murder are deemed particularly heinous. Alternatively, the brutalization hypothesis predicts the opposite effect.
Given these possible and unknown underlying mechanisms, in the re-mainder of this report we discuss empirical estimates of the effects of the death on the homicide rate, not “deterrent” effects. Even more important than this point of nomenclature are the implications of alternative possible mechanisms for using empirical findings on the death penalty effects to predict effects on the crime rate of alternative sanction regimes. As we dis-cuss below, alternative mechanisms can imply very different inferences and interpretations. We emphasize this point because the issue of mechanisms is one of several reasons that inferences about the causal effect of capital pun-ishment on homicide rates cannot be reduced to a simple statistical exercise:

Copyright © National Academy of Sciences. All rights reserved.
Deterrence and the Death Penalty
DETERMINING THE DETERRENT EFFECT OF CAPITAL PUNISHMENT 31
the validity of the inferences also depend on the validity of the theories used to construct the statistical models that generate the estimated effects.
The mechanism by which capital punishment might affect homicide rates also has implications for the time frame over which the effect oper-ates. The socialization processes about which Andenæs (1974) and Packer (1968) speculate would likely take years or even decades to materialize and if present would probably operate gradually. Gradual change over long time frames, even if cumulatively large, is often extremely difficult to measure convincingly.
Another issue related to time frame, to which we return in the conclu-sions of this report, is the processes by which perceptions of sanction risk are formed and are influenced by changes in sanction policy. For example, immediately following the Gregg decision, 33 states had capital punishment statutes in place (see Chapter 2). Individual states subsequently followed very different paths in the frequency, relative to the murder rate, with which death penalties were imposed and carried out. If would-be murderers are re-sponsive to this relative frequency, it would take time for them to calibrate the intensity in the state in which they reside and to recognize any changes in intensity resulting from policy shifts. Thus, any effect on homicide rates of changes in the frequency of execution may not occur until after some unknown interval.
The remainder of this chapter lays out key challenges to estimating the causal effect of capital punishment on murder rates. Many of these chal-lenges stem from the necessity of using nonexperimental data to estimate this effect. A useful way of conceptualizing these challenges is to note the important differences between data generated from experiments and data generated under nonexperimental conditions. In an experiment, the effec-tiveness of a treatment is tested by administering the treatment to a ran-domly selected group of subjects and comparing their outcomes to another group of randomly selected subjects who receive the control treatment. Randomization of treatment status is intended to ensure the equivalence of the treatment and control groups except for treatment status. The purpose of an experiment is to measure the effect of a specified treatment on one or more outcomes relative to an alternative treatment, generally referred to as the control treatment. Experiments are a widely accepted way of scientifi-cally testing for causal effects: there is general agreement that the findings are reflective of causal effects.
For obvious reasons, it is not possible to conduct a randomized capital punishment experiment. Suppose, however, that such an experiment were possible. In such an experiment, three key features would be relevant: (1) specification of what constitutes treatment, (2) randomization of the capi-tal punishment treatment, and (3) experimental control of the treatment. In addition, in an experiment, the experimental and control treatment al-

Copyright © National Academy of Sciences. All rights reserved.
Deterrence and the Death Penalty
32 DETERRENCE AND THE DEATH PENALTY
ternatives must be specified prior to the beginning of the experiment, and treatment status is controlled by the experimenter, not the subjects of the experiment. We develop below the implications of each of the features of experiments for the study of the effect of capital punishment with nonex-perimental data.
SANCTION REGIMES
A sanction regime defines the way a jurisdiction administers a sanc-tion. In an experiment, the differences between the sanction regimes in the treatment and control jurisdictions would define what constitutes treat-ment. In a capital punishment jurisdiction, specification of the sanction regime would require a delineation of the types of crimes and offenders that would be eligible for capital punishment and the rules that would be used to determine whether an eligible offender could be sentenced to death. It would also require a specification of the appeals and pardon processes. In addition, sanctions for individuals not sentenced to death would have to be specified. The sanction regime in a jurisdiction without capital punish-ment would have to be similarly specified. Such an experiment, therefore, would not test the efficacy of “capital punishment” in the abstract. Instead, it would test a particular capital punishment against a specific alternative regime without capital punishment. Only after specification and assignment of the capital and noncapital sanction regimes could the experiment begin and the data collected.
By contrast, in studies based on nonexperimental data, sanction re-gimes are not specified and assigned prior to data collection. Instead, the researcher has to make assumptions about the theoretically relevant dimen-sions of the sanction regimes of the entities administering the punishment, usually states. Thus, a key question in an assessment of the validity of a capital punishment study involves those assumptions: How convincingly does a study specify and explain aspects of the capital punishment sanction regime it is studying?
The legal status of the death penalty in the jurisdiction is one relevant dimension of a sanction regime. States with and without the death penalty have clearly defined differences in their sanction regimes. However, the numerous differences across states in the types of offenses that are capital eligible and the administrative processes related to the imposition and ap-peal of the death sentences (as described in Chapter 2) may be relevant to defining aspects of the sanction regime that have the potential to influence deterrence. For example, Frakes and Harding (2009) attempt to examine whether the explicit delineation of the killing of a child as an aggravating circumstance for the use of the death penalty deters child murder. Still another important dimension of the sanction regime is the severity of non-
Copyright © National Academy of Sciences. All rights reserved.
Deterrence and the Death Penalty
DETERMINING THE DETERRENT EFFECT OF CAPITAL PUNISHMENT 33
capital sanctions for murder in both capital and noncapital punishment states, a point we return to below.
A sanction regime is also defined by how aggressively the authority to use the death penalty is actually applied. Among states that provide authority for the use of the death penalty, the frequency with which that authority is used varies greatly. As pointed out in Chapter 2, since 1976 three states—Florida, Texas, and Virginia—have accounted for more than one-half of all executions carried out in the United States, even though 40 states and the federal government provided the legal authority for the death penalty for at least part of this period. Constructing measures of the inten-sity with which capital punishment is used in states with that authority is a particularly daunting problem. In an experiment, the intensity of applica-tion would have to be specified ex ante by delineating the circumstances in which capital punishment should be applied. With nonexperimental data, intensity must be inferred ex post by the rate of application. The panel stud-ies calculate intensity by an assortment of measures of the probability of ex-ecution based on variations over time and among states in the frequency of executions to distinguish, for example, the very different sanction regimes of Texas and California. Chapter 4 discusses these measures at length.
The concept of deterrence predicts that one relevant dimension of a sanction regime is the probability of execution given conviction for a capital eligible murder. However, if deterrence is predicated on the perception of the risk of execution, short-term or even longer term variations in the rate of executions may not produce changes in the homicide rate, even if the death penalty is a deterrent. If such temporal variation in the actual rate of administration is perceived as confirming stable perceptions about this probability, rather than signaling change in the probability, such variations will not be associated with changes in the homicide rate even though the intensity of the use of capital punishment does deter.
An example from gambling on the outcome of the role of a dice can illustrate this point. Suppose a person knows that the dice are fair. For that person, the actual outcomes of successive roles of the dice will not cause the person to change the estimate that the chance of each number is 1/6. There-fore, that person’s betting patterns will not change in response to short-term variations in the frequency of each of the numbers 1 to 6. The analog for deterrence research is that variations over time in the actual frequency of executions may not alter would-be murderers perceptions of the risk of execution and therefore not alter behavior even if there is a deterrent effect.
However, it is possible that perceptions are influenced by the actual outcomes. If so, a bettor’s betting pattern would change in response to the outcomes of the dice rolls. But if this is the case, it is necessary to posit a specific model of how those perceptions change to infer how behavior changes. For example, the so-called gambler’s fallacy (Gilovich, 1983) pos-

Copyright © National Academy of Sciences. All rights reserved.
Deterrence and the Death Penalty
34 DETERRENCE AND THE DEATH PENALTY
its that if one number, say 6, is rolled several times in a row, people will surmise that the probability of a 6 is reduced at least temporarily and thus reduce their betting on 6. In the context of deterrence, the gambler’s fallacy model suggests that the event of an execution might increase, not decrease, murders because people will surmise that the probability of execution has declined at least temporarily. Alternatively, people may surmise that the dice is weighted to favor 6 and therefore increase their betting on 6. Under this model, the event of an execution might cause individuals to increase their perception of the risk of execution and thereby reduce the murder rate. We do not specifically endorse any of these models of risk percep-tion. Our purpose in this discussion is to emphasize that in the analysis of nonexperimental data, the sanction regime must be constructed ex post on the basis of the researcher’s assumptions about theoretically relevant con-structs. In turn, this fact implies that the relevant dimensions of a sanction regime cannot be specified outside of a model of sanction risk perceptions and their effect on behavior.
It is a truism that sanction threats cannot deter unless at least some would-be offenders are aware of the threat. There is a large literature on sanction risk perceptions that demonstrates that the general public is very poorly informed about actual sanction levels and the frequency of their im-position (Apel, in press). These studies might be interpreted as demonstrat-ing that legal sanctions cannot deter (since people do not really know what they are). This interpretation neglects the possibility that some would-be offenders may be deterred by the mere knowledge that there is a criminal sanction even if the severity of the sanction is not specifically known to them. Moreover, most people do not commit crimes for a host of reasons that are unrelated to the certainty and severity of criminal sanctions. These people have no reason to know, for example, the frequency with which executions are carried out, because they have no intention of committing murder. Some degree of deterrence only requires that some people who are actively considering committing a crime are aware of the penalties and that their behavior is influenced by this awareness.
Still, as the dice example illustrates, the issue of how the death penalty sanction is perceived is fundamental to the interpretation of the evidence on its deterrent effect. Consider an actual, not hypothetical, example. Donohue and Wolfers (2005) compared trends in homicide rates between states with and without capital punishment from 1960 to 2000, a period that spans the 1972 Furman decision that stopped use of the death penalty and 1976 Gregg decision that reinstated it. The time-series data for the two states closely track each other, with no obvious perturbations at the time of the Furman and Gregg decisions. From these data one could conclude there is no obvious evidence that the moratorium on capital punishment or its reinstatement had an effect on murder rates. However, because the last ex-

Copyright © National Academy of Sciences. All rights reserved.
Deterrence and the Death Penalty
DETERMINING THE DETERRENT EFFECT OF CAPITAL PUNISHMENT 35
ecution prior to the Furman decision was in 1967 and executions were rare throughout the 1960s, there are two very different possible interpretations of the data. One interpretation is that the deterrent effect of the potential for a death sentence is small or nonexistent. The other is that the near ab-sence of executions in the decade prior to Furman resulted in people’s stable perceptions in both abolitionist and nonabolitionist states that there was no realistic chance of the death penalty being imposed. With such perceptions there would be no possibility of a deterrent effect even if would-be murder-ers would otherwise be deterred by the threat of execution.
The issue of how sanction threats are perceived is also important in correctly interpreting evidence that is taken as reflecting deterrence. For example, some time-series studies report evidence that suggests reduced homicides in the immediate aftermath of an execution. Suppose this is, in fact, a reflection of a causal effect of an execution on murder. Depending on how the threat of execution is perceived, there are a number of very dif-ferent interpretations of this evidence. One possible model of perceptions is that people respond to the event of an execution, with each execution reducing the number of murders that would otherwise occur according to a dose-response relationship relating murders averted to number of execu-tions in a given time frame. A second model is that people respond not to the event of an execution but to the perceived probability of execution given commission of a murder, and that the event of an execution causes them to update this perceived probability. In this model, the number of both executions and murders is relevant to the updating process. Unlike the first model, there is no single dose-response relationship between number of executions and murders. If the frequency of execution does not keep pace with the rate of increase in murders, would-be murderers might infer that the probability of execution is declining. Yet a third model of such time-series evidence is that the event of an execution only alters the timing of the murder—a murder averted in the immediate aftermath of an execu-tion occurs at a later date. We do not endorse any of these interpretations: we offer them to make concrete the proposition that the interpretation of evidence requires a model of sanction risk perceptions and of the effect of those perceptions on behavior.2
2 We also emphasize that this same observation about the need for a model of sanction risk perceptions and their influence on behavior applies to the interpretation of evidence from an experiment. Only in an impossibly idealized experiment would it be possible to specify the sanction regime in such detail to avoid the need to extrapolate from the experimental findings to explain their implications for unspecified aspects of the sanction regime. Furthermore, even with a completely specified sanction regime, extrapolation of the findings to other settings or modified versions of the tested sanction regime would require a theory of perceptions and behavior.

Copyright © National Academy of Sciences. All rights reserved.
Deterrence and the Death Penalty
36 DETERRENCE AND THE DEATH PENALTY
DATA ISSUES
In any empirical study it is important to question the adequacy of the data used in the analysis. In the context of the studies reviewed for this report a key question is whether the data being used are adequate to pro-duce credible estimates of the effects of those aspects of the sanction regime under investigation.
As noted above, most studies of the deterrent effect of capital punish-ment are based on U.S. data. Although the U.S. data on murder show far less underreporting than data on other types of crime, the data on murders contain flaws that are important to recognize in studies on deterrence. The murder rates used in most studies include murders that are not eligible for capital punishment, either because of characteristics of the perpetrator (such as age or IQ) or because of characteristics of the offense (such as the absence of legally defined aggravating factors). The supplemental homicide reports, a dataset compiled by the Federal Bureau of Investigation (FBI) that provides more detailed data on homicide incidents than the agency’s standardized Uniform Crime Report, in principle provide details of the perpetrator and the event that allow researchers to exclude murders that likely are not eligible for capital punishment; but these data have their own set of problems due to widespread recording errors and omissions about characteristics of the perpetrator and the event itself (Messner, Deane, and Beaulieu, 2002; Wadsworth and Roberts, 2008).
As we emphasize above, the deterrent effect of capital punishment is a meaningful concept only relative to another key dimension of the sanction regime—the severity of noncapital sanctions. After all, as a practical ques-tion of public policy, the key question is not whether a hypothetical capital punishment regime in which execution is the only available sanction for murder would deter some offenders. Rather, it is whether a plausible capital punishment regime will have a meaningful incremental effect on homicide rates in the United States when added to a specific program of lesser sanc-tions. Hence, state-level data on alternative punishments are necessary, most specifically, the prison sentence lengths for murders that might also be candidates for capital punishment.
Such data do not exist. This gap is potentially a serious one for studying deterrence. If the severity of noncapital sanctions for murder is correlated with the legal status or the frequency of use of capital punishment, failure to account for the severity of noncapital sanctions may result in serious bias in estimates of deterrent effect. If, for example, capital punishment ju-risdictions tended also to impose more severe imprisonment sanctions than noncapital jurisdictions, a reduced level of homicide in such jurisdictions may be attributable to these other features of their sanction regime and not to the death penalty. Or, if capital punishment jurisdictions are otherwise

Copyright © National Academy of Sciences. All rights reserved.
Deterrence and the Death Penalty
DETERMINING THE DETERRENT EFFECT OF CAPITAL PUNISHMENT 37
more lenient, any deterrent effect achieved by adding capital punishment might not translate into a similar effect of adding capital punishment in a jurisdiction that already imposes severe prison sentences for murder. Or, if a state relied on the threat of capital punishment to counter an inadequate budget for investigating and prosecuting crimes, the deterrent effect of capi-tal punishment might be masked relative to a noncapital punishment state with more effective crime control policy. Again, we do not endorse any of these hypotheses, but delineate them to illustrate the difficulty of isolating deterrent effects of a single component of any sanction regime.
VARIATIONS IN MURDER RATES
The severity of noncapital sanctions is but one example of other factors that may affect murder rates. If the data being analyzed were the product of a randomized capital punishment experiment, the question of how other factors influence murder rates would not have to be addressed. Randomiza-tion of the capital punishment sanction regime would insure that the use of capital punishment was uncorrelated with other factors influencing murder rates. Thus, for example, if a capital punishment sanction regime were randomized across states, capital punishment would not be more common-place in the Southern states, as in practice it is. By breaking the correlation between treatment, in this case capital punishment, and other factors that may be influencing the outcome of interest, in this case murders, random-ization ensures that the capital punishment deterrent effect estimate is not contaminated by the independent influence of these other factors on murder rates. Because capital punishment research is based on nonexperimental data, equivalence of states without and without capital punishment on all other factors is not insured. Hence, consideration of the influence of factors other than capital punishment on murder rates must be addressed.
Homicide rates in the United States vary enormously over time and place. In 2009, Louisiana had the highest statewide rate, 11.8 homicides per 100,000 population; the state with the lowest rate, New Hampshire, had 0.8 homicides per 100,000 population, 93 percent fewer (Bureau of Justice Statistics, 2010; Federal Bureau of Investigation, 2010). Variations over time are also large. Figure 3-1 plots the U.S. homicide rate over the 25-year period from 1974 to 2009. From 1974 to the early 1990s, the rate rose, then fell, then rose again, and then began declining steadily until level-ing off in the early 2000s.
As we emphasize throughout this report, these variations are important to making a valid determination of the deterrent effect of the death penalty, because if other influences on the murder rate are correlated with the use of the death penalty, the estimated deterrent effect may be contaminated by the effect of these other influences on the homicide rates. Such other

Copyright © National Academy of Sciences. All rights reserved.
Deterrence and the Death Penalty
38 DETERRENCE AND THE DEATH PENALTY
influences may reflect factors related to the criminal justice system. One has already been described: the severity of noncapital sanctions. Another is police effectiveness in apprehending murderers. If the probability of ap-prehension is correlated with the imposition of the death penalty, a finding that the death penalty seemingly deters murders might actually reflect police effectiveness in deterring murder. Such contamination may also come from social, economic, or political factors that affect the homicide rate and that are outside the criminal justice system.
There have been numerous commentaries on the sources of variation in U.S. homicide rates, with many focusing specifically on the sharp drop in homicides since the early 1990s (Blumstein and Wallman, 2000, 2006; Levitt, 2004; Zimring, 2010; Zimring and Fagan, 2000). However, these commentaries provide very limited guidance on how to account for other possible sources of change in homicide rates in a statistical analysis of the deterrent effect of the death penalty.
To provide a concrete illustration of the challenges of inferring the deterrent effects of the death penalty, consider Texas, the state that makes the most frequent use of the death penalty (in absolute numbers). Figure 3-2 plots the annual frequency of executions in Texas from 1974 to 2009. Texas’s first post-Gregg execution occurred in 1982, and executions re-
0
2
4
6
8
10
12
1974 1979 1984 1989 1994 1999 2004 2009
Hom
icid
e R
ate
per
100,
000
R02175Figure 3-1
vectors, editable
Year
FIGURE 3-1 Homicide rates in the United States: 1974 to 2009. SOURCES: Data from Bureau of Justice Statistics (2010) and Federal Bureau of Investigation (2010).

Copyright © National Academy of Sciences. All rights reserved.
Deterrence and the Death Penalty
DETERMINING THE DETERRENT EFFECT OF CAPITAL PUNISHMENT 39
0
5
10
15
20
25
30
35
40
45
1974 1979 1984 1989 1994 1999 2004 2009
Exe
cutio
ns in
Tex
as
R02175Figure 3-2
vectors, editable
Year
FIGURE 3-2 Executions in Texas: 1974 to 2009.SOURCES: Data from Espy and Smykla (2004) and Texas Department of Criminal Justice (2011).
mained relatively infrequent until the early 1990s; the frequency then esca-lated rapidly to a peak of 40 in 2000. Thereafter, there has been drop-off to about 20-25 per year. Figure 3-3 plots the homicide rate in Texas (as well as California and New York) over the same period. The pattern for all three states closely resembles the U.S. national trend. From 1974 through the early 1990s the Texas homicide rate rose then fell and then rose again before falling steadily from 1991 to the early 2000s, when it leveled off. For the period from 1976 to 1991, there is no apparent relationship between the homicide rate and the frequency of execution. However, the steady decline in the homicide rate since 1991 does correspond with the dramatic increase in executions that occurred in the early 1990s. Thus, if the early 1990s is assumed to be the demarcation of Texas shifting to a dramatically higher use of capital punishment, the data are consistent with that shift having a deterrent effect.
However, the data from California and New York challenge that in-terpretation. The death penalty has been an available sentencing option in California for the entire post-1976 period, but the frequency of executions in California is low in comparison with Texas—from 1976 to 2009, Cali-fornia executed 13 people, and Texas executed 447. Both states, however, sentenced sizable numbers of people to death. In this regard, New York offers still another interesting contrast. It sentenced only 10 people to

Copyright © National Academy of Sciences. All rights reserved.
Deterrence and the Death Penalty
40 DETERRENCE AND THE DEATH PENALTY
death between 1973 and 2009 and had executed none as of 2009 (Bureau of Justice Statistics, 2010).3
As shown in Figure 3-3, the California, New York, and Texas homicide rates move in close unison for the entire 1974-2009 period. Like Texas, the California and New York rates rise, then fall, and then rise between 1974 and the early 1990s; the rates for all three states then begin a steep decline to the early 2000s and level out. Thus, even though California, New York, and Texas have made very different use of the death penalty, particularly since 1990, their homicide rates are remarkably the same over about three decades.
Our purpose in reporting these data is not to draw any conclusion about the deterrent effect of the death penalty. The three states were pur-posely selected to illustrate the importance of accounting for variations, across time and place, in factors that influence murder rates other than the use of capital punishment. If informal comparisons of data from a few self-selected jurisdictions were sufficient to settle the question of the deterrent effect of the death penalty, the reviews of the panel studies in Chapter 4 and the of time-series studies in Chapter 5, which are based on application of
3 In New York, the legal authority for the death penalty was available only from 1995 to 2007.
0
2
4
6
8
10
12
14
16
18
1974 1979 1984 1989 1994 1999 2004 2009
Hom
icid
e R
ates
per
100
,000
Texas
New York
California
Year
R02175Figure 3-3
vectors, editable
FIGURE 3-3 Homicide rates in California, New York, and Texas: 1974 to 2009.SOURCES: Data from Bureau of Justice Statistics (2010) and Federal Bureau of Investigation (2010).

Copyright © National Academy of Sciences. All rights reserved.
Deterrence and the Death Penalty
DETERMINING THE DETERRENT EFFECT OF CAPITAL PUNISHMENT 41
formal statistical methods, would be unnecessary. For example, the panel studies are based on data from all 50 states, not just three selected ones.
In addition, and most critically, any inferences about the effects of the death penalty that are based on the data reported in Figure 3-3 require a conception—that is, a plausible hypothesis—of how the death penalty might affect homicide rates. Suppose, as is assumed in some of the time-series studies reviewed in Chapter 5, the residents of these three states respond to deviations away from their state’s long-term trend in executions or death sentences and not to the trend lines themselves. Informal inferences based on visual inspection of long-term homicide rates and death penalty sanction trends cannot provide the basis for detecting such relationships: in Chapter 5 we apply the formal statistical methods that can detect those relationship. More generally, if valid inferences about the effect of the death penalty on homicide rates could be drawn from superficial analysis of data plots like those in Figure 3-3, the question of its effect would have been settled long ago. For the committee’s discussion of this point, see the section on cross-polity comparisons in Chapter 5.
RECIPROCAL EFFECTS BETWEEN HOMICIDE RATES AND SANCTION REGIMES
In an experiment, one very important consequence of random as-signment of treatment is that treatment assignment is not affected by the outcome of interest. For example, in a randomized experiment of the ef-fectiveness of a therapy in reducing depression, the probability of partici-pants receiving the experimental treatment is not influenced by their level of depression at the time of treatment assignment. As a consequence, the direction of causality is clear—any difference in symptoms of depression between the experimental and control groups is a consequence of the treat-ments assigned and not of the level of depression at the time of treatment. In analyses of nonexperimental data, attribution of direction of causality in an association between two variables is often far less clear.
Going back to deterrence research in the 1960s, there has been con-cern about the possibility that estimates of deterrent effects were biased by reciprocal effects between crime rates and sanction levels. That is, while sanction levels may be influencing crime rates through the processes of de-terrence, crime rates may simultaneously be affecting sanction levels. Crime rates may influence sanctions by a variety of mechanisms. One possibility is that, in the short run, increases in crime may strain the resources committed to the criminal justice system and result in a reduction in overall effective sanction levels. Over the longer term, the political process might respond to rising crime rates by increasing the resources committed to crime control and increasing the severity of sanctions.

Copyright © National Academy of Sciences. All rights reserved.
Deterrence and the Death Penalty
42 DETERRENCE AND THE DEATH PENALTY
The possibility of reciprocal effects greatly complicates estimation of the deterrent effect of capital punishment. For example, suppose that states with high rates of executions (as measured by the percentage of homicides that result in executions) tend also to have lower homicide rates. One in-terpretation of this negative association is deterrence: that is, more certain application of the death penalty reduces murders. However, if there are reciprocal effects of crime rates on sanction levels, this negative association might just as well reflect the resource saturation effect noted above: that is, higher murder rates and crime rates tend to overwhelm the capacity of the justice system to respond to crime. Higher crimes rates may, for example, reduce the effectiveness of police in apprehending criminals or may make overburdened prosecutors more receptive to accepting plea bargains for noncapital sanctions in order to avoid trials. Both such mechanisms could contribute to reductions in the frequency of executions.
The possibility of reciprocal causation is not addressed in the time-series research, and only a subset of studies in the panel research make any attempt to address this very challenging problem. Given enough assump-tions, it is possible to disentangle empirically causal effects in the presence of reciprocal causation. Thus, in principle, in the above example, the de-terrent effect of execution certainty can be distinguished from the effect of murder rates on execution certainty. However, such analysis requires the imposition of what are called “identification restrictions.” Identification restrictions can come in many forms, and isolating the role of any one restriction is difficult and sometimes impossible.
In the panel studies in which reciprocal causation is addressed, an important component of identification involves the use of “instrumental variables.” Chapter 4 includes an extended discussion of the validity of the assumptions that underlie the instrumental variable applications in that research. Here we emphasize only that in the presence of reciprocal causation, estimation of causal effects ultimately depends on more than just the data. This is still another example of the fact that the validity of the estimates of the effects of deterrence depends significantly on model-ing assumptions—in this case the plausibility of untestable assumptions about identification restrictions. This is not, by itself, a fatal criticism, since identification restrictions can often be derived from social science theories. However, not all assumptions are equally plausible, so their validity has to be judged in context.
The presence of reciprocal effects also complicates the interpretation of findings on the deterrent effect of the death penalty even if based on plausi-ble identification restrictions. For example, suppose that a state changes its death penalty sanction regime by expanding the types of murders that are eligible for the death penalty and that this change has the desired deterrent effect, which is estimated, based on plausible identification restrictions, to

Copyright © National Academy of Sciences. All rights reserved.
Deterrence and the Death Penalty
DETERMINING THE DETERRENT EFFECT OF CAPITAL PUNISHMENT 43
reduce the murder rate by 5 percent. In the presence of feedback effects, the ultimate reduction in the murder rate will not be 5 percent: it may be more or it may be less because the change in the murder rate may affect other aspects of the sanction regime, such as the way prosecutors and defense attorneys approach plea bargains or the resources available to the criminal justice system. These changes, in turn, may further influence the murder rate. Furthermore, the sentencing regime that caused the 5 percent reduc-tion may differ from a regime without the death penalty, not just because of the possibility of a death sentence, but also because the availability of the death penalty as an option provides prosecutors with greater leverage in plea negotiations (which may result in a greater number of long prison sentences) and because the extra resources required to try capital cases may affect the resources available to prosecute and try other crimes.
In North Carolina, for example, 25 percent of first-degree murder cases are initially prosecuted capitally. Each of these cases requires relatively more resources because of extra care for due process. The in-kind costs include the equivalent of nine assistant prosecutors each year, as well as 345 days of trial court time, approximately 10 percent of the resources of the Supreme Court, and $11 million in cash outlays (Cook, 2009). Only after all these feedbacks have played themselves out could the ultimate effect of a change in sanction regime on the murder rate be determined. This kind of feedback is still another reason that throughout this report we describe empirical estimates of the effects of the death penalty as effects on the homicide rate, not as deterrent effects.
SUMMARY
In this and the preceding chapter we lay out some of the key challenges to using data from the studies reviewed in the next two chapters to infer the causal effect of the death penalty on the homicide rate. Some of these challenges can be resolved empirically. For example, with data on the se-verity of noncapital sanctions, it is possible to test empirically whether the inclusion of these data in the analysis alters estimates of the causal effect of capital punishment on murder rates. More generally, it is also possible to analyze the sensitivity of findings to a specified set of alternative model specifications. We discuss examples of such tests in those chapters.
However, it is also important to recognize that inferences about the ef-fect of alternative capital punishment regimes cannot be reduced to purely statistical questions. Interpretations will always depend on assumptions about the underlying mechanisms by which sanction regimes affect be-havior and how behavior in turn affects sanction regimes and that those assumptions are not testable with the data used in the analysis. As a con-sequence, inferences about the effects of capital and noncapital sanction

Copyright © National Academy of Sciences. All rights reserved.
Deterrence and the Death Penalty
44 DETERRENCE AND THE DEATH PENALTY
regimes on murder rates will depend on more than the data that generate the estimates: the inferences will also depend on the validity of the theories used to construct the models on which the estimates rest.
REFERENCES
Andenæs, J. (1974). Punishment and Deterrence. Ann Arbor: University of Michigan Press.Apel, R. (in press). Sanctions, perceptions, and crime: Implications for criminal deterrence.
Submitted to Journal of Quantitative Criminology, 28.Becker, G.S. (1968). Crime and punishment: An economic approach. Journal of Political
Economy, 76(2), 169-217.Blumstein, A., and Wallman, J. (2000). The Crime Drop in America. New York: Cambridge
University Press.Blumstein, A., and Wallman, J. (2006). The crime drop and beyond. Annual Review of Law
and Social Science, 2(1), 125-146.Braithwaite, J. (1989). Crime, Shame, and Reintegration. New York: Cambridge University
Press.Bureau of Justice Statistics. (2010). Capital Punishment, 2009—Statistical Tables. Wash-
ington, DC: U.S. Department of Justice. Available: http://bjs.ojp.usdoj.gov/index.cfm?ty=pbdetail&iid=2215 [December 2011].
Cook, P.J. (1980). Research in criminal deterrence: Laying the groundwork for the second decade. Crime and Justice, 2, 211-268.
Cook, P.J. (1986). The relationship between victim resistance and injury in noncommercial robbery. Journal of Legal Studies, 15(2), 405-416.
Cook, P.J. (2009). Potential savings from abolition of the death penalty in North Carolina. American Law and Economics Review, 11(2), 498-529.
Donohue, J.J., and Wolfers, J. (2005). Uses and abuses of empirical evidence in the death penalty debate. Stanford Law Review, 58(3), 791-845.
Durlauf, S., and Nagin, D. (2011). The deterrent effect of imprisonment. In P.J. Cook, J. Ludwig, and J. McCrary (Eds.), Controlling Crime: Strategies and Tradeoffs (pp. 43-94). Chicago: University of Chicago Press.
Espy, M.W., and Smykla, J.O. (2004). Executions in the United States, 1608-2002: The Espy File. Available: http://www.deathpenaltyinfo.org/executions-us-1608-2002-espy-file [De-cember 2011].
Federal Bureau of Investigation. (2010). Crime in the United States 2009. Washington, DC: Author.
Frakes, M., and Harding, M.C. (2009). The deterrent effect of death penalty eligibility: Evi-dence from the adoption of child murder eligibility factors. American Law and Econom-ics Review, 11(2), 451-497.
Gilovich, T. (1983). Biased evaluation and persistence in gambling. Journal of Personality and Social Psychology, 44(6), 1,110-1,126.
Kahneman, D., and Tversky, A. (1979). Prospect theory: An analysis of decision under risk. Econometrica, 47(2), 263-291.
Kleiman, M. (2009). When Brute Force Fails: How to Have Less Crime and Less Punishment. Princeton, NJ: Princeton University Press.
Levitt, S.D. (2004). Understanding why crime fell in the 1990s: Four factors that explain the decline and six that do not. The Journal of Economic Perspectives, 18(1), 163-190.
Messner, S.F., Deane, G., and Beaulieu, M. (2002). A log-multiplicative association model for allocating homicides with unknown victim-offender relationships. Criminology, 40(2), 457-480.

Copyright © National Academy of Sciences. All rights reserved.
Deterrence and the Death Penalty
DETERMINING THE DETERRENT EFFECT OF CAPITAL PUNISHMENT 45
Nagin, D.S. (1998). Criminal deterrence research at the outset of the twenty-first century. Crime and Justice, 23, 1-42.
Packer, H.L. (1968). The Limits of the Criminal Sanction. Stanford, CA: Stanford University Press.
Pogarsky, G. (2009). Deterrence and decision-making: Research questions and theoretical refinements. In M.D. Krohn, A. Lizotte and H.G. Penlly (Eds.), Handbook on Crime and Deviance (pp. 241-258). New York: Springer.
Texas Department of Criminal Justice. (2011). Executed Offenders. Available: http://www.tdcj.state.tx.us/death_row/dr_executed_offenders.html.
Wadsworth, T.I.M., and Roberts, J.M. (2008). When missing data are not missing: A new ap-proach to evaluating supplemental homicide report imputation strategies. Criminology, 46(4), 841-870.
Zimring, F.E. (2010). The scale of imprisonment in the United States: Twentieth century patterns and twenty-first century prospects. Journal of Criminal Law and Criminology, 100(3), 1,225-1,246.
Zimring, F.E., and Fagan, J. (2000). The search for causes in an era of crime declines: Some les-sons from the study of New York City homicide. Crime & Delinquency, 46(4), 446-456.

Copyright © National Academy of Sciences. All rights reserved.
Deterrence and the Death Penalty

Copyright © National Academy of Sciences. All rights reserved.
Deterrence and the Death Penalty
4
Panel Studies
In this chapter, we discuss the recent research that used panel data and methods to examine whether the death penalty has a deterrent effect on homicide and if so, the size of this effect. As noted in Chapter 1, “panel
data” and “panel methods” refer to data from many geographic locations followed over time—usually annual state-level data—and a particular set of multiple regression methods. The annual state data include all states, and the time periods covered are typically from the late 1970s (post-Gregg) through the late 1990s or into the 2000s. Over this time period, there have been variations in the frequency of death penalty sentences, executions, and the legal availability of the death penalty. With these types of data, the strategy for identifying an effect of the death penalty on homicides has been, roughly speaking, to compare the variation over time in the average homicide rates among states that changed their death penalty sanctions versus those that did not.
This chapter assesses the extent to which the research using panel data is informative on the question of whether and how much the death penalty has a deterrent effect on homicide. For this assessment, we compare the data and methods used in this literature with those that would be avail-able from an ideal randomized experiment (see Chapter 3). The purpose of this exercise is to clarify the challenges that face researchers using panel methods to study the death penalty and deterrence. We then assess the ex-tent to which this research overcomes these challenges.
This literature is striking in the similarity of the data and methods used across studies and the diversity of the results. Given this diversity of results
47

Copyright © National Academy of Sciences. All rights reserved.
Deterrence and the Death Penalty
48 DETERRENCE AND THE DEATH PENALTY
across and in some cases within studies, a central task for this committee is to assess the validity of the models used in the studies.
We begin the chapter by describing the key features of the studies we reviewed and giving a brief overview of their data and methods. We then discuss the primary challenges to researchers using panel data and methods to inform the question of whether the death penalty affects the homicide rate: the difficulty in measuring changes over time in the relevant sanction policies for homicide and the difficulties in establishing that any changes in homicides that are concurrent with changes in the death penalty are caused by those changes in the death penalty and not vice versa or by other factors that affect both—such as other sanctions for murder. We conclude with our assessment of the informativeness of the panel research.
PANEL STUDIES REVIEWED
Methods Used: Overview
We begin our review of the panel research by briefly describing the regression models used in the studies. Our intention with this description is to establish the extent to which the methods are largely consistent across studies, as context for understanding the particular dimensions on which the studies differ.
The panel research makes use of multiple regression models involving “fixed effects” that take the following form:
yit = ai + bit + gf(Zit) + dXit + eit, (4-1)
where yit is the number of homicides per 100,000 residents in state i in year t, f(Zit) is an expected cost function of committing a capital homicide that depends on the vector of death penalty or other sanction variables Zit with corresponding parameter g measuring the effect of the death penalty on the homicide rate. Importantly, this effect is assumed to be homogeneous across states i and years t.
A primary benefit of panel data is that one observes homicide and ex-ecution rates in the 50 states over many years. This allows researchers to effectively account for unobserved features of the state or of the time period that might be associated with both the application of the death penalty and the homicide rate. Some states, for example, might have unobserved social norms that lead to higher (or lower) execution rates and lower (or higher) rates or homicide: Texas is arguably different than Massachusetts in this regard. The panel data model in Equation (4-1) accounts for some of these differences with a state-specific intercept parameter, ai, referred to as a state fixed effect, that allows the mean homicide rate to vary additively

Copyright © National Academy of Sciences. All rights reserved.
Deterrence and the Death Penalty
PANEL STUDIES 49
by state, and a time-specific intercept, bit, referred to as a time fixed effect, that allows the mean homicide rate to vary additively over time. These fixed effects account for unobserved factors that are state specific but fixed across time, such as the social norms that make Texas different than Mas-sachusetts, and factors that are year specific but apply to all states, such as macroeconomic events that may affect homicide rates across the country. In addition to these fixed effects, some of the researchers also include state-specific linear time trends that allow each state’s homicide rate trend to vary (linearly) from the year-to-year national fluctuations.
The literature also includes a set of covariates, Xit, that are intended to control for additional factors that may vary with both state and year. These sets of covariates are largely similar across studies and include economic indicators, such as the unemployment rate and real per capita income; demographic variables, such as the proportion of the state’s population in each of several age groups; the proportion of the state’s population that is black; and the proportion of the state’s population that reside in urban areas. The covariates also include health and policy variables, such as the infant mortality rate, the legal drinking age, and the governor’s party affili-ation; and crime, policing, or sanctioning variables, such as the number of prisoners per violent crime.
Finally, eit is a random variable that accounts for the unobserved factors determining the homicide rate.1 Researchers make two general assumptions about the relationship between the death penalty variables, Zit, and eit. The most common assumption is that the death penalty, as measured by the variable Zit, is statistically independent of the unobserved factors that determine homicide, as it would be in an ideal randomized experiment. An alternative route is to assume that there is some covariate, termed an instrumental variable, that is independent of eit but not of the death penalty.
The Studies, Their Characteristics, and the Effects Found
Table 4-1 lists the studies reviewed in this chapter and a few of their key characteristics, and briefly notes each one’s results.2 This list does not
1 In estimating these models, the data are typically weighted by state population. 2 One characteristic that is not highlighted in Table 4-1 is the choice of outcome variable,
yit. All of the studies listed in the table and reviewed in this chapter focused on the overall homicide rate (or the log-rate). However, there are a few studies in the panel data literature that examined different outcome measures. Most notably, Fagan, Zimring, and Geller (2006) focused on all capital murders, and Frakes and Harding (2009) examined child murders which, depending on the state and year, may or may not be death penalty eligible. Otherwise, the key characteristics of these two studies are similar to the ones reviewed in this chapter. Interest-ingly, although both studies focused on the impact of the death penalty on capital eligible murders, Fagan, Zimring, and Geller found no evidence that the death penalty deters murder,

Copyright © National Academy of Sciences. All rights reserved.
Deterrence and the Death Penalty
50
TA
BL
E 4
-1 P
anel
Stu
dies
Rev
iew
ed
Stud
y L
egal
Sta
tus
Inte
nsit
y of
Use
Use
of
an
Inst
rum
ent
Res
ults
: Si
gna
and
Sign
ifica
nceb
of P
oint
Est
imat
es
Ber
k (2
005)
NY
NA
ll po
ssib
le r
esul
ts
Coh
en-C
ole
et a
l. (2
009)
YY
YA
ll po
ssib
le r
esul
ts
Don
ohue
and
Wol
fers
(20
05,
2009
)Y
YY
All
poss
ible
res
ults
Dez
hbak
hsh
and
Shep
herd
(20
06)
YY
N–**
Dez
hbak
hsh,
Rub
in,
and
Shep
herd
(20
03)c
YY
Y–**
; an
d –N
S
Kat
z, L
evit
t, a
nd S
hust
orov
ich
(200
3)N
YN
–**;
–NS ;
and
+N
S
Kov
andz
ic,
Vie
rait
is,
and
Boo
ts (
2009
)Y
YN
–NS ;
+N
S
Moc
an a
nd G
itti
ngs
(200
3)Y
YN
–**;
and
–NS
Moc
an a
nd G
itti
ngs
(201
0)N
YN
–**;
and
–NS
Zim
mer
man
(20
04)
NY
Y–* ;
and
–N
S
a Sig
n of
the
est
imat
ed c
oeffi
cien
ts:
–, t
he e
stim
ated
eff
ect
of c
apit
al s
anct
ions
on
hom
icid
e is
neg
ativ
e, i
ndic
atin
g a
dete
rren
t ef
fect
; +,
the
es
tim
ated
eff
ect
of c
apit
al s
anct
ions
on
hom
icid
e is
pos
itiv
e, i
ndic
atin
g a
brut
aliz
atio
n ef
fect
. b S
tati
stic
al s
igni
fican
ce l
evel
s: N
S, n
o st
atis
tica
l si
gnifi
canc
e at
p =
0.0
5; *
, p
< 0.
05;
**,
p <
0.01
. c D
ezhb
akhs
h, R
ubin
, an
d Sh
ephe
rd (
2003
) es
tim
ate
55 d
iffe
rent
pan
el d
ata
regr
essi
on m
odel
s. I
n 49
of
the
mod
els,
the
est
imat
ed e
ffec
t of
cap
ital
sa
ncti
ons
on h
omic
ide
is n
egat
ive
and
stat
isti
cally
sig
nific
ant;
in
4, t
he e
stim
ates
are
neg
ativ
e an
d in
sign
ifica
nt;
and
in 2
, th
e es
tim
ates
are
pos
itiv
e an
d in
sign
ifica
nt.

Copyright © National Academy of Sciences. All rights reserved.
Deterrence and the Death Penalty
PANEL STUDIES 51
include every study of deterrence using panel data, but instead provides information on a set of influential studies that use the different approaches found in the research and that draw a wide range of different conclusions. Studies designed to illustrate the fragility of the results reports in the lit-erature, namely, Donohue and Wolfers (2005, 2009) and Cohen-Cole et al. (2009), apply the same basic models and thus are included in our review.
The first study characteristic is how researchers specify the expected cost function of committing a capital homicide f(Zit). At the most basic level, studies seek to determine the effect of changes in the legal status of the death penalty, changes in the intensity with which the death penalty is applied, or both. Most studies evaluated the intensity of use, but some also focused on the legal status of the death penalty. The specification of the death penalty variables in the panel models varies widely across the research and has been the focus of much debate. The different specifications assume that quite different aspects of the sanction regime are salient for would-be murderers. The research has demonstrated that different death penalty sanction variables, and different specifications of these variables, lead to very different deterrence estimates—negative and positive, large and small, both statistically significant and not statistically significant.
The second characteristic of interest is whether the death penalty mea-sure is assumed to be randomly applied after controlling for the observed covariates and the fixed effects. The choice of whether or not to use instru-mental variables, and the particular variables selected, has led to conten-tious differences in model assumptions invoked across the literature. In most of the studies, the researchers have assumed that the death penalty is unrelated to the unobserved factors associated with the homicide rate. That is, the unobserved factors, eit, are not associated with the death penalty sanctions. Studies using this independence assumption have drawn conflict-ing conclusions (see Table 4-1) with some reporting statistically significant evidence in favor of a deterrence effect, many others finding that capital punishment has a negative but statistically insignificant association with homicide, and a few others reporting evidence in favor of a brutalization effect, that capital punishment increases homicide.
Dezhbakhsh, Rubin, and Shepherd (2003) and Zimmerman (2004) ar-gue that death penalty sanctions are likely to be correlated with unobserved determinants of homicide, and instead propose using instrumental variables to provide variation in the risk perceptions of potential murderers that is separable from the effects of all of the unobserved factors. The results of
and Frakes and Harding reported substantial deterrent effects. Our review does not consider the choice of the outcome variable: although this choice may have important implications for inference, these issues are secondary relative to the more fundamental issues covered in this chapter.

Copyright © National Academy of Sciences. All rights reserved.
Deterrence and the Death Penalty
52 DETERRENCE AND THE DEATH PENALTY
studies that do not use such instrumental variables vary from those that do, and the results of studies that use different instrumental variables vary from each other.
The fact that the estimated effects of the death penalty on homicide are sensitive to the different data and modeling assumptions used is not surprising. Deterrence estimates from the panel models depend on state changes over time in the legal status of the death penalty or the intensity with which the death penalty is applied. Since the moratorium was lifted, such changes have been few and far between (see Chapter 2). Because of the way in which the death penalty has been implemented in the United States in the last 30 years, no executions occur in most states in most years (86 percent of state-year observations), and when there are any, the number is almost always very low. In addition, the executions that do occur are con-centrated in particular states, with Texas carrying out executions an order of magnitude more often than any other state. There also tends to be little variability for states over time in their numbers of or rates of executions and whether they legally allow executions. Only 11 states experienced one or more changes in legal status of the death penalty after the national moratorium was lifted. Overall, in recent decades in the United States the death penalty has been a rare practice that is concentrated in a few places.
Not only is there low variability in the application of the death pen-alty, there are only a small number of state-year observations that exhibit large variations in homicide rates over time. Figure 4-1 illustrates a partial regression plot with a death penalty sanction measure on the horizontal axis and the homicide rate on the vertical axis (adjusted for state and year fixed effects and typical covariates). This plot reflects the data, covariates, and specification used by Kovandzic, Vieraitis, and Boots (2009).3 In dis-playing these regression results, the committee is not endorsing this or any other particular study.4 Instead, our purpose is to illustrate how outlier or influential observations may affect regression results. Since the effect of the death penalty is estimated as the slope of the ordinary least squares regres-sion line between the bulk of the data near zero and the location of the small set of influential values, the estimates in the research studies can vary widely (Berk, 2005). For example, if the particular state-year observations that are influential depend on the death penalty intensity measure used, then the slope of the regression line will vary with this measure. If one believes in the validity of the underlying model applied in Figure 4-1, then the outlier
3 The execution measure is computed using the number of executions the year before the period year divided by the number of death sentences 7 years prior to the period year. For full model specification, see Figure 4-1 notes in the figure caption.
4 In particular, we note that alternative but similar specifications result in a positive sloping, rather than a negative sloping line.

Copyright © National Academy of Sciences. All rights reserved.
Deterrence and the Death Penalty
PANEL STUDIES 53
FIGURE 4-1 Illustration of influential data points.NOTES: The plot reflects the data, covariates, and specification used by Kovandzic, Vieraitis, and Boots (2009), Table 3, Model 6 with the addition of two common sanction variables: death sentences divided by homicide arrests 2 years prior and homicide arrests divided by homicides. These additional variables required a mea-sure of arrests for homicide, which was obtained from J. Wolfers’ web page and was not available for years after 1998. The horizontal axis represents the adjusted execution measure (residuals of execu-tion measure regressed on all the rest of the regressors in the model). The execution measure is defined as the number of executions the prior year per number of death sentences 7 years prior, with missing values set to zero. The vertical axis represents the adjusted homicide rate (residuals of the homicide rate regressed on all the regressors except the execution rate variable). The homi-cide rate is homicides per 100,000 residents. The regression was run on data for 1984-1998, weighted by state population share, and standard errors were clustered by state. The coefficient of the ordinary least squares line between these two sets of ad-justed variables—and hence the coefficient on the execution measure in the multiple linear regression of homicide rates on the execution measure and all covariates—is –0.183 (p = 0.173).SOURCES: Data from T.V. Kovandzic (personal communication) and J. Wolfers. Wolfers’ data are available at http://bpp.wharton.upenn.edu/jwolfers/DeathPenalty.shtml.
–4–2
02
4
Adj
uste
d H
omic
ide
Rat
e
–1 0 1 2 3
Adjusted Execution Measure
R02175Figure 4-1 revisedvectors, editable

Copyright © National Academy of Sciences. All rights reserved.
Deterrence and the Death Penalty
54 DETERRENCE AND THE DEATH PENALTY
observations are informative. But if there is uncertainty about the validity of the model, the outliers can make the estimates highly sensitive to the underlying assumptions.
As noted in Chapter 2, the infrequency of executions does not mean that there is insufficient variation in the data to detect the effect of capital punishment. In fact, as shown in Table 4-1 (above), there is no shortage of statistically significant results reported in the literature. Rather, the problem is that inferences on the impact of the death penalty rest heavily on unsup-ported assumptions.
SPECIFYING THE EXPECTED COST OF COMMITTING A CAPITAL HOMICIDE: f(Zit)
In light of the variability in the estimated effects of the death penalty on homicide, a central question is whether the correct specification is being used and can be identified. We evaluate this question below by first focus-ing on measures of the perceived cost of murder and then taking up more generic issues associated with the panel data models in equation (4-1).
A vital component to evaluating the effect of the death penalty on ho-micide is to properly specify the expected cost function, f(Zit), in Equation (4-1). Yet, researchers have failed to measure the relevant sanction regime and have relied on seemingly ad hoc measures of the relevant sanction probabilities.
What is the relevant treatment? Researchers have struggled to clearly specify and measure the incremental cost of a particular sanction policy. As noted in Chapter 3, there is little information on the sanction regime, and thus the counterfactual policy of interest. In particular, the research aims to determine the effect of an increase (or decrease) in the risk of receiving the death penalty or being executed relative not to no sanction, but rather rela-tive to the other common sanctions for murder—lengthy prison sentences (with or without the possibility of parole). Moreover, these other aspects of the sanction regime may be changing over time, and any changes in the risks of the death penalty have to be evaluated relative to the varying but always higher risks associated with prison sentences. Two mechanisms that could plausibly create associations between changes in death penalty and prison sentence sanctions for homicide are the plea bargaining process, through which the threat of the death penalty may change the likelihood of sentences of different lengths, including life without parole, and the punitiveness of a state’s culture, which influences the severity of the capital and noncapital aspects of the sanction regime.
None of the studies we reviewed made any use of information on other sanction risks for murder or the ways in which they may be changing over time. For this reason, it is not possible to tell if any “treatment” effects
Copyright © National Academy of Sciences. All rights reserved.
Deterrence and the Death Penalty
PANEL STUDIES 55
found in these models are due to death penalty sanction changes or to changes in other more frequently used sanctions that are part of a state’s sanction regime for homicide. If changes in the death penalty are part of a larger “law and order” program, then concurrent changes in other much more heavily used sanctions could be at the root of any associated change in homicide rates.
A related problem in specifying a cost function is the ad hoc and in-consistent measures of subjective sanction probabilities. How do potential offenders measure the expected cost of committing a capital offense? The difficulty in answering this question stems from two interrelated problems: first, there is little information on how offenders perceive the relevant prob-abilities of arrest, conviction, and execution; and second, in practice, these probabilities may be difficult to measure.
In the studies we reviewed, one or both of just two features of the death penalty are assumed to be salient for deterring homicide: the legal status of the death penalty (in each state and year) and what are described as measures of the intensity with which the death penalty is applied (in each state and year). A variety of different and complex temporal structures are used to measure the probabilities of arrest, death sentence, and execution.
Consider, for example, the specifications used for variables described as the risk of execution given a death sentence:
• thenumberof executions in theprior year (prior to the currentyear’s homicide rate);
• thenumberofexecutionsintheprioryeardividedbythenumberof death sentences in the same prior year (or a variant, using a 12-month moving average of these counts for both the numerator and denominator);
• thenumberofexecutionsinthecurrentorprioryeardividedbythenumber of death sentences in an earlier prior year (3, 4, 5, 6, and 7 years prior have all been implemented and similar specifications using executions from the first three quarters of the current year and last quarter of prior year divided by death sentences 6 years prior);
• thenumberofexecutionsintheprioryeardividedbythenumberof death row inmates in the prior year;
• thenumberofexecutionsinthecurrentyeardividedbythenumberof homicides in the prior year;
• thenumberofexecutionsintheprioryeardividedbythenumberof prisoners in the prior year (or 2 or 3 years prior); and
• thenumberofexecutionsintheprioryeardividedbythepopula-tion of the state in the prior year.

Copyright © National Academy of Sciences. All rights reserved.
Deterrence and the Death Penalty
56 DETERRENCE AND THE DEATH PENALTY
There is no empirical basis for choosing among these specifications, and there has been heated debate among researchers about them, particularly on the number of years that should be lagged for the numerator and, even more so, for the denominator in order to best correspond to the relevant risk of execution given a death sentence in each state and year.
This debate, however, is not based on clear and principled arguments as to why the probability timing that is used corresponds to the objective probability of execution, or, even more importantly, to criminal perceptions of that probability. Instead, researchers have constructed ad hoc measures of criminal perceptions. Consequently, the results have proven to be highly sensitive to the specific measures used. Donohue and Wolfers (2005) find, for example, that when reanalyzing the results in Mocan and Gittings (2003), using a 7-year lag implies that the death penalty deters homicide (4.4 lives saved per execution) but using a 1-year lag implies that the death penalty increases the number of homicides (1.2 lives lost per execution). Donohue and Wolfers (2005) question whether would-be murderers are aware of the number of death sentences handed down 7 years prior. Re-sponding to these concerns, Mocan and Gittings (2010) argue that because executions do not take place the same year as a sentence is imposed, models with a 1-year lag are meaningless.
Whether any of these measures accurately reflect the relevant risk prob-abilities is uncertain. The basic problem is that little is known about how those who may commit murder perceive the sanctions for this crime. If the death penalty is going to have an effect on the behavior of this group, it is their perceptions of the sanction regime for murder that matter. It is not known whether the current legal status of the death penalty is salient to potential murderers; other relevant factors could include how often the legal status of the death penalty has changed in recent years and the pres-ence of high-profile cases, which create greater awareness of the legality of the death penalty in a state. Similarly, it is not known whether specific state and year information is salient to potential murderers; no evidence or theory is presented in the studies we reviewed to argue that the particular measures are valid or that alternative measures—such as executions in sur-rounding states or in one’s own county or executions in the last 5 years or the last 3 months—are not equally valid. As potential murderers may be attempting to predict the effective sanction regime several or many years into the future, when they might be sentenced or executed, it is particularly unclear what the relevant geographic or time horizon is for obtaining a salient measure.
Suppose that when deciding whether to commit a crime, potential murderers weigh the benefits and risks that committing murder may bring them along with the likelihood of those benefits or risks occurring. In this setting, the probability of being sentenced to death and henceforth being

Copyright © National Academy of Sciences. All rights reserved.
Deterrence and the Death Penalty
PANEL STUDIES 57
executed are theorized to be among these perceived risks. The sanction risks are necessarily based on the individual’s perceptions. Either implicitly or explicitly, researchers in this field typically make an additional assump-tion that the risk perceptions of potential murderers are accurate and thus the perceived risks of receiving a death sentence, being executed, or being executed within a particular time period, are equivalent to the objective measures of these risks. The accuracy of this assertion that the risk percep-tions of potential murderers are correct is questionable. There is no clear enforcement mechanism or learning process that would create such accu-racy over time in potential murderers’ perceptions of the risk of incurring the death penalty.
Even if potential murderers’ risk perceptions are accurate, research-ers must carefully specify the probabilities that might affect behavior and must confront the practical difficulties involved in measuring the relevant probabilities. The studies to date, however, have failed to address either of these issues. Because the post-Gregg panel research has not developed models based on the potential offender’s decision problem, the studies may mis-specify the relevant risk probabilities.
Much of this research considers how different conditional probabilities—say, the probability of execution given capital sanctions—each separately affects behavior (see, e.g., Dezhbakhsh, Rubin, and Shepherd, 2003). Yet, in standard decision models in which potential offenders weigh the uncertain benefits and costs of committing a crime, the joint probability of execu-tion, capital sanctions, and arrests are germane. In this expected utility framework, Durlauf, Navarro, and Rivers (2010) show that the effect of the conditional probability of execution given a death sentence cannot be un-derstood separately from the effects of the conditional probability of being caught and being sentenced to death if caught. Moreover, under a rational choice assumption, what will matter is the expected execution rate at time t + 6, which is not necessarily equal to the t – 6 years used in the literature.
Aside from this important issue of modeling and functional form, re-searchers also encounter practical obstacles in measuring the objective risks. Consider the risk of being executed given a death sentence, the risk that has been most focused on in the research, and consider how this risk could be objectively measured and updated each year for those in each state, as is assumed relevant in these models. In 1977, the first full year after the Gregg decision, 31 states provided the legal authority to impose the death penalty. In 1977, there were no data on the actual use of the death penalty in any state to create an estimate of the risk of execution. Some people might have predicted that Texas would be more vigorous in its actual use of the death penalty than California or Pennsylvania, but there were as yet no data to confirm such a prediction. Thus, it is unclear what the objective risk of receiving a death sentence or consequently being executed was in

Copyright © National Academy of Sciences. All rights reserved.
Deterrence and the Death Penalty
58 DETERRENCE AND THE DEATH PENALTY
any state for which the death penalty was legal in 1977. Only over time could an objective risk be based on data. Thus, over time one would expect divergent risks to develop in different states as data on the actual use of the death penalty in each state accumulated.
The process of forming and revising objective measures of the risks associated with the death penalty, however, would then be complicated by additional factors. One is that the volume of data on death sentences and executions available for calculating estimates of risk depends on the size of the state. By various measures of execution risk reported in Chapter 2, Delaware was at least as aggressive in its use of the death penalty as Texas. However, over the period from 1976 to 2000, Delaware sentenced 28 people to death and carried out 11 executions, while Texas sentenced 753 people to death and carried out 231 executions. Thus, potential murderers have far more data on the actual practice of capital punishment each year in Texas than in Delaware. As a consequence, even for well- informed potential murderers living in states with similar sanc-tion regimes, one would expect sanction risk perceptions to evolve along different paths that would depend, among other things, on the size of the state.
Perhaps in an environment in which sanction regimes were plausibly stable, the objective risk of execution could be precisely estimated even in small states with low murder rates. However, sanction regimes do not ap-pear to be uniformly stable in large states for which it is feasible to obtain precise measures of year-to-year variation. Indeed, it is changes in the sanc-tion regime for murder that the panel models use to inform their estimates of deterrence. Moratoriums and commutations may signal changes in re-gimes, particularly when accompanied by high-visibility announcements such as that by former Illinois Governor George Ryan in 2000. As noted in Chapter 2, Texas appears to have shifted to a higher intensity execu-tion sanction regime during the 1990s. Thus, in an environment in which sanction regimes are changing, the value of older data in forming a correct estimate of the prevailing sanction regime deteriorates. Moreover, the value of current data in forming a correct estimate of the future sanction regime also deteriorates. This forecast is particularly relevant as those consider-ing murder now would face the sanction regime of the state in which the homicide is prosecuted some significant time in the future. These factors raise the question of whether year-to-year variation in a measure, such as the number of people executed in a state, has any bearing on the risk of execution for someone committing a murder today. Overall, the degree to which this, or other proposed measures of execution risk, predicts later executions has not been established.
To illustrate the problems associated with these different measures, consider using the number of executions in a state 1 year prior to the

Copyright © National Academy of Sciences. All rights reserved.
Deterrence and the Death Penalty
PANEL STUDIES 59
year in which the homicide rate is measured divided by the number of death sentences in that state 7 years earlier. Those at risk for execution in any particular year are all those on death row at some point in that year. Those who were sentenced to death 7 years earlier could be executed at any time after their sentence, with different probabilities of being executed in each year based on the particulars of their crime, the appeals process, their health, the current governor, etc. In the early years after the national death penalty moratorium ended, on a national level, those who were executed had spent an average of 6-7 years on death row (Snell, 2010). There are several problems with using this information to justify lagging the denominator of a risk of execution measure by 7 years. First, only 15 percent of those sentenced to death in the United States since 1977 have been executed, with close to 40 percent leaving death row for other reasons (vacated sentences or convictions, commutations, a successful appeal, or death by other causes), and 45 percent are still on death row (Snell, 2010). Moreover, these figures vary substantially across states and over time.
Table 4-2 displays the number of inmates removed from death row in each state by the reasons for removal. First, there is substantial variation in the execution rates across states. For example, of the 150 people in Virginia sentenced to death from 1973 to 2009, 105—70 percent—have been executed. In contrast, in North Carolina, only 8 percent of the 528 people sentenced to death have been executed. Not only do these rates vary across states, but they also vary over time (see, e.g., Cook, 2009). Clearly, the number of years those executed have spent on death row is not an ac-curate measure of the number of years those on death row will spend there before they are executed, if they are ever executed. Second, the time spent on death row by those executed has varied over time at the national level, and it varies considerably by state (Snell, 2010). Third, no evidence has been given or arguments made to suggest that death sentences that come to some resolution earlier than others are indicative of the resolution for death sentences that have not yet come to resolution. Thus, using a fixed number of years of lag between those sentenced and those executed means that for many states and years this lag will have an uncertain relationship to the objective risk of execution given a death sentence.
The fact that there is a mismatch between the numerator and denomi-nator in the models used is perhaps best illustrated by the many state-year cases in which there are one or more executions the prior year but there were no death sentences imposed 7 years earlier. Researchers have made a variety of ad hoc removals or substitutions for these undefined cases includ-ing: replace with zero or treat as missing (Kovandzic, Vieraitis, and Boots, 2009); numerator set to zero regardless of denominator and non-zero numerator and zero denominator considered missing at random (Donohue and Wolfers, 2005; Mocan and Gittings, 2003, 2010); replace with most

Copyright © National Academy of Sciences. All rights reserved.
Deterrence and the Death Penalty
60
TA
BL
E 4
-2 D
eath
Sen
tenc
es a
nd R
emov
als,
by
Juri
sdic
tion
and
Rea
son
for
Rem
oval
, 19
73-2
009
Juri
sdic
tion
Tota
l Se
nten
ced
to
Dea
th,
19
73-2
009
Rem
oval
sSe
nten
ce o
r C
onvi
ctio
n O
vert
urne
dSe
nten
ce
Com
mut
edO
ther
R
emov
als
Und
er S
ente
nce
of
Dea
th,
Dec
embe
r 31
, 20
09E
xecu
ted
Die
d
U.S
. To
tal
8,11
51,
188
416
2,93
936
534
3,17
3
Fede
ral
653
06
10
55
Ala
bam
a41
244
3113
52
020
0
Ari
zona
286
2314
110
71
131
Ark
ansa
s11
027
338
20
40
Cal
ifor
nia
927
1373
142
150
684
Col
orad
o21
12
151
02
Con
nect
icut
131
02
00
10
Del
awar
e56
140
250
017
Flor
ida
977
6853
447
182
389
Geo
rgia
320
4616
147
91
101
Idah
o42
13
213
014
Illin
ois
307
1215
9615
612
16
Indi
ana
100
204
546
214
Kan
sas
120
03
00
9
Ken
tuck
y81
36
352
035
Lou
isia
na23
827
611
47
183
Mar
ylan
d53
53
364
05
Mas
sach
uset
ts4
00
22
00
Mis
siss
ippi
190
105
112
03
60
Mis
sour
i18
267
1052
20
51
Mon
tana
153
26
20
2
Neb
rask
a32
34
122
011
Nev
ada
147
1215
364
080
New
Ham
pshi
re1
00
00
01
New
Jer
sey
520
333
88
0
New
Mex
ico
281
119
50
2
New
Yor
k10
00
100
00
Nor
th C
arol
ina
528
4321
297
80
159
Ohi
o40
133
2016
815
016
5
Okl
ahom
a35
091
1216
53
079
Ore
gon
582
223
00
31
Penn
sylv
ania
399
324
148
60
218
Rho
de I
slan
d2
00
20
00
Sout
h C
arol
ina
203
425
983
055
Sout
h D
akot
a5
11
10
02
Tenn
esse
e22
16
1510
54
289
Texa
s1,
040
447
3816
756
133
1

Copyright © National Academy of Sciences. All rights reserved.
Deterrence and the Death Penalty
61
TA
BL
E 4
-2 D
eath
Sen
tenc
es a
nd R
emov
als,
by
Juri
sdic
tion
and
Rea
son
for
Rem
oval
, 19
73-2
009
Juri
sdic
tion
Tota
l Se
nten
ced
to
Dea
th,
19
73-2
009
Rem
oval
sSe
nten
ce o
r C
onvi
ctio
n O
vert
urne
dSe
nten
ce
Com
mut
edO
ther
R
emov
als
Und
er S
ente
nce
of
Dea
th,
Dec
embe
r 31
, 20
09E
xecu
ted
Die
d
U.S
. To
tal
8,11
51,
188
416
2,93
936
534
3,17
3
Fede
ral
653
06
10
55
Ala
bam
a41
244
3113
52
020
0
Ari
zona
286
2314
110
71
131
Ark
ansa
s11
027
338
20
40
Cal
ifor
nia
927
1373
142
150
684
Col
orad
o21
12
151
02
Con
nect
icut
131
02
00
10
Del
awar
e56
140
250
017
Flor
ida
977
6853
447
182
389
Geo
rgia
320
4616
147
91
101
Idah
o42
13
213
014
Illin
ois
307
1215
9615
612
16
Indi
ana
100
204
546
214
Kan
sas
120
03
00
9
Ken
tuck
y81
36
352
035
Lou
isia
na23
827
611
47
183
Mar
ylan
d53
53
364
05
Mas
sach
uset
ts4
00
22
00
Mis
siss
ippi
190
105
112
03
60
Mis
sour
i18
267
1052
20
51
Mon
tana
153
26
20
2
Neb
rask
a32
34
122
011
Nev
ada
147
1215
364
080
New
Ham
pshi
re1
00
00
01
New
Jer
sey
520
333
88
0
New
Mex
ico
281
119
50
2
New
Yor
k10
00
100
00
Nor
th C
arol
ina
528
4321
297
80
159
Ohi
o40
133
2016
815
016
5
Okl
ahom
a35
091
1216
53
079
Ore
gon
582
223
00
31
Penn
sylv
ania
399
324
148
60
218
Rho
de I
slan
d2
00
20
00
Sout
h C
arol
ina
203
425
983
055
Sout
h D
akot
a5
11
10
02
Tenn
esse
e22
16
1510
54
289
Texa
s1,
040
447
3816
756
133
1
cont
inue
d

Copyright © National Academy of Sciences. All rights reserved.
Deterrence and the Death Penalty
62
Juri
sdic
tion
Tota
l Se
nten
ced
to
Dea
th,
19
73-2
009
Rem
oval
sSe
nten
ce o
r C
onvi
ctio
n O
vert
urne
dSe
nten
ce
Com
mut
edO
ther
R
emov
als
Und
er S
ente
nce
of
Dea
th,
Dec
embe
r 31
, 20
09E
xecu
ted
Die
d
Uta
h27
61
91
010
Vir
gini
a15
010
56
1411
113
Was
hing
ton
384
125
00
8
Wyo
min
g12
11
90
01
Perc
enta
ge10
014
.65.
136
.24.
50.
439
.1
NO
TE
: Som
e in
mat
es e
xecu
ted
sinc
e 19
77 o
r cu
rren
tly
unde
r se
nten
ces
of d
eath
wer
e se
nten
ced
prio
r to
197
7. F
or t
hose
inm
ates
sen
tenc
ed t
o de
ath
mor
e th
an o
nce,
the
num
bers
are
bas
ed o
n th
e m
ost
rece
nt d
eath
sen
tenc
e.
SOU
RC
E: S
nell
(201
0),
Tabl
e 20
.
TA
BL
E 4
-2 C
onti
nued

Copyright © National Academy of Sciences. All rights reserved.
Deterrence and the Death Penalty
PANEL STUDIES 63
recent defined ratio (Zimmerman, 2004). These (and other) ad hoc adjust-ments highlight the general problem that the people who were sentenced to death 7 years earlier may be executed before or after the year in which executions are counted, and they are not the only people at risk for being executed in the current or prior year. Overall, the interpretation of this ratio is not clear at all, whether the denominator is lagged any particular number of years, and its relevance to the objective risk of execution for each state and year, let alone to the risk perceptions of potential murderers, is highly questionable.
Basing execution risk measures only on data on executions that have actually been carried out, as has been done in the research being discussed, could result in a serious underestimate of the eventual probability of ex-ecution for those given a death sentence. In addition, this fact raises seri-ous questions about whether the risk of ever being executed after a death sentence is the most salient measure or whether additional information is salient, such as measures that consider expected time to death, expected living conditions while on death row, and in comparison, expected time to death during a long prison sentence and conditions while in prison in that state. (Of course, one can only speculate about which, if any, of these variables is salient for potential murderers.)
These many complications make clear that even with a concerted effort by dedicated researchers to assemble and analyze relevant data on death sentences and executions, assessment of the actual and changing objective risk of execution that faces a potential murderer is a daunting challenge. Given the obstacles to obtaining an objective measure of this risk, the com-mittee does not find any of the measures used in the studies to be credible measures of the objective risk of execution given a death sentence. We also reiterate that it is not known whether there is a relationship between any of these measures or any more credible objective measure of execution risk, and the execution risk as perceived by potential murderers.
MODEL ASSUMPTIONS
The conceptual and measurement concerns raised thus far, which are somewhat unique to studies on the effects of the death penalty on homi-cides, make it difficult to even to envision how one could draw valid infer-ences on the deterrent effect using the existing data. There is a complete lack of basic information on the noncapital component of the sanction regime, on how offenders perceive sanction risks, and on how to accurately measure those risks.
Even if these measurement problems are some day fully addressed, all studies using observational data must also address the counterfactual outcomes problem that arises because the data cannot reveal the outcome

Copyright © National Academy of Sciences. All rights reserved.
Deterrence and the Death Penalty
64 DETERRENCE AND THE DEATH PENALTY
that would occur if the death penalty had not been applied in treatment states and had been applied in control states. The data alone cannot reveal the effect of the death penalty. Rather, researchers must combine data with assumptions.
In the studies we reviewed, variations of the model in Equation 1 have been used to identify the impact of the death penalty on homicide. In this section, we consider the credibility of the four assumptions that have been applied in this literature: (1) that the death penalty measures are inde-pendent of the unobserved factors influencing homicide; (2) that certain observed covariates, called instrumental variables, are correlated with the death penalty but not with the unobserved factors that influence homicide; (3) that the effect of the death penalty is the same for all states and years; and (4) that the sanction regimes of adjacent states do not have any bear-ing on the effect of the death penalty in a particular state. We begin with a brief discussion of the benefits of random assignment.
Benefits of Random Assignment
As discussed in Chapter 3, random assignment of treatment to large samples of subjects leads the distributions of all other characteristics of treatment and control subjects, whether observed or unobserved, to be approximately the same across the two groups. With small samples of subjects, this feature will hold on average, meaning that if a given set of subjects is repeatedly randomly assigned to treatment or control conditions, then the features of the subjects over all possible treatment groups and all possible controls groups would be exactly equal. In any particular ran-domization, however, there may be some features that differ by chance for the subjects in the treatment condition and those in the control condition.
This “balancing” of the characteristics of treatment and control subjects justifies the attribution of any difference in outcomes between the treatment and control groups to the treatment and not to other factors that may differ between the treatment and control subjects. Without randomization, the threat of misattributing the cause of any observed differences in outcomes to the treatment when it is actually due to other factors that differ between the groups is always present. In the remainder of this section we focus on the specific challenges this concern raises with regard to the death penalty and deterrence research, discuss the methodological strategies proposed to overcome these challenges, and assess whether these strategies have been successful.
In research on the death penalty and deterrence, the sanction regime for murder (including the legal status of the death penalty and the inten-sity with which the death penalty is applied) is, for obvious reason, not randomly assigned to state-by-year units. Hence, the possibility is present
Copyright © National Academy of Sciences. All rights reserved.
Deterrence and the Death Penalty
PANEL STUDIES 65
that other factors may be the actual causes of any changes seen in homicide rates. Mechanically, what is required for this misattribution to occur is for death penalty changes to occur at similar times and places as changes in the true underlying causal factors. An example is a shift to a political leader with a “law and order” approach, which could both increase death-penalty-related risks and increase the perceived or actual arrest rates, either or both of which could bring down the homicide rate.
Fixed Effect Regression Model
Two methodological strategies are used to try to identify changes in the homicide rate that are caused by changes in the sanction regime for murder and not by other factors. The first methodological strategy is a fixed effect multiple regression (described above), in which fixed state and year effects are used to account for unobserved determinants of homicide. Given these fixed effects, researchers assume that the death penalty measures are statistically independent of the unobserved determinants of homicide, as would be the case in a randomized experiment. The second methodologi-cal strategy is to add an instrumental variables analysis to the fixed effect multiple regression models.
The fixed effects multiple regression models rely on state level variation in death penalty measures over time to attempt to identify a causal effect of death-penalty-related changes on homicide after controlling for the effects of the other variables in the models. But even if one provisionally assumes that the death penalty measures used in these models are correctly specified (i.e., are the salient factors for potential murderers), that the state-year unit is the unit at which potential murderers are assessing death-penalty-associated risks, and that the specification of all other variables and of the functional form of the model are correct, additional strong assumptions are still required for panel models to deliver estimates of a deterrent effect of the death penalty.
In the fixed effect models, states that do not apply the death penalty sanction are used to estimate the missing counterfactual for states that do experience different death penalty sanction levels. This approach identifies a causal effect only if there are no other factors besides the death penalty causing homicide rates to change differently in states that do and do not experience changes in death penalty sanctions. Many such factors may well exist—such as changes in economic conditions, crime rates, public perceptions or political regimes—and there is no reason to believe that these variables are fixed over time or across states. Moreover, the com-mittee considers the omission from these models of other changes in the sanction regime for murder especially problematic. As discussed above, other changes in the sanction regime for murder, such as the likelihood of life without parole or the average sentence length, may well change con-

Copyright © National Academy of Sciences. All rights reserved.
Deterrence and the Death Penalty
66 DETERRENCE AND THE DEATH PENALTY
currently with death-penalty-related changes and so affect homicide rates. If states that do not experience changes in the death penalty also did not experience comparable changes (on average) in other aspects of the sanc-tion regime for murder, then the required assumption is violated, and those states cannot provide the missing counterfactual information for states that do experience changes in the death penalty.
A related concern is that while death penalty sanctions may be af-fecting the homicide rate, the homicide rate may also be affecting death penalty sanctions and statutes. Since factors causing changes in observed in death penalty sanctions are unknown, one cannot rule out that changes in the homicide rate are among such factors. One way this could occur is that an increase in homicides may influence policy makers to increase the seriousness of sanctions or the likelihood of more serious sanctions for murder. Given this possibility, it is interesting to note that states in an available sanction have higher homicide rates on average than states that do not have the death penalty. Alternatively, an increase in the homicide rate may decrease the intensity with which the death penalty is applied as death penalty proceedings require more resources than non-death-penalty proceedings (Alarcón and Mitchell, 2011; California Commission on the Fair Administration of Justice, 2008; Cook, 2009; Roman, Chalfin, and Knight, 2009). This potential reverse causality problem—termed simultane-ity in econometrics and feedback from output to input in the literature on causality—is particularly thorny to overcome. It was a major concern of the earlier National Research Council (1978) report on deterrence.
Instrumental Variables
In light of these concerns, Dezhbakhsh, Rubin, and Shepherd (2003) and Zimmerman (2004) have added an additional identification strategy, the use of instrumental variables. The idea behind an instrument is to separate out the part of any observed relationship between the death pen-alty and homicide that is spurious (i.e., resulting from the relationship of both to other factors) from the part of the relationship between the death penalty and homicide that is causal. The success of an instrument and the consequent instrumental variables analysis depends on the ability of the instrument to identify the portion of the variation in the treatment that is not contaminated by other causal factors that covary with the treatment and affect the outcome.
The success of an instrument depends on the degree to which it meets two requirements: (1) the death penalty sanction must vary with the value of the instrument, and (2) the average outcome must not vary as a function of the value of the instrument conditional on the treatment and levels of other covariates. A sufficient condition for this to hold is that the instru-

Copyright © National Academy of Sciences. All rights reserved.
Deterrence and the Death Penalty
PANEL STUDIES 67
ment affects the homicide rate only through its effect on the death penalty sanctions, that is, that the instrument has no direct effect of its own on ho-micide rates. The first of these requirements can be checked empirically. The second requirement typically cannot be established using data and empirical analysis; it requires, instead, logic or theory to establish its credibility.
In the studies of death penalty and deterrence, the challenge is to find a variable that predicts death penalty sanctions but does not have a direct effect on the homicide rate. Although successful instrumental variables are notoriously difficult to come up with, making an argument for a particular instrument in this setting is complicated by the same fact that makes a spu-rious correlation very difficult to rule out. Little is known about the factors that actually affect homicide rates and, thus, the relevant factors may not be observed, measured, and controlled for. Compounding the problem, even less is known about factors that are associated with death-penalty-related-changes in the sanction regime for murder, or more relevantly, changes in perceptions of sanction risks. As noted above, factors contributing to changes in the legal status of the death penalty or the intensity with which the death penalty is applied could include economic, crime, or political changes that may also have direct consequences for the homicide rate.
These two gaps in knowledge—of factors that contribute to the homi-cide rate and factors that contribute to changes in the legality or practice of the death penalty and of risk perceptions—combine to heighten the concern that any association observed between death penalty changes and homicide rate changes may well be due to other factors. Thus, it is particularly dif-ficult to convincingly establish that a proposed instrument does not directly affect the homicide rate, as is required.
A couple of examples of credible instruments in other settings may be useful to compare with those proposed in the studies of the death penalty and deterrence. In studies of crime and justice, Lee and McCrary (2009) use the age at which an offender can be tried as an adult as an instrument to identify the deterrent effect of incarceration; and Klick and Tabarrok (2005) use terror alerts in Washington, DC, as an instrument to identify the deterrent effect of police on crime on the Washington Mall. In the field of labor economics, a person’s Vietnam draft number has been used as an instrument to identify the effect of military service on future earnings because one’s draft number affects military service but does not have any direct effect on future earnings (Angrist, 1990). Month of birth has been used as an instrument to identify the effect of number of years of schooling on earnings because month of birth affects the academic year in which high school students of similar ages may legally leave school, but it is unlikely to have any direct effect on earnings (Angrist and Kreuger, 1991).
In contrast, the instruments proposed in the panel studies of the death penalty often appear to clearly violate the second requirement and some-

Copyright © National Academy of Sciences. All rights reserved.
Deterrence and the Death Penalty
68 DETERRENCE AND THE DEATH PENALTY
times violate the first. The instruments that have been used include police payroll, judicial expenditures, Republican vote share in each separate presi-dential election, prison admissions, the proportion of a state’s murders in which the assailant and victim are strangers, the proportion of a state’s murders that are nonfelony, the proportion of murders by nonwhite offend-ers, an indicator (yes/no) for whether there were any releases from death row due to a vacated sentence, and an indicator (yes/no) for whether there was a botched execution. The specific death penalty variables for which these instruments are proposed are measures of the risk for murderers of be-ing arrested, the risk for those arrested for murder of receiving a death sen-tence, and the risk for those receiving a death sentence of being executed.
The studies offer very little justification for why these instruments are believed to be unrelated to the unobserved determinants of homicide, and in many cases the committee does not find the assumptions to be credible. To take two examples, it seems highly unlikely that police expenditures or the Republican vote share in a particular presidential election affect homicide rates only through the intensity with which the death penalty is exercised. To the contrary, police expenditures are likely to have a direct effect on ho-micide rates, and Republican vote shares may be related to a host of factors that are thought to influence crime (e.g., “get tough on crime” policies and a state’s demographic composition).
The idea of using instrumental variables to help identify the effect of the death penalty on homicides is sensible. The problem, however, is find-ing variables that are related to the sanction regime but not directly related to homicide rates. In general, the committee finds that the instruments proposed in the research are not credible and, as a result, this identifica-tion strategy has thus far failed to overcome the challenges to identifying a causal effect of the death penalty on homicide rates.5
Homogeneity
Still another assumption of the panel regression model in Equation (4-1) is that any effect that the death penalty has on homicide rates is the same
5 In addition to these fundamental problems with the instruments, Donohue and Wolfers (2005) document that the results are highly sensitive to the specification of the instruments. For example, the results of Dezhbakhsh, Rubin, and Shepherd (2003) notably vary depend-ing on whether and how one specifies the Republican vote share instrument: when using vote shares from six different elections, Dezhbakhsh, Rubin, and Shepherd (2003) report that each additional execution saves an average of 18 lives; when using a single vote share measure from the most recent election, Donohue and Wolfers (2005, p. 826) find that “instead of saving eighteen lives, each execution leads to eighteen lives lost.” Moreover, Donohue and Wolfers find that when the partisanship variables are not included among the instruments, more execu-tions lead to substantially more homicides.

Copyright © National Academy of Sciences. All rights reserved.
Deterrence and the Death Penalty
PANEL STUDIES 69
in every state and every year. This assumption of a homogeneous treat-ment effect is unlikely to hold in practice. This assumption relies on “unit exchangeability,” which requires that if the change in the death penalty measure observed in a particular state and year were instead to be observed in a different state and year, then the effect seen on homicide would be the same. For the legal status of the death penalty, this assumption would mean that the death penalty would have the same effect on homicides in the first year a low-crime state instituted the death penalty by legislative action as it would in the 15th year in Texas, a state in which it is widely used. The assumption would also mean that the effect would be the same in the year before the death penalty was removed as a possible sanction due to the courts’ determining the state’s death penalty law was unconstitutional in a state that had the death penalty but did not implement it. The death-penalty-intensity models also invoke this assumption. These models assume that every possible death-penalty-intensity level would have the same effect on homicide rates in every state and year if it was present in that state and year, regardless of the prior sanction regime, a state’s history with the death penalty, or any other factor.
Although this homogeneity assumption is commonly invoked in regres-sion models, no support is offered for it in studies of the death penalty, and on its face it appears unlikely to hold. In fact, there is some evidence to the contrary. Figure 4-2 displays the distribution of estimates found by Donohue and Wolfers (2005, p. 810, Figure 4) when they estimate state-specific parameters using the same basic specification as in Dezhbakhsh and Shepherd (2006). They find that reinstatement of the death penalty in 1976 is associated with an increased homicide rate in 17 states and a lower rate in 24 states. Similarly, when Shepherd (2005) estimated state-specific deterrence parameters using the same basic specifications as in Dezhbakhsh, Rubin, and Shepherd (2003), she finds that executions deterred murder in 8 states, and increased murders in 13 states. The committee does not endorse these state-specific models and estimates, but the findings do suggest the po-tential for substantial heterogeneity in the effect of the death penalty across states, which violates a basic assumption of the panel data model in Equa-tion (4-1). Moreover, relaxing this homogeneity assumption can lead to very different inferences on the effect of the death penalty (see Chapter 6).
Finally, we note that the panel regression models also rely on the as-sumption that the sanction regimes of adjacent states do not have any bear-ing on the effect the death penalty in a particular state. In other words, the assumption asserts that the effect of the legalization of death penalty (or an increase to a higher death-penalty-intensity level) is the same for a state regardless of whether it is surrounded by states with a death penalty that is rarely implemented or is adjacent to, say, Texas. Although it is possible that the legal status of the death penalty (or an increase to a higher death-

Copyright © National Academy of Sciences. All rights reserved.
Deterrence and the Death Penalty
70 DETERRENCE AND THE DEATH PENALTY
penalty-intensity level) may have the same effect in each of these scenarios, it is also plausible that in the first setting the change in the sanction regime for murder would be perceived as small to potential murderers and in the second it would seem large. No research to date has explored whether the assumption that the treatment effect is insensitive to context created by other states is likely to hold, but violations of this assumption are known to lead to biased inferences (see, e.g., Rubin, 1986, p. 961). While account-ing for social interactions is known to be difficult, Manski (in press) points to constructive ways of further addressing some of the problems that have been identified in the research to date.
CONCLUSION
The committee finds the failure of the panel studies we reviewed to address or overcome the primary challenges discussed above sufficient reason to view this research as noninformative with regard to the effect of the death penalty on homicides. The sanction regime is insufficiently specified and the measures of the intensity with which the death penalty is applied are flawed. No connection has been established between these measures and the perceived sanction risks of potential murderers. Neither
0.0
5.1
.15
.2.2
5D
ensi
ty
-6 -4 -2 0 2 4 6Estimated Effect on Homicide RateAnnual Murders per 100,000 People
Death Penalty Reinstatement
0.0
5.1
.15
.2.2
5D
ensi
ty
-6 -4 -2 0 2 4 6Estimated Effect on Homicide RateAnnual Murders per 100,000 People
Death Penalty Abolition
R02175Figure 4-2
vectors, editabletaken from original source(Donohue & Wolfers, 2006)
FIGURE 4-2 Distribution of regression-estimated effects across states. SOURCE: Donohue and Wolfers (2005, p. 810, Figure 4). Used by permission.

Copyright © National Academy of Sciences. All rights reserved.
Deterrence and the Death Penalty
PANEL STUDIES 71
the fixed effects multiple regression models nor the proposed instruments are credible in overcoming challenges to identifying a causal link between the death penalty and homicide rates. The homogeneous response restric-tion that the effects are the same for all states and all time periods seems patently not credible.
Some researchers have argued that fixed effect models without instru-ments may provide valuable information, although not perfect information about the impact of death penalty on crime. One reason given is that they do not suffer from the defects that attend the use of manifestly invalid instrumental variables (see, for example, Donohue and Wolfers, 2009, and Kovandzic, Vieraitis, and Boots, 2009). This assessment of the informative value of the fixed effects models is dubious for several reasons. Most no-tably, these models do not address the data and modeling issues discussed throughout this chapter. The fixed effects models estimated in the literature do not specify the noncapital component of the sanction regime and setting aside the issue of how sanction risks are actually perceived, the measures of execution risk that are used do not appear to bear any resemblance to the true risk of execution. In addition, the key assumption that the death penalty sanction is independent of other unobserved factors that might in-fluence homicide rates seems untenable. For these reasons, the fixed effects models are no more informative about the effect of the death penalty on homicide rates than other types of model.
Some studies play the useful role, either intentionally or not, of dem-onstrating the fragility of claims to have or not to have found deterrent effects (e.g., see Cohen-Cole et al., 2009; Donohue and Wolfers, 2005, 2009). However, even these studies suffer from the intrinsic shortcomings that severely limit what can be learned about the effect of the death penalty on homicide rates by using data on the death penalty as it has actually been administered in the United States in the past 35 years.
The challenges discussed here are formidable, and breakthroughs on several fronts would be necessary to overcome them. Only then might panel models, with or without instruments, be a fruitful methodology for study-ing the deterrent effects associated with the death penalty.
REFERENCES
Alarcón, A.L., and Mitchell, P.M. (2011). Executing the will of the voters?: A roadmap to mend or end the California legislature’s multibillion-dollar death penalty debacle. Loyola of Los Angeles Law Review, 44(Special), S41-S224.
Angrist, J.D. (1990). Lifetime earnings and the Vietnam era draft lottery: Evidence from Social Security administrative records. American Economic Review, 80(3), 313-336.
Angrist, J.D., and Krueger, A.B. (1991). Does compulsory school attendance affect schooling and earnings? The Quarterly Journal of Economics, 106(4), 979-1,014.

Copyright © National Academy of Sciences. All rights reserved.
Deterrence and the Death Penalty
72 DETERRENCE AND THE DEATH PENALTY
Berk, R. (2005). New claims about executions and general deterrence: Déjà vu all over again? Journal of Empirical Legal Studies, 2(2), 303-330.
California Commission on the Fair Administration of Justice. (2008). Report and Recommen-dations on the Administration of the Death Penalty in California. Sacramento: Author.
Cohen-Cole, E., Durlauf, S., Fagan, J., and Nagin, D. (2009). Model uncertainty and the deter-rent effect of capital punishment. American Law and Economics Review, 11(2), 335-369.
Cook, P.J. (2009). Potential savings from abolition of the death penalty in North Carolina. American Law and Economics Review, 11(2), 498-529.
Dezhbakhsh, H., and Shepherd, J.M. (2006). The deterrent effect of capital punishment: Evi-dence from a “judicial experiment.” Economic Inquiry, 44(3), 512-535.
Dezhbakhsh, H., Rubin, P.H., and Shepherd, J.M. (2003). Does capital punishment have a deterrent effect? New evidence from postmoratorium panel data. American Law and Economics Review, 5(2), 344-376.
Donohue, J.J., and Wolfers, J. (2005). Uses and abuses of empirical evidence in the death penalty debate. Stanford Law Review, 58(3), 791-845.
Donohue, J.J., and Wolfers, J. (2009). Estimating the impact of the death penalty on murder. American Law and Economics Review, 11(2), 249-309.
Durlauf, S., Navarro, S., and Rivers, D.A. (2010). Understanding aggregate crime regressions. Journal of Econometrics, 158(2), 306-317.
Fagan, J., Zimring, F.E., and Geller, A. (2006). Capital punishment and capital murder: Market share and the deterrent effects of the death penalty. Texas Law Review, 84(7), 1,803-1,867.
Frakes, M., and Harding, M.C. (2009). The deterrent effect of death penalty eligibility: Evi-dence from the adoption of child murder eligibility factors. American Law and Econom-ics Review, 11(2), 451-497.
Katz, L., Levitt, S.D., and Shustorovich, E. (2003). Prison conditions, capital punishment, and deterrence. American Law and Economics Review, 5(2), 318-343.
Klick, J., and Tabarrok, A. (2005). Using terror alert levels to estimate the effect of police on crime. Journal of Law & Economics, 48(1), 267-279.
Kovandzic, T.V., Vieraitis, L.M., and Boots, D.P. (2009). Does the death penalty save lives? Criminology & Public Policy, 8(4), 803-843.
Lee, D., and McCrary, J. (2009). The Deterrent Effect of Prison: Dynamic Theory and Evidence. Unpublished paper. Industrial Relations Section, Department of Economics, Princeton University. Available: http://emlab.berkeley.edu/~jmccrary/lee_and_ mccrary2009.pdf [ December 2010].
Manski, C.F. (in press). Identification of treatment response with social interactions. Submit-ted to The Econometrics Journal. Available: http://onlinelibrary.wiley.com/doi/10.1111/j.1368-423X.2011.00368.x/abstract [December 2010].
Mocan, H.N., and Gittings, R.K. (2003). Getting off death row: Commuted sentences and the deterrent effect of capital punishment. Journal of Law & Economics, 46(2), 453-478.
Mocan, H.N., and Gittings, R.K. (2010). The impact of incentives on human behavior: Can we make it disappear? The case of the death penalty. In R.E.S. Di Tella and E. Schar-grodsky (Eds.), The Economics of Crime: Lessons for and from Latin America (pp. 379-420). National Bureau of Economic Research conference report. Chicago: University of Chicago Press.
National Research Council. (1978). Deterrence and Incapacitation: Estimating the Effects ofCriminal Sanctions on Crime Rates. Panel on Research on Deterrent and Incapacita-tive Effects. A. Blumstein, J. Cohen, and D. Nagin (Eds.), Committee on Research on Law Enforcement and Criminal Justice. Assembly of Behavioral and Social Sciences. Washington, DC: National Academy Press.

Copyright © National Academy of Sciences. All rights reserved.
Deterrence and the Death Penalty
PANEL STUDIES 73
Roman, J.K., Chalfin, A.J., and Knight, C.R. (2009). Reassessing the cost of the death penalty using quasi-experimental methods: Evidence from Maryland. American Law and Eco-nomics Review, 11(2), 530-574.
Rubin, D.B. (1986). Statistics and causal inference: Comment: Which ifs have causal answers. Journal of the American Statistical Association, 81(396), 961-962.
Shepherd, J.M. (2005). Deterrence versus brutalization: Capital punishment’s differing impacts among states. Michigan Law Review, 104(2), 203-255.
Snell, T.L. (2010). Capital Punishment, 2009—Statistical Tables. Report, U.S. Department of Justice (NCJ 231676). Available: http://www.ojp.usdoj.gov/index.cfm?ty=pbdetail& iid=2215. [December 2010].
Zimmerman, P.R. (2004). State executions, deterrence, and the incidence of murder. Journal of Applied Economics, 7(1), 163-193.

Copyright © National Academy of Sciences. All rights reserved.
Deterrence and the Death Penalty

Copyright © National Academy of Sciences. All rights reserved.
Deterrence and the Death Penalty
5
Time-Series Studies
Time-series studies of the effect of capital punishment on homicides study the statistical association of executions and homicides over time. As noted in the preceding chapter, panel studies also contain a
time dimension, so the division between the two approaches is not perfect. Indeed, time-series studies can be thought of as a particular type of panel study, characterized by a small number of cross-sectional units, often only one or two. Some time-series studies analyze executions and homicides over a large number of periods; others examine the aftermath of single execution events. Whatever the length of the series, the intuition undergirding the analysis is that the presence of an effect of executions on homicide rates can be seen from the association of fluctuations of executions over time with fluctuations of homicides over time.
The time-series and panel studies we reviewed differ in several other important respects.
• First, the unit of time in time-series studies is usually months, weeks, or even days; in contrast, the unit of time in panel studies is usually a year. Thus, results from time-series studies are generally interpreted as measuring short-term effects of capital punishment.
• Second, time-series studies generally examine the association be-tween execution events and homicides; panel studies generally mea-sure the association of homicide rates with ratios that are intended to measure the probability of execution.
75
Copyright © National Academy of Sciences. All rights reserved.
Deterrence and the Death Penalty
76 DETERRENCE AND THE DEATH PENALTY
• Third, while most panel studies use very similar regression meth-ods, time-series studies use a wide assortment of specialized time series methods.
• Fourth, the designs of time-series studies are more varied than are those of panel studies. Perhaps the most important difference among time-series studies is the number of execution events ex-amined. Some time-series research focuses on the effect of a single execution event, and other studies combine data on many execu-tion events and analyze their temporal association with homicide rates in a single statistical model.
The variation of research methods in the time-series studies makes it challenging to organize a cohesive discussion of the subject. It also is chal-lenging to describe and critique the studies in a way that is understandable to audiences who do not have expertise in time-series methods. Methods for analysis of time-series data are specialized and often very technical. We address the second challenge by beginning this chapter with a nontechnical discussion of some relatively transparent problems of the studies. We then continue with further criticisms that of necessity are more technical.
BASIC CONCEPTUAL ISSUES
Execution Event Studies
Studies of single execution events attempt to identify whether a change in the homicide rate occurs in the immediate aftermath of a single execution. A decline is interpreted as evidence of deterrence; an increase is interpreted as evidence of a brutalization effect, whereby state-sanctioned executions “legitimate” homicide to some in the citizenry. If either such effect could be convincingly demonstrated, it would establish a threshold requirement for capital punishment to affect behavior, namely that “someone is seem-ingly listening.” However, as detailed below, the committee concluded that no existing study has successfully made such a demonstration and that the obstacles to success for a future study are formidable. As importantly, the committee concluded that a successful demonstration would have limited informational value.
Studies of a single execution event are subject to the same problem that bedevils most before-after studies. Because the execution is not conducted in the context of a carefully controlled experimental setting, other factors that affect the homicide rate may coincide with the execution event. Some event studies attempt to deal with this problem by examining changes over very short periods of time, days or a week. Although shortening the time window of observation may provide some protection from the effects of

Copyright © National Academy of Sciences. All rights reserved.
Deterrence and the Death Penalty
TIME-SERIES STUDIES 77
other sources (but see discussion below), it opens other possible interpreta-tions of the result. Even if a short-term effect could be established, it would be difficult to determine whether homicides were actually prevented or simply displaced in time. This possibility creates a fundamental conundrum: the study of short time frames increases the plausibility of the displacement in time interpretation, and the study of longer time frames increases the risk of confounding by other factors.
It is vital to understand that event studies do not speak to the ques-tion of whether and how a state’s sanction regime affects its homicide rate. The simplest illustration of this point involves the interpretation of a study that fails to find evidence that an execution event affects the homicide rate. Consider, for example, a study of the first execution after an extended moratorium. Suppose that the study convincingly demonstrated that the execution was not followed by any change in the homicide rate. One inter-pretation of this result is that capital punishment has no deterrent effect. However, another possibility is that the deterrent effect is large but that it was anticipated in advance of the execution due to the publicity given to the upcoming event. Both possibilities are logical and plausible, but they are not distinguishable by the event study methodology.
Alternatively, suppose that an event study found that homicides are reduced in the immediate aftermath of an execution and not just displaced in time. To generalize from this single execution requires consideration of the context in which the execution occurred. If it was the first execution after an extended moratorium, it is problematic to assume that such an effect would recur for subsequent executions. More generally, the effect of any given execution may depend on the proximity in time of that execution to other executions and to the frequency of executions more generally. For example, if an execution event study established convincingly that it averted one homicide that week, it does not follow that each additional execution would avert one more homicide. To complicate matters further, the effect of any one execution may depend on the identity of the person executed (e.g., an infamous serial killer or a person for whom there is some public sympathy) and the amount of publicity given to the execution.
The problem of generalizing from the findings of even a convincing event study is indicative of still another fundamental committee concern with all the time-series studies. The researchers who carry out such studies never clearly specify why potential murderers respond to execution events. Do potential murderers respond to the shock value of execution? If so, would the magnitude of the shock value change with each additional ex-ecution? One possibility is that the shock value might increase, perhaps be-cause of reinforcement. Alternatively, it might decrease, perhaps because a potential murderer becomes inured to executions. Still another possibility is

Copyright © National Academy of Sciences. All rights reserved.
Deterrence and the Death Penalty
78 DETERRENCE AND THE DEATH PENALTY
that potential murderers respond to sanction risk probabilities and that ex-ecution events cause them to update their perceptions of those probabilities.
Studies of Deviations from Fitted Trends
This issue of why and how potential murderers react to executions is equally important to the interpretation of studies that combine data on executions and homicides over multiple time periods, deploying subtle time-series methods to analyze these data. Consider Figures 5-1 and 5-2, which plot executions and homicides, respectively, in Texas from 1990 to 2008. The most obvious way to examine the association of executions and homicides in Texas is to correlate these two time series. Over the period, this correlation is –0.68. However, there are innumerable obvious objec-tions to interpreting this negative association as deterrence because many factors that influence the homicide rate were also changing over this time period. One manifestation of this observation can be seen in Figure 3-3 (in Chapter 3), which shows the close correspondence over time in the homi-
0
5
10
15
20
25
30
35
40
45
1990 1992 1994 1996 1998 2000 2002 2004 2006 2008
Num
ber
of E
xecu
tions
in T
exas
Year
R02175Figure 5-1
vectors, editable
FIGURE 5-1 Executions in Texas from 1990 to 2008.SOURCE: Data from Texas Department of Criminal Justice (2011).

Copyright © National Academy of Sciences. All rights reserved.
Deterrence and the Death Penalty
TIME-SERIES STUDIES 79
cide rates of three states with very different capital punishment sanction regimes—California, New York, and Texas.
Studies of executions and homicides over multiple time periods do not examine the raw time-series association between the homicide rate and number of executions. Instead they analyze the association between deviations from fitted statistical trend lines that summarize these two time series. One technical adjustment sometimes used to in these studies is that the data series be detrended. By “detrended” it is meant that the time series does not vary systematically with time (e.g., does not increase over time). As a consequence the time-series studies analyze the association between deviations from statistical trend lines that summarizes the execution time series and the homicide rate time series
As an illustration, consider again Figures 5-1 and 5-2. Superimposed on the raw time-series plots of executions and homicides are regression equa-tions fit to the execution and homicide data. In the case of the execution time series, the regression uses a quadratic function of time to fit the raw
0
2
4
6
8
10
12
14
16
18
1990 1992 1994 1996 1998 2000 2002 2004 2006 2008
Hom
icid
e R
ate
in T
exas
per
10,
000
Year
R02175Figure 5-2
vectors, editable
FIGURE 5-2 Texas homicide rate from 1990 to 2008.SOURCES: Data from the Federal Bureau of Investigation (2011).

Copyright © National Academy of Sciences. All rights reserved.
Deterrence and the Death Penalty
80 DETERRENCE AND THE DEATH PENALTY
data. In the case of the homicide time series, the regression uses a cubic function of time to fit the data.
The time-series literature views the fitted regressions as “trends” that should be subtracted from the raw data prior to analysis. After that subtrac-tion, researchers analyze the statistical association between deviations from the respective trends to draw inferences about the effect of executions on homicides. For example, in 1998, during the peak period of executions in Texas, the deviation of the actual number of executions from the fitted trend line is negative. A time-series researcher might examine the statistical association between this negative deviation and corresponding deviations of the homicide rate from its fitted trend line in 1999 and later years.
Unfortunately, the researchers who carry out these studies do not ex-plicitly state their rationale for analyzing deviations in this fashion. They may believe that this form of analysis provides a basis for causal inter-pretation of findings that is more credible than analysis of raw data on homicides and executions. However, the committee concludes that analysis of deviations from fitted trends, at least as conducted in the published stud-ies, does not provide a valid basis for inferring the effects of executions on homicides.
One reason for our conclusion is that the study of deviations from fitted trend lines, even with high frequency data, may not avoid the confounding problem that affects analyses of the raw correlation of executions and ho-micide rates over time. For example, the publicity given to executions may still be systematically related to deviations from an execution trend line. Indeed, one of the studies we reviewed (Stolzenberg and D’Alessio, 2004) reports that, even in deviation form, the execution and publicity time series were highly correlated.
A more fundamental concern is that execution event studies do not clearly specify why potential murderers respond to execution events. For potential murderers to react to a deviation from a fitted trend line re-quires that they recognize it as a deviation. To recognize it as a deviation requires that they be aware of the trend line from which deviations are measured. However, none of the studies discusses why potential murderers might be attentive to the trend lines fit by time-series researchers and, if so, how they might react to deviations from fitted trends. Indeed, the studies do not even ask whether potential murderers perceive the time-series evidence on executions in terms of a trend and deviations from the trend.
If potential murderers are attentive to the trend line, there would have to be a reason for giving it their attention. One possibility is that their behavior is affected by the trend line. For example, the escalation of executions in Texas during the 1990s might have been interpreted as an intensification of the state’s capital punishment sanction regime. Conven-tional deterrence theory would predict that such an escalation would reduce

Copyright © National Academy of Sciences. All rights reserved.
Deterrence and the Death Penalty
TIME-SERIES STUDIES 81
homicides, assuming that intensification of the use of capital punishment did not alter other aspects of the sanction regime. But the brutalization theory might predict that this escalation increases murders. Yet neither of these predictions speaks to the question of how potential murderers react to deviations from the trend.
Consider, for example, the conventional economic model of criminal decision making. This model assumes that potential murderers respond to their perceptions of the probability of capture and punishment, which in this context is execution. Under this model, unless potential murderers perceive a deviation from trend as signaling a change in the probability of execution, they will not change their behavior even though their behavior is affected by the probability of execution. Thus, from the perspective of the economic conception of deterrence, a finding of no association between deviations from fitted execution and homicide trends is not indicative of a lack of deterrence.
In making this point, it is important to emphasize that the committee is not endorsing this deterrence-based model of behavior. We pose it to il-lustrate that the results of time-series analyses are not interpretable in the absence of a behavioral model.
Another possible behavioral model might build from the assumption that potential murderers react in fear to the shock value of executions and are thereby dissuaded from committing a murder. This assumption, how-ever, does not suffice to interpret the results of time-series analyses of de-viations from fitted trends. Why should deviations from a fitted trend have shock value separate from the trend itself? If there is no apparent shock value to a deviation from the trend line, does that mean that the trend line itself has no shock value?
The idea that potential murderers perceive and react to deviations from fitted execution time trends presupposes that they are attentive to trends and have mental models of how trends are formed. Moreover, their percep-tions of trends must coincide with those of the researchers who fit trend lines to raw execution data. Otherwise, potential murderers would have no basis for recognizing deviations as such.
If time-series analysis finds that homicide rates are responsive to such deviations, the question is why? One possibility is that potential murderers interpret a deviation as new information about the intensity of the appli-cation of capital punishment—that is, that the deviation signals a change in the part of the sanction regime that relates to the application of capital punishment. If so, a deviation from the execution trend line may cause po-tential murderers to alter their perceptions of the future course of the trend line, which in turn may change their behavior.
Yet, even accepting this idea, a basic question persists. Why should the trend lines fit by researchers coincide with the perceptions of potential mur-

Copyright © National Academy of Sciences. All rights reserved.
Deterrence and the Death Penalty
82 DETERRENCE AND THE DEATH PENALTY
derers about trends in executions? If researchers and potential murderers do not perceive trends the same way, then time-series analyses do not correctly identify what potential murderers perceive as deviations. However, the pub-lished time-series studies do not ask whether and how potential murderers perceive trends. Moreover, no study performs an empirical analysis that tries to learn how potential murderers perceive the risk of sanctions. Hence, the committee has no basis for assessing whether the findings of time-series studies reflect a real effect of executions on homicides or are artifacts of models that incorrectly specify how deviations cause potential murderers to update their forecasts of the future course of executions.
VECTOR AUTOREGRESSIONS
Evidence Under Existing Criminal Sanction Regimes
One methodology used in time-series studies of deterrence is known as vector autoregressions (VARs). Research of this type estimates dynamic regressions that relate current homicide and execution rates to previous realizations of these two variables. The estimated relationships are then used to make inference about deterrence. Although this methodology has only recently been applied in studies of capital punishment and deterrence, it has been long used in studies of imprisonment and crime: see Durlauf and Nagin (2011) for a review. We extensively discuss its limitations as a source of information on deterrence because it is the methodological state of the art in time-series approaches to deterrence, and it seems poised to become widespread in capital punishment studies, despite the shortcomings we discuss.
VARs were originally developed by macroeconometricians to describe the time-series evolution of an economy (Granger, 1969; Sims, 1972, 1980; Sims, Goldfeld, and Sachs, 1982). The methodology was motivated by the idea that the evolution of an economy can usefully be represented as the superposition of short-run cyclical fluctuations on long-run trends. This idea suggests a three-step analysis. One first uses the raw time-series data on the economy to estimate the trends. One then “detrends” the raw data by subtracting the estimated trends. The detrending step also subtracts the means of each variable, to produce residuals that have no trend and zero mean. One finally estimates a VAR on the detrended and “demeaned” re-sidual data to study the time-series properties of the short-run fluctuations.
VARs are commonly specified to be linear regressions. The use of linear regression is motivated by a statistical idea rather than a substantive one. That is, under relatively weak technical conditions, any stationary time-series can be represented as a dynamic linear relationship that is recoverable

Copyright © National Academy of Sciences. All rights reserved.
Deterrence and the Death Penalty
TIME-SERIES STUDIES 83
from observation of the series.1 The detrending step of the VAR methodol-ogy is intended to render the residual time series stationary.
Some criminologists have used VARs to study deterrence. An immediate question is whether it makes sense to think of the time-series evolution of homicides and executions as the superposition of short-run cyclical fluctua-tions on long-run trends. The researchers have used various definitions of trends, assuming them to be either linear or nonlinear functions of time. The absence of a consensus approach to detrending reflects the absence of any persuasive theory of the generation of the purported trends. In any case, after detrending is somehow accomplished, VARs are estimated on the detrended residual data and used to describe short-run cyclical fluctuations in homicides and executions.
To illustrate the methodology, denote the detrended and demeaned ho-micide and execution rates in political unit i at time t as hi,t and ei,t, respec-tively, and suppose that there are multiple observations on these variables over time.2 The VAR representation of these rates is a two equation system of linear regressions
hi,t = a1hi,t–1 +
a2hi,t–2
+ . . . + b1ei,t–1 + b2ei,t–2 + . . . + ei,t ei,t = c1hi,t–1 +
c2hi,t–2
+ . . . + d1ei,t–1 + d2ei,t–2 + . . . + hi,t (5-1)
Thus, a VAR linearly relates current executions and homicides to previous executions and homicides, as well as to the current values of the random variables ei,t and hi,t. The choice of how many lagged terms to use is made with the intention that ei,t and hi,t be random variables that are uncorrelated across time. That is, these two random variables may be correlated at a point in time, but future and previous values cannot be correlated. For-mally, ei,t and hi,t are the one-period-ahead prediction errors for homicides and executions given that predictor variables are restricted to the linear histories of these variables.3 In the relatively simple case in which only finite lags appear in (1), the coefficients of the VAR may be estimated by ordinary least squares.
In studies of the deterrent effect of capital punishment, systems such as (5-1) have focused on the coefficients b1, b2,…, which relate lagged levels of execution rates to the time t homicide rate. If the bi coefficients are all equal to 0, then execution rates are said not to “Granger-cause” homicide rates. That term comes from econometrician Clive Granger, who proposed
1 This is known as the autoregression form of the Wold representation theorem: see Ash and Gardner (1975) for a fully rigorous treatment.
2 Some studies use levels rather than rates, but this distinction is not essential for understand-ing the methodology.
3 By linear, we refer to the fact that prediction of homicides and executions are not allowed to depend on more complicated functions of their joint histories than the additive structure in (1).

Copyright © National Academy of Sciences. All rights reserved.
Deterrence and the Death Penalty
84 DETERRENCE AND THE DEATH PENALTY
this statistical definition of causality as a way to summarize the dynamic relationships between time series. It is essential to understand that use of the word “cause” notwithstanding, a finding that the b1 coefficients are all equal to 0 is only a statement about the absence of a linear statistical relationship between current homicides and lagged executions, condition-ing on lagged homicides. It is not a statement about causality as it is com-monly understood in social science research that distinguishes statistical association from causation. The absence of Granger causality from execu-tion rates to homicide rates only means that the best linear prediction of homicide rates, given the joint histories of homicide and execution rates, does not require knowledge of the history of execution rates; the history of homicides rates is sufficient. The absence of Granger causality does not imply that a counterfactual change in executions because of a change in the sanction regime facing potential murderers would fail to generate changes in homicides at later dates.
Despite the fact that Granger causality is only a statistical concept, findings on the statistical question of whether executions Granger-cause homicides have been used to make substantive claims about the deterrent effect of capital punishment. The absence of Granger causality has been interpreted by some researchers as evidence that capital punishment does not have a deterrent effect on homicides. In studies in which the estimates of the bi coefficients are negative, such findings have been alleged to be evi-dence of a deterrent effect, with higher execution rates in the past generat-ing lower homicide rates in the future. In studies in which estimates of the bi coefficients are positive, those findings have been alleged to be evidence of a brutalization effect, with higher execution rates in the past generating higher homicide rates in the future.
In a study of the time-series relationships between homicides and execu-tions, as well as the relationship between homicides and execution public-ity in Houston, Stolzenberg and D’Alessio (2004) use this approach. The authors find that neither actual executions nor publicity about executions Granger-cause homicides and conclude that neither deterrence nor brutal-ization effects are present in the Houston data.
Land, Teske, and Zhang (2009) provide a particularly sophisticated analysis of this type, using data from Texas, by focusing directly on how a one-unit increase in hi,t affects homicides at t + 1, t + 2, etc. In order to render this a well-posed question, it is necessary to address the contem-poraneous correlation between hi,t, the one-step-ahead prediction error to executions, and ei,t the one-step-ahead prediction error to homicides. In essence, Land, Teske, and Zhang resolve this contemporaneous correlation by assuming that ei,t = rhi,t + ni,t such that ei,t and ni,t are contemporaneously uncorrelated, and so treat ni,t as the shock to homicides. Thus, the con-temporaneous correlation between hi,t and ei,t is resolved by assuming that

Copyright © National Academy of Sciences. All rights reserved.
Deterrence and the Death Penalty
TIME-SERIES STUDIES 85
the shock to homicides is due to the shock to executions and some other unspecified factor. The researchers do not provide a model of the timing of executions, so it is difficult to assess this assumption.4 They find a negative association between executions and homicide and conclude that there is a net small deterrent effect from an additional execution. However, they also find that executions appear to displace homicides in time. Thus, the long-run deterrent effect is smaller than the short-run effect.
Taken on their own terms, Stolzenberg and D’Alessio (2004) and Land, Teske, and Zhang (2009) provide contradictory evidence on deterrence. Even though each paper uses monthly data from Texas, the papers reach opposite conclusions about the evidence of a deterrent effect. This does not mean that either paper contains errors, as the data sets used and the choice of VAR specification differ across the papers. Nonetheless, the papers’ contradictory findings illustrate that conclusions about a deterrent effect can be very sensitive to the choice of model and details as to how data are transformed prior to estimation. What might be thought to be relatively innocuous assumptions can matter greatly.
This observation leads to a broader critique of both papers. Neither asks what conclusions about deterrence can be drawn when one does not assume a particular time-series specification or when one allows for differ-ent deterrent effects in different time periods. Neither the time-series speci-fication nor the appropriate data range are known a priori to a researcher. Although both papers engage in model selection exercises in order to gen-erate specific VAR forms, this approach is inadequate for policy purposes. Model selection methods in essence assign a weight of 1 to the “best” model, given some criterion, but the data themselves do not necessarily assign such a weight. In other words, neither paper appropriately accounts for model uncertainty in providing deterrence estimates. The committee returns to this issue in Chapter 6.
A more basic question is whether evidence of the type presented in the Land, Teske, and Zhang (2009) and Stolzenberg and D’Alessio (2004) analyses actually speaks to the question of the deterrent effect of capital punishment. VARs only measure statistical associations in data. Thus, the fundamental question is the relationship between the statistical concept of Granger causality and the policy-relevant concept of causality as treatment response. The remainder of this section mainly discusses this basic issue. We then raise a second concern about criminological research that uses VARs.
4 One might plausibly argue that the assumption holds when time increments are short. However it may be that the judicial system’s willingness to grant stays of execution is affected by recent homicide activity, particularly when the homicides generate publicity.

Copyright © National Academy of Sciences. All rights reserved.
Deterrence and the Death Penalty
86 DETERRENCE AND THE DEATH PENALTY
Granger Causality and Causality as Treatment Response
The idea that Granger causality speaks to a deterrent effect of capital punishment is not a logical implication of social science theory. There may perhaps be theories of deterrence in which the presence of a deterrence effect would be equivalent to the statistical concept of Granger causality, but no such theory has yet been advanced. However, there already exist standard models of criminal behavior under which Granger causality tests are uninformative about deterrence.
For the sake of concreteness, we focus on the model of rational criminal behavior that has been the workhorse of much of the modern theory of de-terrence, that of Becker (1968). This model, which assumes that the choice of whether to commit a crime (in this case, homicide) can be understood as a purposeful choice in which costs and benefits are compared, is controver-sial among some criminologists, sociologists, and economists. A particular concern has been the common assumption that potential criminals not only behave rationally, but also have so-called rational expectations; that is, that they correctly perceive the sanctions risk that they face. The discussion be-low should not be interpreted as a committee endorsement of this specific assumption or of the idea of rational criminal behavior more broadly. The discussion is meant to illustrate how this widely used theoretical formula-tion sharply delimits what can be learned from standard VAR estimates.
Put simply, the rational-criminal model places no restrictions on the presence or absence of Granger causality from executions to homicides. The reason the model does not imply such time-series restrictions on the relationship between executions and homicides is not a function of its spe-cific rationality assumptions; rather, the central point is that the rational-criminal model supposes that individual beliefs about sanctions risks derive from their perception of the criminal sanction regime in which they live, not from the occurrence of executions per se.
The idea of a sanction regime is that a potential murderer faces a prob-ability distribution of outcomes that will stem from the choice of committing murder. The first uncertain outcome is whether the murderer will be caught. Conditional on being caught, the potential murderer then faces a probability distribution of punishments. With some simplification of the way the criminal justice system works, the beliefs of a potential murderer about three probabil-ities matter: (1) the probability of not being caught, PNC, (2) the probability of being caught and serving a prison sentence, PP,5 and (3) the probability of being caught and being executed, PE. It is standard to regard PC = 1 – PNC as the certainty of punishment. The outcomes of imprisonment and execu-
5 In this example, we assume that there is a single prison sentence length for murder. In practice, there are many potential prison sentence lengths and a rational criminal will account for the probabilities of each of the sentences.

Copyright © National Academy of Sciences. All rights reserved.
Deterrence and the Death Penalty
TIME-SERIES STUDIES 87
tion constitute the severity of punishment. The criminal sanction regime is defined by those probabilities and the two outcomes, sentence length if not executed and execution.
From the vantage of the rational-criminal model, short-run fluctuations in the occurrence of executions are irrelevant to murder decisions unless they cause individuals to revise their beliefs about the certainty and sever-ity of punishment if a murder is committed. Although one can construct theories as to why the occurrence of executions would lead to revisions in beliefs (and one can find examples of such theories in the literature), tests of Granger causality as they have so far been used do not speak to the deterrence question. In particular, they ignore the distinction between the criminal sanction regime and the time-series realizations of one of the po-tential punishments under that regime, namely, executions. We emphasize that this point does not depend on the assumption that potential murderers rationally weigh the costs and benefits of murder. Rather, it rests on the much weaker assumption that potential murderers respond to their beliefs about sanction risks and not about execution events per se.
More specifically, a potential murderer makes the decision to commit a homicide against the background of a set of uncertain outcomes to that act. In a rational-criminal model, beliefs about sanction risk are not necessarily affected by the occurrence of a relatively high or low number of executions during the previous month or during any other time period. A potential murderer may simply interpret time-series fluctuations in the occurrence of executions as a reflection of time-series fluctuations in the number of people convicted of murder several years earlier, each execution taking place under a stationary sanction regime. Thus, execution events themselves need not alter perceptions of the sanction regime. It follows that an empirical finding of no Granger causality does not necessarily imply the absence of a deter-rence effect to capital punishment.
Furthermore, if the candidate explanations for criminal behavior are either that criminals are not subject to deterrent effects or that potential murderers obey a rational model of criminal behavior, then Granger causal-ity from executions to homicides does not necessarily provide support for the deterrence explanation. For example, suppose the rational choice theory of deterrence, which does not embody any explanation of the timing of ex-ecutions, is correct. For the rational choice models under a stable sanction regime, Granger causality from fluctuations in executions to fluctuations in homicides tautologically occurs because of factors outside of changes in the sanction regime. Hence, Granger causality from executions to homicides cannot be attributed to the deterrence mechanism of the rational choice model. The upshot is that the validity of the claim of deterrence cannot alone be assessed by either the presence or the absence of Granger causal-

Copyright © National Academy of Sciences. All rights reserved.
Deterrence and the Death Penalty
88 DETERRENCE AND THE DEATH PENALTY
ity from executions to homicides. It must be assessed in the context of a behavioral model whether of the rational choice variety or not.
Under the rational-criminal model, one can potentially connect execu-tion events to behavior if one discards the specific assumption of rational expectations and instead supposes that people use data on the occurrence of executions to update their subjective beliefs about the sanction regime in which they live. Suggestions of such updating appear in the some studies, but the committee is unaware of any formal model of beliefs and behavior that make tests of Granger causality that have interpretable implications for deterrence. Furthermore, as we emphasized earlier in the report, remarkably little is known about the perceptions of would-be murderers or about how their perceptions may change in response to executions.
Choice of Variables in VAR Studies
The use of vector autoregressions in the empirical studies of capital punishment and deterrence suffers from a second important limitation: insufficient attention to the choice of variables in the systems under study. The studies that use Granger causality to study deterrence have been al-most exclusively focused on bivariate relations of the type described by equation (5-1). Although bivariate systems are relatively straightforward to analyze, especially when one is interested in the effects of shocks to one series on the behavior of another, they are not nearly as sophisticated as the form of vector autoregression analysis that is now conventionally used in macroeconomics, the field from which these methods are taken. In fact, the evolution of atheoretical models in macroeconomics has illustrated the importance of thinking about the time-series relationships among differ-ent collections of variables. Modern vector autoregression analysis works with far more complex systems than the bivariate ones found in studies of capital punishment.6
Without carefully specifying the set of relevant variables, findings from the VAR studies on deterrence and capital punishment may be an artifice of the choice of executions as the only variable that can affect homicides. For capital punishment, there is an obvious lacuna when focus is restricted to executions and homicides: entirely omitted are variables that measure the severity of punishment for murderers who are not executed. Virtually any behaviorally plausible formulation of deterrence would suggest that these variables are an essential part of the sanction regime relevant to a would-be murderer’s behavior.
The omission of time series of data that describe the noncapital pun-
6 For example, Leeper, Sims, and Zha (1996) analyze systems that use 13 and 18 distinct vari-ables to study monetary policy and draw explicit contrasts with more parsimonious systems.

Copyright © National Academy of Sciences. All rights reserved.
Deterrence and the Death Penalty
TIME-SERIES STUDIES 89
ishments meted out for homicides means that the bivariate systems omit critical variables necessary for complete description of a sanction regime. Therefore, even if people use observations of realized fluctuations in pun-ishments to update their perceptions of sanction regimes, bivariate models cannot be interpreted as giving evidence of the deterrent effect of capital punishment per se. Fluctuations in the occurrence of executions may be correlated with fluctuations in the severity of the prison terms received by murderers who do not receive the death penalty, generating a classic problem of omitted variables. The omitted variables problem affects vector autoregressions just as it affects other types of regressions: spurious correla-tions may be produced and parameter estimates may be biased.
This argument can be generalized. Crime rates are well understood to vary with a host of demographic and socioeconomic variables. Land, Teske, and Zhang (2009) and Stolzenberg and D’Alessio (2004) omit such variables from their analyses. Findings of Granger causality or its absence depends on the set of variables under consideration. Therefore, by the standards of the modern use of vector autoregressions, neither of these studies considers a rich enough system of variables to justify interpreting their findings in terms of deterrence.
Inferences Under Alternative Sanction Regimes
The discussion above has concerned inference on deterrence under existing sanction regimes. A distinct question concerns the capacity of atheoretical time-series methods in general and Granger causality tests in particular to provide information on the deterrent effect of capital punish-ment under alternative sanction regimes from those that have existed and currently exist in the United States. As described elsewhere in this report, the historical capital punishment regime is one in which executions are very infrequent in comparison with the numbers of homicides. Furthermore, when a murderer is apprehended, execution typically does not occur even when the murderer receives the death penalty in trial. Liebman, Fagan, and West (2000) found that two-thirds of capital sentences are reversed on appeal. As we note elsewhere in the report, only 15 percent of capital sentences meted out between 1973 and 2009 have ended in an actual execution.
The alleged strength of atheoretical time-series methods—which is evinced in their reliance on the properties of the historical data as opposed to a priori assumptions on how people or groups behave—has the necessary consequence that these methods cannot speak to the deterrent effects of substantively different criminal sanction regimes. Alternative criminal sanc-tion regimes would imply different coefficients for the vector autoregression system (5-1) if the individuals’ decision making or the process generating

Copyright © National Academy of Sciences. All rights reserved.
Deterrence and the Death Penalty
90 DETERRENCE AND THE DEATH PENALTY
executions was different under an alternative regime. In other words, the relationship between homicides and executions may depend on the criminal sanction regime. Hence, the historical relationships that are estimated when a system such as (5-1) is applied to data may change with the regime.
In macroeconomics, this dependence of statistical relationships on the underlying policy regime (in this case, the sanction regime for murder) is known as the Lucas critique (Lucas, 1976), although the idea goes back to Marschak (1953). In the case of capital punishment, the force of the Lucas-Marschak critique is self-evident. The available data on executions and homicides are generated in a context in which actual executions are quite unusual. As such, they are unlikely to provide useful information on hypo-thetical regimes under which capital sentences are regularly carried out.7
EVENT STUDIES
A second time-series approach used to study deterrence is what we will call the “event study” because it focuses on the association between homicide and a single execution or particular executions. This work takes seriously the idea that an execution is an unusual event and implicitly as-sumes that the event is of sufficient importance, considered relative to the background of other determinants of homicide, that it leaves a discernible footprint in the homicide time series.
This type of analysis was first performed by Phillips (1980), who identi-fied 22 executions of “notorious murderers” in England in the period 1858-1921. For each execution, he studied the number of homicides in London in the weeks before and after the execution. He found a statistically significant difference between homicide rates in the week prior to an execution and the week after an execution. A more detailed analysis found that this reduction was subsequently reversed, so that homicides were displaced in time rather than reduced. In light of these results, Zeisel (1982) argued that Phillips’ evidence should be thought of as a delay rather than a deterrent effect. Phillips (1982) did not dispute this alternative interpretation in his rejoinder.
In our view, the Phillips study is not useful in assessing deterrence ef-fects. One issue, raised by Zeisel, is that the narrow time horizon studied before and after the executions makes it hard to distinguish displacement from deterrence. Another serious problem is Phillips’ assumption that in the absence of a deterrent effect of execution, the process generating homicides
7 This distinction is well understood in the macroeconomic literature using vector autore-gressions. Leeper and Zha (2003), for example, explicitly define criteria for “modest” policy interventions under which VARs may be used for policy evaluation. The explicit objective of their work is to identify vectors of shocks that occur with high enough probability that their effects may be evaluated under the assumption that the policy regime generating the shocks is unchanged.

Copyright © National Academy of Sciences. All rights reserved.
Deterrence and the Death Penalty
TIME-SERIES STUDIES 91
is stationary over time. This assumption motivates his test of the null hy-pothesis that the homicide rate in the week before an execution is the same as in the week after it. There is little reason to believe this null hypothesis given that there are many potential sources of time variation in the deter-minants of homicides beyond the effects of executions. As a stark example of how Phillips’ approach can lead to spurious inferences, suppose that England experienced a long-run decline in homicide during the 1858-1921 period that Phillips studied. In that situation, the data would tend to show lower homicide rates in the week after executions than in the week before simply because the week after occurs later than the week before. Without a full specification of the properties of the total homicide process, one cannot understand the effects of individual executions.
Another limitation of Phillips’ analysis concerns external validity. It is not clear that the homicide process for England in 1858-1921 is the same as that for the modern United States. By analogy, one would not use data on the effects of changes in fiscal policy from 1858-1921 to evaluate current macroeconomic policy proposals.
A second example of this style of analysis is Cochran, Chamblin, and Seth (1994), which analyzed the effects of a particular execution on homicides in Oklahoma. The execution studied was that of Charles Troy Coleman. Coleman’s execution was the first in Oklahoma in 25 years. In addition to sharing the same limitations as those in Phillips’ study, the Oklahoma study has a fatal flaw in the research design. To see this, we describe some of the details of the model used.
The raw data for the study were weekly homicides in Oklahoma, which we denote as HOK,t. Prior to their analysis, the authors detrended and demeaned this time series. The researchers next regressed the residuals on lagged residuals. The result was a white-noise data series, eOK,t which repre-sents the one-step-ahead forecast errors when HOK,t is regressed against its history, after any constant term and trends are removed. They then defined an intervention time series, It, which equals 0 prior to the execution and 1 afterward. Finally, they estimated the equation
eOK,t = a0It + a1It–1 + . . . + xOK,t (5-2)
where xOK,t is a prediction error. They interpreted the coefficient a1 as mea-suring the effects of the execution. Different restrictions on this coefficient were considered. For example, if the a1 is required to sum to 0, this imposes the restriction that there can be no permanent effect of the execution on homicide rates, only a displacement effect.
The key conceptual problem with this approach is that it is logically impossible for a white-noise stochastic process to be correlated with an in-tervention series as it is defined here—there may be a correlation in a finite

Copyright © National Academy of Sciences. All rights reserved.
Deterrence and the Death Penalty
92 DETERRENCE AND THE DEATH PENALTY
data sample but not in the population. The reason is simple: the white-noise series has a mean of 0 and the intervention series does not. Hence, there is nothing that can be learned from the exercise involving specifications that do not impose the restriction that the long-run effect of the execution on homicides is zero. In terms of the underlying time-series mathematics, the “pre-whitening” described in the study assumes statistical properties for the homicide series that are inconsistent with equation 5-2 (see Charles and Durlauf, in press, for details). The authors argue the best specification for 5-2 is one that does not impose the requirement that the a1 coefficient sums to 0. In other words, the authors argue that the best specification for the effect of an execution on homicides is one that cannot in a population produce the result they assert holds in the finite sample.
A more persuasive example of an event study of deterrence is Hjalmarsson (2009). Methodologically, the approach in this paper origi-nated in Grogger (1990), who proposed an appropriate statistical model for such an analysis, treating the homicide level as a count variable. We focus on the Hjalmarsson paper because it uses daily data and specifically focus on cities in which capital punishment is relatively common.
The analysis considered very short-run effects of executions in Dallas, Houston, and San Antonio, Texas. For the study, the daily counts of homi-cides in the cities were analyzed to see whether homicide rates varied in the days before and after an execution. Hjalmarsson found little evidence of a “local” (in time) deterrence effect. She was careful not to extrapolate her results to broader concepts of deterrence, recognizing that her limited time horizon does not allow one to distinguish between displacement and deter-rence. As such, the analysis suffers from one of the same flaws as Phillips (1980), but her use of daily homicide counts may be useful to discern the immediate visceral effect of an execution.
We caution, however, that even this extremely short-run analysis may be susceptible to the problem that events relevant to homicide may co-occur with executions. To give one simple example, police departments may alter deployments of personnel in the periods immediately following executions that draw public attention. If so, one cannot interpret fluctuations in ho-micides immediately before and after an execution in terms of the deterrent effect of the execution.
TIME-SERIES REGRESSIONS
Another strand of the literature estimates time-series regressions that relate homicide rates or levels to executions and other covariates. Although VARs are also time-series regressions, the work discussed in this section dif-fers in several respects from the work discussed above. First, the regressions are estimated using raw homicide and execution data rather than detrended
Copyright © National Academy of Sciences. All rights reserved.
Deterrence and the Death Penalty
TIME-SERIES STUDIES 93
and demeaned data. Second, lagged homicides are not included among the variables used to predict current homicides. Third, various other covari-ates than lags of executions and homicides are used among the predictor variables.
One example is the study by Bailey (1998), which considered the Coleman execution in Oklahoma, but it modifies some aspects of Cochran, Chamblin, and Seth (1994). In particular, this paper works with the time series of the level of homicides rather than a transformation of the time series into a white noise process, and it further includes various predictor variables in addition to the event of the execution to model the homicide level. Unfortunately, the paper does not report any equations, but the de-scription it provides suggests that the analysis is based on the regression
HOK,t = k + aIt + b0EUS,t + b1EUS,t–1
+ . . . g0POK,t + g1POK,t–1+ . . . + dXt + et (5-3)
In this regression, EUS,t is a measure of the number of executions in the United States. The idea is that the public may be aware of these execu-tions through various channels. POK,t is a measure of the publicity given to executions throughout the country, as measured by days of newspaper coverage in the Oklahoman in a given week. This variable is intended to measure public information about executions; it is distinct from EUS,t in that it measures a particular information source. Xt is a vector of control variables, which include socioeconomic and demographic characteristics, as well as month-specific dummy variables; these dummies are included for ad hoc reasons. The study finds that the overall level of murders is positively associated with the publicity variables. When focus is limited to overall kill-ings of strangers, as well as subsets of this category, the results are mixed, with some regressions finding a brutalization effect, others finding no effect, and some cases finding a deterrence effect.
Despite these mixed results, Bailey concludes that “No prior study has shown such strong support for the capital punishment and brutalization argument” (Bailey, 1998, p. 711). The author, in our view, overstates his findings by focusing on regressions with statistically significant coefficients. Other regressions, in which statistical significance fails, are not accounted for in the author’s strong conclusions. As noted in Chapter 4, a finding that an estimate is statistically insignificant does not imply that the true deter-rent effect is zero or even that it is small. In other words, the study does not properly account for the dependence of the brutalization findings on particular regression specifications.
Beyond the specifics of Bailey’s study, this type of regression analy-sis, although still common in the social sciences, does not support causal claims. Regressions of this type are based on many arbitrary assumptions,

Copyright © National Academy of Sciences. All rights reserved.
Deterrence and the Death Penalty
94 DETERRENCE AND THE DEATH PENALTY
such as linearity of the effects of executions and other variables on homi-cides, as well as particular choice of control variables, without attention to the effects of alternative choices. Furthermore, despite the author’s claims, the execution of Coleman does not constitute a quasi-experiment. The tim-ing of the execution is likely to be an endogenous outcome of the criminal justice system and should be modeled as such.
A different type of time-series regression analysis has been used by Cloninger (1992) and Cloninger and Marchesini (2001, 2006). These pa-pers in essence estimate time-series regressions of the form
DHi,t = k + bDHUS,t + ei,t (5-4)
Here DHi,t denotes the change across years in the homicide rate in place I, and DHUS,t denotes the similar change in the United States as a whole. The researchers attempt to motivate this regression specification by analogy to the capital asset pricing model (CAPM) of finance.8 These studies, for peri-ods with executions, evaluate deterrence by asking whether b, the average of DHi,t, and the average of ei,t is smaller in periods in which capital punish-ment either is possible or actually occurs. Taken as a whole, these studies find a deterrent effect for a capital punishment regime.
The committee concludes that the findings of these studies are not in-terpretable as providing evidence of a deterrent effect. The basic problem is that the analogy between a portfolio of assets and a portfolio of crimes is specious. The homicide model under study is constructed exclusively by analogy with finance. It pays no attention to the criminal justice system as an input in criminal decisions, time constraints on the part of criminals, differences in the reasons for crimes, etc. The various studies that use this methodology assert that all such factors are incorporated in the coefficient b, but there is no reason to believe that this is true. Because CAPM is predicated on investors’ optimally investing in financial instruments in the context of competitive markets for these products, for Cloninger’s specifica-tion to be sensible he would have to demonstrate that potential murderers engage in an analogous optimization problem that is aggregated to produce state-level homicide rates. No attempt is made to demonstrate this analogy.
CROSS-POLITY COMPARISONS
Yet another time-series approach to measuring the deterrent effect of capital punishment is comparison of time series for homicides in two coun-tries, one of which has capital punishment and the other of which does not,
8 The capital asset pricing model describes the relationship between risk and expected return for different assets. See Brennan (2008) for a description.
Copyright © National Academy of Sciences. All rights reserved.
Deterrence and the Death Penalty
TIME-SERIES STUDIES 95
to see whether one can identify differences between the time series that may be plausibly attributed to capital punishment. In Chapter 3, for example, the committee displays homicide rates in, California, New York, and Texas, from 1974 through the early 1990s (see Figure 3-3) to illustrate the impor-tance of accounting for variations, across time and place, in factors that influence murder rates other than the use of capital punishment. Donohue and Wolfers (2005) use this method and argue that the close tracking of the U.S. and Canadian homicide rates calls into question any deterrence effect to the death penalty, since this punishment only exists in the United States. Their argument is at best suggestive because they do not account for common trends in the two series, let alone common factors, such as the interdependence of the Canadian and American economies. It also does not take into account the de facto moratorium in the death penalty in the United States prior to the Furman decision. Thus, the fact that the U.S. and Canadian homicide series are highly correlated is not a legitimate basis for concluding that there is no deterrent effect of capital punishment in the United States.
In examining the cross-country differences in the homicide series in Singapore and Hong Kong, Zimring, Fagan, and Johnson (2010), to their credit, recognized that an informal comparison from two selected entities alone is not sufficient to draw inferences. Unfortunately, their more system-atic efforts cannot address the data and modeling flaws in the study.
The basic idea of the Zimring, Fagan, and Johnson (2010) study is to see whether differences in the Singapore and Hong Kong homicide rates can be explained by execution rates in Singapore, none having occurred in Hong Kong over the time frame of the analysis. Letting hS,t denote the Singapore homicide rate in year t and hHK,t the Hong Kong homicide rate in year t, the paper examines whether hS,t – hHK,t, once trends are accounted for, is associated with either the execution rate for Singapore or the execu-tion level in Singapore. Both contemporaneous and lagged effects of these execution variables are considered.
Singapore and Hong Kong were chosen on the basis that they are very similar polities, so that differences in the homicide rates between them can-not be attributed to differences in demographics or socioeconomic factors. The researchers further argue that the relative commonality of executions in Singapore in contrast with the United States makes the analysis of the two cities particularly informative. The study concludes that executions do not have predictive power for homicide differences between the two cities.
The committee concludes that this study fails to provide evidence on the deterrence question. One problem with the analysis has already been raised in our critical discussion above of the vector autoregression approach to deterrence: the failure to distinguish between the effects of a sanction regime on homicides and the effects of fluctuations in the rate of execu-

Copyright © National Academy of Sciences. All rights reserved.
Deterrence and the Death Penalty
96 DETERRENCE AND THE DEATH PENALTY
tions. The researchers argue that “Singapore is a best case for deterrence because a death sentence is mandatory for murder and because of celerity in the appeals process” (Zimring, Fagan, and Johnson, 2010, p. 2). In other words, Singapore, like Hong Kong, has a constant sanction regime over the sample. The authors (pp. 9-10) raise the idea that the execution rate matters for a potential murderer’s beliefs about the likelihood of being executed, but this assertion is rendered less plausible by their claims of regime stability for Singapore. If one thinks that deterrence depends on perceptions of the sanction regime, then the authors’ own argument about regime stability undermines a role for executions in learning. Such stability eliminates one channel by which executions might be informative about deterrence.
A distinct reason that this study is not informative about the deter-rent effect of capital punishment is that the key assumption underlying the analysis—that any systematic or predictable component of the homicide rate difference, hHK,t – hS,t, can only be due to capital punishment—is not credible. The paper’s own regressions lead inevitably to this conclusion. In addition to studying the difference hHK,t – hS,t, the researchers also perform regressions of the Singapore homicide rate hS,t on the Hong Kong homicide rate hHK,t and their various execution measures. The logic of their thought experiment would require that hHK,t is a statistically significant predictor of hS,t, with a regression coefficient of 1. The validity of their analysis, in other words, is predicated on the assumption that the homicide rate in Hong Kong is a sufficient statistic for the homicide rate in Singapore, except for the presence of capital punishment in Singapore. In fact, the study found that the homicide rate in Hong Kong fails to predict the homicide rate in Singapore: the coefficient is far from 1 in value and far from statistical significance. Hence, the researchers’ own analysis indicates that the key assumption that justifies their analysis is not valid.
The study by Zimring, Fagan, and Johnson (2009) also suffers from first-order data problems. As the researchers note, the government of Sin-gapore does not publish statistics on executions, and it routinely executes individuals convicted of a wide variety of crimes other than homicide. This leads the researchers to rely on constructed measures of executions and executions for murder. However, there are problems in the use of these con-structed series. First, measurement error in independent variables produces biased estimates of coefficients; in the standard bivariate regression model, this bias reduces coefficient magnitude toward 0. Hence, their finding of a lack of evidence may be due to defects in their measure. The best the re-searchers can say about their estimated overall homicide series is that “we have developed a reliable minimum estimate of Singapore executions since 1981” (Zimring, Fagan, and Johnson, 2009, p. 7). This is uninformative as to what the degree of bias is in their estimates.
Second, the authors end up in an incoherent position in terms of map-

Copyright © National Academy of Sciences. All rights reserved.
Deterrence and the Death Penalty
TIME-SERIES STUDIES 97
ping executions to the perceptions of potential murderers. In response to the lack of data on the split between executions for murder and executions for other crime, they argue that “But, of course, no data are available to the citizens of Singapore either, so the gross execution rate may be the appro-priate risk for homicide to the extent that potential homicide offenders are aware of executions” (p. 6). The authors give no explanation as to how the potential murderers could possibly be aware of the overall execution rate but have no knowledge of the execution rate for particular offenses. Since the researchers conclude that data limitations prevent them from providing “stable and robust estimates of the unique effects of murder executions on murder” (p. 22), it is not clear why their negative findings on deterrence are informative about deterrence for murder.
The issue is not whether the authors did the best they could with the limited data, but whether the limited data allow one to draw inferences about deterrence. Note as well that given the researchers’ own description of capital punishment in Singapore—“The secret nature of both individual executions and aggregate murder statistics must be a deliberate choice of the highly centralized and statistically meticulous Singapore government” (p. 10)—there is no good reason to believe that any results from their study are informative about capital punishment in the United States, where in-formation available to the public is of course completely different, leaving aside all other differences between the two countries.
CONCLUSIONS
The committee analysis of the different strategies for using time series to uncover deterrent effects for capital punishment has consistently found the inferential claims to be flawed, whether the study in question does or does not find evidence of a deterrence effect. A common theme in our critiques of individual studies is that the underlying “decision theory” of potential murderers is consistently un- or underspecified, so that the impli-cations of the time-series relationships between executions and homicide rates is unclear. Why should actual executions, as opposed to the sanction regime, matter? As discussed above, following the logic of the strong form of the rational-criminal model that assumes rational expectations, there should be no effect from executions by themselves, since the sanction re-gime entirely determines the deterrence effect. This fact means that the time-series studies suffer from a common identification problem: the existence of plausible theories of the behavior of potential murderers for which the time-series relationships are uninformative about the presence or absence of a deterrence effect, let alone its magnitude.
Of course, it is possible that the correct behavioral model for potential murderers is one for which the time-series relationships are informative.

Copyright © National Academy of Sciences. All rights reserved.
Deterrence and the Death Penalty
98 DETERRENCE AND THE DEATH PENALTY
One possibility is that actual executions affect a potential murderer’s sub-jective probability of being executed if he commits the crime. If this is the rationale for the exercises, then Texas is not the ideal context for a study because executions are sufficiently routine in Texas that one would expect the informational content of a specific occurrence to be low. Yet because of the state’s high fraction of executions nationally, Texas data are frequently used for studies. Texas might have experienced changes in the execution sanction regime, which would be useful for identifying deterrent effects, but this perspective has not been systematically explored, despite some oc-casional references to regime shifts in Texas.9 In this respect, we think that the focus on Texas in the time-series literature may be misguided.
Another behavioral framework under which these exercises are infor-mative is one in which an execution renders the possibility of the punish-ment more salient to a potential murderer. But such a framework would appear to imply that the effects of an execution will exhibit heterogeneity across types of potential murderers. For example, when murder is a crime of passion, one might argue that executive mental functioning is impaired. Hence, in this case salience comes into play because of a diminished capac-ity in thinking about consequences. Alternatively, one could argue that the impairment is such that the consequences of the action do not affect choice. This example illustrates that the implications of salience claims are far from obvious. Furthermore, we are unaware of any work that directly addresses salience as a source of deterrence and does so in a way that respects the fact that one needs a model of behavior, whether of the rational choice type or not, to interpret statistical findings.
Finally, we note that it is not even clear that executions per se are the source of salience. Is it obvious that actual executions are the main source of salience of the death penalty rather than, say, highly publicized death sentences? How do changes in the law or Supreme Court decisions affect salience? In the committee’s search of relevant studies, we did not find any in which the sources of salience were explored. Hence, although it is a perfectly logically coherent idea that executions make capital punishment salient and provides a deterrence effect for this reason, there is no empiri-cal work to justify the claim. One of the recommendations in Chapter 6 will involve the collection of data on perceptions of sanction regime, which would facilitate such empirical work.
Another distinct problem with the time-series studies is that they do
9 Land, Teske, and Zheng (2009) should be commended for distinguishing between periods in Texas when the use of capital punishment appears to have been erratic and when it appears to have been systematic. But they fail to integrate this distinction into a coherently delineated behavioral model that incorporates sanctions regimes, salience, and deterrence. And, as explained above, their claims of evidence of deterrence in the systematic regime are flawed.

Copyright © National Academy of Sciences. All rights reserved.
Deterrence and the Death Penalty
TIME-SERIES STUDIES 99
not provide a logical basis for linking the statistical findings back to a state’s capital punishment sanction regime. Suppose, for example, that an execution event study was conducted that provided credible evidence that the execution either increased or decreased homicides that are eligible for capital punishment. Such a study would not provide the basis for altering the sanction regime to either increase or decrease the number of executions because it would not be informative about what aspect of the regime caused the execution to have the effect identified by the study.
In summary, the committee finds that adequate justifications have not been provided to demonstrate that the various time-series-based studies of capital punishment speak to the deterrence question. It is thus immaterial whether the studies purport to find evidence in favor or against deterrence. They do not rise to the level of credible evidence on the deterrent effect of capital punishment as a determinant of aggregate homicide rates and are not useful in evaluating capital punishment as a public policy.
REFERENCES
Ash, R.B., and Gardner, M.F. (1975). Topics in Stochastic Processes. New York: Academic Press.
Bailey, W.C. (1998). Deterrence, brutalization, and the death penalty: Another reexamination of Oklahoma’s return to capital punishment. Criminology, 36(4), 711-733.
Becker, G.S. (1968). Crime and punishment: An economic approach. Journal of Political Economy, 76(2), 169-217.
Brennan, M. (2008). Capital asset pricing model. In S.N. Durlauf and L. Blume (Eds.), The New Palgrave Dictionary of Economics (revised ed., vol. 1, pp. 641-648). London: Palgrave MacMillan.
Charles, K.K., and Durlauf, S. (in press). Pitfalls in the use of time series methods to study de-terrence and capital punishment. Submitted to Journal of Quantitative Criminology, 28.
Cloninger, D.O. (1992). Capital punishment and deterrence: A portfolio approach. Applied Economics, 24(6), 635-645.
Cloninger, D.O., and Marchesini, R. (2001). Execution and deterrence: A quasi-controlled group experiment. Applied Economics, 33(5), 569-576.
Cloninger, D.O., and Marchesini, R. (2006). Execution moratoriums, commutations and deterrence: The case of Illinois. Applied Economics, 38(9), 967-973.
Cochran, J.K., Chamlin, M.B., and Seth, M. (1994). Deterrence or brutalization—An impact assessment of Oklahoma’s return to capital-punishment. Criminology, 32(1), 107-134.
Donohue, J.J., and Wolfers, J. (2005). Uses and abuses of empirical evidence in the death penalty debate. Stanford Law Review, 58(3), 791-845.
Durlauf, S., and Nagin, D. (2011). The deterrent effect of imprisonment. In P.J. Cook, J. Ludwig, and J. McCrary (Eds.), Controlling Crime: Strategies and Tradeoffs (pp. 43-94). Chicago: University of Chicago Press.
Federal Bureau of Investigation (2011). Uniform Crime Reports: Estimated Murder Rate in Texas 1960-2009. Available: http://www.ucrdatatools.gov [December 2011].
Granger, C.W.J. (1969). Investigating causal relations by econometric models and cross-spectral methods. Econometrica, 37(3), 424-438.
Grogger, J. (1990). The deterrent effect of capital punishment: An analysis of daily homicide counts. Journal of the American Statistical Association, 85(410), 295-303.

Copyright © National Academy of Sciences. All rights reserved.
Deterrence and the Death Penalty
100 DETERRENCE AND THE DEATH PENALTY
Hjalmarsson, R. (2009). Does capital punishment have a “local” deterrent effect on homi-cides? American Law and Economics Review, 11(2), 310-334.
Land, K.C., Teske, R.H.C., and Zheng, H. (2009). The short-term effects of executions on homicides: Deterrence, displacement, or both? Criminology, 47(4), 1,009-1,043.
Leeper, E.M., and Zha, T. (2003). Modest policy interventions. Journal of Monetary Econom-ics, 50(8), 1,673-1,700.
Leeper, E.M., Sims, C.A., and Zha, T. (1996). What does monetary policy do? Brookings Papers on Economic Activity, 1996(2), 1-78.
Liebman, J., Fagan, J., and West, V. (2000). Capital attrition: Error rates in capital cases, 1973-1995. Texas Law Review, 78, 1,839-1,861.
Lucas, R. (1976). Econometric policy evaluation: A critique. Carnegie-Rochester Conference Series on Public Policy, 1, 19-46.
Marschak, J. (1953). Economic measurements for policy and prediction. In W.C. Hood and T.C. Koopmans (Eds.), Studies in Econometric Method (pp. 1-26). New Haven: Yale University Press.
Phillips, D.P. (1980). The deterrent effect of capital punishment: New evidence on an old controversy. American Journal of Sociology, 86(1), 138-148.
Phillips, D.P. (1982). The fluctuation of homicides after publicized executions: Reply. American Journal of Sociology, 88(1), 165-167.
Sims, C.A. (1972). Money, income, and causality. American Economic Review, 62(4), 540-552.Sims, C.A. (1980). Macroeconomics and reality. Econometrica, 48(1), 1-48.Sims, C.A., Goldfeld, S.M., and Sachs, J.D. (1982). Policy analysis with econometric models.
Brookings Papers on Economic Activity, 1982(1), 107-164.Stolzenberg, L., and D’Alessio, S.J. (2004). Capital punishment, execution publicity, and
murder in Houston, Texas. Journal of Criminal Law and Criminology, 94(2), 351-379.Texas Department of Criminal Justice. (2011). Executed Offenders. Available: http://www.
tdcj.state.tx.us/death_row/dr_executed_offenders.html [December 2011].Zeisel, H. (1982). The deterrent effect of capital-punishment—Comment. American Journal
of Sociology, 88(1), 167-169.Zimring, F.E., Fagan, J., and Johnson, D.T. (2010). Executions, deterrence, and homicide: A
tale of two cities. Journal of Empirical Legal Studies, 7(1), 1-29.

Copyright © National Academy of Sciences. All rights reserved.
Deterrence and the Death Penalty
6
Challenges to Identifying Deterrent Effects
Researchers from diverse disciplines have contributed to the capital punishment literature, with prominent contributions by economists, criminologists, and sociologists. Although researchers’ disciplinary
backgrounds have affected the methods used and the framing of the re-search questions, the failings of the capital punishment literature are not rooted in the use of particular empirical methods or theoretical models of criminal decision making. Rather, the failings are rooted in manifest deficiencies related to the research data and methods and the researchers’ interpretations of results. Chapters 4 and 5 call attention, respectively, to fundamental deficiencies in panel and time-series studies. Both approaches share two basic deficiencies and also manifest two others to some degree. One shared deficiency is grossly incomplete specification of the sanction re-gime for homicide. Even in states that make the most frequent use of capital sanctions, noncapital sanctions are the most common sanction imposed for a homicide conviction. No study of either type accounts for the noncapi-tal component of the sanction regime in states with and without capital punishment. The second basic deficiency is failure to pose a credible model of the sanction risk perceptions of potential murderers and the behavioral response to such perceptions. In the absence of such a model, it is difficult, at best, to interpret data relating sanction regimes to homicide rates.
As discussed in Chapters 4 and 5, these two deficiencies are sufficient to make existing studies uninformative about the effect of capital punish-ment on homicide. Both of these deficiencies are potentially correctable. However, even if the research and data collection initiatives discussed in this chapter are ultimately successful, research in both literatures share a
101

Copyright © National Academy of Sciences. All rights reserved.
Deterrence and the Death Penalty
102 DETERRENCE AND THE DEATH PENALTY
common characteristic of invoking strong, often unverifiable, assumptions in order to provide point estimates of the effect of capital punishment on homicides. A point estimate may offer the appearance of desirable certitude, but only at a high cost in credibility. Still another deficiency is inattention to potential feedbacks through which homicide rates, and crime rates more generally, may affect the specification and administration of a sanction regime while the regime simultaneously affects homicide rates. Recogni-tion of potential feedbacks is relevant both to identify the direct effect of capital punishment on homicide rates and to predict the ultimate effect after feedbacks occur. Feedbacks affect the time-series and panel studies differ-ently because of differences in the time frames of the data typically used in the two approaches—monthly, weekly, or even daily data in the time-series studies and annual data in the panel studies.
In light of these deficiencies, the committee has reached the following conclusion and recommendation:
CONCLUSION AND RECOMMENDATION: The committee con-cludes that research to date on the effect of capital punishment on homi-cide is not informative about whether capital punishment decreases, increases, or has no effect on homicide rates. Therefore, the committee recommends that these studies not be used to inform deliberations re-quiring judgments about the effect of the death penalty on homicide. Consequently, claims that research demonstrates that capital punish-ment decreases or increases the homicide rate by a specified amount or has no effect on the homicide rate should not influence policy judgments about capital punishment.
The committee was disappointed to reach the conclusion that research conducted in the 30 years since the National Research Council (1978) report on this subject has not sufficiently advanced knowledge to allow a conclusion, however qualified, about the effect of the death penalty on homicide rates. Yet this is our conclusion. Some studies play the useful role, either intentionally or not, of demonstrating the fragility of their claims to have found—or not to have found—deterrent effects. However, even these studies suffer from two intrinsic shortcomings that severely limit what can be learned from them about the effect of the death penalty on homicide rates from an examination of the death penalty as it has actually been ad-ministered in the United States in the past 35 years.
Commentary on research findings often pits studies claiming to find statistically significant deterrent effects against those finding no statistically significant effects, with the latter studies sometimes interpreted as imply-ing that there is no deterrent effect. A fundamental point of logic about hypothesis testing is that failure to reject a null hypothesis does not imply

Copyright © National Academy of Sciences. All rights reserved.
Deterrence and the Death Penalty
CHALLENGES TO IDENTIFYING DETERRENT EFFECTS 103
that the null hypothesis is correct. For the evidence of even a small effect to be credible, it requires a demonstration, first and foremost, that the effect is based on a sound research design. Estimates that lack credibility are not in-formative regardless of the consistency of their estimated size. The amount of the effect must also be small in size and estimated with good precision, for example, by being contained within a tight confidence interval.
Our mandate was not to assess whether competing hypotheses about the existence of marginal deterrence from capital punishment are plausible, but simply to assess whether the empirical studies that we have reviewed provide scientifically valid evidence. In its deliberations and in this report, the committee has made a concerted effort not to approach this question with a prior assumption about deterrence. Having reviewed the research that purports to provide useful evidence for or against the hypothesis that the death penalty affects homicide rates, we conclude that it does not pro-vide such evidence.
We stress, however, as noted above, that a lack of evidence is not evi-dence for or against the hypothesis. Hence, the committee does not construe its conclusion that the existing studies are uninformative as favoring one side or the other side in the long-standing societal debate about deterrence and the death penalty.
In this chapter, we elaborate on these deficiencies that form the basis for this conclusion and cautiously offer some ideas on potential remedies. With regard to remedies, our report provides a somewhat less pessimistic perspective than did the earlier National Research Council (1978, p. 63) report: “[T]he Panel considers that research on this topic is not likely to produce findings that will or should have much influence on policymakers.”
The committee does not expect that advances in collecting data on sanction regimes and obtaining knowledge of sanctions risk perceptions will come quickly or easily. However, data collection on the noncapital component of the sanction regime need not be entirely complete to be use-ful. And even if research on perceptions of the risk of capital punishment cannot resolve all major issues, some progress would be an important step forward. Even if these advances prove unsuccessful in providing useful information on the incremental deterrent effect of capital punishment in relation to a lengthy prison sentence, the committee believes that there are potentially major benefits from new data collection, theory, and methodol-ogy for study of the effect of noncapital sanctions on crimes not subject to the death penalty. As discussed in Chapter 1, because of the overlap in the methods and data used in studies of capital punishment and in broader studies on the effects of sanctions on crime, our charge included a provi-sion for recommending research that might advance that broader research literature, and we do so in the rest of this chapter.

Copyright © National Academy of Sciences. All rights reserved.
Deterrence and the Death Penalty
104 DETERRENCE AND THE DEATH PENALTY
DATA ON SANCTION REGIMES
Incomplete and inaccurate data have marred research on the effect of capital punishment on homicides. The most important data problem is that studies have been based on a very incomplete specification of state sanction regimes. Part of the difficulty has been lack of conceptual agreement on how to measure the intensity of use of capital punishment. However, we see the primary problem as a complete absence of data on the noncapital sanctions that might be applied to offenders convicted of homicide. A study of capital punishment in North Carolina by Cook (2009) illustrates the im-portance of the problem of the absence of information on noncapital sanc-tions. Of 274 cases prosecuted as capital cases, only 11 resulted in a death sentence. Another 42 resulted in dismissal or a verdict of not guilty, which left 221 cases that resulted in convictions and received noncapital sanctions.
As discussed at length in Chapter 4 and below, there are sound reasons for predicting a correlation between the capital and noncapital components of a state’s sanction regime. Two examples of how this might occur are the plea bargaining leverage that the threat of capital punishment may afford prosecutors and the influence of the state’s political culture on the legislated design and administration of both the capital and noncapital components of the regime. Such a correlation would bias the estimated deterrent effect of capital punishment.
None of the studies we reviewed sought to measure the availability and intensity of use of the noncapital sanction alternatives for the punish-ment of homicide. Such alternatives may include a life sentence without the possibility of parole, a life sentence with the possibility of parole, and sentences of less than life. It would also be important to have data on the time actually served for convicted murderers who are paroled or who serve less than a life sentence.
It is currently not possible to measure noncapital sanction alternatives at the state level because the required data are not available. The data that are available include those from the Bureau of Justice Statistics (BJS), which publishes nationwide statistics on sentences for prison admissions and time served for prison releases, based on data collected as part of the National Corrections Reporting Program (NCRP) initiated in the early 1980s. More than 40 states now report annual data on sentences for admissions and time served for releases. Individual-level demographic characteristics are also reported. In principle, these data could be used to measure the actual administration of the legally authorized dimensions of most state sanction regimes, not only for murder but also for other types of crimes. The dif-ficulty is that the data are often extremely incomplete.
In some years, states fail to report any data. Just as important, the data that are sent to BJS are often so incomplete that it is impossible to

Copyright © National Academy of Sciences. All rights reserved.
Deterrence and the Death Penalty
CHALLENGES TO IDENTIFYING DETERRENT EFFECTS 105
construct valid state-level measures of the administration of the sanction regime. Indeed, the committee attempted to use these data for the purposes of this report but concluded that the data gaps made their use infeasible. More complete data on the actual administration of sanction regimes might be obtained by expanding the NCRP to include all 50 states and filling the data gaps due to incomplete reporting. Alternatively, an entirely new data collection system might be desirable. Either way, the collection of more complete data on sanction regimes for murder and other crimes is feasible. The data are available: the challenge is designing and implementing an ef-fective system for their collection.
Even if data on the actual administration of state sanction regimes were complete, they could only be used to measure how sanction regimes are actually administered. The data do not specify the potential sanction regime in a state—the range of sanction alternatives that are legally authorized. We are not aware of any ongoing effort to assemble data on the legislated sanction regimes of the states for murder and other crimes. Data on the legislated regime are important because they define the range of penalties that can potentially be imposed. Thus, the measurement of legally autho-rized sanctions by the states for homicides and other crimes may require a new data collection system.
The committee did not explore the benefits and costs of alternative ap-proaches for measurement of state-level sanction regimes for murder. We only emphasize the vital importance of collecting these data.
RECOMMENDATION: The committee recommends that a concerted effort be made to collect data on the sanctions regimes faced by poten-tial murderers, with particular attention to fixing the current absence of data on noncapital sanctions.
As noted above, because the methods and data used to study the effect of noncapital sanctions on crimes other than murder are similar to those used in research on capital punishment, the committee’s charge includes a provision that we make recommendations for advancing research on the broad effects of sanctions on crime. Thus, we also stress the vital impor-tance of an expanded effort to collect data suitable not only for measuring sanction regimes for murder, but also for measuring sanction regimes for other major crimes.
PERCEPTIONS OF SANCTION RISKS
As emphasized in Chapter 3, it is not possible to interpret empirical evidence on the relationship of homicide rates to sanctions without un-derstanding how potential murderers perceive sanction regimes. The com-

Copyright © National Academy of Sciences. All rights reserved.
Deterrence and the Death Penalty
106 DETERRENCE AND THE DEATH PENALTY
mittee’s review of the time-series and panel studies identified fundamental deficiencies in this regard.
In the case of the time-series studies, none of them explicitly articulates a model of sanction risk perceptions. The studies are silent on whether execution events and their frequency alter perceptions of sanction regimes. Moreover, the studies do not ask whether the trend lines specified by researchers correspond to the trend line (if any) perceived by potential murderers.
Panel studies typically suppose that people who are contemplating mur-der perceive sanctions risks as subjective probabilities of arrest, conviction, and execution. Lacking data on these subjective probabilities, researchers presume that they are somehow based on the observable frequencies of ar-rest, conviction, and execution.
The fundamental problem is that perceptions of the risk of sanction are subjective, but researchers have no direct measurements of the percep-tions of potential murderers. In the absence of data on risk perceptions, the research practice in the panel studies has been to use publicly available data on homicides and executions to construct statistics that purport to measure the objective risk of execution. Then, having done that, many researchers assume that potential murderers have “rational expectations.” The word “rational” suggests that potential murderers carefully assess the risk of execution. What “rational expectations” actually means in practice is that researchers construct their own measures of execution risk and as-sume that potential murderers perceive the risk in the same way. However, the assumption of rational expectations of execution risk has no empirical foundation. Indeed, it hardly seems credible.
In Chapter 4, we discuss in detail the complications of calculating the objective risk of execution. One of these complications is that only 15 per-cent of individuals sentenced to death have actually been executed (since the resumption of the death penalty in 1976) and that a large fraction of death sentences are subsequently reversed. Another complication is that the volume of data on death sentences and executions available for form-ing perceptions depends on the size of the state. By various measures of execution risk, Delaware was at least as aggressive as Texas in its use of the death penalty. However, over the period 1976 to 2000, Delaware sentenced 28 people to death and carried out 11 executions, while Texas sentenced 753 people to death and carried out 231 executions. Still another complication is that sanction regimes are not stable due to changes in a state’s political leadership, moratoriums on executions, and legal decisions. Yet another complication is that there are within-state differences in the risk of execu-tion due to differences across counties in prosecutorial vigor in the use of the death penalty and local differences in receptivity to its application.
These many complications make clear that even with a concerted effort

Copyright © National Academy of Sciences. All rights reserved.
Deterrence and the Death Penalty
CHALLENGES TO IDENTIFYING DETERRENT EFFECTS 107
by careful, conscientious researchers to assemble and analyze relevant data on death sentences and executions, assessment of the evolving objective risk of execution facing a potential murderer is a daunting challenge. It is also clear that perceptions of this risk among potential murderers must at best be highly impressionistic. To make headway on whether and to what degree the death penalty affects the behavior of potential murderers, it is imperative to have knowledge about how their perceptions of execution risk are formed and then possibly revised on the basis of new information.
RECOMMENDATION: The committee strongly recommends that a concerted effort be made to research the origins and nature of execu-tion sanctions risk perceptions specifically and of noncapital sanctions risks more broadly.
Measurement of Perceptions
The essential task is to measure the perceptions of sanctions risks that potential murderers actually hold. How might this be done?
One possibility is to take seriously the presumption in the panel stud-ies that people who are contemplating murder perceive sanctions risks as subjective probabilities of arrest, conviction, and execution. This possibil-ity suggests that the risk perceptions of potential murderers be measured probabilistically.
Researchers have developed considerable experience measuring beliefs probabilistically in broad population surveys. Manski (2004) reviews the history in several disciplines, describes the emergence of the modern litera-ture, summarizes applications, and discusses open issues. Among the major U.S. platforms for collection of such data, the Health and Retirement Study (HRS) has periodically elicited probabilistic expectations of retirement, bequests, and mortality from multiple cohorts of older Americans (see, e.g., Hurd and McGarry, 1995, 2002; Hurd, Smith, and Zissimopoulos, 2004). The Survey of Economic Expectations (SEE) has asked repeated population cross sections to state the percent chance that they will lose their jobs, have health insurance, or be victims of crime in the year ahead (see, e.g., Dominitz and Manski, 1997; Manski and Straub, 2000). The National Longitudinal Survey of Youth 1997 has periodically asked young people about the chance that they will become a parent, be arrested, or complete schooling (see, e.g., Fischhoff et al., 2000; Lochner, 2007). Ex-amples of victimization and arrest questions include, “What do you think is the percent chance that your home will be burglarized in the next year?” “What do you think is the percent chance that you will be arrested in the next year?” Researchers have learned from these and other surveys that most people have little difficulty, once the concept is introduced, in using

Copyright © National Academy of Sciences. All rights reserved.
Deterrence and the Death Penalty
108 DETERRENCE AND THE DEATH PENALTY
subjective probabilities to express the likelihood they place on future events relevant to their lives.
However, success in measuring beliefs probabilistically within the gen-eral public does not imply that survey research could similarly measure the sanction risk perceptions of potential murderers. A major issue when initiating study of this type is to obtain data from the relevant population, in this case, the population of potential murderers. Theoretically, most people who would be legally eligible to be executed (e.g., are not juveniles or of very low intelligence) are also physically capable of committing a murder and thereby are potential murderers. The reality, however, is that the probability of most people committing a murder is so small that as a practical matter it can be treated as zero. Even the probabilities of people committing other serious crimes, such as robbery and burglary, while likely greater, are still extremely small. Thus, when using the term “potential murderer,” one means that part of population with a non-negligible risk of committing murder.
Thus, the first step and an important prerequisite for a program of research on sanction risk perceptions is to define the relevant population of potential murderers and, more generally, potential criminals. Such a defini-tion will be required to devise cost-effective sampling strategies for inter-viewing people with nontrivial risks of committing crimes. We expect that one important segment of the relevant population is people with criminal records. The correlation between past and future offending is among the best documented empirical regularities in criminology (National Research Council, 1986; West and Farrington, 1973; Wolfgang, 1958). In the case of murder, for example, Cook, Ludwig, and Braga (2005) found that 43 percent of murderers in Illinois had a felony conviction.
Some may question the feasibility of collecting data on the sanction risk perceptions and criminal behavior of individuals with prior histories of seri-ous crimes, especially if subjects are repeatedly interviewed for the purpose of obtaining longitudinal data. Longitudinal data are useful to study how offending experience and external events, such as police crackdowns or policy changes, affect sanction risk perceptions. However, experience dem-onstrates that, with sufficient diligence, it is feasible to collect longitudinal data on highly crime-prone people.
A leading example is the Pathways to Desistance Project (Mulvey, 2011), a two-site longitudinal study of desistance from crime among seri-ous adolescent offenders. The project recruited 1,354 adolescents from the Philadelphia and Phoenix juvenile and adult court systems who had been adjudicated as delinquent or found guilty of a serious felony and were 14 to 17 years old at the time that they committed the offense. For the first 4 years of the study, interviews were conducted at 6-month intervals and for the next 3 years the interviews were annual. The retention rate was quite
Copyright © National Academy of Sciences. All rights reserved.
Deterrence and the Death Penalty
CHALLENGES TO IDENTIFYING DETERRENT EFFECTS 109
high, with 87 percent of the subjects interviewed in at least 8 of the 10 interview cycles. Respondents were asked about their perceptions of sanc-tions risks, among other things. The success of this project indicates that collection of data on sanction risk perceptions from crime-prone popula-tions is feasible with a sustained commitment among a cadre of researchers and with the availability of funding.
Apel (in press) reviews the existing research that measures perceptions of sanction risks. Although there have been a scattering of suggestive stud-ies, there has not yet been systematic large-scale research on the subject. Moreover, there has been no research at all on the specific question of per-ceptions of the sanction risk associated with commission of murder.
With so much to learn, we think it prudent for research to proceed sequentially. A good beginning would be small-scale studies that include one-on-one cognitive interviews with respondents in the relevant popula-tion of potential murderers. These interviews, taking the form of structured conversations, would explore the feasibility and usefulness of probabilistic and other modes of questioning about sanction risk perception. The lessons learned from this exploratory research would inform the design of larger studies, the aim being to eventually develop a program of survey research that would regularly measure the perceptions of the sanction risk held by potential murderers and by potential criminals more generally.
The committee is not confident that measurement of the sanctions risk perceptions of potential murderers can succeed in producing information useful to the study of deterrence, but one cannot be sure unless the effort is made. As demonstrated by the discussion in Chapters 4 and 5, the alterna-tive of continuing to make unfounded assumptions about these perceptions is not useful. Measurement of sanction risk perceptions may enable deter-rence research to make progress that thus far has not been possible in the absence of data.
The committee is more optimistic about the feasibility and usefulness of measuring perceptions of sanctions risks among potential criminals more broadly. This greater optimism has two bases. First, homicide is the least frequent of the crimes included in the “Part 1-Crime Index” of the Federal Bureau of Investigation (FBI), which also includes rape, robbery, aggravated assault, burglary, larceny, and auto theft. More people commit all the other crimes than commit homicides. Thus, it will probably be easier to survey sizable numbers of potential perpetrators of these crimes than of potential murderers. The National Survey of Youth, for example, already surveys youth and young adults about their involvement in such crimes as theft, selling drugs, and assault.
Second, perpetrators who are apprehended for crimes less serious than murder are far less likely to receive lengthy prison sentences, particularly if they are juveniles. Thus, these people have more opportunity to learn about

Copyright © National Academy of Sciences. All rights reserved.
Deterrence and the Death Penalty
110 DETERRENCE AND THE DEATH PENALTY
sanction risk on the basis of personal experience, a source of information that may be vital to formation of sanction risk perceptions.
Inference on Perceptions from Homicide Rates Following Executions
As a complement to research that directly measures perceptions, some committee members believe that study of homicide rates immediately fol-lowing execution events might also provide useful evidence of the percep-tions of potential murderers. As discussed in Chapter 5, the time-series research has largely been devoted to the question of whether homicide rates change in the immediate aftermath of an execution. For the reasons detailed in that chapter, the committee concluded that existing studies were not informative about whether capital punishment affects homicide rates, in part because of the absence of any measure of perceptions.
The committee considered at length whether future research on execu-tion events, if properly conducted, might be informative about whether homicide rates, at least in the short term, are responsive to execution events. We concluded that at best the information to be gleaned from this type of research would be limited and fall far short of establishing whether capital punishment increases, decreases, or has no effect on homicide rates. Even if a short-term impact could be established, it would be difficult to determine whether homicides were actually prevented or simply displaced in time. More fundamentally, execution event studies cannot speak to the question of whether and how the state’s overall sanction regime affects the homicide rate. For example, a null finding from an event study would leave open the possibility that a death penalty regime had a deterrent effect relative to a regime that precluded the death penalty or more narrowly prescribed its applicability. It is important to note that any one execution would only have a deterrent effect if it changed potential murderers’ perceptions of the likelihood of an execution, which is not necessarily the case.
Acknowledging these limitations, some committee members nonethe-less argue that if a well-done event study did produce evidence of an effect—whether positive or negative and no matter how temporary—that result would be of considerable interest. It would demonstrate that po-tential murderers as a group are actually paying attention to the state’s actions and are influenced by them. In short, it would confirm a threshold condition for there to be a deterrent or brutalization effect and invite fur-ther inquiry. Other committee members are not convinced of the value of establishing this threshold condition or are not convinced that any study of this sort could make a convincing case that it had isolated a causal ef-fect of executions.
Copyright © National Academy of Sciences. All rights reserved.
Deterrence and the Death Penalty
CHALLENGES TO IDENTIFYING DETERRENT EFFECTS 111
IDENTIFYING EFFECTS: FEEDBACKS AND UNOBSERVED CONFOUNDERS
Even with better data and information on sanction regimes and per-ceptions of sanction risks, formidable difficulties remain to understanding the impact of the death penalty on homicide. With only observational (nonexperimental) data on capital punishment and homicides, researchers must face the fundamental problem that the data alone cannot reveal the counterfactual question of interest: What would have happened if the death penalty not been applied in a “treatment” state or if the death penalty had been applied in a “control” state? Although this counterfactual-outcomes problem is common to all observational studies of cause and effect, it has long been understood to be particularly problematic for understanding the deterrent effect of the death penalty. A capital punishment regime evolves over time as a result, among other things, of a complex interplay of crime trends, social norms, criminal justice budgets, and election results. This context makes it very difficult to identify the effects of the capital sanction regime alone.
To better understand these issues, we highlight three related identi-fication problems that complicate efforts to draw credible inferences on the effect of capital punishment on homicides. The first, referred to as a feedback effect, arises when homicide rates may directly affect the capital sanction regime. The second, referred to as the omitted variable problem, arises when variables that are jointly associated with the sanction regime and homicide rate are either unknown or unobserved. The third, referred to as an equilibrium effect, arises when the capital sanction regime may directly affect other aspects of the criminal justice system, including, most notably, noncapital sanction policies.
Feedback Effects
Deterrence research conducted in the early 1970s (Carr-Hill and Stern, 1973; Ehrlich, 1975; Sjoquist, 1973) recognized the possibility of feedbacks or simultaneity whereby crime rates may affect the sanction risk and sever-ity even as the sanction risk and severity may affect crime rates. The nature of such feedbacks is not well understood, but there are good reasons for believing that feedbacks are present and may be substantial.
To illustrate the problem, suppose that in a particular state during a particular year there is an exogenous increase in the rate of homicide. If, given the additional workload and resulting strain on resources, district attorneys were more reluctant to pursue the death penalty, a continu-ing upward trend in homicides would appear to show that a reduction in the probability of a death sentence is associated with an increase in
Copyright © National Academy of Sciences. All rights reserved.
Deterrence and the Death Penalty
112 DETERRENCE AND THE DEATH PENALTY
homicides—a result compatible with a deterrent effect. But suppose instead that the upward trend in homicides resulted in greater public concern about violence and hence a greater willingness on the part of juries in capital cases to choose a death sentence rather than a life sentence. A continuing upward trend in homicides would then appear to show that an increase in capital sanctions is associated with an increase in homicide, a result compatible with a “brutalization” effect. In both these scenarios, the important fact is that the homicide trends influenced the sanction regime. These particular feedbacks are hypothetical, and indeed the very presence of feedbacks has yet to be documented. Still, there are plausible reasons for believing that feedbacks are present and possibly substantial in magnitude. If so, they increase the difficulty of identifying deterrent effects.
Omitted Variables
The second and related problem arises when unobserved changes in the social, political, and economic environment may have an impact on both capital sanctions and other aspects of the sanction regime. For example, a political shift that results in the election of “law and order” legislators may increase criminal justice resources and produce a broad shift toward greater severity in sentencing, with some effects on the homicide rate. In this case, changes in the capital sanction regime may be spuriously related to the changes in the homicide rate through the associated changes in the noncapital sanction regime. If variables that are jointly associated with the sanction regime and homicide rates are omitted from statistical models of the effect of capital punishment on homicide, then estimates of the deterrent effect will be biased.
The panel research includes studies that recognize and attempt to ad-dress the inferential consequences of feedback effects and omitted variable problems. As discussed in Chapter 4, these attempts have not been suc-cessful in advancing plausible identification strategies to these problems. In particular, the instrumental variables used in these analyses do not plausibly meet criteria for a valid instrument. The two key criteria are that (1) on average, sanction levels vary as a function of the instrumental variable but (2) on average, the crime rate at a given sanction level does not vary as a function of the instrumental variable. In Chapter 4, we argue that the instrumental variable used in the studies do not meet the second test. This criticism echoes the conclusions of the earlier National Research Council report (1978). Thus, the same elementary error in identification is being made in contemporary research on the deterrent effect of capital punish-ment that was made decades ago by early deterrence researchers.
Copyright © National Academy of Sciences. All rights reserved.
Deterrence and the Death Penalty
CHALLENGES TO IDENTIFYING DETERRENT EFFECTS 113
The Equilibrium Effect
We now turn to a third causal process that makes identification prob-lematic, one that has been largely ignored in the research yet is of unique salience to studying the deterrent effect of capital punishment. For capital punishment, changes in the probability of capital sanctions may cause changes to other aspects of the sanctions regime. To illustrate the prob-lem, consider two examples. First, a district attorney who can credibly threaten an accused homicide defendant with the death penalty may have greater bargaining leverage than one who lacks this threat; as a result, the defendants in the former situation may be more willing to plead guilty to first-degree murder with an agreement that their sentence will be life imprisonment rather than death (Cook, 2009; Kuziemko, 2006). Thus, a district attorney who is willing to devote resources to capital prosecutions may end up achieving more severe noncapital sentences, and the two types of sentences are intrinsically linked.
There may also be a negative linkage, if, for example, a district attor-ney’s proclivity to seek the death penalty in homicide cases comes at the cost of reduced prosecutorial resources available for other cases.1 Due to resource constraints and the additional costs of prosecuting capital murder cases rather than noncapital murder cases, emphasis on capital cases may diminish prosecutorial effectiveness in noncapital cases. The result in that situation may be that the more intense capital regime is achieved at the cost of reduced sentencing (and more dismissals) for the majority of homicide cases that are not capital. These potential links between capital and non-capital sentences make it difficult to isolate the deterrent effect of the threat of execution for homicide.
The equilibrium process, whereby capital and noncapital sanction poli-cies are jointly related and jointly influence the outcome of interest, poses a qualitatively different challenge to identification than the first two. In principle, if the probability that a homicide case would result in a death sentence was randomly assigned across jurisdictions, then the identification problems resulting from feedbacks or omitted variables (discussed above) would be solved. What would remain, however, is the potential difficulty in isolating the deterrent effect of the death penalty by itself from the changes in the overall sanction regime that are influenced by the availability and use of the death penalty.
1 Numerous studies have documented that the prosecution of capital homicide cases is far more costly than noncapital homicide cases: see, for example, Roman, Chalfin, and Knight (2009) in Maryland; Cook (2009) in North Carolina; and Alarcón and Mitchell (2011) and the California Commission on the Fair Administration of Justice (2008) in California. Due to resource constraints, emphasis on capital cases may diminish prosecutorial effectiveness in noncapital cases.

Copyright © National Academy of Sciences. All rights reserved.
Deterrence and the Death Penalty
114 DETERRENCE AND THE DEATH PENALTY
Knowledge of the entire system, however, is not a necessary require-ment for learning about the overall impact of the capital sanction regime. For some questions, the effects of the death penalty on sentence bargain-ing and on administrative resource constraints are an intrinsic part of the mechanism by which a capital regime affects murder rates. Consider, for example, a case in which a judicial ruling terminates the use of the death penalty for some category of homicides. It would be of considerable interest to have a reliable estimate of the overall effect of this reform on the murder rate, even if it is not possible to distinguish among the various mechanisms (reduction in the probability of a death sentence, weaker bargaining posi-tion by the district attorney, or increased court resources available for the average case) that led to that effect. Still, this sort of “black box” estimate is not satisfactory if the goal is to estimate the effect of the threat of execu-tion, in part because the ancillary effects of the administration of the death penalty can be generated by other means, such as changes in court budgets.
Is a more reliable approach to identifying the deterrent effect of capital punishment possible? Part of the solution may be to develop a better un-derstanding of the factors that affect sanction regimes, including possible feedbacks from homicide or other crime patterns. The earlier National Research Council report (1978, p. 47) observed: “Knowledge of the effect of crime on the behavior of the criminal justice system is still extremely limited.” This conclusion is still true today, 30 years later. The 1978 report went on to observe: “While the seeming dearth of untainted identification restrictions may reflect the fact that none exist, it is certainly as likely that it simply reflects our ignorance of the determinants of sanctions” (p. 48). Three decades later this committee observes that both of these assessments apply to contemporary research on deterrence.
As noted above, the 1978 report urged more research on the sanction-generation process for the purpose of accumulating a knowledge base that might reveal approaches to plausible identification. Although knowledge of the sanction-generation process is not required for identification of overall effects of certain relevant regime changes, that knowledge may be useful in determining the validity of a proposed identification method. Also, as a practical matter, some committee members believe that without better knowledge of sanction generation, the prospects for credible identifica-tion are small. Committee members holding this perspective argue that a deeper institutional and theoretical knowledge of sanction process would materially increase the chances of researchers’ becoming aware of credible sources of identification and that without such knowledge the chances for credible identification are remote. Other committee members are less pes-simistic that a chance event or insight might provide a basis for credible identification.
However credible identification might ultimately be achieved, the com-

Copyright © National Academy of Sciences. All rights reserved.
Deterrence and the Death Penalty
CHALLENGES TO IDENTIFYING DETERRENT EFFECTS 115
mittee fully endorses another observation from the earlier report (National Research Council, 1978, p. 49):
It must be noted, however, that identification restrictions cannot be manu-factured. If the process generating the data is truly one that leaves the crime function unidentified, then persistent attempts to produce identifying restrictions because of the desire to estimate the deterrent effect will only produce different kinds of error. Even if all such attempts found a “deter-rent” effect, no conclusion would be warranted unless some of them used validly based identification restrictions.
ADDRESSING MODEL UNCERTAINTY WITH WEAKER ASSUMPTIONS
The persistent problems that researchers have had in providing mean-ingful answers about the deterrent effect of capital punishment is unsur-prising once one recognizes that this body of empirical research rests on strong and unverified assumptions. Although, in practice, researchers often recognize and acknowledge that their assumptions may not hold, they are defended as necessary to provide meaningful answers and in order to make inferences. But the use of strong assumptions hides the problem that very little is understood about the process that may link capital punishment to future crimes.
The different findings in the deterrence research reflect different choices of assumptions, most of which cannot be supported by strong a priori justifications. As documented throughout this report, many of the assump-tions used in the research on the deterrent effect of capital punishment are not credible. Furthermore, the state of social science knowledge does not support a unique model that can be used to identify the effects of capital punishment under the current U.S. sanction regime or to permit the evalu-ation of deterrence under alternative regimes. The study of deterrence is plagued by model uncertainty.
The failure of the existing research to address the issue of model un-certainly is evident in the debate initiated by Donohue and Wolfers (2005), who challenged claims of deterrence by a broad set of researchers. Much of their challenge involved demonstrations of how small changes in the models used in the various studies led to very different estimates of deterrence ef-fects, in some case changing from positive to negative or vice versa, and in others eliminating statistical significance. Some of their exercises altered the set of observations over which the analysis had been conducted; in other cases they changed the choice of control or instrumental variables.
Although Donohue and Wolfers provide useful evidence of the sensitiv-ity of many claims of deterrence to model assumptions, their demonstra-tion begs the question of how to adjudicate their findings relative to the

Copyright © National Academy of Sciences. All rights reserved.
Deterrence and the Death Penalty
116 DETERRENCE AND THE DEATH PENALTY
papers they critique. This may be seen in two of the rejoinders that have been written to their study. Dezhbakhsh and Rubin (2011) and Mocan and Gittings (2010) provide a large number of modifications of their baseline homicide regressions and argue that deterrence effects generally appear in them. However, they fail to provide any guidance as to what is learned from the specifications that are inconsistent with their claim of evidence of deterrence. Rather, the authors’ claims are based on ad hoc choices of alternative model specifications; there is no systematic construction of the models from which to draw inferences. That changes in a given statistical model change the output of the model is hardly unique to the studies of capital punishment and deterrence literature. The problem is that there have been almost no serious attempts to reconcile the many different findings reported in the research.
Given this existing uncertainty, how might research proceed? Certainly, research aimed at reducing model uncertainty would be useful. To that end, the committee proposed, above, developing data and research on sanction regimes and perceptions of sanction risk. Another complementary and potentially useful approach would be to explicitly account for model uncertainty when drawing inferences on the impact of capital punishment. Rather than continue with the conventional practice of assuming whatever it takes to achieve point identification, and then providing ad hoc justifica-tions for particular sets of assumptions to justify a given model, deterrent studies might instead consider what can be learned when explicitly rec-ognizing model uncertainty. Although the resulting inferences may reflect a certain degree of ambiguity about the effects of capital punishment on homicides, those inferences will necessarily possess greater credibility.
To explore the idea of addressing model uncertainty, the committee commissioned papers illustrating application of two complementary re-search paradigms—the model averaging approach and the partial identifi-cation approach.
Model Averaging
Model averaging, though based on earlier work (Bates and Granger, 1969; Leamer, 1978), developed theoretically, algorithmically, and as an applied technique in the mid-1990s (examples include Chatfield, 1995; Draper, 1995; Draper et al., 1993; Raftery, Madigan, and Hoeting, 1997). The model averaging approach constructs a probability distribution for a range of estimates of the deterrent effect of capital punishment, and the researcher constructs this distribution to reflect the researcher’s own or others experts’ prior beliefs about the probability that a given model is valid. By asking what can be learned by combining the information ob-tained across a wide range of models, model averaging methods provide

Copyright © National Academy of Sciences. All rights reserved.
Deterrence and the Death Penalty
CHALLENGES TO IDENTIFYING DETERRENT EFFECTS 117
a natural way to make empirical claims robust to the details of uncertain model specifications.
This technique has recently been used in two studies of capital punish-ment: Cohen-Cole et al. (2009) and Durlauf, Fu, and Navarro (in press). These studies apply the modeling average approach to various specifications that have appeared in the research on capital punishment and deterrence. Cohen-Cole et al. (2009) use this method to adjudicate the different find-ings of Dezhbakhsh, Rubin, Shepherd (2003) and Donohue and Wolfers (2005). Durlauf, Fu, and Navarro (in press), whose paper was written for this committee, consider a range of models based on alternative substantive assumptions that have appeared in the research, including, for example, how to measure subjective arrest, sentencing, and execution probabilities and whether the deterrent effect of capital punishment differs across states. These two papers aim to understand how different assumptions matter and whether differences in assumptions render deterrence estimates fragile. In both papers, the researchers find that model uncertainty swamps the informational content about deterrent effects. That is, after accounting for the modeling uncertainty, the empirical evidence does not reveal whether capital punishment increases or decreases homicides.
As an example of this result, consider the Cohen-Cole et al. (2009) analysis of the models in Dezhbakhsh, Rubin, and Shepherd (2003) and Donohue and Wolfers (2005). Dezhbakhsh, Rubin, and Shepherd (2003) report, under their preferred specification, a statistically significant point estimate of 18 lives saved for each execution. However, when all of the different specifications spanned in the two papers are given probability weights, Cohen-Cole et al. estimate an approximate 95 percent confidence interval on the number of lives saved per execution of [–24, 124]: see Fig-ure 6-1, which is from Cohen-Cole et al. The figure illustrates the model uncertainty by providing a weighted histogram of the estimated net lives saved for all of the models considered. For the case illustrated in this histo-gram, the posterior probability for the models with point estimates suggest that deterrence is 72 percent, but there is substantial bunching around 0, the individual estimates vary widely, and there is a nontrivial probability on models that suggest a large increase in homicides associated with ex-ecutions (a probability 0.15 of point estimates of 20 or more homicides). Thus, the heterogeneity of the model-specific estimates makes it impossible to draw strong qualitative conclusions about the deterrent effect of capital punishment.
The model averaging approach provides a formal and elegant Bayesian method for incorporating uncertainty about the correct modeling assump-tions into inferential methods. This approach can be effectively used to illustrate the importance of different assumptions and the fragility of the estimates to these assumptions, as is done in Cohen-Cole et al. (2009) and

Copyright © National Academy of Sciences. All rights reserved.
Deterrence and the Death Penalty
118 DETERRENCE AND THE DEATH PENALTY
Durlauf, Fu, and Navarro (in press). The approach depends on research-ers’ specifications of the model space and prior over that model space, over which there may be disagreement. Such disagreement should not obscure an essential strength of the model averaging approach: model averaging pro-vides an approach for systematically exploring sensitivity over an explicitly defined model space.
Ultimately, this approach might also be used to infer the effect of the death penalty on homicides. However, for this purpose, a key challenge would be selecting a set of models to include in the averaging and provid-ing a prior probability distribution over this set that is plausible. The ap-proach presumes that the range of models included in the averaging routine includes the correct model that accurately describes the real world and,
-200 -100 0 100 200 300 4000
0.05
0.1
0.15
0.2
0.25
0.3
0.35
0.4Net Lives Saved: Weighted Histogram
DRS EstimateDW Estimate
R02175Figure 6-1
vector, editableobtained from original source
(Cohen-Cole et al, 2007)
FIGURE 6-1 Weighted histogram of the net lives saved by the death penalty. NOTES: The figure includes models for each of the DRS (Dezhbakhsh, Rubin, and Shepherd, 2003) categories. The weights are the posterior model probabilities (Bayes factors). The DRS and DW (Donohue and Wolfers, 2005) lines correspond to the individual model from each with the largest and smallest number of lives saved, respectively. The unweighted histogram is similar.SOURCE: Cohen-Cole et al. (2009, Figure 1). Used with permission.

Copyright © National Academy of Sciences. All rights reserved.
Deterrence and the Death Penalty
CHALLENGES TO IDENTIFYING DETERRENT EFFECTS 119
moreover, that the researcher can provide informed prior beliefs about the probability that each model is valid. In the context of the research on capi-tal punishment, we have found no reason to believe that the existing range of point-identified models includes the correct one, and there is currently little basis for assigning probabilities to the correctness of each model in the literature. As discussed in Chapter 4, the committee did not find the instru-mental variables used in the existing research to be credible. If the existing models are all invalid, using the modeling averaging approach to produce interpretable deterrence estimates can be problematic.2 With uncertainty about the model space and the prior probabilities, either research efforts to construct informative priors or research showing the sensitivity of the posterior to different prior distributions may be useful.
Partial Identification
Partial identification methods provide an alternative approach for re-ducing the dependence of claims of a deterrence effect on arbitrary assump-tions. Rather than start with a particular set of point-identified models and prior beliefs about the probability that each model is valid, both as defined by the researcher, one might instead begin by directly considering what can be inferred under a set of weak assumptions that may possess greater credibility. A natural starting point, for example, is to examine what can be learned in the absence of any assumptions. What do the data alone reveal? Under these weaker assumptions, deterrent effects may not be point iden-tified, but they will be partially identified, with bounds rather than point estimates. Thus, the partial identification approach formalizes the inherent tradeoff between the strength of the maintained assumptions and the cred-ibility of inferences (see Manski, 2003).
The partial identification methodology has been developed and applied over the past 20 years, beginning with Manski (1989, 1990). In an early application to criminal justice policy, Manski and Nagin (1998) studied sentencing and recidivism of juvenile offenders in the state of Utah and demonstrated how partial identification can be used to produce more cred-ible inferences than had previously been produced. Youth in Utah faced a policy that gave judges the discretion to order varying sentences. Using this discretion, judges sentenced some offenders to residential confinement and sentenced other offenders to no confinement. A policy question of potential
2 The Cohen-Cole et al. exercise (2009) was narrow in that it considered the smallest model space one could generate around the different assumptions in Donohue and Wolfers (2005) and Dezhbakhsh, Rubin, and Shepherd (2003). One can easily argue that for a full model av-eraging analysis, other models warrant a priori consideration. However, one could also argue that some of the models considered in Cohen-Cole et al. should not have been included, given a prior probability of 0.

Copyright © National Academy of Sciences. All rights reserved.
Deterrence and the Death Penalty
120 DETERRENCE AND THE DEATH PENALTY
interest was to compare recidivism under that policy with the recidivism that would occur under a policy proposal that removed judicial discretion and instead mandated that all offenders be sentenced to confinement. The study showed how bounds of varying width on the existing treatment effect which allows judges’ discretion could be achieved by combining data on outcomes under the status quo with relatively weak assumptions regarding the manner in which (1) judges have made sentencing decisions and (2) criminality was affected by sentencing.
More recently, in a paper written for this committee, Manski and Pepper (in press) illustrate the partial identification approach in a relatively simple setting by examining the effect of death penalty statutes on the national homicide rate (per 100,000) over 2 years, 1975-1977: 1975 was the last full year of the federal moratorium on death penalty, and 1977 was the first full year after the moratorium was lifted. In 1975, the death penalty was illegal throughout the country; and in 1977, 32 states had legal death penalty statutes. Over this 2-year period, homicide rates in the 32 states that had adopted a death penalty statute in 1977 decreased by 0.6; in the remaining states, the homicide rates decreased by 1.1. It has been common in the relevant research to report the difference-in-difference estimate, which in this case is 0.5 (–0.6 + 1.1), as a point estimate of the effect of capital punishment on the national homicide rate. This interpretation suggests that the death penalty increases crime, but Manski and Pepper (in press) show that this difference-in-difference form only point identifies the impact of the death penalty under a number of strong assumptions, most notably that the effect is assumed to be homogeneous across states and dates. Under weaker assumptions that allow the deterrent effect to vary across states, the average effect of the death penalty is only partially identified, and it was found to lie in the interval [–1.9, 8.3]. Under still weaker assumptions under which the effect of the death penalty is allowed to vary over time, the bounds widen further. Thus, under these weaker models, the average treatment effect of capital punishment is bounded, but the data do not identify whether the death penalty increases or decreases homicides.
The committee does not endorse the specific findings of the recent studies applying the model averaging or partial identification approaches. These studies are largely illustrative and do not address many of the key problems identified throughout this report. Most notably, they do not define the counterfactual sanction regime and do not address the issue of how potential murderers perceive sanction risks. Still, these studies serve as a starting point for future research that might inform the debate on the death penalty. Rather than imposing the strong but unsupported assump-tions required to identify the effect of capital punishment on homicides in a single model or an ad hoc set of similar models, approaches that explicitly account for model uncertainty may provide a constructive way for research

Copyright © National Academy of Sciences. All rights reserved.
Deterrence and the Death Penalty
CHALLENGES TO IDENTIFYING DETERRENT EFFECTS 121
to provide credible albeit incomplete answers. The basic insight is that with model uncertainty, the identification of deterrent effects need not be an all-or-nothing undertaking: the available data and credible assumptions may yield partial conclusions.
Some people may find partial conclusions unappealing and be tempted to impose strong assumptions in order to obtain definitive answers. We caution against this reaction. Imposing strong but untenable assumptions cannot truly resolve inferential problems. Rather, it simply replaces the modeling uncertainty with uncertainty associated with the underlying as-sumptions. We have seen this repeatedly in the literature on the death penalty. The earlier Panel on Research on Deterrent and Incapacitative Ef-fects recognized this when it concluded (National Research Council, 1978, p. 63) “research on this topic is not likely to produce findings that will or should have much influence on policymakers.” Today, more than 30 years later, perhaps the primary lesson learned from the latest round of empirical research on the deterrent effect of the death penalty is that researchers and policy makers must cope with ambiguity. Explicitly recognizing and ac-counting for this uncertainty seems like the only hope of moving forward.
RECOMMENDATION: The committee recommends further inves-tigation of the effects of capital punishment using assumptions that are weaker and more credible than those that have traditionally been invoked by empirical researchers.
REFERENCES
Alarcón, A.L., and Mitchell, P.M. (2011). Executing the will of the voters?: A roadmap to mend or end the California legislature’s multi-billion-dollar death penalty debacle. Loyola of Los Angeles Law Review, 44(Special), S41-S224.
Apel, R. (in press). Sanctions, perceptions, and crime: Implications for criminal deterrence. Submitted to Journal of Quantitative Criminology, 28.
Bates, J.M., and Granger, C.W.J. (1969). The combination of forecasts. Operational Research Quarterly, 20(4), 451-468.
California Commission on the Fair Administration of Justice. (2008). Report and Recommen-dations on the Administration of the Death Penalty in California. Sacramento: Author.
Carr-Hill, R.A., and Stern, N.H. (1979). Crime, the Police and Criminal Statistics: An Analysis of Official Statistics for England and Wales Using Econometric Methods. New York: Academic Press.
Chatfield, C. (1995). Model uncertainty, data mining and statistical inference. Journal of the Royal Statistical Society Series A-Statistics in Society, 158(3), 419-466.
Cohen-Cole, E., Durlauf, S., Fagan, J., and Nagin, D. (2009). Model uncertainty and the deter-rent effect of capital punishment. American Law and Economics Review, 11(2), 335-369.
Cook, P.J. (2009). Potential savings from abolition of the death penalty in North Carolina. American Law and Economics Review, 11(2), 498-529.
Cook, P.J., Ludwig, J., and Braga, A.A. (2005). Criminal records of homicide offenders. The Journal of the American Medical Association, 294(5), 598-601.

Copyright © National Academy of Sciences. All rights reserved.
Deterrence and the Death Penalty
122 DETERRENCE AND THE DEATH PENALTY
Dezhbakhsh, H., and Rubin, P.H. (2011). From the “econometrics of capital punishment” to the “capital punishment” of econometrics: On the use and abuse of sensitivity analysis. Applied Economics, 43(25), 3,655-3,670.
Dezhbakhsh, H., Rubin, P.H., and Shepherd, J.M. (2003). Does capital punishment have a deterrent effect? New evidence from postmoratorium panel data. American Law and Economics Review, 5, 344-376.
Dominitz, J., and Manski, C.F. (1997). Perceptions of economic insecurity - evidence from the survey of economic expectations. Public Opinion Quarterly, 61(2), 261-287.
Donohue, J.J., and Wolfers, J. (2005). Uses and abuses of empirical evidence in the death penalty debate. Stanford Law Review, 58(3), 791-845.
Draper, D. (1995). Assessment and propagation of model uncertainty. Journal of the Royal Statistical Society Series B-Methodological, 57(1), 45-97.
Draper, D., Hodges, J.S., Mallows, C.L., and Pregibon, D. (1993). Exchangeability and data-analysis. Journal of the Royal Statistical Society Series A-Statistics in Society, 156(1), 9-37.
Durlauf, S., Fu, C., and Navarro, S. (in press). Capital punishment and deterrence: Under-standing disparate results. Submitted to Journal of Quantitative Criminology, 28.
Ehrlich, I. (1975). Deterrent effect of capital punishment—Question of life and death. Ameri-can Economic Review, 65(3), 397-417.
Fischhoff, B., Parker, A.M., De Bruin, W.B., Downs, J., Palmgren, C., Dawes, R., and Manski, C.F. (2000). Teen expectations for significant life events. Public Opinion Quarterly, 64(2), 189-205.
Hurd, M., and McGarry, K. (1995). Evaluation of the subjective probabilities of survival in the Health and Retirement Study. Journal of Human Resources, 30(5), S268-S292.
Hurd, M.D., and McGarry, K. (2002). The predictive validity of subjective probabilities of survival. The Economic Journal, 112(482), 966-985.
Hurd, M.D., Smith, J.P., and Zissimopoulos, J.M. (2004). The effects of subjective survival on retirement and social security claiming. Journal of Applied Econometrics, 19(6), 761-775.
Kuziemko, I. (2006). Does the threat of the death penalty affect plea bargaining in murder cases? Evidence from New York’s 1995 reinstatement of capital punishment. American Law and Economics Review, 8(1), 116-142.
Leamer, E.E. (1978). Specification Searches: Ad Hoc Inference with Nonexperimental Data. New York: Wiley.
Lochner, L. (2007). Individual perceptions of the criminal justice system. American Economic Review, 97(1), 444-460.
Manski, C.F. (1989). Anatomy of the selection problem. Journal of Human Resources, 24(3), 343-360.
Manski, C.F. (1990). Nonparametric bounds on treatment effects. American Economic Re-view, 80(2), 319-323.
Manski, C.F. (2003). Partial Identification of Probability Distributions. New York: Springer.Manski, C.F. (2004). Measuring expectations. Econometrica, 72(5), 1,329-1,376.Manski, C.F., and Nagin, D.S. (1998). Bounding disagreements about treatment effects: A case
study of sentencing and recidivism. Sociological Methodology, 28(1), 99-137.Manski, C.F., and Pepper, J. (in press). Deterrence and the death penalty: Partial identifi-
cation analysis using repeated cross sections. Submitted to Journal of Quantitative Criminology, 28.
Manski, C.F., and Straub, J.D. (2000). Worker perceptions of job insecurity in the mid-1990s—Evidence from the survey of economic expectations. Journal of Human Re-sources, 35(3), 447-479.

Copyright © National Academy of Sciences. All rights reserved.
Deterrence and the Death Penalty
CHALLENGES TO IDENTIFYING DETERRENT EFFECTS 123
Mocan, N., and Gittings, K. (2010). The impact of incentives on human behavior: Can we make it disappear? The case of the death penalty. In R.E.S. Di Tella and E. Schargrodsky (Eds.), The Economics of Crime: Lessons for and from Latin America (pp. 379-420). Chicago: University of Chicago Press.
Mulvey, E.P. (2011). Highlights from Pathways to Desistance: A Longitudinal Study of Seri-ous Adolescent Offenders. Juvenile Justice Fact Sheet. Washington, DC: U.S. Department of Justice.
National Research Council. (1978). Deterrence and Incapacitation: Estimating the Effects of Criminal Sanctions on Crime Rates. Panel on Research on Deterrent and Incapacitative Effects. A. Blumstein, J. Cohen, and D. Nagin (Eds.), Committee on Research on Law Enforcement and Criminal Justice. Assembly of Behavioral and Social Sciences. Wash-ington, DC: National Academy Press.
National Research Council. (1986). Criminal Careers and “Career Criminals.” Panel on Re-search on Criminal Careers, A. Blumstein, J. Cohen, J.A. Roth, and C.A. Visher (Eds.), Committee on Research on Law Enforcement and the Administration of Justice. Com-mission on Behavioral and Social Sciences and Education. Washington, DC: National Academy Press.
Raftery, A.E., Madigan, D., and Hoeting, J.A. (1997). Bayesian model averaging for linear regression models. Journal of the American Statistical Association, 92(437), 179-191.
Roman, J.K., Chalfin, A.J., and Knight, C.R. (2009). Reassessing the cost of the death penalty using quasi-experimental methods: Evidence from Maryland. American Law and Eco-nomics Review, 11(2), 530-574.
Sjoquist, D.L. (1973). Property crime and economic behavior: Some empirical results. Ameri-can Economic Review, 63(3), 439-446.
West, D.J., and Farrington, D.P. (1973). Who Becomes Delinquent? Second Report of the Cambridge Study in Delinquent Development. London: Heinemann Educational.
Wolfgang, M.E. (1958). Patterns in Criminal Homicide. Philadelphia: University of Pennsyl-vania Press.

Copyright © National Academy of Sciences. All rights reserved.
Deterrence and the Death Penalty

Copyright © National Academy of Sciences. All rights reserved.
Deterrence and the Death Penalty
Appendix
Biographical Sketches of Committee Members and Staff
Daniel S. Nagin (Chair) is Teresa and H. John Heinz III university professor of public policy and statistics in the Heinz College at Carnegie Mellon Uni-versity. His research focuses on the evolution of criminal and antisocial be-haviors over the life course, the deterrent effect of criminal and non criminal penalties on illegal behaviors, and the development of statistical methods for analyzing longitudinal data. His work has appeared in such diverse out-lets as the American Economic Review, the American Sociological Review, the Journal of the American Statistical Association, Archives of General Psychiatry, Psychological Methodology, Law & Society Review, and Stanford Law Review. He is an elected fellow of the American Society of Criminol-ogy and of the American Association for the Advancement of Science, and he was the 2006 recipient of the American Society of Criminology’s Edwin H. Sutherland Award. He holds a Ph.D. from the H. John Heinz III School of Public Policy and Management at Carnegie Mellon University.
Kerwin K. Charles is the Edwin and Betty L. Bergman distinguished service professor in the Harris School of public policy studies at the University of Chicago and a research associate at the National Bureau of Economic Research. His research focuses on a range of subjects in the broad area of applied microeconomics, including how mandated minimum marriage ages affects young people’s marriage and migration behavior; the effect of racial composition of neighborhoods on the social connections people make; differences in visible consumption across racial and ethnic groups; the ef-fect of retirement on subjective well-being; and the propagation of wealth across generations within a family. His recent work has studied the degree
125

Copyright © National Academy of Sciences. All rights reserved.
Deterrence and the Death Penalty
126 DETERRENCE AND THE DEATH PENALTY
to which prejudice can account for wages and employment differences by race and gender. He has a Ph.D. from Cornell University.
Philip J. Cook is the ITT/Sanford professor of public policy and professor of economics and sociology at Duke University. Previously, he served as director and chair of Duke’s Sanford Institute of Public Policy, and he has been a visiting scholar at the Kennedy School of Government at Harvard University. He has served as a consultant to the U.S. Department of Justice (Criminal Division) and the U.S. Department of the Treasury (Enforcement Division). He has published on a wide range of topics, including punish-ment, deterrence of crime, the costs of crime, homicide and economic conditions, and the epidemic in youth violence of the late 1980s and early 1990s. His other research interests include evaluation methods; public health policy; and the regulation of alcohol, guns, and gambling. He is a member of the Institute of Medicine. He holds a Ph.D. in economics from the University of California at Berkeley.
Steven N. Durlauf is the Kenneth J. Arrow and Laurents R. Christensen professor of economics at the University of Wisconsin–Madison and a re-search associate of the National Bureau of Economic Research. Previously, he served as director of the economics program at the Santa Fe Institute and as general editor of the revised edition of the New Palgrave Dictionary of Economics. His primary research interests involve the integration of the so-cial influences into the theoretical and statistical analysis of economic phe-nomena, and he has also studied issues related to racial profiling, deterrence and imprisonment, and deterrence and death penalty. He is a fellow of the Econometric Society. He holds a Ph.D. in economics from Yale University.
Amelia M. Haviland holds the Anna Loomis McCandless chair at the Heinz College at Carnegie Mellon University, and she is a senior statistician at RAND. Her research focuses on causal analysis with observational data and analysis of longitudinal and complex survey data with applications in health, criminology, and economics. Her methodological work has included new methods to combine semi-parametric mixture modeling for longitudinal data with propensity score approaches to causal modeling and methods for creat-ing minimum mean squared error composite estimates from a combination of probability and nonprobability samples. She is a recipient of the Thomas Lord Scholarship Award from the RAND Institute for Civil Justice. She holds a Ph.D. in statistics and public policy from Carnegie Mellon University.
Gerard E. Lynch is a judge on the U.S. Court of Appeals for the Second Circuit, and he is the Paul J. Kellner professor of law at the Columbia Uni-versity School of Law. Previously, he served on the U.S. District Court for

Copyright © National Academy of Sciences. All rights reserved.
Deterrence and the Death Penalty
APPENDIX 127
the Southern District of New York. Prior to his appointment to the bench, he served as vice dean of the Columbia University School of Law. His main areas of expertise include sentencing and criminal law and procedure. He is a recipient of the Edward Weinfeld Award for Distinguished Contribu-tions to the Administration of Justice from the New York County Lawyers’ Association and of the Wien Prize for Social Responsibility from Columbia University. He holds degrees from Columbia College and the Columbia Uni-versity School of Law.
Charles F. Manski is a Board of Trustees professor in economics at North-western University. Previously, he served on the faculties of the University of Wisconsin–Madison, the Hebrew University of Jerusalem, and Carnegie Mellon University. His research spans econometrics, judgment and decision, and the analysis of social policy. He is an elected member of the National Academy of Sciences and an elected fellow of the Econometric Society, the American Academy of Arts and Sciences, and the American Association for the Advancement of Science. He holds a B.S. and a Ph.D. in economics from the Massachusetts Institute of Technology.
John V. Pepper is associate professor of economics at the University of Virginia. His research focuses on program evaluation methods, applied econometrics, and public economics. He has published widely on a range of topics, including evaluation of criminal justice data and programs, food assistance programs, health and disability programs, and welfare programs. He is on the board of the Michigan Retirement Research Center and of the Southern Economics Association. He is a coeditor of the Southern Economic Journal, and he served as a guest editor for a special issue of the American Journal of Law and Economics, which focused on empirical research on the death penalty. He holds a Ph.D. in economics from the University of Wisconsin–Madison.
James Q. Wilson was the Reagan professor of public policy at Pepperdine University and a distinguished scholar in the Department of Political Sci-ence and senior fellow at the Clough Center at Boston College. Previously, he was the Shattuck professor of government at Harvard University and the James Collins professor of management and public policy at the Uni-versity of California at Los Angeles. His national positions related to issues of public policy included chair of the White House Task Force on Crime, chair of the National Advisory Commission on Drug Abuse Prevention, member of the Attorney General’s Task Force on Violent Crime, member of the President’s Foreign Intelligence Advisory Board, and member of the board of directors of the Police Foundation. He held a Ph.D. from the University of Chicago.

Copyright © National Academy of Sciences. All rights reserved.
Deterrence and the Death Penalty

Exhibit B: Daniel S. Nagin,
Deterrence in the Twenty-First Century, 42 Crime &
Just. 199 (2013)

Carnegie Mellon UniversityResearch Showcase @ CMU
Heinz College Research Heinz College
2013
Deterrence in the Twenty-first Century: A Reviewof the EvidenceDaniel S. NaginCarnegie Mellon University, [email protected]
Follow this and additional works at: http://repository.cmu.edu/heinzworks
Part of the Databases and Information Systems Commons, and the Public Policy Commons
This Working Paper is brought to you for free and open access by the Heinz College at Research Showcase @ CMU. It has been accepted for inclusionin Heinz College Research by an authorized administrator of Research Showcase @ CMU. For more information, please contact [email protected].
1
Deterrence in the Twenty-first Century: A Review of the Evidence
Daniel S. Nagin
Abstract
The evidence in support of the deterrent effect of the certainty of punishment is far more
consistent than that for the severity of punishment. However, the evidence in support of
certainty’s effect pertains almost exclusively to apprehension probability. Consequently, the
more precise statement is that certainty of apprehension, not the severity of the ensuing legal
consequence, is the more effective deterrent. This conclusion has important policy
implications among which are that lengthy prison sentences and mandatory minimum
sentencing cannot be justified on deterrence.
There are four major research gaps. The first concerns the mechanism by which
police affect perceptions of the probability of apprehension. The second concerns the
inextricable link between the deterrent effect of the threat of punishment and the
potentially criminogenic effect of the experience of punishment. The third concerns the
concept of a sanction regime defined by the sanctions legally available and how that legal
authority is administered. Theories of deterrence conceive of sanctions in the singular not
the plural and do not provide a conceptual basis for considering the differential deterrent
effects of different components of the sanction regime. The fourth involves sanction risk
perceptions. Establishing the link between risk perceptions and sanction regimes is
imperative; unless perceptions adjust, however crudely, to changes in the sanction regime,
desired deterrent effects will not be achieved.

2
Three enduring questions have occupied centuries of scholarship on crime and punishment. Does
punishment prevent crime? How does punishment prevent crime? And should punishment be
used to prevent crime? This essay is concerned with the first two of these questions.
The criminal justice system dispenses justice by apprehending, prosecuting, and punishing
individuals who break the law. These activities may prevent crime by three distinct mechanisms—
incapacitation, specific deterrence, and general deterrence. Convicted offenders are sometimes
punished with imprisonment. Incapacitation concerns crimes averted by their physical isolation
during the period of their incarceration. Specific and general deterrence involve possible
behavioral responses. General deterrence refers to the crime prevention effects of the threat of
punishment. Specific deterrence concerns the aftermath of the failure of general deterrence—the
effect on reoffending, if any, that results from the experience of actually being punished.
In this essay, I consider the theoretical and evidentiary basis for general deterrence. In
another recent Crime & Justice essay (Nagin, Cullen, and Jonson 2009), I surveyed the evidence
on the specific deterrence effects of imprisonment. Here, I draw heavily from recent and prior
deterrence reviews by myself and others.
My aim is to provide a succinct summary of the current state of theoretical and empirical
knowledge about deterrence in support of several interrelated objectives. The first is to provide a
selective intellectual history of deterrence research that identifies important recurring themes. I
highlight both what has been learned and persistent flaws that should be addressed in future
research.
The second objective concerns the framing of discourse on deterrence, which often takes the
same pattern, particularly in policy discussions: one group arguing that sanction threats always deter
and another group arguing that sanction threats never deter. When deterrence effects are unpacked,

3
it is clear that sanction threats are not universally efficacious: magnitudes of deterrent effects
range from none to seemingly very large. Thus, another primary objective is to move discourse
about deterrence away from the equally indefensible positions that deterrence effects are always
or never present, to a more nuanced and useful inquiry into the basis for variation in the
existence and size of deterrent effects.
The third objective is policy related. Prison populations have been rising in the US for 4
decades. Only recently have there been signs that the increase is abating. In 2009 and 2010 state-
level prison population declined but federal-level population continued to increase (BJS 2012).
Less well-recognized is that prison populations have risen elsewhere in the world, for example,
in the Netherlands since 1975 and more recently in England and Wales, Portugal, Spain, and
New Zealand. An incarceration-based sanction policy that reduces crime solely by incapacitation
will necessarily increase the rate of imprisonment. In contrast, if the crime control policy also
prevents crime by deterrence, it may be possible to reduce both imprisonment and crime—
successful prevention by any mechanism, whether by deterrence or otherwise, has the virtue of
averting not only crime but also the punishment of perpetrators. Hence, it is important to identify
policies that increase imprisonment but have only negligible effects on crime rates.
My main conclusions are as follows: First, there is little evidence that increases in the
length of already long prison sentences yield general deterrent effects that are sufficiently large
to justify their social and economic costs. Such severity-based deterrence measures include
“three strikes, you’re out,” life without the possibility of parole, and other laws that mandate
lengthy prison sentence.
Second, based on the earlier noted Crime and Justice review (Nagin, Cullen, and Jonson
2009), I have concluded that there is little evidence of a specific deterrent effect arising from the

4
experience of imprisonment compared with experience of noncustodial sanctions such as
probation. Instead, the evidence suggests that that reoffending is either unaffected or increased.
Third, there is substantial evidence that increasing the visibility of the police by hiring
more officers and allocating existing officers in ways that materially heighten the perceived risk
of apprehension can deter crimes. This evidence is consistent with the perceptual deterrence
literature which surveys individuals on sanction risk perceptions and relates these perceptions to
their actual or intended offending behavior. This literature finds that perceived certainty of
punishment is associated with reduced self-reported or intended offending.
Thus, I conclude, as have many prior reviews of deterrence research, that evidence in
support of the deterrent effect of various measures of the certainty of punishment is far more
convincing and consistent than for the severity of punishment. However, the certainty of
punishment is conceptually and mathematically the product of a series of conditional probabilities—
the probability of apprehension given commission of a crime, the probability of prosecution given
apprehension, the probability of conviction given prosecution, and the probability of sanction given
conviction. The evidence in support of certainty’s deterrent effect pertains almost exclusively to
apprehension probability. Consequently, the conclusion that certainty not severity is the more
effective deterrent is more precisely stated as certainty of apprehension and not the severity of the
legal consequence ensuing from apprehension is the more effective deterrent. This more precise
statement has important policy implications; the empirical evidence from the policing and
perceptual deterrence literature is silent on the deterrent effectiveness of policies that mandate
incarceration after apprehension. These include policies such as mandatory minimum sentencing
laws or sentencing guidelines that mandate incarceration. Thus, this revised conclusion about the

5
deterrent effect of punishment certainty should not be construed as implying that policies mandating
severe legal consequences have been demonstrated to achieve deterrent effects.
Together these conclusions have a range of policy implications, particularly as they relate to
the United States (Durlauf and Nagin 2011a). First, it is clear that lengthy prison sentences cannot
be justified on a deterrence-based, crime-prevention basis. Thus, the case for crime prevention
benefits of measures requiring lengthy prison sentences such as California’s three-strikes law
must rest on incapacitation. Another implication is that crime prevention would be enhanced by
shifting resources from imprisonment to policing or, in periods of declining criminal justice
system budgets, that policing should get a larger share of a smaller overall budget.
While accumulation of knowledge about deterrence in the past four decades has been
impressive, much remains to be learned. There are four major theoretical and related empirical
gaps. The first concerns the deterrent effect of the certainty of apprehension. There are two distinct
mechanisms by which the police may deter crime. One stems from their effectiveness in
apprehending perpetrators of crimes—by definition this activity involves occurrences in which
deterrence has failed. Thus, police effectiveness in successfully apprehending criminal perpetrators
can have a deterrent effect only on others or on the perpetrator’s future behavior. The second
mechanism involves the effect of the intensity of police presence in creating a perception that
apprehension risk is sufficiently high that no crime is committed in the first place. I speculate that
this second mechanism is the primary source of police effectiveness in deterring crime whereas the
first role primarily prevents crime by capturing and incapacitating crime-prone individuals. The
research gap involves developing rigorous empirical tests of this contention and developing
improved theoretical models of how police presence and tactics can reduce the attractiveness of
criminal opportunities by increasing the perceived risk of apprehension.

6
The second gap concerns the distinction between specific and general deterrence. The
two are inextricably linked because the experience of punishment is a consequence of the failure
of the threat of punishment to deter crime, yet no theory of deterrence explicitly addresses how
the experience of punishment influences the deterrent effect of the threat of punishment.
Relevant issues include: how the experience of punishment affects the proclivity to commit
crime due to potential stigma effects, sustained contacts with criminals in a prison setting, or
participation in rehabilitative programs as well as the effect of the experience of punishment on
perceptions of the certainty and severity of sanctions. Analysis of these and other related issues
will require longitudinal data on individuals who do and do not have the experience of
punishment.
The third theoretical gap concerns the concept of a sanction regime. A sanction regime
defines the sanctions that are legally available for the punishment of various types of crime and
how that legal authority is administered. Depending on the crime and characteristics of the
offenders, such as age or prior record, available sanctions range in severity from verbal
reprimands to fines and different forms of community service to lengthy terms of imprisonment
and execution. How the legal authority is administered determines the relative frequency that the
available sanction options are used and also the swiftness of their application. Thus, both
dimensions of the sanction regime—the legal authority for different types of sanctions and how
that authority is administered—combine to determine the certainty, severity, and celerity of
sanctioning options available for punishment of a specific type of crime.
Theories of deterrence, however, specify sanction threats in the singular, not the plural.
For example, a sizable number of studies examine the question whether capital punishment
deters murder. Yet properly understood, the relevant question is the differential or marginal
7
deterrent effect of execution over the deterrent effect of other available or commonly-used penalties.
In this case the alternative penalty would be a lengthy prison sentence—sometimes life without the
possibility of parole. Yet none of the capital punishment studies take account of differences across
states and over time in the severity of non-capital punishments for murder (Nagin and Pepper 2012).
Theories of deterrence that conceive of sanctions in the singular do not provide a conceptual basis
for considering the differential deterrent effect of different types of sanction options. The empirical
companion to this theoretical expansion involves assembling the data required to measure sanction
regimes. At least in the US, such data are largely unavailable.
The fourth theoretical and empirical gap involves sanction risk perceptions, an issue that I
emphasized in an earlier review of the deterrence literature (Nagin 1998). Deterrence is the
behavioral response to the perception of sanction threats. Establishing the link between risk
perceptions and sanction regimes is imperative; the conclusion that crime decisions are affected by
sanction risk perceptions is not sufficient to conclude that policy can deter crime. Policy cannot
directly manipulate perceptions. It can affect only the variety and severity of sanctions legally
available in the sanction regime and the manner of their administration. Unless perceptions adjust,
however crudely, to changes in the sanction regime the desired deterrent effect will not be achieved.
Since the publication of Nagin (1998), valuable headway has been made in how the
experience of apprehension or not following commission of a crime affects sanction risk
perceptions. This research is valuable for specification of a theory that combines the concepts of
general and specific deterrence. However, it does not address how perceptions are formed about the
two key dimensions of a sanction regime—the legal authority for different types of sanctions and
how that authority is administered. Numerous surveys have been conducted of the general public’s
knowledge of sanction regimes, especially concerning the legal authority for different types of

8
sanctions (Apel, forthcoming). Not surprisingly, the surveys find that knowledge of sanction
regimes is poor. However, the fundamental flaw with these surveys is that knowledge of the
potential legal consequences of lawbreaking is unnecessary for most people; their decisions to
refrain from crime are based on the mere knowledge that the behavior is legally prohibited, or
because of other non-legal considerations such as morality or fear of social censure (Packer 1968;
Zimring and Hawkins 1973; Andenaes 1974; Wikström et al. 2012). That said, for individuals for
whom sanction threats might affect their behavior, it is preposterous to assume that their perceptions
conform to the realities of the legally available sanction options and their administration. More than
a decade after my earlier review, it remains the case that little is known about how individuals form
perceptions of the sanction regimes they confront.
This essay is organized in the following sections. Key concepts of deterrence are
discussed in the first section where I also set out a simplified model of deterrence that is referred
to throughout the essay. Section II provides a brief summary of the themes, conclusions, and
flaws of research on the deterrent effects of prison and the police up to about 1990. In the third
section I summarize the evidence on the deterrent effects of capital punishment. I discuss the
capital punishment literature separately because of its distinctive features and salience. I then in
section IV examine post-1990 studies of the crime prevention effects of imprisonment and in
section V post-1990s studies of the police effects on crime. Section VI discusses the survey-
based literature on the accuracy of sanction risk perceptions, their formation, and their
relationship to self-reported criminality. Section VII offers conclusions.
I. Key Concepts

9
Deterrence is a theory of choice in which would-be offenders balance the benefits and costs of
crime. Benefits may be pecuniary, as in the case of property crime, but may also involve
intangible benefits such as defending one’s honor, expressing outrage, demonstrating dominance,
cementing a reputation, or seeking a thrill. The potential costs of crime are comparably varied.
Crime can entail personal risk if the victim resists. It may also invoke pangs of conscience or
shame (Braithwaite 1989). I am mainly concerned with offender responses to the costs that
attend the imposition of official sanctions such as arrest, imprisonment, execution, fines, and
other restrictions on freedom and liberty such as mandated drug testing or electronic monitoring.
The origins of most modern theories of deterrence can be traced to the work of the
Enlightenment-era legal philosophers (Beccaria 1986[1764]; Bentham 1988[1789]). The
motivation for their work was their mutual abhorrence of the administration of punishment
without constructive purpose. For them the constructive purpose was preventing crime. As
Beccaria observed “it is better to prevent crimes than punish them” (1986[1764], p. 93). Beccaria
and Bentham argued that there are three key ingredients to the deterrence process—the severity,
certainty, and celerity of punishment. These concepts, particularly the certainty and severity of
punishment, form the foundation of nearly all contemporary theories of deterrence. The enduring
impact of their thinking is remarkable testimony to their innovation.
The theory of deterrence is predicated on the idea that if state-imposed sanction costs are
sufficiently severe, criminal activity will be discouraged, at least for some. Thus, one of the key
concepts of deterrence is the severity of punishment. Severity alone, however, cannot deter.
There must also be some possibility that the sanction will be incurred if the crime is committed.
Indeed the argument that the probability of punishment, not severity, is the more potent
component of the deterrence process goes back to Beccaria who observed: “One of the greatest

10
curbs on crime is not the cruelty of punishments, but their infallibility.… The certainty of
punishment even if moderate will always make a stronger impression” (1986[1764], p. 58).
In the lifetimes of Beccaria and Bentham there was no criminal justice system as we
know it. Punishment for lawbreaking was almost certainly less regular and more haphazard than
it is today. Punishment in contemporary society, however, also still remains far from guaranteed.
In order for a formal sanction—whether moderate or severe—to be imposed, the offender must
first be apprehended, usually by the police.1 He must next be charged and successfully
prosecuted, and finally sentenced by the judge. Successful passage through all of these stages is
far from certain. The most important set of actors affecting certainty is the police—absent
detection and apprehension, there is no possibility of conviction or punishment. For this reason
special attention is given to discussing what is known about the deterrent effect of police
activities and presence.
The third conceptual component of the theory of deterrence advanced by Bentham and
Beccaria is the swiftness of punishment, which Bentham referred to as celerity. Celerity is the
least studied of the conceptual troika underlying deterrence theory. The theoretical basis for its
effect on deterrence is ambiguous, as is the empirical evidence on its effectiveness. Even
Beccaria seemed to base his case for celerity more on normative considerations of just
punishment than on deterrence effectiveness. He observed, ‘‘the more promptly and the more
closely punishment follows upon the commission of a crime, the more just and useful will it be. I
say more just, because the criminal is thereby spared the useless and cruel torments of
uncertainty, which increase with the vigor of imagination and with the sense of personal
weakness’’ (Beccaria 1986[1764], p. 36).
1 Crime may also be sanctioned entirely outside of the criminal justice system through retaliation by the victim or by others on his or her behalf (Jacobs and Wright 2006).

11
In 1968 economist Gary Becker published the first modern formalization of the Beccaria-
Bentham conception of the deterrence process (Becker 1968). Since then, other formalizations
have appeared in economics, criminology, law, and sociology—some in the form of
mathematical models and others in the form of non-mathematical conceptual theories (Cornish
and Clarke 1986).
For the purposes of this essay still another formalization is provided. My purpose is
twofold. One is to provide a conceptual structure for framing results that are well established in
the literature. The second is more ambitious. I earlier indicated that the seemingly greater
deterrent effect of certainty rather than severity of punishment reflected a response to the
certainty of apprehension. In this regard, I distinguished two distinct functions of the police—
apprehension of the perpetrators of crime and serving in a sentinel function that deters crime
from happening in the first place. The second purpose is to formalize this distinction. In so doing
I link situational crime prevention theory with deterrence theory.
Bentham’s conception of criminal choice involved the would-be offender balancing the
potential pains of punishment against the pleasures of the offense. In this spirit the model
formalizes the decision of a would-be offender to victimize a potential criminal opportunity,
whether that opportunity is a person in the form of a potential robbery victim, or property that
might be stolen or vandalized.
The choice model is depicted in figure 1. It distinguishes four possible outcomes if the
target is victimized: the criminal act is successfully completed, the act is not successfully
completed but the perpetrator is not apprehended, the act is not successfully completed and the
perpetrator is apprehended but not convicted, and the act is not successfully completed and the
perpetrator is both apprehended and convicted.

12
The probability of each these outcomes is determined by following probabilities:
Perceived Probability of Successful Completion of the Act. This probability, which is
denoted by Ps, measures the would-be offender’s perception of the chances the target can be
successfully victimized. This perception will be affected by how effectively the opportunity is
protected. For property targets, the level of protection is determined by technological safeguards
like alarm and surveillance systems and use of physical protection such as locked showcases. For
human targets, protection level is affected by the care which valuable property is secured, for
example, by keeping it out of sight. Protection may also be provided by what Cohen and Felson
(1979) call capable guardians such as security guards, vigilant employees, or onlookers who are
willing to intervene. Importantly, the police may also serve as a guardian. I refer to police as
acting as sentinels when acting in this role. An idling police car outside a liquor store greatly
reduces the chance, probably to zero, that the store can be successfully robbed. This brings me to
the risk of apprehension.
Perceived Probability of Apprehension Given Non-Completion. Police perform another
crime control function that is distinct from their role as official guardians. They apprehend those
offenders who chose to act upon a criminal opportunity. When acting in this role police are
described as “apprehension agents.” The sentinel and apprehension roles of the police are
conceptually linked but distinct. They are conceptually linked because both roles are based on
the legal authority of the police to arrest persons suspected of committing a crime. Because a
contributing factor to Ps is the risk of apprehension, arrest authority is one source of police
influence on Ps in their sentinel role. However, the sentinel role of police is distinct from their
apprehension role because the latter comes into play only when deterrence has failed and a
would-be offender becomes an actual offender. Thus, at one moment police can be functioning

13
as a sentinel and in the next moment they can be acting as apprehension agent. The would-be
offender’s perception of the probability of apprehension given commission of the crime is
denoted by 𝑝!.
In this model I assume that the risk of apprehension is limited to acts that are not
successfully completed. I make this assumption for several reasons. First, it is useful for
clarifying the distinction between police acting as sentinels and police acting as apprehension
agents. Second, it conforms to the seeming reality that most offenders are apprehended at the
scene of the crime or soon thereafter. I say seeming because I have been able to identify only two
studies (Greenwood, Chaiken, and Petersilia 1977; Blake and Coupe 2001) that report relevant
data. Data reported in both support this assumption.
Perceived Probability of Conviction Given Apprehension. The offender’s perception of
the probability that apprehension will actually result in conviction is denoted by 𝑝!|!.
Under this set-up, the probability of successful completion is Ps, the probability of
nonsuccessful completion but with apprehension avoidance is (1-Ps)(1-Pa), the probability of
nonsuccessful completion followed by apprehension but not conviction is (1-Ps)(Pa )(1-Pa|c ), and
the probability of nonsuccessful completion followed by apprehension and conviction is (1-Ps)
(Pa)(Pa|c ).
The benefits and costs of each of these outcomes are assumed to be determined by the
following factors:
Rewards. Rewards measures the total benefits of victimizing a target. For a crime with a
property motive, the value of the property to the perpetrator likely accounts for all or a
major share of the total reward. However, the thrill of offending or—in the case of

14
violent crimes without a property motive—the satisfaction of humiliating, physically
hurting, or killing the victim may also be relevant to the reward value of a target.
Crime Commission Cost. Crime commission cost measures the total cost of committing
the crime separate from sanction cost defined below. Commission cost includes time
searching for the opportunity, planning time, if any, and the effort required to commit the
crime itself. Importantly, it also includes the potential costs to the perpetrator of victim
retaliation or resistance. Finally, commission cost includes Raskolnikov-like feelings of
guilt or shame that may affect the perpetrator, whether or not he is apprehended and
sanctioned.
Perceived Formal Sanction Costs. Perceived sanction cost measures the would-be
perpetrator’s assessment of the formal sanctions cost that might be imposed if convicted.
These costs include the loss of freedom if imprisoned and the unpleasantness of other
restrictions on freedom due to conditions of parole or probations, and fines.
Perceived Informal Sanction Cost. The imposition of formal sanctions may also trigger
informal sanctions by family, friends, and the community at large, which for some
offenders may be even more costly than the formal sanctions. Informal sanction cost may
also involve large economic costs due to job loss.
Perceived Cost of Apprehension. Apprehension imposes costs that are distinct from
formal and informal sanction cost. These include the unpleasantness of the apprehension

15
itself, possible loss of liberty due to pre-trial detention, and legal fees. Perceived cost of
apprehension also includes the social and economic costs triggered by arrest, even absent
conviction, such as disapproval of family, friends, and the community at large, as well as
job loss.
At the end of each branch, figure 1 shows the costs that attend the various forms of an
unsuccessful attempt or the benefit of a successful attempt. If the individual chooses to act on a
criminal opportunity the benefits and costs of the four possible outcomes and their attendant
probabilities are as follows:
1) The offender successfully completes the criminal act. This occurs with probability Ps and
the net benefit to the offender is reward less commission cost. Thus, the expected benefit
of victimization is Ps (Reward-Commission Cost) which is denoted as Ps(R-CC).
2) The offender is not successful but not apprehended. This occurs with probability (1-Ps)(1-
Pa). The cost to the offender is that much, or all, of the commission cost is incurred but
with no reward. For simplicity it is assumed that all of the commission cost is incurred.
Thus, the contribution of this outcome to expected cost is (1-Ps)(1-Pa)(Commission Cost)
which is denoted as (1-Ps)(1-Pa)CC.
3) The offender is not successful and is apprehended but is not convicted and formally
sanctioned. This occurs with probability (1-Ps)(Pa )(1-Pa|c ). In this case the cost to the
offender is commission cost plus apprehension cost. Thus the contribution of this
outcome to expected cost is (1-Ps)(Pa)(1-Pc|a)(Commission Cost + Apprehension Cost)
which is denoted as (1-Ps)(Pa)(1-Pc|a)(CC + AC). Because, as already noted, most

16
apprehensions occur at the scene of the crime, or shortly thereafter, it is assumed that the
perpetrator does not have the opportunity to enjoy the rewards provided by the act.
4) The offender is not successful, but is apprehended, convicted and formally sanctioned.
This occurs with probability (1-Ps)( Pa)(Pc|a ). In this case the cost to the offender is
commission cost plus apprehension cost plus formal and informal sanction cost. Thus, the
contribution of this outcome to expected cost, again assuming that the rewards are not
enjoyed, is (1-Ps)(Pa)(Pc|a(Commission Cost + Apprehension Cost+ Formal Sanction +
Informal Sanction Cost)) which is denoted as (1-Ps)(Pa)(Pc|a)(CC + AC+ FS + ISC).2
An arrow at the top of figure 1 highlights that the possible events depicted occur over
time. Success or failure at completion is typically immediate, whereas the down tree events occur
later, often months after the criminal event in the case of conviction and sentencing. I return to
this observation in the discussion of the celerity of punishment.
It is assumed that the crime will be committed if the expected benefits from a successful
completion exceeds the expected cost of an unsuccessful attempt. Namely, if
Ps(R-CC)> (1-Ps)(1-Pa)CC+(1-Ps) (Pa)(1-Pc|a)(CC + AC)+(1-Ps) (Pa)(Pc|a)(CC+AC+FS+ISC) (1).
An equivalent form of this relationship moves Ps on the left-side to the right-side in which case
the crime will be committed if:
(R-CC)> [(1-Ps) /Ps][(1-Pa)CC + (Pa)(1-Pc|a)(CC + AC) +(Pa)(Pc|a)(CC + AC+ FS + ISC)] (2)
The left-hand side of equation 2 measures the net benefits of committing the crime and
the right-hand side measures the costs. Several observations about this relationship are relevant
to the remainder of the discussion.
2This model assumes that success precludes the possibility of subsequent apprehension and the attendant risk of formal sanction.

17
First, unless the net benefit of crime commission is positive (i.e., R-C>0),3 the offense
will not be committed regardless of the formal and informal sanction costs specified on the right-
hand side of equation 2. Particularly if commission cost is understood to include the shame of
committing an act that involves taking another person’s property or doing violence to their
person, for most people sanction costs are irrelevant to the decision to refrain from crime. For
example, Bachman, Paternoster, and Ward (1992) found in a study of sexual assault that sanction
risk perceptions were relevant to self-reported intentions to offend only for the least morally
committed. The absence of an effect for those with higher levels of moral commitment, however,
should not be construed as their being impervious to incentives but to their moral commitment
being a sufficient basis for refraining from sexual assault.4 This elementary but fundamental
point has been made repeatedly in the discussion about to the degree which sanction threats
affect behavior among different individuals. See, for example, Zimring and Hawkins (1973) and
more recently Wikström et al. (2012) and Piquero et al. (2011). I return to this point in the
discussion of sanction risk perceptions and their influence on behavior in section VI.
Second, the bottom three branches of the tree pertain to the consequences of failure to
complete the crime. Commission cost contributes to the total cost of all three of these branches,
apprehension cost contributes to two of the three branches—apprehension with and without
conviction—and informal and formal sanctions cost contribute only to the final branch,
apprehension with conviction. This implies that increases in perceived commission cost will
have a greater deterrent effect than equal increases in either perceived apprehension cost or
perceived formal and informal sanction cost. In turn the structure of the tree implies that
increases in apprehension cost will have a greater deterrent effect than equal increases in either
3 Rewards and commission cost may also be affected by risk preferences. 4Knowledge of potential punishment may also reinforce a normative sense of wrongfulness.

18
formal or informal sanction cost. This observation helps to explain the longstanding conclusion
from the perceptual deterrence literature that shame, a key component of commission cost and
apprehension cost, plays a more decisive role in the deterrence process than sanction cost. This
issue is discussed further in section III. It also explains the seeming effectiveness of situational
crime prevention tactics. A topic I allude to in section V.
Third, the structure of the tree also implies that decreases in Ps will have larger deterrent
effects than equal-sized increases in either Pa or Ps|a and that increases in Pa will have a bigger
deterrent impact than an equal increase in Ps|a. This observation is consistent with the
longstanding belief dating back to Beccaria that the certainty of punishment is a more effective
deterrent than the severity of punishment. However, I earlier noted that the evidence suggests
that a more precise statement of the certainty conclusion pertains to the certainty of
apprehension. The decision model laid out here provides a still more precise statement of that
conclusion. Decreases in Ps provide more effective deterrence than equal increases in Pa.
Concerning the distinction between police serving as sentinels or as apprehension agents, when
serving in their role as sentinels they affect Ps whereas when serving as apprehension agents they
affect Pa. This implies the sentinel role of policing is more effective in deterring crime than their
apprehension agent role. This observation is relevant to the discussion in section V of the varying
findings on police effectiveness in preventing crime.
II. Deterrence Research to the 1990s
Empirically-based deterrence research began in earnest in the late 1960s. There were three major
instigators. One was technological—the growing availability of computers and statistical
software for analyzing crime data which itself was growing in availability. The second was

19
social—the steady growth of crime rates during the 1960s. The third was intellectual, especially
within economics—with the publication in 1968 of Gary Becker’s seminal article “Crime and
Punishment: An Economic Approach.”
Deterrence studies up to the 1990s are usefully grouped into three categories:
experimental and quasi-experimental studies, aggregate studies, and perceptual deterrence
studies. My 1998 Crime and Justice review provided an extended discussion of the three types of
studies (Nagin 1998). This section summarizes conclusions of the experimental and quasi-
experimental studies and aggregate studies of this research era that are most relevant to this
review. Because of the persistence of themes in the pre- and post-1990s perceptual deterrence
research and the continuity of the research methods used, I discuss this body of research without
reference to era in section VI.
A. Experimental and Quasi-Experimental Studies
This category of studies examines the effect of targeted policy interventions such as police
crackdowns or implementation of statutes changing penalties. In the experimental studies the
intervention and control treatments are randomly assigned. A classic example is the Minneapolis
Domestic Violence Experiment (Sherman and Berk 1984) in which police responded to
misdemeanor incidents of domestic violence with one of three randomly chosen responses. The
arrest response was found to be most effective in preventing recidivism but as discussed in section
V this finding was not consistent across replications of the experiment in other localities.
True experiments, however, compose only a small fraction of the studies in this category.
Most are quasi-experiments. The best-designed quasi-experimental studies attempt to incorporate
important features of a true experiment—a well-defined treatment regime, measurement of response

20
before and after treatment, and a control group. Two classic studies of this genre are Ross's studies
of the effects on drunk driving of the British Road Safety Act (Ross 1973) and of Scandinavian-
style drunk driving laws. Most studies in this group examine the effects of police crackdowns on
drug markets, disorderly behavior, and drunk driving. Excellent reviews of these studies are
available in Sherman (1990) and Ross (1982). Both Sherman and Ross conclude that the
interventions were generally successful in generating an initial deterrent effect. For instance, in
drunk-driving interventions this was evidenced by a reduction in fatalities in which the driver was
intoxicated or in drug market crackdowns by reduced dealing. However, they also concluded that
the effect was generally only transitory: the initial deterrent effect typically began decaying even
while the intervention was in effect. One exception to this finding of at least initial deterrent
effectiveness concerned studies of increases in sentence severity. Ross (1982) discusses the
ineffectiveness of severity enhancements in three very different places—Finland, Chicago, and New
South Wales, Australia. Evidence even of an initial effect is less consistent than in studies of
interventions that increased the certainty of apprehension.
I take away three important lessons from this literature. First, the generally more consistent
findings of initial effectiveness in the apprehension-based interventions, compared to the severity-
based interventions, provides more evidence in support for my modified version of the certainty
effect, namely that certainty of apprehension is a more effective deterrent than the severity of the
ensuing legal consequences, but with an important proviso. Ross (1982) attributed the
ineffectiveness of severity-enhancing policies to the fact that they trigger a system response that
reduced certainty of punishment. He pointed out that if judges or juries believed the penalties too
harsh, they may have responded by refusing to convict guilty defendants. Police and prosecutors
may respond similarly. Thus, any potential deterrent effect of the severity enhancement may be

21
canceled by the reduction in certainty. This result is a reminder not only of the difficulty of
enforcing penalties that are deemed unjust but also that certainty and severity do not operate
independently—they interact. Tonry (2009) forcefully elaborates upon many of these points.
Second, Sherman (1990) offers useful nomenclature for describing the finding of only
transitory effects. He uses the term "initial deterrence decay" to describe the decline in the deterrent
response as "potential offenders learn through trial and error that they had overestimated the
certainty of getting caught at the beginning of the crackdown," and "residual deterrence" which is a
crime suppression effect that extends beyond the intervention until offenders learn by experience or
word of mouth that "it is once again 'safe' to offend" (p. 10). Sherman’s observations are a reminder
that deterrence is a perceptual phenomenon. In Sherman (1990) and Nagin (1998) we both discuss
the decay of initial deterrence as a possible response to what behavioral economists call ambiguity
aversion. People consistently prefer gambles in which the risks are clearly comprehensible
compared to equivalent gambles in which the risks are less transparent. Initial deterrence may be a
response to perceptions of uncertainty about true risk rather than to any change in the true risk of
apprehension. Thus, unless policy can affect perceptions there will be no behavioral response. It is
also a reminder that perceptions may be updated in response to cues from the environment and
therefore will not necessarily be stable. I return to this important issue in the discussion of the
perceptions studies in section VI.
Third, the findings from these studies have stood the test of time. In my judgment, well
conducted experimental and quasi-experimental studies of deterrence provide the most convincing
evidence of the circumstances under which deterrence is and is not effective. This holds for both the
post-1990s and the pre-1990s literatures.

22
B. Aggregate Studies
The pre-1990s aggregate studies generally analyzed the association of crime rates across
geographic units, usually states, with measures of the certainty and severity of punishment. The
most basic form of these analyses involved bivariate correlations across states of crimes rates for the
crime categories composing the FBI part I crime index (e.g, murder and non-negligent homicide,
robbery, burglary) with certainty of punishment, measured by prison admissions per reported crime,
and severity of punishment, measured by median time served. More elaborate analyses were
conducted in a regression format. These analyses added various state characteristics known to be
correlated with crime (e.g., age and racial composition, urbanization) to the base regression model
relating crime rate to the certainty and severity measures. Negative and significant associations were
generally found between the crime rate and the certainty of imprisonment ratio. The association of
time served with the crime rate was generally insignificant.
Reviews of these studies, including a high-visibility National Research Council (NRC)
report (Blumstein, Cohen, and Nagin 1978), concluded that the aggregate studies suffered from such
grave flaws that they did not provide a basis for valid inference about deterrent effects. Two flaws
are particularly noteworthy because they remain relevant to the interpretation of a successor strand
of post-1990 aggregate studies discussed in section IV. The first is that the associations do not
distinguish the behavioral response to sanction threats, deterrence, from incapacitation. The second
is more fundamental—distinguishing cause from effect. All forms of non-experimental data are
vulnerable to the criticism that the outcome of interest, in this case the crime rate, is the cause of the
predictor of interest, in this case sanctions, and not vice-versa. High crime rates, for example, might
prompt a police crackdown followed by crime rates declining for other reasons. Cross-polity studies
of natural variations in crime rates and sanction levels are particularly vulnerable to this concern

23
because there is generally no basis for assessing whether the variations in sanction levels are the
result of factors independent of the crime rate. By contrast, for quasi-experimental studies
institutional research can reveal whether the intervention was prompted by rising crime rates.
III. Capital Punishment
Studies of the deterrent effect of capital punishment have been and continue to be the source of
bitter contention. Isaac Ehrlich’s 1975 study, in which he concluded that each execution averted
seven to eight homicides, is undoubtedly the most cited study of this kind. The1978 National
Research Council report (Blumstein, Cohen, and Nagin 1978) and an accompanying
commissioned paper (Klein, Forst, and Filatov 1978) laid out a lengthy list of criticisms of the
Ehrlich analysis. The NRC report concluded, “available studies [including Ehrlich’s] provide no
useful evidence on the deterrent effect of capital punishment” (p. 9).
Coincidentally, that report was issued shortly after the 1976 Supreme Court decision
Gregg v. Georgia ended the moratorium on execution in the United States. In the 35 years since
publication of the 1978 report, and more especially in recent years, a considerable number of
post-Gregg studies have attempted to estimate the effect of the legal status or the actual
implementation of the death penalty on homicide rates. These studies have reached widely
varying conclusions and have resulted in often bitter disagreement about their interpretation.
This more recent literature has been the subject of still another NRC report titled
Deterrence and the Death Penalty, which I co-edited (Nagin and Pepper 2012), as well as two
reviews of the literature commissioned by the NRC committee (Chalfin, Haviland, and Raphael
2012; Durlauf and Charles, forthcoming), and two valuable reviews by Donohue and Wolfers

24
(2005, 2009). The NRC report and all of the reviews are highly critical of the post-Gregg
research. The report concluded:
Research to date on the effect of capital punishment on homicide is not informative about
whether capital punishment decreases, increases, or has no effect on homicide rates.
Therefore, the Committee recommends that these studies not be used to inform
deliberations requiring judgments about the effect of the death penalty on homicide.
Consequently, claims that research demonstrates that capital punishment decreases or
increases the homicide rate by a specified amount or has no effect on the homicide rate
should not influence policy judgments about capital punishment. (Nagin and Pepper
2012, p. 3)
The NRC report leveled two key criticisms of the post-Gregg capital punishment
deterrence research that transcend the high profile but still narrow issue of the deterrent effect of
capital punishment. They also apply to studies of the deterrent effect of other forms of
sanction—prison, fines, and community control—that form the backbone of contemporary
sanction policy in the US and most other countries.
One criticism concerned the incomplete specification of the sanction regime for
homicide. Even for capital-eligible convictions for homicide, only a minority of cases result in a
sentence of death, let alone an execution (Nagin and Pepper 2012). This is true even for states
such as Texas and Virginia that make the most intense use of capital punishment. Instead, most
homicides result in a lengthy prison sentence, sometimes life without parole. A study by Cook
(2009) illustrates this point. Of 274 cases prosecuted as capital cases, only 11 resulted in a death
sentence. Another 42 resulted in dismissal or a verdict of not guilty, which left 221 cases
resulting in conviction and sentences to a noncapital sanction.
25
None of the post-Gregg studies take into account the non-capital component of the sanction
regime. As discussed in Chalfin, Haviland, and Raphael (2012) and Nagin and Pepper (2012), there
are sound reasons for expecting that the severity of the non-capital sanctions for homicide vary
systematically with the availability and the intensity of use of capital punishment. For example,
the political culture of a state may affect the frequency of use of capital punishment and also the
severity of non-capital sanctions for homicide. Thus, any effect that these non-capital sanctions
have on homicide may contaminate the estimated effect of capital punishment on homicide. In
capital punishment studies the potential for such bias is particularly strong because, as noted,
non-capital sanctions remain the dominant sanction response to capital eligible murders, even in
states that make the most intense use of capital punishment.
Homicide is not the only criminal offense punishable by a range of qualitatively different
sanction alternatives. Indeed the sanction regimes for most other criminal offenses, even
felonies, include more than one sanction option for their punishment. This point is returned to in
section IV.
A second key criticism elaborated in the NRC report concerned the specification of
perceptions of the capital punishment component of the sanction regime. Studies typically
suppose that people who are contemplating murder perceive sanctions risks as subjective
probabilities of arrest, conviction, and execution. Lacking data on these subjective probabilities,
researchers presume that they are somehow based on the observable frequencies of arrest,
conviction, and execution.
The report concluded that several factors made the attempts by the panel studies to
specify the capital component of state sanctions regimes uninterpretable. First, the findings are
very sensitive to the way the risk of execution is specified. For example, because of delays

26
between the imposition of a death sentence and its being carried out, if ever, researchers
routinely computed ratios in which the numerator was the number of executions in a given state
and year divided by the number of death sentences imposed in that state in some prior year.
Results are very sensitive to how that ratio is computed (Chalfin, Haviland, and Raphael 2012)
and there is no logical basis for resolving disagreements about how the true risk of execution
should be measured. Among the difficulties is that only 15 percent of those sentenced to death in
the United States since 1977 have been executed, with close to 40 percent leaving death row for
other reasons (vacated sentences or convictions, commutations, a successful appeal, or death by
other causes), and 45 percent still awaiting execution (Snell 2010). Available information for
calculating the risk depends upon the size of the state—for large states such as Texas and
California there is far more data for calibrating risk than for small states such as Delaware and
Montana. Further complicating matters, policies can change due to court decisions and
administrative decrees of elected officials. This unpredictability calls into question the usefulness
of prior data on the death penalty when calculating present and future risk. Because none of the
measures used has any clear relationship with the correct measure, there is no reasoned basis for
arbitrating competing claims about which study provides the better estimate of the deterrent
effect of the death penalty.
Even if it were possible to judge which measure more closely corresponds to true risk,
there is no evidence that the perceptions of potential murderers correspond to this risk. The
above discussion concerns only one aspect of sanction regime, the risk of execution given
conviction. Other relevant dimensions of the sanction regime are the risk of conviction given
commission of a murder and the certainty and severity of the non-capital component alternatives
to the death penalty. The assumption that potential murders have accurate perceptions of these

27
risks and consequences is not credible: indeed it is preposterous. I return to the issue of sanction
risk perceptions in section VI.
IV. Imprisonment and Crime
There have been two distinct waves of aggregate studies of the relationship between
imprisonment and crime. Studies in the 1960s and 1970s described in section II examined
associations of state-level crime rates to state-level certainty of punishment, measured by the
ratio of prison admissions to reported crimes, and to state-level severity of punishment as
measured by median time served. These studies suffered from fundamental deficiencies laid out
in the 1978 NRC report (Blumstein, Cohen, and Nagin 1978) and elsewhere. As a consequence,
aggregate-level deterrence research went largely “silent” for more than a decade.
A. Post-1990s Aggregate Studies
By the mid-1990s, a second generation of studies emerged. Unlike the first-generation
studies, which primarily involved cross-sectional analyses of states, second-generation studies
had a longitudinal component in which data were analyzed across states and over time. Another
important difference in the second-generation studies is that they did not attempt to estimate
certainty and severity effects separately. Instead they examined the relationship between the
crime rate and rate of imprisonment as measured by prisoners per capita.
A review by Donohue (2007) identifies six studies of the relationship of crime rates to
imprisonment rates. All find statistically significant negative associations between imprisonment
rates and crime rates, implying a crime prevention effect for imprisonment. However, the
magnitude of the estimate varied widely; from nil for a study that allowed for the possibility that

28
prevention effects decline as the scale of imprisonment increases (Liedka, Piehl, and Useem
2006) to –0.4 percent for each 1 percent increase in the imprisonment rate (Spelman 2000).
Apel and Nagin (2009), Durlauf and Nagin (2011a, 2011b), and Donohue (2007) discuss
important flaws in these studies. One is that they are necessarily measuring the combined effect
of deterrence and incapacitation on crime rates and thus cannot be interpreted as measuring the
deterrent effect of imprisonment. At best they can be said to estimate the upper bound of that
effect.
Other shortcomings are even more fundamental. One concerns the same fundamental
flaw of the first-generation studies—distinguishing cause from effect. While imprisonment
prevents crime through a combination of deterrence and incapacitation, crime also generates the
prison population. The object of interest is the effect of the imprisonment rate on the crime rate
but data available for estimation of that effect also reflects the effect of the crime rate on the
imprisonment rate. Thus, statistical isolation of the crime prevention effect requires properly
accounting for the effect of crime on imprisonment.
The shortcomings in the statistical strategies used in these studies to identify the crime
prevention effect of imprisonment are discussed at length in Durlauf and Nagin (2011a, 2011b).
To summarize, with the exception of Levitt (1996) and Johnson and Raphael (forthcoming a),
the conclusions of the studies rest on a form of statistical analysis pioneered by the Nobel
Laureate Clive Granger (1969). Granger’s method is often mistakenly interpreted as providing
estimates with a causal interpretation, which in the context of the aggregate imprisonment studies
would be the expected change in the crime rate resulting from a policy that changes the
imprisonment rate by a specified amount. In fact, the results are not in general amenable to this
interpretation. Instead, application of Granger’s method provides only a basis for forecasting

29
future changes in the crime rate as a function of prior changes in the imprisonment rate and the
crime rate. While valid forecasts can be based on correlations alone, valid causal interpretation
requires more than establishing correlation.
Figure 2 illustrates the problem. Panel A depicts hypothetical crime and imprisonment
functions. The crime function C(I) describes the crime rate as a function of the imprisonment
rate, I, and the imprisonment function I(C) measures the imprisonment rate as a function of the
crime rate, C. C(I) is shown to be downward sloping in I to reflect the crime reduction effects of
imprisonment via some combination of deterrence and incapacitation. Studies of the relationship
of the crime rate to the imprisonment rate aim to measure whether this line is in fact downward
sloping and if so, by how much. I(C) is depicted as upward sloping because for any fixed set of
policies determining the certainty and severity of punishment, imprisonment rates will be a rising
function of the crime rate.5 The intersection of the C(I) and I(C) functions at I0 and C0 measures
the observed level of crime and imprisonment.
Crime rates and imprisonment rates are, of course, affected by a multitude of other
factors beyond their mutual interaction as depicted in Panel A. The key to estimating C(I) is
identifying some factor, called an instrumental variable, that is thought to affect the
imprisonment rate but which affects the crime rate only via its effect on shifting the location of
imprisonment rate function. Suppose such an instrumental variable (IV) were identified and
denoted by z. Panel B demonstrates how changing values of z from z1 to z2 to z3 shifts the I(C)
function and in so doing, traces out the C(I) function. Connecting the point (I1,C1), (I2,C2), and
(I3,C3) estimates C(I). In this fashion IV regression models can be said to identify C(I) and
5 Like the entire imprisonment and crime literature, I too assume that sanction policies are unaffected by either the crime rate or the imprisonment rate. This is a not a tenable assumption. However, all the points I make in the ensuing discussion would continue to hold if the model were generalized to allow sanction policy to be affected by crime rates and imprisonment rates.
30
thereby the crime reduction effect of the imprisonment rate on the crime rate. However, the key
to IV regression successfully isolating this effect is that C(I) is not directly affected by z. Panel C
illustrates the failure of this assumption. If z also shifts C(I), the changing equilibrium values of
the imprisonment rate and crime rate no longer trace out the C(I) function.
Only Levitt (1996) and Johnson and Raphael (forthcoming b) use a IV regression
approach to identify the causal effect of imprisonment on crime. Levitt (1996) uses court-ordered
prison releases to form a set of instrumental variables. He argues that such court orders meet the
test for providing a valid estimate of the effect of imprisonment rate on the crime rate—the
orders have no direct effect on the crime rate and affect it only insofar as the court orders affect
the imprisonment rate, which in turn affects the crime rate.
Even accepting this argument, the estimated effect has only limited policy value. By its
construction, it is likely measuring the effect on crime of the early release of selected prisoners,
probably those nearing the end of their sentenced terms. It may also be reflecting the effect of
diversion of individuals convicted of less serious crime either to local jails or to community
supervision. In either case, the estimates are not informative about the crime prevention effects,
whether by deterrence or incapacitation, of sentence enhancements related to the manner in
which a crime is committed (e.g., weapon use), or the characteristics of the perpetrator (e.g.,
prior record), or to policies affecting the likelihood of incarceration. More generally, the
uncertainty about what is actually being measured inherently limits the value of the estimated
effects for both policy and social science.
A more recent study by Johnson and Raphael (forthcoming a) is based on a technically
complex IV regression model. Identification is based on the assumption that prison populations
do not change instantaneously in response to changes in the size of the criminal population.

31
Similar to the non-IV-based analysis of Liedka, Piehl, and Useem (2006), Johnson and Raphael
conclude that the crime prevention effect of imprisonment has diminished with the scale of
imprisonment which was rising steadily over the period of their analysis 1978 to 2004.
One explanation for the Johnson and Raphael finding is that the states and the federal
government over this period collectively implemented policies with steadily declining average
deterrent effectiveness. Given that knowledge of the deterrent effectiveness of alternative
sanction policies is so limited, this explanation is not credible. An alternative explanation
involving incapacitation is more credible. If the crime reduction effect of incarceration primarily
stems from incapacitation, the Johnson and Raphael finding is consistent with the concept of
“stochastic selectivity” (Canela-Cacho, Blumstein, and Cohen 1997), whereby high-rate
offenders are more likely to be apprehended and incarcerated than low-rate offenders. Thus, as
the scale of imprisonment increases, higher-rate offenders will be less likely to be at large
committing crimes. Johnson and Raphael’s finding is replicated by Vollaard (forthcoming) in an
analysis of the Netherland’s Habitual Offender Law. Vollaard attributes the entirety of the crime
prevention effect that he estimates to incapacitation. Also of note, Owens (2009) in her analysis
of 2003 data from Maryland finds modest incapacitation effects.
The incapacitation interpretation of the Johnson and Raphael finding of decreasing crime
prevention returns with the scale of imprisonment is more credible than the deterrence
interpretation. This interpretation also implies that the study is not useful for learning about
deterrence. However, even the incapacitation interpretation is cast in doubt by the aging of the
US prison population. Between 1991 and 2010 the percentage of prisoners in state and federal
prisons over 45-years-old has nearly tripled from 10.6 percent to 27.4 percent BJS (1999, 2011).
Thus, the seeming decline in the incapacitative effectiveness of prison with scale may only be
32
reflecting the aging of the prison population which coincides with rising imprisonment rates.
Further complicating the decreasing returns interpretation is the changing composition of the
prison population in terms of the composition of prisoner conviction offense. Over the past four
decades, the percentage of prisoners incarcerated for non-part-I FBI index crimes has increased
substantially (Blumstein and Beck 1999, 2005). Thus, the reduction in crime prevention
effectiveness may be due to the types of prisoners incarcerated not to scale effects.
All of these studies whether IV-based or not also suffer from an important conceptual
flaw that limits their usefulness in understanding deterrence and devising crime-control policy.
Prison population is not a policy variable per se; rather, it is an outcome of sanction policies
dictating who goes to prison and for how long—namely, the certainty and severity of
punishment. In all incentive-based theories of criminal behavior, in the tradition of Bentham and
Beccaria, the deterrence response to sanction threats is posed in terms of the certainty and
severity of punishment, not in terms of the imprisonment rate. Therefore, to predict how changes
in certainty and severity might affect the crime rate requires knowledge of the relationship of the
crime rate to certainty and severity as separate entities which is not provided by the literature that
analyzes the relationship of the crime rate to the imprisonment rate.
The studies are also conducted at a too-global level. In Nagin (1998) I describe the two-
dimensional taxonomy of sanction policies affecting the scale of imprisonment. One dimension
labeled "type" distinguishes three broad categories: policies regulating certainty of punishment such
as laws requiring mandatory imprisonment, policies influencing sentence length such as determinate
sentencing laws, and policies regulating parole powers. The second dimension of the taxonomy,
"scope," distinguishes policies that cast a wide net, such as a general escalation of penalties for

33
broad categories of crime, compared to policies that focus on targeted offenses (e.g., drug dealing)
or offenders (e.g., three-strikes laws).
The nearly 500 percent growth in prison population over the last 2 decades is attributable to
a combination of policies belonging to all cells of this matrix. Parole powers have been greatly
curtailed, sentence lengths increased, both in general and for particular crimes (e.g., drug dealing),
and judicial discretion to impose non-incarcerative sanctions has been reduced (Tonry 1996;
Blumstein and Beck 1999, 2005; Raphael and Stoll 2007). Consequently, any effect on the crime
rate of the increase in prison population reflects the effects of an amalgam of potentially interacting
treatments.
There are good reasons for predicting differences in the crime reduction effects of
different types of sanctions (e.g., mandatory minimums for repeat offenders vs. prison diversion
programs for first-time offenders). Obvious sources of heterogeneity in offender response
include factors such as prior contact with the criminal justice system, demographic
characteristics, and the mechanism by which sanction threats are communicated to their intended
audience. Indeed, available evidence on the deterrent effect of sentence enhancements, the next
topic of discussion, demonstrates such heterogeneity.
B. Policy Evaluation Studies of Sentence Enhancements
There have been comparatively few studies of the deterrent effects of sentence
enhancements, judged relative to their importance in contemporary crime control policy. The
earliest post-1970s attempts to measure severity effects analyzed the deterrent impact of sentence
enhancements for gun crimes. In a series of studies, Loftin, McDowell, and colleagues (Loftin
and McDowall 1981; Loftin, Heumann, and McDowall 1983; Loftin and McDowall 1984)

34
examined whether sentence enhancements for gun use in committing another type of crime such
as robbery deter gun use in the commission of crime. While the findings are mixed, this body of
research has generally failed to uncover evidence of a deterrent effect (but see McDowall, Loftin,
and Wiersema 1992).
However, one important caveat remains with respect to extrapolating these studies to
understanding the link between deterrence and severity. The same literature that found that gun
penalty enhancements were ineffective also found that these laws generally failed to increase the
sentences actually received in gun-related crime prosecutions. Thus, gun-using criminals may
not have responded because the real incentives were not changed. This again is a reminder of
Tonry’s (2009) commentary on the highly inconsistent administration of mandatory minimum
sentencing.
Kessler and Levitt (1999) examine the deterrent impact of another California sentence
enhancement law, Proposition Eight, passed in 1982. Proposition Eight anticipated the three-
strikes laws passed by many states in the 1990s. They estimate a 4 percent decline in crime
attributable to deterrence in the first year after enactment. Within 5 to 7 years, the effect grows to
a 20 percent reduction. As acknowledged by Kessler and Levitt, the longer term estimate
includes incapacitation effects.
Webster, Doob, and Zimring (2006) challenged the basic finding of any preventive
effects. Kessler and Levitt examine data from every other year. When all annual data are used,
Webster, Doob, and Zimring (2006) find that the decline in crime rates in the affected categories
begins before Proposition Eight’s enactment, and the slope of this trend remains constant through
implementation. But see Levitt (2006) for a response and commentary supporting Webster and
colleagues by Raphael (2006) .

35
One exception to the scarcity of studies on the crime prevention effects of sentence
enhancements concerns analyses of the deterrent effect of California’s “three strikes, you’re out”
law, which mandated a minimum sentence of 25 years upon conviction for a third strike offense.
Zimring, Hawkins, and Kamin (2001) concluded that the law reduced the felony crime rate by at
most 2 percent. They also conclude that only those individuals with two convictions for two
offenses qualifying as “strikes” showed any indication of reduced offending. Other studies by
Stolzenberg and D’Alessio (1997) and Greenwood and Hawken (2002), who like Zimring,
Hawkins, and Kamin (2001) examine before and after trends, conclude that the crime prevention
effects were negligible.
I turn now to six studies which in my judgment report particularly convincing evidence
on the deterrent effect of incarceration. They also nicely illustrate heterogeneity in the deterrence
response to the threat of imprisonment. These studies are: Weisburd, Einat, and Kowalski (2008)
and Hawken and Kleiman (2009), who study the use of imprisonment to enforce fine payment
and conditions of probation, respectively, and find substantial deterrent effects; Helland and
Tabarrok (2007), who analyze the deterrent effect of California’s third-strike provision and find a
modest deterrent effect; Raphael and Ludwig (2003) who examine the deterrent effect of prison
sentence enhancements for gun crimes and find no effect; and Lee and McCrary (2009) and
Hjalmarsson (2009), who examine the heightened threat of imprisonment that attends coming
under the jurisdiction of the adult courts at the age of majority, and find no deterrent effect.
Weisburd, Einat, and Kowalski (2008) report on a randomized field trial of alternative
strategies for incentivizing the payment of court-ordered fines. The most salient finding involves
the “miracle of the cells,” namely, that the imminent threat of incarceration provides a powerful
incentive to pay delinquent fines, even when the incarceration is only for a short period. The
36
miracle of the cells provides a valuable perspective on the conclusion that the certainty, rather
than the severity, of punishment is the more powerful deterrent. Consistent with the “certainty
principle,” the common feature of treatment conditions involving incarceration is a high certainty
of imprisonment for failure to pay the fine. However, that Weisburd and colleagues label the
response the “miracle of the cells” and not the “miracle of certainty” is telling. Their choice of
label is a reminder that certainty must result in a distasteful consequence in order for it to be a
deterrent. The consequences need not be draconian, just sufficiently costly, to deter the
proscribed behavior.
The deterrence strategy of certain but non-draconian sanctions has been applied with
apparently great success in Project Hope, an intervention heralded in Hawken and Kleiman
(2009), Kleiman (2009), and Hawken (2010). Project Hope is a Hawaii-based probation
enforcement program. In a randomized experiment probationers assigned to Project Hope had
much lower rates of positive drug tests, missed appointments, and—most importantly—were
significantly less likely to be arrested and imprisoned. The cornerstone of the HOPE intervention
was regular drug testing, including random tests, and certain but short punishment periods of
confinement (e.g., 1–2 days) for positive drug tests or other violation of conditions of probation.
Thus, both the Weisburd, Einatt, and Kowalski (2008) fine experiment and Project Hope show
that highly certain punishment can be an effective deterrent in cases where deterrence has
previously been ineffective in averting crime.
Helland and Tabarrok (2007) examine whether California’s “three strikes, you’re out”
law deters offending among individuals previously convicted of strike-eligible offenses. The
future offending of individuals convicted of two previous eligible offenses was compared with
that of individuals who had been convicted of only one eligible offense but who, in addition, had

37
been tried for a second eligible offense but were ultimately convicted of a noneligible offense.
The two groups of individuals were comparable on many characteristics such as age, race, and
time in prison. Even so, Helland and Tabarrok find that arrest rates were about 20 percent lower
for the group with convictions for two eligible offenses. The authors attribute this to the greatly
enhanced sentence that would have accompanied conviction for a third eligible offense.
Raphael and Ludwig (2003) examine the deterrent effect of sentence enhancements for
gun crimes that formed the basis for a much publicized Richmond, VA federal program called
Project Exile. Perpetrators of gun crimes, with a particular emphasis on those with a felony
record, were the targets of federal prosecution which provided for far more severe sanctions for
weapon use than were provided by Virginia state law. In a careful and thorough analysis
involving comparisons of adult homicide arrest rates with juvenile homicide arrest rates within
Richmond and comparisons of gun homicide rate between Richmond and other cities with
comparable pre-intervention homicide rates, Raphael and Ludwig conclude that the threat of
enhanced sentence had no apparent deterrent effect.
For most crimes, the certainty and severity of punishment increases discontinuously upon
reaching the age of majority, when jurisdiction for criminal wrongdoing shifts from the juvenile
to the adult court. In an extraordinarily careful analysis of individual-level crime histories from
Florida, Lee and McCrary (2009) attempt to identify a discontinuous decline in offending at age
18, the age of majority in Florida. Their point estimate of the discontinuous change is negative as
predicted, but minute in magnitude and not even remotely close to achieving statistical
significance.6
6The finding that the young fail to respond to changes in penalties associated with the age of majority is not uniform across studies. An earlier analysis by Levitt (1998) finds a large drop in the offending of young adults when they reach the age of jurisdiction for adult courts. For several reasons, Durlauf and Nagin (2011a, 2011b) judge the null effect finding of Lee and McCrary more persuasive in terms of understanding deterrence. First, Levitt (1998)

38
Another analysis of the effect, if any, of moving from the jurisdiction of the juvenile to
adult courts by Hjalmarsson (2009) uses the 1997 National Longitudinal Survey of Youth to
examine whether young males’ perception of incarceration risk changed at the age of criminal
majority. Youth were asked, “Suppose you were arrested for stealing a car, what is the percent
chance that you would serve time in jail?” She found that subjective probabilities of being sent to
jail increased discontinuously on average by 5.2 percentage points when youth reached the age
of majority in their state of residence. While youth perceived an increase in incarceration risk,
she found no convincing evidence of an effect on their self-reported criminal behavior.
C. Summary
In combination, these six studies demonstrate that debates on the effectiveness of
deterrence are poorly conceived. Instead, the discussion should be framed in terms argued by
Beccaria and Bentham more than two centuries ago: Does the specific sanction deter or not and
if it does, are the crime reduction benefits sufficient to justify the costs of imposing the sanction?
The Helland and Tabarrok (2007) study is an exemplar of this type of analysis. They conclude
that California’s third-strike provision does indeed have a deterrent effect, a point even conceded
by Zimring, Hawkins, and Kamin (2001). However, Helland and Tabarrok (2007) also conclude,
based on a cost-benefit analysis, that the crime-saving benefits are so much smaller than the
increased costs of incarceration that the lengthy prison sentences mandated by the third-strike
provision cannot be justified based on a cost–benefit criterion. focuses on differences in age measured at annual frequencies, whereas Lee and McCrary measure age in days or weeks. At annual frequencies, the estimated effect is more likely to reflect both deterrence and incapacitation; hence Levitt’s results may be driven by incapacitation effects rather than deterrence per se. Second, the Lee and McCrary analysis is based on individual level data and so avoids problems that can arise because of aggregation (Durlauf, Navarro, and Rivers 2008; Durlauf and Nagin 2011b). On its own terms the individual level data studied by Lee and McCrary are unusually informative since they also contain information on the exact age of arrestees, which allows for the calculation of very short run effects of the discontinuity in sentence severity, e.g. effects within 30 days of turning 18.

39
The six exemplar studies suggest several important sources of the heterogeneity of the
deterrent effect of imprisonment. One concerns the length of the sentence itself. Figure 3 depicts
two alternative forms of the response function relating crime rate to sentence length. Both are
downward sloping, which captures the idea that increases in severity deter crime. At the status quo
sentence length, S1, the crime rate, C1, is the same for both curves. The curves are drawn so that
they predict the same crime rate for a zero sanction level. Thus, the absolute deterrent effect of the
status quo sanction level is the same for both curves. But because the two curves have different
shapes, they also imply different responses to an incremental increase in sentence level to S2. The
linear curve (A) is meant to depict a response function in which there is a material deterrent effect
accompanying the increase to S2, whereas the non-linear curve (B) is meant to depict a small crime
reduction response due to diminishing deterrent returns to increasing sentence length.
My reading of the evidence on the deterrent effect of sentence length is that it implies that
the relationship between crime rate and sentence length more closely conforms to curve B than
curve A. Raphael and Ludwig (2003) find no evidence that gun crime enhancement deter, Lee and
McCrary (2009) and Hjalmarsson (2009) find no evidence that the greater penalties that attend
moving from the juvenile to the adult justice systems deter, and Helland and Tabarrok (2007) find
only a small deterrent effect from California’s third-strike. As a consequence, the deterrent return to
increasing an already long sentence is small, possibly zero. This interpretation forms the basis for
my conclusion that mandatory minimum sentencing is unlikely to have a material deterrent effect.
The fine payment and Project Hope experiments also suggest that Curve B, not Curve A,
more closely resembles what in medical jargon would be described as the dose–response
relationship between crime and sentence length. While neither of these studies is directed at the

40
deterrence of criminal behavior, both suggest that, unlike increments in long sentences,
increments in short sentences do have a material deterrent effect on a crime-prone population.
Notwithstanding their strengths, these six exemplar studies do not address several
important aspects of the offender response, if any, to the sanction regime. Except for the most
trivial offenses, the question at hand is not the deterrent effect of some particular sanction
compared to no sanction whatsoever. Instead, it is the deterrent effectiveness of a specified
sanction relative to alternative sanction options. In the case of the death penalty, the alternative is
a very lengthy prison sentence. For less serious crimes, sanction options to incarceration include
fines and various forms of community supervision, or some combination which may also include
a period of incarceration. In 2006, for example, 10 percent of felony defendants were diverted to
programs like mandatory drug treatment prior to adjudication. Of those convicted, 29 percent did
not receive a jail or prison sentence (BJS 2010) but instead were sentenced to some form of
community control, paid a fine, or both.
Theories of deterrence need to be generalized to specify how offenders perceive and respond
to the multiplicity of sanction options available for the punishment of most crimes. The theories also
need to account for the possibility that offender perceptions of the severity of sanction options may
differ. For example, some may view the possibility of life without parole as worse than execution
and still others may view strict community supervision as more onerous than a short period of
incarceration (Wood and May 2003). The multiplicity of sanction options and heterogeneity in the
response to these options greatly complicate the specification of a deterrence model, but both
features are essential to the deterrence phenomenon.
I also note that testing such generalized models of deterrence will require a major expansion
of the criminal justice data collection infrastructure at least in the US. It is currently not possible to

41
measure the availability and frequency of use of sanction alternatives at the state level because
the required data are not available. Available data include those from the Bureau of Justice
Statistics, which publishes nationwide statistics on sentences for prison admissions and time
served for prison releases, based on data collected as part of the National Corrections Reporting
Program (NCRP) initiated in the early 1980s. More than 40 states now report annual data on
sentences for admissions and time served for releases. Individual-level demographic
characteristics are also reported. In principle, these data could be used to measure the
administration of the legally authorized dimensions of most state sanction regimes by type of
crime. The difficulty is that the data are often extremely incomplete. In some years, some states
fail to report any data and the data that are sent to BJS are often so incomplete that it is
impossible to construct valid state-level measures of the administration of the sanction regime.
V. Police and Crime
The police may prevent crime through many possible mechanisms. Apprehension of active
offenders is a necessary first step for their conviction and punishment. If the sanction involves
imprisonment, crime may be prevented by the incapacitation of the apprehended offender. The
apprehension of active offenders may also deter would-be criminals by increasing their
perception of the risk of apprehension. Many police tactics, such as rapid response to calls for
service at crime scenes or post-crime investigation, are intended not only to capture the offender
but to deter others by projecting a tangible threat of apprehension. Police may, however, deter
without actually apprehending criminals—their very presence may deter a motivated offender
from carrying out a contemplated criminal act.
Research on the deterrent effect of police has evolved in two distinct literatures. One has

42
focused on the deterrent effect of the level of police numbers or resources, for example, by
examining the relationship between police per capita and crime rates. The other has focused on
the crime prevention effectiveness of different strategies for deploying police.
A. Studies of Levels of Police Numbers and Resources
Studies of the effect of police numbers and resource come in two forms. One is an
analogue of the imprisonment rate and crime rate studies described in the preceding section.
These studies are based on panel datasets, usually of US cities over the period circa 1970 to
2000. They relate crime rates to the resources committed to policing as measured by police per
capita or police expenditures per capita. The second form of study is more targeted. They
analyze the effect on crime from abrupt changes in the level of policing due, for example, to
terror alerts.
1. Panel Studies. Panel studies include Marvell and Moody (1994), Levitt (1997, 2002),
McCrary (2002), and Evans and Owens (2007). With the exception of McCrary (2002), these
studies consistently find evidence that larger resource commitments to policing are associated
with lower crime rates.7
The studies use different statistical strategies for estimating the effect of police resource
levels on crime. For example, Marvell and Moody (1996) analyze two panel datasets and apply
Granger-causality type statistical models to these data. Levitt (1997, 2002) uses instrumental
variable-type regression models. In Levitt (1997) election cycles are used as an instrumental
variable to untangle the cause-effect relationship between crime rates and police manpower.
7McCrary identified an error in the computation of standard errors in Levitt (1997) which when corrected
nullified the finding of a crime prevention effect of police numbers. Levitt (2002) argues that McCrary’s findings do not overturn his general claim that increased numbers of police reduce crime rates and presents new evidence to that effect.

43
Levitt (2002) uses the number of firefighters and civil service workers as instrumental variables
for the same purpose.
The panel studies consistently find evidence that higher levels of police resources are
associated with lower crime rates. Durlauf and Nagin (2011a, 2011b) discuss important
qualifications to the interpretation and validity of this form of analysis. One is that the police
panel studies, like the studies of imprisonment and crime, do not distinguish between
incapacitation and deterrent effects. The negative associations between police numbers and crime
rates identified in these studies may reflect increased effectiveness in apprehending and
incarcerating active offenders rather than in deterring crime. More importantly, an under-
appreciated limitation of these analyses is the assumption that the effect of police levels on crime
rates is the same across place and time. As the discussion of studies of the effects of police
deployment strategies on crime makes clear, this assumption is not tenable. Nevertheless, the
findings of these studies are consistent with studies of abrupt changes in police presence that
police numbers do matter.
2. Abrupt Change Studies. Studies of this type, which are sometimes called “interrupted
time series” or “regression discontinuity” studies, examine the effects of abrupt changes in police
presences. If the change in police presence is attributable to an event unrelated to the crime rate,
studies of this type can provide particularly convincing evidence of deterrence. For example, in
September 1944, German soldiers occupying Denmark arrested the entire Danish police force.
According to an account by Andenaes (1974), crime rates rose immediately but not uniformly.
The frequency of street crimes like robbery, whose control depends heavily upon visible police
presence, rose sharply. By contrast, crimes like fraud were less affected. See Sherman and Eck
(2002) and Sherman (in this volume) for other examples of crime increases following a collapse

44
of police presence.
The Andenaes anecdote illustrates several important points. It provides a useful reminder
of the difference between absolute and marginal deterrence. Recalling figure 3, absolute
deterrence refers to the difference in the crime rate between the status quo level of sanction
threat, S1, and a complete (or near) absence of sanction threat, S0. The Andenaes anecdote is a
compelling demonstration that the absolute deterrent effect is large. However, from a policy
perspective, the issue is not the absolute deterrent effect posed by police presence. The question
is whether, on the margin, crime can be prevented by incremental increases in police numbers or
by changes in the way police are deployed. Also, the anecdote is another useful reminder that
deterrent effects are heterogeneous—sanction threats (or the absence thereof) do not uniformly
affect all types of crime or more generally all types of people.
Contemporary tests of the police–crime relationship based on abrupt decreases in police
presence investigate the effect on the crime rate of reductions in police presence and productivity
as a result of large budget cuts or lawsuits following racial profiling scandals. Such studies have
examined the Cincinnati Police Department (Shi 2009), the New Jersey State Police (Heaton,
forthcoming), and the Oregon State Police (DeAngelo and Hansen 2008). Each concludes that
decreases in police presence and activity substantially increase crime. Shi (2009) studies the
fallout from an incident in Cincinnati in which a white police officer shot and killed an unarmed
African American suspect. The incident was followed by 3 days of rioting, heavy media
attention, the filing of a class action lawsuit, a federal civil rights investigation, and the
indictment of the officer in question. These events created an unofficial incentive for officers
from the Cincinnati Police Department to curtail their use of arrest for misdemeanor crimes,
especially in communities with higher proportional representation of African Americans, out of

45
concern for allegations of racial profiling. Shi finds measurable declines in police productivity in
the aftermath of the riot and also documents a substantial increase in criminal activity. The
estimated elasticities of crime to policing based on her approach were –0.5 for violent crime and
–0.3 for property crime.
The ongoing threat of terrorism has also provided a number of unique opportunities to
study the effect of police resource allocation in cities around the world, including the District of
Columbia (Klick and Tabarrok 2005), Buenos Aires (Di Tella and Schargrodsky 2004),
Stockholm (Poutvaara and Priks 2006), and London (Draca, Machin, and Witt 2008). The Klick
and Tabarrok (2005) study examines the effect on crime of the color-coded alert system devised
by the US Department of Homeland Security in the aftermath of the September 11, 2001 terrorist
attack. Its purpose was to signal federal, state, and local law enforcement agencies to occasions
when it might be prudent to divert resources to sensitive locations. Klick and Tabarrok (2005)
use daily police reports of crime collected by the District’s Metropolitan Police Department for
the period March 2002 to July 2003, when the terrorism alert level rose from “elevated” (yellow)
to “high” (orange) and back down to “elevated” on four occasions. During high alerts, anecdotal
evidence suggested that police presence increased by 50 percent. They estimate that each 1
percent increase in number of police during the terror alert reduced total crime by .3 percent.
To summarize, studies of police presence conducted since the mid-1990s consistently
find that putting more police officers on the street—either by hiring new officers or by
reallocating existing officers to put them on the street in larger numbers or for longer periods of
time—has a substantial deterrent effect on serious crime. There is also consistency with respect
to the size of the effect. Most estimates reveal that a 10 percent increase in police presence yields
a reduction in total crime of about 3 percent. Yet these police manpower studies speak only to

46
the number and allocation of police officers and not to what police officers actually do on the
street beyond making arrests.
B. Police Deployment and Crime
Much research has examined the crime prevention effectiveness of alternative strategies
for deploying police resources. This research has mostly been conducted by criminologists and
sociologists. Among this group of researchers, the preferred research designs are quasi-
experiments involving before-and-after studies of the effect of targeted interventions as well as
true randomized experiments. The discussion which follows draws heavily on two excellent
reviews of this research by Weisburd and Eck (2004) and Braga (2008).
For the most part, deployment strategies affect the certainty of punishment through their
effect on the probability of apprehension. One way to increase apprehension risk is to mobilize
police in a fashion that increases the probability that an offender is arrested after committing a
crime. Strong evidence of a deterrent as opposed to an incapacitation effect resulting from the
apprehension of criminals is limited. Studies of the effect of rapid response to calls for service
(Kansas City Police Department 1977; Spelman and Brown 1981) do not directly test for
deterrence but found no evidence of improved apprehension effectiveness. This may be because
most calls for service occur well after the crime event, with the result that the perpetrator has fled
the scene. Thus, it is doubtful that rapid response materially affects crime. Similarly,
apprehension risk is probably not materially affected by improved investigations. Eck concluded
that “it is unlikely that improvements in the way investigations are conducted or managed have a
dramatic effect on crime or criminal justice” (1992, p. 33). This is because most crimes are
solved either by the offender being apprehended at the scene or by eyewitness identification of

47
the perpetrator (Greenwood, Chaiken, and Petersilia 1977). Modern forensic methods may
ultimately improve the effectiveness of post-crime investigations, but as Braga et al. (2011) note,
clearance rates have remained stubbornly stable over the period 1970 to 2007.
The second source of deterrence from police activities involves averting crime in the first
place. In this circumstance, there is no apprehension because there was no offense. In my view,
this is the primary source of deterrence from the presence of police. Thus, measures of
apprehension risk based only on enforcement actions and crimes that actually occur, such as
arrests per reported crime, are not valid measures of the apprehension risk represented by
criminal opportunities not acted upon because the risk was deemed too high (Cook 1979).
One example of a police deployment strategy for which there is good evidence of
effectiveness is “hot spots” policing. The idea of hot spots policing stems from a striking
empirical regularity uncovered by Sherman and colleagues. Sherman, Gartin, and Buerger (1989)
found that only 3 percent of addresses and intersections (“places,” as they were called) in
Minneapolis produced 50 percent of all calls to the police. Weisburd and Green (1995) found
that 20 percent of all disorder crime and 14 percent of crimes against persons in Jersey City, New
Jersey arose from 56 drug-related crime hot spots. Twenty-five years later in a study of Seattle,
Washington, Weisburd et al. (2004) reported that between 4 and 5 percent of street segments in
the city accounted for 50 percent of crime incidents for each year over a 14-year period. Other,
more recent studies finding comparable crime concentrations include Brantingham and
Brantingham (1999), Eck, Gersh, and Taylor (2000), and Roncek (2000).
The rationale for concentrating police in crime hot spots is to create a prohibitively high
risk of apprehension. The first test of the efficacy of concentrating police resources on crime hot
spots was conducted by Sherman and Weisburd (1995). In this randomized experiment, hot spots

48
in the experimental group were subjected to, on average, a doubling of police patrol intensity
compared with hot spots in the control group. Declines in total crime calls ranged from 6 to 13
percent. In another randomized experiment, Weisburd and Green (1995) found that hot spots
policing was similarly effective in suppressing drug markets.
Braga’s (2008) informative review of hot spots policing summarizes the findings from
nine experimental or quasi-experimental evaluations. The studies were conducted in five large
US cities and one suburb of Australia. All but two found evidence of significant reductions in
crime. Further, no evidence was found of material crime displacement to immediately
surrounding locations. On the contrary, some studies found evidence of crime reductions, not
increases, in the surrounding locations—but a “diffusion of crime-control benefits” to non-
targeted locales. Note also that the findings from the previously described econometric studies of
focused police actions—for example, in response to terror alert level—buttress the conclusion
that the strategic targeting of police resources can be very effective in reducing crime.
Another example of a police deployment strategy for which there is credible evidence of
effectiveness, albeit less consistent than for hot spots policing, is problem-oriented policing. One
of the most visible instances of problem-oriented policing is Boston’s Operation Ceasefire
(Kennedy et al. 2001). The objective of the collaborative operation was to prevent inter-gang gun
violence using two deterrence-based strategies. The first strategy was to target enforcement
against weapons traffickers who were supplying weapons to Boston’s violent youth gangs. The
second involved a more novel approach. The youth gangs themselves were assembled by the
police on multiple occasions, in order to send the message that the law enforcement response to
any instance of serious violence would be “pulling every lever” legally available to punish gang
members collectively. This included a salient severity-related dimension—vigorous prosecution

49
for unrelated, non-violent crimes such as drug dealing. Thus, the aim of Operation Ceasefire was
to deter violent crime by increasing the certainty and severity of punishment, but only in targeted
circumstances—specifically, if the gang members commit a violent crime.
Since Operation Cease Fire, the strategy of “pulling every lever” has been the centerpiece
of field interventions in many large and small US cities including Richmond, VA; Chicago, IL;
Stockton, CA; High Point, NC; and Pittsburgh, PA. See Kennedy (2009), one of the architects of
the “pulling every lever” strategy, for an extended description of these interventions and the
philosophy behind them. Independent evaluations have also been conducted of many of these
interventions.8 The conclusions of the independent evaluations are varied but Cook’s (2012)
characterization of the much publicized High Point intervention seems apt: initial conclusions of
eye-catchingly large effects have been replaced with far more modest assessments of effect sizes
and cautions about the generalizability of the results. Reuter and Pollack (2012) wonder whether
a successful intervention in a small urban area such as High Point can be replicated in a large city
such as Chicago. Ferrier and Ludwig (2011) point out the difficulty in understanding the
mechanism that underlies a seemingly successful intervention that pulls many levers. Despite
concerns, these interventions illustrate the potential for combining elements of both certainty and
severity enhancements to generate a targeted deterrent effect. Additional evaluations of the efficacy
of these multi-pronged strategies should be a high priority, with the proviso that any designs
implemented be amenable to rigorous evaluation as emphasized by commentators. For a useful
discussion of the importance of understanding mechanisms, see Ludwig, Kling, and Mullainathan
(2011).
8 For Boston see Cook and Ludwig (2006), for Richmond see Raphael and Ludwig (2003), for Chicago see Papachristos, Meares, and Fagan (2007), for Pittsburgh see Wilson and Chermak (2011), and for High Point see Corsaro et al. (2012).

50
C. Summary
The evidence is clear that large changes in police presence do affect crime rates. The
change in presence may be the result of an unplanned event, such a terror alert that triggers a
large increase in police officers in public spaces, or it may be a strategic response to a known
crime problem, such as in hot spots policing deployments. In either case, crime rates are reduced
in places where police presence has been materially increased. While far from the definitive,
there is no evidence of displacement of crime to places contiguous to the heightened police
presence, at least in the short run. Indeed, there is some evidence of crime reductions in the areas
immediately surrounding the heightened presence. By contrast, there is no evidence that the
rapidity of the response to crime or the thoroughness of the post-crime investigation has a
material influence on crime rates. Combined, these two sets of findings suggest that how police
are deployed is as important as the number of police deployed in their influence on crime rates.
Notwithstanding these important findings, some additional issues about police presence
remain unresolved. The finding from the hot spots policing evaluations that crime is not
displaced to adjacent places may not hold up in the long run. The seeming diffusion of crime
control benefits may evaporate as offenders become aware that the heightened patrol activity is
not present in adjacent places. More fundamentally, the hot spot itself may be displaced to some
new location, for example to a bar that had not previously been a crime hot spot. A longer term
perspective on the effectiveness of hot spots policing is required.
While the evaluations of hot spots policing provide important evidence that police
presence can be a deterrent, overall crime control policy cannot be built around such a narrowly
formulated tactic. Evaluations of problem-oriented policing suggest police effectiveness in a

51
wider set of circumstances than intensive patrol of high crime micro-places. However, these
evaluations do not reveal the mechanism by which prevention is achieved.
The introduction distinguished two distinct crime prevention functions of the police—
their role as apprehension agents following the commission of a crime and their role as sentinels.
In their sentinel role the police are acting in the parlance of Cohen and Felson (1979) as “capable
guardians.” Capable guardians are persons whose presence discourages a motivated offender
from victimizing a criminal opportunity. Capable guardians include persons with no official
crime control authority who nonetheless are personally willing to intervene or to summon those
with the authority to intervene. The police themselves also serve as capable guardians in their
conventional patrol and monitoring functions.
For many reasons the apprehension agent role is the most scrutinized and recognized
crime control function of the police. The apprehension agent function has been and continues to
be glamorized by television in long running programs like Dragnet in the 1950s and 1960s,
Hawaii Five-0 in the 1970s, Hill Street Blues in the 1980s, Homicide Life on the Streets in the
1990s, and CSI and Law and Order in the present. The apprehension role is also salient because
it involves the police response to real victims of sometimes horrendous crime and the ensuing
efforts to bring the perpetrators to justice. From a technocratic perspective, police effectiveness
in this role can be measured with statistics like the clearance rate. From a crime control
perspective, the apprehension agent function protects public safety by capturing and
incapacitating sometimes dangerous and repetitive offenders. However, as yet there is no
evidence that the apprehension agent role results in a material deterrent effect. By contrast, the
evidence on police presence suggests that in their sentinel role police can have a very large
deterrent effect. While the differential deterrent effect of the police in their apprehension and

52
sentinel roles has not been demonstrated, there is sufficient evidence to characterize it as a
hypothesis with sufficient empirical support to make it credible.
What then is the explanation for the differential deterrent effectiveness of the
sentinel/guardian and apprehension roles of the police? The model of the decision to victimize a
criminal opportunity laid out in the introduction, I believe, provides useful perspective on the
answer. The model distinguishes two key probabilities—the probability that the opportunity can
be successfully completed, Ps, and the probability of apprehension conditional upon the
victimization of the target, Pa. In this model, activities that enhance police visibility, like
concentration of police at crime hot spots, affect Ps, whereas actions like rapid response to calls
for service or improved investigation methods affects Pa. The sentinel role of police is distinct
from the apprehension role because the latter comes into play only when deterrence has failed
and a would-be offender becomes an actual offender. Thus, at one moment police can function as
sentinels and in the next as apprehension agents.
The depiction of the decision to victimize a criminal opportunity in figure 1 provides an
explanation for the greater deterrent effectiveness of the police in their sentinel role than in their
apprehension role. The police in their sentinel role influence Ps and thereby the probability of all
four outcome branches. In particular, improved guardianship reduces the probability that the
target can be successfully victimized and increases the probability of the three outcomes that
represent failure from the offender’s perspective. In contrast, improved effectiveness in the
apprehension agent role comes into play only after a crime is committed and can affect only the
three branches of the tree related to failure. Thus, innovations that make police more effective
sentinels will tend to be more influential in the decision process characterized by this model than
innovations in apprehension effectiveness.

53
The model is also useful in clarifying the basis for the effectiveness of situational crime
prevention (Clarke 1995), many forms of which can be construed as reducing Ps. Just as police in
their sentinel role reduce the attractiveness of a criminal opportunity, situational crime
prevention works by affecting all four branches of the tree.
VI. Perceptual Deterrence and Sanction Risk Perceptions Studies
Analyses of perceptual deterrence examine the association between perceptions of sanction risk,
whatever their source, and self-reported illegal behavior or intent to engage in illegal behavior.
Analyses of sanction risk perceptions examine the relationship of an individual’s perceptions
with experience (e.g., being arrested as well as factors external to the individual such as
statutorily defined penalties). Some studies address both topics but most emphasize one or the
other.
A. Perceptual Deterrence
The perceptual deterrence literature was spawned by a cadre of researchers (Meier and
Johnson 1977; Minor 1977; Tittle 1977; Grasmick and Bryjak 1980; Tittle 1980) interested in
probing the perceptual underpinnings of the deterrence process.
Perceptual deterrence studies have been based on three types of data: Cross-sectional survey
studies, panel survey studies, and scenario-based studies. In cross-sectional survey studies
individuals are questioned about their perceptions of the certainty and severity of sanctions and
about either their prior offending behavior or their future intentions to offend. For example,
Grasmick and Bryjak (1980) queried a sample of city residents about their perceptions of the risk of
arrest for offenses such as a petty theft, drunk driving, and tax cheating. They also asked

54
respondents whether they thought they would commit any of these acts in the future. In panel
survey studies the sample is repeatedly surveyed on risk perceptions and criminal behavior. For
example, Paternoster et al. (1982) followed a sample of students through their 3 years in high school
and surveyed them on the frequency with which they engaged in various delinquent acts and their
perceptions of the risks and consequences of being caught. In scenario-based studies individuals are
questioned about their perception of the risks of committing a crime that is described to them in
detail. They are also asked about their own behavior should they find themselves in that situation.
Bachman, Paternoster, and Ward (1992), for instance, constructed a scenario describing the
circumstances of a date rape. They then surveyed a sample of college males about their perceptions
of the risk of the scenario male being arrested for sexual assault, and what they themselves would
do in the same circumstance.
Perceptional deterrence research has been faulted with some justification on a number of
grounds. One is that the sampled populations are typically high school or college students who do
not, by and large, engage in serious crime and delinquency. Other concerns are related to the
veracity of the data collected. How well can respondents actually calibrate sanction risks? Do the
ways questions about perceptions of morality and sanction cost are structured prime responses about
actual or projected offending? Despite these questions, in my judgment this class of studies has
provided enduring contributions to our understanding of deterrence processes.
One contribution is that, with the exception of the early panel studies, perception studies
consistently find that actual or projected offending is negatively related to perceptions of sanction
certainty. Findings of a deterrence-like relationship of self-reported offending with perceptions of
sanction severity are less consistent. When combined, these two findings provide still further
support for the “certainty” principal, but with a proviso that certainty result in a negative but not

55
necessarily draconian consequence. Grasmick and Bryjak (1980) show that when respondents’
assessments of the personal costs of the sanction are incorporated into the analysis, perceptions of
severity are negatively associated with self-reported behavior.
A second contribution of the perceptual deterrence literature, which may also be its most
important, does not involve the evidence it has amassed on deterrence effects per se. Rather it has
focused its attention on the links between formal and informal sources of social control. Recognition
of this connection pre-dates the perceptual deterrence literature. Zimring and Hawkins (1973)
observe, “Official actions can set off societal reactions that may provide potential offenders with
more reason to avoid conviction than the officially imposed unpleasantness of punishment " (p. 174,
emphasis in original). See also Andenaes (1974), Gibbs (1975), Blumstein and Nagin (1976), and
Williams and Hawkins (1986) for this same argument. Perceptual deterrence research has
consistently found that individuals who report higher stakes in conventionality are more deterred by
perceived risk of public exposure for lawbreaking.
A salient finding in this regard concerns my own research on tax evasion. Enforcement
actions by tax authorities are private matters. Criminal prosecutions, however, are the exception to
this rule. They necessarily involve public exposure. Thus, from the taxpayer’s perspective civil
enforcement actions jeopardize money but not reputation whereas criminal prosecution jeopardizes
both. In Klepper and Nagin (1989a, 1989b) we found that if respondents perceived no risk of
criminal prosecution, a majority of respondents reported a material probability of taking advantage
of noncompliance opportunities. However, the perception of a non-zero risk of criminal prosecution
was sufficient to deter most of the middle class respondents to the survey. Stated differently, if the
tax evasion gamble also involved putting reputation and community standing at risk, the middle-
class respondents to the survey were less likely to consider taking the gamble.

56
While my tax evasion research does not pin down the specific sources of these costs, other
research on the effects of a criminal record on access to legal labor markets suggests a real basis for
the fear of stigmatization (Freeman 1991; Bushway 1996). Freeman estimates that a record of
incarceration depresses probability of work by 15 to 30 percent, Waldfogel (1994) estimates that
conviction for fraud reduces income by as much as 40 percent, and Bushway (1996) concludes that
even an arrest for a minor offense impairs access to legal labor markets, at least in the short run.
The findings from the perceptual deterrence studies directly relate to two of the main themes
of this essay. The first concerns the source of the “certainty” effect. In laying out the implications of
the model of the decision to victimize a target, it was pointed out that the cost of apprehension
appeared in two of the terms on the right hand side of equation 2. This side of the equation measures
the potential cost of offending—the term measuring the cost of apprehension without conviction
and the term measuring the cost of apprehension with conviction. Formal and informal sanction cost
appeared only in the second of these terms. Stated differently, apprehension cost is incurred
regardless of whether a conviction ensues, whereas sanction costs can only be incurred if
apprehension is followed by conviction. This structure formalizes the argument of Williams and
Hawkins (1986) that what they call “fear of arrest” serves as a greater deterrent than formal sanction
cost. It is also consistent with the conclusion of my own research with co-authors Raymond
Paternoster (Nagin and Paternoster 1993, 1994) and Greg Pogarsky (Nagin and Pogarsky 2001,
2003) that individuals with the greatest stakes in conformity were the most deterred by informal
sanction costs.
The fourth branch of figure 3 is the total cost of formal and informal sanctions. The
perceptions research combined with the criminal record research suggests that, for people without a
criminal record, informal sanction cost makes a large contribution to this total. That contribution

57
may be substantially reduced once an individual has had contact with the criminal justice system
and obtains a criminal record. This observation relates back to a point I emphasized in Nagin
(1998). If fear of stigma is a key component of the deterrence mechanism, punishment must be a
relatively rare event. Just as the stigma of Hester Prynne's scarlet "A" depended upon adultery being
uncommon in Puritan America, a criminal record cannot be socially and economically isolating if it
is commonplace. For that reason, policies that work well in the short term may erode their
effectiveness over the long run, if they increase the proportion of the population who are
stigmatized.
This observation is also germane to the recommendation that future empirical research and
theorizing should take account of whether and how the experience of punishment (which in my
view is inappropriately referred to as specific deterrence) affects the response to the threat of
punishment, or general deterrence. The experience of punishment may affect general deterrence in
two distinct ways. First, it may affect perceptions of sanction risks. Second, it may affect the basic
proclivity for offending. Proclivity could be reduced, by effective rehabilitation programs or an
individual’s conclusion that prison is not an experience to be repeated. However, proclivity could
also be increased by stigmatization, erosion of human capital during a spell of incarceration, or the
social influence of close contact with a mostly crime-prone population. Nagin, Cullen, and Jonson
(2009) provide a detailed discussion of this issue.
B. Sanction Risk Perceptions Studies
Studies of sanction risk perception come in three primary forms: surveys of the general
public’s knowledge of the sanction regime; studies of the effect of apprehension (or non-
apprehension) on risk perceptions and subsequent behavior, and scenario-based studies in which

58
respondents are questioned about their perceptions of the risk of apprehension and punishment in
specific circumstances.9
1. General Population Surveys. Apel (forthcoming) identifies only two surveys of the
general public’s knowledge of the statutory penalties for the types of crime that compose the
FBI’s crime index (e.g., murder, robbery). Both are dated. A survey of Tucson, Arizona residents
conducted in the 1970s suggests generally good knowledge of the types of sanctions (e.g., fine,
prison) available for the punishment of the 14 types of crime surveyed (Williams, Gibbs, and
Erickson 1980). Erickson and Gibbs (1979) also find that respondents were reasonably well
calibrated on the relative severity of punishments across types of crime (e.g., punishment for
robbery is generally more severe than for larceny). However, a 1960s study commissioned by the
California Assembly (Assembly Committee on Criminal Procedure 1968) found that the general
public’s knowledge of the statutorily prescribed level of punishment was poor. Only about a
quarter of the sample correctly identified the maximum prison sentence available for the
punishment of the various crimes included in the survey. However, 62 percent of incarcerated
adults correctly identified the maximum. I return to the large difference in knowledge between
the incarceration and not-incarcerated samples below.
There have also been general population surveys of sanction perceptions for two types of
crimes—marijuana use and drunk driving—that are far more prevalent in the general population
than crimes like robbery or burglary. The surveys suggest far better, although hardly perfect,
knowledge of the legally available sanctions for these two offenses. MacCoun et al. (2009)
describe a study by Johnston Lloyd, O’Malley, and Bachman (1981) of student knowledge of
punishment for marijuana possession. In states that during decriminalized possession between
1976 and 1980 the percentage reporting a possible jail sentence declined from 58 percent to 18 9 For an exhaustive and thoughtful review, on which this discussion draws heavily, see Apel (forthcoming).

59
percent. Corresponding changes for students living in states that did not decriminalize were not
as large. This finding suggests that for populations in which there is greater need-to-know of
sanction risks, knowledge of the risks is better but still crude. For example, MacCoun et al.
(2009) also report that knowledge of the maximum penalties for marijuana use was not good.
Surveys of knowledge among adults of drunk driving penalties by Ross (1973) and Grube and
Kearney (1983) also suggest greater awareness of the drunk-driving sanctions and available
enforcement tools (e.g., breathalyzers) than corresponding knowledge for street-type crimes.
The Tucson-based survey and more recent surveys by Kleck and colleagues (Kleck et al.
2005; Kleck and Barnes, forthcoming) attempt to assess the accuracy of sanction risk
perceptions. Kleck et al. (2005), for example, survey adults residing in 54 large urban counties.
For crimes such as homicide and robbery they correlate respondent estimates of quantities such
as arrests per crime and convictions per crime with ratios based on the actual data. They find that
the correlation is close to zero.
The results of the surveys by Kleck and colleagues are not surprising on several counts.
First, for the reasons elaborated long ago by Beccaria and Bentham and most recently by
Wikstrom et al. (2012) and Apel (forthcoming), most of the general public have no intention to
commit the types of crime surveyed in these studies.10 Thus, there is no reason for them to be
aware of the sanction regime for these types of crime. Consequently, their ignorance of the
sanction regime is not informative about whether people who have a potential need-to-know of
the sanction regime obtain that knowledge, however crudely, and take it into account in the
decision whether or not to offend. Second, the ratios calculated by Kleck and colleagues pertain
only to criminal opportunities that have actually been acted on. As first pointed out by Cook
10In the context of the decision model laid out in section I, these are individuals for whom the net reward of committing a crime is negative even without consideration of sanction costs.

60
(1979), the ratio of arrest per crime is not a valid measure of the risk of apprehension for
criminal opportunities that are not acted upon. Third, statistics such as arrest per crime are
calculated at the county or city level, and may be very poor indicators of risk at the specific
locations where would-be offenders are plying their trade (Apel, forthcoming).
2. Studies of the Effect of Experience on Perceptions. Salient findings of the early panel
perceptual deterrence studies include considerable instability in sanction risk perceptions and that
non-offenders and novice offenders have higher sanction risk perceptions than experienced
offenders. Paternoster and colleagues (Paternoster et al. 1982; Paternoster 1983) called this an
experiential effect whereby delinquent youths learned that sanction risks were lower than
initially anticipated.
An important study by Horney and Marshall (1992) of serious offenders finds that subjects
who had higher arrest ratios, that is, self-reported arrests to self-reported crime, reported higher risk
perception. Since that time a large number of studies have used longitudinal data to analyze
whether the effect of success or failure in avoiding apprehension influences sanction risk
perceptions. The analytical strategy involves relating experience with success or failure in prior
survey waves with perceptions of apprehension risk in later survey waves. Studies of this type by
criminologists were prompted by an influential article by Stafford and Warr (1993), who
distinguished between two sources of information on sanction risk: one’s own experience and the
experience of peers. A parallel literature has also appeared in economics based on the concept of
“Bayesian updating.”
The Bayesian updating model and the arguments of Stafford and Warr are
complementary. Bayesian updating formalizes their arguments. The Bayesian updating model is
designed to describe the process by which people update their perceptions of a phenomenon of
61
interest based on new information about that phenomenon. In this case individuals would update
their perceptions of sanction risk with new information regarding success or failure of
themselves or their peers in avoiding apprehension. The predictions of the model depend upon
the specifics of its mathematical specification, but models of this type make predictions about the
updating process that are intuitively sensible. The models predict that people generally do not
entirely abandon prior beliefs based on new information. Most commonly, they only
incrementally adjust them.11
In the case of perception of apprehension risk, this implies that the experience of
apprehension will result in an incremental upward shift in risk perception, and experience of
what Stafford and Warr (1993) call “apprehension avoidance” will result in an incremental
reduction in risk. A second prediction of the Bayesian updating model is that the magnitude of
the change will depend on the depth of prior knowledge. Individuals with more prior knowledge
will tend to adjust less to new information than individuals with less prior knowledge. In the
context of sanction risk perceptions, this implies that individuals with more experience with
offending will make smaller adjustments in their risk perceptions based on current experience
with apprehension than will individuals with less experience. Both of these predictions are
supported by studies of risk perception updating.
Concerning the first prediction, numerous studies find that increases (or decreases) in
perceived apprehension risk are associated with failure (success) in avoiding apprehension
(Bridges and Stone 1986; Piliavin et al. 1986; Paternoster and Piquero 1995; Pogarsky, Piquero,
and Paternoster 2004; Pogarsky, Kim, and Paternoster 2005; Matsueda, Kreager, and Huizinga
2006; Lochner 2007; Hjalmarsson 2008). There are, however, exceptions to this finding.
11Prior history may be ignored if a regime change (e.g., the occupying German army arresting the Danish police force) makes it irrelevant.

62
Apospori and Alpert (1993) and Pogarsky and Piquero (2003) report evidence that is the reverse
of this prediction. Pogarsky and Piquero (2003) attribute this to a variant of what is called the
“gambler’s fallacy,” whereby offenders believe that bad luck is not followed by bad luck. This is
an interesting possibility but the evidence is overwhelmingly consistent with the Bayesian
updating model.
Evidence consistent with the second prediction is reported in Pogarsky, Piquero, and
Paternoster (2004), Matsueda, Kreager, and Huizinga (2006), and Anwar and Loughran (2011).
Anwar and Loughran (2011) conducted a particularly thorough test of this prediction. They
analyzed a sample composed of about 1,300 adjudicated/convicted youth from Arizona and
Pennsylvania enrolled in the Pathways to Desistance study who were interviewed eight times in
5 years (Mulvey 2011). Being arrested significantly increased subjective probabilities (prediction
1) but the magnitude of the change was less for more experienced offenders (prediction 2).
Specifically, they showed that experienced offenders placed relatively more weight on their prior
subjective probabilities and therefore updated less in response to new arrests. Inexperienced
offenders, by contrast, updated more by placing more weight on their current arrest ratios and
less weight on their prior subjective probabilities. It is also noteworthy they concluded that the
effect of arrest on subjective probabilities was specific within classes of criminal behaviors—
youth arrested for aggressive crimes did not update their subjective probabilities concerning
income-generating crimes. This finding implies that there are not spillover effects across classes
of crime.
3. Studies of Situational Effects on Risk Perceptions. This grouping of studies examines
the effect of situational factors on risk perceptions. Particularly important in this regard are

63
situational factors that can be manipulated by policy, such as official sanctions and police
presence.
As already noted, knowledge of official sanctions seems to be strongly affected by the
need-to-know principle. Knowledge is better, but hardly perfect, among populations with the
greatest involvement in the illegal activity. Based on the California assembly study, for example,
knowledge of maximum penalties for various FBI index type crimes was far better for
incarcerated sample members than for not-incarcerated sample members.
Other interesting evidence of awareness of official sanctions is the previously discussed
study by Hjalmarsson (2009) of the effect of reaching the age of majority on perceptions of the
risk of incarceration for auto theft. She found that male respondents in the 1997 National
Longitudinal Survey of Youth increased that risk by 5.2 percentage points upon reaching their
age of majority. The increase, however, had no statistically significant effect on behavior.
Evidence on how police presence affects perceptions of apprehension risk is scant. In my
own work with Raymond Paternoster we constructed scenarios and examined how respondent
perceptions of sanction risks were affected by scenario conditions (Nagin and Paternoster 1993).
We found that respondent perceptions of sanction cost in a drunk- driving scenario were higher
in the scenario condition involving a police crackdown on drunk driving vs. a scenario condition
described as involving state police cutbacks. In addition, perceptions of sanction cost were lower
if surveillance could be avoided by driving on back roads. In scenarios concerning peer
provocation, Wikstrom et al. (2012) found that adolescents reported a lower likelihood of violent
response in scenario conditions in which adult monitors were present. Evidence from
ethnographic studies suggests that offenders are very conscious of police presence when
selecting targets. Wright and Decker (1994) report that burglars avoid neighborhoods with a

64
heavy police presence, and that robbers prefer to target individuals unlikely to report the crime to
the police, such as drug dealers.
C. Summary
Perceptual deterrence research has established that self-reported offending or intention to
do so is linked to sanction risk perceptions. The outstanding question is whether those
perceptions are grounded in reality. If they are not, behavior is beyond the reach of public policy.
The evidence on the sources of sanction risk perceptions suggests that risk perceptions are
affected by an individual’s own experience with success or failure at averting apprehension. The
link between perception and the legally authorized sanctions is less compelling, but does indicate
that there is at least a rough awareness among individuals in a need-to-know scenario. The other
key component of the sanction regime is the intensity of application of the legally authorized
sanctions. Research on this topic is based on general population studies of the correlations of
perceptions of quantities of the ratio of arrest to crimes with estimates of these ratios calculated
from official statistics. For reasons discussed above, in my judgment these studies are not
informative about whether perceptions of intensity among the population with a need-to-know
sanction risks are affected by the actual intensity of application of legally authorized sanctions.
Pogarsky (2007) offers a useful taxonomy of responsiveness to legal threats for
considering the implications of these summary observations. The taxonomy distinguishes three
groups—acute conformists, deterrables, and incorrigibles. In the context of the decision model
laid out in section I, conformists are individuals for whom reward minus commission cost is
negative. For reasons I have already discussed, they have no need to gain knowledge of sanction
risks because there is no profit in crime even absent potential sanction costs. Deterrables are

65
individuals for whom reward minus commission cost is positive and who are attentive to
sanctions threats. For such individuals the issue is whether the net benefit of successful
commission exceeds the potential costs attending failure. The incorrigible group is also
composed of individuals for whom crime is profitable but who for whatever reason are not
attentive to sanction threats. The relative sizes of the incorrigible and deterrable groups and the
specific form of the sanction regime will determine the effectiveness of criminal justice public
policy in preventing crime via deterrence and thereby avoiding the sanction costs of
incapacitation.
Future research on sanction risk perceptions needs to target Pogarsky’s deterrables and
incorrigibles to gain better knowledge of their awareness of the two key elements of the sanction
regime—the legally authorized sanctions and the intensity of their application. For the types of
crime in the FBI index this will require abandoning surveys of the general population and instead
sampling populations with a large representation of deterrables and incorrigibles. An example of
such a survey is the Pathways to Desistance project used in the Anwar and Loughran (2011)
analysis, which sampled juveniles adjudicated for felony offenses in Philadelphia and Phoenix.
Surveys targeting deterrables and incorrigibles should also include batteries of questions
designed to learn how the actions of the police and other guardians affect perceptions of the
probability of success which, for the reasons described in section V, is likely to be particularly
decisive in the deterrence process.
VII. Conclusions
Over the past 4 decades, much has been learned about the foundations of deterrence that were
laid out more than two centuries ago by Cesare Beccaria and Jeremy Bentham. We now know
66
that deterrence is ubiquitous but that the effects are heterogeneous, ranging in size from
seemingly null to very large. There is little evidence that increasing already long prison
sentences has a material deterrence effect. Evidence on the deterrent effect of the certainty of
punishment is more consistent but the source of the effect is less clear. In this essay I have
argued that the certainty effect stems primarily from police functioning in their official guardian
role rather than in their apprehension agent role.
These conclusions have important policy implications that are developed in detail in
Durlauf and Nagin (2011a). They suggest that lengthy prison sentences cannot be justified on
deterrent grounds, but rather must be justified either on crime prevention through incapacitation
or on retributive grounds. The crime prevention efficiency of incapacitating aged criminals is
dubious and thus the case for lengthy prison sentences must rest on retributive considerations.
The conclusions also suggest that crime control effectiveness would be improved by shifting
resources from corrections to policing methods that enhance the effectiveness of police in their
official guardian role.
While much progress has been made in understanding sources of deterrence and the
circumstances in which deterrence is and is not effective, much remains to be learned. Theory
needs to be generalized to combine the response to the threat of punishments, known as general
deterrence in criminology, and the response to the experience of punishment, which I have
argued is inappropriately labeled specific deterrence. A second theoretical and empirical gap
concerns the concept of a sanction regime and its two dimensions—the legal authority for
different types of sanctions and the way that authority is administered. These two dimensions
combine to determine the certainty, severity, and celerity of sanction options available for
punishment of a specific type of crime. Theories of deterrence, however, specify sanction threats

67
in the singular, not the plural. Theories of deterrence that conceive of sanctions in the singular do
not provide the conceptual basis for considering the differential deterrent effect of different types of
sanction options. The empirical companion to this theoretical expansion involves assembling the
data required to measure sanction regimes.
A third theoretical and empirical gap involves sanction risk perceptions. Deterrence is the
behavioral response to the perception of sanction threats. Establishing the link between risk
perceptions and actual sanction regimes is imperative because policy cannot directly manipulate
perceptions. Unless perceptions adjust, however crudely, to changes in the sanction regime, the
desired deterrent effect will not be achieved. More research on the sources of sanction risk
perceptions in crime prone populations are likely to pay large dividends for theory and policy.
The fourth major gap in theory and empirical knowledge involves a thorough testing of my
contention that the guardian role, not the apprehension role, of the police is the most important
source of their effectiveness in crime prevention. This theory also needs to be expanded to account
for how the police and other guardians effect the distribution of criminal opportunities.

68
References
Andenaes, Johannes. 1974. Punishment and Deterrence. Ann Arbor: University of Michigan
Press.
Anwar, Shamena, and Thomas A. Loughran. 2011. "Testing a Bayesian Learning Theory of
Deterrence among Serious Juvenile Offenders." Criminology 49:667–98.
Apel, Robert. Forthcoming. "Sanctions, Perceptions, and Crime: Implications For Criminal
Deterrence." Journal of Quantitative Criminology 28.
http://link.springer.com/article/10.1007/s10940-012-9170-1#
Apel, Robert, and Daniel S. Nagin. 2009. "Deterrence." In Crime, edited by James Q. Wilson
and Joan Petersilia. Oxford: Oxford University Press.
Apospori, Eleni, and Geoffrey Alpert. 1993. "Research Note: The Role of Differential
Experience with the Criminal Justice System in Changes in Perceptions of Severity of
Legal Sanctions over Time." Journal of Research in Crime and Delinquency 39:184–94.
Assembly Committee on Criminal Procedure. 1968. Deterrent Effects of Criminal Sanctions.
Sacramento, CA: Assembly of the State of California.
Bachman, Ronet, Raymond Paternoster, and Sally Ward. 1992. "The Rationality of Sexual
Offending: Testing a Deterrence/Rational Choice Conception of Sexual Assault." Law
and Society Review 26(2):343–72.
Beccaria, Cesare. 1986[1764]. On Crimes and Punishments, translated by Henry Paolucci. New
York: Macmillan Publishing.
Becker, Gary S. 1968. "Crime and Punishment: An Economic Approach." The Journal of
Political Economy 79(2):169–217.

69
Bentham, Jeremy. 1988[1789]. An Introduction to the Principles if Moral and Legislation.
Amherst, NY: Prometheus Books.
Blake, L., and R. T. Coupe. 2001. "The Impact of Single and Two-Officer Patrols on Catching
Burglars in the Act." British Journal of Criminology 41:381–96.
Blumstein, Alfred, and Allen J. Beck. 1999. "Population Growth in US Prisons, 1980–1996." In
Prisons, edited by Michael Tonry and Joan Petersilia. Vol. 26 of Crime and Justice: A
Review of Research, edited by Michael Tonry. Chicago: University of Chicago Press.
———. 2005. "Reentry As a Transient State between Liberty and Recommitment." In Prisoner
Reentry and Crime in America, edited by Jeremy Travis and Christy Visher. Cambridge,
UK: Cambridge University Press.
Blumstein, Alfred, Jacqueline Cohen, and Daniel Nagin, eds. 1978. Deterrence and
Incapacitation: Estimating the Effects of Criminal Sanctions on Crime Rates.
Washington, DC: National Academies Press.
Blumstein, Alfred, and Daniel Nagin. 1976. "The Deterrent Effect of Legal Sanctions on Draft
Evasion." Stanford Law Review 29(2):241–75.
Braga, Anthony A. 2008. Police Enforcement Strategies to Prevent Crime in Hot Spot Areas,
edited by Office of Community Oriented Policing. Washington, DC: US Department of
Justice.
Braga, Anthony A., Edward A. Flynn, Goeroge L. Kelling, and Christine M. Cole. 2011.
"Moving the Work of Criminal Investigators towards Crime Control." New Perspectives
in Policing 1–38.
Braithwaite, John. 1989. Crime, Shame, and Reintegration. Cambridge, UK: Cambridge
University Press.

70
Brantingham, Patricia L., and Paul J. Brantingham. 1999. "Theoretical Model of Crime Hot Spot
Generation." Studies on Crime and Crime Prevention 8:7–26.
Bridges, George S., and James A. Stone. 1986. "Effects of Criminal Punishment on Perceived
Threat of Punishment: Toward an Understanding of Specific Deterrence." Journal of
Research in Crime and Delinquency 23:207–39.
Bureau of Justice Statistics. 1999. Prisoners in 1998, edited by Allen J. Beck and Christopher J.
Mumola. Washington, DC: Bureau of Justice Statistics.
———. 2010. Felony Defendants in Large Urban Counties, 2006, edited by Thomas H. Cohen
and Tracey Kyckelhahn. Washington, DC: Bureau of Justice Statistics.
———. 2011. Prisoners in 2010 (Revised), edited by Paul Guerino, Paige M. Harrison, and
William J. Sabol. Washington, DC: Bureau of Justice Statistics.
———. 2012. Correctional Populations in the United States, 2011, edited by Lauren E. Glaze
and Erika Parks. Washington, DC: Bureau of Justice Statistics.
Bushway, Shawn. 1996. The Impact of a Criminal Record on Access to Legitimate Employment.
Pittsburgh, PA: Carnegie Mellon University.
Canela-Cacho, Jose A., Alfred Blumstein, and Jacqueline Cohen. 1997. "Relationship between
the Offending Frequency l of Imprisoned and Free Offenders." Criminology 35(1):133–
76.
Chalfin, Aaron, Amelia M. Haviland, and Steven Raphael. 2012. "What Do Panel Studies Tell
Us about a Deterrent Effect of Capital Punishment? A Critique of the Literature." Journal
of Quantitative Criminology. doi: 10.1007/s10940-012-9168-8.
Clarke, Ronald V. 1995. "Situational Crime Prevention." Crime and Justice 91:91–150.

71
Cohen, Lawrence E., and Marcus Felson. 1979. "Social Change and Crime Rate Trends: A
Routine Activity Approach." American Sociological Review 44(4):588–608.
Cook, Philip J. 1979. "The Clearance Rate as a Measure of Criminal Justice System
Effectiveness." Journal of Public Economics 11:135–42.
———. 2009. "Potential Savings from Abolition of the Death Penalty in North Carolina."
American Law and Economics Review 11(2):498–529.
———. 2012. "The Impact of Drug Market Pulling Levers Policing on Neighborhood Violence:
An Evaluation of the High Point Drug market Intervention." Criminology and Public
Policy 11(2):161–64.
Cook, Philip J., and Jens Ludwig. 2006. "Aiming for Evidence-Based Gun Policy." Journal of
Policy Analysis and Management 48:691–735.
Cornish, D. B., and R. V. Clarke. 1986. Reasoning Criminal—Rational Choice Perspectives on
Offending. Secausus, NJ: Springer-Verlag.
Corsaro, N., E. D. Hunt, N. K. Hipple, and E. F. McGarrell. 2012. "The Impact of Drug Market
Pulling Levers Policing on Neighborhood Violence." Criminology and Public Policy
11:167–99.
DeAngelo, Greg, and Benjamin Hansen. 2008. Life and Death in the Fast Lane: Police
Enforcement and Roadway Safety. Santa Barbara: University of California.
Di Tella, Rafael, and Ernesto Schargrodsky. 2004. "Do Police Reduce Crime? Estimates Using
the Allocation of Police Forces after a Terrorist Attack." American Economic Review
94:115–33.

72
Donohue, John J. 2007. Assessing the Relative Benefits of Incarceration: The Overall Change
over the Previous Decades and the Benefits on the Margin. New Haven, CT: Yale
University.
Donohue, John J., and Justin Wolfers. 2005. "Uses and Abuses of Empirical Evidence in the
Death Penalty Debate." Stanford Law Review 58:791–846.
———. 2009. "Estimating the Impact of the Death Penalty on Murder.” American Law and
Economic Review 11(2):249–309.
Draca, Mirko, Stephen Machin, and Robert Witt. 2008. Panic on the Streets of London: Police,
Crime, and the July 2005 Terror Attacks. Bonn, Germany: Institute for the Study of
Labor.
Durlauf, Steven N., and K. Charles. Forthcoming. "Pitfalls in the Use of Time Series Methods to
Study Deterrence and Capital Punishment." Journal of Quantitative Criminology.
http://link.springer.com/article/10.1007/s10940-012-9169-7?null#.
Durlauf, Steven N., and Daniel S. Nagin. 2011a. "Imprisonment and Crime: Can Both Be
Reduced?" Criminology and Public Police 10:9–54.
———. 2011b. "The Deterrent Effect of Imprisonment." In Controlling Crime; Strategies and
Tradeoffs, edited by Philip J. Cook, Jens Ludwig, and Justin McCrary. Chicago:
University of Chicago Press.
Durlauf, Steven, S. Navarro, and D. Rivers. 2008. "On the Interpretation of Aggregate Crime
Regressions." In Crime Trends, edited by A. Goldberger and R. Rosenfeld. Washington
DC: National Academy of Sciences Press.

73
Eck, John E. 1992. "Criminal Investigation." In What Works in Policing? Operations and
Administrations Examined, edited by Gary W. Cordner and Donna C. Hale. Cincinnati:
Anderson Publishing.
Eck, John E., Jeffrey S. Gersh, and Charlene Taylor. 2000. "Finding Crime Hot Spots through
Repeat Address Mapping." In Analyzing Crime Patterns: Frontiers of Practice, edited by
Victor Goldsmith, Philip G. McGuire, John H. Mollenkopf, and Timothy A. Ross.
Thousand Oaks, CA: Sage Publications.
Ehrlich, I. 1975. "The Deterrent Effect of Capital Punishment: A Question of Life and Death."
American Economic Review 65(3):397–417.
Erickson, Maynard L., and Jack P. Gibbs. 1979. "On the Perceived Severity of Legal Penalties."
Journal of Criminal Law, Criminology, and Police Science 70:102.
Evans, William N., and Emily G. Owens. 2007. "COPS and Crime." Journal of Public
Economics 91:181–201.
Ferrier, M., and Jens Ludwig. 2011. "Crime Policy and Informal Social Control." Criminology
and Public Policy 10:1029–36.
Freeman, Richard B. 1991. Crime and the Employment of Disadvantaged Youths. Cambridge,
MA: National Bureau of Economic Research.
Gibbs, Jack P. 1975. Crime, Punishment, and Deterrence. New York: Elsevier.
Granger, C. W. J. 1969. "Investigating Causal Relations by Econometric Models and Cross-
Spectral Methods." Econometrica 37:424–38.
Grasmick, Harold, and George Bryjak. 1980. "The Deterrent Effect of Perceived Severity of
Punishment." Social Forces 59(2):471–91.

74
Greenwood, Peter, Jan Chaiken, and Joan Petersilia. 1977. The Investigation Process. Lexington,
MA: Lexington Books.
Greenwood, Peter, and Angela Hawken. 2002. An Assessment of the Effect of California's Three-
Strikes Law. Toronto, Ontario: Greenwood Associates.
Grube, Joel W., and Kathleen A. Kearney. 1983. "A 'Mandatory' Jail Sentence for Drinking and
Driving." Evaluation Review 7:235–46.
Hawken, Angela. 2010. "Behavioral Triage: A New Model for Identifying and Treating
Substance-Abusing Offenders." Journal of Drug Policy Analysis 3:1–5.
Hawken, Angela, and Mark Kleiman. 2009. Managing Drug-Involved Probationers with Swift
and Certain Sanctions: Evaluating Hawaii’s HOPE. Washington, DC: National Institute
of Justice.
Heaton, Paul. Forthcoming. "Understanding the Effects of Anti-Profiling Policies." Journal of
Law and Economics 53(1):29–64.
Helland, E., and A. Tabarrok. 2007. "Does Three Strikes Deter? A Nonparametric Estimation."
Journal of Human Resources 42(2):309–30.
Hjalmarsson, Randi. 2008. "Criminal Justice Involvement and High School Completion."
Journal of Urban Economics 63:613–30.
———. 2009. "Crime and Expected Punishment: Changes in Perceptions at the Age of Criminal
Majority." American Law and Economics Review 7:209–48.
Horney, Julie, and Ineke Haen Marshall. 1992. "Risk Perceptions among Serious Offenders: The
Role of Crime and Punishment." Criminology 30:575–93.
Jacobs, Bruce A., and Richard Wright. 2006. Street Justice: Retaliation in the Criminal
Underworld. New York: Cambridge University Press.

75
Johnson, Rucker, and Steven Raphael. Forthcoming a. "How Much Crime Reduction Does the
Marginal Prisoner Buy?" Journal of Labor Economics (May 2012).
———. Forthcoming b. "How Much Crime Reduction Does the Marginal Prisoner Buy?"
Journal of Law and Economics 55(2):275–310.
Johnston Lloyd, D., Patrick M. O’Malley, and Jerald G. Bachman. 1981. "Cannabis
Decriminalization: The Impact on Youth 1975-1980." In Monitoring the Future
Occasional Paper. Ann Arbor, MI: Institute for Social Research.
Kansas City Police Department. 1977. Response Time Analysis, edited by Kansas City Police
Department. Kansas City: Kansas City Police Department.
Kennedy, David. M. 2009. Deterrence and Crime Prevention Reconsidering the Prospect of
Sanction. New York: Routledge.
Kennedy, David M., Anthony A. Braga, Anne Morrison Piehl, and Elin J. Waring. 2001.
Reducing Gun Violence: The Boston Gun Project’s Operation Ceasefire. Washington,
DC: US National Institute of Justice.
Kessler, Daniel, and Steven Levitt. 1999. "Using Sentence Enhancements to Distinguish between
Deterrence and Incapacitation." Journal of Law and Economics 42:348–63.
Kleck, Gary, and J. C. Barnes. Forthcoming. "Do More Police Lead to More Crime Deterrence?"
Crime and Delinquency. doi: 10.1177/0011128710382263.
Kleck, Gary, Brion Sever, Spencer Li, and Marc Gertz. 2005. "The Missing Link in General
Deterrence Research." Criminology 46:623–59.
Kleiman, Mark. 2009. When Brute Force Fails, How to Have Less Crime and Less Punishment
Princton, NJ: Princeton University Press.

76
Klein, Lawrence R., Brian Forst, and Victor Filatov. 1978. "The Deterrent Effect of Capital
Punishment: An Assessment of the Estimates." In Deterrence and Incapacitation:
Estimating the Effects of Criminal Sanctions on Crime Rates, edited by Alfred Blumstein,
J. Cohen, and Daniel S. Nagin. Washington, DC: National Academy of Sciences.
Klepper, Steven, and Daniel Nagin. 1989a. "The Deterrent Effect of Perceived Certainty and
Severity of Punishment Revisited." Criminology 27(4):721–46. doi: 10.1111/j.1745-
9125.1989.tb01052.x.
———. 1989b. "The Deterrent Effect of Perceived Certainty and Severity Revisited."
Criminology 27:721–46.
Klick, Jonathan, and Alexander Tabarrok. 2005. "Using Terror Alert Levels to Estimate the
Effect of Police on Crime." Journal of Law and Economics 46:267–79.
Lee, David S., and Justin McCrary. 2009. The Deterrent Effect of Prison: Dynamic Theory and
Evidence. Princeton, NJ: University of Princeton, Industrial Relations Section.
Levitt, Steven D. 1996. "The Effect of Prison Population Size on Crime Rates: Evidence from
Prison Overcrowding Legislation." Quarterly Journal of Economics 111:319–52.
———. 1997. "Using Electoral Cycles in Police Hiring To Estimate the Effect of Police on
Crime." American Economic Review 87:270–90.
———. 1998. "Juvenile Crime and Punishment." Journal of Political Economy 106:1156–85.
———. 2002. "Using Electoral Cycles in Police Hiring To Estimate the Effect of Police on
Crime: Reply." American Economic Review 92:1244–50.
———. 2006. "The Case of the Critics Who Missed the Point: A Reply to Webster et al."
Criminology and Public Policy 5:449–60.

77
Liedka, Raymond V., Anne Morrison Piehl, and Bert Useem. 2006. "The Crime-Control Effect
of Incarceration: Does Scale Matter?" Criminology and Public Policy 5:245–76.
Lochner, Lance. 2007. "Individual Perceptions of the Criminal Justice System." American
Economic Review 97:444–60.
Loftin, Colin, Milton Heumann, and David McDowall. 1983. "Mandatory Sentencing and
Firearms Violence: Evaluating an Alternative to Gun Control." Law and Society Review
17:287–318.
Loftin, Colin, and David McDowall. 1981. "'One with a Gun Gets You Two’: Mandatory
Sentencing and Firearms Violence in Detroit." Annals of the American Academy of
Political and Social Science 455(1):150–67.
———. 1984. "The Deterrent Effects of the Florida Felony Firearm Law." Journal of Criminal
Law and Criminology 75:250–59.
Loughran, Thomas A., Raymond Paternoster, Alex R. Piquero, and Greg Pogarsky. 2011. "On
Ambiguity in Perceptions of Risk: Implications for Criminal Decision-Making and
Deterrence." Criminology 49:1029–61.
Ludwig, Jens, Jeffrey R. Kling, and Sendhil Mullainathan. 2011. "Mechanism Experiments and
Policy Evaluations." Journal of Economic Perspectives 25(3):17–38.
MacCoun, Robert, Rosalie Liccardo Pacula, Jamie Chriqui, Katherine Harris, and Peter Reuter.
2009. "Do Citizens Know Whether Their State Has Decriminalized Marijuana? Assessing
the Perceptual Component of Deterrence Theory." Review of Law and Economics 5:347–
71.
Marvell, Thomas B., and C. Jr. Moody. 1994. "Prison Population Growth and Crime Reduction."
Journal of Quantitative Criminology 10:109–40.

78
———. 1996. "Specification Problems, Police Levels, and Crime Rates." Criminology 34:609–
46.
Matsueda, Ross L., D. A. Kreager, and D. Huizinga. 2006. "Deterring Delinquents: A Rational
Choice Model of Theft and Violence." American Sociological Review 71:95–122.
McCrary, Justin. 2002. "Using Electoral Cycles in Police Hiring To Estimate the Effect of Police
on Crime: Comment." American Economic Review 92:1236–43.
McDowall, D., C. Loftin, and B. Wiersema. 1992. "A Comparative Study of the Preventive
Effects of Mandatory Sentencing Laws for Gun Crimes." Journal of Criminal Law and
Criminology 83:378–94.
Meier, R. F., and W. T. Johnson. 1977. "Deterrence as Social Control: The Legal and Extralegal
Production of Conformity." American Sociological Review 42:292–304.
Minor, W. W. 1977. "A Deterrence-Control Theory of Crime." In Theory of Criminology, edited
by R. F. Meier. Beverly Hills: Sage.
Mulvey, E. P. 2011. Highlights from Pathways to Desistance: A Longitudinal Study of Serious
Adolescent Offenders. Juvenile Justice Fact Sheet. Washington, DC: Department of
Justice.
Nagin, Daniel S. 1998. "Criminal Deterrence Research at the Outset of the Twenty-First
Century." In Crime and Justice: A Review of Research, vol. 23, edited by Michael Tonry.
Chicago: University of Chicago Press.
Nagin, Daniel S., Francis Cullen, and Cheryl Lero Jonson. 2009. "Imprisonment and
Reoffending." In Crime and Justice: A Review of Research,vol. 38, edited by Michael
Tonry. University of Chicago Press.

79
Nagin, Daniel S., and Raymond Paternoster. 1993. "Enduring Individual Differences and
Rational Choice Theories of Crime." Law and Society Review 27:467–99.
———. 1994. "Personal Capital and Social Control: The Deterrence Implications of Individual
Differences in Criminal Offending." Criminology 32:581–606.
Nagin, Daniel S., and John V. Pepper, eds. 2012. Deterrence and the Death Penalty.
Washington, DC: National Academies Press.
Nagin, Daniel S., and Greg Pogarsky. 2001. "Integrating Celerity, Impulsivity, and Extralegal
Sanction Threats into a Model of General Deterrence: Theory and Evidence."
Criminology 39:865–92.
———. 2003. "An Experimental Investigation of Deterrence: Cheating, Self-Serving Bias, and
Impulsivity." Criminology 41:167–93.
Owens, Emily G. 2009. "More Time, Less Crime? Estimating the Incapacitative Effects of
Sentence Enhancements." Journal of Labor Economics 53(3):551–79.
Packer, H. L. 1968. The Limits of the Criminal Sanction. Stanford, CA: Stanford University
Press.
Papachristos, Andrew V., Tracey L. Meares, and Jeffrey Fagan. 2007. "Attention Felons:
Evaluating Project Safe Neighborhoods in Chicago." Journal of Empirical Legal Studies
4:223–72.
Paternoster, Raymond. 1983. "Estimating Perceptual Stability and Deterrent Effects: The Role of
Perceived Legal Punishment in the Inhibition of Criminal Involvement." Journal of
Criminal Law and Criminology 74:210–97.
———. 2010. "How Much Do We Really Know about Criminal Deterrence?" Journal of
Criminal Law and Criminology 10(3):765–823.

80
Paternoster, Raymond, and Alex Piquero. 1995. "Reconceptualizing Deterrence: An Empirical
Test of Personal and Vicarious Experiences." Journal of Research in Crime and
Delinquency 32:251–86.
Paternoster, Raymond, Linda E. Saltzman, Theodore G. Chiricos, and Gordon P. Waldo. 1982.
"Perceived Risk and Deterrence: Methodological Artifacts in Perceptual Deterrence
Research." Journal of Criminal Law and Criminology 73:1238–58.
Piliavin, Irving, Craig Thornton, Rosemary Gartner, and Ross L. Matsueda. 1986. "Crime,
Deterrence, and Rational Choice." American Sociological Review 51:101–19.
Piquero, Alex, Raymond Paternoster, Greg Pogarsky, and Thomas A. Loughran. 2011.
"Elaborating the Individual Difference Component in Deterrence Theory." Annual
Review of Law and Social Science 7:355–60.
Pogarsky, Greg. 2007. "Deterrence and Individual Differences among Convicted Offenders."
Quantitative Criminology 23(1):59–74.
Pogarsky, Greg, KiDuek Kim, and Ray Paternoster. 2005. "Perceptual Change in the National
Youth Survey: Lessons for Deterrence Theory and Offender Decision-Making." Justice
Quarterly 22:1–29.
Pogarsky, Greg, and Alex R. Piquero. 2003. "Can Punishment Encourage Offending?
Investigating the 'Resetting' Effect." Journal of Research in Crime and Delinquency
40:95–120.
Pogarsky, Greg, Alex R. Piquero, and Ray Paternoster. 2004. "Modeling Change in Perceptions
about Sanction Threats: The Neglected Link in Deterrence Theory." Journal of
Quantitative Criminology 20:343–69.

81
Poutvaara, Panu, and Mikael Priks. 2006. Hooliganism in the Shadow of a Terrorist Attack and
the Tsunami: Do Police Reduce Group Violence? Helsinki, Finland: University of
Helsinki.
Raphael, Steven. 2006. "The Deterrent Effects of California’s Proposition 8: Weighing the
Evidence." Criminology and Public Policy 5:471–78.
Raphael, Steven, and Jens Ludwig. 2003. "Prison Sentence Enhancements: The Case of Project
Exile." In Evaluating Gun Policy: Effects on Crime and Violence, edited by Jens Ludwig
and Philip J. Cook. Washington, DC: Brookings Institution Press.
Raphael, Steven, and Michael A. Stoll. 2007. Why Are So Many Americans in Prison? Berkeley:
University of California, Berkeley.
Reuter, Peter, and Howard Pollack. 2012. "Good Markets Make Bad Neighbors: Regulating
Open-Air Drug Markets." Criminology and Public Policy 11(2):211–20. doi:
10.1111/j.1745-91-9133.2012.00800.x.
Roncek, Dennis W. 2000. "Schools and Crime." In Analyzing Crime Patterns: Frontiers of
Practice, edited by Victor Goldsmith, Philip G. McGuire, John H. Mollenkopf, and
Timothy A. Ross. Thousand Oaks, CA: Sage Publications.
Ross, H. Laurence. 1973. "Law, Science, and Accidents: The British Road Safety Act of 1967."
Journal of Legal Studies 2:1–78.
———. 1982. Deterring the Drinking Driver: Legal Policy and Social Control. Lexington, MA:
Lexington
Sherman, Lawrence W. 1990. "Police Crackdowns: Initial and Residual Deterrence." In Crime
and Justice: A Review of Research, vol. 12, edited by Michael Tonry. Chicago:
University of Chicago Press.

82
Sherman, Lawrence W., and Richard A. Berk. 1984. "The Specific Deterrent Effects of Arrest
for Domestic Assault." American Sociological Review 49:261–72.
Sherman, Lawrence W., and John E. Eck. 2002. "Policing for Prevention." In Evidence Based
Crime Prevention, edited by Lawrence W. Sherman, David Farrington, and Brandon
Welsh. New York: Routledge.
Sherman, Lawrence W., Patrick Gartin, and Michael Buerger. 1989. "Hot Spots of Predatory
Crime: Routine Activities and the Criminology of Place." Criminology 27:27–55.
Sherman, Lawrence, and David Weisburd. 1995. "General Deterrent Effects of Police Patrol in
Crime ‘Hot Spots’: A Randomized Study." Justice Quarterly 12:625–48.
Shi, Lan. 2009. "The Limits of Oversight in Policing: Evidence from the 2001 Cincinnati Riot."
Journal of Public Economics 93:99–113.
Snell, T.L. 2010. Capital Punishment 2009—Statistical Tables, edited by US Department of
Justice. Washington, DC: US Department of Justice.
Spelman, William. 2000. "What Recent Studies Do (and Don’t) Tell Us about Imprisonment and
Crime." In Crime and Justice: A Review of Research, vol. 27, edited by Michael Tonry.
Chicago: University of Chicago Press.
Spelman, William, and Dale K. Brown. 1981. Calling the Police: A Replication of the Citizen
Reporting Component of the Kansas City Response Time Analysis. Washington, DC:
Police Executive Research Forum.
Stafford, Mark C., and Mark Warr. 1993. "A Reconceptualization of General and Specific
Deterrence." Journal of Research in Crime and Delinquency 30:123–35.
83
Stolzenberg, Lisa, and Stewart J. D’Alessio. 1997. "'Three Strikes and You’re Out': The Impact
of California’s New Mandatory Sentencing Law on Serious Crime Rates." Crime and
Delinquency 43(4):457–69.
Tittle, Charles. 1977. "Sanction Fear and the Maintenance of Social Order." Social Forces
55:579–96.
Tittle, Charles. 1980. Sanctions and Social Deviance: The Question of Deterrence. New York:
Praeger.
Tonry, Michael. 1996. Sentencing Matters. Oxford: Oxford University Press.
———. 2007. "Determinants of Penal Policies." In Crime, Punishment, and Politics in a
Comparative Perspective, edited by Michael Tonry. Vol. 36 of Crime and Justice: A
Review of Research, edited by Michael Tonry. Chicago: University of Chicago Press.
———. 2009. "The Mostly Unintended Effects of Mandatory Penalties: Two Centuries of
Consistent Findings." In Crime and Justice: A Review of Research, vol. 38, edited by
Michael H. Tonry. Chicago: University of Chicago Press.
Vollaard, Ben. Forthcoming. "Preventing Crime through Selective Incapacitation." The
Economic Journal. doi: 10.1111/j.1468-0297.2012.02522.x.
Waldfogel, Joel. 1994. "The Effect of Criminal Conviction on Income and the Trust 'Reposed in
the Workmen.'" Journal of Human Resources 29:62–81.
Webster, Cheryl Marie, Anthony Doob, and Franklin Zimring. 2006. "Proposition 8 and Crime
Rates in California: The Case of the Disappearing Deterrent." Criminology and Public
Policy 5:417–48.

84
Weisburd, David, Shawn Bushway, Cynthia Lum, and Su-Ming Yang. 2004. "Trajectories of
Crime at Places: A Longitudinal Study of Street Segments in the City of Seattle."
Criminology 42:238–320.
Weisburd, David, and John Eck. 2004. "What Can Police Do to Reduce Crime, Disorder, and
Fear?" Annals of the American Academy of Political and Social Science 593:42–65.
Weisburd, David, Tomar Einat, and Matt Kowalski. 2008. "The Miracle of the Cells: An
Experimental Study of Interventions to Increase Payment of Court-Ordered Financial
Obligations." Criminology and Public Policy 7:9–36.
Weisburd, David, and Lorraine Green. 1995. "Policing Drug Hot Spots: The Jersey City Drug
Market Analysis Experiment." Justice Quarterly 12:711–35.
Wikström, Per-Olof H., D. Oberwittler, K. Treiber, and B. Hardie. 2012. Breaking Rules: The
Social and Situational Dynamics of Young People's Urban Crime. Oxford: Oxford
University Press.
Williams, Kirk R., Jack P. Gibbs, and Maynard L. Erickson. 1980. "Public Knowledge of
Statutory Penalties: The Extent and Basis of Accurate Perception." Sociological Review
23:105–28.
Williams, Kirk R., and Richard Hawkins. 1986. "Perceptual Research on General Deterrence: A
Critical Overview." Law and Society Review 20:545–72.
Wilson, J. M., and S. Chermak. 2011. "Community-Driven Violence Reduction Programs."
Criminology and Public Policy 10:993–1027.
Wood, Peter B., and David C. May. 2003. "Racial Differences in Perceptions of Severity of
Sanctions: A Comparison of Prison with Alternatives." Justice Quarterly 20(3):605–31.

85
Wright, Richard T., and Scott H. Decker. 1994. Burglars on the Job: Streetlife and Residential
Break-Ins. Boston: Northeastern University Press.
Zimring, Franklin, and Gordon Hawkins. 1973. Deterrence: The Legal Threat in Crime Control.
Chicago: University of Chicago Press.
Zimring, Franklin E., Gordon Hawkins, and Sam Kamin. 2001. Punishment and Democracy:
Three Strikes and You’re Out in California. New York: Oxford University Press.

Exhibit C: Marilyn Peterson Armour
& Mark S. Umbreit, Assessing the Impact of the Ultimate Penal Sanction on Homicide Survivors: A Two
State Comparison, 96 Marq. L. Rev. 1 (Fall 2012)

Marquette Law ReviewVolume 96Issue 1 Fall 2012 Article 3
Assessing the Impact of the Ultimate PenalSanction on Homicide Survivors: A Two StateComparisonMarilyn Peterson Armour
Mark S. Umbreit
Follow this and additional works at: http://scholarship.law.marquette.edu/mulr
Part of the Law Commons
This Article is brought to you for free and open access by the Journals at Marquette Law Scholarly Commons. It has been accepted for inclusion inMarquette Law Review by an authorized administrator of Marquette Law Scholarly Commons. For more information, please [email protected].
Repository CitationMarilyn Peterson Armour and Mark S. Umbreit, Assessing the Impact of the Ultimate Penal Sanction on Homicide Survivors: A Two StateComparison, 96 Marq. L. Rev. 1 (2012).Available at: http://scholarship.law.marquette.edu/mulr/vol96/iss1/3

08 - UMBREIT (DO NOT DELETE) 3/6/2013 9:18 PM
ASSESSING THE IMPACT OF THE ULTIMATE PENAL SANCTION ON
HOMICIDE SURVIVORS: A TWO STATE COMPARISON*
MARILYN PETERSON ARMOUR**
MARK S. UMBREIT***
Numerous studies have examined the psychological sequelae that result from the murder of a loved one. Except for the death penalty, however, sparse attention has been paid to the impact of the murderer’s sentence on homicide survivors’ well-being. Given the steadfastness of the public’s opinion that the death penalty brings satisfaction and closure to survivors, it is surprising that there has been no systematic inquiry directly with survivors about whether obtaining the ultimate punishment affects their healing. This Study used in-person interviews with a randomly selected sample of survivors from four time periods to examine the totality of the ultimate penal sanction (UPS) process and its longitudinal impact on their lives. Moreover, it assessed the differential effect of two types of UPS by comparing survivors’ experiences in Texas, a death penalty state, and Minnesota, a life without the possibility of parole (LWOP) state. Comparing states highlights differences primarily during the postconviction stage, specifically with respect to the appeals process and in regard to survivor well-being. In Minnesota, survivors of adjudicated cases show higher levels of physical, psychological, and behavioral health. This Study’s findings have implications for trial strategy and policy development.
* This Study was made possible through funds provided by the General Convention of
the Episcopal Church, U.S.A. and Marquette University Law School in Milwaukee, Wisconsin. The authors express their appreciation to Stephanie L Rivaux, Ph.D., and Richard Pargament, Ph.D. for their assistance with the quantitative analysis. The authors would also like to thank Margaret McAbee, Executive Director of Survivor Resources, St. Paul, Minnesota and Karen Martin, Regional Coordinator-Austin/Central Texas Region, Office of the Attorney General, Crime Victim Services Division, as well as the survivors who participated in this study.
** Ph.D. University of Texas at Austin, [email protected]. *** Ph.D. University of Minnesota, [email protected].

08 - UMBREIT (DO NOT DELETE) 3/6/2013 9:18 PM
2 MARQUETTE LAW REVIEW [96:1
I. INTRODUCTION .................................................................................... 4 II. THE ULTIMATE PENAL SANCTION .................................................... 5
A. Texas and the Death Penalty......................................................... 6 B. Minnesota and LWOP .................................................................. 9
III. THERAPEUTIC JURISPRUDENCE AND FAMILY SURVIVORS OF HOMICIDE VICTIMS ...................................................................... 11 A. Crime Victims’ Rights .................................................................. 12 B. Therapeutic Jurisprudence .......................................................... 13 C. Closure as Justification for the Death Penalty and LWOP ........................................................................................... 15 D. Evidence of Closure in VIS and Executions ............................. 17
IV. THERAPEUTIC JURISPRUDENCE, SURVIVORS, AND CONTROL ............................................................................................. 20
V. PERCEIVED CONTROL THEORY ....................................................... 23 VI. THE PROCESS OF THE ULTIMATE PENAL SANCTION .................... 24
A. Texas ............................................................................................. 24 B. Minnesota ..................................................................................... 26
VII. SUMMARY OF ULTIMATE PENAL SYSTEM ...................................... 27 VIII. METHODOLOGY ................................................................................. 27
A. Design ........................................................................................... 27 B. Measures ....................................................................................... 28 C. Sample Procurement ................................................................... 30 D. Data Collection ............................................................................ 31 E. Data Analysis ............................................................................... 32 F. Sample Profile .............................................................................. 34
IX. QUALITATIVE FINDINGS ................................................................... 36 A. Category 1: Impact of the UPS on the Conviction
Experience .................................................................................... 36 B. Category 2: Impact of the UPS on the Postconviction
Experience .................................................................................... 49 C. Category 3: Aftermath of Murder and the UPS on
Survivors’ Lives ........................................................................... 68 X. QUANTITATIVE RESULTS.................................................................. 82
A. ICG-R Scores by State and Time ................................................ 83 B. Select Event Themes and ICG-R Scores .................................... 83
XI. DISCUSSION OF FINDINGS ................................................................. 84 A. Outreach and VIS ........................................................................ 85 B. Social Expectations, Ambiguous Loss, and Closure ................ 86 C. The Involuntary Relationship ..................................................... 88 D. Rumination and Vengeance ........................................................ 89 E. Civil Actions and Accumulated Injustices ................................. 90

08 - UMBREIT (DO NOT DELETE) 3/6/2013 9:18 PM
2012] ULTIMATE PENAL SANCTION 3
F. Satisfaction with the Criminal Justice System ............................ 91 G. Physical and Mental Health of Survivors .................................. 92 H. Summary of Findings .................................................................. 93
XII. LIMITATIONS ....................................................................................... 94 XIII. IMPLICATIONS ..................................................................................... 95 XIV. CONCLUSION ....................................................................................... 97 APPENDIX A: FIGURES ................................................................................. 99 APPENDIX B: TABLES ................................................................................. 108 APPENDIX C: UPS INTERVIEW GUIDE ..................................................... 123

08 - UMBREIT (DO NOT DELETE) 3/6/2013 9:18 PM
4 MARQUETTE LAW REVIEW [96:1
I. INTRODUCTION
Homicide bereavement is marked by long-lasting and penetrating upheaval in the lives of victim survivors. Current prevalence estimates project 15% of young adults are survivors of homicide, reflecting a 6% increase over previous estimates made in 1991.1 In most cases, these survivors have unresolved feelings because the murderer, if apprehended, does not receive the punishment he or she deserves—the ultimate penal sanction (UPS), which is death or life without the possibility of parole (LWOP) depending on the jurisdiction.2 Indeed, the chance that the murderer will even be charged with a capital offense is rare—the death penalty is sought in only 1% of capital eligible cases.3 Although small in number, capital murder cases consume the attention of the public through mass media, trend-setting legal decisions, and public opinion polls. In contrast, family survivors receive little attention except when family survivors’ need for justice is used by proponents in debates about the purposes of the death penalty.
Since the early 1990s, the death penalty has been touted as bringing closure to survivors.4 Support for this belief has grown. In 2010, a national poll found that 60% of respondents supported the death penalty.5 The primary reason given for their support was that the death penalty gave victim families satisfaction and closure.6 This same contention is increasingly advanced as the reason to support LWOP.7 This belief, though popularly held, has never been systematically
1. Heidi M. Zinzow et al., Losing a Loved One to Homicide: Prevalence and Mental Health Correlates in a National Sample of Young Adults, 22 J. TRAUMATIC STRESS 20, 24 (2009).
2. Margaret Vandiver, The Death Penalty and the Families of Victims: An Overview of Research Issues, in WOUNDS THAT DO NOT BIND: VICTIM-BASED PERSPECTIVES ON THE DEATH PENALTY 235, 237 (James R. Acker & David R. Karp eds., 2006).
3. Race and the Death Penalty, AM. CIV. LIBERTIES UNION (Feb. 26, 2003), http://www.aclu.org/print/capital-punishment/race-and-death-penalty.
4. Susan A. Bandes, Victims, “Closure,” and the Sociology of Emotion, 72 LAW & CONTEMP. PROBS. 1, 2 (2009).
5. Public Ambivalence Fuels Support for a Halt in U.S. Executions, ABCNEWS.COM (May 2, 2001), http://abcnews.go.com/images/PollingUnit/851a1DeathPenalty.pdf.
6. Id. 7. See Dan Cortez, Sentencing Brings Closure, DETROIT FREE PRESS, Aug.
4, 2006, http://www.accessmylibrary.com/article-1G1-149063827/sentencing-brings-closure-victim.html; Juliette Rule, Blankinship Family Now Has “Closure,” WYOMINGNEWS.COM, (Aug. 25, 2006), http://www.wyomingnews.com/articles/2006/08/25/news/local_news/01local_8-25-06.txt; Yonika Willis, Last of Three Teens Sentenced in Keim Slaying, SOUTHBENDTRIBUNE.COM, Apr. 28, 2006, http://articles.southbendtribune.com/2006-04-28/news/26935013_1_keim-hill-cornfield.
08 - UMBREIT (DO NOT DELETE) 3/6/2013 9:18 PM
2012] ULTIMATE PENAL SANCTION 5
examined. Without evidence, the claim of benefit to survivors is only speculation that achieves the status of truth because of social expectations. It also places the justification for the UPS on the backs of victim survivors who already suffer under the weight of immeasurable grief, horrific trauma, unmet expectations, and empty assurances. The striking absence of survivors’ voices specific to the UPS stands in marked contrast to the volumes written on the death penalty.
The UPS has been promulgated as a punishment for offenders and a mechanism that helps restore equity and reduce suffering in homicide survivors. Studies show that the aftermath of homicide is extremely painful and long-lasting, the provision and impact of solace is limited, and the institutional response tends to revictimize rather than assist survivors in their healing process. Consequently, any claim about the success of an event or intervention deserves attention because so little seems to help. Until survivors speak for themselves, however, society will continue to project its hoped-for outcome on their experience and the voice of survivors will only be heard in reaction to the presumptions and misrepresentation of their journey.8
The purpose of this Study is to answer the question: How does the UPS affect the families of homicide victims (victim survivors)? The two states selected for the Study were Texas (death penalty) and Minnesota (LWOP). By turning directly to survivors as the true experts on their own experience, the Study examines the relevance of closure to their posthomicide experience—asking what constitutes a healing path for survivors where offenders received the UPS and what elements in the criminal justice system foster or hinder the healing process.
II. THE ULTIMATE PENAL SANCTION
All federal and state jurisdictions plus the military have legal sentences for capital or first-degree murder. The primary legal sentences upon conviction are the death penalty and LWOP. Currently, there are thirty-three states with the death penalty and seventeen states and the District of Columbia without the death penalty.9 All states that
8. See Marilyn Peterson Armour & Mark S. Umbreit, Exploring “Closure” and the
Ultimate Penal Sanction for Survivors of Homicide Victims, 19 FED. SENT’G REP. 105 (2006); see also Vandiver, supra note 2 (providing an overview of the issues and the need for a systematic program of research on the effects of capital punishment on the families of murder victims).
9. States With and Without the Death Penalty, DEATH PENALTY INFO. CTR., http://www.deathpenaltyinfo.org/states-and-without-death-penalty (last visited Oct. 8, 2012) [hereinafter States With and Without the Death Penalty].

08 - UMBREIT (DO NOT DELETE) 3/6/2013 9:18 PM
6 MARQUETTE LAW REVIEW [96:1
use the death penalty also use LWOP as an alternate sentence.10 With the exception of Alaska,11 states without the death penalty use LWOP as their ultimate sentence.12 The availability of LWOP both as a primary and secondary option has resulted in a quadrupling of the “lifer population” in prisons from 34,000 in 1984 to 140,000 in 2008.13 Additions to death row have slowed dramatically from a high of 312 in 1995 to 78 in 2011.14 Nationwide, there were 3,170 prisoners on death row as of 2012.15
A. Texas and the Death Penalty
Texas has a long history of use of the death penalty for capital murder. Beginning with a history of local public hangings, seen as necessary for maintaining order during the post-Civil War period, Texas has swung through a number of cycles in its use of executions.16 In the early 1900s, the frequency of lynching diminished.17 In 1923, Texas ordered all executions to be carried out by the state.18 The rope was replaced by the electric chair, and executions were moved from local
10. Life Without Parole, DEATH PENALTY INFO. CTR., http://www.deathpenaltyinfo.org/life-without-parole (last visited Oct. 8, 2012) [hereinafter Life Without Parole] (noting that all thirty-three death penalty states offer life without parole).
11. Id. Although Alaska does not technically have LWOP, see id., some of the sentences imposed are the practical equivalent, see, e.g., ALASKA STAT. § 12.55.125 (2010) (stating that Alaska has a mandatory sentence of ninety-nine years for first-degree murder if there is an aggravating factor).
12. See Life Without Parole, supra note 10. 13. Kevin Johnson, Growing Prison Populations Hinder Budget Cuts,
USATODAY.COM, Oct. 21, 2011, http://usatoday30.usatoday.com/news/nation/story/2011-10-20/prison-life-sentence-budget/50846828/1; see also Californians to Decide in November Whether to Kill the Death Penalty, CALIFORNIA CAPITOL NETWORK, Apr. 23, 2012, http://www.scpr.org/news/2012/04/23/32141/californians-can-decide-come-november-whether-kill/ (asserting that California has the highest number of prisoners on death row). Voters in California rejected a referendum to repeal the death penalty in November 2012. See Aaron Smith, California to Keep Death Penalty, CNN MONEY, Nov. 7, 2012, http://money.cnn.com/2012/11/07/news/economy/california-death-penalty/index.html. If it had passed, the initiative would have changed the status of more than 700 prisoners on death row to LWOP. Id.
14. DEATH PENALTY INFO. CTR., FACTS ABOUT THE DEATH PENALTY 3 (2012), available at http://www.deathpenaltyinfo.org/documents/FactSheet.pdf [hereinafter FACTS ABOUT THE DEATH PENALTY].
15. Id. at 2 (stating that there were 3,170 death row inmates as of April 1, 2012). 16. JAMES W. MARQUART ET AL., THE ROPE, THE CHAIR, AND THE NEEDLE:
CAPITAL PUNISHMENT IN TEXAS, 1923–1990, at ix, 2–3 (1st ed. 1994). 17. Id. at ix. 18. David Carson, History of the Death Penalty in Texas, TEXAS EXECUTION INFO.
CENTER (2012), http://www.txexecutions.org/history.asp.

08 - UMBREIT (DO NOT DELETE) 3/6/2013 9:18 PM
2012] ULTIMATE PENAL SANCTION 7
communities to the privacy of a state prison located in east Texas.19 With the Great Depression, state-sanctioned executions increased, especially in the South, but declined again during World War II.20 This decrease continued through the civil rights movement with anti-death penalty forces bringing about a moratorium on the use of the death penalty out of a nationwide concern with the arbitrary and capricious administration of capital punishment.21 By 1964, Texas had electrocuted 361 offenders.22 Between 1964 and 1982, all executions were suspended.23
In 1972, the U.S. Supreme Court in Furman v. Georgia24 concluded, in a 5–4 decision, that the practice of capital punishment was unconstitutional.25 Besides concluding that it was cruel and unusual punishment, three of the justices, in separate concurring opinions, argued that the infrequent application allowed for too much discretion, which therefore “opened the door to discriminatory practices.”26 Texas, consequently, commuted the sentences of fifty-two inmates to life, clearing death row.27 In response to the Court’s decision, the Texas Legislature standardized the way the death penalty was assessed and created rigid guidelines that eventually became associated with a new mode of execution.28 Lethal injection was used for the first time in 1982 in Texas.29 By the early 1990s, twenty-two other states adopted this method of execution as well.30 In the final decade of the century, Texas led the nation in executions. Indeed, from 1997 to 2000, there were ninety-two executions in Texas, more than all executions in the other thirty-three death penalty states combined.31
Over the next two decades, evidence emerged from DNA profiling that prompted reform efforts.32 In 2001, the Texas Legislature passed a
19. MARQUART, supra note 16, at ix. 20. Id. 21. Id. 22. Carson, supra note 18, at 1. 23. Id.; see also MARQUART, supra note 16, at ix. 24. Furman v. Georgia, 408 U.S. 238 (1972). 25. Id. at 239–40. 26. MARQUART, supra note 16, at x. 27. Carson, supra note 18, at 1. 28. MARQUART, supra note 16, at x. 29. Carson, supra note 18, at 1. 30. MARQUART, supra note 16, at x. 31. Carson, supra note 18, at 2–3. 32. Jay D. Aronson & Simon A. Cole, Science and the Death Penalty: DNA, Innocence,

08 - UMBREIT (DO NOT DELETE) 3/6/2013 9:18 PM
8 MARQUETTE LAW REVIEW [96:1
law guaranteeing DNA testing to prisoners who can establish “a reasonable probability” that their innocence will be secured as a result of the testing.33 From 2000 to the present, “the number of executions, in Texas, decreased from almost 100”34 to 13.35 In addition to the influence of DNA testing, the reduction in executions over the past decade was also influenced by the U.S. Supreme Court’s finding that executing mentally retarded prisoners is cruel and unusual punishment and therefore unconstitutional.36 In 2005, the Court added another restriction to the exercise of the death penalty, ruling that offenders who committed their capital offense when they were younger than eighteen could not be executed.37 Finally, in 2005, the Texas Legislature provided an alternative to death as the UPS.38 It adopted LWOP, making it possible for jurors to sentence an offender to life without the possibility of parole, instead of sentencing to death.
The number of prisoners on death row in Texas is the lowest it has been since 1986. 39 Currently, a death penalty case costs an average of $2.3 million in Texas.40 The average time from sentencing to execution in Texas is 10.8 years.41 Since 1996, victim survivors have been allowed to watch the execution.42
Recent debates surrounding the death penalty center on the makeup of lethal injections due to a worldwide shortage of one of the drugs,43 the
and the Debate over Capital Punishment in the United States, 34 LAW & SOC. INQUIRY 603, 605–06 (2009).
33. 2001 Tex. Gen. Laws 2, 2–3; see Carson, supra note 18, at 3. 34. SHELDON EKLAND-OLSON & DANIELLE DIRKS, HOW ETHICAL SYSTEMS
CHANGE: LYNCHING AND CAPITAL PUNISHMENT xi (2012). 35. DPIC’s Year End Report: Death Sentences Plunge to Historic Lows, DEATH
PENALTY INFO. CTR., http://www.deathpenaltyinfo.org/dpic-releases-2011-year-end-report (last visited Oct. 8, 2012) (“Texas led the country with thirteen executions, but that number represents a 46% decrease from 2009, when there were twenty-four executions.”).
36. Atkins v. Virginia, 536 U.S. 304, 321 (2002); see also Carson, supra note 18, at 3. 37. Roper v. Simmons, 543 U.S. 551, 568 (2005); Carson, supra note 18, at 3. 38. 2005 Tex. Gen. Laws 2705; Carson, supra note 18, at 4. 39. See TRACY L. SNELL, U.S. DEP’T OF JUSTICE, BUREAU OF JUSTICE STATISTICS,
CAPITAL PUNISHMENT, 2009—STATISTICAL TABLES, at 19 tbl.18 (2010) (providing statistics through 2009).
40. FACTS ABOUT THE DEATH PENALTY, supra note 14, at 4. 41. See SNELL, supra note 39 (noting that 10.8 years is the “average number of years
under sentence of death as of 12/31/09,” in Texas). 42. Death Row Facts, TEXAS DEPARTMENT OF CRIM. JUST., http://www.tdcj.state.tx.us/
stat/dr_facts.html (last visited Oct. 8, 2012) (“Effective January 12, 1996, close relatives and friends of the deceased victim were allowed to witness executions.”).
43. Carson, supra note 18, at 4.

08 - UMBREIT (DO NOT DELETE) 3/6/2013 9:18 PM
2012] ULTIMATE PENAL SANCTION 9
high number of wrongful convictions,44 and continuation of the long-standing racial pattern of defendant bias.45
B. Minnesota and LWOP
Although Minnesota is considered a non-death penalty state, it too has an early history of public lynchings—most often of Native Americans and African Americans.46 Moreover, in 1849, when Congress created the Minnesota Territory, territorial law held that “all persons convicted of premeditated murder automatically received death sentences.”47 Prior to the 1880s, lynchings and state-sanctioned executions attracted hordes of spectators, fueling a mob mentality that energized the crowds.48 In particular, the controversial, state-supported hanging of Ann Bilansky, in 1860, laid the groundwork for the anti-death penalty movement, which began in the 1880s.49 In 1868, Minnesota passed a non-retroactive bill making life sentences the norm—“requiring jurors to affirmatively vote for death sentences.”50
However, life sentence as the default ended fifteen years later when a bill passed reinstating the death penalty for first-degree murder.51 The resurgence of public executions again drew large crowds with written invitations sent to the citizenry for viewing from a spectator’s platform.52 In an effort to control these public events, Minnesota passed a statute in 1889 requiring nighttime executions, which quickly generated a nationwide trend toward in-private, after-dark executions.53 This law,
44. See Brandi Grissom, Courts Found DA Error in Nearly 25% of Reversed Cases, TEX. TRIB., July 5, 2012, http://www.texastribune.org/texas-dept-criminal-justice/texas-court-of-criminal-appeals/courts-found-prosecutors-erred-25-exonerations/print.
45. See Laura Bassett, Death Penalty May Be Ruled Unconstitutional in Texas, HUFFINGTON POST, Dec. 1, 2010, http://www.huffingtonpost.com/2010/12/01/death-penalty-may-be-rule_n_790705.html (“Out of the 464 people that have been executed in Texas, about 70 percent have been minorities, according to the Texas Department of Criminal Justice.”).
46. See States With and Without the Death Penalty, supra note 9; JOHN D. BESSLER, LEGACY OF VIOLENCE: LYNCH MOBS AND EXECUTIONS IN MINNESOTA, at xvii, 1 (2003).
47. BESSLER, supra note 46, at 1. 48. See id. at 1–23 (describing the culture that accompanied lynchings); see also Michael
Anderson, Minnesota’s John Day Smith Law and the Death Penalty Debate, MINN. HISTORY MAG., Summer 2002, at 84–86 (describing public executions).
49. BESSLER, supra note 46, at 93–94; see also Anderson, supra note 48, at 86 (describing the significance of the Ann Bilansky murder).
50. BESSLER, supra note 46, at 97. 51. Id. at 104–05. 52. Id. at 110. 53. Id. at xvi–xvii; see also Anderson, supra note 45, at 87–88 (describing the ban on
press coverage and the continued publishing about executions without penalty).

08 - UMBREIT (DO NOT DELETE) 3/6/2013 9:18 PM
10 MARQUETTE LAW REVIEW [96:1
known as the Smith law, eliminated the spectacle of public executions by requiring that executions occur before sunrise inside the jail.54 The law also banned newspaper reporters from attending the executions, which the press ignored based on free speech considerations.55
In 1906, detailed accounts by the press of a botched hanging led to a full-blown criminal investigation that resulted in the indictment of three newspapers56 and the Smith law being upheld.57 The effort to muzzle the press fueled abolitionist efforts.58 Minnesota abolished the death penalty in 1911 based on arguments that innocent people were being executed and criminals were going free because juries were reluctant to impose the death penalty.59 Besides making convictions easier, the option of life imprisonment was made viable, in part, by the Board of Pardon’s willingness to curtail the use of its pardoning power—ensuring that the sentence would be carried out.60 There have been more than a dozen attempts to have the death penalty reinstated, all of which have failed61 (including an effort in 2004 by then-Governor Tim Pawlenty62).
A number of new laws and enhancements to the life imprisonment statutes, however, have been enacted. In 1980, “[s]entencing guidelines were implemented as a modified form of determinate sentencing for all crimes except life sentences for first-degree murder.”63 Between 1980 and 1989, Minnesota set seventeen years as the minimum term for life sentences before parole eligibility.64 In 1989, the legislature set a thirty-year minimum and added life without parole for certain crimes.65 For sixteen years, the thirty-year minimum constituted life imprisonment. A former prisoner explained how a life sentence with the possibility of parole after thirty years works:
54. Anderson, supra note 48, at 87. 55. BESSLER, supra note 46, at 118–20. 56. Id. at 153; see Anderson, supra note 48, at 89 (discussing the reporting on the
botched hanging of William Williams “despite the publishing ban”). 57. BESSLER, supra note 46, at 158–59. 58. Id. at 161; see Anderson, supra note 48, at 90 (discussing the impact of the Smith law
on the rest of the country and the debate about the death penalty in the United States). 59. See generally BESSLER, supra note 46, at 162–80. 60. Id. at 179. 61. Id. at 230. 62. See Dan Haugen, Gov. Lays Out Plans for Death Penalty, MINNESOTA DAILY, Jan.
28, 2004, http://www.mndaily.com/print/23843. 63. See MINN. DEP’T OF CORR., CORRECTIONS RETROSPECTIVE 1959–1999, 21–22
(1999), available at http://www.doc.state.mn.us/publications/documents/docretro.pdf. 64. Id. 65. Id.; see 1989 Minn. Laws 1581, 1589, 1592.

08 - UMBREIT (DO NOT DELETE) 3/6/2013 9:18 PM
2012] ULTIMATE PENAL SANCTION 11
Sadly, there is no chance for early release when you’re serving a life sentence. After 30 years, they will consider you for release but there’s no guarantee you’ll get out. Most lifers end up serving 5–10 years longer than the minimum sentence, and some will never be released due to the severity of their crime, or if it’s a high profile case.66
In 2005, Minnesota passed a bill adding life without release (LWOR) for premeditated first-degree murder.67 Minnesota Department of Corrections reports that there are 569 “lifers” in Minnesota prisons as of January 1, 2012.68
Incapacitation and retribution have become the chief objectives of sentencing in Minnesota over the past two decades.69 Moreover, the state has increasingly focused on repeat sex offenders as an obstacle to community safety. In 1992, it added life imprisonment for certain repeat sex offenders convicted of first-degree criminal sexual conduct.70 In 2005, it enhanced the sanction for repeat offenders by including LWOR for first- and second-degree criminal sexual conduct offenses involving heinous acts.71 The state also used LWOR as a sentence that ensured incapacitation for juveniles convicted of murder in the first-degree.72 LWOR for juveniles, however, was declared cruel and unusual punishment, and therefore, deemed unconstitutional in a 5–4 vote by the U.S. Supreme Court in June 2012.73
III. THERAPEUTIC JURISPRUDENCE AND FAMILY SURVIVORS OF HOMICIDE VICTIMS
Although the literature on sentencing for murder is replete with historic accounts of abolitionist and death penalty developments, there
66. See Mr. C Response, How Does Parole Work in Minnesota, PRISONTALK.COM (Dec. 11, 2008, 2:14PM), http://www.prisontalk.com/forums/archive/index.php/t-381724.html.
67. 2005 Minn. Laws 901, 922. 68. See MINN. DEP’T OF CORR., ADULT INMATE PROFILE AS OF 01/01/2012 (2012),
available at http://www.doc.state.mn.us/aboutdoc/stats/documents/2012JanAdultProfile.pdf. 69. See Phil Carruthers, Sentencing Trends: Analysis and Recommendations, COUNCIL
ON CRIME AND JUSTICE, http://www.crimeandjustice.org/councilinfo.cfm?pID=51(last visited Oct. 27, 2012).
70. 1992 Minn. Laws 1983, 1997, 2000–01. 71. 2005 Minn. Laws 901, 929–31. 72. See MINN. STAT. § 260B.101 (2008) (giving juvenile court original jurisdiction over
“delinquent” children); MINN. STAT. § 260B.007 (2008) (“The term delinquent child does not include a child alleged to have committed murder in the first degree after becoming 16 years of age . . . .”).
73. Miller v. Alabama, 132 S. Ct. 2455, 2460 (2012).

08 - UMBREIT (DO NOT DELETE) 3/6/2013 9:18 PM
12 MARQUETTE LAW REVIEW [96:1
is virtually no mention of homicide survivors. Indeed, it is only in the past thirty years that crime victims’ voices have been added—based on survivors’ demands to be heard, validated, and treated with dignity and respect.74 Their recent visibility is due to a convergence of three forces: the crime victims’ rights movement, the emergence of therapeutic jurisprudence, and a new emphasis on closure for survivors as justification for the death penalty.
A. Crime Victims’ Rights
Support for crime victims’ rights emerged in the late 1970s as a cohesive movement birthed out of a deep frustration with the criminal justice system and its marginalization and treatment of victims.75 After decades of invisibility, crime victims nationwide shared the “widespread sentiment that the legal system did not accord victims the respect or sympathy they deserved, and this lack of support resulted in negative interactions with the criminal justice system.”76 The rights asserted by crime victims focused heavily on their needs for information, involvement in criminal justice proceedings, and demands to be treated with fairness, dignity, and respect throughout the criminal justice process.77 The movement has made significant strides over the past thirty years in establishing the crime victim’s role and enhancing the place of the victim (or victim survivor) in the criminal process. Besides establishing the Office of Victims of Crime under the Department of Justice78 and procuring federal funding for services to crime victims,79 all states either amended their constitution to address victims’ rights or
74. See Bruce J. Winick, Therapeutic Jurisprudence: Perspectives on Dealing with Victims
of Crime, 33 NOVA L. REV. 536, 544 (2009). 75. Like all other victims, survivors are a part of the victims’ rights movement and are
intended beneficiaries of the movement. See Megan A. Mullett, Fulfilling the Promise of Payne: Creating Participatory Opportunities for Survivors in Capital Cases, 86 IND. L.J. 1617, 1618 n.10 (2011).
76. Id. at 1622. 77. Id. at 1622–23. 78. See The History of Crime Victims’ Rights in America, MD. CRIME VICTIMS’
RESOURCE CENTER, http://www.mdcrimevictims.org/laws-and-policies/history-of-crime-victims-rights-in-america/ (last visited Oct. 8, 2012) (noting that the Office of Victims of Crime was created by the U.S. Department of Justice to implement recommendations from President Ronald Reagan’s Task Force).
79. See id. (noting that in 1984 the Victims of Crime Act (VOCA), Pub. L. 98-473, 98 Stat. 2170 (codified as amended at 42 U.S.C. §§ 10601–10604), was passed and established the Crime Victims Fund to support state victim compensation and services).

08 - UMBREIT (DO NOT DELETE) 3/6/2013 9:18 PM
2012] ULTIMATE PENAL SANCTION 13
passed crime victims’ rights legislation.80 The federal Justice for All Act, passed in 2004, established eight specified rights, including “[t]he right to be reasonably heard at any public proceeding . . . involving release, plea, sentencing or any parole proceeding”81—a right which directly affects survivors in capital cases.
B. Therapeutic Jurisprudence
Therapeutic jurisprudence is both a movement and a study of the law’s therapeutic impact that emerged during the late 1980s.82 It calls for a diminution in the law’s antitherapeutic effect and an increase in its potential to enhance the well-being of the people it affects.83 It was initially aimed at civil commitment and the treatment of persons with mental health disorders,84 but evolved to include drug and other problem solving courts,85 military law, bankruptcy law, and worker’s compensation law.86
Only recently has therapeutic jurisprudence expanded beyond its initial focus on the rehabilitation of offenders to include victims.87 This new area of interest reflects concerns about victim retraumatization and the antitherapeutic potential of the criminal justice system to accentuate crime victims’ feelings of powerlessness and compound feelings of
80. See History of Victims’ Rights, NAT’L CRIME VICTIM L. INST., http://law.lclark.edu/centers/national_crime_victim_law_institute/about_ncvli/history_of_victims_rights (last visited Oct. 8, 2012).
81. Justice for All Act of 2004, Pub. L. No. 108-405, § 3771, 118 Stat. 2260, 2261 (codified as amended in scattered sections of 18 U.S.C.).
82. See Peggy Fulton Hora et al., Therapeutic Jurisprudence and the Drug Treatment Court Movement: Revolutionizing the Criminal Justice System’s Response to Drug Abuse and Crime in America, 74 NOTRE DAME L. REV. 439, 439–41 (1999).
83. See David B. Wexler, Putting Mental Health into Mental Health Law: Therapeutic Jurisprudence, 16 LAW & HUM. BEHAV. 27, 32 (1992).
84. See, e.g., DAVID B. WEXLER & BRUCE J. WINICK, ESSAYS IN THERAPEUTIC JURISPRUDENCE (1991); DAVID B. WEXLER, THERAPEUTIC JURISPRUDENCE: THE LAW AS A THERAPEUTIC AGENT (1990); David B. Wexler, New Directions in Therapeutic Jurisprudence: Breaking the Bounds of Conventional Mental Health Law Scholarship, 10 N.Y.L. SCH. J. HUM. RTS. 759 (1993); David B. Wexler, Reflections on the Scope of Therapeutic Jurisprudence, 1 PSYCHOL. PUB. POL’Y & L. 220, 225–26 (1995).
85. See Dennis Roderick & Susan T. Krumholz, Much Ado About Nothing? A Critical Examination of Therapeutic Jurisprudence, 1 S. NEW ENG. ROUNDTABLE SYMP. L.J. 201, 216 (2006).
86. See Amy T. Campbell, Using Therapeutic Jurisprudence to Frame the Role of Emotion in Health Policymaking, 5 PHX. L. REV. 675, 678 (2012).
87. See Edna Erez et al., Therapeutic Jurisprudence and Victim Participation in Justice: An Introduction, in THERAPEUTIC JURISPRUDENCE AND VICTIM PARTICIPATION IN JUSTICE: INTERNATIONAL PERSPECTIVES, at x (Edna Erez et al. eds., 2011).

08 - UMBREIT (DO NOT DELETE) 3/6/2013 9:18 PM
14 MARQUETTE LAW REVIEW [96:1
injustice,88 thereby producing lowered self-esteem,89 depression and discontent,90 and self-degradation.91 Studies support these concerns. Research on survivors from a national representative sample found that the more satisfied survivors were with the criminal justice system’s management of their loved ones’ murder cases, the less likely they were to be depressed or anxious.92 Another study found that 71% of survivors had lifetime PTSD,93 which “might be attributable to . . . aggravation of symptoms produced by interacting with the criminal justice system.”94 Although the criminal justice system can negatively influence victim well-being, a four-state study (n = 1309) also found that crime victim satisfaction can mitigate crime-related PTSD.95
Although therapeutic jurisprudence recognizes the necessity to respond to either the positive or negative impact of the law,96 its more recent focus on victims and their emotional well-being has generated intense controversy about the fundamental purpose of law and due process rights of defendants.97 Fallout from this controversy has significantly influenced the procedural rights of family survivors to give testimony about the impact of the murder during trials in capital cases
88. See Armour & Umbreit, supra note 8. 89. See, e.g., Gerda Koper et al., Procedural Fairness and Self-Esteem, 23 EUROPEAN J.
SOC. PSYCHOL. 313, 314 (1993); Heather J. Smith et al., The Self-Relevant Implications of the Group-Value Model: Group Membership, Self-Worth, and Treatment Quality, 34 J. EXPERIMENTAL SOC. PSYCHOL. 470, 489 (1998).
90. See, e.g., Carolyn L. Hafer & James M. Olson, Beliefs in a Just World, Discontent, and Assertive Actions by Working Women, 19 PERSONALITY & SOC. PSYCHOL. BULL. 30, 34 (1993); Howard Tennen & Glenn Affleck, Blaming Others for Threatening Events, 108 PSYCHOL. BULL. 209, 224 (1990).
91. See generally Madeline E. Heilman et al., Self-Derogating Consequences of Sex-Based Preferential Selection: The Moderating Role of Initial Self-Confidence, 46 ORGANIZATIONAL BEHAV. & HUM. DECISION PROCESSES 202 (1990) (discussing self-derogation generally).
92. Angelynne Amick-McMullan et al., Family Survivors of Homicide Victims: Theoretical Perspectives and an Exploratory Study, 2 J. TRAUMATIC STRESS 21, 32 (1989).
93. John R. Freedy et al., The Psychological Adjustment of Recent Crime Victims in the Criminal Justice System, 9 J. INTERPERSONAL VIOLENCE 450, 457 (1994) (finding lifetime PTSD among 71% of family and friends of homicide victims who had reported the crime to law enforcement).
94. Dean G. Kilpatrick & Mary P. Koss, Homicide and Physical Assault, in THE MENTAL HEALTH CONSEQUENCES OF TORTURE 195, 199 (Ellen Gerrity et al. eds., 2001).
95. Judith Lewis Herman, The Mental Health of Crime Victims: Impact of Legal Intervention, 16 J. TRAUMATIC STRESS 159, 160–61, 163 (2003).
96. Winick, supra note 74, at 541. 97. See, e.g., Bandes, supra note 4.

08 - UMBREIT (DO NOT DELETE) 3/6/2013 9:18 PM
2012] ULTIMATE PENAL SANCTION 15
established under the Justice for All Act.98 The position held by therapeutic jurisprudence proponents, however, has been to staunchly maintain that the antitherapeutic impact of law on victims generally does not mandate change in a law or legal procedure. Rather, if legal values conflict with therapeutic ones, more research is needed into possible creative approaches for reshaping the law or its application in order to balance competing values.99
C. Closure as Justification for the Death Penalty and LWOP
Justifications for the death penalty and LWOP include deterrence, cost effectiveness, incapacitation, and retribution. Deterrence, cost, and the need for incapacitation specific to death penalty cases have been hotly contested for many years. Cost effectiveness and incapacitation, in particular, have less standing today than deterrence and retribution. Taxpayers are increasingly concerned about paying $2–$3 million per case for capital cases.100 Indeed, many of the arguments to advance LWOP in death penalty states are based on cost effectiveness.101 Moreover, the data on the danger posed by death row inmates suggests that the majority are not dangerous and serve time without incident—mitigating the need for incapacitation.102
Deterrence as justification for the death penalty has spawned
98. See Antony Pemberton & Sandra Reynaers, The Controversial Nature of Victim
Participation: Therapeutic Benefits in Victim Impact Statements, in THERAPEUTIC JURISPRUDENCE AND VICTIM PARTICIPATION IN JUSTICE: INTERNATIONAL PERSPECTIVES, supra note 87, at 233 (describing the tension between the therapeutic rationale for victim impact statements during sentencing and criminal justice principles dismissing therapeutic benefits as alien to the criminal justice system).
99. Winick, supra note 74, at 537. 100. See Arthur L. Alarcón & Paula M. Mitchell, Executing the Will of the Voters?: A
Roadmap to Mend or End the California Legislature’s Multi-Billion-Dollar Death Penalty Debacle, 44 LOY. L.A. L. REV. S41, S75 (2011) (noting after a review of individual death penalty cases that the cost of death penalty trials in California between 1983 and 2006 “averaged about $1 million more per trial than the costs of average non-death penalty homicide trials”); see also Costs of the Death Penalty, DEATH PENALTY INFO. CENTER, http://www.deathpenaltyinfo.org/costs-death-penalty#financialfacts (last visited Oct. 8, 2012).
101. See Alarcón & Mitchell, supra note 100, at S221. Alarcón & Mitchell discussed the fiscal impact of using LWOP rather than the death penalty:
This initiative . . . would save taxpayers millions of dollars per year over time. . . . California’s death row population would be immediately and dramatically reduced to a fraction of its current size. This would result in a savings to taxpayers of an additional tens of millions of dollars per year in death row housing costs.
Id. 102. See MARQUART, supra note 16, at 181–82.

08 - UMBREIT (DO NOT DELETE) 3/6/2013 9:18 PM
16 MARQUETTE LAW REVIEW [96:1
numerous studies,103 many of which contest each other.104 In 2012, the National Research Council examined studies on the topic since the 1976 Supreme Court decision in Gregg v. Georgia that ended a four-year moratorium on executions.105 It concluded “[the] research to date . . . is not informative about whether capital punishment decreases, increases, or has no effect on homicide rates.”106 The committee recommended that “claims that research demonstrates that capital punishment decreases or increases the homicide rate . . . or has no effect on [it] should not influence policy judgments about capital punishment.”107
In contrast to the diminishing validity of cost, incapacitation, and deterrence as justifications for the death penalty, retribution has emerged more forcefully because of its current association with survivors and the concept of closure, which has therapeutic appeal to both victims and the public. This association is recent. Although the victim rights movement introduced victim-impact statements (VIS), the claim that the death penalty, and now LWOP, brings closure can be traced to the U.S. Supreme Court’s 1991 decision in Payne v. Tennessee to uphold the use of these statements in capital cases.108 Death penalty scholar Franklin Zimring has documented the history of this association, maintaining that the terms “closure” and “death penalty” were never mentioned together until 1989 when they were used together once.109 In 1993, however, two years after Payne, the association was found more
103. See, e.g., Hashem Dezhbakhsh & Joanna M. Shepherd, The Deterrent Effect of
Capital Punishment: Evidence from a “Judicial Experiment,” 44 ECON. INQUIRY 512, 512 (2006); John J. Donohue & Justin Wolfers, Uses and Abuses of Empirical Evidence in the Death Penalty Debate, 58 STAN. L. REV. 791, 795–96 (2005); Isaac Ehrlich, The Deterrent Effect of Capital Punishment: A Question of Life and Death, 65 AM. ECON. REV. 397, 397 (1975).
104. See Marilyn Peterson Armour & Mark S. Umbreit, The Ultimate Penal Sanction and “Closure” for Survivors of Homicide Victims, 91 MARQ. L. REV. 381, 393 (2007).
105. COMM. ON LAW AND JUSTICE, NAT’L RESEARCH COUNCIL, DETERRENCE AND THE DEATH PENALTY 2 (Daniel S. Nagin & John V. Pepper eds., 2012), available at http://www7.nationalacademies.org/claj/1CLAJ_Publications.html.
106. Id. 107. Id. 108. Payne v. Tennessee, 501 U.S. 808, 832 (1990) (O’Connor, J., concurring). Justice
O’Connor in her concurrence in Payne stated, “Murder is the ultimate act of depersonalization. It transforms a living person with hopes, dreams, and fears into a corpse, thereby taking away all that is special and unique about the person. The Constitution does not preclude a State from deciding to give some of that back.” Id.
109. FRANKLIN E. ZIMRING, THE CONTRADICTIONS OF AMERICAN CAPITAL PUNISHMENT 58 (2003).

08 - UMBREIT (DO NOT DELETE) 3/6/2013 9:18 PM
2012] ULTIMATE PENAL SANCTION 17
than 500 times.110 This recasting of the rationale for retribution—from revenge and just deserts to serving constructive ends for the victim’s healing—has become a core rationale for VIS, preventing undue delays in legal processes, and witnessing executions.111
The rhetoric that binds closure to the death penalty is now being used for LWOP. The New Jersey Death Penalty Study Commission stated in their findings “the non-finality of death penalty appeals hurts victims, drains resources and creates a false sense of justice. Replacing the death penalty with life without parole would be certain punishment, not subject to the lengthy delays of capital cases; it would incapacitate the offenders; and it would provide finality for victims’ families.”112
The role of family survivors has grown exponentially over the past three decades. As advocates for themselves, family survivors pushed forward national legislation for crime victims’ rights, which provided a platform for state and federal legislation specific to VIS. This legitimating of their needs was accompanied by recognition from the therapeutic jurisprudence community, who theretofore had restricted its territory to the offender. As emerging and powerful stakeholders in the criminal justice system, proponents of both the death penalty and LWOP have recognized family survivors and politically advanced their punishment agendas through claims that the UPS helps bring closure to survivors. Indeed, in recent efforts to replace the death penalty with LWOP, proponents have been joined by family survivors as vocal advocates against capital punishment.113
D. Evidence of Closure in VIS and Executions
The use of law as an instrument of healing and rehabilitation calls on criminal justice officials for changes in court procedures to empower survivors, to create mechanisms to assist survivors in the expression of what happened to them, to show dignity and respect, and to add
110. See Bandes, supra note 4, at 1–2 n.3. 111. See Jody Lyneé Madeira, “Why Rebottle the Genie?”: Capitalizing on Closure in
Death Penalty Proceedings, 85 IND. L.J. 1477, 1481, 1506 (2010). 112. See N.J. DEATH PENALTY COMM’N, DEATH PENALTY STUDY COMMISSION
REPORT 61 (2007). 113. See E. Brancato, A Murder Victim Family Member Reflects on Repeal of Death
Penalty in Connecticut, MURDER VICTIMS’ FAMILIES FOR RECONCILIATION, http://www.mvfr.org/?p=955 (last visited Oct. 8, 2012) (describing his role as a survivor in the repeal of the death penalty in Connecticut). See generally WOUNDS THAT DO NOT BIND: VICTIM-BASED PERSPECTIVES ON THE DEATH PENALTY, supra note 2, at 17–140 (compiling personal accounts by survivors).
08 - UMBREIT (DO NOT DELETE) 3/6/2013 9:18 PM
18 MARQUETTE LAW REVIEW [96:1
provisions for survivor choice in the decision-making process to advance survivor self-determination wherever possible. Most of these needs, which have been legislatively codified as rights, are relatively uncontroversial. Tensions between the role of VIS in court and criminal justice principles as well as debates about the power of the defendant’s sentence to advance closure, however, have taken center stage.
VIS are oral or written statements, which, as part of the judicial legal process, allow survivors the opportunity to speak during the sentencing of the defendant.114 They are also referred to as “victim-impact evidence” (VIE) and as “victim allocution” depending on when in the trial process it is heard.115 They are frequently portrayed as assisting in survivor healing and closure because they give survivors a “voice” and allow them to express their pain and sense of loss in a public setting.116 The controversy surrounding victim expressions of harm focuses on the emotional appeal of VIS to prejudicially influence jurors’ sense of sympathy for the pain caused by the defendant, thereby interfering with the due process rights of the defendant. Specifically, VIS are critiqued based on the fact that their purpose is inconsistent with the principles of criminal justice, which view crime as an act against the state, not the specific victim; that they undermine proportionate treatment of offenders and public interest as the sole and legitimate justification for increased punishment severity; and that they subject defendants to excessive allegations.117 Although these concerns continue, evidence of influence on jurors and whether or not VIS lead to harsher, disproportionate, and inconsistent sentences has not been shown in the research.118
114. See Paul G. Cassell, In Defense of Victim Impact Statements, 6 OHIO ST. J. CRIM. L. 611, 611–12 (2009). Cassell noted that the ostensive purpose of VIS, as established under Payne, is to provide information to the sentencing judge or jury about the impact of the crime. Id. As an instrument for self-expression, VIS may also help survivors in their healing process, help educate the defendant about the full consequences of the murder, and ensure, under the principle of fairness that the survivor along with the state and the defendant have been heard. Id.
115. Minnesota allows for victim impact evidence. See MINN. STAT. § 611A.037–.038 (2009). Texas provides a right for survivors to make a statement postsentence. See TEX. CODE CRIM. PROC. ANN. art. 42.03 (West 2006).
116. See Bandes, supra note 4, at 3; see also Edna Erez, Who’s Afraid of The Big Bad Victim? Victim Impact Statements as Victim Empowerment and Enhancement of Justice, 1999 CRIM. L. REV 545, 551; Mullett, supra note 75, at 1622–23 (noting that VIS are premised on the victim deserving closure from their presentation in trial or sentencing).
117. See Erez, supra note 116, at 547. 118. Id. at 547–49 (describing the studies and available evidence disputing concerns
about VIS).
08 - UMBREIT (DO NOT DELETE) 3/6/2013 9:18 PM
2012] ULTIMATE PENAL SANCTION 19
Whether VIS help survivors heal and achieve closure is another point of contention. The research is inconclusive. Studies vary, showing both increased and decreased satisfaction, as well as neither.119 Apart from the lack of evidence showing beneficial effects, proponents of VIS claim that they have a communicative function120—they fulfill a need for expression and provide recognition of survivors’ victim status.
Closure, besides providing justification for the UPS, is also commonly promoted as the basis of the allocation of an opportunity for survivors to witness executions. At least thirteen states have made provisions for survivors to be present when the offender is killed.121 In Texas, the option to attend came about as a result of pressure from survivors and victim advocates who felt it might help the healing process.122 Similar to VIS, there is wide disagreement as to whether the UPS, generally, and witnessing the execution, specifically, bring closure. Survivors are resolute that the concept of “closure” bears little or no relevance to their experience.123 A survey conducted in 1999 by the Victim Services Division of the Texas Department of Criminal Justice found wide variation in survivors’ postexecution responses.124 Interviews
119. See Pemberton & Reynaers, supra note 98, at 235; see also Armour & Umbreit, supra note 104, at 404–05 (describing how editing of VIS by prosecutors and judges may influence survivors’ satisfaction since telling their story may no longer have the same significance).
120. See, e.g., Erez, supra note 116, at 550–54; Madeira, supra note 111; Julian V. Roberts & Edna Erez, Communication in Sentencing: Exploring the Expressive Function of Victim Impact Statements, 10 INT’L REV. VICTIMOLOGY 223 (2004).
121. See Peter Hodgkinson, Capital Punishment: Meeting the Needs of the Families of the Homicide Victim and the Condemned, in CAPITAL PUNISHMENT: STRATEGIES FOR ABOLITION 332, 353 n.63(Peter Hodgkinson & William A. Schabas eds., 2004) (“Oklahoma and Washington guarantee families the right to watch. In addition, California, Florida, Illinois, Louisiana, Montana, North Carolina, Ohio, Pennsylvania, Texas, Utah, and Virginia hold hearings to determine access.”).
122. See Mark Potok, Looking Death in the Eye in Texas: Law Lets Families View Executions, USA TODAY, Feb. 1, 1996, at 3A; see also Frequently Asked Questions: Victim Survivors Viewing Executions, TEXAS DEP’T OF CRIM. JUSTICE, http://www.tdcj.state.tx.us/faq/faq_victim_viewing_execution.html (last visited Oct. 8, 2012) (noting that in 1995, victim survivors and victim advocates asked the Texas Department of Criminal Justice for the opportunity to view executions).
123. See Marilyn Peterson Armour, Journey of Family Members of Homicide Victims: A Qualitative Study of Their Posthomicide Experience, 72 AM. J. ORTHOPSYCHIATRY 372, 380 (2002); Carroll Ann Ellis et al., The Impact of the Death Penalty on Crime Victims and Those Who Serve Them, in WOUNDS THAT DO NOT BIND: VICTIM-BASED PERSPECTIVES ON THE DEATH PENALTY, supra note 2, at 436.
124. Fernando J. Galan & Dan R. Guerra, The Impact of Viewing Executions on Homicide Survivors (1999) (on file with author Marilyn Peterson Armour) (presented before the Crime Victims Institute 1999 Biennial Symposium on Crime Victimization). Studies using

08 - UMBREIT (DO NOT DELETE) 3/6/2013 9:18 PM
20 MARQUETTE LAW REVIEW [96:1
with victims’ families and survivors of the Oklahoma City bombing found that twenty-two out of twenty-seven victims claimed that closure never occurs. Although survivors wanted to witness the execution of Timothy McVeigh out of a personal need to see justice done and carried through to completion, most of them did not expect it to assist them.125
There is increasing commentary in the literature on survivors and “closure,” specifically about the ambiguity of the term and a lack of precision in how it is used. Some scholars advocate for keeping “closure” but moving its definition from a dichotomous outcome associated with resolution of grief and pursuit of vengeance to a process synonymous with restoration of control and accountability as well as coping and healing.126 Others propose that measuring reductions in anger and anxiety would not only reduce the tension between the therapeutic and justice paradigms but that these constructs, unlike closure or healing, are specified well in the psychological literature.127
IV. THERAPEUTIC JURISPRUDENCE, SURVIVORS, AND CONTROL
Aside from the victim rights agenda, concern for the impact of the criminal justice system on victims’ emotional well-being and the goal of “closure” are two main reasons behind the push to give victims greater control over the powerlessness that otherwise accompanies the murder of a loved one. Research repeatedly shows that a sense of personal control over situations positively affects well-being.128 The centrality of powerlessness and need for control is regularly reflected in the literature
newspaper accounts of survivor reports report similar results. See Samuel R. Gross & Daniel J. Matheson, What They Say at the End: Capital Victims’ Families and the Press, 88 CORNELL L. REV. 486, 489 (2003) (stating that a review of statements to the press after family members witnessed an execution found that the dominant theme was pain and that the execution finally happened); see also Thomas J. Mowen & Ryan D. Schroeder, Not In My Name: An Investigation of Victims’ Family Clemency Movements and Court Appointed Closure, 12 WESTERN CRIMINOLOGY REV. 65 (2011) (examining newspaper coverage about executions to report responses and sentiments of covictims); Scott Vollum & Dennis R. Longmire, Covictims of Capital Murder: Statements of Victims’ Family Members and Friends Made at the Time of Execution, 22 VIOLENCE & VICTIMS 601 (2007) (assessing statements from covictims by reviewing articles about executions).
125. See Madeira, supra note 111, at 1501–02. 126. Id. at 1494, 1523. 127. See Pemberton & Reynaers, supra note 98, at 237. 128. See generally JOHN MIROWSKY & CATHERINE E. ROSS, SOCIAL CAUSES OF
PSYCHOLOGICAL DISTRESS 167–68 (1989) (synthesizing data from a decade of their own surveys and others with community populations on the impact of social problems on psychological distress and presenting data to suggest that feeling in control of one’s life is the most critical aspect of well-being).

08 - UMBREIT (DO NOT DELETE) 3/6/2013 9:18 PM
2012] ULTIMATE PENAL SANCTION 21
on homicide survivors.129 Professor Armour, for example, found that the question “Who decides?” determines survivors’ lived experience—survivors are constantly challenged by others’ decisions that impact their lives.130 Indeed, it appears that the restoration of a sense of control may be an essential element in victim healing.131 There has been discussion about the necessity for information,132 the making of meaning,133 and the access to greater participation134 as mechanisms to achieve that control. From the perspective of therapeutic jurisprudence, however, little is known about the impact of the UPS on that sense of control and on survivor well-being. Moreover, the linkage between closure and the actual death of the offender or the finality of the offender spending the rest of his or her natural life in prison is only a part of the extensive experience survivors have with the criminal justice system.135
Besides anecdotal accounts, several studies have attempted to ferret out survivors’ responses to the execution and its ability to provide closure.136 Gross and Matheson analyzed newspaper accounts of
129. See, e.g., Marilyn Armour, Meaning Making in the Aftermath of Homicide, 27
DEATH STUD. 519, 519 (2003). 130. Marilyn Ruth Peterson [Armour], The Search for Meaning in the Aftermath of
Homicide: A Hermeneutic Phenomenological Study of Families of Homicide Victims 204 (Aug. 1, 2000) (unpublished Ph.D dissertation, University of Minnesota, Minneapolis) (on file with author Marilyn Peterson Armour) (“Death by murder is also different because it is a public matter. Consequently, the respect that is usually accorded mourners in the United States is usurped by the public agenda and the boundary that otherwise protects the privacy of the family is violated. Moreover, death by murder means that others, outside the family, take control of what happens and define the social reality for family members. Family members, therefore, deal with their loved one’s death by having to interface with family, friends, and social institutions that have their own reactions to the event.”).
131. See Dean G. Kilpatrick & Randy K. Otto, Constitutionally Guaranteed Participation in Criminal Proceedings for Victims: Potential Effects on Psychological Functioning, 34 WAYNE L. REV. 7 (1987).
132. Paul B. Stretesky et al., Sense-Making and Secondary Victimization Among Unsolved Homicide Co-Victims, 38 J. CRIM. JUST. 880, 882–84 (2010).
133. See Armour, supra note 129, at 534–35; Shirley A. Murphy et al., Finding Meaning in a Child’s Violent Death: A Five-Year Prospective Analysis of Parents’ Personal Narratives and Empirical Data, 27 DEATH STUD. 381, 398 (2003).
134. See Deborah P. Kelly & Edna Erez, Victim Participation in the Criminal Justice System, in VICTIMS OF CRIME 231, 233–35 (Robert C. Davis et al. eds., 2d ed. 1997); Madeira, supra note 113, at 1511; Richard P. Wiebe, The Mental Health Implications of Crime Victims’ Rights, in LAW IN A THERAPEUTIC KEY: DEVELOPMENTS IN THERAPEUTIC JURISPRUDENCE 213, 219–20 (David B. Wexler & Bruce J. Winick eds., 1996).
135. Armour & Umbreit, supra note 104, at 422–23. 136. See generally Gross & Matheson, supra note 124 (examining press stories regarding
executions from January 2001 through June 2002); Mowen & Schroeder, supra note 124 (examining newspaper coverage about executions to report responses and sentiments of

08 - UMBREIT (DO NOT DELETE) 3/6/2013 9:18 PM
22 MARQUETTE LAW REVIEW [96:1
survivors’ statements immediately following executions.137 Vollum and Longmire examined journalists’ reports of survivors’ remarks after the reporters attended executions in Texas.138 Mowen and Schroeder evaluated newspaper coverage of death penalty cases that included statements by, or on behalf of, survivors with regard to their views on the death penalty.139 Although these studies are secondary accounts and only concentrate on the beginning or the end of the conviction and postconviction process, they uniformly conclude that the likelihood of closure, and by extension an increased sense of control, is highly variable and colored by the appeals process, expectations about the murderer’s comments, and feelings of revenge.140
Even less is known about whether LWOP gives survivors back a sense of control or reduces their suffering.141 As with the death penalty, attention has focused principally on societal concerns—including cost-effectiveness and mistakes in death penalty cases.142 Although the reasoning behind LWOP being touted as a victim service is a little different from the justification of the death penalty, there is still the suggestion that the LWOP sanction—through the concept of closure—has the potential to give a sense of control back to survivors.
covictims); Vollum & Longmire, supra note 124 (assessing statements from covictims by reviewing articles about executions).
137. Gross & Matheson, supra note 124, at 487–89. 138. Vollum & Longmire, supra note 124, at 603. 139. Mowen & Schroeder, supra note 124, at 70. 140. Gross & Matheson, supra note 124, at 491–94; Mowen & Schroeder, supra note 124,
at 78; Vollum & Longmire, supra note 124, at 604 tbl.1, 607. 141. The term “life sentence” has been used in a variety of ways over time and
consequently there is much public confusion regarding its meaning. MARC MAUER ET AL., THE MEANING OF “LIFE”: LONG PRISON SENTENCES IN CONTEXT 4 (2004), available at http://www.prisonterminal.com/documents/The%20Meaning%20of%20Life.pdf. While the intuitive definition of a life sentence is a prison term for the remainder of one’s natural life, in fact the term also includes various indeterminate sentences, or sentences whose length can be reduced by commutation, parole, or pardon. Id.
142. See ROBERT M. BOHM, DEATHQUEST: AN INTRODUCTION TO THE THEORY AND PRACTICE OF CAPITAL PUNISHMENT IN THE UNITED STATES 202 (4th ed. 2012) (“In sum, death sentences could be replaced with LWOP at considerable cost savings to the taxpayer, with negligible impact on the current prison overcrowding crisis. LWOP sentences would also allow for the correction of miscarriages of justice when they [are] discovered . . . .”); see also Michael E. Ebert, Weighing the Costs of Capital Punishment v. Life in Prison Without Parole: An Evaluation of Three States’ Studies and Methodologies Comparing Costs of the Death Penalty Versus Life in Prison Without Parole (LWOP), 1 NEW VOICES IN PUB. POL’Y 1 (2007) (examining studies noted as non-biased, done in North Carolina (Duke University), Indiana (Indiana Criminal Law Study Commission), and Tennessee (Tennessee House Judiciary Committee)).

08 - UMBREIT (DO NOT DELETE) 3/6/2013 9:18 PM
2012] ULTIMATE PENAL SANCTION 23
V. PERCEIVED CONTROL THEORY
Although information is sparse, carrying out the sentence of death or LWOP, as examples of ultimate justice, reflect hypothetically a symbolic regaining of control by survivors. This sense of control may facilitate healing,143 but the supposition that any UPS can be remedial remains speculative without direct evidence obtained in a systematic way from homicide survivors. The Study reported in this article uses sense of control theory for its conceptual framework.144 Perceived sense of control “refers to the extent to which individuals believe that they can control events that affect them.”145 This perceived sense of control is positively associated with physical health, self-esteem, personal adjustment, coping, decreased stress and depression, and psychological well-being.146 Studies have also found that a strong prior sense of control may be maladaptive for people who later face situations beyond their control and whose sense of control over their world is severely compromised—such as those affected by homicide—leading to a sense of helplessness or personal failure.147 Frazier assessed perceived control in terms of past, present, and future control over traumatic events.148 Although past and future control had nonsignificant relations with distress, present control—or control over the healing process—was associated with better adjustment, which was associated with less distress, less PTSD, and greater life satisfaction.149 According to Frazier’s temporal model of perceived control theory, “individuals who believe that they have more control over their [healing] process may
143. See MIROWSKY & ROSS, supra note 128, at 167–68. 144. See generally 1 RESEARCH WITH LOCUS CONTROL CONSTRUCT (Herbert M.
Lefcourt ed., 1981); Julian B. Rotter, Generalized Expectancies for Internal Versus External Control of Reinforcement, 80 PSYHOL. MONOGRAPHS 1 (1966).
145. Gregory G. Manley et al., Development of a Personality Biodata Measure to Predict Ethical Decision Making, 22 J. MANAGERIAL PSYCHOL. 664, 666 (2007).
146. Ellen. A. Skinner, A Guide to Constructs of Control, 71 J. PERSONALITY & SOC. PSYCHOL. 549, 549 (1996); Suzanne C. Thompson et al., Maintaining Perceptions of Control: Finding Perceived Control in Low-Control Circumstances, 64 J. PERSONALITY & SOC. PSYCHOL. 293, 293 (1993); Suzanne C. Thompson & Shirlynn Spacapan, Perceptions of Control in Vulnerable Populations, 47 J. OF SOC. ISSUES 1, 3–6 (1991); Deborah L. Volker, Control and End-of-Life Care: Does Ethnicity Matter?, 22 AM. J. HOSPICE & PALLIATIVE MED. 442, 442 (2005); see also RICHARD S. LAZARUS & SUSAN FOLKMAN, STRESS, APPRAISAL, AND COPING 170 (1984); Ute Kunzmann et al., Perceiving Control: A Double-Edged Sword in Old Age, 57B J. GERONTOLOGY 484, 484, 488 (2002).
147. See Volker, supra note 146, at 442. 148. Patricia Frazier et al., Perceived Control and Adjustment to Trauma: A Comparison
Across Events, 23 J. SOC. & CLINICAL PSYCHOL. 303, 303–05 (2004). 149. Id. at 316 tbl.1, 320–22.

08 - UMBREIT (DO NOT DELETE) 3/6/2013 9:18 PM
24 MARQUETTE LAW REVIEW [96:1
engage in more adaptive, approach-oriented coping strategies.”150 Is the perception that the symbolic regaining of control enhances the
well-being of homicide survivors actually realized? Does it affect the healing process of survivors? Is there a differential effect on homicide survivors depending on which UPS is imposed? This Study seeks information from homicide survivors about these questions and their experience of the UPS (whether death penalty or LWOP).
VI. THE PROCESS OF THE ULTIMATE PENAL SANCTION
The purpose of this Study is to examine and compare the conviction and postconviction experiences of family survivors in two states, namely Texas and Minnesota. Besides their regional variations geographically and culturally, the legal proceedings in a capital murder (Texas) or first-degree felony–murder (Minnesota) case contrast greatly.
A. Texas
Texas Penal Code section 19.02 defines murder as “intentionally or knowingly caus[ing] the death of an individual.”151 Section 19.03 of the Texas Penal Code defines capital murder as a murder which occurs under certain enumerated circumstances (e.g., murder of a peace officer or fireman; murder while committing the crime of kidnapping, robbery, burglary, aggravated sexual assault, terroristic threat, or arson; murder for remuneration; murder committed while escaping from a penal institution; or murder of a child under ten years of age).152 People who are under the age of eighteen at the time of commission of the capital crime153 or who are mentally retarded154 are precluded from being executed by the Constitution of the United States. A capital trial is a bifurcated trial consisting of a guilt–innocence phase and a punishment phase.155 For a death sentence to be imposed, the jury must determine that the defendant is a “continuing threat to society” and that the mitigating evidence is not sufficient to warrant a sentence of life imprisonment rather than a death sentence.156 Until 2005, the only
150. Id. at 322. 151. TEX. PENAL CODE ANN. § 19.02(b)(1) (West 2011). 152. Id. § 19.03(a) (West 2011 & Supp. 2012). 153. Roper v. Simmons, 543 U.S. 551, 573–75 (2005). 154. Atkins v. Virginia, 536 U.S. 304, 321 (2002). 155. TEX. CODE CRIM. PROC. ANN. art. 37.071 (West 2006). 156. Texas Execution Primer, TEX. EXECUTION INFO. CTR., http://www.txexecutions.or
g/primer.asp (last visited Dec. 29, 2011) [hereinafter Texas Execution Primer].

08 - UMBREIT (DO NOT DELETE) 3/6/2013 9:18 PM
2012] ULTIMATE PENAL SANCTION 25
option available to juries was death or life imprisonment with the possibility of parole (the offender had to serve forty years before parole could be considered).157 However, since 2005, with the passage of S.B. 60, juries are allowed to consider LWOP in death penalty cases.158
A defendant sentenced to death usually goes through the mandatory processes of review, direct appeal, and postconviction.159 Direct appeal is made to the Texas Court of Criminal Appeals.160 If the conviction is upheld, the defendant may petition the state for a habeas review by the local federal district court and the Fifth Circuit Court of Appeals—focused on either errors not fully known at trial or violations of the defendant’s federal constitutional rights.161 “At any stage in [d]irect [a]ppeal or [p]ost[c]onviction, the case can be remanded to a lower court or reversed and returned to [the] trial court.”162 At the conclusion of each of these processes of review—direct review and postconviction review—the defendant is entitled to ask the U.S. Supreme Court to review the case.163 On occasion the Supreme Court will review a capital case if there are important legal issues.164
The judge presiding over a capital case sets the execution date once
157. Bill Habern & David O’Neil, What About the Parole Process When One Has a Life Sentence on a Capital Murder Charge?, HABERN, O’NEIL & PAWGAN L.L.P. 1–2 (2001), available at http://www.paroletexas.com/articles/life_sentence_parole2.pdf. The 1999 amendment to Article 37.071 Code of Criminal Procedure requires that, upon the defense’s request, the jury in a capital case can be instructed as follows: “[I]f the defendant is sentenced to imprisonment in the institutional division of the Texas Department of Criminal Justice for life, the defendant will become eligible for release on parole, but not until the actual time served by the defendant equals 40 years, without consideration of any good conduct time”). Id.
158. 2005 Tex. Gen. Laws 2705; TEX. PENAL CODE ANN. § 12.31(b) (West 2011). 159. Council for Restorative Justice, Victims and Survivors: Finding Your Way Through
Court Proceedings in Texas Death Capital Cases, GEORGIA ST. U. 53–55 (2009) (on file with author) [hereinafter Council for Restorative Justice, Victims and Survivors].
160. Texas Execution Primer, supra note 156, at 3. 161. Id. at 3–4. 162. CTR. FOR AM. & INT’L LAW, UNIV. TEX. AUSTIN SCH. SOC. WORK, DEFENSE-
INITIATED VICTIM OUTREACH TRAINING MANUAL 53–55 (2008), available at http://www.utexas.edu/research/cswr/rji/divo/training.html (requires downloading the Master Manual) [hereinafter DEFENSE-INITIATED VICTIM OUTREACH TRAINING MANUAL]. John Niland is the Director of the Capital Trial Project for the Texas Defender Service. Staff, TEXAS DEFENDER SERVICE, http://www.texasdefender.org/staff (last visited Nov. 5, 2012). He wrote a chapter (ch. 13, titled Steps in a Death Penalty Case: After the Trial) in Victims and Survivors: Finding Your Way Through Court Proceedings in Texas Death Capital Cases. See Council for Restorative Justice, Victims and Survivors, supra note 159, at 55 (providing a chart of the Texas death penalty appeals and postconviction procedure).
163. Texas Execution Primer, supra note 156, at 3–4. 164. Id.

08 - UMBREIT (DO NOT DELETE) 3/6/2013 9:18 PM
26 MARQUETTE LAW REVIEW [96:1
it appears that the offender’s appeals have been exhausted.165 Persons in attendance at the execution can include five relatives or friends of the condemned.166 In 1996, the Texas Department of Criminal Justice adopted a board rule allowing victim witnesses to attend as well.167 The average length of time from conviction to execution is 10.8 years.168 “[T]he national average is that only about one in eleven—nine percent (9%)—of those sentenced to death are executed; most others spend the rest of their lives in prison, die in prison from other causes, have their sentences overturned on appeal or escape the death penalty through executive clemency.”169
B. Minnesota
In 1989, Minnesota increased sentencing for higher severity crimes, establishing the parameters in use today.170 Specifically, the punishment for first-degree murder was thirty years to life before parole eligibility (referred to as life without parole)171 until 2005 when Minnesota established “life without release (LWOR) for premeditated first-degree murder.”172 In 2008, only forty-eight persons, or 0.5% of the prison population, had been sentenced either under life without parole or
165. Id. at 4 (noting that the prosecution asks the state district judge to set the execution
date with the execution dates generally being set one to six months out). 166. TEX. CODE CRIM. PROC. ANN. art. 43.20 (West 2011). 167. Viewing Executions, VICTIM SERVS. DIV., TEX. DEP’T CRIMINAL JUSTICE,
http://www.tdcj.state.tx.us/divisions/vs/victim_viewing_executions.html (last visited Dec. 29, 2011).
168. SNELL, supra note 39, at 19 tbl.18. 169. Ebert, supra note 142, at 6. “[T]he best description of our capital punishment
system is that of the 6700 people sentenced to die between 1973 and 1999, only 598—less than one in eleven—were executed.” James S. Liebman, The Overproduction of Death, 100 COLUM. L. REV. 2030, 2056 (2000). The U.S. Department of Justice stated that “[o]f the 7,879 people under sentence of death between 1977 and 2010 . . . 6% died by causes other than execution,” TRACEY L. SNELL, BUREAU OF JUSTICE STATISTICS, U.S. DEPT. OF JUSTICE, CAPITAL PUNISHMENT, 2010–STATISTICAL TABLES 1 (2011). Similarly, the Death Penalty Information Center found that “[s]ince 1976, 272 death row inmates have been granted clemency for humanitarian reasons. Clemency, DEATH PENALTY INFO. CENTER, http://www.deathpenaltyinfo.org/clemency (last visited Oct. 27, 2012). “Humanitarian reasons include doubts about the defendant’s guilt or conclusions of the governor regarding the death penalty process.” Id.
170. MINN. DEP’T CORR., MINNESOTA CRIMINAL SENTENCING ENHANCEMENTS: HIGHLIGHTS FROM 1987 TO 2010, at 1 (2010), available at http://www.doc.state.mn.us/publications/documents/10-10Sentencingenhancements.pdf.
171. Id. 172. Id. at 3.

08 - UMBREIT (DO NOT DELETE) 3/6/2013 9:18 PM
2012] ULTIMATE PENAL SANCTION 27
LWOR.173 Under Rule 29, convictions of first-degree murder and decisions in postconviction proceedings involving convictions of first-degree murder are directly appealable to the Minnesota Supreme Court within ninety days after the final judgment.174
VII. SUMMARY OF ULTIMATE PENAL SYSTEM
Although volumes have been written on the death penalty, survivors are the ones most directly affected by the crime and society’s response to it. Apart from arguments about the appropriate role for survivors during the trial or voyeuristic glimpses into their reactions to the execution and their need for closure, little if any attention has been given to survivor experiences unique to capital murder (or its equivalent) and to the totality of their existence subsequent to the murder. The striking absence of survivor voices likely contributes to their marginalized status and the propensity of others to presume and assign meaning and motive to their journeys. This Study seeks to expand the focus within the therapeutic jurisprudence community beyond the therapeutic impact of law enforcement and criminal proceedings to include the long-range impact of the offender’s punishment on the physical and mental health of survivors.
VIII. METHODOLOGY
A. Design
This multisite, mixed-methods Study used a cross sectional research design over four time periods to examine and compare differences in the conviction and postconviction experiences of family survivors of homicide victims. Because the average length of time from conviction to execution in Texas is 10.8 years,175 a comparable time period was used to select participants. Participants in both states were selected from these time periods: sentencing to three years postsentence (Time 1), five to eight years postsentence (Time 2), ten to twelve years postsentence (Time 3), and fourteen to sixteen years postsentence (Time 4). Although it would have been preferable to hold the state context of the punishment consistent for comparative purposes,176 two states were used
173. Ashley Nellis, Throwing Away the Key: The Expansion of Life Without Parole Sentences in the United States, 23 FED. SENT’G REP. 27 app. at 31 (2010).
174. MINN. R. CRIM. P. 29.02(1)(a), .03(3)(a). 175. SNELL, supra note 39, at 19 tbl.18. 176. There are vast differences between Texas and Minnesota including their
08 - UMBREIT (DO NOT DELETE) 3/6/2013 9:18 PM
28 MARQUETTE LAW REVIEW [96:1
because neither Texas nor Minnesota employed both types of UPS over the 10.8 years covered by the Study.177
This Study used a mixed-methods approach, which is a procedure for collecting, analyzing, and “mixing” both qualitative and quantitative data within a single study.178 This method helps to obtain a more complete understanding of human behavior and experience than using one method alone, and it also provides for a convergence or corroboration of findings.179 In this regard, the Study asked two questions, each of which required a different type of data. The qualitative research question was, What are the conviction and postconviction experiences of family survivors in capital murder cases? The quantitative research question was, What is the differential effect of the death penalty and LWOP on survivor well-being? These questions provided the framework for the Study. Although qualitative and quantitative data were collected concurrently, data from the two methods were analyzed separately, and the results were compared between the two. The priority in the design was given to the qualitative method.
B. Measures
1. Demographics
The Demographic Questionnaire (DQ) developed for this Study measured homicide survivor demographics. Participants reported their year of birth; gender; race or ethnicity; marital status; education; age of
geographical location, political history and party affiliation, size and diversity of population, level of educational attainment, and crime and poverty rates. See Jeffrey M. Jones, State of the States: Political Party Affiliation, GALLUP (Jan. 28, 2009), http://www.gallup.com/poll/114016/state-states-political-party-affiliation.aspx; U.S. Dep’t Commerce, Law Enforcement, Courts, & Prisons: Crimes and Crime Rates, CENSUS.GOV (2012), http://www.census.gov/compendia/statab/cats/law_enforcement_courts_prisons/crimes_and_crime_rates.html; U.S. Dep’t Commerce, State and County Estimates for 2010, CENSUS.GOV (June 15, 2012), http://www.census.gov/did/www/saipe/. Compare, e.g., State & County QuickFacts: Texas, U.S. CENSUS BUREAU, http://quickfacts.census.gov/qfd/states/48000.html (last updated Sept. 18, 2012) (describing Texas population, diversity, and educational statistics), with State & County QuickFacts: Minnesota, U.S. CENSUS BUREAU, http://quickfacts.census.gov/qfd/states/27000.html (last updated Sept. 18, 2012) (describing Minnesota population, diversity, and educational statistics).
177. Texas began using LWOP in 2005. See 2005 Tex. Gen. Laws 2706. 178. JOHN W. CRESWELL & VICKI L. PLANO CLARK, UNIV. NEB.-LINCOLN,
DESIGNING AND CONDUCTING MIXED METHODS RESEARCH 7 (2007). 179. Veronica A. Thurmond, The Point of Triangulation, 33 J. NURSING SCHOLARSHIP
253, 257 (2001).

08 - UMBREIT (DO NOT DELETE) 3/6/2013 9:18 PM
2012] ULTIMATE PENAL SANCTION 29
the victim when killed; relationship to the victim; gender of the victim; date of the victim’s death; whether the murderer was known by the victim, the homicide survivor, or both; time since death; time since sentencing; and, for Texas participants, whether the death sentence had been carried out and, if so, time since execution.
2. Well-Being
Well-being was measured by the Inventory of Complicated Grief-Revised (ICG-R).180 The ICG-R is a thirty-seven-item assessment of complicated grief responses in the month prior to survey administration.181 This Study used the composite score of the thirty-two ordinal-level response items in the scale, with higher scores indicating greater symptoms.182 In this sample, scores ranged from 3 to 100. In previous studies, ICG-R reliability has been found to be good.183 This
180. For a discussion of complicated grief, see generally Holly G. Prigerson & Selby C.
Jacobs, Traumatic Grief as a Distinct Disorder: A Rationale, Consensus Criteria, and a Preliminary Empirical Test, in HANDBOOK OF BEREAVEMENT RESEARCH 613 (Margaret S. Stroebe et al. eds., 2001) [hereinafter Prigerson & Jacobs, Traumatic Grief] (discussing “traumatic grief”). Traumatic grief is synonymous with complicated grief. Id. at 615. For a discussion of the development of the ICG, see generally Holly G. Prigerson et al., Inventory of Complicated Grief: A Scale to Measure Maladaptive Symptoms of Loss, 59 PSYCHIATRY RES. 65 (1995) [hereinafter Prigerson et al., Inventory].
181. See Prigerson et al., Inventory, supra note 180 (establishing the ICG, a nineteen-criteria assessment); Prigerson & Jacobs, Traumatic Grief, supra note 180 (revising and expanding the ICG to the Inventory of Traumatic Grief (ITG) a thirty-six-criteria assessment). The ICG-R is a thirty-seven-criteria assessment which is a modified version of the original ICG nineteen-criteria assessment. See Kenneth E. Fowler, The Relationship Between Self Reported Trauma, Complicated Grief, and Depression Among College Students (Apr. 27, 2006) (unpublished Ph.D. dissertation, Florida State University), available at http://diginole.lib.fsu.edu/etd/4409/. The ICG-R consists of five items assessing the context of grieving (two dichotomous questions, two fill-in time period questions, and one short-answer question) and thirty-two ordinal-level items constituting a grief symptoms severity scale.
182. The thirty-two items are measured on a Likert-type scale and can be summed for a total composite score. Each Likert-type scale answer was scored 0 to 4. As with a study about familial grief in physician assisted dying, "[t]he items were summed to form a continuous measure of severity of prolonged grief." See Linda Ganzini et. al., Mental Health Outcomes of Family Members of Oregonians Who Request Physician Aid in Dying, 38 J. PAIN & SYMPTOM MGMT. 807, 809 (2009). Because thirty-two items used Likert-scale type answers, scores on the ICG-R could range from 0 (arrived at by answering 0 for all thirty-two questions) to 128 (arrived at by answering 4 for all thirty-two questions).
183. Robert A. Neimeyer & Laurie A. Burke, Complicated Grief in the Aftermath of Homicide: Spiritual Crisis and Distress in an African American Sample, 2 RELIGIONS 145, 153 (2011) (“High internal consistency (Cronbach’s α = 0.95) has been reported for the ICG-R in samples of both normative and traumatic, premature loss.”); Amy E. Latham & Holly G. Prigerson, Suicidality and Bereavement: Complicated Grief as Psychiatric Disorder Presenting

08 - UMBREIT (DO NOT DELETE) 3/6/2013 9:18 PM
30 MARQUETTE LAW REVIEW [96:1
Study found that the ICG-R showed good internal consistency with a Cronbach’s alpha of 0.952.184
3. Survey Instrument
A fifty-seven-item survey instrument was developed for this Study from focus group interviews in Texas and Minnesota with three groups of homicide survivors and three groups of service providers.185 Individual interviews were also conducted with persons knowledgeable about the execution process. Individual survey items were derived from a template analysis186 of the data gathered from the focus group and individual interviews.187 Survey items covered (1) perceptions of justice, (2) attitudes about the UPS, (3) experiences with the criminal justice system, (4) experiences with the offender, (5) psychological states, (6) social and psychological support, (7) religion and spirituality, (8) media, and (9) family relationships. In addition, participants from Texas in Time 2 to Time 4 were asked questions about the appeals process, execution, and postexecution experience depending on their individual circumstances (e.g., if the execution had already occurred).
C. Sample Procurement
This Study used random purposive sampling to recruit a representative sample of homicide survivors whose loved one was killed in Texas or Minnesota and the offender(s) was tried in the same state
Greatest Risk for Suicidality, 34 SUICIDE & LIFE-THREATENING BEHAV. 350, 354 (2004) (indicating that the ICG-R has a Chronbach’s α of 0.92). Cronbach’s alpha is a coefficient of reliability. See Lee J. Cronbach, Coefficient Alpha and the Internal Structure of Tests, 16 PSYCHOMETRIKA 297, 307 (1951). It is commonly used as a measure of the internal consistency or reliability of a psychometric test score for a sample of examinees. Id. at 297–98.
184. Internal consistency normally ranges between 0 and 1. Joseph A. Gliem & Rosemary R. Gliem, Calculating, Interpreting, and Reporting Cronbach’s Alpha Reliability Coefficient for Likert-Type Scales, in 2003 MIDWEST RESEARCH TO PRACTICE CONFERENCE IN ADULT, CONTINUING, AND COMMUNITY EDUCATION 87 (2003). “The closer Cronbach’s alpha coefficient is to 1.0 the greater the internal consistency of the items in the scale.” Id.
185. See infra Appendix C. 186. See DOING QUALITATIVE RESEARCH 21 (Benjamin F. Crabtree & William L.
Miller eds., 2d ed. 1999). It is appropriate for data collected using semi-structured or structured questions or categories derived from a specific theory. See id. at 164–65. Data is coded according to these a priori codes. See id. at 164–65. Additionally, codes representing themes are defined as these emerge. See id. at 165.
187. See Marilyn Armour & Mark Umbreit, Homicide Survivors: Factors that Influence Their Well-Being, 2 J. FORENSIC SOC. WORK (forthcoming Dec. 2012) (illustrating a study of the findings from the focus group and individual interviews).

08 - UMBREIT (DO NOT DELETE) 3/6/2013 9:18 PM
2012] ULTIMATE PENAL SANCTION 31
between 1992 and 2007. In order to obtain the survivor sample, offenders convicted of capital murder (Texas), or first-degree murder (Minnesota), were randomly selected from offender lists for each of the four time periods (Time 1 to Time 4). These lists are publically available on the Texas Department of Criminal Justice website188 and, upon request, from the Minnesota Department of Criminal Justice. In Texas, the names of each offender were given to a victim assistance coordinator at the Texas State Attorney General’s Office. The victim assistance coordinator then contacted the homicide survivor on file with the office (whose loved one had been killed by the randomly selected offender). In Minnesota, the names of each offender were given to the Director of Survivor Resources, a Minnesota agency that provides services to family survivors of victims of violent death. The director used her extensive network of contacts with victim assistance coordinators employed at district attorney generals’ offices throughout Minnesota to find and contact each homicide survivor whose loved one had been killed by the randomly selected offender. Homicide survivors were given information about the Study by either the victim assistance coordinator (Texas) or the Director of Survivor Resources (Minnesota) and asked if they were interested in participating. Those individuals who were willing to participate were asked whether they would prefer to contact the researcher themselves or have the researcher contact them directly. This procedure was followed until a sample of thirty-nine participants was procured, consisting of approximately five homicide survivors for each time period per state.189
D. Data Collection
Semistructured interviews were conducted with homicide survivors between 2008 and 2010 in Minnesota, Texas, Florida, and Tennessee.190 The principal investigator for the Study conducted all the interviews, which ensured consistency in how the interviews were managed. Each interview was held at a place and time selected by the participant and lasted approximately two hours. Participants signed an informed-
188. Death Row Information: Offenders on Death Row, TEXAS DEP’T OF CRIM. JUST. (Aug. 8, 2012), http://www.tdcj.state.tx.us/death_row/dr_offenders_on_dr.html.
189. Despite numerous attempts, the fortieth participant in the Study sample could not be contacted. Consequently, the sample for Texas Time 4 is limited to four rather than five homicide survivors.
190. Twenty-eight interviews were done in 2008, and eleven were done in 2010. Two of the Texas participants were interviewed in their current state of residence—one in Florida and one in Tennessee.

08 - UMBREIT (DO NOT DELETE) 3/6/2013 9:18 PM
32 MARQUETTE LAW REVIEW [96:1
consent statement and completed the DQ and ICG-R prior to beginning the interview. Interviews were digitally recorded and transcribed for analysis.
E. Data Analysis
Data analysis of the qualitative interviews was conducted by the principal investigator. Data analysis of the quantitative measures (DQ and ICG-R) was done concurrently by a statistician.191 Since the purpose in triangulating methods is to enhance the completeness and confirmation of data in research findings through generating more accurate data,192 the principal investigator and statistician worked separately to ensure that the findings from their analysis did not influence the final product.
1. Qualitative Data
Data analysis was done using matrix analysis, which is a categorization and organization of qualitative data based on comparisons across cases and across time.193 Matrices are used to lay out the available data and to facilitate the comparison and the construction of hypotheses. The analysis consisted of six stages. In Stage 1, each interview transcript was randomly selected and read without regard to time and state to gain familiarity with the words, descriptions, meanings, and personal narrative of the participant. A narrative analysis194 was performed on each case based on temporal aspects of the account including the participant’s personal changes. In Stage 2, cases were grouped by time (Time 1 to Time 4) and state (Texas or Minnesota) (n = 8 groups). Interviews within each time-by-state group were reread for identification of event themes specific to the group. Many of the event themes were common for all groups, but some event themes (e.g., appeals) were distinct to either Texas or Minnesota or to particular time
191. The statistician for this Study was Stephanie Rivaux, Ph.D, LMSW who was
employed, for the Study, as an independent contractor by the University of Texas, School of Social Work.
192. Thurmond, supra note 179, at 257. 193. See MATTHEW B. MILES & A. MICHAEL HUBERMAN, QUALITATIVE DATA
ANALYSIS: AN EXPANDED SOURCEBOOK 93–94 (2d ed. 1994). 194. See CATHERINE KOHLER RIESSMAN, NARRATIVE METHODS FOR THE HUMAN
SCIENCES 11 (2008) (noting that a “[n]arrative analysis refers to a family of methods for interpreting texts that have in common a storied form”). Attention to contingent sequences of action distinguish the analysis as well as how individuals use narrative to construct who they are and how they want to be known, i.e., their identities. Id. at 5–8.

08 - UMBREIT (DO NOT DELETE) 3/6/2013 9:18 PM
2012] ULTIMATE PENAL SANCTION 33
periods. In Stage 3, rating scales, content-based domain typologies, and experiences or attitudes dichotomized into high–low, present–absent, and satisfied–unsatisfied were assigned to the event themes for comparative purposes. In Stage 4, matrices of event themes by case, time, and state were constructed. Event themes in each case were assigned a scale rating, dichotomized ranking, or typology classification. In Stage 5, quotes from each case were retrieved to substantiate the assigned rating, ranking, or classification. In Stage 6, scale ratings, dichotomized rankings, and typology classifications for event themes were compared as follows: cases nested within the states; cases within time periods nested in states; groups of cases by time period nested in states; and groups of cases by time period between states.
Memoranda were written on the definitions of event themes; the bases for rating scales; rankings of dichotomized variables and typology categories; the findings for each event theme; and the hypothesized relationships as a result of the comparisons made between cases (e.g., comparing participant reactions to executions) and comparisons made within and between groups by state and time (e.g., comparing participant experiences in Texas and Minnesota with the prosecution team at Time 1). The qualitative software data analysis computer program NVivo 9 was used to assist with the analysis.
2. Quantitative Data
Analysis was done of descriptive case variables, respondent and victim demographic variables, and responses to the ICG-R. Case characteristics included state of case, time period of case (Time 1 to Time 4), number of victims in the case, ongoing engagement with the murderer, family violence, prior association between the respondent and the murderer, whether the murderer was known to the victim, and, if the case was a death penalty case, whether the sentence had been carried out. Respondent demographic variables included gender, race/ethnicity, year of birth, marital status, and education level. Victim demographic variables included relationship of the victim to the respondent, gender, and age at time of death.
Once descriptive analyses were examined, ICG-R scores were submitted to a two-way factorial analysis of variance (ANOVA) having two levels of state (Minnesota and Texas) and four time periods (Time 1, Time 2, Time 3, Time 4). Factorial ANOVA is useful when examining how two or more grouping variables (in this case, state and time period) predict a single, normally distributed continuous variable

08 - UMBREIT (DO NOT DELETE) 3/6/2013 9:18 PM
34 MARQUETTE LAW REVIEW [96:1
such as the composite ICG-R score. To facilitate quantitative analysis of the qualitative data, the
researcher coded event themes into categorical and ranked ordinal variables (see Stage 5 above). Correlation and regression analyses of select event themes and ICG-R scores were performed on these data. Despite adherence to a fairly rigorous blind coding process, the coding of the data was inherently subjective and was not independently verified. Therefore, the preliminary quantitative findings should be treated with caution due to undetermined reliability of the coding process.
F. Sample Profile
The sample used in the qualitative and quantitative analyses consisted of thirty-nine individuals who had a loved one murdered and who had subsequently experienced the perpetrators’ trial and conviction. Twenty individuals from Minnesota and nineteen from Texas participated in this Study. Each participant was from a separate legal case. Cases were split nearly equally between the four time periods.195
The thirty-nine participants included in the analysis represented forty-six victims, with most respondents losing one significant other, four respondents losing two significant others, and one respondent losing three significant others. Of the thirty-nine participants, eighteen reported continuing engagement with the murderer or the murderer’s family either through the criminal justice system or through community and familial relationships. These participants were divided equally between states. In 38.5% of cases, the respondent knew the person who committed the murder (n = 15), while in 61.5% of cases, the respondent reported that the victim knew the person who committed the murder (n = 24). Nearly 33% of cases were family violence cases (n = 12). The time since the homicide ranged from 2.58 to 19.75 years, with a mean of 10.00 years (σ = 4.5). The time since sentencing ranged from just over 1 year to 19.25 years, with a mean of 8.8 years (σ = 4.9). Of the nineteen Texas cases where the sentence was the death penalty, the sentence had not been carried out in fifteen cases (78.9%)196 and had been in four cases (21.1%). In cases where the death penalty sentence had been
195. Despite numerous attempts, the fortieth participant in the Study sample could not be contacted. Consequently, the sample for Texas Time 4 is limited to four rather than five homicide survivors.
196. An offender committed suicide in a Time 2 Texas case.

08 - UMBREIT (DO NOT DELETE) 3/6/2013 9:18 PM
2012] ULTIMATE PENAL SANCTION 35
carried out, the time since execution ranged from 1 to 6.5 years with a mean of 3.98 years (σ = 2.4). Table 1 below shows the counts and valid percentages of case characteristics for the total sample and for each state separately. This table shows that case characteristics are fairly similar between Minnesota and Texas cases with two exceptions: (1) a much higher proportion of Minnesota victims knew the person who killed them, and (2) all of the multiple murders occurred in Texas.
Respondents were primarily female (n = 31, 79.5%), and the majority reported mainly White/Caucasian (n = 31, 79.5%) or Black/African-American (n = 4, 10.3%) racial/ethnic status. Although age data was not gathered, data regarding year of birth was available, and respondents reported years of birth between 1930 and 1979 with a mean of 1953 (σ = 12.6 years).197 Nearly half of the respondents were married (n = 19, 48.7%), though a significant number were widowed (n = 8, 20.5%) or divorced (n = 6, 15.4%). The remaining participants were single (n = 4, 10.3%), separated (n = 1, 2.6%), or in a committed relationship (n = 1, 2.6%). Regarding education, most respondents had some college (n = 14, 35.9%) or had a high school degree or equivalent (n = 8, 20.5%). Table 2 presents full respondent demographic data for the whole sample broken down by state. Review of this table shows that, again, Minnesota and Texas respondents were relatively similar with two minor differing trends: (1) Texas respondents were slightly more diverse racially/ethnically than Minnesota respondents, and (2) Minnesota respondents showed a slight trend towards higher levels of education.
Victims were split near equally by gender, with 56.5% female (n = 26) and 43.5% male (n = 20). In relation to the respondent, most of the murder victims were parents or stepparents (n = 19). Of the remaining victims, seven were siblings, seven were children or step-children, six were spouses or partners, two were grandparents, and five were “other” (which included aunts, mothers-in-law, and daughters-in-law). Table 3 below shows the distributions for relationship and victim gender for the whole sample and by state. Review of this table shows that participants from the two states were relatively comparable. Victim ages varied considerably in this sample, with a range of four months to ninety-three years. Texas victims showed a wider age range than did Minnesota victims. Specifically, in Minnesota, victim ages ranged from eighteen to
197. Participants’ ages averaged roughly 54 years, with a range of approximately 29
years to 78 years.

08 - UMBREIT (DO NOT DELETE) 3/6/2013 9:18 PM
36 MARQUETTE LAW REVIEW [96:1
sixty-one years with a mean of 38.4 (σ = 13.6), while Texas victim ages ranged considerably more, from four months to ninety-three years, with a mean of 33.6 (σ = 24.6).
IX. QUALITATIVE FINDINGS198
Findings were divided into three categories: impact of the UPS on the conviction experience in the criminal justice system; impact of the UPS on the postconviction experience in the criminal justice system; and impact of murder and the UPS on survivors’ lives.199 Each category has associated tables that consist of event themes and researcher-assigned response ratings for each participant. Tables 4, 5, and 6 below show the event themes for each of the three main categories, response options, and percentage distribution for each option. Discussion of the tables focuses on key differences between cases, time periods, and states, as well as commonalities.
A. Category 1: Impact of the UPS on the Conviction Experience
The conviction experience refers to the initial trial in Minnesota and the bifurcated trial in Texas (guilt–innocence phase and punishment phase). It is both a ritualized social drama and communicative forum that evokes deep emotion and contributes to collective sense-making.200 These legal proceedings, and the preparation for them, are the critical justice juncture for survivors. Their attendance allows them to stand in for the victim and to bear witness to justice. Besides scrutinizing the defendant’s persona and conduct, survivors’ very presence, though silent, is the fulfillment of their duty to hold the defendant personally accountable for his monstrous act and their incalculable suffering. Though bystanders to the main event, their real or mental relationships with the prosecution and defense teams, as well as giving VIS, gives
198. All quotations in this section come from Study participants and are on file with the
author Marilyn Peterson Armour. The participants were interviewed in a series of twenty-eight interviews in 2008 and eleven interviews in 2010. Two of the Texas participants were interviewed in their current state of residence—one in Florida and one in Tennessee. Quotes from Study participants are written verbatim. They include the vernacular of the speaker and may not be grammatically correct or precise in meaning.
199. See infra Appendix B. Tables 8a, 8b, 9a, 9b, 10a, 10b, and 10c show the event themes for each category, rating scales, and the individual participant’s response to each theme by state and time.
200. See Jody Lyneé Madeira, Blood Relations: Collective Memory, Cultural Trauma, and the Prosecution and Execution of Timothy McVeigh, 45 STUD. L., POL., & SOC’Y 75, 84–85 (Austin Sarat ed., 2008).

08 - UMBREIT (DO NOT DELETE) 3/6/2013 9:18 PM
2012] ULTIMATE PENAL SANCTION 37
them preferential access to and membership in this publically historic event.
Table 4 below shows the event themes for Category 1. Event themes include relationships with the court, specifically the prosecution team—consisting of the prosecutor(s), investigators, and victim advocate—and the defense team. In addition, event themes focus on procedures such as giving input to the prosecution about the defendant’s sentence and making victim-impact statements, as well as on occurrences during the trial such as incidents with the murderer and interactions with the defendant’s family.
1. Prosecution Team Contact
Prosecution team contact in preparation for, during, and after the trial was evaluated on a 4-point scale ranging from 1 (none) to 4 (extensive). Most participants perceived that the prosecution team consisted of the prosecutors, victim assistance coordinators, detectives, sometimes the police, and even the judge. The Texas sample for all time periods was consistently satisfied with the amount and quality of the interaction they had with team members and had few, if any, complaints about how they were treated. Participants’ comments focused either on their interaction with the prosecutor, “He listened to everything about what I said and told me everything I wanted to know,” or the prosecutor’s performance,
[She] was better than anyone you see on TV. Best prosecutor ever. She told us to just be patient and let her build the story, fill in the missing puzzle pieces. She was telling us not to get upset about the public defender. She did a really good job.
Minnesotans varied more with 25% of participants having minimal contact throughout the process. The majority of these participants, however, were peripheral to the main family members impacted by the murder so it is not surprising that contact with the prosecution may have been less frequent, if it occurred at all.
As shown in Figure 1, Time 1 in Texas stands out because, in contrast to Minnesota and other time periods in Texas, all participants had extensive contact with the prosecutorial team. Moreover, the tenor of the contact was different from contact described by the Minnesota participants. With one exception,201 in Texas participants felt either
201. In one case, a family member was being prosecuted for a familial homicide and the

08 - UMBREIT (DO NOT DELETE) 3/6/2013 9:18 PM
38 MARQUETTE LAW REVIEW [96:1
partnered with or protected by the prosecution who developed close, personal ties with them. Prosecutors visited them in their homes, took them to lunch, made sidebar comments to them during the trial, shared inside information about the criminal justice system, and gave guidance and direction to participants’ decisions. A participant described how she became friends with several detectives who set her up with an author who wanted to do a book on her case:
I was scared about that. Then I talked to them and they said, “You know, she’s going to do the book anyway. Don’t you want to be cast in a better light than these other people?” So I called her and I said, “Okay, this is the deal. I will talk to you.” Well in the course of that she and I have become friends . . . . She has seen [the murderer] and interviewed him and it’s strange. I think she gets pleasure from his discomfort too.
Another participant described the quality of the interaction she had with prosecutors during a two-hour phone call:
They were talking about the fact that they’d like to go for the death penalty. And I said to them [that] I wasn’t real comfortable with the death penalty. But, yet I thought if anyone deserved it he did. And I hadn’t been to the trial yet and I didn’t know what all had happened. I said, “Well wouldn’t it be better to shut him in a cage somewhere and leave him there without parole?” [T]hey started telling me all the benefits to people in prison in the general public. They can get a college degree. They get their teeth fixed at no charge. They get all this medical coverage. I mean they get everything. I mean we provide them with the best . . . . I’m sitting here going, “Oh my God!” So, finally in conclusion after we talked about all of that and what could and couldn’t happen and how strong we felt their case was, I just in my heart said, “ You know what? This guy doesn’t need to be walking on this earth anymore.” And that’s when I told them, “You go for the death penalty. Can you get it?” And they said, “We feel like we can.”
Similarly, Time 1 Minnesotans relayed that the prosecution was supportive, informative, and hard working. In speaking about one of the prosecutors, a participant said,
She was very nice. She explained everything to us, what we don’t know about. My sister doesn’t understand that much English
participant had extensive—but negative—contact with the prosecution team.

08 - UMBREIT (DO NOT DELETE) 3/6/2013 9:18 PM
2012] ULTIMATE PENAL SANCTION 39
and she understood everything they were saying . . . . [They] contacted me every time something happened or they were going to do something. They’d ask me what we want and we’d always say we wanted the death penalty.
Overall, for Time 1, relationships between homicide survivors and prosecutorial team members in Minnesota seemed more formal and less personal than those experienced by survivors in Texas.
2. Sanction Input
Input from homicide survivors into the decision about the murderer’s punishment was rated from none (1) to a lot (3). With one exception, participants in both states indicated that they generally had no input (Texans during Time 1 reported they had a lot (60%) or some (40%) input). In one instance, the father of a son who was killed pushed on the district attorney saying, “Don’t disrespect my son. This guy needs to die,” which resulted in his finding “a law [that] could be used and followed. And they did it.” Input, however, did not necessarily mean that participants got what they wanted. A participant whose son had killed members of the family expressed that “[w]e argued vehemently and effectively or at least passionately and I think argued well that [the death penalty] wasn’t necessary in this case and nobody wanted it. And to my knowledge there has never been a case where both sides of the victims’ [family] asked the DA not to pursue the death penalty and yet they did.”
3. Input Satisfaction
Regardless of whether they had input into the decision making, most of the participants, in both states for all time periods, felt satisfied with the process. In Texas, some participants pointed out that they were content that the decision was not in their hands: “I got the justice that I so desired. I really did. I felt guilty about that too for a while, but then I wasn’t the jury. I did not make the decision. The decision just happened to fall where I wanted it to fall.” They might have felt relieved when the murderer got the death penalty, but they did not want to live with the responsibility for deciding someone’s life or death. Moreover, some Texans felt their input was not relevant because if the murderer met the prerequisites for the death penalty, he’d likely end up on death row anyway: “I just assumed he’d get the death penalty because he’d killed two people.”
In Minnesota, participants also seemed to feel that LWOP, or a life sentence with no eligibility for parole for at least thirty years, was the

08 - UMBREIT (DO NOT DELETE) 3/6/2013 9:18 PM
40 MARQUETTE LAW REVIEW [96:1
best a homicide survivor could get. In most instances, participants felt that their preference for the death penalty carried no weight and they best accept what was possible as “good enough.” A mother whose daughter was killed by her former husband said,
At the time if we’d had the death sentence, I probably would have been very happy that he would have gotten it. But like I say, I don’t know. That wouldn’t have solved anything. I guess just knowing he’s in jail for life. He can’t get out. He can’t enjoy the privilege of saying when he’s gonna go to lunch or whatever. I guess that’s [it]. I accept it. I don’t fight against it.
Many Minnesotans, however, were confused by the sentence and expressed consternation at their discovery that “life” with parole is sometimes merely thirty years. “I was surprised to find out he’d be eligible for parole in twenty-seven years. I thought he’d just get life without the possibility of parole. I didn’t think it was quite right.” Along with expressing either their personal preference for the death penalty or not understanding the sentencing rules, Minnesotans generally expressed satisfaction that the murderer had gotten the maximum sentence: “I left [the courtroom] with a sense of there really is justice as much as can be given in Minnesota. It felt like as much justice as Minnesota was going to allow had been accomplished.”
4. Defense Attorney’s Behavior
Participants’ reports of defense attorneys’ behavior during the trial ranged from negative (1) to positive (3). Most homicide survivors in both states and for all time periods had either negative or neutral reactions. In comparing the defense attorneys for the two offenders who took her son’s life, a mother shared the criteria she used for seeing one negatively and the other neutrally:
The [first] attorney made me very angry. I can remember thinking he had a big round head. I wanted to take it off and roll it down a bowling alley. And at the end [of the trial] he just did all this, “Oh, he’s coming to Jesus thing.” I found him very upsetting . . . . The other seemed like he was quite a decent [man]. He did his job but he did it respectfully. He didn’t try to tear [my son’s] character down. And he said after he came up [to me], . . . “He’s guilty.” He believed [the murderer] was scum and guilty. . . . I guess I feel he was doing his job, but I don’t feel the kind of animosity towards him that I do with the other one. Because he didn’t play dirty.

08 - UMBREIT (DO NOT DELETE) 3/6/2013 9:18 PM
2012] ULTIMATE PENAL SANCTION 41
Time 3 Texans were a slight exception to the general negative trend. Except for one participant, homicide survivors made positive comments about the defense of the murderer. Comments focused on the competence of the defense attorneys and their sense of fairness: “They were doing their best for a reason—because they wanted to be sure no mistakes were made.”
5. Contact with the Defense Attorney
Contact with the defense attorney or others associated with the defense attorney was either negative (1) or positive (3); no contact was rated as neutral (2). As depicted in Figure 2, participants in Minnesota rarely had interaction with defense attorneys. Those that did engage with the defense felt positively about their brief interaction: “Afterwards she talked to us and said, ‘I’m really sorry.’” In response, the homicide survivor praised her saying, “You know what. You really did a great job for your client. You didn’t win, but you did everything you had to do.” Similar encounters happened in Texas but more frequently. Indeed, 32% of the sample had positive contact with the defense. Contact included asking a homicide survivor if a defense team member could send her a condolence card, acknowledging the homicide survivor every day in court, apologizing for representing the defendant because “he had to be represented by the state,” or making comments that indicated an empathic identification with the participant. Contact sometimes happened between a participant and a member of the defense attorney’s family. In one instance, the defense attorney and his wife came to the cemetery. The wife followed the homicide survivor into the bathroom at the trial to express her sorrow for the loss, and after the trial was over, told the survivor she was in their prayers. In another instance, the defense attorney’s parents sat with the participant’s parents during the trial.
Participants attached various meanings to these contacts. Sometimes the outreach was taken as an expression of kindness:
I didn’t feel, “Oh, they’re all against me.” It felt nice. I think she felt sympathy. She was African-American as was the defendant and I’m different.202 I think she knew that I was in pain. . . . I think it helped me that saying hello to me. Just to feel, “Okay. Wait a minute. She knows who I am. She knows there is a victim involved.”
202. Referring to the fact that she is not being a person of color.

08 - UMBREIT (DO NOT DELETE) 3/6/2013 9:18 PM
42 MARQUETTE LAW REVIEW [96:1
In some instances, interactions were interpreted as telling the homicide survivor that the defense was really on the participant’s side: “I think it says, ‘We’re on your side.’ I think that is basically what is said, ‘I’m on your side but I gotta give this man a defense.’” Participants also construed defense attorneys’ comments to be indicators of their humanity. A participant whose baby had been killed shared that the
[d]efense said it was hard for him to defend [the murderer] because he saw my baby’s high chair in the courtroom and it made him think about his baby. . . . It showed he had feelings and emotions too.. . . He’s thinking, “What if the same thing happened to one of [my] kids?”
Participants who had positive contact with defense-related individuals tended to make neutral or even positive comments about their performance. One homicide survivor remarked that “[w]hen they came up and apologized, I felt a little better, and felt like saying ‘Well, you know they’re just doing their job and this is what they have to do.’” Another person commented that “[s]he did a very good job defending him and really did try to give him life instead of the death penalty.”
6. VIS/Testimony
The majority of participants in both states gave victim-impact testimony or made statements after sentencing was completed. Some of the participants from Time 4 who did not give statements indicated that the practice of making them was not standardized at the time their offender’s case was adjudicated. Others could not remember if they made statements or not. Several participants decided not to make statements because of their feelings, at the time, toward the murderer. One person said, “I didn’t want to waste my breath on him.” Another person claimed, “It wouldn’t have fazed him. I didn’t want to give him any more of me.”
7. Satisfaction with Giving VIS
Participants’ levels of satisfaction with giving VIS ranged from unsatisfied (1) to satisfied (3). If participants reported that they gave their VIS without emotion, they were rated as neutral (2). Most homicide survivors in Minnesota and Texas were satisfied with what they said or how they said it. In relating what happened, most participants would comment on preparing the statement, what they said, how the murderer responded, how they felt giving the VIS, and what they felt having done it. Writing the statement often took time and, for

08 - UMBREIT (DO NOT DELETE) 3/6/2013 9:18 PM
2012] ULTIMATE PENAL SANCTION 43
some, was as important as giving it in court. One participant remarked, “Over the year [before the trial] I must have wrote that thing ten times and tore it up and started over. It’s like, ‘Oh, I forgot this part’ or ‘Oh, I forgot that part.’” Many homicide survivors were surprised at the intensity of their emotions when they gave their statement: “I broke down. I couldn’t stop it. I found myself shouting and he [the murderer] tried to stare me down. I had my speech all ready and I never got to say a word of it because it left my mind completely.” Participants took close note of how the murderer responded. Often the murderer seemed indifferent to them: “He would not look at me which meant he just didn’t care what he did, emotionless. Nothing that I said reached him.” When the murderer did respond, participants felt they had made an impact: “[It had] a huge impact cause I made him cry. It gave me hope that somehow he learned something from what happened . . . .” Some, however, reminded themselves that having an impact did not necessarily mean much: “I got to give my VIS to him and he was shaking and he was crying and I was like, ‘Whatever.’”
8. Trial Disruption by Murderer
Participants in both states reported that the murderers’ behaviors in court were upsetting to them.203 Sometimes the behaviors were nonverbal but held significance in the eyes of the family member:
He looked at me when he got upset in court one day and they ushered him out. He glared at me and his eyes were so black it was like looking into the pits of hell. I’ve never seen anybody’s eyes look like that, but I didn’t waver and then they moved me one row back.
Other times, what the murderer said or did was more explicit. A mother talked about the lasting impact of the murderer’s response after receiving the death sentence:
[T]hey brought him down the aisle . . . of course, I was crying. My mother was crying. Everybody else was crying. Because thank God. [H]e’s going to be put behind bars. Well he decides to yell out. “This ain’t over yet.” [T]hat boy was looking at us
203. In Texas, 39% (n = 7) of participants reported disruption by the murderer. In
Minnesota, 46% (n = 7) reported disruption. Percentages are based on total cases that provided information about behaviors of the murderer, the murderer’s family during the trial, or both. This information was not volunteered during two of the interviews with participants in Texas and seven cases in Minnesota.

08 - UMBREIT (DO NOT DELETE) 3/6/2013 9:18 PM
44 MARQUETTE LAW REVIEW [96:1
like the devil himself. “It’s not over yet. It’s not over yet.” He just kept telling us, “this is not over yet.” We took it like he wasn’t finished with us, like a threat.
The mother later explained that she fears for her son’s life because her husband’s and the murderer’s families are from the same small town and know each other: “I hear those words over and over and over.” For some participants, even the murderer’s neutral appearance was disturbing:
He behaved really good in court. He don’t say a word . . . . He was just being innocent like nothing happened . . . . That affected us because we know in his mind, he’s the one guilty of what he did and still sitting there pretending like nothing happened.
9. Contact with the Murderer’s Family
Interactions with the murderer’s family at the trial were rated from negative (1) to positive (3). A neutral response (2) meant that the family was referenced but only descriptively and that the participant did not indicate that their presence or absence made any difference to their emotional well-being. For example, “[The murderer] had nobody there. He had some little bimbo that showed up, not his wife. And sat in the back row with leather and chains and she was there a couple of days. But there was never anybody else.”
Negative interactions were initiated by both the homicide survivor participants and their family members as well as members of the murderer’s family. Negative interactions directed at participants included the murderer’s family making comments about needing to “get over it” or “needing to forgive the murderer”; cussing at homicide survivors in the elevator at the courthouse; making threatening comments and stalking homicide survivors outside the courthouse; giving them the finger in the courtroom; etc. Similarly, some family members of the person who had been murdered also had difficulty containing their feelings and reactions. A participant stared so relentlessly at the murderer that the murderer asked his attorney to intervene. In another instance, a participant jumped at the murderer as he passed by him. A father described how a bailiff stopped him from acting on his impulse to kill the murderer:
I looked around and saw where the bailiffs were. There wasn’t one who could stop me before I got there. Just smash his face into that table, pull him up, and rip his Adam’s apple out. And I

08 - UMBREIT (DO NOT DELETE) 3/6/2013 9:18 PM
2012] ULTIMATE PENAL SANCTION 45
looked around and this bailiff looked at me . . . and shook his head. And he said at the break, “I watched you light up. Your body tensed. Your eyes got real wide open . . . I saw your muscles just start. I know what you were thinking and I would have had to shoot ya. I don’t think I could have stopped you from getting to him.”
Interactions between the participant and murderer’s families were not always hostile. A participant described the significance of the connection made between her daughter and the sister of the murderer:
My daughter had told me, “Mom I went to school with his sister.” We were out in the hallway (outside the courtroom) and his sister told me. She said, “Ms. Bullingham,204 I am so sorry.” I said, “Baby it’s not your fault. You’re not accountable for him . . . it’s him.” It made a lot of difference. It meant a lot to me that she apologized and that she and my daughter were close at the end, that she and my daughter were hugging each other, together.
Positive contacts between family members of the homicide victim and the murderer’s family were usually initiated by the victim’s family:
I walked up to his father [as] we were leaving and I said, “I’m really sorry for you and your family cause I know this has got to be devastating.” And he looked at me and I could tell by the way he was looking at me that he wanted to tell me he was sorry. But he was afraid to, because it would be like he was owning up to it. But I wanted him to know that I was sorry for him. I told him, “I know what you’re going through.” Because he’s a parent. I know what I’ve gone through with my daughter.
These kinds of exchanges were more frequent in Texas and reported by slightly over 20% (n = 4) of participants. Information about interactions with the murderer’s family during the trial was not given by 40% (n = 8) of Minnesotans. Some of the murders, however, were familial homicides, and negative interaction between these family members occurred in other contexts.
10. Satisfaction with the Criminal Justice System
There were 65% of Minnesotans (n = 13) who were very satisfied or satisfied with the criminal justice system compared to 42% of Texans
204. Names have been replaced by pseudonyms and any identifying references to places have been redacted.

08 - UMBREIT (DO NOT DELETE) 3/6/2013 9:18 PM
46 MARQUETTE LAW REVIEW [96:1
(n = 8). Moreover, as indicated in Figure 3, 53% of Texans were very dissatisfied, dissatisfied, or somewhat satisfied compared to only 20% of Minnesotans. Higher levels of satisfaction were associated with the outcome of the case or the effort people in the system expended in bringing the murderer to justice. A participant concluded, for example, “Based off what laws we have and the limitations they did everything they could. They did a fabulous job.” Another participant echoed the same sentiment: “We were happy with it because we figure we got an outcome. He didn’t get away with it. . . . I’ve got probably more faith in the justice system. I guess because of the way we were treated and the lengths they went, to prove [the case].”
In Texas, lower levels of satisfaction were associated with general comments about the convictions of innocent people and quality of performance. A woman explained, for example, “[H]ere lately there have been cases especially here in Monteray where people have been exonerated after years of being penalized. How could that have happened? Somebody didn’t do their job.” Other participants based their assessments on their direct experience: “The judge during the trial is fixing to go on vacation after the trial. He’s flipping through a freaking magazine for his vacation. You could see him doing it. So, I’m still at the point where I ain’t got no faith in the system at all.” Some participants included the police and detectives in making their evaluations. A daughter commented on the fact that apprehending the murderer was due to involvement from the local city’s Pakistani community:
The Pakistani community really came forward and put pressure on the city. They had a rally downtown. They asked us to come. We came, we went. They caught the guy that same week . . . . The politics helped find the criminal and I’m happy it came in one year. But, I’m unhappy that it’s still dragging, that he gets so much appeal process.
In Minnesota, lower levels of satisfaction were clustered in Time 4 and were associated with disappointment in the case outcome or interactions with the police. In one instance, for example, the participant wanted the death penalty. This participant was upset because the murderer’s wife was alleged to be involved but was never charged. This participant also worried about the murderer’s release after his thirty-year sentence. Because the participant feared retribution, she relentlessly pondered what she might do to delay the murderer’s parole. In another instance, a father was irate because right

08 - UMBREIT (DO NOT DELETE) 3/6/2013 9:18 PM
2012] ULTIMATE PENAL SANCTION 47
after he was allowed back into his home following his daughter’s murder, an argument with the next-door neighbor ensued. The police, based on the neighbor’s report, came in droves to his home, handcuffed him, and threw him on the ground: “They supported this moron next door to me and I hated the . . . police. I still do. That’s one of the reasons I left from [there]. Couldn’t stand the place.”
11. Category 1 Summary
Event themes specific to the impact of the UPS on participants during the conviction process in the criminal justice system point to key players in the minds and memories of participants—criminal justice representatives, the defense attorney, the murderer and his family, and the homicide survivor’s position and power. Findings indicate little difference between Texas and Minnesota participants, except at particular points in time including: extensive engagement with the prosecutorial team in Texas during Time 1; positive reactions to the defense attorney in Texas during Time 3; more instances of positive contact in Texas between participants with defense team members or their families; and more instances of positive contact in Texas between participants and members of the murderer’s family. Although the numbers are small, it appears that there may be some subtle differences between the two states in the quality of the interaction between participants and key players during the conviction process. For example, Texas participants’ descriptions of engagement with the prosecutorial team during Time 1 is marked by less rigid boundaries; stronger and more frequent expression by the prosecutorial team of personal feelings and attitudes toward the murderer, what he did, and what he deserves; and more explicit commitment to the homicide survivor and personal involvement even to the point of friendship. By contrast, descriptions by Minnesota participants of their interactions with the prosecutorial team suggest that team members, though sensitive and empathic, are less revealing of their private responses and have limited personal engagement with homicide survivors, thereby making most visible behaviors reflective of their official role.
A similar trend is evident in the quality of the interactions between participants and the defense team. In Texas, nearly 32% of the participants reported that the defense team members or relatives of defense team members felt compelled to express their condolences to homicide survivors for their loss or lend them support during the trial. These exchanges went beyond what was expected; were evaluated as authentic by participants; and clearly helped survivors to feel

08 - UMBREIT (DO NOT DELETE) 3/6/2013 9:18 PM
48 MARQUETTE LAW REVIEW [96:1
acknowledged, valued, and appreciated. Texas participants’ receptivity to these interactions may be due to their perceptions of the defense attorney’s ambiguous commitment to representing the murderer. That ambiguity may relate to the fact that Texas, in contrast to Minnesota and many other states, depends on a rotation system of court appointed defense attorneys in capital cases—pulling from attorneys who arguably have limited experience in capital murder defenses.205 Based on that reality, Texas participants tended to reason that the outreach they experienced was actually a way for the defense to convey that their empathy was with the homicide survivor and that representing the murderer was only a job. In contrast, Minnesota participants rarely had interaction or positive engagement with the defense team,206 who are not on a rotation system. In that vacuum, the feelings participants expressed toward the defense were based on the conversations they had with them in their minds and consisted primarily of negative reactions about how the defense maligned the victim, kept participants out of the trial courtroom, among others.
These state-identified differences in engagement emerge again in some of the interactions between participants and members of the murderer’s family. Although 33% of the participants in both states had negative contact with the murderer’s family during the trial, the majority of Minnesotans made no reference to these individuals, which suggests they were not present physically at the trial or psychologically in the minds of participants. For Texans, the relationship with the murderer’s family may be more evident as shown by the fact that 33% of them made neutral comments and 25% had empathic exchanges initiated by the participants themselves.
Together, these contrasts suggest a state-based differentiation in how participants experience some aspects of the conviction process and
205. See 2001 Tex. Gen. Laws 1800–01, 1803–07. Minnesota uses a well-established public defender system to represent defendants in capital cases. See 1981 Minn. Laws 1982.
206. The contrast between the two states in how defense attorneys or their family members engage with survivors might be explained by how much defense attorneys identify with their role, which is to represent the defendant. In Texas, many, if not most, defense attorneys are in private practice, serve the indigent on a rotation or “wheel” system, and are appointed by a judge. See 2001 Tex. Gen. Laws 1800–01, 1803. Under the Texas Fair Defense Act passed in 2001, defense attorneys’ representations of the defendant in a capital case, though credible, may be somewhat “involuntary” and more of a service. Id. In Minnesota, defense attorneys are part of the public defender system. See 1981 Minn. Laws 1982. These attorneys may view their representation of the indigent as a “calling” rather than a job. Although speculative, this difference in professional identification could influence how a defense attorney perceives and interacts with victim-survivors in the courtroom.

08 - UMBREIT (DO NOT DELETE) 3/6/2013 9:18 PM
2012] ULTIMATE PENAL SANCTION 49
in how they and other key players engage during that time. It is possible that in Texas the recognition some participants felt from the prosecution, the support they experienced from the defense team, and the compassion they expressed directly to members of the murderer’s family reflect feeling a part of the system as well as empowered by the quality of attention they receive from people in authority. This sense of involvement and association with the system was also evident in the criticisms made by Texas participants about their criminal justice system. Rather than focus on their personal case outcome as the basis for their assessment, Texans critiqued the criminal justice system as if it were accountable to them as state citizens with decidedly vested interests given their status as homicide survivors.
B. Category 2: Impact of the UPS on the Postconviction Experience
After the initial trial and sentencing, survivors enter a no-man’s land. They have no role other than to wait for the culmination of the legal proceedings and the enactment of the sentence, whether life imprisonment or execution. For many, the unknowing outcome of the murderer’s continued existence is an ongoing reminder of the injustice they have to bear. Without finality, there is no resolution of the trauma. Though rarely acknowledged, this involuntary and subjectively created relationship is taken as real and survivors feel they know the murderer, whether or not they actually do. Survivors have scores of unanswered questions and actively fantasize about the murderer’s life and feelings, or lack thereof. In Texas, survivors frequently rehearse the upcoming execution, debate whether or not they will attend, and consider what it will be like and whether the murderer will do or say something that tips the emotional scale.
Table 5 below shows the event themes for Category 2. Besides the emphasis on the appeals and how participants felt about the process, event themes include civil actions initiated during the postconviction period. As well, event themes focus on the relationship with the murderer and consist of participants’ attitudes and desires for his suffering and remorse as well as their remaining questions. In Texas, this phase also includes the execution process.
1. Civil Actions
Many participants considered the possibility of civil suits to redress some of the injustices associated with the murder. Less than 5% of Texans, however, implemented such actions. As shown in Figure 4, the Minnesota sample was more active, particularly during Time 2 when

08 - UMBREIT (DO NOT DELETE) 3/6/2013 9:18 PM
50 MARQUETTE LAW REVIEW [96:1
80% of participants brought lawsuits. Although most of the actions filed were for monies from insurance companies and contested estates or from wrongful death suits, the most substantive motivation was to right the wrongs participants had endured due to the loss of their loved ones.
Part of rebalancing the ledger of justice was to correct manifestations of unfairness that accompanied or were the consequence of the murder. A daughter whose father was ambushed and shot by a neighbor sued the murderer for his assets. She explained the injustice and her decision to take legal action saying:
Why should he be able to take care of his kids now and we don’t have our dad to help us? His kids love him now. And my dad didn’t have a chance to help us do anything or be there for my son to take on vacation or do things with. So I always felt cheated. So, we sued him.
Sometimes survivors filed wrongful death suits against others who were responsible for the conditions that led to the murder. Survivors explained these suits as tools they could use to ensure inclusion of the significant players in their efforts to achieve a stronger sense of accountability and recompense for the injustice they and their loved ones had suffered. In one case, survivors sued a group home because of their failure to appropriately manage the violent behavior and whereabouts of the adolescent boy who killed their daughter after he broke curfew. In another case, after a domestic homicide, the parents (who were raising the children of their murdered daughter) filed suit against the Internal Revenue Service (IRS) because when the IRS agent was interviewing their daughter’s ex-husband (regarding his fraudulent tax statements), the agent left the room briefly and left the case file open on the table. This blunder gave the husband the chance to look at the report and to see that his ex-wife had turned him in to the IRS. Shortly thereafter, he murdered her. Although the out-of-court settlement provided monies to pay for the children’s college and dental work, the victim’s mother talked about how this action shifted some emotional baggage associated with the injustice of her daughter’s murder: “I felt vindicated, kind of, cause I felt it was their fault . . . I proved my point . . . and after that we could get on with our life.”
Many, if not most, of the participants who brought legal actions described what happened and what they did about it with a greater sense of righteous anger than they expressed about going through the criminal trial. The intensity of the anger seemed related to their recognition that their loved one’s death could have been prevented if

08 - UMBREIT (DO NOT DELETE) 3/6/2013 9:18 PM
2012] ULTIMATE PENAL SANCTION 51
others had not made such grievous errors or had been more conscientious. It was also related to the fact that, on top of losing their loved one, survivors had to endure situations where the murderer, or others who were undeserving, gained while they lost.
2. The Appeals Process and Survivors’ Reactions
The movement of a case through the appeals process was assigned a rating of stuck, moving, or completed. Figure 5 shows that, in Minnesota, 90% of twenty-one cases pled or had completed the appeals process. The remaining 10% were moving through the process unimpeded. Minnesotans’ reactions to the process by case were rated as satisfied (48%), neutral (10%), or dissatisfied (10%). The rating of neutral was used if the appeals process was acknowledged but no emotional response was given. Information on reactions was not available for 33% of cases because the cases had pled out or participants made no reference to the appeals process itself.
For most participants, the murderer’s automatic direct appeal to the Minnesota Supreme Court was concluded within two years after conviction and sentencing. Only one murderer received a second trial that reduced his sentence, which he is now appealing. In this case, the appeals process has lasted eight years. The survivor had a hard time reconciling the loss after having achieved the maximum sentence:
The first time around . . . I left with a sense of there is justice as much as can be given in Minnesota . . . . The second trial completely tore that to shreds. I don’t believe in it anymore. It’s kind of like they gave us this and then they just kicked us in the gut and threw us off the curb.
All other cases were moving through or had completed the automatic appeals process without incident. With one exception, survivors whose case convictions and sentences were upheld by the Minnesota Supreme Court indicated satisfaction with the process. Indeed, most of the satisfied survivors expressed only mild apprehension over a possible change in the outcome. A mother whose daughter was killed reported,
There’s an automatic appeal on first-degree murder and . . . I worry about that. They did have a couple of minor things that they said were not handled properly, but not enough to overturn the verdict . . . the minor things they did bring up were things that I wouldn’t have even thought of.
The relative insignificance of the appeal outcome is arguably manifest in the responses of half of the survivors during Time 3 and Time 4 who did

08 - UMBREIT (DO NOT DELETE) 3/6/2013 9:18 PM
52 MARQUETTE LAW REVIEW [96:1
not even mention the appeals process. A very different picture emerged in Texas, where the appeals
process involves a number of different state and federal proceedings. During Time 1 and Time 2, 70% of cases were moving through the process unimpeded. However, one case was stuck because of the possibility that the murderer might be found mentally retarded and, therefore, ineligible for the death penalty.207 The other two cases were rated as completed, based on the fact that one murderer elected to forgo his appeals and had been executed, and the other committed suicide in prison. During Time 3 and Time 4, all cases still in the appeals process (n = 6) were stuck because the murderer was appealing based either on the argument that he was mentally retarded or the contention that the murderer was a Mexican national and was tried in the U.S. without his being informed of his consular rights and without having notification to the Mexican consulate of his situation. The appeals for the remaining cases (n = 3) were completed and the murderers had been executed.
Differences in state reactions to the appeals process are shown in Figure 6a and Figure 6b. Texans’ reactions to the appeals process were rated as follows: 11% were satisfied, 53% were worried, and 37% were nonapprehensive.208 The two participants who were satisfied with the process had a shortened experience as noted above. Two participants were dissatisfied. In one of those situations, the participant’s son had murdered family members, and the son was his only remaining relative. The survivor was hopeful that future appeals might be successful, but he was nevertheless dissatisfied with the sentence and outcome of the appeals already heard.
About a third of Texas participants were nonapprehensive about the appeals process. Those who were nonapprehensive during Time 1 and Time 2 considered the process to be moving smoothly through its various stages. Those who were nonapprehensive during Time 3 and Time 4 were participants in cases where the murderer had been executed, and they were describing the appeals process retrospectively:
I wasn’t worried if they were going to get out or anything like that. I was being informed . . . whenever an appeal came up . . . that they were going for this, but most likely they were going to
207. In Atkins v. Virginia, the Supreme Court held that the execution of mentally
retarded criminals violated the Eighth Amendment’s prohibition on cruel and unusual punishment. 536 U.S. 304, 321 (2002).
208. Percentages do not add up to 100% because of rounding.

08 - UMBREIT (DO NOT DELETE) 3/6/2013 9:18 PM
2012] ULTIMATE PENAL SANCTION 53
be denied. . . . And they were denied. Every one of them was denied.
Specifically, over half of Texas participants, however, were mildly to exceedingly worried about the future. In cases that were successfully proceeding without delay, participants voiced concerns that the offender might get off due to a finding of mental retardation, only having circumstantial evidence, or the possibility that someone other than the person convicted might actually have been the responsible party. Although these concerns had some validity, participants principally worried that the victory gained in obtaining the death penalty might be lost if certain circumstances invalidated their win.
In cases that were stuck, participants voiced extreme apprehension and fear about the unpredictability and possible outcome of the appeals process. Moreover, because the case was stuck, some participants had endured unbearable circumstances. For example, in a twelve-year-old case, a murderer received a stay of execution, which the family learned about as they were within an hour of arriving at the prison for the execution. The case has been suspended since 2006 because the judge in the most recent appeal has not rendered a judgment so that the case can move forward. The participant and his wife are elderly and desperate for a decision regardless of its direction:
I don’t think I’ll live to see it. . . . I feel sure [the judge] is opposed to the death penalty. If I wrote him a letter, I’m afraid he’ll say, “Well, I’m gonna show that fellow. I’ll hold the case open longer.” And he can do it and I can’t do a thing about it . . . [a decision] would end it all. And that would be a blessing, just right there. Get it out of that court and get it on the way. If you want to say it goes back to life then so be it. Render that decision.
In another case, the lengthy appeals process plus the delay caused first by waiting for a hearing to determine the offender’s mental status and now by the murderer’s successful claim that he was not adequately represented by the psychologist and deserves yet another hearing has in some ways imprisoned the family. In this situation, a mother whose mother-in-law and young daughter were murdered had since had three children who knew nothing about their sister’s death. The mother kept the three children close to her at all times, fearful that something might happen to them. Moreover, the mother never visited the community her husband was from because her husband knew the offender’s family; consequently, she was fearful that the offender’s family would seek

08 - UMBREIT (DO NOT DELETE) 3/6/2013 9:18 PM
54 MARQUETTE LAW REVIEW [96:1
retribution once the murderer was executed. She was most concerned that with the new hearing there would be media coverage and her children might find out what happened:
I have to protect my children. Because I don’t want anybody at my doorstep, my school where my kids go . . . the media going to the schools, just to take a picture of my children. If anything happens the first thing we’re gonna do is get the kids. We have to have them in one place. I feel like everybody is going to have to go into seclusion.
The mother went on to describe the intensity of her aggravation with the system:
We haven’t had a sense of justice. I feel like my life is on hold because it just hasn’t been carried out . . . . When is it gonna be over? . . . [T]here are other murders that happened in 1995 that they have already been put to death. And ours is still lingering? Why aren’t things moving on? Why is everything at a standstill? Why are we, cause my children don’t even know. And I’m thinking, “How am I going to?”
As shown in Figure 6a, the majority of Texans who were worried about the appeals process were from Times 3 and 4, where cases were stuck in the appeals process. Participants’ stories about their appeals varied little except that Time 4 Texans’ stories seemed more despairing. Participants from both time periods tended to agonize over how long the process took and having limited to no communication about the legal proceedings. In some instances, they voiced fear and a reluctance to contact officials about the length of time or what was happening in the process. This ambivalence over knowing was accompanied by comments about not being sure what was believable or who to believe:
Now it’s just waiting. I get frustrated at that. In my mind there’s a possibility he might be set free if they’ve lost the evidence. [Prosecutor] Joe Michales says, “Oh no, they won’t do the whole trial. They do pieces.” I don’t trust him because they haven’t told me the same story as the D.A.’s office.
Survivors were frustrated watching other cases go through the system that were not as old as theirs. They reassured themselves about the future in a variety of ways, including turning the outcome over to God or reminding others that if the murderer did not get the death penalty and ended up in the general inmate population, other inmates would undoubtedly torture or kill him.

08 - UMBREIT (DO NOT DELETE) 3/6/2013 9:18 PM
2012] ULTIMATE PENAL SANCTION 55
3. Relationship with the Murderer
Although there are few direct encounters between participants and the person who killed their loved one, participants mentally engaged with the murderer to varying degrees. The range of engagement was rated as none, minimal, or more extensive. Conversations with oneself focused on the injustice of what the murderer did, questions about how the murderer could have done it, imaginings about the murderer’s life in prison, memories of events during the trial, following what is posted on the murderer’s web pages, etc. There were few differences between the states, except for the fact that 30% of Minnesotans had no actual or mental relationship with the murderer compared to 5% of Texans. No mental relationship refers to participant efforts that included conscious decisions not to think about the murderer, the lack of reference to the murderer by name or inability to remember the murderer’s name, or commentary that suggested that the murderer was completely irrelevant to the survivor’s life: “He’s in Oak Park Heights. I rarely think about him. I just don’t.” Minnesotans with no relationship to the murderer were generally from Times 3 and 4.
In both Minnesota (45%) and Texas (47%), participants had more extensive direct or mental involvement because of some actual association with the murderer. This is due to the fact that the murder was a domestic fatality and there were enduring relationships between family members; new hearings where both the survivor and murderer were present; or ongoing community ties between the families of the murderer and the survivor. In Minnesota, some of these relationships involved actual meetings between the survivor and murderer in prison.
4. Attitude Toward the Murderer
In Texas, 79% of participants held negative attitudes toward the murderer, compared to 57% of participants in Minnesota. Although these attitudes occurred in every time period, they were most evident during Time 2. Although negative attitudes usually referred to participants’ feelings of anger, rage, and vengeance, participants’ comments also indicated that many survivors were struggling to resolve these emotions or move beyond them. The tenor of negative feelings, however, remained constant even when individuals and groups were compared across the four time periods.
In some instances, participants focused on the intensity of their dislike and hatred of the murderer: “I hate those guys beyond belief. And even now when I see boys that kind of look like them, I want to go

08 - UMBREIT (DO NOT DELETE) 3/6/2013 9:18 PM
56 MARQUETTE LAW REVIEW [96:1
up and punch them. And I can’t help that. I just feel so much rage inside. Because of what they did to my brother.” Participants also expressed their feelings by noting that the murderer deserved the life he was living now. When describing the prison conditions, a survivor noted,
[H]e’s living like a freaking animal, like he ought to be. He’s not being coddled. When I said something [to a guard] about his parents being able to hug him, he says, “His parents will never be able to touch him until we kill him.” And that’s the way [the guard] put it. And I don’t mind telling you that made me feel good. Because I can’t touch my son. And the last time I touched my son, he’s dead.
Negative attitudes seemed to increase when participants reminded themselves that prison conditions were not as bad as they believed should be for the murderer. A survivor from another country commented,
He’s living a happy life in there. Because we were told that he was going to be in a room, have TV, a toilet, everything in the room . . . . [In our country] he don’t have to have food every day. Like one meal a day, don’t even have bed to sleep. Two, three times in the night they give you a bucket of water so you are in the cold all the time. Over here they have everything, comfort.
Participants got some satisfaction recounting stories about what happened to the murderer in prison: “When he was stabbed by the other prisoners, I felt good because I thought that they were doing it for us because of what he had done to our baby. I felt good and I’m not going to deny that. That was justice.” Besides revenge, however, participants struggled with their negative reactions in an effort to find resolution or peace. A mother described wrestling with conflicting reactions to the murderer:
The last time I saw him he just looked like a normal person. And I didn’t feel like when I saw him at the trial [where] I just saw the devil . . . taking that picture away from my mind, I probably could have said, “Maybe I could forgive him.” But then I see another vision. I see the paper. I see [other things]. There’s no way. I can’t, I cannot forgive. I will not forgive because he took everything, everything that ever meant anything to me.

08 - UMBREIT (DO NOT DELETE) 3/6/2013 9:18 PM
2012] ULTIMATE PENAL SANCTION 57
Not all participants had such volatile reactions. There were 38% of Minnesotans and 21% of Texans that had neutral or even positive attitudes toward the murderer. After learning that the murderer could not sleep because he was having nightmares that her deceased father was sitting at the edge of his bed watching him, a daughter remarked,
There is something [in that story] that humanized [the murderer] in a way nothing else had. . . . It means my Dad has moved on. My Dad always tried to pull the best out of people. He’s trying to pull the best out of [the murderer] at this point. [The murderer] hasn’t got a lot of life left. He’s an old man. I can see my Dad reaching. . . . [So now] it was more about [the murderer] as a person than as a perpetrator.
5. The Murderer’s Suffering and Remorse
Interspersed with survivors’ attitudes toward the murderer were comments about their desires that the murderer suffer and that the murderer feel remorse for what he had done. The concept of suffering for the pain the murderer has inflicted on others, or feeling remorse for that pain, is likely related to participants’ efforts to find some way to resolve the injustice either through the murderer’s suffering as the victim did or through the murderer’s recognition, deep sorrow, and torment associated with having to forever bear the responsibility for taking life away from another person.
Approximately half of the participants in both states indicated a desire that the murderer suffer profoundly for what he or she had done. In Texas, 47% of survivors made statements like: “It makes me feel good that he is suffering, I don’t want to be the only one suffering.” They also felt that suffering was a way to help the murderer realize what he had done: “I just want him to linger on there until it’s his time. That way he can have a lot of time to think about it.” For some Texans, suffering indicated that the murderer was, in fact, being punished. A survivor compared a murderer’s current suffering to his being executed:
The way they do it now, they just put them to sleep. That ain’t cruel to me . . . he’s getting a better death than he gave my daughter . . . . I’ve been told that he don’t like being [at the prison] where he’s at. He’s being punished right where he’s at now.
In Minnesota, 50% of survivors made similar comments. A survivor whose little sister was raped and murdered offered additional insight by invoking a racial stereotype as part of her fantasy about the murderer’s

08 - UMBREIT (DO NOT DELETE) 3/6/2013 9:18 PM
58 MARQUETTE LAW REVIEW [96:1
suffering and how it could help even the score: “Some big black dude would find him and use him as a little girl toy. That would give me a sense of delight because he could suffer the way she had to suffer.”
As depicted in Figure 7, the states showed some difference in the percentage of participants who expressed a need to know if the murderer was remorseful for what he or she had done. In Texas, 32% of survivors indicated that the murderer’s remorse was important to their healing, compared to 50% of survivors in Minnesota. Moreover, none of the Texas participants in Time 1 made reference to the murderer’s remorse or their need for it.
For survivors, the concept of remorse had a number of dimensions. For example, some survivors felt strongly that even if the murderer was remorseful, they either would not believe it or it would make no difference because the opportunity for it mattering passed long ago: “It would do nothing for me whatsoever . . . . I would doubt it was sincere. Because I heard about his behavior in jail. How he bragged about [what he did].” Other participants felt that they might feel differently toward the murderer if he was truly remorseful because being remorseful would mean that the murderer had learned something or had realized he did wrong, or it might even mean that what he did was not intentional. Some participants were interested in doing a face-to-face dialogue in prison with the murderer. However, they were waiting because an apology or sense of remorse was a prerequisite. A woman whose father was killed by his friend explained: “I’m wanting to meet with him and I’m hoping and I hadn’t even said this out loud, that he would have some remorse.” Another participant decided to meet with the murderer after he had expressed some remorse in his testimony against a codefendant:
I guess we want to talk to him to see if what we believe is remorse is really remorse. Is he really feeling this? . . . You know people say you forgive somebody. I know for a fact I never will . . . . He definitely needs to be responsible and acknowledge his part in what happened. I guess I want that. And I think if he does that, if they let him out well . . . there’s less chance that he’s going to land back in some prison again. That’s what I hope.
Besides seeing the murderer differently, some participants expressed that the murderer’s remorse could aid their own healing:
Knowing that he has remorse could be different . . . that the person actually felt remorse would get to a next level. You’re

08 - UMBREIT (DO NOT DELETE) 3/6/2013 9:18 PM
2012] ULTIMATE PENAL SANCTION 59
never going to have complete closure, but it would be a step that would give you back a little of the hate that’s there. I’ve got all this hate and I don’t want to hate people. I’m not that way, but I’ll never forgive him. I’ll probably always dislike but I’d like to get rid of some of that [hate].
6. Opinion About the Ultimate Penal Sanction
Participants’ attitudes about the UPS centered on the issue of time, regardless of their state affiliation. Texans were principally concerned with the amount of time it took to get from being sentenced to death to when the murderer would be executed. Minnesotans were principally concerned that the concept of “life without parole” was confusing, and in many cases, meant only thirty years before the murderer would be eligible for parole.
As Figure 8 shows, in Texas, 37% of participants felt positive about the murderer receiving the death penalty. Most of these survivors, for various reasons, were okay with the length of time it took. A survivor, for example, calculated that the murderer’s execution and her plan to witness it would likely happen when her children were old enough to leave with a housekeeper: “It’s much better than if we went a year ago even or two years ago or . . . when I was pregnant or just having babies and all that. So whenever it’s time to go to hell is when he’s gonna go to hell.” Others felt that the murderer’s lengthy suffering prior to being executed was an important part of the death penalty punishment:
I don’t want it to be an immediate death for him. I’d like him to at least be on death row for at least five to ten years and then . . . stay in solitary confinement all the time, no interaction with people whatsoever because he’s the type of person that flourishes in prison.
In two instances where the murderer had already been executed and survivors had a positive response, neither mentioned difficulties with the prolonged wait. A participant shared that “we could start working on putting our life back together and trying to figure out what’s normal.”
An additional 37% were more ambivalent or neutral about the death penalty, in part, because of the time factor: “[The prosecutor] told us they changed all those rules and now it only took eight years to get to the execution and the appeals went real fast and all that. And here fourteen years later it’s sitting.” A survivor described his feelings after waiting seventeen years for the murderer’s death:
I’m just right on the border. I think it’s what he deserves. I

08 - UMBREIT (DO NOT DELETE) 3/6/2013 9:18 PM
60 MARQUETTE LAW REVIEW [96:1
think it’s a bad thing but I don’t think it’s justice if he doesn’t get executed. So it’s almost as though I really don’t care but I know it’s gotta be done. It really has to be done.
Only 11% of survivors were negative about the death penalty. In one instance, the participant who had witnessed the execution was very disappointed by the results:
I guess I was looking for some kind of pain, not so much pain. I was looking for him to at least turn around and say, “Hey, I’m sorry I killed your [older] brother. I don’t know who he was but I’m sorry this happened.” I think I would have accepted that, just that. But, he didn’t even say that. He didn’t even look at us . . . . Not a word, nothing. I didn’t see any justice in it. My [youngest] brother was there . . . as well and we were all looking at each other. What? Are you kidding me? That’s it?
In Minnesota, 71% of participants felt positive about the sentence the murderer received, often because it was the most he could get. Some of the participants’ reactions were based on the fact that survivors were against the death penalty or the murderer actually received a full LWOP sentence. Others preferred a lifetime of suffering over death: “Rather him suffer than take the easy way out with the lethal injection.” Although many had concerns about the length of the sentence or confusion about the meaning of life without parole, they seemed to find ways to reduce their concerns. For example, a survivor shared how little apprehension she had about the future because of the unpredictability of the murderer’s mental state, the parole board’s discretionary power, and the offender’s age:
In Minnesota after thirty years you can get paroled . . . . There was an arrangement made. They wanted to put him in a mental hospital first until he’s healthy. If he gets well enough, he will go to prison . . . you can have probation in thirty years, if the probation board agrees to that. He will be sixty years old then.209
Another survivor described her reasoning, which enabled her to accept the reality in Minnesota:
I kind of questioned it at first because I didn’t know what they meant by life, how many years that actually is . . . you don’t have another option. There’s no other option that would be better because you don’t have another option. You’ve either got A or
209. Emphasis has been added.

08 - UMBREIT (DO NOT DELETE) 3/6/2013 9:18 PM
2012] ULTIMATE PENAL SANCTION 61
B and that’s all you’ve got, so you make B be okay. So, that’s the best I’m gonna get and I’m thinking, “Well, at least he’s in there.”
No one was neutral in Minnesota about the sanction. However, 29% of participants were negative about the sentencing outcome. For example, one participant explained:
He’ll [the murderer] be forty-nine when he gets out. When you’re forty-nine nowadays that’s young. . . . This boy has his whole life ahead of him and he just took a life. And every day, there’s not a moment. I wake up, it’s the first thing I think about and going to bed, it’s the last thing I think about. It angers me beyond belief.
For some, the lack of death as an option was irresolvable: “I’d just as soon he was wiped off the face of the earth and that’s an honest feeling. Justice, justice was not done in my estimation.”
7. Execution Completed
Executions have been carried out in 26% of cases (n = 4).210 In addition to four executions, a murderer died because he committed suicide in prison. In two of the execution cases, the murderers forfeited their appeals and were executed within four and fourteen years, respectively. The other two cases took five and ten years, respectively. Two of the survivors felt that the murderer’s death was a positive experience because they were then able to reclaim their lives. A mother whose daughter had been killed maintained,
It took a long time for us to, for me, to get back on track where I should be. And the execution, it just helped me to know that okay now, he’s gone now. He’s not going to get out there and hurt somebody else and just start focusing on healing.
A grandmother whose five-year-old granddaughter was raped and murdered felt that the execution had a profound effect on her and the rest of the family:
I felt like it was over. It was actually over. He could not hurt anyone else . . . . I would have nightmares that he had escaped. I would wake up just petrified . . . . When they said that he was dead, the dreams stopped. My son (the victim’s father) quit drinking. He does not have one drink. And he is doing so good.
210. See Table 5.

08 - UMBREIT (DO NOT DELETE) 3/6/2013 9:18 PM
62 MARQUETTE LAW REVIEW [96:1
I see 100% turnaround in him. I’m thankful that they did execute him, because my son’s at peace now.
The three other survivors had different responses. In the case where the murderer committed suicide, the participant felt somewhat cheated because she had fantasized about possibly meeting with him in prison to find out her husband’s last words: “I would have loved to have known what my husband’s last words were or his last thoughts. But, I’ll never get that.” In another case, the participant indicated she had a “neutral” response to the murderer’s death:
It doesn’t bring closure because even though the person is executed even still to this day, we don’t know why he did it. On the tape [he made] he said some reasons why he did it but [these] could just be bologna. To really just tell you the truth like for me I don’t really have closure.
In the third case, the survivor had a negative reaction that increased his distress because the murderer, at the execution, was humorous about it:
His remarks were, “What is everybody doing here? What’s the big deal?” And then he says, “Where is the stunt double when you need one?” . . . He couldn’t care less even at the last moment . . . he got out easy. Cause all he did was lay there, relaxed, joked. His last words were that and he just took a deep breath and he stopped. Did he suffer? No, he didn’t feel anything. He went to sleep. It’s unfair . . . . It was like a slap in the face. I don’t know, I guess all those events even with the execution just . . . blocked my feelings more.
8. Execution Witnessing
In those cases where the murderer had already been executed or otherwise died, all but one survivor witnessed the execution.211 Of the fourteen remaining cases, 64% intended to witness the execution, and 14% did not so intend. Information on the intent to witness was not available for 21% of the participants. As shown in Figure 9, participants differed somewhat by time period. Survivors from Time 1 said little about attending the execution, and only two of them volunteered that they would go.
Survivors from Time 2 actively rehearsed what it would be like to go to the execution. Although one of them did not intend to go, she
211. See Table 5.

08 - UMBREIT (DO NOT DELETE) 3/6/2013 9:18 PM
2012] ULTIMATE PENAL SANCTION 63
planned “for [the family] to get together and wait till that time and just be glad that it’s over and then we can say our true feelings. That’s what I plan.” Another participant hoped that the murderer would apologize:
I still think that maybe when I see him for the execution he’ll turn around and say, “I’m sorry I did it.” At least he’s remorseful or say something that my mom said or say something to us. “I realize now what I did was wrong.” Something. I just want him to say something to me.
Excitement was apparent for a participant who had already driven hundreds of miles to the prison to preview where she thought the execution would take place:
I can’t even imagine how bizarre it’s gonna be and surreal. And so I’m going to go there and I’m going to . . . have a couple of friends with me . . . . And my old trainer wants to go that used to train me . . . and maybe the detective that did my assault deal.
Survivors from Time 3 planned to attend but did not expect it would make much difference. A participant noted that
The best thing about it I guess is just to be there to look him in the eye. . . . The actual execution to me is really so insignificant. Viewing is not . . . I know people fought for it, so by no means do I ever want to make it seem like it’s not a big issue because for some people it probably is. Viewing the execution is not a big deal for me. I could just sit outside and just know that he’s dead.
A father shared that he had already gone to the execution once only to have it called off. It was no longer an active issue for him. A mother originally planned not to go, but after thirteen years, she changed her mind. She explained to her husband, “I need to see it through. I’ve done all this. I’ve gone through all this. I need to see it through. And I don’t want to but it’s something that is gonna finish it.”
Survivors from Time 4 also felt that the execution and attending it would not change much for them: “I won’t be in there clapping or anything like that. I’ll just be there. I’ll just close the book on that and I’ll come home. There won’t be any jubilation like that or anything.” Indeed, a mother who once had wanted to witness the execution to hear the murderer say he was sorry now said,
I just don’t want to be a party to that. I don’t want to hear his last words anymore because they’d be meaningless to me now. Cause he’s had all this time if he wanted to say, “I’m sorry.” I don’t want to see anybody killed. I’ve heard them say they

08 - UMBREIT (DO NOT DELETE) 3/6/2013 9:18 PM
64 MARQUETTE LAW REVIEW [96:1
gurgle. I don’t want to hear any of that. I’ve had enough of them. I’m bleeding every day.
These sentiments were echoed by another participant who claimed, “I’ve already been too close to death. I don’t want to go and watch somebody die. No . . . I don’t feel like I’ll get anything out of it. It might depress me.”
9. Death Penalty Aim
For Texas participants, the purpose of carrying out the death sentence varied, but it included the need to bring an end to the criminal justice process and the murderer’s existence in their lives, as well as the need to honor the victim through an outcome that resulted in the same ending for the murderer as the victim had involuntarily undergone. Information was not available for 26% of participants, and in one case, the survivor was adamantly against the use of the death penalty for his son.
Approximately 42% of participants felt that the aim of the death penalty for them was to finish the chapter in their lives that pertained specifically to the murderer and his punishment. Survivors described the relief they felt they would gain and how their lives would be different once the murderer was gone. A mother who has given birth to children since the ex-husband was sentenced noted that she would no longer have to keep their existence a secret for fear of what he might do to them or her even from prison:
He’ll get newspaper articles and he’ll scratch out other people’s names . . . and put my name or my friend’s names or my mother’s name. . . . He’s written these stories about how he was forced into marriage with me and just these bizarre . . . he’s still stalking me in his mind. It never stopped . . . I’ll just be glad when we’re not breathing the same air. Then I won’t worry about putting a picture of my kids on Facebook . . . or worry about keeping it a secret that I have them.
Many participants expressed that they could move forward with their lives:
It will give total peace of mind. It keeps me bitter. I have a lot of bitter thoughts. Sometimes I can cut them off and other times it just all comes up. That’s why when he is no more . . . things are going to get better once we know this guy is no longer in the world.
There were 21% of Texans who felt that the murderer’s death would

08 - UMBREIT (DO NOT DELETE) 3/6/2013 9:18 PM
2012] ULTIMATE PENAL SANCTION 65
help satisfy the vow they made to their loved one, both as a pledge of their love and as their representative that their death was avenged. For some, fulfillment of the death sentence would help even the score. A father whose son died in his arms said, “I want that son of a bitch to die like I had to see my son die.” For others, it would complete their obligation:
I need to represent my mother through every step of this all the way to the end, regardless of what that is, if I’m still alive. I’m almost seventy years old. I’m in pretty good health. I anticipate being around when he gets his. And that’s because I’m representing my mother. She would do that for me.
10. Remaining Questions
Participants in both states had unanswered questions about their loved one’s murder. In Minnesota, 65% had things they wanted to know, and in Texas, 68% had remaining concerns. Those survivors who had no questions either had received answers because of meeting or corresponding with the murderer, or did not feel compelled to have answers.
Most survivors’ questions had to do with various versions of “Why?” Some participants’ questions were more rhetorical statements of disbelief than actual questions. For example, an aunt whose niece was killed by her (the niece’s) husband proclaimed, “Why did he do what he did? Because she had everything [for him] in her house. She bought him a Caravan to go to work. Bought him a navigator so he could read the road and why did he have to do that?” Much of the time, participants’ questions had to do with wanting to understand the murderer’s mind or motive:
I don’t understand how somebody’s state of mind can be such that they feel they have the right to take somebody else’s life. That will never make sense to me. I don’t get it. If [the murderer] had been crazy I might understand it better. But he’s a rational human being with no mental illness on which to blame this. I don’t get it.
Sometimes survivors’ efforts to understand the mentality of the murderer transferred to others, like the defense attorney. A mother exclaimed, “I don’t see how people can back up somebody like that. People actually have feelings for people like [the murderer] that are on death row. Why? Why?” In some instances, survivors’ “why” questions focused on the particulars, almost as if getting exact

08 - UMBREIT (DO NOT DELETE) 3/6/2013 9:18 PM
66 MARQUETTE LAW REVIEW [96:1
information would help explain the circumstances. A father posed the questions he would like to have asked the murderer:
What made you do this? What was the trigger? Did [my daughter] do something? What was the thing that just made you go nuts? Or did you predetermine that you just wanted to kill her? We had two dogs. Where were the dogs, the pit bull and the cocker spaniel? Where were they?
In addition to having questions about the victim’s last words or if the murderer had any remorse, participants’ “why” questions also encompassed God and how God could have allowed the murder to happen: “I thought to myself gosh, why didn’t you [God] intervene? Why didn’t you come to help her?” Sometimes survivors provided their own answers: “I think to be perfectly honest and this may sound really stupid that the devil sent his advocates to take [my nephew] away and God took his soul because I think that’s what the devil really wanted.”
11. Category 2 Summary
The analysis of event themes specific to the impact of the UPS on participants during the postconviction process suggests important differences between the two states in dealing with the criminal justice system, some distinctions in response to the murderer, and some similarities in the questions that remain unanswered. Many of the findings have implications for participants and their sense of control over their lives.
The percentage of Minnesotans who filed civil suits after the murderer’s conviction is noteworthy because, in comparison, only one Texas survivor planned to do so. Moreover, the majority of legal action occurred for participants in Time 2. The suits filed in Minnesota represented efforts by participants to redress injustices that emerged after the criminal proceedings were completed, including the personal appeals. It is assumed that this trend in participant-initiated civil litigation may reflect participants’ efforts to gain additional control over the outcome of their loved one’s death. The fact that civil litigation did not occur at the same level in Texas suggests that the experience of the criminal justice process may be different. Although speculative, it is possible that the criminal justice process in these cases, and others, continues to override civil considerations due to the ongoing appeals. Moreover, because the odds of winning a suit increase once the finding of guilt and the associated sentence are upheld, Minnesotans may feel more confident than Texans whose cases are still in process. Texans,

08 - UMBREIT (DO NOT DELETE) 3/6/2013 9:18 PM
2012] ULTIMATE PENAL SANCTION 67
however, may feel less need to pursue other avenues for justice. Rather than feeling dropped because the process is finished, Texans may feel less isolation, experience a closer connection to the state, or perhaps have a stronger sense of control due to achieving a death sentence for the murderer.
The difference in the appeals process is particularly striking in terms of time, potential for delay, reversal of the verdict, and participants’ responses. Whereas Minnesotans were finished with the process within two years after the conviction, Texans were waiting, in some cases, for over fifteen years. Moreover, Minnesotans indicated that there was almost no delay in the appeals process or reason for uncertainty about the outcome. In contrast, 37% of all Texas cases and 100% of cases still in appeals during Time 3 and Time 4 were stuck. Indeed, 10% of Minnesotans were dissatisfied with the appeals process in comparison to over 50% of Texans who were clearly worried that the gain they had attained in the death sentence might be undone by a new trial, resentencing, or a determination by the U.S. Supreme Court. Participants’ apprehension about losing the control they thought they had over the murderer’s sentence was significant and likely kept survivors caught and suspended with little sense of who was in charge, what laws and procedures prevailed, what impact new legal proceedings might have on their lives, and how long their waiting to know might last.
Although not necessarily tied to the appeals process, this difference between the states was replicated in certain trends. Texans had more active mental relationships with the murderer (only 5% of Texans have no relationship vs. 30% of Minnesotans). A larger percentage of Texans had negative responses to the murderer (79% vs. 57%). Texans placed lesser importance on remorse (32% vs. 50%). Texans had less positive opinions about the UPS (37% vs. 71%). It is possible, however, that the brevity of the appeals process in Minnesota might have lessened the ongoing centrality of the murderer in survivors’ lives as well as the volatility of possible changes in the outcome of the original trial sentence. In reverse, the extensiveness of the appeals may have stymied participants’ ability to remove the murderer from their thoughts, and impacted the potential for further anger against the murderer caused by feeling victimized by additional and, in some participants’ minds, “unnecessary” legal processes. The reality may also have affected their hope for remorse, and perhaps swayed, for some, a less than desirable acceptance of the UPS as the state’s maximum possible sentence.
A clear difference between the states was that Texans had the likelihood of execution and the option of witnessing the execution as

08 - UMBREIT (DO NOT DELETE) 3/6/2013 9:18 PM
68 MARQUETTE LAW REVIEW [96:1
possible mechanisms for experiencing some sense of control. For survivors where the murderer’s execution had already occurred, their experience vacillated from feeling they had regained control over their lives to feeling that the murderer’s death made little difference to feeling that the execution created additional distress due to how the murderer behaved in the execution chamber. Time between murderers’ deaths and the research interviews were six months, two years, three years, five years, and six years. It is possible that, with more time, these reactions would shift in direction.
The same variation was evident in participants’ responses to witnessing the executions. Although 64% of survivors planned to attend the execution, survivors from Time 3 and Time 4 were uncertain about the impact of witnessing or the actuality of the murderer’s death on their ability to get on with their lives. It is possible, therefore, that the opportunity to witness the murderer’s death might not increase survivors’ sense of control. That assumption, however, must be weighed against the fact that just having the option to make the decision for themselves, that is the option to witness the execution, provides an increased sense of control that would be reduced if that option were not available.
There were similarities between participants from both states in their desire for the murderer to suffer or to hear his or her remorse and answer questions that remain. At least half the participants from each state hoped that the murderer’s life in prison was arduous and created suffering tantamount to what their loved one had experienced. This yearning suggested that if the murderer suffered at least his punishment would be impactful and, as such, provide participants with some measure of power over the murderer. Likewise, the hope for remorse may also be predicated on the belief that accepting responsibility for the murder would reduce participants’ sense of continued victimization by the murderer and lessen their powerlessness because their plight would become more visible to the murderer.
The why questions asked by survivors showed no differences over time or between states. Regardless of the meaning behind the questions, the lack of answers continued to leave participants unknowing, which reinforces not having control. Participants who had answers or no longer needed to know conveyed finality about what they knew, as if there was no more to be done.
C. Category 3: Aftermath of Murder and the UPS on Survivors’ Lives
The murder of a loved one wreaks havoc in survivors’ lives. The

08 - UMBREIT (DO NOT DELETE) 3/6/2013 9:18 PM
2012] ULTIMATE PENAL SANCTION 69
core injustice created by the unexpected, willful, and involuntary death of a loved one gets compounded by a host of additional wrongs that continue to emanate unpredictably from all sides. Survivors repeatedly re-experience their initial helplessness as they watch the fallout from the murder and, over the years, it takes away still more of their existence. Ironically, some of the life-altering change creates new growth adding heretofore-unrealized opportunities. In general, however, there are far-reaching consequences that vastly alter who survivors know themselves to be as well as how they function in the aftermath of their loss.
Table 6 shows the event themes for Category 3 that focused on the consequences of both the murder of a loved one and the UPS on participants and their families. Event themes consisted of injustices survivors endured besides the murder; negative fallout beyond the murder itself; positive consequences in survivors’ lives; current physical reactions associated with the murder; psychological change.
1. Injustices Associated with the Criminal Justice System
In addition to the murder of their loved one, some participants felt they suffered additional injustice because of the criminal justice system. In Texas, 42% reported one or more instances where they did not feel well-served, for example, by police who missed the chance to apprehend the murderer before he killed the survivor’s loved one, or by crime victim’s assistance, which only paid a pittance for the rape counseling needed by the participant’s daughters.
In Minnesota, 50% of survivors also experienced injustices associated with the criminal justice system. In one instance, a survivor who previously had celebrated getting a first-degree murder conviction with thirty years before parole sentence watched a jury settle on second-degree murder after the murderer was awarded a new trial: “We got a jury that didn’t want to be there [in court] cause Christmas was coming. We found out after [the trial was over] they just wanted to go home so they kind of settled on second-degree.” The lasting sting of injustice was also evident in a mother’s comments about how her daughter was portrayed during the trial by the defense:
I don’t understand why we have to vilify the person that’s dead. He was trying to make her out to be . . . . How do I put it, that she was promiscuous and things like that. We couldn’t say that after they got married and she was pregnant, he was dating another woman. We couldn’t say anything bad about him, but they could sure try to knock her down.

08 - UMBREIT (DO NOT DELETE) 3/6/2013 9:18 PM
70 MARQUETTE LAW REVIEW [96:1
2. Injustices Not Associated with the Criminal Justice System
The sense of unfairness felt by participants also included injustices that were unrelated to the criminal justice system. In Texas, 21% of survivors described incidents that upset them greatly. A father relayed that his son, who was a housing inspector, was killed when he went to serve a ticket on a house that already had five different citations. The father discovered that no one had followed up on the citations because the city manager was afraid of the current owner: “It didn’t matter that my son was dead at all. My son dies for nothing. They can’t even finish a $50.00 ticket . . . .” In another instance, a woman felt blamed by her family for the murder of her brother because she had asked him to look in on her children while she was at work:
I feel like they blamed me a lot because he died, because he was killed, because I worked and I asked him to come watch the kids because I was always having to ask somebody to babysit. If I had been able to handle my business he wouldn’t have died.
In Minnesota, 50% of participants shared similar injustices. A brother whose sister had been killed by her husband was incensed that his seventy-year-old mother got nothing from the estate because the murderer’s family claimed it all. Similarly, the grandparents of a young woman whose mother was murdered spent her social security allotment on themselves:
[My grandparents] claimed I was living with them. The $50,000 was meant to supplement. You don’t have any parents left. You’re an orphan essentially. And that money is to help try to fill the void of what they could have done for you. And it’s all gone and I couldn’t tell you where it is and they’ll never fess up to it.
The accumulation of additional injustices—whether associated with the criminal justice system or not—compounded the central injustice, which was the murder of a loved one, and tended to intensify the sense of powerlessness and anger that accompanied the murder.
3. Negative Consequences
Participants in both Texas and Minnesota reported numerous instances of negative fallout on themselves and family members from the murder or experiences associated with the murder. In Texas, 26% made no reference to negative results, but the remaining participants indicated destructive impact of the events on themselves (42%), family

08 - UMBREIT (DO NOT DELETE) 3/6/2013 9:18 PM
2012] ULTIMATE PENAL SANCTION 71
members (26%), or both (5%). In Minnesota, 35% made no reference to negative results, but the remaining participants indicated destructive impact of the events on themselves (10%), family members (40%), or both (15%).
Fallout from the murder included both psychological disasters, such as suicides and drug addictions, and changes in life circumstances, such as fighting for custody of children, rifts between family members, school problems, lack of financial resources, etc. These consequences had reshaped participants’ lives, setting many of them on downward, crisis-ridden trajectories that did not exist prior to the murder. A mother talked about what happened to her daughters, both of whom were violently raped while their uncle was forced to watch before the murderer killed him:
It became a big black white issue, a big racial thing. The girls could not listen to a black person talk. When they heard that voice, that way of speaking, it just flooded them with emotion. . . . The school by then was probably 50/50. And the black kids were really going at them because they thought it was a racial issue. “Y’all knew that guy. Y’all invited him in and then y’all made [him rape you].” My oldest decided she didn’t want to stay in Drummond anymore and went to Nebraska to live with my cousin. The following year my youngest daughter went up there and my cousin home schooled her but then she came back home and she’d been in and out of every different school. We finally sent her to a neighboring town because I knew the principal. I went over there and she was in a room by herself. [Teachers] came in and she did her studies by herself. She had shaved her head. The boy who was with them that night was killed at work six months later. He was electrocuted.
In addition to drug problems and depression, there were five suicides by participants’ family members related to the murder of a loved one. Some of the suicides set off more fallout for families, creating a chain reaction of events. In one instance, a woman’s brother committed suicide after his parents were murdered at the convenience store they ran. Because he did not bring his father dinner where his father worked, his mother had to:
He always felt I should have gone. I think he felt he would have protected papa too. . . . My other sister [has] written emails where she feels she wants to commit suicide. . . . My younger sister I’m very worried about. I’m scared she’s going to follow the same path as my brother.

08 - UMBREIT (DO NOT DELETE) 3/6/2013 9:18 PM
72 MARQUETTE LAW REVIEW [96:1
In another case, a woman explained that after killing her mother-in-law, her father-in-law blamed his dead wife’s son: “Aaron is William’s second victim. He started using drugs. We filed a wrongful death suit because he was beneficiary to everything. So he had money to buy all those drugs.” He eventually died of an overdose. Then the survivor found out her sixteen-year-old had leukemia:
He looks at me. [His younger brother] starts crying and he looks at me and goes, “Am I gonna die?” I couldn’t say no. I didn’t know. . . . Both of the boys are at an alternative school . . . they weren’t getting in trouble at school. But, they just weren’t going. They didn’t care.
4. Positive Consequences
Although survivors were well aware of the negative fallout on them and others they loved, they also experienced positive spinoff because of what they went through and the ways that the murder impacted their lives. Figure 10 shows the differences between states. In Texas, 35% of participants made no reference to positive results, but the remaining survivors indicated positive activities/positive life changes (30%), personal growth/meaning system development (10%), or both (20%). In Minnesota, 20% made no reference to positive results, but the remaining participants indicated positive activities/positive life changes (30%), personal growth/meaning system development (5%), or both (45%). Minnesotans who claimed positive spinoff impacting both their activities/life changes and personal growth/meaning system development came from Time 2, Time 3, and Time 4. Indeed, 60% of participants (n = 3) in each of those time periods claimed positive consequences in both areas. Moreover, more Texans than Minnesotans claimed no positive impact. They also made fewer references to personal growth/meaning system development.
Constructive activities and life changes included caregiving and closer connections with children, decisions to leave abusive relationships, returning to school, becoming more religious, and changing jobs. Some of the changes were subtle, but the activities held important meaning to the survivor. A mother who bemoaned the fact that her daughter’s death meant there would be no grandchildren discovered an unexpected source of nourishment: “I served in the children’s ministry for nine years, loving and hugging those babies and giving them my full attention. I credit a lot of my healing to that, just being able to love those babies.” Others did a complete life overhaul. A survivor whose son murdered family members made the decision to

08 - UMBREIT (DO NOT DELETE) 3/6/2013 9:18 PM
2012] ULTIMATE PENAL SANCTION 73
turn everything over to God: “Once I made the decision to give up and let God take this if that’s what he wanted to do, it was wonderful. It was liberating. I saw insights I hadn’t seen before.” Realizing God’s purpose, this survivor wrote a book about the murders, his experience, and forgiveness, and became a nationally recognized speaker:
I was allowed to live for a purpose and the purpose is to tell my story. . . . I gave away the white flag. “Okay God, I give up. I’m going to stop hiding from all this.” It’s been exciting. It’s a powerful positive thing in my life to talk in front of an audience to tell them about what happened that night and tell them how God works.
Still others found avenues for life changes that were unusual but fitting for them. A young woman who lost her baby, mother, and niece began visiting funeral homes after school:
When I go there it’s my safe place. . . . I can go there and gather my thoughts . . . like a clear head it changes my whole attitude. The guy there tells me, “You’re going to be a help to a lot of people by what [you’ve] been through.” I have a little notebook that I carry around and if I have questions I write them down. And when I go I ask him (the funeral director) the questions and whatever he tells me I just write them down there. . . . I understand some of [how of why] the stuff with my mom was harder to do [to prepare for the funeral] because of the trauma her body had taken.
The young woman eventually decided to become a mortician and has since graduated with a degree in mortuary science.
Positive spinoffs also include personal growth and meaning-making that helped participants to integrate the loss of their loved one, related events, and the way the victim’s death happened. A survivor described her perspective about new challenges, safety, and control:
I’d never been anywhere. I didn’t even have a passport. And I just started traveling. I remember my son standing in front of me with that smile saying, “Mom quit talking about it and just do it or it’s never going to happen.” I feel like my son’s part of me and I’m part of him. So the part of me that’s him is going to Africa. I know too though no matter where you are, no matter where you go, who you’re with you are never safe. . . . There just isn’t. . . . And yet, I think all of us has this part that likes to feel you have a little bit of control over your life. I know there isn’t that. Never was. Never is.

08 - UMBREIT (DO NOT DELETE) 3/6/2013 9:18 PM
74 MARQUETTE LAW REVIEW [96:1
A teacher explained what she has learned from the murder of her father and how she uses these lessons in her teaching:
I can choose my attitude. . . . I have more control and more, I think about it more. Over how I handle things and frankly, I teach my students that if you think you have control over your life forget it. You don’t. You have control over how you respond to the things that happen in your life . . . and therefore, you ultimately control the outcome by your choices. I had a choice when dad died. I could become bitter and angry and live my life that way. I could become productive and use it, use what I learned, use the experience to become more empathic, to become more knowledgeable, to become more of who I could be.
These personal changes often had a celebratory or freeing quality to them: “All of a sudden you have this new outlook on life because you realize how tenuous it really is and so then you say, ‘Okay, I’m going to live life to the fullest.’”
5. Current Physical Reactions
Survivors’ responses to the murder and its aftermath were frequently expressed in physical problems as depicted in Figure 11. Although it was common for participants to report difficulties with issues such as concentration, memory lapses, sleep, nightmares, eating, and endurance, some of them found that the toll from the murder, related stressors, and accumulated stress were long-lasting. In Texas, 42% of participants indicated no current physical manifestations. The remainder experienced current sleep problems (16%); disease or illness associated with the extreme stress (26%); or both sleep and illness or disease (5%). Information was not available in two cases (11%). In Minnesota, 60% of participants indicated no current physical manifestations. The remainder experienced current sleep problems (25%); disease or illness associated with the extreme stress (10%); or both sleep and illness or disease (5%). The contrast between the states is most notable in the percentage of participants who had no current physical reactions and in the higher percentage of participants with self-diagnosed murder-related disease or illness in Texas.
Ongoing sleep disturbance included a range of conditions, including inability to fall asleep, terminal insomnia so survivors could not get back to sleep, nightmares, and light sleeping because of startle reactions. Survivors reported hearing noises in the house, recurrent pictures of finding their loved one dead, and rumination over their difficulties:

08 - UMBREIT (DO NOT DELETE) 3/6/2013 9:18 PM
2012] ULTIMATE PENAL SANCTION 75
If I wake in the middle of the night, which is very, very often, I can’t fall back to sleep. And the problem is that I start thinking. It doesn’t even matter what. But I start thinking about something and almost play scenarios out in my head. [They] haven’t happened yet, but somehow I know.
Participants had a variety of physical conditions that they self-diagnosed as related to the murder. Many of the conditions are commonly associated with stress, such as high blood pressure. A survivor related the gradual onset of her physical problems:
I gained weight in the ten years. I became a diabetic. I have thyroid problems. I have high blood pressure and I’m losing my hair. And it was like my health went down, just down, down, down. And like right now I’m still trying to control my diabetes and it’s all down deep in there.
Besides chronic conditions such as neck problems, migraines, high cholesterol, and problems regulating menstrual bleeding, some survivors had life-threatening reactions:
I didn’t know I was experiencing heart attacks. Right after the trial, I experienced something with my body like it was on fire. And my breath, felt like they had filled up with milk and somebody just lit me on fire. [The doctor told me,] “You’re walking dead. You have 8% [iron in your blood] when you should have 180%.” I was just dying. I was bleeding to death. I’m taking iron pills. They want to give me a transfusion but I’m scared of the blood. They say it’s one in a million, might get bad blood. I told them, “I’m not fixing to be that percent, nope.”
6. Psychological Changes
The murder of their loved one and subsequent challenges produced permanent psychological change in participants. Some had ongoing trauma reactions that consisted of sleep problems, fear and anxiety, crying jags, and responses triggered by reminders of the trauma. Survivors also indicated that they were self- or professionally diagnosed as depressed and emotionally shut down. The majority reported significant issues with trusting others. Participants also described posttraumatic growth as a result of the murder.
There were striking differences between the states on the percentages of survivors who suffered from ongoing trauma reactions. Specifically, 42% of Texans described persistent struggles, compared to 20% of Minnesotans. Some of the struggles were periodic:

08 - UMBREIT (DO NOT DELETE) 3/6/2013 9:18 PM
76 MARQUETTE LAW REVIEW [96:1
I still have nightmares occasionally. Sometime the nightmare is I’m actually there and see him get shot. Sometimes the nightmare is I’m in his place and being shot and then my kids are left orphaned. Sometimes I wake up and don’t remember what the nightmare was and I just wake up in tears. Maybe once a month or every couple of months I may have one [a dream].
Other struggles interrupted survivors’ daily functioning:
I don’t know if I’m scared of people or I don’t trust myself to be alone, but I am really scared as long as it’s dark. I never had that before. And I always have the TV on, not to hear any sound anywhere else. Because if anything knocked hard, I am scared. So I always have the TV on or the music playing. If I go upstairs, I have to have the light on. If I am alone in the house, I have a mattress in front of the chair. As long as it gets dark I just be in one place until somebody gets home.
A similar contrast between the states also applied to the percentage of participants, shown in Figure 12, who reported themselves as depressed or emotionally dulled. In Texas, 63% of survivors fit this profile, compared to 25% of Minnesotans. Many participants described classic symptoms of depression: “I’m just going through life, through the motions. Okay, I’m forced to go to the baseball game. Okay, I need to go to open house. So, life is moving me as it goes because of my three children. Without that, I think I would be stagnant.” Others noted permanent shifts in their ability to respond to emotional highs and lows. They described themselves as not being present, being unemotional, empty, hardened, existing with a cloud over everything, and as realizing that a part of them was gone that they would not get back: “Sometimes I can be happy. But, I am not able to reach the extent of happy that I could before that day. It’s not there anymore. It’s like if it was way up on a scale you can’t go up to the top of the scale anymore.”
The contrast between the states reversed itself in the percentage of participants who had difficulty trusting others. In Texas, 37% of survivors indicated that they had trust issues, whereas 55% of Minnesotans volunteered that their ability to trust was severely hampered as a result of their loved one’s murder. All Minnesotans from Time 1 and 80% from Time 4 had problems with trust. Moreover, in describing their difficulties, Minnesotans gave lengthier and more detailed descriptions. A wife shared,
[T]ell you the truth, I don’t trust anybody anymore. Even my own husband. . . . The only person I can trust is my son. I can

08 - UMBREIT (DO NOT DELETE) 3/6/2013 9:18 PM
2012] ULTIMATE PENAL SANCTION 77
tell him anything, not my husband. . . . You could see a person but you don’t know what is in their mind. Sometime they look very innocent to you, but they could do you harm. That’s why I don’t trust anybody. . . . I protect myself and keep [a] far distance from those I don’t trust.
Another survivor declared,
I don’t trust people. I’m very leery or wondering what it is they’re after or what they’re up to. It’s like I know going down the street that you can look at people—and it’s more men—and they can look normal, but they’re not. How am I supposed to know this man is okay and this man isn’t. I think it shatters a lot of your belief in the goodness of humanity. That some human could do this for nothing.
There was a pronounced difference between the states, shown in Figure 13, in the percentage of survivors who made reference to their psychological growth because of what they had endured. Only 5% of Texans indicated positive psychological changes in comparison to 55% of survivors in Minnesota. Most of the Minnesota participants came from Time 3 and Time 4. In noting their changes, survivors made reference to their strength, accomplishments, realizations, and outspokenness. For example, a woman exclaimed, “It has made me stronger. It has made me. Going through this, I know I can get through anything.” A woman whose mother was killed when she was an adolescent described who she had become, compared to who she likely would have been: “I think I’m a better person in general than I would have been. I think had things been the same, I was so rebellious and so not wanting to have the way things were, that I probably would have been pregnant in high school.” A survivor described what she saw as she surveyed what had happened to her over the years:
All of a sudden I had to make the decisions and I didn’t have anyone I could talk it over with. And it was scary because I had some big decisions to make and know what to do, didn’t trust myself to do the right thing. . . . I probably gained a lot more self-confidence than I had. I’ve changed a lot from what I was twelve years ago. So that’s probably a good thing that’s come out of it. And growing into myself. It gave me that other purpose to go and finish and get this degree. That made me a different person too that I could get through these classes and get good grades and still manage the farm and the kids. All of it. I guess I felt like a super woman for a while. So that maybe was a good thing.
08 - UMBREIT (DO NOT DELETE) 3/6/2013 9:18 PM
78 MARQUETTE LAW REVIEW [96:1
7. Behavioral Changes
Participants noted ways that the murder of their loved one, and related events, impacted their lives and the actions they took to manage their feelings. Stress-reducing behaviors included making sure doors were locked or staying away from situations that could trigger panic reactions. Refocusing behaviors consisted of moving away from the home where the murder happened or throwing oneself into work. Some participants found themselves doing things to preserve memories or keep themselves close to physical reminders of their loved one. Survivors also described behaviors that developed or reinforced a sense of agency in terms of controlling outcomes related to the murder.
As shown in Figure 14, Texas and Minnesota differed on the percentage of participants using different types of stress-reducing behaviors. In Texas, survivors principally used avoidant/distancing behaviors (37%), whereas in Minnesota survivors preferred self-protective behaviors (40%). Moreover, Texans were more likely than Minnesotans to use both avoidant/distancing and self-protective behaviors (26% vs. 15%). Self-protective actions included having guns readily available, checking on family members to be sure they were all right, or taking extra safety precautions. A grandmother who had to fight her son-in-law’s parents for custody of her granddaughters after he had killed their mother decided not to put an announcement in the paper that one of the granddaughters was getting married: “I didn’t trust that if the grandparents saw it that they might have come and tried to push their way into the wedding and made it uncomfortable. I never was real guarded but that has definitely changed. That’s the major change I see in myself.” Avoidant/distancing actions were done usually in reference to triggers that could create strong emotional responses. A survivor whose daughter was killed by her husband decided to stay away from family members who tended to fight. A man who was harassed by the police in conjunction with his daughter’s murder declared, “I can’t think of a reason I would ever call a cop.” A survivor shared her internal struggle with going out among people:
Sometimes I be like I get dressed. I fix myself up. I try to talk to myself about going. . . . I’ll probably dress five times before I go out the door. I’ll be like, “Oh, what am I doing?” I look at the clock. “Let me get out of here,” so I know I got to go. “Oh no, this don’t look good.” I use excuses. “Oh, this don’t look good.” I just sit down. . . . I used to go out a lot. Now I can’t find two friends.

08 - UMBREIT (DO NOT DELETE) 3/6/2013 9:18 PM
2012] ULTIMATE PENAL SANCTION 79
Although 75% of Minnesotans used refocusing behaviors, as shown in Figure 15, to deal with their reactions to the murder, only 37% of Texans did. Refocusing behaviors included busyness to divert survivors from thinking about the murder as well as lifestyle changes to mitigate some of their suffering. The preponderance of participants from Minnesota used either lifestyle changes (30%) or both types of refocusing behaviors (35%). In terms of busyness, a woman who had lost her son explained, “I’d go out and I would dig the yard up. And I’d just work myself to the point where you’d be exhausted. I had to just ride myself to the point that I had to go, go, go.” When asked how he was different since his sister was murdered, a survivor answered, “Guess with me being busy and active, takes your mind away from things.” Lifestyle changes allowed survivors to reduce stressors that otherwise kept the murder fresh or made it difficult to manage their emotions. A participant who was a school bus driver described crying whenever she was by herself: “So I figured that wasn’t a good thing for me to be doing with other people on the bus. . . . So I went into the school. I worked as a janitor and that was better for me because I didn’t have time to think.” A man recounted making the decision to sell his home in order to get further away from disturbing memories:
I tried to stay in the house because I didn’t want to be chased out. But it was hard to sit back in that room where she was murdered. Eventually I just surrendered and left, sold the house and moved. It was hard to leave but it was the right thing to do. . . . You weren’t constantly looking down there and imagining where she was laying. . . . Didn’t have to deal with that jerk next door [either].
In Texas, 32% of participants engaged in behaviors to preserve memories or physical reminders of their loved ones, compared to 5% of Minnesotans. A father shared what he did to keep his son close: “He’s been gone three and a half years and my cell phone has still got his answering message because I had it transferred so that I could play it anytime I wanted it. I could hear his voice.” A mother remembered the time she has spent in her daughter’s room: “I locked myself in that bedroom right there a lot. That was Missy’s room. And I slept in that room a lot. I guess because I felt closer to Missy.”
Sense of agency refers to the subjective awareness that one is initiating, executing, and controlling one’s own volitional actions in the world. Sense-of-agency behaviors included controlling thoughts about the murder and being assertive about making murder-related decisions

08 - UMBREIT (DO NOT DELETE) 3/6/2013 9:18 PM
80 MARQUETTE LAW REVIEW [96:1
that affected participants’ well-being. As shown in Figure 16, Texas and Minnesota varied in the percentage of participants who engaged in sense-of-agency behaviors (47% vs. 85%), as well as the proportion of participants who engaged in being self-assertive (32% vs. 20%), controlling of thought (10% vs. 25%), or both (5% vs. 40%). A survivor talked about the decision she and her husband consciously made not to follow the media coverage of their son’s death because of the debate about whether or not, as a police officer, he had followed protocol and perhaps caused his own death:
We didn’t want to believe it. We didn’t watch TV because they would flash his picture when we didn’t know it. We didn’t read the papers so we really didn’t know what happened to him. My brother, he’s a policeman in Connecticut . . . [h]e wanted to tell me and I said, “I just don’t want to know. I just want you to leave me alone. I don’t want to hear it.” . . . For me it was the right thing cause I don’t think I could have handled knowing.
A woman explained what she did to take charge of her own healing:
At some point along the line, I started taking control, making choices. Some of those choices were very, very hard because of expectations placed from elsewhere. . . . I hate these grief groups were we sit around and we rehash it all over again . . . but Mom is feeling the healing or help from this and thinking that’s the cure for everyone. And finally I just said, “I hate these.” Taking control in those ways was healthy for me. Now did it mean that those issues that typically get worked through in those situations had gone away? No. It just meant that I had to deal with them in my own time, in my own way, in my own pace.
Sense-of-agency behaviors often required extra energy because survivors had to push against their emotional proclivities or go against the grain of what was considered normal. The drive that pushed them to act often had a strong sense of intention or purpose behind it.
8. Category 3 Summary
In contrast to Categories 1 and 2, the focus in Category 3 moves beyond specific topics associated with the criminal justice process and relationship with the murderer to consider the cumulative impact of the UPS on survivors physically, emotionally, and behaviorally; the negative and positive consequences on themselves and others over time; and the decisions they made about how to live with what had happened to their lives. The findings cover a wide time spectrum ranging from two to

08 - UMBREIT (DO NOT DELETE) 3/6/2013 9:18 PM
2012] ULTIMATE PENAL SANCTION 81
nineteen years after the death of participants’ loved ones. Aside from the similarity in the percentage of participants reporting injustices associated with the criminal justice system, findings from the other event themes consistently show considerable variation between Texas and Minnesota.
A higher percentage of Minnesotans than Texans, for example, noted additional injustices not associated with the criminal justice system (50% vs. 21%). Although speculative, this contrast may reflect the fact that Minnesotans, particularly from Time 2, were more likely to concentrate on injustices outside of the criminal justice because the criminal justice process was finished.
Compared to Texans, fewer Minnesotans referenced negative fallout from the murder (65% vs. 74%). Moreover, Texans, when compared to Minnesotans, indicated that they, rather than other family members, were principally affected (42% vs. 10%), whereas for Minnesotans, the ripple effect on others was more prominent than it was for Texans (40% vs. 26%), as was the impact on both themselves and other family members (15% vs. 5%).
Minnesotans also reported more positive results than Texans (80% vs. 65%). In Texas, the preponderance of positive spinoff tended to concentrate on the more recent murders (Time 1 and Time 2), whereas in Minnesota, the positive spinoff was more evident in the later time periods (Time 1, Time 2, and Time 3). There was also a substantial difference between the states in terms of the greater frequency of Minnesotan’s references to their personal growth/meaning system development in combination with positive activities/lifestyle changes (45% vs. 20%). The higher percentage of references from Minnesota participants may reflect integration of the murder, possibly as a result of the fact that the criminal justice process was finished earlier than in Texas.
More Minnesotans indicated no lasting physical reactions compared to Texans (60% vs. 42%). Moreover, more Texans than Minnesotans reported disease or illness (26% vs. 10%). The nature and frequency of their physical issues indicate that Texans may have experienced more ongoing stress.
Texans had more ongoing trauma reactions (42% vs. 20%) and depression/emotional dulling (63% vs. 25%) than Minnesotans. Psychological changes also included posttraumatic growth, which was less for Texans (5%) than for Minnesotans (55%) who were concentrated in Time 3 and Time 4. A seemingly paradoxical development was evident in the higher percentage of Minnesotans who

08 - UMBREIT (DO NOT DELETE) 3/6/2013 9:18 PM
82 MARQUETTE LAW REVIEW [96:1
reported trust issues compared to Texans (55% vs. 37%). It is possible that this finding reflects a regional difference in that there may have been a core shift in trusting others, but that change may not have been perceived as a loss or negative result. It is also important to note that variation in this percentage comes primarily from Time 1 participants in Texas and Minnesota. The percentage of those with trust issues is the same in both states otherwise.
In regard to the impact of the murder on changes in participants’ behavior, both Minnesotans and Texans used stress-reducing behaviors. Minnesotans, however, had higher percentages of self-protective behaviors (40% vs. 11%) and Texans had more avoidant/distancing behaviors (37% vs. 15%). A higher percentage of Minnesotans than Texans used both types of behaviors (26% vs. 15%). Participants also described “refocusing efforts” to move away from the impact of the murder. Refocusing efforts included busyness and lifestyle changes. More Minnesotans than Texans used refocusing behaviors (75% vs. 25%). More Minnesotans than Texans also used lifestyle changes solely (30% vs. 21%) or both busyness and lifestyle changes (35% vs. 5%). Minnesotans and Texans were similar in their use of busyness only (10% vs. 11%). Many more Texans than Minnesotans employed behaviors to preserve their closeness to the immediate presence of their loved one (32% vs. 5%). This finding may reflect a difference in the progress of the bereavement process and may be explained by the extent to which the criminal justice process had been completed. Finally, more Minnesotans than Texans reported instances of using self-agency—using self-assertion and thought control to impact the direction of their lives (85% vs. 47%).
Although the contrast between Texas and Minnesota for each separate finding associated with negative and positive consequences, physical reactions, and psychological and behavioral changes may not individually be particularly important, the accumulation and clustering of the differences between the states for almost all the event themes is suggestive of something beyond randomness. Moreover, the state differences are supported by the consistency in the direction of the findings.
X. QUANTITATIVE RESULTS
Multivariate analysis was conducted for both the ICG-R scores by state and time and for select event themes as predictors of ICG-R scores. A two-way factorial ANOVA was used to assess the interaction and main effects in predicting the grief scores. Event themes were

08 - UMBREIT (DO NOT DELETE) 3/6/2013 9:18 PM
2012] ULTIMATE PENAL SANCTION 83
quantitatively coded and analyzed using correlation and regression techniques.
A. ICG-R Scores by State and Time
The two-way factorial ANOVA yielded a statistically significant interaction effect for state by time period (F (3, 31) = 4.268, p = .012; partial 2 = .292), as well as a statistically significant effect for time (F (3, 31) = 3.859, p = .019; partial 2 = .272). The main effect of state was not statistically significant (F (1, 31) = 0.701, p = .409; partial 2 = .022). As seen in Figure 17 and Table 7 below, ICG-R scores remained relatively stable across time for Texas participants, but Minnesota participants showed higher initial scores and a marked decrease in grief symptom severity from Time 1 to Time 3. Tukey post-hoc analyses showed that the statistically significant findings for time period were due to differences between Time 1 and Time 3 only.
B. Select Event Themes and ICG-R Scores
Four Category 1 event themes were examined to see if they predicted grief scores as measured by the ICG-R. These themes included prosecutor contact, defense attorney contact, defense attorney behavior, and contact with the murderer’s family. The Spearman’s rank order correlation coefficient (i.e., Spearman’s rho) was used for these analyses. The Spearman’s rho tests showed a statistically significant, moderate, negative relationship between ICG-R scores and contact with the murderer’s family (r =- 0.445, p = 0.014). Specifically, increased contact with the murderer’s family predicted lower ICG-R scores, and therefore, a lower level of unresolved grief. The other three event themes did not predict ICG-R scores at a statistically significant level.
To further examine the relationship of these themes with grief scores, multivariate regression models were run with state and time period as covariates, using dummy-coded variables for the themes. In these models, prosecutor contact did not significantly predict ICG-R scores (F (3, 34) = 2.635, p = 0.065). Defense attorney contact did significantly predict ICG-R scores (F (3, 28) = 5.646, p = 0.004), specifically, more positive contact with the defense attorney predicted lower grief scores. Similarly, more positive defense attorney behavior also predicted lower grief scores at a statistically significant level (F (3, 28) = 4.296, p = 0.013). More positive contact with the murderer’s family likewise predicted lower grief scores (F (3, 26) = 4.544, p = 0.011).
Some of the Category 3 event themes were also examined in light of

08 - UMBREIT (DO NOT DELETE) 3/6/2013 9:18 PM
84 MARQUETTE LAW REVIEW [96:1
ICG-R scores. Participant symptoms were examined—specifically, whether the participant had physical reactions, trauma reactions, depression or dulling symptoms, or posttraumatic growth. Changes in behavior were also examined as possible predictors of ICG-R scores, such as whether the respondent reported stress-reducing behaviors, lifestyle changes, busyness, preserving behaviors, or self-assertion. Before presenting the findings from these analyses, it is important to note a caveat—that multiple comparisons like those done here may inflate Type I errors (i.e., that with an alpha of .05, one of every twenty tests will be significant by chance alone). One way to address this is to use a Bonferroni-corrected alpha level. If, however, a Bonferroni-corrected alpha level is used to interpret findings, none of the comparisons would be statistically significant. Given that this is a preliminary study, the following discussion presents findings using an alpha of .05 and asks that the reader keep the issue of possible inferential error in mind. Findings were that physical reactions predicted statistically significant higher grief scores (t (35) = -2.886, p = 0.007), and posttraumatic growth predicted statistically significant lower grief scores (t (36) = 2.481, p = 0.018). Trauma reactions and depression/dulling did not predict grief scores at a statistically significant level (t (36) = -1.989, p = 0.054 for trauma and t (36) = -1.091, p = .283 for depression/dulling). When examining behavioral responses, only self-assertion was found to predict grief scores at a statistically significant level (t (37) = 2.148, p = 0.38), specifically, that self-assertion predicted lower grief scores.
XI. DISCUSSION OF FINDINGS
The intent of this research is to examine homicide survivor experience in the context of the harshest of punishments allowed by law. Conventional wisdom presumes the harshest punishment available will provide survivors with the utmost in justice, vindication, and satisfaction.212 What we know about homicide survivor experience, however, is that “violent, intentional death is linked inextricably with images of powerlessness—the powerlessness of the victim to resist, and the powerlessness of the bereaved to intervene at the time of the killing and to control events thereafter.”213 The Study demonstrates that
212. See, e.g., Bandes, supra note 4, at 1–4. 213. PAUL ROCK, AFTER HOMICIDE: PRACTICAL AND POLITICAL RESPONSES TO
BEREAVEMENT 53 (1998).

08 - UMBREIT (DO NOT DELETE) 3/6/2013 9:18 PM
2012] ULTIMATE PENAL SANCTION 85
although the UPS does provide a sense of justice and satisfaction in the punishment of the murderer, the punishment, by itself, is limited in its healing potential for survivors. Furthermore, the Study indicates that other factors are necessary to aid survivors in their ability to integrate the trauma of the murder, find the psychological space to grieve, and locate the supports that facilitate rebuilding their lives. The Study provides evidence that survivors’ well-being is enhanced if they have a greater sense of control over their lives and this sense of control contributes to a higher level of satisfaction with the justice system and its processes. The Study identifies core factors that offer survivors a stronger sense of control.
A. Outreach and VIS
Study results suggest that outreach to survivors, respectful interactions, and positive relationships with key stakeholders (e.g., the prosecution team, defense attorneys, and members of the murderer’s family) during the pretrial and conviction stage may be associated with lower ICG-R scores. The personal and intense nature of these memorable associations, however brief, makes these associations participative opportunities for survivors. Although speculative, these associations are likely to build survivors’ self-esteem and serve as testament to their special identity as crime victims and deep mourners. These associations were particularly evident in Texas for Time 1 survivors. In contrast to Time 1 survivors in Minnesota, Texans expressed no issues with trust, which, according to Study participants, was majorly damaged by the murder and associated events. This dynamic suggests that survivors may have felt relatively confident about their criminal justice experience and a part of, rather than victimized by, courtroom events. Although these survivors were the youngest in the Study in terms of time since conviction, it is possible that these positive associations with pivotal figures could inoculate them somewhat from the upcoming stress and lengthiness of the appeal processes.
Therapeutic jurisprudence asserts that the giving of victim-impact statements empower survivors with an opportunity to participate.214 Nowhere, however, is the debate about crime victim rights greater than in the literature about due process, procedural justice, VIS, and closure.215 The Study found that survivors were satisfied with the VIS
214. See Erez, supra note 116, at 551. 215. See, e.g., Bandes, supra note 4, at 3; Cassell, supra note 114, at 612; Erez, supra note

08 - UMBREIT (DO NOT DELETE) 3/6/2013 9:18 PM
86 MARQUETTE LAW REVIEW [96:1
experience but varied substantially in their reactions. Some felt exuberant, for example, that the murderer cried. Others felt out of control emotionally or upset that the murderer did not look at them or show expression while they were making their statement. Although Minnesotans gave VIS at sentencing, and Texans made allocution after sentencing, the placement of VIS in the trial proceedings seemed to make no difference. Moreover, survivors said little that could link VIS to victim healing other than it serving an expressive function. Based on these findings, its therapeutic impact in capital murder cases will likely remain questionable. It may be more important, therefore, to consider instead the injustice and negative consequences to survivors if the right, which is now institutionalized, were taken from them.216
B. Social Expectations, Ambiguous Loss, and Closure
Social expectation theory proposes that institutional structures are influenced by assumptions or social norms about what people feel and ought to feel.217 Social expectations play a role in how we see and maneuver our social worlds.218 Socially received expectations also motivate our behavior. The social construction of closure, what it is supposed to accomplish for survivors, and how institutional structures provide for it, is a prime example of how social expectations condition our beliefs and actions. What happens when social expectations are unrealized? How does this disjuncture impact survivors’ sense of control and well-being? Survivors in Texas were particularly susceptible to this distortion because of the length of the appeals process. Survivors whose cases were stuck during Time 3 and Time 4 (ten to sixteen years postsentencing) faced a heretofore-permanent state of suspension, not knowing if and when the case would move forward or move forward in
116.
216. Victims already experience some injustice because they have limited control over their VIS. See Tracey Booth, ‘Cooling Out’ Victims of Crime: Managing Victim Participation in the Sentencing Process in a Superior Sentencing Court, 45 AUSTR. & N.Z. J. CRIMINOLOGY 214, 217 (2012) (noting that not only can the VIS be edited by the court before the sentencing hearing but also that once in court, the defendant can object to the content of VIS and, if it does not comply with the law, it may be edited and parts deleted altogether in open court); see also Charles F. Baird & Elizabeth E. McGinn, Re-Victimizing the Victim: How Prosecutorial and Judicial Discretion Are Being Exercised to Silence Victims Who Oppose Capital Punishment, 15 STAN. L. & POL’Y REV. 447, 466 (2004) (commenting on the fact that VIS that oppose the death penalty are barred from being given).
217. See, e.g., Bandes, supra note 4, at 10. 218. Koichi Hasegawa et al., The Effects of ‘Social Expectation’ on the Development of
Civil Society in Japan, 3 J. CIV. SOC’Y 179, 180–81 (2007).

08 - UMBREIT (DO NOT DELETE) 3/6/2013 9:18 PM
2012] ULTIMATE PENAL SANCTION 87
their lifetimes. The impact of having achieved the ultimate sentence while living under threat of losing it, coupled with a sustained and undeviating lack of resolution, clearly undermines any control that survivors might have initially attained through the guilty verdict.
The concept of ambiguous loss provides a framework for understanding the meaning of this indeterminate reality in survivors’ lives. It refers to an “unclear loss that defies closure.”219 The concept was first formulated by Pauline Boss after interviewing wives whose husbands were missing in action (MIA) in Vietnam and Southeast Asia and later applied to family members whose loved one had Alzheimer’s.220 The inability to resolve ambiguous loss is due to the outside situation but is considered the most devastating of all losses because the ambiguity prevents people from adjusting.221 In the Study, the survivors with stuck cases appeared to be suffering from ambiguous loss, which was marked, as noted by Boss, by their fluctuating between hope and hopelessness, a deadening of emotion, and stagnation in personal movement waiting for some resolution and relief.222
Texas survivors also seemed to be at odds with the social expectation that the execution would bring closure. Besides a mixture of responses in cases where executions had been completed, survivors’ anticipation about the positive impact of any upcoming execution was gradually reduced the longer they had to wait for its finality. Regardless of the circumstances, however, most survivors focused on the execution as the pivotal event and gave strong consideration to the issue of attending and the fantasy of what might happen in the death chamber.
The social expectation of closure newly associated with LWOP seemed absent in Minnesota. The endpoint was the sentencing. The appeals process was sparsely referenced except for one case where the sentence had been reduced on appeal. Although Minnesotans were finished with the criminal justice process sooner and theoretically got control back over their lives earlier, survivors did not appear to notice or value the difference. Instead, many Minnesota survivors wished for the death penalty believing that the murderer’s death would be more
219. See About Pauline Boss: Personal Statement, AMBIGUOUSLOSS.COM,
http://www.ambiguousloss.com/personal_statement.php (last visited Oct. 8, 2012); see also PAULINE BOSS, AMBIGUOUS LOSS: LEARNING TO LIVE WITH UNRESOLVED GRIEF 26–44 (1999).
220. Id. at 12–15. 221. Id. at 6. 222. Id. at 11.

08 - UMBREIT (DO NOT DELETE) 3/6/2013 9:18 PM
88 MARQUETTE LAW REVIEW [96:1
satisfying than LWOP. This reality may demonstrate that, without a collectively held and valued social expectation about what LWOP is supposed to give to survivors, there remains a void that is predictably trumped by the belief, for some, that the death penalty remains the ultimate and preferred outcome.
C. The Involuntary Relationship
Besides the element of time, the postconviction phase was marked by survivors’ mental relationship with the murderer, holding him unrelentingly accountable for what he did. Regardless of the sentence, most survivors felt negatively, wanting the murderer to suffer as they did. Survivors’ concentration on the murderer was present and intense as well in the conviction stage during the trial. Besides having rage and contempt for the murderer, survivors observed defense attorneys closely for how they handled the case, watched the courtroom behaviors and reactions to testimony of defendant’s and persons’ associated with the murderer, and others in the courtroom, and frequently directed their VIS to the murderer, hoping that he would never forget what they had said.
There is an emerging literature on this mental relationship due to the recognition that a situationally induced relationship is forced on the survivor as a consequence of the murder.223 The inextricable tie between the survivor and murderer is based on the fact that the murderer was the last person to be with the survivor’s loved one.224 This involuntary relationship is filled with anger and hostility and kept alive either until the offender is executed or no longer pervades the survivor’s life through appeals outcomes or efforts to resurface.225 Madeira contends that the potency of the relationship is maintained because social expectations disallow it, which, in effect, pushes it into the background
223. See MARK UMBREIT & MARILYN PETERSON ARMOUR, RESTORATIVE JUSTICE
DIALOGUE: AN ESSENTIAL GUIDE FOR RESEARCH AND PRACTICE 315 (2010); Mickell Branham & Richard Burr, Understanding Defense-Initiated Victim Outreach and Why it is Essential in Defending a Capital Client, 36 HOFSTRA L. REV. 1019, 1023, 1026 (2008); Richard Burr, Expanding the Horizons of Capital Defense: Why Defense Teams Should Be Concerned About Victims and Survivors, CHAMPION, Dec. 2006, at 44–47 (discussing the relationship formed between offenders and survivors).
224. Burr, supra note 223. 225. Several survivors commented on offender websites that they visited. They were
incensed by material on the website—including pictures of children killed, and requests for friendship.

08 - UMBREIT (DO NOT DELETE) 3/6/2013 9:18 PM
2012] ULTIMATE PENAL SANCTION 89
where it functions at a subliminal level and is given little attention.226 It is also furthered through the survivor’s subjective creation of who the murderer is—subjective because there is no contact, so little ongoing information available to the survivor, and no give-and-take.227 Madeira suggests that the relationship is most harmful when the offender “appears defiant, remorseless and unemotional” and when the survivor’s subjective creation is taken as real.228 Besides keeping the trauma alive, the lack of social recognition about the relationship’s formation and effects contributes to the survivor’s suffering.229
D. Rumination and Vengeance
The inextricable and ongoing negative connection with the murderer in the Study seemed tied to some survivors’ ruminations and their powerlessness over circumstances beyond their control. For many, their inability to control this ruminating generated ledgers of unresolved injustices accompanied by anger and frustration. Clearly, the delay in stuck appeals processes fostered rumination, but so did non-stranger homicides in both states that involved ongoing contact with people who knew the murderer. The seeming delight in fantasizing the murderer’s suffering, or a wish fulfillment for the murderer’s remorse, also fed out-of-control thinking that led nowhere.
Survivors seeking vengeance for the grievous wrong of murder lies at the conceptual base of justice.230 Vengeance is commonly accepted as a morally worthy attempt to undo evil.231 Although the social expectation is that avenging a wrongdoer will relieve anger and that higher punishment will lead to a better mood, experimental studies show the opposite.232 A study on punishment found that the dorsal striatum, the brain region that is closely related to pleasure,233 was activated when
226. Jody Lyneé Madeira, When It’s so Hard to Relate: Can the Legal System Mitigate the
Trauma of Victim-Offender Relationships?, 46 HOUS. L. REV. 401, 437 (2009). 227. Id. at 443. 228. Id. at 405–06. 229. Id. at 406. 230. Bas van Stokkom, Victims’ Needs, Well-Being and ‘Closure’: Is Revenge
Therapeutic?, in THERAPEUTIC JURISPRUDENCE AND VICTIM PARTICIPATION IN JUSTICE: INTERNATIONAL PERSPECTIVES, supra note 87, at 207, 212–13.
231. Id. 232. See Kevin M. Carlsmith et al., The Paradoxical Consequences of Revenge, 95 J.
PERSONALITY & SOC. PSYCHOL. 1316, 1316 (2008). 233. See Dominique J.-F. de Quervain et al., The Neural Basis of Altruistic Punishment,
305 SCIENCE 1254, 1254 (2004).

08 - UMBREIT (DO NOT DELETE) 3/6/2013 9:18 PM
90 MARQUETTE LAW REVIEW [96:1
participants decided to punish a violator of a social norm, but a subsequent study showed that the predicted and experienced emotion were substantially different.234 Specifically, after the punishment was administered, these participants were substantially less happy than those who did not punish.235 This is because these participants who punished continued to ruminate about the violator.236
To some extent, the Study findings mirror these conclusions. Approximately half of the survivors in both states wanted the murderer to suffer. However, the Minnesota survivors had more neutral attitudes toward the murderer, or no mental relationship with him, particularly for survivors from Time 3 and Time 4. It is possible that the interminable waiting and stuck status of cases in Texas make it more difficult for survivors to control their ruminations.
E. Civil Actions and Accumulated Injustices
The role of civil lawsuits in the postconviction phase has been curiously absent in the literature on homicide bereavement. In addition to the criminal justice system, civil actions provide an important mechanism for survivors to seek justice, in part because the initiative emanates from them as plaintiffs rather than the state and is centered specifically on the wrongs done according to the survivors’ perspective. Nearly all the civil lawsuits were brought by Minnesotans and occurred before Time 2 (5 to 7 years after the sentencing or punishment trial). These survivors often spent as much time describing the civil suit that they themselves brought as they did the criminal trial. Their accounts were frequently accompanied by a sense of vindication and righteousness even when the civil suit outcomes were disappointing. Only one survivor in Texas had considered a civil action. In homicide cases, civil action may rest on obtaining the criminal justice conviction and having it upheld on appeal. The lengthiness of the appeal process in death penalty cases, therefore, may act as a disincentive against civil suits. Moreover, while a criminal case is pending or on appeal or in habeas corpus proceedings, the case is not over and the defendant cannot speak without having what he says used against him.
Regardless of whether survivors brought civil suits, they experienced additional injustices, which fed their tendencies to ruminate and
234. See Carlsmith et al., supra note 232, at 1323. 235. Id. at 1322–23. 236. Id. at 1319.

08 - UMBREIT (DO NOT DELETE) 3/6/2013 9:18 PM
2012] ULTIMATE PENAL SANCTION 91
reinforced their sense of victimization. Indeed, survivors often had a stronger visceral sense of injustice done than any sense of what justice meant other than relief that the murderer had been caught, convicted and sentenced. Though speculative, this expansion of injustices created by outside circumstances may have undermined their ability to re-establish a sense of control.
F. Satisfaction with the Criminal Justice System
Crime victims’ satisfaction with the criminal justice system has been found to be related to their perception of a sense of fairness,237 which is affected by feeling interest from key stakeholders (e.g., police and public prosecutors); a chance to express the victims’ wishes and have those wishes considered, recognized, and respected.238 These same elements are also associated with posttrauma adjustment.239 Research also shows that anger rumination and motivation to seek revenge are associated with “greater levels of negative affect and lower levels of life satisfaction.”240 Although the Study did not examine relationships between event themes (e.g., VIS and criminal justice satisfaction), there were higher levels of satisfaction with the criminal justice system for Minnesota participants compared to Texans. Survivor comments suggest that this difference reflects less confidence in the system. The difference may also be a product of uncompleted cases and the uncertainty and lack of control many Texas survivors experience. This reality may make it difficult for Texas survivors to experience a perceived sense of control, which is essential to emotional well-being.241
237. See generally JO-ANNE WEMMERS, VICTIMS IN THE CRIMINAL JUSTICE SYSTEM 4
(1996) (laying out the need to research the treatment of victims by the criminal justice system and how it affects their attitudes toward criminal justice authorities and the law). For a discussion of the findings, see id. at 198–214.
238. Id. at 4. 239. See Jo-Anne Wemmers, Victims in the Criminal Justice System and Therapeutic
Jurisprudence: A Canadian Perspective, in THERAPEUTIC JURISPRUDENCE AND VICTIM PARTICIPATION IN JUSTICE: INTERNATIONAL PERPECTIVE, supra note 87, at 80.
240. van Stokkom, supra note 230, at 220–21. 241. See BRUCE J. WINICK, THERAPEUTIC JURISPRUDENCE APPLIED: ESSAYS ON
MENTAL HEALTH LAW 68, 70–71 (1997); Bruce J. Winick, On Autonomy: Legal and Psychological Perspectives, 37 VILL. L. REV. 1705, 1755 (1992); see also Armour & Umbreit, supra note 187 (describing that homicide survivor well-being is assessed, in part, through a survivor’s ability to move forward, as opposed to remaining stuck in the aftermath of their loss).

08 - UMBREIT (DO NOT DELETE) 3/6/2013 9:18 PM
92 MARQUETTE LAW REVIEW [96:1
G. Physical and Mental Health of Survivors
A perceived sense of control has been found in numerous studies to be positively associated with physical health, self-esteem, personal adjustment, coping, decreased stress and depression and psychological well-being. The Study found less physical and emotional distress and more health-oriented behaviors (e.g., posttraumatic growth, healthier stress-reducing activities,242 refocusing behaviors, and sense of agency behaviors) in Minnesota participants. Based on the perceived control theory, there may be a positive relationship between these indices of well-being and perceived control suggesting that these survivors more likely believe that they have some control over the events that affect them. There is some support for this supposition in the quantitative findings. Besides the fact that Minnesotans during Time 2, Time 3, and Time 4 had lower ICG-R scores, lower ICG-R scores predicted less illness/disease and more posttraumatic growth and self-assertive behaviors.
The trauma and victimization caused by murder challenges the fundamental components of the assumptive world, including assumptions about benevolence, predictability, and controllability.243 Part of survivors’ struggle is to rebuild a meaning system as a base for moving their lives forward.244 Although this construction is exceedingly difficult,245 studies on the relationship between complicated bereavement and meaning-making find that sense-making is the explanatory mechanism for the association between violent loss and complications in grieving, suggesting that the ability to create meaning may impact complicated bereavement.246 In the Study, more Minnesotans than Texans referenced meaning-making as part of the positive consequences
242. See Todd B. Kashdan & Jennifer Q. Kane, Post-Traumatic Distress and the Presence of Post-Traumatic Growth and Meaning in Life: Experiential Avoidance as a Moderator, 50 PERSONALITY & INDIVIDUAL DIFFERENCES 84, 87 (2011) (finding that less reliance on experiential avoidance predicts greater PTG and meaning in life). In this Study, Texas survivors used more avoidant/distancing behaviors more than Minnesota survivors.
243. RONNIE JANOFF-BULMAN, SHATTERED ASSUMPTIONS: TOWARDS A NEW PSYCHOLOGY OF TRAUMA 4–25 (1992).
244. Armour, supra note 129 (describing how meaning making grounded in action gives homicide survivors avenues for re-establishing a sense of coherence, self-continuity and a new sense of social identity).
245. See Murphy et al., supra note 133, at 397 (finding that 43% of parents whose child suffered a violent death from accident, suicide, or homicide were not able to find meaning after five years).
246. Joseph M. Currier et al., Sense-Making, Grief, and the Experience of Violent Loss: Toward a Mediational Model, 30 DEATH STUD. 403, 403 (2006).

08 - UMBREIT (DO NOT DELETE) 3/6/2013 9:18 PM
2012] ULTIMATE PENAL SANCTION 93
from the tragedy. This state difference surfaced again for posttraumatic growth (PTG) both in the percentage of Minnesotans who make reference to their strength, accomplishments, realizations and outspokenness and in the quantitative findings that showed ICG-R scores predicting posttraumatic growth and self-assertive behavior. The fact that perceptions of present control over the “recovery” process relate to lower levels of psychological distress247 is likely reflected in these relationships.
Increasingly, the evidence shows that posttraumatic growth (PTG)—growing psychologically from traumatic events—happens alongside and is positively correlated with PTSD.248 However, over time the relationship attenuates and becomes more negative.249 This shift is explained by the fact that PTG has a short-term illusory side related to short-term compensatory coping mechanisms (e.g. busyness) and a long-term constructive, self-transcending side related to action250 for a more genuine and lasting growth (e.g. sense-of-agency behaviors).251 This trend is reflected in the Study findings for Minnesotans, the majority of whom indicated PTG during the later time periods (Time 3 and Time 4) as well as behaviors aimed at thought control and self-assertion.
H. Summary of Findings
The need to assess the impact of event themes on survivors’ sense of control and well-being is supported by current research on traumatic events and the temporal model of control, which shows that control over the present is associated with better adjustment.252 The findings from
247. See Ryan M. Walsh & Steven E. Bruce, The Relationships Between Perceived Levels of Control, Psychological Distress, and Legal System Variables in a Sample of Sexual Assault Survivors, 17 VIOLENCE AGAINST WOMEN 603, 603 (2011).
248. Dinu-Stefan Teodorescu et al., Posttraumatic Growth, Depressive Symptoms, Posttraumatic Stress Symptoms, Post-Migration Stressors and Quality of Life in Multi-Traumatized Psychiatric Outpatients with a Refugee Background in Norway, 10 HEALTH & QUALITY OF LIFE OUTCOMES 84, 85 (2012).
249. Id.; Richard G. Tedeschi & Lawrence G. Calhoun, The Posttraumatic Growth Inventory: Measuring the Positive Legacy of Trauma, 9 J. TRAUMATIC STRESS 455 (1996); Vicki S. Helgeson et al., A Meta-Analytic Review of Benefit Finding and Growth, 74 J. CONSULTING & CLINICAL PSYCHOL. 797, 797–98 (2006); Floortje Mols et al., Well-Being, Posttraumatic Growth and Benefit Finding in Long-Term Breast Cancer Survivors, 24 PSYCHOL. & HEALTH 583, 584 (2009).
250. See Armour, supra note 129, at 525. 251. Tanja Zoellner & Andreas Maercker, Posttraumatic Growth in Clinical
Psychology—A Critical Review and Introduction of a Two Component Model, 26 CLINICAL PSYCHOL. REV. 626, 640 (2006).
252. Frazier, supra note 148, at 304–05.

08 - UMBREIT (DO NOT DELETE) 3/6/2013 9:18 PM
94 MARQUETTE LAW REVIEW [96:1
this Study reflect the relative sense of control survivors felt they had over a spectrum of events that collectively comprised their conviction and postconviction experience and the relationship between that control and indicators of their well-being. For example, issues during the conviction process such as giving input to the prosecution about the murderer’s sanction, feeling blocked from responding to the defense attorney’s portrayal of the victim, being recognized by the defense, whether the murderer was present or attentive to the survivor’s VIS, feeling helpless to stop the murderer’s derisive nonverbal behaviors, or feeling powerless over efforts by the murderer’s family to even the score influence survivors’ sense of control. Likewise the bringing of civil actions, lack of information or unpredictability about what is happening with the appeals, delays in the appeal process caused by external forces such as crime labs losing evidence or Supreme Court decisions, negative experiences associated with the execution, and unanswered questions that restrict comprehensibility of the murder impact on the survivors’ sense of control. The consequences, as shown in this Study, of having more or less control over their own healing process impacts survivors’ well-being. Indeed, the issue with control is complex in that survivors reported more situations that denied or removed control than instances that were empowering.
XII. LIMITATIONS
This investigation of survivors and the UPS is a pilot study with a small sample from two states. The inquiry is limited by the fact that qualitative findings cannot be generalized beyond survivors who participated in this research or the socio-historic time when they were interviewed. Moreover, because the two states selected for comparison differ significantly, it is possible that the state differences noted in the findings reflect regional variations rather than differences in the UPS. Although the Minnesota cases were randomly selected from state’s listings of first-degree felony murders, there was variation in the sentence received ranging from LWOR to twenty-seven years before consideration of parole. Consequently, the assignment of the LWOP designation to Minnesota is questionable since the maximum sentence of LWOR for first-degree felony murder was not legislated until 2005. Except for the analysis of the quantitative data, only the principal investigator was involved in doing the Study. Although this reality heightened consistency in the interviewing process and control over the analysis, there was no corroboration of the event themes or ratings assigned to the event themes except through triangulation of the

08 - UMBREIT (DO NOT DELETE) 3/6/2013 9:18 PM
2012] ULTIMATE PENAL SANCTION 95
quantitative results.
XIII. IMPLICATIONS
The findings from the Study have implications for therapeutic jurisprudence and its response to survivors. As a movement and field of study that is concerned with the therapeutic and anti-therapeutic effects of the law and legal system on crime victims, it has the power to guide thinking about many of the issues raised in the Study. Most central is the misguided justification for either the death penalty or LWOP that the UPS brings closure. As repeatedly shown in the literature and again in the Study, survivor well-being is associated with a perceived sense of control, not the lofty or political ideal of closure that is ill-defined and has multiple meanings or is insulting to or in disrepute among survivors themselves. Rather than throwing closure out, we suggest that closure be reconfigured to convey a regained sense of control and that it be considered a sense-making process, synonymous with meaning-making, rather than a destination.253 Within this framework, the criminal justice system can then provide footholds in a variety of areas to encourage agency and the development of strengths rather than an external focus on the finality of the punishment.
Part of regaining control rests on the survivors’ ability to create a personal narrative as a sense-making instrument that pulls together what happened and can assist in interpreting events and comprehending oneself.254 Narrative resolution, however, is often blocked by ongoing and disruptive circumstances and limited information about the murderer, the murder, and what actually happened. Several of the survivors had the opportunity to meet with the murderer for a restorative dialogue.255 Survivors, in these cases, had moved far ahead of
253. Armour has made this argument before. See Armour, supra note 129, at 534–35. This suggestion has also been made by Jody Lyneé Madeira. Madeira, supra note 111, at 1503, 1506.
254. Madeira, supra note 111, at 1509–11. 255. Both Minnesota and Texas offer restorative justice programs to homicide survivors
for a mediated dialogue with the murderer—even in cases involving the death penalty. For a description and evaluation of the program in Texas, see MARK S. UMBREIT ET AL., FACING VIOLENCE: THE PATH OF RESTORATIVE JUSTICE AND DIALOGUE 11–12 (2003). The humanistic approach used in the Minnesota program is described as well. Id. at 16–17. For a brief description of the Minnesota program, see Victim Offender Dialogue, MINNESOTA DEP’T OF CORRECTIONS, https://www.minnesotachoice.com/web/guest/victim-offender-dialogue (last visited Oct. 27, 2012); see also Madeira, supra note 111, at 1516 (noting that eleven out of twenty-seven survivors in her study wanted to meet with McVeigh and another five were willing but unsure of the meeting’s productivity).

08 - UMBREIT (DO NOT DELETE) 3/6/2013 9:18 PM
96 MARQUETTE LAW REVIEW [96:1
others in their resolution of feelings toward the murderer and in having a fuller, more credible picture that they, rather than the criminal justice system, had obtained. This Study found that the involuntary relationship with the murderer was omnipresent and especially so for survivors waiting for the murderer’s execution. The ability of survivors to dialogue directly might help complete their narrative so they could move forward earlier.
Similarly, there are prescribed barriers between survivors and the defense team and between survivors and members of the defendant’s family. The findings suggest that the possibility for respectful interaction is empowering and puts the survivor in charge. Defense-initiated victim outreach (DIVO) is a recent addition to death penalty litigation that offers survivors the opportunity, through an independent victim specialist, for a relationship with the defense team to get needs met as determined by the survivor.256 Mechanisms like DIVO act on the reality of the involuntary relationship through the defense team as proxy for the defendant. Mechanisms like DIVO, or other programs that carefully and sensitively bring together members of the victims and defendant’s families, can be empowering, help provide information, and perhaps reduce some of the rumination that otherwise impedes movement.
A major implication is the need for survivors to have access to the Study findings. Homicide survivors are thrust into the criminal justice system and the public light with little or no knowledge about the process and what to expect. Survivors who are part of UPS proceedings have the additional burden of navigating complex layers of legal proceedings that hold huge implications for their futures. Knowledge of the information in the Study, which was gleaned from survivors like themselves, would aid them in their decision making and leave them less dependent on other well-meaning legal representatives whose political agendas might serve to filter out important information that could be healing for the survivor.
From a therapeutic jurisprudence perspective, the Study findings also have implications for prosecutors and defense attorneys. While maintaining their objectivity, prosecutors need to be mindful that providing information as well as solid and consistent support helps inoculate survivors against some of the stressors in the courtroom. The establishment of a partnered relationship achieved through consultation
256. See Branham & Burr, supra note 223, at 1023–25.
08 - UMBREIT (DO NOT DELETE) 3/6/2013 9:18 PM
2012] ULTIMATE PENAL SANCTION 97
with survivors and making room for their input elevates their diminished status as crime victims in their own eyes thereby providing the building blocks for a stronger sense of participation and control. The findings confirm the need for defense attorneys not to avoid survivors but to engage with them in a respectful, compassionate manner. Defense attorneys do not need to show empathy by conveying an ambivalent commitment to the defendant as purported to have happened to some of the survivors in this study. Rather, the defense outreach must be sincere and responsive to survivor needs. Defense attorneys might also work with their clients, where appropriate, to better understand the enormity of the survivor’s loss and what they did to their lives. Many survivors hunger for genuine remorse as part of what they need to complete, even resolve, the narrative of the murder so they can move forward.
XIV. CONCLUSION
Although a causal relationship between court-generated closure and survivor well-being has been hypothesized, it has never been tested. Media reports of survivor comments at the time of execution, or made immediately following it, and studies based on those comments, have been the best evidence to date but represent partial or indirectly derived approximations of the impact of the UPS on survivors.257 This Study used in-person interviews with a randomly selected sample of survivors from four time periods about the entire UPS process and its longitudinal impact on their lives. Moreover, it assessed the impact of different types of UPS on survivors by comparing their experiences in two different states, namely Texas and Minnesota. Findings include designation of UPS-related event themes at time of conviction and postconviction, as well as event themes associated with the consequences of the homicide on survivor’s lives. State comparisons show differences primarily during postconviction (specific to the appeals process) and in survivor well-being, with Minnesotans having higher levels of physical, psychological, and behavioral health. Quantitative results support these state differences between Time 1 and Time 3 as well as predictive relationships between grief scores and event themes of well-being. The
257. See generally Gross & Matheson, supra note 124 (examining press stories regarding
executions from January 2001 through June 2002); Mowen & Schroeder, supra note 124 (examining newspaper coverage about executions to report responses and sentiments of covictims); Vollum & Longmire, supra note 124 (assessing statements from covictims by reviewing articles about executions).

08 - UMBREIT (DO NOT DELETE) 3/6/2013 9:18 PM
98 MARQUETTE LAW REVIEW [96:1
issue of survivor’s perceived control over present-day circumstances is a critical factor reflected in the event themes as well as the researcher-assigned ratings, of survivors’ reactions. Although the UPS is promulgated as the ultimate justice, this Study found that the critical dynamic was the control survivors felt they had over the process of getting to the end. In Minnesota, survivors had greater control, likely because the appeals process was successful, predictable, and completed within two years after conviction; whereas, the finality of the appeals process in Texas was drawn out, elusive, delayed, and unpredictable. It generated layers of injustice, powerlessness, and in some instances, despair. Although the grief and depth of sorrow remained high for Minnesotans, no longer having to deal with the murderer, his outcome, or the criminal justice system allowed survivors’ control and energy to be put into the present to be used for personal healing.

08 - UMBREIT (DO NOT DELETE) 3/6/2013 9:18 PM
2012] ULTIMATE PENAL SANCTION 99
APPENDIX A: FIGURES
Figure 1. Percentage Distribution of Prosecution Contact at Time 1 by State
Figure 2. Percentage Distribution of Defense Attorney Contact by State
0
20
40
60
80
100
Minnesota Texas
Minimal Average Extensive
0
20
40
60
80
100
Minnesota Texas
Negative Neutral Positive

08 - UMBREIT (DO NOT DELETE) 3/6/2013 9:18 PM
100 MARQUETTE LAW REVIEW [96:1
Figure 3. Percentage Distribution of Criminal Justice Satisfaction by State
Figure 4. Percentage Distribution of Civil Actions by Time and State
0
20
40
60
80
100
Minnesota Texas
Very dissatisfied Dissatisfied Somewhat satisfied
Satisfied Very satisfied
0
20
40
60
80
100
Time 1 Time 2 Time 3 Time 4 Time 1 Time 2 Time 3 Time 4
Minnesota Texas
No Yes

08 - UMBREIT (DO NOT DELETE) 3/6/2013 9:18 PM
2012] ULTIMATE PENAL SANCTION 101
Figure 5. Percentage Distribution of Case Status by State
Figure 6a. Percentage Distribution of Reaction to Appeal Process by State—Texas
0
20
40
60
80
100
Minnesota Texas
Stuck Moving Completed
0
20
40
60
80
100
Time 1 Time 2 Time 3 Time 4
Dissatisfied Worried Non-apprehensive Satisfied

08 - UMBREIT (DO NOT DELETE) 3/6/2013 9:18 PM
102 MARQUETTE LAW REVIEW [96:1
Figure 6b. Percentage Distribution of Reaction to Appeal Process by State—Minnesota
Figure 7. Percentage Distribution of Desire for Murderer Remorse by State
0
20
40
60
80
100
Time 1 Time 2 Time 3 Time 4
Dissatisfied Neutral Satisfied
0
20
40
60
80
100
Minnesota Texas
No Yes

08 - UMBREIT (DO NOT DELETE) 3/6/2013 9:18 PM
2012] ULTIMATE PENAL SANCTION 103
Figure 8. Percentage Distribution of Opinion of UPS by State
Figure 9. Percentage Distribution of Execution Witnessing/Plan to Witness by Time
0
20
40
60
80
100
Minnesota Texas
Negative Neutral Positive
0
20
40
60
80
100
Time 1 Time 2 Time 3 Time 4
No Yes

08 - UMBREIT (DO NOT DELETE) 3/6/2013 9:18 PM
104 MARQUETTE LAW REVIEW [96:1
Figure 10. Percentage Distribution of Positive Spinoff by State
Figure 11. Percentage Distribution of Physical Reactions by State
0
20
40
60
80
100
Minnesota Texas
Both Personal growth / Meaning system
Activities / Life changes None
0
20
40
60
80
100
Minnesota Texas
None Current sleep problems Disease / illness Both

08 - UMBREIT (DO NOT DELETE) 3/6/2013 9:18 PM
2012] ULTIMATE PENAL SANCTION 105
Figure 12. Percentage Distribution of Depression/Emotional Dulling by State
Figure 13. Percentage Distribution of Posttraumatic Growth by State
0
20
40
60
80
100
Minnesota Texas
No Yes
0
20
40
60
80
100
Minnesota Texas
No Yes

08 - UMBREIT (DO NOT DELETE) 3/6/2013 9:18 PM
106 MARQUETTE LAW REVIEW [96:1
Figure 14. Percentage Distribution of Stress-Reducing Behaviors by State
Figure 15. Percentage Distribution of Refocusing Behaviors by State
0
20
40
60
80
100
Minnesota Texas
None Protective behaviors Avoidant / Distancing behaviors Both
0
20
40
60
80
100
Minnesota Texas
No Busyness Life style change Both
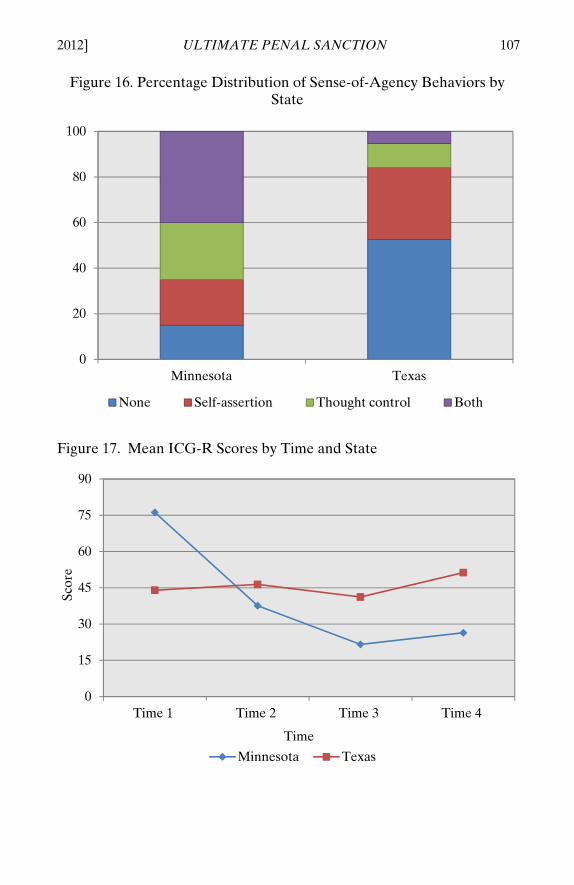
08 - UMBREIT (DO NOT DELETE) 3/6/2013 9:18 PM
2012] ULTIMATE PENAL SANCTION 107
Figure 16. Percentage Distribution of Sense-of-Agency Behaviors by State
Figure 17. Mean ICG-R Scores by Time and State
0
20
40
60
80
100
Minnesota Texas
None Self-assertion Thought control Both
0
15
30
45
60
75
90
Time 1 Time 2 Time 3 Time 4
Scor
e
Time
Minnesota Texas

08 - UMBREIT (DO NOT DELETE) 3/6/2013 9:18 PM
108 MARQUETTE LAW REVIEW [96:1
APPENDIX B: TABLES
Table 1: Case Characteristics of UPS Sample
All Cases Minnesota Texas
n Valid
Percentage n Valid
Percentage n Valid
Percentage
State Minnesota 20 51.3 20 100.0 N/A N/A
Texas 19 48.7 N/A 19 100.0
Timeframes
Time 1 (1992–1994) 10 25.6 5 25.0 5 26.3 Time 2 (1996–1998) 10 25.6 5 25.0 5 26.3 Time 3 (2000–2002) 10 25.6 5 25.0 5 26.3 Time 4 (2004–2006) 9 23.1 5 25.0 4 21.1
Continuing engagement
Yes 18 46.2 9 45.0 9 47.4
No 21 53.8 11 55.0 10 52.6
Family violence case
Yes 12 30.8 7 35.0 5 26.3
No 27 69.2 13 65.0 14 73.7
Participant knew murderer
Yes 15 38.5 9 45.0 6 31.6
No 24 61.5 11 55.0 13 68.4
Victim knew murderer
Yes 24 61.5 15 75.0 9 47.4
No 15 38.5 5 25.0 10 52.6
If death penalty case, has sentence been carried out?
Yes 4 10.3 N/A N/A 4 21.1
No 15 38.5 N/A N/A 15 78.9 Not applicable 20 51.3 20 100.0 N/A N/A

08 - UMBREIT (DO NOT DELETE) 3/6/2013 9:18 PM
2012] ULTIMATE PENAL SANCTION 109
Table 2: Respondent Characteristics of USP Sample
All Cases Minnesota Texas
n Valid Percentage
n Valid Percentage
n Valid Percentage
Gender Female 31 79.5 17 85.0 14 73.7
Male 8 20.5 3 15.0 5 26.3
Race/ Ethnicity
Black / African-American 4 10.3 2 10.0 2 10.5 Hispanic / Mexican American / Chicano 2 5.1 0 0.0 2 10.5
White / Caucasian 31 79.5 17 85.0 14 73.7
Asian / Pacific Islander 1 2.6 0 0.0 1 5.3
Other 1 2.6 1 5.0 0 0.0
Marital Status
Single 4 10.3 1 5.0 3 15.8
Married 19 48.7 8 40.0 11 57.9
Separated 1 2.6 1 5.0 0 0.0
Divorced 6 15.4 4 20.0 2 10.5
Widowed 8 20.5 6 30.0 2 10.5
Committed relationship 1 2.6 0 0.0 1 5.3
Education
Grades 7–9 1 2.6 1 5.0 0 0.0
Grades 10–12 6 15.4 4 20.0 2 10.5
High school graduate / GED 8 20.5 2 10.0 6 31.6 Some college or an associate's degree 14 35.9 7 35.0 7 36.8
Bachelor's degree 4 10.3 2 10.0 2 10.5
Some graduate school 1 2.6 0 0.0 1 5.3 Graduate degree / other professional program 5 12.8 4 20.0 1 5.3

08 - UMBREIT (DO NOT DELETE) 3/6/2013 9:18 PM
110 MARQUETTE LAW REVIEW [96:1
Table 3: Victim Characteristics of UPS Sample
All Cases Minnesota Texas
n Valid Percentage
n Valid Percentage
n Valid Percentage
Relationship to Study Participant
Parent / Step-parent 19 41.3 6 30.0 13 50.0
Spouse / Partner 6 13.0 4 20.0 2 7.7
Child / Step-child 7 15.2 3 15.0 4 15.4
Sibling 7 15.2 3 15.0 4 15.4
Grandparent 2 4.3 0 0.0 2 7.7
Other 5 10.9 4 20.0 1 3.9
Gender
Female 26 56.5 10 50.0 16 61.5
Male 20 43.5 10 50.0 10 38.5

08 - UMBREIT (DO NOT DELETE) 3/6/2013 9:18 PM
2012] ULTIMATE PENAL SANCTION 111
Table 4. Percentage Distributions of Category 1 Event Themes by State and Time Period
MINNESOTA TEXAS
Time
1 Time
2 Time
3 Time
4 Time
1 Time
2 Time
3 Time
4
Theme Response Categories
Prosecution Team Contact
None 0.0 0.0 0.0 0.0 0.0 0.0 0.0 0.0
Minimal 20.0 20.0 60.0 0.0 0.0 0.0 0.0 0.0
Average 60.0 80.0 40.0 50.0 0.0 100.0 100.0 75.0
Extensive 20.0 0.0 0.0 50.0 100.0 0.0 0.0 25.0
Sanction Input
None 80.0 60.0 80.0 100.0 0.0 75.0 75.0 100.0
Some 20.0 20.0 20.0 0.0 40.0 25.0 25.0 0.0
A lot 0.0 20.0 0.0 0.0 60.0 0.0 0.0 0.0
Input Satisfaction
Not satisfied 20.0 0.0 0.0 0.0 20.0 0.0 20.0 0.0
Satisfied 80.0 100.0 100.0 100.0 80.0 100.0 80.0 100.0
Defense Attorney Behavior
Negative 80.0 66.7 75.0 33.3 50.0 25.0 20.0 100.0
Neutral 20.0 33.3 0.0 66.7 50.0 75.0 20.0 0.0
Positive 0.0 0.0 25.0 0.0 0.0 0.0 60.0 0.0
Defense Attorney Contact
Negative 20.0 0.0 0.0 0.0 0.0 25.0 20.0 0.0
Neutral 80.0 100.0 75.0 66.7 50.0 50.0 20.0 100.0
Positive 0.0 0.0 25.0 33.3 50.0 25.0 60.0 0.0 Victim-Impact Statements (VIS)
No 0.0 0.0 25.0 50.0 20.0 0.0 20.0 50.0
Yes 100.0 100.0 75.0 50.0 80.0 100.0 80.0 50.0
VIS Satisfaction
Not satisfied 0.0 20.0 0.0 0.0 20.0 0.0 0.0 0.0
Neutral 20.0 0.0 33.3 0.0 20.0 20.0 25.0 75.0
Satisfied 80.0 80.0 66.7 100.0 60.0 80.0 75.0 25.0 Trial Disruption by Murderer
Yes 80.0 50.0 0.0 0.0 25.0 40.0 50.0 50.0
No 20.0 50.0 100.0 100.0 75.0 60.0 50.0 50.0
Family Contact
Negative 100.0 50.0 0.0 66.7 50.0 40.0 60.0 0.0
Neutral 0.0 50.0 50.0 33.3 0.0 40.0 40.0 75.0
Positive 0.0 0.0 50.0 0.0 50.0 20.0 0.0 25.0
Criminal Justice Satisfaction
Very dissatisfied 0.0 0.0 0.0 0.0 40.0 20.0 0.0 33.3
Dissatisfied 0.0 0.0 0.0 40.0 0.0 0.0 40.0 0.0 Somewhat satisfied 20.0 0.0 0.0 20.0 20.0 20.0 40.0 0.0
Satisfied 20.0 0.0 0.0 0.0 20.0 60.0 0.0 0.0
Very satisfied 60.0 100.0 100.0 40.0 20.0 0.0 20.0 66.7

08 - UMBREIT (DO NOT DELETE) 3/6/2013 9:18 PM
112 MARQUETTE LAW REVIEW [96:1
Table 5. Percentage Distributions of Category 2 Event Themes by State and Time Period
Minnesota Texas
Time
1 Time
2 Time
3 Time
4 Time
1 Time
2 Time
3 Time
4
Theme Response Categories
Civil Action No 100.0 20.0 80.0 80.0 80.0 100.0 100.0 100.0
Yes 0.0 80.0 20.0 20.0 20.0 0.0 0.0 0.0
Appeal Process
Stuck 0.0 0.0 0.0 0.0 20.0 0.0 60.0 75.0
Moving 25.0 0.0 0.0 0.0 80.0 60.0 0.0 0.0
Completed 75.0 100.0 100.0 100.0 0.0 40.0 40.0 25.0
Reaction to Appeal Process—Minnesota
Dissatisfied 0.0 33.3 0.0 0.0 N/A N/A N/A N/A
Neutral 50.0 0.0 0.0 0.0 N/A N/A N/A N/A
Satisfied 50.0 66.7 100.0 100.0 N/A N/A N/A N/A
Reaction to Appeal Process—Texas
Dissatisfied N/A N/A N/A N/A 20.0 0.0 20.0 0.0
Worried N/A N/A N/A N/A 40.0 40.0 40.0 100.0
Non-apprehensive N/A N/A N/A N/A 40.0 60.0 40.0 0.0
Satisfied N/A N/A N/A N/A 0.0 0.0 0.0 0.0
Mental Relationship with Murderer
None 0.0 20.0 40.0 60.0 0.0 0.0 0.0 25.0
Some 60.0 40.0 40.0 0.0 60.0 60.0 40.0 75.0
Much 40.0 40.0 20.0 40.0 40.0 40.0 60.0 0.0
Attitude Toward Murderer
Negative 40.0 80.0 25.0 60.0 80.0 100.0 80.0 50.0
Neutral 60.0 0.0 75.0 20.0 0.0 0.0 20.0 50.0
Positive 0.0 20.0 0.0 20.0 20.0 0.0 0.0 0.0 Desire for Murderer to Suffer
No 40.0 40.0 50.0 60.0 40.0 80.0 60.0 25.0
Yes 60.0 60.0 50.0 40.0 60.0 20.0 40.0 75.0 Desire for Murderer Remorse
No 40.0 60.0 20.0 80.0 100.0 40.0 60.0 75.0
Yes 60.0 40.0 80.0 20.0 0.0 60.0 40.0 25.0
Opinion Toward UPS
Negative 40.0 40.0 0.0 20.0 33.3 0.0 20.0 0.0
Neutral 0.0 0.0 0.0 0.0 33.3 25.0 40.0 75.0
Positive 60.0 60.0 100.0 80.0 33.3 75.0 40.0 25.0
Execution Done
No N/A N/A N/A N/A 100.0 80.0 60.0 75.0
Yes N/A N/A N/A N/A 0.0 20.0 40.0 25.0 Execution Witnessed / Plan to Witness
No N/A N/A N/A N/A 0.0 0.0 20.0 50.0
Yes N/A N/A N/A N/A 100.0 100.0 80.0 50.0
Death Penalty Aim
An ending N/A N/A N/A N/A 0.0 100.0 75.0 33.3
Equity/honoring victim N/A N/A N/A N/A 66.7 0.0 25.0 33.3
Other N/A N/A N/A N/A 33.3 0.0 0.0 33.3
Remaining Questions
No 20.0 0.0 60.0 50.0 40.0 40.0 40.0 0.0
Yes 80.0 100.0 40.0 50.0 60.0 60.0 60.0 100.0
08 - UMBREIT (DO NOT DELETE) 3/6/2013 9:18 PM
2012] ULTIMATE PENAL SANCTION 113
Table 6. Percentage Distributions of Category 3 Event Themes by State and Time Period
Minnesota Texas
Time 1 Time 2 Time 3 Time 4 Time 1 Time 2 Time 3 Time 4
Theme Response Categories
Criminal Justice Injustices / Resentments
None 40 20 100 40 60 80 40 50
1 60 60 0 60 20 0 40 25
2 to 3 0 20 0 0 20 20 20 25
4 or more 0 0 0 0 0 0 0 0
Non-Criminal Justice Injustices / Resentments
None 80 20 60 60 80 100 80 50
1 20 40 40 40 20 0 0 0
2 to 3 0 40 0 0 0 0 20 50
4 or more 0 0 0 0 0 0 0 0
Negative Fallout
None 40 40 40 20 60 0 20 25
On self 20 0 0 20 20 60 40 50
On other 40 60 60 0 20 40 20 25
On both self and other 0 0 0 60 0 0 20 0
Positive Spinoff
None 40 20 20 0 20 20 60 50
Activities / Life changes 60 20 0 40 20 40 20 50 Personal growth / Meaning system 0 0 20 0 20 20 0 0 Both of the above 0 60 60 60 40 20 20 0
Current Physical Reactions
None 40 80 60 60 60 0 60 50
Current sleep problems 40 20 0 40 20 0 20 25 Disease / Illness 0 0 40 0 0 100 20 25 Both of the above 20 0 0 0 20 0 0 0
Trauma Reactions
No 40 100 80 100 40 40 60 100
Yes 60 0 20 0 60 60 40 0
Emotional Dulling / Depressive Symptoms
No 60 50 80 100 60 20 20 50
Yes 40 50 20 0 40 80 80 50
Lack of Trust No 0 75 80 20 80 60 40 75
Yes 100 25 20 80 20 40 60 25
Post Traumatic Growth
No 100 50 20 0 80 100 100 100
Yes 0 50 80 100 20 0 0 0

08 - UMBREIT (DO NOT DELETE) 3/6/2013 9:18 PM
114 MARQUETTE LAW REVIEW [96:1
Stress-Reducing Activities
None 0 40 60 20 20 40 20 25
Protective behaviors 60 20 0 80 0 0 20 25 Avoidant / Distancing behaviors 0 40 20 0 40 40 40 25 Both of the above 40 0 20 0 40 20 20 25
Refocusing Behaviors
No 40 40 20 0 60 40 80 75
Business 0 40 0 0 0 20 0 25 Life style change 60 0 40 20 20 40 20 0 Both of the above 0 20 40 80 20 0 0 0
Preserving Behaviors
No 100 80 100 100 60 40 80 100
Yes 0 20 0 0 40 60 20 0
Sense of Agency Behaviors
None 20 20 20 0 80 60 40 25
Self-assertion 20 0 20 40 0 20 60 50
Thought control 40 60 0 0 0 20 0 25 Both of the above 20 20 60 60 20 0 0 0

08 - UMBREIT (DO NOT DELETE) 3/6/2013 9:18 PM
2012] ULTIMATE PENAL SANCTION 115
Table 7: ICG-R Score Means and Standard Deviations by Time and State
Time 1 Time 2 Time 3 Time 4
Minnesota Mean 76.2 37.6 21.6 26.4
SD 24.4 22.5 8.6 13.2
Texas Mean 44.0 46.4 41.2 51.3
SD 23.8 18.7 15.9 24.3

08 - UMBREIT (DO NOT DELETE) 3/6/2013 9:18 PM
116 MARQUETTE LAW REVIEW [96:1
Table 8a: Category 1 Texas Cases: Impact of UPS on Conviction Experience
Pros Contact
a
Sanction Input
b
Input Satis
c
Def AttBeh
d
Def AttContact
eVIS
f VIS Satis
g
Murd Disrp
h
Fam Contact
i CJ
Satisj
Time 1
Case 1 4 3 2 1 3 2 3 1 3 5
Case 2 4 2 2 2 3 2 1 2 1 3
Case 3 4 3 2 2 2 2 2 2 1 1
Case 4 4 3 1 N/A N/A 2 3 N/A N/A 1
Case 5 4 2 2 1 2 1 3 2 3 4
Time 2
Case 1 3 N/A 2 N/A N/A 2 3 2 3 4
Case 2 3 1 2 2 2 2 2 1 1 4
Case 3 3 1 2 2 2 2 3 2 2 1
Case 4 3 2 2 1 1 2 3 1 1 3
Case 5 3 1 2 2 3 2 3 2 2 4
Time 3
Case 1 3 N/A 2 3 3 2 2 1 1 2
Case 2 3 1 1 2 3 1 N/A 2 2 3
Case 3 3 1 2 3 3 2 3 N/A 2 2
Case 4 3 2 2 3 2 2 3 2 1 3
Case 5 3 1 2 1 1 2 3 1 1 5
Time 4
Case 1 3 1 2 1 2 1 3 2 3 5
Case 2 3 1 2 1 2 2 2 1 2 1
Case 3 4 1 2 1 2 1 2 1 2 N/A
Case 4 3 1 2 1 2 2 2 2 2 5
a Prosecution Team Contact: (1) None (2) Minimal (3) Average (4) Extensive
b Sanction Input: (1) None (2) Some (3) A lot c Input Satisfaction: (1) Not Satisfied (2) Satisfied
d Defense Attorney Behavior: (1) Negative (2) Neutral (3) Positive
e Defense Attorney Contact: (1) Negative (2) Neutral (3) Positive f Victim-Impact Statement/Testimony: (1) No (2) Yes g Victim-Impact Statement/Testimony Satisfaction: (1) Not satisfied (2) Neutral (3) Satisfied h Trial Disruption by Murderer: (1) Yes (2) No i Family Contact: (1) Negative (2) Neutral (3) Positive j Criminal Justice Satisfaction: (1) Very Dissatisfied (2) Dissatisfied (3) Somewhat (4) Satisfied (5) Very
Satisfied

08 - UMBREIT (DO NOT DELETE) 3/6/2013 9:18 PM
2012] ULTIMATE PENAL SANCTION 117
Table 8b: Category 1 Minnesota Cases: Impact of UPS on Conviction Experience
a Prosecution Team Contact: (1) None (2) Minimal (3) Average (4) Extensive b Sanction Input: (1) None (2) Some (3) A lot c Input Satisfaction: (1) Not Satisfied (2) Satisfied
d Defense Attorney Behavior: (1) Negative (2) Neutral (3) Positive e Defense Attorney Contact: (1) Negative (2) Neutral (3) Positive
f Victim-Impact Statement/Testimony: (1) No (2) Yes
g Victim-Impact Statement/Testimony: (1) Not satisfied (2) Neutral (3) Satisfied
h Trial Disruption by Murderer: (1) Yes (2) No i Family Contact: (1) Negative (2) Neutral (3) Positive j Criminal Justice Satisfaction: (1) Very Dissatisfied (2) Dissatisfied (3) Somewhat (4) Satisfied (5) Very
Satisfied k
Death Penalty Attitude: (1) Non Death Penalty (2) Ambivalent (3) Pro Death Penalty
Pros Contact
a
Sanction Input
b
Input Satis
c
Def AttBeh
d
Def Att Contact
e VIS
f VIS Satis
g
Murd Disrp
h
Fam Contact
i CJ
Satisj
Time 1
Case 1 3 2 2 2 2 2 2 2 1 5
Case 2 2 1 2 1 2 2 3 1 N/A 4
Case 3 4 1 2 1 2 2 3 1 1 5
Case 4 3 1 2 1 1 2 3 1 1 5
Case 5 3 1 1 1 2 2 3 1 N/A 3
Time 2
Case 1 2 1 2 2 2 2 3 2 2 N/A
Case 2 3 2 2 (a) 1 (b) 2
(a) 2 (b) 2
2 3 2 2 5
Case 3 3 1 2 N/A N/A 2 1 N/A N/A 5
Case 4 3 1 2 N/A N/A 2 3 1 1 N/A
Case 5 3 3 2 1 2 2 3 1 1 5
Time 3
Case 1 3 1 2 3 3 N/A N/A N/A 3 5
Case 2 3 2 2 1 2 2 3 N/A N/A 5
Case 3 2 1 2 N/A N/A 2 2 2 N/A N/A
Case 4 2 1 2 1 2 1 N/A 2 2 5
Case 5 2 1 2 1 2 2 3 2 N/A 5
Time 4
Case 1 4 1 2 N/A N/A 2 3 N/A 1 2
Case 2 3 1 2 1 2 1 N/A N/A N/A 5
Case 3 4 1 2 2 2 1 N/A N/A 1 2
Case 4 3 1 2 2 3 2 3 2 2 5
Case 5 N/A 2 N/A N/A N/A N/A N/A N/A 3

08 - UMBREIT (DO NOT DELETE) 3/6/2013 9:18 PM
118 MARQUETTE LAW REVIEW [96:1
Table 9a: Category 2 Texas Cases—Impact of UPS on Postconviction Experience
Civil
Acta
Appeal
Procb
Appeal
Reactc
Murd
Relad
Murd
Atte
Murd
Sufff
Murd
Remg
UPS
Opinh
ExecDonei
Exec
Witj
DP
Aimk
Quesl
Time 1
Case 1 1 1 2 3 1 1 1 2 1 2 2 1
Case 2 1 2 2 2 1 2 1 N/A 1 N/A N/A 2
Case 3 2 2 3 2 1 2 1 3 1 2 2 1
Case 4 1 2 1 3 3 1 1 1 1 N/A 3 2
Case 5 1 2 3 2 1 2 1 N/A 1 N/A N/A 2
Time 2
Case 1 1 3 3 2 1 1 1 3 2 2 1 2
Case 2 1 3 3 2 1 1 2 N/A 1* N/A N/A 2
Case 3 1 2 3 3 1 2 2 3 1 2 1 2
Case 4 1 2 2 3 1 1 1 3 1 2 1 1
Case 5 1 2 2 2 1 1 2 2 1 2 1 1
Time 3
Case 1 1 1 1 3 1 2 1 3 1 2 1 2
Case 2 1 3 3 2 1 2 2 1 2 2 2 1
Case 3 1 1 2 3 2 1 2 2 1 2 1 1
Case 4 1 3 3 2 1 1 1 2 2 1 N/A 2
Case 5 1 1 2 3 1 1 1 3 1 2 1 2
Time 4
Case 1 1 1 2 1 2 1 1 2 1 2 3 2
Case 2 1 1 2 2 2 2 2 2 1 1 1 2
Case 3 1 3 2 2 1 2 1 3 2 2 2 2
Case 4 1 1 2 2 1 2 1 2 1 1 N/A 2
* Murdered committed suicide a Civil Legal Action: (1) No (2) Yes b Appeal Process: (1) Stuck (2) Moving (3) Completed c Reaction to Appeal Process: (1) Dissatisfied (2) Worried (3) Non Apprehensive (4) Satisfied
d Mental Relationship with Murderer: (1) None (2) Some (3) Much e Attitude Toward Murderer: (1) Negative (2) Neutral (3) Positive f Desire for Murderer to Suffer: (1) No (2) Yes g Desire for Murderer Remorse: (1) No (2) Yes h Opinion Toward UPS: (1) Negative (2) Neutral (3) Positive I Execution Done: (1) No (2) Yes j Execution Witnessed/Plan to Witness: (1) No (2) Yes k
Death Penalty Aim: (1) An Ending (2) Equity/Honoring of Victim (3) Other l Remaining Questions: (1) No (2) Yes

08 - UMBREIT (DO NOT DELETE) 3/6/2013 9:18 PM
2012] ULTIMATE PENAL SANCTION 119
Table 9b: Category 2 Minnesota Cases—Impact of UPS on Postconviction Experience
Civil Act
a
Appeal Proc
b
Appeal React
c
Murd Rela
d
Murd Att
e
Murd Suff
f
Murd Rem
g
UPS Opin
h
Quesi
Time 1
Case 1 1 3 3 2 1 2 1 3 2
Case 2 1 N/A N/A 3 2 2 2 3 2
Case 3 1 3 2 2 2 2 1 3 2
Case 4 1 2 2 3 1 1 2 1 2
Case 5 1 3 3 2 2 1 2 1 1
Time 2
Case 1 2 3 3 1 1 1 1 3 2
Case 2 1 (a) 2 (b) 3
(a) 1 (b) 3
(a) 3(b) 3
(a) 1 (b) 3
2 2 (a) 1 (b) 3
2
Case 3 2 3 1 3 1 2 2 3 2
Case 4 2 3 N/A 2 1 2 1 1 2
Case 5 2 3 3 2 1 1 1 1 2
Time 3
Case 1 1 N/A N/A 2 2 N/A 2 3 1
Case 2 1 3 3 2 2 1 2 3 2
Case 3 1 3 N/A 1 2 1 2 3 2
Case 4 2 3 3 3 1 2 2 3 1
Case 5 1 N/A 3 1 2 1 3 1
Time 4
Case 1 1 3 N/A 3 3 1 2 3 1
Case 2 2 3 3 1 2 2 1 3 1
Case 3 1 3 N/A 3 1 1 1 1 N/A
Case 4 1 3 3 1 1 1 1 3 2
Case 5 1 3 N/A 1 1 2 1 3 2
a Civil Legal Action: (1) No (2) Yes b Appeal Process: (1) Stuck (2) Moving (3) Completed c Reaction to Appeal Process: (1) Dissatisfied (2) Neutral (3) Satisfied
d Mental Relationship with Murderer: (1) None (2) Some (3) Much e Attitude Toward Murderer: (1) Negative (2) Neutral (3) Positive f Desire for Murderer to Suffer: (1) No (2) Yes g Desire for Murderer Remorse: (1) No (2) Yes h Opinion Toward UPS: (1) Negative (2) Neutral (3) Positive i Remaining Questions: (1) No (2) Yes

08 - UMBREIT (DO NOT DELETE) 3/6/2013 9:18 PM
120 MARQUETTE LAW REVIEW [96:1
Table 10a: Category 3—Impact of Murder and UPS on Survivors’ Lives
TEXAS MINNESOTA
CJ Injus
a
NCJ Injus
b
Neg Cons
c
Post Cons
d
Phy React
e
CJ Injus
a
NCJ Injus
b
Neg Cons
c
Post Cons
d
Phy React
e
Time 1
Case 1 1 1 1 4 1 1 1 1 2 2
Case 2 2 1 1 2 1 2 1 3 2 1
Case 3 1 2 2 1 2 1 1 1 1 1
Case 4 3 1 1 4 1 2 2 2 1 2
Case 5 1 1 3 3 4 2 1 3 2 4
Time 2
Case 1 1 1 2 2 N/A 2 1 1 1 1
Case 2 1 1 2 3 3 2 2 3 4 1
Case 3 3 1 2 2 N/A 3 3 3 4 1
Case 4 1 1 3 1 3 1 2 1 2 1
Case 5 1 1 3 4 3 2 3 3 4 2
Time 3
Case 1 3 3 3 2 2 1 1 3 3 3
Case 2 2 1 2 1 1 1 2 1 4 1
Case 3 2 1 2 1 1 1 1 3 1 1
Case 4 1 1 1 4 1 1 2 3 4 3
Case 5 1 1 4 1 3 1 1 1 4 1
Time 4
Case 1 1 1 2 1 3 2 2 4 4 2
Case 2 3 3 2 2 1 2 1 4 4 1
Case 3 1 1 3 2 1 2 2 4 4 1
Case 4 2 3 1 1 2 1 1 1 2 1
Case 5 N/A N/A N/A N/A N/A 1 1 2 2 2
a Criminal Justice Injustices/Resentments: (1) None (2) 1 (3) 2–3 (4) More than 4 b Non-Criminal Justice Injustices/Resentments: (1) None (2) 1 (3) 2–3 (4) More than 4 c Negative Fallout: (1) None (2) On Self (3) On Other (4) On Both Self and Other
d Positive Spinoff : (1) None (2) Activities/Life Changes (3) Personal Growth/Meaning System (4) Both Activities/Life Changes and Personal Growth/Meaning Systems e Current Physical Reactions: (1) None (2) Current Sleep Problems (3) Disease/Illness (4) Both Sleep and Disease/Illness
08 - UMBREIT (DO NOT DELETE) 3/6/2013 9:18 PM
2012] ULTIMATE PENAL SANCTION 121
Table 10b: Category 3—Psychological Changes in Survivors’ Lives
TEXAS MINNESOTA
Trauma Reaction
a
Emo Dulling/ Depression
b
Trust Issues
c
PT Growth
d
Trauma Reaction
a
Emo Dulling/ Depression
b
Trust Issues
c
PT Growth
d
Time 1
Case 1 2 1 1 2 2 1 2 1
Case 2 1 1 2 1 1 2 2 1
Case 3 1 2 1 1 2 1 2 1
Case 4 2 2 1 1 2 2 2 1
Case 5 2 1 1 1 1 1 2 1
Time 2
Case 1 2 1 1 1 1 1 1 1
Case 2 1 2 2 1 1 2 2 2
Case 3 1 2 1 1 1 1 1 2
Case 4 2 2 1 1 N/A N/A N/A N/A
Case 5 2 2 2 1 1 2 1 1
Time 3
Case 1 2 2 2 1 1 1 1 2
Case 2 1 2 2 1 1 1 1 2
Case 3 1 1 1 1 1 1 1 1
Case 4 1 2 1 1 2 2 2 2
Case 5 2 2 2 1 1 1 1 2
Time 4
Case 1 1 2 1 1 1 1 2 2
Case 2 1 2 2 1 1 1 2 2
Case 3 1 1 1 1 1 1 2 2
Case 4 1 1 1 1 1 1 2 2
Case 5 N/A N/A N/A N/A 1 1 1 2
a Trauma Reactions: (1) No (2) Yes b Emotional Dulling/Depressive Symptoms: (1) No (2) Yes c Lack of Trust: (1) No (2) Yes d PT Growth: (1) No (2) Yes

08 - UMBREIT (DO NOT DELETE) 3/6/2013 9:18 PM
122 MARQUETTE LAW REVIEW [96:1
Table 10c: Category 3—Behavioral Changes in Survivors’ Lives
TEXAS MINNESOTA
Stress Reduce
a
Refocus Behav
b
Preserve Behav
c
Sense of
Agencyd
Stress Reduce
a
Refocus Behav
b
Preserve Behav
c
Sense of
Agencyd
Time 1
Case 1 4 1 1 1 4 1 1 1
Case 2 1 4 2 1 2 3 1 4
Case 3 3 1 2 1 2 1 1 3
Case 4 3 3 1 4 2 3 1 2
Case 5 4 1 1 1 4 3 1 3
Time 2
Case 1 1 3 2 1 1 2 1 1
Case 2 1 3 2 2 2 2 2 3
Case 3 4 1 1 1 3 1 1 4
Case 4 3 1 1 1 1 1 1 3
Case 5 3 2 2 3 3 4 1 3
Time 3
Case 1 2 1 1 2 3 3 1 4
Case 2 3 1 2 1 1 4 1 2
Case 3 1 1 1 2 1 1 1 1
Case 4 3 3 1 2 4 4 1 4
Case 5 4 1 1 1 1 3 1 4
Time 4
Case 1 3 1 1 1 1 4 1 4
Case 2 4 1 1 2 2 4 1 2
Case 3 2 2 1 2 2 3 1 2
Case 4 1 1 1 3 2 4 1 4
Case 5 N/A N/A N/A N/A 2 4 1 4
a Stress Reducing Activities: (1) No (2) Protective Behaviors (3) Avoidant/Distancing Behaviors (4) Protective
and Avoidant/Distancing Behaviors b
Refocusing Behaviors: (1) None (2) Busyness (3) Life Style Change (4) Both Busyness and Life Style Change c Preserving Behaviors: (1) No (2) Yes d Sense of Agency Behaviors: (1) No (2) Self Assertion (3) Thought Control (4) Self Assertion and Thought Control

08 - UMBREIT (DO NOT DELETE) 3/6/2013 9:18 PM
2012] ULTIMATE PENAL SANCTION 123
APPENDIX C: UPS INTERVIEW GUIDE
Preface: A lot of terrible things have happened to you related to your loved one’s death. These things are all very important and we want to honor them. However, what we really want to know about and what hasn’t been studied are answers to the question: What has been helpful in getting you through this process? This interview is completely voluntary and confidential. If I ask you any question you do not want to answer, say “pass” and we’ll go on to the next question. Please also feel free to ask for clarification. This interview could take anywhere from two to three hours, depending on how much you have to say. Also before we begin the interview I am going to ask you to fill out three forms. One is a form that gives me information on things like your age, your gender, and your marital status. The second one is about your reactions to your loved one’s death in the past month. The third one is about your sense of social support. The interview itself is divided into nine parts. The first four parts ask you about your sense of justice, your experience with the criminal justice system, your definition of movement, and your experience with the murderer. The fifth part asks you about personal changes to you since the death of your loved one. The sixth and seventh parts ask you about social and psychological support as well as the role of religion and spirituality in your healing process. The eighth part asks you about the role of the media. The ninth part asks you about changes in your family relationships
OPENER
Let’s take 10–15 minutes for you to familiarize me with your story.
JUSTICE
1. Where is your case now in the criminal justice process?
2. What criminal justice officials and what parts of the criminal justice process have you had contact with?
3. Please check the events that you have experienced.
(a) Offender was apprehended (caught) (b) Offender was convicted, etc. (c) Offender was given the ultimate penal sanction (Death
Penalty or LWOP) (d) The ultimate penal sanction has been carried out

08 - UMBREIT (DO NOT DELETE) 3/6/2013 9:18 PM
124 MARQUETTE LAW REVIEW [96:1
(e) The sentence has been upheld during the appeal process (f) The appeal process is complete (g) The execution date has been set (h) The execution was witnessed by me (i) The execution is completed (j) The offender is suffering in prison (k) The offender will never get out/put away for life.
4. Describe your relationship with the prosecutor?
5. What does justice mean to you?
6. What does injustice mean to you?
7. What events, if any, made you feel that justice was furthered?
8. Although the murderer was charged and sentenced at the highest level, what more would increase your sense that justice was furthered?
9. What events increased your sense of injustice?
10. How satisfied are you with the outcome of the criminal proceedings?
(a) Very Dissatisfied –3 (b) Dissatisfied –2 (c) Somewhat Dissatisfied –1 (d) Neutral 0 (e) Somewhat Satisfied +1 (f) Satisfied +2 (g) Very Satisfied +3
Attitudes About Death Penalty and LWOP
11. What was your attitude about the _______ prior to the murder of your loved one? What impact has the death of your loved one had on your attitude?
(a) Death Penalty (b) LWOP
12. How much faith did you have in the criminal justice system prior to the murder of your loved one? How much faith in the criminal justice system do you have now?

08 - UMBREIT (DO NOT DELETE) 3/6/2013 9:18 PM
2012] ULTIMATE PENAL SANCTION 125
13. People argue that __________ brings closure. What has been your experience?
(a) Death Penalty (b) LWOP
14. What does your religion say about responding to someone who has taken the life of another person? Is your religion morally at odds with the ultimate penal sanction? If yes, how have you dealt with that conflict?
Sentencing to One Year Out: Death Notification, Investigation and Trial
A15. Some people tell us that the way they are notified about their loved one’s murder makes it harder or easier to cope with their loss. What things about the notification process made it harder to cope with your loss? What things helped you to cope with your loss?
A16. Some people tell us that their experience with the coroner’s office makes it harder or easier to cope with their loss. What things did the coroner’s office do that made it harder to cope with your loss? What things did the coroner’s office do to help you cope with your loss?
A17. Some people tell us that there are things about the criminal justice system’s management of their loved one’s homicide case that makes it harder or easier to cope with their loss. What things did the ________________ do that made it harder to cope with your loss? How did you get through that time? What things did the ____________ do that helped you to cope with your loss?
(a) Police Department (b) DA’s Office (c) Judge / Trial (d) Anything else
A18. Comment on the following events and how they made it harder or easier to cope with your loss.
(a) Finding out that the D.A. would go for the ultimate penal sanction
(b) Attendance (lack of attendance) at the pretrial hearings and the trial
(c) Viewing of the crime scene and autopsy photos

08 - UMBREIT (DO NOT DELETE) 3/6/2013 9:18 PM
126 MARQUETTE LAW REVIEW [96:1
(d) Participation in the decision-making about the sentencing and penalty phases of the trial
(e) Information given about the case and/or court proceedings, including incorrect or incomplete information
(f) Behavior by the defense (g) Preparation and delivery of the victim-impact statement (h) Information about the offender’s life
A19. What was your reaction when the offender received __________? What did it mean to you? How did others, including the offender, react? How did their reactions impact you?
(a) the conviction (b) the punishment
Five to Seven Years Out: Appeal Process
B15. Describe your life since the offender received _______________. What postsentence events have occurred that have made it harder to cope with your loss? What helped you during that time?
(a) Death Penalty (b) LWOP
B16. Some people tell us that there are things that happen during the appellate process that make it harder or easier to cope with their loss. How did ____________ affect you?
(a) Waiting for the appeal process to be over (b) Hearing about an offender’s successful appeal in a death
penalty case (c) The extent or lack of information given to you about an
appeal when it is filed in your case (d) Learning the decision after an appeal has been heard (e) Other
B17. What changes, if any, have (did) you noticed in yourself since the offender received ______ (sleep patterns, eating patterns, energy level, physical health, feelings of anxiety, feelings of anger, etc.)? What changes did you notice in other family members?
(a) Death Penalty (b) LWOP

08 - UMBREIT (DO NOT DELETE) 3/6/2013 9:18 PM
2012] ULTIMATE PENAL SANCTION 127
B18. How did you react after all the appeals were finished? Rate the degree to which the end of the appeal process impeded or assisted your journey?
(a) Significantly Impeded –3 (b) Impeded –2 (c) Somewhat Impeded –1 (d) Neutral 0 (e) Somewhat Assisted +1 (f) Assisted +2 (g) Significantly Assisted +3
Nine to Eleven Years Out: Execution
C15. [After the appeal process was over] Describe your experience leading up to the execution. What is (was) the meaning of the execution for you? What hopes do (did) you have for how the execution will (would) make a difference in your life?
C16. Do (did) you plan to view the execution? Why is (was) it important to view (not view) the execution? What do (did) you expect the execution will be (would be) like? What will be (was) the best thing about viewing/not viewing the execution? What will be (was) the hardest thing about viewing/not viewing the execution?
C17. What changes, if any, have (did) you noticed in yourself leading up to the execution (sleep patterns, eating patterns, energy level, physical health, feelings of anxiety, feelings of anger, etc.)? What changes did you notice in other family members?
C18. How do (did) others within and outside the family react to the offender being executed? What is (was) your response to their reactions?
C19. Who else will attend (attended) the execution besides you? What is (was) the nature of the relationship(s) between you?
C20. What are (were) your thoughts about the offender’s family? What are (were) your reactions to the presence of the offender’s family at the execution? Did the offender’s family apologize? What was that like for you?
C21. What did the offender say, if anything, at the execution? What was your reaction to the offender’s statements?

08 - UMBREIT (DO NOT DELETE) 3/6/2013 9:18 PM
128 MARQUETTE LAW REVIEW [96:1
Thirteen to Fifteen Years Out: Post Execution
D15. What changes, if any, did you notice in yourself in the first several months after the execution (sleep patterns, eating patterns, energy level, physical health, feelings of anxiety, feelings of anger, etc.)? What changes did you notice in other family members?
D16. Did the execution give you what you wanted? Did it resolve or complete anything about the grief you feel for the loss of your loved one? If yes, what did it resolve or complete for you?
D17. How did the execution impact your sense of justice served?
D18. Did the execution change any of your views about the murder of your loved one? Do you have any regrets about the execution? What is the meaning you give to the offender’s death? Rate the degree to which the completed execution impeded or assisted your journey?
(a) Significantly Impeded –3 (b) Impeded –2 (c) Somewhat Impeded –1 (d) Neutral 0 (e) Somewhat Assisted +1 (f) Assisted +2 (g) Significantly Assisted +3
MOVEMENT
Preface: Because this is a study about your healing process, I’d like to ask you a few more general questions. Certain things have happened to you that give you a sense of progress. Other things have happened that make you feel that you are just standing in place. Some things seem to push you back.
22. Lots of survivors don’t like the words healing and closure. How do you see the process you’ve gone through?
23. What does movement mean to you? How do you know you moved?
24. Tell me about a recent experience of movement?
25. What would you hope would happen for you as a result of movement?

08 - UMBREIT (DO NOT DELETE) 3/6/2013 9:18 PM
2012] ULTIMATE PENAL SANCTION 129
26. What would you wish for other survivors in terms of a positive outcome for them?
Murderer
27. Describe your relationship with the murderer prior to the murder? How, if at all, have your feelings about the murder or the offender changed over time? How do you feel about the murder or the offender now?
28. How did the murderer behave during the trial? How did that behavior affect you then? How does that behavior affect you today?
29. How did you react when you learned about the murderer’s life?
30. Has there been any acknowledgment of your pain from the murderer or any member the murderer’s family? What difference does it make/would it make that the murderer or member of the murderer’s family feels sorry for what he did?
31. What difference does it/would it make that the offender is suffering?
Psychological States
32. Some people find that the loss of a loved one changes the way they see the world and how it functions. What, if anything, has changed about how you see the world? What difficulties, if any, has that change created for you?
33. What concerns, if any, have others expressed about your ongoing reaction to the murder and the loss of your loved one?
34. Some people try to hold onto things or keep things the way they were before their loved one was murdered? What has remained the same and what has changed?
35. Some people feel guilty about the past or guilty if they feel happy. What, if anything, causes you to feel guilty?
36. What positive changes, if any, have you made in your life as a result of the murder?
37. What experiences, if any, have helped you feel safe and secure in the world again?
38. What questions, if any, remain unanswered about the homicide?

08 - UMBREIT (DO NOT DELETE) 3/6/2013 9:18 PM
130 MARQUETTE LAW REVIEW [96:1
39. What important questions about the homicide, if any, have been answered for you?
40. Have you been able to make some sense out of the murder? If not, do you expect to make sense out of the murder? Rate the degree to which the ability to make some sense out of the murder impeded or assisted your journey?
(a) Significantly Impeded –3 (b) Impeded –2 (c) Somewhat Impeded –1 (d) Neutral 0 (e) Somewhat Assisted +1 (f) Assisted +2 (g) Significantly Assisted +3
41. What experiences, if any, created uncertainty about the offender’s outcome? What did you do to cope with the uncertainty?
42. What experiences, if any, have given you back a sense of control?
Social & Psychological Support
43. People have different experiences with people following this type of loss. I’m interested in what happened to you. To start, who are the main people that you have turned to for help with your loss?
44. Briefly describe the quality of your relationship with ___________.
45. What did this person do to help you cope with your loss?
46. In what ways has your support system changed, if at all, since the loss of your loved one?
47. Some people find that other people treat them differently after this type of loss. What was your experience?
48. What did people do that made it harder for you to cope with your loss?
49. Some people keep to themselves because they feel that other people do not understand their loss. What was your experience?

08 - UMBREIT (DO NOT DELETE) 3/6/2013 9:18 PM
2012] ULTIMATE PENAL SANCTION 131
50. Some people join a bereavement support group or get psychological/pastoral counseling after a loved one dies. What was your experience?
Religion/Spirituality
51. Some people experience changes in their relationship with God or in their religious beliefs or practices. What changes have you experienced over time?
52. What religious/spiritual practices, if any, have you used to help you cope with the loss of your loved one?
53. What does your religion say about forgiveness? Do you experience a conflict between your personal or religious beliefs about forgiveness and your current feelings toward the murderer?
54. What do you believe about forgiving the murderer? What would it take to forgive him? How did you come to forgive him?
Media
55. Describe the significant positive or negative experiences with the media.
Family Relationships
56. How did your _________ react to the death of your loved one?
(a) Spouse/partner (b) Child(ren) (c) Sibling(s) (d) Parent(s) (e) Other
57. What changes, if any, have occurred in your relationship with your __________ since your loss?
(a) Spouse/partner (b) Child(ren) (c) Sibling(s) (d) Parent(s) (e) Other

Exhibit D: Richard C. Dieter, Death
Penalty Information Center, Battle Scars:
Military Veterans and the Death Penalty (Veteran’s
Day 2015)
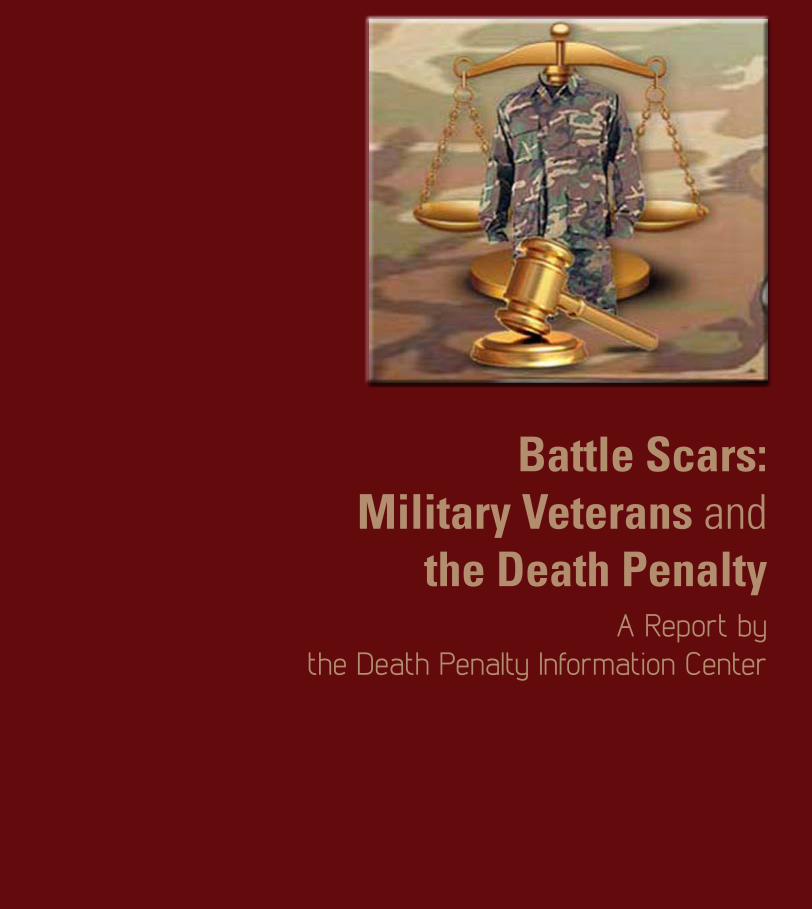
The Death Penalty Information Center is a non-profit organization serving the media and the public with analysis and information on issues concerning capital punishment. The Center provides in-depth reports, issues press releases, conducts briefings for journalists, and serves as a resource to those working on this issue. The Center is funded through the generosity of individual donors and foundations, including the Roderick MacArthur Foundation, the Open Society Foundations, the
Atlantic Philanthropies, and the Proteus Action League.
DEATH PENALTY INFORMATION CENTER
Washington, D.C.
www.deathpenaltyinfo.org
Battle Scars: Military Veterans and
the Death PenaltyA Report by
the Death Penalty Information Center
Battle Scars:
Military Veterans and the Death Penalty
A Death Penalty Information Center Report by Richard C. Dieter
Washington, D.C.
Veterans Day 2015
www.deathpenaltyinfo.org

Battle Scars, p.2
Battle Scars: Military Veterans and the Death Penalty
Executive Summary
In many respects, veterans in the United States are again receiving the respect
and gratitude they deserve for having risked their lives and served their country. Wounded soldiers are welcomed home, and their courage in starting a new and difficult journey in civilian life is rightly applauded. But some veterans with debilitating scars from their time in combat have received a very different reception. They have been judged to be the "worst of the worst" criminals, deprived of mercy, sentenced to death, and executed by the government they served.
Veterans with Post-Traumatic Stress Disorder (PTSD) who have committed heinous crimes present hard cases for our system of justice. The violence that occasionally erupts into murder can easily overcome the special respect that is afforded most veterans. However, looking away and ignoring this issue serves neither veterans nor victims.
PTSD has affected an enormous number of veterans returning from combat
zones. Over 800,000 Vietnam veterans suffered from PTSD. At least 175,000 veterans of Operation Desert Storm were affected by "Gulf War Illness," which has been linked to brain cancer and other mental deficits. Over 300,000 veterans from the Afghanistan and Iraq conflicts have PTSD. In one study, only about half had received treatment in the prior year.
Even with these mental wounds and lifetime disabilities, the overwhelming majority of veterans do not commit violent crime. Many have been helped, and PTSD is now formally recognized in the medical community as a serious illness. But for those who have crossed an indefinable line and have been charged with capital murder, compassion and understanding seem to disappear. Although a definitive count has yet to be made, approximately 300 veterans are on death row today, and many others have already been executed.
Perhaps even more surprising, when many of these veterans faced death penalty trials, their service and related illnesses were barely touched on as their lives were being weighed by judges and juries. Defense attorneys failed to investigate this critical area of mitigation; prosecutors dismissed, or even belittled, their claims of mental trauma from the war; judges discounted such evidence on appeal; and governors passed on their opportunity to bestow the country's mercy. In older cases, some of that dismissiveness might be attributed to ignorance about PTSD and related problems. But many of those death sentences still stand today when the country knows better.
Unfortunately, the plight of veterans facing execution is not of another era. The
first person executed in 2015, Andrew Brannan, was a decorated Vietnam veteran with a diagnosis of PTSD and other forms of mental illness. Despite being given 100% mental

The Death Penalty Information Center is a non-profit organization serving the media and the public with analysis and information on issues concerning capital punishment. The Center provides in-depth reports, issues press releases, conducts briefings for journalists, and serves as a resource to those working on this issue. The Center is funded through the generosity of individual donors and foundations, including the Roderick MacArthur Foundation, the Open Society Foundations, the
Atlantic Philanthropies, and the Proteus Action League.
DEATH PENALTY INFORMATION CENTER
Washington, D.C.
www.deathpenaltyinfo.org
Battle Scars: Military Veterans and
the Death PenaltyA Report by
the Death Penalty Information Center

Battle Scars, p.3
disability by the Veterans Administration after returning from the war, Georgia sought and won a death sentence because he bizarrely killed a police officer after a traffic stop. The Pardons Board refused him clemency. Others, like Courtney Lockhart in Alabama, returned more recently with PTSD from service in Iraq. He was sentenced to death by a judge, even though the jury recommended life. The U.S. Supreme Court turned down a request to review his case this year.
This report is not a definitive study of all the veterans who have been sentenced
to death in the modern era of capital punishment. Rather, it is a wake-up call to the justice system and the public at large: As the death penalty is being questioned in many areas, it should certainly be more closely scrutinized when used against veterans with PTSD and other mental disabilities stemming from their service. Recognizing the difficult challenges many veterans face after their service should warrant a close examination of the punishment of death for those wounded warriors who have committed capital crimes. Moreover, a better understanding of the disabilities some veterans face could lead to a broader conversation about the wide use of the death penalty for others suffering from severe mental illness.

Battle Scars, p.4
I. Introduction
Our Nation has a long tradition of according leniency to veterans in recognition of their service, especially for those who fought on the front lines as Porter did. -Porter v. McCollum, U.S. Supreme Court (2009)
In many sectors of society, U.S. military veterans are finally receiving the respect and assistance they earned by their years of service to the country. Almost every professional sports event begins with a tribute to those currently or formerly in the military. The national and local media frequently highlight the struggles and courageous rehabilitation efforts of veterans from recent conflicts who have come back disfigured or missing a limb. However, another group of veterans has returned from combat zones with other kinds of wounds. Hundreds of thousands of these veterans are suffering from Post-Traumatic Stress Disorder, from addictions related to physical injuries, or from other disabilities that cannot be helped with a prosthetic. Some of these veterans had mental problems before joining the military, but their condition became worse during their service, as they endured life-threatening experiences. A few of these returning soldiers have committed heinous crimes, causing some public officials to abandon their special respect for veterans and allow the imposition of the nation’s worst punishment: the death penalty. The precise number of veterans who have been sentenced to death is unknown. Estimates from a variety of sources indicate that at least 10% of the current death row–that is, over 300 inmates—are military veterans. Many others have already been executed. There are two reasons to reconsider imposing a punishment on veterans that is supposed to be reserved for the very worst offenders: First, veterans have made a vital contribution to the safety of our country. Second, many have experienced trauma that few others in society have ever encountered—trauma that may have played a role in their committing serious crimes. These considerations do not justify ignoring offenses committed by veterans, but should challenge the practice of sentencing veterans—
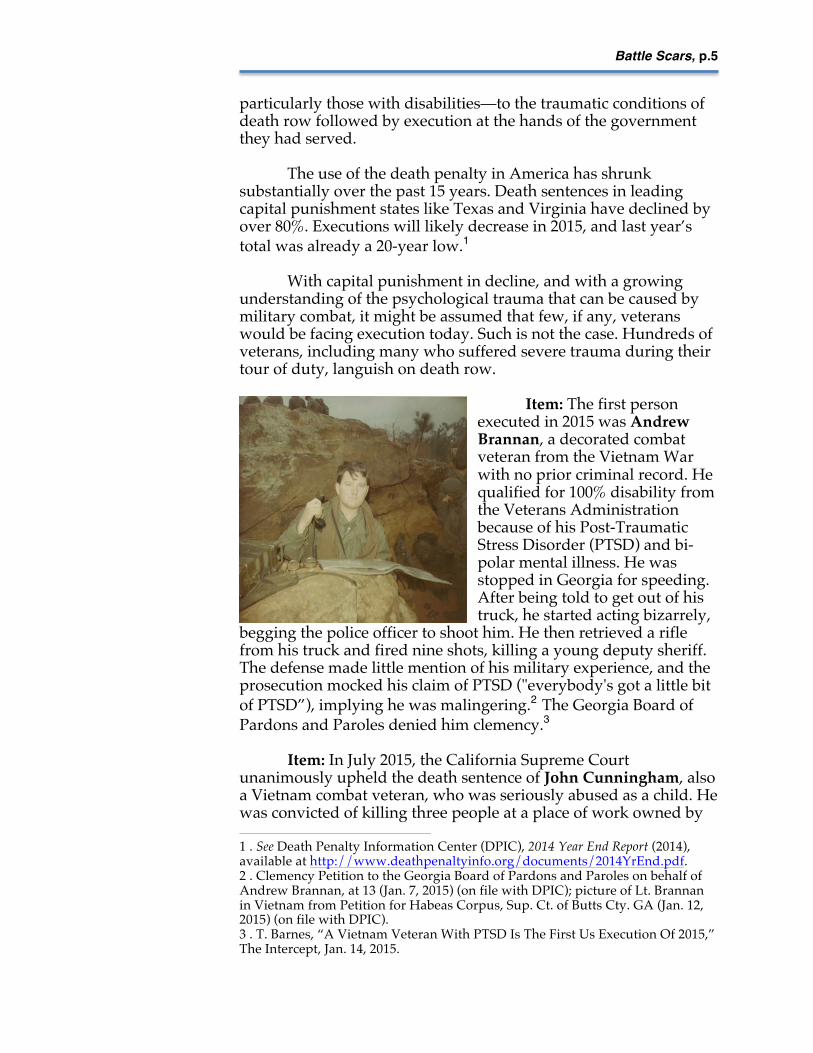
Battle Scars, p.5
particularly those with disabilities—to the traumatic conditions of death row followed by execution at the hands of the government they had served.
The use of the death penalty in America has shrunk substantially over the past 15 years. Death sentences in leading capital punishment states like Texas and Virginia have declined by over 80%. Executions will likely decrease in 2015, and last year’s total was already a 20-year low.1 With capital punishment in decline, and with a growing understanding of the psychological trauma that can be caused by military combat, it might be assumed that few, if any, veterans would be facing execution today. Such is not the case. Hundreds of veterans, including many who suffered severe trauma during their tour of duty, languish on death row.
Item: The first person executed in 2015 was Andrew Brannan, a decorated combat veteran from the Vietnam War with no prior criminal record. He qualified for 100% disability from the Veterans Administration because of his Post-Traumatic Stress Disorder (PTSD) and bi-polar mental illness. He was stopped in Georgia for speeding. After being told to get out of his truck, he started acting bizarrely,
begging the police officer to shoot him. He then retrieved a rifle from his truck and fired nine shots, killing a young deputy sheriff. The defense made little mention of his military experience, and the prosecution mocked his claim of PTSD ("everybody's got a little bit of PTSD”), implying he was malingering.2 The Georgia Board of Pardons and Paroles denied him clemency.3 Item: In July 2015, the California Supreme Court unanimously upheld the death sentence of John Cunningham, also a Vietnam combat veteran, who was seriously abused as a child. He was convicted of killing three people at a place of work owned by 1 . See Death Penalty Information Center (DPIC), 2014 Year End Report (2014), available at http://www.deathpenaltyinfo.org/documents/2014YrEnd.pdf. 2 . Clemency Petition to the Georgia Board of Pardons and Paroles on behalf of Andrew Brannan, at 13 (Jan. 7, 2015) (on file with DPIC); picture of Lt. Brannan in Vietnam from Petition for Habeas Corpus, Sup. Ct. of Butts Cty. GA (Jan. 12, 2015) (on file with DPIC). 3 . T. Barnes, “A Vietnam Veteran With PTSD Is The First Us Execution Of 2015,” The Intercept, Jan. 14, 2015.
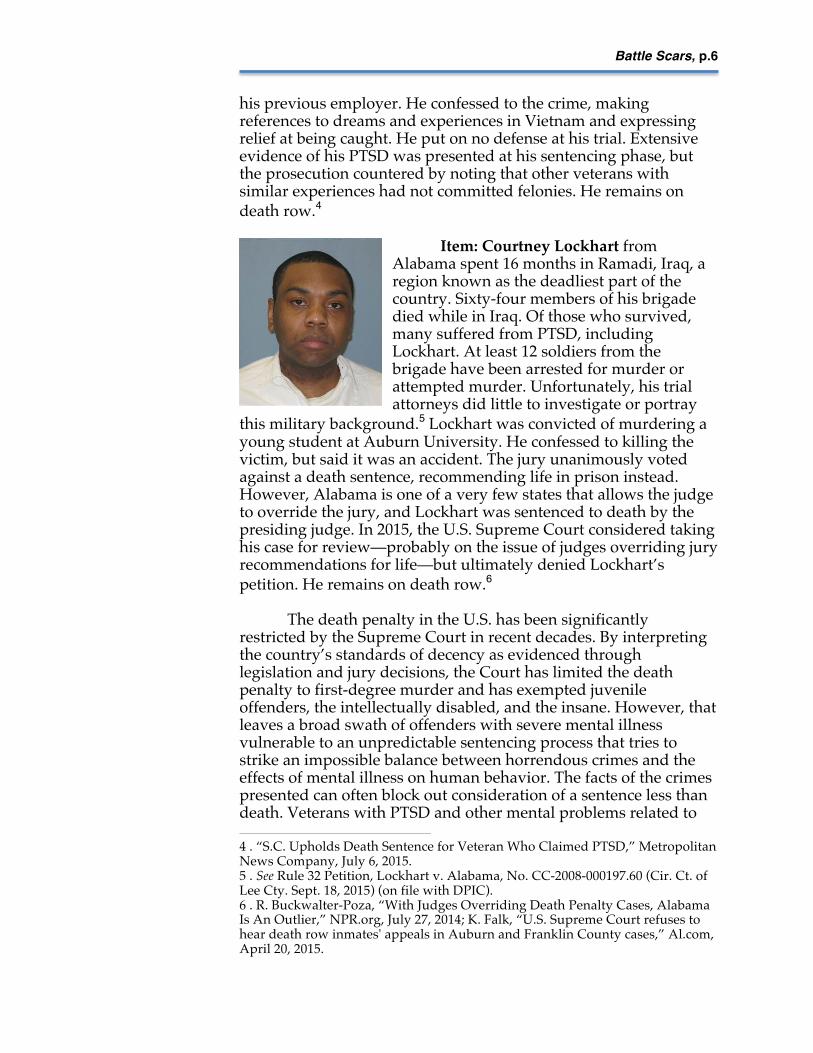
Battle Scars, p.6
his previous employer. He confessed to the crime, making references to dreams and experiences in Vietnam and expressing relief at being caught. He put on no defense at his trial. Extensive evidence of his PTSD was presented at his sentencing phase, but the prosecution countered by noting that other veterans with similar experiences had not committed felonies. He remains on death row.4
Item: Courtney Lockhart from Alabama spent 16 months in Ramadi, Iraq, a region known as the deadliest part of the country. Sixty-four members of his brigade died while in Iraq. Of those who survived, many suffered from PTSD, including Lockhart. At least 12 soldiers from the brigade have been arrested for murder or attempted murder. Unfortunately, his trial attorneys did little to investigate or portray
this military background.5 Lockhart was convicted of murdering a young student at Auburn University. He confessed to killing the victim, but said it was an accident. The jury unanimously voted against a death sentence, recommending life in prison instead. However, Alabama is one of a very few states that allows the judge to override the jury, and Lockhart was sentenced to death by the presiding judge. In 2015, the U.S. Supreme Court considered taking his case for review—probably on the issue of judges overriding jury recommendations for life—but ultimately denied Lockhart’s petition. He remains on death row.6
The death penalty in the U.S. has been significantly restricted by the Supreme Court in recent decades. By interpreting the country’s standards of decency as evidenced through legislation and jury decisions, the Court has limited the death penalty to first-degree murder and has exempted juvenile offenders, the intellectually disabled, and the insane. However, that leaves a broad swath of offenders with severe mental illness vulnerable to an unpredictable sentencing process that tries to strike an impossible balance between horrendous crimes and the effects of mental illness on human behavior. The facts of the crimes presented can often block out consideration of a sentence less than death. Veterans with PTSD and other mental problems related to 4 . “S.C. Upholds Death Sentence for Veteran Who Claimed PTSD,” Metropolitan News Company, July 6, 2015. 5 . See Rule 32 Petition, Lockhart v. Alabama, No. CC-2008-000197.60 (Cir. Ct. of Lee Cty. Sept. 18, 2015) (on file with DPIC). 6 . R. Buckwalter-Poza, “With Judges Overriding Death Penalty Cases, Alabama Is An Outlier,” NPR.org, July 27, 2014; K. Falk, “U.S. Supreme Court refuses to hear death row inmates' appeals in Auburn and Franklin County cases,” Al.com, April 20, 2015.

Battle Scars, p.7
their military service are among those left exposed.
Indeed, such mental health issues—although properly to be considered only as factors against the death penalty—are sometimes considered as reasons to impose the death penalty, and thus are often not presented to the jury by defense counsel. In 2009 in its review of the case of George Porter, a Korean War veteran with PTSD, the Supreme Court noted: “The judge and jury at Porter’s original sentencing heard almost nothing that would humanize Porter or allow them to accurately gauge his moral culpability.”7 A reconsideration of the death penalty for the severely mentally ill8 could begin with a special examination of the death penalty imposed on U.S. veterans.
7 . Porter v. McCollum, 130 S.Ct. 447, 454 (2009) (per curiam). In a more recent federal death penalty case, the prosecutors cited the defendant’s military service as an additional reason why he should be sentenced to death: “[T]here is one mitigating factor that says the defendant served in the United States Army, and he was honorably discharged. Well, that doesn’t mitigate against the imposition of the death penalty, ladies and gentlemen. In fact, it’s the opposite. It is the training that he received in the military, in these other jobs that he has had, that allowed him to commit this crime.” Defendant’s Brief, U.S. v. David Anthony Runyon, No. 09-11 (4th Cir. Feb. 29, 2012) (available from DPIC) (Runyon remains on the federal death row). 8 . The American Bar Association has called for an exemption from the death penalty for defendants with severe mental illness. See http://www.americanbar.org/groups/crsj/projects/death_penalty_due_process_review_project/serious-mental-illness-initiative-.html.
Battle Scars, p.8
II. Scope of the Problem
A large majority of Vietnam Veterans
struggled with chronic PTSD symptoms, with four out of five reporting recent symptoms when interviewed 20-25 years after Vietnam.
-National Vietnam Veterans Readjustment Study
A. Veterans Sentenced to Death Thousands of people have been sentenced to death in the modern era of the death penalty, but states do not uniformly include military status among the information on death row inmates.9 The military also does not have a count of the number of veterans on death row or the number executed.
Immediately after the U.S. Supreme Court struck down the existing death penalty in 1972,10 states began passing new capital punishment laws and sentencing individuals to death under those laws. This coincided with the post-Vietnam era, when many soldiers returned to their communities disillusioned, disrespected, and traumatized by their experience. As this report shows, many veterans ended up in prison and some were sent to death row and were executed. Following the Vietnam era, veterans constituted about 20% of the prison population.11 Although many of the Vietnam veterans who went to prison were eventually released, those sentenced to death may have now been executed and many remain on death row.
A more recent count of veterans in prison was published in 2007 and found that about 10% of state prisoners were veterans.12 Although that was a decline from the Vietnam era, it did not include the likely upsurge due to the wars in Afghanistan and Iraq.13 9 . See, e.g., Texas Dept. of Criminal Justice, Offenders on Death Row, available at <https://www.tdcj.state.tx.us/death_row/dr_offenders_on_dr.html>, with information on each inmate (no veteran status). 10 . See Furman v. Georgia, 408 U.S. 238 (1972). 11 . C. Mumola, & M. Noonan, “Veterans in State and Federal Prison, 2004,” Bureau of Justice Statistics, U.S. Dept. of Justice, April 29, 2007. 12 . Id. at 1. 13 . Id. Only 3.7% of the imprisoned veterans in this 2004 study were from the Afghan and Iraq conflicts that have dominated the most recent decade.

Battle Scars, p.9
The percentage of prisoners who are veterans—10%—can serve as an approximation of the percentage of those on death row who are veterans. In fact, among those in prison, veterans were more likely to be there for homicide than non-veterans, and homicide is the crime for which defendants can receive the death penalty.14 Further evidence supporting an estimate of 10% for the number of death row inmates who are veterans was obtained by contacting litigators in large death penalty states. Responses from states that represent about half of the entire death row in the U.S. indicate that about 11% of the inmates are veterans.15 (Even that figure may be low because litigators can only report on clients they know to be veterans. Defendants who withhold that information or where veteran status has never been investigated would be left out of this count.)
Thus, hundreds of veterans have likely been sentenced to death in the modern era of the death penalty, and approximately 300 remain on death row. This is a much larger cohort of
14 . For those imprisoned for homicide, veterans represented a higher proportion of the population (15%) than the proportion of non-veterans in prison for homicide (12%). Id. at Appendix table 4. The BJS report went further and determined that 13.2% of the veterans in state prison in 2004 were either serving life or were on death row. (Appendix table 8). That represents approximately 16,400 veterans. 15 . Data on death row were reported to DPIC from California, Arizona, Florida, Nevada, and North Carolina. These states represent 1,506 of the 3,002 inmates on death row in 2015.

Battle Scars, p.10
defendants than those implicated in the Supreme Court’s decisions to exempt juveniles, the intellectually disabled, and the insane from the death penalty. The number of veterans on death row is only part of the concern. Being a veteran in times of war exposes individuals to another world that is alien to the common experience. Young military recruits go from their adolescent lives to places where death is a daily and extremely brutal occurrence. Enemies are blown up before their eyes, sometimes at the young recruits’ own hands. Their friends and fellow service members are killed and maimed in numbers hardly anyone outside of a combat zone has witnessed—often leaving veterans feeling guilty about having survived. Item: One soldier described a few hours of this experience during the Iraq conflict:
First there’s a blinding flash, then a deafening sound as my Humvee lurches into the air. My heart jumps to my throat, and in that split-second I know: A roadside bomb. A pressure-plated IED that, somehow, four vehicles passed without detonating. Vehicle Five, about 15 feet behind us, is hit hard, its entire front end gone. I scramble out of my Humvee, and enter a nightmare. Gunny, our platoon sergeant, lies in a crater the size of a Volkswagen, his legs blown apart. Flesh and blood are scattered across the road and paint the inside of the wrecked vehicle. Dazed Marines stumble through the smoke and dust, unsure if they’re hit. Doc, our corpsman, is tying tourniquets to Gunny’s mangled legs as the ground around them turns darker. I run my team’s trauma pack to Doc and hear Gunny, his face twisted in unimaginable pain, ask Doc to kill him. In a rational world, there would be shock and emotion. I am staring at a man near death, the corpsman who tends him kneels on a gruesome composite of turned earth and flesh. No mind should take in such horror. But in war, cruelty is

Battle Scars, p.11
commonplace. So there is calmness in our movements. We have to focus on staying alive.16
Such violence can leave a permanent residue of shock and disconnect from daily life back in the states. Most people who have served in combat areas thankfully return to their civilian lives and carry on without killing anybody or committing other violent crime. In many ways, they are the lucky ones. But the overwhelming conclusion of years of medical and psychological research on veterans is now clear: PTSD is a real mental illness; it is common among those who have served in war zones; it can result in violent outbreaks in otherwise nonviolent individuals; and it can simmer for years before it manifests itself in unpredictable ways. B. Prevalence of PTSD and Other Disorders
There was a strong reported relation between combat experiences, such as being shot at, handling dead bodies, knowing someone who was killed, or killing enemy combatants, and the prevalence of PTSD.
-New England Journal of Medicine (2004)
The fact that hundreds of thousands of veterans have PTSD and other debilitating disorders,17 such as depression, anxiety, and alcohol abuse, represents a major challenge, not only for returning veterans, but also for the families and communities in which they will live. The effects of PTSD remain for years, and sometimes decades, after the soldier returns home. The National Alliance on Mental Illness provides a description of the disorder in plain terms:
Traumatic events, such as military combat,
assault, an accident or a natural disaster, can have long-lasting negative effects. Sometimes our biological responses and instincts, which can be life-saving during a crisis, leave people with ongoing psychological symptoms because they are not integrated into consciousness.
Because the body is busy increasing the heart
rate, pumping blood to muscles for movement and 16 . C. Clark, “Nightmare at a Bend in the Road,” New America Media, Feb. 6, 2010, available at <http://newamericamedia.org/2010/02/nightmare-at-a-bend-in-the-road.php>. 17 . See studies cited in this section.

Battle Scars, p.12
preparing the body to fight off infection and bleeding in case of a wound, all bodily resources and energy get focused on physically getting out of harm’s way. This resulting damage to the brain’s response system is called posttraumatic stress response or disorder, also known as PTSD. …
The symptoms of PTSD fall into the following categories. • Intrusive Memories, which can include flashbacks
of reliving the moment of trauma, bad dreams and scary thoughts.
• Avoidance, which can include staying away from certain places or objects that are reminders of the traumatic event. A person may also feel numb, guilty, worried or depressed or having trouble remembering the traumatic event.
• Dissociation, which can include out-of-body experiences or feeling that the world is "not real" (derealization).
• Hypervigilance, which can include being startled very easily, feeling tense, trouble sleeping or outbursts of anger.18
Item: One of the most comprehensive studies of PTSD in
combat veterans was conducted after the Vietnam War. The Congressionally mandated National Vietnam Veterans Readjustment Study (NVVRS) found that the majority of veterans readjusted successfully to civilian life. However, a substantial minority of those who had served in Vietnam was experiencing psychological problems. Over 800,000 vets had symptoms and impairment related to PTSD. Disturbingly, 15% of male veterans still suffered from severe PTSD more than 10 years after the war ended.
Other results from this study included:
Rates of PTSD were consistently higher for Vietnam theater Veterans than for [other] Vietnam era Veterans and civilians. … Overall, the NVVRS found that at the time of the study approximately 830,000 male and female Vietnam theater Veterans (26%) had
18 . National Alliance on Mental Illness, “Posttraumatic Stress Disorder,” available at <https://www.nami.org/Learn-More/Mental-Health-Conditions/Posttraumatic-Stress-Disorder>, visited Sept. 3, 2015.

Battle Scars, p.13
symptoms and related functional impairment associated with PTSD. … [A] large majority of Vietnam Veterans struggled with chronic PTSD symptoms, with four out of five reporting recent symptoms when interviewed 20-25 years after Vietnam.19
Item: During the Gulf War (1990-91), returning veterans not only experienced PTSD from combat, but also many were exposed to dangerous chemicals with long-term physical and mental effects known as “Gulf War Illness.” A Congressionally mandated study of this phenomenon was released in 2008 and updated in 2014, concluding that the illness was quite real, extensive among veterans who had served, and devastating in its symptoms, which included “memory problems” and “psychological problems.” Among the conclusions of the latter report were:
Studies reviewed in this report show that Gulf War veterans who were most exposed to the release of nerve gas by the destruction of the Khamisiyah Iraqi arms depot have significantly elevated rates of death due to brain cancer. Veterans who were exposed to the highest level of contaminants from oil well fires also have increased rates of brain cancer deaths. … Hazardous exposures in theater are also related to certain other health problems seen in Gulf War veterans. Exposure to the nerve gas agents sarin and cyclosarin has been linked in two more studies to changes in structural magnetic resonance brain imaging that are associated with cognitive decrements, further supporting findings on the nervous system effects of these agents reported in the 2008 report. New evidence has emerged suggesting that oil well fire exposures may be important in the development of Gulf War illness and brain cancer.20
19 . J. Price, “Findings from the National Vietnam Veterans' Readjustment Study,” U.S. Dept. of Veterans Affairs, last updated Aug. 17, 2015, available at http://www.ptsd.va.gov/professional/research-bio/research/vietnam-vets-study.asp (citations omitted). 20 . Research Advisory Committee on Gulf War Veterans’ Illnesses, Gulf War Illness and the Health of Gulf War Veterans: Research Update and Recommendations, 2009-2013, at 2-3, U.S. Dept. of Veterans Affairs (2014).

Battle Scars, p.14
Research on the effects of Gulf War Illness is continuing. A recent study at the Georgetown University Medical Center compared some of the brain damage in Gulf War veterans to that in Alzheimer’s disease: “The use of other brain areas to compensate for a damaged area is seen in other disorders, such as Alzheimer’s disease, which is why we believe our data show that these veterans are suffering from central nervous system dysfunction.”21
Veterans returning from more recent conflicts in Iraq and
Afghanistan have a high prevalence of PTSD, especially among those who had been in combat zones: Item: A study of thousands of veterans before and after deployment in Iraq and Afghanistan was published in the New England Journal of Medicine in 2004. The study found a substantial prevalence of PTSD among vets who had experienced extensive combat:
Rates of PTSD were significantly higher after combat duty in Iraq than before deployment, with similar odds ratios for the Army and Marine samples. Significant associations were observed for major depression and the misuse of alcohol. Most of these associations remained significant after control for demographic factors .…
For all groups responding after deployment, there was a strong reported relation between combat experiences, such as being shot at, handling dead bodies, knowing someone who was killed, or killing enemy combatants, and the prevalence of PTSD.… The rates of PTSD were significantly associated with having been wounded or injured ….22
All war is extremely violent and has always taken a psychological toll on those who have fought.23 The conflicts in Iraq and Afghanistan are no exception. A study of veterans from those conflicts found a very high exposure to just the kind of experiences that can result in PTSD: 21 . J. Wood, “New Study Pinpoints Two Distinct Forms of Gulf War Illness” Psych Central. (2013). Retrieved on October 22, 2015, from http://psychcentral.com/news/2013/06/15/new-study-pinpoints-two-distinct-forms-of-gulf-war-illness/56066.html. 22 . C. Hoge et al., Combat Duty in Iraq and Afghanistan, Mental Health Problems, and Barriers to Care, 351 N. Engl. J. Med. 13-22 (2004). 23 . See J. London, Why Are We Killing Veterans? The Repugnance And Incongruity Of The U.S. Government Executing Psychologically Wounded Veterans, 11 U. St. Thomas L.J. 274, 276-77 (2014)
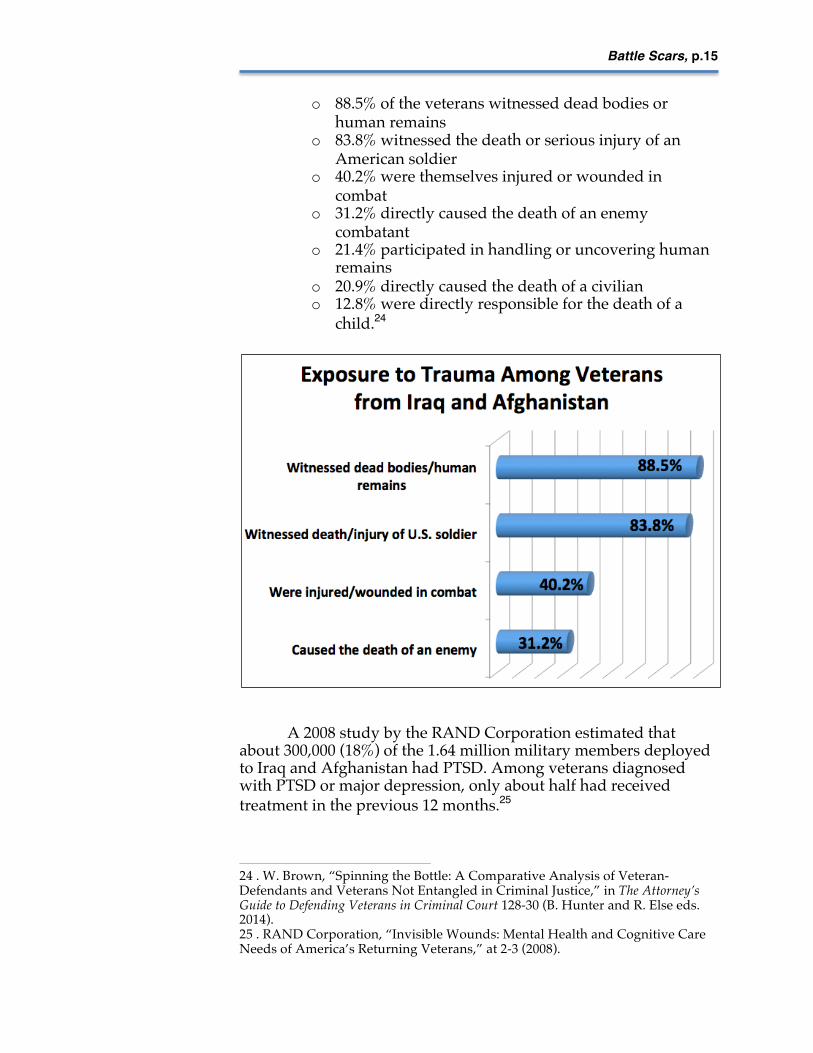
Battle Scars, p.15
o 88.5% of the veterans witnessed dead bodies or human remains !
o 83.8% witnessed the death or serious injury of an American soldier !
o 40.2% were themselves injured or wounded in combat !
o 31.2% directly caused the death of an enemy combatant !
o 21.4% participated in handling or uncovering human remains
o 20.9% directly caused the death of a civilian ! o 12.8% were directly responsible for the death of a
child.24
A 2008 study by the RAND Corporation estimated that
about 300,000 (18%) of the 1.64 million military members deployed to Iraq and Afghanistan had PTSD. Among veterans diagnosed with PTSD or major depression, only about half had received treatment in the previous 12 months.25
24 . W. Brown, “Spinning the Bottle: A Comparative Analysis of Veteran-Defendants and Veterans Not Entangled in Criminal Justice,” in The Attorney’s Guide to Defending Veterans in Criminal Court 128-30 (B. Hunter and R. Else eds. 2014). ! 25 . RAND Corporation, “Invisible Wounds: Mental Health and Cognitive Care Needs of America’s Returning Veterans,” at 2-3 (2008).

Battle Scars, p.16
The outbreak of violence in the lives of veterans can be hard for an overwhelmingly non-veteran public to understand. The victims are often loved ones and even fellow soldiers. Researchers at the New York Times noted a significant uptick in violence among veterans once they began returning from Iraq and Afghanistan. The Times found an 89% increase in homicides among active-duty military personnel and new veterans compared to the six years before the invasion of Afghanistan. The study reviewed 121 cases in which veterans of Iraq and Afghanistan committed or were charged with murder after their return from war. Among the findings:
Three-quarters of these veterans were still in the military at the time of the killing. More than half the killings involved guns, and the rest were stabbings, beatings, strangulations and bathtub drownings. Twenty-five offenders faced murder, manslaughter or homicide charges for fatal car crashes resulting from drunken, reckless or suicidal driving.
About a third of the victims were spouses, girlfriends, children or other relatives ….
A quarter of the victims were fellow service members, including Specialist Richard Davis of the Army, who was stabbed repeatedly and then set ablaze, his body hidden in the woods by fellow soldiers a day after they all returned from Iraq.26
26 . D. Sontag et al., “Across America, Deadly Echoes of Foreign Battles,” N.Y. Times, Jan. 13, 2008.

Battle Scars, p.17
C. Mental Illness, PTSD, and the Death Penalty
The tragedy of the wounded combat veteran
who faces execution by the nation he has served seems to be an avoidable one, and we, as a society, should take action to ensure that it does not happen.
-Dr. Hal Wortzel, Professor of psychiatry, University of Colorado27
The understanding of the relation between mental problems and wartime trauma has expanded greatly in recent years. PTSD is now included among the mental disorders in the practitioner’s manual of the American Psychiatric Association.28 But the symptoms of PTSD do not always manifest themselves immediately after a veteran returns from war.
Crimes committed by people with PTSD can appear to spring out of nowhere. When a sound, a smell, or personal interaction connects with a repressed memory of a terrifying experience, the mind and body can react in violent ways—perhaps helpful towards survival in a military theater—but inappropriate, illegal, and extremely dangerous in a civilian setting. To an ordinary observer not familiar with PTSD, a sudden reaction to a seemingly minor disturbance is very frightening.
Many of the crimes committed by former soldiers with PTSD
were directed at people they had a close relationship with. In the New York Times study cited above, one-third of the homicide victims killed by those returning from Iraq and Afghanistan were family members or girlfriends. Another one-quarter were fellow service members.29 The violence is erratic, generally not triggered by any real threat from the victim. When it is over, there is often deep remorse, admission of guilt, and the danger of suicide.
If the death penalty is sought and mental problems are
introduced at the trial, this forces the decision-makers at sentencing to weigh two strongly competing factors—the heinousness of the 27 . Dr. Hal Wortzel and Dr. David B. Arciniegas, Combat Veterans and the Death Penalty: A Forensic Neuropsychiatric Perspective, 38 Journal of the American Academy of Psychiatry and the Law 407-14 (2010) (Conclusion). 28 . American Psychiatric Association. American Psychiatric Association: Diagnostic and Statistical Manual of Mental Disorders, Fifth Edition 271-72 (2013) (DSM-5). 29 . See Sontag, note 26 above.

Battle Scars, p.18
crime versus the influence of mental illness on the actions of the defendant—and then to choose between two hugely disparate outcomes: life or death. There is no formula for such choices; neither psychiatrists nor judges are prepared for such a decision, much less ordinary jurors. If a veteran’s PTSD was preceded by other forms of mental illness, childhood abuse, or other disabilities, the problems for the justice system are compounded.
Item: Scott Panetti had been in the Navy before his downward spiral into mental illness led him to shave his head, put on combat fatigues, and kill his in-laws in Texas in 1992. Prior to the murder, he was treated and often given medications at mental hospitals,
including VA facilities in Texas.30 At his death penalty trial he called himself “sarge” and was allowed to defend himself dressed in an old-time cowboy suit. During the trial, he told irrelevant stories from his time in the Navy and subpoenaed Jesus Christ as a witness. Despite a farcical legal process, he was convicted, sentenced to death, and remains on death row today. He was in the care of the VA after his service and perhaps more could have been done by officials to treat Panetti earlier, to dissuade the court from allowing him to represent himself in a capital trial, or to convince the state that he should be spared execution.
Panetti’s case stands today at the forefront of the debate
about executing people with severe mental illness. The Supreme Court has barred the execution of the insane, but was vague about the definition of insanity.31 Texas insists that Panetti has some understanding of the fact that he is being punished for his crime and hence is not insane. The U.S. Supreme Court sent Panetti’s case back to Texas to reconsider his mental competency in light of his history of mental illness,32 but has not said that the severely mentally ill should be exempt from the death penalty.
30 . J. Silver, “Panetti Case Argued Again Before 5th Circuit,” Texas Tribune, Sept. 23, 2015. 31 . See Ford v. Wainwright, 477 U.S. 399, 421-22 (1986) (Powell, J., concurring in part). 32 . Panetti v. Quarterman, 551 U.S. 930 (2007); see also Silver, note 30 above (recent 5th Cir. review).

Battle Scars, p.19
III. Areas of Concern in Capital Cases All of the veterans who have faced the death penalty since 1973 fall into three categories: Some have already been executed; some are still on death row or had their death sentence reduced; and some have not yet been sentenced to death. There are lessons to be learned from cases in each category that could prevent injustices in the treatment of veterans facing capital prosecution. For veterans on death row or facing trial, intervention may save their lives. As a start, all persons on death row who are veterans should be identified. Where appropriate, information about PTSD and other debilitating problems related to military service could be shared with prosecutors, defense attorneys, courts, governors, and legislators, with an emphasis on the mitigating value of such information. A. Veterans Already Executed Over 1,400 people have been executed in the U.S. since the death penalty was reinstated in 1976. Many of them were veterans. Some received significant media attention as protests arose close to their execution, but in other cases the military service of the inmate, along with any debilitating effects, may never have been raised. Identifying all the executions of veterans and finding out whether PTSD existed and whether it was raised in legal proceedings would be very instructive in addressing such cases in the future. In the post-Vietnam era, there was significant resistance to recognizing PTSD as a legitimate mental illness and as a critical mitigating factor in capital sentencing.33 The Vietnam War was very unpopular and returning vets bore the brunt of disrespect for the military generally, which overflowed into disrespect even towards individual soldiers. This may not have been a majority view, but the difference between the outward deference and respect for returning soldiers now, compared to the early 1970s, is quite stark. Returning vets not only received little support, but they also found themselves in the midst of a conservative backlash against the rising crime rates that accompanied the late- and post-Vietnam eras. President Richard Nixon strongly supported the death penalty in his re-election bid in 1972, and a crackdown on crime and drugs was a typical part of political campaigns. By 1976, 35 states had quickly passed new death penalty statutes in response to a U.S.
33 . See London, note 23 above, at 277 (PTSD not formally recognized until 1980).

Battle Scars, p.20
Supreme Court ruling that temporarily halted executions.34 The confluence of those societal pressures was apparent in the California case of Manuel Babbitt. Manny Babbitt
The cops promised me they would give him the help he needed. -Bill Babbitt, after turning in his mentally ill brother, who was executed in 1999
Over the course of 40 years in the modern era of the death penalty, California has executed 13 inmates, while over 750 remain on death row. Manny Babbitt was hardly the “worst of the worst” of criminal defendants in the state during that time. After being released from a mental institution, Manny lived with his brother, Bill. He had been suffering from PTSD ever since he returned from Vietnam in 1969. During the 77-day siege at Khe Sanh, he
had picked up pieces of the bodies of his fellow soldiers. When he was wounded, he was evacuated in a helicopter on a pile of dead bodies.
In 1980, he broke into the home of an elderly woman and beat her. She died of a heart attack. After Bill read about the case in the newspaper, he found a cigarette lighter and some money that Manny newly possessed. He decided to turn Manny over to authorities, expecting his war-hero brother to receive the medical attention he needed. Manny did not deny his role in the murder, but said he did not remember it. Manny, who was black, was tried by an all-white jury, sentenced to death, and executed in the gas chamber in 1999, shortly after receiving the Purple Heart in prison.35 He was the first black person executed in California in the modern era.36
In an interview for the New York Times Magazine after the execution, Bill described the changes that had come over his brother after he left the mental institution and moved in with Bill‘s family: 34 . See Gregg v. Georgia, 428 U.S. 153 (1976). 35 . "Should Manny Babbitt Die?" SF Gate, April 5, 1999. ! 36 . J. Doyle et al., “Vietnam Vet Babbitt Executed,” SF Gate, May 4, 1999.

Battle Scars, p.21
We gave him money and tried to help him get work. But when I let him go out on his own, he acted strange. I didn't want to use the word "crazy." But he was bathing less, and his dress was bizarre. I was worried. I had let Manny get away from me and spend too much time by himself. His demons started coming to the surface.
Bill described the guilt he felt in surrendering his brother to the police as a suspect in a murder:
I felt guilty, and ashamed of him. On his last day of freedom, I betrayed him. It was terrible. But I felt I had to do what I did. During his interrogation, an officer told Manny, "You're not going to go to the gas chamber or anything like that." The cops promised me they would give him the help he needed.37
Manny declined his final meal and requested that the $50
allotted be given to homeless Vietnam veterans.38 Although little was made of his PTSD at his 1982 trial, his appellate lawyers raised the issue repeatedly. Ultimately, Gov. Gray Davis, himself a Vietnam vet, declined clemency, saying:
Countless people have suffered the ravages of
war, persecution, starvation, natural disasters, personal calamities and the like. But such experiences cannot justify or mitigate the savage beating and killing of defenseless, law-abiding citizens.39
The governor mistakenly equated the physical suffering from natural calamities with the mental scars of combat soldiers, and failed to distinguish between crimes that cannot be mitigated and the mentally ill criminal, whose responsibility was diminished by such trauma.
37 . B. Babbitt, “My Brother's Guilt Became My Own,” N.Y. Times Magazine, Jan. 14, 2001 (as told to Gabrielle Banks) (picture of M. Babbitt with permission of family). 38 . See Doyle, note 36 above. 39 . Id.

Battle Scars, p.22
Louis Jones, Jr. By 2003, the country had learned more about PTSD and other military-related illnesses, and the attitude towards those who had served their country in the military had changed considerably.40 Therefore, it might seem surprising that Louis Jones, a decorated Gulf War
veteran with no prior criminal record, was executed that year by the federal government, despite clear signs of mental illness following his service in the war.
As with many crimes committed by those with PTSD, the
series of events surrounding Jones’s offense made little sense. In 1995, he entered Goodfellow Air Force Base in Texas, where he was a civilian employee, and where his ex-wife worked. He kidnapped a total stranger, Pvt. Tracie McBride. He brought her to his apartment, raped her, and then brought her to a bridge where he killed her with a tire iron. Jones confessed to the crime and led police to the body. His ex-wife testified at Jones’s trial that he had assaulted her at his apartment 2 days before he kidnapped McBride. She said he was acting "very crazed," "panicked," and was "spinning out of control."41
His attorneys claimed that his exposure to nerve gas in Iraq and post-traumatic stress from his combat tours contributed to his murder of McBride. At his trial, at least some jurors found the existence of important mitigating factors in Jones’s favor but nevertheless unanimously sentenced him to death. A single juror voting for a life sentence would have meant no death penalty. Some of the jurors found:
o Jones committed the offense under severe mental or
emotional disturbance o He was subjected to physical, sexual, and emotional
abuse as a child and was deprived of sufficient parental protection that he needed
o He served his country well in Desert Storm, Grenada, and for 22 years in the United States Army
o He is likely to be a well-behaved inmate o He is remorseful for the crime he committed
40 . See, e.g., A. Giardino, “Combat Veterans, Mental Health Issues, and the Death Penalty: Addressing the Impact of Post-Traumatic Stress Disorder and Traumatic Brain Injury,” 77 Fordham Law Rev. 2955, 2989-91 (2009) (citing changes in contemporary attitudes). 41 . R. Serrano, “A War Hero, a Condemned Killer,” Los Angeles Times, January 14, 2003.

Battle Scars, p.23
o He suffered from numerous neurological or psychological disorders at the time of the offense.42
In 2000, while Jones was on death row, the Pentagon sent
him a letter revealing that he had been exposed to chemical agents when the Army demolished a munitions plant in Khamisiyah, Iraq.43 During Operation Desert Storm, Jones drove through burning oil fields in an area permeated with land mines.44
Nevertheless, Jones was executed on March 18, 2003, at the Federal Penitentiary in Terre Haute, Indiana. President George W. Bush refused Jones's clemency request, while at the same time preparing the country for the start of the Iraq War. Assistant U.S. Attorney Tanya Pierce, who prosecuted Jones, discounted his plea for mercy, asserting that if some soldiers had been able to integrate back into civilian life after the Gulf War, so should all of them: "It is an insult to the thousands and thousands of people who went over there and did their patriotic duty, came back and are law-abiding citizens."45 Jones was barred from burial in a military cemetery. John Allen Muhammad In capital cases, the facts of the crime are often so disturbing and frightening that jurors may have difficulty hearing important mitigating evidence put forward by the defendant. This was likely the case after John Allen Muhammad was convicted of being one of the two “Beltway Snipers,” responsible for 10 deaths in the Washington, D.C., area in 2002. Virginia’s governor, Tim Kaine, who had experience as a capital defense attorney, denied Muhammad clemency, resulting in his execution in 2009. Muhammad’s case was not helped by the fact that he was allowed to initially defend himself and that he made delusional claims of innocence. Like Louis Jones, Muhammad was a Gulf War combat veteran. He, too, had been stationed in Khamisiyah, Iraq, where the destruction of a huge arms depot exposed thousands to poisonous chemicals. He served many years in the military, including three months as part of Operation Desert Storm, for which he received a Kuwait Liberation Medal. He was honorably discharged in 1994.46 42 . Jones v. United States, 527 U.S. 373 (1999), at footnote 4 (aff’g lower court’s denial of relief on grounds unrelated to military service). 43 . S. Tan, "A Hymn on His Lips, Veteran is Executed; Gulf soldier ignores his victim's relatives as they watch him die," Indianapolis Star, March 19, 2003. 44 . "Gulf War Veteran is Executed," Indianapolis Star, March 18, 2003. 45 . S. Tan, note 43 above. 46 . “John Allen Muhammad: How decorated Gulf War veteran became subject of manhunt,” Seattle Times (staff reporters), Oct. 25, 2002.

Battle Scars, p.24
Muhammad’s ex-wife, Mildred Muhammad, described John as a changed man after his return from Saudi Arabia. "Before going to Saudi he was the life of the party," she said. "Everyone wanted to be around him. He came back confused, moody … and was diagnosed with PTSD. He was a proud man -- not one to say, 'I need help.'"47 By the time of his trial, he certainly needed help. Some of his mental problems were summed up by his attorneys in a final petition to the U.S. Supreme Court prior to his execution. Evidence offered included:
• A psychiatrist, Dr. Dorothy Lewis, found Muhammad lacked rational understanding and was incompetent to represent himself
• A neurologist, Dr. Jonathan Pincus, found three serious abnormalities in his MRI brain scan, perhaps due in part to severe physical abuse suffered as a child
• Muhammad repeatedly made delusional statements, including his claim to being present at the falling of the Berlin Wall, and believing he “might be on another planet.”
• He was convinced he was a prophet and that his co-defendant, John Malvo, had concocted a cure for AIDS.48
Whether Muhammad’s mental problems were pre-existing,
caused by childhood abuse, exacerbated during his military service, or some combination of these factors is impossible to know at this point. In any case, mental illness is not a bar to the death penalty. It is supposed to act as a mitigating factor in the jury’s deliberations, but a defendant would have to be insane to be completely exempt from the death penalty.49 Muhammad was executed on the eve of Veterans’ Day in 2009.
47 . M. Norris, “Ex-wife of D.C. sniper speaks out on domestic violence,” www.army.mil, Oct. 12, 2012. 48 . Muhammad v. Kelly, cert. pet. to U.S. Supreme Court (2009), at pp.4-7 (on file with DPIC). 49 . Ford v. Wainwright, 477 U.S. 399 (1986).
Battle Scars, p.25
Andrew Brannan I am proud to have been able to walk point
for my comrades, and pray that the same thing does not happen to any of them.
-Andrew Brannan, Vietnam Vet, before his execution in 2015, on raising the public awareness of PTSD
Andrew Brannan’s case was mentioned in this report’s Introduction as evidence that the crisis of veterans on death row has not been resolved by passage of time. Brannan was the first person executed in 2015, and his case fits the characteristics of many other veterans who have been sentenced to death: evidence of mental illness, probably caused by or exacerbated by PTSD or other military-related trauma; a bizarre and horrendous crime, followed by the vet’s fatalistic admittance of what he did; and finally, a harsh denial of mercy, despite the mitigating evidence of military service and the toll that it might have taken. Brannan had taken to living in a squalid shack in the woods before his crime. Taylor Barnes, a freelance journalist in Georgia, summarized Brannan’s downward spiral of mental illness:
Brannan volunteered for the Army in 1968 and was trained as a parachutist. He served in Vietnam from 1970 to 71, and saw extensive combat. Twice he took charge of his unit after his commanding officers were killed. He would later recount to his psychiatrist several situations of how he narrowly escaped death during the war.!!Brannan was honorably discharged in 1971. He received the Bronze Star and two Army Commendation medals for his service.!!But as he returned to civilian life, deep psychological and personal problems emerged in Brannan’s life. His lawyer said he could not hold down a job and his marriage fell apart. One of Brannan’s brothers was killed in active duty and another committed suicide. In 1984, he was granted partial disability for service-connected Post Traumatic Stress Disorder (PTSD). By 1991, the Department of Veterans Affairs determined Brannan to be 100 percent disabled due to PTSD, a

Battle Scars, p.26
severe diagnosis that means one’s symptoms show “total occupation and social impairment.”!!In 1996, his VA psychiatrist would further diagnos[e] him as bipolar. Brannan was hospitalized at least twice for mental illness. …! Brannan’s lawyer called him hours before his execution and told him that his case had raised public awareness about the impact of PTSD on veterans. Brannan responded, “I am proud to have been able to walk point for my comrades, and pray that the same thing does not happen to any of them.”50
Brannan’s crime was irrational. He killed a police officer who was making a routine traffic stop for speeding. After initially exchanging pleasantries with the officer, he became hysterical, begging the officer to shoot him. The likely explanation for such behavior is mental illness, and in Brannan’s case, that illness was accompanied by PTSD from his service in Vietnam. In the end, Georgia executed a severely mentally ill inmate at age 66 for a crime committed many years ago. Leonel Herrera and the Possibility of Innocence
One of the risks with any use of the
death penalty is the possibility of executing an innocent person. In the cases of veterans, if a defendant’s primary defense is that he did not commit the murder he was charged with, the jury might not hear of his military service and PTSD. One of the military veterans executed in Texas became far better known for bringing the issue of innocence to the Supreme Court than for his military service.
Leonel Herrera was charged with killing a police officer.
Leonel’s primary defense was that his brother Raul, a known drug dealer, had committed the murder, and the officer-victim was himself involved in dealing drugs. Leonel’s case made headlines because the U.S. Supreme Court chose it as a vehicle to consider whether a claim of innocence arises to a federal constitutional issue requiring additional review. Ultimately, the Court (6-3) elected not to resolve this issue, but instead assumed it was unconstitutional to execute someone with extraordinary evidence of innocence, but
50 . See Barnes, note 3 above.

Battle Scars, p.27
nevertheless allowed Herrera to be killed in 1993 because it did not find his exculpatory evidence convincing enough to even merit a hearing.51
Herrera’s hope for mercy from the Texas Board of Pardons
and Paroles or the governor rested on the doubts he had raised about the integrity of his conviction. But he was also a decorated Vietnam veteran, who suffered from PTSD, though his service did not receive a lot of attention. His mother described Leonel’s early life as one marred by extreme poverty, physical abuse, and efforts to escape that world by joining the military. When he came back to south Texas with his additional scars after his service, he turned to drug use and drug trafficking, leading eventually to his arrest for murder.52 If Herrera’s case had been diverted away from the death penalty in the first place because of his service and symptoms of PTSD, this would have been a very different story. At least four other honorable veterans who faced execution were exonerated and freed from death row. The same year that Herrera was executed, Kirk Bloodsworth became the first death row inmate to be freed through DNA testing. Bloodsworth had been convicted and sentenced to death in Maryland for the assault and murder of a nine-year-old girl. His military service in the Marines and his honorable discharge (and clean criminal record) were no match for the horror of the crime in the jury’s mind. People attending his trial applauded when he was sentenced to death, not knowing that a grievous mistake had been made.53 Charles Fain was a Vietnam veteran sentenced to death for a crime similar to Bloodsworth’s: the assault and murder of a nine-year-old girl in Idaho. He was convicted on the basis of a jail-house snitch and faulty hair-comparison evidence provided by the FBI. He was exonerated by DNA testing in 2001.54
Ray Krone was an honorably discharged Air Force veteran, who was sentenced to death in Arizona for the murder of a woman who worked in a neighborhood bar. Because of the emergence of DNA testing and dedicated supporters, he was exonerated in 2002.55
51 . Herrera v. Collins, 506 U.S. 390 (1993). 52 . See N. Herrera, Last Words from Death Row 197 (Nightengale Press 2007) (author is mother of Leonel Herrera). 53 . See generally T. Junkin, Bloodsworth: The True Story of the First Death Row Inmate Exonerated by DNA (Algonquin Books 2004). 54 . See H. Weinstein, “Condemned Man Could Go Free After DNA Testing,” L.A. Times, Aug. 19, 2001. 55 . See generally, J. Rix, Jingle Jangle (Broken Bench Press 2007).

Battle Scars, p.28
Joe D’Ambrosio was charged with murder in Ohio four years after his honorable discharge from the Army. Prosecutors withheld so much information from the defense that the courts not only overturned his conviction, but also prohibited a retrial, and he was freed in 2012.56
These wrongful convictions demonstrate that veterans’ cases
are subject to all the vicissitudes of the capital punishment system, including the risk of executing the innocent.
Other Executed Veterans Many other veterans have been executed in the modern era of the death penalty. Their cases span the various conflicts that the U.S. was engaged in over the past decades. Many involved defendants with PTSD that was not sufficiently raised at trial. David Funchess was among the first veterans executed in the modern era when he was electrocuted in Florida in 1986. He was diagnosed with PTSD and had been wounded while serving in Vietnam as a Marine. He had no criminal record and had graduated in the top third of his high school class. He was drafted in 1967 and served three months in Vietnam, receiving five decorations, including a Purple Heart. He was wounded by a land mine and then discharged. He was also exposed to Agent Orange, which causes neuropsychological damage. The medication he received for his wounds may have contributed to his eventual heroin habit. He was convicted of killing two bar employees in 1974.57 At the time of his trial in 1975, PTSD was little understood. Prior to his execution, his fellow Vietnam vets kept around-the-clock vigil at Florida’s Vietnam War Memorial.58 Wayne Robert Felde was electrocuted in Louisiana in 1988, after asking his trial jury to sentence him to death. He shot a policeman while handcuffed and on his way to jail for drunkenness. Felde had served in Vietnam and was the first person in the state to use his Vietnam experience as the basis for an insanity plea.59
56 . P. Krouse, "Judge bars re-prosecution of Joe D'Ambrosio, slams prosecutors," Plain Dealer, March 3, 2010. Michael McCormick, who was exonerated from death row in Tennessee in 2007, may also have been a veteran. 57 . Associated Press, “Vietnam Veteran Is Put To Death In Florida,” N.Y. Times, April 23, 1986. 58 . M. Mello, “Flashbacks, Vietnam, and Capital Punishment,” Rutland Herald, Dec. 7, 2005. 59 . Associated Press, “A Vietnam Veteran Who Said He’d Kill Again Is Executed,” N.Y. Times, Mar. 15, 1988.

Battle Scars, p.29
Herbert Lee Richardson was put to death in the electric chair in Alabama in 1989. He had served for three years as a military technician in a forward area in Vietnam. He was described as emotionally disturbed by his war experience. He placed a bomb on the porch of a woman with whom he had been in a close relationship, causing one death.60 Robert Black, a Vietnam vet, was executed in Texas in 1992 for the murder of his wife. His case illustrates the danger that PTSD can be mistakenly perceived as aggravating evidence rather than helpful mitigating evidence. According to a federal appellate court that denied him relief, Black’s trial attorneys did not raise his war-related PTSD because they feared it would show him to be a future danger to society. The court deemed that a strategic choice, rather than attorney ineffectiveness, which might have resulted in a new sentence.61 Larry Joe Johnson was electrocuted by the state of Florida in 1993, despite a diagnosis of PTSD. Johnson served in Vietnam and was honorably discharged. He joined the Kentucky National Guard and was hit by a smoke grenade during a training exercise, causing brain damage and hospitalization in a military psychiatric ward.62 He killed a gas station owner. Terry Dennis was executed in Nevada in 2004, after giving up his appeals. Dennis had served in the Air Force in Vietnam and suffered from alcoholism and drug use after the war. He killed a woman with a belt during a drinking binge.63 Kenneth Lee Boyd was executed in North Carolina in 2005, the 1,000th execution in the modern era. He, too, was a Vietnam veteran, having operated bulldozers while being shot at by snipers. Boyd admitted to killing his estranged wife and father-in-law.64 Timothy Adams was executed in Texas in 2011. He had an exemplary service record in the military, serving in Germany, and no criminal record. When his wife threatened to leave him, he
60 . Associated Press, “Alabama Man, 43, Is Executed For Killing Girl With Pipe Bomb,” N.Y. Times, Aug. 19, 1989. 61 . See Black v. Collins, 962 F.2d 394 (5th Cir. 1992). Black’s appellate attorneys said the trial attorneys failed to fully investigate this issue. 62 . “Florida Electrocutes a Vietnam Veteran for a 1979 Murder,” N.Y. Times, May 5, 1993. 63 . “Nevada puts killer to death,” Las Vegas Sun, Aug. 13, 2004. 64 . Associated Press, “N.C. Carries out Nation’s 1,000th Execution,” Dec. 2, 2005.

Battle Scars, p.30
snapped, contemplating suicide and shooting his young son after a standoff in the family’s apartment.65 Cleve Foster served in the military for two decades, including working as an Army recruiter. He was executed in Texas in 2012 for rape and murder.66 His appellate attorneys argued that his trial attorneys should have investigated his military background, pointing to a subsequent diagnosis of PTSD and trauma experienced while serving.67
Further research would be needed to discover all of the veterans executed since the death penalty was reinstated in 1976.68
There may be numerous cases where the veteran’s service was never identified, never investigated, or never presented to the jury or the governor prior to execution. B. Condemned Veterans – Not Executed Many veterans still face execution, but could be spared if their cases are reviewed in light of the service they rendered to the country and any trauma they may have experienced in the military. Others have been removed from death row, and their cases may be equally instructive. The accounts of Courtney Lockhart in Alabama and John Cunningham in California were told briefly in this report’s Introduction. Both suffer from PTSD—Lockhart from his service in Iraq and Cunningham from Vietnam. Both remain on death row
after years of unsuccessful appeals. George Porter and the Supreme Court
In 2009, the U.S. Supreme Court significantly raised the profile of veterans on death row when they decided Porter v. McCollum. Death penalty cases often evoke a sharp division among the Justices, with key
65 . M. Graczyk, "Man who killed toddler son to be executed today," Associated Press, Huntsville Item, Feb. 22, 2011. 66 . C. Stark "Ex-Army recruiter executed after three previous stays," Huntsville Item, September 26, 2012. 67 . Memorandum in support of petition for habeas corpus, Foster v. Quarterman, No. 4:07-CV-210 (U.S.D.C. Northern Dist. of Tex. Mar. 20, 2008), at 36-37 (on file with DPIC). 68 . In addition to those mentioned in this report, other known veterans who have been executed include: Joseph Wood (2014 AZ), Arthur Rutherford (FL), Chadwick Banks (FL), Manuel Pardo Jr. (FL), Oba Chandler (FL), Paul Howell (FL), Harvey Green (NC), Earl Richmond (NC), William Powell (NC), Kenneth Boyd (NC), John Rose (NC), Daryl Holton (TN), and Timothy McVeigh (Fed).

Battle Scars, p.31
cases being decided by the narrowest of margins. The Porter case, however, was decided without oral argument and without dissent. The Court overturned George Porter’s death sentence in Florida, finding his attorney negligent in not investigating Porter’s military service and expressing strong confidence that, had evidence of his combat experience and subsequent mental problems been presented, a different sentence would likely have been rendered. To emphasize its point, the Court described in great detail the battles that Porter had taken part in during the Korean War, the trauma he experienced, and the aftereffects when he returned home:
Petitioner George Porter is a veteran who was both wounded and decorated for his active participation in two major engagements during the Korean War; his combat service unfortunately left him a traumatized, changed man. His commanding officer’s moving description of those two battles was only a fraction of the mitigating evidence that his counsel failed to discover or present during the penalty phase of his trial in 1988.69
The neuropsychologist who testified at Porter’s post-
conviction hearing “concluded that Porter suffered from brain damage that could manifest in impulsive, violent behavior. … [and that] Porter was substantially impaired in his ability to conform his conduct to the law and suffered from an extreme mental or emotional disturbance….”70 The court that decided Porter’s sentence heard none of this and found no mitigating evidence in his favor.
The Court criticized the lower courts for dismissing the impact that such evidence could have had and for “fail[ing] to engage with what Porter actually went through in Korea.”71 The Justices concluded by reminding the nation that a special debt is owed those who have served in the military, and this applies especially in capital cases, where even a modicum of mercy can mean the difference between life and death: “Our Nation has a long tradition of according leniency to veterans in recognition of their service, especially for those who fought on the front lines as Porter did."72
69 . Porter v. McCollum, 130 S.Ct. 447, 448 (2009) (per curiam). 70 . Id. at 451. 71 . Id. at 455. 72 . Id.

Battle Scars, p.32
After the case was sent back to Florida for reconsideration, prosecutors elected not to seek the death penalty for Porter, who was 78.73 He had killed his ex-girlfriend and her boyfriend.
James Floyd Davis: Received His Medals on Death Row Davis is a Vietnam veteran from North Carolina, who was wounded during one of his two tours of duty. Twenty years ago he lashed out with a burst of violence, killing three people including his employer, who had fired him a few days earlier. At age 68, he suffers from mental illness and PTSD. He was also a victim of child abuse. Through the intervention of Jim Johnson, a therapist who also served in Vietnam, it was learned that Davis was entitled
to a Purple Heart and other medals earned during his service. The Army agreed to award him the medals and the prison eventually agreed to let him receive them. A brief description of the presentation appeared in the Fayetteville Observer:
On July 29, James Davis was unshackled and escorted into a small hearing room just off death row…. Johnson, at 6-foot-6, towered over the slouched prisoner standing before him. "But when I prepared to pin his medals on, he stood straight up, hands cupped to the side," he recalled.
Johnson pinned on two of the medals: the Purple Heart and the Good Conduct award. He stepped back and saluted. Davis replied with a textbook-sharp salute. For a moment, it seemed he wasn't a prisoner. Forty years later, he was a soldier again.74
Davis was not allowed to keep his medals. According to his
lawyer, Ken Rose, he remains on death row today, steeped in his mental illness and intent on giving up his appeals.
73 . See K. Basu, “Aging killer may get reprieve from death row,” Florida Today, July 21, 2010 (announcement to not seek death). 74 . C. Jacobs, "N.C. death row inmate receives medals earned in Vietnam," Fayetteville Observer, Sept. 5, 2009.

Battle Scars, p.33
Johnson pinned on two of the medals: the
Purple Heart and the Good Conduct award. He stepped back and saluted. Davis replied with a textbook-sharp salute. For a moment, it seemed he wasn't a prisoner. Forty years later, he was a soldier again.
Robert Fisher – Hearing Only Part of the Story
In the picture at the
left, a young Robert Fisher, wounded in Vietnam in 1967, is receiving a Purple Heart medal from President Lyndon Johnson. Today, Fisher is in his late sixties, still on Pennsylvania’s death row, a victim of PTSD and other mental problems. At his trial for murdering his
girlfriend, Fisher’s lawyer had him tell the jury about his military service and his medal. But no mental health expert testified at sentencing to explain Fisher’s brain damage and the psychological aftereffects of intense combat, including the addictions that sometimes follow. There were no medical experts testifying for Fisher because his attorney had not investigated these problems. He also failed to rebut the prosecution’s portrayal of Fisher as simply a bad soldier. If Fisher were tried today, there would be volumes of mitigating evidence to present on his behalf and numerous experts that could help a jury better understand his tragic life.75 However, overturning a death sentence once it has been imposed is often more difficult than preventing it in the first place.
Gary Cone – Drug Addiction Related to Combat
Drug abuse by returning veterans can be a form of self-medication to deal with PTSD or other disabilities experienced during combat. Gary Cone is a Vietnam veteran who was 75 . See Habeas Corpus Petition, Fisher v. Beard, No. 03-788 (U.S. Dist. Ct. for Eastern Dist. of Pa., Dec. 2, 2003) (available from DPIC) (picture from trial exhibit).

Battle Scars, p.34
sentenced to death in 1984 for murder during a bizarre crime spree. He offered an insanity defense, arguing that psychosis induced by his drug use negated his guilt. He said his drug addiction was attributable to the trauma he had experienced during the war, which included handling the bodies of dead soldiers. The prosecution denied there was any evidence of Cone’s drug problem and referred to his defense as "baloney." However, police reports, FBI files and witness statements discovered in the district attorney’s files 10 years later confirmed Cone’s extensive drug abuse. The U.S. Supreme Court overturned the lower court’s denial of relief and remanded his case for reconsideration of his death sentence in light of the evidence that was withheld, a process that is still under way.76 He has now been on Tennessee’s death row for 30 years and is currently in a special needs unit, as his appellate attorneys continue to fight both his sentence and conviction. John Thuesen – A New Awareness John Thuesen is a current example of the problem identified by the Supreme Court in Porter v. McCollum. After the terror attack of 9/11, Thuesen volunteered for the military and served as a Marine during the height of the Iraq war, experiencing extreme violence in many forms. When he came home, his family noted how the former football standout had changed, how he had turned to drinking and was heard sobbing. In 2008, he checked himself into a Veteran’s hospital, but was released after four days with a prescription for medication and therapy.77 He was later convicted of murdering his ex-girlfriend and her brother and sentenced to death in 2010. He had called the police and confessed to the crime. Thuesen’s trial lawyers mentioned his military service but did little to convey the prevalence and severity of PTSD experienced by Thuesen and many other veterans. Recently, a Texas District Court judge recommended that his death sentence be overturned and that he be given a new sentencing hearing. The judge said the defense attorneys did not do enough in terms of explaining PTSD to the jury. He also noted that Thuesen was never properly diagnosed or treated for PTSD and this should have been presented to the jury. The Texas Court of Criminal Appeals is weighing the judge’s recommendation.78
76 . See generally, Cone v. Bell, 556 U.S. 449 (2009); see also Associated Press, Court rules for Tenn. death-row inmate, April 28, 2009. 77 . B. Grissom, “Considering the Toll of War in a Death Penalty Debate,” Texas Tribune, Dec. 27, 2013. 78 . J. Walker, “Judge recommends overturning death sentence in capital murder case,” The Eagle, July 21, 2015.
Battle Scars, p.35
Identifying all the veterans who remain on death row, especially those with PTSD and other serious mental illness, should be an imperative. Their cases might reveal critical information that could result in their lives being spared.
C. Future Cases Many other accounts could be offered about veterans still on
death row.79 Their life stories are often sad and familiar. However, few veterans have been spared in the appellate stage of the legal process because of revelations about their military service.80 Courts of appeal must find a legal error in the process; they cannot simply extend mercy because someone is a veteran. That is the role of the executive branch. However, a review of all the clemencies issued by governors or pardons boards in capital cases in the modern era does not reveal a single case where military service served as a key ground for the commutation.81 While governors do not always say why they are commuting a death sentence, it seems that reasons related to a person’s service to his country would be highly relevant in a public announcement.
The Supreme Court’s decision in Porter may have raised public consciousness about veterans facing execution, but so far there has been no official effort to identify all of the veterans on death row or to spare them from the death penalty. The best time to avoid the possibility of executing a veteran is before a capital case comes to trial. No chief prosecutor is obligated to seek the death penalty in a particular case. If a defendant’s military service is brought forward early, especially if accompanied by evidence of trauma, drug dependency, or other disabilities experienced during service, a decision could be made to seek a different sentence. However, for that alternative to work, all parties need to be aware not only of the defendant’s military status, but also of conditions like PTSD that could make a difference in the ultimate punishment applied.
79 . Of course, all those under a military death sentence served in the armed forces. The military has shown particular caution in such cases, with no executions in almost 55 years. See DPIC, “U.S. Military Death Penalty” at <http://www.deathpenaltyinfo.org/us-military-death-penalty>. 80 . Recently, the Florida Supreme Court reduced the death sentence of Humberto Delgado to life imprisonment because it found his original sentence disproportionate in light of his severe mental illness, which had manifested itself before he joined the military. When he was stopped by a police officer−whom he eventually killed−he was a homeless veteran, pushing a shopping cart along the roadway. See Delgado v. Florida, 162 So. 3d 971 (2015). 81 . See DPIC, Clemency http://www.deathpenaltyinfo.org/clemency.

Battle Scars, p.36
What Can Be Done Although veterans continue to be sentenced to death82 and
even executed, a recent Texas case that garnered significant public attention illustrates a different approach. Prosecutors declined to seek the death penalty against Eddie Ray Routh who was charged with killing Chris Kyle—of “American Sniper” fame—and Kyle’s friend, Chad Littlefield. Routh had been a Marine and had fought in Iraq, returning home with PTSD. Prior to the shootings, he had been hospitalized four times because of his mental problems. Routh was sentenced to life without parole.83 Kyle had been trying to help Routh as part of his work with returning veterans suffering from PTSD.
For a case to be diverted out of the capital punishment system, it is important that a defendant’s military status be known from the outset. Almost all states have now passed legislation to allow drivers to have a veteran designation on their licenses.84 If a veteran is arrested, this designation gives immediate recognition of his or her military service. Prosecutors and defense attorneys can be encouraged to ask defendants about their military background. Training in how this information can be relevant in a criminal case is also essential.
In a parallel situation, Mexico had been very concerned
about the number of its citizens facing execution in the U.S. Although the U.N.’s Vienna Convention on Consular Relations requires the U.S. to inform arrestees of their right to contact the Mexican consulate,85 that right was often ignored. By the time the defendant had been sentenced to death and faced an execution warrant, it was too late to make a difference. Mexico implemented a plan of closely monitoring potentially capital cases involving its citizens in the U.S. Immediate legal and interpretive assistance is offered, thereby averting many death sentences in the earliest stages of the case.86 The Veterans Administration could similarly intervene in cases involving former service members. 82 . Kesaun Sykes was sentenced to death in 2014, along with two his co-defendants, Emrys John and Tyrone Miller, who were sentenced in 2013. All of the defendants were members of the military at the time of the crime, though PTSD did not appear to be a factor. See L. Juarez, “Ex-Marine sentenced to death for murders,“ ABC7 Eyewitness News (KABC-TV Los Angeles), Nov. 7, 2014. 83 . See R. Jervis, “'American Sniper' killer found guilty in murders,” USA Today, Feb. 25, 2015. 84 . See Military Benefits < http://militarybenefits.info/veterans-id-on-drivers-license-id-card-by-state/>, visited Sept. 1, 2015. 85 . Vienna Convention on Consular Relations, 596 U.N.T.S. 261, Art. 36, April 24, 1967. Mexico was unsuccessful in trying to have the U.S. Supreme Court require adherence to the treaty. See Medellin v. Texas, 552 U.S. 491 (2008). 86 . C. Soohoo et al., Bringing Human Rights Home 107 (2008).

Battle Scars, p.37
The VA does become involved in many criminal cases
outside of the death penalty context. There are now over 200 Veterans Treatment Courts,87 assisting mainly non-violent offenders. The judges in these courts are aware of the problems facing veterans, and peer mentoring and treatment options are offered to help avoid incarceration. The courts are not funded by the VA, but Veterans Justice Outreach representatives from the VA participate in the process. These courts do not require that the vets had been involved in combat or have identified mental health issues. They are open to all vets.
The motivation and ideas behind Veterans Courts could be
applied in death penalty cases. Early intervention, peer assistance from veterans, and involvement of veteran officials with prosecutors, defense attorneys, and judges could all be instrumental in steering a case away from the death penalty. Challenging legislators and governors to fashion ways to better address the special circumstances of veterans who have committed murder is also needed. Comprehensive solutions to the unique problems veterans face in capital cases are beyond the scope of this report. Some commentators have recommended a complete exemption from the death penalty for combat veterans suffering from mental problems at the time of their offense.88 In the interim, experts familiar with this area of the law89 have offered other recommendations, including: mental health assessments for capitally charged veterans by professionals with experience in military health issues; mandatory training and assistance for defense teams handling such litigation from military experts;90 education about PTSD and related matters for prosecutors, judges, and defense attorneys who may be involved in such cases; allowance of mitigation testimony regarding military culture at capital trials; questioning of potential
87 . See Justice for Vets, History of Veterans Treatment Courts, at <http://justiceforvets.org/vtc-history>. 88 . See Giardino, note 40 above at 2988; see also London, note 23 above, at 299 (“categorical death penalty exclusion for service members and veterans suffering from a service-related mental injury when they commit the underlying capital offense”). 89 . Special thanks to Art Cody (Captain USN (Ret), Legal Director Veterans Defense Program, New York State Defenders Association); Anthony Giardino (Attorney and Lieutenant Colonel, U.S. Marine Corps Reserve); Brockton Hunter (former Army Scout; Principal, Law Offices of Brockton D. Hunter, Minneapolis; Co-Founder/President, Veterans Defense Project; and Co-Author and Editor, Defending Veterans in Criminal Court, available at veteransdefenseproject.org). 90 . See, e.g., the New York State Defenders Association’s Veteran Defense Program, at http://www.nysda.org/VeteransDefenseProg.html.

Battle Scars, p.38
jurors regarding their views about the military; and allowing VA therapists to testify in capital cases.

Battle Scars, p.39
Conclusion
In a rational world, there would be shock
and emotion. I am staring at a man near death, the corpsman who tends him kneels on a gruesome composite of turned earth and flesh. No mind should take in such horror. But in war, cruelty is commonplace. So there is calmness in our movements. We have to focus on staying alive. -Chris Clark, diary from Iraq (2010) Hundreds of thousands of military veterans have returned
home after fighting in Vietnam, the Gulf War, Afghanistan, and Iraq suffering from Post-Traumatic Stress Disorder and other mental disabilities and addictions related to their service. A relatively small but significant number of these veterans committed heinous murders and received the nation’s worst punishment—the death penalty. Many have already been executed, but hundreds remain on death row, while others are facing a possible death sentence.
In a country that is proud of its renewed respect for
veterans, and that is using the death penalty for a dwindling number of offenders, capital punishment stands out as a questionable punishment for those who have served in the military. Even today, there are veterans on death row with PTSD that was unexplored at their trial or undervalued for its pernicious effects.
The country owes its veterans a thorough examination of the
use of the death penalty in their cases, even when their offenses are especially grievous. Interim steps could be taken to ensure that key decision-makers in the legal process are aware of a veteran’s military background as soon as capital charges become possible, and that they are informed about the gravity of mental problems that can be traced back to the extremes of combat and training. A broader understanding of the interaction between jarring trauma and the later eruption of violence could pave the way for a thorough re-evaluation of society’s approach to violence and mental illness, perhaps improving prevention and fashioning an appropriate response when prevention fails.

The Death Penalty Information Center is a non-profit organization serving the media and the public with analysis and information on issues concerning capital punishment. The Center provides in-depth reports, issues press releases, conducts briefings for journalists, and serves as a resource to those working on this issue. The Center is funded through the generosity of individual donors and foundations, including the Roderick MacArthur Foundation, the Open Society Foundations, the
Atlantic Philanthropies, and the Proteus Action League.
DEATH PENALTY INFORMATION CENTER
Washington, D.C.
www.deathpenaltyinfo.org
Battle Scars: Military Veterans and
the Death PenaltyA Report by
the Death Penalty Information Center

Exhibit E: Justin D. Levinson, Robert
J. Smith & Danielle M. Young, Devaluing Death:
An Empical Study of Implicit Racial Bias on Jury
Eligible Citizens in Six Death Penalty States 89 N.Y.U. L. Rev. 513 (May
2014)

Devaluing Death:
An Empirical Study of Implicit Racial Bias on Jury-Eligible
Citizens in Six Death Penalty States
Justin D. Levinson, Robert J. Smith & Danielle M. Young
Stark racial disparities define America’s relationship with the
death penalty. Though commentators have scrutinized a range of
possible causes for this uneven racial distribution of death
sentences, no convincing evidence suggests that any one of these
factors consistently account for the unjustified racial disparities at
play in the administration of capital punishment. We propose that
a unifying current running through each of these partial plausible
explanations is the notion that the human mind may unwittingly
contribute bias into the seemingly neutral concepts and processes
of death penalty administration.
To test the effects of implicit bias on the death penalty, we
conducted a study on 445 jury eligible citizens in six leading death
penalty states. We found that jury eligible citizens harbored the
two different kinds of implicit racial bias we tested: implicit racial
stereotypes about Blacks and Whites generally, as well as implicit
associations between race and the value of life. We also found that
death qualified jurors, those that expressed a willingness to
consider imposing both a life sentence and a death sentence,
harbored stronger implicit and self-reported (explicit) racial
biases than excluded jurors. The results of the study underscore
the potentially powerful role of implicit bias and suggest that
racial disparities in the modern death penalty could be linked to
the very concepts entrusted to maintain the continued
constitutionality of capital punishment: its retributive core, its
empowerment of juries to express the cultural consensus of local
communities, and the modern regulatory measures that promised
to eliminate arbitrary death sentencing.

2 DEVALUING DEATH 19-Feb-13
CONTENTS
INTRODUCTION ........................................................................................................ 1
II. RACE AND DEATH: STILL INTERTWINED AND STILL LEGAL ............................... 8
A. Race and the Unregulated Death Penalty: From Lynching Mobs to
Furman v. Georgia.............................................................................................. 8
B. Race and the Regulated Death Penalty: From Furman v. Georgia to the
Present. ............................................................................................................. 11
C. Explanations for Continued Racial Disparities ..................................... 17
1. Spatial and Cultural Explanations ............................................................. 18
2. Race and Procedural Discretion: The Role of Prosecutors and Capital
Jurors ............................................................................................................. 21
i. Prosecutorial Charging Decisions .............................................................. 21
ii. Capital Jurors ............................................................................................ 23
3. Structural Explanations ............................................................................. 25
i. Race and Retribution ................................................................................. 25
ii. Death Qualification ................................................................................... 27
III. IMPLICIT RACIAL BIAS AND CRIMINAL JUSTICE .............................................. 30
A. Biased Evaluation of Evidence and Faulty Story Construction ............. 33
B. Stereotype-Driven Decision Alternatives ............................................... 34
C. Biased Classification of Stories into Verdicts ........................................ 35
IV. THE EMPIRICAL STUDY ................................................................................... 37
A. Methods .................................................................................................. 37
1. Participants. ....................................................................................... 37
2. Materials. ............................................................................................ 38
B. Results- Implicit Bias and the Death Penalty......................................... 41
V. SUMMARY OF RESULTS AND IMPLICATIONS ..................................................... 45
A. Building an Implicit Bias Model of Criminal Law ................................. 45

19-Feb-13 LEVINSON, SMITH & YOUNG 3
B. Spatial and Cultural Explanations of Death Penalty Usage ................. 46
C. Discretion Points: Prosecutors and Capital Jurors ............................... 47
D. Racially Partial Impact of Mechanisms Designed to Reduce Impartiality
48
1. Value of Life and the Core Justifications for Capital Punishment ........... 48
2. Death-Qualification .................................................................................. 49
E. Global Challenges to the Constitutionality of the Death Penalty .......... 52
CONCLUSION .......................................................................................................... 54
Table 1. ............................................................................................................. 56
Table 2. ............................................................................................................. 57
Table 3. ............................................................................................................. 58
Appendix A ........................................................................................................... 59


Devaluing Death:
An Empirical Study of Implicit Racial Bias on Jury-Eligible
Citizens in Six Death Penalty States
Justin D. Levinson•, Robert J. Smith
°, & Danielle M. Young
∗
INTRODUCTION
Stark racial disparities define America’s relationship with the death penalty.1
Scholars began documenting these disparities over a hundred years ago,2 and
modern empirical evidence demonstrates their continued existence.3 The most
Copyright © 2013 by Justin D. Levinson, Robert J. Smith, and Danielle M. Young • Professor of Law & Director, Culture and Jury Project, University of Hawai`i at Manoa, William
S. Richardson School of Law. The researchers would like to thank Proteus Action League for
providing grant support. Participants in works-in-progress presentations at George Washington
University, University of Nevada Las Vegas, and University of Hawai`i offered thoughtful
comments and suggestions. Finally, thank you to Tiara Maumau, Lydia Turnier and Seth
Lawrence for superb research assistance. ° Assistant Professor of Law, University of North Carolina at Chapel Hill
∗ Postdoctoral Researcher, Rutgers University Department of Psychology
1 See generally FROM LYNCH MOBS TO THE KILLING STATE: RACE AND THE DEATH PENALTY IN
AMERICA (Charles J. Ogletree, Jr. & Austin Sarat eds., 2006) [hereinafter FROM LYNCH MOBS];
STUART BANNER, THE DEATH PENALTY: AN AMERICAN HISTORY (2002); RANDALL KENNEDY,
RACE, CRIME, AND THE LAW (1997). See also Craig Haney, Condemning the Other in Death
Penalty Trials: Biographical Racism, Structural Mitigation, and the Empathic Divide, 53
DEPAUL L. REV. 1557, 1559 (2004) (stating that “between 1930 and 1982, African Americans
constituted between 10% and 12% of the United States population but 53% of those executed”)
(citing Bureau of Justice Statistics, U.S. Dep’t of Justice, Capital Punishment 1982, Aug. 1984, at
9). 2 Charles J. Ogletree, Jr., Black Man’s Burden: Race and the Death Penalty in America, 81 OR. L.
REV. 15, 18 (2002) (noting that “the racially disproportionate application of the death penalty can
be seen as being in historical continuity with the long and sordid history of lynching in this
country”). 3 See, e.g., DAVID C. BALDUS ET AL., EQUAL JUSTICE AND THE DEATH PENALTY (1990)
[hereinafter BALDUS ET AL., EQUAL JUSTICE]; SAMUEL R. GROSS & ROBERT MAURO, DEATH AND
DISCRIMINATION: RACIAL DISPARITIES IN CAPITAL SENTENCING (1989). See also David C. Baldus
& George Woodworth, Race Discrimination and the Legitimacy of Capital Punishment:
Reflections on the Interaction of Fact and Perception, 53 DEPAUL L. REV. 1411 (2004)
[hereinafter Baldus & Woodworth, Race Discrimination and the Legitimacy of Capital
Punishment]; David C. Baldus & George Woodworth, Race Discrimination in the Administration
of the Death Penalty: An Overview of the Empirical Evidence with Special Emphasis on the Post-
1990 Research, 39 CRIM. L. BULL. 194 (2003) [hereinafter Baldus & Woodworth, Race
Discrimination in the Administration of the Death Penalty]; Thomas J. Keil & Gennaro F. Vito,
Race and the Death Penalty in Kentucky Murder Trials: 1976–1991, 20 AM. J. CRIM. JUST. 1
(1995); U.S. Gen. Accounting Office, Death Penalty Sentencing: Research Indicates Pattern of
Racial Disparities (GAO/GGD- 90-57, 1990).

2 DEVALUING DEATH 19-Feb-13
consistent and robust finding in this literature is that even after controlling for
dozens and sometimes hundreds of case-related variables, Americans who murder
Whites are more likely to receive a death sentence than those who murder
Blacks.4 Though the effects are smaller (and more controversial), a significant
body of research also finds that, in some jurisdictions, Black defendants are
sentenced to death more frequently than White defendants, especially when the
universe of studied cases is narrowed to include only those cases that result in a
capital trial.5
Commentators have scrutinized a range of possible causes for this uneven racial
distribution of death sentences. These possible explanations fit into three broad
categories: 1) spatial and cultural (for example, prosecutors might be more
inclined to pursue capital charges when a non-White community outsider crosses
geographic and social boundaries to commit a crime against a White community
insider;6 2) procedural (for example, prosecutors might disproportionately pursue
4 See John Blume, Theodore Eisenberg and Martin T. Wells, Explaining Death Row’s Population
and Racial Composition, 1 J. EMPIRICAL LEGAL STUD. 165, 167 (2004) (examining the
composition of the death rows in eight states and finding that “[t]he different death sentence rates
for black defendant-black victim cases and black defendant-white victim cases confirm the well-
known race of- victim effect”); Anthony Amsterdam, Symposium on Pursuing Racial Fairness in
Criminal Justice: Twenty Years After McCleskey v. Kemp: Opening Remarks: Race and the Death
Penalty Before and After McCleskey, 39 COLIM. HUMAN RIGHTS L. REV. 34 (2007) (“Most of the
studies find that the race of the victim is the principal determiner of sentence: killers of white
victims are far more likely to be sentenced to death than killers of African-American victims.
Some studies find bias against African-American defendants as well, but this is ordinarily weaker
and is usually masked by the race-of-victim bias because (1) the overwhelming number of killings
committed by African-American perpetrators involve African-American victims; (2) very few
cases are found in which white perpetrators are convicted of killing African-American victims;
and (3) almost no one convicted of killing an African-American victim gets the death sentence.”). 5 See Mona Lynch and Craig Haney, Looking Across the Empathic Divide: Racialized Decision
Making on the Capital Jury, 2011 MICH. ST. L. REV. 573, 577 (2011) (noting “[s]everal recent
studies have documented racial bias against Black defendants, apart from the interactive effect that
the race of defendant has with the race of victim” and indicating that race of defendant bias is
“especially likely to operate in the juries’ penalty phase decision making”). 6 There are several possible explanations important to mention, but not necessary to expound upon
in text. First, prosecutors might face more death penalty related pressure from families of White
victims than Black victims See, e.g., David Baldus & George Woodworth, Race Discrimination
and the Legitimacy of Capital Punishment: Reflections on the Interaction of Fact and Perception,
53 DEPAUL L. REV. 1411, 1449-1450 (2004) [hereinafter Baldus & Woodworth, Legitimacy of
Capital Punishment] (“Support for capital punishment is substantially lower in Black communities
than it is in white communities. Thus, to the extent that prosecutors take into account the views of
the victim's family, the request for a capital prosecution is likely to be higher when the victim is
white. Moreover, because most prosecutors are white, the families of white victims are more likely
to meet with the prosecutor and press their views on the death penalty.”). Second, Black jurors
might be less willing to impose the death penalty, but more likely to reside in areas where Black
homicide victims are located. See Blume et al, supra at n. 4 (explaining “prosecutors are more
likely to seek death sentences when they believe they can obtain them. In urban communities with
a strong minority presence, prosecutors may face juries that are more reluctant to impose the death
penalty, or those communities may select prosecutors who are reluctant to seek the death penalty);

19-Feb-13 LEVINSON, SMITH & YOUNG 3
the death penalty for crimes against White victims; jurors have a difficult time
empathizing with the mitigating evidence presented by Black defendants and,
conversely, victim impact testimony might disproportionately magnify the loss of
White victims compared to non-White victims7); and 3) structural (for example,
the penological justifications for capital punishment—i.e. retribution—might be
inextricably tied to race; death-qualifying jurors might inadvertently racialize
capital trials despite its purpose of promoting impartiality).
No convincing evidence suggests that any one of these factors consistently
accounts for all—or most—of the unjustified racial disparities at play in the
administration of capital punishment. Indeed, these factors appear to matter in
varying degrees across jurisdictions (and, for that matter, over time within the
same jurisdiction). We propose that a unifying current running through each of
these partial plausible explanations is the notion that the human mind can
automatically introduce massive bias into the seemingly neutral concepts and
processes of death penalty administration.
id. at 203 (“African Americans are, in general, more reluctant to impose the death penalty, tend to
murder other African Americans, and tend to commit within-race murders in communities with
substantial African-American populations.”); id. at 203 (“Prosecutors may be reluctant to seek the
death penalty because they expect the jury to be reluctant to impose it. Since this effect should
occur more in communities with larger African-American populations, where most African-
American murders occur, African-American presence on death row should be understated.”). See
also G. Ben Cohen & Robert J. Smith, The Racial Geography of the Federal Death Penalty, 85
WASH. L. REV. 425 (2010) (documenting the tendency for federal prosecutors to seek—and
obtain—death sentences that occurred in counties with high African American populations and
low death sentencing rates, and noting that the change of venire to the federal district court
significantly “whitens” the jury pool). Finally, crimes committed against White victims might
tend to be disproportionately aggravated—and thus death eligible. See Blume, et al., supra at n. 4
(noting that “murders involving multiple victims” and “murders of strangers” are often considered
to be “more deathworthy,” and arguing that Black defendant / white victim cases are stranger
murder scenarios more often than any other race of the defendant / race of the victim
combination). But see id. at 202 n.71 (cautioning against attributing too much explanatory power
to differences in number of victims or stranger status because “murder characteristics [ ] were not
helpful in explaining interstate differences in death row sizes”). Though this phenomenon appears
to explain some of the disparities in the death sentencing of white and Black defendants in white
victim cases, it does nothing to “explain the extraordinarily low death sentence rate in Black
defendant-Black victim cases.” Id. 202. 7 Robert J. Smith & G. Ben Cohen, Choosing Life or Death (Implicitly), in IMPLICIT RACIAL BIAS
ACROSS THE LAW 229 (Justin D. Levinson & Robert J. Smith, eds. 2012). Others suggest that the
dynamic might run in the opposite direction: prosecutors devalue the worth of Black victims. See
Blume et al, supra at note 4 (noting that “[s]ince most Black offenders murder Black victims,
race-based prosecutorial reluctance to seek the death penalty in this category of cases, or of juries
to impose the death penalty, drives the racial imbalance” and providing as possible explanations
that “Black life is valued less highly than white life” or “the white-dominated social structure is
less threatened by Black-victim homicide”).

4 DEVALUING DEATH 19-Feb-13
Few scholars have relied on modern social science methods or evidence to
deconstruct the ways the human mind may unwittingly contribute to racial
disparities in the death penalty.8 This Article begins to fill that gap by considering
racial disparities in capital punishment through the lens of implicit racial bias.
Implicit bias refers to the automatic attitudes and stereotypes that appear in
individuals.9 These biases have been shown to affect a broad range of behaviors
and decisions, and the breadth of knowledge continues to expand.10
Implicit
biases, for example, have been shown to predict the way economic allocations are
made,11
medical treatments are rendered,12
job interviews are offered,13
and more.
Yet knowledge of implicit cognitive processes has yet to be adequately
considered an underlying source of inequity in capital punishment.14
To address
8 Theodore Eisenberg & Sheri Lynn Johnson, Implicit Racial Attitudes of Death Penalty Lawyers,
53 DEPAUL L. REV. 1539 (2004); Justin D. Levinson, Race, Death and the Complicitous Mind, 58
DEPAUL L. REV. 599 (2009); Smith & Cohen, supra note 7. 9 For a summary of implicit bias social science research, see Justin D. Levinson, Danielle K.
Young & Laurie A. Rudman, Implicit Racial Bias: A Social Science Overview, in IMPLICIT
RACIAL BIAS ACROSS THE LAW, supra note 7, at 9 [hereinafter Levinson et al., A Social Science
Overview] (citing John A. Bargh et al., Automaticity of Social Behavior: Direct Effects of Trait
Construct and Stereotype Activation on Action, 71 J. PERSONALITY & SOC. PSYCHOL. 230, 230
(1996); Patricia G. Devine, Stereotypes and Prejudice: Their Automatic and Controlled
Components, 56 J. PERSONALITY & SOC. PSYCHOL. 5, 9 (1989); Jennifer L. Eberhardt et al., Seeing
Black: Race, Crime, and Visual Processing, 87 J. PERSONALITY & SOC. PSYCHOL. 876 (2004);
Daniel T. Gilbert & J. Gregory Hixon, The Trouble of Thinking: Activation and Application of
Stereotypic Beliefs, 60 J. PERSONALITY & SOC. PSYCHOL. 509 (1991); Anthony Greenwald et al.,
Understanding and Using the Implicit Association Test: III. Meta Analysis of Predictive Validity,
97 J. PERSONALITY & SOC. PSYCHOL. 17 (2009)). For a more theoretical perspective underlying
work on implicit bias, see Mahzarin R. Banaji, Implicit Attitudes Can Be Measured, in THE
NATURE OF REMEMBERING: ESSAYS IN HONOR OF ROBERT G. CROWDER 123 (Henry L. Roediger
III et al. eds., 2001); Anthony G. Greenwald & Mahzarin R. Banaji, Implicit Social Cognition:
Attitudes, Self-esteem, and Stereotypes, 102 PSYCHOL. REV. 4 (1995). 10
See Levinson et al., A Social Science Overview, supra note 9. See, e.g., Joshua Correll et al.,
The Police Officer’s Dilemma: Using Ethnicity to Disambiguate Potentially Threatening
Individuals, 83 J. PERSONALITY & SOC. PSYCHOL. 1314 (2002); Joshua Correll et al., Across the
Thin Blue Line: Police Officers and Racial Bias in the Decision to Shoot, 92 J. PERSONALITY &
SOC. PSYCHOL. 1006 (2007); Greenwald, et al., supra note 9. , 11
Laurie A. Rudman & Richard D. Ashmore, Discrimination and the Implicit Association Test, 10
GROUP PROCESSES & INTERGROUP REL. 359 (2007). 12
Alexander R. Green et al., Implicit Bias among Physicians and its Prediction of Thrombolysis
Decisions for Black and White Patients, 22 J. GEN. INTERNAL MED. 1231 (2007). 13
Dan-Olof Rooth, Automatic Associations and Discrimination in Hiring: Real World Evidence
17 LABOUR ECON. 523 (2010); Jens Agerstrom & Dan-Olof Rooth, The Role of Automatic Obesity
Stereotypes in Real Hiring Discrimination, 96 J. APPLIED PSYCHOL. 790 (2011). 14
See Smith & Cohen , supra note 7. Several scholars have suggested that implicit bias plays a
role in death penalty disparities, but have yet to empirically or deeply explore these hypotheses.
See, e.g., Lucy Adams, Comment, Death by Discretion: Who Decides Who Lives and Dies in the
United States of America? 32 AM. J. CRIM. L. 381, 389–90 (2005) (stating that “a white prosecutor
may — consciously or subconsciously — perceive a crime to be more ‘outrageously or wantonly
vile, horrible, or inhuman’ if it is alleged to have been committed against a white victim” (quoting

19-Feb-13 LEVINSON, SMITH & YOUNG 5
this knowledge gap, we conducted an empirical study of jury eligible citizens
from six of the most active death penalty states.15
The results of the study
underscore the potentially powerful role of implicit bias and suggest that racial
disparities in the modern death penalty could be linked to the very concepts
entrusted to maintain the continued constitutionality of capital punishment: its
retributive core, its empowerment of juries to express the cultural consensus of
local communities, and the post-Gregg regulatory measures that promised to
eliminate arbitrary death sentencing.
Empirical research on race and the death penalty outside the context of implicit
bias has been a model of productivity in early empirical legal scholarship. In a
particularly busy period beginning in the early 1970s, researchers investigated
topics spanning from the role of death qualification on the composition of the
jury,16
to the now famous race of victim effects that (over thirty years after they
were first discovered) continue to define the make-up of death rows everywhere.17
Much of this work has relied on modern and sophisticated empirical methods.
Yet empirical work on implicit bias has barely scratched the surface of issues
GA. CODE ANN. § 17-10-30(b)(7) (1994)); Scott W. Howe, The Futile Quest for Racial
Neutrality in Capital Selection and the Eighth Amendment Argument for Abolition Based on
Unconscious Racial Discrimination, 45 WM. & MARY L. REV. 2083, 2094–2106 (2004)
(considering the extreme deference given to prosecutors); Rory K. Little, What Federal
Prosecutors Really Think: The Puzzle of Statistical Race Disparity Versus Specific Guilt, and the
Specter of Timothy McVeigh, 53 DEPAUL L. REV. 1591, 1599–1600 (2004) (addressing
“unconscious race empathy” that white prosecutors may have with white defendants or white
victims); Jeffrey J. Pokorak, Probing the Capital Prosecutor’s Perspective: Race of the
Discretionary Actors, 83 CORNELL L. REV. 1811, 1819 (1998) (alluding to unconscious biases
produced due to similarities between prosecutors and victims); Yoav Sapir, Neither Intent nor
Impact: A Critique of the Racially Based Selective Prosecution Jurisprudence and a Reform
Proposal, 19 HARV. BLACKLETTER L.J. 127, 140–41 (2003) (proposing that it “is likely that
unconscious racism influences a prosecutor even more than it affects others”). 15
Alabama, Arizona, California, Florida, Oklahoma, and Texas. 16
See, e.g., J. Bronson, On the Conviction Proneness and Representativeness of the Death-
Qualified Jury: An Empirical Study of Colorado Veniremen, 12 U. Colo. L. Rev. 1 (1970); J.
Bronson, Does the Exclusion of Scrupled Jurors in Capital Cases Make the Jury More Likely to
Convcit? Some Evidence from California, 3 Woodrow Wilson L.J. 11 (1980); Claudia L. Cowen
et al., Effects of Death Qualification, 8 LAW & HUM. BEHAV. 53 (1984); Robert Fitzgerald &
Phoebe C. Ellsworth, Due Process vs. Crime Control: Death Qualification and Jury Attitudes, 8
LAW & HUM. BEHAV. 31, 46–48 (1984); Craig Haney, On the Selection of Capital Juries: The
Biasing Effects of the Death-Qualification Process, 8 LAW & HUM. BEHAV. 121 (1984); George L.
Jurow, New Data on the Effect of a “Death Qualified Jury” on the Guilt Determination Process,
84 Harv. L. Rev. 567 (1971); William C. Thompson et al., Death Penalty Attitudes and Conviction
Proneness: The Translation of Attitudes into Verdicts, 8 LAW & HUM. BEHAV. 95, 109 (1984). 17
David C. Baldus & James W.L. Cole, Quantitative Proof of Intentional Discrimination,1
EVALUATION QUARTERLY 53 (1977); David C. Baldus et al., Identifying Comparatively Excessive
Sentences of Death: A Quantitative Approach, 33 STAN. L. REV. 1 (1980); David C. Baldus et al.,
Comparative Review of Death Sentences: An Empirical Study of the Georgia Experience, 74 J.
CRIM. LAW & CRIMINOLOGY 661 (1983); BALDUS ET AL., EQUAL JUSTICE, supra note 3.

6 DEVALUING DEATH 19-Feb-13
related to race and the death penalty.18
In an effort to begin an empirical
consideration of implicit bias in the death penalty, we designed a study that
examined the role of implicit bias in a broad range of jury eligible citizens in six
leading death penalty states. Our study pursued a range of hypotheses relevant to
racial bias and the death penalty, including: (1) do jury eligible citizens in death
penalty states harbor implicit racial stereotypes, such as stereotypes that Blacks
are aggressive, lazy, and worthless, and Whites are virtuous, hard-working, and
valuable; (2) do death qualified jurors hold stronger implicit and explicit racial
biases than non-death qualified jurors; and (3) do implicit and explicit biases
predict death penalty decision-making depending upon the race of the defendant
and the victim.
We hypothesized that capital jurors possess implicit racial biases both as to
traditional racial stereotypes as well as moral stereotypes related to the value of
human life (specifically, that White people are more valuable than Black people).
We also predicted that death qualification, a legal process designed to provide
fairness in the administration of the death penalty, actually functions to remove
the least racially biased jurors from juries. And finally, we hypothesized that
jurors’ implicit biases would help predict their ultimate life and death decisions.
Results of the study confirmed several of our hypotheses. To begin with, we
found, as expected, that jury eligible citizens harbored the two different kinds of
implicit racial bias we tested: implicit racial stereotypes about Blacks and Whites
generally, as well as implicit associations between race and the value of life
(using a measure we designed called the “Value of Life IAT”19
). In addition, we
18
See Eisenberg & Johnson, supra note 8. In Eisenberg and Johnson’s study, the researchers
tested whether a sample of capital defense attorneys held implicit racial bias, as employed by (a
paper and pencil version of) the IAT. They found that the attorneys, a group that one would
expect to resist such biases, harbored similar biases to the rest of the population. Id. at 1556. 19
IAT stands for Implicit Association Test. The IAT:
pairs an attitude object (such as a racial group) with an evaluative dimension
(good or bad) and tests how response accuracy and speed indicate implicit and
automatic attitudes and stereotypes. Participants sit at a computer and are
asked to pair an attitude object (for example, Black or white, man or woman;
fat or thin) with either an evaluative dimension (for example, good or bad) or
an attribute dimension (for example, home or career, science or arts) by
pressing a response key as quickly as they can. For example, in one task,
participants are told to quickly pair together pictures of African-American faces
with positive words from the evaluative dimension. In a second task,
participants are obliged to pair African-American faces with negative words.
The difference in the speed at which the participants can perform the two tasks
is interpreted as the strength of the attitude (or in the case of attributes, the
strength of the stereotype). For example, if participants perform the first task
faster than the second task, they are showing implicitly positive attitudes
toward Blacks. Similarly, if they are faster to perform tasks that oblige

19-Feb-13 LEVINSON, SMITH & YOUNG 7
found, as predicted, that death qualified jurors harbored stronger racial biases than
excluded jurors;20
these differences in racial bias levels were revealed on both
implicit and self-reported (explicit) measures. Turning to the mock trial scenario
we conducted, although our overall results did not replicate the known racial
effects on ultimate life and death decisions, results of the study showed that
implicit racial bias predicted race of defendant effects.21
That is, the more the
mock jurors showed implicit bias that related to race and the value of human life,
the more likely they were to convict a Black defendant relative to a White
defendant. In addition we found that self-reported (explicit) racial bias predicted
death decisions based on the race of the victim.
This Article considers what an implicit bias examination can contribute to the
discussion of racial disparities and capital punishment and presents the empirical
study we conducted to test our hypotheses. The Article is organized as follows:
Section II frames the issue by presenting the historical and constitutional problem.
It considers the history of race in the death penalty, and specifically focuses on
the modern prevalence of race of victim effects and the constitutional challenges
surrounding racial inequalities in capital punishment. Section III introduces
implicit bias to the capital context. It briefly summarizes empirical implicit bias
scholarship in the criminal justice realm, proposes an implicit bias model of jury
decision-making that could be relevant both to non-capital and capital cases, and
presents a theory that attempts to deconstruct the role of implicit bias in capital
cases. Section IV details the empirical study. It begins by describing the methods
and materials of the experiment, which was conducted in six leading death
penalty states, and concludes by presenting the results. Among other things, the
results of the study found that death qualified jurors are more racially biased (both
implicitly and explicitly) than non-death qualified jurors and also that both
implicit and explicit biases can play a role in the ultimate decision of whether a
defendant lives or dies. Section V considers the implications of the study from
multiple perspectives and contextualizes the results both in legal scholarship and
in terms of constitutional jurisprudence. We conclude with a brief examination of
future pathways for identifying and assessing the locations where racial disparities
continue to plague the administration of the death penalty.
categorizing women with home than tasks that oblige categorizing women with
career, they are showing implicit sex stereotyping.
Levinson et al., A Social Science Overview, supra note 9 at 16-17. 20
These jurors would be excluded because they would not be willing to convict when death was a
possible penalty or to impose the death penalty after a conviction. 21
See supra notes 199-200 and accompanying text.
8 DEVALUING DEATH 19-Feb-13
II. RACE AND DEATH: STILL INTERTWINED AND STILL LEGAL
The close connection between race and the death penalty has deep historical and
cultural roots that have been considered by both the Supreme Court and by legal
scholars for generations. This section begins with a brief sketch of the historical
relationship between race and the death penalty in the period before Furman v.
Georgia,22
the 1972 decision that ended the pre-modern death penalty in America.
It then details the doctrinal structure used to regulate capital punishment since
Furman. Next, it considers where unjustified racial disparities enter into the
administration of capital punishment and examines both how scholars have
understood why such disparities persist as well as offers new perspectives that
may further illuminate America’s continuing cultural and legal struggles with race
and death.
A. Race and the Unregulated Death Penalty: From Lynching Mobs to
Furman v. Georgia
Race and capital punishment share a long, intertwined history in the United
States. Pre-Civil War states formally set the punishment for some crimes at death
when committed by a Black man and a lesser sentence when committed by a
White man. 23
These states also labeled some crimes as death-eligible (or not)
based on whether the victim was White or Black.24
Formal discrimination faded
eventually, but the fear of freed Black men escalated across the South (and, as
Black Americans moved North and West, outside of the South, too). This fear
dovetailed with the argument that the death penalty was a necessary tool for
maintaining social order, especially against the threat of Blacks. For example, in
1927, the Governor of Arkansas, addressing “one of the South’s most serious
problems,” i.e., “the negro question,”25
argued that because Blacks were “still
quite primitive, and in general culture and advancement in a childish state of
progress, [i]f the death penalty were to be removed from our statute books, the
22
408 U.S. 238 (1972). 23
See Amsterdam, supra note 4 (“Prior to the Civil War, all Southern States provided by law that
slaves - and sometimes free Negroes as well - should be sentenced to death for crimes punishable
by lesser penalties when whites committed them. After the War ended slavery, formal legal
discrimination against free Negroes and Mulattoes was perpetuated by the Black Codes; African-
Americans continued to be punished by death for crimes with lesser punishments for whites.”). 24
Id. 25
See BANNER, supra note 1 at 228.

19-Feb-13 LEVINSON, SMITH & YOUNG 9
tendency to commit deeds of violence would be heightened [because] the greater
number of the race do not maintain the same ideals as the Whites.”26
Other commentators proposed expansion—or at least opposed abolition—of
capital punishment on the grounds the death penalty served as a structurally
manageable alternative to lynching.27
The general argument was that
“southerners’ strong desire to exact retribution for crime would result in even
more lynching,”28
unless the death penalty remained intact.29
The following
excerpt from an editorial in a Shreveport, Louisiana newspaper in 1914 illustrates
the thrust of the idea:
There are “suggestions from some of the newspapers of the State
that Louisiana follow the lead of a few other States and abolish the
death penalty,” but “[w]ould not one result be to increase the
number of lynchings? Would the murderer be permitted to reach
State prison in safety from the vengeance of an outraged
citizenship . . .?”30
Beginning in the 1920s, the Supreme Court poked around the edges of state
capital statues by intervening in truly abhorrent death penalty cases where Black
26
Id. 27
Id. at 228 (“Southern whites turned toward alternative forms of racial subjugation, and one of
those was the death penalty. That capital punishment was necessary to restrain a primitive,
animalistic Black population became an article of faith among white southerners that persisted
well into the twentieth century.”). 28
Id. at 229. 29
Id.; see also Furman, 408 U.S. at 303 (Brennan, J., concurring) (rejecting the claim that capital
punishment is constitutional because it “satisfies the popular demand for grievous condemnation
of abhorrent crimes and thus prevents disorder, lynching, and attempts by private citizens to take
the law into their own hand”) G. Ben Cohen, The Racial Geography of Retribution, 10 OHIO ST. J.
CRIM. L. 65, 87 (2012) (“[T]he broad correlation between counties with high death sentencing
rates today and counties that had multiple lynchings in the early 1900s justifies specific inquiry.”);
id. (citing Carol S. Steiker and Jordan M. Steiker, Centennial Symposium: A Century Of Criminal
Justice: I. Crimes And Punishment: Capital Punishment: A Century Of Discontinuous Debate
Summer, 100 J. CRIM. L. & CRIMINOLOGY 643, 646-662 (2010) (labeling “the death penalty as a
necessary antidote to lynching”)); id. (noting that “[s]upporters of capital punishment urged that
the maintenance of the death penalty was a necessary antidote to lynching; indeed, it may well be
that some who might otherwise have opposed the death penalty came reluctantly to support it as a
lesser evil, given that the anti-lynching voices tended to come from the more politically
progressive members of communities in which lynching was most prevalent”). 30
Cohen, supra note 29, at 94 (citing Editorial, The Shreveport Times, April 13, 1914). Other
commentators suggest expanding the death penalty based on the need to control freed Blacks. See
BANNER, supra note 1 (“Virginia chemist and farmer Edmund Ruffin complained that the free
slaves were committing so many crimes that “burglary, robbery and arson ought to be again
punished by death.”).

10 DEVALUING DEATH 19-Feb-13
defendants received visible shoddy justice—31
cases that legal historian Michael
Klarman has labeled variously as “Jim Crow at its worst,”32
“legal lynching,”33
and “sentences designed to appease an angry mob.”34
By the 1960s, the problem
of racially disparate death penalty schemes had bubbled to the surface. The South
was the center of gravity for these observed disparities, and nowhere was the
impact greater than in the application of the death penalty to the crime of rape: all
but two of the eighteen jurisdictions that still punished rape capitally in 1953 were
Southern jurisdictions and greater than 90% of Americans executed for rape in the
eight preceding decades had been Black Americans.35
Indeed, the improper
influence of race on the administration of the death penalty contributed to the
United States Supreme Court halting death sentencing nationally in 1972. In
Furman v. Georgia, the Supreme Court struck down Georgia and Texas death
penalty statutes and placed a de facto prohibition on all then existing capital
sentencing schemes.36
The concurring opinions of Justice Douglas and Justice
Marshall highlighted the racially unequal application of the death penalty among
the races.37
Justice Douglas cited to the final report of Lyndon Johnson’s
President’s Commission on Law Enforcement and the Administration of Criminal
Justice, which concluded that “[t]he death sentence is disproportionately imposed
and carried out on the poor, the Negro, and the members of unpopular groups.”38
Justice Douglas also cited to a comprehensive study of the Texas death penalty
31
BANNER, supra note 1 at 215 (“the Court had intervened in a series of Southern cases in which
violence and intimidation had produced death sentences that it regarded as a travesty of justice”);
id. (listing, inter alia, Moore v. Demspey—overturning convictions against six Black men where
their confessions were produced by torture—, Powell v Alabama and Norris v. Alabama—
reversing the convictions of the Scottsboro boys, who were Black men convicted of raping two
white woman and tried in a trial that reflected mob-rule rather than the rule of law—, and Patton v.
Mississippi—reversing conviction where all white jury imposed a death sentence against a Black
defendant in a jury with a 1/3 Black American population). 32
Michael Karlman, Scottsboro, 93 MARQ. L. REV. 379, 422 and 426 (2009). 33
Id. at 393 (quoting DAN T. CARTER, SCOTTSBORO: A TRAGEDY OF THE AMERICAN SOUTH 160
(rev. ed. 1979). 34
Id. at 382 (“Some jurisdictions actually enacted laws deisgned to prevent lynchings by
providing for special terms of court to convene within days of alleged rapes and other incendiary
crimes. In many instances, law enforcement officers explicitly promised would-be lynch mobs
that black defendants would be quickly tried and executed if the mob desisted, and prosecutors
appealed to juries to convict in order to reward mobs for good behavior and thus encourage similar
restraint in the future.”). 35
See Donnald H. Partington, The Incidence of the Death Penalty for Rape in Virginia, 22 WASH.
& LEE L. REV. 43, 53 (“The execution statistics show that the total number of executions for rape
in the states imposing the death penalty during all or some of the period, was 444; of these, 399
were Negroes . . ..”). 36
Furman v. Georgia, supra note 22 at 239-40. 37
Id. at 251, 364 (“The Negro convicted of rape is far more likely to get the death penalty than a
term sentence . . ..” and “It is immediately apparent that Negroes were executed far more often
than whites in proportion to their percentage of the population.”). 38
Id. at 251.

19-Feb-13 LEVINSON, SMITH & YOUNG 11
from 1924-1968, which found “several instances where a White and a Negro were
co-defendants, the White was sentenced to life imprisonment or a term of years,
and the Negro was given the death penalty” and that “[t]he Negro convicted of
rape is far more likely to get the death penalty than a term sentence, whereas
Whites and Latins are far more likely to get a term sentence than the death
penalty.”39
In his concurring opinion, Justice Marshall added that it becomes “immediately
apparent [from historical execution statistics] that Negroes were executed far
more often than whites in proportion to their percentage of the population.”40
Marshall continued: “Studies indicate that while the higher rate of execution
among Negroes is partially due to a higher rate of crime, there is evidence of
racial discrimination.”41
After considering the arguments put forward by Douglas
and Marshall, Justice Stewart wrote, “[m]y concurring Brothers have
demonstrated that, if any basis can be discerned for the selection of these few to
be sentenced to die, it is the constitutionally impermissible basis of race.”42
Nonetheless, Stewart concluded that “racial discrimination has not been proved,”
and thus he “put it to one side.”43
The Furman court simply held in a one
paragraph per curiam opinion that “the imposition and carrying out of the death
penalty in these cases constitute cruel and unusual punishment in violation of the
Eighth and Fourteenth Amendments,” which left the death penalty temporarily
suspended, but with an implicit invitation for reform.44
B. Race and the Regulated Death Penalty: From Furman v. Georgia
to the Present.
In the years immediately following Furman, state legislatures wasted no time in
recalibrating and reenacting death penalty schemes that would withstand
constitutional scrutiny.45
Just four years after Furman, the Court gave its blessing
to capital punishment in the 1976 case of Gregg v. Georgia,46
noting that statutes
like the newly minted Georgia statute contain procedural safeguards that help
39
Id. at 250-251. 40
Id. at 364 (Marshall, J., concurring). 41
Id. 42
Furman v. Georgia supra note 22 at 310 (Stewart, J., concurring). 43
Id. 44
Id. at 240. 45
See Gregg v. Georgia, 428 U.S. 153, 179-180 (1976) (“The most marked indication of society's
endorsement of the death penalty for murder is the legislative response to Furman. The
legislatures of at least 35 States have enacted new statutes that provide for the death penalty for at
least some crimes that result in the death of another person.”). 46
428 U.S. 153 (1976).

12 DEVALUING DEATH 19-Feb-13
guard against arbitrary or discriminatory imposition of the death penalty.47
The
Court noted that some of the procedural safeguards that Georgia adopted were
aimed at stamping out racial arbitrariness: they included a “questionnaire [for trial
judges to complete with] six questions designed to disclose whether race played a
role in the case” and a “provision for appellate review,” which included a
requirement that the Georgia Supreme Court explicitly decide “[w]hether the
sentence of death was imposed under the influence of passion, prejudice, or any
other arbitrary factor.”48
The Gregg Court, then, did not eschew the importance of
a race-neutral death penalty, but rather it placed its faith in the ability of the
revised sentencing statutes to eliminate the importance of race in deciding who
lives and who dies.
The Court’s conclusion in Gregg that sufficient procedural regulation could stamp
out racial and other arbitrariness from capital sentencing has been a source of
great skepticism.49
The biggest post-Gregg race-based systemic challenge to the
modern death penalty came in the 1987 case of McCleskey v. Kemp.50
Warren
McCleskey, a Black man, had been convicted and sentenced to death in Georgia
for the murder of a White police officer.51
McCleskey urged the Supreme Court
to reverse his death sentence due to the influence of racial arbitrariness in the
administration of the Georgia death-sentencing scheme.52
To support this
proposition, McClesksey introduced the results of two large-scale statistical
studies of more than 2,000 Georgia capital cases.53
These studies, known
collectively as “the Baldus study,” demonstrated that a capital defendant who
47
Id. at 180 (explaining how “recently adopted statutes have attempted to address the concerns
expressed by the Court in Furman primarily [] by specifying the factors to be weighed and the
procedures to be followed in deciding when to impose a capital sentence”). 48
Id. at 211-212. Though many states passed statutes that contained safeguards similar to those
enacted in Georgia, states did—and do—tend to give them perfunctory treatment. See e.g. See
Leigh B. Bienen, The Proportionality Review of Capital Cases by State High Courts After Gregg:
Only “The Appearance of Justice,” 87 J. CRIM. L. & CRIMINOLOGY 130, 140 (1996) (noting
that more than 30 states passed similar safeguards, but that most of these states either perform
perfunctory review or else have repealed proportionality / arbitrariness review altogether). 49
See, e.g., Carol Steiker and Jordan Steiker, Sober Second Thoughts: Reflections on Two
Decades of Constitutional Regulation of Capital Punishment," 109 HARV. L. REV. 355 (1995)
(describing the Court’s then twenty year old Gregg experiment and concluding that procedural
regulation failed to satisfy its Eighth Amendment objectives). 50
McCleskey v. Kemp, 481 U.S. 279 (1987). 51
Id. at 283 (noting the race of both McCleskey and the police officer). 52
Id. at 291 (“[McCleskey] argues that race has infected the administration of Georgia's statute in
two ways: persons who murder whites are more likely to be sentenced to death than persons who
murder blacks, and black murderers are more likely to be sentenced to death than white murderers.
As a black defendant who killed a white victim, McCleskey claims that the Baldus study
demonstrates that he was discriminated against because of his race and because of the race of his
victim.”). 53
Id. at 286-287.

19-Feb-13 LEVINSON, SMITH & YOUNG 13
killed a White victim was more than four times as likely to be sentenced to death
than a capital defendant who murdered a Black victim.54
The study also
considered the likelihood of a death sentence given the various race of the
defendant / race of the victim combinations. It found that the death penalty was
imposed in “22% of the cases involving Black defendants and White victims; 8%
of the cases involving White defendants and White victims; 1% of the cases
involving Black defendants and Black victims; and 3% of the cases involving
White defendants and Black victims.”55
The Baldus study demonstrated (as
Justice Brennan explained) that “[o]f the more than 200 variables potentially
relevant to a sentencing decision, race of the victim [was] a powerful explanation
for variation in death sentence rates—as powerful as nonracial aggravating factors
such as a prior murder conviction or acting as the principal planner of the
homicide.”56
McCleskey used the findings of the Baldus study to support his racial arbitrariness
claim on two main grounds. First, McCleksley argued that the results of the
statistical studies sufficed to raise an inference of purposeful discrimination,
which, unless rebutted by Georgia, is enough to violate the Equal Protection
clause.57
Second, he argued that the study demonstrated a constitutionally
intolerable risk under the Eighth Amendment that racial bias infected the Georgia
death-sentencing scheme and thus McClesksey could not be guaranteed that he
received a death sentence based on rationally and consistently applied non-racial
factors.58
The Court rejected McCleskey’s challenge on a variety of grounds. First, it
rejected the Equal Protection challenge, finding “the Baldus study [to be] clearly
insufficient to support an inference that any of the decisionmakers in McCleskey's
case acted with discriminatory purpose.”59
The Court explained “the application
of an inference drawn from the general statistics to a specific decision in a trial
and sentencing simply is not comparable to the application of an inference drawn
from general statistics [in other settings such as petit jury composition or
employment discrimination cases where such inferences are permitted].”60
It
reasoned that the death penalty was a genre particularly unsuited for this type of
statistical inference because in the capital context each capital jury “is unique in
54
Id. 55
Id. 56
McCleskey v. Kemp, 481 U.S. at 326 (Brennan, J., dissenting). 57
Id. at 291 58
Id. at 299. 59
Id. at 297. 60
Id. at 294-295.

14 DEVALUING DEATH 19-Feb-13
its composition,” is “selected from a properly constituted venire” and renders a
final decision that “rest[s] on consideration of innumerable factors that vary
according to the characteristics of the individual defendant and the facts of the
particular capital offense.”61
After noting its own “unceasing efforts to eradicate
racial prejudice from our criminal justice system,”62
the Court characterized the
Baldus study as “at most . . . indicat[ing] a discrepancy that appears to correlate
with race,”63
“decline[d] to assume that what is unexplained is invidious,”64
and
“h[e]ld that the Baldus study does not demonstrate a constitutionally significant
risk of racial bias affecting the Georgia capital sentencing process.”65
Finally, the
Court worried that if it “accepted McCleskey's claim that racial bias has
impermissibly tainted the capital sentencing decision, we could soon be faced
with similar claims as to other types of penalty.”66
This fear, Justice Brennan
quipped in his dissent, is best labeled “a fear of too much justice.”67
The discouragement from the McCleskey Court has not stopped researchers from
documenting continued racial arbitrariness in the administration of capital
sentencing schemes.68
Indeed, a host of empirical studies measuring race of the
defendant effects, race of the victim effects, or both, have been published since
McCleskey.69
Most of the post-McCleskey studies that report unjustified racial
61
Id. 62
McCleskey v. Kemp, 481 U.S. at 309. 63
Id. at 313. 64
Id. 65
Id. 66
Id. at 315. 67
Id. at 339 (Brennan, J., dissenting). 68
See, e.g., infra at notes 82-87; Lynch and Haney, supra note 5 at 576 (noting that “numerous
scholars have used regression analysis to document the influence of race (particularly victim race)
on death penalty decision making in a number of other states [besides Georgia], including
California, Florida, Illinois, Maryland, Mississippi, Missouri, Nebraska, New Jersey, North
Carolina, and South Carolina”). 69
Id.; see, e.g., Samuel R. Gross and Robert Mauro, Patterns of Death: An Analysis of Racial
Disparities in Capital Sentencing and Homicide Victimization, 37 STAN. L. REV. 27, 106 (1984)
(finding “remarkably stable and consistent” race of the victim effects “in the imposition of the
death penalty under post-Furman statutes in the eight states [that the authors] examined” and
explaining that the “legitimate sentencing variables that we considered could not explain these
disparities, whether we controlled for these variables one at a time, organized them into a scale of
aggravation, or used multiple regression analysis”). But see David C. Baldus, George Woodworth,
David Zuckerman, Neil Alan Weiner, Barbara Broffitt, Racial Discrimination and the Death
Penalty in the Post-Furman Era: An Empirical and Legal Overview, With Recent Findings from
Philadelphia, 83 CORNELL L. REV. 1638, 1676-1760 (1998) (finding that Black defendants who
committed mid-range capital crimes were four times more likely to receive a sentence of death
than white defendants that committed similarly aggravated crimes, even after adjusting for case-
related factors); Jennifer L. Eberhardt et al., Looking Deathworthy: Perceived Stereotypicality of
Black Defendants Predicts Capital-Sentencing Outcomes, 17 PSYCHOL. SCI. 383, 386 (2006)
(finding that the degree with which the offenders in the Philadelphia dataset possess

19-Feb-13 LEVINSON, SMITH & YOUNG 15
disparities in the imposition of the death penalty have found that the influence of
racial bias centers on the race of the victim rather than on the race of the
defendant.70
In other words, the death penalty is imposed disproportionately often
for the homicide of White victims. This effect is particularly stark—as it was in
the Baldus studies presented in McCleskey71
—when the victim is White and the
defendant is Black.72
The evidence comes from death penalty jurisdictions across the country. For
example, a study of death-eligible homicide cases from 1990-2005 in southwest
Arkansas found “large and highly statistically significant” death-sentencing
disparities in Black-defendant / White-victim cases.73
Indeed, in the two Arkansas
judicial circuits included in the study, the only death-eligible cases (n=63) to
result in a death sentence involved Black defendants and White victims.74
A 2010
review of 1,100 death-eligible homicides that occurred in East Baton Rouge,
Louisiana over a twenty-eight year period similarly found that though Blacks
constitute four-fifths of homicide victims in East Baton Rouge, over half of the
cases in which a death sentence was obtained involved a White victim.75
A 2010
study that examined more than 15,000 homicide cases across a quarter-century
span found that killing a White person in North Carolina is associated with a
threefold increase in the likelihood of receiving a death sentence over killing a
stereotypically Afrocentric facial features predicts death-sentencing). The reason why race of the
victim effects are not found in this study is because the then-district attorney of Philadelphia, Lynn
Abrahams, prosecuted nearly every case capitally if it was death-eligible. This also provides some
support for the idea that charging practices—more than jury determinations—drive race of the
victim effects. Regarding the lack of consistent findings of race of defendants, Justin Levinson
has argued that this inconsistency may actually cover up true race of defendant disparities. In a
theory called “Racial Bias Masking Hypothesis,” Levinson argued that the construction of the case
facts used by empirical researchers themselves may have been automatically skewed (by implicit
bias) in such a way as to wash away race of defendant effects. See Levinson, Race, Death, and the
Complicitous Mind, supra note 8. Relying on research beginning with classic social psychology
experiments on how stories are told and retold, Levinson claimed that when researchers attempted
to compare like crimes by white and Black defendants, they may have actually been comparing
defendants who had, in actuality, committed different severities of crimes (Whites more severe
than Blacks). See Id. at 603 (citing GORDON W. ALPORT & LEO J. POSTMAN, THE PSYCHOLOGY
OF RUMOR (1947)). 70
See, e.g., Gross & Mauro, Patterns of Death, supra note 69. 71
McCleskey, 481 U.S. at 286-287. 72
See, e.g., infra at notes 82-87. 73
David C. Baldus, Julie Brain, Neil A. Weiner, George Woodworth, Evidence of Racial
Discrimination in the Use of the Death Penalty: A Story from Southwest Arkansas (1990-2005)
with Special Reference to the Case of Death Row Inmate Frank Williams, Jr., 76 TENN. L. REV.
555, 573 (2009). 74
Id. at 586. 75
Glenn L. Pierce & Michael L. Radelet, Death Sentencing in East Baton Rouge Parish, 1990–
2008, 71 LA. L. REV. 647 (2011).

16 DEVALUING DEATH 19-Feb-13
Black person.76
These race of the victim disparities persist at the federal level,
too: a 2000 study conducted by the United States Department of Justice found that
local United States Attorneys sought authorization from the Attorney General to
pursue a federal capital prosecution twice as often when the victim was non-Black
than when the victim was Black.77
Similarly, a 2011 study found statistically
significant race of the victim effects in the context of the military death penalty.78
These differences could not “be explained by legitimate case characteristics or the
effects of chance in a race-neutral system.”79
These studies demonstrate that the
race of the victim effects first demonstrated in McCleskey have been consistently
replicated across many jurisdictions by a number of researchers over thirty years.
Researchers also find race of the defendant effects, though these effects are more
modest today than they were forty years ago.80
The decreased disparities probably
stem from restricting the death penalty to homicide offenses. More specifically,
first a decrease in capital rape prosecutions, and then the Court’s decision in
Coker v. Georgia81
to ban the death penalty for the rape of an adult woman, led to
a decrease in race of defendant disparities because capital rape convictions
constituted the largest source of such disparities.82
The decreased defendant-based
disparities—and indeed the lack of statistically significant findings in most studies
that focus on all death-eligible homicides in a jurisdiction—also are explained, at
least in part, by the fact that race of the defendant discrimination appears mostly
to play out during the penalty phase of a capital trial and not at the stage where
prosecutors decide whether to pursue a case capitally.83
The charging stage is a far
more important sorting tool in the modern era than are capital trials because the
vast majority of homicide cases (even those that are death-eligible) do not proceed
76
Michael L. Radelet & Glenn L. Pierce, Race and Death Sentencing in North Carolina 1980–
2007, 89 N.C. L. REV. (2011). 77
U.S. DEP’T OF JUSTICE, THE FEDERAL DEATH PENALTY SYSTEM: A STATISTICAL
SURVEY (1988–2000) (Sept. 12, 2000), available at
http://www.justice.gov/dag/pubdoc/dpsurvey.html. 78
David C. Baldus et al., Racial Discrimination in the Administration of the Death Penalty: The
Experience of the United States Armed Forces (1984-2005), 101 J. CRIM. L. & CRIMINOLOGY
1227, 1266 (2012). 79
Id. 80
See id. at 1273 n.144 (finding race of the defendant effects in Philadelphia capital cases from
1983-1993); Scott Phillips, Continued Racial Disparities in the Capital of Capital Punishment:
The Rosenthal Era, 50 HOUSTON L. REV. 131 (2012) (finding race of the defendant effects in
Harris County, Texas). 81
433 U.S. 584 (1977). 82
BANNER, supra at 1. 83
Lynch & Haney, supra at note 5 (“The intriguing finding that the race of victim appears to be an
important factor-consciously or not-for prosecutors with the power to seek a death sentence, but
that juries appear to be more influenced by defendant characteristics can be explained by the
context in which both groups-prosecutors and jurors-operate.”).

19-Feb-13 LEVINSON, SMITH & YOUNG 17
to a capital trial.84
Professors Lynch and Haney hypothesize that one normally
does not find significant race of defendant effects until the jury-decision making
stage because (at least from the point of view of a prosecutor) the pre-trial stage is
more likely to focus on the victim of the crime whereas the penalty phase of a
capital trial is centered on the defendant.85
Regardless of whether race of victim
and race of defendant effects persist in equal proportions, the broader point is that
the Court’s Eighth Amendment regulatory framework appears to have failed in
practice to eliminate unjustified racial disparities from the administration of
capital punishment.
C. Explanations for Continued Racial Disparities
In light of the massive disparities in the administration of the death penalty,
present and past, there has been no shortage of scholarly attempts to deconstruct
the reasons behind this continuing and disturbing trend. This section addresses
why racial disparities persist, both by considering legal commentators’ work, as
well as by proposing new implicit bias-based explanations. We sketch three
categories of explanations that scholars have advanced to explain racial disparities
in capital sentencing. The first category is a spatial and cultural explanation:
jurisdictions that sentence people to death regularly tend to possess a core lower-
status minority group population (“outsiders”) and a thick ring of higher-status
White citizens (“spatial”), and also tend be more “parochial,” which results in the
community punishing most harshly crimes committed by lower-status outsiders
against higher status insiders (“cultural”).86
The second category, which is
procedural, has three component parts. First, it questions whether the death-
qualification, a central tenet in death penalty jurisprudence that was enacted for
the purpose of eradicating impartiality, has the unintended consequences of
increasing unjustified racial disparities. It also includes two descriptions of the
stages where racial factors can enter into capital punishment process. The most
important stage involves prosecutorial charging decisions. The other important
84
Felongy Defendants, BUREAU OF JUSTICE STATISTICS,
http://bjs.ojp.usdoj.gov/index.cfm?ty=tp&tid=231 (last visited Feb. 14, 2013). 85
Lynch & Haney, supra note 5 at 586 (“The intriguing finding that the race of victim appears to
be an important factor-consciously or not-for prosecutors with the power to seek a death sentence,
but that juries appear to be more influenced by defendant characteristics can be explained by the
context in which both groups-prosecutors and jurors-operate.”); id. (“The prosecutor's staff
(attorneys, investigators, victim-witness staff) is much more likely to interact with and focus on
the victim's family, particularly in the early stages of case processing, so differential empathic
bonds may be formed as a function of race (among other influences).”). 86
James Liebman and Peter Clark, David H. Bodiker Lecture of Criminal Justice: Minority
Practice, Majority's Burden: The Death Penalty Today, 9 OHIO ST. J. CRIM. L. 255, 288 (2012)
(“Parochialism helps explain . . . why insular communities demand extra punishment, especially
death, for cross-culture crim.”).
18 DEVALUING DEATH 19-Feb-13
stage is when jurors consider whether to impose a death sentence. This latter stage
has racial implications for multiple reasons: when jurors consider aggravating
factors, such as whether the defendant committed a murder that was “heinous,
atrocious and cruel,” the amorphous nature of the inquiry as compared to an
ordinary question of fact (e.g. did the defendant fire this weapon) increases the
opportunity for racial bias to operate;87
jurors consider mitigating evidence in
different ways depending on the race of the defendant;88
and jurors weigh victim
impact testimony differently based on the race of the victim.89
The third category
is a structural one, focusing on a core justification for capital punishment—
retribution—and asking whether it is hopelessly intertwined with race.
1. Spatial and Cultural Explanations
Jurors empanelled in state capital trials are culled from the county in which the
homicide occurred.90
This section explores how the spatial and cultural realities of
this process influences the types of crime for which the death penalty is sought
and obtained. The counties that regularly return death sentences tend to possess a
peculiar geography: a heavily minority populated urban core surrounded by a
thick ring of heavily White populated suburbs.91
The federal jurisdictions that
return the most death sentences follow a similar pattern: the counties where the
homicide occurred are often counties where a majority of the population are
minority group members, but jurors are culled from all of the counties in the
federal district, and the counties surrounding the county of offense tend to be very
heavily White.92
Political scientists Joe Soss and his colleagues argue that the spatial distribution of
Black and White Americans in a jurisdiction matters tremendously because
“individuals with similar characteristics can be expected to respond differently to
this issue depending on their surrounding social environments.”93
Support for the
87
Robert J. Smith & G. Ben Cohen, Choosing Life or Death (Implicitly), in IMPLICIT RACIAL BIAS
ACROSS THE LAW, supra note 7, at 236. 88
Id. at 236, 236-40. 89
Id. at 236, 240-43. 90
G. Ben Cohen & Robert J. Smith, supra note 6 at 432 (explaining that the jury lottery system is
based on county). 91
Robert J. Smith & G. Ben Cohen, supra note 7. at 272 (offering, for example, “Baltimore
County, Maryland-the predominantly white, suburban donut that encircles the majority African-
American Baltimore City”). 92
G. Ben Cohen & Robert J. Smith, supra note 6 at 437 (“[W]hat is striking about these
jurisdictions is that the county of the offense generally has a high percentage of blacks, but is
located within federal districts which are heavily white.”). 93
Joe Soss, Laura Langbein & Alan R. Metelko, Why Do White Americans Support the Death
Penalty?, 65 J. OF POLITICS 397, 414 (2003).

19-Feb-13 LEVINSON, SMITH & YOUNG 19
death penalty fluctuates among White Americans depending on whether they
possess high or low anti-Black prejudice and on their residential proximity to
Black Americans.94
Explicit racial bias is a strong predictor of death penalty
support for White Americans generally, but the predictive quality varies
depending on the racial demographics of a particular location.95
White Americans
with high explicit anti-Black prejudice show increased support for capital
punishment when moving from an all-White county to a county with at least a
20% Black population.96
Indeed the predicative value of explicit racial prejudice
and death penalty support “more than double[s]” for White Americans that live in
“more integrated”—as opposed to all White—counties.97
This appears to be (at
least in part) a function of increased self-reporting of explicit racial bias: among
Americans residing in counties with a 20%, or greater, Black population, explicit
anti-Black prejudice is “staggering[ly]” higher than in all White counties.98
Liebman and Clark posit that the handful of jurisdictions that continue to use the
death penalty with regularity are bound together by their parochial tendencies as
well as their spatial characteristics.99
By parochial, Liebman and Clark mean to
convey a sense of “localism for its own sake,” or “the attribution of innate
importance and validity to the values and experiences one shares with the
members of--and thus to the security, stability and continuity of--one's closely
proximate community.”100
Parochialism also embodies “fears that prized local
values and experiences are embattled, slipping into the minority and at risk from
modernity, cosmopolitanism, immigration-driven demographic change, and a
coterie of ‘progressive’ and secular influences, including permissiveness and
crime.” Thus, communities with parochial characteristics possess “a sense of
anxiety or threat” about “outside influences that threaten to dilute or entirely
dissolve the community's cohesion.”101
High death penalty usage appears to be influenced by both the spatial distribution
of racial diversity and cultural parochialism. As Liebman and Clark conclude,
94
Id. 95
Id. 96
Id.; id. at 416 (“White Americans’ preferences for the death penalty cannot be adequately
understood apart from their racial component. Racial prejudice is, in the aggregate, a significant
part of what white death penalty support means. Just as racial bias remains a feature of how capital
punishment seems to be practiced in the U.S., so too does it continue to distort the ways white
Americans think about and respond to the ultimate penalty.”). 97
Id. 98
Id. 99
James Liebman and Peter Clark, David H. Bodiker Lecture of Criminal Justice: Minority
Practice, Majority's Burden: The Death Penalty Today, 9 OHIO ST. J. CRIM. L. 255 (2012). 100
Id. at 268. 101
Id. 269-270.

20 DEVALUING DEATH 19-Feb-13
[h]eavy use of the death penalty [ ] seems to occur when the worst
effects of crime have spilled over from poor and minority
neighborhoods and are particularly salient to parts of the
community that we can predict will have greater influence over
local law enforcement, prosecution, and judicial officials.102
Professors Shatz and Dalton recently conducted studied 473 first-degree murder
convictions that occurred in Alameda County,103
California over 23 years. There
are two distinct neighborhoods in Alameda County—North County, with a 30%
Black population and South County, with a less than 30% Black population.
Blacks were 4.5 more likely to be a homicide victim than Whites in North
County;104
whereas Whites were 3 times more likely to be a homicide victim in
South County.105
Nonetheless, Shatz and Dalton found that “the Alameda County
District Attorney was substantially more likely to seek death, and capital juries,
drawn from a county-wide jury pool, were substantially more likely to impose
death, for murders that occurred in South County.”106
Indeed, Liebman and Clark conclude that it is the “cross- boundary, cross-class,
and cross-race spill-over effect of crime—or the elevated fear of it—that disposes
communities towards the harshly retributive response of capital punishment.”107
Professor Garland is more blunt: legislators and juries express the moral
consensus of a community, and when those local decision-makers “identify with
offenders, or with the groups to which they belong, the death penalty becomes
less likely.”108
Conversely, “[w]herever punishers and punished are deeply
divided by race or class, death sentences become easier to impose.”109
Divisions
between racial groups living in the locality “foster suspicion and hostility” and the
more powerful group often uses “moral phrasing” to establish “outsiders as
immoral, idle, dirty, or dangerous.”110
The dynamics could feed race of the victim
effects by overvaluing the lives of white victims relative to black victims—even
when black homicide victims are more numerous—and simultaneously
102
Id. 103
Steven F. Shatz & Terry Dalton, Challenging the Death Penalty With Statistics: Furman,
McCleskey and a Single County Case Study, Univ. of San Francisco Law Research Paper No.
2012-23. Available at SSRN: http://dx.doi.org/10.2139/ssrn.2146253. 104
Id. 105
Id. 106
Id. 107
Id. 108
DAVID GARLAND, PECULIAR INSTITUTION: AMERICA’S DEATH PENALTY IN AN AGE OF
ABOLITION 168 (2010). 109
Id. 110
Id. at 169.

19-Feb-13 LEVINSON, SMITH & YOUNG 21
intensifying the perceived need for retribution because the offender crossed
geographic and social boundaries.
Professor Boddie suggests that implicit racial bias might be at play here.111
Labeling the interaction of implicit bias and physical space as a form of “racial
territoriality,”112
she hypothesizes that “buttressed by social and cultural norms of
racial separation and fear”113
implicit biases can be “triggered by spatial
conditions, including not only whether people of color are present but also their
status within the space and how they are treated and/or represented.”114
In this
way, neighborhoods like North County and South County in Alameda County,
California become spaces that “represent more than a physical set of boundaries
or associations.”115
Instead, these “racialized” spaces “correlate with and reinforce
cultural norms about spatial belonging and power.”116
2. Race and Procedural Discretion: The Role of Prosecutors and Capital Jurors
i. Prosecutorial Charging Decisions
Discrimination can enter into capital punishment determinations at the point
where prosecutors decide to pursue cases capitally.117
The typical claim is that
prosecutors choose to pursue the death penalty more often in cases where the
victim is White.118
There is strong support for this proposition.119
For example,
the East Baton Rouge study discussed above indicated that prosecutors in that
Parish pursued capital cases 364% more often when the victim was White than
when the victim was Black.120
Baldus similarly found that charging practices
111
Elise C. Boddie, Racial Territoriality, 58 UCLA L. Rev. 401, 438-442 (2010). 112
Id. 113
Id. 114
Id. 115
Id. 116
Id. 117
See, e.g., McCleskey, 481 U.S. at 287 (“Baldus found that prosecutors sought the death penalty
in 70% of the cases involving Black defendants and white victims; 32% of the cases involving
white defendants and white victims; 15% of the cases involving Black defendants and Black
victims; and 19% of the cases involving white defendants and Black victims.”). 118
See Gross & Mauro, Patterns of Death supra, note 69 at 106-107 (“Since death penalty
prosecutions require large allocations of scarce prosecutorial resources, prosecutors must choose a
small number of cases to receive this expensive treatment. In making these choices they may favor
homicides that are visible and disturbing to the majority of the community, and these will tend to
be white-victim homicides.”). 119
See Blume et al, supra note 4; Lynch and Haney, supra note 5 at 577 (discussing a recent study
of death-eligible Maryland homicide cases that found that “prosecutorial discretion accounted for
much of the race-of-victim effect, but that those biases were not corrected at later stages”). 120
Id.

22 DEVALUING DEATH 19-Feb-13
significantly contribute to the race of victim in Southwest Arkansas.121
But why
do prosecutors make these choices? One theoretically possible explanation for
capital charging discrepancies is that crimes with White victims, and particularly
crimes with Black defendants and White victims, are more aggravated on average
than Black victim crimes.122
Another possibility is that the wishes of the victim’s
surviving family members are important to the prosecution, and that the average
family member of a Black victim is less willing to demand—or even applaud—
capital charges because the average Black American is less likely to support the
death penalty.123
Yet another possibility—consistent with our implicit bias-based
claims—is that prosecutors devalue (perhaps automatically and unintentionally)
the lives of Black victims relative to White victims.124
The prosecutorial
discretion explanation ties in to the spatial and cultural explanation offered above:
When White victims (“the insiders”) are killed by Black citizens (“the outsiders”)
in a jurisdiction where Blacks exist in sufficient numbers to provoke fear and
anxiety, but are not sufficiently integrated into the economy and culture of the
locality, then offenses committed by Blacks against Whites can be perceived to be
more aggravated, White community members can be expected both to be more
punitive and more likely to wield political power, and the humanity of the White
victims can be overvalued and the humanity of the Black offender (and Black
victims) undervalued.
121
Baldus, et al, note 8, supra at 585 (“These large Black-defendant/white-victim race effects were
overwhelmingly the product of prosecutorial charging and jury sentencing decisions.”). 122
There is mixed data on this question. Compare Glenn L. Pierce & Michael Radelet, Race,
Region, and Death Sentencing in Illinois, 1988-1997, 81 OR. L. REV. 39, 67 (2002) (noting if
“homicides with white victims are more aggravated or otherwise more death-eligible than
homicides with Black victims, [race of the victim disparities] can be explained by legally relevant
variables,” but finding that race of victim effects in a ten year dataset of Illinois death-eligible
homicides persist even after controlling for legally relevant factors (including relative aggravation
of the homicides)); with Blume et al, supra note 4 (noting that Black offender / white victim cases
involve “stranger crimes” or multiple victim crimes more than do any other combination of
offender / victim racial groupings, but noting that these categorizations are themselves subject to
racially tinged decision-making and, in any event, that homicide characteristics do not eliminate
race of victim effects). 123
See, e.g., Baldus & Woodworth, Legitimacy of Capital Punishment, supra note 6 at 1449-50
(“Support for capital punishment is substantially lower in Black communities than it is in white
communities. Thus, to the extent that prosecutors take into account the views of the victim's
family, the request for a capital prosecution is likely to be higher when the victim is white.
Moreover, because most prosecutors are white, the families of white victims are more likely to
meet with the prosecutor and press their views on the death penalty.”). 124
See, e.g.,id. at 1450 (“[W]e consider it highly plausible that the statistically significant race-of-
victim effects documented in the literature reflect a devaluing (conscious or unconscious) of Black
murder victims.”); Smith and Cohen, supra, note 7 at 240 (arguing that “white [decision-makers]
are more likely to magnify the humanity of white victims and marginalize the humanity of Black
perpetrators, [which] negatively affects defendants who murder white victims, because the
favorable implicit biases that flow toward white victims enhance the perceived harm of the crime
when the victim is white.”).
19-Feb-13 LEVINSON, SMITH & YOUNG 23
ii. Capital Jurors
Jury decision-making during the penalty phase of a capital trial is another point in
the administration of the death penalty where racial disparities can seep into the
system.125
This can happen through at least two different avenues: 1) through the
use of victim impact evidence and 2) through the inability of jurors to empathize
with the mitigating evidence presented by Black defendants. We address each in
turn. Scholars have suggested that race of the victim bias might enter into the trial
during the introduction of victim impact evidence, which is a type of evidence
that is introduced in the sentencing phase of a capital trial by a surviving family
member.126
Victim impact evidence frequently includes videos, pictures and
music that attempt to capture for the jury a glimpse of the life that has been
lost.127
Robert J. Smith and G. Ben Cohen have observed, “White jurors are more
125
Mona Lynch and Haney, supra note 5at 586 (“Our findings suggest that the problem of racial
bias in the capital jury setting is not merely the product of individual actors who hold racial
animus that they employ privately, in isolation from others. Rather, there appear to be important
group level processes that are also at work, such that the very context of decision making-jury
deliberations-may activate and exacerbate racial bias under certain conditions.”); id. at 577
(“Several recent studies have documented racial bias against Black defendants, apart from the
interactive effect that the race of defendant has with the race of victim. This work suggests that
race-based discrimination against a capital defendant is especially likely to operate in the juries'
penalty phase decision making”) (citing William J. Bowers, Benjamin D. Steiner & Marla Sandys,
Death Sentencing in Black and White: An Empirical Analysis of the Role of Jurors' Race and Jury
Racial Composition, 3 U. PA. J. CONST. L. 171, 189-90 (2001)); William J. Bowers, Marla
Sandys & Thomas W. Brewer, Crossing Racial Boundaries: A Closer Look at the Roots of Racial
Bias in Capital Sentencing when the Defendant is Black and the Victim is White, 53 DEPAUL L.
REV. 1497, 1499-1500 (2004). 126
Smith and Cohen, supra note 7 at 240 (arguing that process whereby “all things being equal,
white jurors are more likely to magnify the humanity of white victims and marginalize the
humanity of Black perpetrators . . . occurs most clearly through the introduction of victim impact
evidence in capital cases”); Booth v. Maryland, 482 U.S. 496 (1987) (White, J., dissenting)
(characterizing the Court’s concern that capital juries will understand victim impact statements to
imply that “defendants whose victims were assets to their community are more deserving of
punishment than those whose victims are perceived to be less worthy” to include a concern that
“sentencing juries might be moved by victim impact statements to rely on impermissible factors
such as the race of the victim”). 127
See, e.g., Kelly v. California, 555 U.S. 1020, 1021 (2008) (Stevens, J., statement respecting the
denial of certiorari) (describing the victim impact evidence presented in one of the consolidated
cases before the Court in Kelly: “The prosecution played a 20-minute video consisting of a
montage of still photographs and video footage documenting [the victim’s] life from her infancy
until shortly before she was killed. The video was narrated by the victim’s mother with soft music
playing in the background, and it showed scenes of her swimming, horseback riding, and attending
school and social functions with her family and friends. The video ended with a view of her grave
marker and footage of people riding horseback in Alberta, Canada—the ‘kind of heaven’ in which
her mother said she belonged.”).

24 DEVALUING DEATH 19-Feb-13
likely to magnify the humanity of White victims and marginalize the humanity of
both Black victims and Black perpetrators. . . . This dynamic [ ] negatively
affects defendants who murder White victims, because the favorable implicit
biases that flow toward White victims enhance the perceived harm of the crime
when the victim is White.”128
Juror difficulty in giving adequate mitigating value to evidence introduced by
Black defendants is a strong candidate for the factor most likely to induce racial
unevenness in the penalty phase of capital trials. In Woodson v. North
Carolina,129
the United States Supreme Court held that state capital sentencing
schemes cannot preclude jurors from considering “relevant aspects of the
[defendant’s] character and record” or any “compassionate or mitigating factors
stemming from the diverse frailties of humankind”130
that tend to suggest that
death is not an appropriate penalty. Mitigation evidence comes in all shapes and
forms, but brain injuries, significant intellectual deficits, several mental illness
and “rotten social background” tend to dominate. The introduction of testimony
that family members and friends love the defendant is also critical mitigation
evidence in many capital cases. Each of the mitigating factors requires that the
capital jury empathize with the defendant, not so that the jury can justify the
terrible conduct in which the defendant has engaged, but so the jury might find
some redeeming qualities that suggest that the defendant should remain alive.
Scholars suggest that consideration of mitigating evidence produces race of
defendant effects (or at least aggravates race of victim effects in Black defendant /
White victim cases) because most capital jurors are White and male. Reporting
the results of a simulated California capital trial using 400 jury eligible
participants, Mona Lynch and Craig Haney concluded:
128
Gross & Mauro, supra note 69. The following refection from Sam Gross and Robert Mauro
offered in 1984 remains at least partially relevant today: “[I]n a society that remains segregated
socially if not legally, and in which the great majority of jurors are white, jurors are not likely to
identify with Black victims or see them as family or friends. This reaction is not an expression of
racial hostility, it is simply a reflection of an emotional fact of interracial relations in our society.”
As Gross and Mauro first suggested, and as Smith and Cohen explain, there may well be an
unintentional yet powerful relationship that has developed, according to which white victims lives
have become overvalued relative to Black victims’ lives. We hypothesize that such effects are not
only due to an identification or empathy disconnect between white jurors or prosecutors and Black
victims, but also may be explained by specific societal stereotypes that cast Blacks as of lesser
worth or value than whites. 129
428 U.S. 280, 303-04 (1976). 130
Id. at 303-04.

19-Feb-13 LEVINSON, SMITH & YOUNG 25
the racial disparities that we found in sentencing outcomes were
likely the result of the jurors' inability or unwillingness to
empathize with a defendant of a different race … [and] [w]hite
jurors who simply could not or would not cross the "empathic
divide" to fully appreciate the life struggles of a Black capital
defendant and take those struggles into account in deciding on his
sentence.131
Interviews with over a thousand jurors that served on real-life capital juries
confirm this dynamic: “White and Black men typically came to very different
conclusions about what they perceived to be the Black defendant's
remorsefulness, dangerousness, and his "cold-bloodedness,” and “Black men
reported being more empathic toward the defendants in these cases than any other
category or group of juror.”132
3. Structural Explanations
i. Race and Retribution
The fact that racial bias persists in capital punishment systems, combined with an
understanding of the close relationship between punitiveness, race and support for
the death penalty,133
has led commentators to question whether race might be
inextricable from retribution.134
The close relationship between race and
retribution is important because capital defendants periodically challenge use of
the death penalty as it relates to a particular crime (e.g. child rape) or a particular
class of offenders (e.g. juveniles). In analyzing those claims, known as Eighth
Amendment categorical challenges, the Supreme Court considers whether
imposition of the death penalty satisfies “the [ ] distinct social purposes”135
embodied in the core punishment rationales. The Court finds “capital punishment
[to be] excessive when . . . it does not fulfill the two distinct social purposes
served by the death penalty: retribution and deterrence of capital crimes.”136
131
Lynch and Haney, supra note 5 at 584. 132
Id. 133
See, e.g., infra notes 145-49 and accompanying text. 134
G. Ben Cohen, McCleskey’s Omission: The Racial Geography of Retribution, OHIO ST. J.
CRIM. L. (forthcoming 2012) 135
Kennedy v. Louisiana, 554 U.S. 407, 441 (2008). 136
Id.

26 DEVALUING DEATH 19-Feb-13
While the Court has expressed ambivalence towards the deterrence rationale,137
it
has closely monitored the retributive value of the death penalty.138
In recent years,
and especially in Kennedy v. Louisiana139
(the most recent capital case decided
under this analysis), the Court at once justified the death penalty primarily on
retributive grounds and acknowledged the vulnerability of doing so: retribution is
the punishment rationale that “most often can contradict the law's own ends,” and
“[w]hen the law punishes by death, it risks its own sudden descent into brutality,
transgressing the constitutional commitment to decency and restraint.”140
Thus the
relationship between race and retribution is important because retribution has
been cast as an indispensible component to the constitutionality of the death
penalty141
while racial arbitrariness is an impermissible consideration for
imposing capital punishment;142
and yet, it might be that one cannot be
contemplated without also considering the corresponding impact of the other.
Moreover, history teaches us that when retribution and race are intertwined,
concerns about a law’s “sudden descent into brutality”143
or its “transgressing [of]
the constitutional commitment to decency and restraint”144
are at their apex.
Retribution and race have an uneasy relationship when it comes to capital
punishment. In Gregg, Justice Stewart, evoking the specter of lynchings, affirmed
the link between race and retribution, asserting that the constitution permits
retributive goals for capital punishment because “[w]hen organized society is
unwilling or unable to impose upon criminal offenders the punishment they
‘deserve, then there are sown the seeds of anarchy—of self-help, vigilante justice,
137
Id. (citing Gregg, 428 U.S. at 185-186) (joint opinion of Powell, J, Stewart, J and Stevens, J)
(underscoring that “no convincing empirical evidence either supporting or refut[es] th[e] view
[that the death penalty serves as a significantly greater deterrent than lesser penalties]”); see also
Baze v. Rees, 553 U.S. 35, 79 (2008) (Stevens, J., concurring) (“The legitimacy of deterrence as
an acceptable justification for the death penalty is also questionable, at best. Despite 30 years of
empirical research in the area, there remains no reliable statistical evidence that capital punishment
in fact deters potential offenders. In the absence of such evidence, deterrence cannot serve as a
sufficient penological justification for this uniquely severe and irrevocable punishment.”). 138
The Court considers the retributive benefit of the death penalty when exercising its
“independent judgment” as part of every Eighth Amendment capital proportionality case. See, e.g.,
id. at 2665; Roper v. Simmons, 543 U.S. 551, 571 (2005) (“Whether viewed as an attempt to
express the community's moral outrage or as an attempt to right the balance for the wrong to the
victim, the case for retribution is not as strong with a minor as with an adult. Retribution is not
proportional if the law's most severe penalty is imposed on one whose culpability or
blameworthiness is diminished, to a substantial degree, by reason of youth and immaturity.”). 139
554 U.S. 407 140
Id. at 420. 141
Id. at 441 (explaining that retribution is one of the “two distinct social purposes” of capital
punishment). 142
See id. at 447 (describing the importance of avoiding “arbitrary and capricious application” of
capital punishment). 143
Id. at 420. 144
Id.
19-Feb-13 LEVINSON, SMITH & YOUNG 27
and lynch law.’”145
Because most victims of lynching were punished for offenses
against Whites,146
one might have believed that the combination of channeling the
societal taste for retribution into the formal justice system and heavy anti-
arbitrariness procedural regulation of the administration of capital punishment
would have interacted to reduce the tendency to punish more those who commit
crimes against White Americans.
ii. Death Qualification
A final explanation for the continued existence of racial disparities is that the very
processes that are suppose to neutralize the system—for example, the so-called
“death qualification” of jurors—unintentionally exacerbate efforts to eradicate
unjustified racially disparate outcomes.
Once it is clear that existing constitutional safeguards have failed to protect
citizens from continued racial bias in the death penalty, it next becomes important
to consider whether regulations not only fail to eliminate racial bias, but also
actually may increase it unwittingly.147
One particular form of regulation that
applies solely to capital cases is the process of “death qualification.” To be
eligible to sit on a capital jury a prospective juror must be willing to consider as a
possible sentence both life without the possibility of parole and the death
penalty.148
Stated as a prohibition, no juror who automatically would vote to reject
(or to impose) the death penalty is eligible to sit on a capital jury.149
To be clear,
145
Gregg, supra note 45at 183 (quoting Furman v. Georgia, 408 U.S. 238, 308 (1972) (Stewart J.,
concurring)). 146
See Cohen, supra note 134 at 67 ”) (quoting John Paul Stevens, On the Death Sentence, in N.Y.
REV. BOOKS, 8, 14 (reviewing DAVID GARLAND, PECULIAR INSTITUTION: AMERICA’S DEATH
PENALTY IN AN AGE OF ABOLITION (2010))) (“Justice John Paul Stevens, after his departure from
the bench, observed the connection between the death penalty and lynchings: ‘That the murder of
black victims is treated as less culpable that the murder of white victims provides a haunting
reminder of once-prevalent Southern lynchings.’”). 147
See Lynch and Craig, supra note 5 at 598 (“Rather than remedying these potential biases, some
capital trial procedures worsen them. For instance, the well-documented problem of under-
representation of minorities in many jurisdictions' jury pools is exacerbated in capital cases by the
added impact of disproportionate exclusion of minorities via death qualification. Because both
minorities and women in most jurisdictions continue to oppose the death penalty at higher rates
than White men, they are disproportionately excludable, and fewer of them are eligible to sit as
jurors on capital cases. Obviously, then, White men are disproportionately likely to be death
qualified, which increases the overall likelihood of "white male dominance effects.”). 148
See Uttecht v. Brown, 551 U.S. 1, 9 (2007) (citing Wainwright v. Witt, 469 U.S. 412, 424
(1985)) (emphasizing that a juror can be removed for cause when (s)he is “substantially impaired
in his or her ability to impose the death penalty under the state-law framework”); Morgan v.
Illinois, 504 U.S. 719 (1992) (finding that jurors whom will not consider a sentence other than
death are excludable for cause). 149
Id.

28 DEVALUING DEATH 19-Feb-13
mere opposition to the death penalty (or to a sentence less than death for those
convicted of a capital murder) is not enough.150
A prospective juror who opposes
the death penalty, but states that she can follow the law and consider voting to
impose a death sentence, is eligible to serve on a capital jury.151
Jurors are “death-
qualified” pre-trial, often immediately preceding (and, in some jurisdictions,
contemporaneous with) traditional voir dire.152
Death qualification is freighted with controversy, but consider how a link between
death qualification and increased racial bias would have an impact on two discrete
concerns: 1) conviction-proneness and 2) indicia of community consensus. First,
studies reveal that death-qualified jurors tend to be more conviction-prone than
ordinary juries.153
Although some scholars have attempted to explain this
qualitative difference by focusing on concepts such as authoritarianism,154
if death
qualified jurors are more biased than non-death qualified jurors, implicit racial
bias could help to explain why death-qualified jurors may exacerbate race of
defendant and race of victim effects compared to a pool of all potential jurors.
One could expect that these greater levels of bias would be activated and lead to
disproportionately harsher and skewed evaluations of crime severity, heinousness,
and cruelty; the race of the defendant, for example, could easily trigger these
stereotypes.155
A more novel, albeit complementary, possibility is that there are
yet undocumented implicit racial stereotypes specifically relevant to the value of
the defendant’s and victim’s life in a capital trial. These would be stereotypes
directly related to race and the value of life, more specifically, stereotypes that
White people are valuable and Black people are worthless. These stereotypes,
which could be derived from age-old race related stories and cultural
150
Witherspoon v. Illinois, 391 U.S. 510, 522 (1968) (holding that a “sentence of death cannot be
carried out if the jury that imposed or recommended it was chosen by excluding veniremen for
cause simply because they voiced general objections to the death penalty or expressed
conscientious or religious scruples against its infliction”). 151
See Wainwright v. Witt, 469 U.S. 412, 424 (1985) (the precise standard is “whether the juror's
views would prevent or substantially impair the performance of his duties as a juror in accordance
with his instructions and his oath") (internal quotations omitted). 152
Lockhart v. McCree, 476 U.S. 162 (1986). 153
Id. at 170-173 (discussing the results of six such studies). 154
See Brooke Butler and Gary Moran, The Impact of Death Qualification, Belief in a Just World,
Legal Authoritarianism, and Locus of Control on Venirepersons’ Evaluations of Aggravating and
Mitigating Circumstances in Capital Trials, 25 BEHAV. SCI. & L. 57, 61 (“Specifically, legal
authoritarians are more likely to feel that the rights of the government outweigh the rights of the
individual with respect to legal issues. Legal authoritarianism has been found to predict verdicts in
both capital and non-capital criminal cases.”). 155
Charles Ogletree, Robert J. Smith & Johanna Wald, Coloring Punishment: Implicit Social
Cognition and Criminal Justice, in IMPLICIT RACIAL BIAS ACROSS THE LAW, 45, 48 (noting that
“Black citizens are often associated with violence, dangerousness, and crime” and detailing social
science findings that demonstrate such associations).
19-Feb-13 LEVINSON, SMITH & YOUNG 29
reinforcement regarding individuality, value, competence, humanness, and worth
could be particularly harmful in capital trials, especially if death qualified jurors
possessed heightened levels of this bias. Activated in a criminal trial, such
stereotypes, if proven, could potentially affect not only how the sanctity of the
defendant’s life is perceived, but also how the victim’s life is valued.
Second, commentators have argued that the process of removing from jury
eligibility any citizen who refuses to impose the death penalty inhibits an accurate
assessment of modern community standards, which is a required Eighth
Amendment function of the jury.156
Previous research has established that death-
qualified juries tend to be populated by a disproportionate number of White
citizens.157
The fact that non-White citizens are disproportionately excluded from
jury service in capital cases alone raises obvious questions about the ability to
read into jury verdicts the imprimatur of community consensus. If our hypothesis
is correct, though, death-qualified jurors are not only disproportionately White,
they also possess stronger implicit and explicit racial biases than jury-eligible
citizens generally, and the reason why capital juries are more implicitly biased is
because the process results in fewer non-White jurors.158
These findings, taken
together, would substantially undercut the notion that the verdicts of capital juries
represent the community consensus on the question of capital punishment.
In light of the continued relevance of both the role of race in the administration of
the death penalty, as well as the dangers of death qualification, we crafted a study
that sought to provide an early yet detailed look at how race and death penalty
jurisprudence would be amplified by new empirical findings. Our study therefore
attempts to provide greater understanding of the ways in which knowledge of
156
G. Ben Cohen & Robert J. Smith, The Death of Death-Qualification, 59 CASE W. RES. L. REV.
87 (2008) (“Measuring the community’s sentiment concerning a specific punishment by gathering
a venire, removing from the venire all people opposed to a punishment, and then taking the
temperature of the remaining citizens concerning the propriety of that punishment, would be like
assessing the impact of global warming by taking the temperature in a room with its air-
conditioning on.”); Lynch and Haney, supra note 5 at 600 (arguing that death-qualification
“undermin[es] the representativeness of the capital jury and widen[s] the empathic divide because
‘death qualified juries are less likely to share the racial and status characteristics or the common
life experiences with capital defendants that would otherwise enable them to bridge the vast
differences in behavior the trial is designed to highlight.’”) (internal citation omitted). 157
Brooke Butler & Adina W. Wasserman, The Role of Death Qualification in Venirepersons’
Attitudes Toward the Insanity Defense, 36 J. APP. SOC. PSYCH. 1744, 1745-1746 (2006) (noting
that “jurors who pass the [Wainwright v.] Witt standard tend to be demographically
distinguishable: They are more likely to be . . . White . . . .”). 158
Brooke Butler has indeed found that death qualified jurors have higher levels of self reported
racial bias than non-qualified jurors. See Brooke Butler, Death Qualification and Prejudice: The
Effect of Implicit Racism, Sexism, and Homophobia on Capital Defendants' Right to Due Process,
25 BEHAV. SCI. & L., 857 (2007) [hereinafter Butler, Death Qualification and Prejudice].
30 DEVALUING DEATH 19-Feb-13
juror bias, particularly implicit racial bias, influences the administration of the
death penalty. Specifically, we sought to add to the discourse on the topics of 1)
whether implicit racial bias helps explain the ineffectiveness of death penalty
regulation for eliminating racial bias, 2) whether, as a result of implicit bias, race
and retribution are inextricable in the capital context, and 3) whether death
penalty procedural regulations might inadvertently aggravate the risk that racial
biases will seep into the capital punishment process. Section IV provides details
of the study. First, however, Section III provides a foundation in implicit bias
literature, particularly in the criminal law setting, by explaining what is known
and not yet known about implicit bias in criminal trials generally. This knowledge
is then applied to the capital context in formulating specific hypotheses for our
study.
III. IMPLICIT RACIAL BIAS AND CRIMINAL JUSTICE
Considering its compelling methods and powerful findings, the growth of implicit
bias research in the cognitive sciences has unsurprisingly triggered an increased
interest of implicit bias in the legal context.159
Legal scholars have now at least
begun considering implicit bias in a broad range of domains across the law.160
159
See generally, IMPLICIT RACIAL BIAS ACROSS THE LAW (Justin D. Levinson & Robert J. Smith,
eds. 2012) (considering how implicit bias functions across fifteen different areas of law). See also
Samuel R. Bagenstos, Implicit Bias, "Science," and Antidiscrimination Law, 1 HARV. L. & POL'Y
REV. 477, 477 (2007) [hereinafter Bagenstos, “Science,” and Antidiscrimination Law]; Mark W.
Bennett, Unraveling the Gordian Knot of Implicit Bias in Jury Selection: The Problems of Judge-
Dominated Voir Dire, the Failed Promise of Batson, and Proposed Solutions, 4 HARV. L. & POL’Y
REV. 149 (2010) (providing a federal judge’s perspective on implicit bias); Jerry Kang, Trojan
Horses of Race, 118 HARV. L. REV. 1489, 1497–1539 (2005) (introducing implicit bias research to
legal scholars generally, and applying it to the communications law and policy context); Linda
Hamilton Krieger, The Content of Our Categories: A Cognitive Bias Approach to Discrimination
and Equal Employment Opportunity, 47 STAN. L. REV. 1161, 1164 (1995) (introducing the
concept of unconscious discrimination to the employment discrimination realm); Linda Hamilton
Krieger & Susan T. Fiske, Behavioral Realism in Employment Discrimination Law: Implicit Bias
and Disparate Treatment, 94 CAL. L. REV. 997, 1027 (2006); Charles R. Lawrence III, The Id, the
Ego, and Equal Protection: Reckoning with Unconscious Racism, 39 STAN. L. REV. 317 (1987)
(drawing primarily upon Freudian psychology, but his powerful arguments set the stage for
discussions of implicit social cognition); Cynthia Lee, The Gay Panic Defense, 42 U.C. DAVIS L.
REV. 471, 479 (2008) (discussing implicit bias in the context of sexual orientation bias); Justin D.
Levinson, Forgotten Racial Equality: Implicit Bias, Decisionmaking, and Misremembering, 57
DUKE L.J. 345, 363 (2007) [hereinafter Levinson, Forgotten Racial Equality] (arguing that judged
and juries remember and misremember case facts in racially biased ways); Justin D. Levinson,
SuperBias: The Collision of Behavioral Economics and Implicit Social Cognition and, 45 AKRON
L. REV. 591 (2012) [hereinafter Levinson, SuperBias] (claiming that the behavioral law and
economics decision model overlooks the role of implicit biases). 160
See, e.g., Michele Wilde Anderson & Victoria C. Plaut, Implicit Bias and the Resilience of
Spatial Colorlines, in IMPLICIT RACIAL BIAS ACROSS THE LAW, supra note 7, at 25 (examining

19-Feb-13 LEVINSON, SMITH & YOUNG 31
For example, it is now not uncommon to see a scholar arguing that implicit bias
affects the way courts and the United States government treat Native American
sovereignty,161
the way the IRS makes auditing decisions,162
or the way corporate
boards allocate funds to charities and executives.163
In the context of race and
criminal justice, considerations of implicit bias have begun to appear more
commonly in discourse.164
In light of this rapid development of implicit bias-
focused criminal law scholarship and because racial disparities in the
administration of the death penalty have been so apparent for decades, it is
noteworthy that scholars have yet to examine deeply implicit racial bias in the
context of capital punishment.165
In the past several years, scholars have tested the role of implicit bias in various
areas of the criminal justice system.166
These studies have begun to provide an
implicit bias in property and land use law); Danielle Conway, Implicit Racial and Gender Bias in
Right of Publicity Cases and Intellectual Property Law Generally, in IMPLICIT RACIAL BIAS
ACROSS THE LAW, supra note 7, at 179 (focusing on gender, race, and implicit bias in the right of
publicity); Michele Goodwin & Dr. Naomi Duke, Cognitive Bias in Medical Decision Making, in
IMPLICIT RACIAL BIAS ACROSS THE LAW, supra note 7, at 95 (looking primarily at health care
disparities as a manifestation of implicit bias); Jerry Kang, Bits of Bias, in IMPLICIT RACIAL BIAS
ACROSS THE LAW, supra note 7, at 132 (focusing on the communications law context); Justin D.
Levinson, Biased Corporate Decision-Making?, in IMPLICIT RACIAL BIAS ACROSS THE LAW,
supra note 7, at 144 (critiquing bias in corporate charitable giving and executive compensation);
Antony Page, Unconscious Bias and the Limits of Director Independence, 2009 ILL. L. REV. 237
(focusing on a range of cognitive biases, including automatic in-group preference); Antony Page
& Michael J. Pitts, Poll Workers, Election Administration, and the Problem of Implicit Bias, 15
MICH. J. RACE & L. 1 (2010) (arguing that poll workers rely on implicit bias in interacting with
voters); Robert G. Schwemm, Why Do Landlords Still Discriminate (And What Can Be Done
About It)?, 40 J. MARSHALL L. REV. 455 (2007); Eric K. Yamamoto & Michele Park Sonen,
Redress Bias? in IMPLICIT RACIAL BIAS ACROSS THE LAW, supra note 7, at 244 (critiquing
reparations discourse for overlooking harms of women of color). 161
Susan Serrano & Breann Swann Nu’uhiwa, Implicit Bias Against Native Peoples as
Sovereigns, in IMPLICIT RACIAL BIAS ACROSS THE LAW, supra note 7 at 209. 162
Dorothy A. Brown, Implicit Bias and the Earned Income Tax Credit, in IMPLICIT RACIAL BIAS
ACROSS THE LAW, supra note 7 at 164. 163
Justin D. Levinson, Biased Corporate Decision Making? in IMPLICIT RACIAL BIAS ACROSS THE
LAW, supra note 7at 144 . 164
See, e.g., L. Song Richardson, Police Efficiency, 87 IND. L.J. 1143 (2012); L. Song Richardson,
Arrest Efficiency and the Fourth Amendment, 95 MINN. L. REV. 2035 (2011). 165
Some early projects in this area have begun to consider implicit bias in the capital context. See,
e.g., Eisenberg & Johnson, supra note 8 (finding that capital defense attorneys possess levels of
implicit racial bias similar to the population); Levinson, Race, Death and the Complicitous Mind,
supra note 8; Smith & Cohen, supra note 7. 166
See Eberhardt et al., Looking Deathworthy, supra note 69; Philip A. Goff et al., Not Yet
Human: Implicit Knowledge, Historical Dehumanization, and Contemporary Consequences, 94 J.
PERSONALITY & SOC. PSYCHOL. 292, 306 (2008); Levinson, Forgotten Racial Equality, supra note
159; Justin D. Levinson & Danielle Young, Different Shades of Bias: Skin Tone, Implicit Racial
Bias, and Judgments of Ambiguous Evidence, 112 W. VA. L. REV. 307 (2010); Levinson et al., A

32 DEVALUING DEATH 19-Feb-13
outline of the potential impact of implicit bias across the criminal law spectrum
and offer clues as to how implicit bias may manifest in the capital context,
specifically leading to racial disparities. In this Section, we rely on recent
empirical studies to demonstrate how implicit bias may permeate the criminal
legal process, with a special focus on jury decision-making.167
We then apply
these lessons to the capital context and set forth the hypotheses for our empirical
study.
Because jurors are often staked with the heavy burden of determining not just
guilt or innocence, but also life or death, it is helpful that much of criminal law’s
empirical implicit bias work has focused on jury decision-making. In several
different projects, Justin Levinson, Danielle Young and colleagues have
attempted to build the early stages of an implicit-bias model of criminal law juror
decision-making.168
Amplifying established research that deconstructs how jurors
make decisions,169
this implicit bias research can be broken down into three
sequential decision-making categories: (1) biased evidence evaluation through
faulty story construction, (2) stereotype-driven representation of the decision
alternatives by learning potentially corrupted verdict category attributes, (3) and
the biased classification of jurors’ stereotype-driven stories into the “best-fitting”
Social Science Overview, supra note 9; Jeffrey J. Rachlinski et al., Does Unconscious Bias Affect
Trial Judges?, 84 NOTRE DAME L. REV 1195, 1197 (2009). 167
We do not mean to exclude other areas, such as policing, prosecutorial discretion, judicial
decisions, and parole decisions, but focus on topics connected to our jury related hypotheses. For
more on implicit bias and prosecutorial discretion, see Robert J. Smith & Justin D. Levinson, The
Impact of Implicit Racial Bias on the Exercise of Prosecutorial Discretion, 35 SEATTLE L. REV.
795 (2012). Although most implicit bias decision-making research has focused on jurors, one
team of researchers has tested how implicit bias may affect sitting judges. Jeffrey Rachlinski and
his colleagues ran race IATs on a population of judges. Rachlinski et al., supra note 166. Like
the rest of the population, these judges displayed implicit racial biases. The researchers found,
however, that the judges were perhaps able to protect again these biases from skewing their
decisions when race was made salient. When race was primed subliminally, however, the effect of
implicit bias appeared to be stronger on decision-making. 168
See Levinson, Forgotten Racial Equality, supra note 159at 364-73; Levinson & Young, supra
note 166 (first critiquing Pennington and Hastie’s “story model” of decision-making); Levinson et
al., A Social Science Overview, supra note 9. 169
We build mainly on the acclaimed Story Model of decision making. See Nancy Pennington &
Reid Hastie, Practical Implications of Psychological Research on Juror and Jury Decision
Making, 16 PERSONALITY & SOC. PSYCHOL BULL. 90, 95 (1990); Nancy Pennington & Reid
Hastie, A Cognitive Theory of Juror Decision Making: The Story Model, 13 CARDOZO L. REV. 519
(1991) [hereinafter Pennington & Hastie, The Story Model]; Nancy Pennington & Reid Hastie,
Explaining the Evidence: Tests of the Story Model for Juror Decision Making, 62 J.
PERSONALITY. & SOC. PSYCHOL. 189, 189–90 (1992) [hereinafter Explaining the Evidence]; See
also Nancy Pennington & Reid Hastie, The Story Model for Juror Decision-Making, in INSIDE THE
JUROR: THE PSYCHOLOGY OF JUROR DECISION-MAKING 192, 200 (Reid Hastie ed., 1993)
[hereinafter The Story Model]. For an earlier detailed implicit bias amplification of the Story
Model, see Levinson & Young, supra note 166 at 340-45.
19-Feb-13 LEVINSON, SMITH & YOUNG 33
verdict category.170
We use these stages, based upon those made prominent by
Professors Pennington and Hastie’s Story Model,171
to explain the early
construction of an implicit bias model of biased decision-making; in each of the
stages, researchers have found that implicit bias has played at least some role in
facilitating inequality.172
In the context of the death penalty, through our
empirical study we attempt to add new and unique death-focused categories to the
model. Each of the existing model steps, however, may already work to explain
the range of biased outcomes in capital decision-making.
A. Biased Evaluation of Evidence and Faulty Story Construction
According to Professors Pennington and Hastie, the first stage of jury decision-
making involves the construction of stories by jurors. That is, jurors “engage in
an active, constructive, comprehension process in which evidence is organized,
elaborated, and interpreted by them during the course of the trial.”173
In our
proposed implicit bias model of decision-making, when jurors evaluate evidence
and construct stories about what they believe happened, at least two types of
implicit biases may manifest. First, jurors may automatically remember and
misremember case facts in racially biased ways.174
And second, jurors may
evaluate ambiguous evidence in a stereotyped way based on racial or skin tone
cues.175
In a study of juror implicit memory bias, Justin Levinson found that
mock jurors more accurately remembered aggression-related case facts when
presented with an aggressive Black actor than when presented with an aggressive
White actor.176
Furthermore, mock jurors sometimes even had false memories for
facts that had not actually happened when these “facts” were consistent with
stereotypes of Black men.177
In a later study, Levinson and Danielle Young found
that mock jurors evaluated ambiguous evidence differently based upon whether a
170
These categories are derived from the three cognitive processing components that explain how
jurors interpret information. See Pennington & Hastie, Explaining the Evidence, supra note 169 at
192. 171
See Pennington & Hastie, The Story Model, supra note 169. The Story Model seeks to explain
how jurors process information and decide cases. 172
Although Pennington and Hastie have not endeavored to examine the role of implicit bias in the
Story Model, they have recognized that the process of juror evaluation and interpretation of
evidence includes both conscious and automatic cognitive processes. Reid Hastie, Conscious and
Nonconscious Cognitive Processes in Jurors’ Decision, in BETTER THAN CONSCIOUS? DECISION-
MAKING, THE HUMAN MIND, AND IMPLICATIONS FOR INSTITUTIONS 371, 384 (Christoph Engel &
Wolf Singer eds., 2008). 173
Pennington & Hastie, The Story Model, supra note 169 at 523. 174
See Levinson, Forgotten Racial Equality, supra note 159 at 373-74. 175
Each of the bias-driven steps has at least initial empirical support. See Id. at 407-17. See also
Levinson & Young, supra note 166 at 316-18. 176
See Levinson, Forgotten Racial Equality, supra note 159 at 398-406. 177
Id. at 407-10.

34 DEVALUING DEATH 19-Feb-13
perpetrator had lighter or darker skin.178
When a perpetrator possessed darker
skin, participants were more likely to interpret ambiguous evidence as indicating
guilt than when a perpetrator possessed lighter skin.179
These studies show that
juror story construction and evidence evaluation, two key processes of juror
decision-making, can be tainted by implicit bias. This type of bias may manifest
in capital trials, as well.180
B. Stereotype-Driven Decision Alternatives
Similarly, when jurors enter the next stage of decision-making, learning the
decision category attributes, research has shown that their decision-making also
may be infected by implicit bias. According to Pennington and Hastie, during this
second stage of juror decision-making, jurors learn about their verdict options,
such as first degree murder, second degree murder, guilty, not guilty, and so on,
primarily through judicial instructions.181
As jurors learn the relevant categories,
existing knowledge structures can interfere with their cognitive processes. For
example, a study by Levinson, Huajian Cai, and Young found that people
implicitly associate the racial category of Black with the legal concept of guilty
and the racial category of White with not guilty.182
In that study, the researchers
devised a “Guilty- Not Guilty IAT” in which participants had to pair the racial
categories of Black and White (exemplified by photos of Black and White faces)
with words representing the legal concepts of guilty and not guilty.183
Consistent
with the experimenters’ predictions, participants implicitly associated Black with
guilty and White with not guilty.184
During this stage of decision-making, jurors in capital trials also learn about and
begin to consider death as a possible penalty. Although it has yet to be tested
empirically, it is possible that even the introduction of the penalty of death as an
outcome possibility actually primes the racial stereotype of violent and dangerous
Black males. Levinson has argued that media, culture, and a history of racial
disparities in the death penalty have led American citizens to cognitively associate
178
See Levinson & Young, supra note 166. 179
Id. at 337. These decisions were shown to be related to implicit bias and not self reported
(explicit) racial attitudes. Id. at 338. 180
Id. at 344 181
Pennington & Hastie, The Story Model, supra note 169 at 529. 182
Levinson et al., A Social Science Overview, note 9. 183
Id. at 201-03. For an explanation of how the IAT works, see supra note 19. 184
Id. at 204. Participants also displayed more traditional race-based stereotyped implicit biases,
and these biases predicted the way jurors made verdict decisions based upon the perpetrator’s skin
tone.

19-Feb-13 LEVINSON, SMITH & YOUNG 35
the death penalty with Black male perpetrators.185
If this hypothesis were
confirmed, simply talking about death as a possible penalty, death qualifying
jurors, or both, could trigger (or “prime”) these racial stereotypes. These
triggered stereotypes of death-worthy Black perpetrators could potentially
prejudice the ensuring trial.186
Thus, implicit bias could not only bias the learning
of the verdict categories of guilty and not guilty, but also could be triggered or
heightened simply by a discussion of the death penalty as being a potential trial
outcome.
C. Biased Classification of Stories into Verdicts
In the final stage of Pennington and Hastie’s decision-making model, jurors match
the stories they construct in the first stage of decision-making into the verdict
categories they learned about in the second stage.187
According to our implicit
bias theory, this means that jurors classify their already biased stories into the
most fitting already biased verdict categories. The risks here are obvious. Yet
this stage even creates novel risks of bias. According to jury researchers, the final
stage of decision-making is not simply a combination of the first two stages; it
also involves the incorporation of the presumption of innocence.188
Interestingly,
even this stage, presumed by many to be one of the core protections underlying
the American criminal trial,189
may introduce bias into an already infected
process. A study by Young, Levinson, and Scott Sinnett provides preliminary
evidence that presumption of innocence jury instructions themselves may prime
jurors in ways consistent with racial stereotypes.190
In that study, mock juror
participants viewed a video containing jury instructions from a federal judge in
which the judge either gave instructions regarding the presumption of innocence
and burden of proof, or other (more innocuous, yet of similar length)
185
Levinson, Race, Death and the Complicitous Mind, supra note 8. Levinson also argued that
implicit bias might account for the unintentional masking of race of defendant effects in large
scale statistical studies. Id. at 632-33. 186
After all, priming racial stereotypes has been shown alter decision-making. Levinson et al., A
Social Science Overview, supra note 9. 187
Id. at 530. 188
Pennington & Hastie, Explaining the Evidence, supra note 169 at 191; Pennington & Hastie,
The Story Model, supra note 169 at 201. 189
Coffin v. United States, 156 U.S. 432, 453 (1895). See also Estelle v. Williams, 425 U.S. 501,
503 (1976) (“The presumption of innocence . . . is a basic component of a fair trial under our
system of criminal justice.”). According to Scott Sundby, “the presumption of innocence is given
vitality primarily through the requirement that the government prove the defendant’s guilt beyond
a reasonable doubt.” Scott E. Sundby, The Reasonable Doubt Rule and the Meaning of Innocence,
40 HASTINGS L.J. 457, 458 (1989). 190
Danielle K. Young et al., Presumption of Innocence: Biasing Racial Cues (2011) (unpublished
manuscript) (on file with authors).

36 DEVALUING DEATH 19-Feb-13
instructions.191
Jurors were then immediately given a dot-probe task, a
computerized visual measure used by attention-perception researchers to
determine where a person is attending/focusing.192
The study showed that
participants who received the presumption of innocence instructions were more
likely to visually focus on a Black face compared to participants who received the
other instructions.193
Drawing on the literature from perception studies, in which
studies have shown that the activation of crime causes people to attend to Black
faces,194
and that the priming of Black stereotypes leads to the faster identification
of weapons,195
the researchers interpreted this finding as indicating the
counterintuitive – that people actually implicitly associate the presumption of
innocence with Black aggression and guilt.196
If it is indeed true that instructing
jurors on the presumption of innocence could presumably prime implicit
associations of Black guilt (all added on top of the biases that have already
occurred in the previous stages), it would serve as a powerful reminder that the
jury decision-making process could serve as an automatic bias delivery
mechanism.
In light of this research on implicit bias in the various stages of criminal trial
decision-making, one could predict that implicit bias could manifest in capital
decision-making in similar ways. Specifically, it could be predicted that jurors
will implicitly associate Black defendants with racial stereotypes, including
aggressiveness, guilt, and perhaps even lack of worth. These same stereotypes
could apply to victims, too. Similarly, juries might remember and misremember
facts from trial in racially biased ways. These facts, too, could include those
relevant to both the defendant (e.g. facts relevant to aggravating or mitigating
factors) and the victim (e.g. facts relevant to their value to their employers,
families, and communities). Jurors may also automatically evaluate ambiguous
evidence in an unjust manner, and be primed by various jury instructions. In the
study we conducted, we were motivated by related research questions that build
on these previous studies as well as draw on decades of research on racial
disparities in the death penalty.
191
The instructions were based upon the Ninth Circuit Model Jury Instructions, available at
http://www3.ce9.uscourts.gov/web/sdocuments.nsf/crim (last visited Oct. 5, 2012). 192
Young et al., supra note 190 at 5. 193
Young et al., supra note 190 at 9. 194
Eberhardt et al., Seeing Black, supra note 9 at 888 (“Indeed, thinking about the concept of
crime not only brought Black faces to mind but brought stereotypically Black faces to mind.”). 195
Id. at 881 (explaining that participants who saw a Black face were more apt at identifying
“crime-relevant objects”). 196
Young et al., supra note 190.

19-Feb-13 LEVINSON, SMITH & YOUNG 37
The history of racial bias in the death penalty, the still troubling application of
death qualification, and the emergence of implicit racial bias scholarship and
methods led us to conduct an empirical study. Consistent with our discussion in
the previous sections, we hypothesized as follows:
Hypothesis 1: Jury eligible citizens harbor implicit racial stereotypes that
may prove relevant to capital cases, including stereotypes specific to the value of
human life. Specifically, jurors will associate Black with aggressive, lazy, and
worthless, and White with virtuous, hard-working, and valuable.
Hypothesis 2: Death qualified jurors will display greater implicit bias and
self-reported bias than jurors who would be excluded from jury service. Thus, the
process of death qualification will remove the least racially biased jurors and lead
to the empanelling of more biased juries.
Hypothesis 3: Implicit racial bias will predict which defendants are
sentenced to death; specifically, the more implicit bias jurors display, the more
likely they will be to sentence a Black defendant to death, and the more likely
they will be to sentence to death a defendant on trial for killing a White victim.
IV. THE EMPIRICAL STUDY
To test these hypotheses, we conducted an empirical study designed to examine
the role of implicit racial bias in death qualification and in capital decision-
making. This Section presents the methodology and results of the study.
A. Methods
1. Participants.
The study involved 445 jury eligible citizens in six leading death peanlty states:
Alabama, Arizona, California, Florida, Oklahoma, and Texas.197
Participants
were recruited on the Internet by a specialized survey recruitment firm.198
The
197
At least 75 participants from each state initially completed the study, totaling 478 participants.
This ranged from a minimum of 75 participants in Alabama to a maximum of 82 participants in
Florida. Participants who were not United States citizens (N=2), or did not meet other
qualifications to serve as jurors (e.g., having been convicted of a felony, N=27), or who were not
from the targeted states (N=4) were removed from the data set. 198
These participants were part of a national database maintained by the private survey company;
they received minimal compensation for participating. Because the participants had chosen to
receive survey solicitations from the soliciting company, the participant pool was not a random
38 DEVALUING DEATH 19-Feb-13
participant pool was diverse, as indicated by several measures. The age of the
participants ranged from 18 to 81, with an average age of 53.39 (SD=14.62) years.
Of the participants, 57.7 percent were women. Participants in the study came from
a wide range of ethnic backgrounds. 82.7 percent of participants identified
themselves as Caucasian, 5 percent of participants identified themselves as
African-American, 3.4 percent of participants identified themselves as multiracial,
2.7 percent of participants identified themselves as Latino, 2.5 percent identified
as Asian, 2.5 percent identified as Native American/Hawaiian, and 1.4 percent
identified themselves as members of other ethnic groups.199
The participant pool
contained tremendous educational diversity. For example, 40.6% of the pool had
completed some college, but did not hold a degree, 20.1% held a bachelor’s
degree, 10.9% held Masters or other non-PhD advanced degrees, 1.4% held PhDs,
and 18.6% of the pool completed less than high school or high school with no
college. There was also substantial religious diversity in the participant pool
(with members of over fifteen different religions represented).
2. Materials.
Participants completed several measures, including two IATs and a mock trial life
or death sentencing task. Participants also completed death qualification
questions prior to the mock trial, two questionnaire style measures of racial
attitudes, and demographic questions. The IATs measured implicit racial
stereotypes, but each had a different focus. One was a Back-White stereotype
IAT that has been used regularly in implicit social cognition research.200
This
IAT measures implicit associations between race and traditional stereotypes, such
as aggression and lazyness. The other was a new IAT we created for purposes of
this study, which we called the “Value of Life IAT.” This IAT required
participants to group together photos of Black and White people with words
incidating value/worth (e.g. valuable, worthwhile) and lack of value/worth (e.g.
worthless, expendable).201
The purpose of this IAT was to determine whether
people hold implicit stereotypes relating to race and human worth. We developed
this particular IAT because we believed that racial disparities in the death penalty
sample of the entire population. Nonetheless, as our reported statistics suggest, the diversity of the
sample was notable. 199
These were groups that were not listed on the checklist the survey instrument provided. Some
of the participants who were in this category separately indicated their ethnic identity on a line
next to the check mark, including participants who checked one or more of the listed ethnicities in
addition to marking “other.” The groups identified by those who marked “other” included
Koreans, Samoans, Vietnamese, North Africans, Portuguese, Puerto Ricans, and others. 200
Anthony Greenwald et al., Measuring Individual Differences in Implicit Cognition: The
Implicit Association Test, 74 J. PERSONALITY & SOC. PSYCHOL. 1464, 1478 (1998). 201
The stimuli words used for worth were: Merit, Worthwhile, Worthy, Value, Valuable. The
stimuli words used for worthless were: Drain, Expendable, Worthless, Waste, Valueless.

19-Feb-13 LEVINSON, SMITH & YOUNG 39
may be at least partially explained by differential values placed on the lives of
defendants and victims.
The explicit (self-reported) measures of racial bias consisted of a measure known
as the Modern Racism Scale (MRS).202
The MRS asks participants to rate their
agreement or disagreement with a series of statements, such as “Discrimination
against Blacks is no longer a problem in the United States.”
The mock-trial presented to the participants was inspired by an actual case. The
trial facts were presented as follows:
At 10:00 p.m. on May 22, 2009, Edward Walsh, a 48 year old
Caucasian man, just finished his shift as assistant manager at
Walmart. He noticed a Walmart private security employee stop a
customer as the customer was leaving the store. The security guard
thought that the customer had shoplifted two disposable cameras.
Walsh proceeded to the location where the security officer had
stopped the customer. When he saw the customer, he remembered
ringing up his purchases. He did not recall him purchasing any
cameras. A physical struggle ensued between the security officer
and the customer.
As Walsh attempted to aid the security officer in detaining the
customer, the customer pulled out a handgun and discharged the
weapon several times. The customer then fled the scene. Edward
Walsh died from a gunshot wound to the chest. The customer, who
was later identified as Tyrone Jones, a 22 year old African-
American man, subsequently turned himself in to the police.
After the description of the crime, participants read the Victim Impact Testimony
given by the victim’s wife.203
During this testimony, the prosecutor questions the
victim’s wife about the loss of his life. The following is an excerpt:204
Attorney: Where do you stand today?
202
See J.B. McConahay, Modern Racism, Ambivalence, and the Modern Racism Scale, in
PREJUDICE, DISCRIMINATION, AND RACISM 91 (John F. Davido & Samuel L. Gaertner eds., 1986). 203
This was a portion of the actual victim impact statement given at trial. 204
Appendix A contains this complete testimony.

40 DEVALUING DEATH 19-Feb-13
Mrs. Walsh [Mrs. Washington]: Obviously life is not the same.
It has completely fallen apart, for all the dreams, you know. I was
probably married longer than possibly some of y 'all in here were
alive at the time. And, you know, it's your friend, it's your lover,
it's your confidant and your husband, and that more than
disappeared one morning, you never get that back. You never get
that back.
The death qualification questions were presented at the beginning of the
sentencing mock trial task, and were designed to comport with existing case law
on death qualification.205
Thus participants were asked:
(1) If the State proves beyond a reasonable doubt that Mr. Baker206
intentionally murdered Edward Walsh, would you be able to
find the defendant guilty even though he would then be eligible
for the death penalty?
(2) If the State proves beyond a reasonable doubt that Mr. Baker
intentionally murdered Edward Walsh, you will be responsible
for deciding his punishment. Would you: a) Automatically vote
for a life sentence without the possibility of parole, b)
Automatically vote for the death penalty, c) Be able to consider
both a life sentence without the possibility of parole and a
sentence of death.
If participants answered that they were unwilling to convict the defendant (N= 27)
or if participants answered that they would be unwilling to consider giving a
convicted defendant the death penalty (N= 51), those participants completed the
remainder of the study, and their data was retained in order to compare how death
qualified jurors compare with non death qualified jurors.207
205
The death qualification questions were presented at the beginning of the sentencing mock trial
task, and were designed to comport with existing case law on death qualification. See Wainwright
v. Witt, supra note 151. 206
There were two conditions based on the race of the defendant and two conditions based on the
race of the victim, known as a 2 * 2 study design. 207
Participants who answered that they would automatically vote for the death penalty (N= 53)
were similarly not treated as death qualified and were removed from statistical analyses of death
qualified only jurors.

19-Feb-13 LEVINSON, SMITH & YOUNG 41
The tasks described above were all completed on computers of the participants’
choice and were presented in the following manner. Participants first responded
to death qualification questions, after which they read a written description of the
case. The case summation was followed by an evidence slideshow consisting of
four photographs shown for four seconds each. One of these photos was a
tombstone that displayed the name of the victim; the name could be altered
depending upon the race of victim condition.208
After viewing this slideshow,
participants were informed that the defendant had been found guilty, and that their
job was to decide if the defendant should be sentenced to either death or life in
prison. They read that “One important factor to take into consideration is the
impact that the crime had on the family members of [the victim],” and then were
presented with the Victim Impact Testimony. After reading the testimony,
participants decided how the defendant should be punished. Next, participants
completed counterbalanced implicit and explicit measures of bias, with the order
of the IATs also counterbalanced. Demographic questions were completed last.
B. Results- Implicit Bias and the Death Penalty
To test our hypotheses, and to analyze the results more generally, we conducted
several statistical analyses: For hypothesis one, we tested whether death qualified
jurors harbor significant implicit biases using one-sample t-tests.209
Hypothesis
two was tested using a multivariate ANOVA (MANOVA)210
comparing death
qualified jurors and non-death qualified jurors on the three bias measures (two
implicit and one explicit). To test hypothesis three, dichotomous death penalty
decisions (life in prison v. death sentence) were regressed upon race of defendant
and victim, explicit and implicit biases, and the two-way interactions between
these variables.211
1. White Jurors More Racially Biased Than Non-White Jurors
208
These slides are attached as Appendix B. 209
A one-sample t-test tests whether or not a single population differs from a hypothesized value.
In the case of the IAT, the hypothesize value is zero, or no bias. Thus, the one-sample t-test
referenced here tested whether or not the study population’s IAT score was significantly different
than zero. RONALD CHRISTENSEN, ANALYSIS OF VARIANCE, DESIGN AND REGRESSION– APPLIED
STATISTICAL METHODS (2000). 210
MANOVA is a special case of ANOVA that allows the testing of several dependent variables
while reducing Type 1 error, or the probability of finding a significant difference between groups
when there is not a true difference. BARBARA G. TABACHNICK ET AL., USING MULTIVARIATE
STATISTICS (2001). 211
The regression controlled for race and gender of the participant.

42 DEVALUING DEATH 19-Feb-13
White jurors displayed higher levels of implicit racial bias (M=.48) than non-
White jurors (M=.34), as measured by both the stereotype IAT (F(1,311)=15.11,
p<.001, ηρ²=.05), and the Value of Life IAT (White juror M= .38; non-White
juror M= .15), (F(1,311)=4.50, p=.035, ηρ²=.01). White jurors also displayed
higher levels of explicit racial bias (M=2.49), as measured by the Modern Racism
Scale, than non-White jurors (M=2.04; F(1,311)=12.97, p<.001, ηρ²=.04).212
2. Male and Female Jurors Similarly Biased
Male jurors displayed marginally higher levels of explicit racial bias (M=2.51), as
measured by the Modern Racism Scale, than female jurors (M=2.36;
F(1,311)=2.91, p=.09, ηρ²=.01).213
Male jurors did not display significantly
higher levels of implicit racial bias (M=.49) or higher levels on the Value of Life
IAT (M=.34) than female jurors (M=.44; M=.36, all ps>.05 ).
3. Male Jurors More Likely to Sentence to Death
30.9 percent (N=137) of the participants voted to sentence the defendant to death.
Male jurors (38.3%) were significantly more likely to vote for death than female
jurors (25.4%) (χ2=8.46, p=.004), a result that was true for all jurors as well as
death-qualified jurors only (Male= 34.1%, Female=24.0%, χ2=3.84, p=.05).
Although the percentages trend in that direction, White participants were not
significantly more likely to levy the death penalty (32.2%) than non-White
participants (24.7%; χ2=1.67, p=.20).
4. Women and Non-White Jurors Less Likely to be Death Qualified214
Female jurors were significantly more likely to be excluded for failing to be death
qualified. 24% percent of female jurors indicated that they would be unwilling to
sentence a defendant to death, compared to 14.3% of male jurors ( χ2=5.85,
p=.02). White participants were significantly more likely to be death qualified
(83.2%) than non-White participants (64.3%; χ2=12.82, p<.001). These results
indicate that death qualification leads to more male and White juries.
5. Death Qualified Jurors Possess Moderate to Strong Implicit Racial
Biases
212
We ran a MANOVA on all of the bias DVs, multivariate significance is: F(3,309)=7.86,
p<.001, ηρ²=.07. The results presented are for death qualified jurors. 213
A MANOVA on all of the bias DVs failed to reach multivariate significance. We report the
results here to demonstrate the trends in the data: F (3,309)=1.89, p>.05, ηρ²=.08. The results
reported are for death qualified jurors. 214
Due to our limited sample size, we combine jurors who would be excluded because they either
could not vote to convict (traditionally called “nullifiers”) and could not vote for death
(traditionally called “Witherspoon Excludables).

19-Feb-13 LEVINSON, SMITH & YOUNG 43
Death qualified jurors displayed moderate to strong implicit biases both on the
racial stereotype IAT, M=.46, t(312)=19.75, p<.001, and the Value of Life IAT,
M=.35, t(312)=16.02, p<.001, such that they implicitly associated White with
positive stereotypes and Black with negative stereotypes and implicitly associated
White with worth and Black with worthless.215
6. Death Qualified Jurors held Greater Self-Reported (Explicit) Racial
Bias
Jurors who were death qualified displayed higher levels of racial bias (M=2.42)
on the MRS than jurors who would be excluded because they may be unwilling to
convict or unwilling to sentence a defendant to death (M=2.03; F(1,390) 14.35,
p<.001, ηρ²=.04).216
7. Death Qualified Jurors Held Greater Implicit Racial Bias
Jurors who were death qualified displayed higher levels of implicit racial bias
(M=.46), as measured by the stereotype IAT, than jurors who would be excluded
because they may be unwilling to convict or unwilling to sentence a defendant to
death (M=.36, F(1,390)=3.87, p=.05, ηρ²=.01). Similarly, jurors who were death
qualified displayed higher levels of bias related to implicit racial worth (M=.34),
as measured by the Value of Life IAT, than non-death qualified jurors (M=.25,
F(1,390)=4.46, p=.035, ηρ²=.01).
8. Death Qualification Implicit and Explicit Bias Differential Driven By
Exclusion of Non-White Jurors
We next investigated whether the exclusion of non-White individuals contributes
to the higher levels of racial bias (on the Value of Life IAT, Stereotype IAT, and
MRS) in death qualified juries. To test this, three separate mediation models were
run on each of the three measures of bias using the zMediation method.217
The
mediation results for the Value of Life IAT suggest that the race of a juror fully
mediates the relationship between death qualification and implicit worth.218
This
215
These two measures were moderately positively correlated, r(313)=.46, p<.001. 216
We conducted a MANOVA on all of the bias DVs: F(4,387)=4.14, p=.003, ηρ²=.04. 217
Dawn Iacobucci, Mediation Analysis and Categorical Variables: The Final Frontier, 22 J.
CONSUMER PSYCHOL. 582 (2012). 218
The direct effect of death qualification on value of life bias was, as in previous analyses,
significant, B = .10, p = .04. As expected, the relationship between death qualification and race of
the individual (White/Not-White) was significant, B = -1.01, SE=.29, p < .001, as was the
relationship between race of the individual and value of life bias, B = .22, SE=.05, p < .001.

44 DEVALUING DEATH 19-Feb-13
suggests that the difference between White and non-White jurors’ implicit value
of life bias completely mediates the differences between death qualified jurors
and non-death qualified jurors, zMediation = -2.69, p<.05. Similarly, the
mediation results for implicit bias as measured by the stereotype IAT mirror those
of the value of life IAT.219
The difference between White and non-White jurors’
implicit stereotype bias completely mediates the differences between death
qualified jurors and non-death qualified jurors, zMediation = -2.12, p<.05.
Finally, the mediation results for the explicit racism, as measured by the MRS,
suggest that the race of a juror partially mediates the relationship between death
qualification and explicit racism.220
This suggests that the difference between
White and non-White jurors’ explicit bias partially mediates the differences
between death qualified jurors and those who would not consider the death
penalty, zMediation = -2.60, p<.05.
[Insert Table 1 Here: Implicit Racial Bias and Probability of Death Based on Race
of Defendant]
9. No Main Effects for Race of Defendant or Race of Victim
Although studies on actual court decisions have revealed consistent effects across
jurisdictions over the past thirty years, particularly on race of the victim, the
results of our study did not reach statistical significance in this regard. Neither
race of the defendant (β=.20, p=.62), race of the victim (β=.26, p=.67), nor their
interaction (β=-.59, p=.55), predicted increased probability of giving a death
sentence (See Table 3).
[Insert Table 2 Here: Self Reported Bias and Probability of Death based on Race
of Victim]
10. Racial Bias, Implicit and Explicit, Predicts Death Verdicts
Including race of the individual in the model reduced the effect of death qualification to non-
significance, B = .06, SE=.05, p = .18. 219
The direct effect of death qualification on stereotype bias was significant, B = .1, p = .05. The
the relationship between death qualification and race of the individual (White/Not-White) was
significant, B = -1.01, SE=.29, p < .001, as was the relationship between race of the individual and
stereotype bias, B = .15, SE=.05, p = .006. Including race of the individual in the model reduced
the effect of death qualification to non-significance, B = .08, SE=.05, p = .15. 220
The direct effect of death qualification on explicit racism was significant, B = .39, p < .001.
The relationship between death qualification and race of the individual (White/Not-White) was
significant, B = -1.01, SE=.29, p < .001, as was the relationship between race of the individual and
explicit bias, B = .43, SE=.11, p < .001. Including race of the individual in the model does not
reduce the effect of death qualification to non-significance, B = .31, SE=.10, p = .002.

19-Feb-13 LEVINSON, SMITH & YOUNG 45
Logistic regression analysis on the life/death decision partially supported our
hypothesis that biases would interact with race of the defendant and victim to
increase the likelihood that the jurors would support the death penalty for a
convicted defendant (See Tables 1 & 2). Specifically, interaction effects
involving racial bias measures and the race of either the defendant or the victim
significantly increased the odds of a death penalty outcome. Having a higher
“value of life” implicit association between White and worth and Black and
worthless increased the probability of sentencing a defendant to death when the
defendant was Black (β=-1.77, p=.03). Interestingly, the “value of life” IAT did
not interact with the race of the victim, nor did the stereotype IAT significantly
increase the odds of a death penalty decision (all ps >.05).
The explicit measure of racial bias interacted with the race of the victim.
Specifically, the MRS interacted with the race of the victim, such that a higher
self-reported racial bias score led to an increased chance of giving the death
penalty when the victim of the murder was White ((β=.75, p=.05). The MRS did
not interact with the race of the defendant.
[Insert Table 3 Here: Regression Results]
V. SUMMARY OF RESULTS AND IMPLICATIONS
The study we conducted helps to build a model of implicit bias in the law,
provides corroborating evidence for spatial and cultural understandings of death
penalty usage, supports critiques of both procedural and substantive safeguards
that supposedly add fairness to the capital process, and raises questions with
implications for a broad range of issues relating to the constitutionality of capital
punishment. We address each of the contributions in turn.
A. Building an Implicit Bias Model of Criminal Law
The expansion of knowledge of implicit bias in the law is significant; only a
handful of studies have empirically examined how implicit bias functions in legal
processes. The findings of the study raise several implications for building a
broader understanding of implicit bias in criminal law and beyond. Several of our
specific findings contribute to this literature. First, as expected, the study
confirmed that jury eligible citizens display moderate to strong implicit racial
stereotypes of Black Americans. Because these particular implicit stereotypes,

46 DEVALUING DEATH 19-Feb-13
such as aggression and laziness, have been shown to predict a wide range of
decisions and behaviors,221
this alone raises concerns regarding the role of racial
bias, not only in life and death decisions, but also in all criminal proceedings.
Other results heighten the concerns. Specifically, in addition to the traditional
measure of stereotype biases that we used, we also found that jury eligible citizens
held specific biases related to race and the value of life. The idea that jury
eligible citizens specifically associate Black with worthless and White with value
is both unsurprising (considering death penalty statistics, economic and job
figures, etc.) and yet hard to fathom (because of the deep moral implications).
This result suggests that people not only still hold age-old stereotypes of Black
Americans, such as aggression and laziness, but that they normatively and
implicitly value them as humans less than their White American counterparts.222
This finding is concerning in all areas of the law, with all types of remedies (in
tort and contract, for example) and sentencing (in criminal law) potentially
implicated, but is particularly heightened because human life is actually at stake
in capital trials.
Unfortunately, as our study showed, the strength of these implicit biases was
actually heightened by the exclusion of less biased Americans in the death
qualification process. Specifically, a process designed to ensure fairness in the
implementation of the law was found to create a situation in which the chances of
injustice became magnified. But what kind of injustice? Our results show that,
indeed, implicit bias has the potential to implicate race-based decision-making.
Because of our finding that increased implicit bias predicted a higher likelihood of
death decisions for Black defendants, we are left to wonder about all the other
domains in which it too may be active. One mild surprise in our results, however,
was that explicit bias matters, too. Even though the days of rampant and overt
racism are gone, our study shows that it is still valuable to monitor explicit racial
bias, at least in capital cases. If higher self-reported bias indeed leads, as we
found, to more death sentences for the killers of White victims, then it seems
natural that courts would place energy in rooting out those jurors who will
acknowledge their own biases. It is unclear, however, whether existing
questioning efforts in most trials succeed in this regard (and it is similarly unclear
whether jurors in real trials will admit these biases as readily to judges, as they did
in an anonymous questionnaire).
B. Spatial and Cultural Explanations of Death Penalty Usage
221
See, e.g., Rudman & Ashmore, supra note 11. 222
See generally Goff et al, Not Yet Human, supra note 166.

19-Feb-13 LEVINSON, SMITH & YOUNG 47
The spatial and cultural “explanation” is largely a sociological description of the
places where death sentences are still imposed with regularity. Recall that these
jurisdictions tend to have unique spatial (relatively high Black populations in a
central zone, surrounded by bands of predominately White areas) and cultural
(tend to be parochial, with anxiety towards outsiders and hostility to cultural
change) attributes. Implicit racial bias helps to explain the psychological
dynamics that undergird the sociological phenomenon. For example, previous
research on implicit associations between “Black” and “dangerousness”, as well
as research showing the exposure to a Black face causes a disproportionate
response in the area of the brain associated with fear,223
would suggest that
residential isolation between Blacks and Whites bolsters the intensity of the
anxiety towards outsiders.
Our finding that death-qualified participants more rapidly associate White
subjects with the concept of “worth” or “value” and Black subjects with the
concepts “worthless” or “expendable” suggests that another form of implicit racial
bias—implicit in-group favoritism—is at play in “donut” jurisdictions that
regularly impose death sentences. One of the social groups for which people show
the strongest and most consistent preferences is the racial in-group. In the United
States, of the nearly two million Americans that have completed an IAT, roughly
75-80% of White and Asian (and about 50% of Black Americans) implicitly favor
White Americans. In donut jurisdictions, the outer ring occupied
disproportionately by White residents tends to be more affluent. Prosecutors and
capital jurors alike tend to be White, and, in donut jurisdictions, probably tend to
live in the outer ring. In other words, in many Black-defendant, White-victim
cases, the decision-makers are “insiders”, the White victim is an “insider” and the
Black defendant is an “outsider.” Of the factors that create insider / outsider
boundaries—spatial segregation and affluence, for example—race is the most
salient. The fact that participants, who were predominately White, associated
White with “worth” and “value” suggests that White insiders implicitly associate
the loss of a White citizen with more harm or loss than the death of a Black
citizen. True, these same dynamics could exist even in spatially and culturally
integrated communities, but the spatial segregation and outsider anxiety
associated with donut jurisdictions facilitates and intensifies the problem.
C. Discretion Points: Prosecutors and Capital Jurors
223
Matthew D Lieberman et al., An fMRI Investigation of Race-related Amygdala Activity in
African-American and Caucasian-American Individuals, 8 NATURE NEUROSCIENCE 720
(2005), available at http://www.scn.ucla.edu/pdf/nature%20neuroscience%20press/nn1465.pdf.

48 DEVALUING DEATH 19-Feb-13
Our results suggest that it is plausible that prosecutors magnify the damage done
to white victims while paying too little attention to the redeeming quality of black
offenders. Capital jurors are susceptible to the same dynamics. Although we did
not find a race of defendant main effect, the white / worth and black / expendable
findings have haunting implications for the penalty phase of capital trials. The
defendant is humanized during the penalty phase. Jurors hear about the
defendant’s background and his character. In many cases, the defendant suffers
from mental deficiencies or severe mental illness or has suffered extreme physical
abuse. If jurors—who mostly are white—are faster to associate value or worth
with a white defendant than a black defendant—then the race of the defendant
effects during the penalty phase might be attributable to an unintentional decrease
in receptivity to mitigation evidence proffered by a Black defendant.
D. Racially Partial Impact of Mechanisms Designed to Reduce
Impartiality
1. Value of Life and the Core Justifications for Capital Punishment
Our findings challenge the idea that retribution—the core justification for capital
punishment—is race-neutral. Instead, taken together, three of our findings suggest
that the retributive rationale could be inextricably tied to race. First, we found that
death-qualified jurors implicitly valued White lives over Black lives by more
rapidly associating White subjects with the concepts of “worth” or “value” and
Black subjects with the concepts of “worthless” or “expendable.” This finding
could potentially help to explain why real capital juries impose death sentences
more regularly for White victims: at least at an implicit level we value White lives
more than Black lives, and thus, perhaps, we seek to punish those individuals who
have destroyed those whom we value most.224
Next, our finding that explicit
racial bias predicts life and death decisions based on the race of the victim also
offers support for the idea that we demand more retribution when the life of a
White person is lost. Finally, our findings also demonstrate that a higher value of
life implicit association between White and worth and Black and worthless
increased the probability of sentencing a defendant to death when the defendant
was Black. This finding might suggest that jurors who are predisposed to seeing
Black Americans as comparatively worthless have an easier time retaliating by
voting to take the life of a Black offender whom himself has taken a life.
Considered together, our findings strengthen the notion that the relationship
between race and retribution continues to contribute to the same disparities in
224
Future research would be needed in this regard, as our regression did not significantly link this
score to race of victim effects.

19-Feb-13 LEVINSON, SMITH & YOUNG 49
capital punishment that it did in the context of extra-legal lynching. Importantly,
our findings suggest that the race-retribution link is not simply historically
inextricable, but might also be culturally programmed into minds of those citizens
that serve on death-qualified juries.
2. Death-Qualification
Although the operation of implicit racial bias in the criminal justice system
generally has been considered fairly extensively, comparatively little empirical
evidence evaluates the role that implicit bias plays in capital sentencing. A more
technical aim in this study, then, was to gather more information about the
location and manner in which racial bias enters into capital cases. Our findings
that the death qualification process results in jurors that are more implicitly and
explicitly racially biased suggest that jury selection is a location where racial bias
operates.
Scholars’ first major critique of death qualification was that death-qualified juries
tend to be more conviction-prone than ordinary juries. In other words, those
citizens that refuse to consider voting to impose a death sentence are the same
jurors that are more likely on the margins to vote not guilty during the guilty /
innocence phase of the trial. By 1986, when the Supreme Court heard arguments
in Lockhart v. McCree225
on whether “the Constitution prohibit[s] the removal …
of prospective jurors whose opposition to the death penalty is so strong that it
would prevent or substantially impair the performance of their duties as
jurors[,]”226
a variety of empirical studies provided support for the contention that
death qualified juries are comparatively more conviction prone than ordinary
juries.227
The defendant relied upon these studies to argue that a conviction-prone
225
Lockhart v. McCree, 476 U.S. 162 (1986). 226
Id. at 165. 227
See id. at 169-170 (noting the existence of fifteen studies, of which the Court found six to be
relevant); see, e.g., Claudia L. Cowan, William C. Thompson, & Phoebe C, Ellsworth, The Effects
of Death Qualification on Jurors' Pre-disposition to Convict and on the Quality of Deliberation, 8
Law & Hum. Behav. 53 (1984) (finding that death-qualified jurors are more likely to vote guilty
both on initial ballots and after one hour of twelve-person jury deliberations). Social science
scholars have continued to document that death qualification leads to conviction-prone juries, and
have done so while addressing the specific deficits that the Supreme Court found in the original
studies. See Susan D. Rozelle, The Principled Executioner: Capital Juries' Bias and the Benefits
of True Bifurcation, 38 ARIZ. ST. L.J. 769, 784-785 (2006) quoting Benjamin Fleury-Steiner,
Juror's Stories of Death: How America's Death Penalty Invests in Inequality, University of
Michigan Press, pp. 24-25 (2004) (using data collected from 1201 real capital jurors from more
than 350 trials and concluding that death-qualified jurors are “disproportionately punitive
orientations toward crime and criminal justice, are more likely to be conviction-prone. . . .”); id. at
784 (noting that the findings of the Capital Jury Project eliminate any “nullifier effect” by using

50 DEVALUING DEATH 19-Feb-13
jury is a partial jury and that the Sixth Amendment prohibits partial juries.228
Responding to this argument, the Lockhart Court spent little energy in reviewing
the studies themselves, instead avoiding the experiments’ thoughtful methods and
important findings by seeking to dismiss their validity.229
One notable dismissal
of all of these studies’ external validity was the Court’s claim that the research did
not use actual jurors deciding actual cases, a standard that would essentially be
impossible to meet.230
Nonetheless, the Supreme Court assumed for the sake of argument that the
“studies are both methodologically valid and adequate to establish that ‘death
qualification’ in fact produces juries somewhat more ‘conviction-prone’ than
‘non-death-qualified’ juries,” and held that the Constitution still would “not
prohibit the States from ‘death qualifying’ juries in capital cases.”231
The Court
reasoned that jurors that are excluded due to death qualification are not a “distinct
group” in the same way that “Blacks” or “women” are distinct groups.232
Furthermore, the Court noted that the jurors excluded by death qualification are
not historically disadvantaged (unlike the groups, e.g. Black Americans, that are
traditionally covered under the Sixth Amendment’s Fair Cross Section
requirement).233
Instead, they are eliminated based on chosen conscious
choices—an unwillingness to follow the law by considering a possible death
sentence.
We found that the process of death qualification results in capital jurors with
significantly stronger implicit racial biases—on both the stereotype and value of
life IAT—and explicit racial biases than jury-eligible citizens generally. We also
found that stronger implicit biases scores predict the likelihood that death-
actual jurors who survived the process of death qualification and thus by definition are not
nullifiers). 228
Lockhart, 476 U.S. at 165. 229
Id. at 186 (“[T]he Court was unable to conclude that ‘the exclusion of jurors opposed to capital
punishment results in an unrepresentative jury on the issue of guilt or substantially increases the
risk of conviction.’”) (quoting Witherspoon v. State of Ill., 391 U.S. 510, 518). 230
Id. at 171-173. Interestingly, a range of studies have continued to emerge post-Lockhart that
build on the research showing that death qualified jurors are quite different from non-death
qualified jurors. See Butler, Death Qualification and Prejudice, supra note 158 at 857 (finding
that death-qualified jurors display higher levels of explicit racism, sexism (modern sexism scale)
and racism (modern racism scale)); Brooke Butler and Adina Wasserman, supra note 157 at 1745-
46. 231
Lockhart v. McCree, 476 U.S. 162, , 173 (1986). 232
Id. at 175-176. 233
Id. at 162-63 (“[T]he essence of a fair-cross-section claim is the systematic exclusion of a
‘distinctive group’ in the community such as blacks, women, and Mexican-Americans-for reasons
completely unrelated to the ability of members of the group to serve as jurors in a particular
case.’”).

19-Feb-13 LEVINSON, SMITH & YOUNG 51
qualified jurors vote to impose a death sentence when the defendant is Black, and
that explicit bias scores predict the likelihood that death-qualified jurors vote to
impose a death sentence when the victim is White. These findings themselves are
a significant indictment of the death-qualification process. The biggest
indictment, however, is our finding that death qualified juries possess stronger
implicit biases because the process results in the disproportionate elimination of
non-White jurors.
These findings, then, not only shine light on where in the capital punishment
structure racial bias might operate, but also suggest a deeper structural concern:
the procedures that regulate capital punishment might inadvertently increase the
risk that racial arbitrariness will infect capital proceedings. A number of studies
document that implicit racial biases already operate to the detriment of Black
defendants by: undermining the presumption of innocence, affecting the
evaluation of ambiguous evidence of guilt, and triggering stereotypes of the guilty
Black male.234
The fact that death-qualified jurors possess greater implicit biases
might be one reason why death-qualified juries are conviction-prone in cases
involving Black defendants (and especially in cases with White victims and Black
defendants). Thus, our findings that death-qualified jurors are more implicitly
biased, that these implicit racial biases could drive death-proneness, and that the
increased implicit racial bias on death-qualified juries is explained by the
exclusion of minority group jurors cast considerable doubt on a core rationale that
undergirds the Lockhart decision. The Fair Cross Section requirement is primarily
motivated out of a concern for jury legitimacy.235
The Lockhart Court’s point that
jurors who are excluded due to death qualification are not a “distinct group” in the
same way that “Blacks” are distinct group loses much of its power in the face of
these findings that suggest that the Court substantially underestimated the racial
influence that death qualification has on the cross section of citizens that hear and
decide capital cases.
Finally, our findings also lend credence to the notion that death qualification
impedes accurate assessment of community standards.236
The Eighth
Amendment’s Cruel and Unusual Punishment clause draws meaning from “the
234
Id. at 169-70. 235
Id. at 184 (“But the Constitution presupposes that a jury selected from a fair cross section of
the community is impartial . . . .”). 236
See, e.g., G. Ben Cohen & Robert J. Smith, The Death of Death-Qualification, 59 CASE W.
RES. L. REV. 87 (2008) (“Measuring the community’s sentiment concerning a specific punishment
by gathering a venire, removing from the venire all people opposed to a punishment, and then
taking the temperature of the remaining citizens concerning the propriety of that punishment,
would be like assessing the impact of global warming by taking the temperature in a room with its
air-conditioning on.”).

52 DEVALUING DEATH 19-Feb-13
evolving standards of decency that mark the progress of a maturing society.”237
In
order to assess whether modern decency prohibits a particular sentencing practice,
courts look to several “objective indicia,” including the behavior of juries.238
The
idea is that juries, as Justice Scalia has put it, “maintain a link between
contemporary community values and the penal system that this Court cannot
claim for itself.”239
Eliminating jurors that refuse to impose a particular
punishment practice (here, the death penalty), then, has the effect of eliminating
the voice of a discrete segment of the community, and thus, making it impossible
to get a true read on community consensus. Our findings that death-qualified
jurors possess greater implicit racial biases than jury-eligible citizens generally—
especially when considered alongside our findings that implicit racial bias
predicts race of defendant effects and explicit racial bias predicts race of victim
effects—suggests that, for Eighth Amendment purposes, assessing “community
consensus” based on the jury verdicts of a more biased pool of Americans (i.e.
death-qualified jurors) might not be a methodology particularly prone to accuracy.
This broken thermometer for gauging community consensus is even more
troubling when one considers that the disproportionate exclusion of non-White
jurors explains the difference in implicit bias score between death-qualified jurors
and those jury-eligible citizens that cannot survive death-qualification. Stated
broadly, our findings both hint at where in the capital case racial biases might
seep into the system and suggest that regulating—as opposed to eliminating—the
death penalty through mechanisms like death-qualification might have had the
unintended effect of contributing to rather than detracting from racial
arbitrariness.
E. Global Challenges to the Constitutionality of the Death Penalty
In Gregg, the Court espoused the belief that a combination of carefully drafted
statutes and well-crafted procedural mechanisms would reduce the Furman
arbitrariness (including racial discrimination) concerns.240
In McCleskey, the
Court had—and exercised—the option of ducking the reality that these new
statutes and all of the extensive regulations were not, in fact, reducing the risk of
racial discrimination to a constitutionally tolerable level. If the source of the racial
bias in the death penalty is not just conscious (and perhaps capable of eradication
237
Trop v. Dulles, 356 U.S. 86, 101 (1958). 238
See Gregg v Georgia, 428 U.S. 153 (1976) (“The jury also is a significant and reliable objective
index of contemporary values because it is so directly involved.”). 239
Roper v. Simmons, 543 U.S. 551, 616 (2005) (Scalia, J. dissenting) (internal quotation
omitted). 240
Gregg, 428 U.S. at 195 (“[T]he concerns expressed in Furman that the penalty of death not be
imposed in an arbitrary or capricious manner can be met by a carefully drafted statute that ensures
that the sentencing authority is given adequate information and guidance.”).

19-Feb-13 LEVINSON, SMITH & YOUNG 53
through rigid procedural regulations), but is implicit, then the Court should
address head-on whether there is a constitutionally intolerable risk of arbitrariness
when states inflict the death penalty despite evidence that racialized sentencing is
built-in to the capital punishment regulatory structure via the implicit biases that
operate in the minds of death-qualified jurors. In other words, if, as we found,
death-qualified jurors implicitly believe that White Americans possess higher
worth than Black Americans, then the McCleskey Court focused on the wrong
question when considering evidence of intentional bias; the real question was
whether the Court had fallen short on its promise in Gregg: that new and
improved procedural regulation would suffice to eliminate arbitrariness.241
If the
seeds of that arbitrariness live literally within death-qualified jurors, and if we
continue to see race of victim or defendant effects when researchers study state
and local death sentencing, then, perhaps, Justice Blackmun was correct in his
assessment that no amount of “tinker[ing] with the machinery of death” could
create a fair, rational, race-neutral death sentencing scheme.242
Our findings also question the wisdom and validity of particular assumptions that
the Supreme Court has made in effecting constitutional regulation of capital
punishment. The McCleskey Court took the findings of the Baldus studies at face
value, but nonetheless found that proof of racial bias in the form of a large-scale
statistical study does not suffice to prove racial bias in a particular capital case.
The finding that death-qualified juries implicitly value White Americans over
Black Americans provides a potential pathway to explaining how the statistical
studies that show race of the victim effects in a county (or a state) could stem, at
least in part, from broad swaths of the population (and especially death-qualified
jurors). Thus, implicit racial bias evidence contributes to the broader literature on
race and the death penalty both by diversifying the type of evidence that
documents the influence of race on death sentencing and because implicit bias
evidence is not as easily subjected to the argument that one cannot deduce racial
discrimination from racial disparities (the primary complaint lobbied at the Baldus
study), nor is it hostage to the claim that any racial discriminatory outcome is
based on vestiges of past racism (in fact, people continue to harbor these implicit
attitudes and stereotypes). The fact that we tend to implicitly value White lives
over Black lives demonstrates a potential explanation for the results found in the
Baldus studies, and it powerfully illustrates that the seeds for discriminatory
decision-making in the capital context are not dead and gone; but instead, they
live, literally, within us.
241
Id. at 204-05. 242
See Callins v. Collins, 510 U.S. 1141, 1143 (1994) (Blackmun, J., dissenting) (statement
regarding the denial of certiorari).

54 DEVALUING DEATH 19-Feb-13
CONCLUSION
This Article presented the results of an experimental study of 445 jury eligible
citizens located in six of the most active death penalty states in the country.
Cognizant of persistent racial disparities in the administration of the modern death
penalty, we sought to examine whether implicit racial bias helps to shed light on
where and how race influences death penalty outcomes. Our findings—among
them: jury eligible citizens implicitly associate Whites with “worth” and Blacks
with “worthless,” death-qualified jurors hold stronger implicit and self reported
biases than do jury eligible citizens generally, the exclusion of non-White jurors
accounts for the differing level of implicit racial bias between death-qualified and
non-death qualified jurors, implicit racial bias predicts race of the defendant
effects and explicit racial bias predicts race of the victim effects—strongly
suggest that implicit racial bias does have an impact on the administration of the
death penalty in America. Specifically, we conclude that implicit bias complicates
the Supreme Court’s reliance on retribution as the legitimizing punishment
rationale for the death penalty, complements and diversifies the proof that the
post-Gregg procedural regulation of capital punishment has not been successful at
eliminating racial arbitrariness, and hints that procedural regulations intended to
promote impartiality—for example, death-qualification—might, in fact,
exacerbate the influence of race on death penalty outcomes.
We hope that this Article is seen as a beginning—proof that research into the
locations and procedures that drive racial disparities are worth exploring through
the lens of implicit social cognition. Future researchers might want to explore
directly the relationship between race and retribution by testing, for example,
whether implicit racial bias scores predict support for capital punishment as
expressed through policy statements (or even newspaper stories) that present
retributive (compared to, say, deterrence) rationales for capital punishment.
Scholars might also test whether implicit racial bias plays a role in pre-trial
sorting of capital cases. For example, do prosecutors perceive cases to be more
serious when they involve White victims, and, if so, do value of life implicit bias
scores predict these seriousness evaluations?
Whether the audience consists of state legislators examining whether capital
punishment remains a wise policy choice, the Supreme Court deciding if the death
penalty can be sustained on retributive grounds or if procedural regulations have
eradicated intolerable racial arbitrariness, or even individual prosecutors or capital
jurors deciding whether to impose the death penalty in a particular case, more
research is needed to isolate when, where and how race influences the
administration of capital punishment. Tools such as the methods developed in the

19-Feb-13 LEVINSON, SMITH & YOUNG 55
field of implicit social cognition provide the mechanisms necessary to glean the
answers that decision-makers need in a way that scholars simply could not
imagine at the time that Furman and Gregg were decided. We hope that this
Article—and the study that anchors it—is the first of many studies to engage
these questions through the implicit social cognition lens.
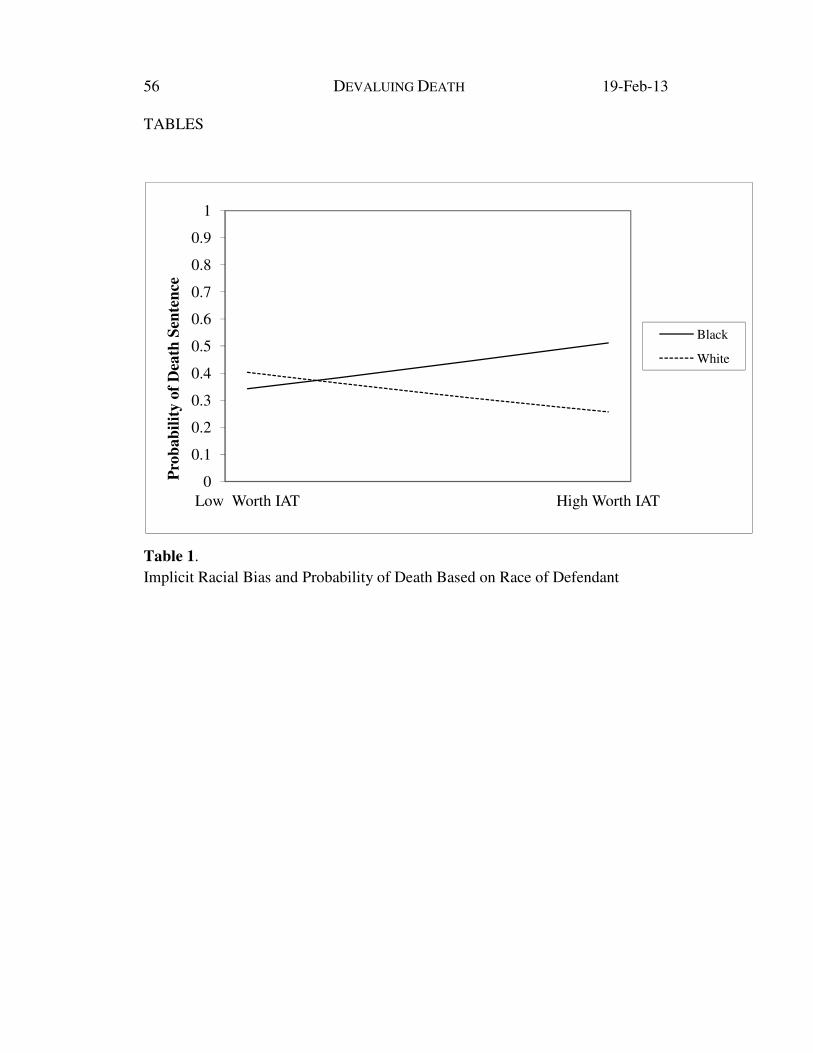
56 DEVALUING DEATH 19-Feb-13
TABLES
Table 1.
Implicit Racial Bias and Probability of Death Based on Race of Defendant
0
0.1
0.2
0.3
0.4
0.5
0.6
0.7
0.8
0.9
1
Low Worth IAT High Worth IAT
Pro
bab
ilit
y o
f D
eath
Sen
ten
ce
Black
White

19-Feb-13 LEVINSON, SMITH & YOUNG 57
Table 2.
Self Reported Bias and Probability of Death based on Race of Victim
0
0.1
0.2
0.3
0.4
0.5
0.6
0.7
0.8
0.9
1
Low Modern Racism Scale High Modern Racism Scale
Pro
bab
ilit
y o
f D
eath
Sen
ten
ce
Black
White

58 DEVALUING DEATH 19-Feb-13
B Wald Exp(B)
Race of Victim (RV) 0.15 0.08 1.16
Race of Defendant
(RD) 0.20 0.16 1.22
Value of Life IAT
(VIAT) 0.91 1.97 2.48
Stereotype IAT
(SIAT) -0.68 1.31 0.51
MRS 0.20 0.50 1.22
RV*RD -0.54 0.91 0.58
RV*VIAT -0.77 0.88 0.46
RD*VIAT -1.77 4.69 0.17*
RV*SIAT 0.19 0.06 1.21
RD*SIAT 0.87 1.35 2.38
RV*MRS 0.75 3.95 2.12*
RD*MRS 0.17 0.20 1.18
Gender -0.44 2.65 0.64
White Participant -0.18 0.18 0.83
*p<.05
Table 3.
Regression Results

19-Feb-13 LEVINSON, SMITH & YOUNG 59
Appendix A
Attorney: And what was your relation to Edward Walsh [Jamal Washington]?
Mrs. Walsh [Mrs. Washington]: He was my husband.
Attorney: How long had Edward [Jamal] and you been married prior to his
death?
Mrs. Walsh [Mrs. Washington]: Over 25 years.
Attorney: And we've heard some testimony that Edward [Jamal] worked a lot.
Would you ever go see him?
Mrs. Walsh [Mrs. Washington]: Yeah. I'd go see him. I was working days at the
time, you know, a regular 8 to 5 job. So in the evening I'd usually go pick up
supper somewhere and take it and go meet him and we'd sit and have supper.
Attorney: And what types of things did you and Edward [Jamal] like to do
together?
Mrs. Walsh [Mrs. Washington]: Just about everything.
We had both decided that we were going to retire early and spend a lot of time
together we would take trips, you know, short weekend trips, sneak off for a day
somewhere. Go down to the city, walk through the center of town.
Attorney: Despite your busy schedules, did you make time for each other?
Mrs. Walsh [Mrs. Washington]: Yes, sir, we tried to. Tried to make the time we
could.
Attorney: Did you and Edward [Jamal] have children?
Mrs. Walsh [Mrs. Washington]: Yes, sir. We have one boy and one girl, both
grown now.
Attorney: Had Edward just passed some tests that was of importance to you and
to him, as well?
Mrs. Walsh [Mrs. Washington]: Edward [Jamal] just found out that, I'm sorry,
[Witness sobbing. Requests tissues from bailiff] Edward had just found out that
he had passed the test for manager, and he would have probably made manager.
So when he made assistant manager, which was his job at the time he was killed,
he had passed me up because when I left I was a department manager. So when
he made assistant manager, his first joke was now you've got to take orders from
me. But it was, it was, it was a milestone we were both proud of.
Attorney: Where do you stand today?
Mrs. Walsh [Mrs. Washington]: Obviously life is not the same. It has
completely fallen apart, for all the dreams, you know. I was probably married
longer than possibly some of y 'all in here were alive at the time. And, you know,
it's your friend, it's your lover, it's your confidant and your husband, and that more
than disappeared one morning, you never get that back. You never get that back.
Attorney: Thank you very much, Mrs. Walsh [Mrs. Washington].

60 DEVALUING DEATH 19-Feb-13
Appendix B
Photo 1
Photo 2
Photo 3

19-Feb-13 LEVINSON, SMITH & YOUNG 61
Photo 4 (White Victim)
Photo 4 (Black Victim)