Embed Size (px)
Citation preview
Senate Counsel, Research, and Fiscal Analysis
G-17 STATE CAPITOL
75 REV. OR. MARTIN LUTHER KING, JR. BLVD.
Sr. PAUL, MN 55155-1606
(651) 296-4791 FAX. (651) 296-7747
Jo ANNE ZOFF SELLNER
DIRECTOR
TO: Senator Rob
DATE: March 10, 2005
enate State of Minnesota
enate Research (651/296-4855)
RE: Summary: S.F. 1174: Governor's Higher Education Funding Bill
ARTICLE 1
Section 1 delineates appropriations.
Section 2, subdivision 1 appropriates money to the higher education services office.
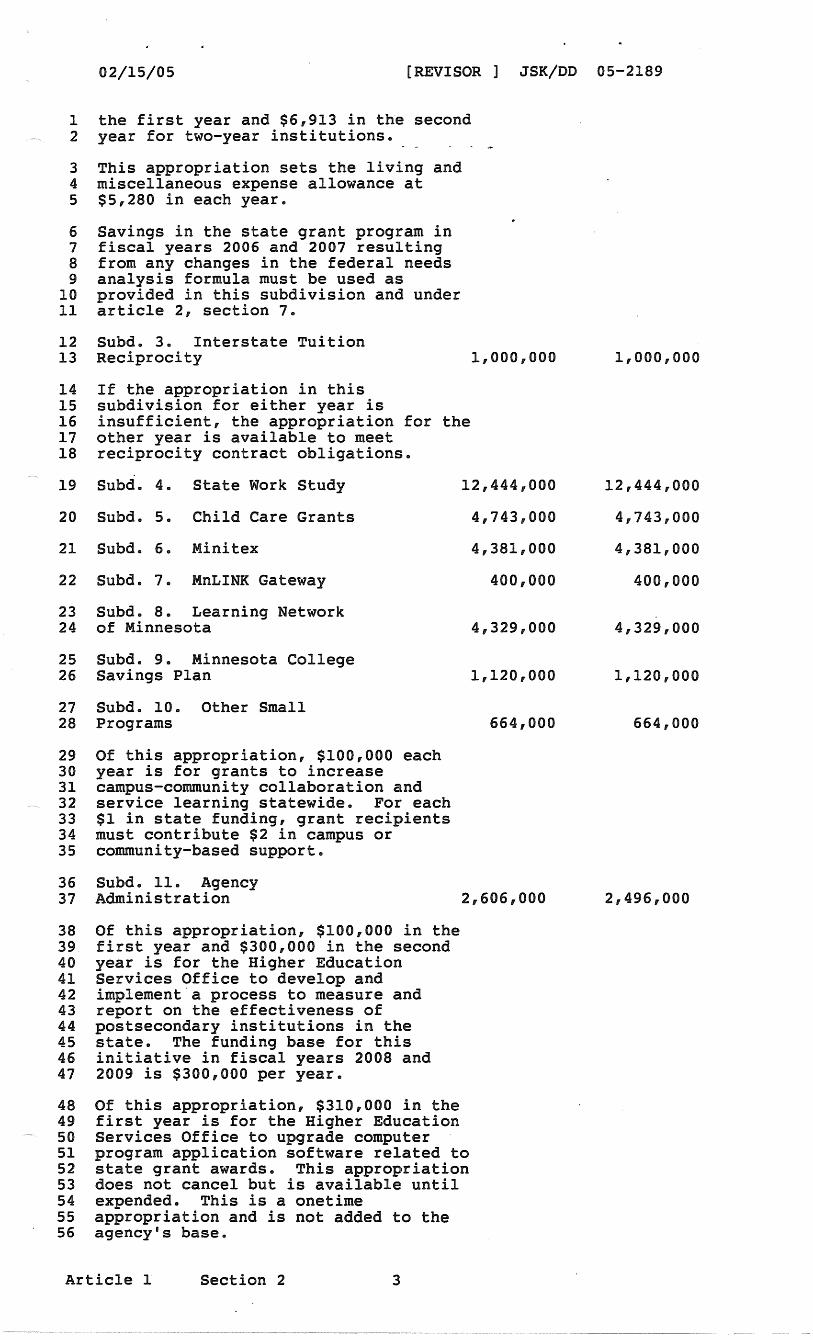
Subdivision 2 appropriates $140,575,000 in each year for the state grant program. If the appropriation for either year is insufficient, the appropriation for the other year is available. Sets the private institution tuition and fee maximums: $8,983 in both years for four-year institutions and $6,913 in both years for two-year institutions. Sets the living and miscellaneous expense allowance at $5,280 in each year.
, Subdivisions 3 through IO appropriate money for tuition reciprocity payments, state work study, childcare grants, Minitex, the MnLINK Gateway, the Learning Network of Minnesota, the Minnesota College Savings Plan, and various early intervention and service learning programs.
Subdivision 11 appropriates money for agency administration.
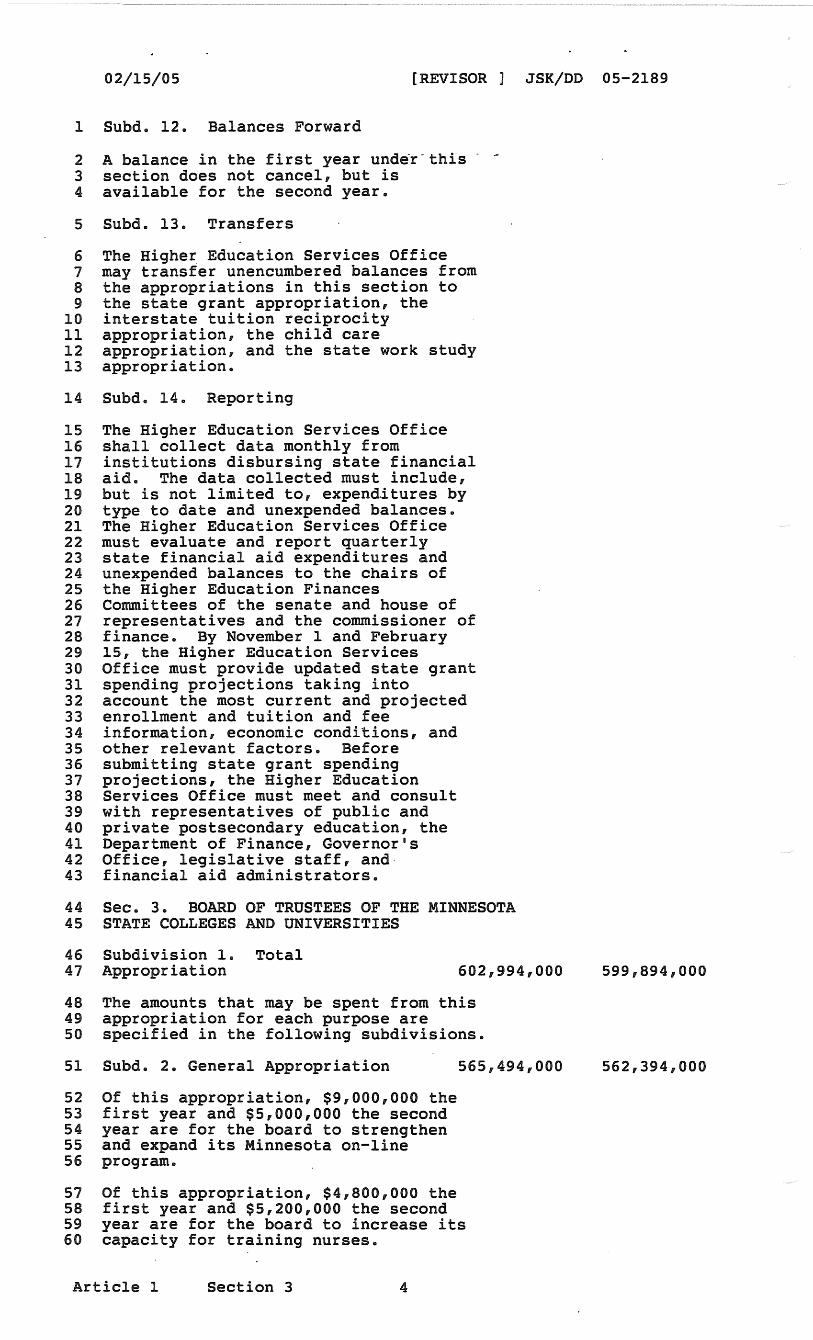
Subdivision 12 states that a balance in the first year under this section does not caned, but is available for the second year.
Subdivision 13 authorizes the transfer of unencumbered balances in this section to the state grant program appropriation, the interstate tuition reciprocity program appropriation, the chi.ldcare grant appropriation, and the work study appropriation.
Subdivision 14 requires monthly reporting of institutional disbursements and unexpended balances of state financial aid. Also requires the submission of state grant spending projections employing updated enrollment, tuition and fee, and economic data on No~ember 1 and February 15. Delineates procedures to be followed in gathering and disseminating data.
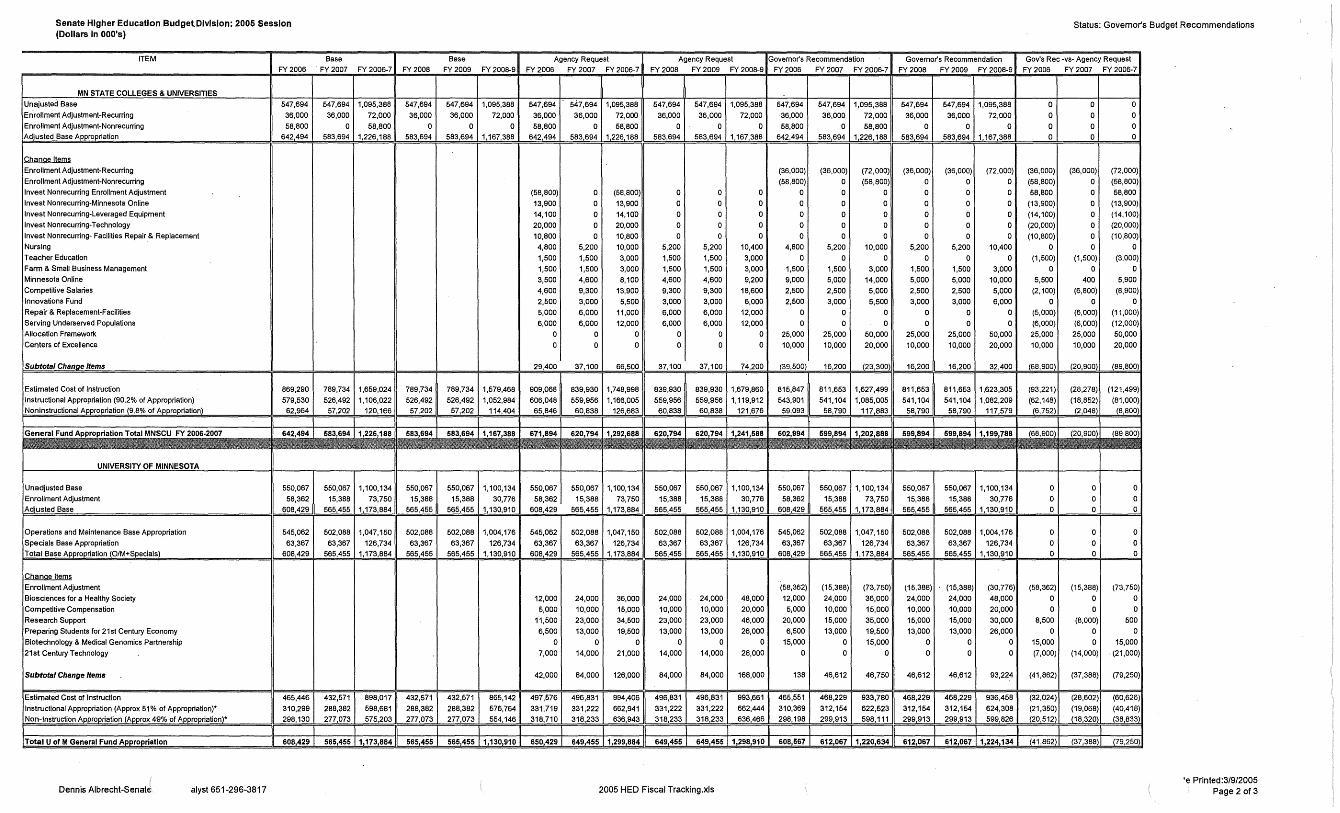
Section 3, Sub4ivision 1 appropriates $602,994,000 in the first year and $599,894,000 in the second year to the board of trustees of MnSCU.
Subdivision 2 makes a general appropriation of $565,494,000 in the first year and $562,394,000 in the second year. Of this amount:
• $9,000,000 the first year and $5,000,000 the second year are to strengthen and expand MnSCU's Minnesota online program.
• $4,800,000 the first year and $5,200,000 the second year are to increase MnSCU's capacity to train nurses.
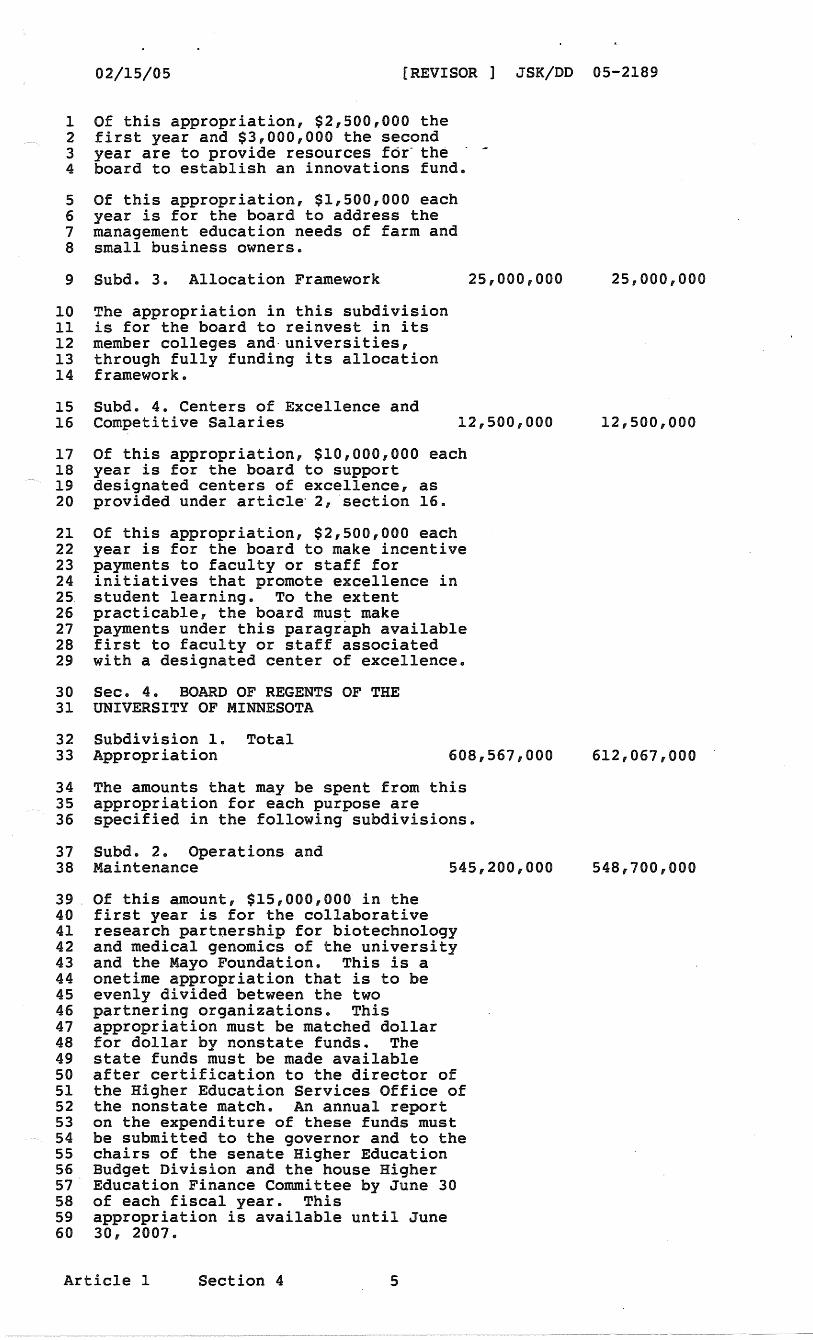
• $2,500,000 the first year and.$3,000,000 the second year are to establish an innovations fund.
• $1,500,000 each year is to address the management education needs of farm and small business owners.
Subdivision 3 appropriates $25,000,000 in each year for the allocation formula.
Subdivision 4 appropriates $12,500,000 in each year to. support designated centers of excellence and competitive salaries. Of this appropriation, $10,000,000 in each year is to support the centers of excellence and $2,500,000 in each year is to make incentive payments to faculty or staff for initiatives that promote excellence in student learning. · ·
Section 4, subdivision 1 appropriates $608,567,000 in the first year and· $612,067,000 in the second year to the board of regents of the University of Minnesota.
Subdivision 2 appropriates $545,200,000 in the first year and $548, 700,000 in the .second year for operations and maintenance. Of this amount:
• $15,000,000 in the first year is for the biotechnology and medical genomics collaborative research project. The money is a one-time appropriation to be divided equally between the University of Minnesota and the Mayo Foundation. The appropriation must be matched dollar for dollar with nonstate funds. The money for the project will be released upon certification to the director of HESO of the receipt of the nonstate match. Requires the submission of an annual report.
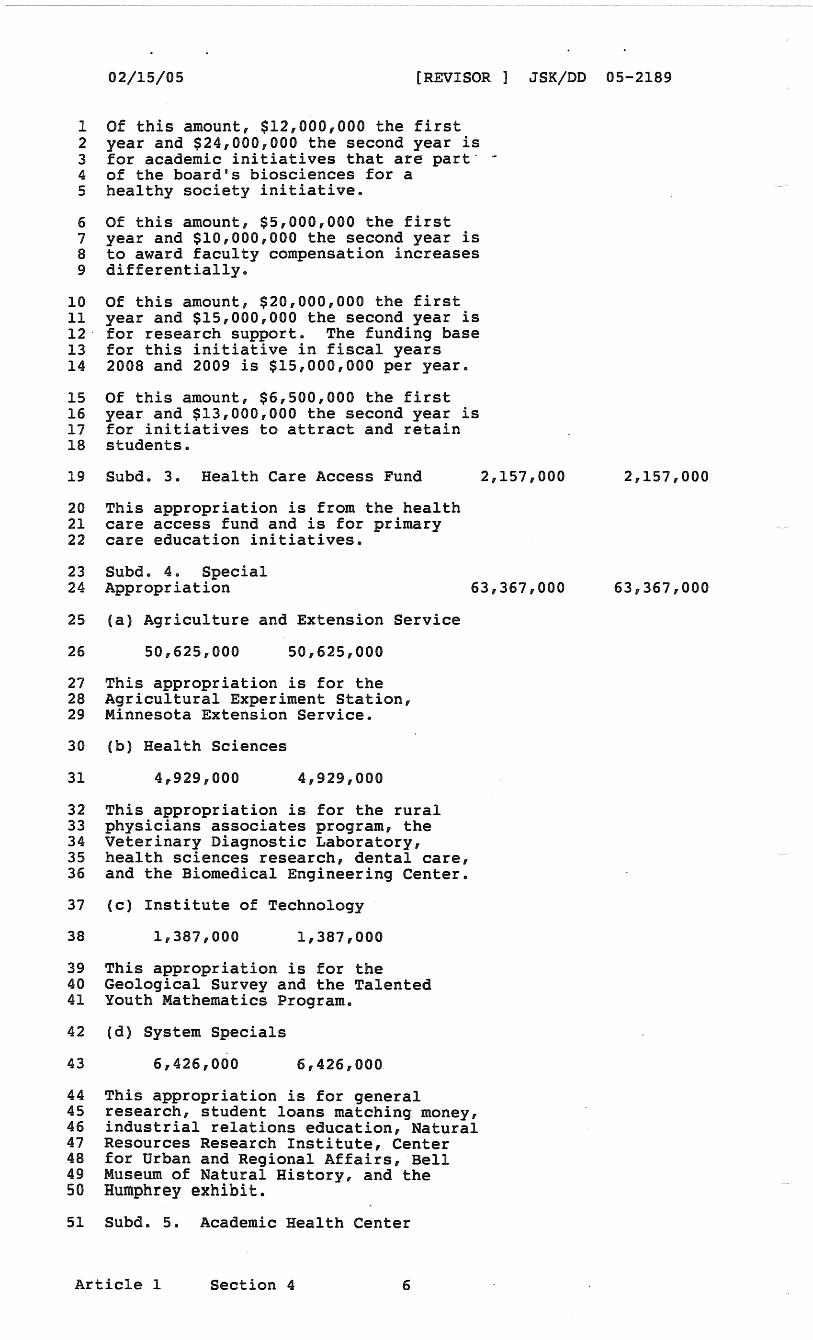
• $12,000,000 the first year and $24,000,000 the second year is for the biosciences for a healthy society initiative.
• $5,000,000 the first year and $10,000,000 the second year is for faculty compensation. • $20,000,000 the first year and $15,000,000 the second year is for research support.· The
funding base for this initiative in fiscal years 2008 and 2009 is $15,000,000 per year. • $6,500,000 the first year and $13,000,000 the second year is for initiatives to attract and
retain students.
Subdivision 3 appropriates $2,157,000 in each year from the health care access fund for primary care education initiatives.
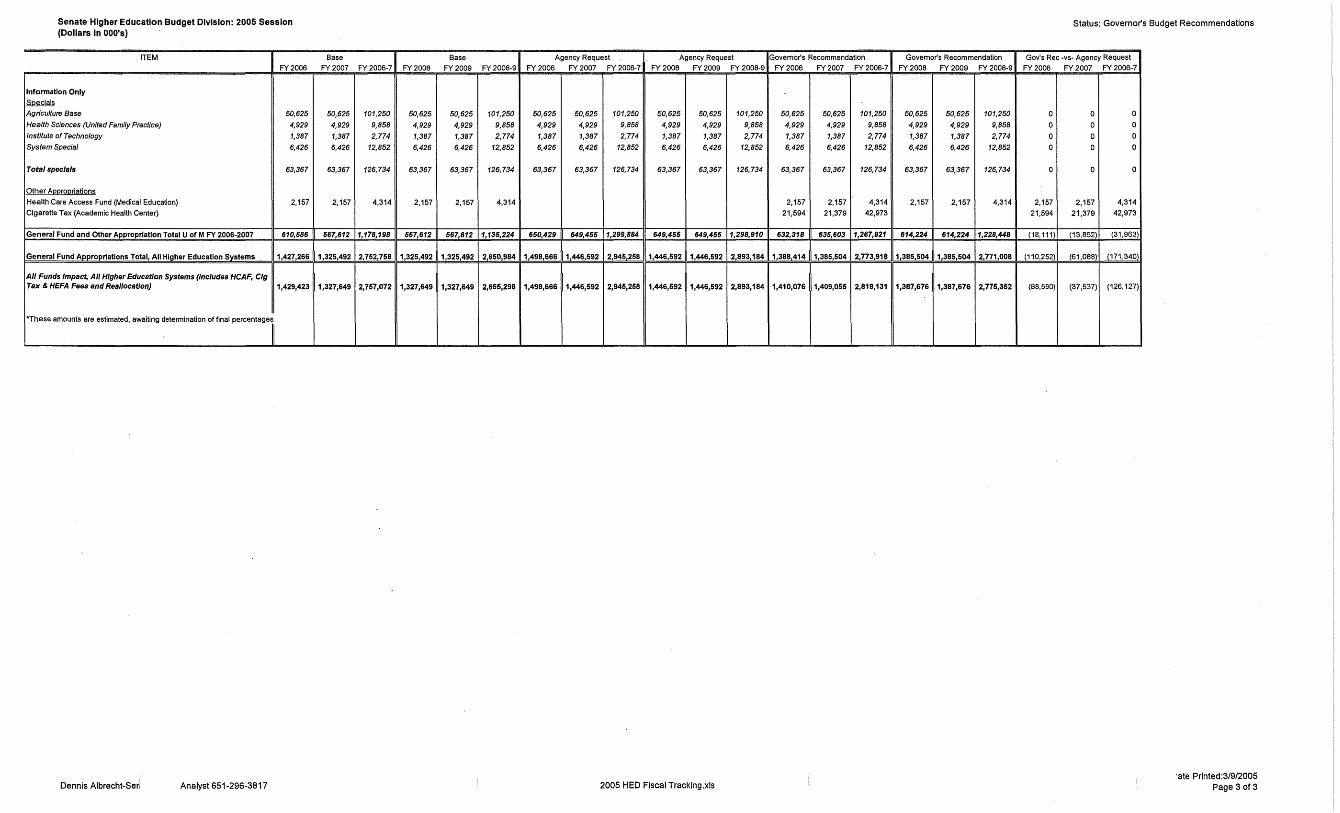
Subdivision 4 appropriates $63,367,000 in each year for system specials. Of this amount: • $50,625~000 in each year is for agriculture and extensio.n services. • $4,929,000 in each year is for health sciences • $1,387,00o'in eac~ year is for the instltute of technology
2
• $6,426,000 is for system specials.
Subdivision 5 estimates the anticipated portion of the tobacco tax and use revenue proceeds to be allocated to the Academic Health Center.
Section 5, subdivision 1 appropriates $1,391,000 in each year to the Mayo Medical Foundation. Of this amount, $514,000 in each year is for use as capitation money to increase the number of doctors practicing in rural areas, $531,000 in each year is to pay a capitation for up to 27 family practice and graduate residents, and $346,000 in each year is to support 12 resident physicians
. each year in the St. Cloud-Mayo family practice residency program.
Section 6 appropriates $390,000 of the HEFA reserve to HESO; the balance is transferred to the general fund.
ARTICLE2
Sections 1, 6, and 10 amend language stating that state grant and childc~e grant applicants cannot be in arrears on child support payments.
·Section 2 expands the data collection authority of HESO to include the collection, maintenance, and reporting of data on students and p9stsecondary institutions to measure progress in student learning.
Section 3 modifies the activities of the higher education advisory council.
Section 4 makes technical changes to reflect elimination of higher education services council.
Section 5 au~orizes the HESO director to appoint students to HESO task forces.
Section 7 changes the definition of "tuition and fees" used in the formula used to calculate the "cost of attendance"; "actual" tuition and fees will be used in the formula rather than "average" tuition and fees.
Sections 8, 11, 31, and 32 provide an additional semester of eligibility for various financial programs to students that withdraw from school to go into active military services.
Section 9 requires s_tate grant eligible institutions to provide HESO with student enrollment, financial aid, financial, and other data as determined by the director, to enable the office to carry out its responsibilities.
Section 12 requires institutions receiving SELF ·loan money to provide HESO with student enrollment, financial aid, financial, and other data as determined by the director, to enable the office to carry out its responsibilities.
Section 13 adds language to clarify that to be eligible to receive the SELF loan, students must be a Minnesota resident who is enrolled or accepted for enrollment at an eligible institution in Minnesota or in another state or provinc~. No.n-Minnesota residents are eligible if they are
3
enrolled or accepted for enrollment at an eligible institution in Minnesota and will be physically attending classes in Minnesota for at least ~O percent of the academic term. Non-Minnesota resident students not physically attending classes in Minnesota due to an approved study abroad for 12 months or less are eligible to receive a loan.
Section 14 codifies language pertaining to HESO's administration of.the income-contingent loan repayment program.
Section 15 contains language recommended by bond counsel codifying the manner in which HESO deposits and holds assets from the opera~on of its loan program.
Section 16, subdivisions 1through3 direct the MnSCU board to designate at least three and up to eight different program centers of excellence, specifies the criteria the b.oard must use in the selection of the centers, and requires that the centers must establish advisory committees, and report on their activity.
Sections 17 through 22 and 24 through 30 make language changes recommended by TIAACREFF, the Minnesota College Savings Plan program administrator. The changes are necessary to conform. with federal rulings on section 529 of the federal tax code, and to clarify existing language. · ·
Section 23. contains language proposed by the legislative auditor clarifying the parties that can hold Minnesota College Savings Plan assets.
Section 33 authorizes HESO to enter into an agreement with the Minnesota Housing Finance Agency to issue tax exempt bonds for student loans.
Section 34 specifies that the additional semester of grant eligibility under sections 8, 11, 31, and 32 applies to students who withdrew from school after December 31, 2002, because the student was ordered to active duty service as defined in Minnesota Statutes, section 190.05, subdivisions 5b or Sc.
Section 35 directs HESO to convene an advisory task force on postsecondary funding
Section 36 directs the. revisor to change the term "HESO" and "Higher Education Services Office" to "Minnesota Office of Higher Education" wherever the term appears in statutes and rules.
Section 37 repeals: Minnesota Statutes 2004, sections i36A.Oll [Higher Education Services Council] and 136A.031, subdivision I [authorizing the Higher Education Services Council to appoint advisory committees] and obsolete rules associated with two repealed programs: Y outhworks and the AP /IB Scholarship Program.
ARTICLE3
Section 1 defines "multiple location" as it pertains to private career schools.
Sections 2 a~d 3 increase the surety bond amount private career schools must hold .
4
Sections 4, 5, and 6 make technical changes.
Section 7 amends language specifying requirements for the maintenance of the school's records.
Section 8 increases the time by which schools must renew their licenses from 30 to 60 days prior to the expiration of the current license.
Section 9 codifies the various fees career schools must pay; these are currently in rules.
Section 10 makes a statutory reference.
Section 11 provides for the refund of money to students for schools offering programs that do not exceed 40 hours in length ..
Section 12 amends language addressing the refund of tuition, fees, and other charges to students.
Section 13 provides for the sale of equipment and supplies furnished to the student.
. Section 14 defines the criteria to be used in determining when a student is considered to have withdrawn from a school.
Section 15 provides for the repayment of money if a school closes.·
Section 16 specifies the wording career schools must use when they state that they are licensed.
Section 17 provides for the procedures schools must follow when collecting, assessing, and distributing funds received from loans or other financial aid.
Section 18 requires that HESO .shall, rather than may, grant a reasonable time for a school to respond to complaints directed towards it.
Section 19 makes data submitted to HESO as part of the license application or renewal are nonpublic data.
Section 20 amends the statutory language delineating the institutions that are exempt for the licensing process. The amended language allows HESO to define "schools with no physical presence in Minnesota engaged exclusively in offering distance instruction that are located in and regulated by other states or jurisdictions"
Article 4
Section 1 transfers the authority, duties, and unexpended funds of the Higher Education Facilities Authority to HESO.
Section 2 contains instructions to the revisor.
5

Section 3 repeals Minnesota Statutes 2004, sections 136A.25 and 136A.26 pertaining to the Higher Education Facilities Authority.
Section 4 makes sections I to 3 effective July 1, 2005.
6
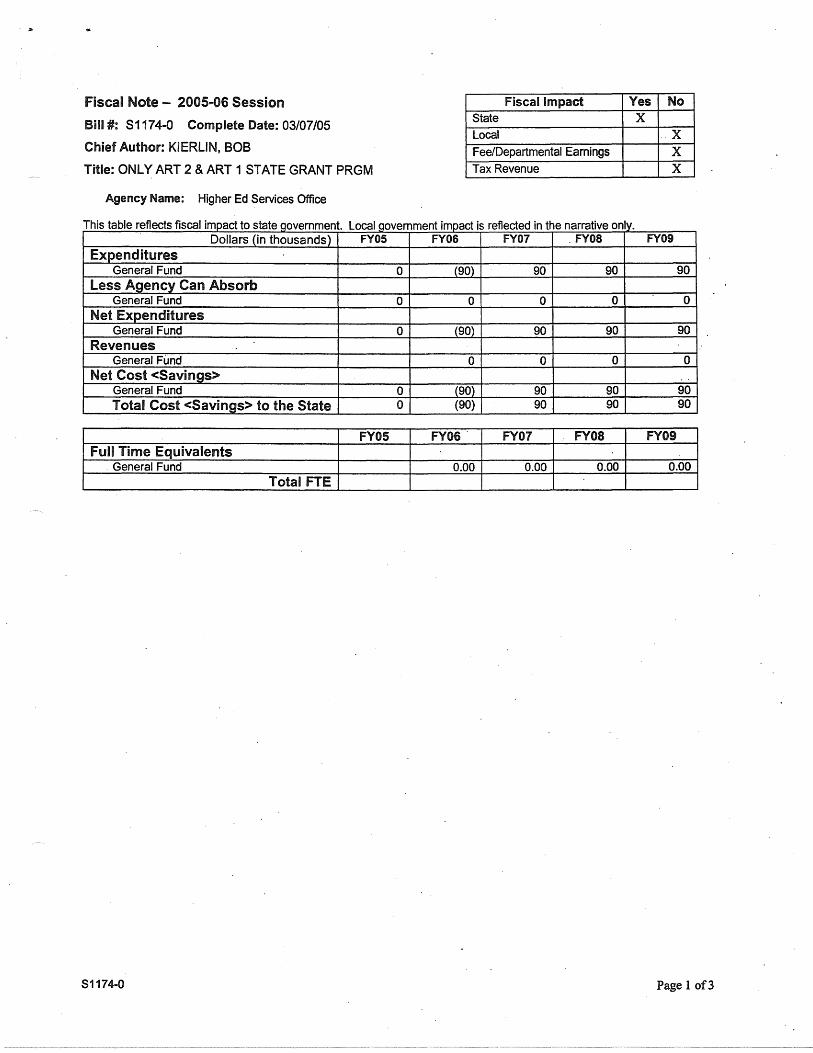
Fiscal Note - 2005-06 Session
Bill#: 81174-0 Complete Date: 03/07/05
Chief Author: KIERLIN, BOB
Title: ONLY ART 2 & ART 1 STATE GRANT PRGM
Agency Name: Higher Ed Services Office
Fiscal Impact State
Local
Fee/Departmental Earnings
Tax Revenue
Yes No x
x x x
Th' bl fl fi I . 1s ta ere ects 1sca impact to state government. Local government impact is reflected in the narrative onlv. Dollars (in thousands) FY05 FY06 FY07 _ FY08 FY09
Expenditures General Fund 0 (90) 90 90 90
less Agency Can Absorb General Fund 0 0 0 0 0
Net Expenditures General Fund 0 (90) 90 90 90
Revenues General Fund 0 0 0 0
Net Cost <Savings> ..
General Fund 0 (90) 90 90 90 Total Cost <Savings> to the State 0 (90) 90 90 90
FYOS FY06. FY07 .· FYOS FY09 Full Time Equivalents
. General Fund 0.00 0.00 0.00 0.00 Total FTE
S1174-0 Pagel of3
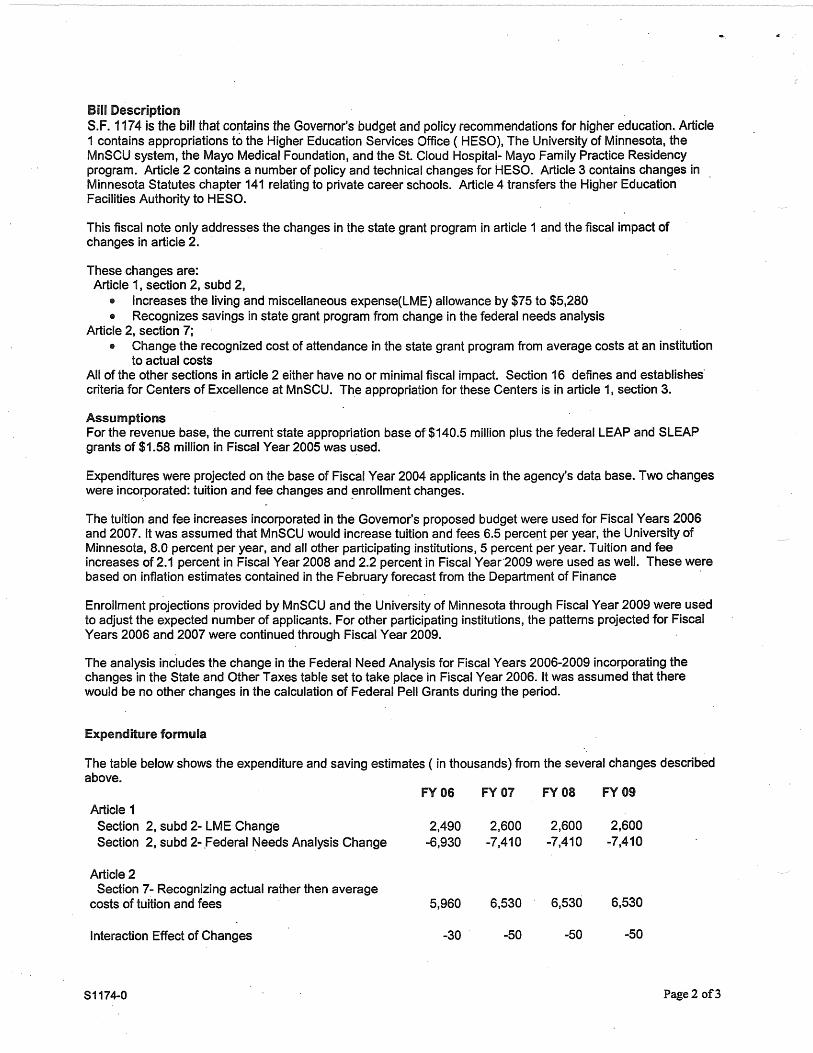
Bill Description S.F. 1174 is the bill that contains the Governor's budget and policy recommendations for higher education. Article 1 contains appropriations to the Higher Education Services Office ( HESO), The University of Minnesota, the MnSCU system, the Mayo Medical Foundation, and the St. Cloud Hospital- Mayo Family Practice Residency program. Article 2 contains a number of policy and technical changes for HESO. Article 3 contains changes in Minnesota Statutes chapter 141 relating to private career schools. Article 4 transfers the Higher Education Facilities Authority to HESO.
This fiscal note only addresses the changes in the state grant program in article 1 and the fiscal impact of changes in article 2.
These changes are: Article 1, section 2, subd 2,
• Increases the living and miscellaneous expense(LME) allowance by $75 to $5,280 • Recognizes savings in state grant program from change in the federal needs analysis
Article 2, section 7; • Change the recognized cost of attendance in the state grant program from average costs at an institution
to actual costs All of the other sections in article 2 either have no or minimal fiscal impact. Section 16 defines and establishes· criteria for Centers of Excellence at MnSCU. The appropriation for these Centers is in article 1, section 3.
Assumptions For the revenue base, the current state appropriation base of $140.5 million plus the federal LEAP and SLEAP grants of $1.58 million in Fiscal Year 2005 was u.sed.
Expenditures were projected on the base of Fiscal Year 2004 applicants in the agency's data base. Two changes were incorporated: tuition and fee changes and ~nrollment changes.
The tuition and fee increases incorporated in the Governor's proposed budget were used for Fiscal Years 2006 and 2007. It was assumed that MnSCU would increase tuition and fees 6.5 percerit per year, the University of Minnesota, 8.0 percent per year, and all other participating institutions, 5 percent per year. Tuition and fee increases of 2.1 percent in Fiscal Year 2008 and 2.2 percent in Fiscal Year"2009 were used as well. These were based on inflation estimates contained in the February forecast from the Department of Finance ·
Enrollment projections provided by MnSCU and the University of Minnesota through Fiscal Year 2009 were used to adjust the expected number of applicants. For other participating institutions, the patterns projected for Fiscal Years 2006 and 2007 were continued through Fiscal Year 2009.
The analysis inciudes the change in the Federal Need Analysis for Fiscal Years 2006-2009 incorporating the changes in the State and Other Taxes table set to take place in Fiscal Year 2006. It was assumed that there would be no other changes in the calculation of Federal Pell Grants during the period.
Expenditure formula
The table below shows the expenditure and saving estimates ( in thousands) from the several changes described above.
FY06 FY07 FY08 FY09 Article 1
Section 2, subd 2- LME Change 2,490 2,600 2,600 2,600 Section 2, subd 2- .Federal Needs Analysis Change -6,930 -7,410 -7,410 -7,410
Article 2 Section 7-:- Recognizing actual rather then average
6,530 costs of tuition and fees 5,960 6,530 6.,530
Interaction Effect of Changes -30 -50 -50 -50
....
$1174-0 Page2 of3
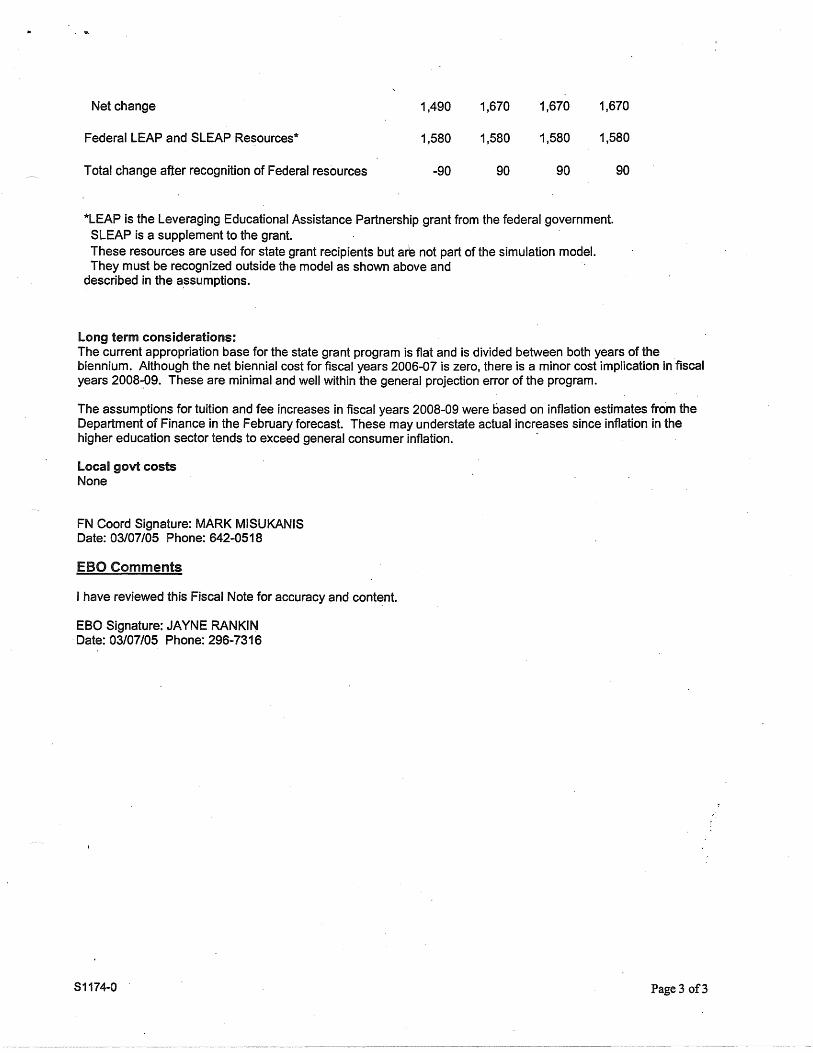
Net change 1,490 1,670 1,670 1,670
Federal LEAP and SLEAP Resources* 1,580 1,580 1,580 1,580
Total change after recognition of Federal resources -90 90 90 90
*LEAP is the Leveraging Educational Assistance Partnership grant from the federal government. SLEAP is a supplement to the grant. These resources are used for state grant recipients but are not part of the simulation model. They must be recognized outside the model as shown above and
described in the a.ssumptions.
Long term considerations: The current appropriation base for the state grant program is flat and is divided between both years of the biennium. Although the net biennial cost for fiscal years 2006-07 is zero, there is a minor cost implication in fiscal years 2008-09. These are minimal and well within the general projection error of the program.
The assumptions for tuition and fee increases in fiscal years 2008-09 were cased on inflation estimates fro·m the Department of Finance in the February forecast. These may understate actual increases since inflation in the higher education sector tends to exceed general consumer inflation. -
Local govt costs None
FN Coard Signature: MARK MISUKANIS Date: 03/07/05 Phone: 642-0518
EBO Comments
I have reviewed this Fiscal Note for accuracy and content.
EBO Signature: JAYNE RANKIN · Date: 03/07 /05 Phone: 296-7316
51174-0 Page 3 of3
II Providing a Tradition ef Quality
for a Changing World,
One Student at a Time
Augsburg College
Bethany Lutheran College
Bethel College
Carleton College
College of Saint Benedict
College of St. Catherine
College of St. Scholastica
Concordia College, Moorhead
Concordia University, St. Paul
Gustavus Adolphus College
Harnline University
Macalester College
Minneapolis College
of Art and Design
Saint John's University
Saint Mary's University
of Minnesota
St. Olaf College
University of St. Thomas
North Central Life Tower
445 Minnesota Street, Suite 500
St. Paul, Minnesota 55101
Phone: 651-228-9061
Fax: 651-228-0379
E-mail: [email protected]
Websites: www.mnprivatecolleges.com
www.worldsofdifference.com
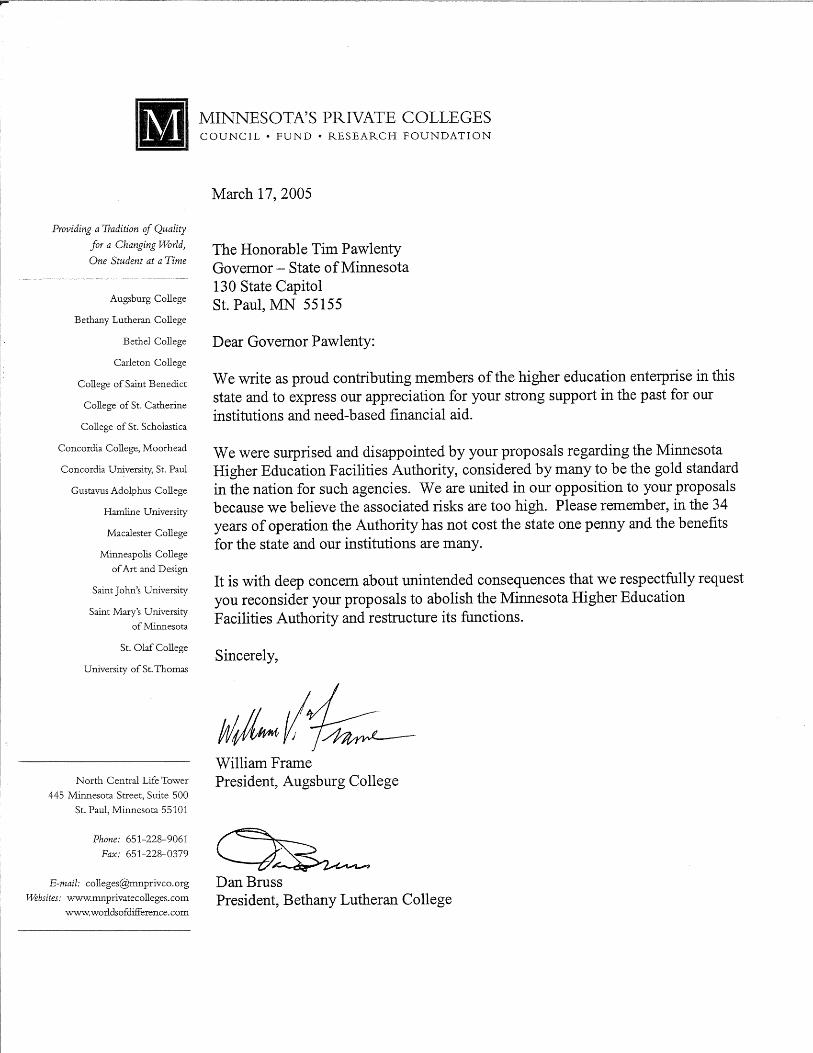
MINNESOTA'S PRIVATE COLLEGES COUNCIL • FUND • RESEARCH FOUNDATION
March 17, 2005
The Honorable Tim Pawlenty Governor-State of Minnesota 130 State Capitol St. Paul, MN 55155
Dear Governor Pawlenty:
We write as proud contributing members of the higher education enterprise in this state and to express our appreciation for your strong support in the past for our institutions and need-based financial aid.
We were surprised and disappointed by your proposals regarding the Minnesota Higher Education Facilities Authority, considered by many to be the gold standard in the nation for such agencies. We are united in our opposition to your proposals because we believe the associated risks are too high. Please remember, in the 34 years of operation the Authority has not cost the state one penny and the benefits for the state and our institutions are many.
It is with deep concern about unintended consequences that we respectfully request you reconsider your proposals to abolish the Minnesota Higher Education Facilities Authority and restructure its functions.
Sincerely,
William Frame President, Augsburg College
Dan Bruss President, Bethany Lutheran College
"'
Governor Pawlenty Page Two, March 1 7, 2005
~f( George Brushaber President, Bethel University
19- cfL_ Robert A. Oden, Jr. President, Carleton College
~L~ President, College of St. Benedict
An~~lu_,/b--_ Sr . .A.ndrea'tee:IHM President, College of St. Catherine
-t:_ ~<> Larry Goodwin President, College of St. Scholastica
~/~ Robert Holst President, Concordia University
o~/UC.~ Pamela Jolicoeurf President, Concordia College
.-v~ es Peterson
resident, Gustavus Adolphus College
~G:tJ~ Larry06fs President, Hamline University
~c.~ Brian Rosenberg President, Macalester College
~'~ Michael 0 'Keefe President, Minneapolis College of Art and Design
~~ {2e..i ~ ~ rJ)g
Br. Dietrich Reinhart President, St. John's University
~ ~~)~/IPY"tf.AA;> 7!'c Br. Louis DeThomasis, FSC President, Saint Mary's University of Minnesota
{1.ft(. ~ Christopher Thomf or~ President, St. Olaf College
st1-~~~ Rev. Dennis Dease President, University of St. Thomas
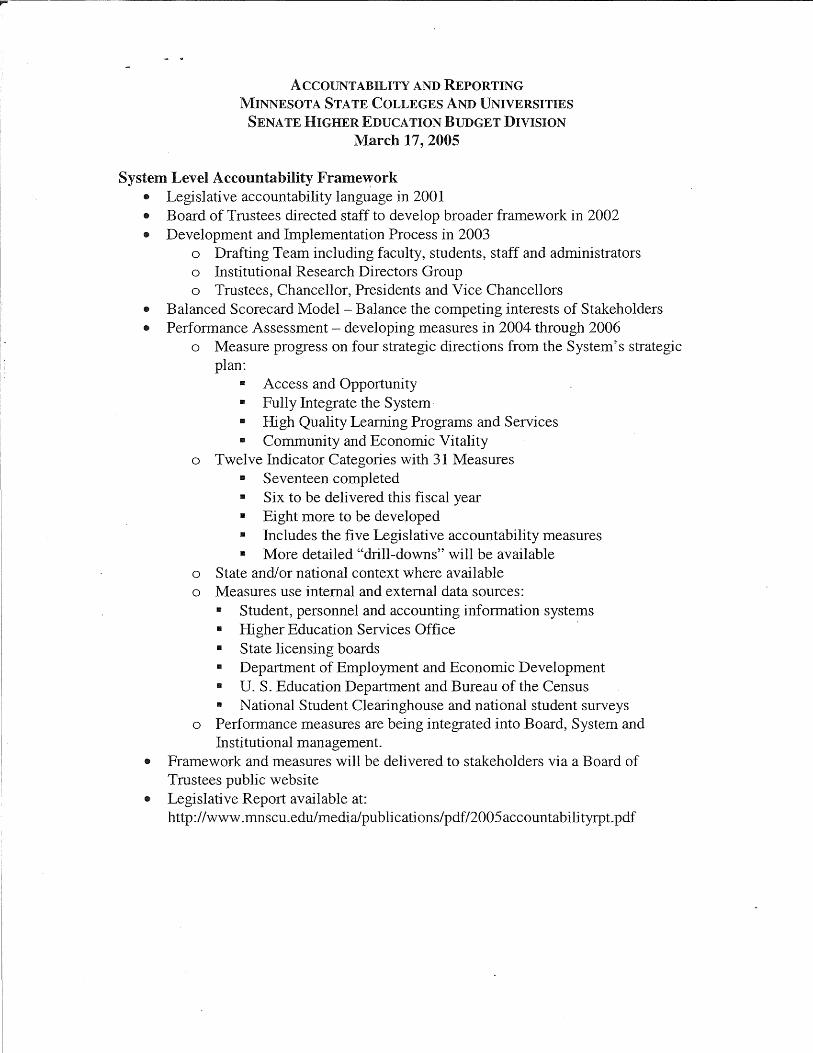
ACCOUNTABILITY AND REPORTING
MINNESOTA STATE COLLEGES AND UNIVERSITIES
SENATE HIGHER EDUCATION BUDGET DIVISION
March 17, 2005
System Level Accountability Framework • Legislative accountability language in 2001 • Board of Trustees directed staff to develop broader framework in 2002 • Development and Implementation Process in 2003
o Drafting Team including faculty, students, staff and administrators o Institutional Research Directors Group o Trustees, Chancellor, Presidents and Vice Chancellors
• Balanced Scorecard Model - Balance the competing interests of Stakeholders • Performance Assessment - developing measures in 2004 through 2006
o Measure progress on four strategic directions from the System's strategic plan:
111 Access and Opportunity 111 Fully Integrate the System· 1111 High Quality Leaming Programs and Services 111 Community and Economic Vitality
o Twelve Indicator Categories with 31 Measures 111 Seventeen completed 111 Six to be delivered this fiscal year 111 Eight more to be developed 111 Includes the five Legislative accountability measures 111 More detailed "drill-downs" will be available
o State and/or national context where available o Measures use internal and external data sources:
111 Student, personnel and accounting information systems 111 Higher Education Services Office 111 State licensing boards 111 Department of Employment and Economic Development 111 U.S. Education Department and Bureau of the Census 111 National Student Clearinghouse and national student surveys
o Performance measures are being integrated into Board, System and Institutional management.
• Framework and measures will be delivered to stakeholders via a Board of Trustees public website
• Legislative Report available at: http://www.mnscu.edu/media/publications/pdf/2005accountabilityrpt.pdf
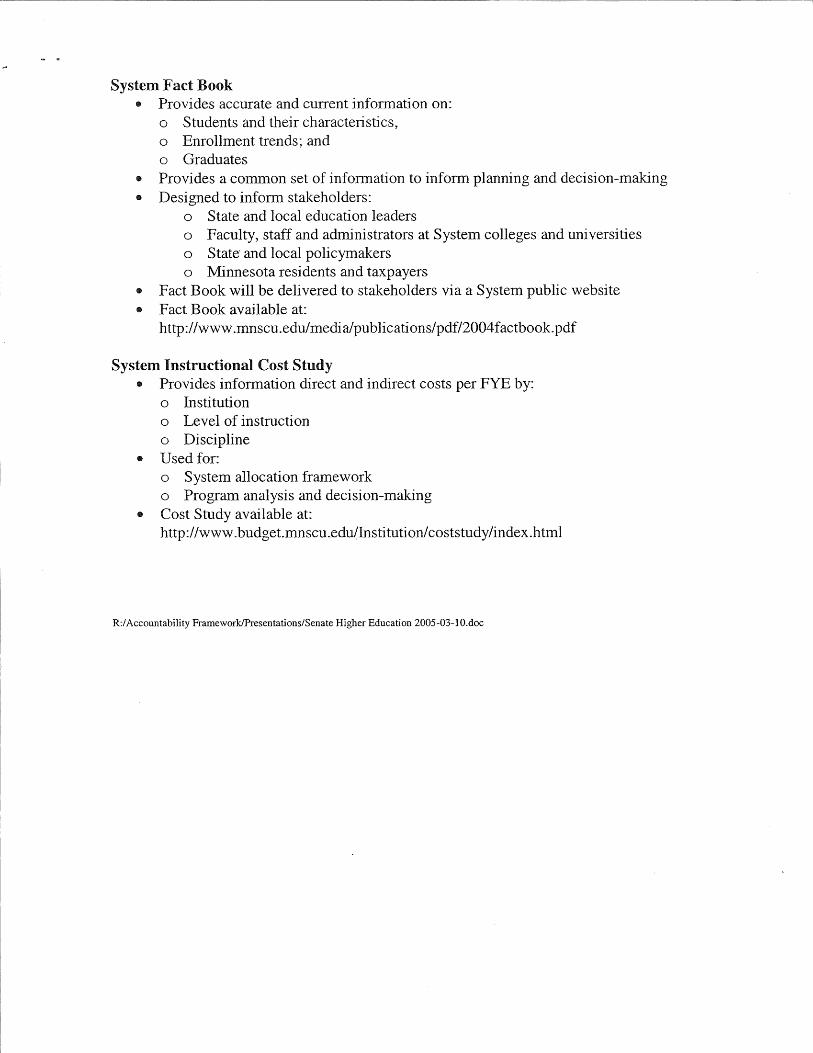
System Fact Book • Provides accurate and current information on:
o Students and their characteristics, o Enrollment trends; and o Graduates
• Provides a common set of information to inform planning and decision-making • Designed to inform stakeholders:
o State and local education leaders o Faculty, staff and administrators at System colleges and universities o State and local policymakers o Minnesota residents and taxpayers
• Fact Book will be delivered to stakeholders via a System public website • Fact Book available at:
http://www.mnscu.edu/media/publicati ons/pdf/2004 factbook. pdf
System Instructional Cost Study • Provides information direct and indirect costs per FYE by:
o Institution o Level of instruction o Discipline
• Used for: o System allocation framework o Program analysis and decision-making
• Cost Study available at: http://www.budget.mnscu.edu/lnstituti on/ coststudy/index.html
R:/ Accountability Framework/Presentations/Senate Higher Education 2005-03-1 O.doc
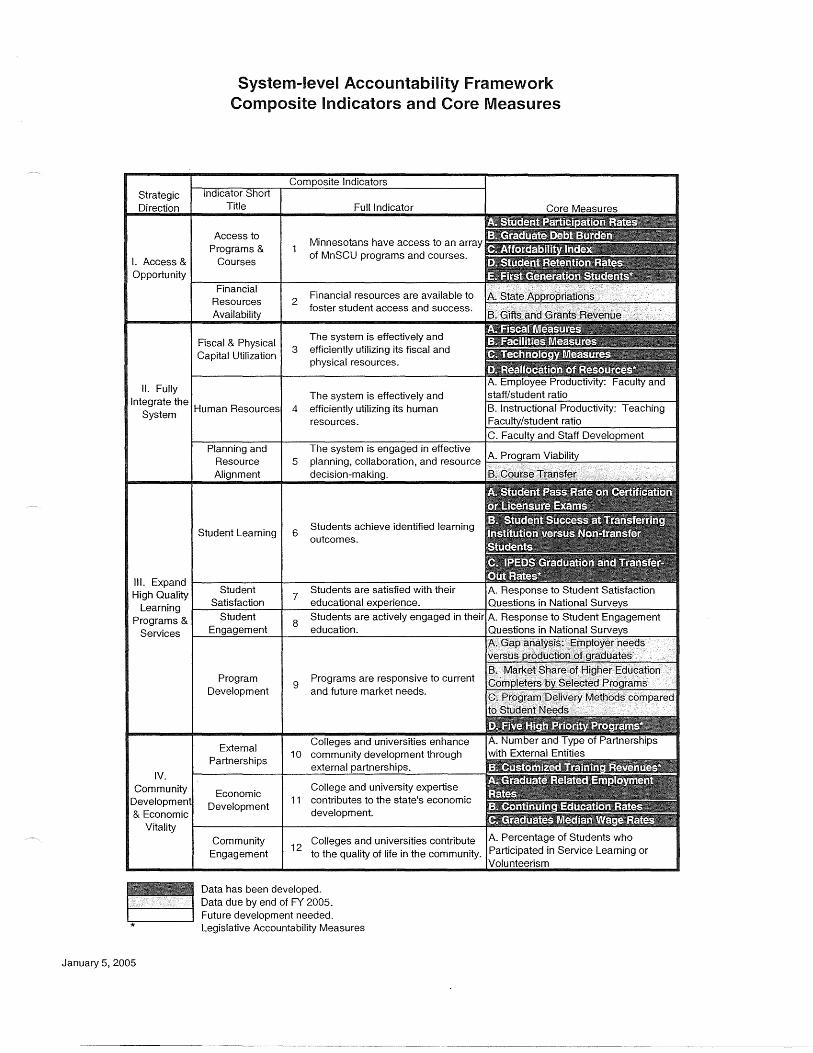
Strategic Direction
L Access & Opportunity
System-level Accountability Framework Composite Indicators and Core Measures
Indicator Short Title
Access to Programs &
Courses
Composite Indicators
Full Indicator
Minnesotans have access to an array of MnSCU programs and courses.
Core Measures
1---------+-----------------Financial Resources Availability
Fiscal & Physical Capital Utilization
Financial resources are available to 2
foster student access and success.
The system is effectively and 3 efficiently utilizing its fiscal and
physical resources.
A. Employee Productivity: Faculty and staff/student ratio
IL Fully Integrate the
S t Human Resources
ys em
The system is effectively and 4 efficiently utilizing its human
resources. B. Instructional Productivity: Teaching Faculty/student ratio
Ill. Expand High Quality
Learning Programs &
Services
IV. Community
Development & Economic
Vitality
January 5, 2005
Planning and Resource Alignment
Student Leaming
Student Satisfaction
Student Engagement
Program Development
External Partnerships
Economic Development
Community Engagement
5
6
7
8
9
C. Faculty and Staff Development The system is engaged in effective planning, collaboration, and resource 1-A_._P_r..,..o,__g_ra_m_V..,..ia_b_i_lity~--------111 decision-making.
Students achieve identified learning outcomes.
Students are satisfied with their A. Response to Student Satisfaction educational experience. Questions in National Surveys
Students are actively engaged in their A. Response to Student Engagement education. Questions in National Surveys
f\. Gap analysi~: Employer needs: versus pr6quctlori Qf graduates
Et . M~rket Share of. Higher ~do cation Programs are responsive to current Gompleters by selected Programs and future market needs. C .. P~ogram,Deliv~ry Methqds compared
to Student Needs ·
Colleges and universities enhance 1 O community development through
external partnerships.
College and university expertise 11 contributes to the state's economic
development
Colleges and universities contribute A. Percentage of Students who 12 to the quality of life in the community. Participated in Service Learning or
Volunteerism
Data has been developed. Data due by end of FY 2005. Future development needed. Legislative Accountability Measures
03/16/05 [REVISOR JLR/SK A05-0296
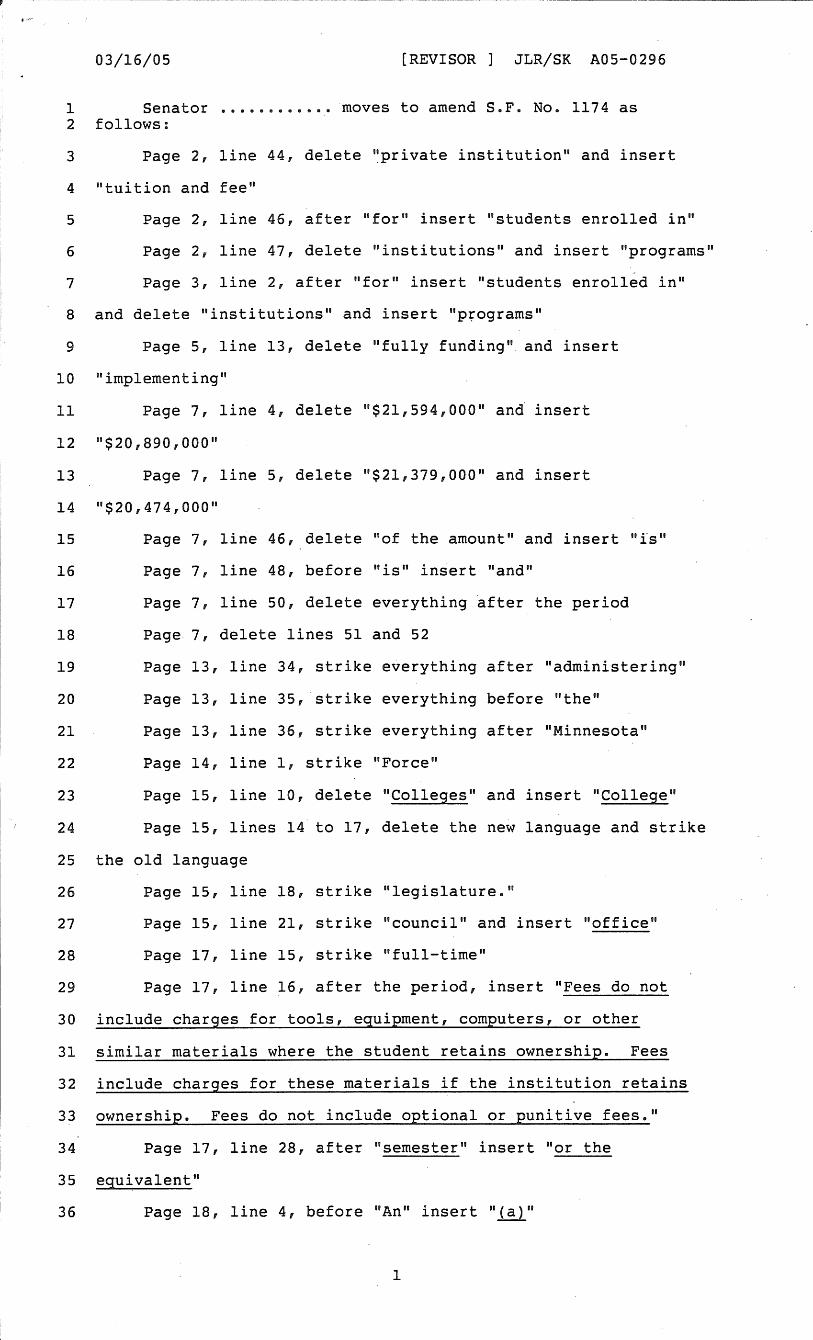
l Senator .......•.... moves to amend S.F. No. 1174 as 2 follows:
3 Page 2, line 44, delete ·~private institution" and insert
4 "tuition and fee"
5 Page 2, line 46, after 11 for" insert "students enrolled in"
6 Page 2, line 47, delete "institutions" and insert "programs"
7 Page 3, line 2, after "for" insert "students enrolled in"
8 and delete "institutions" and insert "p~ograms 11
9 Page 5, line 13, delete 11 fully funding" and insert
10 "implementing"
11 Page 7, line 4, delete "$21, 594, 000" and· insert
12 "$20,890,000"
13 Page 7, line 5, delete 11 $21,379,000" and insert
14 "$20,474,000 11
15 Page 7, line 46, delete 11 of the amount 11 and insert "fs 11
16 Page 7, line 48, before "is" insert 11 and 11
17 Page 7, line 50, delete everything after the period
18 Page 7, delete lines 51 and 52
19 Page 13, line 34, strike everything after "administering"
20 Page 13, line 35, strike everything before II the"
21 Page 13, line 36, strike everything after "Minnesota"
22 Page 14, line 1, strike "Force"
23 Page 15, line 10, delete "Colleges" and insert 11 College"
24 Page 15, lines 14 to 17, delete the new language and strike
25 the old language
26 Page 15, line 18, strike "legislature."
27 Page 15, line 21, strike "council" and insert "off ice"
28 Page 17, line 15, strike "full-time"
29 Page 17, line .16, after the period, insert "Fees do not
30 include charges for tools, equipment, computers, or other
31 similar materials where the student retains ownership. Fees
32 include charges for these materials if the institution retains
33 ownership. Fees do not include optional or punitive fees. 11
34 Page 17, line 28, after "semester" insert "or the
35 equivalent 11
36 Page 18, line 4, before "An" insert "ill"
l
""'
03/16/05 [REVISOR JLR/SK A05-0296
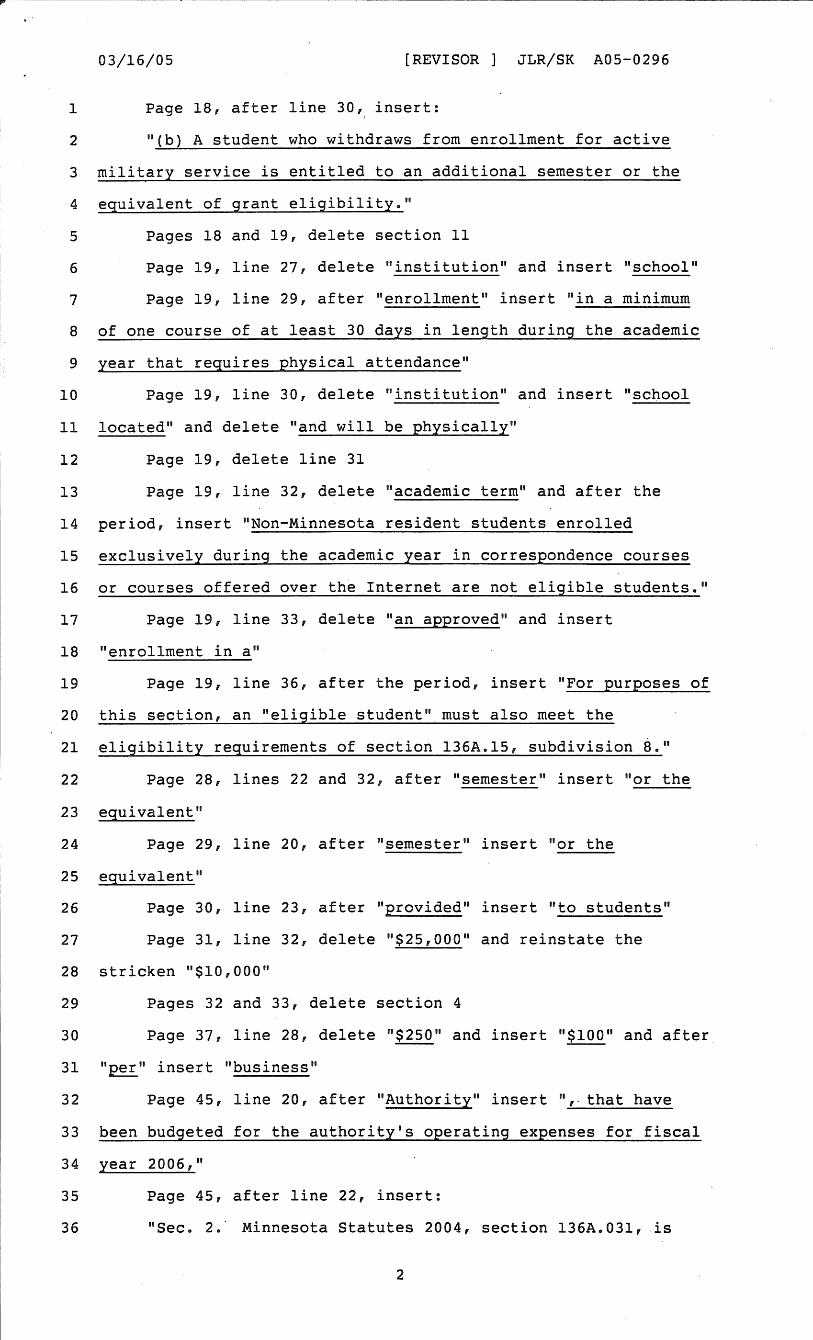
1 Page 18, after line 30 ', insert:
2 "(b) A student who withdraws from enrollment for active
3 military service is entitled to an additional semester or the
4 equivalent of grant eligibility. 11
5 Pages 18 and 19, delete section 11
6 Page 19, line 27, delete "institution" and insert "school 08
7 Page 19, line 29, after "enrollment" insert 11 in a minimum
8 of one course of at least 30 days in length during the academic
9 year that requires physical attendance"
10 Page 19, line 30, delete "institution" and insert "school
11 located" and delete 11 and will be physically"
12 Page 19, delete line 31
13 Page 19, line 32, delete "academic term" and after the
14 period, insert "Non-Minnesota resident students enrolled
15 exclusively during the academic year in correspondence courses
16 or courses offered over the Internet are not eligible students."
17 Page 19, line 33, delete "an approved" and insert
18 "enrollment in a"
19 Page 19, line 36, after the period, insert "For purposes of
20 this section, an "eligible student" must also meet the
21 eligibility requirements of section 136A.15, subdivision 8. 11
22 Page 28, lines 22 and 32, after "semester" insert "or the
23 equivalent"
24 Page 29, line 20, after 91 semester 11 insert "or the
25 equivalent"
26 Page 30, line 23, after "provided" insert 11 to students"
27 Page 31, line 32, delete "$25,000" and reinstate the
28 stricken 11 $10,000 11
29 Pages 32 and 33, delete section 4
30 Page 37, line 28, delete "$250" and insert "$100" and after
31 "~" insert "business"
32 Page 45, line 20, after "Authority" insert 11,. that have
33 been budgeted for the authority's operating expenses for fiscal
34 year 2006,"
35 Page 45, after line 22, insert:
36 "Sec. 2. · Minnesota Statutes 2004, section 136A. 031, .is
2
03/16/05 [REVISOR JLR/SK A05-0296
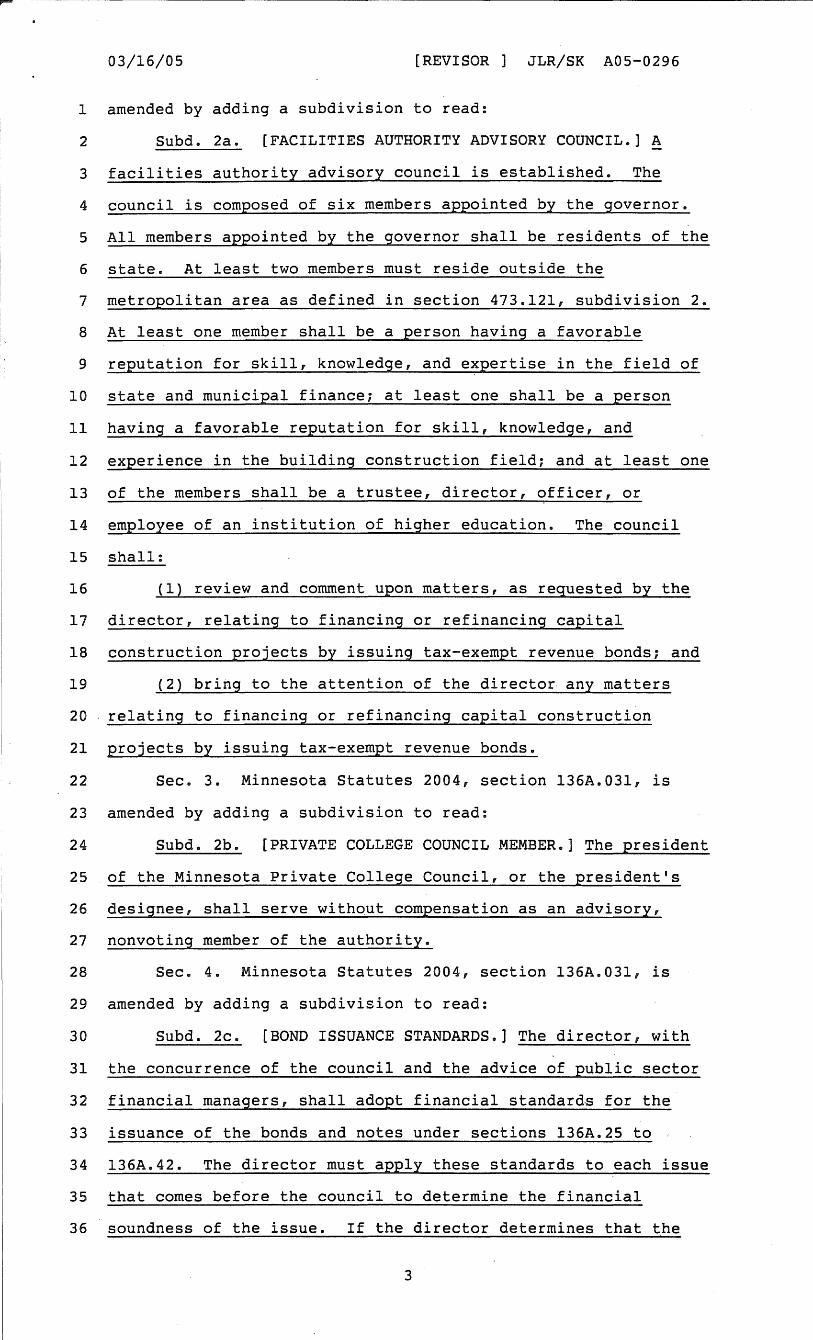
1 amended by adding a subdivision to read:
2 Subd. 2a. [FACILITIES AUTHORITY ADVISORY COUNCIL.]~
3 facilities authority advisory council is established. The
4 council is composed of six members appointed by the governor.
5 All members appointed by the governor shall be residents of the
6 state~ At least two members must reside outside the
7 metropolitan area as defined in section 473.121, subdivision 2.
8 At least one member shall be a person having a favorable
9 reputation for skill, knowledge, and expertise in the field of
10 state and municipal finance; at least one shall be a person
11 having a favorable reputation for skill, knowledge, and
12 experience in the building construction field; and at least one
13 of the members shall be a trustee, director, officer, or
14 employee of an institution of higher education. The council
15 shall:
16 (1) review and comment upon matters, as requested by the
17 director, relating to financing or refinancing capital
18 construction projects by issuing tax-exempt revenue bonds; and
19 (2) bring to the attention of the director any matters
20 relating to financing or refinancing capital construction
21 projects by issuing tax-exempt revenue bonds.
22 Sec. 3. Minnesota Statutes 2004, section 136A.031, is
23 amended by adding a subdivision to read:
24 Subd. 2b. [PRIVATE COLLEGE COUNCIL MEMBER.] The president
25 of the Minnesota Private College Council, or the president's
26 designee, shall serve without compensation as an advisory,
27 nonvoting member of the authority.
28 Sec. 4. Minnesota Statutes 2004, section 136A.031, is
29 amended by adding a subdivision to read:
30 Subd. 2c. [BOND ISSUANCE STANDARDS.] The director, with
31 the concurrence of the council and the advice of public sector
32 financial managers, shall adopt financial standard.s for the
33 issuance of the bonds and notes under sections 136A.25 to
34 136A.42. The director must apply these standards to each issue
35 that comes before the council to determine the financial
36 soundness of the issue. If the director determines that ~he
3

03/16/05 [REVISOR JLR/SK AOS-0296
1 bonds or notes should not be issued, the director must. report to
2 the council which standard has not been met and the financial
3 measures used to make this determination. The· director may not
4 use other standards to evaluate the bonds or notes. The
5 adoption of these standards is not subject to chapter 14."
6 Renumber the sections in sequence and correct the internal
7 references
8 Amend the title accordingly
4
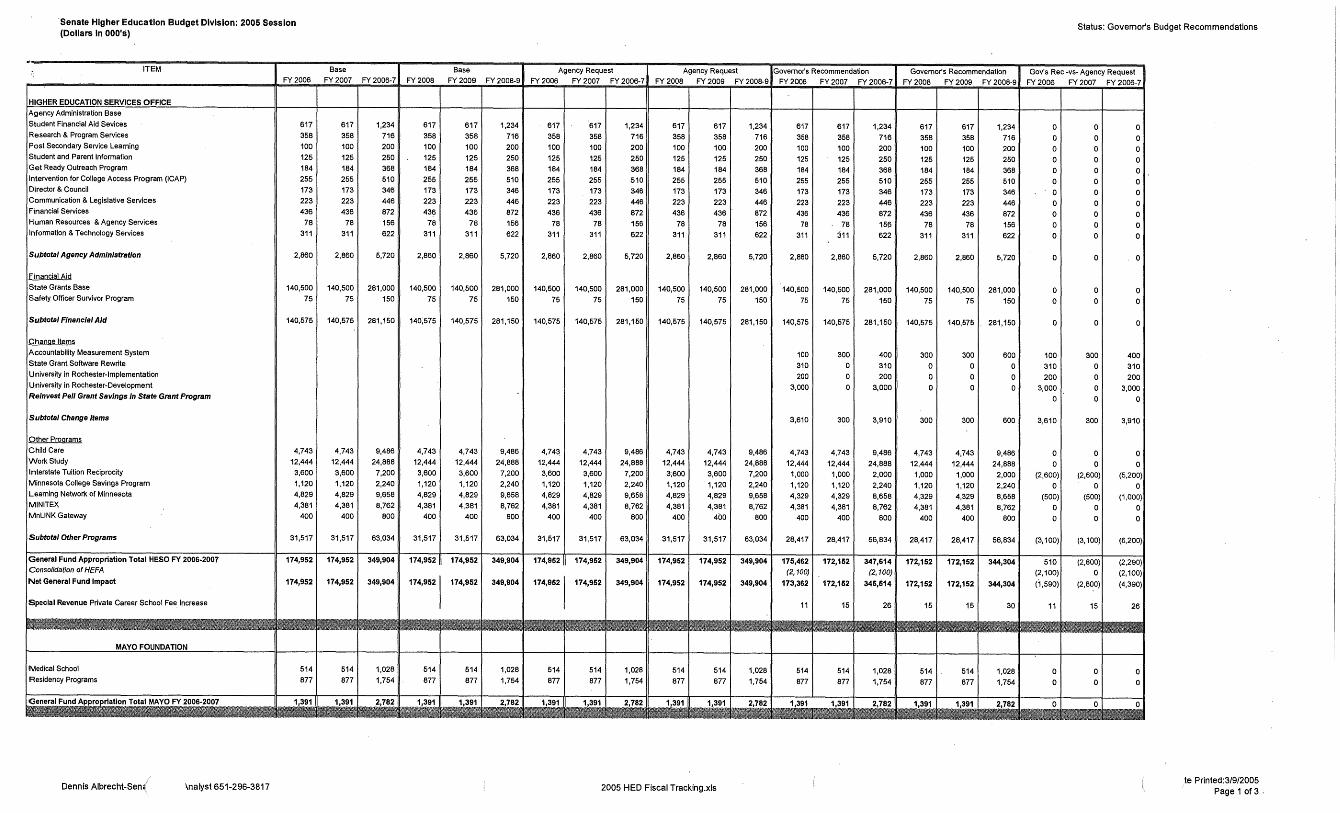
Senate Higher Education Budget Division: 2005 Session (Dollars In OOO's)
.. ITEM
FY 2006
HIGHER EDUCATION SERVICES OFFICE
Agency Administration Base
Student Financial Aid Sevices 617 Research & Program Services 358 Post Secondary Service Learning 100 Student and Parent lnfonnation 125 Get Ready Outreach Program 184 Intervention for College Access Program (ICAP) 255 Director & Council 173 Communication & Legislative Services 223 Financial Services 436 Human Resources & Agency Services 78 lnfonnation & Technology Services 311
Subtotal Agency Admlnlstratlon 2,860
Financial Aid
State Grants Base 140,500 Safety Officer Survivor Program 75
Subtotal Financlal Aid 140,575
Change Items
Accountability Measurement System
State Grant Software Rewrite
University in Rochester-Implementation
University in Rochester-Development
Reinvest Pell Grant Savings In State Grant Program
Subtotal Change Items
Other Programs
Child Care 4,743 Work Study 12,444 Interstate Tuition Reciprocity 3,600 Minnesota College Savings Program 1,120 Leaming Network of Minnesota 4,829 MINITEX 4,381 MnLINK Gateway 400
Subtotal Other Programs 31,517
General Fund Appropriation Total HESO FY 2006-2007 174,952 Consolidation of HEFA
Net General Fund Impact 174,952
Special Revenue Private Career School Fee_ Increase
MAYO FOUNDATION
Nedical School 514 Residency Programs 877
General Fund Aporopriation Total MAYO FY 2006-2007 1,391
Dennis Albrecht-Sent \nalyst 651-296-3817
Base
FY2007 FY 2006-7 FY2008
617 1,234 617 358 716 358
100 200 100
125 250 125 184 368 184
255 510 255 173 346 173
223 446 223
436 872 436 78 156 78
311 622 311
2,860 5,720 2,860
140,500 281,000 140,500
75 150 75
140,575 281,150 140;575
4,743 9,486 4,743 12,444 24,888 12,444
3,600 7,200 3,600
1,120 2,240 1,120
4,829 9,658 4,829
4,381 8,762 4,381 400 800 400
31,517 63,034 31,517
174,952 349,904 174,952
174,952 349,904 174,9521
514 1,028 514
877 1,754 877
1,391 2,782 1,391
Base Agency Request Agency Request FY 2009 FY 2008-9 FY 2006 FY 2007 FY 2006-7 FY 2008 FY 2009 FY 2008-9
617 1,234 617 617 1,234 617 617 1,234 358 716 358 358 716 358 358 716 100 200 100 100 200 100 100 200 125 250 125 125 250 125 125 250 184 368 184 184 368 184 184 368 255 510 255 255 510 255 255 510 173 346 173 173 346 173 173 346 223 446 223 223 446 223 223 446 436 872 436 436 872 436 436 872
78 156 78 78 156 78 78 156 311 622 311 311 622 311 311 622
2,860 5,720 2,860 2,860 5,720 2,860 2,860 5,720
140,500 281,000 140,500 140,500 281,000 140,500 140,500 281,000 75 150 75 75 150 75 75 150
140,575 281,150 140,575 140,575 281,150 140,575 140,575 281,150
4,743 9,486 4,743, 4,743 9,486 4,743 4,743 9,486 12,444 24,888 12,444 12,444 24,888 12,444 12,444 24,888 3,600 7,200 3,600 3,600 7,200 3',600 3,600 7,200 1,120 2,240 1,120 1,120 2,240 1,120 1,120 2,240 4,829 9,658 4,829 4,829 9,658 4,829 4,829 9,658 4,381 8,762 4,381 4,381 8,762 4,381 4,381 8,762
400 800 400 400 800 400 400 800
31,517 63,034 31,517 31,517 63,034 31,517 31,517 63,034
174,952 349,904 174,952 174,952 349,904 174,952 174,952 349,904
174,952 349,904 174,9521 174,952 349,904 174,952 174,952 349,904
514 1,028 514 514 1,028 514 514 1,028 877 1,754 877 877 1,754 877 877 1,754
1,391 2,782 1,391 1,391 2,782 1,391 1,391 2,782
2005 HED Fiscal Tracking.xis
Governor's Recommendation FY2006 FY2007 FY 2006-7
617 617 1,234 358 358 716
100 100 200 125 125 250
184 184 368 255 255 510
173 173 346
223 223 446 436 436 872
78 78 15!3 311 311 622
2,860 2,860 5,720
140,500 140,500 281,000
75 75 150
140,575 140,575 281,150
100 300 400
310 0 310
200 0 200 3,000 0 3,000
3,610 300 3,910
4,743 4,743 9,486
12,444 12,444 24,888 1,000 1,000 2,000
1,120 1,120 2,240 4,329 4,329 8,658
4,381 4,381 8,762 400 400 800
28,417 28,417 56,834
175,462 172,152 347,614 (2,100) (2, 100)
173,362 172,152 345,514
11 15 26
514 514 1,028
877 877 1,754
1,391 1,391 2,782
Governor's Recommendation FY 2008 FY 2009 FY 2008-9
617 617 1,234
358 358 716
100 100 200
125 125 250
184 184 368
255 255 510
173 173 346
223 223 446
436 436 872
78 78 156
311 311 622
2,860 2,860 5,720
140,500 140,500 281,000
75 75 150
140,575 140,575 281,150
300 300 600
0 0 0 0 0 0 0 0 0
300 300 600
4,743 4,743 9,486
12,444 12,444 24,888 1,000 1,000 2,000
1,120 1,120 2,240 4,329 4,329 8,658
4,381 4,381 8,762
400 400 800
28,417 28,417 56,834
172,152 172,152 344,304
172,152 172,152 344,304
15 15 30
514 514 1,028
877 877 1,754
1,391 1,391 2,782
Status: Governor's Budget Recommendations
Gav's Rec -vs- Agency Request FY 2006
0
0
0
0
0
0
0
0
0
0
0
0
0
0
0
100
310
200
3,000
0
3,610
0
0
(2,600)
0
(500)
0
0
(3,100)
510
(2,100)
(1,590)
11
0
0
0
FY2007
0
0
0
0
0
0
0
0
0
0
0
0
0
0
0
300
0
0
0
0
300
0
0
(2,600)
0
(500)
0
0
(3,100)
(2,800)
0
(2,800)
15
0
0
0
FY 2006-7
0
0
0
0
0
0
0
0
0
0
0
0
0
0
0
400
310
200
3,000
0
3,910
0
0
(5,200)
0
(1,000)
0
0
(6,200)
(2,290)
(2,100)
(4,390)
26
0
0
0
te Printed:3/9/2005 Page 1of3 -
Senate Higher Education Budget Division: 2005 Session (Dollars In OOO's)
ITEM
MN STATE COLLEGES & UNNERSITIES
Unajusted Base
Enrollment Adjustment-Recurring
Enrollment Adjustment-Nonrecurring Adjusted Base Appropriation
Change Items
Enrollment Adjustment-Recurring
Enrollment Adjustment-Nonrecurring
Invest Nonrecurring Enrollment Adjustment
Invest Nonrecurring-Minnesota Online
Invest Nonrecurring-Leveraged Equipment
Invest Nonrecurring-Technology
Invest Nonrecurring- Facilities Repair & Replacement
Nursing
Teacher Education
Farm & Small Business Management
Minnesota Online
Competitive Salaries
Innovations Fund
Repair & Replacement-Facilities
Serving Underserved Populations
Allocation Framework
Centers of Excellence
Subtotal Change Items
Estimated Cost of Instruction
Instructional Appropriation (90.2% of Appropriation)
Noninstructional Appropriation (9.8% of Appropriation)
General Fund Appropriation Total MNSCU FY 2006-2007
UNIVERSITY OF MINNESOTA
Unadjusted Base
Enrollment Adjustment
Adiusted Base
Operations and Maintenance Base Appropriation
Specials Base Appropriation
Total Base APPropriation (0/M+Specials)
Change Items
Enrollment Adjustment
Biosciences for a Healthy Society
Competitive Compensation
Research Support
Preparing Students for 21st Century Economy
Biotechnology & Medical Genomics Partnership
21st Century Technology
Subtotal Change Items
Estimated Cost of Instruction
Instructional Appropriation (Approx 51% of Appropriation)*
Non-Instruction Appropriation (Approx 49% of Appropriation)*
Total U of M General Fund Appropriation
I Dennis Albrecht-Senate alyst 651-296-3817
FY2006
547,694
36,000
58,800
642,494
869,290
579,530
62,964
642,494
550,067
58,362
608,429
545,062
63,367
608,429
465,446
310,299
298,130
I 608,4291
Base Base
FY2007 FY 2006-7 FY 2008 FY 2009 FY2008-9
547,694 1,095,388 547,694 547,694 1,095,388
36,000 72,000 36,000 36,000 72,000
0 58,800 0 0 0 583,694 1,226,188 583,694 583,694 1,167,388
789,734 1,659,024 789,734 789,734 1,579,468
526,492 1,106,022 526,492 526,492 1,052,984
57,202 120,166 57,202 57,202 114,404
583,694 1,226,188 583,694 583,694 1,167,388
550,067 1,100,134 550,067 550,067 1,100,134
15,388 73,750 15,388 15,388 30,776
565,455 1,173,884 565,455 565,455 1,130,910
502,088 1,047,150 502,088 502,088 1,004,176
63,367 126,734 63,367 63,367 126,734 565,455 1,173,884 565,455 565,455 1,130,910
432,571 898,017 432,571 432,571 865,142
288,382 598,681 288,382 288,382 576,764
277,073 575,203 277,073 277,073 554,146
565,45511,173,8841 565,455 565,455 1,130910
Agency Request Agency Request
FY 2006 FY 2007 FY 2006-7 FY2008 FY 2009 FY 2008-9
547,694 547,694 1,095,388 547,694 547,694 1,095,388
36,000 36,000 72,000 36,000 36,000 72,000
58,800 0 58,800 0 0 0
642,494 583,694 1,226,188 583,694 583,694 1,167,388
(58,800) 0 (58.800) 0 0 0
13,900 0 13,900 0 0 0
14, 100 0 14,100 0 0 0
20,000 0 20,000 0 0 0
10,800 0 10,800 0 0 0
4,800 5,200 10,000 5,200 5,200 10,400
1,500 1,500 3,000 1,500 1,500 3,000
1,500 1,500 3,000 1,500 1,500 3,000
3,500 4,600 8,100 4,600 4,600 9,200
4,600 9,300 13,900 9,300 9,300 18,600
2,500 3,000 5,500 3,000 3,000 6,000
5,000 6,000 11,000 6,000 6,000 12,000
6,000 6,000 12,000 6,000 6,000 12,000
0 0 0 0 0 0
0 0 0 0 0 0
29,400 37,100 66,500 37,100 37, 100 74,200
909,068 839,930 1,748,998 839,930 839,930 1,679,860
606,048 559,956 1,166,005 559,956 559,956 1,119,912
65,846 60,838 126,683 60,838 60,838 121,676
671,894 620,794 1,292,688 620,794 620,794 1,241,588
550,067 550,067 1,100,134 550,067 550,067 1,100,134
58,362 15,388 73,750 15,388 15,388 30,776
608,429 565,455 1,173,884 565,455 565,455 1,130,910
545,062 502,088 1,047,150 502,088 502,088 1,004,176
63,367 63,367 126,734 63,367 63,367 126,734
608,429 565,455 1,173,884 565,455 565,455 1,130,910
12,000 24,000 36,000 24,000 24,000 48,000
5,000 10,000 15,000 10,000 10,000 20,000
11,500 23,000 34,500 23,000 23,000 46,000
6,500 13,000 19,500 13,000 13,000 26,000
0 0 0 0 0 0
7,000 14,000 21,000 14,000 14,000 28,000
42,000 84,000 126,000 84,000 84,000 168,000
497,576 496,831 994,406 496,831 496,831 993,661
331,719 331,222 662,941 331,222 331,222 662,444
318,710 318,233 636,943 318,233 318,233 636,466
650429 649,455 1,299 884 649,455 649 455 1 298 910
2005 HED Fiscal Tracking.xis
Governor's Recommendation Governor's Recommendation FY2006 FY 2007 FY 2006-7 FY 2008 FY 2009 FY2008-9
547,694 547,694 1,095,388 547,694 547,694 1,095,388
36,000 36,000 72,000 36,000 36,000 72,000
58,800 0 58,800 0 0 0
642,494 583,694 1,226,188 583,694 583,694 1,167,388
(36,000) (36,000) (72,000) (36,000) (36,000) (72.000)
(58.800) 0 (58,800) 0 0 0
0 0 0 0 0 0
0 0 0 0 0 0
0 0 0 0 0 0
0 0 0 0 0 0
0 0 0 0 0 0
4,800 5,200 10,000 5,200 5,200 10,400
0 0 0 0 0 0
1,500 1,500 3,000 1,500 1,500 3,000
9,000 5,000 14,000 5,000 5,000 10,000
2,500 2,500 5,000 2,500 2,500 5,000
2,500 3,000 5,500 3,000 3,000 6,000
0 0 0 0 0 0
0 0 0 0 0 0
25,000 25,000 50,000 25,000 25,000 50,000
10,000 10,000 20,000 10,000 10,000 20,000
(39,500) 16,200 (23,300) 16,200 16,200 32,400
815,847 811,653 1,627,499 811,653 811,653 1,623,305
543,901 541,104 1,085,005 541,104 541,104 1,082,209 59,093 58,790 117,883 58,790 58,790 117,579
602,994 599,894 1,202,888 599,894 599,894 1,199,788
550,067 550,067 1,100,134 550,067 550,067 1,100,134
58,362 15,388 73,750 15,388 15,388 30,776 608,429 565,455 1,173,884 565,455 565,455 1,130,910
545,062 502,088 1,047, 150 502,088 502,088 1,004,176
63,367 63,367 126,734 63,367 63,367 126,734 608,429 565,455 1,173,884 565,455 565,455 1,130,910
(58,362) (15,388) (73,750) (15,388) (15,388) (30.776)
12,000 24,000 36,000 24,000 24,000 48,000
5,000 10,000 15,000 10,000 10,000 20,000
20,000 15,000 35,000 15,000 15,000 30,000
6,500 13,000 19,500 13,000 13,000 26,000
15,000 0 15,000 0 0 0
0 0 0 0 0 0
138 46,612 46,750 46,612 46,612 93,224
465,551 468,229 933,780 468,229 468,229 936,458
310,369 312,154 622,523 312,154 312,154 624,308
298,198 299,913 598,111 299,913 299,913 599,826
608,567 612,067 1,220 634 612,067 612,067 1,224134
Status: Governor's Budget Recommendations
Gav's Rec -vs- Agency Request
FY 2006 FY 2007
0 0
0 0
0 0
0 0
(36,000) (36,000)
(58,800) 0
58,llOO 0
(13,900) 0
(14,100) 0
(20,000) 0
(10,800) 0
0 0
(1,500) (1,500)
0 0
5,500 400
(2,100) (6,800)
0 0
(5,000) (6,000)
(6,000) (6,000)
25,000 25,000
10,000 10,000
(68,900) (20,900)
(93,221) (28,278)
(62,148) (18,852)
(6,752) (2,048)
(68,900) (20,900)
0 0
0 0
0 0
0 0
0 0
0 0
(58,362) (15,388)
0 0
0 0
8,500 (8,000)
0 0
15,000 0
(7,000) (14,000)
(41,862) (37,388)
(32,024) (28,602)
(21,350) (19,068) (20,512) (18,320)
(41,862 (37,388)
FY 2006-7
0
0
0
0
(72,000)
(58,800)
58,800
(13,900)
(14,100)
(20,000)
(10,800)
0
(3,000)
0
5,900
(8,900)
0
(11,000)
(12,000)
50,000
20,000
(89,800)
(121,499)
(81,000) (8,800)
(89,800)
0
0
0
0
0
0
(73,750)
0
0
500
0
15,000
(21,000)
(79,250)
(60,626)
(40,418) (38,833)
(79,250)
'e Printed:3/9/2005 Page 2 of3
Senate Higher Education Budget Division: 2005 Session (Dollars In OOO's)
ITEM FY2006
lnfonnation Only
Specials
Agriculture Base 50,625
Health Sciences (United Family Practice) 4,929 Institute of Technology 1,387 System Special 6,426
Total specials 63,367
Other Appropriations
Health Care Access Fund (Medical Education) 2,157 Cigarette Tax (Academic Health Center)
General Fund and Other Appropriation Total U of M FY 2006-2007 610,586
General Fund Aoorooriations Total, All Higher Education Systems 1,427 266
All Funds Impact, All Higher Education Systems (Includes HCAF, C/g Tax & HEFA Fees and Reallocation) 1,429,423
*These amounts are estimated, awaiting determination of final percentageil
Dennis Albrecht-Ser, Analyst 651-296-3817
Base Base FY 2007 FY 2006-7 FY 2008 FY 2009
50,625 101,250 50,625 50,625
4,929 9,858 4,929 4,929
.1,387 2,774 1,387 1,387
6,426 12,852 6,426 6,426
63,367 126,734 63,367 63,367
2,157 4,314 2,157 2,157
567,612 1, 178, 198 567,612 567,612
1,325,492 2,752,758 1 325,492 1,325,492
1,327,649 2,757,072 1,327,649 1,327,649
Agency Request Agency Request 'FY 2008-9 FY 2006 FY 2007 FY 2006-7 FY 2008 FY 2009 FY 2008-9
101,250 50,625 50,625 101,250 50,625 50,625 101,250
9,858 4,929 4,929 9,858 4,929 4,929 9,858
2,774 1,387 1,387 2,774 1,387 1,387 2,774
12,852 6,426 6,426 12,852 6,426 6,426 12,852
126,734 63,367 63,367 126,734 63,367 63,367 126,734
4,314
1,135,224 650,429 649,455 1,299,884 649,455 649,455 1,298,910
2650 984 1498666 1 446,592 2,945 258 1,446,592 1,446,592 2 893,184
2,655,298 1,498,666 1,446,592 2,945,258 1,446,592 1,446,592 2,893,184
2005 HED Fiscal Tracking.xis
Governor's Recommendation FY 2006 FY2007 FY 2006-7
50,625 50,625 101,250
4,929 4,929 9,858
1,387 1,387 2,774
6,426 6,426 12,852
63,367 63,367 126,734
2,157 2,157 4,314 21,594 21,379 42,973
632,318 635,603 1,267,921
1.388 414 1385 504 2,773 918
1,410,076 1,409,055 2,819,131
Governor's Recommendation FY 2008 FY 2009 FY2008-9
50,625 50,625 101,250
4,929 4,929 9,858
1,387 1,387 2,774
6,426 6,426 12,852
63,367 63,367 126,734
2,157 2,157 4,314
614,224 614,224 1,228,448
1 385,504 1 385,504 2,771 008
1,387,676 1,387,676 2,775,352
Status: Governor's Budget Recommendations
Gov's Rec -vs- Agency Request FY 2006 FY 2007
0 0 0 0
0 0
0 0
0 0
2,157 2,157 21,594 21,379
(18,111) (13,852)
(110,252) (61,088)
(88,590) (37,537)
FY2006-7
0 0
0
0
0
4,314 42,973
(31,963)
(171,340)
(126,127)
'ate Printed:3/9/2005 Page 3 of 3
02/15/05 [REVISOR ] JSK/DD 05-2189
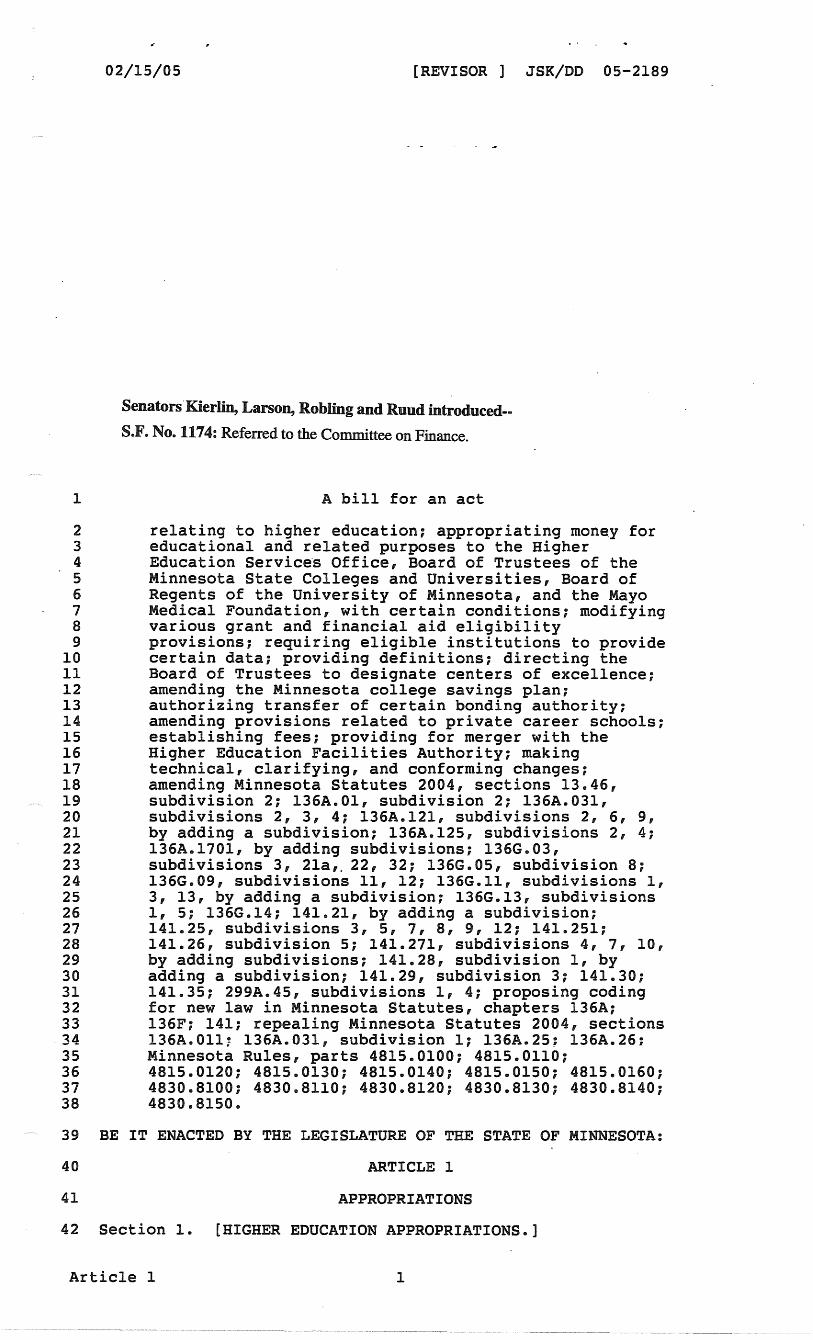
Senators.Kierlin, Larson, Rohling and Ruud introduced-
S.F. No. 117 4: Referred to the Committee on Finance.
1 A bill for an act
2 relating to higher education; appropriating money for 3 educational and related purposes to the Higher 4 Education Service·s Office, Board of Trustees of the 5 Minnesota State Colleges and Universities, Board of 6 Regents of the University of Minnesota, and the Mayo 7 Medical Foundation, with certain conditions; modifying 8 various grant and financial aid eligibility 9 provisions; requiring eligible institutions to provide
10 certain data; providing definitions; directing the 11 Board of Trustees to designate centers of excellence; 12 amending the Minnesota college savings plan; 13 authorizing transfer of certain bonding authority; 14 amending provisions related to private career schools; 15 establishing fees; providing for merger with the 16 Higher Education Facilities Authority; making 17 technical, clarifying, and conforming changes; 18 amending Minnesota Statutes 2004, sections 13.46, 19 subdivision 2; 136A.Ol, subdivision 2; 136A.031, 20 subdivisions 2, 3, 4; 136A.121, subdivisions 2, 6, 9, 21 by adding a subdivision; 136A.125, subdivisions 2, 4; 22 136A.1701, by adding subdivisions; 136G.03, 23 subdivisions 3, 2la,. 22, 32; 136G.05, subdivision 8; 24 136G.09, subdivisions 11, 12; 136G.ll, subdivisions 1, 25 3, 13, by adding a subdivision; 136G.13, subdivisions 26 1, 5; 136G.14; 141.21, by adding a subdivision; 27 141.25, subdivisions 3, 5, 7, 8, 9, 12; 141.251; 28 141.26, subdivision 5; 141.271, subdivisions 4, 7, 10, 29 by adding subdivisions; 141.28, subdivision 1, by 30 adding a subdivision; 141.29, subdivision 3; 141.30; 31 141.35; 299A.45, subdivisions 1, 4; proposing coding 32 for new law in Minnesota Statutes, chapters 136A; 33 136F; 141; repealing Minnesota Statutes 2004, sections
.34 136A.011; 136A.031, subdivision l; 136A.25; 136A.26: 35 Minnesota Rules, parts 4815.0100; 4815.0110; 36 4815.0120; 4815.0130; 4815.0140; 4815.0150; 4815.0160; 37 4830.8100; 4830.8110; 4830.8120; 4830.8130; 4830.8140; 38 4830.8150.
39 BE IT ENACTED BY THE LEGISLATURE OF THE STATE OF MINNESOTA:
40 ARTICLE 1
41 APPROPRIATIONS
42 Section 1. [HIGHER EDUCATION APPROPRIATIONS.]
Article l 1
02/15/05 [REVISOR ] JSK/DD 05-2189
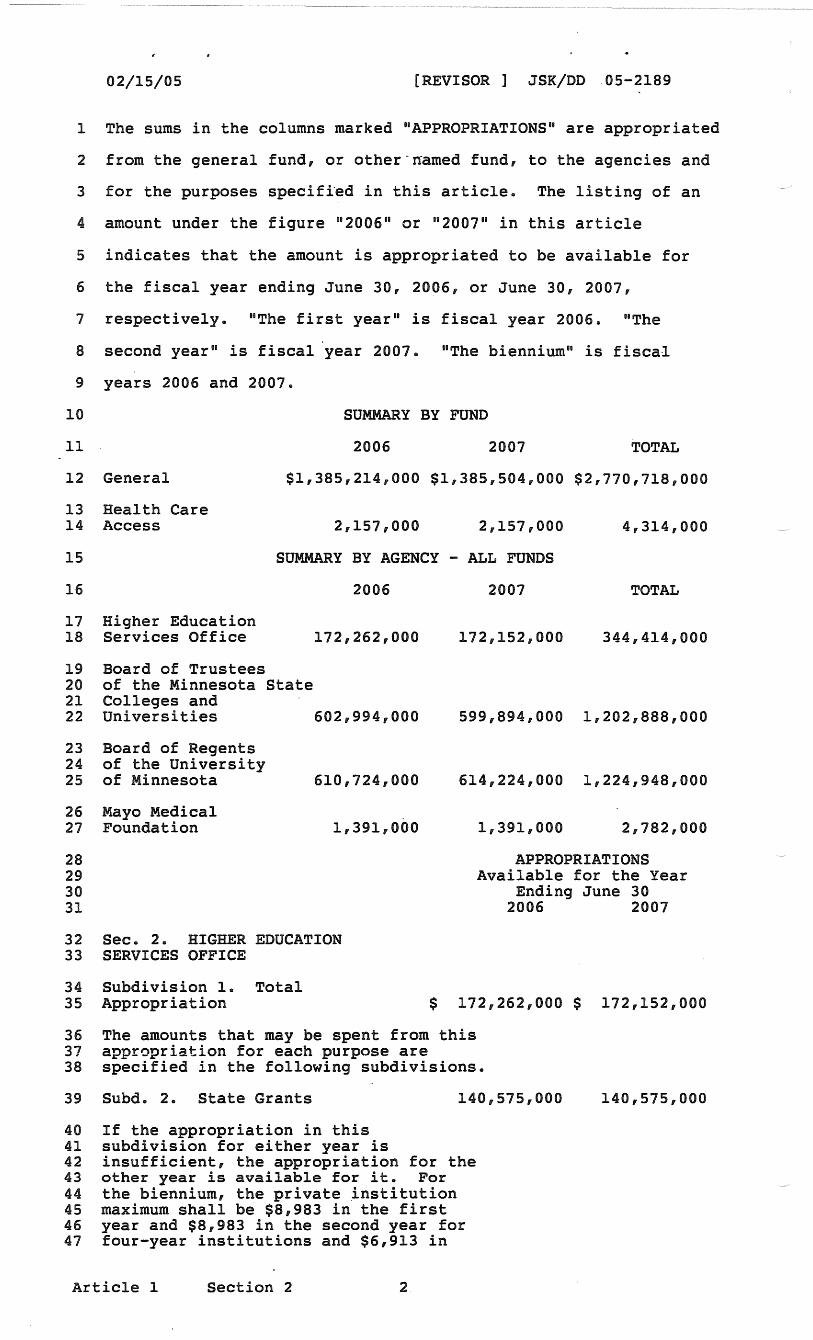
1 The sums in the columns marked "APPROPRIATIONS" are appropriated
2 from the general fund, or other-named fund, to the agencies and
3 for the purposes specified in this article.. The listing of an
4 amount under the figure 11 2006" or 11 2007" in this article
5 indicates that the amount is appropriated to be available for
6 the fiscal year ending June 30, 2006, or June 30, 2007,
7 respectively.. "The first year" is fiscal year 2006.. "The
8 second year" is fiscal year 2007.. "The biennium" is fiscal
9 years 2006 and 2007 ..
10 SUMMARY BY FUND
11 2006 2007
12 General $1,385,214,000 $1,385,504,000
13 Health Care 14 Access 2,157,000 2,157,000
15 SUMMARY BY AGENCY - ALL FUNDS
16
17 Higher Education 18 Services Off ice
19 Board of Trustees 20 of the Minnesota State 21 Colleges and
2006 2007
172,262,000 172,152,000
TOTAL
$2,770,718,000
4,314,000
TOTAL
344,414,000
22 Universities 602,994,000 599,894,000 1,202,888,000
23 Board of Regents 24 of the University 25 of Minnesota 610,724,000 614,224,000 1,224,948,000
26 Mayo Medical 27 Foundation 1,391,000 1,391,000 2,782,000
28 APPROPRIATIONS 29 Available for the Year 30 Ending June 30 31 2006 2007
32 Sec .. 2.. HIGHER EDUCATION 33 SERVICES OFFICE
34 Subdivision 1. Total 35 Appropriation $ 172,262,000 $ 172,152,000
36 The amounts that may be spent from this 37 appropriation for each purpose are 38 specified in the following subdivisions.
39 Subd. 2. State Grants
40 If the appropriation in this 41 subdivision for either year is
140,575,000
42 insufficient, the appropriation for the 43 other year is available for it. For 44 the biennium, the private institution 45 maximum shall be $8,983 in the first 46 year and $8,983 in the second year for 47 four-year institutions and $6,913 in
Article 1 Section 2 2
140,575,000
02/15/05 [REVISOR JSK/DD 05-2189
1 the first year and $6,913 in the second 2 year for two-year institutions.
3 This appropriation sets the living and 4 miscellaneous expense allowance at 5 $5,280 in each year.
6 Savings in the state grant program in 7 fiscal years 2006 and 2007 resulting 8 from any changes in the federal needs 9 analysis formula must be used as
10 provided in this subdivision and under 11 article 2, section 7.
12 Subd. 3. Interstate Tuition 13 Reciprocity
14 If tne appropriation in this 15 subdivision for either year is 16 insufficient, the appropriation for the 17 other year is available to meet 18 reciprocity contract obligations.
1,000,000
19 Subd. 4. State Work Study
20 Subd. 5. Child Care Grants
12,444,000
21 Subd. 6. Minitex
22 Subd. 7. MnLINK Gateway
23 Subd. 8. Learning Network 24 of Minnesota
25 Subd. 9. Minnesota College 26 Savings Plan
27 Subd. 10. Other Small 28 Programs
29 Of this appropriation, $100,000 each 30 year is for grants to increase 31 campus-community collaboration and 32 service learning statewide. For each 33 $1 in state funding, grant recipients 34 must contribute $2 in campus or 35 community-based support.
4,743,000
4,381,000
400,000
4,329,000
1,120,000
664,000
36 Subd. 11. Agency 37 Administration 2,606,000
38 Of this appropriation, $100,000 in the 39 first year and $300,000 in the second 40 year is for the Higher Education 41 Services Off ice to develop and 42 implement a process to measure and 43 report on the effectiveness of 44 postsecondary institutions in the 45 state. The funding base for this 46 initiative in fiscal years 2008 and 47 2009 is $300,000 per year.
48 Of this appropriation, $310,000 in the 49 first year is for the Higher Education 50 Services Off ice to upgrade computer 51 program application software related to 52 state grant awards. This appropriation 53 does not cancel but is available until 54 expended. This is a onetime 55 appropriation and is not added to the 56 agency's base.
Article 1 Section 2 3
1,000,000
12,444,000
4,743,000
4,381,000
400,000
4,329,000
1,120,000
664,000
2,496,000
02/15/05 [REVISOR ] JSK/DD 05-2189
1 Subd. 12. Balances Forward
2 A balance in the first year under-this 3 section does not cancel, but is 4 available for the second year.
5 Subd. 13. Transfers
6 The Higher Education Services Off ice 7 may transfer unencumbered balances from 8 the appropriations in this section to 9 the state grant appropriation, the
10 interstate tuition reciprocity 11 appropriation, the child care 12 appropriation, and the state work study 13 appropriation.
14 Subd. 14. Reporting
15 The Higher Education Services Off ice 16 shall collect data monthly from 17 institutions disbursing state financial 18 aid. The data collected must include, 19 but is not limited to, expenditures by 20 type to date and unexpended balances. 21 The Higher Education Services Off ice 22 must evaluate and report quarterly 23 state financial aid expenditures and 24 unexpended balances to the chairs of 25 the Higher Education Finances 26 Committees of the senate and house of 27 representatives and the commissioner of 28 finance. By November 1 and February 29 15, the Higher Education Services 30 Off ice must provide updated state grant 31 spending projections taking into 32 account the most current and projected 33 enrollment and tuition and fee 34 information, economic conditions, and 35 other relevant factors. Before 36 submitting state grant spending 37 projections, the Higher Education 38 Services Office must meet and consult 39 with representatives of public and 40 private postsecondary education, the 41 Department of Finance, Governor's 42 Office, legislative staff, and· 43 financial aid administrators.
44 Sec. 3. BOARD OF TRUSTEES OF THE MINNESOTA 45 STATE COLLEGES AND UNIVERSITIES
46 Subdivision 1. Total 47 Appropriation 602,994,000
48 The amounts that may be spent from this 49 appropriation for each purpose are 50 specified in the following subdivisions.
51 Subd. 2. General Appropriation
52 Of this appropriation, $9,000,000 the 53 first year and $5,000,000 the second 54 year are for the board to strengthen 55 and expand its Minnesota on-line 56 program.
565,494,000
57 Of this appropriation, $4,800,000 the 58 first year and $5,200,000 the second 59 year are for the board to increase its 60 capacity for training nurses.
Article 1 Section 3 4
599,894,000
562,394,000
02/15/05 [REVISOR ] JSK/DD 05-2189
1 Of this appropriation, $2,500,000 the 2 first year and $3,000,000 the second 3 year are to provide resources for- the 4 board to establish an innovations fund.
5 Of this appropriation, $1,500,000 each 6 year is for the board to address the 7 management education needs of farm and 8 small business owners.
9 Subd. 3. Allocation Framework
10 The appropriation in this subdivision 11 is for the board to reinvest in its 12 member colleges and-universities, 13 through fully funding its allocation 14 framework.
25,000,000
15 Subd. 4. Centers of Excellence and 16 Competitive Salaries 12,500,000
17 Of this appropriation, $10,000,000 each 18 year is for the board to support 19 designated centers of excellence, as 20 provided under article· 2, ·section 16.
21 Of this appropriation, $2,500,000 each 22 year is for the board to make incentive 23 payments to faculty or staff for 24 initiatives that promote excellence in 25 student learning. To the extent 26 practicable, the board must make 27 payments under this paragraph available 28 first to faculty or s.taff associated 29 with a designated center of excellence.
30 Sec. 4. BOARD OF REGENTS OF THE 31 UNIVERSITY OF MINNESOTA
32 Subdivision 1. Total 33 Appropriation 608,567,000
34 The amounts that may be spent from this 35 appropriation for each purpose are 36 specified in the following subdivisions.
37 Subd. 2. Operations and 38 Maintenance
39 . Of this amount, $15,000,000 in the 40 first year is for the collaborative
545,200,000
41 research partnership for biotechnology 42 and medical genomics of the university 43 and the Mayo Foundation. This is a 44 onetime appropriation that is to be 45 evenly divided between the two 46 partnering organizations. This 47 appropriation must be matched dollar 48 for dollar by nonstate funds. The 49 state funds must be made available 50 after certification to the director of 51 the Higher Education Services Off ice of 52 the nonstate match. An annual report 53 on the expenditure of these funds must 54 be submitted to the governor and to the 55 chairs of the senate Higher Education 56 Budget Division and the house Higher 57· Education Finance Committee by June 30 58 of each fiscal year. This 59 appropriation is available until June 60 30, 2007.
Article 1 Section 4 5
25,000,000
12,500,000
612,067,000
548,700,000
02/15/05 [REVISOR JSK/DD 05-2189
l Of this amount, $12,000,000 the first 2 year and $24,000,000 the second year is 3 for academic initiatives that are part- -4 of the board's biosciences for a 5 healthy society initiative.
6 Of this amount, $5,000,000 the first 7 year and $10,000,000 the second year is 8 to award faculty compensation increases 9 differentially.
10 Of this amount, $20,000,000 the first 11 year and $15,000,000 the second year is 12· for research support. The funding base 13 for this initiative in fiscal years 14 2008 and 2009 is $15,000,000 per year.
15 Of this amount, $6,500,000 the first 16 year and $13,000,000 the second year is 17 for initiatives to attract and retain 18 students.
19 S.ubd. 3. Health Care Access Fund
20 This appropriation is from the health 21 care access fund and is for primary 22 care education initiatives.
2,157,000
23 Subd. 4. Special 24 Appropriation 63,367,000
25 (a) Agriculture and Extension Service
26 50,625,000 50,625,000
27 This appropriation is for the 28 Agricultural Experiment Station, 29 Minnesota Extension Service.
30 (b) Health Sciences
31 4,.929,000 4,929,000
32 This appropriation is for the rural 33 physicians associates program, the 34 Veterinary Diagnostic Laboratory, 35 health sciences research, dental care, 36 and the Biomedical Engineering Center.
37 (c) Institute of Technology
38 1,387,000 1,387,000
39 This appropriation is for the 40 Geological Survey and the Talented 41 Youth Mathematics Program.
42 (d) System Specials
43 6,426,000 6,426,000.
44 This appropriation is for general 45 research, student loans matching money, 46 industrial relations education, Natural 47 Resources Research Institute, Center 48 for Urban and Regional Affairs, Bell 49 Museum of Natural History, and the 50 Humphrey exhibit.
51 Subd. 5. Academic Health Center
Article 1 Section 4 6
2,157,000
63,367,000
02/15/05 [REVISOR ] JSK/DD 05-2189
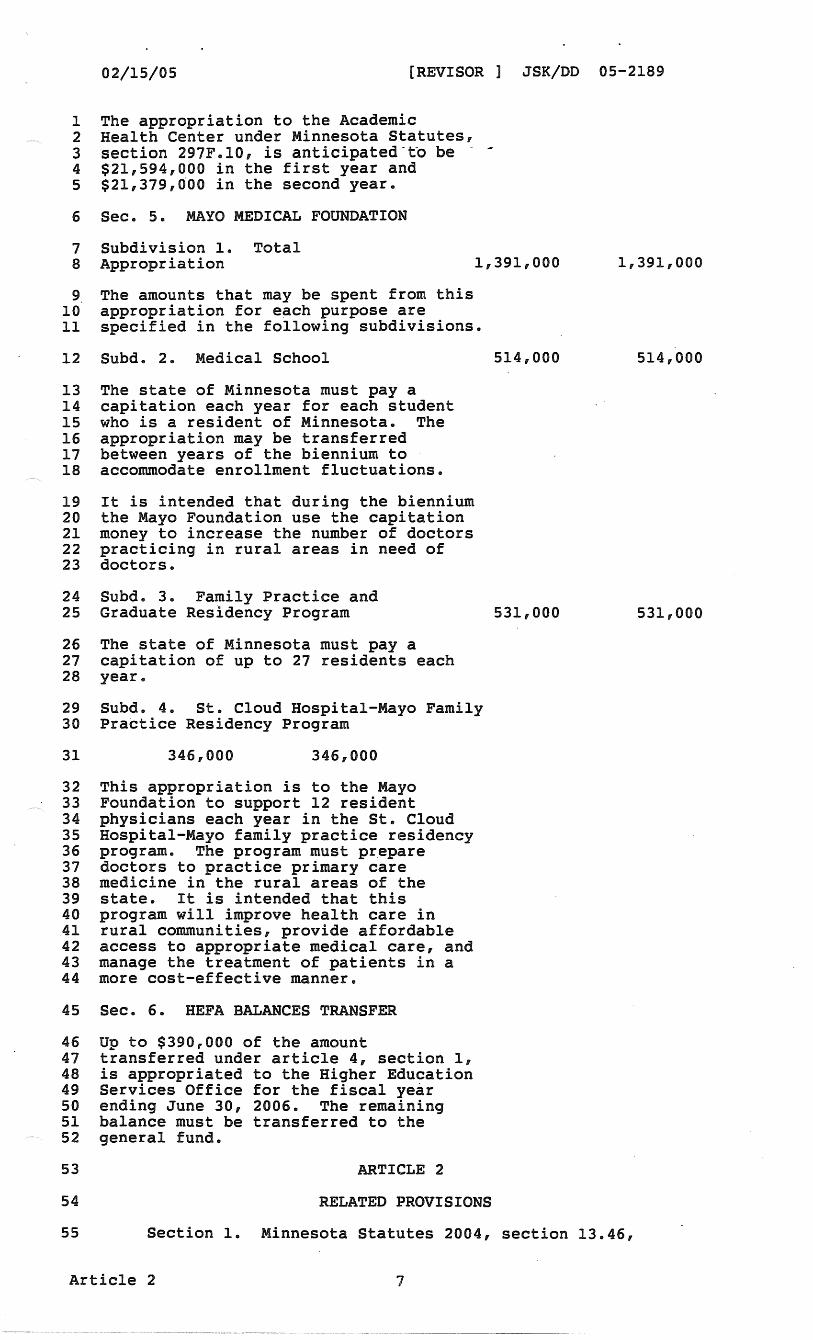
1 The appropriation to the Academic 2 Health Center under Minnesota Statutes, 3 section 297F.10, is anticipated-~o be - -4 $21,594,000 in the first year and 5 $21,379,000 in the second year.
6 Sec. 5. MAYO MEDICAL FOUNDATION
7 Subdivision 1. Total 8 Appropriation 1,391,000
9 The amounts that may be spent from this 10 appropriation for e~ch purpose are 11 specified in the following subdivisions.
12 Subd. 2. Medical School
13 The state of Minnesota must pay a 14 capitation each year for each student 15 who is a resident of Minnesota. The 16 appropriation may be transferred 17 between years of the biennium to 18 accommodate enrollment fluctuations.
19 It is intended that during the biennium 20 the Mayo Foundation use the capitation 21 money to increase the number of doctors 22 practicing in rural areas in need of 23 doctors.
24 Subd. 3. Family Practice and 25 Graduate Residency Program
26 The state of Minnesota must pay a 27 capitation of up to 27 residents each 28 year.
29 Subd. 4. St. Cloud Hospital-Mayo Family 30 Practice Residency Program
31 346,000 346,000
32 This appropriation is to the Mayo 33 Foundation to support 12 resident 34 physicians each year in the St. Cloud 35 Hospital-Mayo family practice residency 36 program. The program must pr_epare 37 doctors to practice primary care 38 medicine in the rural areas of the 39 state. It is intended that this 40 program will improve health care in 41 rural communities, provide affordable 42 access to appropriate medical care, and 43 manage the treatment of patients in a 44 more cost-effective manner.
45 Sec. 6. HEFA BALANCES TRANSFER
46 Up to $390,000 of the amount 47 transferred under article 4, section 1, 48 is appropriated to the Higher Education 49 Services Off ice for the fiscal year 50 ending June 30, 2006. The remaining 51 balance must be transferred to the 52 general fund.
53 ARTICLE 2
54 RELATED PROVISIONS
514,000
531,000
1,391,000
514,000
531,000
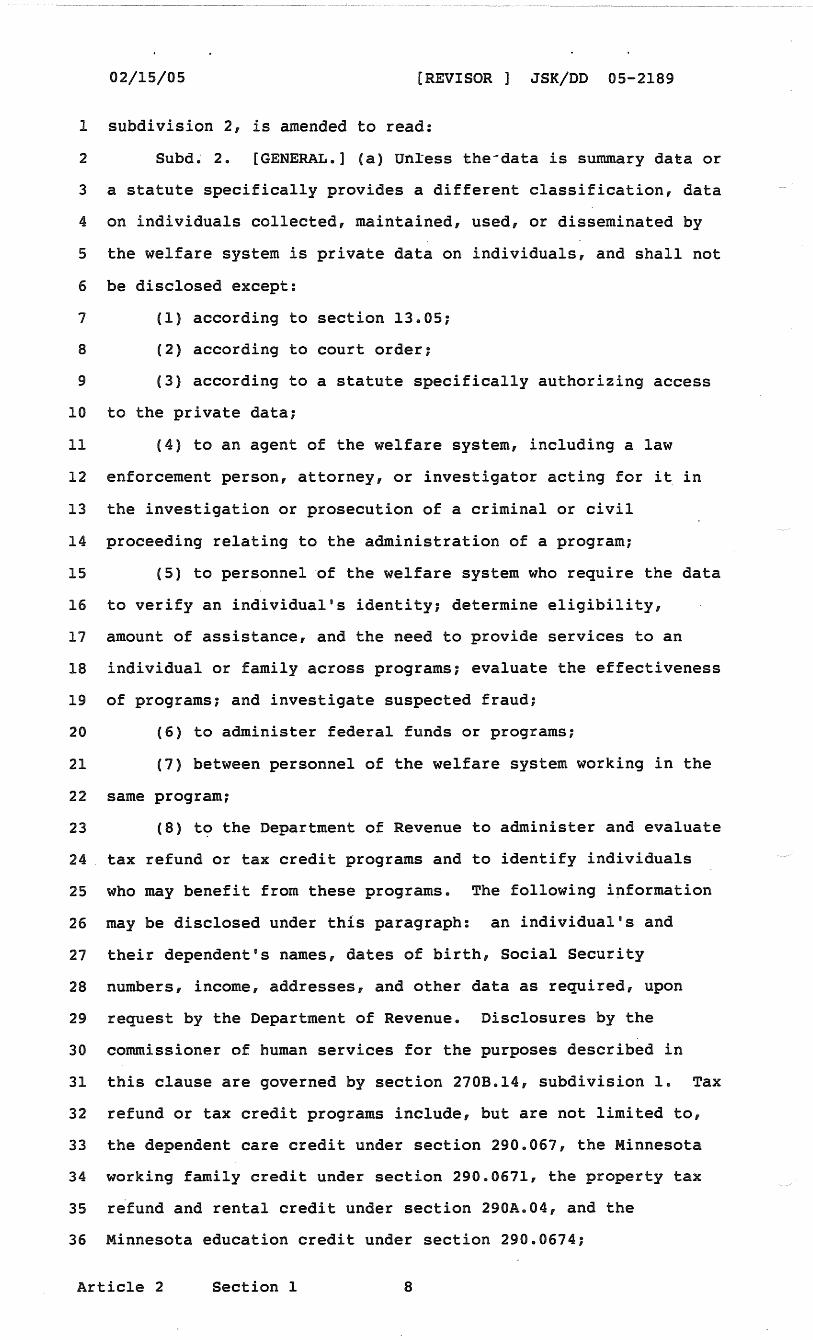
55 Section 1. Minnesota Statutes 2004, section 13.46,
Article 2 7
02/15/05 [REVISOR ] JSK/DD 05-2189
be disclosed except:
(1) according to section 13.05;
(2) according to court order;
(3) according to a statute specifically authorizing access
to the private data;
Article 2 Section 1 8
02/15/05 [REVISOR ] JSK/DD 05-2189
1 (9) between the Department of Human Services, the
2 Department of Education, and the "Department of Employment and
3 Economic Development for the purpose of monitoring the
4 eligibility of the data subject for unemployment benefits, for
5 any employment or training program administered, supervised, or
6 certified by that agency, for the purpose of administering any
7 rehabilitation program or child care assistance program, whether
8 alone or in conjunction with the welfare system, or to monitor
9 and evaluate the Minnesota family investment program by
10 exchanging data on recipients and former recipients of food
11 support, cash assistance under chapter 256, 2560, 256J, or 256K,
12 child care assistance under chapter 119B, or medical programs
13 under chapter 256B, 2560, or 256L; .
14 (10) to appropriate parties in connection with an emergency
15 if knowledge of the information is necessary to protect the
16 health or safety of the individual or other individuals or
17 persons;
18 (11) data maintained by residential programs as defined in
19 section 245A.02 may be disclosed to the protection and advocacy
20 system established in this state according to Part C of Public
21 Law 98-527 to protect the legal and human rights of persons with
22 mental retardation or other related conditions who live in
23 residential facilities for these persons if the protection and
24 advocacy system receives a complaint by or on behalf of that
25 person and the person does not have a legal guardian or the
26 state or a designee of the state is the legal guardian of the
27 person;
28 (12) to the county medical examiner or the county coroner
29 for identifying or locating relatives or friends of a deceased
30 person;
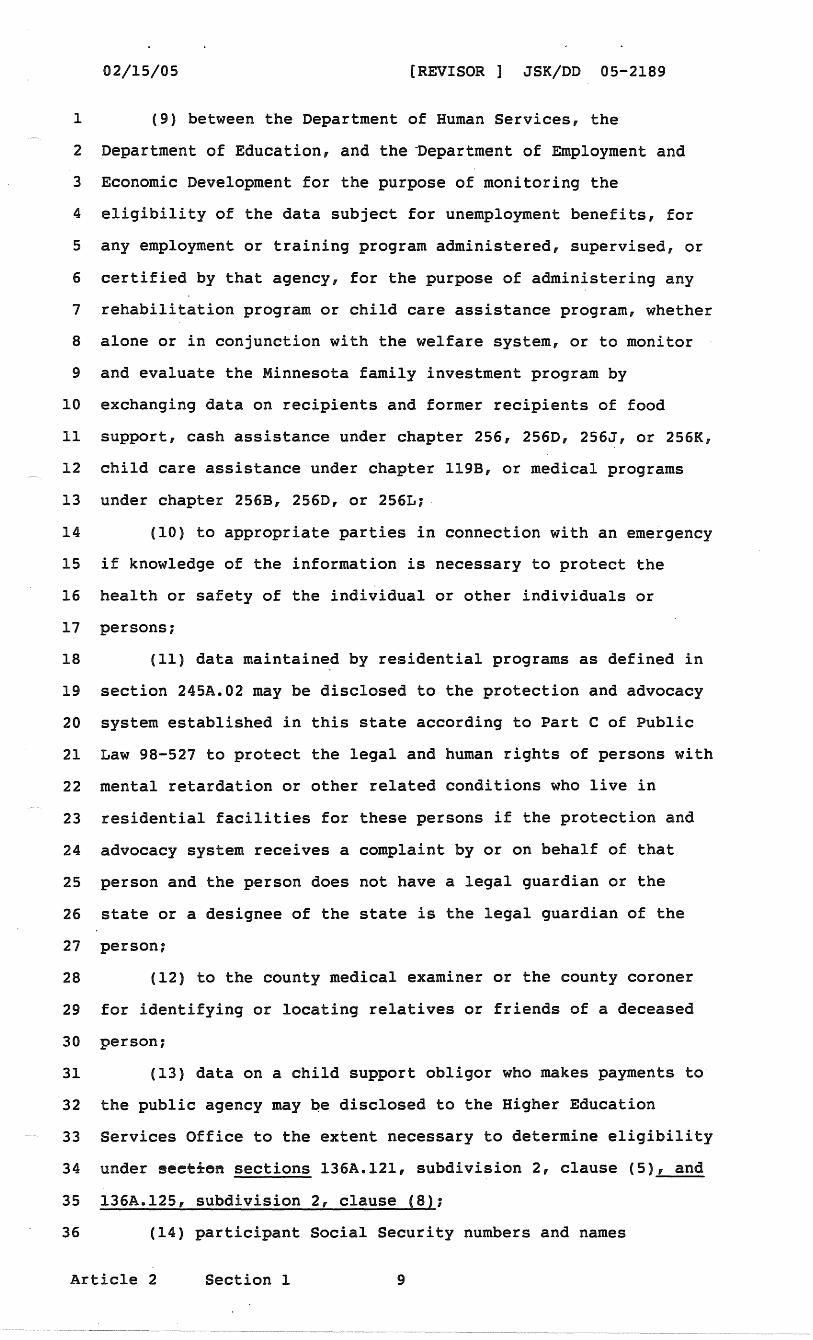
31 (13) data on a child support obliger who makes payments to
32 the public agency may ~e disclosed to the Higher Education
33 Services Office to the extent necessary to determine eligibility
34 under seee~en sections 136A.121, subdivision 2, clause (5), and
35 136A.125, subdivision 2, clause (8);
36 {14) participant Social Security numbers and names
Article 2 Section 1 9
02/15/05 [REVISOR ] JSK/DD 05-2189
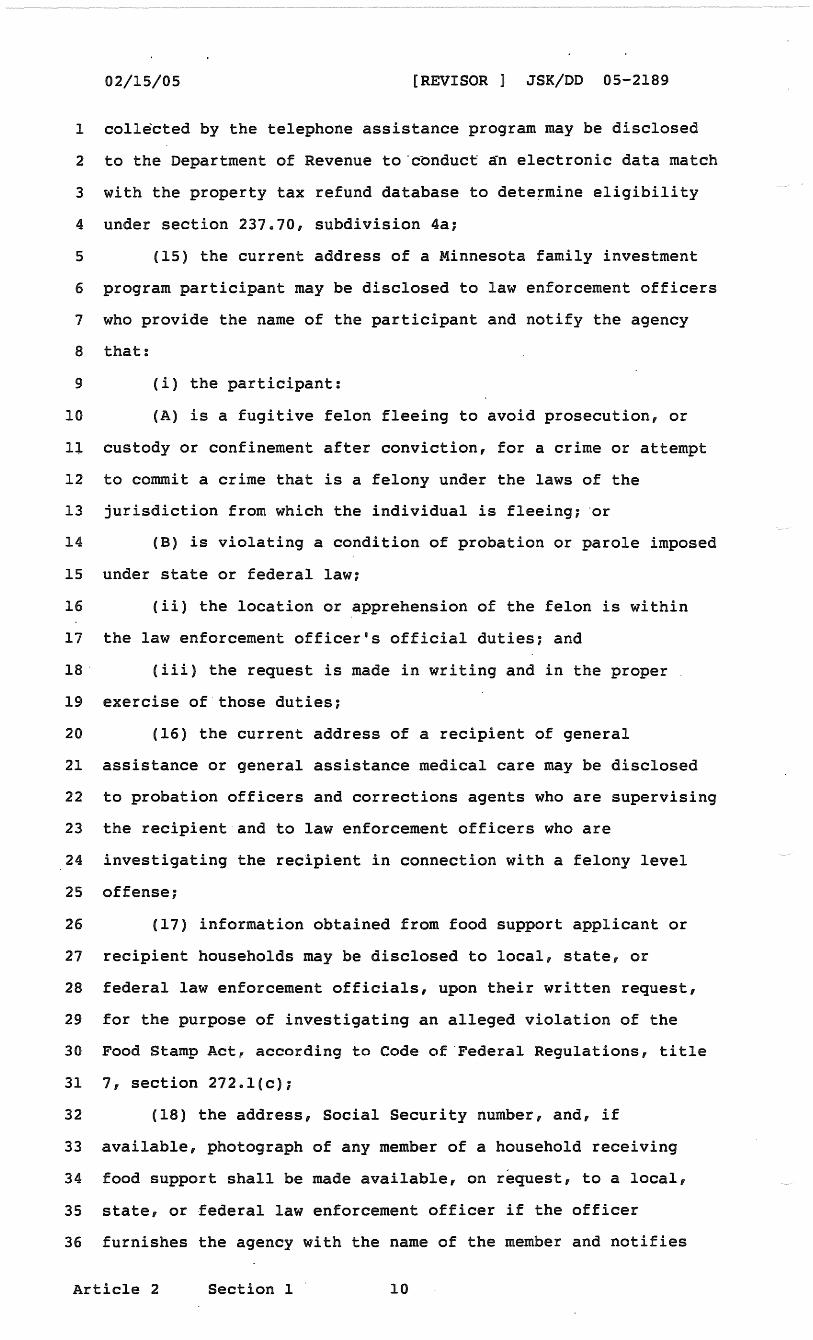
1 collected by the telephone assistance program may be disclosed
2 to the Department of Revenue to-conduct ~n electronic data match
3 with the property tax refund database to determine eligibility
4 under section 237.70, subdivision 4a;
5 (15) the current address of a Minnesota family investment
6 program participant may be disclosed to law enforcement officers
7 who provide the name of the participant and notify the agency
8 that:
9 (i) the participant:
10 (A) is a fugitive felon fleeing to avoid prosecution, or
ll custody or confinement after conviction, for a crime or attempt
12 to commit a crime that is a felony under the laws of the
13 jurisdiction from which the individual is fleeing; ·or
14 (B) is violating a condition of probation or parole imposed
15 under state or federal law;
16 (ii) the location or apprehension of the felon is within
17 the law enforcement officer's official duties; and
18 · (iii) the request is made in writing and in the proper
19 exercise of those duties;
20 (16) the current address of a recipient of general
21 assistance or general assistance medical care may be disclosed
22 to probation officers and corrections agents who are supervising
23 the recipient and to law enforcement officers who are
24 investigating the recipient in connection with a felony level
25 offense;
26 (17) information obtained from food support applicant or
27 recipient households may be disclosed to local, state, or
28 federal law enforcement officials, upon their written request,
29 for the purpose of investigating an alleged violation of the
30 Food Stamp Act, according to Code of .Federal Regulations, title
31 7, section 272ol(c);
32 (18) the address, Social Security number, and, if
33 available, photograph of any member of a household receiving
34 food support shall be made available, on request, to a local,
35 state, or federal law enforcement officer if the officer
36 furnishes the agency with the name of the member and notifies
Article 2 Section 1 10
02/15/05 [REVISOR ] JSK/DD 05-2189
1 the agency that:
2 (i) the member:
3 (A) is fleeing to avoid prosecution, or custody or
4 confinement after conviction, for a crime or attempt to commit a
5 crime that is a felony in the jurisdiction the member is
6 fleeing;
7 (B) is violating a condition of probation or parole imposed
8 under state or federal law; or
9 (C) has information that is necessary for the officer to
10 conduct an official duty related to conduct described in subitem
11 (A) or (B);
12 (ii) locating or apprehending the member is within the
13 officer's official duties; and
14 (iii) the request is made in writing and in the proper
15 exercise of the officer's official duty;
16 (19) the current address of a recipient of Minnesota family
17 investment program, general assistance, general assistance
18 medical care, or food support may be disclosed to law
19 enforcement officers who, in writing, provide the name of the
20 recipient and notify the agency that the recipient is a person
21 required to register under section 243.166, but is not residing
22 at the address at which the recipient is registered under
23 section 243.166;
24 (20) certain information regarding child support obligors
25 who are in arrears may be made public according to section
26 518.575;
27 (21) data on child support payments made by a child support
28 obliger and data on the distribution of those payments excluding
29 identifying information on obligees may be disclosed to all
30 obligees to whom the obliger owes support, and data on the
31 enforcement actions undertaken by the public authority, the
32 status of those actions, and data on the income of the obliger
33 or obligee may be disclosed to the other party;
34 (22) data in the work reporting system may be disclosed
35 under section 256.998, subdivision 7;
36 (23) to the Department of Education for the purpose of
Article 2 Section 1 11
02/15/05 [REVISOR ] JSK/DD 05-2189
1 matching Department of Education student data with public
2 assistance data to determine students el1gible for free and
3 reduced price meals, meal supplements, and free milk according
4 to United States Code, title 42, sections 1758, 1761, 1766,
5 1766a, 1772, and 1773; to allocate federal and state funds that
6 are distributed based on income of the student's family; and to
7 verify receipt of energy assistance for the telephone assistance
8 plan;
9 (24) the current address and telephone number of program
10 recipients and emergency contacts may be released to the
11. commissioner of health or a local board of health as defined in
12 section 145A.02, subdivision 2, when the commissioner or local
13 board of health has reason to believe that a program recipient
14 is a disease case, carrier, suspect case, or at risk of illness,
15 and the data are necessary to locate the person;
16 (25) to other state agencies, statewide systems, and
17 political subdivisions of this state, including the attorney
18 general, and agencies of other states, interstate information
19 networks, federal agencies, and other entities as required by
20 federal regulation or law for the administration of the child
21 support enforcement program;
22 (26) to personnel of public assistance programs as defined
23 in section 256.741, for access to the child support system
24 dataQase for the purpose of administration, including monitoring
25 and evaluation of those public assistance programs;
26 (27) to monitor and evaluate the Minnesota family
27 investment program by exchanging data between the Departments of
28 Human Services and Education, on recipients and former
29 recipients of food support, cash assistance under chapter 256,
30 256Dr 256J; or 256K, child care assistance under chapter 119B,
31 or medical programs under chapter 256B, 256D, or 256L;
32 (28) to evaluate child support program performance and to
33 identify and prevent fraud in the child support program by
34 exchanging data between the Department of Human Services,
35 Department of Revenue under section 270B.14, subdivision 1,
36 paragraphs (a) and (b), without regard to the limitation of use
Article 2 Section 1 12
02/15/05 [REVISOR ] JSK/DD 05-2189
1 in par·agraph (c), Department of Health, Department of Employment
2 and Economic Development, and other state agencies as is
3 reasonably necessary to perform these functions; or
4 (29) counties operating child care assistance programs
5 under chapter 119B may disseminate data on program participants,
6 applicants, and providers to the commissioner of education.
7 (b) Information on persons who have been treated for drug
8 or alcohol abuse may only be disclosed according to the
9 requirements of Code of Federal Regulations, title 42, sections
10 2.1 to 2.67.
11 (c) Data provided to law enforcement agencies under
12 paragraph (a), clause (15), (16), (17), or (18), or paragraph
13 (b), are investigative data and are confidential or protected
14 nonpublic while the investigation is active. The data are
15 private after the investigation becomes inactive under section
16 13.82, subdivision 5, paragraph (a) or (b).
17 (d) Mental health data shall be treated as provided in
18 subdivisions 7, 8, and 9, but is not subject to the access
19 ·provisions of subdivision 10, paragraph (b).
20 For the purposes of this subdivision, a request will be
21 deemed to be made in writing if made through a computer
22 interface system.
23 Sec. 2. Minnesota Statutes 2004, section 136A.Ol,
24 subdivision 2, is amended to read:
25 Subd. 2. [RESPONSIBILITIES.] The Higher Education Services
26 Office is responsible for:
27 {l) necessary state level administration of financial aid
28 programs, including accounting, auditing, and disbursing state
29 and federal financial aid funds, and reporting on financial aid
30 programs to the governor and the legislature;
31 (2) approval, registration, licensing, and f_inancial aid
32 eligibility of private collegiate and career schools, under
33 sections 136A.61 to 136A.71 and chapter 141;
34 (3) administering the Telecommunications Council under Laws
35 1993, First Special Session chapter 2, article 5, section 2, the
36 Learning Network of Minnesota, and the Statewide Library Task
Article 2 Section 2 13
02/15/05 [REVISOR ] JSK/DD 05-2189
1 Force;
2 (4) negotiating and administering-reciprocity agreements;
3 (5) publishing and distributing financial aid information
4 and materials, and other information and materials under section
5 136A.87, to students and parents;
6 (6) collecting and maintaining setteene-enre±±mene-ane
7 £inaneie±-aie~eaea and reporting data on students and
8 postsecondary institutions to measure progress in student-
9 learning and the effective use of public resources;
10 (7) administering the federal programs that affect students
11 and institutions on a statewide basis; and
12 (8) prescribing policies, procedures, and rules under
13 chapter 14 necessary to administer the programs under its
14 supervision.
15 Sec. 3. Minnesota Statutes 2004, section 136A.031,
16 subdivision 2, is amended to read:
17 Subd. 2. [HIGHER EDUCATION ADVISORY COUNCIL.] A Higher
18 Education Advisoiy Council (HEAC) is established. The HEAC is
19 composed of the president of the University of Minnesota or
20 designee; the chancellor of the Minnesota State Colleges and
21 Universities or·designee; the commissioner of education; the
22 president of the Private College Council; a representative from
23 the Minnesota Association of Private Postsecondary Schools; and
24 a member appointed by the governor. The HEAC shall fit bring to
25 the attention of the Higher Education Services eettnei± Off ice
26 any matters that the HEAC deems necessary,-ane-fit-review-ane
27 eemmene-ttpen-maeeers-be£ere-ehe-eettnei±.--~he-eettnei±-sha±±
28 re£er-a±±-prepesa±s-ee-ehe-HBAe-be£ere-sttemieeing
29 reeemmeneaeiens-ee-ehe-geverner-ane-ehe-±egis±aettre.--~he
30 eett~e~i-~ha~±-previee-eime-£er-a-repere-£rem-ehe-HBAe-ae-eaeh
31 meeeing-e£-ehe-eettnei±.
32 Sec. 4. Minnesota Statutes 2004, section 136A.031,
33 subdivision 3, is amended to read:
34 Subd. 3. [STUDENT ADVISORY COUNCIL.] A Student Advisory
35 Council (SAC) to the Higher Education Services eettnei± Office is
36 established. The members of SAC shall include: the chair of
Article 2 Section 4 14
02/15/05 [REVISOR ] JSK/DD 05-2189
1 the University of Minnesota student senate; the state chair of
2 the Minnesota State University Student A~sociation; the
3 president of the Minnesota State College Student Association and
4 an officer of the Minnesota State College Student Association,
5 one in a community college course of study and one in a
6 technical college course of study; the president of the
7 Minnesota Association of Private College Students; and a student
8 who is enrolled in a private vocational school, to be appointed
9 by the Minnesota Assoe±ae±on-0£-Pr±vaee-Poseseeondary-Sehoois
10 Career Colleges Association. A member may be represented by a
11 student designee who attends an institution from the same system
12 that the absent member represents. The SAC shall select one of
13 its members to serve as chair.
14 The Higher Education Services eottne±i Off ice shall inform
15 the SAC of all matters related to student issues under
16 consideration and shall refer all proposals to the SAC before
17 taking action or sending the proposals to the governor or
18 legislature. The SAC shall report to the Higher Education
19 Services eottne±i Off ice quarterly and at other times that the
20 SAC considers desirable. The SAC shall determine its meeting
21 times, but it .shall also meet with the council within 30 days
22 after the director's request for a meeting.
23 The SAC shall:
24 (1) bring to the attention of the Higher Education Services
25 eottne±i Off ice any matter that the SAC believes needs the
26 attention of the eottne±i office; and
27 (2) make recommendations to the Higher Education Services
28 eottne±i Office as it finds appropriate;
29 t3t-a~~o±ne-settdene-members-eo-ehe-H±gher-Bdtteae±on
30 Ser~±ees-eettne±i-adv±sory-grottps-as-~rev±ded-±n-sttbd±v±s±on-4;
31 and
32 t4t-~rov±de-any-reasonabie-ass±seanee-eo-ehe-eottne±i.
33 Sec. 5. Minnesota Statutes 2004, section 136A.031,
34 subdivision 4, is amended to read:
35 Subd. 4. [STUDENT REPRESENTATION.] If requested by the
36 SAC, the director must place at least ·one student from an
Article 2 Section 5 15
02/15/05 [REVISOR ] JSK/DD 05-2189
1 affected educational system on any task force created under
2 subdivision 1. ~he-settdene-member-er-members-shaii-be-appe±need
3 by-ehe-sAe.
4 Sec. 6. Minnesota Statutes 2004, section 136A.121,
5 subdivision 2, is amended to read:
6 Subd. 2. [ELIGIBILITY FOR GRANTS.] An applicant is
7 eligible to be considered for a grant, regardless of the
8 applicant's sex, creed, race, color, national origin, or
9 ancestry, under sections 136A.095 to 136A.131 if the office
10 finds that the applicant:
11 (1) is a resident of the state of Minnesota;
12 (2) is a graduate of a secondary school or its equivalent,
13 or is 17 years of age or over, and .has met all requirements for
14 admission as a student to an eligible college or technical
15 college of choice as defined in sections 136A.095 to 136A.131;
16 (3) has met the financial need criteria established in
17 Minnesota Rules;
18 (4) is not in default, as defined by the office, of any
19 federal or state student educational loan; and
20 (5) is not more than 30 days in arrears £er-any in
21 court-ordered child support paymenes-ewed-ee-a that. is collected
22 or enforced by the public ageney authority responsible for child
23 support enforcement or, if the applicant is more than 30 days in
24 arrears in court-ordered child support that is collected or
25 enforced by the public authority responsible for child support
26 enforcement, but is complying with a written payment
27 agreement under section 518.553 or order for arrearages. An
28 agreemene-mttse-prev±de-£er-a-repaymene-e£-arrearages-ae-ne-iess
29 than-z9-pereene-per-meneh-e£-ehe-amettne-e£-the-menehiy-ehiid
30 stt~pere-ebiigaeien-er-ne-iess-ehan-$39-per-meneh-i£-ehere-is-ne
31 ettrrene-monehiy-ehiid-sttppore-obiigaeion.--eompiianee-means-ehae
32 paymenes-are-made-by-ehe~paymene-date•
33 ~he-direeeor-and-the-eo:mmissioner-0£-httman-serviees-shaii
34 deveie~-~reeedttres-ee-im~iement-eiattse-t5t•
35 Sec. 1. Minnesota Statutes 2004, section 136A.121,
36 subdivision 6, is amended to read:
Article 2 Section 7
02/15/05 [REVISOR JSK/DD 05-2189
1 Subd. 6. [COST OF ATTENDANCE.] (a) The recognized cost of
2 attendance consists of allowance~-specifi~d in law for living
3 and miscellaneous expenses, and an allowance for tuition and
4 fees equal to the lesser of the average actual tuition and fees
5 cha:ged by the institution, or the tuition and fee maximums
6 established in law.
7 (b) For a student registering for less than full time, the
a off ice shall prorate the cost of attendance to the actual number
9 of credits for which the student is enrolled.
10 The recognized cost of attendance for a student who is
11 confined to a Minnesota correctional institution shall consist
12 of the tuition and fee component in paragraph (a), with no
13 allowance for living and miscellaneous expenses.
14 For the purpose of this subdivision, "fees" include only
15 those fees that are mandatory and charged to full-time resident
16 students attending-the institution.
17 Sec. 8. Minnesota Statutes 2004, section 136A.121,
18 subdivision 9, is amended to read:
19 . Subd. 9. [AWARDS.] An undergraduate student who meets the
20 office's requirements is eligible-to apply for and receive a
21 grant in any year of undergraduate study unless the student has
22 obtained a baccalaureate degree or previously has been enrolled
23 full time or the equivalent for eight semesters or the
24 equivalent, excluding courses taken from a Minnesota school or
25 postsecondary institution which is not participating in the
26 state grant program and from which a student transferred no
27 credit. A student who withdraws from enrollment for active
28 military service is entitled to an additional semester of grant
29 eligibility. A student enrolled in a two-year program at a
30 four-year institution is only eligible for the tuition and fee
31 maximums established by law for two-year institutions.
32 Sec. 9. Minnesota Statutes 2004, section 136A~l21, is
33 amended by adding a subdivision to read:
34 Subd. 18. [DATA.] An eligible institution must provide to
35 the office student enrollment, financial aid, financial, and
36 other data as determined by the director, to enable the office
Article 2 Section 9 17
02/15/05 [REVISOR ] JSK/DD 05-2189
1 to carry out its responsibilities under chapter 136A.
2 Sec. 10. Minnesota Statute~ 2004i section 136A.125,
3 subdivision 2, is amended to read:
4 Subd. 2. [ELIGIBLE STUDENTS.] An applicant is eligible for ~
5 a child care grant if the applicant:
6 (1) is a resident of the state of Minnesota;
7 (2) has a child 12 years of age or younger, or 14 years of
8 age or younger who is handicapped as defined in section 125A.02,
9 and who is receiving or will receive care on a regular basis
10 from a licensed or legal, nonlicensed caregiver;
11 (3) is income eligible as determined by the office's
12 policies and rules, but is not a recipient of assistance from
13 the Minnesota family investment program;
14 (4) has not earned a baccalaureate degree and has been
15 enrolled full time less than eight semesters or the equivalent;
16 (5) is pursuing a nonsectarian program or course of study
17 that applies to an undergraduate degree, diploma, or
18 certificate;
19 (6) is enrolled at least half time in an eligible
20 institution; and
21 (7) is in good academic standing and making satisfactory
22 academic progress; and
23 (8) is not more than 30 days in arrears in court-ordered
24 child support that is collected or enforced by the public
25 authority responsible for child support enforcement or, if the
26 applicant is more than 30 days in arrears in court-ordered child
27 support that is collected or enforced by the public authority
28 responsible for child support enforcement, but is complying with
29 a written payment agreement under section 518.553 or order for
30 arrearaaes.
31 Sec. 11. Minnesota Statutes 2004, section 136A.125,
32 subdivision 4, is amended to read:
33 Subd. 4. [AMOUNT AND LENGTH OF GRANTS.] The amount of a
34 child care grant must be based on:
35 (1) the income of the applicant and the applicant's spouse;
36 (2) the number in the applicant's family, as defined by the
Article 2 Section 11 18
02/15/05 [REVISOR ] JSK/DD 05-2189
1 office; and
2 (3) the number of eligible-children-in the applicant's
3 family.
4 The maximum award to the applicant shall be $2,200 for each
5 eligible child per academic year, except that the campus
6 financial aid officer may apply to the off ice for approval to
7 increase grants by up to ten percent to compensate for higher
8 market charges for infant care in a community. A student who
9 withdraws from enrollment for active military service is
10 entitled to an additional semester of grant eligibility. The
11 office shall develop policies to determine community market
12 costs and review institutional requests for compensatory grant
13 increases to ensure need and equal treatment. The office shall
14 prepare a chart to show the amount of a grant that will be
15 awarded per child based on the factors in this subdivision. The
16 chart shall include a range of income and family size.
17 Sec. 12. Minnesota Statutes 2004, section 136A.1701, is
18 amended by adding a subdivision to read:
19 Subd. 11. [DATA.] An eligible institution must provide to
20 the office student enrollment, financial aid, financial, and
21 other data as determined by the director, to enable the office
22 to carry out its responsibilities under chapter 136A.
23 Sec. 13. Minnesota Statutes 2004, section 136A.1701, is
24 amended by adding a subdivision to read:
25 Subd. 12. [ELIGIBLE STUDENT.] ·"Eligible student" means a
26 student who is a Minnesota resident who is enrolled or accepted
27 for enrollment at an eligible institution in Minnesota or in
28 another state or province. Non-Minnesota residents are eligible
29 students if they are enrolled or accepted for. enrollment at an
30 eliaible institution in Minnesota and will be physically
31 attending classes in Minnesota for at least 50 percent of the
32 academic term. Non-Minnesota resident students not physically
33 attending classes in Minnesota due to an approved study abroad
34 program for 12 months or less are eligible students.
35 Non-Minnesota residents enrolled in study abroad programs
36 exceeding 12 months are not eligible students.
Article 2 Section 13 19
02/15/05 [REVISOR ] JSK/DD 05-2189
1 Sec. 14. [136A.1703] [INCOME-CONTINGENT LOANS.]
2 The off ice shall administer an income-contingent loan
3 repayment program to assist graduates of Minnesota schools in
4 medicine, dentistry, pharmacy, chiropractic medicine, public
5 health, and veterinary medicine, and Minnesota residents
6 graduating from optometry and osteopathy programs. Applicant
7 data collected by the off ice for this program may be disclosed
8 to a consumer credit reporting agency under the same conditions
9 as those that apply to the supplemental loan program under
10 section 136A.162. No new applicants may be accepted after June
11 30, 1995.
12 Sec. 15. [136A.1785] [LOAN CAPITAL FUND.]
13 The office may deposit and hold assets derived from the
14 operation of its student loan programs authorized by this
15 chapter in a fund known as the loan capital fund. Assets in the
16 loan capital fund are available to the office solely for
17 carrying out the purposes and terms of sections 136A.15 to
18 136A.1702, including, but not limited to, making student loans
19 authorized by this chapter, paying administrative expenses
20 associated with the operation of its student loan programs,
21 repurchasing defaulted student loans, and paying expenses in
22 connection with the issuance of revenue bonds authorized under
23 this chapter. Assets in the loan capital fund may be invested
24 as provided in sections llA.24 and 136A.16, subdivision 8. All
25 interest and earnings from the investment of the loan capital
26 fund inure to the benefit of the fund and are deposited into the
27 fund.
28 Sec. 16. [136F.31] [CENTERS OF EXCELLENCE.]
29 Subdivision 1. [BOARD DESIGNATION.] The board must
30 desianate at least three and uo to eight different orogram
31 centers of excellence in manufacturing technology,
32 science/engineering, health care, information technology,
33 business, and teacher education. The board must determine the
34 form and required information contained in applications from
35 member institutions. A center of excellence must include no
36 more than one state university working with up to two community
Article 2 Section 16 20
02/15/05 [REVISOR ] JSK/DD 05-2189
1 and technical colleges.
2 Subd. 2. [CENTER SELECTION CRITERIA.] The board must
3 select programs based on institutional proposals demonstrating:
4 (1) a comprehensive academic plan that includes a seamless
5 continuum of academic offerings in the program area including
6 associate, baccalaureate, and customized training and continuing
7 education;
8 (2) a specific development plan that includes a description
9 of how the institution will pursue continuous improvement,
10 accountability and work toward becoming nationally recognized;
11 (3) identified commitments from employers that include a
12 measurable financial and programmatic commitment to the center
13 of excellence on the part of employers who will benefit from the
14 development of the center. A center for teacher education must
15 demonstrate support from local school districts;
16 (4) a commitment from the institution that demonstrates
17 support from the entire institution for the proposal, and that
18 new designated funding will not supplant current budgets for the
19 programs; and
20 (5) a separate endowment amount created for the prog~am
21 within current institutional foundations.
22 Subd. 3. [ADVISORY COMMITTEE AND REPORTS REQUIRED.] A
23 center of excellence must create an advisory committee
24 representing local, statewide, and national leaders in the
25 field. By January 15 of each odd-numbered year, each designated
26 center must provide a report to the governor and the chairs of
27 the senate Higher Education Budget Division and the house Higher
28 Education Finance Committee· that includes annual and integrated
29 data on program enrollment, student demographics, student
30 admission data, endowment growth, graduation rates~ graduation
31 outcomes, employer involvement, and other outcomes as determined
32 by the board. A report under this subdivision must also include
33 the use of any funds made available by a legislative
34 appropriation for incentive payments to faculty or staff.
35 Sec. 17. Minnesota Statutes 2004, section 136G.03,
36 subdivision 3, is amended to read:
Article 2 Section 17 21
02/15/05 [REVISOR ] JSK/DD 05-2189
1 Subd. 3. [ACCOUNT OWNER.] "Account owner" means a person
2 who enters into a participation agreemen~ and is entitled
3 to se±eee-er-ehange conduct transactions on the account,
4 including selecting and changing the beneficiary of an account
5 er-ee-reeei~e and receiving distributions from the account £er .
6 eeher-ehan-paymene-e£-qtta±i£iee-higher-eetteaeien-expenses.
7 Sec. 18. Minnesota Statutes 2004, section 136G.03,
8 subdivision 2la, is amended to read:
9 Subd. 2la. [MINOR TRUST ACCOUNT.] "Minor trust account"
10 means a Uniform Gift to Minors Act account, or a Uniform
11 Transfers to Minors Act account,-er-a-erttse-inserttmene-naming-a
12 minor-person-as-bene£ieiary, created and operating under the
13 laws of Minnesota or another state.
14 Sec. 19. Minnesota Statutes 2004, section 136G.03,
15 . subdivision 22, is amended to read:
16 Subd. 22. [NONQUALIFIED DISTRIBUTION.] "Nonqualified
17 distribution" means a distribution made from an account other
18 than (1) a qualified distribution; or (2) a distribution due to
19 the death or disability of, or scholarship to, or attendance at
20 a United States military academy by, a beneficiary.
21 Sec. 20. Minnesota Statutes 2004, section 136G.03,
22 subdivision 32, is amended to read:
23 Subd. 32. [SCHOLARSHIP.] "Scholarship" means a
24 scholarship, or educational assistance allowance,-or-paymene
25 ttneer-seeeien-5i9fbtt3ttet-o£-ehe-%neerna±-Re~entte-eoee.
26· Sec. 21. Minnesota Statutes 2004, section 136G.05,
27 subdivision 8, is amended to read:
28 Subd. 8. [ADMINISTRATION.] The director shall administer
29 the program, including accepting and processing applications,
30 maintaining account records, making payments, making m~tching
31 grants under section 136G.ll, and undertaking any other
32 necessary tasks to administer the program. The off ice may
33 contract with qne or more third parties to carry out some or all
34 of these administrative duties, including promoeien providing
35 incentives and marketing 0£ the program. The office and the
36 board may jointly contract with third-party providers, if the
Article 2 Section 21 22
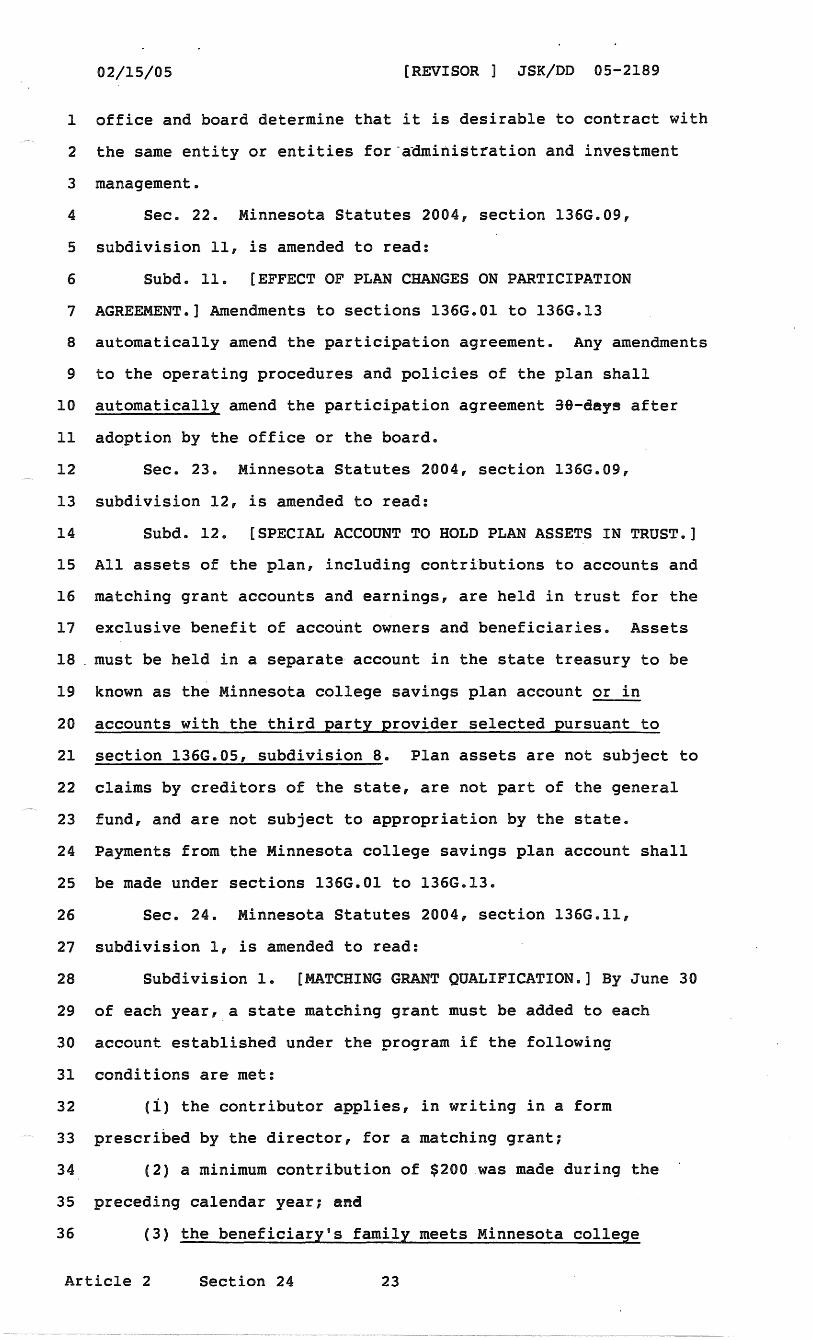
02/15/05 [REVISOR ] JSK/DD 05-2189
1 office and board determine that it is desirable to contract with
2 the same entity or entities for-a~ministration and investment
3 management.
4 Sec. 22. Minnesota Statutes 2004, section 136G.09,
5 subdivision 11, is amended to read:
6 Subd. 11. [EFFECT OF PLAN CHANGES ON PARTICIPATION
7 AGREEMENT.] Amendments to sections 136G.Ol to 136G.13
8 automatically amend the participation agreement. Any amendments
9 to the operating procedures and policies of the plan shall
10 automatically amend the participation agreement 39-days after
11 adoption by the off ice or the board.
12 Sec. 23. Minnesota Statutes 2004, section 136G.09,
13 subdivision 12, is amended to read:
14 Subd. 12. [SPECIAL ACCOUNT TO HOLD PLAN ASSETS IN TRUST.]
15 All assets of the plan, including contributions to accounts and
16 matching grant accounts and earnings, are held in trust for the
17 exclusive benefit of account owners and beneficiaries. Assets
18 . must be held in a separate account in the state treasury to be
19 known as the Minnesota college savings plan account or in
20 accounts with the third party provider selected pursuant to
21 section 136G.05, subdivision 8. Plan assets are not subject to
22 claims by creditors of the state, are not part of the general
23 fund, and are not subject to appropriation by the state.
24 Payments from the Minnesota college savings plan account shall
25 be made under sections 136G.Ol to 136G.13.
26 Sec. 24. Minnesota Statutes 2004, section 136G.ll,
27 subdivision 1, is amended to read:
28 Subdivision 1. [MATCHING GRANT QUALIFICATION.] By June 30
29 of each year, a state matching grant must be added to each
30 account established under the program if the following
31 conditions are met:
32 (i) the contributor applies, in writing in a form
33 prescribed by the director, for a matching grant;
34 (2) a minimum contribution of $200 was made during the
35 preceding calendar year; and
36 {3) the beneficiary's family meets Minnesota college
Article 2 Section 24 23
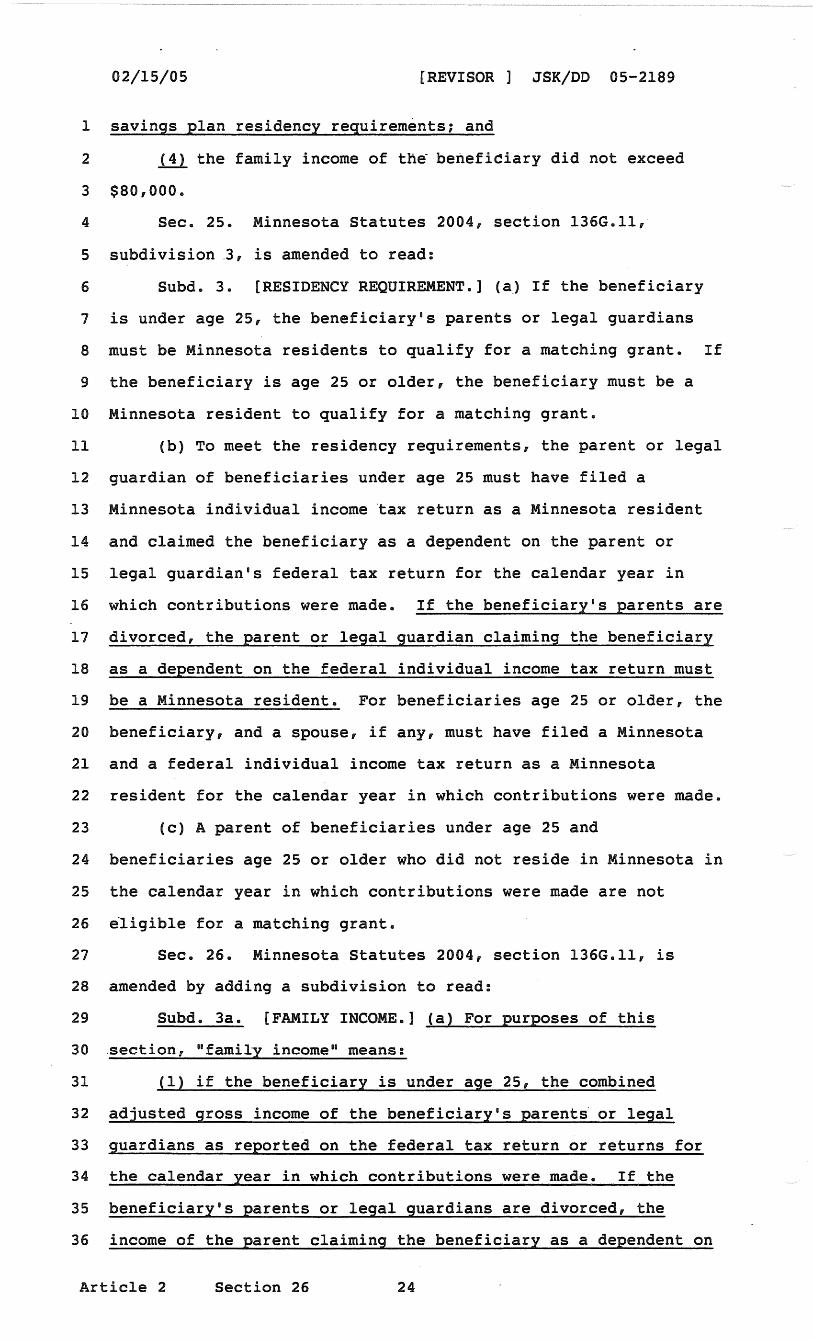
02/15/05 [REVISOR JSK/DD 05-2189
1 savings plan residency requirements; and
2 ill_ the family income of the beneficiary did not exceed
3 $80,000.
4 Sec. 25. Minnesota Statutes 2004, section 136G.ll,
5 subdivision .3, is amended to read:
6 Subd. 3. [RESIDENCY REQUIREMENT.] (aJ If the beneficiary
7 is under age 25, the beneficiary's parents or legal guardians
8 must be Minnesota residents to qualify for a matching grant. If
9 the beneficiary is age 25 or older, the beneficiary must be a
10 Minnesota resident to qualify for a matching grant.
11 (b) To meet the residency requirements, the parent or legal
12 guardian of beneficiaries under age 25 must have filed a
13 Minnesota individual income tax return as a Minnesota resident
14 and claimed the beneficiary as a dependent on the parent or
15 legal guardian's federal tax return for the calendar year in
16 which contributions were made. If the beneficiary's parents are
17 divorced, the parent or legal guardian claiming the beneficiary
18 as a dependent on the federal individual income tax return must
19 be a Minnesota resident. For beneficiaries age 25 or older, the
20 beneficiary, and a spouse, if any, must have filed a Minnesota
21 and a federal individual income tax return as a Minnesota
22 resident for the calendar year in which contributions were made.
23 (c) A parent of beneficiaries under age 25 and
24 beneficiaries age 25 or older who did not reside in Minnesota in
25 the calendar year in which contributions were made are not
26 e·ligible for a matching grant.
27 Sec. 26. Minnesota Statutes 2004, section 136G.ll, is
28 amended by adding a subdivision to read:
29 Subd. 3a. [FAMILY INCOME.] (a) For purposes of this
30 .section,. "famil·y income" means:
31 (1) if the beneficiary is under age 25, the combined
32 adjusted gross income of the beneficiary• s parents· or legal
33 guardians as reported on the federal tax return or returns for
34 the calendar year in which contributions were made. If the
35 beneficiary's parents or legal guardians are divorced, the
36 income of the parent claiming the beneficiary as a dependent on
Article 2 Section 26 24
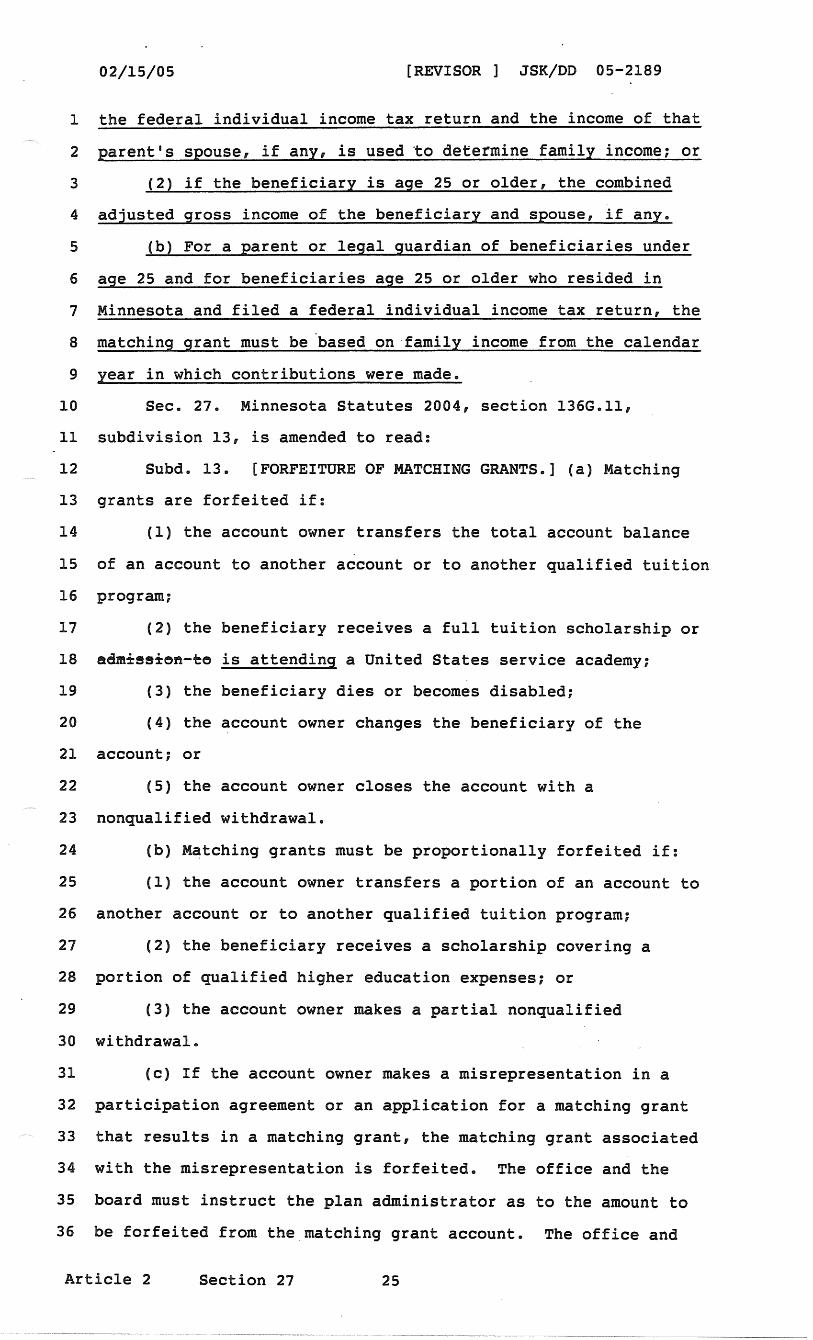
02/15/05 [REVISOR ] JSK/DD 05-2189
l the federal individual income tax return and the income of that
2 parent's spouse, if any, is used ~o determine family income: or
3 {2) if the beneficiary is age 25 or older, the combined
4 adjusted gross income of the beneficiary and spouse, if any.
5 (b) For a parent or legal guardian of beneficiaries under
6 age 25 and for beneficiaries age 25 or older who resided in
7 Minnesota and filed a federal individual income tax return, the
8 matching grant must be ·based on·family income from the calendar
9 year in which contributions were made.
10 Sec. 27. Minnesota Statutes 2004, section 136G.ll,
11 subdivision 13, is amended to read:
12 Subd. 13. [FORFEITURE OF MATCHING GRANTS.] (a) Matching
13 grants are forfeited if:
14 (1) the account owner transfers the total account balance
15 of an account to another account or to another qualified tuition
16 program;
17 (2) the beneficiary receives a full tuition scholarship or
18 admissien-~e is attending a United States service academy;
19 (3) the beneficiary dies or becomes disabled;
20 (4) the account owner changes the beneficiary of the
21 account; or
22 (5) the account owner closes the account with a
23 nonqualified withdrawal.
24 (b) M~tching grants must be proportionally forfeited if:
25 (1) the account owner transfers a portion of an account to
26 another account or to another qualified tuition program;
27 (2) the beneficiary receives a scholarship covering a
28 portion of qualified higher education expenses; or
29 (3) the account owner makes a partial nonqualified
30 withdrawal.
31 (c) If the account owner makes a misrepresentation in a
32 participation agreement or an application for a matching grant
33 that results in a matching grant, the matching grant associated
34 with the misrepresentation is forfeited. The office and the
35 board must instruct the plan administrator as to the amount to
36 be forfeited from the matching grant account. The office and
Article 2 Section 27 25
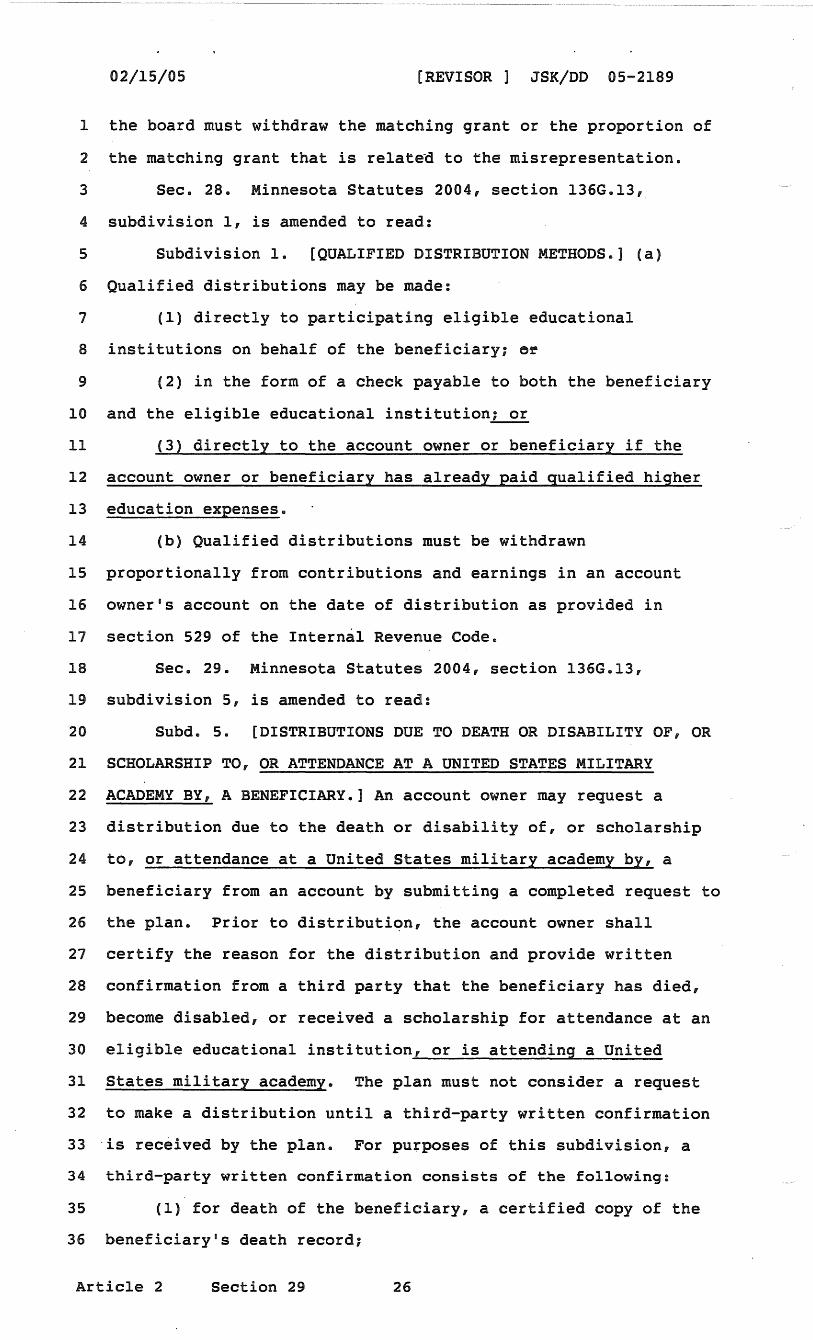
02/15/05 [REVISOR ] JSK/DD 05-2189
1 the board must withdraw the matching grant or the proportion of
2 the matching grant that is relatad to the misrepresentation.
3 Sec. 28. Minnesota Statutes 2004, section 136G.13,
4 subdivision 1, is amended to read:
5 Subdivision 1. [QUALIFIED DISTRIBUTION METHODS.] (a)
6 Qualified distributions may be made:
7 (1) directly to participating eligible educational
8 institutions on behalf of the beneficiary; er
9 (2) in the form of a check payable to both the beneficiary
10 and the eligible educational institution; or
11 (3) directly to the account owner or beneficiary if the
12 account owner or beneficiary has already paid gualif ied higher
13 education expenses.
14 (b) Qualified distributions must be withdrawn
15 proportionally from contributions and earnings in an account
16 owner's account on the date of distribution as provided in
17 section 529 of the Internal Revenue Code.
18 Sec. 29. Minnesota Statutes 2004, section 136G.13,
19 subdivision 5, is amended to read:
20 Subd. 5. [DISTRIBUTIONS DUE TO DEATH OR DISABILITY OF, OR
21 SCHOLARSHIP TO, OR ATTENDANCE AT A UNITED STATES MILITARY
22 ACADEMY BY, A BENEFICIARY.] An account owner may request a
23 distribution due to the death or disability of, or scholarship
24 to, or attendance at a United States military academy by, a
25 beneficiary from an account by submitting a completed request to
26 the plan. Prior to distributiqn, the account owner shall
27 certify the reason for the distribution and provide written
28 confirmation from a third party that the beneficiary has died,
29 become disabled, or received a scholarship for attendance at an
30 eligible educational institution, or is attending a United
31 States military academy. The plan must not consider a request
32 to make a distribution until a third-party written confirmation
33 ·is received by the plan. For purposes of this subdivision, a
34 third-party written confirmation consists of the following:
35 (1) for death of the beneficiary, a certified copy of the
36 beneficiary's death record;
Article 2 Section 29 26
02/15/05 [REVISOR ] JSK/DD 05-2189
1 (2) for disability of the beneficiary, a certification by a
2 physician who is a doctor of med1cine or-osteopathy stating that
3 the doctor is legally authorized to practice in a state of the
4 United States and that the beneficiary is unable to attend any
5 eligible educational institution because of an injury or illness
6 that is expected to continue indefinitely or result in death.
7 Certification must be on a form approved by the plan; or
8 (3) for a scholarship award to the beneficiary, a letter
9 from the grantor of the scholarship or from the eligible
10 educational institution receiving or administering the
11 scholarship, that identifies the beneficiary by name and Social
12 Security number or taxpayer identification number as the
13 recipient of the scholarship and states the amount of the
14 scholarship, the period of time or number of credits or units to
15 which it applies, the date of the scholarship, and, if
16 applicable, the eligible educational institution to which the
17 scholarship is to be applied; or
18 (4) for attendance by the beneficiary at a United States
19 military academy, a letter from the military academy indicating
20 the beneficiary's enrollment and attendance.
21 Sec. 30. Minnesota Statutes 2004, section 136G.14, is
22 amended to read:
23 136G.14 [MINOR TRUST ACCOUNTS.]
24 (a) This section applies to a plan account in which funds
25 of a minor trust account are invested.
26 (b) The account owner may not be changed to any person
27 other than a successor custodian or the beneficiary unless a
28 court order directing the change of ownership is provided to the
29 plan administrator. The custodian must sign all forms and
30 requests submitted to the plan administrator in the custodian's
31 representative capacity. The custodian must notify the plan
32 administrator in writing when the beneficiary becomes legally
33 entitled to be the account owner. An account owner under this
34 section may not select a contingent account owner.
35 (c) The beneficiary of an account under this section may
36 not be changed. If the beneficiary dies, assets in a plan
Article 2 Section 30 27
02/15/05 [REVISOR ] JSK/DD 05-2189
l account become the property of the beneficiary's estate. Funds
2 in an account must not be transferred or-rolled over to another
3 account owner or to an account for another beneficiary. A
4 nonqualified distribution from an account, or a distribution due
5 to the disability or scholarship award to the beneficiary, or
6 made on account of the beneficiary's attendance at a United
7 States military academy, must be used for the benefit of the
8 beneficiary.
9 Sec. 31. Minnesota Statutes 2004, section 299A.45,
10 subdivision 1, is amended to read:
11 Subdivision 1. [ELIGIBILITY.] Following certification
12 under section 299A.44 and compliance with this section and rules
13 of the commissioner of public safety and the higher education
14 services office, dependent children less than 23 years of age
15 and the surviving spouse of a public safety officer killed in
16 the·line of duty on or after January 1, 1973, are eligible to
17 receive educational benefits under this section. To qualify for
18 an award, they must be enrolled in undergraduate degree or
19 certificate programs after June 30, 1990, at an eligible
20 Minnesota institution as provided in section 136A.101,
21 subdivision 4. A student who withdraws from enrollment for
22 active military service is entitled to an additional semester of
23 grant eligibility. Persons who have received a baccalaureate
24 degree or have been enrolled full time or the equivalent of ten
25 semesters or the equivalent, whichever occurs first, are no
26 longer eligible.
27 Sec. 32. Minnesota Statutes 2004, section 299A.45,
28 subdivision 4, is amended to read:
29 Subd. 4. [RENEWAL.] Each award must be given for one
30 academic year and is renewable for a maximum of eight semesters
31 or the equivalent. A student who withdraws from enrollment for
32 active military service is entitled to an additional semester of
33 grant eligibility. An award must not be given to a dependent
34 child who is 23 years of age or older on· the first day of the
35 academic year.
36 Sec. 33. [TRANSFER OF MHFA BONDING AUTHORITY TO HESO.]
Article 2 Section 33 28
02/lS/OS [REVISOR JSK/DD OS-2189
1 Notwithstanding Minnesota Statutes, section 474A.03,
2 subdivision 2a, paragraph {b), the Minnesota Housing Finance
3 Agency may enter into an agreement with the Higher Education
4 Services Off ice under which the Higher Education Services Off ice
s issues gualified student loan bonds, up to $SO,OOO,OOO of which
6 are issued pursuant to bonding authority allocated to the
7 Minnesota Housing Finance Agency in 200S under Minnesota
8 Statutes, section 474A.03, subdivision 2a, paragraph (a). This
9 amount is in addition to the bonding authority otherwise
10 allocated to the Higher Education Services Off ice under
11 Minnesota Statutes, chapter 474A. Notwithstanding Minnesota
12 Statutes, section 474A.04, subdivision la, 474A.061, or
13 474A.091, subdivision 2, bonding authority carried forward by
14 the Minnesota Housing Financing Agency from its allocation for
lS 200S under Minnesota Statutes, section 474A.03, subdivision 2a,
16 paragraph (b), are exempt from the reguirement that the bonding
17 authority be permanently issued by December 31 of the next
18 succeeding calendar year.
19 Sec. 34. [APPLICATION OF ELIGIBILITY.]
20 The additional semester of grant eligibility under sections
21 8, 11, 31, and 32 applies to any student who withdrew from
22 enrollment in a postsecondary institution after December 31,
23 2002, because the student was ordered to active military service
24 as defined in Minnesota Statutes, section 190.0S, subdivision Sb
2S or Sc.
26 Sec. 3S. [ADVISORY TASK FORCE ON PUBLIC POSTSECONDARY
27 FUNDING.]
28 The Higher Education Services Off ice shall convene an
29 advisory task force to study the current postsecondary funding
30 oolicv under Minnesota Statutes! sections 13SA.Ol to 13SA.034.
31 The task force must include the chief financial officers of the
32 University of Minnesota and the Minnesota State Colleges and
33 Universities and the commissioner of finance, or their
34 designees. The task force may include other members as selected
3S by the Higher Education Services Office. The task force must
36 study and make specific recommendations on alternatives to the
Article 2 Section' 3S 29
02/15/05 [REVISOR ] JSK/DD 05-2189
1 methods currently used by the postsecondary systems to implement
2 the provisions of Minnesota Statutes; section 135A.031,
3 subdivision 4. The task force must submit its recommendations
4 to the legislature and the governor by January 15, 2006. The
5 task force expires on June 30, 2007.
6 Sec. 36. [REVISOR INSTRUCTION.]
7 The reviser of statutes shall change the terms "HESO" and
8 "Higher Education Services Office" to "Minnesota Office of
9 Higher Education" wherever in Minnesota Statutes and Minnesota
10 Rules the terms appear.
11 Sec. 37. [REPEALER.]
12 (a) Minnesota Statutes 2004, sections 136A.Oll and
13 136A.031, subdivision 1, are repealed.
14 (b) Minnesota Rules, parts 4815.0100; 4815.0110; 4815.0120;
15 4815.0130; 4815.0140; 4815.0150; 4815.0160; 4830.8100;
16 4830. 8110; 4830. 8120; _ 4830. 8130; 4830. 8140; and 4830. 8150, are
17 repealed.
18 ARTICLE 3
19 PRIVATE CAREER SCHOOLS
20 Section 1. Minnesota Statutes 2004, section 141.21, is
21 amended by adding a subdivision to read:
22 Subd. 6a. [MULTIPLE LOCATION.] "Multiple location" means
23 any site where classes or administrative services are provided
24 and which has a street address that is different than the street
25 address found on the school's private career school license.
26 Sec. 2. Minnesota Statutes 2004, section 141.25,
27 subdivision 3, i~ amended to read: ·
28 Subd. 3. [APPLICATION.] Application for a license shall be
29 on forms prepared and furnished by the office, and shall include
30 the following and other information as the office may require:
31 (1) the title or name of the school, ownership and
32 controlling officers, members, managing employees, and director;
33 (2) the specific programs which will be offered and the
34 specific purposes of the instruction;
35 (3) the place or places where the instruction will be
36 given;
Article 3 Section 2 30
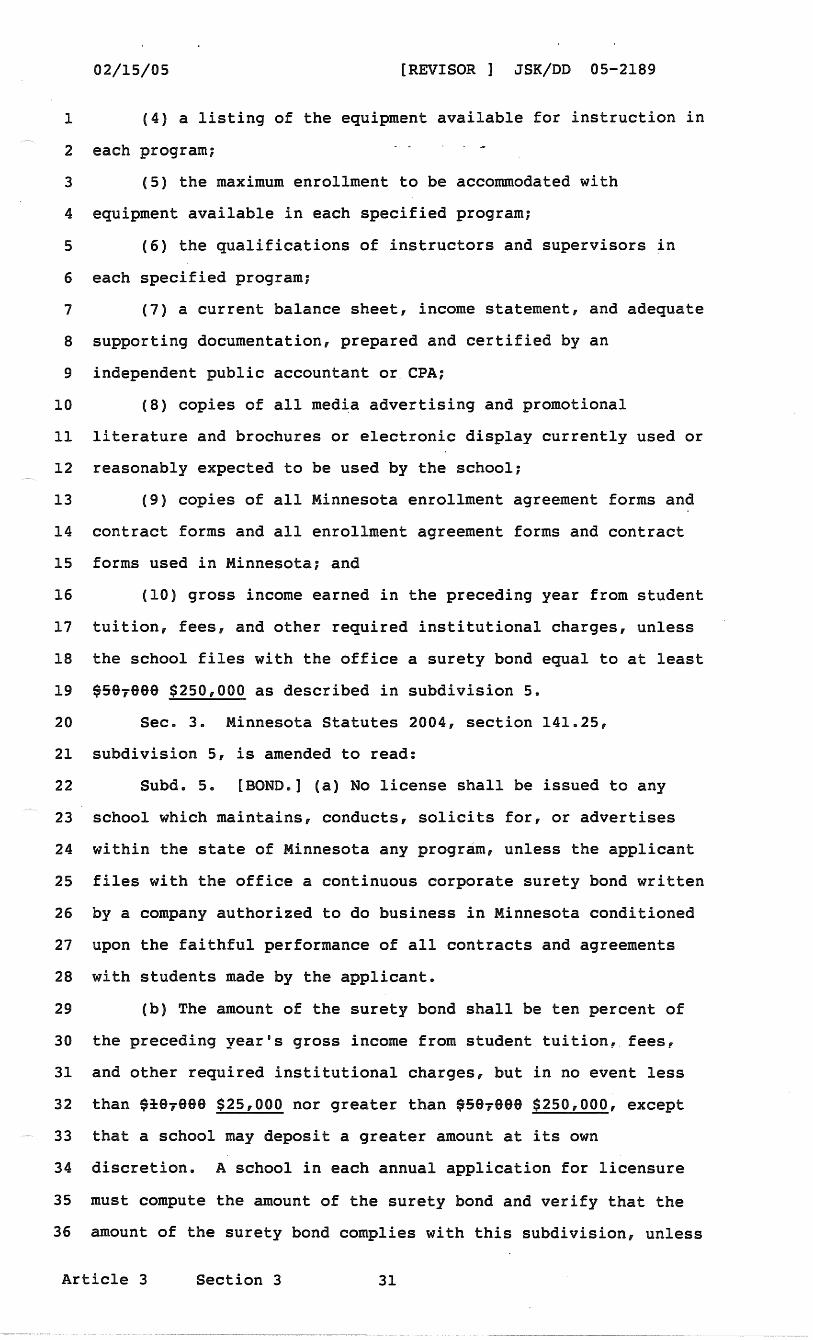
02/15/05 [REVISOR ] JSK/DD 05-2189
1 (4) a listing of the equipment available for instruction in
2 each program;
3 (5) the maximum enrollment to be accommodated with
4 equipment available in each specified program;
5 (6) the qualifications of instructors and supervisors in
6 each specified program;
7 (7) a current balance sheet, income statement, and adequate
8 supporting documentation, prepared and certified by an
9 independent public accountant or CPA;
10 (8) copies of all media advertising and promotional
11 literature and brochures or electronic display currently used or
12 reasonably expected to be used by the school;
13 (9) copies of all Minnesota enrollment agreement forms and
14 contract forms and all enrollment agreement forms and contract
15 forms used in Minnesota; and
16 (10) gross income earned in the preceding year from student
17 tuition, fees, and other required institutional charges, unless
18 the school files with the office a surety bond equal to at least
19 $591999 $250,000 as described in subdivision 5.
20 Sec. 3. Minnesota Statutes 2004, section 141.25,
21 subdivision 5, is amended to read:
22 Subd. 5. [BOND.] (a) No license shall be issued to any
23 school which maintains, conducts, solicits for, or advertises
24 within the state of Minnesota any program, unless the applicant
25 files with the office a continuous corporate surety bond written
26 by a company authorized to do business in Minnesota conditioned
27 upon the faithful performance of all contracts and agreements
28 with students made by the applicant.
29 (b) The amount of the surety bond shall be ten percent of
30 the preceding year's gross income from student tuition, fees,
31 and other required institutional charges, but in no event less
32 than $%91999 $25,000 nor greater than $591999 $250,000, except
33 that a school may deposit a greater amount at its own
34 discretion. A school in each annual application for licensure
35 must compute the amount of the surety bond and verify that the
36 amount of the surety bond complies with this subdivision, unless
Article 3 Section 3 31
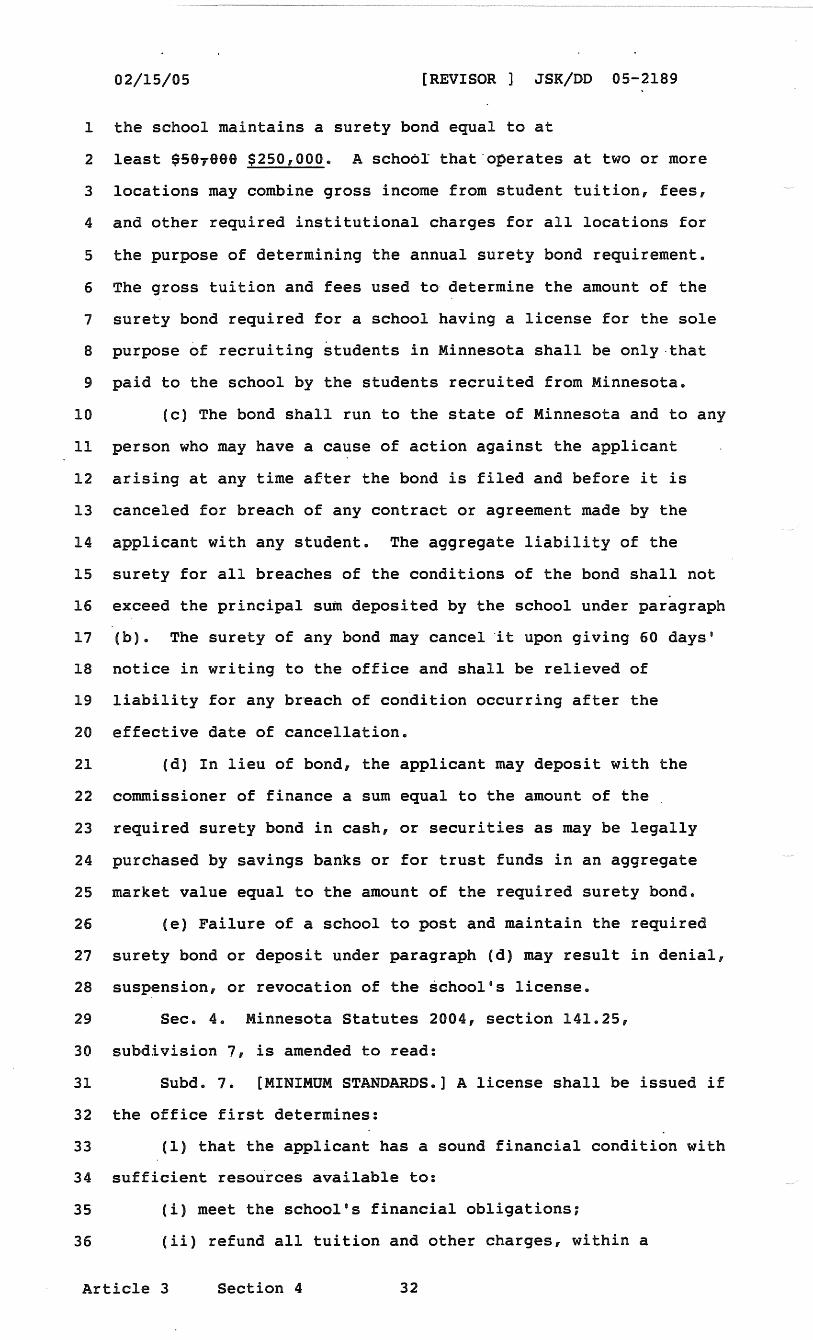
02/15/05 [REVISOR JSK/DD 05-2189
1 the school maintains a surety bond equal to at
2 least $507 eee $250,000. A schoor that-operates at two or more
3 locations may combine gross income from student tuition, fees,
4 and other required institutional charges for all locations for
5 the purpose of determining the annual surety bond requirement.
6 The gross tuition and fees used to· determine the amount of the
7 surety bond required for a school having a license for the sole
8 purpose of recruiting students in Minnesota shall be only-that
9 paid to the school by the students recruited from Minnesota.
10 (c) The bond shall run to the state of Minnesota and to any
11 person who may have a cause of action against the applicant
12 arising at any time after the bond is filed and before it is
13 canceled for breach of any contract or agreement made by the
14 applicant with any student. The aggregate liability of the
15 surety for all breaches of the conditions of the bond shall not
16 exceed the principal sum deposited by the school under paragraph
17 (b). The surety of any bond may cancel ·it upon giving 60 days•
18 notice in writing to the office and shall be relieved of
19 liability for any breach of condition occurring after the
20 effective date of cancellation.
21 (d) In lieu of bond, the applicant may deposit with the
22 commissioner of finance a sum equal to the amount of the
23 required surety bond in cash, or securities as may be legally
24 purchased by savings banks or for trust funds in an aggregate
25 market value equal to the amount of the required surety bond.
26 (e) Failure of a school to post and maintain the required
27 surety bond or deposit under paragraph (d) may result in denial,
28 suspension, or revocation of the school's license.
29 Sec. 4. Minnesota Statutes 2004, section 141.25,
30 subdivision 7, is amended to read:
31 Subd. 7. [MINIMUM STANDARDS.] A license shall be issued if
32 the office first determines:
33 (1) that the applicant has a sound financial condition with
34 sufficient resorirces available to:
35 (i) meet the school's financial obligations;
36 (ii) refund all tuition and other charges, within a
Article 3 Section 4 32
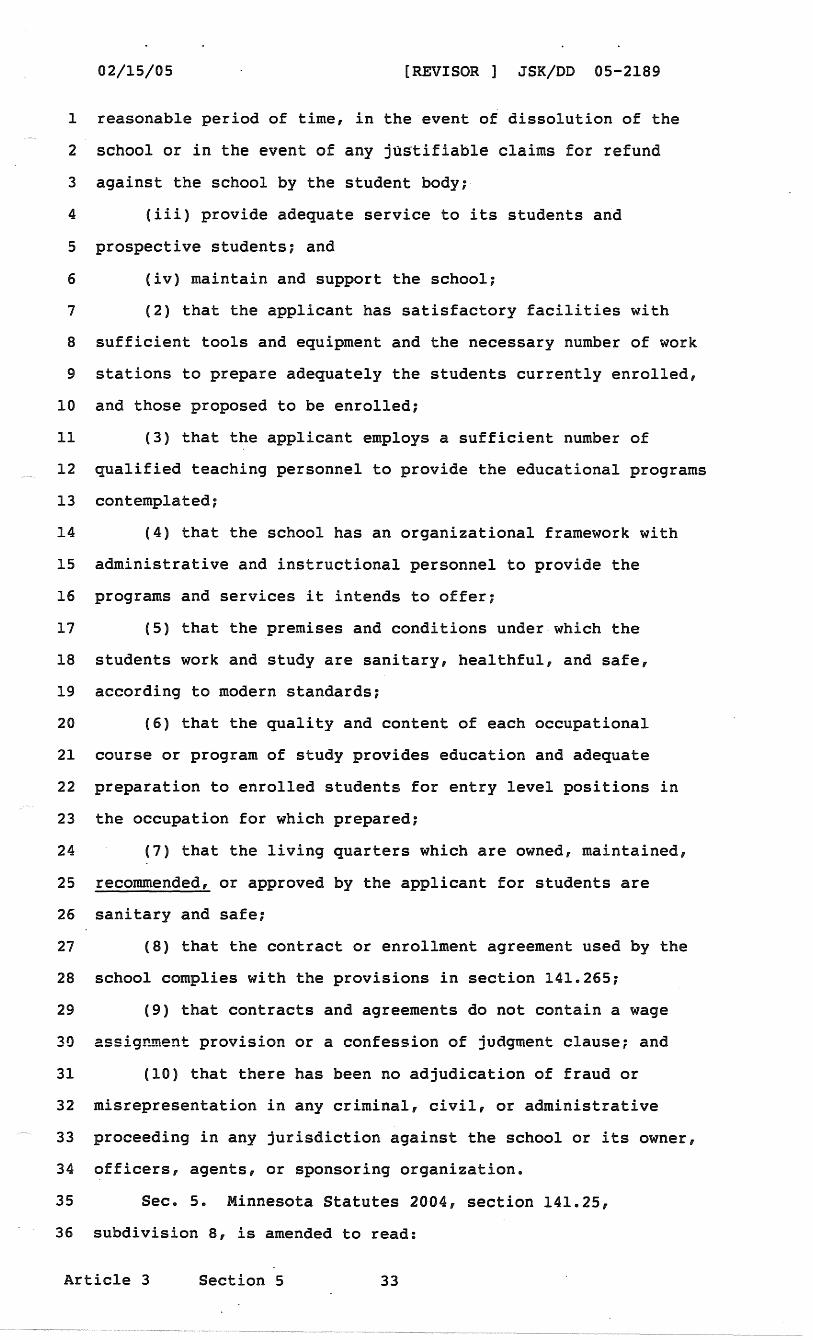
02/15/05 [REVISOR ] JSK/DD 05-2189
l reasonable period of time, in the event of dissolution of the
2 school or in the event of any justifiable claims for refund
3 against the school by the student body;
4 (iii) provide adequate service to its students and
5 prospective students; and
6 (iv) maintain and support the school;
7 (2) that the applicant has satisfactory facilities with
8 sufficient tools and equipment and the necessary number of work
9 stations to prepare adequately the students currently enrolled,
10 and those proposed to be enrolled;
11 (3) that the applicant employs a sufficient number of
12 qualified teaching personnel to provide the educational programs
13 contemplated;
14 (4) that the school has an organizational framework with
15 administrative and instructional personnel to provide the
16 programs and services it intends to offer;
17 (5) that the premises and conditions under-which the
18 students work and study are sanitary, healthful, and safe,
19 according to modern standards;
20 (6) that the quality and content of each occupational
21 course or program of study provides education and adequate
22 preparation to enrolled students for entry level positions in
23 the occupation for which prepared;
24 (7) that the living quarters which are owned, maintained,
25 recommended, or approved by the applicant for students are
26 sanitary and safe;
27 (8) that the contract or enrollment agreement used by the
28 school complies with the provisions in section 141.265;
29 (9) that contracts and agreements do not contain a wage
30 assignment provision or a confession of judgment clause; and
31 (10) that there has been no adjudication of fraud or
32 misrepresentation in any criminal, civil, or administrative
33 proceeding in any jurisdiction against the school or its owner,
34 officers, agents, or sponsoring organization.
35 Sec. 5. Minnesota Statutes 2004, section 141.25,
36 subdivision 8, is amended to read:
Article 3 Section 5 33
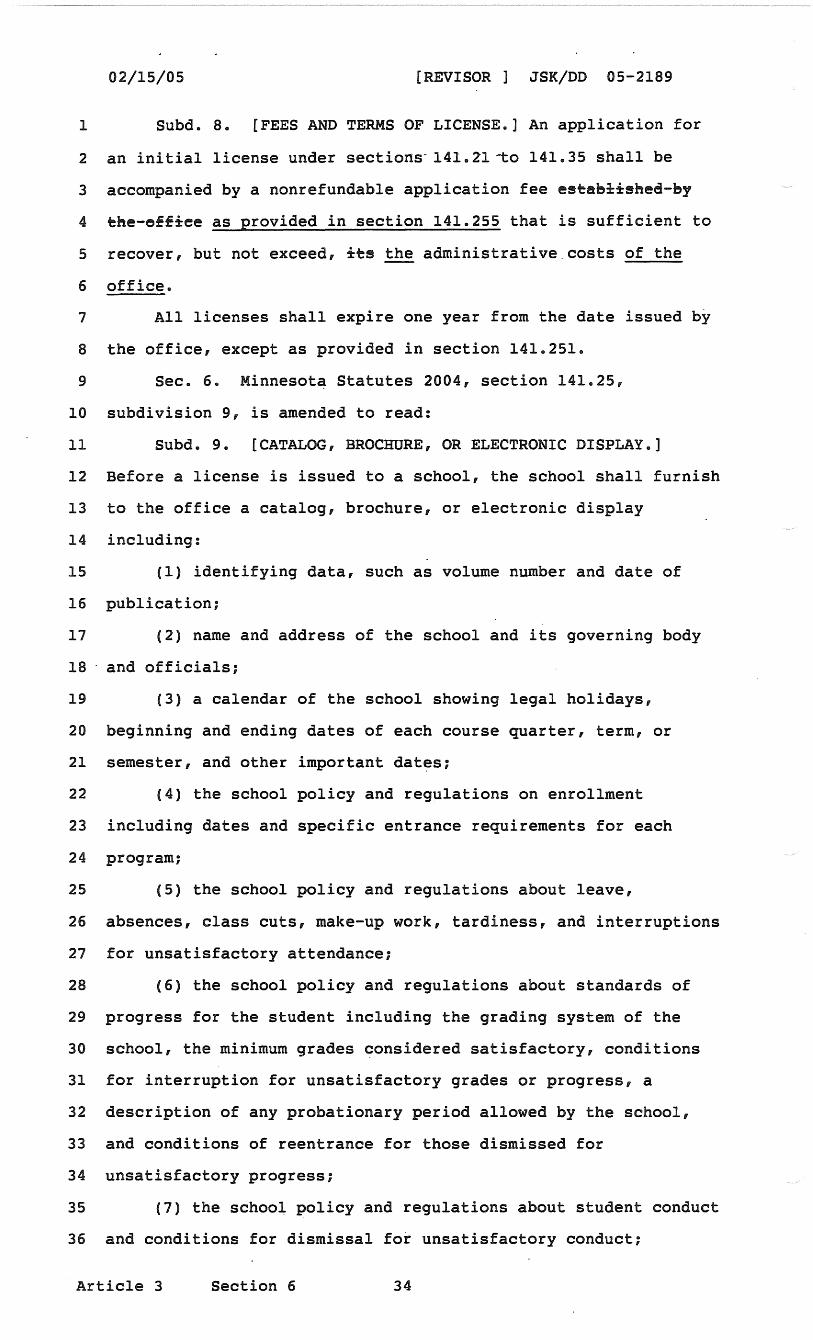
02/15/05 [REVISOR ] JSK/DD 05-2189
1 Subd. 8. [FEES AND TERMS OF LICENSE.] An application for
2 an initial license under sections-141.214:0 141.35 shall be
3 accompanied by a nonrefundable application fee estab3:±shee-by
4 the-e££±ee as provided in section 141.255 that is sufficient to
5 recover, but not exceed, ±ts the administrative.costs of the
6 office ..
7 All licenses shall expire one year from the date issued by
8 the office, except as provided in section 141.251.
9 Sec. 6.. Minnesot~ Statutes 2004, section 141.25,
10 subdivision 9, is amended to read:
11 Subd. 9.. [CATALOG, BROCHURE, OR ELECTRONIC DISPLAY.]
12 Before a license is issued to a school, the school shall furnish
13 to the office a catalog, brochure, or electronic display
14 including:
15 {l) identifying data, such as volume number and date of
16 publication;
17 {2) name and address of the school and its governing body
18 · and officials;
19 (3) a calendar of the school showing legal holidays,
20 beginning and ending dates of each course quarter, term, or
21 semester, and other important dat~s;
22 (4) the school policy and regulations on enrollment
23 including dates and specific entrance requirements for each
24 program;
25 (5) the school policy and regulations about leave,
26 absences, class cuts, make-up work, tardiness, and interruptions
27 for unsatisfactory attendance;
28 (6) the school policy and regulations about standards of
29 progress for the student including the grading system of the
30 school, the minimum grades considered satisfactory, conditions
31 for interruption for unsatisfactory grades or progress, a
32 description of any probationary period allowed by the school,
33 and conditions of reentrance for those dismissed for
34 unsatisfactory progress;
35 (7) the school policy and regulations about student conduct
36 and conditions for dismissal for unsatisfactory conduct;
Article 3 Section 6 34
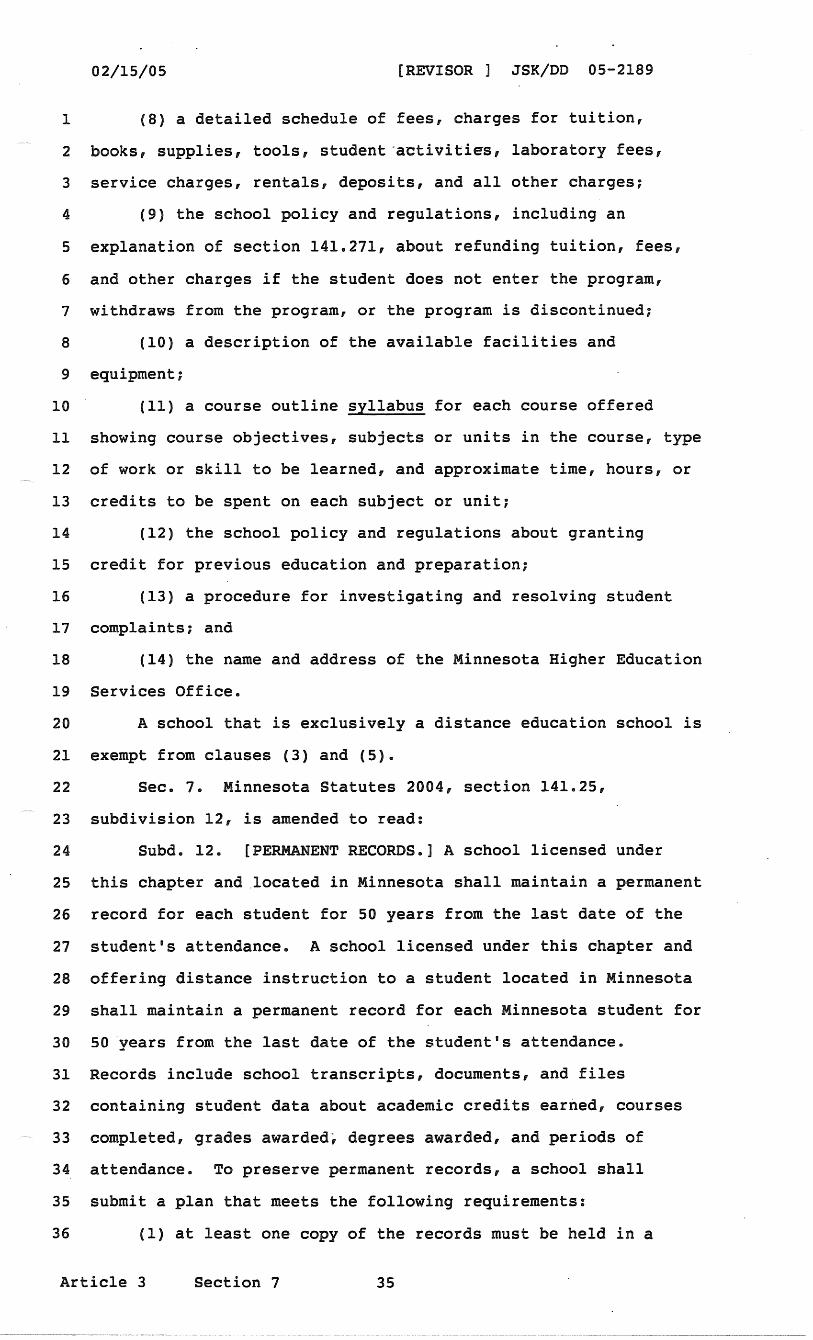
02/15/05 [REVISOR ] JSK/DD 05-2189
1 (8) a detailed schedule of fees, charges for tuition,
2 books, supplies, tools, student-activities, laboratory fees,
3 service charges, rentals, deposits, and all other charges;
4 (9) the school policy and regulations, including an
5 explanation of section 141.271, about refunding tuition, fees,
6 and other charges if the student does not enter the program,
7 withdraws from the program, or the program is discontinued;
8 (10) a description of the available facilities and
9 equipment;
10 (11) a course outline syllabus for each course offered
11 showing course objectives, subjects or units in the course, type
12 of work or skill to be learned, and approximate time, hours, or
13 credits to be spent on each subject or unit;
14 (12) the school policy and regulations about granting
15 credit for previous education and preparation;
16 (13) a procedure for investigating and resolving student
17 complaints; and
18 (14) the name and address of the Minnesota Higher Education
19 Services Office.
20 A school that is exclusively a distance education school is
21 exempt from clauses (3) and (5).
22 Sec. 7. Minnesota Statutes 2004, section 141.25,
23 subdivision 12, is amended to read:
24 Subd. 12. [PERMANENT RECORDS.] A school licensed under
25 this chapter and .located in Minnesota shall maintain a permanent
26 record for each student for 50 years from the last date of the
27 student's attendance. A school licensed under this chapter and
28 offering distance instruction to a student located in Minnesota
29 shall maintain a permanent record for each Minnesota student for
30 50 years from the last date of the student's attendance.
31 Records include school transcripts, documents, and files
32 containing student data about academic credits earned, courses
33 completed, grades awarded; degrees awarded, and periods of
34 attendance. To preserve permanent records, a school shall
35 submit a plan that meets the following requirements:
36 (1) at least one copy of the records must be held in a
Article 3 Section 7 35
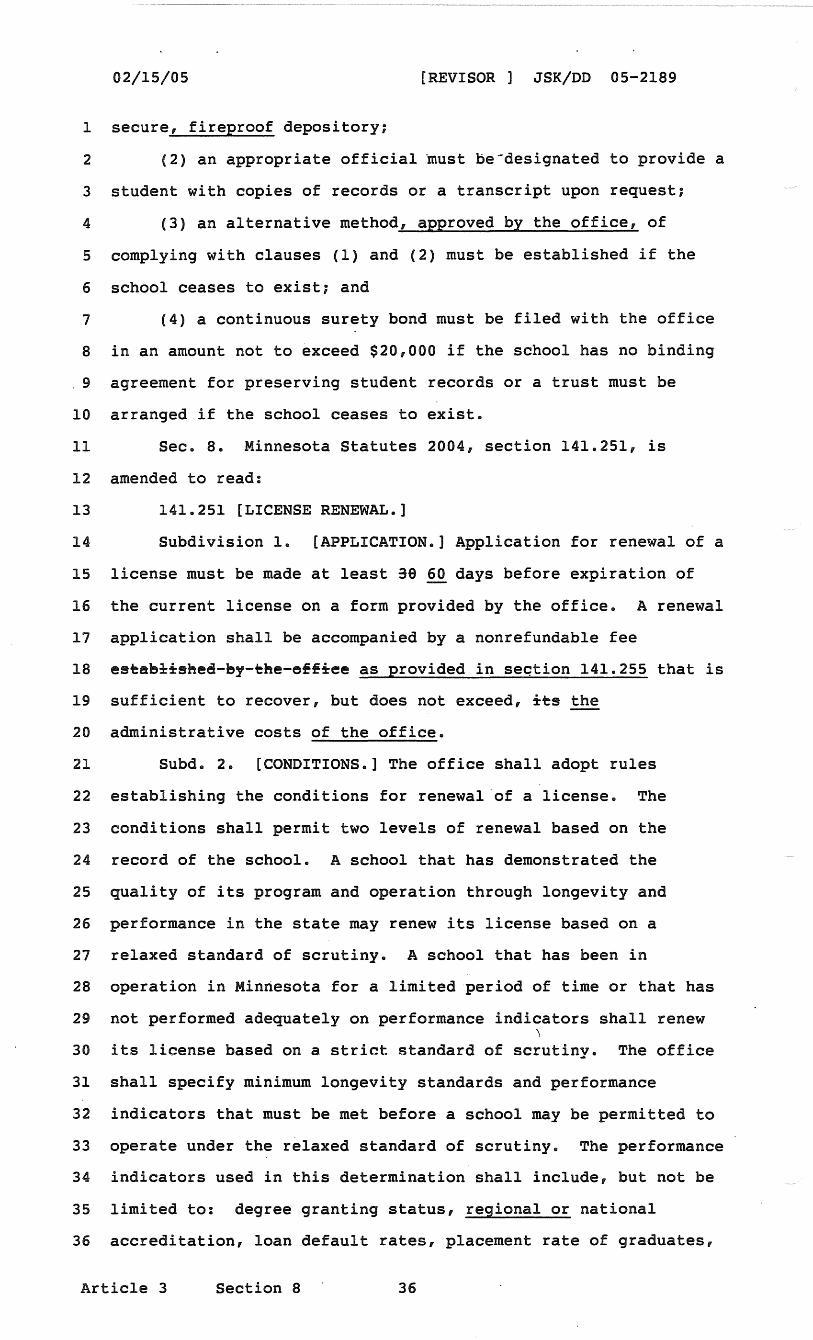
02/15/05 [REVISOR ] JSK/DD 05-2189
1 secure, fireproof depository;
2 (2) an appropriate official must be-designated to provide a
3 student with copies of records or a transcript upon request;
4 (3) an alternative method, approved by the office, of
5 complying with clauses (1) and (2) must be established if the
6 school ceases to exist; and
7 (4) a continuous surety bond must be filed with the office
8 in an amount not to exceed $20,000 if the school has no binding
. 9 agreement for preserving student records or a trust must be
10 arranged if the school ceases to exist.
11 Sec. 8. Minnesota Statutes 2004, section 141.251, is
12 amended to read:
13 141.251 [LICENSE RENEWAL.]
14 Subdivision 1. [APPLICATION.] Application for renewal of a
15 license must be made at least 30 60 days before expiration of
16 the current license on a form provided by the office. A renewal
17 application shall be accompanied by a nonrefundable fee
18 estab~isned-by-the-e££iee as provided in seqtion 141.255 that is
19 sufficient to recover, but does not exceed, its the
20 administrative costs of the office.
21 Subd. 2. [CONDITIONS.] The office shall adopt rules
22 establishing the conditions for renewal ·of a license. The
23 conditions shall permit two levels of renewal based on the
24 record of the school. A school that has demonstrated the
25 quality of its program and operation through longevity and
26 performance in the state may renew its license based on a
27 relaxed standard of scrutiny. A school that has been in
28 operation in Minnesota for a limited·period of time or that has
29 not performed adequately on performance indicators shall renew ~
30 its license based on a strict standard of scrutiny. The office
31 shall specify minimum longevity standards and performance
32 indicators that must be met before a school may be permitted to
33 operate under the relaxed standard of scrutiny. The performance
34 indicators used in this determination shall include, but not be
35 limited to: degree granting status, regional or national
36 accreditation, loan default rates, placement rate of graduates,
Article 3 Section 8 36
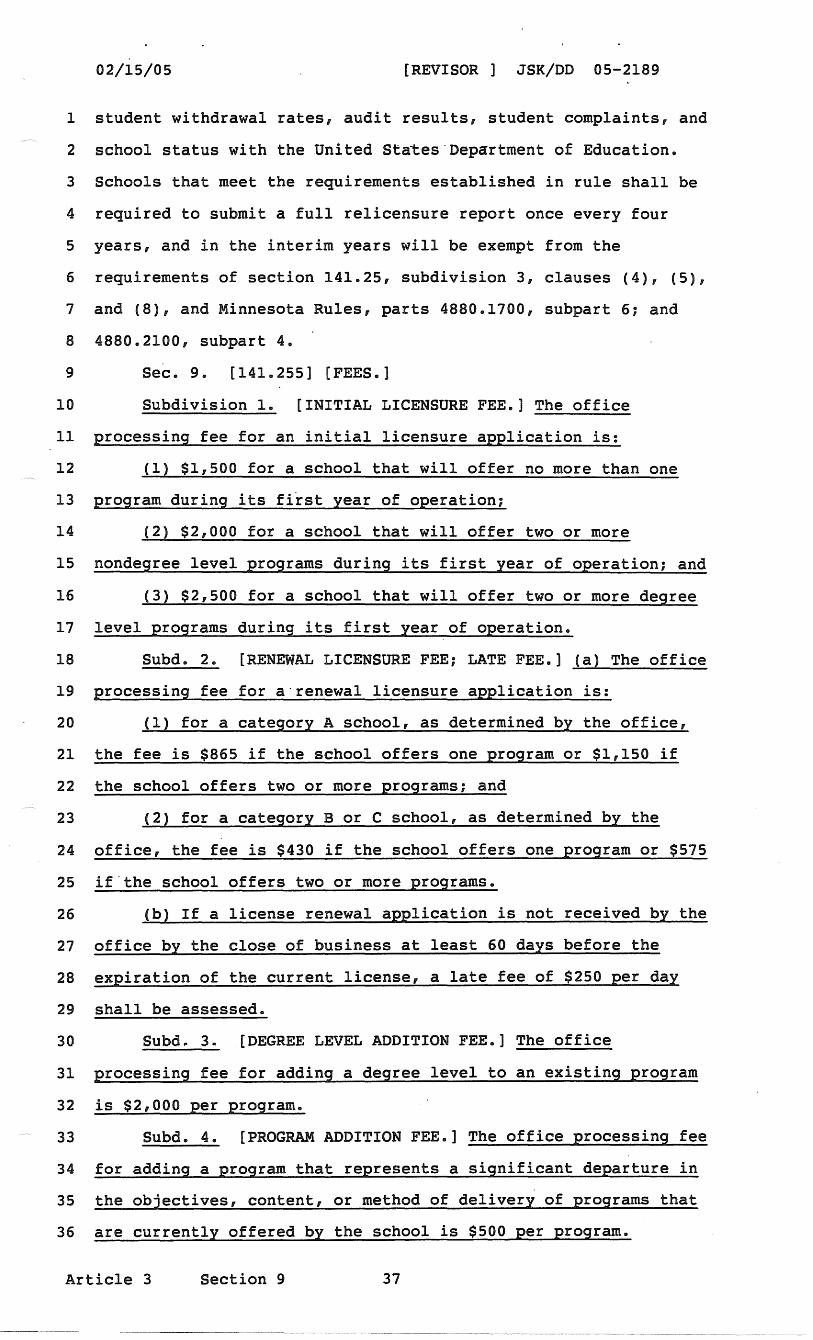
02/15/05 [REVISOR ] JSK/DD 05-2189
l student withdrawal rates, audit results, student complaints, and
2 school status with the United States·Department of Education.
3 Schools that meet the requirements established in rule shall be
4 required to submit a full relicensure report once every four
5 years, and in the interim years will be exempt from the
6 requirements of section 141.25, subdivision 3, clauses (4), (5),
7 and (8), and Minnesota Rules, parts 4880.1700, subpart 6; and
8 4880.2100, subpart 4.
9 Sec. 9. [141.255] [FEES.]
10 Subdivision 1. [INITIAL LICENSURE FEE.] The office
11 processing fee for an initial licensure application is:
12 (1) $1,500 for a school that will offer no more than one
13 program during its first year of operation;
14 (2) $2,000 for a school that will offer two or more
15 nondegree level programs during its first year of operation; and
16 (3) $2,500 for a school that will offer two or more degree
17 level programs during its first year of operation.
18 Subd. 2. [RENEWAL LICENSURE FEE; LATE FEE.] (a) The office
19 processing fee for a·renewal licensure application is:
20 {l) for a category A school, as determined by the office,
21 the fee is $865 if the school offers one program or $1,150 if
22 the school offers two or more programs; and
23 (2) for a category B or C school, as determined by the
24 office, the fee is $430 if the school offers one program or $575
25 if .the school offers two or more programs.
26 (b) If a license renewal application is not received by the
27 off ice by the close of business at least 60 days before the
28 expiration of the current license, a late fee of $250 per day
29 shall be assessed.
30 Subd~ 3. [DEGREE LEVEL ADDITION FEE.] The office
31 processing fee for adding a degree level to an existing program
32 is $2,000 per program.
33 Subd. 4. [PROGRAM ADDITION FEE.] The office processing fee
34 for adding a program that represents a significant departure in
35 the objectives, content, or method of delivery of programs that
36 are currently offered by the school is $500 per program.
Article 3 Section 9 37
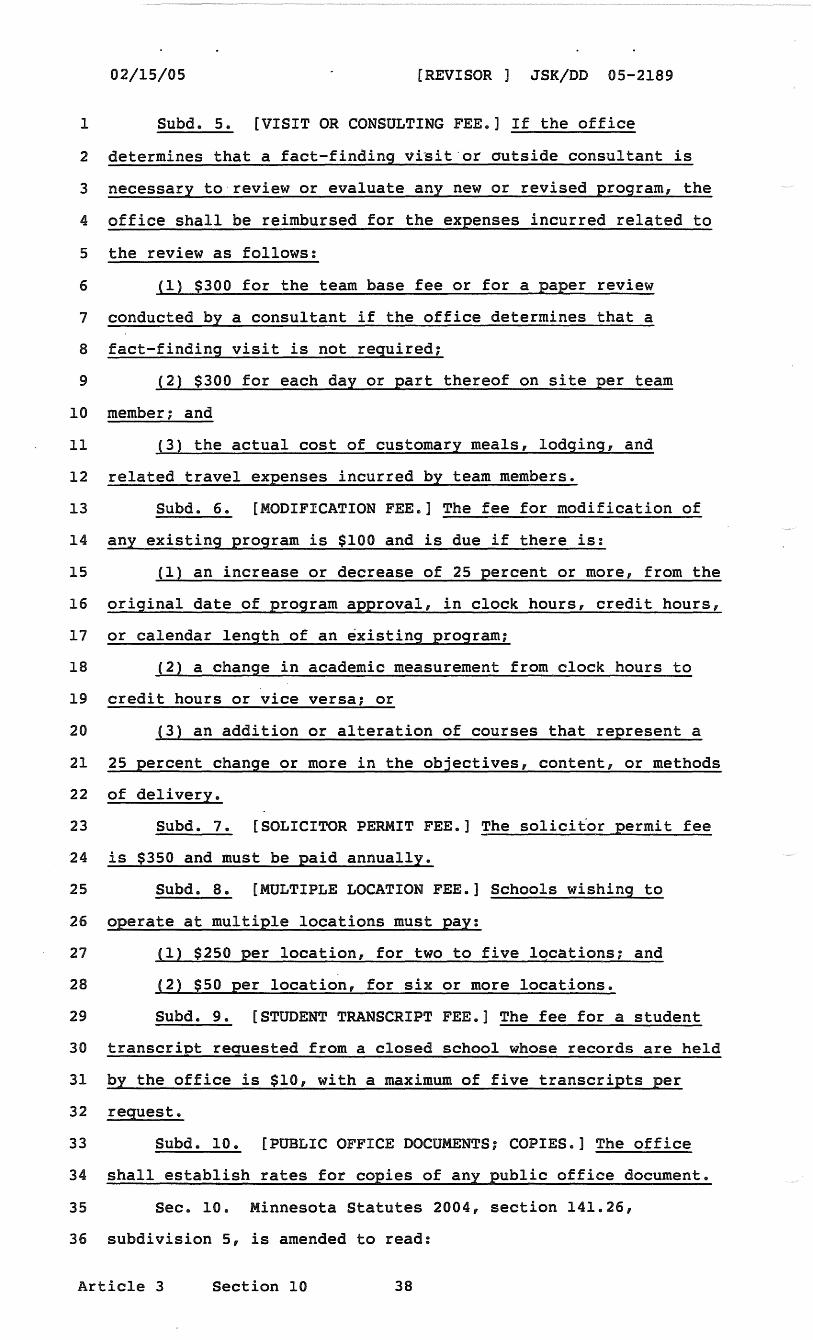
02/15/05 [REVISOR ] JSK/DD 05-2189
1 Subd. 5. [VISIT OR CONSULTING FEE.] If the office
2 determines that a fact-finding visit·or outside consultant is
3 necessary to· review or evaluate any new or revised program, the
4 off ice shall be reimbursed for the expenses incurred related to
5 the review as follows:
6 (1) $300 for the team base fee or for a paper review
7 conducted by a consultant if the office determines that a
8 fact-finding visit is not required;
9 (2) $300 for each day or part thereof on site per team
10 member; and
11 (3) the actual cost of customary meals, lodging, and
12 related travel expenses incurred by team members.
13 Subd. 6. [MODIFICATION FEE.] The fee for modification of
14 any existing program is $100 and is due if there is:
15 (1) an increase or decrease of 25 percent or more, from the
16 original date of program approval, in clock hours, credit hours,
17 or calendar length of an existing program;
18 (2) a change in academic measurement from clock hours to
19 credit hours or vice versa; or
20 (3) an addition or alteration of courses that represent a
21 25 percent change or more in the objectives, content, or methods
22 of delivery.
23 Subd. 7. [SOLICITOR PERMIT FEE.] The solicitor permit fee
24 is $350 and must be paid annually.
25 Subd. 8. [MULTIPLE LOCATION FEE.] Schools wishing to
26 operate at multiple locations must pay:
27 (1) $250 per location, for two to five locations; and
28 (2) $50 per location, for six or more locations.
29 Subd. 9. [STUDENT TRANSCRIPT FEE.] The fee for a student
30 transcriot reauested from a closed school whose records are held
31 by the office is $10, with a maximum of five transcripts per
32 request.
33 Subd. 10. [PUBLIC OFFICE DOCUMENTS; COPIES.] The office
34 shall establish rates for copies of any public office document.
35 Sec. 10. Minnesota Statutes 2004, section 141.26,
36 subdivision 5, is amended to read:
Article 3 Section 10 38
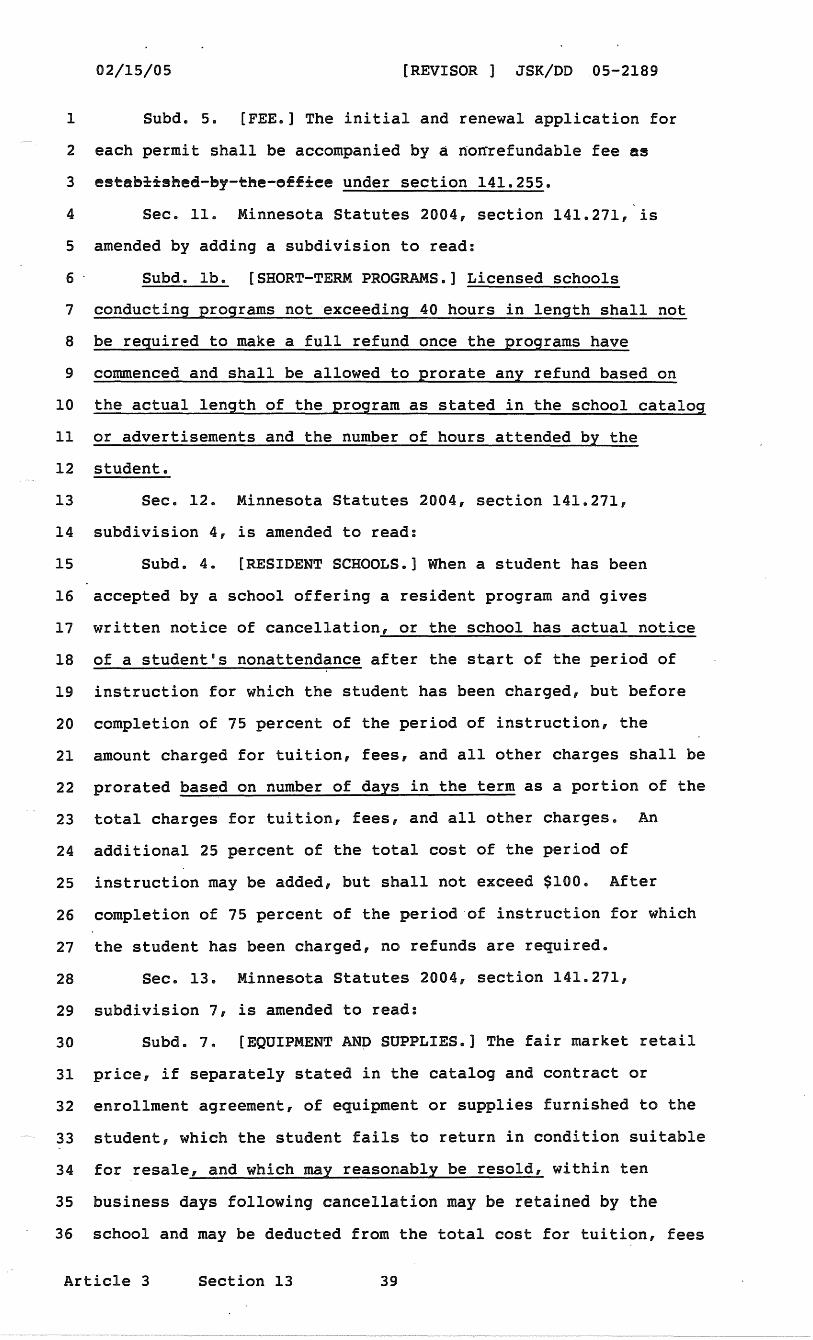
02/15/05 [REVISOR ] JSK/DD 05-2189
1 Subd. 5. [FEE.] The initial and renewal application for
2 each permit shall be accompanied by a nonrefundable fee as
3 eseabi±sned-by-ene-e££±ee under section 141.255.
4 Sec. 11. Minnesota Statutes 2004, section 141.271, is
5 amended by adding a subdivision to read:
6 Subd. lb. [SHORT-TERM PROGRAMS.] Licensed schools
7 conducting programs not exceeding 40 hours in length shall not
8 be required to make a full refund once the programs have
9 commenced and shall be allowed to prorate any refund based on
10 the actual length of the program as stated in the school catalog
11 or advertisements and the number of hours attended by the
12 student.
13 Sec. 12. Minnesota Statutes 2004, section 141.271,
14 subdivision 4, is amended to read:
15 Subd. 4. [RESIDENT SCHOOLS.] When a student has been
16 accepted by a school offering a resident program and gives
17 written notice of cancellation, or the school has actual notice
18 of a student's nonattendance after the start of the period of
19 instruction for which the student has been charged, but before
20 completion of 75 percent of the period of instruction, the
21 amount charged for tuition, fees, and all other charges shall be
22 prorated based on number of days in the term as a portion of the
23 total charges for tuition, fees, and all other charges. An
24 additional 25 percent of the total cost of the period of
25 instruction may be added, but shall not exceed $100. After
26 completion of 75 percent of the period of instruction for which
27 the student has been charged, no refunds are required.
28 Sec. 13. Minnesota Statutes 2004, section 141.271,
29 subdivision 7, is amended to read:
30 Subd. 7. [EQUIPMENT AND SUPPLIES.] The fair market retail
31 price, if separately stated in the catalog and contract or
32 enrollment agreement, of equipment or supplies furnished to the
33 student, which the student fails to return in condition suitable
34 for resale, and which may reasonably be resold, within ten
35 business days following cancellation may be retained by the
36 school and may be deducted from the total cost for tuition, fees
Article 3 Section 13 39
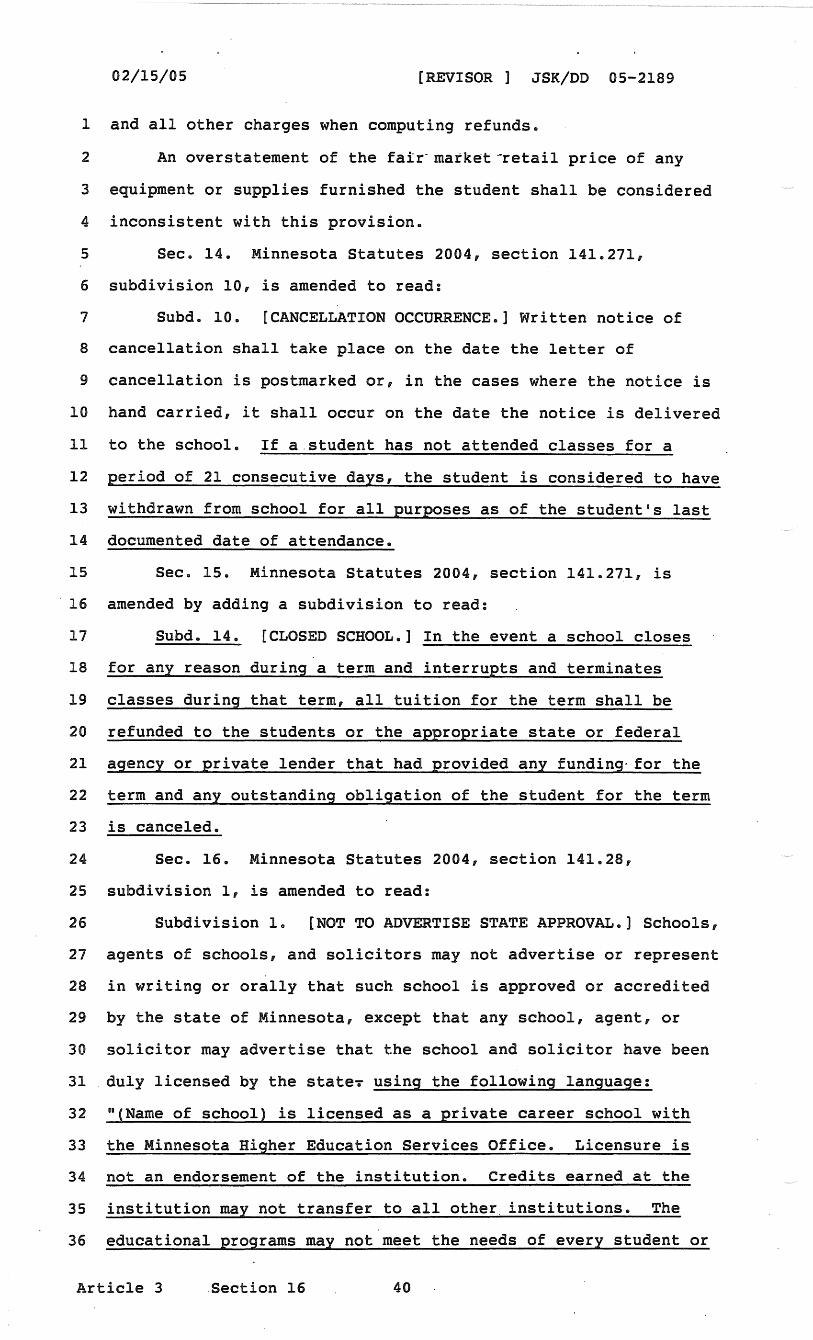
02/15/05 [REVISOR ] JSK/DD 05-2189
1 and all other charges when computing refunds.
2 An overstatement of the fair-market-retail price of any
3 equipment or supplies furnished the student shall be considered
4 inconsistent with this provision.
5 Sec. 14. Minnesota Statutes 2004, section 141.271,
6 subdivision 10, is amended to read:
7 Subd. 10. [CANCELLATION OCCURRENCE.] Written notice of
8 cancellation shall take place on the date the letter of
9 cancellation is postmarked or, in the cases where the notice is
10 hand carried, it shall occur on the date the notice is delivered
11 to the school. If a.student has not attended classes for a
12 period of 21 consecutive days, the student is considered to have
13 withdrawn from school for all purposes as of the student's last
14 documented date of attendance.
15 Sec. 15. Minnesota Statutes 2004, section 141.271, is
· 16 amended by adding a subdivision to read:
17 Subd. 14. [CLOSED SCHOOL.] In the event a school closes
18 for any reason during a term and interrupts and terminates
19 classes during that term, all tuition for the term shall be
20 refunded to the students or the appropriate state or federal
21 agency or private lender that had provided any funding· for the
22 term and any outstanding obligation of the student for the term
23 is canceled.
24 Sec. 16. Minnesota Statutes 2004, section 141.28,
25 subdivision 1, is amended to read:
26 Subdivision la [NOT TO ADVERTISE STATE APPROVAL.] Schools,
27 agents of schools, and solicitors may not advertise or represent
28 in writing or orally that such school is approved or accredited
29 by the state of Minnesota, except that any school, agent, or
30 solicitor may advertise that the school and solicitor have been
31 duly licensed by the state. using the following language:
32 "(Name of school) is licensed as a private career school with
33 the Minnesota Higher Education Services Office. Licensure is
34 not an endorsement of the institution. Credits earned at the
35 institution may not transfer to all other_ institutions. The
36 educational programs may not meet the needs of every student or
Article 3 Section 16 40
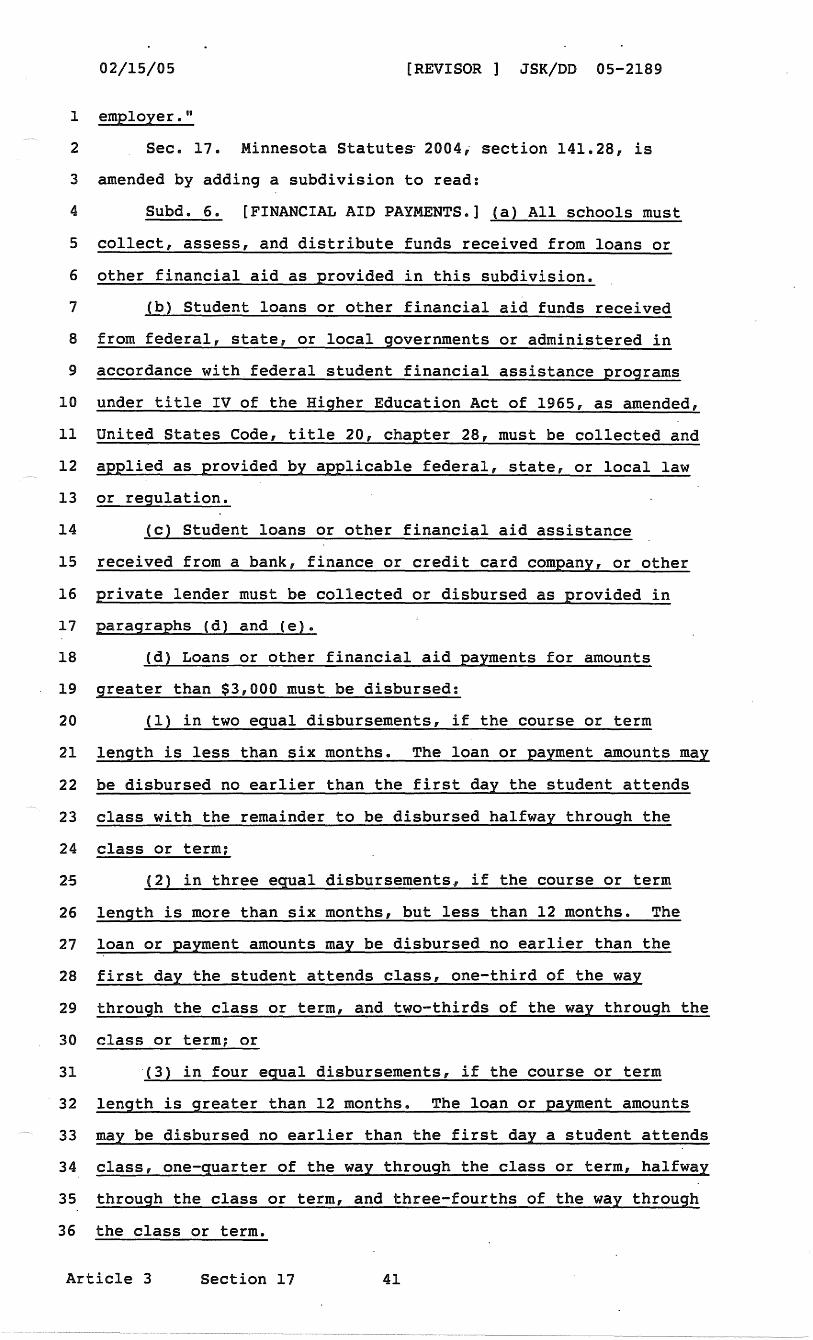
02/15/05 [REVISOR ] JSK/DD 05-2189
1 employer."
2 Sec. 17. Minnesota Statutes 2004i section 141.28, is
3 amended by adding a subdivision to read:
4 Subd. 6. [FINANCIAL AID PAYMENTS.] (a) All schools must
5 collect, assess, and distribute funds received from loans or
6 other financial aid as provided in this subdivision.
7 (b) Student loans or other financial aid funds received
8 from federal, state, or local governments or administered in
9 accordance with federal student financial assistance programs
10 under title IV of the Higher Education Act of 1965, as amended,
11 United States Code, title 20, chapter 28, must be collected and
12 applied as provided by applicable federal, state, or local law
13 or regulation.
14 (c) Student loans or other financial aid assistance
15 received from a bank, finance or credit card company, or other
16 private lender must be collected or disbursed as provided in
17 paragraphs {d) and {e).
18 (d) Loans or other financial aid payments for amounts
19 greater than $3,000 must be disbursed:
20 (1) in two equal disbursements, if the course or term
21 length is less than six months. The loan or payment amounts may
22 be disbursed no earlier than the first day the student attends
23 class with the remainder to be disbursed halfway through the
24 class or term;
25 ( 2) in three equal disbursements., if the course or term
26 length is more than six months, but less than 12 months. The
27 loan or payment amounts may be disbursed no earlier than the
28 first day the student attends class, one-third of the way
29 through the class or term, and two-thirds of the way through the
30 class or term; or
31 '(3) in four equal disbursements, if the course or term
32 length is greater than 12 months. The loan or payment amounts
33 may be disbursed no earlier than the first day a student attends
34 class, one-guarter of the way through the class or term, halfway
35 through the class or term, and three-fourths of the way through
36 the class or term.
Article 3 Section 17 41
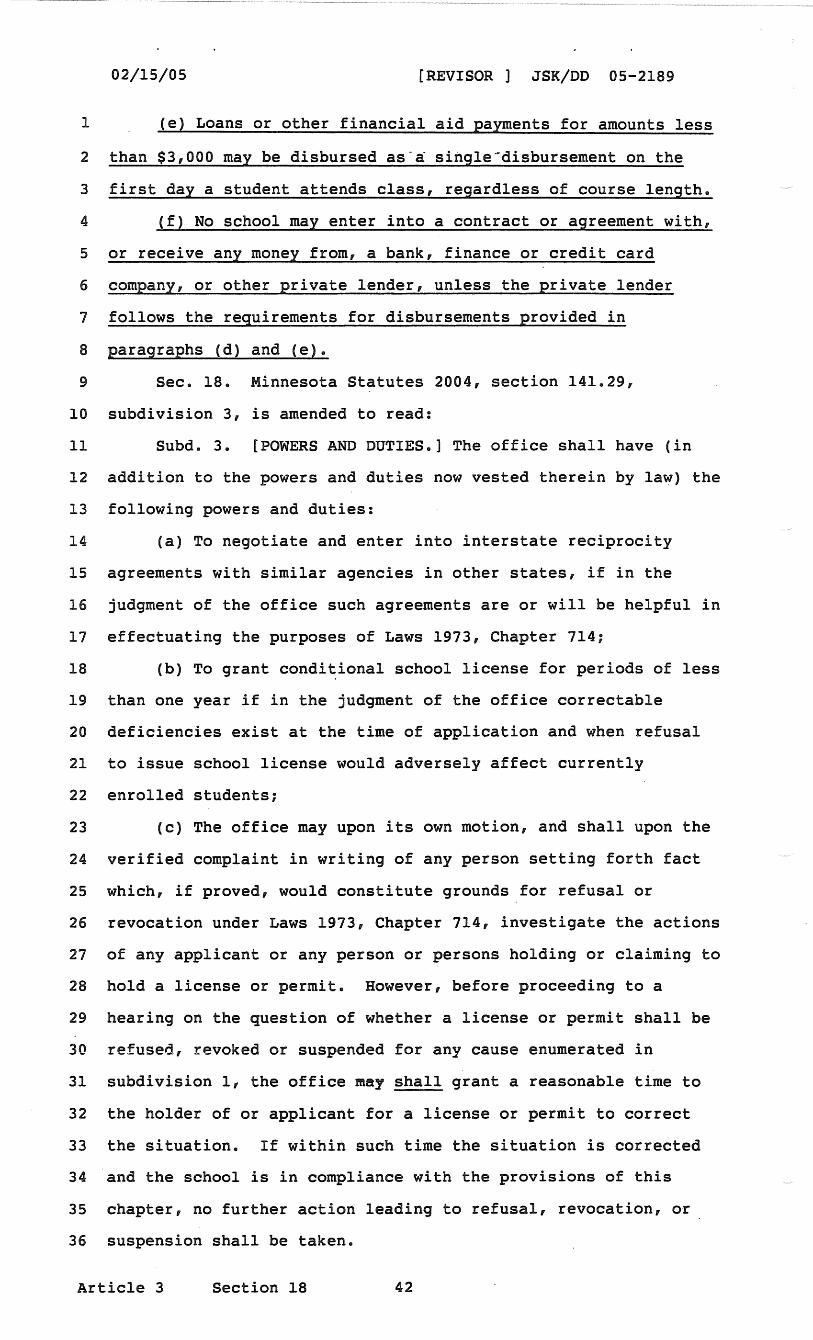
02/15/05 [REVISOR ] JSK/DD 05-2189
1 (e) Loans or other financial aid payments for amounts less
2 than $3,000 may be disbursed as-a single-disbursement on the
3 first day a student attends class, regardless of course length.
4 (f) No school may enter into a contract or agreement with,
5 or receive any money from, a bank, finance or credit card
6 company, or other private lender, unless the private lender
7 follows the requirements for disbursements provided in
8 paragraphs (d) and (e).
9 Sec. 18. Minnesota Statutes 2004, section 141.29,
10 subdivision 3, is amended to read:
11 Subd. 3. [POWERS AND DUTIES.] The office shall have (in
12 addition to the powers and duties now vested therein by law) the
13 following powers and duties:
14 (a) To negotiate and enter into interstate reciprocity
15 agreements with similar agencies in other states, if in the
16 judgment of the off ice such agreements are or will be helpful in
17 effectuating the purposes of Laws 1973, Chapter 714;
18 (b) To grant condi~ional school license for periods of less
19 than one year if in the judgment of the off ice correctable
20 deficiencies exist at the time of application and when refusal
21 to issue school license would adversely affect currently
22 enrolled students;
23 (c) The office may upon its own motion, and shall upon the
24 verified complaint in writing of any person setting forth fact
25 which, if proved, would constitute grounds for refusal or
26 revocation under Laws 1973, Chapter 714, investigate the actions
27 of any applicant or any person or persons holding or claiming to
28 hold a license or permit. However, before proceeding to a
29 hearing on the question of whether a license or permit shall be
30 refused, revoked or suspended for any cause enumerated in
31 subdivision 1, the office may shall grant a reasonable time to
32 the holder of or applicant for a license or permit to correct
33 the situation. If within such time the situation is corrected
34 and the school is in compliance with the provisions of this
35 chapter, no further action leading to refusal, revocation, or
36 suspension shall be taken.
Article 3 Section 18 42
02/15/05 [REVISOR ] JSK/DD 05-2189
l Sec. 19. Minnesota Statutes 2004, section 141.30, is
2 amended to read:
3 141.30 [INSPECTION.]
4 (a) The office or a delegate may inspect the instructional
5 books and records, classrooms, dormitories, tools, equipment and
6 classes of any school or applicant for license at any reasonable
7 time. The office may require the submission of a certified
8 public audit, or if th~re is no such audit available the office
9 or a delegate may inspect the financial books and records of the
10 school. In no event shall such financial information be used by
11 the office to regulate or set the tuition or fees charged by the
12 school.
13 (b) Data obtained from an inspection of the financial
14 records of a school or submitted to the office as part of a
15 license application or renewal are nonpublic data· as defined in
16 section 13.02, subdivision 9. Data obtained from inspections
17 may be disclosed to other members of the office, to law
18 enforcement officials, or in connection with a legal or
19 administrative proceeding commenced to enforce a requirement of
20 law.
21 Sec. 20. Minnesota Statutes 2004, section 141.35, is
22 amended to read:
23 141.35 [EXEMPTIONS.]
24 Sections 141.21 to 141.35 shall not apply to the following:
25 (1) public postsecondary institutions;
26 (2) private postsecondary institutions registered under
27 sections 136A.61 to 136A.71 that are nonprofit, or that are for
28 profit and registered under sections 136A.61 to 136A.71 as of
29 December 31, 1998, or are approved to offer exclusively
30 baccalaureate or postbaccalaureate programs;
31 (3) schools of nursing accredited by the state Board of
32 Nursing or an equivalent public board of another state or
33 foreign country;
34 (4) private schools complying with the requirements of
35 section 120A.22, subdivision 4;
36 (5) courses taught to students in a valid apprenticeship
Article 3 Section 20 43
02/15/05 [REVISOR JSK/DD 05-2189
1 program taught by or required by a trade union;
2 (6) schools exclusively engaged-in craining physically or
3 mentally handicapped persons for the state of Minnesota;
4 (7) schools licensed by boards authorized under Minnesota
5 law to issue licenses;
6 (8) schools and educational programs, or training programs,
7 contracted for by persons, firms, corporations, government
8 agencies, or associations, for the training of their own
9 employees, for which no fee is charged the employee;
10 (9) schools engaged exclusively in the teaching of purely
11 avocational, recreational, or remedial subjects as determined by
12 the office;
13 (10) diiver training schools and instructors as defined in
14 section 171.33, subdivisions 1 and 2;
15 (11) classes, courses, or programs conducted by a bona fide
16 trade, professional, or fraternal organization, solely for that
17 organization's membership;·
18 (12) programs in the fine arts provided by organizations
19 exempt from taxation under section 290.05 and registered with
20 the attorney general under chapter 309. For the purposes of
21 this clause, "fine arts" means activities resulting in artistic
22 creation or artistic performance of works of the imagination
23 which are engaged in for the primary purpose of creative
24 expression rather than commercial sale or employment. In making
25 this determination the off ice may seek the advice and
26 recommendation of the Minnesota Board of the Arts;
27 {13) classes, courses, or programs ~ntended to fulfill the
28 continuing education requirements for licensure or certification
29 in a profession, that have been approved by a legislatively or
30 judicially established board or agency responsible for
31 regulating the practice of the profession, and that are offered
32 ~rimariiy exclusively to an individual practicing the
33 profession;
34 (14) classes, courses, or programs intended to prepare
35 students to sit for undergraduate, graduate, postgraduate, or
36 occupational licensing and occupational entrance examinations;
Article 3 Section 20 44
02/15/05 [REVISOR ] JSK/DD 05-2189
1 (15) classes, courses, or programs providing 16 or fewer
2 clock hours of instruction that-are rtot part of the curriculum
3 for an occupation or entry level employment;
4 (16) classes, courses, or programs providing instruction in
5 personal development, modeling, or acting;
6 (17) training or instructional programs, in which one
7 instructor teaches an individual student, that are not part of
8 the curriculum for an occupation or are not intended to prepare
9 a person for entry level employment; and
10 (18) schools with no physical presence in Minnesota~
11 determined by the office, engaged exclusively in offering
12 distance instruction that are located in and regulated by other
13 states or jurisdictions.
14 ARTICLE 4
15 FACILITIES AUTHORITY MERGER
16 Section 1. [FACILITIES AUTHORITY; MERGER.]
17 The authority, duties, and unexpended balance of any funds
18 collected pursuant to Minnesota Statutes, section 136A.29,
19 subdivision 12, of the Minnesota Higher Education Facilities
20 Authority are transferred to the Higher Education Services
21 Office. Minnesota Statutes, section 15.039, applies to the
22 transfer of responsibilities under this section.
23 Sec. 2. [REVISOR INSTRUCTION.]
24 The reviser of statutes shall prepare a bill for
25 introduction in the 2006 regular legislative session making any
26 technical changes to Minnesota Statutes and Minnesota Rules made
27 necessary by section 1.
28 Sec. 3. [REPEALER.]
29 Minnesota Statutes 2004, sections 136A.25 and 136A.26, are
30 repealed.
31 Sec. 4. [EFFECTIVE DATE.]
32 Sections 1 to 3 are effective July 1, 2005.
45
ARTICLE locations in 05-2189 Page la 02/15/05
Article 1 APPROPRIATIONS • •••••••••••••••••••••••••••••••••••••••••.••• page 1
Article 2 RELATED PROVISIONS • ••••.••••••••••••••••••••••• Cl •••••••••••• page 7
Article 3 PRIVATE CAREER SCHOOLS • • • • • • • • • • • • • • • • • • • • • • • • • • • • • • • • • • • • •• page 30
Article 4 FACILITIES AUTHORITY MER.GER • •••••••••••••••••••••••••••••••• page 45
la
APPENDIX Repealed Minnesota Statutes for 05-2189
136A.Oll HIGHER EDUCATION SERVICES COUNCIL. Subdivision 1. Membership. The Higher Education
Services Council consists of eight citizens and one student appointed by the governor. In making appointments, the governor shall consider the geographic, gender, and ethnic diversity in the state. No more than five members of the council may belong to the same political party. The student member must be a full-time student enrolled in a Minnesota postsecondary institution at the tim~ of appointment. The Student Advisory Council shall recommend two to four candidates for the student position. The governor is not bound by these recommendations. A nonstudent member of the council may not be an employee of or receive compensation from a public or private postsecondary institution while serving on the council. A student member may receive compensation as a student body officer or may be a recipient of financial aid, including work study, but may not otherwise be employed or compensated by a postsecondary institution while serving on the council.
The term of each citizen member is six years, and that of the student member is two years. As nearly as possible, one-third of the terms of the members must expire every two years. The compensation, removal of voting members, and filling of vacancies among voting members on the council is governed by section 15.0575, subdivisions 3, 4, and 5.
Subd. 2. Duties. The council shall: {l) provide advice and review regarding the performance of
the Higher Education Services Office in its duties and in any policies, procedures, or rules the office prescribes to perform its duties; and
(2) communicate with and make recommendations to the governor and the legislature. 136A.031 ADVISORY GROUPS.
Subdivision 1. Appointment. The Higher Education Services Council may appoint advisory task forces as necessary to assist in the administration of the Higher Education Services Office responsibilities. The task forces• expiration and the terms, compensation, and removal of members are as provided in section 15.059. 136A.25 CREATION.
A state agency known as the Minnesota Higher Education Facilities Authority is hereby created. 136A.26 MEMBERSHIPS; OFFICERS; COMPENSATION; REMOVAL.
Subdivision 1. Membership. The Minnesota Higher Education Facilities Authority shall consist of eight members appointed by the governor with the advice and consent of the senate, and a representative of the Higher Education Services Office.
All members to be appointed by the governor shall be residents of the state. At least two members must reside outside the metropolitan area as defined in section 473.121, subdivision 2. At least one of the members shall be a person having a favorable reputation for skill, knowledge, and experience in the field of state and municipal finance; and at least one shall be a person having a favorable reputation fo~ skill, knowledge, and experience in the building construction field; and at least one of the members shall be a trustee, director, officer, or employee of an institution of higher education.
Subd. la. Private College Council member. The
136A.26 lR
APPENDIX Repealed Minnesota Statutes .for 05-2189
president of the Minnesota Private College Council, or the president's designee, shall serve without compensation as an advisory, nonvoting member of the authority.
Subd. 2. Term; compensation; removal. The membership terms, compensation, removal of members, and filling of vacancies for authority members other than the representative of the Higher Education Services Office, and the president of the Private College Council, shall be as provided in section 15.0575.
136A.26 2R
UNIVE SITY OF MINNESOTA
Accountable to U
2004-05 University Plan, Performance,
and Accountability Report
Office of Planning and Academic Affairs University of Minnesota Minneapolis, Minnesota
February 2005
Accountable to U 2004-05
University Plan, Performance, and Accountability Report
Office of Planning and Academic Affairs University of Minnesota Minneapolis, Minnesota
February 2005
Contact:
Office of Planning and Academic Affairs University of Minnesota
220 Morrill Hall 100 Church Street S.E.
Minneapolis, MN 55455 612-626-3838
www.academic.mnn.edu/planning/index.html
This publication is available in alternative formats upon request. Please contact Sandra Ecklein, 612-626-3838.
The University of Minnesota is committed to the policy that all persons shall have equal access to its programs, facilities, and employment without regard to race, color, creed, religion, national origin, sex, age, marital status, disability, public assistance status, veteran status, or sexual orientation.
The University's mission, carried out on multiple campuses and throughout the state, is threefold: research and discovery, teaching and learning, and outreach and public service.
Contents
Cited Minnesota Statutes for This Report
Executive Summary
1: University of Minnesota Profile A. 10 Things to Know About the University B. Academic Priorities
2: Twin Cities Campus A. Campus Profile B. Academic Quality C. Academic Health Center D. University Libraries E. University Research F. Undergraduate Students G. Graduate and First-Professional Students H. Intercollegiate Athletics I. Human Resources J. Campus Facilities and Environment
3: Duluth Campus A. Campus Profile B. Academic Priorities C. Students D. Intercollegiate Athletics E. Human Resources F. Endowment and Annual Giving
4: Morris Campus A. Campus Profile B. Academic Priorities C. Students D. Intercollegiate Athletics E. Human Resources
1 3
11 12 23 25 29 38 49 55 59 71
79 80 84 91 92 98
99 100 102 108 108
Contents (continued)
5: Crookston Campus A. Campus Profile 115 B. Academic Priorities 116 C. Students 117 D. Intercollegiate Athletics 123 E. Human Resources 123
6: Rochester Campus 129
7: Public Engagement - Access and Outreach A. Technology Commercialization 135 B. University of Minnesota Extension Service 139 C. University Libraries 141 D. Research and Outreach Centers 142 E. State Economic Impact 143 F. State Social hnpact 143 G. Council on Public Engagement 144 H. Citizen Satisfaction 145
8: Efficiency and Effectiveness A. Enhanced Service and Productivity 149 B. Information Technology Initiatives 150 C. Technology-Enhanced Learning (TEL) 152
9: Finances A. Revenues and Expenditures 155 B. Key Financial Indicators 156 C. Tuition and Fees 160 D. Debt Management 165 E. Key Ratios 166 F. Return on Invested Assets 168 G. Endowment and Annual Giving 169 H. Internal Allocation of State Appropriations 175 I. Leveraging Other Resources 177
Appendices
A: Key Data Sources and Web Links 179
B: List of Tables and Figures 181
C: Report Contributors 191
D: Board of Regents 193
Index 195
Cited Minnesota Statutes for
University Plan, Performance, and Accountability Report
Minnesota Session Laws 2003, Chapter 133-S.F. No. 675:
An act relating to higher education; appropriating money for educational and related purposes to the higher education services office, board of trustees of the Minnesota state colleges and universities, board of regents of the university of Minnesota ...
Article 1, Section 4, Subd. 6. Accountability:
The board shall continue to submit the data and information enumerated in Laws 2001, First Special Session chapter 1, article 1, section 4, subdivision 5, in the board's university plan, performance, and accountability report. For the purposes of those reports, a first generation student is a student neither of whose parents received any postsecondary education.
Minnesota Session Laws 2001, 1st Special Session, Chapter 1-S .F. No 11:
An act relating to education; appropriating money for education and related purposes to the higher education services office, board of trustees of the Minnesota state colleges and universities, board of regents of the University of Minnesota ...
Article 1, Section 4, Subd. 5. Accountability:
(a) By February 1 of each even-numbered year, the board must submit a report to the chairs of the appropriate education committees of the legislature describing the following: (1) how it allocated the state appropriations made to the system in the omnibus higher education funding bill in the odd-numbered year; (2) the tuition rates and fees set by the board; and (3) the amount of state money used to leverage money from other funding sources and the level of support from those sources.
(b) By February 15, 2002, and each odd-numbered year, thereafter, the board ofregents of the University of Minnesota must submit a report to the commissioner of finance and the chairs of the higher education finance committees delineating: (1) the five undergraduate degree programs determined to be of highest priority to the system, and the revenue necessary to advance each program to be a center of excellence; (2) the reallocation of money and curricular and staffing changes, by campus and program, made to advance the system's priorities; (3) baseline data, and the methodology used to measure, the number of first generation students admitted systemwide, together with a plan to increase both the recruitment and retention through graduation of these students; ( 4) progress towards increasing the percentage of students graduating within four, five, and six years as reported in IPEDS. Data should be provided for each institution by race, ethnicity, and gender. Data provided should include information on successful retention strategies and the money allocated to enhance student retention; (5) progress towards increasing the revenue received, from all sources, to support research activities. Data provided should include information on the increase in funding from each source; and ( 6) progress of the academic health center in meeting the goals and outcomes in paragraph ( c) including how money appropriated from the medical· endowment fund contributed to meeting specific workforce training and health education goals for the academic health center.
(c) The Academic Health Center, in cooperation with the department of health, shall: (1) develop new strategies for health care delivery and professional training in this state that takes into account the changing racial and ethnic composition of this state; (2) develop new strategies to meet the health care workforce needs in the state; and (3) base these strategies on analysis of the population's health status and opportunities for improvement.
University of Minnesota: 2004-05 Accountable to U i
Executive Summary
“…[The regents shall] make a report annually, to the Legislature…exhibiting the state and progress of the University…and such other information as they may deem proper, or may from time to time be required of them.”
– University charter, 1851 Territorial Laws, Chapter 3, Section 16 Since the University of Minnesota’s inception 154 years ago, citizens, the state legislature, the federal government, the Board of Regents, alumni, students, parents, employers, and many others have held the University accountable for fulfilling its fundamental land-grant mission of teaching, research, and public engagement.
Over the years, the ways in which the University has demonstrated its accountability and its progress in meeting mission-related goals have been many – legislative reports and testimony, financial reports, accreditation reviews, and collegiate and unit annual reports to their constituencies. Origins of the Report
In 2000, the Regents asked University administration to review three institutional reports – the institutional measures, the unit compact plans, and the annual academic plan and report – to determine the feasibility of providing a single, consolidated report each year rather than three individual reports.
In November 2000, the Board approved the creation of the University Plan, Performance, and Accountability Report. In its resolution, the Board noted that it “…holds itself accountable to the public for accomplishing the mission of the University” and that the report was to become the principal annual documentation of that accountability.
The first report was published in 2001. The 2004-05 edition of the University Plan, Performance, and Accountability Report is the fourth produced for the Board of Regents. Starting with last year’s edition, the report also serves as the University of Minnesota’s principal annual report to the State, as mandated by the 2003 Legislature. Organization of the Report
The 2004-05 report provides an overview of the University of Minnesota and its academic priorities (Section 1), accountability measures for each campus (Sections 2-6), as well as University-wide measures related to public engagement (Section 7), efficiency and effectiveness (Section 8), and finances (Section 9). University Performance Measures The Executive Summary represents the University’s continuing efforts to provide a concise assessment of University performance, as requested by the Board of Regents. The assessment on the following pages includes multi-year comparisons, an analysis of the findings, and conclusions based on the findings. For each measure, the location in the report where a full discussion may be found is referenced.
Most rankings are derived from the University of Florida’s 2004 edition of The Top American
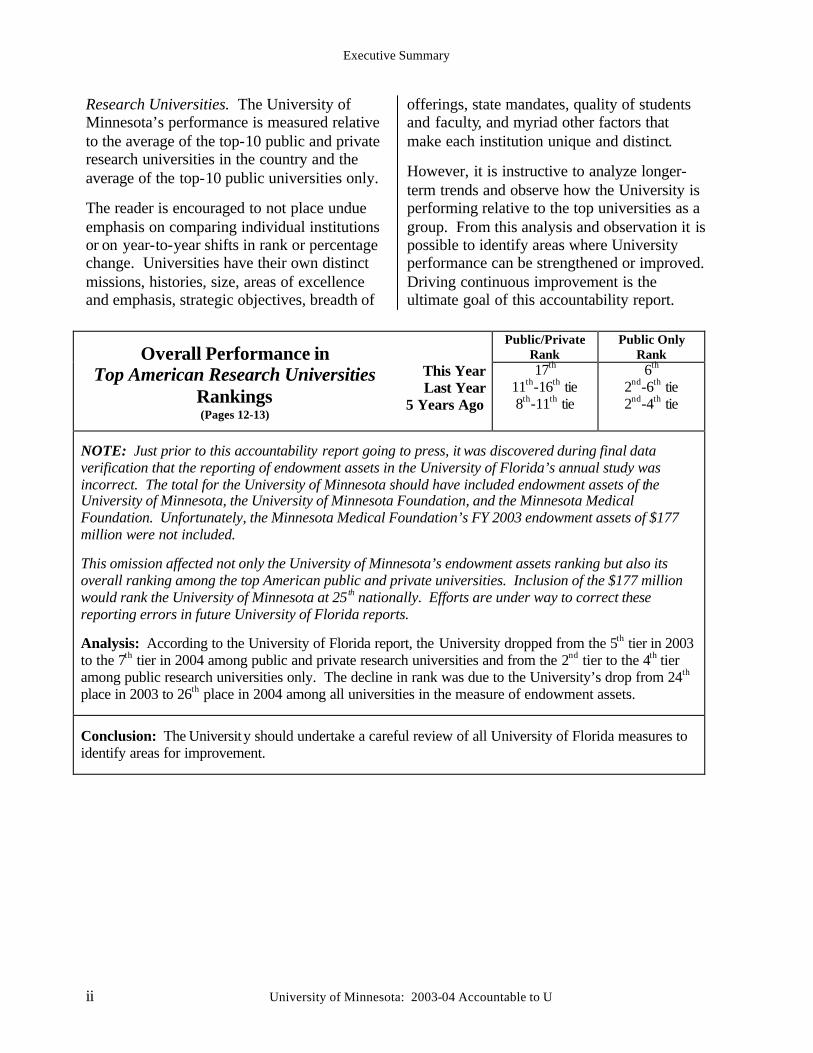
Executive Summary
ii University of Minnesota: 2003-04 Accountable to U
Research Universities. The University of Minnesota’s performance is measured relative to the average of the top-10 public and private research universities in the country and the average of the top-10 public universities only.
The reader is encouraged to not place undue emphasis on comparing individual institutions or on year-to-year shifts in rank or percentage change. Universities have their own distinct missions, histories, size, areas of excellence and emphasis, strategic objectives, breadth of
offerings, state mandates, quality of students and faculty, and myriad other factors that make each institution unique and distinct.
However, it is instructive to analyze longer-term trends and observe how the University is performing relative to the top universities as a group. From this analysis and observation it is possible to identify areas where University performance can be strengthened or improved. Driving continuous improvement is the ultimate goal of this accountability report.
Public/Private
Rank Public Only
Rank
Overall Performance in Top American Research Universities
Rankings (Pages 12-13)
This Year Last Year
5 Years Ago
17th 11th-16th tie 8th-11th tie
6th 2nd-6th tie 2nd-4th tie
NOTE: Just prior to this accountability report going to press, it was discovered during final data verification that the reporting of endowment assets in the University of Florida’s annual study was incorrect. The total for the University of Minnesota should have included endowment assets of the University of Minnesota, the University of Minnesota Foundation, and the Minnesota Medical Foundation. Unfortunately, the Minnesota Medical Foundation’s FY 2003 endowment assets of $177 million were not included. This omission affected not only the University of Minnesota’s endowment assets ranking but also its overall ranking among the top American public and private universities. Inclusion of the $177 million would rank the University of Minnesota at 25 th nationally. Efforts are under way to correct these reporting errors in future University of Florida reports. Analysis: According to the University of Florida report, the University dropped from the 5th tier in 2003 to the 7th tier in 2004 among public and private research universities and from the 2nd tier to the 4th tier among public research universities only. The decline in rank was due to the University’s drop from 24th place in 2003 to 26th place in 2004 among all universities in the measure of endowment assets. Conclusion: The University should undertake a careful review of all University of Florida measures to identify areas for improvement.
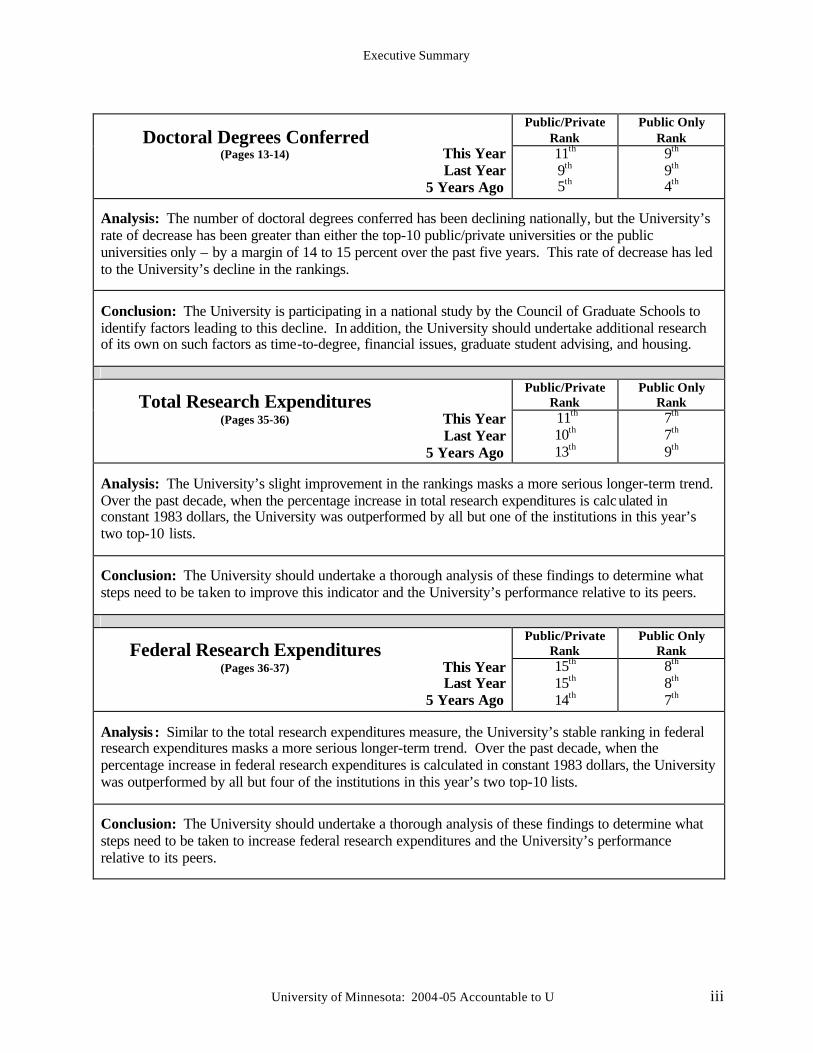
Executive Summary
University of Minnesota: 2004-05 Accountable to U iii
Public/Private
Rank Public Only
Rank
Doctoral Degrees Conferred (Pages 13-14)
This Year Last Year
5 Years Ago
11th 9th 5th
9th 9th 4th
Analysis: The number of doctoral degrees conferred has been declining nationally, but the University’s rate of decrease has been greater than either the top-10 public/private universities or the public universities only – by a margin of 14 to 15 percent over the past five years. This rate of decrease has led to the University’s decline in the rankings. Conclusion: The University is participating in a national study by the Council of Graduate Schools to identify factors leading to this decline. In addition, the University should undertake additional research of its own on such factors as time-to-degree, financial issues, graduate student advising, and housing.
Public/Private Rank
Public Only Rank
Total Research Expenditures (Pages 35-36)
This Year Last Year
5 Years Ago
11th
10th
13th
7th
7th
9th
Analysis: The University’s slight improvement in the rankings masks a more serious longer-term trend. Over the past decade, when the percentage increase in total research expenditures is calculated in constant 1983 dollars, the University was outperformed by all but one of the institutions in this year’s two top-10 lists. Conclusion: The University should undertake a thorough analysis of these findings to determine what steps need to be taken to improve this indicator and the University’s performance relative to its peers.
Public/Private Rank
Public Only Rank
Federal Research Expenditures (Pages 36-37)
This Year Last Year
5 Years Ago
15th 15th 14th
8th
8th
7th
Analysis : Similar to the total research expenditures measure, the University’s stable ranking in federal research expenditures masks a more serious longer-term trend. Over the past decade, when the percentage increase in federal research expenditures is calculated in constant 1983 dollars, the University was outperformed by all but four of the institutions in this year’s two top-10 lists. Conclusion: The University should undertake a thorough analysis of these findings to determine what steps need to be taken to increase federal research expenditures and the University’s performance relative to its peers.
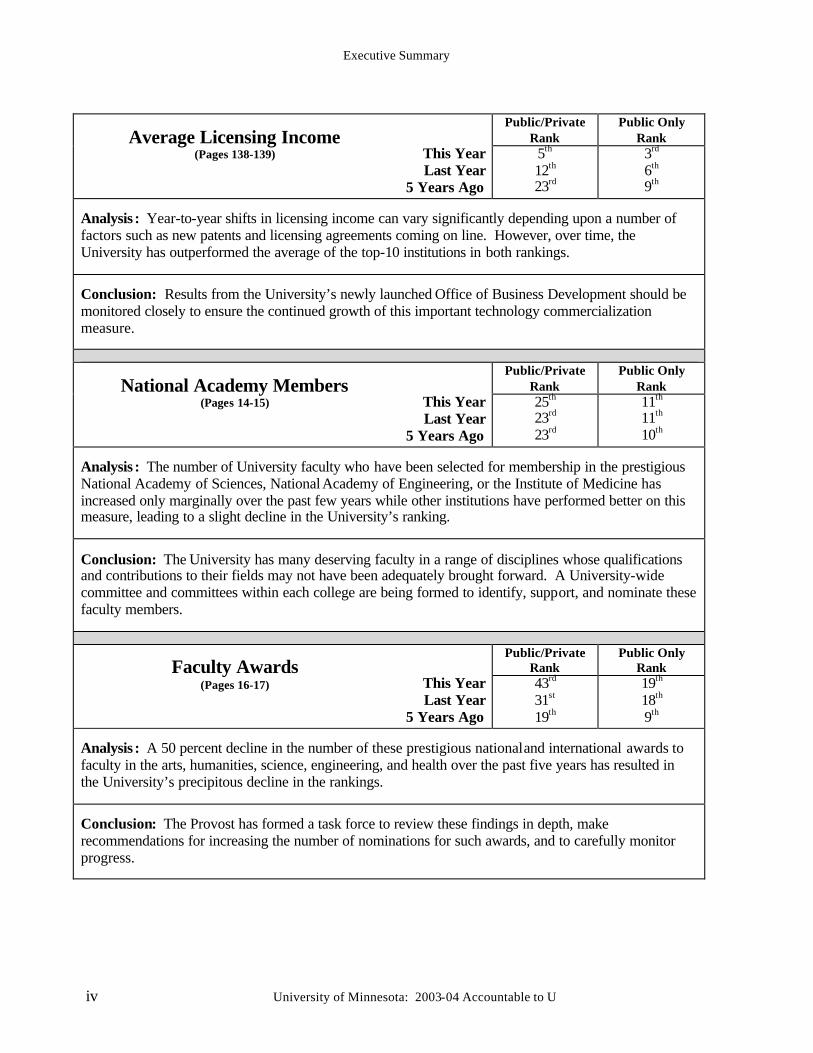
Executive Summary
iv University of Minnesota: 2003-04 Accountable to U
Public/Private
Rank Public Only
Rank
Average Licensing Income (Pages 138-139)
This Year Last Year
5 Years Ago
5th 12th 23rd
3rd 6th 9th
Analysis : Year-to-year shifts in licensing income can vary significantly depending upon a number of factors such as new patents and licensing agreements coming on line. However, over time, the University has outperformed the average of the top-10 institutions in both rankings. Conclusion: Results from the University’s newly launched Office of Business Development should be monitored closely to ensure the continued growth of this important technology commercialization measure.
Public/Private Rank
Public Only Rank
National Academy Members (Pages 14-15)
This Year Last Year
5 Years Ago
25th 23rd 23rd
11th
11th
10th
Analysis : The number of University faculty who have been selected for membership in the prestigious National Academy of Sciences, National Academy of Engineering, or the Institute of Medicine has increased only marginally over the past few years while other institutions have performed better on this measure, leading to a slight decline in the University’s ranking. Conclusion: The University has many deserving faculty in a range of disciplines whose qualifications and contributions to their fields may not have been adequately brought forward. A University-wide committee and committees within each college are being formed to identify, support, and nominate these faculty members.
Public/Private Rank
Public Only Rank
Faculty Awards (Pages 16-17)
This Year Last Year
5 Years Ago
43rd 31st 19th
19th
18th
9th
Analysis : A 50 percent decline in the number of these prestigious national and international awards to faculty in the arts, humanities, science, engineering, and health over the past five years has resulted in the University’s precipitous decline in the rankings. Conclusion: The Provost has formed a task force to review these findings in depth, make recommendations for increasing the number of nominations for such awards, and to carefully monitor progress.
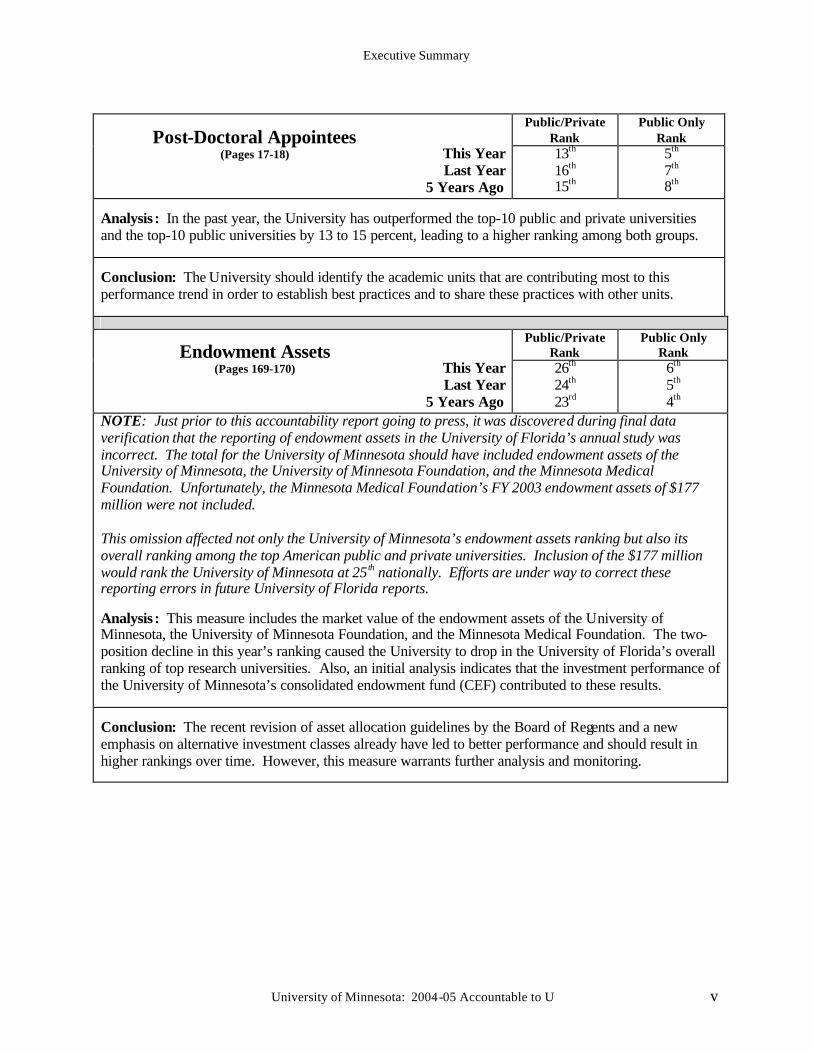
Executive Summary
University of Minnesota: 2004-05 Accountable to U v
Public/Private
Rank Public Only
Rank
Post-Doctoral Appointees (Pages 17-18)
This Year Last Year
5 Years Ago
13th 16th 15th
5th
7th
8th
Analysis : In the past year, the University has outperformed the top-10 public and private universities and the top-10 public universities by 13 to 15 percent, leading to a higher ranking among both groups. Conclusion: The University should identify the academic units that are contributing most to this performance trend in order to establish best practices and to share these practices with other units.
Public/Private Rank
Public Only Rank
Endowment Assets (Pages 169-170)
This Year Last Year
5 Years Ago
26th 24th 23rd
6th
5th
4th
NOTE: Just prior to this accountability report going to press, it was discovered during final data verification that the reporting of endowment assets in the University of Florida’s annual study was incorrect. The total for the University of Minnesota should have included endowment assets of the University of Minnesota, the University of Minnesota Foundation, and the Minnesota Medical Foundation. Unfortunately, the Minnesota Medical Foundation’s FY 2003 endowment assets of $177 million were not included. This omission affected not only the University of Minnesota’s endowment assets ranking but also its overall ranking among the top American public and private universities. Inclusion of the $177 million would rank the University of Minnesota at 25 th nationally. Efforts are under way to correct these reporting errors in future University of Florida reports. Analysis : This measure includes the market value of the endowment assets of the University of Minnesota, the University of Minnesota Foundation, and the Minnesota Medical Foundation. The two-position decline in this year’s ranking caused the University to drop in the University of Florida’s overall ranking of top research universities. Also, an initial analysis indicates that the investment performance of the University of Minnesota’s consolidated endowment fund (CEF) contributed to these results. Conclusion: The recent revision of asset allocation guidelines by the Board of Regents and a new emphasis on alternative investment classes already have led to better performance and should result in higher rankings over time. However, this measure warrants further analysis and monitoring.
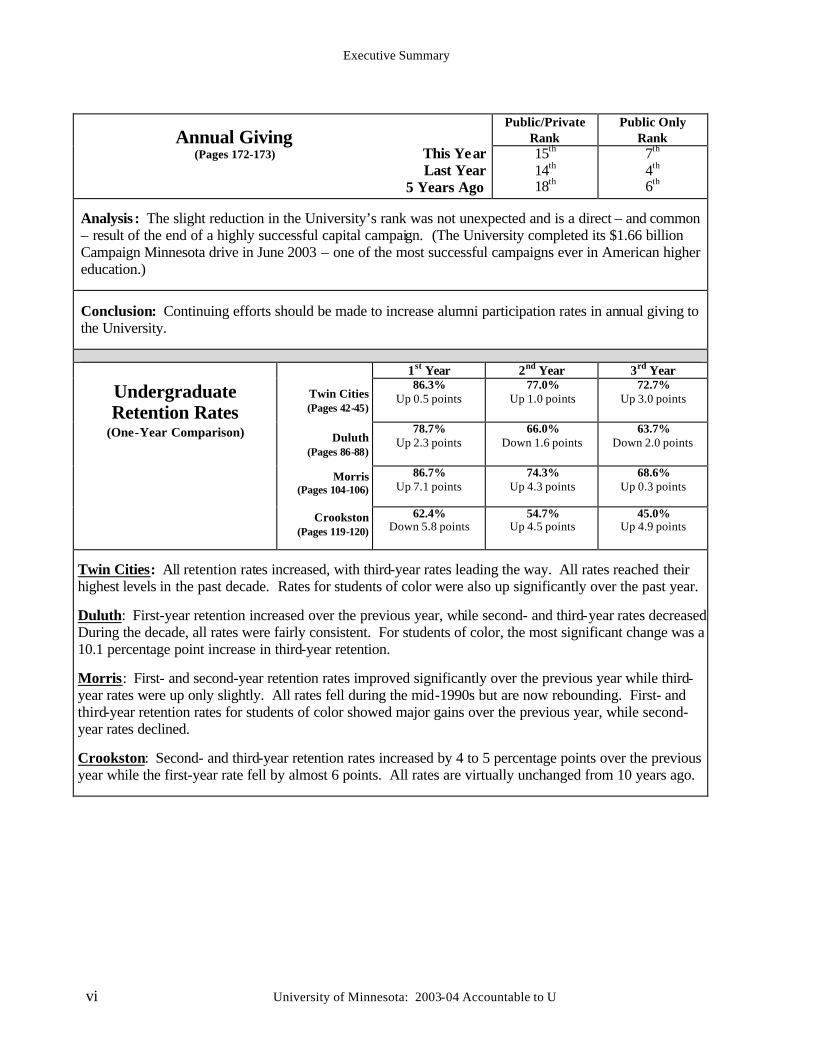
Executive Summary
vi University of Minnesota: 2003-04 Accountable to U
Public/Private
Rank Public Only
Rank
Annual Giving (Pages 172-173)
This Year Last Year
5 Years Ago
15th 14th 18th
7th
4th
6th
Analysis : The slight reduction in the University’s rank was not unexpected and is a direct – and common – result of the end of a highly successful capital campaign. (The University completed its $1.66 billion Campaign Minnesota drive in June 2003 – one of the most successful campaigns ever in American higher education.) Conclusion: Continuing efforts should be made to increase alumni participation rates in annual giving to the University.
1st Year 2nd Year 3rd Year 86.3%
Up 0.5 points 77.0%
Up 1.0 points 72.7%
Up 3.0 points
78.7% Up 2.3 points
66.0% Down 1.6 points
63.7% Down 2.0 points
86.7% Up 7.1 points
74.3% Up 4.3 points
68.6% Up 0.3 points
Undergraduate Retention Rates
(One-Year Comparison)
Twin Cities (Pages 42-45)
Duluth
(Pages 86-88)
Morris (Pages 104-106)
Crookston
(Pages 119-120)
62.4% Down 5.8 points
54.7% Up 4.5 points
45.0% Up 4.9 points
Twin Cities: All retention rates increased, with third-year rates leading the way. All rates reached their highest levels in the past decade. Rates for students of color were also up significantly over the past year. Duluth: First-year retention increased over the previous year, while second- and third-year rates decreased. During the decade, all rates were fairly consistent. For students of color, the most significant change was a 10.1 percentage point increase in third-year retention. Morris: First- and second-year retention rates improved significantly over the previous year while third-year rates were up only slightly. All rates fell during the mid-1990s but are now rebounding. First- and third-year retention rates for students of color showed major gains over the previous year, while second-year rates declined. Crookston: Second- and third-year retention rates increased by 4 to 5 percentage points over the previous year while the first-year rate fell by almost 6 points. All rates are virtually unchanged from 10 years ago.
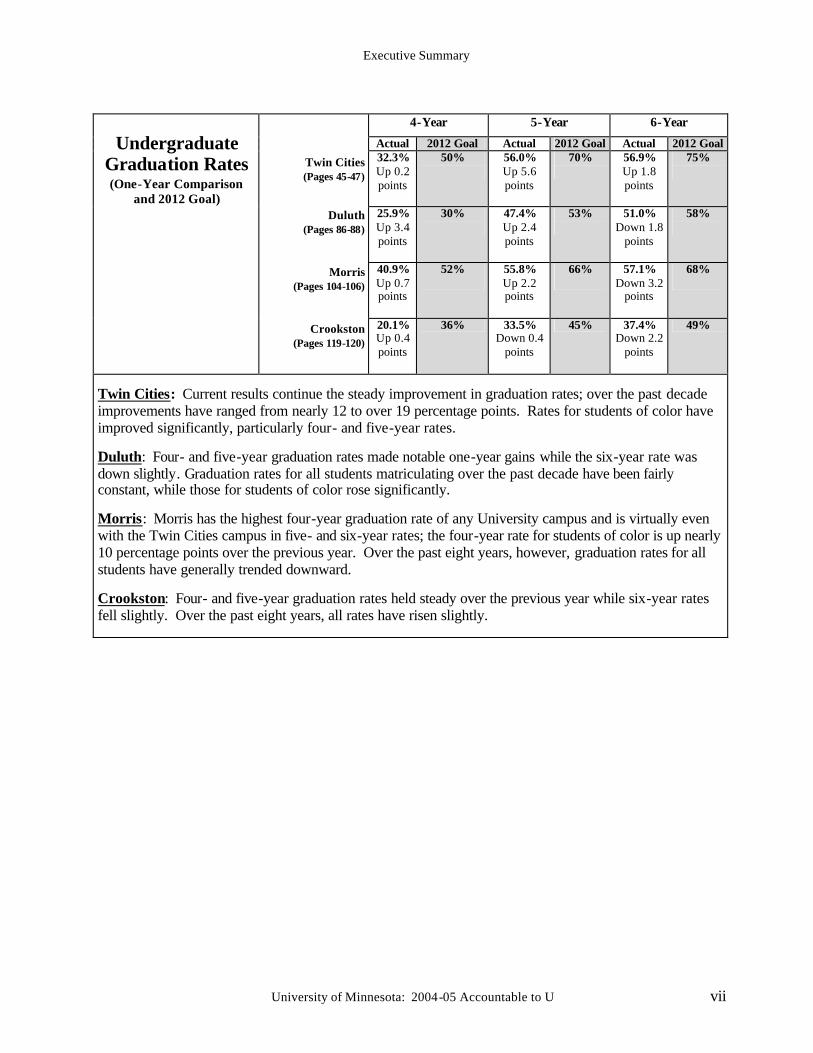
Executive Summary
University of Minnesota: 2004-05 Accountable to U vii
4-Year 5-Year 6-Year
Actual 2012 Goal Actual 2012 Goal Actual 2012 Goal 32.3% Up 0.2 points
50%
56.0% Up 5.6 points
70%
56.9% Up 1.8 points
75%
25.9% Up 3.4 points
30%
47.4% Up 2.4 points
53%
51.0% Down 1.8
points
58%
40.9% Up 0.7 points
52%
55.8% Up 2.2 points
66%
57.1% Down 3.2
points
68%
Undergraduate
Graduation Rates (One-Year Comparison
and 2012 Goal)
Twin Cities (Pages 45-47)
Duluth (Pages 86-88)
Morris (Pages 104-106)
Crookston (Pages 119-120)
20.1% Up 0.4 points
36% 33.5% Down 0.4
points
45% 37.4% Down 2.2
points
49%
Twin Cities: Current results continue the steady improvement in graduation rates; over the past decade improvements have ranged from nearly 12 to over 19 percentage points. Rates for students of color have improved significantly, particularly four- and five-year rates. Duluth: Four- and five-year graduation rates made notable one-year gains while the six-year rate was down slightly. Graduation rates for all students matriculating over the past decade have been fairly constant, while those for students of color rose significantly. Morris: Morris has the highest four-year graduation rate of any University campus and is virtually even with the Twin Cities campus in five- and six-year rates; the four-year rate for students of color is up nearly 10 percentage points over the previous year. Over the past eight years, however, graduation rates for all students have generally trended downward. Crookston: Four- and five-year graduation rates held steady over the previous year while six-year rates fell slightly. Over the past eight years, all rates have risen slightly.
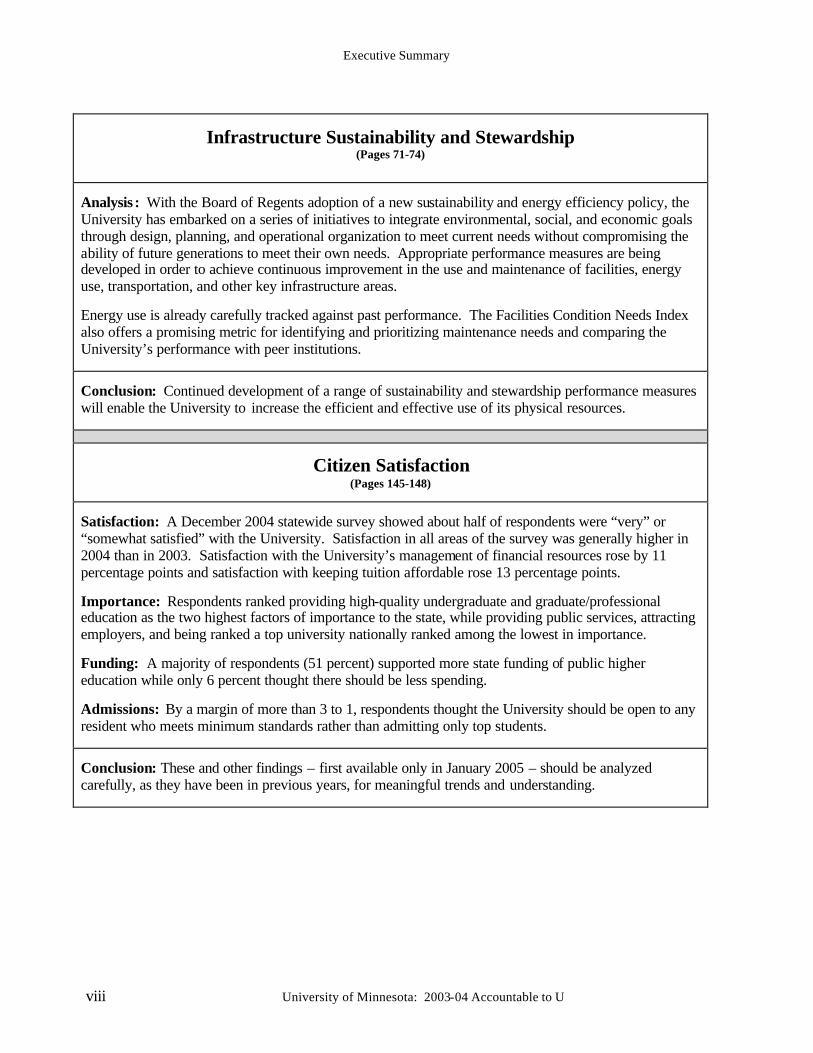
Executive Summary
viii University of Minnesota: 2003-04 Accountable to U
Infrastructure Sustainability and Stewardship (Pages 71-74)
Analysis : With the Board of Regents adoption of a new sustainability and energy efficiency policy, the University has embarked on a series of initiatives to integrate environmental, social, and economic goals through design, planning, and operational organization to meet current needs without compromising the ability of future generations to meet their own needs. Appropriate performance measures are being developed in order to achieve continuous improvement in the use and maintenance of facilities, energy use, transportation, and other key infrastructure areas. Energy use is already carefully tracked against past performance. The Facilities Condition Needs Index also offers a promising metric for identifying and prioritizing maintenance needs and comparing the University’s performance with peer institutions. Conclusion: Continued development of a range of sustainability and stewardship performance measures will enable the University to increase the efficient and effective use of its physical resources.
Citizen Satisfaction (Pages 145-148)
Satisfaction: A December 2004 statewide survey showed about half of respondents were “very” or “somewhat satisfied” with the University. Satisfaction in all areas of the survey was generally higher in 2004 than in 2003. Satisfaction with the University’s management of financial resources rose by 11 percentage points and satisfaction with keeping tuition affordable rose 13 percentage points. Importance: Respondents ranked providing high-quality undergraduate and graduate/professional education as the two highest factors of importance to the state, while providing public services, attracting employers, and being ranked a top university nationally ranked among the lowest in importance. Funding: A majority of respondents (51 percent) supported more state funding of public higher education while only 6 percent thought there should be less spending. Admissions: By a margin of more than 3 to 1, respondents thought the University should be open to any resident who meets minimum standards rather than admitting only top students. Conclusion: These and other findings – first available only in January 2005 – should be analyzed carefully, as they have been in previous years, for meaningful trends and understanding.
Executive Summary
University of Minnesota: 2004-05 Accountable to U ix
University Faculty and Staff Satisfaction (Pages 66-67)
An April 2004 survey of over 6,000 faculty and staff examined experiences and attitudes about: job satisfaction, pay and benefits, supervisor and departmental support, university climate, retention and considerations in leaving, and life outside of work. For complete results see: www.umn.edu/ohr/pulse Faculty: Most favorable results – job satisfaction, satisfaction with University as employer, satisfaction with co-workers, satisfaction with immediate administrator, intentions to remain at the University, and general well-being outside of work. Less favorable results – pay satisfaction, work-family conflict, support from departmental chair or responsible administrator. Staff: Most favorable results – job satisfaction, satisfaction with University as employer, satisfaction with co-workers and supervisors, intentions to remain at the University, and general well-being outside of work. Less favorable results – satisfaction with promotion, pay satisfaction, supervisor support for career development, and perceptions of job security. Conclusion: These and other findings – first available only in January 2005 – should be analyzed carefully for meaningful trends and understanding, with results communicated broadly.
Executive Summary
x University of Minnesota: 2003-04 Accountable to U
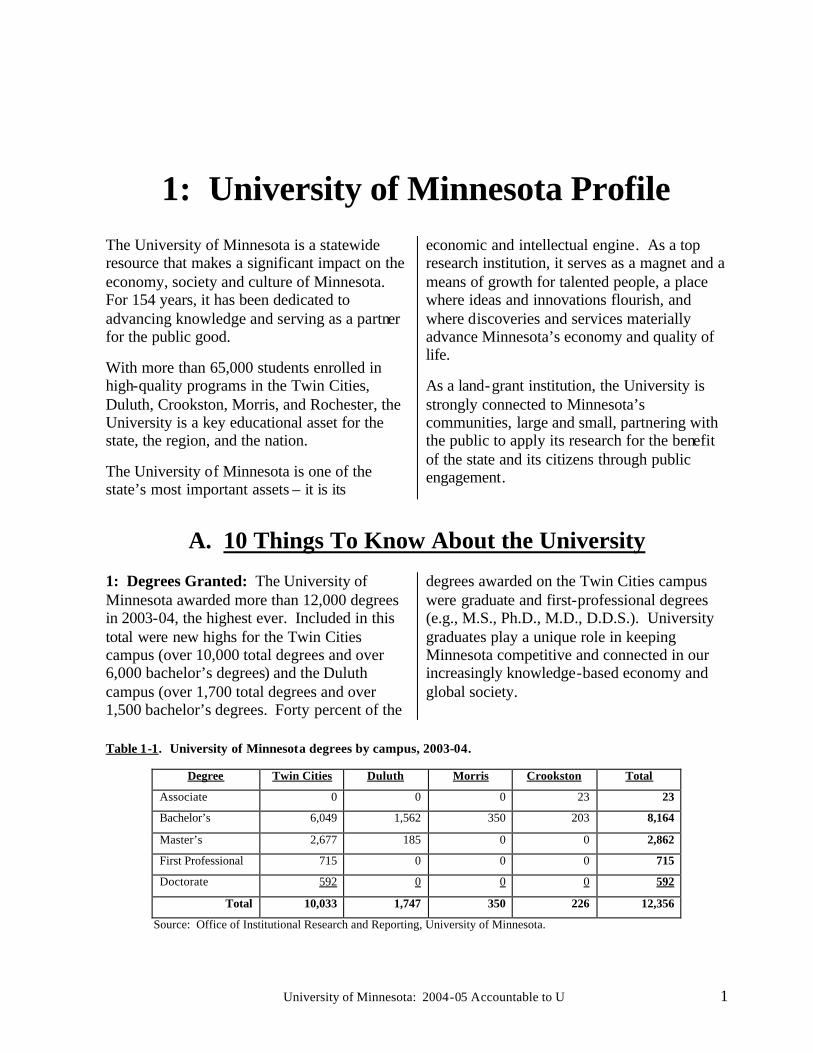
University of Minnesota: 2004-05 Accountable to U 1
1: University of Minnesota Profile
The University of Minnesota is a statewide resource that makes a significant impact on the economy, society and culture of Minnesota. For 154 years, it has been dedicated to advancing knowledge and serving as a partner for the public good.
With more than 65,000 students enrolled in high-quality programs in the Twin Cities, Duluth, Crookston, Morris, and Rochester, the University is a key educational asset for the state, the region, and the nation.
The University of Minnesota is one of the state’s most important assets – it is its
economic and intellectual engine. As a top research institution, it serves as a magnet and a means of growth for talented people, a place where ideas and innovations flourish, and where discoveries and services materially advance Minnesota’s economy and quality of life.
As a land-grant institution, the University is strongly connected to Minnesota’s communities, large and small, partnering with the public to apply its research for the benefit of the state and its citizens through public engagement.
A. 10 Things To Know About the University
1: Degrees Granted: The University of Minnesota awarded more than 12,000 degrees in 2003-04, the highest ever. Included in this total were new highs for the Twin Cities campus (over 10,000 total degrees and over 6,000 bachelor’s degrees) and the Duluth campus (over 1,700 total degrees and over 1,500 bachelor’s degrees. Forty percent of the
degrees awarded on the Twin Cities campus were graduate and first-professional degrees (e.g., M.S., Ph.D., M.D., D.D.S.). University graduates play a unique role in keeping Minnesota competitive and connected in our increasingly knowledge-based economy and global society.
Table 1-1. University of Minnesota degrees by campus, 2003-04.
Degree Twin Cities Duluth Morris Crookston Total
Associate 0 0 0 23 23
Bachelor’s 6,049 1,562 350 203 8,164
Master’s 2,677 185 0 0 2,862
First Professional 715 0 0 0 715
Doctorate 592 0 0 0 592
Total 10,033 1,747 350 226 12,356
Source: Office of Institutional Research and Reporting, University of Minnesota.
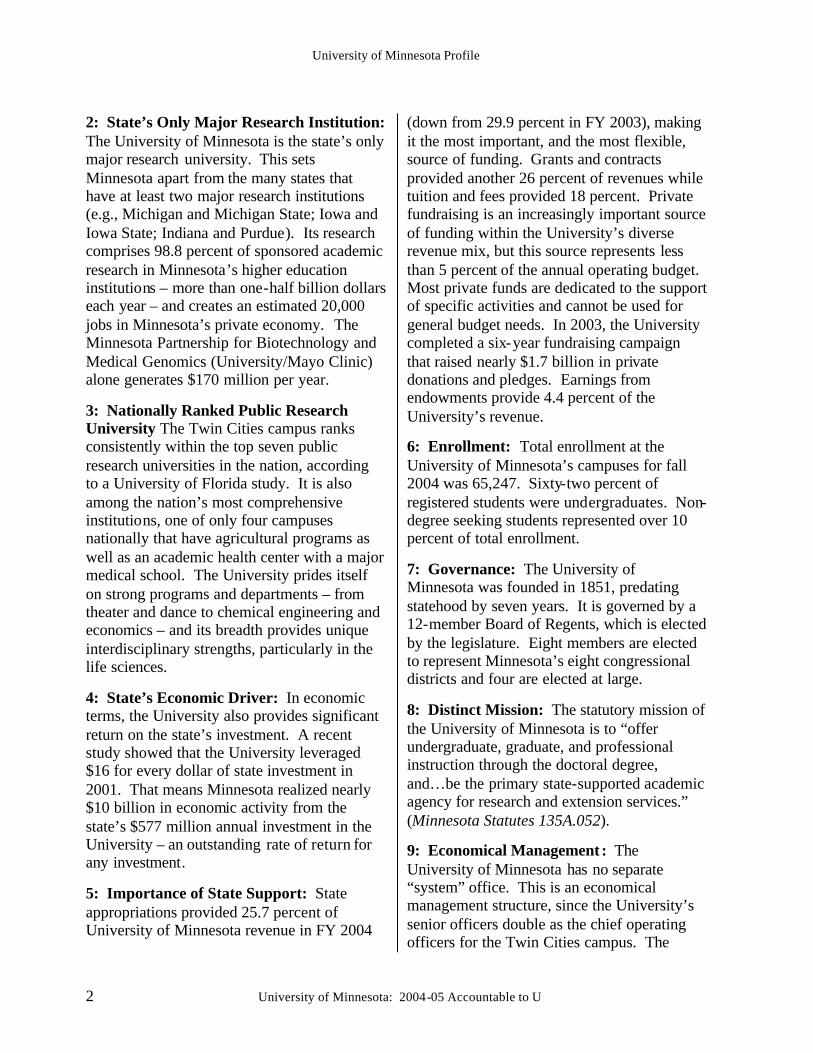
University of Minnesota Profile
2 University of Minnesota: 2004-05 Accountable to U
2: State’s Only Major Research Institution: The University of Minnesota is the state’s only major research university. This sets Minnesota apart from the many states that have at least two major research institutions (e.g., Michigan and Michigan State; Iowa and Iowa State; Indiana and Purdue). Its research comprises 98.8 percent of sponsored academic research in Minnesota’s higher education institutions – more than one-half billion dollars each year – and creates an estimated 20,000 jobs in Minnesota’s private economy. The Minnesota Partnership for Biotechnology and Medical Genomics (University/Mayo Clinic) alone generates $170 million per year.
3: Nationally Ranked Public Research University The Twin Cities campus ranks consistently within the top seven public research universities in the nation, according to a University of Florida study. It is also among the nation’s most comprehensive institutions, one of only four campuses nationally that have agricultural programs as well as an academic health center with a major medical school. The University prides itself on strong programs and departments – from theater and dance to chemical engineering and economics – and its breadth provides unique interdisciplinary strengths, particularly in the life sciences.
4: State’s Economic Driver: In economic terms, the University also provides significant return on the state’s investment. A recent study showed that the University leveraged $16 for every dollar of state investment in 2001. That means Minnesota realized nearly $10 billion in economic activity from the state’s $577 million annual investment in the University – an outstanding rate of return for any investment.
5: Importance of State Support: State appropriations provided 25.7 percent of University of Minnesota revenue in FY 2004
(down from 29.9 percent in FY 2003), making it the most important, and the most flexible, source of funding. Grants and contracts provided another 26 percent of revenues while tuition and fees provided 18 percent. Private fundraising is an increasingly important source of funding within the University’s diverse revenue mix, but this source represents less than 5 percent of the annual operating budget. Most private funds are dedicated to the support of specific activities and cannot be used for general budget needs. In 2003, the University completed a six-year fundraising campaign that raised nearly $1.7 billion in private donations and pledges. Earnings from endowments provide 4.4 percent of the University’s revenue.
6: Enrollment: Total enrollment at the University of Minnesota’s campuses for fall 2004 was 65,247. Sixty-two percent of registered students were undergraduates. Non-degree seeking students represented over 10 percent of total enrollment.
7: Governance: The University of Minnesota was founded in 1851, predating statehood by seven years. It is governed by a 12-member Board of Regents, which is elected by the legislature. Eight members are elected to represent Minnesota’s eight congressional districts and four are elected at large.
8: Distinct Mission: The statutory mission of the University of Minnesota is to “offer undergraduate, graduate, and professional instruction through the doctoral degree, and…be the primary state-supported academic agency for research and extension services.” (Minnesota Statutes 135A.052).
9: Economical Management : The University of Minnesota has no separate “system” office. This is an economical management structure, since the University’s senior officers double as the chief operating officers for the Twin Cities campus. The
University of Minnesota Profile
University of Minnesota: 2004-05 Accountable to U 3
University’s auditor, Deloitte & Touche, commented in November 2004: “The University has really tightened itself up. It is an excellent example of an organization that is very focused and very efficient. I’d call it a model of fiscal responsibility.” 10: Statewide Presence: The University of Minnesota has four established campuses (Twin Cities, Duluth, Morris, Crookston), a
developing cooperative campus in Rochester, six agricultural experiment stations, one forestry center, 18 regional extension offices, and extension personnel in counties throughout the state. The University’s public service programs (e.g., Extension Service, clinics in medicine, dentistry, and veterinary medicine, outreach to K-12 education) touch more than 1,000,000 people annually.
B. Academic Priorities
Maintaining Excellence, Pushing the Boundaries of Knowledge
The University of Minnesota is actively committed to maintaining and strengthening excellence by investing in its outstanding academic programs and building a culture that supports interdisciplinary work. The University is committed to building excellence through a coherent vision.
The University of Minnesota has many highly ranked academic programs; it is critical that the University continues to provide significant support to these programs in order to maintain the strong disciplines that form the core of basic knowledge. The distinctive contributions of individual disciplines create an intellectual framework for developing deep expertise in specific arenas.
At the same time the University community recognizes that today, more than ever, pushing the boundaries of knowledge in one field often means crossing into other disciplines. Addressing the big questions that confront society in the 21st century requires interdisciplinary teams of researchers working together. In the last decade, the academy has begun to realize the untapped potential of interdisciplinary research, and increasingly funding agencies are encouraging interdisciplinary proposals.
Many scholars at the University of Minnesota already are involved in interdisciplinary research collaboratives, and new initiatives will provide the infrastructure for enhancing these collaborations. 2005 Status of President’s Interdisciplinary Initiatives Investments in interdisciplinary academic programs are achieving new prominence through the President’s Interdisciplinary Initiatives. In addition, through the University’s strategic positioning and planning process, colleges are being encouraged to consider investments in the highest level of interdisciplinary collaboration.
Also, the President’s 21st Century Interdisciplinary Conference Series is providing opportunities for developing new interdisciplinary collaborations and expanding the connections of University of Minnesota research to the needs of society.
In 2003, President Bruininks launched eight interdisciplinary initiatives representing areas of strength and comparative advantage for the University. These areas have high-quality foundational programs, are central to the University’s land-grant mission and research
University of Minnesota Profile
4 University of Minnesota: 2004-05 Accountable to U
enterprise, and reflect the needs and resources of Minnesota.
They represent areas where further investment will yield significant return in intellectual quality and capital, where the University and the state possess a comparative advantage, and where considerable outside resources can be leveraged. University students at all levels also reap the rewards of these initiatives as they learn in the midst of a dynamic interdisciplinary academic enterprise.
Three of these interdisciplinary priorities are being funded through reallocation of existing resources and private philanthropy. These three initiatives – Children, Youth, and Families; Arts and Humanities; and the Consortium on Law and Values in Health, Environment and the Life Sciences – are more established programs where significant resources already have been allocated.
The remaining five are in the bio-sciences: Brain Function Across the Lifespan; New Products from Biotechnology (Biocatalysis); Healthy Foods, Healthy Lives; Environment and Renewable Energy; and Translational Research in Human Health. These initiatives cannot be fully capitalized without additional support from the state and partnerships with the private sector.
The 2006-2007 biennial budget proposal to the Legislature includes a request to support four of the initiatives in a proposal called “Biosciences for a Healthy Society.”
For the past year, working groups have convened to map the future of the initiatives, and interdisciplinary collaborations are under way.
Initiative on Arts and Humanities: This initiative builds on the University’s strengths in the arts and humanities to expand interdisciplinary and collaborative efforts. At the core of this expanded effort will be the
University’s Institute for Advanced Study, scheduled to open in late 2005. The Institute will promote and support distinguished, path-breaking research and creative work at the intersection of the arts, humanities, and social sciences.
The initiative also seeks to transform the arts and humanities at the University and beyond by developing a new interdisciplinary arts and humanities curriculum, supporting new creative processes and works of art, and deepening collaborations with other arts organizations and educators in the community.
An international conference, “Reclaiming the Arts: Strategies for Commitment,” was held in December 2004 to begin the transformation of the arts at the University. Searches are under way for distinguished faculty in the arts and humanities whose research and teaching is path-breaking and interdisciplinary.
Initiative on Children, Youth, and Families: The contributions a child can make to society as an adult can be traced directly to the first few years of life. Minnesota has an important stake in the adults its children will become. This initiative represents an institutional commitment to deepen and broaden the University’s capacity to address the pressing issues that face the state when it comes to children, youth, and families.
President Bruininks launched this initiative in 2002 through a statewide summit. It is focused on creating new and enhancing existing mechanisms for leveraging faculty support for cross-disciplinary approaches to research, teaching, and public engagement. By bringing together researchers and educators from around the University with practitioners, policy makers, and opinion leaders, the initiative seeks to encourage research by creating a new understanding of how to enhance outcomes for children at every developmental stage in their lives.
University of Minnesota Profile
University of Minnesota: 2004-05 Accountable to U 5
In so doing, tangible benefits will be reaped for not only the children and families themselves, but also the common public good, including enhanced returns in school readiness, parenting skills, children’s mental health, workforce capacity, improved public policy and best practices, and economic and community development. A new interdisciplinary research agenda is being developed as part of this initiative. The new Center for Children’s Mental Health and the Commission on Out-of-School-Time developed from partnerships launched by the initiative.
New Products from Biotechnology (Biocatalysis): As a result of former President Yudof’s initiative in molecular and cellular biology (see 1998 Initiatives summary below), the University has a strengthened basic science program in these areas. It is critical that the University maintain its strength in basic science by continuing investment. The University is building on these investments in basic research by launching a wide range of investments in applications of molecular and cellular biology and genetics.
The University has a long tradition and world-class expertise in the science of biocatalysis, the use of biological catalysts and processes to transform plant material into useful products. Biocatalysis enables renewable resources, such as forests, grasslands, and the wheat and corn raised by farmers, to become the new raw materials for production and energy needs.
This initiative takes the most modern approaches to biology, in areas where the University has great strength in faculty and facilities, to develop exciting new uses for Minnesota’s abundant agricultural products and natural resources, from plastics and other industrial products to new drugs. A number of collaborative projects have been funded in both industrial biocatalysis and chemical
biology. More than 10 departments are involved in this effort.
Initiative on Translational Research in Human Health: This initiative strengthens the ability of the University to continue to play a leading role in the rapidly changing world of health sciences. The working group for this initiative is collaborating with working groups from the other bioscience/health science-based initiatives in an effort to solidify the University’s commitment and reach.
Two key components of this initiative are: 1) the McGuire Translational Research Facility that will provide scientists with a physical environment that promotes collaboration, fosters creativity, promotes innovation, and shortens the time to develop new technologies; and 2) targeted investments in faculty to maintain leadership in cutting-edge research in areas such as oncology (cancer), neurosciences (brain functions and diseases), cardiovascular (heart) disease, organ transplantation, stem-cell development applications, and clinical research. This initiative works in close alliance with the Minnesota Partnership for Biotechnology and Medical Genomics where Mayo Clinic and University researchers collaborate to generate innovative technology that can be translated into new treatment methods.
Initiative on Brain Development and Vitality Across the Lifespan: The brain governs every aspect of people’s lives. Throughout life, the brain changes in response to new challenges – experiences, physical development, aging, injury, and disease. New tools, including modern genetics, molecular/ cellular biology and state-of-the-art imaging techniques, are now giving researchers fresh insight into how changes in the brain influence the way people think, feel, and act from infancy to old age.
Research scientists are beginning to answer some of the biggest questions about the brain,
University of Minnesota Profile
6 University of Minnesota: 2004-05 Accountable to U
such as how its structure and function are affected by age, injury, or disease. The University is the only major research institution taking a lifespan approach to brain development and function. This approach will transform the way scientists understand and treat brain disease and disorders including devastating diseases such as Alzheimer’s.
A team of University researchers focusing on brain function across the lifespan has the potential to begin to solve the puzzle of the brain, resulting in better diagnosis, new treatments for brain disorders and disease, and a new ability to support learning and memory in healthy individuals across the lifespan. The working group is developing a proposal for a Center for Developmental Cognitive Neuroscience modeled after the Cancer Center.
Initiative on Healthy Foods, Healthy Lives: The University is uniquely positioned as a national leader for an initiative focusing on food and health promotion, being one of only two U.S. universities to integrate six key components on one campus: agriculture, human nutrition, medicine, public health, exercise science, and veterinary medicine.
The initiative links activities in four priority areas to address critical health issues over the next 10 years – bridging quality science to sound public policy and transforming what we know into what we do. The four priority areas are: to use and advance knowledge about the integration of agriculture, food science, nutrition, and medicine to promote healthy lives; to emphasize prevention of diet-related chronic diseases and obesity through diet, exercise, and human behavior; to enhance food safety at all stages, from farm to table; and to inform public policy.
A conference in fall 2004 brought together researchers and practitioners to develop a coordinated agenda for this initiative. The initiative has received a grant from the
Homeland Security Administration to fund a center focused on food safety.
Initiative on Environment and Renewable Energy: Perhaps the most critical global challenge for the 21st century is maintaining a healthy, productive environment that will continue to support life in the face of an increasing world population, energy shortages, shrinking freshwater supplies, destruction of natural habitats, and declining genetic diversity. Integrating all we know – from scientific, economic, social, and spiritual perspectives – is key to understanding and resolving these issues.
The initiative is grounded in three major inter-related projects. The first builds on the recommendations of the Commission on Environmental Science and Policy, appointed by then Provost Robert Bruininks, to create an integrated and transparent approach to the environment at the University. A coordinator has been hired to support these activities. The second focuses research and technology transfer on renewable energy with funding from Xcel Energy under a mandate from the legislature through the Prairie Island Bill.
The third is aimed at integrating sustainable practices and energy conservation across the full range of University activities under the leadership of University Services. A steering committee is developing a comprehensive plan to fulfill the expectations of a new Regents Policy on Sustainability.
Initiative on Law and Values in Health, Environment, and the Life Sciences: This initiative deepens the University’s commitment to the Consortium on Law and Values in Health, Environment, and the Life Sciences. The Consortium was founded in 2000 to respond to the most challenging legal and ethical questions of the 21st century, questions posed by biomedicine and the life sciences.
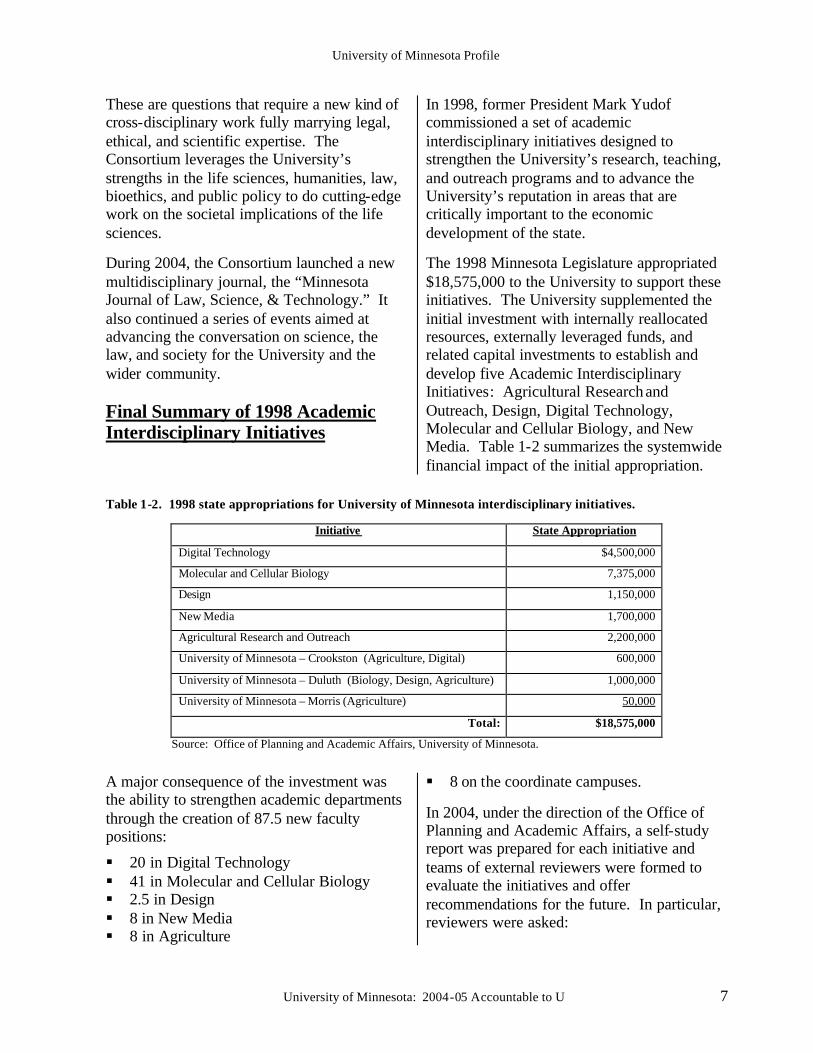
University of Minnesota Profile
University of Minnesota: 2004-05 Accountable to U 7
These are questions that require a new kind of cross-disciplinary work fully marrying legal, ethical, and scientific expertise. The Consortium leverages the University’s strengths in the life sciences, humanities, law, bioethics, and public policy to do cutting-edge work on the societal implications of the life sciences.
During 2004, the Consortium launched a new multidisciplinary journal, the “Minnesota Journal of Law, Science, & Technology.” It also continued a series of events aimed at advancing the conversation on science, the law, and society for the University and the wider community. Final Summary of 1998 Academic Interdisciplinary Initiatives
In 1998, former President Mark Yudof commissioned a set of academic interdisciplinary initiatives designed to strengthen the University’s research, teaching, and outreach programs and to advance the University’s reputation in areas that are critically important to the economic development of the state.
The 1998 Minnesota Legislature appropriated $18,575,000 to the University to support these initiatives. The University supplemented the initial investment with internally reallocated resources, externally leveraged funds, and related capital investments to establish and develop five Academic Interdisciplinary Initiatives: Agricultural Research and Outreach, Design, Digital Technology, Molecular and Cellular Biology, and New Media. Table 1-2 summarizes the systemwide financial impact of the initial appropriation.
Table 1-2. 1998 state appropriations for University of Minnesota interdisciplinary initiatives.
Initiative State Appropriation
Digital Technology $4,500,000
Molecular and Cellular Biology 7,375,000
Design 1,150,000
New Media 1,700,000
Agricultural Research and Outreach 2,200,000
University of Minnesota – Crookston (Agriculture, Digital) 600,000
University of Minnesota – Duluth (Biology, Design, Agriculture) 1,000,000
University of Minnesota – Morris (Agriculture) 50,000
Total: $18,575,000
Source: Office of Planning and Academic Affairs, University of Minnesota.
A major consequence of the investment was the ability to strengthen academic departments through the creation of 87.5 new faculty positions:
§ 20 in Digital Technology § 41 in Molecular and Cellular Biology § 2.5 in Design § 8 in New Media § 8 in Agriculture
§ 8 on the coordinate campuses.
In 2004, under the direction of the Office of Planning and Academic Affairs, a self-study report was prepared for each initiative and teams of external reviewers were formed to evaluate the initiatives and offer recommendations for the future. In particular, reviewers were asked:
University of Minnesota Profile
8 University of Minnesota: 2004-05 Accountable to U
§ to consider whether the initiative had achieved its stated objectives
§ to compare the initiative to similar programs across the country
§ to assess the initiative’s impact on the University and the fostering of interdisciplinary activities
§ to evaluate the return on investment § to identify theoretical and empirical
advancements that occurred as a result of the initiative.
Each external review team prepared a written report summarizing their findings and recommendations. Following is a summary of the 1998 initiatives.
Agricultural Research and Outreach: The investment in Agricultural Research and Outreach enables the University to respond to important challenges in food production, food quality, and the marketing of agricultural products – all areas of critical importance to the state’s rural economy. In these areas, agricultural research is strongly linked to the University’s initiatives in genomics.
The external review team used such terms as “dramatic progress” and noted that the University had increased its research and outreach capacity within and outside the institution.
Design: The Design Institute develops advanced research, educational programs, and interdisciplinary partnerships to improve design in the public realm. The Institute addresses the design of products, services, and environments, as well as the social processes that bring the everyday material landscape into being. Looking beyond issues of styling, the Institute sees design as a strategic mode of thinking, a form of conflict resolution whose tangible outcomes express successful negotiation of diverse values and interests. Through its program of fellowships, events,
and communications, the Institute fosters new models for collaboration and connection among many fields of inquiry, such as genetics, computer science, anthropology, public art, engineering, civic governance, and graphic design. By supporting the development of new design tools and prototypes, the Design Institute champions expanded design choices to enhance the lives of citizens, in Minnesota and nationwide. The external review team concluded that the objectives “[had] been achieved, and in a remarkably short period of time.” It noted the exemplary achievement in design research.
Digital Technology: The Digital Technology Center’s goal is to become a center of excellence at the University of Minnesota and to form partnerships with the community to re-establish Minnesota’s commanding position in digital technology as we move ahead in the information era. The Center focuses on leading-edge research and business areas: data storage, analysis and visualization, scientific computation, telecommunications, and software engineering. The Digital Technology Center also includes the Supercomputing Institute for Digital Simulation and Advance Computation and the Laboratory for Computational Science and Engineering, two research units which predate the establishment of the Academic Interdisciplinary Initiatives.
The external review team noted that this initiative better positions the University to attract greater funding for research. Molecular and Cellular Biology: The University aspires to be at the leading edge of the revolution occurring in the biological sciences. The Molecular and Cellular Biology Initiative is founded on reorganization of the biological sciences into four new departments: Biochemistry, Molecular Biology, and Biophysics; Neuroscience; Genetics, Cell Biology, and Development; and Plant Biology.
University of Minnesota Profile
University of Minnesota: 2004-05 Accountable to U 9
The initiative is strengthening the University’s capacity to connect science to industrial applications across plant, animal, and medical fields. The initiative focuses on functional genomics, a branch of science that determines the mechanisms by which thousands of genes are orchestrated to develop and maintain an organism.
The external review team observed that this initiative had fortified basic cellular and molecular biology throughout the University. New Media: The New Media Initiative is strengthening the School of Journalism and Mass Communication by building a nationally preeminent program which provides students with the best possible academic and professional education for entry into diverse careers in this rapidly changing industry. The School’s Institute for New Media Studies is a center for interdisciplinary research, industry outreach, and collaboration on emerging issues in the new media arena.
The external review team stated that this initiative has been “transformative” for journalism and mass communication at the University: “The institution’s responsiveness and foresight has allowed it to reclaim its place among the elite schools of journalism in the country.”
University of Minnesota – Crookston: Investments at the University’s Crookston campus have been made through the Agricultural Research and Outreach Initiative and the Digital Technology Initiative, funding two new faculty positions.
University of Minnesota – Duluth: Investments at the Duluth campus have been
made through three of the Academic Interdisciplinary Initiatives – Molecular and Cellular Biology, Design, and Agricultural Research and Outreach – funding six new faculty positions.
University of Minnesota – Morris: Funds from the Agricultural Research and Outreach Initiative were used at the Morris campus to support the Center for Small Towns, a community outreach program that assists small towns with locally identified issues by creating applied learning opportunities for faculty and students. 2006-07 Biennial Budget Proposal
The University of Minnesota’s biennial budget proposal to the state is a partnership proposal designed to support the University’s academic priorities and fulfill its mission as the state’s research and land-grant university.
The request proposes a 50/50 partnership between the University and the state, with the University investing $42 million in FY 2006 and an additional $42 million in FY 2007 in support of base compensation increases, operating costs, and academic priorities.
The University’s investment will be supported by internal reallocation and modest tuition increases. The state is asked to provide a matching investment targeted at biosciences for a healthy society; attracting and retaining talent for Minnesota’s future; and creating and sustaining essential research and technology infrastructure.
University of Minnesota Profile
10 University of Minnesota: 2004-05 Accountable to U
University of Minnesota: 2004-05 Accountable to U 11
2: Twin Cities Campus
A. Campus Profile The University of Minnesota – Twin Cities is a classic Big Ten campus set on the banks of the Mississippi River near downtown Minneapolis with an additional campus in the rolling hills of St. Paul. Not only does the Twin Cities campus have the most comprehensive
academic programs of any institution in Minnesota – encompassing both agricultural and professional programs and an academic health center built around a major medical school – it is also the nation’s second largest university campus as measured by enrollment.
Founded 1851 Leadership Robert H. Bruininks, President E. Thomas Sullivan, Senior Vice President
for Academic Affairs and Provost Frank B. Cerra, Senior Vice President
for Health Sciences Robert J. Jones, Senior Vice President
for System Administration Colleges/Schools Agricultural, Food, and Environmental Sciences Architecture and Landscape Architecture Biological Sciences Continuing Education Dentistry Education and Human Development General College Graduate School Human Ecology Law Liberal Arts Management Medicine Natural Resources Nursing Pharmacy Public Affairs Public Health Technology Veterinary Medicine Minnesota Extension Service
Degrees/majors offered 152 undergraduate degree programs; 131 master’s degree programs; 104 doctoral degree programs; and professional programs in law, dentistry, medicine, pharmacy, and veterinary medicine. Fall 2004 Enrollment
Undergraduate 28,740 Graduate 13,841 Professional* 3,044 Non-degree 5,569 Total 51,194
*includes students in UMD School of Medicine and College of Pharmacy Faculty Size (FY 2004)
Tenured/Tenure Track 2,377 Other Faculty 739
Degrees Awarded (FY 2004)
Undergraduate 6,049 Master’s 2,677 Doctoral and First-Professional 1,307
Alumni (FY 2004)
Alumni Association Members 55,518 Living Alumni 365,000
Staff (FY 2004)
Civil Service and Bargaining Unit 8,576 Professional and Administrative 4,149
Number of Buildings 253 (12,972,000 assignable square feet) Expenditures (FY 2004) $1,899,018,319
Twin Cities Campus
12 University of Minnesota: 2004-05 Accountable to U
B. Academic Quality The University of Minnesota – Twin Cities aspires to provide undergraduate, graduate, and professional student experiences that are consistently characterized by educational excellence, timely degree and academic program completion, and a supportive institutional environment. Through world-class research, scholarship, and public engagement, it also aims to solve challenges facing the state, nation, and world and provide broad access to programs and resources. The Twin Cities campus intends to advance its reputation as a leading research university in the nation and the world. It aspires to be known for excellence in teaching, research, and public engagement and for continually setting new standards of quality and service.
To achieve these goals, the Twin Cities campus invests in its strongest programs and in new and existing areas of strategic importance. It also seeks resources for programs through sponsored funding and voluntary support, significantly leveraging state investments in the University. Rankings
Higher education institutions are ranked and rated by numerous sources. Most of them are commercial and purport to provide consumers with precise measures of quality and distinctions between and among individual institutions. Despite numerous limitations and methodological flaws, these ranking are used by consumers and cited by colleges and universities with the highest ratings.
There is no single, consistent peer group for all of the indicators included in this report. National comparisons focus on a variety of peer groups defined in different ways depending on the topic. Each ranking system has its own inconsistencies and
methodological weaknesses. However, among the better known and most reliable are the University of Florida’s annual rankings of research universities and the National Research Council’s periodic rankings of graduate program quality. In addition, U.S. News & World Report, a commercial publication, ranks undergraduate and graduate programs. Details of these rankings are provided below. Quality Indicators The Center at the University of Florida annually ranks the top 200 American research universities on nine measures. These measures reflect what The Center regards as the core function of universities: garnering resources to support research. The measures, and their locations within this report, are:
§ doctorates granted (Tables 2-2 and 2-3), § National Academy members (Tables 2-4
and 2-5), § faculty awards (Tables 2-6 and 2-7), § post-doctoral appointees (Tables 2-8 and
2-9), § total research expenditures (Tables 2-28
and 2-29), § federal research expenditures (Tables 2-30
and 2-31), § endowment assets (Tables 9-14 and 9-15), § annual giving (Tables 9-18 and 9-19).
NOTE: Just prior to this accountability report going to press, it was discovered during final data verification that the reporting of endowment assets in the University of Florida’s annual study was incorrect. The total for the University of Minnesota should have included endowment assets of the University of Minnesota, the University of Minnesota Foundation, and the Minnesota Medical Foundation. Unfortunately, the Minnesota Medical Foundation’s FY 2003
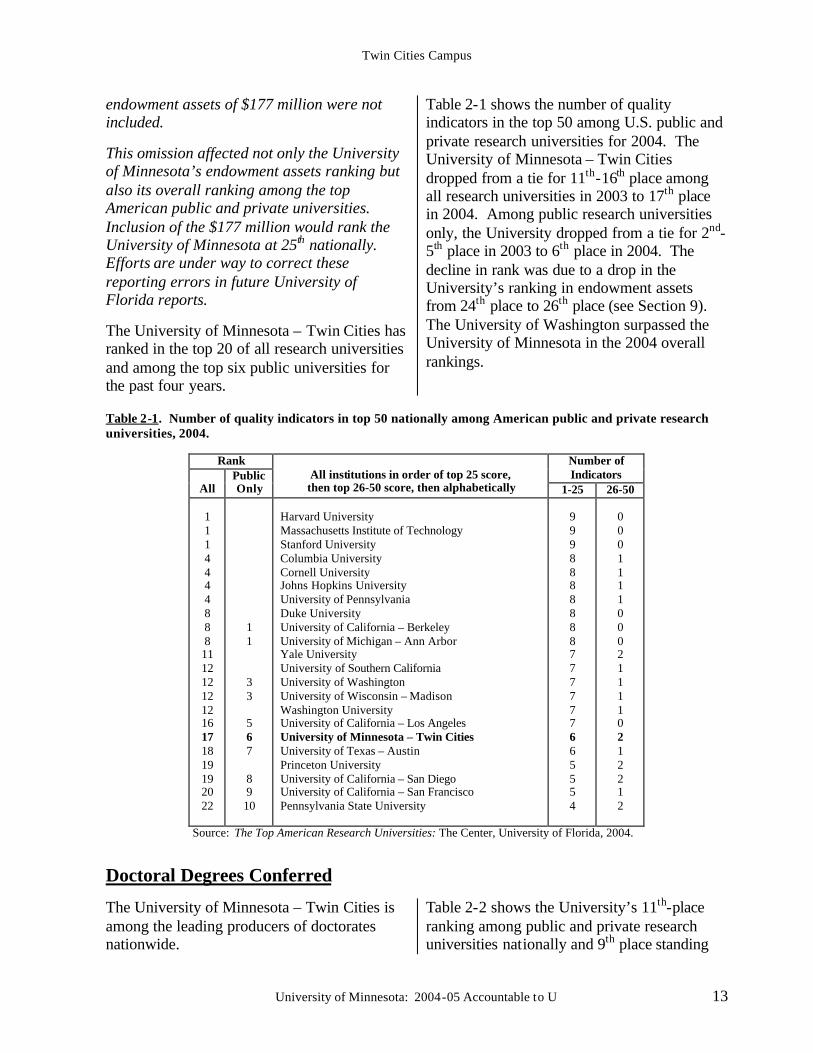
Twin Cities Campus
University of Minnesota: 2004-05 Accountable to U 13
endowment assets of $177 million were not included.
This omission affected not only the University of Minnesota’s endowment assets ranking but also its overall ranking among the top American public and private universities. Inclusion of the $177 million would rank the University of Minnesota at 25th nationally. Efforts are under way to correct these reporting errors in future University of Florida reports.
The University of Minnesota – Twin Cities has ranked in the top 20 of all research universities and among the top six public universities for the past four years.
Table 2-1 shows the number of quality indicators in the top 50 among U.S. public and private research universities for 2004. The University of Minnesota – Twin Cities dropped from a tie for 11th-16th place among all research universities in 2003 to 17th place in 2004. Among public research universities only, the University dropped from a tie for 2nd-5th place in 2003 to 6th place in 2004. The decline in rank was due to a drop in the University’s ranking in endowment assets from 24th place to 26th place (see Section 9). The University of Washington surpassed the University of Minnesota in the 2004 overall rankings.
Table 2-1. Number of quality indicators in top 50 nationally among American public and private research universities, 2004.
Rank Number of
Indicators All
Public Only
All institutions in order of top 25 score, then top 26-50 score, then alphabetically 1-25 26-50
1 1 1 4 4 4 4 8 8 8 11 12 12 12 12 16 17 18 19 19 20 22
1 1 3 3 5 6 7 8 9 10
Harvard University Massachusetts Institute of Technology Stanford University Columbia University Cornell University Johns Hopkins University University of Pennsylvania Duke University University of California – Berkeley University of Michigan – Ann Arbor Yale University University of Southern California University of Washington University of Wisconsin – Madison Washington University University of California – Los Angeles University of Minnesota – Twin Cities University of Texas – Austin Princeton University University of California – San Diego University of California – San Francisco Pennsylvania State University
9 9 9 8 8 8 8 8 8 8 7 7 7 7 7 7 6 6 5 5 5 4
0 0 0 1 1 1 1 0 0 0 2 1 1 1 1 0 2 1 2 2 1 2
Source: The Top American Research Universities: The Center, University of Florida, 2004.
Doctoral Degrees Conferred
The University of Minnesota – Twin Cities is among the leading producers of doctorates nationwide.
Table 2-2 shows the University’s 11th-place ranking among public and private research universities nationally and 9th place standing

Twin Cities Campus
14 University of Minnesota: 2004-05 Accountable to U
among public research universities for doctoral degrees conferred during 2002-03. Table 2-3 shows the University’s production of doctoral degrees from 1998 to 2003 and its performance relative to other top-10 public and private research universities.
The University of Minnesota’s conferral of doctoral degrees declined more sharply (23.2 percent) over the five years than did the average of other top-10 public and private research universities in this category (9.4 percent) and the average of top-10 public research universities only (8.0 percent).
Table 2-2. Doctoral and other degrees conferred by top 10 U.S. public and private research universities and University of Minnesota, 2002-03.
Rank
All Public Only
Institution
Doctorates
Masters
First
Professional
Bachelors 1 2 3 4 5 5 7 8 9 10 11
1 2 3 4 4 6 7 8 9 10
University of California – Berkeley Nova Southeastern University University of Texas – Austin University of Wisconsin – Madison University of Illinois – Urbana-Champaign University of Michigan – Ann Arbor Stanford University University of California – Los Angeles University of Florida Ohio State University – Columbus University of Minnesota – Twin Cities Pennsylvania State University
772 732 674 656 617 617 611 596 591 575 560 503
1,834 3,252 2,637 2,019 2,703 3,431 1,930 2,303 2,853 2,525 2,546 1,079
323 698 595 618 301 644 284 578 941 739 719 0
7,055
942 8,397 6,139 7,233 6,606 1,914 7,503 8,110 8,422 5,972 9,014
Source: The Top American Research Universities: The Center, University of Florida, 2004.
Table 2-3. Average number of doctoral degrees conferred by top 10 U.S. public and private research universities and University of Minnesota – Twin Cities, 1998-2003.
1998
2000
2001
2002
2003
5-Year Change
Top 10 Public/Private Average % Change
7111 6431 - 9.6%
6411 - 0.3%
6311 - 1.6%
644 + 2.1%
- 67 - 9.4%
Top 10 Public Only Average % Change
6761 6251 - 7.5%
6351 + 1.6%
6271 - 1.3%
6221 - 0.8%
- 54 - 8.0%
U of M – Twin Cities
% Change
Public/Private Rank Public Only Rank
729
5th
4th
604 - 17.1%
7th 7th
632 + 4.6%
5th 5th
560 - 11.4%
9th 9th
560 no change
11th 9th
- 269 - 23.2%
Source: The Top American Research Universities: The Center, University of Florida, 2004. 1 Excluding University of Minnesota.
National Academy Members
These prestigious honors are granted by the National Academies of Sciences and Engineering and the Institute of Medicine.
These private, nonprofit organizations serve as advisors to the federal government on science, technology, and medicine.
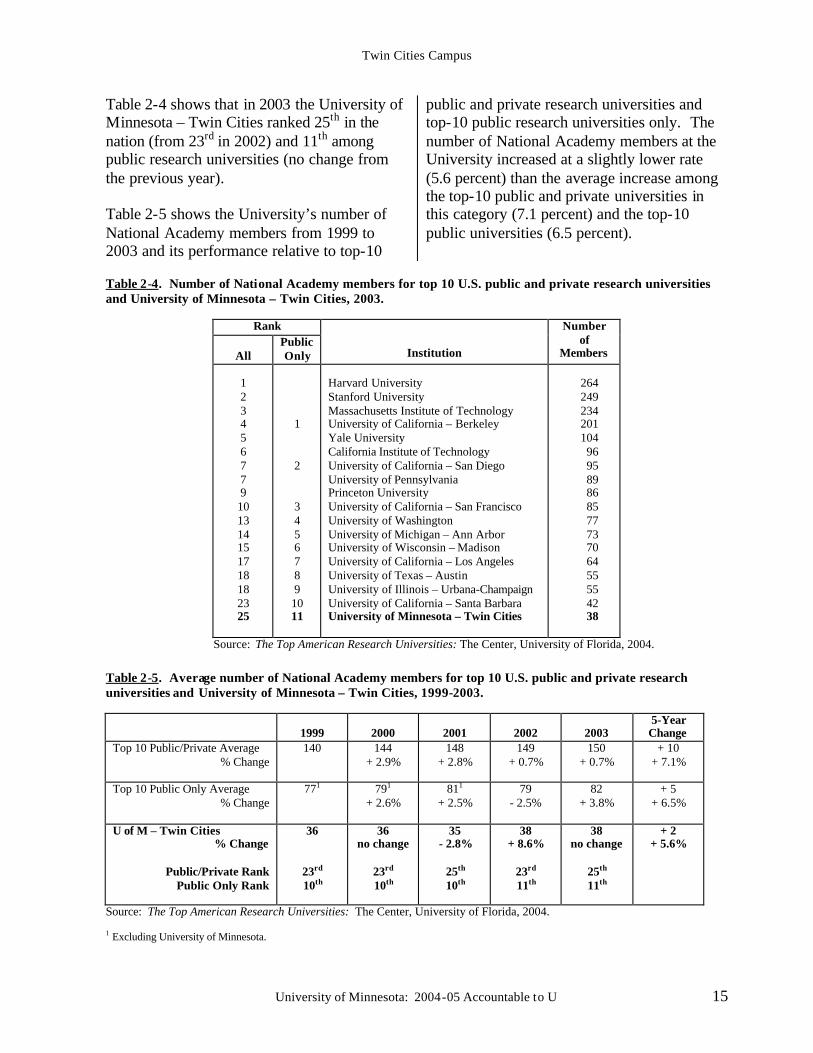
Twin Cities Campus
University of Minnesota: 2004-05 Accountable to U 15
Table 2-4 shows that in 2003 the University of Minnesota – Twin Cities ranked 25th in the nation (from 23rd in 2002) and 11th among public research universities (no change from the previous year). Table 2-5 shows the University’s number of National Academy members from 1999 to 2003 and its performance relative to top-10
public and private research universities and top-10 public research universities only. The number of National Academy members at the University increased at a slightly lower rate (5.6 percent) than the average increase among the top-10 public and private universities in this category (7.1 percent) and the top-10 public universities (6.5 percent).
Table 2-4. Number of National Academy members for top 10 U.S. public and private research universities and University of Minnesota – Twin Cities, 2003.
Rank
All Public Only
Institution
Number of
Members 1 2 3 4 5 6 7 7 9 10 13 14 15 17 18 18 23 25
1 2 3 4 5 6 7 8 9 10 11
Harvard University Stanford University Massachusetts Institute of Technology University of California – Berkeley Yale University California Institute of Technology University of California – San Diego University of Pennsylvania Princeton University University of California – San Francisco University of Washington University of Michigan – Ann Arbor University of Wisconsin – Madison University of California – Los Angeles University of Texas – Austin University of Illinois – Urbana-Champaign University of California – Santa Barbara University of Minnesota – Twin Cities
264 249 234 201 104 96 95 89 86 85 77 73 70 64 55 55 42 38
Source: The Top American Research Universities: The Center, University of Florida, 2004. Table 2-5. Average number of National Academy members for top 10 U.S. public and private research universities and University of Minnesota – Twin Cities, 1999-2003.
1999
2000
2001
2002
2003
5-Year Change
Top 10 Public/Private Average % Change
140
144 + 2.9%
148 + 2.8%
149 + 0.7%
150 + 0.7%
+ 10 + 7.1%
Top 10 Public Only Average % Change
771 791 + 2.6%
811 + 2.5%
79 - 2.5%
82 + 3.8%
+ 5 + 6.5%
U of M – Twin Cities % Change
Public/Private Rank
Public Only Rank
36
23rd
10th
36 no change
23rd 10th
35 - 2.8%
25th 10th
38 + 8.6%
23rd 11th
38 no change
25th 11th
+ 2 + 5.6%
Source: The Top American Research Universities: The Center, University of Florida, 2004. 1 Excluding University of Minnesota.
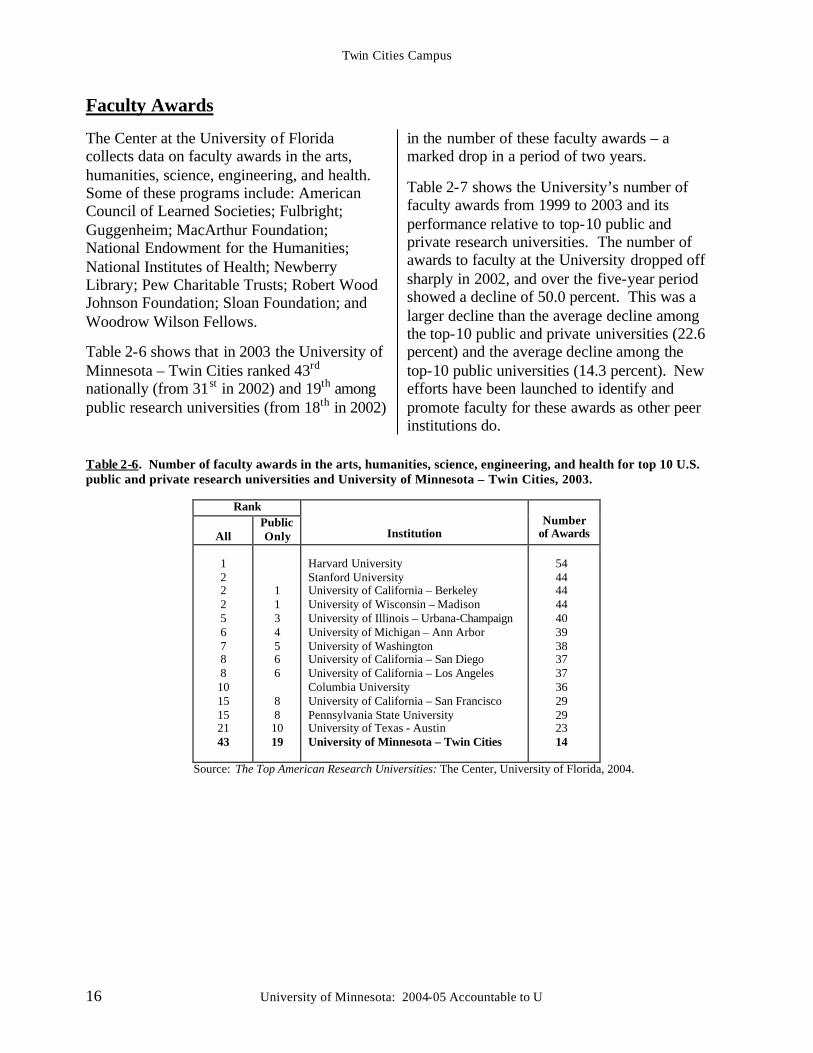
Twin Cities Campus
16 University of Minnesota: 2004-05 Accountable to U
Faculty Awards
The Center at the University of Florida collects data on faculty awards in the arts, humanities, science, engineering, and health. Some of these programs include: American Council of Learned Societies; Fulbright; Guggenheim; MacArthur Foundation; National Endowment for the Humanities; National Institutes of Health; Newberry Library; Pew Charitable Trusts; Robert Wood Johnson Foundation; Sloan Foundation; and Woodrow Wilson Fellows.
Table 2-6 shows that in 2003 the University of Minnesota – Twin Cities ranked 43rd nationally (from 31st in 2002) and 19th among public research universities (from 18th in 2002)
in the number of these faculty awards – a marked drop in a period of two years.
Table 2-7 shows the University’s number of faculty awards from 1999 to 2003 and its performance relative to top-10 public and private research universities. The number of awards to faculty at the University dropped off sharply in 2002, and over the five-year period showed a decline of 50.0 percent. This was a larger decline than the average decline among the top-10 public and private universities (22.6 percent) and the average decline among the top-10 public universities (14.3 percent). New efforts have been launched to identify and promote faculty for these awards as other peer institutions do.
Table 2-6. Number of faculty awards in the arts, humanities, science, engineering, and health for top 10 U.S. public and private research universities and University of Minnesota – Twin Cities, 2003.
Rank
All Public Only
Institution
Number
of Awards 1 2 2 2 5 6 7 8 8 10 15 15 21 43
1 1 3 4 5 6 6 8 8 10 19
Harvard University Stanford University University of California – Berkeley University of Wisconsin – Madison University of Illinois – Urbana-Champaign University of Michigan – Ann Arbor University of Washington University of California – San Diego University of California – Los Angeles Columbia University University of California – San Francisco Pennsylvania State University University of Texas - Austin University of Minnesota – Twin Cities
54 44 44 44 40 39 38 37 37 36 29 29 23 14
Source: The Top American Research Universities: The Center, University of Florida, 2004.
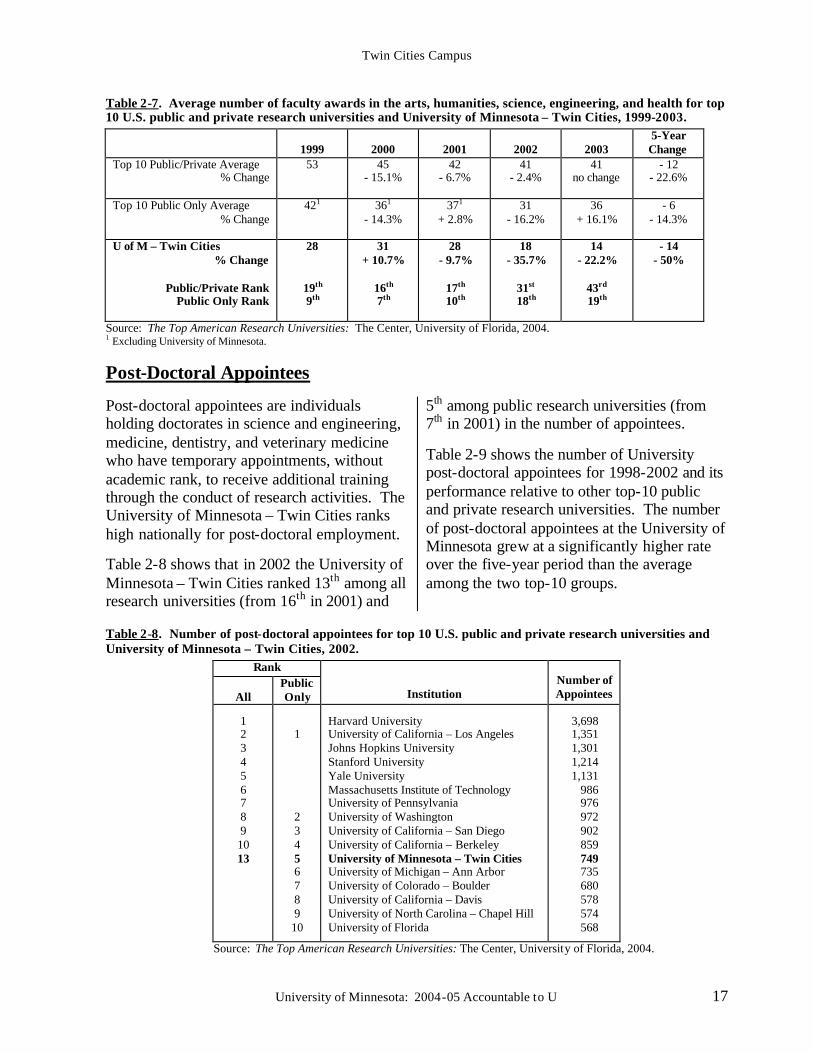
Twin Cities Campus
University of Minnesota: 2004-05 Accountable to U 17
Table 2-7. Average number of faculty awards in the arts, humanities, science, engineering, and health for top 10 U.S. public and private research universities and University of Minnesota – Twin Cities, 1999-2003.
1999
2000
2001
2002
2003
5-Year Change
Top 10 Public/Private Average % Change
53 45 - 15.1%
42 - 6.7%
41 - 2.4%
41 no change
- 12 - 22.6%
Top 10 Public Only Average % Change
421 361 - 14.3%
371 + 2.8%
31 - 16.2%
36 + 16.1%
- 6 - 14.3%
U of M – Twin Cities % Change
Public/Private Rank
Public Only Rank
28
19th 9th
31 + 10.7%
16th 7th
28 - 9.7%
17th 10th
18 - 35.7%
31st 18th
14 - 22.2%
43rd 19th
- 14 - 50%
Source: The Top American Research Universities: The Center, University of Florida, 2004. 1 Excluding University of Minnesota. Post-Doctoral Appointees
Post-doctoral appointees are individuals holding doctorates in science and engineering, medicine, dentistry, and veterinary medicine who have temporary appointments, without academic rank, to receive additional training through the conduct of research activities. The University of Minnesota – Twin Cities ranks high nationally for post-doctoral employment.
Table 2-8 shows that in 2002 the University of Minnesota – Twin Cities ranked 13th among all research universities (from 16th in 2001) and
5th among public research universities (from 7th in 2001) in the number of appointees.
Table 2-9 shows the number of University post-doctoral appointees for 1998-2002 and its performance relative to other top-10 public and private research universities. The number of post-doctoral appointees at the University of Minnesota grew at a significantly higher rate over the five-year period than the average among the two top-10 groups.
Table 2-8. Number of post-doctoral appointees for top 10 U.S. public and private research universities and University of Minnesota – Twin Cities, 2002.
Rank
All Public Only
Institution
Number of Appointees
1 2 3 4 5 6 7 8 9 10 13
1 2 3 4 5 6 7 8 9 10
Harvard University University of California – Los Angeles Johns Hopkins University Stanford University Yale University Massachusetts Institute of Technology University of Pennsylvania University of Washington University of California – San Diego University of California – Berkeley University of Minnesota – Twin Cities University of Michigan – Ann Arbor University of Colorado – Boulder University of California – Davis University of North Carolina – Chapel Hill University of Florida
3,698 1,351 1,301 1,214 1,131
986 976 972 902 859 749 735 680 578 574 568
Source: The Top American Research Universities: The Center, University of Florida, 2004.
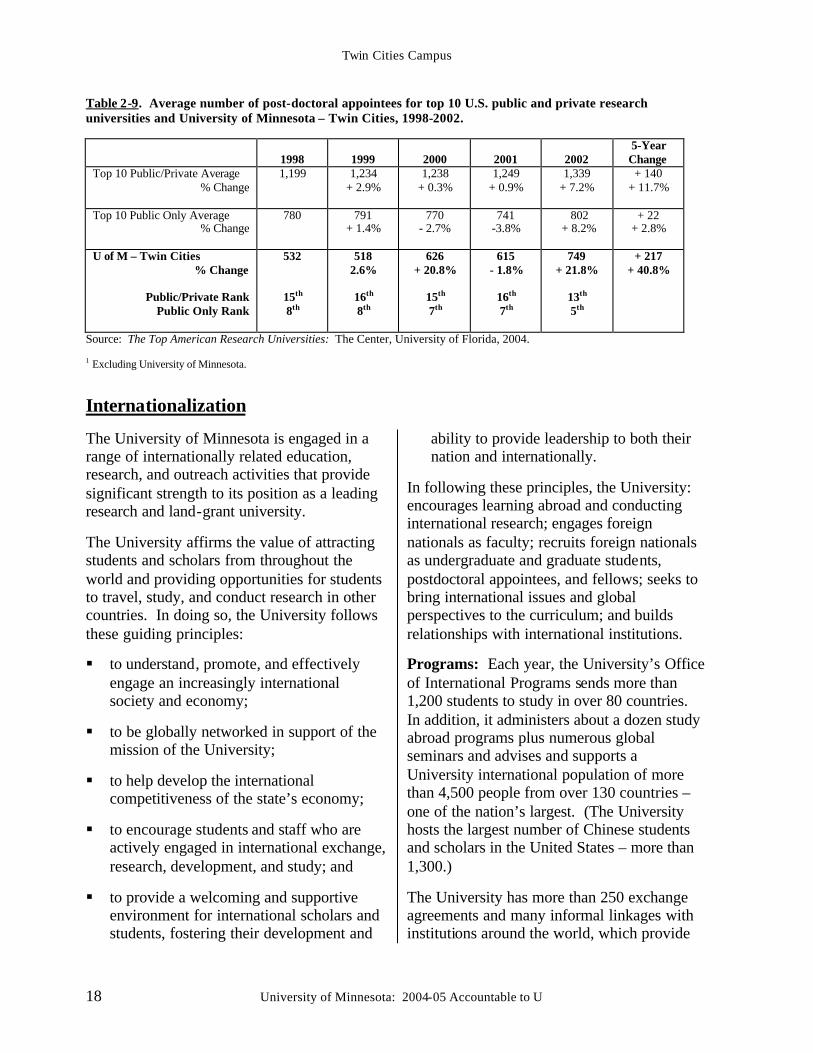
Twin Cities Campus
18 University of Minnesota: 2004-05 Accountable to U
Table 2-9. Average number of post-doctoral appointees for top 10 U.S. public and private research universities and University of Minnesota – Twin Cities, 1998-2002.
1998
1999
2000
2001
2002
5-Year Change
Top 10 Public/Private Average % Change
1,199 1,234 + 2.9%
1,238 + 0.3%
1,249 + 0.9%
1,339 + 7.2%
+ 140 + 11.7%
Top 10 Public Only Average % Change
780 791 + 1.4%
770 - 2.7%
741 -3.8%
802 + 8.2%
+ 22 + 2.8%
U of M – Twin Cities % Change
Public/Private Rank
Public Only Rank
532
15th 8th
518 2.6%
16th 8th
626 + 20.8%
15th 7th
615 - 1.8%
16th 7th
749 + 21.8%
13th 5th
+ 217 + 40.8%
Source: The Top American Research Universities: The Center, University of Florida, 2004. 1 Excluding University of Minnesota.
Internationalization
The University of Minnesota is engaged in a range of internationally related education, research, and outreach activities that provide significant strength to its position as a leading research and land-grant university.
The University affirms the value of attracting students and scholars from throughout the world and providing opportunities for students to travel, study, and conduct research in other countries. In doing so, the University follows these guiding principles:
§ to understand, promote, and effectively engage an increasingly international society and economy;
§ to be globally networked in support of the mission of the University;
§ to help develop the international competitiveness of the state’s economy;
§ to encourage students and staff who are actively engaged in international exchange, research, development, and study; and
§ to provide a welcoming and supportive environment for international scholars and students, fostering their development and
ability to provide leadership to both their nation and internationally.
In following these principles, the University: encourages learning abroad and conducting international research; engages foreign nationals as faculty; recruits foreign nationals as undergraduate and graduate students, postdoctoral appointees, and fellows; seeks to bring international issues and global perspectives to the curriculum; and builds relationships with international institutions.
Programs: Each year, the University’s Office of International Programs sends more than 1,200 students to study in over 80 countries. In addition, it administers about a dozen study abroad programs plus numerous global seminars and advises and supports a University international population of more than 4,500 people from over 130 countries – one of the nation’s largest. (The University hosts the largest number of Chinese students and scholars in the United States – more than 1,300.)
The University has more than 250 exchange agreements and many informal linkages with institutions around the world, which provide
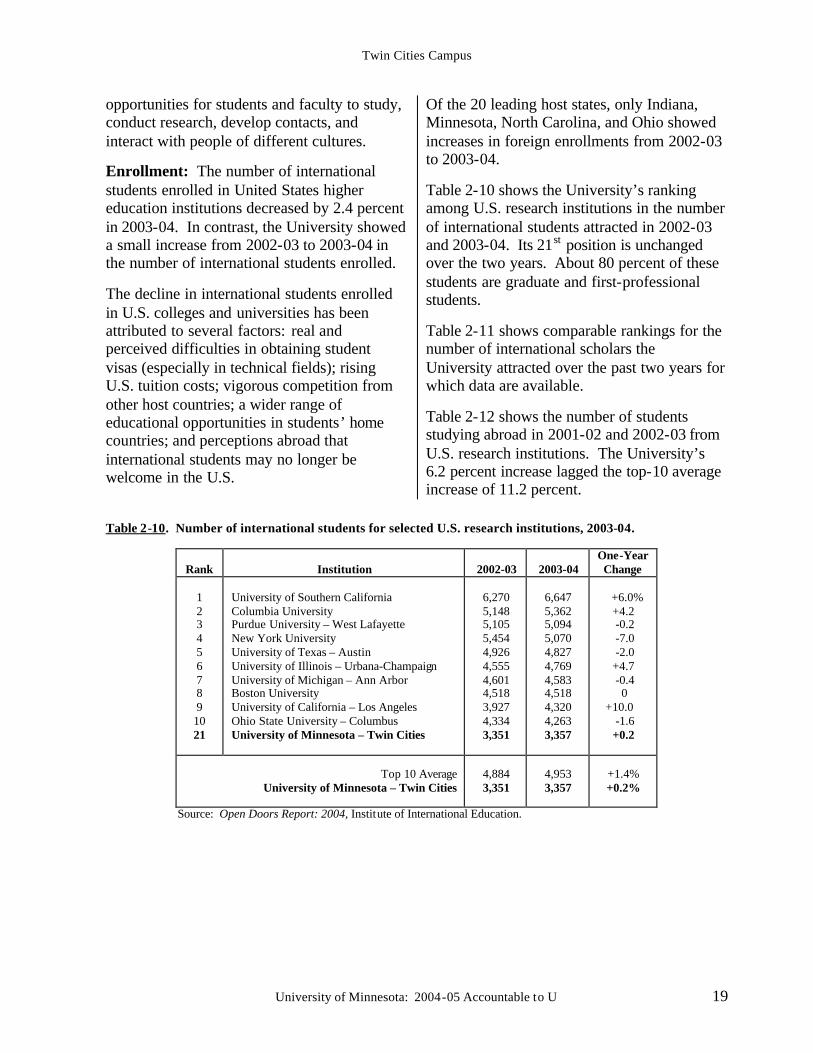
Twin Cities Campus
University of Minnesota: 2004-05 Accountable to U 19
opportunities for students and faculty to study, conduct research, develop contacts, and interact with people of different cultures.
Enrollment: The number of international students enrolled in United States higher education institutions decreased by 2.4 percent in 2003-04. In contrast, the University showed a small increase from 2002-03 to 2003-04 in the number of international students enrolled. The decline in international students enrolled in U.S. colleges and universities has been attributed to several factors: real and perceived difficulties in obtaining student visas (especially in technical fields); rising U.S. tuition costs; vigorous competition from other host countries; a wider range of educational opportunities in students’ home countries; and perceptions abroad that international students may no longer be welcome in the U.S.
Of the 20 leading host states, only Indiana, Minnesota, North Carolina, and Ohio showed increases in foreign enrollments from 2002-03 to 2003-04.
Table 2-10 shows the University’s ranking among U.S. research institutions in the number of international students attracted in 2002-03 and 2003-04. Its 21st position is unchanged over the two years. About 80 percent of these students are graduate and first-professional students.
Table 2-11 shows comparable rankings for the number of international scholars the University attracted over the past two years for which data are available.
Table 2-12 shows the number of students studying abroad in 2001-02 and 2002-03 from U.S. research institutions. The University’s 6.2 percent increase lagged the top-10 average increase of 11.2 percent.
Table 2-10. Number of international students for selected U.S. research institutions, 2003-04.
Rank
Institution
2002-03
2003-04
One-Year Change
1 2 3 4 5 6 7 8 9 10 21
University of Southern California Columbia University Purdue University – West Lafayette New York University University of Texas – Austin University of Illinois – Urbana-Champaign University of Michigan – Ann Arbor Boston University University of California – Los Angeles Ohio State University – Columbus University of Minnesota – Twin Cities
6,270 5,148 5,105 5,454 4,926 4,555 4,601 4,518 3,927 4,334 3,351
6,647 5,362 5,094 5,070 4,827 4,769 4,583 4,518 4,320 4,263 3,357
+6.0%
+4.2 -0.2 -7.0 -2.0 +4.7 -0.4 0
+10.0 -1.6 +0.2
Top 10 Average University of Minnesota – Twin Cities
4,884 3,351
4,953 3,357
+1.4% +0.2%
Source: Open Doors Report: 2004, Institute of International Education.
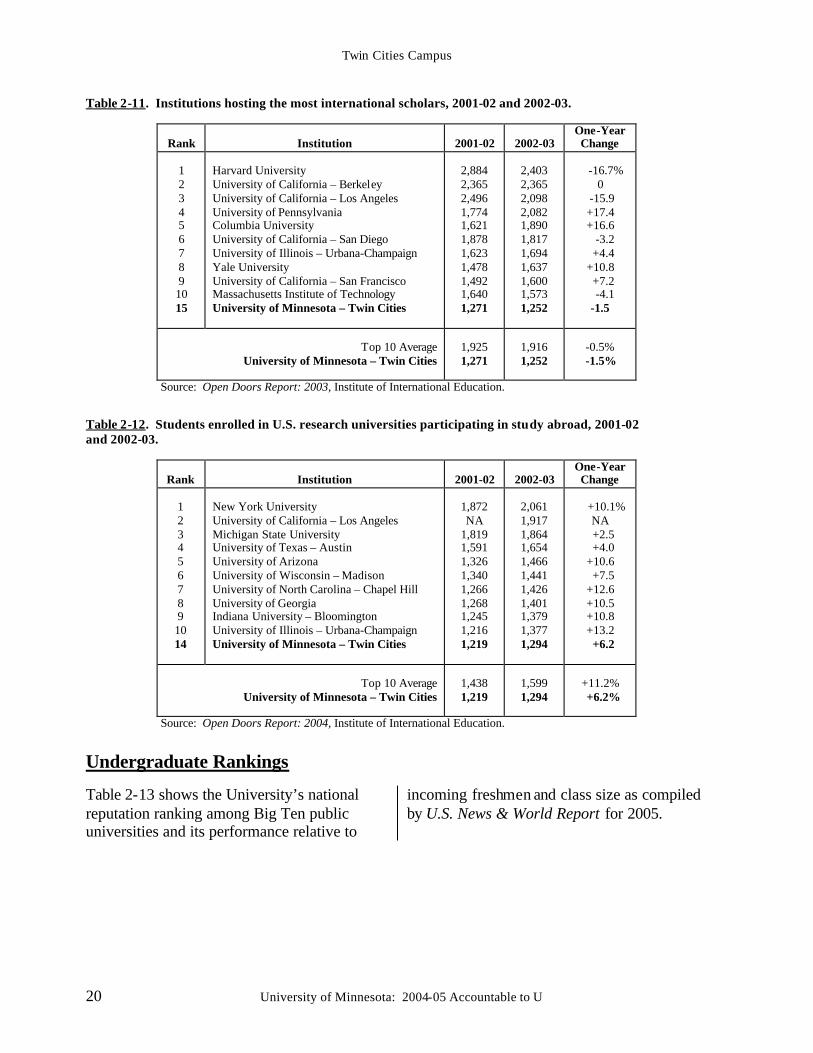
Twin Cities Campus
20 University of Minnesota: 2004-05 Accountable to U
Table 2-11. Institutions hosting the most international scholars, 2001-02 and 2002-03.
Rank
Institution
2001-02
2002-03
One-Year Change
1 2 3 4 5 6 7 8 9 10 15
Harvard University University of California – Berkeley University of California – Los Angeles University of Pennsylvania Columbia University University of California – San Diego University of Illinois – Urbana-Champaign Yale University University of California – San Francisco Massachusetts Institute of Technology University of Minnesota – Twin Cities
2,884 2,365 2,496 1,774 1,621 1,878 1,623 1,478 1,492 1,640 1,271
2,403 2,365 2,098 2,082 1,890 1,817 1,694 1,637 1,600 1,573 1,252
-16.7%
0 -15.9 +17.4 +16.6 -3.2 +4.4 +10.8 +7.2 -4.1 -1.5
Top 10 Average
University of Minnesota – Twin Cities
1,925 1,271
1,916 1,252
-0.5% -1.5%
Source: Open Doors Report: 2003, Institute of International Education.
Table 2-12. Students enrolled in U.S. research universities participating in study abroad, 2001-02 and 2002-03.
Rank
Institution
2001-02
2002-03
One-Year Change
1 2 3 4 5 6 7 8 9 10 14
New York University University of California – Los Angeles Michigan State University University of Texas – Austin University of Arizona University of Wisconsin – Madison University of North Carolina – Chapel Hill University of Georgia Indiana University – Bloomington University of Illinois – Urbana-Champaign University of Minnesota – Twin Cities
1,872 NA
1,819 1,591 1,326 1,340 1,266 1,268 1,245 1,216 1,219
2,061 1,917 1,864 1,654 1,466 1,441 1,426 1,401 1,379 1,377 1,294
+10.1%
NA +2.5 +4.0 +10.6 +7.5 +12.6 +10.5 +10.8 +13.2 +6.2
Top 10 Average University of Minnesota – Twin Cities
1,438 1,219
1,599 1,294
+11.2% +6.2%
Source: Open Doors Report: 2004, Institute of International Education. Undergraduate Rankings
Table 2-13 shows the University’s national reputation ranking among Big Ten public universities and its performance relative to
incoming freshmen and class size as compiled by U.S. News & World Report for 2005.
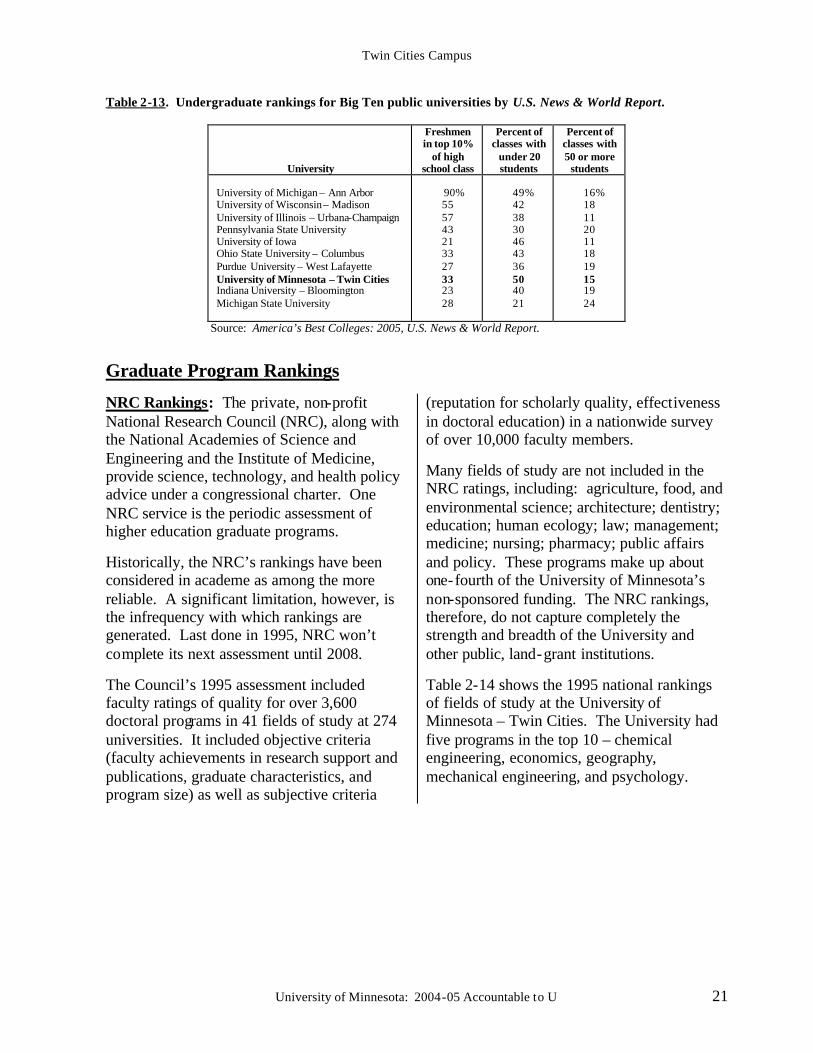
Twin Cities Campus
University of Minnesota: 2004-05 Accountable to U 21
Table 2-13. Undergraduate rankings for Big Ten public universities by U.S. News & World Report.
University
Freshmen in top 10%
of high school class
Percent of classes with
under 20 students
Percent of classes with 50 or more
students University of Michigan – Ann Arbor University of Wisconsin – Madison University of Illinois – Urbana-Champaign Pennsylvania State University University of Iowa Ohio State University – Columbus Purdue University – West Lafayette University of Minnesota – Twin Cities Indiana University – Bloomington Michigan State University
90%
55 57 43 21 33 27 33 23 28
49%
42 38 30 46 43 36 50 40 21
16%
18 11 20 11 18 19 15 19 24
Source: America’s Best Colleges: 2005, U.S. News & World Report.
Graduate Program Rankings
NRC Rankings: The private, non-profit National Research Council (NRC), along with the National Academies of Science and Engineering and the Institute of Medicine, provide science, technology, and health policy advice under a congressional charter. One NRC service is the periodic assessment of higher education graduate programs.
Historically, the NRC’s rankings have been considered in academe as among the more reliable. A significant limitation, however, is the infrequency with which rankings are generated. Last done in 1995, NRC won’t complete its next assessment until 2008.
The Council’s 1995 assessment included faculty ratings of quality for over 3,600 doctoral programs in 41 fields of study at 274 universities. It included objective criteria (faculty achievements in research support and publications, graduate characteristics, and program size) as well as subjective criteria
(reputation for scholarly quality, effectiveness in doctoral education) in a nationwide survey of over 10,000 faculty members.
Many fields of study are not included in the NRC ratings, including: agriculture, food, and environmental science; architecture; dentistry; education; human ecology; law; management; medicine; nursing; pharmacy; public affairs and policy. These programs make up about one-fourth of the University of Minnesota’s non-sponsored funding. The NRC rankings, therefore, do not capture completely the strength and breadth of the University and other public, land-grant institutions.
Table 2-14 shows the 1995 national rankings of fields of study at the University of Minnesota – Twin Cities. The University had five programs in the top 10 – chemical engineering, economics, geography, mechanical engineering, and psychology.
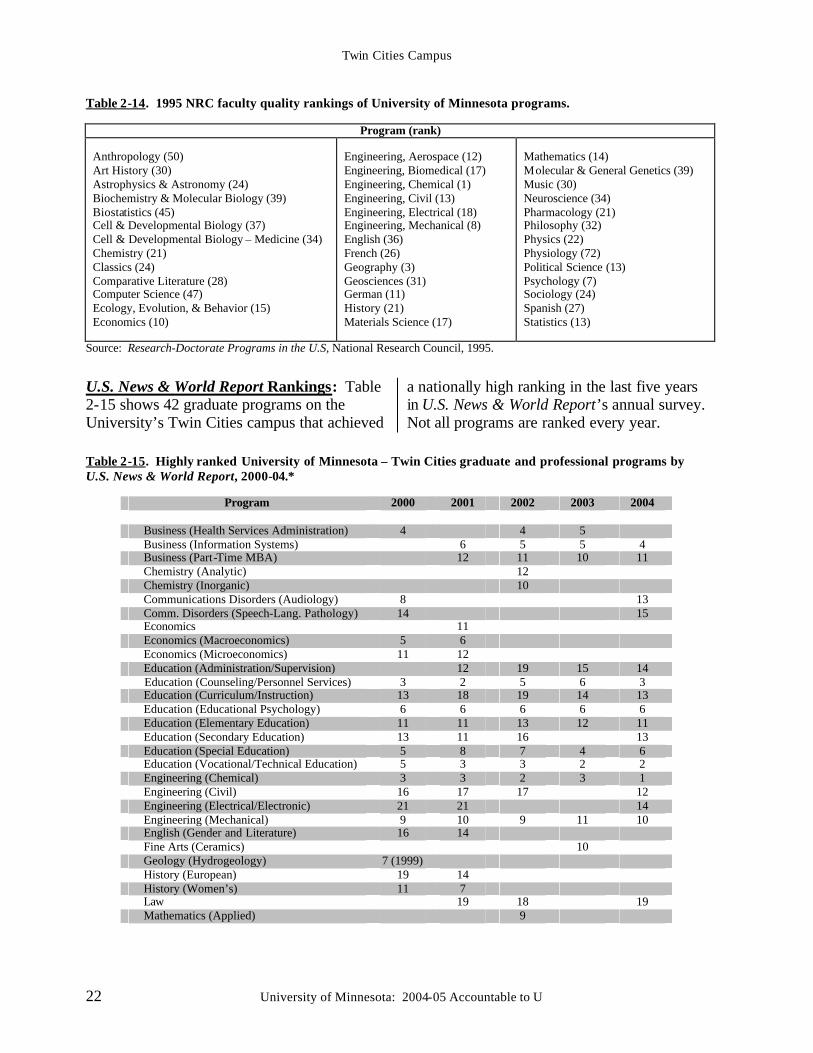
Twin Cities Campus
22 University of Minnesota: 2004-05 Accountable to U
Table 2-14. 1995 NRC faculty quality rankings of University of Minnesota programs.
Program (rank) Anthropology (50) Art History (30) Astrophysics & Astronomy (24) Biochemistry & Molecular Biology (39) Biostatistics (45) Cell & Developmental Biology (37) Cell & Developmental Biology – Medicine (34) Chemistry (21) Classics (24) Comparative Literature (28) Computer Science (47) Ecology, Evolution, & Behavior (15) Economics (10)
Engineering, Aerospace (12) Engineering, Biomedical (17) Engineering, Chemical (1) Engineering, Civil (13) Engineering, Electrical (18) Engineering, Mechanical (8) English (36) French (26) Geography (3) Geosciences (31) German (11) History (21) Materials Science (17)
Mathematics (14) Molecular & General Genetics (39) Music (30) Neuroscience (34) Pharmacology (21) Philosophy (32) Physics (22) Physiology (72) Political Science (13) Psychology (7) Sociology (24) Spanish (27) Statistics (13)
Source: Research-Doctorate Programs in the U.S, National Research Council, 1995.
U.S. News & World Report Rankings: Table 2-15 shows 42 graduate programs on the University’s Twin Cities campus that achieved
a nationally high ranking in the last five years in U.S. News & World Report’s annual survey. Not all programs are ranked every year.
Table 2-15. Highly ranked University of Minnesota – Twin Cities graduate and professional programs by U.S. News & World Report, 2000-04.*
Program 2000 2001 2002 2003 2004 Business (Health Services Administration) 4 4 5 Business (Information Systems) 6 5 5 4 Business (Part-Time MBA) 12 11 10 11 Chemistry (Analytic) 12 Chemistry (Inorganic) 10 Communications Disorders (Audiology) 8 13 Comm. Disorders (Speech-Lang. Pathology) 14 15 Economics 11 Economics (Macroeconomics) 5 6 Economics (Microeconomics) 11 12 Education (Administration/Supervision) 12 19 15 14 Education (Counseling/Personnel Services) 3 2 5 6 3 Education (Curriculum/Instruction) 13 18 19 14 13 Education (Educational Psychology) 6 6 6 6 6 Education (Elementary Education) 11 11 13 12 11 Education (Secondary Education) 13 11 16 13 Education (Special Education) 5 8 7 4 6 Education (Vocational/Technical Education) 5 3 3 2 2 Engineering (Chemical) 3 3 2 3 1 Engineering (Civil) 16 17 17 12 Engineering (Electrical/Electronic) 21 21 14 Engineering (Mechanical) 9 10 9 11 10 English (Gender and Literature) 16 14 Fine Arts (Ceramics) 10 Geology (Hydrogeology) 7 (1999) History (European) 19 14 History (Women’s) 11 7 Law 19 18 19 Mathematics (Applied) 9
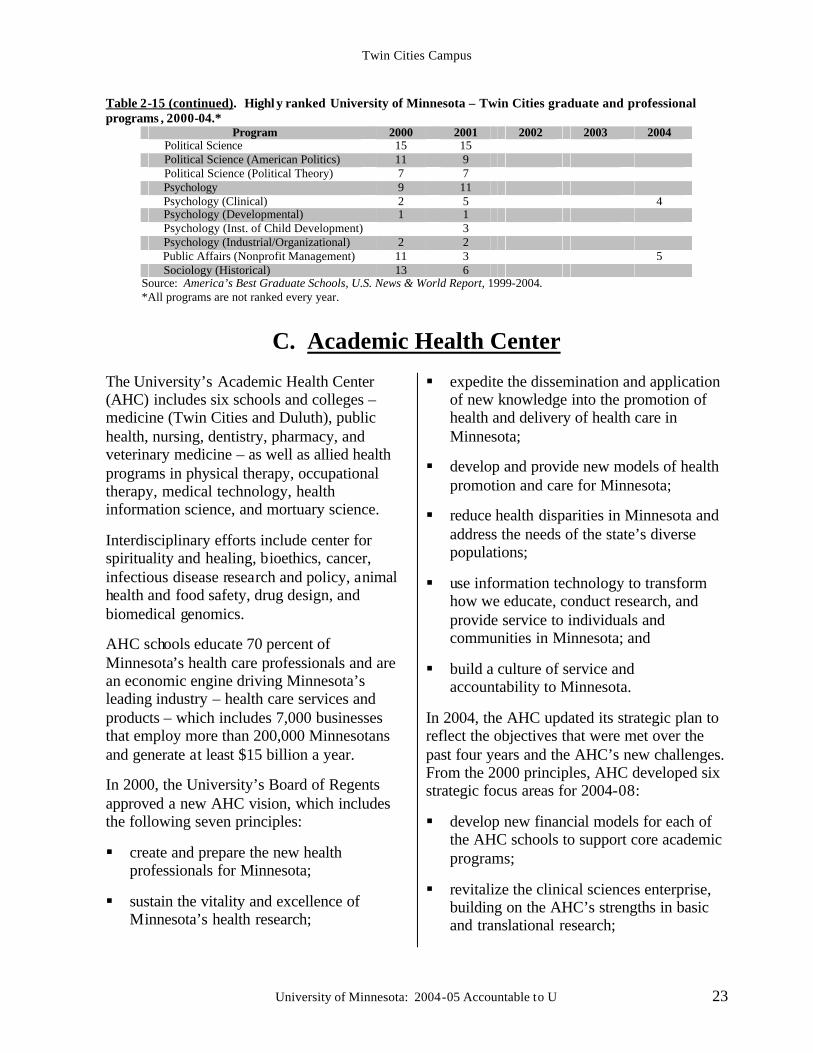
Twin Cities Campus
University of Minnesota: 2004-05 Accountable to U 23
Table 2-15 (continued). Highl y ranked University of Minnesota – Twin Cities graduate and professional programs , 2000-04.*
Program 2000 2001 2002 2003 2004 Political Science 15 15 Political Science (American Politics) 11 9 Political Science (Political Theory) 7 7 Psychology 9 11 Psychology (Clinical) 2 5 4 Psychology (Developmental) 1 1 Psychology (Inst. of Child Development) 3 Psychology (Industrial/Organizational) 2 2 Public Affairs (Nonprofit Management) 11 3 5 Sociology (Historical) 13 6
Source: America’s Best Graduate Schools, U.S. News & World Report, 1999-2004. *All programs are not ranked every year.
C. Academic Health Center
The University’s Academic Health Center (AHC) includes six schools and colleges – medicine (Twin Cities and Duluth), public health, nursing, dentistry, pharmacy, and veterinary medicine – as well as allied health programs in physical therapy, occupational therapy, medical technology, health information science, and mortuary science.
Interdisciplinary efforts include center for spirituality and healing, bioethics, cancer, infectious disease research and policy, animal health and food safety, drug design, and biomedical genomics.
AHC schools educate 70 percent of Minnesota’s health care professionals and are an economic engine driving Minnesota’s leading industry – health care services and products – which includes 7,000 businesses that employ more than 200,000 Minnesotans and generate at least $15 billion a year.
In 2000, the University’s Board of Regents approved a new AHC vision, which includes the following seven principles:
§ create and prepare the new health professionals for Minnesota;
§ sustain the vitality and excellence of Minnesota’s health research;
§ expedite the dissemination and application of new knowledge into the promotion of health and delivery of health care in Minnesota;
§ develop and provide new models of health promotion and care for Minnesota;
§ reduce health disparities in Minnesota and address the needs of the state’s diverse populations;
§ use information technology to transform how we educate, conduct research, and provide service to individuals and communities in Minnesota; and
§ build a culture of service and accountability to Minnesota.
In 2004, the AHC updated its strategic plan to reflect the objectives that were met over the past four years and the AHC’s new challenges. From the 2000 principles, AHC developed six strategic focus areas for 2004-08:
§ develop new financial models for each of the AHC schools to support core academic programs;
§ revitalize the clinical sciences enterprise, building on the AHC’s strengths in basic and translational research;
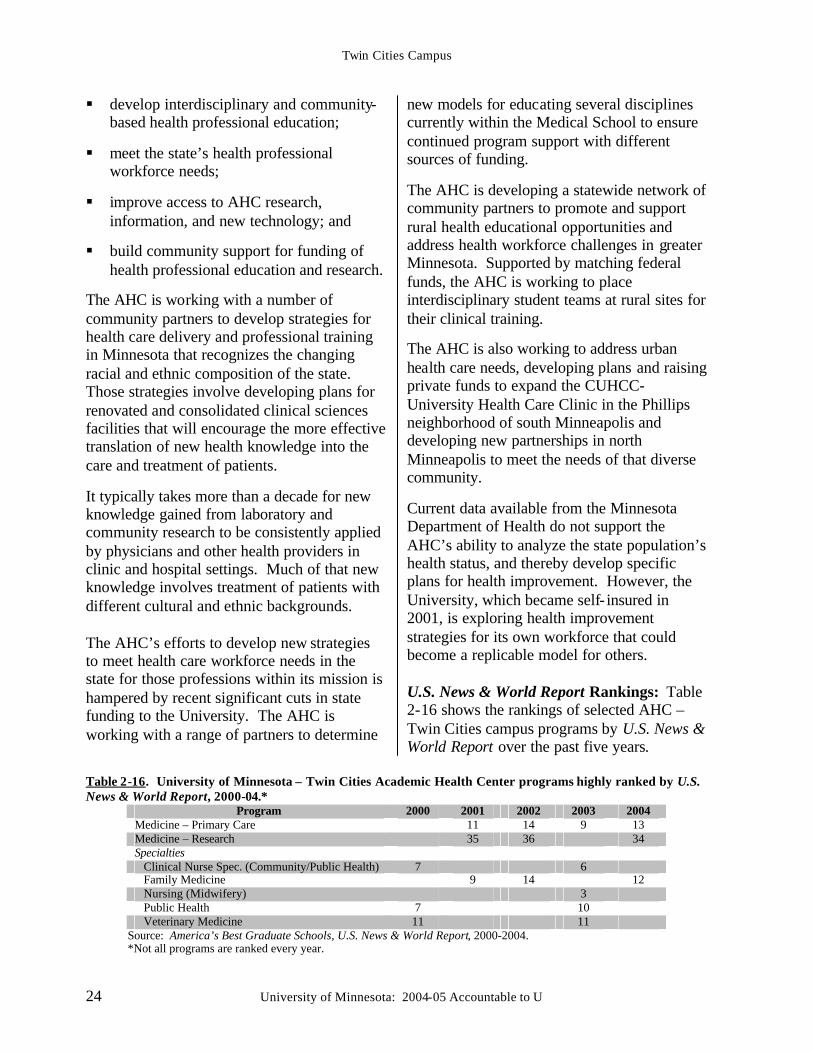
Twin Cities Campus
24 University of Minnesota: 2004-05 Accountable to U
§ develop interdisciplinary and community-based health professional education;
§ meet the state’s health professional workforce needs;
§ improve access to AHC research, information, and new technology; and
§ build community support for funding of health professional education and research.
The AHC is working with a number of community partners to develop strategies for health care delivery and professional training in Minnesota that recognizes the changing racial and ethnic composition of the state. Those strategies involve developing plans for renovated and consolidated clinical sciences facilities that will encourage the more effective translation of new health knowledge into the care and treatment of patients.
It typically takes more than a decade for new knowledge gained from laboratory and community research to be consistently applied by physicians and other health providers in clinic and hospital settings. Much of that new knowledge involves treatment of patients with different cultural and ethnic backgrounds. The AHC’s efforts to develop new strategies to meet health care workforce needs in the state for those professions within its mission is hampered by recent significant cuts in state funding to the University. The AHC is working with a range of partners to determine
new models for educating several disciplines currently within the Medical School to ensure continued program support with different sources of funding.
The AHC is developing a statewide network of community partners to promote and support rural health educational opportunities and address health workforce challenges in greater Minnesota. Supported by matching federal funds, the AHC is working to place interdisciplinary student teams at rural sites for their clinical training.
The AHC is also working to address urban health care needs, developing plans and raising private funds to expand the CUHCC-University Health Care Clinic in the Phillips neighborhood of south Minneapolis and developing new partnerships in north Minneapolis to meet the needs of that diverse community.
Current data available from the Minnesota Department of Health do not support the AHC’s ability to analyze the state population’s health status, and thereby develop specific plans for health improvement. However, the University, which became self- insured in 2001, is exploring health improvement strategies for its own workforce that could become a replicable model for others. U.S. News & World Report Rankings: Table 2-16 shows the rankings of selected AHC – Twin Cities campus programs by U.S. News & World Report over the past five years.
Table 2-16. University of Minnesota – Twin Cities Academic Health Center programs highly ranked by U.S. News & World Report, 2000-04.*
Program 2000 2001 2002 2003 2004 Medicine – Primary Care 11 14 9 13 Medicine – Research 35 36 34 Specialties Clinical Nurse Spec. (Community/Public Health) 7 6 Family Medicine 9 14 12 Nursing (Midwifery) 3 Public Health 7 10 Veterinary Medicine 11 11
Source: America’s Best Graduate Schools, U.S. News & World Report, 2000-2004. *Not all programs are ranked every year.
Twin Cities Campus
University of Minnesota: 2004-05 Accountable to U 25
D. University Libraries The University Libraries on the Twin Cities campus provide collections, access, and service to students, researchers, and citizens. As such, the Libraries are a key component in the educational and information infrastructure for the state of Minnesota.
The University Libraries system is comprised of 14 locations on the Twin Cities campus. In addition, the University Libraries provide services in support of several independent libraries (e.g., Law, Journalism, and the coordinate campus libraries). Over 6 million volumes are held within five large facilities as well as specialized branch libraries. With nearly 2 million user visits to campus libraries annually, the Libraries remain a critical and heavily used resource for the University.
For a more detailed description of how the University Libraries support the University’s public engagement mission, see Section 7: Engagement and Outreach.
University Libraries Rankings: As shown in Table 2-17, the University of Minnesota
currently ranks 19th among the 113 North American university library members of the Association of Research Libraries (ARL), a drop of five places (from 14th) since 2000.
The ARL membership ranking is a composite index of size and growth of collections, funding, and staff. The index takes into account the number of volumes held, number of volumes added during the previous fiscal year, number of current serials, total operating expenditures, and size of “permanent” staff, a figure that includes professional and support workers and excludes student assistants.
While this is a useful indicator of traditional resources, it does not provide a full picture of 21st century library programs or the quality of library services. The index does not measure a library’s services, the quality of its collections, or its success in meeting the needs of users. Tables 2-18 shows more detailed library trends and rankings across a number of other measures.
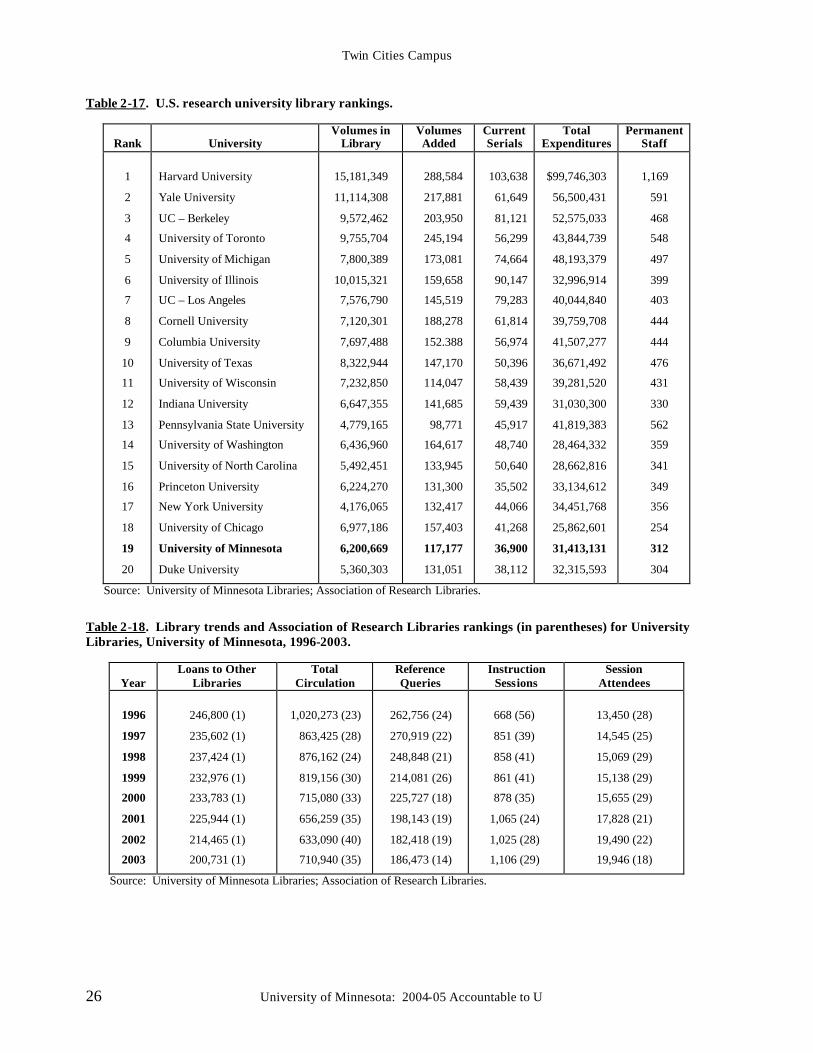
Twin Cities Campus
26 University of Minnesota: 2004-05 Accountable to U
Table 2-17. U.S. research university library rankings.
Rank
University
Volumes in Library
Volumes Added
Current Serials
Total Expenditures
Permanent Staff
1
2
3
4
5
6
7
8
9
10
11
12
13
14
15
16
17
18
19
20
Harvard University
Yale University
UC – Berkeley
University of Toronto
University of Michigan
University of Illinois
UC – Los Angeles
Cornell University
Columbia University
University of Texas
University of Wisconsin
Indiana University
Pennsylvania State University
University of Washington
University of North Carolina
Princeton University
New York University
University of Chicago
University of Minnesota
Duke University
15,181,349
11,114,308
9,572,462
9,755,704
7,800,389
10,015,321
7,576,790
7,120,301
7,697,488
8,322,944
7,232,850
6,647,355
4,779,165
6,436,960
5,492,451
6,224,270
4,176,065
6,977,186
6,200,669
5,360,303
288,584
217,881
203,950
245,194
173,081
159,658
145,519
188,278
152.388
147,170
114,047
141,685
98,771
164,617
133,945
131,300
132,417
157,403
117,177
131,051
103,638
61,649
81,121
56,299
74,664
90,147
79,283
61,814
56,974
50,396
58,439
59,439
45,917
48,740
50,640
35,502
44,066
41,268
36,900
38,112
$99,746,303
56,500,431
52,575,033
43,844,739
48,193,379
32,996,914
40,044,840
39,759,708
41,507,277
36,671,492
39,281,520
31,030,300
41,819,383
28,464,332
28,662,816
33,134,612
34,451,768
25,862,601
31,413,131
32,315,593
1,169
591
468
548
497
399
403
444
444
476
431
330
562
359
341
349
356
254
312
304
Source: University of Minnesota Libraries; Association of Research Libraries.
Table 2-18. Library trends and Association of Research Libraries rankings (in parentheses) for University Libraries, University of Minnesota, 1996-2003.
Year
Loans to Other Libraries
Total Circulation
Reference Queries
Instruction Sessions
Session Attendees
1996
1997
1998
1999
2000
2001
2002
2003
246,800 (1)
235,602 (1)
237,424 (1)
232,976 (1)
233,783 (1)
225,944 (1)
214,465 (1)
200,731 (1)
1,020,273 (23)
863,425 (28)
876,162 (24)
819,156 (30)
715,080 (33)
656,259 (35)
633,090 (40)
710,940 (35)
262,756 (24)
270,919 (22)
248,848 (21)
214,081 (26)
225,727 (18)
198,143 (19)
182,418 (19)
186,473 (14)
668 (56)
851 (39)
858 (41)
861 (41)
878 (35)
1,065 (24)
1,025 (28)
1,106 (29)
13,450 (28)
14,545 (25)
15,069 (29)
15,138 (29)
15,655 (29)
17,828 (21)
19,490 (22)
19,946 (18)
Source: University of Minnesota Libraries; Association of Research Libraries.
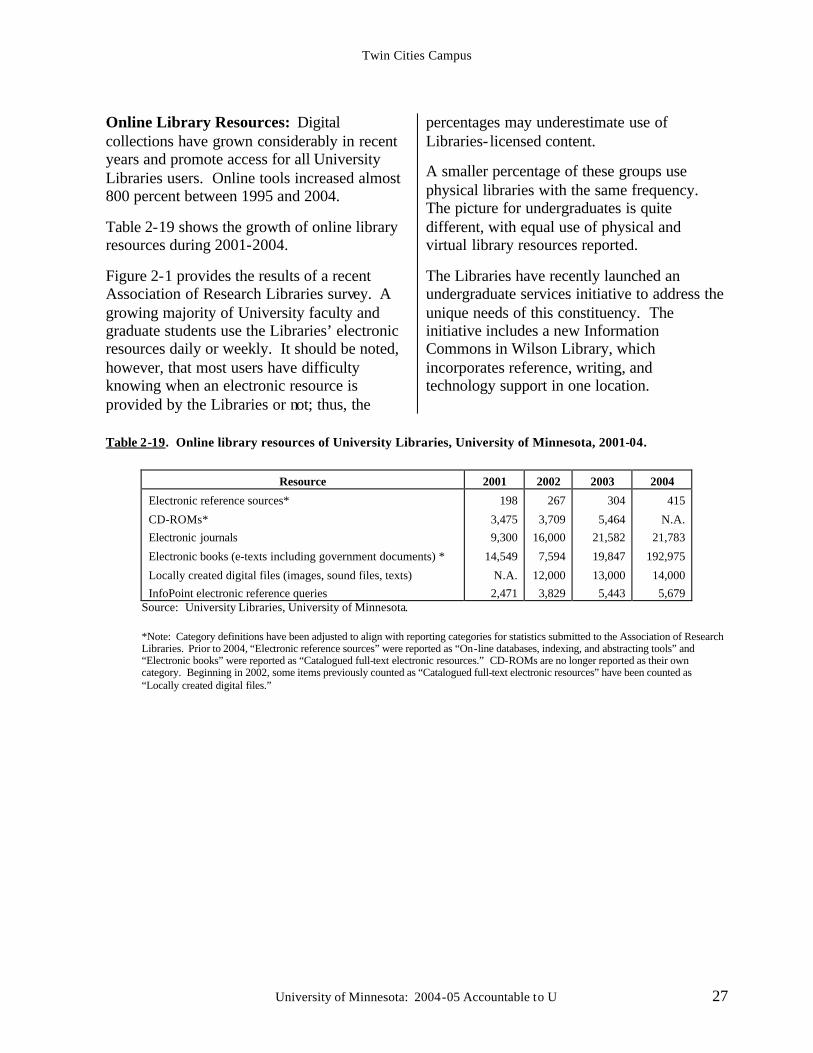
Twin Cities Campus
University of Minnesota: 2004-05 Accountable to U 27
Online Library Resources: Digital collections have grown considerably in recent years and promote access for all University Libraries users. Online tools increased almost 800 percent between 1995 and 2004.
Table 2-19 shows the growth of online library resources during 2001-2004.
Figure 2-1 provides the results of a recent Association of Research Libraries survey. A growing majority of University faculty and graduate students use the Libraries’ electronic resources daily or weekly. It should be noted, however, that most users have difficulty knowing when an electronic resource is provided by the Libraries or not; thus, the
percentages may underestimate use of Libraries- licensed content.
A smaller percentage of these groups use physical libraries with the same frequency. The picture for undergraduates is quite different, with equal use of physical and virtual library resources reported.
The Libraries have recently launched an undergraduate services initiative to address the unique needs of this constituency. The initiative includes a new Information Commons in Wilson Library, which incorporates reference, writing, and technology support in one location.
Table 2-19. Online library resources of University Libraries, University of Minnesota, 2001-04.
Resource 2001 2002 2003 2004
Electronic reference sources*
CD-ROMs* Electronic journals
Electronic books (e-texts including government documents) *
Locally created digital files (images, sound files, texts) InfoPoint electronic reference queries
198
3,475 9,300
14,549
N.A. 2,471
267
3,709 16,000
7,594
12,000 3,829
304
5,464 21,582
19,847
13,000 5,443
415
N.A. 21,783
192,975
14,000 5,679
Source: University Libraries, University of Minnesota. *Note: Category definitions have been adjusted to align with reporting categories for statistics submitted to the Association of Research Libraries. Prior to 2004, “Electronic reference sources” were reported as “On-line databases, indexing, and abstracting tools” and “Electronic books” were reported as “Catalogued full-text electronic resources.” CD-ROMs are no longer reported as their own category. Beginning in 2002, some items previously counted as “Catalogued full-text electronic resources” have been counted as “Locally created digital files.”
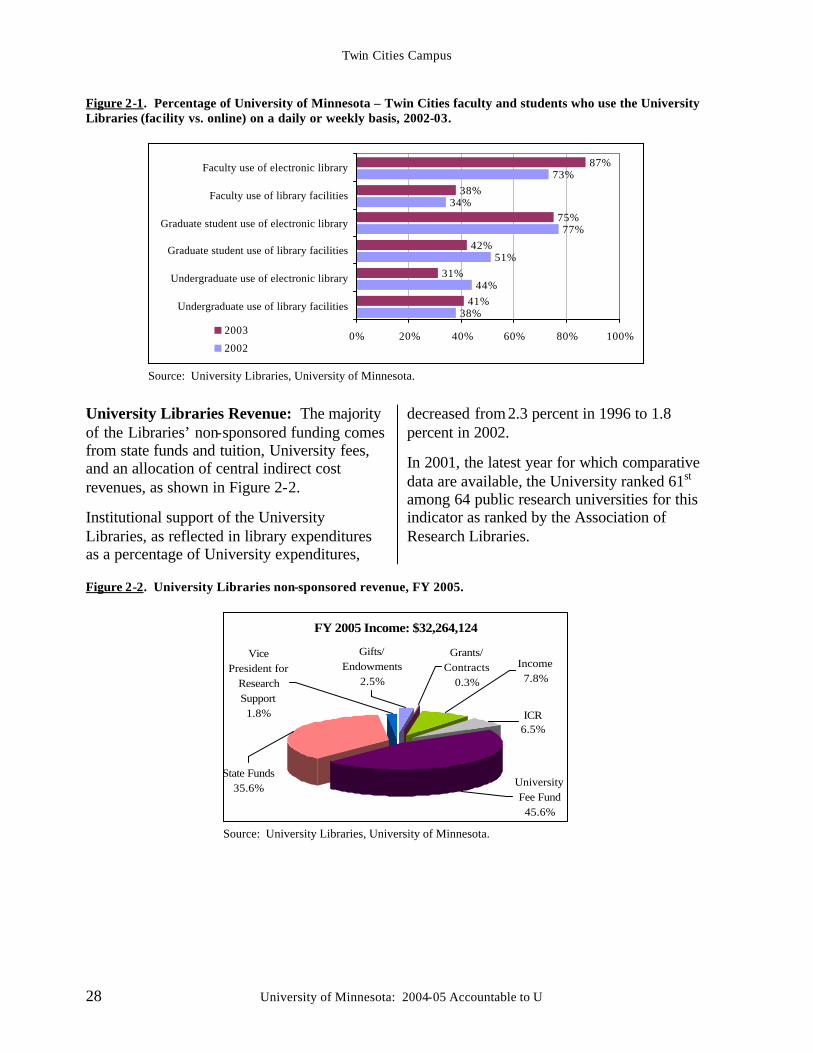
Twin Cities Campus
28 University of Minnesota: 2004-05 Accountable to U
Figure 2-1. Percentage of University of Minnesota – Twin Cities faculty and students who use the University Libraries (facility vs. online) on a daily or weekly basis, 2002-03.
38%
44%
51%
77%
34%
73%
41%
31%
42%
75%
38%
87%
0% 20% 40% 60% 80% 100%
Undergraduate use of library facilities
Undergraduate use of electronic library
Graduate student use of library facilities
Graduate student use of electronic library
Faculty use of library facilities
Faculty use of electronic library
2003
2002
Source: University Libraries, University of Minnesota.
University Libraries Revenue: The majority of the Libraries’ non-sponsored funding comes from state funds and tuition, University fees, and an allocation of central indirect cost revenues, as shown in Figure 2-2.
Institutional support of the University Libraries, as reflected in library expenditures as a percentage of University expenditures,
decreased from 2.3 percent in 1996 to 1.8 percent in 2002.
In 2001, the latest year for which comparative data are available, the University ranked 61st among 64 public research universities for this indicator as ranked by the Association of Research Libraries.
Figure 2-2. University Libraries non-sponsored revenue, FY 2005.
FY 2005 Income: $32,264,124
University Fee Fund
45.6%
ICR6.5%
State Funds35.6%
Income7.8%
Gifts/Endowments
2.5%
Grants/Contracts
0.3%
Vice President for
Research Support
1.8%
Source: University Libraries, University of Minnesota.
Twin Cities Campus
University of Minnesota: 2004-05 Accountable to U 29
E. University Research The University of Minnesota has long been a national and international leader in research, and, in this capacity, serves as an important component of the state’s economic engine. Its research programs attract outstanding faculty and students from a national and international pool. Many students are actively recruited by Minnesota employers looking for highly motivated, well-educated employees.
The University’s research programs may be thought of as a valuable Minnesota industry in and of themselves. The U.S. Department of Commerce estimates that 39 jobs are created in Minnesota for every $1 million spent on research by colleges and universities in the state. The University of Minnesota plays a commanding and central role: it attracts over 98 percent of all sponsored research performed by colleges and universities in the state.
As one of the country’s premier research institutions, and the only one of its kind in the state, the University of Minnesota takes seriously its mission to discover new medical treatments, develop new technologies, and expand the bounds of human knowledge through extensive research programs. Achieving this mission depends directly on the quality of the University’s faculty and their ability to compete for external funding to support their research, scholarly, and other activities.
The funds the University attracts for research come from many sources. Faculty, staff, and students compete for research funds from federal agencies like the National Institutes of Health and the National Science Foundation. The University also receives sponsored funding from state and local governments, businesses, and foundations.
While sponsored funding is a key measure of research activities and quality, there are other
significant factors, such as the University Libraries, that contribute to and help support a strong research infrastructure.
As competition intensifies for the best researchers and scholars and for the funding to support their endeavors, the University is well positioned to continue as a leading research university. The University has made significant progress in generating external funding to support its research programs. Research Proposals and Awards
The dollar value of sponsored research proposals submitted provides an early predictive measure of the University’s future research activity.
Figures 2-3 and 2-4 show the University’s performance in terms of the number of proposals submitted and awarded and the amount of those proposals.
Although the number and dollar value of proposals submitted has increased since 2000, the number of proposals funded has been relatively flat. However, the total value of sponsored funding proposals awarded also has increased and, in FY 2004, rebounded from a slight dip in the previous year.
In FY 2004, the Medical School led all University academic units in the amount of sponsored funds awarded, followed by the Institute of Technology and the School of Public Health, as shown in Figure 2-5.
Figure 2-6 shows grant and contract awards by source. Only 5.6 percent of grant and contract awards came from state and local governments in FY 2004. In FY 2003, state and local governments provided 15 percent of total grant and contract awards.
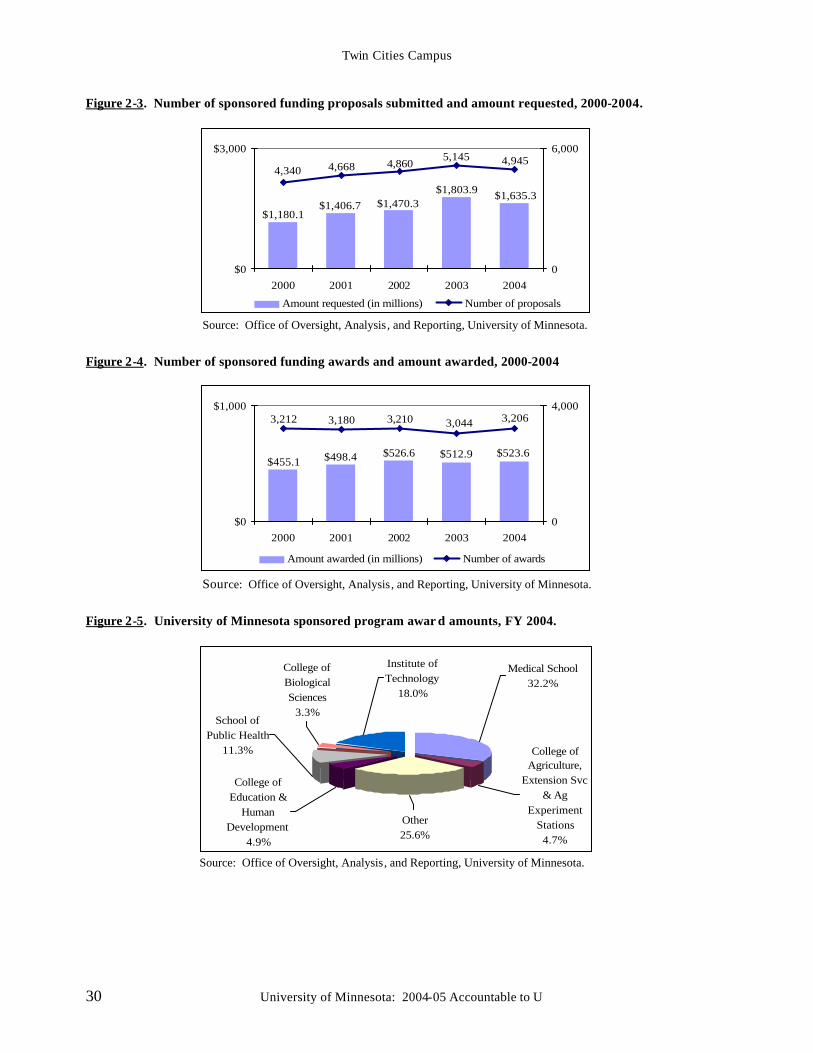
Twin Cities Campus
30 University of Minnesota: 2004-05 Accountable to U
Figure 2-3. Number of sponsored funding proposals submitted and amount requested, 2000-2004.
$1,635.3$1,803.9$1,470.3$1,406.7
$1,180.1
4,9455,1454,8604,6684,340
$0
$3,000
2000 2001 2002 2003 20040
6,000
Amount requested (in millions) Number of proposals
Source: Office of Oversight, Analysis, and Reporting, University of Minnesota.
Figure 2-4. Number of sponsored funding awards and amount awarded, 2000-2004
$523.6$512.9$526.6$498.4$455.1
3,2063,0443,2103,1803,212
$0
$1,000
2000 2001 2002 2003 20040
4,000
Amount awarded (in millions) Number of awards
Source: Office of Oversight, Analysis, and Reporting, University of Minnesota.
Figure 2-5. University of Minnesota sponsored program awar d amounts, FY 2004.
College of Agriculture,
Extension Svc & Ag
Experiment Stations
4.7%
Medical School32.2%
Other25.6%
College of Education &
Human Development
4.9%
School of Public Health
11.3%
College of Biological Sciences
3.3%
Institute of Technology
18.0%
Source: Office of Oversight, Analysis, and Reporting, University of Minnesota.
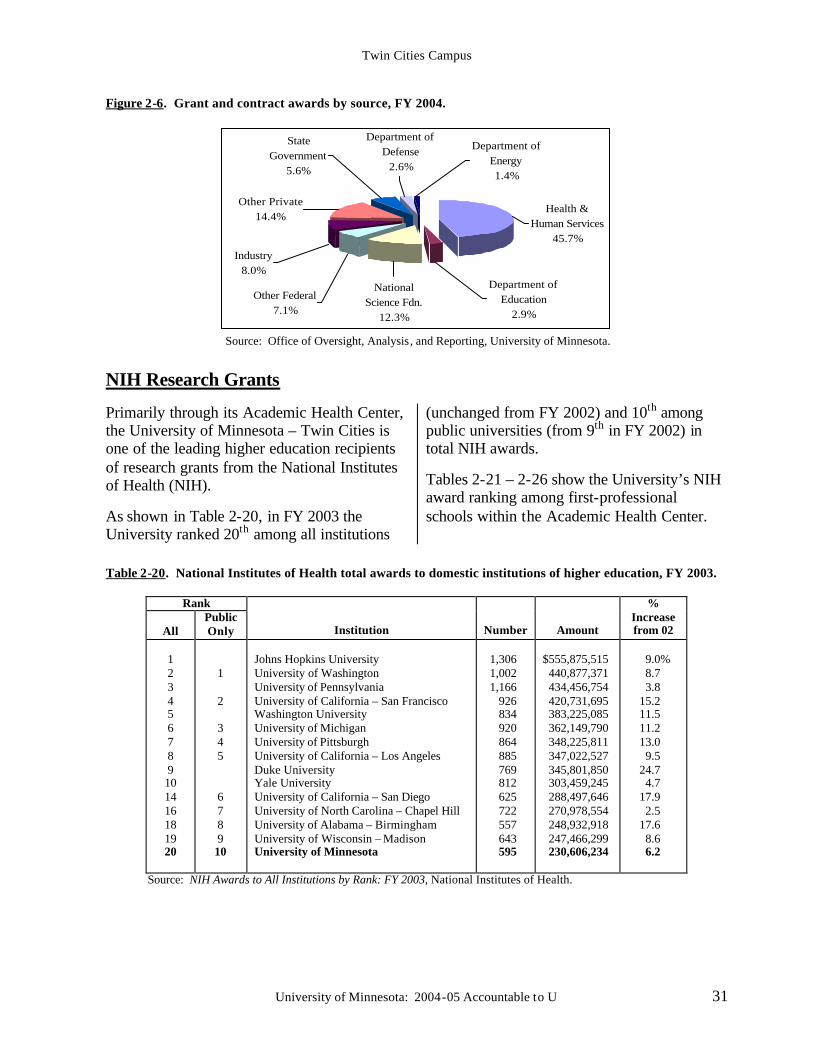
Twin Cities Campus
University of Minnesota: 2004-05 Accountable to U 31
Figure 2-6. Grant and contract awards by source, FY 2004.
Other Federal7.1%
National Science Fdn.
12.3%
Department of Education
2.9%
Industry8.0%
Other Private14.4%
State Government
5.6%
Department of Defense
2.6%
Department of Energy1.4%
Health & Human Services
45.7%
Source: Office of Oversight, Analysis, and Reporting, University of Minnesota.
NIH Research Grants
Primarily through its Academic Health Center, the University of Minnesota – Twin Cities is one of the leading higher education recipients of research grants from the National Institutes of Health (NIH).
As shown in Table 2-20, in FY 2003 the University ranked 20th among all institutions
(unchanged from FY 2002) and 10th among public universities (from 9th in FY 2002) in total NIH awards.
Tables 2-21 – 2-26 show the University’s NIH award ranking among first-professional schools within the Academic Health Center.
Table 2-20. National Institutes of Health total awards to domestic institutions of higher education, FY 2003.
Rank
All Public Only
Institution
Number
Amount
% Increase from 02
1 2 3 4 5 6 7 8 9 10 14 16 18 19 20
1 2 3 4 5 6 7 8 9 10
Johns Hopkins University University of Washington University of Pennsylvania University of California – San Francisco Washington University University of Michigan University of Pittsburgh University of California – Los Angeles Duke University Yale University University of California – San Diego University of North Carolina – Chapel Hill University of Alabama – Birmingham University of Wisconsin – Madison University of Minnesota
1,306 1,002 1,166 926 834 920 864 885 769 812 625 722 557 643 595
$555,875,515 440,877,371 434,456,754 420,731,695 383,225,085 362,149,790 348,225,811 347,022,527 345,801,850 303,459,245 288,497,646 270,978,554 248,932,918 247,466,299 230,606,234
9.0%
8.7 3.8
15.2 11.5 11.2 13.0
9.5 24.7
4.7 17.9
2.5 17.6
8.6 6.2
Source: NIH Awards to All Institutions by Rank: FY 2003, National Institutes of Health.
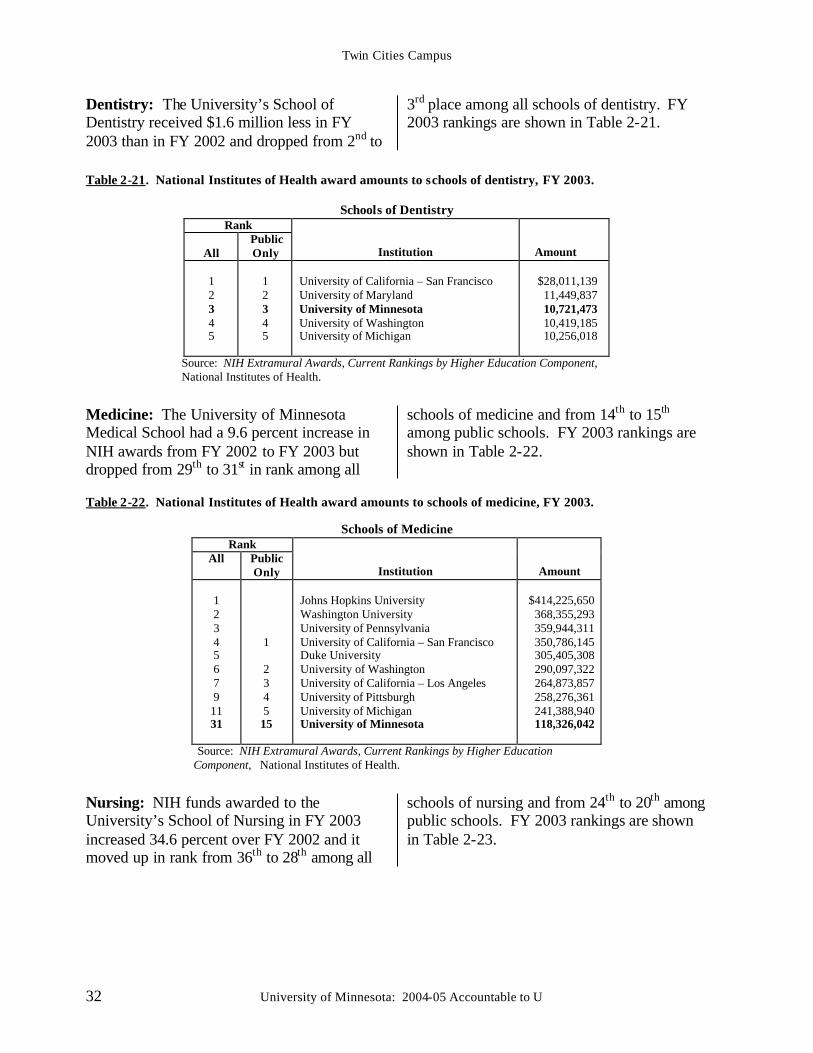
Twin Cities Campus
32 University of Minnesota: 2004-05 Accountable to U
Dentistry: The University’s School of Dentistry received $1.6 million less in FY 2003 than in FY 2002 and dropped from 2nd to
3rd place among all schools of dentistry. FY 2003 rankings are shown in Table 2-21.
Table 2-21. National Institutes of Health award amounts to schools of dentistry, FY 2003.
Schools of Dentistry Rank
All
Public Only
Institution
Amount 1 2 3 4 5
1 2 3 4 5
University of California – San Francisco University of Maryland University of Minnesota University of Washington University of Michigan
$28,011,139 11,449,837 10,721,473 10,419,185 10,256,018
Source: NIH Extramural Awards, Current Rankings by Higher Education Component, National Institutes of Health.
Medicine: The University of Minnesota Medical School had a 9.6 percent increase in NIH awards from FY 2002 to FY 2003 but dropped from 29th to 31st in rank among all
schools of medicine and from 14th to 15th among public schools. FY 2003 rankings are shown in Table 2-22.
Table 2-22. National Institutes of Health award amounts to schools of medicine, FY 2003.
Schools of Medicine Rank
All Public Only
Institution
Amount 1 2 3 4 5 6 7 9 11 31
1 2 3 4 5 15
Johns Hopkins University Washington University University of Pennsylvania University of California – San Francisco Duke University University of Washington University of California – Los Angeles University of Pittsburgh University of Michigan University of Minnesota
$414,225,650 368,355,293 359,944,311 350,786,145 305,405,308 290,097,322 264,873,857 258,276,361 241,388,940 118,326,042
Source: NIH Extramural Awards, Current Rankings by Higher Education Component, National Institutes of Health.
Nursing: NIH funds awarded to the University’s School of Nursing in FY 2003 increased 34.6 percent over FY 2002 and it moved up in rank from 36th to 28th among all
schools of nursing and from 24th to 20th among public schools. FY 2003 rankings are shown in Table 2-23.
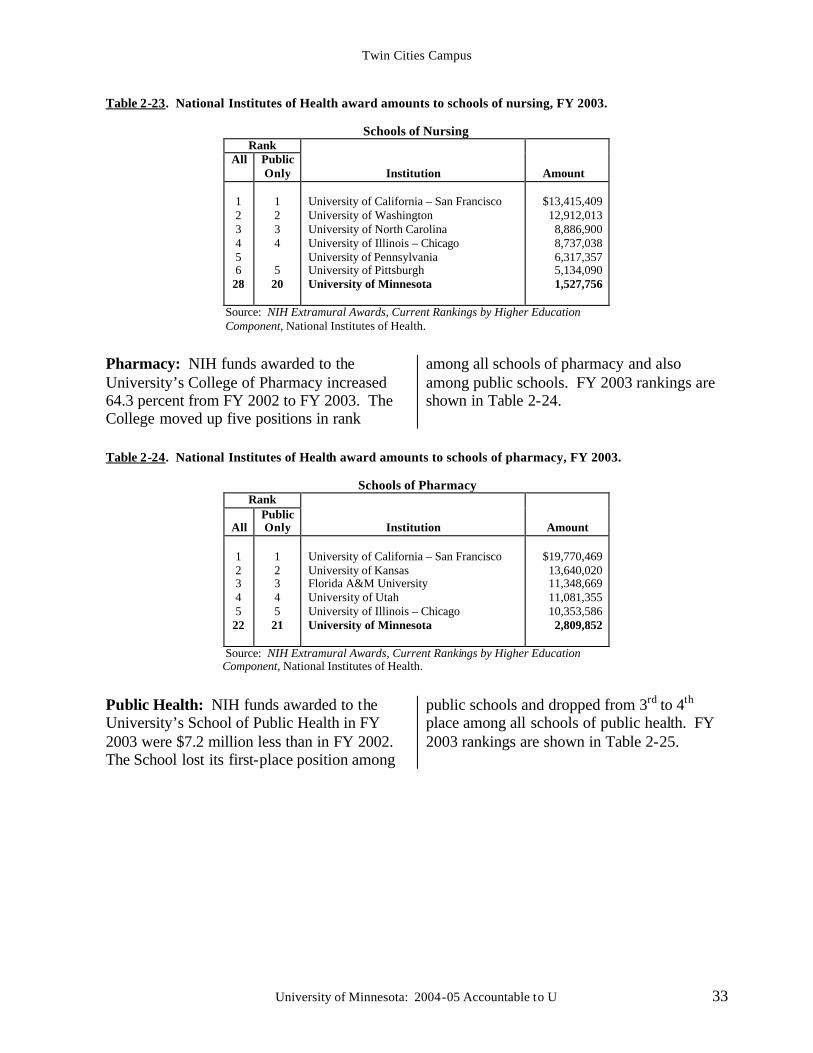
Twin Cities Campus
University of Minnesota: 2004-05 Accountable to U 33
Table 2-23. National Institutes of Health award amounts to schools of nursing, FY 2003.
Schools of Nursing Rank
All Public Only
Institution
Amount 1 2 3 4 5 6 28
1 2 3 4 5 20
University of California – San Francisco University of Washington University of North Carolina University of Illinois – Chicago University of Pennsylvania University of Pittsburgh University of Minnesota
$13,415,409 12,912,013 8,886,900 8,737,038 6,317,357 5,134,090 1,527,756
Source: NIH Extramural Awards, Current Rankings by Higher Education Component, National Institutes of Health.
Pharmacy: NIH funds awarded to the University’s College of Pharmacy increased 64.3 percent from FY 2002 to FY 2003. The College moved up five positions in rank
among all schools of pharmacy and also among public schools. FY 2003 rankings are shown in Table 2-24.
Table 2-24. National Institutes of Health award amounts to schools of pharmacy, FY 2003.
Schools of Pharmacy Rank
All
Public Only
Institution
Amount 1 2 3 4 5 22
1 2 3 4 5 21
University of California – San Francisco University of Kansas Florida A&M University University of Utah University of Illinois – Chicago University of Minnesota
$19,770,469 13,640,020 11,348,669 11,081,355 10,353,586 2,809,852
Source: NIH Extramural Awards, Current Rankings by Higher Education Component, National Institutes of Health.
Public Health: NIH funds awarded to the University’s School of Public Health in FY 2003 were $7.2 million less than in FY 2002. The School lost its first-place position among
public schools and dropped from 3rd to 4th place among all schools of public health. FY 2003 rankings are shown in Table 2-25.
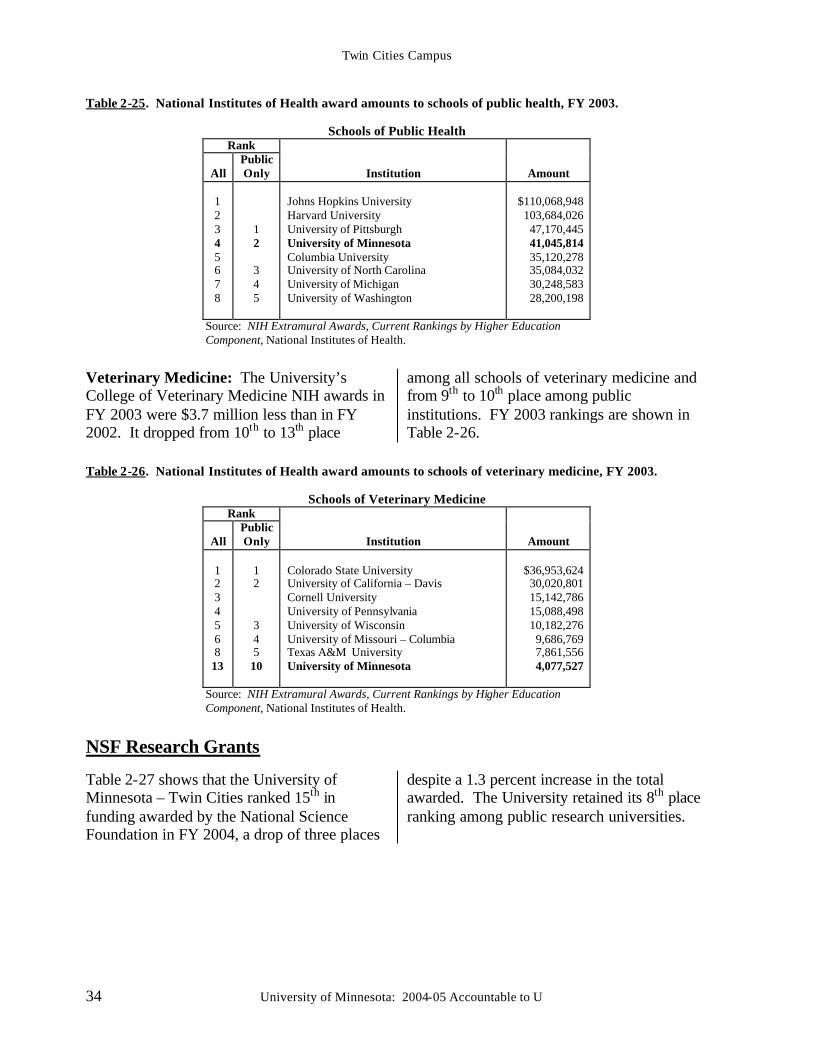
Twin Cities Campus
34 University of Minnesota: 2004-05 Accountable to U
Table 2-25. National Institutes of Health award amounts to schools of public health, FY 2003.
Schools of Public Health Rank
All
Public Only
Institution
Amount 1 2 3 4 5 6 7 8
1 2 3 4 5
Johns Hopkins University Harvard University University of Pittsburgh University of Minnesota Columbia University University of North Carolina University of Michigan University of Washington
$110,068,948 103,684,026 47,170,445 41,045,814 35,120,278 35,084,032 30,248,583 28,200,198
Source: NIH Extramural Awards, Current Rankings by Higher Education Component, National Institutes of Health.
Veterinary Medicine: The University’s College of Veterinary Medicine NIH awards in FY 2003 were $3.7 million less than in FY 2002. It dropped from 10th to 13th place
among all schools of veterinary medicine and from 9th to 10th place among public institutions. FY 2003 rankings are shown in Table 2-26.
Table 2-26. National Institutes of Health award amounts to schools of veterinary medicine, FY 2003.
Schools of Veterinary Medicine Rank
All
Public Only
Institution
Amount 1 2 3 4 5 6 8 13
1 2 3 4 5 10
Colorado State University University of California – Davis Cornell University University of Pennsylvania University of Wisconsin University of Missouri – Columbia Texas A&M University University of Minnesota
$36,953,624 30,020,801 15,142,786 15,088,498 10,182,276 9,686,769 7,861,556 4,077,527
Source: NIH Extramural Awards, Current Rankings by Higher Education Component, National Institutes of Health.
NSF Research Grants Table 2-27 shows that the University of Minnesota – Twin Cities ranked 15th in funding awarded by the National Science Foundation in FY 2004, a drop of three places
despite a 1.3 percent increase in the total awarded. The University retained its 8th place ranking among public research universities.
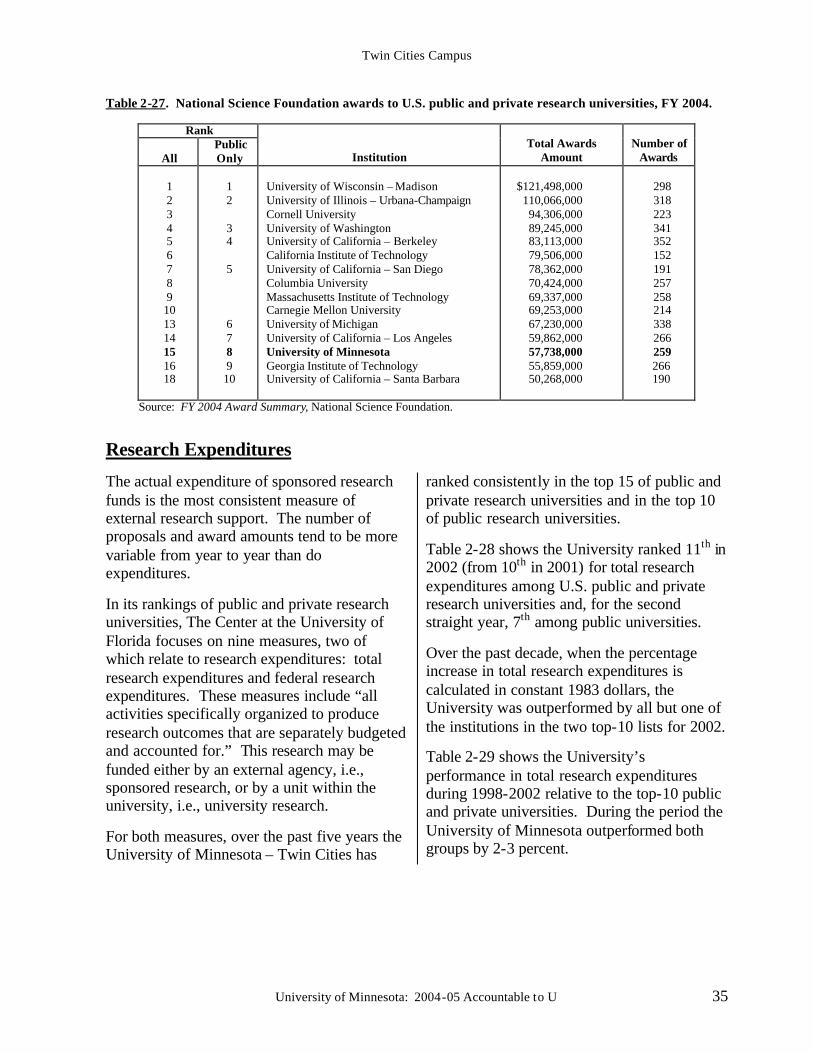
Twin Cities Campus
University of Minnesota: 2004-05 Accountable to U 35
Table 2-27. National Science Foundation awards to U.S. public and private research universities, FY 2004.
Rank
All Public Only
Institution
Total Awards
Amount
Number of
Awards 1 2 3 4 5 6 7 8 9 10 13 14 15 16 18
1 2 3 4 5 6 7 8 9 10
University of Wisconsin – Madison University of Illinois – Urbana-Champaign Cornell University University of Washington University of California – Berkeley California Institute of Technology University of California – San Diego Columbia University Massachusetts Institute of Technology Carnegie Mellon University University of Michigan University of California – Los Angeles University of Minnesota Georgia Institute of Technology University of California – Santa Barbara
$121,498,000 110,066,000 94,306,000 89,245,000 83,113,000 79,506,000 78,362,000 70,424,000 69,337,000 69,253,000 67,230,000 59,862,000 57,738,000 55,859,000 50,268,000
298 318 223 341 352 152 191 257 258 214 338 266 259
266 190
Source: FY 2004 Award Summary, National Science Foundation.
Research Expenditures
The actual expenditure of sponsored research funds is the most consistent measure of external research support. The number of proposals and award amounts tend to be more variable from year to year than do expenditures.
In its rankings of public and private research universities, The Center at the University of Florida focuses on nine measures, two of which relate to research expenditures: total research expenditures and federal research expenditures. These measures include “all activities specifically organized to produce research outcomes that are separately budgeted and accounted for.” This research may be funded either by an external agency, i.e., sponsored research, or by a unit within the university, i.e., university research.
For both measures, over the past five years the University of Minnesota – Twin Cities has
ranked consistently in the top 15 of public and private research universities and in the top 10 of public research universities.
Table 2-28 shows the University ranked 11th in 2002 (from 10th in 2001) for total research expenditures among U.S. public and private research universities and, for the second straight year, 7th among public universities.
Over the past decade, when the percentage increase in total research expenditures is calculated in constant 1983 dollars, the University was outperformed by all but one of the institutions in the two top-10 lists for 2002.
Table 2-29 shows the University’s performance in total research expenditures during 1998-2002 relative to the top-10 public and private universities. During the period the University of Minnesota outperformed both groups by 2-3 percent.
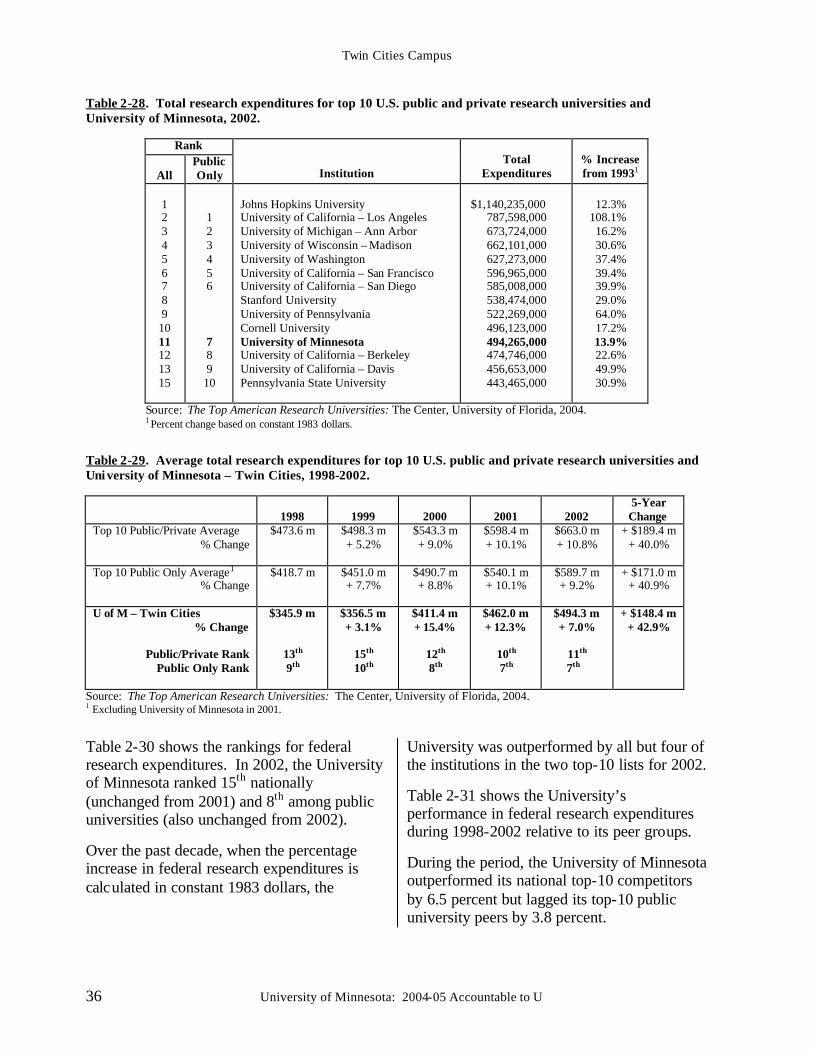
Twin Cities Campus
36 University of Minnesota: 2004-05 Accountable to U
Table 2-28. Total research expenditures for top 10 U.S. public and private research universities and University of Minnesota, 2002.
Rank
All Public Only
Institution
Total
Expenditures
% Increase from 19931
1 2 3 4 5 6 7 8 9 10 11 12 13 15
1 2 3 4 5 6 7 8 9 10
Johns Hopkins University University of California – Los Angeles University of Michigan – Ann Arbor University of Wisconsin – Madison University of Washington University of California – San Francisco University of California – San Diego Stanford University University of Pennsylvania Cornell University University of Minnesota University of California – Berkeley University of California – Davis Pennsylvania State University
$1,140,235,000
787,598,000 673,724,000 662,101,000 627,273,000 596,965,000 585,008,000 538,474,000 522,269,000 496,123,000 494,265,000 474,746,000 456,653,000 443,465,000
12.3%
108.1% 16.2% 30.6% 37.4% 39.4% 39.9% 29.0% 64.0% 17.2% 13.9% 22.6% 49.9% 30.9%
Source: The Top American Research Universities: The Center, University of Florida, 2004.
1 Percent change based on constant 1983 dollars.
Table 2-29. Average total research expenditures for top 10 U.S. public and private research universities and University of Minnesota – Twin Cities, 1998-2002.
1998
1999
2000
2001
2002
5-Year Change
Top 10 Public/Private Average % Change
$473.6 m
$498.3 m + 5.2%
$543.3 m + 9.0%
$598.4 m + 10.1%
$663.0 m + 10.8%
+ $189.4 m + 40.0%
Top 10 Public Only Average1 % Change
$418.7 m $451.0 m + 7.7%
$490.7 m + 8.8%
$540.1 m + 10.1%
$589.7 m + 9.2%
+ $171.0 m + 40.9%
U of M – Twin Cities % Change
Public/Private Rank
Public Only Rank
$345.9 m
13th 9th
$356.5 m + 3.1%
15th 10th
$411.4 m + 15.4%
12th 8th
$462.0 m + 12.3%
10th 7th
$494.3 m + 7.0%
11th 7th
+ $148.4 m + 42.9%
Source: The Top American Research Universities: The Center, University of Florida, 2004. 1 Excluding University of Minnesota in 2001.
Table 2-30 shows the rankings for federal research expenditures. In 2002, the University of Minnesota ranked 15th nationally (unchanged from 2001) and 8th among public universities (also unchanged from 2002).
Over the past decade, when the percentage increase in federal research expenditures is calculated in constant 1983 dollars, the
University was outperformed by all but four of the institutions in the two top-10 lists for 2002.
Table 2-31 shows the University’s performance in federal research expenditures during 1998-2002 relative to its peer groups.
During the period, the University of Minnesota outperformed its national top-10 competitors by 6.5 percent but lagged its top-10 public university peers by 3.8 percent.
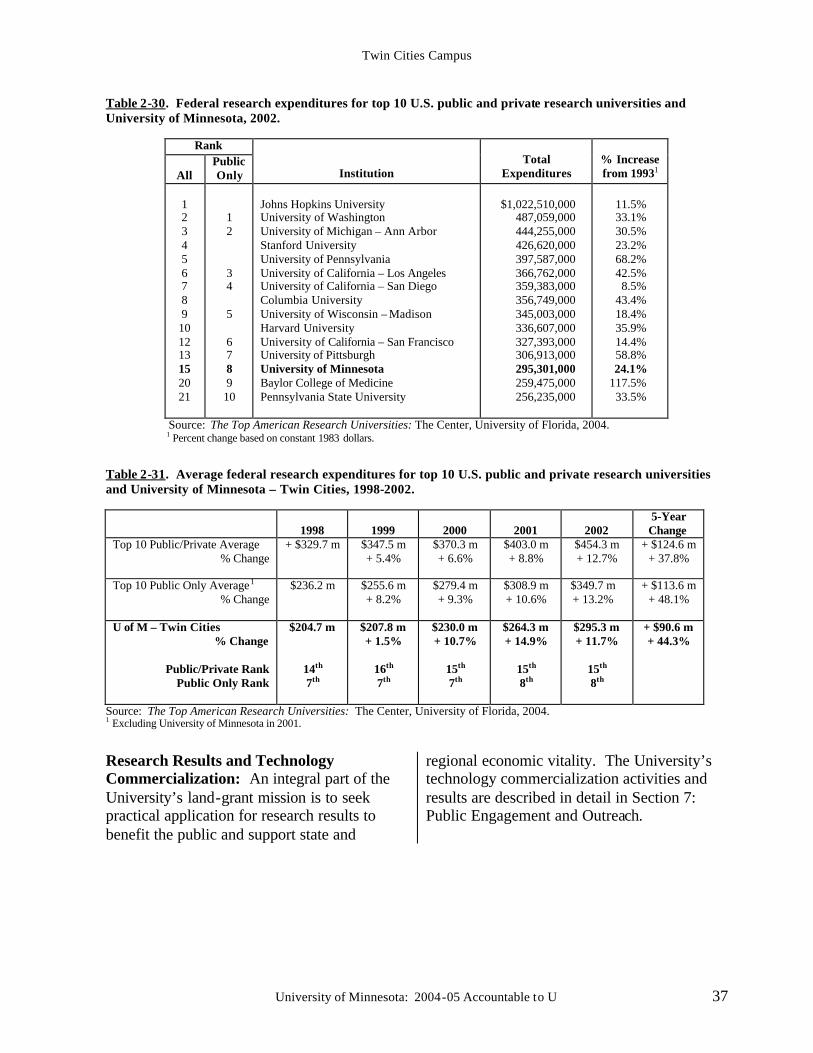
Twin Cities Campus
University of Minnesota: 2004-05 Accountable to U 37
Table 2-30. Federal research expenditures for top 10 U.S. public and private research universities and University of Minnesota, 2002.
Rank
All Public Only
Institution
Total
Expenditures
% Increase from 19931
1 2 3 4 5 6 7 8 9 10 12 13 15 20 21
1 2 3 4 5 6 7 8 9 10
Johns Hopkins University University of Washington University of Michigan – Ann Arbor Stanford University University of Pennsylvania University of California – Los Angeles University of California – San Diego Columbia University University of Wisconsin – Madison Harvard University University of California – San Francisco University of Pittsburgh University of Minnesota Baylor College of Medicine Pennsylvania State University
$1,022,510,000
487,059,000 444,255,000 426,620,000 397,587,000 366,762,000 359,383,000 356,749,000 345,003,000 336,607,000 327,393,000 306,913,000 295,301,000 259,475,000 256,235,000
11.5% 33.1% 30.5% 23.2% 68.2% 42.5% 8.5%
43.4% 18.4% 35.9% 14.4% 58.8% 24.1%
117.5% 33.5%
Source: The Top American Research Universities: The Center, University of Florida, 2004. 1 Percent change based on constant 1983 dollars.
Table 2-31. Average federal research expenditures for top 10 U.S. public and private research universities and University of Minnesota – Twin Cities, 1998-2002.
1998
1999
2000
2001
2002
5-Year Change
Top 10 Public/Private Average % Change
+ $329.7 m $347.5 m + 5.4%
$370.3 m + 6.6%
$403.0 m + 8.8%
$454.3 m + 12.7%
+ $124.6 m + 37.8%
Top 10 Public Only Average1 % Change
$236.2 m
$255.6 m + 8.2%
$279.4 m + 9.3%
$308.9 m + 10.6%
$349.7 m + 13.2%
+ $113.6 m + 48.1%
U of M – Twin Cities % Change
Public/Private Rank
Public Only Rank
$204.7 m
14th
7th
$207.8 m + 1.5%
16th 7th
$230.0 m + 10.7%
15th 7th
$264.3 m + 14.9%
15th 8th
$295.3 m + 11.7%
15th 8th
+ $90.6 m + 44.3%
Source: The Top American Research Universities: The Center, University of Florida, 2004. 1 Excluding University of Minnesota in 2001.
Research Results and Technology Commercialization: An integral part of the University’s land-grant mission is to seek practical application for research results to benefit the public and support state and
regional economic vitality. The University’s technology commercialization activities and results are described in detail in Section 7: Public Engagement and Outreach.
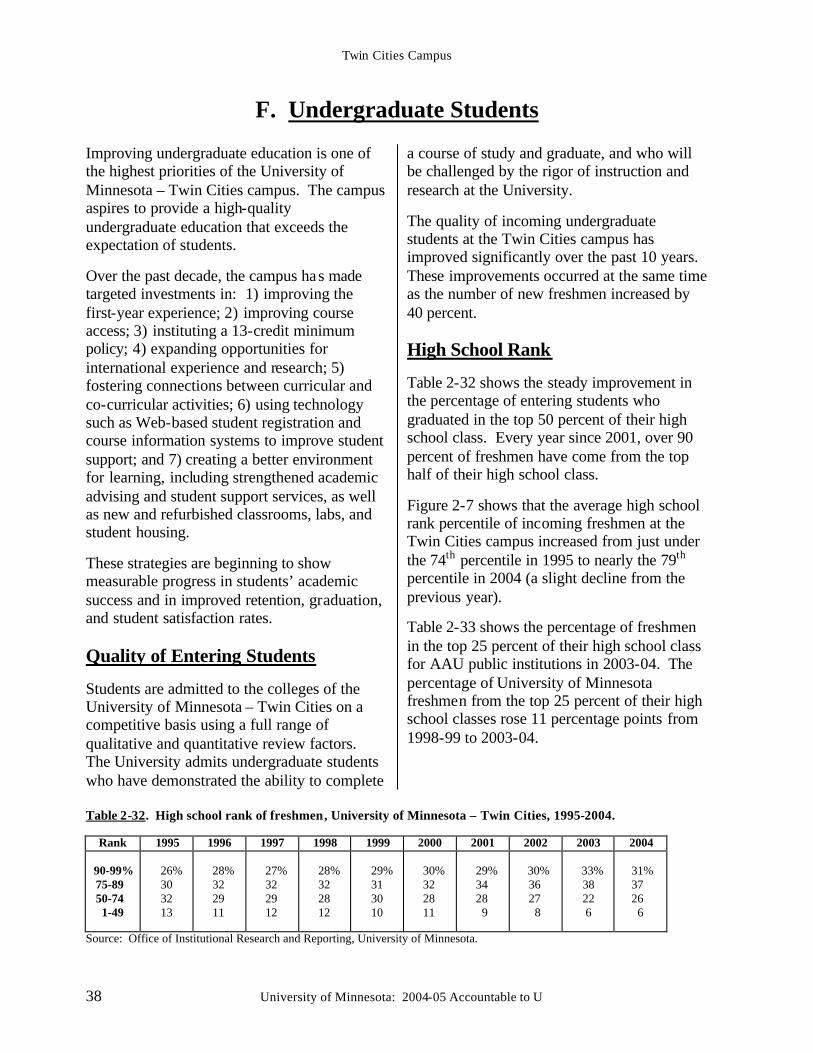
Twin Cities Campus
38 University of Minnesota: 2004-05 Accountable to U
F. Undergraduate Students Improving undergraduate education is one of the highest priorities of the University of Minnesota – Twin Cities campus. The campus aspires to provide a high-quality undergraduate education that exceeds the expectation of students.
Over the past decade, the campus has made targeted investments in: 1) improving the first-year experience; 2) improving course access; 3) instituting a 13-credit minimum policy; 4) expanding opportunities for international experience and research; 5) fostering connections between curricular and co-curricular activities; 6) using technology such as Web-based student registration and course information systems to improve student support; and 7) creating a better environment for learning, including strengthened academic advising and student support services, as well as new and refurbished classrooms, labs, and student housing.
These strategies are beginning to show measurable progress in students’ academic success and in improved retention, graduation, and student satisfaction rates. Quality of Entering Students
Students are admitted to the colleges of the University of Minnesota – Twin Cities on a competitive basis using a full range of qualitative and quantitative review factors. The University admits undergraduate students who have demonstrated the ability to complete
a course of study and graduate, and who will be challenged by the rigor of instruction and research at the University.
The quality of incoming undergraduate students at the Twin Cities campus has improved significantly over the past 10 years. These improvements occurred at the same time as the number of new freshmen increased by 40 percent. High School Rank Table 2-32 shows the steady improvement in the percentage of entering students who graduated in the top 50 percent of their high school class. Every year since 2001, over 90 percent of freshmen have come from the top half of their high school class.
Figure 2-7 shows that the average high school rank percentile of incoming freshmen at the Twin Cities campus increased from just under the 74th percentile in 1995 to nearly the 79th percentile in 2004 (a slight decline from the previous year).
Table 2-33 shows the percentage of freshmen in the top 25 percent of their high school class for AAU public institutions in 2003-04. The percentage of University of Minnesota freshmen from the top 25 percent of their high school classes rose 11 percentage points from 1998-99 to 2003-04.
Table 2-32. High school rank of freshmen, University of Minnesota – Twin Cities, 1995-2004.
Rank 1995 1996 1997 1998 1999 2000 2001 2002 2003 2004 90-99% 75-89 50-74 1-49
26% 30 32 13
28% 32 29 11
27% 32 29 12
28% 32 28 12
29% 31 30 10
30% 32 28 11
29% 34 28 9
30%
36 27 8
33%
38 22 6
31%
37 26 6
Source: Office of Institutional Research and Reporting, University of Minnesota.
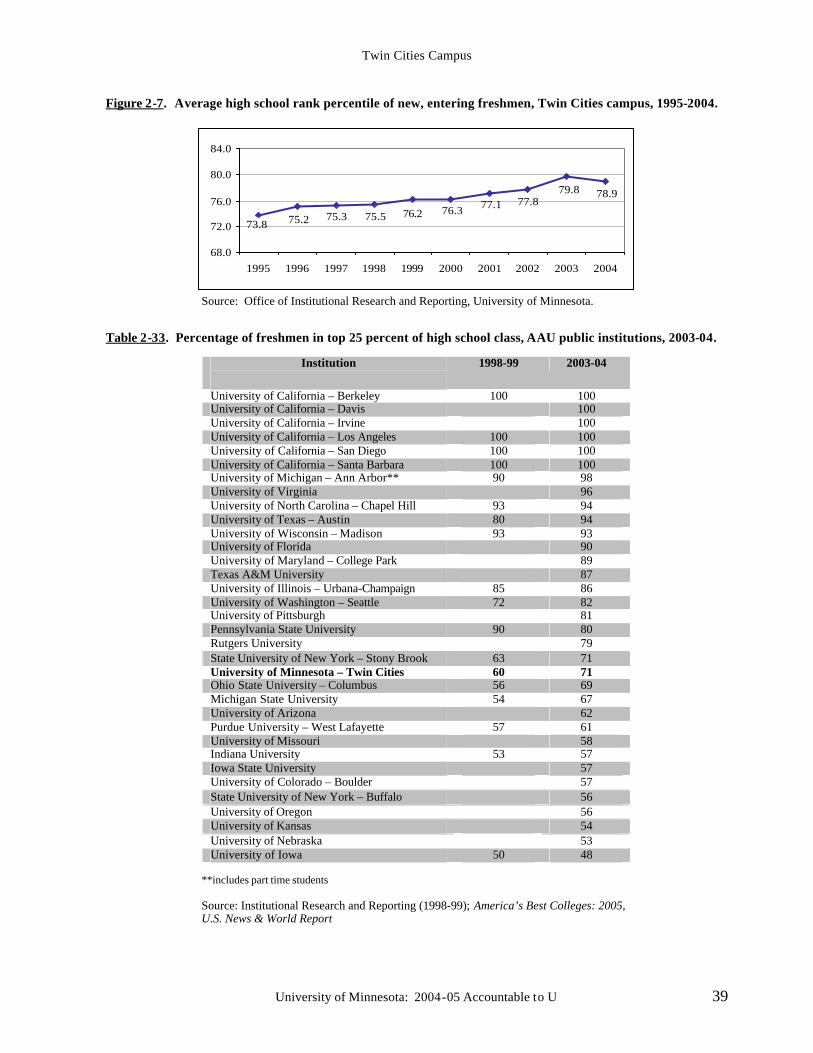
Twin Cities Campus
University of Minnesota: 2004-05 Accountable to U 39
Figure 2-7. Average high school rank percentile of new, entering freshmen, Twin Cities campus, 1995-2004.
78.979.877.877.176.376.275.575.375.273.8
68.0
72.0
76.0
80.0
84.0
1995 1996 1997 1998 1999 2000 2001 2002 2003 2004
Source: Office of Institutional Research and Reporting, University of Minnesota.
Table 2-33. Percentage of freshmen in top 25 percent of high school class, AAU public institutions, 2003-04.
Institution
1998-99 2003-04
University of California – Berkeley 100 100 University of California – Davis 100 University of California – Irvine 100 University of California – Los Angeles 100 100 University of California – San Diego 100 100 University of California – Santa Barbara 100 100 University of Michigan – Ann Arbor** 90 98 University of Virginia 96 University of North Carolina – Chapel Hill 93 94 University of Texas – Austin 80 94 University of Wisconsin – Madison 93 93 University of Florida 90 University of Maryland – College Park 89 Texas A&M University 87 University of Illinois – Urbana-Champaign 85 86 University of Washington – Seattle 72 82 University of Pittsburgh 81 Pennsylvania State University 90 80 Rutgers University 79 State University of New York – Stony Brook 63 71 University of Minnesota – Twin Cities 60 71 Ohio State University – Columbus 56 69 Michigan State University 54 67 University of Arizona 62 Purdue University – West Lafayette 57 61 University of Missouri 58 Indiana University 53 57 Iowa State University 57 University of Colorado – Boulder 57 State University of New York – Buffalo 56 University of Oregon 56 University of Kansas 54 University of Nebraska 53 University of Iowa 50 48
**includes part time students Source: Institutional Research and Reporting (1998-99); America’s Best Colleges: 2005, U.S. News & World Report
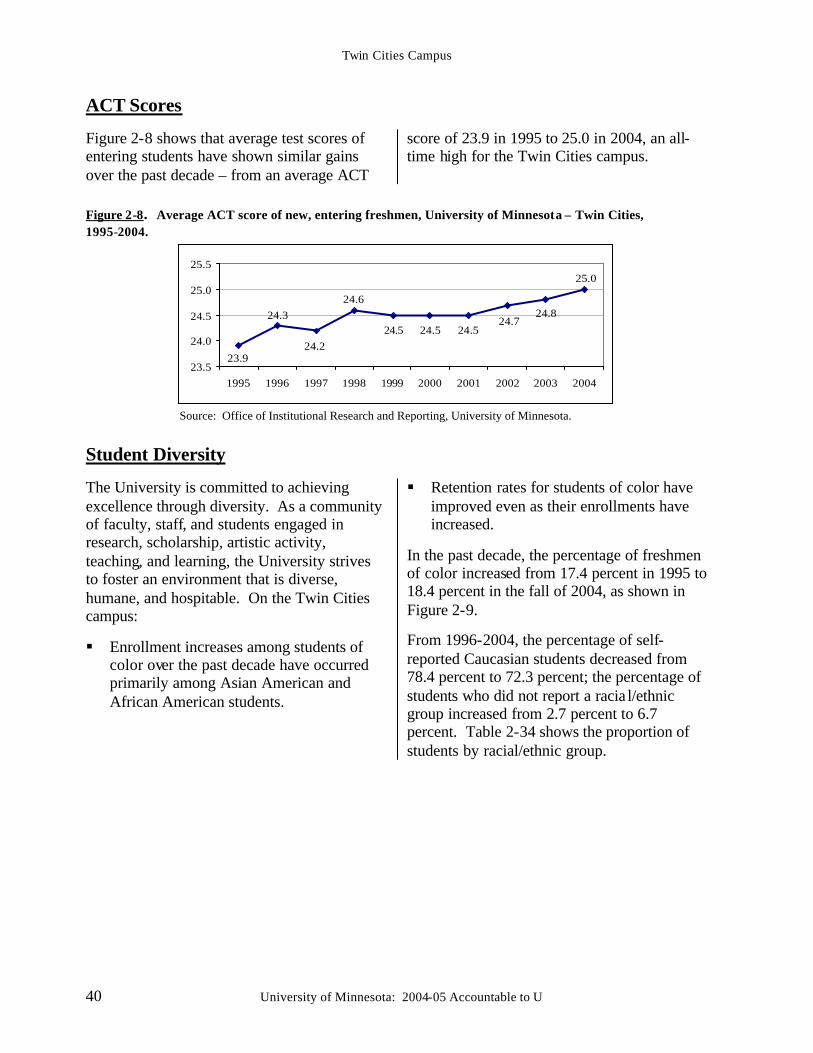
Twin Cities Campus
40 University of Minnesota: 2004-05 Accountable to U
ACT Scores
Figure 2-8 shows that average test scores of entering students have shown similar gains over the past decade – from an average ACT
score of 23.9 in 1995 to 25.0 in 2004, an all-time high for the Twin Cities campus.
Figure 2-8. Average ACT score of new, entering freshmen, University of Minnesota – Twin Cities, 1995-2004.
25.0
24.824.7
24.524.524.5
24.6
24.2
24.3
23.923.5
24.0
24.5
25.0
25.5
1995 1996 1997 1998 1999 2000 2001 2002 2003 2004
Source: Office of Institutional Research and Reporting, University of Minnesota.
Student Diversity The University is committed to achieving excellence through diversity. As a community of faculty, staff, and students engaged in research, scholarship, artistic activity, teaching, and learning, the University strives to foster an environment that is diverse, humane, and hospitable. On the Twin Cities campus:
§ Enrollment increases among students of color over the past decade have occurred primarily among Asian American and African American students.
§ Retention rates for students of color have improved even as their enrollments have increased.
In the past decade, the percentage of freshmen of color increased from 17.4 percent in 1995 to 18.4 percent in the fall of 2004, as shown in Figure 2-9.
From 1996-2004, the percentage of self-reported Caucasian students decreased from 78.4 percent to 72.3 percent; the percentage of students who did not report a racia l/ethnic group increased from 2.7 percent to 6.7 percent. Table 2-34 shows the proportion of students by racial/ethnic group.
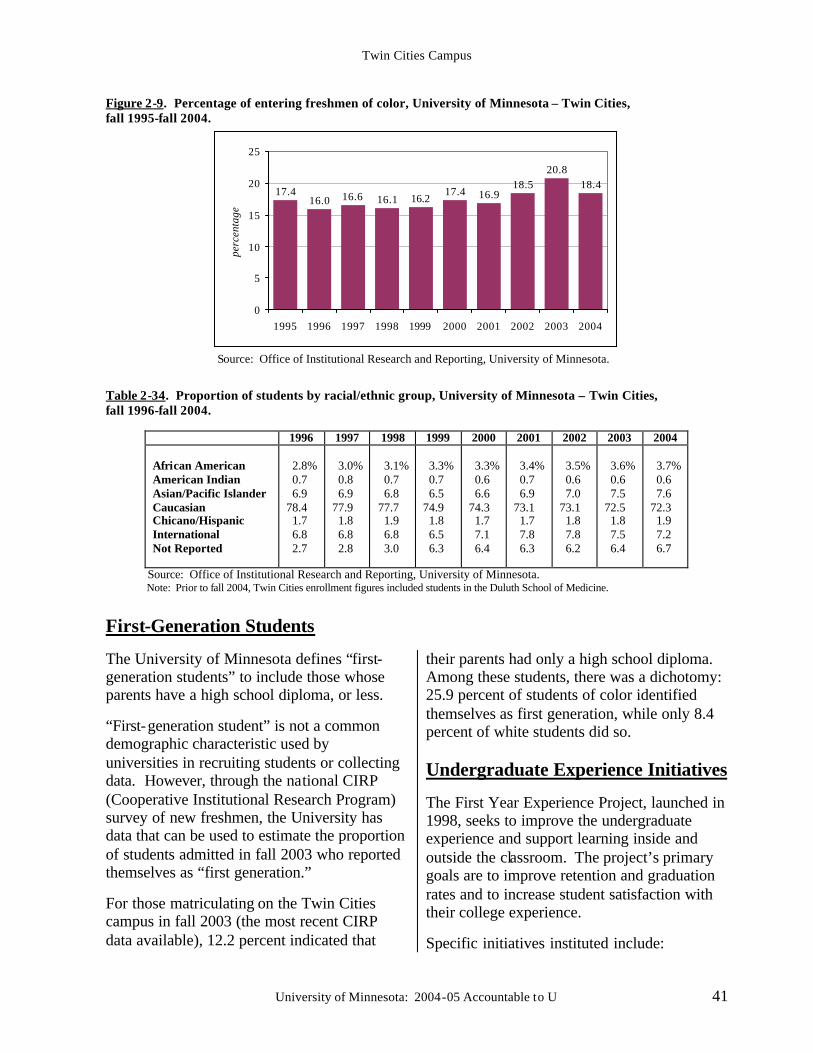
Twin Cities Campus
University of Minnesota: 2004-05 Accountable to U 41
Figure 2-9. Percentage of entering freshmen of color, University of Minnesota – Twin Cities, fall 1995-fall 2004.
18.420.8
18.516.917.4
16.216.116.616.017.4
0
5
10
15
20
25
1995 1996 1997 1998 1999 2000 2001 2002 2003 2004
perc
enta
ge
Source: Office of Institutional Research and Reporting, University of Minnesota. Table 2-34. Proportion of students by racial/ethnic group, University of Minnesota – Twin Cities, fall 1996-fall 2004.
1996 1997 1998 1999 2000 2001 2002 2003 2004 African American American Indian Asian/Pacific Islander Caucasian Chicano/Hispanic International Not Reported
2.8% 0.7 6.9 78.4 1.7 6.8 2.7
3.0% 0.8 6.9 77.9 1.8 6.8 2.8
3.1% 0.7 6.8 77.7 1.9 6.8 3.0
3.3% 0.7 6.5 74.9 1.8 6.5 6.3
3.3% 0.6 6.6 74.3 1.7 7.1 6.4
3.4% 0.7 6.9 73.1 1.7 7.8 6.3
3.5% 0.6 7.0 73.1 1.8 7.8 6.2
3.6% 0.6 7.5 72.5 1.8 7.5 6.4
3.7% 0.6 7.6 72.3 1.9 7.2 6.7
Source: Office of Institutional Research and Reporting, University of Minnesota. Note: Prior to fall 2004, Twin Cities enrollment figures included students in the Duluth School of Medicine.
First-Generation Students
The University of Minnesota defines “first-generation students” to include those whose parents have a high school diploma, or less.
“First-generation student” is not a common demographic characteristic used by universities in recruiting students or collecting data. However, through the national CIRP (Cooperative Institutional Research Program) survey of new freshmen, the University has data that can be used to estimate the proportion of students admitted in fall 2003 who reported themselves as “first generation.”
For those matriculating on the Twin Cities campus in fall 2003 (the most recent CIRP data available), 12.2 percent indicated that
their parents had only a high school diploma. Among these students, there was a dichotomy: 25.9 percent of students of color identified themselves as first generation, while only 8.4 percent of white students did so. Undergraduate Experience Initiatives
The First Year Experience Project, launched in 1998, seeks to improve the undergraduate experience and support learning inside and outside the classroom. The project’s primary goals are to improve retention and graduation rates and to increase student satisfaction with their college experience.
Specific initiatives instituted include:
Twin Cities Campus
42 University of Minnesota: 2004-05 Accountable to U
Freshman Seminars: Over 115 seminars, enrolling about 1,700 students, were offered in fall 2004 across a wide variety of disciplines.
New Student Orientation: Over 5,500 students participated in orientation activities preceding the fall 2004 semester; 825 students participated in New Student Weekend.
Parent Orientation: Nearly 4,300 parents participated in parent orientation activities preceding the fall 2004 semester.
Transfer Students: Orientation activities specifically for transfer students and their parents were held prior to fall semester 2004. More than 1,600 students and nearly 300 parents participated.
Convocation: About 4,000 students attended convocation-related activities in fall 2004.
Living/Learning Communities: In fall 2004, 850 students participated in 21 living/learning communities in the residence halls.
Assessment of how well these initiatives are meeting their objectives and contributing to the achievement of retention, graduation, and student satisfaction goals is ongoing. Council for Enhancing Student Learning
In 2002, the Twin Cities campus launched a comprehensive initiative to enhance student success at all levels and across all academic units. This initiative is helping to strengthen academic quality by focusing on improving teaching and learning and increasing student retention and graduation rates.
The driving force for this initiative is the Council for Enhancing Student Learning, which is comprised of representatives from all collegiate units and other faculty, academic administrators, and students.
The Council’s mission is: “to enhance educational effectiveness in the colleges and schools, departments, and classrooms on the Twin Cities campus by: 1) providing models, tools, and learning opportunities for faculty and students, 2) encouraging and supporting the use of data to enhance student learning and conducting research in learning assessment, and 3) sharing expertise across disciplines and among undergraduate, graduate, and professional education units.”
Among the Council’s 2003-04 accomplishments were:
§ conducting a baseline survey of faculty and instructors on perceptions and attitudes related to teaching and learning,
§ identifying a set of general learning outcomes for all Twin Cities campus undergraduates,
§ exploring ways that technology can strengthen student learning assessment,
§ hosting a series of campus-wide workshops and symposia on teaching and learning, featuring nationally recognized assessment experts.
Retention Rates
The Twin Cities campus long has been at or near the bottom of its Big Ten public institution and national research university peer groups in terms of undergraduate retention and graduation rates.
In 2000-01, a campus-wide task force examined the reasons for these low rates and developed specific recommendations to enhance retention and graduation rates. These recommendations, along with previous efforts in the mid- to late-1990s, have led to substantial improvements.
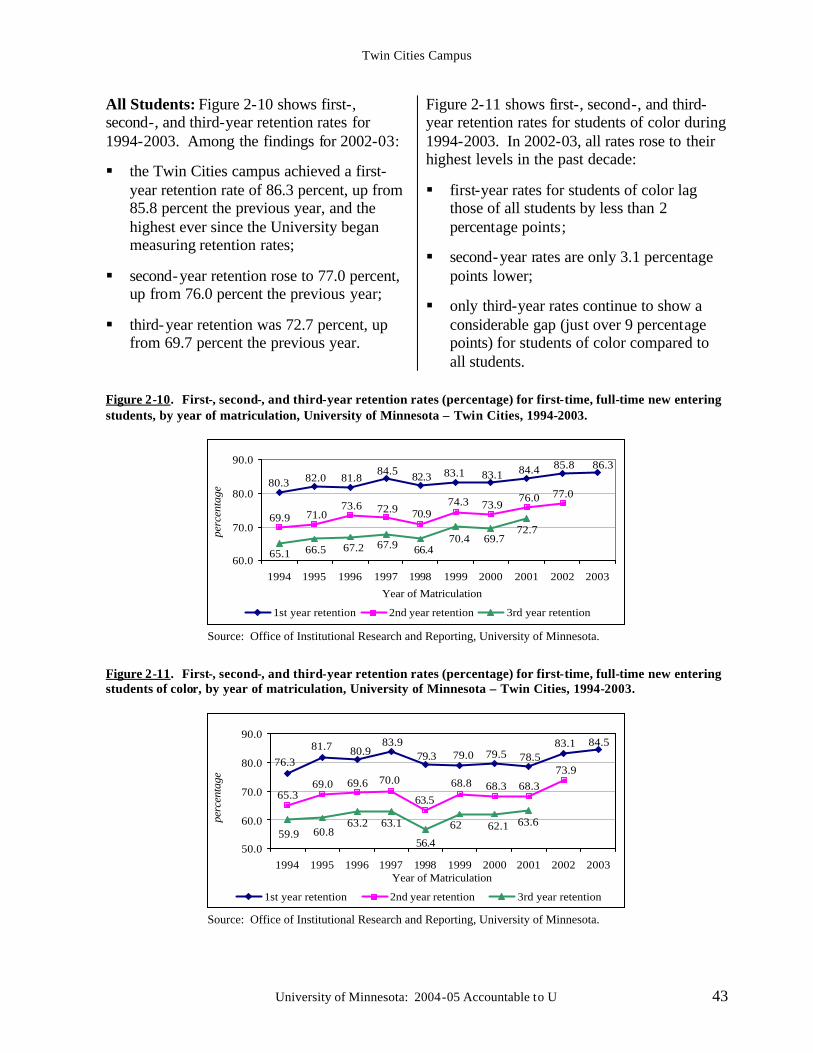
Twin Cities Campus
University of Minnesota: 2004-05 Accountable to U 43
All Students: Figure 2-10 shows first-, second-, and third-year retention rates for 1994-2003. Among the findings for 2002-03:
§ the Twin Cities campus achieved a first-year retention rate of 86.3 percent, up from 85.8 percent the previous year, and the highest ever since the University began measuring retention rates;
§ second-year retention rose to 77.0 percent, up from 76.0 percent the previous year;
§ third-year retention was 72.7 percent, up from 69.7 percent the previous year.
Figure 2-11 shows first-, second-, and third-year retention rates for students of color during 1994-2003. In 2002-03, all rates rose to their highest levels in the past decade:
§ first-year rates for students of color lag those of all students by less than 2 percentage points;
§ second-year rates are only 3.1 percentage points lower;
§ only third-year rates continue to show a considerable gap (just over 9 percentage points) for students of color compared to all students.
Figure 2-10. First-, second-, and third-year retention rates (percentage) for first-time, full-time new entering students, by year of matriculation, University of Minnesota – Twin Cities, 1994-2003.
86.385.884.483.183.182.384.581.882.080.3
77.076.073.974.3
70.972.973.671.069.9
72.7
65.169.770.4
66.467.967.266.560.0
70.0
80.0
90.0
1994 1995 1996 1997 1998 1999 2000 2001 2002 2003
Year of Matriculation
perc
enta
ge
1st year retention 2nd year retention 3rd year retention
Source: Office of Institutional Research and Reporting, University of Minnesota.
Figure 2-11. First-, second-, and third-year retention rates (percentage) for first-time, full-time new entering students of color, by year of matriculation, University of Minnesota – Twin Cities, 1994-2003.
84.583.178.579.579.079.3
83.980.981.7
76.373.9
68.368.368.8
63.5
70.069.669.065.3
63.662.162
56.4
63.163.260.859.9
50.0
60.0
70.0
80.0
90.0
1994 1995 1996 1997 1998 1999 2000 2001 2002 2003Year of Matriculation
perc
enta
ge
1st year retention 2nd year retention 3rd year retention
Source: Office of Institutional Research and Reporting, University of Minnesota.
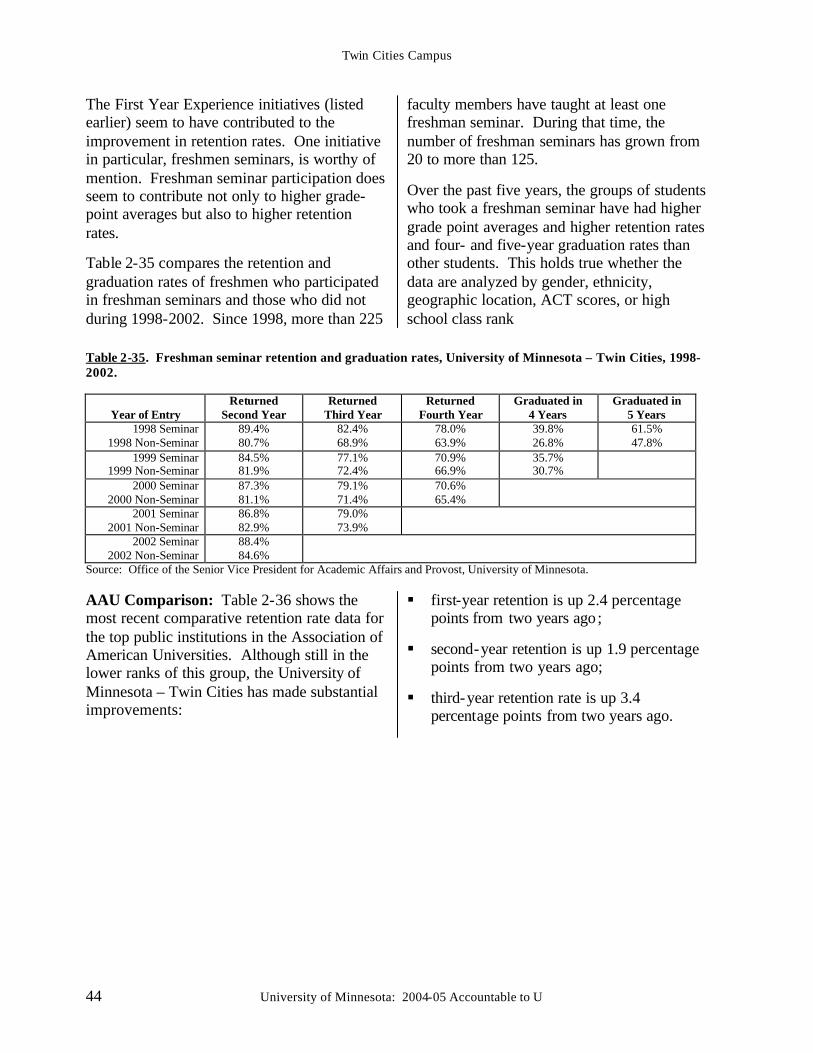
Twin Cities Campus
44 University of Minnesota: 2004-05 Accountable to U
The First Year Experience initiatives (listed earlier) seem to have contributed to the improvement in retention rates. One initiative in particular, freshmen seminars, is worthy of mention. Freshman seminar participation does seem to contribute not only to higher grade-point averages but also to higher retention rates.
Table 2-35 compares the retention and graduation rates of freshmen who participated in freshman seminars and those who did not during 1998-2002. Since 1998, more than 225
faculty members have taught at least one freshman seminar. During that time, the number of freshman seminars has grown from 20 to more than 125.
Over the past five years, the groups of students who took a freshman seminar have had higher grade point averages and higher retention rates and four- and five-year graduation rates than other students. This holds true whether the data are analyzed by gender, ethnicity, geographic location, ACT scores, or high school class rank
Table 2-35. Freshman seminar retention and graduation rates, University of Minnesota – Twin Cities, 1998-2002.
Year of Entry
Returned Second Year
Returned Third Year
Returned Fourth Year
Graduated in 4 Years
Graduated in 5 Years
1998 Seminar 1998 Non-Seminar
89.4% 80.7%
82.4% 68.9%
78.0% 63.9%
39.8% 26.8%
61.5% 47.8%
1999 Seminar 1999 Non-Seminar
84.5% 81.9%
77.1% 72.4%
70.9% 66.9%
35.7% 30.7%
2000 Seminar 2000 Non-Seminar
87.3% 81.1%
79.1% 71.4%
70.6% 65.4%
2001 Seminar 2001 Non-Seminar
86.8% 82.9%
79.0% 73.9%
2002 Seminar 2002 Non-Seminar
88.4% 84.6%
Source: Office of the Senior Vice President for Academic Affairs and Provost, University of Minnesota. AAU Comparison: Table 2-36 shows the most recent comparative retention rate data for the top public institutions in the Association of American Universities. Although still in the lower ranks of this group, the University of Minnesota – Twin Cities has made substantial improvements:
§ first-year retention is up 2.4 percentage points from two years ago;
§ second-year retention is up 1.9 percentage points from two years ago;
§ third-year retention rate is up 3.4 percentage points from two years ago.
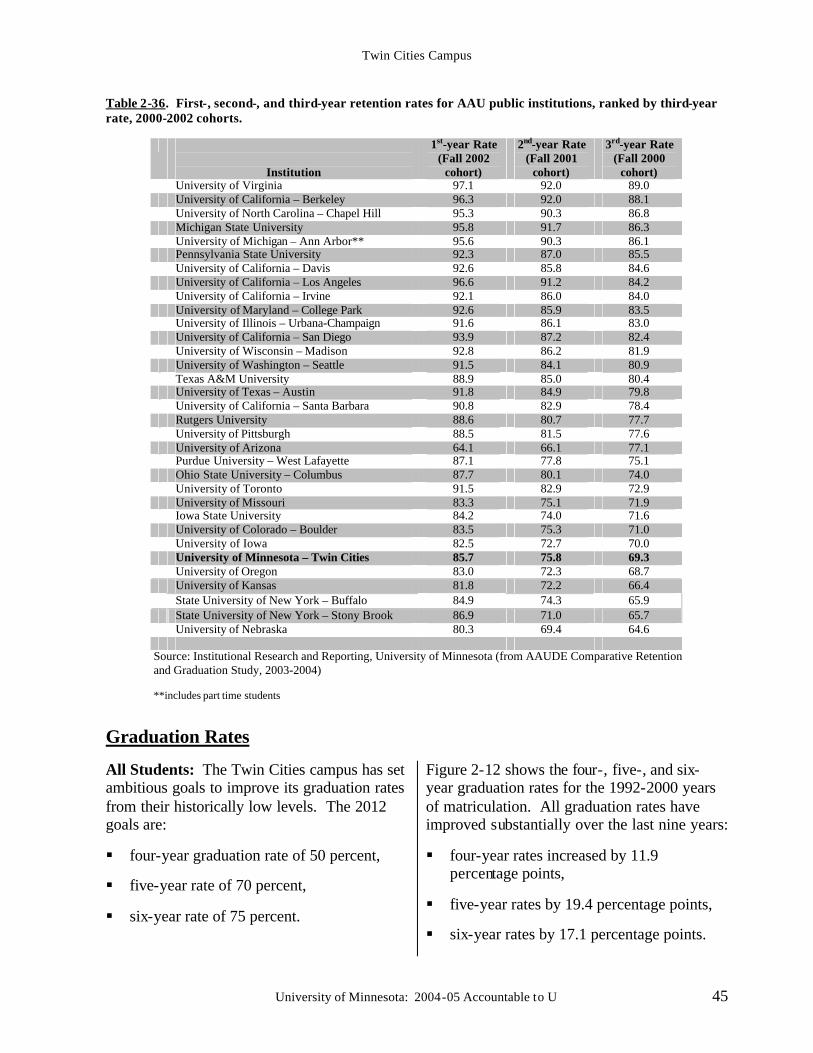
Twin Cities Campus
University of Minnesota: 2004-05 Accountable to U 45
Table 2-36. First-, second-, and third-year retention rates for AAU public institutions, ranked by third-year rate, 2000-2002 cohorts.
Institution
1st-year Rate (Fall 2002
cohort)
2nd-year Rate (Fall 2001
cohort)
3rd-year Rate (Fall 2000
cohort) University of Virginia 97.1 92.0 89.0 University of California – Berkeley 96.3 92.0 88.1 University of North Carolina – Chapel Hill 95.3 90.3 86.8 Michigan State University 95.8 91.7 86.3 University of Michigan – Ann Arbor** 95.6 90.3 86.1 Pennsylvania State University 92.3 87.0 85.5 University of California – Davis 92.6 85.8 84.6 University of California – Los Angeles 96.6 91.2 84.2 University of California – Irvine 92.1 86.0 84.0 University of Maryland – College Park 92.6 85.9 83.5 University of Illinois – Urbana-Champaign 91.6 86.1 83.0 University of California – San Diego 93.9 87.2 82.4 University of Wisconsin – Madison 92.8 86.2 81.9 University of Washington – Seattle 91.5 84.1 80.9 Texas A&M University 88.9 85.0 80.4 University of Texas – Austin 91.8 84.9 79.8 University of California – Santa Barbara 90.8 82.9 78.4 Rutgers University 88.6 80.7 77.7 University of Pittsburgh 88.5 81.5 77.6 University of Arizona 64.1 66.1 77.1 Purdue University – West Lafayette 87.1 77.8 75.1 Ohio State University – Columbus 87.7 80.1 74.0 University of Toronto 91.5 82.9 72.9 University of Missouri 83.3 75.1 71.9 Iowa State University 84.2 74.0 71.6 University of Colorado – Boulder 83.5 75.3 71.0 University of Iowa 82.5 72.7 70.0 University of Minnesota – Twin Cities 85.7 75.8 69.3 University of Oregon 83.0 72.3 68.7 University of Kansas 81.8 72.2 66.4 State University of New York – Buffalo 84.9 74.3 65.9 State University of New York – Stony Brook 86.9 71.0 65.7 University of Nebraska 80.3 69.4 64.6
Source: Institutional Research and Reporting, University of Minnesota (from AAUDE Comparative Retention and Graduation Study, 2003-2004)
**includes part time students
Graduation Rates All Students: The Twin Cities campus has set ambitious goals to improve its graduation rates from their historically low levels. The 2012 goals are:
§ four-year graduation rate of 50 percent,
§ five-year rate of 70 percent,
§ six-year rate of 75 percent.
Figure 2-12 shows the four-, five-, and six-year graduation rates for the 1992-2000 years of matriculation. All graduation rates have improved substantially over the last nine years:
§ four-year rates increased by 11.9 percentage points,
§ five-year rates by 19.4 percentage points,
§ six-year rates by 17.1 percentage points.
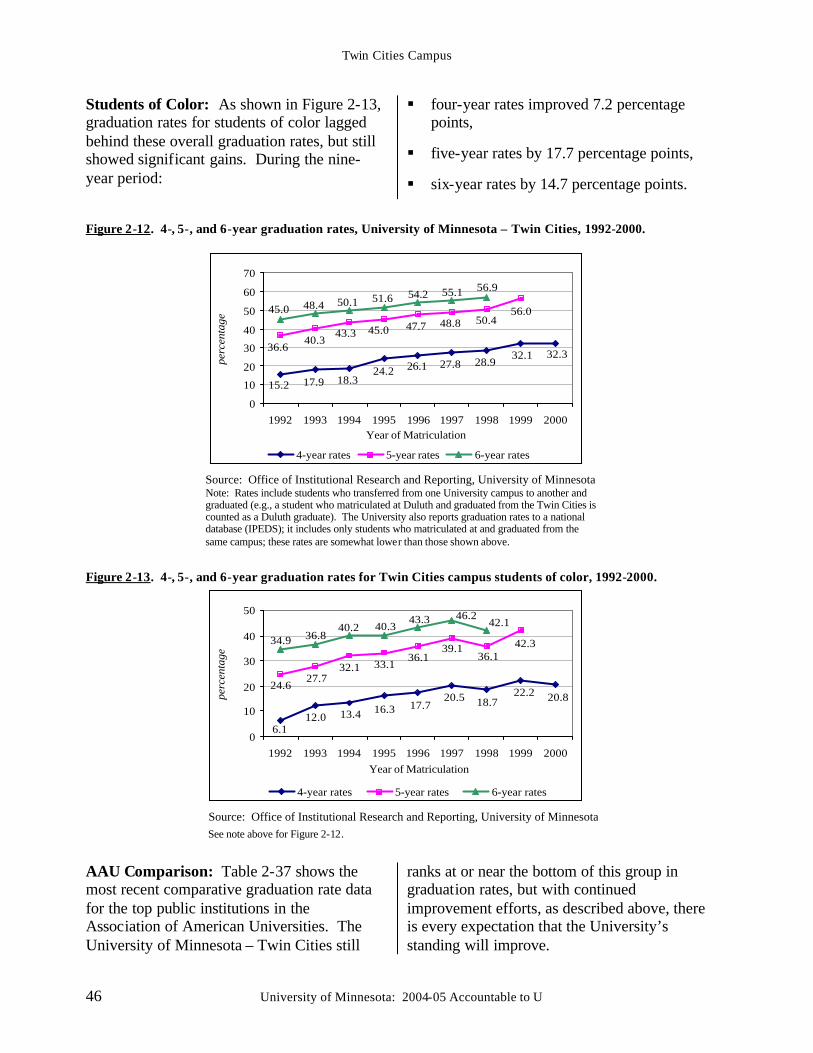
Twin Cities Campus
46 University of Minnesota: 2004-05 Accountable to U
Students of Color: As shown in Figure 2-13, graduation rates for students of color lagged behind these overall graduation rates, but still showed significant gains. During the nine-year period:
§ four-year rates improved 7.2 percentage points,
§ five-year rates by 17.7 percentage points,
§ six-year rates by 14.7 percentage points.
Figure 2-12. 4-, 5-, and 6-year graduation rates, University of Minnesota – Twin Cities, 1992-2000.
32.332.128.927.826.124.2
18.317.915.2
56.050.448.847.745.043.3
40.336.6
56.955.154.251.650.148.445.0
0
10
20
30
40
50
60
70
1992 1993 1994 1995 1996 1997 1998 1999 2000Year of Matriculation
perc
enta
ge
4-year rates 5-year rates 6-year rates
Source: Office of Institutional Research and Reporting, University of Minnesota Note: Rates include students who transferred from one University campus to another and graduated (e.g., a student who matriculated at Duluth and graduated from the Twin Cities is counted as a Duluth graduate). The University also reports graduation rates to a national database (IPEDS); it includes only students who matriculated at and graduated from the same campus; these rates are somewhat lower than those shown above.
Figure 2-13. 4-, 5-, and 6-year graduation rates for Twin Cities campus students of color, 1992-2000.
20.822.218.720.5
17.716.313.412.06.1
42.336.1
39.136.1
33.132.127.7
24.6
42.146.243.3
40.340.236.834.9
0
10
20
30
40
50
1992 1993 1994 1995 1996 1997 1998 1999 2000Year of Matriculation
perc
enta
ge
4-year rates 5-year rates 6-year rates
Source: Office of Institutional Research and Reporting, University of Minnesota See note above for Figure 2-12.
AAU Comparison: Table 2-37 shows the most recent comparative graduation rate data for the top public institutions in the Association of American Universities. The University of Minnesota – Twin Cities still
ranks at or near the bottom of this group in graduation rates, but with continued improvement efforts, as described above, there is every expectation that the University’s standing will improve.

Twin Cities Campus
University of Minnesota: 2004-05 Accountable to U 47
Table 2-37. Four-, five -, and six-year graduation rates for AAU public institutions, ranked by six-year rate, 1997-1999 cohorts.
Institution
4-year Rate (Fall 1999
cohort)
5-year Rate (Fall 1998
cohort)
6-year Rate (Fall 1997
cohort) University of Virginia 84.2 91.6 91.9 University of California – Los Angeles 45.9 79.4 86.3 University of California – Berkeley 58.3 82.6 85.4 University of Michigan – Ann Arbor** 69.4 84.3 85.1 University of North Carolina – Chapel Hill 70.5 79.7 82.7 University of California – San Diego 47.0 74.8 82.6 Pennsylvania State University 53.8 79.6 82.5 University of California – Davis 56.1 78.1 80.9 University of Illinois – Urbana-Champaign 59.1 78.2 80.4 University of Wisconsin – Madison 41.7 74.5 78.8 University of California – Irvine 42.2 72.9 78.7 University of Florida 51.8 73.9 76.8 Texas A&M University 35.4 69.4 75.1 University of Toronto 41.6 68.8 74.8 University of California – Santa Barbara 54.5 71.2 73.4 Rutgers University 44.6 65.8 72.4 Michigan State University 41.8 67.1 70.9 University of Texas – Austin 41.7 67.4 70.5 University of Washington – Seattle 45.7 66.9 70.5 University of Maryland – College Park 49.3 68.2 70.4 University of Colorado – Boulder 37.9 61.2 67.8 Purdue University – West Lafayette 32.0 59.2 67.0 University of Missouri 37.8 64.4 66.4 Iowa State University 31.4 60.2 65.7 University of Pittsburgh 46.2 63.7 64.9 University of Iowa 37.7 60.9 64.6 Ohio State University – Columbus 34.9 56.4 62.1 University of Oregon 39.0 58.2 61.4 University of Nebraska 21.8 53.6 59.4 University of Kansas 30.5 51.1 58.1 State University of New York – Buffalo 34.4 51.7 56.7 State University of New York – Stony Brook 36.6 53.6 55.9 University of Arizona 30.7 52.5 54.7 University of Minnesota – Twin Cities 31.6 49.9 54.4
Source: Institutional Research and Reporting, University of Minnesota (from AAUDE Comparative Retention and Graduation Study, 2003-2004) **includes part time students
Undergraduate Student Satisfaction
Over the past 10 years the University has placed an increased emphasis on improving the student experience on all campuses. To measure student satisfaction with these efforts, every other year since 1997 the University of Minnesota has administered the Student Experiences Survey (SES). The 2003 SES was administered to a random sample of
students enrolled on the four campuses during spring semester 2003. The survey will be administered again in 2005.
The results of the 2003 SES survey show overall improvement in most areas over the results for 2001. The 2001 results were probably low in some areas because of the disruption caused by the change to the
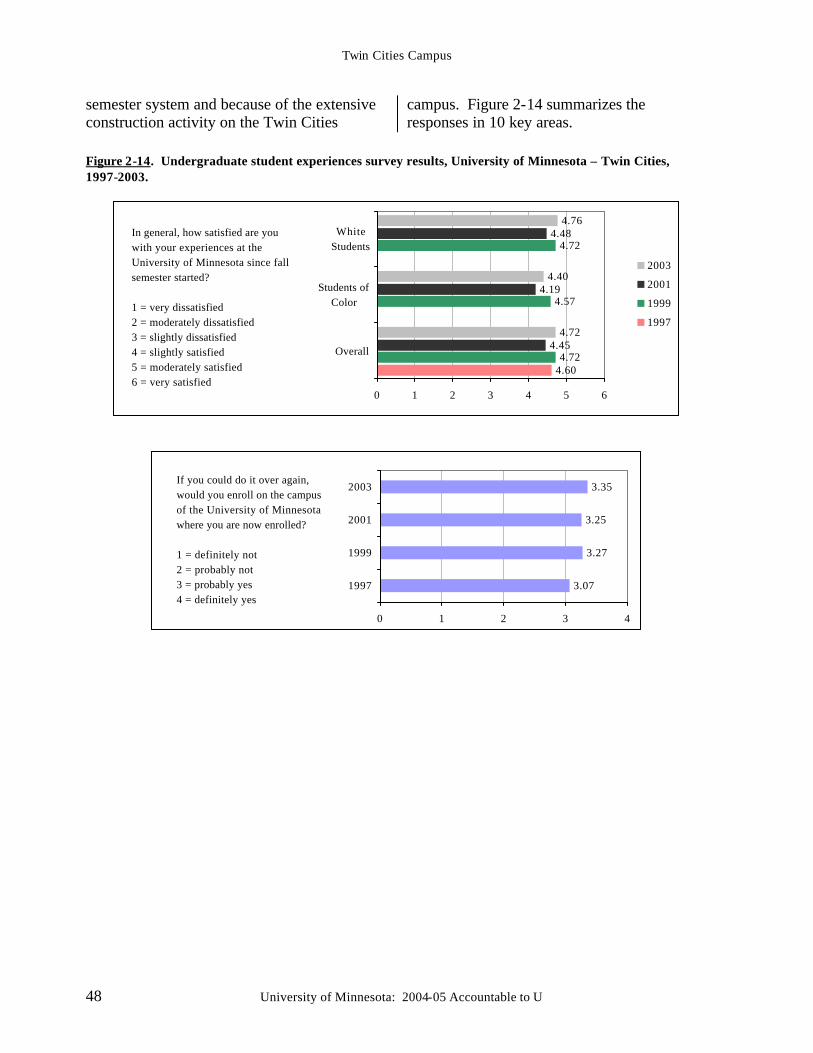
Twin Cities Campus
48 University of Minnesota: 2004-05 Accountable to U
semester system and because of the extensive construction activity on the Twin Cities
campus. Figure 2-14 summarizes the responses in 10 key areas.
Figure 2-14. Undergraduate student experiences survey results, University of Minnesota – Twin Cities, 1997-2003.
4.604.72
4.57
4.72
4.45
4.19
4.48
4.72
4.40
4.76
0 1 2 3 4 5 6
Overall
Students ofColor
WhiteStudents
2003
2001
1999
1997
In general, how satisfied are you with your experiences at the University of Minnesota since fall semester started?
1 = very dissatisfied2 = moderately dissatisfied3 = slightly dissatisfied4 = slightly satisfied5 = moderately satisfied6 = very satisfied
3.07
3.27
3.25
3.35
0 1 2 3 4
1997
1999
2001
2003If you could do it over again, would you enroll on the campus of the University of Minnesota where you are now enrolled?
1 = definitely not2 = probably not3 = probably yes4 = definitely yes
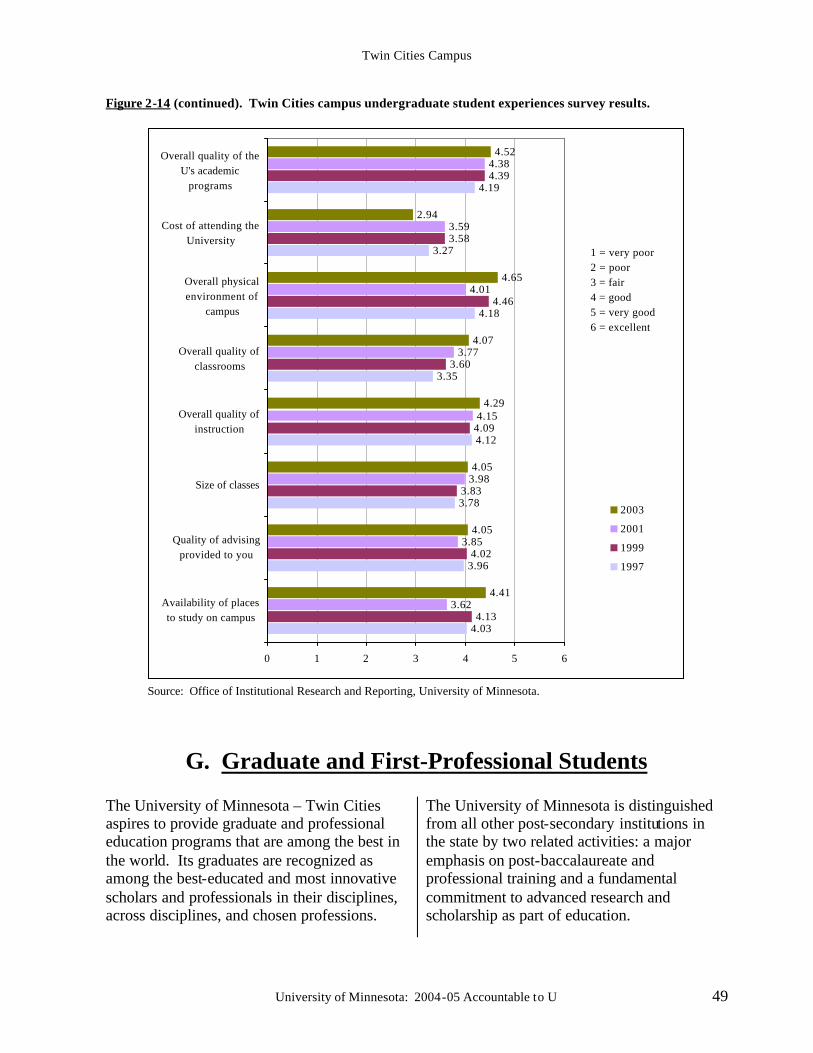
Twin Cities Campus
University of Minnesota: 2004-05 Accountable to U 49
Figure 2-14 (continued). Twin Cities campus undergraduate student experiences survey results.
4.03
3.96
3.78
4.12
3.35
4.18
3.27
4.19
4.13
4.02
3.83
4.09
3.60
4.46
3.58
4.39
3.62
3.85
3.98
4.15
3.77
4.01
3.59
4.38
4.41
4.05
4.05
4.29
4.07
4.65
2.94
4.52
0 1 2 3 4 5 6
Availability of placesto study on campus
Quality of advisingprovided to you
Size of classes
Overall quality ofinstruction
Overall quality ofclassrooms
Overall physicalenvironment of
campus
Cost of attending theUniversity
Overall quality of theU's academic
programs
2003
2001
1999
1997
1 = very poor2 = poor3 = fair4 = good5 = very good6 = excellent
Source: Office of Institutional Research and Reporting, University of Minnesota.
G. Graduate and First-Professional Students The University of Minnesota – Twin Cities aspires to provide graduate and professional education programs that are among the best in the world. Its graduates are recognized as among the best-educated and most innovative scholars and professionals in their disciplines, across disciplines, and chosen professions.
The University of Minnesota is distinguished from all other post-secondary institutions in the state by two related activities: a major emphasis on post-baccalaureate and professional training and a fundamental commitment to advanced research and scholarship as part of education.
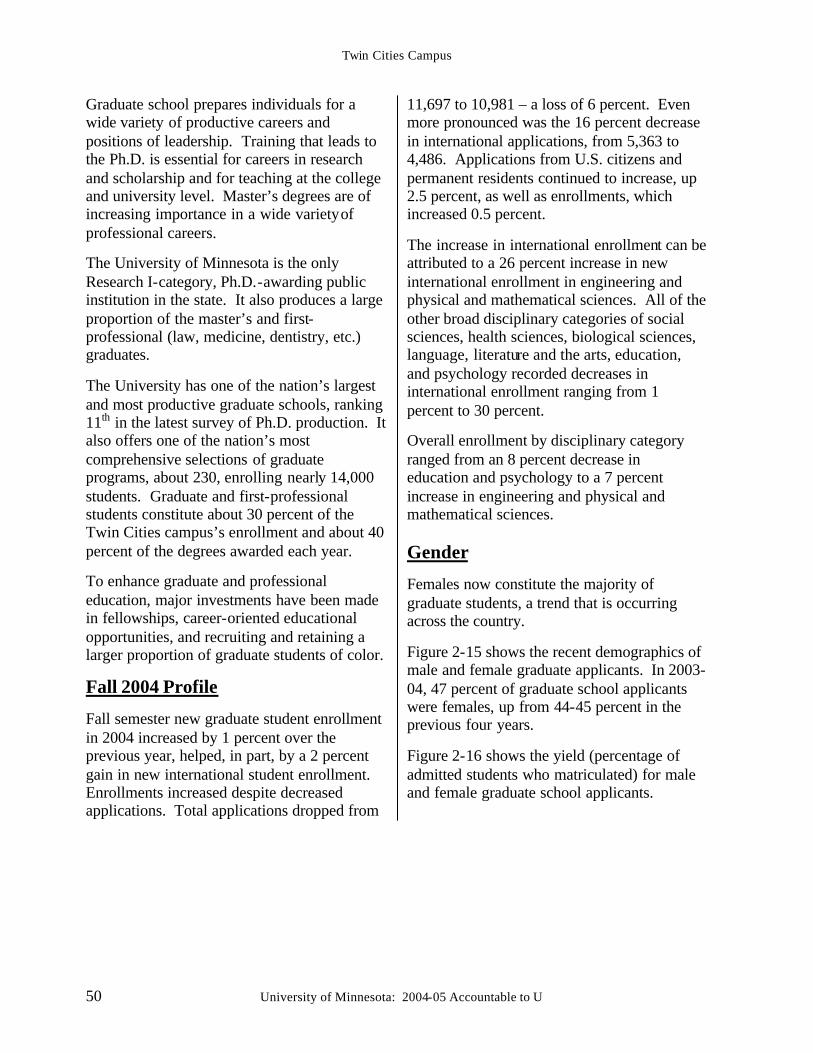
Twin Cities Campus
50 University of Minnesota: 2004-05 Accountable to U
Graduate school prepares individuals for a wide variety of productive careers and positions of leadership. Training that leads to the Ph.D. is essential for careers in research and scholarship and for teaching at the college and university level. Master’s degrees are of increasing importance in a wide variety of professional careers.
The University of Minnesota is the only Research I-category, Ph.D.-awarding public institution in the state. It also produces a large proportion of the master’s and first-professional (law, medicine, dentistry, etc.) graduates.
The University has one of the nation’s largest and most productive graduate schools, ranking 11th in the latest survey of Ph.D. production. It also offers one of the nation’s most comprehensive selections of graduate programs, about 230, enrolling nearly 14,000 students. Graduate and first-professional students constitute about 30 percent of the Twin Cities campus’s enrollment and about 40 percent of the degrees awarded each year.
To enhance graduate and professional education, major investments have been made in fellowships, career-oriented educational opportunities, and recruiting and retaining a larger proportion of graduate students of color.
Fall 2004 Profile
Fall semester new graduate student enrollment in 2004 increased by 1 percent over the previous year, helped, in part, by a 2 percent gain in new international student enrollment. Enrollments increased despite decreased applications. Total applications dropped from
11,697 to 10,981 – a loss of 6 percent. Even more pronounced was the 16 percent decrease in international applications, from 5,363 to 4,486. Applications from U.S. citizens and permanent residents continued to increase, up 2.5 percent, as well as enrollments, which increased 0.5 percent.
The increase in international enrollment can be attributed to a 26 percent increase in new international enrollment in engineering and physical and mathematical sciences. All of the other broad disciplinary categories of social sciences, health sciences, biological sciences, language, literature and the arts, education, and psychology recorded decreases in international enrollment ranging from 1 percent to 30 percent.
Overall enrollment by disciplinary category ranged from an 8 percent decrease in education and psychology to a 7 percent increase in engineering and physical and mathematical sciences. Gender Females now constitute the majority of graduate students, a trend that is occurring across the country.
Figure 2-15 shows the recent demographics of male and female graduate applicants. In 2003-04, 47 percent of graduate school applicants were females, up from 44-45 percent in the previous four years.
Figure 2-16 shows the yield (percentage of admitted students who matriculated) for male and female graduate school applicants.
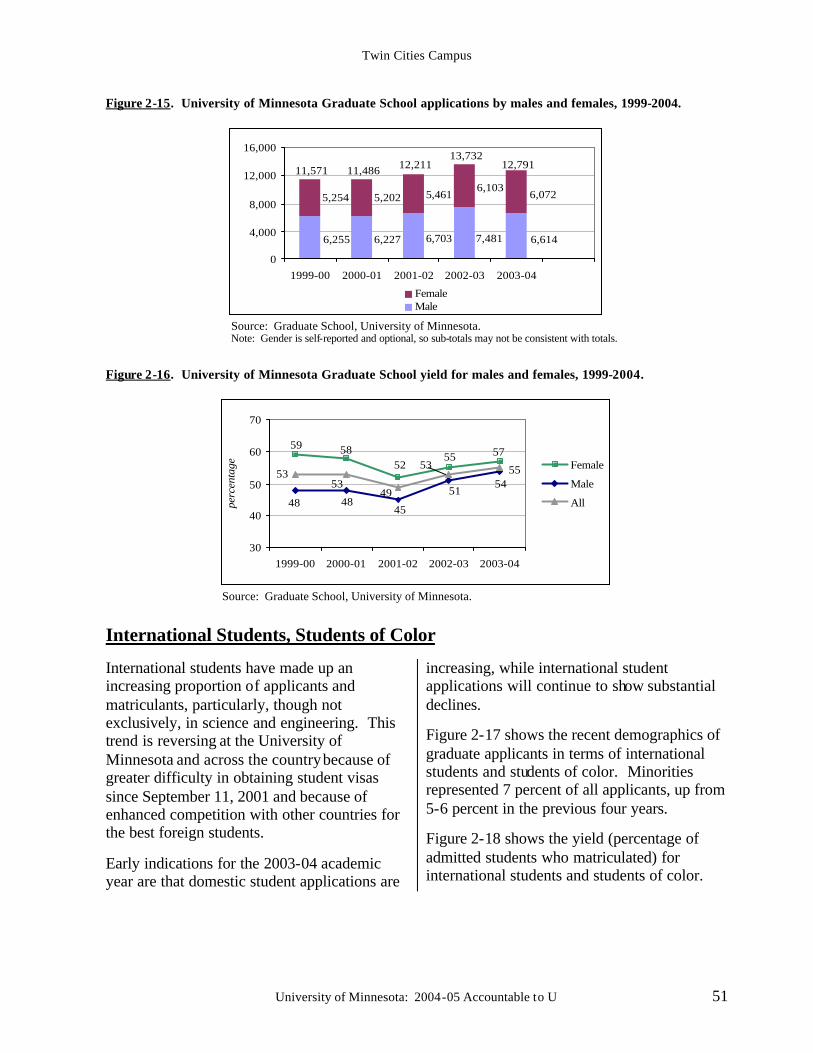
Twin Cities Campus
University of Minnesota: 2004-05 Accountable to U 51
Figure 2-15. University of Minnesota Graduate School applications by males and females, 1999-2004.
6,255 6,227 6,703 7,481 6,614
6,0726,103
5,4615,2025,254
0
4,000
8,000
12,000
16,000
1999-00 2000-01 2001-02 2002-03 2003-04
FemaleMale
11,571 11,486 12,21113,732
12,791
Source: Graduate School, University of Minnesota. Note: Gender is self-reported and optional, so sub-totals may not be consistent with totals.
Figure 2-16. University of Minnesota Graduate School yield for males and females, 1999-2004.
575552
5859
5451
4845
48
5553
4953
53
30
40
50
60
70
1999-00 2000-01 2001-02 2002-03 2003-04
perc
enta
ge Female
Male
All
Source: Graduate School, University of Minnesota.
International Students, Students of Color
International students have made up an increasing proportion of applicants and matriculants, particularly, though not exclusively, in science and engineering. This trend is reversing at the University of Minnesota and across the country because of greater difficulty in obtaining student visas since September 11, 2001 and because of enhanced competition with other countries for the best foreign students.
Early indications for the 2003-04 academic year are that domestic student applications are
increasing, while international student applications will continue to show substantial declines.
Figure 2-17 shows the recent demographics of graduate applicants in terms of international students and students of color. Minorities represented 7 percent of all applicants, up from 5-6 percent in the previous four years.
Figure 2-18 shows the yield (percentage of admitted students who matriculated) for international students and students of color.
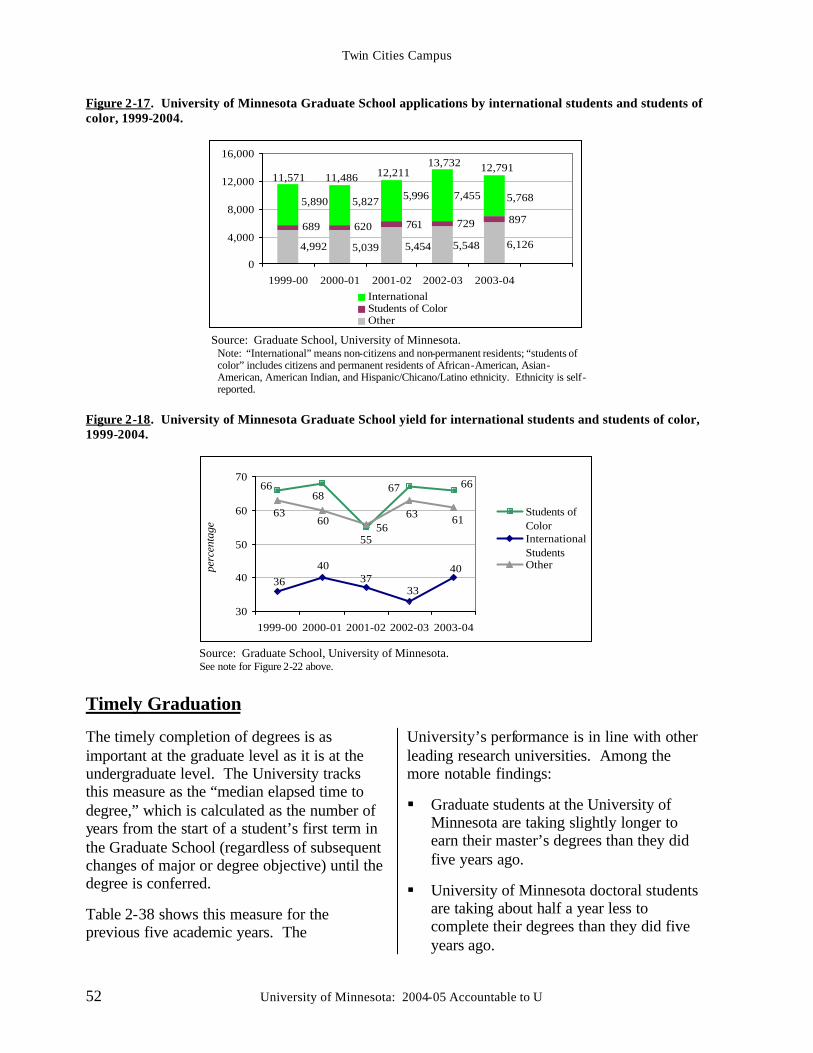
Twin Cities Campus
52 University of Minnesota: 2004-05 Accountable to U
Figure 2-17. University of Minnesota Graduate School applications by international students and students of color, 1999-2004.
4,992 5,039 5,454 5,548 6,126
897729761620689
5,7687,4555,9965,8275,890
0
4,000
8,000
12,000
16,000
1999-00 2000-01 2001-02 2002-03 2003-04InternationalStudents of ColorOther
11,571 11,486 12,21113,732 12,791
Source: Graduate School, University of Minnesota.
Note: “International” means non-citizens and non-permanent residents; “students of color” includes citizens and permanent residents of African-American, Asian-American, American Indian, and Hispanic/Chicano/Latino ethnicity. Ethnicity is self-reported.
Figure 2-18. University of Minnesota Graduate School yield for international students and students of color, 1999-2004.
6768
66
55
66
40
3337
4036
616356
6063
30
40
50
60
70
1999-00 2000-01 2001-02 2002-03 2003-04
perc
enta
ge
Students ofColorInternationalStudentsOther
Source: Graduate School, University of Minnesota. See note for Figure 2-22 above.
Timely Graduation
The timely completion of degrees is as important at the graduate level as it is at the undergraduate level. The University tracks this measure as the “median elapsed time to degree,” which is calculated as the number of years from the start of a student’s first term in the Graduate School (regardless of subsequent changes of major or degree objective) until the degree is conferred.
Table 2-38 shows this measure for the previous five academic years. The
University’s performance is in line with other leading research universities. Among the more notable findings:
§ Graduate students at the University of Minnesota are taking slightly longer to earn their master’s degrees than they did five years ago.
§ University of Minnesota doctoral students are taking about half a year less to complete their degrees than they did five years ago.
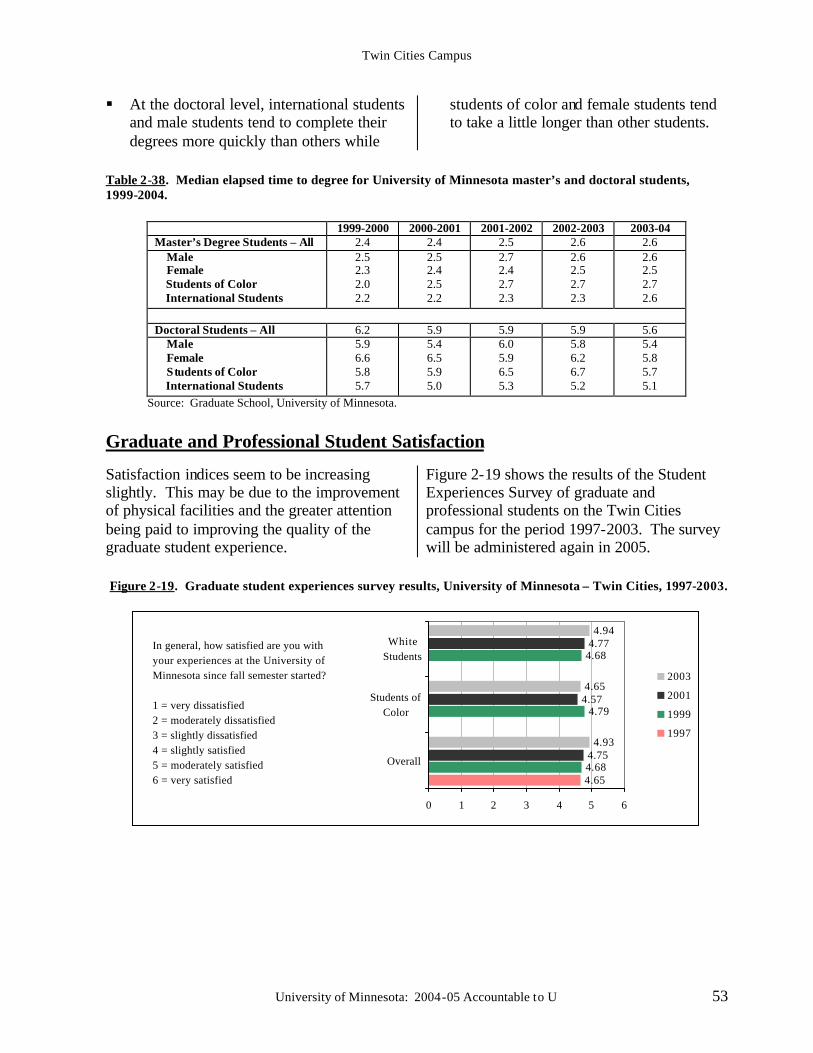
Twin Cities Campus
University of Minnesota: 2004-05 Accountable to U 53
§ At the doctoral level, international students and male students tend to complete their degrees more quickly than others while
students of color and female students tend to take a little longer than other students.
Table 2-38. Median elapsed time to degree for University of Minnesota master’s and doctoral students, 1999-2004.
1999-2000 2000-2001 2001-2002 2002-2003 2003-04 Master’s Degree Students – All 2.4 2.4 2.5 2.6 2.6 Male Female Students of Color International Students
2.5 2.3 2.0 2.2
2.5 2.4 2.5 2.2
2.7 2.4 2.7 2.3
2.6 2.5 2.7 2.3
2.6 2.5 2.7 2.6
Doctoral Students – All 6.2 5.9 5.9 5.9 5.6 Male Female Students of Color International Students
5.9 6.6 5.8 5.7
5.4 6.5 5.9 5.0
6.0 5.9 6.5 5.3
5.8 6.2 6.7 5.2
5.4 5.8 5.7 5.1
Source: Graduate School, University of Minnesota.
Graduate and Professional Student Satisfaction
Satisfaction indices seem to be increasing slightly. This may be due to the improvement of physical facilities and the greater attention being paid to improving the quality of the graduate student experience.
Figure 2-19 shows the results of the Student Experiences Survey of graduate and professional students on the Twin Cities campus for the period 1997-2003. The survey will be administered again in 2005.
Figure 2-19. Graduate student experiences survey results, University of Minnesota – Twin Cities, 1997-2003.
4.654.68
4.79
4.68
4.75
4.57
4.77
4.93
4.65
4.94
0 1 2 3 4 5 6
Overall
Students ofColor
WhiteStudents
2003
2001
1999
1997
In general, how satisfied are you with your experiences at the University of Minnesota since fall semester started?
1 = very dissatisfied2 = moderately dissatisfied3 = slightly dissatisfied4 = slightly satisfied5 = moderately satisfied6 = very satisfied
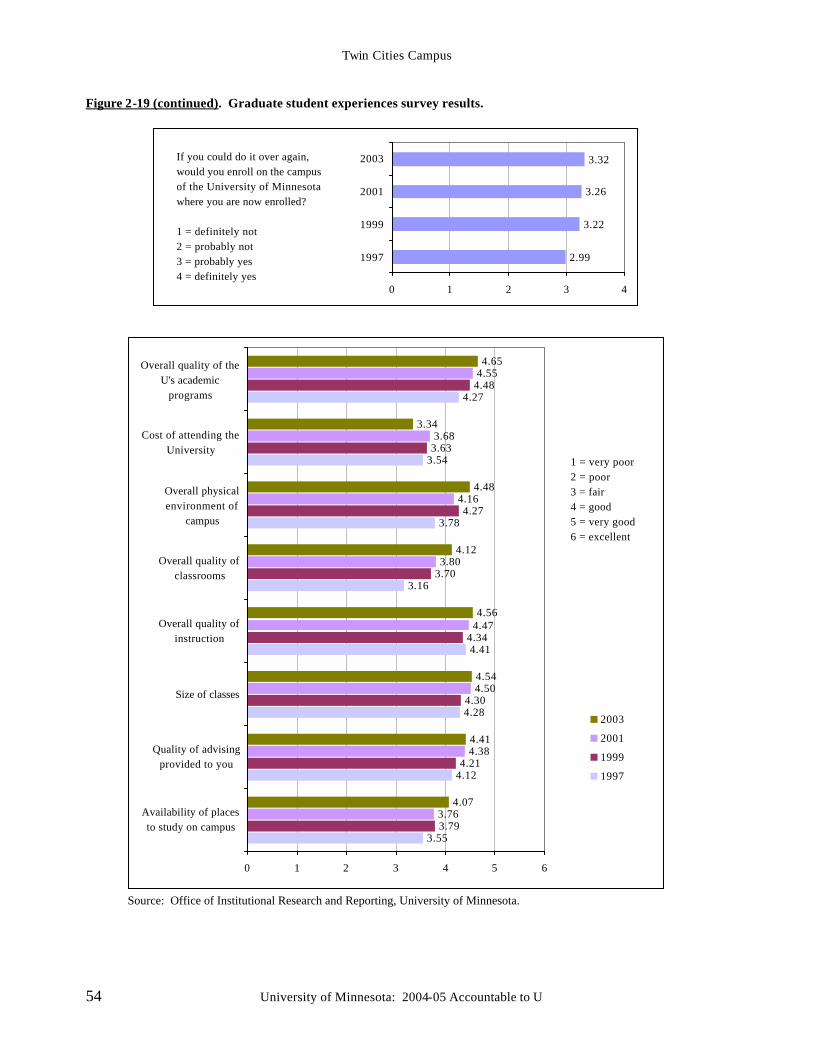
Twin Cities Campus
54 University of Minnesota: 2004-05 Accountable to U
Figure 2-19 (continued). Graduate student experiences survey results.
2.99
3.22
3.26
3.32
0 1 2 3 4
1997
1999
2001
2003If you could do it over again, would you enroll on the campus of the University of Minnesota where you are now enrolled?
1 = definitely not2 = probably not3 = probably yes4 = definitely yes
3.55
4.12
4.28
4.41
3.16
3.78
3.54
4.27
3.79
4.21
4.30
4.34
3.70
4.27
3.63
4.48
3.76
4.38
4.50
4.47
3.80
4.16
3.68
4.55
4.07
4.41
4.54
4.56
4.12
4.48
3.34
4.65
0 1 2 3 4 5 6
Availability of placesto study on campus
Quality of advisingprovided to you
Size of classes
Overall quality ofinstruction
Overall quality ofclassrooms
Overall physicalenvironment of
campus
Cost of attending theUniversity
Overall quality of theU's academic
programs
2003
2001
1999
1997
1 = very poor2 = poor3 = fair4 = good5 = very good6 = excellent
Source: Office of Institutional Research and Reporting, University of Minnesota.
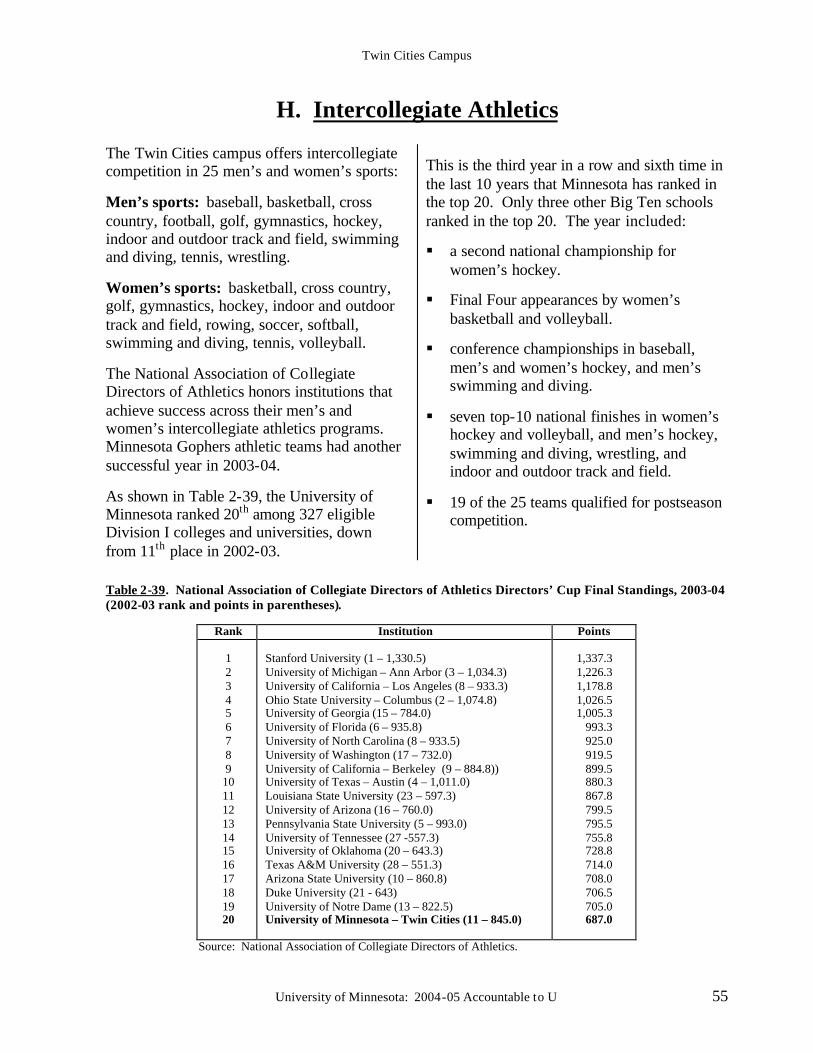
Twin Cities Campus
University of Minnesota: 2004-05 Accountable to U 55
H. Intercollegiate Athletics The Twin Cities campus offers intercollegiate competition in 25 men’s and women’s sports:
Men’s sports: baseball, basketball, cross country, football, golf, gymnastics, hockey, indoor and outdoor track and field, swimming and diving, tennis, wrestling.
Women’s sports: basketball, cross country, golf, gymnastics, hockey, indoor and outdoor track and field, rowing, soccer, softball, swimming and diving, tennis, volleyball.
The National Association of Collegiate Directors of Athletics honors institutions that achieve success across their men’s and women’s intercollegiate athletics programs. Minnesota Gophers athletic teams had another successful year in 2003-04.
As shown in Table 2-39, the University of Minnesota ranked 20th among 327 eligible Division I colleges and universities, down from 11th place in 2002-03.
This is the third year in a row and sixth time in the last 10 years that Minnesota has ranked in the top 20. Only three other Big Ten schools ranked in the top 20. The year included:
§ a second national championship for women’s hockey.
§ Final Four appearances by women’s basketball and volleyball.
§ conference championships in baseball, men’s and women’s hockey, and men’s swimming and diving.
§ seven top-10 national finishes in women’s hockey and volleyball, and men’s hockey, swimming and diving, wrestling, and indoor and outdoor track and field.
§ 19 of the 25 teams qualified for postseason competition.
Table 2-39. National Association of Collegiate Directors of Athletics Directors’ Cup Final Standings, 2003-04 (2002-03 rank and points in parentheses).
Rank Institution Points 1 2 3 4 5 6 7 8 9 10 11 12 13 14 15 16 17 18 19 20
Stanford University (1 – 1,330.5) University of Michigan – Ann Arbor (3 – 1,034.3) University of California – Los Angeles (8 – 933.3) Ohio State University – Columbus (2 – 1,074.8) University of Georgia (15 – 784.0) University of Florida (6 – 935.8) University of North Carolina (8 – 933.5) University of Washington (17 – 732.0) University of California – Berkeley (9 – 884.8)) University of Texas – Austin (4 – 1,011.0) Louisiana State University (23 – 597.3) University of Arizona (16 – 760.0) Pennsylvania State University (5 – 993.0) University of Tennessee (27 -557.3) University of Oklahoma (20 – 643.3) Texas A&M University (28 – 551.3) Arizona State University (10 – 860.8) Duke University (21 - 643) University of Notre Dame (13 – 822.5) University of Minnesota – Twin Cities (11 – 845.0)
1,337.3 1,226.3 1,178.8 1,026.5 1,005.3
993.3 925.0 919.5 899.5 880.3 867.8 799.5 795.5 755.8 728.8 714.0 708.0 706.5 705.0 687.0
Source: National Association of Collegiate Directors of Athletics.
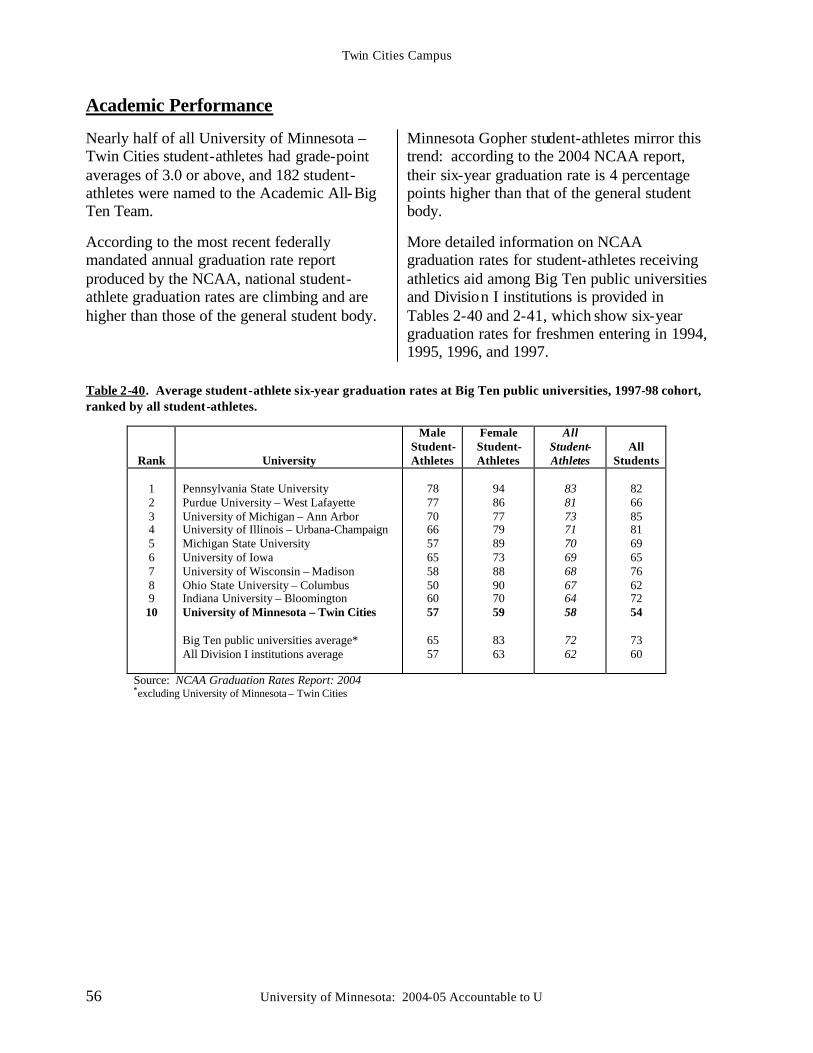
Twin Cities Campus
56 University of Minnesota: 2004-05 Accountable to U
Academic Performance
Nearly half of all University of Minnesota – Twin Cities student-athletes had grade-point averages of 3.0 or above, and 182 student-athletes were named to the Academic All-Big Ten Team.
According to the most recent federally mandated annual graduation rate report produced by the NCAA, national student-athlete graduation rates are climbing and are higher than those of the general student body.
Minnesota Gopher student-athletes mirror this trend: according to the 2004 NCAA report, their six-year graduation rate is 4 percentage points higher than that of the general student body.
More detailed information on NCAA graduation rates for student-athletes receiving athletics aid among Big Ten public universities and Division I institutions is provided in Tables 2-40 and 2-41, which show six-year graduation rates for freshmen entering in 1994, 1995, 1996, and 1997.
Table 2-40. Average student-athlete six-year graduation rates at Big Ten public universities, 1997-98 cohort, ranked by all student-athletes.
Rank
University
Male Student-Athletes
Female Student-Athletes
All Student-Athletes
All
Students 1 2 3 4 5 6 7 8 9 10
Pennsylvania State University Purdue University – West Lafayette University of Michigan – Ann Arbor University of Illinois – Urbana-Champaign Michigan State University University of Iowa University of Wisconsin – Madison Ohio State University – Columbus Indiana University – Bloomington University of Minnesota – Twin Cities Big Ten public universities average* All Division I institutions average
78 77 70 66 57 65 58 50 60 57
65 57
94 86 77 79 89 73 88 90 70 59
83 63
83 81 73 71 70 69 68 67 64 58
72 62
82 66 85 81 69 65 76 62 72 54
73 60
Source: NCAA Graduation Rates Report: 2004 *excluding University of Minnesota – Twin Cities
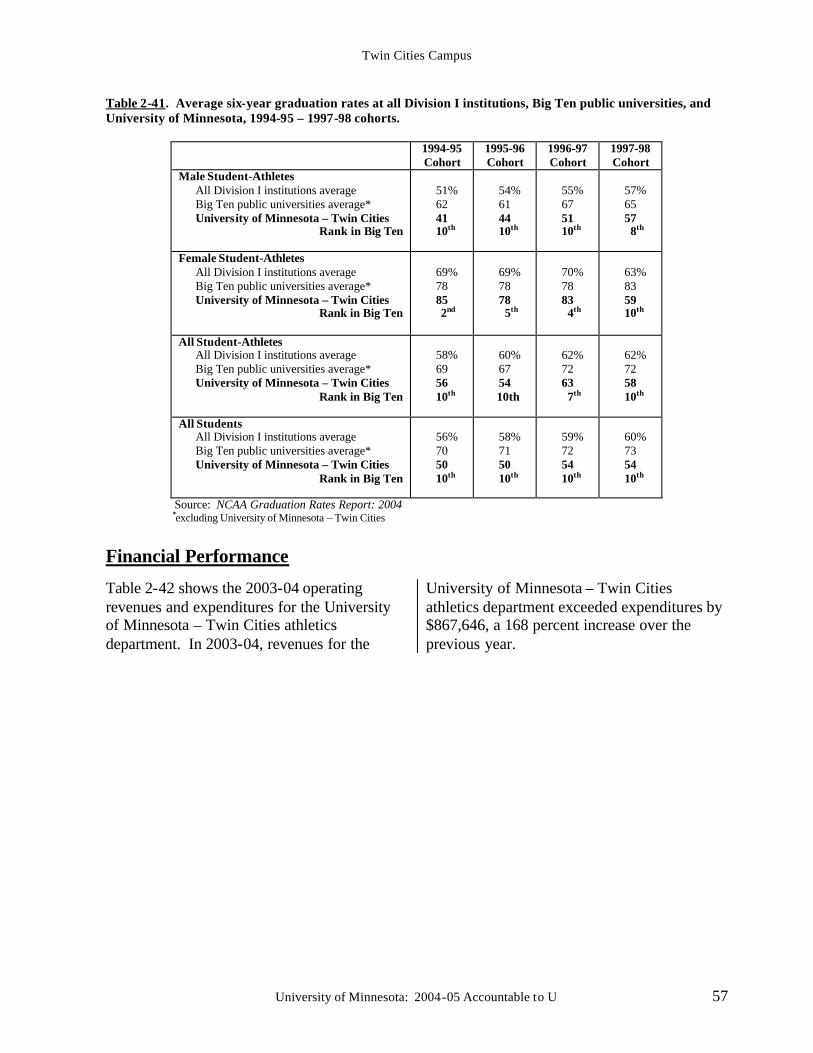
Twin Cities Campus
University of Minnesota: 2004-05 Accountable to U 57
Table 2-41. Average six-year graduation rates at all Division I institutions, Big Ten public universities, and University of Minnesota, 1994-95 – 1997-98 cohorts.
1994-95 Cohort
1995-96 Cohort
1996-97 Cohort
1997-98 Cohort
Male Student-Athletes All Division I institutions average Big Ten public universities average* University of Minnesota – Twin Cities
Rank in Big Ten
51%
62 41
10th
54%
61 44
10th
55%
67 51
10th
57%
65 57
8th
Female Student-Athletes All Division I institutions average Big Ten public universities average* University of Minnesota – Twin Cities
Rank in Big Ten
69%
78 85
2nd
69%
78 78
5th
70%
78 83
4th
63%
83 59
10th
All Student-Athletes All Division I institutions average Big Ten public universities average* University of Minnesota – Twin Cities
Rank in Big Ten
58%
69 56
10th
60%
67 54
10th
62%
72 63
7th
62%
72 58
10th
All Students All Division I institutions average Big Ten public universities average* University of Minnesota – Twin Cities
Rank in Big Ten
56%
70 50
10th
58%
71 50
10th
59%
72 54
10th
60%
73 54
10th
Source: NCAA Graduation Rates Report: 2004 *excluding University of Minnesota – Twin Cities
Financial Performance
Table 2-42 shows the 2003-04 operating revenues and expenditures for the University of Minnesota – Twin Cities athletics department. In 2003-04, revenues for the
University of Minnesota – Twin Cities athletics department exceeded expenditures by $867,646, a 168 percent increase over the previous year.
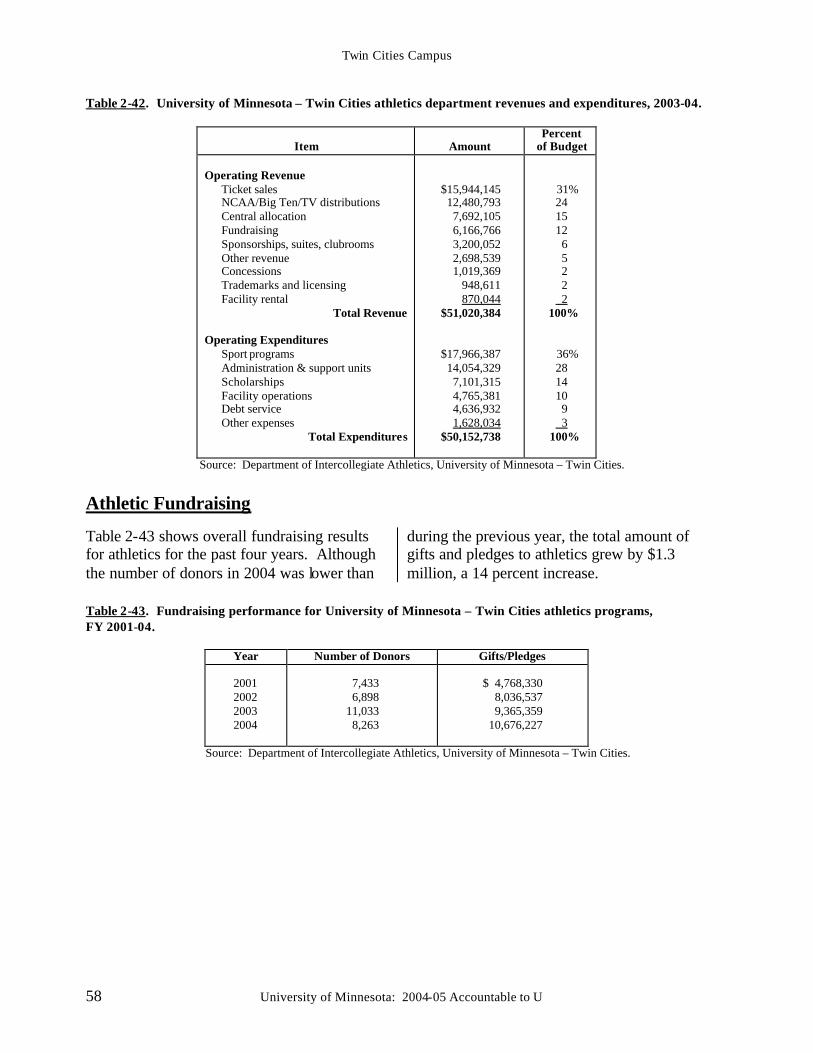
Twin Cities Campus
58 University of Minnesota: 2004-05 Accountable to U
Table 2-42. University of Minnesota – Twin Cities athletics department revenues and expenditures, 2003-04.
Item
Amount
Percent of Budget
Operating Revenue
Ticket sales NCAA/Big Ten/TV distributions Central allocation Fundraising Sponsorships, suites, clubrooms Other revenue Concessions Trademarks and licensing Facility rental
Total Revenue Operating Expenditures
Sport programs Administration & support units Scholarships Facility operations Debt service Other expenses
Total Expenditures
$15,944,145 12,480,793 7,692,105 6,166,766 3,200,052 2,698,539 1,019,369
948,611 870,044
$51,020,384
$17,966,387 14,054,329 7,101,315 4,765,381 4,636,932 1,628,034
$50,152,738
31% 24 15 12 6 5 2 2 2
100%
36% 28 14 10 9 3
100%
Source: Department of Intercollegiate Athletics, University of Minnesota – Twin Cities.
Athletic Fundraising
Table 2-43 shows overall fundraising results for athletics for the past four years. Although the number of donors in 2004 was lower than
during the previous year, the total amount of gifts and pledges to athletics grew by $1.3 million, a 14 percent increase.
Table 2-43. Fundraising performance for University of Minnesota – Twin Cities athletics programs, FY 2001-04.
Year Number of Donors Gifts/Pledges
2001 2002 2003 2004
7,433 6,898 11,033 8,263
$ 4,768,330 8,036,537 9,365,359 10,676,227
Source: Department of Intercollegiate Athletics, University of Minnesota – Twin Cities.
Twin Cities Campus
University of Minnesota: 2004-05 Accountable to U 59
I. Human Resources The University’s Human Resources System consists of the policies, procedures, technology systems, and the network of staff directly responsible for supporting the management of the University’s human capital. Positioned with the Office of Human Resources, the Office of Equal Opportunity, and throughout the University, human resource professionals strive to create an environment in which all employees may be successful. Values and Goals
The human resource system works to achieve the University’s commitment to the open exchange of ideas in an environment that:
§ embodies the values of academic freedom, responsibility, integrity, and cooperation;
§ provides an atmosphere of mutual respect, free from racism, sexism, and forms of prejudice and intolerance;
§ supports individuals, institutions, and communities in responding to a continuously changing world;
§ is conscious of and responsive to the needs of the many communities it is committed to serving;
§ creates and supports partnerships within the University and with communities to achieve common goals; and
§ inspires, sets high expectations for, and empowers the individuals within the community.
Based on these values, the University’s primary human resources goal is to attract, retain, and develop top talent. This is accomplished through these objectives:
§ provide a competitive total rewards package.
§ create and sustain great work environments
§ ensure responsible conduct and accountability
§ recognize and reward excellence
§ demonstrate exemplary leadership
§ promote administrative efficiency, effectiveness and continuous improvement
Faculty Salary and Compensation The American Association of University Professors (AAUP) conducts annual salary and compensation surveys of full-time instructional faculty (excluding medical school faculty).
Comparing salaries and compensation across institutions and campuses, however, is inherently imperfect because they differ in many ways, e.g., mission, public vs. private, size, mix of disciplines, etc. Cost-of- living, tax burden, and variations in fringe benefits only add to the imperfection.
In addition, it is important to emphasize that changes in average salary reflect not only salary increases for continuing faculty but also are influenced by retirements, promotions, and new hires. Thus, percentage changes will be different than those stipulated in an annual salary plan. This is true for all campuses nationwide. These differences will vary from year to year, and they can be very significant when the cohort sizes are relatively small. Peer Group Comparisons
The Twin Cities campus’s peer group – the nation’s top 30 research universities (16
Twin Cities Campus
60 University of Minnesota: 2004-05 Accountable to U
private, 14 public) – is representative of the kinds of campuses with which the Twin Cities campus competes in recruiting and retaining faculty.
Tables 2-44 and 2-45 show average faculty salary and compensation, respectively, for University of Minnesota –Twin Cities faculty in comparison to peer group averages for the period 1999-2004:
§ In FY 2004, the University of Minnesota Twin Cities lost ground compared to its peer group in both average salary and average compensation for professors at all levels.
§ The greatest disparity is at the full professor level, where both average salary and average compensation lag the peer group averages by $19,700.
A more detailed picture of one-year changes is presented in Tables 2-46 – 2-48. These tables show faculty salary and compensation figures among selected Association of American Universities’ top 30 institutions for 2003-04 at the full, associate, and assistant professor levels.
From 2002-03 to 2003-04:
§ At the full professor level, the University of Minnesota – Twin Cities maintained its 27th-place ranking among AAU institutions and its relative position among
Big Ten peers for average salary and average compensation.
§ At the associate professor level, the University of Minnesota – Twin Cities dropped from 23rd to 26th place among AAU institutions in average salary. Meanwhile, Big Ten peers Pennsylvania State University and the University of Illinois – Urbana-Champaign moved ahead to 23rd and 24th places, respectively.
The University of Minnesota – Twin Cities maintained its ranking of 20th among AAU institutions for average compensation while the University of Wisconsin – Madison dropped to 21st place.
§ At the assistant professor level, the University of Minnesota – Twin Cities dropped from 22nd to 28th place in average salary among AAU institutions, and Big Ten peers Pennsylvania State University and the University of Illinois – Urbana-Champaign moved ahead of it.
The University dropped from 16th to 17th in average compensation among AAU institutions and now ranks behind the University of Michigan – Ann Arbor as the Big Ten institution with the highest average compensation for assistant professors.
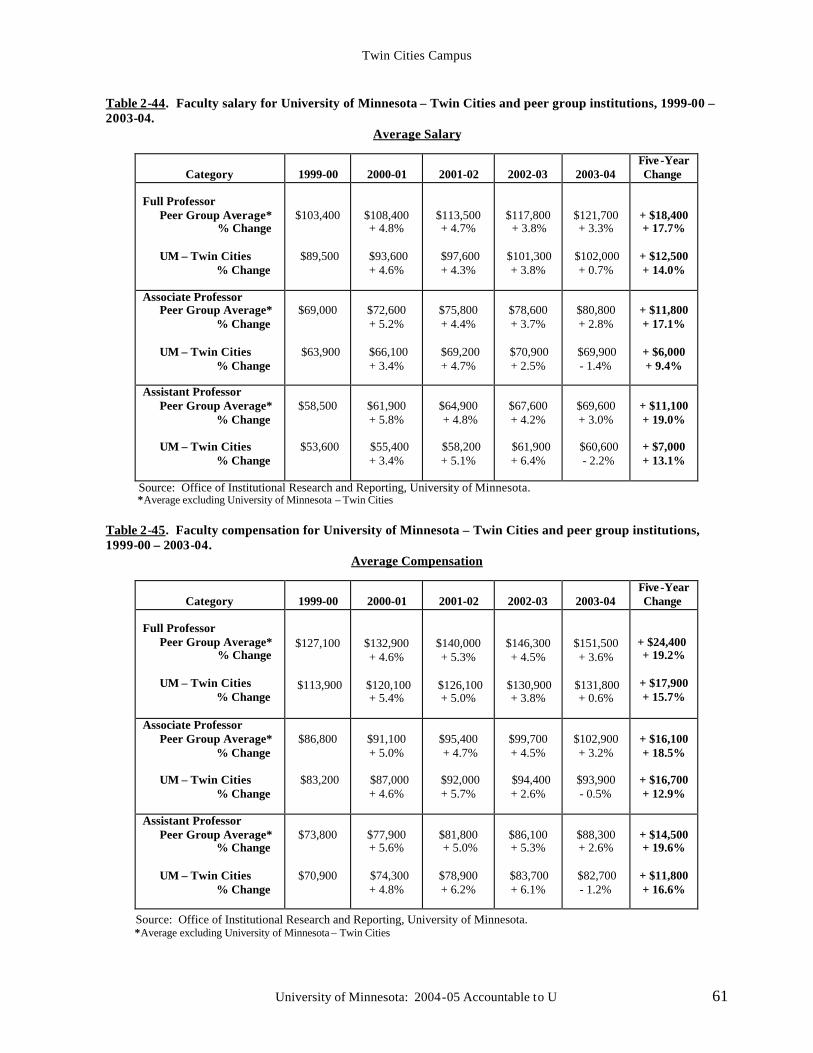
Twin Cities Campus
University of Minnesota: 2004-05 Accountable to U 61
Table 2-44. Faculty salary for University of Minnesota – Twin Cities and peer group institutions, 1999-00 – 2003-04.
Average Salary
Category
1999-00
2000-01
2001-02
2002-03
2003-04
Five -Year Change
Full Professor
Peer Group Average* % Change
UM – Twin Cities % Change
$103,400
$89,500
$108,400 + 4.8%
$93,600 + 4.6%
$113,500 + 4.7%
$97,600 + 4.3%
$117,800 + 3.8%
$101,300
+ 3.8%
$121,700 + 3.3%
$102,000
+ 0.7%
+ $18,400 + 17.7%
+ $12,500 + 14.0%
Associate Professor
Peer Group Average* % Change UM – Twin Cities % Change
$69,000
$63,900
$72,600 + 5.2%
$66,100 + 3.4%
$75,800 + 4.4%
$69,200 + 4.7%
$78,600 + 3.7%
$70,900 + 2.5%
$80,800 + 2.8%
$69,900 - 1.4%
+ $11,800 + 17.1%
+ $6,000 + 9.4%
Assistant Professor
Peer Group Average* % Change UM – Twin Cities % Change
$58,500
$53,600
$61,900 + 5.8%
$55,400 + 3.4%
$64,900 + 4.8%
$58,200 + 5.1%
$67,600 + 4.2%
$61,900 + 6.4%
$69,600 + 3.0%
$60,600 - 2.2%
+ $11,100 + 19.0%
+ $7,000 + 13.1%
Source: Office of Institutional Research and Reporting, University of Minnesota. *Average excluding University of Minnesota – Twin Cities Table 2-45. Faculty compensation for University of Minnesota – Twin Cities and peer group institutions, 1999-00 – 2003-04.
Average Compensation
Category
1999-00
2000-01
2001-02
2002-03
2003-04
Five -Year Change
Full Professor
Peer Group Average* % Change
UM – Twin Cities % Change
$127,100
$113,900
$132,900 + 4.6%
$120,100 + 5.4%
$140,000 + 5.3%
$126,100 + 5.0%
$146,300 + 4.5%
$130,900
+ 3.8%
$151,500 + 3.6%
$131,800
+ 0.6%
+ $24,400 + 19.2%
+ $17,900 + 15.7%
Associate Professor Peer Group Average* % Change UM – Twin Cities % Change
$86,800
$83,200
$91,100 + 5.0%
$87,000 + 4.6%
$95,400 + 4.7%
$92,000 + 5.7%
$99,700 + 4.5%
$94,400 + 2.6%
$102,900 + 3.2%
$93,900 - 0.5%
+ $16,100 + 18.5%
+ $16,700 + 12.9%
Assistant Professor Peer Group Average* % Change UM – Twin Cities % Change
$73,800
$70,900
$77,900 + 5.6%
$74,300 + 4.8%
$81,800 + 5.0%
$78,900 + 6.2%
$86,100 + 5.3%
$83,700 + 6.1%
$88,300 + 2.6%
$82,700 - 1.2%
+ $14,500 + 19.6%
+ $11,800 + 16.6%
Source: Office of Institutional Research and Reporting, University of Minnesota. *Average excluding University of Minnesota – Twin Cities
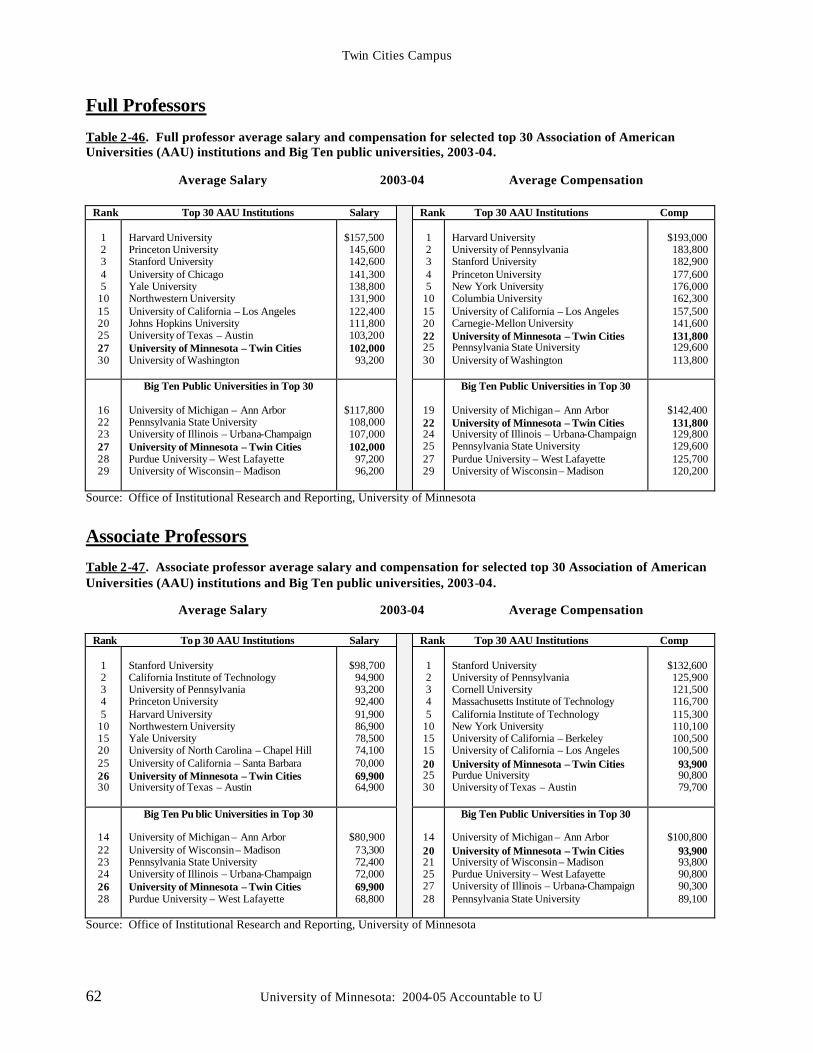
Twin Cities Campus
62 University of Minnesota: 2004-05 Accountable to U
Full Professors Table 2-46. Full professor average salary and compensation for selected top 30 Association of American Universities (AAU) institutions and Big Ten public universities, 2003-04. Average Salary 2003-04 Average Compensation
Rank Top 30 AAU Institutions Salary Rank Top 30 AAU Institutions Comp
1 2 3 4 5
10 15 20 25 27 30
Harvard University Princeton University Stanford University University of Chicago Yale University Northwestern University University of California – Los Angeles Johns Hopkins University University of Texas – Austin University of Minnesota – Twin Cities University of Washington
$157,500 145,600 142,600 141,300 138,800 131,900 122,400 111,800 103,200 102,000
93,200
1 2 3 4 5
10 15 20 22 25 30
Harvard University University of Pennsylvania Stanford University Princeton University New York University Columbia University University of California – Los Angeles Carnegie-Mellon University University of Minnesota – Twin Cities Pennsylvania State University University of Washington
$193,000 183,800 182,900 177,600 176,000 162,300 157,500 141,600 131,800 129,600 113,800
16 22 23 27 28 29
Big Ten Public Universities in Top 30
University of Michigan – Ann Arbor Pennsylvania State University University of Illinois – Urbana-Champaign University of Minnesota – Twin Cities Purdue University – West Lafayette University of Wisconsin – Madison
$117,800 108,000 107,000 102,000
97,200 96,200
19 22 24 25 27 29
Big Ten Public Universities in Top 30 University of Michigan – Ann Arbor University of Minnesota – Twin Cities University of Illinois – Urbana-Champaign Pennsylvania State University Purdue University – West Lafayette University of Wisconsin – Madison
$142,400 131,800 129,800 129,600 125,700 120,200
Source: Office of Institutional Research and Reporting, University of Minnesota Associate Professors Table 2-47. Associate professor average salary and compensation for selected top 30 Association of American Universities (AAU) institutions and Big Ten public universities, 2003-04. Average Salary 2003-04 Average Compensation
Rank To p 30 AAU Institutions Salary Rank Top 30 AAU Institutions Comp
1 2 3 4 5
10 15 20 25 26 30
Stanford University California Institute of Technology University of Pennsylvania Princeton University Harvard University Northwestern University Yale University University of North Carolina – Chapel Hill University of California – Santa Barbara University of Minnesota – Twin Cities University of Texas – Austin
$98,700
94,900 93,200 92,400 91,900 86,900 78,500 74,100 70,000 69,900 64,900
1 2 3 4 5
10 15 15 20 25 30
Stanford University University of Pennsylvania Cornell University Massachusetts Institute of Technology California Institute of Technology New York University University of California – Berkeley University of California – Los Angeles University of Minnesota – Twin Cities Purdue University University of Texas – Austin
$132,600 125,900 121,500 116,700 115,300 110,100 100,500 100,500
93,900 90,800 79,700
14 22 23 24 26 28
Big Ten Pu blic Universities in Top 30
University of Michigan – Ann Arbor University of Wisconsin – Madison Pennsylvania State University University of Illinois – Urbana-Champaign University of Minnesota – Twin Cities Purdue University – West Lafayette
$80,900 73,300 72,400 72,000 69,900 68,800
14 20 21 25 27 28
Big Ten Public Universities in Top 30
University of Michigan – Ann Arbor University of Minnesota – Twin Cities University of Wisconsin – Madison Purdue University – West Lafayette University of Illinois – Urbana-Champaign Pennsylvania State University
$100,800 93,900 93,800 90,800 90,300 89,100
Source: Office of Institutional Research and Reporting, University of Minnesota
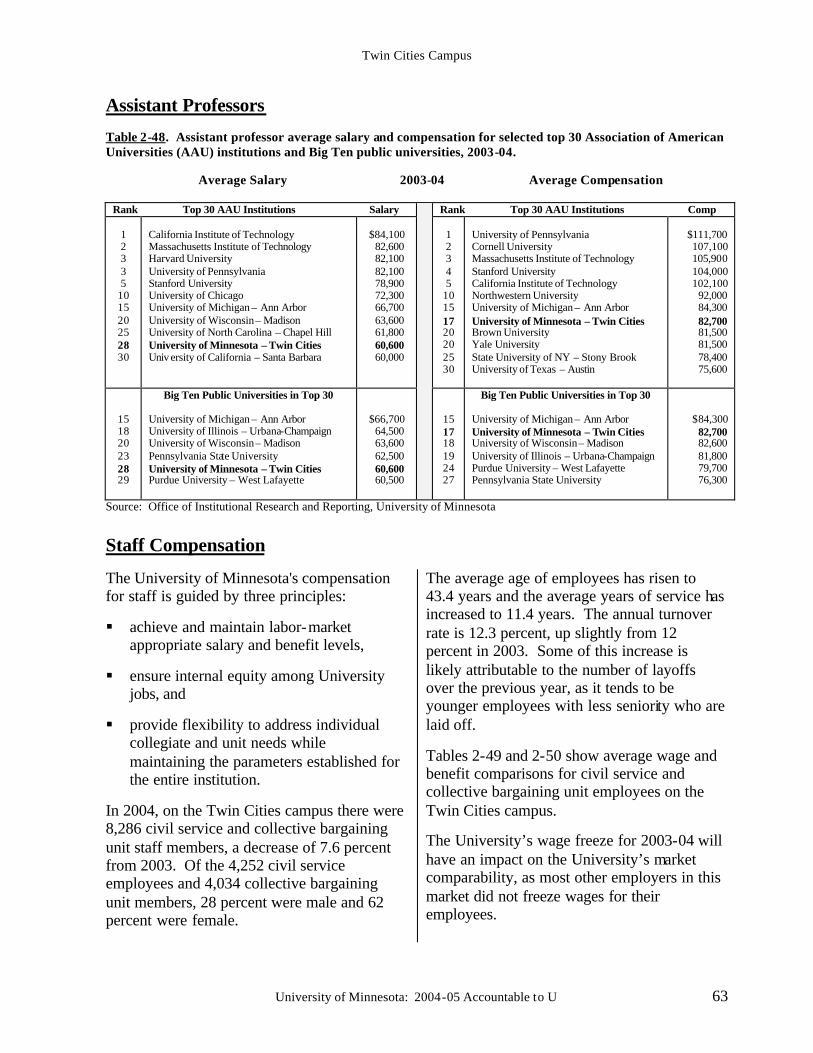
Twin Cities Campus
University of Minnesota: 2004-05 Accountable to U 63
Assistant Professors Table 2-48. Assistant professor average salary and compensation for selected top 30 Association of American Universities (AAU) institutions and Big Ten public universities, 2003-04. Average Salary 2003-04 Average Compensation
Rank Top 30 AAU Institutions Salary Rank Top 30 AAU Institutions Comp
1 2 3 3 5
10 15 20 25 28 30
California Institute of Technology Massachusetts Institute of Technology Harvard University University of Pennsylvania Stanford University University of Chicago University of Michigan – Ann Arbor University of Wisconsin – Madison University of North Carolina – Chapel Hill University of Minnesota – Twin Cities Univ ersity of California – Santa Barbara
$84,100
82,600 82,100 82,100 78,900 72,300 66,700 63,600 61,800 60,600 60,000
1 2 3 4 5
10 15 17 20 20 25 30
University of Pennsylvania Cornell University Massachusetts Institute of Technology Stanford University California Institute of Technology Northwestern University University of Michigan – Ann Arbor University of Minnesota – Twin Cities Brown University Yale University State University of NY – Stony Brook University of Texas – Austin
$111,700 107,100 105,900 104,000 102,100
92,000 84,300 82,700 81,500 81,500 78,400 75,600
15 18 20 23 28 29
Big Ten Public Universities in Top 30
University of Michigan – Ann Arbor University of Illinois – Urbana-Champaign University of Wisconsin – Madison Pennsylvania State University University of Minnesota – Twin Cities Purdue University – West Lafayette
$66,700 64,500 63,600 62,500 60,600 60,500
15 17 18 19 24 27
Big Ten Public Universities in Top 30
University of Michigan – Ann Arbor University of Minnesota – Twin Cities University of Wisconsin – Madison University of Illinois – Urbana-Champaign Purdue University – West Lafayette Pennsylvania State University
$84,300 82,700 82,600 81,800 79,700 76,300
Source: Office of Institutional Research and Reporting, University of Minnesota Staff Compensation
The University of Minnesota's compensation for staff is guided by three principles:
§ achieve and maintain labor-market appropriate salary and benefit levels,
§ ensure internal equity among University jobs, and
§ provide flexibility to address individual collegiate and unit needs while maintaining the parameters established for the entire institution.
In 2004, on the Twin Cities campus there were 8,286 civil service and collective bargaining unit staff members, a decrease of 7.6 percent from 2003. Of the 4,252 civil service employees and 4,034 collective bargaining unit members, 28 percent were male and 62 percent were female.
The average age of employees has risen to 43.4 years and the average years of service has increased to 11.4 years. The annual turnover rate is 12.3 percent, up slightly from 12 percent in 2003. Some of this increase is likely attributable to the number of layoffs over the previous year, as it tends to be younger employees with less seniority who are laid off.
Tables 2-49 and 2-50 show average wage and benefit comparisons for civil service and collective bargaining unit employees on the Twin Cities campus.
The University’s wage freeze for 2003-04 will have an impact on the University’s market comparability, as most other employers in this market did not freeze wages for their employees.
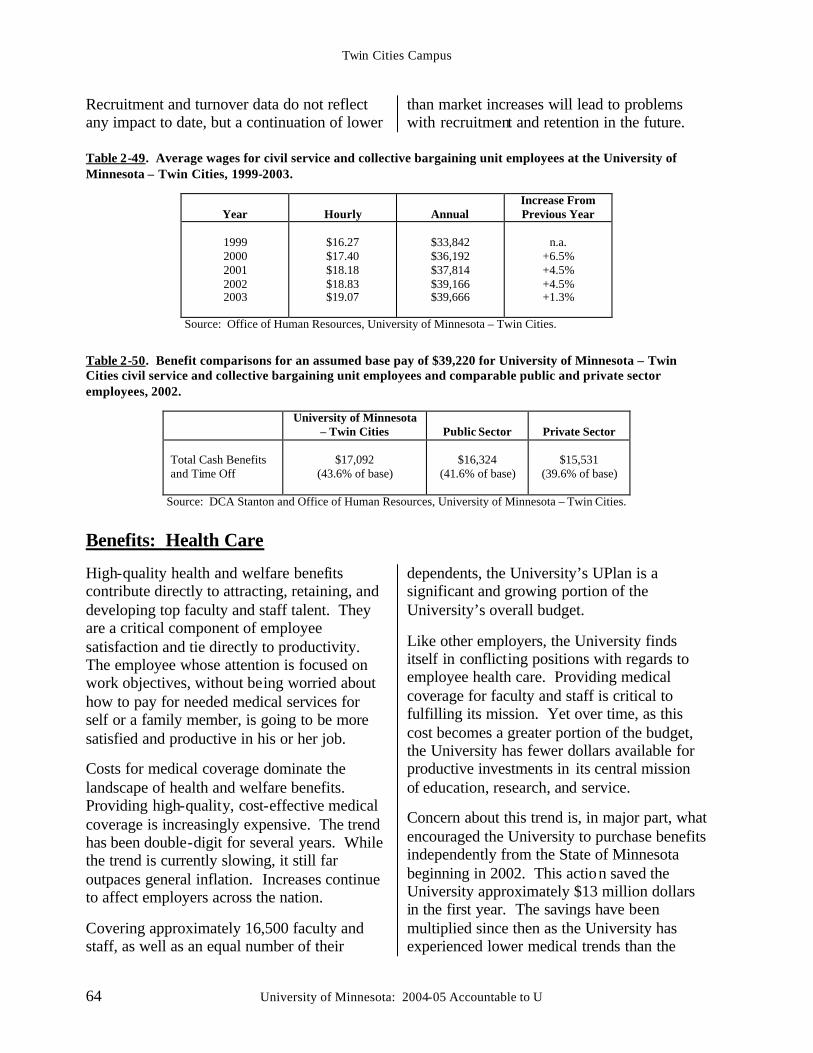
Twin Cities Campus
64 University of Minnesota: 2004-05 Accountable to U
Recruitment and turnover data do not reflect any impact to date, but a continuation of lower
than market increases will lead to problems with recruitment and retention in the future.
Table 2-49. Average wages for civil service and collective bargaining unit employees at the University of Minnesota – Twin Cities, 1999-2003.
Year
Hourly
Annual
Increase From Previous Year
1999 2000 2001 2002 2003
$16.27 $17.40 $18.18 $18.83 $19.07
$33,842 $36,192 $37,814 $39,166 $39,666
n.a.
+6.5% +4.5% +4.5% +1.3%
Source: Office of Human Resources, University of Minnesota – Twin Cities.
Table 2-50. Benefit comparisons for an assumed base pay of $39,220 for University of Minnesota – Twin Cities civil service and collective bargaining unit employees and comparable public and private sector employees, 2002.
University of Minnesota – Twin Cities
Public Sector
Private Sector
Total Cash Benefits and Time Off
$17,092
(43.6% of base)
$16,324
(41.6% of base)
$15,531
(39.6% of base)
Source: DCA Stanton and Office of Human Resources, University of Minnesota – Twin Cities.
Benefits: Health Care
High-quality health and welfare benefits contribute directly to attracting, retaining, and developing top faculty and staff talent. They are a critical component of employee satisfaction and tie directly to productivity. The employee whose attention is focused on work objectives, without being worried about how to pay for needed medical services for self or a family member, is going to be more satisfied and productive in his or her job.
Costs for medical coverage dominate the landscape of health and welfare benefits. Providing high-quality, cost-effective medical coverage is increasingly expensive. The trend has been double-digit for several years. While the trend is currently slowing, it still far outpaces general inflation. Increases continue to affect employers across the nation.
Covering approximately 16,500 faculty and staff, as well as an equal number of their
dependents, the University’s UPlan is a significant and growing portion of the University’s overall budget.
Like other employers, the University finds itself in conflicting positions with regards to employee health care. Providing medical coverage for faculty and staff is critical to fulfilling its mission. Yet over time, as this cost becomes a greater portion of the budget, the University has fewer dollars available for productive investments in its central mission of education, research, and service.
Concern about this trend is, in major part, what encouraged the University to purchase benefits independently from the State of Minnesota beginning in 2002. This action saved the University approximately $13 million dollars in the first year. The savings have been multiplied since then as the University has experienced lower medical trends than the
Twin Cities Campus
University of Minnesota: 2004-05 Accountable to U 65
State group. It also positioned the University strategically to take corrective action to mitigate the cost impact of this program on its mission.
In 2004-05, the University also took steps to limit its liability for medical coverage by realigning the portion of overall responsibility for costs shared with employees to a more competitive level. This action resulted in less cost for the University and more cost for employees, while keeping the University positioned competitively in the markets in which it competes for faculty and staff.
Shifting costs to employees, however, cannot be the complete answer to this problem. Diminishing returns would be experienced over time, both in employee satisfaction and the University’s ability to compete for top talent. Beyond these practical constraints, as an employer committed to socially responsible hiring and employment practices, the institution has a high level of concern about health care becoming unaffordable, especially for lower-paid employees.
The University maintains a “base plan” option available to all employees that delivers comprehensive coverage, high-quality care, an affordable premium, and low out-of-pocket exposure. This is accomplished largely through a restriction in provider choice. Employees who choose broader provider access pay for that through higher premiums and out-of-pocket expenses.
The University is committed to finding ways to reduce the impact of medical costs for employees and dependents, without resorting to further cost-shifts to employees. Using all the tools at its disposal, the University is pursuing several paths to mitigate future medical cost increases.
The first re-bidding process since implementing the UPlan is currently under way. New vendor contracts will be placed in
2006 using improved purchasing methodologies as well as the latest pharmacy benefits management strategies and several health improvement programs.
In the past, certain purchasing strategies, such as shifting to managed care, produced savings in health care delivery. The next gains are likely to come from health improvement, or wellness. The University has begun a health improvement initiative with walking, nutrition, and self-care campaigns. This effort will expand significantly in 2006 with new vendor contracts and other initiatives such as health coaching for employees whose health is at risk and disease management programs for all employees with active disease conditions.
The goal is to continue to provide high-quality, cost-effective benefits that meet employee needs, enable the University to be competitive in attracting, retaining, and developing top talent, while managing costs to minimize the impact to the overall budget. This is a difficult goal, with elements that may prove mutually exclusive. Short of a national reform of the health care system, the University will strive to manage these competing objectives. Retirement The University ranks 2nd in the Big Ten in its contributions to retirement plans (13 percent) for faculty and academic staff. It ranks 4th in terms of the replacement ratio, an estimate of the percentage of pre-retirement income provided by a retirement plan. The University’s replacement ratios of 60 percent for academic employees and 56 percent for non-academic employees compare favorably to those in the Big Ten and are slightly lower than the average replacement ratios for local, public sector employers.
In 2003-04, about 2.3 percent of the faculty retired. Overall attrition for faculty, for all reasons including retirement, has ranged from
Twin Cities Campus
66 University of Minnesota: 2004-05 Accountable to U
4-6 percent across the past 10 years. The average age of faculty at retirement is 66 years, a figure that has remained constant over the past five years. Approximately 15 percent of retired faculty are rehired at some percentage level to return to the University.
All other employee groups show a younger average retirement age, typically between 60 and 62 with the average years of service at least 20 years, suggesting that many staff tend to choose the University as their long-term employer. This information points to the need for programs which help long-term staff adapt to changing conditions and workplace demands. New skills are needed as fields change and as technology dramatically impacts the nature of the work carried out by most staff. Faculty and Staff Attitudes
Large employers recognize the value of continuously monitoring employee attitudes and perspective on the workplace. Level of satisfaction with compensation, benefits, supervisor behaviors, and work- life support play an important role in an individual’s decision to stay or leave. With this monitoring goal in mind, the Pulse Survey was commissioned by the University’s central administration and conducted in partnership with the Human Resources Research Institute of the Carlson School of Management.
The first Pulse Survey was conducted in April 2004. Over 6,000 faculty and staff responded to the survey. The survey asked a variety of questions about employees’ job experiences and attitudes about their jobs, departments, and the University. The survey examined the following areas:
§ job satisfaction § pay and benefits § supervisor and departmental support § University climate § retention and considerations in leaving
§ Life Outside of Work § Characteristics of the Respondents
Taken as a whole, the survey results suggest that faculty and staff at the University of Minnesota are satisfied with a variety of features regarding their employment and the University.
Faculty Results: Across a number of indicators, results suggest that faculty respondents feel quite good about their jobs at the University. Some of the most favorable results were in the following areas:
§ overall job satisfaction and satisfaction with the University as an employer
§ satisfaction with co-workers § satisfaction with department chair or
responsible administrator § intentions to remain at the University § general well-being outside of work
Despite the generally favorable results for faculty, some areas showed more moderate degrees of favorability. This is not to say that results were unfavorable, but rather when considered in the context of the overall positive results, individuals were more moderately favorable or neutral:
§ satisfaction with pay § work family conflict § support from department chair or
responsible administrator
There was a tendency for faculty on the Crookston campus to report slightly less favorable responses in several of the areas. However, the Crookston sample size is small and caution must be taken in making inferences about these differences.
Staff Results: With respect to staff, some of the most favorable results were in the following areas:
§ overall job satisfaction and satisfaction with the University as an employer
Twin Cities Campus
University of Minnesota: 2004-05 Accountable to U 67
§ satisfaction with co-workers § satisfaction with supervisors § intentions to remain at the University § general well-being outside of work
Despite the generally favorable results, some areas showed more moderate degrees of favorability. Respondents were more moderately favorable or neutral:
§ satisfaction with promotion § satisfaction with pay § supervisor support for career development § perceptions of job security
Conclusions: The results from this first survey suggest the University must continue to address the issue of salary levels. Retention of faculty and staff will depend on increasing the University’s competitive position in this area. While University benefits programs are viewed as a positive feature of employment, good benefits cannot compensate for erosion of base salaries against peer institutions.
Efforts to better prepare supervisors and managers appear to be paying off, as the survey indicates many employees feel positive about the quality of their supervisors and managers. More attention to career development opportunities seems particularly important for staff employees, many of whom remain at the University for their careers.
The Pulse Survey will be an ongoing University-wide effort to “take the pulse” of University employees. In the years to come, similar surveys will be administered to track changes in the experiences of University employees. Faculty and Staff Diversity
The recruitment and retention of a diverse faculty and staff remains one of the most challenging and important issues facing higher education. The University remains committed
to recruiting and retaining a diverse faculty and staff.
This commitment is exemplified in the University’s mission statement, which clearly articulates diversity as a core goal and strategic initiative: “…share that knowledge, understanding, and creativity…in a strong and diverse community of learners and teachers, and prepare…students…for active roles in a multiracial and multicultural world….[T]he University strives to sustain an open exchange of ideas in an… atmosphere of mutual respect, free from racism, sexism, and other forms of prejudice and intolerance…”
The Twin Cities campus has made modest but steady progress in hiring and retaining faculty and staff of color over the past eight years. Figure 2-20 shows that between 1996 and 2003, the percentage of female tenured/tenure-track faculty and other female faculty increased from 23.6 percent to 27.9 percent and from 27.2 percent to 30.7 percent, respectively.
Figures 2-21 and 2-22 show that during the same period the percentage of faculty of color increased steadily among Hispanics, American Indians, Asians, and blacks. Tenured/tenure-track faculty of color increased from 8.2 percent in 1996 to 12.6 percent in 2003. Other faculty of color increased from 6.1 percent in 1996 to 9.3 percent in 2003.
In 2004, the Twin Cities campus had 12,918 staff in the Executive, Professional and Administrative, and Civil Service/Bargaining Unit classifications. Of these, 7,674 (59 percent) were female, approximately the same percentage as in 1996.
The percentage of staff of color increased from 8.7 percent in 1996 to 11.5 percent in 2004. The Twin Cities campus is the only University of Minnesota campus that had a greater percentage of staff of color in 2004 than it did in 1996. In 2004, the largest minority group
Twin Cities Campus
68 University of Minnesota: 2004-05 Accountable to U
among staff were blacks, at 4.8 percent, followed by Asians at 4.1 percent.
Figure 2-23 shows that similar gains were made in terms of the percentage of female staff employees in the executive and professional and administrative categories, while the civil service/collective bargaining unit category showed a slight decline.
Figure 2-24 shows that during 1996-2004 the percentage of staff members of color increased
only in the civil service/collective bargaining unit category, while remaining unchanged among executive staff of color and declining slightly within the professional and administrative category.
Individuals in executive and administrative positions may also be tenured faculty. For the purposes of this report, each person was counted only once, according to his/her primary appointment.
Figure 2-20. Percentage of female faculty, University of Minnesota – Twin Cities, 1996-2004.
28.027.927.627.126.725.725.724.223.6
32.330.730.828.729.128.828.629.227.2
0
10
20
30
40
1996 1997 1998 1999 2000 2001 2002 2003 2004
perc
enta
ge
Tenured/Tenure Track faculty Other faculty
Source: Office of Equal Opportunity and Affirmative Action, University of Minnesota.
Figure 2-21. Percentage of faculty of color, University of Minnesota – Twin Cities, 1996-2004.
13.012.612.411.411.3
10.59.58.58.2 11.0
9.39.57.78.0
9.18.67.6
6.1
0
5
10
15
1996 1997 1998 1999 2000 2001 2002 2003 2004
perc
enta
ge
Tenured/Tenure Track faculty Other faculty
Source: Office of Equal Opportunity and Affirmative Action, University of Minnesota.
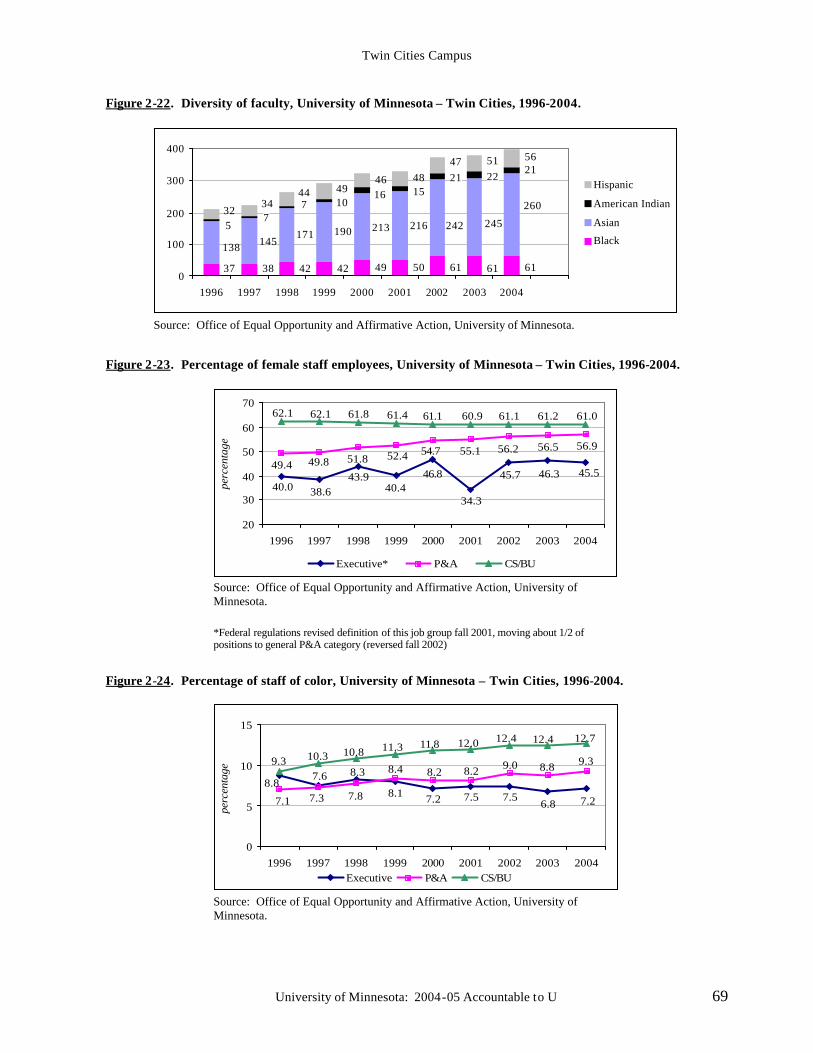
Twin Cities Campus
University of Minnesota: 2004-05 Accountable to U 69
Figure 2-22. Diversity of faculty, University of Minnesota – Twin Cities, 1996-2004.
616161504942423837
260
245242216213190171145138
212221
1516107
7532
5651474846
494434
0
100
200
300
400
1996 1997 1998 1999 2000 2001 2002 2003 2004 2005
Hispanic
American Indian
Asian
Black
Source: Office of Equal Opportunity and Affirmative Action, University of Minnesota.
Figure 2-23. Percentage of female staff employees, University of Minnesota – Twin Cities, 1996-2004.
45.546.345.7
34.3
46.840.4
43.938.640.0
56.956.556.255.154.752.451.849.849.4
61.061.261.160.961.161.461.862.162.1
20
30
40
50
60
70
1996 1997 1998 1999 2000 2001 2002 2003 2004
perc
enta
ge
Executive* P&A CS/BU
Source: Office of Equal Opportunity and Affirmative Action, University of Minnesota.
*Federal regulations revised definition of this job group fall 2001, moving about 1/2 of positions to general P&A category (reversed fall 2002)
Figure 2-24. Percentage of staff of color, University of Minnesota – Twin Cities, 1996-2004.
7.26.87.57.57.28.1
8.37.68.8
9.38.89.08.28.28.4
7.87.37.1
12.712.412.412.011.811.310.810.39.3
0
5
10
15
1996 1997 1998 1999 2000 2001 2002 2003 2004
perc
enta
ge
Executive P&A CS/BU
Source: Office of Equal Opportunity and Affirmative Action, University of Minnesota.
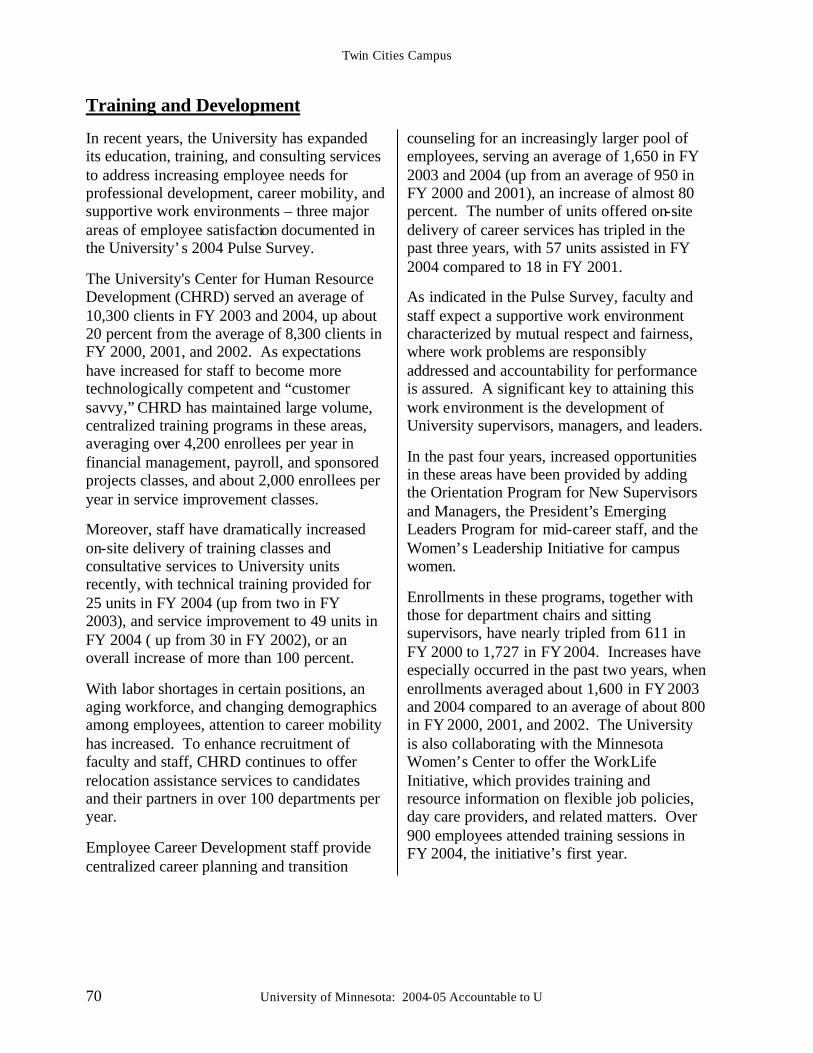
Twin Cities Campus
70 University of Minnesota: 2004-05 Accountable to U
Training and Development
In recent years, the University has expanded its education, training, and consulting services to address increasing employee needs for professional development, career mobility, and supportive work environments – three major areas of employee satisfaction documented in the University’ s 2004 Pulse Survey.
The University's Center for Human Resource Development (CHRD) served an average of 10,300 clients in FY 2003 and 2004, up about 20 percent from the average of 8,300 clients in FY 2000, 2001, and 2002. As expectations have increased for staff to become more technologically competent and “customer savvy,” CHRD has maintained large volume, centralized training programs in these areas, averaging over 4,200 enrollees per year in financial management, payroll, and sponsored projects classes, and about 2,000 enrollees per year in service improvement classes.
Moreover, staff have dramatically increased on-site delivery of training classes and consultative services to University units recently, with technical training provided for 25 units in FY 2004 (up from two in FY 2003), and service improvement to 49 units in FY 2004 ( up from 30 in FY 2002), or an overall increase of more than 100 percent.
With labor shortages in certain positions, an aging workforce, and changing demographics among employees, attention to career mobility has increased. To enhance recruitment of faculty and staff, CHRD continues to offer relocation assistance services to candidates and their partners in over 100 departments per year.
Employee Career Development staff provide centralized career planning and transition
counseling for an increasingly larger pool of employees, serving an average of 1,650 in FY 2003 and 2004 (up from an average of 950 in FY 2000 and 2001), an increase of almost 80 percent. The number of units offered on-site delivery of career services has tripled in the past three years, with 57 units assisted in FY 2004 compared to 18 in FY 2001.
As indicated in the Pulse Survey, faculty and staff expect a supportive work environment characterized by mutual respect and fairness, where work problems are responsibly addressed and accountability for performance is assured. A significant key to attaining this work environment is the development of University supervisors, managers, and leaders.
In the past four years, increased opportunities in these areas have been provided by adding the Orientation Program for New Supervisors and Managers, the President’s Emerging Leaders Program for mid-career staff, and the Women’s Leadership Initiative for campus women.
Enrollments in these programs, together with those for department chairs and sitting supervisors, have nearly tripled from 611 in FY 2000 to 1,727 in FY 2004. Increases have especially occurred in the past two years, when enrollments averaged about 1,600 in FY 2003 and 2004 compared to an average of about 800 in FY 2000, 2001, and 2002. The University is also collaborating with the Minnesota Women’s Center to offer the WorkLife Initiative, which provides training and resource information on flexible job policies, day care providers, and related matters. Over 900 employees attended training sessions in FY 2004, the initiative’s first year.
Twin Cities Campus
University of Minnesota: 2004-05 Accountable to U 71
J. Campus Facilities and Environment The Twin Cities campus – with its more than 250 buildings and almost 13 million assignable square feet – is perhaps the most visible but only one part of the University of Minnesota’s statewide presence. To operate this statewide infrastructure, the University has three overarching goals:
§ become a model of sustainability and environmental stewardship,
§ create a culture of safety and security,
§ provide services to students, faculty and staff.
The University’s commitment to the phys ical environment of the Twin Cities campus remains strong. While the University continues to build new facilities like the $37 million translational research facility, the focus has shifted more toward preservation and renewal of existing facilities. The $24 million rehabilitation of Nicholson Hall and the $8 million reuse of Jones Hall are examples of building new life into historic facilities.
Although the legislature did not provide any new bonding for construction projects in 2004, the University is using existing funds carefully by investing in repair and replacement projects to keep existing buildings functional and responsive to the changing needs of students, faculty, staff, and researchers.
Creating a culture of safety and security means informing students, staff, and faculty on how they can take part in making the campus a safe environment for themselves, their property, and each other, as well as ensuring campus-wide preparedness for emergencies. The departments of environmental health and safety, police, central security, and emergency management work in partnership with other
divisions and academic units to build campus awareness of safety issues.
At the University, a culture of service means providing excellent services – such as campus mail, bookstores, printing services, dining, and many other services – as well as delivering great service on a one-to-one or vendor-to-customer basis. Sustainability and Stewardship
The University is home to one of the country’s largest libraries, some of the world’s most sophisticated research laboratories, and hundreds of classrooms, offices, and public spaces. The University is committed to discovering new and better ways to manage its resources so that the institution becomes stronger over time. A key to this goal is taking care of what we have. With more than 800 buildings on its campuses, six research and outreach centers, and three biological and forestry field stations comprising 28 million square feet of space, the sound stewardship of the University’s facilities is essential to achieving excellence in its mission.
Building toward sustainability, several initiatives have been undertaken:
Regental Policy: In July 2004, the Board of Regents adopted a new sustainability and energy efficiency policy for the University. Sustainability is a continuous effort integrating environmental, social, and economic goals through design, planning, and operational organization to meet current needs without compromising the ability of future generations to meet their own needs.
Sustainability requires the collective actions of the University community and is guided by the balanced use of all resources, within budgetary constraints. The University is committed to
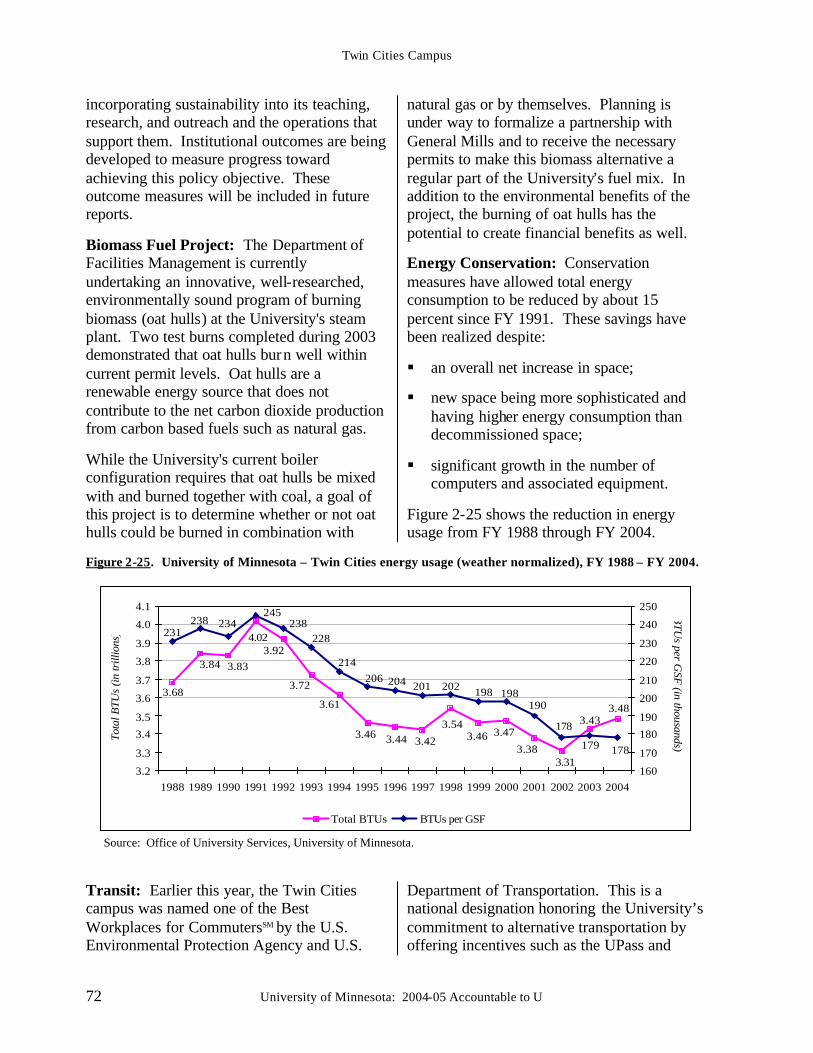
Twin Cities Campus
72 University of Minnesota: 2004-05 Accountable to U
incorporating sustainability into its teaching, research, and outreach and the operations that support them. Institutional outcomes are being developed to measure progress toward achieving this policy objective. These outcome measures will be included in future reports.
Biomass Fuel Project: The Department of Facilities Management is currently undertaking an innovative, well-researched, environmentally sound program of burning biomass (oat hulls) at the University's steam plant. Two test burns completed during 2003 demonstrated that oat hulls burn well within current permit levels. Oat hulls are a renewable energy source that does not contribute to the net carbon dioxide production from carbon based fuels such as natural gas.
While the University's current boiler configuration requires that oat hulls be mixed with and burned together with coal, a goal of this project is to determine whether or not oat hulls could be burned in combination with
natural gas or by themselves. Planning is under way to formalize a partnership with General Mills and to receive the necessary permits to make this biomass alternative a regular part of the University’s fuel mix. In addition to the environmental benefits of the project, the burning of oat hulls has the potential to create financial benefits as well.
Energy Conservation: Conservation measures have allowed total energy consumption to be reduced by about 15 percent since FY 1991. These savings have been realized despite:
§ an overall net increase in space;
§ new space being more sophisticated and having higher energy consumption than decommissioned space;
§ significant growth in the number of computers and associated equipment.
Figure 2-25 shows the reduction in energy usage from FY 1988 through FY 2004.
Figure 2-25. University of Minnesota – Twin Cities energy usage (weather normalized), FY 1988 – FY 2004.
3.483.43
3.313.38
3.473.463.54
3.423.443.46
3.61
3.72
3.923.833.84
3.68
4.02
178
178
190198198202201204
228
206
179
214
238245
234238231
3.2
3.3
3.4
3.5
3.6
3.7
3.8
3.9
4.0
4.1
1988 1989 1990 1991 1992 1993 1994 1995 1996 1997 1998 1999 2000 2001 2002 2003 2004
Tota
l BTU
s (in
trill
ions
)
160
170
180
190
200
210
220
230
240
250
BTU
s per GSF
(in thousands)
Total BTUs BTUs per GSF
Source: Office of University Services, University of Minnesota.
Transit: Earlier this year, the Twin Cities campus was named one of the Best Workplaces for CommutersSM by the U.S. Environmental Protection Agency and U.S.
Department of Transportation. This is a national designation honoring the University’s commitment to alternative transportation by offering incentives such as the UPass and
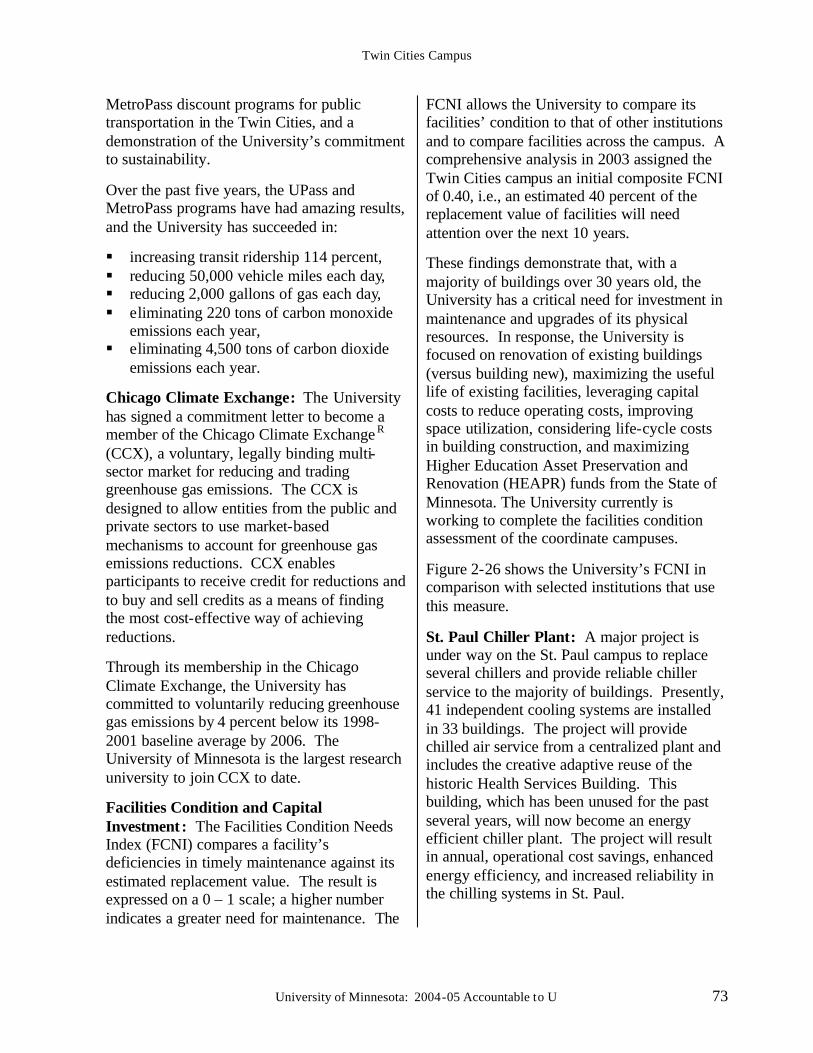
Twin Cities Campus
University of Minnesota: 2004-05 Accountable to U 73
MetroPass discount programs for public transportation in the Twin Cities, and a demonstration of the University’s commitment to sustainability.
Over the past five years, the UPass and MetroPass programs have had amazing results, and the University has succeeded in:
§ increasing transit ridership 114 percent, § reducing 50,000 vehicle miles each day, § reducing 2,000 gallons of gas each day, § eliminating 220 tons of carbon monoxide
emissions each year, § eliminating 4,500 tons of carbon dioxide
emissions each year.
Chicago Climate Exchange: The University has signed a commitment letter to become a member of the Chicago Climate Exchange R (CCX), a voluntary, legally binding multi-sector market for reducing and trading greenhouse gas emissions. The CCX is designed to allow entities from the public and private sectors to use market-based mechanisms to account for greenhouse gas emissions reductions. CCX enables participants to receive credit for reductions and to buy and sell credits as a means of finding the most cost-effective way of achieving reductions.
Through its membership in the Chicago Climate Exchange, the University has committed to voluntarily reducing greenhouse gas emissions by 4 percent below its 1998-2001 baseline average by 2006. The University of Minnesota is the largest research university to join CCX to date.
Facilities Condition and Capital Investment: The Facilities Condition Needs Index (FCNI) compares a facility’s deficiencies in timely maintenance against its estimated replacement value. The result is expressed on a 0 – 1 scale; a higher number indicates a greater need for maintenance. The
FCNI allows the University to compare its facilities’ condition to that of other institutions and to compare facilities across the campus. A comprehensive analysis in 2003 assigned the Twin Cities campus an initial composite FCNI of 0.40, i.e., an estimated 40 percent of the replacement value of facilities will need attention over the next 10 years.
These findings demonstrate that, with a majority of buildings over 30 years old, the University has a critical need for investment in maintenance and upgrades of its physical resources. In response, the University is focused on renovation of existing buildings (versus building new), maximizing the useful life of existing facilities, leveraging capital costs to reduce operating costs, improving space utilization, considering life-cycle costs in building construction, and maximizing Higher Education Asset Preservation and Renovation (HEAPR) funds from the State of Minnesota. The University currently is working to complete the facilities condition assessment of the coordinate campuses.
Figure 2-26 shows the University’s FCNI in comparison with selected institutions that use this measure.
St. Paul Chiller Plant: A major project is under way on the St. Paul campus to replace several chillers and provide reliable chiller service to the majority of buildings. Presently, 41 independent cooling systems are installed in 33 buildings. The project will provide chilled air service from a centralized plant and includes the creative adaptive reuse of the historic Health Services Building. This building, which has been unused for the past several years, will now become an energy efficient chiller plant. The project will result in annual, operational cost savings, enhanced energy efficiency, and increased reliability in the chilling systems in St. Paul.
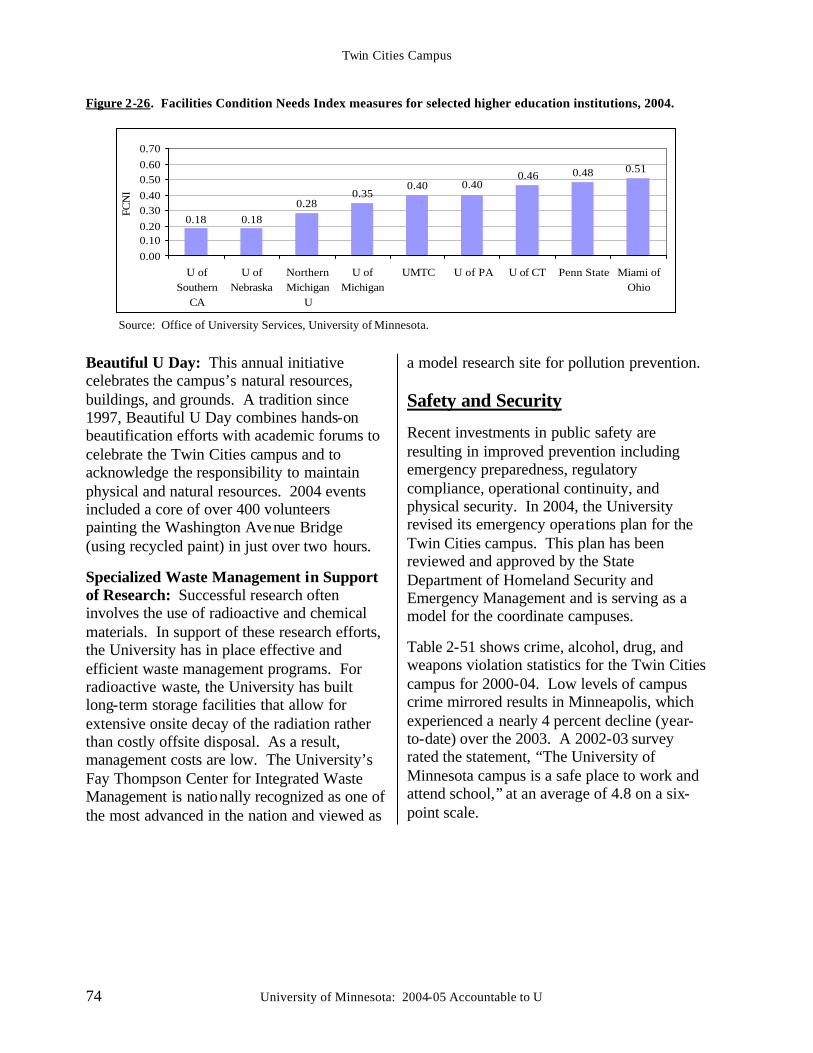
Twin Cities Campus
74 University of Minnesota: 2004-05 Accountable to U
Figure 2-26. Facilities Condition Needs Index measures for selected higher education institutions, 2004.
0.510.480.460.400.40
0.350.28
0.180.18
0.000.100.200.300.400.500.600.70
U ofSouthern
CA
U ofNebraska
NorthernMichigan
U
U ofMichigan
UMTC U of PA U of CT Penn State Miami ofOhio
FCN
I
Source: Office of University Services, University of Minnesota.
Beautiful U Day: This annual initiative celebrates the campus’s natural resources, buildings, and grounds. A tradition since 1997, Beautiful U Day combines hands-on beautification efforts with academic forums to celebrate the Twin Cities campus and to acknowledge the responsibility to maintain physical and natural resources. 2004 events included a core of over 400 volunteers painting the Washington Avenue Bridge (using recycled paint) in just over two hours.
Specialized Waste Management in Support of Research: Successful research often involves the use of radioactive and chemical materials. In support of these research efforts, the University has in place effective and efficient waste management programs. For radioactive waste, the University has built long-term storage facilities that allow for extensive onsite decay of the radiation rather than costly offsite disposal. As a result, management costs are low. The University’s Fay Thompson Center for Integrated Waste Management is nationally recognized as one of the most advanced in the nation and viewed as
a model research site for pollution prevention. Safety and Security
Recent investments in public safety are resulting in improved prevention including emergency preparedness, regulatory compliance, operational continuity, and physical security. In 2004, the University revised its emergency operations plan for the Twin Cities campus. This plan has been reviewed and approved by the State Department of Homeland Security and Emergency Management and is serving as a model for the coordinate campuses.
Table 2-51 shows crime, alcohol, drug, and weapons violation statistics for the Twin Cities campus for 2000-04. Low levels of campus crime mirrored results in Minneapolis, which experienced a nearly 4 percent decline (year-to-date) over the 2003. A 2002-03 survey rated the statement, “The University of Minnesota campus is a safe place to work and attend school,” at an average of 4.8 on a six-point scale.
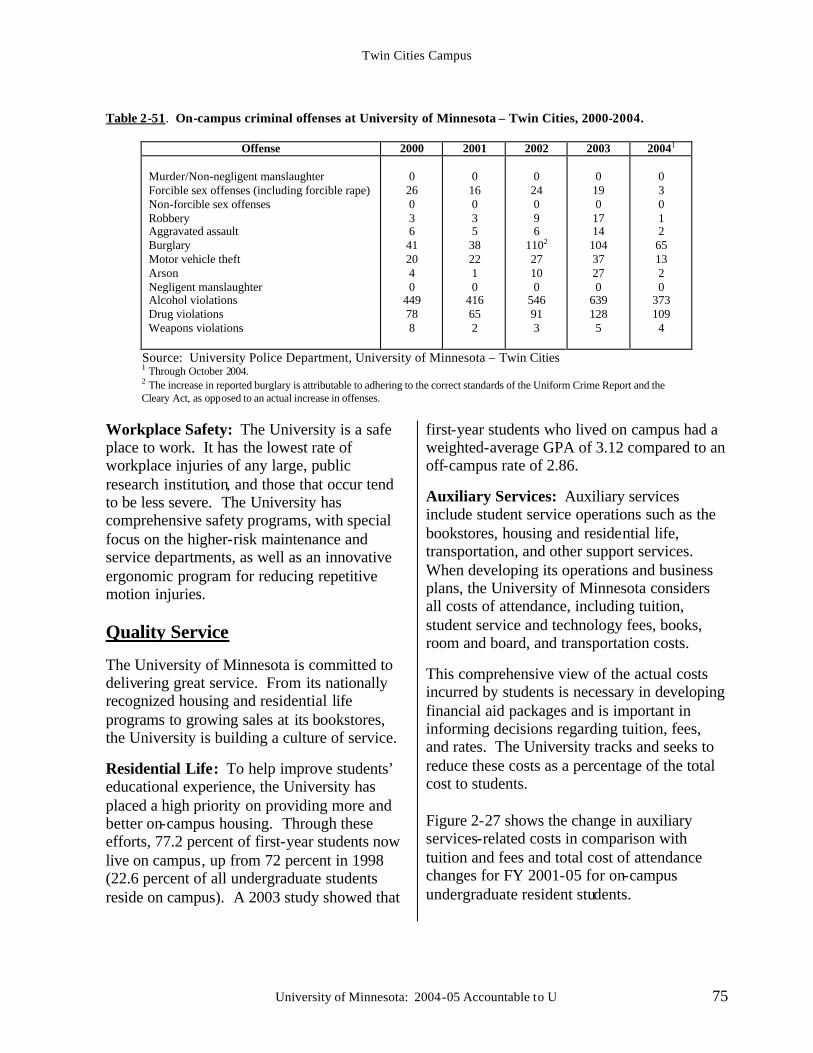
Twin Cities Campus
University of Minnesota: 2004-05 Accountable to U 75
Table 2-51. On-campus criminal offenses at University of Minnesota – Twin Cities, 2000-2004.
Offense 2000 2001 2002 2003 20041 Murder/Non-negligent manslaughter Forcible sex offenses (including forcible rape) Non-forcible sex offenses Robbery Aggravated assault Burglary Motor vehicle theft Arson Negligent manslaughter Alcohol violations Drug violations Weapons violations
0 26 0 3 6 41 20 4 0
449 78 8
0 16 0 3 5 38 22 1 0
416 65 2
0 24 0 9 6
1102
27 10 0
546 91 3
0 19 0 17 14 104 37 27 0
639 128 5
0 3 0 1 2 65 13 2 0
373 109 4
Source: University Police Department, University of Minnesota – Twin Cities 1 Through October 2004. 2 The increase in reported burglary is attributable to adhering to the correct standards of the Uniform Crime Report and the Cleary Act, as opposed to an actual increase in offenses.
Workplace Safety: The University is a safe place to work. It has the lowest rate of workplace injuries of any large, public research institution, and those that occur tend to be less severe. The University has comprehensive safety programs, with special focus on the higher-risk maintenance and service departments, as well as an innovative ergonomic program for reducing repetitive motion injuries. Quality Service
The University of Minnesota is committed to delivering great service. From its nationally recognized housing and residential life programs to growing sales at its bookstores, the University is building a culture of service.
Residential Life: To help improve students’ educational experience, the University has placed a high priority on providing more and better on-campus housing. Through these efforts, 77.2 percent of first-year students now live on campus, up from 72 percent in 1998 (22.6 percent of all undergraduate students reside on campus). A 2003 study showed that
first-year students who lived on campus had a weighted-average GPA of 3.12 compared to an off-campus rate of 2.86.
Auxiliary Services: Auxiliary services include student service operations such as the bookstores, housing and residential life, transportation, and other support services. When developing its operations and business plans, the University of Minnesota considers all costs of attendance, including tuition, student service and technology fees, books, room and board, and transportation costs.
This comprehensive view of the actual costs incurred by students is necessary in developing financial aid packages and is important in informing decisions regarding tuition, fees, and rates. The University tracks and seeks to reduce these costs as a percentage of the total cost to students. Figure 2-27 shows the change in auxiliary services-related costs in comparison with tuition and fees and total cost of attendance changes for FY 2001-05 for on-campus undergraduate resident students.
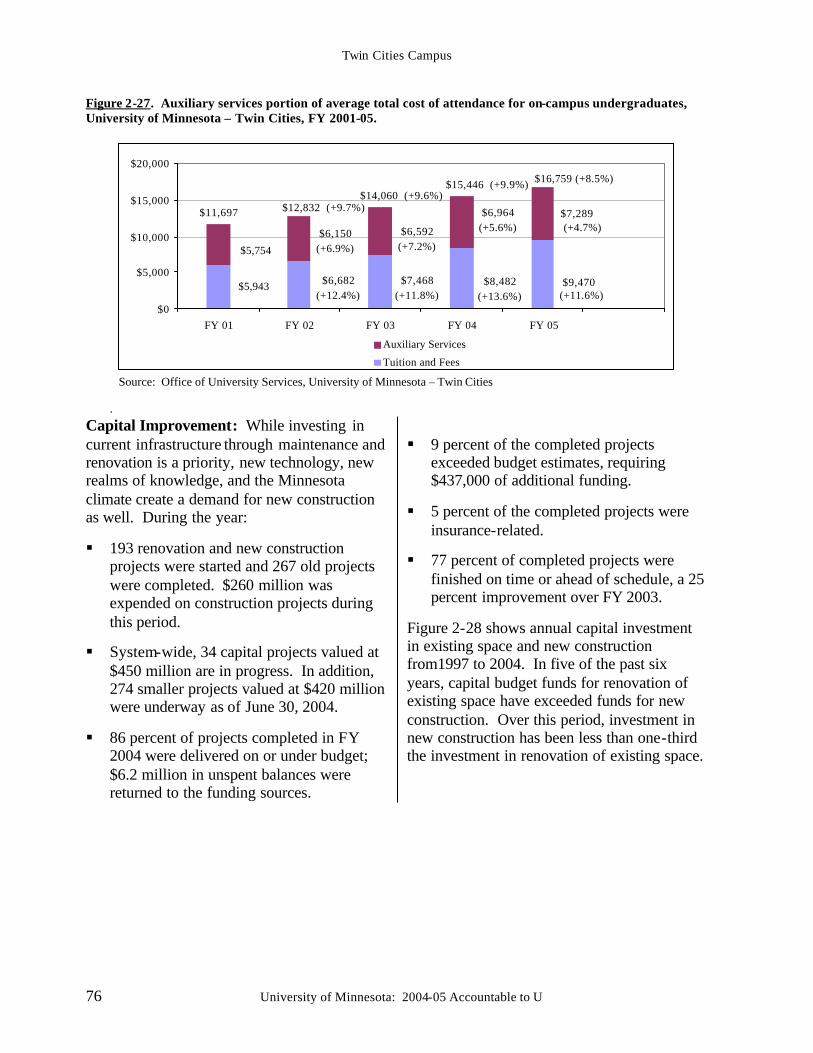
Twin Cities Campus
76 University of Minnesota: 2004-05 Accountable to U
Figure 2-27. Auxiliary services portion of average total cost of attendance for on-campus undergraduates, University of Minnesota – Twin Cities, FY 2001-05.
$9,470$8,482(+13.6%)
$7,468(+11.8%)
$6,682(+12.4%)
$5,943
$7,289$6,964(+5.6%)$6,592
(+7.2%)$6,150
(+6.9%)$5,754
$0
$5,000
$10,000
$15,000
$20,000
FY 01 FY 02 FY 03 FY 04 FY 05
Auxiliary Services
Tuition and Fees
$11,697 $12,832 (+9.7%)$14,060 (+9.6%)
$15,446 (+9.9%)
(+4.7%)
(+11.6%)
$16,759 (+8.5%)
Source: Office of University Services, University of Minnesota – Twin Cities .
Capital Improvement: While investing in current infrastructure through maintenance and renovation is a priority, new technology, new realms of knowledge, and the Minnesota climate create a demand for new construction as well. During the year:
§ 193 renovation and new construction projects were started and 267 old projects were completed. $260 million was expended on construction projects during this period.
§ System-wide, 34 capital projects valued at $450 million are in progress. In addition, 274 smaller projects valued at $420 million were underway as of June 30, 2004.
§ 86 percent of projects completed in FY 2004 were delivered on or under budget; $6.2 million in unspent balances were returned to the funding sources.
§ 9 percent of the completed projects
exceeded budget estimates, requiring $437,000 of additional funding.
§ 5 percent of the completed projects were insurance-related.
§ 77 percent of completed projects were
finished on time or ahead of schedule, a 25 percent improvement over FY 2003.
Figure 2-28 shows annual capital investment in existing space and new construction from1997 to 2004. In five of the past six years, capital budget funds for renovation of existing space have exceeded funds for new construction. Over this period, investment in new construction has been less than one-third the investment in renovation of existing space.
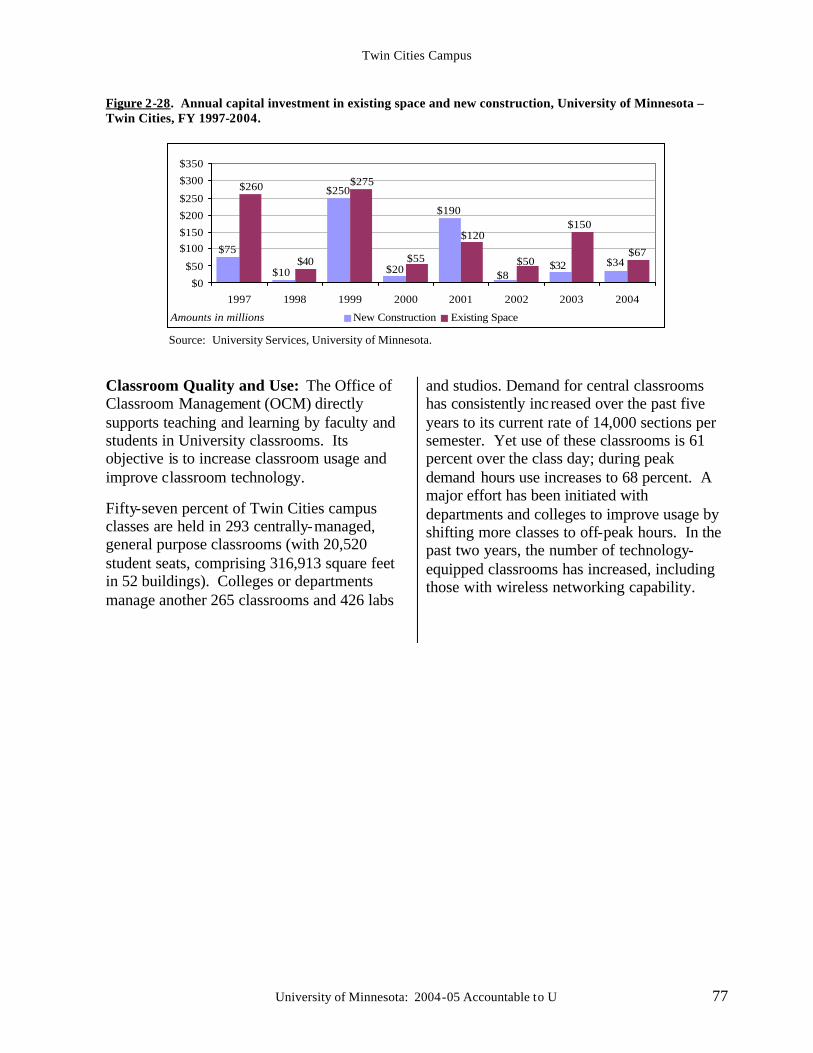
Twin Cities Campus
University of Minnesota: 2004-05 Accountable to U 77
Figure 2-28. Annual capital investment in existing space and new construction, University of Minnesota – Twin Cities, FY 1997-2004.
$34$75
$10
$250
$20
$190
$8$32
$67
$260
$40
$275
$55
$120
$50
$150
$0
$50
$100$150
$200
$250
$300
$350
1997 1998 1999 2000 2001 2002 2003 2004
Amounts in millions New Construction Existing Space
Source: University Services, University of Minnesota.
Classroom Quality and Use: The Office of Classroom Management (OCM) directly supports teaching and learning by faculty and students in University classrooms. Its objective is to increase classroom usage and improve classroom technology.
Fifty-seven percent of Twin Cities campus classes are held in 293 centrally-managed, general purpose classrooms (with 20,520 student seats, comprising 316,913 square feet in 52 buildings). Colleges or departments manage another 265 classrooms and 426 labs
and studios. Demand for central classrooms has consistently inc reased over the past five years to its current rate of 14,000 sections per semester. Yet use of these classrooms is 61 percent over the class day; during peak demand hours use increases to 68 percent. A major effort has been initiated with departments and colleges to improve usage by shifting more classes to off-peak hours. In the past two years, the number of technology-equipped classrooms has increased, including those with wireless networking capability.
Twin Cities Campus
78 University of Minnesota: 2004-05 Accountable to U
University of Minnesota: 2004-05 Accountable to U 79
3: Duluth Campus
A. Campus Profile The University of Minnesota – Duluth (UMD) is a comprehensive regional university. Undergraduate students can choose from 12 bachelor’s degrees in 75 majors. In addition to a two-year program at the School of Medicine and a four-year College of Pharmacy program, UMD offers graduate programs in 19 fields (16 Graduate School programs and three collegiate graduate programs), plus six cooperative programs offered through the
Twin Cities. UMD consistently ranks among the top Midwestern, regional universities in U.S. News and World Report’s “America's Best Colleges.” Providing an alternative to large research universities and small liberal arts colleges, UMD attracts students looking for a personalized learning experience on a medium-sized campus of a major university. The campus is set on 244 acres overlooking Lake Superior.
Founded 1895
Leadership Kathryn A. Martin, Chancellor
Colleges/Schools Business and Economics Continuing Education Education and Human Service Professions Fine Arts Liberal Arts Medicine* Pharmacy* Science and Engineering *Students in UMD’s School of Medicine and College of Pharmacy are counted as part of Twin Cities campus enrollment.
Degrees and Majors Offered Undergraduate degrees in 75 majors. Graduate programs in 19 fields, plus six cooperative programs offered through the University of Minnesota – Twin Cities. Two-year program at the School of Medicine and a four-year College of Pharmacy program.
Number of Buildings 54 (1,679,000 assignable square feet) Degrees Awarded (FY2004) Undergraduate 1,562 Master’s 185
Fall 2004 Enrollment
Undergraduate Graduate Non-degree Total
8,850 661 615
10,126 Faculty (Fall 2004)* Tenured/Tenure Track 301 Other Faculty 185
*does not include Duluth School of Medicine or Duluth College of Pharmacy faculty, which are counted as part of the Twin Cities Alumni (FY 2004) Living Alumni 47,173
Staff (FY 2004) Civil Service/ Bargaining Unit 736 Professional and Administrative 203
Expenditures (FY 2004) $150,488,241
Duluth Campus
80 University of Minnesota: 2004-05 Accountable to U
B. Academic Priorities UMD’s current academic priorities are: advising, undergraduate research, public engagement, American Indian education, fine arts, freshwater resources, emerging technology, and study abroad programs. Advising
Enhancing undergraduate advising has been a campus priority for the past five years. Four major areas of advising are supported:
Advisement Coordination Center (ACC): Started in 1999, ACC coordinates advising among collegiate units in an effort to increase student satisfaction in academic advising and improve retention and graduation rates.
Electronic Portfolio: Building on years of research, development, and practical application at UMD, ePortfolio changes the way a student’s records are gathered, stored, and shared. University of Minnesota students, faculty, and staff across all four campuses can now safely store and access their educational records, work and writing samples, resumes, and legal documents in a secure, globally accessible computing environment. In 2003, the University released ePortfolio as open source software, providing non-proprietary, open access to the technology.
Student Affairs: Collegiate unit student affairs offices have increased their advising efforts by: piloting new advising models; enhancing peer advisement programs; working more closely with undergraduates to select majors; equipping an advising resource center; and implementing an early alert system.
Outstanding Faculty Adviser Award: This annual award honors faculty members and includes individual and departmental cash bonuses and/or travel or equipment allocations.
First Year Experience Programs Students’ first year experience is enhanced by programs such as: a one-credit introduction to college learning course; a full-day academic orientation session; social and educational events throughout the year; freshman yearbook and other publications; a freshman workshop series; and a first-year electronic portal designed for new students. In addition, parents receive a monthly newsletter and can participate in Parents and Family Weekend. Undergraduate Research
The Undergraduate Research Opportunities Program (UROP) provides undergraduates and faculty members the opportunity to work together on research, scholarly, or creative activities. Started in 1985, this competitive program provides students with financial support while they assist with a faculty member’s scholarship or carry out their own projects under faculty supervision. Students develop experience in research methods while their faculty sponsors gain useful assistance.
Table 3-1 shows UROP participation from fall 2001 to spring 2004. In addition to UROP funding, $75,000 of undergraduate research funding was provided by UMD campus funds. Approximately 45 students received funding to carry out research under the direction of faculty mentors.
UROP students have an opportunity to present their research at the National Conference on Undergraduate Research. In each of the past three years 12-15 students and a half dozen faculty members have participated. UMD also hosts an annual undergraduate artistic fair, where 60-90 students participate each year.
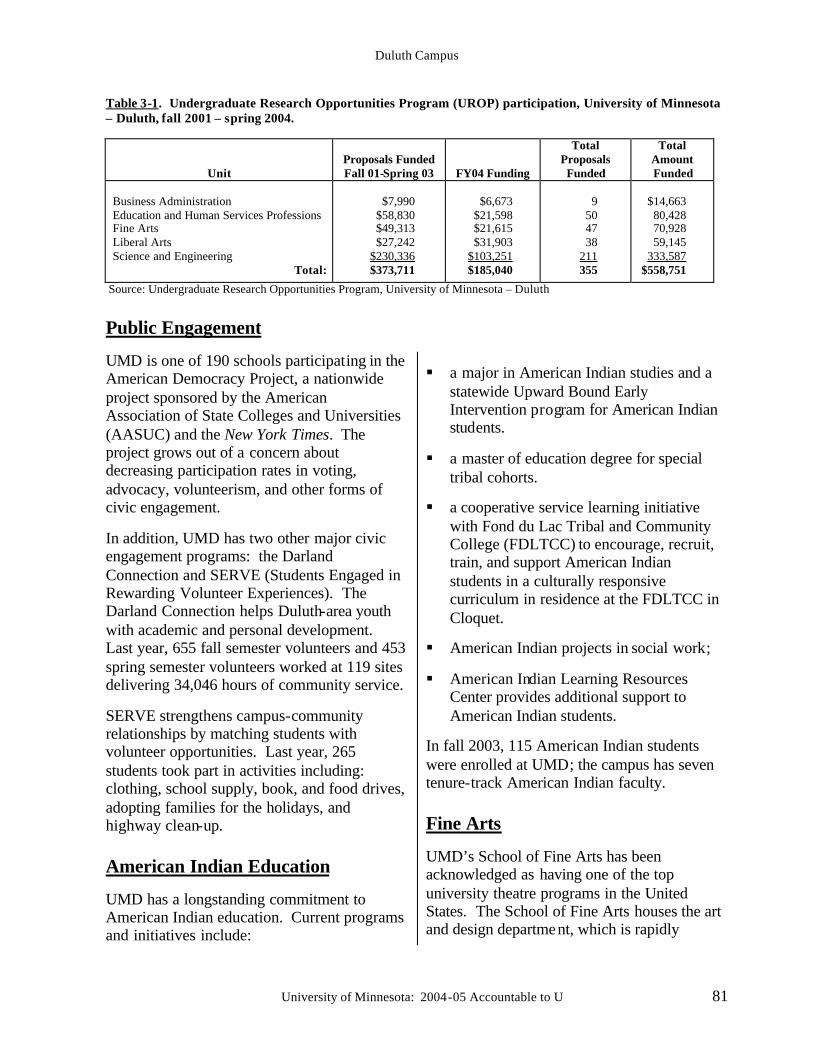
Duluth Campus
University of Minnesota: 2004-05 Accountable to U 81
Table 3-1. Undergraduate Research Opportunities Program (UROP) participation, University of Minnesota – Duluth, fall 2001 – spring 2004.
Unit
Proposals Funded Fall 01-Spring 03
FY04 Funding
Total Proposals Funded
Total Amount Funded
Business Administration Education and Human Services Professions Fine Arts Liberal Arts Science and Engineering
Total:
$7,990
$58,830 $49,313 $27,242
$230,336 $373,711
$6,673
$21,598 $21,615 $31,903
$103,251 $185,040
9
50 47 38
211 355
$14,663 80,428 70,928 59,145
333,587 $558,751
Source: Undergraduate Research Opportunities Program, University of Minnesota – Duluth
Public Engagement
UMD is one of 190 schools participating in the American Democracy Project, a nationwide project sponsored by the American Association of State Colleges and Universities (AASUC) and the New York Times. The project grows out of a concern about decreasing participation rates in voting, advocacy, volunteerism, and other forms of civic engagement.
In addition, UMD has two other major civic engagement programs: the Darland Connection and SERVE (Students Engaged in Rewarding Volunteer Experiences). The Darland Connection helps Duluth-area youth with academic and personal development. Last year, 655 fall semester volunteers and 453 spring semester volunteers worked at 119 sites delivering 34,046 hours of community service.
SERVE strengthens campus-community relationships by matching students with volunteer opportunities. Last year, 265 students took part in activities including: clothing, school supply, book, and food drives, adopting families for the holidays, and highway clean-up. American Indian Education
UMD has a longstanding commitment to American Indian education. Current programs and initiatives include:
§ a major in American Indian studies and a statewide Upward Bound Early Intervention program for American Indian students.
§ a master of education degree for special tribal cohorts.
§ a cooperative service learning initiative with Fond du Lac Tribal and Community College (FDLTCC) to encourage, recruit, train, and support American Indian students in a culturally responsive curriculum in residence at the FDLTCC in Cloquet.
§ American Indian projects in social work;
§ American Indian Learning Resources Center provides additional support to American Indian students.
In fall 2003, 115 American Indian students were enrolled at UMD; the campus has seven tenure-track American Indian faculty. Fine Arts
UMD’s School of Fine Arts has been acknowledged as having one of the top university theatre programs in the United States. The School of Fine Arts houses the art and design department, which is rapidly
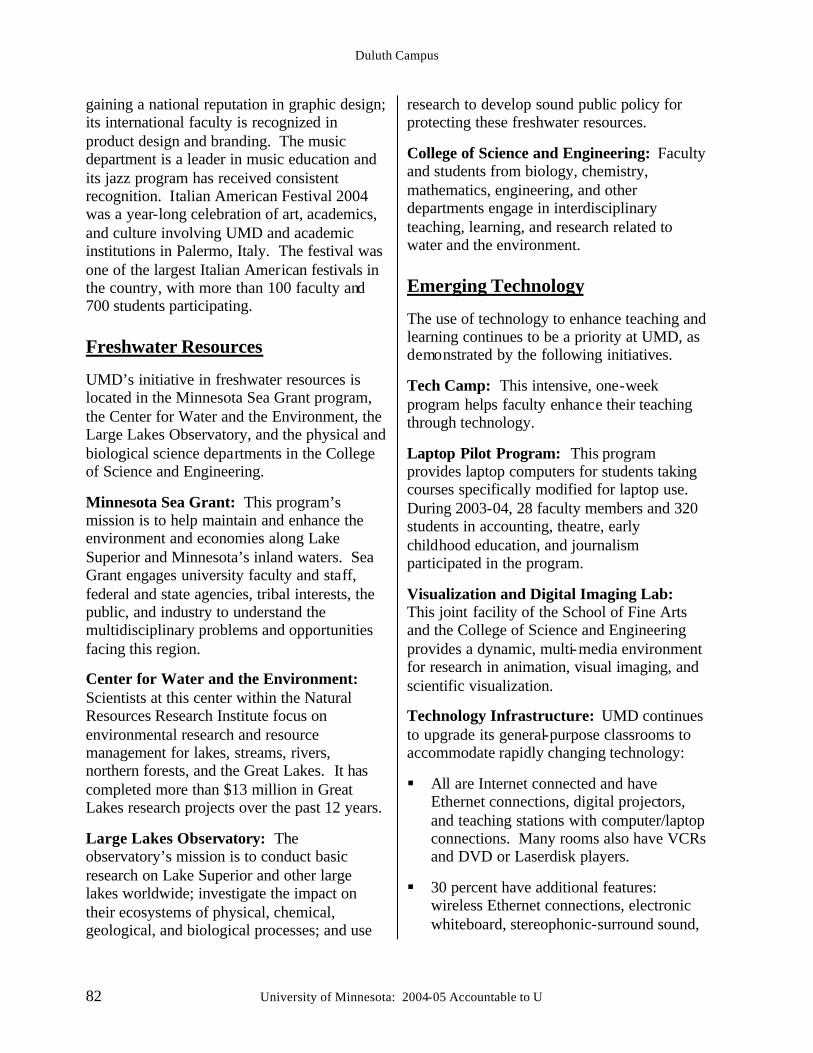
Duluth Campus
82 University of Minnesota: 2004-05 Accountable to U
gaining a national reputation in graphic design; its international faculty is recognized in product design and branding. The music department is a leader in music education and its jazz program has received consistent recognition. Italian American Festival 2004 was a year-long celebration of art, academics, and culture involving UMD and academic institutions in Palermo, Italy. The festival was one of the largest Italian American festivals in the country, with more than 100 faculty and 700 students participating. Freshwater Resources
UMD’s initiative in freshwater resources is located in the Minnesota Sea Grant program, the Center for Water and the Environment, the Large Lakes Observatory, and the physical and biological science departments in the College of Science and Engineering.
Minnesota Sea Grant: This program’s mission is to help maintain and enhance the environment and economies along Lake Superior and Minnesota’s inland waters. Sea Grant engages university faculty and staff, federal and state agencies, tribal interests, the public, and industry to understand the multidisciplinary problems and opportunities facing this region.
Center for Water and the Environment: Scientists at this center within the Natural Resources Research Institute focus on environmental research and resource management for lakes, streams, rivers, northern forests, and the Great Lakes. It has completed more than $13 million in Great Lakes research projects over the past 12 years.
Large Lakes Observatory: The observatory’s mission is to conduct basic research on Lake Superior and other large lakes worldwide; investigate the impact on their ecosystems of physical, chemical, geological, and biological processes; and use
research to develop sound public policy for protecting these freshwater resources.
College of Science and Engineering: Faculty and students from biology, chemistry, mathematics, engineering, and other departments engage in interdisciplinary teaching, learning, and research related to water and the environment. Emerging Technology
The use of technology to enhance teaching and learning continues to be a priority at UMD, as demonstrated by the following initiatives.
Tech Camp: This intensive, one-week program helps faculty enhance their teaching through technology.
Laptop Pilot Program: This program provides laptop computers for students taking courses specifically modified for laptop use. During 2003-04, 28 faculty members and 320 students in accounting, theatre, early childhood education, and journalism participated in the program.
Visualization and Digital Imaging Lab: This joint facility of the School of Fine Arts and the College of Science and Engineering provides a dynamic, multi-media environment for research in animation, visual imaging, and scientific visualization.
Technology Infrastructure: UMD continues to upgrade its general-purpose classrooms to accommodate rapidly changing technology:
§ All are Internet connected and have Ethernet connections, digital projectors, and teaching stations with computer/laptop connections. Many rooms also have VCRs and DVD or Laserdisk players.
§ 30 percent have additional features: wireless Ethernet connections, electronic whiteboard, stereophonic-surround sound,
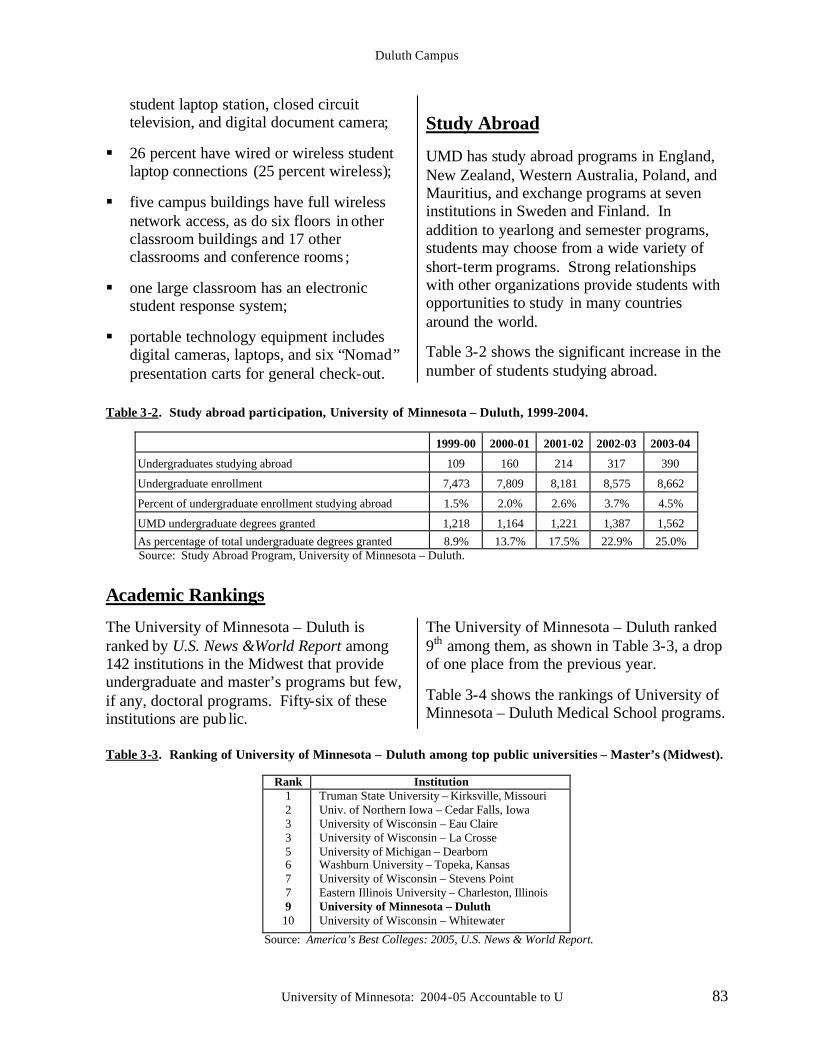
Duluth Campus
University of Minnesota: 2004-05 Accountable to U 83
student laptop station, closed circuit television, and digital document camera;
§ 26 percent have wired or wireless student laptop connections (25 percent wireless);
§ five campus buildings have full wireless network access, as do six floors in other classroom buildings and 17 other classrooms and conference rooms ;
§ one large classroom has an electronic student response system;
§ portable technology equipment includes digital cameras, laptops, and six “Nomad” presentation carts for general check-out.
Study Abroad
UMD has study abroad programs in England, New Zealand, Western Australia, Poland, and Mauritius, and exchange programs at seven institutions in Sweden and Finland. In addition to yearlong and semester programs, students may choose from a wide variety of short-term programs. Strong relationships with other organizations provide students with opportunities to study in many countries around the world.
Table 3-2 shows the significant increase in the number of students studying abroad.
Table 3-2. Study abroad participation, University of Minnesota – Duluth, 1999-2004.
1999-00 2000-01 2001-02 2002-03 2003-04
Undergraduates studying abroad 109 160 214 317 390
Undergraduate enrollment 7,473 7,809 8,181 8,575 8,662
Percent of undergraduate enrollment studying abroad 1.5% 2.0% 2.6% 3.7% 4.5%
UMD undergraduate degrees granted 1,218 1,164 1,221 1,387 1,562 As percentage of total undergraduate degrees granted 8.9% 13.7% 17.5% 22.9% 25.0%
Source: Study Abroad Program, University of Minnesota – Duluth.
Academic Rankings The University of Minnesota – Duluth is ranked by U.S. News &World Report among 142 institutions in the Midwest that provide undergraduate and master’s programs but few, if any, doctoral programs. Fifty-six of these institutions are pub lic.
The University of Minnesota – Duluth ranked 9th among them, as shown in Table 3-3, a drop of one place from the previous year.
Table 3-4 shows the rankings of University of Minnesota – Duluth Medical School programs.
Table 3-3. Ranking of University of Minnesota – Duluth among top public universities – Master’s (Midwest).
Rank Institution 1 2 3 3 5 6 7 7 9 10
Truman State University – Kirksville, Missouri Univ. of Northern Iowa – Cedar Falls, Iowa University of Wisconsin – Eau Claire University of Wisconsin – La Crosse University of Michigan – Dearborn Washburn University – Topeka, Kansas University of Wisconsin – Stevens Point Eastern Illinois University – Charleston, Illinois University of Minnesota – Duluth University of Wisconsin – Whitewater
Source: America’s Best Colleges: 2005, U.S. News & World Report.
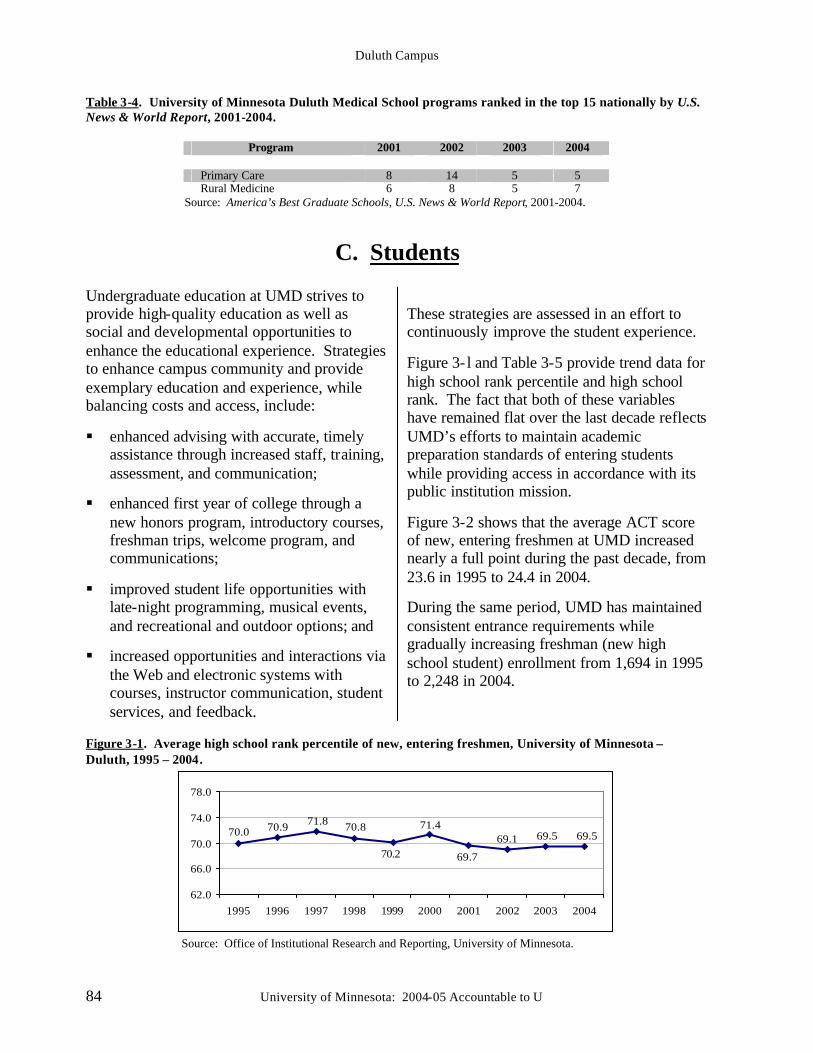
Duluth Campus
84 University of Minnesota: 2004-05 Accountable to U
Table 3-4. University of Minnesota Duluth Medical School programs ranked in the top 15 nationally by U.S. News & World Report, 2001-2004.
Program 2001 2002 2003 2004 Primary Care 8 14 5 5 Rural Medicine 6 8 5 7
Source: America’s Best Graduate Schools, U.S. News & World Report, 2001-2004.
C. Students
Undergraduate education at UMD strives to provide high-quality education as well as social and developmental opportunities to enhance the educational experience. Strategies to enhance campus community and provide exemplary education and experience, while balancing costs and access, include:
§ enhanced advising with accurate, timely assistance through increased staff, training, assessment, and communication;
§ enhanced first year of college through a new honors program, introductory courses, freshman trips, welcome program, and communications;
§ improved student life opportunities with late-night programming, musical events, and recreational and outdoor options; and
§ increased opportunities and interactions via the Web and electronic systems with courses, instructor communication, student services, and feedback.
These strategies are assessed in an effort to continuously improve the student experience.
Figure 3- l and Table 3-5 provide trend data for high school rank percentile and high school rank. The fact that both of these variables have remained flat over the last decade reflects UMD’s efforts to maintain academic preparation standards of entering students while providing access in accordance with its public institution mission.
Figure 3-2 shows that the average ACT score of new, entering freshmen at UMD increased nearly a full point during the past decade, from 23.6 in 1995 to 24.4 in 2004.
During the same period, UMD has maintained consistent entrance requirements while gradually increasing freshman (new high school student) enrollment from 1,694 in 1995 to 2,248 in 2004.
Figure 3-1. Average high school rank percentile of new, entering freshmen, University of Minnesota – Duluth, 1995 – 2004.
69.569.569.1
69.7
71.4
70.2
70.871.870.970.0
62.0
66.0
70.0
74.0
78.0
1995 1996 1997 1998 1999 2000 2001 2002 2003 2004
Source: Office of Institutional Research and Reporting, University of Minnesota.
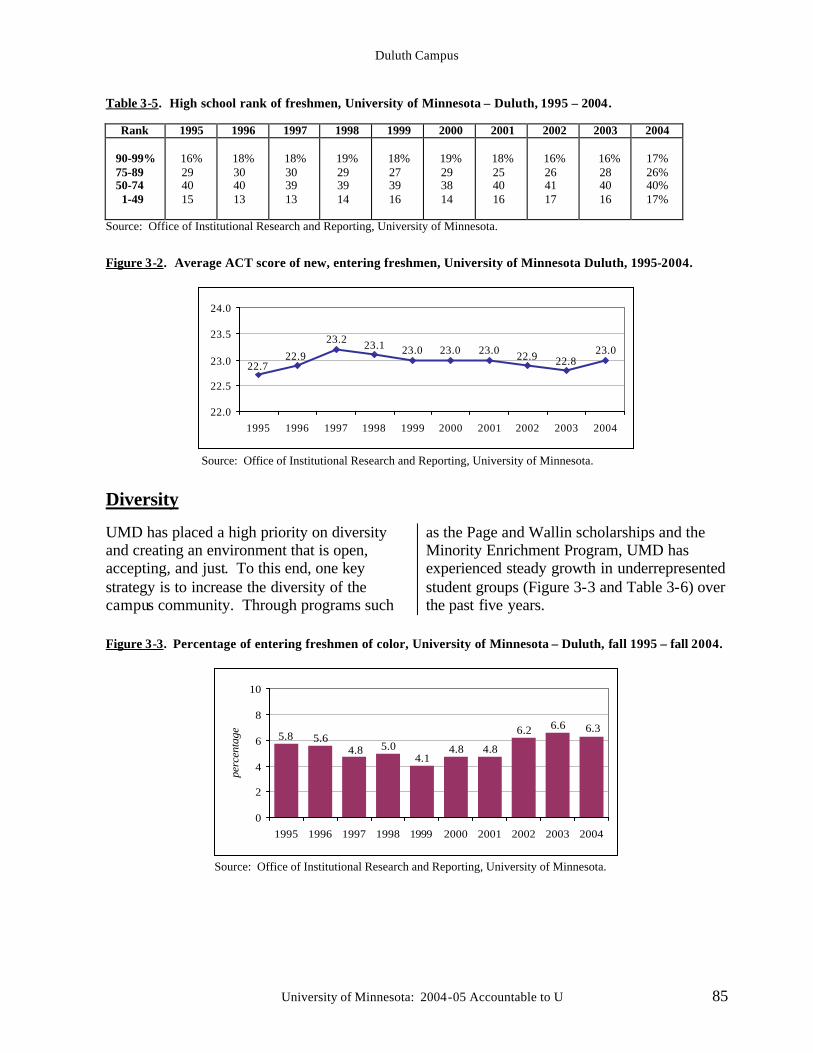
Duluth Campus
University of Minnesota: 2004-05 Accountable to U 85
Table 3-5. High school rank of freshmen, University of Minnesota – Duluth, 1995 – 2004.
Rank 1995 1996 1997 1998 1999 2000 2001 2002 2003 2004 90-99% 75-89 50-74 1-49
16%
29 40 15
18%
30 40 13
18%
30 39 13
19%
29 39 14
18%
27 39 16
19%
29 38 14
18%
25 40 16
16%
26 41 17
16%
28 40 16
17% 26% 40% 17%
Source: Office of Institutional Research and Reporting, University of Minnesota.
Figure 3-2. Average ACT score of new, entering freshmen, University of Minnesota Duluth, 1995-2004.
23.022.822.923.023.023.023.123.2
22.922.7
22.0
22.5
23.0
23.5
24.0
1995 1996 1997 1998 1999 2000 2001 2002 2003 2004
Source: Office of Institutional Research and Reporting, University of Minnesota.
Diversity
UMD has placed a high priority on diversity and creating an environment that is open, accepting, and just. To this end, one key strategy is to increase the diversity of the campus community. Through programs such
as the Page and Wallin scholarships and the Minority Enrichment Program, UMD has experienced steady growth in underrepresented student groups (Figure 3-3 and Table 3-6) over the past five years.
Figure 3-3. Percentage of entering freshmen of color, University of Minnesota – Duluth, fall 1995 – fall 2004.
6.36.66.2
4.84.84.1
5.04.85.65.8
0
2
4
6
8
10
1995 1996 1997 1998 1999 2000 2001 2002 2003 2004
perc
enta
ge
Source: Office of Institutional Research and Reporting, University of Minnesota.
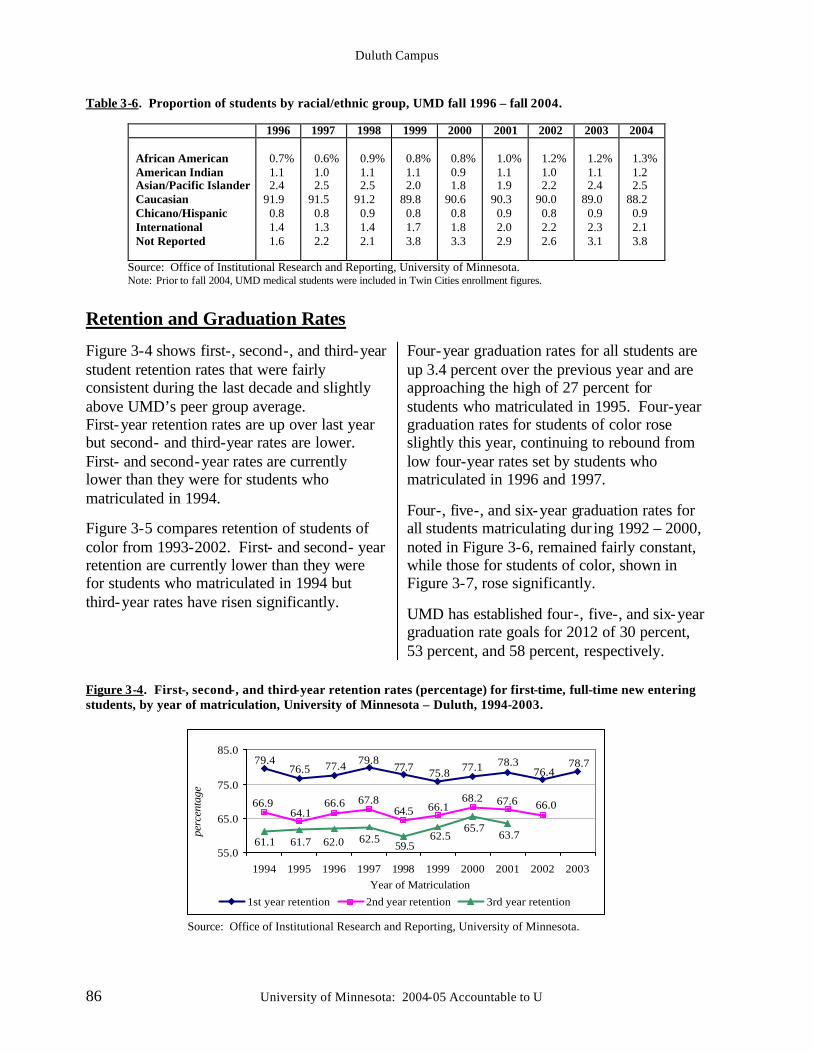
Duluth Campus
86 University of Minnesota: 2004-05 Accountable to U
Table 3-6. Proportion of students by racial/ethnic group, UMD fall 1996 – fall 2004.
1996 1997 1998 1999 2000 2001 2002 2003 2004 African American American Indian Asian/Pacific Islander Caucasian Chicano/Hispanic International Not Reported
0.7% 1.1 2.4 91.9 0.8 1.4 1.6
0.6% 1.0 2.5 91.5 0.8 1.3 2.2
0.9% 1.1 2.5 91.2 0.9 1.4 2.1
0.8% 1.1 2.0 89.8 0.8 1.7 3.8
0.8% 0.9 1.8 90.6 0.8 1.8 3.3
1.0% 1.1 1.9 90.3 0.9 2.0 2.9
1.2% 1.0 2.2 90.0 0.8 2.2 2.6
1.2% 1.1 2.4 89.0 0.9 2.3 3.1
1.3% 1.2 2.5 88.2 0.9 2.1 3.8
Source: Office of Institutional Research and Reporting, University of Minnesota. Note: Prior to fall 2004, UMD medical students were included in Twin Cities enrollment figures.
Retention and Graduation Rates
Figure 3-4 shows first-, second-, and third-year student retention rates that were fairly consistent during the last decade and slightly above UMD’s peer group average. First-year retention rates are up over last year but second- and third-year rates are lower. First- and second-year rates are currently lower than they were for students who matriculated in 1994.
Figure 3-5 compares retention of students of color from 1993-2002. First- and second- year retention are currently lower than they were for students who matriculated in 1994 but third-year rates have risen significantly.
Four-year graduation rates for all students are up 3.4 percent over the previous year and are approaching the high of 27 percent for students who matriculated in 1995. Four-year graduation rates for students of color rose slightly this year, continuing to rebound from low four-year rates set by students who matriculated in 1996 and 1997.
Four-, five-, and six-year graduation rates for all students matriculating dur ing 1992 – 2000, noted in Figure 3-6, remained fairly constant, while those for students of color, shown in Figure 3-7, rose significantly.
UMD has established four-, five-, and six-year graduation rate goals for 2012 of 30 percent, 53 percent, and 58 percent, respectively.
Figure 3-4. First-, second-, and third-year retention rates (percentage) for first-time, full-time new entering students, by year of matriculation, University of Minnesota – Duluth, 1994-2003.
78.776.4
78.377.175.877.779.877.476.5
79.4
66.067.668.266.164.5
67.866.664.1
66.9
63.761.1
65.762.5
59.562.562.061.7
55.0
65.0
75.0
85.0
1994 1995 1996 1997 1998 1999 2000 2001 2002 2003Year of Matriculation
perc
enta
ge
1st year retention 2nd year retention 3rd year retention
Source: Office of Institutional Research and Reporting, University of Minnesota.
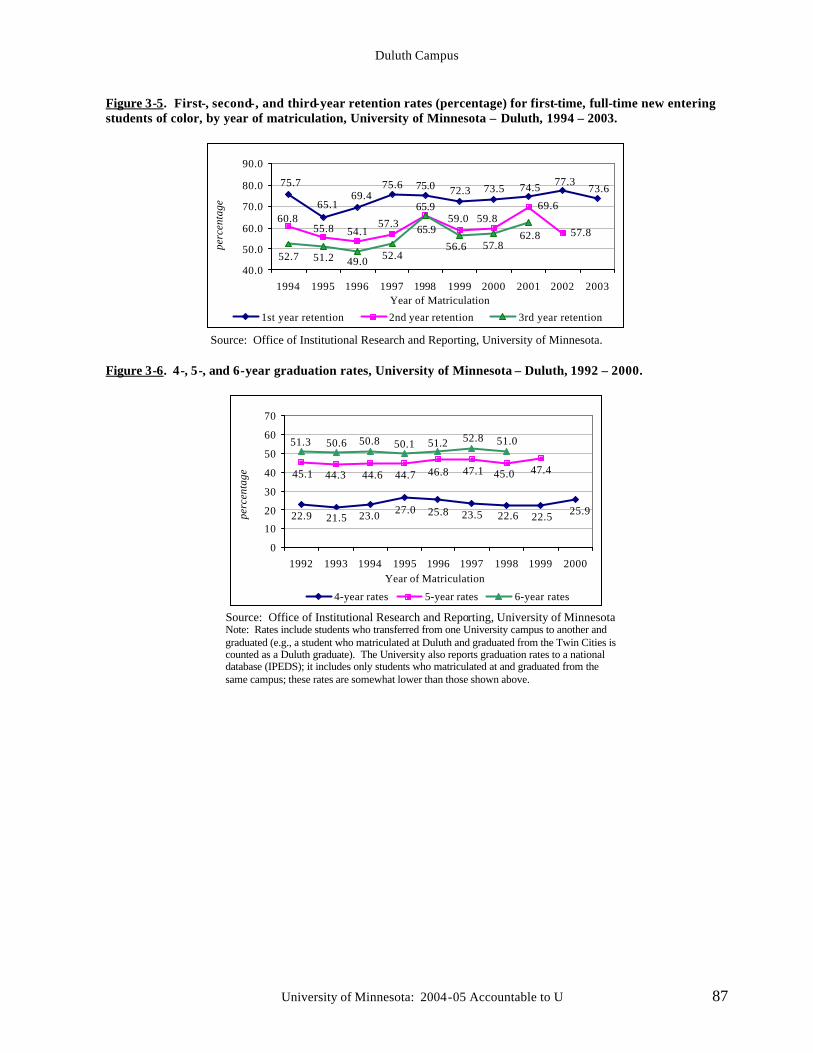
Duluth Campus
University of Minnesota: 2004-05 Accountable to U 87
Figure 3-5. First-, second-, and third-year retention rates (percentage) for first-time, full-time new entering students of color, by year of matriculation, University of Minnesota – Duluth, 1994 – 2003.
73.677.374.573.572.375.075.6
69.465.1
75.7
57.8
69.659.859.0
65.9
57.354.155.8
60.8
62.8
52.7
65.9
52.449.051.257.856.6
40.0
50.0
60.0
70.0
80.0
90.0
1994 1995 1996 1997 1998 1999 2000 2001 2002 2003Year of Matriculation
perc
enta
ge
1st year retention 2nd year retention 3rd year retention
Source: Office of Institutional Research and Reporting, University of Minnesota. Figure 3-6. 4-, 5-, and 6-year graduation rates, University of Minnesota – Duluth, 1992 – 2000.
25.922.522.623.525.827.023.021.522.9
47.445.047.146.844.744.644.345.1
51.052.851.250.150.850.651.3
0
10
20
30
40
50
60
70
1992 1993 1994 1995 1996 1997 1998 1999 2000Year of Matriculation
perc
enta
ge
4-year rates 5-year rates 6-year rates
Source: Office of Institutional Research and Reporting, University of Minnesota Note: Rates include students who transferred from one University campus to another and graduated (e.g., a student who matriculated at Duluth and graduated from the Twin Cities is counted as a Duluth graduate). The University also reports graduation rates to a national database (IPEDS); it includes only students who matriculated at and graduated from the same campus; these rates are somewhat lower than those shown above.
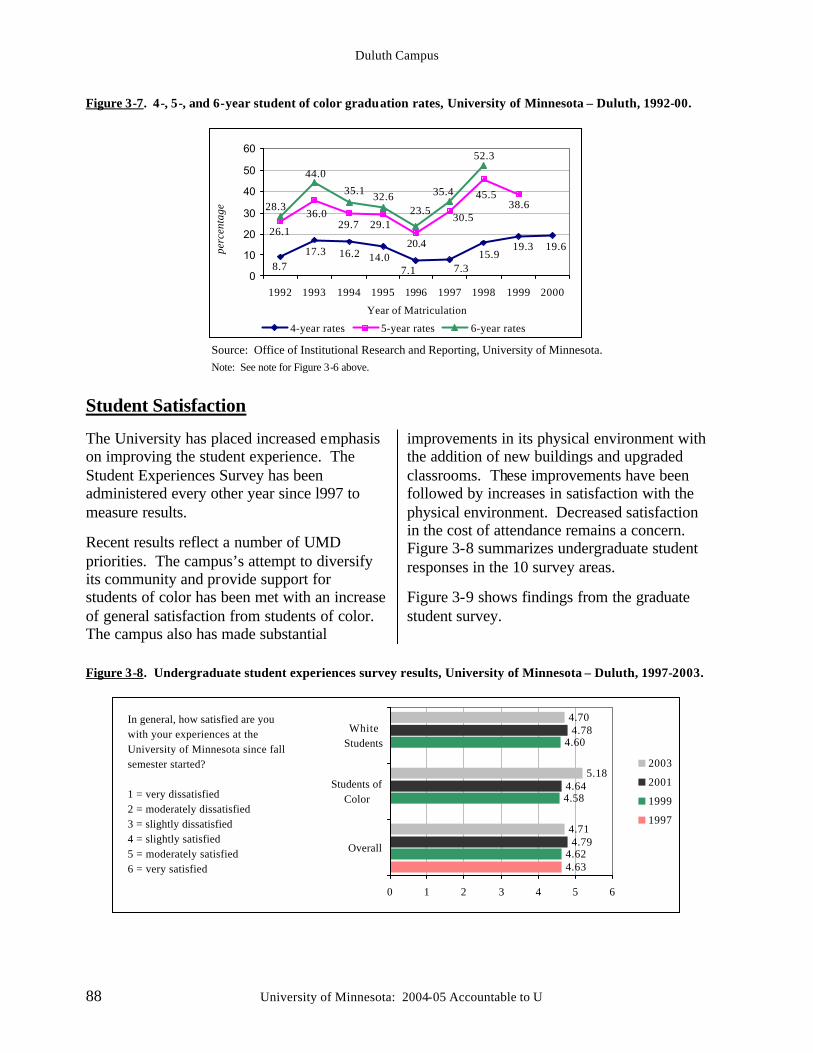
Duluth Campus
88 University of Minnesota: 2004-05 Accountable to U
Figure 3-7. 4-, 5-, and 6-year student of color graduation rates, University of Minnesota – Duluth, 1992-00.
19.619.315.9
7.37.114.016.217.3
8.7
38.645.5
30.5
20.4
29.129.736.0
26.1
52.3
35.4
23.532.635.1
44.0
28.3
0
10
20
30
40
50
60
1992 1993 1994 1995 1996 1997 1998 1999 2000
Year of Matriculation
perc
enta
ge
4-year rates 5-year rates 6-year rates
Source: Office of Institutional Research and Reporting, University of Minnesota. Note: See note for Figure 3-6 above.
Student Satisfaction
The University has placed increased emphasis on improving the student experience. The Student Experiences Survey has been administered every other year since l997 to measure results.
Recent results reflect a number of UMD priorities. The campus’s attempt to diversify its community and provide support for students of color has been met with an increase of general satisfaction from students of color. The campus also has made substantial
improvements in its physical environment with the addition of new buildings and upgraded classrooms. These improvements have been followed by increases in satisfaction with the physical environment. Decreased satisfaction in the cost of attendance remains a concern. Figure 3-8 summarizes undergraduate student responses in the 10 survey areas.
Figure 3-9 shows findings from the graduate student survey.
Figure 3-8. Undergraduate student experiences survey results, University of Minnesota – Duluth, 1997-2003.
4.634.62
4.58
4.60
4.79
4.64
4.78
4.71
5.18
4.70
0 1 2 3 4 5 6
Overall
Students ofColor
WhiteStudents
2003
2001
1999
1997
In general, how satisfied are you with your experiences at the University of Minnesota since fall semester started?
1 = very dissatisfied2 = moderately dissatisfied3 = slightly dissatisfied4 = slightly satisfied5 = moderately satisfied6 = very satisfied
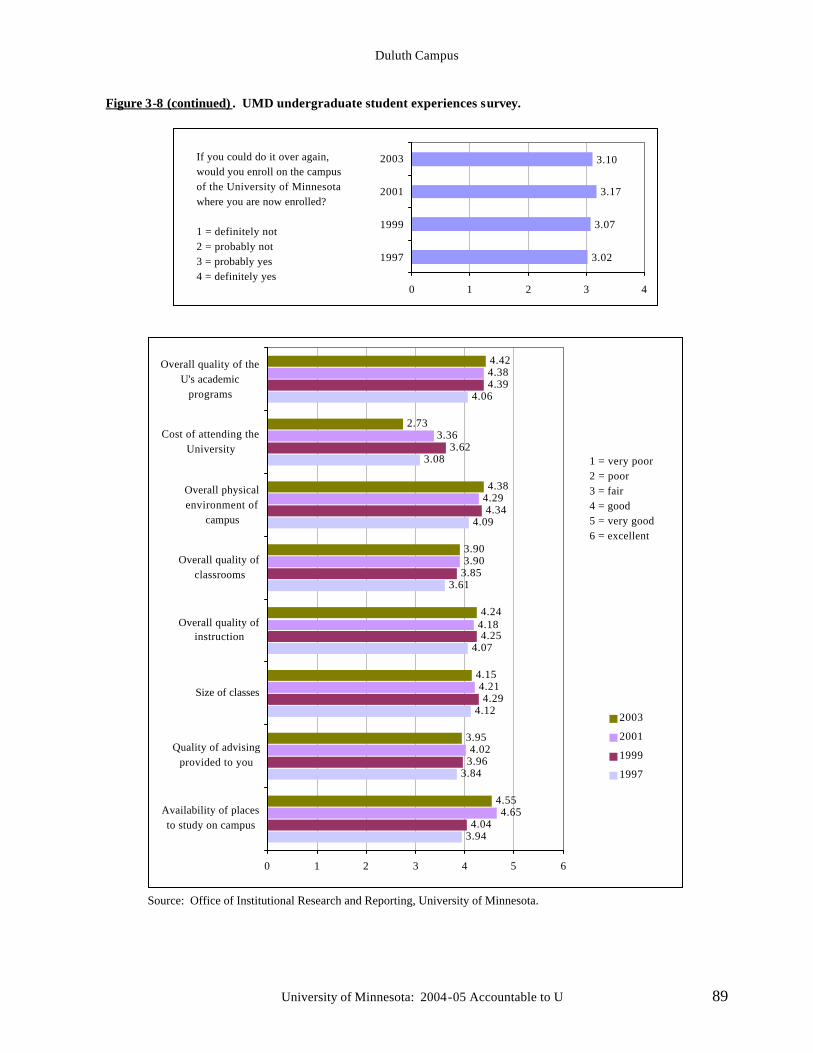
Duluth Campus
University of Minnesota: 2004-05 Accountable to U 89
Figure 3-8 (continued) . UMD undergraduate student experiences survey.
3.02
3.07
3.17
3.10
0 1 2 3 4
1997
1999
2001
2003If you could do it over again, would you enroll on the campus of the University of Minnesota where you are now enrolled?
1 = definitely not2 = probably not3 = probably yes4 = definitely yes
3.94
3.84
4.12
4.07
3.61
4.09
3.08
4.06
4.04
3.96
4.29
4.25
3.85
4.34
3.62
4.39
4.65
4.02
4.21
4.18
3.90
4.29
3.36
4.38
4.55
3.95
4.15
4.24
3.90
4.38
2.73
4.42
0 1 2 3 4 5 6
Availability of placesto study on campus
Quality of advisingprovided to you
Size of classes
Overall quality ofinstruction
Overall quality ofclassrooms
Overall physicalenvironment of
campus
Cost of attending theUniversity
Overall quality of theU's academic
programs
2003
2001
1999
1997
1 = very poor2 = poor3 = fair4 = good5 = very good6 = excellent
Source: Office of Institutional Research and Reporting, University of Minnesota.
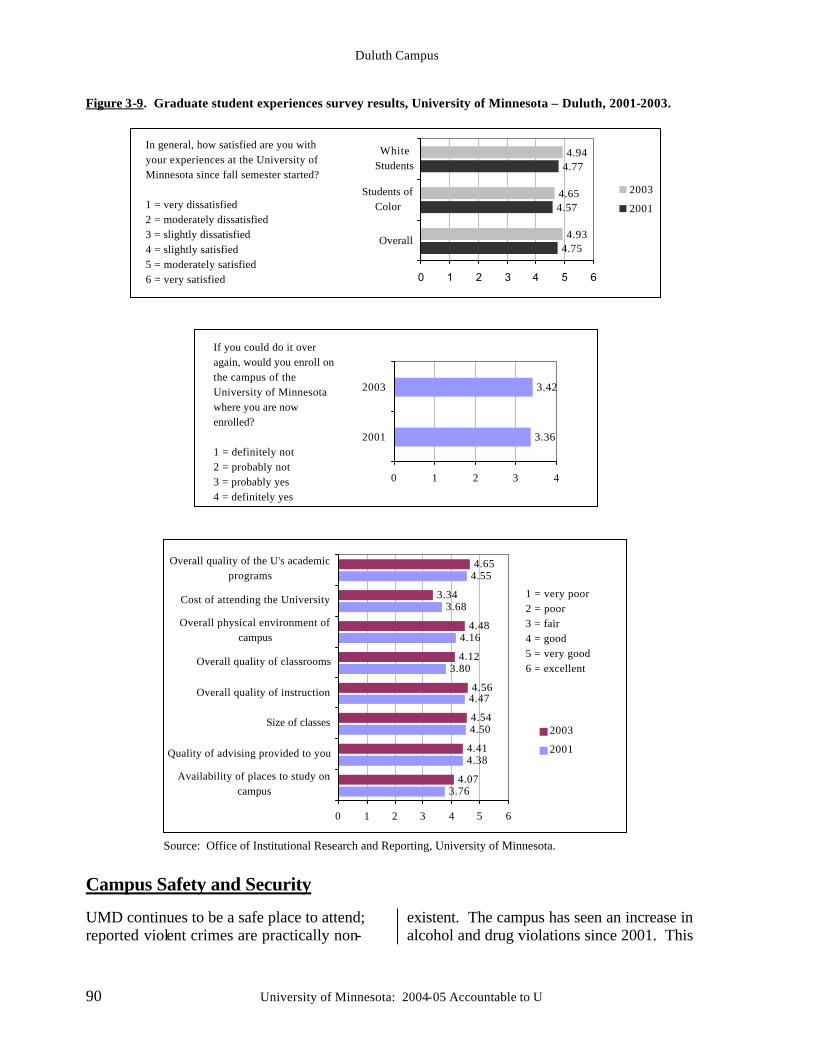
Duluth Campus
90 University of Minnesota: 2004-05 Accountable to U
Figure 3-9. Graduate student experiences survey results, University of Minnesota – Duluth, 2001-2003.
4.75
4.57
4.77
4.93
4.65
4.94
0 1 2 3 4 5 6
Overall
Students ofColor
WhiteStudents
2003
2001
In general, how satisfied are you with your experiences at the University of Minnesota since fall semester started?
1 = very dissatisfied2 = moderately dissatisfied3 = slightly dissatisfied4 = slightly satisfied5 = moderately satisfied6 = very satisfied
3.36
3.42
0 1 2 3 4
2001
2003
If you could do it over again, would you enroll on the campus of the University of Minnesota where you are now enrolled?
1 = definitely not2 = probably not3 = probably yes4 = definitely yes
3.76
4.38
4.50
4.47
3.80
4.16
3.68
4.55
4.07
4.41
4.54
4.56
4.12
4.48
3.34
4.65
0 1 2 3 4 5 6
Availability of places to study oncampus
Quality of advising provided to you
Size of classes
Overall quality of instruction
Overall quality of classrooms
Overall physical environment ofcampus
Cost of attending the University
Overall quality of the U's academicprograms
2003
2001
1 = very poor2 = poor3 = fair4 = good5 = very good6 = excellent
Source: Office of Institutional Research and Reporting, University of Minnesota.
Campus Safety and Security
UMD continues to be a safe place to attend; reported violent crimes are practically non-
existent. The campus has seen an increase in alcohol and drug violations since 2001. This
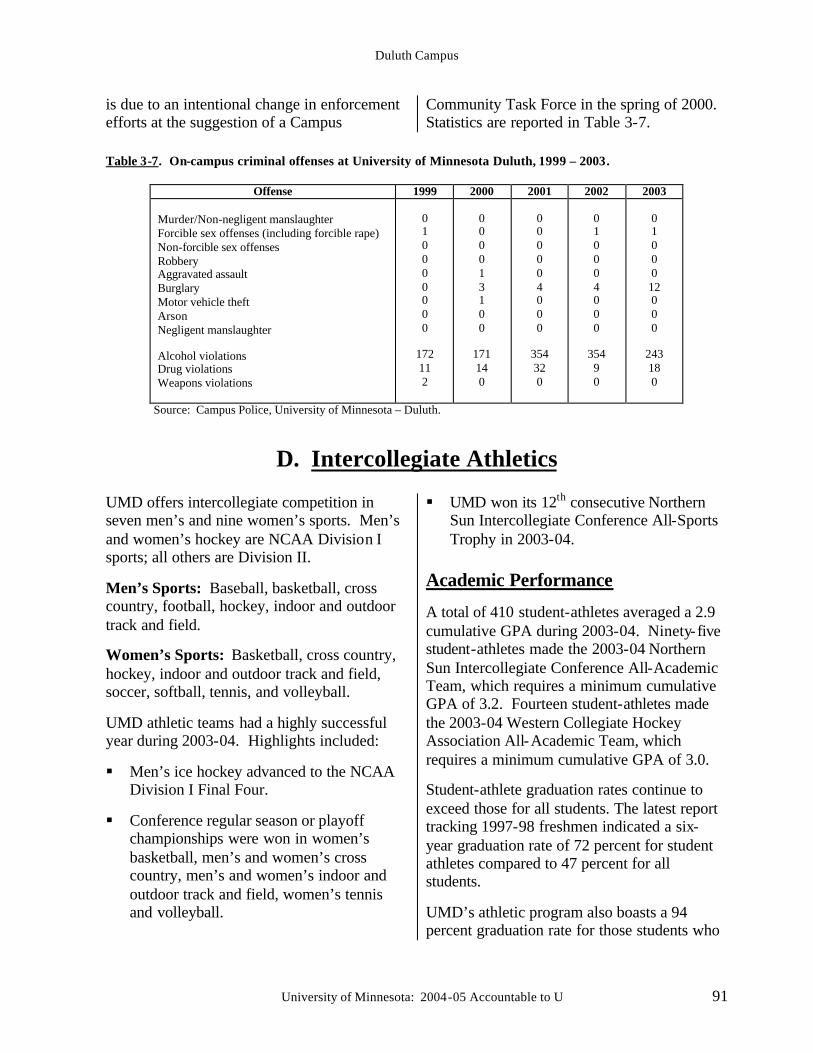
Duluth Campus
University of Minnesota: 2004-05 Accountable to U 91
is due to an intentional change in enforcement efforts at the suggestion of a Campus
Community Task Force in the spring of 2000. Statistics are reported in Table 3-7.
Table 3-7. On-campus criminal offenses at University of Minnesota Duluth, 1999 – 2003.
Offense 1999 2000 2001 2002 2003 Murder/Non-negligent manslaughter Forcible sex offenses (including forcible rape) Non-forcible sex offenses Robbery Aggravated assault Burglary Motor vehicle theft Arson Negligent manslaughter Alcohol violations Drug violations Weapons violations
0 1 0 0 0 0 0 0 0
172 11 2
0 0 0 0 1 3 1 0 0
171 14 0
0 0 0 0 0 4 0 0 0
354 32 0
0 1 0 0 0 4 0 0 0
354 9 0
0 1 0 0 0 12 0 0 0
243 18 0
Source: Campus Police, University of Minnesota – Duluth.
D. Intercollegiate Athletics
UMD offers intercollegiate competition in seven men’s and nine women’s sports. Men’s and women’s hockey are NCAA Division I sports; all others are Division II.
Men’s Sports: Baseball, basketball, cross country, football, hockey, indoor and outdoor track and field.
Women’s Sports: Basketball, cross country, hockey, indoor and outdoor track and field, soccer, softball, tennis, and volleyball.
UMD athletic teams had a highly successful year during 2003-04. Highlights included:
§ Men’s ice hockey advanced to the NCAA Division I Final Four.
§ Conference regular season or playoff championships were won in women’s basketball, men’s and women’s cross country, men’s and women’s indoor and outdoor track and field, women’s tennis and volleyball.
§ UMD won its 12th consecutive Northern Sun Intercollegiate Conference All-Sports Trophy in 2003-04.
Academic Performance A total of 410 student-athletes averaged a 2.9 cumulative GPA during 2003-04. Ninety-five student-athletes made the 2003-04 Northern Sun Intercollegiate Conference All-Academic Team, which requires a minimum cumulative GPA of 3.2. Fourteen student-athletes made the 2003-04 Western Collegiate Hockey Association All-Academic Team, which requires a minimum cumulative GPA of 3.0.
Student-athlete graduation rates continue to exceed those for all students. The latest report tracking 1997-98 freshmen indicated a six-year graduation rate of 72 percent for student athletes compared to 47 percent for all students.
UMD’s athletic program also boasts a 94 percent graduation rate for those students who
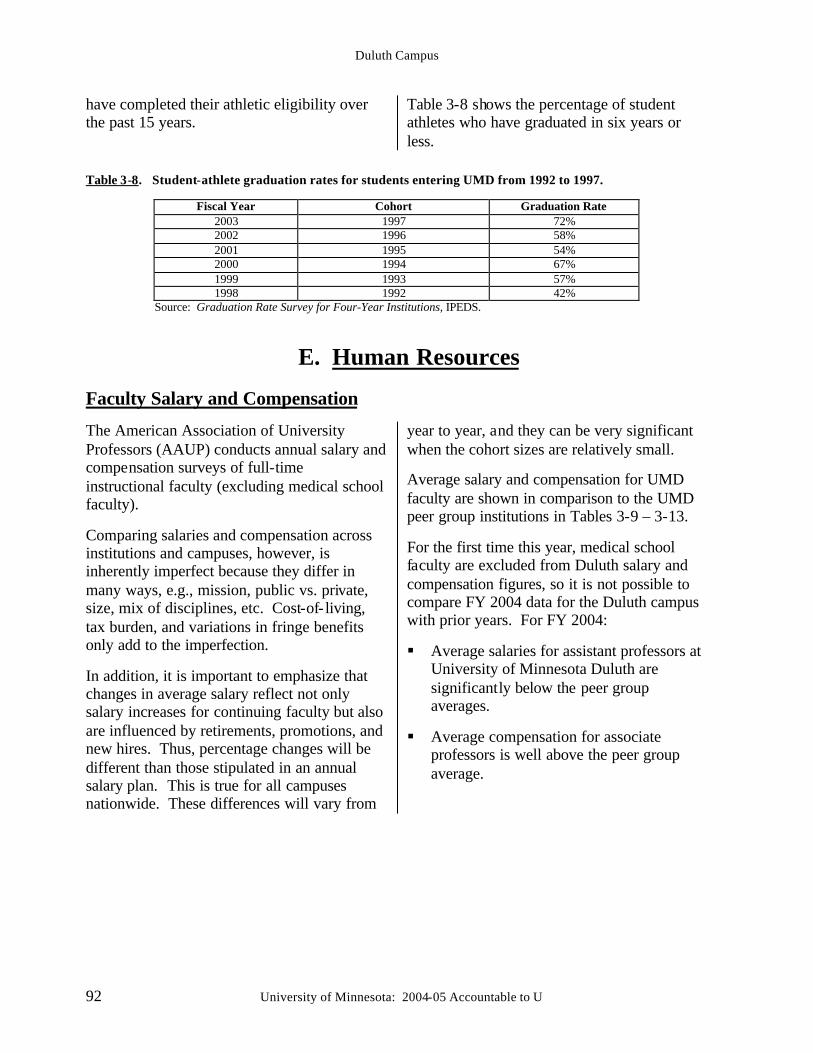
Duluth Campus
92 University of Minnesota: 2004-05 Accountable to U
have completed their athletic eligibility over the past 15 years.
Table 3-8 shows the percentage of student athletes who have graduated in six years or less.
Table 3-8. Student-athlete graduation rates for students entering UMD from 1992 to 1997.
Fiscal Year Cohort Graduation Rate 2003 1997 72% 2002 1996 58% 2001 1995 54% 2000 1994 67% 1999 1993 57% 1998 1992 42%
Source: Graduation Rate Survey for Four-Year Institutions, IPEDS.
E. Human Resources
Faculty Salary and Compensation The American Association of University Professors (AAUP) conducts annual salary and compensation surveys of full-time instructional faculty (excluding medical school faculty).
Comparing salaries and compensation across institutions and campuses, however, is inherently imperfect because they differ in many ways, e.g., mission, public vs. private, size, mix of disciplines, etc. Cost-of- living, tax burden, and variations in fringe benefits only add to the imperfection.
In addition, it is important to emphasize that changes in average salary reflect not only salary increases for continuing faculty but also are influenced by retirements, promotions, and new hires. Thus, percentage changes will be different than those stipulated in an annual salary plan. This is true for all campuses nationwide. These differences will vary from
year to year, and they can be very significant when the cohort sizes are relatively small.
Average salary and compensation for UMD faculty are shown in comparison to the UMD peer group institutions in Tables 3-9 – 3-13.
For the first time this year, medical school faculty are excluded from Duluth salary and compensation figures, so it is not possible to compare FY 2004 data for the Duluth campus with prior years. For FY 2004:
§ Average salaries for assistant professors at University of Minnesota Duluth are significantly below the peer group averages.
§ Average compensation for associate professors is well above the peer group average.
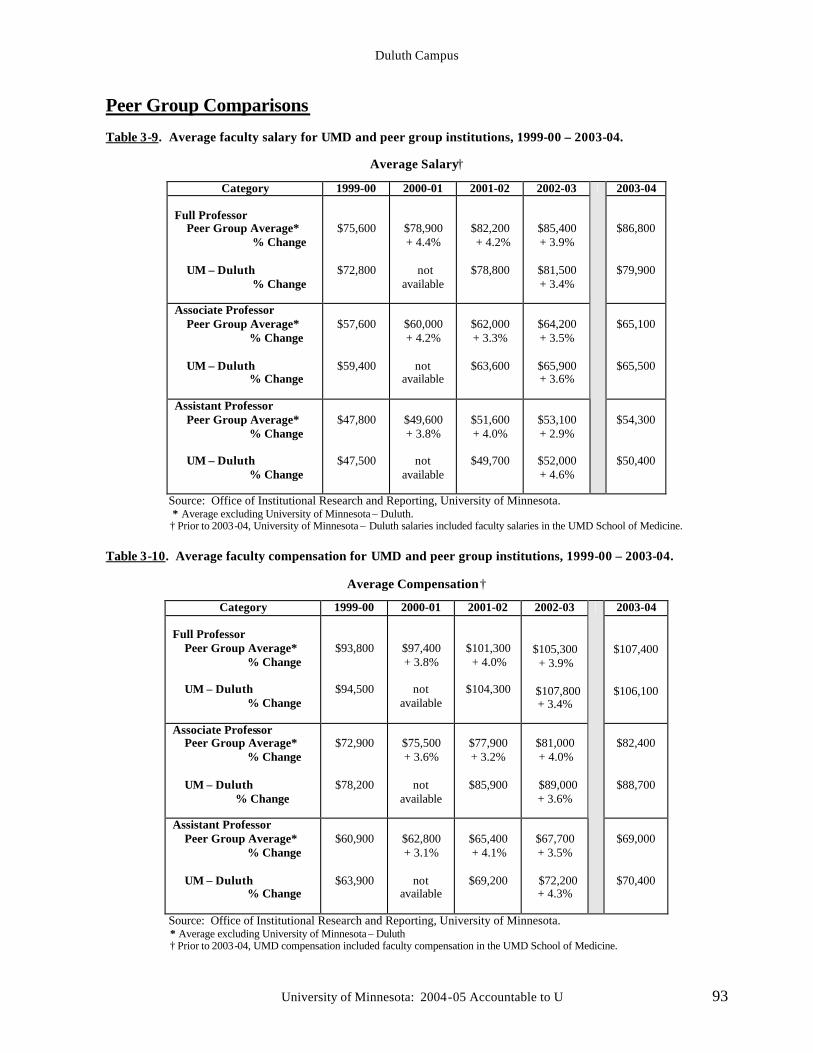
Duluth Campus
University of Minnesota: 2004-05 Accountable to U 93
Peer Group Comparisons Table 3-9. Average faculty salary for UMD and peer group institutions, 1999-00 – 2003-04.
Average Salary†
Category 1999-00 2000-01 2001-02 2002-03 2003-04 Full Professor
Peer Group Average* % Change UM – Duluth % Change
$75,600
$72,800
$78,900 + 4.4%
not
available
$82,200 + 4.2%
$78,800
$85,400 + 3.9%
$81,500 + 3.4%
$86,800
$79,900
Associate Professor Peer Group Average* % Change UM – Duluth % Change
$57,600
$59,400
$60,000 + 4.2%
not
available
$62,000 + 3.3%
$63,600
$64,200 + 3.5%
$65,900 + 3.6%
$65,100
$65,500
Assistant Professor Peer Group Average* % Change UM – Duluth % Change
$47,800
$47,500
$49,600 + 3.8%
not
available
$51,600 + 4.0%
$49,700
$53,100 + 2.9%
$52,000 + 4.6%
$54,300
$50,400
Source: Office of Institutional Research and Reporting, University of Minnesota. * Average excluding University of Minnesota – Duluth. † Prior to 2003-04, University of Minnesota – Duluth salaries included faculty salaries in the UMD School of Medicine.
Table 3-10. Average faculty compensation for UMD and peer group institutions, 1999-00 – 2003-04.
Average Compensation†
Category 1999-00 2000-01 2001-02 2002-03 2003-04 Full Professor
Peer Group Average* % Change UM – Duluth % Change
$93,800
$94,500
$97,400 + 3.8%
not
available
$101,300 + 4.0%
$104,300
$105,300 + 3.9%
$107,800
+ 3.4%
$107,400
$106,100
Associate Professor Peer Group Average* % Change UM – Duluth
% Change
$72,900
$78,200
$75,500 + 3.6%
not
available
$77,900 + 3.2%
$85,900
$81,000 + 4.0%
$89,000 + 3.6%
$82,400
$88,700
Assistant Professor Peer Group Average* % Change UM – Duluth % Change
$60,900
$63,900
$62,800 + 3.1%
not
available
$65,400 + 4.1%
$69,200
$67,700 + 3.5%
$72,200 + 4.3%
$69,000
$70,400
Source: Office of Institutional Research and Reporting, University of Minnesota. * Average excluding University of Minnesota – Duluth † Prior to 2003-04, UMD compensation included faculty compensation in the UMD School of Medicine.
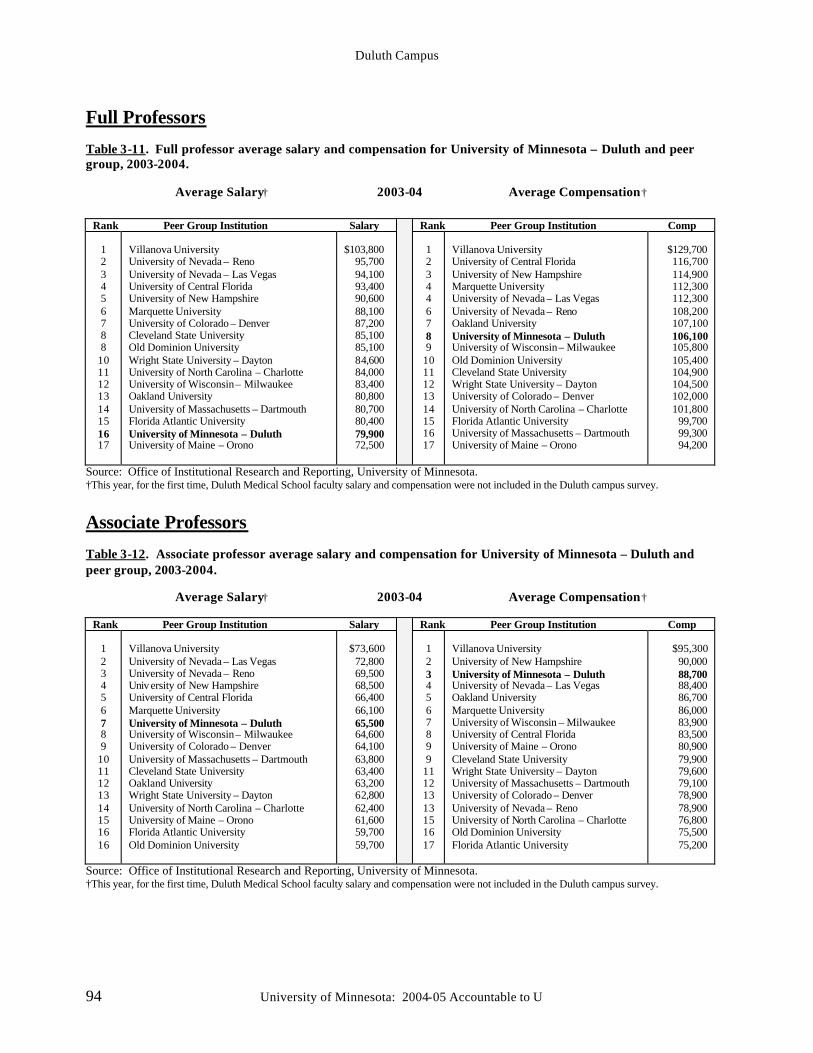
Duluth Campus
94 University of Minnesota: 2004-05 Accountable to U
Full Professors Table 3-11. Full professor average salary and compensation for University of Minnesota – Duluth and peer group, 2003-2004. Average Salary† 2003-04 Average Compensation†
Rank Peer Group Institution Salary Rank Peer Group Institution Comp
1 2 3 4 5 6 7 8 8
10 11 12 13 14 15 16 17
Villanova University University of Nevada – Reno University of Nevada – Las Vegas University of Central Florida University of New Hampshire Marquette University University of Colorado – Denver Cleveland State University Old Dominion University Wright State University – Dayton University of North Carolina – Charlotte University of Wisconsin – Milwaukee Oakland University University of Massachusetts – Dartmouth Florida Atlantic University University of Minnesota – Duluth University of Maine – Orono
$103,800
95,700 94,100 93,400 90,600 88,100 87,200 85,100 85,100 84,600 84,000 83,400 80,800 80,700 80,400 79,900 72,500
1 2 3 4 4 6 7 8 9
10 11 12 13 14 15 16 17
Villanova University University of Central Florida University of New Hampshire Marquette University University of Nevada – Las Vegas University of Nevada – Reno Oakland University University of Minnesota – Duluth University of Wisconsin – Milwaukee Old Dominion University Cleveland State University Wright State University – Dayton University of Colorado – Denver University of North Carolina – Charlotte Florida Atlantic University University of Massachusetts – Dartmouth University of Maine – Orono
$129,700 116,700 114,900 112,300 112,300 108,200 107,100 106,100 105,800 105,400 104,900 104,500 102,000 101,800
99,700 99,300 94,200
Source: Office of Institutional Research and Reporting, University of Minnesota. †This year, for the first time, Duluth Medical School faculty salary and compensation were not included in the Duluth campus survey.
Associate Professors Table 3-12. Associate professor average salary and compensation for University of Minnesota – Duluth and peer group, 2003-2004. Average Salary† 2003-04 Average Compensation†
Rank Peer Group Institution Salary Rank Peer Group Institution Comp
1 2 3 4 5 6 7 8 9
10 11 12 13 14 15 16 16
Villanova University University of Nevada – Las Vegas University of Nevada – Reno Univ ersity of New Hampshire University of Central Florida Marquette University University of Minnesota – Duluth University of Wisconsin – Milwaukee University of Colorado – Denver University of Massachusetts – Dartmouth Cleveland State University Oakland University Wright State University – Dayton University of North Carolina – Charlotte University of Maine – Orono Florida Atlantic University Old Dominion University
$73,600
72,800 69,500 68,500 66,400 66,100 65,500 64,600 64,100 63,800 63,400 63,200 62,800 62,400 61,600 59,700 59,700
1 2 3 4 5 6 7 8 9 9
11 12 13 13 15 16 17
Villanova University University of New Hampshire University of Minnesota – Duluth University of Nevada – Las Vegas Oakland University Marquette University University of Wisconsin – Milwaukee University of Central Florida University of Maine – Orono Cleveland State University Wright State University – Dayton University of Massachusetts – Dartmouth University of Colorado – Denver University of Nevada – Reno University of North Carolina – Charlotte Old Dominion University Florida Atlantic University
$95,300
90,000 88,700 88,400 86,700 86,000 83,900 83,500 80,900 79,900 79,600 79,100 78,900 78,900 76,800 75,500 75,200
Source: Office of Institutional Research and Reporting, University of Minnesota. †This year, for the first time, Duluth Medical School faculty salary and compensation were not included in the Duluth campus survey.
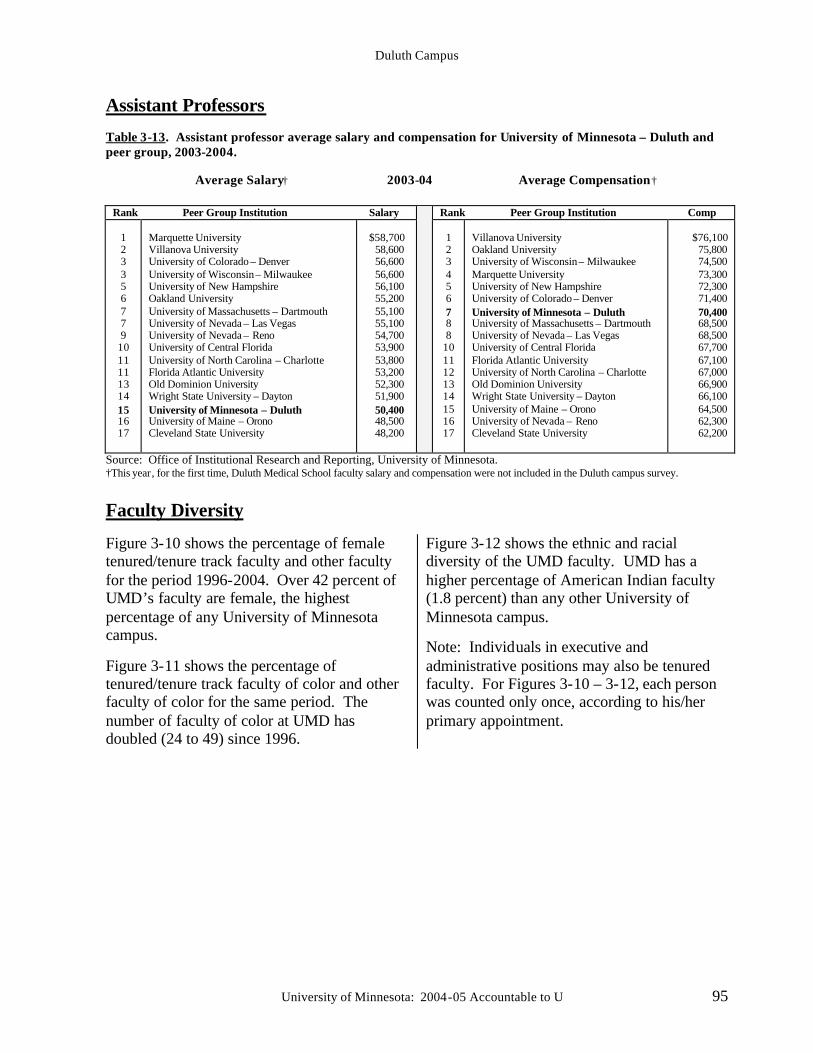
Duluth Campus
University of Minnesota: 2004-05 Accountable to U 95
Assistant Professors Table 3-13. Assistant professor average salary and compensation for University of Minnesota – Duluth and peer group, 2003-2004. Average Salary† 2003-04 Average Compensation†
Rank Peer Group Institution Salary Rank Peer Group Institution Comp
1 2 3 3 5 6 7 7 9
10 11 11 13 14 15 16 17
Marquette University Villanova University University of Colorado – Denver University of Wisconsin – Milwaukee University of New Hampshire Oakland University University of Massachusetts – Dartmouth University of Nevada – Las Vegas University of Nevada – Reno University of Central Florida University of North Carolina – Charlotte Florida Atlantic University Old Dominion University Wright State University – Dayton University of Minnesota – Duluth University of Maine – Orono Cleveland State University
$58,700
58,600 56,600 56,600 56,100 55,200 55,100 55,100 54,700 53,900 53,800 53,200 52,300 51,900 50,400 48,500 48,200
1 2 3 4 5 6 7 8 8
10 11 12 13 14 15 16 17
Villanova University Oakland University University of Wisconsin – Milwaukee Marquette University University of New Hampshire University of Colorado – Denver University of Minnesota – Duluth University of Massachusetts – Dartmouth University of Nevada – Las Vegas University of Central Florida Florida Atlantic University University of North Carolina – Charlotte Old Dominion University Wright State University – Dayton University of Maine – Orono University of Nevada – Reno Cleveland State University
$76,100
75,800 74,500 73,300 72,300 71,400 70,400 68,500 68,500 67,700 67,100 67,000 66,900 66,100 64,500 62,300 62,200
Source: Office of Institutional Research and Reporting, University of Minnesota. †This year, for the first time, Duluth Medical School faculty salary and compensation were not included in the Duluth campus survey.
Faculty Diversity
Figure 3-10 shows the percentage of female tenured/tenure track faculty and other faculty for the period 1996-2004. Over 42 percent of UMD’s faculty are female, the highest percentage of any University of Minnesota campus.
Figure 3-11 shows the percentage of tenured/tenure track faculty of color and other faculty of color for the same period. The number of faculty of color at UMD has doubled (24 to 49) since 1996.
Figure 3-12 shows the ethnic and racial diversity of the UMD faculty. UMD has a higher percentage of American Indian faculty (1.8 percent) than any other University of Minnesota campus.
Note: Individuals in executive and administrative positions may also be tenured faculty. For Figures 3-10 – 3-12, each person was counted only once, according to his/her primary appointment.
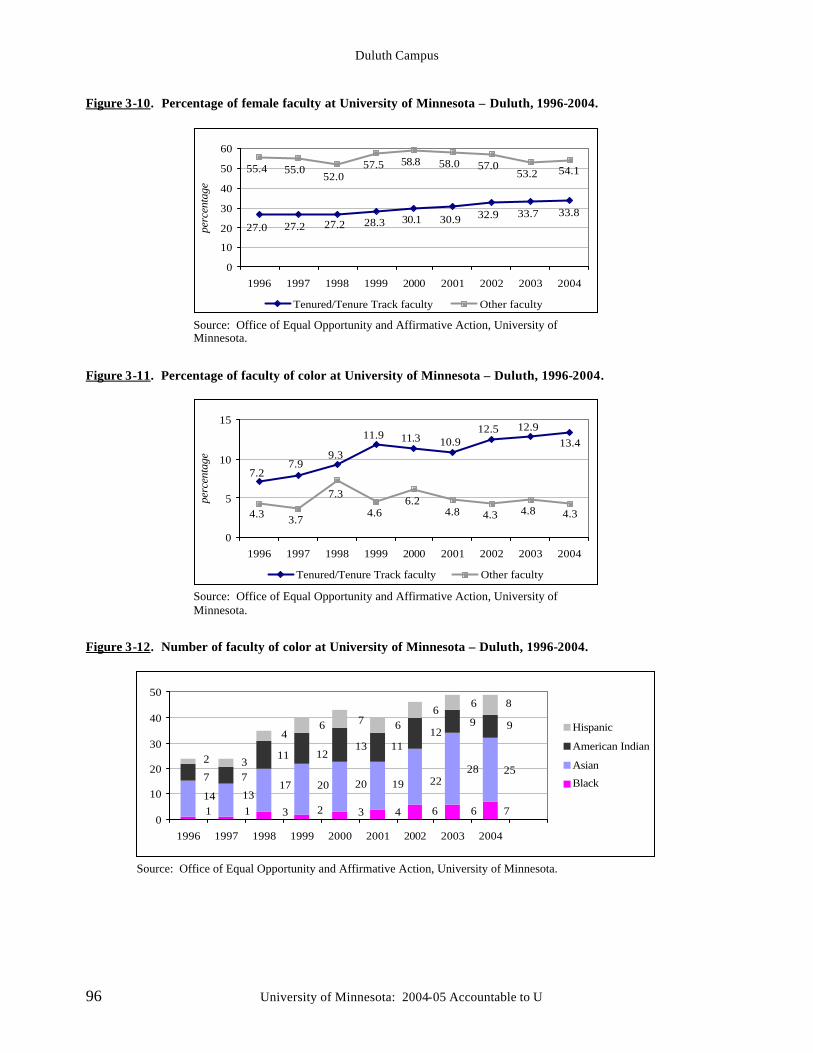
Duluth Campus
96 University of Minnesota: 2004-05 Accountable to U
Figure 3-10. Percentage of female faculty at University of Minnesota – Duluth, 1996-2004.
33.833.732.930.930.128.327.227.227.0
54.153.257.058.058.857.5
52.055.055.4
0
10
20
30
40
50
60
1996 1997 1998 1999 2000 2001 2002 2003 2004
perc
enta
ge
Tenured/Tenure Track faculty Other faculty
Source: Office of Equal Opportunity and Affirmative Action, University of Minnesota.
Figure 3-11. Percentage of faculty of color at University of Minnesota – Duluth, 1996-2004.
13.412.912.5
10.911.311.9
9.37.9
7.2
4.34.84.34.86.2
4.6
7.3
3.74.3
0
5
10
15
1996 1997 1998 1999 2000 2001 2002 2003 2004
perc
enta
ge
Tenured/Tenure Track faculty Other faculty
Source: Office of Equal Opportunity and Affirmative Action, University of Minnesota.
Figure 3-12. Number of faculty of color at University of Minnesota – Duluth, 1996-2004.
766432311
25282219202017
1314
9912
11131211
77
866
6764
32
0
10
20
30
40
50
1996 1997 1998 1999 2000 2001 2002 2003 2004 2005
Hispanic
American Indian
Asian
Black
Source: Office of Equal Opportunity and Affirmative Action, University of Minnesota.
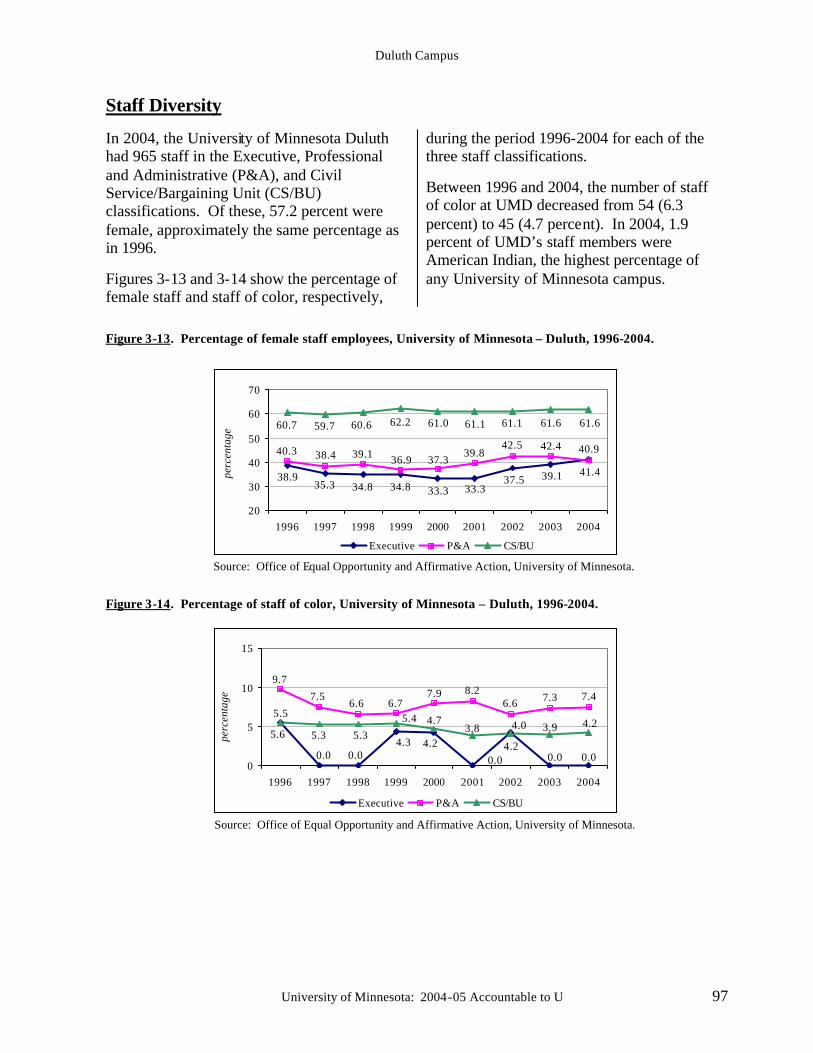
Duluth Campus
University of Minnesota: 2004-05 Accountable to U 97
Staff Diversity
In 2004, the University of Minnesota Duluth had 965 staff in the Executive, Professional and Administrative (P&A), and Civil Service/Bargaining Unit (CS/BU) classifications. Of these, 57.2 percent were female, approximately the same percentage as in 1996.
Figures 3-13 and 3-14 show the percentage of female staff and staff of color, respectively,
during the period 1996-2004 for each of the three staff classifications.
Between 1996 and 2004, the number of staff of color at UMD decreased from 54 (6.3 percent) to 45 (4.7 percent). In 2004, 1.9 percent of UMD’s staff members were American Indian, the highest percentage of any University of Minnesota campus.
Figure 3-13. Percentage of female staff employees, University of Minnesota – Duluth, 1996-2004.
41.439.137.533.333.334.834.835.3
38.9
40.942.442.539.8
37.336.939.138.440.3
61.661.661.161.161.062.260.659.760.7
20
30
40
50
60
70
1996 1997 1998 1999 2000 2001 2002 2003 2004
perc
enta
ge
Executive P&A CS/BU
Source: Office of Equal Opportunity and Affirmative Action, University of Minnesota.
Figure 3-14. Percentage of staff of color, University of Minnesota – Duluth, 1996-2004.
0.00.00.0
4.24.30.00.0
4.25.6
7.47.36.68.27.9
6.76.67.5
9.7
4.23.94.03.84.75.4
5.35.3
5.5
0
5
10
15
1996 1997 1998 1999 2000 2001 2002 2003 2004
perc
enta
ge
Executive P&A CS/BU
Source: Office of Equal Opportunity and Affirmative Action, University of Minnesota.
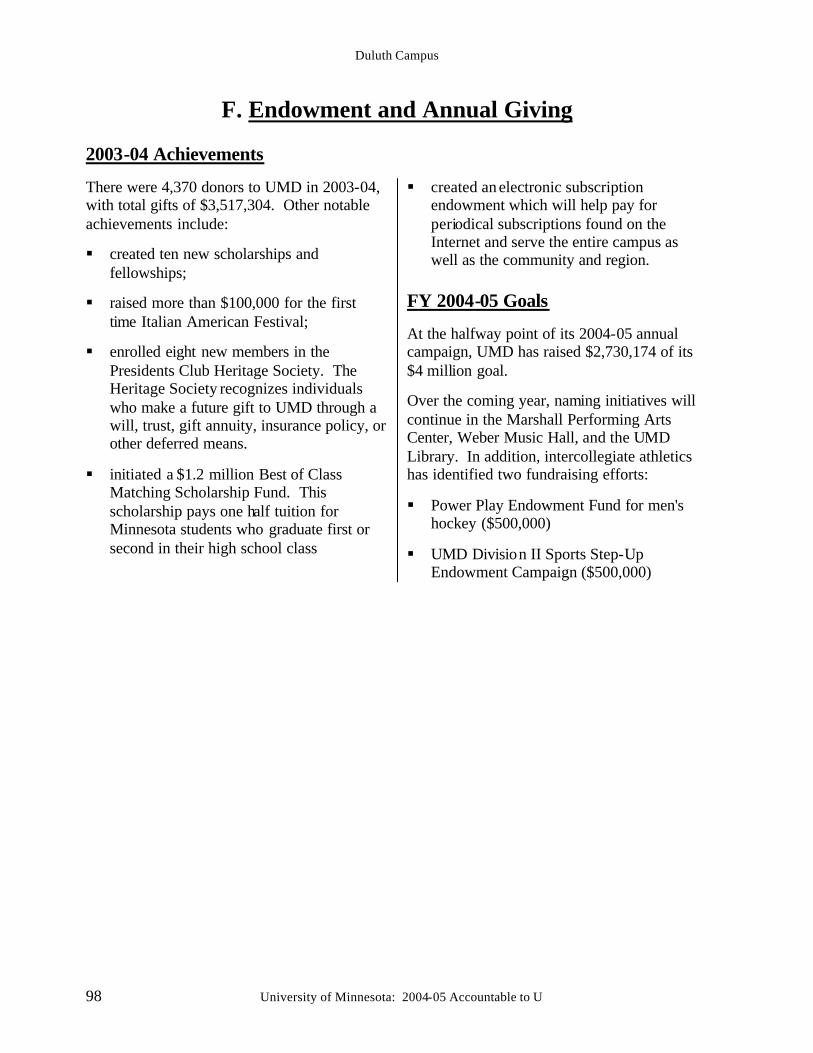
Duluth Campus
98 University of Minnesota: 2004-05 Accountable to U
F. Endowment and Annual Giving 2003-04 Achievements
There were 4,370 donors to UMD in 2003-04, with total gifts of $3,517,304. Other notable achievements include:
§ created ten new scholarships and fellowships;
§ raised more than $100,000 for the first time Italian American Festival;
§ enrolled eight new members in the Presidents Club Heritage Society. The Heritage Society recognizes individuals who make a future gift to UMD through a will, trust, gift annuity, insurance policy, or other deferred means.
§ initiated a $1.2 million Best of Class Matching Scholarship Fund. This scholarship pays one half tuition for Minnesota students who graduate first or second in their high school class
§ created an electronic subscription endowment which will help pay for periodical subscriptions found on the Internet and serve the entire campus as well as the community and region.
FY 2004-05 Goals
At the halfway point of its 2004-05 annual campaign, UMD has raised $2,730,174 of its $4 million goal.
Over the coming year, naming initiatives will continue in the Marshall Performing Arts Center, Weber Music Hall, and the UMD Library. In addition, intercollegiate athletics has identified two fundraising efforts:
§ Power Play Endowment Fund for men's hockey ($500,000)
§ UMD Division II Sports Step-Up Endowment Campaign ($500,000)
University of Minnesota: 2004-05 Accountable to U 99
4: Morris Campus
A. Campus Profile The University of Minnesota – Morris is the academically rigorous, public undergraduate liberal arts campus of the University of Minnesota and a public honors college for the state. The Morris campus has repeatedly received national recognition for its distinctive liberal arts mission and strong academic quality in U.S. News & World Report, Kiplinger’s, Changing Times, and rankings in Peterson’s Guide to Competitive Colleges and the Fiske Guide to Colleges. The campus’s
strength comes primarily from: a focused, narrowly defined mission; an intellectually gifted student body; and a faculty dedicated to teaching, to personal contact with students, and to research with full student participation. Ninety-eight percent of Morris’s tenured and tenure-track faculty hold terminal degrees. Thirty faculty members are recipients of the University of Minnesota’s highest teaching award, the Horace T. Morse-University of Minnesota Alumni Association Award.
Founded 1960
Leadership Samuel Schuman, Chancellor
Divisions Education Humanities Interdisciplinary Studies Science and Mathematics Social Sciences
Degrees Offered Bachelor of Arts
Academic Programs Offered 30 majors; 7 pre-professional programs
Fall 2004 Enrollment Undergraduate Non-degree Total
1,685 154
1,839
Faculty Size (FY 2004) Tenured/Tenure Track 110 Other Faculty 15
Undergraduate Degrees Awarded (FY 2004) 350
Living Alumni (FY 2004) 17,397 (graduates and non-grads) Staff (FY 2004) Civil Service/ Bargaining Unit 194 Professional and Administrative 88
Number of Buildings 28 (561,000 assignable square feet)
Expenditures (FY 2004) $36,219,565
Morris Campus
100 University of Minnesota: 2004-05 Accountable to U
B. Academic Priorities Current academic priorities include:
§ continuing to offer an uncompromisingly high-quality undergraduate liberal arts education to students during a period of significant fiscal constraints;
§ recruiting and retaining a diverse community of student learners and faculty teacher/scholars without peer in American undergraduate institutions;
§ developing selected new majors and minors, such as Native American studies;
§ strengthening the first-year seminar and honors programs; and
§ strengthening the international component of a UMM education, through study abroad, exchange programs, etc.
Based on an extensive self-study, the first-year seminar program was approved in 2003 as a permanent part of the universal undergraduate curriculum. Three majors – women’s studies, anthropology, and statistics – have been added in the last few years, as well as an African American studies minor. The campus continues to provide creative alternatives to students through programs of “areas of emphasis” and “areas of concentration” where students and faculty can develop their own custom-made majors and minors.
The Morris campus has provided important leadership across the University in student advising and has initiated a comprehensive assessment program for advising in the freshman year and in the major. The Council of Undergraduate Deans on the Twin Cities campus identified these programs as models for other units of the University.
The Morris campus recently joined the National Student Exchange (NSE) and placed
its first student last year. (NSE is a national consortium of 177 higher education institutions that permits students from one member institution to study at another’s while paying their normal tuition and fees or the in-state tuition and fees rate of the host institution.) Participation levels are expected to grow, especially among students whose particular interest might lie in fields other than those represented on the Morris campus.
The Morris campus has also begun to work with faculty and students to compete more systematically for national scholarships, such as Rhodes, Truman, Goldwater, and Fulbright scholarships. Other areas of excellence and emphasis include:
§ revitalizing the honors program, offering students an interdisciplinary experience to accompany the traditional major;
§ increased success in raising money for scholarships through the University’s “promise of tomorrow” campaign;
§ recruiting and retaining a diverse faculty,
including the addition of Native American women in the English and anthropology programs; and
§ the continued success of Morris faculty winning the Horace T. Morse Award for undergraduate teaching.
Academic Rankings The University of Minnesota – Morris is ranked by the Carnegie Foundation for the Advancement of Teaching among 217 national- level liberal arts colleges across the country that emphasize undergraduate education and award at least half of their degrees in the liberal arts disciplines. Of these colleges, 21 are public institutions, and the
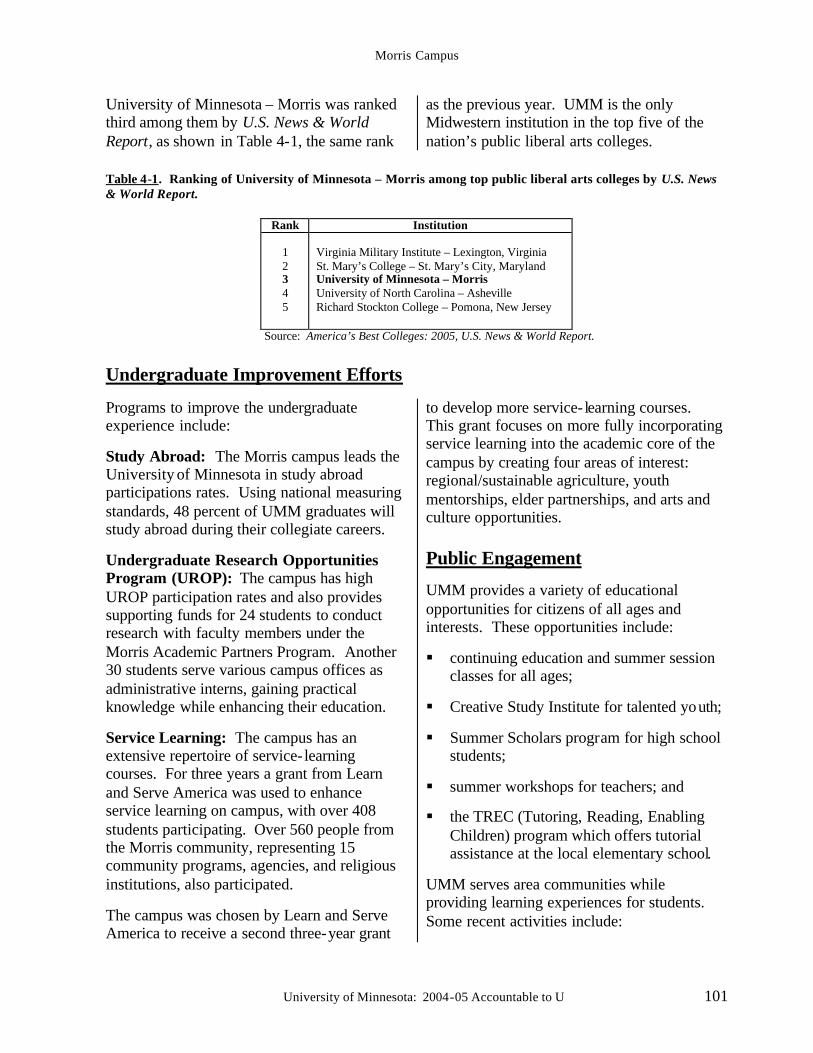
Morris Campus
University of Minnesota: 2004-05 Accountable to U 101
University of Minnesota – Morris was ranked third among them by U.S. News & World Report, as shown in Table 4-1, the same rank
as the previous year. UMM is the only Midwestern institution in the top five of the nation’s public liberal arts colleges.
Table 4-1. Ranking of University of Minnesota – Morris among top public liberal arts colleges by U.S. News & World Report.
Rank Institution
1 2 3 4 5
Virginia Military Institute – Lexington, Virginia St. Mary’s College – St. Mary’s City, Maryland University of Minnesota – Morris University of North Carolina – Asheville Richard Stockton College – Pomona, New Jersey
Source: America’s Best Colleges: 2005, U.S. News & World Report.
Undergraduate Improvement Efforts
Programs to improve the undergraduate experience include:
Study Abroad: The Morris campus leads the University of Minnesota in study abroad participations rates. Using national measuring standards, 48 percent of UMM graduates will study abroad during their collegiate careers. Undergraduate Research Opportunities Program (UROP): The campus has high UROP participation rates and also provides supporting funds for 24 students to conduct research with faculty members under the Morris Academic Partners Program. Another 30 students serve various campus offices as administrative interns, gaining practical knowledge while enhancing their education.
Service Learning: The campus has an extensive repertoire of service- learning courses. For three years a grant from Learn and Serve America was used to enhance service learning on campus, with over 408 students participating. Over 560 people from the Morris community, representing 15 community programs, agencies, and religious institutions, also participated.
The campus was chosen by Learn and Serve America to receive a second three-year grant
to develop more service- learning courses. This grant focuses on more fully incorporating service learning into the academic core of the campus by creating four areas of interest: regional/sustainable agriculture, youth mentorships, elder partnerships, and arts and culture opportunities. Public Engagement
UMM provides a variety of educational opportunities for citizens of all ages and interests. These opportunities include:
§ continuing education and summer session classes for all ages;
§ Creative Study Institute for talented youth;
§ Summer Scholars program for high school students;
§ summer workshops for teachers; and
§ the TREC (Tutoring, Reading, Enabling Children) program which offers tutorial assistance at the local elementary school.
UMM serves area communities while providing learning experiences for students. Some recent activities include:
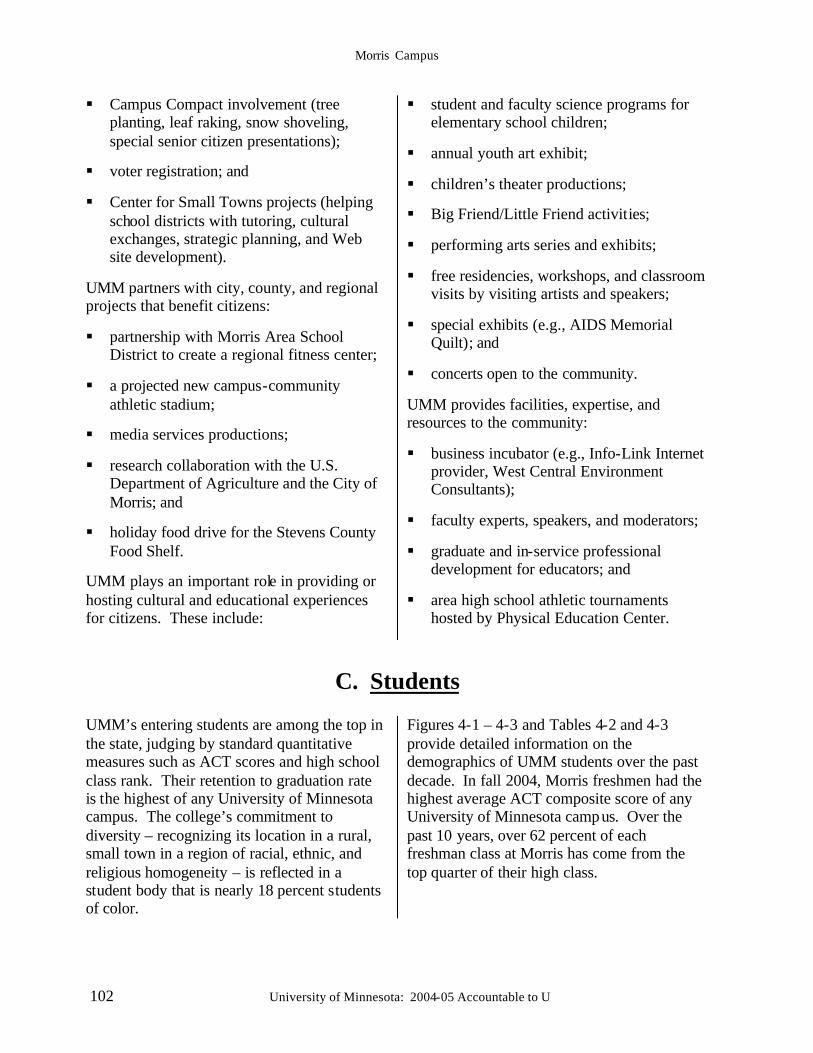
Morris Campus
102 University of Minnesota: 2004-05 Accountable to U
§ Campus Compact involvement (tree planting, leaf raking, snow shoveling, special senior citizen presentations);
§ voter registration; and
§ Center for Small Towns projects (helping school districts with tutoring, cultural exchanges, strategic planning, and Web site development).
UMM partners with city, county, and regional projects that benefit citizens:
§ partnership with Morris Area School District to create a regional fitness center;
§ a projected new campus-community athletic stadium;
§ media services productions;
§ research collaboration with the U.S. Department of Agriculture and the City of Morris; and
§ holiday food drive for the Stevens County Food Shelf.
UMM plays an important role in providing or hosting cultural and educational experiences for citizens. These include:
§ student and faculty science programs for elementary school children;
§ annual youth art exhibit;
§ children’s theater productions;
§ Big Friend/Little Friend activities;
§ performing arts series and exhibits;
§ free residencies, workshops, and classroom visits by visiting artists and speakers;
§ special exhibits (e.g., AIDS Memorial Quilt); and
§ concerts open to the community.
UMM provides facilities, expertise, and resources to the community:
§ business incubator (e.g., Info-Link Internet provider, West Central Environment Consultants);
§ faculty experts, speakers, and moderators;
§ graduate and in-service professional development for educators; and
§ area high school athletic tournaments hosted by Physical Education Center.
C. Students
UMM’s entering students are among the top in the state, judging by standard quantitative measures such as ACT scores and high school class rank. Their retention to graduation rate is the highest of any University of Minnesota campus. The college’s commitment to diversity – recognizing its location in a rural, small town in a region of racial, ethnic, and religious homogeneity – is reflected in a student body that is nearly 18 percent students of color.
Figures 4-1 – 4-3 and Tables 4-2 and 4-3 provide detailed information on the demographics of UMM students over the past decade. In fall 2004, Morris freshmen had the highest average ACT composite score of any University of Minnesota campus. Over the past 10 years, over 62 percent of each freshman class at Morris has come from the top quarter of their high class.
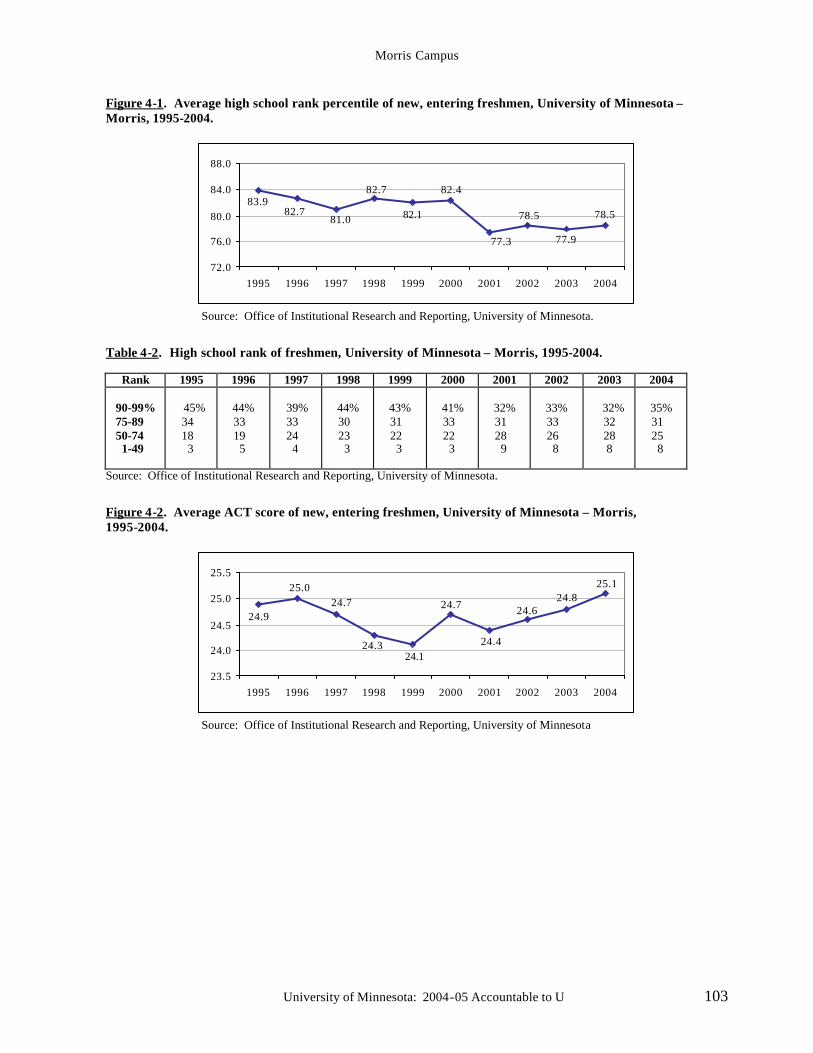
Morris Campus
University of Minnesota: 2004-05 Accountable to U 103
Figure 4-1. Average high school rank percentile of new, entering freshmen, University of Minnesota – Morris, 1995-2004.
78.5
77.9
78.5
77.3
82.4
82.1
82.7
81.082.7
83.9
72.0
76.0
80.0
84.0
88.0
1995 1996 1997 1998 1999 2000 2001 2002 2003 2004
Source: Office of Institutional Research and Reporting, University of Minnesota.
Table 4-2. High school rank of freshmen, University of Minnesota – Morris, 1995-2004.
Rank 1995 1996 1997 1998 1999 2000 2001 2002 2003 2004 90-99% 75-89 50-74 1-49
45%
34 18 3
44%
33 19 5
39%
33 24 4
44%
30 23 3
43%
31 22 3
41%
33 22 3
32%
31 28 9
33%
33 26 8
32%
32 28 8
35%
31 25 8
Source: Office of Institutional Research and Reporting, University of Minnesota.
Figure 4-2. Average ACT score of new, entering freshmen, University of Minnesota – Morris, 1995-2004.
25.124.8
24.6
24.4
24.7
24.124.3
24.725.0
24.9
23.5
24.0
24.5
25.0
25.5
1995 1996 1997 1998 1999 2000 2001 2002 2003 2004
Source: Office of Institutional Research and Reporting, University of Minnesota
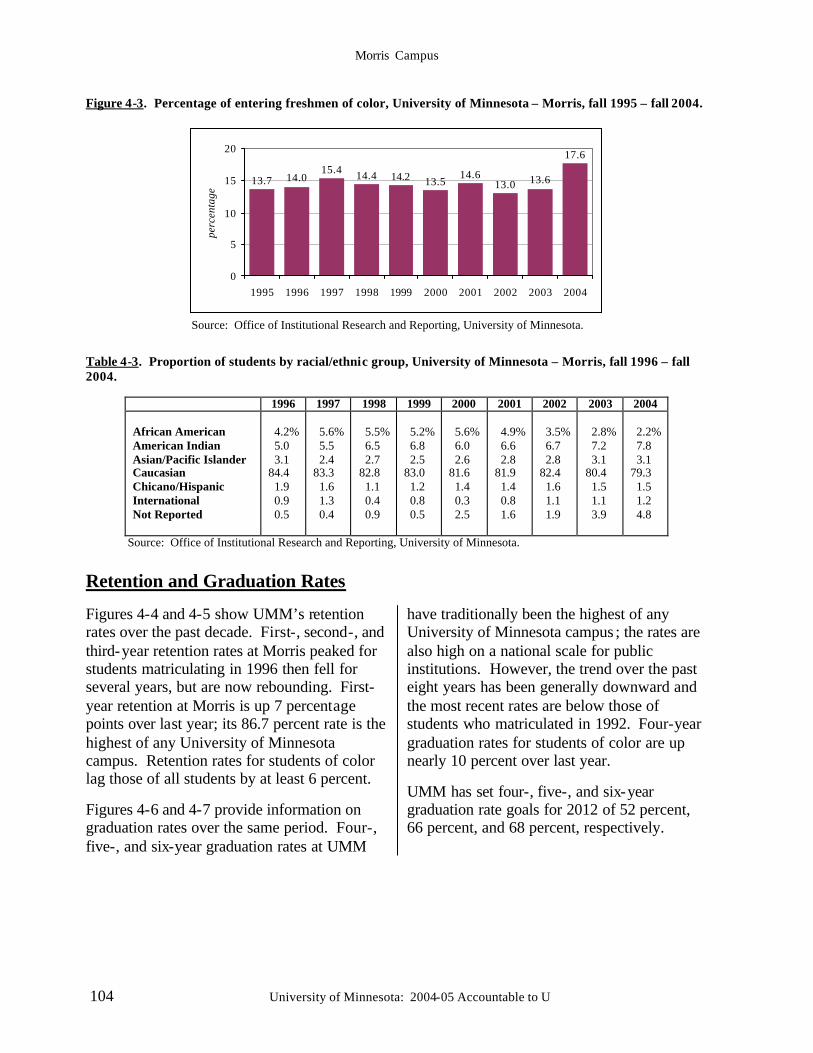
Morris Campus
104 University of Minnesota: 2004-05 Accountable to U
Figure 4-3. Percentage of entering freshmen of color, University of Minnesota – Morris, fall 1995 – fall 2004.
17.6
13.613.014.6
13.514.214.415.414.013.7
0
5
10
15
20
1995 1996 1997 1998 1999 2000 2001 2002 2003 2004
perc
enta
ge
Source: Office of Institutional Research and Reporting, University of Minnesota.
Table 4-3. Proportion of students by racial/ethnic group, University of Minnesota – Morris, fall 1996 – fall 2004.
1996 1997 1998 1999 2000 2001 2002 2003 2004 African American American Indian Asian/Pacific Islander Caucasian Chicano/Hispanic International Not Reported
4.2% 5.0 3.1 84.4 1.9 0.9 0.5
5.6% 5.5 2.4 83.3 1.6 1.3 0.4
5.5% 6.5 2.7 82.8 1.1 0.4 0.9
5.2% 6.8 2.5 83.0 1.2 0.8 0.5
5.6% 6.0 2.6 81.6 1.4 0.3 2.5
4.9% 6.6 2.8 81.9 1.4 0.8 1.6
3.5% 6.7 2.8 82.4 1.6 1.1 1.9
2.8% 7.2 3.1 80.4 1.5 1.1 3.9
2.2% 7.8 3.1 79.3 1.5 1.2 4.8
Source: Office of Institutional Research and Reporting, University of Minnesota.
Retention and Graduation Rates Figures 4-4 and 4-5 show UMM’s retention rates over the past decade. First-, second-, and third-year retention rates at Morris peaked for students matriculating in 1996 then fell for several years, but are now rebounding. First-year retention at Morris is up 7 percentage points over last year; its 86.7 percent rate is the highest of any University of Minnesota campus. Retention rates for students of color lag those of all students by at least 6 percent.
Figures 4-6 and 4-7 provide information on graduation rates over the same period. Four-, five-, and six-year graduation rates at UMM
have traditionally been the highest of any University of Minnesota campus ; the rates are also high on a national scale for public institutions. However, the trend over the past eight years has been generally downward and the most recent rates are below those of students who matriculated in 1992. Four-year graduation rates for students of color are up nearly 10 percent over last year.
UMM has set four-, five-, and six-year graduation rate goals for 2012 of 52 percent, 66 percent, and 68 percent, respectively.
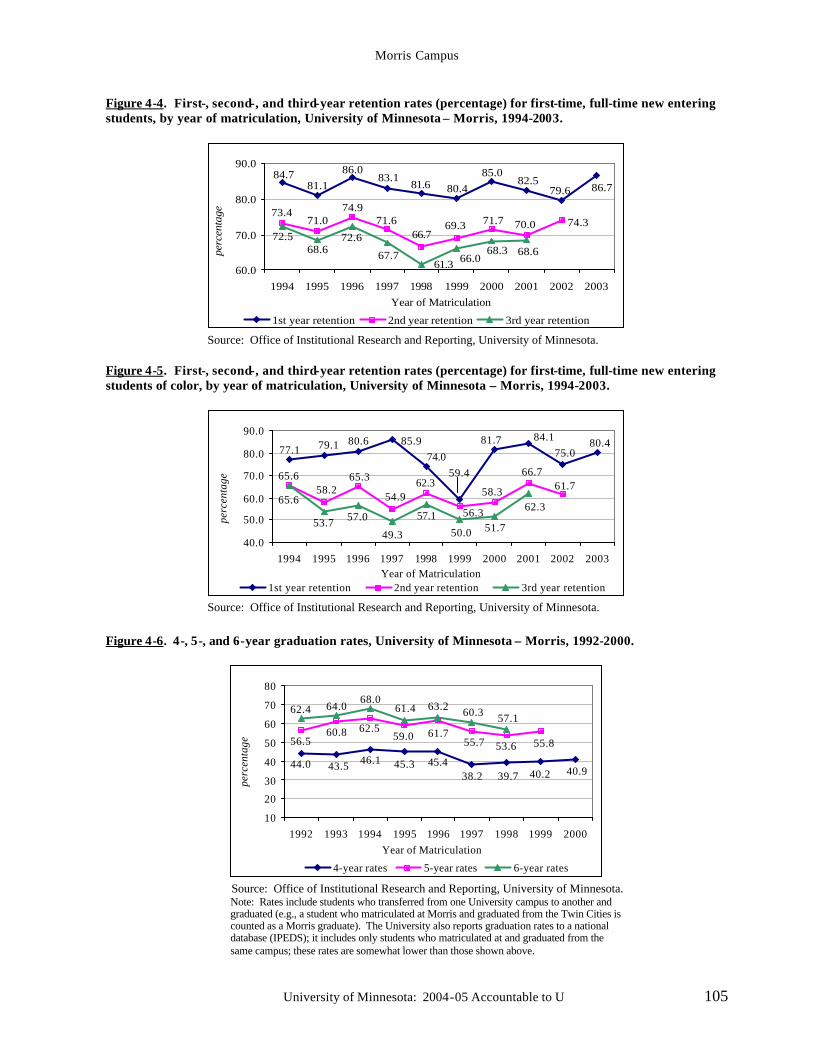
Morris Campus
University of Minnesota: 2004-05 Accountable to U 105
Figure 4-4. First-, second-, and third-year retention rates (percentage) for first-time, full-time new entering students, by year of matriculation, University of Minnesota – Morris, 1994-2003.
86.779.682.5
85.080.481.6
83.186.0
81.184.7
74.370.071.769.366.7
71.674.9
71.073.4
68.672.5
68.366.061.3
67.7
72.668.6
60.0
70.0
80.0
90.0
1994 1995 1996 1997 1998 1999 2000 2001 2002 2003Year of Matriculation
perc
enta
ge
1st year retention 2nd year retention 3rd year retention
Source: Office of Institutional Research and Reporting, University of Minnesota. Figure 4-5. First-, second-, and third-year retention rates (percentage) for first-time, full-time new entering students of color, by year of matriculation, University of Minnesota – Morris, 1994-2003.
74.080.4
75.084.1
59.4
85.980.679.1 81.777.1
61.766.7
58.3
56.3
62.365.3
54.958.2
65.6
62.365.6
51.750.0
57.1
49.3
57.053.7
40.0
50.0
60.0
70.0
80.0
90.0
1994 1995 1996 1997 1998 1999 2000 2001 2002 2003Year of Matriculation
perc
enta
ge
1st year retention 2nd year retention 3rd year retention
Source: Office of Institutional Research and Reporting, University of Minnesota.
Figure 4-6. 4-, 5-, and 6-year graduation rates, University of Minnesota – Morris, 1992-2000.
40.940.239.738.245.445.346.143.544.0
55.853.655.761.759.0
62.560.856.5
57.160.368.0
62.4 63.261.464.0
10
20
30
40
50
60
70
80
1992 1993 1994 1995 1996 1997 1998 1999 2000Year of Matriculation
perc
enta
ge
4-year rates 5-year rates 6-year rates
Source: Office of Institutional Research and Reporting, University of Minnesota. Note: Rates include students who transferred from one University campus to another and graduated (e.g., a student who matriculated at Morris and graduated from the Twin Cities is counted as a Morris graduate). The University also reports graduation rates to a national database (IPEDS); it includes only students who matriculated at and graduated from the same campus; these rates are somewhat lower than those shown above.
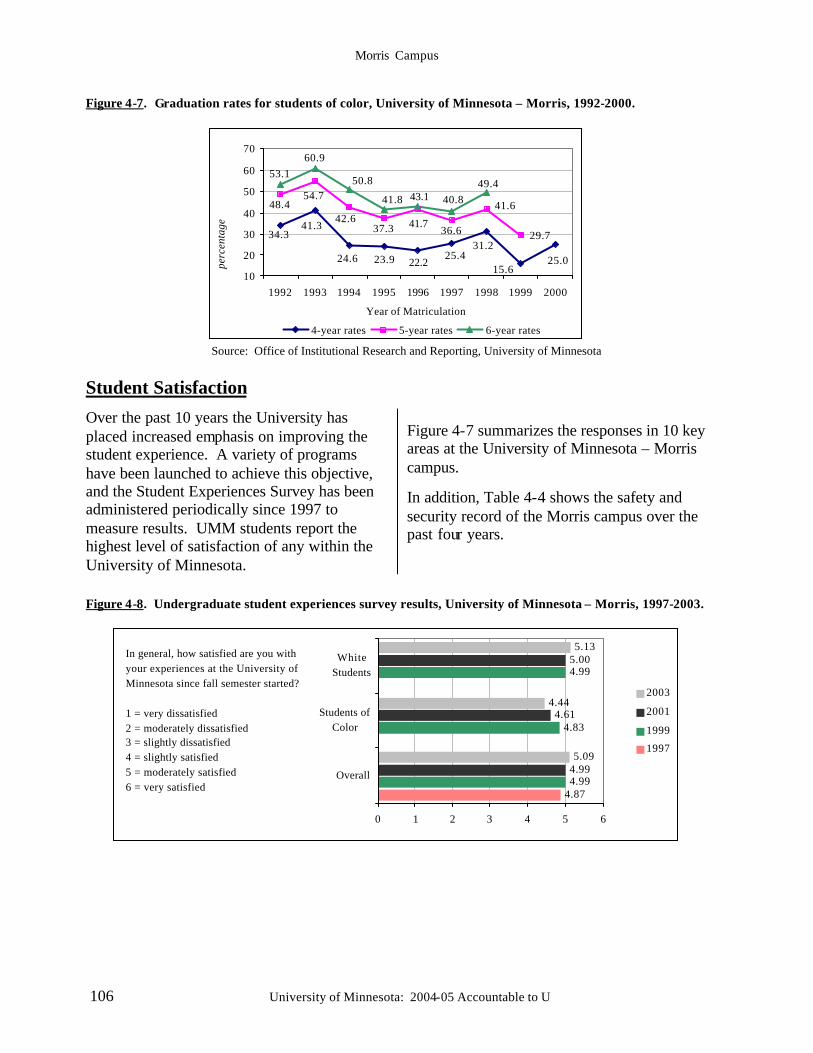
Morris Campus
106 University of Minnesota: 2004-05 Accountable to U
Figure 4-7. Graduation rates for students of color, University of Minnesota – Morris, 1992-2000.
29.7
25.015.6
31.225.4
22.223.924.6
41.334.3
41.6
36.641.737.3
42.6
54.748.4
49.440.843.141.8
50.8
60.953.1
10
20
30
40
50
60
70
1992 1993 1994 1995 1996 1997 1998 1999 2000
Year of Matriculation
perc
enta
ge
4-year rates 5-year rates 6-year rates
Source: Office of Institutional Research and Reporting, University of Minnesota
Student Satisfaction
Over the past 10 years the University has placed increased emphasis on improving the student experience. A variety of programs have been launched to achieve this objective, and the Student Experiences Survey has been administered periodically since 1997 to measure results. UMM students report the highest level of satisfaction of any within the University of Minnesota.
Figure 4-7 summarizes the responses in 10 key areas at the University of Minnesota – Morris campus.
In addition, Table 4-4 shows the safety and security record of the Morris campus over the past four years.
Figure 4-8. Undergraduate student experiences survey results, University of Minnesota – Morris, 1997-2003.
4.874.99
4.83
4.99
4.99
4.61
5.00
5.09
4.44
5.13
0 1 2 3 4 5 6
Overall
Students ofColor
WhiteStudents
2003
2001
1999
1997
In general, how satisfied are you with your experiences at the University of Minnesota since fall semester started?
1 = very dissatisfied2 = moderately dissatisfied3 = slightly dissatisfied4 = slightly satisfied5 = moderately satisfied6 = very satisfied
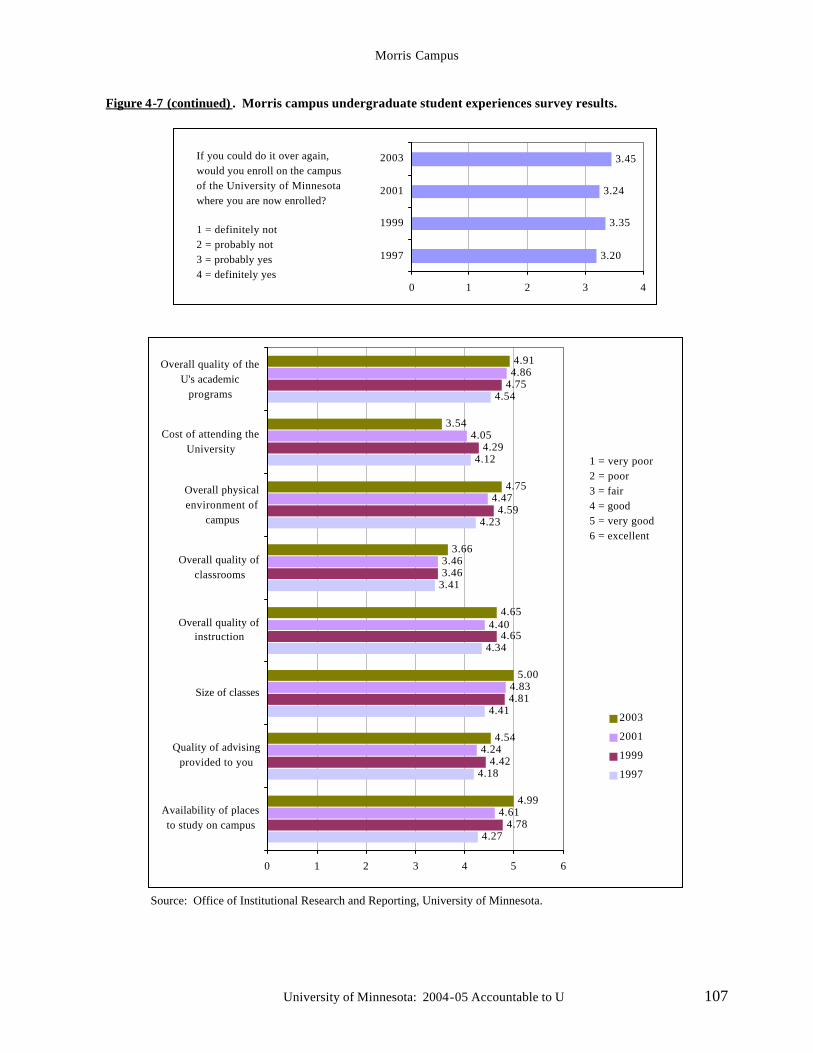
Morris Campus
University of Minnesota: 2004-05 Accountable to U 107
Figure 4-7 (continued) . Morris campus undergraduate student experiences survey results.
3.20
3.35
3.24
3.45
0 1 2 3 4
1997
1999
2001
2003If you could do it over again, would you enroll on the campus of the University of Minnesota where you are now enrolled?
1 = definitely not2 = probably not3 = probably yes4 = definitely yes
4.27
4.18
4.41
4.34
3.41
4.23
4.12
4.54
4.78
4.42
4.81
4.65
3.46
4.59
4.29
4.75
4.61
4.24
4.83
4.40
3.46
4.47
4.05
4.86
4.99
4.54
5.00
4.65
3.66
4.75
3.54
4.91
0 1 2 3 4 5 6
Availability of placesto study on campus
Quality of advisingprovided to you
Size of classes
Overall quality ofinstruction
Overall quality ofclassrooms
Overall physicalenvironment of
campus
Cost of attending theUniversity
Overall quality of theU's academic
programs
2003
2001
1999
1997
1 = very poor2 = poor3 = fair4 = good5 = very good6 = excellent
Source: Office of Institutional Research and Reporting, University of Minnesota.
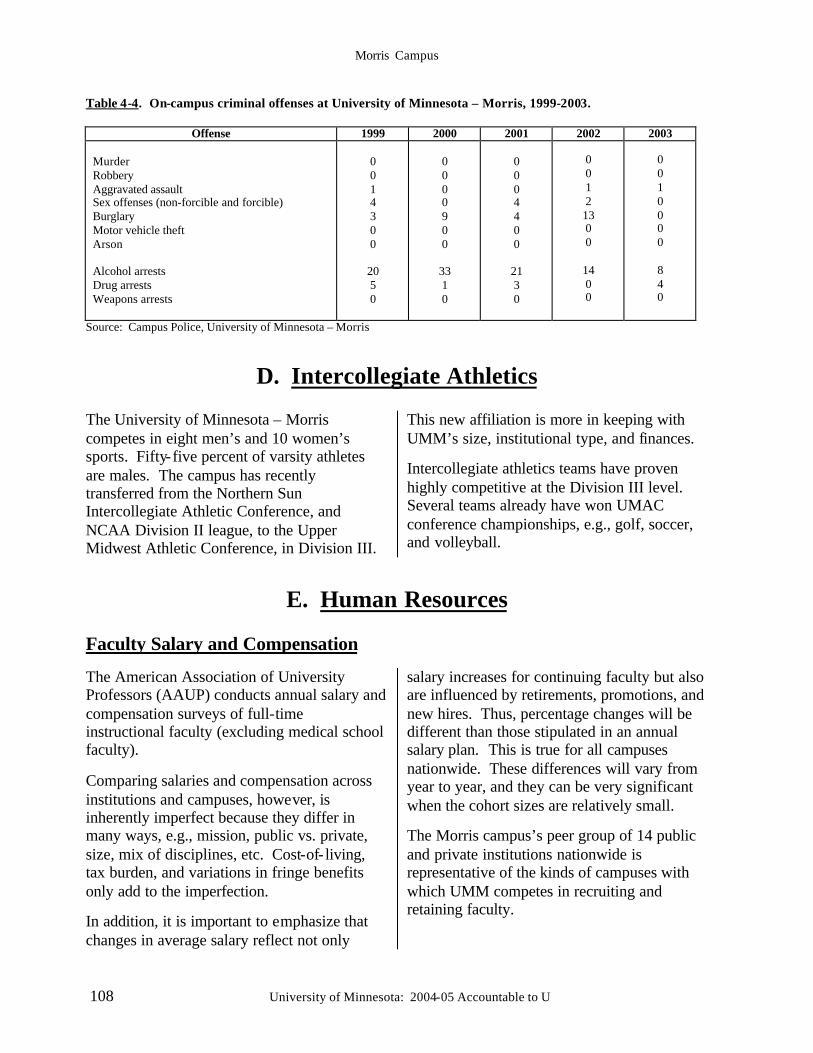
Morris Campus
108 University of Minnesota: 2004-05 Accountable to U
Table 4-4. On-campus criminal offenses at University of Minnesota – Morris, 1999-2003.
Offense 1999 2000 2001 2002 2003 Murder Robbery Aggravated assault Sex offenses (non-forcible and forcible) Burglary Motor vehicle theft Arson Alcohol arrests Drug arrests Weapons arrests
0 0 1 4 3 0 0
20 5 0
0 0 0 0 9 0 0
33 1 0
0 0 0 4 4 0 0
21 3 0
0 0 1 2 13 0 0
14 0 0
0 0 1 0 0 0 0 8 4 0
Source: Campus Police, University of Minnesota – Morris
D. Intercollegiate Athletics
The University of Minnesota – Morris competes in eight men’s and 10 women’s sports. Fifty-five percent of varsity athletes are males. The campus has recently transferred from the Northern Sun Intercollegiate Athletic Conference, and NCAA Division II league, to the Upper Midwest Athletic Conference, in Division III.
This new affiliation is more in keeping with UMM’s size, institutional type, and finances.
Intercollegiate athletics teams have proven highly competitive at the Division III level. Several teams already have won UMAC conference championships, e.g., golf, soccer, and volleyball.
E. Human Resources
Faculty Salary and Compensation The American Association of University Professors (AAUP) conducts annual salary and compensation surveys of full-time instructional faculty (excluding medical school faculty).
Comparing salaries and compensation across institutions and campuses, however, is inherently imperfect because they differ in many ways, e.g., mission, public vs. private, size, mix of disciplines, etc. Cost-of- living, tax burden, and variations in fringe benefits only add to the imperfection.
In addition, it is important to emphasize that changes in average salary reflect not only
salary increases for continuing faculty but also are influenced by retirements, promotions, and new hires. Thus, percentage changes will be different than those stipulated in an annual salary plan. This is true for all campuses nationwide. These differences will vary from year to year, and they can be very significant when the cohort sizes are relatively small.
The Morris campus’s peer group of 14 public and private institutions nationwide is representative of the kinds of campuses with which UMM competes in recruiting and retaining faculty.
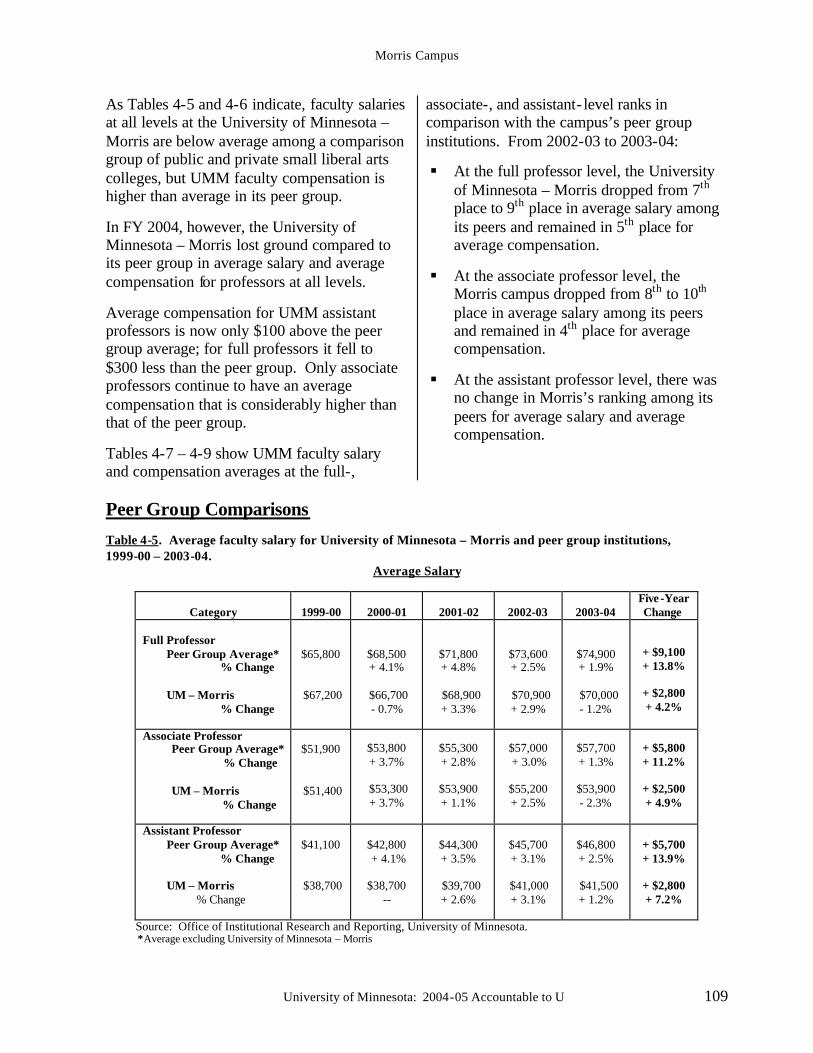
Morris Campus
University of Minnesota: 2004-05 Accountable to U 109
As Tables 4-5 and 4-6 indicate, faculty salaries at all levels at the University of Minnesota – Morris are below average among a comparison group of public and private small liberal arts colleges, but UMM faculty compensation is higher than average in its peer group.
In FY 2004, however, the University of Minnesota – Morris lost ground compared to its peer group in average salary and average compensation for professors at all levels.
Average compensation for UMM assistant professors is now only $100 above the peer group average; for full professors it fell to $300 less than the peer group. Only associate professors continue to have an average compensation that is considerably higher than that of the peer group.
Tables 4-7 – 4-9 show UMM faculty salary and compensation averages at the full-,
associate-, and assistant- level ranks in comparison with the campus’s peer group institutions. From 2002-03 to 2003-04:
§ At the full professor level, the University of Minnesota – Morris dropped from 7th place to 9th place in average salary among its peers and remained in 5th place for average compensation.
§ At the associate professor level, the Morris campus dropped from 8th to 10th place in average salary among its peers and remained in 4th place for average compensation.
§ At the assistant professor level, there was no change in Morris’s ranking among its peers for average salary and average compensation.
Peer Group Comparisons Table 4-5. Average faculty salary for University of Minnesota – Morris and peer group institutions, 1999-00 – 2003-04.
Average Salary
Category
1999-00
2000-01
2001-02
2002-03
2003-04
Five -Year Change
Full Professor
Peer Group Average* % Change
UM – Morris % Change
$65,800
$67,200
$68,500 + 4.1%
$66,700 - 0.7%
$71,800 + 4.8%
$68,900 + 3.3%
$73,600 + 2.5%
$70,900 + 2.9%
$74,900 + 1.9%
$70,000 - 1.2%
+ $9,100 + 13.8%
+ $2,800 + 4.2%
Associate Professor Peer Group Average*
% Change UM – Morris % Change
$51,900
$51,400
$53,800 + 3.7%
$53,300 + 3.7%
$55,300 + 2.8%
$53,900 + 1.1%
$57,000 + 3.0%
$55,200 + 2.5%
$57,700 + 1.3%
$53,900 - 2.3%
+ $5,800 + 11.2%
+ $2,500 + 4.9%
Assistant Professor Peer Group Average*
% Change UM – Morris
% Change
$41,100
$38,700
$42,800 + 4.1%
$38,700
--
$44,300 + 3.5%
$39,700 + 2.6%
$45,700 + 3.1%
$41,000 + 3.1%
$46,800 + 2.5%
$41,500 + 1.2%
+ $5,700 + 13.9%
+ $2,800 + 7.2%
Source: Office of Institutional Research and Reporting, University of Minnesota. *Average excluding University of Minnesota – Morris
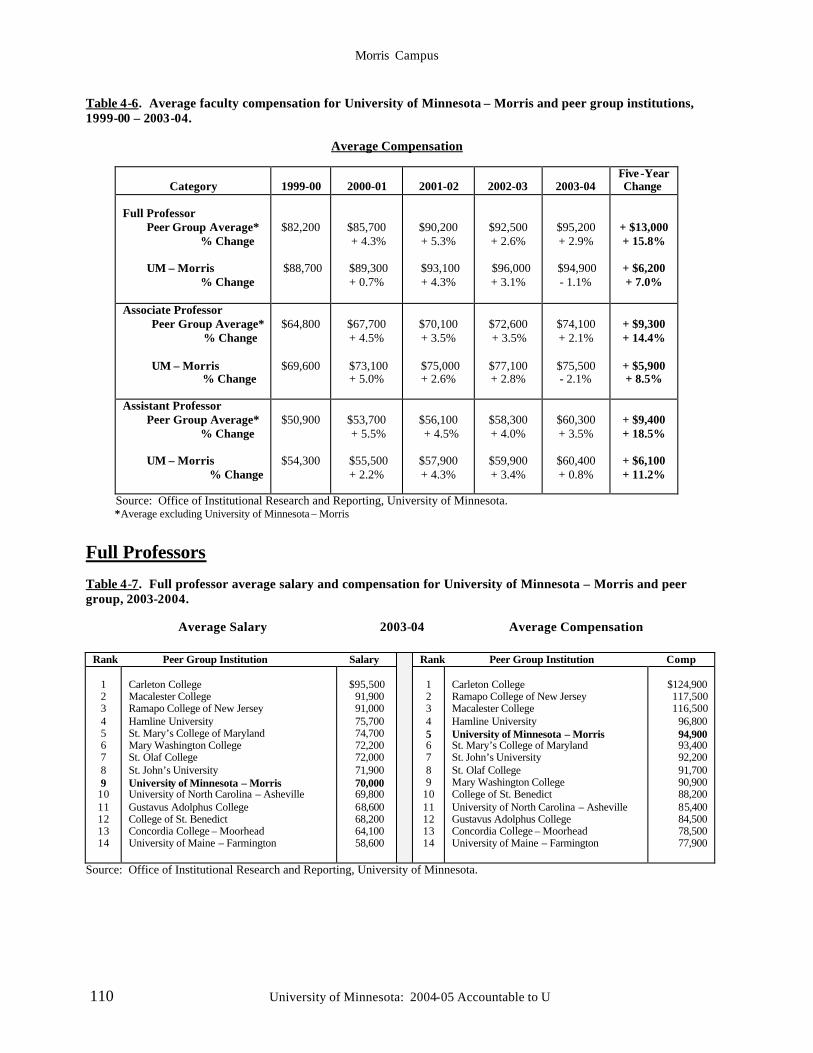
Morris Campus
110 University of Minnesota: 2004-05 Accountable to U
Table 4-6. Average faculty compensation for University of Minnesota – Morris and peer group institutions, 1999-00 – 2003-04.
Average Compensation
Category
1999-00
2000-01
2001-02
2002-03
2003-04
Five -Year Change
Full Professor
Peer Group Average* % Change
UM – Morris % Change
$82,200
$88,700
$85,700 + 4.3%
$89,300 + 0.7%
$90,200 + 5.3%
$93,100 + 4.3%
$92,500 + 2.6%
$96,000 + 3.1%
$95,200 + 2.9%
$94,900 - 1.1%
+ $13,000 + 15.8%
+ $6,200 + 7.0%
Associate Professor Peer Group Average*
% Change UM – Morris % Change
$64,800
$69,600
$67,700 + 4.5%
$73,100 + 5.0%
$70,100 + 3.5%
$75,000 + 2.6%
$72,600 + 3.5%
$77,100 + 2.8%
$74,100 + 2.1%
$75,500 - 2.1%
+ $9,300 + 14.4%
+ $5,900 + 8.5%
Assistant Professor Peer Group Average*
% Change UM – Morris
% Change
$50,900
$54,300
$53,700 + 5.5%
$55,500 + 2.2%
$56,100 + 4.5%
$57,900 + 4.3%
$58,300 + 4.0%
$59,900 + 3.4%
$60,300 + 3.5%
$60,400 + 0.8%
+ $9,400 + 18.5%
+ $6,100 + 11.2%
Source: Office of Institutional Research and Reporting, University of Minnesota. *Average excluding University of Minnesota – Morris
Full Professors Table 4-7. Full professor average salary and compensation for University of Minnesota – Morris and peer group, 2003-2004. Average Salary 2003-04 Average Compensation
Rank Peer Group Institution Salary Rank Peer Group Institution Comp
1 2 3 4 5 6 7 8 9
10 11 12 13 14
Carleton College Macalester College Ramapo College of New Jersey Hamline University St. Mary’s College of Maryland Mary Washington College St. Olaf College St. John’s University University of Minnesota – Morris University of North Carolina – Asheville Gustavus Adolphus College College of St. Benedict Concordia College – Moorhead University of Maine – Farmington
$95,500
91,900 91,000 75,700 74,700 72,200 72,000 71,900 70,000 69,800 68,600 68,200 64,100 58,600
1 2 3 4 5 6 7 8 9
10 11 12 13 14
Carleton College Ramapo College of New Jersey Macalester College Hamline University University of Minnesota – Morris St. Mary’s College of Maryland St. John’s University St. Olaf College Mary Washington College College of St. Benedict University of North Carolina – Asheville Gustavus Adolphus College Concordia College – Moorhead University of Maine – Farmington
$124,900 117,500 116,500
96,800 94,900 93,400 92,200 91,700 90,900 88,200 85,400 84,500 78,500 77,900
Source: Office of Institutional Research and Reporting, University of Minnesota.
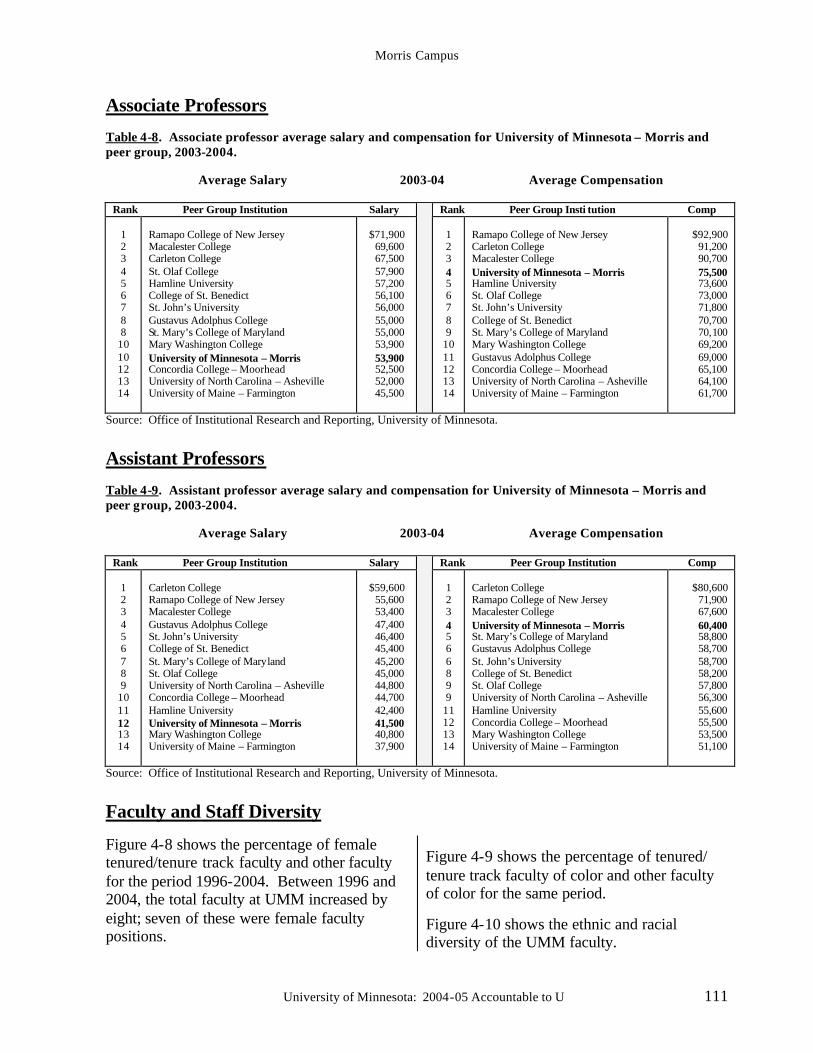
Morris Campus
University of Minnesota: 2004-05 Accountable to U 111
Associate Professors Table 4-8. Associate professor average salary and compensation for University of Minnesota – Morris and peer group, 2003-2004. Average Salary 2003-04 Average Compensation
Rank Peer Group Institution Salary Rank Peer Group Insti tution Comp
1 2 3 4 5 6 7 8 8
10 10 12 13 14
Ramapo College of New Jersey Macalester College Carleton College St. Olaf College Hamline University College of St. Benedict St. John’s University Gustavus Adolphus College St. Mary’s College of Maryland Mary Washington College University of Minnesota – Morris Concordia College – Moorhead University of North Carolina – Asheville University of Maine – Farmington
$71,900
69,600 67,500 57,900 57,200 56,100 56,000 55,000 55,000 53,900 53,900 52,500 52,000 45,500
1 2 3 4 5 6 7 8 9
10 11 12 13 14
Ramapo College of New Jersey Carleton College Macalester College University of Minnesota – Morris Hamline University St. Olaf College St. John’s University College of St. Benedict St. Mary’s College of Maryland Mary Washington College Gustavus Adolphus College Concordia College – Moorhead University of North Carolina – Asheville University of Maine – Farmington
$92,900
91,200 90,700 75,500 73,600 73,000 71,800 70,700 70,100 69,200 69,000 65,100 64,100 61,700
Source: Office of Institutional Research and Reporting, University of Minnesota.
Assistant Professors Table 4-9. Assistant professor average salary and compensation for University of Minnesota – Morris and peer group, 2003-2004. Average Salary 2003-04 Average Compensation
Rank Peer Group Institution Salary Rank Peer Group Institution Comp
1 2 3 4 5 6 7 8 9
10 11 12 13 14
Carleton College Ramapo College of New Jersey Macalester College Gustavus Adolphus College St. John’s University College of St. Benedict St. Mary’s College of Maryland St. Olaf College University of North Carolina – Asheville Concordia College – Moorhead Hamline University University of Minnesota – Morris Mary Washington College University of Maine – Farmington
$59,600
55,600 53,400 47,400 46,400 45,400 45,200 45,000 44,800 44,700 42,400 41,500 40,800 37,900
1 2 3 4 5 6 6 8 9 9
11 12 13 14
Carleton College Ramapo College of New Jersey Macalester College University of Minnesota – Morris St. Mary’s College of Maryland Gustavus Adolphus College St. John’s University College of St. Benedict St. Olaf College University of North Carolina – Asheville Hamline University Concordia College – Moorhead Mary Washington College University of Maine – Farmington
$80,600
71,900 67,600 60,400 58,800 58,700 58,700 58,200 57,800 56,300 55,600 55,500 53,500 51,100
Source: Office of Institutional Research and Reporting, University of Minnesota.
Faculty and Staff Diversity
Figure 4-8 shows the percentage of female tenured/tenure track faculty and other faculty for the period 1996-2004. Between 1996 and 2004, the total faculty at UMM increased by eight; seven of these were female faculty positions.
Figure 4-9 shows the percentage of tenured/ tenure track faculty of color and other faculty of color for the same period.
Figure 4-10 shows the ethnic and racial diversity of the UMM faculty.
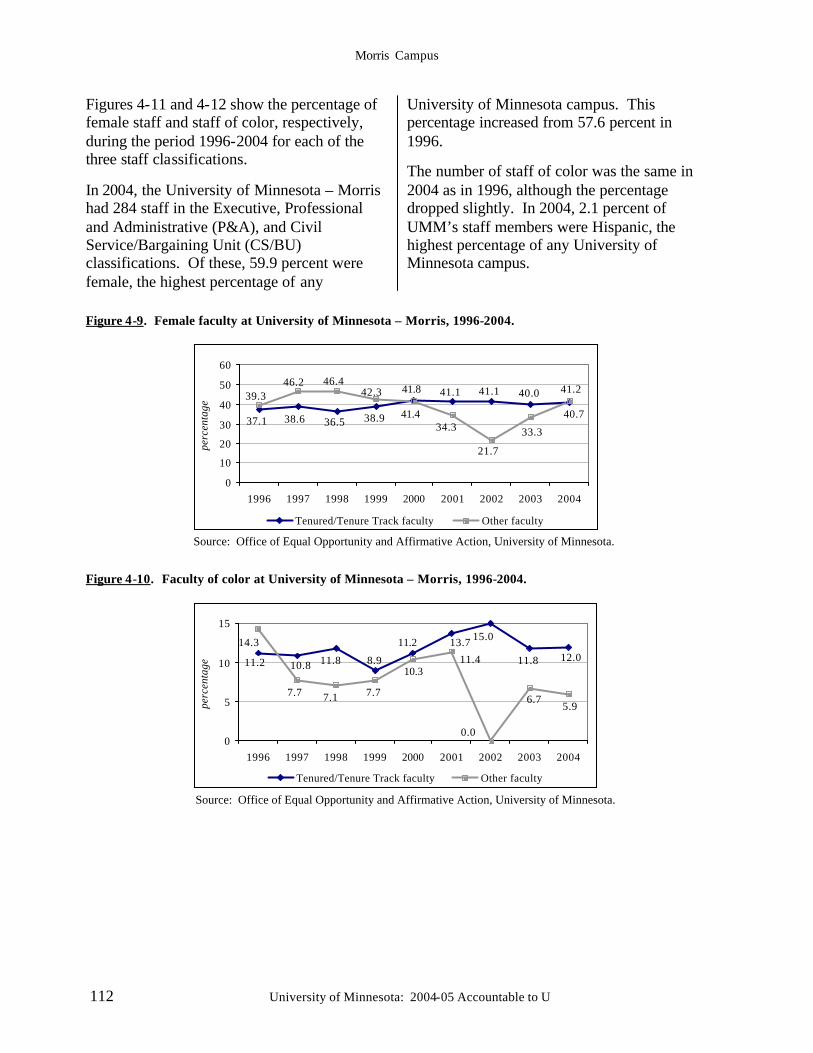
Morris Campus
112 University of Minnesota: 2004-05 Accountable to U
Figures 4-11 and 4-12 show the percentage of female staff and staff of color, respectively, during the period 1996-2004 for each of the three staff classifications.
In 2004, the University of Minnesota – Morris had 284 staff in the Executive, Professional and Administrative (P&A), and Civil Service/Bargaining Unit (CS/BU) classifications. Of these, 59.9 percent were female, the highest percentage of any
University of Minnesota campus. This percentage increased from 57.6 percent in 1996.
The number of staff of color was the same in 2004 as in 1996, although the percentage dropped slightly. In 2004, 2.1 percent of UMM’s staff members were Hispanic, the highest percentage of any University of Minnesota campus.
Figure 4-9. Female faculty at University of Minnesota – Morris, 1996-2004.
40.737.1 38.6 36.5 38.9
41.8 41.1 41.1 40.0 41.239.3
46.2 46.442.3
41.434.3
21.7
33.3
0
10
20
30
40
50
60
1996 1997 1998 1999 2000 2001 2002 2003 2004
perc
enta
ge
Tenured/Tenure Track faculty Other faculty
Source: Office of Equal Opportunity and Affirmative Action, University of Minnesota.
Figure 4-10. Faculty of color at University of Minnesota – Morris, 1996-2004.
12.011.8
15.013.711.2
8.911.810.811.2
5.96.7
0.0
11.410.3
7.77.17.7
14.3
0
5
10
15
1996 1997 1998 1999 2000 2001 2002 2003 2004
perc
enta
ge
Tenured/Tenure Track faculty Other faculty
Source: Office of Equal Opportunity and Affirmative Action, University of Minnesota.
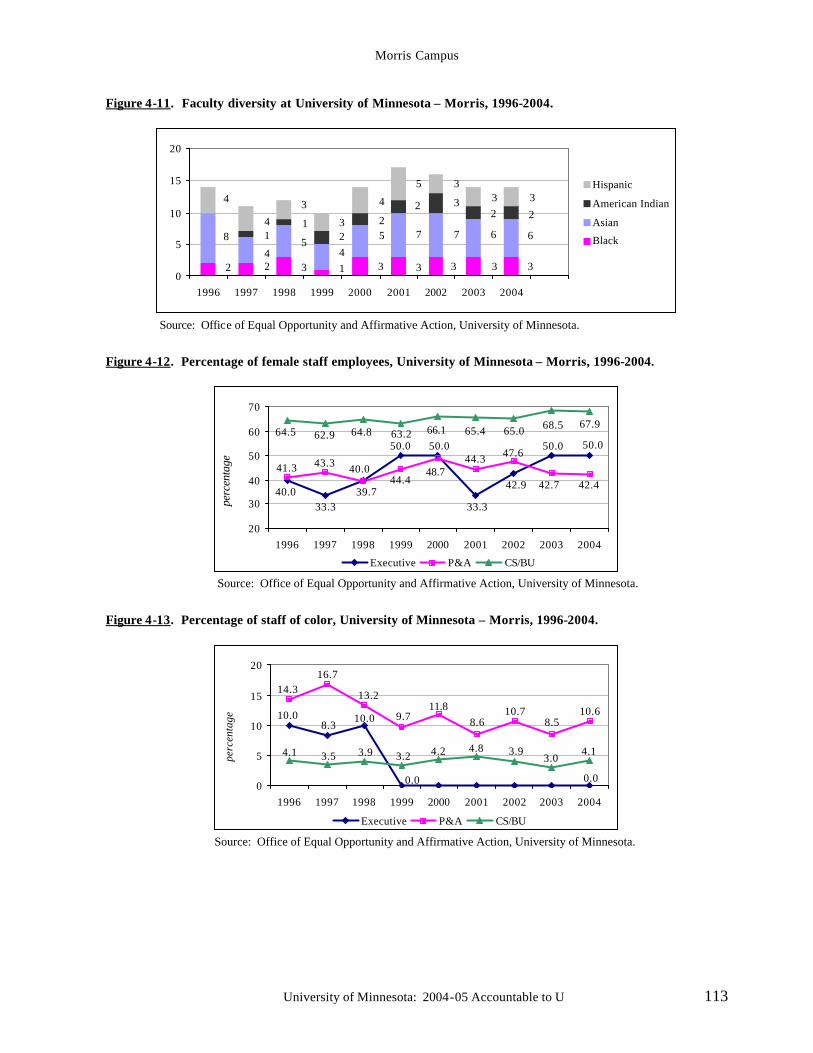
Morris Campus
University of Minnesota: 2004-05 Accountable to U 113
Figure 4-11. Faculty diversity at University of Minnesota – Morris, 1996-2004.
333331322
66775
45
4
8
2232
22
11
3335
4
3
3
4
4
0
5
10
15
20
1996 1997 1998 1999 2000 2001 2002 2003 2004
Hispanic
American Indian
Asian
Black
Source: Office of Equal Opportunity and Affirmative Action, University of Minnesota.
Figure 4-12. Percentage of female staff employees, University of Minnesota – Morris, 1996-2004.
50.050.0
42.9
33.3
50.050.0
40.0
33.340.0
42.442.7
47.644.348.7
44.439.7
43.341.3
67.968.565.065.466.163.264.862.964.5
20
30
40
50
60
70
1996 1997 1998 1999 2000 2001 2002 2003 2004
perc
enta
ge
Executive P&A CS/BU
Source: Office of Equal Opportunity and Affirmative Action, University of Minnesota.
Figure 4-13. Percentage of staff of color, University of Minnesota – Morris, 1996-2004.
0.00.0
10.08.3
10.0 10.68.5
10.78.6
11.89.7
13.2
16.714.3
4.13.0
3.94.84.23.23.93.54.1
0
5
10
15
20
1996 1997 1998 1999 2000 2001 2002 2003 2004
perc
enta
ge
Executive P&A CS/BU
Source: Office of Equal Opportunity and Affirmative Action, University of Minnesota.
Morris Campus
114 University of Minnesota: 2004-05 Accountable to U
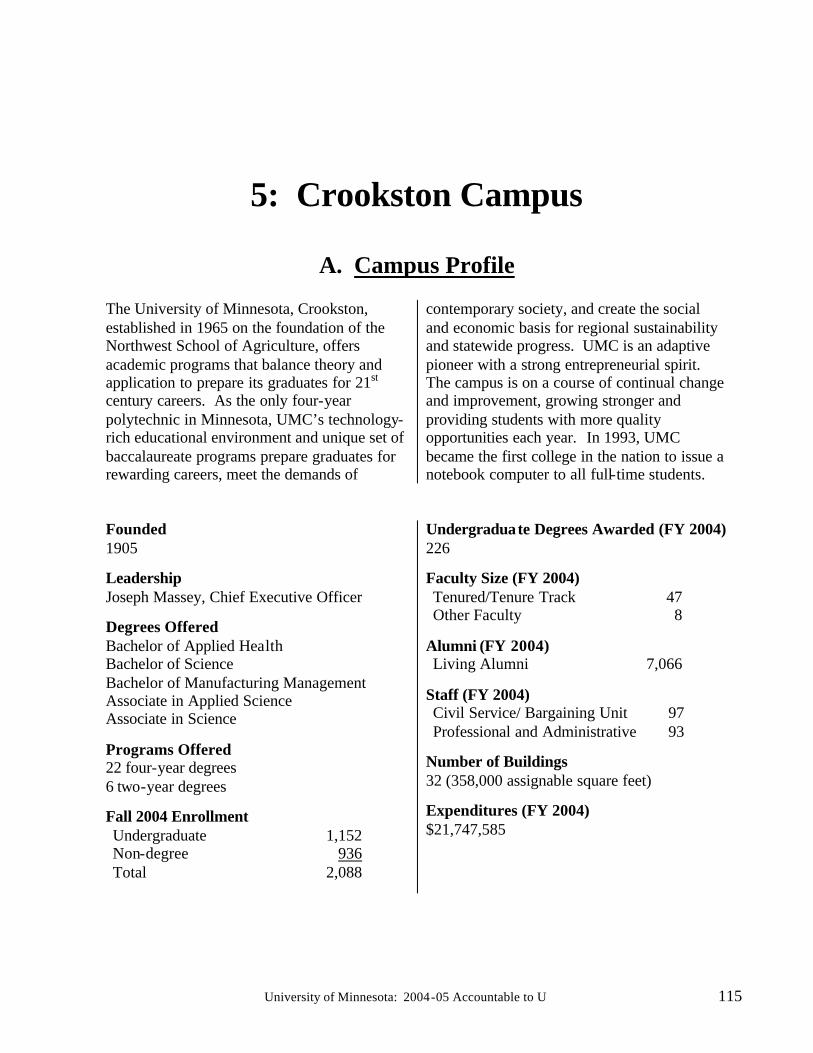
University of Minnesota: 2004-05 Accountable to U 115
5: Crookston Campus
A. Campus Profile The University of Minnesota, Crookston, established in 1965 on the foundation of the Northwest School of Agriculture, offers academic programs that balance theory and application to prepare its graduates for 21st century careers. As the only four-year polytechnic in Minnesota, UMC’s technology-rich educational environment and unique set of baccalaureate programs prepare graduates for rewarding careers, meet the demands of
contemporary society, and create the social and economic basis for regional sustainability and statewide progress. UMC is an adaptive pioneer with a strong entrepreneurial spirit. The campus is on a course of continual change and improvement, growing stronger and providing students with more quality opportunities each year. In 1993, UMC became the first college in the nation to issue a notebook computer to all full-time students.
Founded 1905
Leadership Joseph Massey, Chief Executive Officer
Degrees Offered Bachelor of Applied Health Bachelor of Science Bachelor of Manufacturing Management Associate in Applied Science Associate in Science
Programs Offered 22 four-year degrees 6 two-year degrees
Fall 2004 Enrollment Undergraduate Non-degree Total
1,152 936
2,088
Undergraduate Degrees Awarded (FY 2004) 226 Faculty Size (FY 2004) Tenured/Tenure Track 47 Other Faculty 8
Alumni (FY 2004) Living Alumni 7,066
Staff (FY 2004) Civil Service/ Bargaining Unit 97 Professional and Administrative 93
Number of Buildings 32 (358,000 assignable square feet)
Expenditures (FY 2004) $21,747,585
Crookston Campus
116 University of Minnesota: 2004-05 Accountable to U
B. Academic Priorities
Crookston’s highest priorities are to serve a larger and more diverse learner audience and to create unique value for the region and the state. New, mission-centered programs that meet the needs of students and regional employers have been launched; others are in development.
The campus is working to strengthen the academic profile of its students. Admission has moved from open enrollment to traditional enrollment, and evidence of corresponding increases in average ACT scores and class rank is observable.
Assessment and continuous improvement of student learning are high priorities. The campus is establishing a plan to enhance teaching and learning in the three core components of the curriculum – critical thinking, working with others, and communication. Students will also acquire liberal education competencies as defined by the Minnesota Transfer Curriculum.
This will be accomplished by setting clear learner outcomes and through specific measures. Bush Foundation funding provides partial support to this work. Student Experience Enrichment
Efforts to enrich the student experience include:
§ Undergraduate Research Opportunities Program applications have historically averaged two or three per semester. Seven applications were received for spring 2004, and eight were submitted for fall 2004.
§ A new emphasis on promoting global awareness is emerging. Engagement with the University’s Study Abroad Curriculum Integration initiative and significant on-
campus effort resulted in 13 study abroad students in 2003-04, and more are expected in coming years.
Public Engagement
Service learning at UMC is a high-profile activity and is embedded in the learner outcomes of many courses. Specific public engagement activities have included:
§ continuous enhancement of partnerships with regional employers;
§ two planning grants for the new Center for Sustainable Development and continued support for faculty outreach and research in rural development from the Veden Charitable Trust;
§ opening of a new diversity center on campus and highlighting the need for curriculum integration of diversity issues;
§ engaging faculty and staff in the Crookston Vitality Project and in a community-wide alcohol and other drug abuse prevention effort. The University’s “Mini Medical School” was presented in fall 2004 and a free public seminar series is planned.
Efficiency and Effectiveness
The University of Minnesota – Crookston has been a leader among institutions of its type in using technology to enhance learning, make effective use of resources, and maximize efficiency. The campus tracks academic degree program costs per student to provide valuable decision-making information. Crookston’s inclusive strategic planning process links resource allocation and management with mission-driven activities, efficient operations, and fiscally responsible budget planning.
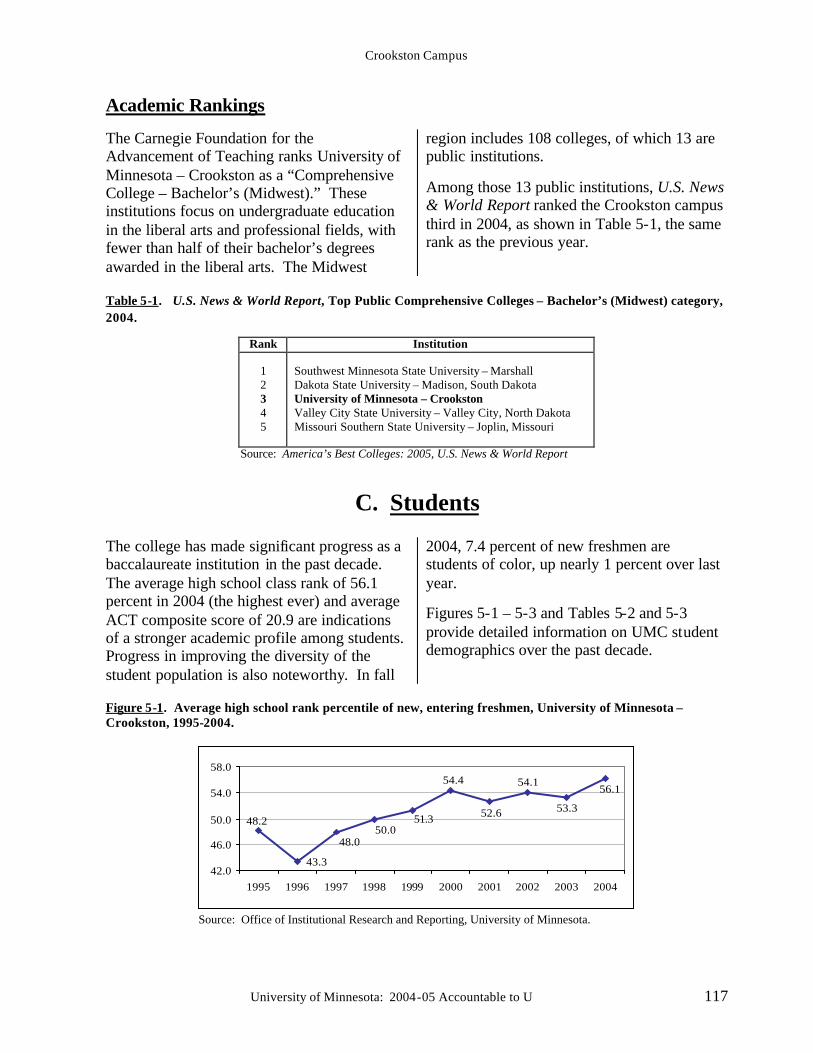
Crookston Campus
University of Minnesota: 2004-05 Accountable to U 117
Academic Rankings
The Carnegie Foundation for the Advancement of Teaching ranks University of Minnesota – Crookston as a “Comprehensive College – Bachelor’s (Midwest).” These institutions focus on undergraduate education in the liberal arts and professional fields, with fewer than half of their bachelor’s degrees awarded in the liberal arts. The Midwest
region includes 108 colleges, of which 13 are public institutions.
Among those 13 public institutions, U.S. News & World Report ranked the Crookston campus third in 2004, as shown in Table 5-1, the same rank as the previous year.
Table 5-1. U.S. News & World Report, Top Public Comprehensive Colleges – Bachelor’s (Midwest) category, 2004.
Rank Institution
1 2 3 4 5
Southwest Minnesota State University – Marshall Dakota State University – Madison, South Dakota University of Minnesota – Crookston Valley City State University – Valley City, North Dakota Missouri Southern State University – Joplin, Missouri
Source: America’s Best Colleges: 2005, U.S. News & World Report
C. Students
The college has made significant progress as a baccalaureate institution in the past decade. The average high school class rank of 56.1 percent in 2004 (the highest ever) and average ACT composite score of 20.9 are indications of a stronger academic profile among students. Progress in improving the diversity of the student population is also noteworthy. In fall
2004, 7.4 percent of new freshmen are students of color, up nearly 1 percent over last year.
Figures 5-1 – 5-3 and Tables 5-2 and 5-3 provide detailed information on UMC student demographics over the past decade.
Figure 5-1. Average high school rank percentile of new, entering freshmen, University of Minnesota – Crookston, 1995-2004.
43.3
56.1
53.3
54.1
52.6
54.4
51.350.0
48.0
48.2
42.0
46.0
50.0
54.0
58.0
1995 1996 1997 1998 1999 2000 2001 2002 2003 2004
Source: Office of Institutional Research and Reporting, University of Minnesota.
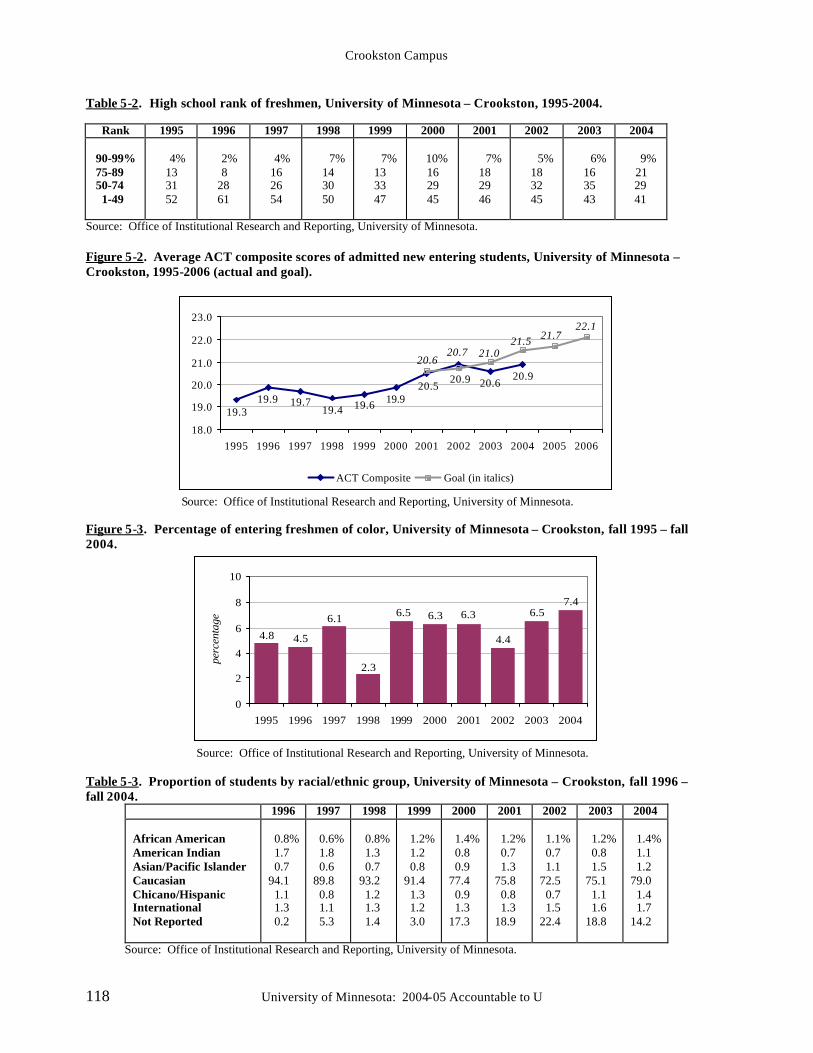
Crookston Campus
118 University of Minnesota: 2004-05 Accountable to U
Table 5-2. High school rank of freshmen, University of Minnesota – Crookston, 1995-2004.
Rank 1995 1996 1997 1998 1999 2000 2001 2002 2003 2004 90-99% 75-89 50-74 1-49
4%
13 31 52
2%
8 28 61
4%
16 26 54
7%
14 30 50
7%
13 33 47
10%
16 29 45
7%
18 29 46
5%
18 32 45
6%
16 35 43
9%
21 29 41
Source: Office of Institutional Research and Reporting, University of Minnesota. Figure 5-2. Average ACT composite scores of admitted new entering students, University of Minnesota – Crookston, 1995-2006 (actual and goal).
20.920.620.9
20.519.919.619.4
19.719.919.3
22.121.721.5
21.020.720.6
18.0
19.0
20.0
21.0
22.0
23.0
1995 1996 1997 1998 1999 2000 2001 2002 2003 2004 2005 2006
ACT Composite Goal (in italics)
Source: Office of Institutional Research and Reporting, University of Minnesota.
Figure 5-3. Percentage of entering freshmen of color, University of Minnesota – Crookston, fall 1995 – fall 2004.
7.46.5
4.4
6.36.36.5
2.3
6.1
4.54.8
0
2
4
6
8
10
1995 1996 1997 1998 1999 2000 2001 2002 2003 2004
perc
enta
ge
Source: Office of Institutional Research and Reporting, University of Minnesota.
Table 5-3. Proportion of students by racial/ethnic group, University of Minnesota – Crookston, fall 1996 – fall 2004.
1996 1997 1998 1999 2000 2001 2002 2003 2004 African American American Indian Asian/Pacific Islander Caucasian Chicano/Hispanic International Not Reported
0.8% 1.7 0.7 94.1 1.1 1.3 0.2
0.6% 1.8 0.6 89.8 0.8 1.1 5.3
0.8% 1.3 0.7 93.2 1.2 1.3 1.4
1.2% 1.2 0.8 91.4 1.3 1.2 3.0
1.4% 0.8 0.9 77.4 0.9 1.3 17.3
1.2% 0.7 1.3 75.8 0.8 1.3 18.9
1.1% 0.7 1.1 72.5 0.7 1.5 22.4
1.2% 0.8 1.5 75.1 1.1 1.6 18.8
1.4% 1.1 1.2 79.0 1.4 1.7 14.2
Source: Office of Institutional Research and Reporting, University of Minnesota.
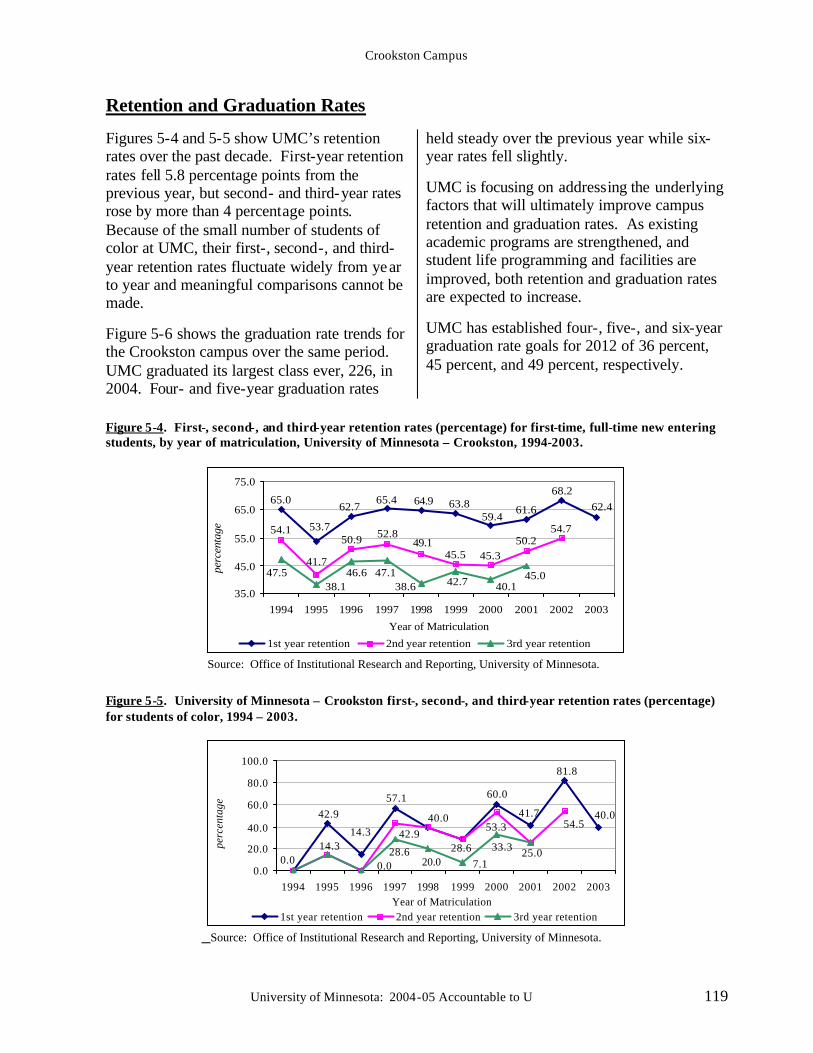
Crookston Campus
University of Minnesota: 2004-05 Accountable to U 119
Retention and Graduation Rates
Figures 5-4 and 5-5 show UMC’s retention rates over the past decade. First-year retention rates fell 5.8 percentage points from the previous year, but second- and third-year rates rose by more than 4 percentage points. Because of the small number of students of color at UMC, their first-, second-, and third-year retention rates fluctuate widely from year to year and meaningful comparisons cannot be made.
Figure 5-6 shows the graduation rate trends for the Crookston campus over the same period. UMC graduated its largest class ever, 226, in 2004. Four- and five-year graduation rates
held steady over the previous year while six-year rates fell slightly.
UMC is focusing on addressing the underlying factors that will ultimately improve campus retention and graduation rates. As existing academic programs are strengthened, and student life programming and facilities are improved, both retention and graduation rates are expected to increase.
UMC has established four-, five-, and six-year graduation rate goals for 2012 of 36 percent, 45 percent, and 49 percent, respectively.
Figure 5-4. First-, second-, and third-year retention rates (percentage) for first-time, full-time new entering students, by year of matriculation, University of Minnesota – Crookston, 1994-2003.
62.468.2
61.659.4
63.864.965.462.7
53.7
65.0
54.750.2
45.345.549.1
52.850.9
41.7
54.1
45.047.540.142.738.6
47.146.638.1
35.0
45.0
55.0
65.0
75.0
1994 1995 1996 1997 1998 1999 2000 2001 2002 2003
Year of Matriculation
perc
enta
ge
1st year retention 2nd year retention 3rd year retention
Source: Office of Institutional Research and Reporting, University of Minnesota.
Figure 5-5. University of Minnesota – Crookston first-, second-, and third-year retention rates (percentage) for students of color, 1994 – 2003.
40.0
81.8
60.057.142.9 41.740.0
14.354.5
0.025.0
53.3
28.642.9
33.3
7.120.028.6
0.0
14.3
0.0
20.0
40.0
60.0
80.0
100.0
1994 1995 1996 1997 1998 1999 2000 2001 2002 2003Year of Matriculation
perc
enta
ge
1st year retention 2nd year retention 3rd year retention
Source: Office of Institutional Research and Reporting, University of Minnesota.
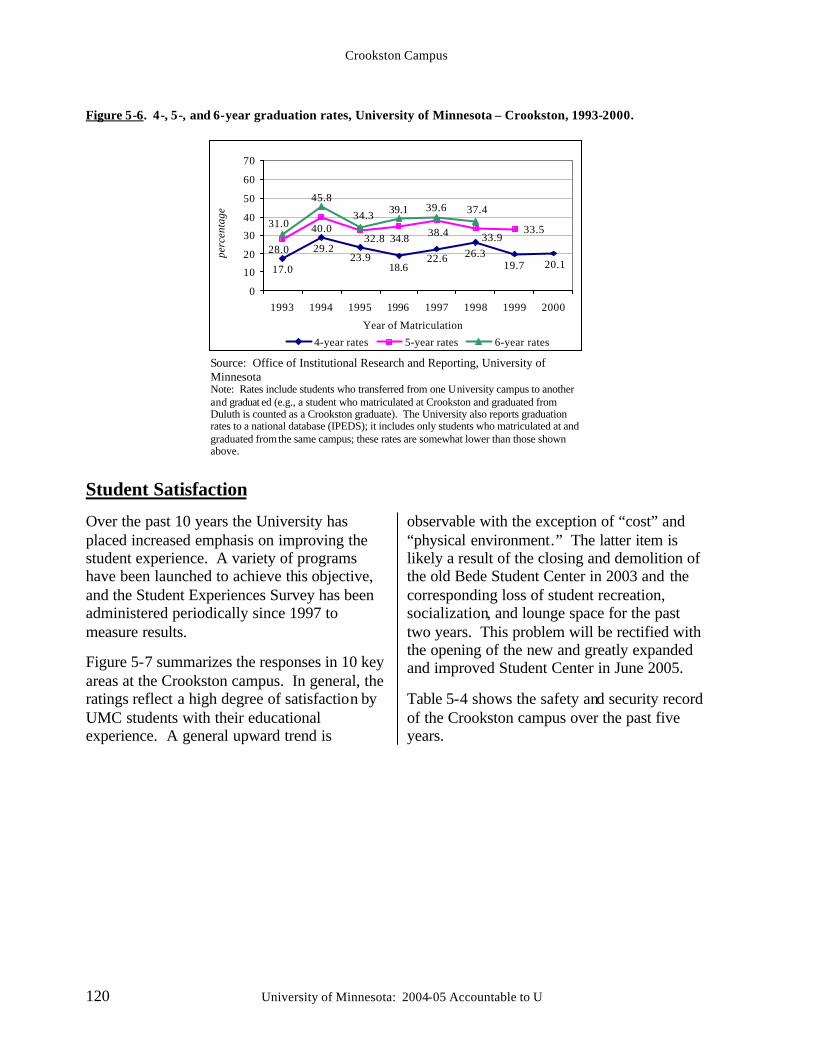
Crookston Campus
120 University of Minnesota: 2004-05 Accountable to U
Figure 5-6. 4-, 5-, and 6-year graduation rates, University of Minnesota – Crookston, 1993-2000.
33.5
20.119.726.322.6
18.623.9
29.2
17.0
33.938.434.832.840.0
28.0
39.145.8
37.439.634.3
31.0
0
10
20
30
40
50
60
70
1993 1994 1995 1996 1997 1998 1999 2000
Year of Matriculation
perc
enta
ge
4-year rates 5-year rates 6-year rates
Source: Office of Institutional Research and Reporting, University of Minnesota Note: Rates include students who transferred from one University campus to another and graduat ed (e.g., a student who matriculated at Crookston and graduated from Duluth is counted as a Crookston graduate). The University also reports graduation rates to a national database (IPEDS); it includes only students who matriculated at and graduated from the same campus; these rates are somewhat lower than those shown above.
Student Satisfaction Over the past 10 years the University has placed increased emphasis on improving the student experience. A variety of programs have been launched to achieve this objective, and the Student Experiences Survey has been administered periodically since 1997 to measure results.
Figure 5-7 summarizes the responses in 10 key areas at the Crookston campus. In general, the ratings reflect a high degree of satisfaction by UMC students with their educational experience. A general upward trend is
observable with the exception of “cost” and “physical environment.” The latter item is likely a result of the closing and demolition of the old Bede Student Center in 2003 and the corresponding loss of student recreation, socialization, and lounge space for the past two years. This problem will be rectified with the opening of the new and greatly expanded and improved Student Center in June 2005.
Table 5-4 shows the safety and security record of the Crookston campus over the past five years.
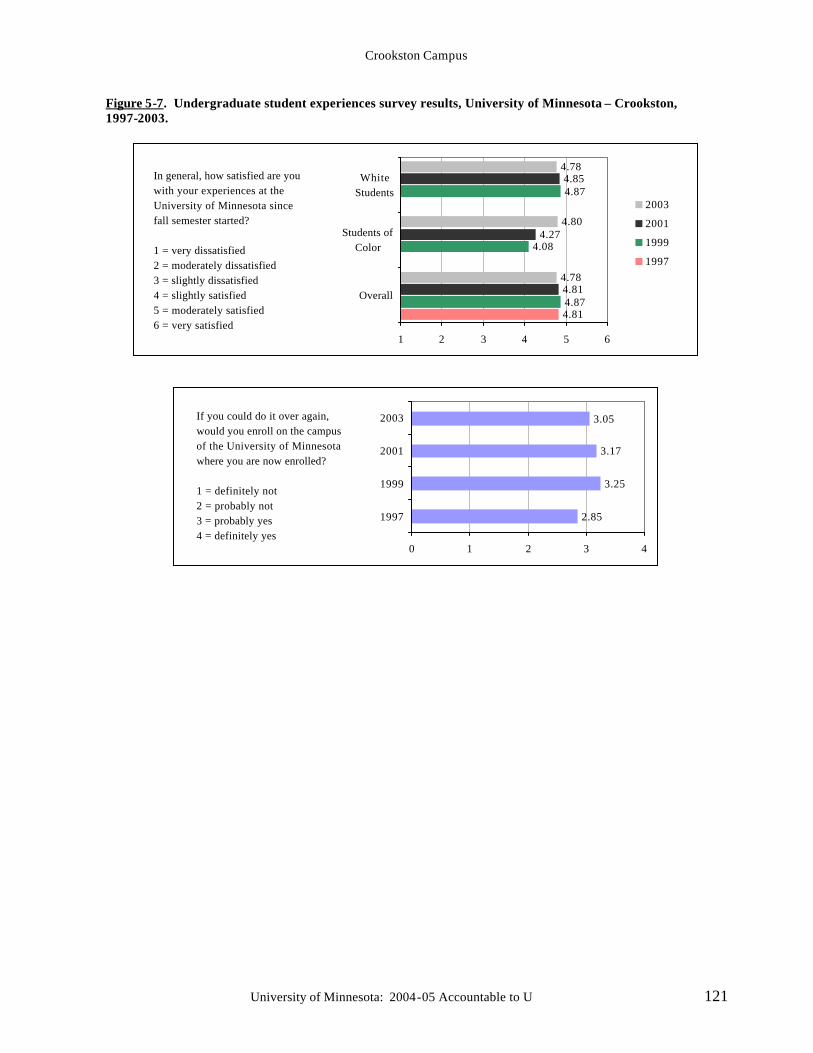
Crookston Campus
University of Minnesota: 2004-05 Accountable to U 121
Figure 5-7. Undergraduate student experiences survey results, University of Minnesota – Crookston, 1997-2003.
4.814.87
4.08
4.87
4.81
4.27
4.85
4.78
4.80
4.78
1 2 3 4 5 6
Overall
Students ofColor
WhiteStudents
2003
2001
1999
1997
In general, how satisfied are you with your experiences at the University of Minnesota since fall semester started?
1 = very dissatisfied2 = moderately dissatisfied3 = slightly dissatisfied4 = slightly satisfied5 = moderately satisfied6 = very satisfied
2.85
3.25
3.17
3.05
0 1 2 3 4
1997
1999
2001
2003If you could do it over again, would you enroll on the campus of the University of Minnesota where you are now enrolled?
1 = definitely not2 = probably not3 = probably yes4 = definitely yes
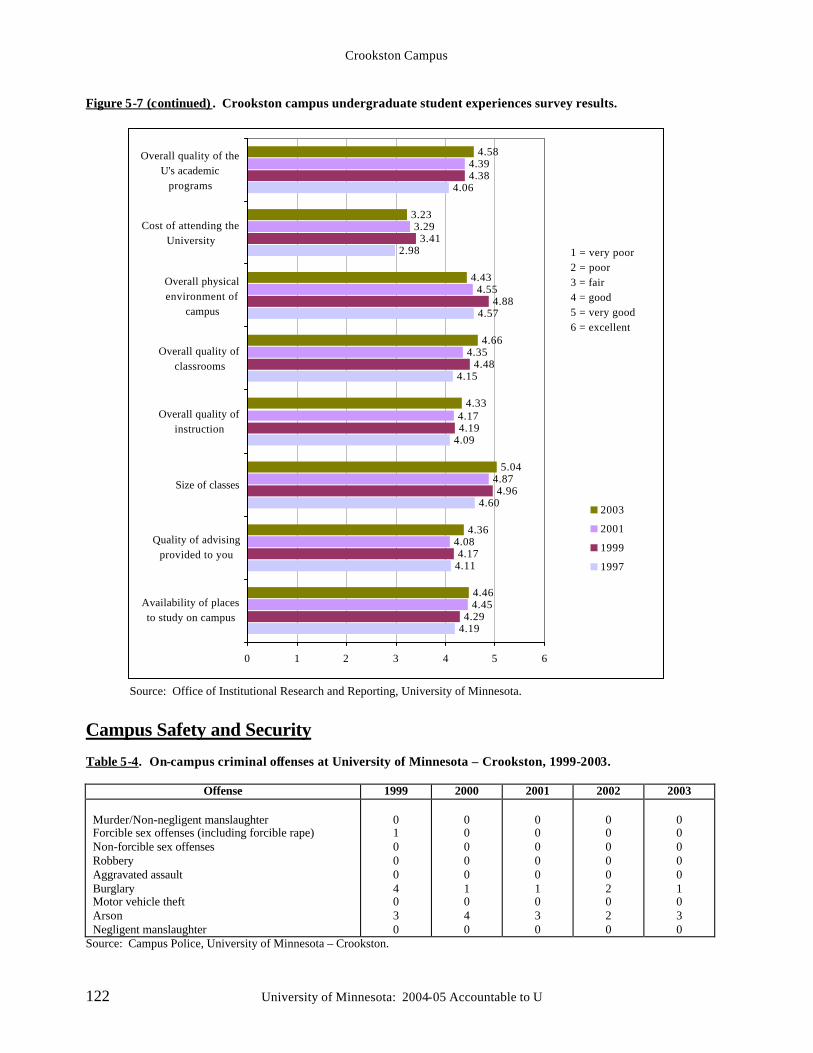
Crookston Campus
122 University of Minnesota: 2004-05 Accountable to U
Figure 5-7 (continued) . Crookston campus undergraduate student experiences survey results.
4.19
4.11
4.60
4.09
4.15
4.57
2.98
4.06
4.29
4.17
4.96
4.19
4.48
4.88
3.41
4.38
4.45
4.08
4.87
4.17
4.35
4.55
3.29
4.39
4.46
4.36
5.04
4.33
4.66
4.43
3.23
4.58
0 1 2 3 4 5 6
Availability of placesto study on campus
Quality of advisingprovided to you
Size of classes
Overall quality ofinstruction
Overall quality ofclassrooms
Overall physicalenvironment of
campus
Cost of attending theUniversity
Overall quality of theU's academic
programs
2003
2001
1999
1997
1 = very poor2 = poor3 = fair4 = good5 = very good6 = excellent
Source: Office of Institutional Research and Reporting, University of Minnesota.
Campus Safety and Security Table 5-4. On-campus criminal offenses at University of Minnesota – Crookston, 1999-2003.
Offense 1999 2000 2001 2002 2003 Murder/Non-negligent manslaughter Forcible sex offenses (including forcible rape) Non-forcible sex offenses Robbery Aggravated assault Burglary Motor vehicle theft Arson Negligent manslaughter
0 1 0 0 0 4 0 3 0
0 0 0 0 0 1 0 4 0
0 0 0 0 0 1 0 3 0
0 0 0 0 0 2 0 2 0
0 0 0 0 0 1 0 3 0
Source: Campus Police, University of Minnesota – Crookston.
Crookston Campus
University of Minnesota: 2004-05 Accountable to U 123
D. Intercollegiate Athletics UMC is committed to a strong, well-balanced program of intercollegiate athletics which offers competition in 11 sports:
§ Men – baseball, basketball, football, golf, hockey;
§ Women – basketball, equestrian, golf, soccer, softball, volleyball.
UMC is in its seventh season in Division II of the National Collegiate Athletic Association (NCAA) and is a member of the Northern Sun Intercollegiate Conference (NSIC). The hockey program is a member of the Midwest Collegiate Hockey Association (MCHA) and the equestrian team is a member of the Intercollegiate Horse Show Association.
Nearly 300 student-athletes compete in UMC athletics – 58 percent, men; 42 percent, women. Many athletes have earned All-Conference and All-Academic honors while competing for UMC. Some of the athletic teams’ recent accomplishments include:
§ Women’s soccer qualified for their first ever NSIC Tournament.
§ Three students participated in the NCAA Division II Men’s Golf Championship.
§ Hockey won its fourth MCHA championship in five years in 2004.
§ Equestrian advanced to the 2004 national tournament.
§ In the Division II Top 25 poll, the UMC women’s basketball team was ranked 8th with a 3.451 cumulative team grade point average, the highest-rated NSIC team.
UMC mirrors the national trend of improved student-athlete graduation rates that exceed those of the general student body. According to the 2003 NCAA report, UMC’s student-athletes’ six-year graduation rate is 42 percent higher than that of the general student body.
Student-athletes also participate in many community service activities through the Student Athletic Advisory Committee (SAAC). SAAC projects such as “Book Buddies” and “Meals on Wheels” have been a positive bridge builder to the community.
While student-athlete centered, the UMC athletic program enhances the University experience of all students, and embraces its role in building community and pride on campus among alumni, friends, and the community at large.
E. Human Resources
Faculty Salary and Compensation Comparisons based on American Association of University Professors (AAUP) annual surveys cover full-time instructional faculty and exclude medical school faculty. The Crookston campus’s peer group of seven institutions nationwide is representative of the kinds of campuses with which UMC competes in recruiting and retaining faculty. However,
comparing salaries and compensation across campuses is inherently imperfect because campuses differ in many ways, e.g., mission, public vs. private, size, mix of disciplines, etc. Cost-of- living, tax burden, and variations in fringe benefits only add to the imperfection.
As shown in Tables 5-5 – 5-9, UMC compares very favorably with its peer institutions in
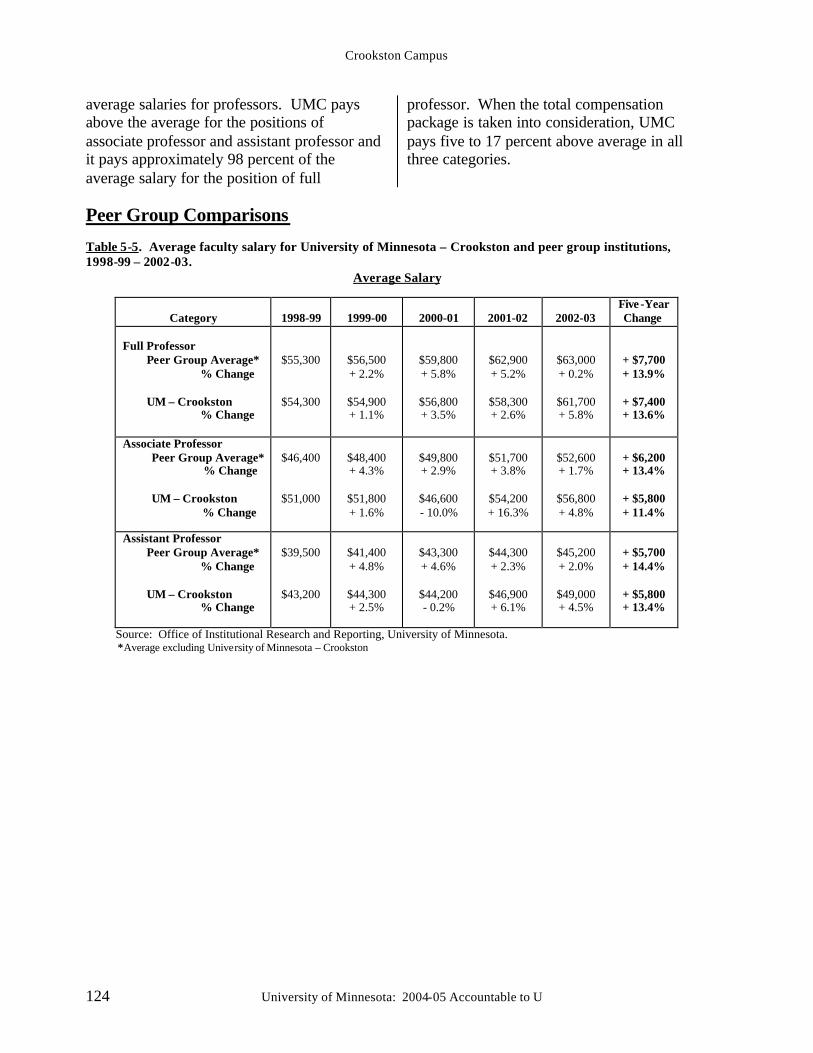
Crookston Campus
124 University of Minnesota: 2004-05 Accountable to U
average salaries for professors. UMC pays above the average for the positions of associate professor and assistant professor and it pays approximately 98 percent of the average salary for the position of full
professor. When the total compensation package is taken into consideration, UMC pays five to 17 percent above average in all three categories.
Peer Group Comparisons Table 5-5. Average faculty salary for University of Minnesota – Crookston and peer group institutions, 1998-99 – 2002-03.
Average Salary
Category
1998-99
1999-00
2000-01
2001-02
2002-03
Five -Year Change
Full Professor
Peer Group Average* % Change
UM – Crookston % Change
$55,300
$54,300
$56,500 + 2.2%
$54,900 + 1.1%
$59,800 + 5.8%
$56,800 + 3.5%
$62,900 + 5.2%
$58,300 + 2.6%
$63,000 + 0.2%
$61,700 + 5.8%
+ $7,700 + 13.9%
+ $7,400 + 13.6%
Associate Professor Peer Group Average*
% Change UM – Crookston % Change
$46,400
$51,000
$48,400 + 4.3%
$51,800 + 1.6%
$49,800 + 2.9%
$46,600 - 10.0%
$51,700 + 3.8%
$54,200 + 16.3%
$52,600 + 1.7%
$56,800 + 4.8%
+ $6,200 + 13.4%
+ $5,800 + 11.4%
Assistant Professor Peer Group Average*
% Change UM – Crookston % Change
$39,500
$43,200
$41,400 + 4.8%
$44,300 + 2.5%
$43,300 + 4.6%
$44,200 - 0.2%
$44,300 + 2.3%
$46,900 + 6.1%
$45,200 + 2.0%
$49,000 + 4.5%
+ $5,700 + 14.4%
+ $5,800 + 13.4%
Source: Office of Institutional Research and Reporting, University of Minnesota. *Average excluding University of Minnesota – Crookston
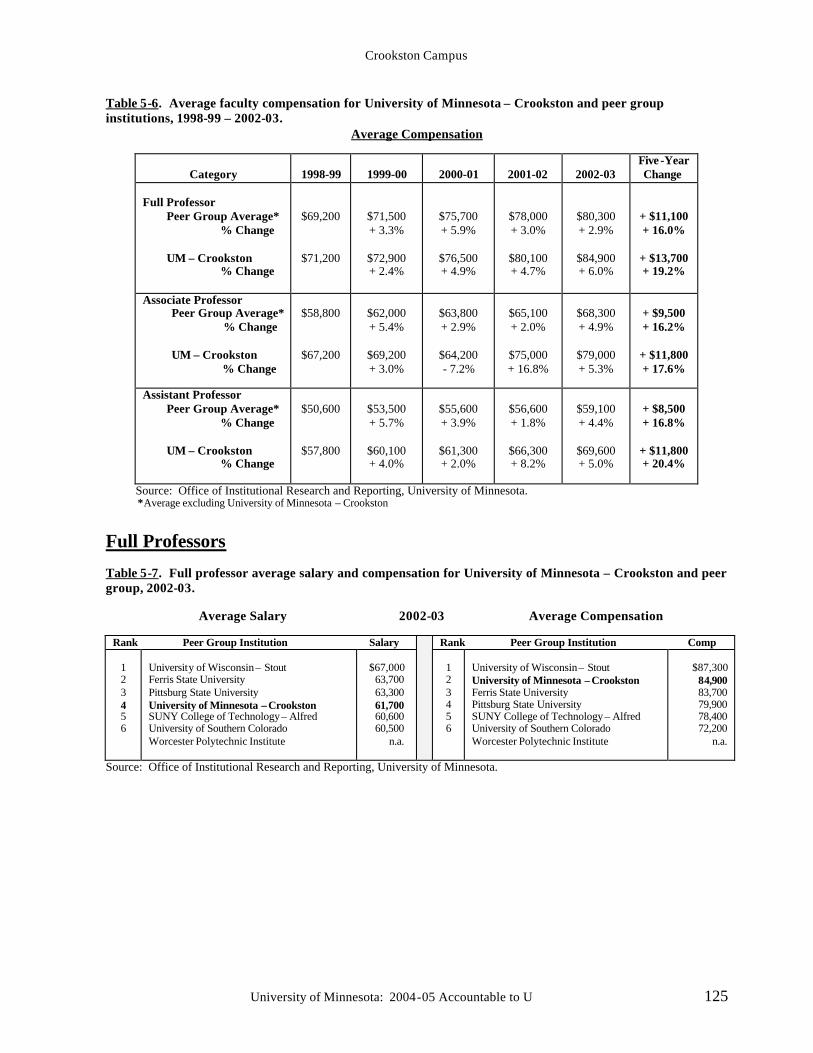
Crookston Campus
University of Minnesota: 2004-05 Accountable to U 125
Table 5-6. Average faculty compensation for University of Minnesota – Crookston and peer group institutions, 1998-99 – 2002-03.
Average Compensation
Category
1998-99
1999-00
2000-01
2001-02
2002-03
Five -Year Change
Full Professor
Peer Group Average* % Change
UM – Crookston % Change
$69,200
$71,200
$71,500 + 3.3%
$72,900 + 2.4%
$75,700 + 5.9%
$76,500 + 4.9%
$78,000 + 3.0%
$80,100 + 4.7%
$80,300 + 2.9%
$84,900 + 6.0%
+ $11,100 + 16.0%
+ $13,700 + 19.2%
Associate Professor Peer Group Average*
% Change UM – Crookston % Change
$58,800
$67,200
$62,000 + 5.4%
$69,200 + 3.0%
$63,800 + 2.9%
$64,200 - 7.2%
$65,100 + 2.0%
$75,000 + 16.8%
$68,300 + 4.9%
$79,000 + 5.3%
+ $9,500 + 16.2%
+ $11,800 + 17.6%
Assistant Professor Peer Group Average*
% Change UM – Crookston % Change
$50,600
$57,800
$53,500 + 5.7%
$60,100 + 4.0%
$55,600 + 3.9%
$61,300 + 2.0%
$56,600 + 1.8%
$66,300 + 8.2%
$59,100 + 4.4%
$69,600 + 5.0%
+ $8,500 + 16.8%
+ $11,800 + 20.4%
Source: Office of Institutional Research and Reporting, University of Minnesota. *Average excluding University of Minnesota – Crookston
Full Professors Table 5-7. Full professor average salary and compensation for University of Minnesota – Crookston and peer group, 2002-03. Average Salary 2002-03 Average Compensation
Rank Peer Group Institution Salary Rank Peer Group Institution Comp
1 2 3 4 5 6
University of Wisconsin – Stout Ferris State University Pittsburg State University University of Minnesota – Crookston SUNY College of Technology – Alfred University of Southern Colorado Worcester Polytechnic Institute
$67,000
63,700 63,300 61,700 60,600 60,500
n.a.
1 2 3 4 5 6
University of Wisconsin – Stout University of Minnesota – Crookston Ferris State University Pittsburg State University SUNY College of Technology – Alfred University of Southern Colorado Worcester Polytechnic Institute
$87,300
84,900 83,700 79,900 78,400 72,200
n.a.
Source: Office of Institutional Research and Reporting, University of Minnesota.
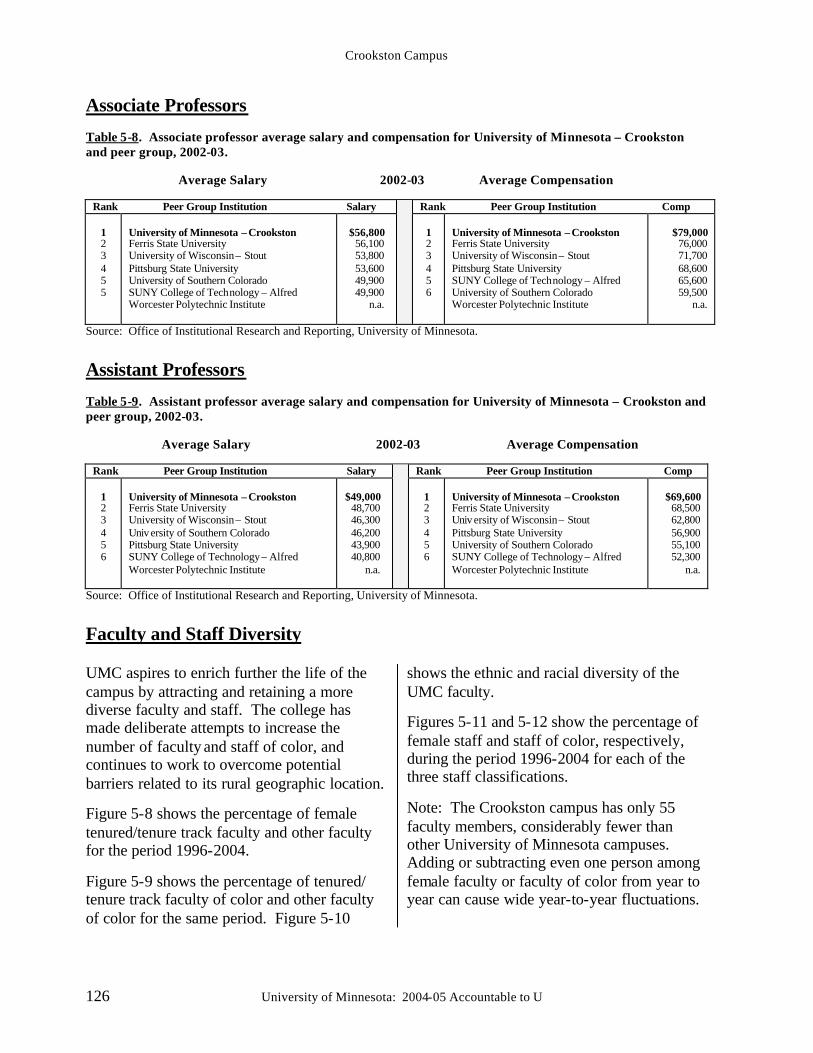
Crookston Campus
126 University of Minnesota: 2004-05 Accountable to U
Associate Professors Table 5-8. Associate professor average salary and compensation for University of Minnesota – Crookston and peer group, 2002-03. Average Salary 2002-03 Average Compensation
Rank Peer Group Institution Salary Rank Peer Group Institution Comp
1 2 3 4 5 5
University of Minnesota – Crookston Ferris State University University of Wisconsin – Stout Pittsburg State University University of Southern Colorado SUNY College of Technology – Alfred Worcester Polytechnic Institute
$56,800
56,100 53,800 53,600 49,900 49,900
n.a.
1 2 3 4 5 6
University of Minnesota – Crookston Ferris State University University of Wisconsin – Stout Pittsburg State University SUNY College of Technology – Alfred University of Southern Colorado Worcester Polytechnic Institute
$79,000
76,000 71,700 68,600 65,600 59,500
n.a.
Source: Office of Institutional Research and Reporting, University of Minnesota.
Assistant Professors Table 5-9. Assistant professor average salary and compensation for University of Minnesota – Crookston and peer group, 2002-03. Average Salary 2002-03 Average Compensation
Rank Peer Group Institution Salary Rank Peer Group Institution Comp
1 2 3 4 5 6
University of Minnesota – Crookston Ferris State University University of Wisconsin – Stout Univ ersity of Southern Colorado Pittsburg State University SUNY College of Technology – Alfred Worcester Polytechnic Institute
$49,000
48,700 46,300 46,200 43,900 40,800
n.a.
1 2 3 4 5 6
University of Minnesota – Crookston Ferris State University Univ ersity of Wisconsin – Stout Pittsburg State University University of Southern Colorado SUNY College of Technology – Alfred Worcester Polytechnic Institute
$69,600
68,500 62,800 56,900 55,100 52,300
n.a.
Source: Office of Institutional Research and Reporting, University of Minnesota.
Faculty and Staff Diversity UMC aspires to enrich further the life of the campus by attracting and retaining a more diverse faculty and staff. The college has made deliberate attempts to increase the number of faculty and staff of color, and continues to work to overcome potential barriers related to its rural geographic location.
Figure 5-8 shows the percentage of female tenured/tenure track faculty and other faculty for the period 1996-2004.
Figure 5-9 shows the percentage of tenured/ tenure track faculty of color and other faculty of color for the same period. Figure 5-10
shows the ethnic and racial diversity of the UMC faculty.
Figures 5-11 and 5-12 show the percentage of female staff and staff of color, respectively, during the period 1996-2004 for each of the three staff classifications.
Note: The Crookston campus has only 55 faculty members, considerably fewer than other University of Minnesota campuses. Adding or subtracting even one person among female faculty or faculty of color from year to year can cause wide year-to-year fluctuations.
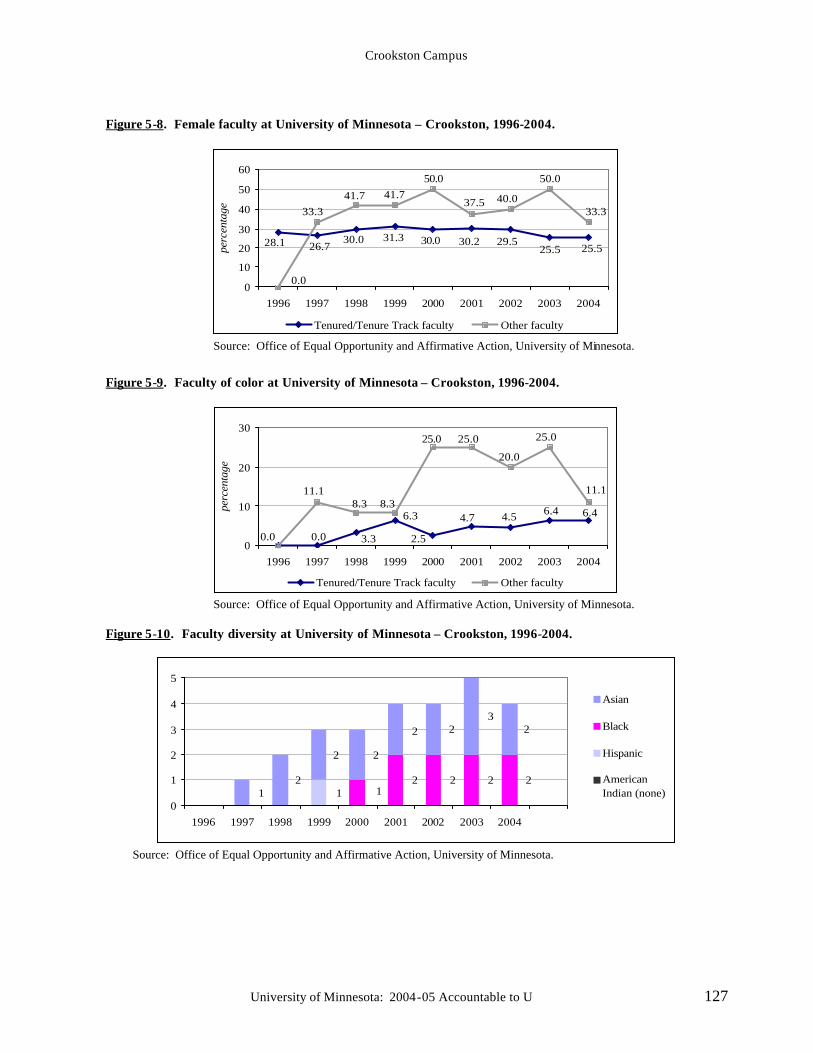
Crookston Campus
University of Minnesota: 2004-05 Accountable to U 127
Figure 5-8. Female faculty at University of Minnesota – Crookston, 1996-2004.
25.528.1 26.730.0 31.3 30.0 30.2 29.5
25.5
33.3
0.0
33.341.7 41.7
50.0
37.5 40.0
50.0
0
10
20
30
40
50
60
1996 1997 1998 1999 2000 2001 2002 2003 2004
perc
enta
ge
Tenured/Tenure Track faculty Other faculty
Source: Office of Equal Opportunity and Affirmative Action, University of Minnesota.
Figure 5-9. Faculty of color at University of Minnesota – Crookston, 1996-2004.
6.46.44.54.7
2.5
6.3
3.30.00.0
11.1
25.0
20.0
25.025.0
8.38.311.1
0
10
20
30
1996 1997 1998 1999 2000 2001 2002 2003 2004
perc
enta
ge
Tenured/Tenure Track faculty Other faculty
Source: Office of Equal Opportunity and Affirmative Action, University of Minnesota.
Figure 5-10. Faculty diversity at University of Minnesota – Crookston, 1996-2004.
12222
1
23
22
22
21
0
1
2
3
4
5
1996 1997 1998 1999 2000 2001 2002 2003 2004
Asian
Black
Hispanic
AmericanIndian (none)
Source: Office of Equal Opportunity and Affirmative Action, University of Minnesota.
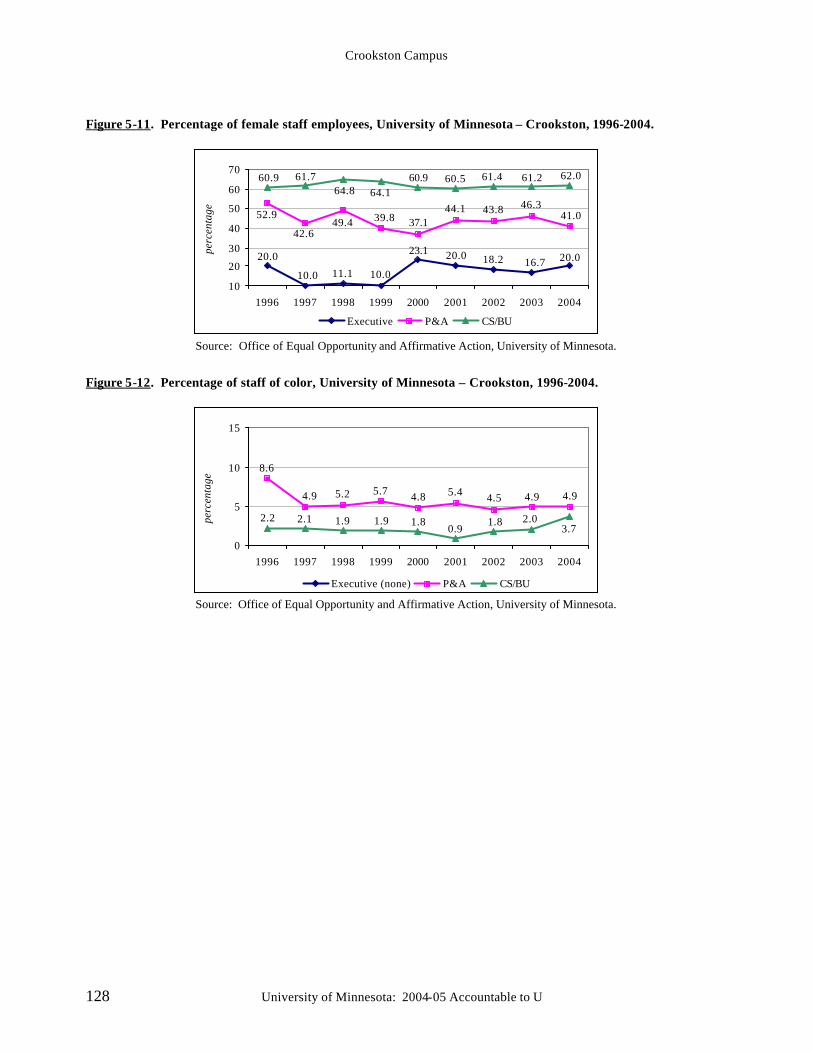
Crookston Campus
128 University of Minnesota: 2004-05 Accountable to U
Figure 5-11. Percentage of female staff employees, University of Minnesota – Crookston, 1996-2004.
20.016.718.220.023.1
10.011.110.0
20.0
41.046.343.844.1
37.139.849.442.6
52.9
62.061.261.460.560.964.164.8
61.760.9
10
20
30
40
50
60
70
1996 1997 1998 1999 2000 2001 2002 2003 2004
perc
enta
ge
Executive P&A CS/BU
Source: Office of Equal Opportunity and Affirmative Action, University of Minnesota.
Figure 5-12. Percentage of staff of color, University of Minnesota – Crookston, 1996-2004.
4.94.94.55.44.85.75.24.9
8.6
3.72.01.8
0.91.81.91.92.12.2
0
5
10
15
1996 1997 1998 1999 2000 2001 2002 2003 2004
perc
enta
ge
Executive (none) P&A CS/BU
Source: Office of Equal Opportunity and Affirmative Action, University of Minnesota.
University of Minnesota: 2004-05 Accountable to U 129
6: Rochester Campus
The University of Minnesota – Rochester (UMR) meets the higher education needs of southeastern Minnesota by providing and promoting academic programs, research, and public engagement. In collaboration with the Minnesota State Colleges and Universities system (MnSCU), the University of Minnesota – Rochester provides leadership for upper-division undergraduate and post-baccalaureate programs reflecting the University’s tradition of excellence. The University of Minnesota has provided quality higher education opportunities in Rochester and southeastern Minnesota since 1966. In 1999, the establishment of the University of Minnesota – Rochester created an even stronger local presence. UMR is one of three public higher education institutions located on the University Center Rochester (UCR) campus, which is also home to Rochester Community and Technical College and Winona State University-Rochester Center.
Rochester, the third largest city in Minnesota, is growing rapidly in population, diversity (57 languages are spoken by children in public schools), and economic vitality. Rochester and southeastern Minnesota are distinctive and recognized for world-class health care services, research, and high-technology industries.
These industries and this region are major economic drivers for the state. Rochester-area residents have a strong conviction that locally provided University of Minnesota higher education opportunities, research, and public engagement are critical to the continued
growth and economic development of southeastern Minnesota and the state. Academic Priorities
UMR’s academic strategy focuses on education programs in selected areas: health sciences, business, technology, education, and social work. Increasing emphasis is being placed on additional health science, technology, and business programs in direct response to the needs of southeastern Minnesota’s business community. UMR offers four doctoral degrees, 15 master’s degrees, seven baccalaureate degrees, 11 professional certificates, and four licensure programs. Degree programs at UMR are provided by the Twin Cities and Duluth campuses. UMR also offers non-credit programming for continuing education and professional development.
Among new academic programs implemented in the past four years are: a doctoral program in higher education; master’s programs in public health, social work, and business administration; baccalaureate programs in nursing, respiratory care, radiation therapy, information technology infrastructure, and manufacturing technology; and certificate programs in translation and business.
Future programming plans include baccalaureate degrees in fine arts (digital technologies) and music technology, as well as graduate studies in healthcare administration. In addition to offering educational programming, UMR has pursued a number of
Rochester Campus
130 University of Minnesota: 2004-05 Accountable to U
research opportunities. Over the past two years, UMR faculty/staff have submitted two patents in the area of image processing and a third in alternative energies that integrate fuel cells and geothermal systems. Ongoing research is being conducted in a public/private partnership in which UMR provides the lead scientist for the study of alternative energy systems. This multi-year initiative is entering phase two of a three-phase project.
Efforts continue to be devoted to a fundraising campaign for student scholarships and academic strategic investments. Building upon President Bruininks’s initiative for matching payout of endowment funds, six newly endowed scholarships have been created in the past 18 months. Students who have previously been unable to pursue educational opportunities at UMR are now being served by these scholarship resources. Developing additional endowments and other scholarship funding remains a priority. Public Engagement
UMR faculty and staff are involved in public engagement activities in Rochester and southeastern Minnesota. Examples include:
§ serving on community and non-profit governing boards;
§ serving in leadership positions for the local chapter of the University of Minnesota Alumni Association (UMAA), which won its Chapter of the Year Award in 2003-04;
§ conducting “Management of Technology-Signature Series” seminars for high-technology industry leaders;
§ co-sponsoring political debates and community issues forums;
§ conducting a presentation on microbiology and genomics for high school biology teachers;
§ conducting summer computer camps for high school students;
§ bringing national speakers, University scholars, and researchers to Rochester;
§ participating in the University of Minnesota Talented Youth Math Program;
§ organizing and coordinating two national health sciences conferences with Mayo Clinic; and
§ collaborating with community groups to develop a corporate responsibility theme that integrates parts of the UMR and UCR curricula.
Student Satisfaction
Since UMR leverages talent and resources from the University’s Twin Cities and coordinate campuses and from MnSCU institutions, it is necessary to maintain a local student services environment that serves as a central clearing point-of-contact for students.
Current initiatives to strengthen student services include: relocating the student services director, academic program directors, and support staff into a single, identifiable location; enhancing Web pages to better organize information for student use; fully integrating Rochester student services with the University of Minnesota’s OneStop service; implement ing the College Board’s Recruitment Plus software for the University Center partner institutions to jointly identify, track, and respond to student inquiries; and educating staff to serve as effective liaisons between UMR students and the University system.
In 2004, the University of Minnesota – Rochester conducted a second student experiences survey in order to identify key areas of service requirements for the predominantly non-tradit ional student population and to establish baseline values
Rochester Campus
University of Minnesota: 2004-05 Accountable to U 131
from which UMR can measure changes in performance satisfaction.
Comparison of results between the 2002 and 2004 surveys reveals an increase in student satisfaction with the educational experience at UMR. The customer service experience also improved, with the most dramatic increase taking place in student satisfaction with the quality of advisement toward career and academic goals. These results can be attributed to several actions, including reassigning staff responsibilities to better accommodate students in specific programs, extending office hours while providing a better work/life balance for support staff (flexible scheduling), and centralizing the UMR program director office location.
UMR will continue to improve the student and customer experience. In an effort to further enhance service to prospective students, a new position has been created with responsib ilities in academic programming, advising, and development/ coordination of activities and
events to increase the student connection to the University. Space is being reassigned for use as a student self-service area, which will incorporate computer equipment donated by IBM. Services will include dedicated access to online University of Minnesota resources.
UMR personnel have also focused on expanding relationships with Twin Cities campus staff. These efforts are improving UMR’s ability to respond quickly and accurately to student concerns, and will be especially important as the number of undergraduate students increases.
The student survey will be conducted annually to track changes and identify requirements as soon as possible. The next survey is scheduled for spring 2005.
Table 6-1 summarizes the 2004 survey responses in three key areas at the UMR campus – overall student experience, customer service, and institutional environment.
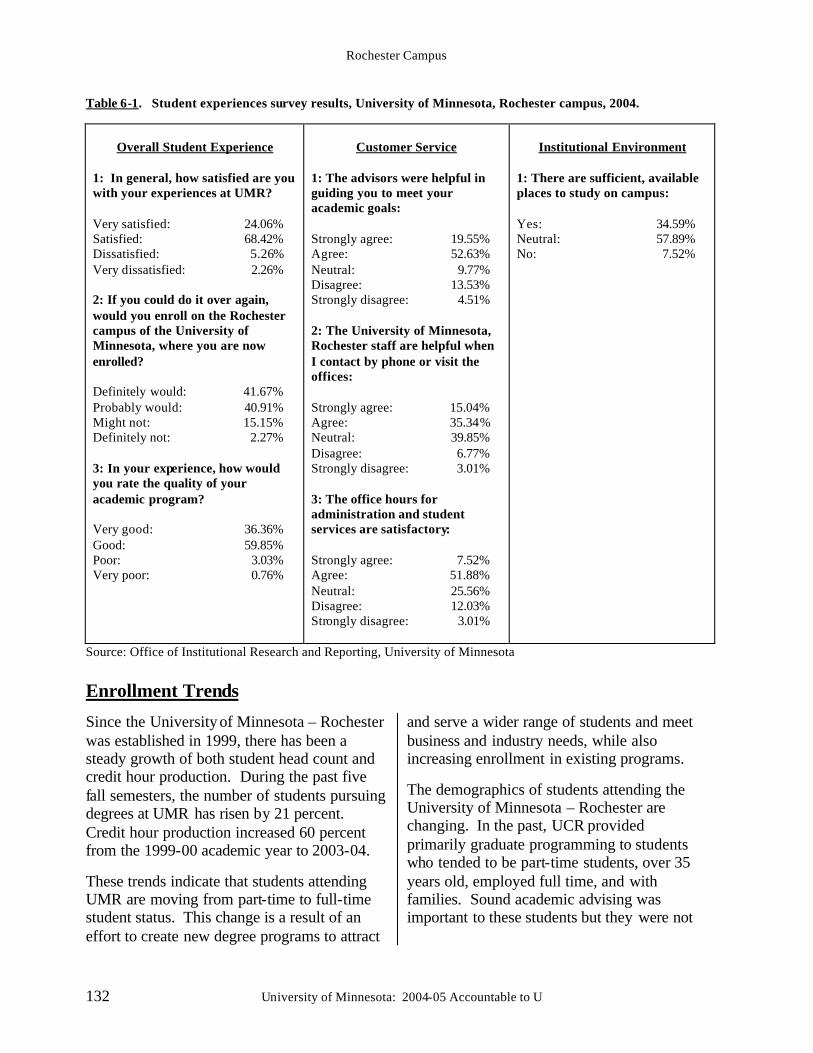
Rochester Campus
132 University of Minnesota: 2004-05 Accountable to U
Table 6-1. Student experiences survey results, University of Minnesota, Rochester campus, 2004.
Overall Student Experience
1: In general, how satisfied are you with your experiences at UMR? Very satisfied: 24.06% Satisfied: 68.42% Dissatisfied: 5.26% Very dissatisfied: 2.26% 2: If you could do it over again, would you enroll on the Rochester campus of the University of Minnesota, where you are now enrolled? Definitely would: 41.67% Probably would: 40.91% Might not: 15.15% Definitely not: 2.27% 3: In your experience, how would you rate the quality of your academic program? Very good: 36.36% Good: 59.85% Poor: 3.03% Very poor: 0.76%
Customer Service
1: The advisors were helpful in guiding you to meet your academic goals: Strongly agree: 19.55% Agree: 52.63% Neutral: 9.77% Disagree: 13.53% Strongly disagree: 4.51% 2: The University of Minnesota, Rochester staff are helpful when I contact by phone or visit the offices: Strongly agree: 15.04% Agree: 35.34% Neutral: 39.85% Disagree: 6.77% Strongly disagree: 3.01% 3: The office hours for administration and student services are satisfactory: Strongly agree: 7.52% Agree: 51.88% Neutral: 25.56% Disagree: 12.03% Strongly disagree: 3.01%
Institutional Environment
1: There are sufficient, available places to study on campus: Yes: 34.59% Neutral: 57.89% No: 7.52%
Source: Office of Institutional Research and Reporting, University of Minnesota
Enrollment Trends
Since the University of Minnesota – Rochester was established in 1999, there has been a steady growth of both student head count and credit hour production. During the past five fall semesters, the number of students pursuing degrees at UMR has risen by 21 percent. Credit hour production increased 60 percent from the 1999-00 academic year to 2003-04.
These trends indicate that students attending UMR are moving from part-time to full-time student status. This change is a result of an effort to create new degree programs to attract
and serve a wider range of students and meet business and industry needs, while also increasing enrollment in existing programs.
The demographics of students attending the University of Minnesota – Rochester are changing. In the past, UCR provided primarily graduate programming to students who tended to be part-time students, over 35 years old, employed full time, and with families. Sound academic advising was important to these students but they were not
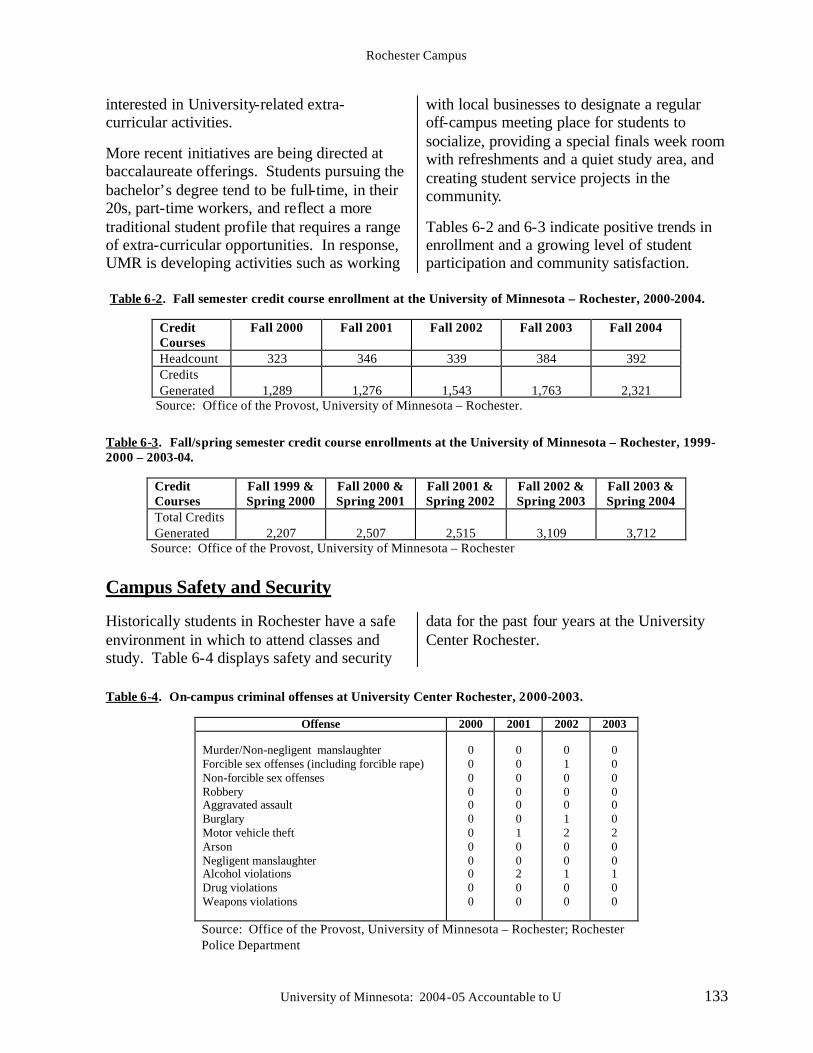
Rochester Campus
University of Minnesota: 2004-05 Accountable to U 133
interested in University-related extra-curricular activities.
More recent initiatives are being directed at baccalaureate offerings. Students pursuing the bachelor’s degree tend to be full-time, in their 20s, part-time workers, and reflect a more traditional student profile that requires a range of extra-curricular opportunities. In response, UMR is developing activities such as working
with local businesses to designate a regular off-campus meeting place for students to socialize, providing a special finals week room with refreshments and a quiet study area, and creating student service projects in the community.
Tables 6-2 and 6-3 indicate positive trends in enrollment and a growing level of student participation and community satisfaction.
Table 6-2. Fall semester credit course enrollment at the University of Minnesota – Rochester, 2000-2004.
Credit Courses
Fall 2000 Fall 2001 Fall 2002 Fall 2003 Fall 2004
Headcount 323 346 339 384 392 Credits Generated
1,289
1,276
1,543
1,763
2,321
Source: Office of the Provost, University of Minnesota – Rochester.
Table 6-3. Fall/spring semester credit course enrollments at the University of Minnesota – Rochester, 1999-2000 – 2003-04.
Credit Courses
Fall 1999 & Spring 2000
Fall 2000 & Spring 2001
Fall 2001 & Spring 2002
Fall 2002 & Spring 2003
Fall 2003 & Spring 2004
Total Credits Generated
2,207
2,507
2,515
3,109
3,712
Source: Office of the Provost, University of Minnesota – Rochester
Campus Safety and Security
Historically students in Rochester have a safe environment in which to attend classes and study. Table 6-4 displays safety and security
data for the past four years at the University Center Rochester.
Table 6-4. On-campus criminal offenses at University Center Rochester, 2000-2003.
Offense 2000 2001 2002 2003 Murder/Non-negligent manslaughter Forcible sex offenses (including forcible rape) Non-forcible sex offenses Robbery Aggravated assault Burglary Motor vehicle theft Arson Negligent manslaughter Alcohol violations Drug violations Weapons violations
0 0 0 0 0 0 0 0 0 0 0 0
0 0 0 0 0 0 1 0 0 2 0 0
0 1 0 0 0 1 2 0 0 1 0 0
0 0 0 0 0 0 2 0 0 1 0 0
Source: Office of the Provost, University of Minnesota – Rochester; Rochester Police Department
Rochester Campus
134 University of Minnesota: 2004-05 Accountable to U
University of Minnesota: 2004-05 Accountable to U 135
7: Public Engagement – Access and Outreach
As a publicly supported, land-grant institution, the University of Minnesota has an obligation to fill an essential outreach and public service function for the state.
The University’s mission statement specifies this obligation to: “Extend, apply, and exchange knowledge between the University and society by applying scholarly expertise to community problems, by helping organizations and individuals respond to their changing environments, and by making the knowledge and resources created and preserved at the University accessible to the citizens of the state, the nation, and the world.”
This historic public service mission has, more recently, been coined “public engagement,” and there are concerted efforts within higher education to more precisely define the role and measure the results of colleges’ and universities’ public engagement responsibilities.
The Committee on Institutional Cooperation (CIC), comprised of Big Ten universities and the University of Chicago, has endorsed a definition of public engagement, which the
University of Minnesota has adopted for the purposes of organizing and evaluating its efforts in this area:
“Public engagement is the partnership of university knowledge and resources with those of the public and private sectors to:
§ enrich scholarship and research, § enhance curriculum teaching and learning, § prepare citizen scholars, § endorse democratic values and civic
responsibility, § address critical societal issues, and § contribute to the public good.”
This section of the report details the contributions to the state of the University’s technology commercialization activities, the University of Minnesota Extension Service, the University Libraries, and the Research and Outreach Centers. It also provides information on the University’s economic and social impact on the state, an overview of the University’s Council on Public Engagement, and a summary of the findings from the latest citizen satisfaction survey, conducted in December 2004.
A. Technology Commercialization
An integral part of the University’s land-grant mission is to seek practical application for research results to benefit the public and support regional economic vitality. University faculty and researchers are increasingly active
in disclosing new technologies and negotiating licenses of the University’s intellectual property. This process is important as a contribution to the state’s economy. It also
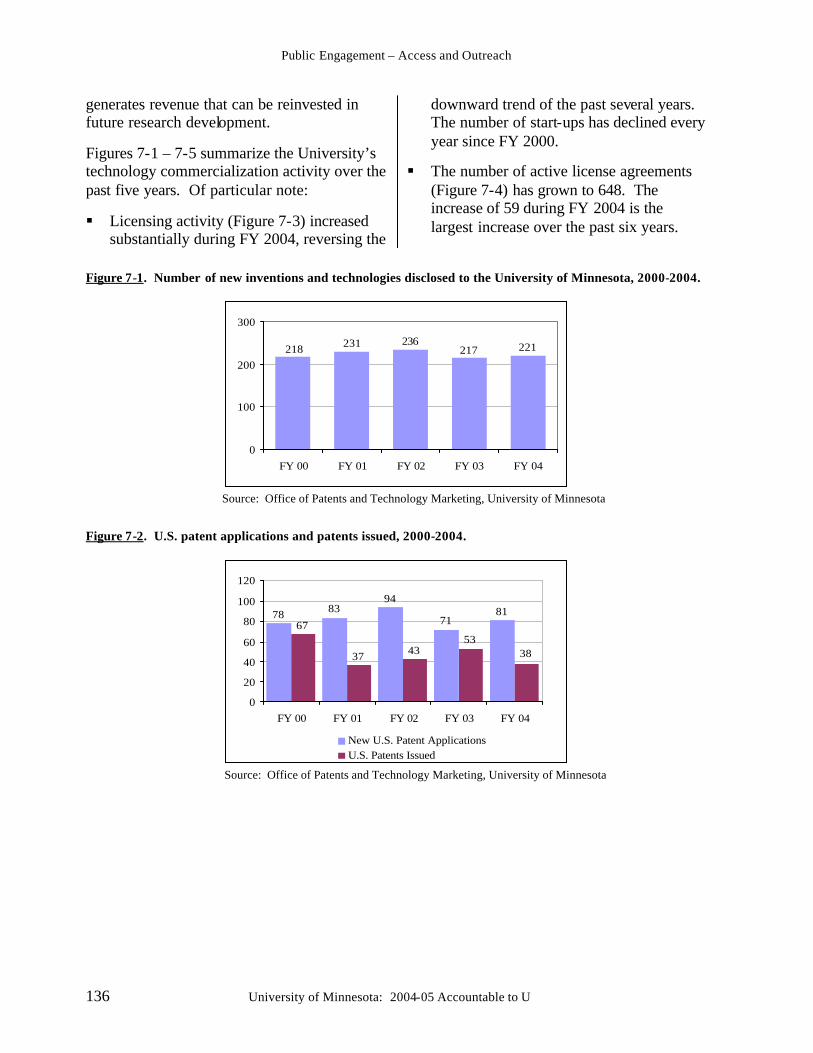
Public Engagement – Access and Outreach
136 University of Minnesota: 2004-05 Accountable to U
generates revenue that can be reinvested in future research development.
Figures 7-1 – 7-5 summarize the University’s technology commercialization activity over the past five years. Of particular note:
§ Licensing activity (Figure 7-3) increased substantially during FY 2004, reversing the
downward trend of the past several years. The number of start-ups has declined every year since FY 2000.
§ The number of active license agreements (Figure 7-4) has grown to 648. The increase of 59 during FY 2004 is the largest increase over the past six years.
Figure 7-1. Number of new inventions and technologies disclosed to the University of Minnesota, 2000-2004.
221217236231218
0
100
200
300
FY 00 FY 01 FY 02 FY 03 FY 04
Source: Office of Patents and Technology Marketing, University of Minnesota
Figure 7-2. U.S. patent applications and patents issued, 2000-2004.
8171
948378
3853
4337
67
0
20
40
60
80
100
120
FY 00 FY 01 FY 02 FY 03 FY 04
New U.S. Patent ApplicationsU.S. Patents Issued
Source: Office of Patents and Technology Marketing, University of Minnesota
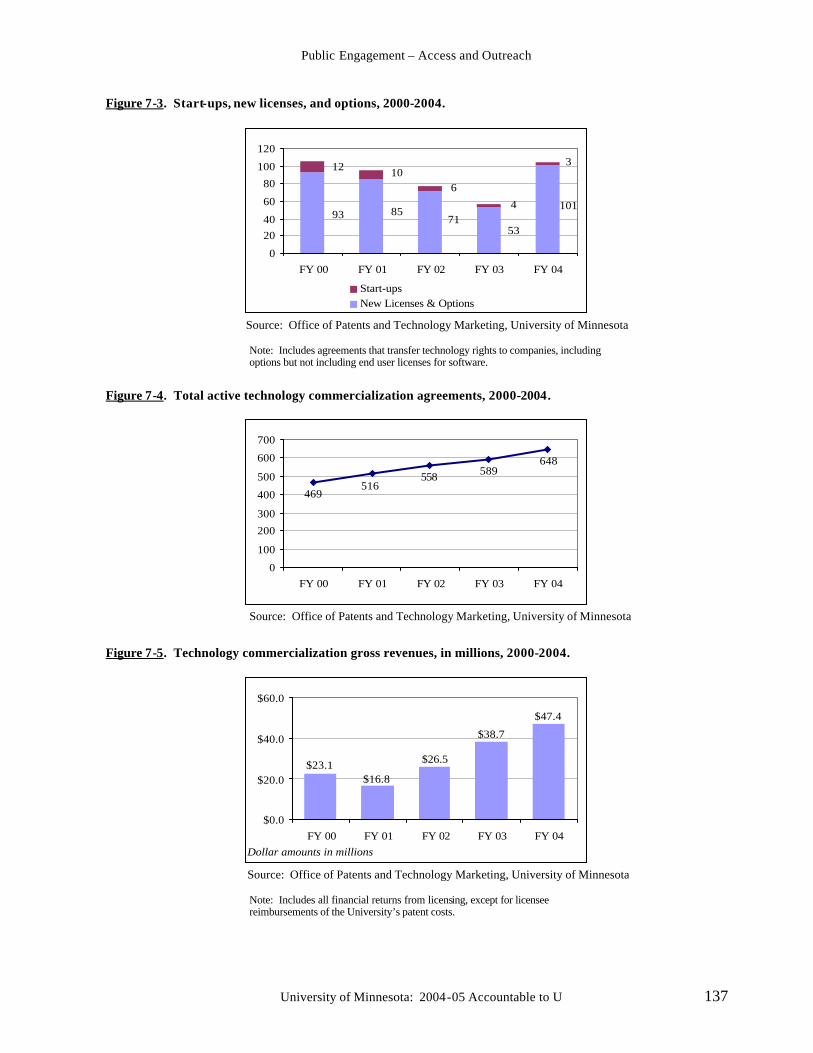
Public Engagement – Access and Outreach
University of Minnesota: 2004-05 Accountable to U 137
Figure 7-3. Start-ups, new licenses, and options, 2000-2004.
101
5371
8593
3
4
61012
0
2040
60
80
100
120
FY 00 FY 01 FY 02 FY 03 FY 04
Start-upsNew Licenses & Options
Source: Office of Patents and Technology Marketing, University of Minnesota
Note: Includes agreements that transfer technology rights to companies, including options but not including end user licenses for software.
Figure 7-4. Total active technology commercialization agreements, 2000-2004.
648589558
516469
0
100
200
300
400
500
600
700
FY 00 FY 01 FY 02 FY 03 FY 04
Source: Office of Patents and Technology Marketing, University of Minnesota
Figure 7-5. Technology commercialization gross revenues, in millions, 2000-2004.
$47.4
$38.7
$26.5
$16.8$23.1
$0.0
$20.0
$40.0
$60.0
FY 00 FY 01 FY 02 FY 03 FY 04Dollar amounts in millions
Source: Office of Patents and Technology Marketing, University of Minnesota
Note: Includes all financial returns from licensing, except for licensee reimbursements of the University’s patent costs.
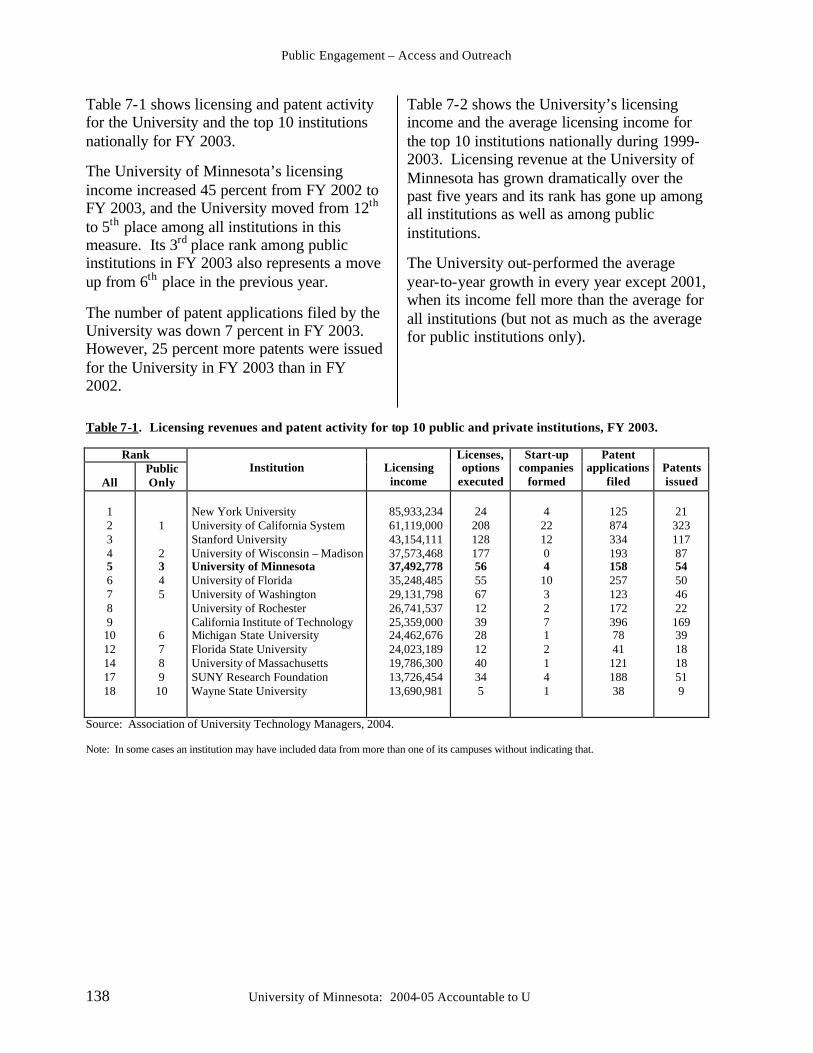
Public Engagement – Access and Outreach
138 University of Minnesota: 2004-05 Accountable to U
Table 7-1 shows licensing and patent activity for the University and the top 10 institutions nationally for FY 2003.
The University of Minnesota’s licensing income increased 45 percent from FY 2002 to FY 2003, and the University moved from 12th to 5th place among all institutions in this measure. Its 3rd place rank among public institutions in FY 2003 also represents a move up from 6th place in the previous year.
The number of patent applications filed by the University was down 7 percent in FY 2003. However, 25 percent more patents were issued for the University in FY 2003 than in FY 2002.
Table 7-2 shows the University’s licensing income and the average licensing income for the top 10 institutions nationally during 1999-2003. Licensing revenue at the University of Minnesota has grown dramatically over the past five years and its rank has gone up among all institutions as well as among public institutions.
The University out-performed the average year-to-year growth in every year except 2001, when its income fell more than the average for all institutions (but not as much as the average for public institutions only).
Table 7-1. Licensing revenues and patent activity for top 10 public and private institutions, FY 2003.
Rank
All Public Only
Institution
Licensing income
Licenses, options
executed
Start-up companies
formed
Patent applications
filed
Patents issued
1 2 3 4 5 6 7 8 9 10 12 14 17 18
1 2 3 4 5 6 7 8 9 10
New York University University of California System Stanford University University of Wisconsin – Madison University of Minnesota University of Florida University of Washington University of Rochester California Institute of Technology Michigan State University Florida State University University of Massachusetts SUNY Research Foundation Wayne State University
85,933,234 61,119,000 43,154,111 37,573,468 37,492,778 35,248,485 29,131,798 26,741,537 25,359,000 24,462,676 24,023,189 19,786,300 13,726,454 13,690,981
24 208 128 177 56 55 67 12 39 28 12 40 34 5
4 22 12 0 4 10 3 2 7 1 2 1 4 1
125 874 334 193 158 257 123 172 396 78 41 121 188 38
21 323 117 87 54 50 46 22 169 39 18 18 51 9
Source: Association of University Technology Managers, 2004. Note: In some cases an institution may have included data from more than one of its campuses without indicating that.
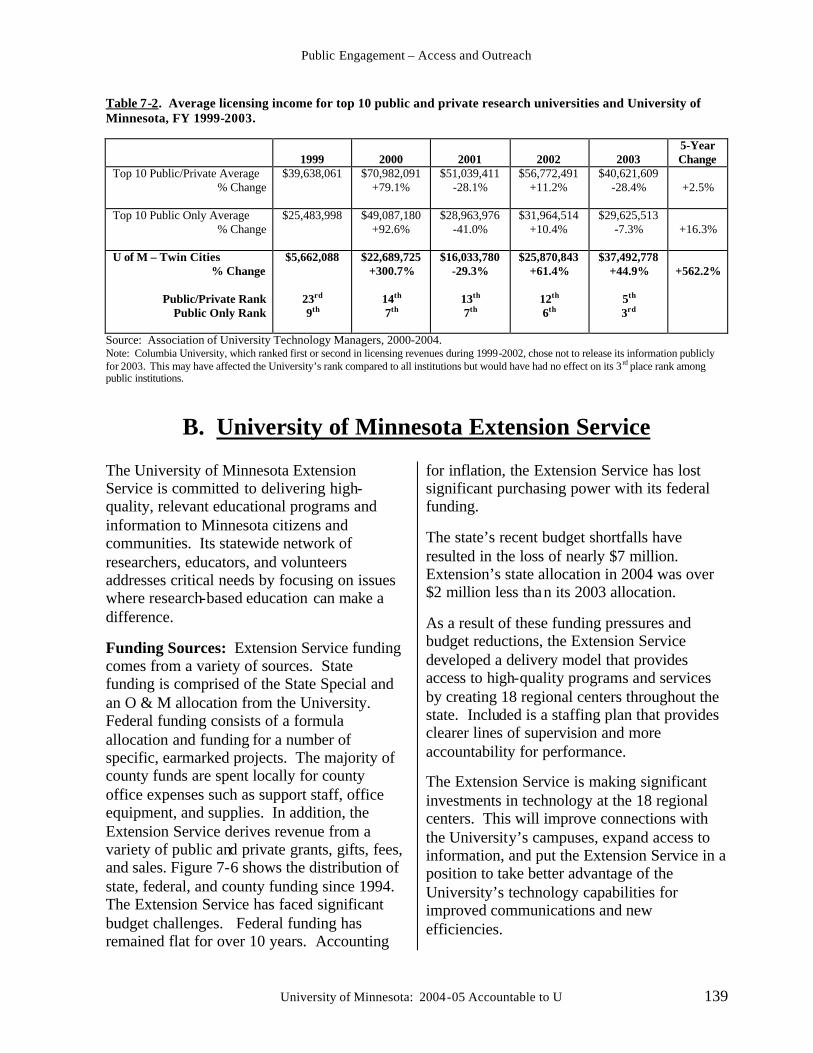
Public Engagement – Access and Outreach
University of Minnesota: 2004-05 Accountable to U 139
Table 7-2. Average licensing income for top 10 public and private research universities and University of Minnesota, FY 1999-2003.
1999
2000
2001
2002
2003
5-Year Change
Top 10 Public/Private Average % Change
$39,638,061 $70,982,091 +79.1%
$51,039,411 -28.1%
$56,772,491 +11.2%
$40,621,609 -28.4%
+2.5%
Top 10 Public Only Average
% Change
$25,483,998 $49,087,180 +92.6%
$28,963,976 -41.0%
$31,964,514 +10.4%
$29,625,513 -7.3%
+16.3%
U of M – Twin Cities % Change
Public/Private Rank
Public Only Rank
$5,662,088
23rd 9th
$22,689,725 +300.7%
14th 7th
$16,033,780 -29.3%
13th 7th
$25,870,843 +61.4%
12th 6th
$37,492,778 +44.9%
5th 3rd
+562.2%
Source: Association of University Technology Managers, 2000-2004. Note: Columbia University, which ranked first or second in licensing revenues during 1999-2002, chose not to release its information publicly for 2003. This may have affected the University’s rank compared to all institutions but would have had no effect on its 3 rd place rank among public institutions.
B. University of Minnesota Extension Service
The University of Minnesota Extension Service is committed to delivering high-quality, relevant educational programs and information to Minnesota citizens and communities. Its statewide network of researchers, educators, and volunteers addresses critical needs by focusing on issues where research-based education can make a difference.
Funding Sources: Extension Service funding comes from a variety of sources. State funding is comprised of the State Special and an O & M allocation from the University. Federal funding consists of a formula allocation and funding for a number of specific, earmarked projects. The majority of county funds are spent locally for county office expenses such as support staff, office equipment, and supplies. In addition, the Extension Service derives revenue from a variety of public and private grants, gifts, fees, and sales. Figure 7-6 shows the distribution of state, federal, and county funding since 1994. The Extension Service has faced significant budget challenges. Federal funding has remained flat for over 10 years. Accounting
for inflation, the Extension Service has lost significant purchasing power with its federal funding.
The state’s recent budget shortfalls have resulted in the loss of nearly $7 million. Extension’s state allocation in 2004 was over $2 million less than its 2003 allocation.
As a result of these funding pressures and budget reductions, the Extension Service developed a delivery model that provides access to high-quality programs and services by creating 18 regional centers throughout the state. Included is a staffing plan that provides clearer lines of supervision and more accountability for performance.
The Extension Service is making significant investments in technology at the 18 regional centers. This will improve connections with the University’s campuses, expand access to information, and put the Extension Service in a position to take better advantage of the University’s technology capabilities for improved communications and new efficiencies.
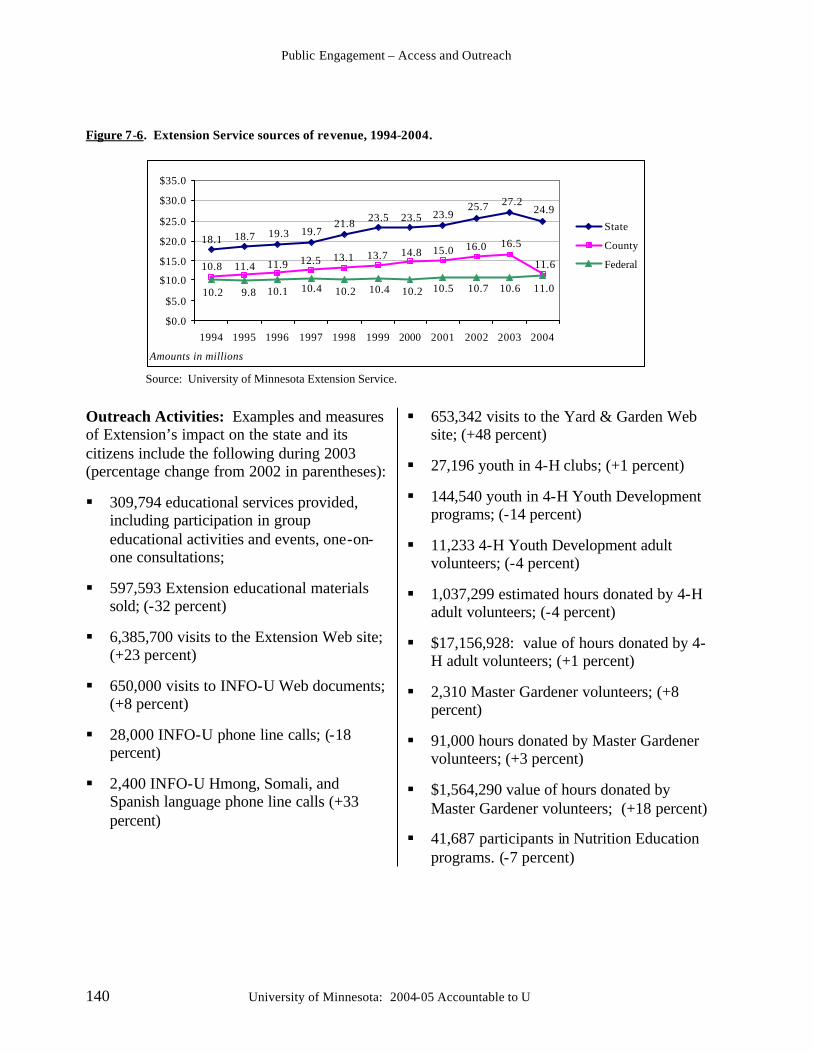
Public Engagement – Access and Outreach
140 University of Minnesota: 2004-05 Accountable to U
Figure 7-6. Extension Service sources of revenue, 1994-2004.
24.927.225.7
23.923.523.521.819.719.318.718.1
11.6
16.516.015.014.813.713.112.511.911.410.8
11.010.610.710.510.210.410.210.410.19.810.2
$0.0
$5.0
$10.0
$15.0
$20.0
$25.0
$30.0
$35.0
1994 1995 1996 1997 1998 1999 2000 2001 2002 2003 2004
Amounts in millions
State
County
Federal
Source: University of Minnesota Extension Service.
Outreach Activities: Examples and measures of Extension’s impact on the state and its citizens include the following during 2003 (percentage change from 2002 in parentheses):
§ 309,794 educational services provided, including participation in group educational activities and events, one-on-one consultations;
§ 597,593 Extension educational materials sold; (-32 percent)
§ 6,385,700 visits to the Extension Web site; (+23 percent)
§ 650,000 visits to INFO-U Web documents; (+8 percent)
§ 28,000 INFO-U phone line calls; (-18 percent)
§ 2,400 INFO-U Hmong, Somali, and Spanish language phone line calls (+33 percent)
§ 653,342 visits to the Yard & Garden Web site; (+48 percent)
§ 27,196 youth in 4-H clubs; (+1 percent)
§ 144,540 youth in 4-H Youth Development programs; (-14 percent)
§ 11,233 4-H Youth Development adult volunteers; (-4 percent)
§ 1,037,299 estimated hours donated by 4-H adult volunteers; (-4 percent)
§ $17,156,928: value of hours donated by 4-H adult volunteers; (+1 percent)
§ 2,310 Master Gardener volunteers; (+8 percent)
§ 91,000 hours donated by Master Gardener volunteers; (+3 percent)
§ $1,564,290 value of hours donated by Master Gardener volunteers; (+18 percent)
§ 41,687 participants in Nutrition Education programs. (-7 percent)
Public Engagement – Access and Outreach
University of Minnesota: 2004-05 Accountable to U 141
C. University Libraries The Libraries make a crucial contribution to the University’s public engagement activities. In 2003, they responded to over 186,000 reference questions and offered over 1,100 class sessions. The Libraries’ instructional programs help University students and other users navigate the rich physical and electronic collections available. Among the Libraries’ most significant programs are:
Interlibrary Loans: Among North American research libraries, the University of Minnesota ranks first in the provision of interlibrary loans of library materials.
The University Libraries have played a lead role in the implementation and management of the Minnesota Library Information Network (MnLINK), a statewide virtual library that electronically links public, academic, K-12, and government libraries.
MINITEX, a cooperative library organization based at the University of Minnesota Libraries, serves libraries in Minnesota, North Dakota, and South Dakota. In 2003, it processed requests for 273,509 books and articles for interlibrary resource sharing among more than 200 Minnesota libraries of all types. MINITEX helps participating libraries save hundreds of thousands of dollars by cooperative purchasing programs. As more publishing moves to electronic form, MINITEX plays a lead role in licensing electronic content for libraries throughout the state. These large-scale licenses provide access to resources that would be beyond the means of individual libraries.
The Minnesota Library Access Center (MLAC), administered by the University Libraries, supports libraries throughout Minnesota by providing efficient, climate-controlled storage for important, but infrequently used collections.
InfoPoint, the Libraries’ premier digital reference service, provides information services seven days a week for users through a single online point of access. Since the service was implemented in 1998, traffic has increased over 400 percent.
The University’s Government Publications Library serves as the Regional Depository Library for Minnesota and South Dakota.
The University Libraries’ online catalog, MNCAT, provides Minnesotans free and convenient access to more than 6 million volumes in the Libraries’ collections.
The Libraries cooperate with K-12 schools throughout the state, many of which send classes of students to the University Libraries to work on research projects.
The Borchert Map Library provides access to any walk-in client to a variety of geographic resources, including U.S. Geological Survey maps of Minnesota as well as nearly 331,000 aerial photographs of the state, including photographs of all counties in Minnesota from 1936 to date.
ESTIS (Engineering, Science, and Technology Information Service) and BIS (Biomedical Information Service) provide fee-based research services and resources from the Libraries’ collections for unaffiliated users and Minnesota organizations, including small business.
Public Engagement – Access and Outreach
142 University of Minnesota: 2004-05 Accountable to U
D. Research and Outreach Centers Six Research and Outreach Centers (ROCs) strategically located throughout Minnesota are key units of the College of Agricultural, Food, and Environmental Sciences that extend its research to all regions of the state.
The ROCs conduct site-specific, coordinated research and outreach programs in cooperation with several colleges and departments within the University of Minnesota. By focusing on regional strengths and issues, the ROCs function as an integrated unit to address the diverse agricultural and rural needs of Minnesota.
The ROCs take advantage of their unique geographical locations to conduct interdisciplinary research, to engage in teaching, and to transfer research-based knowledge to citizens. The ROCs are also linked to the University of Minnesota Extension Service and to regional Extension educators.
The six ROCs are:
North Central ROC, Grand Rapids: In addition to traditional crop and livestock research and outreach activities, scientists at this ROC use their 873-acre site to conduct research in agricultural engineering, environmental issues, forestry, by-product utilization, small fruit and vegetable crops, tourism and travel, and wild rice.
Northwest ROC, Crookston: This ROC is situated on 1,500 acres adjacent to the University of Minnesota – Crookston campus. In addition to providing experiential learning for students enrolled in agriculture programs at UMC, the center serves the surrounding area with prairie management research and crop
research in sugar beets, potatoes, wheat, and barley.
Southern ROC, Waseca: This center occupies a 955-acre site in an area that produces over one-third of Minnesota’s cash farm sales. Research focuses on groundwater and surface water quality as well as animal product technology for swine and dairy, with a major emphasis on waste management and odor reduction.
Southwest ROC, Lamberton: The 828-acre site of this center includes the Elwell Agro-ecology Farm, where research emphasizes cropping systems that efficiently cycle water, nutrients, and energy while enhancing profitability. Scientists at the center also conduct research on water quality, soil structural degradation, and soybean pathogens.
UMore Park, Rosemount: Research programs at this center focus on precision agricultural methods, carbon sequestration, and biological methods for potato pest control. Scientists at the 7,500-acre site also investigate strategies for weed management and maintain ongoing research on swine and poultry. The site also hosts a new immigrant agricultural program.
West Central ROC, Morris: Research and education on this 1,200-acre site focus on environmental management of crop and livestock agricultural systems, swine production, and forage-based livestock systems. The work is a collaboration among community partners and University of Minnesota – Morris faculty from the departments of animal science, agronomy, applied economics, agricultural engineering, and soil, water, and climate.
Public Engagement – Access and Outreach
University of Minnesota: 2004-05 Accountable to U 143
E. State Economic Impact The University of Minnesota has a significant impact on the state economy. A 2002 economic impact study conducted under the auspices of the Humphrey Institute of Public Affairs showed that the University:
§ received 98 percent of all sponsored research grants awarded in the state;
§ created 39 jobs for every $1 million spent on research;
§ developed more than 230 patents in the past five years and currently holds nearly 600 active technology transfer agreements;
§ ranks 6th in start-up companies among 142 research universities;
§ spent $800 million on sales to vendors
(January 2000 – September 2002);
§ paid $995 million in salary to 39,039 employees in FY2002; and
§ has 213,573 University alumni living in Minnesota.
In addition:
§ University alumni have founded 1,200 technology companies in Minnesota that employ 10,000 people and contribute $30 billion to the state’s annual economy.
§ University employees generated $178 million in tax revenue in 2000.
§ University employees spent $729 million, students spent $363 million, and visitors to the University spent $463 million – for more than $1.5 billion in 2000.
F. State Social Impact
Among the more important social impacts of the University of Minnesota are the following examples:
§ granted 12,356 degrees in 2003-04.
§ enrolled 65,247 students in fall 2004.
§ Over the years, graduated more than 17,000 health professionals – Medical School, 5,425 (more than half the state total); School of Dentistry, 2,768 (about 75 percent of the state total); School of Nursing, 3,153 (majority of advanced-practice nurses); College of Veterinary
Medicine, 3,453; College of Pharmacy, 2,502.
§ ranked 11th in the nation in total number of Ph.D. degrees awarded in 2003.
§ University Libraries system (16th largest in North America) is accessible to every Minnesotan.
§ 23 percent of Minnesotans use Extens ion Service.
§ nearly half of state residents connect with the University through sporting and cultural events.
Public Engagement – Access and Outreach
144 University of Minnesota: 2004-05 Accountable to U
G. Council on Public Engagement The University of Minnesota’s Council on Public Engagement (COPE) seeks to incorporate public engagement as a permanent and pervasive priority in teaching, learning, and research activities throughout the University and to enlist support for public engagement among all segments of the University and in the larger community.
Currently, the Council has five working groups addressing:
Partnerships: To identify and promote conditions for successful, interactive, mutually beneficial partnerships as the main basis for the University’s connections to external groups, organizations, and communities.
Innovations: To identify opportunities to develop new programs, as well as support continuation and expansion of existing programs that are effective in involving students, faculty, alumni, and others in engaged activities.
Communication: To develop, implement, and evaluate the results of a more robust internal and external communications strategy focused on themes of publicly engaged research and scholarship, teaching and learning, and community partnerships.
Recognition: To develop, implement, and evaluate the results of an integrated strategy for embedding recognition of publicly engaged work more deeply within institutional processes for incentives, rewards, and awards.
Assessment: To develop appropriate and feasible measures of the University efforts in publicly engaged teaching, learning, and research, and the impacts and outcomes of those efforts. Among COPE’s 2003-04 accomplishments:
§ assisting President Bruininks in implementing his “engaged university” goal;
§ coordinating with the leaders of the President’s Interdisciplinary Initiatives in recognizing, communicating, and assessing their public impact;
§ including public engagement as a formal part of the University’s annual budget and planning process;
§ establishing a network of college liaisons to communicate examples of each unit's engaged activities, nominate candidates for public engagement awards, develop appropriate assessment measures, and institute effective incentives and rewards for engaged work;
§ awarding 18 seed grants for innovative projects that integrate public scholarship, civic learning, and community partnerships; that are multi-disciplinary in approach with multi-unit participation; that involve undergraduate students, graduate students, or research assistant s; that are sustainable with long-term impact and institutional support; or that meet other criteria for strengthening public engagement across the University;
§ launching a news channel on the University’s portal, creating a COPE Web site, and sponsoring a nationally distributed electronic newsletter that features stories about public engagement at the University;
§ ongoing discussions with academic departments to incorporate public engagement more explicitly in recruitment of new faculty, annual merit reviews, and criteria for promotion and tenure;
Public Engagement – Access and Outreach
University of Minnesota: 2004-05 Accountable to U 145
§ establishing the Community Engagement Scholar Program to recognize by transcript notation students with significant involvement in community service/service learning;
§ developing strategies for increasing student engagement as part of freshman orientation;
§ contributing to Minnesota Campus Compact’s civic engagement study that developed indicators to assist campuses in assessing their civic engagement;
§ co-sponsoring two University-wide forums: “The University and Engaged Research: What Matters” and “Celebrating Community Partnerships;”
§ co-sponsoring the Mary McEvoy Award for Outstanding Service.
Service Learning
One example of public engagement that involves University students and faculty in the life of the community is service learning. Service learning is a teaching strategy that integrates community-based learning experiences with the academic curriculum to enhance student learning and address community issues.
For example, on the Twin Cities campus, students participate in a wide variety of service- learning and other community-based learning opportunities throughout the metropolitan area. Faculty members support these students’ active learning and connection to Twin Cities community and thereby underscore the land-grant mission of public service. Non-profit and governmental sector partners play key roles as co-educators, with faculty, while students contribute and help carry out the mission and goals of hundreds of organizations.
In 2002-03, over 70 courses in nine colleges provided opportunities for over 1,750 students to participate in service learning. Sixty-three faculty members and instructors taught courses integrating service learning. Results from the previous year were similar. In both years, faculty members were actively involved in the development of new courses with service-learning components.
Another example of student involvement in public engagement activities is the America Reads program, which places students as tutors with children in kindergarten through third grade across the Twin Cities. In just five years, the program has grown from 100 tutors to 650 tutors in 2003-04 serving over 2,500 elementary students at 31 sites.
H. Citizen Satisfaction
A December 2004 telephone survey of 603 Minnesota residents ages 25 and older, selected at random, gathered information about their attitudes and perceptions of the University of Minnesota, the state’s funding of higher education, and tuition issues. Nearly half of all respondents reported a personal connection to the University of Minnesota, such as having a degree from the University, being the parent of a current or former University student, working with the
University on a professional basis, or attending sporting events at the University. In fact, 24 percent of respondents reported a connection through sports.
Table 7-4 shows overall citizen satisfaction with the University. About half of respondents indicated they were “very” or “somewhat” satisfied with the University. A significant percentage responded that they were “neutral” or unsure about their overall satisfaction.
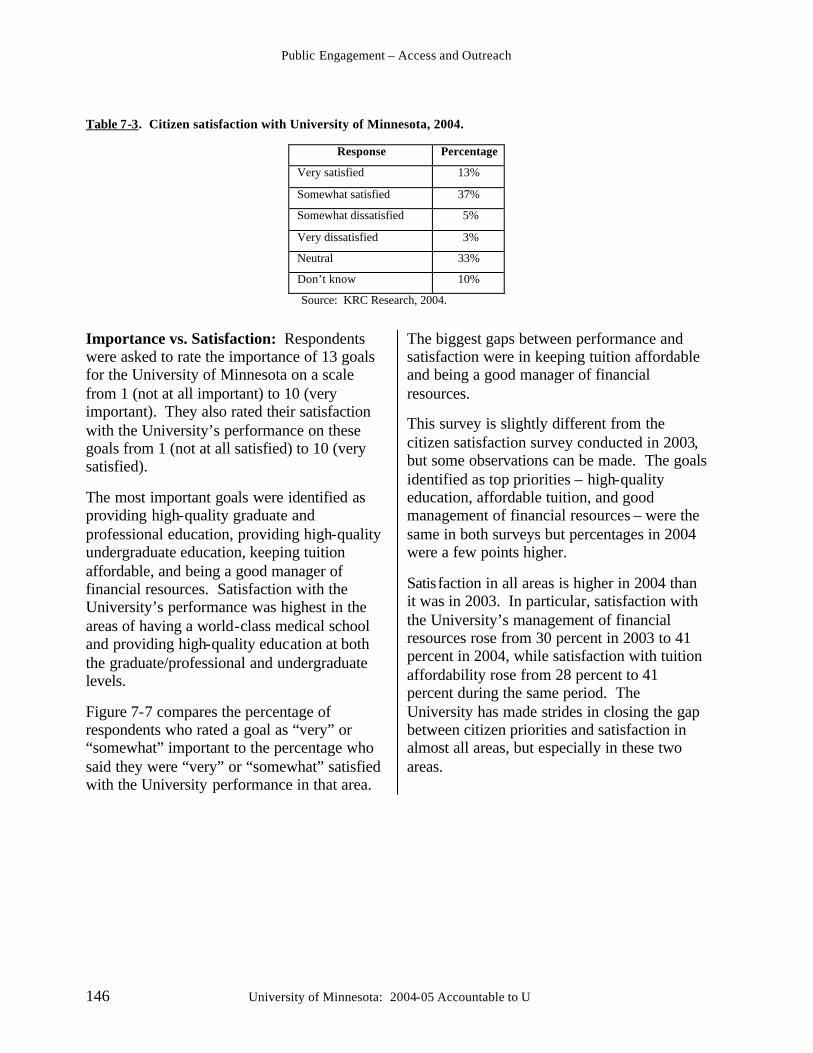
Public Engagement – Access and Outreach
146 University of Minnesota: 2004-05 Accountable to U
Table 7-3. Citizen satisfaction with University of Minnesota, 2004.
Response Percentage
Very satisfied 13%
Somewhat satisfied 37%
Somewhat dissatisfied 5%
Very dissatisfied 3%
Neutral 33%
Don’t know 10%
Source: KRC Research, 2004.
Importance vs. Satisfaction: Respondents were asked to rate the importance of 13 goals for the University of Minnesota on a scale from 1 (not at all important) to 10 (very important). They also rated their satisfaction with the University’s performance on these goals from 1 (not at all satisfied) to 10 (very satisfied).
The most important goals were identified as providing high-quality graduate and professional education, providing high-quality undergraduate education, keeping tuition affordable, and being a good manager of financial resources. Satisfaction with the University’s performance was highest in the areas of having a world-class medical school and providing high-quality education at both the graduate/professional and undergraduate levels.
Figure 7-7 compares the percentage of respondents who rated a goal as “very” or “somewhat” important to the percentage who said they were “very” or “somewhat” satisfied with the University performance in that area.
The biggest gaps between performance and satisfaction were in keeping tuition affordable and being a good manager of financial resources.
This survey is slightly different from the citizen satisfaction survey conducted in 2003, but some observations can be made. The goals identified as top priorities – high-quality education, affordable tuition, and good management of financial resources – were the same in both surveys but percentages in 2004 were a few points higher.
Satisfaction in all areas is higher in 2004 than it was in 2003. In particular, satisfaction with the University’s management of financial resources rose from 30 percent in 2003 to 41 percent in 2004, while satisfaction with tuition affordability rose from 28 percent to 41 percent during the same period. The University has made strides in closing the gap between citizen priorities and satisfaction in almost all areas, but especially in these two areas.
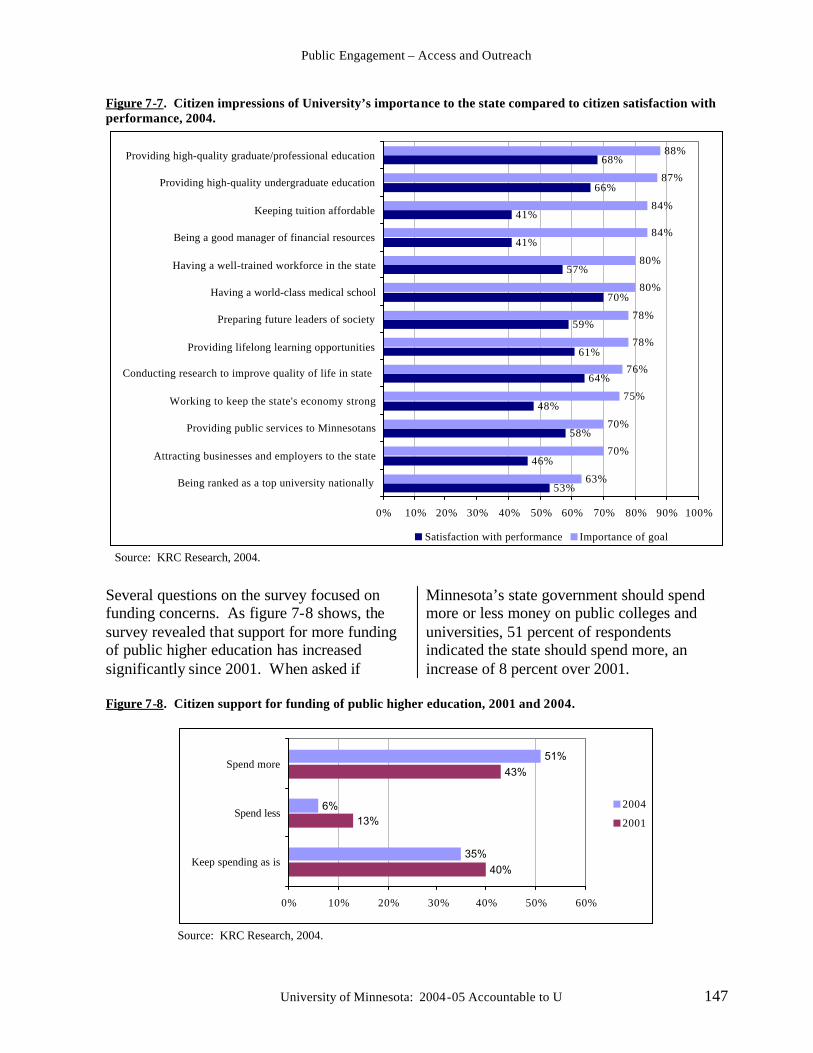
Public Engagement – Access and Outreach
University of Minnesota: 2004-05 Accountable to U 147
Figure 7-7. Citizen impressions of University’s importance to the state compared to citizen satisfaction with performance, 2004.
53%
46%
58%
48%
64%
61%
59%
70%
57%
41%
41%
66%
68%
63%
70%
70%
75%
76%
78%
78%
80%
80%
84%
84%
87%
88%
0% 10% 20% 30% 40% 50% 60% 70% 80% 90% 100%
Being ranked as a top university nationally
Attracting businesses and employers to the state
Providing public services to Minnesotans
Working to keep the state's economy strong
Conducting research to improve quality of life in state
Providing lifelong learning opportunities
Preparing future leaders of society
Having a world-class medical school
Having a well-trained workforce in the state
Being a good manager of financial resources
Keeping tuition affordable
Providing high-quality undergraduate education
Providing high-quality graduate/professional education
Satisfaction with performance Importance of goal
Source: KRC Research, 2004.
Several questions on the survey focused on funding concerns. As figure 7-8 shows, the survey revealed that support for more funding of public higher education has increased significantly since 2001. When asked if
Minnesota’s state government should spend more or less money on public colleges and universities, 51 percent of respondents indicated the state should spend more, an increase of 8 percent over 2001.
Figure 7-8. Citizen support for funding of public higher education, 2001 and 2004.
40%
13%
43%
35%
6%
51%
0% 10% 20% 30% 40% 50% 60%
Keep spending as is
Spend less
Spend more
2004
2001
Source: KRC Research, 2004.
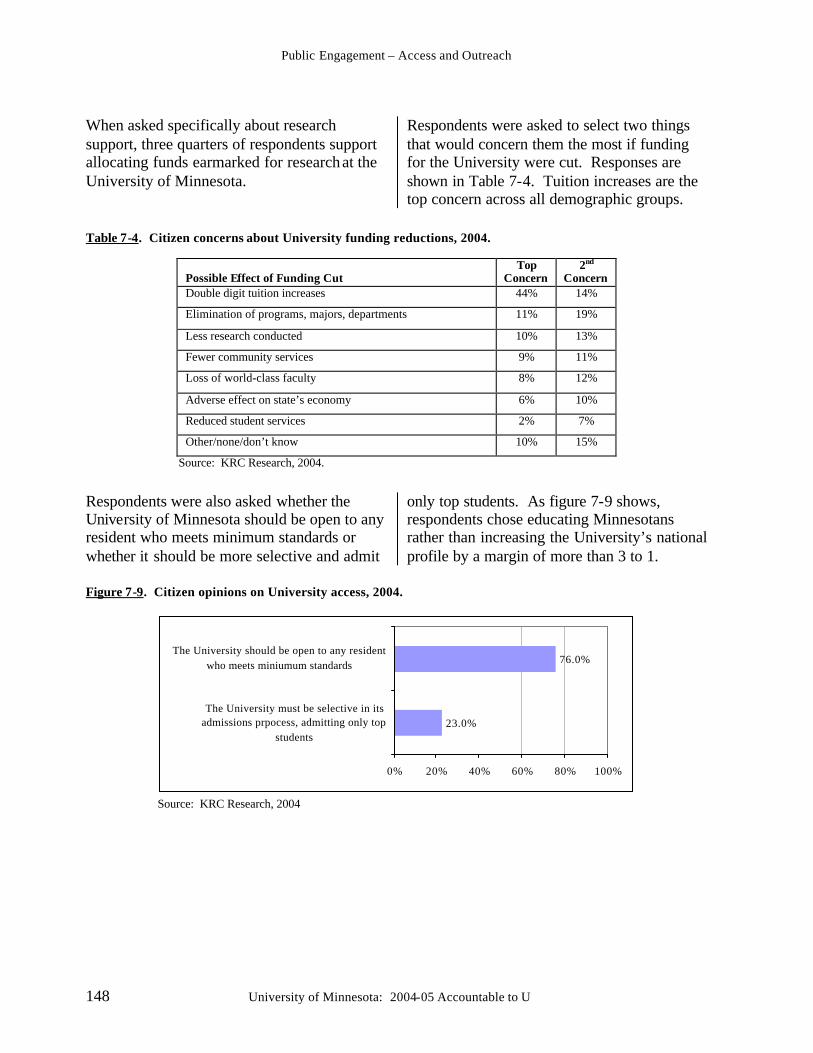
Public Engagement – Access and Outreach
148 University of Minnesota: 2004-05 Accountable to U
When asked specifically about research support, three quarters of respondents support allocating funds earmarked for research at the University of Minnesota.
Respondents were asked to select two things that would concern them the most if funding for the University were cut. Responses are shown in Table 7-4. Tuition increases are the top concern across all demographic groups.
Table 7-4. Citizen concerns about University funding reductions, 2004.
Possible Effect of Funding Cut
Top Concern
2nd Concern
Double digit tuition increases 44% 14%
Elimination of programs, majors, departments 11% 19%
Less research conducted 10% 13%
Fewer community services 9% 11%
Loss of world-class faculty 8% 12%
Adverse effect on state’s economy 6% 10%
Reduced student services 2% 7%
Other/none/don’t know 10% 15%
Source: KRC Research, 2004.
Respondents were also asked whether the University of Minnesota should be open to any resident who meets minimum standards or whether it should be more selective and admit
only top students. As figure 7-9 shows, respondents chose educating Minnesotans rather than increasing the University’s national profile by a margin of more than 3 to 1.
Figure 7-9. Citizen opinions on University access, 2004.
23.0%
76.0%
0% 20% 40% 60% 80% 100%
The University must be selective in itsadmissions prpocess, admitting only top
students
The University should be open to any residentwho meets miniumum standards
Source: KRC Research, 2004
University of Minnesota: 2004-05 Accountable to U 149
8: Efficiency and Effectiveness Colleges and universities are expected to be good stewards of public resources. With declining state support for higher education, mounting health care and other costs, and rising competition for quality faculty, staff, and students, institutions need to be more creative than ever in addressing these significant financial challenges. In an effort to
fulfill their missions and sustain their future viability, universities must embody the values of efficient and effective management. In this state and national context, the University is placing a high priority on fiscal resourcefulness, institutional efficiency, and quality student services.
A. Enhanced Service and Productivity
With capabilities made available by new technologies, and with a history of strong working partnerships that exist among faculty, staff, and administration, the University launched in 2002 the Enhanced Service and Productivity Initiative. This initiative encompasses four broad goals:
§ create a system-wide culture of customer service excellence,
§ identify opportunities where resources can be used to bolster the University’s internal economy,
§ develop approaches for how the University can regularly monitor the effectiveness of key service and support areas, and
§ identify innovations that transform University business practices.
Office of Service and Continuous Improvement To take this work to the next level and consistently promote a culture of service and operational improvement, President Bruininks
established the Office of Service and Continuous Improvement (OSCI) in June 2004 with this vision: “It is my desire that this great university will soon be known as much for its service and business innovation as it is for its high-quality research and education.” OSCI supports the University by:
§ serving as a catalyst and mentor for sustainable improvement;
§ energizing and enabling a culture of continuous improvement; and
§ collaborating with University units to identify and realize sustainable improvements.
OSCI’s goal is to promote and facilitate transformation of the University in three ways:
§ cultural transformation – advancing a culture of operational progress and service improvement;
§ operational transformation – creating accountability structures;
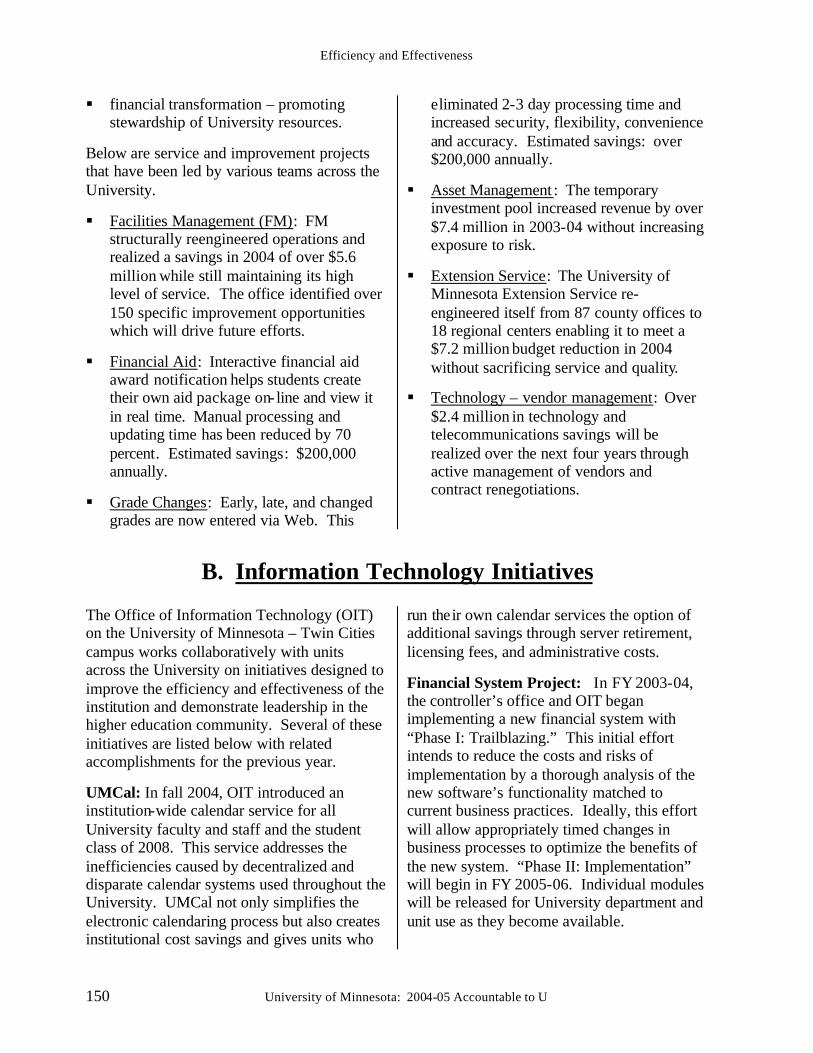
Efficiency and Effectiveness
150 University of Minnesota: 2004-05 Accountable to U
§ financial transformation – promoting stewardship of University resources.
Below are service and improvement projects that have been led by various teams across the University.
§ Facilities Management (FM): FM structurally reengineered operations and realized a savings in 2004 of over $5.6 million while still maintaining its high level of service. The office identified over 150 specific improvement opportunities which will drive future efforts.
§ Financial Aid: Interactive financial aid award notification helps students create their own aid package on- line and view it in real time. Manual processing and updating time has been reduced by 70 percent. Estimated savings: $200,000 annually.
§ Grade Changes: Early, late, and changed grades are now entered via Web. This
eliminated 2-3 day processing time and increased security, flexibility, convenience and accuracy. Estimated savings: over $200,000 annually.
§ Asset Management : The temporary investment pool increased revenue by over $7.4 million in 2003-04 without increasing exposure to risk.
§ Extension Service: The University of Minnesota Extension Service re-engineered itself from 87 county offices to 18 regional centers enabling it to meet a $7.2 million budget reduction in 2004 without sacrificing service and quality.
§ Technology – vendor management: Over $2.4 million in technology and telecommunications savings will be realized over the next four years through active management of vendors and contract renegotiations.
B. Information Technology Initiatives
The Office of Information Technology (OIT) on the University of Minnesota – Twin Cities campus works collaboratively with units across the University on initiatives designed to improve the efficiency and effectiveness of the institution and demonstrate leadership in the higher education community. Several of these initiatives are listed below with related accomplishments for the previous year.
UMCal: In fall 2004, OIT introduced an institution-wide calendar service for all University faculty and staff and the student class of 2008. This service addresses the inefficiencies caused by decentralized and disparate calendar systems used throughout the University. UMCal not only simplifies the electronic calendaring process but also creates institutional cost savings and gives units who
run their own calendar services the option of additional savings through server retirement, licensing fees, and administrative costs.
Financial System Project: In FY 2003-04, the controller’s office and OIT began implementing a new financial system with “Phase I: Trailblazing.” This initial effort intends to reduce the costs and risks of implementation by a thorough analysis of the new software’s functionality matched to current business practices. Ideally, this effort will allow appropriately timed changes in business processes to optimize the benefits of the new system. “Phase II: Implementation” will begin in FY 2005-06. Individual modules will be released for University department and unit use as they become available.
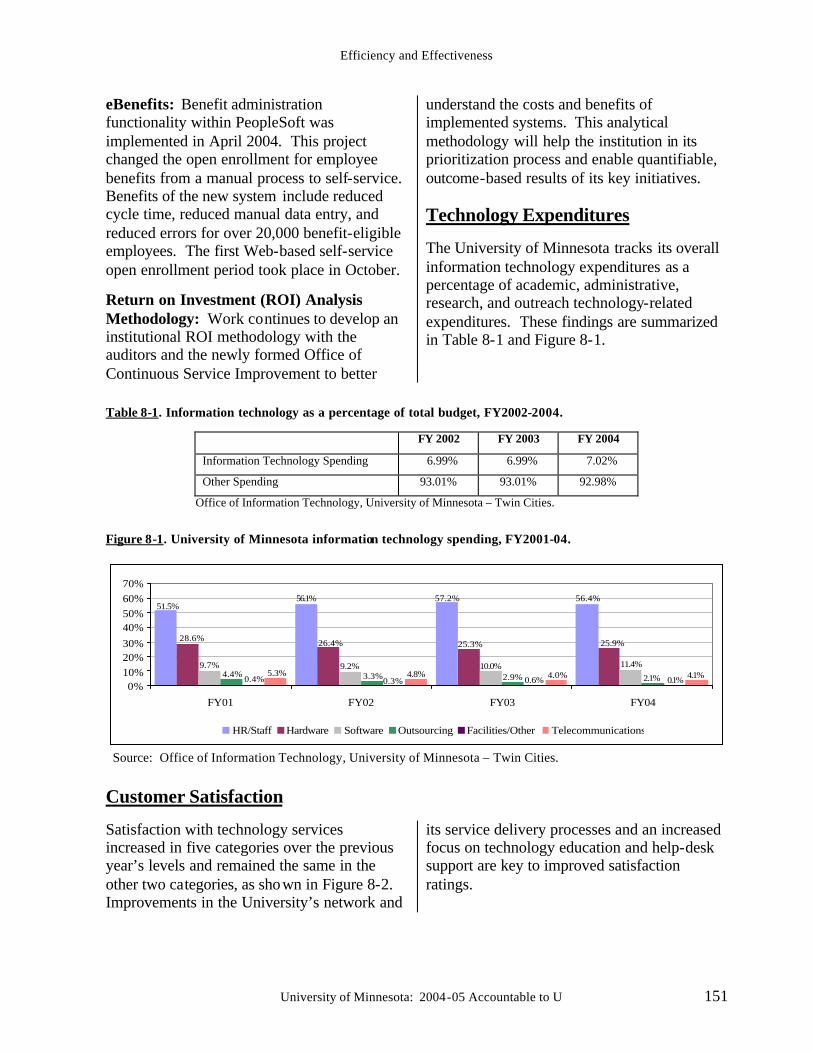
Efficiency and Effectiveness
University of Minnesota: 2004-05 Accountable to U 151
eBenefits: Benefit administration functionality within PeopleSoft was implemented in April 2004. This project changed the open enrollment for employee benefits from a manual process to self-service. Benefits of the new system include reduced cycle time, reduced manual data entry, and reduced errors for over 20,000 benefit-eligible employees. The first Web-based self-service open enrollment period took place in October.
Return on Investment (ROI) Analysis Methodology: Work continues to develop an institutional ROI methodology with the auditors and the newly formed Office of Continuous Service Improvement to better
understand the costs and benefits of implemented systems. This analytical methodology will help the institution in its prioritization process and enable quantifiable, outcome-based results of its key initiatives. Technology Expenditures The University of Minnesota tracks its overall information technology expenditures as a percentage of academic, administrative, research, and outreach technology-related expenditures. These findings are summarized in Table 8-1 and Figure 8-1.
Table 8-1. Information technology as a percentage of total budget, FY2002-2004.
FY 2002 FY 2003 FY 2004
Information Technology Spending 6.99% 6.99% 7.02%
Other Spending 93.01% 93.01% 92.98%
Office of Information Technology, University of Minnesota – Twin Cities.
Figure 8-1. University of Minnesota information technology spending, FY2001-04.
56.4%57.2%56.1%51.5%
25.9%25.3%26.4%28.6%
11.4%10.0%9.2%9.7%2.1%2.9%3.3%4.4%
0.1%0.6%0.3%0.4% 4.1%4.0%4.8%5.3%
0%10%20%30%40%50%60%70%
FY01 FY02 FY03 FY04
HR/Staff Hardware Software Outsourcing Facilities/Other Telecommunications
Source: Office of Information Technology, University of Minnesota – Twin Cities.
Customer Satisfaction
Satisfaction with technology services increased in five categories over the previous year’s levels and remained the same in the other two categories, as shown in Figure 8-2. Improvements in the University’s network and
its service delivery processes and an increased focus on technology education and help-desk support are key to improved satisfaction ratings.
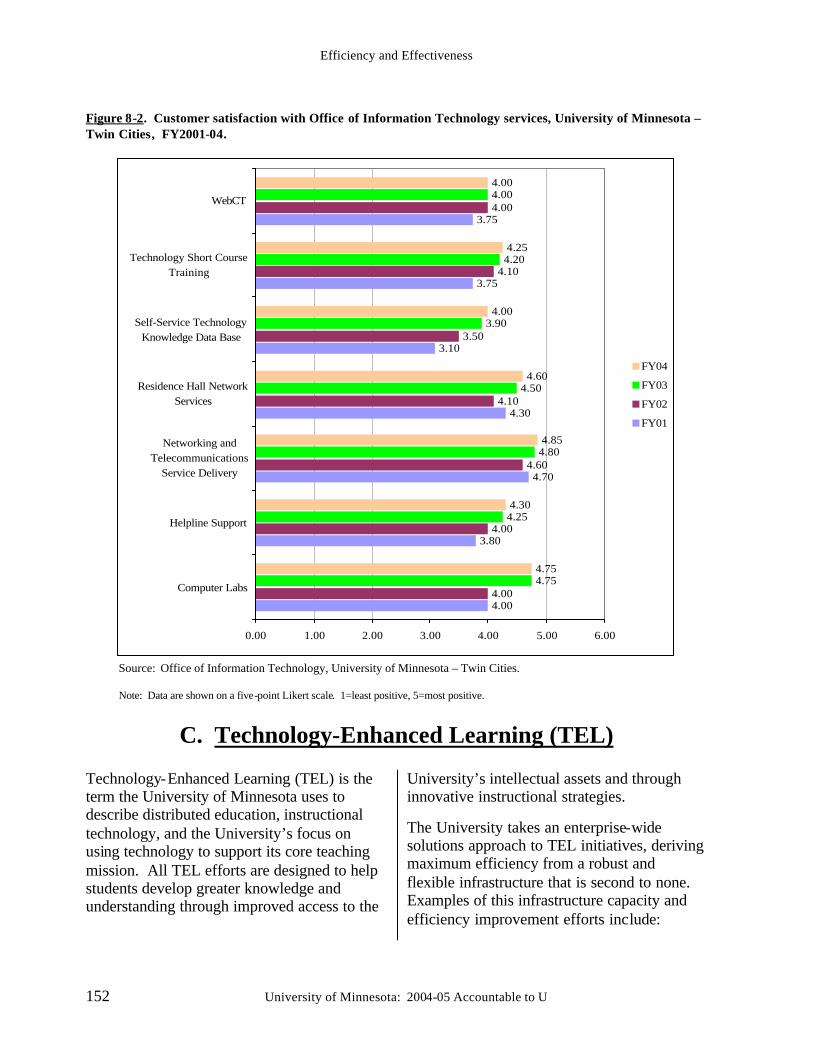
Efficiency and Effectiveness
152 University of Minnesota: 2004-05 Accountable to U
Figure 8-2. Customer satisfaction with Office of Information Technology services, University of Minnesota – Twin Cities, FY2001-04.
4.00
3.80
4.70
4.30
3.10
3.75
3.75
4.00
4.00
4.60
4.10
3.50
4.10
4.00
4.75
4.25
4.80
4.50
3.90
4.20
4.00
4.75
4.30
4.85
4.60
4.00
4.25
4.00
0.00 1.00 2.00 3.00 4.00 5.00 6.00
Computer Labs
Helpline Support
Networking andTelecommunications
Service Delivery
Residence Hall NetworkServices
Self-Service TechnologyKnowledge Data Base
Technology Short CourseTraining
WebCT
FY04
FY03
FY02
FY01
Source: Office of Information Technology, University of Minnesota – Twin Cities. Note: Data are shown on a five-point Likert scale. 1=least positive, 5=most positive.
C. Technology-Enhanced Learning (TEL) Technology-Enhanced Learning (TEL) is the term the University of Minnesota uses to describe distributed education, instructional technology, and the University’s focus on using technology to support its core teaching mission. All TEL efforts are designed to help students develop greater knowledge and understanding through improved access to the
University’s intellectual assets and through innovative instructional strategies.
The University takes an enterprise-wide solutions approach to TEL initiatives, deriving maximum efficiency from a robust and flexible infrastructure that is second to none. Examples of this infrastructure capacity and efficiency improvement efforts include:
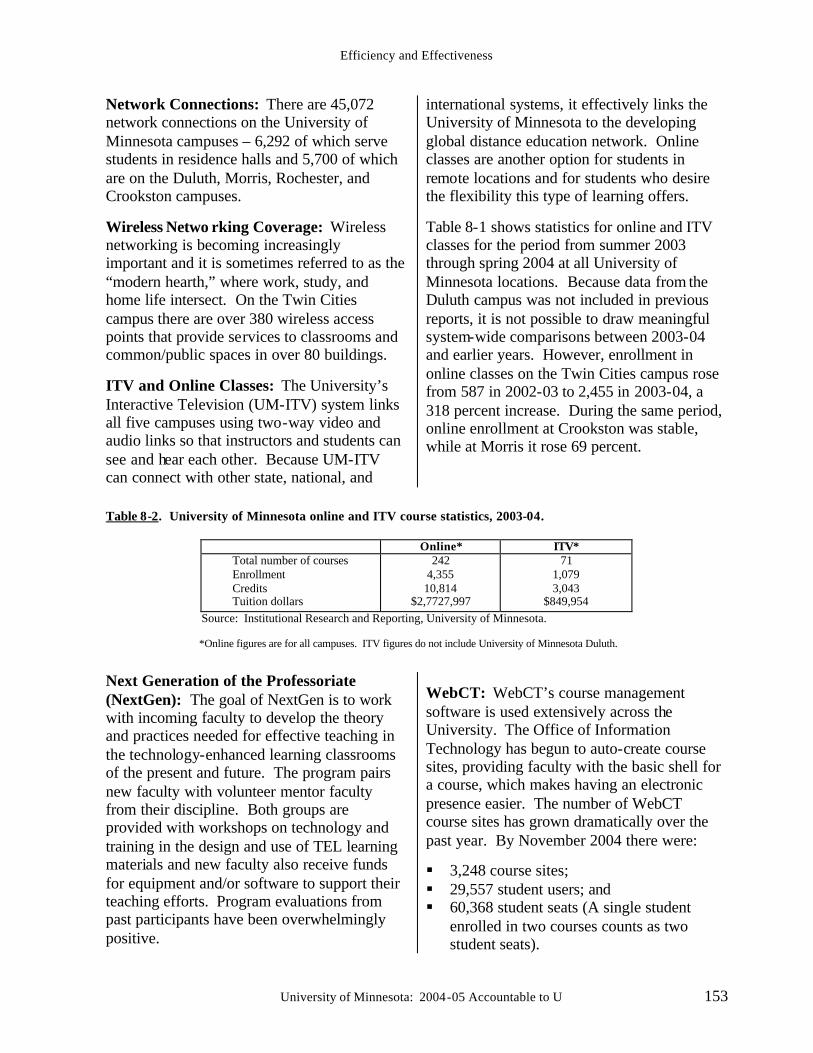
Efficiency and Effectiveness
University of Minnesota: 2004-05 Accountable to U 153
Network Connections: There are 45,072 network connections on the University of Minnesota campuses – 6,292 of which serve students in residence halls and 5,700 of which are on the Duluth, Morris, Rochester, and Crookston campuses.
Wireless Netwo rking Coverage: Wireless networking is becoming increasingly important and it is sometimes referred to as the “modern hearth,” where work, study, and home life intersect. On the Twin Cities campus there are over 380 wireless access points that provide services to classrooms and common/public spaces in over 80 buildings.
ITV and Online Classes: The University’s Interactive Television (UM-ITV) system links all five campuses using two-way video and audio links so that instructors and students can see and hear each other. Because UM-ITV can connect with other state, national, and
international systems, it effectively links the University of Minnesota to the developing global distance education network. Online classes are another option for students in remote locations and for students who desire the flexibility this type of learning offers.
Table 8-1 shows statistics for online and ITV classes for the period from summer 2003 through spring 2004 at all University of Minnesota locations. Because data from the Duluth campus was not included in previous reports, it is not possible to draw meaningful system-wide comparisons between 2003-04 and earlier years. However, enrollment in online classes on the Twin Cities campus rose from 587 in 2002-03 to 2,455 in 2003-04, a 318 percent increase. During the same period, online enrollment at Crookston was stable, while at Morris it rose 69 percent.
Table 8-2. University of Minnesota online and ITV course statistics, 2003-04.
Online* ITV* Total number of courses Enrollment Credits Tuition dollars
242 4,355 10,814
$2,7727,997
71 1,079 3,043
$849,954 Source: Institutional Research and Reporting, University of Minnesota.
*Online figures are for all campuses. ITV figures do not include University of Minnesota Duluth.
Next Generation of the Professoriate (NextGen): The goal of NextGen is to work with incoming faculty to develop the theory and practices needed for effective teaching in the technology-enhanced learning classrooms of the present and future. The program pairs new faculty with volunteer mentor faculty from their discipline. Both groups are provided with workshops on technology and training in the design and use of TEL learning materials and new faculty also receive funds for equipment and/or software to support their teaching efforts. Program evaluations from past participants have been overwhelmingly positive.
WebCT: WebCT’s course management software is used extensively across the University. The Office of Information Technology has begun to auto-create course sites, providing faculty with the basic shell for a course, which makes having an electronic presence easier. The number of WebCT course sites has grown dramatically over the past year. By November 2004 there were:
§ 3,248 course sites; § 29,557 student users; and § 60,368 student seats (A single student
enrolled in two courses counts as two student seats).
Efficiency and Effectiveness
154 University of Minnesota: 2004-05 Accountable to U
Interactive Technology—Breeze and Blogs : The University now offers Breeze, an automated system for creating and publishing multi-media presentations and conducting live meetings via the Web from a desktop computer. Presenters can display graphics and PowerPoint slides, broadcast audio and video, interact using chat and whiteboard tools, and gather real-time feedback from both on-site and distributed audience members. Students or audience members gain access via a link from a WebCT course site, a myU (portal) site, or a general Web site.
Another example of interactive technology that gained momentum during 2004 is the weblog, or “blog,” a Web page created as an interactive electronic journal. University Libraries and the Office of Information
Technology have collaborated to promote blogs as an effective form of personal expression, a record of the student voice, a discussion tool, and a basis for forming communities of learners. The number of blogs established to date has surpassed the initial goal of 1,000 per year. Technology for Life : Also known as “K to gray,” this initiative connects learners of all ages with technology such as email, portfolio, and the portal. Portfolio now has 30,000 users; over 60,000 individuals have initiated accounts on the portal.
OneHelp: The University improved efficiency this year by expanding its technical helpline into a 24/7 service with staff who are able to help callers with a wide range of technical problems.
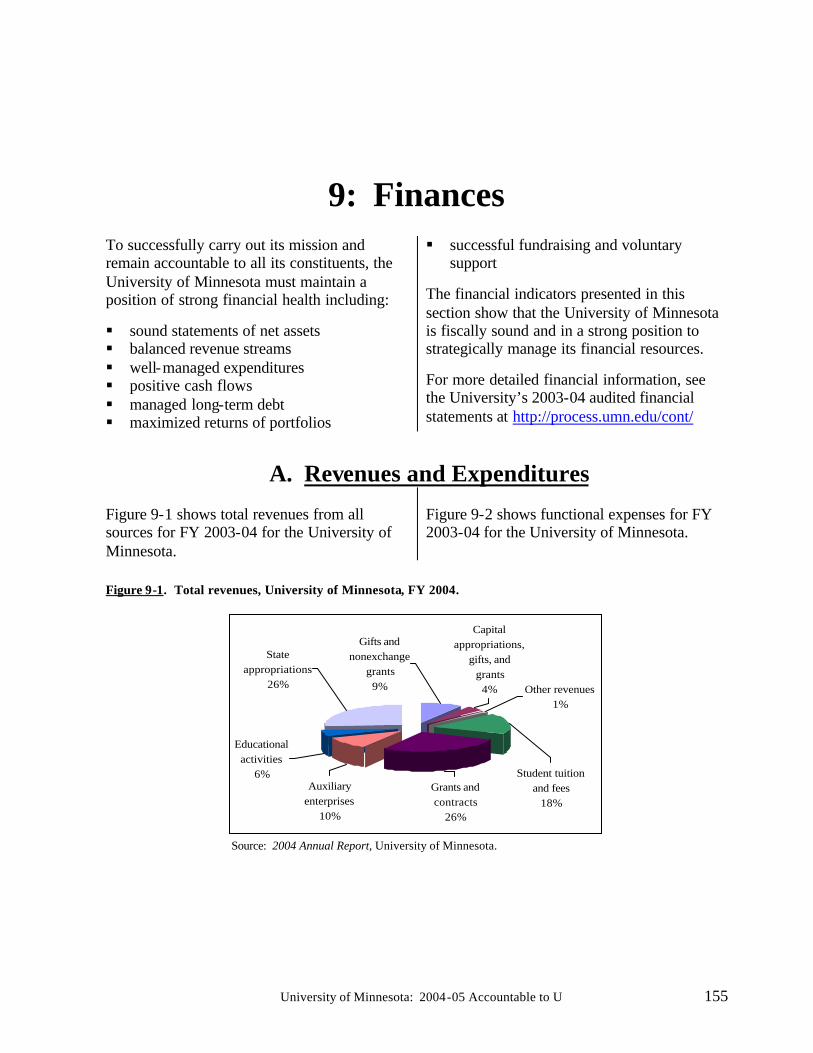
University of Minnesota: 2004-05 Accountable to U 155
9: Finances To successfully carry out its mission and remain accountable to all its constituents, the University of Minnesota must maintain a position of strong financial health including:
§ sound statements of net assets § balanced revenue streams § well-managed expenditures § positive cash flows § managed long-term debt § maximized returns of portfolios
§ successful fundraising and voluntary support
The financial indicators presented in this section show that the University of Minnesota is fiscally sound and in a strong position to strategically manage its financial resources.
For more detailed financial information, see the University’s 2003-04 audited financial statements at http://process.umn.edu/cont/
A. Revenues and Expenditures
Figure 9-1 shows total revenues from all sources for FY 2003-04 for the University of Minnesota.
Figure 9-2 shows functional expenses for FY 2003-04 for the University of Minnesota.
Figure 9-1. Total revenues, University of Minnesota, FY 2004.
Capital appropriations,
gifts, and grants
4% Other revenues1%
Gifts and nonexchange
grants9%
Student tuition and fees
18%Grants and contracts
26%
Auxiliary enterprises
10%
Educational activities
6%
State appropriations
26%
Source: 2004 Annual Report, University of Minnesota.
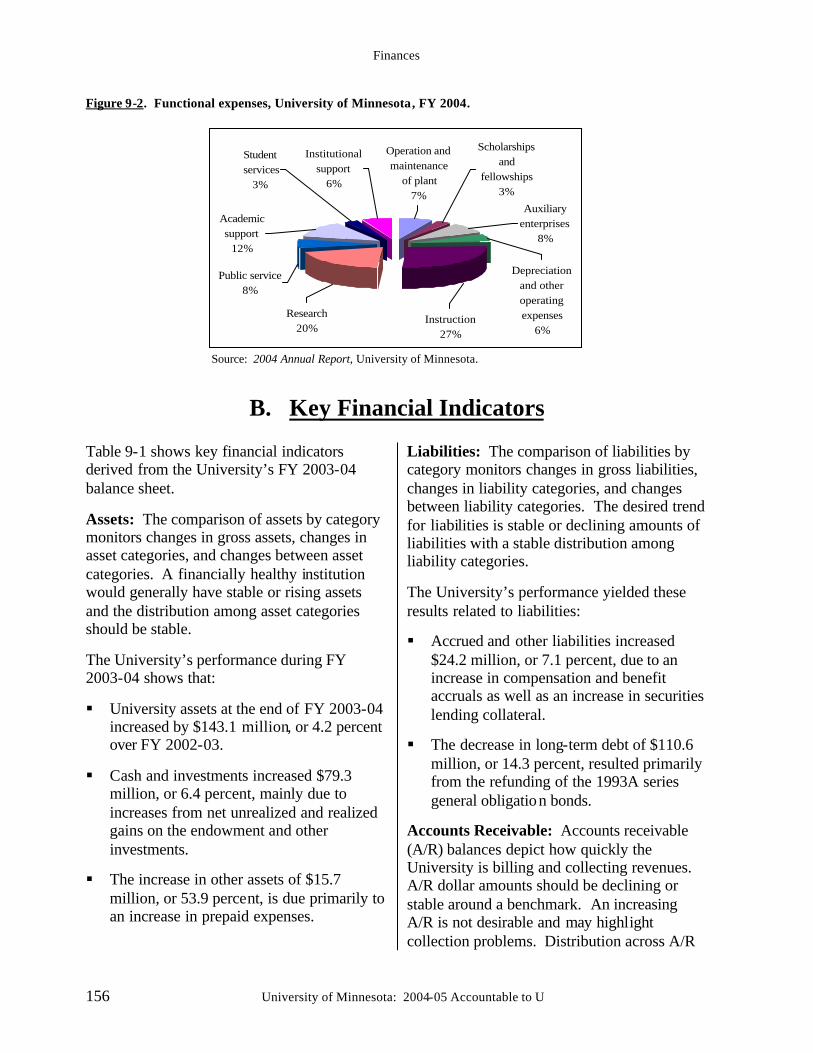
Finances
156 University of Minnesota: 2004-05 Accountable to U
Figure 9-2. Functional expenses, University of Minnesota, FY 2004.
Depreciation and other operating expenses
6%Instruction
27%
Research 20%
Public service8%
Academic support
12%
Student services
3%
Operation and maintenance
of plant7%
Scholarships and
fellowships3%
Auxiliary enterprises
8%
Institutional support
6%
Source: 2004 Annual Report, University of Minnesota.
B. Key Financial Indicators
Table 9-1 shows key financial indicators derived from the University’s FY 2003-04 balance sheet.
Assets: The comparison of assets by category monitors changes in gross assets, changes in asset categories, and changes between asset categories. A financially healthy institution would generally have stable or rising assets and the distribution among asset categories should be stable.
The University’s performance during FY 2003-04 shows that:
§ University assets at the end of FY 2003-04 increased by $143.1 million, or 4.2 percent over FY 2002-03.
§ Cash and investments increased $79.3 million, or 6.4 percent, mainly due to increases from net unrealized and realized gains on the endowment and other investments.
§ The increase in other assets of $15.7 million, or 53.9 percent, is due primarily to an increase in prepaid expenses.
Liabilities: The comparison of liabilities by category monitors changes in gross liabilities, changes in liability categories, and changes between liability categories. The desired trend for liabilities is stable or declining amounts of liabilities with a stable distribution among liability categories.
The University’s performance yielded these results related to liabilities:
§ Accrued and other liabilities increased $24.2 million, or 7.1 percent, due to an increase in compensation and benefit accruals as well as an increase in securities lending collateral.
§ The decrease in long-term debt of $110.6 million, or 14.3 percent, resulted primarily from the refunding of the 1993A series general obligation bonds.
Accounts Receivable: Accounts receivable (A/R) balances depict how quickly the University is billing and collecting revenues. A/R dollar amounts should be declining or stable around a benchmark. An increasing A/R is not desirable and may highlight collection problems. Distribution across A/R
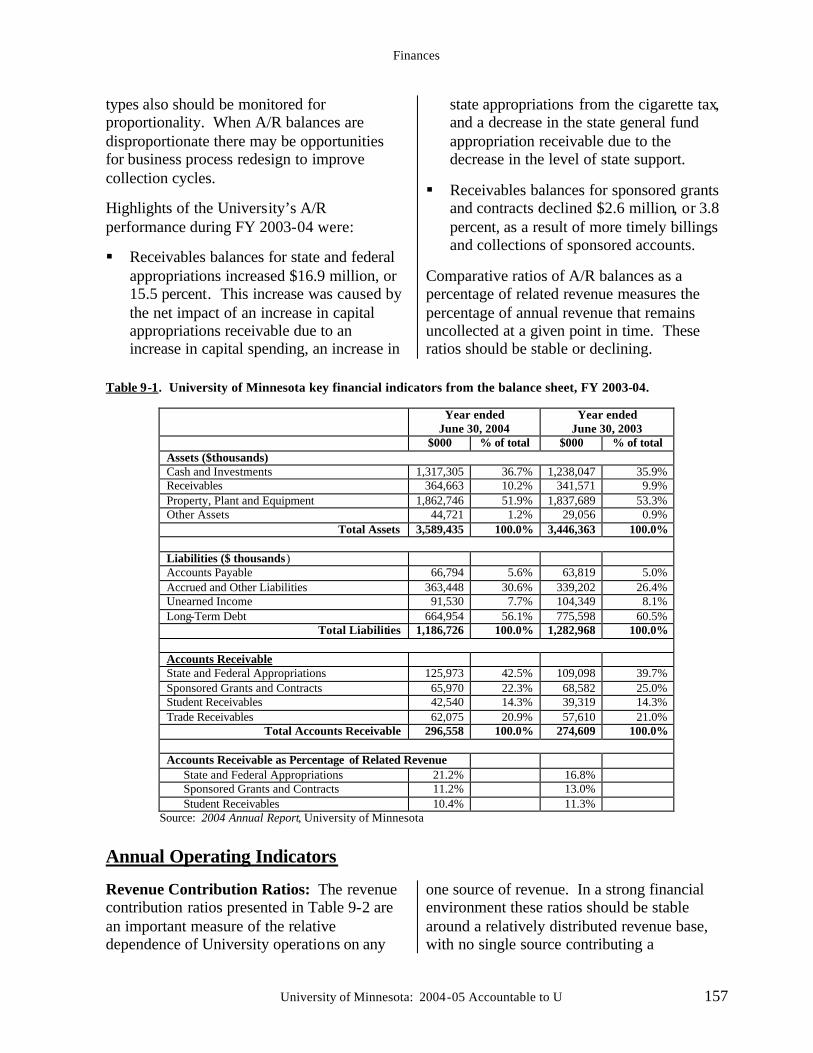
Finances
University of Minnesota: 2004-05 Accountable to U 157
types also should be monitored for proportionality. When A/R balances are disproportionate there may be opportunities for business process redesign to improve collection cycles.
Highlights of the University’s A/R performance during FY 2003-04 were:
§ Receivables balances for state and federal appropriations increased $16.9 million, or 15.5 percent. This increase was caused by the net impact of an increase in capital appropriations receivable due to an increase in capital spending, an increase in
state appropriations from the cigarette tax, and a decrease in the state general fund appropriation receivable due to the decrease in the level of state support.
§ Receivables balances for sponsored grants and contracts declined $2.6 million, or 3.8 percent, as a result of more timely billings and collections of sponsored accounts.
Comparative ratios of A/R balances as a percentage of related revenue measures the percentage of annual revenue that remains uncollected at a given point in time. These ratios should be stable or declining.
Table 9-1. University of Minnesota key financial indicators from the balance sheet, FY 2003-04.
Year ended June 30, 2004
Year ended June 30, 2003
$000 % of total $000 % of total Assets ($thousands) Cash and Investments 1,317,305 36.7% 1,238,047 35.9% Receivables 364,663 10.2% 341,571 9.9% Property, Plant and Equipment 1,862,746 51.9% 1,837,689 53.3% Other Assets 44,721 1.2% 29,056 0.9%
Total Assets 3,589,435 100.0% 3,446,363 100.0%
Liabilities ($ thousands) Accounts Payable 66,794 5.6% 63,819 5.0% Accrued and Other Liabilities 363,448 30.6% 339,202 26.4% Unearned Income 91,530 7.7% 104,349 8.1% Long-Term Debt 664,954 56.1% 775,598 60.5%
Total Liabilities 1,186,726 100.0% 1,282,968 100.0%
Accounts Receivable State and Federal Appropriations 125,973 42.5% 109,098 39.7% Sponsored Grants and Contracts 65,970 22.3% 68,582 25.0% Student Receivables 42,540 14.3% 39,319 14.3% Trade Receivables 62,075 20.9% 57,610 21.0%
Total Accounts Receivable 296,558 100.0% 274,609 100.0%
Accounts Receivable as Percentage of Related Revenue State and Federal Appropriations 21.2% 16.8% Sponsored Grants and Contracts 11.2% 13.0% Student Receivables 10.4% 11.3%
Source: 2004 Annual Report, University of Minnesota
Annual Operating Indicators Revenue Contribution Ratios: The revenue contribution ratios presented in Table 9-2 are an important measure of the relative dependence of University operations on any
one source of revenue. In a strong financial environment these ratios should be stable around a relatively distributed revenue base, with no single source contributing a
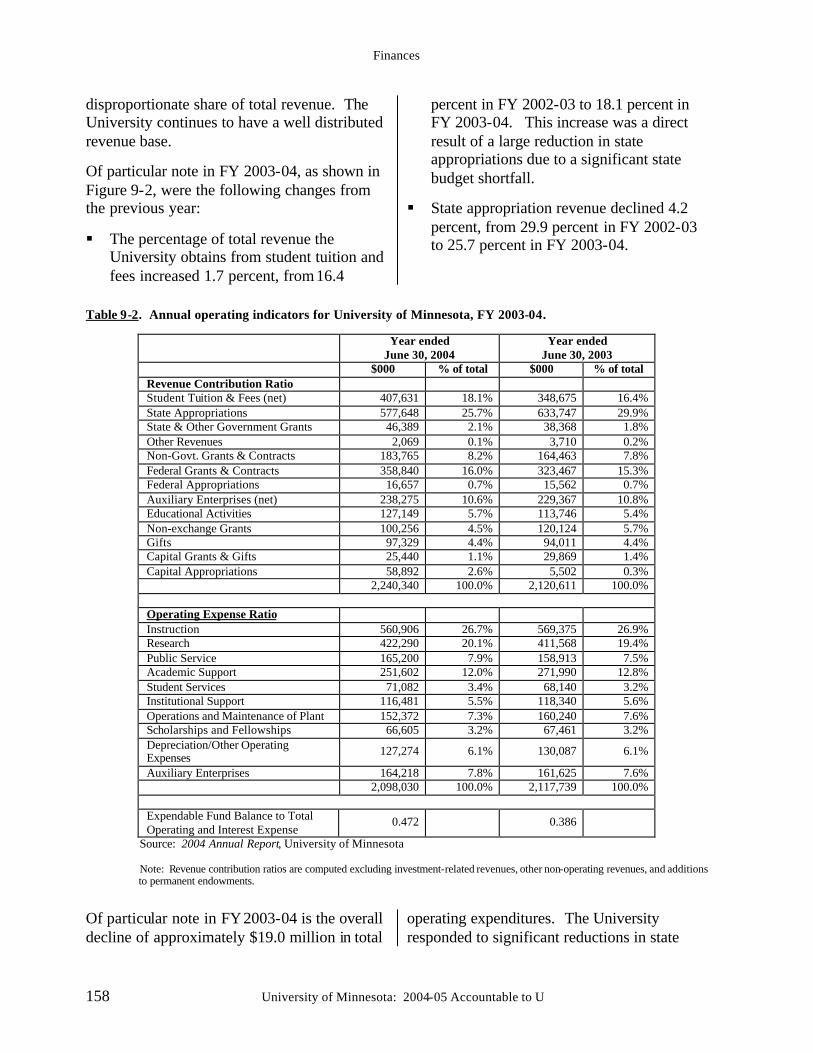
Finances
158 University of Minnesota: 2004-05 Accountable to U
disproportionate share of total revenue. The University continues to have a well distributed revenue base.
Of particular note in FY 2003-04, as shown in Figure 9-2, were the following changes from the previous year:
§ The percentage of total revenue the University obtains from student tuition and fees increased 1.7 percent, from 16.4
percent in FY 2002-03 to 18.1 percent in FY 2003-04. This increase was a direct result of a large reduction in state appropriations due to a significant state budget shortfall.
§ State appropriation revenue declined 4.2 percent, from 29.9 percent in FY 2002-03 to 25.7 percent in FY 2003-04.
Table 9-2. Annual operating indicators for University of Minnesota, FY 2003-04.
Year ended June 30, 2004
Year ended June 30, 2003
$000 % of total $000 % of total Revenue Contribution Ratio Student Tuition & Fees (net) 407,631 18.1% 348,675 16.4% State Appropriations 577,648 25.7% 633,747 29.9% State & Other Government Grants 46,389 2.1% 38,368 1.8% Other Revenues 2,069 0.1% 3,710 0.2% Non-Govt. Grants & Contracts 183,765 8.2% 164,463 7.8% Federal Grants & Contracts 358,840 16.0% 323,467 15.3% Federal Appropriations 16,657 0.7% 15,562 0.7% Auxiliary Enterprises (net) 238,275 10.6% 229,367 10.8% Educational Activities 127,149 5.7% 113,746 5.4% Non-exchange Grants 100,256 4.5% 120,124 5.7% Gifts 97,329 4.4% 94,011 4.4% Capital Grants & Gifts 25,440 1.1% 29,869 1.4% Capital Appropriations 58,892 2.6% 5,502 0.3% 2,240,340 100.0% 2,120,611 100.0%
Operating Expense Ratio Instruction 560,906 26.7% 569,375 26.9% Research 422,290 20.1% 411,568 19.4% Public Service 165,200 7.9% 158,913 7.5% Academic Support 251,602 12.0% 271,990 12.8% Student Services 71,082 3.4% 68,140 3.2% Institutional Support 116,481 5.5% 118,340 5.6% Operations and Maintenance of Plant 152,372 7.3% 160,240 7.6% Scholarships and Fellowships 66,605 3.2% 67,461 3.2% Depreciation/Other Operating Expenses 127,274 6.1% 130,087 6.1%
Auxiliary Enterprises 164,218 7.8% 161,625 7.6% 2,098,030 100.0% 2,117,739 100.0%
Expendable Fund Balance to Total Operating and Interest Expense
0.472 0.386
Source: 2004 Annual Report, University of Minnesota
Note: Revenue contribution ratios are computed excluding investment-related revenues, other non-operating revenues, and additions to permanent endowments.
Of particular note in FY 2003-04 is the overall decline of approximately $19.0 million in total
operating expenditures. The University responded to significant reductions in state
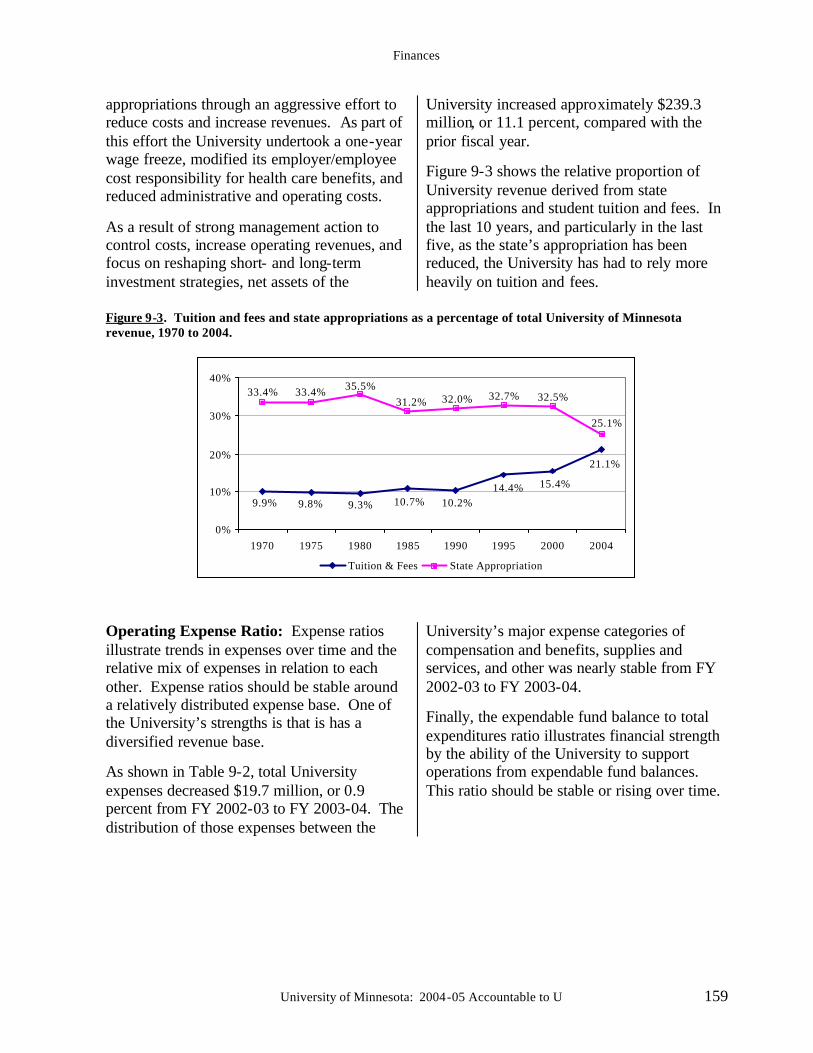
Finances
University of Minnesota: 2004-05 Accountable to U 159
appropriations through an aggressive effort to reduce costs and increase revenues. As part of this effort the University undertook a one-year wage freeze, modified its employer/employee cost responsibility for health care benefits, and reduced administrative and operating costs.
As a result of strong management action to control costs, increase operating revenues, and focus on reshaping short- and long-term investment strategies, net assets of the
University increased approximately $239.3 million, or 11.1 percent, compared with the prior fiscal year.
Figure 9-3 shows the relative proportion of University revenue derived from state appropriations and student tuition and fees. In the last 10 years, and particularly in the last five, as the state’s appropriation has been reduced, the University has had to rely more heavily on tuition and fees.
Figure 9-3. Tuition and fees and state appropriations as a percentage of total University of Minnesota revenue, 1970 to 2004.
21.1%
15.4%14.4%10.2%10.7%9.3%9.8%9.9%
25.1%
32.5%32.7%32.0%31.2%35.5%33.4%33.4%
0%
10%
20%
30%
40%
1970 1975 1980 1985 1990 1995 2000 2004
Tuition & Fees State Appropriation
Operating Expense Ratio: Expense ratios illustrate trends in expenses over time and the relative mix of expenses in relation to each other. Expense ratios should be stable around a relatively distributed expense base. One of the University’s strengths is that is has a diversified revenue base.
As shown in Table 9-2, total University expenses decreased $19.7 million, or 0.9 percent from FY 2002-03 to FY 2003-04. The distribution of those expenses between the
University’s major expense categories of compensation and benefits, supplies and services, and other was nearly stable from FY 2002-03 to FY 2003-04.
Finally, the expendable fund balance to total expenditures ratio illustrates financial strength by the ability of the University to support operations from expendable fund balances. This ratio should be stable or rising over time.
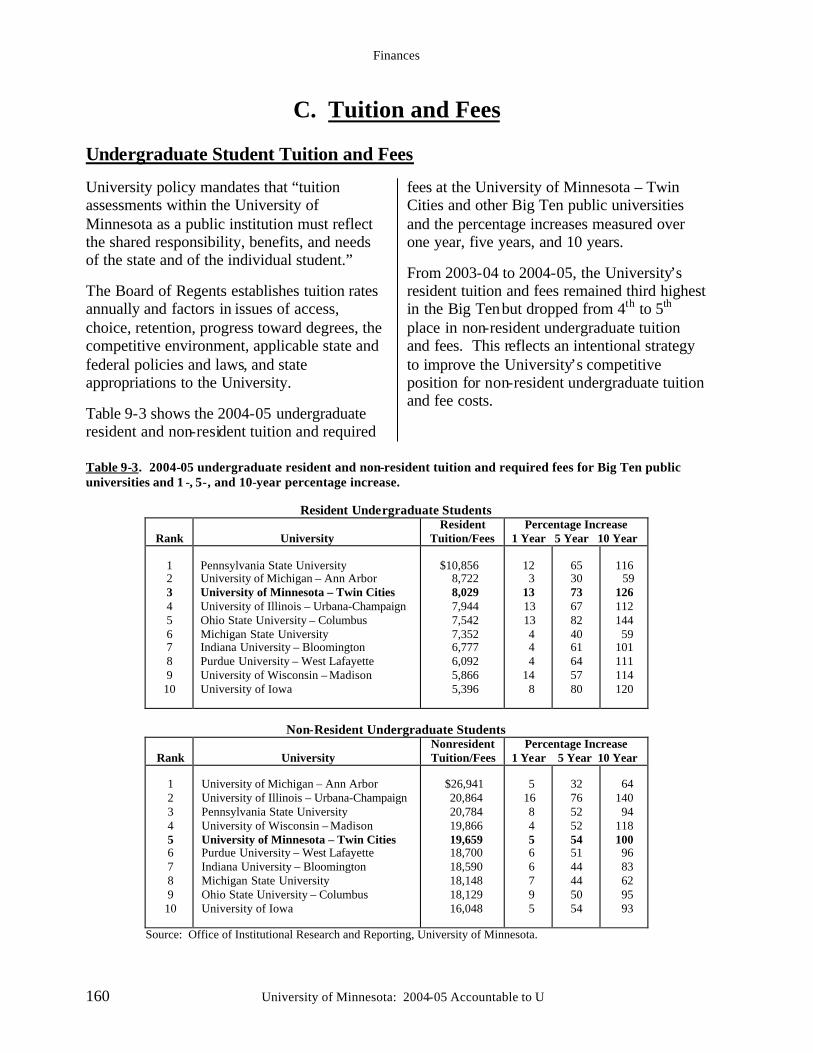
Finances
160 University of Minnesota: 2004-05 Accountable to U
C. Tuition and Fees
Undergraduate Student Tuition and Fees
University policy mandates that “tuition assessments within the University of Minnesota as a public institution must reflect the shared responsibility, benefits, and needs of the state and of the individual student.”
The Board of Regents establishes tuition rates annually and factors in issues of access, choice, retention, progress toward degrees, the competitive environment, applicable state and federal policies and laws, and state appropriations to the University.
Table 9-3 shows the 2004-05 undergraduate resident and non-resident tuition and required
fees at the University of Minnesota – Twin Cities and other Big Ten public universities and the percentage increases measured over one year, five years, and 10 years.
From 2003-04 to 2004-05, the University’s resident tuition and fees remained third highest in the Big Ten but dropped from 4th to 5th place in non-resident undergraduate tuition and fees. This reflects an intentional strategy to improve the University’s competitive position for non-resident undergraduate tuition and fee costs.
Table 9-3. 2004-05 undergraduate resident and non-resident tuition and required fees for Big Ten public universities and 1 -, 5-, and 10-year percentage increase.
Resident Undergraduate Students
Rank
University Resident
Tuition/Fees Percentage Increase
1 Year 5 Year 10 Year 1 2 3 4 5 6 7 8 9 10
Pennsylvania State University University of Michigan – Ann Arbor University of Minnesota – Twin Cities University of Illinois – Urbana-Champaign Ohio State University – Columbus Michigan State University Indiana University – Bloomington Purdue University – West Lafayette University of Wisconsin – Madison University of Iowa
$10,856
8,722 8,029 7,944 7,542 7,352 6,777 6,092 5,866 5,396
12 3 13 13 13 4 4 4 14 8
65 30 73 67 82 40 61 64 57 80
116 59 126 112 144 59 101 111 114 120
Non-Resident Undergraduate Students
Rank
University
Nonresident Tuition/Fees
Percentage Increase 1 Year 5 Year 10 Year
1 2 3 4 5 6 7 8 9 10
University of Michigan – Ann Arbor University of Illinois – Urbana-Champaign Pennsylvania State University University of Wisconsin – Madison University of Minnesota – Twin Cities Purdue University – West Lafayette Indiana University – Bloomington Michigan State University Ohio State University – Columbus University of Iowa
$26,941 20,864 20,784 19,866 19,659 18,700 18,590 18,148 18,129 16,048
5 16 8 4 5 6 6 7 9 5
32 76 52 52 54 51 44 44 50 54
64 140 94 118 100 96 83 62 95 93
Source: Office of Institutional Research and Reporting, University of Minnesota.
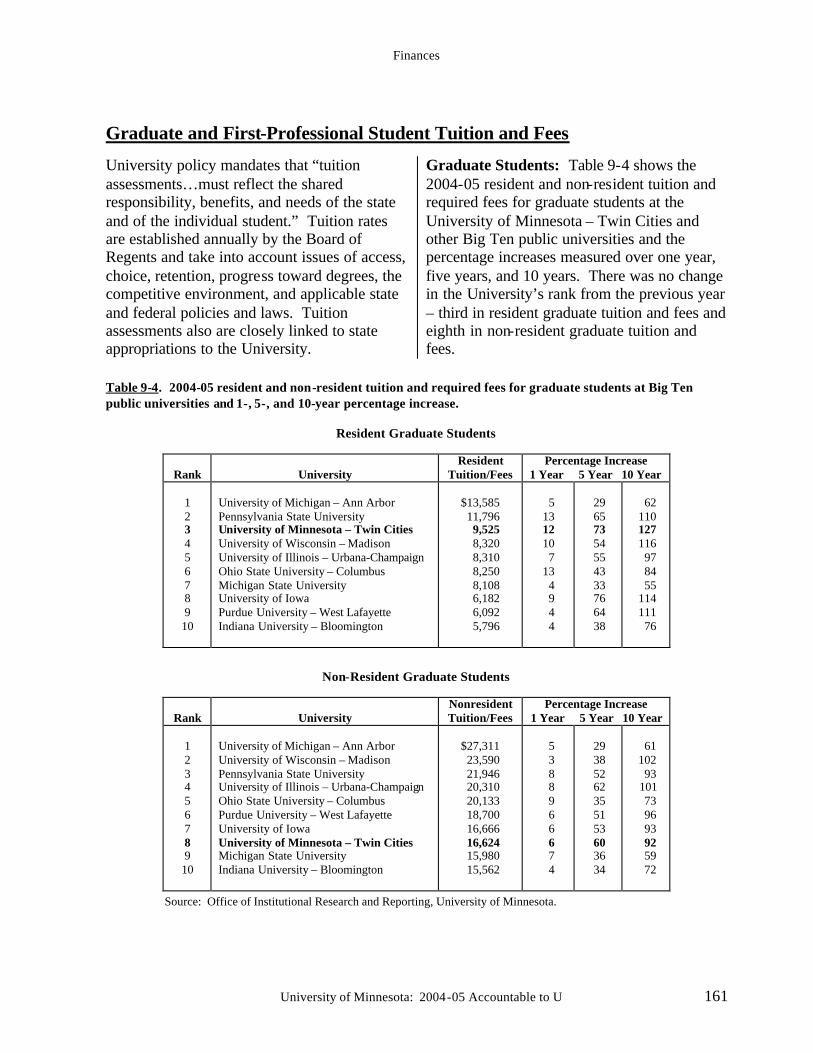
Finances
University of Minnesota: 2004-05 Accountable to U 161
Graduate and First-Professional Student Tuition and Fees
University policy mandates that “tuition assessments…must reflect the shared responsibility, benefits, and needs of the state and of the individual student.” Tuition rates are established annually by the Board of Regents and take into account issues of access, choice, retention, progress toward degrees, the competitive environment, and applicable state and federal policies and laws. Tuition assessments also are closely linked to state appropriations to the University.
Graduate Students: Table 9-4 shows the 2004-05 resident and non-resident tuition and required fees for graduate students at the University of Minnesota – Twin Cities and other Big Ten public universities and the percentage increases measured over one year, five years, and 10 years. There was no change in the University’s rank from the previous year – third in resident graduate tuition and fees and eighth in non-resident graduate tuition and fees.
Table 9-4. 2004-05 resident and non-resident tuition and required fees for graduate students at Big Ten public universities and 1-, 5-, and 10-year percentage increase.
Resident Graduate Students
Rank
University
Resident Tuition/Fees
Percentage Increase 1 Year 5 Year 10 Year
1 2 3 4 5 6 7 8 9 10
University of Michigan – Ann Arbor Pennsylvania State University University of Minnesota – Twin Cities University of Wisconsin – Madison University of Illinois – Urbana-Champaign Ohio State University – Columbus Michigan State University University of Iowa Purdue University – West Lafayette Indiana University – Bloomington
$13,585 11,796 9,525 8,320 8,310 8,250 8,108 6,182 6,092 5,796
5 13 12 10 7 13 4 9 4 4
29 65 73 54 55 43 33 76 64 38
62 110 127 116 97 84 55 114 111 76
Non-Resident Graduate Students
Rank
University Nonresident Tuition/Fees
Percentage Increase 1 Year 5 Year 10 Year
1 2 3 4 5 6 7 8 9 10
University of Michigan – Ann Arbor University of Wisconsin – Madison Pennsylvania State University University of Illinois – Urbana-Champaign Ohio State University – Columbus Purdue University – West Lafayette University of Iowa University of Minnesota – Twin Cities Michigan State University Indiana University – Bloomington
$27,311 23,590 21,946 20,310 20,133 18,700 16,666 16,624 15,980 15,562
5 3 8 8 9 6 6 6 7 4
29 38 52 62 35 51 53 60 36 34
61 102 93 101 73 96 93 92 59 72
Source: Office of Institutional Research and Reporting, University of Minnesota.
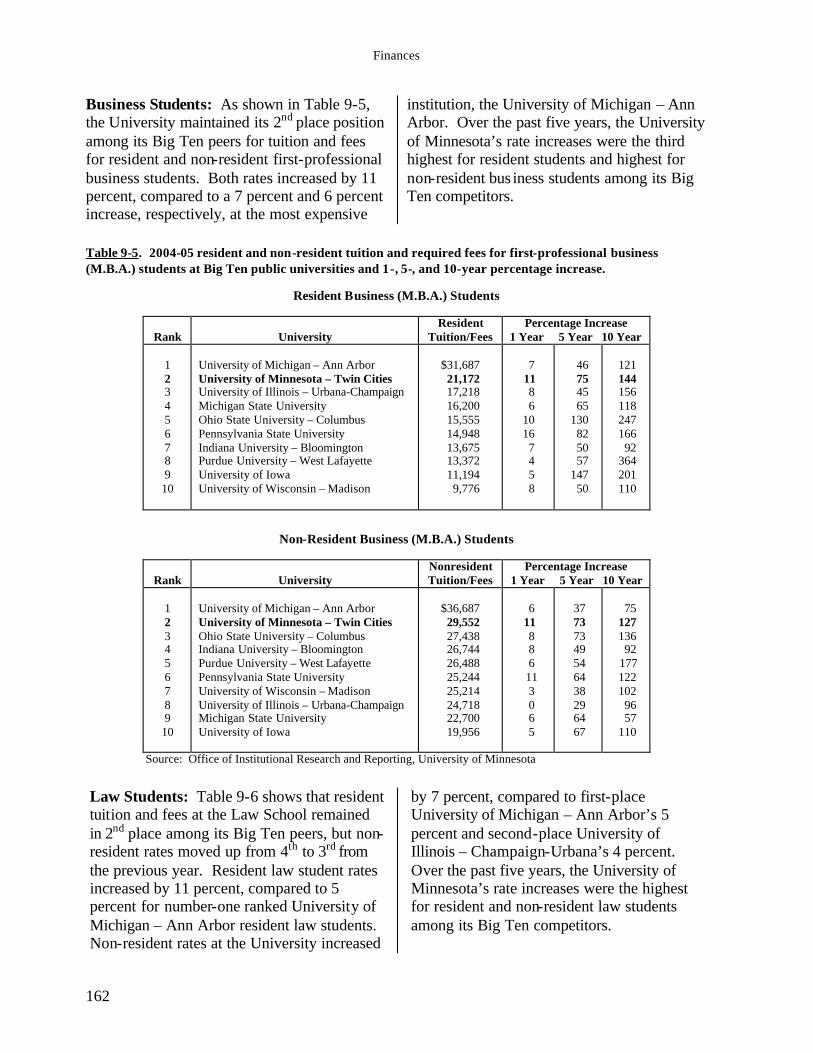
Finances
162
Business Students: As shown in Table 9-5, the University maintained its 2nd place position among its Big Ten peers for tuition and fees for resident and non-resident first-professional business students. Both rates increased by 11 percent, compared to a 7 percent and 6 percent increase, respectively, at the most expensive
institution, the University of Michigan – Ann Arbor. Over the past five years, the University of Minnesota’s rate increases were the third highest for resident students and highest for non-resident bus iness students among its Big Ten competitors.
Table 9-5. 2004-05 resident and non-resident tuition and required fees for first-professional business (M.B.A.) students at Big Ten public universities and 1-, 5-, and 10-year percentage increase.
Resident Business (M.B.A.) Students
Rank
University
Resident Tuition/Fees
Percentage Increase 1 Year 5 Year 10 Year
1 2 3 4 5 6 7 8 9 10
University of Michigan – Ann Arbor University of Minnesota – Twin Cities University of Illinois – Urbana-Champaign Michigan State University Ohio State University – Columbus Pennsylvania State University Indiana University – Bloomington Purdue University – West Lafayette University of Iowa University of Wisconsin – Madison
$31,687 21,172 17,218 16,200 15,555 14,948 13,675 13,372 11,194 9,776
7 11 8 6 10 16 7 4 5 8
46 75 45 65 130 82 50 57 147 50
121 144 156 118 247 166 92 364 201 110
Non-Resident Business (M.B.A.) Students
Rank
University Nonresident Tuition/Fees
Percentage Increase 1 Year 5 Year 10 Year
1 2 3 4 5 6 7 8 9 10
University of Michigan – Ann Arbor University of Minnesota – Twin Cities Ohio State University – Columbus Indiana University – Bloomington Purdue University – West Lafayette Pennsylvania State University University of Wisconsin – Madison University of Illinois – Urbana-Champaign Michigan State University University of Iowa
$36,687 29,552 27,438 26,744 26,488 25,244 25,214 24,718 22,700 19,956
6 11 8 8 6 11 3 0 6 5
37 73 73 49 54 64 38 29 64 67
75 127 136 92 177 122 102 96 57 110
Source: Office of Institutional Research and Reporting, University of Minnesota Law Students: Table 9-6 shows that resident tuition and fees at the Law School remained in 2nd place among its Big Ten peers, but non-resident rates moved up from 4th to 3rd from the previous year. Resident law student rates increased by 11 percent, compared to 5 percent for number-one ranked University of Michigan – Ann Arbor resident law students. Non-resident rates at the University increased
by 7 percent, compared to first-place University of Michigan – Ann Arbor’s 5 percent and second-place University of Illinois – Champaign-Urbana’s 4 percent. Over the past five years, the University of Minnesota’s rate increases were the highest for resident and non-resident law students among its Big Ten competitors.
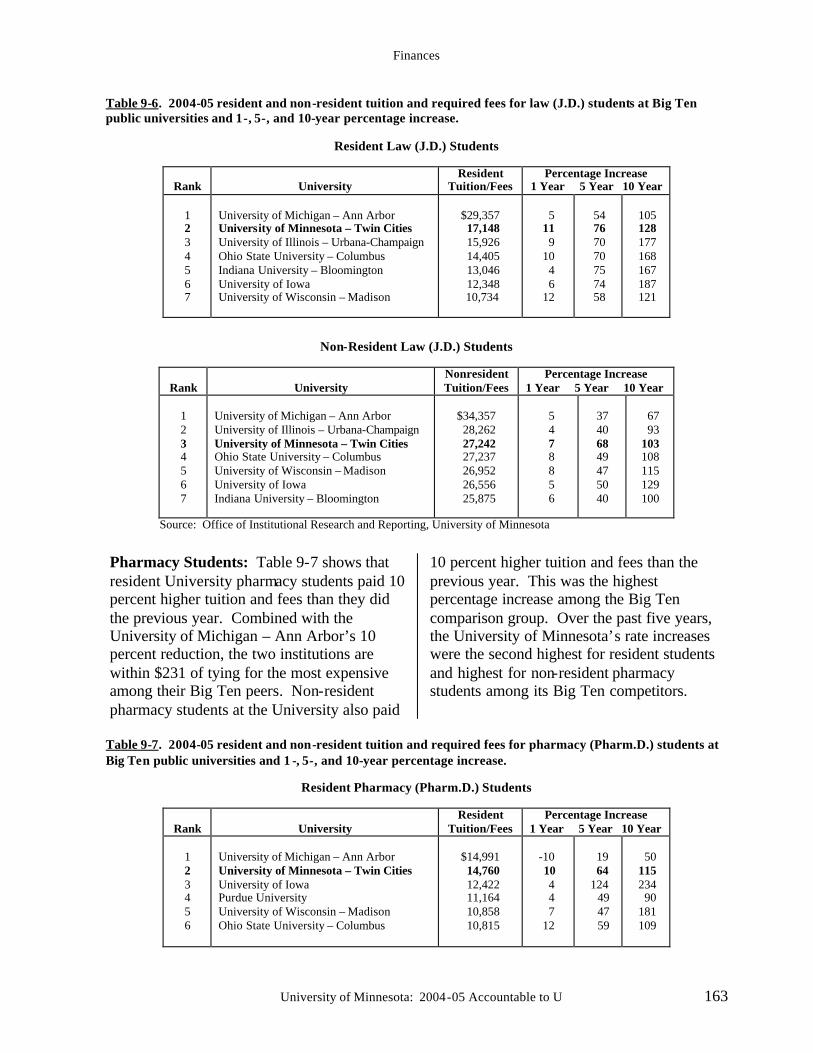
Finances
University of Minnesota: 2004-05 Accountable to U 163
Table 9-6. 2004-05 resident and non-resident tuition and required fees for law (J.D.) students at Big Ten public universities and 1-, 5-, and 10-year percentage increase.
Resident Law (J.D.) Students
Rank
University
Resident Tuition/Fees
Percentage Increase 1 Year 5 Year 10 Year
1 2 3 4 5 6 7
University of Michigan – Ann Arbor University of Minnesota – Twin Cities University of Illinois – Urbana-Champaign Ohio State University – Columbus Indiana University – Bloomington University of Iowa University of Wisconsin – Madison
$29,357 17,148 15,926 14,405 13,046 12,348 10,734
5 11 9 10 4 6 12
54 76 70 70 75 74 58
105 128 177 168 167 187 121
Non-Resident Law (J.D.) Students
Rank
University Nonresident Tuition/Fees
Percentage Increase 1 Year 5 Year 10 Year
1 2 3 4 5 6 7
University of Michigan – Ann Arbor University of Illinois – Urbana-Champaign University of Minnesota – Twin Cities Ohio State University – Columbus University of Wisconsin – Madison University of Iowa Indiana University – Bloomington
$34,357 28,262 27,242 27,237 26,952 26,556 25,875
5 4 7 8 8 5 6
37 40 68 49 47 50 40
67 93 103 108 115 129 100
Source: Office of Institutional Research and Reporting, University of Minnesota
Pharmacy Students: Table 9-7 shows that resident University pharmacy students paid 10 percent higher tuition and fees than they did the previous year. Combined with the University of Michigan – Ann Arbor’s 10 percent reduction, the two institutions are within $231 of tying for the most expensive among their Big Ten peers. Non-resident pharmacy students at the University also paid
10 percent higher tuition and fees than the previous year. This was the highest percentage increase among the Big Ten comparison group. Over the past five years, the University of Minnesota’s rate increases were the second highest for resident students and highest for non-resident pharmacy students among its Big Ten competitors.
Table 9-7. 2004-05 resident and non-resident tuition and required fees for pharmacy (Pharm.D.) students at Big Ten public universities and 1 -, 5-, and 10-year percentage increase.
Resident Pharmacy (Pharm.D.) Students
Rank
University
Resident Tuition/Fees
Percentage Increase 1 Year 5 Year 10 Year
1 2 3 4 5 6
University of Michigan – Ann Arbor University of Minnesota – Twin Cities University of Iowa Purdue University University of Wisconsin – Madison Ohio State University – Columbus
$14,991 14,760 12,422 11,164 10,858 10,815
-10
10 4 4 7 12
19 64 124 49 47 59
50 115 234 90 181 109
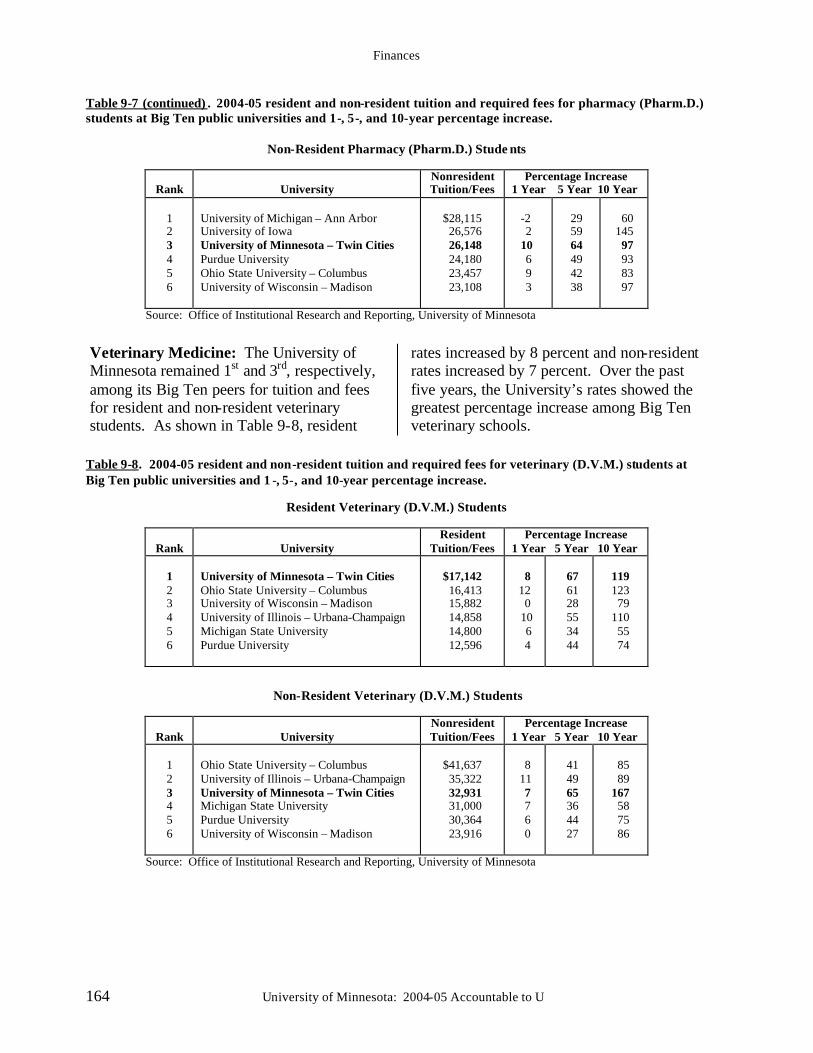
Finances
164 University of Minnesota: 2004-05 Accountable to U
Table 9-7 (continued) . 2004-05 resident and non-resident tuition and required fees for pharmacy (Pharm.D.) students at Big Ten public universities and 1-, 5-, and 10-year percentage increase.
Non-Resident Pharmacy (Pharm.D.) Stude nts
Rank
University
Nonresident Tuition/Fees
Percentage Increase 1 Year 5 Year 10 Year
1 2 3 4 5 6
University of Michigan – Ann Arbor University of Iowa University of Minnesota – Twin Cities Purdue University Ohio State University – Columbus University of Wisconsin – Madison
$28,115 26,576 26,148 24,180 23,457 23,108
-2
2 10
6 9 3
29 59 64 49 42 38
60 145 97 93 83 97
Source: Office of Institutional Research and Reporting, University of Minnesota
Veterinary Medicine: The University of Minnesota remained 1st and 3rd, respectively, among its Big Ten peers for tuition and fees for resident and non-resident veterinary students. As shown in Table 9-8, resident
rates increased by 8 percent and non-resident rates increased by 7 percent. Over the past five years, the University’s rates showed the greatest percentage increase among Big Ten veterinary schools.
Table 9-8. 2004-05 resident and non-resident tuition and required fees for veterinary (D.V.M.) students at Big Ten public universities and 1 -, 5-, and 10-year percentage increase.
Resident Veterinary (D.V.M.) Students
Rank
University
Resident Tuition/Fees
Percentage Increase 1 Year 5 Year 10 Year
1 2 3 4 5 6
University of Minnesota – Twin Cities Ohio State University – Columbus University of Wisconsin – Madison University of Illinois – Urbana-Champaign Michigan State University Purdue University
$17,142 16,413 15,882 14,858 14,800 12,596
8 12 0
10 6 4
67 61 28 55 34 44
119 123 79 110 55 74
Non-Resident Veterinary (D.V.M.) Students
Rank
University Nonresident Tuition/Fees
Percentage Increase 1 Year 5 Year 10 Year
1 2 3 4 5 6
Ohio State University – Columbus University of Illinois – Urbana-Champaign University of Minnesota – Twin Cities Michigan State University Purdue University University of Wisconsin – Madison
$41,637 35,322 32,931 31,000 30,364 23,916
8 11 7 7 6 0
41 49 65 36 44 27
85 89 167 58 75 86
Source: Office of Institutional Research and Reporting, University of Minnesota
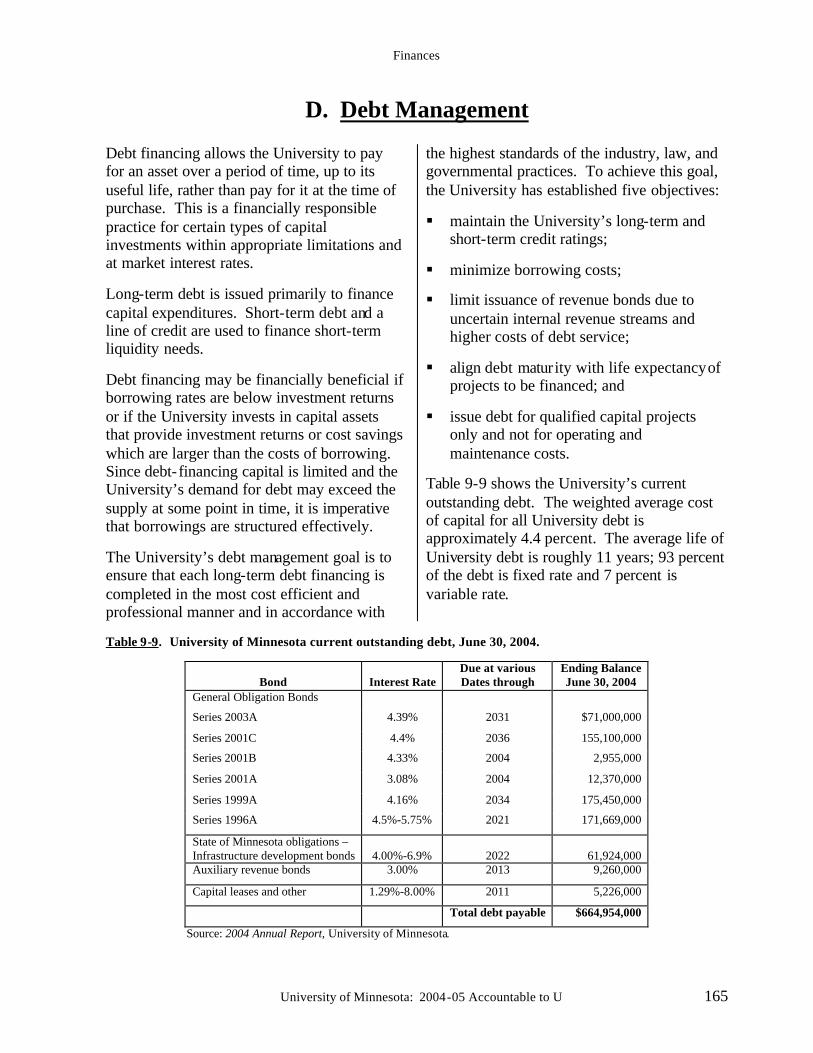
Finances
University of Minnesota: 2004-05 Accountable to U 165
D. Debt Management Debt financing allows the University to pay for an asset over a period of time, up to its useful life, rather than pay for it at the time of purchase. This is a financially responsible practice for certain types of capital investments within appropriate limitations and at market interest rates.
Long-term debt is issued primarily to finance capital expenditures. Short-term debt and a line of credit are used to finance short-term liquidity needs.
Debt financing may be financially beneficial if borrowing rates are below investment returns or if the University invests in capital assets that provide investment returns or cost savings which are larger than the costs of borrowing. Since debt- financing capital is limited and the University’s demand for debt may exceed the supply at some point in time, it is imperative that borrowings are structured effectively.
The University’s debt management goal is to ensure that each long-term debt financing is completed in the most cost efficient and professional manner and in accordance with
the highest standards of the industry, law, and governmental practices. To achieve this goal, the University has established five objectives:
§ maintain the University’s long-term and short-term credit ratings;
§ minimize borrowing costs;
§ limit issuance of revenue bonds due to uncertain internal revenue streams and higher costs of debt service;
§ align debt maturity with life expectancy of projects to be financed; and
§ issue debt for qualified capital projects only and not for operating and maintenance costs.
Table 9-9 shows the University’s current outstanding debt. The weighted average cost of capital for all University debt is approximately 4.4 percent. The average life of University debt is roughly 11 years; 93 percent of the debt is fixed rate and 7 percent is variable rate.
Table 9-9. University of Minnesota current outstanding debt, June 30, 2004.
Bond
Interest Rate
Due at various Dates through
Ending Balance June 30, 2004
General Obligation Bonds
Series 2003A 4.39% 2031 $71,000,000
Series 2001C 4.4% 2036 155,100,000
Series 2001B 4.33% 2004 2,955,000
Series 2001A 3.08% 2004 12,370,000
Series 1999A 4.16% 2034 175,450,000
Series 1996A 4.5%-5.75% 2021 171,669,000
State of Minnesota obligations – Infrastructure development bonds
4.00%-6.9%
2022
61,924,000
Auxiliary revenue bonds 3.00% 2013 9,260,000
Capital leases and other 1.29%-8.00% 2011 5,226,000
Total debt payable $664,954,000
Source: 2004 Annual Report, University of Minnesota.
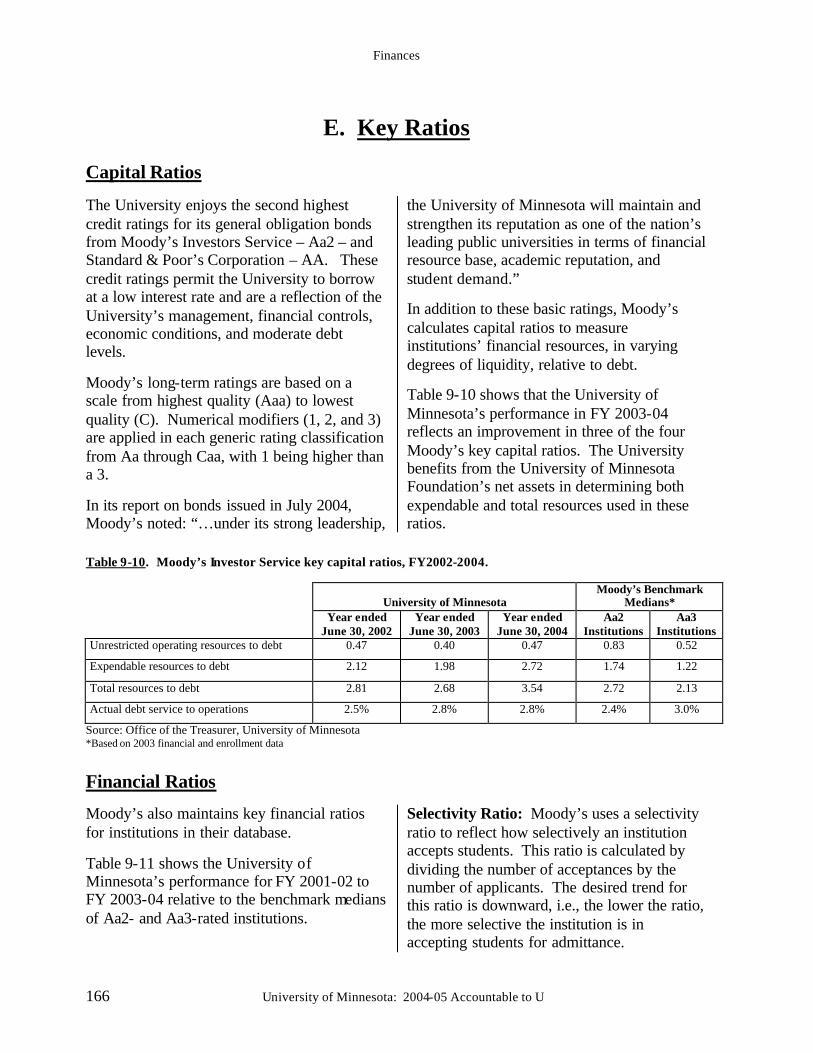
Finances
166 University of Minnesota: 2004-05 Accountable to U
E. Key Ratios Capital Ratios The University enjoys the second highest credit ratings for its general obligation bonds from Moody’s Investors Service – Aa2 – and Standard & Poor’s Corporation – AA. These credit ratings permit the University to borrow at a low interest rate and are a reflection of the University’s management, financial controls, economic conditions, and moderate debt levels.
Moody’s long-term ratings are based on a scale from highest quality (Aaa) to lowest quality (C). Numerical modifiers (1, 2, and 3) are applied in each generic rating classification from Aa through Caa, with 1 being higher than a 3.
In its report on bonds issued in July 2004, Moody’s noted: “…under its strong leadership,
the University of Minnesota will maintain and strengthen its reputation as one of the nation’s leading public universities in terms of financial resource base, academic reputation, and student demand.”
In addition to these basic ratings, Moody’s calculates capital ratios to measure institutions’ financial resources, in varying degrees of liquidity, relative to debt.
Table 9-10 shows that the University of Minnesota’s performance in FY 2003-04 reflects an improvement in three of the four Moody’s key capital ratios. The University benefits from the University of Minnesota Foundation’s net assets in determining both expendable and total resources used in these ratios.
Table 9-10. Moody’s Investor Service key capital ratios, FY2002-2004.
University of Minnesota Moody’s Benchmark
Medians* Year ended
June 30, 2002 Year ended
June 30, 2003 Year ended
June 30, 2004 Aa2
Institutions Aa3
Institutions Unrestricted operating resources to debt 0.47 0.40 0.47 0.83 0.52
Expendable resources to debt 2.12 1.98 2.72 1.74 1.22
Total resources to debt 2.81 2.68 3.54 2.72 2.13
Actual debt service to operations 2.5% 2.8% 2.8% 2.4% 3.0%
Source: Office of the Treasurer, University of Minnesota *Based on 2003 financial and enrollment data
Financial Ratios
Moody’s also maintains key financial ratios for institutions in their database.
Table 9-11 shows the University of Minnesota’s performance for FY 2001-02 to FY 2003-04 relative to the benchmark medians of Aa2- and Aa3-rated institutions.
Selectivity Ratio: Moody’s uses a selectivity ratio to reflect how selectively an institution accepts students. This ratio is calculated by dividing the number of acceptances by the number of applicants. The desired trend for this ratio is downward, i.e., the lower the ratio, the more selective the institution is in accepting students for admittance.
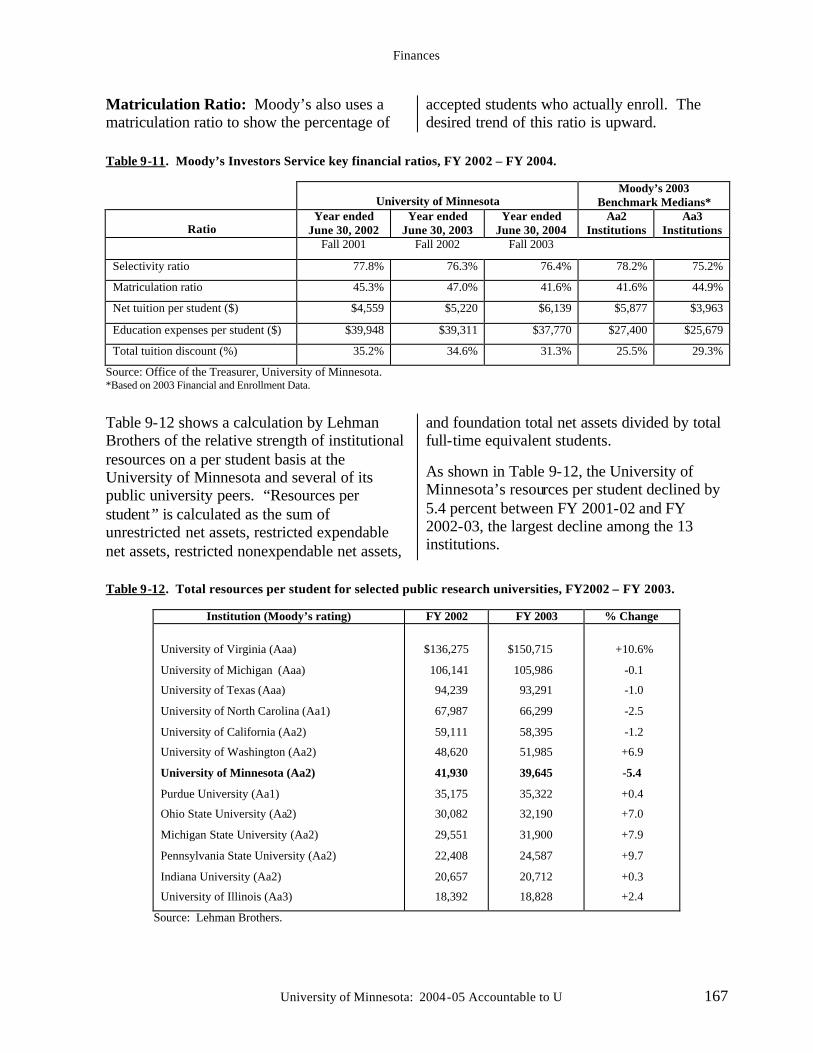
Finances
University of Minnesota: 2004-05 Accountable to U 167
Matriculation Ratio: Moody’s also uses a matriculation ratio to show the percentage of
accepted students who actually enroll. The desired trend of this ratio is upward.
Table 9-11. Moody’s Investors Service key financial ratios, FY 2002 – FY 2004.
University of Minnesota
Moody’s 2003 Benchmark Medians*
Ratio Year ended
June 30, 2002 Year ended
June 30, 2003 Year ended
June 30, 2004 Aa2
Institutions Aa3
Institutions Fall 2001 Fall 2002 Fall 2003
Selectivity ratio 77.8% 76.3% 76.4% 78.2% 75.2%
Matriculation ratio 45.3% 47.0% 41.6% 41.6% 44.9%
Net tuition per student ($) $4,559 $5,220 $6,139 $5,877 $3,963
Education expenses per student ($) $39,948 $39,311 $37,770 $27,400 $25,679
Total tuition discount (%) 35.2% 34.6% 31.3% 25.5% 29.3%
Source: Office of the Treasurer, University of Minnesota. *Based on 2003 Financial and Enrollment Data.
Table 9-12 shows a calculation by Lehman Brothers of the relative strength of institutional resources on a per student basis at the University of Minnesota and several of its public university peers. “Resources per student” is calculated as the sum of unrestricted net assets, restricted expendable net assets, restricted nonexpendable net assets,
and foundation total net assets divided by total full-time equivalent students.
As shown in Table 9-12, the University of Minnesota’s resources per student declined by 5.4 percent between FY 2001-02 and FY 2002-03, the largest decline among the 13 institutions.
Table 9-12. Total resources per student for selected public research universities, FY2002 – FY 2003.
Institution (Moody’s rating) FY 2002 FY 2003 % Change
University of Virginia (Aaa)
University of Michigan (Aaa)
University of Texas (Aaa)
University of North Carolina (Aa1)
University of California (Aa2)
University of Washington (Aa2)
University of Minnesota (Aa2)
Purdue University (Aa1)
Ohio State University (Aa2)
Michigan State University (Aa2)
Pennsylvania State University (Aa2)
Indiana University (Aa2)
University of Illinois (Aa3)
$136,275
106,141
94,239
67,987
59,111
48,620
41,930
35,175
30,082
29,551
22,408
20,657
18,392
$150,715
105,986
93,291
66,299
58,395
51,985
39,645
35,322
32,190
31,900
24,587
20,712
18,828
+10.6%
-0.1
-1.0
-2.5
-1.2
+6.9
-5.4
+0.4
+7.0
+7.9
+9.7
+0.3
+2.4
Source: Lehman Brothers.
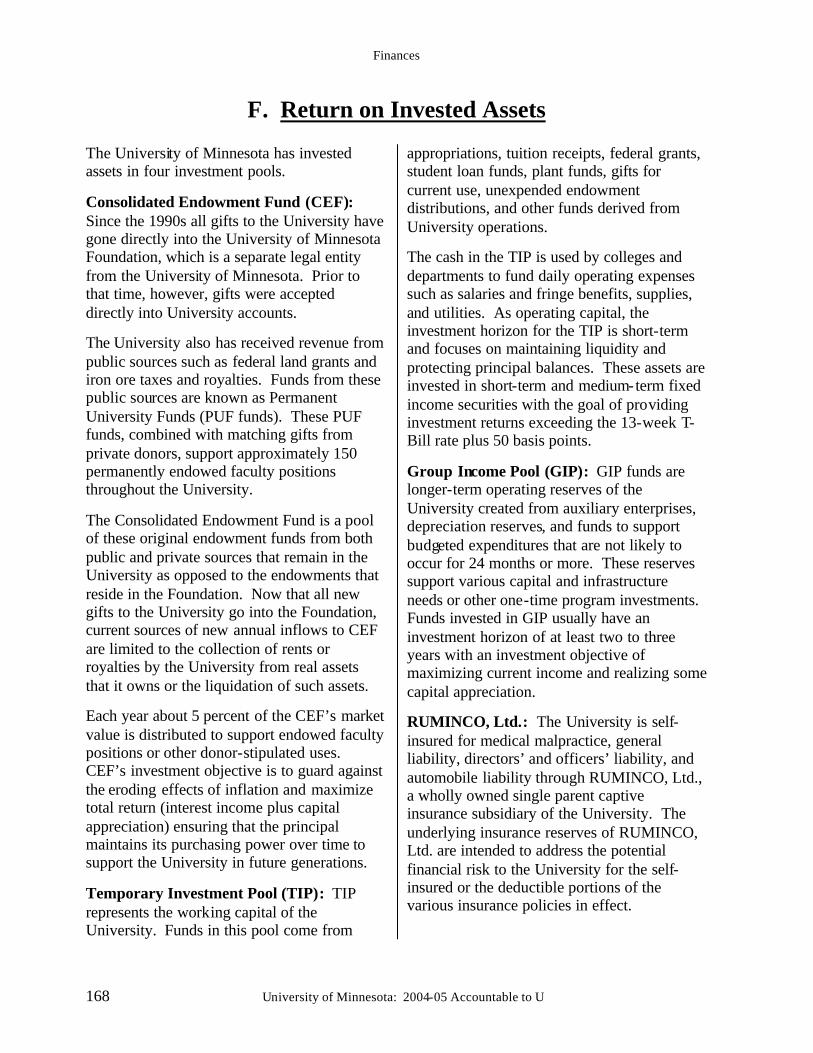
Finances
168 University of Minnesota: 2004-05 Accountable to U
F. Return on Invested Assets The University of Minnesota has invested assets in four investment pools.
Consolidated Endowment Fund (CEF): Since the 1990s all gifts to the University have gone directly into the University of Minnesota Foundation, which is a separate legal entity from the University of Minnesota. Prior to that time, however, gifts were accepted directly into University accounts.
The University also has received revenue from public sources such as federal land grants and iron ore taxes and royalties. Funds from these public sources are known as Permanent University Funds (PUF funds). These PUF funds, combined with matching gifts from private donors, support approximately 150 permanently endowed faculty positions throughout the University.
The Consolidated Endowment Fund is a pool of these original endowment funds from both public and private sources that remain in the University as opposed to the endowments that reside in the Foundation. Now that all new gifts to the University go into the Foundation, current sources of new annual inflows to CEF are limited to the collection of rents or royalties by the University from real assets that it owns or the liquidation of such assets.
Each year about 5 percent of the CEF’s market value is distributed to support endowed faculty positions or other donor-stipulated uses. CEF’s investment objective is to guard against the eroding effects of inflation and maximize total return (interest income plus capital appreciation) ensuring that the principal maintains its purchasing power over time to support the University in future generations.
Temporary Investment Pool (TIP): TIP represents the working capital of the University. Funds in this pool come from
appropriations, tuition receipts, federal grants, student loan funds, plant funds, gifts for current use, unexpended endowment distributions, and other funds derived from University operations.
The cash in the TIP is used by colleges and departments to fund daily operating expenses such as salaries and fringe benefits, supplies, and utilities. As operating capital, the investment horizon for the TIP is short-term and focuses on maintaining liquidity and protecting principal balances. These assets are invested in short-term and medium-term fixed income securities with the goal of providing investment returns exceeding the 13-week T-Bill rate plus 50 basis points.
Group Income Pool (GIP): GIP funds are longer-term operating reserves of the University created from auxiliary enterprises, depreciation reserves, and funds to support budgeted expenditures that are not likely to occur for 24 months or more. These reserves support various capital and infrastructure needs or other one-time program investments. Funds invested in GIP usually have an investment horizon of at least two to three years with an investment objective of maximizing current income and realizing some capital appreciation.
RUMINCO, Ltd.: The University is self-insured for medical malpractice, general liability, directors’ and officers’ liability, and automobile liability through RUMINCO, Ltd., a wholly owned single parent captive insurance subsidiary of the University. The underlying insurance reserves of RUMINCO, Ltd. are intended to address the potential financial risk to the University for the self-insured or the deductible portions of the various insurance policies in effect.
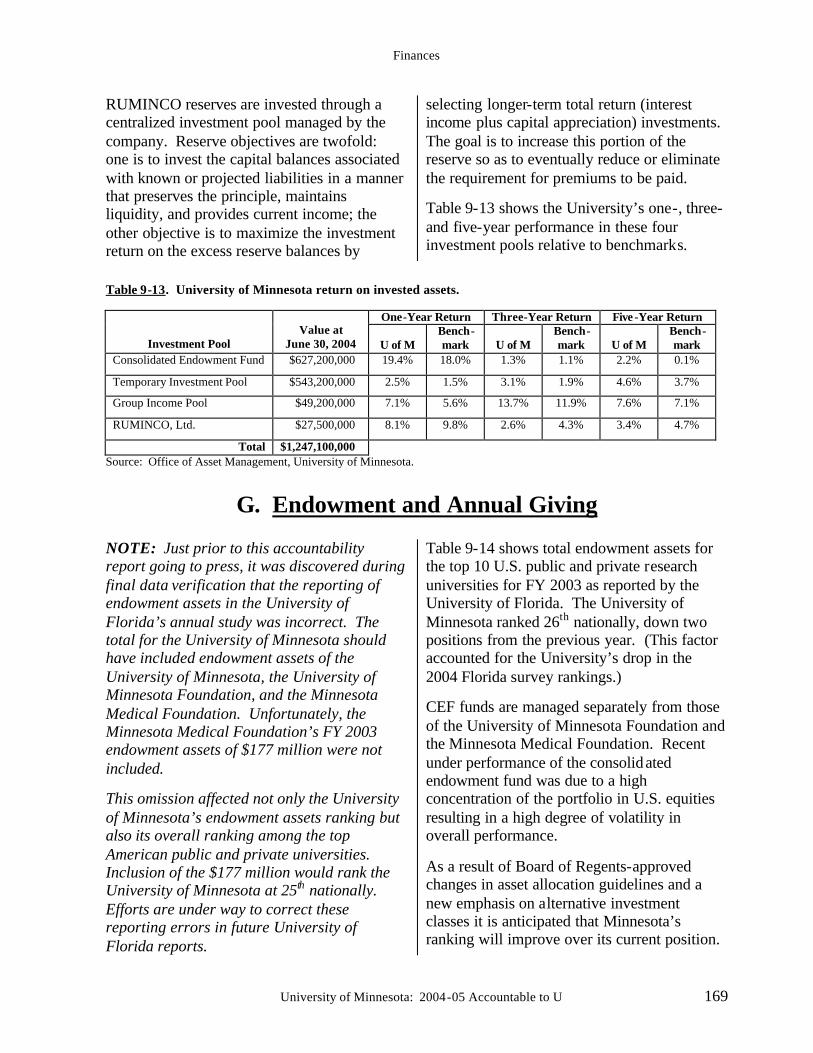
Finances
University of Minnesota: 2004-05 Accountable to U 169
RUMINCO reserves are invested through a centralized investment pool managed by the company. Reserve objectives are twofold: one is to invest the capital balances associated with known or projected liabilities in a manner that preserves the principle, maintains liquidity, and provides current income; the other objective is to maximize the investment return on the excess reserve balances by
selecting longer-term total return (interest income plus capital appreciation) investments. The goal is to increase this portion of the reserve so as to eventually reduce or eliminate the requirement for premiums to be paid.
Table 9-13 shows the University’s one-, three- and five-year performance in these four investment pools relative to benchmarks.
Table 9-13. University of Minnesota return on invested assets.
One-Year Return Three-Year Return Five -Year Return
Investment Pool
Value at
June 30, 2004
U of M Bench-mark
U of M
Bench-mark
U of M
Bench-mark
Consolidated Endowment Fund $627,200,000 19.4% 18.0% 1.3% 1.1% 2.2% 0.1%
Temporary Investment Pool $543,200,000 2.5% 1.5% 3.1% 1.9% 4.6% 3.7%
Group Income Pool $49,200,000 7.1% 5.6% 13.7% 11.9% 7.6% 7.1%
RUMINCO, Ltd. $27,500,000 8.1% 9.8% 2.6% 4.3% 3.4% 4.7%
Total $1,247,100,000 Source: Office of Asset Management, University of Minnesota.
G. Endowment and Annual Giving
NOTE: Just prior to this accountability report going to press, it was discovered during final data verification that the reporting of endowment assets in the University of Florida’s annual study was incorrect. The total for the University of Minnesota should have included endowment assets of the University of Minnesota, the University of Minnesota Foundation, and the Minnesota Medical Foundation. Unfortunately, the Minnesota Medical Foundation’s FY 2003 endowment assets of $177 million were not included.
This omission affected not only the University of Minnesota’s endowment assets ranking but also its overall ranking among the top American public and private universities. Inclusion of the $177 million would rank the University of Minnesota at 25th nationally. Efforts are under way to correct these reporting errors in future University of Florida reports.
Table 9-14 shows total endowment assets for the top 10 U.S. public and private research universities for FY 2003 as reported by the University of Florida. The University of Minnesota ranked 26th nationally, down two positions from the previous year. (This factor accounted for the University’s drop in the 2004 Florida survey rankings.)
CEF funds are managed separately from those of the University of Minnesota Foundation and the Minnesota Medical Foundation. Recent under performance of the consolidated endowment fund was due to a high concentration of the portfolio in U.S. equities resulting in a high degree of volatility in overall performance.
As a result of Board of Regents-approved changes in asset allocation guidelines and a new emphasis on alternative investment classes it is anticipated that Minnesota’s ranking will improve over its current position.
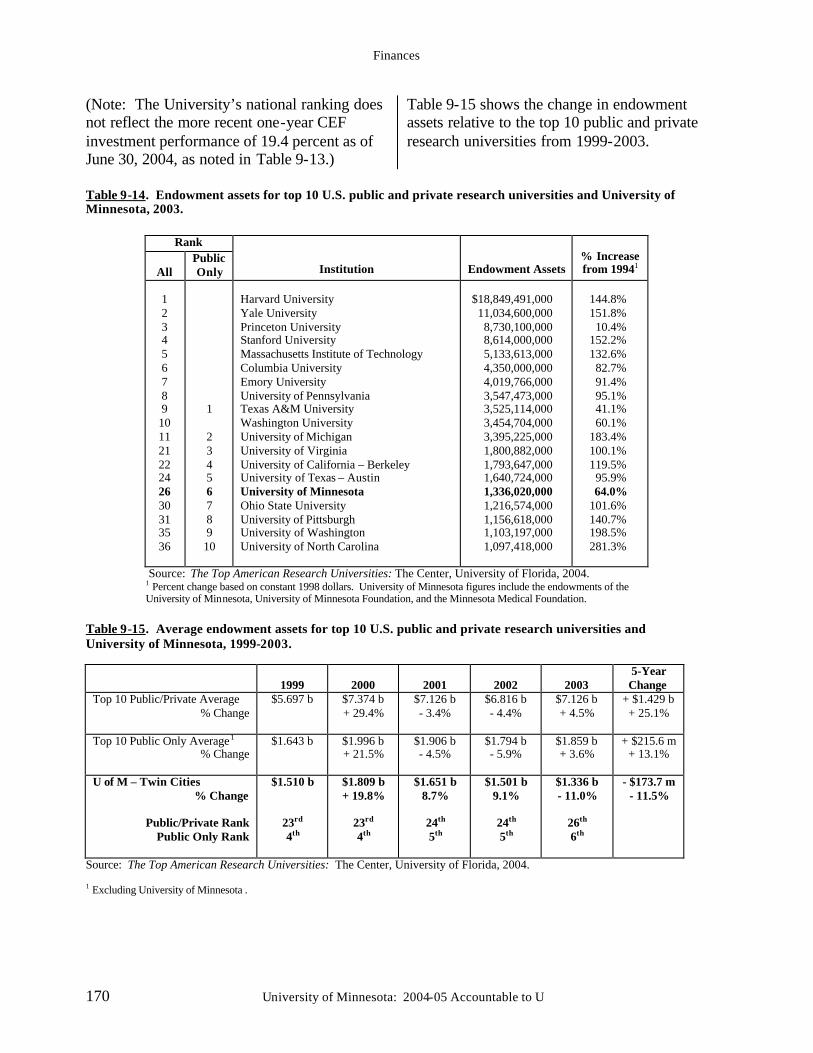
Finances
170 University of Minnesota: 2004-05 Accountable to U
(Note: The University’s national ranking does not reflect the more recent one-year CEF investment performance of 19.4 percent as of June 30, 2004, as noted in Table 9-13.)
Table 9-15 shows the change in endowment assets relative to the top 10 public and private research universities from 1999-2003.
Table 9-14. Endowment assets for top 10 U.S. public and private research universities and University of Minnesota, 2003.
Rank
All Public Only
Institution
Endowment Assets
% Increase from 19941
1 2 3 4 5 6 7 8 9 10 11 21 22 24 26 30 31 35 36
1 2 3 4 5 6 7 8 9 10
Harvard University Yale University Princeton University Stanford University Massachusetts Institute of Technology Columbia University Emory University University of Pennsylvania Texas A&M University Washington University University of Michigan University of Virginia University of California – Berkeley University of Texas – Austin University of Minnesota Ohio State University University of Pittsburgh University of Washington University of North Carolina
$18,849,491,000 11,034,600,000 8,730,100,000 8,614,000,000 5,133,613,000 4,350,000,000 4,019,766,000 3,547,473,000 3,525,114,000 3,454,704,000 3,395,225,000 1,800,882,000 1,793,647,000 1,640,724,000 1,336,020,000 1,216,574,000 1,156,618,000 1,103,197,000 1,097,418,000
144.8% 151.8% 10.4%
152.2% 132.6% 82.7% 91.4% 95.1% 41.1% 60.1%
183.4% 100.1% 119.5% 95.9% 64.0%
101.6% 140.7% 198.5% 281.3%
Source: The Top American Research Universities: The Center, University of Florida, 2004.
1 Percent change based on constant 1998 dollars. University of Minnesota figures include the endowments of the University of Minnesota, University of Minnesota Foundation, and the Minnesota Medical Foundation.
Table 9-15. Average endowment assets for top 10 U.S. public and private research universities and University of Minnesota, 1999-2003.
1999
2000
2001
2002
2003
5-Year Change
Top 10 Public/Private Average % Change
$5.697 b $7.374 b + 29.4%
$7.126 b - 3.4%
$6.816 b - 4.4%
$7.126 b + 4.5%
+ $1.429 b + 25.1%
Top 10 Public Only Average1 % Change
$1.643 b $1.996 b + 21.5%
$1.906 b - 4.5%
$1.794 b - 5.9%
$1.859 b + 3.6%
+ $215.6 m + 13.1%
U of M – Twin Cities % Change
Public/Private Rank
Public Only Rank
$1.510 b
23rd 4th
$1.809 b + 19.8%
23rd 4th
$1.651 b 8.7%
24th 5th
$1.501 b 9.1%
24th 5th
$1.336 b - 11.0%
26th 6th
- $173.7 m - 11.5%
Source: The Top American Research Universities: The Center, University of Florida, 2004.
1 Excluding University of Minnesota .
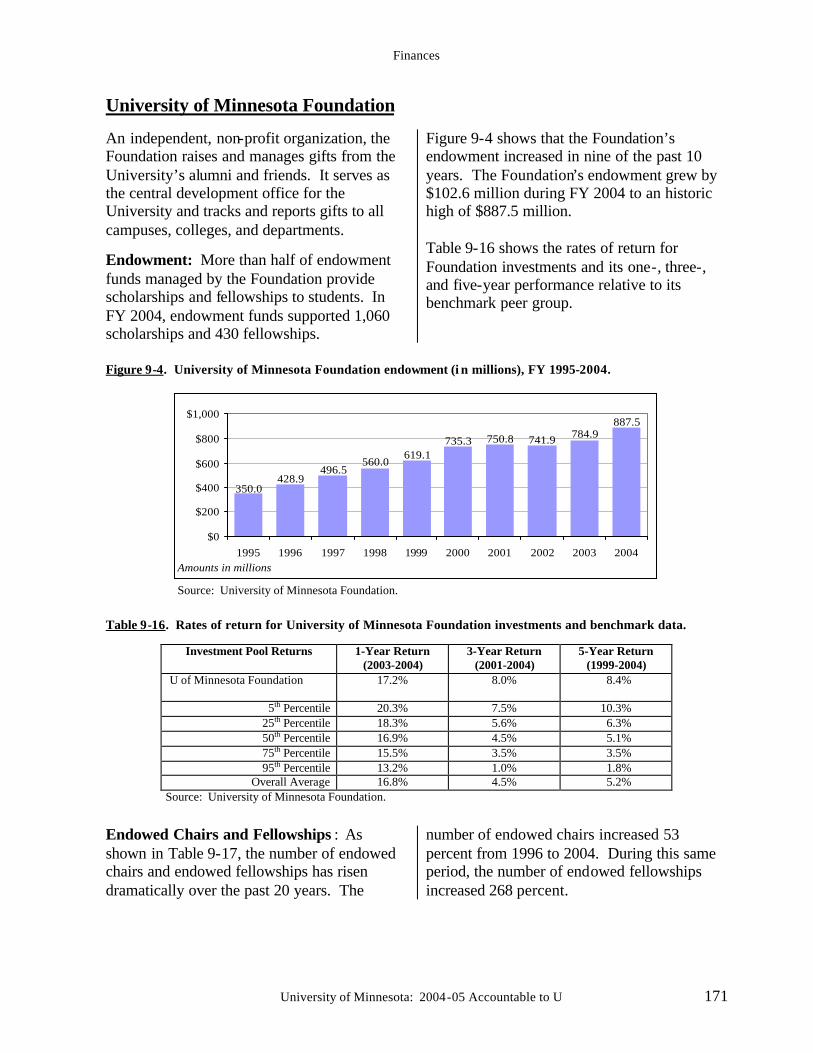
Finances
University of Minnesota: 2004-05 Accountable to U 171
University of Minnesota Foundation
An independent, non-profit organization, the Foundation raises and manages gifts from the University’s alumni and friends. It serves as the central development office for the University and tracks and reports gifts to all campuses, colleges, and departments.
Endowment: More than half of endowment funds managed by the Foundation provide scholarships and fellowships to students. In FY 2004, endowment funds supported 1,060 scholarships and 430 fellowships.
Figure 9-4 shows that the Foundation’s endowment increased in nine of the past 10 years. The Foundation’s endowment grew by $102.6 million during FY 2004 to an historic high of $887.5 million. Table 9-16 shows the rates of return for Foundation investments and its one-, three-, and five-year performance relative to its benchmark peer group.
Figure 9-4. University of Minnesota Foundation endowment (i n millions), FY 1995-2004.
350.0428.9
496.5560.0
619.1735.3 750.8 741.9 784.9
887.5
$0
$200
$400
$600
$800
$1,000
1995 1996 1997 1998 1999 2000 2001 2002 2003 2004Amounts in millions
Source: University of Minnesota Foundation.
Table 9-16. Rates of return for University of Minnesota Foundation investments and benchmark data.
Investment Pool Returns 1-Year Return (2003-2004)
3-Year Return (2001-2004)
5-Year Return (1999-2004)
U of Minnesota Foundation
17.2% 8.0% 8.4%
5th Percentile 20.3% 7.5% 10.3% 25th Percentile 18.3% 5.6% 6.3% 50th Percentile 16.9% 4.5% 5.1% 75th Percentile 15.5% 3.5% 3.5% 95th Percentile 13.2% 1.0% 1.8%
Overall Average 16.8% 4.5% 5.2% Source: University of Minnesota Foundation.
Endowed Chairs and Fellowships : As shown in Table 9-17, the number of endowed chairs and endowed fellowships has risen dramatically over the past 20 years. The
number of endowed chairs increased 53 percent from 1996 to 2004. During this same period, the number of endowed fellowships increased 268 percent.
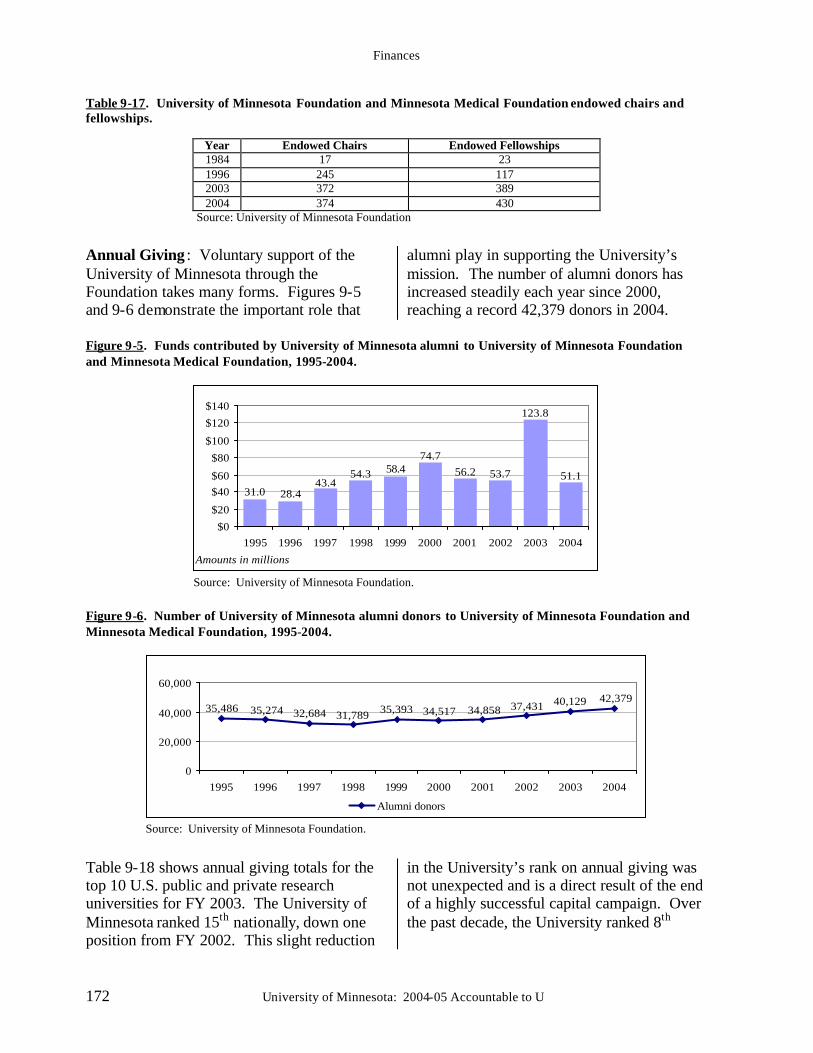
Finances
172 University of Minnesota: 2004-05 Accountable to U
Table 9-17. University of Minnesota Foundation and Minnesota Medical Foundation endowed chairs and fellowships.
Year Endowed Chairs Endowed Fellowships 1984 17 23 1996 245 117 2003 372 389 2004 374 430
Source: University of Minnesota Foundation
Annual Giving : Voluntary support of the University of Minnesota through the Foundation takes many forms. Figures 9-5 and 9-6 demonstrate the important role that
alumni play in supporting the University’s mission. The number of alumni donors has increased steadily each year since 2000, reaching a record 42,379 donors in 2004.
Figure 9-5. Funds contributed by University of Minnesota alumni to University of Minnesota Foundation and Minnesota Medical Foundation, 1995-2004.
51.1
123.8
53.756.274.7
58.454.343.4
28.431.0
$0
$20
$40$60
$80
$100
$120
$140
1995 1996 1997 1998 1999 2000 2001 2002 2003 2004
Amounts in millions
Source: University of Minnesota Foundation.
Figure 9-6. Number of University of Minnesota alumni donors to University of Minnesota Foundation and Minnesota Medical Foundation, 1995-2004.
42,37940,12937,43134,85834,51735,39331,78932,68435,27435,486
0
20,000
40,000
60,000
1995 1996 1997 1998 1999 2000 2001 2002 2003 2004
Alumni donors
Source: University of Minnesota Foundation.
Table 9-18 shows annual giving totals for the top 10 U.S. public and private research universities for FY 2003. The University of Minnesota ranked 15th nationally, down one position from FY 2002. This slight reduction
in the University’s rank on annual giving was not unexpected and is a direct result of the end of a highly successful capital campaign. Over the past decade, the University ranked 8th
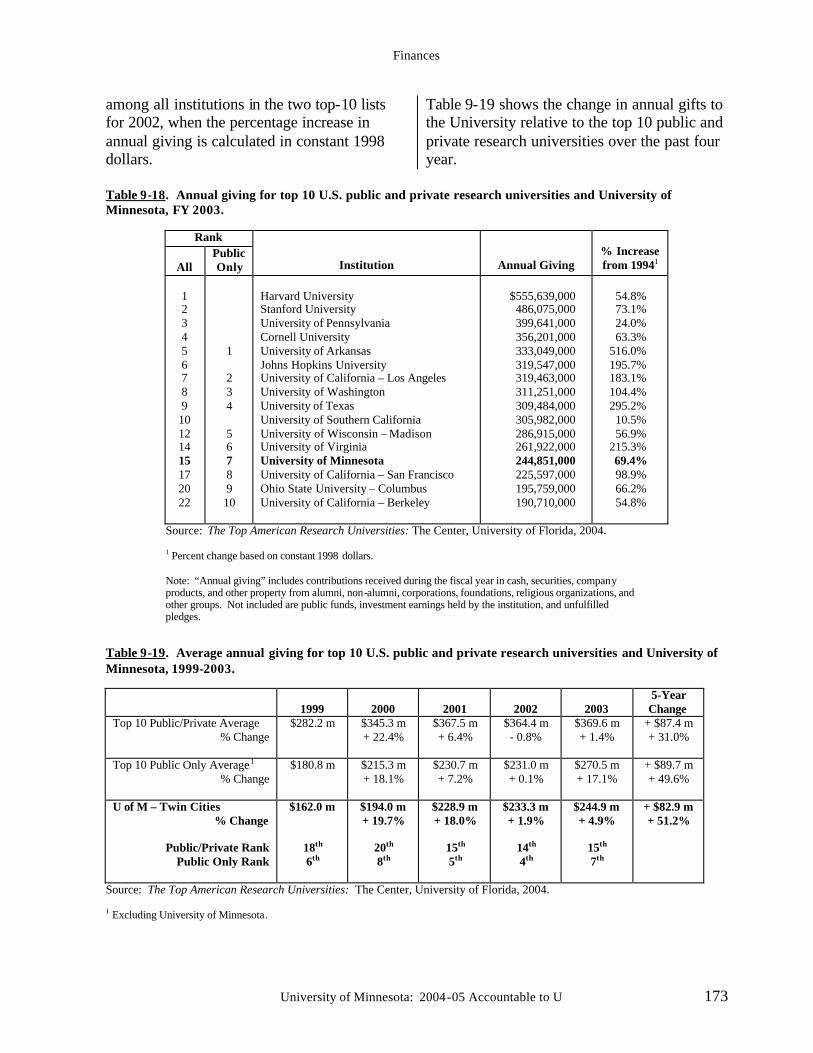
Finances
University of Minnesota: 2004-05 Accountable to U 173
among all institutions in the two top-10 lists for 2002, when the percentage increase in annual giving is calculated in constant 1998 dollars.
Table 9-19 shows the change in annual gifts to the University relative to the top 10 public and private research universities over the past four year.
Table 9-18. Annual giving for top 10 U.S. public and private research universities and University of Minnesota, FY 2003.
Rank
All Public Only
Institution
Annual Giving
% Increase from 19941
1 2 3 4 5 6 7 8 9 10 12 14 15 17 20 22
1 2 3 4 5 6 7 8 9 10
Harvard University Stanford University University of Pennsylvania Cornell University University of Arkansas Johns Hopkins University University of California – Los Angeles University of Washington University of Texas University of Southern California University of Wisconsin – Madison University of Virginia University of Minnesota University of California – San Francisco Ohio State University – Columbus University of California – Berkeley
$555,639,000 486,075,000 399,641,000 356,201,000 333,049,000 319,547,000 319,463,000 311,251,000 309,484,000 305,982,000 286,915,000 261,922,000 244,851,000 225,597,000 195,759,000 190,710,000
54.8% 73.1% 24.0% 63.3%
516.0% 195.7% 183.1% 104.4% 295.2% 10.5% 56.9%
215.3% 69.4% 98.9% 66.2% 54.8%
Source: The Top American Research Universities: The Center, University of Florida, 2004.
1 Percent change based on constant 1998 dollars. Note: “Annual giving” includes contributions received during the fiscal year in cash, securities, company products, and other property from alumni, non-alumni, corporations, foundations, religious organizations, and other groups. Not included are public funds, investment earnings held by the institution, and unfulfilled pledges.
Table 9-19. Average annual giving for top 10 U.S. public and private research universities and University of Minnesota, 1999-2003.
1999
2000
2001
2002
2003
5-Year Change
Top 10 Public/Private Average % Change
$282.2 m $345.3 m + 22.4%
$367.5 m + 6.4%
$364.4 m - 0.8%
$369.6 m + 1.4%
+ $87.4 m + 31.0%
Top 10 Public Only Average1 % Change
$180.8 m $215.3 m + 18.1%
$230.7 m + 7.2%
$231.0 m + 0.1%
$270.5 m + 17.1%
+ $89.7 m + 49.6%
U of M – Twin Cities % Change
Public/Private Rank
Public Only Rank
$162.0 m
18th
6th
$194.0 m + 19.7%
20th 8th
$228.9 m + 18.0%
15th 5th
$233.3 m + 1.9%
14th 4th
$244.9 m + 4.9%
15th 7th
+ $82.9 m + 51.2%
Source: The Top American Research Universities: The Center, University of Florida, 2004.
1 Excluding University of Minnesota .
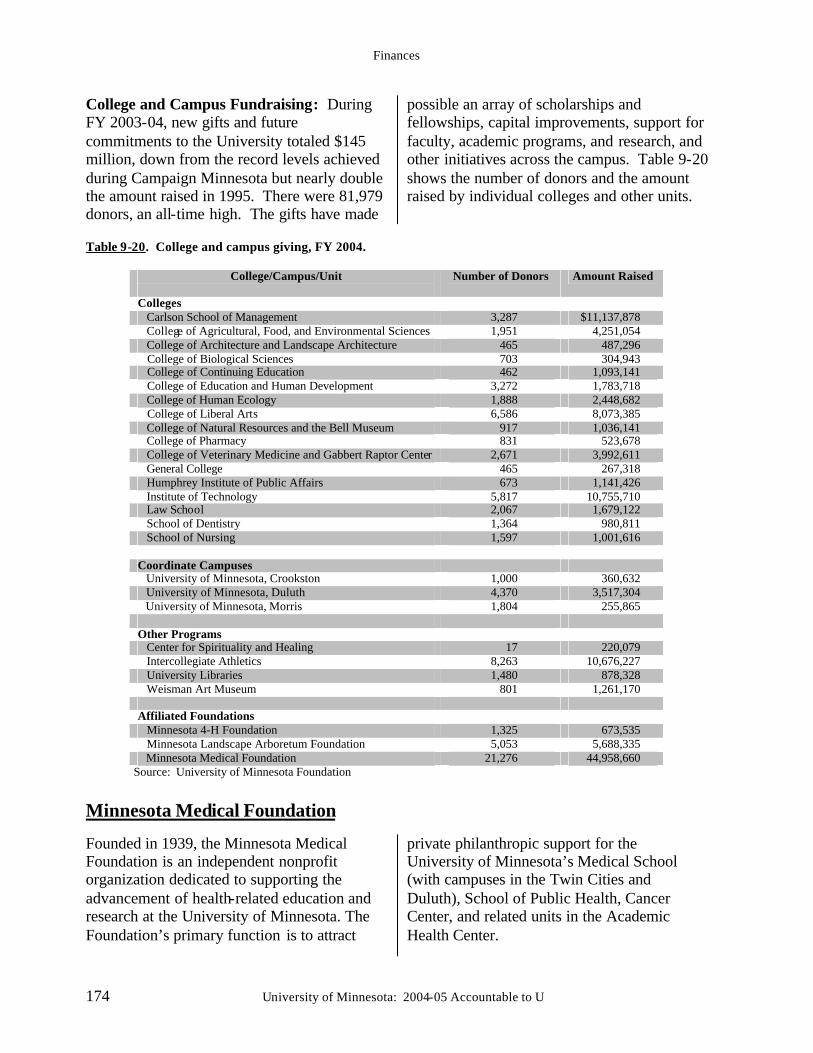
Finances
174 University of Minnesota: 2004-05 Accountable to U
College and Campus Fundraising: During FY 2003-04, new gifts and future commitments to the University totaled $145 million, down from the record levels achieved during Campaign Minnesota but nearly double the amount raised in 1995. There were 81,979 donors, an all-time high. The gifts have made
possible an array of scholarships and fellowships, capital improvements, support for faculty, academic programs, and research, and other initiatives across the campus. Table 9-20 shows the number of donors and the amount raised by individual colleges and other units.
Table 9-20. College and campus giving, FY 2004.
College/Campus/Unit
Number of Donors Amount Raised
Colleges Carlson School of Management 3,287 $11,137,878 College of Agricultural, Food, and Environmental Sciences 1,951 4,251,054 College of Architecture and Landscape Architecture 465 487,296 College of Biological Sciences 703 304,943 College of Continuing Education 462 1,093,141 College of Education and Human Development 3,272 1,783,718 College of Human Ecology 1,888 2,448,682 College of Liberal Arts 6,586 8,073,385 College of Natural Resources and the Bell Museum 917 1,036,141 College of Pharmacy 831 523,678 College of Veterinary Medicine and Gabbert Raptor Center 2,671 3,992,611 General College 465 267,318 Humphrey Institute of Public Affairs 673 1,141,426 Institute of Technology 5,817 10,755,710 Law School 2,067 1,679,122 School of Dentistry 1,364 980,811 School of Nursing 1,597 1,001,616 Coordinate Campuses University of Minnesota, Crookston 1,000 360,632 University of Minnesota, Duluth 4,370 3,517,304 University of Minnesota, Morris 1,804 255,865 Other Programs Center for Spirituality and Healing 17 220,079 Intercollegiate Athletics 8,263 10,676,227 University Libraries 1,480 878,328 Weisman Art Museum 801 1,261,170 Affiliated Foundations Minnesota 4-H Foundation 1,325 673,535 Minnesota Landscape Arboretum Foundation 5,053 5,688,335 Minnesota Medical Foundation 21,276 44,958,660
Source: University of Minnesota Foundation
Minnesota Medical Foundation
Founded in 1939, the Minnesota Medical Foundation is an independent nonprofit organization dedicated to supporting the advancement of health-related education and research at the University of Minnesota. The Foundation’s primary function is to attract
private philanthropic support for the University of Minnesota’s Medical School (with campuses in the Twin Cities and Duluth), School of Public Health, Cancer Center, and related units in the Academic Health Center.
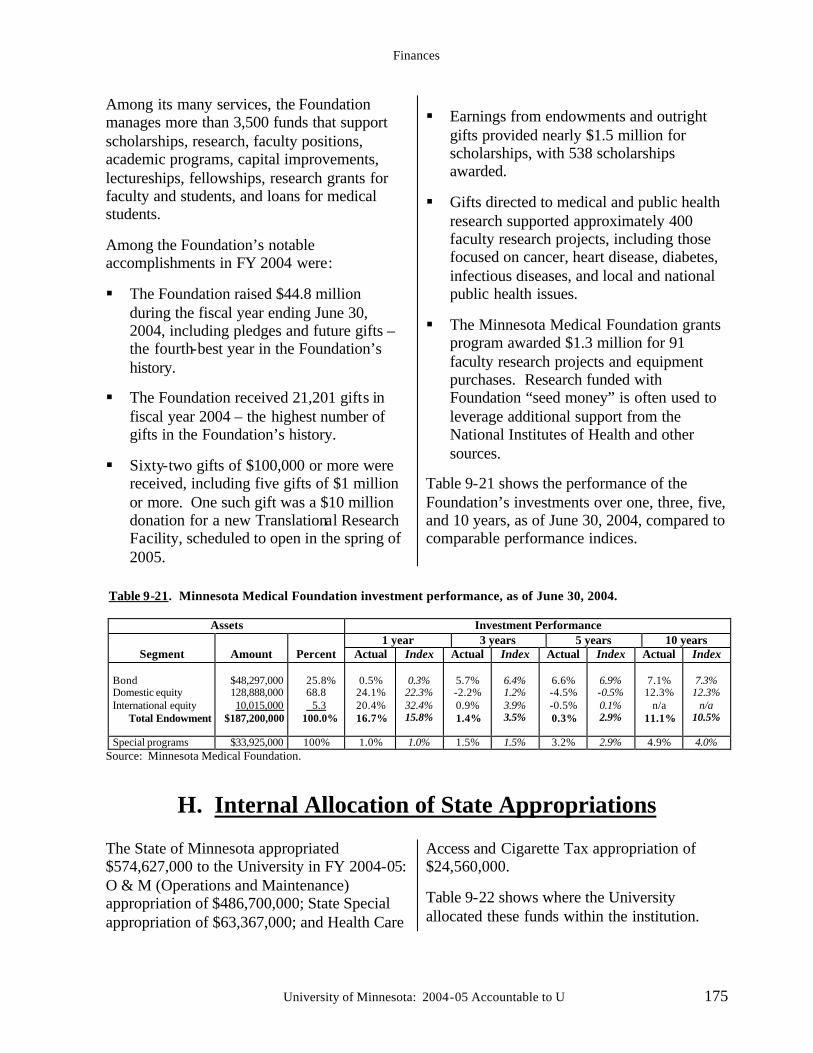
Finances
University of Minnesota: 2004-05 Accountable to U 175
Among its many services, the Foundation manages more than 3,500 funds that support scholarships, research, faculty positions, academic programs, capital improvements, lectureships, fellowships, research grants for faculty and students, and loans for medical students.
Among the Foundation’s notable accomplishments in FY 2004 were:
§ The Foundation raised $44.8 million during the fiscal year ending June 30, 2004, including pledges and future gifts – the fourth-best year in the Foundation’s history.
§ The Foundation received 21,201 gifts in fiscal year 2004 – the highest number of gifts in the Foundation’s history.
§ Sixty-two gifts of $100,000 or more were received, including five gifts of $1 million or more. One such gift was a $10 million donation for a new Translational Research Facility, scheduled to open in the spring of 2005.
§ Earnings from endowments and outright gifts provided nearly $1.5 million for scholarships, with 538 scholarships awarded.
§ Gifts directed to medical and public health research supported approximately 400 faculty research projects, including those focused on cancer, heart disease, diabetes, infectious diseases, and local and national public health issues.
§ The Minnesota Medical Foundation grants program awarded $1.3 million for 91 faculty research projects and equipment purchases. Research funded with Foundation “seed money” is often used to leverage additional support from the National Institutes of Health and other sources.
Table 9-21 shows the performance of the Foundation’s investments over one, three, five, and 10 years, as of June 30, 2004, compared to comparable performance indices.
Table 9-21. Minnesota Medical Foundation investment performance, as of June 30, 2004.
Assets Investment Performance 1 year 3 years 5 years 10 years
Segment
Amount
Percent Actual Index Actual Index Actual Index Actual Index Bond Domestic equity International equity
Total Endowment
$48,297,000 128,888,000 10,015,000
$187,200,000
25.8%
68.8 5.3
100.0%
0.5%
24.1% 20.4% 16.7%
0.3%
22.3% 32.4% 15.8%
5.7% -2.2% 0.9% 1.4%
6.4% 1.2% 3.9% 3.5%
6.6% -4.5% -0.5% 0.3%
6.9% -0.5% 0.1% 2.9%
7.1%
12.3% n/a
11.1%
7.3%
12.3% n/a
10.5%
Special programs $33,925,000 100% 1.0% 1.0% 1.5% 1.5% 3.2% 2.9% 4.9% 4.0% Source: Minnesota Medical Foundation.
H. Internal Allocation of State Appropriations
The State of Minnesota appropriated $574,627,000 to the University in FY 2004-05: O & M (Operations and Maintenance) appropriation of $486,700,000; State Special appropriation of $63,367,000; and Health Care
Access and Cigarette Tax appropriation of $24,560,000.
Table 9-22 shows where the University allocated these funds within the institution.
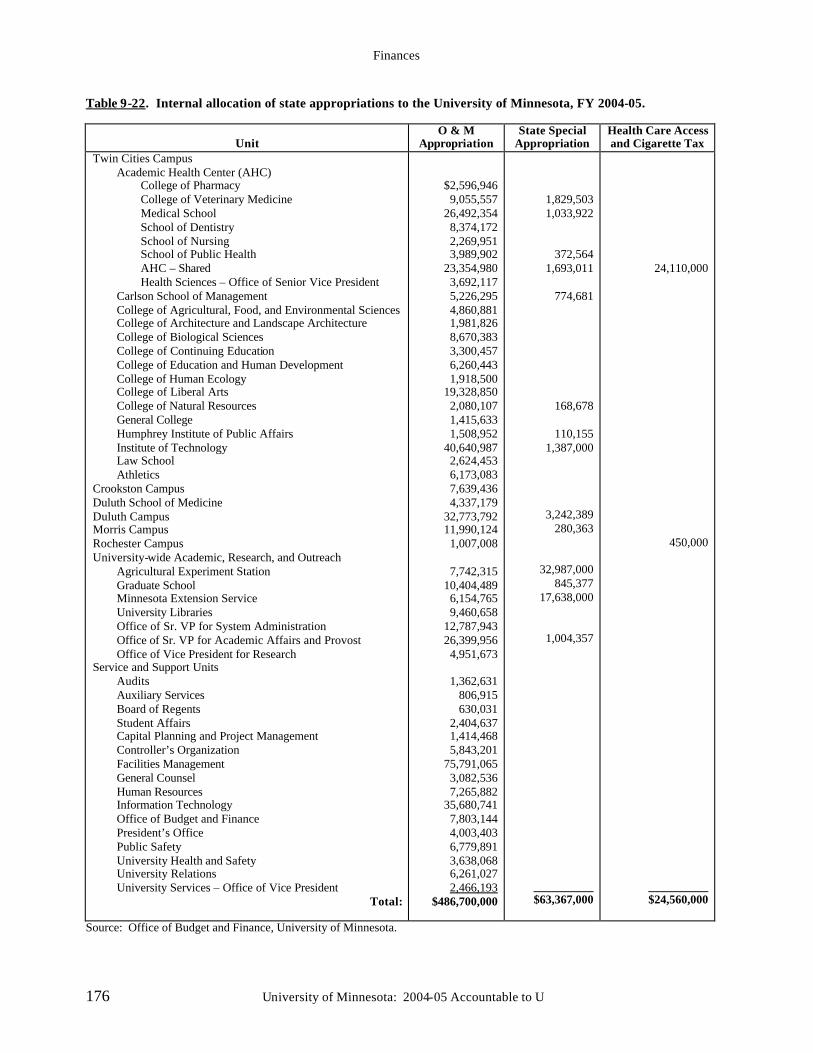
Finances
176 University of Minnesota: 2004-05 Accountable to U
Table 9-22. Internal allocation of state appropriations to the University of Minnesota, FY 2004-05.
Unit
O & M Appropriation
State Special Appropriation
Health Care Access and Cigarette Tax
Twin Cities Campus Academic Health Center (AHC)
College of Pharmacy College of Veterinary Medicine Medical School School of Dentistry School of Nursing School of Public Health AHC – Shared Health Sciences – Office of Senior Vice President
Carlson School of Management College of Agricultural, Food, and Environmental Sciences College of Architecture and Landscape Architecture College of Biological Sciences College of Continuing Education College of Education and Human Development College of Human Ecology College of Liberal Arts College of Natural Resources General College Humphrey Institute of Public Affairs Institute of Technology Law School Athletics
Crookston Campus Duluth School of Medicine Duluth Campus Morris Campus Rochester Campus University-wide Academic, Research, and Outreach
Agricultural Experiment Station Graduate School Minnesota Extension Service University Libraries Office of Sr. VP for System Administration Office of Sr. VP for Academic Affairs and Provost Office of Vice President for Research
Service and Support Units Audits Auxiliary Services Board of Regents Student Affairs Capital Planning and Project Management Controller’s Organization Facilities Management General Counsel Human Resources Information Technology Office of Budget and Finance President’s Office Public Safety University Health and Safety University Relations University Services – Office of Vice President
Total:
$2,596,946 9,055,557
26,492,354 8,374,172 2,269,951 3,989,902
23,354,980 3,692,117 5,226,295 4,860,881 1,981,826 8,670,383 3,300,457 6,260,443 1,918,500
19,328,850 2,080,107 1,415,633 1,508,952
40,640,987 2,624,453 6,173,083 7,639,436 4,337,179
32,773,792 11,990,124 1,007,008
7,742,315
10,404,489 6,154,765 9,460,658
12,787,943 26,399,956 4,951,673
1,362,631
806,915 630,031
2,404,637 1,414,468 5,843,201
75,791,065 3,082,536 7,265,882
35,680,741 7,803,144 4,003,403 6,779,891 3,638,068 6,261,027 2,466,193
$486,700,000
1,829,503 1,033,922
372,564 1,693,011
774,681
168,678
110,155 1,387,000
3,242,389 280,363
32,987,000 845,377
17,638,000
1,004,357
__________ $63,367,000
24,110,000
450,000
__________ $24,560,000
Source: Office of Budget and Finance, University of Minnesota.
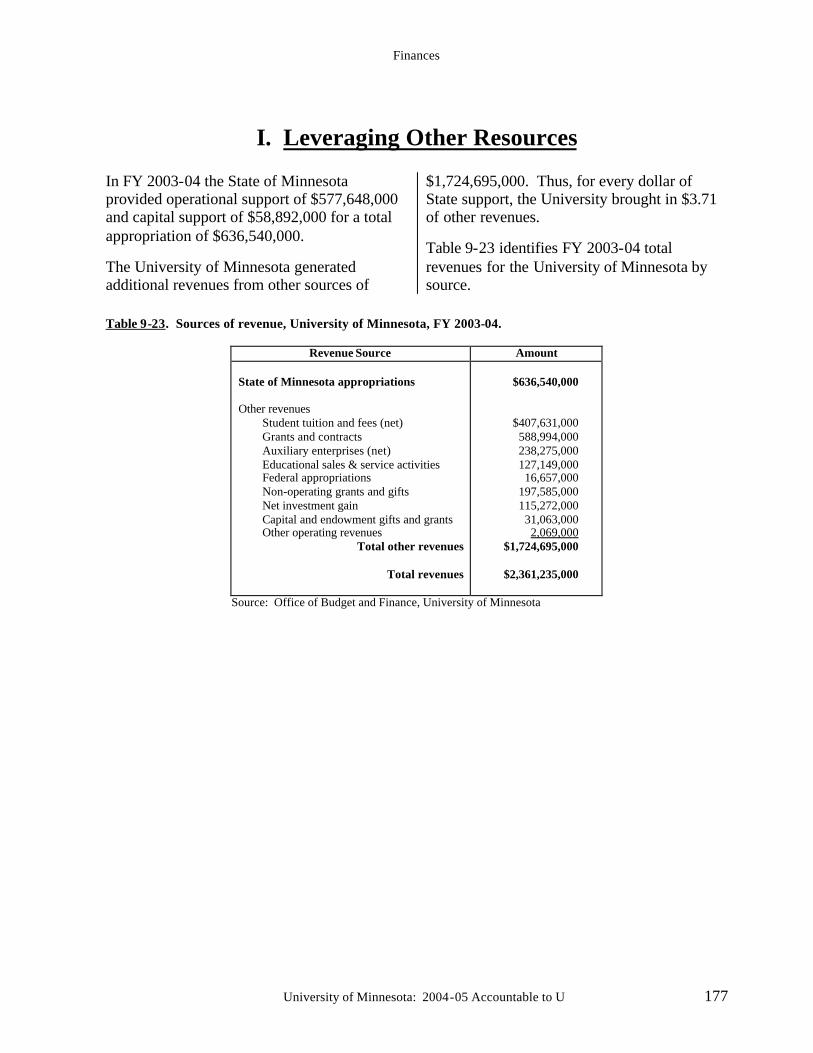
Finances
University of Minnesota: 2004-05 Accountable to U 177
I. Leveraging Other Resources
In FY 2003-04 the State of Minnesota provided operational support of $577,648,000 and capital support of $58,892,000 for a total appropriation of $636,540,000.
The University of Minnesota generated additional revenues from other sources of
$1,724,695,000. Thus, for every dollar of State support, the University brought in $3.71 of other revenues.
Table 9-23 identifies FY 2003-04 total revenues for the University of Minnesota by source.
Table 9-23. Sources of revenue, University of Minnesota, FY 2003-04.
Revenue Source Amount State of Minnesota appropriations Other revenues
Student tuition and fees (net) Grants and contracts Auxiliary enterprises (net) Educational sales & service activities Federal appropriations Non-operating grants and gifts Net investment gain Capital and endowment gifts and grants Other operating revenues
Total other revenues
Total revenues
$636,540,000
$407,631,000 588,994,000 238,275,000 127,149,000 16,657,000
197,585,000 115,272,000 31,063,000 2,069,000
$1,724,695,000
$2,361,235,000
Source: Office of Budget and Finance, University of Minnesota
Finances
178 University of Minnesota: 2004-05 Accountable to U
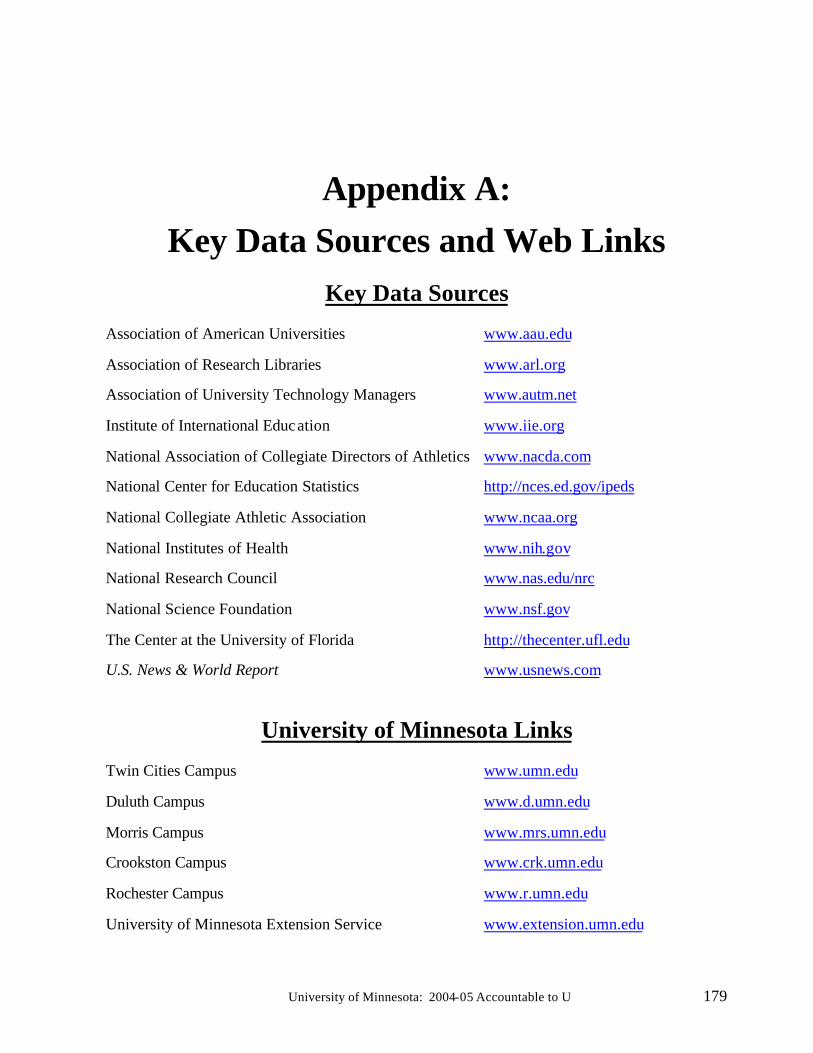
University of Minnesota: 2004-05 Accountable to U 179
Appendix A:
Key Data Sources and Web Links
Key Data Sources
Association of American Universities www.aau.edu
Association of Research Libraries
www.arl.org
Association of University Technology Managers
www.autm.net
Institute of International Education
www.iie.org
National Association of Collegiate Directors of Athletics
www.nacda.com
National Center for Education Statistics
http://nces.ed.gov/ipeds
National Collegiate Athletic Association
www.ncaa.org
National Institutes of Health
www.nih.gov
National Research Council
www.nas.edu/nrc
National Science Foundation
www.nsf.gov
The Center at the University of Florida
http://thecenter.ufl.edu
U.S. News & World Report
www.usnews.com
University of Minnesota Links
Twin Cities Campus
www.umn.edu
Duluth Campus www.d.umn.edu
Morris Campus
www.mrs.umn.edu
Crookston Campus
www.crk.umn.edu
Rochester Campus
www.r.umn.edu
University of Minnesota Extension Service
www.extension.umn.edu
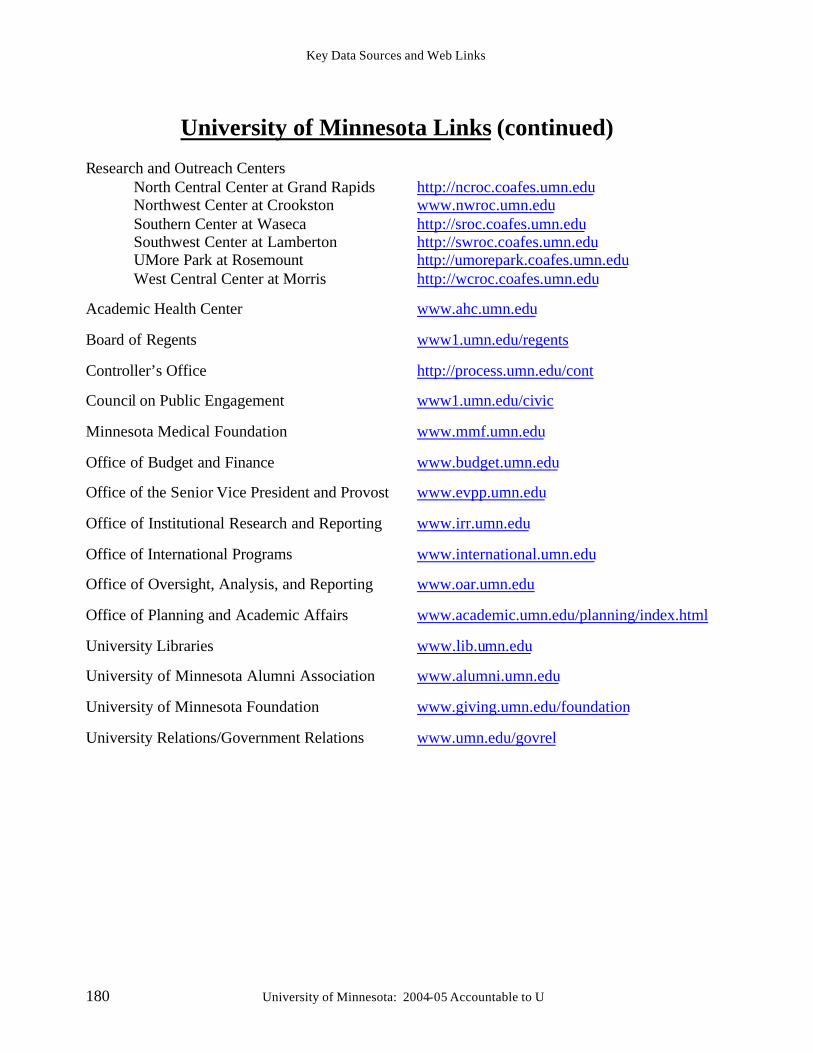
Key Data Sources and Web Links
180 University of Minnesota: 2004-05 Accountable to U
University of Minnesota Links (continued) Research and Outreach Centers
North Central Center at Grand Rapids http://ncroc.coafes.umn.edu Northwest Center at Crookston www.nwroc.umn.edu Southern Center at Waseca http://sroc.coafes.umn.edu Southwest Center at Lamberton http://swroc.coafes.umn.edu UMore Park at Rosemount http://umorepark.coafes.umn.edu West Central Center at Morris
http://wcroc.coafes.umn.edu
Academic Health Center
www.ahc.umn.edu
Board of Regents
www1.umn.edu/regents
Controller’s Office
http://process.umn.edu/cont
Council on Public Engagement
www1.umn.edu/civic
Minnesota Medical Foundation
www.mmf.umn.edu
Office of Budget and Finance
www.budget.umn.edu
Office of the Senior Vice President and Provost
www.evpp.umn.edu
Office of Institutional Research and Reporting
www.irr.umn.edu
Office of International Programs
www.international.umn.edu
Office of Oversight, Analysis, and Reporting www.oar.umn.edu
Office of Planning and Academic Affairs
www.academic.umn.edu/planning/index.html
University Libraries
www.lib.umn.edu
University of Minnesota Alumni Association
www.alumni.umn.edu
University of Minnesota Foundation
www.giving.umn.edu/foundation
University Relations/Government Relations www.umn.edu/govrel
University of Minnesota: 2004-05 Accountable to U 181
Appendix B:
List of Tables and Figures
Section 1: Profile of the University of Minnesota Section 1 Table Table 1-1. University of Minnesota degrees by campus, 2003-04. Table 1-2. 1998 state appropriations for University of Minnesota interdisciplinary initiatives.
Section 2: Twin Cities Campus
Section 2 Tables Table 2-1. Number of quality indicators in top 50 nationally among American public and private research universities, 2004. Table 2-2. Doctoral and other degrees conferred by top 10 U.S. public and private research universities and Big Ten public universities, 2002-03. Table 2-3. Average number of doctoral degrees conferred by top 10 U.S. public and private research universities and University of Minnesota – Twin Cities, 1998 – 2003. Table 2-4. Number of National Academy members for top 10 U.S. public and private research universities and University of Minnesota – Twin Cities, 2003. Table 2-5. Average number of National Academy members for top 10 U.S. public and private research universities and University of Minnesota – Twin Cities, 1999 – 2003. Table 2-6. Number of faculty awards in the arts, humanities, science, engineering, and health for top 10 U.S. public and private research universities and University of Minnesota – Twin Cities, 2003. Table 2-7. Average number of faculty awards in the arts, humanities, science, engineering, and health for top 10 U.S. public and private research universities and University of Minnesota – Twin Cities, 1999 – 2003. Table 2-8. Number of post-doctoral appointees for top 10 U.S. public and private research universities and University of Minnesota – Twin Cities, 2002. Table 2-9. Average number of post-doctoral appointees for top 10 U.S. public and private research universities and University of Minnesota – Twin Cities, 1998 – 2002. Table 2-10. Number of international students for selected U.S. research institutions, 2003-04. Table 2-11. Institutions hosting the most international scholars, 2001-02 and 2002-03. Table 2-12. Students enrolled in U.S. research universities participating in study abroad, 2001-02 and 2002-03. Table 2-13. Undergraduate rankings for Big Ten public universities by U.S. News & World Report. Table 2-14. 1995 NRC faculty quality rankings of University of Minnesota programs.
List of Tables and Figures
182 University of Minnesota: 2004-05 Accountable to U
Table 2-15. Highly ranked University of Minnesota – Twin Cities graduate programs by U.S. News & World Report, 2000-04. Table 2-16. University of Minnesota – Twin Cities Academic Health Center programs ranked in the top 15 nationally by U.S. News & World Report, 2000-04. Table 2-17. U.S. research university library rankings. Table 2-18. Library trends and Association of Research Libraries rankings for University Libraries, University of Minnesota, 1996-2003. Table 2-19. Online library resources of University Libraries, University of Minnesota, 2001-04. Table 2-20. National Institutes of Health total awards to domestic institutions of higher education, FY 2003. Table 2-21. National Institutes of Health award amounts to schools of dentistry , FY 2003. Table 2-22. National Institutes of Health award amounts to schools of medicine, FY 2003. Table 2-23. National Institutes of Health award amounts to schools of nursing, FY 2003. Table 2-24. National Institutes of Health award amounts to schools of pharmacy, FY 2003. Table 2-25. National Institutes of Health award amounts to schools of public health, FY 2003. Table 2-26. National Institutes of Health award amounts to schools of veterinary medicine, FY 2003. Table 2-27. National Science Foundation awards to U.S. public and private research universities, FY 2004. Table 2-28. Total research expenditures for top 10 U.S. public and private research universities and University of Minnesota, 2002. Table 2-29. Average total research expenditures for top 10 U.S. public and private research universities and University of Minnesota – Twin Cities, 1998-2002. Table 2-30. Federal research expenditures for top 10 U.S. public and private research universities and University of Minnesota, 2002. Table 2-31. Average federal research expenditures for top 10 U.S. public and private research universities and University of Minnesota – Twin Cities, 1998-2002. Table 2-32. High school rank of freshmen, University of Minnesota – Twin Cities, 1995 – 2004. Table 2-33. Percentage of freshmen in top 25 percent of high school class, AAU public institutions, 2003-04. Table 2-34. Proportion of students by racial/ethnic group, University of Minnesota – Twin Cities, fall 1996 – fall 2004. Table 2-35. Freshman seminar retention and graduation rates for students entering University of Minnesota – Twin Cities, 1998 – 2002. Table 2-36. First-, second-, and third-year retention rates for AAU public institutions, 2000 – 2002 cohorts. Table 2-37. Four-, five-, and six-year graduation rates for AAU public institutions, 1997 – 1999 cohorts. Table 2-38. Median elapsed time to degree for University of Minnesota master’s and doctoral students, 1999 – 2004. Table 2-39. National Association of Collegiate Directors of Athletics Directors’ Cup Final Standings, 2003-04. Table 2-40. Average student-athlete six-year graduation rates at Big Ten public universities, 1997-98 cohort. Table 2-41. Average six-year graduation rates at all Division I institutions, Big Ten public universities, and University of Minnesota, 1994-95 – 1997-98 cohorts. Table 2-42. University of Minnesota – Twin Cities athletics department revenues and expenditures, 2003-04. Table 2-43. Fundraising performance for University of Minnesota – Twin Cities athletics programs, FY 2001-04.
List of Tables and Figures
University of Minnesota: 2004-05 Accountable to U 183
Table 2-44. Faculty salary for University of Minnesota – Twin Cities and peer group institutions, 1999-00 – 2003-04. Table 2-45. Faculty compensation for University of Minnesota – Twin Cities and peer group institutions, 1999-00 – 2003-04. Table 2-46. Full professor average salary and compensation for selected top 30 AAU institutions and Big Ten public universities, 2003-04. Table 2-47. Associate professor average salary and compensation for selected top 30 AAU institutions and Big Ten public universities, 2003-04. Table 2-48. Assistant professor average salary and compensation for selected top 30 AAU institutions and Big Ten public universities, 2003-04. Table 2-49. Average wages for civil service and collective bargaining unit employees at the University of Minnesota – Twin Cities, 1999 – 2003. Table 2-50. Benefit comparisons for University of Minnesota – Twin Cities civil service and collective bargaining unit employees and comparable public and private sector employees, 2002. Table 2-51. On-campus criminal offenses at University of Minnesota – Twin Cities, 2000-03. Section 2 Figures Figure 2-1. Percentage of University of Minnesota – Twin Cities faculty and students who use the University Libraries (facility vs. online) on a daily or weekly basis, 2002-03. Figure 2-2. University Libraries non-sponsored revenue, FY 2005. Figure 2-3. Number of sponsored funding proposals submitted and amounts requested, 1999 – 2004. Figure 2-4. Number of sponsored funding awards and amount awarded, 1999 – 2004. Figure 2-5. University of Minnesota sponsored program award amounts, FY 2003. Figure 2-6. Grant and contract awards by source, FY 2004. Figure 2-7. Average high school rank percentile of new, entering freshmen, Twin Cities campus, 1995 – 2004. Figure 2-8. Average ACT score of new, entering freshmen, University of Minnesota – Twin Cities, 1995 – 2004. Figure 2-9. Percentage of entering freshmen of color, University of Minnesota – Twin Cities, fall 1995 – fall 2004. Figure 2-10. First-, second-, and third-year retention rates (percentage) for first-time, full-time new entering students, by year of matriculation, University of Minnesota – Twin Cities, 1994 – 2003. Figure 2-11. First-, second-, and third-year retention rates (percentage) for first-time, full-time new entering students of color, by year of matriculation, University of Minnesota – Twin Cities, 1994 – 2003. Figure 2-12. 4-, 5-, and 6-year graduation rates, University of Minnesota – Twin Cities, 1992 – 2000. Figure 2-13. 4-, 5-, and 6-year graduation rates for Twin Cities campus students of color, 1992 – 2000. Figure 2-14. Undergraduate student experiences survey results, University of Minnesota – Twin Cities, 1997 – 2003. Figure 2-15. University of Minnesota Graduate School applications by males and females, 1999 – 2004. Figure 2-16. University of Minnesota Graduate School yield for males and females, 1999 – 2004. Figure 2-17. University of Minnesota Graduate School applications by international students and students of color, 1999 – 2004. Figure 2-18. University of Minnesota Graduate School yield for international students and students of color, 1999 – 2004. Figure 2-19. Graduate student experiences survey results, University of Minnesota – Twin Cities, 1997 – 2003.
List of Tables and Figures
184 University of Minnesota: 2004-05 Accountable to U
Figure 2-20. Percentage of female faculty, University of Minnesota – Twin Cities, 1996-2004. Figure 2-21. Percentage of faculty of color, University of Minnesota – Twin Cities, 1996-2004. Figure 2-22. Diversity of faculty, University of Minnesota – Twin Cities, 1996-2004. Figure 2-23. Percentage of female staff employees, University of Minnesota – Twin Cities, 1996-2004. Figure 2-24. Percentage of staff of color, University of Minnesota – Twin Cities, 1996-2004. Figure 2-25. Auxiliary services portion of average total cost of attendance for on-campus undergraduates, University of Minnesota – Twin Cities, FY 2001-05. Figure 2-26. Facilities Condition Needs Index measures for selected higher education institutions, 2004. Figure 2-27. University of Minnesota – Twin Cities energy usage, FY 1988 – FY 2004. Figure 2-28. Annual capital investment in existing space and new construction, University of Minnesota – Twin Cities, FY 1997 – FY 2004.
Section 3: Duluth Campus
Section 3 Tables Table 3-1. Undergraduate Research Opportunities Program (UROP) participation, University of Minnesota – Duluth, fall 2001 – spring 2004. Table 3-2. Study abroad participation, University of Minnesota – Duluth, 1999-2004. Table 3-3. Ranking of University of Minnesota – Duluth among top public universities – Master’s (Midwest). Table 3-4. University of Minnesota – Duluth Medical School programs ranked in the top 15 nationally by U.S. News & World Report, 2001-2004. Table 3-5. High school rank of freshmen, University of Minnesota – Duluth, 1995-2004. Table 3-6. Proportion of students by racial/ethnic group, University of Minnesota – Duluth, fall 1996 – fall 2004. Table 3-7. On-campus criminal offenses at University of Minnesota – Duluth, 1999-2003. Table 3-8. Student-athlete graduation rates for students entering UMD from 1992 to 1997. Table 3-9. Average faculty salary for University of Minnesota – Duluth and peer group institutions, 1998-99 – 2002-03. Table 3-10. Average faculty compensation for University of Minnesota – Duluth and peer group institutions, 1999-00 – 2003-04. Table 3-11. Full professor average salary and compensation for University of Minnesota – Duluth and peer group, 2003-04. Table 3-12. Associate professor average salary and compensation for University of Minnesota – Duluth and peer group, 2003-04. Table 3-13. Assistant professor average salary and compensation for University of Minnesota – Duluth and peer group, 2003-04. Section 3 Figures Figure 3-1. Average high school rank percentile of new, entering freshmen, University of Minnesota – Duluth, 1995-2004. Figure 3-2. Average ACT score of new, entering freshmen, University of Minnesota – Duluth, 1995-2004. Figure 3-3. Percentage of entering freshmen of color, University of Minnesota – Duluth, fall 1995 – fall 2004. Figure 3-4. First-, second-, and third-year retention rates (percentage) for first-time, full-time new entering students, by year of matriculation, University of Minnesota – Duluth, 1994-2003.
List of Tables and Figures
University of Minnesota: 2004-05 Accountable to U 185
Figure 3-5. First-, second-, and third-year retention rates (percentage) for first-time, full-time new entering students of color, by year of matriculation, University of Minnesota – Duluth, 1994-2003. Figure 3-6. 4-, 5-, and 6-year graduation rates, University of Minnesota – Duluth, 1992-2000. Figure 3-7. 4-, 5-, and 6-year graduation rates for students of color, University of Minnesota – Duluth, 1992-2000. Figure 3-8. Undergraduate student experiences survey results, University of Minnesota – Duluth, 1997-2003. Figure 3-9. Graduate student experiences survey results, University of Minnesota – Duluth, 2001-2003. Figure 3-10. Percentage of female faculty at University of Minnesota – Duluth, 1996-2004. Figure 3-11. Percentage of faculty of color at University of Minnesota – Duluth, 1996-2004. Figure 3-12. Number of faculty of color at University of Minnesota – Duluth, 1996-2004. Figure 3-13. Percentage of female staff employees, University of Minnesota – Duluth, 1996-2004. Figure 3-14. Percentage of staff of color, University of Minnesota – Duluth, 1996-2004.
Section 4: Morris Campus
Section 4 Tables Table 4-1. Ranking of University of Minnesota – Morris campus among top public liberal arts colleges by U.S. News & World Report. Table 4-2. High school rank of freshmen, University of Minnesota – Morris, 1995-2004. Table 4-3. Proportion of students by racial/ethnic group, University of Minnesota – Morris, fall 1996 – fall 2004. Table 4-4. On-campus criminal offenses at University of Minnesota – Morris, 1999-2003. Table 4-5. Average faculty salary for University of Minnesota – Morris and peer group institutions, 1999-00 – 2003-04. Table 4-6. Average faculty compensation for University of Minnesota – Morris and peer group institutions, 1999-00 – 2003-04. Table 4-7. Full professor average salary and compensation for University of Minnesota – Morris and peer group, 2003-04. Table 4-8. Associate professor average salary and compensation for University of Minnesota – Morris and peer group, 2003-04. Table 4-9. Assistant professor average salary and compensation for University of Minnesota – Morris and peer group, 2003-04. Section 4 Figures Figure 4-1. Average high school rank percentile of new, entering freshmen, University of Minnesota – Morris, 1994-2003. Figure 4-2. Average ACT score of new, entering freshmen, University of Minnesota – Morris, 1995-2004. Figure 4-3. Percentage of entering freshmen of color, University of Minnesota – Morris, fall 1995 – fall 2004. Figure 4-4. First-, second-, and third-year retention rates (percentage) for first-time, full-time new entering students, by year of matriculation, University of Minnesota – Morris, 1994-2003. Figure 4-5. First-, second-, and third-year retention rates (percentage) for first-time, full-time new entering students of color, by year of matriculation, University of Minnesota – Morris, 1994,2003. Figure 4-6. 4-, 5-, and 6-year graduation rates, University of Minnesota – Morris, 1992-2000. Figure 4-7. 4-, 5-, and 6-year graduation rates for students of color, University of Minnesota – Morris, 1992-2000.
List of Tables and Figures
186 University of Minnesota: 2004-05 Accountable to U
Figure 4-8. Undergraduate student experiences survey results, University of Minnesota – Morris, 1997-2003. Figure 4-9. Female faculty at University of Minnesota – Morris, 1996-2004. Figure 4-10. Faculty of color at University of Minnesota – Morris, 1996-2004. Figure 4-11. Faculty diversity at University of Minnesota – Morris, 1996-2004. Figure 4-12. Percentage of female staff employees, University of Minnesota – Morris, 1996-2004. Figure 4-13. Percentage of staff of color, University of Minnesota – Morris, 1996-2004.
Section 5: Crookston Campus
Section 5 Tables Table 5-1. U.S. News & World Report, Top Public Comprehensive Colleges – Bachelor’s (Midwest) category, 2004. Table 5-2. High school rank of freshmen, University of Minnesota – Crookston, 1995-2004. Table 5-3. Proportion of students by racial/ethnic group, University of Minnesota – Crookston, fall 1996 – fall 2004. Table 5-4. On-campus criminal offenses at University of Minnesota – Crookston, 1999-2003. Table 5-5. Average faculty salary for University of Minnesota – Crookston and peer group institutions, 1998-99 – 2002-03. Table 5-6. Average faculty compensation for University of Minnesota – Crookston and peer group institutions, 1998-99 – 2002-03. Table 5-7. Full professor average salary and compensation for University of Minnesota – Crookston and peer group, 2002-2003. Table 5-8. Associate professor average salary and compensation for UMC and peer group, 2002-2003. Table 5-9. Assistant professor average salary and compensation for University of Minnesota – Crookston and peer group, 2002-2003. Section 5 Figures Figure 5-1. Average high school rank percentile of new, entering freshmen, University of Minnesota – Crookston, 1995-2004. Figure 5-2. Average ACT composite scores of admitted new entering students, University of Minnesota – Crookston, 1995-2006 (actual and goal). Figure 5-3. Percentage of entering freshmen of color, University of Minnesota – Crookston, fall 1995 – fall 2004. Figure 5-4. First-, second-, and third-year retention rates (percentage) for first-time, full-time new entering students, by year of matriculation, University of Minnesota – Crookston, 1994-2003. Figure 5-5. University of Minnesota – Crookston first-, second-, and third-year retention rates for students of color, 1994-2003. Figure 5-6. 4-, 5-, and 6-year graduation rates, University of Minnesota – Crookston, 1993-2000. Figure 5-7. Undergraduate student experiences survey results, University of Minnesota – Crookston, 1997-2003. Figure 5-8. Female faculty at University of Minnesota – Crookston, 1996-2004. Figure 5-9. Faculty of color at University of Minnesota – Crookston, 1996-2004. Figure 5-10. Faculty diversity at University of Minnesota – Crookston, 1996-2004. Figure 5-11. Percentage of female staff employees, University of Minnesota – Crookston, 1996-2004. Figure 5-12. Percentage of staff of color, University of Minnesota – Crookston, 1996-2004.
List of Tables and Figures
University of Minnesota: 2004-05 Accountable to U 187
Section 6: Rochester Center
Section 6 Tables Table 6-1. Student experiences survey results, University of Minnesota, Rochester campus, 2004. Table 6-2. Fall semester credit course enrollment at the University of Minnesota – Rochester, 2000-2004. Table 6-3. Fall/spring semester credit course enrollments at the University of Minnesota – Rochester, 1999-00 – 2003-04. Table 6-4. On-campus criminal offenses at University Center Rochester, 2000-03.
Section 7: Public Engagement – Access and Outreach
Section 7 Tables Table 7-1. Licensing revenues and patent activity for top 10 public and private institutions, FY 2003. Table 7-2. Average licensing income for top 10 public and private research universities and University of Minnesota, FY 1999 – FY 2003. Table 7-3. Extension Service revenue, FY 2002. Table 7-4. Extension Service distribution of revenue, FY 2002. Table 7-5. Citizen estimates of current state funding of the University of Minnesota’s budget. Section 7 Figures Figure 7-1. Number of new inventions and technologies disclosed to the University of Minnesota, 2000-2004. Figure 7-2. U.S. patent applications and patents issued, 2000-2004. Figure 7-3. Start-ups, new licenses, and options, 2000-2004. Figure 7-4. Total active technology commercialization agreements, 2000-2004. Figure 7-5. Technology commercialization gross revenues, in millions, 2000-2004. Figure 7-6. Extension Service sources of revenue, 1994-2004. Figure 7-7. Citizen impressions of University’s importance to the state, 2003. Figure 7-8. Citizen impressions of University’s importance to the state compared to citizen satisfaction, 2003. Figure 7-9. Public understanding of the University of Minnesota’s role as a research institution.
Section 8: Efficiency and Effectiveness
Section 8 Tables Table 8-1. Information technology as a percentage of total budget FY 2002 – FY 2004. Table 8-2. University of Minnesota online and ITV course statistics, 2003-04. Section 8 Figures Figure 8-1. University of Minnesota information technology spending, FY 2001-04. Figure 8-2. Customer satisfaction with Office of Information Technology services, University of Minnesota, FY 2001-04.
List of Tables and Figures
188 University of Minnesota: 2004-05 Accountable to U
Section 9: Finances
Section 9 Tables Table 9-1. University of Minnesota key financial indicators from the balance sheet, FY 2003-04. Table 9-2. Annual operating indicators for University of Minnesota, FY 2003-04. Table 9-3. 2004-05 undergraduate resident and non-resident tuition and required fees for Big Ten public universities and 1-, 5-, and 10-year percentage increase. Table 9-4. 2004-05 resident and non-resident tuition and required fees for graduate students at Big Ten public universities and 1-, 5-, and 10-year percentage increase. Table 9-5. 2004-05 resident and non-resident tuition and required fees for first-professional business (M.B.A.) students at Big Ten public universities and 1-, 5-, and 10-year percentage increase. Table 9-6. 2004-05 resident and non-resident tuition and required fees for law (J.D.) students at Big Ten public universities and 1-, 5-, and 10-year percentage increase. Table 9-7. 2004-05 resident and non-resident tuition and required fees for pharmacy (Pharm.D.) students at Big Ten public universities and 1-, 5-, and 10-year percentage increase. Table 9-8. 2004-05 resident and non-resident tuition and required fees for veterinary (D.V.M.) students at Big Ten public universities and 1-, 5-, and 10-year percentage increase. Table 9-9. University of Minnesota current outstanding debt, June 30, 2004. Table 9-10. Moody’s Investors Service key capital ratios, FY 2002 – FY 2004. Table 9-11. Moody’s Investors Service key financial ratios, FY 2002 – FY 2004. Table 9-12. Total resources per student for selected public research universities, FY 2002 – FY 2003. Table 9-13. University of Minnesota return on invested assets. Table 9-14. Endowment assets for top 10 U.S. public and private research universities and University of Minnesota, 2003. Table 9-15. Average endowment assets for top 10 U.S. public and private research universities, and University of Minnesota, 1999-2003. Table 9-16. Rates of return for University of Minnesota Foundation investments and benchmark data. Table 9-17. University of Minnesota Foundation and Minnesota Medical Foundation endowed chairs and fellowships. Table 9-18. Annual giving for top 10 U.S. public and private research universities and University of Minnesota, 2003. Table 9-19. Average annual giving for top 10 U.S. public and private research universities and University of Minnesota, 1999-2003. Table 9-20. College and campus giving, FY 2004. Table 9-21. Minnesota Medical Foundation investment performance, as of June 30, 2004. Table 9-22. Internal allocation of state appropriations to the University of Minnesota, FY 2004-05. Table 9-23. Sources of revenue, University of Minnesota, FY 2003-04. Section 9 Figures Figure 9-1. Total revenues, University of Minnesota, FY 2004.
List of Tables and Figures
University of Minnesota: 2004-05 Accountable to U 189
Figure 9-2. Functional expenses, University of Minnesota, FY 2004. Figure 9-3. Tuition and fees and state appropriations as a percentage of total University of Minnesota revenue, 1970 to 2004. Figure 9-4. University of Minnesota Foundation endowment (in millions), FY 1995 – FY 2004. Figure 9-5. Funds contributed by University of Minnesota alumni to University of Minnesota Foundation and Minnesota Medical Foundation, 1995-2004. Figure 9-6. Number of University of Minnesota alumni donors to University of Minnesota Foundation and Minnesota Medical Foundation, 1995-2004.

190 University of Minnesota: 2004-05 Accountable to U
University of Minnesota: 2004-05 Accountable to U 191
Appendix C:
Report Contributors This report includes information from a wide range of sources across all of the University of Minnesota’s campuses. We gratefully acknowledge the help of the following individuals who have contributed information, advice, and encouragement, and who have been instrumental in creating the report.
Although this report is the result of many contributors, the Office of the Executive Vice President and Provost is responsible for its contents. Questions and comments may be directed to the editors, John Ziegenhagen ([email protected]) and Sandra Ecklein ([email protected]).
Academic Health Center Terry Bock, Beth Nunnally, Mark Paller
Board of Regents
Clyde Allen, Anthony Baraga, Peter Bell, Frank Berman, Dallas Bohnsack, John Frobenius, William Hogan, Richard McNamara, David Metzen, Lakeesha Ransom, Maureen Reed, Patricia Simmons
Budget and Finance, Office of Carole Fleck, Lincoln Kallsen, Richard Pfutzenreuter, Julie Tonneson
Career and Community Learning Center (CLA)
Laurel Hirt Controller’s Office
Robin Markowitz, Warren Skallman Equal Opportunity and Affirmative Action, Office of
John Felipe, Julie Sweitzer Senior Vice President for Academic Affairs & Provost, Office of
Laura Coffin Koch, Ronald Matross, Sharon Reich Paulsen, E. Thomas Sullivan, Craig Swan, Billie Wahlstrom, Leanne Wirkkula,
Graduate School
Victor Bloomfield, Brad Bostrom
Human Resources, Office of Carol Carrier, Dann Chapman, Timothy Delmont, Joe Kelly, Karen Linquist, Jacqueline Singer, Lori Ann Vicich, Diane Walters
Information Technology, Office of
Steve Cawley, Bernard Gulachek Institutional Research and Reporting, Office of
Sarah Delaney, Ronald Huesman, John Kellogg, Cynthia James Murdoch, Scott Murdoch, Peter Zetterberg
Intercollegiate Athletics, Department of
Julie Grebin, Michael Halloran International Programs
C. Eugene Allen, Kathleen Sellew
Minnesota Medical Foundation Catherine Henry
Planning and Academic Affairs, Office of Alfred Sullivan President, Office of
Kathryn Brown, Robert Bruininks, Jeanie Taylor
Printing Services Robert Swoverland
System Administration, Office of the Senior Vice President for
Robert Jones
Report Contributors
192 University of Minnesota: 2004-05 Accountable to U
University Libraries Erin George, Christopher James, Wendy Lougee, Catherine Tweedie
University Relations, Office of
Amy Anderson, Donna Peterson, Cynthia Scott University Services, Office of
Michael Berthelsen, Greg Hestness, Leslie Krueger, Kevin McCourt, Craig Moody, Kathleen O’Brien, Andrew Phelan, Jennifer Rowe, Laurie Scheich, Steve Spehn, Lori-Ann Williams, Jane Zimmerman
University of Minnesota Alumni Association
James Larson, Bruce Rader University of Minnesota Extension Service
Charles Casey, George Morse, Phil O’Brien University of Minnesota Foundation
James Aagaard, Judy Kirk
University of Minnesota – Crookston Stehanie Helgeson, Les Johnson, Rose Mary Koch, Joseph Massey, Bob Nelson, Richard Nelson
University of Minnesota – Duluth
Greg Fox, Vickery French, Bruce Gildseth, Steve Hedman, Gail Kehoe, Paula Knudson, Bob Krumwiede, Vincent Magnuson, Kathryn A. Martin, Bob Nielson, Maryann Soleim, Carol Threinen, Bill Wade
University of Minnesota – Morris
Charles Grussing, Carla Riley, Samuel Schuman University of Minnesota – Rochester
David Carl Vice President for Research, Office of
David Hamilton, Winifred Schumi and the staff of the Office of Oversight, Analysis, and Reporting
University of Minnesota: 2004-05 Accountable to U 193
Appendix D:
University of Minnesota Board of Regents
Honorable David R. Metzen, Chair
Congressional District 4 Elected by the Legislature in 1997, 2003 Term expires: 2009
Honorable Anthony R. Baraga, Vice Chair
Congressional District 8 Elected by the Legislature in 1999 Term expires: 2005
Honorable Clyde E. Allen, Jr.
Congressional District 7 Elected by the Legislature in 2003 Term expires: 2009
Honorable Peter Bell
Congressional District 5 Appointed by the Governor in 2002 Elected by the Legislature in 2003 Term expires: 2007
Honorable Frank R. Berman
At Large Appointed by the Governor in 2001 Elected by the Legislature in 2003 Term expires: 2007
Honorable Dallas Bohnsack
Congressional District 2 Elected by the Legislature in 1999
Term expires: 2005
Honorable John Frobenius Congressional District 6 Elected by the Legislature in 2003 Term expires: 2009
Honorable William E. Hogan II
Congressional District 3 Elected by the Legislature in 1993, 1999 Term expires: 2005
Honorable Richard F. McNamara
At Large Appointed by the Governor in 2001 Elected by the Legislature in 2003 Term expires: 2007
Honorable Lakeesha K. Ransom
At Large Appointed by the Governor in 2001 Elected by the Legislature in 2003 Term expires: 2007
Honorable Maureen K. Reed
At Large Elected by the Legislature in 1997, 2003
Term expires: 2009
Honorable Patricia Simmons Congressional District 1 Elected by the Legislature in 2003 Term expires: 2009
Ann D. Cieslak
Executive Director and Corporate Secretary 600 McNamara Alumni Center
200 Oak Street S.E. University of Minnesota
Minneapolis, MN 55455-2020

194 University of Minnesota: 2004-05 Accountable to U

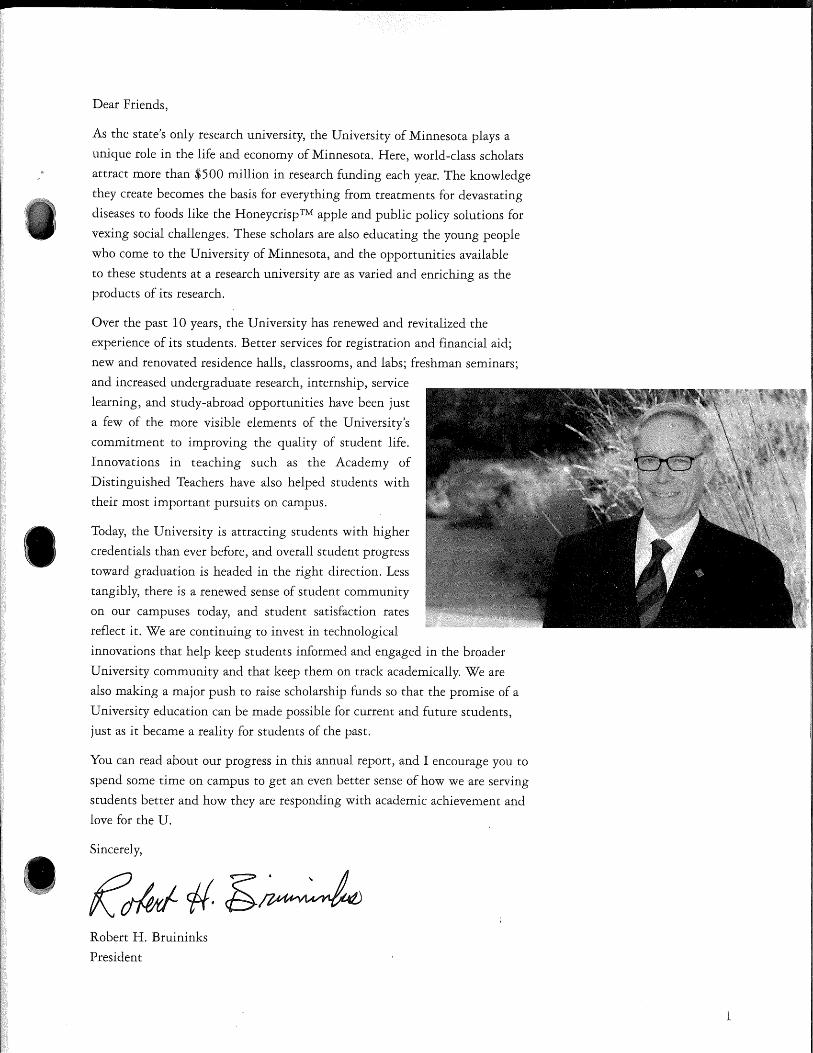
I
Dear Friends,
As the state's only research university, the University of Minnesota plays a
unique role in the life and economy of Minnesota. Here, world-class scholars
attract more than $500 million in research funding each year. The knowledge
they create becomes the basis for everything from treatments for devastating
diseases to foods like the Honeycrisp TM apple and public policy solutions for
vexing social challenges. These scholars are also educating the young people
who come to the University of Minnesota, and the opportunities available
to these students at a research university are as varied and enriching as the
products of its research.
Over the past 10 years, the University has renewed and revitalized the
experience of its students. Better services for registration and financial aid;
new and renovated residence halls, classrooms, and labs; freshman seminars;
and increased undergraduate research, internship, service
learning, and study-abroad opportunities have been just
a few of the more visible elements of the University's
commitment to improving the quality of student life.
Innovations in teaching such as the Academy of
Distinguished Teachers have also helped students with
their most important pursuits on campus.
Today, the University is attracting students with higher
credentials than ever before, and overall student progress
toward graduation is headed in the right direction. Less
tangibly, there is a renewed sense of student community
on our campuses today, and student satisfaction rates
reflect it. We are continuing to invest in technological
innovations that help keep students informed and engaged in the broader
University community and that keep them on track academically. We are
also making a major push to raise scholarship funds so that the promise of a
University education can be made possible for current and future students,
just as it became a reality for students of the past.
You can read about our progress in this annual report, and I encourage you to
spend some time on campus to get an even better sense of how we are serving
students better and how they are responding with academic achievement and
love for the U.
Sincerely,
Robert H. Bruininks
President
1
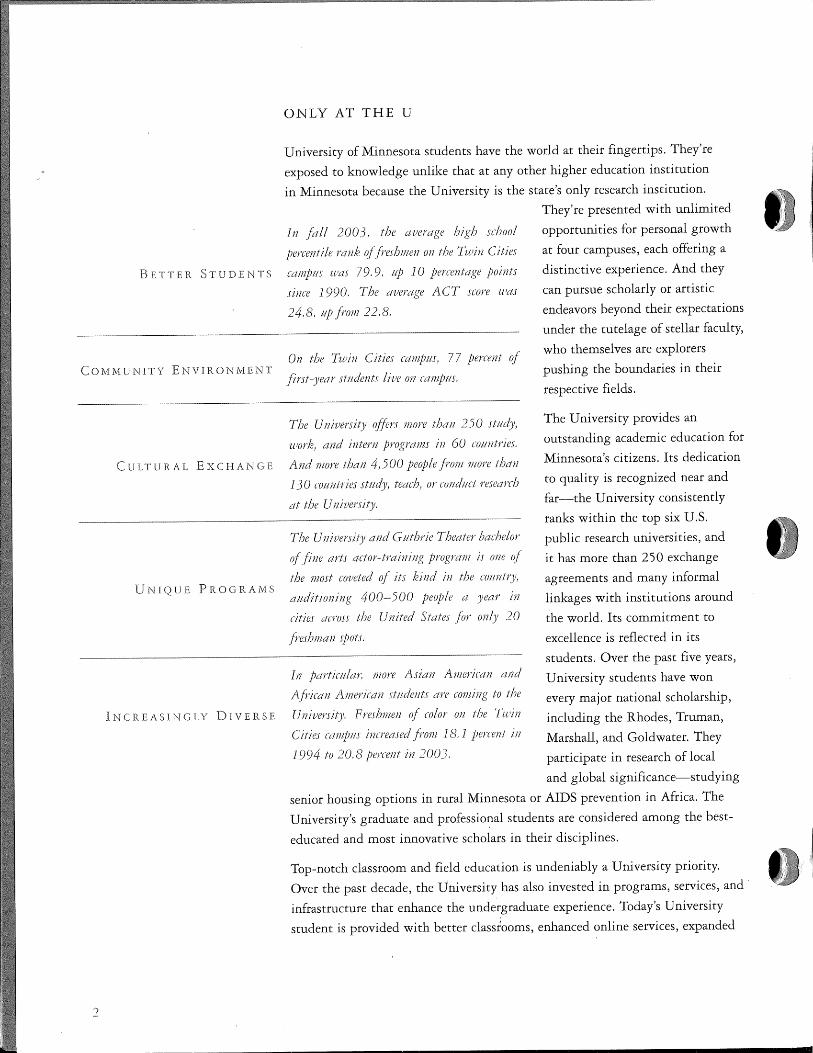
ONLY AT THE U
University of Minnesota students have the world at their fingertips. They're
exposed to knowledge unlike that at any other higher education institution
in Minnesota because the University is the state's only research institution.
In fall 2003. the averc,1ge high school
percentile rank a/freshmen on the Twin Cities
BETTER STUDENTS ccimpm was 79.9. Hp 10 points
since 1990. The average ACT score was
24.8. i!p from 22.8.
They're presented with unlimited
OMMUNITY ENVIRONMENT On the Twin Cities campm) 77 percent of
first-year st11dents Hve 011 campm.
opportunities for personal growth
at four campuses, each offering a
distinctive experience. And they
can pursue scholarly or artistic
endeavors beyond their expectations
under the tutelage of stellar faculty,
who themselves are explorers
pushing the boundaries in their
respective fields.
2
The University offers more than 250 study,
work1
and iutern programs in 60 countries.
CULTURAL EXCHANGE And more than 4.500 people from more than
The University provides an
outstanding academic education for
Minnesota's citizens. Its dedication
to quality is recognized near and
far-the University consistently
ranks within the top six U.S.
public research universities, and
UNIQUE PROGRAMS
INCREASINGLY IVER SE
13 0 comztries study, te.:ich) or cond11ct research
at the
The University and G;,1thrie The.:iter bachelor
of fine arts actor-training program is one ~f
the most coveted of its kind in the co11ntry,
auditioning 400-500 people a year m
cities across the United States for only 20
freshman spots.
In more Asicm American and
A}i'ican American st11dents are to the
Freshmen of color on the Tu/in
Cities campm 18.1 m
1994 to 20.8 in 2003.
it has more than 250 exchange
agreements and many informal
linkages with institutions around
the world. Its commitment to
excellence is reflected in its
students. Over the past five years,
University students have won
every major national scholarship,
including the Rhodes, Truman,
Marshall, and Goldwater. They
participate in research of local
and global significance-studying
senior housing options in rural Minnesota or AIDS prevention in Africa. The
University's graduate and professional students are considered among the best
educated and most innovative scholars in their disciplines.
Top-notch classroom and field education is undeniably a University priority.
Over the past decade, the University has also invested in programs, services, and·
infrastructure that enhance the undergraduate experience. Today's University
student is provided with better classrooms, enhanced online services, expanded
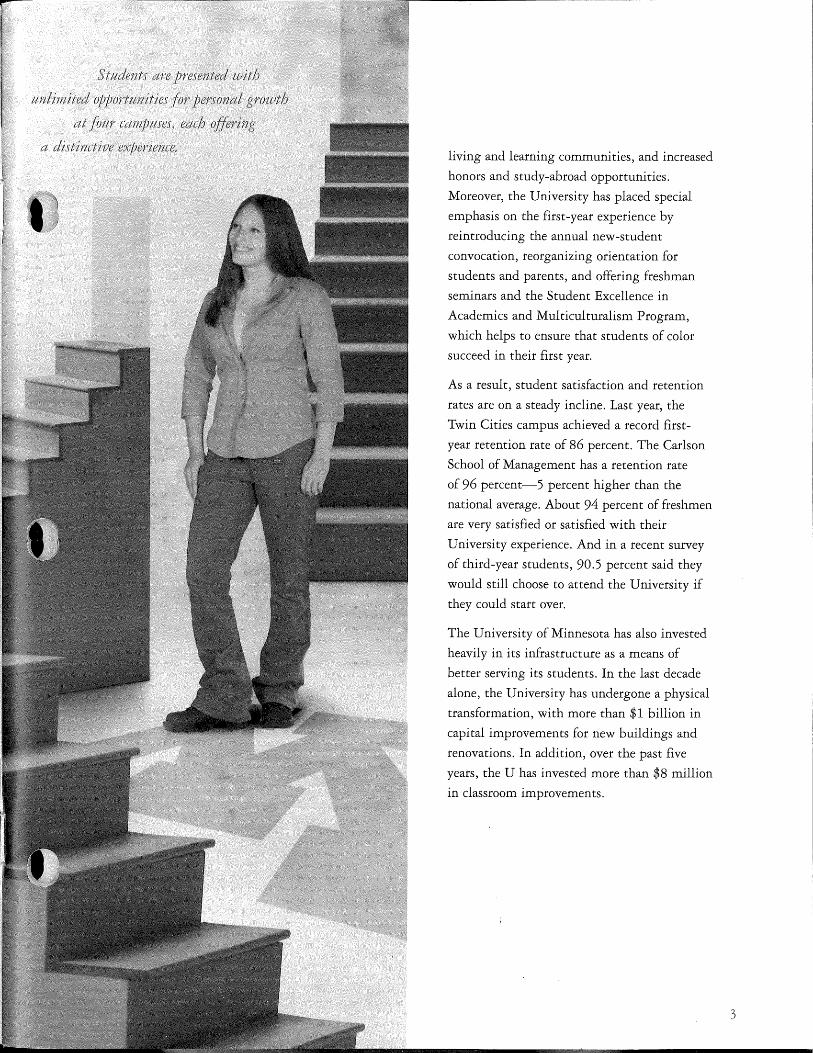
living and learning communities, and increased
honors and study-abroad opportunities.
Moreover, the University has placed special
emphasis on the first-year experience by
reintroducing the annual new-student
convocation, reorganizing orientation for
students and parents, and offering freshman
seminars and the Student Excellence in
Academics and Multiculturalism Program,
which helps to ensure that students of color
succeed in their first year.
As a result, student satisfaction and retention
rates are on a steady incline. Last year, the
Twin Cities campus achieved a record first
year retention rate of 86 percent. The Carlson
School of Management has a retention rate
of 96 percent-5 percent higher than the
national average. About 94 percent of freshmen
are very satisfied or satisfied with their
University experience. And in a recent survey
of third-year students, 90.5 percent said they
would still choose to attend the University if
they could start over.
The University of Minnesota has also invested
heavily in its infrastructure as a means of
better serving its students. In the last decade
alone, the University has undergone a physical
transformation, with more than $1 billion in
capital improvements for new buildings and
renovations. In addition, over the past five
years, the Uhas invested more than $8 million
in classroom improvements.
3
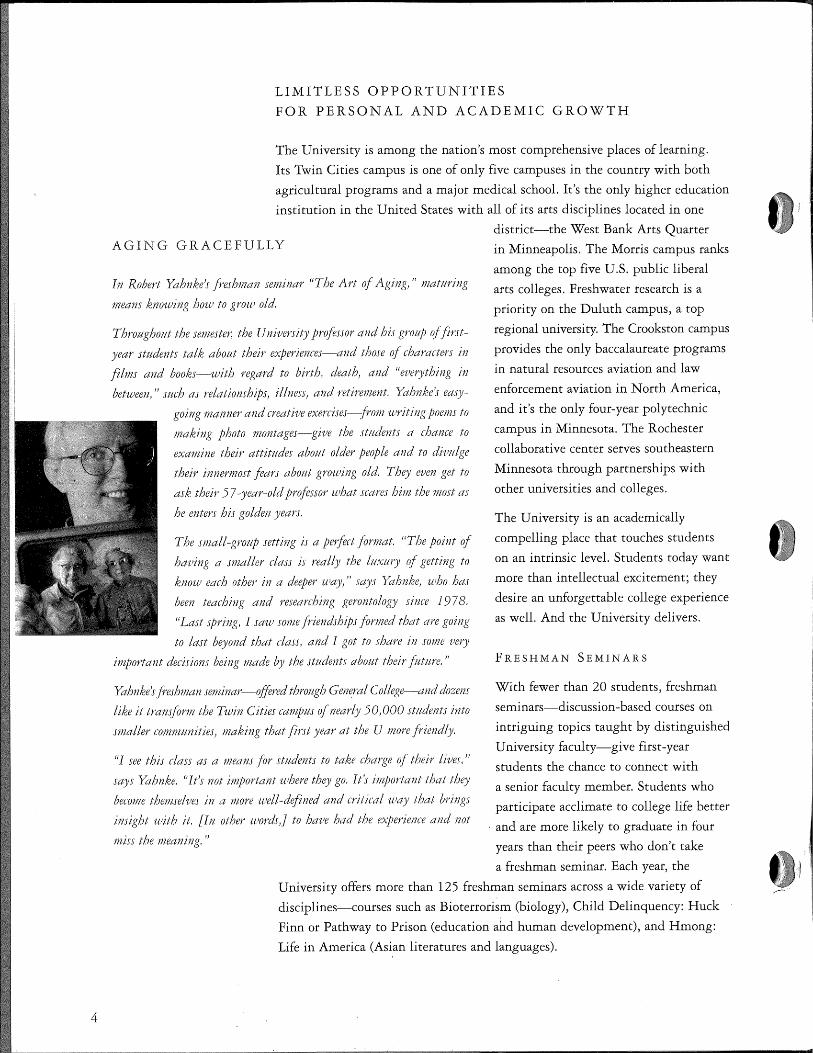
4
LIMITLESS OPPORTUNITIES
FOR PERSONAL AND ACADEMIC GROWTH
The University is among the nation's most comprehensive places oflearning.
Its Twin Cities campus is one of only five campuses in the country with both
agricultural programs and a major medical school. It's the only higher education
institution in the United States with all of its arts disciplines located in one
AGING GRACEFULLY
In Robert Yahnke)s freshman seminar 11The Art of Aging))! matttring
means knowing hoit' to grow old.
Througho11t the semester; the University professor and his group of first
year students talk abottt their experiences-and those of charr:trters in
films and books-with regard to birth, death, and "everything in
between," rnch as relationships, illness) and retirement. Yahnke's eaJJ'
going mr:tnner and creative exercises-from writing poems to
making photo montages-give the st11dents a chance to
exctmine their attitudes abottt older people and to div11lge
their innermost fears abo11t growing old. They even get to
ask their 5 7 -year-old professor what scares him the most as
he enters his golden years.
The small-group setting is a perfect format. ''The point of
having a smaller class is really the ltt.'x:ttry of getting to
know each other in a deeper way," says Yahnke, who has
been teaching and researching gerontology since 1978.
"Last Jpring, I saw some friendships formed thctt are going
to last beyond that class, and I got to share i11 some very
important decisions being made by the stttdents abottt their fi1t1tre. ''
Yahnke}s freshman seminar-{)ffered through General College-and dozens
like it transform the T,win Cities campus of nearly 5 0, 000 students into
smaller comnumities) making that first year at the U more friendly.
''I see this class as a means for st11.dents to take charge of their lives,!!
says Yahnke. "Jt!s not important ·where they go. It's important that they
become themselves in cz more well-defined and critical way that brings
insight with it. [In other wordsJ to have httd the experience and not
miss the meaning.''
district-the West Bank Arts Quarter
in Minneapolis. The Morris campus ranks
among the top five U.S. public liberal
arts colleges. Freshwater research is a
priority on the Duluth campus, a top
regional university. The Crookston campus
provides the only baccalaureate programs
in natural resources aviation and law
enforcement aviation in North America,
and it's the only four-year polytechnic
campus in Minnesota. The Rochester
collaborative center serves southeastern
Minnesota through partnerships with
other universities and colleges.
The University is an academically
compelling place that touches students
on an intrinsic level. Students today want
more than intellectual excitement; they
desire an unforgettable college experience
as well. And the University delivers.
FRESHMAN SEMINARS
With fewer than 20 students, freshman
seminars-discussion-based courses on
intriguing topics taught by distinguished
University faculty-give first-year
students the chance to connect with
a senior faculty member. Students who
participate acclimate to college life better
· and are more likely to graduate in four
years than their peers who don't take
a freshman seminar. Each year, the
University offers more than 12 5 freshman seminars across a wide variety of
disciplines-courses such as Bioterrorism (biology), Child Delinquency: Huck
Finn or Pathway to Prison (education ahd human development), and Hmong:
Life in America (Asi.an literatures and languages).
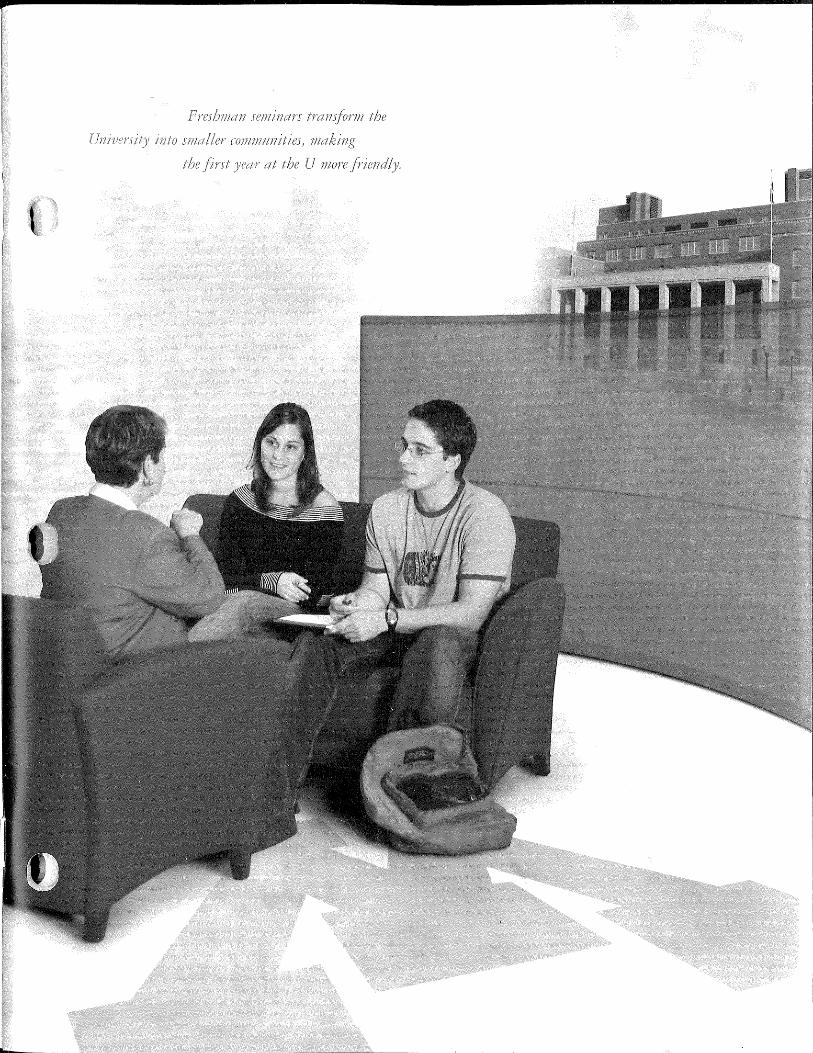
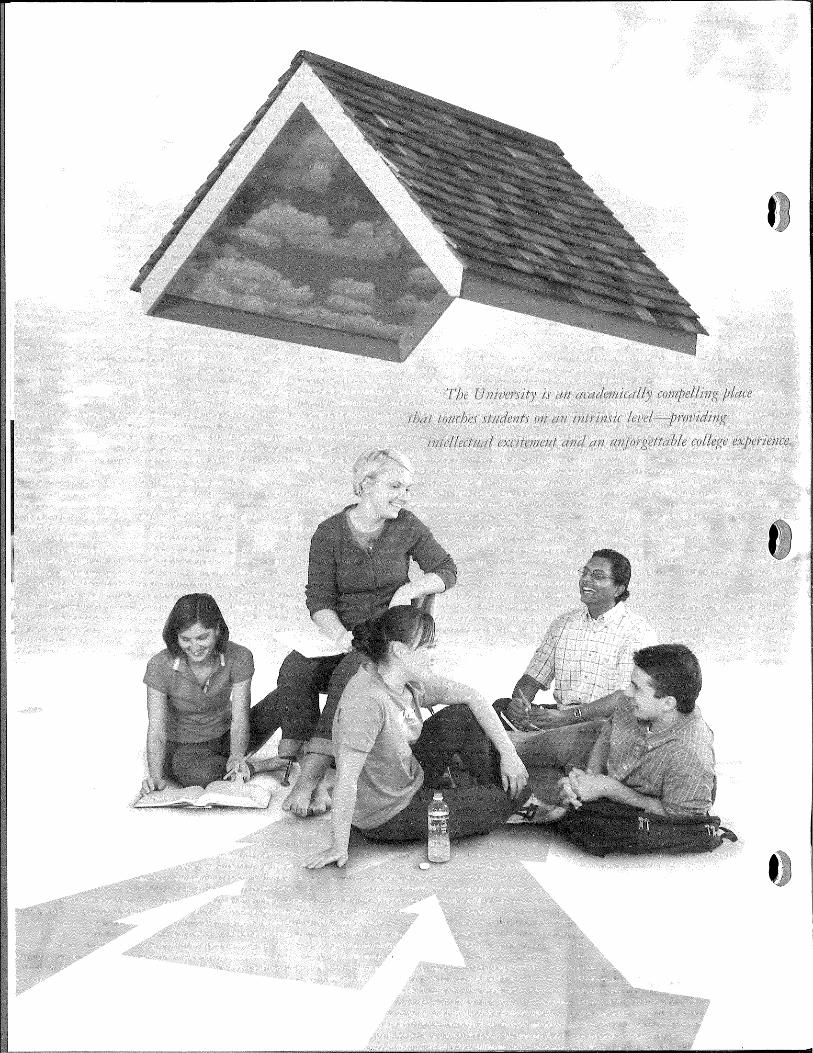
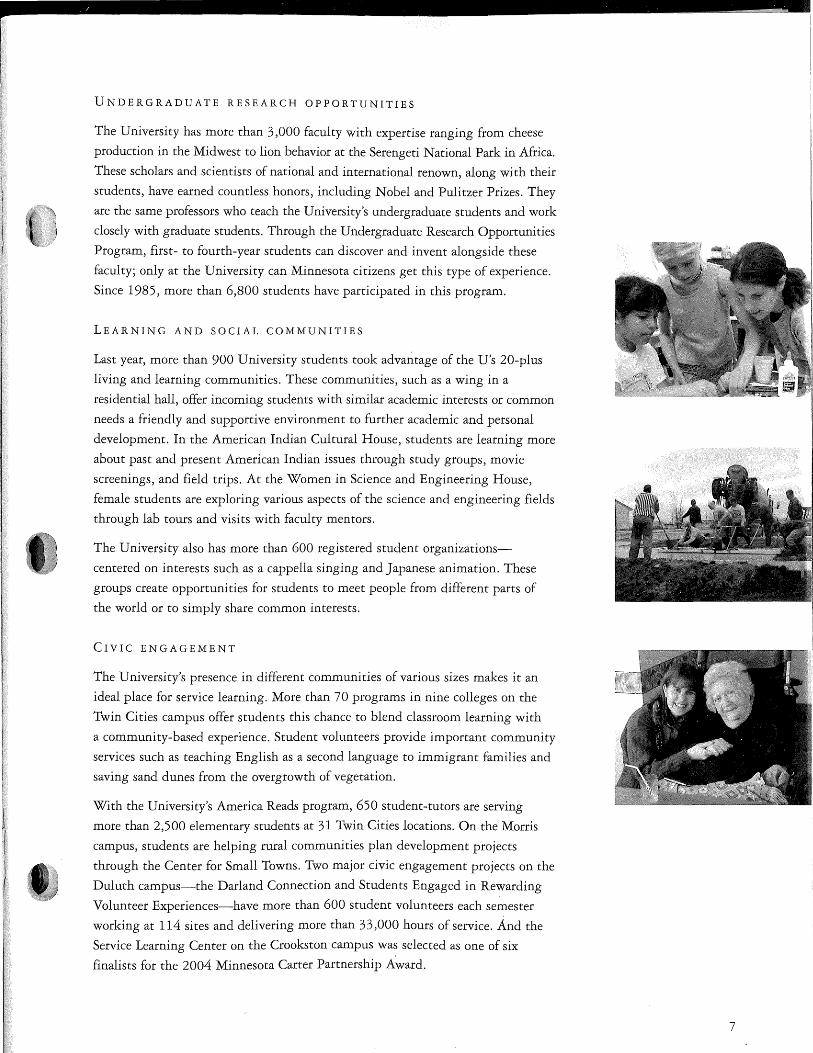
UNDERGRADUATE RESEARCH OPPORTUNITIES
The University has more than 3,000 faculty with expertise ranging from cheese
production in the Midwest to lion behavior at the Serengeti National Park in Africa.
These scholars and scientists of national and international renown, along with their
students, have earned countless honors, including Nobel and Pulitzer Prizes. They
are the same professors who teach the University's undergraduate students and work
closely with graduate students. Through the Undergraduate Research Opportunities
Program, first- to fourth-year students can discover and invent alongside these
faculty; only at the University can Minnesota citizens get this type of experience.
Since 1985, more than 6,800 students have participated in this program.
LEARNING AND SOCIAL COMMUNITIES
Last year, more than 900 University students took advantage of the U's 20-plus
living and learning communities. These communities, such as a wing in a
residential hall, offer incoming students with similar academic interests or common
needs a friendly and supportive environment to further academic and personal
development. In the American Indian Cultural House, students are learning more
about past and present American Indian issues through study groups, movie
screenings, and field trips. At the Women in Science and Engineering House,
female students are exploring various aspects of the science and engineering fields
through lab tours and visits with faculty mentors.
The University also has more than 600 registered student organizations
centered on interests such as a cappella singing and Japanese animation. These
groups create opportunities for students to meet people from different parts of
the world or to simply share common interests.
CIVIC ENGAGEMENT
The University's presence in different communities of various sizes makes it an
ideal place for service learning. More than 70 programs in nine colleges on the
Twin Cities campus offer students this chance to blend classroom learning with
a community-based experience. Student volunteers provide important community
services such as teaching English as a second language to immigrant families and
saving sand dunes from the overgrowth of vegetation.
With the University's America Reads program, 650 student-tutors are serving
more than 2,500 elementary students at 31 Twin Cities locations. On the Morris
campus, students are helping rural communities plan development projects
through the Center for Small Towns. Two major civic engagement projects on the
Duluth campus-the Darland Connection and Students Engaged in Rewarding
Volunteer Experiences-have more than 600 student volunteers each semester
working at 114 sites and delivering more than 33,000 hours of service. And the
Service Learning Center on the Crookston campus was selected as one of six
finalists for the 2004 Minnesota Carter Partnership A~ard.
7
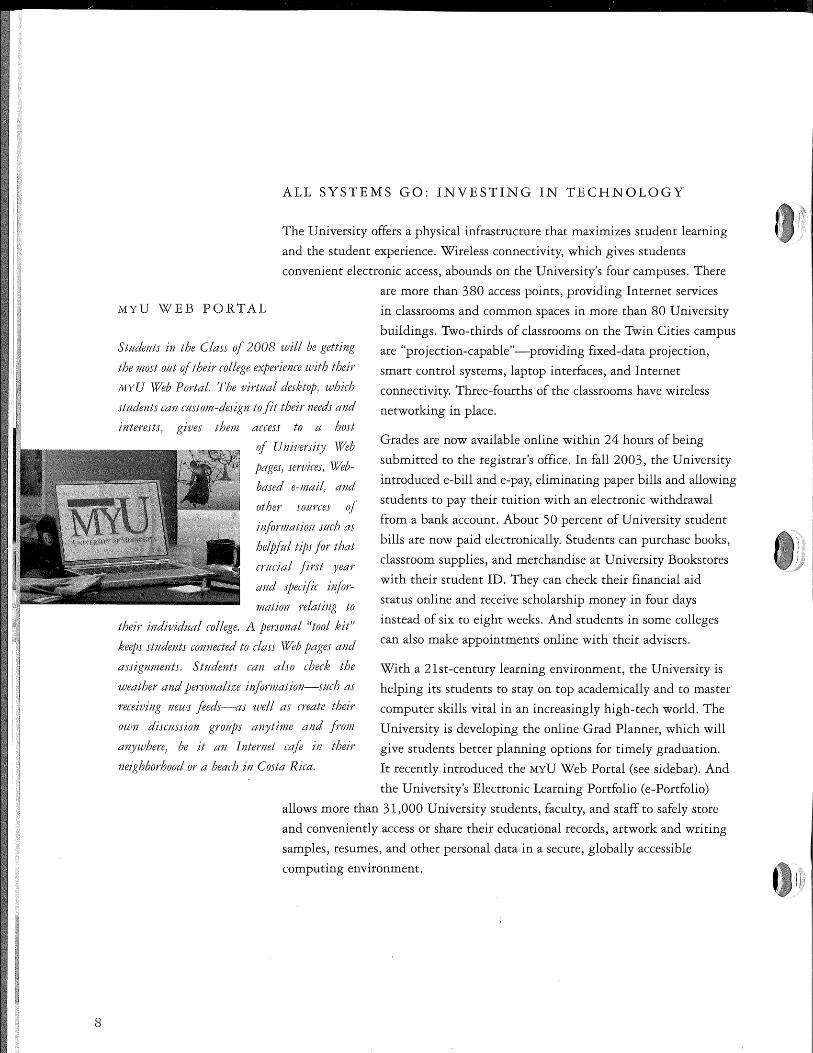
8
ALL SYSTEMS GO: INVESTING IN TECHNOLOGY
The University offers a physical infrastructure that maximizes student learning
and the student experience. Wireless connectivity, which gives students
convenient electronic access, abounds on the University's four campuses. There
MYU WEB PORTAL
Students in the Class of 2008 will be getting
the most ottt of their college experience tuith their
MYU Web Portal. The virtttal desktop! which
st1tdents can ettstom-design to fit their needs and
interests, gives them access to a host
of University Web
pages! services, \Veb
based e-mai/1 and
other sources of
information s11ch as
helpf11l tips for that
mtcial first year
and specific infor
mation relating to
their individual college. A personal "tool kit"
keeps st11dents connected to class \Veb pages and
assignments. Students can also check the
weather and personalize information-such as
receiving news feeds-as well as create their
own dismssion groups anytime and from
anywhere1 be it an Internet cafe in their
neighborhood or a beach in Costa Rica.
are more than 380 access points, providing Internet services
in classrooms and common spaces in more than 80 University
buildings. Two-thirds of classrooms on the Twin Cities campus
are "projection-capable"-providing fixed-data projection,
smart control systems, laptop interfaces, and Internet
connectivity. Three-fourths of the classrooms have wireless
networking in place.
Grades are now available online within 24 hours of being
submitted to the registrar's office. In fall 2003, the University
introduced e-bill and e-pay, eliminating paper bills and allowing
students to pay their tuition with an electronic withdrawal
from a bank account. About 50 percent of University student
bills are now paid electronically. Students can purchase books,
classroom supplies, and merchandise at University Bookstores
with their student ID. They can check their financial aid
status online and receive scholarship money in four days
instead of six to eight weeks. And students in some colleges
can also make appointments online with their advisers.
With a 21st-century learning environment, the University is
helping its students to stay on top academically and to master
computer skills vital in an increasingly high-tech world. The
University is developing the online Grad Planner, which will
give students better planning options for timely graduation.
It recently introduced the MYU Web Portal (see sidebar). And
the University's Electronic Learning Portfolio (e-Portfolio)
allows more than 31,000 University students, faculty, and staff to safely store
and conveniently access or share their educational records, artwork and writing
samples, resumes, and other personal data in a secure, globally accessible
computing environment. l))
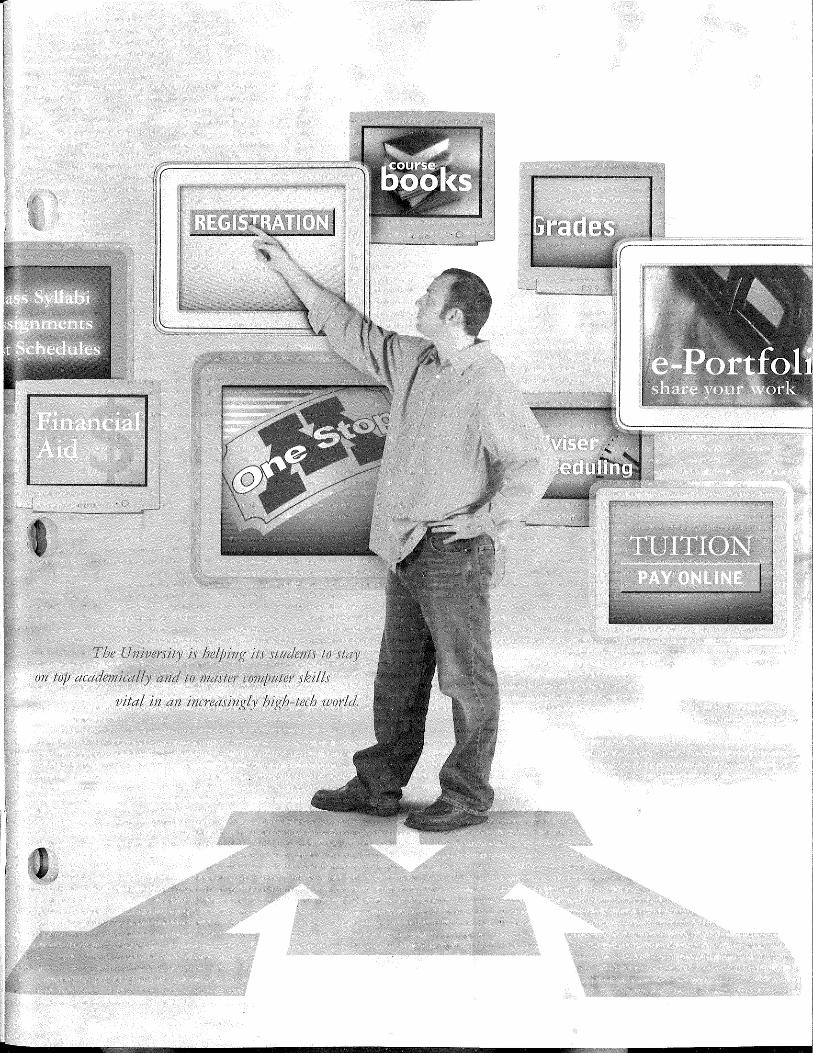
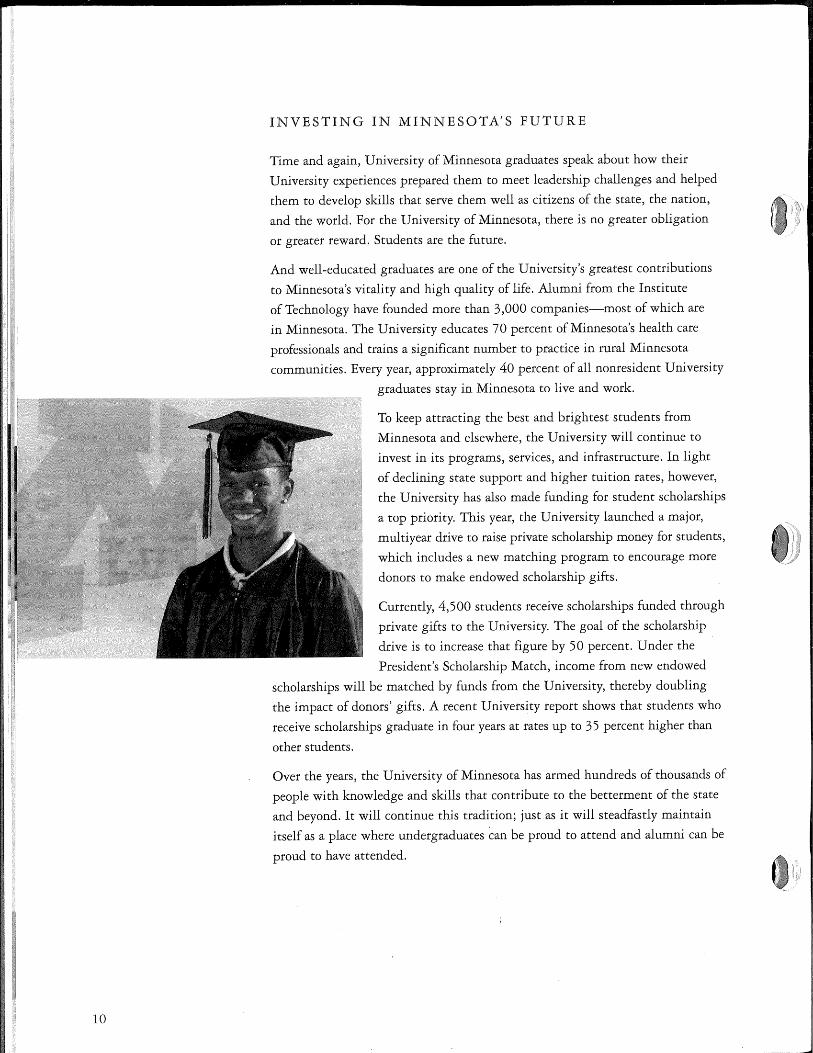
10
INVESTING IN MINNESOTA'S FUTURE
Time and again, University of Minnesota graduates speak about how their
University experiences prepared them to meet leadership challenges and helped
them to develop skills that serve them well as citizens of the state, the nation,
and the world. For the University of Minnesota, there is no greater obligation
or greater reward. Students are the future.
And well-educated graduates are one of the University's greatest contributions
to Minnesota's vitality and high quality of life. Alumni from the Institute
of Technology have founded more than 3,000 companies-most of which are
in Minnesota. The University educates 70 percent of Minnesota's health care
professionals and trains a significant number to practice in rural Minnesota
communities. Every year, approximately 40 percent of all nonresident University
graduates stay in Minnesota to live and work.
To keep attracting the best and brightest students from
Minnesota and elsewhere, the University will continue to
invest in its programs, services, and infrastructure. In light
of declining state support and higher tuition rates, however,
the University has also made funding for student scholarships
a top priority. This year, the University launched a major,
multiyear drive to raise private scholarship money for students,
which includes a new matching program to encourage more
donors to make endowed scholarship gifts.
Currently, 4,500 students receive scholarships funded through
private gifts to the University. The goal of the scholarship
drive is to increase that figure by 50 percent. Under the
President's Scholarship Match, income from new endowed
scholarships will be matched by funds from the University, thereby doubling
the impact of donors' gifts. A recent University report shows that students who
receive scholarships graduate in four years at rates up to 35 percent higher than
other students.
Over the years, the University of Minnesota has armed hundreds of thousands of
people with knowledge and skills that contribute to the betterment of the state
and beyond. It will continue this tradition; just as it will steadfastly maintain
itself as a place where undergraduates ~an be proud to attend and alumni can be
proud to have attended.
ANALYSIS
INTRODUCTION
This discussion and analysis of the University of Minnesota's (the University) consolidated financial statements provides an overview of the consolidated financial position and activities of the University for the years ended June 30, 2004 ~nd 2003. The discussion has been prepared by management and should be read in conjunction with the consolidated financial statements and the accompanying notes.
The University of Minnesota is both the state's landgrant university, with a strong tradition of education and public service, and a major research institution, with faculty of national and international reputation. Its statutory mission is to offer undergraduate, graduate, and professional instruction through the doctoral degree, and to be the primary state-supported academic institution for research and extension services.
The University of Minnesota, founded in 1851, has four campuses (Twin Cities, Duluth, Morris, Crookston), a collaborative center at Rochester, research and outreach centers, and extension service offices throughout the state.
The Twin Cities campus is the third largest campus in the country in terms of enrollment (approximately 50,000 students) and also one of the most comprehensive. It is the state's major research campus, with expenditures of approximately $422.3 million and $411.6 million in fiscal years 2004 and 2003, respectively, for research under various programs funded by governmental and private sources.
The Duluth campus (approximately 10,100 students) is a comprehensive regional university that offers instruction through the master's degree and has unique research strengths in natural and freshwater resources.
The Morris campus (approximately 1,900 students) provides an innovative and high-quality residential undergraduate liberal arts education to a very select and intellectually gifted student body.
12
The Crookston campus (approximately 2,300 students; including 1,100 degree-seeking undergraduates) provides career-oriented education at the baccalaureate level, primarily in polytechnical disciplines.
The Rochester collaborative center is focused on meeting the educational needs of students in the Rochester area at the upper division and postbaccalaureate levels.
MISSION
The University of Minnesota's three mission activities are instruction, research, and public service.
~~·-~~·-U to provide instruction through a broad range of educational programs that prepare undergraduate, graduate, and professional students for productive roles in society.
-"-"'"""'"'"'--'-'~-u. to generate and preserve knowledge, understanding, and creativity by conducting research, scholarship, and artistic activity.
to exchange the University's knowledge and resources with society by making them accessible to the citizens of the state.
OPERATIONS
The University of Minnesota conducts its mission activities at its campuses and other facilities throughout the state. Each year, the University of Minnesota:
• provides instruction for more than 64,300 students;
• graduates approximately 11,500 students, 41 percent with graduate or first professional degrees on the Twin Cities campus;
• conducts research sponsored by the National Institutes of Health, the National Science Foundation, other federal agencies, and numerous private companies and foundations;
• reaches out to more than one million Minnesotans through various outreach and public service activities.
CONSOLIDATED FIN AN CI AL STATEMENTS
The consolidated financial statements are prepared in accordance with generally accepted accounting principles prescribed by the Governmental Accounting Standards Board (GASB). The consolidated financial statements required under these reporting standards include the Consolidated Statements of Net Assets; the Consolidated Statements of Revenues, Expenses, and Changes in Net Assets; and the Consolidated Statements of Cash Flows. All are reported on a consolidated basis for the University as a whole. Also required are the financial results of the University's legally separate component units.
CONSOLIDATED STATEMENTS OF NET ASSETS
The Consolidated Statements of Net Assets present the consolidated financial position of the University at the end of the fiscal year, under a classified balance sheet format that reflects current and noncurrent assets and liabilities, and reports net assets under the following three separate classifications:
Unrestricted. Includes assets that are not subject to limitations or stipulations imposed by external entities and that have not been set aside for capital or endowment purposes. These assets are available for any lawful purpose of the institution and include resources that may be designated for specific purposes as determined by management, financial, or Board of Regents policies.
_._,..,,.,.., ... ,L_.._._._, ... , which is divided into two ca1te2:or1es -ex1oe1J.a:a.bJ,e and Expendable assets are available for expenditure by the institution, but only in accordance with restrictions placed on their use by donors and other external entities. Nonexpendable assets are also externally restricted, but are required to be retained in perpetuity, including the University's true endowments and institutional contributions to refundable loan programs.
Invested in assets, net of related debt. This category includes property, plant, and equipment, net of accumulated depreciation, reduced by the outstanding balances of debt attributable to these capital assets.
The University's consolidated assets, liabilities, and net assets at June 30, 2004 and 2003, are summarized below (in thousands of dollars).
Current assets
Capital assets, net
Other noncurrent assets
Total assets
Current liabilities
Noncurrent liabilities
Total liabilities
Net assets
Unrestricted
Restricted-expendable
Restricted-nonexpendable
Invested in capital assets, net of related debt
Net assets
2004
$ 548,431 1,862,746 1,178,258 3,589,435
665,640 521,086
1,186,726
315,377 687,461 199,369
1,200,502 $2,402,709
2003
$ 626,710 1,837,689
981,964 3,446,363
846,435 436,533
1,282,968
313,401 515,079 192,604
1,142,311 $2,163,395
Current assets at June 30, 2004, totaled $548.4 million, a decrease of 12.5 percent or $78.3 million over the prior year. Current assets consist primarily of cash and cash equivalents, securities lending collateral, and net receivables. Cash and cash equivalents decreased by $138.1 million or 52.6 percent to $124.5 million at June 30, 2004. The majority of this decrease is due to a change in the nature of the investments held, which reduced the amount classified as cash and cash equivalents. State and federal appropriations receivable increased $16.9 million or 15.5 percent to $126.0 million at June 30, 2004, from $109.1 million at June 30, 2003. The increase in the receivables was due to: a $17.0 million increase in capital appropriations receivable due to increased capital spending in fiscal year 2004; an $8.0 million increase in state special appropriations due mainly to increases in the tobacco settlement receipts, partially offset by reductions in other special appropriations; and an $8.1 million reduction in the state general fund appropriation receivable due to the $60.5 million decrease in the level of state support in fiscal year 2004 versus fiscal year 2003. Federal appropriation~ receivable remained consistent.
13
ANALYSIS
Receivables from students amounted to $ 3 5. 5 million and $36.8 million at June 30, 2004 and 2003, respectively, net of estimated uncollectible amounts of $7 .0 million and $2.5 million, at June 30, 2004 and 2003, respectively. The gross receivable balance did increase by $3.2 million or 8.2 percent to $42.5 million at June 30, 2004, from $39.3 million at June 30, 2003; however, the increase in th~ allowance for uncollectible amounts as a result of an increase in overdue balances, due in part to rising tuition and fees experienced during the past years, had the impact of decreasing the net student receivables. Sponsored receivables, net of allowances, were $63.0 million and $65.5 million at June 30, 2004 and 2003, respectively. The decrease of $2.5 million or 3.8 percent is mainly a result of more timely billings and collections of sponsored accounts. Trade and other receivables, net of allowances, increased $6.0 million or 9.7 percent to $66.3 million at June 30, 2004, from $60.3 million at June 30, 2003. Several increases in various departmental receivable accounts made up the change, the most significant of which was an increase of $4. 7 million in the receivable from the state of Minnesota for Medical Education and Research Costs (MERC) and the Prepaid Medical Assistance Program (PMAP).
Total student loans receivable remained fairly consistent at $70.2 million, net of allowances of $3.8 million, at June 30, 2004, compared with $67 .8 million, net of allowances of $3.8 million, at June 30, 2003.
Capital assets, net of accumulated depreciation, totaled $1,862.7 million at June 30, 2004. Capital assets increased $25 .1 million or 1.4 percent over the prior year. Fiscal year 2004 saw increased spending on capital projects as compared with the prior year. The majority of capital spending was funded by state capital appropriations, related to projects included in prior year capital requests, as well as capital gifts and grants. No significant spending was funded through bond proceeds in fiscal year 2004 because the Minnesota legislature failed to enact a bonding bill during the 2004 legislative session. The University had submitted a total capital request of $188.7 million in 2004, which included $155.5 million in state bonds and $33.2 million in University financing. The University intends to resubmit a capital request in fiscal year 2005. See Note 4 to the consolidated financial statements for more detailed information regarding . capital assets.
14
Other noncurrent assets totaled $1, 178. 3 million and $982.0 million at June 30, 2004 and 2003, respectively, and include long-term endowment and other investments of $1,112.2 million and $844.8 million, respectively. The increase of $267.4 million or 31. 7 percent in longterm endowment and other investments includes increases from net unrealized and realized gains on the endowment and other investments of $107.4 million; reinvested endowment earnings of $ 7 .1 million; and a decrease of $30.1 million related to the annual distribution of 5 percent of the three-year, moving average market value of the endowment to departments. The remaining increase relates to a change in the nature of the investments held, which increased the amount classified as investments. Also included in other noncurrent assets are unspent bond proceeds of $.4 million at June 30, 2004, and $78.1 million at June 30, 2003, which are earmarked for approved capital projects. Included in the June 30, 2003, balance was the $71.0 million Series 2003A bond issuance, which was used, along with additional University funds, to refund the Series 1993A debt in August 2004. Student loan receivables scheduled for collection beyond June 2004 and 2003, respectively, and prepaid expenses and deferred charges make up the majority of the remaining noncurrent assets.
Current liabilities totaled $665 .6 million at June 30, 2004, down 21.4 percent or $180.8 million from $846.4 million at June 30, 2003. Current liabilities consisted primarily of accounts payable, securities lending collateral, and accrued liabilities and other, including significant expected obligations under the University's self-insured medical plan. Current liabilities also included revenue related to summer session tuition and fees deferred to the next fiscal year, funds received in advance of expenditures on sponsored accounts, and the current portion of bonds payable.
Accounts payable of $66.8 million at June 30, 2004, were relatively consistent, increasing $3.0 million or 4.7 percent from $63.8 million at June 30, 2003. Securities lending collateral increased $24.0 million or 46.3 percent to $75.7 million at June 30, 2004, up from $51.7 million at June 30, 2003, due to increased investing activity in this area.
Accrued liabilities and other increased $17.2 million or 10.3 percent to $185.3 million at June 30, 2004, from $168.1 million at June 30, 2003. Accrued liabilities and other consists primarily of the current portions of
compensation and benefit accruals and the University's self-insurance reserves. Compensation and benefit accruals increased $9.4 million or 8.2 percent to $123.8 million at June 30, 2004. Of this increase, $9.0 million was due to higher payroll accruals resulting from two extra days of accrued payroll versus June 30, 2003. Trade liabilities of $14.7 million at June 30, 2004, were $6.7 million or 82. 8 percent higher than June 30, 200 3. Several increases, including increased capital spending, made up the change, the most significant of which was an increase of $2.6 million in the current portion of retainage accruals associated with construction in progress at the University. Accrued interest totaled $2.3 million and $5.7 million at June 30, 2004 and 2003, respectively. The $ 3 .4 million or 5 9 .4 percent decrease was the result of a payment related to arbitrage. Other accrued liabilities increased $3.8 million or 23.0 percent to $20.5 million at June 30, 2004. This change is mainly attributable to a $4.5 million increase in payables related to Minnesota for Medical Education and Research Costs (MERC) and the Prepaid Medical Assistance Program (PMAP), partially offset by decreases in several other accrued liabilities.
Unearned income of $86.2 million at June 30, 2004, consisted of revenue related to summer session tuition and fees deferred to fiscal year 2005, funds received in advance of expenditures on sponsored accounts, and deferred revenue related to contracts with outside corporations. This balance decreased $17.4 million or 16.8 percent from June 30, 2003, due to a decrease in sponsored deferred revenue of $23.8 million resulting from increased sponsored expenditures during fiscal year 2004. This was partially offset by an increase in summer session tuition and fees of $2.2 million due to increased enrollment rates and a $6.4 million deferral of an up-front payment from TCP related to a new U Card contract. Other smaller net decreases also impacted the unearned income account.
Four of the University's bond issuances totaling $345.9 million have demand provisions that require the University to repurchase the bonds upon notice from bondholders. As of June 30, 2004, the University had standby purchase agreements related to .the 1999A and 2001C bonds. While the 2001C standby purchase agreement provides long-term liquidity support, the 1999 A standby purchase agreement was no longer classified long-term as it was set to expire in June 2005, and the University did not renew this agreement.
Although management believes that all of these bonds will continue to be paid according to the original noncurrent payment schedules, $23 7.3 million and $362.0 million was reported as current liabilities at June 30, 2004 and 2003, respectively. Included in current liabilities at June 30, 2004, were all of the outstanding obligations under the Series 1999A, 2001A, and 2001B bonds and a portion of the Series 2001C bonds that would be due within the next year if the standby purchase agreement were exercised for the year then ended. Included in current liabilities at June 30, 2003, were all of the outstanding obligations under the Series 1999A, 2001A, 2001B, and 2001C bonds.
N oncurrent liabilities, totaling $ 5 21.1 million and $436.5 million at June 30, 2004 and 2003, respectively, primarily included principal amounts due on University bonds and long-term vacation and other compensationrelated liabilities. As discussed above, the portion of the University's Series 2001C bonds that was classified as current at June 30, 2003, has been moved to noncurrent liabilities at June 30, 2004. This change in classification was the primary cause of the increase in long-term debt at June 30, 2004, of $96.9 million or 30.6 percent. See Note 5 to the consolidated financial statements for more detailed information regarding long-term debt. Noncurrent accrued liabilities and other decreased to $102.4 million at June 30, 2004, from $119.4 million at June 30, 2003. This $17.0 million or 14.2 percent decrease was caused by several factors including: settlement of claims related to the University steam plant resulting in a $12.0 million decrease; a $9.0 million decrease in the liability to Fairview for the prior settlement of hospital claims due to payments as well as a reclassification of amounts to current liabilities; and a decrease in the accrued pension liability of $1.2 million. These decreases were partially offset by an increase of $2.2 million in accrued vacation liabilities; an increase in accrued severance liabilities of $1. 7 million due to a larger number of employees than the prior year; and a $1.0 million increase in student loan advances from the federal government.
CONSOLIDATED STATEMENTS OF REVENUES,
EXPENSES, AND CHANGES IN NET ASSETS
The Consolidated Statements of Revenues, Expenses, and Changes in Net Assets present the institution's operating, nonoperating, and capital- and endowmentrelated financial activity during the year. This statement
15
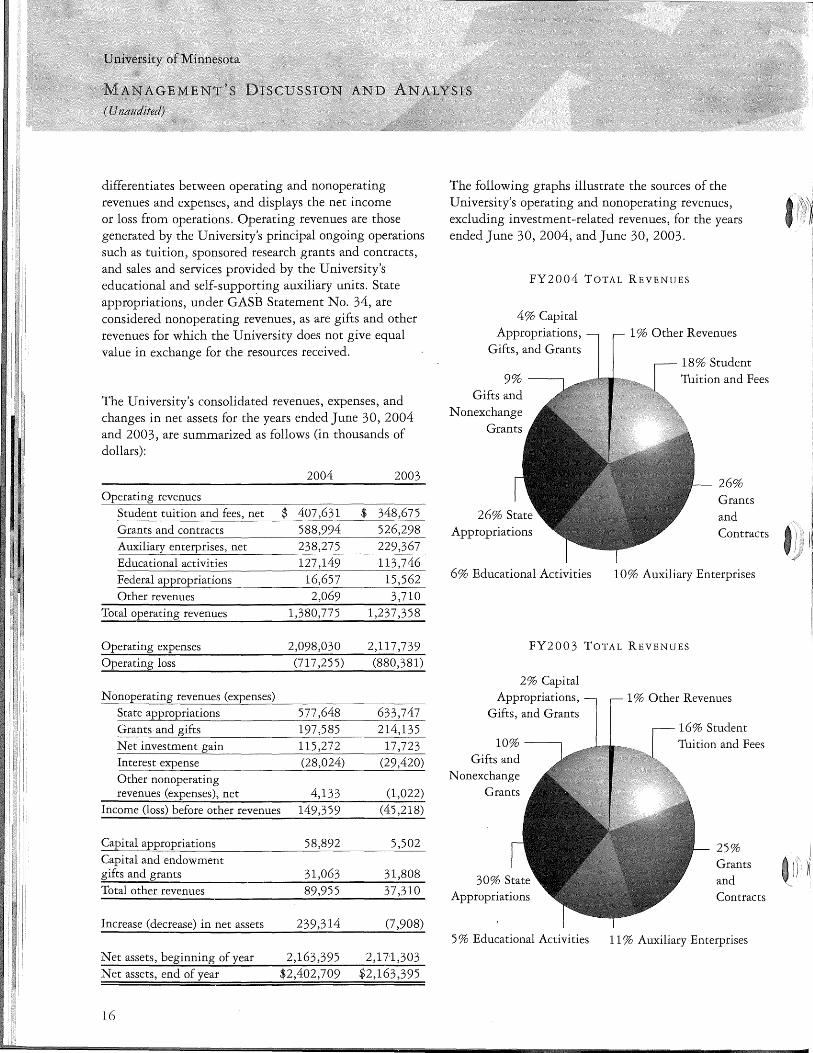
differentiates between operating and nonoperating revenues and expenses, and displays the net income or loss from operations. Operating revenues are those generated by the University's principal ongoing operations such as tuition, sponsored research grants and contracts, and sales and services provided by the University's educational and self-supporting auxiliary units. State appropriations, under GASB Statement No. 34, are considered nonoperating revenues, as are gifts and other revenues for which the University does not give equal value in exchange for the resources received.
The University's consolidated revenues, expenses, and changes in net assets for the years ended June 30, 2004 and 2003, are summarized as follows (in thousands of dollars):
The following graphs illustrate the sources of the University's operating and nonoperating revenues, excluding investment-related revenues, for the years ended June 30, 2004, and June 30, 2003.
FY2004 TOTAL REVENUES
4% Capital Appropriations,
Gifts, and Grants
Nonexchange
1 % Other Revenues
18% Student Tuition and Fees
CUSSION AND ANALYSIS
One of the University's strengths is that it has a diversified revenue base including: student tuition and fees, grants and contracts, sales by auxiliary and educational units, and state appropriations.
For the year ended June 30, 2004, student tuition and fees totaled $407 .6 million, net of $88.9 million of scholarship allowances. This revenue represents an increase of $58.9 million or 16.9 percent over the year ended June 30, 2003, when student tuition and fees totaled $348.7 million, net of $81.4 million of scholarship allowances. The increase in student tuition and fees revenue was due to tuition and required fee increases ranging from 9 percent to 15 percent, depending on campus, student level, and residency status; combined with increased enrollment and average credit hours of 1.6 percent and 2.3 percent, respectively.
Grants and contracts from the federal government totaled $358.8 million in fiscal year 2004, up $35.3 million or 10.9 percent from $323.5 million in fiscal year 2003. The majority of this increase is due to increased spending of $21.5 million on federal grants and contracts as well as an increase in new grant activity. State and other governmental grants increased $8.0 million, or 20.9 percent, to $46.4 million for fiscal year 2004 from $38.4 million for fiscal year 2003. This increase is due in part to new grant activity, as well as a large grant of $5.0 million that was appropriately shifted from nonoperating to operating revenues, based on a change in the nature of the activities. Nongovernmental grants and contracts of $18 3. 8 million for fiscal year 2004 increased by $19.3 million or 11.7 percent from $164.5 million in fiscal year 2003. The majority of this increase is due to a decrease in deferred revenue of $16.0 million as more expenses were incurred on existing sponsored projects, as well as an increase in new sponsored activity. These increases were partially offset by the shift, due to a change in the nature of the activities, of $5 .8 million to nonexchange grant activity from exchange activity.
Auxiliary revenues increased slightly to $238.3 million, net of $ 9. 7 million of scholarship allowances for the year ended June 30, 2004, up from $229.4 million, net of $8.6 million of scholarship allowances for the year ended June 30, 2003. This $8.9 million or 3.9 percent increase was the result of a blended increase in room and board rates of 5 .2 percent, increases in contract parking rates of up to 2.4 percent, and an increase in event parking rates. of $1.00. Other significant auxiliary rates were not increased during fiscal year 2004.
Revenues from sales and services of educational activities for fiscal year 2004 were $127.1 million, up $13.4 million or 11. 8 percent from the prior year revenues of $113. 7 million. Several factors contributed to this increase, including: $3.2 million in increased revenue from the Learning Abroad Center due to a 15 percent increase in enrollment; $2.6 million resulting from increases in royalty receipts from sales of products using University patents or technology; settlement funds received by the University of $2.6 million; and $2.1 million from the Dentistry Clinic due to increased patient volume.
State appropriations (excluding capital appropriations) totaled $577.6 million for fiscal year 2004, down $56.1 million or 8.9 percent from $633.7 million for fiscal year 2003. These totals include state general fund appropriations of $483.9 million and $544.4 million during fiscal years 2004 and 2003, respectively, as well as special appropriations designated by the state of $93.7 million and $89.3 million during the respective fiscal years.
State appropriations, in addition to other sources of unrestricted revenue (tuition and educational and auxiliary activities) and nonoperating grants totaling $100.3 million, fund a number of University priorities, including competitive compensation plans for faculty and staff; various academic initiatives; enhancement of services to students including technology improvements, upgrades to the financial aid process, and freshman seminars; and increases in facilities costs.
Other significant sources of revenue to the University included donations and gifts in support of operating expenses of $97 .3 million and $94.0 million, and gifts for capital purposes of $25.4 million and $29.9 million in fiscal years 2004 and 2003, respectively.
Capital appropriations are awarded biennially. The University requested $155.5 million in state capital appropriations in fiscal year 2004, but the Minnesota legislature failed to enact a bonding bill during the 2004 legislative session, so none of the University's 2004 capital appropriations request was funded. The University records state capital appropriation revenue only when approved capital expenditures have been incurred. Capital appropriations recorded in fiscal year 2004 were $5S.9 million, an increase of $53.4 million over fiscal year 2003 capital appropriations of $5.5 million. This increase is due to increased spending on capital projects approved prior to 2004.
17
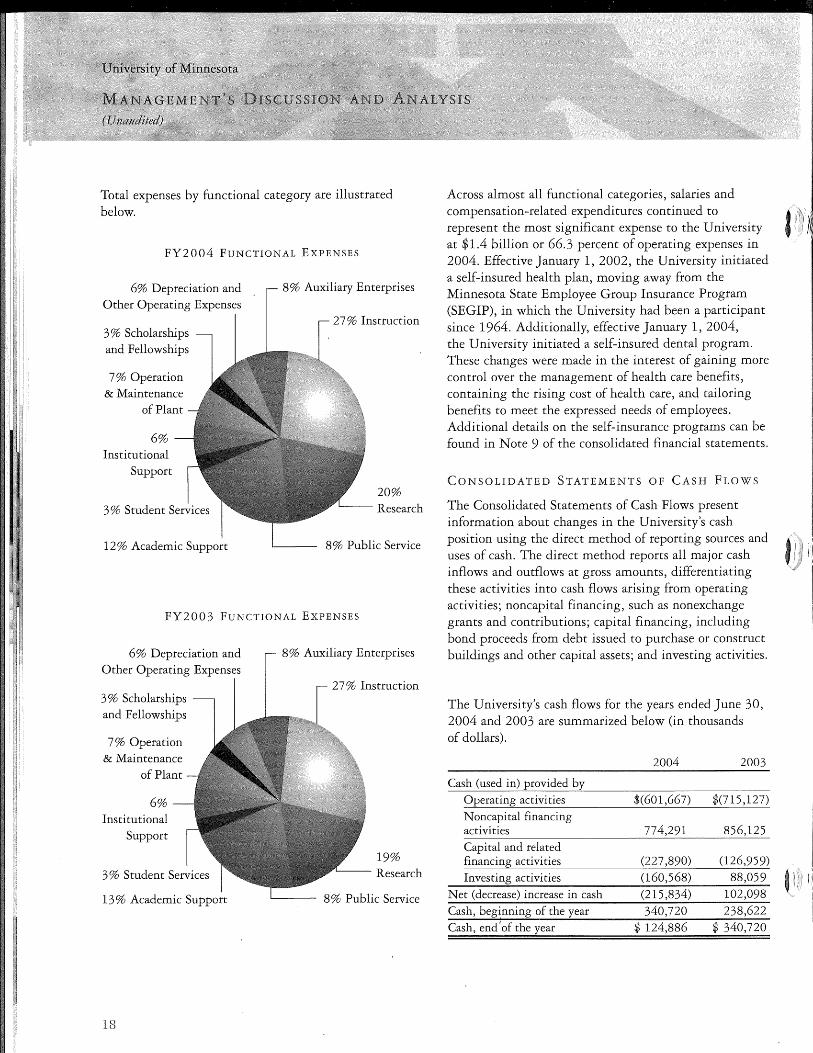
Total expenses by functional category are illustrated below.
FY2004 FUNCTIONAL EXPENSES
6% Depreciation and Other Operating Expenses
3% Scholarships and Fellowships
7 % Operation & Maintenance
of Plant
6% Institutional
Support
8% Auxiliary Enterprises
27% Instruction
20% Research
8% Public Service
FY2003 FUNCTIONAL EXPENSES
6% Depreciation and Other Operating Expenses
3% Scholarships and Fellowships
7 % Operation & Maintenance
of Plant
6% Institutional
Support
18
8% Auxiliary Enterprises
27 % Instruction
19% Research
8% Public Service
Across almost all functional categories, salaries and
compensation-related expenditures continued to t r.\~.'.; )~ represent the most significant expense to the University t //~
at $1. 4 billion or 66. 3 percent of operating expenses in 2004. Effective January 1, 2002, the University initiated a self-insured health plan, moving away from the Minnesota State Employee Group Insurance Program (SEGIP), in which the University had been a participant since 1964. Additionally, effective January 1, 2004, the University initiated a self-insured dental program. These changes were made in the interest of gaining more control over the management of health care benefits, containing the rising cost of health care, and tailoring benefits to meet the expressed needs of employees. Additional details on the self-insurance programs can be found in Note 9 of the consolidated financial statements.
CONSOLIDATED STATEMENTS OF CASH FLOWS
The Consolidated Statements of Cash Flows present information about changes in the University's cash position using the direct method of reporting sources and uses of cash. The direct method reports all major cash inflows and outflows at gross amounts, differentiating these activities into cash flows arising from operating activities; noncapital financing, such as nonexchange grants and contributions; capital financing, including bond proceeds from debt issued to purchase or construct buildings and other capital assets; and investing activities.
The University's cash flows for the years ended June 30, 2004 and 2003 are summarized below (in thousands of dollars).
2004 2003
Cash (used in) provided by Operating activities $(601,667) $(715,127) Noncapital financing activities 774,291 856,125 Capital and related financing activities (227,890) (126,959) Investing activities (160,568) 88,059
Net (decrease) increase in cash (215,834) 102,098 Cash, beginning of the year 340,720 238,622 Cash, end' of the year $ 124,886 $ 340,720
I
fl
'n1
University of Minnesota
MANAGEMENT'S
(Unaudited)
CUSSION AND ANALYSIS
The University's cash and cash equivalents decreased $215 .8 million due to the use offunds for operating activities, capital and related financing activities, and investing activities, partially offset by the inflow of funds provided by noncapital financing activities. The most significant sources of cash provided by noncapital financing activities, included st.ate appropriations totaling $577.6 million, grants of $91.8 million, and gifts of $97.4 million in fiscal year 2004. Cash inflows for capital acquisitions from state appropriations, gifts and grants, and bonds issued during the year funded the University's equipment needs and ongoing renovation and construction initiatives.
INVESTMENT ACTIVITIES
The endowment funds of the University are invested to preserve the inflation-adjusted value of the endowment and to maximize total return within acceptable risk parameters. These objectives are meant to be achieved over three- to five-year periods.
During fiscal year 2004, the value of the University's endowment funds increased significantly. This increase was due to new contributions to the endowment fund as well as market value and realized gains of $93.5 million and $1.6 million, respectively, and $7 .1 million in reinvested earnings. These increases were partially offset by distributions of $30.1 million to departments for spending purposes.
To provide a relative! y stable level of support for endowed programs, a specified percent of a three-year, moving average market value of the endowment is distributed each year. These distributions provide funds for a variety of purposes, including instructional needs, research activities, scholarships, and academic support. An endowment spending policy requires balancing current needs with the long-term focus of the institution. At the beginning of year 2002, the University reduced the endowment funds distribution rate from 5. 5 0 percent to 5.25 percent mid-year, and then to 5.00 percent beginning July 1, 2003. These adjustments were made according to University policy, which links the distribution rate to the ability to maintain the real value of the endowment funds.
CAPITAL AND DEBT ACTIVITIES
Capital additions totaled $164. 6 million in fiscal year 2004. Total additions were down from the prior year's total additions of $180.9 million as several significant projects were in the final stages of completion in fiscal 2003 and moved from construction in progress to capital additions. These completed projects include the Molecular and Cellular Biology building, Coffman Memorial Union remodeling, and the Art Teaching and Research building.
.Fiscal year 2004 spending included Duluth's Swenson Science building, the Cargill building, Duluth's Kirby Plaza renovation, the Arboretum Visitor Center, and the Translational Research Facility. Although there was an overall decrease in capital spending, cash provided by capital appropriations increased by $13. 0 million to $42.4 million in fiscal year 2004, as more capital appropriation funding was used to fund capital expenditures.
Bonds and other debt payable totaled $665.0 million at June 30, 2004, and included proceeds from capital leases and debt service obligations related to state of Minnesota infrastructure development bonds of $ 3. 3 million. During fiscal year 2003, the University issued $71.0 million in General Obligation Refunding Bonds. These bonds were used, along with additional funds provided by the University, to refund the University's $84.0 million Series 1993A General Obligation Bonds in fiscal year 2004. Additional details on capital and long-term debt activities can be found in Notes 4 and 5 of the consolidated financial statements.
FACTORS AFFECTING FUTURE ECONOMIC
CONDITIONS
In the course of the last fiscal year, the University has successfully faced significant financial challenges stemming primarily from a reduction in state support brought about by continued economic challenges facing the nation and the state of Minnesota. As evidenced in the annual ~onsolidated financial statements, state appropriations declined by approximately $56.1 million or 8.9 percent compared with the prior fiscal year. As a result of this reduction, the University initiated an aggressive effort to reduce costs and increase revenues in order to ensure overall; continued financial strength. As part of this effort, the University undertook a one-year wage freeze, modified its employer/employee cost responsibility for health care benefits, reduced administrative and operating costs, and increased tuition revenue.
19
As a result of strong management actions to control costs, increase operating revenues, and focus on reshaping short- and long-term investment strategies, net assets of the University increased approximately $239.3 million or 11.1 percent compared with the prior fiscal year.
Looking toward the future, management believes that the University is well positioned to maintain its strong financial position and level of excellence in service to students, faculty, staff, and the citizens of the state of . Minnesota. The University's strong financial position, strong leadership, and responsive management decision making has served to ease recent financial challenges brought about by the economic downturn and its impact on state revenues. The University is engaged in ongoing efforts toward revenue diversification and cost containment that will assist the University in continuing to provide the necessary resources to support excellence in its teaching, research, and public service missions.
The University has implemented more broadly diversified investment strategies for both the endowment and reserve pools, intended to enhance the total returns while reducing the overall levels of risk. In the endowment pool, these strategies often involve owning assets that are much less liquid but have more stable returns than stocks or bonds. In addition, the University is in the process of installing new technologies that will enhance its ability to evaluate new investment opportunities and monitor more sophisticated portfolios. The value of all funds managed by the University, including the consolidated endowment fund, long-term reserves, and short-term reserves, totaled approximately $1. 31 billion on June 30, 2004, compared with $1.24 billion the prior year, net of investment gains and losses and the impact of distribution to the academic units of the institution. The University plans to continue its present spending policy for the endowment pool, which is intended to insulate the University's operation units from market volatility.
In light of higher tuition rates and declining state support, the University now more than ever needs to place the highest priority on fiscal resourcefulness, institutional efficiency, and quality student services to remain competitive. With capabilities now available through new technologies and a history of strong working partnerships among faculty, staff, and administration, this is an opportune time to think
20
creatively about ways the University can seize natural opportunities to enhance service and productivity while at the same time reducing unnecessary costs across the entire University of Minnesota system.
The University has recently initiated a concentrated effort to improve service and productivity in both academic and support units; and it expects to capture significant financial benefits through changes in operational practices, such as smarter purchasing practices. The new service and productivity initiative has been designed to serve as a catalyst and guide for sustainable improvement throughout the University, to work with leadership and the University community to energize and enable a culture of continuous improvement, and to work collaboratively with units to help identify and realize sustainable improvements in value, service, and productivity.
The University has begun preliminary planning to replace its enterprisewide financial system. The new financial system is the final component of the University's very successful enterprise system projects, which have included replacement of student, human resource, libraries, and grants management systems. The new financial system is intended to provide users with more control and access to financial information; automate and streamline business processes such as purchasing, vendor payments, and cash management; provide more robust financial analysis and reporting capabilities; and provide enhanced policy-level financial information for decision making by the University's Board of Regents and administration. Based on preliminary planning, the project is expected to begin in July 2005, last 24 to 30 months, and cost between $22.0 and $26.0 million.
Private gifts are an important supplement to the fundamental support from the state of Minnesota and student tuition and represent a crucial 'tipping point' in the advancement of the quality of academic units. A record number of donors made gifts and pledges totaling $145 million to the University of Minnesota during fiscal year 2004. This included gifts from 81,979 donors, the largest number of individual donors in the University's history. Most of the new donors are the result of~ 6 percent increase in the number of alumni making gifts. The 42,379 alumni who pledged funds to the University account for 52 percent of all donors to the University.
' 1 .
' )I
The number of faculty and staff contributions also increased by 9 percent to more than 5 ,000 in 2004. The increase came in a year when state appropriation reductions produced a one-year salary freeze at the University.
Fiscal year 2004 marked the first full year offund-raising at the University since the close of Campaign Minnesota, the hugely successful seven-year effort by the University and its related foundations that raised $1.66 billion in current and future resources for the University. Nevertheless, gift production in 2004 showed continued strength, even after the highly successful capital campaign, and was about double the level of new gift commitments in the years prior to Campaign Minnesota.
The University is now focused on raising funds specifically for scholarships. October 2004 has been designated Scholarship Month at the University, as part of the fund-raising drive.
A crucial element for the University's future will be to strengthen its financial partnership with the state of Minnesota. The biennial budget proposal for fiscal years 2006 and 2007 calls for a "50-50 partnership" with the state of Minnesota, in which the state would contribute $84 million in new funding to the University over the two-year period. In return, the University would generate its share of new funding through tuition increases of 5.5 percent each year (generating $27 million per year) plus internal reallocations of $15 million each year.
The proposed state contribution of $42 million each year would fund three broad categories: investing in biosciences; attracting and retaining talent-students, faculty, and staff-for Minnesota's future; and sustaining the University's research and technology infrastructure.
As a result of the 2004 Minnesota Legislature's failure to enact a capital appropriation bill, the University will be seeking action on its original 2004 capital appropriation request of approximately $186.5 million from the state of Minnesota in the 2005 legislative session. The University will also be updating its six-year capital plan in November 2004. The updated six-year capital plan will continue to reflect a long-range sttategic plan to "take care of what we have and to shape the future." The major focus of the six-year capital plan will be centered on outlining projects that will be requested from the state of Minnesota. Approximately 82 percent of the six-
year capital plan reflects the renewal and renovation of existing facilities, while the remaining 18 percent is targeted for the construction of critical new facilities in support of academic programs.
The University's outstanding debt totaled $665.0 million on June 30, 2004. The weighted average cost of capital was 4.33 percent per the original bond agreements, and the average life of debt was 12.3 years, with 96 percent fixed and 4 percent variable. The six-year capital plan
. will reflect a prudent use of debt financing based upon a careful financial analysis coupled with longterm modeling of the impact of the six-year plan on key financial operating ratios. An analysis of student demand, market position, and financial indicators places the University of Minnesota solidly in the strong "Aa" category, as rated by Moody's Investors Services and affirmed in July 2004.
As disclosed in Note 6 of the accompanying financial statements, most of the University's contributions to fund pension plans are for a defined-contribution plan, and the remaining defined-benefit plans do not have significant unfunded accrued liabilities.
As solid as the University's financial and operational accomplishments have been during the past year, University management believes that it can accomplish even more. Because of the strength and commitment of the faculty, staff, and students, the University has positioned itself well to respond to future opportunities and challenges.
21
U nhtfasity of Minnesota
PENDENT
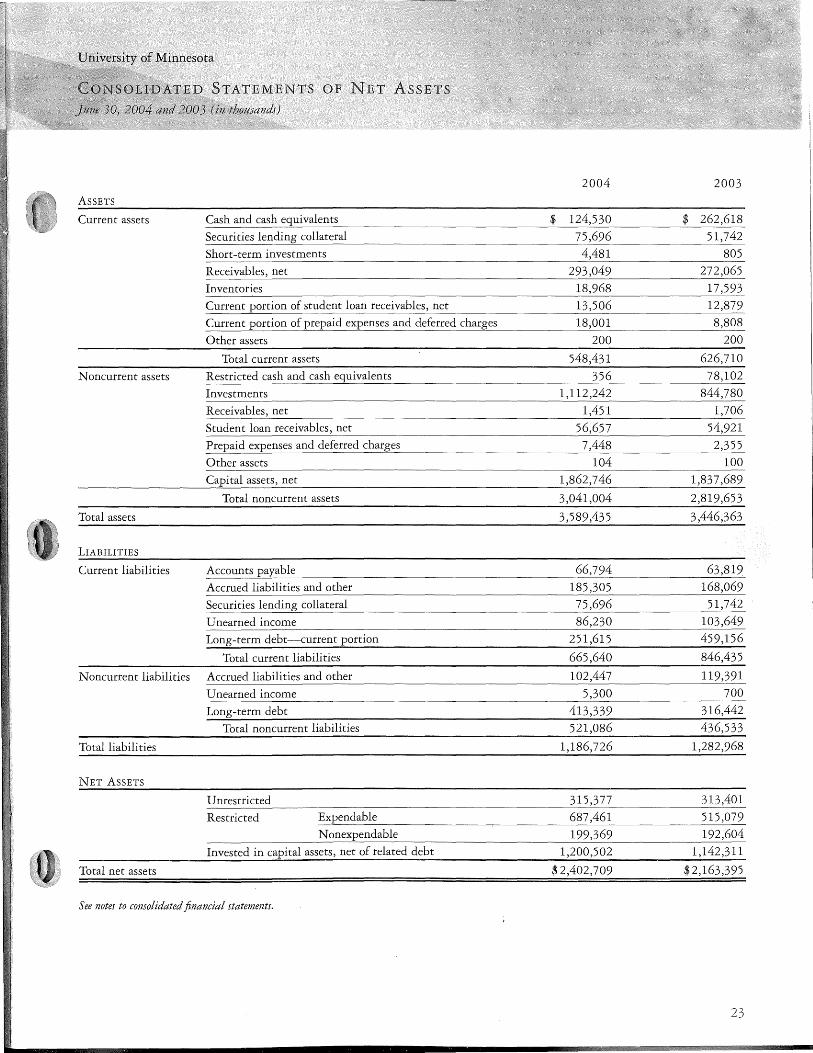
OF NET ASSETS
2004 2003 ASSETS
Current assets Cash and cash equivalents $ 124,530 $ 262,618 Securities lending collateral 75,696 51,742 Short-term investments 4,481 805 Receivables, net 293,049 272,065
Inventories 18,968 17,593 Current portion of student loan receivables, net 13,506 12,879 Current portion of prepaid expenses and deferred charges 18,001 8,808
Other assets 200 200
Total current assets 548,431 626,710
N oncurrent assets Restricted cash and cash equivalents 356 78,102
Investments 1,112,242 844,780
Receivables, net 1,451 1,706 Student loan receivables, net 56,657 54,921 Prepaid expenses and deferred charges 7,448 2,355 Other assets 104 100
Capital assets, net 1,862,746 1,837,689
Total noncurrent assets 3,041,004 2,819,653
Total assets 3,589,435 3,446,363
LIABILITIES
Current liabilities Accounts payable 66,794 63,819 Accrued liabilities and other 185,305 168,069
Securities lending collateral 75,696 51,742
Unearned income 86,230 103,649
Long-term debt-current portion 251,615 459,156
Total current liabilities 665,640 846,435
Noncurrent liabilities Accrued liabilities and other 102,447 119,391
Unearned income 5,300 700
Long-term debt 413,339 316,442
Total noncurrent liabilities 521,086 436,533
Total liabilities 1,186,726 1,282,968
NET ASSETS
Unrestricted 315,377 313,401
Restricted Expendable 687,461 515,079 N onexpendable 199,369 192,604
Invested in capital assets, net of related debt 1,200,502 1,142,311
Total net assets $2,402,709 $2,163,395
See notes to consolidated financial statements.
23
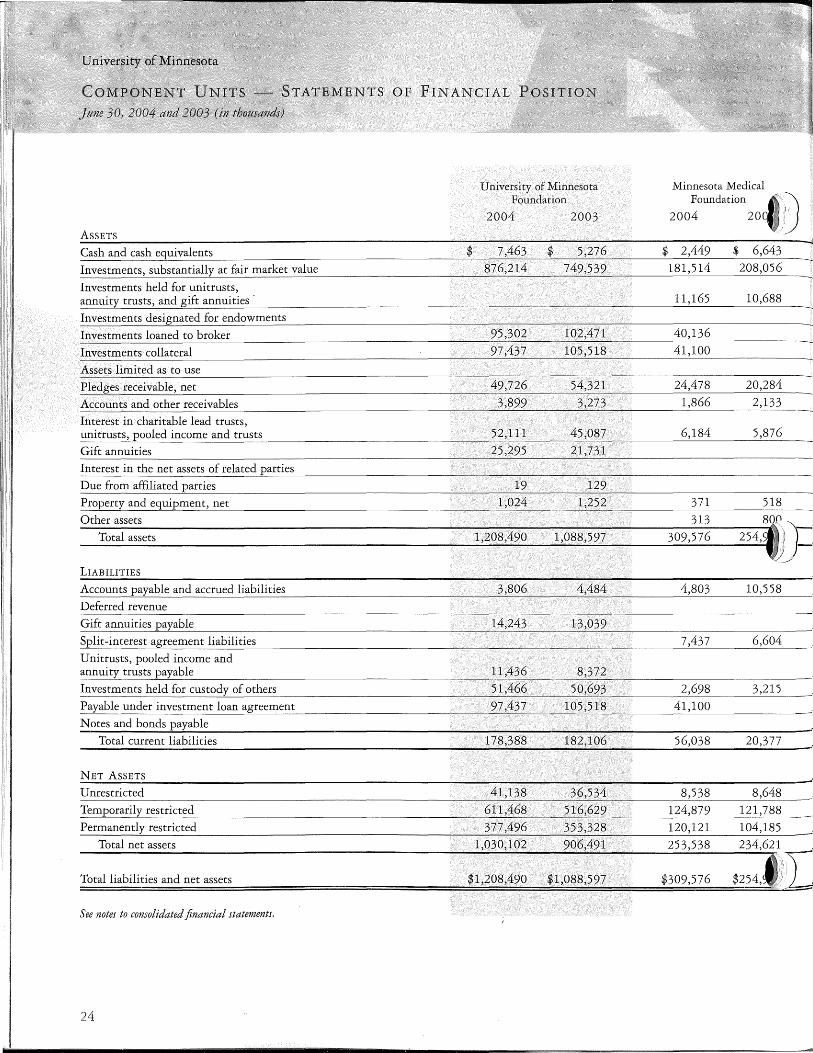
STATEMENTS OF FINANCIAL
University of Minnesota Minnesota Medical Foundation Foundation ~;)
2004 2003 2004 20 i ASSETS
Cash and cash equivalents $ 7,463 $ 5,276 $ 2,449 $ 6,643
Investments, substantially at fair market value 876,214 749,539 181,514 208,056
Investments held for unitrusts, annuity trusts, and gift annuities 11,165 10,688
Investments designated for endowments
Investments loaned to broker 95,302 102,471 40,136
Investments collateral 97,437 105,518 41,100
Assets limited as to use
Pledges receivable, net 49,726 54,321 24,478 20,284
Accounts and other receivables 3,899 3,273 1,866 2,133
Interest in charitable lead trusts, unitrusts, pooled income and trusts 52,111 45,087 6,184 5,876
Due from affiliated parties 19 129 Property and equipment, net 1,024 1,252 371 518 Other assets 313 800
Total assets 1,208,490 1,088,597 309,576 254, fr--: / __,/
LIABILITIES
Accounts payable and accrued liabilities 3,806 4,484 4,803 10,558 Deferred revenue
Gift annuities payable 14,243 13,039 Split-interest agreement liabilities 7,437 6,604 Unitrusts, pooled income and annuity trusts payable 11,436 8,372 Investments held for custody of others 51,466 50,693 2,698 3,215 Payable under investment loan agreement 97,437 105,518 41,100 Notes and bonds payable
Total current liabilities 178,388 182,106 56,038 20,377
NET ASSETS
Unrestricted 41,138 36,534 8,538 8,648 Temporarily restricted 611,468 516,629 124,879 121,788 Permanently restricted 377,496 353,328 120,121 104,185
Total net assets 1,030,102 906,491 253,538 234,621 __
Total liabilities and net assets $1,208,490 $1,088,597 $309,576 11!L $254, .... i~ -
See notes to consolidated financial statements.
24
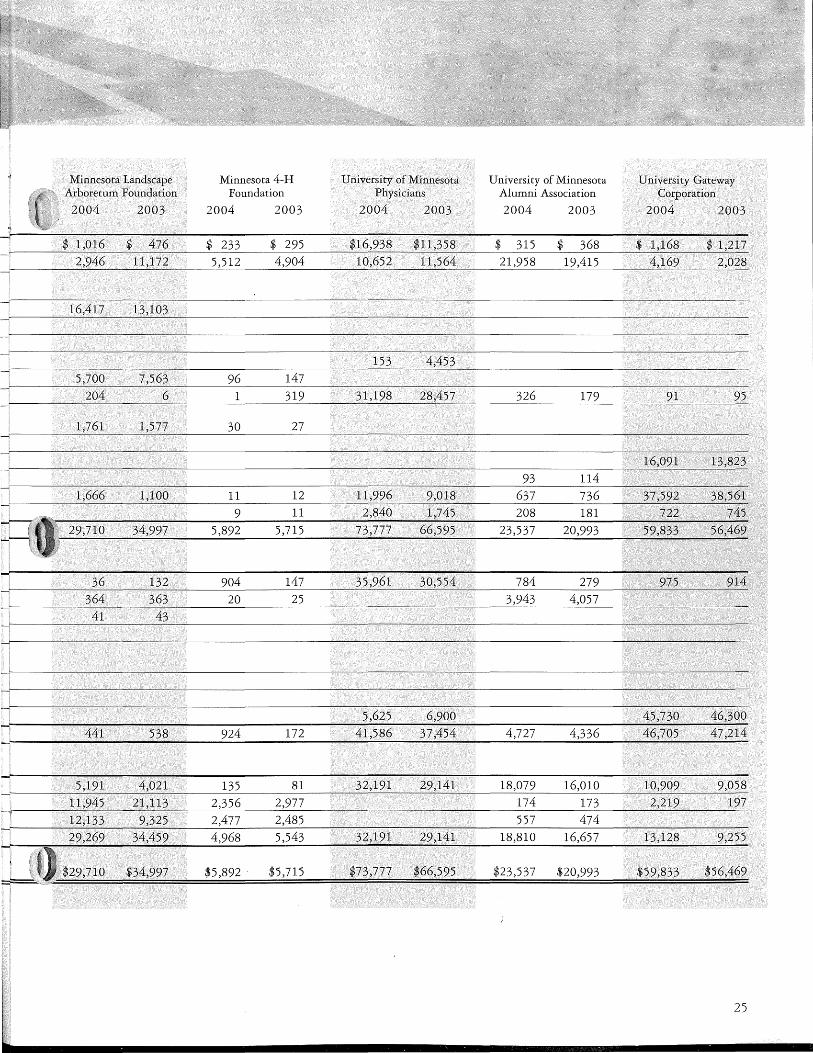
Minnesota Landscape Minnesota 4-H University of Minnesota University of Minnesota University Gateway Arboretum Foundation Foundation Physicians Alumni Association Corporation
2004 2003 2004 2003 2004 2003 2004 2003 2004 2003
$ 1,016 $ 476 $ 233 $ 295 $16,938 $11,358 $ 315 $ 368 $ 1,168 $ 1,217 2,946 11,172 5,512 4,904 10,652 11,564 21,958 19,415 4,169 2,028
153
27
114 1,666 1,100 11 12 11,996 9,018 637 736 37,592 38,561
9 11 2,840 1,745 208 181 722 745 -;---7
!:;
~>1 66,595 34,997 20,993 59,833 56,469 73,777 29,710 5,715 23,537 5,892
'
147 25
5,625 6,900 45,730 46,300
441 538 924 172 41,586 37,454 4,727 4,336 46,705 47 ,214
5,191 4,021 135 81 32,191 29,141 18,079 16,010 10,909 9,058
11,945 21,113 2,356 2,977 174 173 2,219 197 12,133 9,325 2,477 2,485 557 474 29,269 34,459 4,968 5,543 32,191 29,141 18,810 16,657 13,128 9,255
~· f u $29,710 $34,997 $5,892 . $5,715 $73,777 $66,595 $23,537 $20,993 $59,833 $56,469
25
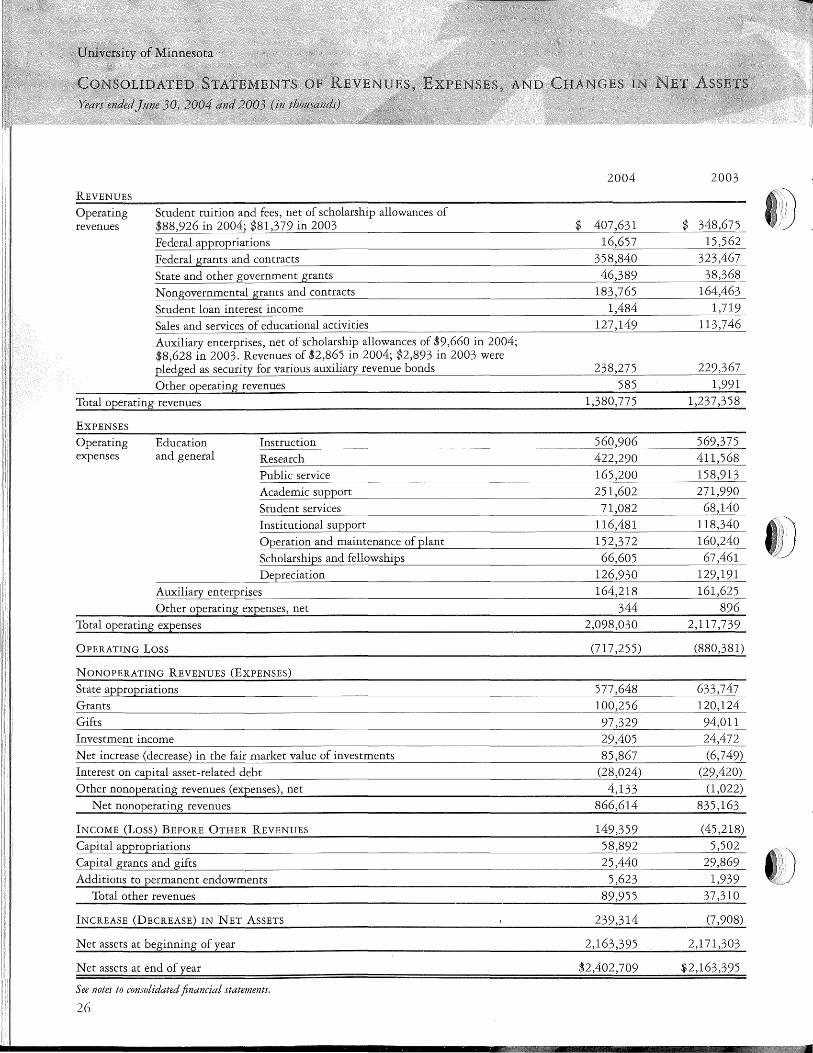
I
I,',
Operating revenues
Student tuition and fees, net of scholarship allowances of $88,926 in 2004; $81,379 in 2003 Federal appropriations Federal grants and contracts State and other government grants Nongovernmental grants and contracts
Student loan interest income Sales and services of educational activities Auxiliary enterprises, net of scholarship allowances of $9,660 in 2004; $8,628 in 2003. Revenues of $2,865 in 2004; $2,893 in 2003 were pledged as security for various auxiliary revenue bonds
Other operating revenues
Total operating revenues
EXPENSES
Operating expenses
Education and general
Instruction
Research Public service Academic support Student services Institutional support Operation and maintenance of plant
Scholarships and fellowships Depreciation
Auxiliary enterprises Other operating expenses, net
Total operating expenses
OPERATING Loss
NONOPERATING REVENUES (EXPENSES)
State appropriations
Gifts
Investment income Net increase (decrease) in the fair market value of investments
Interest on capital asset-related debt
Other nonoperating revenues (expenses), net
Net nonoperating revenues
INCOME (Loss) BEFORE OTHER REVENUES
Capital appropriations Capital grants and gifts
Additions to permanent endowments Total other revenues
INCREASE (DECREASE) IN NET ASSETS
Net assets at beginning of year
Net assets at end of year
See notes to consolidated financial statements.
26
2004 2003
$ 407,631 $ 348,675
16,657 15,562
358,840 323,467
46,389 38,368
183,765 164,463
1,484 1,719
127,149 113,746
238,275 229,367
585 1,991
1,380,775 1,237,358
560,906 569,375 422,290 411,568
165,200 158,913
251,602 271,990 71,082 68,140
116,481 118,340 tD 152,372 160,240
66,605 67,461
126,930 129,191 164,218 161,625
344 896
2,098,030 2,117,739
(717,255) (880,381)
577,648 633,747
97,329 94,011
29,405 24,472
85,867 (6, 749)
(28,024) (29,420)
4,133 (1,022)
866,614 835,163
149,359 (45,218)
58,892 5,502
t»J 25,440 29,869
5,623 1,939
89,955 37,310
239,314 (7 ,908)
2,163,395 2,171,303
$2,402,709 $2,163,395
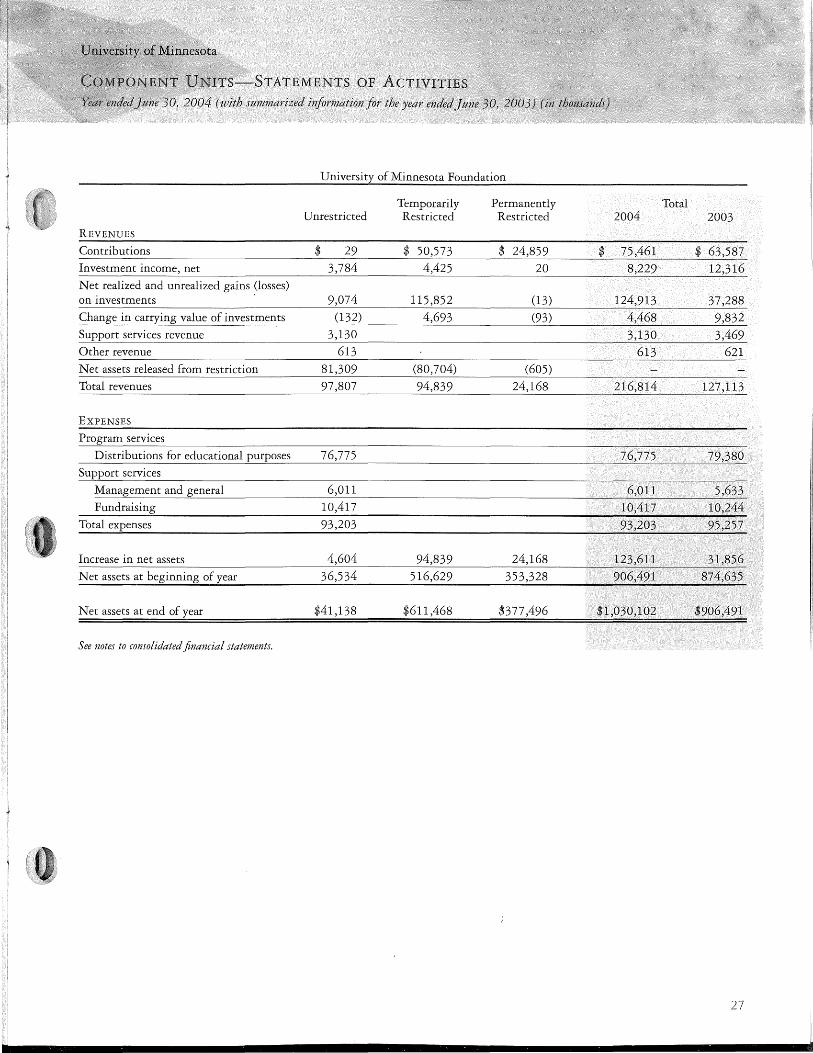
OF
2004 (with summarized information for the year ended j une
University of Minnesota Foundation
Temporarily Permanently Total Unrestricted Restricted Restricted 2004 2003
REVENUES
Contributions $ 29 $ 50,573 $ 24,859 $ 75,461 $ 63,587 Investment income, net 3,784 4,425 20 8,229 12,316 Net realized and unrealized gains (losses) on investments 9,074 115,852 (13) 124,913 37,288 Change in carrying value of investments (132) 4,693 (93) 4,468 9,832 Support services revenue 3,130 3,130 3,469 Other revenue 613 613 621 Net assets released from restriction 81,309 (80,704) (605) Total revenues 97,807 94,839 24,168 216,814 127,113
EXPENSES
services
Distributions for educational purposes 76,775 76,775 79,380 Support services
Management and general 6,011 6,011 5,633 Fundraising 10,417 10,417 10,244
Total expenses 93,203 93,203 95,257
Increase in net assets 4,604 94,839 24,168 123,611 31,856 Net assets at beginning of year 36,534 516,629 353,328 906,491 874,635
Net assets at end of year $41,138 $611,468 $377,496 $1,030,102 $906,491
See notes to consolidated financial statements.
27
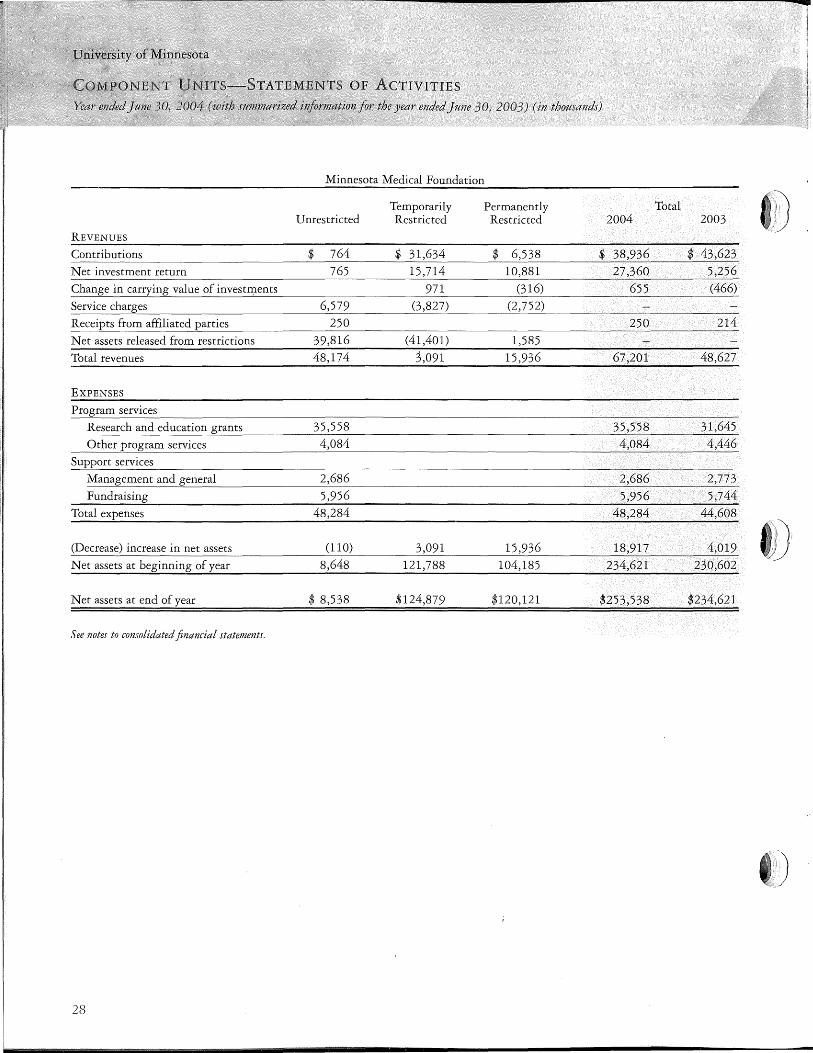
the year ended June 30, 2003) (in thottsands)
Minnesota Medical Foundation
Temporarily Permanently Total Unrestricted Restricted Restricted 2004 2003
REVENUES
Contributions $ 764 $ 31,634 $ 6,538 $ 38,936 $ 43,623 Net investment return 765 15,714 10,881 27,360 5,256 Change in carrying value of invest!l).ents 971 (316) 655 (466)
Service charges 6,579 (3,827) (2,752) Receipts from affiliated parties 250 250 214 Net assets released from restrictions 39,816 (41,401) 1,585 Total revenues 48,174 3,091 15,936 67,201 48,627
EXPENSES
Program services
Research and education
Other program services 4,084 4,084 4,446 Support services
Management and general 2,686 2,686 2,773 Fundraising 5,956 5,956 5,744
Total expenses 48,284 48,284 44,608
(Decrease) increase in net assets (110) 3,091 15,936 18,917 4,019 ID Net assets at beginning of year 8,648 121,788 104,185 234,621 230,602
Net assets at end of year $ 8,538 $124,879 $120,121 $253,538 $234,621
See notes to consolidated financial statements.
28
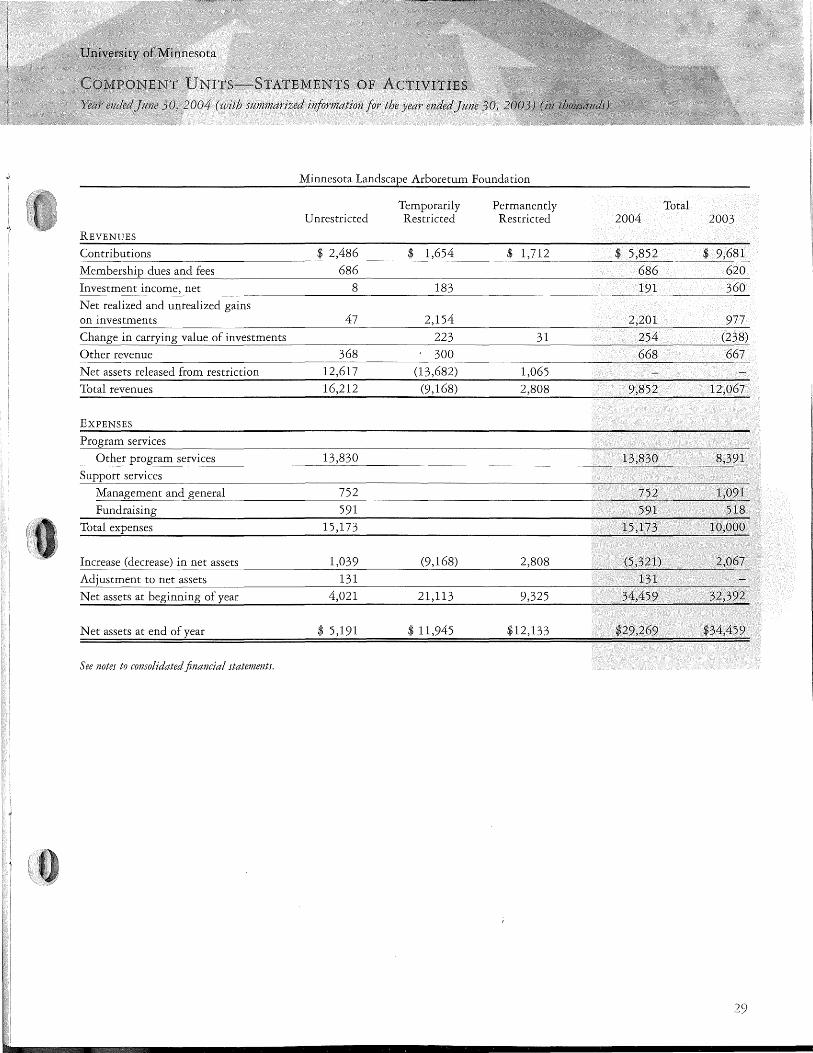
2004 (with sttmmarized information far the year ended }ttne
Minnesota Landscape Arboretum Foundation
Temporarily Permanently Total Unrestricted Restricted Restricted 2004 2003
REVENUES
Contributions $ 2,486 $ 1,654 $ 1,712 $ 5,852 $ 9,681 Membership dues and fees 686 686 620
Investment income, net 8 183 191 360 Net realized and unrealized gains on investments 47 Change in carrying value of investments 223 31 254 (238)
Other revenue 368 300 668 667 Net assets released from restriction 12,617 (13,682) 1,065 Total revenues 16,212 (9,168) 2,808 9,852 12,067
EXPENSES
Program services
Other program services 13,830 13,830 8,391 services
Management and general 752 752 1,091 Fundraising 591 591 518
Total expenses 15,173 15,173 10,000
Increase (decrease) in net assets 1,039 (9,168) 2,808 (5,321) 2,067
Adjustment to net assets 131 131 Net assets at beginning of year 4,021 21,113 9,325 34,459 32,392
Net assets at end of year $ 5,191 $ 11,945 $12,133 $29,269 $34,459
See notes to consolidated financial statements.
29
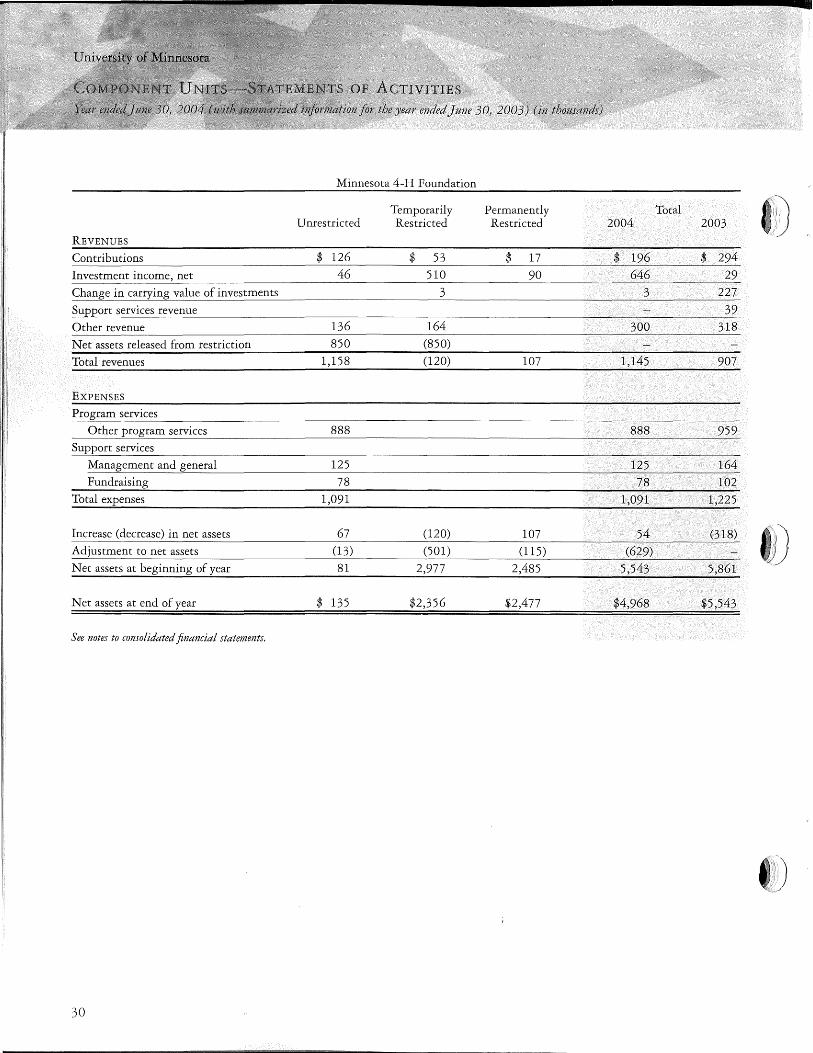
Minnesota 4-H Foundation
Temporarily Permanently Total Unrestricted Restricted Restricted 2004 2003
REVENUES
Contributions $ 126 $ 53 $ 17 $ 196 $ 294 46 510 646
of investments 3 227
Support services revenue 39
Other revenue 136 164 300 318
Net assets released from restriction 850 (850)
Total revenues 1,158 (120) 107 1,145 907
EXPENSES
services 888 888
Management and general 125 125 164 Fundraising 78 78 102
Total expenses 1,091 1,091 1,225
Increase (decrease) in net assets 67 (120) 107 54 (318) IJ) Adjustment to net assets (13) (501) (115) (629)
Net assets at beginning of year 81 2,977 2,485 5,543 5,861
Net assets at end of year $ 135 $2,356 $2,477 $4,968 $5,543
See notes to consolidated financial statements.
30
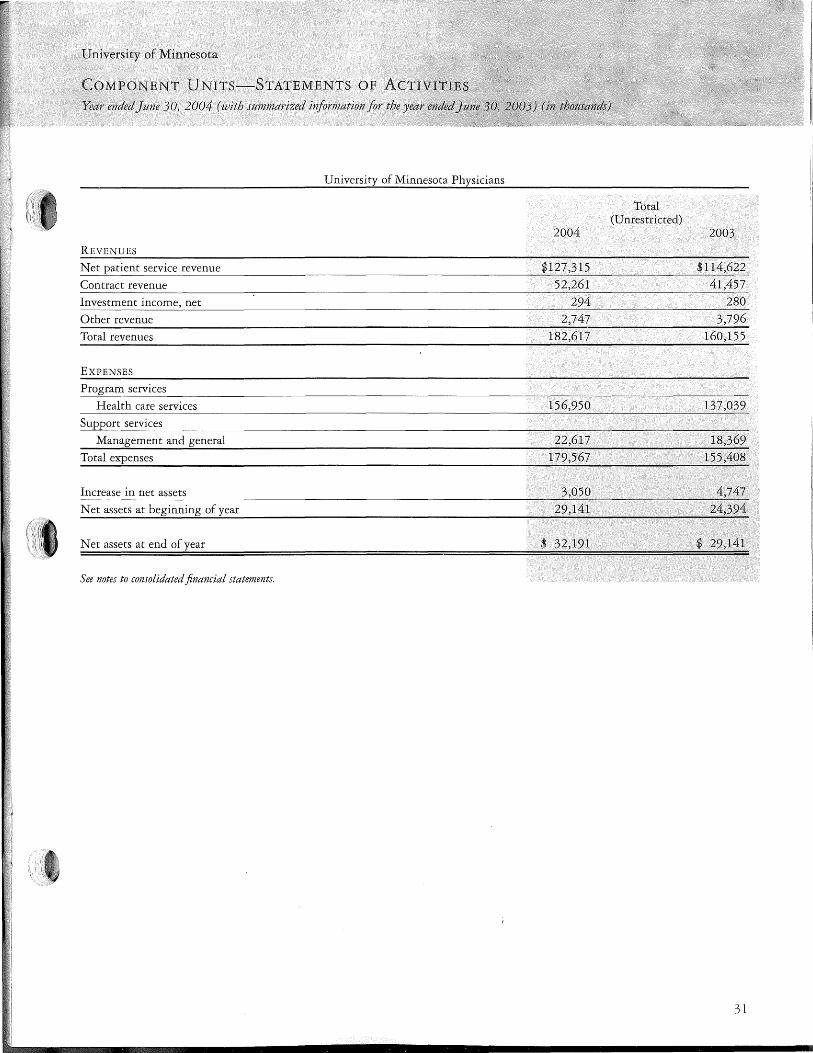
University of Minnesota
COMPONENT UNITS-STATEMENTS OF
Year ended June 3 0 .. 2004 (with summarized information for the year
University of Minnesota Physicians
2004 REVENUES
Net patient service revenue $127 ,315 Contract revenue
Other revenue 2,747 Total revenues 182,617
EXPENSES
Health care services
Management and general 22,617 Total expenses 179,567
Increase in net assets 3,050 Net assets at beginning of year 29,141
Net assets at end of year $ 32,191
See notes to consolidated financial statements.
Total (Unrestricted)
2003
$114,622
280 3,796
160,155
18,369 155,408
4,747 24,394
$ 29,141
31
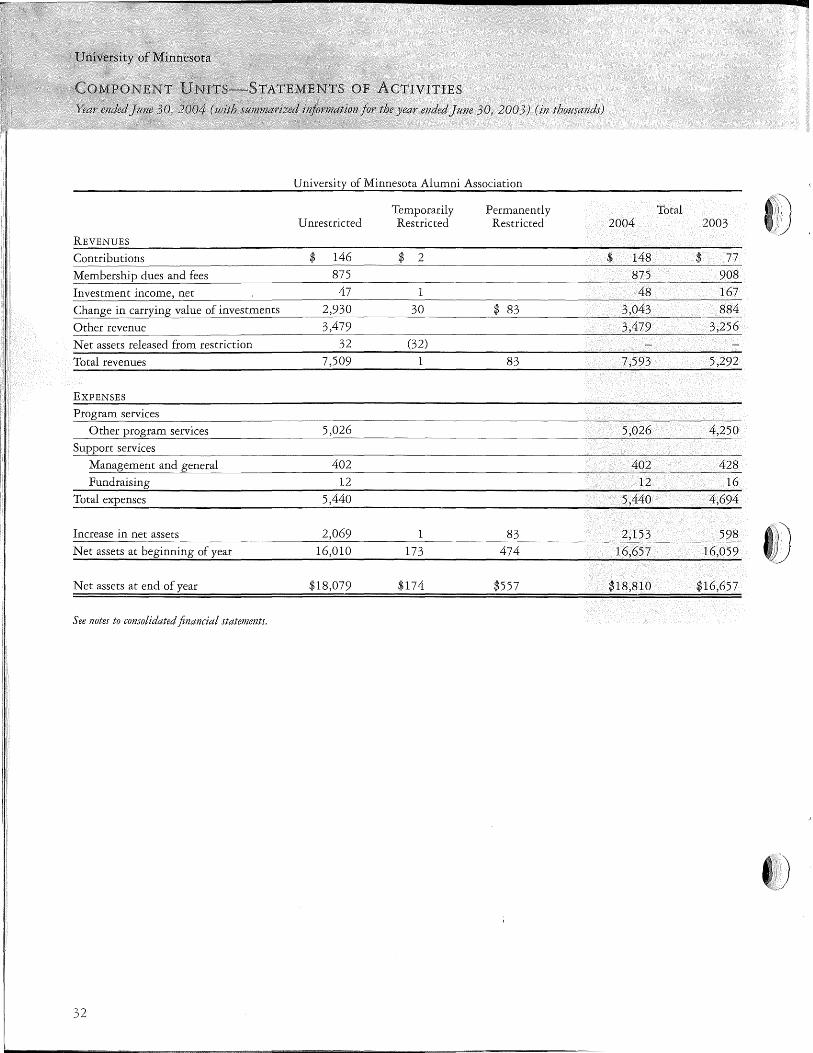
University of Minnesota Alumni Association
Temporarily Permanently Total Unrestricted Restricted Restricted 2004 2003
REVENUES
Contributions $ 146 $ 2 $ 148 $ 77 Membership dues and fees 875 875 908 Investment income, net 47 1 48 167 Change in carrying value of investments 2,930 30 $ 83 3,043 884
Other revenue 3,479 3,479 3,256 Net assets released from restriction 32 (32)
Total revenues 7,509 1 83 7,593 5,292
EXPENSES
Program services
Other program services 5,026 5,026 4,250 Support services
Management and general 402 402 428 Fundraising 12 12 16
Total expenses 5,440 5,440 4,694
Increase in net assets 2,069 1 83 2,153 598 Net assets at beginning of year 16,010 173 474 16,657 16,059
Net assets at end of year $18,079 $174 $557 $18,810 $16,657
See notes to consolidated financial statements.
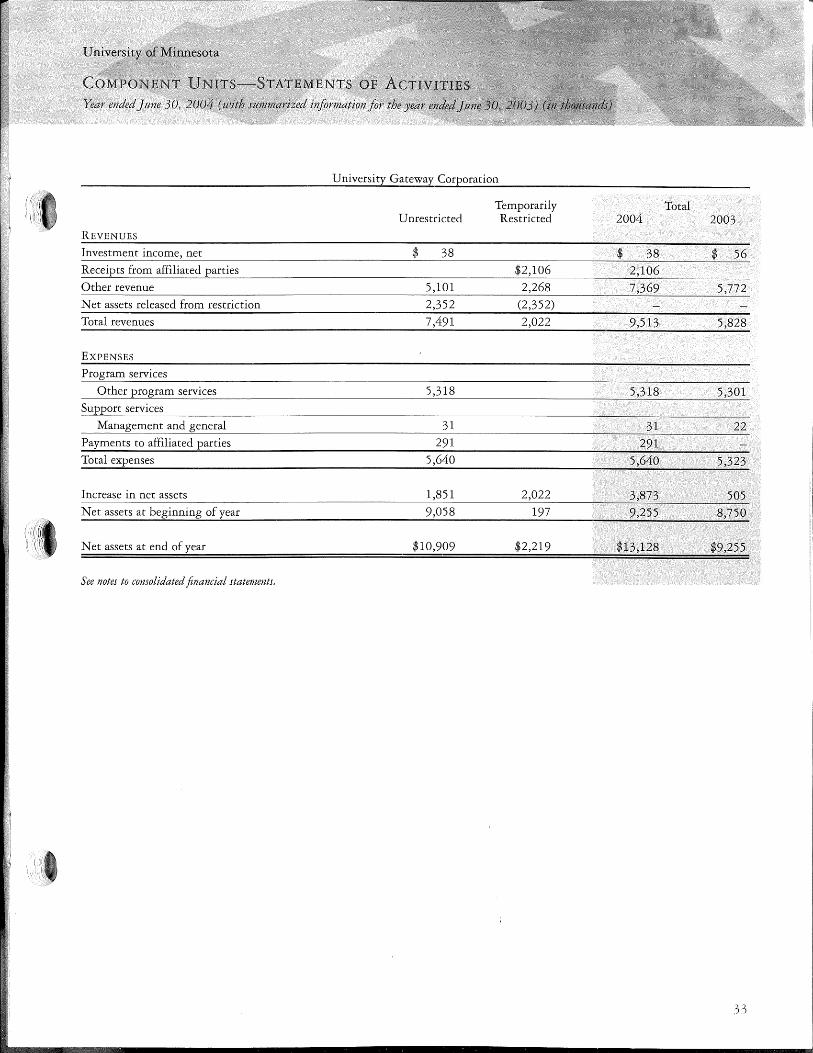
University Gateway Corporation
Temporarily Total Unrestricted Restricted 2004 2003
REVENUES
Investment income, net $ 38 $ 38 $ 56 Receipts from affiliated parties $2,106 2,106 Other revenue 5,101 2,268 7,369 5,772 Net assets released from restriction 2,352 (2,352) Total revenues 7,491 2,022 9,513 5,828
EXPENSES
Program services
Other program services 5,318 5,318 5,301 services
Management and general 31 31 22 Payments to affiliated parties 291 291 Total expenses 5,640 5,640 5,323
Increase in net assets 1,851 2,022 3,873 505 Net assets at beginning of year 9,058 197 9,255 8,750
Net assets at end of year $10,909 $2,219 $13,128 $9,255
See notes to consolidated financial statements.
33
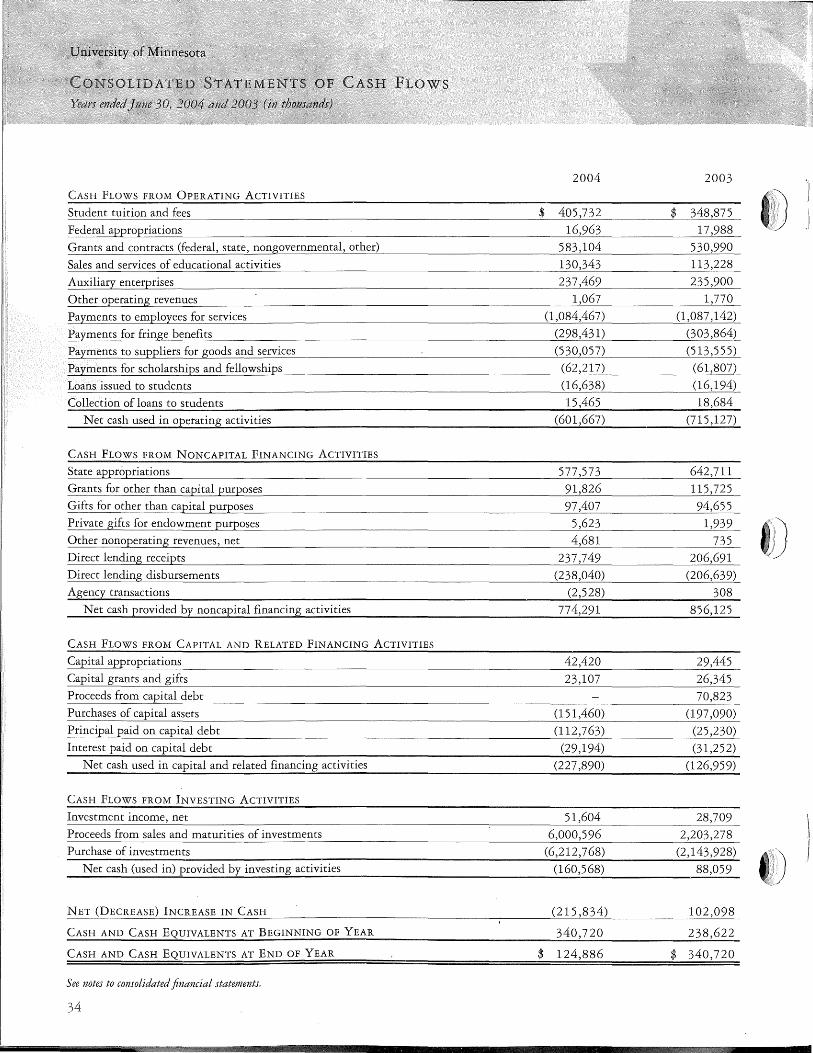
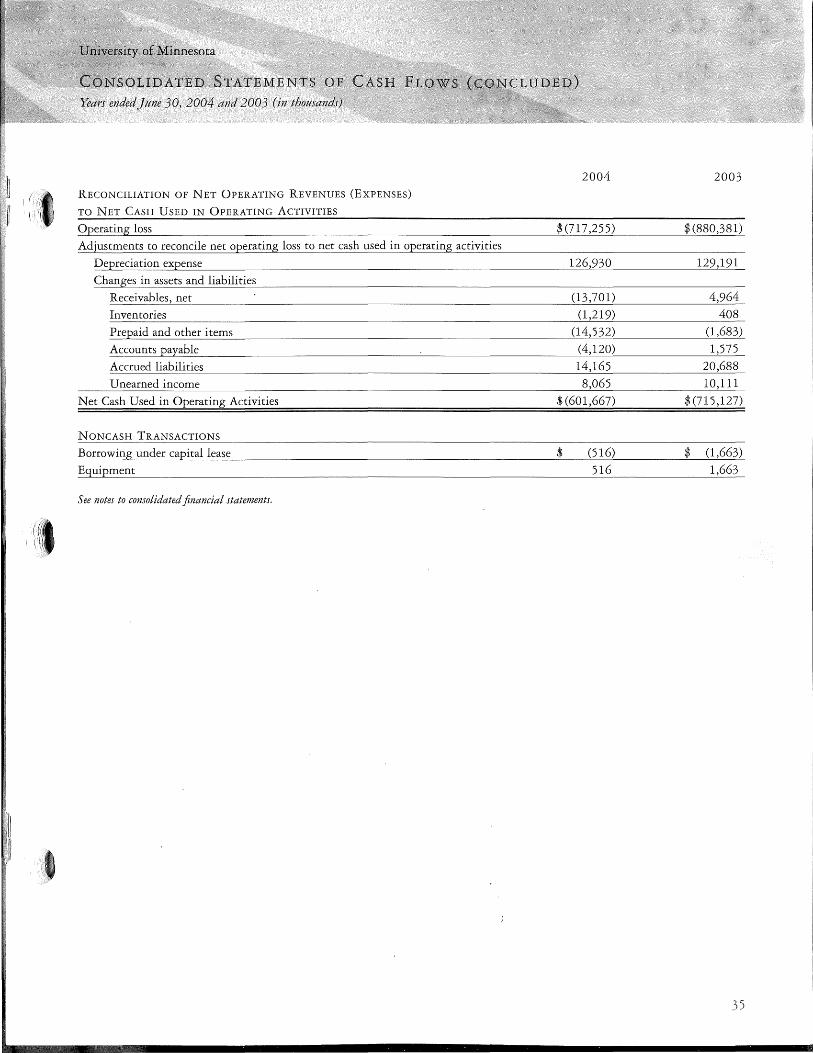
·11
·~
1
( RECONCILIATION OF NET OPERATING REVENUES (EXPENSES)
(I TO NET CASH USED IN OPERATING ACTIVITIES
Operating loss
Adjustments to reconcile net operating loss to net cash used in operating activities
Depreciation expense
Changes in assets and liabilities
Receivables, net
Inventories
Prepaid and other items
Accounts payable
Accrued liabilities
Unearned income
Net Cash Used in Operating Activities
N ONCASH TRANSACTIONS
Borrowing under capital lease
Equipment
See notes to consolidated financial statements.
2004 2003
$ (717 ,255) $ (880,381)
126,930 129,191
(13,701) 4,964
(1,219) 408
(14,532) (1,683)
(4,120) 1,575
14,165 20,688
8,065 10,111
$(601,667) $(715,127)
$ (516) $ (1,663)
516 1,663
35
ORGANIZATION, BASIS OF
PRESENTATION, AND SUMMARY OF
SIGNIFICANT ACCOUNTING POLICIES
ORGANIZATION
The University of Minnesota is both a state land-grant university, with a strong tradition of education and public service, and a major research institution serving the state of Minnesota through four campuses: Crookston, Duluth, Morris, and Twin Cities.
The University is considered a constitutional corporation and an agency of the state of Minnesota. As a result of this unique status, authority to govern the University is reserved to the Board of Regents rather than state law. The University complies with state law when specifically included by statute or when compliance does not conflict with the University's ability to accomplish its mission and purpose as established by the constitution of the state of Minnesota.
REPORTING ENTITY
The financial reporting entity for the University of Minnesota includes the financial results of the four campuses and, as required under GASB Statement No. 39, Determining Whether Certain Organizations Are Component Units (GASB 39), its legally separate component units. The component units are included in the University's reporting entity because of the significance of their operational or financial relationships with the University or its other component units.
Blended Unit-RUMINCO, Ltd. is a wholly owned single parent captive insurance company. Although it is legally separate from the University, RUMINCO, Ltd. is reported as if it were part of the University because its sole purpose is to handle medical malpractice, general liability, directors and officers' liability, and automobile liability on behalf of the University.
Presented Component Units-The University's financial statements include the financial data of several tax-exempt component units. They are reported in separate columns on separate pages. GASB 39 requires discrete presentation of component units when either the resources held by these entities can only be used by, or for the benefit of, the University or its
36
component units; or the component units are closely related to, or financially integrated with, the University.
,,,,,,,1).1,.. ,,." of !Vlinnesota Fotmdation
The University of Minnesota Foundation (UMF) is a legally separate, tax-exempt organization dedicated to raising and managing private gifts to benefit the University of Minnesota. The Board of Trustees of the UMF consists of between thirty and forty-five members, and includes the president of the University of Minnesota. One-fourth of the members of the Board of Trustees are appointed by the University. Although the UMF is an independent organization, the majority of resources that the UMF holds and invests, including income from its investments, are restricted to activities of the University by donors.
During the year ended June 30, 2004, the UMF distributed $74,139 to the University. Complete financial statements for the University of Minnesota Foundation can be obtained from the UMF office, McNamara Alumni Center, 200 Oak Street S.E., Suite 500, Minneapolis, MN 55455.
Minnesot?i Medical Foundation
The Minnesota Medical Foundation (MMF) is a legally separate, tax-exempt organization dedicated to raising and managing private gifts in support of the advancement of health-related education, research, and service at the University of Minnesota. The Board of Trustees of the MMF consists of not less than twentyfour elected members, one-third of whom must be physicians. Although the MMF is an independent organization, the majority of resources that the MMF holds and invests, including income from its investments, are restricted to activities of the University by donors.
During the year ended June 30~ 2004, the MMF distributed $31,332 to the University. Complete financial statements for the Minnesota Medical Foundation can be obtained from the MMF office, McNamara Alumni Center, 200 Oak Street S.E., Suite 300, Minneapolis, MN 55455.
!Vlinnesotct LandrmjJe Arhoretimz F 0111zdt1ti011
The Minnesota Landscape Arboretum Foundation (Foundation) is a legally separate, tax-exempt
organization dedicated to raising and managing private gifts for the benefit of the Minnesota Landscape Arboretum of the University of Minnesota. The Board of Trustees of the Foundation consists of between eight and thirty-six trustees, and the number of trustees must be divisible by four. One-fourth of the trustees are appointed by the University of Minnesota. Although the Foundation is an independent·organization, the majority of resources that the Foundation holds and invests, including income from its investments, are restricted to activities of the University by donors.
During the year ended June 30, 2004, the Minnesota Landscape Arboretum Foundation distributed $14,617 to the University. Complete financial statements for the Minnesota Landscape Arboretum Foundation can be obtained from the Foundation office, 3675 Arboretum Drive, Chaska, MN 55318.
!Winnesota 4-H Prwndcition
The Minnesota 4-H Foundation is a legally separate, tax-exempt organization, organized to receive, hold, invest, and administer assets and to make expenditures to or for the benefit of the programs of the Center for 4-H Youth Development, including support of the University of Minnesota Extension Service. The Board of Trustees consists of not fewer than 18 and not more than 21 persons elected from a slate of candidates prepared by the Board of Trustees.
During the year ended June 30, 2004, the Minnesota 4-H Foundation distributed $658 to the University. Complete financial statements for the Minnesota 4-H Foundation can be obtained from the Foundation office, McNamara Alumni Center, 200 Oak Street S.E., Suite 270B, Minneapolis, MN 55455.
Almnni Associcltion
The University of Minnesota Alumni Association (Association) is a legally separate, tax-exempt organization that serves alumni and the University of Minnesota with a mission to connect alumni to the University, advocating and supporting excellence in education, and building pride, spirit, and community. A volunteer board of 46 directors governs the Association. Members of the board are elected as follows: officers (9) and an honorary director (1) by the Board of Directors; at-large and geographical representatives (18) by the Association's
general membership; and collegiate/professional representatives (18) by their respective societies.
During the year ended June 30, 2004, the Association distributed $5 31 to the University. Complete financial statements for the Association can be obtained from the University of Minnesota Alumni Association, McNamara Alumni Center, 200 Oak Street S.E., Suite 200, Minneapolis, MN 55455.
Corporation
The University Gateway Corporation (Gateway) is a legally separate, tax-exempt entity that owns and operates a facility used to support three beneficiary organizations and the University of Minnesota in student recruiting, alumni relations, fund-raising activities, and general operations. The beneficiary organizations include the University of Minnesota Foundation, the University of Minnesota Alumni Association, and the Minnesota Medical Foundation. Gateway's six-member Board of Directors is composed of three members from the University of Minnesota Foundation, two members from the University of Minnesota Alumni Association, and one member from the Minnesota Medical Foundation.
Complete financial statements for the University Gateway Corporation can be obtained from the McNamara Alumni Center Management Office, 200 Oak Street S.E., Suite 035, Minneapolis, MN 55455.
University of Minnesota Physicians (UMPhysicians) is a legally separate, tax-exempt clinical practice organization for the faculty of the University of Minnesota School of Medicine. The Board of UMPhysicians consists of twenty-four voting directors, including the UMPhysicians chief executive officer, the dean of the University of Minnesota Medical School, faculty and department heads of the University Medical School (18 members), and individuals from the community at large (4 members); and two nonvoting directors.
During the year ended June 30, 2004, UMPhysicians distributed $26,289 to the University. Complete financial stat~ments for University of Minnesota Physicians can be obtained from Patti Andreini Arnold, Chief Financial Officer, 25 50 University Avenue West, Suite 401 South, St. Paul, MN 55114.
37
Tax Status-The Internal Revenue Service has ruled that the University is an integral part of the state of Minnesota. As an integral part of the state, the University is generally exempt from federal income taxes, although certain activities are subject to federal unrelated business income tax.
FINANCIAL STATEMENT PRESENTATION
The financial statements have been prepared in accordance with accounting principles prescribed by the Governmental Accounting Standards Board. These statements are prepared on a consolidated, entitywide basis. All significant interfund balances have been eliminated upon consolidation.
Effective July 1, 2003, the University adopted GASB Statement No. 39, Determining Whether Certain Organizations Are Component Units. This statement, which amends GASB Statement No. 14, The Financial Reporting Entity, requires the University to present the financial results of its component units, either in a discrete or blended presentation, within the University's financial statements, depending on the nature and significance of their relationship to the University or its other component units.
BASIS OF ACCOUNTING
The University is considered to be a special purpose government engaged primarily in business type activities (BTA). As a BTA, the University prepares its financial statements using the accrual basis of accounting and the economic-resources-measurement focus. Under the accrual basis of accounting, revenue and expense are recognized when earned or incurred.
As a GASB institution, the University has the option of applying pronouncements issued by the Financial Accounting Standards Board (FASB) after November 30, 1989, unless FASB conflicts with GASB. The University has elected not to adopt FASB pronouncements issued after the applicable date.
SIGNIFICANT ACCOUNTING POLICI.ES
Cash and Cash Equivalents-For purposes of the statement of cash flows, the University defines cash and cash equivalents as highly liquid, short-term (90 days or
38
less) investments that bear little or no market risk. Cash equivalents held in the Consolidated Endowment Fund (CEF), the Group Income Pool (GIP), and the Separately Invested Funds (SIP) are included in investments because the intent of these pools is long-term appreciation. Any cash balances held at the date of the statements are due to the timing of reinvesting the proceeds within the funds.
Investments-Investments in securities are reported at market value as determined by the major securities markets. Alternative investment strategies involving thinly traded securities are determined by the most recent purchase or sale price publicly available for that security. Private investments including real estate, timber, and venture capital are independently appraised annually and reported by investment managers as an updated estimate to that appraisal. As a result, these investments bear a greater risk that the reported value may be materially different than actual value. Purchases and sales of investments are recorded on a trade-date basis. Investment income is reported on the accrual basis and includes interest income and endowment income (interest earned on endowments but allocated to other funds). Realized and unrealized gains and losses are reported as a net increase (decrease) in the fair market value of investments.
The University uses derivative instruments for a variety of purposes. Financial futures are used to maintain investment portfolio asset allocations in accordance with institutional policy and to enhance the investment returns of certain asset classes. Forward foreign exchange contracts are used to hedge foreign currency exposure while interest rate swaps are used to manage the cost of debt. Financial futures and forward foreign exchange contracts are recorded on the contract date and are carried at fair value using listed price quotations or amounts that approximate fair value. The University is required to post collateral, typically U.S. Treasury bills, for derivative contracts held. ·Collateral required by these contracts is monitored daily, and required deposits or withdrawals are made as necessary.
In general, the University follows the Uniform Management oflnstitutional Funds Act (UMIFA), as adopted in Minn~sota, for donor-restricted endowments. Under UMIFA, the Board of Regents determines the prudent amount of realized and unrealized endowment appreciation to be allocated to fund current operations.
University of Minnesota
NOTES TO CONSOLIDATED FINANCIAL
Years ended]tme 30, 2004 and 2003 (amottnts in thottSands)
Investment of the realized or unrealized appreciation in excess of the annual spending limits is discussed in Note 2.
Inventories-Inventories held for resale are carried at the lower of cost (first-in, first-out) or market value. Other inventories are carried primarily at cost, which approximates market value.
Restricted Cash and Cash Equivalents-Restricted cash and cash equivalents represent unspent bond proceeds of $356 at June 30, 2004, and $78,102 at June 30, 2003, which are externally restricted for the construction or purchase of buildings or other capital assets. Although these funds meet the University's definition of cash and cash equivalents, they are recorded as long-term assets to be consistent with the purpose for which the funds are required to be used-for long-term capital projects.
Capital Assets-Land, buildings, and other property are recorded at cost if purchased or constructed, or at market value on the date of gift, if received by gift or bequest. Interest expense of $28,022 and $31,156 was incurred during construction for the years ended June 30, 2004 and 2003, respectively. No interest qualified for interest capitalization in 2004; however, $1,736 was capitalized in 2003 as a cost of the assets constructed. Depreciation is determined using the straight-line method, based on the estimated useful lives of the assets.
The following schedule summarizes the useful lives and capitalization threshold for capitalized, depreciable assets.
Useful life Capitalization Asset Category (in years) threshold
Buildings and improvements 10-40 $50,000
Leasehold improvements Lease term 50,000
Infrastructure 20-40 50,000
Equipment-technology 3-12 2,500
Equipment-other 3-20 2,500
Library and
reference books 10 NIA
The University maintains certain collections (works of art or historical treasures) for public exhibition, education, or research in furtherance of public service. These
collections are preserved, unencumbered, and cannot be disposed of for financial gain (proceeds from sales of collection items must be used to acquire other items for the collections). As such, the collections are not capitalized for financial statement reporting purposes.
Unearned Income-Unearned income represents amounts received for tuition, auxiliary services, and grants and contracts prior to fiscal year-end but not yet earned.
Noncurrent Liabilities-Noncurrent liabilities represent the principal portion of bonds, notes, and capital lease obligations as well as estimated amounts of accrued compensated absences and other liabilities that will not be paid within the next fiscal year.
Net Assets-Net assets are reported in three components based upon the type of external restriction imposed.
• Unrestricted: Net assets that have no external restriction imposed. Unrestricted net assets may be designated for specific purposes by the Board of Regents or subject to contractual limitations, but generally are designated to fund the academic, research, and public service mission of the University.
• Restricted:
Expendable-Net assets that are restricted for specific purposes by grantors, donors, or law. Restrictions on these assets are released when the University complies with the stipulations required by the grantor, donor, or legislative act.
Nonexpendable-Net assets that are required to be retained permanently by the University. These assets represent the principal portion (historical value) of gifts to the University's true and life endowment funds and institutional contributions to refundable loan programs.
• Invested in capital assets, net of related debt: Capital assets, net of accumulated depreciation and outstanding debt used to purchase, construct, or improve such assets. If debt has been incurred but not yet expended for capital assets, these unspent proceeds are classified as restricted-expendable net assets.
If both restricted and unrestricted resources are to be used for the same purpose, the resources are used in accordance with applicable instructions of the grantor, donor, or law.
39
Reventte Classification-The University has classified revenues as operating or nonoperating based upon the following criteria:
• Operating revenues result from exchange activities. Exchange activities are transactions where the amount received approximates the fair market value of the goods or services given up. The University considers student tuition and fees (net of scholarship allowances), federal appropriations, most grants and contracts, interest on student loans, and sales and services of auxiliary and educational activities to be exchange transactions.
• N onoperating revenues represent nonexchange activities. The primary source of these revenues is state appropriations, gifts, capital grants, federal and state financial aid grants (such as Pell and SEOG), and other nonexchange grants and contracts. Although the institution relies upon these revenue sources to fund the cost of operations, the grantor or donor is not the direct recipient of the goods or services delivered under the grant or gift terms.
Expense Classification-The University has classified operating expenses based upon their functional classification. Operating expenses by natural classification are presented in Note 10.
During fiscal year 2004 and 2003, separately budgeted departmental research in nonsponsored accounts of $94,688 and $79,570, respectively, was recorded as research expense.
Use of Estimates-To prepare the consolidated financial statements in conformity with accounting principles generally accepted in the United States of America, management must make estimates and assumptions. These estimates and assumptions may affect the reported amounts of assets and liabilities and disclosure of contingent assets and liabilities at the date of the financial statements and the reported amounts of revenues and expenses during the reporting period. Actual results could differ from those estimates. The most significant areas that require the use of management's estimates relate to allowances for uncollectible accounts and selfinsurance reserves, scholarship discounts and allowances, arbitrage rebates, and vacation pay and pension accruals.
40
Reclassifications-Certain prior year amounts have been reclassified to conform to the presentation used in the current year. These reclassifications had no impact on net assets as previously reported.
NEW ACCOUNTING PRONOUNCEMENTS
In March 2003, the GASB issued Statement No. 40, Deposit and Investment Risk Disc!osttres. This statement, which amends GASB Statement No. 3, Deposits with
·Financial Instittttions} Investments (Inc!ttding Repttrchase Agreements) and Reverse Repttrchase Agreements} is effective for the University for the year ending June 30, 2005. The University will be required to address common deposit and investment risks related to credit risk, concentration of credit risk, interest rate risk, and foreign currency risk. This statement also requires certain disclosures of investments that have fair values that are highly sensitive to changes in interest rates. The University is also required to disclose its deposit and investment policies. The University has not yet determined the full impact of GASB Statement No. 40 on its consolidated financial statements.
COMPONENT UNITS
The University's component units are private nonprofit organizations that report under FASB standards, including FASB Statement No. 117, Financial Reporting for Not-for-Profit Organizations. As such, certain revenue recognition criteria and presentation features are different from GASB revenue recognition criteria and presentation features. No modifications have been made to the component units' financial information in the University's financial report for these differences. The component units' financial data has, however, been aggregated into like categories for presentation purposes and is shown in these statements in thousands. In all cases, except the University of Minnesota Physicians, the separately issued component units' financial statements are not rounded.
CASH AND lNVESTlVfENTS
SUMMARY
The University maintains centralized management for substantially all of its cash and investments. With the exception of insurance reserves maintained by RUMINCO, Ltd., the wholly owned insurance subsidiary (Note 9), and other funds whose terms require separate management, the invested assets of the University are managed through several internal investment pools. Each investment pool has a different set of objectives designed to maximize investment return within consistent risk parameters established for that pool.
In general, investment securities are exposed to various risks, such as interest rate, credit, and overall market volatility. Due to the level of risk associated with certain investment securities, it is reasonably possible that changes in the values of investment securities will occur in the near term, and that such changes could materially affect the amounts reported in the consolidated financial statements.
AUTHORIZATIONS
The Board of Regents establishes the University's investment policies and objectives. The internal investment pools created under these guidelines to manage the invested assets of the University are described below.
Temporary Investment Pool (TIP )-Short-Term ReservesThe Temporary Investment Pool is invested to meet the current obligations of the University. The investment objective for the TIP is to maximize current income while preserving principal and maintaining liquidity. The pool is invested primarily in commercial paper, money market funds, corporate obligations, and U.S. government and agency securities within the credit quality and term constraints of the portfolio.
Consolidated Endowment Fttnd (CEF)-The Consolidated Endowment Fund represents the pooling of funds from both public and private sources for which donor intent, law, or institutional decree determines the principal amount that must be invested either in perpetuity or
other specified time frames. The funds are invested to achieve a return of at least 5 percent above inflation over a three- to five-year period. The allocation policy for this fund targets a 3 5 percent investment in domestic equities, 20 percent investment in international equities, 25 percent investment in alternative investments, and 20 percent in fixed-income related investments. To maintain the allocation targets, the CEF may invest in various bond and stock index futures contracts. The University has deposited U.S. government securities with a market value of $2,114 at June 30, 2004, and $3,675 at June 30, 2003, as collateral for these future commitments.
The University distributes funds from the CEF to activities targeted by the endowment purpose. The annual distribution is based on the University's spending policy of 5 percent of the three-year moving average of the unit value of the fund. When investment income is less than 5 percent, accumulated capital gains are used to supplement investment income to meet the spending policy. If investment income exceeds the amount needed for distribution, the excess remains in the respective endowment funds.
Group Income Pool (GIP)-Long-Term Reserves-The Group Income Pool represents assets invested for the purpose of various auxiliary and support-service units as well as long-term capital purposes. The investment objective of the GIP is to maximize income until the principal is required for departmental needs; therefore the GIP is invested in global, fixed-income securities through an institutional mutual fund. All income received from these investments is available for spending.
Separately Invested Funds (SIF)-Separately invested funds represent endowment and other restricted assets that by the terms of the gift or by administrative decision cannot be combined with the major investment pools.
Invested Assets Related to Indebtedness (IARI)-lncluded in investments are the invested assets related to indebtedness that are held by the bond trustee primarily in the debt-service reserve funds of the outstanding University bond issuances. In addition, unspent bond proceeds held;by the University are invested for shortterm income until needed for the capital projects for which the bonds were issued. The market value of debt-
41
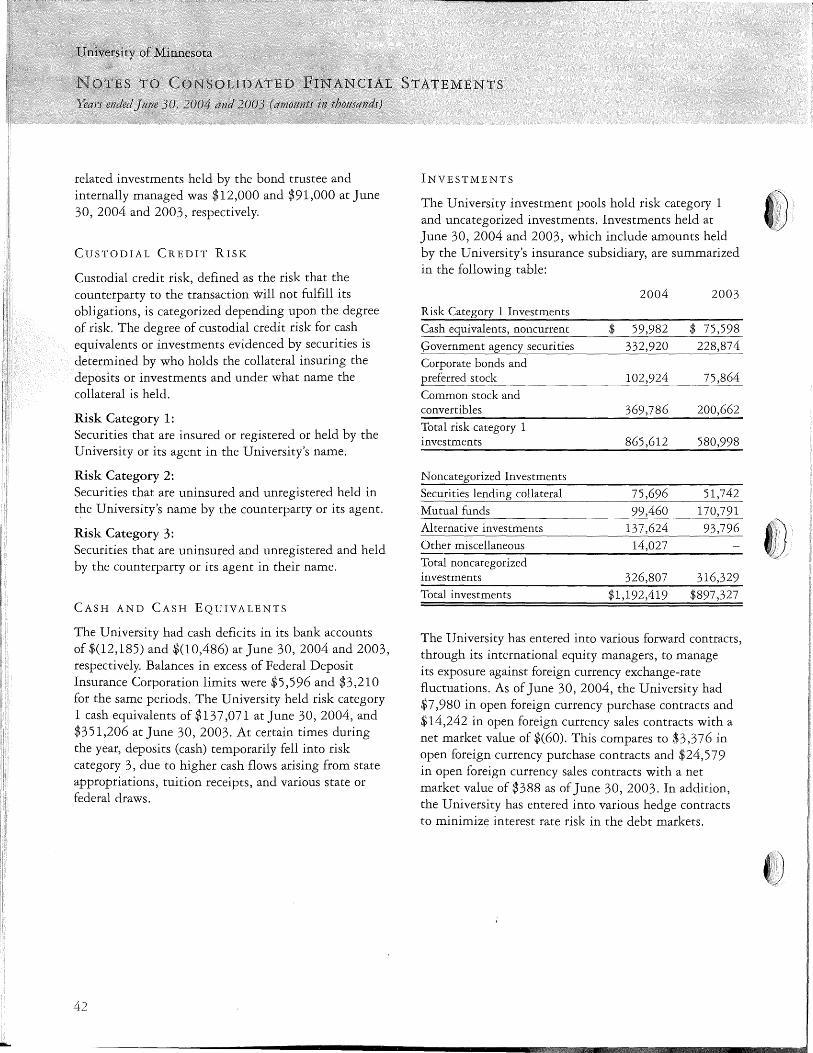
l
related investments held by the bond trustee and internally managed was $12,000 and $91,000 at June 30, 2004 and 2003, respectively.
CUSTODIAL CREDIT RISK
Custodial credit risk, defined as the risk that the counterparty to the transaction will not fulfill its obligations, is categorized depending upon the degree of risk. The degree of custodial credit risk for cash equivalents or investments evidenced by securities is determined by who holds the collateral insuring the deposits or investments and under what name the collateral is held.
Risk Category 1: Securities that are insured or registered or held by the University or its agent in the University's name.
Risk Category 2: Securities that are uninsured and unregistered held in the University's name by the counterparty or its agent.
Risk Category 3: Securities that are uninsured and unregistered and held by the counterparty or its agent in their name.
CASH AND CASH EQUIVALENTS
The University had cash deficits in its bank accounts of $(12,185) and $(10,486) at June 30, 2004 and 2003, respectively. Balances in excess of Federal Deposit Insurance Corporation limits were $5,596 and $3,210 for the same periods. The University held risk category 1 cash equivalents of $13 7 ,071 at June 30, 2004, and $351,206 at June 30, 2003. At certain times during the year, deposits (cash) temporarily fell into risk category 3, due to higher cash flows arising from state appropriations, tuition receipts, and various state or federal draws.
42
STATEMENTS
INVESTMENTS
The University investment pools hold risk category 1 and uncategorized investments. Investments held at June 30, 2004 and 2003, which include amounts held by the University's insurance subsidiary, are summarized in the following table:
2004 2003
Risk Category 1 Investments
Cash equivalents, noncurrent $ 59,982 $ 75,598
µovernment agency securities 332,920 228,874
Corporate bonds and preferred stock 102,924 75,864
Common stock and convertibles 369,786 200,662
Total risk category 1 investments 865,612 580,998
Noncategorized Investments
Securities lending collateral 75,696 51,742
Mutual funds 99,460 170,791
Alternative investments 137,624 93,796
Other miscellaneous 14,027
Total noncategorized investments 326,807 316,329 Total investments $1,192,419 $897,327
The University has entered into various forward contracts, through its international equity managers, to manage its exposure against foreign currency exchange-rate fluctuations. As of June 30, 2004, the University had $7 ,980 in open foreign currency purchase contracts and $14,242 in open foreign currency sales contracts with a net market value of $(60). This compares to $3,376 in open foreign currency purchase contracts and $24,579 in open foreign currency sales contracts with a net market value of $388 as of June 30, 2003. In addition, the University has entered into various hedge contracts to minimiz~ interest rate risk in the debt markets.
~)
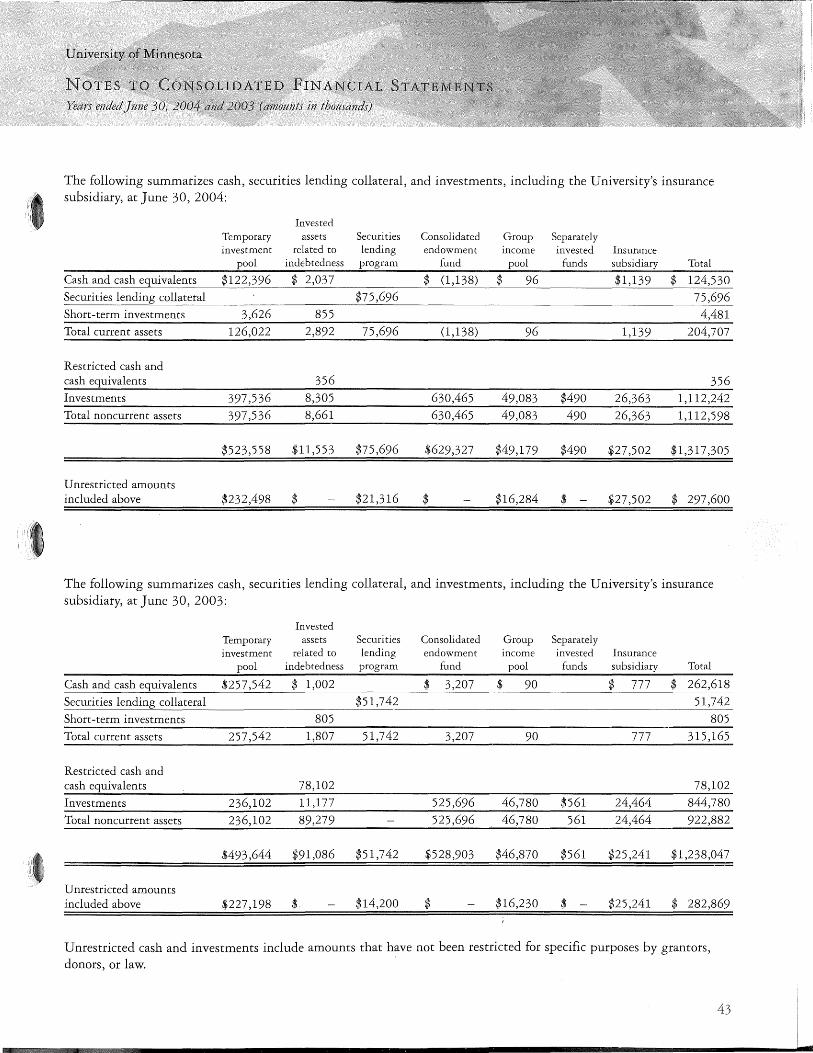
The following summarizes cash, securities lending collateral, and investments, including the University's insurance subsidiary, at June 30, 2004:
Invested Temporary assets Securities Consolidated Group Separately investment related to lending endowment income invested Insurance
pool indebtedness program fund pool funds subsidiary Total
Cash and cash equivalents $122,396 $ 2,037 $ (1,138) $ 96 $1,139 $ 124,530 Securities lending collateral $75,696 75,696 Short-term investments 3,626 855 4,481 Total current assets 126,022 2,892 75,696 (1,138) 96 1,139 204,707
Restricted cash and cash equivalents 356 356 Investments 397,536 8,305 630,465 49,083 $490 26,363 1,112,242 Total noncurrent assets 397,536 8,661 630,465 49,083 490 26,363 1,112,598
$523,558 $11,553 $75,696 $629,327 $49,179 $490 $27,502 $1,317 ,305
Unrestricted amounts included above $232,498 $ $21,316 $ $16,284 $ - $27,502 $ 297,600
The following summarizes cash, securities lending collateral, and investments, including the University's insurance subsidiary, at June 30, 2003:
Invested Temporary assets Securities Consolidated Group Separately investment related to lending endowment income invested Insurance
pool indebtedness program fund pool funds subsidiary Total
Cash and cash equivalents $257,542 $ 1,002 $ 3,207 $ 90 $ 777 $ 262,618
Securities collateral 5 Short-term investments 805 805 Total current assets 257 ,542 1,807 51,742 3,207 90 777 315,165
Restricted cash and cash equivalents 78,102 78,102 Investments 236,102 11,177 525,696 46,780 $561 24,464 844,780 Total noncurrent assets 236,102 89,279 525,696 46,780 561 24,464 922,882
$493,644 $91,086 $51,742 $528,903 $46,870 $561 $25,241 $1,238,047
Unrestricted amounts included above $227,198 $ $14,200 $ $16,230 $ $25,241 $ 282,869
Unrestricted cash and investments include amounts that have not been restricted for specific purposes by grantors, donors, or law.
i
SECURITIES LENDING
To enhance the return on investments, the Board of Regents of the University has authorized participation in a global securities lending program. The program is managed by the University's custodian bank, which lends securities to approved broker-dealers in return for cash or other acceptable collateral. By contractual agreement, the level of collateralization must be at least 100 percent of the market value of the securities loaned. Types of securities lent include domestic and foreign equities and domestic government, agency, and corporate bonds, as well as foreign, sovereign, fixed-income securities. Collateral received is generally in the form of cash, although U.S. government or agency securities, sovereign debt-rated A or better-convertible bonds, and irrevocable bank letters of credit are also acceptable forms of collateral. The University retains all rights to ownership of the loaned securities and receives all dividend and interest income. Neither the University nor its securities lending agent has the ability to pledge or sell collateral securities unless a borrower defaults.
In accordance with GASB Statement No. 28, Accounting and Financial Reporting for Securities Lending Transactions} the University records the market value of the collateral as an asset in the balance sheet along with a corresponding liability. The University had loaned securities with market values of approximately $73,592 and $49,621 at June 30, 2004 and 2003, respectively.
44
STATEMENTS
These loaned securities were supported by collateral of approximately $75,696 and $51,742, which is included as securities lending collateral in the consolidated statements of net assets at June 30, 2004 and 2003, respectively. Of this collateral amount, approximately $73,754 and $43,901 was cash and approximately $1,942 and $7 ,841 was acceptable noncash collateral at June 30, 2004 and 2003, respectively.
In general, since the value of collateral received exceeded the market value of the securities on loan, the University's credit risk was minimal. The University and the borrowers of its securities maintain the right to terminate all securities lending transactions on demand. The cash collateral received on each loan is invested, together with the cash collateral of other qualified tax-exempt plan lenders, in a collective investment pool. The average duration of such pools were 49 and 5 7 days as of June 2004 and 2003, respectively. Since the loans are terminable at will, their duration does not generally match the duration of the investments made with the cash collateral. If the University must terminate a term loan, the lending agent has the ability to substitute the same security from a different client while returning the University's security.
Income and cost from its participation in this securities lending program were $67 2 and $486, respectively, for the year ended June 30, 2004, and $574 and $422 at June 30, 2003, respectively.
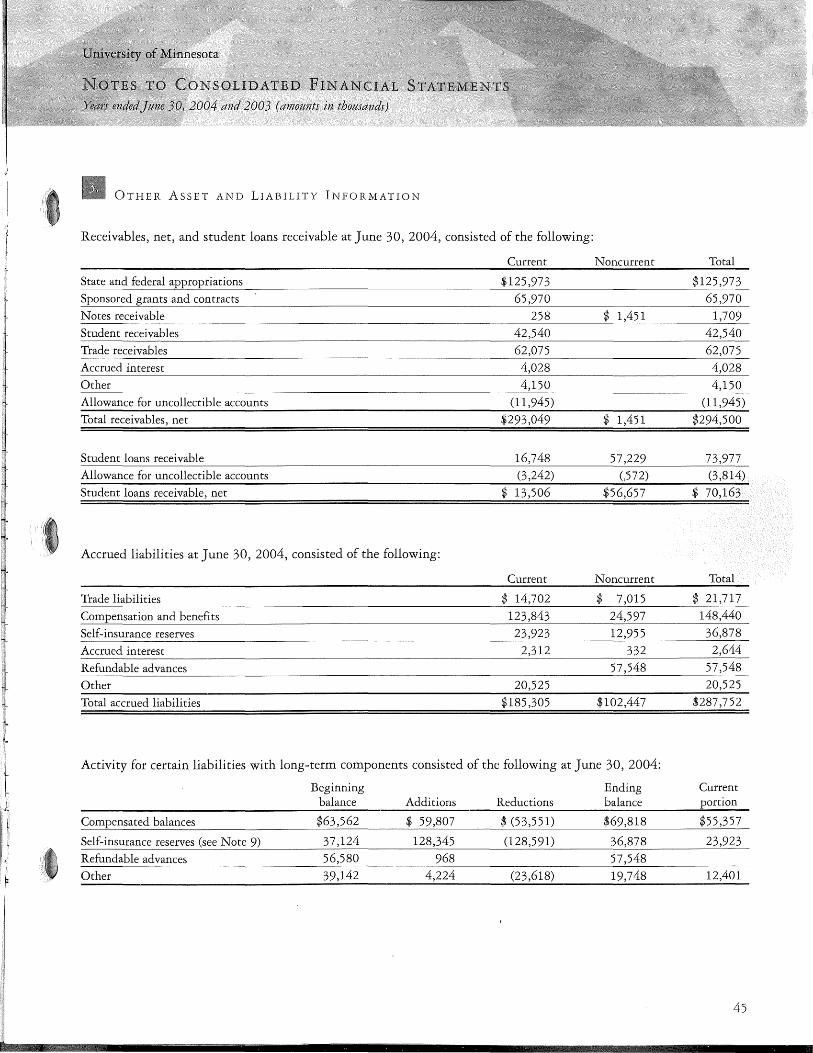
OTHER ASSET AND LIABILITY INFORMATION
Receivables, net, and student loans receivable at June 30, 2004, consisted of the following:
Current Noncurrent Total
State and federal appropriations $125,973 $125,973 Sponsored grants and contracts 65,970 65,970 Notes receivable
Student receivables
Trade receivables
Accrued interest
Other 4,150 4,150
Allowance for uncollectible accounts (11,945) (11,945)
Total receivables, net $293,049 $ 1,451 $294,500
Student loans receivable 16,748 57,229 73,977 Allowance for uncollectible accounts (3,242) (,572) (3,814)
Student loans receivable, net $ 13,506 $56,657 $ 70,163
Accrued liabilities at June 30, 2004, consisted of the following:
Current Noncurrent Total
Trade liabilities $ 14,702 $ 7,015 $ 21,717
Compensation and benefits 123,843 24,597 148,440
Self-insurance reserves 23,923 12,955 36,878
Accrued interest 2,312 332 2,644
Refundable advances 57,548 57,548
Other 20,525 20,525
Total accrued liabilities $185,305 $102,447 $287,752
Activity for certain liabilities with long-term components consisted of the following at June 30, 2004:
Beginning Ending Current balance Additions Reductions balance portion
Compensated balances $63,562 $ 59,807 $ (53,551) $69,818 $55,357
Self-insurance reserves (see Note 9) 37,124 128,345 (128,591) 36,878 23,923
Refundable advances 56,580 968 57,548
Other 39,142 4,224 (23,618) 19,748 12,401
45

~) Receivables, net, and student loans receivable at June 30, 2003, consisted of the following:
Current Noncurrent Total
State and federal appropriations $109,098 $109,098
Sponsored grants and contracts 68,582 68,582
Notes receivable 325 $ 1,706 2,031
Student receivables 39,319 39,319
Trade receivables 57,610 57,610
Accrued interest 2,612 2,612
Other 2,736 2,736
Allowance for uncollectible accounts (8,217) (8,217)
Total receivables, net $272,065 $ 1,706 273,771
Student loans receivable 16,138 55,476 71,614
Allowance for uncollectible accounts (3,259) ( 555) (3,814)
Student loans receivable, net $ 12,879 $ 54,921 $ 67,800
Accrued liabilities at June 30, 2003, consisted of the following: ~) Current Noncurrent Total
Trade liabilities $ 8,042 $ 27,742 $ 35,784 Compensation and benefits 114,449 20,811 135,260 Self-insurance reserves Accrued interest
Refundable advances 56,580 56,580 Other 16,688 16,688 Total accrued liabilities $168,069 $119,391 $287,460
Activity for certain liabilities with long-term components consisted of the following at June 30, 2003:
Beginning Ending Current balance Additions Reductions balance portion
Compensated balances $61,679 $53,640 ' $(51,757) $63,562 $54,044 Self-insurance reserves (see Note 9) 28,989 121,520 (113,385) 37,124 23,198 Refundable advances 55,166 1,414 56,580 () Other 40,439 19,911 (21,208) 39,142 11,068
46
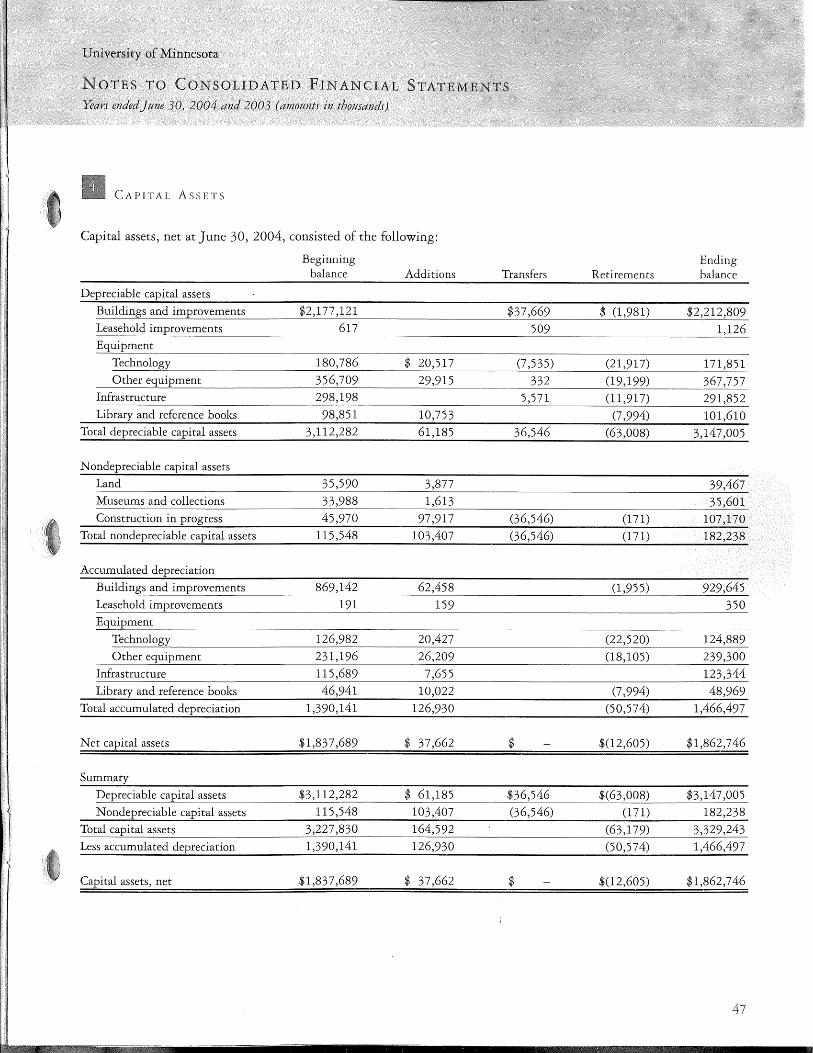
University of Minnesota
NOTES TO CONSOLIDATED FINANCIAL
Years ended]tme 30, 2004 and 2003 (amozmts in thottsands)
CAPITAL ASSETS
Capital assets, net at June 30, 2004, consisted of the following:
Beginning balance Additions
Depreciable capital assets
Buildings and improvements $2,177 ,121 Leasehold improvements 617 Equipment
Technology 180,786 $ 20,517 Other equipment 356,709 29,915
Infrastructure 298,198 Library and reference books 98,851 10,753
Total depreciable capital assets 3,112,282 61,185
Nondepreciable capital assets
Land 35,590 3,877 Museums and collections
Construction in progress 45,970 97,917 Total nondepreciable capital assets 115,548 103,407
Accumulated depreciation
Buildings and improvements 869,142 62,458 Leasehold 191
Technology 126,982 20,427 Other equipment 231,196 26,209
Infrastructure 115,689 7,655 Library and reference books 46,941 10,022
Total accumulated depreciation 1,390,141 126,930
Net capital assets $1,837,689 $ 37,662
Summary
Depreciable capital assets $3,112,282 $ 61,185
Nondepreciable capital assets 115,548 103,407 Total capital assets 3,227,830 164,592 Less accumulated depreciation 1,390,141 126,930
Capital assets, net $1,837,689 $ 37,662
Ending Transfers Retirements balance
$37,669 $ (1,981) $2,212,809
509 1,126
(7,535) (21,917) 171,851 332 (19,199) 367,757
5,571 (11,917) 291,852 (7,994) 101,610
36,546 (63,008) 3,147,005
39,467
(36,546) (171) 107,170 (36,546) (171) 182,238
(1,955) 929,645
(22,520) 124,889 (18,105) 239,300
123,344
(7 ,994) 48,969 (50,574) 1,466,497
$ $(12,605) $1,862,746
$36,546 $(63,008) $3,147,005 (36,546) (171) 182,238
(63,179) 3,329,243 (50,574) 1,466,497
$ $(12,605) $1,862,746
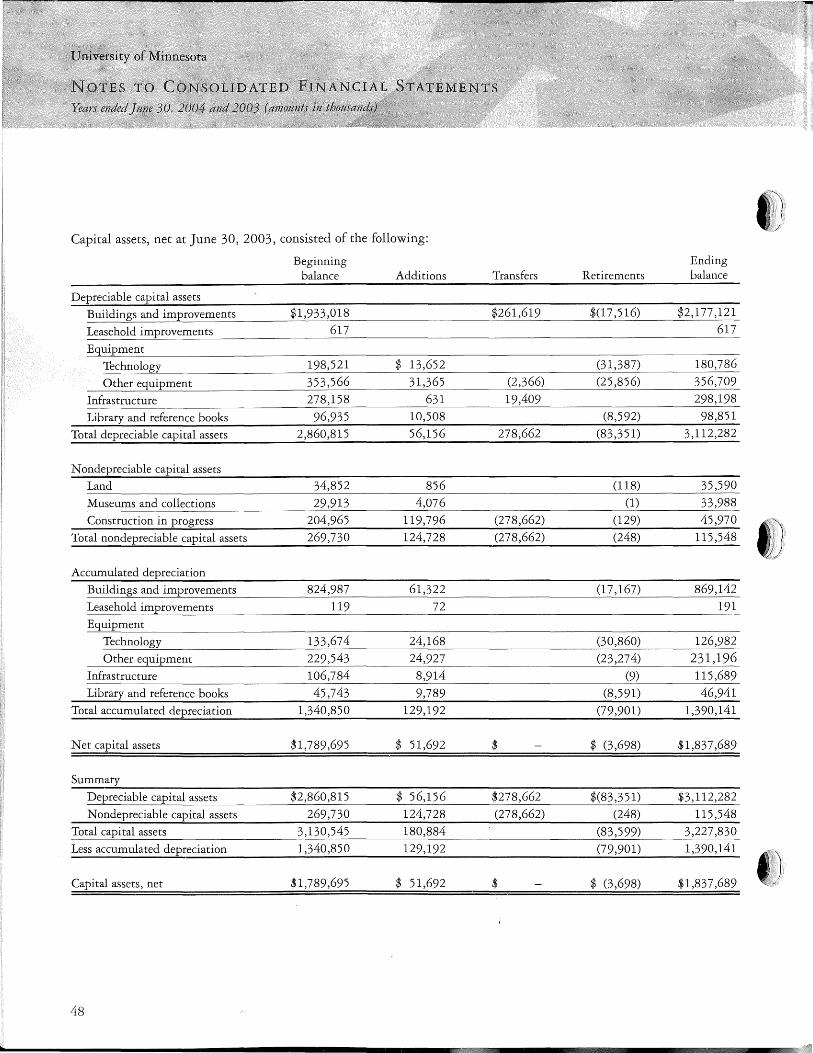
Capital assets, net at June 30, 2003, consisted of the following:
Depreciable capital assets
Buildings and improvements
Leasehold improvements
Equipment
Technology
Other equipment
Infrastructure
Library and reference books
Total depreciable capital assets
Nondepreciable capital assets
Land
Museums and collections
Construction in progress
Total nondepreciable capital assets
Accumulated depreciation
Buildings and improvements
Leasehold improvements
Equipment
Technology
Other equipment
Infrastructure
Library and reference books
Total accumulated depreciation
Net capital assets
Summary
Depreciable capital assets
Nondepreciable capital assets
Total capital assets
Less accumulated depreciation
Capital assets, net
48
Beginning balance
$1,933,018 617
198,521
353,566 278,158
96,935 2,860,815
34,852
29,913 204,965
269,730
824,987
119
133,674 229,543 106,784
45,743 1,340,850
$1,789,695
$2,860,815
269,730 3,130,545 1,340,850
$1,789,695
Additions
$ 13,652
31,365 631
10,508
56,156
856 4,076
119,796 124,728
61,322
72
24,168
24,927 8,914
9,789 129,192
$ 51,692
$ 56,156 124,728 180,884
129,192
$ 51,692
Transfers Retirements
$261,619 $(17,516)
(31,387) (2,366) (25,856)
19,409 (8,592)
278,662 (83,351)
(118) (1)
(278,662) (129) (278,662) (248)
(17 ,167)
(30,860) (23,274)
(9) (8,591)
(79,901)
$ $ (3,698)
$278,662 $(83,351) (278,662) (248)
(83,599) (79,901)
$ $ (3,698)
Ending balance
$2,177,121 617
180,786
356,709 298,198
98,851 3,112,282
35,590
33,988 45,970
115,548
869,142
191
126,982
231,196 115,689 46,941
1,390,141
$1,837,689
$3,112,282
115,548 3,227,830 1,390,141
$1,837,689
..._ ______________________________________ ,,
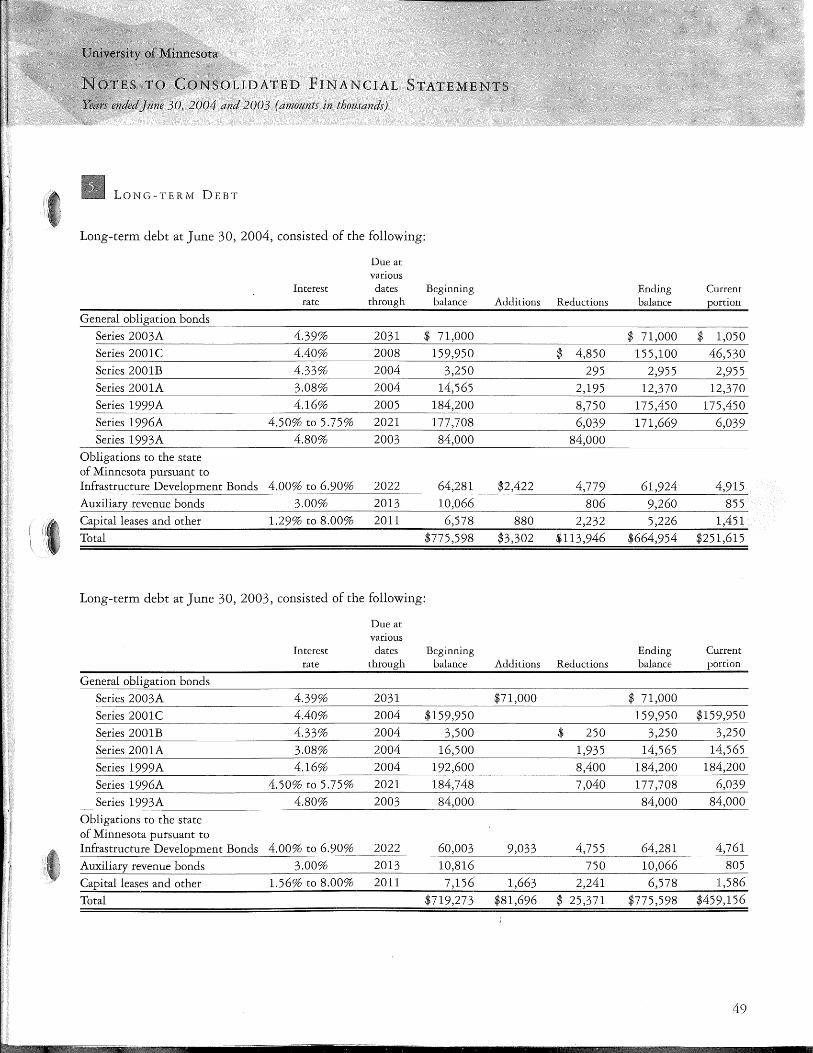
LONG-TERM DEBT
Long-term debt at June 30, 2004, consisted of the following:
Due at various
Interest dates Beginning Ending Current rate through balance Additions Reductions balance portion
General obligation bonds
Series 2003A 4.39% 2031 $ 71,000 $ 71,000 $ 1,050 Series 2001C 4.40% 2008 159,950 $ 4,850 155,100 46,530 Series 2001B 4.33% 2004 3,250 295 2,955 2,955 Series 2001A 3.08% 2004
Series 1999A 4.16% 2005 184,200 8,750 175,450 175,450 Series 1996A 4.50% to 5.75% 2021 177,708 6,039 171,669 6,039 Series 1993A 4.80% 2003 84,000 84,000
Obligations to the state of Minnesota pursuant to Infrastructure Development Bonds 4.00% to 6.90% 2022 64,281 $2,422 4,779 61,924 4,915 Auxiliary revenue bonds 3.00% 2013 10,066 806 9,260 855 Capital leases and other 1.29% to 8.00% 2011 6,578 880 2,232 5,226 1,451
Total $775,598 $3,302 $113,946 $664,954 $251,615
Long-term debt at June 30, 2003, consisted of the following:
Due at various
Interest dates Beginning Ending Current rate through balance Additions Reductions balance portion
General obligation bonds
Series 2003A 4.39% 2031 $71,000 $ 71,000
Series 2001C 4.40% 2004 $159,950 159,950 $159,950
Series 2001B 4.33% 2004 3,500 $ 250 3,250 3,250
Series 2001A 3.08% 2004 16,500 1,935 14,565 14,565
Series 1999A 4.16% 2004 192,600 8,400 184,200 184,200
Series 1996A 4.50% to 5.75% 2021 184,748 7,040 177,708 6,039
Series 1993A 4.80% 2003 84,000 84,000 84,000
Obligations to the state of Minnesota pursuant to Infrastructure Development Bonds 4.00% to 6.90% 2022 60,003 9,033 4,755 64,281 4,761
Auxiliary revenue bonds 3.00% 2013 10,816 750 10,066 805
Capital leases and other 1.56% to 8.00% 2011 7,156 1,663 2,241 6,578 1,586
Total $719,273 $81,696 $ 25,371 $775,598 $459,156
49
GENERAL OBLIGATION BONDS
In November 2001, the Board of Regents of the University of Minnesota authorized the issuance of new general obligation debt securities to provide funds for certain approved capital projects, costs of issuance, and refunding of the Series 1993A bonds. Of the $501,000 of debt authorized under the February 2001 and November 2001 resolutions, $380,600 was issued for the Series 1999A and 2001 bonds, and $71,000 was issued for the 2003A bonds for the refunding of the Series 1993A bonds. Subsequent to year-end, on July 13, 2004, an additional, $20, 720 was issued for the 2004A bonds, with $28,680 remaining unissued.
On May 20, 2003, the University issued $71,000 General Obligation Refunding Bonds, Series 2003A. The bond proceeds were applied, along with certain additional funds provided by the University, to the refunding on August 15, 2003, of the University's $84,000 General Obligation Bonds, Series 1993A.
Under generally accepted accounting principles, the Series 2001A, 2001B, 2001C, and 1999A bonds are defined as demand bonds because bondholders have the option to put the bonds back (demand repayment) to the University at any time. In the absence of standby bond purchase agreements, the University has classified the entire obligation of the Series 2001A and 2001B bonds as current liabilities. As of the date of this report, none of the bondholders have exercised the put option. Thus, management believes that the bond obligations will continue to be met in accordance with the longerterm payment schedules provided for within the bond prospectuses.
In December 2003, the University entered into a standby bond purchase agreement to provide liquidity support for the Series 2001C bonds. The agreement requires the banks to provide funds for the purchase of Series 2001 C bonds that have been tendered or deemed tendered and not remarketed subject to certain conditions. The available principal commitment is initially the aggregate principal amount of the Series 2001C bonds outstanding of $155,100. The agreement, expiring on December 16, 2008, provides for ten equal semi-annual installments at six-month intervals of the bonds put back to the banks holding the agreement. No amounts have been drawn under this agreement through June 30, 2004.
In June 2004, the University entered into a standby bond purchase agreement to provide liquidity support for the
so
Series 1999A bonds. The agreement provides for four equal semi-annual installment payments on June 1 and December 1. No amounts have been drawn under this agreement through June 30, 2004. Since the agreement expires on June 13, 2005, the entire obligation of the Series 1999A bonds has been classified as a current liability.
The University has sold a put option, which allows the counterparty to put up to $171,669 at June 30, 2004, and $177 ,708 at June 30, 2003, of Series 1996A University bonds or eligible AAA-rated governmental or municipal securities to the University. This option may be exercised at any time. At the date of this report, the counterparty has not exercised the put option.
Subsequent to year-end, on July 13, 2004, the University issued $20,720 General Obligation Intermediate Term Financing Program Bonds, Series 2004A. The bond proceeds are to be applied for certain capital projects of the University to include the purchase of equipment and related services in connection with the upgrade of the University's Twin Cities campus data network, as well as a portion of the acquisition cost of certain property to be operated as an office building on the Twin Cities campus. The bonds were issued at coupon rates of 4-5 percent, with a premium of $1,511.
All general obligation bonds are secured by the full faith and credit of the University and subject to mandatory sinking fund requirements set forth in the prospectuses. In addition, the bonds are tax-exempt with the exception of the Series 2001B bonds.
AUXILIARY BONDS
The University's auxiliary bonds are secured by the net revenues of the auxiliary activity to which they relate, debt-service subsidy grants provided by the U.S. Department of Housing and Urban Development, and the full faith and credit of the University. The auxiliary bond agreements require minimum mandatory reserves sufficient to cover the principal and interest due in any future fiscal year. To comply with this requirement, the University set aside $1,217 at June 30, 2004, and $1,301 at June 30, 2003, for future debt service. An additional $9,979 and $11,481 was set aside for building replacement reserves for June 30, 2004 and 2003, respectively. These mandatory reserves are included in restricted expendable net assets in the financial statements.
f H
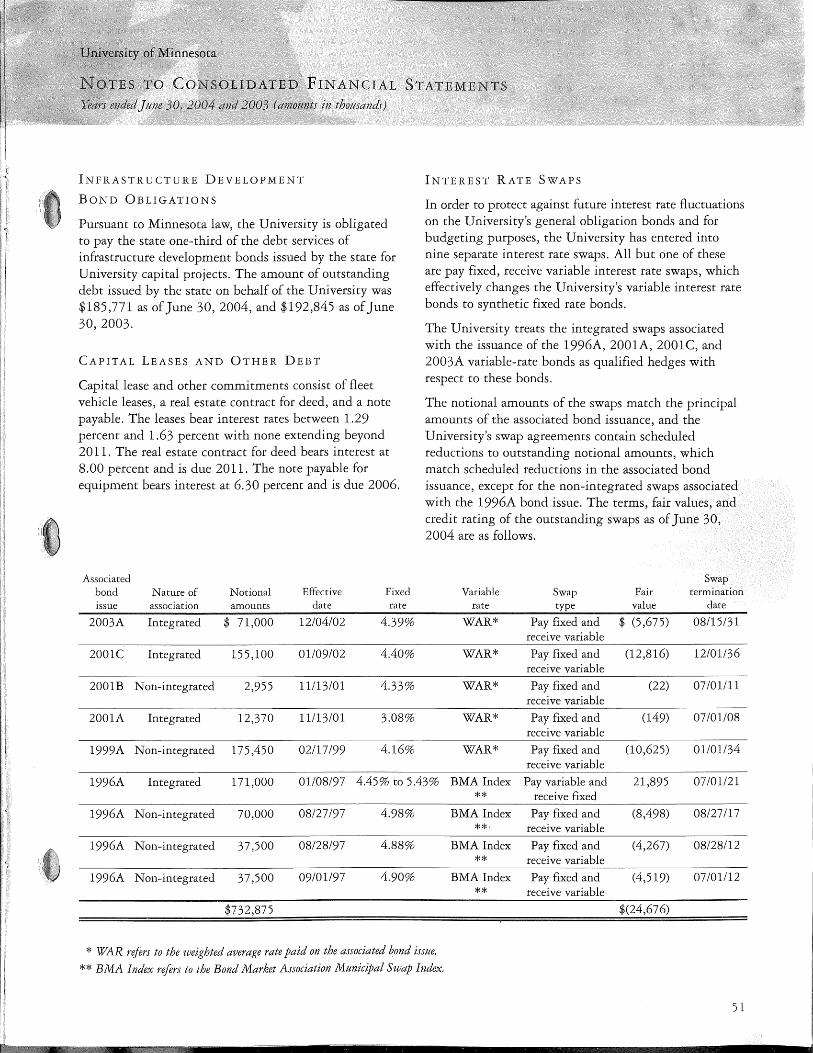
STATEMENTS
INFRASTRUCTURE DEVELOPMENT
BOND OBLIGATIONS
Pursuant to Minnesota law, the University is obligated to pay the state one-third of the debt services of infrastructure development bonds issued by the state for University capital projects. The amount of outstanding debt issued by the state on behalf of the University was $185,771 as of June 30, 2004, and $192,845 as of June 30, 2003.
CAPITAL LEASES AND OTHER DEBT
Capital lease and other commitments consist of fleet vehicle leases, a real estate contract for deed, and a note payable. The leases bear interest rates between 1.29 percent and 1.63 percent with none extending beyond 2011. The real estate contract for deed bears interest at 8.00 percent and is due 2011. The note payable for equipment bears interest at 6.30 percent and is due 2006.
Associated bond Nature of Notional Effective Fixed issue association amounts date rate
2003A Integrated $ 71,000 12/04/02 4.39%
2001C Integrated 155,100 01/09/02 4.40%
2001B Non-integrated 2,955 11/13/01 4.33%
2001A Integrated 12,370 11/13/01 3.08%
1999A Non-integrated 175,450 02/17/99 4.16%
INTEREST RATE SWAPS
In order to protect against future interest rate fluctuations on the University's general obligation bonds and for budgeting purposes, the University has entered into nine separate interest rate swaps. All but one of these are pay fixed, receive variable interest rate swaps, which effectively changes the University's variable interest rate bonds to synthetic fixed rate bonds.
The University treats the integrated swaps associated with the issuance of the 1996A, 2001A, 2001C, and 2003A variable-rate bonds as qualified hedges with respect to these bonds.
The notional amounts of the swaps match the principal amounts of the associated bond issuance, and the University's swap agreements contain scheduled reductions to outstanding notional amounts, which match scheduled reductions in the associated bond issuance, except for the non-integrated swaps associated with the 1996A bond issue. The terms, fair values, and credit rating of the outstanding swaps as of June 30, 2004 are as follows.
Swap Variable Swap Fair termination
rate type value date
WAR* Pay fixed and $ (5,675) 08/15/31 receive variable
WAR* Pay fixed and (12,816) 12/01/36 receive variable
WAR* Pay fixed and (22) 07 /01/11 receive variable
WAR* Pay fixed and (149) 07 /01/08 receive variable
WAR* Pay fixed and (10,625) 01/01/34 receive variable
1996A Integrated 171,000 01/08/97 4.45% to 5.43% BMA Index Pay variable and 21,895 07 /01/21
1996A Non-integrated 70,000 08127197 4.98%
1996A Non-integrated 37,500 08128197 4.88%
1996A Non-integrated 37,500 09/01/97 4.90%
$732,875
* WAR refers to the weighted average rate paid on the associated bond issue.
**EMA Index refers to the Bond Market Association Municipal Swap Index.
** receive fixed
BMA Index Pay fixed and (8,498) 08/27 /17 ** receive variable
BMA Index Pay fixed and (4,267) 08/28/12 ** receive variable
BMA Index Pay fixed and (4,519) 07 /01/12 ** receive variable
$(24,676)
51
The fair value was developed by the pricing service of the counterparties by computing the net present value of forecasted expected cash flows. Because interest rates have declined, all the pay fixed, receive variable interest rate swaps had negative fair values as of June 30, 2004.
The University has swap transactions with three separate counterparties. The percentage of the notional amount of swaps outstanding at June 30, 2004 for each counterparty is 57, 28, and 15 percent, respectively, while these counterparties are rated Al, Aa3, and Aa3, respectively, by Moody's Investors Service.
The integrated swap associated with the 1996A bond issue with a positive fair value of $21,895 at June 30, 2004 represents the University's credit risk exposure to the counterparty as of June 30, 2004. Should the counterparty to this transaction fail to perform according to the terms of the swap contract, the University faces a maximum possible loss equivalent of $21,895. As of June 30, 2004, the counterparty was rated Aa3 by Moody's Investors Service. In addition, this swap increases the University's exposure to variable interest rates. As the BMA Index increases, the University's net payment on the swap increases.
The other swap contracts are not exposed to credit risk because these swaps have negative fair values. However, should interest rates change and the fair values of the swaps become positive, the University would be exposed to credit risk in the amount of the derivative's fair value.
The University or the counterparty may terminate any of the swaps if the other party fails to perform under the terms of the contract. In addition, the University is exposed to termination risk on two of the swaps associated
52
STATEMENTS
with the 1996A bond issue. The integrated swap provides either party with the option to terminate the swap agreement each January 1 and July 1, commencing January 1, 2007. The non-integrated swap with a notional amount of $70,000 allows the counterparty to terminate the swap agreement if the variable rate paid by the counterparty to the University averages above 7 percent for any rolling consecutive 90-day period. If any of the swaps are terminated, other than the non-integrated 1999A swaps, the associated variable-rate bonds would no longer carry synthetic interest rates. Also, if at the time of termination the swap had a negative fair value, the University would be liable to the counterparty for a payment equal to the fair value of the swap.
The University is exposed to rollover risk on swaps that mature or may terminate prior to the maturity of the associated debt. When these swaps terminate, or in the case of a termination option that is exercised by the counterparty, the University does not realize the synthetic interest rate offered by the swaps on the underlying bond issue. The 1996A general obligation bonds that have a final maturity date of July 1, 2021, are subject to rollover risk from the non-integrated swaps that terminate on August 27, 2017; August 28, 2012; and July 1, 2012; respectively.
Using rates as of June 30, 2004, debt service requirements of the University's outstanding long-term debt obligations and net swap payments are as follows. As rates vary, variable-rate bond interest payments and net swap payments will vary.
'·~ .• ··.! ... ''.\.
f, \
/
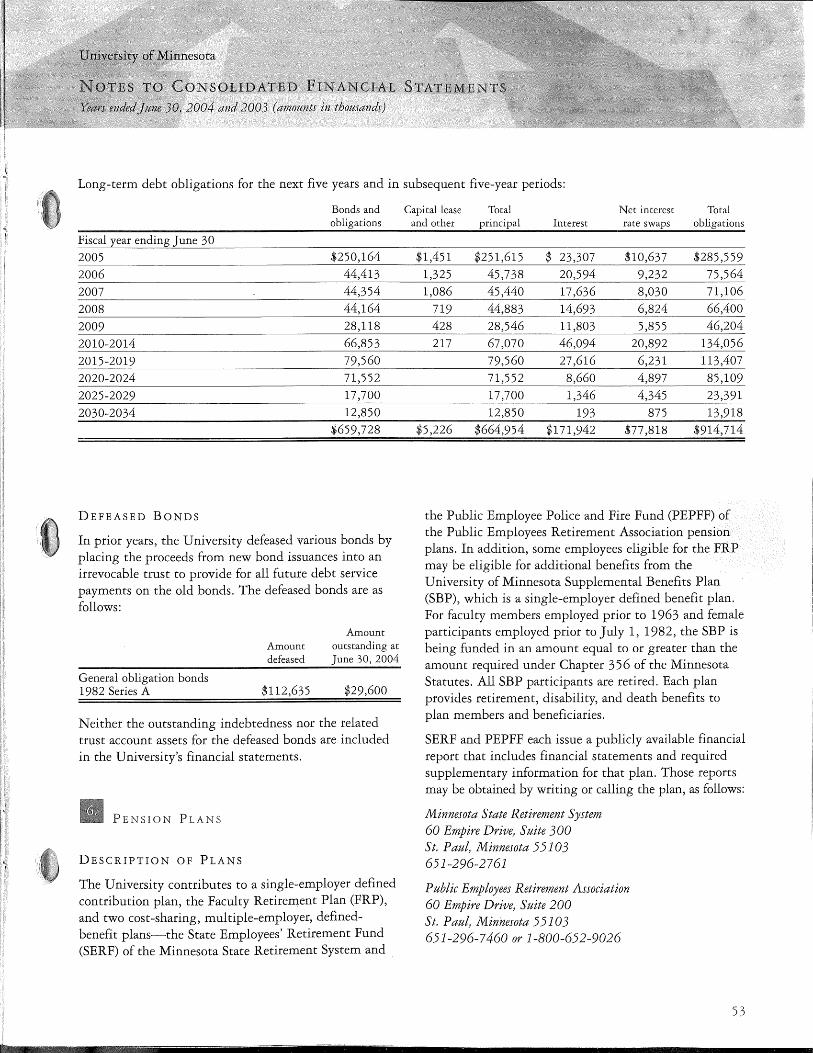
Long-term debt obligations for the next five years and in subsequent five-year periods:
Bonds and obligations
Fiscal year ending June 30 2005 $250,164
2006 44,413
2007 44,354
2008 44,164
2009 28,118
2010-2014 66,853
2015-2019 79,560
2020-2024 71,552
2025-2029 17,700
2030-2034 12,850
$659,728
DEFEASED BONDS
In prior years, the University defeased various bonds by placing the proceeds from new bond issuances into an irrevocable trust to provide for all future debt service payments on the old bonds. The defeased bonds are as follows:
General obligation bonds 1982 Series A
Amount defeased
$112,635
Amount outstanding at June 30, 2004
$29,600
Neither the outstanding indebtedness nor the related trust account assets for the defeased bonds are included in the University's financial statements.
PENSION PLANS
DESCRIPTION OF PLANS
The University contributes to a single-employer defined contribution plan, the Faculty Retirement Plan (FRP), and two cost-sharing, multiple-employer, definedbenefit plans-the State Employees' Retirement Fund (SERF) of the Minnesota State Retirement System and .
Capital lease Total Net interest Total and other principal Interest rate swaps obligations
$1,451 $251,615 $ 23,307 $10,637 $285,559 1,325 45,738 20,594 9,232 75,564 1,086 45,440 17,636 8,030 71,106
719 44,883 14,693 6,824 66,400
428 28,546 11,803 5,855 46,204
217 67 ,070 46,094 20,892 134,056
79,560 27,616 6,231 113,407
71,552 8,660 4,897 85,109 17,700 1,346 4,345 23,391 12,850 193 875 13,918
$5,226 $664,954 $171,942 $77 ,818 $914,714
the Public Employee Police and Fire Fund (PEPFF) of the Public Employees Retirement Association pension plans. In addition, some employees eligible for the FRP may be eligible for additional benefits from the University of Minnesota Supplemental Benefits Plan (SBP), which is a single-employer defined benefit plan. For faculty members employed prior to 1963 and female participants employed prior to July 1, 1982, the SBP is being funded in an amount equal to or greater than the amount required under Chapter 356 of the Minnesota Statutes. All SBP participants are retired. Each plan provides retirement, disability, and death benefits to plan members and beneficiaries.
SERF and PEPFF each issue a publicly available financial report that includes financial statements and required supplementary information for that plan. Those reports may be obtained by writing or calling the plan, as follows:
Minnesota State Retirement System 60 Empire Drive) Suite 300 St. Paul) Minnesota 55103 651-296-2761
Public Employees Retirement Association 60 Empire Drive) Suite 200 St. Paul) Minnesota 55103 651-296-7460 or 1-800-652-9026
53
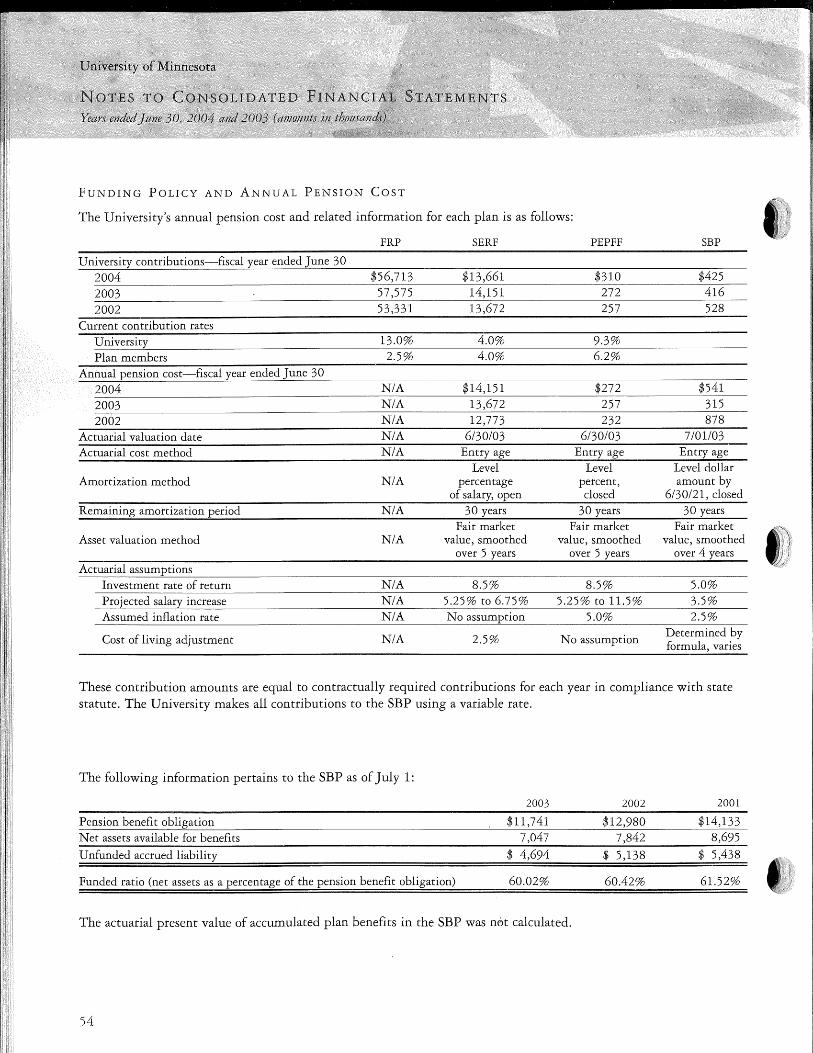
FUNDING POLICY AND ANNUAL PENSION COST
The University's annual pension cost and related information for each plan is as follows:
FRP SERF PEP FF SBP
University contributions-fiscal year ended June 30 2004 $56,713 $13,661 $310 $425
2003 57,575 14,151 272 416
2002 53,331 13,672 257 528
Current contribution rates University 13.0% 4.0% 9.3%
Plan members 2.5% 4.0% 6.2%
Annual pension cost-fiscal year ended June 30 2004 NIA $14,151 $272 $541
2003 NIA 13,672 257 315
2002 NIA 12,773 232 878
Actuarial valuation date NIA 6130103 6130103 7101/03 Actuarial cost method NIA Entry age Entry age Entry age
Level Level Level dollar Amortization method NIA percentage percent, amount by
of salary, open closed 6130121, closed Remaining amortization period NIA 30 years 30 years 30 years
Fair market Fair market Fair market Asset valuation method NIA value, smoothed value, smoothed value, smoothed
over 5 years over 5 years over 4 years Actuarial assumptions
Investment rate of return NIA 8.5% 8.5% 5.0% Projected salary increase NIA 5.25% to 6.75% 5.25% to 11.5% 3.5% Assumed inflation rate NIA No assumption 5.0% 2.5%
Cost of living adjustment NIA 2.5% No assumption Determined by formula, varies
These contribution amounts are equal to contractually required contributions for each year in compliance with state statute. The University makes all contributions to the SBP using a variable rate.
The following information pertains to the SBP as of July 1:
2003 2002 2001
Pension benefit obligation $11,741 $12,980 $14,133 Net assets available for benefits 7,047 7,842 8,695
Unfunded accrued liability $ 4,694 $ 5,138 $ 5,438
Funded ratio (net assets as a percentage of the pension benefit obligation) 60.02% 60.42% 61.52%
The actuarial present value of accumulated plan benefits in the SBP was n6t calculated.
54
f \s '.i
j
/
~!
t\r ,~h) ~ ~,..;:,j
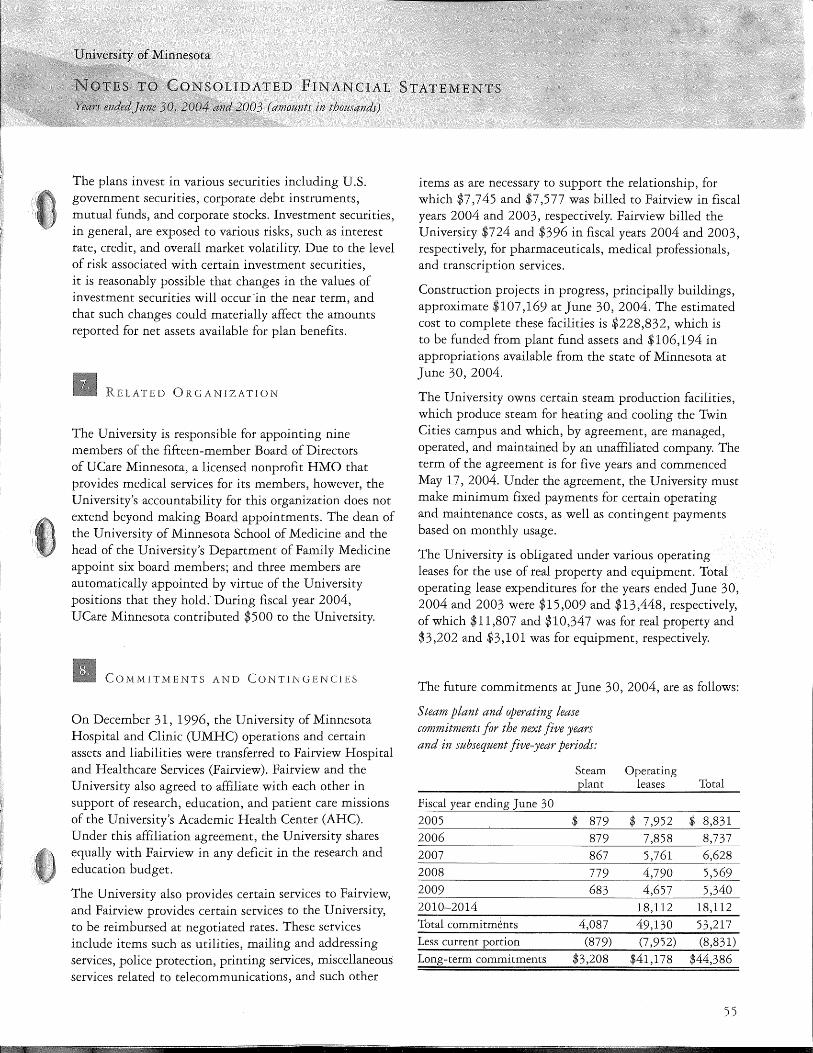
FINANCIAL
The plans invest in various securities including U.S. government securities, corporate debt instruments, mutual funds, and corporate stocks. Investment securities, in general, are exposed to various risks, such as interest rate, credit, and overall market volatility. Due to the level of risk associated with certain investment securities, it is reasonably possible that changes in the values of investment securities will occur'in the near term, and that such changes could materially affect the amounts reported for net assets available for plan benefits.
RELATED ORGANIZATION
The University is responsible for appointing nine members of the fifteen-member Board of Directors of UCare Minnesota, a licensed nonprofit HMO that provides medical services for its members, however, the University's accountability for this organization does not extend beyond making Board appointments. The dean of the University of Minnesota School of Medicine and the head of the University's Department of Family Medicine appoint six board members; and three members are automatically appointed by virtue of the University positions that they hold.· During fiscal year 2004, UCare Minnesota contributed $500 to the University.
COMMITMENTS AND CONTINGENCIES
On December 31, 1996, the University of Minnesota Hospital and Clinic (UMHC) operations and certain assets and liabilities were transferred to Fairview Hospital and Healthcare Services (Fairview). Fairview and the University also agreed to affiliate with each other in support of research, education, and patient care missions of the University's Academic Health Center (AHC). Under this affiliation agreement, the University shares equally with Fairview in any deficit in the research and education budget.
The University also provides certain services to Fairview, and Fairview provides certain services tci the University, to be reimbursed at negotiated rates. These services include items such as utilities, mailing and addressing services, police protection, printing services, miscellaneous' services related to telecommunications, and such other
items as are necessary to support the relationship, for which $7 ,745 and $7 ,577 was billed to Fairview in fiscal years 2004 and 2003, respectively. Fairview billed the University $724 and $396 in fiscal years 2004 and 2003, respectively, for pharmaceuticals, medical professionals, and transcription services.
Construction projects in progress, principally buildings, approximate $107 ,169 at June 30, 2004. The estimated cost to complete these facilities is $228,832, which is to be funded from plant fund assets and $106,194 in appropriations available from the state of Minnesota at June 30, 2004.
The University owns certain steam production facilities, which produce steam for heating and cooling the Twin Cities campus and which, by agreement, are managed, operated, and maintained by an unaffiliated company. The term of the agreement is for five years and commenced May 17, 2004. Under the agreement, the University must make minimum fixed payments for certain operating and maintenance costs, as well as contingent payments based on monthly usage.
The University is obligated under various operating leases for the use of real property and equipment. Total operating lease expenditures for the years ended June 30, 2004 and 2003 were $15,009 and $13,448, respectively, of which $11,807 and $10,347 was for real property and $3,202 and $3,101 was for equipment, respectively.
The future commitments at June 30, 2004, are as follows:
Steam plant and operating lease commitments for the next five years and in subsequent five-year periods:
Fis cal year ending June 3 0
2005 2006
2007 2008
2009 2010-2014
Total commitments
Less current portion
Long-term commitments
Steam plant
$ 879
879 867
779 683
4,087 (879)
$3,208
Operating leases
$ 7,952 7,858
5,761
4,790
4,657 18,112
49,130 (7 ,952)
$41,178
Total
$ 8,831
8,737 6,628
5,569 5,340
18,112
53,217 (8,831)
$44,386
SS
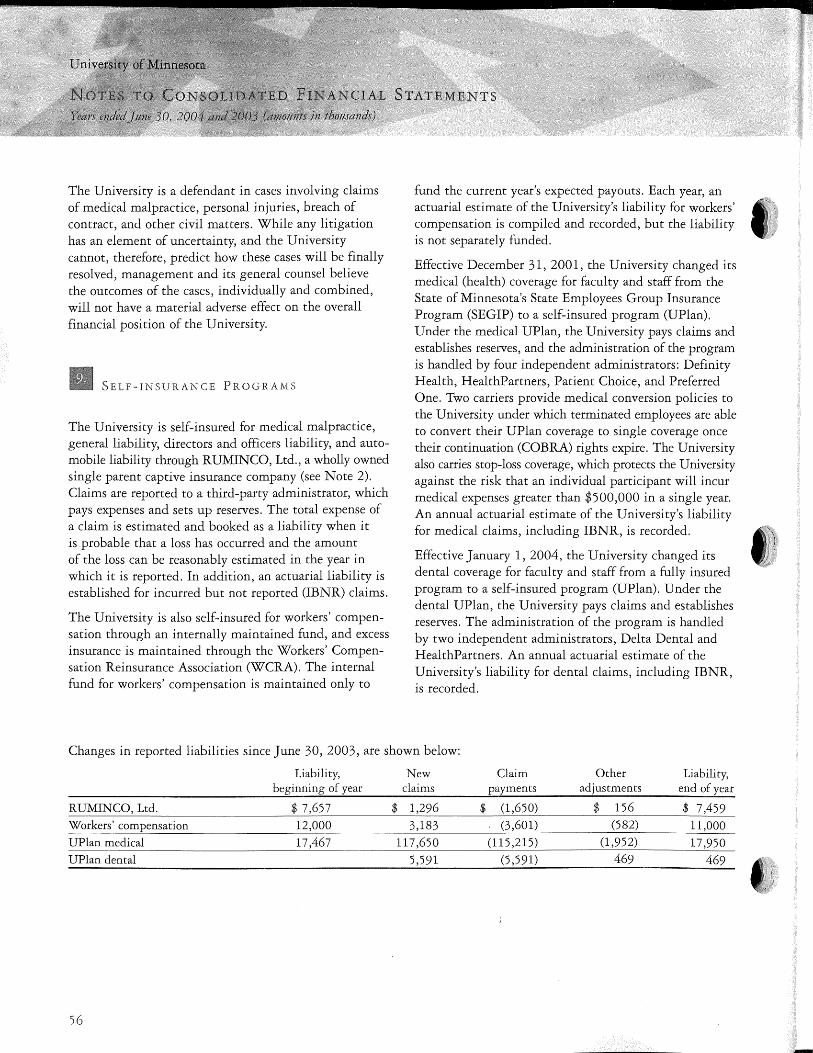
The University is a defendant in cases involving claims of medical malpractice, personal injuries, breach of contract, and other civil matters. While any litigation has an element of uncertainty, and the University cannot, therefore, predict how these cases will be finally resolved, management and its general counsel believe the outcomes of the cases, individually and combined, will not have a material adverse effect on the overall financial position of the University.
SELF-INSURANCE PROGRAMS
The University is self-insured for medical malpractice, general liability, directors and officers liability, and automobile liability through RUMINCO, Ltd., a wholly owned single parent captive insurance company (see Note 2). Claims are reported to a third-party administrator, which pays expenses and sets up reserves. The total expense of a claim is estimated and booked as a liability when it is probable that a loss has occurred and the amount of the loss can be reasonably estimated in the year in which it is reported. In addition, an actuarial liability is established for incurred but not reported (IBNR) claims.
The University is also self-insured for workers' compensation through an internally maintained fund, and excess insurance is maintained through the Workers' Compensation Reinsurance Association (WCRA). The internal fund for workers' compensation is maintained only to
fund the current year's expected payouts. Each year, an actuarial estimate of the University's liability for workers' compensation is compiled and recorded, but the liability is not separately funded.
Effective December 31, 2001, the University changed its medical (health) coverage for faculty and staff from the State of Minnesota's State Employees Group Insurance Program (SEGIP) to a self-insured program (UPlan). Under the medical UPlan, the University pays claims and establishes reserves, and the administration of the program is handled by four independent administrators: Definity Health, HealthPartners, Patient Choice, and Preferred One. Two carriers provide medical conversion policies to the University under which terminated employees are able to convert their UPlan coverage to single coverage once their continuation (COBRA) rights expire. The University also carries stop-loss coverage, which protects the University against the risk that an individual participant will incur medical expenses greater than $500,000 in a single year. An annual actuarial estimate of the University's liability for medical claims, including IBNR, is recorded.
Effective January 1, 2004, the University changed its dental coverage for faculty and staff from a fully insured program to a self-insured program (UPlan). Under the dental UPlan, the University pays claims and establishes reserves. The administration of the program is handled by two independent administrators, Delta Dental and HealthPartners. An annual actuarial estimate of the University's liability for dental claims, including IBNR, is recorded.
Changes in reported liabilities since June 30, 2003, are shown below:
Liability, New Claim Other Liability, beginning of year claims payments adjustments end of year
RUMINCO, Ltd. $ 7,657 $ 1,296 $ (1,650) $ 156 $ 7,459 Workers' compensation 12,000 3,183 (3,601) (582) 11,000
UPlan medical 17,467 117,650 (115,215) (1,952) 17,950 UPlan dental 5,591 (5,591) 469 469
56
f 1 ~} ff
-
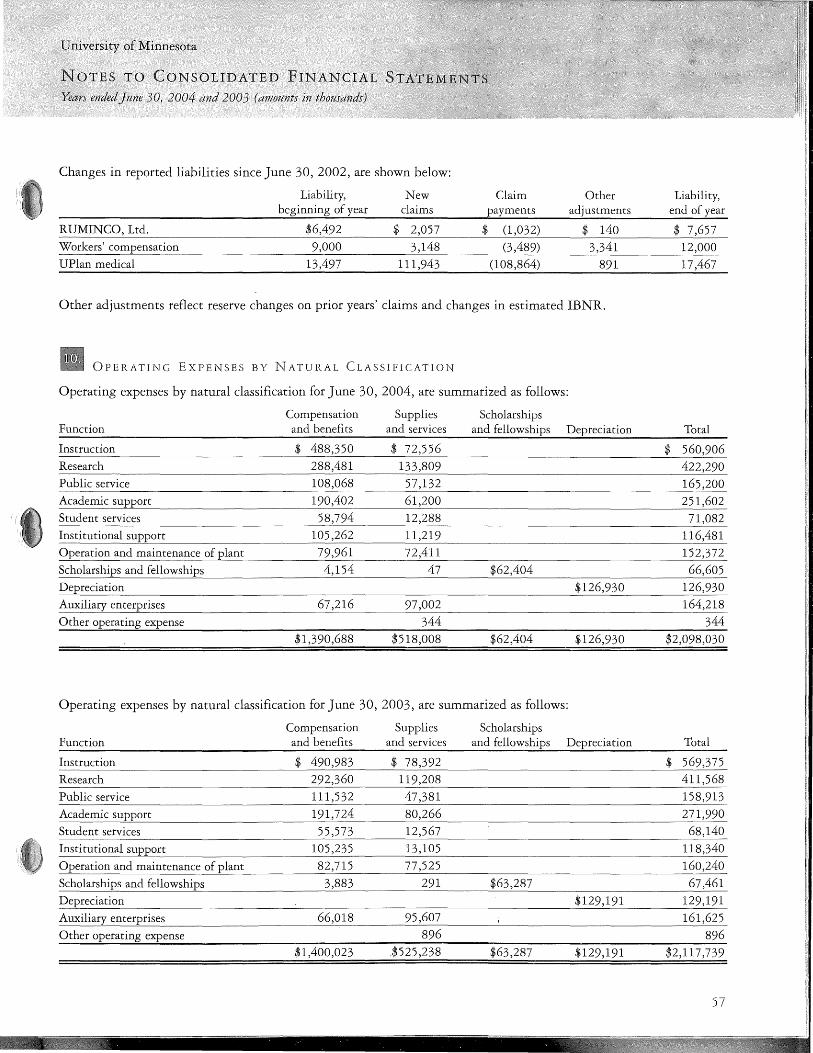
University of Minnesota
NOTES TO CONSOLIDATED FINANCIAL
Years ended }ttne 30, 2004 and 2003 (amottnts in thousands)
Changes in reported liabilities since June 30, 2002, are shown below:
Liability, New beginning of year claims
RUMINCO, Ltd. $6,492 $ 2,057 Workers' compensation 9,000 3,148 UPlan medical 13,497 111,943
Claim Other payments adjustments
$ (1,032) $ 140 (3,489) 3,341
(108,864) 891
Other adjustments reflect reserve changes on prior years' claims and changes in estimated IBNR.
OPERATING EXPENSES BY NATURAL CLASSIFICATION
Operating expenses by natural classification for June 30, 2004, are summarized as follows:
Compensation Supplies Scholarships Function and benefits and services and fellowships Depreciation
Instruction $ 488,350 $ 72,556 Research 288,481 133,809 Public service 108,068 57 ,132 Academic support 190,402 61,200 Student services 58,794 12,288 Institutional support 105,262 11,219 Operation and maintenance of plant 79,961 72,411 Scholarships and fellowships 4,154 47 $62,404 Depreciation $126,930 Auxiliary enterprises 67,216 97,002 Other operating expense 344
$1,390,688 $518,008 $62,404 $126,930
Operating expenses by natural classification for June 30, 2003, are summarized as follows:
Compensation Supplies Scholarships Function and benefits and services and fellowships Depreciation
Instruction $ 490,983 $ 78,392 Research 292,360 119,208
Public service 111,532 47,381 Academic support 191,724 80,266
Student services 55,573 12,567 Institutional support 105,235 13,105
Operation and maintenance of plant 82,715 77,525
Scholarships and fellowships 3,883 291 $63,287 Depreciation $129,191 Auxiliary enterprises 66,018 95,607
Other operating expense 896
$1,400,023 .$525,238 $63,287 $129,191
Liability, end of year
$ 7,657 12,000
17,467
Total
$ 560,906 422,290 165,200 251,602
71,082 116,481
152,372 66,605
126,930 164,218
344
$2,098,030
Total
$ 569,375 411,568
158,913
271,990 68,140
118,340 160,240
67,461
129,191 161,625
896
$2,117,739
57
COMPONENT UNITS
The significant accounting policies and related note disclosures for investments, securities lending, temporarily restricted net assets, and permanently restricted net assets, as reported in the separately issved financial statements of the University of Minnesota Foundation and the Minnesota Medical Foundation; as well as disclosures for guarantee agreements and financing agreements for the University Gateway Corporation, are presented below.
SUMMARY OF SIGNIFICANT ACCOUNTING
POLICIES
University of Minnesota Foundation
Contributions
Contributions, including unconditional promises to give, are recognized as revenues in the period received. Conditional promises to give are not recognized until they become unconditional, that is, when the conditions on which they depend are substantially met. Contributions to be received after one year are discounted at rates of 2.65 to 5.00 percent based on when the contribution was made. Amortization of discounts is recorded as additional contribution revenue. An allowance for uncollectible contributions receivable is provided based upon management's judgment including such factors as prior collection history.
Contributions as stated in the statement of activities include $786 of indirect support received by the Foundation.
U nitrmts, Pooled Income, and Amu1ity Agreements
UMF has entered into unitrust, pooled income, and annuity agreements that provide, among other matters, that the trustee shall pay to the beneficiaries an annual income payment until the income obligation is completed in accordance with the donor's trust agreement. The Foundation records its interest in these trusts at the current market value of the related assets and a corresponding liability recorded for the actuarially determined present value of payments to be made to the designated beneficiaries with the residual amount recorded for the
58
STATEMENTS
purposes designated when the gift is received. Upon termination of the income obligation, property in the trust or pooled income fund is held by the Foundation in accordance with the donor's trust agreement.
Gift Ann11ity
UMF has entered into gift annuity agreements that provide that the Foundation shall pay to the designated beneficiaries an annual amount until the death of the designated beneficiaries. The payments continue even if the assets of the gift annuity fund have been exhausted. The Foundation records these gift annuities at market value, and a corresponding liability is recorded for the actuarially determined present value of payments to be made to the designated beneficiaries, with the residual amount recorded for the purposes designated when the gift is received. Upon the death of the beneficiaries, property in the gift annuity fund is held by UMF in accordance with the agreements.
Minnesota Medical Foundation
Contriht1tions
Contributions, which include pledges, are recognized as revenues in the period received. All contributions are available for unrestricted use unless specifically restricted by the donor.
Pledges are recorded as pledges receivable using discount rates ranging from 3.50 to 5.00 percent. Additionally, an allowance for uncollectible pledges is provided based on management's judgment, including factors such as aging schedules, prior collection history, and the nature of fund-raising activity.
Investments, fixed assets, and contributed materials are initially recorded at fair value when received.
Contributions with donor-imposed conditions, such as time or purpose restrictions, are recorded as temporarily restricted net assets. When donor-imposed time conditions expire, or a donor-imposed purpose restriction is fulfilled, the temporarily restricted net assets are reclassified to unrestricted net assets. This reclassification is reported as net assets released from restriction on' the statement of activities.
•.· .. ·•· •. • ... •.·•·.· ... ·.· •.... ' .•••. ·•· ,r~
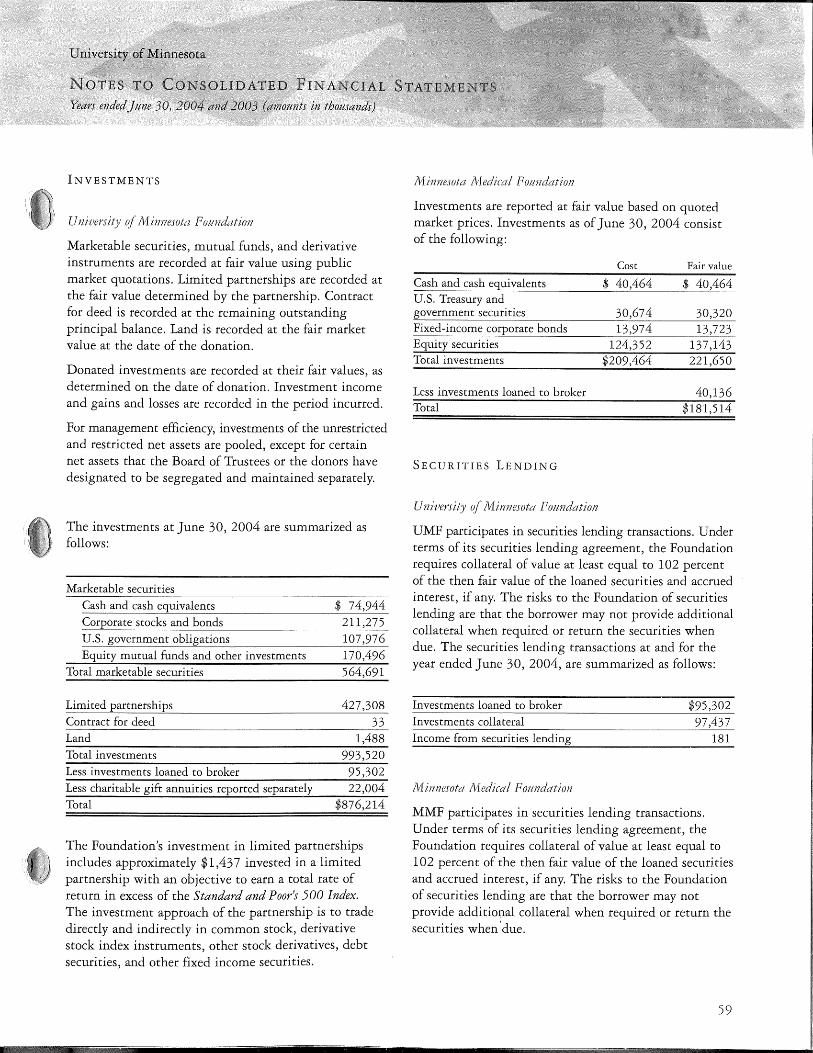
INVESTMENTS
,.,,,,,,,,,.,,.,.,." ~( J\!Iinnesotcz Fo1mdation
Marketable securities, mutual funds, and derivative instruments are recorded at fair value using public market quotations. Limited partnerships are recorded at the fair value determined by the partnership. Contract for deed is recorded at the remaining outstanding principal balance. Land is recorded at the fair market value at the date of the donation.
Donated investments are recorded at their fair values, as determined on the date of donation. Investment income and gains and losses are recorded in the period incurred.
For management efficiency, investments of the unrestricted and restricted net assets are pooled, except for certain net assets that the Board of Trustees or the donors have designated to be segregated and maintained separately.
The investments at June 30, 2004 are summarized as follows:
Marketable securities
Cash and cash equivalents $ 74,944 Corporate stocks and bonds 211,275 U.S. government obligations 107,976 Equity mutual funds and other investments 170,496
Total marketable securities 564,691
Limited partnerships 427,308 Contract for deed
Land 1,488 Total investments 993,520 Less investments loaned to broker 95,302 Less charitable gift annuities reported separately 22,004 Total $876,214
The Foundation's investment in limited partnerships includes approximately $1,43 7 invested in a limited partnership with an objective to earn a total rate of return in excess of the Standard and Poor1s 500 Index. The investment approach of the partnership is to trade directly and indirectly in common stock, derivative stock index instruments, other stock derivatives, debt securities, and other fixed income securities.
Minnesotti Medical Fo1mdation
Investments are reported at fair value based on quoted market prices. Investments as of June 30, 2004 consist of the following:
Cash and cash equivalents U.S. Treasury and government securities Fixed-income corporate bonds Equity securities Total investments
Less investments loaned to broker Total
SECURITIES LENDING
Cost Fair value
$ 40,464 $ 40,464
30,674 30,320 13,974 13,723
124,352 137,143 $209,464 221,650
40,136 $181,514
UMP participates in securities lending transactions. Under terms of its securities lending agreement, the Foundation requires collateral of value at least equal to 102 percent of the then fair value of the loaned securities and accrued interest, if any. The risks to the Foundation of securities lending are that the borrower may not provide additional collateral when required or return the securities when due. The securities lending transactions at and for the year ended June 30, 2004, are summarized as follows:
Investments loaned to broker $95,302 Investments collateral
Income from securities lending 181
Minnesota Medical F01mdation
MMF participates in securities lending transactions. Under terms of its securities lending agreement, the Foundation requires collateral of value at least equal to 102 percent of the then fair value of the loaned securities and accrued interest, if any. The risks to the Foundation of securities lending are that the borrower may not provide additional collateral when required or return the securities when
1
due.
59
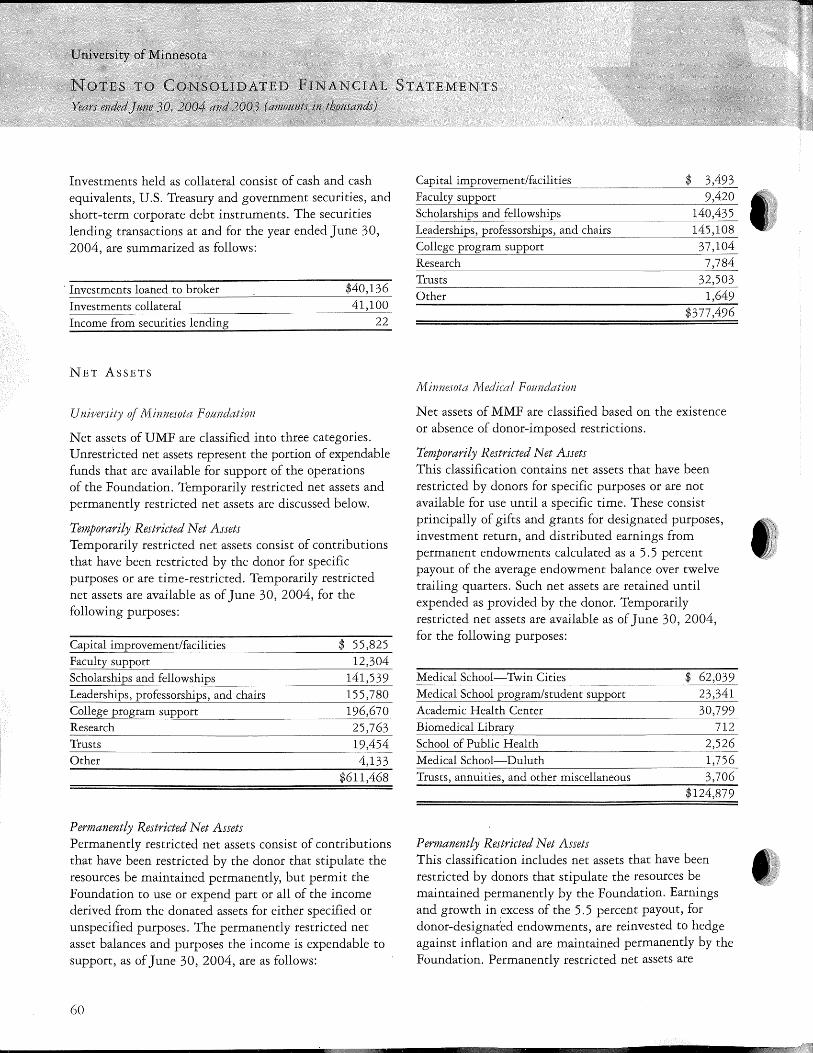
Investments held as collateral consist of cash and cash equivalents, U.S. Treasury and government securities, and short-term corporate debt instruments. The securities lending transactions at and for the year ended June 30, 2004, are summarized as follows:
· Investments loaned to broker $40,136 Investments collateral 41,100
Income from securities lending 22
NET ASSETS
University of Minnesota Fotmdation
Net assets of UMP are classified into three categories. Unrestricted net assets represent the portion of expendable funds that are available for support of the operations of the Foundation. Temporarily restricted net assets and permanently restricted net assets are discussed below.
Temporarily Restricted Net Assets Temporarily restricted net assets consist of contributions that have been restricted by the donor for specific purposes or are time-restricted. Temporarily restricted net assets are available as of June 30, 2004, for the following purposes:
Capital improvement/facilities $ 55,825 Faculty support 12,304 Scholarships and fellowships 141,539 Leaderships, professorships, and chairs 155,780 College program support 196,670 Research 25,763 Trusts 19,454 Other 4,133
$611,468
Permanently Restricted Net Assets Permanently restricted net assets consist of contributions that have been restricted by the donor that stipulate the resources be maintained permanently, but permit the Foundation to use or expend part or all of the income derived from the donated assets for either specified or unspecified purposes. The permanently restricted net asset balances and purposes the income is expendable to support, as of June 30, 2004, are as follows:
60
STATEMENTS
Capital improvement/facilities $ 3,493 Faculty support 9,420 Scholarships and fellowships 140,435
College program support 37,104 Research 7,784 Trusts 32,503 Other 1,649
$377,496
1VIim1esota Medical Foundation
Net assets of MMF are classified based on the existence or absence of donor-imposed restrictions.
Temporarily Restricted Net Assets This classification contains net assets that have been restricted by donors for specific purposes or are not available for use until a specific time. These consist principally of gifts and grants for designated purposes, investment return, and distributed earnings from permanent endowments calculated as a 5. 5 percent payout of the average endowment balance over twelve trailing quarters. Such net assets are retained until expended as provided by the donor. Temporarily restricted net assets are available as of June 30, 2004, for the following purposes:
Medical School-Twin Cities $ 62,039 Medical School program/student support 23,341 Academic Health Center 30,799 Biomedical Library 712 School of Public Health 2,526 Medical School-Duluth 1,756 Trusts, annuities, and other miscellaneous 3,706
$124,879
Permanently Restricted Net Assets This classification includes net assets that have been restricted by donors that stipulate the resources be maintained permanently by the Foundation. Earnings and growth in excess of the 5. 5 percent payout, for donor-designated endowments, are reinvested to hedge against inflation and are maintained permanently by the Foundation. Permanently restricted net assets are
------------------------------------------------------------------..................... w~,
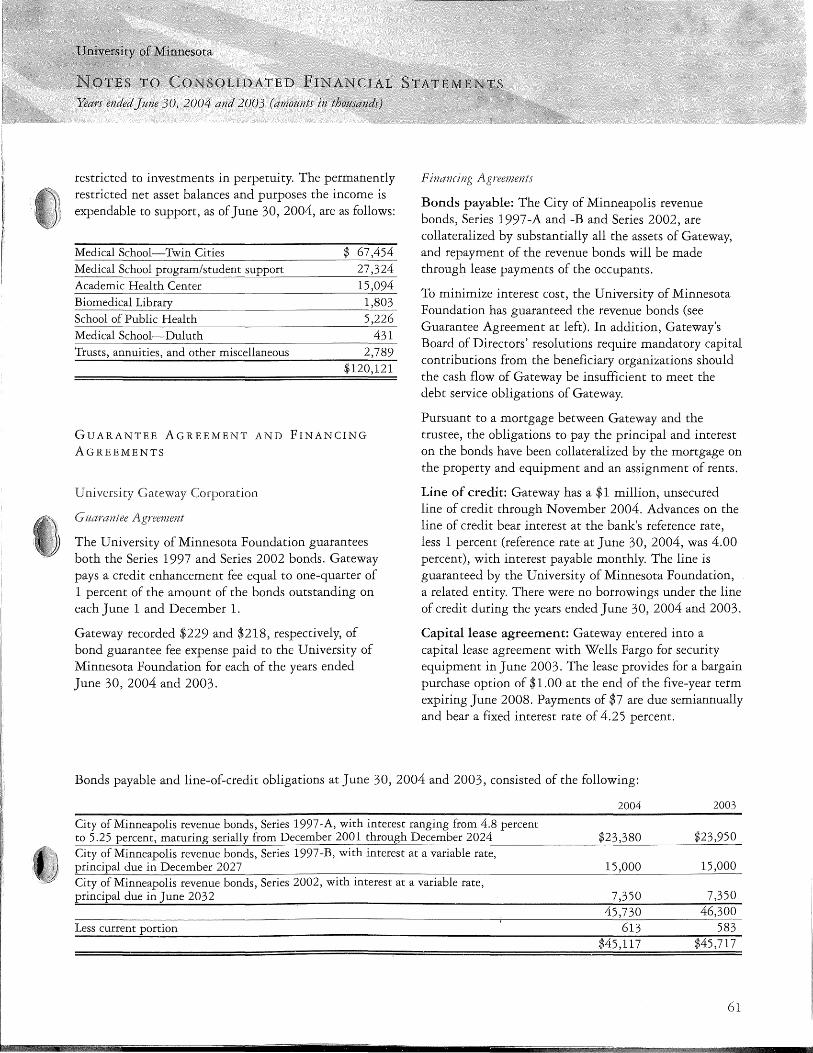
Years ended }ttne 30, 2004 and 2003 (amottnts in thottsands)
restricted to investments in perpetuity. The permanently restricted net asset balances and purposes the income is expendable to support, as of June 30, 2004, are as follows:
Medical School-Twin Cities $ 67,454 Medical School program/student support 27,324 Academic Health Center 15,094 Biomedical
School of Public Health 5,226 Medical School-Duluth
Trusts, annuities, and other miscellaneous 2,789 $120,121
GUARANTEE AGREEMENT AND FINANCING
AGREEMENTS
University
Guarantee Agreeme11t
The University of Minnesota Foundation guarantees both the Series 1997 and Series 2002 bonds. Gateway pays a credit enhancement fee equal to one-quarter of 1 percent of the amount of the bonds outstanding on each June 1 and December 1.
Gateway recorded $229 and $218, respectively, of bond guarantee fee expense paid to the University of Minnesota Foundation for each of the years ended June 30, 2004 and 2003.
Financing Agreements
Bonds payable: The City of Minneapolis revenue bonds, Series 1997-A and-Band Series 2002, are collateralized by substantially all the assets of Gateway, and repayment of the revenue bonds will be made through lease payments of the occupants.
To minimize interest cost, the University of Minnesota Foundation has guaranteed the revenue bonds (see Guarantee Agreement at left). In addition, Gateway's Board of Directors' resolutions require mandatory capital contributions from the beneficiary organizations should the cash flow of Gateway be insufficient to meet the debt service obligations of Gateway.
Pursuant to a mortgage between Gateway and the trustee, the obligations to pay the principal and interest on the bonds have been collateralized by the mortgage on the property and equipment and an assignment of rents.
Line of credit: Gateway has a $1 million, unsecured line of credit through November 2004. Advances on the line of credit bear interest at the bank's reference rate, less 1 percent (reference rate at June 30, 2004, was 4.00 percent), with interest payable monthly. The line is guaranteed by the University of Minnesota Foundation, a related entity. There were no borrowings under the line of credit during the years ended June 30, 2004 and 2003.
Capital lease agreement: Gateway entered into a capital lease agreement with Wells Fargo for security equipment in June 2003. The lease provides for a bargain purchase option of $1.00 at the end of the five-year term expiring June 2008. Payments of $7 are due semiannually and bear a fixed interest rate of 4.25 percent.
Bonds payable and line-of-credit obligations at June 30, 2004 and 2003, consisted of the following:
City of Minneapolis revenue bonds, Series 1997-A, with interest ranging from 4.8 percent to 5.25 percent, maturing serially from December 2001 through December 2024 City of Minneapolis revenue bonds, Series 1997-B, with interest at a variable rate, principal due in December 2027 City of Minneapolis revenue bonds, Series 2002, with interest at a variable rate, principal due in June 2032
Less current portion
2004
$23,380
15,000
7,350 45,730
613 $45,117
2003
$23,950
15,000
7,350 46,300
583 $45,717
61
I I
University of Minnesota
PENDENT PLEMENTAL CHEDULES j:
q
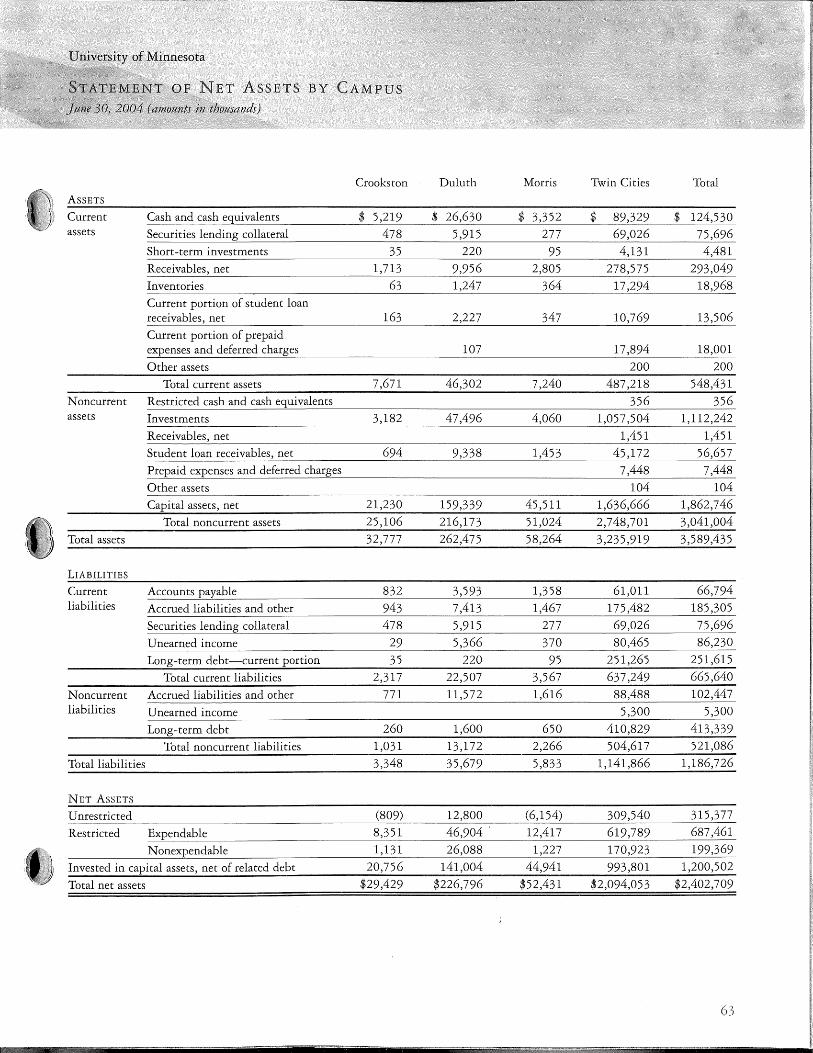
BY CAMPUS
Crookston Duluth Morris Twin Cities Total
ASSETS
Current Cash and cash equivalents $ 5,219 $ 26,630 $ 3,352 $ 89,329 $ 124,530 assets Securities lending collateral 478 5,915 277 69,026 75,696
Short-term investments 35 220 95 4,131 4,481 Receivables, net 1,713 9,956 2,805 278,575 293,049 Inventories 63 1,247 364 17,294 18,968 Current portion of student loan receivables, net 163 2,227 347 10,769 13,506 Current portion of prepaid expenses and deferred charges 107 17,894 18,001
Other assets 200 200
Total current assets 7,671 46,302 7,240 487,218 548,431 Noncurrent Restricted cash and cash equivalents 356 356 assets Investments 3,182 47,496 4,060 1,057,504 1,112,242
Receivables, net 1,451 1,451 Student loan receivables, net 694 9,338 1,453 45,172 56,657 Prepaid expenses and deferred charges 7,448 7,448
Other assets 104 104
Capital assets, net 21,230 159,339 45,511 1,636,666 1,862,746
Total noncurrent assets 25,106 216,173 51,024 2,748,701 3,041,004
Total assets 32,777 262,475 58,264 3,235,919 3,589,435
LIABILITIES
Current Accounts payable 832 3,593 1,358 61,011 66,794 liabilities Accrued liabilities and other 943 7,413 1,467 175,482 185,305
Securities lending collateral 478 5,915 277 69,026 75,696
Unearned income 29 5,366 370 80,465 86,230
Long-term debt-current portion 35 220 95 251,265 251,615
Total current liabilities 2,317 22,507 3,567 637,249 665,640
Noncurrent Accrued liabilities and other 771 11,572 1,616 88,488 102,447 liabilities Unearned income 5,300 5,300
Long-term debt 260 1,600 650 410,829 413,339
Total noncurrent liabilities 1,031 13,172 2,266 504,617 521,086
Total liabilities 3,348 35,679 5,833 1,141,866 1,186,726
NET ASSETS
Unrestricted (809) 12,800 (6,154) 309,540 315,377
Restricted Expendable 8,351 46,904 ' 12,417 619,789 687,461
N onexpendable 1,131 26,088 1,227 170,923 199,369
Invested in capital assets, net of related debt 20,756 141,004 44,941 993,801 1,200,502
Total net assets $29,429 $226,796 $52,431 $2,094,053 $2,402,709
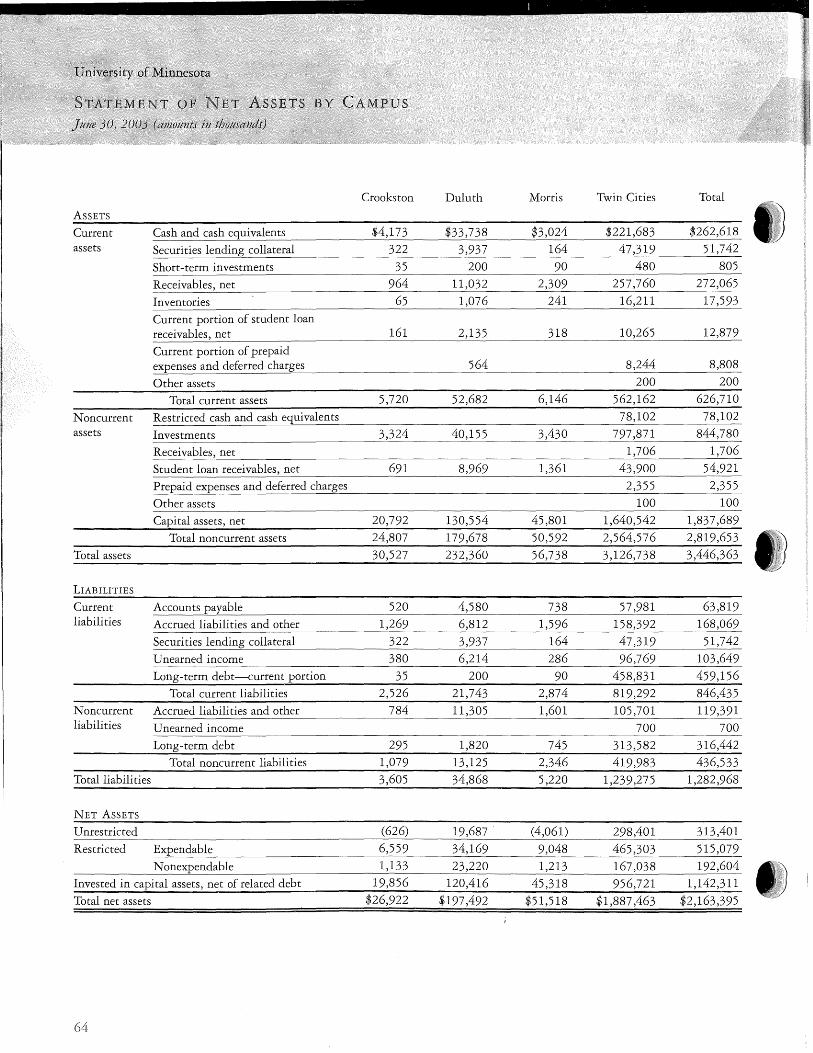
Crookston Duluth Morris Twin Cities Total
ASSETS I Current Cash and cash equivalents $4,173 $33,738 $3,024 $221,683 $262,618 }'
assets Securities lending collateral 322 3,937 164 47,319 51,742
Short-term investments 35 200 90 480 805
Receivables, net 964 11,032 2,309 257,760 272,065
Inventories 65 1,076 241 16,211 17 ,593
Current portion of student loan receivables, net 161 2,135 318 10,265 12,879
Current portion of prepaid expenses and deferred charges 564 8,244 8,808
Other assets 200 200
Total current assets 5,720 52,682 6,146 562,162 626,710
Noncurrent Restricted cash and cash equivalents 78,102 78,102 assets Investments 3,324 40,155 3,430 797,871 844,780
Receivables, net 1,706 1,706
Student loan receivables, net 691 8,969 1,361 43,900 54,921
Prepaid expenses and deferred charges 2,355 2,355
Other 100 100
Capital assets, net 20,792 130,554 45,801 1,640,542 1,837,689
Total noncurrent assets 24,807 179,678 50,592 2,564,576 2,819,653
Total assets 30,527 232,360 56,738 3,126,738 3,446,363
LIABILITIES
Current Accounts payable 520 4,580 738 57 ,981 63,819 liabilities Accrued liabilities and other 1,269 6,812 1,596 158,392 168,069
Securities lending collateral 322 3,937 164 47,319 51,742
Unearned income 380 6,214 286 96,769 103,649 Long-term debt-current portion 35 200 90 458,831 459,156
Total current liabilities 2,526 21,743 2,874 819,292 846,435 Noncurrent Accrued liabilities and other 784 11,305 1,601 105,701 119,391 liabilities Unearned income 700 700
Long-term debt 295 1,820 745 313,582 316,442
Total noncurrent liabilities 1,079 13,125 2,346 419,983 436,533 Total liabilities 3,605 34,868 5,220 1,239,275 1,282,968
NET ASSETS
Unrestricted (626) 19,687. (4,061) 298,401 313,401 Restricted Expendable 6,559 34,169 9,048 465,303 515,079
N onexpendable 1,133 23,220 1,213 167,038 192,604
Invested in capital assets, net of related debt 19,856 120,416 45,318 956,721 1,142,311
Total net assets $26,922 $197,492 $51,518 $1,887,463 $2,163,395
64
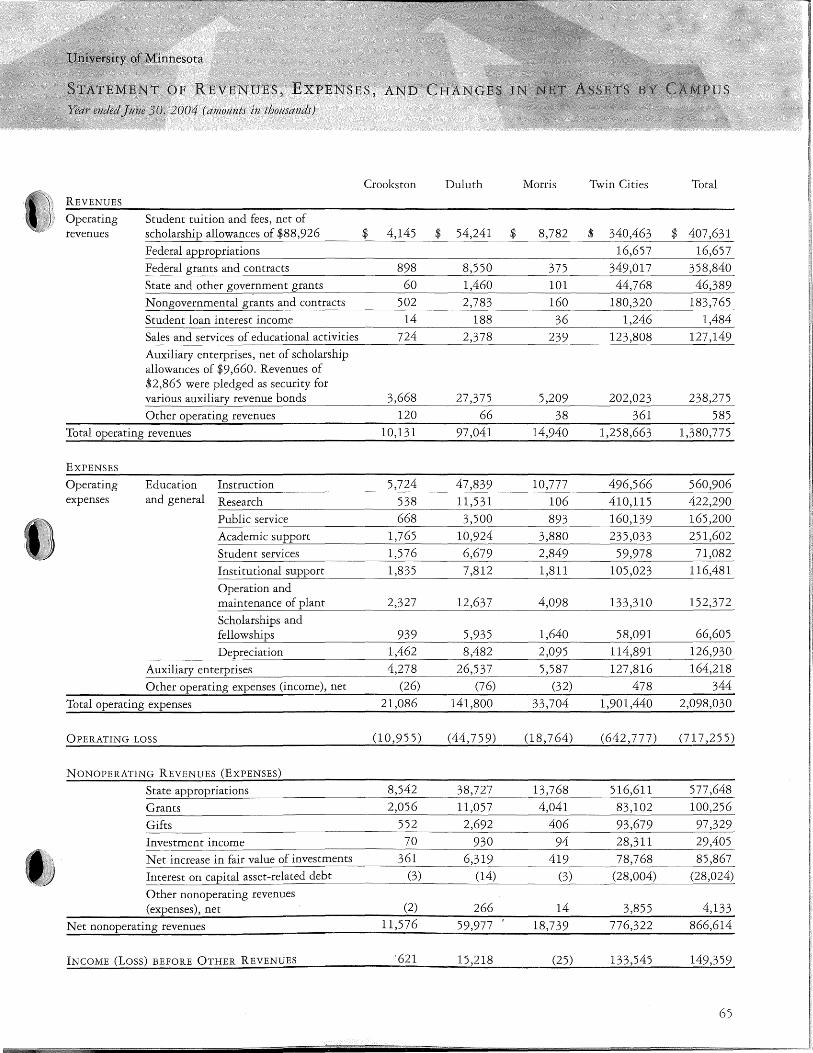
(amounts in thousands)
Crookston Duluth Morris Twin Cities Total
REVENUES
Operating Student tuition and fees, net of revenues scholarship allowances of $88,926 $ 4,145 $ 54,241 $ 8,782 $ 340,463 $ 407,631
Federal appropriations 16,657 16,657
Federal grants and contracts 898 8,550 375 349,017 358,840
State and other government grants 60 1,460 101 44,768 46,389
Nongovernmental grants and contracts 502 2,783 160 180,320 183,765
Student loan interest income 14
Sales and services of educational activities 724
Auxiliary enterprises, net of scholarship allowances of $9,660. Revenues of $2,865 were pledged as security for various auxiliary revenue bonds 3,668 27,375 5,209 202,023 238,275
Other operating revenues 120 66 38 361 585
Total operating revenues 10,131 97,041 14,940 1,258,663 1,380,775
EXPENSES
Operating Education Instruction 5,724 47,839 10,777 496,566 560,906 expenses and general Research 538 11,531 106 410,115 422,290
Public service 668 3,500 893 160,139 165,200
Academic support 1,765 10,924 3,880 235,033 251,602
Student services 1,576 6,679 2,849 59,978 71,082
Institutional support 1,835 7,812 1,811 105,023 116,481
Operation and maintenance of plant 2,327 12,637 4,098 133,310 152,372
Scholarships and fellowships 939 5,935 1,640 58,091 66,605
Depreciation 1,462 8,482 2,095 114,891 126,930
Auxiliary enterprises 4,278 26,537 5,587 127 ,816 164,218
Other operating expenses (income), net (26) (76) (32) 478 344
Total operating expenses 21,086 141,800 33,704 1,901,440 2,098,030
OPERATING LOSS (10,955) (44, 7 5 9) (18,764) (642,777) (717,255)
NONOPERATING REVENUES (EXPENSES)
State appropriations 8,542 38,727 13,768 516,611 577,648
Grants 2,056 11,057 4,041 83,102 100,256
Gifts 552 2,692 406 93,679 97,329
Investment income 70 930 94 28,311 29,405
Net increase in fair value of investments 361 6,319 419 78,768 85,867
Interest on capital asset-related debt (3) (14) (3) (28,004) (28,024)
Other nonoperating revenues (expenses), net (2) 266 14 3,855 4,133
Net nonoperating revenues 11,576 59,977 18,739 776,322 866,614
INCOME (Loss) BEFORE OTHER REVENUES '621 15,218 (25) 133,545 149,359
65
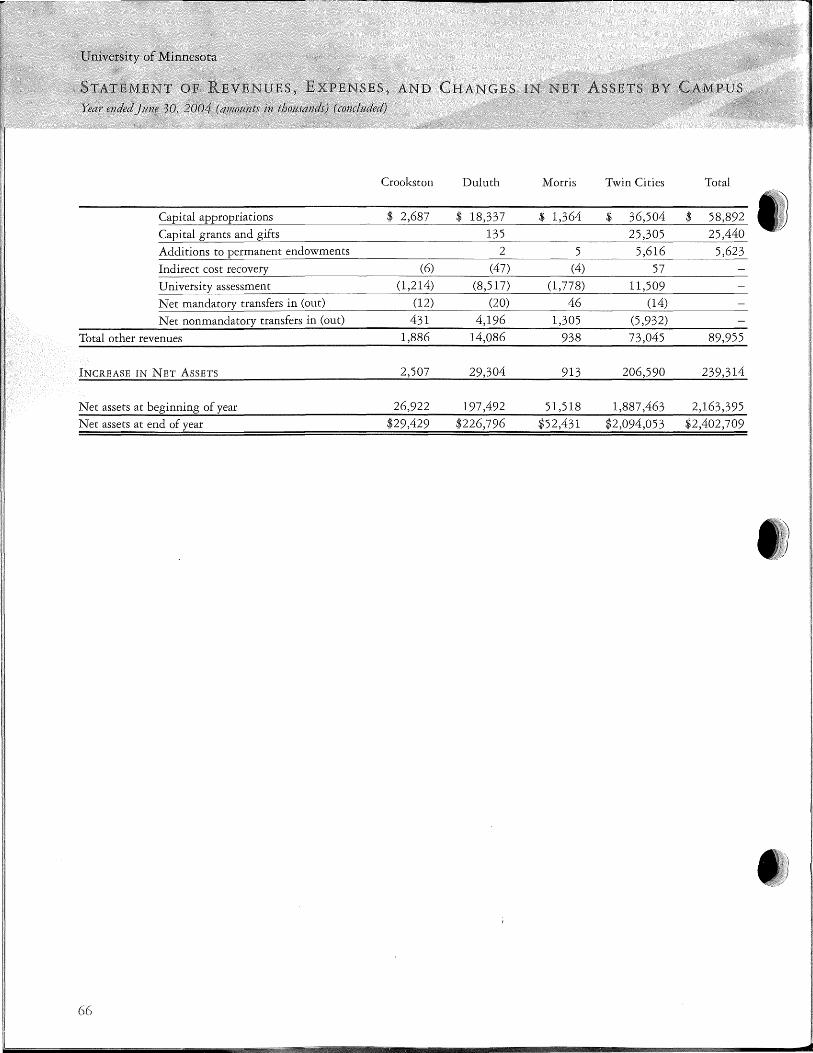
Crookston Duluth Morris Twin Cities Total
Capital appropriations $ 2,687 $ 18,337 $ 1,364 $ 36,504 $ 58,892 Capital grants and gifts 135 25,305 25,440 Additions to permanent endowments 2 5 5,616 5,623 Indirect cost recovery (6) (47) (4) 57 University assessment (1,214) (8,517) (1,778) 11,509 Net mandatory transfers in (out) (12) (20) 46 (14)
Net nonmandatory transfers in (out) 431 4,196 1,305 (5,932)
Total other revenues 1,886 14,086 938 73,045 89,955
INCREASE IN NET ASSETS 2,507 29,304 913 206,590 239,314
Net assets at beginning of year 26,922 197,492 51,518 1,887,463 2,163,395 Net assets at end of year $29,429 $226,796 $52,431 $2,094,053 $2,402,709
66
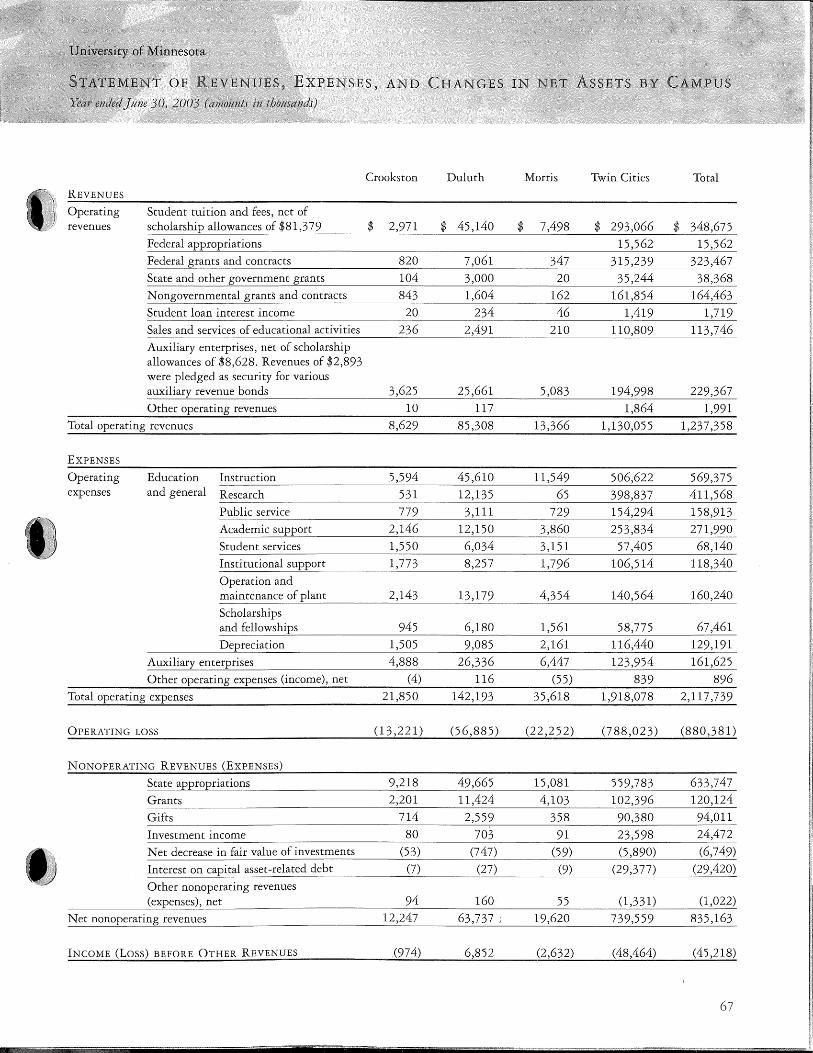
XPENSES, AND
Crookston Duluth Morris Twin Cities Total REVENUES
Operating Student tuition and fees, net of revenues scholarship allowances of $81,379 $ 2,971 $ 45,140 $ 7,498 $ 293,066 $ 348,675
Federal appropriations 15,562 15,562
Federal grants and contracts 820 7,061 347 315,239 323,467 State and other government grants 104 3,000 20 35,244 38,368 Nongovernmental grants and contracts 843 1,604 162 161,854 164,463
Student loan interest income 20 46
Sales and services of educational activities 236 2,491 210 110,809 113,746
Auxiliary enterprises, net of scholarship allowances of $8,628. Revenues of $2,893 were pledged as security for various auxiliary revenue bonds 3,625 25,661 5,083 194,998 229,367
Other operating revenues 10 117 1,864 1,991
Total operating revenues 8,629 85,308 13,366 1,130,055 1,237,358
EXPENSES
Operating Education Instruction 5,594 45,610 11,549 506,622 569,375 expenses and general Research 531 12,135 65 398,837 411,568
Public service 779 3,111 729 154,294 158,913
Academic support 2,146 12,150 3,860 253,834 271,990
Student services 1,550 6,034 3,151 57,405 68,140
Institutional support 1,773 8,257 1,796 106,514 118,340
Operation and maintenance of plant 2,143 13,179 4,354 140,564 160,240
Scholarships and fellowships 945 6,180 1,561 58,775 67,461
Depreciation 1,505 9,085 2,161 116,440 129,191
Auxiliary enterprises 4,888 26,336 6,447 123,954 161,625
Other operating expenses (income), net (4) 116 (55) 839 896
Total operating expenses 21,850 142,193 35,618 1,918,078 2,117 ,739
OPERATING LOSS (13,221) (56,885) (22,252) (788,023) (880,381)
NONOPERATING REVENUES (EXPENSES)
State appropriations 9,218 49,665 15,081 559,783 633,747
Grants 2,201 11,424 4,103 102,396 120,124
Gifts 714 2,559 358 90,380 94,011
Investment income 80 703 91 23,598 24,472
Net decrease in fair value of investments (53) (747) (59) (5 ,890) (6,749)
I' J Interest on capital asset-related debt (7) (27) (9) (29,377) (29,420)
Other nonoperating revenues 160 55
Net nonoperating revenues 12,247 63,737 ; 19,620 739,559 835,163
INCOME (Loss) BEFORE OTHER REVENUES .(974) 6,852 (2,632) (48,464) (45,218)
67
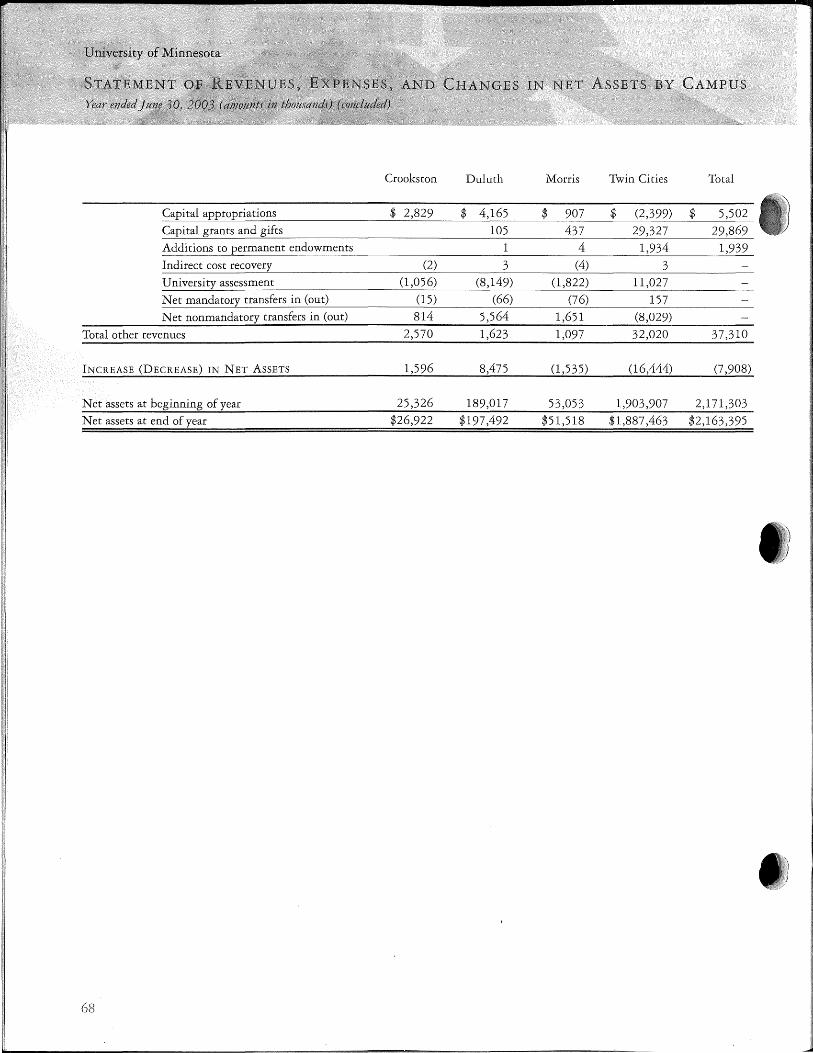
Crookston Duluth Morris Twin Cities Total
Capital appropriations $ 2,829 $ 4,165 $ 907 $ (2,399) $ 5,502 Capital grants and gifts 105 437 29,327 29,869 Additions to permanent endowments 1 4 1,934 1,939 Indirect cost recovery (2) 3 (4) 3 University assessment (1,056) (8,149) (1,822) 11,027 Net mandatory transfers in (out) (15) (66) (76) 157 Net nonmandatory transfers in (out) 814 5,564 1,651 (8,029)
Total other revenues 2,570 1,623 1,097 32,020 37,310
INCREASE (DECREASE) IN NET ASSETS 1,596 8,475 (1,535) (16,444) (7,908)
Net assets at beginning of year 25,326 189,017 53,053 1,903,907 2,171,303 Net assets at end of year $26,922 $197,492 $51,518 $1,887,463 $2,163,395
68

~ )
FY2004 ~--- c
February
Minnesota State Colleges & Universities 500 Wells Fargo Place 30 East Seventh Street St. Paul MN 55101
For additional copies, please call: Minnesota State Colleges & Universities
Finance Division at 651/296-3755
Upon request, this information will be made available in an alternative format, such as Braille, large print, audio tape, etc.
Available on the web at www.budget.mnscu.edu
Minnesota State Colleges and Universities FY2004 Instructional Cost Study
Table of Contents
Page
Development Notes 11
Lower Division by CIP 1 Upper Division by CIP 6 Graduate by CIP 8
Lower Division by Institution 10 Upper Division by Institution 43 Graduate by Institution 49
Development Notes
Data Source: The instructional cost study examines all of the institutions general fund operating expenditures including chargebacks (such as Attorney General charges, debt service, etc.) to the institution from the Office of the Chancellor. The instructional cost study does not include federal, state and private grant funds or auxiliary enterprises. Cost per student figures are derived by analyzing the expenditure data obtained from the Minnesota State Colleges and Universities accounting system against the student full year equivalent (FYE) data obtained from the system student iriformation system
Cost centers are pooled together by the federal Integrated Postsecondary Data System (IPEDS) categories as well as one additional category "other" as the state of Minnesota isolates intercollegiate athletics and grants from other state agencies. Expenditures that roll up into IPEDS categories of research, public service (which includes Minnesota State Colleges and Universities' non-credit instruction), and the "other" category (which includes intercollegiate athletics and grants from other state agencies) are not included in this analysis.
Definition of Academic Programs: Academic programs are defined by an institutional assignment of a 2-, 4- or 6-digit CIP (Classification of Instructional Programs) designation. CIP is a national numerical coding system that classifies instructional programs. The 1990 CIP manual defines an instructional program as "A combination of courses and experiences that is designed to accomplish a predetermined objective or set of allied objectives such as preparation for advanced study, qualification for an occupation or range of occupations, or simply the increase of knowledge and understanding."
Instructional Cost Detail: Direct instruction includes only cost centers generating for-credit-instruction that aggregate into the IPEDS instructional category. Average direct instruction and fully allocated cost per student is summarized by lower, upper and graduate levels of instruction for each institution, as well as system averages. The methodology for the allocation of cost to lower division, upper division and graduate level of instruction is outlined in the instruction booklet Allocation Formula: Faculty Load Calculation Definitions available through the Budget Unit of the Office of the Chancellor. Instructional expenditures are reduced by the resale revenue (i.e. sale of houses in the carpentry program, sale of food in the culinary arts programs, etc.).
Indirect Cost Allocations: Include a portion of the expenditures for academic support, student services, institutional support and operations and maintenance of plant. Indirect costs are allocated using a step-down methodology. A proportionate share of indirect expenditures is allocated to instruction in the order of operations and maintenance of physical plant, institution support, student services and academic support. Copies of the institutional step-down tables are available through the Budget Unit of the Office of the Chancellor. This methodology assumes that the indirect activities also support the direct activities of research, public service (including non-credit instruction), and the "other" category (which includes intercollegiate athletics and grants from other state agencies).
;i
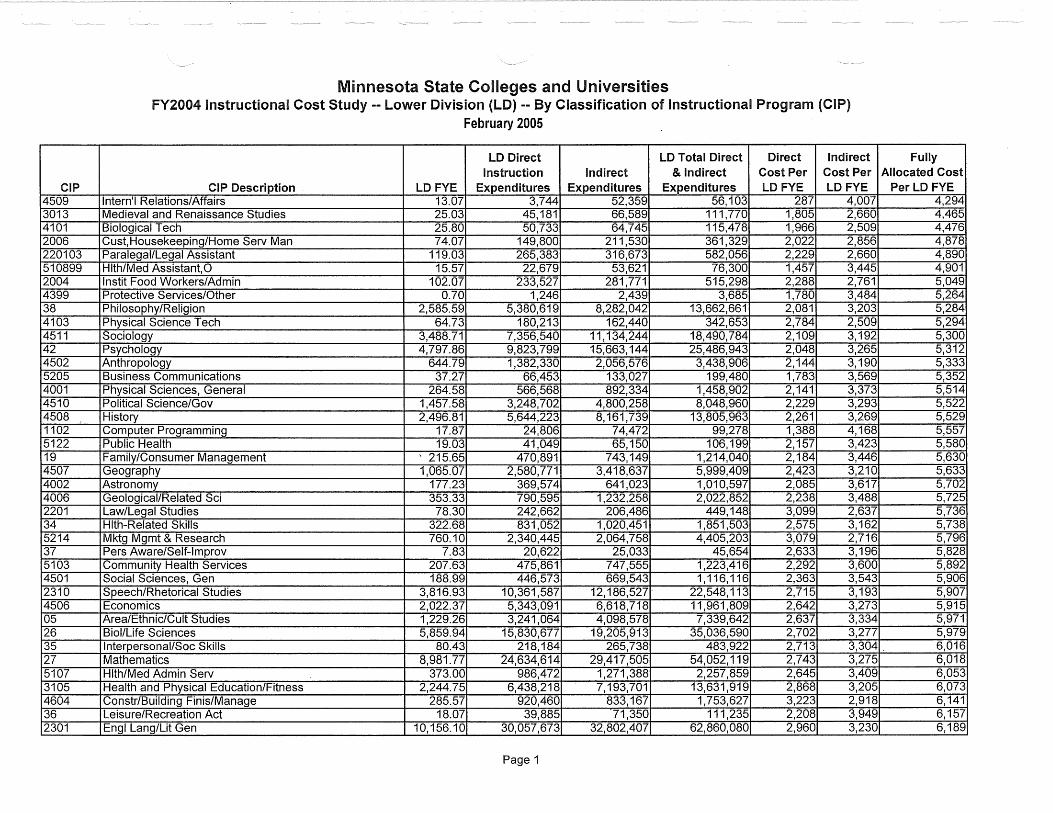
CIP 4509 3013 4101 2006 220103 510899 2004 4399 38 4103 4511 42 4502 5205 4001 4510 4508 1102 5122 19 4507 4002 4006 2201 34 5214 37 5103 4501 2310 4506 05 26 35 27 5107 3105 4604 36 2301
Minnesota State Colleges and Universities FY2004 Instructional Cost Study -- Lower Division (LO) -- By Classification of Instructional Program (CIP)
February 2005
LD Direct LD Total Direct Direct Indirect Instruction Indirect & Indirect Cost Per Cost Per
CIP Description LDFYE Expenditures Expenditures Expenditures LDFYE LDFYE I ntern'I Relations/ Affairs 13.07 3,744 52,359 56,103 287 4,007 Medieval and Renaissance Studies 25.03 45, 181 66,589 111,770 1,805 2,660 Biological Tech 25.80 50,733 64,745 115,478 1,966 2,509 Gust, Housekeeping/Home Serv Man 74.07 149,800 211,530 361,329 2,022 2,856 Paralegal/Legal Assistant 119.03 265,383 316,673 582,056 2,229 2,660 Hlth/Med Assistant,O 15.57 22,679 53,621 76,300 1,457 3,445 lnstit Food Workers/Admin 102.07 233,527 281 ;771 515,298 2,288 2,761 Protective Services/other 0.70 1,246 2,439 3,685 1,780 3,484 Philosophy/Religion 2,585.59 5,380,619 8,282,042 13,662,661 2,081 3,203 Physical Science Tech 64.73 180,213 162,440 342,653 2,784 2,509 Sociology 3,488.71 7,356,540 11,134,244 18,490,784 2,109 3,192 Psychology 4,797.86 9,823,799 15,663, 144 25,486,943 2,048 3,265 Anthropology 644.79 1,382,330 2,056,576 3,438,906 2,144 3,190 Business Communications 37.27 66,453 133,027 199,480 1,783 3,569 Physical Sciences, General 264.58 566,568 892,334 1,458,902 2,141 3,373 Political Science/Gov 1,457.58 3,248,702 4,800,258 8,048,960 2,229 3,293 History 2,496.81 5,644,223 8,161,739 13,805,963 2,261 3,269 Computer Programming 17.87 24,806 74,472 99,278 1,388 4,168 Public Health 19.03 41,049 65,150 106,199 2,157 3,423 Family/Consumer Management ' 215.65 470,891 743, 149 1,214,040 2,184 3,446 Geography 1,065.07 2,580,771 3,418,637 5,999,409 2,423 3,210 Astronomy 177.23 369,574 641,023 1,Q10,597 2,085 3,617 Geological/Related Sci 353.33 790,595 1,232,258 2,022,852 2,238 3,488 Law/Legal Studies 78.30 242,662 206,486 449,148 3,099 2,637 Hlth-Related Skills 322.68 831,052 1,020,451 1,851,503 2,575 3,162 Mktg Mgmt & Research 760.10 2,340,445 2,064,758 4,405,203 3,079 2,716 Pers Aware/Self-lmprov 7.83 20,622 25,033 45,654 2,633 3,196 Community Health Services 207.63 475,861 747,555 1,223,416 2,292 3,600 Social Sciences, Gen 188.99 446,573 669,543 1, 116, 116 2,363 3,543 Speech/Rhetorical Studies 3,816.93 10,361,587 12, 186,527 . 22,548,113 2,715 3,193 Economics 2,022.37 5,343,091 6,618,718 11,961,809 2,642 3,273 Area/Ethnic/Cult Studies 1,229.26 3,241,064 4,098,578 7,339,642 2,637 3,334 Biol/Life Sciences 5,859.94 15,830,677 19,205,913 35,036,590 2,702 3,277
Fully Allocated Cost
Per LD FYE 4,294 4,465 4,476 4,878 4,890 4,901 5,049 5,264 5,284 5,294 5,300 5,312 5,333 5,352 5,514 5,522 5,529 5,557 5,580 5,630 5,633 5,702 5,725 5.736 5,738 5,796 5,828 5,892 5,906 5,907 5,915 5,971 5,979
Interpersonal/Soc Skills 80.43 218,184 265,738 483,922 2,713 3,304. 6,016 Mathematics 8,981.77 24,634,614 29,417,505 54,052,119 2,743 3,275 6,018 Hlth/Med Admin Serv 373.00 986,472 1,271,388 2,257,859 2,645 3,409 6,053 Health and Physical Education/Fitness 2,244.75 6,438,218 7,193,701 13,631,919 2,868 3,205 6,073 Constr/Building Finis/Manage 285.57 920,460 833, 167 1,753,627 3,223 2,918 6, 141 Leisure/Recreation Act 18.07 39,885 71,350 111,235 2,208 3,949 6,157 Engl Lang/Lit Gen 10,156.10 30,057,673 32,802,407 62,860,080 2,960 3,230 6,189
Page 1
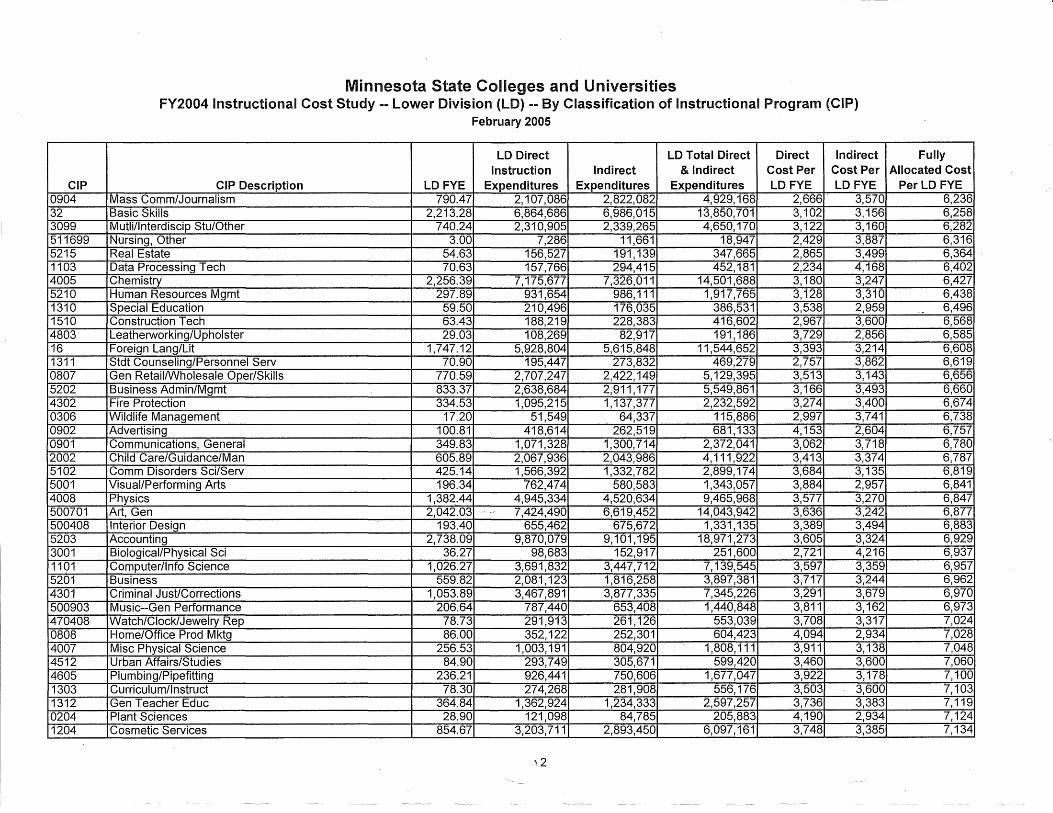
CIP 0904 32 3099 511699 5215 1103 4005 5210 1310 1510 4803 16 1311 0807 5202 4302 0306 0902 0901 2002 5102 5001 4008 500701 500408 5203 3001 1101 5201 4301 500903 470408 0808 4007 4512 4605 1303 1312 0204 1204
Minnesota State Colleges and Universities FY2004 Instructional Cost Study -- lower Division· {LD) -- By Classification of Instructional Program (CIP)
February 2005
LD Direct LD Total Direct Direct Indirect Instruction Indirect & Indirect Cost Per Cost Per
CIP Description LD FYE Expenditures Expenditures Expenditures LDFYE LDFYE Mass Comm/Journalism 790.47 2, 107,086 2,822,082 4,929,168 2,666. 3,570 Basic Skills 2,213.28 6,864,686 6,986,015 13,850,701 3,102 3,156 Mutli/lnterdiscip Stu/Other 740.24 2,310,905 2,339,265 4,650,170 3,122 3,160 Nursing, Other 3.00 7,286 11,661 18,947 2,429 3,887 Real Estate 54.63 156,527 191,139 347,665 2,865 3,499 Data Processing Tech 70.63 157,766 294,415 452,181 2,234 4,168 Chemistry 2,256.39 7,175,677 7,326,011 14,501,688 3,180 3,247 Human Resources Mgmt 297.89 931,654 986, 111 1,917,765 3,128 3,310 Special Education 59.50 210,496 176,035 386,531 3,538 2,959 Construction Tech 63.43 188,219 228,383 416,602 2,967. 3,600 Leatherworking/U pholster 29.03 108,269 82,917 191, 186 3,729 2,856 Foreign Lang/Lit 1,747.12 5,928,804 5,615,848 11,544,652 3,393 3,214 Stdt Counseling/Personnel Serv 70.90 195,447 273,832 469,279 2,757 3,862 Gen Retail/Wholesale Oper/Skills 770.59 2,707,247 2,422, 149 5, 129,395 3,513 3,143 Business Admin/Mgmt 833.37 2,638,684 2,911, 177 5,549,861 3,166 3,493 Fire Protection 334.53 1,095,215 1,137,377 2,232,592 3,274 3,400 Wildlife Management 17.20 51,549 64,337 115,886 2,997 3,741 Advertising 100.81 418,614 262,519 681, 133 4,153 2,604 Communications, General 349.83 1,071,328 1,300,714 2,372,041 3,062 3,718 Child Care/Guidance/Man 605.89 2,067,936 2,043,986 4,111,922 3,413 3,374 Comm Disorders Sci/Serv 425.14 1,566,392 1,332,782 2,899,174 3,684 3,135 Visual/Performing Arts 196.34 762,474 580,583 1,343,057 3,884 2,957 Physics 1,382.44 4,945,334 4,520,634 9,465,968 3,577 3,270 Art, Gen 2,042.03 7,424,490 6,619,452 14,043,942 3,636 3,242 Interior Design 193.40 655,462 675,672 1,331, 135 3,389 3,494 Accounting 2,738.09 9,870,079 9,101,195 18,971,273 3,605 3,324 Biological/Physical Sci 36.27 98,683 152,917 251,600 2,721 4,216 Computer/Info Science 1,026.27 3,691,832 3,447,712 7, 139,545 3,597 3,359 Business 559.82 2,081,123 1,816,258 3,897,381 3,717 3,244 Criminal Just/Corrections 1,053.89 3,467,891 3,877,335 7,345,226 3,291 3,679 Music--Gen Performance 206.64 787,440 653,408 1,440,848 3,811 3,162 Watch/Clock/Jewelry Rep 78.73 291,913 261,126 553,039 3,708 3,317 Home/Office Prod Mktg 86.00 352,122 252,301 604,423 4,094 2,934 Misc Physical Science 256.53 1,003,191 804,920 1,808,111 3,911 3,138 Urban Affairs/Studies 84.90 293,749 305,671 599,420 3,460 3,600 Plumbing/Pipefitting 236.21 926,441 750,606 1,677,047 3,922 3,178 Curriculum/Instruct 78.30 274,268 281,908 556, 176 3,503 3,600 Gen Teacher Educ 364.84 1,362,924 1,234,333 2,597,257 3,736 3,383 Plant Sciences 28.90 121,098 84,785 205,883 4,190 2,934 Cosmetic Services 854.67 3,203,711 2,893,450 6,097,161 3,748 3,385
'2
Fully Allocated Cost
Per LD FYE 6,236 6,258 6,282 6,316 6,364 6,402 6,427 6,438
. - 6,496 6,568 6,585 6,608 6,619 6,656 6,660 6,674 6,738 6,757 6,780 6,787 6,819 6,841 6,847 6,877 6,883 6,929 6,937 6,957 6,962 6,970 6,973 7,024 7,028 7,048 7,060 7,100 7,103 7,119 7,124 7,134
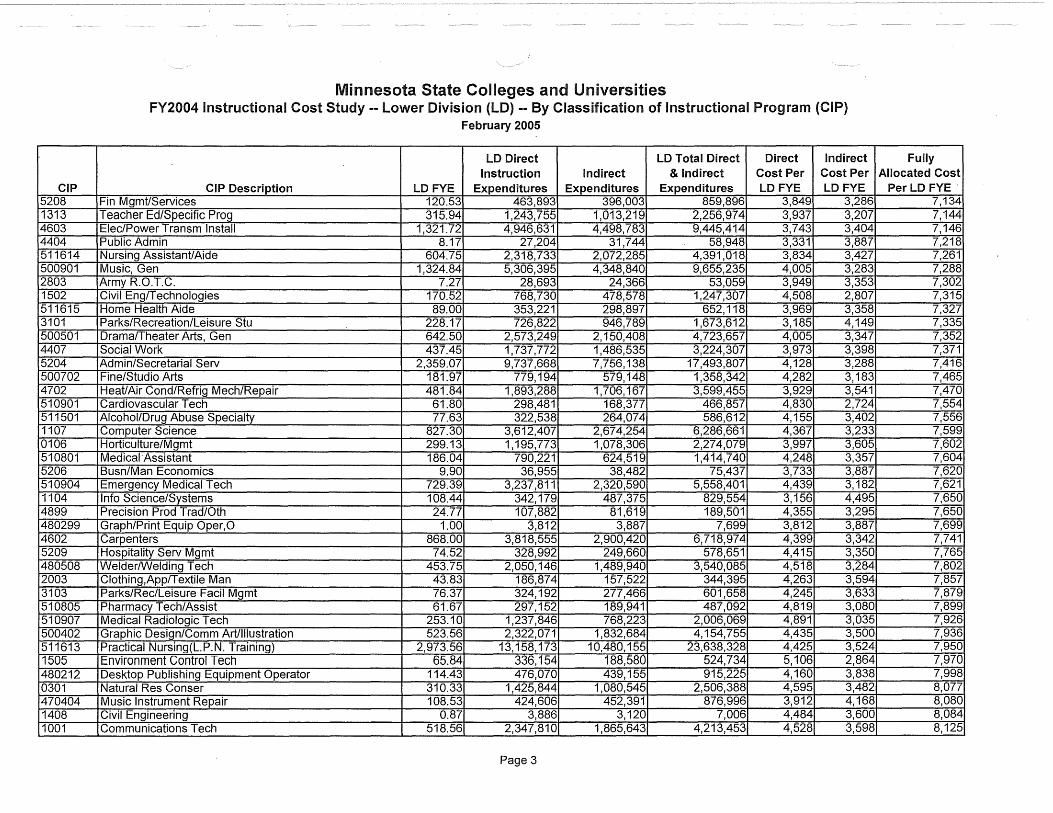
CIP 5208 1313 4603 4404 511614 500901 2803 1502 511615 3101 500501 4407 5204 500702 4702 510901 511501 1107 0106 510801 5206 510904 1104 4899 480299 4602 5209 480508 2003 3103 510805 510907 500402 511613 1505 480212 0301 470404 1408 1001
Minnesota State Colleges and Universities FY2004 Instructional Cost Study -- Lower Division (LD) -- By Classification of Instructional Program (CIP)
February 2005
LD Direct LD Total Direct Direct Indirect Instruction Indirect & Indirect Cost Per Cost Per
CIP Description LD FYE Expenditures Expenditures Expenditures LDFYE LDFYE Fin Mgmt/Services 120.53 463,893 396,003 859,896 3,849 3,286 Teacher Ed/Specific Prog 315.94 1,243,755 1,013,219 2,256,974 3,937 3,207 Elec/Power Transm Install 1,321.72 4,946,631 4,498,783 9,445,414 3,743 3,404 Public Admin 8.17 27,204 31,744 58,948 3,331 3,887 Nursing Assistant/Aide 604.75 2,318,733 2,072,285 4,391,018 3,834 3,427 Music, Gen 1,324.84 5,306,395 4,348,840 9,655,235 4,005 3,283 Army R.O.T.C. 7.27 28,693 24,366 53,059 3,949 3,353 Civil Eng/Technologies 170.52 768,730 478,578 1,247,307 4,508 2,807 Home Health Aide 89.00 353,221 298,897 652, 118 3,969 3,358 Parks/Recreation/Leisure Stu 228.17 726,822 946,789 1,673,612 3,185 4,149 Drama/Theater Arts, Gen 642.50 2,573,249 2,150,408 4,723,657 4,005 3,347 Social Work 437.45 1,737,772 1,486,535 3,224,307 3,973 3,398 Admin/Secretarial Serv 2,359.07 9,737,668 7,756,138 17,493,807 4,128 3,288 Fine/Studio Arts 181.97 779, 194 579,148 1,358,342 4,282 3,183 Heat/Air Cond/Refrig Mech/Repair 481.84 1,893,288 1,706,167 3,599,455 3,929 3,541 Cardiovascular Tech 61.80 298,481 168,377 466,857 4,830 2,724 Alcohol/Drug Abuse Specialty 77.63 322,538 264,074 586,612 4,155 3,402 Computer Science 827.30 3,612,407 2,674,254 6,286,661 4,367 3,233 Horticulture/Mgmt 299.13 1,195,773 1 ,078,306 2,274,079 3,997 3,605 Medical Assistant 186.04 790,221 624,519 1,414,740 4,248 3,357 Busn/Man Economics 9.90 36,955 38,482 75,437 3,733 3,887 Emergency Medical Tech 729.39 3,237,811 2,320,590 5,558,401 4,439 3,182 Info Science/Systems 108.44 342, 179 487,375 829,554 3,156 4,495 Precision Prod Trad/0th 24.77 107,882 81,619 189,501 4,355 3,295 Graph/Print Equip Oper,O 1.00 3,812 3,887 7,699 3,812 3,887 Carpenters 868.00 3,818,555 2,900,420 6,718,974 4,399 3,342 Hospitality Serv Mgmt 74.52 328,992 249,660 578,651 4,415 3,350 Welder/Welding Tech 453.75 2,050,146 1,489,940 3,540,085 4,518 3,284 Clothing,App/Textile Man 43.83 186,874 157,522 344,395 4,263 3,594 Parks/Rec/Leisure Facil Mgmt 76.37 324,192 277,466 601,658 4,245 3,633 Pharmacy Tech/Assist 61.67 297, 152 189,941 487,092 4,819 3,080 Medical Radiologic Tech 253.10 1,237,846 768,223 2,006,069 4,891 3,035 Graphic Design/Comm Art/Illustration 523.56 2,322,071 1,832,684 4,154,755 4,435 3,500 Practical Nursing(L.P.N. Training) 2,973.56 13, 158, 173 10,480,155 23,638,328 4,425 3,524 Environment Control Tech 65.84 336, 154 188,580 524,734 5,106 2,864 Desktop Publishing Equipment Operator 114.43 476,070 439,155 915,225 4,160 3,838 Natural Res Conser 310.33 1,425,844 1,080,545 2,506,388 4,595 3,482 Music Instrument Repair 108.53 424,606 452,391 876,996 3,912 4,168 Civil Engineering 0.87 3,886 3,120 7,006 4,484 3,600 Communications Tech 518.56 2,347,810 1,865,643 4,213,453 4,528 3,598
Page 3
Fully Allocated Cost
Per LD FYE. 7,134 7,144 7,146 7,218 7,261 7,288 7,302 7,315 7,327 7,335 7,352 7,371 7,416 7,465 7,470 7,554 7,556 7,599 7,602 7,604 7,620 7,621 7,650 7,650 7,699 7,741 7,765 7,802 7,857 7,879 7,899 7,926 7,936 7,950 7,970 7,998 8,077 8,080 8,084 8,125
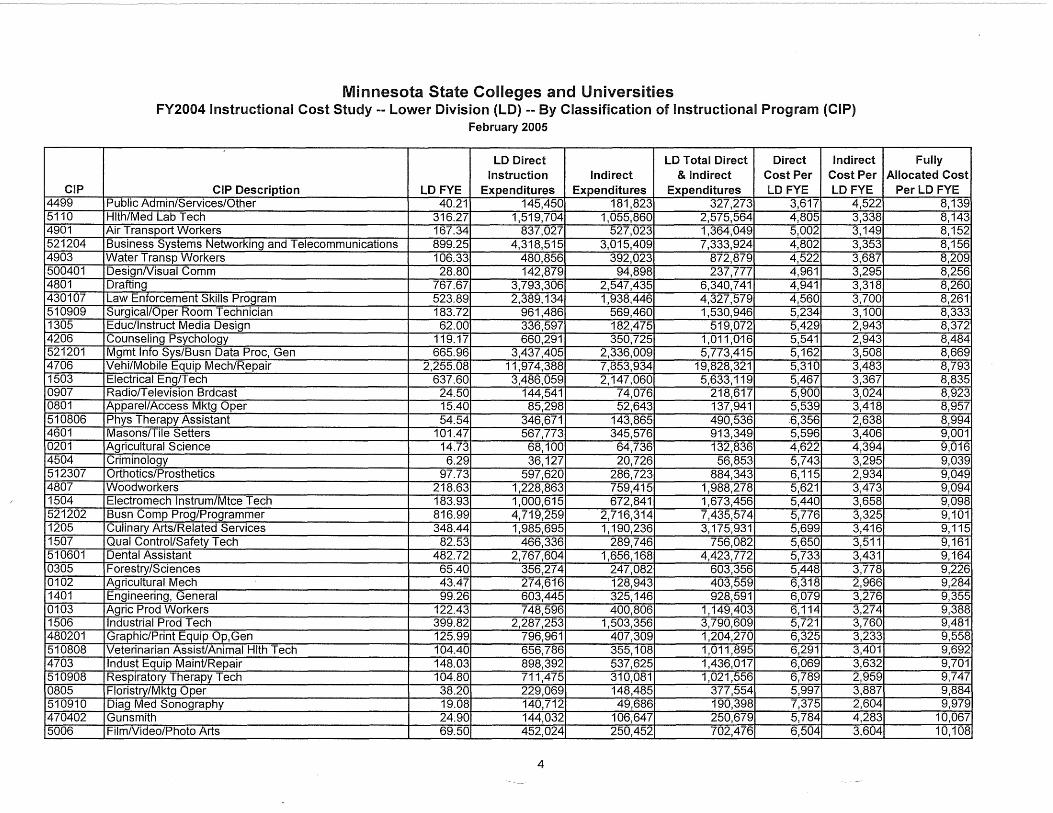
CIP 4499 5110 4901 521204 4903 500401 4801 430107 510909 1305 4206 521201 4706 1503 0907 0801 510806 4601 0201 4504 512307 4807 1504 521202 1205 1507 510601 0305 0102 1401 0103 1506 480201 510808 4703 510908 0805 510910 470402 5006
Minnesota State Colleges and Universities FY2004 Instructional Cost Study -- Lower Division {LO) -- By Classification of Instructional Program {CIP)
February 2005
LD Direct LD Total Direct Direct Indirect Instruction Indirect & Indirect Cost Per Cost Per
CIP Description LD FYE Expenditures Expenditures Expenditures LD FYE LDFYE Public Admin/Services/Other 40.21 145,450 181,823 327,273 3,617 4,522 Hlth/Med Lab Tech 316.27 1,519,704 1,055,860 2,575,564 4,805 3,338 Air Transport Workers 167.34 837,027 527,023 1,364,049 5,002 3,149 Business Systems Networking and Telecommunications 899.25 4,318,515 3,015,409 7,333,924 4,802 3,353 Water Transp Workers 106.33 480,856 392,023 872,879 4,522 3,687 DesignNisual Comm 28.80 142,879 94,898 237,777 4,961 3,295 Drafting 767.67 3,793,306 2,547,435 6,340,741 4,941 3,318 Law Enforcement Skills Program 523.89 2,389,134 1,938,446 4,327,579 4,560 3,700 Surgical/Oper Room Technician 183.72 961,486 569,460 1,530,946 5,234 3,100 Educ/Instruct Media Design 62.00 336,597 182,475 519,072 5,429 2,943 Counseling Psychology 119.17 660,291 350,725 1,011,0-16 5,541 2,943 Mgmt Info Sys/Busn Data Proc, Gen 665.96 3,437,405 2,336,009 5,773,415 5,162 3,508 Vehi/Mobile Equip Mech/Repair 2,255.08 11,974,388 7,853,934 19,828,321 5,310 3,483 Electrical Eng/Tech 637.60 3,486,059 2,147,060 5,633,119 5,467 3,367 Radio/Television Brdcast 24.50 144,541 74,076 218,617 5,900 3,024 Apparel/Access Mktg Oper 15.40 85,298 52,643 137,941 5,539 3,418 Phys Therapy Assistant 54.54 346,671 143,865 490,536 6,356 2,638 Masons/Tile Setters 101.47 567,773 345,576 913,349 5,596 3,406 Agricultural Science 14.73 68,100 64,736 132,836 4,622 4,394 Criminology 6.29 36,127 20,726 56,853 5,743 3,295 Orthotics/Prosthetics 97.73 597,620 286,723 884,343 6,115 2,934 Woodworkers 218.63 1,228,863 759,415 1,988,278 5,621 3,473 Electromech lnstrum/Mtce Tech 183.93 1,000,615 672,841 1,673,456 5,440 3,658 Busn Comp Prag/Programmer 816.99 4,719,259 2,716,314 7,435,574 5,776 3,325 Culinary Arts/Related Services 348.44 1,985,695 1, 190,236 3, 175,931 5,699 3,416 Qual Control/Safety Tech 82.53 466,336 289,746 756,082 5,650 3,511 Dental Assistant 482.72 2,767,604 1,656, 168 4,423,772 5,733 3,431 Forestry/Sciences 65.40 356,274 247,082 603,356 5,448 3,778 Agricultural Mech 43.47 274,616 128,943 403,559 6,318 2,966 Engineering, General 99.26 603,445 325,146 928,591 6,079 3,276 Agric Prod Workers 122.43 748,596 400,806 1, 149,403 6,114 3,274 Industrial Prod Tech 399.82 2,287,253 1,503,356 3,790,609 5,721 3,760 Graphic/Print Equip Op,Gen 125.99 796,961 407,309 1,204,270 6,325 3,233 Veterinarian Assist/Animal Hlth Tech 104.40 656,786 355,108 1,011,895 6,291 3,401 lndust Equip Maint/Repair 148.03 898,392 537,625 1,436,017 6,069 3,632 Respiratory Therapy Tech 104.80 711,475 310,081 1,021,556 6,789 2,959 Floristry/Mktg Oper 38.20 229,069 148,485 377,554 5,997 3,887 Diag Med Sonography 19.08 140,712 49,686 190,398 7,375 2,604 Gunsmith 24.90 144,032 106,647 250,679 5,784 4,283 FilmNideo/Photo Arts 69.50 452,024 250,452 702,476 6,504 3,604
4
Fully Allocated Cost
Per LD FYE 8,139 8,143 8,152 8,156 8,209 8,256 8,260 8,261 8,333 8,372 8,484 8,669 8,793 8,835 8,923 8,957 8,994 9,001 9,016 9,039 9,049 9,094 9,098 9, 101 9, 115 9, 161 9,164 9,226 9,284 9,355 9,388 9,481 9,558 9,692 9,701 9,747 9,884 9,979
10,067 10, 108
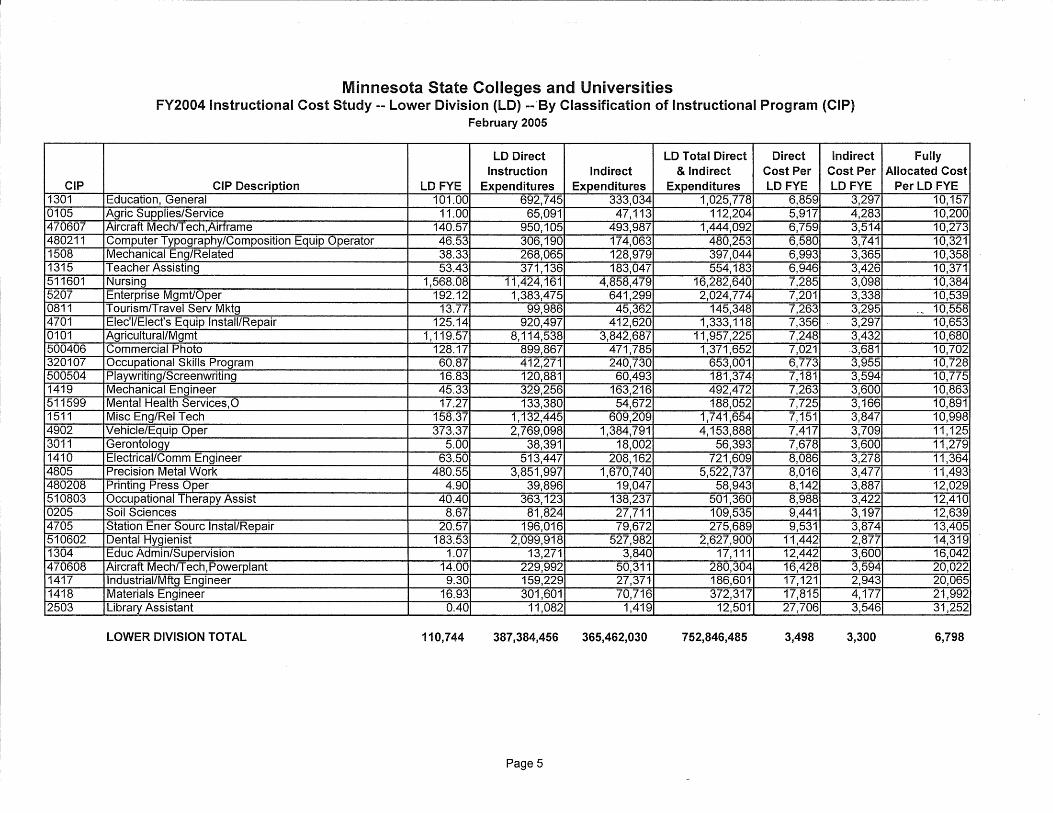
CIP 1301 0105 470607 480211 1508 1315 511601 5207 0811 4701 0101 500406 320107 500504 1419 511599 1511 4902 3011 1410 4805 480208 510803 0205 4705 510602 1304 470608 1417 1418 2503
Minnesota State Colleges and Universities FY2004 Instructional Cost Study -- lower Division (LO) --·sy Classification of Instructional Program (CIP)
February 2005
LD Direct LD Total Direct Direct Indirect Instruction Indirect & Indirect Cost Per Cost Per
CIP Description LDFYE Expenditures Expenditures Expenditures LD FYE LDFYE Education, General 101.00 692,745 333,034 1,025,778 6,859 3,297 Agric Supplies/Service 11.00 65,091 47,113 112,204 5,917 4,283 Aircraft Mech/T ech,Airframe 140.57 950,105 493,987 1,444,092 6,759 3,514 Computer Typography/Composition Equip Operator 46.53 306,190 174,063 480,253 6,580 3,741 Mechanical Eng/Related 38.33 268,065 128,979 397,044 6,993 3,365 Teacher Assisting 53.43 371,136 183,047 554, 183 6,946 3,426 Nursing 1,568.08 11,424, 161 4,858,479 16,282,640 7,285 3,098 Enterprise Mgmt/Oper 192.12 1,383,475 641,299 2,024,774 7,201 3,338 Tourism/Travel Serv Mktg 13.77 99,986 45,362 145,348 7,263 3,295 Elec'l/Elect's Equip Install/Repair 125.14 920,497 412,620 1,333, 118 7,356 3,297 Agricultural/Mgmt 1, 119.57 8, 114,538 3,842,687 11,957,225 7,248 3,432 Commercial Photo 128.17 899,867 471,785 1,371,652 7,021 3,681 Occupational Skills Program 60.87 412,271 240,730 653,001 6,773 3,955 Playwriting/Screenwriting 16.83 120,881 60,493 181,374 7,181 3,594 Mechanical Engineer 45.33 329,256 163,216 492,472 7,263 3,600 Mental Health Services, 0 17.27 133,380 54,672 188,052 7,725 3,166 Misc Eng/Rel Tech 158.37 1, 132,445 609,209 1,741,654 7, 151 3,847 Vehicle/Equip Oper 373.37 2,769,098 1,384,791 4, 153,888 7,417 3,709 Gerontology 5.00 38,391 18,002 56,393 7,678 3,600 Electrical/Comm Engineer 63.50 513,447 208,162 721,609 8,086 3,278 Precision Metal Work 480.55 3,851,997 1,670,740 5,522,737 8,016 3,477 Printing Press Oper 4.90 39,896 19,047 58,943 8,142 3,887 Occupational Therapy Assist 40.40 363,123 138,237 501,360 8,988 3,422 Soil Sciences 8.67 81,824 27,711 109,535 9,441 3,197 Station Ener Sourc lnstal/Repair 20.57 196,016 79,672 275,689 9,531 3,874 Dental Hygienist 183.53 2,099,918 527,982 2,627,900 11,442 2,877 Educ Admin/Supervision 1.07 13,271 3,840 17,111 12,442 3,600 Aircraft Mech/Tech, Powerplant 14.00 229,992 50,311 280,304 16,428 3,594 lndustrial/Mftg Engineer 9.30 159,229 27,371 186,601 17, 121 2,943 Materials Engineer 16.93 301,601 70,716 372,317 17,815 4,177 Library Assistant 0.40 11,082 1,419 12,501 27,706 3,546
LOWER DIVISION TOTAL 110,744 387 ,384,456 365,462,030 752,846,485 3,498 3,300
Page 5
Fully Allocated Cost
Per LD FYE 10,157 10,200 10,273 10,321 10,358 10,371 10,384 10,539
-- 10,558 10,653 10,680 10,702 10,728 10,775 10,863 10,891 10,998 11, 125 11,279 11,364 11,493 12,029 12,410 12,639 13,405 14,319 16,042 20,022 20,065 21,992 31,252
6,798
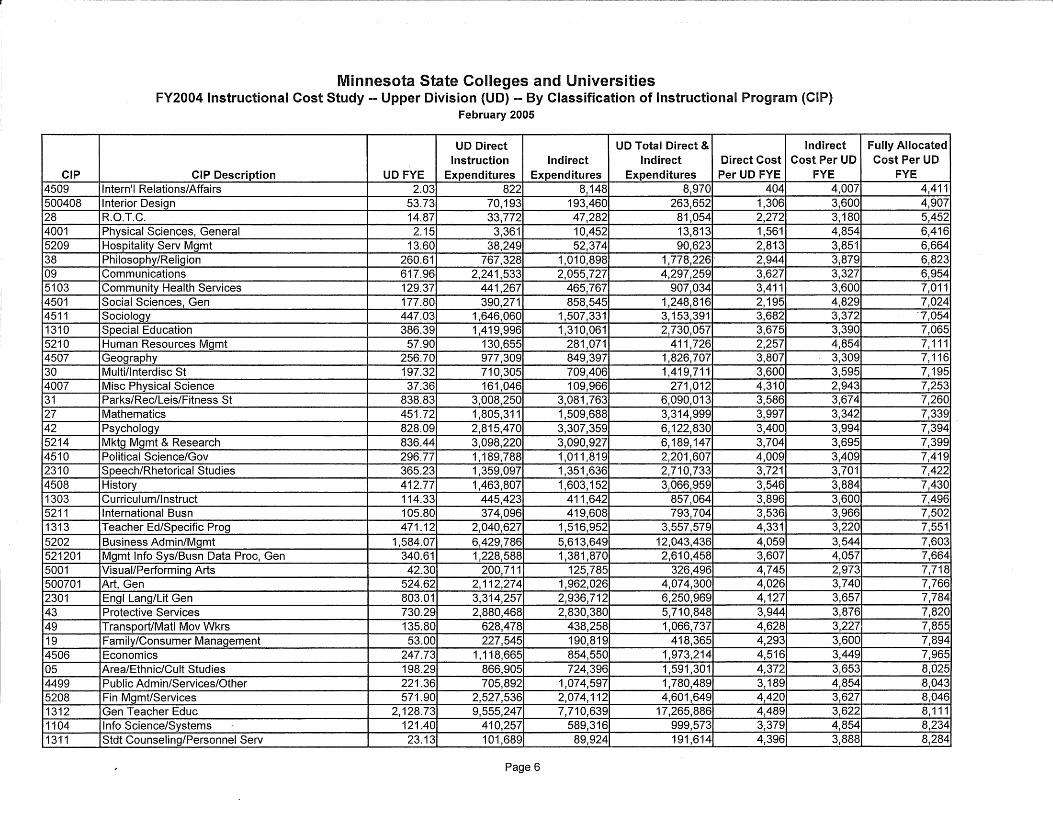
CIP 4509 500408 28 4001 5209 38 09 5103 4501 4511 1310 5210 4507 30 4007 31 27 42 5214 4510 2310 4508 1303 5211 1313 5202 521201 5001 500701 2301 43 49 19 4506 05 4499 5208 1312 1104 131'1
Minnesota State Colleges and Universities FY2004 Instructional Cost Study -- Upper Division (UD) -- By Classification of Instructional Program (CIP)
February 2005
UD Direct UD Total Direct & Indirect Instruction Indirect Indirect Direct Cost Cost Per UD
CIP Description UD FYE Expenditures Expenditures Expenditures Per UD FYE FYE Intern'! Relations/Affairs 2.03 822 8,148 8,970 404 4,007 Interior Design 53.73 70,193 193,460 263,652 1,306 3,600 R.O.T.C. 14.87 33,772 47,282 81,054 2,272 3,180 Physical Sciences, General 2.15 3,361 10,452 13,813 1,561 4,854 Hospitality Serv Mgmt 13.60 38,249 52,374 90,623 2,813 3,851 Philosophy/Religion 260.61 767,328 1,010,898 1,778,226. 2,944 3,879 Communications 617.96 2,241,533 2,055,727 4,297,259 3,627 3,327 Community Health Services 129.37 441,267 465,767 907,034 3,411 3,600 Social Sciences, Gen 177.80 390,271 858,545 1,248,816 2,195 4,829 Sociology 447.03 1,646,060 1,507,331 3, 153,391 3,682 3,372 Special Education 386.39 1,419,996 1,310,061 2,730,057 3,675 3,390 Human Resources Mgmt 57.90 130,655 281,071 411,726 2,257 4,854 Geography 256.70 977,309 849,397 1,826,707 3,807 3,309 Multi/lnterdisc St 197.32 710,305 709,406 1,419,711 3,600 3,595 Misc Physical Science 37.36 161,046 109,966 271,012 4,310 2,943 Parks/Rec/Leis/Fitness St 838.83 3,008,250 3,081,763 6,090,013 3,586 3,674 Mathematics 451.72 1,805,311 1,509,688 3,314,999 3,997 3,342 Psychology 828.09 2,815,470 3,307,359 6,122,830 3,400 3,994 Mktg Mgmt & Research 836.44 3,098,220 3,090,927 6,189,147 3,704 3,695 Political Science/Gov 296.77 1, 189,788 1,011,819 2,201,607 4,009 3,409 Speech/Rhetorical Studies 365.23 1,359,097 1,351,636 2,710,733 3,721 3,701 History 412.77 1,463,807 1,603,152 3,066,959 3,546 3,884 Curriculum/Instruct 114.33 445,423 411,642 857,064 3,896 3,600 International Busn 105.80 374,096 419,608 793,704 3,536 3,966 Teacher Ed/Specific Prog 471.12 2,040,627 1,516,952 3,557,579 4,331 3,220 Business Admin/Mgmt 1,584.07 6,429,786 5,613,649 12,043,436 4,059 3,544 Mgmt Info Sys/Busn Data Proc, Gen 340.61 1,228,588 1,381,870 2,610,458 3,607 4,057 Visual/Performing Arts 42.30 200,711 125,785 326,496 4,745 2,973 Art, Gen 524.62 2, 112,274 1,962,026 4,074,300 4,026 3,740 Engl Lang/Lit Gen 803.01 3,314,257 2,936,712 6,250,969 4,127 3,657 Protective Services 730.29 2,880,468 2,830,380 5,710,848 3,944 3,876 Transport/Mat! Mov Wkrs 135.80 628,478 438,258 1,066,737 4,628 3,227 Family/Consumer Management 53.00 227,545 190,819 418,365 4,293 3,600 Economics 247.73 1, 118,665 854,550 1,973,214 4,516 3,449 Area/Ethnic/Cult Studies 198.29 866,905 724,396 1,591,301 4,372 3,653 Public Admin/Services/Other 221.36 705,892 1,074,597 1,780,489 3,189 4,854 Fin Mgmt/Services 571.90 2,527,536 2,074,112 4,601,649 4,420 3,627 Gen Teacher Educ 2,128.73 9,555,247 7,710,639 17,265,886 4,489 3,622 Info Science/Systems 121.40 410,257 589,316 999,573 3,379 4,854 Stdt Counseling/Personnel Serv 23.13 101,689 89,924 191,614 4,396 3,888
Page 6
Fully Allocated Cost Per UD
FYE 4,411 4,907 5,452 6,416 6,664 6,823 6,954 7,011 7,024
'7,054 7,065 7, 111 7,116 7,195 7,253 7,260 7,339 7,394 7,399 7,419 7,422 7,430 7,496 7,502 7,551 7,603 7,664 7,718 7,766 7,784 7,820 7,855 7,894 7,965 8,025 8,043 8,046 8, 111 8,234 8,284
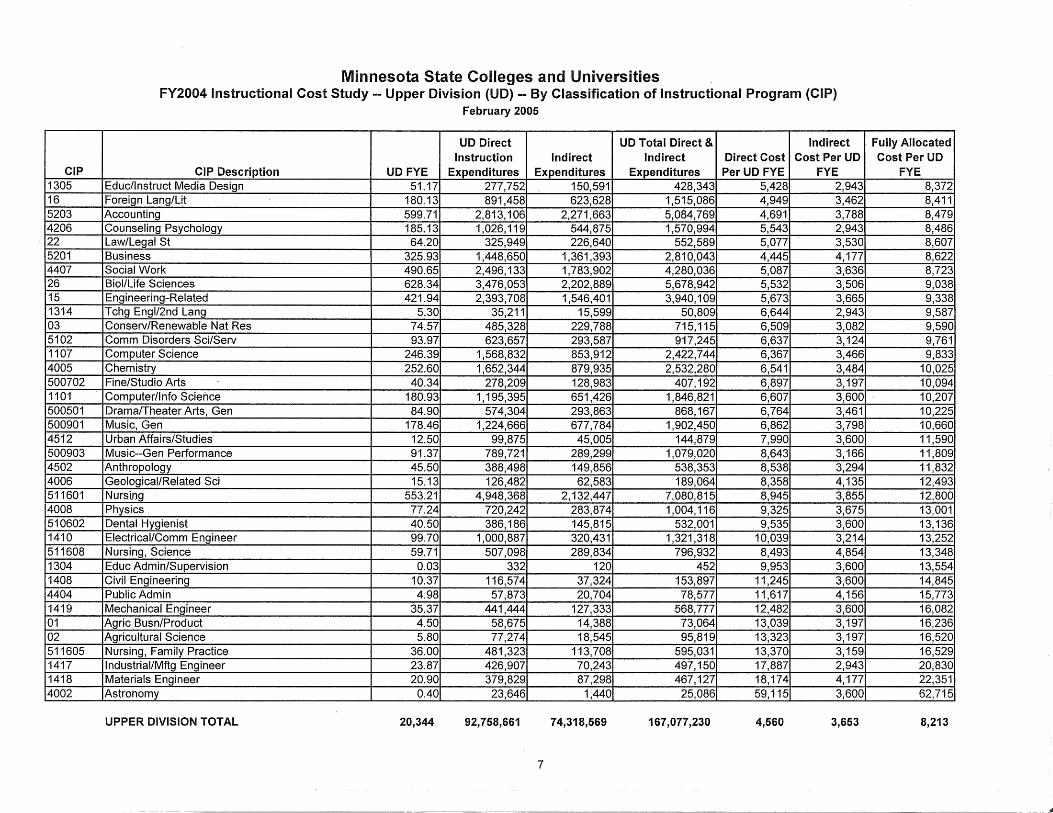
CIP 1305 16 5203 4206 22 5201 4407 26 15 1314 03 5102 1107 4005 500702 1101 500501 500901 4512 500903 4502 4006 511601 4008 510602 1410 511608 1304 1408 4404 1419 01 02 511605 1417 1418 4002
Minnesota State Colleges and Universities FY2004 Instructional Cost Study -- Upper Division (UD) -- By Classification of Instructional Program (CIP)
February 2005
UD Direct UD Total Direct & Indirect Instruction Indirect Indirect Direct Cost Cost Per UD
CIP Description UD FYE Expenditures Expenditures Expenditures Per UD FYE FYE Educ/Instruct Media Design 51.17 277,752 150,591 428,343 5,428 2,943 Foreign Lang/Lit 180.13 891,458 623,628 1,515,086 4,949 3,462 Accounting 599.71 2,813,106 2,271,663 5,084,769 4,691 3,788 Counseling Psychology 185.13 1,026, 119 544,875 1,570,994 5,543 2,943 Law/Legal St 64.20 325,949 226,640 552,589 5,077 3,530 Business 325.93 1,448,650 1,361,393 2,810,043 4,445 4,177 Social Work 490.65 2,496, 133 1,783,902 4,280,036 5,087 3,636 Biol/Life Sciences 628.34 3,47~,053 2,202,889 5,678,942 5,532 3,506 Engineering-Related 421.94 2,393,708 1,546,401 3,940,109 5,673 3,665 Tchg Engl/2nd Lang 5.30 35,211 15,599 50,809 6,644 2,943 Conserv/Renewable Nat Res 74.57 485,328 229,788 715,115 6,509 3,082 Comm Disorders Sci/Serv 93.97 623,657 293,587 917,245 6,637 3,124 Computer Science 246.39 1,568,832 853,912 2,422,744 6,367 3,466 Chemistry 252.60 1,652,344 879,935 2,532,280 6,541 3,484 Fine/Studio Arts 40.34 278,209 128,983 407,192 6,897 3,197
· Computer/Info Science 180.93 1, 195,395 651,426 1,846,821 6,607 3,600 Drama/Theater Arts, Gen 84.90 574,304 293,863 868,167 6,764 3,461 Music, Gen 178.46 1,224,666 677,784 1,902,450 6,862 3,798 Urban Affairs/Studies 12.50 99,875 45,005 144;879 7,990 3,600 Music--Gen Performance 91.37 789,721 289,299 1,079,020 8,643 3,166 Anthropology 45.50 388,498 149,856 538,353 8,538 3,294 Geological/Related Sci 15.13 126,482 62,583 189,064 8,358 4,135 Nursing 553.21 4,948,368 2, 132,447 7,080,815 8,945 3,855 Physics 77.24 720,242 283,874 1,004, 116 9,325 3,675 Dental Hygienist 40.50 386,186 145,815 532,001 9,535 3,600 Electrical/Comm Engineer 99.70 1,000,887 320,431 1,321,318 10,039 3,214 Nursing, Science 59.71 507,098 289,834 796,932 8,493 4,854 Educ Admin/Supervision 0.03 332 120 452 9,953 3,600 Civil Engineering 10.37 116,574 37,324 153,897 11 ,245 3,600 Public Admin 4.98 57,873 20,704 78,577 11,617 4,156 Mechanical Engineer 35.37 441,444 127,333 568,777 12,482 3,600 Agric Busn/Product 4.50 58,675 14,388 73,064 13,039 3,197 Agricultural Science 5.80 77,274 18,545 95,819 13,323 3,197 Nursing, Family Practice 36.00 481,323 113,708 595,031 13,370 3,159 lndustrial/Mftg Engineer 23.87 426,907 70,243 497,150 17,887 2,943 Materials Engineer 20.90 379,829 87,298 467,127 18, 174 4,177 Astronomy 0.40 23,646 1,440 25,086 59, 115 3,600
UPPER DIVISION TOTAL 20,344 92,758,661 74,318,569 167,077,230 4,560 3,653
7
Fully Allocated Cost Per UD
FYE 8,372 8,411 8,479 8,486 8,607 8,622 8,723 9,038 9,338 9,587 9,590 9,761 9,833
10,025 10,094 10,207 10,225 10,660 11 ,590 11,809 11,832 12,493 12,800 13,001 13,136 13,252 13,348 13,554 14,845 15,773 16,082 16,236 16,520 16,529 20,830 22,351 62,715
8,213
. ..,j
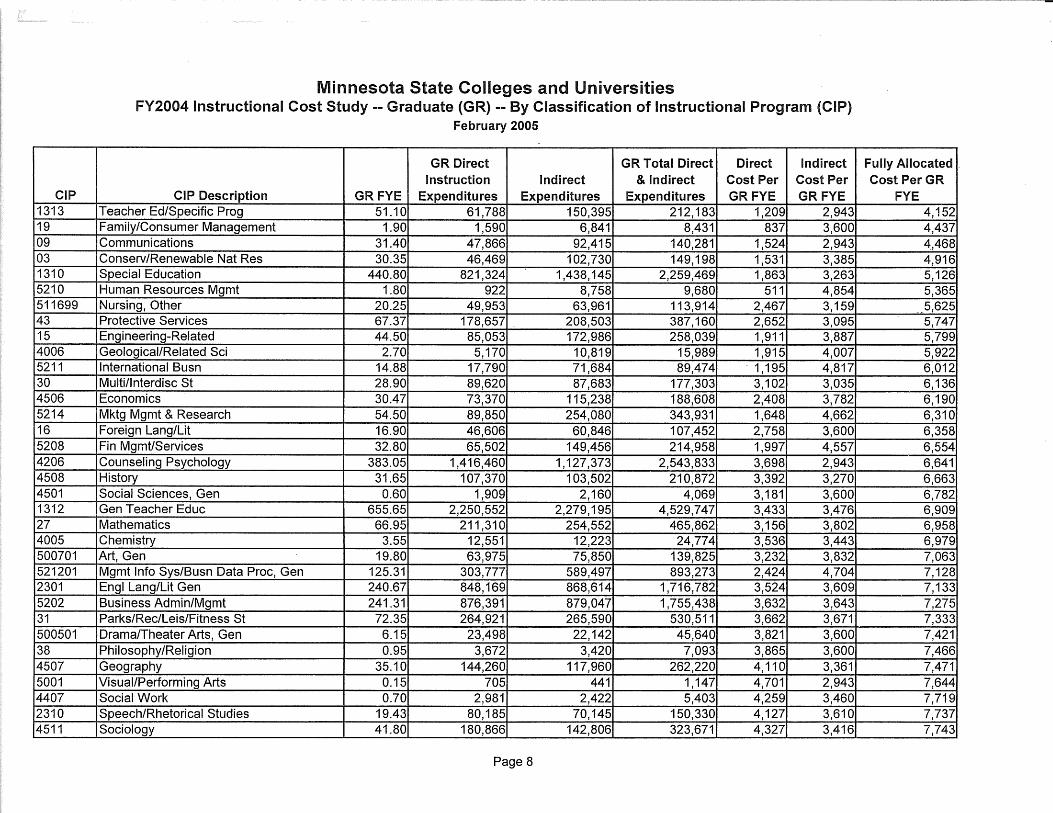
CIP 1313 19 09 03 1310 5210 511699 43 15 4006 5211 30 4506 5214 16 5208 4206 4508 4501 1312 27 4005 500701 521201 2301 5202 31 500501 38 4507 5001 4407 2310 4511
Minnesota State Colleges and Universities FY2004 Instructional Cost Study -- Graduate (GR) -- By Classification of Instructional Program (CIP)
February 2005
GR Direct GR Total Direct Direct Indirect Instruction Indirect & Indirect Cost Per Cost Per
CIP Description GR FYE Expenditures Expenditures Expenditures GR FYE GR FYE Teacher Ed/Specific Prog 51.10 61,788 150,395 212,183 1,209 2,943 Family/Consumer Management 1.90 1,590 6,841 8,431 837 3,600 Communications 31.40 47,866 92,415 140,281 1,524 2,943 Conserv/Renewable Nat Res 30.35 46,469 102,730 149,198 1,531 3,385 Special Education 440.80 821,324 1,438, 145 2,259,469 1,863 3,263 Human Resources Mgmt 1.80 922 8,758 9,680 511 4,854 Nursing, Other 20.25 49,953 63,961 113,914 2,467 3,159 Protective Services 67.37 178,657 . 208,503 387,160 2,652 3,095 Engineering-Related 44.50 85,053 172,986 258,039 1,911 3,887 Geological/Related Sci 2.70 5,170 10,819 15,989 1,915 4,007 International Busn 14.88 17,790 71,684 89,474 . 1,195 4,817 Multi/lnterdisc St 28.90 89,620 87,683 177,303 3,102 3,035 Economics 30.47 73,370 115,238 188,608 2,408 3,782 Mktg Mgmt & Research 54.50 89,850 254,080 343,931 1,648 4,662 Foreign Lang/lit 16.90 46,606 60,846 107,452 2,758 3,600 Fin Mgmt/Services 32.80 65,502 149,456 214,958 1,997 4,557 Counseling Psychology 383.05 1,416,460 1,127,373 2,543,833 3,698 2,943 History 31.65 107,370 103,502 210,872 3,392 3,270 Social Sciences, Gen 0.60 1,909 2,160 4,069 3, 181 3,600 Gen Teacher Educ 655.65 2,250,552 2,279,195 4,529,747 3,433 3,476 Mathematics 66.95 211,310 254,552 465,862 3,156 3,802 Chemistry 3.55 12,551 12,223 24,774 3,536 3,443 Art, Gen 19.80 63,975 75,850 139,825 3,232 3,832 Mgmt Info Sys/Busn Data Proc, Gen 125.31 303,777 589,497 893,273 2,424 4,704 Engl Lang/lit Gen 240.67 848,169 868,614 1,716,782 3,524 3,609 Business Admin/Mgmt 241.31 876,391 879,047 1,755,438 3,632 3,643 Parks/Rec/Leis/Fitness St 72.35 264,921 265,590 530,511 3,662 3,671 Drama/Theater Arts, Gen 6.15 23,498 22,142 45,640 3,821 3,600 Philosophy/Religion 0.95 3,672 3,420 7,093 3,865 3,600 Geography 35.10 144,260 117,960 262,220 4,110 3,361 Visual/Performing Arts 0.15 705 441 1,147 4,701 2,943 Social Work 0.70 2,981 2,422 5,403 4,259 3,460 Speech/Rhetorical Studies 19.43 80, 185 70,145 150,330 4,127 3,610 Sociology 41.80 180,866 142,806 323,671 4,327 3,416
Page 8
Fully Allocated . Cost Per GR
FYE 4,152 4,437 4,468 4,916 5,126 5,365
. 5,625 5,747 5,799 5,922 6,012 6,136 6,190 6,310 6,358 6,554 6,641 6,663 6,782 6,909 6,958 6,979 7,063 7,128 7,133 7,275 7,333 7,421 7,466 7,471 7,644 7,719 7,737 7,743
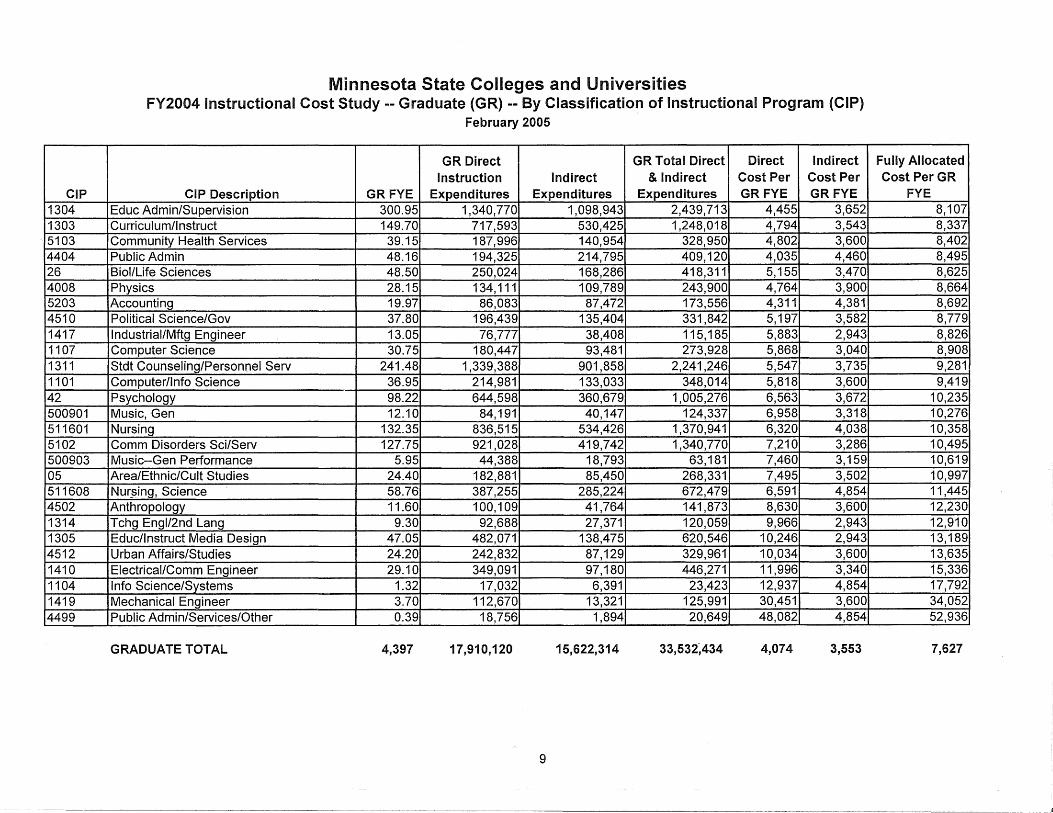
CIP 1304 1303 5103 4404 26 4008 5203 4510 1417 1107 1311 1101 42 500901 511601 5102 500903 05 511608 4502 1314 1305 4512 1410 1104 1419 4499
Minnesota State Colleges and Universities FY2004 Instructional Cost Study -- Graduate (GR) -- By Classification of Instructional Program (CIP)
February 2005
GR Direct GR Total Direct Direct Indirect Instruction Indirect & Indirect Cost Per Cost Per
CIP Description GR FYE Expenditures Expenditures Expenditures GR FYE GR FYE Educ Admin/Supervision 300.95 1,340,770 1,098,943 2,439,713 4,455 3,652 Curriculum/Instruct 149.70 717,593 530,425 1,248,018 4,794 3,543 Community Health Services 39.15 187,996 140,954 328,950 4,802 3,600 Public Admin 48.16 194,325 214,795 409,120 4,035 4,460 Biol/Life Sciences 48.50 250,024 168,286 418,311 5,155 3,470 Physics 28.15 134, 111 109,789 243,900 4,764 3,900 Accounting 19.97 86,083 87,472 173,556 4,311 4,381 Political Science/Gov 37.80 196,439 135,404 331,842 5,197 3,582 lndustrial/Mftg Engineer 13.05 76,777 38,408 115,185 5,883 2,943 Computer Science 30.75 180,447 93,481 273,928 5,868 3,040 Stdt Counseling/Personnel Serv 241.48 1,339,388 901,858 2,241,246 5,547 3,735 Computer/Info Science 36.95 214,981 133,033 348,014 5,818 3,600 Psychology 98.22 644,598 360,679 1,005,276 6,563 3,672 Music, Gen 12.10 84, 191 40,147 124,337 6,958 3,318 Nursing 132.35 836,515 534,426 1,370,941 6,320 4,038 Comm Disorders Sci/Serv 127.75 921,028 419,742 1,340,770 7,210 3,286 Music--Gen Performance 5.95 44,388 18,793 63,181 7,460 3,159 Area/Ethnic/Cult Studies 24.40 182,881 85,450 268,331 7,495 3,502 Nur§ing, Science 58.76 387,255 285,224 672,479 6,591 4,854 Anthropology 11.60 100,109 41,764 141,873 8,630 3,600 Tchg Engl/2nd Lang 9.30 92,688 27,371 120,059 9,966 2,943 Educ/Instruct Media Design 47.05 482,071 138,475 620,546 10,246 2,943 Urban Affairs/Studies 24.20 242,832 87,129 329,961 10,034 3,600 Electrical/Comm Engineer 29.10 349,091 97,180 446,271 11,996 3,340 Info Science/Systems 1.32 17,032 6,391 23,423 12,937 4,854 Mechanical Engineer 3.70 112,670 13,321 125,991 30,451 3,600 Public Admin/Services/Other 0.39 18,756 1,894 20,649 48,082 4,854
GRADUATE TOTAL 4,397 17,910,120 15,622,314 33,532A34 4,074 3,553
9
Fully Allocated Cost Per GR
FYE 8,107 8,337 8,402 8,495 8,625 8,664 8,692 8,779 8,826 8,908 9,281 9,419
10,235 10,276 10,358 10,495 10,619 10,997 11,445 12,230 12,910 13,189 13,635 15,336 17,792 34,052 52,936
7,627
_i
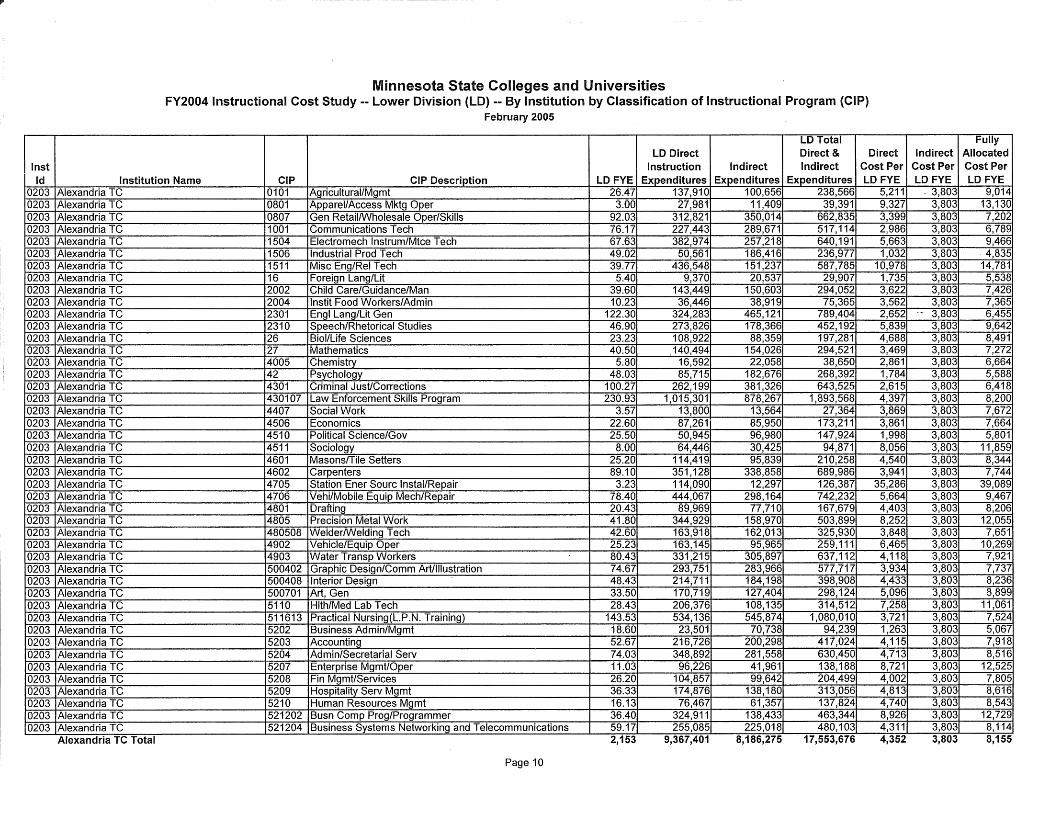
II"
Inst Id
0203 0203 0203 0203 0203 0203 0203 0203 0203 0203 0203 0203 0203 0203 0203 0203 0203 0203 0203 0203 0203 0203 0203 0203 0203 0203 0203 0203 0203 0203 0203 0203 0203 0203 0203 0203 0203 0203 0203 0203 0203 0203 0203 0203 0203
Minnesota State Colleges and Universities FY2004 Instructional Cost Study -- Lower Division (LD) -- By Institution by Classification of Instructional Program (CIP)
February 2005
LD Total LD Direct Direct & Direct
Instruction Indirect Indirect Cost Per Institution Name CIP CIP Description LO FYE Expenditures Expenditures Expenditures LD FYE
Alexandria TC 0101 Agricultural/Mgmt 26.47 137,910 100,656 238,566 5,211 Alexandria TC 0801 Apparel/Access Mktg Oper 3.00 27,981 11,409 39,391 9,327 Alexandria TC 0807 Gen Retail/Wholesale Oper/Skills 92.03 312,821 350,014 662,835 3,399 Alexandria TC 1001 Communications Tech 76.17 227,443 289,671 517,114 2,986 Alexandria TC 1504 Electromech lnstrum/Mtce Tech 67.63 382,974 257,218 640,191 5,663 Alexandria TC 1506 Industrial Prod Tech 49.02 50,561 186,416 236,977 1,032 Alexandria TC 1511 Misc Eng/Rel Tech 39.77 436,548 151,237 587,785 10,978 Alexandria TC 16 Foreign Lang/Lit 5.40 9,370 20,537 29,907 1,735 Alexandria TC 2002 Child Care/Guidance/Man 39.60 143,449 150,603 294,052 3,622 Alexandria TC 2004 lnstit Food Workers/Admin 10.23 36,446 38,919 75,365 3,562 Alexandria TC 2301 Engl Lang/Lit Gen 122.30 324,283 465,121 789,404 2,652 Alexandria TC 2310 Speech/Rhetorical Studies 46.90 273,826 178,366 452,192 5,839 Alexandria TC 26 Biol/Life Sciences 23.23 108,922 88,359 197,281 4,688 Alexandria TC 27 Mathematics 40.50 .140,494 154,026 294,521 3,469 Alexandria TC 4005 Chemistry 5.80 16,592 22,058 38,650 2,861 Alexandria TC 42 Psychology 48.03 85,715 182,676 268,392 1,784 Alexandria TC 4301 Criminal Just/Corrections 100.27 262,199 381,326 643,525 2,615 Alexandria TC 430107 Law Enforcement Skills Program 230.93 1,015,301 878,267 1,893,568 4,397 Alexandria TC 4407 Social Work 3.57 13,800 13,564 27,364 3,869 Alexandria TC 4506 Economics 22.60 87,261 85,950 173,211 3,861 Alexandria TC 4510 Political Science/Gov 25.50 50,945 96,980 147,924 1,998 Alexandria TC 4511 Sociology 8.00 64,446 30,425 94,871 8,056 Alexandria TC 4601 Masons/Tile Setters 25.20 114,419 95,839 210,258 4,540 Alexandria TC 4602 Carpenters 89.10 351,128 338,858 689,986 3,941 Alexandria TC 4705 Station Ener Sourc lnstal/Repair 3.23 114,090 12,297 126,387 35,286 Alexandria TC 4706 Vehi/Mobile Equip Mech/Repair 78.40 444,067 298,164 742,232 5,664 Alexandria TC 4801 Drafting 20.43 89,969 77,710 167,679 4,403 Alexandria TC 4805 Precision Metal Work 41.80 344,929 158,970 503,899 8,252 Alexandria TC 480508 Welder/Welding Tech 42.60 163,918 162,013 325,930 3,848 Alexandria TC 4902 Vehicle/Equip Oper 25.23 163,145 95,965 259,111 6,465 Alexandria TC 4903 Water Transp Workers 80.43 331,215 305,897 637,112 4,118 Alexandria TC 500402 Graphic Design/Comm Art/Illustration 74.67 293,751 283,966 577,717 3,934 Alexandria TC 500408 Interior Design 48.43 214,711 184,198 398,908 4,433 Alexandria TC 500701 Art, Gen 33.50 170,719 127,404 298,124 5,096 Alexandria TC 5110 Hlth/Med Lab Tech 28.43 206,376 108,135 314,512 7,258 Alexandria TC 511613 Practical Nursing(L.P.N. Training) 143.53 534,136 545,874 1,080,010 3,721 Alexandria TC 5202 Business Admin/Mgmt 18.60 23,501 70,738 94,239 1,263 Alexandria TC 5203 Accounting 52.67 216,726 200,298 417,024 4,115 Alexandria TC 5204 Admin/Secretarial Serv 74.03 348,892 281,558 630,450 4,713 Alexandria TC 5207 Enterprise Mgmt/Oper 11.03 96,226 41,961 138,188 8,721 Alexandria TC 5208 Fin Mgmt/Services 26.20 104,857 99,642 204,499 4,002 Alexandria TC 5209 Hospitality Serv Mgmt 36.33 174,876 138,180 313,056 4,813 Alexandria TC 5210 Human Resources Mgmt 16.13 76,467 61,357 137,824 4,740 Alexandria TC 521202 Busn Comp Prog/Programmer 36.40 324,911 138,433 463,344 8,926 Alexandria TC 521204 Business Systems Networking and Telecommunications 59.17 255,085 225,018 480,103 4,311 Alexandria TC Total 2,153 9,367,401 8,186,275 17,553,676 4,352
Page 10
Fully Indirect Allocated
Cost Per Cost Per LD FYE LD FYE
. 3,803 9,014 3,803 13,130 3,803 7,202 3,803 6,789 3,803 9,466 3,803 4,835 3,803 14,781 3,803 5,538 3,803 7,426 3,803 7,365
-- 3,803 6,455 3,803 9,642 3,803 8,491 3,803 7,272 3,803 6,664 3,803 5,588 3,803 6,418 3,803 8,200 3,803 7,672 3,803 7,664 3,803 5,801 3,803 11,859 3,803 8,344 3,803 7,744 3,803 39,089 3,803 9,467 3,803 8,206 3,803 12,055 3,803 7,651 3,803 10,269 3,803 7,921 3,803 7,737 3,803 8,236 3,803 8,899 3,803 11,061 3,803 7,524 3,803 5,067 3,803 7,918 3,803 8,516 3,803 12,525 3,803 7,805 3,803 8,616 3,803 8,543 3,803 12,729 3,803 8, 114 3,803 8,155
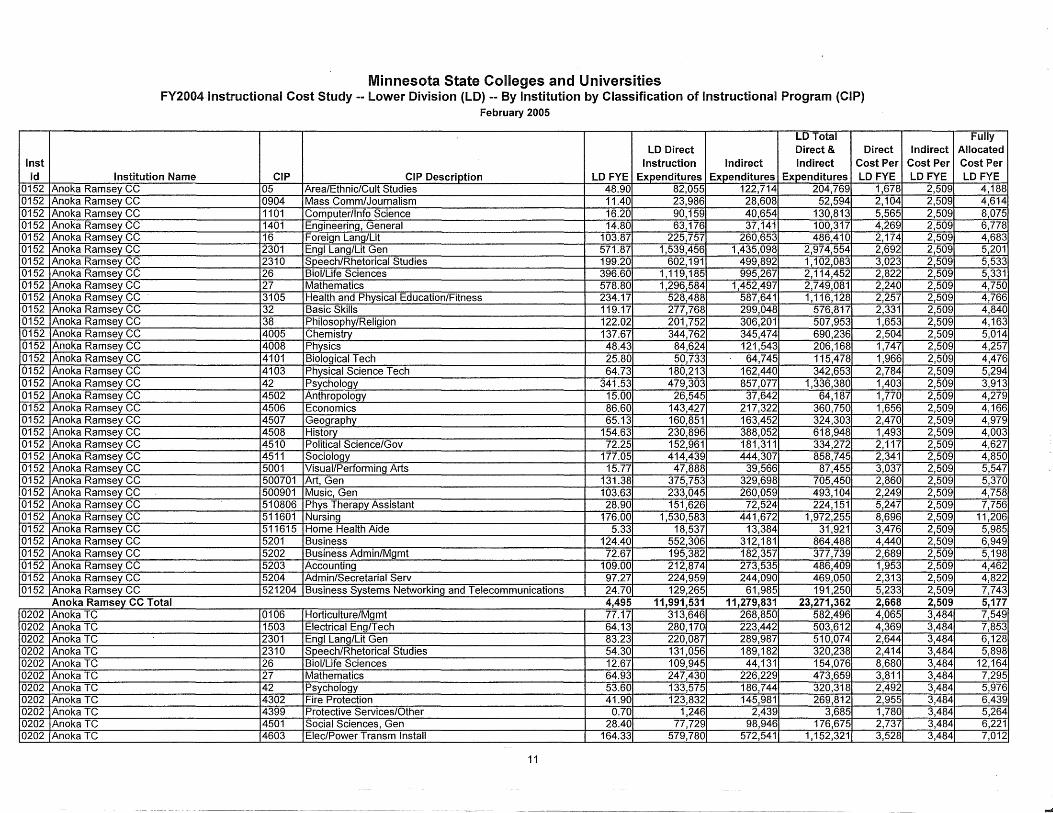
Inst Id
0152 0152 0152 0152 0152 0152 0152 0152 0152 0152 0152 0152 0152 0152 0152 0152 0152 0152 0152 0152 0152 0152 0152 0152 0152 0152 0152 0152 0152 0152 0152 0152 0152 0152
0202 0202 0202 0202 0202 0202 0202 0202 0202 0202 0202
Minnesota State Colleges and Universities FY2004·1nstructional Cost Study -- Lower Division (LD) -- By Institution by Classification of Instructional Program (CIP)
February 2005
LD Total LD Direct Direct & Direct
Instruction Indirect Indirect Cost Per Institution Name CIP CIP Description LDFYE Expenditures Expenditures Expenditures LD FYE
Anoka Ramsey CC 05 Area/Ethnic/Cult Studies 48.90 82,055 122,714 204,769 1,678 Anoka Ramsey CC 0904 Mass Comm/Journalism 11.40 23,986 28,608 52,594 2,104 Anoka Ramsey CC 1101 Computer/Info Science 16.20 90,159 40,654 130,813 5,565 Anoka Ramsey CC 1401 Engineering, General 14.80 63,176 37,141 100,317 4,269 Anoka Ramsey CC 16 Foreign Lang/Lit 103.87 225,757 260,653 486,410 2,174 Anoka Ramsey CC 2301 Engl Lang/Lit Gen 571.87 1,539,456 1,435,098 2,974,554 2,692 Anoka Ramsey CC 2310 Speech/Rhetorical Studies 199.20 602, 191 499,892 1, 102,083 3,023 Anoka Ramsey CC 26 Biol/Life Sciences 396.60 1, 119, 185 995,267 2,114,452 2,822 Anoka Ramsey CC 27 Mathematics 578.80 1,296,584 1,452,497 2,749,081 2,240 Anoka Ramsey CC 3105 Health and Physical Education/Fitness 234.17 528,488 587,641 1,116,128 2,257 Anoka Ramsey CC 32 Basic Skills 119.17 277,768 299,048 576,817 2,331 Anoka Ramsey CC 38 Philosophy/Religion 122.02 201,752 306,201 507,953 1,653 Anoka Ramsey CC 4005 Chemistry 137.67 344,762 345,474 690,236 2,504 Anoka Ramsey CC 4008 Physics 48.43 84,624 121 ,543 206,168 1,747 Anoka Ramsey CC 4101 Biological Tech 25.80 50,733 64,745 115,478 1,966 Anoka Ramsey CC 4103 Physical Science Tech 64.73 180,213 162,440 342,653 2,784 Anoka Ramsey CC 42 Psychology 341.53 479,303 857,077 1,336,380 1,403 Anoka Ramsey CC 4502 Anthropology 15.00 26,545 37,642 64,187 1,770 Anoka Ramsey CC 4506 Economics 86.60 143,427 217,322 360,750 1,656 Anoka Ramsey CC 4507 Geography 65.13 160,851 163,452 324,303 2,470 Anoka Ramsey CC 4508 History 154.63 230,896 388,052 618,948 1,493 Anoka Ramsey CC 4510 Political Science/Gov 72.25 152,961 181,311 334,272 2,117 Anoka Ramsey CC 4511 Sociology 177.05 414,439 444,307 858,745 2,341 Anoka Ramsey CC 5001 Visual/Performing Arts 15.77 47,888 39,566 87,455 3,037 Anoka Ramsey CC 500701 Art, Gen 131.38 375,753 329,698 705,450 2,860 Anoka Ramsey CC 500901 Music, Gen 103.63 233,045 260,059 493,104 2,249 Anoka Ramsey CC 510806 Phys Therapy Assistant 28.90 151 ,626 72,524 224,151 5,247 Anoka Ramsey CC 511601 Nursing 176.00 1,530,583 441,672 1,972,255 8,696 Anoka Ramsey CC 511615 Home Health Aide 5.33 18,537 13,384 31 ,921 3,476 Anoka Ramsey CC 5201 Business 124.40 552,306 312,181 864,488 4,440 Anoka Ramsey CC 5202 Business Admin/Mgmt 72.67 195,382 182,357 377,739 2,689 Anoka Ramsey CC 5203 Accounting 109.00 212,874 273,535 486,409 1,953 Anoka Ramsey CC 5204 Admin/Secretarial Serv 97.27 224,959 244,090 469,050 2,313 Anoka Ramsey CC 521204 Business Systems Networking and Telecommunications 24.70 129,265 61 ,985 191 ,250 5,233 Anoka Ramsey CC Total Anoka R CC Total 4.495 4,495 11.991.531 11,991,531 11.279.831 11,279,831 23.271.362 23,271,362 2.668 2,668 Anoka TC 0106 Horticulture/Mgmt 77.17 313,646 268,850 582,496 4,065 Anoka TC 1503 Electrical Eng/Tech 64.13 280,170 223,442 503,612 4,369 Anoka TC 2301 Engl Lang/Lit Gen 83.23 220,087 289,987 510,074 2,644 Anoka TC 2310 Speech/Rhetorical Studies 54.30 131,056 189,182 320,238 2,414 Anoka TC 26 Biol/Life Sciences 12.67 109,945 44,131 154,076 8,680 Anoka TC 27 Mathematics 64.93 247,430 226,229 473,659 3,811 Anoka TC 42 Psychology 53.60 133,575 186,744 320,318 2,492 Anoka TC 4302 Fire Protection 41.90 123,832 145,981 269,812 2,955 Anoka TC 4399 Protective Services/Other 0.70 1,246 2,439 3,685 1,780 Anoka TC 4501 Social Sciences, Gen 28.40 77,729 98,946 176,675 2,737 Anoka TC 4603 Elec/Power Transm Install 164.33 579,780 572,541 1 ,152,321 3,528
11
Fully Indirect Allocated
Cost Per Cost Per LDFYE LD FYE
2,509 4,188 2,509 4,614 2,509 8,075 2,509 6,778 2,509 4,683 2,509 5,201 2,509 5,533 2,509 5,331 2,509 4,750 2,509 4,766 2,509 4,840 2,509 4,163 2,509 5,014 2,509 4,257 2,509 4,476 2,509 5,294 2,509 3,913 2,509 4,279 2,509 4,166 2,509 4,979 2,509 4,003 2,509 4,627 2,509 4,850 2,509 5,547 2,509 5,370 2,509 4,758 2,509 7,756 2,509 11 ,206 2,509 5,985 2,509 6,949 2,509 5,198 2,509 4,462 2,509 4,822 2,509 7,743 2.509 2,509 5.177 5,177 3,484 7,549 3,484 7,853 3,484 6,128 3,484 5,898 3,484 12, 164 3,484 7,295 3,484 5,976 3,484 6,439 3,484 5,264 3,484 6,221 3,484 7,012
...ii
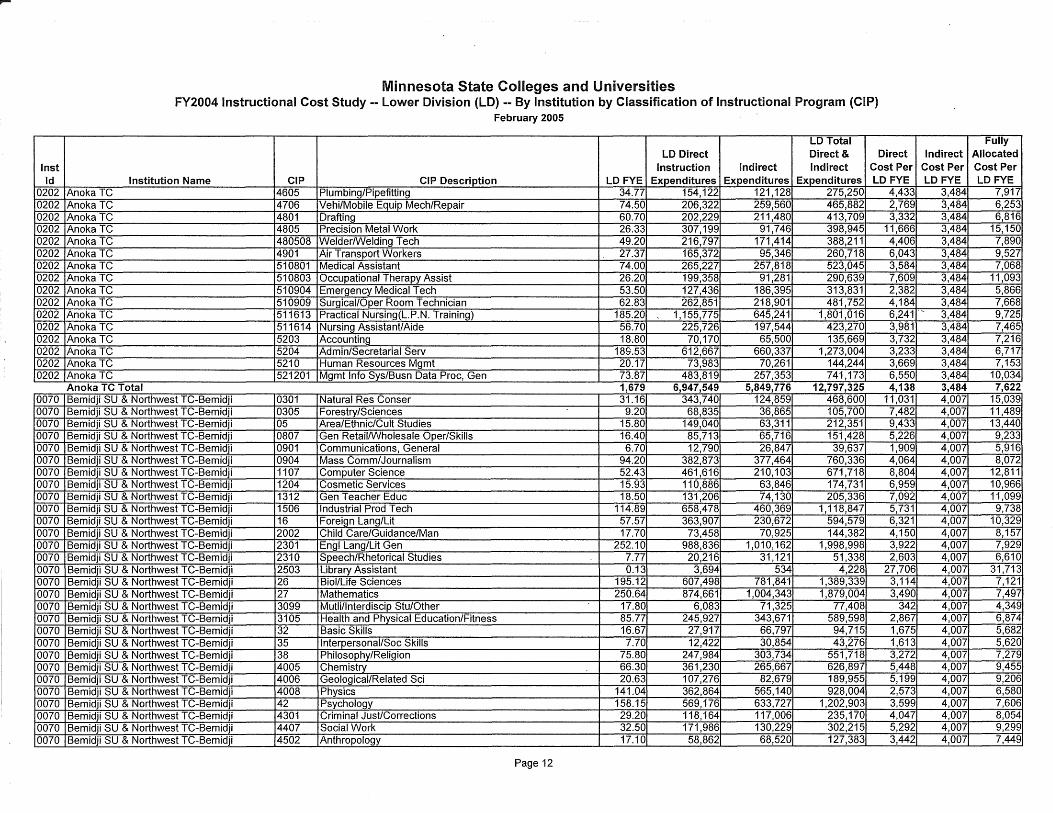
~
Inst Id
0202 0202 0202 0202 0202 0202 0202 0202 0202 0202 0202 0202 0202 0202 0202 0202
0070 0070 0070 0070 0070 0070 0070 0070 0070 0070 0070 0070 0070 0070 0070 0070 0070 0070 0070 0070 0070 0070 0070 0070 0070 0070 0070 0070 0070
Anoka TC Anoka TC Anoka TC Anoka TC Anoka TC Anoka TC Anoka TC Anoka TC Anoka TC Anoka TC
Minnesota State Colleges and Universities FY2004 Instructional Cost Study -- Lower Division (LO) -- By Institution by Classification of Instructional Program (CIP)
February 2005
LD Total LD Direct Direct & Direct
Instruction Indirect Indirect Cost Per Institution Name CIP CIP Description LDFYE Expenditures Expenditures Expenditures LD FYE
4605 Plumbing/Pipefitting 34.77 154, 122 121,128 275,250 4,433 4706 Vehi/Mobile Equip Mech/Repair 74.50 206,322 259,560 465,882 2,769 4801 Drafting 60.70 202,229 211,480 413,709 3,332 4805 Precision Metal Work 26.33 307,199 91,746 398,945 11 ,666 480508 Welder/Welding Tech 49.20 216,797 171,414 388,211 4,406 4901 Air Transport Workers 27.37 165,372 95,346 260,718 6,043 510801 Medical Assistant 74.00 265,227 257,818 523,045 3,584 510803 Occupational Therapy Assist 26.20 199,358 91 ,281 290,639 7,609 510904 Emergency Medical Tech 53.50 127,436 186,395 313,831 2,382 510909 Surgical/Oper Room Technician 62.83 262,851 218,901 481,752 4,184
Indirect Cost Per LDFYE
3,484 3,484 3,484 3,484 3,484 3,484 3,484 3,484 3,484 3,484
Anoka TC 511613 Practical Nursing(l.P.N. Training) 185.20 1,155,775 645,241 1 ,801 ,016 6,241 -- 3,484 Anoka TC 511614 Nursing Assistant/Aide 56.70 225,726 197,544 423,270 3,981 3,484 Anoka TC 5203 Accounting 18.80 70,170 65,500 135,669 3,732 3,484 Anoka TC 5204 Admin/Secretarial Serv 189.53 612,667 660,337 1,273,004 3,233 3,484 Anoka TC 5210 Human Resources Mgmt 20.17 73,983 70,261 144,244 3,669 3,484 Anoka TC 521201 Mgmt Info Sys/Busn Data Proc, Gen 73.87 483,819 257,353 741,173 6,550 3,484 Anoka TC Total 1,679 6,947,549 5,849,776 12,797,325 4,138 3,484 Bemidji SU & Northwest TC-Bemidji 0301 Natural Res Conser 31.16 343,740 124,859 468,600 11,031 4,007 Bemidji SU & Northwest TC-Bemidji 0305 Forestry/Sciences 9.20 68,835 36,865 105,700 7,482 4,007 Bemidji SU & Northwest TC-Bemidji 05 Area/Ethnic/Cult Studies 15.80 149,040 63,311 212,351 9,433 4,007 Bemidji SU & Northwest TC-Bemidji 0807 Gen Retail/Wholesale Oper/Skills 16.40 85,713 65,716 151,428 5,226 4,007 Bemidji SU & Northwest TC-Bemidji 0901 Communications, General 6.70 12,790 26,847 39,637 1,909 4,007 Bemidji SU & Northwest TC-Bemidji 0904 Mass Comm/Journalism 94.20 382,873 377,464 760,336 4,064 4,007 Bemidji SU & Northwest TC-Bemidji 1107 Computer Science 52.43 461,616 210,103 671 ,718 8,804 4,007 Bemidji SU & Northwest TC-Bemidji 1204 Cosmetic Services 15.93 110,886 63,846 174,731 6,959 4,007 Bemidji SU & Northwest TC-Bemidji 1312 Gen Teacher Educ 18.50 131 ,206 74,130 205,336 7,092 4,007 Bemidji SU & Northwest TC-Bemidji 1506 Industrial Prod Tech 114.89 658,478 460,369 1,118,847 5,731 4,007 Bemidji SU & Northwest TC-Bemidji 16 Foreign Lang/Lit 57.57 363,907 230,672 594,579 6,321 4,007 Bemidji SU & Northwest TC-Bemidji 2002 Child Care/Guidance/Man 17.70 73,458 70,925 144,382 4,150 4,007 Bemidji SU & Northwest TC-Bemidji 2301 Engl Lang/Lit Gen 252.10 988,836 1,010,162 1,998,998 3,922 4,007 Bemidji SU & Northwest TC-Bemidji 2310 Speech/Rhetorical Studies 7.77 20,216 31,121 51,338 2,603 4,007 Bemidji SU & Northwest TC-Bemidji 2503 Library Assistant 0.13 3,694 534 4,228 27,706 4,007 Bemidji SU & Northwest TC-Bemidji 26 Biol/Life Sciences 195.12 607,498 781,841 1,389,339 3,114 4,007 Bemidji SU & Northwest TC-Bemidji 27 Mathematics 250.64 874,661 1,004,343 1,879,004 3,490 4,007 Bemidji SU & Northwest TC-Bemidji 3099 Mutli/lnterdiscip Stu/Other 17.80 6,083 71,325 77,408 342 4,007 Bemidji SU & Northwest TC-Bemidji 3105 Health and Physical Education/Fitness 85.77 245,927 343,671 589,598 2,867 4,007 Bemidji SU & Northwest TC-Bemidji 32 Basic Skills 16.67 27,917 66,797 94,715 1,675 4,007 Bemidji SU & Northwest TC-Bemidji 35 Interpersonal/Soc Skills 7.70 12,422 30,854 43,276 1,613 4,007 Bemidji SU & Northwest TC-Bemidji 38 Philosophy/Religion 75.80 247,984 303,734 551,718 3,272 4,007 Bemidji SU & Northwest TC-Bemidji 4005 Chemistry 66.30 361,230 265,667 626,897 5,448 4,007 Bemidji SU & Northwest TC-Bemidji 4006 Geological/Related Sci 20.63 107,276 82,679 189,955 5,199 4,007 Bemidji SU & Northwest TC-Bemidji 4008 Physics 141.04 362,864 565,140 928,004 2,573 4,007 Bemidji SU & Northwest TC-Bemidji 42 Psychology 158.15 569,176 633,727 1,202,903 3,599 4,007 Bemidji SU & Northwest TC-Bemidji 4301 Criminal Just/Corrections 29.20 118, 164 117,006 235,170 4,047 4,007 Bemidji SU & Northwest TC-Bemidji 4407 Social Work 32.50 171,986 130,229 302,215 5,292 4,007 Bemidji SU & Northwest TC-Bemidji 4502 Anthropology 17.10 58,862 68,520 127,383 3,442 4,007
Page 12
Fully Allocated Cost Per LDFYE
7,917 6,253 6,816
15, 150 7,890 9,527 7,068
11,093 5,866 7,668 9,725 7,465 7,216 6,717 7,153
10,034 7,622
15,039 11,489 13,440 9,233 5,916 8,072
12,811 10,966 11,099 9,738
10,329 8,157 7,929 6,610
31,713 7,121 7,497 4,349 6,874 5,682 5,620 7,279 9,455 9,206 6,580 7,606 8,054 9,299 7,449
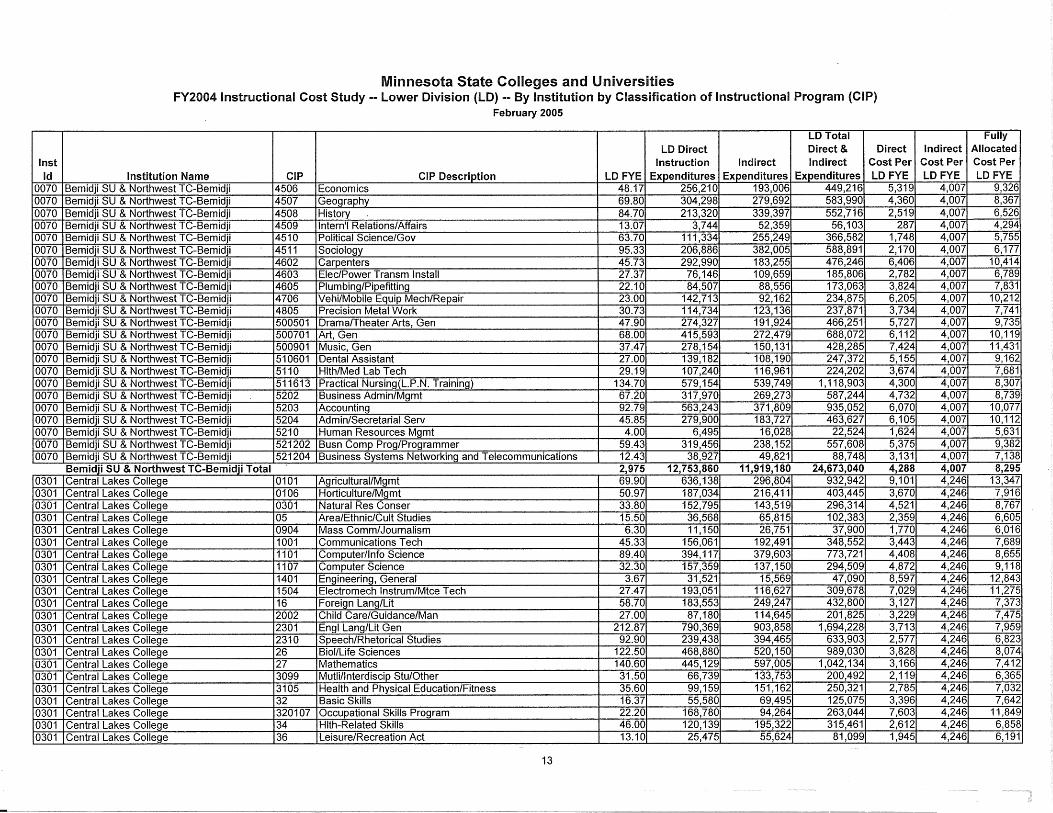
Inst Id
0070 0070 0070 0070 0070 0070 0070 0070 0070 0070 0070 0070 0070 0070 0070 0070 0070 0070 0070 0070 0070 0070 0070
0301 0301 0301 0301 0301 0301 0301 0301 0301 0301 0301 0301 0301 0301 0301 0301 0301 0301 0301 0301 0301 0301
Minnesota State Colleges and Universities FY2004 Instructional Cost Study -- Lower Division (LD) -- By Institution by Classification of Instructional Program (CIP)
February 2005
Institution Name CIP CIP Description Bemidji SU & Northwest TC-Bemidji 4506 Economics Bemidji SU & Northwest TC-Bemidji 4507 Geography Bemidji SU & Northwest TC-Bemidji 4508 History Bemidji SU & Northwest TC-Bemidji 4509 Intern'! Relations/Affairs Bemidji SU & Northwest TC-Bemidji 4510 Political Science/Gov Bemidji SU & Northwest TC-Bemidji 4511 Sociology Bemidji SU & Northwest TC-Bemidji 4602 Carpenters Bemidji SU & Northwest TC-Bemidji 4603 Elec/Power Transm Install Bemidji SU & Northwest TC-Bemidji 4605 Plumbing/Pipefitting Bemidji SU & Northwest TC-Bemidji 4706 Vehi/Mobile Equip Mech/Repair Bemidji SU & Northwest TC-Bemidji 4805 Precision Metal Work Bemidji SU & Northwest TC-Bemidji 500501 Drama/Theater Arts, Gen Bemidji SU & Northwest TC-Bemidji 500701 Art, Gen Bemidji SU & Northwest TC-Bemidji 500901 Music, Gen Bemidji SU & Northwest TC-Bemidji 510601 Dental Assistant Bemidji SU & Northwest TC-Bemidji 5110 Hlth/Med Lab Tech Bemidji SU & Northwest TC-Bemidji 511613 Practical Nursing(L.P.N. Training) Bemidji SU & Northwest TC-Bemidji 5202 Business Admin/Mgmt Bemidji SU & Northwest TC-Bemidji 5203 Accounting Bemidji SU & Northwest TC-Bemidji 5204 Admin/Secretarial Serv Bemidji SU & Northwest TC-Bemidji 5210 Human Resources Mgmt Bemidji SU & Northwest TC-Bemidji 521202 Busn Comp Prag/Programmer Bemidji SU & Northwest TC-Bemidji 521204 Business Systems Networking and Telecommunications Bemidji SU & Northwest TC-Bemidji Total Central Lakes College 10101 Agricultural/Mgmt Central Lakes College I 0106 Horticulture/Mgmt Central Lakes College 10301 Natural Res Conser Central Lakes College I 05 Area/Ethnic/Cult Studies Central Lakes College I 0904 Mass Comm/Journalism Central Lakes College 11001 Communications Tech Central Lakes College 11101 Computer/Info Science Central Lakes College 11107 Computer Science Central Lakes College 11401 Engineering, General Central Lakes College 11504 Electromech lnstrum/Mtce Tech Central Lakes College 116 Foreign Lang/Lit Central Lakes College 12002 Child Care/Guidance/Man Central Lakes College 12301 Engl Lang/Lit Gen Central Lakes College 1231 O Speech/Rhetorical Studies Central Lakes College 126 Biol/Life Sciences Central Lakes College 127 Mathematics Central Lakes College 13099 Mutli/lnterdiscip Stu/Other Central Lakes College 13105 Health and Physical Education/Fitness Central Lakes College 132 Basic Skills Central Lakes College 1320107 Occupational Skills Program Central Lakes College 134 Hlth-Related Skills Central Lakes College I 36 Leisure/Recreation Act
13
LD Direct Instruction
LD FYE I Expenditures 48.17 256,210 69.80 304,298 84.70 213,320 13.07 3,744 63.70 111,334 95.33 206,886 45.73 292,990 27.37 76,146 22.10 84,507 23.00 142,713 30.73 114,734 47.90 274,327 68.00 415,593 37.47 278,154 27.00 139,182 29.19 107,240
134.70 579,154 67.20 317,970 92.79 563,243 45.85 279,900
4.00 6,495 59.43 319,456 12.43 38,927 2,975 12,753,860 69.90 636,138 50.97 187,034 33.80 152,795 15.50 36,568 6.30 11, 150
45.33 156,061 89.40 394, 117 32.30 157,359
3.67 31,521 27.47 193,051 58.70 183,553 27.00 87,180
212.87 790,369 92.90 239,438
122.50 468,880 140.60 445,129 31.50 66,739 35.60 99,159 16.37 55,580 22.20 168,780 46.00 120,139 13.10 25,475
LD Total Direct &
Indirect I Indirect Expenditures Expenditures
193,0061 449,216 279,6921 583,990 339,3971 552,716
52,3591 56, 103 255,2491 366,582 382,0051 588,891 183,2551 476,246 109,6591 185,806
88,5561 173,063 92, 1621 234,875
123,1361 237,871 191,9241 466,251 272,4791 688,072 150,1311 428,285 108,1901 247,372 116,9611 224,202 539,7491 1, 118,903 269,2731 587,244 371,8091 935,052 183,7271 463,627
16,0281 22,524 238,1521 557,608
49,8211 88,748 11,919,180 24,673,040
296,804 932,942 216,411 403,445 143,519 296,314 65,815 102,383 26,751 37,900
192,491 348,552 379,603 773,721 137,150 294,509
15,569 47,090 116,627 309,678 249,247 432,800 114,645 201,825 903,858 1,694,228 394,465 633,903 520,150 989,030 597,005 1,042,134 133,753 200,492 151,162 250,321 69,495 125,075 94,264 263,044
195,322 315,461 55,624 81,099
Direct Cost Per LD FYE
5,319 4,360 2,519
287 1,748 2,170 6,406 2,782 3,824 6,205 3,734 5,727 6,112 7,424 5,155 3,674 4,300 4,732 6,070 6,105 1,624 5,375 3,131 4,288 9,101 3,670 4,521 2,359 1,770 3,443 4,408 4,872 8,597 7,029 3,127 3,229 3,713 2,577 3,828 3,166 2, 119 2,785 3,396 7,603 2,612 1,945
Fully Indirect I Allocated
Cost Per LD FYE
4,007 4,007 4,007 4,007 4,007 4,007 4,007 4,007 4,007 4,007 4,007 4,007 4,007 4,007 4,007 4,007 4,007 4,007 4,007 4,007 4,007 4,007 4,007 4,007 4,246 4,246 4,246 4,246 4,246 4,246 4,246 4,246 4,246 4,246 4,246 4,246 4,246 4,246 4,246 4,246 4,246 4,246 4,246 4,246 4,246 4,246
Cost Per LD FYE
9,326 8,367 6,526 4,294 5,755 6,177
10,414 6,789 7,831
10,212 7,741 9,735
10,119 11,431 9,162 7,681 8,307 8,739
10,077 10, 112 5,631 9,382 7,138 8,295
13,347 7,916 8,767 6,605 6,016 7,689 8,655 9, 118
12,843 11,275 7,373 7,475 7,959 6,823 8,074 7,412 6,365 7,032 7,642
11,849 6,858 6, 191
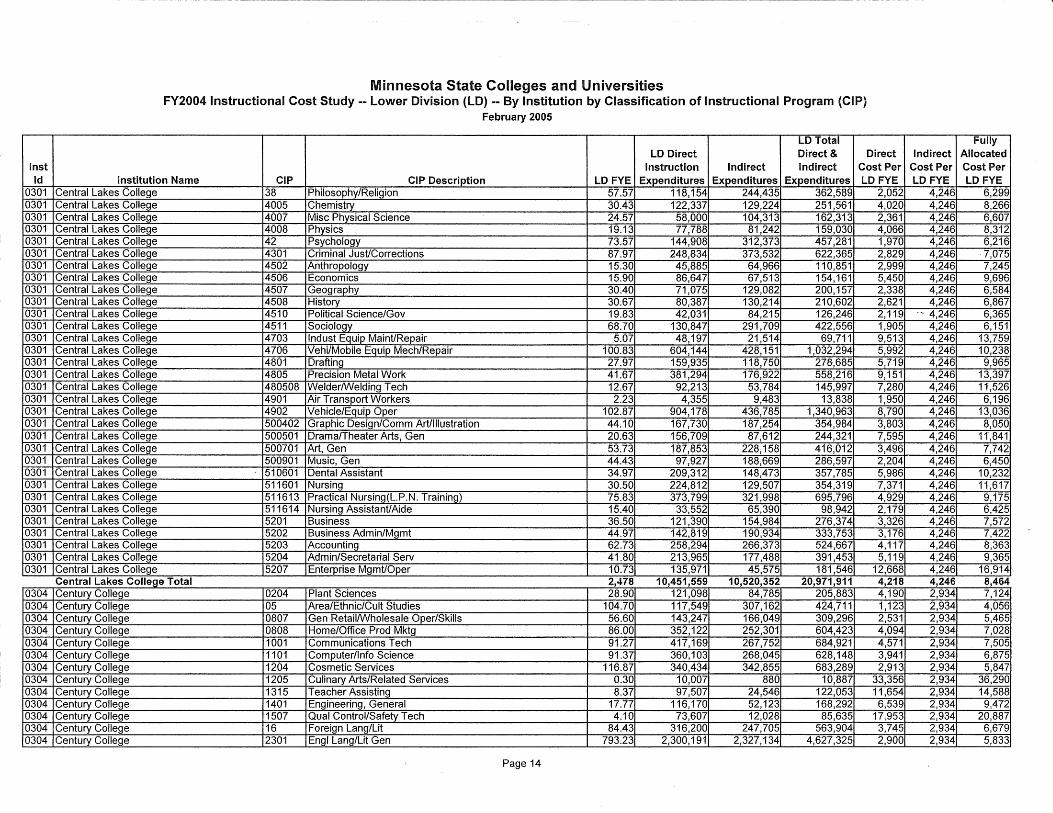
Inst Id
0301 0301 0301 0301 0301 0301 0301 0301 0301 0301 0301 0301 0301 0301 0301 0301 0301 0301 0301 0301 0301 0301 0301 0301 0301 0301 0301 0301 0301 0301 0301 0301
0304 0304 0304 0304 0304 0304 0304 0304 0304 0304 0304 0304 0304
Minnesota State Colleges and Universities FY2004 Instructional Cost Study -- Lower Division (LD) -- By Institution by Classification of Instructional Program (CIP)
February 2005
LD Total LD Direct Direct & Direct
Instruction Indirect Indirect Cost Per Institution Name CIP CIP Description LD FYE Expenditures Expenditures Expenditures LD FYE
Central Lakes College 38 Philosophy/Religion 57.57 118, 154 244,435 362,589 2,052 Central Lakes College 4005 Chemistry 30.43 122,337 129,224 251,561 4,020 Central Lakes College 4007 Misc Physical Science 24.57 58,000 104,313 162,313 2,361 Central Lakes College 4008 Physics 19.13 77,788 81,242 159,030 4,066 Central Lakes College 42 Psychology 73.57 144,908 312,373 457,281 1,970 Central Lakes College 4301 Criminal Just/Corrections 87.97 248,834 373,532 622,365 2,829 Central Lakes College 4502 Anthropology 15.30 45,885 64,966 110,851 2,999 Central Lakes College 4506 Economics 15.90 86,647 67,513 154,161 5,450 Central Lakes College 4507 Geography 30.40 71,075 129,082 200,157 2,338 Central Lakes College 4508 History 30.67 80,387 130,214 210,602 2,621 Central Lakes College 4510 Political Science/Gov 19.83 42,031 84,215 126,246 2,119 Central Lakes College 4511 Sociology 68.70 130,847 291,709 422,556 1,905 Central Lakes College 4703 lndust Equip Maint/Repair 5.07 48,197 21,514 69,711 9,513 Central Lakes College 4706 Vehi/Mobile Equip Mech/Repair 100.83 604,144 428,151 1,032,294 5,992 Central Lakes College 4801 Drafting 27.97 159,935 118,750 278-,685 5,719 Central Lakes College 4805 Precision Metal Work 41.67 381,294 176,922 558,216 9, 151 Central Lakes College 480508 Welder/Welding Tech 12.67 92,213 53,784 145,997 7,280 Central Lakes College 4901 Air Transport Workers 2.23 4,355 9,483 13,838 1,950 Central Lakes College 4902 Vehicle/Equip Oper 102.87 904,178 436,785 1,340,963 8,790 Central Lakes College 500402 Graphic Design/Comm Art/Illustration 44.10 167,730 187,254 354,984 3,803 Central Lakes College 500501 Drama/Theater Arts, Gen 20.63 156,709 87,612 244,321 7,595 Central Lakes College 500701 Art, Gen 53.73 187,853 228,158 416,012 3,496 Central Lakes College 500901 Music, Gen 44.43 97,927 188,669 286,597 2,204 Central Lakes College . 510601 Dental Assistant 34.97 209,312 148,473 357,785 5,986 Central Lakes College 511601 Nursing 30.50 224,812 129,507 354,319 7,371 Central Lakes College 511613 Practical Nursing(L.P.N. Training) 75.83 373,799 321,998 695,796 4,929 Central Lakes College 511614 Nursing Assistant/Aide 15.40 33,552 65,390 98,942 2,179 Central Lakes College 5201 Business 36.50 121,390 154,984 276,374 3,326 Central Lakes College 5202 Business Admin/Mgmt 44.97 142,819 190,934 333,753 3,176 Central Lakes College 5203 Accounting 62.73 258,294 266,373 524,667 4,117 Central Lakes College 5204 Admin/Secretarial Serv 41.80 213,965 177,488 391,453 5,119 Central Lakes College 5207 Enterprise Mgmt/Oper 10.73 135,971 45,575 181,546 12,668 Central Lakes College Total Central Lakes Coll T 2.47 2,478 10,451,559 10,520,352 10.451.559 10.520.352 20.971.911 20,971,911 4.218 4,218 Century College 0204 Plant Sciences 28.90 121,098 84,785 205,883 4,190 Century College 05 Area/Ethnic/Cult Studies 104.70 117,549 307,162 424,711 1,123 Century College 0807 Gen Retail/Wholesale Oper/Skills 56.60 143,247 166,049 309,296 2,531 Century College 0808 Home/Office Prod Mktg 86.00 352,122 252,301 604,423 4,094 Century College 1001 Communications Tech 91.27 417, 169 267,752 684,921 4,571 Century College 1101 Computer/Info Science 91.37 360,103 268,045 628,148 3,941 Century College 1204 Cosmetic Services 116.87 340,434 342,855 683,289 2,913 Century College 1205 Culinary Arts/Related Services 0.30 10,007 880 10,887 33,356 Century College 1315 Teacher Assisting 8.37 97,507 24,546 122,053 11,654 Century College 1401 Engineering, General 17.77 116,170 52,123 168,292 6,539 Century College 1507 Qual Control/Safety Tech 4.10 73,607 12,028 85,635 17,953 Century College 16 Foreign Lang/Lit 84.43 316,200 247,705 563,904 3,745 Century College 2301 Engl Lang/Lit Gen 793.23 2,300, 191 2,327,134 4,627,325 2,900
Page 14
Fully Indirect Allocated
Cost Per Cost Per LDFYE LDFYE
4,246 6,299 4,246 8,266 4,246 6,607 4,246 8,312 4,246 6,216 4,246 7,075 4,246 7,245 4,246 9,696 4,246 6,584 4,246 6,867
-- 4,246 6,365 4,246 6, 151 4,246 13,759 4,246 10,238 4,246 9,965 4,246 13,397 4,246 11,526 4,246 6,196 4,246 13,036 4,246 8,050 4,246 11,841 4,246 7,742 4,246 6,450 4,246 10,232 4,246 11,617 4,246 9,175 4,246 6,425 4,246 7,572 4,246 7,422 4,246 8,363 4,246 9,365 4,246 16,914 4.246 4,246 8.464 8,464 2,934 7,124 2,934 4,056 2,934 5,465 2,934 7,028 2,934 7,505 2,934 6,875 2,934 5,847 2,934 36,290 2,934 14,588 2,934 9,472 2,934 20,887 2,934 6,679 2,934 5,833
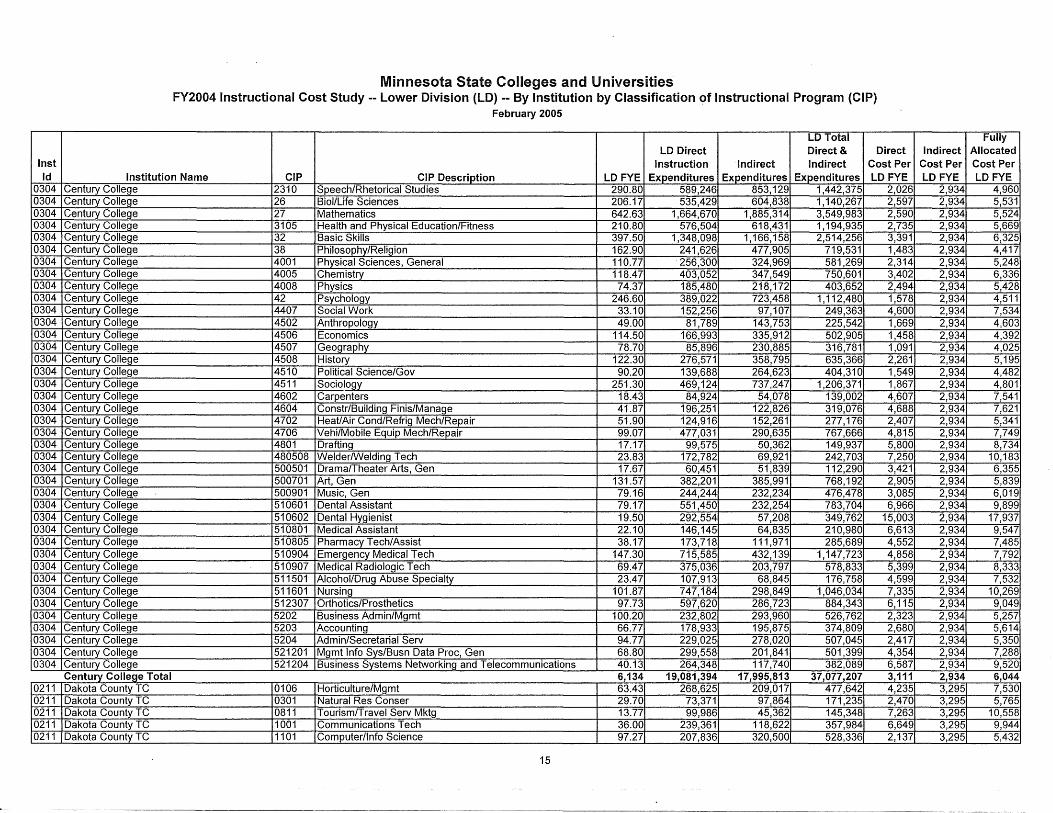
Inst Id
0304 0304 0304 0304 0304 0304 0304 0304 0304 0304 0304 0304 0304 0304 0304 0304 0304 0304 0304 0304 0304 0304 0304 0304 0304 0304 0304 0304 0304 0304 0304 0304 0304 0304 0304 0304 0304 0304 0304 0304
0211 0211 0211 0211 0211
Minnesota State Colleges and Universities FY2004 Instructional Cost Study -- Lower Division (LD) -- By Institution by Classification of Instructional Program (CIP)
February 2005
LD Total LD Direct Direct & Direct
Instruction Indirect Indirect Cost Per Institution Name CIP CIP Description LO FYE Expenditures Expenditures Expenditures LDFYE
Century College 2310 Speech/Rhetorical Studies 290.80 589,246 853,129 1,442,375 2,026 Century College 26 Biol/Life Sciences 206.17 535,429 604,838 1,140,267 2,597 Century College 27 Mathematics 642.63 1,664,670 1,885,314 3,549,983 2,590 Century College 3105 Health and Physical Education/Fitness 210.80 576,504 618,431 1,194,935 2,735 Century College 32 Basic Skills 397.50 1,348,098 1,166,158 2,514,256 3,391 Century College 38 Philosophy/Religion 162.90 241,626 477,905 719,531 1,483 Century College 4001 Physical Sciences, General 110.77 . 256,300 324,969 581,269 2,314 Century College 4005 Chemistry 118.47 403,052 347,549 750,601 3,402 Century College 4008 Physics 74.37 185,480 218,172 403,652 2,494 Century College 42 Psychology 246.60 389,022 723,458 1, 112,480 1,578 Century College 4407 Social Work 33.10 152,256 97,107 249,363 4,600 Century College 4502 Anthropology 49.00 81,789 143,753 225,542 1,669 Century College 4506 Economics 114.50 166,993 335,912 502,905 1,458 Century College 4507 Geography 78.70 85,896 230,885 316,781 1,091 Century College 4508 History 122.30 276,571 358,795 635,366 2,261 Century College 4510 Political Science/Gov 90.20 139,688 264,623 404,310 1,549 Century College 4511 Sociology 251.30 469,124 737,247 1,206,371 1,867 Century College 4602 Carpenters 18.43 84,924 54,078 139,002 4,607 Century College 4604 Constr/Building Finis/Manage 41.87 196,251 122,826 319,076 4,688 Century College 4702 Heat/Air Cond/Refrig Mech/Repair 51.90 124,916 152,261 277, 176 2,407 Century College 4706 Vehi/Mobile Equip Mech/Repair 99.07 477,031 290,635 767,666 4,815 Century College 4801 Drafting 17.17 99,575 50,362 149,937 5,800 Century College 480508 Welder/Welding Tech 23.83 172,782 69,921 242,703 7,250 Century College 500501 Drama/Theater Arts, Gen 17.67 60,451 51,839 112,290 3,421 Century College 500701 Art, Gen 131.57 382,201 385,991 768,192 2,905 Century ColleQ.e 500901 Music, Gen 79.16 244,244 232,234 476,478 3,085 Century College 510601 Dental Assistant 79.17 551,450 232,254 783,704 6,966 Century College 510602 Dental Hygienist 19.50 292,554 57,208 349,762 15,003 Century College 510801 Medical Assistant 22.10 146, 145 64,835 210,980 6,613 Century College 510805 Pharmacy Tech/Assist 38.17 173,718 111,971 285,689 4,552 Century College 510904 Emergency Medical Tech 147.30 715,585 432,139 1, 147,723 4,858 Century College 510907 Medical Radiologic Tech 69.47 375,036 203,797 578,833 5,399 Century College 511501 Alcohol/Drug Abuse Specialty 23.47 107,913 68,845 176,758 4,599 Century College 511601 Nursing 101.87 747,184 298,849 1,046,034 7,335 Century College 512307 Orthotics/Prosthetics 97.73 597,620 286,723 884,343 6, 115 Century College 5202 Business Admin/Mgmt 100.20 232,802 293,960 526,762 2,323 Century College 5203 Accounting 66.77 178,933 195,875 374,809 2,680 Century College 5204 Admin/Secretarial Serv 94.77 229,025 278,020 507,045 2,417 Century College 521201 Mgmt Info Sys/Busn Data Proc, Gen 68.80 299,558 201,841 501,399 4,354 Century College 521204 Business Systems Networking and Telecommunications 40.13 264,348 117,740 382,089 6,587 Century College Total c Coll Total 6.134 6,134 19.081.3 19,081,394 17.995.813 17,995,813 37.077.207 37,077,207 3.111 3,111 Dakota County TC 0106 Horticulture/Mgmt 63.43 268,625 209,017 477,642 4,235 Dakota County TC 0301 Natural Res Conser 29.70 73,371 97,864 171,235 2,470 Dakota County TC 0811 Tourism/Travel Serv Mktg 13.77 99,986 45,362 145,348 7,263 Dakota County TC 1001 Communications Tech 36.00 239,361 118,622 357,984 6,649 Dakota County TC 1101 Computer/Info Science 97.27 207,836 320,500 528,336 2,137
15
Fully Indirect Allocated
Cost Per Cost Per LO FYE LD FYE
2,934 4,960 2,934 5,531 2,934 5,524 2,934 5,669 2,934 6,325 2,934 4,417 2,934 5,248 2,934 6,336 2,934 5,428 2,934 4,511 2,934 7,534 2,934 4,603 2,934 4,392 2,934 4,025 2,934 5,195 2,934 4,482 2,934 4,801 2,934 7,541 2,934 7,621 2,934 5,341 2,934 7,749 2,934 8,734 2,934 10,183 2,934 6,355 2,934 5,839 2,934 6,019 2,934 9,899 2,934 17,937 2,934 9,547 2,934 7,485 2,934 7,792 2,934 8,333 2,934 7,532 2,934 10,269 2,934 9,049 2,934 5,257 2,934 5,614 2,934 5,350 2,934 7,288 2,934 9,520 2,934 6.044 6,044 3,295 7,530 3,295 5,765 3,295 10,558 3,295 9,944 3,295 5,432
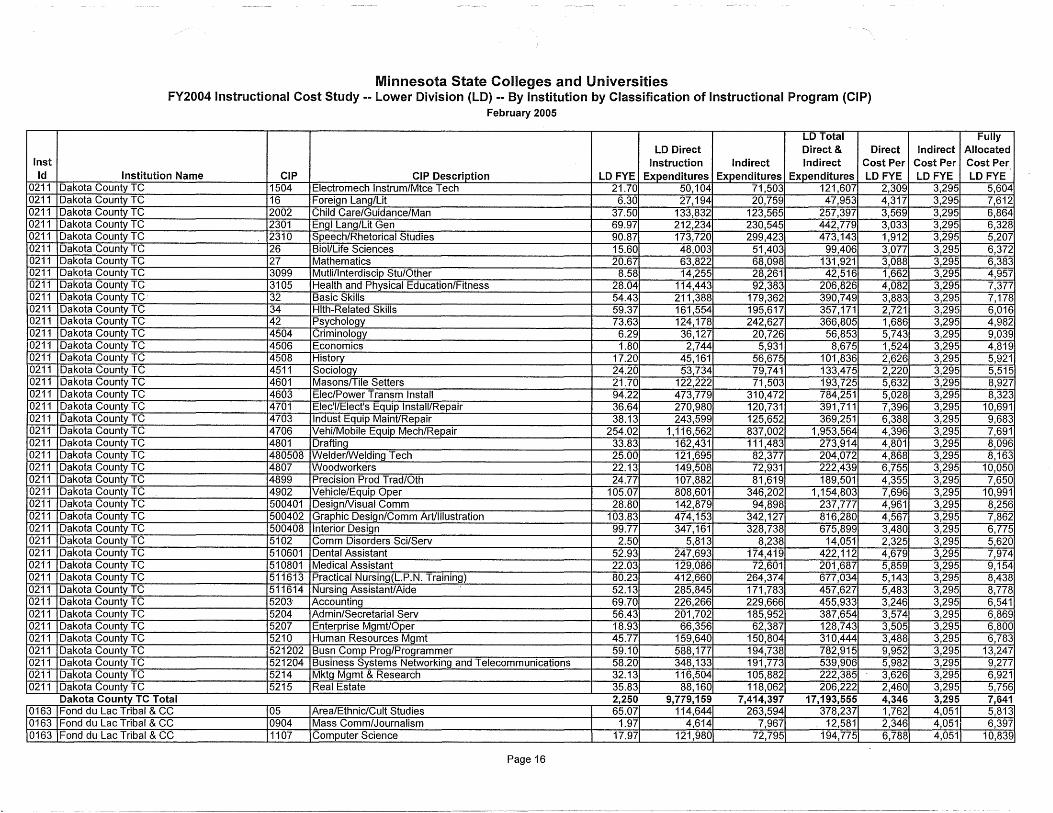
Minnesota State Colleges and Universities FY2004 Instructional Cost Study -- Lower Division (LD) -- By Institution by Classification of Instructional Program (CIP)
February 2005
LD Total LD Direct Direct & Direct
Inst Instruction Indirect Indirect Cost Per Id Institution Name CIP CIP Description LD FYE Expenditures Expenditures Expenditures LD FYE
0211 Dakota County TC 1504 Electromech lnstrum/Mtce Tech 21.70 50,104 71,503 121,607 2,309 0211 Dakota County TC 16 Foreign Lang/Lit 6.30 27,194 20,759 47,953 4,317 0211 Dakota County TC 2002 Child Care/Guidance/Man 37.50 133,832 123,565 257,397 3,569 0211 Dakota County TC 2301 Engl Lang/Lit Gen 69.97 212,234 230,545 442,779 3,033 0211 Dakota County TC 2310 Speech/Rhetorical Studies 90.87 173,720 299,423 473,143 1,912 0211 Dakota County TC 26 Biol/Life Sciences 15.60 48,003 51,403 99,406 3,077 0211 Dakota County TC 27 Mathematics 20.67 63,822 68,098 131,921 3,088 0211 Dakota County TC 3099 Mutli/lnterdiscip Stu/Other 8.58 14,255 28,261 42,516 1,662 0211 Dakota County TC 3105 Health and Physical Education/Fitness 28.04 114,443 92,383 206,826 4,082 0211 Dakota County TC· 32 Basic Skills 54.43 211,388 179,362 390,749 3,883 0211 Dakota County TC 34 Hlth-Related Skills 59.37 161,554 195,617 357,171 2,721 0211 Dakota County TC 42 Psychology 73.63 124,178 242,627 366,805 1,686 0211 Dakota County TC 4504 Criminology 6.29 36,127 20,726 56,853 5,743 0211 Dakota County TC 4506 Economics 1.80 2,744 5,931 8,675 1,524 0211 Dakota County TC 4508 History 17.20 45, 161 56,675 101,836 2,626 0211 Dakota County TC 4511 Sociology 24.20 53,734 79,741 133,475 2,220 0211 Dakota County TC 4601 Masons/Tile Setters 21.70 122,222 71,503 193,725 5,632 0211 Dakota County TC 4603 Elec/Power Transm Install 94.22 473,779 310,472 784,251 5,028 0211 Dakota County TC 4701 Elec'l/Elect's Equip Install/Repair 36.64 270,980 120,731 391,711 7,396 0211 Dakota County TC 4703 lndust Equip Maint/Repair 38.13 243,599 125,652 369,251 6,388 0211 Dakota County TC 4706 Vehi/Mobile Equip Mech/Repair 254.02 1, 116,562 837,002 1,953,564 4,396 0211 Dakota County TC 4801 Drafting 33.83 162,431 111,483 273,914 4,801 0211 Dakota County TC 480508 Welder/Welding Tech 25.00 121,695 82,377 204,072 4,868 0211 Dakota County TC 4807 Woodworkers 22.13 149,508 72,931 222,439 6,755 0211 Dakota County TC 4899 Precision Prod Trad/0th 24.77 107,882 81,619 189,501 4,355 0211 Dakota County TC 4902 Vehicle/Equip Oper 105.07 808,601 346,202 1,154,803 7,696 0211 Dakota County TC 500401 DesignNisual Comm 28".80 142,879 94,898 237,777 4,961 0211 Dakota County TC 500402 Graphic Design/Comm Art/Illustration 103.83 474,153 342,127 816,280 4,567 0211 Dakota County TC 500408 Interior Design 99.77 347, 161 328,738 675,899 3,480 0211 Dakota County TC 5102 Comm Disorders Sci/Serv 2.50 5,813 8,238 14,051 2,325 0211 Dakota County TC 510601 Dental Assistant 52.93 247,693 174,419 422, 112 4,679 0211 Dakota County TC 510801 Medical Assistant 22.03 129,086 72,601 201,687 5,859 0211 Dakota County TC 511613 Practical Nursing(L.P.N. Training) 80.23 412,660 264,374 677,034 5,143 0211 Dakota County TC 511614 Nursing Assistant/Aide 52.13 285,845 171,783 457,627 5,483 0211 Dakota County TC 5203· Accounting 69.70 226,266 229,666 455,933 3,246 0211 Dakota County TC 5204 Admin/Secretarial Serv 56.43 201,702 185,952 387,654 3,574 0211 Dakota County TC 5207 Enterprise Mgmt/Oper 18.93 66,356 62,387 128,743 3,505 0211 Dakota County TC 5210 Human Resources Mgmt 45.77 159,640 150,804 310,444 3,488 0211 Dakota County TC 521202 Busn Comp Prog/Programmer 59.10 588,177 194,738 782,915 9,952 0211 Dakota County TC 521204 Business Systems Networking and Telecommunications 58.20 348,133 191,773 539,906 5,982 0211 Dakota County TC 5214 Mktg Mgmt & Research 32.13 116,504 105,882 222,385 3,626 0211 Dakota County TC 5215 Real Estate 35.83 88,160 118,062 206,222 2,460
Dakota Countv TC Total 2,250 9,779,159 7,414,397 17,193,555 4,346 0163 I Fond du Lac Tribal & CC 05 Area/Ethnic/Cult Studies 65.07 114,644 263,594 378,237 1,762 0163 I Fond du Lac Tribal & CC 0904 Mass Comm/Journalism 1.97 4,614 7,967 12,581 2,346 0163 I Fond du Lac Tribal & CC 1107 Computer Science 17.97 121,980 72,795 194,775 6,788
Page 16
Fully Indirect Allocated
Cost Per Cost Per LD FYE LD FYE
3,295 5,604 3,295 7,612 3,295 6,864 3,295 6,328 3,295 5,207 3,295 6,372 3,295 6,383 3,295 4,957 3,295 7,377 3,295 7,178 3,295 6,016 3,295 4,982 3,295 9,039 3,295 4,819 3,295 5,921 3,295 5,515 3,295 8,927 3,295 8,323 3,295 10,691 3,295 9,683 3,295 7,691 3,295 8,096 3,295 8,163 3,295 10,050 3,295 7,650 3,295 101991 3,295 8,256 3,295 7,862 3,295 6,775 3,295 5,620 3,295 7,974 3,295 9,154 3,295 8,438 3,295 8,778 3,295 6,541 3,295 6,869 3,295 6,800 3,295 6,783 3,295 13,247 3,295 9,277 3,295 6,921 3,295 5,756 3,295 7,641 4,051 5,813 4,051 6,397 4,051 10,839
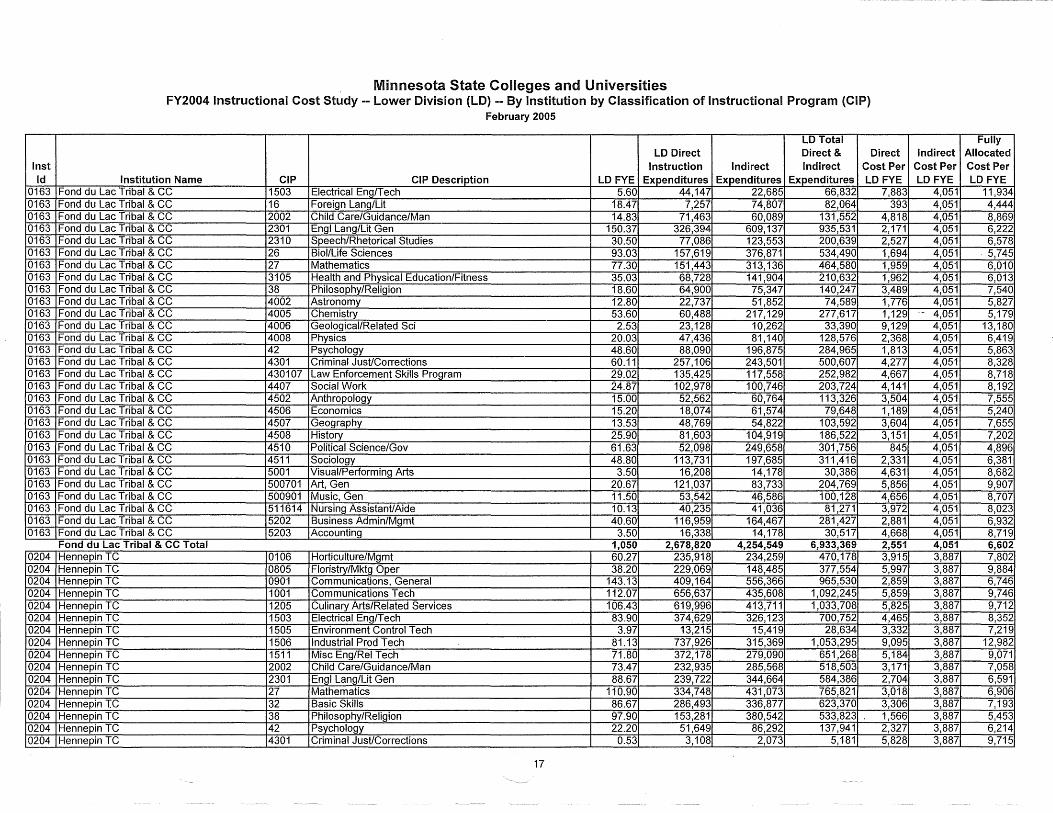
Inst Id
0163 0163 0163 0163 0163 0163 0163 0163 0163 0163 0163 0163 0163 0163 0163 0163 0163 0163 0163 0163 0163 0163 0163 0163 0163 0163 0163 0163 0163
0204 0204 0204 0204 0204 0204 0204 0204 0204 0204 0204 0204 0204 0204 0204 0204
Minnesota State Colleges and Universities FY2004 Instructional Cost Study -- Lower Division {LD) -- By Institution by Classification of Instructional Program (CIP)
February 2005
LO Total LO Direct Direct & Direct
Instruction Indirect Indirect Cost Per Institution Name CIP CIP Description LO FYE Expenditures Expenditures Expenditures LO FYE
Fond du Lac Tribal & CC 1503 Electrical Eng/Tech 5.60 44,147 22,685 66,832 7,883 Fond du Lac Tribal & CC 16 Foreign Lang/Lit 18.47 7,257 74,807 82,064 393 Fond du Lac Tribal & CC 2002 Child Care/Guidance/Man 14.83 71,463 60,089 131,552 4,818 Fond du Lac Tribal & CC 2301 Engl Lang/Lit Gen 150.37 326,394 609,137 935,531 2,171 Fond du Lac Tribal & CC 2310 Speech/Rhetorical Studies 30.50 77,086 123,553 200,639 2,527 Fond du Lac Tribal & CC 26 Biol/life Sciences 93.03 157,619 376,871 534,490 1,694 Fond du Lac Tribal & CC 27 Mathematics 77.30 151,443 313, 136 464,580 1,959 Fond du Lac Tribal & CC 3105 Health and Physical Education/Fitness 35.03 68,728 141,904 210,632 1,962 Fond du Lac Tribal & CC 38 Philosophy/Religion 18.60 64,900 75,347 140,247 3,489 Fond du Lac Tribal & CC 4002 Astronomy 12.80 22,737 51,852 74,589 1,776 Fond du Lac Tribal & CC 4005 Chemistry 53.60 60,488 217, 129 277,617 1, 129 Fond du Lac Tribal & CC 4006 Geological/Related Sci 2.53 23,128 10,262 33,390 9,129 Fond du Lac Tribal & CC 4008 Physics 20.03 47,436 81,140 128,576 2,368 Fond du Lac Tribal & CC 42 Psychology 48.60 88,090 196,875 284,965 1,813 Fond du Lac Tribal & CC 4301 Criminal Just/Corrections 60.11 257,106 243,501 500,607 4,277 Fond du Lac Tribal & CC 430107 Law Enforcement Skills Program 29.02 135,425 117,558 252,982 4,667 Fond du Lac Tribal & CC 4407 Social Work 24.87 102,978 100,746 203,724 4,141 Fond du Lac Tribal & CC 4502 Anthropology 15.00 52,562 60,764 113,326 3,504 Fond du Lac Tribal & CC 4506 Economics 15.20 18,074 61,574 79,648 1,189 Fond du Lac Tribal & CC 4507 Geography 13.53 48,769 54,822 103,592 3,604 Fond du Lac Tribal & CC 4508 History 25.90 81,603 104,919 186,522 3,151 Fond du Lac Tribal & CC 4510 Political Science/Gov 61.63 52,098 249,658 301,756 845 Fond du Lac Tribal & CC 4511 Sociology 48.80 113,731 197,685 311,416 2,331 Fond du Lac Tribal & CC 5001 Visual/Performing Arts 3.50 16,208 14,178 30,386 4,631 Fond du Lac Tribal & CC 500701 Art, Gen 20.67 121,037 83,733 204,769 5,856 Fond du Lac Tribal & CC 500901 Music, Gen 11.50 53,542 46,586 100,128 4,656 Fond du Lac Tribal & CC 511614 Nursing Assistant/Aide 10.13 40,235 41,036 81,271 3,972 Fond du Lac Tribal & CC 5202 Business Admin/Mgmt 40.60 116,959 164,467 281,427 2,881 Fond du Lac Tribal & CC 5203 Accounting 3.50 16,338 14, 178 30,517 4,668 Fond du Lac Tribal & CC Total 1,050 2,678,820 4,254,549 6,933,369 2,551 Hennepin TC 0106 Horticulture/Mgmt 60.27 235,918 234,259 470,178 3,915 Hennepin TC 0805 Floristry/Mktg Oper 38.20 229,069 148,485 377,554 5,997 Hennepin TC 0901 Communications, General 143.13 409,164 556,366 965,530 2,859 Hennepin TC 1001 Communications Tech 112.07 656,637 435,608 1,092,245 5,859 Hennepin TC 1205 Culinary Arts/Related Services 106.43 619,996 413,711 1,033,708 5,825 Hennepin TC 1503 Electrical Eng/Tech 83.90 374,629 326,123 700,752 4,465 Hennepin TC 1505 Environment Control Tech 3.97 13,215 15,419 28,634 3,332 Hennepin TC 1506 Industrial Prod Tech 81.13 737,926 315,369 1,053,295 9,095 Hennepin TC 1511 Misc Eng/Rel Tech 71.80 372,178 279,090 651,268 5,184 Hennepin TC 2002 Child Care/Guidance/Man 73.47 232,935 285,568 518,503 3,171 Hennepin TC 2301 Engl Lang/Lit Gen 88.67 239,722 344,664 584,386 2,704 Hennepin TC 27 Mathematics 110.90 334,748 431,073 765,821 3,018 Hennepin T.C 32 Basic Skills 86.67 286,493 336,877 623,370 3,306 Hennepin TC 38 Philosophy/Religion 97.90 153,281 380,542 533,823 . 1,566 Hennepin TC 42 Psychology 22.20 51,649 86,292 137,941 2,327 Hennepin TC 4301 Criminal Just/Corrections 0.53 3,108 2,073 5, 181 5,828
17
Fully Indirect Allocated
Cost Per Cost Per LD FYE LO FYE
4,051 11,934 4,051 4,444 4,051 8,869 4,051 6,222 4,051 6,578 4,051 5,745 4,051 6,010 4,051 6,013 4,051 7,540 4,051 5,827
-- 4,051 5,179 4,051 13, 180 4,051 6,419 4,051 5,863 4,051 8,328 4,051 8,718 4,051 8,192 4,051 7,555 4,051 5,240 4,051 7,655 4,051 7,202 4,051 4,896 4,051 6,381 4,051 8,682 4,051 9,907 4,051 8,707 4,051 8,023 4,051 6,932 4,051 8,719 4,051 6,602 3,887 7,802 3,887 9,884 3,887 6,746 3,887 9,746 3,887 9,712 3,887 8,352 3,887 7,219 3,887 12,982 3,887 9,071 3,887 7,058 3,887 6,591 3,887 6,906 3,887 7,193 3,887 5,453 3,887 6,214 3,887 9,715
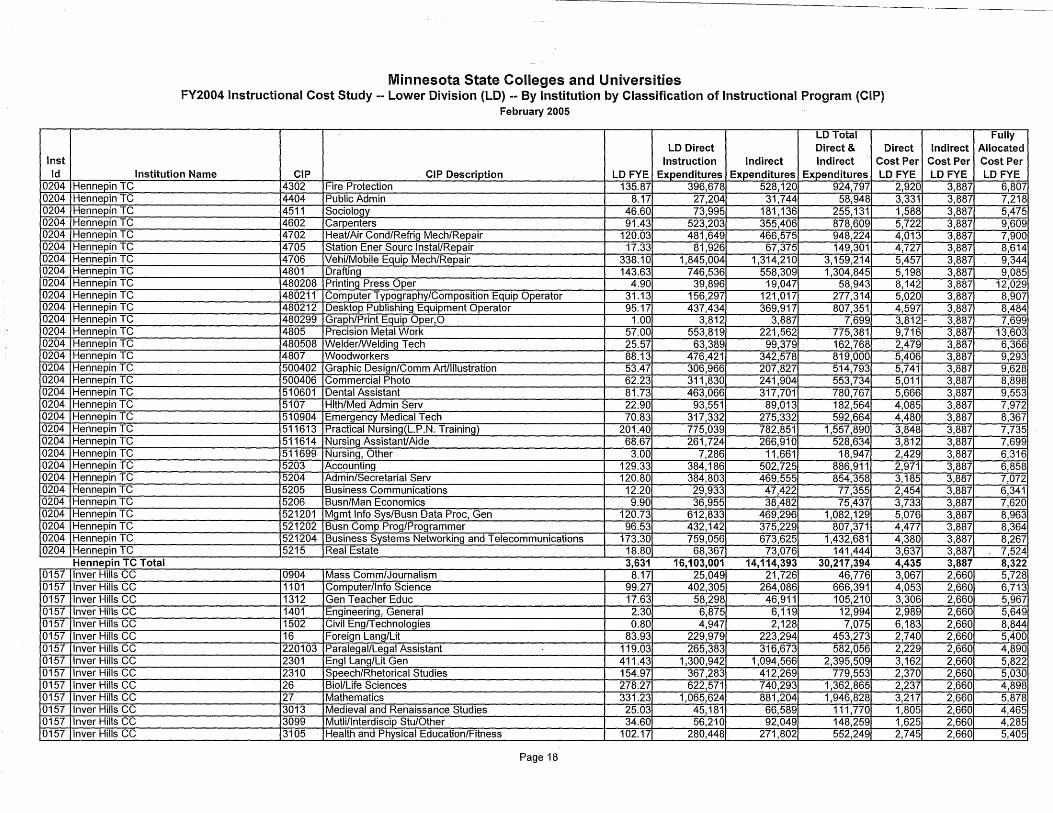
II"""'
Inst
Minnesota State Colleges and Universities FY2004 Instructional Cost Study -- lower Division (LO) -- By Institution by Classification of Instructional Program (CIP)
February 2005
LO Total LO Direct Direct & Direct
Instruction Indirect Indirect Cost Per Id Institution Name CIP CIP Description LO FYE Expenditures Expenditures Expenditures LO FYE
0204 Hennepin TC 4302 Fire Protection 135.87 396,678 528,120 924,797 2,920 0204 Hennepin TC 4404 PublicAdmin 8.17 27,204 31,744 58,948 3,331 0204 Hennepin TC 4511 Sociology 46.60 73,995 181,136 255,131 1,588 0204 Hennepin TC 4602 Carpenters 91.43 523,203 355,406 878,609 5,722 0204 Hennepin TC 4702 Heat/Air Cond/Refrig Mech/Repair 120.03 481,649 466,575 948,224 4,013 0204 Hennepin TC 4705 Station Ener Sourc lnstal/Repair 17.33 81,926 67,375 149,301 4,727 0204 Hennepin TC 4706 Vehi/Mobile Equip Mech/Repair 338.10 1,845,004 1,314,210 3,159,214 5,457 0204 Hennepin TC 4801 Drafting 143.63 746,536 558,309 1,304,845 5,198 0204 Hennepin TC 480208 Printing Press Oper 4.90 39,896 19,047 58,943 8,142 0204 Hennepin TC 480211 Computer Typography/Composition Equip Operator 31.13 156,297 121,017 277,314 5,020 0204 Hennepin TC 480212 Desktop Publishing Equipment Operator 95.17 437,434 369,917 807,351 4,597 0204 Hennepin TC 480299 Graph/Print Equip Oper,O 1.00 3,812 3,887 7,699 3~812-0204 Hennepin TC 4805 Precision Metal Work 57.00 553,819 221,562 ·115,381 9,716 0204 Hennepin TC 480508 Welder/Welding Tech 25.57 63,389 99,379 162,768 2,479 0204 Hennepin TC 4807 Woodworkers 88.13 476,421 342,578 819,000 5,406 0204 Hennepin TC 500402 Graphic Design/Comm Art/Illustration 53.47 306,966 207,827 514,793 5,741 0204 Hennepin TC 500406 Commercial Photo 62.23 311,830 241,904 553,734 5,011 0204 Hennepin TC 510601 Dental Assistant 81.73 463,066 317,701 780,767 5,666 0204 Hennepin TC 5107 Hlth/Med Admin Serv 22.90 93,551 89,013 182,564 4,085 0204 Hennepin TC 510904 Emergency Medical Tech 70.83 317,332 275,332 592,664 4,480 0204 Hennepin TC 511613 Practical Nursing(L.P.N. Training) 201.40 775,039 782,851 1,557,890 3,848 0204 Hennepin TC 511614 Nursing Assistant/Aide 68.67 261,724 266,910 528,634 3,812 0204 Hennepin TC 511699 Nursing, Other 3.00 7,286 11,661 18,947 2,429 0204 Hennepin TC 5203 Accounting 129.33 384,186 502,725 886,911 2,971 0204 Hennepin TC 5204 Admin/Secretarial Serv 120.80 384,803 469,555 854,358 3,185 0204 Hennepin TC 5205 Business Communications 12.20 29,933 47,422 77,355 2,454 0204 Hennepin TC 5206 Busn/Man Economics 9.90 36,955 38,482 75,437 3,733 0204 Hennepin TC 521201 Mgmt Info Sys/Busn Data Proc, Gen 120.73 612,833 469,296 1,082,129 5,076 0204 Hennepin TC 521202 Busn Comp Prag/Programmer 96.53 432,142 375,229 807,371 4,477 0204 Hennepin TC 521-204 Business Systems Networking and Telecommunications 173.30 759,056 673,625 1,432,681 4,380 0204 Hennepin TC 5215 Real Estate 18.80 68,367 73,076 141,444 3,637
Hennepin TC Total 3,631 16,103,001 14.114.393 30,217,394 4.435 0157 Inver Hills CC 0904 Mass Comm/Journalism 8.17 25,049 21,726 46,776 3,067 0157 Inver Hills CC 1101 Computer/Info Science 99.27 402,305 264,086 666,391 4,053 0157 Inver Hills CC 1312 Gen Teacher Educ 17.63 58,298 46,911 105,210 3,306 0157 Inver Hills CC 1401 Engineering, General 2.30 6,875 6,119 12,994 2,989 0157 Inver Hills CC 1502 Civil Eng/Technologies 0.80 4,947 2,128 7,075 6,183 0157 Inver Hills CC 16 Foreign Lang/Lit 83.93 229,979 223,294 453,273 2,740 0157 Inver Hills CC 220103 Paralegal/Legal Assistant 119.03 265,383 316,673 582,056 2,229 0157 Inver Hills CC 2301 Engl Lang/Lit Gen 411.43 1,300,942 1,094,566 2,395,509 3,162 0157 Inver Hills CC 2310 Speech/Rhetorical Studies 154.97 367,283 412,269 779,553 2,370 0157 Inver Hills CC 26 Biol/Life Sciences 278.27 622,571 740,293 1,362,865 2,237 0157 Inver Hills CC 27 Mathematics 331.23 1,065,624 881,204 1,946,828 3,217 0157 Inver Hills CC 3013 Medieval and Renaissance Studies 25.03 45, 181 66,589 111,770 1,805 0157 Inver Hills CC 3099 Mutli/lnterdiscip Stu/Other 34.60 56,210 92,049 148,259 1,625 0157 Inver Hills CC 3105 Health and Physical Education/Fitness 102.17 280,448 271,802 552,249 2,745
Page 18
Fully Indirect Allocated
Cost Per Cost Per LO FYE LO FYE
3,887 6,807 3,887 7,218 3,887 5,475 3,887 9,609 3,887 7,900 3,887 8,614 3,887 9,344 3,887 9,085 3,887 12,029 3,887 8,907 3,887 8,484 3,887 7,699 3,887 13,603 3,887 6,366 3,887 9,293 3,887 9,628 3,887 8,898 3,887 9,553 3,887 7,972 3,887 8,367 3,887 7,735 3,887 7,699 3,887 6,316 3,887 6,858 3,887 7,072 3,887 6,341 3,887 7,620 3,887 8,963 3,887 8,364 3,887 8,267 3,887 7,524 3,887 8.322 2,660 5,728 2,660 6,713 2,660 5,967 2,660 5,649 2,660 8,844 2,660 5,400 2,660 4,890 2,660 5,822 2,660 5,030 2,660 4,898 2,660 5,878 2,660 4,465 2,660 4,285 2,660 5,405
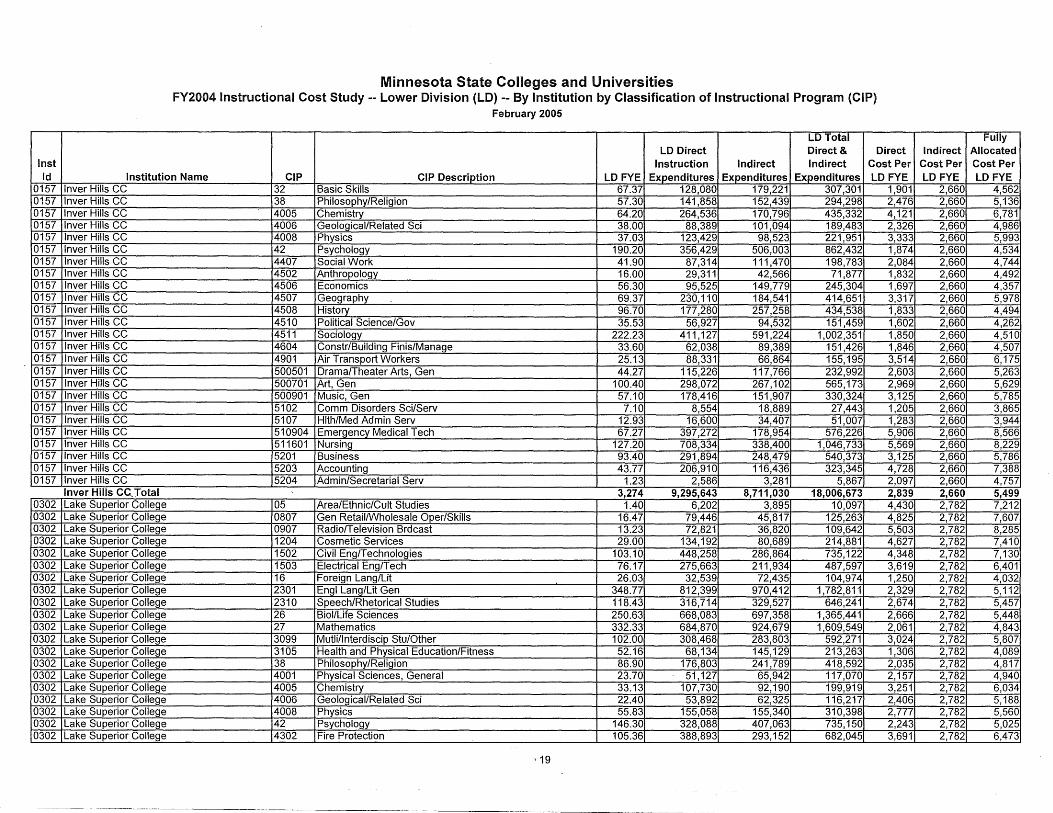
Inst Id
0157 0157 0157 0157 0157 0157 0157 0157 0157 0157 0157 0157 0157 0157 0157 0157 0157 0157 0157 0157 0157 0157 0157 0157 0157
0302 0302 0302 0302 0302 0302 0302 0302 0302 0302 0302 0302 0302 0302 0302 0302 0302 0302 0302 0302
Minnesota State Colleges and Universities FY2004 Instructional Cost Study -- Lower Division (LO) -- By Institution by Classification of Instructional Program (CIP)
February 2005
LD Total LD Direct Direct & Direct
Instruction Indirect Indirect Cost Per Institution Name CIP CIP Description LD FYE Expenditures Expenditures Expenditures LDFYE
Inver Hills CC 32 Basic Skills 67.37 128,080 179,221 307,301 1,901 Inver Hills CC 38 Philosophy/Religion 57.30 141,858 152,439 294,298 2,476 Inver Hills CC 4005 Chemistry 64.20 264,536 170,796 435,332 4,121 Inver Hills CC 4006 Geological/Related Sci 38.00 88,389 101,094 189,483 2,326 Inver Hills CC 4008 Physics 37.03 123,429 98,523 221,951 3,333 Inver Hills CC 42 Psychology 190.20 356,429 506,003 862,432 1,874 Inver Hills CC 4407 Social Work 41.90 87,314 111,470 198,783 2,084 Inver Hills CC 4502 Anthropology 16.00 29,311 42,566 71,877 1,832 Inver Hills CC 4506 Economics 56.30 95,525 149,779 245,304 1,697 Inver Hills CC 4507 Geography 69.37 230, 110 184,541 414,651 3,317 Inver Hills CC 4508 History 96.70 177,280 257,258 434,538 1,833 Inver Hills CC 4510 Political Science/Gov 35.53 56,927 94,532 151,459 1,602 Inver Hills CC 4511 Sociology 222.23 411,127 591,224 1,002,351 1,850 Inver Hills CC 4604 Constr/Building Finis/Manage 33.60 62,038 89,389 151,426 1,846 Inver Hills CC 4901 Air Transport Workers 25.13 88,331 66,864 155, 195 3,514 Inver Hills CC 500501 Drama/Theater Arts, Gen 44.27 115,226 117,766 232,992 2,603 Inver HUis CC 500701 Art, Gen 100.40 298,072 267,102 565,173 2,969 Inver Hills CC 500901 Music, Gen 57.10 178,416 151,907 330,324 3,125 Inver Hills CC 5102 Comm Disorders Sci/Serv 7.10 8,554 18,889 27,443 1,205 Inver Hills CC 5107 Hlth/Med Admin Serv 12.93 16,600 34,407 51,007 1,283 Inver Hills CC 510904 Emergency Medical Tech 67.27 397,272 178,954 576,226 5,906 Inver Hills CC 511601 Nursing 127.20 708,334 338,400 1,046,733 5,569 Inver Hills CC 5201 Business 93.40 291,894 248,479 540,373 3,125 Inver Hills CC 5203 Accounting 43.77 206,910 116,436 323,345 4,728 Inver Hills CC 5204 Admin/Secretarial Serv 1.23 2,586 3,281 5,867 2,097 Inver Hills CC_ Total 3,274 9,295.643 8.711,030 18,006.673 2,839 Lake Superior College 05 Area/Ethnic/Cult Studies 1.40 6,202 3,895 10,097 4,430 Lake Superior College 0807 Gen Retail/Wholesale Oper/Skills 16.47 79,446 45,817 125,263 4,825 Lake Superior College 0907 Radio/Television Brdcast 13.23 72,821 36,820 109,642 5,503 Lake Superior College 1204 Cosmetic Services 29.00 134,192 80,689 214,881 4,627 Lake Superior College 1502 Civil Eng/Technologies 103.10 448,258 286,864 735,122 4,348 Lake Superior College 1503 Electrical Eng/Tech 76.17 275,663 211,934 487,597 3,619 Lake Superior College 16 Foreign Lang/Lit 26.03 32,539 72,435 104,974 1,250 Lake Superior College 2301 Engl Lang/Lit Gen 348.77 812,399 970,412 1,782,811 2,329 Lake Superior College 2310 Speech/Rhetorical Studies 118.43 316,714 329,527 646,241 2,674 Lake Superior College 26 Biol/Life Sciences 250.63 668,083 697,358 1,365,441 2,666 Lake Superior College 27 Mathematics 332.33 684,870 924,679 1,609,549 2,061 Lake Superior College 3099 Mutli/lnterdiscip Stu/Other 102.00 308,468 283,803 592,271 3,024 Lake Superior College 3105 Health and Physical Education/Fitness 52.16 68,134 145,129 213,263 1,306 Lake Superior College 38 Philosophy/Religion 86.90 176,803 241,789 418,592 2,035 Lake Superior College 4001 Physical Sciences, General 23.70 51, 127 65,942 117,070 2,157 Lake Superior College 4005 Chemistry 33.13 107,730 92,190 199,919 3,251 Lake Superior College 4006 Geological/Related Sci 22.40 53,892 62,325 116,217 2,406 Lake Superior College 4008 Physics 55.83 155,058 155,340 310,398 2,777 Lake Superior College 42 Psychology 146.30 328,088 407,063 735,150 2,243 Lake Superior College 4302 Fire Protection 105.36 388,893 293,152 682,045 3,691
\19
Fully Indirect Allocated
Cost Per Cost Per LD FYE LD FYE
2,660 4,562 2,660 5,136 2,660 6,781 2,660 4,986 2,660 5,993 2,660 4,534 2,660 4,744 2,660 4,492 2,660 4,357 2,660 5,978 2,660 4,494 2,660 4,262 2,660 4,510 2,660 4,507 2,660 6,175 2,660 5,263 2,660 5,629 2,660 5,785 2,660 3,865 2,660 3,944 2,660 8,566 2,660 8,229 2,660 5,786 2,660 7,388 2,660 4,757 2.660 5.499 2,782 7,212 2,782 7,607 2,782 8,285 2,782 7,410 2,782 7,130 2,782 6,401 2,782 4,032 2,782 5, 112 2,782 5,457 2,782 5,448 2,782 4,843 2,782 5,807 2,782 4,089 2,782 4,817 2,782 4,940 2,782 6,034 2,782 5,188 2,782 5,560 2,782 5,025 2,782 6,473
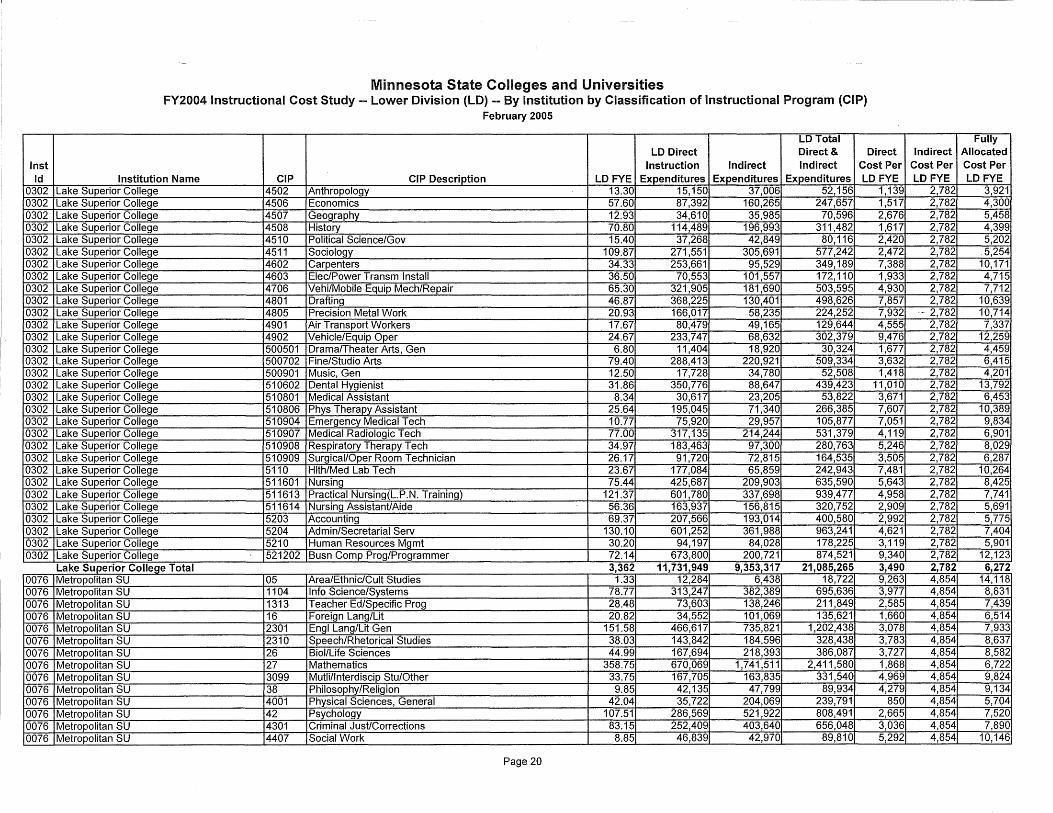
Inst Id
0302 0302 0302 0302 0302 0302 0302 0302 0302 0302 0302 0302 0302 0302 0302 0302 0302 0302 0302 0302 0302 0302 0302 0302 0302 0302 0302 0302 0302 0302 0302
0076 0076 0076 0076 0076 0076 0076 0076 0076 0076 0076 0076 0076 0076
Minnesota State Colleges and Universities FY2004 Instructional Cost Study -- Lower Division (LD) -- By Institution by Classification of Instructional Program (CIP)
February 2005
LO Total LO Direct Direct & Direct
Instruction Indirect Indirect Cost Per Institution Name CIP CIP Description LO FYE Expenditures Expenditures Expenditures LO FYE
Lake Superior College 4502 Anthropology 13.30 15, 150 37,006 52,156 1,139 Lake Superior College 4506 Economics 57.60 87,392 160,265 247,657 1,517 Lake Superior College 4507 Geography 12.93 34,610 35,985 70,596 2,676 Lake Superior College 4508 History 70.80 114,489 196,993 311,482 1,617 Lake Superior College 4510 Political Science/Gov 15.40 37,268 42,849 80,116 2,420 Lake Superior College 4511 Sociology 109.87 271,551 305,691 577,242 2,472 Lake Superior College 4602 Carpenters 34.33 253,661 95,529 349,189 7,388 Lake Superior College 4603 Elec/Power Transm Install 36.50 70,553 101,557 172,110 1,933 Lake Superior College 4706 Vehi/Mobile Equip Mech/Reoair 65.30 321,905 181,690 503,595 4,930 Lake Superior College 4801 Drafting 46.87 368,225 130,401 498,626 7,857 Lake Superior College 4805 Precision Metal Work 20.93 166,017 58,235 224,252 7,932 Lake Superior College 4901 Air Transport Workers 17.67 80,479 49,165 129,644 4,555 Lake Superior College 4902 Vehicle/Equip Oper 24.67 233,747 68,632 302,379 9,476 Lake Superior College 500501 Drama/Theater Arts, Gen 6.80 11,404 18,920 30,324 1,677 Lake Superior College 500702 Fine/Studio Arts 79.40 288,413 220,921 509,334 3,632 Lake Superior College 500901 Music, Gen 12.50 17,728 34,780 52,508 1,418 Lake Superior College 510602 Dental Hygienist 31.86 350,776 88,647 439,423 11,010 Lake Superior College 510801 Medical Assistant 8.34 30,617 23,205 53,822 3,671 Lake Superior College 510806 Phys Therapy Assistant 25.64 195,045 71,340 266,385 7,607 Lake Superior College 510904 Emergency Medical Tech 10.77 75,920 29,957 105,877 7,051 Lake Superior College 510907 Medical Radiologic Tech 77.00 317,135 214,244 531,379 4,119 Lake Superior College 510908 Respiratory Therapy Tech 34.97 183,463 97,300 280,763 5,246 Lake Superior College 510909 Surgical/Oper Room Technician 26.17 91,720 72,815 164,535 3,505 Lake Superior College 5110 Hlth/Med Lab Tech 23.67 177,084 65,859 242,943 7,481 Lake Superior College 511601 Nursing 75.44 425,687 209,903 635,590 5,643 Lake Superior College 511613 Practical Nursing(L.P.N. Training) 121.37 601,780 337,698 939,477 4,958 Lake Superior College 511614 Nursing Assistant/Aide 56.36 163,937 156,815 320,752 2,909 Lake Superior College 5203 Accounting 69.37 207,566 193,014 400,580 2,992. Lake Superior College 5204 Admin/Secretarial Serv 130.10 601,252 361,988 963,241 4,621 Lake Superior College 5210 Human Resources Mgmt 30.20 94,197 84,028 178,225 3,119 Lake Superior College 521202 Busn Comp Prag/Programmer 72.14 673,800 200,721 874,521 9,340 Lake Superior College Total 3 3,362 1.731.949 11,731,949 3.317 9,353,317 21.085.265 21,085,265 3.490 3,490 Metropolitan SU 05 Area/Ethnic/Cult Studies 1.33 12,284 6,438 18,722 9,263 Metropolitan SU 1104 Info Science/Systems 78.77 313,247 382,389 695,636 3,977 Metropolitan SU 1313 Teacher Ed/Specific Prog 28.48 73,603 138,246 211,849 2,585 Metropolitan SU 16 Foreign Lang/Lit 20.82 34,552 101,069 135,621 1,660 Metropolitan SU 2301 Engl Lang/Lit Gen 151.58 466,617 735,821 1,202,438 3,078 Metropolitan SU 2310 Speech/Rhetorical Studies 38.03 143,842 184,596 328,438 3,783 Metropolitan SU 26 Biol/Life Sciences 44.99 167,694 218,393 386,087 3,727 Metropolitan SU 27 Mathematics 358.75 670,069 1,741,511 2,411,580 1,868 Metropolitan SU 3099 Mutli/lnterdiscip Stu/Other 33.75 167,705 163,835 331,540 4,969 Metropolitan SU 38 Philosophy/Religion 9.85 42,135 47,799 89,934 4,279 Metropolitan SU 4001 Physical Sciences, General 42.04 35,722 204,069 239,791 850 Metropolitan SU 42 Psychology 107.51 286,569 521,922 808,491 2,665 Metropolitan SU 4301 Criminal Just/Corrections 83.15 252,409 403,640 656,048 3,036 Metropolitan SU 4407 Social Work 8.85 46,839 42,970 89,810 5,292
Page 20
Fully Indirect Allocated
Cost Per Cost Per LO FYE LO FYE
2,782 3,921 2,782 4,300 2,782 5,458 2,782 4,399 2,782 5,202 2,782 5,254 2,782 10, 171 2,782 4,715 2,782 7,712 2,782 10,639
-- 2,782 10,714 2,782 7,337 2,782 12,259 2,782 4,459 2,782 6,415 2,782 4,201 2,782 13,792 2,782 6,453 2,782 10,389 2,782 9,834 2,782 6,901 2,782 8,029 2,782 6,287 2,782 10,264 2,782 8,425 2,782 7,741 2,782 5,691 2,782 5,775 2,782 7,404 2,782 5,901 2,782 12, 123 2.782 2,782 6.272 6,272 4,854 14,118 4,854 8,831 4,854 7,439 4,854 6,514 4,854 7,933 4,854 8,637 4,854 8,582 4,854 6,722 4,854 9,824 4,854 9,134 4,854 5,704 4,854 7,520 4,854 7,890 4,854 10, 146
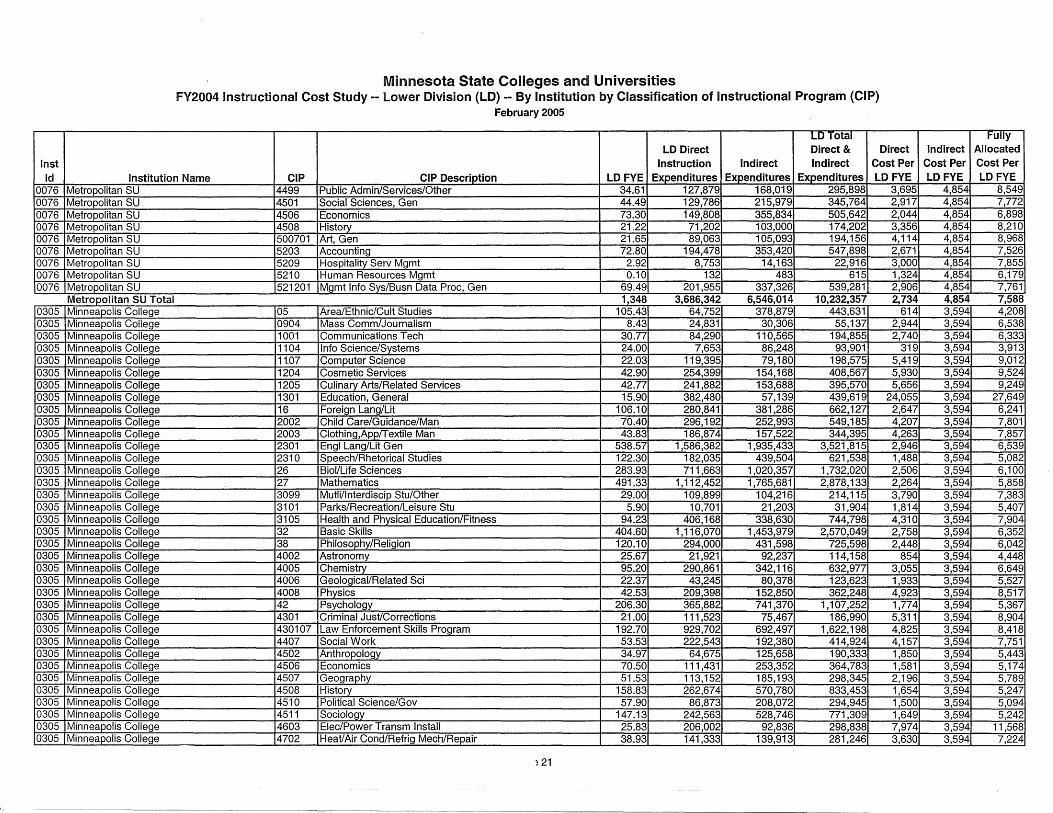
Inst Id
0076 0076 0076 0076 0076 0076 0076 0076 0076
0305 0305 0305 0305 0305 0305 0305 0305 0305 0305 0305 0305 0305 0305 0305 0305 0305 0305 0305 0305 0305 0305 0305 0305 0305 0305 0305 0305 0305 0305 0305 0305 0305 0305 0305 0305
Minnesota State Colleges and Universities FY2004 Instructional Cost Study -- Lower Division (LO) -- By Institution by Classification of Instructional Program (CIP)
February 2005
LU Total LD Direct Direct & Direct
Instruction Indirect Indirect Cost Per Institution Name CIP CIP Description LDFYE Expenditures Expenditures Expenditures LDFYE
Metropolitan SU 4499 Public Admin/Services/Other 34.61 127,879 168,019 295,898 3,695 Metropolitan SU 4501 Social Sciences, Gen 44.49 129,786 215,979 345,764 2,917 Metropolitan SU 4506 Economics 73.30 149,808 355,834 505,642 2,044 Metropolitan SU 4508 History 21.22 71,202 103,000 174,202 3,356 Metropolitan SU 500701 Art, Gen 21.65 89,063 105,093 194,156 4,114 Metropolitan SU 5203 Accounting 72.80 194,478 353,420 547,898 2,671 Metropolitan SU 5209 Hospitality Serv Mgmt 2.92 8,753 14,163 22,916 3,000 Metropolitan SU 5210 Human Resources Mgmt 0.10 132 483 615 1,324 Metropolitan SU 521201 Mgmt Info Svs/Busn Data Proc, Gen 69.49 201,955 337,326 539,281 2,906 M Metropolitan SU Total 1.348 1,348 3.686.342 3,686,342 6.546.014 6,546,014 10.232.357 10,232,357 2.734 2,734 Minneapolis College 05 Area/Ethnic/Cult Studies 105.43 64,752 378,879 443,631 614 Minneapolis College 0904 Mass Comm/Journalism 8.43 24,831 30,306 55,137 2,944 Minneapolis College 1001 Communications Tech 30.77 84,290 110,565 194,855 2,740 Minneapolis College 1104 Info Science/Systems 24.00 7,653 86,248 93,901 319 Minneapolis College 1to7 Computer Science 22.03 119,395 79,180 198,575 5,419 Minneapolis College 1204 Cosmetic Services 42.90 254,399 154,168 408,567 5,930 Minne~polis College 1205 Culinary Arts/Related Services 42.77 241,882 153,688 395,570 5,656 Minneapolis College 1301 Education, General 15.90 382,480 57,139 439,619 24,055 Minneapolis College 16 Foreign Lang/Lit 106.10 280,841 381,286 662,127 2,647 Minneapolis College 2002 Child Care/Guidance/Man 70.40 296,192 252,993 549,185 4,207 Minneapolis College 2003 Clothing,App/Textile Man 43.83 186,874 157,522 344,395 4,263 Minneapolis College 2301 Engl Lang/Lit Gen 538.57 1,586,382 1,935,433 3,521,815 2,946 Minneapolis College 2310 Speech/Rhetorical Studies 122.30 182,035 439,504 621,538 1,488 Minneapolis College 26 Biol/Life Sciences 283.93 711,663 1,020,357 1,732,020 2,506 Minneapolis Colleoe 27 Mathematics 491.33 1, 112,452 1,765,681 2,878,133 2,264 Minneapolis College 3099 Mutli/lnterdiscip Stu/Other 29.00 109,899 104,216 214,115 3,790 Minneapolis College 3101 Parks/Recreation/Leisure Stu 5.90 10,701 21,203 31,904 1,814 Minneapolis College 3105 Health and Physical Education/Fitness 94.23 406,168 338,630 744,798 4,310 Minneapolis College 32 Basic Skills 404.60 1,116,070 1,453,979 2,570,049 2,758 Minneapolis College 38 Philosophy/Religion 120.10 294,000 431,598 725,598 2,448 Minneapolis College 4002 Astronomy 25.67 21,921 92,237 114,158 854 Minneapolis College 4005 Chemistry 95.20 290,861 342,116 632,977 3,055 Minneapolis College 4006 Geological/Related Sci 22.37 43,245 80,378 123,623 1,933 Minneapolis College 4008 Physics 42.53 209,398 152,850 362,248 4,923 Minneapolis College 42 Psychology 206.30 365,882 741,370 1,107,252 1,774 Minneapolis College 4301 Criminal Just/Corrections 21.00 111,523 75,467 186,990 5,311 Minneapolis College 430107 Law Enforcement Skills Program 192.70 929,702 692,497 1,622,198 4,825 Minneapolis ColleQe 4407 Social Work 53.53 222,543 192,380 414,924 4,157 Minneapolis College 4502 Anthropology 34.97 64,675 125,658 190,333 1,850 Minneapolis College 4506 Economics 70.50 111,431 253,352 364,783 1,581 Minneapolis College 4507 Geography 51.53 113,152 185, 193 298,345 2,196 Minneapolis College 4508 History 158.83 262,674 570,780 833,453 1,654 Minneapolis College 4510 Political Science/Gov 57.90 86,873 208,072 294,945 1,500 Minneapolis College 4511 Sociology 147.13 242,563 528,746 771,309 1,649 Minneapolis College 4603 Elec/Power Transm Install 25.83 206,002 92,836 298,838 7,974 Minneapolis College 4702 Heat/Air Cond/Refrig Mech/Repair 38.93 141,333 139,913 281,246 3,630
} 21
Fully Indirect Allocated
Cost Per Cost Per LD FYE LDFYE
4,854 8,549 4,854 7,772 4,854 6,898 4,854 8,210 4,854 8,968 4,854 7,526 4,854 7,855 4,854 6,179 4,854 7,761 4.854 4,854 7.588 7,588 3,594 4,208 3,594 6,538 3,594 6,333 3,594 3,913 3,594 9,012 3,594 9,524 3,594 9,249 3,594 27,649 3,594 6,241 3,594 7,801 3,594 7,857 3,594 6,539 3,594 5,082 3,594 6,100 3,594 5,858 3,594 7,383 3,594 5,407 3,594 7,904 3,594 6,352 3,594 6,042 3,594 4,448 3,594 6,649 3,594 5,527 3,594 8,517 3,594 5,367 3,594 8,904 3,594 8,418 3,594 7,751 3,594 5,443 3,594 5,174 3,594 5,789 3,594 5,247 3,594 5,094 3,594 5,242 3,594 11,568 3,594 7,224
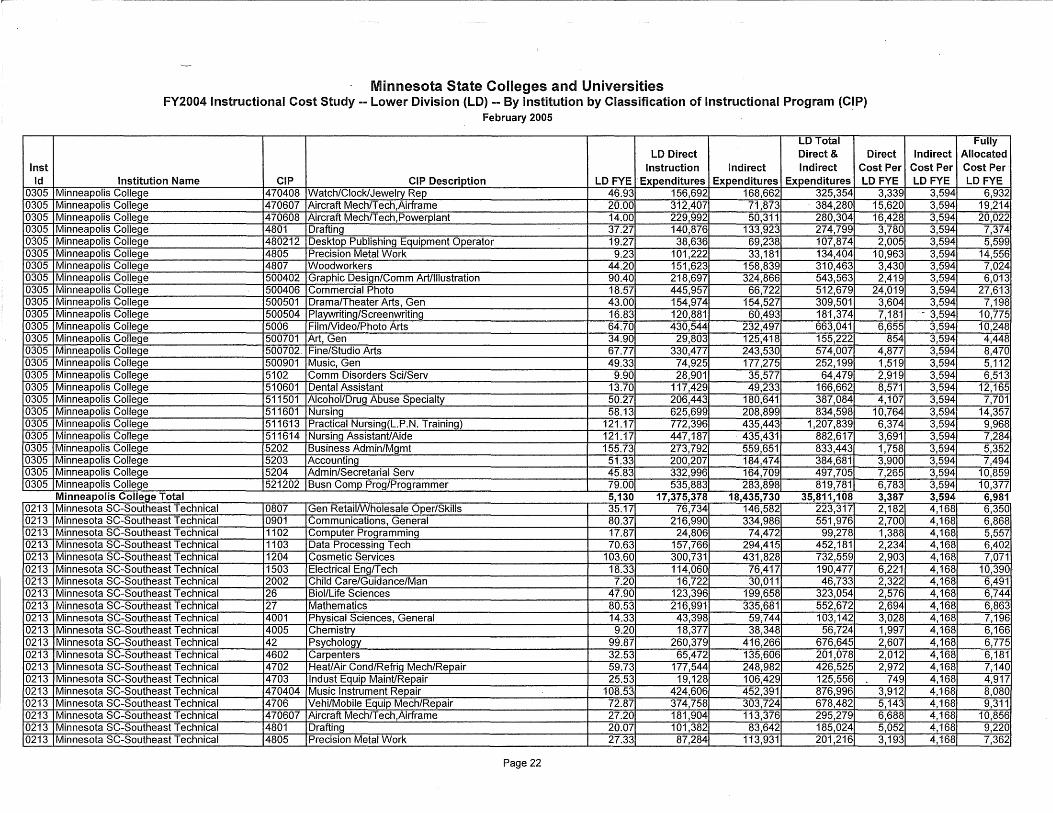
Inst Id
0305 0305 0305 0305 0305 0305 0305 0305 0305 0305 0305 0305 0305 0305 0305 0305 0305 0305 0305 0305 0305 0305 0305 0305 0305
0213 0213 0213 0213 0213 0213 0213 0213 0213 0213 0213 0213 0213 0213 0213 0213 0213 0213 0213 0213
Minnesota State Colleges and Universities FY2004 Instructional Cost Study -- Lower Division (LD) -- By Institution by Classification of Instructional Program (CIP)
February 2005
LO Total LO Direct Direct & Direct
Instruction Indirect Indirect Cost Per Institution Name CIP CIP Description LO FYE ·Expenditures Expenditures Expenditures LO FYE
Minneapolis College 470408 Watch/Clock/Jewelry Rep 46.93 156,692 168,662 325,354 3,339 Minneapolis College 470607 Aircraft Mech/T ech,Airframe 20.00 312,407 71,873 . 384,280 15,620 Minneapolis College 470608 Aircraft Mech/Tech,Powerplant 14.00 229,992 50,311 280,304 16,428 Minneapolis College 4801 Drafting 37.27 140,876 133,923 274,799 3,780 Minneapolis College 480212 Desktop Publishing Equipment Operator 19.27 38,636 69,238 107,874 2,005 Minneapolis College 4805 Precision Metal Work 9.23 101,222 33,181 134,404 10,963 Minneapolis College 4807 Woodworkers 44.20 151,623 158,839 310,463 3,430 Minneapolis College 500402 Graphic Design/Comm Art/Illustration 90.40 218,697 324,866 543,563 2,419 Minneapolis College 500406 Commercial Photo 18.57 445,957 66,722 512,679 24,019 Minneapolis College 500501 Drama/Theater Arts, Gen 43.00 154,974 154,527 309,501 3,604 Minneapolis College 500504 Playwriting/Screenwriting 16.83 120,881 60,493 181,374 7,181 Minneapolis College 5006 FilmNideo/Photo Arts 64.70 430,544 232,497 663,041 6,655 Minneapolis College 500701 Art, Gen 34.90 29,803 125,418 155,222 854 Minneapolis College 500702. Fine/Studio Arts 67.77 330,477 243,530 574,007 4,877 Minneapolis College 500901 Music, Gen 49.33 74,925 177,275 252,199 1,519 Minneapolis College 5102 Comm Disorders Sci/Serv 9.90 28,901 35,577 64,479 2,919 Minneapolis College 510601 Dental Assistant 13.70 117,429 49,233 166,662 8,571 Minneapolis College 511501 Alcohol/Drug Abuse Specialty 50.27 206,443 180,641 387,084 4,107 Minneapolis College 511601 Nursing 58.13 625,699 208,899 834,598 10,764 Minneapolis College 511613 Practical Nursing(L.P.N. Training) 121.17 772,396 435,443 1,207,839 6,374 Minneapolis College 511614 Nursing Assistant/ Aide 121.17 447,187 435,431 882,617 3,691 Minneapolis College 5202 Business Admin/Mgmt 155.73 273,792 559,651 833,443 1,758 Minneapolis College 5203 Accounting 51.33 200,207 184,474 384,681 3,900 Minneapolis College 5204 Admin/Secretarial Serv 45.83 332,996 164,709 497,705 7,265 Minneapolis College 521202 Busn Comp Prog/Programmer 79.00 535,883 283,898 819,781 6,783 Minneapolis College Total M lisColl T 5,130 17,375,378 18,435,730 35,811,108 3,387 Minnesota SC-Southeast Technical 0807 Gen Retail/Wholesale Oper/Skills 35.17 76,734 146,582 223,317 2,182 Minnesota SC-Southeast Technical 0901 Communications, General 80.37 216,990 334,986 551,976 2,700 Minnesota SC-Southeast Technical 1102 Computer Programming 17.87 24,806 74,472 99,278 1,388 Minnesota SC-Southeast Technical 1103 Data Processing Tech 70.63 157,766 294,415 452,181 2,234 Minnesota SC-Southeast Technical 1204 Cosmetic Services 103.60 300,731 431,828 732,559 2,903 Minnesota SC-Southeast Technical 1503 Electrical Eng/Tech 18.33 114,060 76,417 190,477 6,221 Minnesota SC-Southeast Technical 2002 Child Care/Guidance/Man 7.20 16,722 30,011 46,733 2,322 Minnesota SC-Southeast Technical 26 Biol/Life Sciences 47.90 123,396 199,658 323,054 2,576 Minnesota SC-Southeast Technical 27 Mathematics 80.53 216,991 335,681 552,672 2,694 Minnesota SC-Southeast Technical 4001 Physical Sciences, General 14.33 43,398 59,744 103,142 3,028 Minnesota SC-Southeast Technical 4005 Chemistry 9.20 18,377 38,348 56,724 1,997 Minnesota SC-Southeast Technical 42 Psychology 99.87 260,379 416,266 676,645 2,607 Minnesota SC-Southeast Technical 4602 Carpenters 32.53 65,472 135,606 201,078 2,012 Minnesota SC-Southeast Technical 4702 Heat/Air Cond/Refrig Mech/Repair 59.73 177,544 248,982 426,525 2,972 Minnesota SC-Southeast Technical 4703 lndust Equip Maint/Repair 25.53 19,128 106,429 125,556 749 Minnesota SC-Southeast Technical 470404 Music Instrument Repair 108.53 424,606 452,391 876,996 3,912 Minnesota SC-Southeast Technical 4706 Vehi/Mobile Equip Mech/Repair 72.87 374,758 303,724 678,482 5,143 Minnesota SC-Southeast Technical 470607 Aircraft Mech/Tech,Airframe 27.20 181,904 113,376 295,279 6,688 Minnesota SC-Southeast Technical 4801 Drafting 20.07 101 ,382 83,642 185,024 5,052 Minnesota SC-Southeast Technical 4805 Precision Metal Work 27.33 87,284 113,931 201,216 3,193
Page 22
Fully Indirect Allocated
Cost Per Cost Per LDFYE LDFYE
3,594 6,932 3,594 19,214 3,594 20,022 3,594 7,374 3,594 5,599 3,594 14,556 3,594 7,024 3,594 6,013 3,594 27,613 3,594 7,198
·- 3,594 10,775 3,594 10,248 3,594 4,448 3,594 8,470 3,594 5, 112 3,594 6,513 3,594 12,165 3,594 7,701 3,594 14,357 3,594 9,968 3,594 7,284 3,594 5,352 3,594 7,494 3,594 10,859 3,594 10,377 3,594 6,981 4,168 6,350 4,168 6,868 4,168 5,557 4,168 6,402 4,168 7,071 4,168 10,390 4,168 6,491 4,168 6,744 4,168 6,863 4,168 7,196 4,168 6,166 4,168 6,775 4,168 6,181 4,168 7,140 4,168 4,917 4,168 8,080 4,168 9,311 4,168 10,856 4,168 9,220 4,168 7,362
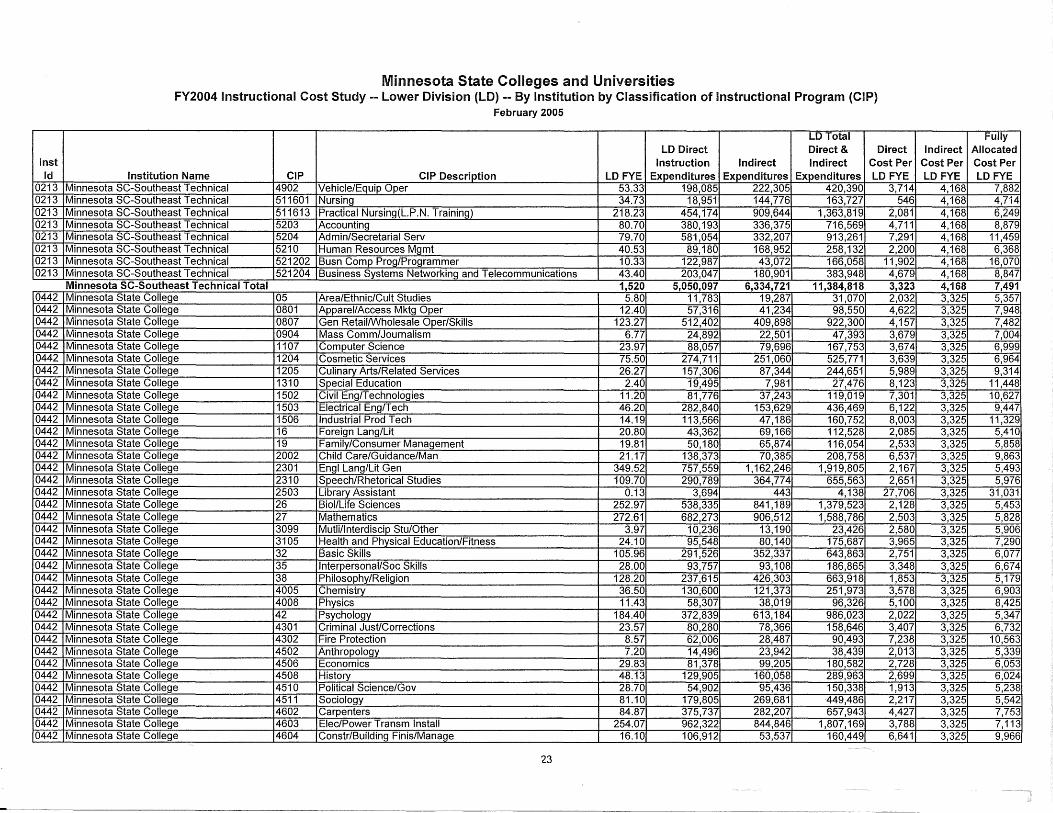
Inst Id
0213 0213 0213 0213 0213 0213 0213 0213
0442 0442 0442 0442 0442 0442 0442 0442 0442 0442 0442 0442 0442 0442 0442 0442 0442 0442 0442 0442 0442 0442 0442 0442 0442 0442 0442 0442 0442 0442 0442 0442 0442 0442 0442 0442 0442
Minnesota State Colleges and Universities FY2004 Instructional Cost Study -- Lower Division (LD) -- By Institution by Classification of Instructional Program (CIP)
February 2005
LD Total LD Direct Direct & Direct
Instruction Indirect Indirect Cost Per Institution Name CIP CIP Description LD FYE Expenditures Expenditures Expenditures LD FYE
Minnesota SC-Southeast Technical 4902 Vehicle/Equip Oper 53.33 198,085 222,305 420,390 3,714 Minnesota SC-Southeast Technical 511601 Nursing 34.73 18,951 144,776 163,727 546 Minnesota SC-Southeast Technical 511613 Practical Nursing(L.P .N. Training) 218.23 454,174 909,644 1,363,819 2,081 Minnesota SC-Southeast Technical 5203 Accounting 80.70 380,193 336,375 716,569 4,711 Minnesota SC-Southeast Technical 5204 Admin/Secretarial Serv 79.70 581,054 332,207 913,261 7,291 Minnesota SC-Southeast Technical 5210 Human Resources Mgmt 40.53 89,180 168,952 258,132 2,200 Minnesota SC-Southeast Technical 521202 Busn Comp Prag/Programmer 10.33 122,987 43,072 166,058 11,902 Minnesota SC-Southeast Technical 521204 Business Systems Networking and Telecommunications 43.40 203,047 180,901 383,948 4,679 Minnesota SC-Southeast Technical Total 1,520 5,050,097 6,334,721 11,384,818 3,323 Minnesota State College 05 Area/Ethnic/Cult Studies 5.80 11,783 19,287 31,070 2,032 Minnesota State College 0801 Apparel/Access Mktg Oper 12.40 57,316 41,234 98,550 4,622 Minnesota State College 0807 Gen Retail/Wholesale Oper/Skills 123.27 512,402 409,898 922,300 4,157 Minnesota State College 0904 Mass Comm/Journalism 6.77 24,892 22,501 47,393 3,679 Minnesota State College 1107 Computer Science 23.97 88,057 79,696 167,753 3,674 Minnesota State College 1204 Cosmetic Services 75.50 274,711 251,060 525,771 3,639 Minnesota State College 1205 Culinary Arts/Related Services 26.27 157,306 87,344 244,651 5,989 Minnesota State College 1310 Special Education 2.40 19,495 7,981 27,476 8,123 Minnesota State College 1502 Civil Eng/Technologies 11.20 81,776 37,243 119,019 7,301 Minnesota State College 1503 Electrical Eng/Tech 46.20 282,840 153,629 436,469 6,122 Minnesota State College 1506 Industrial Prod Tech 14.19 113,566 47,186 160,752 8,003 Minnesota State College 16 Foreign Lang/Lit 20.80 43,362 69,166 112,528 2,085 Minnesota State College 19 Family/Consumer Management 19.81 50, 180 65,874 116,054 2,533 Minnesota State College 2002 Child Care/Guidance/Man 21.17 138,373 70,385 208,758 6,537 Minnesota State College 2301 Engl Lang/Lit Gen 349.52 757,559 1,162,246 1,919,805 2,167 Minnesota State College 2310 Speech/Rhetorical Studies 109.70 290,789 364,774 655,563 2,651 Minnesota Sta_te College 2503 Library Assistant 0.13 3,694 443 4,138 27,706 Minnesota State College 26 Biol/Life Sciences 252.97 538,335 841,189 1,379,523 2,128 Minnesota State College 27 Mathematics 272.61 682,273 906,512 1,588,786 2,503 Minnesota State College 3099 Mutli/lnterdiscip Stu/Other 3.97 10,236 13,190 23,426 2,580 Minnesota State College 3105 Health and Physical Education/Fitness 24.10 95,548 80,140 175,687 3,965 Minnesota State College 32 Basic Skills 105.96 291,526 352,337 643,863 2,751 Minnesota State College 35 Interpersonal/Soc Skills 28.00 93,757 93,108 186,865 3,348 Minnesota State College 38 Philosophy/Religion 128.20 237,615 426,303 663,918 1,853 Minnesota State College 4005 Chemistry 36.50 130,600 121,373 251,973 3,578 Minnesota State College 4008 Physics 11.43 58,307 38,019 96,326 5,100 Minnesota State College 42 Psychology 184.40 372,839 613,184 986,023 2,022 Minnesota State College 4301 Criminal Just/Corrections 23.57 80,280 78,366 158,646 3,407 Minnesota State College 4302 Fire Protection 8.57 62,006 28,487 90,493 7,238 Minnesota State College 4502 Anthropology 7.20 14,496 23,942 38,439 2,013 Minnesota State College 4506 Economics 29.83 81,378 99,205 180,582 2,728 Minnesota State College 4508 History 48.13 129,905 160,058 289,963 2,699 Minnesota State College 4510 Political Science/Gov 28.70 54,902 95,436 150,338 1,913 Minnesota State College 4511 Sociology 81.10 179,805 269,681 449,486 2,217 Minnesota State College 4602 Carpenters 84.87 375,737 282,207 657,943 4,427 Minnesota State College 4603 Elec/Power Transm Install 254.07 962,322 844,846 1,807,169 3,788 Minnesota State College 4604 Constr/Building Finis/Manage 16.10 106,912 53,537 160,449 6,641
'23
Fully Indirect Allocated
Cost Per Cost Per LO FYE LDFYE
4,168 7,882 4,168 4,714 4,168 6,249 4,168 8,879 4,168 11,459 4,168 6,368 4,168 16,070 4,168 8,847 4,168 7,491 3,325 5,357 3,325 7,948 3,325 7,482 3,325 7,004 3,325 6,999 3,325 6,964 3,325 9,314 3,325 11,448 3,325 10,627 3,325 9,447 3,325 11,329 3,325 5,410 3,325 5,858 3,325 9,863 3,325 5,493 3,325 5,976 3,325 31,031 3,325 5,453 3,325 5,828 3,325 5,906 3,325 7,290 3,325 6,077 3,325 6,674 3,325 5,179 3,325 6,903 3,325 8,425 3,325 5,347 3,325 6,732 3,325 10,563 3,325 5,339 3,325 6,053 3,325 6,024 3,325 5,238 3,325 5,542 3,325 7,753 3,325 7,113 3,325 9,966
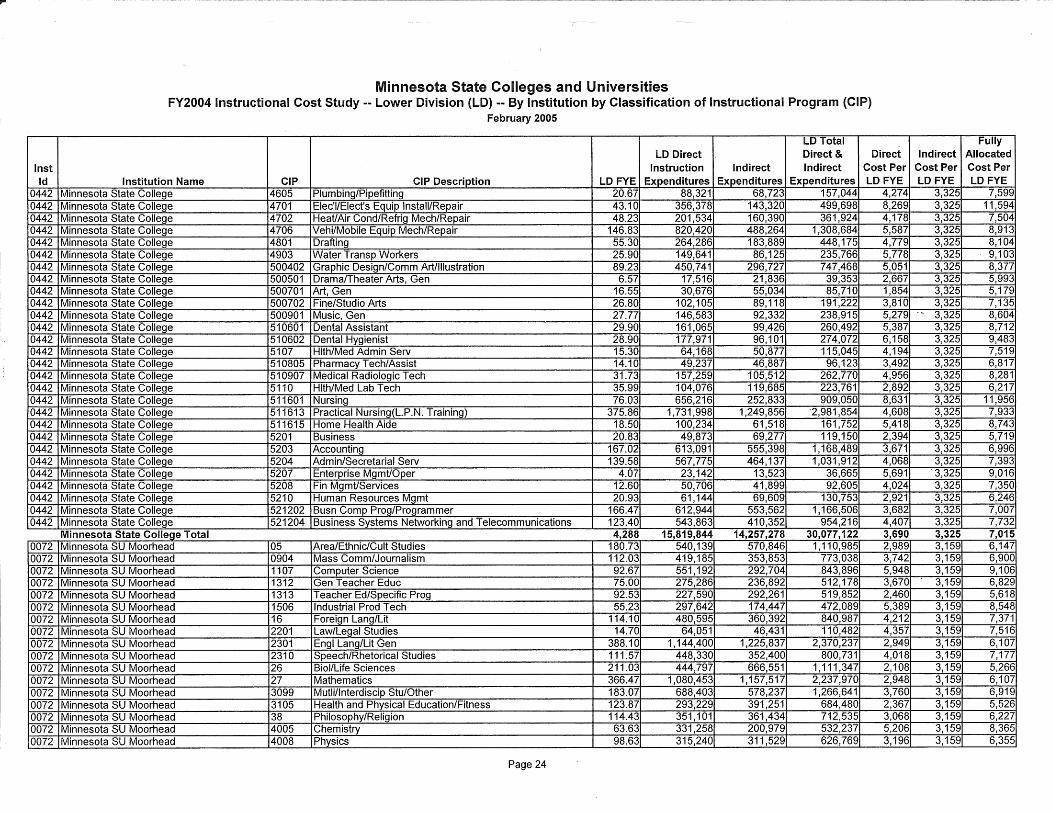
II'"'-
Inst Id
0442 0442 0442 0442 0442 0442 0442 0442 0442 0442 0442 0442 0442 0442 0442 0442 0442 0442 0442 0442 0442 0442 0442 0442 0442 0442 0442 0442
0072 0072 0072 0072 0072 0072 0072 0072 0072 0072 0072 0072 0072 0072 0072 0072 0072
Minnesota State Colleges and Universities FY2004 Instructional Cost Study -- Lower Division (LD) -- By Institution by Classification of Instructional Program (CIP)
February 2005
LD Total LD Direct Direct & Direct
Instruction Indirect Indirect Cost Per Institution Name CIP CIP Descriotion LD FYE Expenditures Expenditures Expenditures LD FYE
Minnesota State College 4605 Plumbing/Pipefitting 20.67 88,321 68,723 157,044 4,274 Minnesota State College 4701 Elec'l/Elect's Equip Install/Repair 43.10 356,378 143,320 499,698 8,269 Minnesota State College 4702 Heat/Air Cond/Refrig Mech/Repair 48.23 201,534 160,390 361,924 4,178 Minnesota State College 4706 Vehi/Mobile Equip Mech/Repair 146.83 820,420 488,264 1,308,684 5,587 Minnesota State College 4801 Drafting 55.30 264,286 183,889 448,175 4,779 Minnesota State College 4903 Water Transp Workers 25.90 149,641 86,125 235,766 5,778 Minnesota State College 500402 Graphic Design/Comm Art/Illustration 89.23 450,741 296,727 747,468 5,051 Minnesota State College 500501 Drama/Theater Arts, Gen 6.57 17,516 21,836 39,353 2,667 Minnesota State College 500701 Art, Gen 16.55 30,676 55,034 85,710 1,854 Minnesota State College 500702 Fine/Studio Arts 26.80 102,105 89, 118 191,222 3,810 Minnesota State College 500901 Music, Gen 27.77 146,583 92,332 238,915 5,279 Minnesota State College 510601 Dental Assistant 29.90 161,065 99,426 260,492 5,387 Minnesota State College 510602 Dental Hygienist 28.90 177,971 96,101 274,072 6,158 Minnesota State College 5107 Hlth/Med Admin Serv 15.30 64,168 50,877 115,045 4,194 Minnesota State College 510805 Pharmacy Tech/Assist 14.10 49,237 46,887 96,123 3,492 Minnesota State College 510907 Medical Radiologic Tech 31.73 157,259 105,512 262,770 4,956 Minnesota State College 5110 Hlth/Med Lab Tech 35.99 104,076 119,685 223,761 2,892 Minnesota State College 511601 Nursing 76.03 656,216 252,833 909,050 8,631 Minnesota State College 511613 Practical Nursing(L.P.N. Training) 375.86 1,731,998 1,249,856 ·2,981,854 4,608 Minnesota State College 511615 Home Health Aide 18.50 100,234 61,518 161,752 5,418 Minnesota State College 5201 Business 20.83 49,873 69,277 119,150 2,394 Minnesota State College 5203 Accounting 167.02 613,091 555,398 1, 168,489 3,671 Minnesota State College 5204 Admin/Secretarial Serv 139.58 567,775 464, 137 1,031,912 4,068 Minnesota State College 5207 Enterprise Mgmt/Oper 4.07 23,142 13,523 36,665 5,691 Minnesota State College 5208 Fin Mgmt/Services 12.60 50,706 41,899 92,605 4,024 Minnesota State College 5210 Human Resources Mgmt 20.93 61, 144 69,609 130,753 2,921 Minnesota State College 521202 Busn Comp Prog/Programmer 166.47 612,944 553,562 1, 166,506 3,682 Minnesota State College 521204 Business Systems Networking and Telecommunications 123.40 543,863 410,352 954,216 4,407 Minnesota State College Total M ta S Coll T 4,288 15,819,844 14,257,278 30,077,122 3,690 Minnesota SU Moorhead 05 Area/Ethnic/Cult Studies 180.73 540,139 570,846 1, 110,985 2,989 Minnesota SU Moorhead 0904 Mass Comm/Journalism 112.03 419,185 353,853 773,038 3,742 Minnesota SU Moorhead 1107 Computer Science 92.67 551,192 292,704 843,896 5,948 Minnesota SU Moorhead 1312 Gen Teacher Educ 75.00 275,286 236,892 512,178 3,670 Minnesota SU Moorhead 1313 Teacher Ed/Specific Prog 92.53 227,590 292,261 519,852 2,460 Minnesota SU Moorhead 1506 Industrial Prod Tech 55.23 297,642 174,447 472,089 5,389 Minnesota SU Moorhead 16 Foreign Lang/Lit 114.10 480,595 360,392 840,987 4,212 Minnesota SU Moorhead 2201 Law/Legal Studies 14.70 64,051 46,431 110,482 4,357 Minnesota SU Moorhead 2301 Engl Lang/Lit Gen 388.10 1, 144,400 1,225,837 2,370,237 2,949 Minnesota SU Moorhead 2310 Speech/Rhetorical Studies 111.57 448,330 352,400 800,731 4,018 Minnesota SU Moorhead 26 Biol/Life Sciences 211.03 444,797 666,551 1,111,347 2,108 Minnesota SU Moorhead 27 Mathematics 366.47 1,080,453 1,157,517 2,237,970 2,948 Minnesota SU Moorhead 3099 Mutli/lnterdiscip Stu/Other 183.07 688,403 578,237 1,266,641 3,760 Minnesota SU Moorhead 3105 Health and Physical Education/Fitness 123.87 293,229 391,251 684,480 2,367 Minnesota SU Moorhead 38 Philosophy/Religion 114.43 351,101 361,434 712,535 3,068 Minnesota SU Moorhead 4005 Chemistry 63.63 331,258 200,979 532,237 5,206 Minnesota SU Moorhead 4008 Physics 98.63 315,240 311,529 626,769 3,196
Page 24
Fully Indirect Allocated
Cost Per Cost Per LD FYE LD FYE
3,325 7,599 3,325 11,594 3,325 7,504 3,325 8,913 3,325 8,104 3,325 9,103 3,325 8,377 3,325 5,993 3,325 5,179 3,325 7,135
-- 3,325 8,604 3,325 8,712 3,325 9,483 3,325 7,519 3,325 6,817 3,325 8,281 3,325 6,217 3,325 11,956 3,325 7,933 3,325 8,743 3,325 5,719 3,325 6,996 3,325 7,393
'3,325 9,016 3,325 7,350 3,325 6,246 3,325 7,007 3,325 7,732 3,325 7,015 3,159 6,147 3,159 6,900 3,159 9,106 3,159 6,829 3,159 5,618 3,159 8,548 3,159 7,371 3,159 7,516 3,159 6,107 3,159 7,177 3,159 5,266 3,159 6,107 3,159 6,919 3,159 5,526 3,159 6,227 3,159 8,365 3,159 6,355
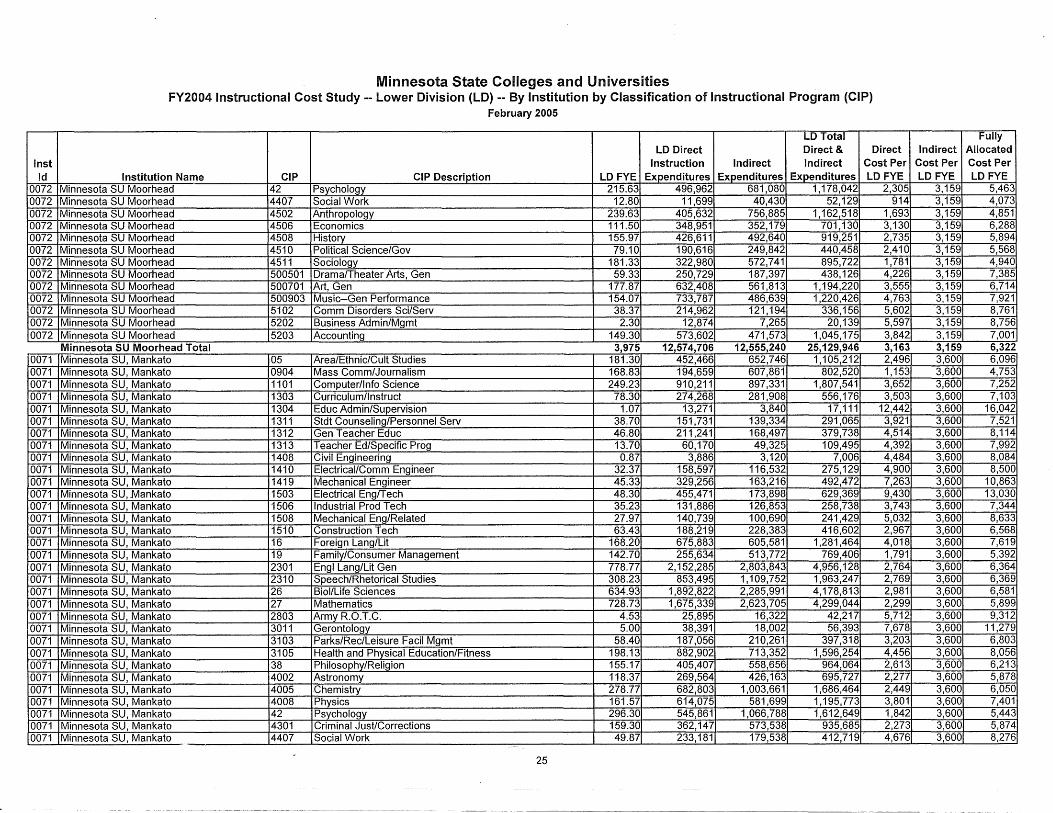
Inst Id
0072 0072 0072 0072 0072 0072 0072 0072 0072 0072 0072 0072 0072
0071 0071 0071 0071 0071 0071 0071 0071 0071 0071 0071 0071 0071 0071 0071 0071 0071 0071 0071 0071 0071 0071 0071 0071 0071 0071 0071 0071 0071 0071 0071 0071
Minnesota State Colleges and Universities FY2004 Instructional Cost Study -- Lower Division (LO) -- By Institution by Classification of Instructional Program (CIP)
February 2005
LD Total LD Direct Direct & Direct
Instruction Indirect Indirect Cost Per Institution Name CIP CIP Description LDFYE Expenditures Expenditures Expenditures LD FYE
Minnesota SU Moorhead 42 Psychology 215.63 496,962 681,080 1,178,042 2,305 Minnesota SU Moorhead 4407 Social Work 12.80 11,699 40,430 52,129 914 Minnesota SU Moorhead 4502 Anthropology 239.63 405,632 756,885 1,162,518 1,693 Minnesota SU Moorhead 4506 Economics 111.50 348,951 352,179 701, 130 3,130 Minnesota SU Moorhead 4508 History 155.97 426,611 492,640 919,251 2,735 Minnesota SU Moorhead 4510 Political Science/Gov 79.10 190,616 249,842 440,458 2,410 Minnesota SU Moorhead 4511 Sociology 181.33 322,980 572,741 895,722 1,781 Minnesota SU Moorhead 500501 Drama/Theater Arts, Gen 59.33 250,729 187,397 438,126 4,226 Minnesota SU Moorhead 500701 Art, Gen 177.87 632,408 561,813 1,194,220 3,555 Minnesota SU Moorhead 500903 Music--Gen Performance 154.07 733,787 486,639 1,220,426 4,763 Minnesota SU Moorhead 5102 Comm Disorders Sci/Serv 38.37 214,962 121,194 336,156 5,602 Minnesota SU Moorhead 5202 Business Admin/Mgmt 2.30 12,874 7,265 20,139 5,597 Minnesota SU Moorhead 5203 Accounting 149.30 573,602 471,573 1,045,175 3,842 Minnesota SU Moorhead Total 3,975 12,574,706 12.555,240 25,129,946 - - -3,163 Minnesota SU, Mankato 05 Area/Ethnic/Cult Studies 181.30 452,466 652,746 1,105,212 2,496 Minnesota SU, Mankato 0904 Mass Comm/Journalism 168.83 194,659 607,861 802,520 1, 153 Minnesota SU, Mankato 1101 Computer/Info Science 249.23 910,211 897,331 1,807,541 3,652 Minnesota SU, Mankato 1303 Curriculum/Instruct 78.30 274,268 281,908 556,176 3,503 Minnesota SU, Mankato 1304 Educ Admin/Supervision 1.07 13,271 3,840 17,111 12,442 Minnesota SU, Mankato 1311 Stdt Counseling/Personnel Serv 38.70 151,731 139,334 291,065 3,921 Minnesota SU, Mankato 1312 Gen Teacher Educ 46.80 211,241 168,497 379,738 4,514 Minnesota SU, Mankato 1313 Teacher Ed/Specific Prog 13.70 60,170 49,325 109,495 4,392 Minnesota SU, Mankato 1408 Civil Engineering 0.87 3,886 3,120 7,006 4,484 Minnesota SU, Mankato 1410 Electrical/Comm Engineer 32.37 158,597 116,532 275,129 4,900 Minnesota SU, Mankato 1419 Mechanical Engineer 45.33 329,256 163,216 492,472 7,263 Minnesota SU, .Mankato 1503 Electrical Eng/Tech 48.30 455,471 173,898 629,369 9,430 Minnesota SU, Mankato 1506 Industrial Prod Tech 35.23 131,886 126,853 258,738 3,743 Minnesota SU, Mankato 1508 Mechanical Eng/Related 27.97 140,739 100,690 241,429 5,032 Minnesota SU, Mankato 1510 Construction Tech 63.43 188,219 228,383 416,602 2,967 Minnesota SU, Mankato 16 Foreign Lang/Lit 168.20 675,883 605,581 1,281,464 4,018 Minnesota SU, Mankato 19 Family/Consumer Management 142.70 255,634 513,772 769,406 1,791 Minnesota SU, Mankato 2301 Engl Lang/Lit Gen 778.77 2,152,285 2,803,843 4,956,128 2,764 Minnesota SU, Mankato 2310 Speech/Rhetorical Studies 308.23 853,495 1,109,752 1,963,247 2,769 Minnesota SU, Mankato 26 Biol/Life Sciences 634.93 1,892,822 2,285,991 4, 178,813 2,981 Minnesota SU, Mankato 27 Mathematics 728.73 1,675,339 2,623,705 4,299,044 2,299 Minnesota SU, Mankato 2803 Army R.O.T.C. 4.53 25,895 16,322 42,217 5,712 Minnesota SU, Mankato 3011 Gerontology 5.00 38,391 18,002 56,393 7,678 Minnesota SU, Mankato 3103 Parks/Rec/Leisure Facil Mgmt 58.40 187,056 210,261 397,318 3,203 Minnesota SU, Mankato 3105 Health and Physical Education/Fitness 198.13 882,902 713,352 1,596,254 4,456 Minnesota SU, Mankato 38 Philosophy/Religion 155.17 405,407 558,656 964,064 2,613 Minnesota SU, Mankato 4002 Astronomy 118.37 269,564 426,163 695,727 2,277 Minnesota SU, Mankato 4005 Chemistry 278.77 682,803 1,003,661 1,686,464 2,449 Minnesota SU, Mankato 4008 Physics 161.57 614,075 581,699 1,195,773 3,801 Minnesota SU, Mankato 42 Psychology 296.30 545,861 1,066,788 1,612,649 1,842 Minnesota SU, Mankato 4301 Criminal Just/Corrections 159.30 362,147 573,538 935,685 2,273 Minnesota SU, Mankato 4407 Social Work 49.87 233,181 179,538 412,719. 4,676
25
Fully Indirect Allocated
Cost Per Cost Per LD FYE LD FYE
3,159 5,463 3,159 4,073 3,159 4,851 3,159 6,288 3,159 5,894 3,159 5,568 3,159 4,940 3,159 7,385 3,159 6,714 3,159 7,921 3,159 8,761 3,159 8,756 3,159 7,001 3.159 6.322 3,600 6,096 3,600 4,753 3,600 7,252 3,600 7,103 3,600 16,042 3,600 7,521 3,600 8,114 3,600 7,992 3,600 8,084 3,600 8,500 3,600 10,863 3,600 13,030 3,600 7,344 3,600 8,633 3,600 6,568 3,600 7,619 3,600 5,392 3,600 6,364 3,600 6,369 3,600 6,581 3,600 5,899 3,600 9,312 3,600 11,279 3,600 6,803 3,600 8,056 3,600 6,213 3,600 5,878 3,600 6,050 3,600 7,401 3,600 5,443 3,600 5,874 3,600 8,276
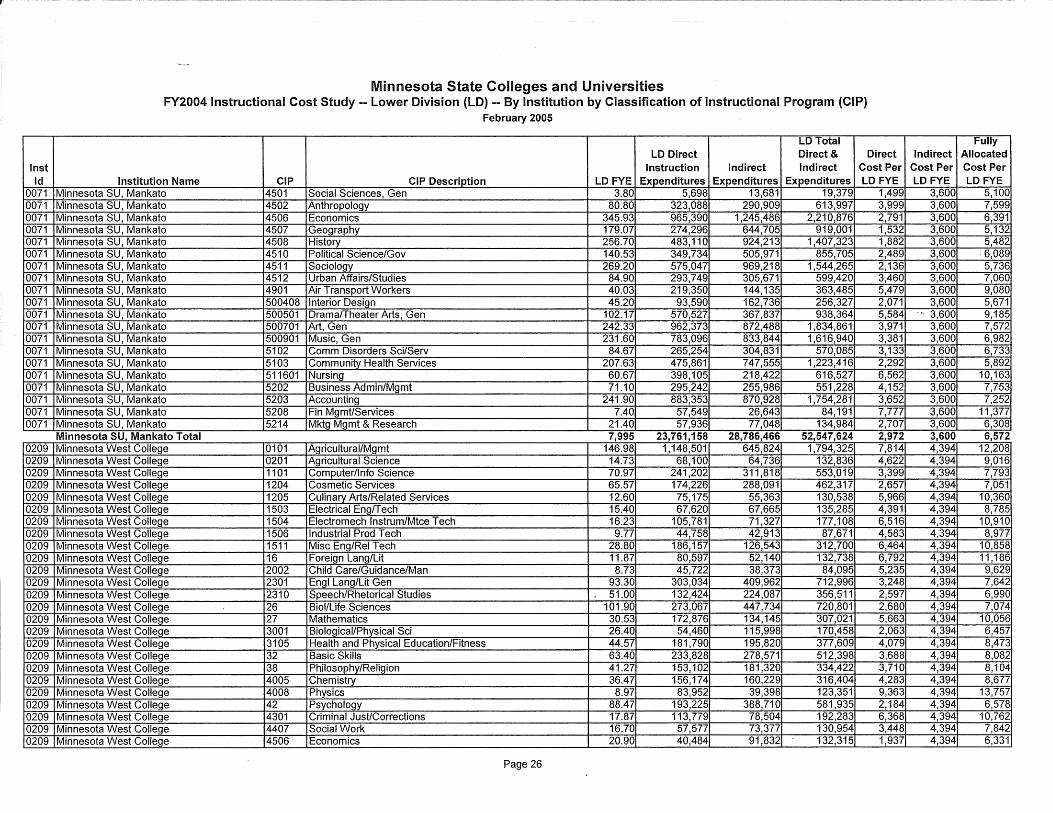
Inst Id
0071 0071 0071 0071 0071 0071 0071 0071 0071 0071 0071 0071 0071 0071 0071 0071 0071 0071 0071 0071
0209 0209 0209 0209 0209 0209 0209 0209 0209 0209 0209 0209 0209 0209 0209 0209 0209 0209 0209 0209 0209 0209 0209 0209 0209
Minnesota State Colleges and Universities FY2004 Instructional Cost Study -- Lower Division (LD) -- By Institution by Classification of Instructional Program (CIP)
February 2005
LD Total LD Direct Direct & Direct
Instruction Indirect Indirect Cost Per Institution Name CIP CIP Description LD FYE Expenditures Expenditures Expenditures LD FYE
Minnesota SU, Mankato 4501 Social Sciences, Gen 3.80 5,698 13,681 19,379 1,499 Minnesota SU, Mankato 4502 Anthropology 80.80 323,088 290,909 613,997 3,999 Minnesota SU, Mankato 4506 Economics 345.93 965,390 1,245,486 2,210,876 2,791 Minnesota SU, Mankato 4507 Geography 179.07 274,296 644,705 919,001 1,532 Minnesota SU, Mankato 4508 History 256.70 483,110 924,213 1,407,323 1,882 Minnesota SU, Mankato 4510 Political Science/Gov 140.53 349,734 505,971 855,705 2,489 Minnesota SU, Mankato 4511 Sociology 269.20 575,047 969,218 1,544,265 2,136 Minnesota SU, Mankato 4512 Urban Affairs/Studies 84.90 293,749 305,671 599,420 3,460 Minnesota SU, Mankato 4901 Air Transport Workers 40.03 219,350 144,135 363,485 5,479 Minnesota SU, Mankato 500408 Interior Design 45.20 93,590 162,736 256,327 2,071 Minnesota SU, Mankato 500501 Drama/Theater Arts, Gen 102.17 570,527 367,837 938,364 5,584 Minnesota SU, Mankato 500701 Art, Gen 242.33 962,373 872,488 1,834,861 3,971 Minnesota SU, Mankato 500901 Music, Gen 231.60 783,096 833,844 1,616,940 3,381 Minnesota SU, Mankato 5102 Comm Disorders Sci/Serv 84.67 265,254 304,831 570,085 3,133 Minnesota SU, Mankato 5103 Community Health Services 207.63 475,861 747,555 1,223,416 2,292 Minnesota SU, Mankato 511601 Nursing 60.67 398,105 218,422 616,527 6,562 Minnesota SU, Mankato 5202 Business Admin/Mgmt 71.10 295,242 255,986 551,228 4,152 Minnesota SU, Mankato 5203 Accounting 241.90 883,353 870,928 1,754,281 3,652 Minnesota SU, Mankato 5208 Fin Mgmt/Services 7.40 57,549 26,643 84,191 7,777 Minnesota SU, Mankato 5214 Mktg Mgmt & Research 21.40 57,936 77,048 134,984 2,707 Minnesota SU, Mankato Total 7,995 23, 761, 158 28, 786,466 52,547,624 2,972 Minnesota West College 0101 Agricultural/Mgmt 146.98 1,148,501 645,824 1,794,325 7,814 Minnesota West College 0201 Agricultural Science 14.73 68,100 64,736 132,836 4,622 Minnesota West College 1101 Computer/Info Science 70.97 241,202 311,818 553,019 3,399 Minnesota West College 1204 Cosmetic Services 65.57 174,226 288,091 462,317 2,657 Minnesota West College 1205 Culinary Arts/Related Services 12.60 75,175 55,363 130,538 5,966 Minnesota West College 1503 Electrical Eng/Tech 15.40 67,620 67,665 135,285 4,391 Minnesota West College 1504 Electromech lnstrum/Mtce Tech 16.23 105,781 71,327 177,108 6,516 Minnesota West College 1506 Industrial Prod Tech 9.77 44,758 42,913 87,671 4,583 Minnesota West College 1511 Misc Eng/Rel Tech 28.80 186,157 126,543 312,700 6,464 Minnesota West College 16 Foreign Lang/Lit 11.87 80,597 52,140 132,738 6,792 Minnesota West College 2002 Child Care/Guidance/Man 8.73 45,722 38,373 84,095 5,235 Minnesota West College 2301 Engl Lang/Lit Gen 93.30 303,034 409,962 712,996 3,248 Minnesota West College 2310 Speech/Rhetorical Studies 51.00 132,424 224,087 356,511 2,597 Minnesota West College 26 Biol/Life Sciences 101.90 273,067 447,734 720,801 2,680 Minnesota West College 27 Mathematics 30.53 172,876 134,145 307,021 5,663 Minnesota West College 3001 Biological/Physical Sci 26.40 54,460 115,998 170,458 2,063 Minnesota West College 3105 Health and Physical Education/Fitness 44.57 181,790 195,820 377,609 4,079 Minnesota West College 32 Basic Skills 63.40 233,828 278,571 512,398 3,688 Minnesota West College 38 Philosophy/Religion 41.27 153,102 181,320 334,422 3,710 Minnesota West College 4005 Chemistry 36.47 156, 174 160,229 316,404 4,283 Minnesota West College 4008 Physics 8.97 83,952 39,398 123,351 9,363 Minnesota West College 42 Psychology 88.47 193,225 388,710 581,935 2,184 Minnesota West College 4301 Criminal Just/Corrections 17.87 113,779 78,504 192,283 6,368 Minnesota West College 4407 Social Work 16.70 57,577 73,377 130,954 3,448 Minnesota West College 4506 Economics 20.90 40,484 91,832 132,315 1,937
Page 26
Fully Indirect Allocated
Cost Per Cost Per LD FYE LD FYE
3,600 5,100 3,600 7,599 3,600 6,391 3,600 5,132 3,600 5,482 3,600 6,089 3,600 5,736 3,600 7,060 3,600 9,080 3,600. 5,671
- 3,600 9,185 3,600 7,572 3,600 6,982 3,600 6,733 3,600 5,892 3,600 10,163 3,600 7,753 3,600 7,252 3,600 11,377 3,600 6,308 3,600 6,572 4,394 12,208 4,394 9,016 4,394 7,793 4,394 7,051 4,394 10,360 4,394 8,785 4,394 10,910 4,394 8,977 4,394 10,858 4,394 11, 186 4,394 9,629 4,394 7,642 4,394 6,990 4,394 7,074 4,394 10,056 4,394 6,457 4,394 8,473 4,394 8,082 4,394 8,104 4,394 8,677 4,394 13,757 4,394 6,578 4,394 10,762 4,394 7,842 4,394 6,331
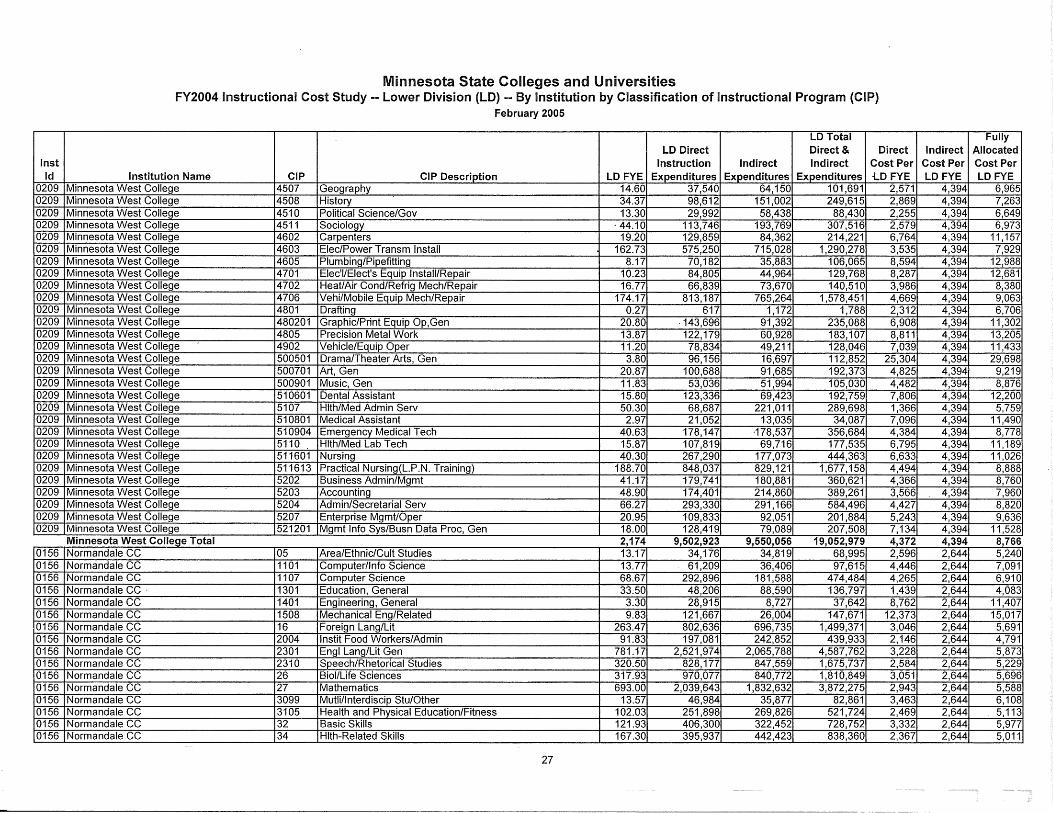
Inst Id
0209 0209 0209 0209 0209 0209 0209 0209 0209 0209 0209 0209 0209 0209 0209 0209 0209 0209 0209 0209 0209 0209 0209 0209 0209 0209 0209 0209 0209
0156 0156 0156 0156 0156 0156 0156 0156 0156 0156 0156 0156 0156 0156 0156 0156
Minnesota State Colleges and Universities FY2004 Instructional Cost Study -- Lower Division (LO) -- By Institution by Classification of Instructional Program (CIP)
February 2005
LD Total LD Direct Direct & Direct
Instruction Indirect Indirect Cost Per Institution Name CIP CIP Description LD FYE Expenditures Expenditures Expenditures -LD FYE
Minnesota West College 4507 Geography 14.60 37,540 64,150 101,691 2,571 Minnesota West College 4508 History 34.37 98,612 151,002 249,615 2,869 Minnesota West College 4510 Political Science/Gov 13.30 29,992 58,438 88,430 2,255 Minnesota West College 4511 Sociology . 44.10 113,746 193,769 307,516 2,579 Minnesota West College 4602 Carpenters 19.20 129,859 84,362 214,221 6,764 Minnesota West College 4603 Elec/Power Transm Install 162.73 575,250 715,028 1,290,278 3,535 Minnesota West College 4605 Plumbing/Pipefitting 8.17 70,182 35,883 106,065 8,594 Minnesota West College 4701 Elec'l/Elect's Equip Install/Repair 10.23 84,805 44,964 129,768 8,287 Minnesota West College 4702 Heat/Air Cond/Refrig Mech/Repair 16.77 66,839 73,670 140,510 3,986 Minnesota West College 4706 Vehi/Mobile Equip Mech/Repair 174.17 813,187 765,264 1,578,451 4,669 Minnesota West College 4801 Drafting 0.27 617 1, 172 1,788 2,312 Minnesota West College 480201 Graphic/Print Equip Op,Gen 20.80 · 143,696 91,392 235,088 6,908 Minnesota West College 4805 Precision Metal Work 13.87 122, 179 60,928 183, 107 8,811 Minnesota West College 4902 Vehicle/Equip Oper 11.20 78,834 49,211 128,046 7,039 Minnesota West College 500501 Drama/Theater Arts, Gen 3.80 96,156 16,697 112,852 25,304 Minnesota West College 500701 Art, Gen 20.87 100,688 91,685 192,373 4,825 Minnesota West College 500901 Music, Gen 11.83 53,036 51,994 105,030 4,482 Minnesota West College 510601 Dental Assistant 15.80 123,336 69,423 192,759 7,806 Minnesota West College 5107 Hlth/Med Admin Serv 50.30 68,687 221,011 289,698 1,366 Minnesota West College 510801 Medical Assistant 2.97 21,052 13,035 34,087 7,096 Minnesota West College 510904 Emergency Medical Tech 40.63 178,147 ·178,537 356,684 4,384 Minnesota West College 5110 Hlth/Med Lab Tech 15.87 107,819 69,716 177,535 6,795 Minnesota West College 511601 Nursing 40.30 267,290 177,073 444,363 6,633 Minnesota West College 511613 Practical Nursing(L.P.N. Training) 188.70 848,037 829,121 1,677, 158 4,494 Minnesota West College 5202 Business Admin/Mgmt 41.17 179,741 180,881 360,621 4,366 Minnesota West College 5203 Accounting 48.90 174,401 214,860 389,261 3,566 Minnesota West College 5204 Admin/Secretarial Serv 66.27 293,330 291, 166 584,496 4,427 Minnesota West College 5207 Enterprise Mgmt/Oper 20.95 109,833 92,051 201,884 5,243 Minnesota West College 521201 Mgmt Info Sys/Busn Data Proc, Gen 18.00 128,419 79,089 207,508 7,134 Minnesota West Colle~e Total 2,174 9,502,923 9,550,056 19,052,979 4,372 Normandale CC 05 Area/Ethnic/Cult Studies 13.17 34,176 34,819 68,995 2,596 Normandale CC 1101 Computer/Info Science 13.77 61,209 36,406 97,615 4,446 Normandale CC 1107 Computer Science 68.67 292,896 181,588 474,484 4,265 Normandale CC · 1301 Education, General 33.50 48,206 88,590 136,797 1,439 Normandale CC 1401 Engineering, General 3.30 28,915 8,727 37,642 8,762 Normandale CC 1508 Mechanical Eng/Related 9.83 121,667 26,004 147,671 12,373 Normandale CC 16 Foreign Lang/Lit 263.47 802,636 696,735 1,499,371 3,046 Normandale CC 2004 lnstit Food Workers/Admin 91.83 197,081 242,852 439,933 2,146 Normandale CC 2301 Engl Lang/Lit Gen 781.17 2,521,974 2,065,788 4,587,762 3,228 Normandale CC 2310 Speech/Rhetorical Studies 320.50 828,177 847,559 1,675,737 2,584 Normandale CC 26 Biol/Life Sciences 317.93 970,077 840,772 1,810,849 3,051 Normandale CC 27 Mathematics 693.00 2,039,643 1,832,632 3,872,275 2,943 Normandale CC 3099 Mutli/lnterdiscip Stu/Other 13.57 46,984 35,877 82,861 3,463 Normandale CC 3105 Health and Physical Education/Fitness 102.03 251,898 269,826 521,724 2,469 Normandale CC 32 Basic Skills 121.93 406,300 322,452 728,752 3,332 Normandale CC 34 Hlth-Related Skills 167.30 395,937 442,423 838,360 2,367
27
Fully Indirect Allocated
Cost Per Cost Per LD FYE LD FYE
4,394 6,965 4,394 7,263 4,394 6,649 4,394 6,973 4,394 11, 157 4,394 7,929 4,394 12,988 4,394 12,681 4,394 8,380 4,394 9,063 4,394 6,706 4,394 11,302 4,394 13,205 4,394 11,433 4,394 29,698 4,394 9,219 4,394 8,876 4,394 12,200 4,394 5,759 4,394 11,490 4,394 8,778 4,394 11, 189 4,394 11,026 4,394 8,888 4,394 8,760 4,394 7,960 4,394 8,820 4,394 9,636 4,394 11,528 4,394 8,766 2,644 5,240 2,644 7,091 2,644 6,910 2,644 4,083 2,644 11,407 2,644 15,017 2,644 5,691 2,644 4,791 2,644 5,873 2,644 5,229 2,644 5,696 2,644 5,588 2,644 6,108 2,644 5,113 2,644 5,977 2,644 5,011
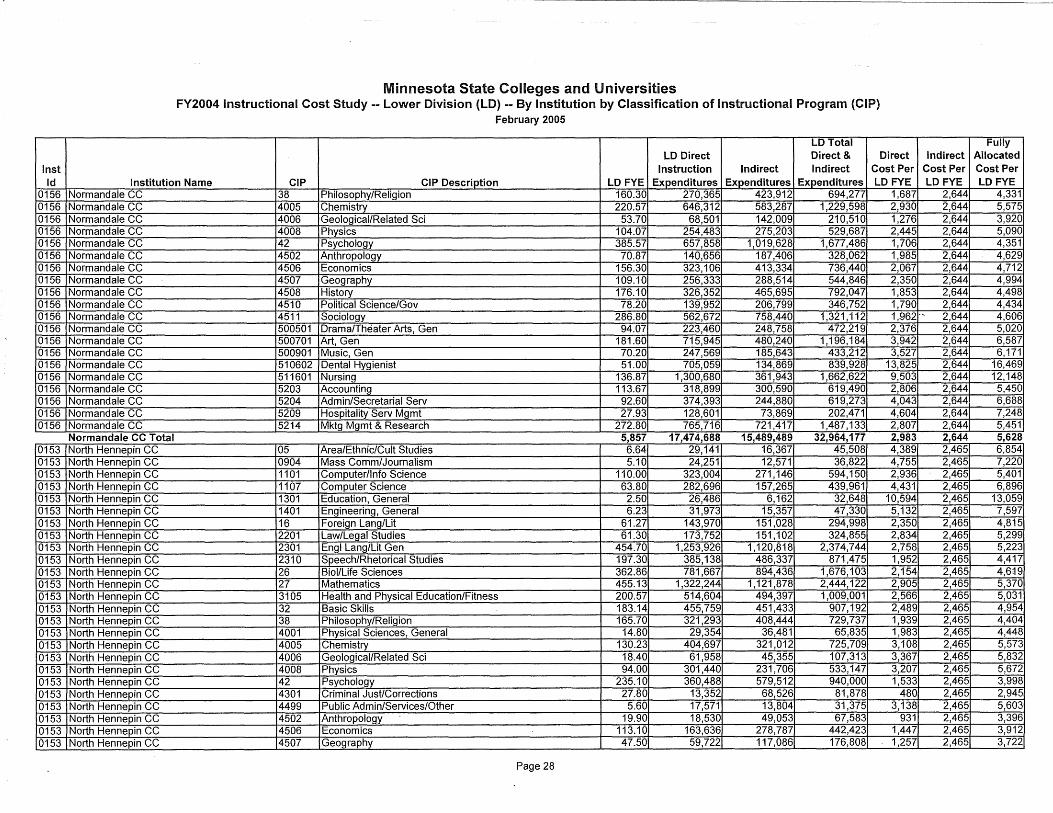
,...-
Inst Id
0156 0156 0156 0156 0156 0156 0156 0156 0156 0156 0156 0156 0156 0156 0156 0156 0156 0156 0156 0156
0153 0153 0153 0153 0153 0153 0153 0153 0153 0153 0153 0153 0153 0153 0153 0153 0153 0153 0153 0153 0153 0153 0153 0153 0153
Minnesota State Colleges and Universities FY2004 Instructional Cost Study -- Lower Division (LD) -- By Institution by Classification of Instructional Program (CIP)
February 2005
LD Total LO Direct Direct & Direct
Instruction Indirect Indirect Cost Per Institution Name CIP CIP Description LO FYE Expenditures Expenditures Expenditures LO FYE
Normandale CC 38 Philosophy/Religion 160.30 270,365 423,912 694,277 1,687 Normandale CC 4005 Chemistry 220.57 646,312 583,287 1,229,598 2,930 Normandale CC 4006 Geological/Related Sci 53.70 68,501 142,009 210,510 1,276 Normandale CC 4008 Physics 104.07 254,483 275,203 529,687 2,445 Normandale CC 42 Psychology 385.57 657,858 1,019,628 1,677,486 1,706 Normandale CC 4502 Anthropology 70.87 140,656 187,406 328,062 1,985 Normandale CC 4506 Economics 156.30 323,106 413,334 736,440 2,067 Normandale CC 4507 Geography 109.10 256,333 288,514 544,846 2,350 Normandale CC 4508 History 176.10 326,352 465,695 792,047 1,853 Normandale CC 4510 Political Science/Gov 78.20 139,952 206,799 346,752 1,790
Indirect Cost Per LO FYE
2,644 2,644 2,644 2,644 2,644 2,644 2,644 2,644 2,644 2,644
Normandale CC 4511 Sociology 286.80 562,672 758,440 1,321,112 1 ,962 -- 2,644 Normandale CC 500501 Drama/Theater Arts, Gen 94.07 223,460 248,758 472,219 2,376 2,644 Normandale CC 500701 Art, Gen 181.60 715,945 480,240 1,196,184 3,942 2,644 Normandale CC 500901 Music, Gen 70.20 247,569 185,643 433,212 3,527 2,644 Normandale CC 510602 Dental Hygienist 51.00 705,059 134,869 839,928 13,825 2,644 Normandale CC 511601 Nursing 136.87 1,300,680 361,943 1,662,622 9,503 2,644 Normandale CC 5203 Accounting 113.67 318,899 300,590 619,490 2,806 2,644 Normandale CC 5204 Admin/Secretarial Serv 92.60 374,393 244,880 619,273 4,043 2,644 Normandale CC 5209 Hospitality Serv Mgmt 27.93 128,601 73,869 202,471 4,604 2,644 Normandale CC 5214 Mktg Mgmt & Research 272.80 765,716 721,417 1,487,133 2,807 2,644 Normandale CC Total 5.857 17,474,688 15,489,489 32,964,177 2,983 2,644 North Hennepin CC 05 Area/Ethnic/Cult Studies 6.64 29,141 16,367 45,508 4,389 2,465 North Hennepin CC 0904 Mass Comm/Journalism 5.10 24,251 12,571 36,822 4,755 2,465 North Hennepin CC 1101 Computer/Info Science 110.00 323,004 271, 146 594,150 2,936 2,465 North Hennepin CC 1107 Computer Science 63.80 282,696 157,265 439,961 4,431 2,465 North Hennepin CC 1301 Education, General 2.50 26,486 6,162 32,648 10,594 2,465 North Hennepin CC 1401 Engineering, General 6.23 31 ,973 15,357 47,330 5,132 2,465 North Hennepin CC 16 Foreign Lang/Lit 61.27 143,970 151,028 294,998 2,350 2,465 North Hennepin CC 2201 Law/Legal Studies 61.30 173,752 151,102 324,855 2,834 2,465 North Hennepin CC 2301 Engl Lang/Lit Gen 454.70 1,253,926 1,120,818 2,374,744 2,758 2,465 North Hennepin CC 2310 Speech/Rhetorical Studies 197.30 385,138 486,337 871,475 1,952 2,465 North Hennepin CC 26 Biol/Life Sciences 362.86 781,667 894,436 1,676, 103 2,154 2,465 North Hennepin CC 27 Mathematics 455.13 1,322,244 1,121,878 2,444,122 2,905 2,465 North Hennepin CC 3105 Health and Physical Education/Fitness 200.57 514,604 494,391 1,009,001 2,566 2,465 North Hennepin CC 32 Basic Skills 183.14 455,759 451,433 907,192 2,489 2,465 North Hennepin CC 38 Philosophy/Religion 165.70 321,293 408,444 729,737 1,939 2,465 North Hennepin CC 4001 Physical Sciences, General 14.80 29,354 36,481 65,835 1,983 2,465 North Hennepin CC 4005 Chemistry 130.23 404,697 321,012 725,709 3,108 2,465 North Hennepin CC 4006 Geological/Related Sci 18.40 61,958 45,355 107,313 3,367 2,465 North Hennepin CC 4008 Physics 94.00 301,440 231,706 533,147 3,207 2,465 North Hennepin CC 42 Psychology 235.10 360,488 579,512 940,000 1,533 2,465 North Hennepin CC 4301 Criminal Just/Corrections 27.80 13,352 68,526 81,878 480 2,465 North Hennepin CC 4499 Public Admin/Services/Other 5.60 17,571 13,804 31,375 3,138 2,465 North Hennepin CC 4502 Anthropology 19.90 18,530 49,053 67,583 931 2,465 North Hennepin CC 4506 Economics 113.10 163,636 278,787 442,423 1,447 2,465 North Hennepin CC 4507 Geography 47.50 59,722 117,086 176,808 1,257 2,465
Page 28
Fully Allocated Cost Per LDFYE
4,331 5,575 3,920 5,090 4,351 4,629 4,712 4,994 4,498 4,434 4,606 5,020 6,587 6,171
16,469 12,148
5,450 6,688 7,248 5,451 5,628 6,854 7,220 5,401 6,896
13,059 7,597 4,815 5,299 5,223 4,417 4,619 5,370 5,031 4,954 4,404 4,448 5,573 5,832 5,672 3,998 2,945 5,603 3,396 3,912 3,722
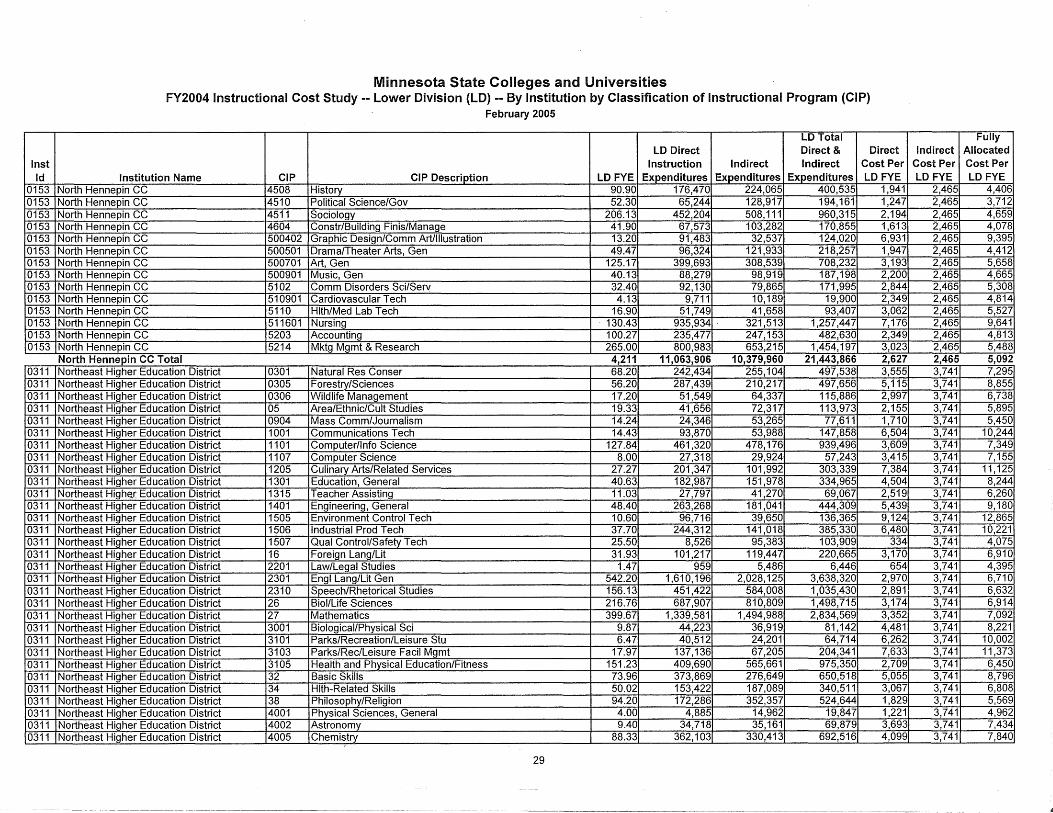
Inst Id
0153 0153 0153 0153 0153 0153 0153 0153 0153 0153 0153 0153 0153 0153
0311 0311 0311 0311 0311 0311 0311 0311 0311 0311 0311 0311 0311 0311 0311 0311 0311 0311 0311 0311 0311 0311 0311 0311 0311 0311 0311 0311 0311 0311 0311
Minnesota State Colleges and Universities FY2004 Instructional Cost Study -- Lower Division (LO) -- By Institution by Classification of Instructional Program (CIP)
February 2005
LD Total LD Direct Direct & Direct
Instruction Indirect Indirect Cost Per Institution Name CIP CIP Description LD FYE Expenditures Expenditures Expenditures LD FYE
North Hennepin CC 4508 History 90.90 176,470 224,065 400,535 1,941 North Hennepin CC 4510 Political Science/Gov 52.30 65,244 128,917 194,161 1,247 North Hennepin CC 4511 Sociology 206.13 452,204 508, 111 960,315 2,194 North Hennepin CC 4604 Constr/Building Finis/Manage 41.90 67,573 103,282 170,855 1,613 North Hennepin CC 500402 Graphic Design/Comm Art/Illustration 13.20 91,483 32,537 124,020 6,931 North Hennepin CC 500501 Drama/Theater Arts, Gen 49.47 96,324 121,933 218,257 1,947 North Hennepin CC 500701 Art, Gen 125.17 399,693 308,539 708,232 3,193 North Hennepin CC 500901 Music, Gen 40.13 88,279 98,919 187,198 2,200 North Hennepin CC 5102 Comm Disorders Sci/Serv 32.40 92,130 79,865 171,995 2,844 North Hennepin CC 510901 Cardiovascular Tech 4.13 9,711 10,189 19,900 2,349 North Hennepin CC 5110 Hlth/Med Lab Tech 16.90 51,749 41,658 93,407 3,062 North Hennepin CC 511601 Nursing . 130.43 935,934 . 321,513 1,257,447 7,176 North Hennepin CC 5203 Accounting 100.27 235,477 247,153 482,630 2,349 North Hennepin CC 5214 Mktg Mgmt & Research 265.00 800,983 653,215 1,454,197 3,023 North Hennepin CC Total North H CC Total 4.211 4,211 11.063.906 11,063,906 10.379.960 10,379,960 21.443.866 21,443,866 2.627 2,627 Northeast Higher Education District 0301 Natural Res Conser 68.20 242,434 255,104 497,538 3,555 Northeast Higher Education District 0305 Forestry/Sciences 56.20 287,439 210,217 497,656 5,115 Northeast Higher Education District 0306 Wildlife Management 17.20 51,549 64,337 115,886 2,997 Northeast Higher Education District 05 Area/Ethnic/Cult Studies 19.33 41,656 72,317 113,973 2,155 Northeast Higher Education District 0904 Mass Comm/Journalism 14.24 24,346 53,265 77,611 1,710 Northeast Higher Education District 1001 Communications Tech 14.43 93,870 53,988 147,858 6,504 Northeast Higher Education District 1101 Computer/Info Science 127.84 461,320 478,176 939,496 3,609 Northeast Higher Education District 1107 Computer Science 8.00 27,318 29,924 57,243 3,415 Northeast Higher Education District 1205 Culinary Arts/Related Services 27.27 201,347 101,992 303,339 7,384 Northeast Higher Education District 1301 Education, General 40.63 182,987 151,978 334,965 4,504 Northeast Higher Education District 1315 Teacher Assisting 11.03 27,797 41,270 69,067 2,519 Northeast Higher Education District 1401 Engineering, General 48.40 263,268 181,041 444,309 5,439 Northeast Higher Education District 1505 Environment Control Tech 10.60 96,716 39,650 136,365 9,124 Northeast Higher Education District 1506 Industrial Prod Tech 37.70 244,312 141,018 385,330 6,480 Northeast Higher Education District 1507 Qua I Control/Safety Tech 25.50 8,526 95,383 103,909 334 Northeast Higher Education District 16 Foreign Lang/Lit 31.93 101,217 119,447 220,665 3,170 Northeast Higher Education District 2201 Law/Legal Studies 1.47 959 5,486 6,446 654 Northeast Higher Education District 2301 Engl Lang/Lit Gen 542.20 1,610, 196 2,028,125 3,638,320 2,970 Northeast Higher Education District 2310 Speech/Rhetorical Studies 156.13 451,422 584,008 1,035,430 2,891 Northeast Higher Education District 26 Biol/Life Sciences 216.76 687,907 810,809 1,498,715 3,174 Northeast Higher Education District 27 Mathematics 399.67 1,339,581 1,494,988 2,834,569 3,352 Northeast Higher Education District 3001 Biological/Physical Sci 9.87 44,223 36,919 81,142 4,481 Northeast Higher Education District 3101 Parks/Recreation/Leisure Stu 6.47 40,512 24,201 64,714 6,262 Northeast Higher Education District 3103 Parks/Rec/Leisure Facil Mgmt 17.97 137, 136 67,205 204,341 7,633 Northeast Higher Education District 3105 Health and Physical Education/Fitness 151.23 409,690 565,661 975,350 2,709 Northeast Higher Education District 32 Basic Skills 73.96 373,869 276,649 650,518 5,055 Northeast Higher Education District 34 Hlth-Related Skills 50.02 153,422 187,089 340,511 3,067 Northeast Higher Education District 38 Philosophy/Religion 94.20 172,286 352,357 524,644 1,829 Northeast Higher Education District 4001 Physical Sciences, General 4.00 4,885 14,962 19,847 1,221 Northeast Higher Education District 4002 Astronomy 9.40 34,718 35,161 69,879 3,693 Northeast Higher Education District 4005 Chemistry 88.33 362,103 330,413 692,516 4,099
29
Fully Indirect Allocated
Cost Per Cost Per LD FYE LD FYE
2,465 4,406 2,465 3,712 2,465 4,659 2,465 4,078 2,465 9,395 2,465 4,412 2,465 5,658 2,465 4,665 2,465 5,308 2,465 4,814 2,465 5,527 2,465 9,641 2,465 4,813 2,465 5,488 2.465 2,465 5.092 5,092 3,741 7,295 3,741 8,855 3,741 6,738 3,741 5,895 3,741 5,450 3,741 10,244 3,741 7,349 3,741 7,155 3,741 11, 125 3,741 8,244 3,741 6,260 3,741 9,180 3,741 12,865 3,741 10,221 3,741 4,075 3,741 6,910 3,741 4,395 3,741 6,710 3,741 6,632 3,741 6,914 3,741 7,092 3,741 8,221 3,741 10,002 3,741 11,373 3,741 6,450 3,741 8,796 3,741 6,808 3,741 5,569 3,741 4,962 3,741 7,434 3,741 7,840
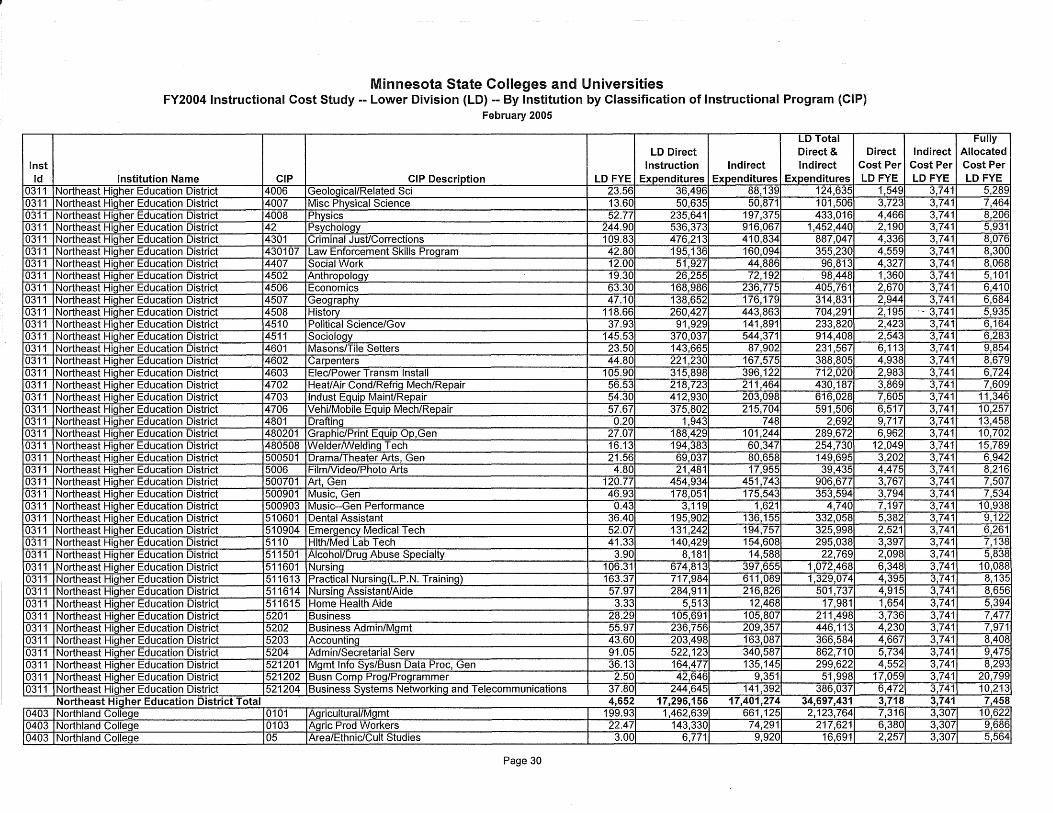
Inst Id
0311 0311 0311 0311 0311 0311 0311 0311 0311 0311 0311 0311 0311 0311 0311 0311 0311 0311 0311 0311 0311 0311 0311 0311 0311 0311 0311 0311 0311 0311 0311 0311 0311 0311 0311 0311 0311 0311 0311 0311 0311 0311
Minnesota State Colleges and Universities FY2004 Instructional Cost Study -- lower Division (LD) -- By Institution by Classification of Instructional Program (CIP)
February 2005
LD Total LD Direct Direct & Direct
Instruction Indirect Indirect Cost Per Institution Name CIP CIP Description LD FYE Expenditures Expenditures Expenditures LD FYE
Northeast Higher Education District 4006 Geological/Related Sci 23.56 36,496 88,139 124,635 1,549 Northeast Higher Education District 4007 Misc Physical Science 13.60 50,635 50,871 101,506 3,723 Northeast Higher Education District 4008 Physics 52.77 235,641 197,375 433,016 4,466 Northeast Higher Education District 42 Psychology 244.90 536,373 916,067 1,452,440 2,190 Northeast Higher Education District 4301 Criminal Just/Corrections 109.83 476,213 410,834 887,047 4,336 Northeast Higher Education District 430107 Law Enforcement Skills Program 42.80 195, 136 160,094 355,230 4,559 Northeast Higher Education District 4407 Social Work 12.00 51,927 44,886 96,813 4,327 Northeast Higher Education District 4502 Anthropology 19.30 26,255 72,192 98,448 1,360 Northeast Higher Education District 4506 Economics 63.30 168,986 236,775 405,761 2,670 Northeast Higher Education District 4507 Geography 47.10 138,652 176,179 314,831 2,944 Northeast Higher Education District 4508 History 118.66 260,427 443,863 704,291 2,195 Northeast Higher Education District 4510 Political Science/Gov 37.93 91,929 141,891 233,820 2,423 Northeast Higher Education District 4511 Sociology 145.53 370,037 544,371 914,408 2,543 Northeast Higher Education District 4601 Masons/Tile Setters 23.50 143,665 87,902 231,567 6,113 Northeast Higher Education District 4602 Carpenters 44.80 221,230 167,575 388,805 4,938 Northeast Higher Education District 4603 Elec/Power Transm Install 105.90 315,898 396, 122 712,020 2,983 Northeast Higher Education District 4702 Heat/Air Cond/Refrig Mech/Repair 56.53 218,723 211,464 430,187 3,869 Northeast Higher Education District 4703 lndust Equip Maint/Repair 54.30 412,930 203,098 616,028 7,605 Northeast Higher Education District 4706 Vehi/Mobile Equip Mech/Repair 57.67 375,802 215,704 591,506 6,517 Northeast Higher Education District 4801 Drafting 0.20 1,943 748 2,692 9,717 Northeast Higher Education District 480201 Graphic/Print Equip Op,Gen 27.07 188,429 101,244 289,672 6,962 Northeast Higher Education District 480508 Welder/Welding Tech 16.13 194,383 60,347 254,730 12,049 Northeast Higher Education District 500501 Drama/Theater Arts, Gen 21.56 69,037 80,658 149,695 3,202 Northeast Higher Education District 5006 FilmNideo/Photo Arts 4.80 21,481 17,955 39,435 4,475 Northeast Higher Education District 500701 Art, Gen 120.77 454,934 451,743 906,677 3,767 Northeast Higher Education District 500901 Music, Gen 46.93 178,051 175,543 353,594 3,794 Northeast Higher Education District 500903 Music--Gen Performance 0.43 3,119 1,621 4,740 7,197 Northeast Higher Education District 510601 Dental Assistant 36.40 195,902 136, 155 332,058 5,382. Northeast Higher Education District 510904 Emergency Medical Tech 52.07 131,242 194,757 325,998 2,521 Northeast Higher Education District 5110 Hlth/Med Lab Tech 41.33 140,429 154,608 295,038 3,397 Northeast Higher Education District 511501 Alcohol/Drug Abuse Specialty 3.90 8,181 14,588 22,769 2,098 Northeast Higher Education District 511601 Nursing 106.31 674,813 397,655 1,072,468 6,348 Northeast Higher Education District 511613 Practical Nursing(L.P.N. Training) 163.37 717,984 611,089 1,329,074 4,395 Northeast Higher Education District 511614 Nursing Assistant/Aide 57.97 284,911 216,826 501,737 4,915 Northeast Higher Education District 511615 Home Health Aide 3.33 5,513 12,468 17,981 1,654 Northeast Higher Education District 5201 Business 28.29 105,691 105,807 211,498 3,736 Northeast Higher Education District 5202 Business Admin/Mgmt 55.97 236,756 209,357 446, 113 4,230 Northeast Higher Education District 5203 Accounting 43.60 203,498 163,087 366,584 4,667 Northeast Higher Education District 5204 Admin/Secretarial Serv 91.05 522,123 340,587 862,710 5,734 Northeast Higher Education District 521201 Mgmt Info Sys/Busn Data Proc, Gen 36.13 164,477 135, 145 299,622 4,552 Northeast Higher Education District 521202 Busn Comp Prog/Programmer 2.50 42,646 9,351 51,998 17,059 Northeast Higher Education District 521204 Business Systems Networking and Telecommunications 37.80 244,645 141,392 386,037 6,472 Northeast Hiaher Education District Total 4,652 17,296,156 17,401,274 34,697,431
- - - -3,718
Northland College I 0101 Agricultural/Mgmt 199.93 1,462,639 661, 125 2,123,764 7,316 Northland College I 0103 Agric Prod Workers 22.47 143,330 74,291 217,621 6,380 Northland College I 05 Area/Ethnic/Cult Studies 3.00 6,771 9,920 16,691 2,257
Page 30
Fully Indirect Allocated
Cost Per Cost Per LDFYE LD FYE
3,741 5,289 3,741 7,464 3,741 8,206 3,741 5,931 3,741 8,076 3,741 8,300 3,741 8,068 3,741 5, 101 3,741 6,410 3,741 6,684
-- 3,741 5,935 3,741 6,164 3,741 6,283 3,741 9,854 3,741 8,679 3,741 6,724 3,741 7,609 3,741 11,346 3,741 10,257 3,741. 13,458 3,741 10,702 3,741 15,789 3,741 6,942 3,741 8,216 3,741 7,507 3,741 7,534 3,741 10,938 3,741 9,122 3,741 6,261 3,741 7,138 3,741 5,838 3,741 10,088 3,741 8,135 3,741 8,656 3,741 5,394 3,741 7,477 3,741 7,971 3,741 8,408 3,741 9,475 3,741 8,293 3,741 20,799 3,741 10,213 - -- - -3,741 7,458 3,307 10,622 3,307 9,686 3,307 5,564
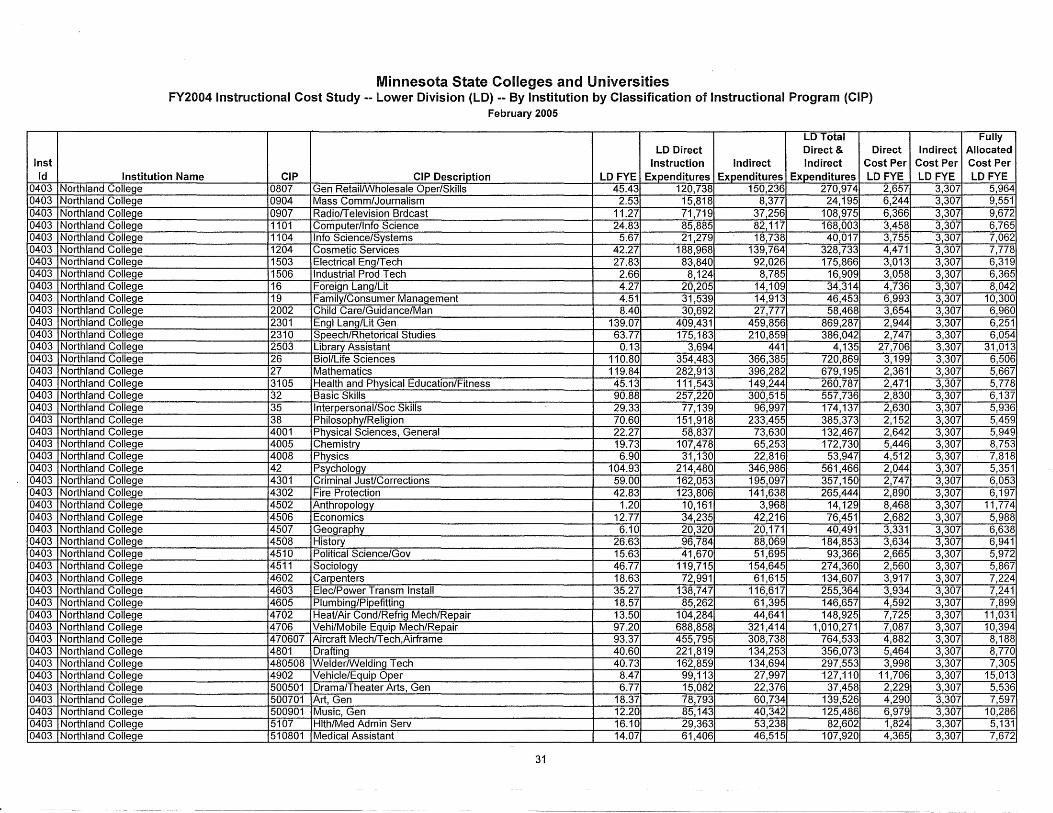
Inst Id
0403 0403 0403 0403 0403 0403 0403 0403 0403 0403 0403 0403 0403 0403 0403 0403 0403 0403 0403 0403 0403 0403 0403 0403 0403 0403 0403 0403 0403 0403 0403 0403 0403 0403 0403 0403 0403 0403 0403 0403 0403 0403 0403 0403 0403 0403
Minnesota State Colleges and Universities FY2004 Instructional Cost Study -- Lower Division (LO) -- By Institution by Classification of Instructional Program (CIP)
February 2005
LD Total LD Direct Direct & Direct
Instruction Indirect Indirect Cost Per Institution Name CIP CIP Description LO FYE Expenditures Expenditures Expenditures LO FYE
Northland College 0807 Gen Retail/Wholesale Oper/Skills 45.43 120,738 150,236 270,974 2,657 Northland College 0904 Mass Comm/Journalism 2.53 15,818 8,377 24,195 6,244 Northland College 0907 Radio/Television Brdcast 11.27 71,719 37,256 108,975 6,366 Northland College 1101 Computer/Info Science 24.83 85,885 82, 117 168,003 3,458 Northland College 1104 Info Science/Systems 5.67 21,279 18,738 40,017 3,755 Northland College 1204 Cosmetic Services 42.27 188,968 139,764 328,733 4,471 Northland College 1503 Electrical Eng/Tech 27.83 83,840 92,026 175,866 3,013 Northland College 1506 Industrial Prod Tech 2.66 8,124 8,785 16,909 3,058 Northland College 16 Foreign Lang/Lit 4.27 20,205 14,109 34,314 4,736 Northland College · 19 Family/Consumer Management 4.51 31,539 14,913 46,453 6,993 Northland College 2002 Child Care/Guidance/Man 8.40 30,692 27,777 58,468 3,654 Northland College 2301 Engl Lang/Lit Gen 139.07 409,431 459,856 869,287 2,944 Northland College 2310 Speech/Rhetorical Studies 63.77 175,183 210,859 386,042 2,747 Northland College 2503 Library Assistant 0.13 3,694 441 4,135 27,706 Northland College 26 Biol/Life Sciences 110.80 354,483 366,385 720,869 3,199 Northland College 27 Mathematics 119.84 282,913 396,282 679,195 2,361 Northland College 3105 Health and Physical Education/Fitness 45.13 111,543 149,244 260,787 2,471 Northland College 32 Basic Skills 90.88 257,220 300,515 557,736 2,830 Northland College 35 Interpersonal/Soc Skills 29.33 77,139 96,997 174,137 2,630 Northland College 38 Philosophy/Religion 70.6Q 151,918 233,455 385,373 2,152 Northland College 4001 Physical Sciences, General 22.27 58,837 73,630 132,467 2,642 Northland College 4005 Chemistry 19.73 107,478 65,253 172,730 5,446 Northland College 4008 Physics 6.90 31,130 22,816 53,947 4,512 Northland College 42 Psychology 104.93 214,480 346,986 561,466 2,044 Northland College 4301 Criminal Just/Corrections 59.00 162,053 195,097 357,150 2,747 Northland Colle_ge 4302 Fire Protection 42.83 123,806 141,638 265,444 2,890 Northland College 4502 Anthropology 1.20 10,161 3,968 14,129 8,468 Northland College 4506 Economics 12.77 34,235 42,216 76,451 2,682 Northland College 4507 Geography 6.10 20,320 20,171 40,491 3,331 Northland College 4508 History 26.63 96,784 88,069 184,853 3,634 Northland College 4510 Political Science/Gov 15.63 41,670 51,695 93,366 2,665 Northland College 4511 Sociology 46.77 119,715 154,645 274,360 2,560 Northland College 4602 Carpenters 18.63 72,991 61,615 134,607 3,917 Northland College 4603 Elec/Power Transm Install 35.27 138,747 116,617 255,364 3,934 Northland College 4605 Plumbing/Pipefitting 18.57 85,262 61,395 146,657 4,592 Northland College 4702 Heat/Air Cond/Refrig Mech/Repair 13.50 104,284 44,641 148,925 7,725 Northland College 4706 Vehi/Mobile Equip Mech/Repair 97.20 688,858 321,414 1,010,271 7,087 Northland College 470607 Aircraft Mech/Tech.Airframe 93.37 455,795 308,738 764,533 4,882 Northland College 4801 Drafting 40.60 221,819 134,253 356,073 5,464 Northland College 480508 Welder/Welding Tech 40.73 162,859 134,694 297,553 3,998 Northland College 4902 Vehicle/Equip Oper 8.47 99,113 27,997 127,110 11,706 Northland College 500501 Drama/Theater Arts, Gen 6.77 15,082 22,376 37,458 2,229 Northland College 500701 Art, Gen 18.37 78,793 60,734 139,526 4,290 Northland College 500901 Music, Gen 12.20 85,143 40,342 125,486 6,979 Northland College 5107 Hlth/Med Admin Serv 16.10 29,363 53,238 82,602 1,824 Northland College 510801 Medical Assistant 14.07 61,406 46,515 107,920 4,365
31
Fully Indirect Allocated
Cost Per Cost Per LO FYE LO FYE
3,307 5,964 3,307 9,551 3,307 9,672 3,307 6,765 3,307 7,062 3,307 7,778 3,307 6,319 3,307 6,365 3,307 8,042 3,307 10,300 3,307 6,960 3,307 6,251 3,307 6,054 3,307 31,013 3,307 6,506 3,307 5,667 3,307 5,778 3,307 6,137 3,307 5,936 3,307 5,459 3,307 5,949 3,307 8,753 3,307 7,818 3,307 5,351 3,307 6,053 3,307 6,197 3,307 11,774 3,307 5,988 3,307 6,638 3,307 6,941 3,307 5,972 3,307 5,867 3,307 7,224 3,307 7,241 3,307 7,899 3,307 11,031 3,307 10,394 3,307 8,188 3,307 8,770 3,307 7,305 3,307 15,013 3,307 5,536 3,307 7,597 3,307 10,286 3,307 5,131 3,307 7,672
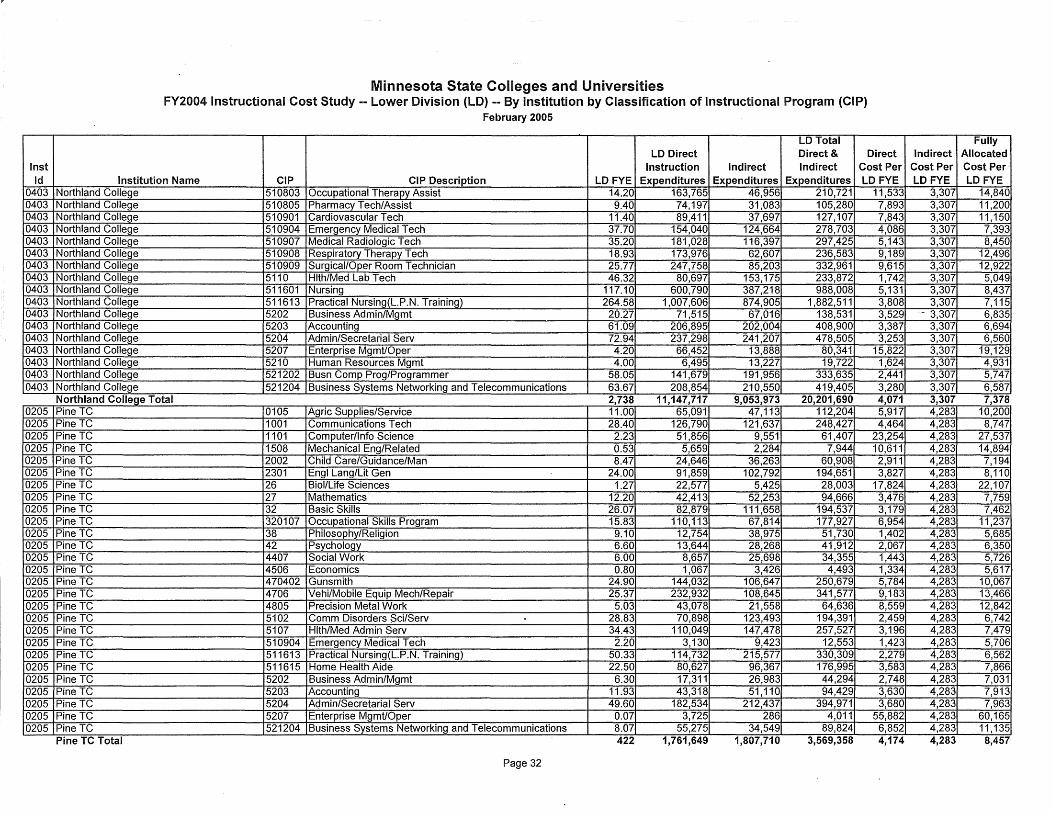
Inst Id
0403 0403 0403 0403 0403 0403 0403 0403 0403 0403 0403 0403 0403 0403 0403 0403 0403
0205 0205 0205 0205 0205 0205 0205 0205 0205 0205 0205 0205 0205 0205 0205 0205 0205 0205 0205 0205 0205 0205 0205 0205 0205 0205 0205
Minnesota State Colleges and Universities FY2004 Instructional Cost Study -- Lower Division (LD) -- By Institution by Classification of Instructional Program (CIP)
February 2005
LD Total LD Direct Direct & Direct
Instruction Indirect Indirect Cost Per Institution Name CIP CIP Description LD FYE Expenditures Expenditures Expenditures LD FYE
Northland College 510803 Occupational Therapy Assist 14.20 163,765 46,956 210,721 11,533 Northland College 510805 Pharmacy Tech/Assist 9.40 74,197 31,083 105,280 7,893 Northland College 510901 Cardiovascular Tech 11.40 89,411 37,697 127,107 7,843 Northland College 5_10904 Emergency Medical Tech 37.70 154,040 124,664 278,703 4,086 Northland College 510907 Medical Radiologic Tech 35.20 181,028 116,397 297,425 5,143 Northland College 510908 Respiratory Therapy Tech 18.93 173,976 62,607 236,583 9,189 Northland College 510909 Surgical/Oper Room Technician 25.77 247,758 85,203 332,961 9,615 Northland College 5110 Hlth/Med Lab Tech 46.32 80,697 153,175 233,872 1,742 Northland College 511601 Nursing 117.10 600,790 387,218 988,008 5,131 Northland College 511613 Practical Nursing(L.P.N. Training) 264.58 1,007,606 874,905 1,882,511 3,808 Northland College 5202 Business Admin/Mgmt 20.27 71,515 67,016 138,531 3,529 Northland College 5203 Accounting 61.09 206,895 202,004 408,900 3,387 Northland College 5204 Admin/Secretarial Serv 72.94 237,298 241,207 478,505 3,253 Northland College 5207 Enterprise Mgmt/Oper 4.20 66,452 13,888 80,341 15,822 Northland College 5210 Human Resources Mgmt 4.00 6,495 13,227 19,722 1,624 Northland College 521202 Busn Comp Prog/Programmer 58.05 141,679 191,956 333,635 2,441 Northland College 521204 Business Systems Networking and Telecommunications 63.67 208,854 210,550 419,405 3,280 Northland College Total Northland Coll Total 2.738 2,738 11.147.717 11,147,717 9.053.973 9,053,973 20.201.690 20,201,690 4.071 4,071 Pine TC 0105 Agric Supplies/Service 11.00 65,091 47,113 112,204 5,917 Pine TC 1001 Communications Tech 28.40 126,790 121,637 248,427 4,464 Pine TC 1101 Computer/Info Science 2.23 51,856 9,551 61,407 23,254 Pine TC 1508 Mechanical Eng/Related 0.53 5,659 2,284 7,944 10,611 Pine TC 2002 Child Care/Guidance/Man 8.47 24,646 36,263 60,908 2,911 Pine TC 2301 Engl Lang/Lit Gen 24.00 91,859 102,792 194,651 3,827 Pine TC 26 Biol/Life Sciences 1.27 22,577 5,425 28,003 17,824 Pine TC 27 Mathematics 12.20 42,413 52,253 94,666 3,476 Pine TC 32 Basic Skills 26.07 82,879 111,658 194,537 3,179 Pine TC 320107 Occupational Skills Program 15.83 110,113 67,814 177,927 6,954 Pine TC 38 Philosophy/Religion 9.10 12,754 38,975 51,730 1,402 Pine TC 42 Psychology 6.60 13,644 28,268 41,912 2,067 Pine TC 4407 Social Work 6.00 8,657 25,698 34,355 1,443 Pine TC 4506 Economics 0.80 1,067 3,426 4,493 1,334 Pine TC 470402 Gunsmith 24.90 144,032 106,647 250,679 5,784 Pine TC 4706 Vehi/Mobile Equip Mech/Repair 25.37 232,932 108,645 341,577 9,183 Pine TC 4805 Precision Metal Work 5.03 43,078 21,558 64,636 8,559 Pine TC 5102 Comm Disorders $ci/Serv 28.83 70,898 123,493 194,391 2,459 Pine TC 5107 Hlth/Med Admin Serv 34.43 110,049 147,478 257,527 3,196 Pine TC 510904 Emergency Medical Tech 2.20 3,130 9,423 12,553 1,423 Pine TC 511613 Practical Nursing(L.P.N. Training) 50.33 114,732 215,577 330,309 2,279 Pine TC 511615 Home Health Aide 22.50 80,627 96,367 176,995 3,583 Pine TC 5202 Business Admin/Mgmt 6.30 17,311 26,983 44,294 2,748 Pine TC 5203 Accounting 11.93 43,318 51,110 94,429 3,630 Pine TC 5204 Ac;lmin/Secretarial Serv 49.60 182,534 212,437 394,971 3,680 Pine TC 5207 Enterprise Mgmt/Oper 0.07 3,725 286 4,011 55,882 Pine TC 521204 Business Systems Networking and Telecommunications 8.07 55,275 34,549 89,824 6,852 Pine TC Total 422 1,761,649 1,807,710 3,569,358 4,174
Page 32
Fully Indirect Allocated
Cost Per Cost Per LD FYE LD FYE
3,307 14,840 3,307 11,200 3,307 11, 150 3,307 7,393 3,307 8,450 3,307 12,496 3,307. 12,922 3,307 5,049 3,307 8,437 3,307 7,115
·- 3,307 6,835 3,307 6,694 3,307 6,560 3,307 19, 129 3,307 4,931 3,307 5,747 3,307 6,587 3.307 3,307 7.378 7,378 4,283 10,200 4,283 8,747 4,283 27,537 4,283 14,894 4,283 7,194 4,283 8,110 4,283 22,107 4,283 7,759 4,283 7,462 4,283 11,237 4,283 5,685 4,283 6,350 4,283 5,726 4,283 5,617 4,283 10,067 4,283 13,466 4,283 12,842 4,283 6,742 4,283 7,479 4,283 5,706 4,283 6,562 4,283 7,866 4,283 7,031 4,283 7,913 4,283 7,963 4,283 60,165 4,283 11, 135 4,283 8,457
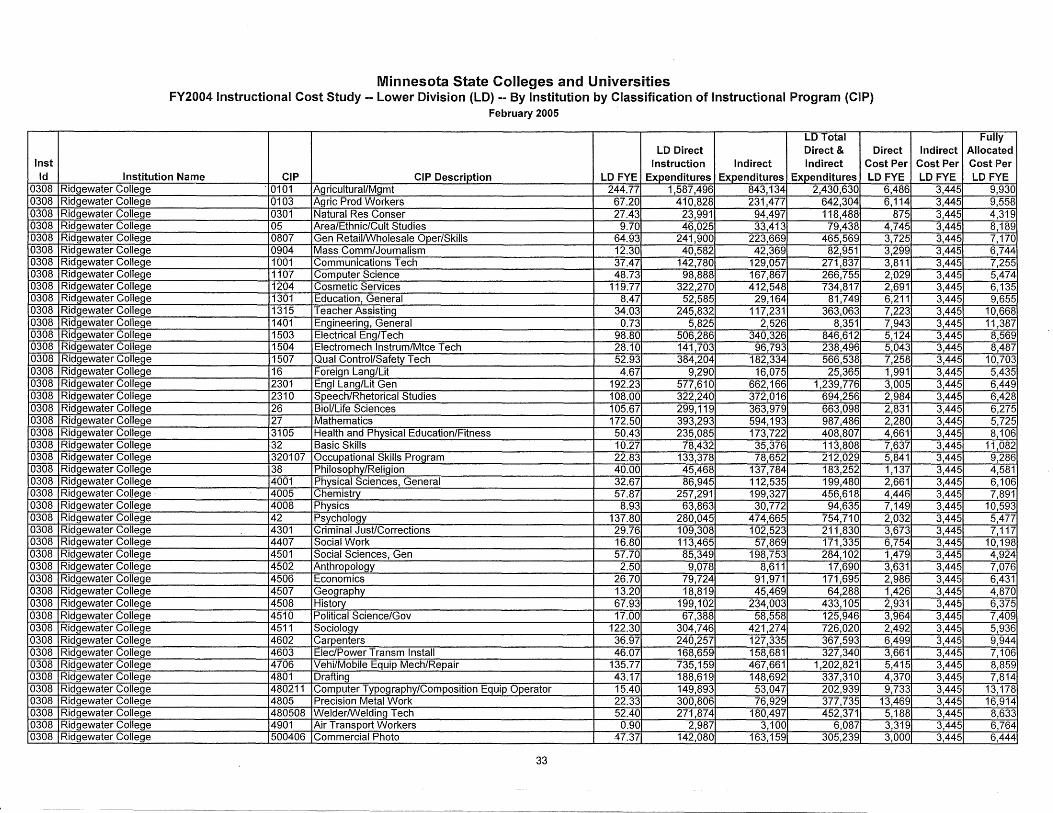
Inst Id
0308 0308 0308 0308 0308 0308 0308 0308 0308 0308 0308 0308 0308 0308 0308 0308 0308 0308 0308 0308 0308 0308 0308 0308 0308 0308 0308 0308 0308 0308 0308 0308 0308 0308 0308 0308 0308 0308 0308 0308 0308 0308 0308 0308 0308 0308
Minnesota State Colleges and Universities FY2004 Instructional Cost Study -- Lower Division (LD) -- By Institution by Classification of Instructional Program (CIP)
February 2005
LD Total LD Direct Direct & Direct
Instruction Indirect Indirect Cost Per Institution Name CIP CIP Description LD FYE Expenditures Expenditures Expenditures LD FYE
Ridgewater College . 0101 Agricultural/Mgmt 244.77 1,587,496 843,134 2,430,630 6,486 Ridgewater College 0103 Agric Prod Workers 67.20 410,828 231,477 642,304 6,114 Ridgewater College 0301 Natural Res Conser 27.43 23,991 94,497 118,488 875 Ridgewater College 05 Area/Ethnic/Cult Studies 9.70 46,025 33,413 79,438 4,745 Ridgewater College 0807 Gen Retail/Wholesale Oper/Skills 64.93 241,900 223,669 465,569 3,725 Ridgewater College 0904 Mass Comm/Journalism 12.30 40,582 42,369 82,951 3,299 Ridgewater College 1001 Communications Tech 37.47 142,780 129,057 271,837 3,811 Ridgewater College 1107 Computer Science 48.73 98,888 167,867 266,755 2,029 Ridgewater College 1204 Cosmetic Services 119.77 322,270 412,548 734,817 2,691 Ridgewater College 1301 Education, General 8.47 52,585 29,164 81,749 6,211 Ridgewater College 1315 Teacher Assisting 34.03 245,832 117,231 363,063 7,223 Ridgewater College 1401 Engineering, General 0.73 5,825 2,526 8,351 7,943 Ridgewater College 1503 Electrical Eng/Tech 98.80 506,286 340,326 846,612 5,124 Ridgewater College 1504 Electromech lnstrum/Mtce Tech 28.10 141,703 96,793 238,496 5,043 Ridgewater College 1507 Qual Control/Safety Tech 52.93 384,204 182,334 566,538 7,258 Ridgewater College 16 Foreign Lang/Lit 4.67 9,290 16,075 25,365 1,991 Ridgewater College 2301 Engl Lang/Lit Gen 192.23 577,610 662,166 1,239,776 3,005 Ridgewater College 2310 Speech/Rhetorical Studies 108.00 322,240 372,016 694,256 2,984 Ridgewater College 26 Biol/Life Sciences 105.67 299, 119 363,979 663,098 2,831 Ridgewater College 27 Mathematics 172.50 393,293 594,193 987,486 2,280 Ridgewater College 3105 Health and Physical Education/Fitness 50.43 235,085 173,722 408,807 4,661 Ridgewater College 32 Basic Skills 10.27 78,432 35,376 113,808 7,637 Ridgewater College 320107 Occupational Skills Program 22.83 133,378 78,652 212,029 5,841 Ridgewater College 38 Philosophy/Religion 40.00 45,468 137,784 183,252 1,137 Ridgewater College 4001 Physical Sciences, General 32.67 86,945 112,535 199,480 2,661 Ridgewater College 4005 Chemistry 57.87 257,291 199,327 456,618 4,446 Ridgewater College 4008 Physics 8.93 63,863 30,772 94,635 7,149 Ridgewater College 42 Psychology 137.80 280,045 474,665 754,710 2,032 Ridgewater College 4301 Criminal Just/Corrections 29.76 109,308 102,523 211,830 3,673 Ridgewater College 4407 Social Work 16.80 113,465 57,869 171,335 6,754 Ridgewater College 4501 Social Sciences, Gen 57.70 85,349 198,753 284,102 1,479 Ridgewater College 4502 Anthropology 2.50 9,078 8,611 17,690 3,631 Ridgewater College 4506 Economics 26.70 79,724 91,971 171,695 2,986 Ridgewater College 4507 Geography 13.20 18,819 45,469 64,288 1,426 Ridgewater College 4508 History 67.93 199, 102 234,003 433,105 2,931 Ridgewater College 4510 Political Science/Gov 17.00 67,388 58,558 125,946 3,964 Ridgewater College 4511 Sociology 122.30 304,746 421,274 726,020 2,492 Ridgewater College 4602 Carpenters 36.97 240,257 127,335 367,593 6,499 Ridgewater College 4603 Elec/Power Transm Install 46.07 168,659 158,681 327,340 3,661 Ridgewater College 4706 Vehi/Mobile Equip Mech/Repair 135.77 735,159 467,661 1,202,821 5,415 Ridgewater College 4801 Drafting 43.17 188,619 148,692 337,310 4,370 Ridgewater College 480211 Computer Typography/Composition Equip Operator 15.40 149,893 53,047 202,939 9,733 Ridgewater College 4805 Precision Metal Work 22.33 300,806 76,929 377,735 13,469 Ridgewater College 480508 Welder/Welding Tech 52.40 271,874 180,497 452,371 5,188 Ridgewater College 4901 Air Transport Workers 0.90 2,987 3,100 6,087 3,319 Ridgewater College 500406 Commercial Photo 47.37 142,080 163,159 305,239 3,000
33
Fully Indirect Allocated
Cost Per Cost Per LO FYE LO FYE
3,445 9,930 3,445 9,558 3,445 4,319 3,445 8,189 3,445 7,170 3,445 6,744 3,445 7,255 3,445 5,474 3,445 6,135 3,445 9,655 3,445 10,668 3,445 11,387 3,445 8,569 3,445 8,487 3,445 10,703 3,445 5,435 3,445 6,449 3,445 6,428 3,445 6,275 3,445 5,725 3,445 8,106 3,445 11,082 3,445 9,286 3,445 4,581 3,445 6,106 3,445 7,891 3,445 10,593 3,445 5,477 3,445 7,117 3,445 10, 198 3,445 4,924 3,445 7,076 3,445 6,431 3,445 4,870 3,445 6,375 3,445 7,409 3,445 5,936 3,445 9,944 3,445 7,106 3,445 8,859 3,445 7,814 3,445 13, 178 3,445 16,914 3,445 8,633 3,445 6,764 3,445 6,444
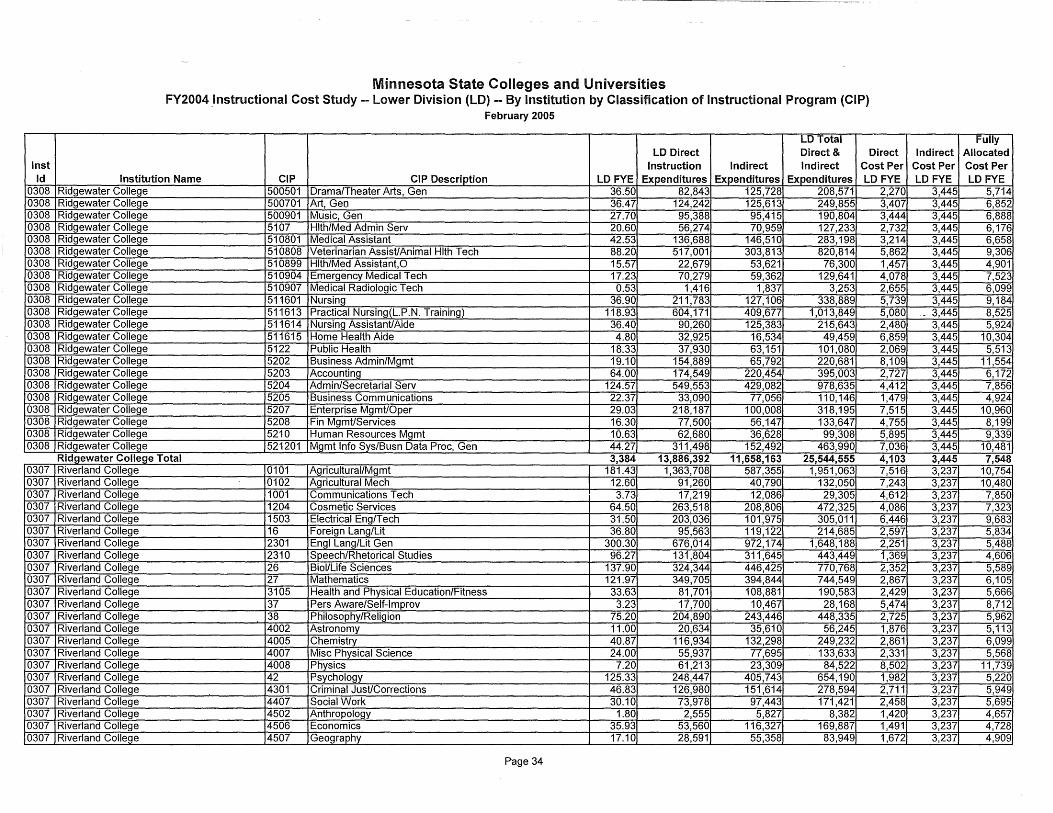
Inst Id
0308 0308 0308 0308 0308 0308 0308 0308 0308 0308 0308 0308 0308 0308 0308 0308 0308 0308 0308 0308 0308 0308
0307 0307 0307 0307 0307 0307 0307 0307 0307 0307 0307 0307 0307 0307 0307 0307 0307 0307 0307 0307 0307 0307 0307
Minnesota State Colleges and Universities FY2004 .Instructional Cost Study -- Lower Division (LO) -- By Institution by Classification of Instructional Program (CIP)
February 2005
LO Total LO Direct Direct & Direct
Instruction Indirect Indirect Cost Per Institution Name CIP CIP Description LO FYE Expenditures Expenditures Expenditures LO FYE
Ridgewater College 500501 Drama/Theater Arts, Gen 36.50 82,843 125,728 208,571 2,270 Ridgewater College 500701 Art, Geo 36.47 124,242 125,613 249,855 3,407 Ridgewater College 500901 Music, Gen 27.70 95,388 95,415 190,804 3,444 Ridgewater College 5107 Hlth/Med Admin Serv 20.60 56,274 70,959 127,233 2,732 Ridgewater College 510801 Medical Assistant 42.53 136,688 146,510 283,198 3,214 Ridgewater College 510808 Veterinarian Assist/Animal Hlth Tech 88.20 517,001 303,813 820,814 5,862 Ridgewater College 510899 Hlth/Med Assistant,O 15.57 22,679 53,621 76,300 1,457 Ridgewater College 510904 Emergency Medical Tech 17.23 70,279 59,362 129,641 4,078 Ridgewater College 510907 Medical Radiologic Tech 0.53 1,416 1,837 3,253 2,655 Ridgewater College 511601 Nursing 36.90 211,783 127,106 338,889 5,739 Ridgewater College 511613 Practical Nursing(L.P.N. Training) 118.93 604,171 409,677 1,013,849 5,080 Ridgewater College 511614 Nursing Assistant/Aide 36.40 90,260 125,383 215,643 2,480 Ridgewater College 511615 Home Health Aide 4.80 32,925 16,534 49,459 6,859 Ridgewater College 5122 Public Health 18.33 37,930 63,151 101,080 2,069 Ridgewater College 5202 Business Admin/Mgmt 19.10 154,889 65,792 220,681 8,109 Ridgewater College 5203 Accounting 64.00 174,549 220,454 395,003 2,727 Ridgewater College 5204 Admin/Secretarial Serv 124.57 549,553 429,082 978,635 4,412 Ridgewater College 5205 Business Communications 22.37 33,090 77,056 110,146 1,479 Ridgewater College 5207 Enterprise Mgmt/Oper 29.03 218,187 100,008 318,195 7,515 Ridgewater College 5208 Fin Mgmt/Services 16.30 77,500 56,147 133,647 4,755 Ridgewater College 5210 Human Resources Mgmt 10.63 62,680 36,628 99,308 5,895 Ridgewater College 521201 Mgmt Info Sys/Busn Data Proc, Gen 44.27 311,498 152,492 463,990 7,036 Ridgewater College Total 3,384 13,886,392 11,658,163 25,544,555 4,103 Riverland College 0101 Agricultural/Mgmt 181.43 1,363,708 587,355 1,951,063 7,516 Riverland College 0102 Agricultural Mech 12.60 91,260 40,790 132,050 7,243 Riverland College 1001 Communications Tech 3.73 17,219 12,086 29,305 4,612 Riverland College 1204 Cosmetic Services 64.50 263,518 208,806 472,325 4,086 Riverland College 1503 Electrical Eng/Tech 31.50 203,036 101,975 305,011 6,446 Riverland College 16 Foreign Lang/Lit 36.80 95,563 119, 122 214,685 2,597 Riverland College 2301 Engl Lang/Lit Gen 300.30 676,014 972,174 1,648, 188 2,251 Riverland College 2310 Speech/Rhetorical Studies 96.27 131,804 311,645 443,449 1,369 Riverland College 26 Biol/Life Sciences 137.90 324,344 446,425 770,768 2,352 Riverland College 27 Mathematics 121.97 349,705 394,844 744,549 2,867 Riverland College 3105 Health and Physical Education/Fitness 33.63 81,701 108,881 190,583 2,429 Riverland College 37 Pers Aware/Self-lmprov 3.23 17,700 - 10,467 28,168 5,474 Riverland College 38 Philosophy/Religion 75.20 204,890 243,446 448,335 2,725 Riverland College 4002 Astronomy 11.00 20,634 35,610 56,245 1,876 Riverland College 4005 Chemistry 40.87 · 116,934 132,298 249,232 2,861 Riverland College 4007 Misc Physical Science 24.00 55,937 77,695 133,633 2,331 Riverland College 4008 Physics 7.20 61,213 23,309 84,522 8,502 Riverland College 42 Psychology 125.33 248,447 405,743 654,190 1,982 Riverland College 4301 Criminal Just/Corrections 46.83 126,980 151,614 278,594 2,711 Riverland College 4407 Social Work 30.10 73,978 97,443 171,421 2,458 Riverland College 4502 Anthropology 1.80 2,555 5,827 8,382 1,420 Riverland College 4506 Economics 35.93 53,560 116,327 169,887 1,491 Riverland College 4507 Geography 17.10 28,591 55,358 83,949 1,672
Page 34
Fully Indirect Allocated
Cost Per Cost Per LO FYE LDFYE
3A45 5,714 3,445 6,852 3,445 6,888 3,445 6,176 3,445 6,658 3,445 9,306 3,445 4,901 3,445 7,523 3,445 6,099 3,445 9,184
·- 3,445 8,525 3,445 5,924 3,445 10,304 3,445 5,513 3,445 11,554 3,445 6,172 3,445 7,856 3,445 4,924 3,445 10,960 3,445 8,199 3,445 9,339 3,445 10,481 3,445 7,548 3,237 10,754 3,237 10,480 3,237 7,850 3,237 7,323 3,237 9,683 3,237 5,834 3,237 5,488 3,237 4,606 3,237 5,589 3,237 6,105 3,237 5,666 3,237 8,712 3,237 5,962 3,237 5,113 3,237 6,099 3,237 5,568 3,237 11,739 3,237 5,220 3,237 5,949 3,237 5,695 3,237 4,657 3,237 4,728 3,237 4,909
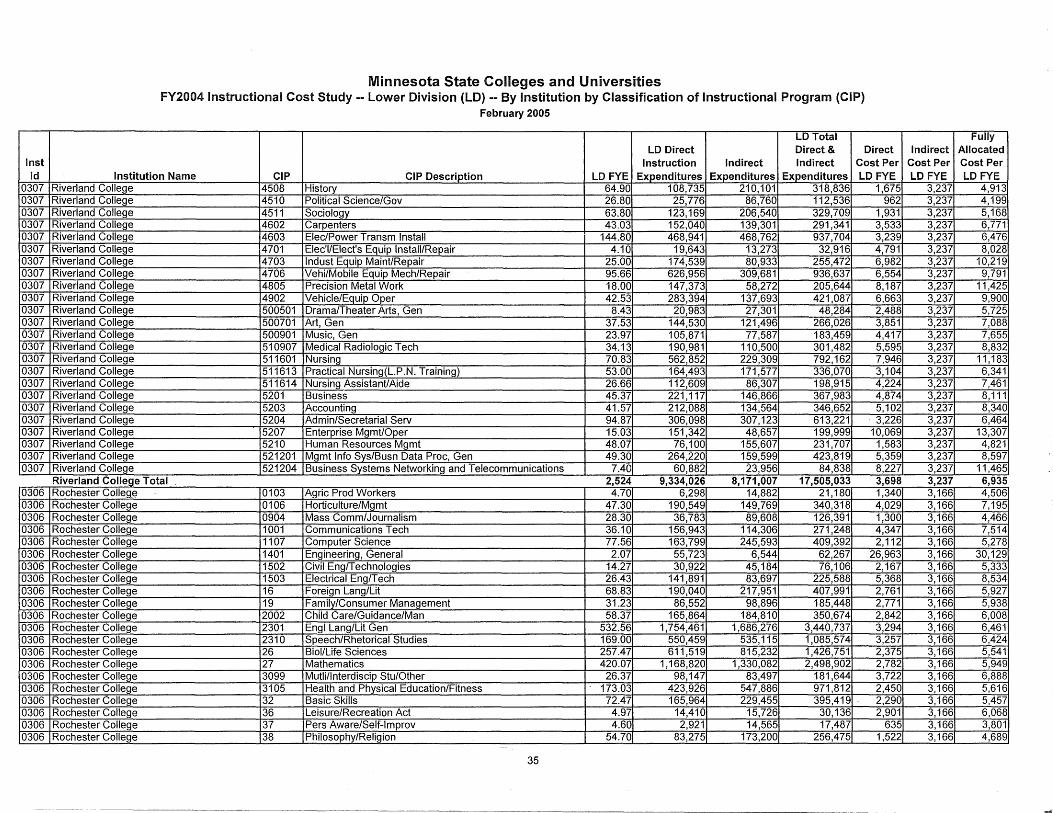
Inst Id
0307 0307 0307 0307 0307 0307 0307 0307 0307 0307 0307 0307 0307 0307 0307 0307 0307 0307 0307 0307 0307 0307 0307 0307
0306 0306 0306 0306 0306 0306 0306 0306 0306 0306 0306 0306 0306 0306 0306 0306 0306 0306 0306 0306 0306
Minnesota State Colleges and Universities FY2004 Instructional Cost Study -- Lower Division (LD) -- By Institution by Classification of Instructional Program (CIP)
February 2005
LD Total LD Direct Direct& Direct
Instruction Indirect Indirect Cost Per Institution Name CIP CIP Description LD FYE Expenditures Expenditures Expenditures LD FYE
Riverland College 4508 History 64.90 108,735 210,101 318,836 1,675 Riverland College 4510 Political Science/Gov 26.80 25,776 86,760 112,536 962 Riverland College 4511 Sociology 63.80 123,169 206,540 329,709 1,931 Riverland College 4602 Carpenters 43.03 152,040 139,301 291,341 3,533 Riverland College 4603 Elec/Power Transm Install 144.80 468,941 468,762 937,704 3,239 Riverland College 4701 Elec'l/Elect's Equip Install/Repair 4.10 19,643 13,273 32,916 4,791 Riverland College 4703 lndust Equip Maint/Repair 25.00 174,539 80,933 255,472 6,982 Riverland College 4706 Vehi/Mobile Equip Mech/Repair 95.66 626,956 309,681 936,637 6,554 Riverland College 4805 Precision Metal Work 18.00 147,373 58,272 205,644 8,187 Riverland College 4902 Vehicle/Equip Oper 42.53 283,394 137,693 421,087 6,663 Riverland College 500501 Drama/Theater Arts, Gen 8.43 20,983 27,301 48,284 2,488 Riverland College 500701 Art, Gen 37.53 144,530 121,496 266,026 3,851 Riverland College 500901 Music, Gen 23.97 105,871 77,587 183,459 4,417 Riverland College 510907 Medical Radiologic Tech 34.13 190,981 110,500 301,482 5,595 Riverland College 511601 Nursing 70.83 562,852 229,309 792,162 7,946 Riverland College 511613 Practical Nursing(L.P.N. Training) 53.00 164,493 171,577 336,070 3,104 Riverland College 511614 Nursing Assistant/Aide 26.66 112,609 86,307 198,915 4,224 Riverland College 5201 Business 45.37 221, 117 146,866 367,983 4,874 Riverland College 5203 Accounting 41.57 212,088 134,564 346,652 5,102 Riverland College 5204 Admin/Secretarial Serv 94.87 306,098 307,123 613,221 3,226 Riverland College 5207 Enterprise Mgmt/Oper 15.03 151,342 48,657 199,999 10,069 Riverland College 5210 Human Resources Mgmt 48.07 76,100 155,607 231,707 1,583 Riverland College 521201 Mgmt Info Sys/Busn Data Proc, Gen 49.30 264,220 159,599 423,819 5,359 Riverland College 521204 Business Systems Networking and Telecommunications 7.40 60,882 23,956 84,838 8,227 Riverland ColleQe Total R d Col 2,524 9,334,026 8,171,007 17,505,033 3,698 Rochester College 0103 Agric Prod Workers 4.70 6,298 14,882 21, 180 1,340 Rochester College 0106 Horticulture/Mgmt 47.30 190,549 149,769 340,318 4,029 Rochester College 0904 Mass Comm/Journalism 28.30 36,783 89,608 126,391 1,300 Rochester College 1001 Communications Tech 36.10 156,943 114,306 271,248 4,347 Rochester College 1107 Computer Science 77.56 163,799 245,593 409,392 2,112 Rochester College 1401 Engineering, General 2.07 55,723 6,544 62,267 26,963 Rochester College 1502 Civil Eng/Technologies 14.27 30,922 45,184 76,106 2,167 Rochester College 1503 Electrical Eng/Tech 26.43 141,891 83,697 225,588 5,368 Rochester College 16 Foreign Lang/Lit 68.83 190,040 217,951 407,991 2,761 Rochester College 19 Family/Consumer Management 31.23 86,552 98,896 185,448 2,771 Rochester College 2002 Child Care/Guidance/Man 58.37 165,864 184,810 350,674 2,842 Rochester College 2301 Engl Lang/lit Gen 532.56 1,754,461 1,686,276 3,440,737 3,294 Rochester College 2310 Speech/Rhetorical Studies 169.00 550,459 535, 115 1,085,574 3,257 Rochester College 26 Biol/Life Sciences 257.47 611,519 815,232 1,426,751 2,375 Rochester College 27 Mathematics 420.07 1,168,820 1,330,082 2,498,902 2,782 Rochester College 3099 Mutli/lnterdiscip Stu/Other 26.37 98,147 83,497 181,644 3,722 Rochester College 3105 Health and Physical Education/Fitness . 173.03 423,926 547,886 971,812 2,450 Rochester College 32 Basic Skills 72.47 165,964 229,455 395,419 . 2,290 Rochester College 36 Leisure/Recreation Act 4.97 14,410 15,726 30, 136 2,901 Rochester College 37 Pers Aware/Self-lmprov 4.60 2,921 14,565 17,487 635 Rochester College 38 Philosophy/Religion 54.70 83,275 173,200 256,475 1,522
35
Fully Indirect Allocated
Cost Per Cost Per LD FYE LD FYE
3,237 4,913 3,237 4,199 3,237 5,168 3,237 6,771 3,237 6,476 3,237 8,028 3,237 10,219 3,237 9,791 3,237 11,425 3,237 9,900 3,237 5,725 3,237 7,088 3,237 7,655 3,237 8,832 3,237 11, 183 3,237 6,341 3,237 7,461 3,237 8, 111 3,237 8,340 3,237 6,464 3,237 13,307 3,237 4,821 3,237 8,597 3,237 11,465 3 3,237 6 6,935 3,166 4,506 3,166 7,195 3,166 4,466 3,166 7,514 3,166 5,278 3,166 30,129 3,166 5,333 3,166 8,534 3,166 5,927 3,166 5,938 3,166 6,008 3,166 6,461 3,166 6,424 3,166 5,541 3,166 5,949 3,166 6,888 3,166 5,616 3,166 5,457 3,166 6,068 3,166 3,801 3,166 4,689
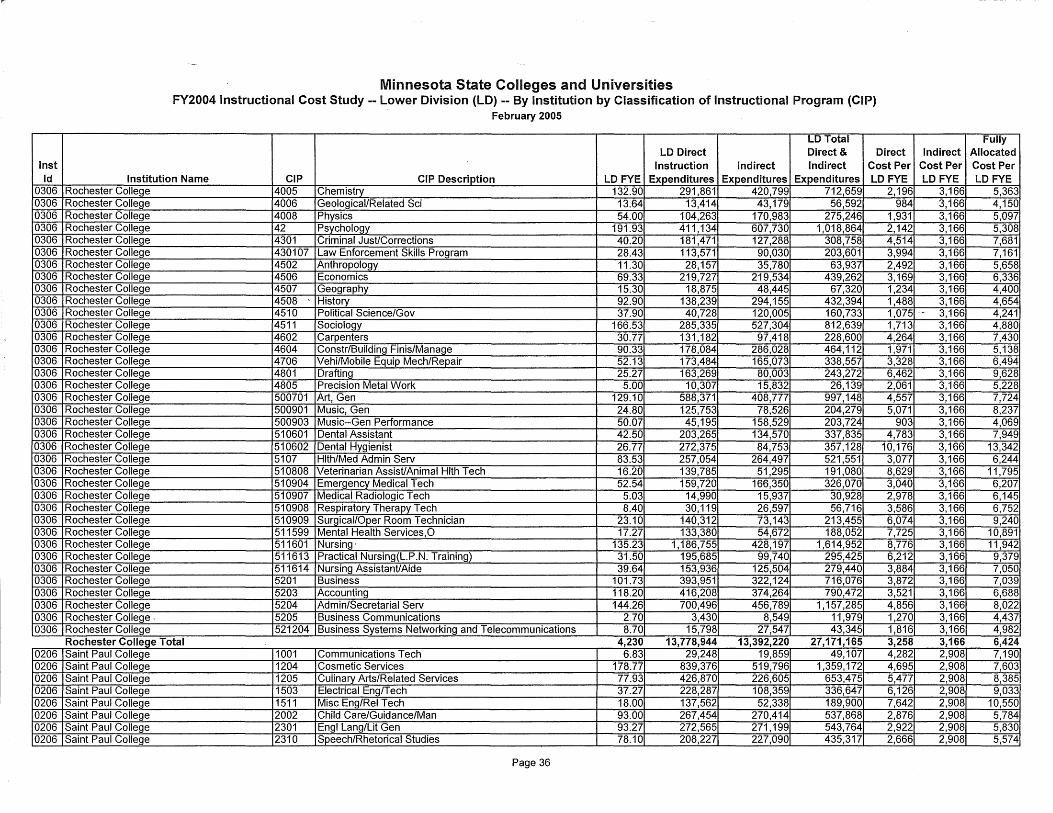
,.....
Inst Id
0306 0306 0306 0306 0306 0306 0306 0306 0306 0306 0306 0306 0306 0306 0306 0306 0306 0306 0306 0306 0306 0306 0306 0306 0306 0306 0306 0306 0306 0306 0306 0306 0306 0306 0306 0306 0306
0206 0206 0206 0206 0206 0206 0206 0206
Minnesota State Colleges and Universities FY2004 Instructional Cost Study -- Lower Division (LD) -- By Institution by Classification of Instructional Program (CIP)
February 2005
LD Total LD Direct Direct & Direct
Instruction Indirect Indirect Cost Per Institution Name CIP CIP Description LDFYE Expenditures Expenditures Expenditures LO FYE
Rochester College 4005 Chemistry 132.90 291,861 420,799 712,659 2,196 Rochester College 4006 Geological/Related Sci 13.64 13,414 43,179 56,592 984 Rochester College 4008 Physics 54.00 104,263 170,983 275,246 1,931 Rochester College 42 Psychology 191.93 411, 134 607,730 1,018,864 2,142 Rochester College 4301 Criminal Just/Corrections 40.20 181,471 127,288 308,758 4,514 Rochester College 430107 Law Enforcement Skills Program 28.43 113,571 90,030 203,601 3,994 Rochester College 4502 Anthropology 11.30 28,157 35,780 63,937 2,492 Rochester College 4506 Economics 69.33 219,727 219,534 439,262 3,169 Rochester College 4507 Geography 15.30 18,875 48,445 67,320 1,234 Rochester College 4508 ' History 92.90 138,239 294,155 432,394 1,488 Rochester College 4510 Political Science/Gov 37.90 40,728 120,005 160,733 1,075 Rochester College 4511 Sociology 166.53 285,335 527,304 812,639 1,713 Rochester College 4602 Carpenters 30.77 131,182 97,418 228,600 4,264 Rochester College 4604 Constr/Building Finis/Manage 90.33 178,084 286,028 464, 112 1,971 Rochester College 4706 Vehi/Mobile Equip Mech/Repair 52.13 173,484 165,073 338,557 3,328 Rochester College 4801 Drafting 25.27 163,269 80,003 243,272 6,462 Rochester College 4805 Precision Metal Work 5.00 10,307 15,832 26,139 2,061 Rochester College 500701 Art, Gen 129.10 588,371 408,777 997,148 4,557 Rochester College 500901 Music, Gen 24.80 125,753 78,526 204,279 5,071 Rochester College 500903 Music--Gen Performance 50.07 45,195 158,529 203,724 903 Rochester College 510601 Dental Assistant 42.50 203,265 134,570 337,835 4,783 Rochester College 510602 Dental Hygienist 26.77 272,375 84,753 357,128 10,176 Rochester College 5107 Hlth/Med Admin Serv 83.53 257,054 264,497 521,551 3,077 Rochester College 510808 Veterinarian Assist/Animal Hlth Tech 16.20 139,785 51,295 191,080 8,629 Rochester College 510904 Emergency Medical Tech 52.54 159,720 166,350 326,070 3,040 Rochester College 510907 Medical Radiologic Tech 5.03 14,990 15,937 30,928 2,978 Rochester College 510908 Respiratory Therapy Tech 8.40 30,119 26,597 56,716 3,586 Rochester College 510909 Surgical/Oper Room Technician 23.10 140,312 73,143 213,455 6,074 Rochester College 511599 Mental Health Services,O 17.27 133,380 54,672 188,052 7,725 Rochester College 511601 Nursing· 135.23 1,186,755 428,197 1,614,952 8,776 Rochester College 511613 Practical Nursing(L.P.N. Training) 31.50 195,685 99,740 295,425 6,212 Rochester College 511614 Nursing Assistant/Aide 39.64 153,936 125,504 279,440 3,884 Rochester College 5201 Business 101.73 393,951 322,124 716,076 3,872 Rochester College 5203 Accounting 118.20 416,208 374,264 790,472 3,521 Rochester College 5204 Admin/Secretarial Serv 144.26 700,496 456,789 1,157,285 4,856 Rochester College . 5205 Business Communications 2.70 3,430 8,549 11,979 1,270 Rochester College 521204 Business Systems Networking and Telecommunications 8.70 15,798 27,547 43,345 1,816 Rochester College Total Rochester Coll Total 4.230 4,230 13,778,944 13,392,220 13.778.944 13.392.220 27.171.165 27,171, 165 3.258 3,258 Saint Paul College 1001 Communications Tech 6.83 29,248 19,859 49,107 4,282 Saint Paul College 1204 Cosmetic Services 178.77 839,376 519,796 1,359, 172 4,695 Saint Paul College 1205 Culinary Arts/Related Services 77.93 426,870 226,605 653,475 5,477 Saint Paul College 1503 Electrical Eng/Tech 37.27 228,287 108,359 336,647 6,126 Saint Paul College 1511 Misc Eng/Rel Tech 18.00 137,562 52,338 189,900 7,642 Saint Paul College 2002 Child Care/Guidance/Man 93.00 267,454 270,414 537,868 2,876 Saint Paul College 2301 Engl Lang/Lit Gen 93.27 272,565 271,199 543,764 2,922 Saint Paul College 2310 Speech/Rhetorical Studies 78.10 208,227 227,090 435,317 2,666
Page 36
Fully Indirect Allocated
Cost Per Cost Per LDFYE LDFYE
3,166 5,363 3,166 4,150 3,166 5,097 3,166 5,308 3,166 7,681 3,166 7,161 3,166 5,658 3,166 6,336 3,166 4,400 3,166 4,654
- - 3,166 4,241 3,166 4,880 3,166 7,430 3,166 5,13-8 3,166 6,494 3,166 9,628 3,166 5,228 3,166 7,724 3,166 8,237 3,166 4,069 3,166 7,949 3,166 13,342 3,166 6,244 3,166 11,795 3,166 6,207 3,166 6,145 3,166 6,752 3,166 9,240 3,166 10,891 3,166 11,942 3,166 9,379 3,166 7,050 3,166 7,039 3,166 6,688 3,166 8,022 3,166 4,437 3,166 4,982 3.166 3,166 6.424 6,424 2,908 7,190 2,908 7,603 2,908 8,385 2,908 9,033 2,908 10,550 2,908 5,784 2,908 5,830 2,908 5,574
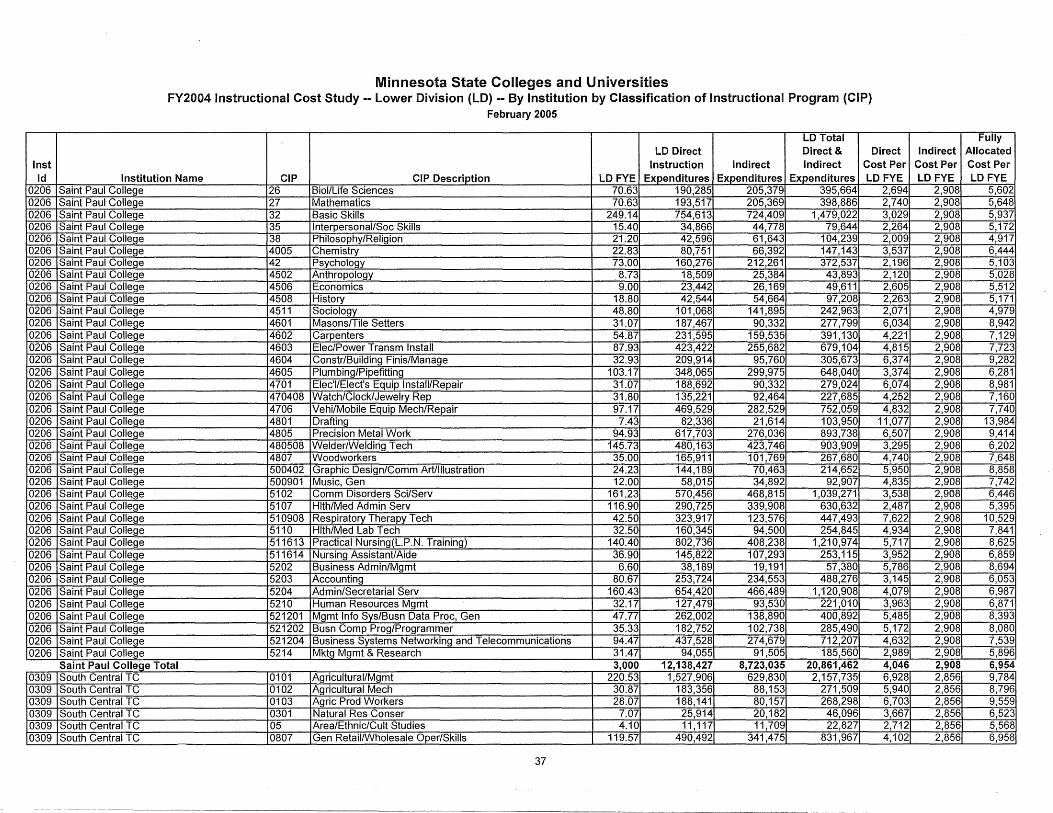
Inst Id
0206 0206 0206 0206 0206 0206 0206 0206 0206 0206 0206 0206 0206 0206 0206 0206 0206 0206 0206 0206 0206 0206 0206 0206 0206 0206 0206 0206 0206 0206 0206 0206 0206 0206 0206 0206 0206 0206 0206
0309 0309 0309 0309 0309 0309
Minnesota State Colleges and Universities FY2004 Instructional Cost Study -- Lower Division (LO) -- By Institution by Classification of Instructional Program (CIP)
February 2005
LO Total LO Direct Direct & Direct
Instruction Indirect Indirect Cost Per Institution Name CIP CIP Description LDFYE Expenditures Expenditures Expenditures LO FYE
Saint Paul College 26 Biol/Life Sciences 70.63 190,285 205,379 395,664 2,694 Saint Paul College 27 Mathematics 70.63 193,517 205,369 398,886 2,740 Saint Paul College 32 Basic Skills 249.14 754,613 724,409 1,479,022 3,029 Saint Paul College 35 Interpersonal/Soc Skills 15.40 34,866 44,778 79,644 2,264 Saint Paul College 38 Philosophy/Religion 21.20 42,596 61,643 104,239 2,009 Saint Paul College 4005 Chemistry 22.83 80,751 66,392 147,143 3,537 Saint Paul College 42 Psychology 73.00 160,276 212,261 372,537 2,196 Saint Paul College 4502 Anthropology 8.73 18,509 25,384 43,893 2,120 Saint Paul College 4506 Economics 9.00 23,442 26,169 49,611 2,605 Saint Paul College 4508 History 18.80 42,544 54,664 97,208 2,263 Saint Paul College 4511 Sociology 48.80 101,068 141,895 242,963 2,071 Saint Paul College 4601 Masons/Tile Setters 31.07 187,467 90,332 277,799 6,034 Saint Paul College 4602 Carpenters 54.87 231,595 159,535 391, 130 4,221 Saint Paul College 4603 Elec/Power Transm Install 87.93 423,422 255,682 679,104 4,815 Saint Paul College 4604 Constr/Building Finis/Manage 32.93 209,914 95,760 305,673 6,374 Saint Paul College 4605 Plumbing/Pipefitting 103.17 348,065 299,975 648,040 3,374 Saint Paul College 4701 Elec'l/Elect's Equip Install/Repair 31.07 188,692 90,332 279,024 6,074 Saint Paul College 470408 Watch/Clock/Jewelry Rep 31.80 135,221 92,464 227,685 4,252 Saint Paul College 4706 Vehi/Mobile Equip Mech/Repair 97.17 469,529 282,529 752,059 4,832 Saint Paul College 4801 Drafting 7.43 82,336 21,614 103,950 11,077 Saint Paul College 4805 Precision Metal Work 94.93 617,703 276,036 893,738 6,507 Saint Paul College 480508 Welder/Welding Tech 145.73 480,163 423,746 903,909 3,295 Saint Paul College 4807 Woodworkers 35.00 165,911 101,769 267,680 4,740 Saint Paul College 500402 Graphic Design/Comm Art/Illustration 24.23 144,189 70,463 214,652 5,950 Saint Paul College 500901 Music, Gen 12.00 58,015 34,892 92,907 4,835 Saint Paul College 5102 Comm Disorders Sci/Serv 161.23 570,456 468,815 1,039,271 3,538 Saint Paul College 5107 Hlth/Med Admin Serv 116.90 290,725 339,908 630,632 2,487 Saint Paul College 510908 Respiratory Therapy Tech 42.50 323,917 123,576 447,493 7,622 Saint Paul College 5110 Hlth/Med Lab Tech 32.50 160,345 94,500 254,845 4,934 Saint Paul College 511613 Practical Nursing(L.P.N. Training) 140.40 802,736 408,238 1,210,974 5,717 Saint Paul College 511614 Nursing Assistant/Aide 36.90 145,822 107,293 253,115 3,952 Saint Paul College 5202 Business Admin/Mgmt 6.60 38,189 19, 191 57,380 5,786 Saint Paul College 5203 Accounting 80.67 253,724 234,553 488,276 3,145 Saint Paul College 5204 Admin/Secretarial Serv 160.43 654,420 466,489 1,120,908 4,079 Saint Paul College 5210 Human Resources Mgmt 32.17 127,479 93,530 221,010 3,963 Saint Paul College 521201 Mgmt Info Sys/Busn Data Proc, Gen 47.77 262,002 138,890 400,892 5,485 Saint Paul College 521202 Busn Comp Prag/Programmer 35.33 182,752 102,738 285,490 5,172 Saint Paul College 521204 Business Systems Networking and Telecommunications 94.47 437,528 274,679 712,207 4,632 Saint Paul College 5214 Mktg Mgmt & Research 31.47 94,055 91,505 185,560 2,989 Saint Paul Colleae Total s Paul Coll 3.000 3,000 12.138.427 12,138,427 8.723.035 8,723,035 20.861.462 20,861,462 4.046 4,046 South Central TC 0101 Agricultural/Mgmt 220.53 1,527,906 629,830 2,157,735 6,928 South Central TC 0102 Agricultural Mech 30.87 183,356 88,153 271,509 5,940 South Central TC 0103 Agric Prod Workers 28.07 188,141 80,157 268,298 6,703 South Central TC 0301 Natural Res Conser 7.07 25,914 20,182 46,096 3,667 South Central TC 05 Area/Ethnic/Cult Studies 4.10 11,117 11,709 22,827 2,712 South Central TC 0807 Gen Retail/Wholesale Oper/Skills 119.57 490,492 341,475 831,967 4,102
37
Fully Indirect Allocated
Cost Per Cost Per LD FYE LDFYE
2,908 5,602 2,908 5,648 2,908 5,937 2,908 5,172 2,908 4,917 2,908 6,444 2,908 5,103 2,908 5,028 2,908 5,512 2,908 5,171 2,908 4,979 2,908 8,942 2,908 7,129 2,908 7,723 2,908 9,282 2,908 6,281 2,908 8,981 2,908 7,160 2,908 7,740 2,908 13,984 2,908 9,414 2,908 6,202 2,908 7,648 2,908 8,858 2,908 7,742 2,908 6,446 2,908 5,395 2,908 10,529 2,908 7,841 2,908 8,625 2,908 6,859 2,908 8,694 2,908 6,053 2,908 6,987 2,908 6,871 2,908 8,393 2,908 8,080 2,908 7,539 2,908 5,896 2.908 2,908 6.954 6,954 2,856 9,784 2,856 8,796 2,856 9,559 2,856 6,523 2,856 5,568 2,856 6,958
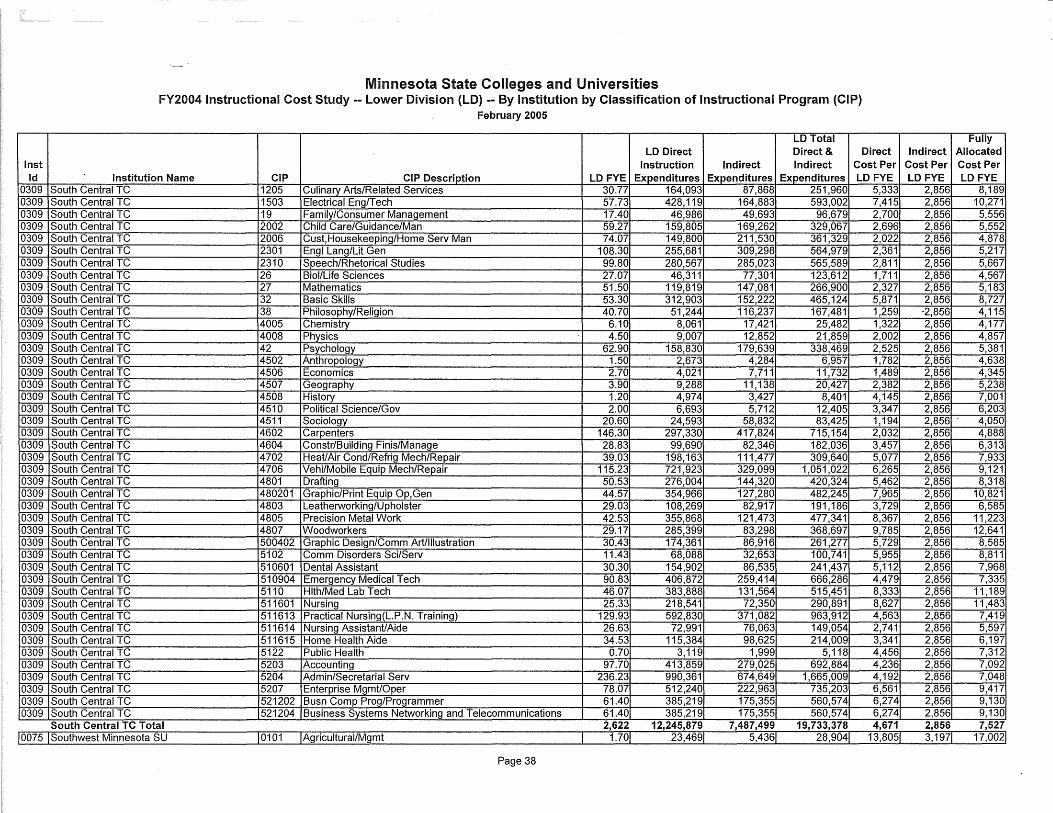
Inst Id
0309 0309 0309 0309 0309 0309 0309 0309 0309 0309 0309 0309 0309 0309 0309 0309 0309 0309 0309 0309 0309 0309 0309 0309 0309 0309 0309 0309 0309 0309 0309 0309 0309 0309 0309 0309 0309 0309 0309 0309 0309 0309 0309 0309
Minnesota State Colleges and Universities FY2004 Instructional Cost Study -- Lower Division (LD) -- By Institution by Classification of Instructional Program (CIP)
February 2005
LD Total LD Direct Direct & Direct
Instruction Indirect Indirect Cost Per Institution Name CIP CIP Description LD FYE Expenditures Expenditures Expenditures LDFYE
South Central TC 1205 Culinary Arts/Related Services 30.77 164,093 87,868 251,960 5,333 South Central TC 1503 Electrical Eng/Tech 57.73 428,119 164,883 593,002 7,415 South Central TC 19 Family/Consumer Management 17.40 46,986 49,693 96,679 2,700 South Central TC 2002 Child Care/Guidance/Man 59.27 159,805 169,262 329,067 2,696 South Central TC 2006 Cust,Housekeeping/Home Serv Man 74.07 149,800 211,530 361,329 2,022 South Central TC 2301 Engl Lang/Lit Gen 108.30 255,681 309,298 564,979 2,361 South Central TC 2310 Speech/Rhetorical Studies 99.80 280,567 285,023 565,589 2,811 South Central TC 26 Biol/Life Sciences 27.07 46,311 77,301 123,612 1,711 South Central TC 27 Mathematics 51.50 119,819 147,081 266,900 2,327 South Central TC 32 Basic Skills 53.30 312,903 152,222 465,124 5,871 South Central TC 38 Philosophy/Religion 40.70 51,244 116,237 167,481 1,259 South Central TC 4005 Chemistry 6.10 8,061 17,421 ZS-,482 1,322 South Central TC 4008 Physics 4.50 9,007 12,852 21,859 2,002 South Central TC 42 Psychology 62.90 158,830 179,639 338,469 2,525 South Central TC 4502 Anthropology 1.50 2,673 4,284 6,957 1,782 South Central TC 4506 Economics 2.70 4,021 7,711 11,732 1,489 South Central TC 4507 Geography 3.90 9,288 11, 138 20,427 2,382 South Central TC 4508 History 1.20 4,974 3,427 8,401 4,145 South Central TC 4510 Political Science/Gov 2.00 6,693 5,712 12,405 3,347 South Central TC 4511 Sociology 20.60 24,593 58,832 83,425 1,194 South Central TC 4602 Carpenters 146.30 297,330 417,824 715, 154 2,032 South Central TC 4604 Constr/Building Finis/Manage 28.83 99,690 82,346 182,036 3,457 South Central TC 4702 Heat/Air Cond/Refrig Mech/Repair 39.03 198,163 111,477 309,640 5,077 South Central TC 4706 Vehi/Mobile Equip Mech/Repair 115.23 721,923 329,099 1,051,022 6,265 South Central TC 4801 Drafting 50.53 276,004 144,320 420,324 5,462 South Central TC 480201 Graphic/Print Equip Op,Gen 44.57 354,966 127,280 482,245 7,965 South Central TC 4803 Leatherworking/Upholster 29.03 108,269 82,917 191,186 3,729 South Central TC 4805 Precision Metal Work 42.53 355,868 121,473 477,341 8,367 South Central TC 4807 Woodworkers 29.17 285,399 83,298 368,697 9,785 South Central TC 500402 Graphic Design/Comm Art/Illustration 30.43 174,361 86,916 261,277 5,729 South Central TC 5102 Comm Disorders Sci/Serv 11.43 68,088 32,653 100,741 5,955 South Central TC 510601 Dental Assistant 30.30 154,902 86,535 241,437 5,112 South Central TC 510904 Emergency Medical Tech 90.83 406,872 259,414 666,286 4,479 South Central TC 5110 Hlth/Med Lab Tech 46.07 383,888 131,564 515,451 8,333 South Central TC 511601 Nursing 25.33 218,541 72,350 290,891 8,627 South Central TC 511613 Practical Nursing(L.P.N. Training) 129.93 592,830 371,082 963,912 4,563 South Central TC 511614 Nursing Assistant/Aide 26.63 72,991 76,063 149,054 2,741 South Central TC 511615 Home Health Aide 34.53 115,384 98,625 214,009 3,341 South Central TC 5122 Public Health 0.70 3, 119 1,999 5, 118 4,456 South Central TC 5203 Accounting 97.70 413,859 279,025 692,884 4,236 South Central TC 5204 Admin/Secretarial Serv 236.23 990,361 674,649 1,665,009 4,192 South Central TC 5207 Enterprise Mgmt/Oper 78.07 512,240 222,963 735,203 6,561 South Central TC 521202 Busn Comp Prag/Programmer 61.40 385,219 175,355 560,574 6,274 South Central TC 521204 Business Systems Networking and Telecommunications 61.40 385,219 175,355 560,574 6,274
Fully Indirect Allocated
Cost Per Cost Per LD FYE LD FYE
2,856 8,189 2,856 10,271 2,856 5,556 2,856 5,552 2,856 4,878 2,856 5,217 2,856 5,667 2,856 4,567 2,856 5,183 2,856 8,727
--2,856 4,115 2,856 4,177 2,856 4,857 2,856 5,381 2,856 4,638 2,856 4,345 2,856 5,238 2,856 7,001 2,856 6,203 2,856 4,050 2,856 4,888 2,856 6,313 2,856 7,933 2,856 9, 121 2,856 8,318 2,856 10,821 2,856 6,585 2,856 11,223 2,856 12,641 2,856 8,585 2,856 8,811 2,856 7,968 2,856 7,335 2,856 11, 189 2,856 11,483 2,856 7,419 2,856 5,597 2,856 6,197 2,856 7,312 2,856 7,092 2,856 7,048 2,856 9,417 2,856 9,130 2,856 9,130
South Central TC Total 2,622 12,245,879 7,487,499 19,733,378 4,671 2,856 7,527 10075 !Southwest Minnesota SU 10101 !Agricultural/Mgmt I 1.701 23,4691 5,4361 28,9041 13,805j--3,1971~17,0021
Page 38
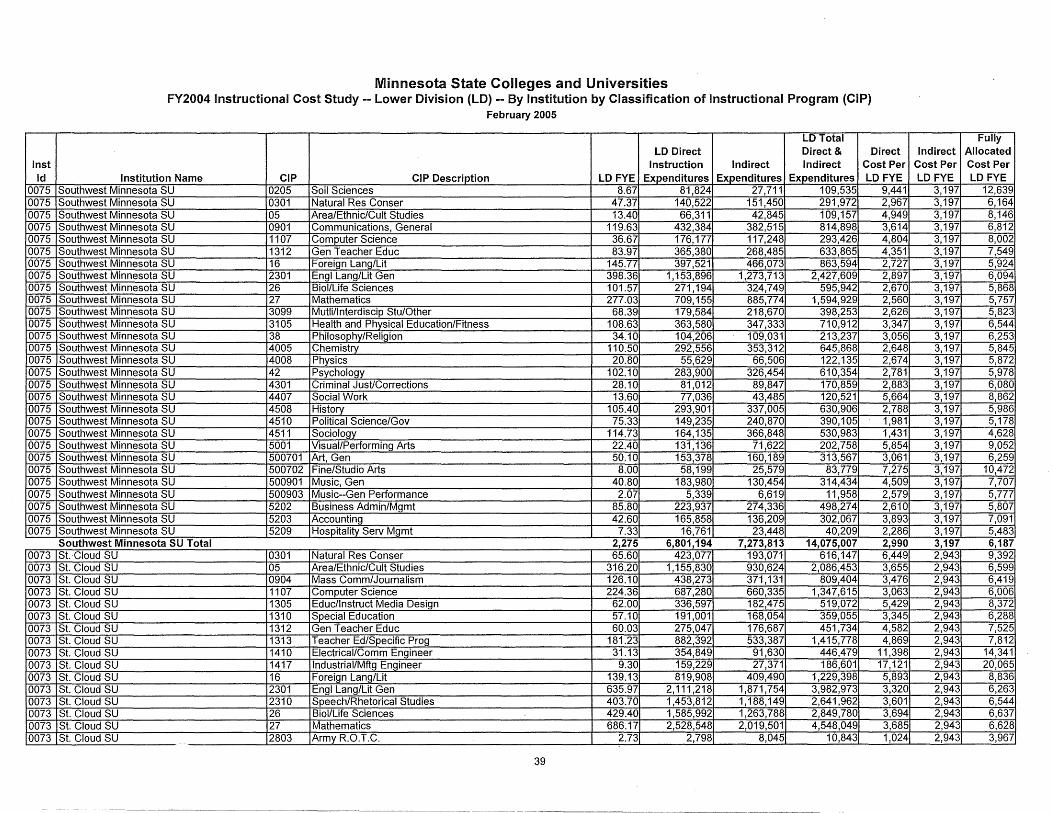
Inst Id
0075 0075 0075 0075 0075 0075 0075 0075 0075 0075 0075 0075 0075 0075 0075 0075 0075 0075 0075 0075 0075 0075 0075 0075 0075 0075 0075 0075 0075
0073 0073 0073 0073 0073 0073 0073 0073 0073 0073 0073 0073 0073 0073 0073 0073
Minnesota State Colleges and Universities FY2004 Instructional Cost Study -- Lower Division (LD) -- By Institution by Classification of Instructional Program (CIP)
February 2005
LD Total LD Direct Direct & Direct
Instruction Indirect Indirect Cost Per Institution Name CIP CIP Description LD FYE Expenditures Expenditures Expenditures LD FYE
Southwest Minnesota SU 0205 Soil Sciences 8.67 81,824 27,711 109,535 9,441 Southwest Minnesota SU 0301 Natural Res Conser 47.37 140,522 151,450 291,972 2,967 Southwest Minnesota SU 05 Area/Ethnic/Cult Studies 13.40 66,311 42,845 109, 157 4,949 Southwest Minnesota SU 0901 Communications, General 119.63 432,384 382,515 814,898 3,614 Southwest Minnesota SU 1107 Computer Science 36.67 176, 177 117,248 293,426 4,804 Southwest Minnesota SU 1312 Gen Teacher Educ 83.97 365,380 268,485 633,865 4,351 Southwest Minnesota SU 16 Foreign Lang/Lit 145.77 397,521 466,073 863,594 2,727 Southwest Minnesota SU 2301 Engl Lang/Lit Gen 398.36 1,153,896 1,273,713 2,427,609 2,897 Southwest Minnesota SU 26 Biol/Life Sciences 101.57 271,194 324,749 595,942 2,670 Southwest Minnesota SU 27 Mathematics 277.03 709,155 885,774 1,594,929 2,560 Southwest Minnesota SU 3099 Mutli/lnterdiscip Stu/Other 68.39 179,584 218,670 398,253 2,626 Southwest Minnesota SU 3105 Health and Physical Education/Fitness 108.63 363,580 347,333 710,912 3,347 Southwest Minnesota SU 38 Philosophy/Religion 34.10 104,206 109,031 213,237 3,056 Southwest Minnesota SU 4005 Chemistry 110.50 292,556 353,312 645,868 2,648 Southwest Minnesota SU 4008 Physics 20.80 55,629 66,506 122,135 2,674 Southwest Minnesota SU 42 Psychology 102.10 283,900 326,454 610,354 2,781 Southw~st Minnesota SU 4301 Criminal JusUCorrections 28.10 81,012 89,847 170,859 2,883 Southwest Minnesota SU 4407 Social Work 13.60 77,036 43,485 120,521 5,664 Southwest Minnesota SU 4508 History 105.40 293,901 337,005 630,906 2,788 Southwest Minnesota SU 4510 Political Science/Gov 75.33 149,235 240,870 390,105 1,981 Southwest Minnesota SU 4511 Sociology 114.73 164,135 366,848 530,983 1,431 Southwest Minnesota SU 5001 Visual/Performing Arts 22.40 131,136 71,622 202,758 5,854 Southwest Minnesota SU 500701 Art, Gen 50.10 153,378 160, 189 313,567 3,061 Southwest Minnesota SU 500702 Fine/Studio Arts 8.00 58,199 25,579 83,779 7,275 Southwest Minnesota SU 500901 Music, Gen 40.80 183,980 130,454 314,434 4,509 Southwest Minnesota SU 500903 Music--Gen Performance 2.07 5,339 6,619 11,958 2,579 Southwest Minnesota SU 5202 Business Admin/Mgmt 85.80 223,937 274,336 498,274 2,610 Southwest Minnesota SU 5203 Accounting 42.60 165,858 136,209 302,067 3,893 Southwest Minnesota SU 5209 Hospitality Serv Mgmt 7.33 16,761 23,448 40,209 2,286 Southwest Minnesota SU Total 2,275 6,801,194 7,273,813 14,075,007 2,990 St. Cloud SU 0301 Natural Res Conser 65.60 423,077 193,071 616, 147 6,449 St. Cloud SU 05 Area/Ethnic/Cult Studies 316.20 1,155,830 930,624 2,086,453 3,655 St. Cloud SU 0904 Mass Comm/Journalism 126.10 438,273 371,131 809,404 3,476 St. Cloud SU 1107 Computer Science 224.36 687,280 660,335 1,347,615 3,063 St. Cloud SU 1305 Educ/Instruct Media Design 62.00 336,597 182,475 519,072 5,429 St. Cloud SU 1310 Special Education 57.10 191,001 168,054 359,055 3,345 St. Cloud SU 1312 Gen Teacher Educ 60.03 275,047 176,687 451,734 4,582 St. Cloud SU 1313 Teacher Ed/Specific Prog 181.23 882,392 533,387 1,415,778 4,869 St. Cloud SU 1410 Electrical/Comm Engineer 31.13 354,849 91,630 446,479 11,398 St. Cloud SU 1417 lndustrial/Mftg Engineer 9.30 159,229 27,371 186,601 17,121 St. Cloud SU 16 Foreign Lang/Lit 139.13 819,908 409,490 1,229,398 5,893 St. Cloud SU 2301 Engl Lang/Lit Gen 635.97 2,111,218 1,871,754 3,982,973 3,320 St. Cloud SU 2310 Speech/Rhetorical Studies 403.70 1,453,812 1,188, 149 2,641,962 3,601 St. Cloud SU 26 Biol/Life Sciences 429.40 1,585,992 1,263,788 2,849,780 3,694 St. Cloud SU 27 Mathematics 686.17 2,528,548 2,019,501 4,548,049 3,685 St. Cloud SU 2803 Army R.O.T.C. 2.73 2,798 8,045 10,843 1,024
39
Fully Indirect Allocated
Cost Per Cost Per LD FYE LDFYE
3,197 12,639 3,197 6,164 3,197 8,146 3,197 6,812 3,197 8,002 3,197 7,549 3,197 5,924 3,197 6,094 3,197 5,868 3,197 5,757 3,197 5,823 3,197 6,544 3,197 6,253 3,197 5,845 3,197 5,872 3,197 5,978 3,197 6,080 3,197 8,862 3,197 5,986 3,197 5,178 3,197 4,628 3,197 9,052 3,197 6,259 3,197 10,472 3,197 7,707 3,197 5,777 3,197 5,807 3,197 7,091 3,197 5,483 3,197 6,187 2,943 9,392 2,943 6,599 2,943 6,419 2,943 6,006 2,943 8,372 2,943 6,288 2,943 7,525 2,943 7,812 2,943 14,341 2,943 20,065 2,943 8,836 2,943 6,263 2,943 6,544 2,943 6,637 2,943 6,628 2,943 3,967
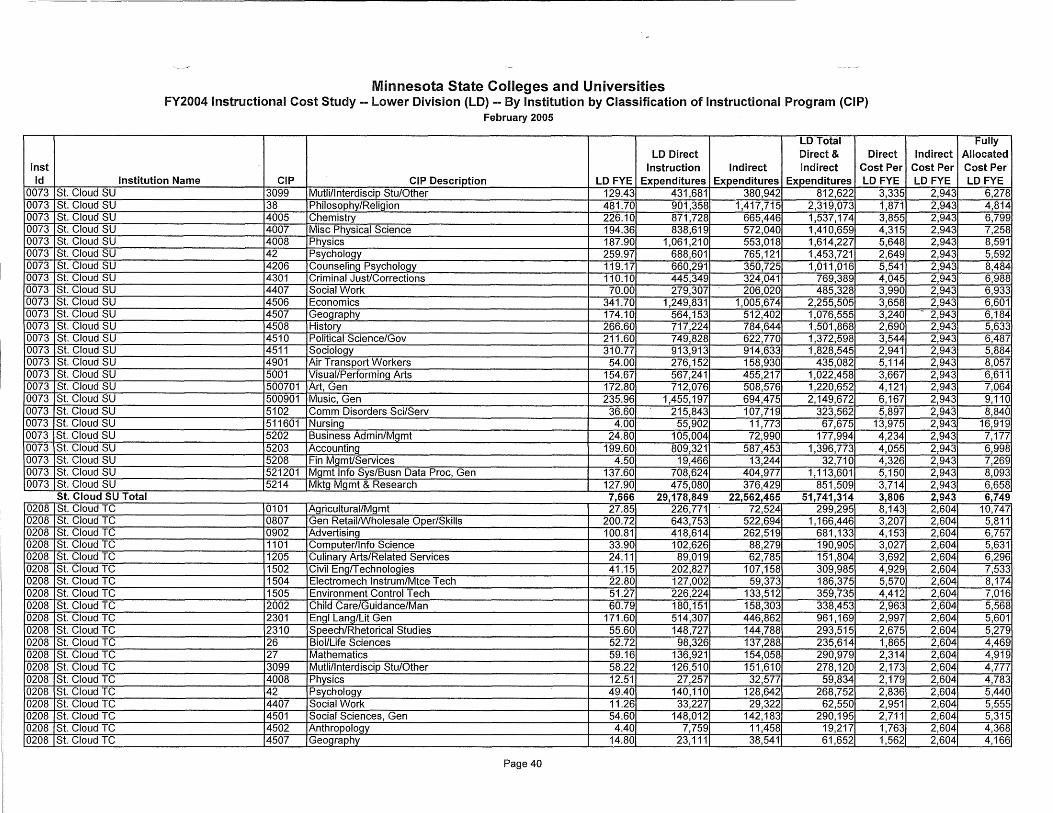
Inst Id
0073 0073 0073 0073 0073 0073 0073 0073 0073 0073 0073 0073 0073 0073 0073 0073 0073 0073 0073 0073 0073 0073 0073 0073 0073
0208 0208 0208 0208 0208 0208 0208 0208 0208 0208 0208 0208 0208 0208 0208 0208 0208 0208 0208 0208
Minnesota State Colleges and Universities FY2004 Instructional Cost Study -- Lower Division (LO) -- By Institution by Classification of Instructional Program (CIP)
February 2005
LD Total LD Direct Direct & Direct
Instruction Indirect Indirect Cost Per Institution Name CIP CIP Description LD FYE Expenditures Expenditures Expenditures LD FYE
St. Cloud SU 3099 Mutli/lnterdiscip Stu/Other 129.43 431,681 380,942 812,622 3,335 St. Cloud SU 38 Philosophy/Religion 481.70 901,358 1,417,715 2,319,073 1,871 St. Cloud SU 4005 Chemistry 226.10 871,728 665,446 1,537,174 3,855 St. Cloud SU 4007 Misc Physical Science 194.36 838,619 572,040 1,410,659 4,315 St. Cloud SU 4008 Physics 187.90 1,061,210 553,018 1,614,227 5,648 St. Cloud SU 42 Psychology 259.97 688,601 765,121 1,453,721 2,649 St. Cloud SU 4206 Counseling Psychology 119.17 660,291 350,725 1,011,016 5,541 St. Cloud SU 4301 Criminal JusUCorrections 110.10 445,349 324,041 769,389 4,045 St. Cloud SU 4407 Social Work 70.00 279,307 206,020 485,328 3,990 St. Cloud SU 4506 Economics 341.70 1,249,831 1,005,674 2,255,505 3,658 St. Cloud SU 4507 Geography 174.10 564,153 512,402 1,076,555 3,240 St. Cloud SU 4508 History 266.60 717,224 784,644 1,501,868 2,690 St. Cloud SU 4510 Political Science/Gov 211.60 749,828 622,770 1,372,598 3,544 St. Cloud SU 4511 Sociology 310.77 913,913 914,633 1,828,545 2,941 St. Cloud SU 4901 Air Transport Workers 54.00 276,152 158,930 435,082 5,114 St. Cloud SU 5001 Visual/Performing Arts 154.67 567,241 455,217 1,022,458 3,667 St. Cloud SU 500701 Art, Gen 172.80 712,076 508,576 1,220,652 4,121 St. Cloud SU 500901 Music, Gen 235.96 1,455, 197 694,475 2,149,672 6,167 St. Cloud SU 5102 Comm Disorders Sci/Serv 36.60 215,843 107,719 323,562 5,897 St. Cloud SU 511601 Nursing 4.00 55,902 11,773 67,675 13,975 St. Cloud SU 5202 Business Admin/Mgmt 24.80 105,004 72,990 177,994 4,234 St. Cloud SU 5203 Accounting 199.60 809,321 587,453 1,396,773 4,055 St. Cloud SU 5208 Fin MgmUServices 4.50 19,466 13,244 32,710 4,326 St. Cloud SU 521201 Mgmt Info Sys/Busn Data Proc, Gen 137.60 708,624 404,977 1,113,601 5,150 St. Cloud SU 5214 Mktg Mgmt & Research 127.90 475,080 376,429 851,509 3,714 St. Cloud SU Total 7,666 29, 178,849 22,562,465 51,741,314 3,806 St. Cloud TC 0101 Agricultural/Mgmt 27.85 226,771 72,524 299,295 8,143 St. Cloud TC 0807 Gen Retail/Wholesale Oper/Skills 200.72 643,753 522,694 1,166,446 3,207 St. Cloud TC 0902 Advertising 100.81 418,614 262,519 681,133 4,153 St. Cloud TC 1101 Computer/Info Science 33.90 102,626 88,279 190,905 3,027 St. Cloud TC 1205 Culinary Arts/Related Services 24.11 89,019 62,785 151,804 3,692 St. Cloud TC 1502 Civil Eng/Technologies 41.15 202,827 107,158 309,985 4,929 St. Cloud TC 1504 Electromech lnstrum/Mtce Tech 22.80 127,002 59,373 186,375 5,570 St. Cloud TC 1505 Environment Control Tech 51.27 226,224 133,512 359,735 4,412 St. Cloud TC 2002 Child Care/Guidance/Man 60.79 180,151 158,303 338,453 2,963 St. Cloud TC 2301 Engl Lang/Lit Gen 171.60 514,307 446,862 961,169 2,997 St. Cloud TC 2310 Speech/Rhetorical Studies 55.60 148,727 144,788 293,515 2,675 St. Cloud TC 26 Biol/Life Sciences 52.72 98,326 137,288 235,614 1,865 St. Cloud TC 27 Mathematics 59.16 136,921 154,058 290,979 2,314 St. Cloud TC 3099 Mutli/lnterdiscip Stu/Other 58.22 126,510 151,610 278,120 2,173 St. Cloud TC 4008 Physics 12.51 27,257 32,577 59,834 2,179 St. Cloud TC 42 Psychology 49.40 140,110 128,642 268,752 2,836 St. Cloud TC 4407 Social Work 11.26 33,227 29,322 62,550 2,951 St. Cloud TC 4501 Social Sciences, Gen 54.60 148,012 142,183 290,195 2,711 St. Cloud TC 4502 Anthropology 4.40 7,759 11,458 19,217 1,763 St. Cloud TC 4507 Geography 14.80 23, 111 38,541 61,652 1,562
Page 40
Fully Indirect Allocated
Cost Per Cost Per LD FYE LD FYE
2,943 6,278 2,943 4,814 2,943 6,799 2,943 7,258 2,943 8,591 2,943 5,592 2,943 8,484 2,943 6,988 2,943 6,933 2,943 6,601
·- 2,943 6,184 2,943 5,633 2,943 6,487 2,943 5,884 2,943 8,057 2,943 6,611 2,943 7,064 2,943 9,110 2,943 8,840 2,943 16,919 2,943 7,177 2,943 6,998 2,943 7,269 2,943 8,093 2,943 6,658 2,943 6,749 2,604 10,747 2,604 5,811 2,604 6,757 2,604 5,631 2,604 6,296 2,604 7,533 2,604 8,174 2,604 7,016 2,604 5,568 2,604 5,601 2,604 5,279 2,604 4,469 2,604 4,919 2,604 4,777 2,604 4,783 2,604 5,440 2,604 5,555 2,604 5,315 2,604 4,368 2,604 4,166
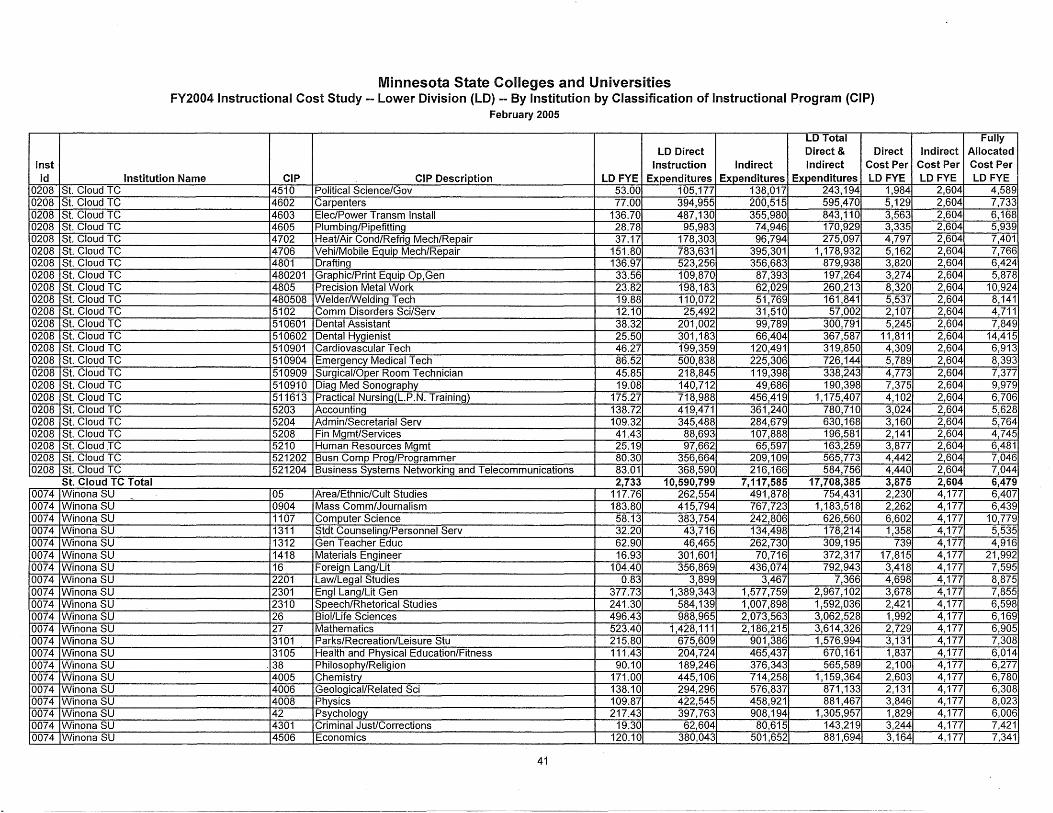
Inst Id
0208 0208 0208 0208 0208 0208 0208 0208 0208 0208 0208 0208 0208 0208 0208 0208 0208 0208 0208 0208 0208 0208 0208 0208
0074 0074 0074 0074 0074 0074 0074 0074 0074 0074 0074 0074 0074 0074 0074 0074 0074 0074 0074 0074 0074
Minnesota State Colleges and Universities FY2004 Instructional Cost Study -- Lower Division (LD) -- By Institution by Classification of Instructional Program (CIP)
February 2005
LD Total LD Direct Direct & Direct
Instruction Indirect Indirect Cost Per Institution Name CIP CIP Description LDFYE Expenditures Expenditures Expenditures LDFYE
St. Cloud TC 4510 Political Science/Gov 53.00 105,177 138,017 243,194 1,984 St. Cloud TC 4602 Carpenters 77.00 394,955 200,515 595,470 5,129 St. Cloud TC 4603 Elec/Power Transm Install 136.70 487,130 355,980 843,110 3,563 St. Cloud TC 4605 Plumbing/Pipefitting 28.78 95,983 74,946 170,929 3,335 St. Cloud TC 4702 Heat/Air Cond/Refrig Mech/Repair 37.17 178,303 96,794 275,097 4,797 St. Cloud TC 4706 Vehi/Mobile Equip Mech/Repair 151.80 783,631 395,301 1,178,932 5,162 St. Cloud TC 4801 Drafting 136.97 523,256 356,683 879,938 3,820 St. Cloud TC 480201 Graphic/Print Equip Op,Gen 33.56 109,870 87,393 197,264 3-,274 St. Cloud TC 4805 Precision Metal Work 23.82 198, 183 62,029 260,213 8,320 St. Cloud TC 480508 Welder/Welding Tech 19.88 110,072 51,769 161,841 5,537 St. Cloud TC 5102 Comm Disorders Sci/Serv 12.10 25,492 31,510 57,002 2,107 St. Cloud TC 510601 Dental Assistant 38.32 201,002 99,789 300,791 5,245 St. Cloud TC 510602 Dental Hygienist 25.50 301,183 66,404 367,587 11,811 St. Cloud TC 510901 Cardiovascular Tech 46.27 199,359 120,491 319,850 4,309 St. Cloud TC 510904 Emergency Medical Tech 86.52 500,838 225,306 726,144 5,789 St. Cloud TC 510909 Surgical/Oper Room Technician 45.85 218,845 119,398 338,243 4,773 St. Cloud TC 510910 Diag Med Sonography 19.08 140,712 49,686 190,398 7,375 St. Cloud TC 511613 Practical Nursing(L.P.N. Training) 175.27 718,988 456,419 1,175,407 4,102 St. Cloud TC 5203 Accounting 138.72 419,471 361,240 780,710 3,024 St. Cloud TC 5204 Admin/Secretarial Serv 109.32 345,488 284,679 630,168 3,160 St. Cloud TC 5208 Fin Mgmt/Services 41.43 88,693 107,888 196,581 2, 141 St. Cloud .TC 5210 Human Resources Mgmt 25.19 97,662 65,597 163,259 3,877 St. Cloud TC 521202 Busn Comp Prag/Programmer 80.30 356,664 209,109 565,773 4,442 St. Cloud TC 521204 Business Systems Networking and Telecommunications 83.01 368,590 216,166 584,756 4,440 St. Cloud TC Total 2,733 10,590,799 7,117,585 17,708,385 3,875 Winona SU - 05 Area/Ethnic/Cult Studies 117.76 262,554 491,878 754,431 2,230 Winona SU 0904 Mass Comm/Journalism 183.80 415,794 767,723 1,183,518 2,262 Winona SU 1107 Computer Science 58.13 383,754 242,806 626,560 6,602 Winona SU 1311 Stdt Counseling/Personnel Serv 32.20 43,716 134,498 178,214 1,358 Winona SU 1312 Gen Teacher Educ 62.90 46,465 262,730 309,195 739 Winona SU 1418 Materials Engineer 16.93 301,601 70,716 372,317 17,815 Winona SU 16 Foreign Lang/Lit 104.40 356,869 436,074 792,943 3,418 Winona SU 2201 Law/Legal Studies 0.83 3,899 3,467 7,366 4,698 Winona SU 2301 Engl Lang/Lit Gen 377.73 1,389,343 1,577,759 2,967,102 3,678 Winona SU 2310 Speech/Rhetorical Studies 241.30 584,139 1,007,898 1,592,036 2,421 Winona SU 26 Biol/Life Sciences 496.43 988,965 2,073,563 3,062,528 1,992 Winona SU 27 Mathematics 523.40 1,428, 111 2,186,215 3,614,326 2,729 Winona SU 3101 Parks/Recreation/Leisure Stu 215.80 675,609 901,386 1,576,994 3, 131 Winona SU 3105 Health and Physical Education/Fitness 111.43 204,724 465,437 670,161 1,837 Winona SU . 38 Philosophy/Religion 90.10 189,246 376,343 565,589 2,100 Winona SU 4005 Chemistry 171.00 445,106 714,258 1,159,364 2,603 Winona SU 4006 Geological/Related Sci 138.10 294,296 576,837 871, 133 2,131 Winona SU 4008 Physics 109.87 422,545 458,921 881,467 3,846 Winona SU 42 Psychology 217.43 397,763 908,194 1,305,957 1,829 Winona SU 4301 Criminal Just/Corrections 19.30 62,604 80,615 143,219 3,244 Winona SU 4506 Economics 120.10 380,043 501,652 881,694 3,164
41
Fully Indirect Allocated
Cost Per Cost Per LD FYE LD FYE
2,604 4,589 2,604 7,733 2,604 6,168 2,604 5,939 2,604 7,401 2,604 7,766 2,604 6,424 2,604 5,878 2,604 10,924 2,604 8,141 2,604 4,711 2,604 7,849 2,604 14,415 2,604 6,913 2,604 8,393 2,604 7,377 2,604 9,979 2,604 6,706 2,604 5,628 2,604 5,764 2,604 4,745 2,604 6,481 2,604 7,046 2,604 7,044 2,604 6,479 4,177 6,407 4,177 6,439 4,177 10,779 4,177 5,535 4,177 4,916 4,177 21,992 4,177 7,595 4,177 8,875 4,177 7,855 4,177 6,598 4,177 6,169 4,177 6,905 4,177 7,308 4,177 6,014 4,177 6,277 4,177 6,780 4,177 6,308 4,177 8,023 4,177 6,006 4,177 7,421 4,177 7,341
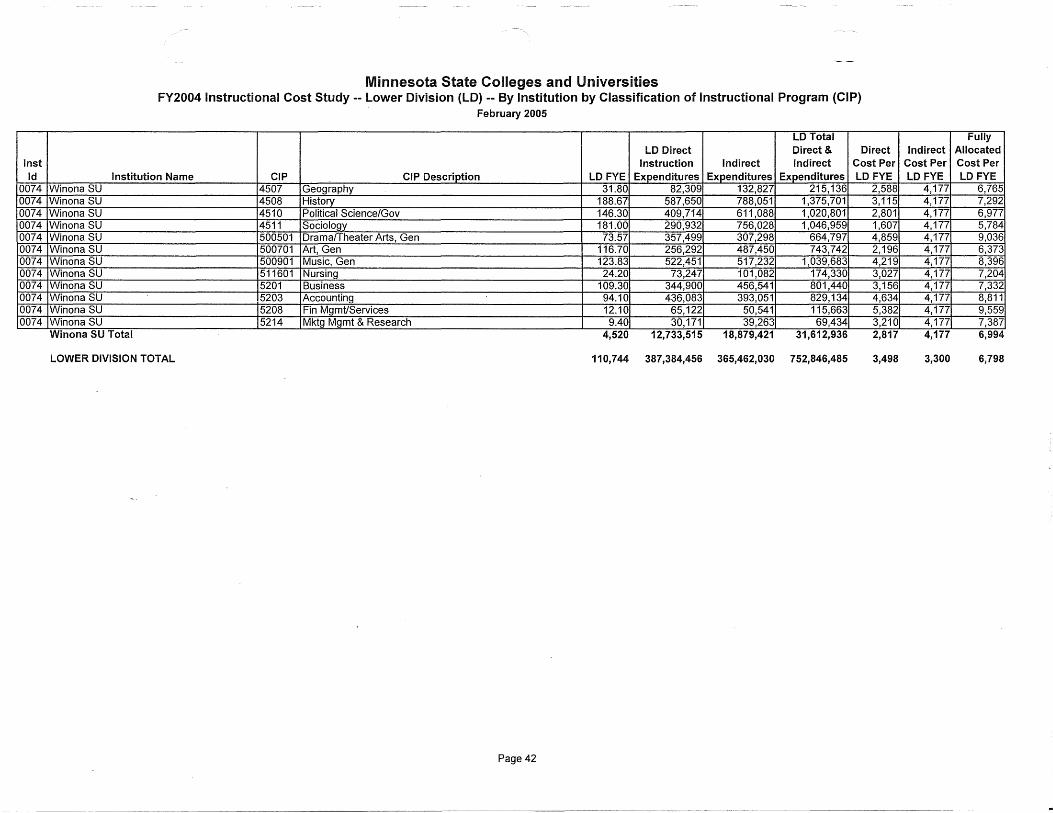
Inst Id
0074 0074 0074 0074 0074 0074 0074 0074 0074 0074 0074 0074
Minnesota State Colleges and Universities FY2004 Instructional Cost Study -- Lower Division (LD) -- By Institution by Classification of Instructional Program (CIP)
February 2005
LD Total LO Direct Direct & Direct
Instruction Indirect Indirect Cost Per Institution Name CIP CIP Description LO FYE Expenditures Expenditures Expenditures LDFYE
Winona SU 4507 Geography 31.80 82,309 132,827 215,136 2,588 Winona SU 4508 History 188.67 587,650 788,051 1,375,701 3,115 Winona SU 4510 Political Science/Gov 146.30 409,714 611,088 1,020,801 2,801 Winona SU 4511 Sociology 181.00 290,932 756,028 1,046,959 1,607 Winona SU 500501 Drama/Theater Arts, Gen 73.57 357,499 307,298 664,797 4,859 Winona SU 500701 Art, Gen 116.70 256,292 487,450 743,742 2,196 Winona SU 500901 Music, Gen 123.83 522,451 517,232 1,039,683 4,219 Winona SU 511601 Nursing 24.20 73,247 101,082 174,330 3,027 Winona SU 5201 Business 109.30 344,900 456,541 801,440 3,156 Winona SU 5203 Accounting 94.10 436,083 393,051 829,134 4,634 Winona SU 5208 Fin Mgmt/Services 12.10 65,122 50,541 115,663 5,382 Winona SU 5214 Mktg Mgmt & Research 9.40 30,171 39,263 69,434 3,210 Winona SU Total 4,520 12,733,515 18,879,421 31,612,936 2,817
LOWER DIVISION TOTAL 110,744 387,384,456 365,462,030 752,846,485 3,498
Page 42
Fully Indirect Allocated
Cost Per Cost Per LD FYE LD FYE
4,177 6,765 4,177 7,292 4,177 6,977 4,177 5,784 4,177 9,036 4,177 6,373 4,177 8,396 4,177 7,204 4,177 7,332 4,177 8,811 4,177 9,559 4,177 7,387 4,177 6,994
3,300 6,798
,..j
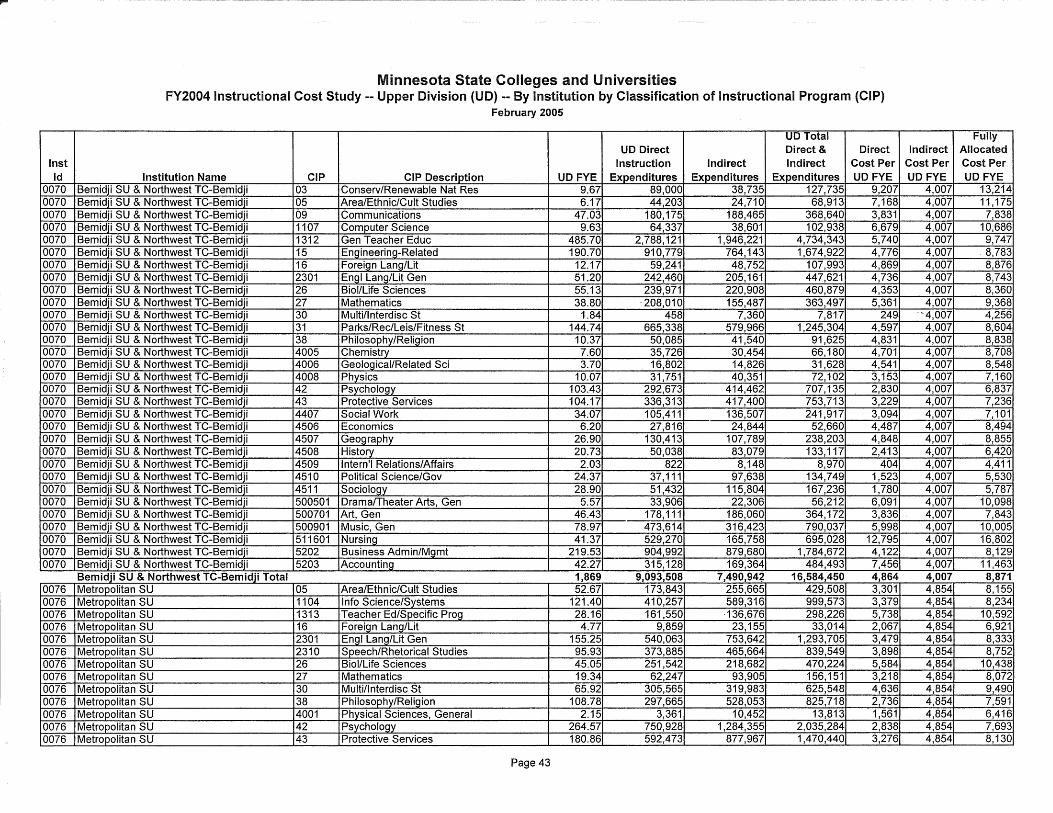
,...--·-
Inst Id
0070 0070 0070 0070 0070 0070 0070 0070 0070 0070 0070 0070 0070 0070 0070 0070 0070 0070 0070 0070 0070 0070 0070 0070 0070 0070 0070 0070 0070 0070 0070
0076 0076 0076 0076 0076 0076 0076 0076 0076 0076 0076 0076 0076
Minnesota State Colleges and Universities FY2004 Instructional Cost Study -- Upper Division (UD) -- By Institution by Classification of Instructional Program (CIP)
February 2005
UD Total UD Direct Direct & Direct
Instruction Indirect Indirect Cost Per Institution Name CIP CIP Description UD FYE Expenditures Expenditures Expenditures UD FYE
Bemidji SU & Northwest TC-Bemidji 03 Conserv/Renewable Nat Res 9.67 89,000 38,735 127,735 9,207 Bemidji SU & Northwest TC-Bemidji 05 Area/Ethnic/Cult Studies 6.17 44,203 24,710 68,913 7,168 Bemidji SU & Northwest TC-Bemidji 09 Communications 47.03 180,175 188,465 368,640 3,831 Bemidji SU & Northwest TC-Bemidji 1107 Computer Science 9.63 64,337 38,601 102,938 6,679 Bemidji SU & Northwest TC-Bemidji 1312 Gen Teacher Educ 485.70 2,788, 121 1,946,221 4,734,343 5,740 Bemidji SU & Northwest TC-Bemidji 15 EnQineerinQ-Related 190.70 910,779 764, 143 1,674,922 4,776 Bemidji SU & Northwest TC-Bemidji 16 Foreion Lano/Lit 12.17 59,241 48,752 107,993 4,869 Bemidji SU & Northwest TC-Bemidji 2301 Engl Lang/Lit Gen 51.20 242,460 205,161 447,621 4,736 Bemidji SU & Northwest TC-Bemidji 26 Biol/Life Sciences 55.13 239,971 220,908 460,879 4,353 Bemidji SU & Northwest TC-Bemidji 27 Mathematics 38.80 . 208,010 155,487 363,497 5,361 Bemidji SU & Northwest TC-Bemidji 30 Multi/lnterdisc St 1.84 458 7,360 7,817 249 Bemidji SU & Northwest TC-Bemidji 31 Parks/Rec/Leis/Fitness St 144.74 665,338 579,966 1,245,304 4,597 Bemidji SU & Northwest TC-Bemidji 38 Philosophy/Religion 10.37 50,085 41,540 91,625 4,831 Bemidji SU & Northwest TC-Bemidji 4005 Chemistry 7.60 35,726 30,454 66,180 4,701 Bemidji SU & Northwest TC-Bemidji 4006 Geolooical/Related Sci 3.70 16,802 14,826 31,628 4,541 Bemidji SU & Northwest TC-Bemidji 4008 Physics 10.07 31,751 40,351 72,102 3,153 Bemidji SU & Northwest TC-Bemidji 42 Psychology 103.43 292,673 414,462 707,135 2,830 Bemidji SU & Northwest TC-Bemidji 43 Protective Services 104.17 336,313 417,400 753,713 3,229 Bemidji SU & Northwest TC-Bemidji 4407 Social Work 34.07 105,411 136,507 241,917 3,094 Bemidji SU & Northwest TC-Bemidji 4506 Economics 6.20 27,816 24,844 52,660 4,487 Bemidji SU & Northwest TC-Bemidji 4507 Geography 26.90 130,413 107,789 238,203 4,848 Bemidji SU & Northwest TC-Bemidji 4508 History 20.73 50,038 83,079 133, 117 2,413 Bemidji SU & Northwest TC-Bemidji 4509 Intern'! Relations/Affairs 2.03 822 8,148 8,970 404 Bemidji SU & Northwest TC-Bemidji 4510 Political Science/Gov 24.37 37, 111 97,638 134,749 1,523 Bemidji SU & Northwest TC-Bemidji 4511 Sociology 28.90 51,432 115,804 167,236 1,780 Bemidji SU & Northwest TC-Bemidji 500501 Drama/Theater Arts, Gen 5.57 33,906 22,306 56,212 6,091 Bemidji SU & Northwest TC-Bemidji 500701 Art, Gen 46.43 178,111 186,060 364,172 3,836 Bemidji SU & Northwest TC-Bemidji 500901 Music, Gen 78.97 473,614 316,423 790,037 5,998 Bemidji SU & Northwest TC-Bemidji 511601 Nursing 41.37 529,270 165,758 695,028 12,795 Bemidji SU & Northwest TC-Bemidji 5202 Business Admin/Mgmt 219.53 904,992 879,680 1,784,672 4,122 Bemidji SU & Northwest TC-Bemidji 5203 Accounting 42.27 315,128 169,364 484,493 7,456 Bemidji SU & Northwest TC-Bemidji Total Bemidii SU & North TC-Bemidii T 1.869 1,869 9.093.508 9,093,508 7.490.942 7,490,94Z 16.584.450 16,584,450 4.864 4,864 Metropolitan SU 05 Area/Ethnic/Cult Studies 52.67 173,843 255,665 429,508 3,301 Metropolitan SU 1104 Info Science/Systems 121.40 410,257 589,316 999,573 3,379 Metropolitan SU 1313 Teacher Ed/Specific ProQ 28.16 161,550 ·136,676 298,226 5,738 Metropolitan SU 16 Foreign Lang/Lit 4.77 9,859 23,155 33,014 2,067 Metropolitan SU 2301 EnQI LanQ/Lit Gen 155.25 540,063 753,642 1,293,705 3,479 Metropolitan SU 2310 Speech/Rhetorical Studies 95.93 373,885 465,664 839,549 3,898 Metropolitan SU 26 Biol/Life Sciences 45.05 251,542 218,682 470,224 5,584 Metropolitan SU 27 Mathematics 19.34 62,247 93,905 156,151 3,218 Metropolitan SU 30 Multi/lnterdisc St 65.92 305,565 319,983 625,548 4,636 Metropolitan SU 38 Philosophy/ReliQion 108.78 297,665 528,053 825,718 2,736 Metropolitan SU 4001 Physical Sciences, General 2.15 3,361 10,452 13,813 1,561 Metropolitan SU 42 Psychology 264.57 750,928 1,284,355 2,035,284 2,838 Metropolitan SU 43 Protective Services 180.86 592,473 877,967 1,470,440 3,276
Page 43
Fully Indirect Allocated
Cost Per Cost Per UD FYE UD FYE
4,007 13,214 4,007 11, 175 4,007 7,838 4,007 10,686 4,007 9,747 4,007 8,783 4,007 8,876 4,007 8,743 4,007 8,360 4,007 9,368
-4,007 4,256 4,007 8,604 4,007 8,838 4,007 8,708 4,007 8,548 4,007 7,160 4,007 6,837 4,007 7,236 4,007 7,101 4,007 8,494 4,007 8,855 4,007 6,420 4,007 4,411 4,007 5,530 4,007 5,787 4,007 10,098 4,007 7,843 4,007 10,005 4,007 16,802 4,007 8,129 4,007 11,463 4.007 4,007 8.871 8,871 4,854 8,155 4,854 8,234 4,854 10,592 4,854 6,921 4,854 8,333 4,854 8,752 4,854 10,438 4,854 8,072 4,854 9,490 4,854 7,591 4,854 6,416 4,854 7,693 4,854 8,130
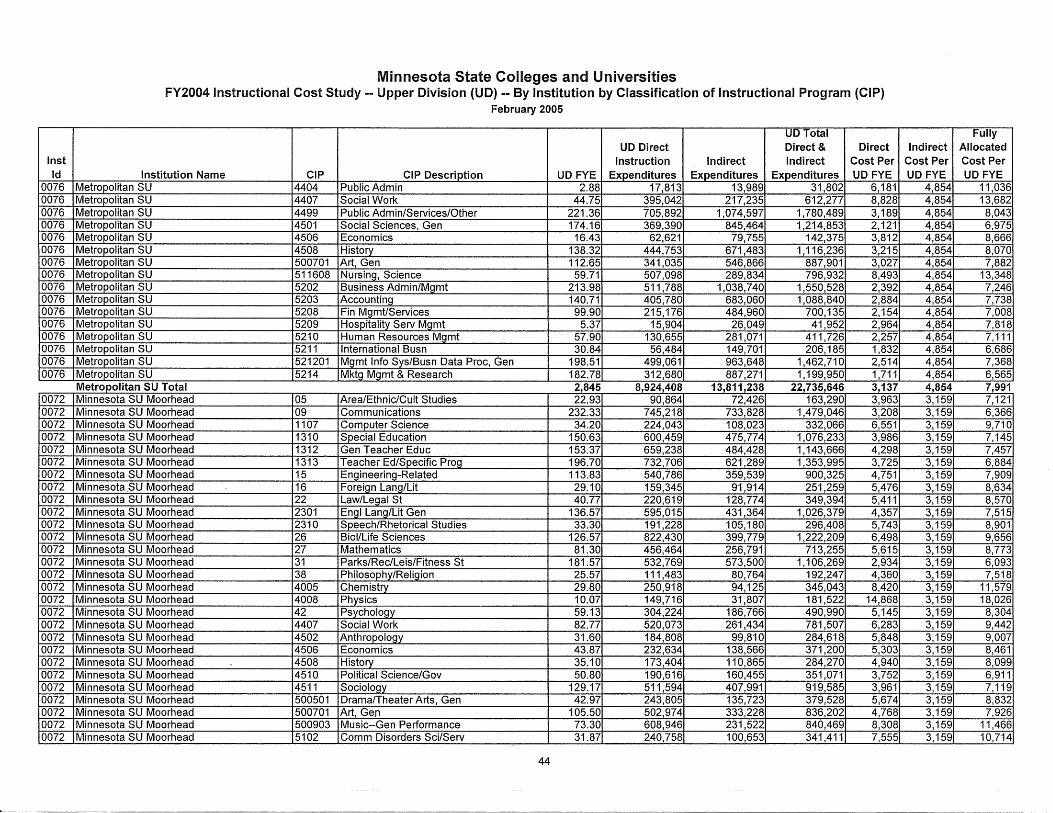
Inst Id
0076 0076 0076 0076 0076 0076 0076 0076 0076 0076 0076 0076 0076 0076 0076 0076
0072 0072 0072 0072 0072 0072 0072 0072 0072 0072 0072 0072 0072 0072 0072 0072 0072 0072 0072 0072 0072 0072 0072 0072 0072 0072 0072 0072
Minnesota State Colleges and Universities FY2004 Instructional Cost Study -- Upper Division (UD) -- By Institution by Classification of Instructional Program (CIP)
February 2005
UD Total UD Direct Direct & Direct
Instruction Indirect Indirect Cost Per Institution Name CIP CIP Description UD FYE Expenditures Expenditures Expenditures UDFYE
Metropolitan SU 4404 PublicAdmin 2.88 17,813 13,989 31,802 6,181 Metropolitan SU 4407 Social Work 44.75 395,042 217,235 612,277 8,828 Metropolitan SU 4499 Public Adm in/Services/Other 221.36 705,892 1,074,597 1,780,489 3,189 Metropolitan SU 4501 Social Sciences, Gen 174.16 369,390 845,464 1,214,853 2,121 Metropolitan SU 4506 Economics 16.43 62,621 79,755 142,375 3,812 Metropolitan SU 4508 History 138.32 444,753 671,483 1,116,236 3,215 Metropolitan SU 500701 Art, Gen 112.65 341,035 546,866 887,901 3,027 Metropolitan SU 511608 Nursing, Science 59.71 507,098 289,834 796,932 8,493 Metropolitan SU 5202 Business Admin/Mgmt 213.98 511,788 1,038,740 1,550,528 2,392 Metropolitan SU 5203 Accounting 140.71 405,780 683,060 1,088,840 2,884 Metropolitan SU 5208 Fin Mgmt/Services 99.90 215, 176 484,960 700,135 2,154 Metropolitan SU 5209 Hospitality Serv Mgmt 5.37 15,904 26,049 41,952 2,964 Metropolitan SU 5210 Human Resources Mqmt 57.90 130,655 281,071 411,726 2,257 Metropolitan SU 5211 International Busn 30.84 56,484 149,701 206, 185 1,832 Metropolitan SU 521201 Mgmt Info Sys/Busn Data Proc, Gen 198.51 499,061 963,648 1,462,710 2,514 Metropolitan SU 5214 Mktg Mgmt & Research 182.78 312,680 887,271 1, 199,950 1,711 Metropolitan SU Total 2,845 8,924,408 13,811,238 22,735,646 3,137 Minnesota SU Moorhead 05 Area/Ethnic/Cult Studies 22.93 90,864 72,426 163,290 3,963 Minnesota SU Moorhead 09 Communications 232.33 745,218 733,828 1,479,046 3,208 Minnesota SU Moorhead 1107 Computer Science 34.20 224,043 108,023 332,066 6,551 Minnesota SU Moorhead 1310 Special Education 150.63 600,459 475,774 1,076,233 3,986 Minnesota SU Moorhead 1312 Gen Teacher Educ 153.37 659,238 484,428 1,143,666 4,298 Minnesota SU Moorhead 1313 Teacher Ed/Specific ProQ 196.70 732,706 621,289 1,353,995 3,725 Minnesota SU Moorhead 15 Engineering-Related 113.83 540,786 359,539 900,325 4,751 Minnesota SU Moorhead 16 Foreign Lang/Lit 29.10 159,345 91,914 251,259 5,476 Minnesota SU Moorhead 22 Law/Legal St 40.77 220,619 128,774 349,394 5,411 Minnesota SU Moorhead 2301 Engl Lang/Lit Gen 136.57 595,015 431,364 1,026,379 4,357 Minnesota SU Moorhead 2310 Speech/Rhetorical Studies 33.30 191,228 105,180 296,408 5,743 Minnesota SU Moorhead 26 Biol/Life Sciences 126.57 822,430 399,779 1,222,209 6,498 Minnesota SU Moorhead 27 Mathematics 81.30 456,464 256,791 713,255 5,615 Minnesota SU Moorhead 31 Parks/Rec/Leis/Fitness St 181.57 532,769 573,500 1, 106,269 2,934 Minnesota SU Moorhead 38 Philosophy/Religion 25.57 111,483 80,764 192,247 4,360 Minnesota SU Moorhead 4005 Chemistry 29.80 250,918 94,125 345,043 8,420 Minnesota SU Moorhead 4008 Physics 10.07 149,716 31,807 181,522 14,868 Minnesota SU Moorhead 42 Psychology 59.13 304,224 186,766 490,990 5,145 Minnesota SU Moorhead 4407 Social Work 82.77 520,073 261,434 781,507 6,283 Minnesota SU Moorhead 4502 Anthropoloqy 31.60 184,808 99,810 284,618 5,848 Minnesota SU Moorhead 4506 Economics 43.87 232,634 138,566 371,200 5,303 Minnesota SU Moorhead 4508 History 35.10 173,404 110,865 284,270 4,940 Minnesota SU Moorhead 4510 Political Science/Gov 50.80 190,616 160,455 351,071 3,752 Minnesota SU Moorhead 4511 Sociology 129.17 511,594 407,991 919,585 3,961 Minnesota SU Moorhead 500501 Drama/Theater Arts, Gen 42.97 243,805 135,723 379,528 5,674 Minnesota SU Moorhead 500701 Art, Ge_n 105.50 502,974 333,228 836,202 4,768 Minnesota SU Moorhead 500903 Music--Gen Performance 73.30 608,946 231,522 840,469 8,308 Minnesota SU Moorhead 5102 Comm Disorders Sci/Serv 31.87 240,758 100,653 341,411 7,555
44
Fully Indirect Allocated
Cost Per Cost Per UDFYE UDFYE
4,854 11,036 4,854 13,682 4,854 8,043 4,854 6,975 4,854 8,666 4,854. 8,070 4,854 7,882 4,854 13,348 4,854 7,246 4,854 7,738 4,854 7,008 4,854 7,818 4,854 7, 111 4,854 6,686 4,854 7,368 4,854 6,565 4,854 7,991 3,159 7,121 3,159 6,366 3,159 9,710 3,159 7,145 3,159 7,457 3,159 6,884 3,159 7,909 3,159 8,634 3,159 8,570 3,159 7,515 3,159 8,901 3,159 9,656 3,159 8,773 3,159 6,093 3,159 7,518 3,159 11,579 3,159 18,026 3,159 8,304 3,159 9,442 3,159 9,007 3,159 8,461 3,159 8,099 3,159 6,911 3,159 7,119 3,159 8,832 3,159 7,926 3,159 11,466 3,159 10,714
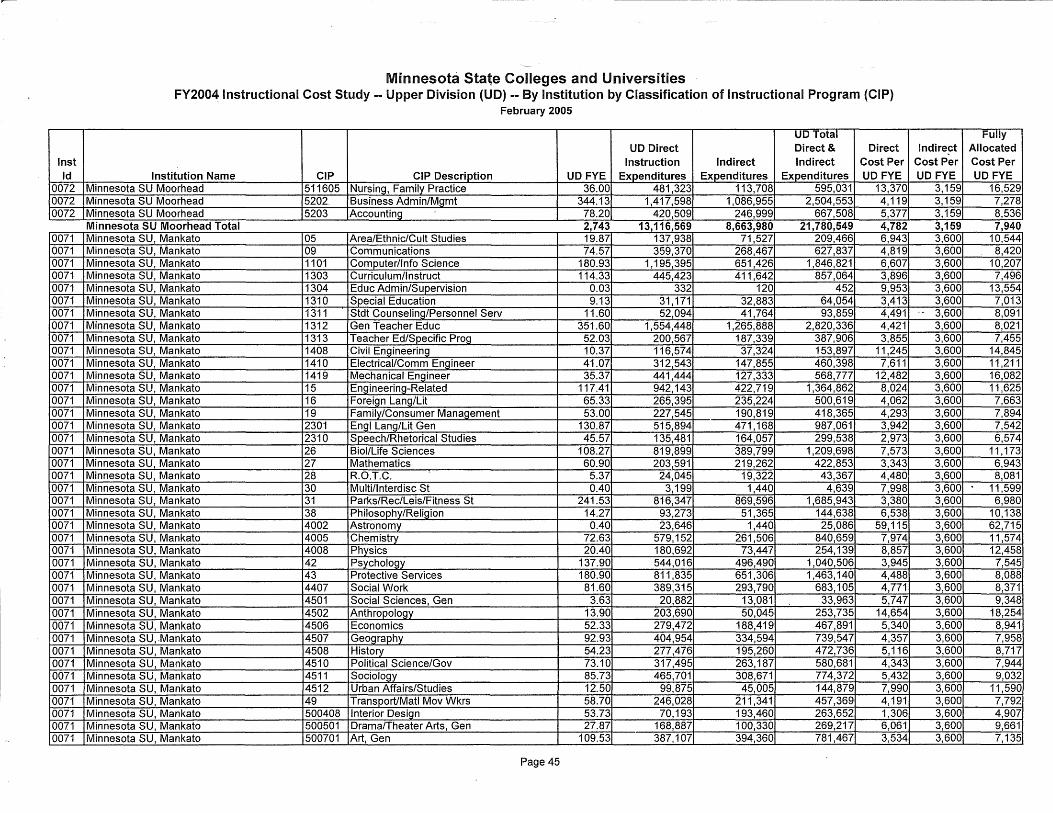
Inst Id
0072 0072 0072
0071 0071 0071 0071 -0071 0071 0071 0071 0071 0071 0071 0071 0071 0071 0071 0071 0071 0071 0071 0071 0071 0071 0071 0071 0071 0071 0071 0071 0071 0071 0071 0071 0071 0071 0071 0071 0071 0071 0071 0071 0071
Minnesota State Colleges and Universities FY2004 Instructional Cost Study -- Upper Division (UD) -- By Institution by Classification of Instructional Program (CIP)
February 2005
UD Total UD Direct Direct & Direct
Instruction Indirect Indirect Cost Per Institution Name CIP CIP Description UD FYE Expenditures Expenditures Expenditures UDFYE
Minnesota SU Moorhead 511605 Nursing, Family Practice 36.00 481,323 113,708 595,031 13,370 Minnesota SU Moorhead 5202 Business Admin/Mgmt 344.13 1,417,598 1,086,955 2,504,553 4,119 Minnesota SU Moorhead 5203 Accounting 78.20 420,509 246,999 667,508 5,377 Minnesota SU Moorhead Total 2,743 13,116,569 8,663,980 21,780,549 4,782 Minnesota SU, Mankato 05 Area/Ethnic/Cult Studies 19.87 137,938 71,527 209,466 6,943 Minnesota SU, Mankato 09 Communications 74.57 359,370 268,467 627,837 4,819 Minnesota SU, Mankato 1101 Computer/Info Science 180.93 1, 195,395 651,426 1,846,821 6,607 Minnesota SU, Mankato 1303 Curriculum/Instruct 114.33 445,423 411,642 857,064 3,896 Minnesota SU, Mankato 1304 Educ Admin/Supervision 0.03 332 120 452 9,953 Minnesota SU, Mankato 1310 Special Education 9.13 31,171 32,883 64,054 3,413 Minnesota SU, Mankato 1311 Stdt Counseling/Personnel Serv 11.60 52,094 41,764 93,859 4,491 Minnesota SU, Mankato 1312 Gen Teacher Educ 351.60 1,554,448 1,265,888 2,820,336 4,421 Minnesota SU, Mankato 1313 Teacher Ed/Specific Prog 52.03 200,567 187,339 387,906 3,855 Minnesota SU, Mankato 1408 Civil Engineering 10.37 116,574 37,324 153,897 11,245 Minnesota SU, Mankato 1410 Electrical/Comm Engineer 41.07 312,543 147,855 460,398 7,611 Minnesota SU, Mankato 1419 Mechanical Engineer 35.37 441,444 127,333 568,777 12,482 Minnesota SU, Mankato 15 Engineering-Related 117.41 942,143 422,719 1,364,862 8,024 Minnesota SU, Mankato 16 Foreign Lang/Lit 65.33 265,395 235,224 500,619 4,062 Minnesota SU, Mankato 19 Family/Consumer Management 53.00 227,545 190,819 418,365 4,293 Minnesota SU, Mankato 2301 Engl Lang/Lit Gen 130.87 515,894 471,168 987,061 3,942 Minnesota SU, Mankato 2310 Speech/Rhetorical Studies 45.57 135,481 164,057 299,538 2,973 Minnesota SU, Mankato 26 Biol/Life Sciences 108.27 819,899 389,799 1,209,698 7,573 Minnesota SU, Mankato 27 Mathematics 60.90 203,591 219,262 422,853 3,343 Minnesota SU, Mankato 28 R.O.T.C. 5.37 24,045 19,322 43,367 4,480 Minnesota SU, Mankato 30 Multi/lnterdisc St 0.40 3,199 1,440 4,639 7,998 Minnesota SU, Mankato 31 Parks/Rec/Leis/Fitness St 241.53 816,347 869,596 1,685,943 3,380 Minnesota SU, Mankato 38 Philosophy/Religion 14.27 93,273 51,365 144,638 6,538 Minnesota SU, Mankato 4002 Astronomy 0.40 23,646 1,440 25,086 59, 115 Minnesota SU, Mankato 4005 Chemistry 72.63 579,152 261,506 840,659 7,974 Minnesota SU, Mankato 4008 Physics 20.40 180,692 73,447 254,139 8,857 Minnesota SU, Mankato 42 Psychology 137.90 544,016 496,490 1,040,506 3,945 Minnesota SU, Mankato 43 Protective Services 180.90 811,835 651,306 1,463,140 4,488 Minnesota SU, Mankato 4407 Social Work 81.60 389,315 293,790 683,105 4,771 Minnesota SU, Mankato 4501 Social Sciences, Gen 3.63 20,882 13,081 33,963 5,747 Minnesota SU, Mankato 4502 Anthropology 13.90 203,690 50,045 253,735 14,654 Minnesota SU, Mankato 4506 Economics 52.33 279,472 188,419 467,891 5,340 Minnesota SU, -Mankato 4507 Geography 92.93 404,954 334,594 739,547 4,357 Minnesota SU, Mankato 4508 History 54.23 277,476 195,260 472,736 5,116 Minnesota SU, Mankato 4510 Political Science/Gov 73.10 317,495 263,187 580,681 4,343 Minnesota SU, Mankato 4511 Sociology 85.73 465,701 308,671 774,372 5,432 Minnesota SU, Mankato 4512 Urban Affairs/Studies 12.50 99,875 45,005 144,879 7,990 Minnesota SU, Mankato 49 Transport/Mat! Mov Wkrs 58.70 246,028 211,341 457,369 4,191 Minnesota SU, Mankato 500408 Interior Design 53.73 70,193 193,460 263,652 1,306 Minnesota SU, Mankato 500501 Drama/Theater Arts, Gen 27.87 168,887 100,330 269,217 6,061 Minnesota SU, Mankato 500701 Art, Gen 109.53 387,107 394,360 781,467 3,534
Page 45
Fully Indirect Allocated
Cost Per Cost Per UD FYE UDFYE
3,159 16,529 3,159 7,278 3,159 8,536 3,159 7,940 3,600 10,544 3,600 8,420 3,600 10,207 3,600 7,496 3,600 13,554 3,600 7,013
-- 3,600 8,091 3,600 8,021 3,600 7,455 3,600 14,845 3,600 11,211 3,600 16,082 3,600 11,625 3,600 7,663 3,600 7,894 3,600 7,542 3,600 6,574 3,600 11, 173 3,600 6,943 3,600 8,081 3,600 11,599 3,600 6,980 3,600 10,138 3,600 62,715 3,600 11,574 3,600 12,458 3,600 7,545 3,600 8,088 3,600 8,371 3,600 9,348 3,600 18,254 3,600 8,941 3,600 7,958 3,600 8,717 3,600 7,944 3,600 9,032 3,600 11,590 3,600 7,792 3,600 4,907 3,600 9,661 3,600 7,135
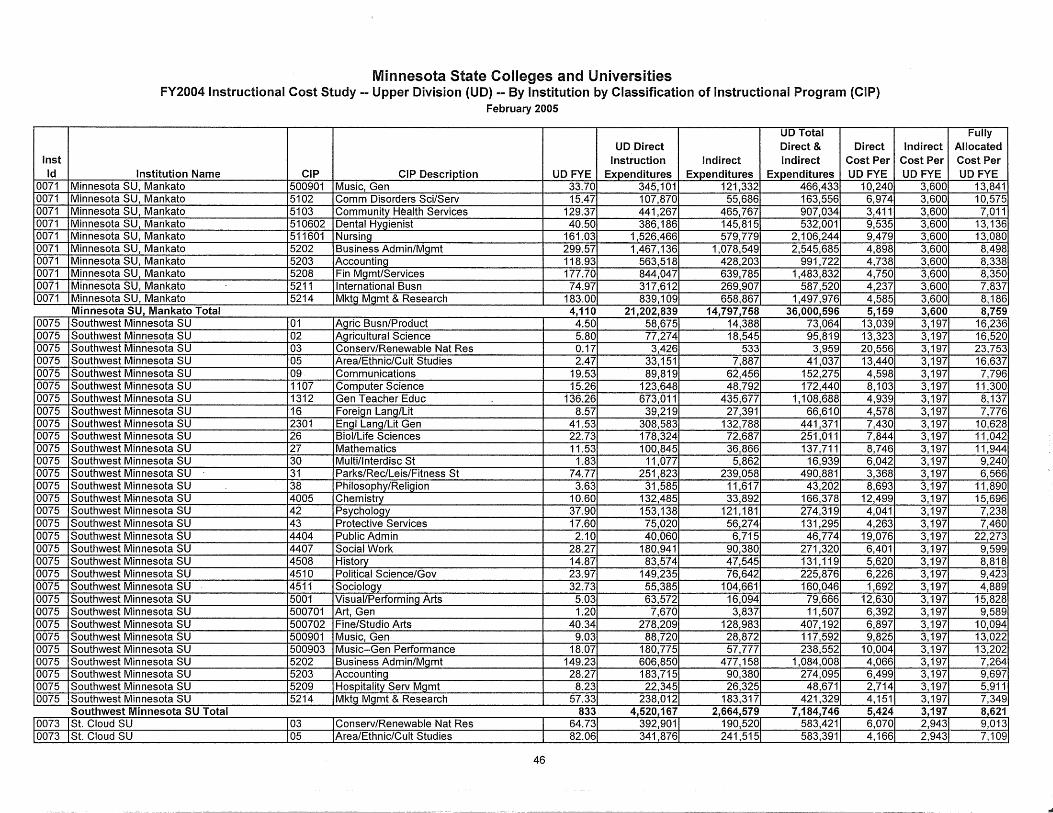
Minnesota State Colleges and Universities FY2004 Instructional Cost Study -- Upper Division (UD) -- By Institution by Classification of Instructional Program (CIP)
February 2005
UD Total UD Direct Direct & Direct
Inst Instruction Indirect Indirect Cost Per Id Institution Name CIP CIP Description UDFYE Expenditures Expenditures Expenditures UDFYE
0071 Minnesota SU, Mankato 500901 Music, Gen 33.70 345, 101 121,332 466,433 10,240 0071 Minnesota SU, Mankato 5102 Comm Disorders Sci/Serv 15.47 107,870 55,686 163,556 6,974 0071 Minnesota SU, Mankato 5103 Community Health Services 129.37 441,267 465,767 907,034 3,411 0071 Minnesota SU, Mankato 510602 Dental Hygienist 40.50 386,186 145,815 532,001 9,535 0071 Minnesota SU, Mankato 511601 Nursing 161.03 1,526,466 579,779 2,106,244 9,479 0071 Minnesota SU, Mankato 5202 Business Admin/Mgmt 299.57 1,467, 136 1,078,549 2,545,685 4,898 0071 Minnesota SU, Mankato 5203 Accounting 118.93 563,518 428,203 991,722 4,738 0071 Minnesota SU, Mankato 5208 Fin Mgmt/Services 177.70 844,047 639,785 1,483,832 4,750 0071 Minnesota SU, Mankato 5211 International Busn 74.97 317,612 269,907 587,520 4,237 0071 Minnesota SU, Mankato 5214 Mktg Momt & Research 183.00 839,109 658,867 1,497,976 4,585
Minnesota SU, Mankato Total 4,110 21,202,839 14,797,758 36,000,596 5,159 0075 Southwest Minnesota SU 01 Agric Busn/Product 4.50 58,675 14,388 73,064 13,039 0075 Southwest Minnesota SU 02 Agricultural Science 5.80 77,274 18,545 95,819 13,323 0075 Southwest Minnesota SU 03 Conserv/Renewable Nat Res 0.17 3,426 533 3,959 20,556 0075 Southwest Minnesota SU 05 Area/Ethnic/Cult Studies 2.47 33, 151 7,887 41,037 13,440 0075 Southwest Minnesota SU 09 Communications 19.53 89,819 62,456 152,275 4,598 0075 Southwest Minnesota SU 1107 Computer Science 15.26 123,648 48,792 172,440 8,103 0075 Southwest Minnesota SU 1312 Gen Teacher Educ 136.26 673,011 435,677 1, 108,688 4,939 0075 Southwest Minnesota SU 16 Foreion Lano/Lit 8.57 39,219 27,391 66,610 4,578 0075 Southwest Minnesota SU 2301 Enol Lano/Lit Gen 41.53 308,583 132,788 441,371 7,430 0075 Southwest Minnesota SU 26 Biol/Life Sciences 22.73 178,324 72,687 251,011 7,844 0075 Southwest Minnesota SU 27 Mathematics 11.53 100,845 36,866 137,711 8,746 0075 Southwest Minnesota SU 30 Multi/lnterdisc St 1.83 11,077 5,862 16,939 6,042 0075 Southwest Minnesota SU 31 Parks/Rec/Leis/Fitness St 74.77 251,823 239,058 490,881 3,368 0075 Southwest Minnesota SU 38 Philosophy/Relioion 3.63 31,585 11,617 43,202 8,693 0075 Southwest Minnesota SU 4005 Chemistry 10.60 132,485 33,892 166,378 12,499 0075 Southwest Minnesota SU 42 Psvcholoov 37.90 153,138 121,181 274,319 4,041 0075 Southwest Minnesota SU 43 Protective Services 17.60 75,020 56,274 131,295 4,263 0075 Southwest Minnesota SU 4404 Public Admin 2.10 40,060 6,715 46,774 19,076 0075 Southwest Minnesota SU 4407 Social Work 28.27 180,941 90,380 271,320 6,401 0075 Southwest Minnesota SU 4508 History 14.87 83,574 47,545 131,119 5,620 0075 Southwest Minnesota SU 4510 Political Science/Gov 23.97 149,235 76,642 225,876 6,226 0075 Southwest Minnesota SU 4511 Socioloov 32.73 55,385 104,661 160,046 1,692 0075 Southwest Minnesota SU 5001 Visual/Performino Arts 5.03 63,572 16,094 79,666 12,630 0075 Southwest Minnesota SU 500701 Art, Gen 1.20 7,670 3,837 11,507 6,392 0075 Southwest Minnesota SU 500702 Fine/Studio Arts 40.34 278,209 128,983 407,192 6,897 0075 Southwest Minnesota SU 500901 Music, Gen 9.03 88,720 28,872 117,592 9,825 0075 Southwest Minnesota SU 500903 Music--Gen Performance 18.07 180,775 57,777 238,552 10,004 0075 Southwest Minnesota SU 5202 Business Admin/Mgmt 149.23 606,850 477,158 1,084,008 4,066 0075 Southwest Minnesota SU 5203 Accounting 28.27 183,715 90,380 274,095 6,499 0075 Southwest Minnesota SU 5209 Hospitality Serv Mgmt 8.23 22,345 26,325 48,671 2,714 0075 Southwest Minnesota SU 5214 Mktg Mgmt & Research 57.33 238,012 183,317 421,329 4,151
Southwest Minnesota SU Total 833 4,520,167 2,664,579 7,184,746 5,424 0073 I St. Cloud SU 03 Conserv/Renewable Nat Res 64.73 392,901 190,520 583,421 6,070 0073 ISt. Cloud SU 05 Area/Ethnic/Cult Studies 82.06 341,876 241,515 583,391 4,166
46
Fully Indirect Allocated
Cost Per Cost Per UDFYE UD FYE
3,600 13,841 3,600 10,575 3,600 7,011 3,600 13, 136 3,600 13,080 3,600 8,498 3,600 8,338 3,600 8,350 3,600 7,837 3,600 8,186 3,600 8,759 3,197 16,236 3,197 16,520 3,197 23,753 3,197 16,637 3,197 7,796 3,197 11,300 3,197 8,137 3,197 7,776 3,197 10,628 3,197 11,042 3,197 11,944 3,197 9,240 3,197 6,566 3,197 11,890 3,197 15,696 3,197 7,238 3,197 7,460 3,197 22,273 3,197 9,599 3,197 8,818 3,197 9,423 3,197 4,889 3,197 15,828 3,197 9,589 3,197 10,094 3,197 13,022 3,197 13,202 3,197 7,264 3,197 9,697 3,197 5,911 3,197 7,349 3,197 8,621 2,943 9,013 2,943 7,109
ad
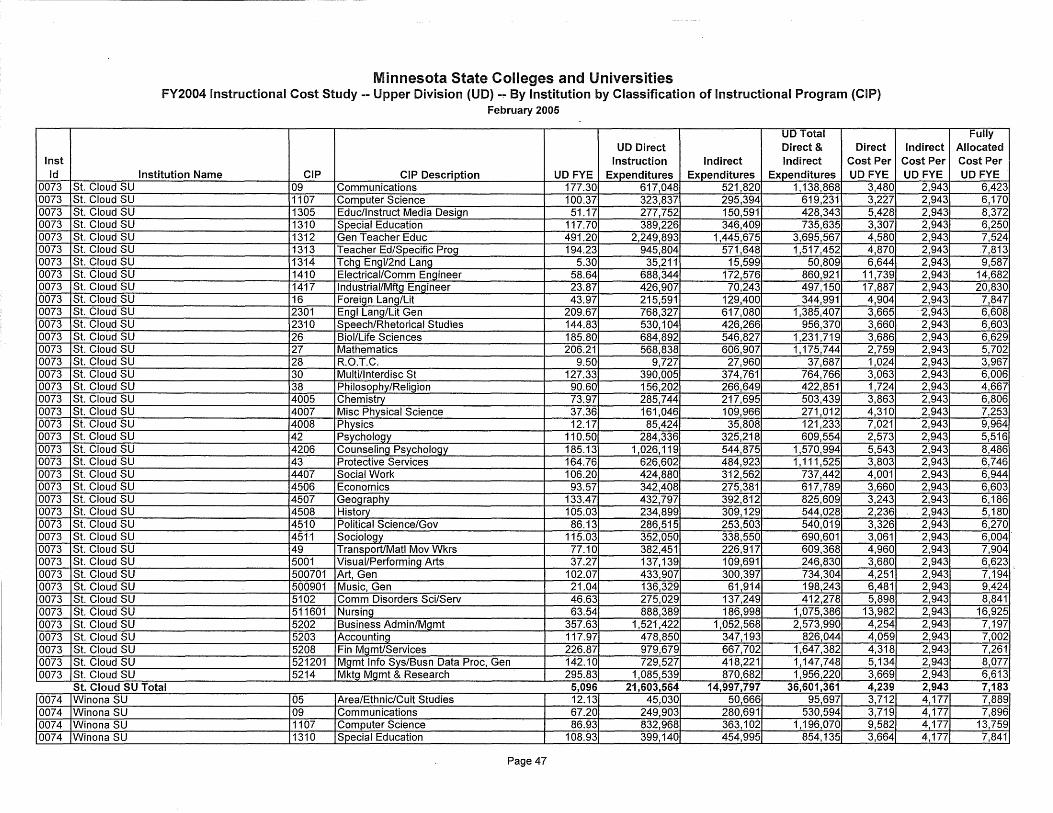
Inst Id
0073 0073 0073 0073 0073 0073 0073 0073 0073 0073 0073 0073 0073 0073 0073 0073 0073 0073 0073 0073 0073 0073 0073 0073 0073 0073 0073 0073 0073 0073 0073 0073 0073 0073 0073 0073 0073 0073 0073 0073
0074 0074 0074 0074
St. Cloud SU St. Cloud SU St. Cloud SU St. Cloud SU St. Cloud SU St. Cloud SU St. Cloud SU St. Cloud SU St. Cloud SU St. Cloud SU St. Cloud SU St. Cloud SU St. Cloud SU St. Cloud SU St. Cloud SU St. Cloud SU St. Cloud SU St. Cloud SU St. Cloud SU St. Cloud SU St. Cloud SU St. Cloud SU St. Cloud SU St. Cloud SU St. Cloud SU St. Cloud SU St. Cloud SU St. Cloud SU St. Cloud SU St. Cloud SU St. Cloud SU St. Cloud SU St. Cloud SU St. Cloud SU St. Cloud SU St. Cloud SU St. Cloud SU St. Cloud SU St. Cloud SU St. Cloud SU
Minnesota State Colleges and Universities FY2004 Instructional Cost Study -- Upper Division (UD) -- By Institution by Classification of Instructional Program (CIP)
February 2005
UD Total UD Direct Direct & Direct
Instruction Indirect Indirect Cost Per Institution Name CIP CIP Description UDFYE Expenditures Expenditures Expenditures UD FYE
09 Communications 177.30 617,048 521,820 1, 138,868 3,480 1107 Computer Science 100.37 323,837 295,394 619,231 3,227 1305 Educ/Instruct Media Desiqn 51.17 277,752 150,591 428,343 5,428 1310 Special Education 117.70 389,226 346,409 735,635 3,307 1312 Gen Teacher Educ 491.20 2,249,893 1,445,675 3,695,567 4,580 1313 Teacher Ed/Specific Proq 194.23 945,804 571,648 1,517,452 4,870 1314 Tcho Enql/2nd Lano 5.30 35,211 15,599 50,809 6,644 1410 Electrical/Comm Engineer 58.64 688,344 172,576 860,921 11,739 1417 lndustrial/Mftq Engineer 23.87 426,907 70,243 497,150 17,887 16 Foreiqn Lang/Lit 43.97 215,591 129,400 344,991 4,904 2301 Enql Lanq/Lit Gen 209.67 768,327 617,080 1,385,407 3,665' 2310 Speech/Rhetorical Studies 144.83 530,104 426,266 956,370 3,660 26 Biol/Life Sciences 185.80 684,892 546,827 1,231,719 3,686 27 Mathematics 206.21 568,838 606,907 1,175,744 2,759 28 R.O.T.C. 9.50 9,727 27,960 37,687 1,024 30 Multi/lnterdisc St 127.33 390,005 374,761 764,766 3,063 38 Philosophy/Reliqion 90.60 156,202 266,649 422,851 1,724 4005 Chemistry 73.97 285,744 217,695 503,439 3,863 4007 Misc Physical Science 37.36 161,046 109,966 271,012 4,310 4008 Physics 12.17 85,424 35,808 121,233 7,021 42 Psychology 110.50 284,336 325,218 609,554 2,573 4206 Counseling Psychology 185.13 1,026, 119 544,875 1,570,994 5,543 43 Protective Services 164.76 626,602 484,923 1,111,525 3,803 4407 Social Work 106.20 424,880 312,562 737,442 4,001 4506 Economics 93.57 342,408 275,381 617,789 3,660 4507 Geography 133.47 432,797 392,812 825,609 3,243 4508 History 105.03 234,899 309,129 544,028 2,236 4510 Political Science/Gov 86.13 286,515 253,503 540,019 3,326 4511 Sociology 115.03 352,050 338,550 690,601 3,061 49 Transport/Mat! Mov Wkrs 77.10 382,451 226,917 609,368 4,960 5001 Visual/Performing Arts 37.27 137,139 109,691 246,830 3,680 500701 Art, Gen 102.07 433,907 300,397 734,304 4,251 500901 Music, Gen 21.04 136,329 61,914 198,243 6,481 5102 Comm Disorders Sci/Serv 46.63 275,029 137,249 412,278 5,898 511601 Nursing 63.54 888,389 186,998 1,075,386 13,982 5202 Business Admin/Momt 357.63 1,521,422 1,052,568 2,573,990 4,254 5203 Accounting 117.97 478,850 347,193 826,044 4,059 5208 Fin Mgmt/Services 226.87 979,679 667,702 1,647,382 4,318 521201 Mgmt Info Sys/Busn Data Proc, Gen 142.10 729,527 418,221 1, 147,748 5,134 5214 Mktg Mgmt & Research 295.83 1,085,539 870,682 1,956,220 3,669
St. Cloud SU Total 5,096 21,603,564 14,997,797 36,601,361 4,239 Winona SU 05 Area/Ethnic/Cult Studies 12.13 45,030 50,666 95,697 3,712 Winona SU 09 Communications 67.20 249,903 280,691 530,594 3,719 Winona SU 1107 Computer Science 86.93 832,968 363,102 1, 196,070 9,582 Winona SU 1310 Special Education 108.93 399, 140 454,995 854,135 3,664
Page 47
Fully Indirect Allocated
Cost Per Cost Per UD FYE UD FYE
2,943 6,423 2,943 6,170 2,943 8,372 2,943 6,250 2,943 7,524 2,943 7,813 2,943 9,587 2,943 14,682 2,943 20,830 2,943 7,847
·2,943 6,608 2,943 6,603 2,943 6,629 2,943 5,702 2,943 3,967 2,943 6,006 2,943 4,667 2,943 6,806 2,943 7,253 2,943 9,964 2,943 5,516 2,943 8,486 2,943 6,746 2,943 6,944 2,943 6,603 2,943 6,186 2,943 5,180 2,943 6,270 2,943 6,004' 2,943 7,904 2,943 6,623 2,943 7,194 2,943 9,424 2,943 8,841 2,943 16,925 2,943 7,197 2,943 7,002 2,943 7,261 2,943 8,077 2,943 6,613 2,943 7,183 4,177 7,889 4,177 7,896 4,177 13,759 4,177 7,841
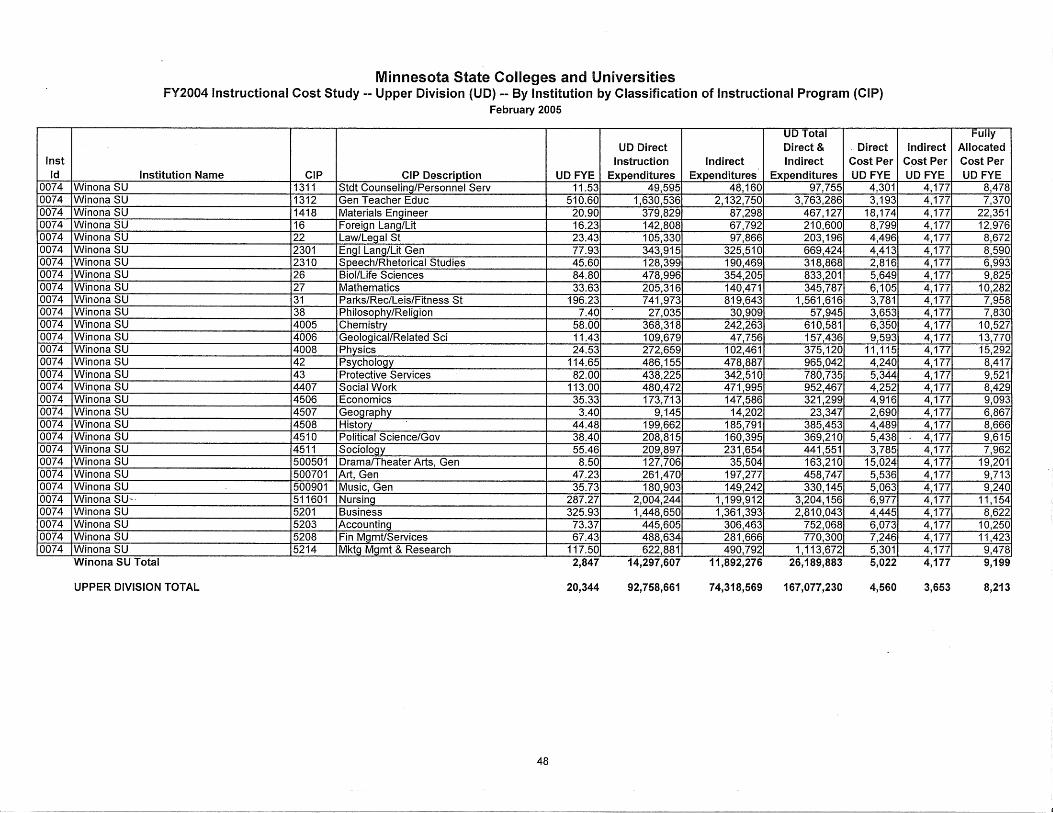
Inst Id
0074 0074 0074 0074 .0074 0074 0074 0074 0074 0074 0074 0074 0074 0074 0074 0074 0074 0074 0074 0074 0074 0074 0074 0074 0074 0074 0074 0074 0074 0074
Minnesota State Colleges and Universities FY2004 Instructional Cost Study -- Upper Division (UD) -- By Institution by Classification of Instructional Program (CIP)
February 2005
UD Total UD Direct Direct & . Direct
Instruction Indirect Indirect Cost Per Institution Name CIP CIP Description UDFYE Expenditures Expenditures Expenditures UD FYE
Winona SU 1311 Stdt Counseling/Personnel Serv 11.53 49,595 48, 160 97,755 4,301 Winona SU 1312 Gen Teacher Educ 510.60 1,630,536 2,132,750 3,763,286 3,193 Winona SU 1418 Materials Engineer 20.90 379,829 87,298 467, 127 18,174 Winona SU 16 Foreign Lang/Lit 16.23 142,808 67,792 210,600 8,799 Winona SU 22 Law/Legal St 23.43 105,330 97,866 203,196 4,496 Winona SU 2301 Engl Lang/Lit Gen 77.93 343,915 325,510 669,424 4,413 Winona SU 2310 Speech/Rhetorical Studies 45.60 128,399 190,469 318,868 2,816 Winona SU 26 Biol/Life Sciences 84.80 478,996 354,205 833,201 5,649 Winona SU 27 Mathematics 33.63 205,316 140,471 345,787 6,105 Winona SU 31 Parks/Rec/Leis/Fitness St 196.23 741,973 819,643 1,561,616 3,781 Winona SU 38 Philosophy/Religion 7.40 27,035 30,909 57,945 3,653 Winona SU 4005 Chemistry 58.00 368,318 242,263 610,581 6,350 Winona SU 4006 Geological/Related Sci 11.43 109,679 47,756 157,436 9,593 Winona SU 4008 Physics 24.53 272,659 102,461 375,120 11,115 Winona SU 42 Psychology 114.65 486,155 478,887 965,042 4,240 Winona SU 43 Protective Services 82.00 438,225 342,510 780,735 5,344 Win9na SU 4407 Social Work 113.00 480,472 471,995 952,467 4,252 Winona SU 4506 Economics 35.33 173,713 147,586 321,299 4,916 Winona SU 4507 Geography 3.40 9,145 14,202 23,347 2,690 Winona SU 4508 History 44.48 199,662 185,791 385,453 4,489 Winona SU 4510 Political Science/Gov 38.40 208,815 160,395 369,210 5,438 Winona SU 4511 Sociology 55.46 209,897 231,654 441,551 3,785 Winona SU 500501 Drama/Theater Arts, Gen 8.50 127,706 35,504 163,210 15,024 Winona SU 500701 Art, Gen 47.23 261,470 197,277 458,747 5,536 Winona SU 500901 Music, Gen 35.73 180,903 149,242 330,145 5,063 Winona SU-· 511601 Nursing 287.27 2,004,244 1,199,912 3,204,156 6,977 Winona SU 5201 Business 325.93 1,448,650 1,361,393 2,810,043 4,445 Winona SU 5203 Accounting 73.37 445,605 306,463 752,068 6,073 Winona SU 5208 Fin Mgmt/Services 67.43 488,634 281,666 770,300 7,246 Winona SU 5214 Mktg Mgmt & Research 117.50 622,881 490,792 1,113,672 5,301 Winona SU Total 2,847 14,297,607 11,892,276 26, 189,883 5,022
UPPER DIVISION TOTAL 20,344 92,758,661 74,318,569 167,077,230 4,560
48
Fully Indirect Allocated
Cost Per Cost Per UDFYE UD FYE
4,177 8,478 4,177 7,370 4,177 22,351 4,177 12,976 4,177 8,672 4,177 8,590 4,177 6,993 4,177 9,825 4,177 10,282 4,177 7,958 4,177 7,830 4,177 10,527 4,177 13,770 4,177 15,292 4,177 8,417 4,177 9,521 4,177 8,429 4,177 9,093 4,177 6,867 4,177 8,666 4,177 9,615 4,177 7,962 4,177 19,201 4,177 9,713 4,177 9,240 4,177 11,154 4,177 8,622 4,177 10,250 4,177 11,423 4,177 9,478 4,177 9,199
3,653 8,213
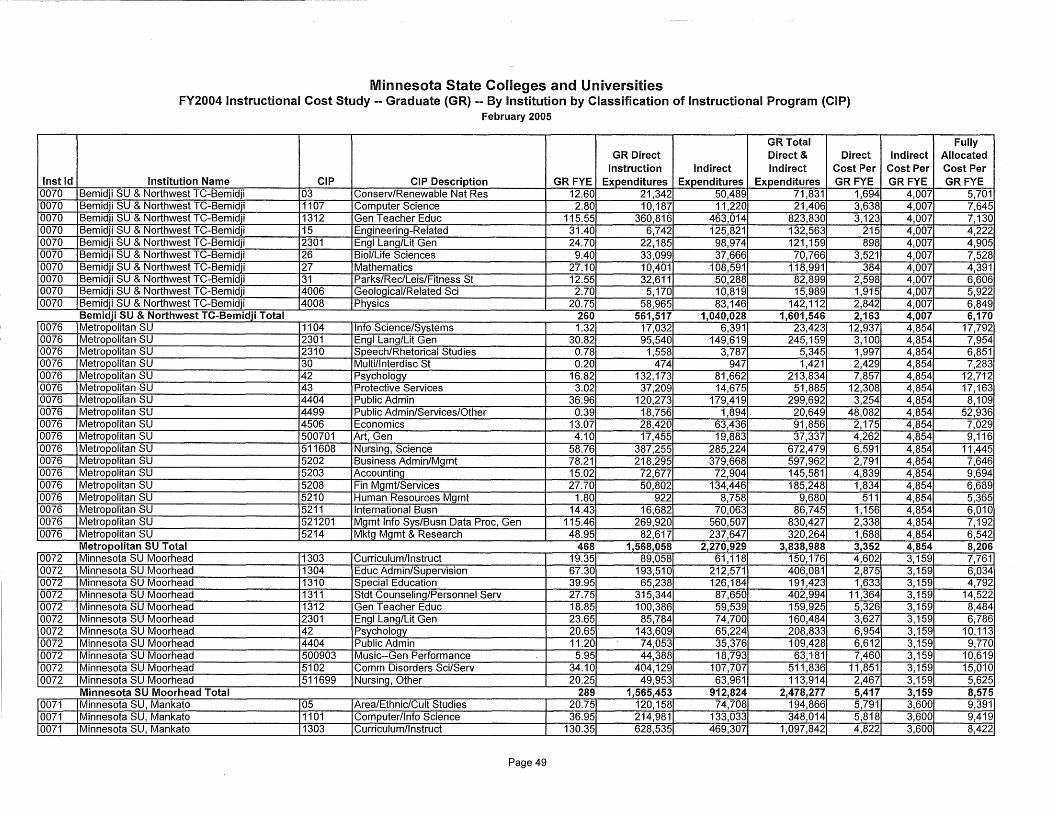
r ~
Minnesota State Colleges and Universities FY2004 Instructional Cost Study -- Graduate (GR) -- By Institution by Classification of Instructional Program (CIP)
February 2005
GR Total GR Direct Direct & Direct
Instruction Indirect Indirect Cost Per Inst Id Institution Name CIP CIP Description GR FYE Expenditures Expenditures Expenditures GR FYE
0070 Bemidji SU & Northwest TC-Bemidji 03 Conserv/Renewable Nat Res 12.60 21,342 50,489 71,831 1,694 0070 Bemidji SU & Northwest TC-Bemidji 1107 Computer Science 2.80 10,187 11,220 21,406 3,638 0070 Bemidji SU & Northwest TC-Bemidji 1312 Gen Teacher Educ 115.55 360,816 463,014 823,830 3,123 0070 Bemidji SU & Northwest TC-Bemidji 15 Engineering-Related 31.40 6,742 125,821 132,563 215 0070 Bemidji SU & Northwest TC-Bemidji 2301 Engl Lang/Lit Gen 24.70 22,185 98,974 121, 159 898 0070 Bemidji SU & Northwest TC-Bemidji 26 Biol/Life Sciences 9.40 33,099 37,666 70,766 3,521 0070 Bemidji SU & Northwest TC-Bemidji 27 Mathematics 27.10 10,401 -108,591 118,991 384 0070 Bemidji SU & Northwest TC-Bemidji 31 Parks/Rec/leis/Fitness St 12.55 32,611 50,288 82,899 2,598 0070 Bemidji SU & Northwest TC-Bemidji 4006 Geological/Related Sci 2.70 5,170 10,819 15,989 1,915 0070 Bemidji SU & Northwest TC-Bemidji 4008 Physics 20.75 58,965 83,146 142,112 2,842
Bemidji SU & Northwest TC-Bemidji Total 260 561,517 1,040,028 1,601,546 2,163 0076 Metropolitan SU 1104 Info Science/Systems 1.32 17,032 6,391 23,423 12,937 0076 Metropolitan SU 2301 Engl Lang/Lit Gen 30.82 95,540 149,619 245,159 3,100 0076 Metropolitan SU 2310 Speech/Rhetorical Studies 0.78 1,558 3,787 5,345 1,997 0076 Metropolitan SU 30 Multi/lnterdisc St 0.20 474 947 1,421 2,429 0076 Metropolitan SU 42 Psychology 16.82 132,173 81,662 213,834 7,857 0076 Metropolitan SU 43 Protective Services 3.02 37,209 14,675 51,885 12,308 0076 Metropolitan SU 4404 PublicAdmin 36.96 120,273 179,419 299,692 3,254 0076 Metropolitan SU 4499 Public Admin/Services/Other 0.39 18,756 1,894. 20,649 48,082 0076 Metropolitan SU 4506 Economics 13.07 28,420 63,436 91,856 2,175 0076 Metropolitan SU 500701 Art, Gen 4.10 17,455 19,883 37,337 4,262 0076 Metropolitan SU 511608 Nursing, Science 58.76 387,255 285,224 672,479 6,591 0076 Metropolitan SU 5202 Business Admin/Mgmt 78.21 218,295 379,668 597,962 2,791 0076 Metropolitan SU 5203 Accounting 15.02 72,677 72,904 145,581 4,839 0076 Metropolitan SU 5208 Fin Mgmt/Services 27.70 50,802 134,446 185,248 1,834 0076 Metropolitan SU 5210 Human Resources Mgmt 1.80 922 8,758 9,680 511 0076 Metropolitan SU 5211 International Busn 14.43 16,682 70,063 86,745 1,156 0076 Metropolitan SU 521201 Mgmt Info Sys/Busn Data Proc, Gen 115.46 269,920 560,507 830,427 2,338 0076 Metropolitan SU 5214 Mktg Mgmt & Research 48.95 82,617 237,647 320,264 1,688
Metropolitan SU Total 468 1,568,058 2,270,929 3,838,988 3,352 0072 Minnesota SU Moorhead 1303 Curriculum/Instruct 19.35 89,058 61, 118 150,176 4,602 0072 Minnesota SU Moorhead 1304 Educ Admin/Supervision 67.30 193,510 212,571 406,081 2,875 0072 Minnesota SU Moorhead 1310 Special Education 39.95 65,238 126,184 191,423 1,633 0072 Minnesota SU Moorhead 1311 Stdt Counseling/Personnel Serv 27.75 315,344 87,650 402,994 11,364 0072 Minnesota SU Moorhead 1312 Gen Teacher Educ 18.85 100,386 59,539 159,925 5,326 0072 Minnesota SU Moorhead 2301 Engl Lang/Lit Gen 23.65 85,784 74,700 160,484 3,627 0072 Minnesota SU Moorhead 42 Psychology 20.65 143,609 65,224 208,833 6,954 0072 Minnesota SU Moorhead 4404 PublicAdmin 11.20 74,053 35,376 109,428 6,612 0072 Minnesota SU Moorhead 500903 Music--Gen Performance 5.95 44,388 18,793 63,181 7,460 0072 Minnesota SU Moorhead 5102 Comm Disorders Sci/Serv 34.10 404,129 107,707 511,836 11,851 0072 Minnesota SU Moorhead 511699 Nursing, Other 20.25 49,953 63,961 113,914 2,467
Minnesota SU Moorhead Total 289 1,565,453 912,824 2,478,277 5,417 0071 !Minnesota SU, Mankato 05 Area/Ethnic/Cult Studies 20.75 120,158 74,708 194,866 5,791 0071 !Minnesota SU, Mankato 1101 Computer/Info Science 36.95 214,981 133,033 348,014 5,818 0071 !Minnesota SU, Mankato 1303 Curriculum/Instruct 130.35 628,535 469,307 1,097,842 4,822
Page 49
Fully Indirect Allocated
Cost Per Cost Per GR FYE GR FYE
4,007 5,701 4,007 7,645 4,007 7,130 4,007 4,222 4,007 4,905 4,007 7,528 4,007 4,391 4,007 6,606 4,007 5,922 4,007 6,849 4,007 6,170 4,854 17,792 4,854 7,954 4,854 6,851 4,854 7,283 4,854 12,712 4,854 17,163 4,854 8,109 4,854 52,936 4,854 7,029 4,854 9, 116 4,854 11,445 4,854 7,646 4,854 9,694 4,854 6,689 4,854 5,365 4,854 6,010 4,854 7,192 4,854 6,542 4,854 8,206 3,159 7,761 3,159 6,034 3,159 4,792 3,159 14,522 3,159 8,484 3,159 6,786 3,159 10, 113 3,159 9,770 3,159 10,619 3,159 15,010 3,159 5,625 3,159 8,575 3,600 9,391 3,600 9,419 3,600 8,422
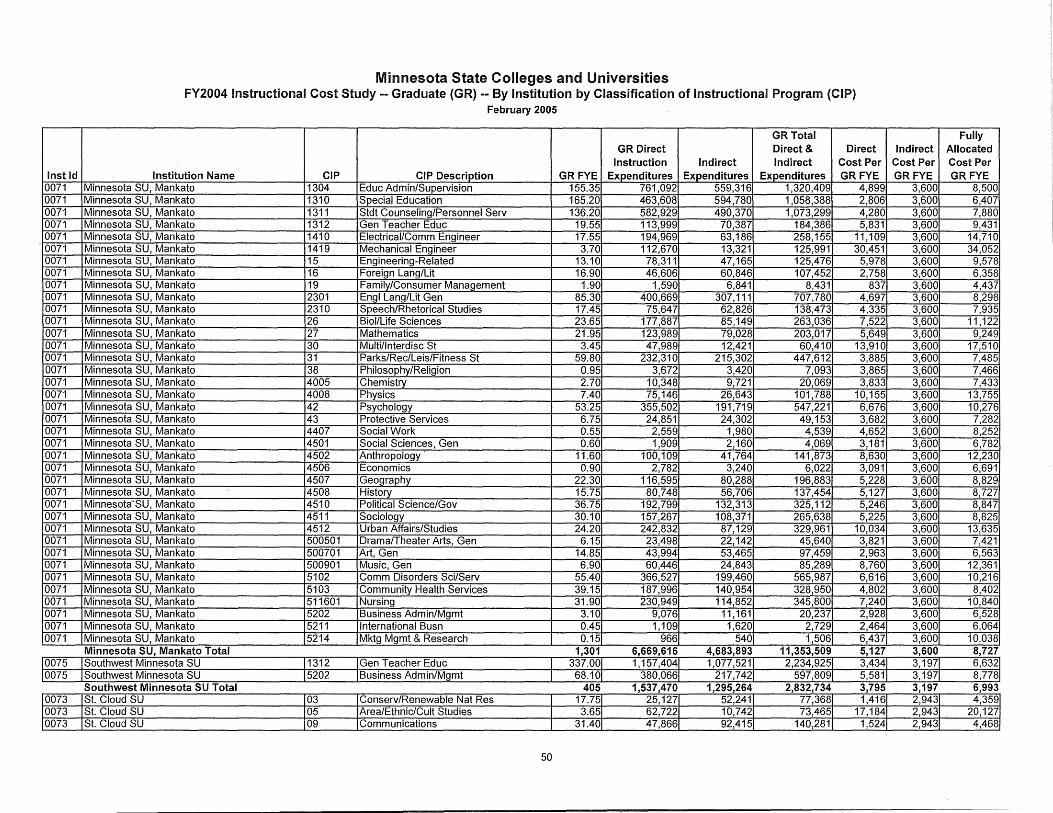
Inst Id 0071 0071 0071 0071 0071 0071 0071 0071 0071 0071 0071 0071 0071 0071 0071 0071 0071 0071 0071 0071 0071 0071 0071 0071 0071 0071 0071 0071 0071 0071 0071 0071 0071 0071 0071 0071 0071 0071
0075 0075
0073 0073 0073
Minnesota State Colleges and Universities FY2004 Instructional Cost Study -- Graduate (GR) -- By Institution by Classification of Instructional Program (CIP)
February 2005
GR Total GR Direct Direct & Direct
Instruction Indirect Indirect Cost Per Institution Name CIP CIP Description GR FYE Expenditures Expenditures Expenditures GR FYE
Minnesota SU, Mankato 1304 Educ Admin/Supervision 155.35 761,092 559,316 1,320,409 4,899 Minnesota SU, Mankato 1310 Special Education 165.20 463,608 594,780 1,058,388 2,806 Minnesota SU, Mankato 1311 Stdt Counseling/Personnel Serv 136.20 582,929 490,370 1,073,299 4,280 Minnesota SU, Mankato 1312 Gen Teacher Educ 19.55 113,999 70,387 184,386 5,831 Minnesota SU, Mankato 1410 Electrical/Comm Engineer 17.55 194,969 63,186 258,155 11, 109 Minnesota SU, Mankato 1419 Mechanical Engineer 3.70 112,670 13,321 125,991 30,451 Minnesota SU, Mankato 15 Engineering-Related 13.10 78,311 47,165 125,476 5,978 Minnesota SU, Mankato 16 Foreign Lang/Lit 16.90 46,606 60,846 107,452 2,758 Minnesota SU, Mankato 19 Family/Consumer Management 1.90 1,590 6,841 8,431 837 Minnesota SU, Mankato 2301 Engl Lang/Lit Gen 85.30 400,669 307, 111 707,780 4,697 Minnesota SU, Mankato 2310 Speech/Rhetorical Studies 17.45 75,647 62,826 138,473 4,335 Minnesota SU, Mankato 26 Biol/Life Sciences 23.65 177,887 85,149 263,036 7,522 Minnesota SU, Mankato 27 Mathematics 21.95 123,989 79,028 203,017 5,649 Minnesota SU, Mankato 30 Multi/lnterdisc St 3.45 47,989 12,421 60,410 13,910 Minnesota SU, Mankato 31 Parks/Rec/leis/Fitness St 59.80 232,310 215,302 447,612 3,885 Minnesota SU, Mankato 38 Philosophy/Religion 0.95 3,672 3,420 7,093 3,865 Minnesota SU, Mankato 4005 Chemistry 2.70 10,348 9,721 20,069 3,833 Minnesota SU, Mankato 4008 Physics 7.40 75,146 26,643 101,788 10, 155 Minnesota SU, Mankato 42 Psychology 53.25 355,502 191,719 547,221 6,676 Minnesota SU, Mankato 43 Protective Services 6.75 24,851 24,302 49,153 3,682 Minnesota SU, Mankato 4407 Social Work 0.55 2,559 1,980 4,539 4,652 Minnesota SU, Mankato 4501 Social Sciences, Gen 0.60 1,909 2,160 4,069 3,181 Minnesota SU, Mankato 4502 Anthropology 11.60 100, 109 41,764 141,873 8,630 Minnesota SU, Mankato 4506 Economics 0.90 2,782 3,240 6,022 3,091 Minnesota SU, Mankato 4507 Geography 22.30 116,595 80,288 196,883 5,228 Minnesota SU, Mankato 4508 History 15.75 80,748 56,706 137,454 5,127 Minnesota-SU, Mankato 4510 Political Science/Gov 36.75 192,799 132,313 325, 112 5,246 Minnesota SU, Mankato 4511 Sociology 30.10 157,267 108,371 265,638 5,225 Minnesota SU, Mankato 4512 Urban Affairs/Studies 24.20 242,832 87,129 329,961 10,034 Minnesota SU, Mankato 500501 Drama/Theater Arts, Gen 6.15 23,498 22,142 45,640 3,821 Minnesota SU, Mankato 500701 Art, Gen 14.85 43,994 53,465 97,459 2,963 Minnesota SU, Mankato 500901 Music, Gen 6.90 60,446 24,843 85,289 8,760 Minnesota SU, Mankato 5102 Comm Disorders Sci/Serv 55.40 366,527 199,460 565,987 6,616 Minnesota SU, Mankato 5103 Community Health Services 39.15 187,996 140,954 328,950 4,802 Minnesota SU, Mankato 511601 Nursing 31.90 230,949 114,852 345,800 7,240 Minnesota SU, Mankato 5202 Business Admin/Mgmt 3.10 9,076 11,161 20,237 2,928 Minnesota SU, Mankato 5211 International Busn 0.45 1, 109 1,620 2,729 2,464 Minnesota SU, Mankato 5214 Mktg Mgmt & Research 0.15 966 540 1,506 6,437 Minnesota SU, Mankato Total 1,301 6,669,616 4,683,893 11,353,509 5,127 Southwest Minnesota SU 1312 Gen Teacher Educ 337.00 1, 157,404 1,077,521 2,234,925 3,434 Southwest Minnesota SU 5202 Business Admin/Mgmt 68.10 380,066 217,742 597,809 5,581 Southwest Minnesota SU Total 405 1,537,470 1,295,264 2,832,734 3,795 St. Cloud SU 03 Conserv/Renewable Nat Res 17.75 25,127 52,241 77,368 1,416 St. Cloud SU 05 Area/Ethnic/Cult Studies 3.65 62,722 10,742 73,465 17,184 St. Cloud SU 09 Communications 31.40 47,866 92,415 140,281 1,524
50
Fully Indirect Allocated
Cost Per Cost Per GR FYE GR FYE
3,600 8,500 3,600 6,407 3,600 7,880 3,600 9,431 3,600 14,710 3,600 34,052 3,600 9,578 3,600 6,358 3,600 4,437 3,600 8,298 3,600 7,935 3,600 11,122 3,600 9,249 3,600 17,510 3,600 7,485 3,600 7,466 3,600 7,433 3,600 13,755 3,600 10,276 3,600 7,282 3,600 8,252 3,600 6,782 3,600 12,230 3,600 . 6,691 3,600 8,829 3,600 8,727 3,600 8,847 3,600 8,825 3,600 13,635 3,600 7,421 3,600 6,563 3,600 12,361 3,600 10,216 3,600 8,402 3,600 10,840 3,600 6,528 3,600 6,064 3,600 10,038 3,600 8,727 3,197 6,632 3,197 8,778 3,197 6,993 2,943 4,359 2,943 20,127 2,943 4,468
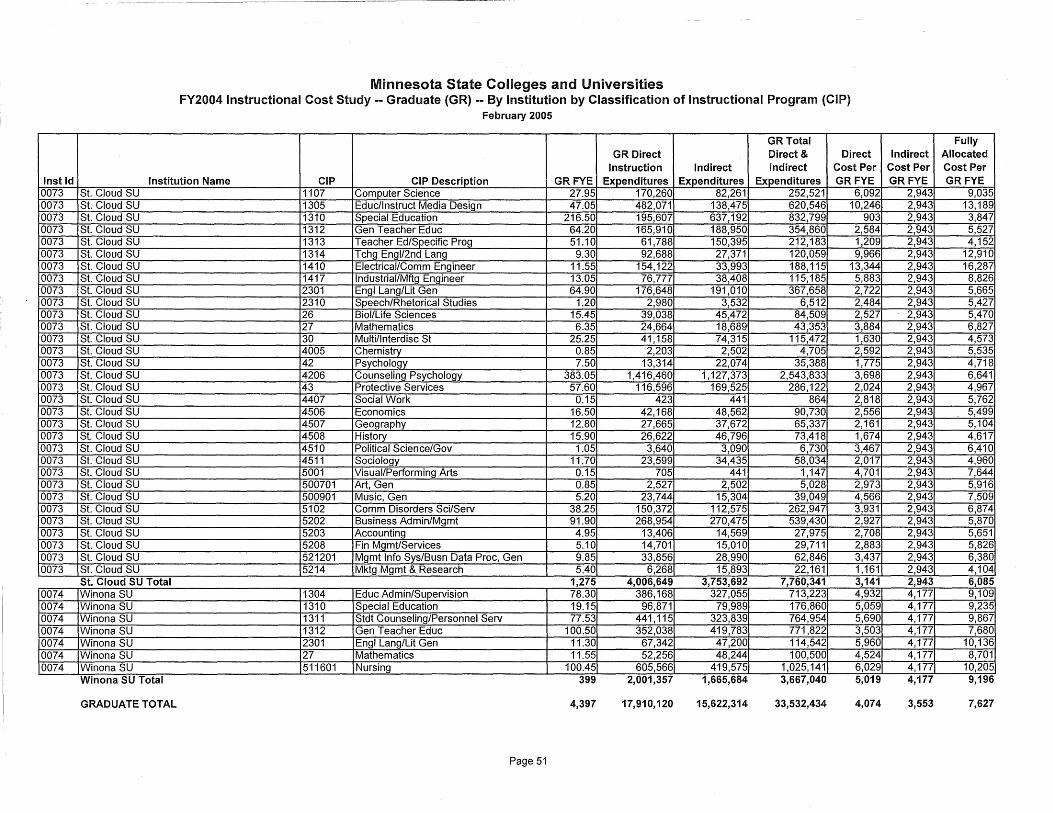
Inst Id 0073 0073 0073 0073 0073 0073 0073 0073 0073 0073 0073 0073 0073 0073 0073 0073 0073 0073 0073 0073 0073 0073 0073 0073 0073 0073 0073 0073 0073 0073 0073 0073
0074 0074 0074 0074 0074 0074 0074
Minnesota State Colleges and Universities FY2004 Instructional Cost Study -- Graduate (GR) -- By Institution by Classification of Instructional Program (CIP)
February 2005
GR Total GR Direct Direct & Direct
Instruction Indirect Indirect Cost Per Institution Name CIP CIP Description GR FYE Expenditures Expenditures Expenditures GR FYE
St. Cloud SU 1107 Computer Science 27.95 St. Cloud SU 1305 Educ/Instruct Media Design 47.05 St. Cloud SU 1310 Special Education 216.50 St. Cloud SU 1312 Gen Teacher Educ 64.20 St. Cloud SU 1313 Teacher Ed/Specific Prog 51.10 St. Cloud SU 1314 Tchg Engl/2nd Lang 9.30 St. Cloud SU 1410 Electrical/Comm Engineer 11.55 St. Cloud SU 1417 lndustrial/Mftg Engineer 13.05 St. Cloud SU 2301 Engl Lang/Lit Gen 64.90 St. Cloud SU 2310 Speech/Rhetorical Studies 1.20 St. Cloud SU 26 Biol/Life Sciences 15.45 St. Cloud SU 27 Mathematics 6.35 St. Cloud SU 30 Multi/lnterdisc St 25.25 St. Cloud SU 4005 Chemistry 0.85 St. Cloud SU 42 Psychology 7.50 St. Cloud SU 4206 Counseling Psychology 383.05 St. Cloud SU 43 Protective Services 57.60 St. Cloud SU 4407 Social Work 0.15 St. Cloud SU 4506 Economics 16.50 St. Cloud SU 4507 Geography 12.80 St. Cloud SU 4508 History 15.90 St. Cloud SU 4510 Political Science/Gov 1.05 St. Cloud SU 4511 Sociology 11.70 St. Cloud SU 5001 Visual/Performing Arts 0.15 St. Cloud SU 500701 Art, Gen 0.85 St. Cloud SU 500901 Music, Gen 5.20 St. Cloud SU 5102 Comm Disorders Sci/Serv 38.25 St. Cloud SU 5202 Business Admin/Mgmt 91.90 St. Cloud SU 5203 Accounting 4.95 St. Cloud SU 5208 Fin Mgmt/Services 5.10 St. Cloud SU 521201 Mgmt Info Sys/Busn Data Proc, Gen 9.85 St. Cloud SU 5214 Mktg Mgmt & Research 5.40 St. Cloud SU Total 1,275 Winona SU 1304 Educ Admin/Supervision 78.30 Winona SU 1310 Special Education 19.15 Winona SU 1311 Stdt Counseling/Personnel Serv 77.53 Winona SU 1312 Gen Teacher Educ 100.50 Winona SU 2301 Engl Lang/Lit Gen 11.30 Winona SU 27 Mathematics 11.55 Winona SU 511601 Nursing 100.45 Winona SU Total 399
GRADUATE TOTAL 4,397
Page 51
170,260 482,071 195,607 165,910 61,788 92,688
154, 122 76,777
176,648 2,980
39,038 24,664 41 ,158
2,203 13,314
1,416,460 116,596
423 42,168 27,665 26,622
3,640 23,599
705 2,527
23,744 150,372 268,954
13,406 14,701 33,856
6,268 4,006,649
386,168 96,871
441,115 352,038
67,342 52,256
605,566 2,001,357
17,910,120
82,261 138,475 637,192 188,950 150,395 27,371 33,993 38,408
191,010 3,532
45,472 18,689 74,315
2,502 22,074
1f127,373 169,525
441 48,562 37,672 46,796
3,090 34,435
441 2,502
15,304 112,575 270,475
14,569 15,010 28,990 15,893
3,753,692 327,055
79,989 323,839 419,783
47,200 48,244
419,575 1,665,684
15,622,314
252,521 620,546 832,799 354,860 212,183 120,059 188, 115 115,185 367,658
6,512 84,509 43,353
115,472 4,705
35,388 2,543,833
286,122 864
90,730 65,337 73,418 6,730
58,034 1,147 5,028
39,049 262,947 539,430
27,975 29,711 62,846 22,161
7,760,341 713,223 176,860 764,954 771 ,822 114,542 100,500
1,025,141 3,667,040
33,532,434
6,092 10,246
903 2,584 1,209 9,966
13,344 5,883 2,722 2,484 2,527 3,884 1,630 2,592 1,775 3,698 2,024 2,818 2,556 2,161 1,674 3,467 2,017 4,701 2,973 4,566 3,931 2,927 2,708 2,883 3,437 1 ,161 3,141 4,932 5,059 5,690 3,503 5,960 4,524 6,029 5,019
4,074
Indirect Cost Per GR FYE
2,943 2,943 2,943 2,943 2,943 2,943 2,943 2,943 2,943 2,943 2,943
. 2,943 2,943 2,943 2,943 2,943 2,943 2,943 2,943 2,943 2,943 2,943 2,943 2,943 2,943 2,943 2,943 2,943 2,943 2,943 2,943 2,943 2,943 4,177 4,177 4,177 4,177 4,177 4,177 4,177 4,177
3,553
Fully Allocated Cost Per GR FYE
9,035 13, 189 3,847 5,527 4,152
12,910 16,287 8,826 5,665 5,427 5,470 6,827 4,573 5,535 4,718 6,641 4,967 5,762 5,499 5,104 4,617 6,410 4,960 7,644 5,916 7,509 6,874 5,870 5,651 5,826 6,380 4,104 6,085 9,109 9,235 9,867 7,680
10,136 8,701
10,205 9,196
7,627

System-Level Accountability Framework:
Report to the Legislature February 15, 2005
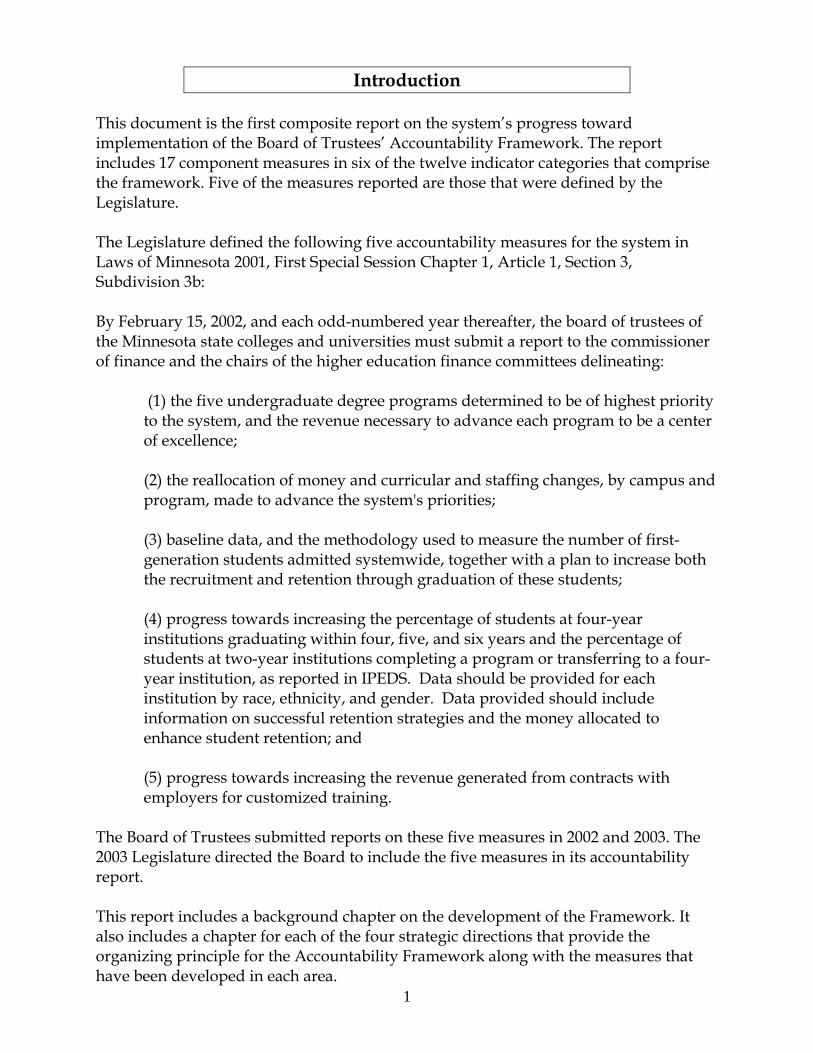
1
Introduction This document is the first composite report on the system’s progress toward implementation of the Board of Trustees’ Accountability Framework. The report includes 17 component measures in six of the twelve indicator categories that comprise the framework. Five of the measures reported are those that were defined by the Legislature. The Legislature defined the following five accountability measures for the system in Laws of Minnesota 2001, First Special Session Chapter 1, Article 1, Section 3, Subdivision 3b: By February 15, 2002, and each odd-numbered year thereafter, the board of trustees of the Minnesota state colleges and universities must submit a report to the commissioner of finance and the chairs of the higher education finance committees delineating:
(1) the five undergraduate degree programs determined to be of highest priority to the system, and the revenue necessary to advance each program to be a center of excellence; (2) the reallocation of money and curricular and staffing changes, by campus and program, made to advance the system's priorities; (3) baseline data, and the methodology used to measure the number of first-generation students admitted systemwide, together with a plan to increase both the recruitment and retention through graduation of these students; (4) progress towards increasing the percentage of students at four-year institutions graduating within four, five, and six years and the percentage of students at two-year institutions completing a program or transferring to a four-year institution, as reported in IPEDS. Data should be provided for each institution by race, ethnicity, and gender. Data provided should include information on successful retention strategies and the money allocated to enhance student retention; and (5) progress towards increasing the revenue generated from contracts with employers for customized training.
The Board of Trustees submitted reports on these five measures in 2002 and 2003. The 2003 Legislature directed the Board to include the five measures in its accountability report. This report includes a background chapter on the development of the Framework. It also includes a chapter for each of the four strategic directions that provide the organizing principle for the Accountability Framework along with the measures that have been developed in each area.
2
Background on the Framework The Board of Trustees of Minnesota State Colleges and Universities is responsible for balancing the various and sometimes competing interests of system stakeholders. Accordingly, the board is uniquely positioned to provide a comprehensive vantage point for serving the information needs that stakeholders have about system performance. Accordingly, the board adopted a system-level accountability framework1 in June of 2003. The purpose of the accountability framework is as follows:
Emanating from the system mission and vision, the purpose of the system-level accountability framework is to inform stakeholders and enable the Board of Trustees to evaluate system performance and direct strategic improvements by aligning (1) planning assumptions and scans of higher education’s external environment, (2) assessments of the system’s progress on strategic directions and goals relative to benchmarks, targets, and stakeholder satisfaction and (3) assurances that the system meets expectations of statutes, laws, policies, and ethical standards,
The “Assumptions” and “Assessment” components of the purpose were developed from standard principles of strategic planning and are concerned with performance outcomes. These two components of the scorecard are intended to place performance issues at the foreground of the board’s attention. The “Assurances” component of the purpose is concerned with process issues that are not governance responsibilities, but that the board has delegated to management. It is intended to bring only exceptions to the board’s attention. If the board has assurance about management carrying out its responsibilities properly, then it is able to focus primary attention on matters of governance and strategic importance. ASSUMPTIONS: Strategy Alignment with External Environment The “Assumptions” component focuses on the external environment that is outside of the direct control of the system. It illustrates whether existing strategies remain aligned with the macro-environmental (demographics, economics, government, and technology) and competitive forces that influence the system. In essence this component addresses the question, “Does the system have the right strategies in place to address threats and opportunities presented by the external environment?” It has an external focus for judging performance. When environmental conditions change significantly and deviate from planning assumptions, strategies must be reconsidered.
1 A cross-functional task force of system employees designed the framework. The design was influenced by the work of Dr. David Norton and Dr. Robert Kaplan, creators of the “balanced scorecard” concept, Dr. John Carver, creator of the “Policy Governance” concept, and Dr. Robert Behn, author of Rethinking Democratic Accountability.
3
ASSESSMENTS: Progress toward Strategic Directions The “Assessments” component showcases the system’s strategic plan and the critical priorities of the annual work plan. In essence the indicators in this component address the question, “Is the system making sufficient progress toward its strategic directions?” This component has an internal focus for judging performance. It may use internal benchmarks and targets as a basis for determining whether expectations are being met, but professional judgment is also required. This component is the heart of the scorecard. It is organized according to the four strategic directions contained in the system strategic plan. Twelve composite indicators have been created to assist with developing common expectations for the adequacy of progress toward implementing the strategic plan. Indicators were developed by asking the question, “How will we know if a strategic direction is being attained?” Each indicator is a composite in that it is supported by one or more core measures of quantifiable data, e.g., participation rates, retention, graduate related employment rates. The five legislative accountability measures have been integrated into the appropriate indicator categories. The objective data must be interpreted and complemented with the judgment of system leadership to assess the sufficiency of progress. ASSURANCES: Meeting Legal & Policy Expectations The assurances component of the scorecard is intended to have a much more muted presence. It is concerned with process responsibilities that the board has delegated to the Chancellor through board policies. While it is important that the board have assurances that these management responsibilities are being executed effectively, it does not need extensive evidence. Thus, the component is designed to bring matters to the board’s attention only on an “exception” basis. Then the board is free to focus primarily on strategic and governance matters and only secondarily on process issues when an exception merits their attention. IMPLEMENTATION The system-level accountability framework is envisioned as a primary governance tool for the Minnesota State Colleges and Universities Board of Trustees. It will develop common expectations for the board and stakeholders about expected outcomes. The chancellor will use the framework to manage system performance. Furthermore, it will serve as an information management tool and ensure that attention is focused on important strategic issues. College, university and system staff members have been working since April 2003 to define and develop the component measures within the Framework. Staff also is developing a Board of Trustees website for public reporting on the three components of the Accountability Framework. Figure 1 on the following page is an image of the design for the main dashboard from the Accountability Framework website.
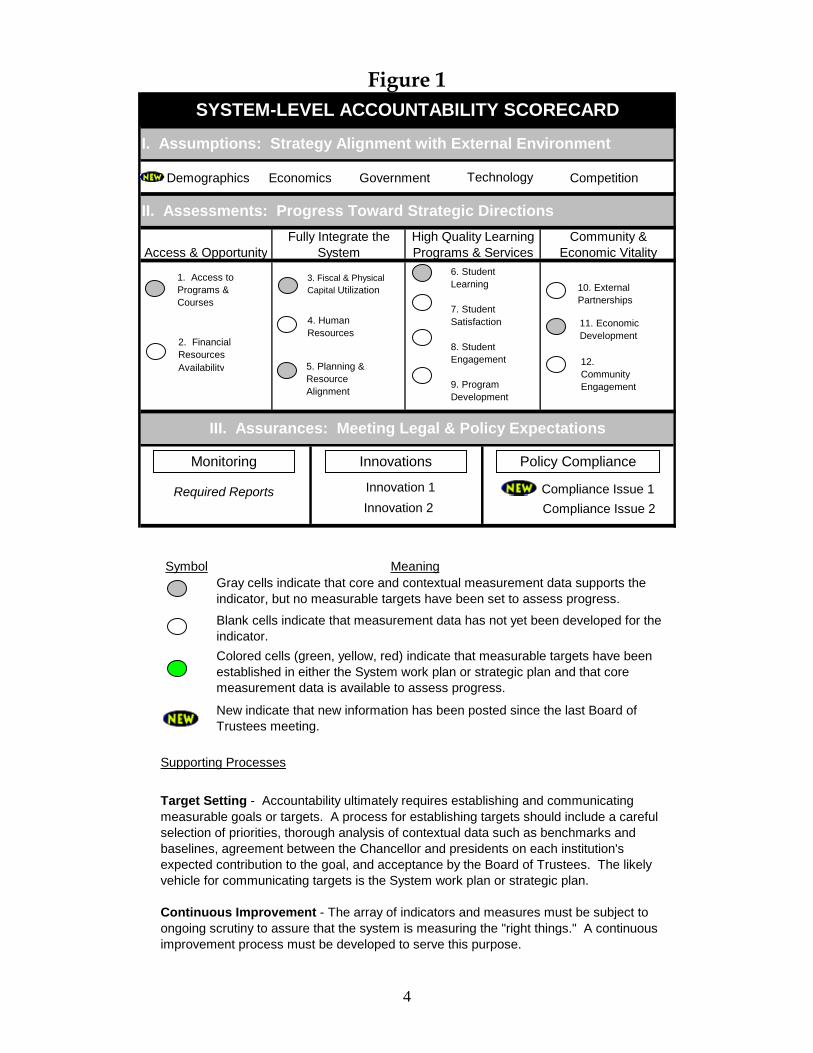
4
Figure 1
Meaning
Supporting Processes
Target Setting - Accountability ultimately requires establishing and communicating measurable goals or targets. A process for establishing targets should include a careful selection of priorities, thorough analysis of contextual data such as benchmarks and baselines, agreement between the Chancellor and presidents on each institution's expected contribution to the goal, and acceptance by the Board of Trustees. The likely vehicle for communicating targets is the System work plan or strategic plan.
Continuous Improvement - The array of indicators and measures must be subject to ongoing scrutiny to assure that the system is measuring the "right things." A continuous improvement process must be developed to serve this purpose.
Gray cells indicate that core and contextual measurement data supports the indicator, but no measurable targets have been set to assess progress.
Blank cells indicate that measurement data has not yet been developed for the indicator.Colored cells (green, yellow, red) indicate that measurable targets have been established in either the System work plan or strategic plan and that core measurement data is available to assess progress.
New indicate that new information has been posted since the last Board of Trustees meeting.
Symbol
I. Assumptions: Strategy Alignment with External Environment
High Quality Learning Programs & Services
Community & Economic Vitality
SYSTEM-LEVEL ACCOUNTABILITY SCORECARD
III. Assurances: Meeting Legal & Policy Expectations
II. Assessments: Progress Toward Strategic Directions
Access & OpportunityFully Integrate the
System
2. Financial ResourcesAvailability
1. Access to Programs & Courses
5. Planning & Resource Alignment
Demographics Economics Government CompetitionTechnology
6. Student Learning
7. Student Satisfaction
8. StudentEngagement
9. Program Development
10. External Partnerships
11. Economic Development
3. Fiscal & Physical Capital Utilization
4. Human Resources
Monitoring
Required Reports
Innovations Policy Compliance
Innovation 1
Compliance Issue 2
12. Community Engagement
Innovation 2Compliance Issue 1
5
Strategic Direction One: Access & Opportunity
The Minnesota State Colleges and Universities will provide more people from different backgrounds with the opportunity to experience the benefits of higher education.
Rationale - Minnesota has a long history of investing in higher education and providing accessible education for all people who want to improve themselves and their communities. As Minnesota's diversity increases through immigration and growing communities of color, the system has an obligation to provide the benefits of education to people from all ethnic, cultural and economic backgrounds, as well as those with disabilities.
Indicator 1: Access to Programs & Courses Measure 1A: System Participation Rate Definition: Measure 1A-1 reports Minnesota resident students enrolled at a state college or university as a percent Minnesota population. The numerator is Minnesota resident students aged 15 to 84 enrolled at a Minnesota State college or university. The denominator is Minnesota population aged 15 to 84. Measure 1A-2 reports the system’s percentage market share of resident students at all higher education institutions in the state. Significance: Measure 1A-1 and 1A-2 are signficant in that they indicate the extent to which Minnesota State Colleges and Univesities are providing higher education access to the residents of the state. Measure: Minnesota residents enrolled in system institutions during Fiscal Year 2000 represented 7.1 percent of the state’s population aged 15 to 84. Participation in credit courses was 5.1 percent and participation in non-credit courses was 1.9 percent. Context: Contextual information on participation rates in higher education indicate that Minnesota ranks 11th nationally on a measure of enrollment as a percent of the population aged 18 to 64. The state’s rate is 10 percent above the national average. Minnesota’s college going rate for high school graduates ranks ninth nationally and is 13 percent above the national average. Drill-Downs: Participation rates in credit courses at system colleges and universities are highest among the traditional 18- to 24-year-old age group, with 21.4 percent of the population in this age group enrolled, as shown in Figure 1A-1. The participation rate was 4 percent in the 25- to 49-year-old age group and 3.6 percent in the 15- to 17-year-old group. Three racial-ethnic minority groups, African Americans, American Indians and Asians had participation rates in the system that were higher than whites, as shown in Figure 1A-2. Hispanics had a lower participation rate.
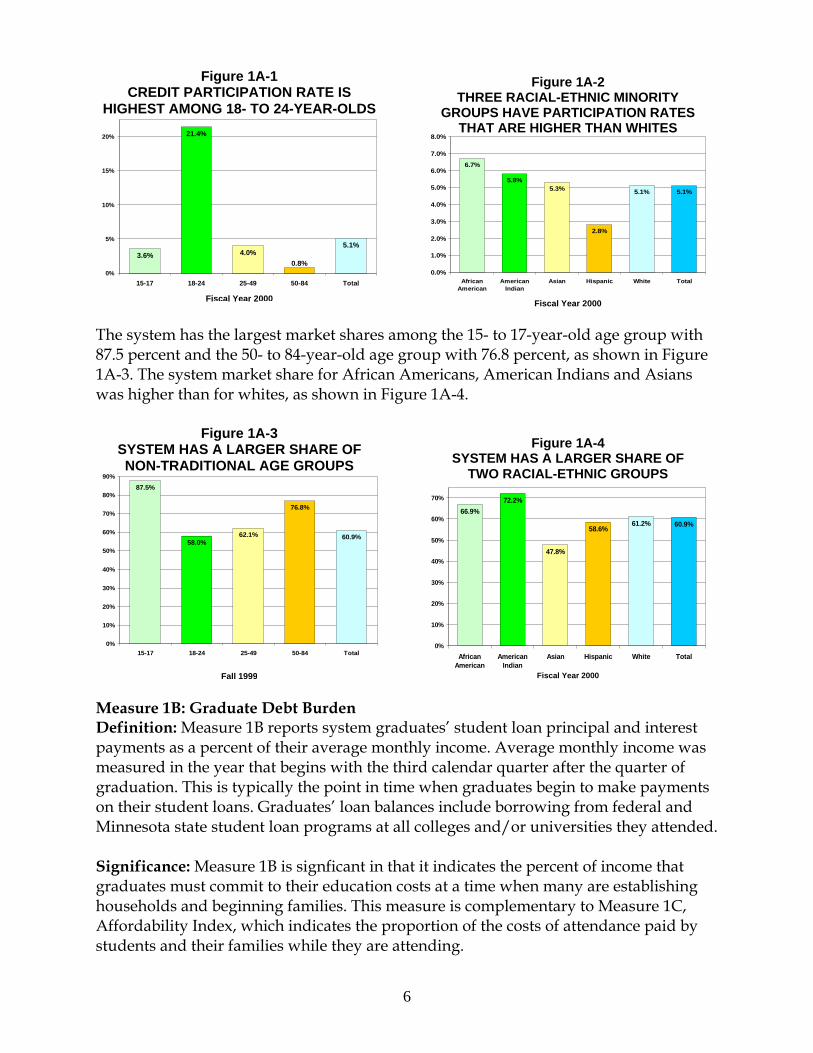
6
Figure 1A-2 THREE RACIAL-ETHNIC MINORITY
GROUPS HAVE PARTICIPATION RATES THAT ARE HIGHER THAN WHITES
6.7%
5.8%5.3%
2.8%
5.1% 5.1%
0.0%
1.0%
2.0%
3.0%
4.0%
5.0%
6.0%
7.0%
8.0%
AfricanAmerican
AmericanIndian
Asian Hispanic White Total
Fiscal Year 2000
Figure 1A-3 SYSTEM HAS A LARGER SHARE OF NON-TRADITIONAL AGE GROUPS
87.5%
58.0%62.1%
76.8%
60.9%
0%
10%
20%
30%
40%
50%
60%
70%
80%
90%
15-17 18-24 25-49 50-84 Total
Fall 1999
Figure 1A-4 SYSTEM HAS A LARGER SHARE OF
TWO RACIAL-ETHNIC GROUPS
66.9%72.2%
47.8%
58.6%61.2% 60.9%
0%
10%
20%
30%
40%
50%
60%
70%
AfricanAmerican
AmericanIndian
Asian Hispanic White Total
Fiscal Year 2000
The system has the largest market shares among the 15- to 17-year-old age group with 87.5 percent and the 50- to 84-year-old age group with 76.8 percent, as shown in Figure 1A-3. The system market share for African Americans, American Indians and Asians was higher than for whites, as shown in Figure 1A-4.
Measure 1B: Graduate Debt Burden Definition: Measure 1B reports system graduates’ student loan principal and interest payments as a percent of their average monthly income. Average monthly income was measured in the year that begins with the third calendar quarter after the quarter of graduation. This is typically the point in time when graduates begin to make payments on their student loans. Graduates’ loan balances include borrowing from federal and Minnesota state student loan programs at all colleges and/or universities they attended. Significance: Measure 1B is signficant in that it indicates the percent of income that graduates must commit to their education costs at a time when many are establishing households and beginning families. This measure is complementary to Measure 1C, Affordability Index, which indicates the proportion of the costs of attendance paid by students and their families while they are attending.
Figure 1A-1 CREDIT PARTICIPATION RATE IS
HIGHEST AMONG 18- TO 24-YEAR-OLDS
3.6%
21.4%
4.0%5.1%
0.8%0%
5%
10%
15%
20%
15-17 18-24 25-49 50-84 Total
Fiscal Year 2000
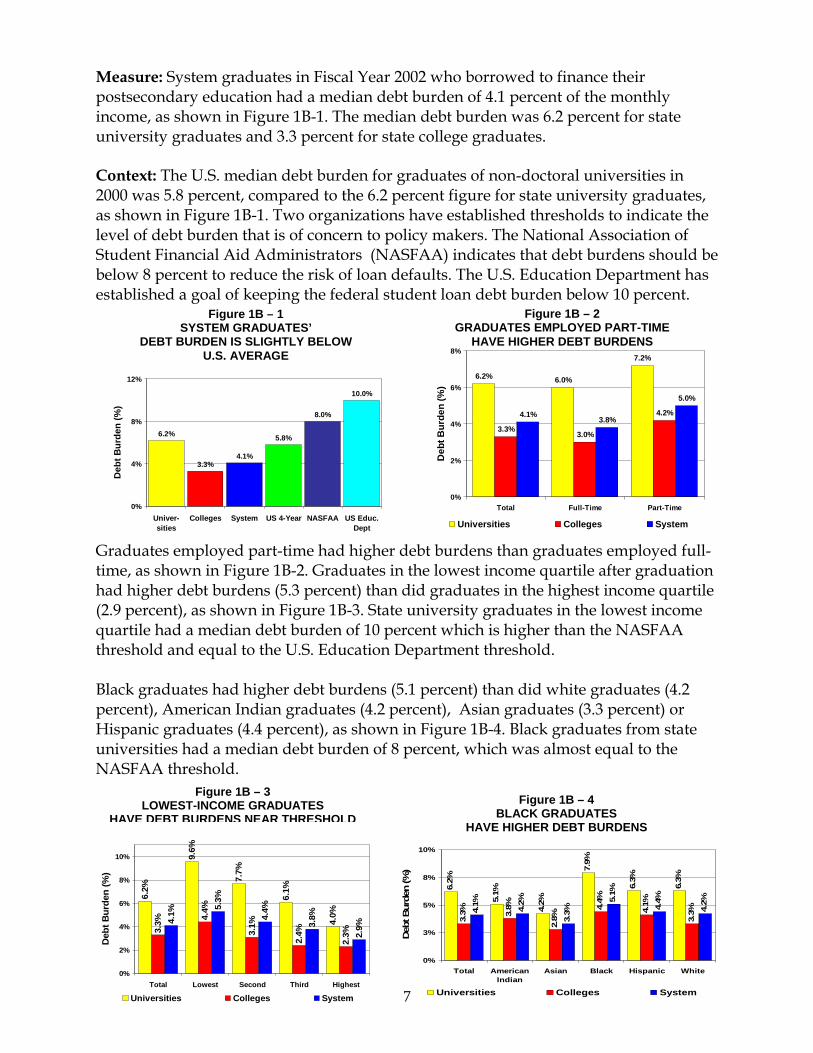
7
Figure 1B – 2 GRADUATES EMPLOYED PART-TIME
HAVE HIGHER DEBT BURDENS
6.2% 6.0%
7.2%
3.3%3.0%
4.2%4.1%3.8%
5.0%
0%
2%
4%
6%
8%
Total Full-Time Part-Time
Deb
t Bur
den
(%)
Universities Colleges System
Figure 1B – 3 LOWEST-INCOME GRADUATES
HAVE DEBT BURDENS NEAR THRESHOLD
6.2%
9.6%
7.7%
6.1%
4.0%
3.3% 4.
4%
3.1%
2.4%
2.3%
4.1%
5.3%
4.4%
3.8%
2.9%
0%
2%
4%
6%
8%
10%
Total Lowest Second Third Highest
Deb
t Bur
den
(%)
Universities Colleges System
6.2%
5.1%
4.2%
7.9%
6.3%
6.3%
3.3% 3.
8%
2.8%
4.4%
4.1%
3.3%
3.3%
5.1%
4.4%
4.2%
4.1%
4.2%
0%
3%
5%
8%
10%
Total AmericanIndian
Asian Black Hispanic White
Deb
t Bur
den
(%)
Universities Colleges System
Figure 1B – 4 BLACK GRADUATES
HAVE HIGHER DEBT BURDENS
Figure 1B – 1 SYSTEM GRADUATES’
DEBT BURDEN IS SLIGHTLY BELOW U.S. AVERAGE
6.2%
3.3%4.1%
5.8%
8.0%
10.0%
0%
4%
8%
12%
Univer-sities
Colleges System US 4-Year NASFAA US Educ.Dept
Deb
t Bur
den
(%)
Measure: System graduates in Fiscal Year 2002 who borrowed to finance their postsecondary education had a median debt burden of 4.1 percent of the monthly income, as shown in Figure 1B-1. The median debt burden was 6.2 percent for state university graduates and 3.3 percent for state college graduates. Context: The U.S. median debt burden for graduates of non-doctoral universities in 2000 was 5.8 percent, compared to the 6.2 percent figure for state university graduates, as shown in Figure 1B-1. Two organizations have established thresholds to indicate the level of debt burden that is of concern to policy makers. The National Association of Student Financial Aid Administrators (NASFAA) indicates that debt burdens should be below 8 percent to reduce the risk of loan defaults. The U.S. Education Department has established a goal of keeping the federal student loan debt burden below 10 percent.
Graduates employed part-time had higher debt burdens than graduates employed full-time, as shown in Figure 1B-2. Graduates in the lowest income quartile after graduation had higher debt burdens (5.3 percent) than did graduates in the highest income quartile (2.9 percent), as shown in Figure 1B-3. State university graduates in the lowest income quartile had a median debt burden of 10 percent which is higher than the NASFAA threshold and equal to the U.S. Education Department threshold. Black graduates had higher debt burdens (5.1 percent) than did white graduates (4.2 percent), American Indian graduates (4.2 percent), Asian graduates (3.3 percent) or Hispanic graduates (4.4 percent), as shown in Figure 1B-4. Black graduates from state universities had a median debt burden of 8 percent, which was almost equal to the NASFAA threshold.
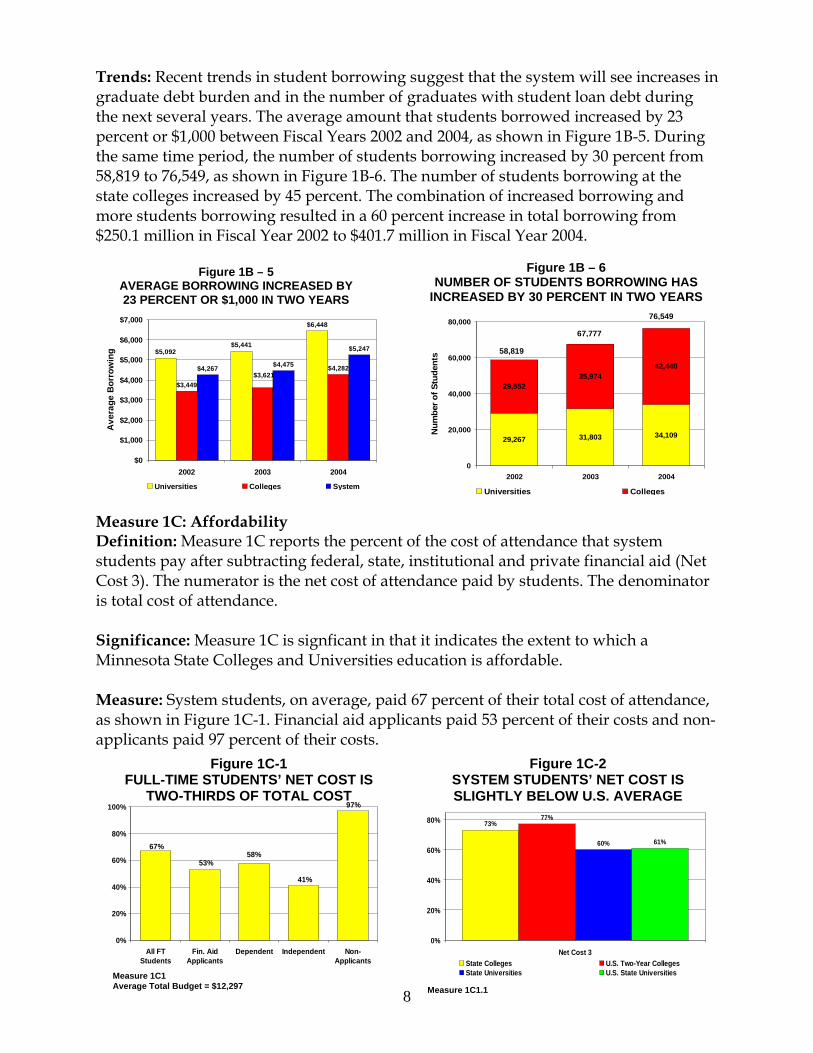
8
Figure 1B – 6 NUMBER OF STUDENTS BORROWING HAS
INCREASED BY 30 PERCENT IN TWO YEARS
29,267 31,803 34,109
29,55235,974
42,440
0
20,000
40,000
60,000
80,000
2002 2003 2004
Num
ber o
f Stu
dent
s
Universities Colleges
76,549
67,777
58,819
Figure 1C-1 FULL-TIME STUDENTS’ NET COST IS
TWO-THIRDS OF TOTAL COST
67%58%
97%
41%
53%
0%
20%
40%
60%
80%
100%
All FTStudents
Fin. AidApplicants
Dependent Independent Non-Applicants
Measure 1C1 Average Total Budget = $12,297
Figure 1C-2 SYSTEM STUDENTS’ NET COST IS SLIGHTLY BELOW U.S. AVERAGE
73%77%
61%60%
0%
20%
40%
60%
80%
Net Cost 3State Colleges U.S. Two-Year CollegesState Universities U.S. State Universities
Measure 1C1.1
Trends: Recent trends in student borrowing suggest that the system will see increases in graduate debt burden and in the number of graduates with student loan debt during the next several years. The average amount that students borrowed increased by 23 percent or $1,000 between Fiscal Years 2002 and 2004, as shown in Figure 1B-5. During the same time period, the number of students borrowing increased by 30 percent from 58,819 to 76,549, as shown in Figure 1B-6. The number of students borrowing at the state colleges increased by 45 percent. The combination of increased borrowing and more students borrowing resulted in a 60 percent increase in total borrowing from $250.1 million in Fiscal Year 2002 to $401.7 million in Fiscal Year 2004.
Measure 1C: Affordability Definition: Measure 1C reports the percent of the cost of attendance that system students pay after subtracting federal, state, institutional and private financial aid (Net Cost 3). The numerator is the net cost of attendance paid by students. The denominator is total cost of attendance. Significance: Measure 1C is signficant in that it indicates the extent to which a Minnesota State Colleges and Universities education is affordable. Measure: System students, on average, paid 67 percent of their total cost of attendance, as shown in Figure 1C-1. Financial aid applicants paid 53 percent of their costs and non-applicants paid 97 percent of their costs.
Figure 1B – 5 AVERAGE BORROWING INCREASED BY 23 PERCENT OR $1,000 IN TWO YEARS
$5,092$5,441
$6,448
$3,449
$4,282$4,475
$5,247
$3,621$4,267
$0
$1,000
$2,000
$3,000
$4,000
$5,000
$6,000
$7,000
2002 2003 2004
Ave
rage
Bor
row
ing
Universities Colleges System
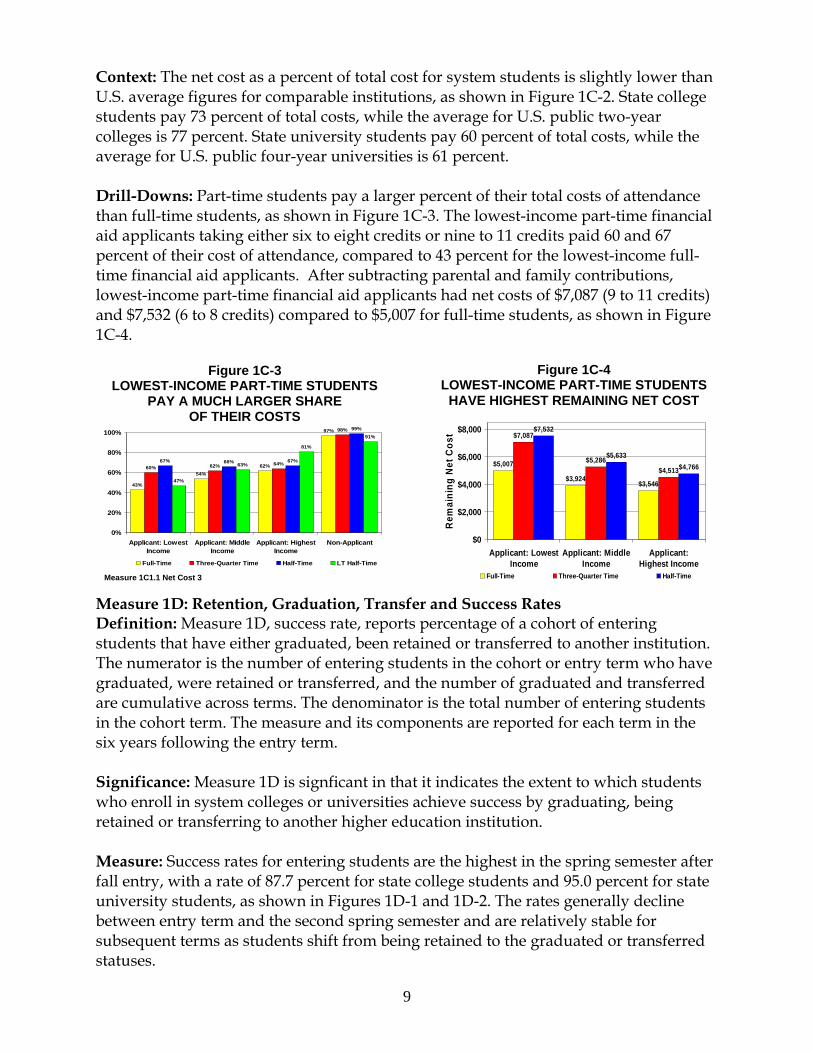
9
Figure 1C-3 LOWEST-INCOME PART-TIME STUDENTS
PAY A MUCH LARGER SHARE OF THEIR COSTS
43%
54%62%
97%
60% 62% 64%
98%
66% 67%
99%
47%
63%
81%
91%
67%
0%
20%
40%
60%
80%
100%
Applicant: LowestIncome
Applicant: MiddleIncome
Applicant: HighestIncome
Non-Applicant
Full-Time Three-Quarter Time Half-Time LT Half-Time
Measure 1C1.1 Net Cost 3
Figure 1C-4 LOWEST-INCOME PART-TIME STUDENTS
HAVE HIGHEST REMAINING NET COST
$5,007
$3,924$3,546
$7,087
$5,286$4,513
$5,633$4,766
$7,532
$0
$2,000
$4,000
$6,000
$8,000
Applicant: LowestIncome
Applicant: MiddleIncome
Applicant:Highest Income
Rem
aini
ng N
et C
ost
Full-Time Three-Quarter Time Half-Time
Context: The net cost as a percent of total cost for system students is slightly lower than U.S. average figures for comparable institutions, as shown in Figure 1C-2. State college students pay 73 percent of total costs, while the average for U.S. public two-year colleges is 77 percent. State university students pay 60 percent of total costs, while the average for U.S. public four-year universities is 61 percent. Drill-Downs: Part-time students pay a larger percent of their total costs of attendance than full-time students, as shown in Figure 1C-3. The lowest-income part-time financial aid applicants taking either six to eight credits or nine to 11 credits paid 60 and 67 percent of their cost of attendance, compared to 43 percent for the lowest-income full-time financial aid applicants. After subtracting parental and family contributions, lowest-income part-time financial aid applicants had net costs of $7,087 (9 to 11 credits) and $7,532 (6 to 8 credits) compared to $5,007 for full-time students, as shown in Figure 1C-4.
Measure 1D: Retention, Graduation, Transfer and Success Rates Definition: Measure 1D, success rate, reports percentage of a cohort of entering students that have either graduated, been retained or transferred to another institution. The numerator is the number of entering students in the cohort or entry term who have graduated, were retained or transferred, and the number of graduated and transferred are cumulative across terms. The denominator is the total number of entering students in the cohort term. The measure and its components are reported for each term in the six years following the entry term. Significance: Measure 1D is signficant in that it indicates the extent to which students who enroll in system colleges or universities achieve success by graduating, being retained or transferring to another higher education institution. Measure: Success rates for entering students are the highest in the spring semester after fall entry, with a rate of 87.7 percent for state college students and 95.0 percent for state university students, as shown in Figures 1D-1 and 1D-2. The rates generally decline between entry term and the second spring semester and are relatively stable for subsequent terms as students shift from being retained to the graduated or transferred statuses.
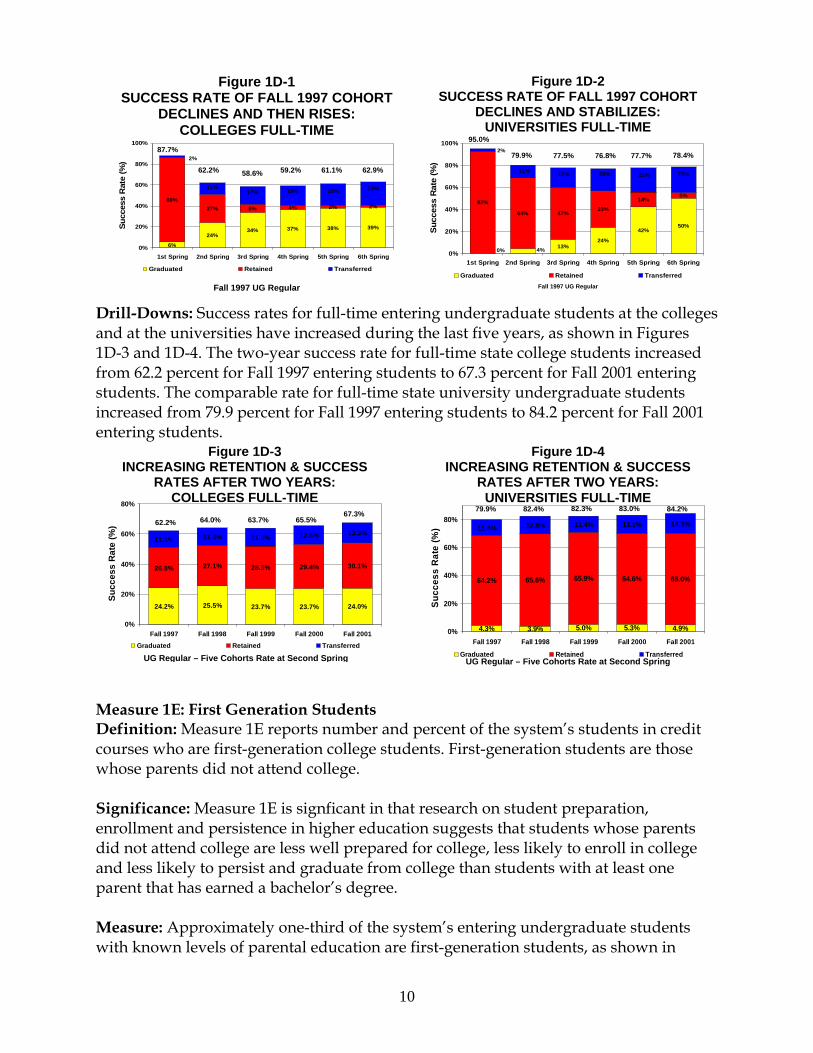
10
Figure 1D-1 SUCCESS RATE OF FALL 1997 COHORT
DECLINES AND THEN RISES: COLLEGES FULL-TIME
6%
24%34% 37% 38% 39%
80%27% 8% 4% 2% 2%
23%21%19%17%11%
2%
0%
20%
40%
60%
80%
100%
1st Spring 2nd Spring 3rd Spring 4th Spring 5th Spring 6th Spring
Succ
ess
Rat
e (%
)
Graduated Retained Transferred
Fall 1997 UG Regular
62.9% 61.1% 59.2% 58.6% 62.2%
87.7%
Figure 1D-2 SUCCESS RATE OF FALL 1997 COHORT
DECLINES AND STABILIZES: UNIVERSITIES FULL-TIME
13%24%
42%50%
92%
64% 47%33%
14%5%
4%0%
23%22%20%17%11%
2%
0%
20%
40%
60%
80%
100%
1st Spring 2nd Spring 3rd Spring 4th Spring 5th Spring 6th Spring
Succ
ess
Rat
e (%
)
Graduated Retained Transferred
Fall 1997 UG Regular
77.5% 76.8% 77.7% 78.4%79.9%
95.0%
Figure 1D-3 INCREASING RETENTION & SUCCESS
RATES AFTER TWO YEARS: COLLEGES FULL-TIME
24.2% 25.5% 23.7% 23.7% 24.0%
26.8% 27.1% 28.3% 29.4% 30.1%
11.4% 11.8% 12.5% 13.3%11.1%
0%
20%
40%
60%
80%
Fall 1997 Fall 1998 Fall 1999 Fall 2000 Fall 2001
Succ
ess
Rat
e (%
)
Graduated Retained Transferred
UG Regular – Five Cohorts Rate at Second Spring
62.2% 64.0% 63.7% 65.5% 67.3%
Figure 1D-4 INCREASING RETENTION & SUCCESS
RATES AFTER TWO YEARS: UNIVERSITIES FULL-TIME
4.3% 3.9% 5.0% 5.3% 4.9%
64.2% 65.6% 65.9% 64.6% 65.0%
12.8% 11.4% 13.1% 14.3%11.4%
0%
20%
40%
60%
80%
Fall 1997 Fall 1998 Fall 1999 Fall 2000 Fall 2001
Succ
ess
Rat
e (%
)
Graduated Retained TransferredUG Regular – Five Cohorts Rate at Second Spring
79.9% 82.4% 82.3% 83.0% 84.2%
Drill-Downs: Success rates for full-time entering undergraduate students at the colleges and at the universities have increased during the last five years, as shown in Figures 1D-3 and 1D-4. The two-year success rate for full-time state college students increased from 62.2 percent for Fall 1997 entering students to 67.3 percent for Fall 2001 entering students. The comparable rate for full-time state university undergraduate students increased from 79.9 percent for Fall 1997 entering students to 84.2 percent for Fall 2001 entering students.
Measure 1E: First Generation Students Definition: Measure 1E reports number and percent of the system’s students in credit courses who are first-generation college students. First-generation students are those whose parents did not attend college. Significance: Measure 1E is signficant in that research on student preparation, enrollment and persistence in higher education suggests that students whose parents did not attend college are less well prepared for college, less likely to enroll in college and less likely to persist and graduate from college than students with at least one parent that has earned a bachelor’s degree. Measure: Approximately one-third of the system’s entering undergraduate students with known levels of parental education are first-generation students, as shown in
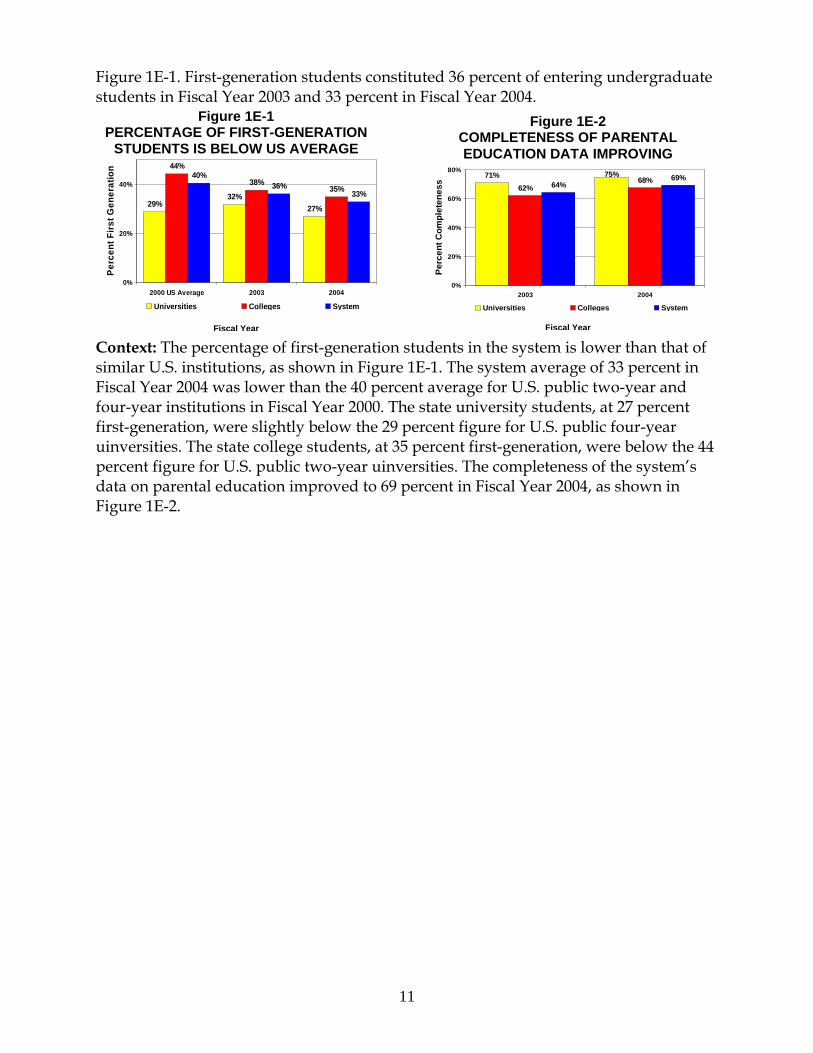
11
Figure 1E-1 PERCENTAGE OF FIRST-GENERATION
STUDENTS IS BELOW US AVERAGE
29%32%
27%
44%
38%35%36%
33%
40%
0%
20%
40%
2000 US Average 2003 2004
Perc
ent F
irst G
ener
atio
n
Universities Colleges System
Fiscal Year
Figure 1E-2 COMPLETENESS OF PARENTAL EDUCATION DATA IMPROVING
71%62%
68% 69%75%64%
0%
20%
40%
60%
80%
2003 2004
Perc
ent C
ompl
eten
ess
Universities Colleges System
Fiscal Year
Figure 1E-1. First-generation students constituted 36 percent of entering undergraduate students in Fiscal Year 2003 and 33 percent in Fiscal Year 2004.
Context: The percentage of first-generation students in the system is lower than that of similar U.S. institutions, as shown in Figure 1E-1. The system average of 33 percent in Fiscal Year 2004 was lower than the 40 percent average for U.S. public two-year and four-year institutions in Fiscal Year 2000. The state university students, at 27 percent first-generation, were slightly below the 29 percent figure for U.S. public four-year uinversities. The state college students, at 35 percent first-generation, were below the 44 percent figure for U.S. public two-year uinversities. The completeness of the system’s data on parental education improved to 69 percent in Fiscal Year 2004, as shown in Figure 1E-2.
12
Strategic Direction Two: Fully Integrate the System
The Minnesota State Colleges and Universities will become a more fully coordinated and integrated system of distinct higher education institutions that provide high-quality education.
Rationale - A primary reason for creating the Minnesota State Colleges and Universities System was to coordinate programs and services, providing students with easy and seamless access to higher education. The system has a public responsibility to fully integrate its programs and services to provide students with access to the collective programs, services and strengths of its distinct institutions. Indicator 3: Fiscal & Physical Capital Utilization Measure 3A: Fiscal Measures Definition: Measure 3A1 is fully allocated instructional expenditures per full-year-equivalent student. The numerator is direct instructional expenditures plus support expenditures attributable to instruction in a fiscal year. The denominator is full-year-equivalent enrollment for that fiscal year. Measure 3A2 is the percent distribution of education and general expenditures among functional categories. Significance: Measures 3A1 and 3A2 are key measures of the system’s fiscal resource utilization. Measure: The system’s fully allocated instructional expenditures per full-year-equivalent student in Fiscal Year 2003 were $7,028. The system spent 49.4 percent of its total educational and general expenditures on instruction and 14.3 percent for academic support in Fiscal Year 2003. Measure 3B: Facilities Measures Definition: Measure 3B-1 is the facilities condition index. The numerator is the total dollar amount of existing major maintenance repairs and replacements as identified by a comprehensive facilities condition audit. The denominator is the current replacement value for all college and university educational and general facilities. Measure 3B-2 is the expenditures for facilities renewal per gross square foot of space. The numerator includes expenditures for repair and replacement, Higher Education Asset Preservation and Renewal Allocation, capital renewal and campus maintenance. The denominator is gross square feet of academic space. Significance: Measures 3B-1 and 3B-2 are key measures of the system’s facilities resource stewardship. Measure: The system’s facilities condition index was 17 percent in 1999, the last time a facilities condition audit was conducted, as shown in Figure 3B-1. This compares to a
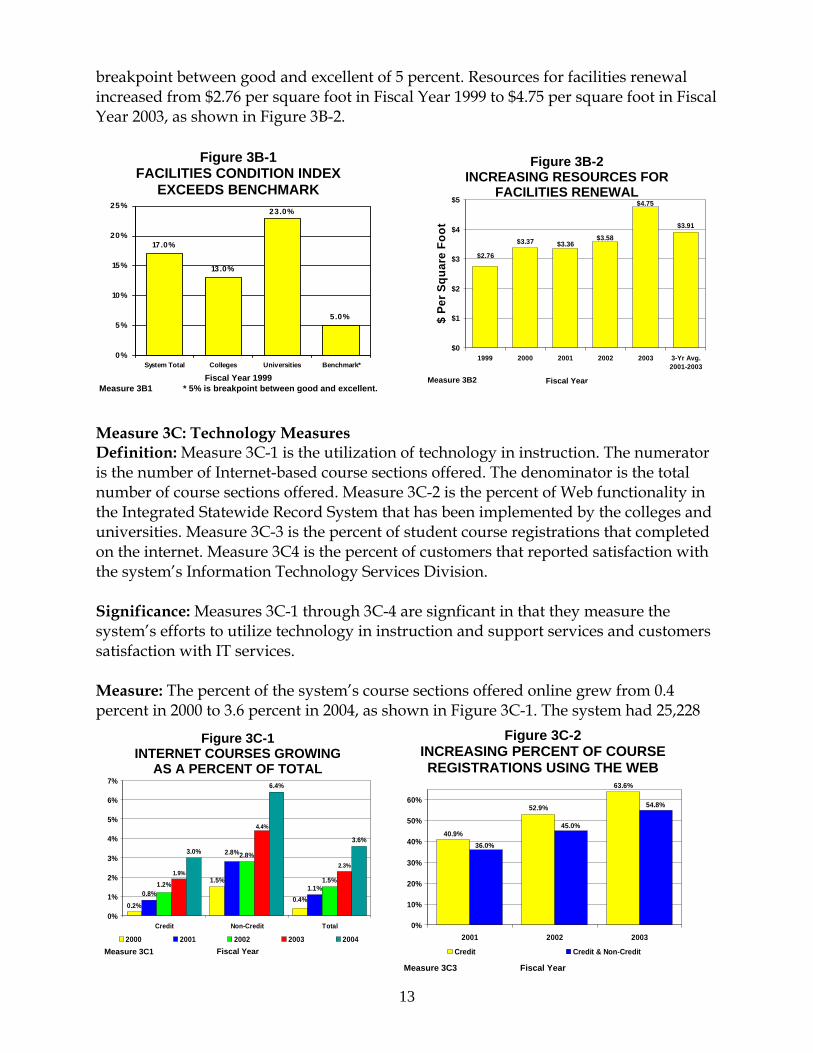
13
Figure 3B-1 FACILITIES CONDITION INDEX
EXCEEDS BENCHMARK
17.0%
13.0%
5.0%
23.0%
0%
5%
10%
15%
20%
25%
System Total Colleges Universities Benchmark*
Measure 3B1 Fiscal Year 1999
* 5% is breakpoint between good and excellent.
Figure 3B-2 INCREASING RESOURCES FOR
FACILITIES RENEWAL
$3.37
$3.91
$2.76
$4.75
$3.58$3.36
$0
$1
$2
$3
$4
$5
1999 2000 2001 2002 2003 3-Yr Avg.2001-2003
$ Pe
r Squ
are
Foot
Measure 3B2 Fiscal Year
Figure 3C-1 INTERNET COURSES GROWING
AS A PERCENT OF TOTAL
1.5%
0.8%1.1%
2.8%
1.5%1.9%
2.3%
3.0%
6.4%
3.6%
0.2%0.4%
2.8%
1.2%
4.4%
0%
1%
2%
3%
4%
5%
6%
7%
Credit Non-Credit Total
2000 2001 2002 2003 2004Measure 3C1 Fiscal Year
Figure 3C-2 INCREASING PERCENT OF COURSE REGISTRATIONS USING THE WEB
52.9%
63.6%
40.9%
54.8%
36.0%
45.0%
0%
10%
20%
30%
40%
50%
60%
2001 2002 2003
Credit Credit & Non-Credit
Measure 3C3 Fiscal Year
breakpoint between good and excellent of 5 percent. Resources for facilities renewal increased from $2.76 per square foot in Fiscal Year 1999 to $4.75 per square foot in Fiscal Year 2003, as shown in Figure 3B-2.
Measure 3C: Technology Measures Definition: Measure 3C-1 is the utilization of technology in instruction. The numerator is the number of Internet-based course sections offered. The denominator is the total number of course sections offered. Measure 3C-2 is the percent of Web functionality in the Integrated Statewide Record System that has been implemented by the colleges and universities. Measure 3C-3 is the percent of student course registrations that completed on the internet. Measure 3C4 is the percent of customers that reported satisfaction with the system’s Information Technology Services Division. Significance: Measures 3C-1 through 3C-4 are signficant in that they measure the system’s efforts to utilize technology in instruction and support services and customers satisfaction with IT services. Measure: The percent of the system’s course sections offered online grew from 0.4 percent in 2000 to 3.6 percent in 2004, as shown in Figure 3C-1. The system had 25,228
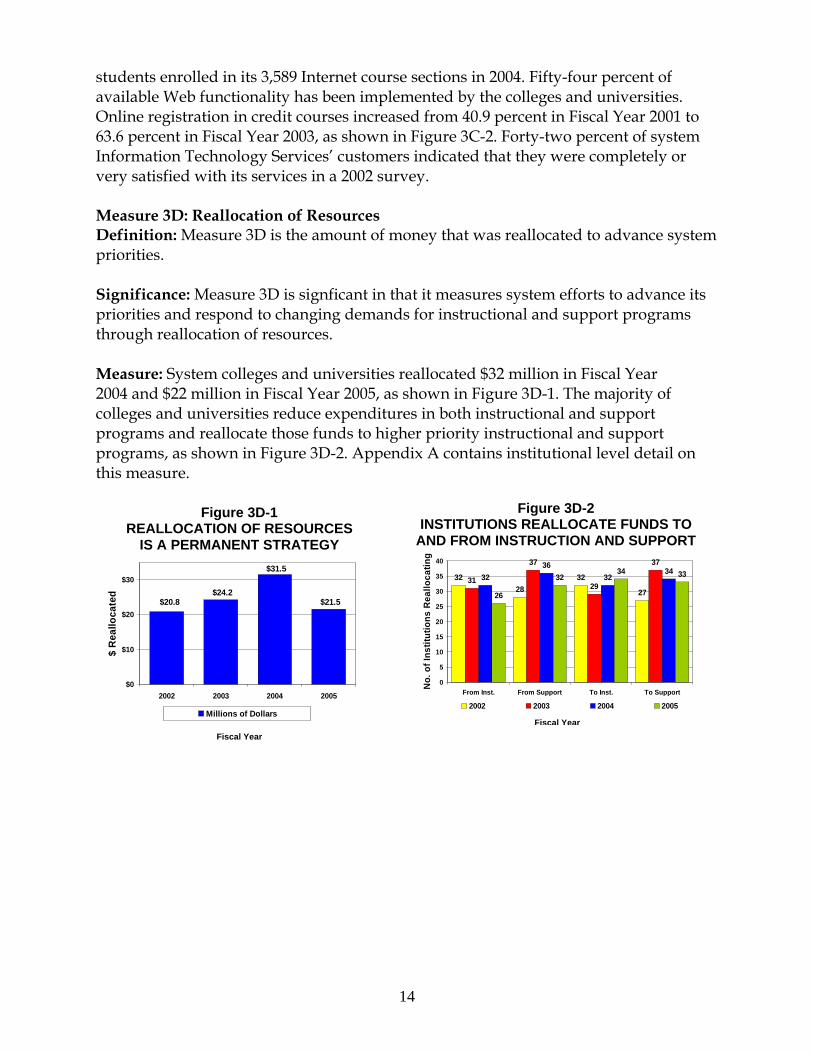
14
Figure 3D-2 INSTITUTIONS REALLOCATE FUNDS TO
AND FROM INSTRUCTION AND SUPPORT
3228
32
2731
37
29
373632
34
26
3234 3332
0
5
10
15
20
25
30
35
40
From Inst. From Support To Inst. To Support
No.
of I
nstit
utio
ns R
eallo
catin
g
2002 2003 2004 2005
Fiscal Year
Figure 3D-1 REALLOCATION OF RESOURCES
IS A PERMANENT STRATEGY
$21.5
$31.5
$24.2$20.8
$0
$10
$20
$30
2002 2003 2004 2005
$ R
eallo
cate
d
Millions of Dollars
Fiscal Year
students enrolled in its 3,589 Internet course sections in 2004. Fifty-four percent of available Web functionality has been implemented by the colleges and universities. Online registration in credit courses increased from 40.9 percent in Fiscal Year 2001 to 63.6 percent in Fiscal Year 2003, as shown in Figure 3C-2. Forty-two percent of system Information Technology Services’ customers indicated that they were completely or very satisfied with its services in a 2002 survey. Measure 3D: Reallocation of Resources Definition: Measure 3D is the amount of money that was reallocated to advance system priorities. Significance: Measure 3D is signficant in that it measures system efforts to advance its priorities and respond to changing demands for instructional and support programs through reallocation of resources. Measure: System colleges and universities reallocated $32 million in Fiscal Year 2004 and $22 million in Fiscal Year 2005, as shown in Figure 3D-1. The majority of colleges and universities reduce expenditures in both instructional and support programs and reallocate those funds to higher priority instructional and support programs, as shown in Figure 3D-2. Appendix A contains institutional level detail on this measure.
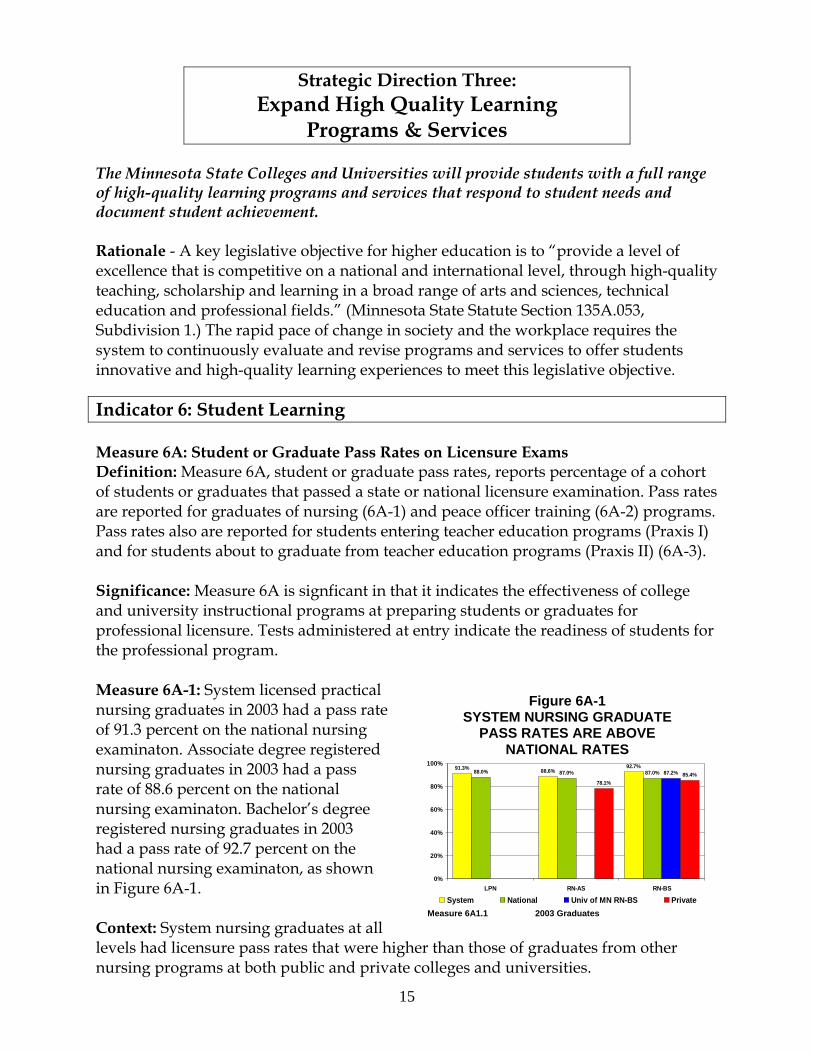
15
Figure 6A-1 SYSTEM NURSING GRADUATE
PASS RATES ARE ABOVE NATIONAL RATES
91.3% 88.6%92.7%
88.0% 87.0% 87.0% 87.2%
78.1%85.4%
0%
20%
40%
60%
80%
100%
LPN RN-AS RN-BS
System National Univ of MN RN-BS PrivateMeasure 6A1.1 2003 Graduates
Strategic Direction Three: Expand High Quality Learning
Programs & Services The Minnesota State Colleges and Universities will provide students with a full range of high-quality learning programs and services that respond to student needs and document student achievement. Rationale - A key legislative objective for higher education is to “provide a level of excellence that is competitive on a national and international level, through high-quality teaching, scholarship and learning in a broad range of arts and sciences, technical education and professional fields.” (Minnesota State Statute Section 135A.053, Subdivision 1.) The rapid pace of change in society and the workplace requires the system to continuously evaluate and revise programs and services to offer students innovative and high-quality learning experiences to meet this legislative objective. Indicator 6: Student Learning Measure 6A: Student or Graduate Pass Rates on Licensure Exams Definition: Measure 6A, student or graduate pass rates, reports percentage of a cohort of students or graduates that passed a state or national licensure examination. Pass rates are reported for graduates of nursing (6A-1) and peace officer training (6A-2) programs. Pass rates also are reported for students entering teacher education programs (Praxis I) and for students about to graduate from teacher education programs (Praxis II) (6A-3). Significance: Measure 6A is signficant in that it indicates the effectiveness of college and university instructional programs at preparing students or graduates for professional licensure. Tests administered at entry indicate the readiness of students for the professional program. Measure 6A-1: System licensed practical nursing graduates in 2003 had a pass rate of 91.3 percent on the national nursing examinaton. Associate degree registered nursing graduates in 2003 had a pass rate of 88.6 percent on the national nursing examinaton. Bachelor’s degree registered nursing graduates in 2003 had a pass rate of 92.7 percent on the national nursing examinaton, as shown in Figure 6A-1. Context: System nursing graduates at all levels had licensure pass rates that were higher than those of graduates from other nursing programs at both public and private colleges and universities.
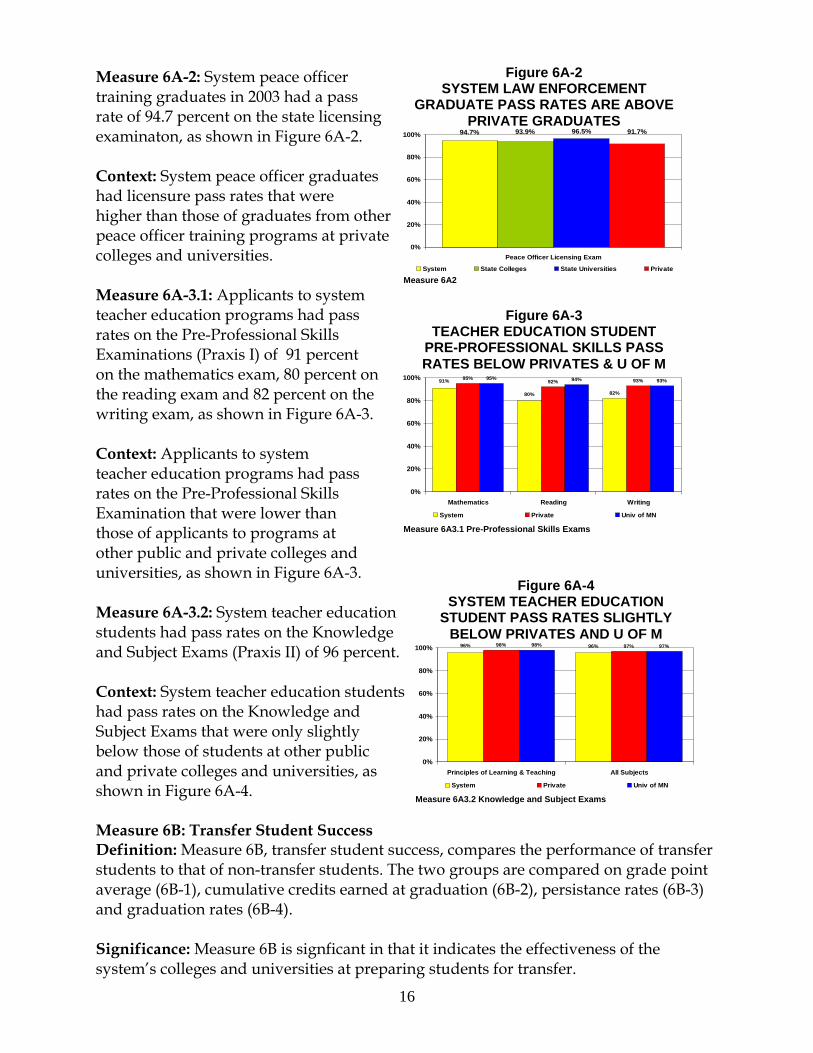
16
Figure 6A-2 SYSTEM LAW ENFORCEMENT
GRADUATE PASS RATES ARE ABOVE PRIVATE GRADUATES
94.7% 93.9% 96.5% 91.7%
0%
20%
40%
60%
80%
100%
Peace Officer Licensing Exam
System State Colleges State Universities Private
Measure 6A2
Figure 6A-4 SYSTEM TEACHER EDUCATION
STUDENT PASS RATES SLIGHTLY BELOW PRIVATES AND U OF M
98% 97% 97%96%96% 98%
0%
20%
40%
60%
80%
100%
Principles of Learning & Teaching All Subjects
System Private Univ of MN
Measure 6A3.2 Knowledge and Subject Exams
Figure 6A-3 TEACHER EDUCATION STUDENT
PRE-PROFESSIONAL SKILLS PASS RATES BELOW PRIVATES & U OF M
82%
95% 92% 93%94% 93%
80%
91% 95%
0%
20%
40%
60%
80%
100%
Mathematics Reading Writing
System Private Univ of MN
Measure 6A3.1 Pre-Professional Skills Exams
Measure 6A-2: System peace officer training graduates in 2003 had a pass rate of 94.7 percent on the state licensing examinaton, as shown in Figure 6A-2. Context: System peace officer graduates had licensure pass rates that were higher than those of graduates from other peace officer training programs at private colleges and universities. Measure 6A-3.1: Applicants to system teacher education programs had pass rates on the Pre-Professional Skills Examinations (Praxis I) of 91 percent on the mathematics exam, 80 percent on the reading exam and 82 percent on the writing exam, as shown in Figure 6A-3. Context: Applicants to system teacher education programs had pass rates on the Pre-Professional Skills Examination that were lower than those of applicants to programs at other public and private colleges and universities, as shown in Figure 6A-3. Measure 6A-3.2: System teacher education students had pass rates on the Knowledge and Subject Exams (Praxis II) of 96 percent. Context: System teacher education students had pass rates on the Knowledge and Subject Exams that were only slightly below those of students at other public and private colleges and universities, as shown in Figure 6A-4. Measure 6B: Transfer Student Success Definition: Measure 6B, transfer student success, compares the performance of transfer students to that of non-transfer students. The two groups are compared on grade point average (6B-1), cumulative credits earned at graduation (6B-2), persistance rates (6B-3) and graduation rates (6B-4). Significance: Measure 6B is signficant in that it indicates the effectiveness of the system’s colleges and universities at preparing students for transfer.
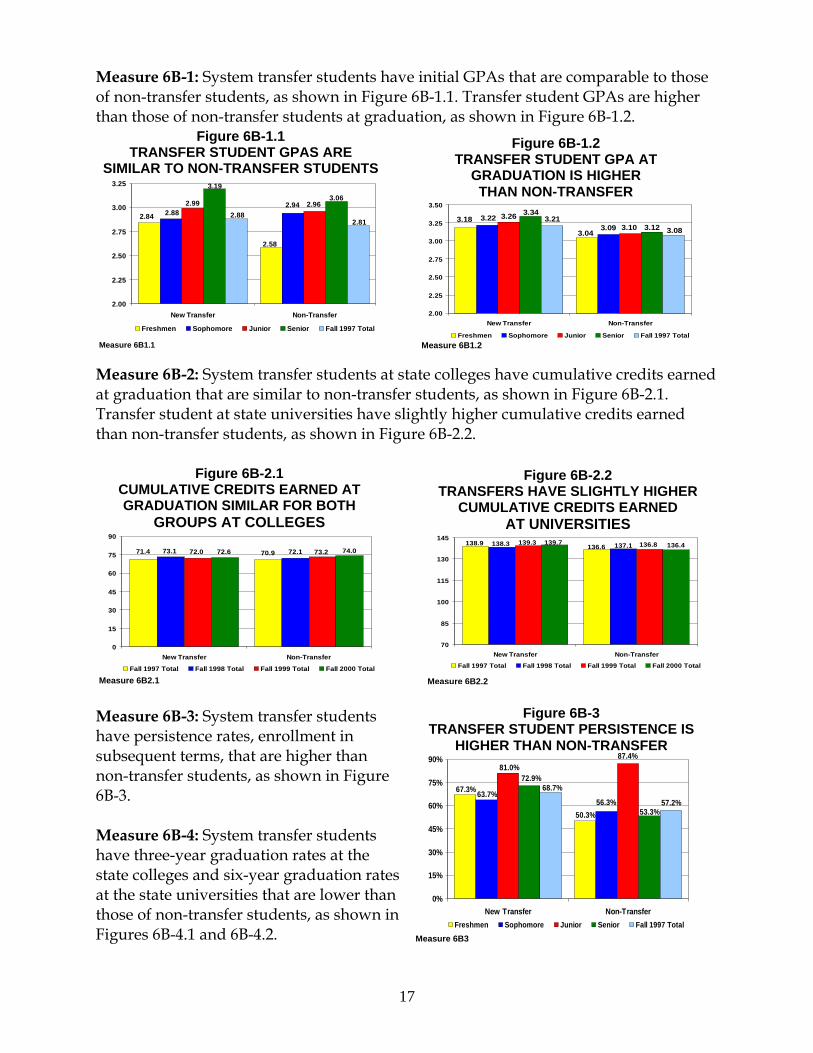
17
Figure 6B-1.1 TRANSFER STUDENT GPAS ARE
SIMILAR TO NON-TRANSFER STUDENTS
2.84
2.58
2.942.88
2.99 2.96
3.193.06
2.812.88
2.00
2.25
2.50
2.75
3.00
3.25
New Transfer Non-Transfer
Freshmen Sophomore Junior Senior Fall 1997 Total
Measure 6B1.1
Figure 6B-1.2 TRANSFER STUDENT GPA AT
GRADUATION IS HIGHER THAN NON-TRANSFER
3.18
3.043.09
3.22 3.263.10
3.34
3.12 3.083.21
2.00
2.25
2.50
2.75
3.00
3.25
3.50
New Transfer Non-Transfer
Freshmen Sophomore Junior Senior Fall 1997 TotalMeasure 6B1.2
Figure 6B-2.2 TRANSFERS HAVE SLIGHTLY HIGHER
CUMULATIVE CREDITS EARNED AT UNIVERSITIES
138.9 136.6 137.1138.3 139.3 136.8139.7 136.4
70
85
100
115
130
145
New Transfer Non-Transfer
Fall 1997 Total Fall 1998 Total Fall 1999 Total Fall 2000 Total
Measure 6B2.2
Figure 6B-3 TRANSFER STUDENT PERSISTENCE IS
HIGHER THAN NON-TRANSFER
57.2%67.3%
50.3%56.3%
63.7%
81.0%87.4%
72.9%
53.3%
68.7%
0%
15%
30%
45%
60%
75%
90%
New Transfer Non-TransferFreshmen Sophomore Junior Senior Fall 1997 Total
Measure 6B3
Measure 6B-1: System transfer students have initial GPAs that are comparable to those of non-transfer students, as shown in Figure 6B-1.1. Transfer student GPAs are higher than those of non-transfer students at graduation, as shown in Figure 6B-1.2.
Measure 6B-2: System transfer students at state colleges have cumulative credits earned at graduation that are similar to non-transfer students, as shown in Figure 6B-2.1. Transfer student at state universities have slightly higher cumulative credits earned than non-transfer students, as shown in Figure 6B-2.2.
Measure 6B-3: System transfer students have persistence rates, enrollment in subsequent terms, that are higher than non-transfer students, as shown in Figure 6B-3. Measure 6B-4: System transfer students have three-year graduation rates at the state colleges and six-year graduation rates at the state universities that are lower than those of non-transfer students, as shown in Figures 6B-4.1 and 6B-4.2.
Figure 6B-2.1 CUMULATIVE CREDITS EARNED AT GRADUATION SIMILAR FOR BOTH
GROUPS AT COLLEGES
71.4 70.9 72.173.1 72.0 73.272.6 74.0
0
15
30
45
60
75
90
New Transfer Non-Transfer
Fall 1997 Total Fall 1998 Total Fall 1999 Total Fall 2000 Total
Measure 6B2.1
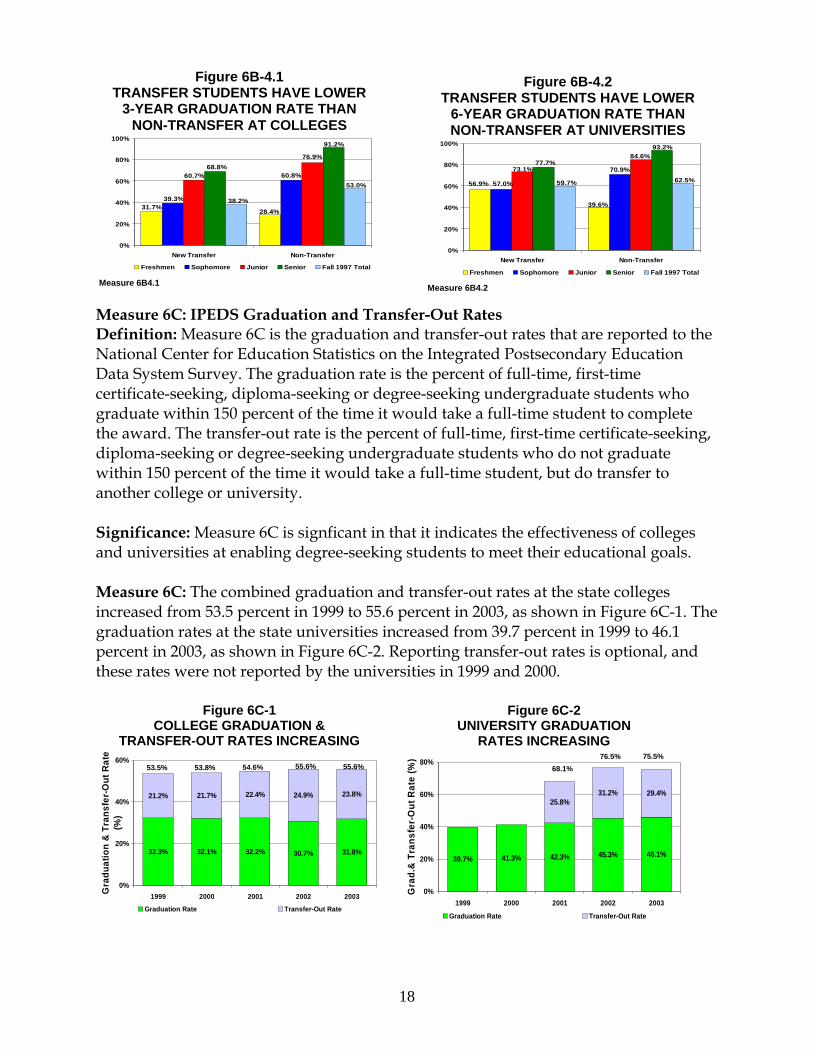
18
Figure 6B-4.1 TRANSFER STUDENTS HAVE LOWER
3-YEAR GRADUATION RATE THAN NON-TRANSFER AT COLLEGES
31.7%28.4%
60.8%
39.3%
60.7%
76.9%68.8%
91.2%
53.0%
38.2%
0%
20%
40%
60%
80%
100%
New Transfer Non-Transfer
Freshmen Sophomore Junior Senior Fall 1997 Total
Measure 6B4.1
Figure 6B-4.2 TRANSFER STUDENTS HAVE LOWER
6-YEAR GRADUATION RATE THAN NON-TRANSFER AT UNIVERSITIES
56.9%
39.6%
70.9%
57.0%
73.1%
84.6%77.7%
93.2%
62.5%59.7%
0%
20%
40%
60%
80%
100%
New Transfer Non-Transfer
Freshmen Sophomore Junior Senior Fall 1997 Total
Measure 6B4.2
Figure 6C-1 COLLEGE GRADUATION &
TRANSFER-OUT RATES INCREASING
32.3% 32.1% 32.2% 30.7% 31.8%
21.2% 21.7% 22.4% 24.9% 23.8%
0%
20%
40%
60%
1999 2000 2001 2002 2003Gra
duat
ion
& T
rans
fer-
Out
Rat
e (%
)
Graduation Rate Transfer-Out Rate
53.5% 53.8% 54.6% 55.6% 55.6%
Figure 6C-2 UNIVERSITY GRADUATION
RATES INCREASING
39.7% 41.3% 42.3% 45.3% 46.1%
25.8%31.2% 29.4%
0%
20%
40%
60%
80%
1999 2000 2001 2002 2003
Gra
d.&
Tra
nsfe
r-O
ut R
ate
(%)
Graduation Rate Transfer-Out Rate
68.1% 76.5% 75.5%
Measure 6C: IPEDS Graduation and Transfer-Out Rates Definition: Measure 6C is the graduation and transfer-out rates that are reported to the National Center for Education Statistics on the Integrated Postsecondary Education Data System Survey. The graduation rate is the percent of full-time, first-time certificate-seeking, diploma-seeking or degree-seeking undergraduate students who graduate within 150 percent of the time it would take a full-time student to complete the award. The transfer-out rate is the percent of full-time, first-time certificate-seeking, diploma-seeking or degree-seeking undergraduate students who do not graduate within 150 percent of the time it would take a full-time student, but do transfer to another college or university. Significance: Measure 6C is signficant in that it indicates the effectiveness of colleges and universities at enabling degree-seeking students to meet their educational goals. Measure 6C: The combined graduation and transfer-out rates at the state colleges increased from 53.5 percent in 1999 to 55.6 percent in 2003, as shown in Figure 6C-1. The graduation rates at the state universities increased from 39.7 percent in 1999 to 46.1 percent in 2003, as shown in Figure 6C-2. Reporting transfer-out rates is optional, and these rates were not reported by the universities in 1999 and 2000.
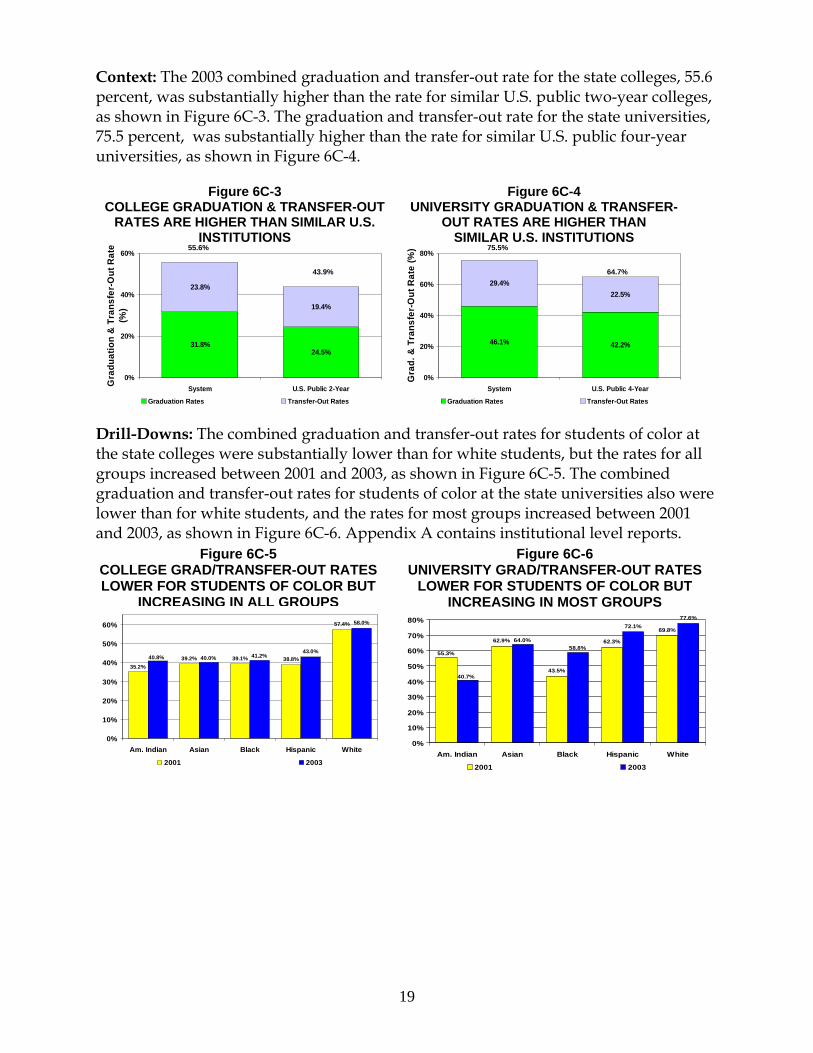
19
Figure 6C-4 UNIVERSITY GRADUATION & TRANSFER-
OUT RATES ARE HIGHER THAN SIMILAR U.S. INSTITUTIONS
46.1% 42.2%
29.4%22.5%
0%
20%
40%
60%
80%
System U.S. Public 4-Year
Gra
d. &
Tra
nsfe
r-O
ut R
ate
(%)
Graduation Rates Transfer-Out Rates
75.5%
64.7%
Figure 6C-3 COLLEGE GRADUATION & TRANSFER-OUT
RATES ARE HIGHER THAN SIMILAR U.S. INSTITUTIONS
31.8%24.5%
23.8%
19.4%
0%
20%
40%
60%
System U.S. Public 2-YearGra
duat
ion
& T
rans
fer-
Out
Rat
e (%
)
Graduation Rates Transfer-Out Rates
55.6%
43.9%
Figure 6C-5 COLLEGE GRAD/TRANSFER-OUT RATESLOWER FOR STUDENTS OF COLOR BUT
INCREASING IN ALL GROUPS
39.2% 39.1% 38.8%
57.4%
43.0%
58.0%
35.2%
41.2%40.8% 40.0%
0%
10%
20%
30%
40%
50%
60%
Am. Indian Asian Black Hispanic White
2001 2003
Figure 6C-6 UNIVERSITY GRAD/TRANSFER-OUT RATES
LOWER FOR STUDENTS OF COLOR BUT INCREASING IN MOST GROUPS
62.9%
43.5%
62.3%
69.8%72.1%
77.6%
55.3%58.8%
40.7%
64.0%
0%
10%
20%
30%
40%
50%
60%
70%
80%
Am. Indian Asian Black Hispanic White
2001 2003
Context: The 2003 combined graduation and transfer-out rate for the state colleges, 55.6 percent, was substantially higher than the rate for similar U.S. public two-year colleges, as shown in Figure 6C-3. The graduation and transfer-out rate for the state universities, 75.5 percent, was substantially higher than the rate for similar U.S. public four-year universities, as shown in Figure 6C-4.
Drill-Downs: The combined graduation and transfer-out rates for students of color at the state colleges were substantially lower than for white students, but the rates for all groups increased between 2001 and 2003, as shown in Figure 6C-5. The combined graduation and transfer-out rates for students of color at the state universities also were lower than for white students, and the rates for most groups increased between 2001 and 2003, as shown in Figure 6C-6. Appendix A contains institutional level reports.
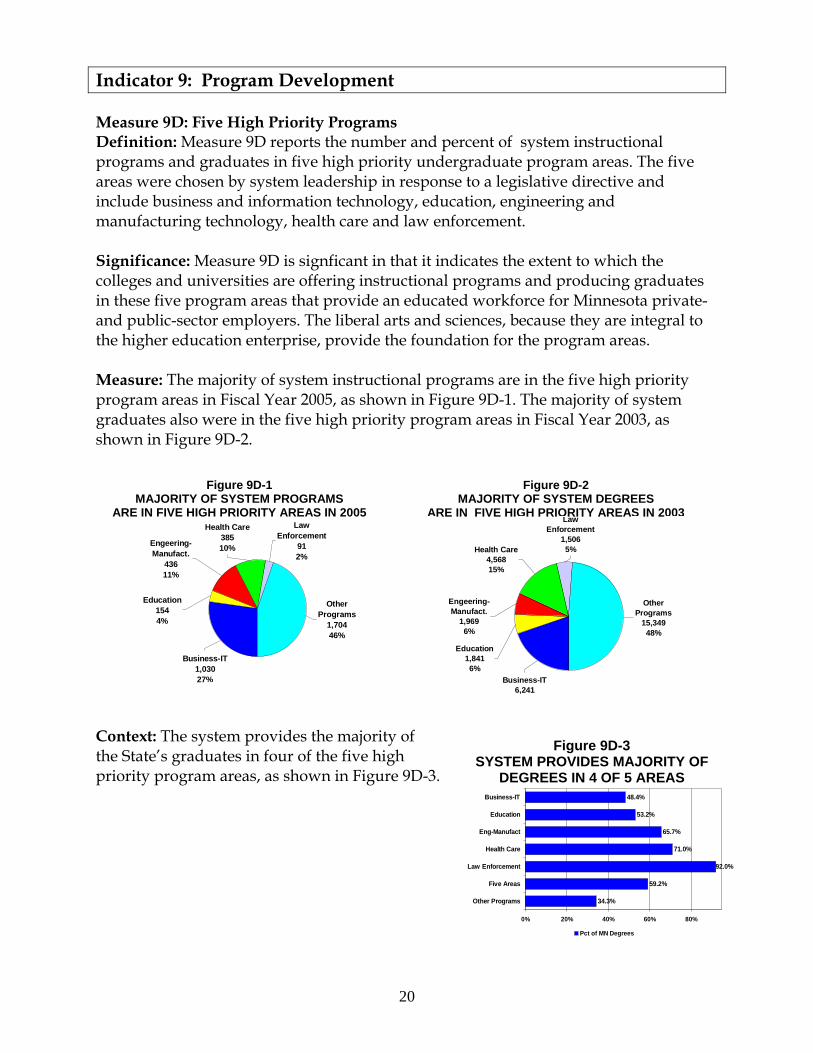
20
Figure 9D-3 SYSTEM PROVIDES MAJORITY OF
DEGREES IN 4 OF 5 AREAS
59.2%
92.0%
71.0%
65.7%
53.2%
48.4%
34.3%
0% 20% 40% 60% 80%
Other Programs
Five Areas
Law Enforcement
Health Care
Eng-Manufact
Education
Business-IT
Pct of MN Degrees
Figure 9D-1 MAJORITY OF SYSTEM PROGRAMS
ARE IN FIVE HIGH PRIORITY AREAS IN 2005
Other Programs
1,70446%
Law Enforcement
912%
Health Care38510%
Business-IT1,03027%
Engeering-Manufact.
43611%
Education1544%
Figure 9D-2 MAJORITY OF SYSTEM DEGREES
ARE IN FIVE HIGH PRIORITY AREAS IN 2003
Other Programs
15,34948%
Education1,8416%
Engeering-Manufact.
1,9696%
Business-IT6,241
Health Care4,56815%
Law Enforcement
1,5065%
Indicator 9: Program Development Measure 9D: Five High Priority Programs Definition: Measure 9D reports the number and percent of system instructional programs and graduates in five high priority undergraduate program areas. The five areas were chosen by system leadership in response to a legislative directive and include business and information technology, education, engineering and manufacturing technology, health care and law enforcement. Significance: Measure 9D is signficant in that it indicates the extent to which the colleges and universities are offering instructional programs and producing graduates in these five program areas that provide an educated workforce for Minnesota private- and public-sector employers. The liberal arts and sciences, because they are integral to the higher education enterprise, provide the foundation for the program areas. Measure: The majority of system instructional programs are in the five high priority program areas in Fiscal Year 2005, as shown in Figure 9D-1. The majority of system graduates also were in the five high priority program areas in Fiscal Year 2003, as shown in Figure 9D-2. Context: The system provides the majority of the State’s graduates in four of the five high priority program areas, as shown in Figure 9D-3.
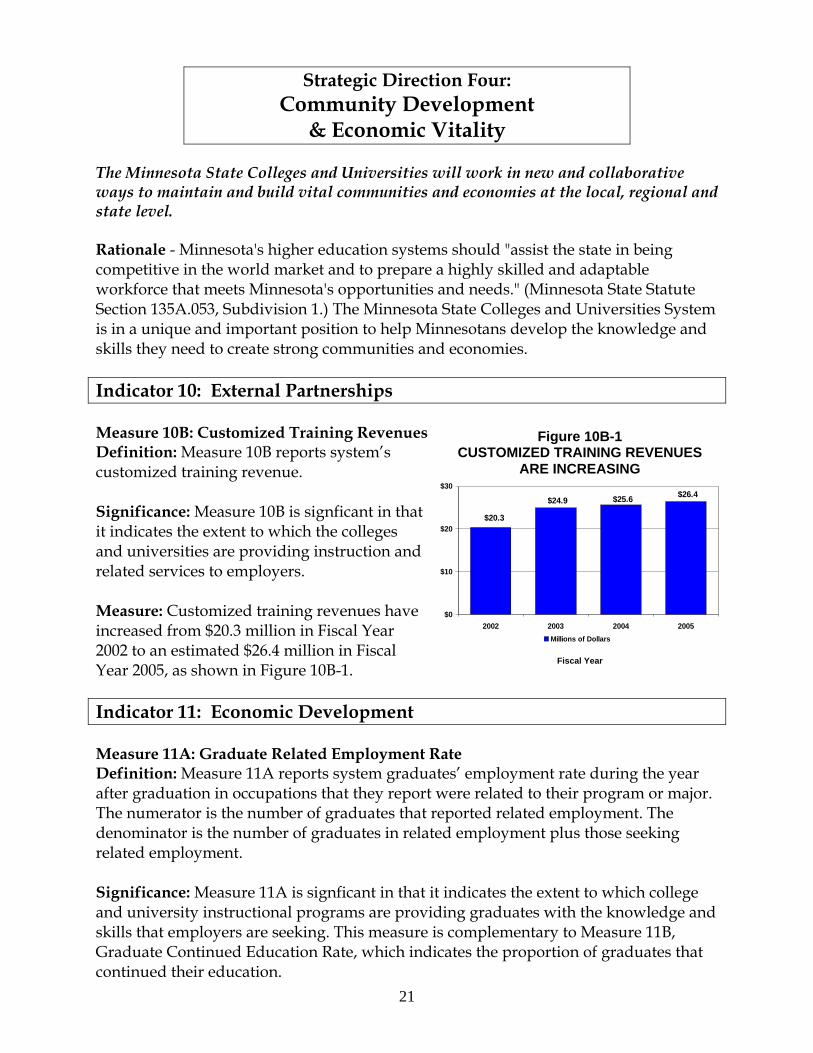
21
Figure 10B-1 CUSTOMIZED TRAINING REVENUES
ARE INCREASING $26.4$25.6$24.9
$20.3
$0
$10
$20
$30
2002 2003 2004 2005Millions of Dollars
Fiscal Year
Strategic Direction Four: Community Development
& Economic Vitality
The Minnesota State Colleges and Universities will work in new and collaborative ways to maintain and build vital communities and economies at the local, regional and state level.
Rationale - Minnesota's higher education systems should "assist the state in being competitive in the world market and to prepare a highly skilled and adaptable workforce that meets Minnesota's opportunities and needs." (Minnesota State Statute Section 135A.053, Subdivision 1.) The Minnesota State Colleges and Universities System is in a unique and important position to help Minnesotans develop the knowledge and skills they need to create strong communities and economies.
Indicator 10: External Partnerships Measure 10B: Customized Training Revenues Definition: Measure 10B reports system’s customized training revenue. Significance: Measure 10B is signficant in that it indicates the extent to which the colleges and universities are providing instruction and related services to employers. Measure: Customized training revenues have increased from $20.3 million in Fiscal Year 2002 to an estimated $26.4 million in Fiscal Year 2005, as shown in Figure 10B-1. Indicator 11: Economic Development Measure 11A: Graduate Related Employment Rate Definition: Measure 11A reports system graduates’ employment rate during the year after graduation in occupations that they report were related to their program or major. The numerator is the number of graduates that reported related employment. The denominator is the number of graduates in related employment plus those seeking related employment. Significance: Measure 11A is signficant in that it indicates the extent to which college and university instructional programs are providing graduates with the knowledge and skills that employers are seeking. This measure is complementary to Measure 11B, Graduate Continued Education Rate, which indicates the proportion of graduates that continued their education.
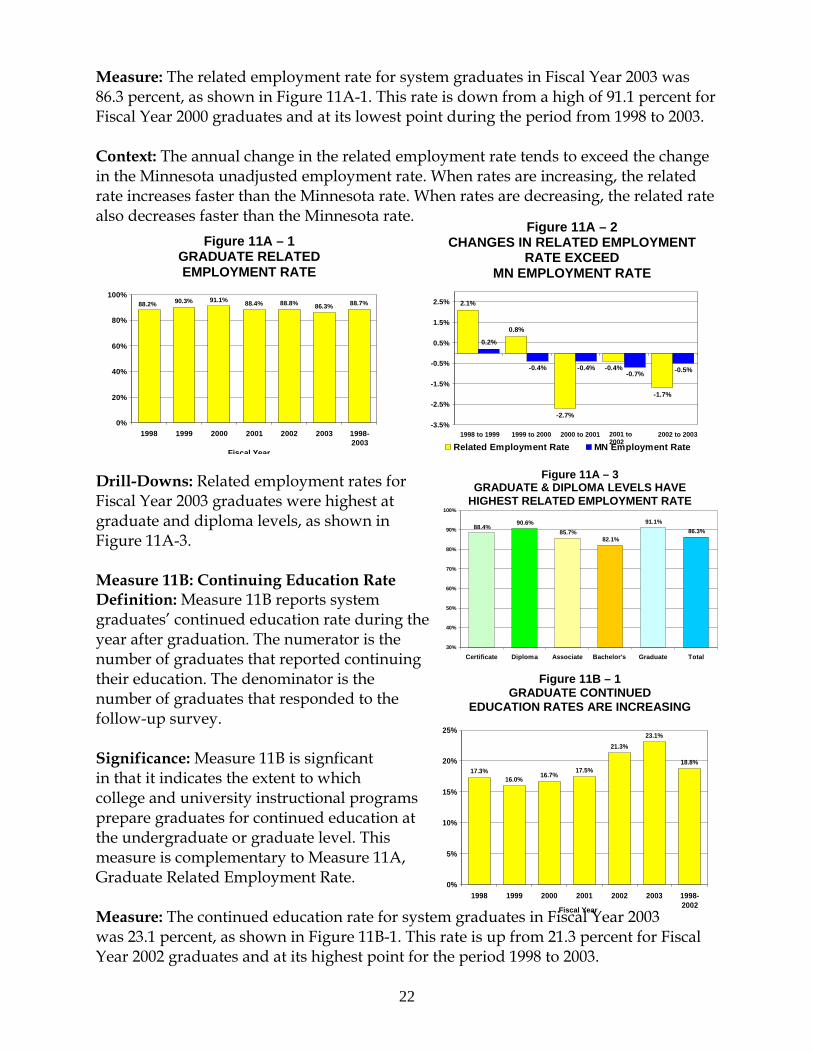
22
Figure 11A – 1 GRADUATE RELATED EMPLOYMENT RATE
90.3% 91.1% 88.4% 88.8% 86.3% 88.7%88.2%
0%
20%
40%
60%
80%
100%
1998 1999 2000 2001 2002 2003 1998-2003
Fiscal Year
Figure 11A – 2 CHANGES IN RELATED EMPLOYMENT
RATE EXCEED MN EMPLOYMENT RATE
2.1%
0.8%
-2.7%
-0.4%
-1.7%
-0.4% -0.4%-0.7% -0.5%
0.2%
-3.5%
-2.5%
-1.5%
-0.5%
0.5%
1.5%
2.5%
Related Employment Rate MN Employment Rate1998 to 1999 1999 to 2000 2000 to 2001 2001 to
2002 2002 to 2003
Figure 11A – 3 GRADUATE & DIPLOMA LEVELS HAVE
HIGHEST RELATED EMPLOYMENT RATE
88.4%90.6%
85.7%82.1%
91.1%86.3%
30%
40%
50%
60%
70%
80%
90%
100%
Certificate Diploma Associate Bachelor's Graduate Total
Figure 11B – 1 GRADUATE CONTINUED
EDUCATION RATES ARE INCREASING
16.0% 16.7%17.5%
21.3%23.1%
18.8%17.3%
0%
5%
10%
15%
20%
25%
1998 1999 2000 2001 2002 2003 1998-2002Fiscal Year
Measure: The related employment rate for system graduates in Fiscal Year 2003 was 86.3 percent, as shown in Figure 11A-1. This rate is down from a high of 91.1 percent for Fiscal Year 2000 graduates and at its lowest point during the period from 1998 to 2003. Context: The annual change in the related employment rate tends to exceed the change in the Minnesota unadjusted employment rate. When rates are increasing, the related rate increases faster than the Minnesota rate. When rates are decreasing, the related rate also decreases faster than the Minnesota rate.
Drill-Downs: Related employment rates for Fiscal Year 2003 graduates were highest at graduate and diploma levels, as shown in Figure 11A-3. Measure 11B: Continuing Education Rate Definition: Measure 11B reports system graduates’ continued education rate during the year after graduation. The numerator is the number of graduates that reported continuing their education. The denominator is the number of graduates that responded to the follow-up survey. Significance: Measure 11B is signficant in that it indicates the extent to which college and university instructional programs prepare graduates for continued education at the undergraduate or graduate level. This measure is complementary to Measure 11A, Graduate Related Employment Rate. Measure: The continued education rate for system graduates in Fiscal Year 2003 was 23.1 percent, as shown in Figure 11B-1. This rate is up from 21.3 percent for Fiscal Year 2002 graduates and at its highest point for the period 1998 to 2003.
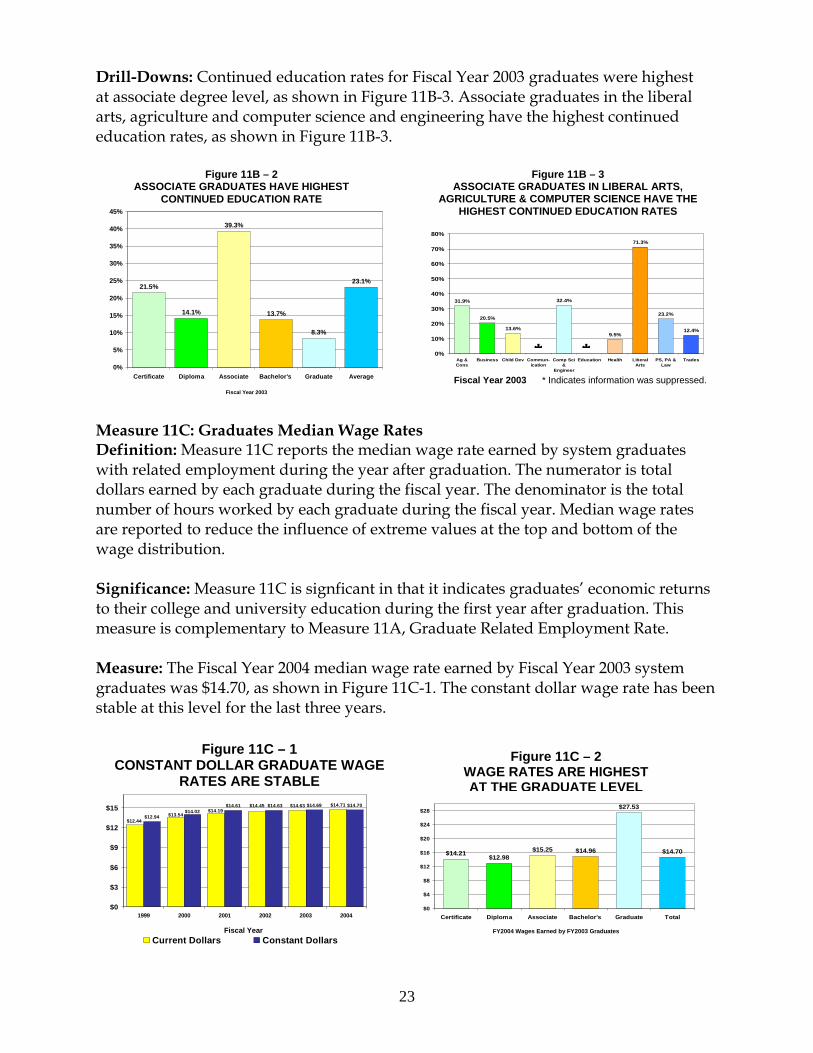
23
Figure 11B – 3 ASSOCIATE GRADUATES IN LIBERAL ARTS,
AGRICULTURE & COMPUTER SCIENCE HAVE THE HIGHEST CONTINUED EDUCATION RATES
31.9%
20.5%
13.6%
32.4%
9.5%
71.3%
23.2%
12.4%
0%
10%
20%
30%
40%
50%
60%
70%
80%
Ag &Cons
Business Child Dev Commun-ication
Comp Sci&
Engineer
Education Health LiberalArts
PS, PA &Law
Trades
Fiscal Year 2003 * Indicates information was suppressed.
* *
Figure 11C – 1 CONSTANT DOLLAR GRADUATE WAGE
RATES ARE STABLE $14.63 $14.71
$12.94
$14.69 $14.70$14.45$14.19
$13.54$12.44
$14.63$14.02
$14.61
$0
$3
$6
$9
$12
$15
1999 2000 2001 2002 2003 2004
Current Dollars Constant DollarsFiscal Year
Figure 11C – 2 WAGE RATES ARE HIGHEST AT THE GRADUATE LEVEL
$14.21 $12.98$15.25 $14.96
$27.53
$14.70
$0
$4
$8
$12
$16
$20
$24
$28
Certificate Diploma Associate Bachelor's Graduate Total
FY2004 Wages Earned by FY2003 Graduates
Figure 11B – 2 ASSOCIATE GRADUATES HAVE HIGHEST
CONTINUED EDUCATION RATE
21.5%
14.1%
39.3%
13.7%
8.3%
23.1%
0%
5%
10%
15%
20%
25%
30%
35%
40%
45%
Certificate Diploma Associate Bachelor's Graduate Average
Fiscal Year 2003
Drill-Downs: Continued education rates for Fiscal Year 2003 graduates were highest at associate degree level, as shown in Figure 11B-3. Associate graduates in the liberal arts, agriculture and computer science and engineering have the highest continued education rates, as shown in Figure 11B-3.
Measure 11C: Graduates Median Wage Rates Definition: Measure 11C reports the median wage rate earned by system graduates with related employment during the year after graduation. The numerator is total dollars earned by each graduate during the fiscal year. The denominator is the total number of hours worked by each graduate during the fiscal year. Median wage rates are reported to reduce the influence of extreme values at the top and bottom of the wage distribution. Significance: Measure 11C is signficant in that it indicates graduates’ economic returns to their college and university education during the first year after graduation. This measure is complementary to Measure 11A, Graduate Related Employment Rate. Measure: The Fiscal Year 2004 median wage rate earned by Fiscal Year 2003 system graduates was $14.70, as shown in Figure 11C-1. The constant dollar wage rate has been stable at this level for the last three years.
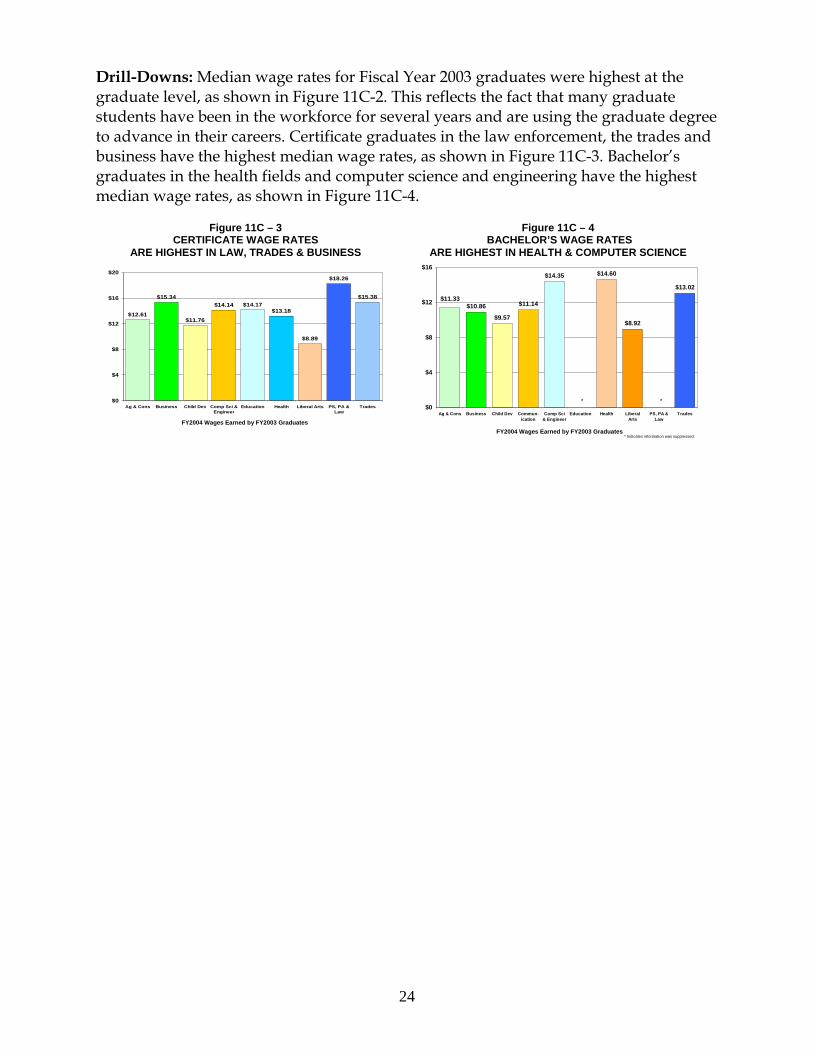
24
Figure 11C – 3 CERTIFICATE WAGE RATES
ARE HIGHEST IN LAW, TRADES & BUSINESS
$12.61
$15.34
$11.76
$14.14 $14.17$13.18
$8.89
$18.26
$15.38
$0
$4
$8
$12
$16
$20
Ag & Cons Business Child Dev Comp Sci &Engineer
Education Health Liberal Arts PS, PA &Law
Trades
FY2004 Wages Earned by FY2003 Graduates
Figure 11C – 4 BACHELOR’S WAGE RATES
ARE HIGHEST IN HEALTH & COMPUTER SCIENCE
$10.86
$9.57
$11.14
$14.35 $14.60
$8.92
$13.02
$11.33
$0
$4
$8
$12
$16
Ag & Cons Business Child Dev Commun-ication
Comp Sci& Engineer
Education Health LiberalArts
PS, PA &Law
Trades
FY2004 Wages Earned by FY2003 Graduates * Indicates information was suppressed.
* *
Drill-Downs: Median wage rates for Fiscal Year 2003 graduates were highest at the graduate level, as shown in Figure 11C-2. This reflects the fact that many graduate students have been in the workforce for several years and are using the graduate degree to advance in their careers. Certificate graduates in the law enforcement, the trades and business have the highest median wage rates, as shown in Figure 11C-3. Bachelor’s graduates in the health fields and computer science and engineering have the highest median wage rates, as shown in Figure 11C-4.
25
Appendix A Measure 3D: Reallocation of Resources – Institutional Level Detail Measure 6C: IPEDS Graduation and Transfer-Out Rates – Institutional Level Detail
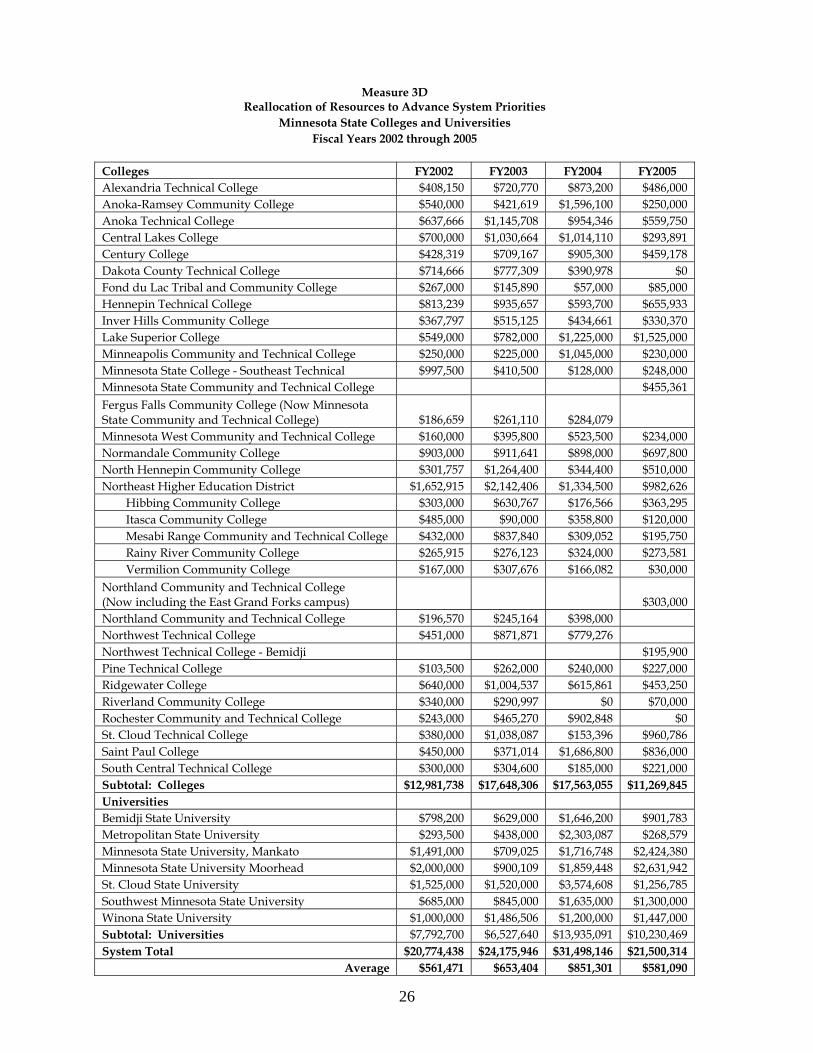
26
Measure 3D
Reallocation of Resources to Advance System Priorities Minnesota State Colleges and Universities
Fiscal Years 2002 through 2005 Colleges FY2002 FY2003 FY2004 FY2005 Alexandria Technical College $408,150 $720,770 $873,200 $486,000 Anoka-Ramsey Community College $540,000 $421,619 $1,596,100 $250,000 Anoka Technical College $637,666 $1,145,708 $954,346 $559,750 Central Lakes College $700,000 $1,030,664 $1,014,110 $293,891 Century College $428,319 $709,167 $905,300 $459,178 Dakota County Technical College $714,666 $777,309 $390,978 $0 Fond du Lac Tribal and Community College $267,000 $145,890 $57,000 $85,000 Hennepin Technical College $813,239 $935,657 $593,700 $655,933 Inver Hills Community College $367,797 $515,125 $434,661 $330,370 Lake Superior College $549,000 $782,000 $1,225,000 $1,525,000 Minneapolis Community and Technical College $250,000 $225,000 $1,045,000 $230,000 Minnesota State College - Southeast Technical $997,500 $410,500 $128,000 $248,000 Minnesota State Community and Technical College $455,361 Fergus Falls Community College (Now Minnesota State Community and Technical College) $186,659 $261,110 $284,079 Minnesota West Community and Technical College $160,000 $395,800 $523,500 $234,000 Normandale Community College $903,000 $911,641 $898,000 $697,800 North Hennepin Community College $301,757 $1,264,400 $344,400 $510,000 Northeast Higher Education District $1,652,915 $2,142,406 $1,334,500 $982,626
Hibbing Community College $303,000 $630,767 $176,566 $363,295 Itasca Community College $485,000 $90,000 $358,800 $120,000 Mesabi Range Community and Technical College $432,000 $837,840 $309,052 $195,750 Rainy River Community College $265,915 $276,123 $324,000 $273,581 Vermilion Community College $167,000 $307,676 $166,082 $30,000
Northland Community and Technical College (Now including the East Grand Forks campus) $303,000 Northland Community and Technical College $196,570 $245,164 $398,000 Northwest Technical College $451,000 $871,871 $779,276 Northwest Technical College - Bemidji $195,900 Pine Technical College $103,500 $262,000 $240,000 $227,000 Ridgewater College $640,000 $1,004,537 $615,861 $453,250 Riverland Community College $340,000 $290,997 $0 $70,000 Rochester Community and Technical College $243,000 $465,270 $902,848 $0 St. Cloud Technical College $380,000 $1,038,087 $153,396 $960,786 Saint Paul College $450,000 $371,014 $1,686,800 $836,000 South Central Technical College $300,000 $304,600 $185,000 $221,000 Subtotal: Colleges $12,981,738 $17,648,306 $17,563,055 $11,269,845 Universities Bemidji State University $798,200 $629,000 $1,646,200 $901,783 Metropolitan State University $293,500 $438,000 $2,303,087 $268,579 Minnesota State University, Mankato $1,491,000 $709,025 $1,716,748 $2,424,380 Minnesota State University Moorhead $2,000,000 $900,109 $1,859,448 $2,631,942 St. Cloud State University $1,525,000 $1,520,000 $3,574,608 $1,256,785 Southwest Minnesota State University $685,000 $845,000 $1,635,000 $1,300,000 Winona State University $1,000,000 $1,486,506 $1,200,000 $1,447,000 Subtotal: Universities $7,792,700 $6,527,640 $13,935,091 $10,230,469 System Total $20,774,438 $24,175,946 $31,498,146 $21,500,314
Average $561,471 $653,404 $851,301 $581,090
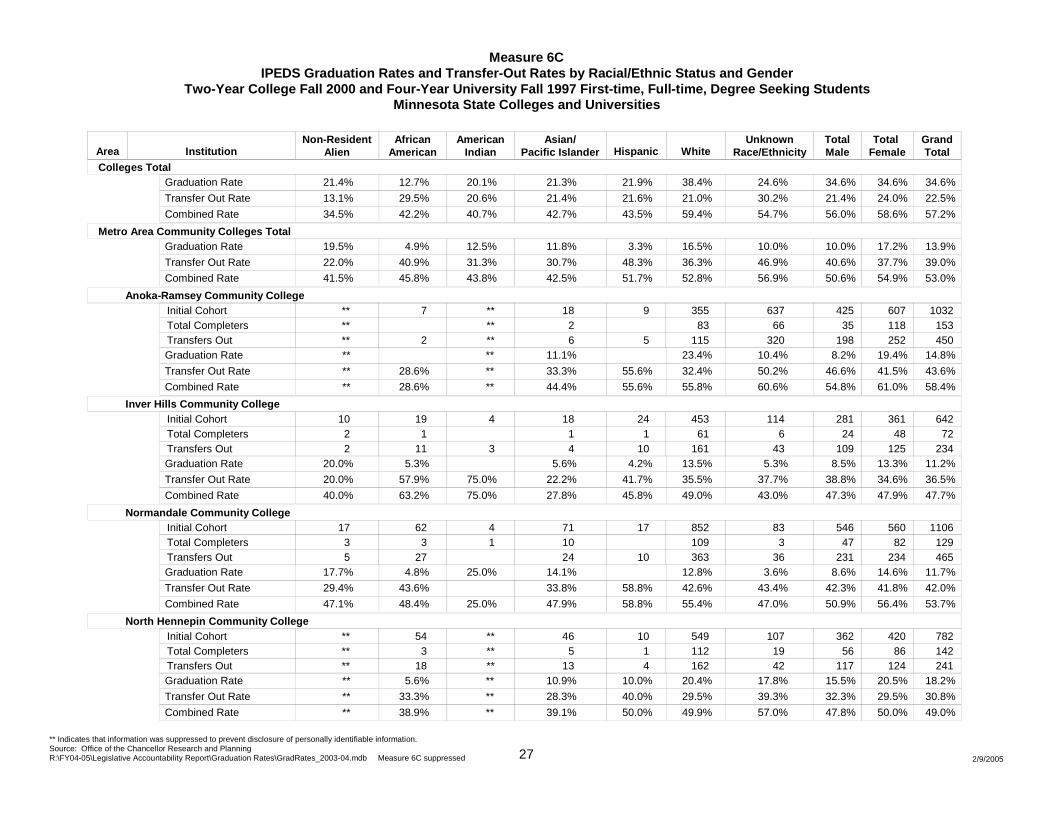
Measure 6CIPEDS Graduation Rates and Transfer-Out Rates by Racial/Ethnic Status and Gender
Two-Year College Fall 2000 and Four-Year University Fall 1997 First-time, Full-time, Degree Seeking StudentsMinnesota State Colleges and Universities
Area InstitutionNon-Resident
AlienAfrican
AmericanAmerican
IndianAsian/
Pacific Islander Hispanic WhiteUnknown
Race/EthnicityTotalMale
Total Female
GrandTotal
Colleges TotalGraduation Rate 21.4% 12.7% 20.1% 21.3% 21.9% 38.4% 24.6% 34.6% 34.6% 34.6%
Transfer Out Rate 13.1% 29.5% 20.6% 21.4% 21.6% 21.0% 30.2% 21.4% 24.0% 22.5%
Combined Rate 34.5% 42.2% 40.7% 42.7% 43.5% 59.4% 54.7% 56.0% 58.6% 57.2%
Metro Area Community Colleges TotalGraduation Rate 19.5% 4.9% 12.5% 11.8% 3.3% 16.5% 10.0% 10.0% 17.2% 13.9%
Transfer Out Rate 22.0% 40.9% 31.3% 30.7% 48.3% 36.3% 46.9% 40.6% 37.7% 39.0%
Combined Rate 41.5% 45.8% 43.8% 42.5% 51.7% 52.8% 56.9% 50.6% 54.9% 53.0%
Anoka-Ramsey Community College** 7 ** 18 9 355 637 425 607 1032 Initial Cohort** ** 2 83 66 35 118 153 Total Completers** 2 ** 6 5 115 320 198 252 450 Transfers Out
Graduation Rate ** ** 11.1% 23.4% 10.4% 8.2% 19.4% 14.8%
Transfer Out Rate ** 28.6% ** 33.3% 55.6% 32.4% 50.2% 46.6% 41.5% 43.6%
Combined Rate ** 28.6% ** 44.4% 55.6% 55.8% 60.6% 54.8% 61.0% 58.4%
Inver Hills Community College10 19 4 18 24 453 114 281 361 642 Initial Cohort2 1 1 1 61 6 24 48 72 Total Completers2 11 3 4 10 161 43 109 125 234 Transfers Out
Graduation Rate 20.0% 5.3% 5.6% 4.2% 13.5% 5.3% 8.5% 13.3% 11.2%
Transfer Out Rate 20.0% 57.9% 75.0% 22.2% 41.7% 35.5% 37.7% 38.8% 34.6% 36.5%
Combined Rate 40.0% 63.2% 75.0% 27.8% 45.8% 49.0% 43.0% 47.3% 47.9% 47.7%
Normandale Community College17 62 4 71 17 852 83 546 560 1106 Initial Cohort3 3 1 10 109 3 47 82 129 Total Completers5 27 24 10 363 36 231 234 465 Transfers Out
Graduation Rate 17.7% 4.8% 25.0% 14.1% 12.8% 3.6% 8.6% 14.6% 11.7%
Transfer Out Rate 29.4% 43.6% 33.8% 58.8% 42.6% 43.4% 42.3% 41.8% 42.0%
Combined Rate 47.1% 48.4% 25.0% 47.9% 58.8% 55.4% 47.0% 50.9% 56.4% 53.7%
North Hennepin Community College** 54 ** 46 10 549 107 362 420 782 Initial Cohort** 3 ** 5 1 112 19 56 86 142 Total Completers** 18 ** 13 4 162 42 117 124 241 Transfers Out
Graduation Rate ** 5.6% ** 10.9% 10.0% 20.4% 17.8% 15.5% 20.5% 18.2%
Transfer Out Rate ** 33.3% ** 28.3% 40.0% 29.5% 39.3% 32.3% 29.5% 30.8%
Combined Rate ** 38.9% ** 39.1% 50.0% 49.9% 57.0% 47.8% 50.0% 49.0%
** Indicates that information was suppressed to prevent disclosure of personally identifiable information.Source: Office of the Chancellor Research and PlanningR:\FY04-05\Legislative Accountability Report\Graduation Rates\GradRates_2003-04.mdb Measure 6C suppressed 2/9/200527
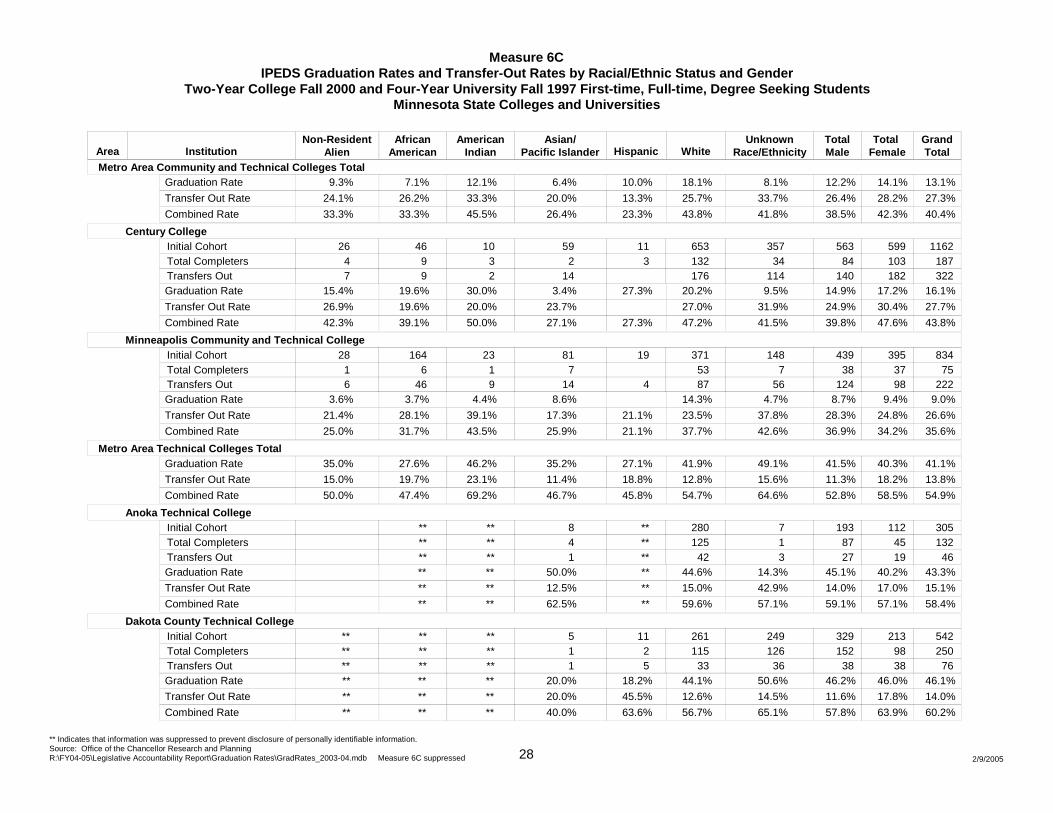
Measure 6CIPEDS Graduation Rates and Transfer-Out Rates by Racial/Ethnic Status and Gender
Two-Year College Fall 2000 and Four-Year University Fall 1997 First-time, Full-time, Degree Seeking StudentsMinnesota State Colleges and Universities
Area InstitutionNon-Resident
AlienAfrican
AmericanAmerican
IndianAsian/
Pacific Islander Hispanic WhiteUnknown
Race/EthnicityTotalMale
Total Female
GrandTotal
Metro Area Community and Technical Colleges TotalGraduation Rate 9.3% 7.1% 12.1% 6.4% 10.0% 18.1% 8.1% 12.2% 14.1% 13.1%
Transfer Out Rate 24.1% 26.2% 33.3% 20.0% 13.3% 25.7% 33.7% 26.4% 28.2% 27.3%
Combined Rate 33.3% 33.3% 45.5% 26.4% 23.3% 43.8% 41.8% 38.5% 42.3% 40.4%
Century College26 46 10 59 11 653 357 563 599 1162 Initial Cohort4 9 3 2 3 132 34 84 103 187 Total Completers7 9 2 14 176 114 140 182 322 Transfers Out
Graduation Rate 15.4% 19.6% 30.0% 3.4% 27.3% 20.2% 9.5% 14.9% 17.2% 16.1%
Transfer Out Rate 26.9% 19.6% 20.0% 23.7% 27.0% 31.9% 24.9% 30.4% 27.7%
Combined Rate 42.3% 39.1% 50.0% 27.1% 27.3% 47.2% 41.5% 39.8% 47.6% 43.8%
Minneapolis Community and Technical College28 164 23 81 19 371 148 439 395 834 Initial Cohort1 6 1 7 53 7 38 37 75 Total Completers6 46 9 14 4 87 56 124 98 222 Transfers Out
Graduation Rate 3.6% 3.7% 4.4% 8.6% 14.3% 4.7% 8.7% 9.4% 9.0%
Transfer Out Rate 21.4% 28.1% 39.1% 17.3% 21.1% 23.5% 37.8% 28.3% 24.8% 26.6%
Combined Rate 25.0% 31.7% 43.5% 25.9% 21.1% 37.7% 42.6% 36.9% 34.2% 35.6%
Metro Area Technical Colleges TotalGraduation Rate 35.0% 27.6% 46.2% 35.2% 27.1% 41.9% 49.1% 41.5% 40.3% 41.1%
Transfer Out Rate 15.0% 19.7% 23.1% 11.4% 18.8% 12.8% 15.6% 11.3% 18.2% 13.8%
Combined Rate 50.0% 47.4% 69.2% 46.7% 45.8% 54.7% 64.6% 52.8% 58.5% 54.9%
Anoka Technical College ** ** 8 ** 280 7 193 112 305 Initial Cohort ** ** 4 ** 125 1 87 45 132 Total Completers ** ** 1 ** 42 3 27 19 46 Transfers Out
Graduation Rate ** ** 50.0% ** 44.6% 14.3% 45.1% 40.2% 43.3%
Transfer Out Rate ** ** 12.5% ** 15.0% 42.9% 14.0% 17.0% 15.1%
Combined Rate ** ** 62.5% ** 59.6% 57.1% 59.1% 57.1% 58.4%
Dakota County Technical College** ** ** 5 11 261 249 329 213 542 Initial Cohort** ** ** 1 2 115 126 152 98 250 Total Completers** ** ** 1 5 33 36 38 38 76 Transfers Out
Graduation Rate ** ** ** 20.0% 18.2% 44.1% 50.6% 46.2% 46.0% 46.1%
Transfer Out Rate ** ** ** 20.0% 45.5% 12.6% 14.5% 11.6% 17.8% 14.0%
Combined Rate ** ** ** 40.0% 63.6% 56.7% 65.1% 57.8% 63.9% 60.2%
** Indicates that information was suppressed to prevent disclosure of personally identifiable information.Source: Office of the Chancellor Research and PlanningR:\FY04-05\Legislative Accountability Report\Graduation Rates\GradRates_2003-04.mdb Measure 6C suppressed 2/9/200528
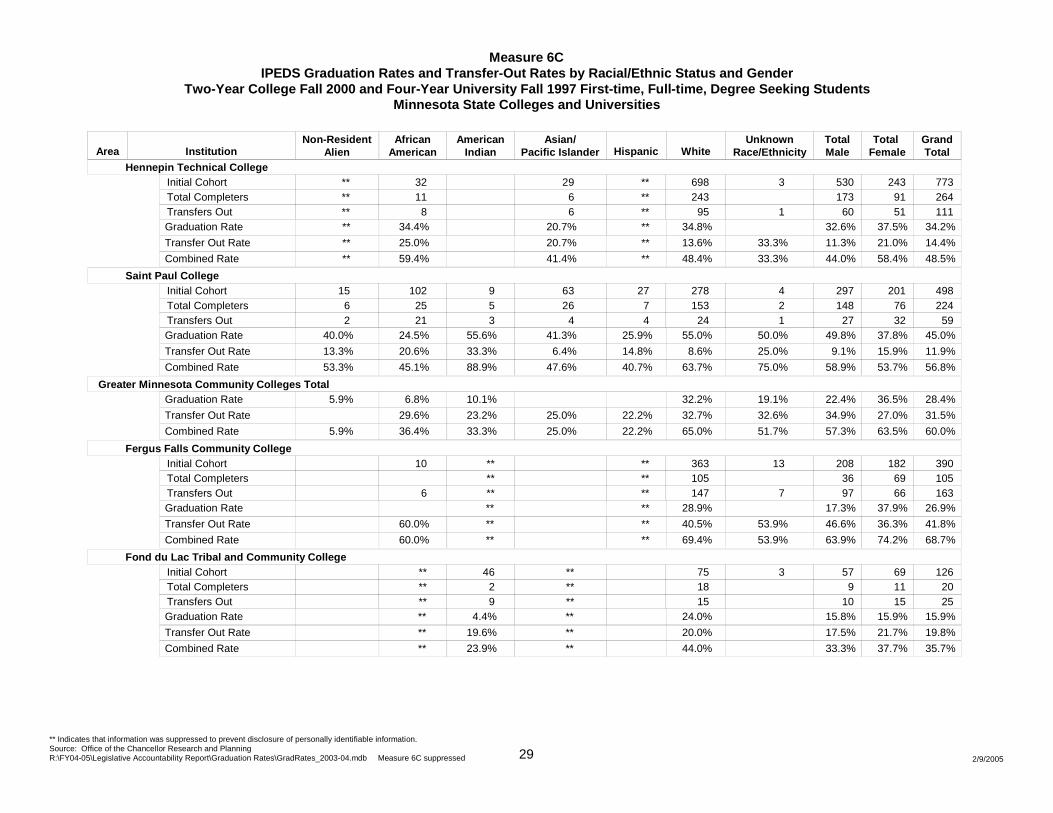
Measure 6CIPEDS Graduation Rates and Transfer-Out Rates by Racial/Ethnic Status and Gender
Two-Year College Fall 2000 and Four-Year University Fall 1997 First-time, Full-time, Degree Seeking StudentsMinnesota State Colleges and Universities
Area InstitutionNon-Resident
AlienAfrican
AmericanAmerican
IndianAsian/
Pacific Islander Hispanic WhiteUnknown
Race/EthnicityTotalMale
Total Female
GrandTotal
Hennepin Technical College** 32 29 ** 698 3 530 243 773 Initial Cohort** 11 6 ** 243 173 91 264 Total Completers** 8 6 ** 95 1 60 51 111 Transfers Out
Graduation Rate ** 34.4% 20.7% ** 34.8% 32.6% 37.5% 34.2%
Transfer Out Rate ** 25.0% 20.7% ** 13.6% 33.3% 11.3% 21.0% 14.4%
Combined Rate ** 59.4% 41.4% ** 48.4% 33.3% 44.0% 58.4% 48.5%
Saint Paul College15 102 9 63 27 278 4 297 201 498 Initial Cohort6 25 5 26 7 153 2 148 76 224 Total Completers2 21 3 4 4 24 1 27 32 59 Transfers Out
Graduation Rate 40.0% 24.5% 55.6% 41.3% 25.9% 55.0% 50.0% 49.8% 37.8% 45.0%
Transfer Out Rate 13.3% 20.6% 33.3% 6.4% 14.8% 8.6% 25.0% 9.1% 15.9% 11.9%
Combined Rate 53.3% 45.1% 88.9% 47.6% 40.7% 63.7% 75.0% 58.9% 53.7% 56.8%
Greater Minnesota Community Colleges TotalGraduation Rate 5.9% 6.8% 10.1% 32.2% 19.1% 22.4% 36.5% 28.4%
Transfer Out Rate 29.6% 23.2% 25.0% 22.2% 32.7% 32.6% 34.9% 27.0% 31.5%
Combined Rate 5.9% 36.4% 33.3% 25.0% 22.2% 65.0% 51.7% 57.3% 63.5% 60.0%
Fergus Falls Community College 10 ** ** 363 13 208 182 390 Initial Cohort ** ** 105 36 69 105 Total Completers 6 ** ** 147 7 97 66 163 Transfers Out
Graduation Rate ** ** 28.9% 17.3% 37.9% 26.9%
Transfer Out Rate 60.0% ** ** 40.5% 53.9% 46.6% 36.3% 41.8%
Combined Rate 60.0% ** ** 69.4% 53.9% 63.9% 74.2% 68.7%
Fond du Lac Tribal and Community College ** 46 ** 75 3 57 69 126 Initial Cohort ** 2 ** 18 9 11 20 Total Completers ** 9 ** 15 10 15 25 Transfers Out
Graduation Rate ** 4.4% ** 24.0% 15.8% 15.9% 15.9%
Transfer Out Rate ** 19.6% ** 20.0% 17.5% 21.7% 19.8%
Combined Rate ** 23.9% ** 44.0% 33.3% 37.7% 35.7%
** Indicates that information was suppressed to prevent disclosure of personally identifiable information.Source: Office of the Chancellor Research and PlanningR:\FY04-05\Legislative Accountability Report\Graduation Rates\GradRates_2003-04.mdb Measure 6C suppressed 2/9/200529
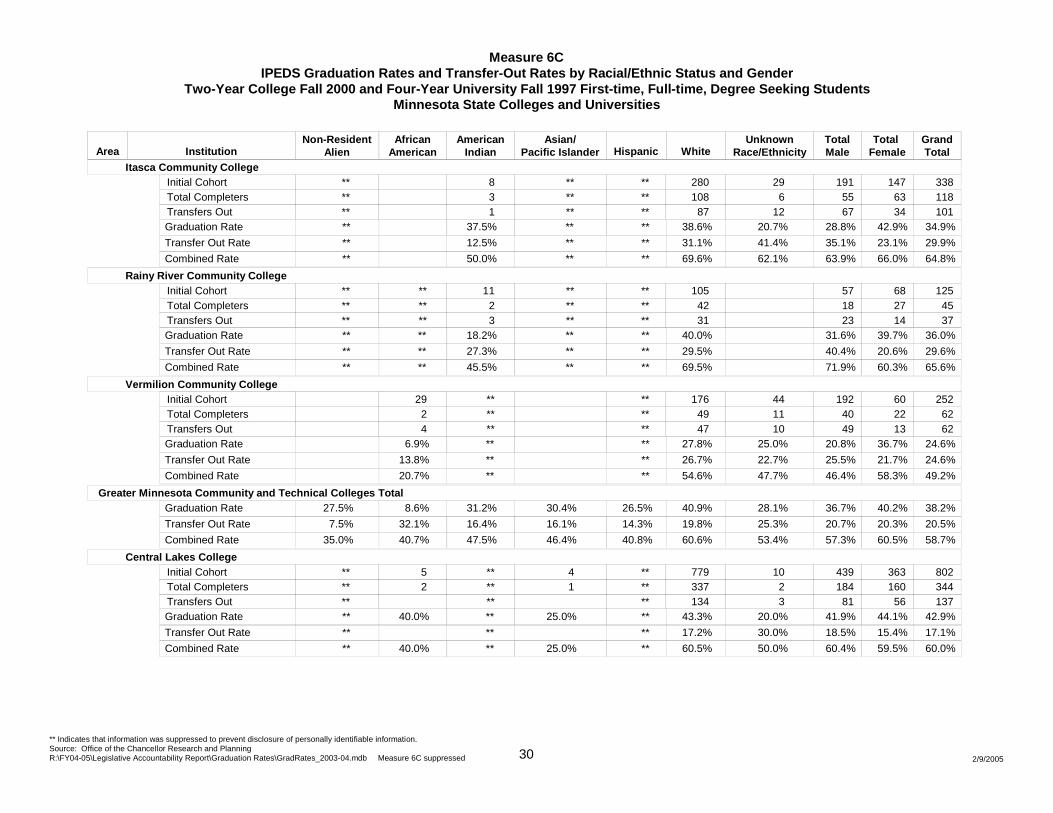
Measure 6CIPEDS Graduation Rates and Transfer-Out Rates by Racial/Ethnic Status and Gender
Two-Year College Fall 2000 and Four-Year University Fall 1997 First-time, Full-time, Degree Seeking StudentsMinnesota State Colleges and Universities
Area InstitutionNon-Resident
AlienAfrican
AmericanAmerican
IndianAsian/
Pacific Islander Hispanic WhiteUnknown
Race/EthnicityTotalMale
Total Female
GrandTotal
Itasca Community College** 8 ** ** 280 29 191 147 338 Initial Cohort** 3 ** ** 108 6 55 63 118 Total Completers** 1 ** ** 87 12 67 34 101 Transfers Out
Graduation Rate ** 37.5% ** ** 38.6% 20.7% 28.8% 42.9% 34.9%
Transfer Out Rate ** 12.5% ** ** 31.1% 41.4% 35.1% 23.1% 29.9%
Combined Rate ** 50.0% ** ** 69.6% 62.1% 63.9% 66.0% 64.8%
Rainy River Community College** ** 11 ** ** 105 57 68 125 Initial Cohort** ** 2 ** ** 42 18 27 45 Total Completers** ** 3 ** ** 31 23 14 37 Transfers Out
Graduation Rate ** ** 18.2% ** ** 40.0% 31.6% 39.7% 36.0%
Transfer Out Rate ** ** 27.3% ** ** 29.5% 40.4% 20.6% 29.6%
Combined Rate ** ** 45.5% ** ** 69.5% 71.9% 60.3% 65.6%
Vermilion Community College 29 ** ** 176 44 192 60 252 Initial Cohort 2 ** ** 49 11 40 22 62 Total Completers 4 ** ** 47 10 49 13 62 Transfers Out
Graduation Rate 6.9% ** ** 27.8% 25.0% 20.8% 36.7% 24.6%
Transfer Out Rate 13.8% ** ** 26.7% 22.7% 25.5% 21.7% 24.6%
Combined Rate 20.7% ** ** 54.6% 47.7% 46.4% 58.3% 49.2%
Greater Minnesota Community and Technical Colleges TotalGraduation Rate 27.5% 8.6% 31.2% 30.4% 26.5% 40.9% 28.1% 36.7% 40.2% 38.2%
Transfer Out Rate 7.5% 32.1% 16.4% 16.1% 14.3% 19.8% 25.3% 20.7% 20.3% 20.5%
Combined Rate 35.0% 40.7% 47.5% 46.4% 40.8% 60.6% 53.4% 57.3% 60.5% 58.7%
Central Lakes College** 5 ** 4 ** 779 10 439 363 802 Initial Cohort** 2 ** 1 ** 337 2 184 160 344 Total Completers** ** ** 134 3 81 56 137 Transfers Out
Graduation Rate ** 40.0% ** 25.0% ** 43.3% 20.0% 41.9% 44.1% 42.9%
Transfer Out Rate ** ** ** 17.2% 30.0% 18.5% 15.4% 17.1%
Combined Rate ** 40.0% ** 25.0% ** 60.5% 50.0% 60.4% 59.5% 60.0%
** Indicates that information was suppressed to prevent disclosure of personally identifiable information.Source: Office of the Chancellor Research and PlanningR:\FY04-05\Legislative Accountability Report\Graduation Rates\GradRates_2003-04.mdb Measure 6C suppressed 2/9/200530
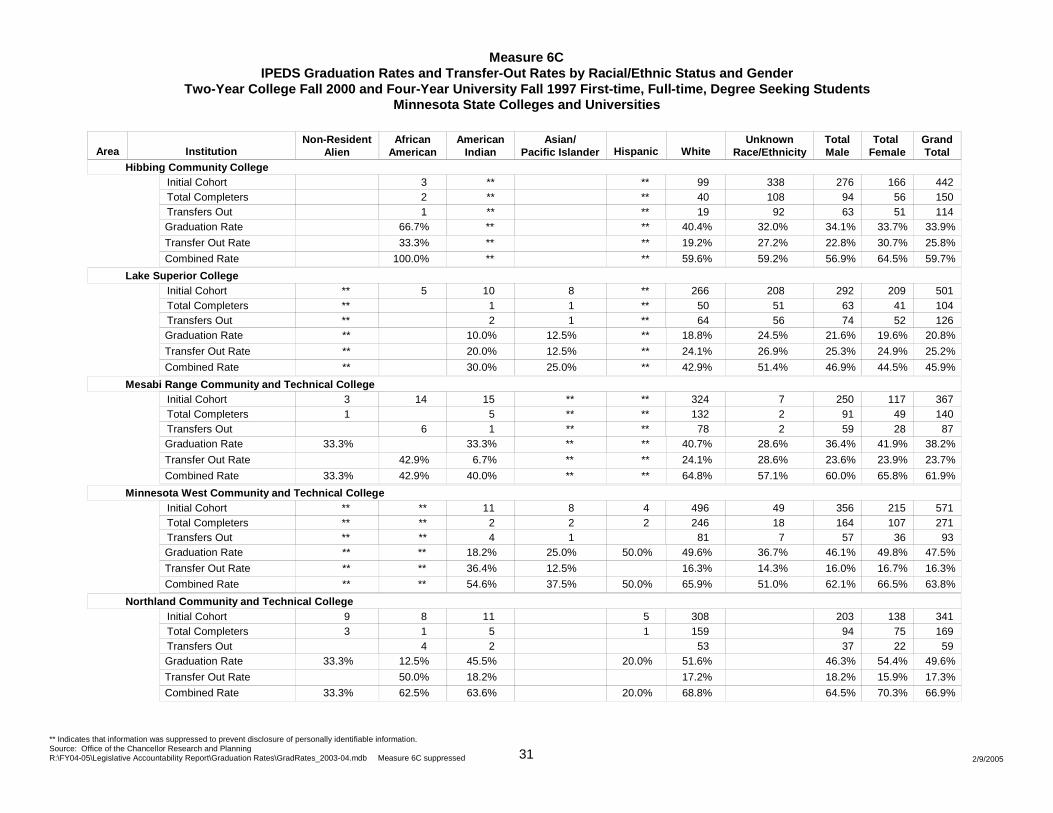
Measure 6CIPEDS Graduation Rates and Transfer-Out Rates by Racial/Ethnic Status and Gender
Two-Year College Fall 2000 and Four-Year University Fall 1997 First-time, Full-time, Degree Seeking StudentsMinnesota State Colleges and Universities
Area InstitutionNon-Resident
AlienAfrican
AmericanAmerican
IndianAsian/
Pacific Islander Hispanic WhiteUnknown
Race/EthnicityTotalMale
Total Female
GrandTotal
Hibbing Community College 3 ** ** 99 338 276 166 442 Initial Cohort 2 ** ** 40 108 94 56 150 Total Completers 1 ** ** 19 92 63 51 114 Transfers Out
Graduation Rate 66.7% ** ** 40.4% 32.0% 34.1% 33.7% 33.9%
Transfer Out Rate 33.3% ** ** 19.2% 27.2% 22.8% 30.7% 25.8%
Combined Rate 100.0% ** ** 59.6% 59.2% 56.9% 64.5% 59.7%
Lake Superior College** 5 10 8 ** 266 208 292 209 501 Initial Cohort** 1 1 ** 50 51 63 41 104 Total Completers** 2 1 ** 64 56 74 52 126 Transfers Out
Graduation Rate ** 10.0% 12.5% ** 18.8% 24.5% 21.6% 19.6% 20.8%
Transfer Out Rate ** 20.0% 12.5% ** 24.1% 26.9% 25.3% 24.9% 25.2%
Combined Rate ** 30.0% 25.0% ** 42.9% 51.4% 46.9% 44.5% 45.9%
Mesabi Range Community and Technical College3 14 15 ** ** 324 7 250 117 367 Initial Cohort1 5 ** ** 132 2 91 49 140 Total Completers
6 1 ** ** 78 2 59 28 87 Transfers OutGraduation Rate 33.3% 33.3% ** ** 40.7% 28.6% 36.4% 41.9% 38.2%
Transfer Out Rate 42.9% 6.7% ** ** 24.1% 28.6% 23.6% 23.9% 23.7%
Combined Rate 33.3% 42.9% 40.0% ** ** 64.8% 57.1% 60.0% 65.8% 61.9%
Minnesota West Community and Technical College** ** 11 8 4 496 49 356 215 571 Initial Cohort** ** 2 2 2 246 18 164 107 271 Total Completers** ** 4 1 81 7 57 36 93 Transfers Out
Graduation Rate ** ** 18.2% 25.0% 50.0% 49.6% 36.7% 46.1% 49.8% 47.5%
Transfer Out Rate ** ** 36.4% 12.5% 16.3% 14.3% 16.0% 16.7% 16.3%
Combined Rate ** ** 54.6% 37.5% 50.0% 65.9% 51.0% 62.1% 66.5% 63.8%
Northland Community and Technical College9 8 11 5 308 203 138 341 Initial Cohort3 1 5 1 159 94 75 169 Total Completers
4 2 53 37 22 59 Transfers OutGraduation Rate 33.3% 12.5% 45.5% 20.0% 51.6% 46.3% 54.4% 49.6%
Transfer Out Rate 50.0% 18.2% 17.2% 18.2% 15.9% 17.3%
Combined Rate 33.3% 62.5% 63.6% 20.0% 68.8% 64.5% 70.3% 66.9%
** Indicates that information was suppressed to prevent disclosure of personally identifiable information.Source: Office of the Chancellor Research and PlanningR:\FY04-05\Legislative Accountability Report\Graduation Rates\GradRates_2003-04.mdb Measure 6C suppressed 2/9/200531
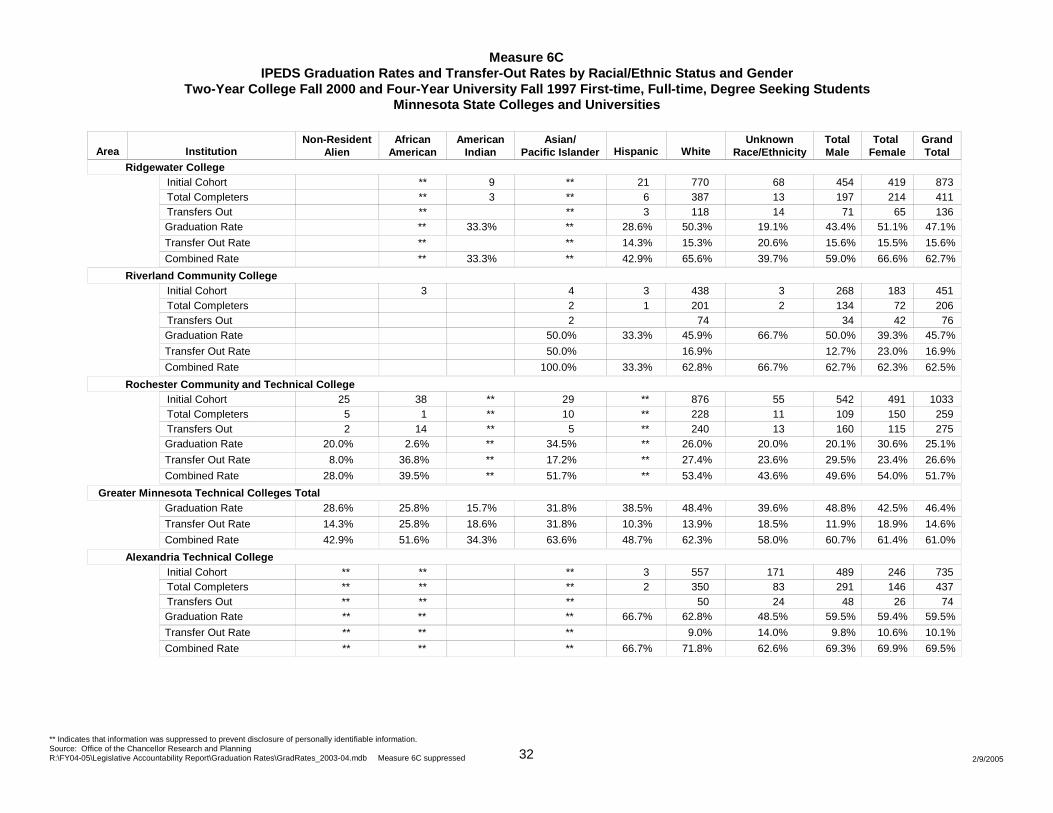
Measure 6CIPEDS Graduation Rates and Transfer-Out Rates by Racial/Ethnic Status and Gender
Two-Year College Fall 2000 and Four-Year University Fall 1997 First-time, Full-time, Degree Seeking StudentsMinnesota State Colleges and Universities
Area InstitutionNon-Resident
AlienAfrican
AmericanAmerican
IndianAsian/
Pacific Islander Hispanic WhiteUnknown
Race/EthnicityTotalMale
Total Female
GrandTotal
Ridgewater College ** 9 ** 21 770 68 454 419 873 Initial Cohort ** 3 ** 6 387 13 197 214 411 Total Completers ** ** 3 118 14 71 65 136 Transfers Out
Graduation Rate ** 33.3% ** 28.6% 50.3% 19.1% 43.4% 51.1% 47.1%
Transfer Out Rate ** ** 14.3% 15.3% 20.6% 15.6% 15.5% 15.6%
Combined Rate ** 33.3% ** 42.9% 65.6% 39.7% 59.0% 66.6% 62.7%
Riverland Community College 3 4 3 438 3 268 183 451 Initial Cohort 2 1 201 2 134 72 206 Total Completers 2 74 34 42 76 Transfers Out
Graduation Rate 50.0% 33.3% 45.9% 66.7% 50.0% 39.3% 45.7%
Transfer Out Rate 50.0% 16.9% 12.7% 23.0% 16.9%
Combined Rate 100.0% 33.3% 62.8% 66.7% 62.7% 62.3% 62.5%
Rochester Community and Technical College25 38 ** 29 ** 876 55 542 491 1033 Initial Cohort5 1 ** 10 ** 228 11 109 150 259 Total Completers2 14 ** 5 ** 240 13 160 115 275 Transfers Out
Graduation Rate 20.0% 2.6% ** 34.5% ** 26.0% 20.0% 20.1% 30.6% 25.1%
Transfer Out Rate 8.0% 36.8% ** 17.2% ** 27.4% 23.6% 29.5% 23.4% 26.6%
Combined Rate 28.0% 39.5% ** 51.7% ** 53.4% 43.6% 49.6% 54.0% 51.7%
Greater Minnesota Technical Colleges TotalGraduation Rate 28.6% 25.8% 15.7% 31.8% 38.5% 48.4% 39.6% 48.8% 42.5% 46.4%
Transfer Out Rate 14.3% 25.8% 18.6% 31.8% 10.3% 13.9% 18.5% 11.9% 18.9% 14.6%
Combined Rate 42.9% 51.6% 34.3% 63.6% 48.7% 62.3% 58.0% 60.7% 61.4% 61.0%
Alexandria Technical College** ** ** 3 557 171 489 246 735 Initial Cohort** ** ** 2 350 83 291 146 437 Total Completers** ** ** 50 24 48 26 74 Transfers Out
Graduation Rate ** ** ** 66.7% 62.8% 48.5% 59.5% 59.4% 59.5%
Transfer Out Rate ** ** ** 9.0% 14.0% 9.8% 10.6% 10.1%
Combined Rate ** ** ** 66.7% 71.8% 62.6% 69.3% 69.9% 69.5%
** Indicates that information was suppressed to prevent disclosure of personally identifiable information.Source: Office of the Chancellor Research and PlanningR:\FY04-05\Legislative Accountability Report\Graduation Rates\GradRates_2003-04.mdb Measure 6C suppressed 2/9/200532
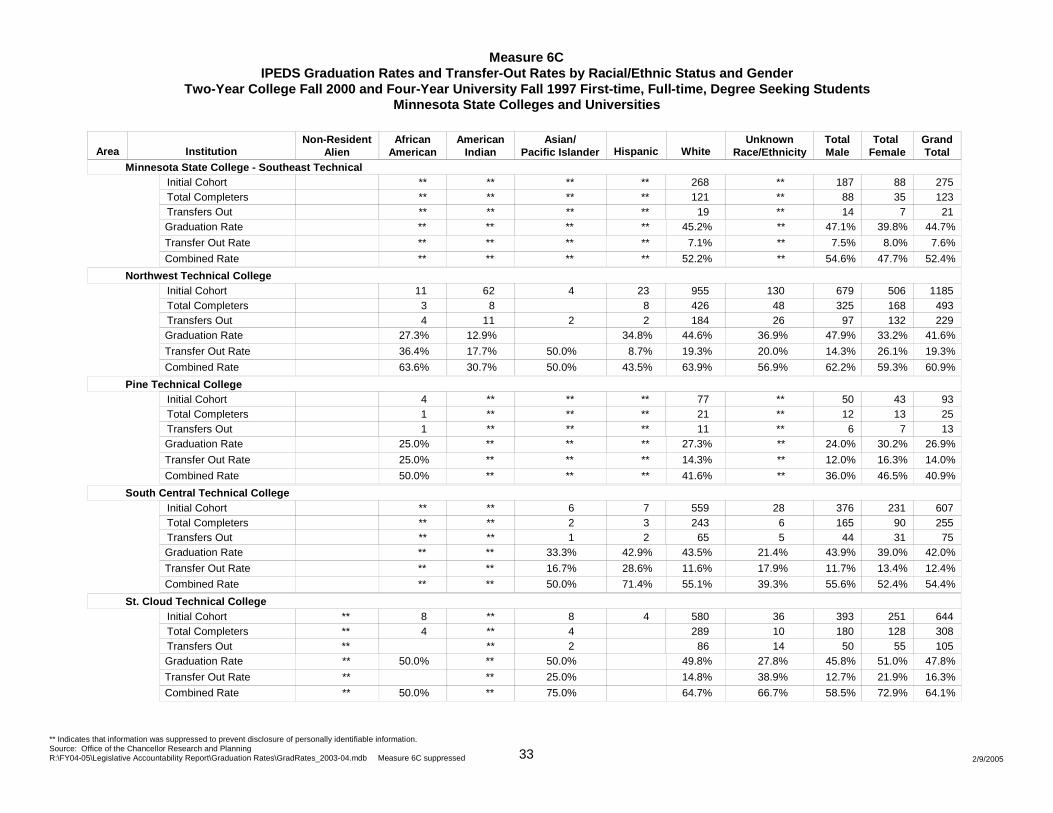
Measure 6CIPEDS Graduation Rates and Transfer-Out Rates by Racial/Ethnic Status and Gender
Two-Year College Fall 2000 and Four-Year University Fall 1997 First-time, Full-time, Degree Seeking StudentsMinnesota State Colleges and Universities
Area InstitutionNon-Resident
AlienAfrican
AmericanAmerican
IndianAsian/
Pacific Islander Hispanic WhiteUnknown
Race/EthnicityTotalMale
Total Female
GrandTotal
Minnesota State College - Southeast Technical ** ** ** ** 268 ** 187 88 275 Initial Cohort ** ** ** ** 121 ** 88 35 123 Total Completers ** ** ** ** 19 ** 14 7 21 Transfers Out
Graduation Rate ** ** ** ** 45.2% ** 47.1% 39.8% 44.7%
Transfer Out Rate ** ** ** ** 7.1% ** 7.5% 8.0% 7.6%
Combined Rate ** ** ** ** 52.2% ** 54.6% 47.7% 52.4%
Northwest Technical College 11 62 4 23 955 130 679 506 1185 Initial Cohort 3 8 8 426 48 325 168 493 Total Completers 4 11 2 2 184 26 97 132 229 Transfers Out
Graduation Rate 27.3% 12.9% 34.8% 44.6% 36.9% 47.9% 33.2% 41.6%
Transfer Out Rate 36.4% 17.7% 50.0% 8.7% 19.3% 20.0% 14.3% 26.1% 19.3%
Combined Rate 63.6% 30.7% 50.0% 43.5% 63.9% 56.9% 62.2% 59.3% 60.9%
Pine Technical College 4 ** ** ** 77 ** 50 43 93 Initial Cohort 1 ** ** ** 21 ** 12 13 25 Total Completers 1 ** ** ** 11 ** 6 7 13 Transfers Out
Graduation Rate 25.0% ** ** ** 27.3% ** 24.0% 30.2% 26.9%
Transfer Out Rate 25.0% ** ** ** 14.3% ** 12.0% 16.3% 14.0%
Combined Rate 50.0% ** ** ** 41.6% ** 36.0% 46.5% 40.9%
South Central Technical College ** ** 6 7 559 28 376 231 607 Initial Cohort ** ** 2 3 243 6 165 90 255 Total Completers ** ** 1 2 65 5 44 31 75 Transfers Out
Graduation Rate ** ** 33.3% 42.9% 43.5% 21.4% 43.9% 39.0% 42.0%
Transfer Out Rate ** ** 16.7% 28.6% 11.6% 17.9% 11.7% 13.4% 12.4%
Combined Rate ** ** 50.0% 71.4% 55.1% 39.3% 55.6% 52.4% 54.4%
St. Cloud Technical College** 8 ** 8 4 580 36 393 251 644 Initial Cohort** 4 ** 4 289 10 180 128 308 Total Completers** ** 2 86 14 50 55 105 Transfers Out
Graduation Rate ** 50.0% ** 50.0% 49.8% 27.8% 45.8% 51.0% 47.8%
Transfer Out Rate ** ** 25.0% 14.8% 38.9% 12.7% 21.9% 16.3%
Combined Rate ** 50.0% ** 75.0% 64.7% 66.7% 58.5% 72.9% 64.1%
** Indicates that information was suppressed to prevent disclosure of personally identifiable information.Source: Office of the Chancellor Research and PlanningR:\FY04-05\Legislative Accountability Report\Graduation Rates\GradRates_2003-04.mdb Measure 6C suppressed 2/9/200533
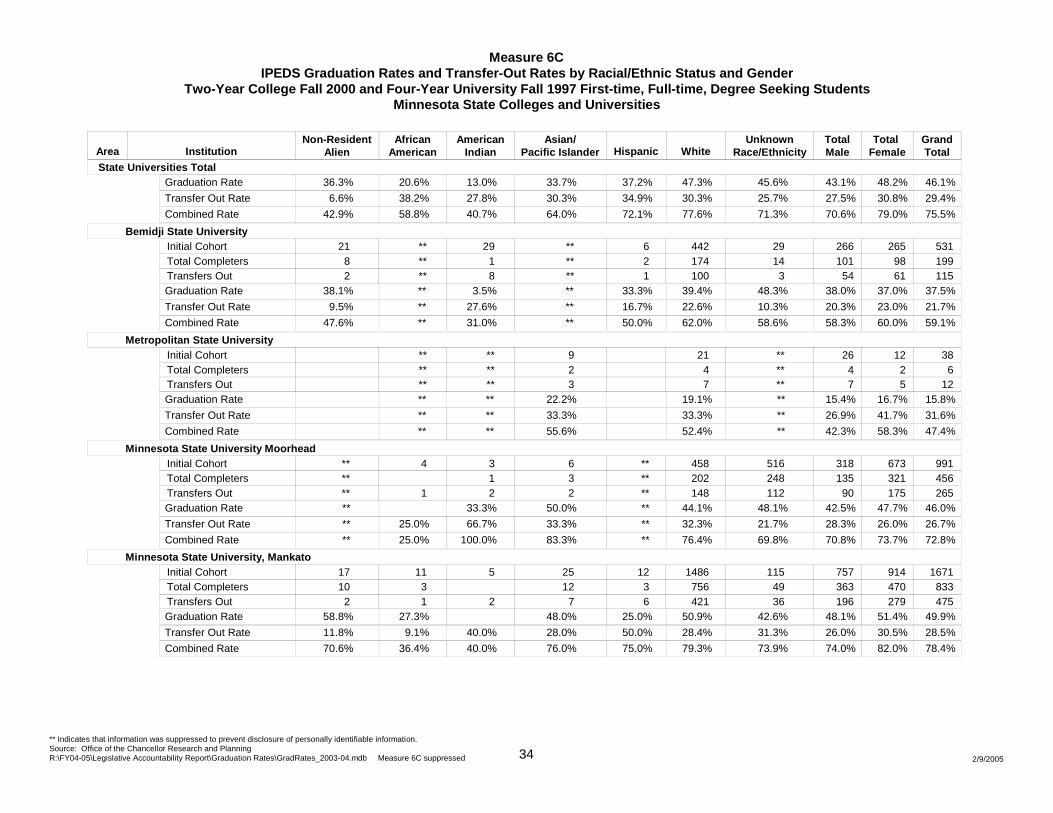
Measure 6CIPEDS Graduation Rates and Transfer-Out Rates by Racial/Ethnic Status and Gender
Two-Year College Fall 2000 and Four-Year University Fall 1997 First-time, Full-time, Degree Seeking StudentsMinnesota State Colleges and Universities
Area InstitutionNon-Resident
AlienAfrican
AmericanAmerican
IndianAsian/
Pacific Islander Hispanic WhiteUnknown
Race/EthnicityTotalMale
Total Female
GrandTotal
State Universities TotalGraduation Rate 36.3% 20.6% 13.0% 33.7% 37.2% 47.3% 45.6% 43.1% 48.2% 46.1%
Transfer Out Rate 6.6% 38.2% 27.8% 30.3% 34.9% 30.3% 25.7% 27.5% 30.8% 29.4%
Combined Rate 42.9% 58.8% 40.7% 64.0% 72.1% 77.6% 71.3% 70.6% 79.0% 75.5%
Bemidji State University21 ** 29 ** 6 442 29 266 265 531 Initial Cohort8 ** 1 ** 2 174 14 101 98 199 Total Completers2 ** 8 ** 1 100 3 54 61 115 Transfers Out
Graduation Rate 38.1% ** 3.5% ** 33.3% 39.4% 48.3% 38.0% 37.0% 37.5%
Transfer Out Rate 9.5% ** 27.6% ** 16.7% 22.6% 10.3% 20.3% 23.0% 21.7%
Combined Rate 47.6% ** 31.0% ** 50.0% 62.0% 58.6% 58.3% 60.0% 59.1%
Metropolitan State University ** ** 9 21 ** 26 12 38 Initial Cohort ** ** 2 4 ** 4 2 6 Total Completers ** ** 3 7 ** 7 5 12 Transfers Out
Graduation Rate ** ** 22.2% 19.1% ** 15.4% 16.7% 15.8%
Transfer Out Rate ** ** 33.3% 33.3% ** 26.9% 41.7% 31.6%
Combined Rate ** ** 55.6% 52.4% ** 42.3% 58.3% 47.4%
Minnesota State University Moorhead** 4 3 6 ** 458 516 318 673 991 Initial Cohort** 1 3 ** 202 248 135 321 456 Total Completers** 1 2 2 ** 148 112 90 175 265 Transfers Out
Graduation Rate ** 33.3% 50.0% ** 44.1% 48.1% 42.5% 47.7% 46.0%
Transfer Out Rate ** 25.0% 66.7% 33.3% ** 32.3% 21.7% 28.3% 26.0% 26.7%
Combined Rate ** 25.0% 100.0% 83.3% ** 76.4% 69.8% 70.8% 73.7% 72.8%
Minnesota State University, Mankato17 11 5 25 12 1486 115 757 914 1671 Initial Cohort10 3 12 3 756 49 363 470 833 Total Completers2 1 2 7 6 421 36 196 279 475 Transfers Out
Graduation Rate 58.8% 27.3% 48.0% 25.0% 50.9% 42.6% 48.1% 51.4% 49.9%
Transfer Out Rate 11.8% 9.1% 40.0% 28.0% 50.0% 28.4% 31.3% 26.0% 30.5% 28.5%
Combined Rate 70.6% 36.4% 40.0% 76.0% 75.0% 79.3% 73.9% 74.0% 82.0% 78.4%
** Indicates that information was suppressed to prevent disclosure of personally identifiable information.Source: Office of the Chancellor Research and PlanningR:\FY04-05\Legislative Accountability Report\Graduation Rates\GradRates_2003-04.mdb Measure 6C suppressed 2/9/200534
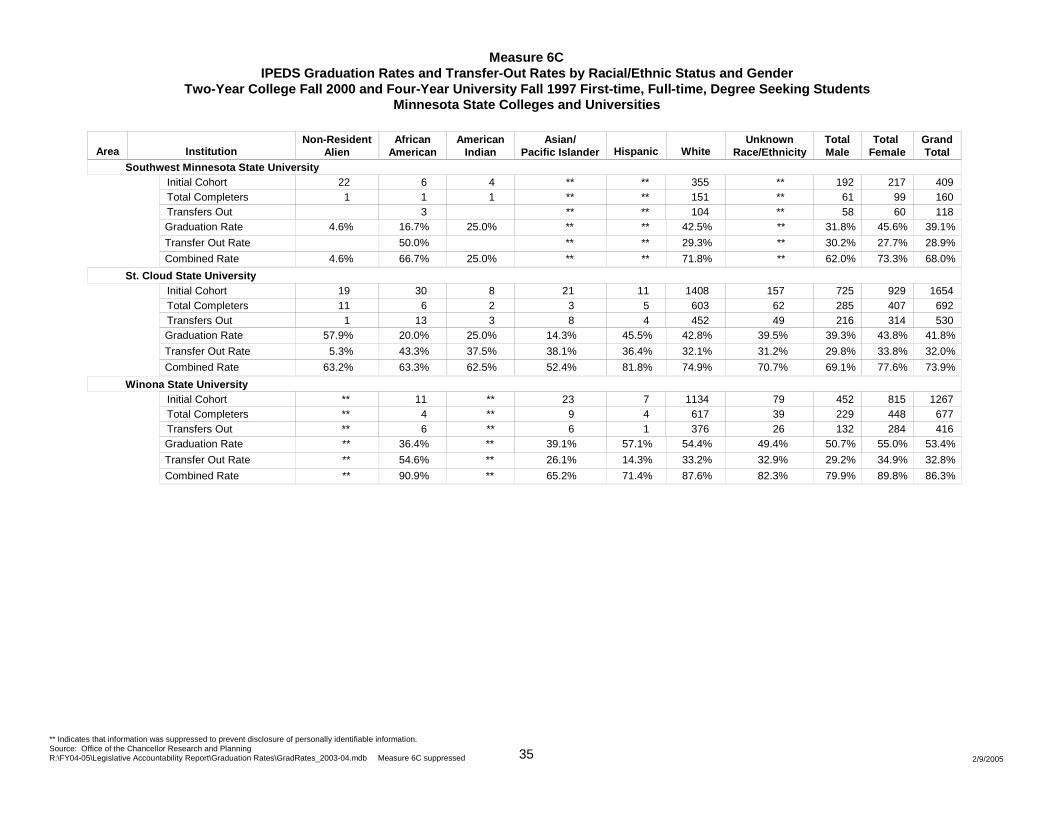
Measure 6CIPEDS Graduation Rates and Transfer-Out Rates by Racial/Ethnic Status and Gender
Two-Year College Fall 2000 and Four-Year University Fall 1997 First-time, Full-time, Degree Seeking StudentsMinnesota State Colleges and Universities
Area InstitutionNon-Resident
AlienAfrican
AmericanAmerican
IndianAsian/
Pacific Islander Hispanic WhiteUnknown
Race/EthnicityTotalMale
Total Female
GrandTotal
Southwest Minnesota State University22 6 4 ** ** 355 ** 192 217 409 Initial Cohort1 1 1 ** ** 151 ** 61 99 160 Total Completers
3 ** ** 104 ** 58 60 118 Transfers OutGraduation Rate 4.6% 16.7% 25.0% ** ** 42.5% ** 31.8% 45.6% 39.1%
Transfer Out Rate 50.0% ** ** 29.3% ** 30.2% 27.7% 28.9%
Combined Rate 4.6% 66.7% 25.0% ** ** 71.8% ** 62.0% 73.3% 68.0%
St. Cloud State University19 30 8 21 11 1408 157 725 929 1654 Initial Cohort11 6 2 3 5 603 62 285 407 692 Total Completers1 13 3 8 4 452 49 216 314 530 Transfers Out
Graduation Rate 57.9% 20.0% 25.0% 14.3% 45.5% 42.8% 39.5% 39.3% 43.8% 41.8%
Transfer Out Rate 5.3% 43.3% 37.5% 38.1% 36.4% 32.1% 31.2% 29.8% 33.8% 32.0%
Combined Rate 63.2% 63.3% 62.5% 52.4% 81.8% 74.9% 70.7% 69.1% 77.6% 73.9%
Winona State University** 11 ** 23 7 1134 79 452 815 1267 Initial Cohort** 4 ** 9 4 617 39 229 448 677 Total Completers** 6 ** 6 1 376 26 132 284 416 Transfers Out
Graduation Rate ** 36.4% ** 39.1% 57.1% 54.4% 49.4% 50.7% 55.0% 53.4%
Transfer Out Rate ** 54.6% ** 26.1% 14.3% 33.2% 32.9% 29.2% 34.9% 32.8%
Combined Rate ** 90.9% ** 65.2% 71.4% 87.6% 82.3% 79.9% 89.8% 86.3%
** Indicates that information was suppressed to prevent disclosure of personally identifiable information.Source: Office of the Chancellor Research and PlanningR:\FY04-05\Legislative Accountability Report\Graduation Rates\GradRates_2003-04.mdb Measure 6C suppressed 2/9/200535
5 0 0 W E L L S F A R G O P L A C E 3 0 E A S T S E V E N T H S T R E E T S T . P A U L , M N 5 5 1 0 1 - 4 9 4 6
p h 6 5 1 . 2 9 6 - 2 4 3 0 f x 6 5 1 . 2 9 6 - 8 4 8 8 w w w . i n t e r n a l a u d i t i n g . m n s c u . e d u
The Minnesota State Colleges and Universities System is an Equal Opportunity educator and employer. This document can be made available in alternate formats upon request.

Minnesota State Colleges & Universities Fact Book
Office of the Chancellor Academic and Student Affairs Division
Research, Planning and Academic Programs
December 2004
Student and Graduate Follow-up Data


Minnesota State Colleges & Universities Fact Book
Office of the Chancellor Academic and Student Affairs Division
Research, Planning and Academic Programs
December 2004
Student and Graduate Follow-up Data
Minnesota State Colleges & Universities500 Wells Fargo Place30 East 7th StreetSt. Paul, MN 55101-4946
ph 651-296-8012fx 651-297-5550www.mnscu.edu
The Minnesota State Colleges and Universities system is an Equal Opportunityemployer and educator. This document can be made available in alternativeformats by calling 651.296.2848; toll-free, 888.667.2848; or TTY 651.282.2660.

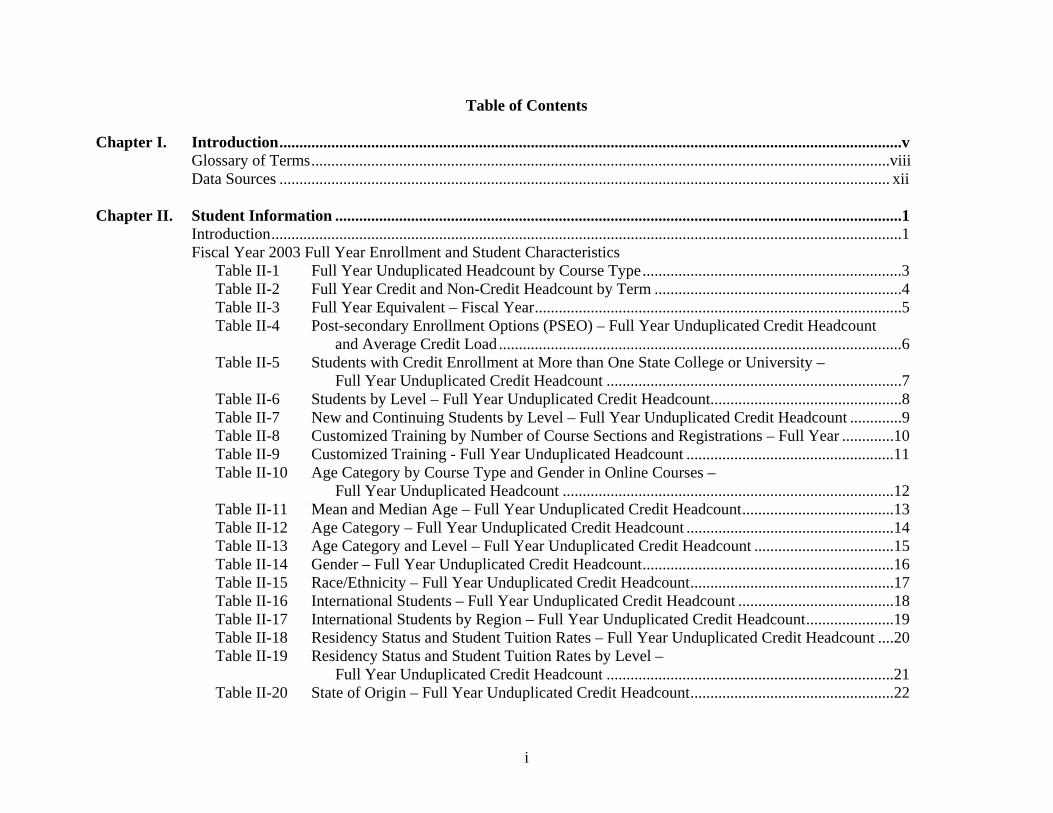
i
Table of Contents Chapter I. Introduction............................................................................................................................................................v
Glossary of Terms.................................................................................................................................................viii Data Sources ......................................................................................................................................................... xii
Chapter II. Student Information ..............................................................................................................................................1 Introduction..............................................................................................................................................................1 Fiscal Year 2003 Full Year Enrollment and Student Characteristics
Table II-1 Full Year Unduplicated Headcount by Course Type.................................................................3 Table II-2 Full Year Credit and Non-Credit Headcount by Term ..............................................................4 Table II-3 Full Year Equivalent – Fiscal Year............................................................................................5 Table II-4 Post-secondary Enrollment Options (PSEO) – Full Year Unduplicated Credit Headcount and Average Credit Load .....................................................................................................6 Table II-5 Students with Credit Enrollment at More than One State College or University – Full Year Unduplicated Credit Headcount ..........................................................................7 Table II-6 Students by Level – Full Year Unduplicated Credit Headcount................................................8 Table II-7 New and Continuing Students by Level – Full Year Unduplicated Credit Headcount .............9 Table II-8 Customized Training by Number of Course Sections and Registrations – Full Year .............10 Table II-9 Customized Training - Full Year Unduplicated Headcount ....................................................11 Table II-10 Age Category by Course Type and Gender in Online Courses – Full Year Unduplicated Headcount ...................................................................................12 Table II-11 Mean and Median Age – Full Year Unduplicated Credit Headcount......................................13 Table II-12 Age Category – Full Year Unduplicated Credit Headcount ....................................................14 Table II-13 Age Category and Level – Full Year Unduplicated Credit Headcount ...................................15 Table II-14 Gender – Full Year Unduplicated Credit Headcount...............................................................16 Table II-15 Race/Ethnicity – Full Year Unduplicated Credit Headcount...................................................17 Table II-16 International Students – Full Year Unduplicated Credit Headcount .......................................18 Table II-17 International Students by Region – Full Year Unduplicated Credit Headcount......................19 Table II-18 Residency Status and Student Tuition Rates – Full Year Unduplicated Credit Headcount ....20 Table II-19 Residency Status and Student Tuition Rates by Level – Full Year Unduplicated Credit Headcount ........................................................................21 Table II-20 State of Origin – Full Year Unduplicated Credit Headcount...................................................22
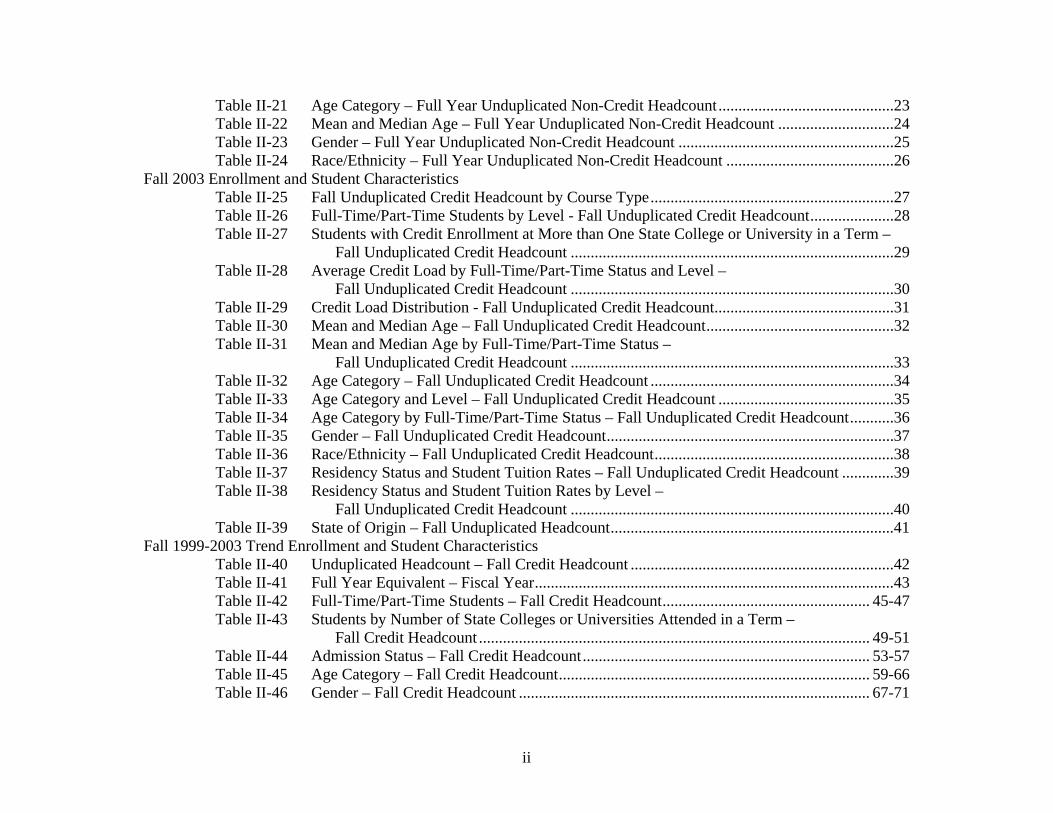
ii
Table II-21 Age Category – Full Year Unduplicated Non-Credit Headcount............................................23 Table II-22 Mean and Median Age – Full Year Unduplicated Non-Credit Headcount .............................24 Table II-23 Gender – Full Year Unduplicated Non-Credit Headcount ......................................................25 Table II-24 Race/Ethnicity – Full Year Unduplicated Non-Credit Headcount ..........................................26
Fall 2003 Enrollment and Student Characteristics Table II-25 Fall Unduplicated Credit Headcount by Course Type.............................................................27 Table II-26 Full-Time/Part-Time Students by Level - Fall Unduplicated Credit Headcount.....................28 Table II-27 Students with Credit Enrollment at More than One State College or University in a Term – Fall Unduplicated Credit Headcount .................................................................................29 Table II-28 Average Credit Load by Full-Time/Part-Time Status and Level – Fall Unduplicated Credit Headcount .................................................................................30 Table II-29 Credit Load Distribution - Fall Unduplicated Credit Headcount.............................................31 Table II-30 Mean and Median Age – Fall Unduplicated Credit Headcount...............................................32 Table II-31 Mean and Median Age by Full-Time/Part-Time Status – Fall Unduplicated Credit Headcount .................................................................................33 Table II-32 Age Category – Fall Unduplicated Credit Headcount .............................................................34 Table II-33 Age Category and Level – Fall Unduplicated Credit Headcount ............................................35 Table II-34 Age Category by Full-Time/Part-Time Status – Fall Unduplicated Credit Headcount...........36 Table II-35 Gender – Fall Unduplicated Credit Headcount........................................................................37 Table II-36 Race/Ethnicity – Fall Unduplicated Credit Headcount............................................................38 Table II-37 Residency Status and Student Tuition Rates – Fall Unduplicated Credit Headcount .............39 Table II-38 Residency Status and Student Tuition Rates by Level – Fall Unduplicated Credit Headcount .................................................................................40 Table II-39 State of Origin – Fall Unduplicated Headcount.......................................................................41
Fall 1999-2003 Trend Enrollment and Student Characteristics Table II-40 Unduplicated Headcount – Fall Credit Headcount ..................................................................42 Table II-41 Full Year Equivalent – Fiscal Year..........................................................................................43 Table II-42 Full-Time/Part-Time Students – Fall Credit Headcount.................................................... 45-47 Table II-43 Students by Number of State Colleges or Universities Attended in a Term – Fall Credit Headcount .................................................................................................. 49-51 Table II-44 Admission Status – Fall Credit Headcount........................................................................ 53-57 Table II-45 Age Category – Fall Credit Headcount.............................................................................. 59-66 Table II-46 Gender – Fall Credit Headcount ........................................................................................ 67-71
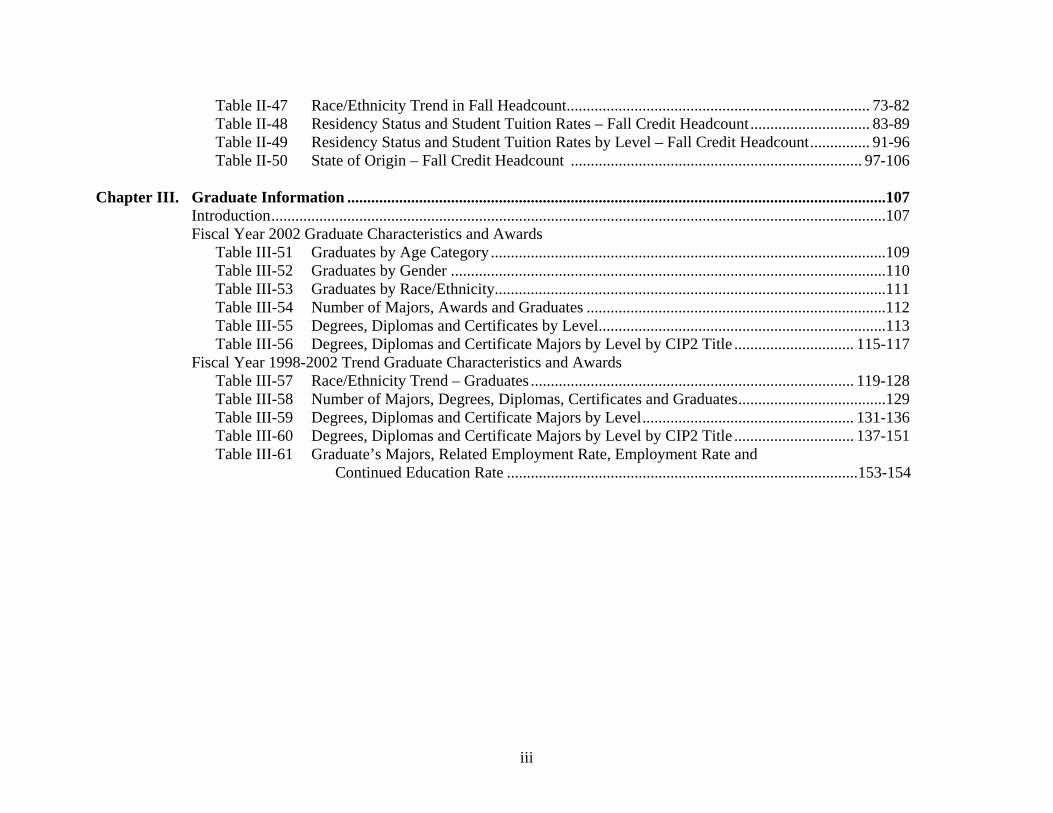
iii
Table II-47 Race/Ethnicity Trend in Fall Headcount............................................................................ 73-82 Table II-48 Residency Status and Student Tuition Rates – Fall Credit Headcount.............................. 83-89 Table II-49 Residency Status and Student Tuition Rates by Level – Fall Credit Headcount............... 91-96 Table II-50 State of Origin – Fall Credit Headcount ......................................................................... 97-106
Chapter III. Graduate Information .......................................................................................................................................107
Introduction..........................................................................................................................................................107 Fiscal Year 2002 Graduate Characteristics and Awards
Table III-51 Graduates by Age Category ...................................................................................................109 Table III-52 Graduates by Gender .............................................................................................................110 Table III-53 Graduates by Race/Ethnicity..................................................................................................111 Table III-54 Number of Majors, Awards and Graduates ...........................................................................112 Table III-55 Degrees, Diplomas and Certificates by Level........................................................................113 Table III-56 Degrees, Diplomas and Certificate Majors by Level by CIP2 Title .............................. 115-117
Fiscal Year 1998-2002 Trend Graduate Characteristics and Awards Table III-57 Race/Ethnicity Trend – Graduates ................................................................................. 119-128 Table III-58 Number of Majors, Degrees, Diplomas, Certificates and Graduates.....................................129 Table III-59 Degrees, Diplomas and Certificate Majors by Level..................................................... 131-136 Table III-60 Degrees, Diplomas and Certificate Majors by Level by CIP2 Title .............................. 137-151 Table III-61 Graduate’s Majors, Related Employment Rate, Employment Rate and Continued Education Rate ........................................................................................153-154

This Page is Intentionally Left Blank
v
Chapter I: Introduction
INTRODUCTION
This is the 2004 Fact Book for the Minnesota State Colleges and Universities System. It provides accurate and current information about students and graduates at both the system and institutional levels and will be updated annually. In addition to the most recent information available, the fact book also shows student trends over time. The fact book was designed to provide current and useful information for: • State and local education leaders; • All faculty, staff and administrators in the system’s institutions; • State and local policymakers; and • Residents and taxpayers in Minnesota Helpful Hints for Using the Fact Book Listed below are some helpful hints for using the information in the fact book.
Table Titles – The illustration that follows provides an overview of purpose of the table headings and column titles. Descriptions are in italics.
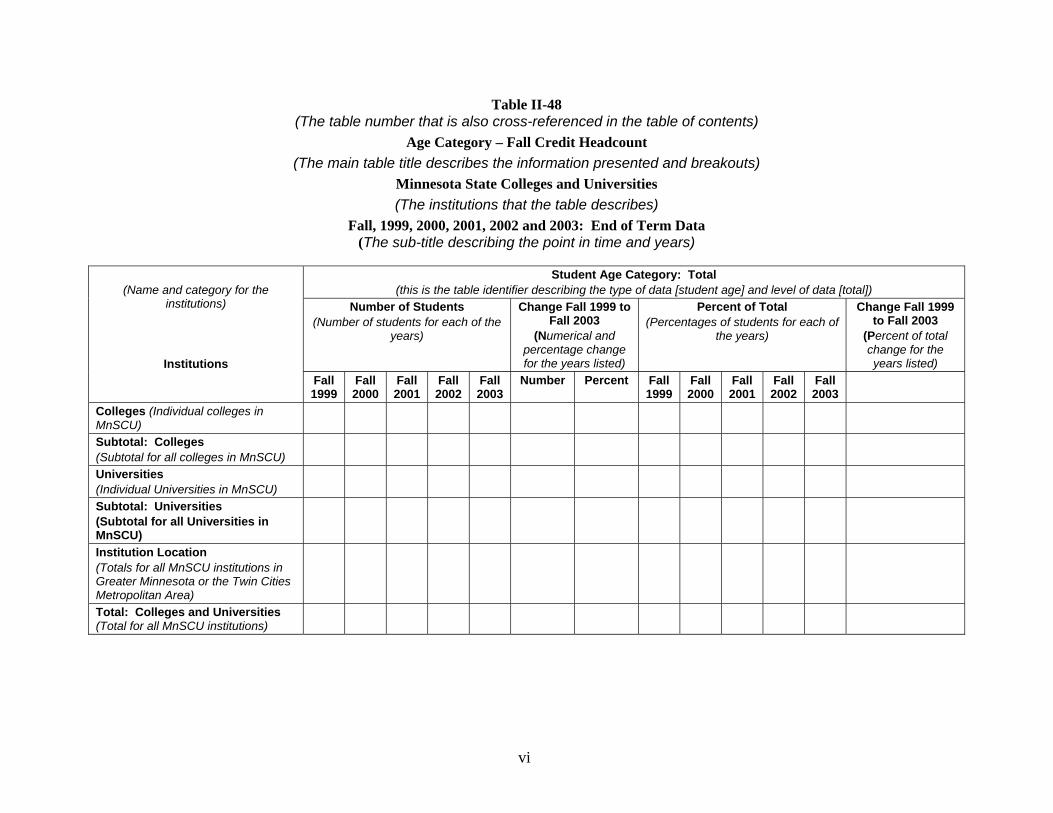
vi
Table II-48 (The table number that is also cross-referenced in the table of contents)
Age Category – Fall Credit Headcount (The main table title describes the information presented and breakouts)
Minnesota State Colleges and Universities (The institutions that the table describes)
Fall, 1999, 2000, 2001, 2002 and 2003: End of Term Data (The sub-title describing the point in time and years)
Student Age Category: Total
(this is the table identifier describing the type of data [student age] and level of data [total]) Number of Students
(Number of students for each of the years)
Change Fall 1999 to Fall 2003
(Numerical and percentage change for the years listed)
Percent of Total (Percentages of students for each of
the years)
Change Fall 1999 to Fall 2003
(Percent of total change for the years listed)
(Name and category for the
institutions)
Institutions Fall 1999
Fall 2000
Fall 2001
Fall 2002
Fall 2003
Number Percent Fall 1999
Fall 2000
Fall 2001
Fall 2002
Fall 2003
Colleges (Individual colleges in MnSCU)
Subtotal: Colleges (Subtotal for all colleges in MnSCU)
Universities (Individual Universities in MnSCU)
Subtotal: Universities (Subtotal for all Universities in MnSCU)
Institution Location (Totals for all MnSCU institutions in Greater Minnesota or the Twin Cities Metropolitan Area)
Total: Colleges and Universities (Total for all MnSCU institutions)
vii
Multi-Page Tables - Since one of the main purposes of the fact book is provide the most detailed information available, tables are often broken down into subcategories. For example, Table II-42 on page 45 Full-time/Part-time Students – Fall Credit Headcount, stretches across three pages. The first page describes fall credit headcount for full-time students. The second page describe fall credit headcount for part-time students and the final page of the table aggregates the total for the full-time and part-time students listed in the previous two pages. Another example is Table II-45 on page 59 describes student age categories for Fall credit headcount. The first page of the table lists the Fall credit headcount for students less than age 20. The second page describes fall credit headcount for students ages 20-24. The table then goes on to provide one page of Fall credit headcount for each of the remaining age categories. The student age table ends by listing a page each for total known student age categories, total unknown student age categories, and the overall total for students in all age categories. This table design was intended to give the reader both specific data for each category by institution and then aggregate data across age categories. This design applies to most of the multi-page tables. For Further Information The Research, Planning and Academic Programs Unit of the Office of the Chancellor of the Minnesota State Colleges and Universities produced this fact book and manages the information contained within it. Further information on the fact book can be obtained by contacting Craig Schoenecker, System Director for Research, Office of the Chancellor, Minnesota State Colleges and Universities at 651-296-9600 or [email protected].
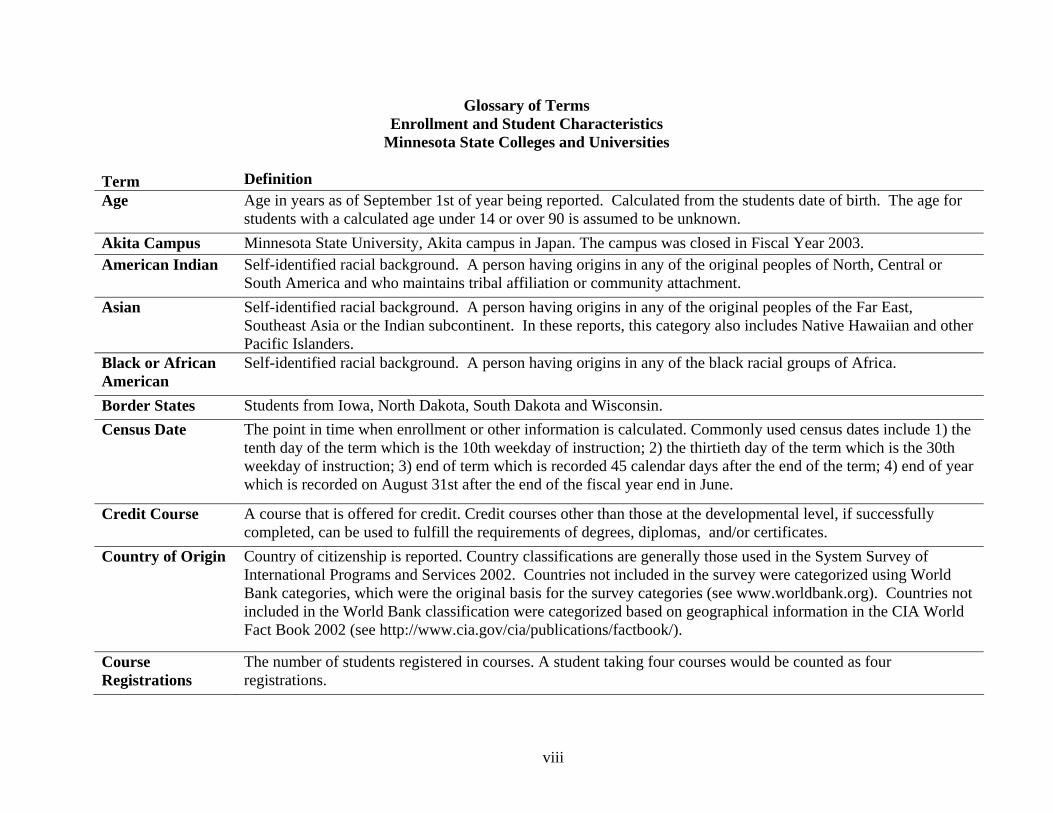
viii
Glossary of Terms Enrollment and Student Characteristics
Minnesota State Colleges and Universities Term Definition Age Age in years as of September 1st of year being reported. Calculated from the students date of birth. The age for
students with a calculated age under 14 or over 90 is assumed to be unknown. Akita Campus Minnesota State University, Akita campus in Japan. The campus was closed in Fiscal Year 2003. American Indian Self-identified racial background. A person having origins in any of the original peoples of North, Central or
South America and who maintains tribal affiliation or community attachment. Asian Self-identified racial background. A person having origins in any of the original peoples of the Far East,
Southeast Asia or the Indian subcontinent. In these reports, this category also includes Native Hawaiian and other Pacific Islanders.
Black or African American
Self-identified racial background. A person having origins in any of the black racial groups of Africa.
Border States Students from Iowa, North Dakota, South Dakota and Wisconsin. Census Date The point in time when enrollment or other information is calculated. Commonly used census dates include 1) the
tenth day of the term which is the 10th weekday of instruction; 2) the thirtieth day of the term which is the 30th weekday of instruction; 3) end of term which is recorded 45 calendar days after the end of the term; 4) end of year which is recorded on August 31st after the end of the fiscal year end in June.
Credit Course A course that is offered for credit. Credit courses other than those at the developmental level, if successfully completed, can be used to fulfill the requirements of degrees, diplomas, and/or certificates.
Country of Origin Country of citizenship is reported. Country classifications are generally those used in the System Survey of International Programs and Services 2002. Countries not included in the survey were categorized using World Bank categories, which were the original basis for the survey categories (see www.worldbank.org). Countries not included in the World Bank classification were categorized based on geographical information in the CIA World Fact Book 2002 (see http://www.cia.gov/cia/publications/factbook/).
Course Registrations
The number of students registered in courses. A student taking four courses would be counted as four registrations.
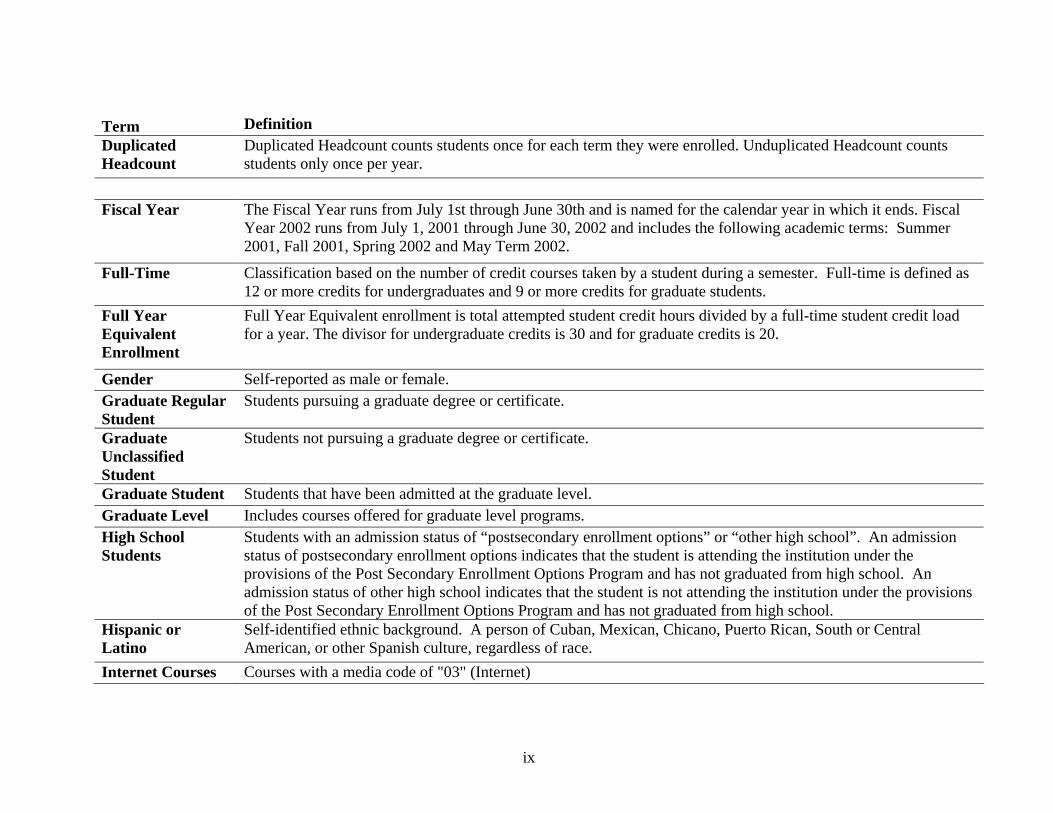
ix
Term Definition Duplicated Headcount
Duplicated Headcount counts students once for each term they were enrolled. Unduplicated Headcount counts students only once per year.
Fiscal Year The Fiscal Year runs from July 1st through June 30th and is named for the calendar year in which it ends. Fiscal
Year 2002 runs from July 1, 2001 through June 30, 2002 and includes the following academic terms: Summer 2001, Fall 2001, Spring 2002 and May Term 2002.
Full-Time Classification based on the number of credit courses taken by a student during a semester. Full-time is defined as 12 or more credits for undergraduates and 9 or more credits for graduate students.
Full Year Equivalent Enrollment
Full Year Equivalent enrollment is total attempted student credit hours divided by a full-time student credit load for a year. The divisor for undergraduate credits is 30 and for graduate credits is 20.
Gender Self-reported as male or female. Graduate Regular Student
Students pursuing a graduate degree or certificate.
Graduate Unclassified Student
Students not pursuing a graduate degree or certificate.
Graduate Student Students that have been admitted at the graduate level. Graduate Level Includes courses offered for graduate level programs. High School Students
Students with an admission status of “postsecondary enrollment options” or “other high school”. An admission status of postsecondary enrollment options indicates that the student is attending the institution under the provisions of the Post Secondary Enrollment Options Program and has not graduated from high school. An admission status of other high school indicates that the student is not attending the institution under the provisions of the Post Secondary Enrollment Options Program and has not graduated from high school.
Hispanic or Latino
Self-identified ethnic background. A person of Cuban, Mexican, Chicano, Puerto Rican, South or Central American, or other Spanish culture, regardless of race.
Internet Courses Courses with a media code of "03" (Internet)
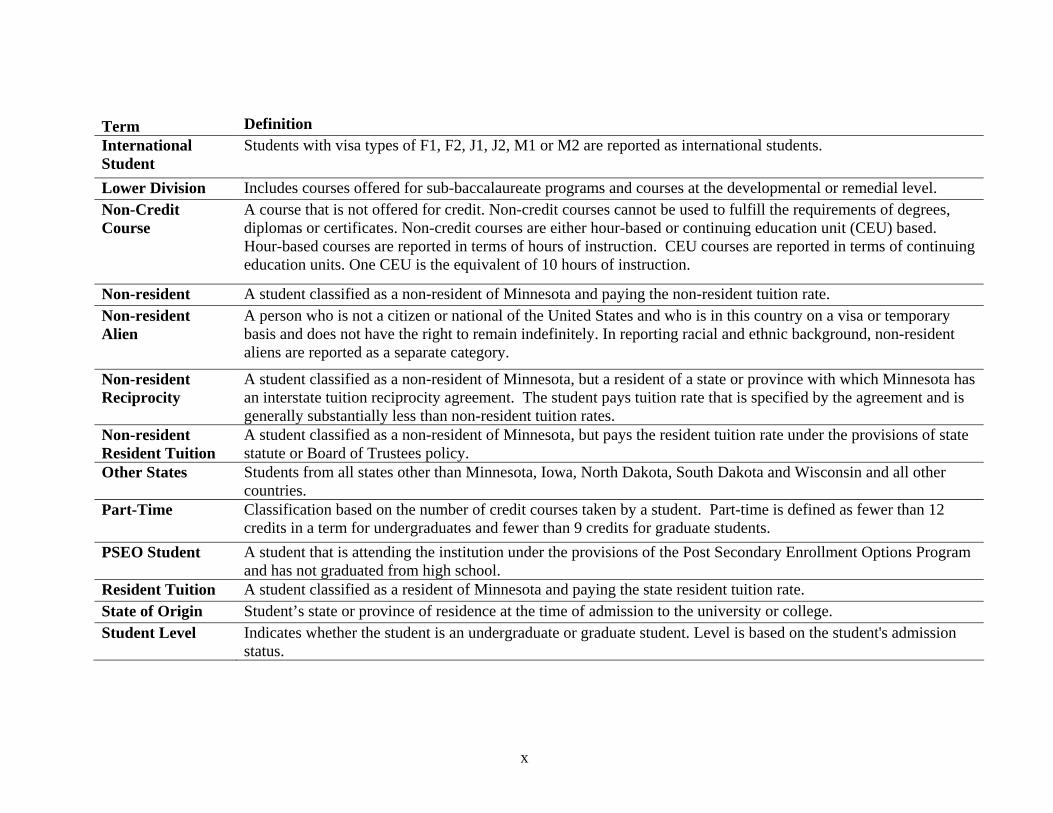
x
Term Definition International Student
Students with visa types of F1, F2, J1, J2, M1 or M2 are reported as international students.
Lower Division Includes courses offered for sub-baccalaureate programs and courses at the developmental or remedial level. Non-Credit Course
A course that is not offered for credit. Non-credit courses cannot be used to fulfill the requirements of degrees, diplomas or certificates. Non-credit courses are either hour-based or continuing education unit (CEU) based. Hour-based courses are reported in terms of hours of instruction. CEU courses are reported in terms of continuing education units. One CEU is the equivalent of 10 hours of instruction.
Non-resident A student classified as a non-resident of Minnesota and paying the non-resident tuition rate. Non-resident Alien
A person who is not a citizen or national of the United States and who is in this country on a visa or temporary basis and does not have the right to remain indefinitely. In reporting racial and ethnic background, non-resident aliens are reported as a separate category.
Non-resident Reciprocity
A student classified as a non-resident of Minnesota, but a resident of a state or province with which Minnesota has an interstate tuition reciprocity agreement. The student pays tuition rate that is specified by the agreement and is generally substantially less than non-resident tuition rates.
Non-resident Resident Tuition
A student classified as a non-resident of Minnesota, but pays the resident tuition rate under the provisions of state statute or Board of Trustees policy.
Other States Students from all states other than Minnesota, Iowa, North Dakota, South Dakota and Wisconsin and all other countries.
Part-Time Classification based on the number of credit courses taken by a student. Part-time is defined as fewer than 12 credits in a term for undergraduates and fewer than 9 credits for graduate students.
PSEO Student A student that is attending the institution under the provisions of the Post Secondary Enrollment Options Program and has not graduated from high school.
Resident Tuition A student classified as a resident of Minnesota and paying the state resident tuition rate. State of Origin Student’s state or province of residence at the time of admission to the university or college. Student Level Indicates whether the student is an undergraduate or graduate student. Level is based on the student's admission
status.
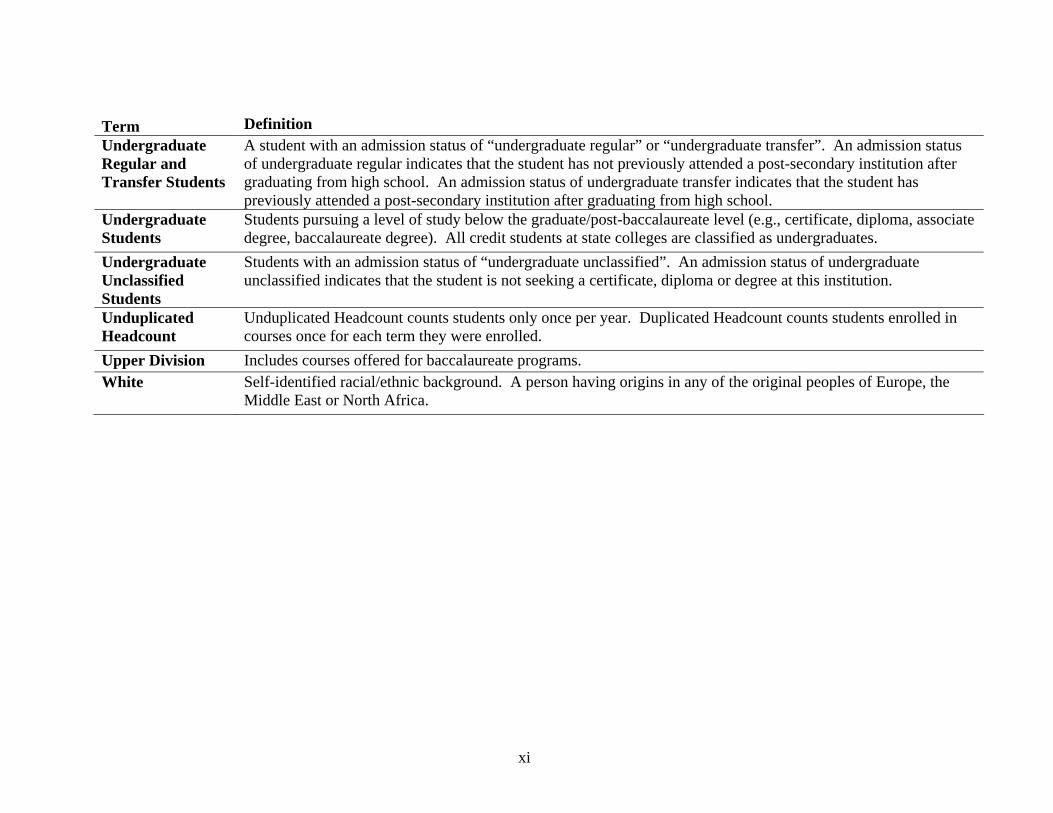
xi
Term Definition Undergraduate Regular and Transfer Students
A student with an admission status of “undergraduate regular” or “undergraduate transfer”. An admission status of undergraduate regular indicates that the student has not previously attended a post-secondary institution after graduating from high school. An admission status of undergraduate transfer indicates that the student has previously attended a post-secondary institution after graduating from high school.
Undergraduate Students
Students pursuing a level of study below the graduate/post-baccalaureate level (e.g., certificate, diploma, associate degree, baccalaureate degree). All credit students at state colleges are classified as undergraduates.
Undergraduate Unclassified Students
Students with an admission status of “undergraduate unclassified”. An admission status of undergraduate unclassified indicates that the student is not seeking a certificate, diploma or degree at this institution.
Unduplicated Headcount
Unduplicated Headcount counts students only once per year. Duplicated Headcount counts students enrolled in courses once for each term they were enrolled.
Upper Division Includes courses offered for baccalaureate programs. White Self-identified racial/ethnic background. A person having origins in any of the original peoples of Europe, the
Middle East or North Africa.
xii
Data Sources and Reporting Standards Data Sources The reports contained in the 2004 Fact Book were prepared using the following data sources: 1. Reporting on enrollment and or student characteristics for a term: ST_TERM_DATA from the Oracle Data Warehouse 2. Reporting on enrollment and or student characteristics for a fiscal year: ENROL_INST from the Oracle Data Warehouse 3. Reporting on graduates, employment and continuing education: GRFU Final All Majors from Research, Planning and Academic Programs data files. Reporting Standards The reports were created using the student and graduate reporting standards that were developed by the System’s Institutional Research Directors Group. A copy of the document that describes the standards is available on request. Census Dates: 1. Reports on enrollment and student characteristics for fall term or several fall terms: Final Term Records from ST_TERM_DATA 2. Reports on enrollment and student characteristics for a fiscal year: End of Year Records from ENROL_INST Institutional Configuration: The institutional configuration used in the reports was the one in place in the System during Fiscal Year 2003.
Chapter II: Student Information Introduction This Student Information chapter of the Fact Book contains over 60 tables that provide a wide variety of information on students who attend the Minnesota State Colleges and Universities. The information is generally provided for all state colleges, for all state universities and for the entire system. This allows for comparisons across institutions and institutional types and puts institutional information in the context of system-wide totals. The information in this chapter describes enrollment, student characteristics, Fall data, and Fall data Trends. This is the chapter where you find current and trend information on: • The number of students who take both credit and non-credit courses at the state colleges and universities both in-person and
online, • The gender, race/ethnicity, residency and age of students, and • Fall student enrollment.
1

This Page is Intentionally Left Blank
2
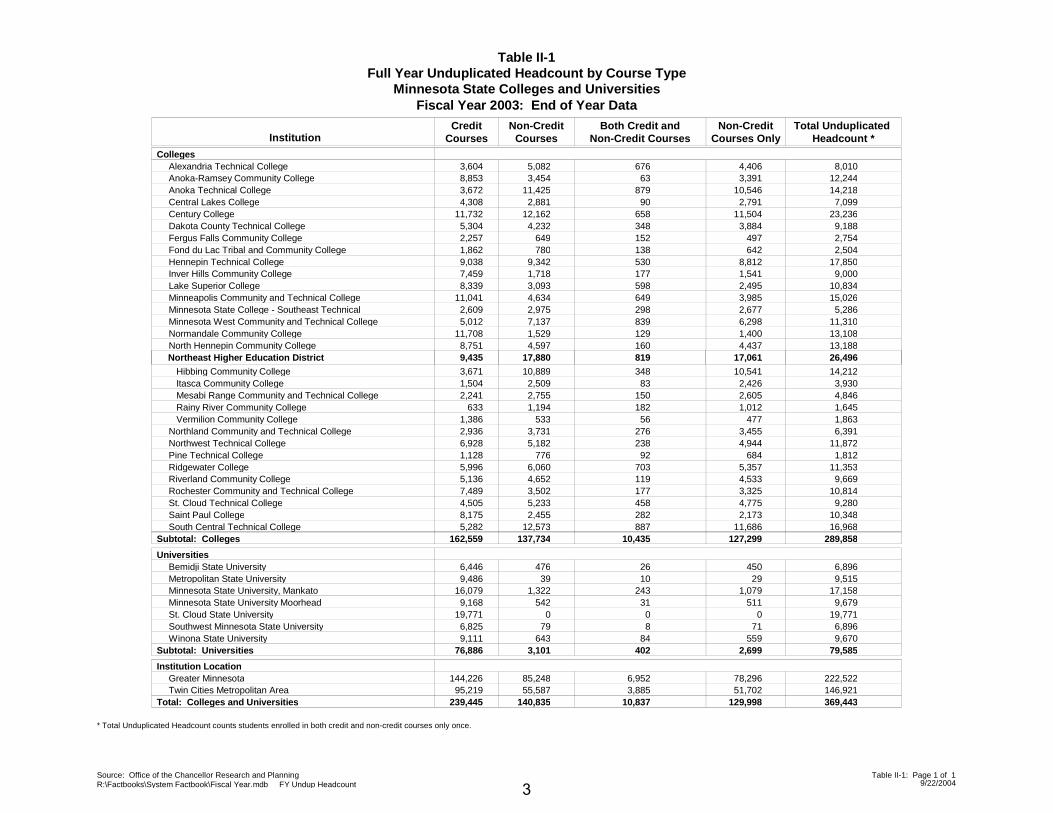
Table II-1Full Year Unduplicated Headcount by Course Type
Minnesota State Colleges and Universities
CreditCourses
Non-CreditCourses
Both Credit andNon-Credit Courses
Non-CreditCourses Only
Total Unduplicated Headcount *Institution
Fiscal Year 2003: End of Year Data
Colleges3,604Alexandria Technical College 5,082 676 4,406 8,0108,853Anoka-Ramsey Community College 3,454 63 3,391 12,2443,672Anoka Technical College 11,425 879 10,546 14,2184,308Central Lakes College 2,881 90 2,791 7,099
11,732Century College 12,162 658 11,504 23,2365,304Dakota County Technical College 4,232 348 3,884 9,1882,257Fergus Falls Community College 649 152 497 2,7541,862Fond du Lac Tribal and Community College 780 138 642 2,5049,038Hennepin Technical College 9,342 530 8,812 17,8507,459Inver Hills Community College 1,718 177 1,541 9,0008,339Lake Superior College 3,093 598 2,495 10,834
11,041Minneapolis Community and Technical College 4,634 649 3,985 15,0262,609Minnesota State College - Southeast Technical 2,975 298 2,677 5,2865,012Minnesota West Community and Technical College 7,137 839 6,298 11,310
11,708Normandale Community College 1,529 129 1,400 13,1088,751North Hennepin Community College 4,597 160 4,437 13,188
Northeast Higher Education District
3,671 Hibbing Community College 10,889 348 10,541 14,212
9,435 17,880 819 17,061 26,496
1,504 Itasca Community College 2,509 83 2,426 3,9302,241 Mesabi Range Community and Technical College 2,755 150 2,605 4,846
633 Rainy River Community College 1,194 182 1,012 1,6451,386 Vermilion Community College 533 56 477 1,8632,936Northland Community and Technical College 3,731 276 3,455 6,3916,928Northwest Technical College 5,182 238 4,944 11,8721,128Pine Technical College 776 92 684 1,8125,996Ridgewater College 6,060 703 5,357 11,3535,136Riverland Community College 4,652 119 4,533 9,6697,489Rochester Community and Technical College 3,502 177 3,325 10,8144,505St. Cloud Technical College 5,233 458 4,775 9,2808,175Saint Paul College 2,455 282 2,173 10,3485,282South Central Technical College 12,573 887 11,686 16,968
Subtotal: Colleges 162,559 137,734 10,435 127,299 289,858
Universities6,446Bemidji State University 476 26 450 6,8969,486Metropolitan State University 39 10 29 9,515
16,079Minnesota State University, Mankato 1,322 243 1,079 17,1589,168Minnesota State University Moorhead 542 31 511 9,679
19,771St. Cloud State University 0 0 0 19,7716,825Southwest Minnesota State University 79 8 71 6,8969,111Winona State University 643 84 559 9,670
Subtotal: Universities 76,886 3,101 402 2,699 79,585
Institution Location144,226Greater Minnesota 85,248 6,952 78,296 222,522
95,219Twin Cities Metropolitan Area 55,587 3,885 51,702 146,921Total: Colleges and Universities 239,445 140,835 10,837 129,998 369,443
* Total Unduplicated Headcount counts students enrolled in both credit and non-credit courses only once.
Source: Office of the Chancellor Research and PlanningR:\Factbooks\System Factbook\Fiscal Year.mdb FY Undup Headcount 9/22/2004
Table II-1: Page 1 of 1
3
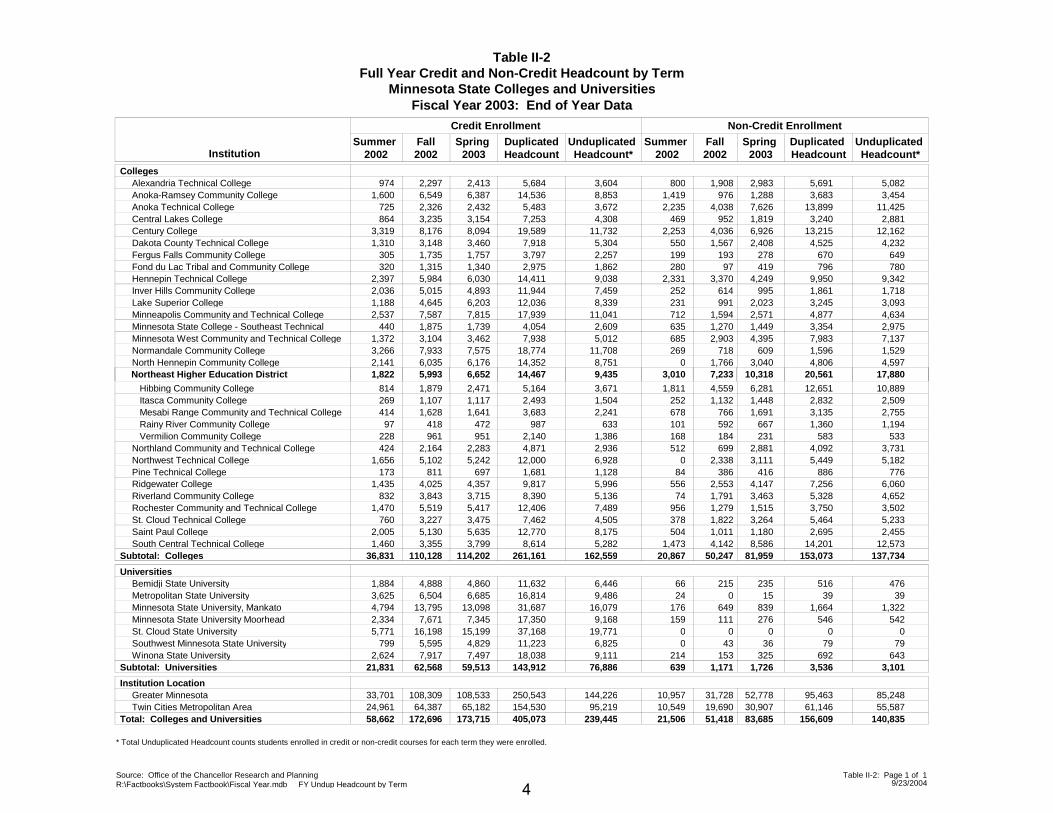
Table II-2Full Year Credit and Non-Credit Headcount by Term
Minnesota State Colleges and Universities
Summer 2002Institution
Fiscal Year 2003: End of Year Data
Fall2002
Spring 2003
Duplicated Headcount
Unduplicated Headcount*
Credit Enrollment
Summer 2002
Fall2002
Spring 2003
Duplicated Headcount
Unduplicated Headcount*
Non-Credit Enrollment
Colleges974Alexandria Technical College 2,297 2,413 1,908 2,9838003,604 5,0825,684 5,691
1,600Anoka-Ramsey Community College 6,549 6,387 976 1,2881,4198,853 3,45414,536 3,683725Anoka Technical College 2,326 2,432 4,038 7,6262,2353,672 11,4255,483 13,899864Central Lakes College 3,235 3,154 952 1,8194694,308 2,8817,253 3,240
3,319Century College 8,176 8,094 4,036 6,9262,25311,732 12,16219,589 13,2151,310Dakota County Technical College 3,148 3,460 1,567 2,4085505,304 4,2327,918 4,525
305Fergus Falls Community College 1,735 1,757 193 2781992,257 6493,797 670320Fond du Lac Tribal and Community College 1,315 1,340 97 4192801,862 7802,975 796
2,397Hennepin Technical College 5,984 6,030 3,370 4,2492,3319,038 9,34214,411 9,9502,036Inver Hills Community College 5,015 4,893 614 9952527,459 1,71811,944 1,8611,188Lake Superior College 4,645 6,203 991 2,0232318,339 3,09312,036 3,2452,537Minneapolis Community and Technical College 7,587 7,815 1,594 2,57171211,041 4,63417,939 4,877
440Minnesota State College - Southeast Technical 1,875 1,739 1,270 1,4496352,609 2,9754,054 3,3541,372Minnesota West Community and Technical College 3,104 3,462 2,903 4,3956855,012 7,1377,938 7,9833,266Normandale Community College 7,933 7,575 718 60926911,708 1,52918,774 1,5962,141North Hennepin Community College 6,035 6,176 1,766 3,04008,751 4,59714,352 4,806
Northeast Higher Education District
814 Hibbing Community College
1,822
1,879
5,993
2,471
6,652 3,010
4,559
7,233
6,281
10,318
1,8113,671
9,435
10,889
17,88014,467
5,164
20,561
12,651269 Itasca Community College 1,107 1,117 1,132 1,4482521,504 2,5092,493 2,832414 Mesabi Range Community and Technical College 1,628 1,641 766 1,6916782,241 2,7553,683 3,13597 Rainy River Community College 418 472 592 667101633 1,194987 1,360
228 Vermilion Community College 961 951 184 2311681,386 5332,140 583424Northland Community and Technical College 2,164 2,283 699 2,8815122,936 3,7314,871 4,092
1,656Northwest Technical College 5,102 5,242 2,338 3,11106,928 5,18212,000 5,449173Pine Technical College 811 697 386 416841,128 7761,681 886
1,435Ridgewater College 4,025 4,357 2,553 4,1475565,996 6,0609,817 7,256832Riverland Community College 3,843 3,715 1,791 3,463745,136 4,6528,390 5,328
1,470Rochester Community and Technical College 5,519 5,417 1,279 1,5159567,489 3,50212,406 3,750760St. Cloud Technical College 3,227 3,475 1,822 3,2643784,505 5,2337,462 5,464
2,005Saint Paul College 5,130 5,635 1,011 1,1805048,175 2,45512,770 2,6951,460South Central Technical College 3,355 3,799 4,142 8,5861,4735,282 12,5738,614 14,201
Subtotal: Colleges 36,831 110,128 114,202 20,867 50,247 81,959162,559 137,734261,161 153,073
Universities1,884Bemidji State University 4,888 4,860 215 235666,446 47611,632 5163,625Metropolitan State University 6,504 6,685 0 15249,486 3916,814 394,794Minnesota State University, Mankato 13,795 13,098 649 83917616,079 1,32231,687 1,6642,334Minnesota State University Moorhead 7,671 7,345 111 2761599,168 54217,350 5465,771St. Cloud State University 16,198 15,199 0 0019,771 037,168 0
799Southwest Minnesota State University 5,595 4,829 43 3606,825 7911,223 792,624Winona State University 7,917 7,497 153 3252149,111 64318,038 692
Subtotal: Universities 21,831 62,568 59,513 639 1,171 1,72676,886 3,101143,912 3,536
Institution Location33,701Greater Minnesota 108,309 108,533 31,728 52,77810,957144,226 85,248250,543 95,46324,961Twin Cities Metropolitan Area 64,387 65,182 19,690 30,90710,54995,219 55,587154,530 61,146
Total: Colleges and Universities 58,662 172,696 173,715 21,506 51,418 83,685239,445 140,835405,073 156,609
* Total Unduplicated Headcount counts students enrolled in credit or non-credit courses for each term they were enrolled.
Source: Office of the Chancellor Research and PlanningR:\Factbooks\System Factbook\Fiscal Year.mdb FY Undup Headcount by Term 9/23/2004
Table II-2: Page 1 of 1
4
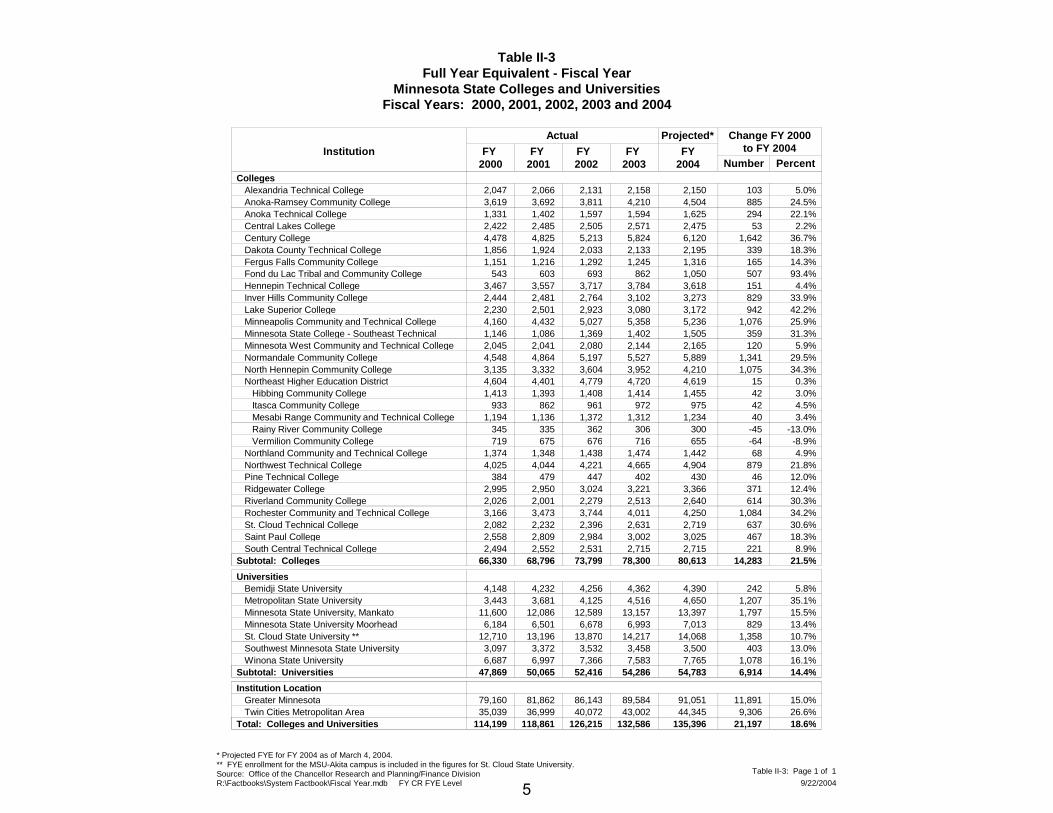
Table II-3Full Year Equivalent - Fiscal Year
Minnesota State Colleges and UniversitiesFiscal Years: 2000, 2001, 2002, 2003 and 2004
Institution FY 2000
FY 2001
FY 2002
FY 2003
FY2004
Actual Projected* Change FY 2000to FY 2004
Number PercentColleges
Alexandria Technical College 2,047 2,066 2,131 2,158 2,150 103 5.0%Anoka-Ramsey Community College 3,619 3,692 3,811 4,210 4,504 885 24.5%Anoka Technical College 1,331 1,402 1,597 1,594 1,625 294 22.1%Central Lakes College 2,422 2,485 2,505 2,571 2,475 53 2.2%Century College 4,478 4,825 5,213 5,824 6,120 1,642 36.7%Dakota County Technical College 1,856 1,924 2,033 2,133 2,195 339 18.3%Fergus Falls Community College 1,151 1,216 1,292 1,245 1,316 165 14.3%Fond du Lac Tribal and Community College 543 603 693 862 1,050 507 93.4%Hennepin Technical College 3,467 3,557 3,717 3,784 3,618 151 4.4%Inver Hills Community College 2,444 2,481 2,764 3,102 3,273 829 33.9%Lake Superior College 2,230 2,501 2,923 3,080 3,172 942 42.2%Minneapolis Community and Technical College 4,160 4,432 5,027 5,358 5,236 1,076 25.9%Minnesota State College - Southeast Technical 1,146 1,086 1,369 1,402 1,505 359 31.3%Minnesota West Community and Technical College 2,045 2,041 2,080 2,144 2,165 120 5.9%Normandale Community College 4,548 4,864 5,197 5,527 5,889 1,341 29.5%North Hennepin Community College 3,135 3,332 3,604 3,952 4,210 1,075 34.3%Northeast Higher Education District 4,604 4,401 4,779 4,720 4,619 15 0.3% Hibbing Community College 1,413 1,393 1,408 1,414 1,455 42 3.0% Itasca Community College 933 862 961 972 975 42 4.5% Mesabi Range Community and Technical College 1,194 1,136 1,372 1,312 1,234 40 3.4% Rainy River Community College 345 335 362 306 300 -45 -13.0% Vermilion Community College 719 675 676 716 655 -64 -8.9%Northland Community and Technical College 1,374 1,348 1,438 1,474 1,442 68 4.9%Northwest Technical College 4,025 4,044 4,221 4,665 4,904 879 21.8%Pine Technical College 384 479 447 402 430 46 12.0%Ridgewater College 2,995 2,950 3,024 3,221 3,366 371 12.4%Riverland Community College 2,026 2,001 2,279 2,513 2,640 614 30.3%Rochester Community and Technical College 3,166 3,473 3,744 4,011 4,250 1,084 34.2%St. Cloud Technical College 2,082 2,232 2,396 2,631 2,719 637 30.6%Saint Paul College 2,558 2,809 2,984 3,002 3,025 467 18.3%South Central Technical College 2,494 2,552 2,531 2,715 2,715 221 8.9%
Subtotal: Colleges 66,330 68,796 73,799 78,300 80,613 14,283 21.5%
UniversitiesBemidji State University 4,148 4,232 4,256 4,362 4,390 242 5.8%Metropolitan State University 3,443 3,681 4,125 4,516 4,650 1,207 35.1%Minnesota State University, Mankato 11,600 12,086 12,589 13,157 13,397 1,797 15.5%Minnesota State University Moorhead 6,184 6,501 6,678 6,993 7,013 829 13.4%St. Cloud State University ** 12,710 13,196 13,870 14,217 14,068 1,358 10.7%Southwest Minnesota State University 3,097 3,372 3,532 3,458 3,500 403 13.0%Winona State University 6,687 6,997 7,366 7,583 7,765 1,078 16.1%
Subtotal: Universities 47,869 50,065 52,416 54,286 54,783 6,914 14.4%
Institution LocationGreater Minnesota 79,160 81,862 86,143 89,584 91,051 11,891 15.0%Twin Cities Metropolitan Area 35,039 36,999 40,072 43,002 44,345 9,306 26.6%
Total: Colleges and Universities 114,199 118,861 126,215 132,586 135,396 21,197 18.6%
* Projected FYE for FY 2004 as of March 4, 2004.** FYE enrollment for the MSU-Akita campus is included in the figures for St. Cloud State University.Source: Office of the Chancellor Research and Planning/Finance DivisionR:\Factbooks\System Factbook\Fiscal Year.mdb FY CR FYE Level 9/22/2004
Table II-3: Page 1 of 1
5
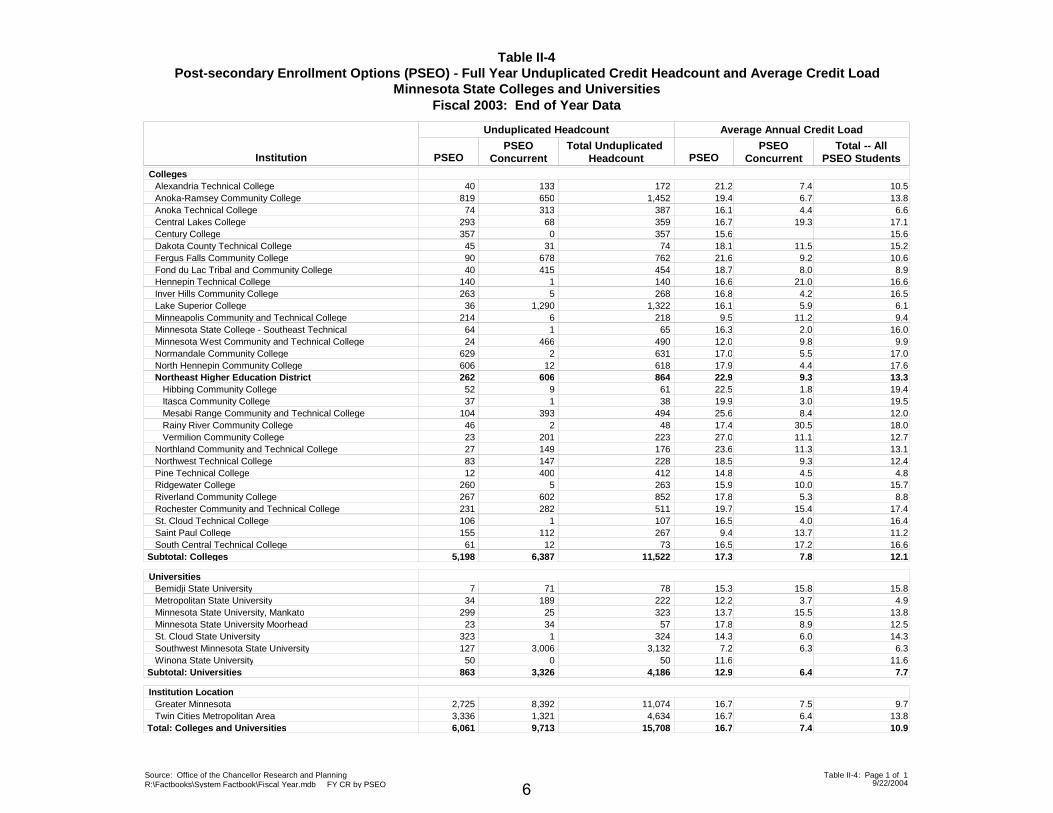
Table II-4Post-secondary Enrollment Options (PSEO) - Full Year Unduplicated Credit Headcount and Average Credit Load
Minnesota State Colleges and Universities
PSEOConcurrentInstitution
Fiscal 2003: End of Year Data
Average Annual Credit Load
Total -- AllPSEO StudentsPSEO
PSEOConcurrent
Unduplicated Headcount
Total Unduplicated HeadcountPSEO
Colleges40 133 Alexandria Technical College 172 7.421.2 10.5
819 650 Anoka-Ramsey Community College 1,452 6.719.4 13.874 313 Anoka Technical College 387 4.416.1 6.6
293 68 Central Lakes College 359 19.316.7 17.1357 0 Century College 357 15.6 15.645 31 Dakota County Technical College 74 11.518.1 15.290 678 Fergus Falls Community College 762 9.221.6 10.640 415 Fond du Lac Tribal and Community College 454 8.018.7 8.9
140 1 Hennepin Technical College 140 21.016.6 16.6263 5 Inver Hills Community College 268 4.216.8 16.536 1,290 Lake Superior College 1,322 5.916.1 6.1
214 6 Minneapolis Community and Technical College 218 11.29.5 9.464 1 Minnesota State College - Southeast Technical 65 2.016.3 16.024 466 Minnesota West Community and Technical College 490 9.812.0 9.9
629 2 Normandale Community College 631 5.517.0 17.0606 12 North Hennepin Community College 618 4.417.9 17.6262 606 Northeast Higher Education District 864 9.322.9 13.352 9 Hibbing Community College 61 1.822.5 19.437 1 Itasca Community College 38 3.019.9 19.5
104 393 Mesabi Range Community and Technical College 494 8.425.6 12.046 2 Rainy River Community College 48 30.517.4 18.023 201 Vermilion Community College 223 11.127.0 12.727 149 Northland Community and Technical College 176 11.323.6 13.183 147 Northwest Technical College 228 9.318.5 12.412 400 Pine Technical College 412 4.514.8 4.8
260 5 Ridgewater College 263 10.015.9 15.7267 602 Riverland Community College 852 5.317.8 8.8231 282 Rochester Community and Technical College 511 15.419.7 17.4106 1 St. Cloud Technical College 107 4.016.5 16.4155 112 Saint Paul College 267 13.79.4 11.261 12 South Central Technical College 73 17.216.5 16.6
5,198 6,387 Subtotal: Colleges 11,522 7.817.3 12.1
Universities7 71 Bemidji State University 78 15.815.3 15.8
34 189 Metropolitan State University 222 3.712.2 4.9299 25 Minnesota State University, Mankato 323 15.513.7 13.823 34 Minnesota State University Moorhead 57 8.917.8 12.5
323 1 St. Cloud State University 324 6.014.3 14.3127 3,006 Southwest Minnesota State University 3,132 6.37.2 6.350 0 Winona State University 50 11.6 11.6
863 3,326 Subtotal: Universities 4,186 6.412.9 7.7
Institution Location2,725 8,392 Greater Minnesota 11,074 7.516.7 9.73,336 1,321 Twin Cities Metropolitan Area 4,634 6.416.7 13.86,061 9,713 Total: Colleges and Universities 15,708 7.416.7 10.9
Source: Office of the Chancellor Research and PlanningR:\Factbooks\System Factbook\Fiscal Year.mdb FY CR by PSEO 9/22/2004
Table II-4: Page 1 of 1
6
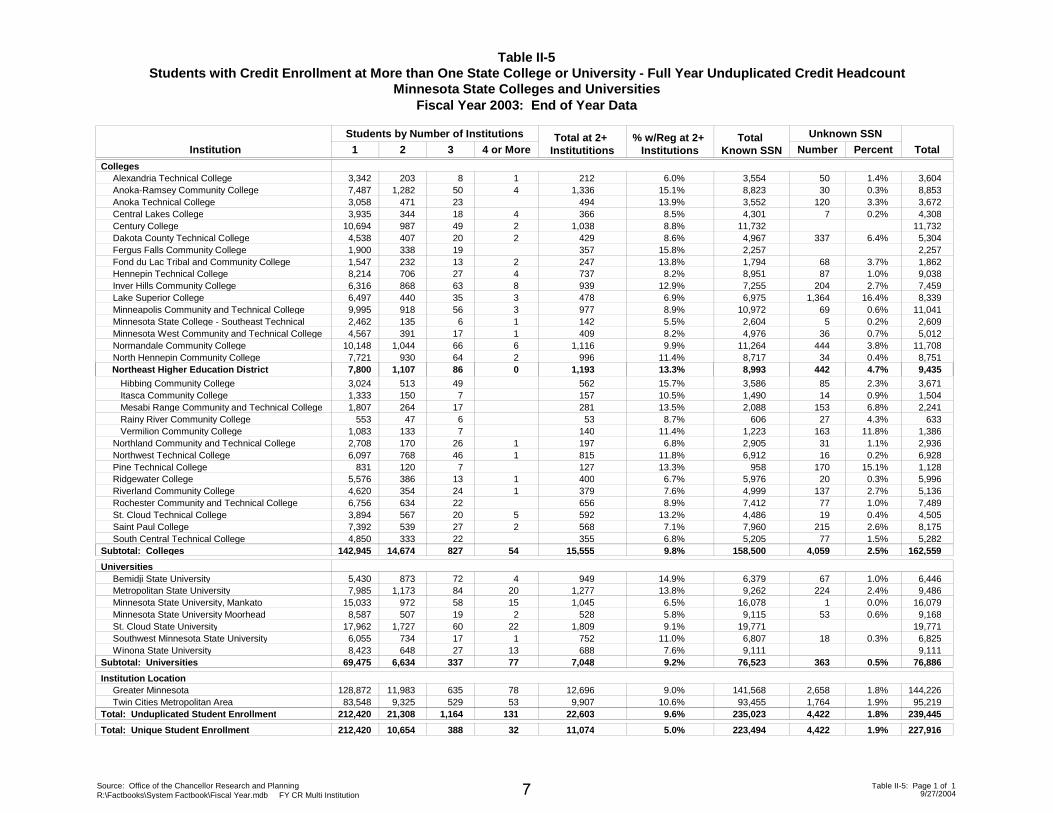
Table II-5Students with Credit Enrollment at More than One State College or University - Full Year Unduplicated Credit Headcount
Minnesota State Colleges and Universities
1 2 NumberInstitution
Fiscal Year 2003: End of Year Data
TotalTotal at 2+
Institutitions3 4 or More% w/Reg at 2+
InstitutionsTotal
Known SSN
Students by Number of Institutions
Percent
Unknown SSN
Colleges3,342Alexandria Technical College 203 212 508 6.0% 3,554 3,6041.4%17,487Anoka-Ramsey Community College 1,282 1,336 3050 15.1% 8,823 8,8530.3%43,058Anoka Technical College 471 494 12023 13.9% 3,552 3,6723.3%3,935Central Lakes College 344 366 718 8.5% 4,301 4,3080.2%4
10,694Century College 987 1,03849 8.8% 11,732 11,73224,538Dakota County Technical College 407 429 33720 8.6% 4,967 5,3046.4%21,900Fergus Falls Community College 338 35719 15.8% 2,257 2,2571,547Fond du Lac Tribal and Community College 232 247 6813 13.8% 1,794 1,8623.7%28,214Hennepin Technical College 706 737 8727 8.2% 8,951 9,0381.0%46,316Inver Hills Community College 868 939 20463 12.9% 7,255 7,4592.7%86,497Lake Superior College 440 478 1,36435 6.9% 6,975 8,33916.4%39,995Minneapolis Community and Technical College 918 977 6956 8.9% 10,972 11,0410.6%32,462Minnesota State College - Southeast Technical 135 142 56 5.5% 2,604 2,6090.2%14,567Minnesota West Community and Technical College 391 409 3617 8.2% 4,976 5,0120.7%1
10,148Normandale Community College 1,044 1,116 44466 9.9% 11,264 11,7083.8%67,721North Hennepin Community College 930 996 3464 11.4% 8,717 8,7510.4%2
Northeast Higher Education District
3,024 Hibbing Community College 513
7,800 1,107 442
562
1,193 9,435
8549
86 0 13.3% 8,993 4.7%
15.7% 3,586 3,6712.3%1,333 Itasca Community College 150 157 147 10.5% 1,490 1,5040.9%1,807 Mesabi Range Community and Technical College 264 281 15317 13.5% 2,088 2,2416.8%
553 Rainy River Community College 47 53 276 8.7% 606 6334.3%1,083 Vermilion Community College 133 140 1637 11.4% 1,223 1,38611.8%2,708Northland Community and Technical College 170 197 3126 6.8% 2,905 2,9361.1%16,097Northwest Technical College 768 815 1646 11.8% 6,912 6,9280.2%1
831Pine Technical College 120 127 1707 13.3% 958 1,12815.1%5,576Ridgewater College 386 400 2013 6.7% 5,976 5,9960.3%14,620Riverland Community College 354 379 13724 7.6% 4,999 5,1362.7%16,756Rochester Community and Technical College 634 656 7722 8.9% 7,412 7,4891.0%3,894St. Cloud Technical College 567 592 1920 13.2% 4,486 4,5050.4%57,392Saint Paul College 539 568 21527 7.1% 7,960 8,1752.6%24,850South Central Technical College 333 355 7722 6.8% 5,205 5,2821.5%
Subtotal: Colleges 142,945 14,674 4,05915,555827 54 9.8% 158,500 2.5% 162,559
Universities5,430Bemidji State University 873 949 6772 14.9% 6,379 6,4461.0%47,985Metropolitan State University 1,173 1,277 22484 13.8% 9,262 9,4862.4%20
15,033Minnesota State University, Mankato 972 1,045 158 6.5% 16,078 16,0790.0%158,587Minnesota State University Moorhead 507 528 5319 5.8% 9,115 9,1680.6%2
17,962St. Cloud State University 1,727 1,80960 9.1% 19,771 19,771226,055Southwest Minnesota State University 734 752 1817 11.0% 6,807 6,8250.3%18,423Winona State University 648 68827 7.6% 9,111 9,11113
Subtotal: Universities 69,475 6,634 3637,048337 77 9.2% 76,523 0.5% 76,886
Institution Location128,872Greater Minnesota 11,983 12,696 2,658635 9.0% 141,568 144,2261.8%7883,548Twin Cities Metropolitan Area 9,325 9,907 1,764529 10.6% 93,455 95,2191.9%53
Total: Unduplicated Student Enrollment 212,420 21,308 4,42222,6031,164 131 9.6% 235,023 1.8% 239,445
Total: Unique Student Enrollment 212,420 4,42211,074 5.0% 223,49410,654 388 32 227,9161.9%
Source: Office of the Chancellor Research and PlanningR:\Factbooks\System Factbook\Fiscal Year.mdb FY CR Multi Institution 9/27/2004
Table II-5: Page 1 of 17
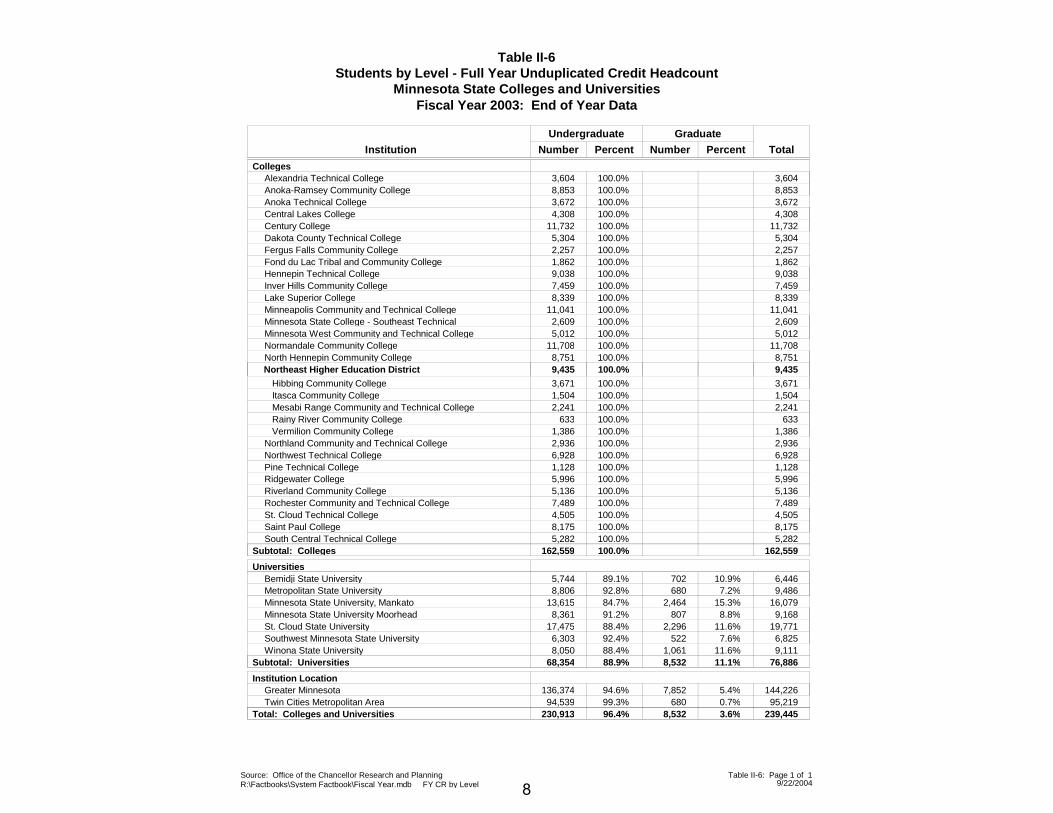
Table II-6Students by Level - Full Year Unduplicated Credit Headcount
Minnesota State Colleges and UniversitiesFiscal Year 2003: End of Year Data
Undergraduate
Institution TotalNumber Percent Number Percent
Graduate
Colleges3,604Alexandria Technical College 100.0% 3,6048,853Anoka-Ramsey Community College 100.0% 8,8533,672Anoka Technical College 100.0% 3,6724,308Central Lakes College 100.0% 4,308
11,732Century College 100.0% 11,7325,304Dakota County Technical College 100.0% 5,3042,257Fergus Falls Community College 100.0% 2,2571,862Fond du Lac Tribal and Community College 100.0% 1,8629,038Hennepin Technical College 100.0% 9,0387,459Inver Hills Community College 100.0% 7,4598,339Lake Superior College 100.0% 8,339
11,041Minneapolis Community and Technical College 100.0% 11,0412,609Minnesota State College - Southeast Technical 100.0% 2,6095,012Minnesota West Community and Technical College 100.0% 5,012
11,708Normandale Community College 100.0% 11,7088,751North Hennepin Community College 100.0% 8,751
Northeast Higher Education District
3,671 Hibbing Community College
9,435
100.0%
100.0%
3,671
9,435
1,504 Itasca Community College 100.0% 1,5042,241 Mesabi Range Community and Technical College 100.0% 2,241
633 Rainy River Community College 100.0% 6331,386 Vermilion Community College 100.0% 1,3862,936Northland Community and Technical College 100.0% 2,9366,928Northwest Technical College 100.0% 6,9281,128Pine Technical College 100.0% 1,1285,996Ridgewater College 100.0% 5,9965,136Riverland Community College 100.0% 5,1367,489Rochester Community and Technical College 100.0% 7,4894,505St. Cloud Technical College 100.0% 4,5058,175Saint Paul College 100.0% 8,1755,282South Central Technical College 100.0% 5,282
Subtotal: Colleges 162,559 100.0% 162,559
Universities5,744Bemidji State University 89.1% 6,446702 10.9%8,806Metropolitan State University 92.8% 9,486680 7.2%
13,615Minnesota State University, Mankato 84.7% 16,0792,464 15.3%8,361Minnesota State University Moorhead 91.2% 9,168807 8.8%
17,475St. Cloud State University 88.4% 19,7712,296 11.6%6,303Southwest Minnesota State University 92.4% 6,825522 7.6%8,050Winona State University 88.4% 9,1111,061 11.6%
Subtotal: Universities 68,354 88.9% 76,8868,532 11.1%
Institution Location136,374Greater Minnesota 94.6% 144,2267,852 5.4%94,539Twin Cities Metropolitan Area 99.3% 95,219680 0.7%
Total: Colleges and Universities 230,913 96.4% 239,4458,532 3.6%
Source: Office of the Chancellor Research and PlanningR:\Factbooks\System Factbook\Fiscal Year.mdb FY CR by Level 9/22/2004
Table II-6: Page 1 of 1
8
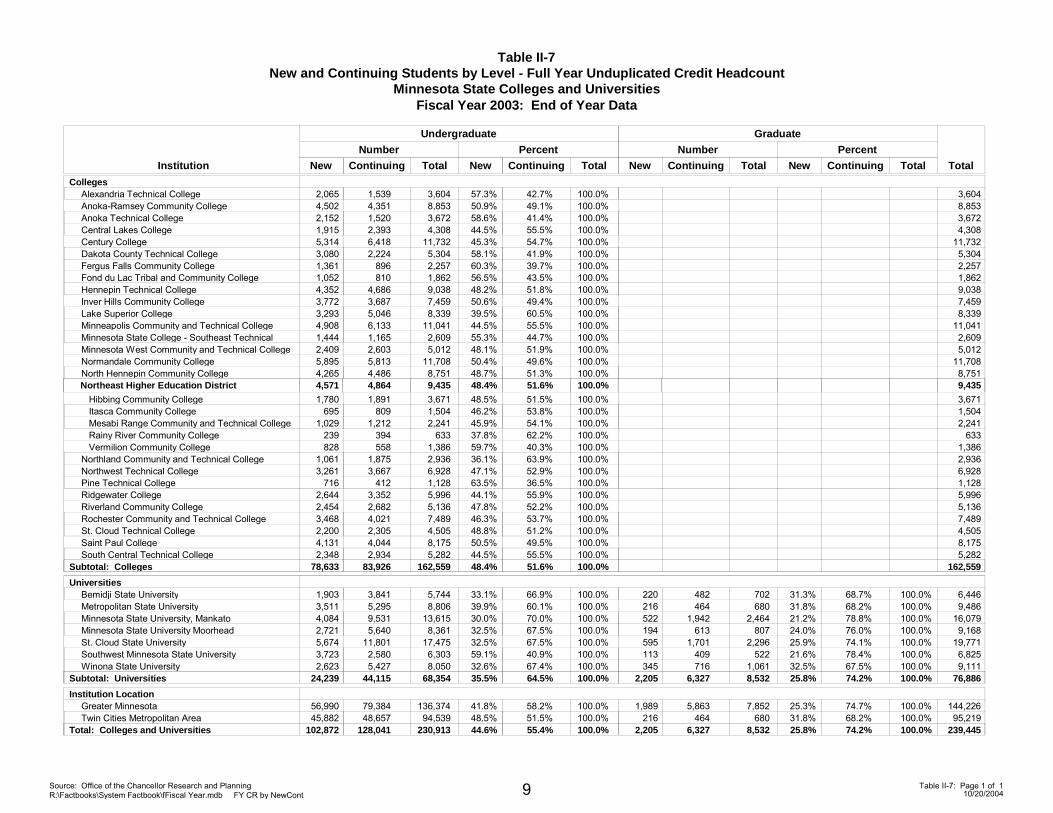
Table II-7New and Continuing Students by Level - Full Year Unduplicated Credit Headcount
Minnesota State Colleges and Universities
New ContinuingInstitution
Fiscal Year 2003: End of Year Data
Total
UndergraduateNumber Percent
Total New Continuing
GraduateNumber Percent
New Continuing Total New ContinuingTotal TotalColleges
2,065Alexandria Technical College 1,539 3,60457.3%3,604 42.7% 100.0%4,502Anoka-Ramsey Community College 4,351 8,85350.9%8,853 49.1% 100.0%2,152Anoka Technical College 1,520 3,67258.6%3,672 41.4% 100.0%1,915Central Lakes College 2,393 4,30844.5%4,308 55.5% 100.0%5,314Century College 6,418 11,73245.3%11,732 54.7% 100.0%3,080Dakota County Technical College 2,224 5,30458.1%5,304 41.9% 100.0%1,361Fergus Falls Community College 896 2,25760.3%2,257 39.7% 100.0%1,052Fond du Lac Tribal and Community College 810 1,86256.5%1,862 43.5% 100.0%4,352Hennepin Technical College 4,686 9,03848.2%9,038 51.8% 100.0%3,772Inver Hills Community College 3,687 7,45950.6%7,459 49.4% 100.0%3,293Lake Superior College 5,046 8,33939.5%8,339 60.5% 100.0%4,908Minneapolis Community and Technical College 6,133 11,04144.5%11,041 55.5% 100.0%1,444Minnesota State College - Southeast Technical 1,165 2,60955.3%2,609 44.7% 100.0%2,409Minnesota West Community and Technical College 2,603 5,01248.1%5,012 51.9% 100.0%5,895Normandale Community College 5,813 11,70850.4%11,708 49.6% 100.0%4,265North Hennepin Community College 4,486 8,75148.7%8,751 51.3% 100.0%
Northeast Higher Education District1,780 Hibbing Community College 1,8914,571 4,864
3,6719,435
48.5%48.4%
3,6719,435
51.5%51.6%
100.0%100.0%
695 Itasca Community College 809 1,50446.2%1,504 53.8% 100.0%1,029 Mesabi Range Community and Technical College 1,212 2,24145.9%2,241 54.1% 100.0%
239 Rainy River Community College 394 63337.8%633 62.2% 100.0%828 Vermilion Community College 558 1,38659.7%1,386 40.3% 100.0%
1,061Northland Community and Technical College 1,875 2,93636.1%2,936 63.9% 100.0%3,261Northwest Technical College 3,667 6,92847.1%6,928 52.9% 100.0%
716Pine Technical College 412 1,12863.5%1,128 36.5% 100.0%2,644Ridgewater College 3,352 5,99644.1%5,996 55.9% 100.0%2,454Riverland Community College 2,682 5,13647.8%5,136 52.2% 100.0%3,468Rochester Community and Technical College 4,021 7,48946.3%7,489 53.7% 100.0%2,200St. Cloud Technical College 2,305 4,50548.8%4,505 51.2% 100.0%4,131Saint Paul College 4,044 8,17550.5%8,175 49.5% 100.0%2,348South Central Technical College 2,934 5,28244.5%5,282 55.5% 100.0%
Subtotal: Colleges 78,633 83,926 162,55948.4%162,559 51.6% 100.0%Universities
1,903Bemidji State University 3,841 6,44633.1%5,744 66.9% 702220 482 68.7%31.3%100.0% 100.0%3,511Metropolitan State University 5,295 9,48639.9%8,806 60.1% 680216 464 68.2%31.8%100.0% 100.0%4,084Minnesota State University, Mankato 9,531 16,07930.0%13,615 70.0% 2,464522 1,942 78.8%21.2%100.0% 100.0%2,721Minnesota State University Moorhead 5,640 9,16832.5%8,361 67.5% 807194 613 76.0%24.0%100.0% 100.0%5,674St. Cloud State University 11,801 19,77132.5%17,475 67.5% 2,296595 1,701 74.1%25.9%100.0% 100.0%3,723Southwest Minnesota State University 2,580 6,82559.1%6,303 40.9% 522113 409 78.4%21.6%100.0% 100.0%2,623Winona State University 5,427 9,11132.6%8,050 67.4% 1,061345 716 67.5%32.5%100.0% 100.0%
Subtotal: Universities 24,239 44,115 76,88635.5%68,354 64.5% 2,205 6,327 25.8%8,532 74.2%100.0% 100.0%Institution Location
56,990Greater Minnesota 79,384 144,22641.8%136,374 58.2% 7,8521,989 5,863 74.7%25.3%100.0% 100.0%45,882Twin Cities Metropolitan Area 48,657 95,21948.5%94,539 51.5% 680216 464 68.2%31.8%100.0% 100.0%
Total: Colleges and Universities 102,872 128,041 239,44544.6%230,913 55.4% 2,205 6,327 25.8%8,532 74.2%100.0% 100.0%
Source: Office of the Chancellor Research and PlanningR:\Factbooks\System Factbook\fFiscal Year.mdb FY CR by NewCont 10/20/2004
Table II-7: Page 1 of 19
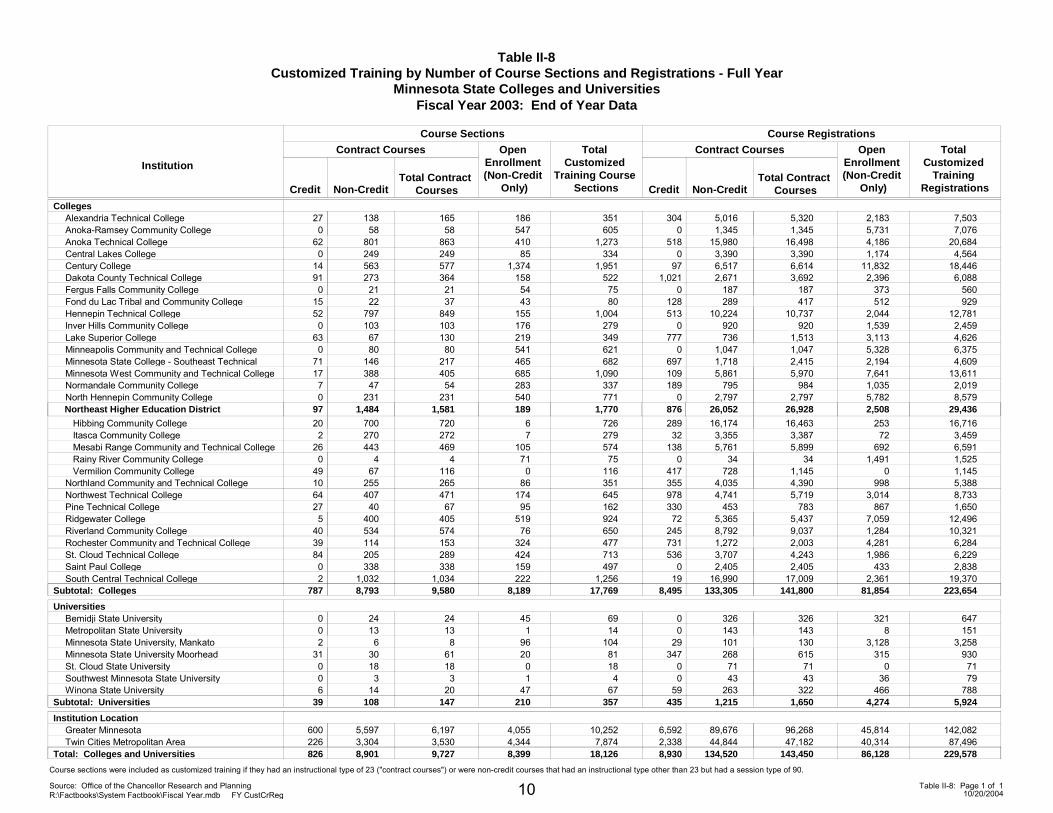
Table II-8Customized Training by Number of Course Sections and Registrations - Full Year
Minnesota State Colleges and Universities
Credit Non-Credit
Institution
Fiscal Year 2003: End of Year Data
Course SectionsContract Courses
Total Contract Courses
Open Enrollment (Non-Credit
Only)
Total Customized
Training Course Sections Credit Non-Credit
Course RegistrationsContract Courses
Total Contract Courses
Open Enrollment (Non-Credit
Only)
Total Customized
Training Registrations
Colleges27Alexandria Technical College 138 165 351186 304 5,016 5,320 7,5032,1830Anoka-Ramsey Community College 58 58 605547 0 1,345 1,345 7,0765,731
62Anoka Technical College 801 863 1,273410 518 15,980 16,498 20,6844,1860Central Lakes College 249 249 33485 0 3,390 3,390 4,5641,174
14Century College 563 577 1,9511,374 97 6,517 6,614 18,44611,83291Dakota County Technical College 273 364 522158 1,021 2,671 3,692 6,0882,3960Fergus Falls Community College 21 21 7554 0 187 187 560373
15Fond du Lac Tribal and Community College 22 37 8043 128 289 417 92951252Hennepin Technical College 797 849 1,004155 513 10,224 10,737 12,7812,0440Inver Hills Community College 103 103 279176 0 920 920 2,4591,539
63Lake Superior College 67 130 349219 777 736 1,513 4,6263,1130Minneapolis Community and Technical College 80 80 621541 0 1,047 1,047 6,3755,328
71Minnesota State College - Southeast Technical 146 217 682465 697 1,718 2,415 4,6092,19417Minnesota West Community and Technical College 388 405 1,090685 109 5,861 5,970 13,6117,6417Normandale Community College 47 54 337283 189 795 984 2,0191,0350North Hennepin Community College 231 231 771540 0 2,797 2,797 8,5795,782
Northeast Higher Education District20 Hibbing Community College 70097 1,484
7201,581
7261,770
6189
289 16,174876 26,052
16,46326,928
16,71629,436
2532,508
2 Itasca Community College 270 272 2797 32 3,355 3,387 3,4597226 Mesabi Range Community and Technical College 443 469 574105 138 5,761 5,899 6,5916920 Rainy River Community College 4 4 7571 0 34 34 1,5251,491
49 Vermilion Community College 67 116 1160 417 728 1,145 1,145010Northland Community and Technical College 255 265 35186 355 4,035 4,390 5,38899864Northwest Technical College 407 471 645174 978 4,741 5,719 8,7333,01427Pine Technical College 40 67 16295 330 453 783 1,6508675Ridgewater College 400 405 924519 72 5,365 5,437 12,4967,059
40Riverland Community College 534 574 65076 245 8,792 9,037 10,3211,28439Rochester Community and Technical College 114 153 477324 731 1,272 2,003 6,2844,28184St. Cloud Technical College 205 289 713424 536 3,707 4,243 6,2291,9860Saint Paul College 338 338 497159 0 2,405 2,405 2,8384332South Central Technical College 1,032 1,034 1,256222 19 16,990 17,009 19,3702,361
Subtotal: Colleges 8,793 9,580 17,769787 8,189 133,305 141,800 223,6548,495 81,854Universities
0Bemidji State University 24 24 6945 0 326 326 6473210Metropolitan State University 13 13 141 0 143 143 15182Minnesota State University, Mankato 6 8 10496 29 101 130 3,2583,128
31Minnesota State University Moorhead 30 61 8120 347 268 615 9303150St. Cloud State University 18 18 180 0 71 71 7100Southwest Minnesota State University 3 3 41 0 43 43 79366Winona State University 14 20 6747 59 263 322 788466
Subtotal: Universities 108 147 35739 210 1,215 1,650 5,924435 4,274Institution Location
600Greater Minnesota 5,597 6,197 10,2524,055 6,592 89,676 96,268 142,08245,814226Twin Cities Metropolitan Area 3,304 3,530 7,8744,344 2,338 44,844 47,182 87,49640,314
Total: Colleges and Universities 8,901 9,727 18,126826 8,399 134,520 143,450 229,5788,930 86,128
Source: Office of the Chancellor Research and PlanningR:\Factbooks\System Factbook\Fiscal Year.mdb FY CustCrReg 10/20/2004
Course sections were included as customized training if they had an instructional type of 23 ("contract courses") or were non-credit courses that had an instructional type other than 23 but had a session type of 90.
Table II-8: Page 1 of 110
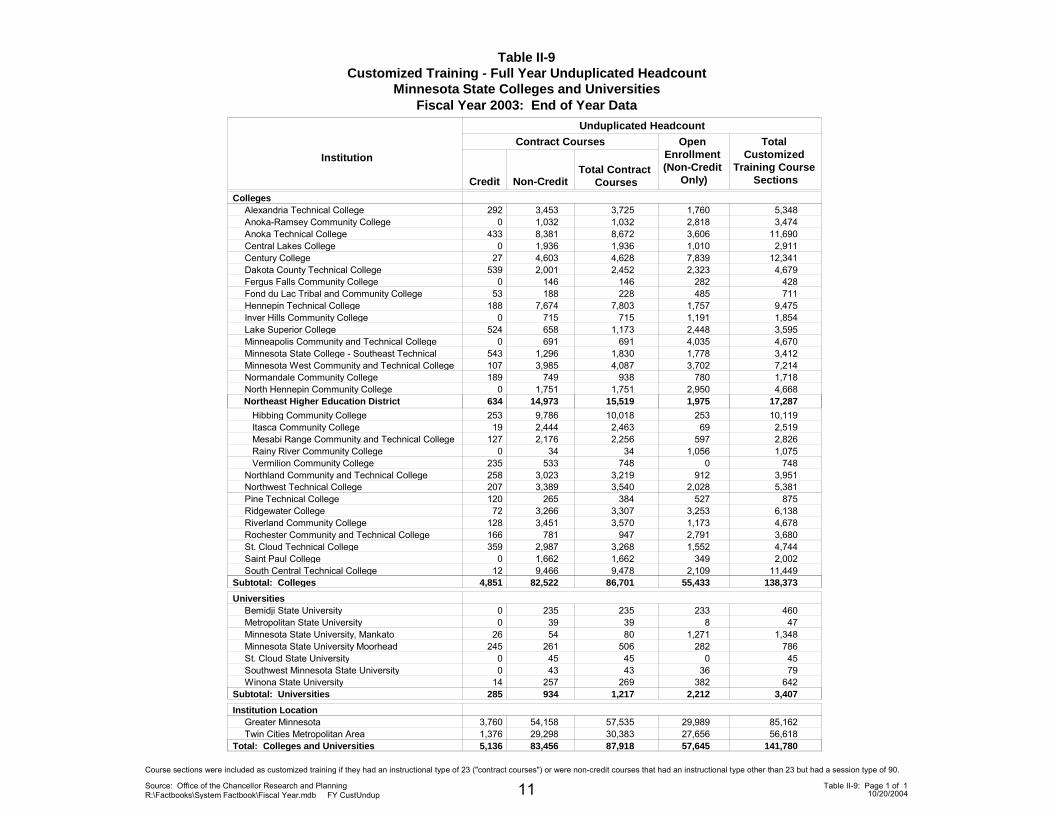
Table II-9Customized Training - Full Year Unduplicated Headcount
Minnesota State Colleges and Universities
Credit Non-Credit
Institution
Fiscal Year 2003: End of Year DataUnduplicated Headcount
Contract Courses
Total Contract Courses
Open Enrollment (Non-Credit
Only)
Total Customized
Training Course Sections
Colleges292Alexandria Technical College 3,453 3,725 5,3481,760
0Anoka-Ramsey Community College 1,032 1,032 3,4742,818433Anoka Technical College 8,381 8,672 11,6903,606
0Central Lakes College 1,936 1,936 2,9111,01027Century College 4,603 4,628 12,3417,839
539Dakota County Technical College 2,001 2,452 4,6792,3230Fergus Falls Community College 146 146 428282
53Fond du Lac Tribal and Community College 188 228 711485188Hennepin Technical College 7,674 7,803 9,4751,757
0Inver Hills Community College 715 715 1,8541,191524Lake Superior College 658 1,173 3,5952,448
0Minneapolis Community and Technical College 691 691 4,6704,035543Minnesota State College - Southeast Technical 1,296 1,830 3,4121,778107Minnesota West Community and Technical College 3,985 4,087 7,2143,702189Normandale Community College 749 938 1,718780
0North Hennepin Community College 1,751 1,751 4,6682,950 Northeast Higher Education District
253 Hibbing Community College 9,786634 14,973
10,01815,519
10,11917,287
2531,975
19 Itasca Community College 2,444 2,463 2,51969127 Mesabi Range Community and Technical College 2,176 2,256 2,826597
0 Rainy River Community College 34 34 1,0751,056235 Vermilion Community College 533 748 7480258Northland Community and Technical College 3,023 3,219 3,951912207Northwest Technical College 3,389 3,540 5,3812,028120Pine Technical College 265 384 87552772Ridgewater College 3,266 3,307 6,1383,253
128Riverland Community College 3,451 3,570 4,6781,173166Rochester Community and Technical College 781 947 3,6802,791359St. Cloud Technical College 2,987 3,268 4,7441,552
0Saint Paul College 1,662 1,662 2,00234912South Central Technical College 9,466 9,478 11,4492,109
Subtotal: Colleges 82,522 86,701 138,3734,851 55,433Universities
0Bemidji State University 235 235 4602330Metropolitan State University 39 39 478
26Minnesota State University, Mankato 54 80 1,3481,271245Minnesota State University Moorhead 261 506 786282
0St. Cloud State University 45 45 4500Southwest Minnesota State University 43 43 7936
14Winona State University 257 269 642382Subtotal: Universities 934 1,217 3,407285 2,212Institution Location
3,760Greater Minnesota 54,158 57,535 85,16229,9891,376Twin Cities Metropolitan Area 29,298 30,383 56,61827,656
Total: Colleges and Universities 83,456 87,918 141,7805,136 57,645
Source: Office of the Chancellor Research and PlanningR:\Factbooks\System Factbook\Fiscal Year.mdb FY CustUndup 10/20/2004
Course sections were included as customized training if they had an instructional type of 23 ("contract courses") or were non-credit courses that had an instructional type other than 23 but had a session type of 90.
Table II-9: Page 1 of 111
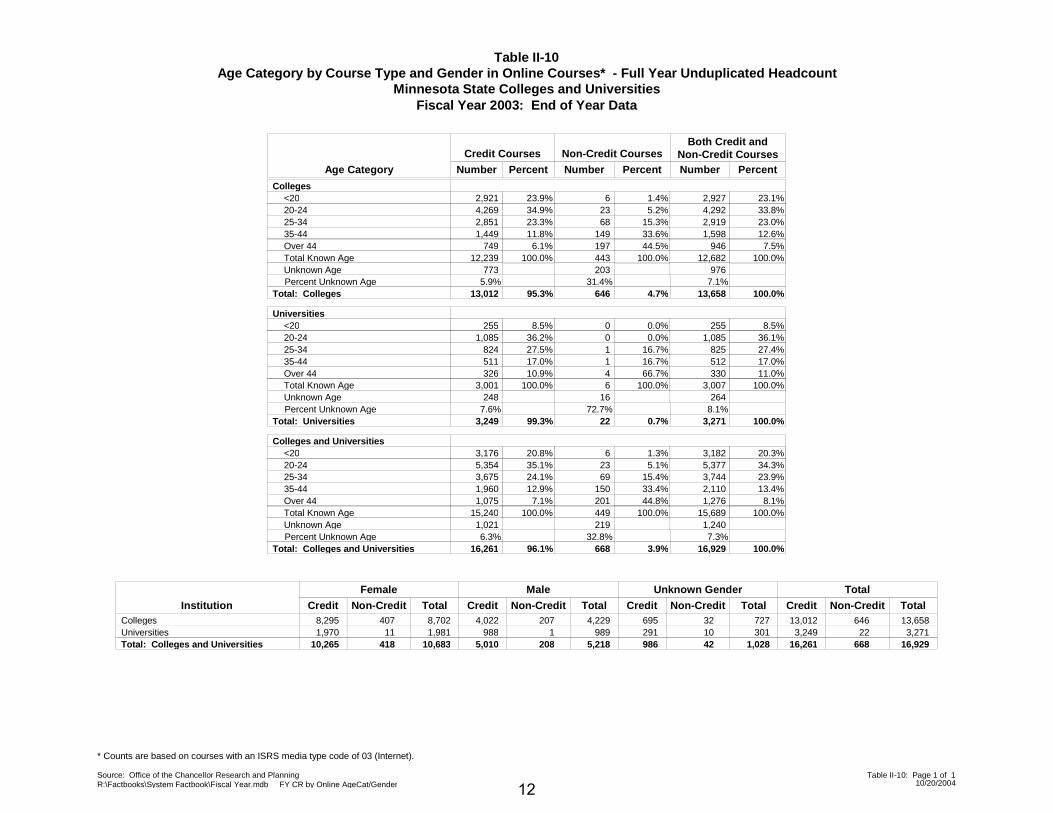
Table II-10Age Category by Course Type and Gender in Online Courses* - Full Year Unduplicated Headcount
Minnesota State Colleges and UniversitiesFiscal Year 2003: End of Year Data
Credit Courses Non-Credit CoursesBoth Credit and
Non-Credit CoursesAge Category Number Percent Number Percent Number Percent
Colleges 2,921 6 2,927 <20 23.9% 1.4% 23.1%4,269 23 4,292 20-24 34.9% 5.2% 33.8%2,851 68 2,919 25-34 23.3% 15.3% 23.0%1,449 149 1,598 35-44 11.8% 33.6% 12.6%
749 197 946 Over 44 6.1% 44.5% 7.5%12,239 443 12,682 Total Known Age 100.0% 100.0% 100.0%
773 203 976 Unknown Age
13,012Total: Colleges 5.9%Percent Unknown Age 31.4% 7.1%
95.3% 4.7% 100.0%646 13,658
Universities 255 0 255 <20 8.5% 0.0% 8.5%
1,085 0 1,085 20-24 36.2% 0.0% 36.1%824 1 825 25-34 27.5% 16.7% 27.4%511 1 512 35-44 17.0% 16.7% 17.0%326 4 330 Over 44 10.9% 66.7% 11.0%
3,001 6 3,007 Total Known Age 100.0% 100.0% 100.0%248 16 264 Unknown Age
3,249Total: Universities 7.6%Percent Unknown Age 72.7% 8.1%
99.3% 0.7% 100.0%22 3,271
Colleges and Universities3,176 6 3,182 <20 20.8% 1.3% 20.3%5,354 23 5,377 20-24 35.1% 5.1% 34.3%3,675 69 3,744 25-34 24.1% 15.4% 23.9%1,960 150 2,110 35-44 12.9% 33.4% 13.4%1,075 201 1,276 Over 44 7.1% 44.8% 8.1%
15,240 449 15,689 Total Known Age 100.0% 100.0% 100.0%1,021 219 1,240 Unknown Age
16,261Total: Colleges and Universities6.3%Percent Unknown Age 32.8% 7.3%
96.1% 3.9% 100.0%668 16,929
Credit Non-Credit Total
Female
Credit Non-Credit Total
Male
Credit Non-Credit Total
Unknown Gender
Credit Non-Credit Total
Total
Institution8,295Colleges 407 8,702 4,022 207 4,229 695 32 727 13,012 646 13,6581,970Universities 11 1,981 988 1 989 291 10 301 3,249 22 3,271
10,265Total: Colleges and Universities 418 10,683 5,010 208 5,218 986 42 1,028 16,261 668 16,929
Source: Office of the Chancellor Research and PlanningR:\Factbooks\System Factbook\Fiscal Year.mdb FY CR by Online AgeCat/Gender 10/20/2004
* Counts are based on courses with an ISRS media type code of 03 (Internet).
Table II-10: Page 1 of 1
12
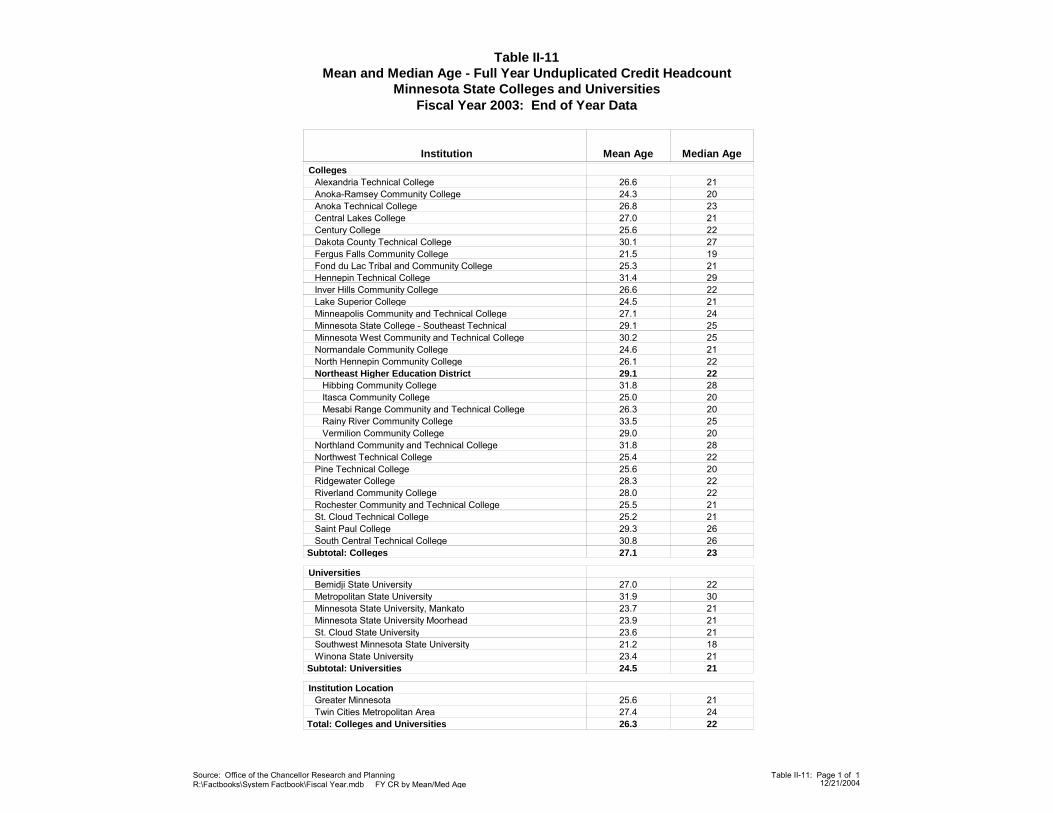
Table II-11Mean and Median Age - Full Year Unduplicated Credit Headcount
Minnesota State Colleges and Universities
Mean Age Median AgeInstitution
Fiscal Year 2003: End of Year Data
Colleges26.6 21 Alexandria Technical College24.3 20 Anoka-Ramsey Community College26.8 23 Anoka Technical College27.0 21 Central Lakes College25.6 22 Century College30.1 27 Dakota County Technical College21.5 19 Fergus Falls Community College25.3 21 Fond du Lac Tribal and Community College31.4 29 Hennepin Technical College26.6 22 Inver Hills Community College24.5 21 Lake Superior College27.1 24 Minneapolis Community and Technical College29.1 25 Minnesota State College - Southeast Technical30.2 25 Minnesota West Community and Technical College24.6 21 Normandale Community College26.1 22 North Hennepin Community College29.1 22 Northeast Higher Education District31.8 28 Hibbing Community College25.0 20 Itasca Community College26.3 20 Mesabi Range Community and Technical College33.5 25 Rainy River Community College29.0 20 Vermilion Community College31.8 28 Northland Community and Technical College25.4 22 Northwest Technical College25.6 20 Pine Technical College28.3 22 Ridgewater College28.0 22 Riverland Community College25.5 21 Rochester Community and Technical College25.2 21 St. Cloud Technical College29.3 26 Saint Paul College30.8 26 South Central Technical College27.1 23 Subtotal: Colleges
Universities27.0 22 Bemidji State University31.9 30 Metropolitan State University23.7 21 Minnesota State University, Mankato23.9 21 Minnesota State University Moorhead23.6 21 St. Cloud State University21.2 18 Southwest Minnesota State University23.4 21 Winona State University24.5 21 Subtotal: Universities
Institution Location25.6 21 Greater Minnesota27.4 24 Twin Cities Metropolitan Area26.3 22 Total: Colleges and Universities
Source: Office of the Chancellor Research and PlanningR:\Factbooks\System Factbook\Fiscal Year.mdb FY CR by Mean/Med Age 12/21/2004
Table II-11: Page 1 of 1
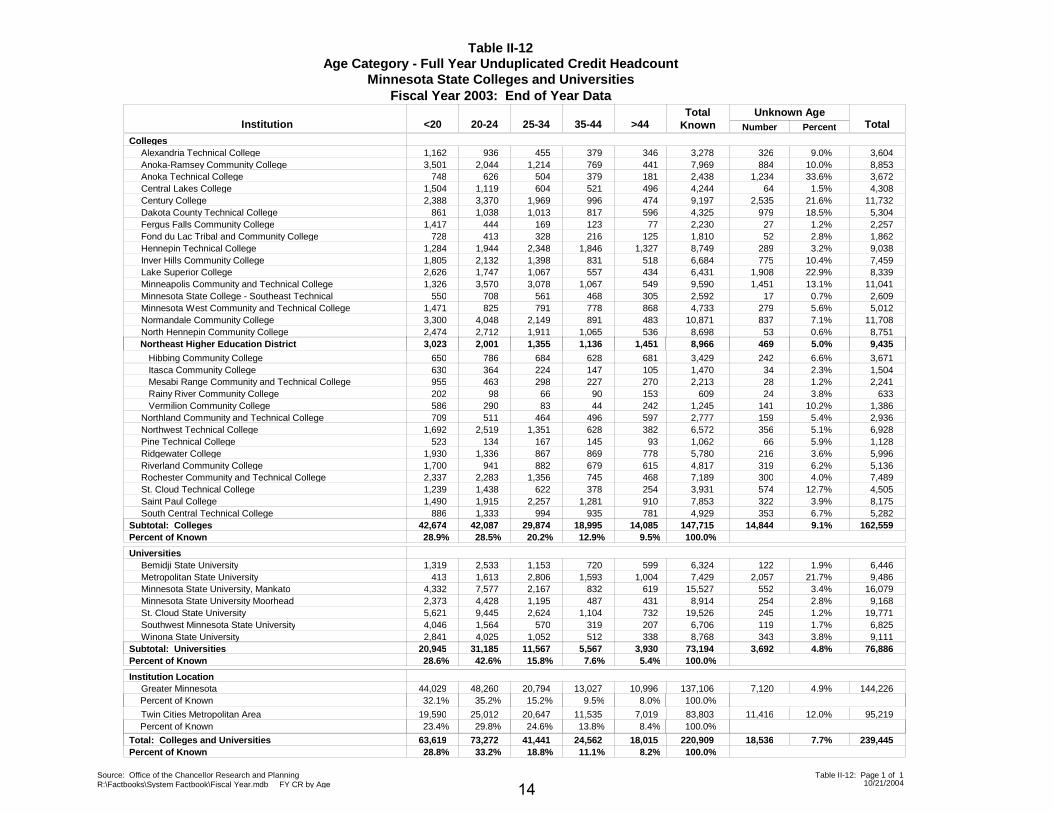
Table II-12Age Category - Full Year Unduplicated Credit Headcount
Minnesota State Colleges and Universities
<20 20-24 25-34 PercentInstitution
Fiscal Year 2003: End of Year DataUnknown Age
TotalTotal
Known35-44 >44 NumberColleges
1,162Alexandria Technical College 936 3,278 3,6049.0%455 379 346 3263,501Anoka-Ramsey Community College 2,044 7,969 8,85310.0%1,214 769 441 884
748Anoka Technical College 626 2,438 3,67233.6%504 379 181 1,2341,504Central Lakes College 1,119 4,244 4,3081.5%604 521 496 642,388Century College 3,370 9,197 11,73221.6%1,969 996 474 2,535
861Dakota County Technical College 1,038 4,325 5,30418.5%1,013 817 596 9791,417Fergus Falls Community College 444 2,230 2,2571.2%169 123 77 27
728Fond du Lac Tribal and Community College 413 1,810 1,8622.8%328 216 125 521,284Hennepin Technical College 1,944 8,749 9,0383.2%2,348 1,846 1,327 2891,805Inver Hills Community College 2,132 6,684 7,45910.4%1,398 831 518 7752,626Lake Superior College 1,747 6,431 8,33922.9%1,067 557 434 1,9081,326Minneapolis Community and Technical College 3,570 9,590 11,04113.1%3,078 1,067 549 1,451
550Minnesota State College - Southeast Technical 708 2,592 2,6090.7%561 468 305 171,471Minnesota West Community and Technical College 825 4,733 5,0125.6%791 778 868 2793,300Normandale Community College 4,048 10,871 11,7087.1%2,149 891 483 8372,474North Hennepin Community College 2,712 8,698 8,7510.6%1,911 1,065 536 53
Northeast Higher Education District
650 Hibbing Community College 786
3,023 2,001 1,355
3,429
8,966
3,6716.6%
5.0% 9,435
684
1,136
628
1,451
681
469
242630 Itasca Community College 364 1,470 1,5042.3%224 147 105 34955 Mesabi Range Community and Technical College 463 2,213 2,2411.2%298 227 270 28202 Rainy River Community College 98 609 6333.8%66 90 153 24586 Vermilion Community College 290 1,245 1,38610.2%83 44 242 141709Northland Community and Technical College 511 2,777 2,9365.4%464 496 597 159
1,692Northwest Technical College 2,519 6,572 6,9285.1%1,351 628 382 356523Pine Technical College 134 1,062 1,1285.9%167 145 93 66
1,930Ridgewater College 1,336 5,780 5,9963.6%867 869 778 2161,700Riverland Community College 941 4,817 5,1366.2%882 679 615 3192,337Rochester Community and Technical College 2,283 7,189 7,4894.0%1,356 745 468 3001,239St. Cloud Technical College 1,438 3,931 4,50512.7%622 378 254 5741,490Saint Paul College 1,915 7,853 8,1753.9%2,257 1,281 910 322
886South Central Technical College 1,333 4,929 5,2826.7%994 935 781 353Subtotal: Colleges
28.9%42,087 29,874 147,715 162,5599.1%18,995 14,085 14,844
Percent of Known42,674
28.5% 20.2% 12.9% 9.5% 100.0%
Universities1,319Bemidji State University 2,533 6,324 6,4461.9%1,153 720 599 122
413Metropolitan State University 1,613 7,429 9,48621.7%2,806 1,593 1,004 2,0574,332Minnesota State University, Mankato 7,577 15,527 16,0793.4%2,167 832 619 5522,373Minnesota State University Moorhead 4,428 8,914 9,1682.8%1,195 487 431 2545,621St. Cloud State University 9,445 19,526 19,7711.2%2,624 1,104 732 2454,046Southwest Minnesota State University 1,564 6,706 6,8251.7%570 319 207 1192,841Winona State University 4,025 8,768 9,1113.8%1,052 512 338 343
Subtotal: Universities28.6%
31,185 11,567 73,194 76,8864.8%5,567 3,930 3,692Percent of Known
20,94542.6% 15.8% 7.6% 5.4% 100.0%
Institution Location44,029Greater Minnesota 48,260 137,106 144,2264.9%20,794 13,027 10,996 7,120
Percent of Known 32.1% 35.2% 15.2% 9.5% 8.0% 100.0%
19,590Twin Cities Metropolitan Area 25,012 83,803 95,21912.0%20,647 11,535 7,019 11,416 Percent of Known 23.4% 29.8% 24.6% 13.8% 8.4% 100.0%
Total: Colleges and Universities28.8%
73,272 41,441 220,909 239,4457.7%24,562 18,015 18,536Percent of Known
63,61933.2% 18.8% 11.1% 8.2% 100.0%
Source: Office of the Chancellor Research and PlanningR:\Factbooks\System Factbook\Fiscal Year.mdb FY CR by Age 10/21/2004
Table II-12: Page 1 of 1
14
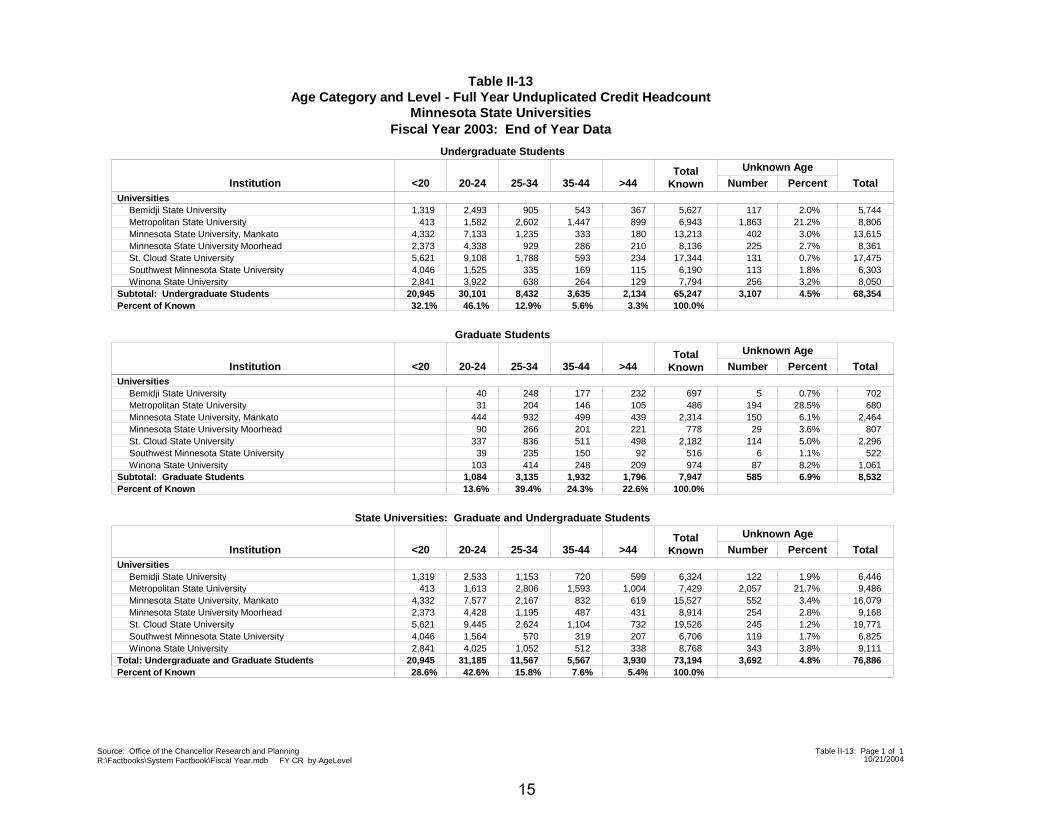
Table II-13Age Category and Level - Full Year Unduplicated Credit Headcount
Minnesota State UniversitiesFiscal Year 2003: End of Year Data
Undergraduate Students
<20 20-24 25-34Institution Number TotalTotal
Known35-44 >44 Percent
Unknown Age
UniversitiesBemidji State University 2,493 5,627 5,7442.0%905 543 367 1171,319Metropolitan State University 1,582 6,943 8,80621.2%2,602 1,447 899 1,863413Minnesota State University, Mankato 7,133 13,213 13,6153.0%1,235 333 180 4024,332Minnesota State University Moorhead 4,338 8,136 8,3612.7%929 286 210 2252,373St. Cloud State University 9,108 17,344 17,4750.7%1,788 593 234 1315,621Southwest Minnesota State University 1,525 6,190 6,3031.8%335 169 115 1134,046Winona State University 3,922 7,794 8,0503.2%638 264 129 2562,841
Subtotal: Undergraduate Students 20,945 30,101 8,432 65,247 68,3544.5%3,635 2,134 3,10732.1%Percent of Known 46.1% 12.9% 5.6% 3.3% 100.0%
Graduate Students
<20 20-24 25-34Institution Number TotalTotal
Known35-44 >44 Percent
Unknown Age
UniversitiesBemidji State University 40 697 7020.7%248 177 232 5Metropolitan State University 31 486 68028.5%204 146 105 194Minnesota State University, Mankato 444 2,314 2,4646.1%932 499 439 150Minnesota State University Moorhead 90 778 8073.6%266 201 221 29St. Cloud State University 337 2,182 2,2965.0%836 511 498 114Southwest Minnesota State University 39 516 5221.1%235 150 92 6Winona State University 103 974 1,0618.2%414 248 209 87
Subtotal: Graduate Students 1,084 3,135 7,947 8,5326.9%1,932 1,796 585Percent of Known 13.6% 39.4% 24.3% 22.6% 100.0%
State Universities: Graduate and Undergraduate Students
<20 20-24 25-34Institution Number TotalTotal
Known35-44 >44 Percent
Unknown Age
UniversitiesBemidji State University 2,533 6,324 6,4461.9%1,153 720 599 1221,319Metropolitan State University 1,613 7,429 9,48621.7%2,806 1,593 1,004 2,057413Minnesota State University, Mankato 7,577 15,527 16,0793.4%2,167 832 619 5524,332Minnesota State University Moorhead 4,428 8,914 9,1682.8%1,195 487 431 2542,373St. Cloud State University 9,445 19,526 19,7711.2%2,624 1,104 732 2455,621Southwest Minnesota State University 1,564 6,706 6,8251.7%570 319 207 1194,046Winona State University 4,025 8,768 9,1113.8%1,052 512 338 3432,841
Total: Undergraduate and Graduate Students 20,945 31,185 11,567 73,194 76,8864.8%5,567 3,930 3,69228.6%Percent of Known 42.6% 15.8% 7.6% 5.4% 100.0%
Source: Office of the Chancellor Research and PlanningR:\Factbooks\System Factbook\Fiscal Year.mdb FY CR by AgeLevel 10/21/2004
Table II-13: Page 1 of 1
15
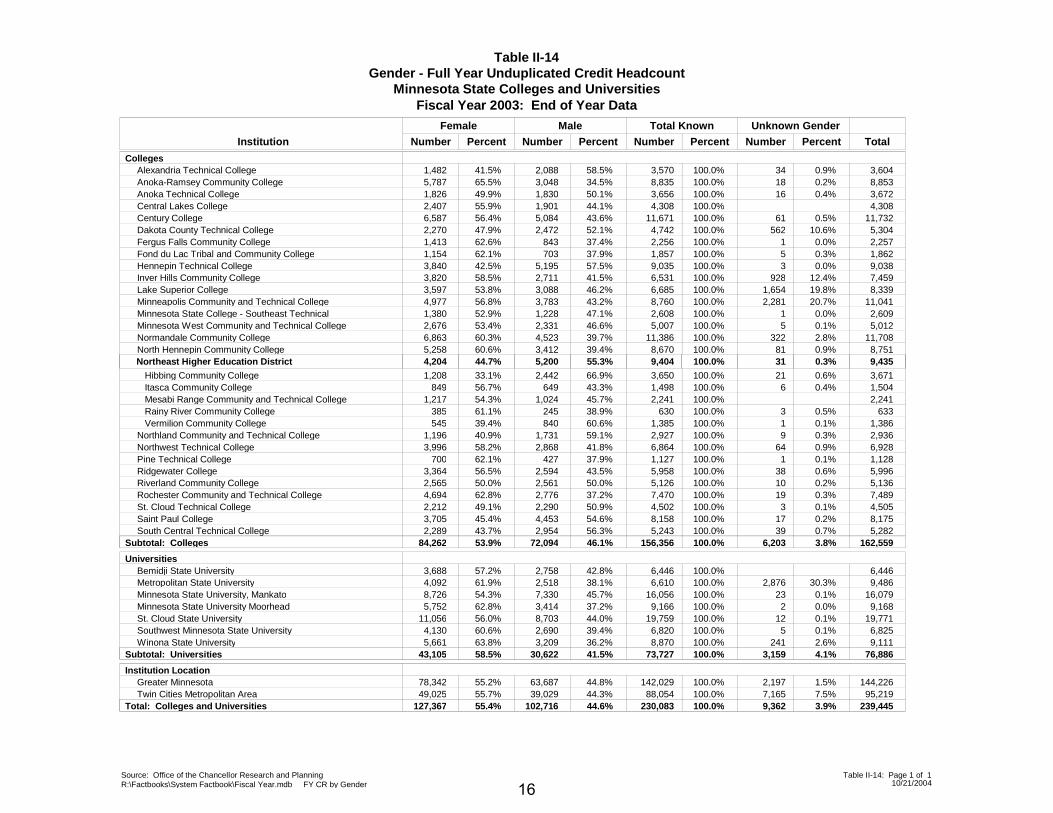
Table II-14Gender - Full Year Unduplicated Credit Headcount
Minnesota State Colleges and UniversitiesFiscal Year 2003: End of Year Data
Female Unknown Gender
Institution Total
Total Known
Number Percent Number Percent
Male
Number PercentNumber Percent
Colleges1,482Alexandria Technical College 2,088 3,57041.5% 58.5% 3,6040.9%34100.0%5,787Anoka-Ramsey Community College 3,048 8,83565.5% 34.5% 8,8530.2%18100.0%1,826Anoka Technical College 1,830 3,65649.9% 50.1% 3,6720.4%16100.0%2,407Central Lakes College 1,901 4,30855.9% 44.1% 4,308100.0%6,587Century College 5,084 11,67156.4% 43.6% 11,7320.5%61100.0%2,270Dakota County Technical College 2,472 4,74247.9% 52.1% 5,30410.6%562100.0%1,413Fergus Falls Community College 843 2,25662.6% 37.4% 2,2570.0%1100.0%1,154Fond du Lac Tribal and Community College 703 1,85762.1% 37.9% 1,8620.3%5100.0%3,840Hennepin Technical College 5,195 9,03542.5% 57.5% 9,0380.0%3100.0%3,820Inver Hills Community College 2,711 6,53158.5% 41.5% 7,45912.4%928100.0%3,597Lake Superior College 3,088 6,68553.8% 46.2% 8,33919.8%1,654100.0%4,977Minneapolis Community and Technical College 3,783 8,76056.8% 43.2% 11,04120.7%2,281100.0%1,380Minnesota State College - Southeast Technical 1,228 2,60852.9% 47.1% 2,6090.0%1100.0%2,676Minnesota West Community and Technical College 2,331 5,00753.4% 46.6% 5,0120.1%5100.0%6,863Normandale Community College 4,523 11,38660.3% 39.7% 11,7082.8%322100.0%5,258North Hennepin Community College 3,412 8,67060.6% 39.4% 8,7510.9%81100.0%
Northeast Higher Education District
1,208 Hibbing Community College 2,442
4,204 5,200 31
3,650
9,404
33.1%
44.7%
66.9%
55.3%
3,6710.6%
0.3% 9,435
21100.0%
100.0%
849 Itasca Community College 649 1,49856.7% 43.3% 1,5040.4%6100.0%1,217 Mesabi Range Community and Technical College 1,024 2,24154.3% 45.7% 2,241100.0%
385 Rainy River Community College 245 63061.1% 38.9% 6330.5%3100.0%545 Vermilion Community College 840 1,38539.4% 60.6% 1,3860.1%1100.0%
1,196Northland Community and Technical College 1,731 2,92740.9% 59.1% 2,9360.3%9100.0%3,996Northwest Technical College 2,868 6,86458.2% 41.8% 6,9280.9%64100.0%
700Pine Technical College 427 1,12762.1% 37.9% 1,1280.1%1100.0%3,364Ridgewater College 2,594 5,95856.5% 43.5% 5,9960.6%38100.0%2,565Riverland Community College 2,561 5,12650.0% 50.0% 5,1360.2%10100.0%4,694Rochester Community and Technical College 2,776 7,47062.8% 37.2% 7,4890.3%19100.0%2,212St. Cloud Technical College 2,290 4,50249.1% 50.9% 4,5050.1%3100.0%3,705Saint Paul College 4,453 8,15845.4% 54.6% 8,1750.2%17100.0%2,289South Central Technical College 2,954 5,24343.7% 56.3% 5,2820.7%39100.0%
Subtotal: Colleges 84,262 72,094 6,203156,35653.9% 46.1% 162,5593.8%100.0%
Universities3,688Bemidji State University 2,758 6,44657.2% 42.8% 6,446100.0%4,092Metropolitan State University 2,518 6,61061.9% 38.1% 9,48630.3%2,876100.0%8,726Minnesota State University, Mankato 7,330 16,05654.3% 45.7% 16,0790.1%23100.0%5,752Minnesota State University Moorhead 3,414 9,16662.8% 37.2% 9,1680.0%2100.0%
11,056St. Cloud State University 8,703 19,75956.0% 44.0% 19,7710.1%12100.0%4,130Southwest Minnesota State University 2,690 6,82060.6% 39.4% 6,8250.1%5100.0%5,661Winona State University 3,209 8,87063.8% 36.2% 9,1112.6%241100.0%
Subtotal: Universities 43,105 30,622 3,15973,72758.5% 41.5% 76,8864.1%100.0%
Institution Location78,342Greater Minnesota 63,687 142,02955.2% 44.8% 144,2261.5%2,197100.0%49,025Twin Cities Metropolitan Area 39,029 88,05455.7% 44.3% 95,2197.5%7,165100.0%
Total: Colleges and Universities 127,367 102,716 9,362230,08355.4% 44.6% 239,4453.9%100.0%
Source: Office of the Chancellor Research and PlanningR:\Factbooks\System Factbook\Fiscal Year.mdb FY CR by Gender 10/21/2004
Table II-14: Page 1 of 1
16
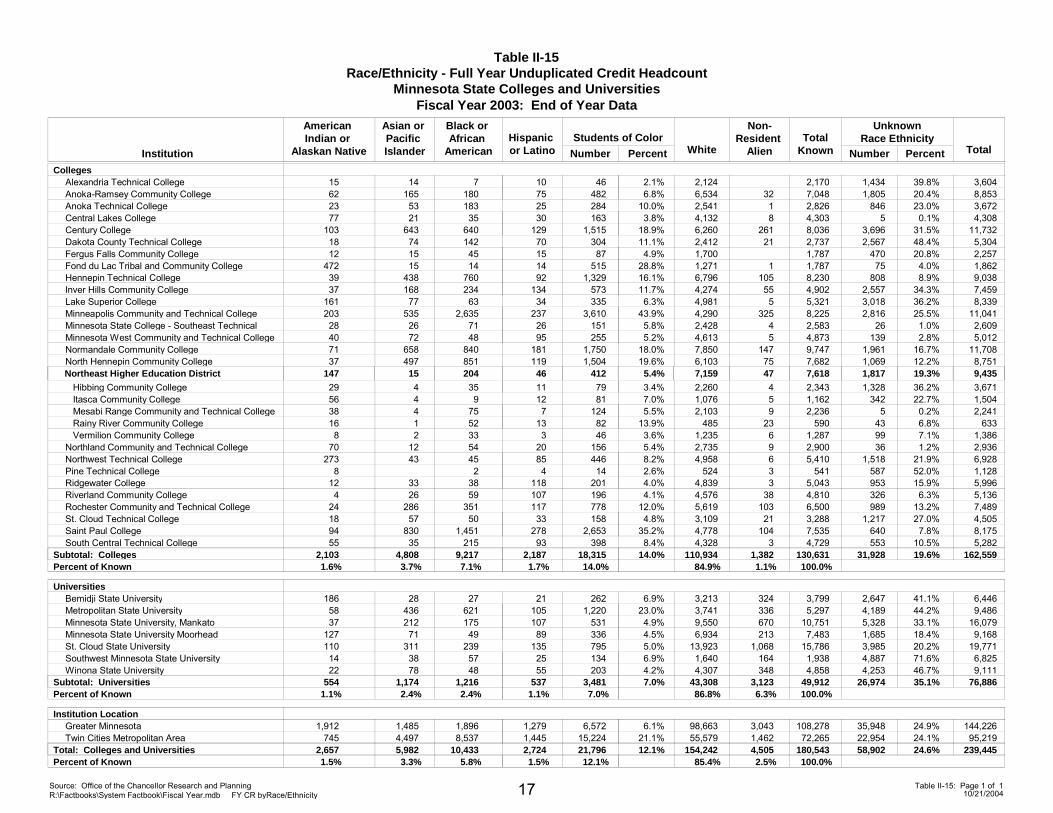
Table II-15Race/Ethnicity - Full Year Unduplicated Credit Headcount
Minnesota State Colleges and Universities
American Indian or
Alaskan Native
Asian or Pacific Islander
TotalKnown Percent PercentInstitution
Fiscal Year 2003: End of Year Data
TotalNumber
Black or African
AmericanHispanic or Latino White
Non-Resident
Alien Number
UnknownRace EthnicityStudents of Color
Colleges15Alexandria Technical College 14 46 2.1% 3,60439.8%2,1707 10 2,124 1,43462Anoka-Ramsey Community College 165 482 6.8% 8,85320.4%7,048180 75 6,534 32 1,80523Anoka Technical College 53 284 10.0% 3,67223.0%2,826183 25 2,541 1 84677Central Lakes College 21 163 3.8% 4,3080.1%4,30335 30 4,132 8 5
103Century College 643 1,515 18.9% 11,73231.5%8,036640 129 6,260 261 3,69618Dakota County Technical College 74 304 11.1% 5,30448.4%2,737142 70 2,412 21 2,56712Fergus Falls Community College 15 87 4.9% 2,25720.8%1,78745 15 1,700 470
472Fond du Lac Tribal and Community College 15 515 28.8% 1,8624.0%1,78714 14 1,271 1 7539Hennepin Technical College 438 1,329 16.1% 9,0388.9%8,230760 92 6,796 105 80837Inver Hills Community College 168 573 11.7% 7,45934.3%4,902234 134 4,274 55 2,557
161Lake Superior College 77 335 6.3% 8,33936.2%5,32163 34 4,981 5 3,018203Minneapolis Community and Technical College 535 3,610 43.9% 11,04125.5%8,2252,635 237 4,290 325 2,81628Minnesota State College - Southeast Technical 26 151 5.8% 2,6091.0%2,58371 26 2,428 4 2640Minnesota West Community and Technical College 72 255 5.2% 5,0122.8%4,87348 95 4,613 5 13971Normandale Community College 658 1,750 18.0% 11,70816.7%9,747840 181 7,850 147 1,96137North Hennepin Community College 497 1,504 19.6% 8,75112.2%7,682851 119 6,103 75 1,069
Northeast Higher Education District29 Hibbing Community College 4
147 15 7,61879
4123.4%5.4%
3,67136.2%19.3% 9,435
2,34335204
1146
2,2607,159
447
1,3281,817
56 Itasca Community College 4 81 7.0% 1,50422.7%1,1629 12 1,076 5 34238 Mesabi Range Community and Technical College 4 124 5.5% 2,2410.2%2,23675 7 2,103 9 516 Rainy River Community College 1 82 13.9% 6336.8%59052 13 485 23 438 Vermilion Community College 2 46 3.6% 1,3867.1%1,28733 3 1,235 6 99
70Northland Community and Technical College 12 156 5.4% 2,9361.2%2,90054 20 2,735 9 36273Northwest Technical College 43 446 8.2% 6,92821.9%5,41045 85 4,958 6 1,518
8Pine Technical College 14 2.6% 1,12852.0%5412 4 524 3 58712Ridgewater College 33 201 4.0% 5,99615.9%5,04338 118 4,839 3 9534Riverland Community College 26 196 4.1% 5,1366.3%4,81059 107 4,576 38 326
24Rochester Community and Technical College 286 778 12.0% 7,48913.2%6,500351 117 5,619 103 98918St. Cloud Technical College 57 158 4.8% 4,50527.0%3,28850 33 3,109 21 1,21794Saint Paul College 830 2,653 35.2% 8,1757.8%7,5351,451 278 4,778 104 64055South Central Technical College 35 398 8.4% 5,28210.5%4,729215 93 4,328 3 553
Subtotal: Colleges 2,103 4,808 130,63118,315 14.0% 162,55919.6%9,217 2,187 110,934 1,382 31,9281.6%Percent of Known 3.7% 7.1% 1.7% 14.0% 84.9% 1.1% 100.0%
Universities186Bemidji State University 28 262 6.9% 6,44641.1%3,79927 21 3,213 324 2,64758Metropolitan State University 436 1,220 23.0% 9,48644.2%5,297621 105 3,741 336 4,18937Minnesota State University, Mankato 212 531 4.9% 16,07933.1%10,751175 107 9,550 670 5,328
127Minnesota State University Moorhead 71 336 4.5% 9,16818.4%7,48349 89 6,934 213 1,685110St. Cloud State University 311 795 5.0% 19,77120.2%15,786239 135 13,923 1,068 3,98514Southwest Minnesota State University 38 134 6.9% 6,82571.6%1,93857 25 1,640 164 4,88722Winona State University 78 203 4.2% 9,11146.7%4,85848 55 4,307 348 4,253
Subtotal: Universities 554 1,174 49,9123,481 7.0% 76,88635.1%1,216 537 43,308 3,123 26,9741.1%Percent of Known 2.4% 2.4% 1.1% 7.0% 86.8% 6.3% 100.0%
Institution Location1,912Greater Minnesota 1,485 6,572 6.1% 144,22624.9%108,2781,896 1,279 98,663 3,043 35,948
745Twin Cities Metropolitan Area 4,497 15,224 21.1% 95,21924.1%72,2658,537 1,445 55,579 1,462 22,954Total: Colleges and Universities 2,657 5,982 180,54321,796 12.1% 239,44524.6%10,433 2,724 154,242 4,505 58,902
1.5%Percent of Known 3.3% 5.8% 1.5% 12.1% 85.4% 2.5% 100.0%
Source: Office of the Chancellor Research and PlanningR:\Factbooks\System Factbook\Fiscal Year.mdb FY CR byRace/Ethnicity 10/21/2004
Table II-15: Page 1 of 117
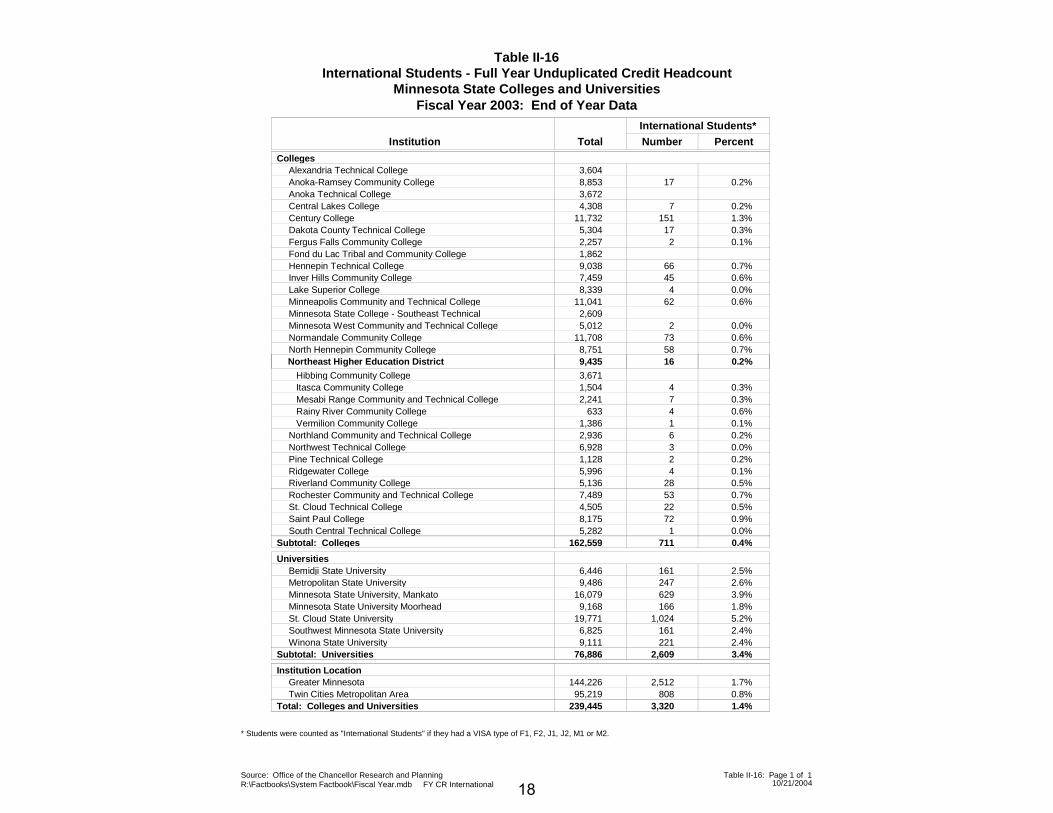
Table II-16International Students - Full Year Unduplicated Credit Headcount
Minnesota State Colleges and Universities
Total
International Students*
Institution
Fiscal Year 2003: End of Year Data
Number Percent
CollegesAlexandria Technical College 3,604Anoka-Ramsey Community College 17 0.2%8,853Anoka Technical College 3,672Central Lakes College 7 0.2%4,308Century College 151 1.3%11,732Dakota County Technical College 17 0.3%5,304Fergus Falls Community College 2 0.1%2,257Fond du Lac Tribal and Community College 1,862Hennepin Technical College 66 0.7%9,038Inver Hills Community College 45 0.6%7,459Lake Superior College 4 0.0%8,339Minneapolis Community and Technical College 62 0.6%11,041Minnesota State College - Southeast Technical 2,609Minnesota West Community and Technical College 2 0.0%5,012Normandale Community College 73 0.6%11,708North Hennepin Community College 58 0.7%8,751
Northeast Higher Education District
Hibbing Community College
9,435 16 0.2%
3,671 Itasca Community College 4 0.3%1,504 Mesabi Range Community and Technical College 7 0.3%2,241 Rainy River Community College 4 0.6%633 Vermilion Community College 1 0.1%1,386Northland Community and Technical College 6 0.2%2,936Northwest Technical College 3 0.0%6,928Pine Technical College 2 0.2%1,128Ridgewater College 4 0.1%5,996Riverland Community College 28 0.5%5,136Rochester Community and Technical College 53 0.7%7,489St. Cloud Technical College 22 0.5%4,505Saint Paul College 72 0.9%8,175South Central Technical College 1 0.0%5,282
Subtotal: Colleges 162,559 711 0.4%
UniversitiesBemidji State University 161 2.5%6,446Metropolitan State University 247 2.6%9,486Minnesota State University, Mankato 629 3.9%16,079Minnesota State University Moorhead 166 1.8%9,168St. Cloud State University 1,024 5.2%19,771Southwest Minnesota State University 161 2.4%6,825Winona State University 221 2.4%9,111
Subtotal: Universities 76,886 2,609 3.4%
Institution LocationGreater Minnesota 2,512 1.7%144,226Twin Cities Metropolitan Area 808 0.8%95,219
Total: Colleges and Universities 239,445 3,320 1.4%
* Students were counted as "International Students" if they had a VISA type of F1, F2, J1, J2, M1 or M2.
Source: Office of the Chancellor Research and PlanningR:\Factbooks\System Factbook\Fiscal Year.mdb FY CR International 10/21/2004
Table II-16: Page 1 of 1
18
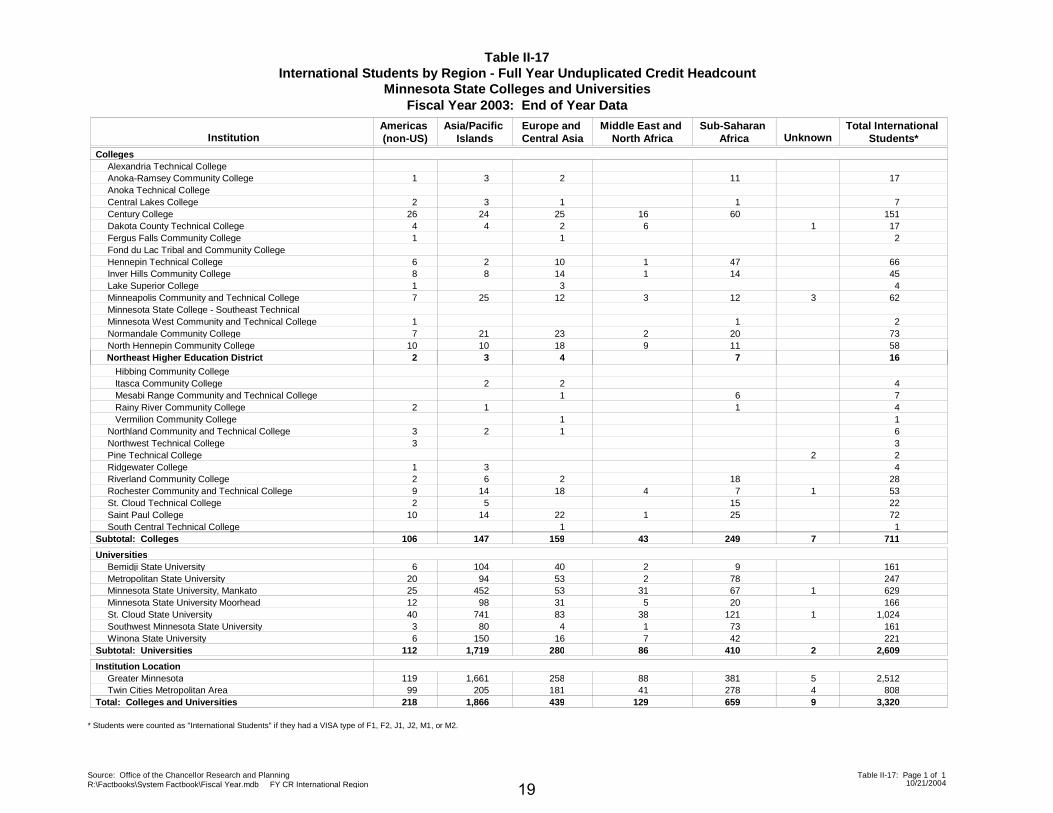
Table II-17International Students by Region - Full Year Unduplicated Credit Headcount
Minnesota State Colleges and Universities
Americas (non-US)
Asia/Pacific Islands
Total International Students*Institution
Fiscal Year 2003: End of Year DataEurope and Central Asia
Middle East and North Africa
Sub-Saharan Africa Unknown
CollegesAlexandria Technical College
1Anoka-Ramsey Community College 3 2 1711Anoka Technical College
2Central Lakes College 3 1 7126Century College 24 25 16 151604Dakota County Technical College 4 2 6 1711Fergus Falls Community College 1 2
Fond du Lac Tribal and Community College6Hennepin Technical College 2 10 1 66478Inver Hills Community College 8 14 1 45141Lake Superior College 3 47Minneapolis Community and Technical College 25 12 3 6212 3
Minnesota State College - Southeast Technical1Minnesota West Community and Technical College 217Normandale Community College 21 23 2 7320
10North Hennepin Community College 10 18 9 5811 Northeast Higher Education District
Hibbing Community College
2 3 4 167
Itasca Community College 2 2 4 Mesabi Range Community and Technical College 1 76
2 Rainy River Community College 1 41 Vermilion Community College 1 1
3Northland Community and Technical College 2 1 63Northwest Technical College 3
Pine Technical College 221Ridgewater College 3 42Riverland Community College 6 2 28189Rochester Community and Technical College 14 18 4 537 12St. Cloud Technical College 5 2215
10Saint Paul College 14 22 1 7225South Central Technical College 1 1
Subtotal: Colleges 106 147 159 43 711249 7
Universities6Bemidji State University 104 40 2 1619
20Metropolitan State University 94 53 2 2477825Minnesota State University, Mankato 452 53 31 62967 112Minnesota State University Moorhead 98 31 5 1662040St. Cloud State University 741 83 38 1,024121 13Southwest Minnesota State University 80 4 1 161736Winona State University 150 16 7 22142
Subtotal: Universities 112 1,719 280 86 2,609410 2
Institution Location119Greater Minnesota 1,661 258 88 2,512381 599Twin Cities Metropolitan Area 205 181 41 808278 4
Total: Colleges and Universities 218 1,866 439 129 3,320659 9
* Students were counted as "International Students" if they had a VISA type of F1, F2, J1, J2, M1, or M2.
Source: Office of the Chancellor Research and PlanningR:\Factbooks\System Factbook\Fiscal Year.mdb FY CR International Region 10/21/2004
Table II-17: Page 1 of 1
19
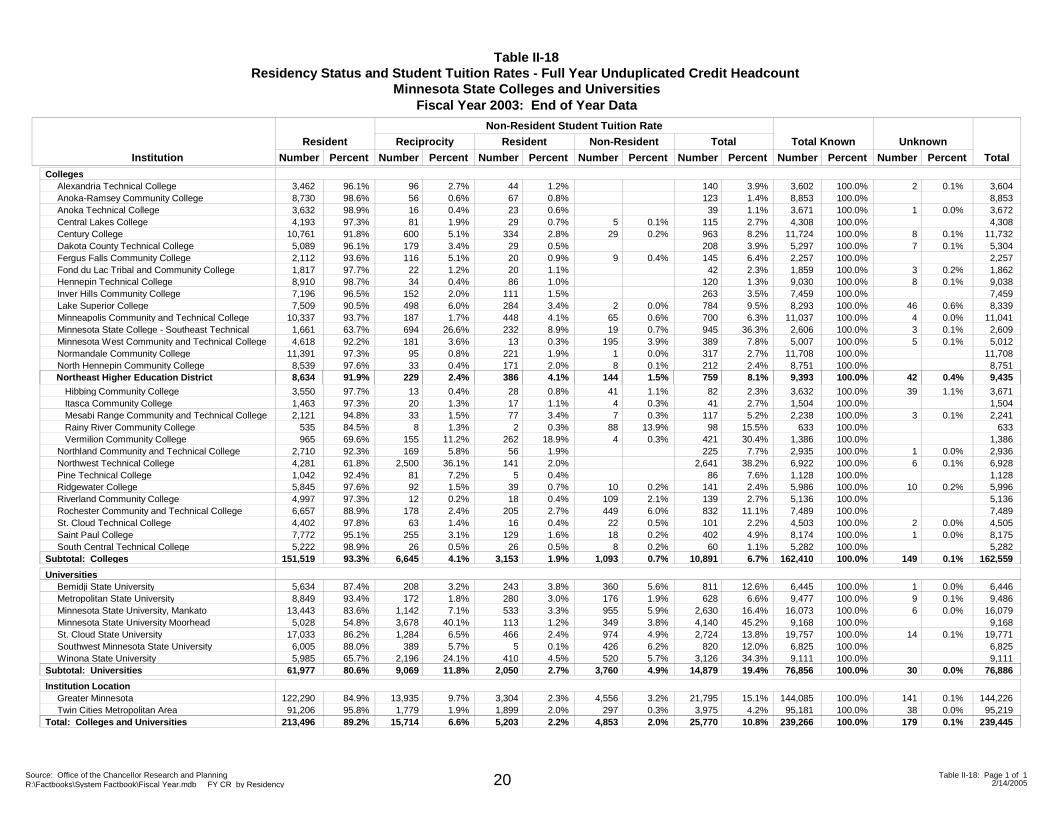
Table II-18Residency Status and Student Tuition Rates - Full Year Unduplicated Credit Headcount
Minnesota State Colleges and UniversitiesFiscal Year 2003: End of Year Data
Institution
Total Known
Number Percent
Resident
Number Percent
Non-Resident Student Tuition Rate
Unknown
Number Percent
Reciprocity
Number Percent
Resident
Number Percent
Non-Resident
Number Percent
Total
TotalPercentNumber
Colleges3,462Alexandria Technical College 3,60496.1% 96 2.7% 2 0.1%3,60244 1.2% 140 3.9% 100.0%8,730Anoka-Ramsey Community College 8,85398.6% 56 0.6% 8,85367 0.8% 123 1.4% 100.0%3,632Anoka Technical College 3,67298.9% 16 0.4% 1 0.0%3,67123 0.6% 39 1.1% 100.0%4,193Central Lakes College 4,30897.3% 81 1.9% 4,30829 0.7% 5 0.1% 115 2.7% 100.0%
10,761Century College 11,73291.8% 600 5.1% 8 0.1%11,724334 2.8% 29 0.2% 963 8.2% 100.0%5,089Dakota County Technical College 5,30496.1% 179 3.4% 7 0.1%5,29729 0.5% 208 3.9% 100.0%2,112Fergus Falls Community College 2,25793.6% 116 5.1% 2,25720 0.9% 9 0.4% 145 6.4% 100.0%1,817Fond du Lac Tribal and Community College 1,86297.7% 22 1.2% 3 0.2%1,85920 1.1% 42 2.3% 100.0%8,910Hennepin Technical College 9,03898.7% 34 0.4% 8 0.1%9,03086 1.0% 120 1.3% 100.0%7,196Inver Hills Community College 7,45996.5% 152 2.0% 7,459111 1.5% 263 3.5% 100.0%7,509Lake Superior College 8,33990.5% 498 6.0% 46 0.6%8,293284 3.4% 2 0.0% 784 9.5% 100.0%
10,337Minneapolis Community and Technical College 11,04193.7% 187 1.7% 4 0.0%11,037448 4.1% 65 0.6% 700 6.3% 100.0%1,661Minnesota State College - Southeast Technical 2,60963.7% 694 26.6% 3 0.1%2,606232 8.9% 19 0.7% 945 36.3% 100.0%4,618Minnesota West Community and Technical College 5,01292.2% 181 3.6% 5 0.1%5,00713 0.3% 195 3.9% 389 7.8% 100.0%
11,391Normandale Community College 11,70897.3% 95 0.8% 11,708221 1.9% 1 0.0% 317 2.7% 100.0%8,539North Hennepin Community College 8,75197.6% 33 0.4% 8,751171 2.0% 8 0.1% 212 2.4% 100.0%
Northeast Higher Education District
3,550 Hibbing Community College
8,634 91.9%
3,671
9,435
97.7% 13
229 2.4%
0.4% 39
42 0.4%
1.1%
9,393
3,63228
386 4.1%
0.8% 41
144 1.5%
1.1% 82 2.3%
759 8.1% 100.0%
100.0%1,463 Itasca Community College 1,50497.3% 20 1.3% 1,50417 1.1% 4 0.3% 41 2.7% 100.0%2,121 Mesabi Range Community and Technical College 2,24194.8% 33 1.5% 3 0.1%2,23877 3.4% 7 0.3% 117 5.2% 100.0%
535 Rainy River Community College 63384.5% 8 1.3% 6332 0.3% 88 13.9% 98 15.5% 100.0%965 Vermilion Community College 1,38669.6% 155 11.2% 1,386262 18.9% 4 0.3% 421 30.4% 100.0%
2,710Northland Community and Technical College 2,93692.3% 169 5.8% 1 0.0%2,93556 1.9% 225 7.7% 100.0%4,281Northwest Technical College 6,92861.8% 2,500 36.1% 6 0.1%6,922141 2.0% 2,641 38.2% 100.0%1,042Pine Technical College 1,12892.4% 81 7.2% 1,1285 0.4% 86 7.6% 100.0%5,845Ridgewater College 5,99697.6% 92 1.5% 10 0.2%5,98639 0.7% 10 0.2% 141 2.4% 100.0%4,997Riverland Community College 5,13697.3% 12 0.2% 5,13618 0.4% 109 2.1% 139 2.7% 100.0%6,657Rochester Community and Technical College 7,48988.9% 178 2.4% 7,489205 2.7% 449 6.0% 832 11.1% 100.0%4,402St. Cloud Technical College 4,50597.8% 63 1.4% 2 0.0%4,50316 0.4% 22 0.5% 101 2.2% 100.0%7,772Saint Paul College 8,17595.1% 255 3.1% 1 0.0%8,174129 1.6% 18 0.2% 402 4.9% 100.0%5,222South Central Technical College 5,28298.9% 26 0.5% 5,28226 0.5% 8 0.2% 60 1.1% 100.0%
Subtotal: Colleges 151,519 93.3% 162,5596,645 4.1% 149 0.1%162,4103,153 1.9% 1,093 0.7% 10,891 6.7% 100.0%
Universities5,634Bemidji State University 6,44687.4% 208 3.2% 1 0.0%6,445243 3.8% 360 5.6% 811 12.6% 100.0%8,849Metropolitan State University 9,48693.4% 172 1.8% 9 0.1%9,477280 3.0% 176 1.9% 628 6.6% 100.0%
13,443Minnesota State University, Mankato 16,07983.6% 1,142 7.1% 6 0.0%16,073533 3.3% 955 5.9% 2,630 16.4% 100.0%5,028Minnesota State University Moorhead 9,16854.8% 3,678 40.1% 9,168113 1.2% 349 3.8% 4,140 45.2% 100.0%
17,033St. Cloud State University 19,77186.2% 1,284 6.5% 14 0.1%19,757466 2.4% 974 4.9% 2,724 13.8% 100.0%6,005Southwest Minnesota State University 6,82588.0% 389 5.7% 6,8255 0.1% 426 6.2% 820 12.0% 100.0%5,985Winona State University 9,11165.7% 2,196 24.1% 9,111410 4.5% 520 5.7% 3,126 34.3% 100.0%
Subtotal: Universities 61,977 80.6% 76,8869,069 11.8% 30 0.0%76,8562,050 2.7% 3,760 4.9% 14,879 19.4% 100.0%
Institution Location122,290Greater Minnesota 144,22684.9% 13,935 9.7% 141 0.1%144,0853,304 2.3% 4,556 3.2% 21,795 15.1% 100.0%91,206Twin Cities Metropolitan Area 95,21995.8% 1,779 1.9% 38 0.0%95,1811,899 2.0% 297 0.3% 3,975 4.2% 100.0%
Total: Colleges and Universities 213,496 89.2% 239,44515,714 6.6% 179 0.1%239,2665,203 2.2% 4,853 2.0% 25,770 10.8% 100.0%
Source: Office of the Chancellor Research and PlanningR:\Factbooks\System Factbook\Fiscal Year.mdb FY CR by Residency 2/14/2005
Table II-18: Page 1 of 120
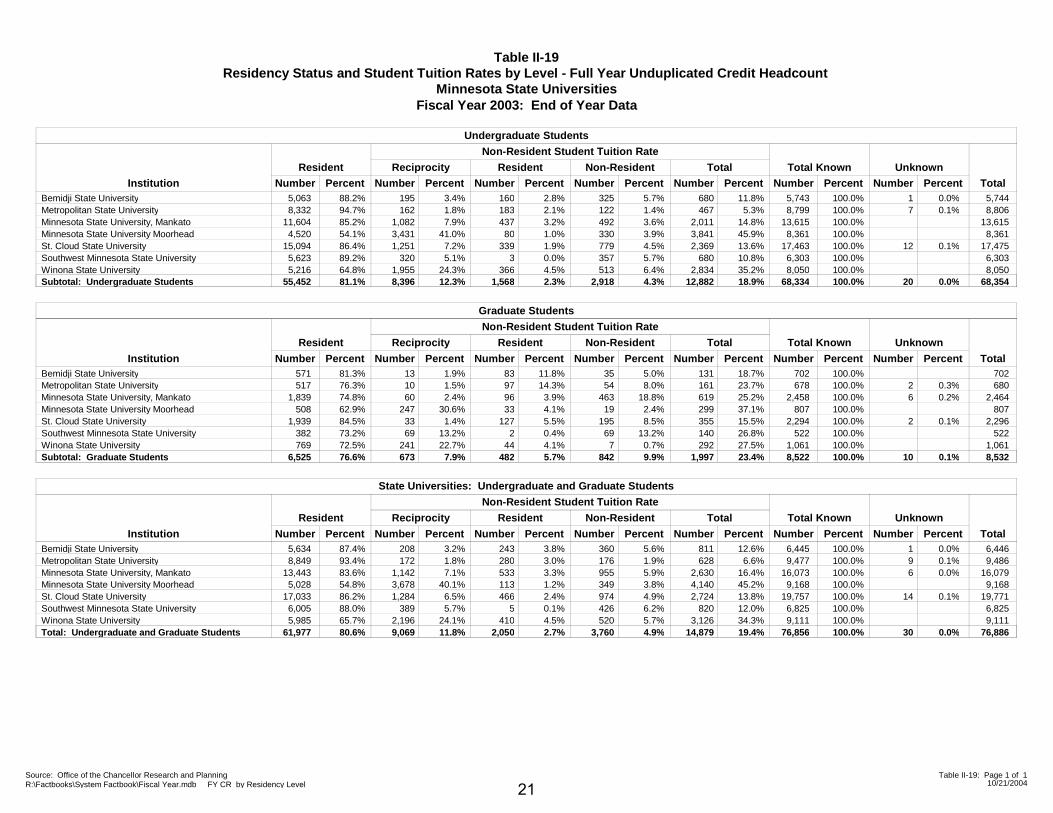
Table II-19Residency Status and Student Tuition Rates by Level - Full Year Unduplicated Credit Headcount
Minnesota State UniversitiesFiscal Year 2003: End of Year Data
InstitutionTotal Known
Number PercentResident
Number Percent
Non-Resident Student Tuition Rate
UnknownNumber Percent
ReciprocityNumber Percent
ResidentNumber Percent
Non-ResidentNumber Percent
TotalTotalPercentNumber
Undergraduate Students
5,063 5,74488.2% 195 3.4% 1 0.0%5,743160 2.8% 325 5.7% 680 11.8% 100.0%Bemidji State University8,332 8,80694.7% 162 1.8% 7 0.1%8,799183 2.1% 122 1.4% 467 5.3% 100.0%Metropolitan State University
11,604 13,61585.2% 1,082 7.9% 13,615437 3.2% 492 3.6% 2,011 14.8% 100.0%Minnesota State University, Mankato4,520 8,36154.1% 3,431 41.0% 8,36180 1.0% 330 3.9% 3,841 45.9% 100.0%Minnesota State University Moorhead
15,094 17,47586.4% 1,251 7.2% 12 0.1%17,463339 1.9% 779 4.5% 2,369 13.6% 100.0%St. Cloud State University5,623 6,30389.2% 320 5.1% 6,3033 0.0% 357 5.7% 680 10.8% 100.0%Southwest Minnesota State University5,216 8,05064.8% 1,955 24.3% 8,050366 4.5% 513 6.4% 2,834 35.2% 100.0%Winona State University
Subtotal: Undergraduate Students 55,452 81.1% 68,3548,396 12.3% 20 0.0%68,3341,568 2.3% 2,918 4.3% 12,882 18.9% 100.0%
Institution
Total Known
Number Percent
Resident
Number Percent
Non-Resident Student Tuition Rate
Unknown
Number Percent
Reciprocity
Number Percent
Resident
Number Percent
Non-Resident
Number Percent
Total
TotalPercentNumber
Graduate Students
571 70281.3% 13 1.9% 70283 11.8% 35 5.0% 131 18.7% 100.0%Bemidji State University517 68076.3% 10 1.5% 2 0.3%67897 14.3% 54 8.0% 161 23.7% 100.0%Metropolitan State University
1,839 2,46474.8% 60 2.4% 6 0.2%2,45896 3.9% 463 18.8% 619 25.2% 100.0%Minnesota State University, Mankato508 80762.9% 247 30.6% 80733 4.1% 19 2.4% 299 37.1% 100.0%Minnesota State University Moorhead
1,939 2,29684.5% 33 1.4% 2 0.1%2,294127 5.5% 195 8.5% 355 15.5% 100.0%St. Cloud State University382 52273.2% 69 13.2% 5222 0.4% 69 13.2% 140 26.8% 100.0%Southwest Minnesota State University769 1,06172.5% 241 22.7% 1,06144 4.1% 7 0.7% 292 27.5% 100.0%Winona State University
Subtotal: Graduate Students 6,525 76.6% 8,532673 7.9% 10 0.1%8,522482 5.7% 842 9.9% 1,997 23.4% 100.0%
Institution
Total Known
Number Percent
Resident
Number Percent
Non-Resident Student Tuition Rate
Unknown
Number Percent
Reciprocity
Number Percent
Resident
Number Percent
Non-Resident
Number Percent
Total
TotalPercentNumber
State Universities: Undergraduate and Graduate Students
5,634 6,44687.4% 208 3.2% 1 0.0%6,445243 3.8% 360 5.6% 811 12.6% 100.0%Bemidji State University8,849 9,48693.4% 172 1.8% 9 0.1%9,477280 3.0% 176 1.9% 628 6.6% 100.0%Metropolitan State University
13,443 16,07983.6% 1,142 7.1% 6 0.0%16,073533 3.3% 955 5.9% 2,630 16.4% 100.0%Minnesota State University, Mankato5,028 9,16854.8% 3,678 40.1% 9,168113 1.2% 349 3.8% 4,140 45.2% 100.0%Minnesota State University Moorhead
17,033 19,77186.2% 1,284 6.5% 14 0.1%19,757466 2.4% 974 4.9% 2,724 13.8% 100.0%St. Cloud State University6,005 6,82588.0% 389 5.7% 6,8255 0.1% 426 6.2% 820 12.0% 100.0%Southwest Minnesota State University5,985 9,11165.7% 2,196 24.1% 9,111410 4.5% 520 5.7% 3,126 34.3% 100.0%Winona State University
Total: Undergraduate and Graduate Students 61,977 80.6% 76,8869,069 11.8% 30 0.0%76,8562,050 2.7% 3,760 4.9% 14,879 19.4% 100.0%
Source: Office of the Chancellor Research and PlanningR:\Factbooks\System Factbook\Fiscal Year.mdb FY CR by Residency Level 10/21/2004
Table II-19: Page 1 of 1
21
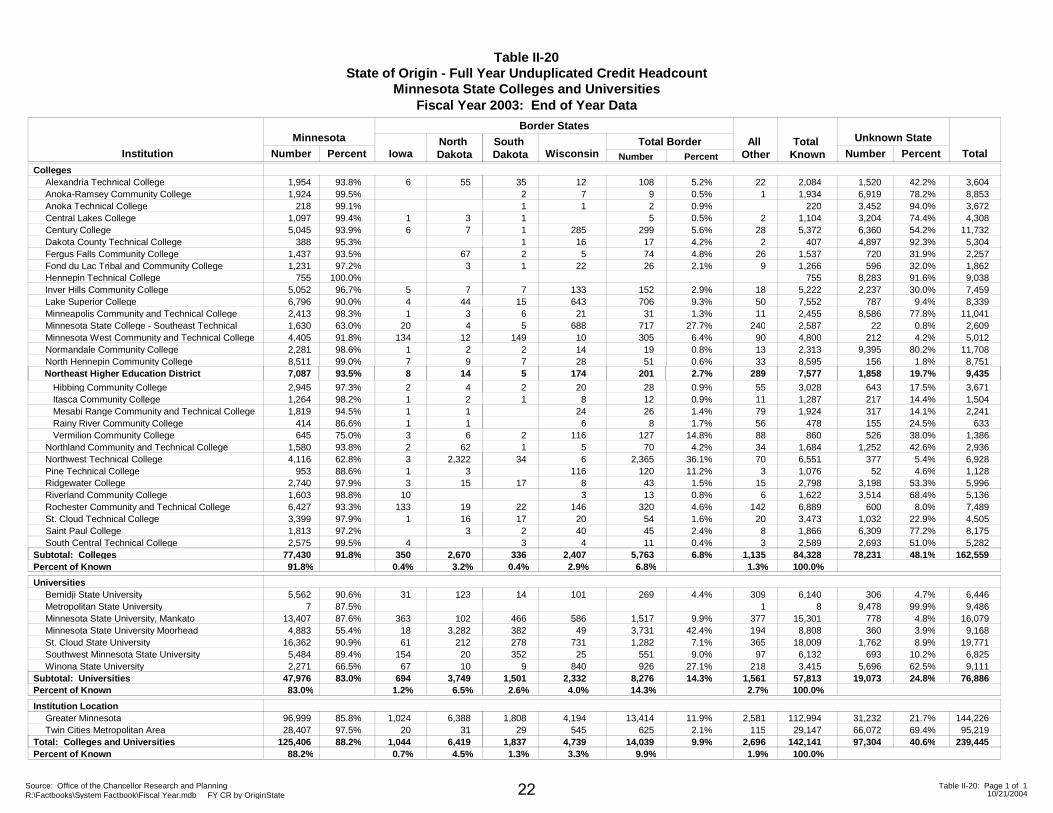
Table II-20State of Origin - Full Year Unduplicated Credit Headcount
Minnesota State Colleges and Universities
Minnesota
Iowa PercentInstitution
Fiscal Year 2003: End of Year Data
TotalWisconsinNorth Dakota
South Dakota
All Other
Total Known Number Percent
Unknown State
Number Percent Number
Border States
Total Border
Colleges1,954Alexandria Technical College 6 12 5.2% 3,60493.8% 55 35 22 2,084 1,520 42.2%1081,924Anoka-Ramsey Community College 7 0.5% 8,85399.5% 2 1 1,934 6,919 78.2%9
218Anoka Technical College 1 0.9% 3,67299.1% 1 220 3,452 94.0%21,097Central Lakes College 1 0.5% 4,30899.4% 3 1 2 1,104 3,204 74.4%55,045Century College 6 285 5.6% 11,73293.9% 7 1 28 5,372 6,360 54.2%299
388Dakota County Technical College 16 4.2% 5,30495.3% 1 2 407 4,897 92.3%171,437Fergus Falls Community College 5 4.8% 2,25793.5% 67 2 26 1,537 720 31.9%741,231Fond du Lac Tribal and Community College 22 2.1% 1,86297.2% 3 1 9 1,266 596 32.0%26
755Hennepin Technical College 9,038100.0% 755 8,283 91.6%5,052Inver Hills Community College 5 133 2.9% 7,45996.7% 7 7 18 5,222 2,237 30.0%1526,796Lake Superior College 4 643 9.3% 8,33990.0% 44 15 50 7,552 787 9.4%7062,413Minneapolis Community and Technical College 1 21 1.3% 11,04198.3% 3 6 11 2,455 8,586 77.8%311,630Minnesota State College - Southeast Technical 20 688 27.7% 2,60963.0% 4 5 240 2,587 22 0.8%7174,405Minnesota West Community and Technical College 134 10 6.4% 5,01291.8% 12 149 90 4,800 212 4.2%3052,281Normandale Community College 1 14 0.8% 11,70898.6% 2 2 13 2,313 9,395 80.2%198,511North Hennepin Community College 7 28 0.6% 8,75199.0% 9 7 33 8,595 156 1.8%51
Northeast Higher Education District
2,945 Hibbing Community College 2
7,087 893.5%
20
174
0.9%
2.7%
3,671
9,435
97.3% 4
14
2
5
55
289
3,028
7,577
643
1,858
17.5%
19.7%
28
201
1,264 Itasca Community College 1 8 0.9% 1,50498.2% 2 1 11 1,287 217 14.4%121,819 Mesabi Range Community and Technical College 1 24 1.4% 2,24194.5% 1 79 1,924 317 14.1%26
414 Rainy River Community College 1 6 1.7% 63386.6% 1 56 478 155 24.5%8645 Vermilion Community College 3 116 14.8% 1,38675.0% 6 2 88 860 526 38.0%127
1,580Northland Community and Technical College 2 5 4.2% 2,93693.8% 62 1 34 1,684 1,252 42.6%704,116Northwest Technical College 3 6 36.1% 6,92862.8% 2,322 34 70 6,551 377 5.4%2,365
953Pine Technical College 1 116 11.2% 1,12888.6% 3 3 1,076 52 4.6%1202,740Ridgewater College 3 8 1.5% 5,99697.9% 15 17 15 2,798 3,198 53.3%431,603Riverland Community College 10 3 0.8% 5,13698.8% 6 1,622 3,514 68.4%136,427Rochester Community and Technical College 133 146 4.6% 7,48993.3% 19 22 142 6,889 600 8.0%3203,399St. Cloud Technical College 1 20 1.6% 4,50597.9% 16 17 20 3,473 1,032 22.9%541,813Saint Paul College 40 2.4% 8,17597.2% 3 2 8 1,866 6,309 77.2%452,575South Central Technical College 4 4 0.4% 5,28299.5% 3 3 2,589 2,693 51.0%11
Subtotal: Colleges 77,430 35091.8% 2,407 6.8% 162,5592,670 336 1,135 84,328 78,23191.8%Percent of Known 0.4% 3.2% 0.4% 2.9% 1.3% 100.0%
48.1%5,7636.8%
Universities5,562Bemidji State University 31 101 4.4% 6,44690.6% 123 14 309 6,140 306 4.7%269
7Metropolitan State University 9,48687.5% 1 8 9,478 99.9%13,407Minnesota State University, Mankato 363 586 9.9% 16,07987.6% 102 466 377 15,301 778 4.8%1,5174,883Minnesota State University Moorhead 18 49 42.4% 9,16855.4% 3,282 382 194 8,808 360 3.9%3,731
16,362St. Cloud State University 61 731 7.1% 19,77190.9% 212 278 365 18,009 1,762 8.9%1,2825,484Southwest Minnesota State University 154 25 9.0% 6,82589.4% 20 352 97 6,132 693 10.2%5512,271Winona State University 67 840 27.1% 9,11166.5% 10 9 218 3,415 5,696 62.5%926
Subtotal: Universities 47,976 69483.0% 2,332 14.3% 76,8863,749 1,501 1,561 57,813 19,07383.0%Percent of Known 1.2% 6.5% 2.6% 4.0% 2.7% 100.0%
24.8%8,27614.3%
Institution Location96,999Greater Minnesota 1,024 4,194 11.9% 144,22685.8% 6,388 1,808 2,581 112,994 31,232 21.7%13,41428,407Twin Cities Metropolitan Area 20 545 2.1% 95,21997.5% 31 29 115 29,147 66,072 69.4%625
Total: Colleges and Universities 125,406 1,04488.2% 4,739 9.9% 239,4456,419 1,837 2,696 142,141 97,30488.2%Percent of Known 0.7% 4.5% 1.3% 3.3% 1.9% 100.0%
40.6%14,0399.9%
Source: Office of the Chancellor Research and PlanningR:\Factbooks\System Factbook\Fiscal Year.mdb FY CR by OriginState 10/21/2004
Table II-20: Page 1 of 122
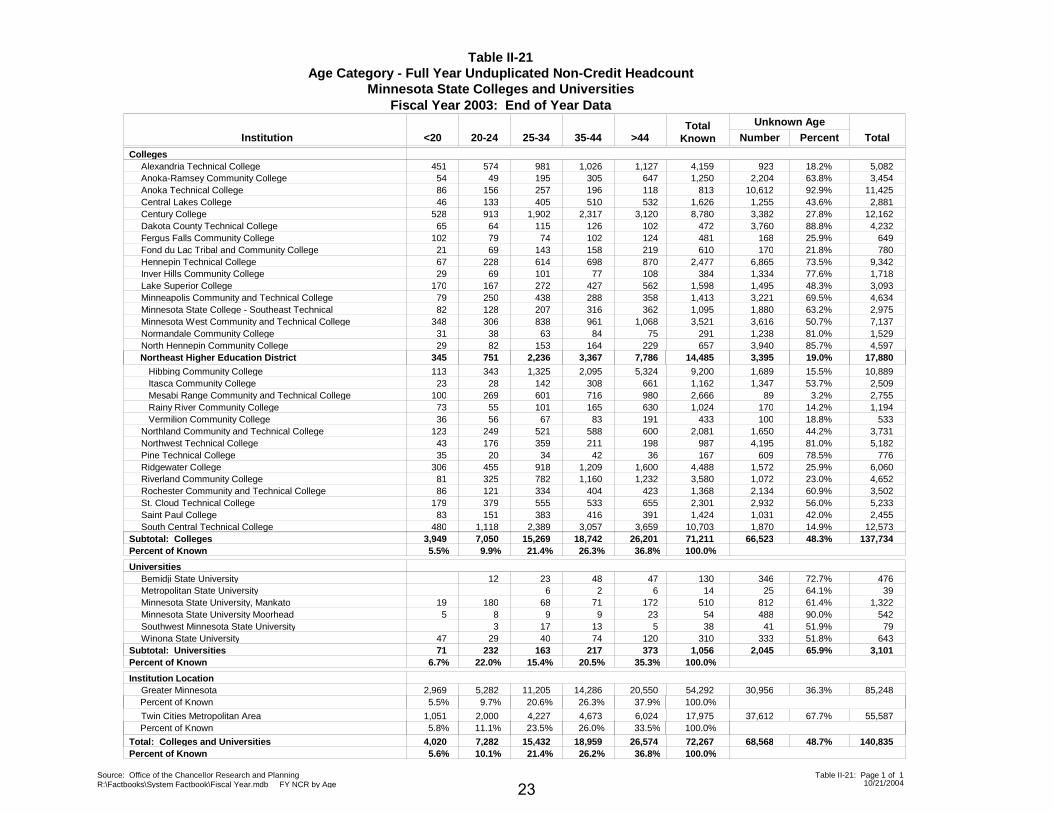
Table II-21Age Category - Full Year Unduplicated Non-Credit Headcount
Minnesota State Colleges and Universities
<20 20-24 25-34 PercentInstitution
Fiscal Year 2003: End of Year DataUnknown Age
TotalTotal
Known35-44 >44 Number
Colleges451Alexandria Technical College 574 4,159 5,08218.2%981 1,026 1,127 92354Anoka-Ramsey Community College 49 1,250 3,45463.8%195 305 647 2,20486Anoka Technical College 156 813 11,42592.9%257 196 118 10,61246Central Lakes College 133 1,626 2,88143.6%405 510 532 1,255
528Century College 913 8,780 12,16227.8%1,902 2,317 3,120 3,38265Dakota County Technical College 64 472 4,23288.8%115 126 102 3,760
102Fergus Falls Community College 79 481 64925.9%74 102 124 16821Fond du Lac Tribal and Community College 69 610 78021.8%143 158 219 17067Hennepin Technical College 228 2,477 9,34273.5%614 698 870 6,86529Inver Hills Community College 69 384 1,71877.6%101 77 108 1,334
170Lake Superior College 167 1,598 3,09348.3%272 427 562 1,49579Minneapolis Community and Technical College 250 1,413 4,63469.5%438 288 358 3,22182Minnesota State College - Southeast Technical 128 1,095 2,97563.2%207 316 362 1,880
348Minnesota West Community and Technical College 306 3,521 7,13750.7%838 961 1,068 3,61631Normandale Community College 38 291 1,52981.0%63 84 75 1,23829North Hennepin Community College 82 657 4,59785.7%153 164 229 3,940
Northeast Higher Education District
113 Hibbing Community College 343
345 751 2,236
9,200
14,485
10,88915.5%
19.0% 17,880
1,325
3,367
2,095
7,786
5,324
3,395
1,68923 Itasca Community College 28 1,162 2,50953.7%142 308 661 1,347
100 Mesabi Range Community and Technical College 269 2,666 2,7553.2%601 716 980 8973 Rainy River Community College 55 1,024 1,19414.2%101 165 630 17036 Vermilion Community College 56 433 53318.8%67 83 191 100
123Northland Community and Technical College 249 2,081 3,73144.2%521 588 600 1,65043Northwest Technical College 176 987 5,18281.0%359 211 198 4,19535Pine Technical College 20 167 77678.5%34 42 36 609
306Ridgewater College 455 4,488 6,06025.9%918 1,209 1,600 1,57281Riverland Community College 325 3,580 4,65223.0%782 1,160 1,232 1,07286Rochester Community and Technical College 121 1,368 3,50260.9%334 404 423 2,134
179St. Cloud Technical College 379 2,301 5,23356.0%555 533 655 2,93283Saint Paul College 151 1,424 2,45542.0%383 416 391 1,031
480South Central Technical College 1,118 10,703 12,57314.9%2,389 3,057 3,659 1,870Subtotal: Colleges
5.5%7,050 15,269 71,211 137,73448.3%18,742 26,201 66,523
Percent of Known3,949
9.9% 21.4% 26.3% 36.8% 100.0%
UniversitiesBemidji State University 12 130 47672.7%23 48 47 346Metropolitan State University 14 3964.1%6 2 6 25
19Minnesota State University, Mankato 180 510 1,32261.4%68 71 172 8125Minnesota State University Moorhead 8 54 54290.0%9 9 23 488
Southwest Minnesota State University 3 38 7951.9%17 13 5 4147Winona State University 29 310 64351.8%40 74 120 333
Subtotal: Universities6.7%
232 163 1,056 3,10165.9%217 373 2,045Percent of Known
7122.0% 15.4% 20.5% 35.3% 100.0%
Institution Location2,969Greater Minnesota 5,282 54,292 85,24836.3%11,205 14,286 20,550 30,956
Percent of Known 5.5% 9.7% 20.6% 26.3% 37.9% 100.0%
1,051Twin Cities Metropolitan Area 2,000 17,975 55,58767.7%4,227 4,673 6,024 37,612 Percent of Known 5.8% 11.1% 23.5% 26.0% 33.5% 100.0%
Total: Colleges and Universities5.6%
7,282 15,432 72,267 140,83548.7%18,959 26,574 68,568Percent of Known
4,02010.1% 21.4% 26.2% 36.8% 100.0%
Source: Office of the Chancellor Research and PlanningR:\Factbooks\System Factbook\Fiscal Year.mdb FY NCR by Age 10/21/2004
Table II-21: Page 1 of 1
23
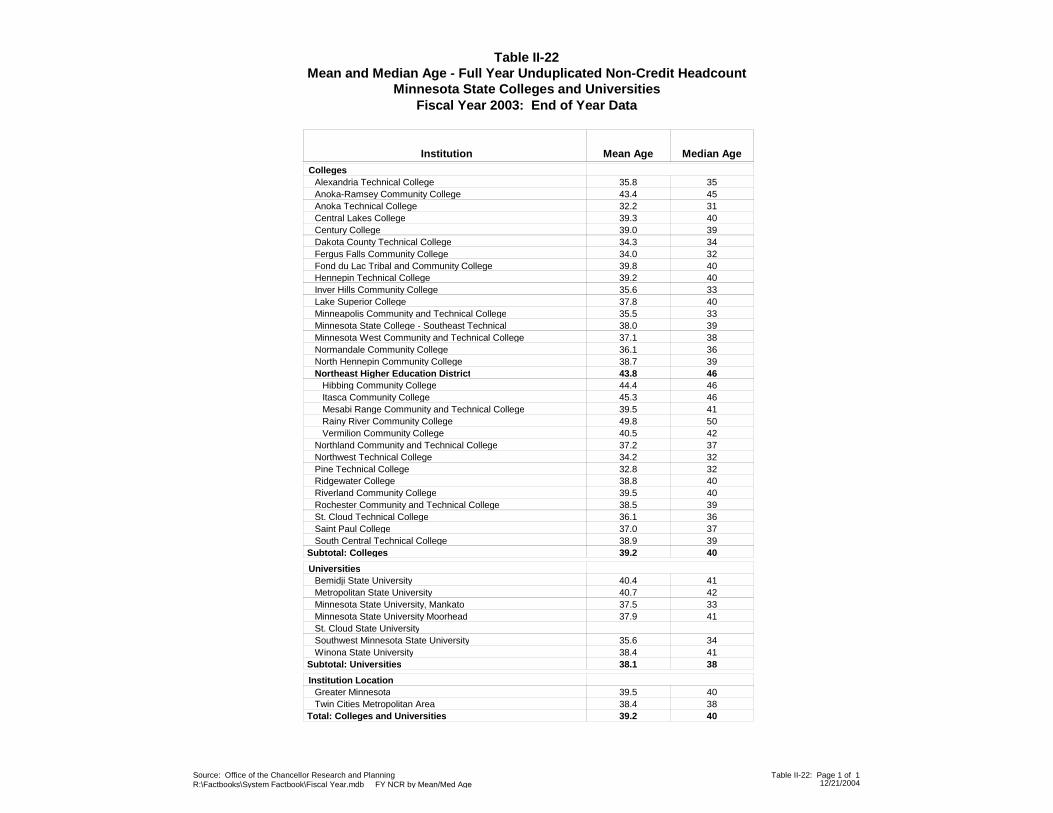
Table II-22Mean and Median Age - Full Year Unduplicated Non-Credit Headcount
Minnesota State Colleges and Universities
Mean Age Median AgeInstitution
Fiscal Year 2003: End of Year Data
Colleges35.8 35 Alexandria Technical College43.4 45 Anoka-Ramsey Community College32.2 31 Anoka Technical College39.3 40 Central Lakes College39.0 39 Century College34.3 34 Dakota County Technical College34.0 32 Fergus Falls Community College39.8 40 Fond du Lac Tribal and Community College39.2 40 Hennepin Technical College35.6 33 Inver Hills Community College37.8 40 Lake Superior College35.5 33 Minneapolis Community and Technical College38.0 39 Minnesota State College - Southeast Technical37.1 38 Minnesota West Community and Technical College36.1 36 Normandale Community College38.7 39 North Hennepin Community College43.8 46 Northeast Higher Education District44.4 46 Hibbing Community College45.3 46 Itasca Community College39.5 41 Mesabi Range Community and Technical College49.8 50 Rainy River Community College40.5 42 Vermilion Community College37.2 37 Northland Community and Technical College34.2 32 Northwest Technical College32.8 32 Pine Technical College38.8 40 Ridgewater College39.5 40 Riverland Community College38.5 39 Rochester Community and Technical College36.1 36 St. Cloud Technical College37.0 37 Saint Paul College38.9 39 South Central Technical College39.2 40 Subtotal: Colleges
Universities40.4 41 Bemidji State University40.7 42 Metropolitan State University37.5 33 Minnesota State University, Mankato37.9 41 Minnesota State University Moorhead
St. Cloud State University35.6 34 Southwest Minnesota State University38.4 41 Winona State University38.1 38 Subtotal: Universities
Institution Location39.5 40 Greater Minnesota38.4 38 Twin Cities Metropolitan Area39.2 40 Total: Colleges and Universities
Source: Office of the Chancellor Research and PlanningR:\Factbooks\System Factbook\Fiscal Year.mdb FY NCR by Mean/Med Age 12/21/2004
Table II-22: Page 1 of 1
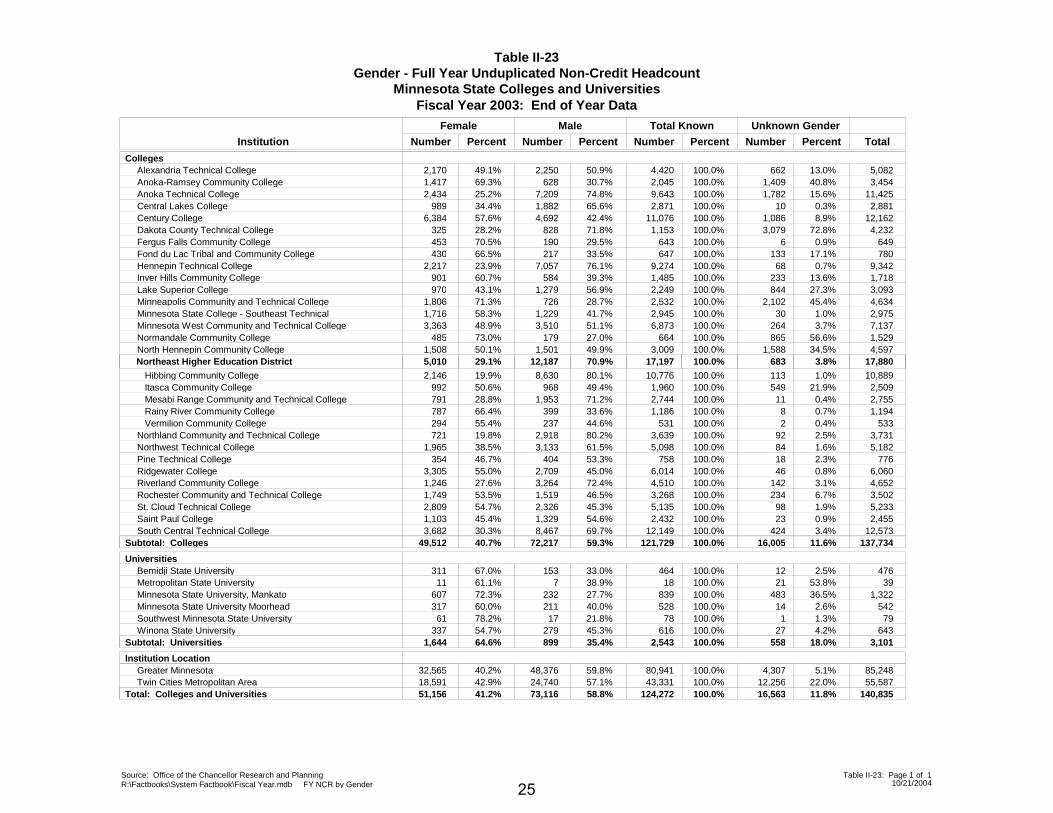
Table II-23Gender - Full Year Unduplicated Non-Credit Headcount
Minnesota State Colleges and UniversitiesFiscal Year 2003: End of Year Data
Female Unknown Gender
Institution Total
Total Known
Number Percent Number Percent
Male
Number PercentNumber Percent
Colleges2,170Alexandria Technical College 2,250 4,42049.1% 50.9% 5,08213.0%662100.0%1,417Anoka-Ramsey Community College 628 2,04569.3% 30.7% 3,45440.8%1,409100.0%2,434Anoka Technical College 7,209 9,64325.2% 74.8% 11,42515.6%1,782100.0%
989Central Lakes College 1,882 2,87134.4% 65.6% 2,8810.3%10100.0%6,384Century College 4,692 11,07657.6% 42.4% 12,1628.9%1,086100.0%
325Dakota County Technical College 828 1,15328.2% 71.8% 4,23272.8%3,079100.0%453Fergus Falls Community College 190 64370.5% 29.5% 6490.9%6100.0%430Fond du Lac Tribal and Community College 217 64766.5% 33.5% 78017.1%133100.0%
2,217Hennepin Technical College 7,057 9,27423.9% 76.1% 9,3420.7%68100.0%901Inver Hills Community College 584 1,48560.7% 39.3% 1,71813.6%233100.0%970Lake Superior College 1,279 2,24943.1% 56.9% 3,09327.3%844100.0%
1,806Minneapolis Community and Technical College 726 2,53271.3% 28.7% 4,63445.4%2,102100.0%1,716Minnesota State College - Southeast Technical 1,229 2,94558.3% 41.7% 2,9751.0%30100.0%3,363Minnesota West Community and Technical College 3,510 6,87348.9% 51.1% 7,1373.7%264100.0%
485Normandale Community College 179 66473.0% 27.0% 1,52956.6%865100.0%1,508North Hennepin Community College 1,501 3,00950.1% 49.9% 4,59734.5%1,588100.0%
Northeast Higher Education District
2,146 Hibbing Community College 8,630
5,010 12,187 683
10,776
17,197
19.9%
29.1%
80.1%
70.9%
10,8891.0%
3.8% 17,880
113100.0%
100.0%
992 Itasca Community College 968 1,96050.6% 49.4% 2,50921.9%549100.0%791 Mesabi Range Community and Technical College 1,953 2,74428.8% 71.2% 2,7550.4%11100.0%787 Rainy River Community College 399 1,18666.4% 33.6% 1,1940.7%8100.0%294 Vermilion Community College 237 53155.4% 44.6% 5330.4%2100.0%721Northland Community and Technical College 2,918 3,63919.8% 80.2% 3,7312.5%92100.0%
1,965Northwest Technical College 3,133 5,09838.5% 61.5% 5,1821.6%84100.0%354Pine Technical College 404 75846.7% 53.3% 7762.3%18100.0%
3,305Ridgewater College 2,709 6,01455.0% 45.0% 6,0600.8%46100.0%1,246Riverland Community College 3,264 4,51027.6% 72.4% 4,6523.1%142100.0%1,749Rochester Community and Technical College 1,519 3,26853.5% 46.5% 3,5026.7%234100.0%2,809St. Cloud Technical College 2,326 5,13554.7% 45.3% 5,2331.9%98100.0%1,103Saint Paul College 1,329 2,43245.4% 54.6% 2,4550.9%23100.0%3,682South Central Technical College 8,467 12,14930.3% 69.7% 12,5733.4%424100.0%
Subtotal: Colleges 49,512 72,217 16,005121,72940.7% 59.3% 137,73411.6%100.0%
Universities311Bemidji State University 153 46467.0% 33.0% 4762.5%12100.0%11Metropolitan State University 7 1861.1% 38.9% 3953.8%21100.0%
607Minnesota State University, Mankato 232 83972.3% 27.7% 1,32236.5%483100.0%317Minnesota State University Moorhead 211 52860.0% 40.0% 5422.6%14100.0%61Southwest Minnesota State University 17 7878.2% 21.8% 791.3%1100.0%
337Winona State University 279 61654.7% 45.3% 6434.2%27100.0%Subtotal: Universities 1,644 899 5582,54364.6% 35.4% 3,10118.0%100.0%
Institution Location32,565Greater Minnesota 48,376 80,94140.2% 59.8% 85,2485.1%4,307100.0%18,591Twin Cities Metropolitan Area 24,740 43,33142.9% 57.1% 55,58722.0%12,256100.0%
Total: Colleges and Universities 51,156 73,116 16,563124,27241.2% 58.8% 140,83511.8%100.0%
Source: Office of the Chancellor Research and PlanningR:\Factbooks\System Factbook\Fiscal Year.mdb FY NCR by Gender 10/21/2004
Table II-23: Page 1 of 1
25
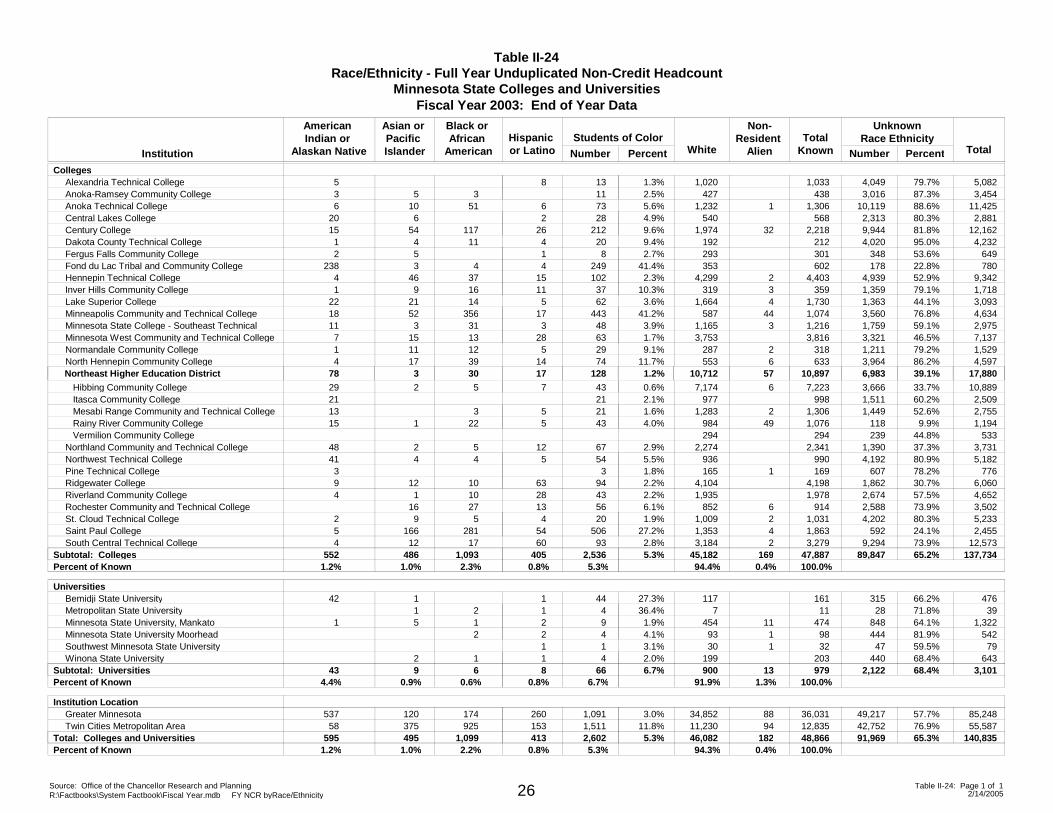
Table II-24Race/Ethnicity - Full Year Unduplicated Non-Credit Headcount
Minnesota State Colleges and Universities
American Indian or
Alaskan Native
Asian or Pacific Islander
TotalKnown Percent PercentInstitution
Fiscal Year 2003: End of Year Data
TotalNumber
Black or African
AmericanHispanic or Latino White
Non-Resident
Alien Number
UnknownRace EthnicityStudents of Color
Colleges5Alexandria Technical College 13 1.3% 5,08279.7%1,0338 1,020 4,0493Anoka-Ramsey Community College 5 11 2.5% 3,45487.3%4383 427 3,0166Anoka Technical College 10 73 5.6% 11,42588.6%1,30651 6 1,232 1 10,119
20Central Lakes College 6 28 4.9% 2,88180.3%5682 540 2,31315Century College 54 212 9.6% 12,16281.8%2,218117 26 1,974 32 9,9441Dakota County Technical College 4 20 9.4% 4,23295.0%21211 4 192 4,0202Fergus Falls Community College 5 8 2.7% 64953.6%3011 293 348
238Fond du Lac Tribal and Community College 3 249 41.4% 78022.8%6024 4 353 1784Hennepin Technical College 46 102 2.3% 9,34252.9%4,40337 15 4,299 2 4,9391Inver Hills Community College 9 37 10.3% 1,71879.1%35916 11 319 3 1,359
22Lake Superior College 21 62 3.6% 3,09344.1%1,73014 5 1,664 4 1,36318Minneapolis Community and Technical College 52 443 41.2% 4,63476.8%1,074356 17 587 44 3,56011Minnesota State College - Southeast Technical 3 48 3.9% 2,97559.1%1,21631 3 1,165 3 1,7597Minnesota West Community and Technical College 15 63 1.7% 7,13746.5%3,81613 28 3,753 3,3211Normandale Community College 11 29 9.1% 1,52979.2%31812 5 287 2 1,2114North Hennepin Community College 17 74 11.7% 4,59786.2%63339 14 553 6 3,964
Northeast Higher Education District
29 Hibbing Community College 2
78 3 10,897
43
128
0.6%
1.2%
10,88933.7%
39.1% 17,880
7,2235
30
7
17
7,174
10,712
6
57
3,666
6,983
21 Itasca Community College 21 2.1% 2,50960.2%998977 1,51113 Mesabi Range Community and Technical College 21 1.6% 2,75552.6%1,3063 5 1,283 2 1,44915 Rainy River Community College 1 43 4.0% 1,1949.9%1,07622 5 984 49 118
Vermilion Community College 53344.8%294294 23948Northland Community and Technical College 2 67 2.9% 3,73137.3%2,3415 12 2,274 1,39041Northwest Technical College 4 54 5.5% 5,18280.9%9904 5 936 4,1923Pine Technical College 3 1.8% 77678.2%169165 1 6079Ridgewater College 12 94 2.2% 6,06030.7%4,19810 63 4,104 1,8624Riverland Community College 1 43 2.2% 4,65257.5%1,97810 28 1,935 2,674
Rochester Community and Technical College 16 56 6.1% 3,50273.9%91427 13 852 6 2,5882St. Cloud Technical College 9 20 1.9% 5,23380.3%1,0315 4 1,009 2 4,2025Saint Paul College 166 506 27.2% 2,45524.1%1,863281 54 1,353 4 5924South Central Technical College 12 93 2.8% 12,57373.9%3,27917 60 3,184 2 9,294
Subtotal: Colleges 552 486 47,8872,536 5.3% 137,73465.2%1,093 405 45,182 169 89,8471.2%Percent of Known 1.0% 2.3% 0.8% 5.3% 94.4% 0.4% 100.0%
Universities42Bemidji State University 1 44 27.3% 47666.2%1611 117 315
Metropolitan State University 1 4 36.4% 3971.8%112 1 7 281Minnesota State University, Mankato 5 9 1.9% 1,32264.1%4741 2 454 11 848
Minnesota State University Moorhead 4 4.1% 54281.9%982 2 93 1 444Southwest Minnesota State University 1 3.1% 7959.5%321 30 1 47Winona State University 2 4 2.0% 64368.4%2031 1 199 440
Subtotal: Universities 43 9 97966 6.7% 3,10168.4%6 8 900 13 2,1224.4%Percent of Known 0.9% 0.6% 0.8% 6.7% 91.9% 1.3% 100.0%
Institution Location537Greater Minnesota 120 1,091 3.0% 85,24857.7%36,031174 260 34,852 88 49,21758Twin Cities Metropolitan Area 375 1,511 11.8% 55,58776.9%12,835925 153 11,230 94 42,752
Total: Colleges and Universities 595 495 48,8662,602 5.3% 140,83565.3%1,099 413 46,082 182 91,9691.2%Percent of Known 1.0% 2.2% 0.8% 5.3% 94.3% 0.4% 100.0%
Source: Office of the Chancellor Research and PlanningR:\Factbooks\System Factbook\Fiscal Year.mdb FY NCR byRace/Ethnicity 2/14/2005
Table II-24: Page 1 of 126
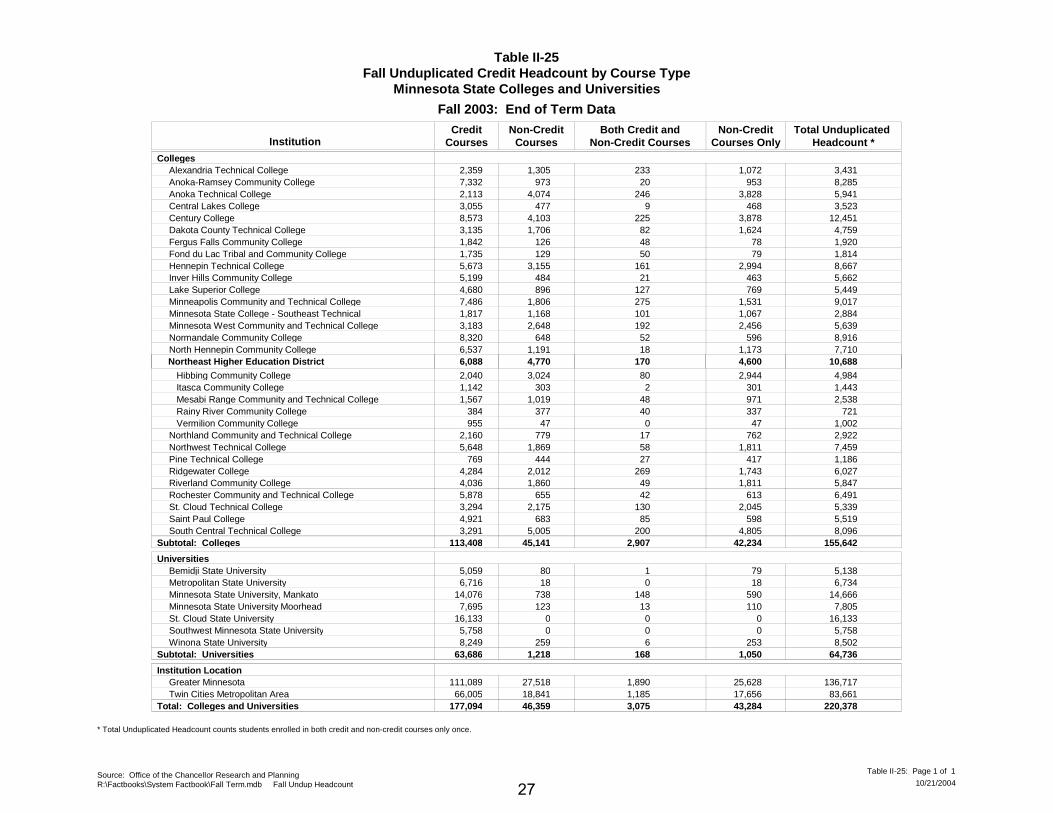
Table II-25Fall Unduplicated Credit Headcount by Course Type
Minnesota State Colleges and Universities
CreditCourses
Non-CreditCourses
Both Credit andNon-Credit Courses
Non-CreditCourses Only
Total Unduplicated Headcount *Institution
Fall 2003: End of Term Data
Colleges2,359Alexandria Technical College 1,305 233 1,072 3,4317,332Anoka-Ramsey Community College 973 20 953 8,2852,113Anoka Technical College 4,074 246 3,828 5,9413,055Central Lakes College 477 9 468 3,5238,573Century College 4,103 225 3,878 12,4513,135Dakota County Technical College 1,706 82 1,624 4,7591,842Fergus Falls Community College 126 48 78 1,9201,735Fond du Lac Tribal and Community College 129 50 79 1,8145,673Hennepin Technical College 3,155 161 2,994 8,6675,199Inver Hills Community College 484 21 463 5,6624,680Lake Superior College 896 127 769 5,4497,486Minneapolis Community and Technical College 1,806 275 1,531 9,0171,817Minnesota State College - Southeast Technical 1,168 101 1,067 2,8843,183Minnesota West Community and Technical College 2,648 192 2,456 5,6398,320Normandale Community College 648 52 596 8,9166,537North Hennepin Community College 1,191 18 1,173 7,710
Northeast Higher Education District
2,040 Hibbing Community College 3,024 80 2,944 4,984
6,088 4,770 170 4,600 10,688
1,142 Itasca Community College 303 2 301 1,4431,567 Mesabi Range Community and Technical College 1,019 48 971 2,538
384 Rainy River Community College 377 40 337 721955 Vermilion Community College 47 0 47 1,002
2,160Northland Community and Technical College 779 17 762 2,9225,648Northwest Technical College 1,869 58 1,811 7,459
769Pine Technical College 444 27 417 1,1864,284Ridgewater College 2,012 269 1,743 6,0274,036Riverland Community College 1,860 49 1,811 5,8475,878Rochester Community and Technical College 655 42 613 6,4913,294St. Cloud Technical College 2,175 130 2,045 5,3394,921Saint Paul College 683 85 598 5,5193,291South Central Technical College 5,005 200 4,805 8,096
Subtotal: Colleges 113,408 45,141 2,907 42,234 155,642
Universities5,059Bemidji State University 80 1 79 5,1386,716Metropolitan State University 18 0 18 6,734
14,076Minnesota State University, Mankato 738 148 590 14,6667,695Minnesota State University Moorhead 123 13 110 7,805
16,133St. Cloud State University 0 0 0 16,1335,758Southwest Minnesota State University 0 0 0 5,7588,249Winona State University 259 6 253 8,502
Subtotal: Universities 63,686 1,218 168 1,050 64,736
Institution Location111,089Greater Minnesota 27,518 1,890 25,628 136,71766,005Twin Cities Metropolitan Area 18,841 1,185 17,656 83,661
Total: Colleges and Universities 177,094 46,359 3,075 43,284 220,378
* Total Unduplicated Headcount counts students enrolled in both credit and non-credit courses only once.
Source: Office of the Chancellor Research and PlanningR:\Factbooks\System Factbook\Fall Term.mdb Fall Undup Headcount 10/21/2004
Table II-25: Page 1 of 1
27
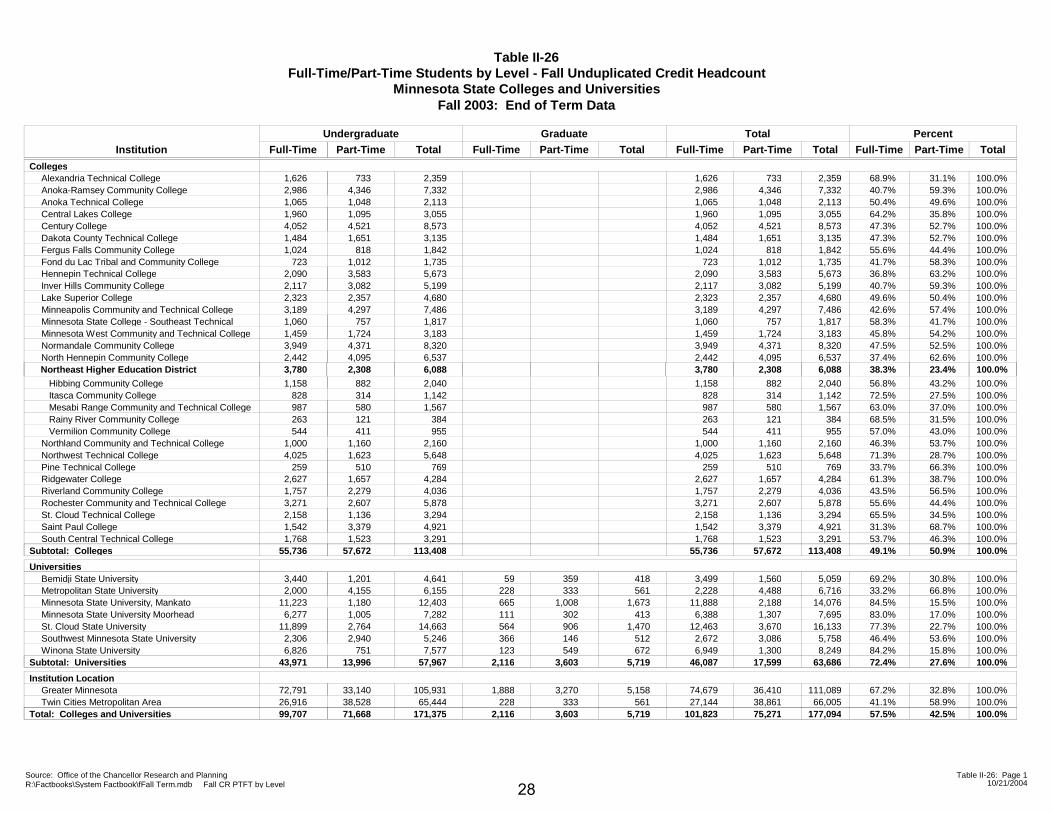
Table II-26Full-Time/Part-Time Students by Level - Fall Unduplicated Credit Headcount
Minnesota State Colleges and Universities
Part-TimeFull-TimeInstitution
Fall 2003: End of Term Data
Undergraduate
Part-TimeFull-Time
Graduate
Part-TimeFull-Time
Total
Part-TimeFull-Time
Percent
TotalTotalTotal Total
Colleges733Alexandria Technical College 1,626 2,359 68.9%7331,626 31.1% 100.0%2,359
4,346Anoka-Ramsey Community College 2,986 7,332 40.7%4,3462,986 59.3% 100.0%7,3321,048Anoka Technical College 1,065 2,113 50.4%1,0481,065 49.6% 100.0%2,1131,095Central Lakes College 1,960 3,055 64.2%1,0951,960 35.8% 100.0%3,0554,521Century College 4,052 8,573 47.3%4,5214,052 52.7% 100.0%8,5731,651Dakota County Technical College 1,484 3,135 47.3%1,6511,484 52.7% 100.0%3,135
818Fergus Falls Community College 1,024 1,842 55.6%8181,024 44.4% 100.0%1,8421,012Fond du Lac Tribal and Community College 723 1,735 41.7%1,012723 58.3% 100.0%1,7353,583Hennepin Technical College 2,090 5,673 36.8%3,5832,090 63.2% 100.0%5,6733,082Inver Hills Community College 2,117 5,199 40.7%3,0822,117 59.3% 100.0%5,1992,357Lake Superior College 2,323 4,680 49.6%2,3572,323 50.4% 100.0%4,6804,297Minneapolis Community and Technical College 3,189 7,486 42.6%4,2973,189 57.4% 100.0%7,486
757Minnesota State College - Southeast Technical 1,060 1,817 58.3%7571,060 41.7% 100.0%1,8171,724Minnesota West Community and Technical College 1,459 3,183 45.8%1,7241,459 54.2% 100.0%3,1834,371Normandale Community College 3,949 8,320 47.5%4,3713,949 52.5% 100.0%8,3204,095North Hennepin Community College 2,442 6,537 37.4%4,0952,442 62.6% 100.0%6,537
Northeast Higher Education District
882 Hibbing Community College 1,158
2,3083,780
2,040 56.8%
38.3%6,088
8821,158
2,3083,780
43.2%
23.4%
100.0%
100.0%
2,040
6,088
314 Itasca Community College 828 1,142 72.5%314828 27.5% 100.0%1,142580 Mesabi Range Community and Technical College 987 1,567 63.0%580987 37.0% 100.0%1,567121 Rainy River Community College 263 384 68.5%121263 31.5% 100.0%384411 Vermilion Community College 544 955 57.0%411544 43.0% 100.0%955
1,160Northland Community and Technical College 1,000 2,160 46.3%1,1601,000 53.7% 100.0%2,1601,623Northwest Technical College 4,025 5,648 71.3%1,6234,025 28.7% 100.0%5,648
510Pine Technical College 259 769 33.7%510259 66.3% 100.0%7691,657Ridgewater College 2,627 4,284 61.3%1,6572,627 38.7% 100.0%4,2842,279Riverland Community College 1,757 4,036 43.5%2,2791,757 56.5% 100.0%4,0362,607Rochester Community and Technical College 3,271 5,878 55.6%2,6073,271 44.4% 100.0%5,8781,136St. Cloud Technical College 2,158 3,294 65.5%1,1362,158 34.5% 100.0%3,2943,379Saint Paul College 1,542 4,921 31.3%3,3791,542 68.7% 100.0%4,9211,523South Central Technical College 1,768 3,291 53.7%1,5231,768 46.3% 100.0%3,291
Subtotal: Colleges 57,67255,736 113,408 49.1%57,67255,736 50.9% 100.0%113,408
Universities1,201Bemidji State University 3,440 5,059 69.2%35959 1,5603,499 30.8% 100.0%4184,6414,155Metropolitan State University 2,000 6,716 33.2%333228 4,4882,228 66.8% 100.0%5616,1551,180Minnesota State University, Mankato 11,223 14,076 84.5%1,008665 2,18811,888 15.5% 100.0%1,67312,4031,005Minnesota State University Moorhead 6,277 7,695 83.0%302111 1,3076,388 17.0% 100.0%4137,2822,764St. Cloud State University 11,899 16,133 77.3%906564 3,67012,463 22.7% 100.0%1,47014,6632,940Southwest Minnesota State University 2,306 5,758 46.4%146366 3,0862,672 53.6% 100.0%5125,246
751Winona State University 6,826 8,249 84.2%549123 1,3006,949 15.8% 100.0%6727,577Subtotal: Universities 13,99643,971 63,686 72.4%3,6032,116 17,59946,087 27.6% 100.0%5,71957,967
Institution Location33,140Greater Minnesota 72,791 111,089 67.2%3,2701,888 36,41074,679 32.8% 100.0%5,158105,93138,528Twin Cities Metropolitan Area 26,916 66,005 41.1%333228 38,86127,144 58.9% 100.0%56165,444
Total: Colleges and Universities 71,66899,707 177,094 57.5%3,6032,116 75,271101,823 42.5% 100.0%5,719171,375
Source: Office of the Chancellor Research and PlanningR:\Factbooks\System Factbook\fFall Term.mdb Fall CR PTFT by Level 10/21/2004
Table II-26: Page 1
28
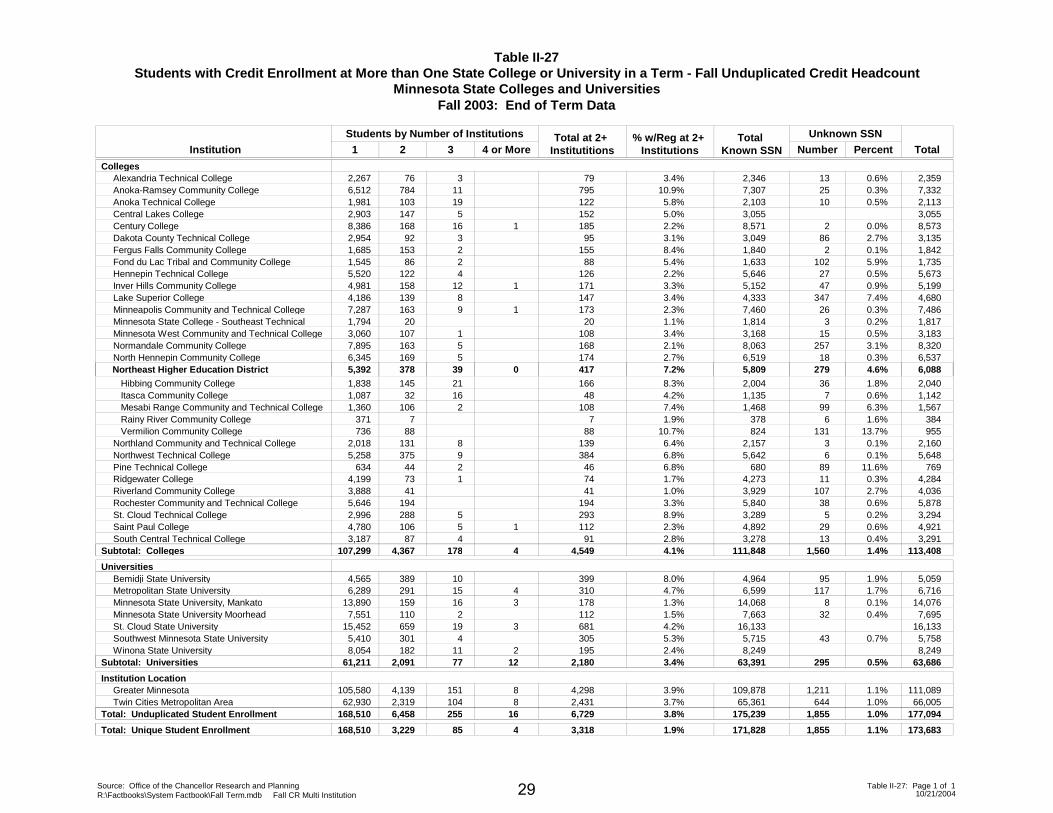
Table II-27Students with Credit Enrollment at More than One State College or University in a Term - Fall Unduplicated Credit Headcount
Minnesota State Colleges and Universities
1 2 NumberInstitution
Fall 2003: End of Term Data
TotalTotal at 2+
Institutitions3 4 or More% w/Reg at 2+
InstitutionsTotal
Known SSN
Students by Number of Institutions
Percent
Unknown SSN
Colleges2,267Alexandria Technical College 76 79 133 3.4% 2,346 2,3590.6%6,512Anoka-Ramsey Community College 784 795 2511 10.9% 7,307 7,3320.3%1,981Anoka Technical College 103 122 1019 5.8% 2,103 2,1130.5%2,903Central Lakes College 147 1525 5.0% 3,055 3,0558,386Century College 168 185 216 2.2% 8,571 8,5730.0%12,954Dakota County Technical College 92 95 863 3.1% 3,049 3,1352.7%1,685Fergus Falls Community College 153 155 22 8.4% 1,840 1,8420.1%1,545Fond du Lac Tribal and Community College 86 88 1022 5.4% 1,633 1,7355.9%5,520Hennepin Technical College 122 126 274 2.2% 5,646 5,6730.5%4,981Inver Hills Community College 158 171 4712 3.3% 5,152 5,1990.9%14,186Lake Superior College 139 147 3478 3.4% 4,333 4,6807.4%7,287Minneapolis Community and Technical College 163 173 269 2.3% 7,460 7,4860.3%11,794Minnesota State College - Southeast Technical 20 20 31.1% 1,814 1,8170.2%3,060Minnesota West Community and Technical College 107 108 151 3.4% 3,168 3,1830.5%7,895Normandale Community College 163 168 2575 2.1% 8,063 8,3203.1%6,345North Hennepin Community College 169 174 185 2.7% 6,519 6,5370.3%
Northeast Higher Education District
1,838 Hibbing Community College 145
5,392 378 279
166
417 6,088
3621
39 0 7.2% 5,809 4.6%
8.3% 2,004 2,0401.8%1,087 Itasca Community College 32 48 716 4.2% 1,135 1,1420.6%1,360 Mesabi Range Community and Technical College 106 108 992 7.4% 1,468 1,5676.3%
371 Rainy River Community College 7 7 61.9% 378 3841.6%736 Vermilion Community College 88 88 13110.7% 824 95513.7%
2,018Northland Community and Technical College 131 139 38 6.4% 2,157 2,1600.1%5,258Northwest Technical College 375 384 69 6.8% 5,642 5,6480.1%
634Pine Technical College 44 46 892 6.8% 680 76911.6%4,199Ridgewater College 73 74 111 1.7% 4,273 4,2840.3%3,888Riverland Community College 41 41 1071.0% 3,929 4,0362.7%5,646Rochester Community and Technical College 194 194 383.3% 5,840 5,8780.6%2,996St. Cloud Technical College 288 293 55 8.9% 3,289 3,2940.2%4,780Saint Paul College 106 112 295 2.3% 4,892 4,9210.6%13,187South Central Technical College 87 91 134 2.8% 3,278 3,2910.4%
Subtotal: Colleges 107,299 4,367 1,5604,549178 4 4.1% 111,848 1.4% 113,408
Universities4,565Bemidji State University 389 399 9510 8.0% 4,964 5,0591.9%6,289Metropolitan State University 291 310 11715 4.7% 6,599 6,7161.7%4
13,890Minnesota State University, Mankato 159 178 816 1.3% 14,068 14,0760.1%37,551Minnesota State University Moorhead 110 112 322 1.5% 7,663 7,6950.4%
15,452St. Cloud State University 659 68119 4.2% 16,133 16,13335,410Southwest Minnesota State University 301 305 434 5.3% 5,715 5,7580.7%8,054Winona State University 182 19511 2.4% 8,249 8,2492
Subtotal: Universities 61,211 2,091 2952,18077 12 3.4% 63,391 0.5% 63,686
Institution Location105,580Greater Minnesota 4,139 4,298 1,211151 3.9% 109,878 111,0891.1%862,930Twin Cities Metropolitan Area 2,319 2,431 644104 3.7% 65,361 66,0051.0%8
Total: Unduplicated Student Enrollment 168,510 6,458 1,8556,729255 16 3.8% 175,239 1.0% 177,094
Total: Unique Student Enrollment 168,510 1,8553,318 1.9% 171,8283,229 85 4 173,6831.1%
Source: Office of the Chancellor Research and PlanningR:\Factbooks\System Factbook\Fall Term.mdb Fall CR Multi Institution 10/21/2004
Table II-27: Page 1 of 129
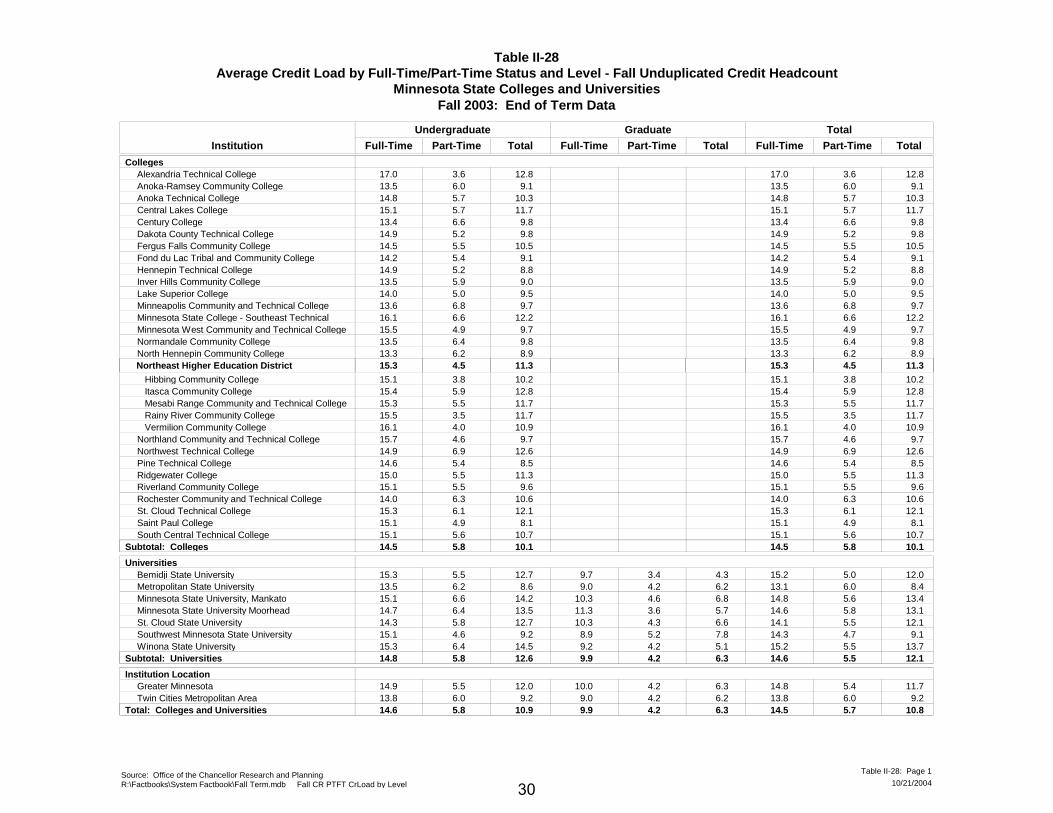
Table II-28Average Credit Load by Full-Time/Part-Time Status and Level - Fall Unduplicated Credit Headcount
Minnesota State Colleges and Universities
Part-TimeFull-TimeInstitution
Fall 2003: End of Term Data
Undergraduate
Part-TimeFull-Time
Graduate
Part-TimeFull-Time
Total
TotalTotalTotal
CollegesAlexandria Technical College 17.0 3.6 12.817.0 3.6 12.8Anoka-Ramsey Community College 13.5 6.0 9.113.5 6.0 9.1Anoka Technical College 14.8 5.7 10.314.8 5.7 10.3Central Lakes College 15.1 5.7 11.715.1 5.7 11.7Century College 13.4 6.6 9.813.4 6.6 9.8Dakota County Technical College 14.9 5.2 9.814.9 5.2 9.8Fergus Falls Community College 14.5 5.5 10.514.5 5.5 10.5Fond du Lac Tribal and Community College 14.2 5.4 9.114.2 5.4 9.1Hennepin Technical College 14.9 5.2 8.814.9 5.2 8.8Inver Hills Community College 13.5 5.9 9.013.5 5.9 9.0Lake Superior College 14.0 5.0 9.514.0 5.0 9.5Minneapolis Community and Technical College 13.6 6.8 9.713.6 6.8 9.7Minnesota State College - Southeast Technical 16.1 6.6 12.216.1 6.6 12.2Minnesota West Community and Technical College 15.5 4.9 9.715.5 4.9 9.7Normandale Community College 13.5 6.4 9.813.5 6.4 9.8North Hennepin Community College 13.3 6.2 8.913.3 6.2 8.9
Northeast Higher Education District
Hibbing Community College
15.3 4.5 15.3 4.5 11.3
15.1 3.8 10.2
11.3
15.1 3.8 10.2 Itasca Community College 15.4 5.9 12.815.4 5.9 12.8 Mesabi Range Community and Technical College 15.3 5.5 11.715.3 5.5 11.7 Rainy River Community College 15.5 3.5 11.715.5 3.5 11.7 Vermilion Community College 16.1 4.0 10.916.1 4.0 10.9Northland Community and Technical College 15.7 4.6 9.715.7 4.6 9.7Northwest Technical College 14.9 6.9 12.614.9 6.9 12.6Pine Technical College 14.6 5.4 8.514.6 5.4 8.5Ridgewater College 15.0 5.5 11.315.0 5.5 11.3Riverland Community College 15.1 5.5 9.615.1 5.5 9.6Rochester Community and Technical College 14.0 6.3 10.614.0 6.3 10.6St. Cloud Technical College 15.3 6.1 12.115.3 6.1 12.1Saint Paul College 15.1 4.9 8.115.1 4.9 8.1South Central Technical College 15.1 5.6 10.715.1 5.6 10.7
Subtotal: Colleges 14.5 5.8 14.5 5.8 10.110.1
UniversitiesBemidji State University 15.2 5.0 12.015.3 5.5 12.7 9.7 3.4 4.3Metropolitan State University 13.1 6.0 8.413.5 6.2 8.6 9.0 4.2 6.2Minnesota State University, Mankato 14.8 5.6 13.415.1 6.6 14.2 10.3 4.6 6.8Minnesota State University Moorhead 14.6 5.8 13.114.7 6.4 13.5 11.3 3.6 5.7St. Cloud State University 14.1 5.5 12.114.3 5.8 12.7 10.3 4.3 6.6Southwest Minnesota State University 14.3 4.7 9.115.1 4.6 9.2 8.9 5.2 7.8Winona State University 15.2 5.5 13.715.3 6.4 14.5 9.2 4.2 5.1
Subtotal: Universities 14.8 5.8 9.9 4.2 14.6 5.5 12.112.6 6.3
Institution LocationGreater Minnesota 14.8 5.4 11.714.9 5.5 12.0 10.0 4.2 6.3Twin Cities Metropolitan Area 13.8 6.0 9.213.8 6.0 9.2 9.0 4.2 6.2
Total: Colleges and Universities 14.6 5.8 9.9 4.2 14.5 5.7 10.810.9 6.3
Source: Office of the Chancellor Research and PlanningR:\Factbooks\System Factbook\Fall Term.mdb Fall CR PTFT CrLoad by Level 10/21/2004
Table II-28: Page 1
30
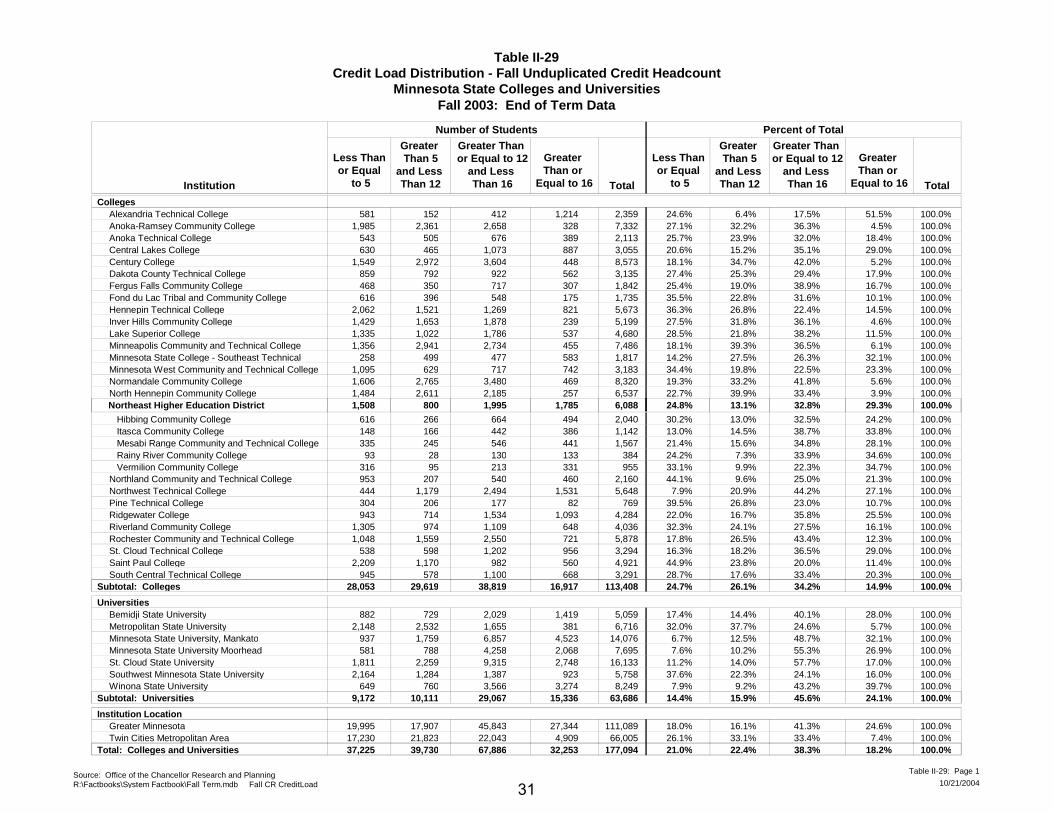
Table II-29Credit Load Distribution - Fall Unduplicated Credit Headcount
Minnesota State Colleges and Universities
Greater Than 5
and Less Than 12
Less Than or Equal
to 5Institution
Fall 2003: End of Term Data
Greater Than or
Equal to 16 Total
Greater Than or Equal to 12
and Less Than 16
Number of Students
Total
Percent of Total
Greater Than 5
and Less Than 12
Less Than or Equal
to 5
Greater Than or
Equal to 16
Greater Than or Equal to 12
and Less Than 16
CollegesAlexandria Technical College 581 152 412 1,214 2,359 100.0%24.6% 6.4% 17.5% 51.5%Anoka-Ramsey Community College 1,985 2,361 2,658 328 7,332 100.0%27.1% 32.2% 36.3% 4.5%Anoka Technical College 543 505 676 389 2,113 100.0%25.7% 23.9% 32.0% 18.4%Central Lakes College 630 465 1,073 887 3,055 100.0%20.6% 15.2% 35.1% 29.0%Century College 1,549 2,972 3,604 448 8,573 100.0%18.1% 34.7% 42.0% 5.2%Dakota County Technical College 859 792 922 562 3,135 100.0%27.4% 25.3% 29.4% 17.9%Fergus Falls Community College 468 350 717 307 1,842 100.0%25.4% 19.0% 38.9% 16.7%Fond du Lac Tribal and Community College 616 396 548 175 1,735 100.0%35.5% 22.8% 31.6% 10.1%Hennepin Technical College 2,062 1,521 1,269 821 5,673 100.0%36.3% 26.8% 22.4% 14.5%Inver Hills Community College 1,429 1,653 1,878 239 5,199 100.0%27.5% 31.8% 36.1% 4.6%Lake Superior College 1,335 1,022 1,786 537 4,680 100.0%28.5% 21.8% 38.2% 11.5%Minneapolis Community and Technical College 1,356 2,941 2,734 455 7,486 100.0%18.1% 39.3% 36.5% 6.1%Minnesota State College - Southeast Technical 258 499 477 583 1,817 100.0%14.2% 27.5% 26.3% 32.1%Minnesota West Community and Technical College 1,095 629 717 742 3,183 100.0%34.4% 19.8% 22.5% 23.3%Normandale Community College 1,606 2,765 3,480 469 8,320 100.0%19.3% 33.2% 41.8% 5.6%North Hennepin Community College 1,484 2,611 2,185 257 6,537 100.0%22.7% 39.9% 33.4% 3.9%
Northeast Higher Education District
Hibbing Community College
1,508
616
800
266
1,995 1,785 6,088
664 494 2,040
24.8%
100.0%30.2% 13.0% 32.5% 24.2%
100.0%13.1% 32.8% 29.3%
Itasca Community College 148 166 442 386 1,142 100.0%13.0% 14.5% 38.7% 33.8% Mesabi Range Community and Technical College 335 245 546 441 1,567 100.0%21.4% 15.6% 34.8% 28.1% Rainy River Community College 93 28 130 133 384 100.0%24.2% 7.3% 33.9% 34.6% Vermilion Community College 316 95 213 331 955 100.0%33.1% 9.9% 22.3% 34.7%Northland Community and Technical College 953 207 540 460 2,160 100.0%44.1% 9.6% 25.0% 21.3%Northwest Technical College 444 1,179 2,494 1,531 5,648 100.0%7.9% 20.9% 44.2% 27.1%Pine Technical College 304 206 177 82 769 100.0%39.5% 26.8% 23.0% 10.7%Ridgewater College 943 714 1,534 1,093 4,284 100.0%22.0% 16.7% 35.8% 25.5%Riverland Community College 1,305 974 1,109 648 4,036 100.0%32.3% 24.1% 27.5% 16.1%Rochester Community and Technical College 1,048 1,559 2,550 721 5,878 100.0%17.8% 26.5% 43.4% 12.3%St. Cloud Technical College 538 598 1,202 956 3,294 100.0%16.3% 18.2% 36.5% 29.0%Saint Paul College 2,209 1,170 982 560 4,921 100.0%44.9% 23.8% 20.0% 11.4%South Central Technical College 945 578 1,100 668 3,291 100.0%28.7% 17.6% 33.4% 20.3%
Subtotal: Colleges 28,053 29,619 38,819 16,917 113,408 24.7% 100.0%26.1% 34.2% 14.9%
UniversitiesBemidji State University 882 729 2,029 1,419 5,059 100.0%17.4% 14.4% 40.1% 28.0%Metropolitan State University 2,148 2,532 1,655 381 6,716 100.0%32.0% 37.7% 24.6% 5.7%Minnesota State University, Mankato 937 1,759 6,857 4,523 14,076 100.0%6.7% 12.5% 48.7% 32.1%Minnesota State University Moorhead 581 788 4,258 2,068 7,695 100.0%7.6% 10.2% 55.3% 26.9%St. Cloud State University 1,811 2,259 9,315 2,748 16,133 100.0%11.2% 14.0% 57.7% 17.0%Southwest Minnesota State University 2,164 1,284 1,387 923 5,758 100.0%37.6% 22.3% 24.1% 16.0%Winona State University 649 760 3,566 3,274 8,249 100.0%7.9% 9.2% 43.2% 39.7%
Subtotal: Universities 9,172 10,111 29,067 15,336 63,686 14.4% 100.0%15.9% 45.6% 24.1%
Institution LocationGreater Minnesota 19,995 17,907 45,843 27,344 111,089 100.0%18.0% 16.1% 41.3% 24.6%Twin Cities Metropolitan Area 17,230 21,823 22,043 4,909 66,005 100.0%26.1% 33.1% 33.4% 7.4%
Total: Colleges and Universities 37,225 39,730 67,886 32,253 177,094 21.0% 100.0%22.4% 38.3% 18.2%
Source: Office of the Chancellor Research and PlanningR:\Factbooks\System Factbook\Fall Term.mdb Fall CR CreditLoad 10/21/2004
Table II-29: Page 1
31
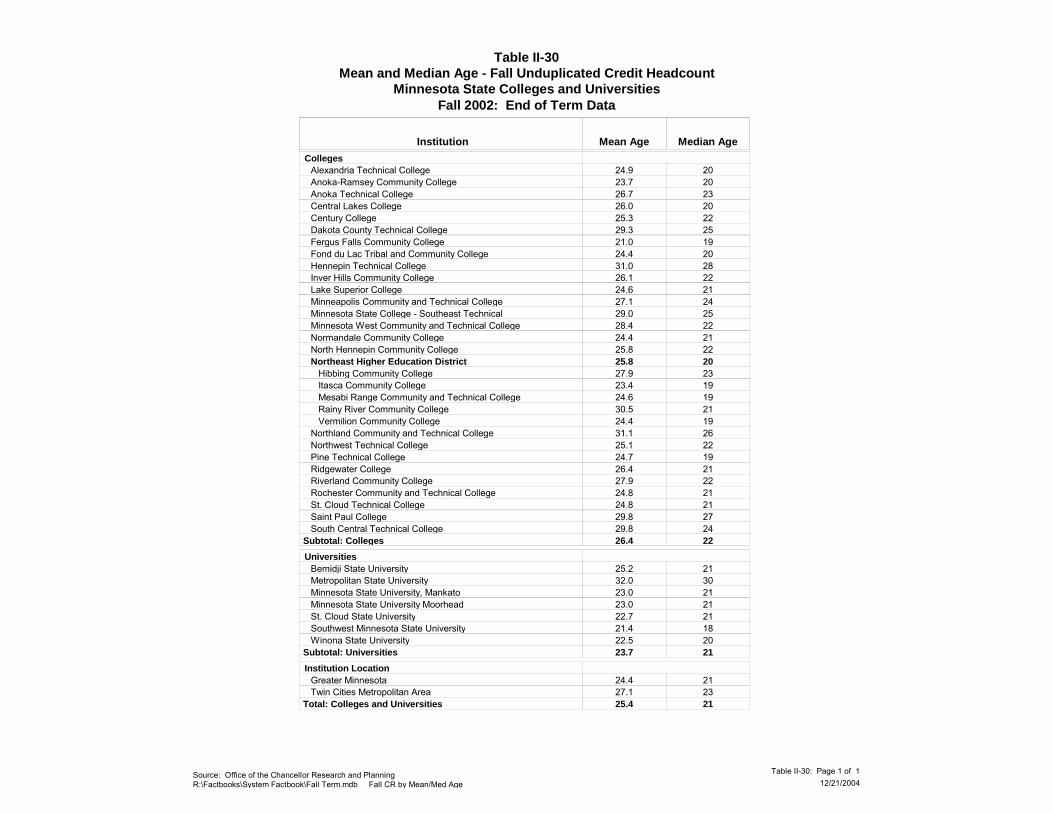
Table II-30Mean and Median Age - Fall Unduplicated Credit Headcount
Minnesota State Colleges and Universities
Mean Age Median AgeInstitution
Fall 2002: End of Term Data
Colleges24.9 20 Alexandria Technical College23.7 20 Anoka-Ramsey Community College26.7 23 Anoka Technical College26.0 20 Central Lakes College25.3 22 Century College29.3 25 Dakota County Technical College21.0 19 Fergus Falls Community College24.4 20 Fond du Lac Tribal and Community College31.0 28 Hennepin Technical College26.1 22 Inver Hills Community College24.6 21 Lake Superior College27.1 24 Minneapolis Community and Technical College29.0 25 Minnesota State College - Southeast Technical28.4 22 Minnesota West Community and Technical College24.4 21 Normandale Community College25.8 22 North Hennepin Community College25.8 20 Northeast Higher Education District27.9 23 Hibbing Community College23.4 19 Itasca Community College24.6 19 Mesabi Range Community and Technical College30.5 21 Rainy River Community College24.4 19 Vermilion Community College31.1 26 Northland Community and Technical College25.1 22 Northwest Technical College24.7 19 Pine Technical College26.4 21 Ridgewater College27.9 22 Riverland Community College24.8 21 Rochester Community and Technical College24.8 21 St. Cloud Technical College29.8 27 Saint Paul College29.8 24 South Central Technical College26.4 22 Subtotal: Colleges
Universities25.2 21 Bemidji State University32.0 30 Metropolitan State University23.0 21 Minnesota State University, Mankato23.0 21 Minnesota State University Moorhead22.7 21 St. Cloud State University21.4 18 Southwest Minnesota State University22.5 20 Winona State University23.7 21 Subtotal: Universities
Institution Location24.4 21 Greater Minnesota27.1 23 Twin Cities Metropolitan Area25.4 21 Total: Colleges and Universities
Source: Office of the Chancellor Research and PlanningR:\Factbooks\System Factbook\Fall Term.mdb Fall CR by Mean/Med Age 12/21/2004
Table II-30: Page 1 of 1
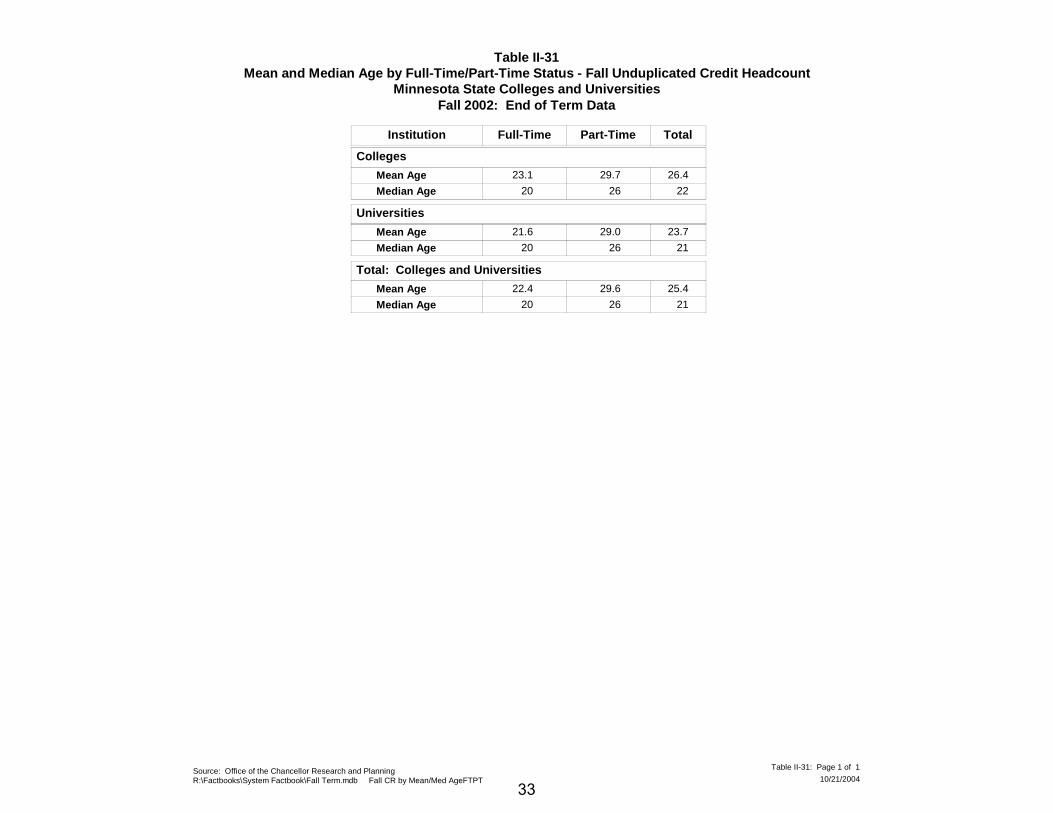
Table II-31Mean and Median Age by Full-Time/Part-Time Status - Fall Unduplicated Credit Headcount
Minnesota State Colleges and Universities
Full-Time Part-TimeInstitution
Fall 2002: End of Term Data
Total
Colleges
Mean Age
Median Age
23.1
20
29.7
26
26.4
22
Universities
Mean Age
Median Age
21.6
20
29.0
26
23.7
21
Total: Colleges and Universities
Mean Age
Median Age
22.4
20
29.6
26
25.4
21
Source: Office of the Chancellor Research and PlanningR:\Factbooks\System Factbook\Fall Term.mdb Fall CR by Mean/Med AgeFTPT 10/21/2004
Table II-31: Page 1 of 1
33
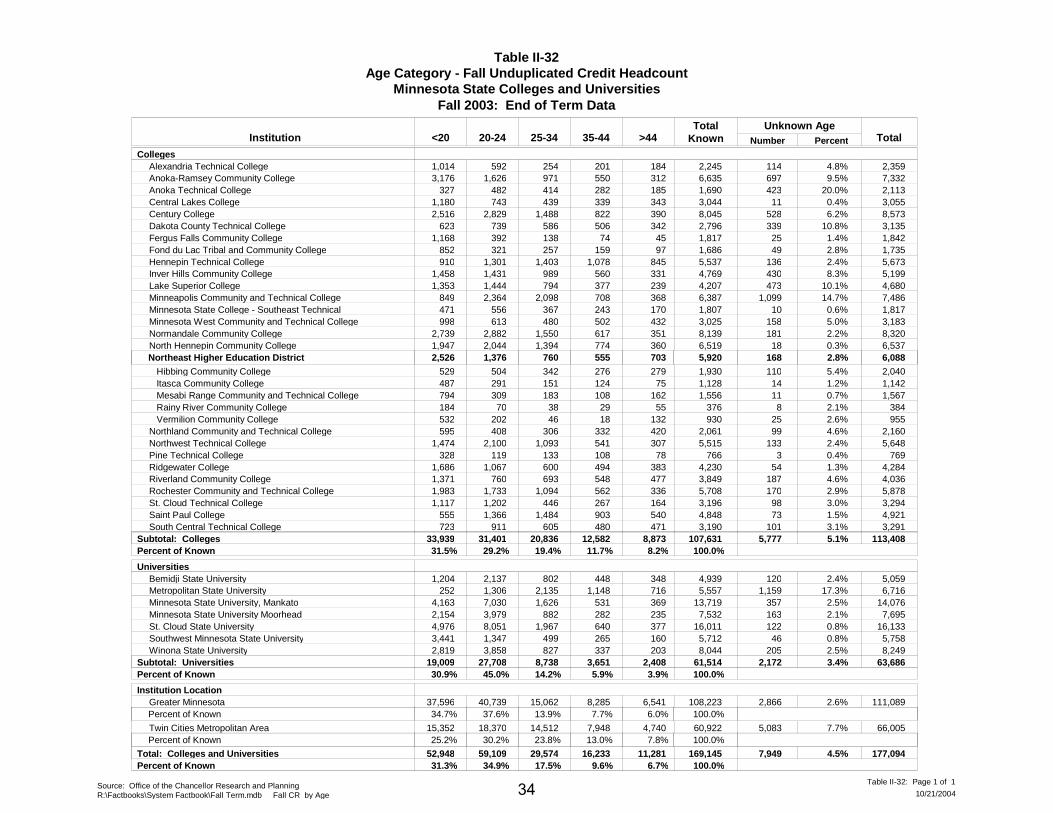
Table II-32Age Category - Fall Unduplicated Credit Headcount
Minnesota State Colleges and Universities
<20 20-24 25-34 PercentInstitution
Fall 2003: End of Term DataUnknown Age
TotalTotal
Known35-44 >44 NumberColleges
1,014Alexandria Technical College 592 2,245 2,3594.8%254 201 184 1143,176Anoka-Ramsey Community College 1,626 6,635 7,3329.5%971 550 312 697
327Anoka Technical College 482 1,690 2,11320.0%414 282 185 4231,180Central Lakes College 743 3,044 3,0550.4%439 339 343 112,516Century College 2,829 8,045 8,5736.2%1,488 822 390 528
623Dakota County Technical College 739 2,796 3,13510.8%586 506 342 3391,168Fergus Falls Community College 392 1,817 1,8421.4%138 74 45 25
852Fond du Lac Tribal and Community College 321 1,686 1,7352.8%257 159 97 49910Hennepin Technical College 1,301 5,537 5,6732.4%1,403 1,078 845 136
1,458Inver Hills Community College 1,431 4,769 5,1998.3%989 560 331 4301,353Lake Superior College 1,444 4,207 4,68010.1%794 377 239 473
849Minneapolis Community and Technical College 2,364 6,387 7,48614.7%2,098 708 368 1,099471Minnesota State College - Southeast Technical 556 1,807 1,8170.6%367 243 170 10998Minnesota West Community and Technical College 613 3,025 3,1835.0%480 502 432 158
2,739Normandale Community College 2,882 8,139 8,3202.2%1,550 617 351 1811,947North Hennepin Community College 2,044 6,519 6,5370.3%1,394 774 360 18
Northeast Higher Education District
529 Hibbing Community College 504
2,526 1,376 760
1,930
5,920
2,0405.4%
2.8% 6,088
342
555
276
703
279
168
110487 Itasca Community College 291 1,128 1,1421.2%151 124 75 14794 Mesabi Range Community and Technical College 309 1,556 1,5670.7%183 108 162 11184 Rainy River Community College 70 376 3842.1%38 29 55 8532 Vermilion Community College 202 930 9552.6%46 18 132 25595Northland Community and Technical College 408 2,061 2,1604.6%306 332 420 99
1,474Northwest Technical College 2,100 5,515 5,6482.4%1,093 541 307 133328Pine Technical College 119 766 7690.4%133 108 78 3
1,686Ridgewater College 1,067 4,230 4,2841.3%600 494 383 541,371Riverland Community College 760 3,849 4,0364.6%693 548 477 1871,983Rochester Community and Technical College 1,733 5,708 5,8782.9%1,094 562 336 1701,117St. Cloud Technical College 1,202 3,196 3,2943.0%446 267 164 98
555Saint Paul College 1,366 4,848 4,9211.5%1,484 903 540 73723South Central Technical College 911 3,190 3,2913.1%605 480 471 101
Subtotal: Colleges31.5%
31,401 20,836 107,631 113,4085.1%12,582 8,873 5,777Percent of Known
33,93929.2% 19.4% 11.7% 8.2% 100.0%
Universities1,204Bemidji State University 2,137 4,939 5,0592.4%802 448 348 120
252Metropolitan State University 1,306 5,557 6,71617.3%2,135 1,148 716 1,1594,163Minnesota State University, Mankato 7,030 13,719 14,0762.5%1,626 531 369 3572,154Minnesota State University Moorhead 3,979 7,532 7,6952.1%882 282 235 1634,976St. Cloud State University 8,051 16,011 16,1330.8%1,967 640 377 1223,441Southwest Minnesota State University 1,347 5,712 5,7580.8%499 265 160 462,819Winona State University 3,858 8,044 8,2492.5%827 337 203 205
Subtotal: Universities30.9%
27,708 8,738 61,514 63,6863.4%3,651 2,408 2,172Percent of Known
19,00945.0% 14.2% 5.9% 3.9% 100.0%
Institution Location37,596Greater Minnesota 40,739 108,223 111,0892.6%15,062 8,285 6,541 2,866
Percent of Known 34.7% 37.6% 13.9% 7.7% 6.0% 100.0%
15,352Twin Cities Metropolitan Area 18,370 60,922 66,0057.7%14,512 7,948 4,740 5,083 Percent of Known 25.2% 30.2% 23.8% 13.0% 7.8% 100.0%
Total: Colleges and Universities31.3%
59,109 29,574 169,145 177,0944.5%16,233 11,281 7,949Percent of Known
52,94834.9% 17.5% 9.6% 6.7% 100.0%
Source: Office of the Chancellor Research and PlanningR:\Factbooks\System Factbook\Fall Term.mdb Fall CR by Age 10/21/2004
Table II-32: Page 1 of 134
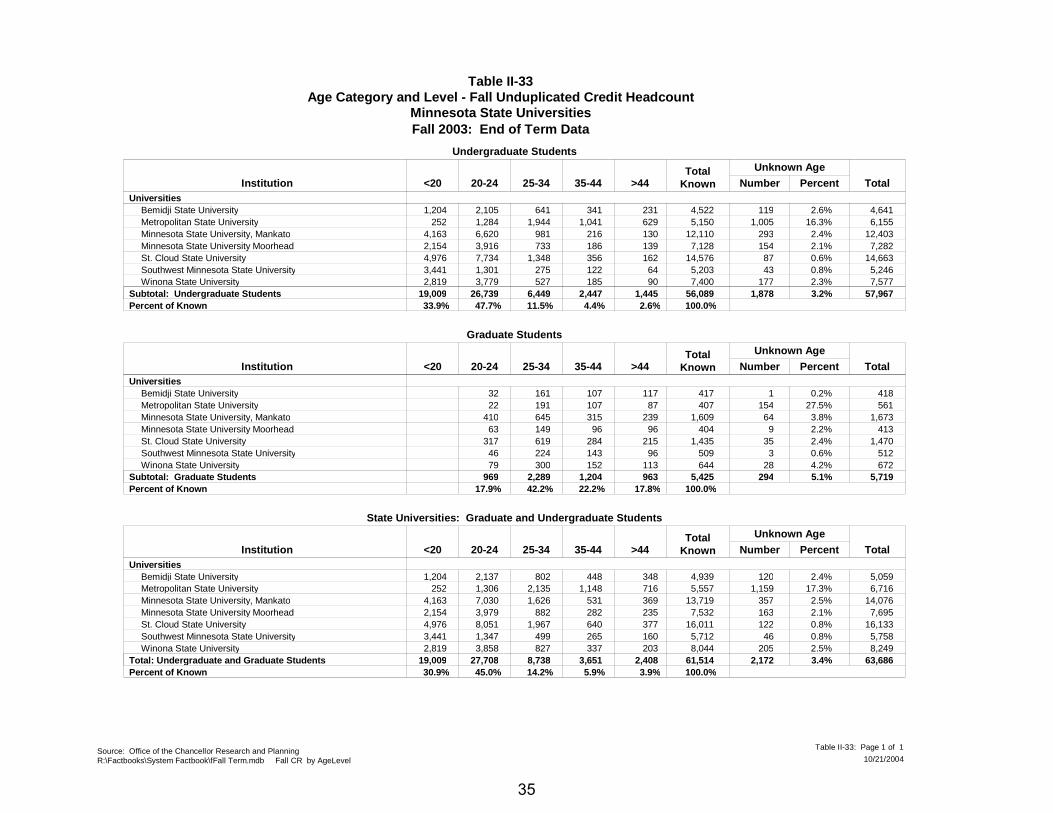
Table II-33Age Category and Level - Fall Unduplicated Credit Headcount
Minnesota State UniversitiesFall 2003: End of Term Data
Undergraduate Students
<20 20-24 25-34Institution Number TotalTotal
Known35-44 >44 Percent
Unknown Age
UniversitiesBemidji State University 2,105 4,522 4,6412.6%641 341 231 1191,204Metropolitan State University 1,284 5,150 6,15516.3%1,944 1,041 629 1,005252Minnesota State University, Mankato 6,620 12,110 12,4032.4%981 216 130 2934,163Minnesota State University Moorhead 3,916 7,128 7,2822.1%733 186 139 1542,154St. Cloud State University 7,734 14,576 14,6630.6%1,348 356 162 874,976Southwest Minnesota State University 1,301 5,203 5,2460.8%275 122 64 433,441Winona State University 3,779 7,400 7,5772.3%527 185 90 1772,819
Subtotal: Undergraduate Students 19,009 26,739 6,449 56,089 57,9673.2%2,447 1,445 1,87833.9%Percent of Known 47.7% 11.5% 4.4% 2.6% 100.0%
Graduate Students
<20 20-24 25-34Institution Number TotalTotal
Known35-44 >44 Percent
Unknown Age
UniversitiesBemidji State University 32 417 4180.2%161 107 117 1Metropolitan State University 22 407 56127.5%191 107 87 154Minnesota State University, Mankato 410 1,609 1,6733.8%645 315 239 64Minnesota State University Moorhead 63 404 4132.2%149 96 96 9St. Cloud State University 317 1,435 1,4702.4%619 284 215 35Southwest Minnesota State University 46 509 5120.6%224 143 96 3Winona State University 79 644 6724.2%300 152 113 28
Subtotal: Graduate Students 969 2,289 5,425 5,7195.1%1,204 963 294Percent of Known 17.9% 42.2% 22.2% 17.8% 100.0%
State Universities: Graduate and Undergraduate Students
<20 20-24 25-34Institution Number TotalTotal
Known35-44 >44 Percent
Unknown Age
UniversitiesBemidji State University 2,137 4,939 5,0592.4%802 448 348 1201,204Metropolitan State University 1,306 5,557 6,71617.3%2,135 1,148 716 1,159252Minnesota State University, Mankato 7,030 13,719 14,0762.5%1,626 531 369 3574,163Minnesota State University Moorhead 3,979 7,532 7,6952.1%882 282 235 1632,154St. Cloud State University 8,051 16,011 16,1330.8%1,967 640 377 1224,976Southwest Minnesota State University 1,347 5,712 5,7580.8%499 265 160 463,441Winona State University 3,858 8,044 8,2492.5%827 337 203 2052,819
Total: Undergraduate and Graduate Students 19,009 27,708 8,738 61,514 63,6863.4%3,651 2,408 2,17230.9%Percent of Known 45.0% 14.2% 5.9% 3.9% 100.0%
Source: Office of the Chancellor Research and PlanningR:\Factbooks\System Factbook\fFall Term.mdb Fall CR by AgeLevel 10/21/2004
Table II-33: Page 1 of 1
35
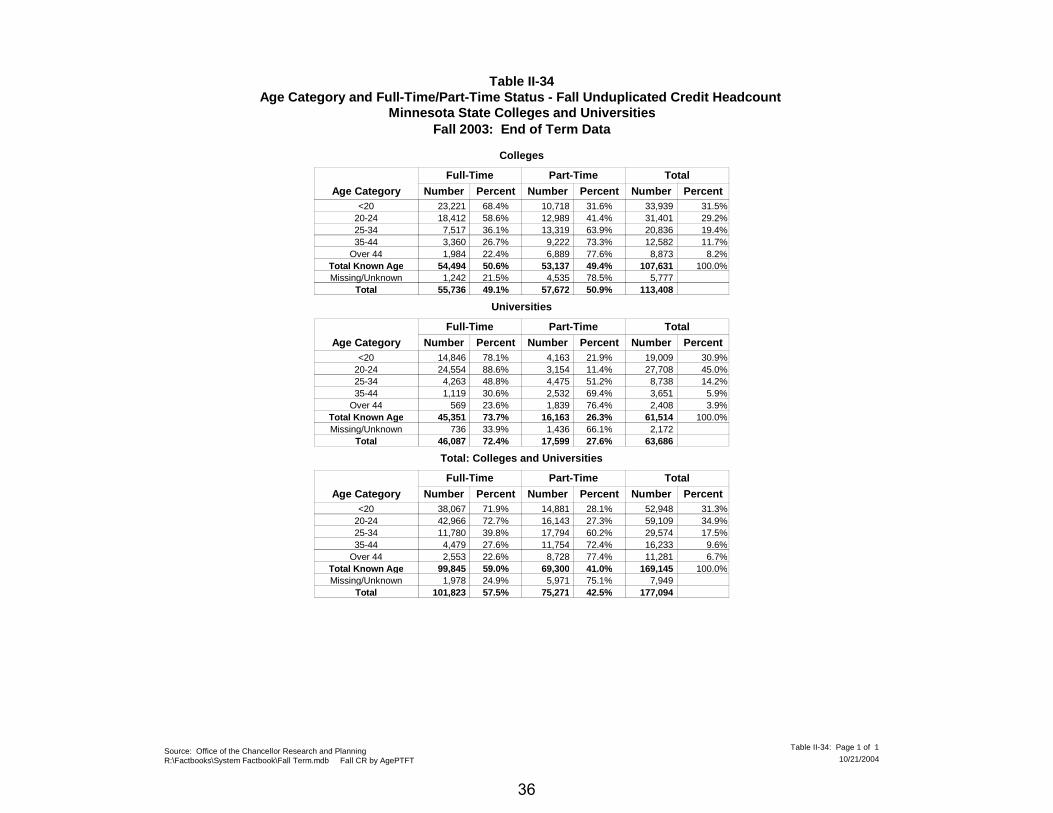
Table II-34Age Category and Full-Time/Part-Time Status - Fall Unduplicated Credit Headcount
Minnesota State Colleges and UniversitiesFall 2003: End of Term Data
Number PercentAge Category
Part-Time
Number Percent
Full-Time
Number Percent
Total
Colleges
10,71823,221<20 33,93931.6%68.4% 31.5%12,98918,41220-24 31,40141.4%58.6% 29.2%13,3197,51725-34 20,83663.9%36.1% 19.4%9,2223,36035-44 12,58273.3%26.7% 11.7%6,8891,984Over 44 8,87377.6%22.4% 8.2%
53,13754,494Total Known Age 107,63149.4%50.6% 100.0%4,5351,242Missing/Unknown 5,77778.5%21.5%
57,67255,736Total 113,40850.9%49.1%
Number PercentAge Category
Part-Time
Number Percent
Full-Time
Number Percent
Total
Universities
4,16314,846<20 19,00921.9%78.1% 30.9%3,15424,55420-24 27,70811.4%88.6% 45.0%4,4754,26325-34 8,73851.2%48.8% 14.2%2,5321,11935-44 3,65169.4%30.6% 5.9%1,839569Over 44 2,40876.4%23.6% 3.9%
16,16345,351Total Known Age 61,51426.3%73.7% 100.0%1,436736Missing/Unknown 2,17266.1%33.9%
17,59946,087Total 63,68627.6%72.4%
Number PercentAge Category
Part-Time
Number Percent
Full-Time
Number Percent
Total
Total: Colleges and Universities
14,88138,067<20 52,94828.1%71.9% 31.3%16,14342,96620-24 59,10927.3%72.7% 34.9%17,79411,78025-34 29,57460.2%39.8% 17.5%11,7544,47935-44 16,23372.4%27.6% 9.6%8,7282,553Over 44 11,28177.4%22.6% 6.7%
69,30099,845Total Known Age 169,14541.0%59.0% 100.0%5,9711,978Missing/Unknown 7,94975.1%24.9%
75,271101,823Total 177,09442.5%57.5%
Source: Office of the Chancellor Research and PlanningR:\Factbooks\System Factbook\Fall Term.mdb Fall CR by AgePTFT 10/21/2004
Table II-34: Page 1 of 1
36
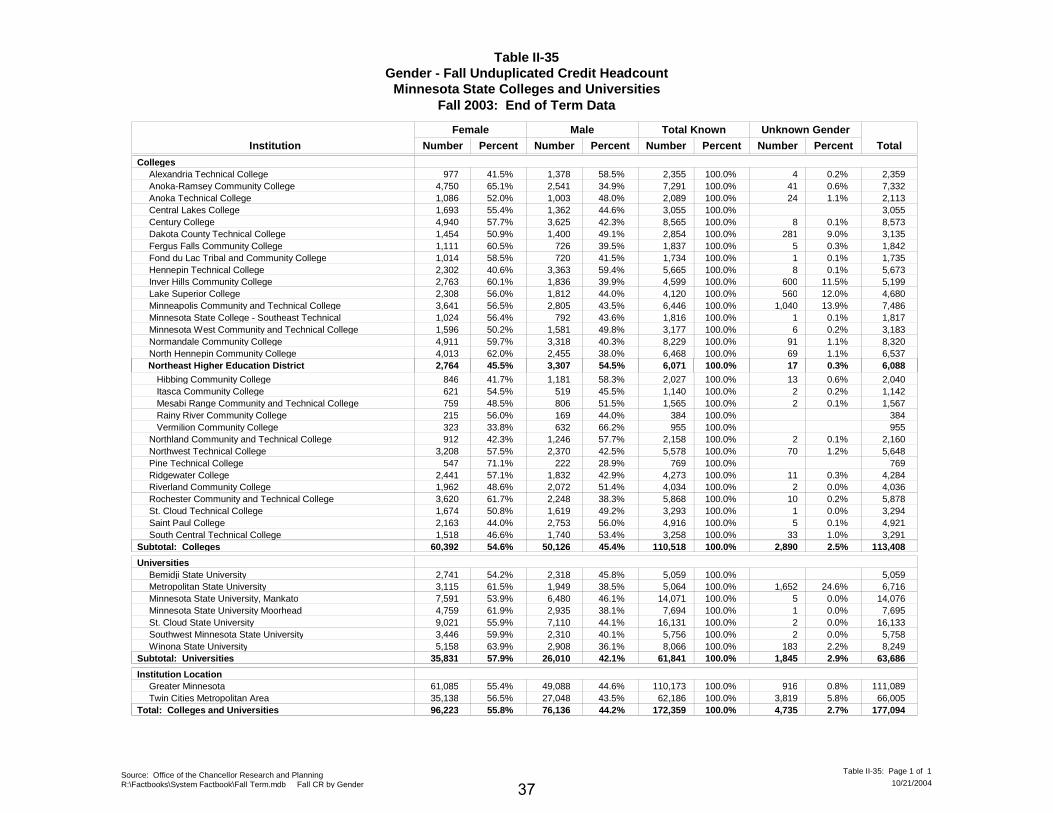
Table II-35Gender - Fall Unduplicated Credit Headcount
Minnesota State Colleges and UniversitiesFall 2003: End of Term Data
Female Unknown Gender
Institution Total
Total Known
Number Percent Number Percent
Male
Number PercentNumber Percent
Colleges977Alexandria Technical College 1,378 2,35541.5% 58.5% 2,3590.2%4100.0%
4,750Anoka-Ramsey Community College 2,541 7,29165.1% 34.9% 7,3320.6%41100.0%1,086Anoka Technical College 1,003 2,08952.0% 48.0% 2,1131.1%24100.0%1,693Central Lakes College 1,362 3,05555.4% 44.6% 3,055100.0%4,940Century College 3,625 8,56557.7% 42.3% 8,5730.1%8100.0%1,454Dakota County Technical College 1,400 2,85450.9% 49.1% 3,1359.0%281100.0%1,111Fergus Falls Community College 726 1,83760.5% 39.5% 1,8420.3%5100.0%1,014Fond du Lac Tribal and Community College 720 1,73458.5% 41.5% 1,7350.1%1100.0%2,302Hennepin Technical College 3,363 5,66540.6% 59.4% 5,6730.1%8100.0%2,763Inver Hills Community College 1,836 4,59960.1% 39.9% 5,19911.5%600100.0%2,308Lake Superior College 1,812 4,12056.0% 44.0% 4,68012.0%560100.0%3,641Minneapolis Community and Technical College 2,805 6,44656.5% 43.5% 7,48613.9%1,040100.0%1,024Minnesota State College - Southeast Technical 792 1,81656.4% 43.6% 1,8170.1%1100.0%1,596Minnesota West Community and Technical College 1,581 3,17750.2% 49.8% 3,1830.2%6100.0%4,911Normandale Community College 3,318 8,22959.7% 40.3% 8,3201.1%91100.0%4,013North Hennepin Community College 2,455 6,46862.0% 38.0% 6,5371.1%69100.0%
Northeast Higher Education District
846 Hibbing Community College 1,181
2,764 3,307 17
2,027
6,071
41.7%
45.5%
58.3%
54.5%
2,0400.6%
0.3% 6,088
13100.0%
100.0%
621 Itasca Community College 519 1,14054.5% 45.5% 1,1420.2%2100.0%759 Mesabi Range Community and Technical College 806 1,56548.5% 51.5% 1,5670.1%2100.0%215 Rainy River Community College 169 38456.0% 44.0% 384100.0%323 Vermilion Community College 632 95533.8% 66.2% 955100.0%912Northland Community and Technical College 1,246 2,15842.3% 57.7% 2,1600.1%2100.0%
3,208Northwest Technical College 2,370 5,57857.5% 42.5% 5,6481.2%70100.0%547Pine Technical College 222 76971.1% 28.9% 769100.0%
2,441Ridgewater College 1,832 4,27357.1% 42.9% 4,2840.3%11100.0%1,962Riverland Community College 2,072 4,03448.6% 51.4% 4,0360.0%2100.0%3,620Rochester Community and Technical College 2,248 5,86861.7% 38.3% 5,8780.2%10100.0%1,674St. Cloud Technical College 1,619 3,29350.8% 49.2% 3,2940.0%1100.0%2,163Saint Paul College 2,753 4,91644.0% 56.0% 4,9210.1%5100.0%1,518South Central Technical College 1,740 3,25846.6% 53.4% 3,2911.0%33100.0%
Subtotal: Colleges 60,392 50,126 2,890110,51854.6% 45.4% 113,4082.5%100.0%
Universities2,741Bemidji State University 2,318 5,05954.2% 45.8% 5,059100.0%3,115Metropolitan State University 1,949 5,06461.5% 38.5% 6,71624.6%1,652100.0%7,591Minnesota State University, Mankato 6,480 14,07153.9% 46.1% 14,0760.0%5100.0%4,759Minnesota State University Moorhead 2,935 7,69461.9% 38.1% 7,6950.0%1100.0%9,021St. Cloud State University 7,110 16,13155.9% 44.1% 16,1330.0%2100.0%3,446Southwest Minnesota State University 2,310 5,75659.9% 40.1% 5,7580.0%2100.0%5,158Winona State University 2,908 8,06663.9% 36.1% 8,2492.2%183100.0%
Subtotal: Universities 35,831 26,010 1,84561,84157.9% 42.1% 63,6862.9%100.0%
Institution Location61,085Greater Minnesota 49,088 110,17355.4% 44.6% 111,0890.8%916100.0%35,138Twin Cities Metropolitan Area 27,048 62,18656.5% 43.5% 66,0055.8%3,819100.0%
Total: Colleges and Universities 96,223 76,136 4,735172,35955.8% 44.2% 177,0942.7%100.0%
Source: Office of the Chancellor Research and PlanningR:\Factbooks\System Factbook\Fall Term.mdb Fall CR by Gender 10/21/2004
Table II-35: Page 1 of 1
37
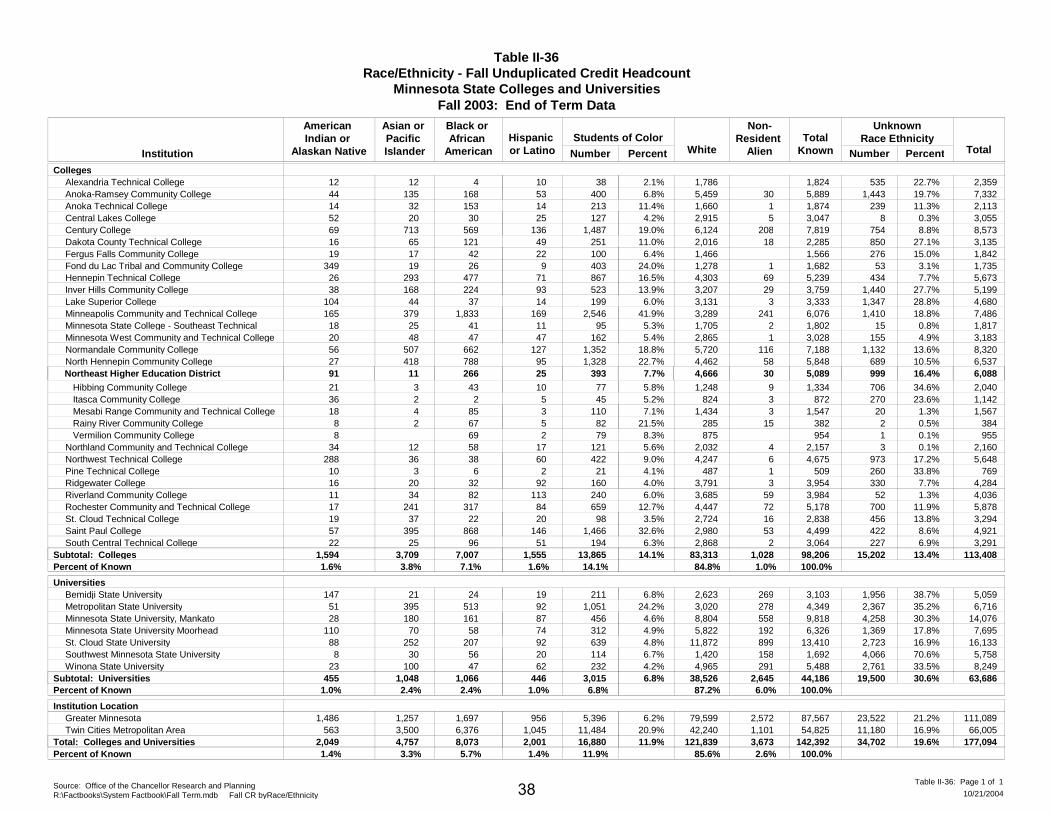
Table II-36Race/Ethnicity - Fall Unduplicated Credit Headcount
Minnesota State Colleges and Universities
American Indian or
Alaskan Native
Asian or Pacific Islander
TotalKnown Percent PercentInstitution
Fall 2003: End of Term Data
TotalNumber
Black or African
AmericanHispanic or Latino White
Non-Resident
Alien Number
UnknownRace EthnicityStudents of Color
Colleges12Alexandria Technical College 12 38 2.1% 2,35922.7%1,8244 10 1,786 53544Anoka-Ramsey Community College 135 400 6.8% 7,33219.7%5,889168 53 5,459 30 1,44314Anoka Technical College 32 213 11.4% 2,11311.3%1,874153 14 1,660 1 23952Central Lakes College 20 127 4.2% 3,0550.3%3,04730 25 2,915 5 869Century College 713 1,487 19.0% 8,5738.8%7,819569 136 6,124 208 75416Dakota County Technical College 65 251 11.0% 3,13527.1%2,285121 49 2,016 18 85019Fergus Falls Community College 17 100 6.4% 1,84215.0%1,56642 22 1,466 276
349Fond du Lac Tribal and Community College 19 403 24.0% 1,7353.1%1,68226 9 1,278 1 5326Hennepin Technical College 293 867 16.5% 5,6737.7%5,239477 71 4,303 69 43438Inver Hills Community College 168 523 13.9% 5,19927.7%3,759224 93 3,207 29 1,440
104Lake Superior College 44 199 6.0% 4,68028.8%3,33337 14 3,131 3 1,347165Minneapolis Community and Technical College 379 2,546 41.9% 7,48618.8%6,0761,833 169 3,289 241 1,41018Minnesota State College - Southeast Technical 25 95 5.3% 1,8170.8%1,80241 11 1,705 2 1520Minnesota West Community and Technical College 48 162 5.4% 3,1834.9%3,02847 47 2,865 1 15556Normandale Community College 507 1,352 18.8% 8,32013.6%7,188662 127 5,720 116 1,13227North Hennepin Community College 418 1,328 22.7% 6,53710.5%5,848788 95 4,462 58 689
Northeast Higher Education District
21 Hibbing Community College 3
91 11 5,089
77
393
5.8%
7.7%
2,04034.6%
16.4% 6,088
1,33443
266
10
25
1,248
4,666
9
30
706
999
36 Itasca Community College 2 45 5.2% 1,14223.6%8722 5 824 3 27018 Mesabi Range Community and Technical College 4 110 7.1% 1,5671.3%1,54785 3 1,434 3 208 Rainy River Community College 2 82 21.5% 3840.5%38267 5 285 15 28 Vermilion Community College 79 8.3% 9550.1%95469 2 875 1
34Northland Community and Technical College 12 121 5.6% 2,1600.1%2,15758 17 2,032 4 3288Northwest Technical College 36 422 9.0% 5,64817.2%4,67538 60 4,247 6 97310Pine Technical College 3 21 4.1% 76933.8%5096 2 487 1 26016Ridgewater College 20 160 4.0% 4,2847.7%3,95432 92 3,791 3 33011Riverland Community College 34 240 6.0% 4,0361.3%3,98482 113 3,685 59 5217Rochester Community and Technical College 241 659 12.7% 5,87811.9%5,178317 84 4,447 72 70019St. Cloud Technical College 37 98 3.5% 3,29413.8%2,83822 20 2,724 16 45657Saint Paul College 395 1,466 32.6% 4,9218.6%4,499868 146 2,980 53 42222South Central Technical College 25 194 6.3% 3,2916.9%3,06496 51 2,868 2 227
Subtotal: Colleges 1,594 3,709 98,20613,865 14.1% 113,40813.4%7,007 1,555 83,313 1,028 15,2021.6%Percent of Known 3.8% 7.1% 1.6% 14.1% 84.8% 1.0% 100.0%
Universities147Bemidji State University 21 211 6.8% 5,05938.7%3,10324 19 2,623 269 1,95651Metropolitan State University 395 1,051 24.2% 6,71635.2%4,349513 92 3,020 278 2,36728Minnesota State University, Mankato 180 456 4.6% 14,07630.3%9,818161 87 8,804 558 4,258
110Minnesota State University Moorhead 70 312 4.9% 7,69517.8%6,32658 74 5,822 192 1,36988St. Cloud State University 252 639 4.8% 16,13316.9%13,410207 92 11,872 899 2,7238Southwest Minnesota State University 30 114 6.7% 5,75870.6%1,69256 20 1,420 158 4,066
23Winona State University 100 232 4.2% 8,24933.5%5,48847 62 4,965 291 2,761Subtotal: Universities 455 1,048 44,1863,015 6.8% 63,68630.6%1,066 446 38,526 2,645 19,500
1.0%Percent of Known 2.4% 2.4% 1.0% 6.8% 87.2% 6.0% 100.0%
Institution Location1,486Greater Minnesota 1,257 5,396 6.2% 111,08921.2%87,5671,697 956 79,599 2,572 23,522
563Twin Cities Metropolitan Area 3,500 11,484 20.9% 66,00516.9%54,8256,376 1,045 42,240 1,101 11,180Total: Colleges and Universities 2,049 4,757 142,39216,880 11.9% 177,09419.6%8,073 2,001 121,839 3,673 34,702
1.4%Percent of Known 3.3% 5.7% 1.4% 11.9% 85.6% 2.6% 100.0%
Source: Office of the Chancellor Research and PlanningR:\Factbooks\System Factbook\Fall Term.mdb Fall CR byRace/Ethnicity 10/21/2004
Table II-36: Page 1 of 138
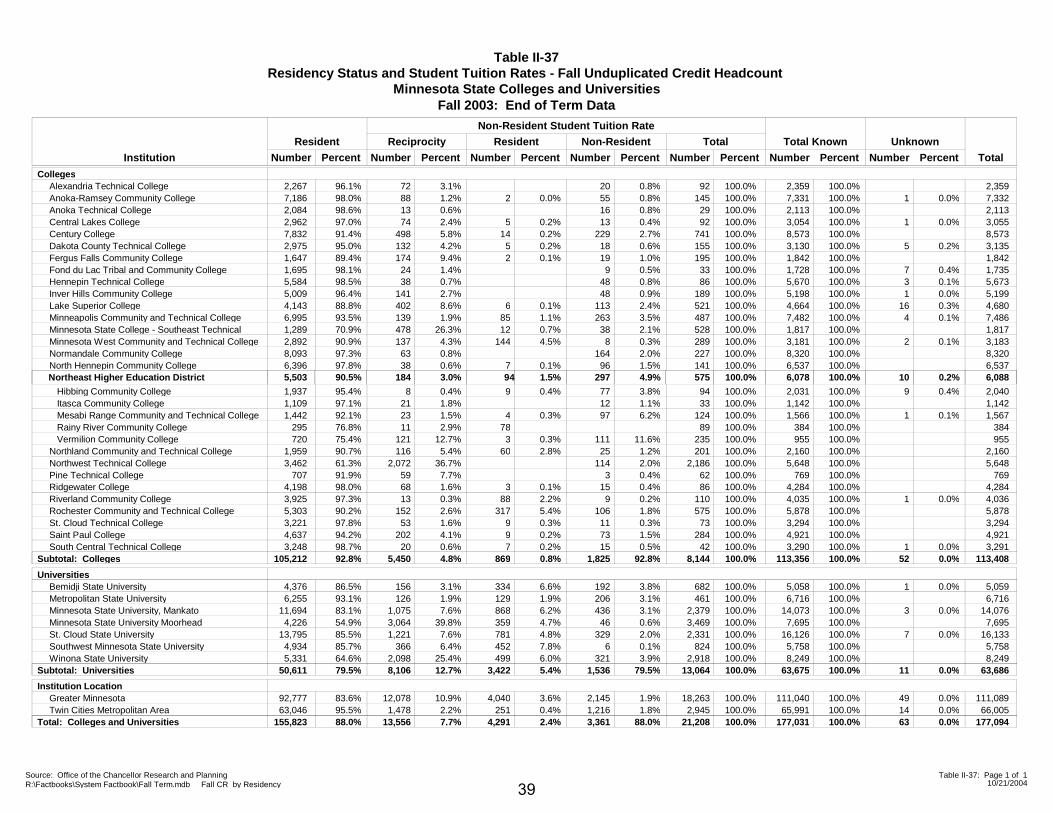
Table II-37Residency Status and Student Tuition Rates - Fall Unduplicated Credit Headcount
Minnesota State Colleges and UniversitiesFall 2003: End of Term Data
Institution TotalNumber Percent
Resident
Number Percent
Non-Resident Student Tuition Rate
Reciprocity
Number Percent
Resident
Number Percent
Non-Resident
Number Percent
Total
Number Percent
Total Known
Number Percent
Unknown
Colleges2,267Alexandria Technical College 2,35996.1% 72 3.1% 20 0.8% 92 100.0% 2,359 100.0%7,186Anoka-Ramsey Community College 7,33298.0% 88 1.2% 2 0.0% 55 0.8% 145 100.0% 7,331 100.0% 0.0%12,084Anoka Technical College 2,11398.6% 13 0.6% 16 0.8% 29 100.0% 2,113 100.0%2,962Central Lakes College 3,05597.0% 74 2.4% 5 0.2% 13 0.4% 92 100.0% 3,054 100.0% 0.0%17,832Century College 8,57391.4% 498 5.8% 14 0.2% 229 2.7% 741 100.0% 8,573 100.0%2,975Dakota County Technical College 3,13595.0% 132 4.2% 5 0.2% 18 0.6% 155 100.0% 3,130 100.0% 0.2%51,647Fergus Falls Community College 1,84289.4% 174 9.4% 2 0.1% 19 1.0% 195 100.0% 1,842 100.0%1,695Fond du Lac Tribal and Community College 1,73598.1% 24 1.4% 9 0.5% 33 100.0% 1,728 100.0% 0.4%75,584Hennepin Technical College 5,67398.5% 38 0.7% 48 0.8% 86 100.0% 5,670 100.0% 0.1%35,009Inver Hills Community College 5,19996.4% 141 2.7% 48 0.9% 189 100.0% 5,198 100.0% 0.0%14,143Lake Superior College 4,68088.8% 402 8.6% 6 0.1% 113 2.4% 521 100.0% 4,664 100.0% 0.3%166,995Minneapolis Community and Technical College 7,48693.5% 139 1.9% 85 1.1% 263 3.5% 487 100.0% 7,482 100.0% 0.1%41,289Minnesota State College - Southeast Technical 1,81770.9% 478 26.3% 12 0.7% 38 2.1% 528 100.0% 1,817 100.0%2,892Minnesota West Community and Technical College 3,18390.9% 137 4.3% 144 4.5% 8 0.3% 289 100.0% 3,181 100.0% 0.1%28,093Normandale Community College 8,32097.3% 63 0.8% 164 2.0% 227 100.0% 8,320 100.0%6,396North Hennepin Community College 6,53797.8% 38 0.6% 7 0.1% 96 1.5% 141 100.0% 6,537 100.0%
Northeast Higher Education District
1,937 Hibbing Community College
5,503 90.5%
2,040
6,088
95.4% 8
184 3.0%
0.4% 9
94 1.5%
0.4% 77
297 4.9%
3.8% 94 100.0%
575 100.0%
2,031 100.0%
6,078 100.0%
0.4%
10 0.2%
91,109 Itasca Community College 1,14297.1% 21 1.8% 12 1.1% 33 100.0% 1,142 100.0%1,442 Mesabi Range Community and Technical College 1,56792.1% 23 1.5% 4 0.3% 97 6.2% 124 100.0% 1,566 100.0% 0.1%1
295 Rainy River Community College 38476.8% 11 2.9% 78 89 100.0% 384 100.0%720 Vermilion Community College 95575.4% 121 12.7% 3 0.3% 111 11.6% 235 100.0% 955 100.0%
1,959Northland Community and Technical College 2,16090.7% 116 5.4% 60 2.8% 25 1.2% 201 100.0% 2,160 100.0%3,462Northwest Technical College 5,64861.3% 2,072 36.7% 114 2.0% 2,186 100.0% 5,648 100.0%
707Pine Technical College 76991.9% 59 7.7% 3 0.4% 62 100.0% 769 100.0%4,198Ridgewater College 4,28498.0% 68 1.6% 3 0.1% 15 0.4% 86 100.0% 4,284 100.0%3,925Riverland Community College 4,03697.3% 13 0.3% 88 2.2% 9 0.2% 110 100.0% 4,035 100.0% 0.0%15,303Rochester Community and Technical College 5,87890.2% 152 2.6% 317 5.4% 106 1.8% 575 100.0% 5,878 100.0%3,221St. Cloud Technical College 3,29497.8% 53 1.6% 9 0.3% 11 0.3% 73 100.0% 3,294 100.0%4,637Saint Paul College 4,92194.2% 202 4.1% 9 0.2% 73 1.5% 284 100.0% 4,921 100.0%3,248South Central Technical College 3,29198.7% 20 0.6% 7 0.2% 15 0.5% 42 100.0% 3,290 100.0% 0.0%1
Subtotal: Colleges 105,212 92.8% 113,4085,450 4.8% 869 0.8% 1,825 92.8% 8,144 100.0% 113,356 100.0% 52 0.0%
Universities4,376Bemidji State University 5,05986.5% 156 3.1% 334 6.6% 192 3.8% 682 100.0% 5,058 100.0% 0.0%16,255Metropolitan State University 6,71693.1% 126 1.9% 129 1.9% 206 3.1% 461 100.0% 6,716 100.0%
11,694Minnesota State University, Mankato 14,07683.1% 1,075 7.6% 868 6.2% 436 3.1% 2,379 100.0% 14,073 100.0% 0.0%34,226Minnesota State University Moorhead 7,69554.9% 3,064 39.8% 359 4.7% 46 0.6% 3,469 100.0% 7,695 100.0%
13,795St. Cloud State University 16,13385.5% 1,221 7.6% 781 4.8% 329 2.0% 2,331 100.0% 16,126 100.0% 0.0%74,934Southwest Minnesota State University 5,75885.7% 366 6.4% 452 7.8% 6 0.1% 824 100.0% 5,758 100.0%5,331Winona State University 8,24964.6% 2,098 25.4% 499 6.0% 321 3.9% 2,918 100.0% 8,249 100.0%
Subtotal: Universities 50,611 79.5% 63,6868,106 12.7% 3,422 5.4% 1,536 79.5% 13,064 100.0% 63,675 100.0% 11 0.0%
Institution Location92,777Greater Minnesota 111,08983.6% 12,078 10.9% 4,040 3.6% 2,145 1.9% 18,263 100.0% 111,040 100.0% 0.0%4963,046Twin Cities Metropolitan Area 66,00595.5% 1,478 2.2% 251 0.4% 1,216 1.8% 2,945 100.0% 65,991 100.0% 0.0%14
Total: Colleges and Universities 155,823 88.0% 177,09413,556 7.7% 4,291 2.4% 3,361 88.0% 21,208 100.0% 177,031 100.0% 63 0.0%
Source: Office of the Chancellor Research and PlanningR:\Factbooks\System Factbook\Fall Term.mdb Fall CR by Residency 10/21/2004
Table II-37: Page 1 of 1
39
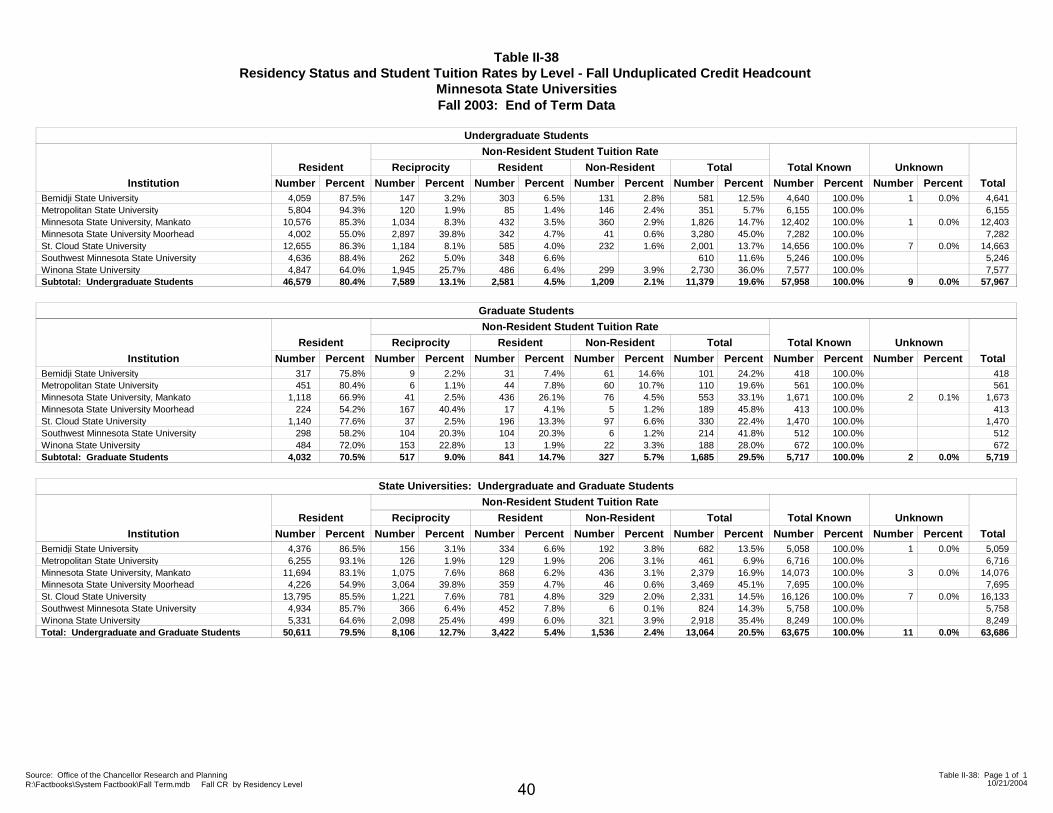
Table II-38Residency Status and Student Tuition Rates by Level - Fall Unduplicated Credit Headcount
Minnesota State UniversitiesFall 2003: End of Term Data
InstitutionTotal Known
Number PercentResident
Number Percent
Non-Resident Student Tuition Rate
UnknownNumber Percent
ReciprocityNumber Percent
ResidentNumber Percent
Non-ResidentNumber Percent
TotalTotalPercentNumber
Undergraduate Students
4,059 4,64187.5% 147 3.2% 1 0.0%4,640303 6.5% 131 2.8% 581 12.5% 100.0%Bemidji State University5,804 6,15594.3% 120 1.9% 6,15585 1.4% 146 2.4% 351 5.7% 100.0%Metropolitan State University
10,576 12,40385.3% 1,034 8.3% 1 0.0%12,402432 3.5% 360 2.9% 1,826 14.7% 100.0%Minnesota State University, Mankato4,002 7,28255.0% 2,897 39.8% 7,282342 4.7% 41 0.6% 3,280 45.0% 100.0%Minnesota State University Moorhead
12,655 14,66386.3% 1,184 8.1% 7 0.0%14,656585 4.0% 232 1.6% 2,001 13.7% 100.0%St. Cloud State University4,636 5,24688.4% 262 5.0% 5,246348 6.6% 610 11.6% 100.0%Southwest Minnesota State University4,847 7,57764.0% 1,945 25.7% 7,577486 6.4% 299 3.9% 2,730 36.0% 100.0%Winona State University
Subtotal: Undergraduate Students 46,579 80.4% 57,9677,589 13.1% 9 0.0%57,9582,581 4.5% 1,209 2.1% 11,379 19.6% 100.0%
Institution
Total Known
Number Percent
Resident
Number Percent
Non-Resident Student Tuition Rate
Unknown
Number Percent
Reciprocity
Number Percent
Resident
Number Percent
Non-Resident
Number Percent
Total
TotalPercentNumber
Graduate Students
317 41875.8% 9 2.2% 41831 7.4% 61 14.6% 101 24.2% 100.0%Bemidji State University451 56180.4% 6 1.1% 56144 7.8% 60 10.7% 110 19.6% 100.0%Metropolitan State University
1,118 1,67366.9% 41 2.5% 2 0.1%1,671436 26.1% 76 4.5% 553 33.1% 100.0%Minnesota State University, Mankato224 41354.2% 167 40.4% 41317 4.1% 5 1.2% 189 45.8% 100.0%Minnesota State University Moorhead
1,140 1,47077.6% 37 2.5% 1,470196 13.3% 97 6.6% 330 22.4% 100.0%St. Cloud State University298 51258.2% 104 20.3% 512104 20.3% 6 1.2% 214 41.8% 100.0%Southwest Minnesota State University484 67272.0% 153 22.8% 67213 1.9% 22 3.3% 188 28.0% 100.0%Winona State University
Subtotal: Graduate Students 4,032 70.5% 5,719517 9.0% 2 0.0%5,717841 14.7% 327 5.7% 1,685 29.5% 100.0%
Institution
Total Known
Number Percent
Resident
Number Percent
Non-Resident Student Tuition Rate
Unknown
Number Percent
Reciprocity
Number Percent
Resident
Number Percent
Non-Resident
Number Percent
Total
TotalPercentNumber
State Universities: Undergraduate and Graduate Students
4,376 5,05986.5% 156 3.1% 1 0.0%5,058334 6.6% 192 3.8% 682 13.5% 100.0%Bemidji State University6,255 6,71693.1% 126 1.9% 6,716129 1.9% 206 3.1% 461 6.9% 100.0%Metropolitan State University
11,694 14,07683.1% 1,075 7.6% 3 0.0%14,073868 6.2% 436 3.1% 2,379 16.9% 100.0%Minnesota State University, Mankato4,226 7,69554.9% 3,064 39.8% 7,695359 4.7% 46 0.6% 3,469 45.1% 100.0%Minnesota State University Moorhead
13,795 16,13385.5% 1,221 7.6% 7 0.0%16,126781 4.8% 329 2.0% 2,331 14.5% 100.0%St. Cloud State University4,934 5,75885.7% 366 6.4% 5,758452 7.8% 6 0.1% 824 14.3% 100.0%Southwest Minnesota State University5,331 8,24964.6% 2,098 25.4% 8,249499 6.0% 321 3.9% 2,918 35.4% 100.0%Winona State University
Total: Undergraduate and Graduate Students 50,611 79.5% 63,6868,106 12.7% 11 0.0%63,6753,422 5.4% 1,536 2.4% 13,064 20.5% 100.0%
Source: Office of the Chancellor Research and PlanningR:\Factbooks\System Factbook\Fall Term.mdb Fall CR by Residency Level 10/21/2004
Table II-38: Page 1 of 1
40
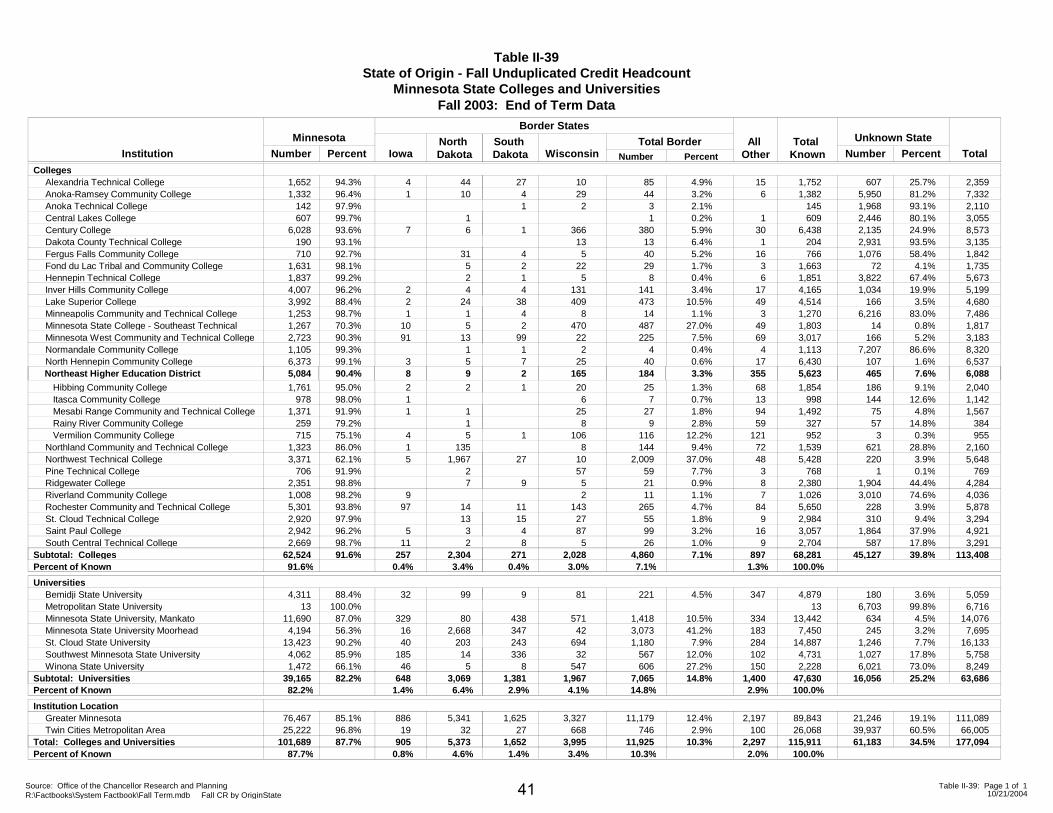
Table II-39State of Origin - Fall Unduplicated Credit Headcount
Minnesota State Colleges and Universities
Minnesota
Iowa PercentInstitution
Fall 2003: End of Term Data
TotalWisconsinNorth Dakota
South Dakota
All Other
Total Known Number Percent
Unknown State
Number Percent Number
Border States
Total Border
Colleges1,652Alexandria Technical College 4 10 4.9% 2,35994.3% 44 27 15 1,752 607 25.7%851,332Anoka-Ramsey Community College 1 29 3.2% 7,33296.4% 10 4 6 1,382 5,950 81.2%44
142Anoka Technical College 2 2.1% 2,11097.9% 1 145 1,968 93.1%3607Central Lakes College 0.2% 3,05599.7% 1 1 609 2,446 80.1%1
6,028Century College 7 366 5.9% 8,57393.6% 6 1 30 6,438 2,135 24.9%380190Dakota County Technical College 13 6.4% 3,13593.1% 1 204 2,931 93.5%13710Fergus Falls Community College 5 5.2% 1,84292.7% 31 4 16 766 1,076 58.4%40
1,631Fond du Lac Tribal and Community College 22 1.7% 1,73598.1% 5 2 3 1,663 72 4.1%291,837Hennepin Technical College 5 0.4% 5,67399.2% 2 1 6 1,851 3,822 67.4%84,007Inver Hills Community College 2 131 3.4% 5,19996.2% 4 4 17 4,165 1,034 19.9%1413,992Lake Superior College 2 409 10.5% 4,68088.4% 24 38 49 4,514 166 3.5%4731,253Minneapolis Community and Technical College 1 8 1.1% 7,48698.7% 1 4 3 1,270 6,216 83.0%141,267Minnesota State College - Southeast Technical 10 470 27.0% 1,81770.3% 5 2 49 1,803 14 0.8%4872,723Minnesota West Community and Technical College 91 22 7.5% 3,18390.3% 13 99 69 3,017 166 5.2%2251,105Normandale Community College 2 0.4% 8,32099.3% 1 1 4 1,113 7,207 86.6%46,373North Hennepin Community College 3 25 0.6% 6,53799.1% 5 7 17 6,430 107 1.6%40
Northeast Higher Education District
1,761 Hibbing Community College 2
5,084 890.4%
20
165
1.3%
3.3%
2,040
6,088
95.0% 2
9
1
2
68
355
1,854
5,623
186
465
9.1%
7.6%
25
184
978 Itasca Community College 1 6 0.7% 1,14298.0% 13 998 144 12.6%71,371 Mesabi Range Community and Technical College 1 25 1.8% 1,56791.9% 1 94 1,492 75 4.8%27
259 Rainy River Community College 8 2.8% 38479.2% 1 59 327 57 14.8%9715 Vermilion Community College 4 106 12.2% 95575.1% 5 1 121 952 3 0.3%116
1,323Northland Community and Technical College 1 8 9.4% 2,16086.0% 135 72 1,539 621 28.8%1443,371Northwest Technical College 5 10 37.0% 5,64862.1% 1,967 27 48 5,428 220 3.9%2,009
706Pine Technical College 57 7.7% 76991.9% 2 3 768 1 0.1%592,351Ridgewater College 5 0.9% 4,28498.8% 7 9 8 2,380 1,904 44.4%211,008Riverland Community College 9 2 1.1% 4,03698.2% 7 1,026 3,010 74.6%115,301Rochester Community and Technical College 97 143 4.7% 5,87893.8% 14 11 84 5,650 228 3.9%2652,920St. Cloud Technical College 27 1.8% 3,29497.9% 13 15 9 2,984 310 9.4%552,942Saint Paul College 5 87 3.2% 4,92196.2% 3 4 16 3,057 1,864 37.9%992,669South Central Technical College 11 5 1.0% 3,29198.7% 2 8 9 2,704 587 17.8%26
Subtotal: Colleges 62,524 25791.6% 2,028 7.1% 113,4082,304 271 897 68,281 45,12791.6%Percent of Known 0.4% 3.4% 0.4% 3.0% 1.3% 100.0%
39.8%4,8607.1%
Universities4,311Bemidji State University 32 81 4.5% 5,05988.4% 99 9 347 4,879 180 3.6%221
13Metropolitan State University 6,716100.0% 13 6,703 99.8%11,690Minnesota State University, Mankato 329 571 10.5% 14,07687.0% 80 438 334 13,442 634 4.5%1,4184,194Minnesota State University Moorhead 16 42 41.2% 7,69556.3% 2,668 347 183 7,450 245 3.2%3,073
13,423St. Cloud State University 40 694 7.9% 16,13390.2% 203 243 284 14,887 1,246 7.7%1,1804,062Southwest Minnesota State University 185 32 12.0% 5,75885.9% 14 336 102 4,731 1,027 17.8%5671,472Winona State University 46 547 27.2% 8,24966.1% 5 8 150 2,228 6,021 73.0%606
Subtotal: Universities 39,165 64882.2% 1,967 14.8% 63,6863,069 1,381 1,400 47,630 16,05682.2%Percent of Known 1.4% 6.4% 2.9% 4.1% 2.9% 100.0%
25.2%7,06514.8%
Institution Location76,467Greater Minnesota 886 3,327 12.4% 111,08985.1% 5,341 1,625 2,197 89,843 21,246 19.1%11,17925,222Twin Cities Metropolitan Area 19 668 2.9% 66,00596.8% 32 27 100 26,068 39,937 60.5%746
Total: Colleges and Universities 101,689 90587.7% 3,995 10.3% 177,0945,373 1,652 2,297 115,911 61,18387.7%Percent of Known 0.8% 4.6% 1.4% 3.4% 2.0% 100.0%
34.5%11,92510.3%
Source: Office of the Chancellor Research and PlanningR:\Factbooks\System Factbook\Fall Term.mdb Fall CR by OriginState 10/21/2004
Table II-39: Page 1 of 141
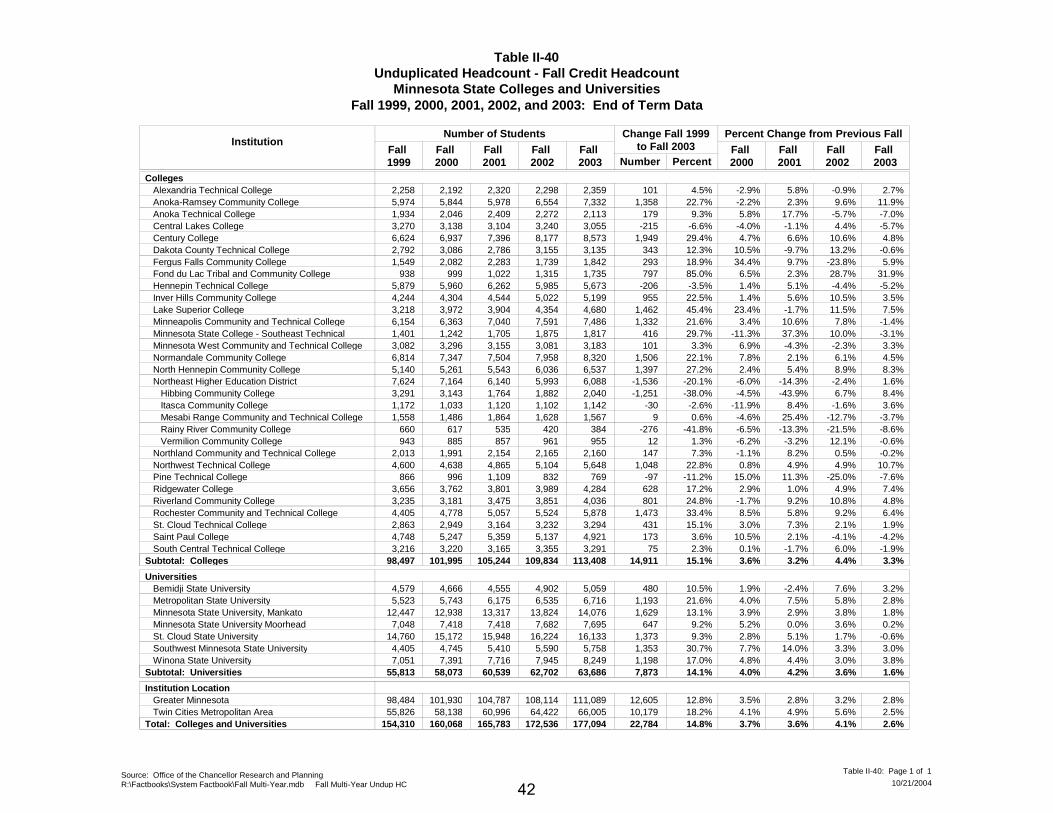
Table II-40Unduplicated Headcount - Fall Credit Headcount
Minnesota State Colleges and UniversitiesFall 1999, 2000, 2001, 2002, and 2003: End of Term Data
InstitutionPercent Change from Previous Fall
Fall 1999
Fall 2000
Fall 2001
Fall 2002
Fall 2003
Number of Students Change Fall 1999to Fall 2003
Number PercentFall 2000
Fall 2001
Fall 2002
Fall 2003
CollegesAlexandria Technical College 2,258 2,192 2,320 2,298 2,359 101 4.5% -2.9% 5.8% -0.9% 2.7%Anoka-Ramsey Community College 5,974 5,844 5,978 6,554 7,332 1,358 22.7% -2.2% 2.3% 9.6% 11.9%Anoka Technical College 1,934 2,046 2,409 2,272 2,113 179 9.3% 5.8% 17.7% -5.7% -7.0%Central Lakes College 3,270 3,138 3,104 3,240 3,055 -215 -6.6% -4.0% -1.1% 4.4% -5.7%Century College 6,624 6,937 7,396 8,177 8,573 1,949 29.4% 4.7% 6.6% 10.6% 4.8%Dakota County Technical College 2,792 3,086 2,786 3,155 3,135 343 12.3% 10.5% -9.7% 13.2% -0.6%Fergus Falls Community College 1,549 2,082 2,283 1,739 1,842 293 18.9% 34.4% 9.7% -23.8% 5.9%Fond du Lac Tribal and Community College 938 999 1,022 1,315 1,735 797 85.0% 6.5% 2.3% 28.7% 31.9%Hennepin Technical College 5,879 5,960 6,262 5,985 5,673 -206 -3.5% 1.4% 5.1% -4.4% -5.2%Inver Hills Community College 4,244 4,304 4,544 5,022 5,199 955 22.5% 1.4% 5.6% 10.5% 3.5%Lake Superior College 3,218 3,972 3,904 4,354 4,680 1,462 45.4% 23.4% -1.7% 11.5% 7.5%Minneapolis Community and Technical College 6,154 6,363 7,040 7,591 7,486 1,332 21.6% 3.4% 10.6% 7.8% -1.4%Minnesota State College - Southeast Technical 1,401 1,242 1,705 1,875 1,817 416 29.7% -11.3% 37.3% 10.0% -3.1%Minnesota West Community and Technical College 3,082 3,296 3,155 3,081 3,183 101 3.3% 6.9% -4.3% -2.3% 3.3%Normandale Community College 6,814 7,347 7,504 7,958 8,320 1,506 22.1% 7.8% 2.1% 6.1% 4.5%North Hennepin Community College 5,140 5,261 5,543 6,036 6,537 1,397 27.2% 2.4% 5.4% 8.9% 8.3%Northeast Higher Education District 7,624 7,164 6,140 5,993 6,088 -1,536 -20.1% -6.0% -14.3% -2.4% 1.6% Hibbing Community College 3,291 3,143 1,764 1,882 2,040 -1,251 -38.0% -4.5% -43.9% 6.7% 8.4% Itasca Community College 1,172 1,033 1,120 1,102 1,142 -30 -2.6% -11.9% 8.4% -1.6% 3.6% Mesabi Range Community and Technical College 1,558 1,486 1,864 1,628 1,567 9 0.6% -4.6% 25.4% -12.7% -3.7% Rainy River Community College 660 617 535 420 384 -276 -41.8% -6.5% -13.3% -21.5% -8.6% Vermilion Community College 943 885 857 961 955 12 1.3% -6.2% -3.2% 12.1% -0.6%Northland Community and Technical College 2,013 1,991 2,154 2,165 2,160 147 7.3% -1.1% 8.2% 0.5% -0.2%Northwest Technical College 4,600 4,638 4,865 5,104 5,648 1,048 22.8% 0.8% 4.9% 4.9% 10.7%Pine Technical College 866 996 1,109 832 769 -97 -11.2% 15.0% 11.3% -25.0% -7.6%Ridgewater College 3,656 3,762 3,801 3,989 4,284 628 17.2% 2.9% 1.0% 4.9% 7.4%Riverland Community College 3,235 3,181 3,475 3,851 4,036 801 24.8% -1.7% 9.2% 10.8% 4.8%Rochester Community and Technical College 4,405 4,778 5,057 5,524 5,878 1,473 33.4% 8.5% 5.8% 9.2% 6.4%St. Cloud Technical College 2,863 2,949 3,164 3,232 3,294 431 15.1% 3.0% 7.3% 2.1% 1.9%Saint Paul College 4,748 5,247 5,359 5,137 4,921 173 3.6% 10.5% 2.1% -4.1% -4.2%South Central Technical College 3,216 3,220 3,165 3,355 3,291 75 2.3% 0.1% -1.7% 6.0% -1.9%
Subtotal: Colleges 98,497 101,995 105,244 109,834 113,408 14,911 15.1% 3.6% 3.2% 4.4% 3.3%
UniversitiesBemidji State University 4,579 4,666 4,555 4,902 5,059 480 10.5% 1.9% -2.4% 7.6% 3.2%Metropolitan State University 5,523 5,743 6,175 6,535 6,716 1,193 21.6% 4.0% 7.5% 5.8% 2.8%Minnesota State University, Mankato 12,447 12,938 13,317 13,824 14,076 1,629 13.1% 3.9% 2.9% 3.8% 1.8%Minnesota State University Moorhead 7,048 7,418 7,418 7,682 7,695 647 9.2% 5.2% 0.0% 3.6% 0.2%St. Cloud State University 14,760 15,172 15,948 16,224 16,133 1,373 9.3% 2.8% 5.1% 1.7% -0.6%Southwest Minnesota State University 4,405 4,745 5,410 5,590 5,758 1,353 30.7% 7.7% 14.0% 3.3% 3.0%Winona State University 7,051 7,391 7,716 7,945 8,249 1,198 17.0% 4.8% 4.4% 3.0% 3.8%
Subtotal: Universities 55,813 58,073 60,539 62,702 63,686 7,873 14.1% 4.0% 4.2% 3.6% 1.6%
Institution LocationGreater Minnesota 98,484 101,930 104,787 108,114 111,089 12,605 12.8% 3.5% 2.8% 3.2% 2.8%Twin Cities Metropolitan Area 55,826 58,138 60,996 64,422 66,005 10,179 18.2% 4.1% 4.9% 5.6% 2.5%
Total: Colleges and Universities 154,310 160,068 165,783 172,536 177,094 22,784 14.8% 3.7% 3.6% 4.1% 2.6%
Source: Office of the Chancellor Research and PlanningR:\Factbooks\System Factbook\Fall Multi-Year.mdb Fall Multi-Year Undup HC 10/21/2004
Table II-40: Page 1 of 1
42
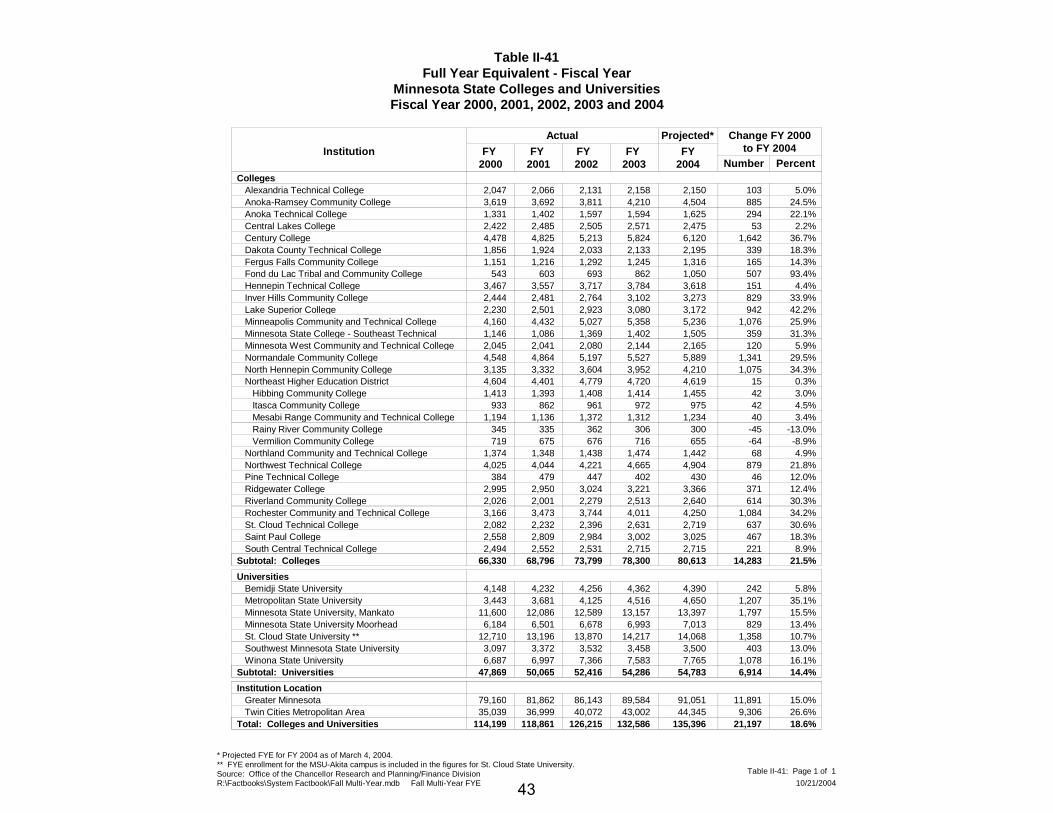
Table II-41Full Year Equivalent - Fiscal Year
Minnesota State Colleges and UniversitiesFiscal Year 2000, 2001, 2002, 2003 and 2004
Institution FY 2000
FY 2001
FY 2002
FY 2003
FY2004
Actual Projected* Change FY 2000to FY 2004
Number PercentColleges
Alexandria Technical College 2,047 2,066 2,131 2,158 2,150 103 5.0%Anoka-Ramsey Community College 3,619 3,692 3,811 4,210 4,504 885 24.5%Anoka Technical College 1,331 1,402 1,597 1,594 1,625 294 22.1%Central Lakes College 2,422 2,485 2,505 2,571 2,475 53 2.2%Century College 4,478 4,825 5,213 5,824 6,120 1,642 36.7%Dakota County Technical College 1,856 1,924 2,033 2,133 2,195 339 18.3%Fergus Falls Community College 1,151 1,216 1,292 1,245 1,316 165 14.3%Fond du Lac Tribal and Community College 543 603 693 862 1,050 507 93.4%Hennepin Technical College 3,467 3,557 3,717 3,784 3,618 151 4.4%Inver Hills Community College 2,444 2,481 2,764 3,102 3,273 829 33.9%Lake Superior College 2,230 2,501 2,923 3,080 3,172 942 42.2%Minneapolis Community and Technical College 4,160 4,432 5,027 5,358 5,236 1,076 25.9%Minnesota State College - Southeast Technical 1,146 1,086 1,369 1,402 1,505 359 31.3%Minnesota West Community and Technical College 2,045 2,041 2,080 2,144 2,165 120 5.9%Normandale Community College 4,548 4,864 5,197 5,527 5,889 1,341 29.5%North Hennepin Community College 3,135 3,332 3,604 3,952 4,210 1,075 34.3%Northeast Higher Education District 4,604 4,401 4,779 4,720 4,619 15 0.3% Hibbing Community College 1,413 1,393 1,408 1,414 1,455 42 3.0% Itasca Community College 933 862 961 972 975 42 4.5% Mesabi Range Community and Technical College 1,194 1,136 1,372 1,312 1,234 40 3.4% Rainy River Community College 345 335 362 306 300 -45 -13.0% Vermilion Community College 719 675 676 716 655 -64 -8.9%Northland Community and Technical College 1,374 1,348 1,438 1,474 1,442 68 4.9%Northwest Technical College 4,025 4,044 4,221 4,665 4,904 879 21.8%Pine Technical College 384 479 447 402 430 46 12.0%Ridgewater College 2,995 2,950 3,024 3,221 3,366 371 12.4%Riverland Community College 2,026 2,001 2,279 2,513 2,640 614 30.3%Rochester Community and Technical College 3,166 3,473 3,744 4,011 4,250 1,084 34.2%St. Cloud Technical College 2,082 2,232 2,396 2,631 2,719 637 30.6%Saint Paul College 2,558 2,809 2,984 3,002 3,025 467 18.3%South Central Technical College 2,494 2,552 2,531 2,715 2,715 221 8.9%
Subtotal: Colleges 66,330 68,796 73,799 78,300 80,613 14,283 21.5%
UniversitiesBemidji State University 4,148 4,232 4,256 4,362 4,390 242 5.8%Metropolitan State University 3,443 3,681 4,125 4,516 4,650 1,207 35.1%Minnesota State University, Mankato 11,600 12,086 12,589 13,157 13,397 1,797 15.5%Minnesota State University Moorhead 6,184 6,501 6,678 6,993 7,013 829 13.4%St. Cloud State University ** 12,710 13,196 13,870 14,217 14,068 1,358 10.7%Southwest Minnesota State University 3,097 3,372 3,532 3,458 3,500 403 13.0%Winona State University 6,687 6,997 7,366 7,583 7,765 1,078 16.1%
Subtotal: Universities 47,869 50,065 52,416 54,286 54,783 6,914 14.4%
Institution LocationGreater Minnesota 79,160 81,862 86,143 89,584 91,051 11,891 15.0%Twin Cities Metropolitan Area 35,039 36,999 40,072 43,002 44,345 9,306 26.6%
Total: Colleges and Universities 114,199 118,861 126,215 132,586 135,396 21,197 18.6%
* Projected FYE for FY 2004 as of March 4, 2004.** FYE enrollment for the MSU-Akita campus is included in the figures for St. Cloud State University.Source: Office of the Chancellor Research and Planning/Finance DivisionR:\Factbooks\System Factbook\Fall Multi-Year.mdb Fall Multi-Year FYE 10/21/2004
Table II-41: Page 1 of 1
43

This Page is Intentionally Left Blank
44

Table II-42Full-Time/Part-Time Students - Fall Credit Headcount
Minnesota State Colleges and UniversitiesFall 1999, 2000, 2001, 2002, and 2003: End of Term Data
InstitutionPercent of Total
Full-Time Students
Fall 1999
Fall 2000
Fall 2001
Fall 2002
Fall 2003
Number of Students Change Fall 1999to Fall 2003
Number PercentFall 1999
Fall 2000
Fall 2001
Fall 2002
Fall 2003
Change Fall 1999 to
Fall 2003
CollegesAlexandria Technical College 1,593 1,565 1,620 1,604 1,626 70.5% 71.4% 69.8% 69.8% 68.9%33 2.1% -1.6%Anoka-Ramsey Community College 2,416 2,506 2,542 2,812 2,986 40.4% 42.9% 42.5% 42.9% 40.7%570 23.6% 0.3%Anoka Technical College 815 847 970 989 1,065 42.1% 41.4% 40.3% 43.5% 50.4%250 30.7% 8.3%Central Lakes College 1,874 1,973 2,019 2,083 1,960 57.3% 62.9% 65.0% 64.3% 64.2%86 4.6% 6.8%Century College 2,803 3,089 3,308 3,830 4,052 42.3% 44.5% 44.7% 46.8% 47.3%1,249 44.6% 4.9%Dakota County Technical College 1,164 1,237 1,257 1,332 1,484 41.7% 40.1% 45.1% 42.2% 47.3%320 27.5% 5.6%Fergus Falls Community College 777 848 874 937 1,024 50.2% 40.7% 38.3% 53.9% 55.6%247 31.8% 5.4%Fond du Lac Tribal and Community College 390 436 497 564 723 41.6% 43.6% 48.6% 42.9% 41.7%333 85.4% 0.1%Hennepin Technical College 1,749 1,794 1,838 2,056 2,090 29.7% 30.1% 29.4% 34.4% 36.8%341 19.5% 7.1%Inver Hills Community College 1,436 1,551 1,669 1,906 2,117 33.8% 36.0% 36.7% 38.0% 40.7%681 47.4% 6.9%Lake Superior College 1,571 1,774 1,965 2,114 2,323 48.8% 44.7% 50.3% 48.6% 49.6%752 47.9% 0.8%Minneapolis Community and Technical College 2,382 2,591 2,952 3,240 3,189 38.7% 40.7% 41.9% 42.7% 42.6%807 33.9% 3.9%Minnesota State College - Southeast Technical 818 777 910 985 1,060 58.4% 62.6% 53.4% 52.5% 58.3%242 29.6% 0.0%Minnesota West Community and Technical College 1,288 1,330 1,393 1,374 1,459 41.8% 40.4% 44.2% 44.6% 45.8%171 13.3% 4.0%Normandale Community College 3,018 3,266 3,475 3,753 3,949 44.3% 44.5% 46.3% 47.2% 47.5%931 30.8% 3.2%North Hennepin Community College 1,951 2,003 2,150 2,363 2,442 38.0% 38.1% 38.8% 39.1% 37.4%491 25.2% -0.6%
Hibbing Community College 1,028 1,073 1,093 1,110 1,158 31.2% 34.1% 62.0% 59.0% 56.8%130 12.6% 25.5%
Northeast Higher Education District
Itasca Community College 808 747 814 851 828 68.9% 72.3% 72.7% 77.2% 72.5%20 2.5% 3.6% Mesabi Range Community and Technical College 973 922 1,057 993 987 62.5% 62.0% 56.7% 61.0% 63.0%14 1.4% 0.5% Rainy River Community College 263 272 311 246 263 39.8% 44.1% 58.1% 58.6% 68.5%0 0.0% 28.6% Vermilion Community College 662 610 590 621 544 70.2% 68.9% 68.8% 64.6% 57.0%-118 -17.8% -13.2%Northland Community and Technical College 873 822 915 984 1,000 43.4% 41.3% 42.5% 45.5% 46.3%127 14.5% 2.9%Northwest Technical College 3,361 3,317 3,490 3,733 4,025 73.1% 71.5% 71.7% 73.1% 71.3%664 19.8% -1.8%Pine Technical College 201 191 218 210 259 23.2% 19.2% 19.7% 25.2% 33.7%58 28.9% 10.5%Ridgewater College 2,122 2,180 2,280 2,443 2,627 58.0% 57.9% 60.0% 61.2% 61.3%505 23.8% 3.3%Riverland Community College 1,303 1,241 1,446 1,617 1,757 40.3% 39.0% 41.6% 42.0% 43.5%454 34.8% 3.3%Rochester Community and Technical College 2,378 2,655 2,838 3,048 3,271 54.0% 55.6% 56.1% 55.2% 55.6%893 37.6% 1.7%St. Cloud Technical College 1,669 1,796 1,903 2,099 2,158 58.3% 60.9% 60.1% 64.9% 65.5%489 29.3% 7.2%Saint Paul College 1,190 1,243 1,366 1,495 1,542 25.1% 23.7% 25.5% 29.1% 31.3%352 29.6% 6.3%South Central Technical College 1,577 1,663 1,629 1,772 1,768 49.0% 51.6% 51.5% 52.8% 53.7%191 12.1% 4.7%
Subtotal: Colleges 44,453 46,319 49,389 53,164 55,736 45.1% 45.4% 46.9% 48.4% 49.1%11,283 25.4% 4.0%Universities
Bemidji State University 3,264 3,305 3,467 3,494 3,499 71.3% 70.8% 76.1% 71.3% 69.2%235 7.2% -2.1%Metropolitan State University 1,332 1,546 1,740 2,065 2,228 24.1% 26.9% 28.2% 31.6% 33.2%896 67.3% 9.1%Minnesota State University, Mankato 9,719 10,274 10,889 11,487 11,888 78.1% 79.4% 81.8% 83.1% 84.5%2,169 22.3% 6.4%Minnesota State University Moorhead 5,382 5,732 5,898 6,321 6,388 76.4% 77.3% 79.5% 82.3% 83.0%1,006 18.7% 6.7%St. Cloud State University 10,987 11,425 12,300 12,416 12,463 74.4% 75.3% 77.1% 76.5% 77.3%1,476 13.4% 2.8%Southwest Minnesota State University 2,530 2,775 2,798 2,652 2,672 57.4% 58.5% 51.7% 47.4% 46.4%142 5.6% -11.0%Winona State University 5,636 6,057 6,373 6,625 6,949 79.9% 82.0% 82.6% 83.4% 84.2%1,313 23.3% 4.3%
Subtotal: Universities 38,850 41,114 43,465 45,060 46,087 69.6% 70.8% 71.8% 71.9% 72.4%7,237 18.6% 2.8%Institution Location
Greater Minnesota 63,047 65,760 69,587 72,383 74,679 64.0% 64.5% 66.4% 67.0% 67.2%11,632 18.4% 3.2%Twin Cities Metropolitan Area 20,256 21,673 23,267 25,841 27,144 36.3% 37.3% 38.1% 40.1% 41.1%6,888 34.0% 4.8%
Total: Colleges and Universities 83,303 87,433 92,854 98,224 101,823 54.0% 54.6% 56.0% 56.9% 57.5%18,520 22.2% 3.5%
Source: Office of the Chancellor Research and PlanningR:\Factbooks\System Factbook\Fall Multi-Year.mdb Fall Multi-Year PTFT 10/21/2004
Table II-42: Page 1 of 3
45

Table II-42Full-Time/Part-Time Students - Fall Credit Headcount
Minnesota State Colleges and UniversitiesFall 1999, 2000, 2001, 2002, and 2003: End of Term Data
InstitutionPercent of Total
Part-Time Students
Fall 1999
Fall 2000
Fall 2001
Fall 2002
Fall 2003
Number of Students Change Fall 1999to Fall 2003
Number PercentFall 1999
Fall 2000
Fall 2001
Fall 2002
Fall 2003
Change Fall 1999 to
Fall 2003
CollegesAlexandria Technical College 665 627 700 694 733 29.5% 28.6% 30.2% 30.2% 31.1%68 10.2% 1.6%Anoka-Ramsey Community College 3,558 3,338 3,436 3,742 4,346 59.6% 57.1% 57.5% 57.1% 59.3%788 22.1% -0.3%Anoka Technical College 1,119 1,199 1,439 1,283 1,048 57.9% 58.6% 59.7% 56.5% 49.6%-71 -6.3% -8.3%Central Lakes College 1,396 1,165 1,085 1,157 1,095 42.7% 37.1% 35.0% 35.7% 35.8%-301 -21.6% -6.8%Century College 3,821 3,848 4,088 4,347 4,521 57.7% 55.5% 55.3% 53.2% 52.7%700 18.3% -4.9%Dakota County Technical College 1,628 1,849 1,529 1,823 1,651 58.3% 59.9% 54.9% 57.8% 52.7%23 1.4% -5.6%Fergus Falls Community College 772 1,234 1,409 802 818 49.8% 59.3% 61.7% 46.1% 44.4%46 6.0% -5.4%Fond du Lac Tribal and Community College 548 563 525 751 1,012 58.4% 56.4% 51.4% 57.1% 58.3%464 84.7% -0.1%Hennepin Technical College 4,130 4,166 4,424 3,929 3,583 70.3% 69.9% 70.6% 65.6% 63.2%-547 -13.2% -7.1%Inver Hills Community College 2,808 2,753 2,875 3,116 3,082 66.2% 64.0% 63.3% 62.0% 59.3%274 9.8% -6.9%Lake Superior College 1,647 2,198 1,939 2,240 2,357 51.2% 55.3% 49.7% 51.4% 50.4%710 43.1% -0.8%Minneapolis Community and Technical College 3,772 3,772 4,088 4,351 4,297 61.3% 59.3% 58.1% 57.3% 57.4%525 13.9% -3.9%Minnesota State College - Southeast Technical 583 465 795 890 757 41.6% 37.4% 46.6% 47.5% 41.7%174 29.8% 0.0%Minnesota West Community and Technical College 1,794 1,966 1,762 1,707 1,724 58.2% 59.6% 55.8% 55.4% 54.2%-70 -3.9% -4.0%Normandale Community College 3,796 4,081 4,029 4,205 4,371 55.7% 55.5% 53.7% 52.8% 52.5%575 15.1% -3.2%North Hennepin Community College 3,189 3,258 3,393 3,673 4,095 62.0% 61.9% 61.2% 60.9% 62.6%906 28.4% 0.6%
Hibbing Community College 2,263 2,070 671 772 882 68.8% 65.9% 38.0% 41.0% 43.2%-1,381 -61.0% -25.5%
Northeast Higher Education District
Itasca Community College 364 286 306 251 314 31.1% 27.7% 27.3% 22.8% 27.5%-50 -13.7% -3.6% Mesabi Range Community and Technical College 585 564 807 635 580 37.5% 38.0% 43.3% 39.0% 37.0%-5 -0.9% -0.5% Rainy River Community College 397 345 224 174 121 60.2% 55.9% 41.9% 41.4% 31.5%-276 -69.5% -28.6% Vermilion Community College 281 275 267 340 411 29.8% 31.1% 31.2% 35.4% 43.0%130 46.3% 13.2%Northland Community and Technical College 1,140 1,169 1,239 1,181 1,160 56.6% 58.7% 57.5% 54.5% 53.7%20 1.8% -2.9%Northwest Technical College 1,239 1,321 1,375 1,371 1,623 26.9% 28.5% 28.3% 26.9% 28.7%384 31.0% 1.8%Pine Technical College 665 805 891 622 510 76.8% 80.8% 80.3% 74.8% 66.3%-155 -23.3% -10.5%Ridgewater College 1,534 1,582 1,521 1,546 1,657 42.0% 42.1% 40.0% 38.8% 38.7%123 8.0% -3.3%Riverland Community College 1,932 1,940 2,029 2,234 2,279 59.7% 61.0% 58.4% 58.0% 56.5%347 18.0% -3.3%Rochester Community and Technical College 2,027 2,123 2,219 2,476 2,607 46.0% 44.4% 43.9% 44.8% 44.4%580 28.6% -1.7%St. Cloud Technical College 1,194 1,153 1,261 1,133 1,136 41.7% 39.1% 39.9% 35.1% 34.5%-58 -4.9% -7.2%Saint Paul College 3,558 4,004 3,993 3,642 3,379 74.9% 76.3% 74.5% 70.9% 68.7%-179 -5.0% -6.3%South Central Technical College 1,639 1,557 1,536 1,583 1,523 51.0% 48.4% 48.5% 47.2% 46.3%-116 -7.1% -4.7%
Subtotal: Colleges 54,044 55,676 55,855 56,670 57,672 54.9% 54.6% 53.1% 51.6% 50.9%3,628 6.7% -4.0%Universities
Bemidji State University 1,315 1,361 1,088 1,408 1,560 28.7% 29.2% 23.9% 28.7% 30.8%245 18.6% 2.1%Metropolitan State University 4,191 4,197 4,435 4,470 4,488 75.9% 73.1% 71.8% 68.4% 66.8%297 7.1% -9.1%Minnesota State University, Mankato 2,728 2,664 2,428 2,337 2,188 21.9% 20.6% 18.2% 16.9% 15.5%-540 -19.8% -6.4%Minnesota State University Moorhead 1,666 1,686 1,520 1,361 1,307 23.6% 22.7% 20.5% 17.7% 17.0%-359 -21.5% -6.7%St. Cloud State University 3,773 3,747 3,648 3,808 3,670 25.6% 24.7% 22.9% 23.5% 22.7%-103 -2.7% -2.8%Southwest Minnesota State University 1,875 1,970 2,612 2,938 3,086 42.6% 41.5% 48.3% 52.6% 53.6%1,211 64.6% 11.0%Winona State University 1,415 1,334 1,343 1,320 1,300 20.1% 18.0% 17.4% 16.6% 15.8%-115 -8.1% -4.3%
Subtotal: Universities 16,963 16,959 17,074 17,642 17,599 30.4% 29.2% 28.2% 28.1% 27.6%636 3.7% -2.8%Institution Location
Greater Minnesota 35,437 36,170 35,200 35,731 36,410 36.0% 35.5% 33.6% 33.0% 32.8%973 2.7% -3.2%Twin Cities Metropolitan Area 35,570 36,465 37,729 38,581 38,861 63.7% 62.7% 61.9% 59.9% 58.9%3,291 9.3% -4.8%
Total: Colleges and Universities 71,007 72,635 72,929 74,312 75,271 46.0% 45.4% 44.0% 43.1% 42.5%4,264 6.0% -3.5%
Source: Office of the Chancellor Research and PlanningR:\Factbooks\System Factbook\Fall Multi-Year.mdb Fall Multi-Year PTFT 10/21/2004
Table II-42: Page 2 of 3
46
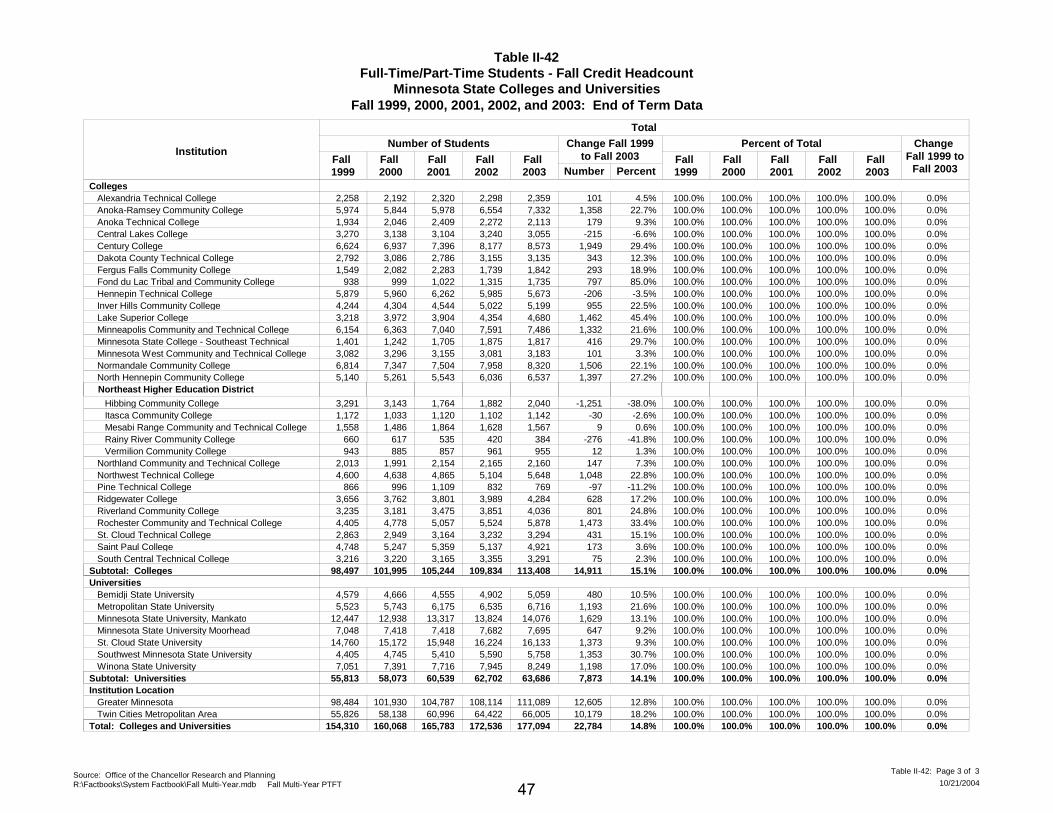
Table II-42Full-Time/Part-Time Students - Fall Credit Headcount
Minnesota State Colleges and UniversitiesFall 1999, 2000, 2001, 2002, and 2003: End of Term Data
InstitutionPercent of Total
Total
Fall 1999
Fall 2000
Fall 2001
Fall 2002
Fall 2003
Number of Students Change Fall 1999to Fall 2003
Number PercentFall 1999
Fall 2000
Fall 2001
Fall 2002
Fall 2003
Change Fall 1999 to
Fall 2003
CollegesAlexandria Technical College 2,258 2,192 2,320 2,298 2,359 100.0% 100.0% 100.0% 100.0% 100.0%101 4.5% 0.0%Anoka-Ramsey Community College 5,974 5,844 5,978 6,554 7,332 100.0% 100.0% 100.0% 100.0% 100.0%1,358 22.7% 0.0%Anoka Technical College 1,934 2,046 2,409 2,272 2,113 100.0% 100.0% 100.0% 100.0% 100.0%179 9.3% 0.0%Central Lakes College 3,270 3,138 3,104 3,240 3,055 100.0% 100.0% 100.0% 100.0% 100.0%-215 -6.6% 0.0%Century College 6,624 6,937 7,396 8,177 8,573 100.0% 100.0% 100.0% 100.0% 100.0%1,949 29.4% 0.0%Dakota County Technical College 2,792 3,086 2,786 3,155 3,135 100.0% 100.0% 100.0% 100.0% 100.0%343 12.3% 0.0%Fergus Falls Community College 1,549 2,082 2,283 1,739 1,842 100.0% 100.0% 100.0% 100.0% 100.0%293 18.9% 0.0%Fond du Lac Tribal and Community College 938 999 1,022 1,315 1,735 100.0% 100.0% 100.0% 100.0% 100.0%797 85.0% 0.0%Hennepin Technical College 5,879 5,960 6,262 5,985 5,673 100.0% 100.0% 100.0% 100.0% 100.0%-206 -3.5% 0.0%Inver Hills Community College 4,244 4,304 4,544 5,022 5,199 100.0% 100.0% 100.0% 100.0% 100.0%955 22.5% 0.0%Lake Superior College 3,218 3,972 3,904 4,354 4,680 100.0% 100.0% 100.0% 100.0% 100.0%1,462 45.4% 0.0%Minneapolis Community and Technical College 6,154 6,363 7,040 7,591 7,486 100.0% 100.0% 100.0% 100.0% 100.0%1,332 21.6% 0.0%Minnesota State College - Southeast Technical 1,401 1,242 1,705 1,875 1,817 100.0% 100.0% 100.0% 100.0% 100.0%416 29.7% 0.0%Minnesota West Community and Technical College 3,082 3,296 3,155 3,081 3,183 100.0% 100.0% 100.0% 100.0% 100.0%101 3.3% 0.0%Normandale Community College 6,814 7,347 7,504 7,958 8,320 100.0% 100.0% 100.0% 100.0% 100.0%1,506 22.1% 0.0%North Hennepin Community College 5,140 5,261 5,543 6,036 6,537 100.0% 100.0% 100.0% 100.0% 100.0%1,397 27.2% 0.0%
Hibbing Community College 3,291 3,143 1,764 1,882 2,040 100.0% 100.0% 100.0% 100.0% 100.0%-1,251 -38.0% 0.0%
Northeast Higher Education District
Itasca Community College 1,172 1,033 1,120 1,102 1,142 100.0% 100.0% 100.0% 100.0% 100.0%-30 -2.6% 0.0% Mesabi Range Community and Technical College 1,558 1,486 1,864 1,628 1,567 100.0% 100.0% 100.0% 100.0% 100.0%9 0.6% 0.0% Rainy River Community College 660 617 535 420 384 100.0% 100.0% 100.0% 100.0% 100.0%-276 -41.8% 0.0% Vermilion Community College 943 885 857 961 955 100.0% 100.0% 100.0% 100.0% 100.0%12 1.3% 0.0%Northland Community and Technical College 2,013 1,991 2,154 2,165 2,160 100.0% 100.0% 100.0% 100.0% 100.0%147 7.3% 0.0%Northwest Technical College 4,600 4,638 4,865 5,104 5,648 100.0% 100.0% 100.0% 100.0% 100.0%1,048 22.8% 0.0%Pine Technical College 866 996 1,109 832 769 100.0% 100.0% 100.0% 100.0% 100.0%-97 -11.2% 0.0%Ridgewater College 3,656 3,762 3,801 3,989 4,284 100.0% 100.0% 100.0% 100.0% 100.0%628 17.2% 0.0%Riverland Community College 3,235 3,181 3,475 3,851 4,036 100.0% 100.0% 100.0% 100.0% 100.0%801 24.8% 0.0%Rochester Community and Technical College 4,405 4,778 5,057 5,524 5,878 100.0% 100.0% 100.0% 100.0% 100.0%1,473 33.4% 0.0%St. Cloud Technical College 2,863 2,949 3,164 3,232 3,294 100.0% 100.0% 100.0% 100.0% 100.0%431 15.1% 0.0%Saint Paul College 4,748 5,247 5,359 5,137 4,921 100.0% 100.0% 100.0% 100.0% 100.0%173 3.6% 0.0%South Central Technical College 3,216 3,220 3,165 3,355 3,291 100.0% 100.0% 100.0% 100.0% 100.0%75 2.3% 0.0%
Subtotal: Colleges 98,497 101,995 105,244 109,834 113,408 100.0% 100.0% 100.0% 100.0% 100.0%14,911 15.1% 0.0%Universities
Bemidji State University 4,579 4,666 4,555 4,902 5,059 100.0% 100.0% 100.0% 100.0% 100.0%480 10.5% 0.0%Metropolitan State University 5,523 5,743 6,175 6,535 6,716 100.0% 100.0% 100.0% 100.0% 100.0%1,193 21.6% 0.0%Minnesota State University, Mankato 12,447 12,938 13,317 13,824 14,076 100.0% 100.0% 100.0% 100.0% 100.0%1,629 13.1% 0.0%Minnesota State University Moorhead 7,048 7,418 7,418 7,682 7,695 100.0% 100.0% 100.0% 100.0% 100.0%647 9.2% 0.0%St. Cloud State University 14,760 15,172 15,948 16,224 16,133 100.0% 100.0% 100.0% 100.0% 100.0%1,373 9.3% 0.0%Southwest Minnesota State University 4,405 4,745 5,410 5,590 5,758 100.0% 100.0% 100.0% 100.0% 100.0%1,353 30.7% 0.0%Winona State University 7,051 7,391 7,716 7,945 8,249 100.0% 100.0% 100.0% 100.0% 100.0%1,198 17.0% 0.0%
Subtotal: Universities 55,813 58,073 60,539 62,702 63,686 100.0% 100.0% 100.0% 100.0% 100.0%7,873 14.1% 0.0%Institution Location
Greater Minnesota 98,484 101,930 104,787 108,114 111,089 100.0% 100.0% 100.0% 100.0% 100.0%12,605 12.8% 0.0%Twin Cities Metropolitan Area 55,826 58,138 60,996 64,422 66,005 100.0% 100.0% 100.0% 100.0% 100.0%10,179 18.2% 0.0%
Total: Colleges and Universities 154,310 160,068 165,783 172,536 177,094 100.0% 100.0% 100.0% 100.0% 100.0%22,784 14.8% 0.0%
Source: Office of the Chancellor Research and PlanningR:\Factbooks\System Factbook\Fall Multi-Year.mdb Fall Multi-Year PTFT 10/21/2004
Table II-42: Page 3 of 3
47

This Page is Intentionally Left Blank
48
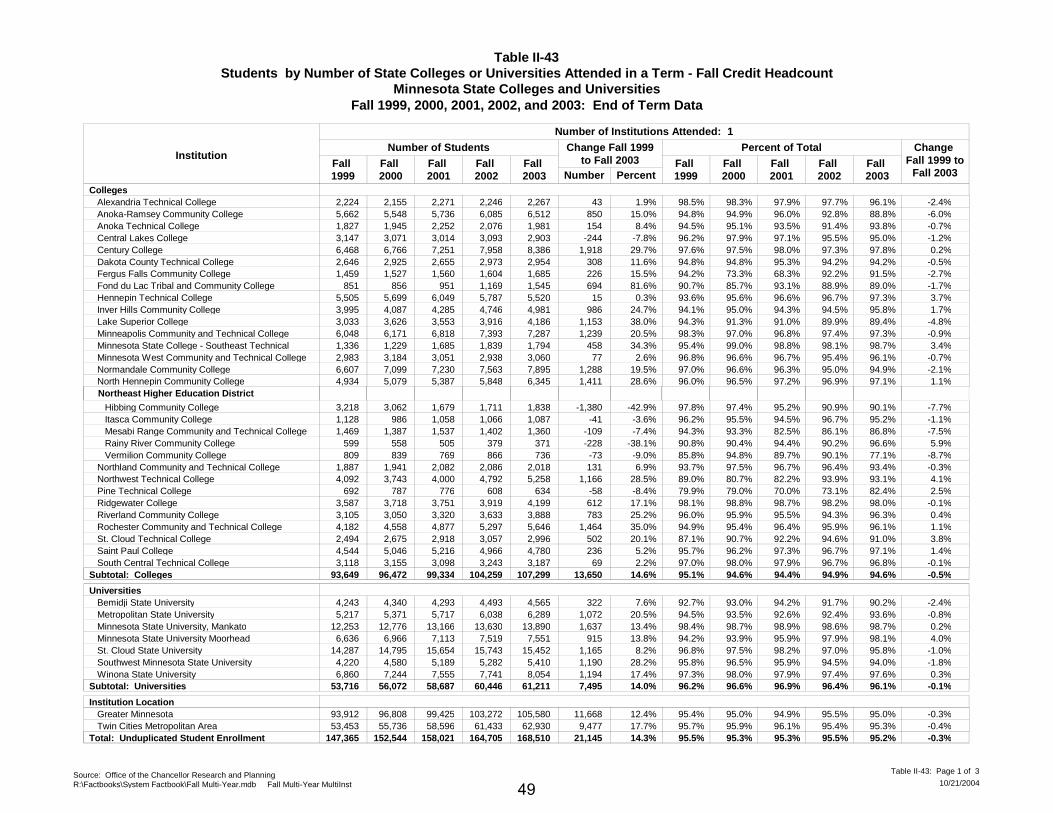
Table II-43Students by Number of State Colleges or Universities Attended in a Term - Fall Credit Headcount
Minnesota State Colleges and UniversitiesFall 1999, 2000, 2001, 2002, and 2003: End of Term Data
InstitutionFall 1999
Fall 2000
Fall 2001
Fall 2002
Fall 2003
Change Fall 1999to Fall 2003
Number PercentFall 1999
Fall 2000
Fall 2001
Fall 2002
Fall 2003
Change Fall 1999 to
Fall 2003
Number of Students
Number of Institutions Attended: 1
Percent of Total
CollegesAlexandria Technical College 2,224 2,155 2,271 2,246 2,267 43 1.9% 98.5% 98.3% 97.9% 97.7% 96.1% -2.4%Anoka-Ramsey Community College 5,662 5,548 5,736 6,085 6,512 850 15.0% 94.8% 94.9% 96.0% 92.8% 88.8% -6.0%Anoka Technical College 1,827 1,945 2,252 2,076 1,981 154 8.4% 94.5% 95.1% 93.5% 91.4% 93.8% -0.7%Central Lakes College 3,147 3,071 3,014 3,093 2,903 -244 -7.8% 96.2% 97.9% 97.1% 95.5% 95.0% -1.2%Century College 6,468 6,766 7,251 7,958 8,386 1,918 29.7% 97.6% 97.5% 98.0% 97.3% 97.8% 0.2%Dakota County Technical College 2,646 2,925 2,655 2,973 2,954 308 11.6% 94.8% 94.8% 95.3% 94.2% 94.2% -0.5%Fergus Falls Community College 1,459 1,527 1,560 1,604 1,685 226 15.5% 94.2% 73.3% 68.3% 92.2% 91.5% -2.7%Fond du Lac Tribal and Community College 851 856 951 1,169 1,545 694 81.6% 90.7% 85.7% 93.1% 88.9% 89.0% -1.7%Hennepin Technical College 5,505 5,699 6,049 5,787 5,520 15 0.3% 93.6% 95.6% 96.6% 96.7% 97.3% 3.7%Inver Hills Community College 3,995 4,087 4,285 4,746 4,981 986 24.7% 94.1% 95.0% 94.3% 94.5% 95.8% 1.7%Lake Superior College 3,033 3,626 3,553 3,916 4,186 1,153 38.0% 94.3% 91.3% 91.0% 89.9% 89.4% -4.8%Minneapolis Community and Technical College 6,048 6,171 6,818 7,393 7,287 1,239 20.5% 98.3% 97.0% 96.8% 97.4% 97.3% -0.9%Minnesota State College - Southeast Technical 1,336 1,229 1,685 1,839 1,794 458 34.3% 95.4% 99.0% 98.8% 98.1% 98.7% 3.4%Minnesota West Community and Technical College 2,983 3,184 3,051 2,938 3,060 77 2.6% 96.8% 96.6% 96.7% 95.4% 96.1% -0.7%Normandale Community College 6,607 7,099 7,230 7,563 7,895 1,288 19.5% 97.0% 96.6% 96.3% 95.0% 94.9% -2.1%North Hennepin Community College 4,934 5,079 5,387 5,848 6,345 1,411 28.6% 96.0% 96.5% 97.2% 96.9% 97.1% 1.1%
Hibbing Community College 3,218 3,062 1,679 1,711 1,838 -1,380 -42.9% 97.8%
Northeast Higher Education District
97.4% 95.2% 90.9% 90.1% -7.7% Itasca Community College 1,128 986 1,058 1,066 1,087 -41 -3.6% 96.2% 95.5% 94.5% 96.7% 95.2% -1.1% Mesabi Range Community and Technical College 1,469 1,387 1,537 1,402 1,360 -109 -7.4% 94.3% 93.3% 82.5% 86.1% 86.8% -7.5% Rainy River Community College 599 558 505 379 371 -228 -38.1% 90.8% 90.4% 94.4% 90.2% 96.6% 5.9% Vermilion Community College 809 839 769 866 736 -73 -9.0% 85.8% 94.8% 89.7% 90.1% 77.1% -8.7%Northland Community and Technical College 1,887 1,941 2,082 2,086 2,018 131 6.9% 93.7% 97.5% 96.7% 96.4% 93.4% -0.3%Northwest Technical College 4,092 3,743 4,000 4,792 5,258 1,166 28.5% 89.0% 80.7% 82.2% 93.9% 93.1% 4.1%Pine Technical College 692 787 776 608 634 -58 -8.4% 79.9% 79.0% 70.0% 73.1% 82.4% 2.5%Ridgewater College 3,587 3,718 3,751 3,919 4,199 612 17.1% 98.1% 98.8% 98.7% 98.2% 98.0% -0.1%Riverland Community College 3,105 3,050 3,320 3,633 3,888 783 25.2% 96.0% 95.9% 95.5% 94.3% 96.3% 0.4%Rochester Community and Technical College 4,182 4,558 4,877 5,297 5,646 1,464 35.0% 94.9% 95.4% 96.4% 95.9% 96.1% 1.1%St. Cloud Technical College 2,494 2,675 2,918 3,057 2,996 502 20.1% 87.1% 90.7% 92.2% 94.6% 91.0% 3.8%Saint Paul College 4,544 5,046 5,216 4,966 4,780 236 5.2% 95.7% 96.2% 97.3% 96.7% 97.1% 1.4%South Central Technical College 3,118 3,155 3,098 3,243 3,187 69 2.2% 97.0% 98.0% 97.9% 96.7% 96.8% -0.1%
Subtotal: Colleges 93,649 96,472 99,334 104,259 107,299 13,650 14.6% 95.1% 94.6% 94.4% 94.9% 94.6% -0.5%
UniversitiesBemidji State University 4,243 4,340 4,293 4,493 4,565 322 7.6% 92.7% 93.0% 94.2% 91.7% 90.2% -2.4%Metropolitan State University 5,217 5,371 5,717 6,038 6,289 1,072 20.5% 94.5% 93.5% 92.6% 92.4% 93.6% -0.8%Minnesota State University, Mankato 12,253 12,776 13,166 13,630 13,890 1,637 13.4% 98.4% 98.7% 98.9% 98.6% 98.7% 0.2%Minnesota State University Moorhead 6,636 6,966 7,113 7,519 7,551 915 13.8% 94.2% 93.9% 95.9% 97.9% 98.1% 4.0%St. Cloud State University 14,287 14,795 15,654 15,743 15,452 1,165 8.2% 96.8% 97.5% 98.2% 97.0% 95.8% -1.0%Southwest Minnesota State University 4,220 4,580 5,189 5,282 5,410 1,190 28.2% 95.8% 96.5% 95.9% 94.5% 94.0% -1.8%Winona State University 6,860 7,244 7,555 7,741 8,054 1,194 17.4% 97.3% 98.0% 97.9% 97.4% 97.6% 0.3%
Subtotal: Universities 53,716 56,072 58,687 60,446 61,211 7,495 14.0% 96.2% 96.6% 96.9% 96.4% 96.1% -0.1%
Institution LocationGreater Minnesota 93,912 96,808 99,425 103,272 105,580 11,668 12.4% 95.4% 95.0% 94.9% 95.5% 95.0% -0.3%Twin Cities Metropolitan Area 53,453 55,736 58,596 61,433 62,930 9,477 17.7% 95.7% 95.9% 96.1% 95.4% 95.3% -0.4%
Total: Unduplicated Student Enrollment 147,365 152,544 158,021 164,705 168,510 21,145 14.3% 95.5% 95.3% 95.3% 95.5% 95.2% -0.3%
Source: Office of the Chancellor Research and PlanningR:\Factbooks\System Factbook\Fall Multi-Year.mdb Fall Multi-Year MultiInst 10/21/2004
Table II-43: Page 1 of 3
49
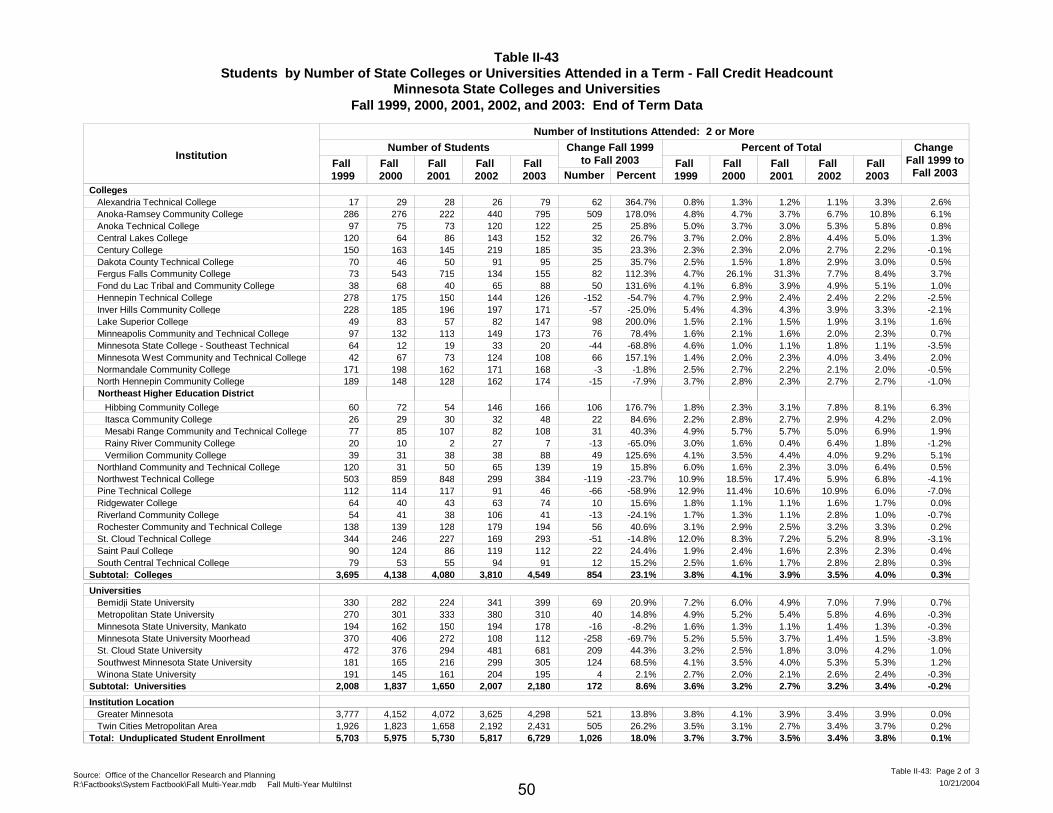
Table II-43Students by Number of State Colleges or Universities Attended in a Term - Fall Credit Headcount
Minnesota State Colleges and UniversitiesFall 1999, 2000, 2001, 2002, and 2003: End of Term Data
InstitutionFall 1999
Fall 2000
Fall 2001
Fall 2002
Fall 2003
Change Fall 1999to Fall 2003
Number PercentFall 1999
Fall 2000
Fall 2001
Fall 2002
Fall 2003
Change Fall 1999 to
Fall 2003
Number of Students
Number of Institutions Attended: 2 or More
Percent of Total
CollegesAlexandria Technical College 17 29 28 26 79 62 364.7% 0.8% 1.3% 1.2% 1.1% 3.3% 2.6%Anoka-Ramsey Community College 286 276 222 440 795 509 178.0% 4.8% 4.7% 3.7% 6.7% 10.8% 6.1%Anoka Technical College 97 75 73 120 122 25 25.8% 5.0% 3.7% 3.0% 5.3% 5.8% 0.8%Central Lakes College 120 64 86 143 152 32 26.7% 3.7% 2.0% 2.8% 4.4% 5.0% 1.3%Century College 150 163 145 219 185 35 23.3% 2.3% 2.3% 2.0% 2.7% 2.2% -0.1%Dakota County Technical College 70 46 50 91 95 25 35.7% 2.5% 1.5% 1.8% 2.9% 3.0% 0.5%Fergus Falls Community College 73 543 715 134 155 82 112.3% 4.7% 26.1% 31.3% 7.7% 8.4% 3.7%Fond du Lac Tribal and Community College 38 68 40 65 88 50 131.6% 4.1% 6.8% 3.9% 4.9% 5.1% 1.0%Hennepin Technical College 278 175 150 144 126 -152 -54.7% 4.7% 2.9% 2.4% 2.4% 2.2% -2.5%Inver Hills Community College 228 185 196 197 171 -57 -25.0% 5.4% 4.3% 4.3% 3.9% 3.3% -2.1%Lake Superior College 49 83 57 82 147 98 200.0% 1.5% 2.1% 1.5% 1.9% 3.1% 1.6%Minneapolis Community and Technical College 97 132 113 149 173 76 78.4% 1.6% 2.1% 1.6% 2.0% 2.3% 0.7%Minnesota State College - Southeast Technical 64 12 19 33 20 -44 -68.8% 4.6% 1.0% 1.1% 1.8% 1.1% -3.5%Minnesota West Community and Technical College 42 67 73 124 108 66 157.1% 1.4% 2.0% 2.3% 4.0% 3.4% 2.0%Normandale Community College 171 198 162 171 168 -3 -1.8% 2.5% 2.7% 2.2% 2.1% 2.0% -0.5%North Hennepin Community College 189 148 128 162 174 -15 -7.9% 3.7% 2.8% 2.3% 2.7% 2.7% -1.0%
Hibbing Community College 60 72 54 146 166 106 176.7% 1.8%
Northeast Higher Education District
2.3% 3.1% 7.8% 8.1% 6.3% Itasca Community College 26 29 30 32 48 22 84.6% 2.2% 2.8% 2.7% 2.9% 4.2% 2.0% Mesabi Range Community and Technical College 77 85 107 82 108 31 40.3% 4.9% 5.7% 5.7% 5.0% 6.9% 1.9% Rainy River Community College 20 10 2 27 7 -13 -65.0% 3.0% 1.6% 0.4% 6.4% 1.8% -1.2% Vermilion Community College 39 31 38 38 88 49 125.6% 4.1% 3.5% 4.4% 4.0% 9.2% 5.1%Northland Community and Technical College 120 31 50 65 139 19 15.8% 6.0% 1.6% 2.3% 3.0% 6.4% 0.5%Northwest Technical College 503 859 848 299 384 -119 -23.7% 10.9% 18.5% 17.4% 5.9% 6.8% -4.1%Pine Technical College 112 114 117 91 46 -66 -58.9% 12.9% 11.4% 10.6% 10.9% 6.0% -7.0%Ridgewater College 64 40 43 63 74 10 15.6% 1.8% 1.1% 1.1% 1.6% 1.7% 0.0%Riverland Community College 54 41 38 106 41 -13 -24.1% 1.7% 1.3% 1.1% 2.8% 1.0% -0.7%Rochester Community and Technical College 138 139 128 179 194 56 40.6% 3.1% 2.9% 2.5% 3.2% 3.3% 0.2%St. Cloud Technical College 344 246 227 169 293 -51 -14.8% 12.0% 8.3% 7.2% 5.2% 8.9% -3.1%Saint Paul College 90 124 86 119 112 22 24.4% 1.9% 2.4% 1.6% 2.3% 2.3% 0.4%South Central Technical College 79 53 55 94 91 12 15.2% 2.5% 1.6% 1.7% 2.8% 2.8% 0.3%
Subtotal: Colleges 3,695 4,138 4,080 3,810 4,549 854 23.1% 3.8% 4.1% 3.9% 3.5% 4.0% 0.3%
UniversitiesBemidji State University 330 282 224 341 399 69 20.9% 7.2% 6.0% 4.9% 7.0% 7.9% 0.7%Metropolitan State University 270 301 333 380 310 40 14.8% 4.9% 5.2% 5.4% 5.8% 4.6% -0.3%Minnesota State University, Mankato 194 162 150 194 178 -16 -8.2% 1.6% 1.3% 1.1% 1.4% 1.3% -0.3%Minnesota State University Moorhead 370 406 272 108 112 -258 -69.7% 5.2% 5.5% 3.7% 1.4% 1.5% -3.8%St. Cloud State University 472 376 294 481 681 209 44.3% 3.2% 2.5% 1.8% 3.0% 4.2% 1.0%Southwest Minnesota State University 181 165 216 299 305 124 68.5% 4.1% 3.5% 4.0% 5.3% 5.3% 1.2%Winona State University 191 145 161 204 195 4 2.1% 2.7% 2.0% 2.1% 2.6% 2.4% -0.3%
Subtotal: Universities 2,008 1,837 1,650 2,007 2,180 172 8.6% 3.6% 3.2% 2.7% 3.2% 3.4% -0.2%
Institution LocationGreater Minnesota 3,777 4,152 4,072 3,625 4,298 521 13.8% 3.8% 4.1% 3.9% 3.4% 3.9% 0.0%Twin Cities Metropolitan Area 1,926 1,823 1,658 2,192 2,431 505 26.2% 3.5% 3.1% 2.7% 3.4% 3.7% 0.2%
Total: Unduplicated Student Enrollment 5,703 5,975 5,730 5,817 6,729 1,026 18.0% 3.7% 3.7% 3.5% 3.4% 3.8% 0.1%
Source: Office of the Chancellor Research and PlanningR:\Factbooks\System Factbook\Fall Multi-Year.mdb Fall Multi-Year MultiInst 10/21/2004
Table II-43: Page 2 of 3
50
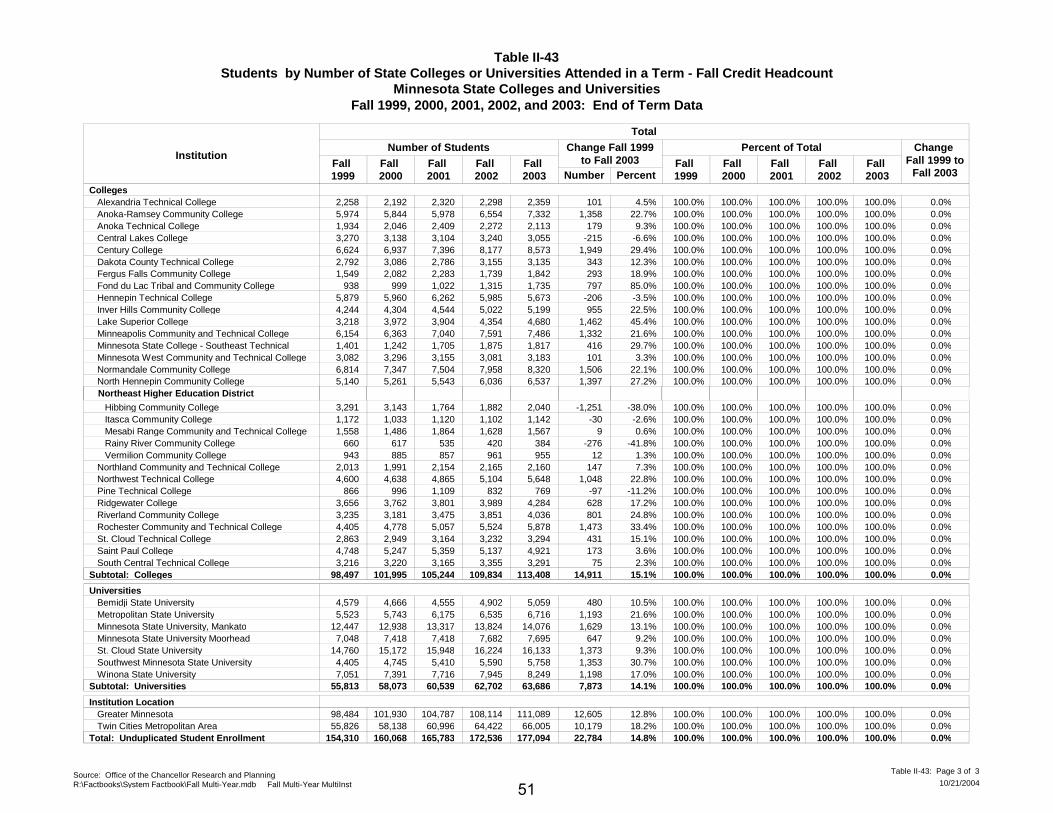
Table II-43Students by Number of State Colleges or Universities Attended in a Term - Fall Credit Headcount
Minnesota State Colleges and UniversitiesFall 1999, 2000, 2001, 2002, and 2003: End of Term Data
InstitutionFall 1999
Fall 2000
Fall 2001
Fall 2002
Fall 2003
Change Fall 1999to Fall 2003
Number PercentFall 1999
Fall 2000
Fall 2001
Fall 2002
Fall 2003
Change Fall 1999 to
Fall 2003
Number of Students
Total
Percent of Total
CollegesAlexandria Technical College 2,258 2,192 2,320 2,298 2,359 101 4.5% 100.0% 100.0% 100.0% 100.0% 100.0% 0.0%Anoka-Ramsey Community College 5,974 5,844 5,978 6,554 7,332 1,358 22.7% 100.0% 100.0% 100.0% 100.0% 100.0% 0.0%Anoka Technical College 1,934 2,046 2,409 2,272 2,113 179 9.3% 100.0% 100.0% 100.0% 100.0% 100.0% 0.0%Central Lakes College 3,270 3,138 3,104 3,240 3,055 -215 -6.6% 100.0% 100.0% 100.0% 100.0% 100.0% 0.0%Century College 6,624 6,937 7,396 8,177 8,573 1,949 29.4% 100.0% 100.0% 100.0% 100.0% 100.0% 0.0%Dakota County Technical College 2,792 3,086 2,786 3,155 3,135 343 12.3% 100.0% 100.0% 100.0% 100.0% 100.0% 0.0%Fergus Falls Community College 1,549 2,082 2,283 1,739 1,842 293 18.9% 100.0% 100.0% 100.0% 100.0% 100.0% 0.0%Fond du Lac Tribal and Community College 938 999 1,022 1,315 1,735 797 85.0% 100.0% 100.0% 100.0% 100.0% 100.0% 0.0%Hennepin Technical College 5,879 5,960 6,262 5,985 5,673 -206 -3.5% 100.0% 100.0% 100.0% 100.0% 100.0% 0.0%Inver Hills Community College 4,244 4,304 4,544 5,022 5,199 955 22.5% 100.0% 100.0% 100.0% 100.0% 100.0% 0.0%Lake Superior College 3,218 3,972 3,904 4,354 4,680 1,462 45.4% 100.0% 100.0% 100.0% 100.0% 100.0% 0.0%Minneapolis Community and Technical College 6,154 6,363 7,040 7,591 7,486 1,332 21.6% 100.0% 100.0% 100.0% 100.0% 100.0% 0.0%Minnesota State College - Southeast Technical 1,401 1,242 1,705 1,875 1,817 416 29.7% 100.0% 100.0% 100.0% 100.0% 100.0% 0.0%Minnesota West Community and Technical College 3,082 3,296 3,155 3,081 3,183 101 3.3% 100.0% 100.0% 100.0% 100.0% 100.0% 0.0%Normandale Community College 6,814 7,347 7,504 7,958 8,320 1,506 22.1% 100.0% 100.0% 100.0% 100.0% 100.0% 0.0%North Hennepin Community College 5,140 5,261 5,543 6,036 6,537 1,397 27.2% 100.0% 100.0% 100.0% 100.0% 100.0% 0.0%
Hibbing Community College 3,291 3,143 1,764 1,882 2,040 -1,251 -38.0% 100.0%
Northeast Higher Education District
100.0% 100.0% 100.0% 100.0% 0.0% Itasca Community College 1,172 1,033 1,120 1,102 1,142 -30 -2.6% 100.0% 100.0% 100.0% 100.0% 100.0% 0.0% Mesabi Range Community and Technical College 1,558 1,486 1,864 1,628 1,567 9 0.6% 100.0% 100.0% 100.0% 100.0% 100.0% 0.0% Rainy River Community College 660 617 535 420 384 -276 -41.8% 100.0% 100.0% 100.0% 100.0% 100.0% 0.0% Vermilion Community College 943 885 857 961 955 12 1.3% 100.0% 100.0% 100.0% 100.0% 100.0% 0.0%Northland Community and Technical College 2,013 1,991 2,154 2,165 2,160 147 7.3% 100.0% 100.0% 100.0% 100.0% 100.0% 0.0%Northwest Technical College 4,600 4,638 4,865 5,104 5,648 1,048 22.8% 100.0% 100.0% 100.0% 100.0% 100.0% 0.0%Pine Technical College 866 996 1,109 832 769 -97 -11.2% 100.0% 100.0% 100.0% 100.0% 100.0% 0.0%Ridgewater College 3,656 3,762 3,801 3,989 4,284 628 17.2% 100.0% 100.0% 100.0% 100.0% 100.0% 0.0%Riverland Community College 3,235 3,181 3,475 3,851 4,036 801 24.8% 100.0% 100.0% 100.0% 100.0% 100.0% 0.0%Rochester Community and Technical College 4,405 4,778 5,057 5,524 5,878 1,473 33.4% 100.0% 100.0% 100.0% 100.0% 100.0% 0.0%St. Cloud Technical College 2,863 2,949 3,164 3,232 3,294 431 15.1% 100.0% 100.0% 100.0% 100.0% 100.0% 0.0%Saint Paul College 4,748 5,247 5,359 5,137 4,921 173 3.6% 100.0% 100.0% 100.0% 100.0% 100.0% 0.0%South Central Technical College 3,216 3,220 3,165 3,355 3,291 75 2.3% 100.0% 100.0% 100.0% 100.0% 100.0% 0.0%
Subtotal: Colleges 98,497 101,995 105,244 109,834 113,408 14,911 15.1% 100.0% 100.0% 100.0% 100.0% 100.0% 0.0%
UniversitiesBemidji State University 4,579 4,666 4,555 4,902 5,059 480 10.5% 100.0% 100.0% 100.0% 100.0% 100.0% 0.0%Metropolitan State University 5,523 5,743 6,175 6,535 6,716 1,193 21.6% 100.0% 100.0% 100.0% 100.0% 100.0% 0.0%Minnesota State University, Mankato 12,447 12,938 13,317 13,824 14,076 1,629 13.1% 100.0% 100.0% 100.0% 100.0% 100.0% 0.0%Minnesota State University Moorhead 7,048 7,418 7,418 7,682 7,695 647 9.2% 100.0% 100.0% 100.0% 100.0% 100.0% 0.0%St. Cloud State University 14,760 15,172 15,948 16,224 16,133 1,373 9.3% 100.0% 100.0% 100.0% 100.0% 100.0% 0.0%Southwest Minnesota State University 4,405 4,745 5,410 5,590 5,758 1,353 30.7% 100.0% 100.0% 100.0% 100.0% 100.0% 0.0%Winona State University 7,051 7,391 7,716 7,945 8,249 1,198 17.0% 100.0% 100.0% 100.0% 100.0% 100.0% 0.0%
Subtotal: Universities 55,813 58,073 60,539 62,702 63,686 7,873 14.1% 100.0% 100.0% 100.0% 100.0% 100.0% 0.0%
Institution LocationGreater Minnesota 98,484 101,930 104,787 108,114 111,089 12,605 12.8% 100.0% 100.0% 100.0% 100.0% 100.0% 0.0%Twin Cities Metropolitan Area 55,826 58,138 60,996 64,422 66,005 10,179 18.2% 100.0% 100.0% 100.0% 100.0% 100.0% 0.0%
Total: Unduplicated Student Enrollment 154,310 160,068 165,783 172,536 177,094 22,784 14.8% 100.0% 100.0% 100.0% 100.0% 100.0% 0.0%
Source: Office of the Chancellor Research and PlanningR:\Factbooks\System Factbook\Fall Multi-Year.mdb Fall Multi-Year MultiInst 10/21/2004
Table II-43: Page 3 of 3
51

This Page is Intentionally Left Blank
52

Table II-44Admission Status - Fall Credit HeadcountMinnesota State Colleges and Universities
Fall 1999, 2000, 2001, 2002, and 2003: End of Term Data
Institution Fall 1999
Fall 2000
Fall 2001
Fall 2002
Fall 2003
Number of Students Change Fall 1999to Fall 2003
Number PercentFall 1999
Fall 2000
Fall 2001
Fall 2002
Fall 2003
Change Fall 1999 to
Fall 2003
Percent of Total
Undergraduate Regular & Transfer
CollegesAlexandria Technical College 2,156 1,859 1,930 1,852 1,815 95.5%-341 -15.8% -18.5%84.8% 83.2% 80.6% 76.9%Anoka-Ramsey Community College 5,377 5,262 4,942 5,305 6,160 90.0%783 14.6% -6.0%90.0% 82.7% 80.9% 84.0%Anoka Technical College 1,835 1,883 2,126 2,020 1,984 94.9%149 8.1% -1.0%92.0% 88.3% 88.9% 93.9%Central Lakes College 2,818 2,812 2,854 2,935 2,765 86.2%-53 -1.9% 4.3%89.6% 91.9% 90.6% 90.5%Century College 6,325 6,634 7,089 7,859 8,236 95.5%1,911 30.2% 0.6%95.6% 95.8% 96.1% 96.1%Dakota County Technical College 2,586 2,157 1,969 2,163 2,305 92.6%-281 -10.9% -19.1%69.9% 70.7% 68.6% 73.5%Fergus Falls Community College 987 1,461 1,752 1,139 1,257 63.7%270 27.4% 4.5%70.2% 76.7% 65.5% 68.2%Fond du Lac Tribal and Community College 684 674 728 865 1,033 72.9%349 51.0% -13.4%67.5% 71.2% 65.8% 59.5%Hennepin Technical College 5,768 5,738 6,023 5,689 5,411 98.1%-357 -6.2% -2.7%96.3% 96.2% 95.1% 95.4%Inver Hills Community College 3,661 3,551 3,780 4,264 4,488 86.3%827 22.6% 0.1%82.5% 83.2% 84.9% 86.3%Lake Superior College 2,752 3,106 2,995 3,092 3,421 85.5%669 24.3% -12.4%78.2% 76.7% 71.0% 73.1%Minneapolis Community and Technical College 6,092 5,825 6,476 7,095 6,932 99.0%840 13.8% -6.4%91.5% 92.0% 93.5% 92.6%Minnesota State College - Southeast Technical 1,322 1,171 1,639 1,824 1,754 94.4%432 32.7% 2.2%94.3% 96.1% 97.3% 96.5%Minnesota West Community and Technical College 2,353 2,497 2,335 2,302 2,367 76.3%14 0.6% -2.0%75.8% 74.0% 74.7% 74.4%Normandale Community College 6,455 6,901 7,006 7,339 7,685 94.7%1,230 19.1% -2.4%93.9% 93.4% 92.2% 92.4%North Hennepin Community College 4,766 4,834 5,083 5,515 6,008 92.7%1,242 26.1% -0.8%91.9% 91.7% 91.4% 91.9%
Hibbing Community College 3,237 3,058 1,603 1,695 1,787 98.4%-1,450 -44.8% -10.8%
Northeast Higher Education District
97.3% 90.9% 90.1% 87.6% Itasca Community College 1,069 944 1,031 1,023 1,063 91.2%-6 -0.6% 1.9%91.4% 92.1% 92.8% 93.1% Mesabi Range Community and Technical College 1,154 1,205 1,301 1,187 1,129 74.1%-25 -2.2% -2.0%81.1% 69.8% 72.9% 72.0% Rainy River Community College 553 551 462 376 336 83.8%-217 -39.2% 3.7%89.3% 86.4% 89.5% 87.5% Vermilion Community College 832 744 741 627 542 88.2%-290 -34.9% -31.5%84.1% 86.5% 65.2% 56.8%Northland Community and Technical College 1,872 1,844 1,937 1,987 1,923 93.0%51 2.7% -4.0%92.6% 89.9% 91.8% 89.0%Northwest Technical College 4,507 4,511 4,742 4,941 5,496 98.0%989 21.9% -0.7%97.3% 97.5% 96.8% 97.3%Pine Technical College 538 509 554 473 532 62.1%-6 -1.1% 7.1%51.1% 50.0% 56.9% 69.2%Ridgewater College 3,504 3,594 3,628 3,786 4,021 95.8%517 14.8% -2.0%95.5% 95.4% 94.9% 93.9%Riverland Community College 3,020 2,773 2,882 3,158 3,396 93.4%376 12.5% -9.2%87.2% 82.9% 82.0% 84.1%Rochester Community and Technical College 3,623 4,182 4,286 4,671 5,057 82.2%1,434 39.6% 3.8%87.5% 84.8% 84.6% 86.0%St. Cloud Technical College 2,190 2,391 2,629 2,823 2,928 76.5%738 33.7% 12.4%81.1% 83.1% 87.3% 88.9%Saint Paul College 3,345 3,638 3,844 3,824 3,862 70.5%517 15.5% 8.0%69.3% 71.7% 74.4% 78.5%South Central Technical College 2,312 2,403 2,635 2,741 2,662 71.9%350 15.1% 9.0%74.6% 83.3% 81.7% 80.9%
Subtotal: Colleges 87,693 88,712 91,002 94,570 98,355 89.0%10,662 12.2% -2.3%87.0% 86.5% 86.1% 86.7%
UniversitiesBemidji State University 3,818 3,945 4,043 4,139 4,146 83.4%328 8.6% -1.4%84.5% 88.8% 84.4% 82.0%Metropolitan State University 4,440 4,605 4,987 5,348 5,501 80.4%1,061 23.9% 1.5%80.2% 80.8% 81.8% 81.9%Minnesota State University, Mankato 10,347 10,908 11,390 11,748 12,102 83.1%1,755 17.0% 2.8%84.3% 85.5% 85.0% 86.0%Minnesota State University Moorhead 6,111 6,436 6,642 7,034 7,045 86.7%934 15.3% 4.8%86.8% 89.5% 91.6% 91.6%St. Cloud State University 12,363 12,897 13,624 13,800 13,473 83.8%1,110 9.0% -0.2%85.0% 85.4% 85.1% 83.5%Southwest Minnesota State University 2,383 2,475 2,534 2,618 2,546 54.1%163 6.8% -9.9%52.2% 46.8% 46.8% 44.2%Winona State University 6,154 6,567 6,938 7,163 7,452 87.3%1,298 21.1% 3.1%88.9% 89.9% 90.2% 90.3%
Subtotal: Universities 45,616 47,833 50,158 51,850 52,265 81.7%6,649 14.6% 0.3%82.4% 82.9% 82.7% 82.1%
Institution LocationGreater Minnesota 82,659 85,517 87,835 89,999 92,048 83.9%9,389 11.4% -1.1%83.9% 83.8% 83.2% 82.9%Twin Cities Metropolitan Area 50,650 51,028 53,325 56,421 58,572 90.7%7,922 15.6% -2.0%87.8% 87.4% 87.6% 88.7%
Total: Colleges and Universities 133,309 136,545 141,160 146,420 150,620 86.4%17,311 13.0% -1.3%85.3% 85.1% 84.9% 85.1%
Source: Office of the Chancellor Research and PlanningR:\Factbooks\System Factbook\Fall Multi-Year.mdb Fall Multi-Year AdmStat 10/21/2004
Table II-44: Page 1 of 5
53
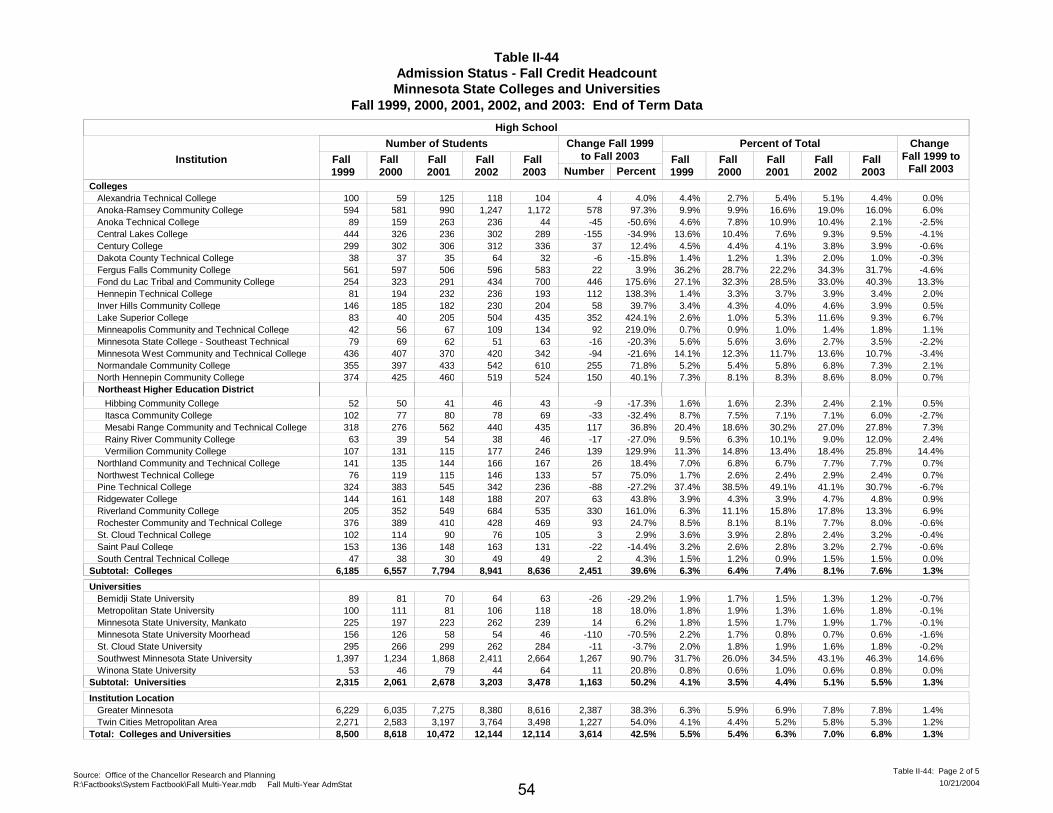
Table II-44Admission Status - Fall Credit HeadcountMinnesota State Colleges and Universities
Fall 1999, 2000, 2001, 2002, and 2003: End of Term Data
Institution Fall 1999
Fall 2000
Fall 2001
Fall 2002
Fall 2003
Number of Students Change Fall 1999to Fall 2003
Number PercentFall 1999
Fall 2000
Fall 2001
Fall 2002
Fall 2003
Change Fall 1999 to
Fall 2003
Percent of Total
High School
CollegesAlexandria Technical College 100 59 125 118 104 4.4%4 4.0% 0.0%2.7% 5.4% 5.1% 4.4%Anoka-Ramsey Community College 594 581 990 1,247 1,172 9.9%578 97.3% 6.0%9.9% 16.6% 19.0% 16.0%Anoka Technical College 89 159 263 236 44 4.6%-45 -50.6% -2.5%7.8% 10.9% 10.4% 2.1%Central Lakes College 444 326 236 302 289 13.6%-155 -34.9% -4.1%10.4% 7.6% 9.3% 9.5%Century College 299 302 306 312 336 4.5%37 12.4% -0.6%4.4% 4.1% 3.8% 3.9%Dakota County Technical College 38 37 35 64 32 1.4%-6 -15.8% -0.3%1.2% 1.3% 2.0% 1.0%Fergus Falls Community College 561 597 506 596 583 36.2%22 3.9% -4.6%28.7% 22.2% 34.3% 31.7%Fond du Lac Tribal and Community College 254 323 291 434 700 27.1%446 175.6% 13.3%32.3% 28.5% 33.0% 40.3%Hennepin Technical College 81 194 232 236 193 1.4%112 138.3% 2.0%3.3% 3.7% 3.9% 3.4%Inver Hills Community College 146 185 182 230 204 3.4%58 39.7% 0.5%4.3% 4.0% 4.6% 3.9%Lake Superior College 83 40 205 504 435 2.6%352 424.1% 6.7%1.0% 5.3% 11.6% 9.3%Minneapolis Community and Technical College 42 56 67 109 134 0.7%92 219.0% 1.1%0.9% 1.0% 1.4% 1.8%Minnesota State College - Southeast Technical 79 69 62 51 63 5.6%-16 -20.3% -2.2%5.6% 3.6% 2.7% 3.5%Minnesota West Community and Technical College 436 407 370 420 342 14.1%-94 -21.6% -3.4%12.3% 11.7% 13.6% 10.7%Normandale Community College 355 397 433 542 610 5.2%255 71.8% 2.1%5.4% 5.8% 6.8% 7.3%North Hennepin Community College 374 425 460 519 524 7.3%150 40.1% 0.7%8.1% 8.3% 8.6% 8.0%
Hibbing Community College 52 50 41 46 43 1.6%-9 -17.3% 0.5%
Northeast Higher Education District
1.6% 2.3% 2.4% 2.1% Itasca Community College 102 77 80 78 69 8.7%-33 -32.4% -2.7%7.5% 7.1% 7.1% 6.0% Mesabi Range Community and Technical College 318 276 562 440 435 20.4%117 36.8% 7.3%18.6% 30.2% 27.0% 27.8% Rainy River Community College 63 39 54 38 46 9.5%-17 -27.0% 2.4%6.3% 10.1% 9.0% 12.0% Vermilion Community College 107 131 115 177 246 11.3%139 129.9% 14.4%14.8% 13.4% 18.4% 25.8%Northland Community and Technical College 141 135 144 166 167 7.0%26 18.4% 0.7%6.8% 6.7% 7.7% 7.7%Northwest Technical College 76 119 115 146 133 1.7%57 75.0% 0.7%2.6% 2.4% 2.9% 2.4%Pine Technical College 324 383 545 342 236 37.4%-88 -27.2% -6.7%38.5% 49.1% 41.1% 30.7%Ridgewater College 144 161 148 188 207 3.9%63 43.8% 0.9%4.3% 3.9% 4.7% 4.8%Riverland Community College 205 352 549 684 535 6.3%330 161.0% 6.9%11.1% 15.8% 17.8% 13.3%Rochester Community and Technical College 376 389 410 428 469 8.5%93 24.7% -0.6%8.1% 8.1% 7.7% 8.0%St. Cloud Technical College 102 114 90 76 105 3.6%3 2.9% -0.4%3.9% 2.8% 2.4% 3.2%Saint Paul College 153 136 148 163 131 3.2%-22 -14.4% -0.6%2.6% 2.8% 3.2% 2.7%South Central Technical College 47 38 30 49 49 1.5%2 4.3% 0.0%1.2% 0.9% 1.5% 1.5%
Subtotal: Colleges 6,185 6,557 7,794 8,941 8,636 6.3%2,451 39.6% 1.3%6.4% 7.4% 8.1% 7.6%
UniversitiesBemidji State University 89 81 70 64 63 1.9%-26 -29.2% -0.7%1.7% 1.5% 1.3% 1.2%Metropolitan State University 100 111 81 106 118 1.8%18 18.0% -0.1%1.9% 1.3% 1.6% 1.8%Minnesota State University, Mankato 225 197 223 262 239 1.8%14 6.2% -0.1%1.5% 1.7% 1.9% 1.7%Minnesota State University Moorhead 156 126 58 54 46 2.2%-110 -70.5% -1.6%1.7% 0.8% 0.7% 0.6%St. Cloud State University 295 266 299 262 284 2.0%-11 -3.7% -0.2%1.8% 1.9% 1.6% 1.8%Southwest Minnesota State University 1,397 1,234 1,868 2,411 2,664 31.7%1,267 90.7% 14.6%26.0% 34.5% 43.1% 46.3%Winona State University 53 46 79 44 64 0.8%11 20.8% 0.0%0.6% 1.0% 0.6% 0.8%
Subtotal: Universities 2,315 2,061 2,678 3,203 3,478 4.1%1,163 50.2% 1.3%3.5% 4.4% 5.1% 5.5%
Institution LocationGreater Minnesota 6,229 6,035 7,275 8,380 8,616 6.3%2,387 38.3% 1.4%5.9% 6.9% 7.8% 7.8%Twin Cities Metropolitan Area 2,271 2,583 3,197 3,764 3,498 4.1%1,227 54.0% 1.2%4.4% 5.2% 5.8% 5.3%
Total: Colleges and Universities 8,500 8,618 10,472 12,144 12,114 5.5%3,614 42.5% 1.3%5.4% 6.3% 7.0% 6.8%
Source: Office of the Chancellor Research and PlanningR:\Factbooks\System Factbook\Fall Multi-Year.mdb Fall Multi-Year AdmStat 10/21/2004
Table II-44: Page 2 of 5
54
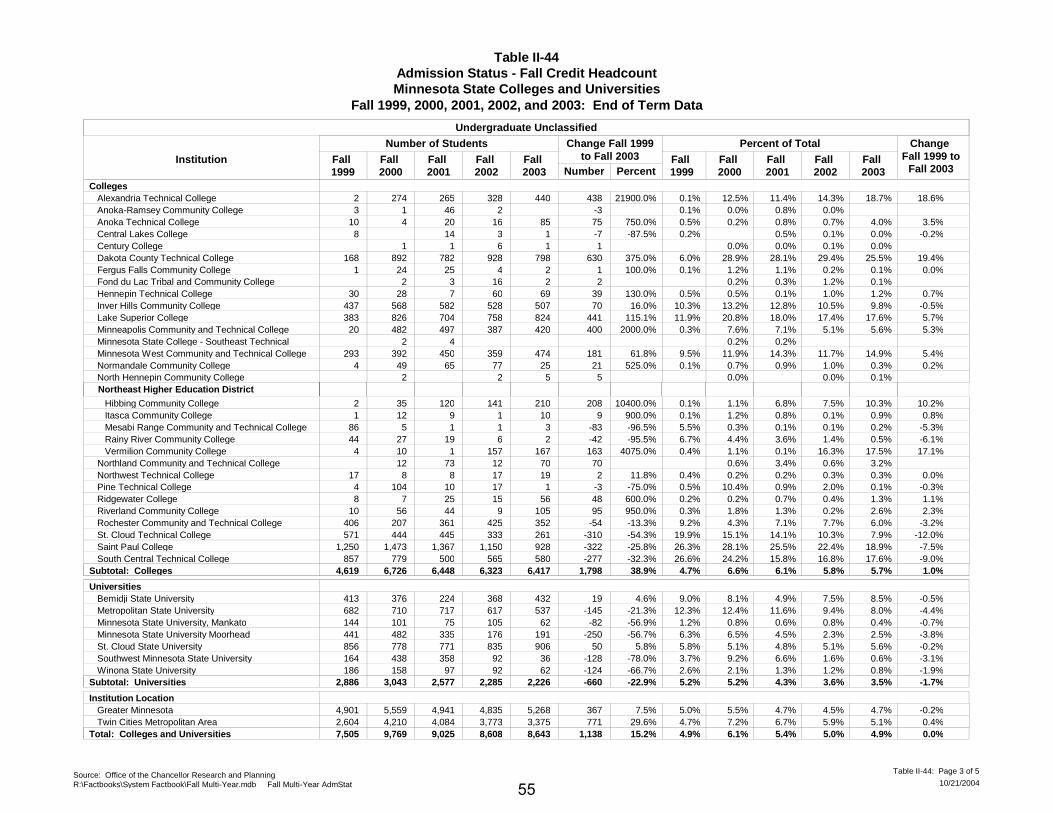
Table II-44Admission Status - Fall Credit HeadcountMinnesota State Colleges and Universities
Fall 1999, 2000, 2001, 2002, and 2003: End of Term Data
Institution Fall 1999
Fall 2000
Fall 2001
Fall 2002
Fall 2003
Number of Students Change Fall 1999to Fall 2003
Number PercentFall 1999
Fall 2000
Fall 2001
Fall 2002
Fall 2003
Change Fall 1999 to
Fall 2003
Percent of Total
Undergraduate Unclassified
CollegesAlexandria Technical College 2 274 265 328 440 0.1%438 21900.0% 18.6%12.5% 11.4% 14.3% 18.7%Anoka-Ramsey Community College 3 1 46 2 0.1%-3 0.0% 0.8% 0.0%Anoka Technical College 10 4 20 16 85 0.5%75 750.0% 3.5%0.2% 0.8% 0.7% 4.0%Central Lakes College 8 14 3 1 0.2%-7 -87.5% -0.2%0.5% 0.1% 0.0%Century College 1 1 6 1 1 0.0% 0.0% 0.1% 0.0%Dakota County Technical College 168 892 782 928 798 6.0%630 375.0% 19.4%28.9% 28.1% 29.4% 25.5%Fergus Falls Community College 1 24 25 4 2 0.1%1 100.0% 0.0%1.2% 1.1% 0.2% 0.1%Fond du Lac Tribal and Community College 2 3 16 2 2 0.2% 0.3% 1.2% 0.1%Hennepin Technical College 30 28 7 60 69 0.5%39 130.0% 0.7%0.5% 0.1% 1.0% 1.2%Inver Hills Community College 437 568 582 528 507 10.3%70 16.0% -0.5%13.2% 12.8% 10.5% 9.8%Lake Superior College 383 826 704 758 824 11.9%441 115.1% 5.7%20.8% 18.0% 17.4% 17.6%Minneapolis Community and Technical College 20 482 497 387 420 0.3%400 2000.0% 5.3%7.6% 7.1% 5.1% 5.6%Minnesota State College - Southeast Technical 2 4 0.2% 0.2%Minnesota West Community and Technical College 293 392 450 359 474 9.5%181 61.8% 5.4%11.9% 14.3% 11.7% 14.9%Normandale Community College 4 49 65 77 25 0.1%21 525.0% 0.2%0.7% 0.9% 1.0% 0.3%North Hennepin Community College 2 2 5 5 0.0% 0.0% 0.1%
Hibbing Community College 2 35 120 141 210 0.1%208 10400.0% 10.2%
Northeast Higher Education District
1.1% 6.8% 7.5% 10.3% Itasca Community College 1 12 9 1 10 0.1%9 900.0% 0.8%1.2% 0.8% 0.1% 0.9% Mesabi Range Community and Technical College 86 5 1 1 3 5.5%-83 -96.5% -5.3%0.3% 0.1% 0.1% 0.2% Rainy River Community College 44 27 19 6 2 6.7%-42 -95.5% -6.1%4.4% 3.6% 1.4% 0.5% Vermilion Community College 4 10 1 157 167 0.4%163 4075.0% 17.1%1.1% 0.1% 16.3% 17.5%Northland Community and Technical College 12 73 12 70 70 0.6% 3.4% 0.6% 3.2%Northwest Technical College 17 8 8 17 19 0.4%2 11.8% 0.0%0.2% 0.2% 0.3% 0.3%Pine Technical College 4 104 10 17 1 0.5%-3 -75.0% -0.3%10.4% 0.9% 2.0% 0.1%Ridgewater College 8 7 25 15 56 0.2%48 600.0% 1.1%0.2% 0.7% 0.4% 1.3%Riverland Community College 10 56 44 9 105 0.3%95 950.0% 2.3%1.8% 1.3% 0.2% 2.6%Rochester Community and Technical College 406 207 361 425 352 9.2%-54 -13.3% -3.2%4.3% 7.1% 7.7% 6.0%St. Cloud Technical College 571 444 445 333 261 19.9%-310 -54.3% -12.0%15.1% 14.1% 10.3% 7.9%Saint Paul College 1,250 1,473 1,367 1,150 928 26.3%-322 -25.8% -7.5%28.1% 25.5% 22.4% 18.9%South Central Technical College 857 779 500 565 580 26.6%-277 -32.3% -9.0%24.2% 15.8% 16.8% 17.6%
Subtotal: Colleges 4,619 6,726 6,448 6,323 6,417 4.7%1,798 38.9% 1.0%6.6% 6.1% 5.8% 5.7%
UniversitiesBemidji State University 413 376 224 368 432 9.0%19 4.6% -0.5%8.1% 4.9% 7.5% 8.5%Metropolitan State University 682 710 717 617 537 12.3%-145 -21.3% -4.4%12.4% 11.6% 9.4% 8.0%Minnesota State University, Mankato 144 101 75 105 62 1.2%-82 -56.9% -0.7%0.8% 0.6% 0.8% 0.4%Minnesota State University Moorhead 441 482 335 176 191 6.3%-250 -56.7% -3.8%6.5% 4.5% 2.3% 2.5%St. Cloud State University 856 778 771 835 906 5.8%50 5.8% -0.2%5.1% 4.8% 5.1% 5.6%Southwest Minnesota State University 164 438 358 92 36 3.7%-128 -78.0% -3.1%9.2% 6.6% 1.6% 0.6%Winona State University 186 158 97 92 62 2.6%-124 -66.7% -1.9%2.1% 1.3% 1.2% 0.8%
Subtotal: Universities 2,886 3,043 2,577 2,285 2,226 5.2%-660 -22.9% -1.7%5.2% 4.3% 3.6% 3.5%
Institution LocationGreater Minnesota 4,901 5,559 4,941 4,835 5,268 5.0%367 7.5% -0.2%5.5% 4.7% 4.5% 4.7%Twin Cities Metropolitan Area 2,604 4,210 4,084 3,773 3,375 4.7%771 29.6% 0.4%7.2% 6.7% 5.9% 5.1%
Total: Colleges and Universities 7,505 9,769 9,025 8,608 8,643 4.9%1,138 15.2% 0.0%6.1% 5.4% 5.0% 4.9%
Source: Office of the Chancellor Research and PlanningR:\Factbooks\System Factbook\Fall Multi-Year.mdb Fall Multi-Year AdmStat 10/21/2004
Table II-44: Page 3 of 5
55
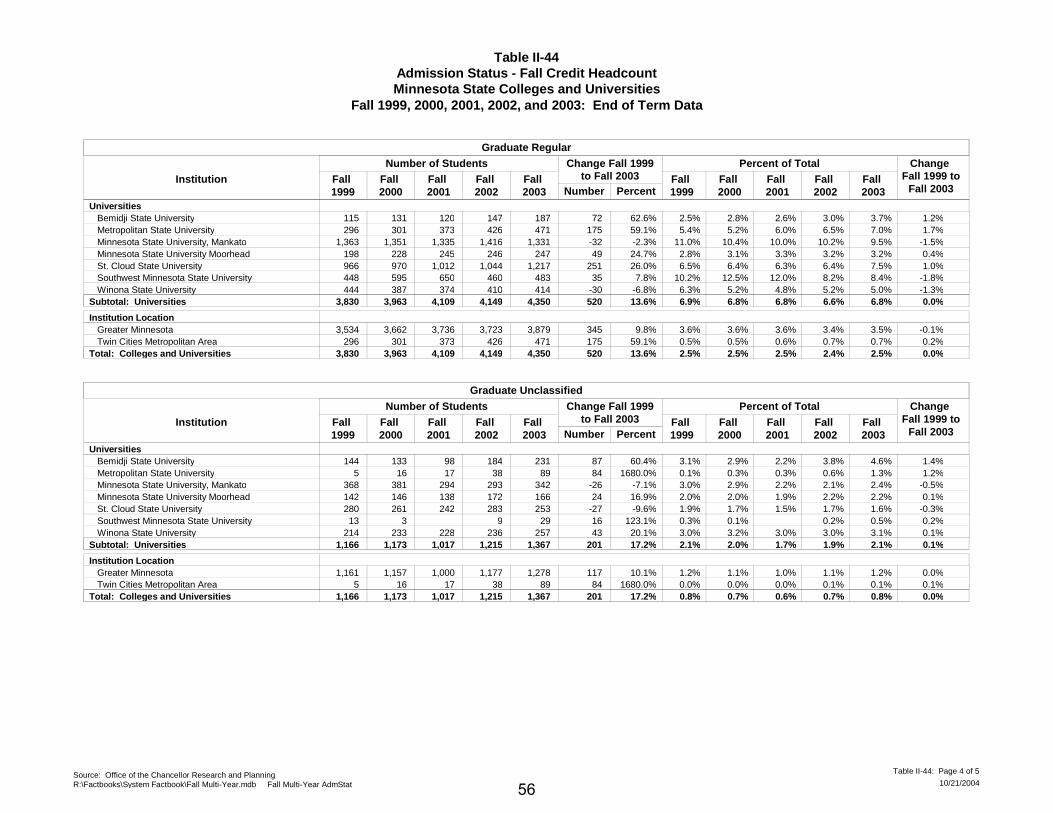
Table II-44Admission Status - Fall Credit HeadcountMinnesota State Colleges and Universities
Fall 1999, 2000, 2001, 2002, and 2003: End of Term Data
Institution Fall 1999
Fall 2000
Fall 2001
Fall 2002
Fall 2003
Number of Students Change Fall 1999to Fall 2003
Number PercentFall 1999
Fall 2000
Fall 2001
Fall 2002
Fall 2003
Change Fall 1999 to
Fall 2003
Percent of Total
Graduate Regular
UniversitiesBemidji State University 115 131 120 147 187 2.5%72 62.6% 1.2%2.8% 2.6% 3.0% 3.7%Metropolitan State University 296 301 373 426 471 5.4%175 59.1% 1.7%5.2% 6.0% 6.5% 7.0%Minnesota State University, Mankato 1,363 1,351 1,335 1,416 1,331 11.0%-32 -2.3% -1.5%10.4% 10.0% 10.2% 9.5%Minnesota State University Moorhead 198 228 245 246 247 2.8%49 24.7% 0.4%3.1% 3.3% 3.2% 3.2%St. Cloud State University 966 970 1,012 1,044 1,217 6.5%251 26.0% 1.0%6.4% 6.3% 6.4% 7.5%Southwest Minnesota State University 448 595 650 460 483 10.2%35 7.8% -1.8%12.5% 12.0% 8.2% 8.4%Winona State University 444 387 374 410 414 6.3%-30 -6.8% -1.3%5.2% 4.8% 5.2% 5.0%
Subtotal: Universities 3,830 3,963 4,109 4,149 4,350 6.9%520 13.6% 0.0%6.8% 6.8% 6.6% 6.8%
Institution LocationGreater Minnesota 3,534 3,662 3,736 3,723 3,879 3.6%345 9.8% -0.1%3.6% 3.6% 3.4% 3.5%Twin Cities Metropolitan Area 296 301 373 426 471 0.5%175 59.1% 0.2%0.5% 0.6% 0.7% 0.7%
Total: Colleges and Universities 3,830 3,963 4,109 4,149 4,350 2.5%520 13.6% 0.0%2.5% 2.5% 2.4% 2.5%
Institution Fall 1999
Fall 2000
Fall 2001
Fall 2002
Fall 2003
Number of Students Change Fall 1999to Fall 2003
Number PercentFall 1999
Fall 2000
Fall 2001
Fall 2002
Fall 2003
Change Fall 1999 to
Fall 2003
Percent of Total
Graduate Unclassified
UniversitiesBemidji State University 144 133 98 184 231 3.1%87 60.4% 1.4%2.9% 2.2% 3.8% 4.6%Metropolitan State University 5 16 17 38 89 0.1%84 1680.0% 1.2%0.3% 0.3% 0.6% 1.3%Minnesota State University, Mankato 368 381 294 293 342 3.0%-26 -7.1% -0.5%2.9% 2.2% 2.1% 2.4%Minnesota State University Moorhead 142 146 138 172 166 2.0%24 16.9% 0.1%2.0% 1.9% 2.2% 2.2%St. Cloud State University 280 261 242 283 253 1.9%-27 -9.6% -0.3%1.7% 1.5% 1.7% 1.6%Southwest Minnesota State University 13 3 9 29 0.3%16 123.1% 0.2%0.1% 0.2% 0.5%Winona State University 214 233 228 236 257 3.0%43 20.1% 0.1%3.2% 3.0% 3.0% 3.1%
Subtotal: Universities 1,166 1,173 1,017 1,215 1,367 2.1%201 17.2% 0.1%2.0% 1.7% 1.9% 2.1%
Institution LocationGreater Minnesota 1,161 1,157 1,000 1,177 1,278 1.2%117 10.1% 0.0%1.1% 1.0% 1.1% 1.2%Twin Cities Metropolitan Area 5 16 17 38 89 0.0%84 1680.0% 0.1%0.0% 0.0% 0.1% 0.1%
Total: Colleges and Universities 1,166 1,173 1,017 1,215 1,367 0.8%201 17.2% 0.0%0.7% 0.6% 0.7% 0.8%
Source: Office of the Chancellor Research and PlanningR:\Factbooks\System Factbook\Fall Multi-Year.mdb Fall Multi-Year AdmStat 10/21/2004
Table II-44: Page 4 of 5
56
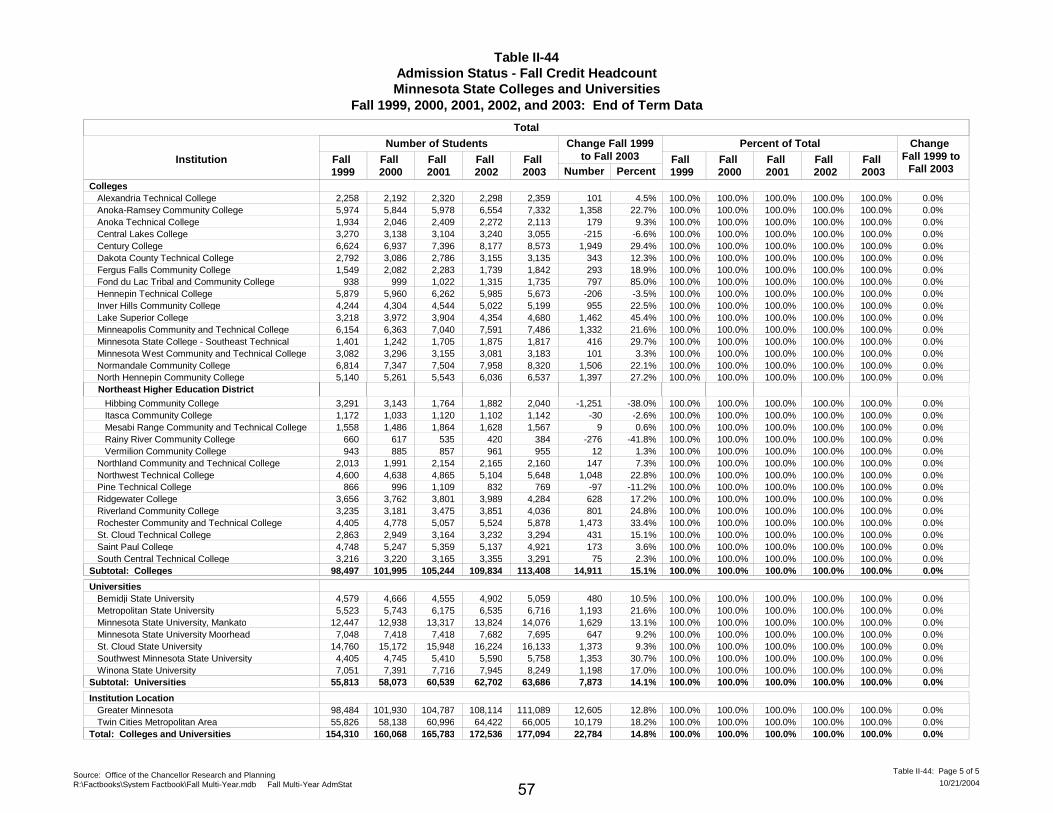
Table II-44Admission Status - Fall Credit HeadcountMinnesota State Colleges and Universities
Fall 1999, 2000, 2001, 2002, and 2003: End of Term Data
Institution Fall 1999
Fall 2000
Fall 2001
Fall 2002
Fall 2003
Number of Students Change Fall 1999to Fall 2003
Number PercentFall 1999
Fall 2000
Fall 2001
Fall 2002
Fall 2003
Change Fall 1999 to
Fall 2003
Percent of Total
Total
CollegesAlexandria Technical College 2,258 2,192 2,320 2,298 2,359 100.0%101 4.5% 0.0%100.0% 100.0% 100.0% 100.0%Anoka-Ramsey Community College 5,974 5,844 5,978 6,554 7,332 100.0%1,358 22.7% 0.0%100.0% 100.0% 100.0% 100.0%Anoka Technical College 1,934 2,046 2,409 2,272 2,113 100.0%179 9.3% 0.0%100.0% 100.0% 100.0% 100.0%Central Lakes College 3,270 3,138 3,104 3,240 3,055 100.0%-215 -6.6% 0.0%100.0% 100.0% 100.0% 100.0%Century College 6,624 6,937 7,396 8,177 8,573 100.0%1,949 29.4% 0.0%100.0% 100.0% 100.0% 100.0%Dakota County Technical College 2,792 3,086 2,786 3,155 3,135 100.0%343 12.3% 0.0%100.0% 100.0% 100.0% 100.0%Fergus Falls Community College 1,549 2,082 2,283 1,739 1,842 100.0%293 18.9% 0.0%100.0% 100.0% 100.0% 100.0%Fond du Lac Tribal and Community College 938 999 1,022 1,315 1,735 100.0%797 85.0% 0.0%100.0% 100.0% 100.0% 100.0%Hennepin Technical College 5,879 5,960 6,262 5,985 5,673 100.0%-206 -3.5% 0.0%100.0% 100.0% 100.0% 100.0%Inver Hills Community College 4,244 4,304 4,544 5,022 5,199 100.0%955 22.5% 0.0%100.0% 100.0% 100.0% 100.0%Lake Superior College 3,218 3,972 3,904 4,354 4,680 100.0%1,462 45.4% 0.0%100.0% 100.0% 100.0% 100.0%Minneapolis Community and Technical College 6,154 6,363 7,040 7,591 7,486 100.0%1,332 21.6% 0.0%100.0% 100.0% 100.0% 100.0%Minnesota State College - Southeast Technical 1,401 1,242 1,705 1,875 1,817 100.0%416 29.7% 0.0%100.0% 100.0% 100.0% 100.0%Minnesota West Community and Technical College 3,082 3,296 3,155 3,081 3,183 100.0%101 3.3% 0.0%100.0% 100.0% 100.0% 100.0%Normandale Community College 6,814 7,347 7,504 7,958 8,320 100.0%1,506 22.1% 0.0%100.0% 100.0% 100.0% 100.0%North Hennepin Community College 5,140 5,261 5,543 6,036 6,537 100.0%1,397 27.2% 0.0%100.0% 100.0% 100.0% 100.0%
Hibbing Community College 3,291 3,143 1,764 1,882 2,040 100.0%-1,251 -38.0% 0.0%
Northeast Higher Education District
100.0% 100.0% 100.0% 100.0% Itasca Community College 1,172 1,033 1,120 1,102 1,142 100.0%-30 -2.6% 0.0%100.0% 100.0% 100.0% 100.0% Mesabi Range Community and Technical College 1,558 1,486 1,864 1,628 1,567 100.0%9 0.6% 0.0%100.0% 100.0% 100.0% 100.0% Rainy River Community College 660 617 535 420 384 100.0%-276 -41.8% 0.0%100.0% 100.0% 100.0% 100.0% Vermilion Community College 943 885 857 961 955 100.0%12 1.3% 0.0%100.0% 100.0% 100.0% 100.0%Northland Community and Technical College 2,013 1,991 2,154 2,165 2,160 100.0%147 7.3% 0.0%100.0% 100.0% 100.0% 100.0%Northwest Technical College 4,600 4,638 4,865 5,104 5,648 100.0%1,048 22.8% 0.0%100.0% 100.0% 100.0% 100.0%Pine Technical College 866 996 1,109 832 769 100.0%-97 -11.2% 0.0%100.0% 100.0% 100.0% 100.0%Ridgewater College 3,656 3,762 3,801 3,989 4,284 100.0%628 17.2% 0.0%100.0% 100.0% 100.0% 100.0%Riverland Community College 3,235 3,181 3,475 3,851 4,036 100.0%801 24.8% 0.0%100.0% 100.0% 100.0% 100.0%Rochester Community and Technical College 4,405 4,778 5,057 5,524 5,878 100.0%1,473 33.4% 0.0%100.0% 100.0% 100.0% 100.0%St. Cloud Technical College 2,863 2,949 3,164 3,232 3,294 100.0%431 15.1% 0.0%100.0% 100.0% 100.0% 100.0%Saint Paul College 4,748 5,247 5,359 5,137 4,921 100.0%173 3.6% 0.0%100.0% 100.0% 100.0% 100.0%South Central Technical College 3,216 3,220 3,165 3,355 3,291 100.0%75 2.3% 0.0%100.0% 100.0% 100.0% 100.0%
Subtotal: Colleges 98,497 101,995 105,244 109,834 113,408 100.0%14,911 15.1% 0.0%100.0% 100.0% 100.0% 100.0%
UniversitiesBemidji State University 4,579 4,666 4,555 4,902 5,059 100.0%480 10.5% 0.0%100.0% 100.0% 100.0% 100.0%Metropolitan State University 5,523 5,743 6,175 6,535 6,716 100.0%1,193 21.6% 0.0%100.0% 100.0% 100.0% 100.0%Minnesota State University, Mankato 12,447 12,938 13,317 13,824 14,076 100.0%1,629 13.1% 0.0%100.0% 100.0% 100.0% 100.0%Minnesota State University Moorhead 7,048 7,418 7,418 7,682 7,695 100.0%647 9.2% 0.0%100.0% 100.0% 100.0% 100.0%St. Cloud State University 14,760 15,172 15,948 16,224 16,133 100.0%1,373 9.3% 0.0%100.0% 100.0% 100.0% 100.0%Southwest Minnesota State University 4,405 4,745 5,410 5,590 5,758 100.0%1,353 30.7% 0.0%100.0% 100.0% 100.0% 100.0%Winona State University 7,051 7,391 7,716 7,945 8,249 100.0%1,198 17.0% 0.0%100.0% 100.0% 100.0% 100.0%
Subtotal: Universities 55,813 58,073 60,539 62,702 63,686 100.0%7,873 14.1% 0.0%100.0% 100.0% 100.0% 100.0%
Institution LocationGreater Minnesota 98,484 101,930 104,787 108,114 111,089 100.0%12,605 12.8% 0.0%100.0% 100.0% 100.0% 100.0%Twin Cities Metropolitan Area 55,826 58,138 60,996 64,422 66,005 100.0%10,179 18.2% 0.0%100.0% 100.0% 100.0% 100.0%
Total: Colleges and Universities 154,310 160,068 165,783 172,536 177,094 100.0%22,784 14.8% 0.0%100.0% 100.0% 100.0% 100.0%
Source: Office of the Chancellor Research and PlanningR:\Factbooks\System Factbook\Fall Multi-Year.mdb Fall Multi-Year AdmStat 10/21/2004
Table II-44: Page 5 of 5
57

This Page is Intentionally Left Blank
58

Table II-45Age Category - Fall Credit Headcount
Minnesota State Colleges and UniversitiesFall 1999, 2000, 2001, 2002, and 2003: End of Term Data
InstitutionFall 1999
Fall 2000
Fall 2001
Fall 2002
Fall 2003
Number of Students Change Fall 1999to Fall 2003
Number PercentFall 1999
Fall 2000
Fall 2001
Fall 2002
Fall 2003
Change Fall 1999 to
Fall 2003
Student Age Category: Less Than 20
Percent of Total Known
CollegesAlexandria Technical College 1,000 935 1,018 998 1,014 45.9% 44.5% 45.7% 44.4% 45.2%14 1.4% -0.7%Anoka-Ramsey Community College 2,862 2,421 2,517 2,932 3,176 48.5% 45.0% 46.2% 48.3% 47.9%314 11.0% -0.6%Anoka Technical College 376 501 607 526 327 27.2% 33.1% 33.6% 29.2% 19.3%-49 -13.0% -7.9%Central Lakes College 1,495 1,375 1,243 1,286 1,180 46.5% 44.7% 40.5% 39.9% 38.8%-315 -21.1% -7.7%Century College 2,067 2,030 1,930 2,134 2,516 31.3% 31.6% 29.9% 29.9% 31.3%449 21.7% 0.0%Dakota County Technical College 456 528 507 577 623 27.5% 26.2% 22.3% 20.7% 22.3%167 36.6% -5.2%Fergus Falls Community College 1,032 1,208 1,112 1,129 1,168 66.7% 66.4% 62.3% 65.4% 64.3%136 13.2% -2.4%Fond du Lac Tribal and Community College 435 482 433 581 852 46.9% 48.6% 42.6% 45.2% 50.5%417 95.9% 3.7%Hennepin Technical College 886 977 993 926 910 15.9% 17.1% 16.1% 15.8% 16.4%24 2.7% 0.6%Inver Hills Community College 1,216 1,252 1,267 1,335 1,458 29.4% 30.3% 29.6% 29.4% 30.6%242 19.9% 1.2%Lake Superior College 840 1,035 1,031 1,345 1,353 27.7% 28.3% 30.3% 34.7% 32.2%513 61.1% 4.4%Minneapolis Community and Technical College 803 828 961 911 849 13.4% 13.8% 14.4% 13.0% 13.3%46 5.7% -0.1%Minnesota State College - Southeast Technical 421 369 389 400 471 30.0% 29.9% 22.8% 21.4% 26.1%50 11.9% -4.0%Minnesota West Community and Technical College 1,079 1,057 1,024 1,078 998 38.2% 35.3% 35.6% 36.4% 33.0%-81 -7.5% -5.2%Normandale Community College 2,269 2,335 2,390 2,568 2,739 33.6% 33.2% 33.6% 33.5% 33.7%470 20.7% 0.0%North Hennepin Community College 1,639 1,681 1,741 1,863 1,947 32.6% 32.2% 31.7% 31.0% 29.9%308 18.8% -2.8%
Hibbing Community College 570 590 531 519 529 19.0% 20.3% 31.1% 28.6% 27.4%-41 -7.2% 8.4%
Northeast Higher Education District
Itasca Community College 542 499 528 555 487 47.3% 50.5% 49.2% 50.6% 43.2%-55 -10.1% -4.2% Mesabi Range Community and Technical College 793 715 980 817 794 51.8% 48.8% 53.6% 50.5% 51.0%1 0.1% -0.7% Rainy River Community College 191 192 220 173 184 29.9% 33.6% 43.1% 41.9% 48.9%-7 -3.7% 19.0% Vermilion Community College 491 488 449 480 532 54.0% 56.5% 57.9% 54.1% 57.2%41 8.4% 3.2%Northland Community and Technical College 598 539 611 616 595 30.0% 28.4% 29.3% 29.4% 28.9%-3 -0.5% -1.1%Northwest Technical College 1,274 1,374 1,389 1,343 1,474 29.0% 31.1% 29.5% 27.1% 26.7%200 15.7% -2.3%Pine Technical College 372 237 598 407 328 49.4% 39.3% 61.7% 50.2% 42.8%-44 -11.8% -6.6%Ridgewater College 1,470 1,412 1,407 1,538 1,686 41.5% 38.5% 38.1% 39.1% 39.9%216 14.7% -1.7%Riverland Community College 1,018 1,050 1,294 1,370 1,371 33.2% 34.2% 38.5% 37.1% 35.6%353 34.7% 2.4%Rochester Community and Technical College 1,687 1,865 1,857 1,932 1,983 38.5% 39.7% 37.7% 36.2% 34.7%296 17.5% -3.7%St. Cloud Technical College 945 1,010 1,026 1,009 1,117 38.1% 37.9% 35.7% 33.0% 34.9%172 18.2% -3.1%Saint Paul College 524 560 611 616 555 11.4% 10.9% 11.5% 12.3% 11.4%31 5.9% 0.1%South Central Technical College 716 731 690 726 723 23.3% 23.6% 22.5% 22.2% 22.7%7 1.0% -0.6%
Subtotal: Colleges 30,067 30,276 31,354 32,690 33,939 32.1% 31.7% 31.8% 31.4% 31.5%3,872 12.9% -0.6%Universities
Bemidji State University 1,137 1,145 1,199 1,178 1,204 24.9% 24.6% 26.4% 24.4% 24.4%67 5.9% -0.5%Metropolitan State University 123 223 199 245 252 2.5% 4.4% 3.8% 4.5% 4.5%129 104.9% 2.1%Minnesota State University, Mankato 3,763 3,870 4,013 4,029 4,163 30.4% 30.2% 30.6% 29.8% 30.3%400 10.6% 0.0%Minnesota State University Moorhead 2,124 2,221 2,165 2,172 2,154 30.1% 30.0% 29.4% 28.7% 28.6%30 1.4% -1.6%St. Cloud State University 4,831 4,757 4,912 4,941 4,976 32.8% 31.4% 30.9% 30.7% 31.1%145 3.0% -1.7%Southwest Minnesota State University 2,289 2,367 2,919 3,203 3,441 53.4% 50.6% 54.6% 57.8% 60.2%1,152 50.3% 6.8%Winona State University 2,430 2,571 2,728 2,701 2,819 35.1% 35.3% 36.3% 34.9% 35.0%389 16.0% 0.0%
Subtotal: Universities 16,697 17,154 18,135 18,469 19,009 30.4% 30.1% 30.7% 30.4% 30.9%2,312 13.8% 0.5%Institution Location
Greater Minnesota 33,543 34,094 35,766 36,526 37,596 34.9% 34.5% 35.3% 34.6% 34.7%4,053 12.1% -0.2%Twin Cities Metropolitan Area 13,221 13,336 13,723 14,633 15,352 25.1% 24.9% 24.4% 24.7% 25.2%2,131 16.1% 0.1%
Total: Colleges and Universities 46,764 47,430 49,489 51,159 52,948 31.5% 31.1% 31.4% 31.0% 31.3%6,184 13.2% -0.2%
Source: Office of the Chancellor Research and PlanningR:\Factbooks\System Factbook\Fall Multi-Year.mdb Fall Multi-Year AgeCat 10/21/2004
Table II-45: Page 1 of 8
59
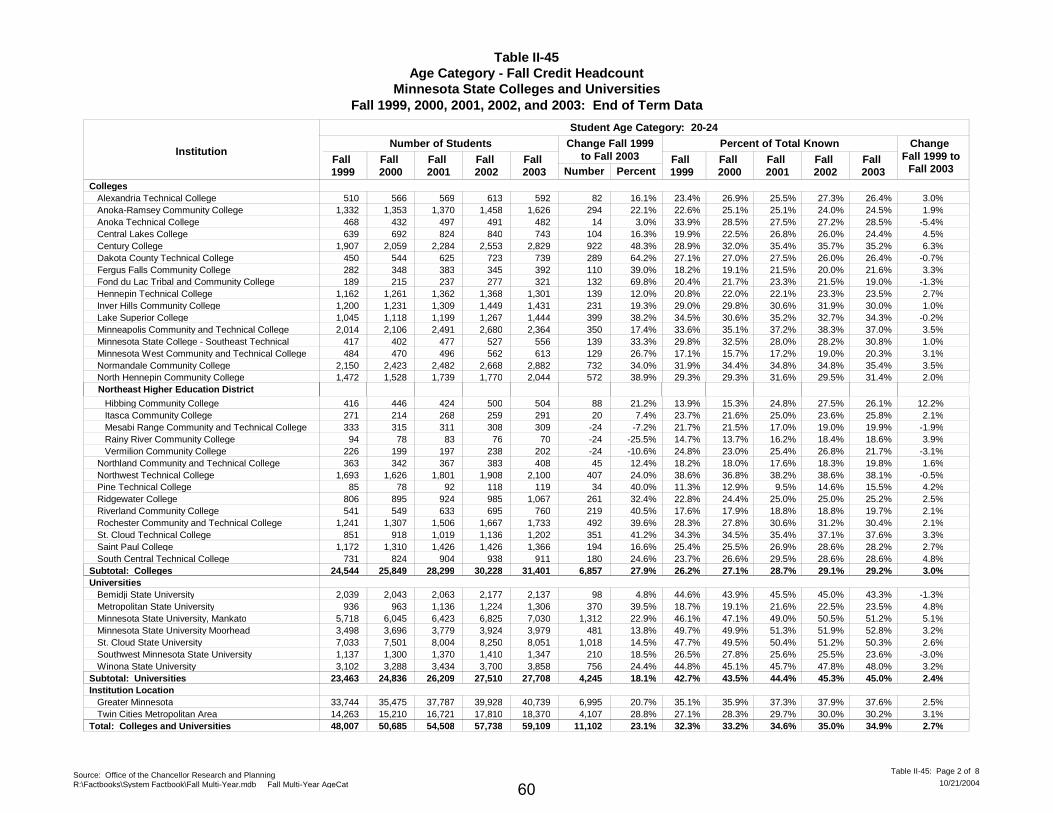
Table II-45Age Category - Fall Credit Headcount
Minnesota State Colleges and UniversitiesFall 1999, 2000, 2001, 2002, and 2003: End of Term Data
InstitutionFall 1999
Fall 2000
Fall 2001
Fall 2002
Fall 2003
Number of Students Change Fall 1999to Fall 2003
Number PercentFall 1999
Fall 2000
Fall 2001
Fall 2002
Fall 2003
Change Fall 1999 to
Fall 2003
Student Age Category: 20-24
Percent of Total Known
CollegesAlexandria Technical College 510 566 569 613 592 23.4% 26.9% 25.5% 27.3% 26.4%82 16.1% 3.0%Anoka-Ramsey Community College 1,332 1,353 1,370 1,458 1,626 22.6% 25.1% 25.1% 24.0% 24.5%294 22.1% 1.9%Anoka Technical College 468 432 497 491 482 33.9% 28.5% 27.5% 27.2% 28.5%14 3.0% -5.4%Central Lakes College 639 692 824 840 743 19.9% 22.5% 26.8% 26.0% 24.4%104 16.3% 4.5%Century College 1,907 2,059 2,284 2,553 2,829 28.9% 32.0% 35.4% 35.7% 35.2%922 48.3% 6.3%Dakota County Technical College 450 544 625 723 739 27.1% 27.0% 27.5% 26.0% 26.4%289 64.2% -0.7%Fergus Falls Community College 282 348 383 345 392 18.2% 19.1% 21.5% 20.0% 21.6%110 39.0% 3.3%Fond du Lac Tribal and Community College 189 215 237 277 321 20.4% 21.7% 23.3% 21.5% 19.0%132 69.8% -1.3%Hennepin Technical College 1,162 1,261 1,362 1,368 1,301 20.8% 22.0% 22.1% 23.3% 23.5%139 12.0% 2.7%Inver Hills Community College 1,200 1,231 1,309 1,449 1,431 29.0% 29.8% 30.6% 31.9% 30.0%231 19.3% 1.0%Lake Superior College 1,045 1,118 1,199 1,267 1,444 34.5% 30.6% 35.2% 32.7% 34.3%399 38.2% -0.2%Minneapolis Community and Technical College 2,014 2,106 2,491 2,680 2,364 33.6% 35.1% 37.2% 38.3% 37.0%350 17.4% 3.5%Minnesota State College - Southeast Technical 417 402 477 527 556 29.8% 32.5% 28.0% 28.2% 30.8%139 33.3% 1.0%Minnesota West Community and Technical College 484 470 496 562 613 17.1% 15.7% 17.2% 19.0% 20.3%129 26.7% 3.1%Normandale Community College 2,150 2,423 2,482 2,668 2,882 31.9% 34.4% 34.8% 34.8% 35.4%732 34.0% 3.5%North Hennepin Community College 1,472 1,528 1,739 1,770 2,044 29.3% 29.3% 31.6% 29.5% 31.4%572 38.9% 2.0%
Hibbing Community College 416 446 424 500 504 13.9% 15.3% 24.8% 27.5% 26.1%88 21.2% 12.2%
Northeast Higher Education District
Itasca Community College 271 214 268 259 291 23.7% 21.6% 25.0% 23.6% 25.8%20 7.4% 2.1% Mesabi Range Community and Technical College 333 315 311 308 309 21.7% 21.5% 17.0% 19.0% 19.9%-24 -7.2% -1.9% Rainy River Community College 94 78 83 76 70 14.7% 13.7% 16.2% 18.4% 18.6%-24 -25.5% 3.9% Vermilion Community College 226 199 197 238 202 24.8% 23.0% 25.4% 26.8% 21.7%-24 -10.6% -3.1%Northland Community and Technical College 363 342 367 383 408 18.2% 18.0% 17.6% 18.3% 19.8%45 12.4% 1.6%Northwest Technical College 1,693 1,626 1,801 1,908 2,100 38.6% 36.8% 38.2% 38.6% 38.1%407 24.0% -0.5%Pine Technical College 85 78 92 118 119 11.3% 12.9% 9.5% 14.6% 15.5%34 40.0% 4.2%Ridgewater College 806 895 924 985 1,067 22.8% 24.4% 25.0% 25.0% 25.2%261 32.4% 2.5%Riverland Community College 541 549 633 695 760 17.6% 17.9% 18.8% 18.8% 19.7%219 40.5% 2.1%Rochester Community and Technical College 1,241 1,307 1,506 1,667 1,733 28.3% 27.8% 30.6% 31.2% 30.4%492 39.6% 2.1%St. Cloud Technical College 851 918 1,019 1,136 1,202 34.3% 34.5% 35.4% 37.1% 37.6%351 41.2% 3.3%Saint Paul College 1,172 1,310 1,426 1,426 1,366 25.4% 25.5% 26.9% 28.6% 28.2%194 16.6% 2.7%South Central Technical College 731 824 904 938 911 23.7% 26.6% 29.5% 28.6% 28.6%180 24.6% 4.8%
Subtotal: Colleges 24,544 25,849 28,299 30,228 31,401 26.2% 27.1% 28.7% 29.1% 29.2%6,857 27.9% 3.0%Universities
Bemidji State University 2,039 2,043 2,063 2,177 2,137 44.6% 43.9% 45.5% 45.0% 43.3%98 4.8% -1.3%Metropolitan State University 936 963 1,136 1,224 1,306 18.7% 19.1% 21.6% 22.5% 23.5%370 39.5% 4.8%Minnesota State University, Mankato 5,718 6,045 6,423 6,825 7,030 46.1% 47.1% 49.0% 50.5% 51.2%1,312 22.9% 5.1%Minnesota State University Moorhead 3,498 3,696 3,779 3,924 3,979 49.7% 49.9% 51.3% 51.9% 52.8%481 13.8% 3.2%St. Cloud State University 7,033 7,501 8,004 8,250 8,051 47.7% 49.5% 50.4% 51.2% 50.3%1,018 14.5% 2.6%Southwest Minnesota State University 1,137 1,300 1,370 1,410 1,347 26.5% 27.8% 25.6% 25.5% 23.6%210 18.5% -3.0%Winona State University 3,102 3,288 3,434 3,700 3,858 44.8% 45.1% 45.7% 47.8% 48.0%756 24.4% 3.2%
Subtotal: Universities 23,463 24,836 26,209 27,510 27,708 42.7% 43.5% 44.4% 45.3% 45.0%4,245 18.1% 2.4%Institution Location
Greater Minnesota 33,744 35,475 37,787 39,928 40,739 35.1% 35.9% 37.3% 37.9% 37.6%6,995 20.7% 2.5%Twin Cities Metropolitan Area 14,263 15,210 16,721 17,810 18,370 27.1% 28.3% 29.7% 30.0% 30.2%4,107 28.8% 3.1%
Total: Colleges and Universities 48,007 50,685 54,508 57,738 59,109 32.3% 33.2% 34.6% 35.0% 34.9%11,102 23.1% 2.7%
Source: Office of the Chancellor Research and PlanningR:\Factbooks\System Factbook\Fall Multi-Year.mdb Fall Multi-Year AgeCat 10/21/2004
Table II-45: Page 2 of 8
60
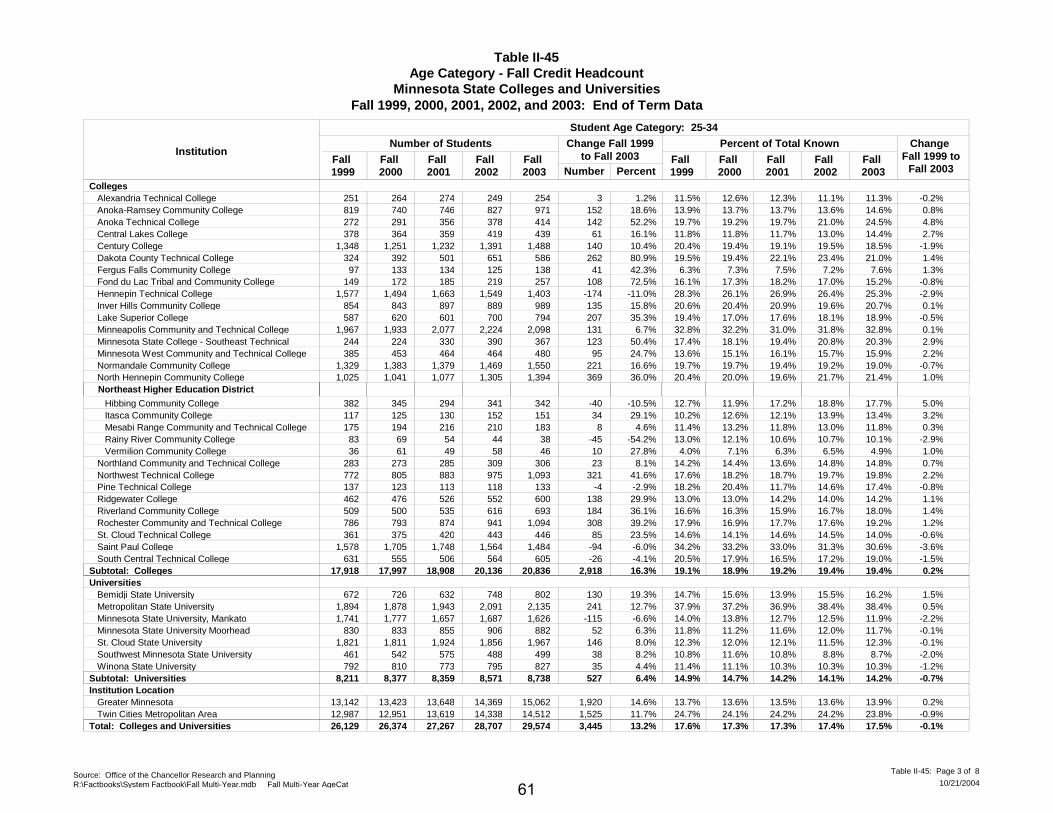
Table II-45Age Category - Fall Credit Headcount
Minnesota State Colleges and UniversitiesFall 1999, 2000, 2001, 2002, and 2003: End of Term Data
InstitutionFall 1999
Fall 2000
Fall 2001
Fall 2002
Fall 2003
Number of Students Change Fall 1999to Fall 2003
Number PercentFall 1999
Fall 2000
Fall 2001
Fall 2002
Fall 2003
Change Fall 1999 to
Fall 2003
Student Age Category: 25-34
Percent of Total Known
CollegesAlexandria Technical College 251 264 274 249 254 11.5% 12.6% 12.3% 11.1% 11.3%3 1.2% -0.2%Anoka-Ramsey Community College 819 740 746 827 971 13.9% 13.7% 13.7% 13.6% 14.6%152 18.6% 0.8%Anoka Technical College 272 291 356 378 414 19.7% 19.2% 19.7% 21.0% 24.5%142 52.2% 4.8%Central Lakes College 378 364 359 419 439 11.8% 11.8% 11.7% 13.0% 14.4%61 16.1% 2.7%Century College 1,348 1,251 1,232 1,391 1,488 20.4% 19.4% 19.1% 19.5% 18.5%140 10.4% -1.9%Dakota County Technical College 324 392 501 651 586 19.5% 19.4% 22.1% 23.4% 21.0%262 80.9% 1.4%Fergus Falls Community College 97 133 134 125 138 6.3% 7.3% 7.5% 7.2% 7.6%41 42.3% 1.3%Fond du Lac Tribal and Community College 149 172 185 219 257 16.1% 17.3% 18.2% 17.0% 15.2%108 72.5% -0.8%Hennepin Technical College 1,577 1,494 1,663 1,549 1,403 28.3% 26.1% 26.9% 26.4% 25.3%-174 -11.0% -2.9%Inver Hills Community College 854 843 897 889 989 20.6% 20.4% 20.9% 19.6% 20.7%135 15.8% 0.1%Lake Superior College 587 620 601 700 794 19.4% 17.0% 17.6% 18.1% 18.9%207 35.3% -0.5%Minneapolis Community and Technical College 1,967 1,933 2,077 2,224 2,098 32.8% 32.2% 31.0% 31.8% 32.8%131 6.7% 0.1%Minnesota State College - Southeast Technical 244 224 330 390 367 17.4% 18.1% 19.4% 20.8% 20.3%123 50.4% 2.9%Minnesota West Community and Technical College 385 453 464 464 480 13.6% 15.1% 16.1% 15.7% 15.9%95 24.7% 2.2%Normandale Community College 1,329 1,383 1,379 1,469 1,550 19.7% 19.7% 19.4% 19.2% 19.0%221 16.6% -0.7%North Hennepin Community College 1,025 1,041 1,077 1,305 1,394 20.4% 20.0% 19.6% 21.7% 21.4%369 36.0% 1.0%
Hibbing Community College 382 345 294 341 342 12.7% 11.9% 17.2% 18.8% 17.7%-40 -10.5% 5.0%
Northeast Higher Education District
Itasca Community College 117 125 130 152 151 10.2% 12.6% 12.1% 13.9% 13.4%34 29.1% 3.2% Mesabi Range Community and Technical College 175 194 216 210 183 11.4% 13.2% 11.8% 13.0% 11.8%8 4.6% 0.3% Rainy River Community College 83 69 54 44 38 13.0% 12.1% 10.6% 10.7% 10.1%-45 -54.2% -2.9% Vermilion Community College 36 61 49 58 46 4.0% 7.1% 6.3% 6.5% 4.9%10 27.8% 1.0%Northland Community and Technical College 283 273 285 309 306 14.2% 14.4% 13.6% 14.8% 14.8%23 8.1% 0.7%Northwest Technical College 772 805 883 975 1,093 17.6% 18.2% 18.7% 19.7% 19.8%321 41.6% 2.2%Pine Technical College 137 123 113 118 133 18.2% 20.4% 11.7% 14.6% 17.4%-4 -2.9% -0.8%Ridgewater College 462 476 526 552 600 13.0% 13.0% 14.2% 14.0% 14.2%138 29.9% 1.1%Riverland Community College 509 500 535 616 693 16.6% 16.3% 15.9% 16.7% 18.0%184 36.1% 1.4%Rochester Community and Technical College 786 793 874 941 1,094 17.9% 16.9% 17.7% 17.6% 19.2%308 39.2% 1.2%St. Cloud Technical College 361 375 420 443 446 14.6% 14.1% 14.6% 14.5% 14.0%85 23.5% -0.6%Saint Paul College 1,578 1,705 1,748 1,564 1,484 34.2% 33.2% 33.0% 31.3% 30.6%-94 -6.0% -3.6%South Central Technical College 631 555 506 564 605 20.5% 17.9% 16.5% 17.2% 19.0%-26 -4.1% -1.5%
Subtotal: Colleges 17,918 17,997 18,908 20,136 20,836 19.1% 18.9% 19.2% 19.4% 19.4%2,918 16.3% 0.2%Universities
Bemidji State University 672 726 632 748 802 14.7% 15.6% 13.9% 15.5% 16.2%130 19.3% 1.5%Metropolitan State University 1,894 1,878 1,943 2,091 2,135 37.9% 37.2% 36.9% 38.4% 38.4%241 12.7% 0.5%Minnesota State University, Mankato 1,741 1,777 1,657 1,687 1,626 14.0% 13.8% 12.7% 12.5% 11.9%-115 -6.6% -2.2%Minnesota State University Moorhead 830 833 855 906 882 11.8% 11.2% 11.6% 12.0% 11.7%52 6.3% -0.1%St. Cloud State University 1,821 1,811 1,924 1,856 1,967 12.3% 12.0% 12.1% 11.5% 12.3%146 8.0% -0.1%Southwest Minnesota State University 461 542 575 488 499 10.8% 11.6% 10.8% 8.8% 8.7%38 8.2% -2.0%Winona State University 792 810 773 795 827 11.4% 11.1% 10.3% 10.3% 10.3%35 4.4% -1.2%
Subtotal: Universities 8,211 8,377 8,359 8,571 8,738 14.9% 14.7% 14.2% 14.1% 14.2%527 6.4% -0.7%Institution Location
Greater Minnesota 13,142 13,423 13,648 14,369 15,062 13.7% 13.6% 13.5% 13.6% 13.9%1,920 14.6% 0.2%Twin Cities Metropolitan Area 12,987 12,951 13,619 14,338 14,512 24.7% 24.1% 24.2% 24.2% 23.8%1,525 11.7% -0.9%
Total: Colleges and Universities 26,129 26,374 27,267 28,707 29,574 17.6% 17.3% 17.3% 17.4% 17.5%3,445 13.2% -0.1%
Source: Office of the Chancellor Research and PlanningR:\Factbooks\System Factbook\Fall Multi-Year.mdb Fall Multi-Year AgeCat 10/21/2004
Table II-45: Page 3 of 8
61
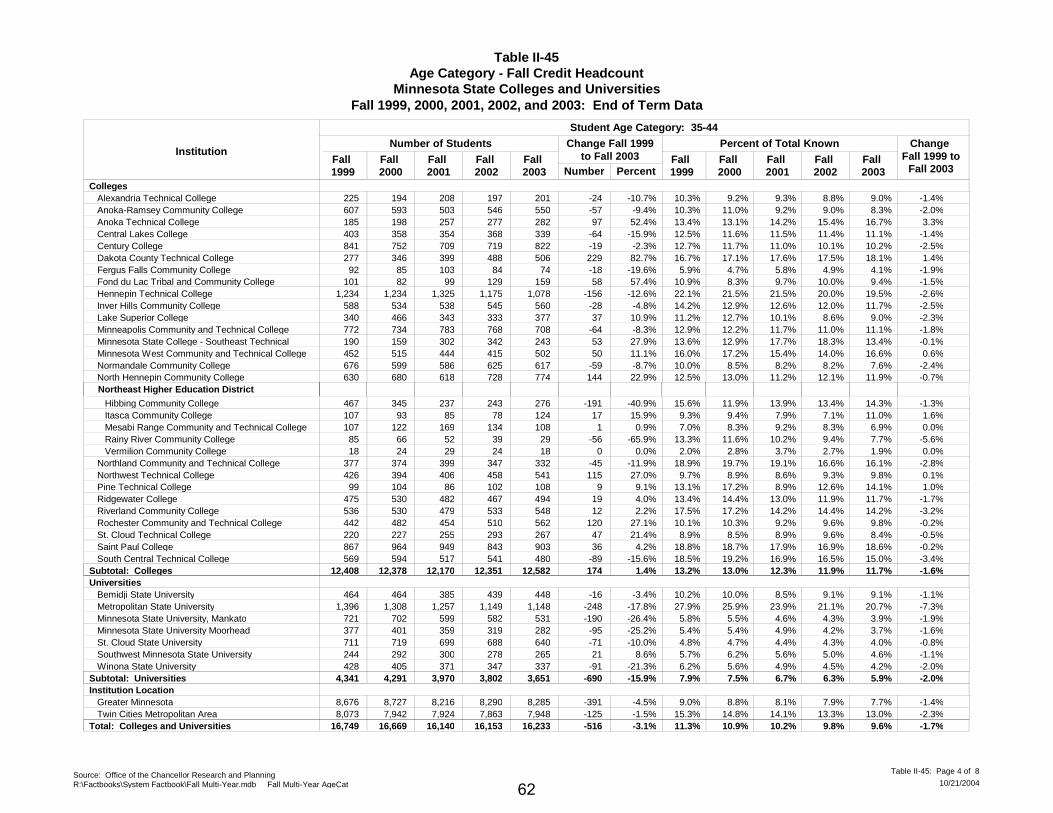
Table II-45Age Category - Fall Credit Headcount
Minnesota State Colleges and UniversitiesFall 1999, 2000, 2001, 2002, and 2003: End of Term Data
InstitutionFall 1999
Fall 2000
Fall 2001
Fall 2002
Fall 2003
Number of Students Change Fall 1999to Fall 2003
Number PercentFall 1999
Fall 2000
Fall 2001
Fall 2002
Fall 2003
Change Fall 1999 to
Fall 2003
Student Age Category: 35-44
Percent of Total Known
CollegesAlexandria Technical College 225 194 208 197 201 10.3% 9.2% 9.3% 8.8% 9.0%-24 -10.7% -1.4%Anoka-Ramsey Community College 607 593 503 546 550 10.3% 11.0% 9.2% 9.0% 8.3%-57 -9.4% -2.0%Anoka Technical College 185 198 257 277 282 13.4% 13.1% 14.2% 15.4% 16.7%97 52.4% 3.3%Central Lakes College 403 358 354 368 339 12.5% 11.6% 11.5% 11.4% 11.1%-64 -15.9% -1.4%Century College 841 752 709 719 822 12.7% 11.7% 11.0% 10.1% 10.2%-19 -2.3% -2.5%Dakota County Technical College 277 346 399 488 506 16.7% 17.1% 17.6% 17.5% 18.1%229 82.7% 1.4%Fergus Falls Community College 92 85 103 84 74 5.9% 4.7% 5.8% 4.9% 4.1%-18 -19.6% -1.9%Fond du Lac Tribal and Community College 101 82 99 129 159 10.9% 8.3% 9.7% 10.0% 9.4%58 57.4% -1.5%Hennepin Technical College 1,234 1,234 1,325 1,175 1,078 22.1% 21.5% 21.5% 20.0% 19.5%-156 -12.6% -2.6%Inver Hills Community College 588 534 538 545 560 14.2% 12.9% 12.6% 12.0% 11.7%-28 -4.8% -2.5%Lake Superior College 340 466 343 333 377 11.2% 12.7% 10.1% 8.6% 9.0%37 10.9% -2.3%Minneapolis Community and Technical College 772 734 783 768 708 12.9% 12.2% 11.7% 11.0% 11.1%-64 -8.3% -1.8%Minnesota State College - Southeast Technical 190 159 302 342 243 13.6% 12.9% 17.7% 18.3% 13.4%53 27.9% -0.1%Minnesota West Community and Technical College 452 515 444 415 502 16.0% 17.2% 15.4% 14.0% 16.6%50 11.1% 0.6%Normandale Community College 676 599 586 625 617 10.0% 8.5% 8.2% 8.2% 7.6%-59 -8.7% -2.4%North Hennepin Community College 630 680 618 728 774 12.5% 13.0% 11.2% 12.1% 11.9%144 22.9% -0.7%
Hibbing Community College 467 345 237 243 276 15.6% 11.9% 13.9% 13.4% 14.3%-191 -40.9% -1.3%
Northeast Higher Education District
Itasca Community College 107 93 85 78 124 9.3% 9.4% 7.9% 7.1% 11.0%17 15.9% 1.6% Mesabi Range Community and Technical College 107 122 169 134 108 7.0% 8.3% 9.2% 8.3% 6.9%1 0.9% 0.0% Rainy River Community College 85 66 52 39 29 13.3% 11.6% 10.2% 9.4% 7.7%-56 -65.9% -5.6% Vermilion Community College 18 24 29 24 18 2.0% 2.8% 3.7% 2.7% 1.9%0 0.0% 0.0%Northland Community and Technical College 377 374 399 347 332 18.9% 19.7% 19.1% 16.6% 16.1%-45 -11.9% -2.8%Northwest Technical College 426 394 406 458 541 9.7% 8.9% 8.6% 9.3% 9.8%115 27.0% 0.1%Pine Technical College 99 104 86 102 108 13.1% 17.2% 8.9% 12.6% 14.1%9 9.1% 1.0%Ridgewater College 475 530 482 467 494 13.4% 14.4% 13.0% 11.9% 11.7%19 4.0% -1.7%Riverland Community College 536 530 479 533 548 17.5% 17.2% 14.2% 14.4% 14.2%12 2.2% -3.2%Rochester Community and Technical College 442 482 454 510 562 10.1% 10.3% 9.2% 9.6% 9.8%120 27.1% -0.2%St. Cloud Technical College 220 227 255 293 267 8.9% 8.5% 8.9% 9.6% 8.4%47 21.4% -0.5%Saint Paul College 867 964 949 843 903 18.8% 18.7% 17.9% 16.9% 18.6%36 4.2% -0.2%South Central Technical College 569 594 517 541 480 18.5% 19.2% 16.9% 16.5% 15.0%-89 -15.6% -3.4%
Subtotal: Colleges 12,408 12,378 12,170 12,351 12,582 13.2% 13.0% 12.3% 11.9% 11.7%174 1.4% -1.6%Universities
Bemidji State University 464 464 385 439 448 10.2% 10.0% 8.5% 9.1% 9.1%-16 -3.4% -1.1%Metropolitan State University 1,396 1,308 1,257 1,149 1,148 27.9% 25.9% 23.9% 21.1% 20.7%-248 -17.8% -7.3%Minnesota State University, Mankato 721 702 599 582 531 5.8% 5.5% 4.6% 4.3% 3.9%-190 -26.4% -1.9%Minnesota State University Moorhead 377 401 359 319 282 5.4% 5.4% 4.9% 4.2% 3.7%-95 -25.2% -1.6%St. Cloud State University 711 719 699 688 640 4.8% 4.7% 4.4% 4.3% 4.0%-71 -10.0% -0.8%Southwest Minnesota State University 244 292 300 278 265 5.7% 6.2% 5.6% 5.0% 4.6%21 8.6% -1.1%Winona State University 428 405 371 347 337 6.2% 5.6% 4.9% 4.5% 4.2%-91 -21.3% -2.0%
Subtotal: Universities 4,341 4,291 3,970 3,802 3,651 7.9% 7.5% 6.7% 6.3% 5.9%-690 -15.9% -2.0%Institution Location
Greater Minnesota 8,676 8,727 8,216 8,290 8,285 9.0% 8.8% 8.1% 7.9% 7.7%-391 -4.5% -1.4%Twin Cities Metropolitan Area 8,073 7,942 7,924 7,863 7,948 15.3% 14.8% 14.1% 13.3% 13.0%-125 -1.5% -2.3%
Total: Colleges and Universities 16,749 16,669 16,140 16,153 16,233 11.3% 10.9% 10.2% 9.8% 9.6%-516 -3.1% -1.7%
Source: Office of the Chancellor Research and PlanningR:\Factbooks\System Factbook\Fall Multi-Year.mdb Fall Multi-Year AgeCat 10/21/2004
Table II-45: Page 4 of 8
62
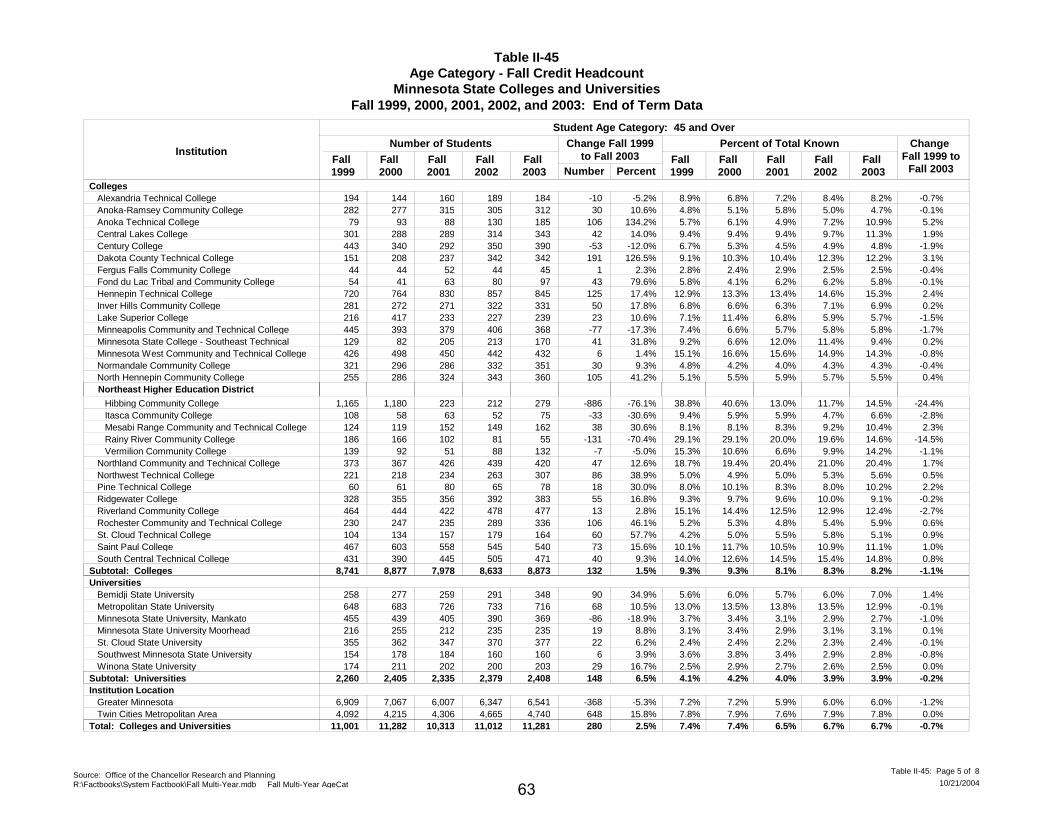
Table II-45Age Category - Fall Credit Headcount
Minnesota State Colleges and UniversitiesFall 1999, 2000, 2001, 2002, and 2003: End of Term Data
InstitutionFall 1999
Fall 2000
Fall 2001
Fall 2002
Fall 2003
Number of Students Change Fall 1999to Fall 2003
Number PercentFall 1999
Fall 2000
Fall 2001
Fall 2002
Fall 2003
Change Fall 1999 to
Fall 2003
Student Age Category: 45 and Over
Percent of Total Known
CollegesAlexandria Technical College 194 144 160 189 184 8.9% 6.8% 7.2% 8.4% 8.2%-10 -5.2% -0.7%Anoka-Ramsey Community College 282 277 315 305 312 4.8% 5.1% 5.8% 5.0% 4.7%30 10.6% -0.1%Anoka Technical College 79 93 88 130 185 5.7% 6.1% 4.9% 7.2% 10.9%106 134.2% 5.2%Central Lakes College 301 288 289 314 343 9.4% 9.4% 9.4% 9.7% 11.3%42 14.0% 1.9%Century College 443 340 292 350 390 6.7% 5.3% 4.5% 4.9% 4.8%-53 -12.0% -1.9%Dakota County Technical College 151 208 237 342 342 9.1% 10.3% 10.4% 12.3% 12.2%191 126.5% 3.1%Fergus Falls Community College 44 44 52 44 45 2.8% 2.4% 2.9% 2.5% 2.5%1 2.3% -0.4%Fond du Lac Tribal and Community College 54 41 63 80 97 5.8% 4.1% 6.2% 6.2% 5.8%43 79.6% -0.1%Hennepin Technical College 720 764 830 857 845 12.9% 13.3% 13.4% 14.6% 15.3%125 17.4% 2.4%Inver Hills Community College 281 272 271 322 331 6.8% 6.6% 6.3% 7.1% 6.9%50 17.8% 0.2%Lake Superior College 216 417 233 227 239 7.1% 11.4% 6.8% 5.9% 5.7%23 10.6% -1.5%Minneapolis Community and Technical College 445 393 379 406 368 7.4% 6.6% 5.7% 5.8% 5.8%-77 -17.3% -1.7%Minnesota State College - Southeast Technical 129 82 205 213 170 9.2% 6.6% 12.0% 11.4% 9.4%41 31.8% 0.2%Minnesota West Community and Technical College 426 498 450 442 432 15.1% 16.6% 15.6% 14.9% 14.3%6 1.4% -0.8%Normandale Community College 321 296 286 332 351 4.8% 4.2% 4.0% 4.3% 4.3%30 9.3% -0.4%North Hennepin Community College 255 286 324 343 360 5.1% 5.5% 5.9% 5.7% 5.5%105 41.2% 0.4%
Hibbing Community College 1,165 1,180 223 212 279 38.8% 40.6% 13.0% 11.7% 14.5%-886 -76.1% -24.4%
Northeast Higher Education District
Itasca Community College 108 58 63 52 75 9.4% 5.9% 5.9% 4.7% 6.6%-33 -30.6% -2.8% Mesabi Range Community and Technical College 124 119 152 149 162 8.1% 8.1% 8.3% 9.2% 10.4%38 30.6% 2.3% Rainy River Community College 186 166 102 81 55 29.1% 29.1% 20.0% 19.6% 14.6%-131 -70.4% -14.5% Vermilion Community College 139 92 51 88 132 15.3% 10.6% 6.6% 9.9% 14.2%-7 -5.0% -1.1%Northland Community and Technical College 373 367 426 439 420 18.7% 19.4% 20.4% 21.0% 20.4%47 12.6% 1.7%Northwest Technical College 221 218 234 263 307 5.0% 4.9% 5.0% 5.3% 5.6%86 38.9% 0.5%Pine Technical College 60 61 80 65 78 8.0% 10.1% 8.3% 8.0% 10.2%18 30.0% 2.2%Ridgewater College 328 355 356 392 383 9.3% 9.7% 9.6% 10.0% 9.1%55 16.8% -0.2%Riverland Community College 464 444 422 478 477 15.1% 14.4% 12.5% 12.9% 12.4%13 2.8% -2.7%Rochester Community and Technical College 230 247 235 289 336 5.2% 5.3% 4.8% 5.4% 5.9%106 46.1% 0.6%St. Cloud Technical College 104 134 157 179 164 4.2% 5.0% 5.5% 5.8% 5.1%60 57.7% 0.9%Saint Paul College 467 603 558 545 540 10.1% 11.7% 10.5% 10.9% 11.1%73 15.6% 1.0%South Central Technical College 431 390 445 505 471 14.0% 12.6% 14.5% 15.4% 14.8%40 9.3% 0.8%
Subtotal: Colleges 8,741 8,877 7,978 8,633 8,873 9.3% 9.3% 8.1% 8.3% 8.2%132 1.5% -1.1%Universities
Bemidji State University 258 277 259 291 348 5.6% 6.0% 5.7% 6.0% 7.0%90 34.9% 1.4%Metropolitan State University 648 683 726 733 716 13.0% 13.5% 13.8% 13.5% 12.9%68 10.5% -0.1%Minnesota State University, Mankato 455 439 405 390 369 3.7% 3.4% 3.1% 2.9% 2.7%-86 -18.9% -1.0%Minnesota State University Moorhead 216 255 212 235 235 3.1% 3.4% 2.9% 3.1% 3.1%19 8.8% 0.1%St. Cloud State University 355 362 347 370 377 2.4% 2.4% 2.2% 2.3% 2.4%22 6.2% -0.1%Southwest Minnesota State University 154 178 184 160 160 3.6% 3.8% 3.4% 2.9% 2.8%6 3.9% -0.8%Winona State University 174 211 202 200 203 2.5% 2.9% 2.7% 2.6% 2.5%29 16.7% 0.0%
Subtotal: Universities 2,260 2,405 2,335 2,379 2,408 4.1% 4.2% 4.0% 3.9% 3.9%148 6.5% -0.2%Institution Location
Greater Minnesota 6,909 7,067 6,007 6,347 6,541 7.2% 7.2% 5.9% 6.0% 6.0%-368 -5.3% -1.2%Twin Cities Metropolitan Area 4,092 4,215 4,306 4,665 4,740 7.8% 7.9% 7.6% 7.9% 7.8%648 15.8% 0.0%
Total: Colleges and Universities 11,001 11,282 10,313 11,012 11,281 7.4% 7.4% 6.5% 6.7% 6.7%280 2.5% -0.7%
Source: Office of the Chancellor Research and PlanningR:\Factbooks\System Factbook\Fall Multi-Year.mdb Fall Multi-Year AgeCat 10/21/2004
Table II-45: Page 5 of 8
63
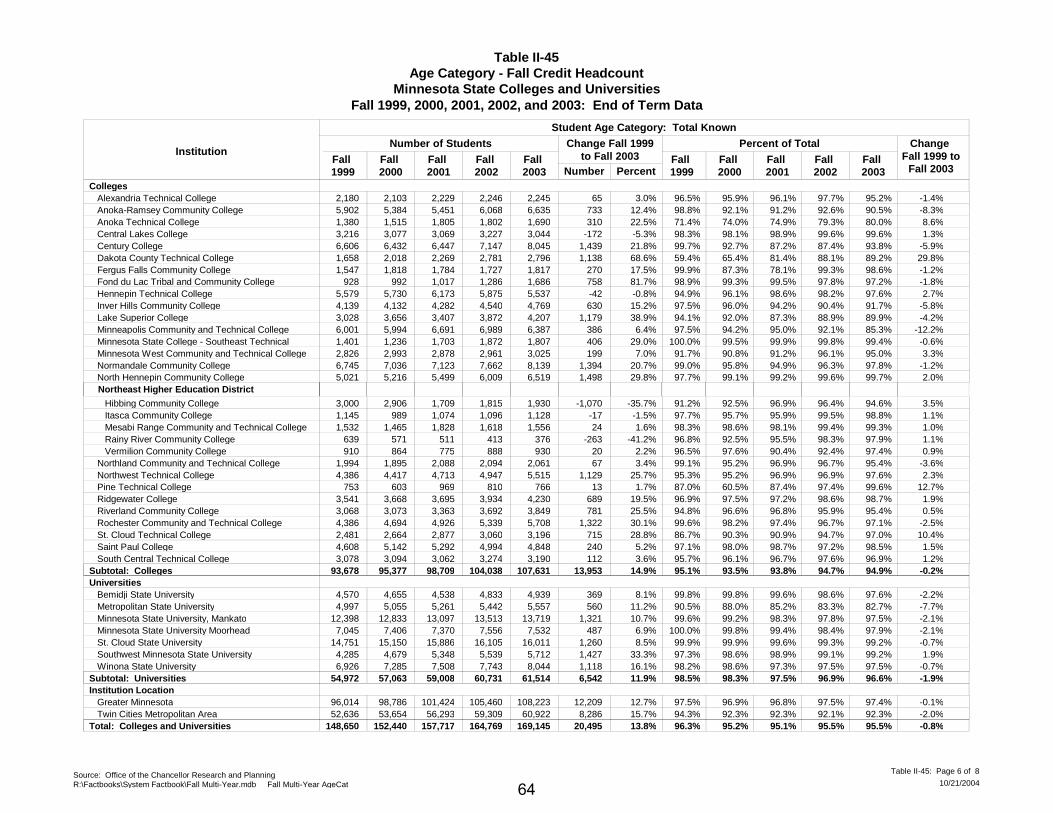
Table II-45Age Category - Fall Credit Headcount
Minnesota State Colleges and UniversitiesFall 1999, 2000, 2001, 2002, and 2003: End of Term Data
InstitutionFall 1999
Fall 2000
Fall 2001
Fall 2002
Fall 2003
Number of Students Change Fall 1999to Fall 2003
Number PercentFall 1999
Fall 2000
Fall 2001
Fall 2002
Fall 2003
Change Fall 1999 to
Fall 2003
Student Age Category: Total Known
Percent of Total
CollegesAlexandria Technical College 2,180 2,103 2,229 2,246 2,245 96.5% 95.9% 96.1% 97.7% 95.2%65 3.0% -1.4%Anoka-Ramsey Community College 5,902 5,384 5,451 6,068 6,635 98.8% 92.1% 91.2% 92.6% 90.5%733 12.4% -8.3%Anoka Technical College 1,380 1,515 1,805 1,802 1,690 71.4% 74.0% 74.9% 79.3% 80.0%310 22.5% 8.6%Central Lakes College 3,216 3,077 3,069 3,227 3,044 98.3% 98.1% 98.9% 99.6% 99.6%-172 -5.3% 1.3%Century College 6,606 6,432 6,447 7,147 8,045 99.7% 92.7% 87.2% 87.4% 93.8%1,439 21.8% -5.9%Dakota County Technical College 1,658 2,018 2,269 2,781 2,796 59.4% 65.4% 81.4% 88.1% 89.2%1,138 68.6% 29.8%Fergus Falls Community College 1,547 1,818 1,784 1,727 1,817 99.9% 87.3% 78.1% 99.3% 98.6%270 17.5% -1.2%Fond du Lac Tribal and Community College 928 992 1,017 1,286 1,686 98.9% 99.3% 99.5% 97.8% 97.2%758 81.7% -1.8%Hennepin Technical College 5,579 5,730 6,173 5,875 5,537 94.9% 96.1% 98.6% 98.2% 97.6%-42 -0.8% 2.7%Inver Hills Community College 4,139 4,132 4,282 4,540 4,769 97.5% 96.0% 94.2% 90.4% 91.7%630 15.2% -5.8%Lake Superior College 3,028 3,656 3,407 3,872 4,207 94.1% 92.0% 87.3% 88.9% 89.9%1,179 38.9% -4.2%Minneapolis Community and Technical College 6,001 5,994 6,691 6,989 6,387 97.5% 94.2% 95.0% 92.1% 85.3%386 6.4% -12.2%Minnesota State College - Southeast Technical 1,401 1,236 1,703 1,872 1,807 100.0% 99.5% 99.9% 99.8% 99.4%406 29.0% -0.6%Minnesota West Community and Technical College 2,826 2,993 2,878 2,961 3,025 91.7% 90.8% 91.2% 96.1% 95.0%199 7.0% 3.3%Normandale Community College 6,745 7,036 7,123 7,662 8,139 99.0% 95.8% 94.9% 96.3% 97.8%1,394 20.7% -1.2%North Hennepin Community College 5,021 5,216 5,499 6,009 6,519 97.7% 99.1% 99.2% 99.6% 99.7%1,498 29.8% 2.0%
Hibbing Community College 3,000 2,906 1,709 1,815 1,930 91.2% 92.5% 96.9% 96.4% 94.6%-1,070 -35.7% 3.5%
Northeast Higher Education District
Itasca Community College 1,145 989 1,074 1,096 1,128 97.7% 95.7% 95.9% 99.5% 98.8%-17 -1.5% 1.1% Mesabi Range Community and Technical College 1,532 1,465 1,828 1,618 1,556 98.3% 98.6% 98.1% 99.4% 99.3%24 1.6% 1.0% Rainy River Community College 639 571 511 413 376 96.8% 92.5% 95.5% 98.3% 97.9%-263 -41.2% 1.1% Vermilion Community College 910 864 775 888 930 96.5% 97.6% 90.4% 92.4% 97.4%20 2.2% 0.9%Northland Community and Technical College 1,994 1,895 2,088 2,094 2,061 99.1% 95.2% 96.9% 96.7% 95.4%67 3.4% -3.6%Northwest Technical College 4,386 4,417 4,713 4,947 5,515 95.3% 95.2% 96.9% 96.9% 97.6%1,129 25.7% 2.3%Pine Technical College 753 603 969 810 766 87.0% 60.5% 87.4% 97.4% 99.6%13 1.7% 12.7%Ridgewater College 3,541 3,668 3,695 3,934 4,230 96.9% 97.5% 97.2% 98.6% 98.7%689 19.5% 1.9%Riverland Community College 3,068 3,073 3,363 3,692 3,849 94.8% 96.6% 96.8% 95.9% 95.4%781 25.5% 0.5%Rochester Community and Technical College 4,386 4,694 4,926 5,339 5,708 99.6% 98.2% 97.4% 96.7% 97.1%1,322 30.1% -2.5%St. Cloud Technical College 2,481 2,664 2,877 3,060 3,196 86.7% 90.3% 90.9% 94.7% 97.0%715 28.8% 10.4%Saint Paul College 4,608 5,142 5,292 4,994 4,848 97.1% 98.0% 98.7% 97.2% 98.5%240 5.2% 1.5%South Central Technical College 3,078 3,094 3,062 3,274 3,190 95.7% 96.1% 96.7% 97.6% 96.9%112 3.6% 1.2%
Subtotal: Colleges 93,678 95,377 98,709 104,038 107,631 95.1% 93.5% 93.8% 94.7% 94.9%13,953 14.9% -0.2%Universities
Bemidji State University 4,570 4,655 4,538 4,833 4,939 99.8% 99.8% 99.6% 98.6% 97.6%369 8.1% -2.2%Metropolitan State University 4,997 5,055 5,261 5,442 5,557 90.5% 88.0% 85.2% 83.3% 82.7%560 11.2% -7.7%Minnesota State University, Mankato 12,398 12,833 13,097 13,513 13,719 99.6% 99.2% 98.3% 97.8% 97.5%1,321 10.7% -2.1%Minnesota State University Moorhead 7,045 7,406 7,370 7,556 7,532 100.0% 99.8% 99.4% 98.4% 97.9%487 6.9% -2.1%St. Cloud State University 14,751 15,150 15,886 16,105 16,011 99.9% 99.9% 99.6% 99.3% 99.2%1,260 8.5% -0.7%Southwest Minnesota State University 4,285 4,679 5,348 5,539 5,712 97.3% 98.6% 98.9% 99.1% 99.2%1,427 33.3% 1.9%Winona State University 6,926 7,285 7,508 7,743 8,044 98.2% 98.6% 97.3% 97.5% 97.5%1,118 16.1% -0.7%
Subtotal: Universities 54,972 57,063 59,008 60,731 61,514 98.5% 98.3% 97.5% 96.9% 96.6%6,542 11.9% -1.9%Institution Location
Greater Minnesota 96,014 98,786 101,424 105,460 108,223 97.5% 96.9% 96.8% 97.5% 97.4%12,209 12.7% -0.1%Twin Cities Metropolitan Area 52,636 53,654 56,293 59,309 60,922 94.3% 92.3% 92.3% 92.1% 92.3%8,286 15.7% -2.0%
Total: Colleges and Universities 148,650 152,440 157,717 164,769 169,145 96.3% 95.2% 95.1% 95.5% 95.5%20,495 13.8% -0.8%
Source: Office of the Chancellor Research and PlanningR:\Factbooks\System Factbook\Fall Multi-Year.mdb Fall Multi-Year AgeCat 10/21/2004
Table II-45: Page 6 of 8
64
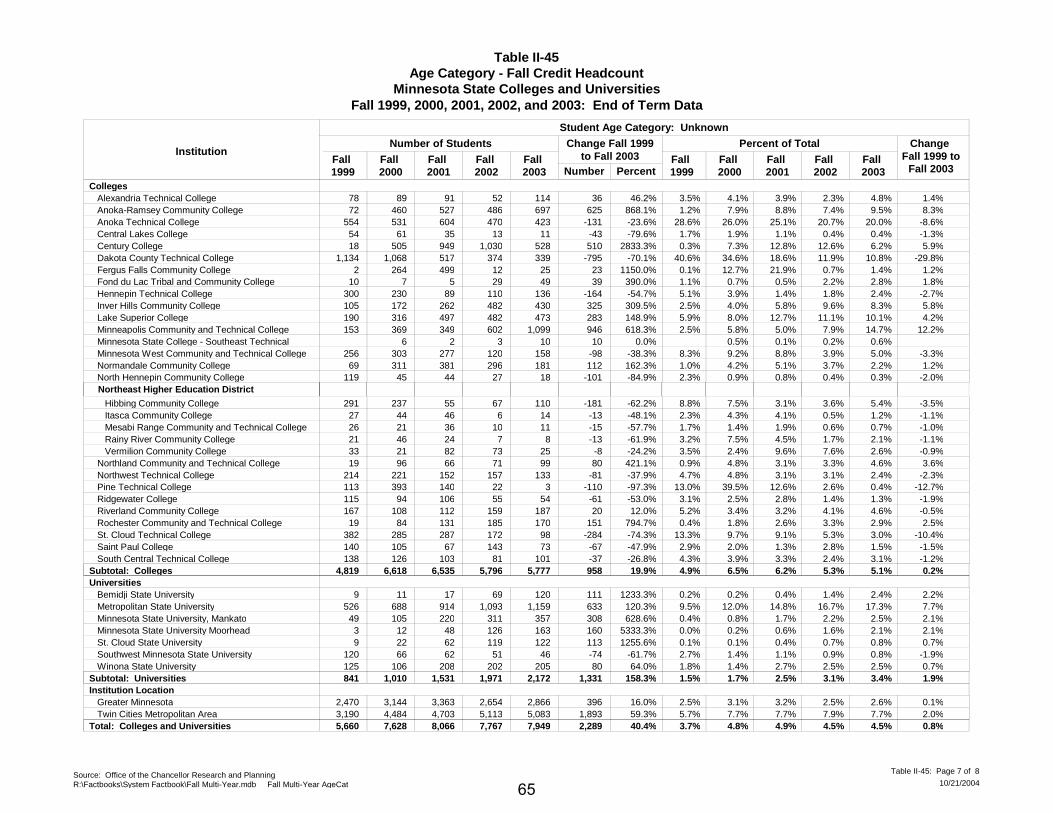
Table II-45Age Category - Fall Credit Headcount
Minnesota State Colleges and UniversitiesFall 1999, 2000, 2001, 2002, and 2003: End of Term Data
InstitutionFall 1999
Fall 2000
Fall 2001
Fall 2002
Fall 2003
Number of Students Change Fall 1999to Fall 2003
Number PercentFall 1999
Fall 2000
Fall 2001
Fall 2002
Fall 2003
Change Fall 1999 to
Fall 2003
Student Age Category: Unknown
Percent of Total
CollegesAlexandria Technical College 78 89 91 52 114 3.5% 4.1% 3.9% 2.3% 4.8%36 46.2% 1.4%Anoka-Ramsey Community College 72 460 527 486 697 1.2% 7.9% 8.8% 7.4% 9.5%625 868.1% 8.3%Anoka Technical College 554 531 604 470 423 28.6% 26.0% 25.1% 20.7% 20.0%-131 -23.6% -8.6%Central Lakes College 54 61 35 13 11 1.7% 1.9% 1.1% 0.4% 0.4%-43 -79.6% -1.3%Century College 18 505 949 1,030 528 0.3% 7.3% 12.8% 12.6% 6.2%510 2833.3% 5.9%Dakota County Technical College 1,134 1,068 517 374 339 40.6% 34.6% 18.6% 11.9% 10.8%-795 -70.1% -29.8%Fergus Falls Community College 2 264 499 12 25 0.1% 12.7% 21.9% 0.7% 1.4%23 1150.0% 1.2%Fond du Lac Tribal and Community College 10 7 5 29 49 1.1% 0.7% 0.5% 2.2% 2.8%39 390.0% 1.8%Hennepin Technical College 300 230 89 110 136 5.1% 3.9% 1.4% 1.8% 2.4%-164 -54.7% -2.7%Inver Hills Community College 105 172 262 482 430 2.5% 4.0% 5.8% 9.6% 8.3%325 309.5% 5.8%Lake Superior College 190 316 497 482 473 5.9% 8.0% 12.7% 11.1% 10.1%283 148.9% 4.2%Minneapolis Community and Technical College 153 369 349 602 1,099 2.5% 5.8% 5.0% 7.9% 14.7%946 618.3% 12.2%Minnesota State College - Southeast Technical 6 2 3 10 0.5% 0.1% 0.2% 0.6%10 0.0%Minnesota West Community and Technical College 256 303 277 120 158 8.3% 9.2% 8.8% 3.9% 5.0%-98 -38.3% -3.3%Normandale Community College 69 311 381 296 181 1.0% 4.2% 5.1% 3.7% 2.2%112 162.3% 1.2%North Hennepin Community College 119 45 44 27 18 2.3% 0.9% 0.8% 0.4% 0.3%-101 -84.9% -2.0%
Hibbing Community College 291 237 55 67 110 8.8% 7.5% 3.1% 3.6% 5.4%-181 -62.2% -3.5%
Northeast Higher Education District
Itasca Community College 27 44 46 6 14 2.3% 4.3% 4.1% 0.5% 1.2%-13 -48.1% -1.1% Mesabi Range Community and Technical College 26 21 36 10 11 1.7% 1.4% 1.9% 0.6% 0.7%-15 -57.7% -1.0% Rainy River Community College 21 46 24 7 8 3.2% 7.5% 4.5% 1.7% 2.1%-13 -61.9% -1.1% Vermilion Community College 33 21 82 73 25 3.5% 2.4% 9.6% 7.6% 2.6%-8 -24.2% -0.9%Northland Community and Technical College 19 96 66 71 99 0.9% 4.8% 3.1% 3.3% 4.6%80 421.1% 3.6%Northwest Technical College 214 221 152 157 133 4.7% 4.8% 3.1% 3.1% 2.4%-81 -37.9% -2.3%Pine Technical College 113 393 140 22 3 13.0% 39.5% 12.6% 2.6% 0.4%-110 -97.3% -12.7%Ridgewater College 115 94 106 55 54 3.1% 2.5% 2.8% 1.4% 1.3%-61 -53.0% -1.9%Riverland Community College 167 108 112 159 187 5.2% 3.4% 3.2% 4.1% 4.6%20 12.0% -0.5%Rochester Community and Technical College 19 84 131 185 170 0.4% 1.8% 2.6% 3.3% 2.9%151 794.7% 2.5%St. Cloud Technical College 382 285 287 172 98 13.3% 9.7% 9.1% 5.3% 3.0%-284 -74.3% -10.4%Saint Paul College 140 105 67 143 73 2.9% 2.0% 1.3% 2.8% 1.5%-67 -47.9% -1.5%South Central Technical College 138 126 103 81 101 4.3% 3.9% 3.3% 2.4% 3.1%-37 -26.8% -1.2%
Subtotal: Colleges 4,819 6,618 6,535 5,796 5,777 4.9% 6.5% 6.2% 5.3% 5.1%958 19.9% 0.2%Universities
Bemidji State University 9 11 17 69 120 0.2% 0.2% 0.4% 1.4% 2.4%111 1233.3% 2.2%Metropolitan State University 526 688 914 1,093 1,159 9.5% 12.0% 14.8% 16.7% 17.3%633 120.3% 7.7%Minnesota State University, Mankato 49 105 220 311 357 0.4% 0.8% 1.7% 2.2% 2.5%308 628.6% 2.1%Minnesota State University Moorhead 3 12 48 126 163 0.0% 0.2% 0.6% 1.6% 2.1%160 5333.3% 2.1%St. Cloud State University 9 22 62 119 122 0.1% 0.1% 0.4% 0.7% 0.8%113 1255.6% 0.7%Southwest Minnesota State University 120 66 62 51 46 2.7% 1.4% 1.1% 0.9% 0.8%-74 -61.7% -1.9%Winona State University 125 106 208 202 205 1.8% 1.4% 2.7% 2.5% 2.5%80 64.0% 0.7%
Subtotal: Universities 841 1,010 1,531 1,971 2,172 1.5% 1.7% 2.5% 3.1% 3.4%1,331 158.3% 1.9%Institution Location
Greater Minnesota 2,470 3,144 3,363 2,654 2,866 2.5% 3.1% 3.2% 2.5% 2.6%396 16.0% 0.1%Twin Cities Metropolitan Area 3,190 4,484 4,703 5,113 5,083 5.7% 7.7% 7.7% 7.9% 7.7%1,893 59.3% 2.0%
Total: Colleges and Universities 5,660 7,628 8,066 7,767 7,949 3.7% 4.8% 4.9% 4.5% 4.5%2,289 40.4% 0.8%
Source: Office of the Chancellor Research and PlanningR:\Factbooks\System Factbook\Fall Multi-Year.mdb Fall Multi-Year AgeCat 10/21/2004
Table II-45: Page 7 of 8
65
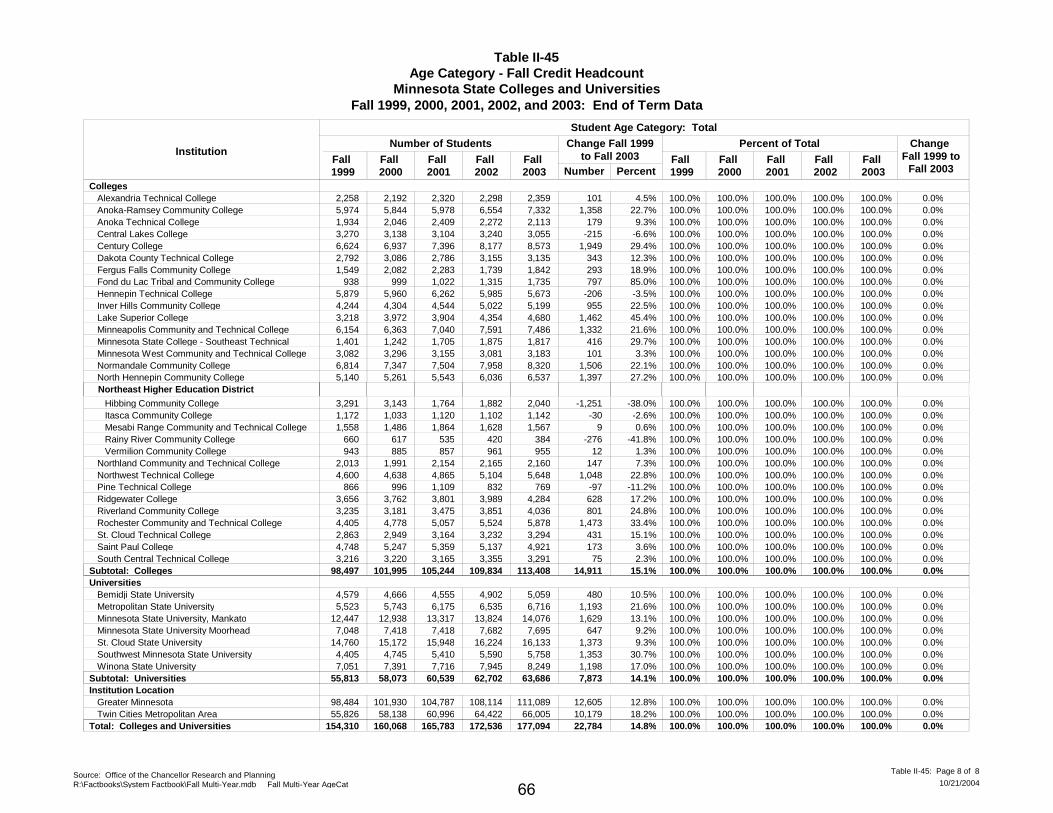
Table II-45Age Category - Fall Credit Headcount
Minnesota State Colleges and UniversitiesFall 1999, 2000, 2001, 2002, and 2003: End of Term Data
InstitutionFall 1999
Fall 2000
Fall 2001
Fall 2002
Fall 2003
Number of Students Change Fall 1999to Fall 2003
Number PercentFall 1999
Fall 2000
Fall 2001
Fall 2002
Fall 2003
Change Fall 1999 to
Fall 2003
Student Age Category: Total
Percent of Total
CollegesAlexandria Technical College 2,258 2,192 2,320 2,298 2,359 100.0% 100.0% 100.0% 100.0% 100.0%101 4.5% 0.0%Anoka-Ramsey Community College 5,974 5,844 5,978 6,554 7,332 100.0% 100.0% 100.0% 100.0% 100.0%1,358 22.7% 0.0%Anoka Technical College 1,934 2,046 2,409 2,272 2,113 100.0% 100.0% 100.0% 100.0% 100.0%179 9.3% 0.0%Central Lakes College 3,270 3,138 3,104 3,240 3,055 100.0% 100.0% 100.0% 100.0% 100.0%-215 -6.6% 0.0%Century College 6,624 6,937 7,396 8,177 8,573 100.0% 100.0% 100.0% 100.0% 100.0%1,949 29.4% 0.0%Dakota County Technical College 2,792 3,086 2,786 3,155 3,135 100.0% 100.0% 100.0% 100.0% 100.0%343 12.3% 0.0%Fergus Falls Community College 1,549 2,082 2,283 1,739 1,842 100.0% 100.0% 100.0% 100.0% 100.0%293 18.9% 0.0%Fond du Lac Tribal and Community College 938 999 1,022 1,315 1,735 100.0% 100.0% 100.0% 100.0% 100.0%797 85.0% 0.0%Hennepin Technical College 5,879 5,960 6,262 5,985 5,673 100.0% 100.0% 100.0% 100.0% 100.0%-206 -3.5% 0.0%Inver Hills Community College 4,244 4,304 4,544 5,022 5,199 100.0% 100.0% 100.0% 100.0% 100.0%955 22.5% 0.0%Lake Superior College 3,218 3,972 3,904 4,354 4,680 100.0% 100.0% 100.0% 100.0% 100.0%1,462 45.4% 0.0%Minneapolis Community and Technical College 6,154 6,363 7,040 7,591 7,486 100.0% 100.0% 100.0% 100.0% 100.0%1,332 21.6% 0.0%Minnesota State College - Southeast Technical 1,401 1,242 1,705 1,875 1,817 100.0% 100.0% 100.0% 100.0% 100.0%416 29.7% 0.0%Minnesota West Community and Technical College 3,082 3,296 3,155 3,081 3,183 100.0% 100.0% 100.0% 100.0% 100.0%101 3.3% 0.0%Normandale Community College 6,814 7,347 7,504 7,958 8,320 100.0% 100.0% 100.0% 100.0% 100.0%1,506 22.1% 0.0%North Hennepin Community College 5,140 5,261 5,543 6,036 6,537 100.0% 100.0% 100.0% 100.0% 100.0%1,397 27.2% 0.0%
Hibbing Community College 3,291 3,143 1,764 1,882 2,040 100.0% 100.0% 100.0% 100.0% 100.0%-1,251 -38.0% 0.0%
Northeast Higher Education District
Itasca Community College 1,172 1,033 1,120 1,102 1,142 100.0% 100.0% 100.0% 100.0% 100.0%-30 -2.6% 0.0% Mesabi Range Community and Technical College 1,558 1,486 1,864 1,628 1,567 100.0% 100.0% 100.0% 100.0% 100.0%9 0.6% 0.0% Rainy River Community College 660 617 535 420 384 100.0% 100.0% 100.0% 100.0% 100.0%-276 -41.8% 0.0% Vermilion Community College 943 885 857 961 955 100.0% 100.0% 100.0% 100.0% 100.0%12 1.3% 0.0%Northland Community and Technical College 2,013 1,991 2,154 2,165 2,160 100.0% 100.0% 100.0% 100.0% 100.0%147 7.3% 0.0%Northwest Technical College 4,600 4,638 4,865 5,104 5,648 100.0% 100.0% 100.0% 100.0% 100.0%1,048 22.8% 0.0%Pine Technical College 866 996 1,109 832 769 100.0% 100.0% 100.0% 100.0% 100.0%-97 -11.2% 0.0%Ridgewater College 3,656 3,762 3,801 3,989 4,284 100.0% 100.0% 100.0% 100.0% 100.0%628 17.2% 0.0%Riverland Community College 3,235 3,181 3,475 3,851 4,036 100.0% 100.0% 100.0% 100.0% 100.0%801 24.8% 0.0%Rochester Community and Technical College 4,405 4,778 5,057 5,524 5,878 100.0% 100.0% 100.0% 100.0% 100.0%1,473 33.4% 0.0%St. Cloud Technical College 2,863 2,949 3,164 3,232 3,294 100.0% 100.0% 100.0% 100.0% 100.0%431 15.1% 0.0%Saint Paul College 4,748 5,247 5,359 5,137 4,921 100.0% 100.0% 100.0% 100.0% 100.0%173 3.6% 0.0%South Central Technical College 3,216 3,220 3,165 3,355 3,291 100.0% 100.0% 100.0% 100.0% 100.0%75 2.3% 0.0%
Subtotal: Colleges 98,497 101,995 105,244 109,834 113,408 100.0% 100.0% 100.0% 100.0% 100.0%14,911 15.1% 0.0%Universities
Bemidji State University 4,579 4,666 4,555 4,902 5,059 100.0% 100.0% 100.0% 100.0% 100.0%480 10.5% 0.0%Metropolitan State University 5,523 5,743 6,175 6,535 6,716 100.0% 100.0% 100.0% 100.0% 100.0%1,193 21.6% 0.0%Minnesota State University, Mankato 12,447 12,938 13,317 13,824 14,076 100.0% 100.0% 100.0% 100.0% 100.0%1,629 13.1% 0.0%Minnesota State University Moorhead 7,048 7,418 7,418 7,682 7,695 100.0% 100.0% 100.0% 100.0% 100.0%647 9.2% 0.0%St. Cloud State University 14,760 15,172 15,948 16,224 16,133 100.0% 100.0% 100.0% 100.0% 100.0%1,373 9.3% 0.0%Southwest Minnesota State University 4,405 4,745 5,410 5,590 5,758 100.0% 100.0% 100.0% 100.0% 100.0%1,353 30.7% 0.0%Winona State University 7,051 7,391 7,716 7,945 8,249 100.0% 100.0% 100.0% 100.0% 100.0%1,198 17.0% 0.0%
Subtotal: Universities 55,813 58,073 60,539 62,702 63,686 100.0% 100.0% 100.0% 100.0% 100.0%7,873 14.1% 0.0%Institution Location
Greater Minnesota 98,484 101,930 104,787 108,114 111,089 100.0% 100.0% 100.0% 100.0% 100.0%12,605 12.8% 0.0%Twin Cities Metropolitan Area 55,826 58,138 60,996 64,422 66,005 100.0% 100.0% 100.0% 100.0% 100.0%10,179 18.2% 0.0%
Total: Colleges and Universities 154,310 160,068 165,783 172,536 177,094 100.0% 100.0% 100.0% 100.0% 100.0%22,784 14.8% 0.0%
Source: Office of the Chancellor Research and PlanningR:\Factbooks\System Factbook\Fall Multi-Year.mdb Fall Multi-Year AgeCat 10/21/2004
Table II-45: Page 8 of 8
66

Table II-46Gender - Fall Credit Headcount
Minnesota State Colleges and UniversitiesFall 1999, 2000, 2001, 2002, and 2003: End of Term Data
Institution
Female
Fall 1999
Fall 2000
Fall 2001
Fall 2002
Fall 2003
Number of Students Change Fall 1999to Fall 2003
Number PercentFall 1999
Fall 2000
Fall 2001
Fall 2002
Fall 2003
Change Fall 1999 to
Fall 2003
Percent of Total Known
CollegesAlexandria Technical College 877 808 927 978 977 38.9% 37.2% 40.7% 42.6% 41.5%100 11.4% 2.6%Anoka-Ramsey Community College 3,804 3,790 3,897 4,293 4,750 63.8% 65.0% 65.3% 65.6% 65.1%946 24.9% 1.4%Anoka Technical College 996 985 1,085 1,161 1,086 51.6% 48.3% 45.1% 51.1% 52.0%90 9.0% 0.4%Central Lakes College 1,768 1,703 1,676 1,774 1,693 54.1% 54.3% 54.0% 54.8% 55.4%-75 -4.2% 1.4%Century College 3,692 3,886 4,189 4,634 4,940 55.9% 56.1% 56.8% 56.7% 57.7%1,248 33.8% 1.8%Dakota County Technical College 1,051 1,221 1,252 1,410 1,454 48.7% 43.9% 45.6% 50.2% 50.9%403 38.3% 2.3%Fergus Falls Community College 951 1,313 1,469 1,064 1,111 61.8% 63.1% 64.3% 61.2% 60.5%160 16.8% -1.3%Fond du Lac Tribal and Community College 571 629 635 813 1,014 61.1% 63.5% 63.6% 61.9% 58.5%443 77.6% -2.7%Hennepin Technical College 2,454 2,565 2,568 2,503 2,302 41.7% 43.0% 41.0% 41.8% 40.6%-152 -6.2% -1.1%Inver Hills Community College 2,531 2,513 2,569 2,536 2,763 59.7% 58.5% 56.7% 58.4% 60.1%232 9.2% 0.4%Lake Superior College 1,694 1,843 1,785 2,136 2,308 53.3% 49.4% 53.7% 56.2% 56.0%614 36.2% 2.8%Minneapolis Community and Technical College 3,312 3,136 3,555 3,573 3,641 55.0% 54.6% 55.1% 56.8% 56.5%329 9.9% 1.4%Minnesota State College - Southeast Technical 678 568 788 914 1,024 48.4% 45.7% 46.2% 48.7% 56.4%346 51.0% 8.0%Minnesota West Community and Technical College 1,309 1,448 1,392 1,476 1,596 42.9% 44.2% 44.7% 47.9% 50.2%287 21.9% 7.4%Normandale Community College 3,992 4,287 4,454 4,713 4,911 59.2% 58.6% 59.7% 59.9% 59.7%919 23.0% 0.5%North Hennepin Community College 3,102 3,217 3,362 3,673 4,013 61.0% 61.3% 61.0% 61.4% 62.0%911 29.4% 1.0%
Hibbing Community College 851 805 739 788 846 26.2% 25.8% 41.9% 42.0% 41.7%-5 -0.6% 15.6%
Northeast Higher Education District
Itasca Community College 649 579 602 598 621 55.4% 56.1% 54.6% 54.4% 54.5%-28 -4.3% -0.9% Mesabi Range Community and Technical College 806 719 890 856 759 51.7% 48.5% 47.8% 52.6% 48.5%-47 -5.8% -3.2% Rainy River Community College 435 401 340 257 215 65.9% 66.0% 63.8% 61.2% 56.0%-220 -50.6% -9.9% Vermilion Community College 364 333 303 348 323 38.6% 37.8% 35.4% 36.3% 33.8%-41 -11.3% -4.8%Northland Community and Technical College 691 721 840 890 912 34.3% 36.4% 39.2% 41.2% 42.3%221 32.0% 7.9%Northwest Technical College 2,480 2,510 2,673 2,854 3,208 54.7% 54.5% 55.2% 56.3% 57.5%728 29.4% 2.8%Pine Technical College 447 537 658 559 547 51.7% 54.2% 60.8% 67.3% 71.1%100 22.4% 19.4%Ridgewater College 1,913 1,988 2,103 2,313 2,441 52.4% 52.9% 55.5% 58.2% 57.1%528 27.6% 4.7%Riverland Community College 1,519 1,525 1,697 1,863 1,962 47.0% 48.0% 48.9% 48.5% 48.6%443 29.2% 1.6%Rochester Community and Technical College 2,655 2,860 3,089 3,418 3,620 60.3% 60.3% 61.4% 62.1% 61.7%965 36.3% 1.4%St. Cloud Technical College 1,363 1,436 1,517 1,644 1,674 47.6% 48.7% 47.9% 50.9% 50.8%311 22.8% 3.2%Saint Paul College 1,852 1,960 1,976 2,149 2,163 39.1% 37.4% 36.9% 41.9% 44.0%311 16.8% 4.9%South Central Technical College 1,121 1,186 1,418 1,532 1,518 34.9% 36.9% 44.9% 45.8% 46.6%397 35.4% 11.7%
Subtotal: Colleges 49,928 51,472 54,448 57,720 60,392 10,464 21.0% 51.3% 51.2% 52.5% 54.1% 54.6% 3.4%Universities
Bemidji State University 2,541 2,639 2,491 2,686 2,741 55.6% 56.6% 54.7% 54.8% 54.2%200 7.9% -1.4%Metropolitan State University 3,025 2,982 2,927 3,003 3,115 59.6% 61.0% 61.7% 62.6% 61.5%90 3.0% 1.9%Minnesota State University, Mankato 6,793 6,968 7,081 7,390 7,591 54.6% 53.9% 53.2% 53.5% 53.9%798 11.7% -0.6%Minnesota State University Moorhead 4,421 4,662 4,675 4,824 4,759 62.7% 62.8% 63.0% 62.8% 61.9%338 7.6% -0.9%St. Cloud State University 8,084 8,402 8,759 8,974 9,021 54.8% 55.4% 55.0% 55.3% 55.9%937 11.6% 1.1%Southwest Minnesota State University 2,581 2,831 3,288 3,372 3,446 58.8% 59.7% 60.9% 60.3% 59.9%865 33.5% 1.0%Winona State University 4,320 4,636 4,846 4,983 5,158 62.3% 63.7% 63.7% 64.0% 63.9%838 19.4% 1.7%
Subtotal: Universities 31,765 33,120 34,067 35,232 35,831 4,066 12.8% 57.5% 58.0% 57.8% 58.0% 57.9% 0.4%Institution Location
Greater Minnesota 51,882 54,050 56,681 59,304 61,085 52.9% 53.3% 54.6% 55.3% 55.4%9,203 17.7% 2.6%Twin Cities Metropolitan Area 29,811 30,542 31,834 33,648 35,138 54.8% 54.3% 54.1% 55.9% 56.5%5,327 17.9% 1.7%
Total: Colleges and Universities 81,693 84,592 88,515 92,952 96,223 14,530 17.8% 53.5% 53.7% 54.4% 55.5% 55.8% 2.3%
Source: Office of the Chancellor Research and PlanningR:\Factbooks\System Factbook\Fall Multi-Year.mdb Fall Multi-Year Gender 10/21/2004
Table II-46: Page 1 of 5
67
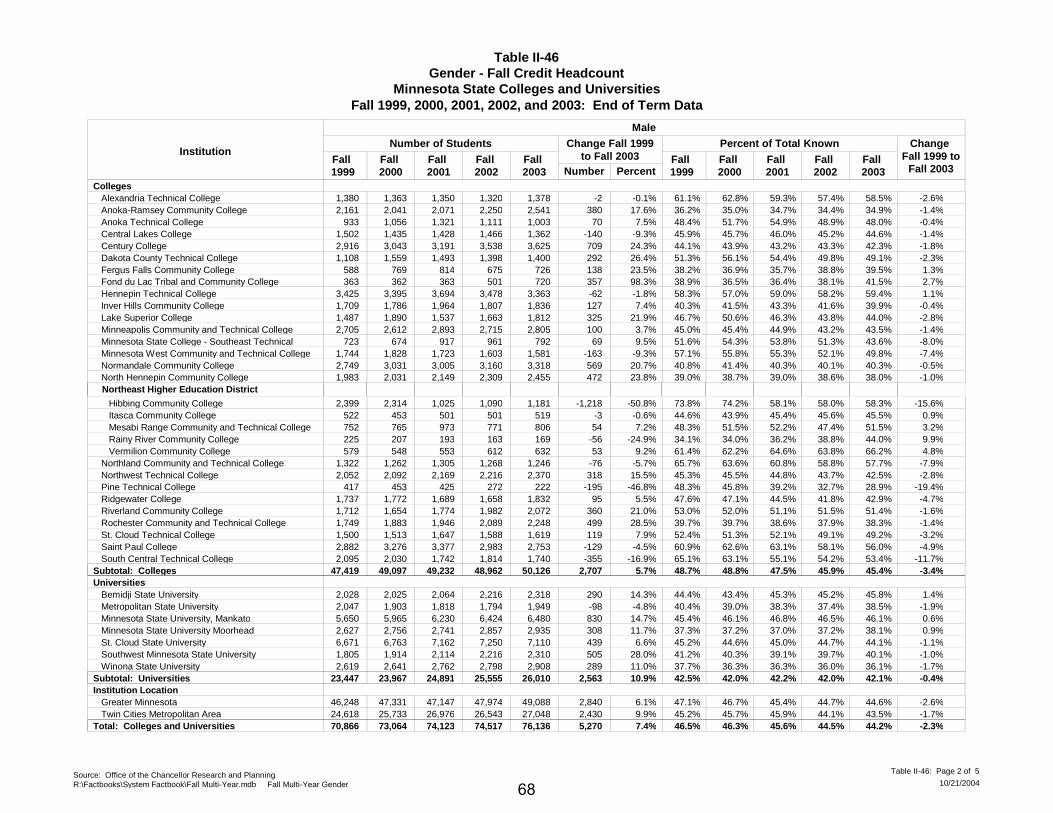
Table II-46Gender - Fall Credit Headcount
Minnesota State Colleges and UniversitiesFall 1999, 2000, 2001, 2002, and 2003: End of Term Data
Institution
Male
Fall 1999
Fall 2000
Fall 2001
Fall 2002
Fall 2003
Number of Students Change Fall 1999to Fall 2003
Number PercentFall 1999
Fall 2000
Fall 2001
Fall 2002
Fall 2003
Change Fall 1999 to
Fall 2003
Percent of Total Known
CollegesAlexandria Technical College 1,380 1,363 1,350 1,320 1,378 61.1% 62.8% 59.3% 57.4% 58.5%-2 -0.1% -2.6%Anoka-Ramsey Community College 2,161 2,041 2,071 2,250 2,541 36.2% 35.0% 34.7% 34.4% 34.9%380 17.6% -1.4%Anoka Technical College 933 1,056 1,321 1,111 1,003 48.4% 51.7% 54.9% 48.9% 48.0%70 7.5% -0.4%Central Lakes College 1,502 1,435 1,428 1,466 1,362 45.9% 45.7% 46.0% 45.2% 44.6%-140 -9.3% -1.4%Century College 2,916 3,043 3,191 3,538 3,625 44.1% 43.9% 43.2% 43.3% 42.3%709 24.3% -1.8%Dakota County Technical College 1,108 1,559 1,493 1,398 1,400 51.3% 56.1% 54.4% 49.8% 49.1%292 26.4% -2.3%Fergus Falls Community College 588 769 814 675 726 38.2% 36.9% 35.7% 38.8% 39.5%138 23.5% 1.3%Fond du Lac Tribal and Community College 363 362 363 501 720 38.9% 36.5% 36.4% 38.1% 41.5%357 98.3% 2.7%Hennepin Technical College 3,425 3,395 3,694 3,478 3,363 58.3% 57.0% 59.0% 58.2% 59.4%-62 -1.8% 1.1%Inver Hills Community College 1,709 1,786 1,964 1,807 1,836 40.3% 41.5% 43.3% 41.6% 39.9%127 7.4% -0.4%Lake Superior College 1,487 1,890 1,537 1,663 1,812 46.7% 50.6% 46.3% 43.8% 44.0%325 21.9% -2.8%Minneapolis Community and Technical College 2,705 2,612 2,893 2,715 2,805 45.0% 45.4% 44.9% 43.2% 43.5%100 3.7% -1.4%Minnesota State College - Southeast Technical 723 674 917 961 792 51.6% 54.3% 53.8% 51.3% 43.6%69 9.5% -8.0%Minnesota West Community and Technical College 1,744 1,828 1,723 1,603 1,581 57.1% 55.8% 55.3% 52.1% 49.8%-163 -9.3% -7.4%Normandale Community College 2,749 3,031 3,005 3,160 3,318 40.8% 41.4% 40.3% 40.1% 40.3%569 20.7% -0.5%North Hennepin Community College 1,983 2,031 2,149 2,309 2,455 39.0% 38.7% 39.0% 38.6% 38.0%472 23.8% -1.0%
Hibbing Community College 2,399 2,314 1,025 1,090 1,181 73.8% 74.2% 58.1% 58.0% 58.3%-1,218 -50.8% -15.6%
Northeast Higher Education District
Itasca Community College 522 453 501 501 519 44.6% 43.9% 45.4% 45.6% 45.5%-3 -0.6% 0.9% Mesabi Range Community and Technical College 752 765 973 771 806 48.3% 51.5% 52.2% 47.4% 51.5%54 7.2% 3.2% Rainy River Community College 225 207 193 163 169 34.1% 34.0% 36.2% 38.8% 44.0%-56 -24.9% 9.9% Vermilion Community College 579 548 553 612 632 61.4% 62.2% 64.6% 63.8% 66.2%53 9.2% 4.8%Northland Community and Technical College 1,322 1,262 1,305 1,268 1,246 65.7% 63.6% 60.8% 58.8% 57.7%-76 -5.7% -7.9%Northwest Technical College 2,052 2,092 2,169 2,216 2,370 45.3% 45.5% 44.8% 43.7% 42.5%318 15.5% -2.8%Pine Technical College 417 453 425 272 222 48.3% 45.8% 39.2% 32.7% 28.9%-195 -46.8% -19.4%Ridgewater College 1,737 1,772 1,689 1,658 1,832 47.6% 47.1% 44.5% 41.8% 42.9%95 5.5% -4.7%Riverland Community College 1,712 1,654 1,774 1,982 2,072 53.0% 52.0% 51.1% 51.5% 51.4%360 21.0% -1.6%Rochester Community and Technical College 1,749 1,883 1,946 2,089 2,248 39.7% 39.7% 38.6% 37.9% 38.3%499 28.5% -1.4%St. Cloud Technical College 1,500 1,513 1,647 1,588 1,619 52.4% 51.3% 52.1% 49.1% 49.2%119 7.9% -3.2%Saint Paul College 2,882 3,276 3,377 2,983 2,753 60.9% 62.6% 63.1% 58.1% 56.0%-129 -4.5% -4.9%South Central Technical College 2,095 2,030 1,742 1,814 1,740 65.1% 63.1% 55.1% 54.2% 53.4%-355 -16.9% -11.7%
Subtotal: Colleges 47,419 49,097 49,232 48,962 50,126 2,707 5.7% 48.7% 48.8% 47.5% 45.9% 45.4% -3.4%Universities
Bemidji State University 2,028 2,025 2,064 2,216 2,318 44.4% 43.4% 45.3% 45.2% 45.8%290 14.3% 1.4%Metropolitan State University 2,047 1,903 1,818 1,794 1,949 40.4% 39.0% 38.3% 37.4% 38.5%-98 -4.8% -1.9%Minnesota State University, Mankato 5,650 5,965 6,230 6,424 6,480 45.4% 46.1% 46.8% 46.5% 46.1%830 14.7% 0.6%Minnesota State University Moorhead 2,627 2,756 2,741 2,857 2,935 37.3% 37.2% 37.0% 37.2% 38.1%308 11.7% 0.9%St. Cloud State University 6,671 6,763 7,162 7,250 7,110 45.2% 44.6% 45.0% 44.7% 44.1%439 6.6% -1.1%Southwest Minnesota State University 1,805 1,914 2,114 2,216 2,310 41.2% 40.3% 39.1% 39.7% 40.1%505 28.0% -1.0%Winona State University 2,619 2,641 2,762 2,798 2,908 37.7% 36.3% 36.3% 36.0% 36.1%289 11.0% -1.7%
Subtotal: Universities 23,447 23,967 24,891 25,555 26,010 2,563 10.9% 42.5% 42.0% 42.2% 42.0% 42.1% -0.4%Institution Location
Greater Minnesota 46,248 47,331 47,147 47,974 49,088 47.1% 46.7% 45.4% 44.7% 44.6%2,840 6.1% -2.6%Twin Cities Metropolitan Area 24,618 25,733 26,976 26,543 27,048 45.2% 45.7% 45.9% 44.1% 43.5%2,430 9.9% -1.7%
Total: Colleges and Universities 70,866 73,064 74,123 74,517 76,136 5,270 7.4% 46.5% 46.3% 45.6% 44.5% 44.2% -2.3%
Source: Office of the Chancellor Research and PlanningR:\Factbooks\System Factbook\Fall Multi-Year.mdb Fall Multi-Year Gender 10/21/2004
Table II-46: Page 2 of 5
68
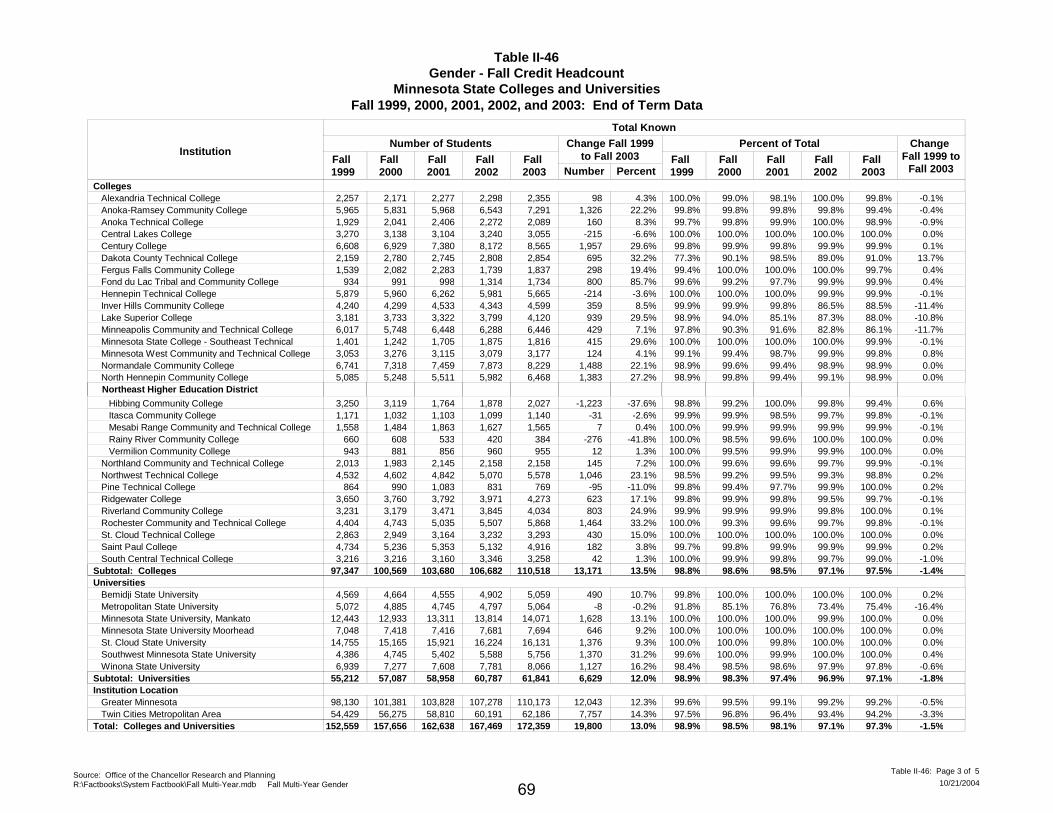
Table II-46Gender - Fall Credit Headcount
Minnesota State Colleges and UniversitiesFall 1999, 2000, 2001, 2002, and 2003: End of Term Data
Institution
Total Known
Fall 1999
Fall 2000
Fall 2001
Fall 2002
Fall 2003
Number of Students Change Fall 1999to Fall 2003
Number PercentFall 1999
Fall 2000
Fall 2001
Fall 2002
Fall 2003
Change Fall 1999 to
Fall 2003
Percent of Total
CollegesAlexandria Technical College 2,257 2,171 2,277 2,298 2,355 100.0% 99.0% 98.1% 100.0% 99.8%98 4.3% -0.1%Anoka-Ramsey Community College 5,965 5,831 5,968 6,543 7,291 99.8% 99.8% 99.8% 99.8% 99.4%1,326 22.2% -0.4%Anoka Technical College 1,929 2,041 2,406 2,272 2,089 99.7% 99.8% 99.9% 100.0% 98.9%160 8.3% -0.9%Central Lakes College 3,270 3,138 3,104 3,240 3,055 100.0% 100.0% 100.0% 100.0% 100.0%-215 -6.6% 0.0%Century College 6,608 6,929 7,380 8,172 8,565 99.8% 99.9% 99.8% 99.9% 99.9%1,957 29.6% 0.1%Dakota County Technical College 2,159 2,780 2,745 2,808 2,854 77.3% 90.1% 98.5% 89.0% 91.0%695 32.2% 13.7%Fergus Falls Community College 1,539 2,082 2,283 1,739 1,837 99.4% 100.0% 100.0% 100.0% 99.7%298 19.4% 0.4%Fond du Lac Tribal and Community College 934 991 998 1,314 1,734 99.6% 99.2% 97.7% 99.9% 99.9%800 85.7% 0.4%Hennepin Technical College 5,879 5,960 6,262 5,981 5,665 100.0% 100.0% 100.0% 99.9% 99.9%-214 -3.6% -0.1%Inver Hills Community College 4,240 4,299 4,533 4,343 4,599 99.9% 99.9% 99.8% 86.5% 88.5%359 8.5% -11.4%Lake Superior College 3,181 3,733 3,322 3,799 4,120 98.9% 94.0% 85.1% 87.3% 88.0%939 29.5% -10.8%Minneapolis Community and Technical College 6,017 5,748 6,448 6,288 6,446 97.8% 90.3% 91.6% 82.8% 86.1%429 7.1% -11.7%Minnesota State College - Southeast Technical 1,401 1,242 1,705 1,875 1,816 100.0% 100.0% 100.0% 100.0% 99.9%415 29.6% -0.1%Minnesota West Community and Technical College 3,053 3,276 3,115 3,079 3,177 99.1% 99.4% 98.7% 99.9% 99.8%124 4.1% 0.8%Normandale Community College 6,741 7,318 7,459 7,873 8,229 98.9% 99.6% 99.4% 98.9% 98.9%1,488 22.1% 0.0%North Hennepin Community College 5,085 5,248 5,511 5,982 6,468 98.9% 99.8% 99.4% 99.1% 98.9%1,383 27.2% 0.0%
Hibbing Community College 3,250 3,119 1,764 1,878 2,027 98.8% 99.2% 100.0% 99.8% 99.4%-1,223 -37.6% 0.6%
Northeast Higher Education District
Itasca Community College 1,171 1,032 1,103 1,099 1,140 99.9% 99.9% 98.5% 99.7% 99.8%-31 -2.6% -0.1% Mesabi Range Community and Technical College 1,558 1,484 1,863 1,627 1,565 100.0% 99.9% 99.9% 99.9% 99.9%7 0.4% -0.1% Rainy River Community College 660 608 533 420 384 100.0% 98.5% 99.6% 100.0% 100.0%-276 -41.8% 0.0% Vermilion Community College 943 881 856 960 955 100.0% 99.5% 99.9% 99.9% 100.0%12 1.3% 0.0%Northland Community and Technical College 2,013 1,983 2,145 2,158 2,158 100.0% 99.6% 99.6% 99.7% 99.9%145 7.2% -0.1%Northwest Technical College 4,532 4,602 4,842 5,070 5,578 98.5% 99.2% 99.5% 99.3% 98.8%1,046 23.1% 0.2%Pine Technical College 864 990 1,083 831 769 99.8% 99.4% 97.7% 99.9% 100.0%-95 -11.0% 0.2%Ridgewater College 3,650 3,760 3,792 3,971 4,273 99.8% 99.9% 99.8% 99.5% 99.7%623 17.1% -0.1%Riverland Community College 3,231 3,179 3,471 3,845 4,034 99.9% 99.9% 99.9% 99.8% 100.0%803 24.9% 0.1%Rochester Community and Technical College 4,404 4,743 5,035 5,507 5,868 100.0% 99.3% 99.6% 99.7% 99.8%1,464 33.2% -0.1%St. Cloud Technical College 2,863 2,949 3,164 3,232 3,293 100.0% 100.0% 100.0% 100.0% 100.0%430 15.0% 0.0%Saint Paul College 4,734 5,236 5,353 5,132 4,916 99.7% 99.8% 99.9% 99.9% 99.9%182 3.8% 0.2%South Central Technical College 3,216 3,216 3,160 3,346 3,258 100.0% 99.9% 99.8% 99.7% 99.0%42 1.3% -1.0%
Subtotal: Colleges 97,347 100,569 103,680 106,682 110,518 13,171 13.5% 98.8% 98.6% 98.5% 97.1% 97.5% -1.4%Universities
Bemidji State University 4,569 4,664 4,555 4,902 5,059 99.8% 100.0% 100.0% 100.0% 100.0%490 10.7% 0.2%Metropolitan State University 5,072 4,885 4,745 4,797 5,064 91.8% 85.1% 76.8% 73.4% 75.4%-8 -0.2% -16.4%Minnesota State University, Mankato 12,443 12,933 13,311 13,814 14,071 100.0% 100.0% 100.0% 99.9% 100.0%1,628 13.1% 0.0%Minnesota State University Moorhead 7,048 7,418 7,416 7,681 7,694 100.0% 100.0% 100.0% 100.0% 100.0%646 9.2% 0.0%St. Cloud State University 14,755 15,165 15,921 16,224 16,131 100.0% 100.0% 99.8% 100.0% 100.0%1,376 9.3% 0.0%Southwest Minnesota State University 4,386 4,745 5,402 5,588 5,756 99.6% 100.0% 99.9% 100.0% 100.0%1,370 31.2% 0.4%Winona State University 6,939 7,277 7,608 7,781 8,066 98.4% 98.5% 98.6% 97.9% 97.8%1,127 16.2% -0.6%
Subtotal: Universities 55,212 57,087 58,958 60,787 61,841 6,629 12.0% 98.9% 98.3% 97.4% 96.9% 97.1% -1.8%Institution Location
Greater Minnesota 98,130 101,381 103,828 107,278 110,173 99.6% 99.5% 99.1% 99.2% 99.2%12,043 12.3% -0.5%Twin Cities Metropolitan Area 54,429 56,275 58,810 60,191 62,186 97.5% 96.8% 96.4% 93.4% 94.2%7,757 14.3% -3.3%
Total: Colleges and Universities 152,559 157,656 162,638 167,469 172,359 19,800 13.0% 98.9% 98.5% 98.1% 97.1% 97.3% -1.5%
Source: Office of the Chancellor Research and PlanningR:\Factbooks\System Factbook\Fall Multi-Year.mdb Fall Multi-Year Gender 10/21/2004
Table II-46: Page 3 of 5
69
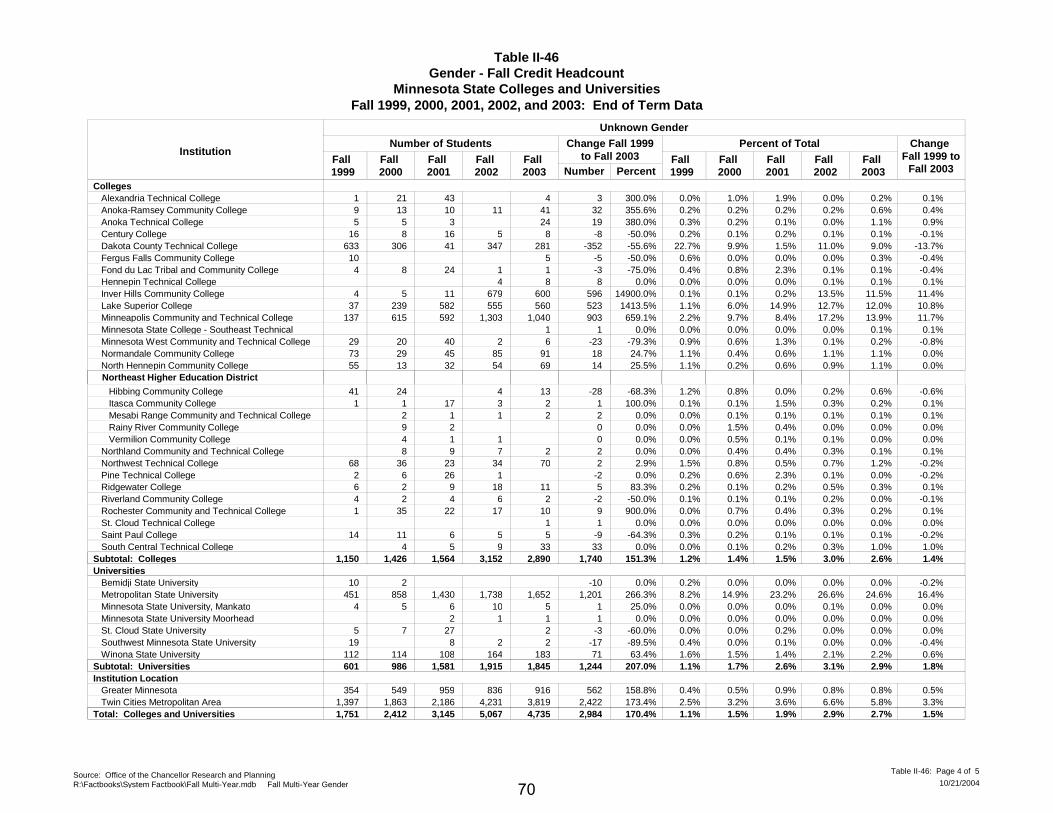
Table II-46Gender - Fall Credit Headcount
Minnesota State Colleges and UniversitiesFall 1999, 2000, 2001, 2002, and 2003: End of Term Data
Institution
Unknown Gender
Fall 1999
Fall 2000
Fall 2001
Fall 2002
Fall 2003
Number of Students Change Fall 1999to Fall 2003
Number PercentFall 1999
Fall 2000
Fall 2001
Fall 2002
Fall 2003
Change Fall 1999 to
Fall 2003
Percent of Total
CollegesAlexandria Technical College 1 21 43 4 0.0% 1.0% 1.9% 0.0% 0.2%3 300.0% 0.1%Anoka-Ramsey Community College 9 13 10 11 41 0.2% 0.2% 0.2% 0.2% 0.6%32 355.6% 0.4%Anoka Technical College 5 5 3 24 0.3% 0.2% 0.1% 0.0% 1.1%19 380.0% 0.9%Century College 16 8 16 5 8 0.2% 0.1% 0.2% 0.1% 0.1%-8 -50.0% -0.1%Dakota County Technical College 633 306 41 347 281 22.7% 9.9% 1.5% 11.0% 9.0%-352 -55.6% -13.7%Fergus Falls Community College 10 5 0.6% 0.0% 0.0% 0.0% 0.3%-5 -50.0% -0.4%Fond du Lac Tribal and Community College 4 8 24 1 1 0.4% 0.8% 2.3% 0.1% 0.1%-3 -75.0% -0.4%Hennepin Technical College 4 8 0.0% 0.0% 0.0% 0.1% 0.1%8 0.0% 0.1%Inver Hills Community College 4 5 11 679 600 0.1% 0.1% 0.2% 13.5% 11.5%596 14900.0% 11.4%Lake Superior College 37 239 582 555 560 1.1% 6.0% 14.9% 12.7% 12.0%523 1413.5% 10.8%Minneapolis Community and Technical College 137 615 592 1,303 1,040 2.2% 9.7% 8.4% 17.2% 13.9%903 659.1% 11.7%Minnesota State College - Southeast Technical 1 0.0% 0.0% 0.0% 0.0% 0.1%1 0.0% 0.1%Minnesota West Community and Technical College 29 20 40 2 6 0.9% 0.6% 1.3% 0.1% 0.2%-23 -79.3% -0.8%Normandale Community College 73 29 45 85 91 1.1% 0.4% 0.6% 1.1% 1.1%18 24.7% 0.0%North Hennepin Community College 55 13 32 54 69 1.1% 0.2% 0.6% 0.9% 1.1%14 25.5% 0.0%
Hibbing Community College 41 24 4 13 1.2% 0.8% 0.0% 0.2% 0.6%-28 -68.3% -0.6%
Northeast Higher Education District
Itasca Community College 1 1 17 3 2 0.1% 0.1% 1.5% 0.3% 0.2%1 100.0% 0.1% Mesabi Range Community and Technical College 2 1 1 2 0.0% 0.1% 0.1% 0.1% 0.1%2 0.0% 0.1% Rainy River Community College 9 2 0.0% 1.5% 0.4% 0.0% 0.0%0 0.0% 0.0% Vermilion Community College 4 1 1 0.0% 0.5% 0.1% 0.1% 0.0%0 0.0% 0.0%Northland Community and Technical College 8 9 7 2 0.0% 0.4% 0.4% 0.3% 0.1%2 0.0% 0.1%Northwest Technical College 68 36 23 34 70 1.5% 0.8% 0.5% 0.7% 1.2%2 2.9% -0.2%Pine Technical College 2 6 26 1 0.2% 0.6% 2.3% 0.1% 0.0%-2 0.0% -0.2%Ridgewater College 6 2 9 18 11 0.2% 0.1% 0.2% 0.5% 0.3%5 83.3% 0.1%Riverland Community College 4 2 4 6 2 0.1% 0.1% 0.1% 0.2% 0.0%-2 -50.0% -0.1%Rochester Community and Technical College 1 35 22 17 10 0.0% 0.7% 0.4% 0.3% 0.2%9 900.0% 0.1%St. Cloud Technical College 1 0.0% 0.0% 0.0% 0.0% 0.0%1 0.0% 0.0%Saint Paul College 14 11 6 5 5 0.3% 0.2% 0.1% 0.1% 0.1%-9 -64.3% -0.2%South Central Technical College 4 5 9 33 0.0% 0.1% 0.2% 0.3% 1.0%33 0.0% 1.0%
Subtotal: Colleges 1,150 1,426 1,564 3,152 2,890 1,740 151.3% 1.2% 1.4% 1.5% 3.0% 2.6% 1.4%Universities
Bemidji State University 10 2 0.2% 0.0% 0.0% 0.0% 0.0%-10 0.0% -0.2%Metropolitan State University 451 858 1,430 1,738 1,652 8.2% 14.9% 23.2% 26.6% 24.6%1,201 266.3% 16.4%Minnesota State University, Mankato 4 5 6 10 5 0.0% 0.0% 0.0% 0.1% 0.0%1 25.0% 0.0%Minnesota State University Moorhead 2 1 1 0.0% 0.0% 0.0% 0.0% 0.0%1 0.0% 0.0%St. Cloud State University 5 7 27 2 0.0% 0.0% 0.2% 0.0% 0.0%-3 -60.0% 0.0%Southwest Minnesota State University 19 8 2 2 0.4% 0.0% 0.1% 0.0% 0.0%-17 -89.5% -0.4%Winona State University 112 114 108 164 183 1.6% 1.5% 1.4% 2.1% 2.2%71 63.4% 0.6%
Subtotal: Universities 601 986 1,581 1,915 1,845 1,244 207.0% 1.1% 1.7% 2.6% 3.1% 2.9% 1.8%Institution Location
Greater Minnesota 354 549 959 836 916 0.4% 0.5% 0.9% 0.8% 0.8%562 158.8% 0.5%Twin Cities Metropolitan Area 1,397 1,863 2,186 4,231 3,819 2.5% 3.2% 3.6% 6.6% 5.8%2,422 173.4% 3.3%
Total: Colleges and Universities 1,751 2,412 3,145 5,067 4,735 2,984 170.4% 1.1% 1.5% 1.9% 2.9% 2.7% 1.5%
Source: Office of the Chancellor Research and PlanningR:\Factbooks\System Factbook\Fall Multi-Year.mdb Fall Multi-Year Gender 10/21/2004
Table II-46: Page 4 of 5
70

Table II-46Gender - Fall Credit Headcount
Minnesota State Colleges and UniversitiesFall 1999, 2000, 2001, 2002, and 2003: End of Term Data
Institution
Total
Fall 1999
Fall 2000
Fall 2001
Fall 2002
Fall 2003
Number of Students Change Fall 1999to Fall 2003
Number PercentFall 1999
Fall 2000
Fall 2001
Fall 2002
Fall 2003
Change Fall 1999 to
Fall 2003
Percent of Total
CollegesAlexandria Technical College 2,258 2,192 2,320 2,298 2,359 100.0% 100.0% 100.0% 100.0% 100.0%101 4.5% 0.0%Anoka-Ramsey Community College 5,974 5,844 5,978 6,554 7,332 100.0% 100.0% 100.0% 100.0% 100.0%1,358 22.7% 0.0%Anoka Technical College 1,934 2,046 2,409 2,272 2,113 100.0% 100.0% 100.0% 100.0% 100.0%179 9.3% 0.0%Central Lakes College 3,270 3,138 3,104 3,240 3,055 100.0% 100.0% 100.0% 100.0% 100.0%-215 -6.6% 0.0%Century College 6,624 6,937 7,396 8,177 8,573 100.0% 100.0% 100.0% 100.0% 100.0%1,949 29.4% 0.0%Dakota County Technical College 2,792 3,086 2,786 3,155 3,135 100.0% 100.0% 100.0% 100.0% 100.0%343 12.3% 0.0%Fergus Falls Community College 1,549 2,082 2,283 1,739 1,842 100.0% 100.0% 100.0% 100.0% 100.0%293 18.9% 0.0%Fond du Lac Tribal and Community College 938 999 1,022 1,315 1,735 100.0% 100.0% 100.0% 100.0% 100.0%797 85.0% 0.0%Hennepin Technical College 5,879 5,960 6,262 5,985 5,673 100.0% 100.0% 100.0% 100.0% 100.0%-206 -3.5% 0.0%Inver Hills Community College 4,244 4,304 4,544 5,022 5,199 100.0% 100.0% 100.0% 100.0% 100.0%955 22.5% 0.0%Lake Superior College 3,218 3,972 3,904 4,354 4,680 100.0% 100.0% 100.0% 100.0% 100.0%1,462 45.4% 0.0%Minneapolis Community and Technical College 6,154 6,363 7,040 7,591 7,486 100.0% 100.0% 100.0% 100.0% 100.0%1,332 21.6% 0.0%Minnesota State College - Southeast Technical 1,401 1,242 1,705 1,875 1,817 100.0% 100.0% 100.0% 100.0% 100.0%416 29.7% 0.0%Minnesota West Community and Technical College 3,082 3,296 3,155 3,081 3,183 100.0% 100.0% 100.0% 100.0% 100.0%101 3.3% 0.0%Normandale Community College 6,814 7,347 7,504 7,958 8,320 100.0% 100.0% 100.0% 100.0% 100.0%1,506 22.1% 0.0%North Hennepin Community College 5,140 5,261 5,543 6,036 6,537 100.0% 100.0% 100.0% 100.0% 100.0%1,397 27.2% 0.0%
Hibbing Community College 3,291 3,143 1,764 1,882 2,040 100.0% 100.0% 100.0% 100.0% 100.0%-1,251 -38.0% 0.0%
Northeast Higher Education District
Itasca Community College 1,172 1,033 1,120 1,102 1,142 100.0% 100.0% 100.0% 100.0% 100.0%-30 -2.6% 0.0% Mesabi Range Community and Technical College 1,558 1,486 1,864 1,628 1,567 100.0% 100.0% 100.0% 100.0% 100.0%9 0.6% 0.0% Rainy River Community College 660 617 535 420 384 100.0% 100.0% 100.0% 100.0% 100.0%-276 -41.8% 0.0% Vermilion Community College 943 885 857 961 955 100.0% 100.0% 100.0% 100.0% 100.0%12 1.3% 0.0%Northland Community and Technical College 2,013 1,991 2,154 2,165 2,160 100.0% 100.0% 100.0% 100.0% 100.0%147 7.3% 0.0%Northwest Technical College 4,600 4,638 4,865 5,104 5,648 100.0% 100.0% 100.0% 100.0% 100.0%1,048 22.8% 0.0%Pine Technical College 866 996 1,109 832 769 100.0% 100.0% 100.0% 100.0% 100.0%-97 -11.2% 0.0%Ridgewater College 3,656 3,762 3,801 3,989 4,284 100.0% 100.0% 100.0% 100.0% 100.0%628 17.2% 0.0%Riverland Community College 3,235 3,181 3,475 3,851 4,036 100.0% 100.0% 100.0% 100.0% 100.0%801 24.8% 0.0%Rochester Community and Technical College 4,405 4,778 5,057 5,524 5,878 100.0% 100.0% 100.0% 100.0% 100.0%1,473 33.4% 0.0%St. Cloud Technical College 2,863 2,949 3,164 3,232 3,294 100.0% 100.0% 100.0% 100.0% 100.0%431 15.1% 0.0%Saint Paul College 4,748 5,247 5,359 5,137 4,921 100.0% 100.0% 100.0% 100.0% 100.0%173 3.6% 0.0%South Central Technical College 3,216 3,220 3,165 3,355 3,291 100.0% 100.0% 100.0% 100.0% 100.0%75 2.3% 0.0%
Subtotal: Colleges 98,497 101,995 105,244 109,834 113,408 14,911 15.1% 100.0% 100.0% 100.0% 100.0% 100.0% 0.0%Universities
Bemidji State University 4,579 4,666 4,555 4,902 5,059 100.0% 100.0% 100.0% 100.0% 100.0%480 10.5% 0.0%Metropolitan State University 5,523 5,743 6,175 6,535 6,716 100.0% 100.0% 100.0% 100.0% 100.0%1,193 21.6% 0.0%Minnesota State University, Mankato 12,447 12,938 13,317 13,824 14,076 100.0% 100.0% 100.0% 100.0% 100.0%1,629 13.1% 0.0%Minnesota State University Moorhead 7,048 7,418 7,418 7,682 7,695 100.0% 100.0% 100.0% 100.0% 100.0%647 9.2% 0.0%St. Cloud State University 14,760 15,172 15,948 16,224 16,133 100.0% 100.0% 100.0% 100.0% 100.0%1,373 9.3% 0.0%Southwest Minnesota State University 4,405 4,745 5,410 5,590 5,758 100.0% 100.0% 100.0% 100.0% 100.0%1,353 30.7% 0.0%Winona State University 7,051 7,391 7,716 7,945 8,249 100.0% 100.0% 100.0% 100.0% 100.0%1,198 17.0% 0.0%
Subtotal: Universities 55,813 58,073 60,539 62,702 63,686 7,873 14.1% 100.0% 100.0% 100.0% 100.0% 100.0% 0.0%Institution Location
Greater Minnesota 98,484 101,930 104,787 108,114 111,089 100.0% 100.0% 100.0% 100.0% 100.0%12,605 12.8% 0.0%Twin Cities Metropolitan Area 55,826 58,138 60,996 64,422 66,005 100.0% 100.0% 100.0% 100.0% 100.0%10,179 18.2% 0.0%
Total: Colleges and Universities 154,310 160,068 165,783 172,536 177,094 22,784 14.8% 100.0% 100.0% 100.0% 100.0% 100.0% 0.0%
Source: Office of the Chancellor Research and PlanningR:\Factbooks\System Factbook\Fall Multi-Year.mdb Fall Multi-Year Gender 10/21/2004
Table II-46: Page 5 of 5
71

This Page is Intentionally Left Blank
72
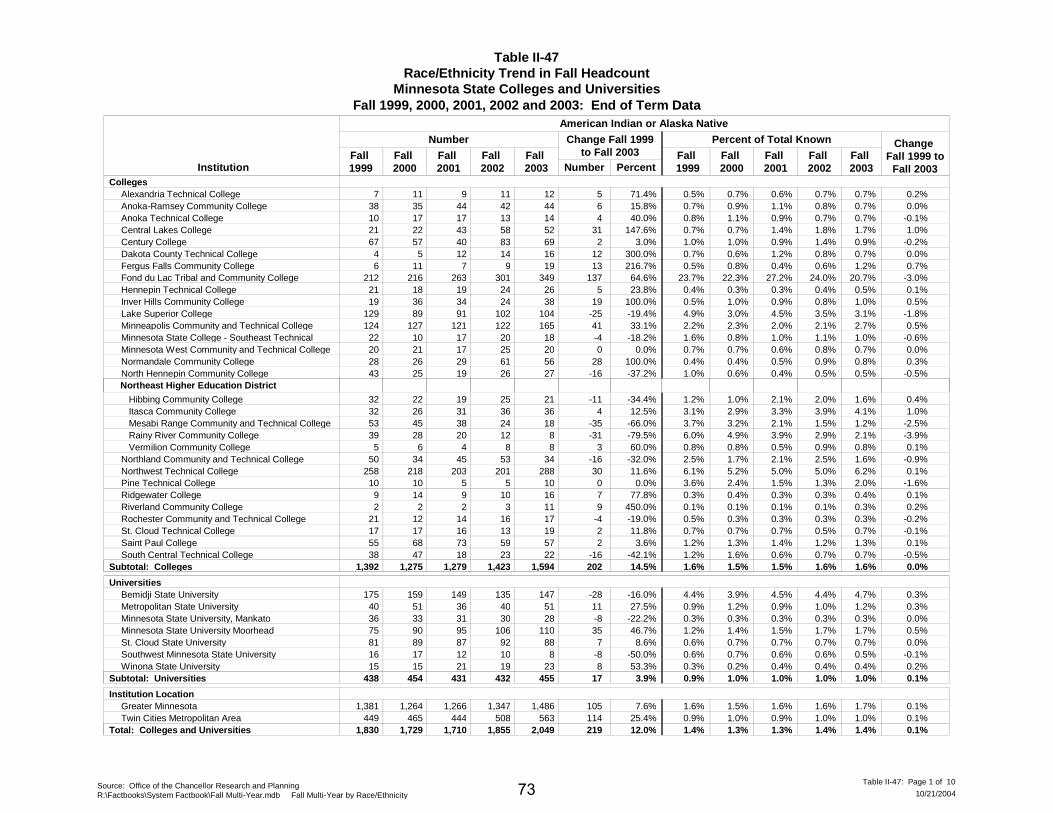
Table II-47Race/Ethnicity Trend in Fall Headcount
Minnesota State Colleges and UniversitiesFall 1999, 2000, 2001, 2002 and 2003: End of Term Data
InstitutionFall 1999
Fall 2000
Fall 2001
Fall 2002
Number
Fall 1999
Fall 2000
Fall 2001
Fall 2003
Change Fall 1999 to
Fall 2003
Change Fall 1999to Fall 2003
Number Percent
American Indian or Alaska Native
Percent of Total Known
Fall 2003
Fall 2002
CollegesAlexandria Technical College 7 11 9 11 5 71.4% 0.2%0.5% 0.7% 0.6% 0.7%12 0.7%Anoka-Ramsey Community College 38 35 44 42 6 15.8% 0.0%0.7% 0.9% 1.1% 0.7%44 0.8%Anoka Technical College 10 17 17 13 4 40.0% -0.1%0.8% 1.1% 0.9% 0.7%14 0.7%Central Lakes College 21 22 43 58 31 147.6% 1.0%0.7% 0.7% 1.4% 1.7%52 1.8%Century College 67 57 40 83 2 3.0% -0.2%1.0% 1.0% 0.9% 0.9%69 1.4%Dakota County Technical College 4 5 12 14 12 300.0% 0.0%0.7% 0.6% 1.2% 0.7%16 0.8%Fergus Falls Community College 6 11 7 9 13 216.7% 0.7%0.5% 0.8% 0.4% 1.2%19 0.6%Fond du Lac Tribal and Community College 212 216 263 301 137 64.6% -3.0%23.7% 22.3% 27.2% 20.7%349 24.0%Hennepin Technical College 21 18 19 24 5 23.8% 0.1%0.4% 0.3% 0.3% 0.5%26 0.4%Inver Hills Community College 19 36 34 24 19 100.0% 0.5%0.5% 1.0% 0.9% 1.0%38 0.8%Lake Superior College 129 89 91 102 -25 -19.4% -1.8%4.9% 3.0% 4.5% 3.1%104 3.5%Minneapolis Community and Technical College 124 127 121 122 41 33.1% 0.5%2.2% 2.3% 2.0% 2.7%165 2.1%Minnesota State College - Southeast Technical 22 10 17 20 -4 -18.2% -0.6%1.6% 0.8% 1.0% 1.0%18 1.1%Minnesota West Community and Technical College 20 21 17 25 0 0.0% 0.0%0.7% 0.7% 0.6% 0.7%20 0.8%Normandale Community College 28 26 29 61 28 100.0% 0.3%0.4% 0.4% 0.5% 0.8%56 0.9%North Hennepin Community College 43 25 19 26 -16 -37.2% -0.5%1.0% 0.6% 0.4% 0.5%27 0.5%
Hibbing Community College 32 22 19 25 -11 -34.4% 0.4%1.2% 1.0% 2.1% 1.6%21 2.0%
Northeast Higher Education District
Itasca Community College 32 26 31 36 4 12.5% 1.0%3.1% 2.9% 3.3% 4.1%36 3.9% Mesabi Range Community and Technical College 53 45 38 24 -35 -66.0% -2.5%3.7% 3.2% 2.1% 1.2%18 1.5% Rainy River Community College 39 28 20 12 -31 -79.5% -3.9%6.0% 4.9% 3.9% 2.1%8 2.9% Vermilion Community College 5 6 4 8 3 60.0% 0.1%0.8% 0.8% 0.5% 0.8%8 0.9%Northland Community and Technical College 50 34 45 53 -16 -32.0% -0.9%2.5% 1.7% 2.1% 1.6%34 2.5%Northwest Technical College 258 218 203 201 30 11.6% 0.1%6.1% 5.2% 5.0% 6.2%288 5.0%Pine Technical College 10 10 5 5 0 0.0% -1.6%3.6% 2.4% 1.5% 2.0%10 1.3%Ridgewater College 9 14 9 10 7 77.8% 0.1%0.3% 0.4% 0.3% 0.4%16 0.3%Riverland Community College 2 2 2 3 9 450.0% 0.2%0.1% 0.1% 0.1% 0.3%11 0.1%Rochester Community and Technical College 21 12 14 16 -4 -19.0% -0.2%0.5% 0.3% 0.3% 0.3%17 0.3%St. Cloud Technical College 17 17 16 13 2 11.8% -0.1%0.7% 0.7% 0.7% 0.7%19 0.5%Saint Paul College 55 68 73 59 2 3.6% 0.1%1.2% 1.3% 1.4% 1.3%57 1.2%South Central Technical College 38 47 18 23 -16 -42.1% -0.5%1.2% 1.6% 0.6% 0.7%22 0.7%
Subtotal: Colleges 1,392 1,275 1,279 1,423 202 14.5% 1.6% 1.5% 1.5% 1.6% 0.0%1,594 1.6%
UniversitiesBemidji State University 175 159 149 135 -28 -16.0% 0.3%4.4% 3.9% 4.5% 4.7%147 4.4%Metropolitan State University 40 51 36 40 11 27.5% 0.3%0.9% 1.2% 0.9% 1.2%51 1.0%Minnesota State University, Mankato 36 33 31 30 -8 -22.2% 0.0%0.3% 0.3% 0.3% 0.3%28 0.3%Minnesota State University Moorhead 75 90 95 106 35 46.7% 0.5%1.2% 1.4% 1.5% 1.7%110 1.7%St. Cloud State University 81 89 87 92 7 8.6% 0.0%0.6% 0.7% 0.7% 0.7%88 0.7%Southwest Minnesota State University 16 17 12 10 -8 -50.0% -0.1%0.6% 0.7% 0.6% 0.5%8 0.6%Winona State University 15 15 21 19 8 53.3% 0.2%0.3% 0.2% 0.4% 0.4%23 0.4%
Subtotal: Universities 438 454 431 432 17 3.9% 0.9% 1.0% 1.0% 1.0% 0.1%455 1.0%
Institution LocationGreater Minnesota 1,381 1,264 1,266 1,347 105 7.6% 0.1%1.6% 1.5% 1.6% 1.7%1,486 1.6%Twin Cities Metropolitan Area 449 465 444 508 114 25.4% 0.1%0.9% 1.0% 0.9% 1.0%563 1.0%
Total: Colleges and Universities 1,830 1,729 1,710 1,855 219 12.0% 1.4% 1.3% 1.3% 1.4% 0.1%2,049 1.4%
Source: Office of the Chancellor Research and PlanningR:\Factbooks\System Factbook\Fall Multi-Year.mdb Fall Multi-Year by Race/Ethnicity 10/21/2004
Table II-47: Page 1 of 1073

Table II-47Race/Ethnicity Trend in Fall Headcount
Minnesota State Colleges and UniversitiesFall 1999, 2000, 2001, 2002 and 2003: End of Term Data
InstitutionFall 1999
Fall 2000
Fall 2001
Fall 2002
Number
Fall 1999
Fall 2000
Fall 2001
Fall 2003
Change Fall 1999 to
Fall 2003
Change Fall 1999to Fall 2003
Number Percent
Asian or Pacific Islander
Percent of Total Known
Fall 2003
Fall 2002
CollegesAlexandria Technical College 5 4 6 9 7 140.0% 0.3%0.3% 0.3% 0.4% 0.7%12 0.5%Anoka-Ramsey Community College 71 74 90 121 64 90.1% 0.9%1.4% 1.9% 2.2% 2.3%135 2.3%Anoka Technical College 12 31 36 38 20 166.7% 0.7%1.0% 2.1% 1.9% 1.7%32 2.0%Central Lakes College 9 8 11 15 11 122.2% 0.4%0.3% 0.3% 0.4% 0.7%20 0.5%Century College 353 361 329 480 360 102.0% 3.7%5.5% 6.3% 7.3% 9.1%713 8.1%Dakota County Technical College 18 28 23 52 47 261.1% -0.4%3.3% 3.4% 2.3% 2.8%65 2.9%Fergus Falls Community College 10 7 8 9 7 70.0% 0.3%0.8% 0.5% 0.5% 1.1%17 0.6%Fond du Lac Tribal and Community College 5 8 6 13 14 280.0% 0.6%0.6% 0.8% 0.6% 1.1%19 1.0%Hennepin Technical College 340 372 314 318 -47 -13.8% -0.2%5.8% 6.3% 5.0% 5.6%293 5.8%Inver Hills Community College 124 99 136 104 44 35.5% 1.1%3.4% 2.7% 3.5% 4.5%168 3.3%Lake Superior College 21 28 24 42 23 109.5% 0.5%0.8% 1.0% 1.2% 1.3%44 1.4%Minneapolis Community and Technical College 411 423 423 391 -32 -7.8% -1.0%7.2% 7.7% 6.9% 6.2%379 6.6%Minnesota State College - Southeast Technical 27 14 15 17 -2 -7.4% -0.5%1.9% 1.1% 0.9% 1.4%25 0.9%Minnesota West Community and Technical College 25 31 39 44 23 92.0% 0.7%0.9% 1.0% 1.3% 1.6%48 1.4%Normandale Community College 337 420 427 490 170 50.4% 1.8%5.2% 6.4% 6.6% 7.1%507 7.0%North Hennepin Community College 149 210 265 327 269 180.5% 3.8%3.3% 4.6% 5.6% 7.1%418 6.2%
Hibbing Community College 2 1 3 2 1 50.0% 0.2%0.1% 0.0% 0.3% 0.2%3 0.2%
Northeast Higher Education District
Itasca Community College 3 4 2 3 -1 -33.3% -0.1%0.3% 0.4% 0.2% 0.2%2 0.3% Mesabi Range Community and Technical College 7 2 3 3 -3 -42.9% -0.2%0.5% 0.1% 0.2% 0.3%4 0.2% Rainy River Community College 4 3 3 1 -2 -50.0% -0.1%0.6% 0.5% 0.6% 0.5%2 0.2% Vermilion Community College 6 1 3 -6 0.0% -0.9%0.9% 0.0% 0.1% 0.0%0.3%Northland Community and Technical College 8 3 9 4 50.0% 0.2%0.4% 0.0% 0.1% 0.6%12 0.4%Northwest Technical College 49 38 34 35 -13 -26.5% -0.4%1.2% 0.9% 0.8% 0.8%36 0.9%Pine Technical College 1 7 1 2 200.0% 0.2%0.4% 1.7% 0.3% 0.6%3 0.0%Ridgewater College 14 14 14 28 6 42.9% 0.0%0.5% 0.4% 0.4% 0.5%20 0.8%Riverland Community College 45 27 21 21 -11 -24.4% -0.5%1.4% 0.9% 0.6% 0.9%34 0.6%Rochester Community and Technical College 155 175 209 225 86 55.5% 0.8%3.9% 3.9% 4.6% 4.7%241 4.7%St. Cloud Technical College 34 34 36 46 3 8.8% -0.2%1.5% 1.4% 1.6% 1.3%37 1.8%Saint Paul College 387 420 425 431 8 2.1% 0.4%8.4% 8.2% 8.1% 8.8%395 9.0%South Central Technical College 28 27 27 26 -3 -10.7% -0.1%0.9% 0.9% 0.9% 0.8%25 0.8%
Subtotal: Colleges 2,660 2,870 2,934 3,303 1,049 39.4% 3.1% 3.3% 3.4% 3.8% 0.7%3,709 3.6%
UniversitiesBemidji State University 22 26 21 24 -1 -4.5% 0.1%0.6% 0.6% 0.6% 0.7%21 0.8%Metropolitan State University 285 305 327 325 110 38.6% 2.7%6.4% 7.4% 8.4% 9.1%395 8.1%Minnesota State University, Mankato 233 228 179 184 -53 -22.7% -0.3%2.1% 2.0% 1.9% 1.8%180 2.0%Minnesota State University Moorhead 64 61 57 58 6 9.4% 0.1%1.0% 0.9% 0.9% 1.1%70 0.9%St. Cloud State University 214 221 246 260 38 17.8% 0.2%1.7% 1.7% 1.9% 1.9%252 2.0%Southwest Minnesota State University 37 45 35 33 -7 -18.9% 0.3%1.4% 1.8% 1.7% 1.8%30 1.8%Winona State University 123 96 94 82 -23 -18.7% -0.3%2.1% 1.6% 1.8% 1.8%100 1.6%
Subtotal: Universities 978 982 959 966 70 7.2% 2.1% 2.1% 2.2% 2.4% 0.3%1,048 2.3%
Institution LocationGreater Minnesota 1,151 1,109 1,098 1,192 106 9.2% 0.1%1.4% 1.3% 1.4% 1.4%1,257 1.4%Twin Cities Metropolitan Area 2,487 2,743 2,795 3,077 1,013 40.7% 1.3%5.1% 5.8% 5.8% 6.4%3,500 6.1%
Total: Colleges and Universities 3,638 3,852 3,893 4,269 1,119 30.8% 2.7% 2.9% 3.0% 3.3% 0.6%4,757 3.2%
Source: Office of the Chancellor Research and PlanningR:\Factbooks\System Factbook\Fall Multi-Year.mdb Fall Multi-Year by Race/Ethnicity 10/21/2004
Table II-47: Page 2 of 1074
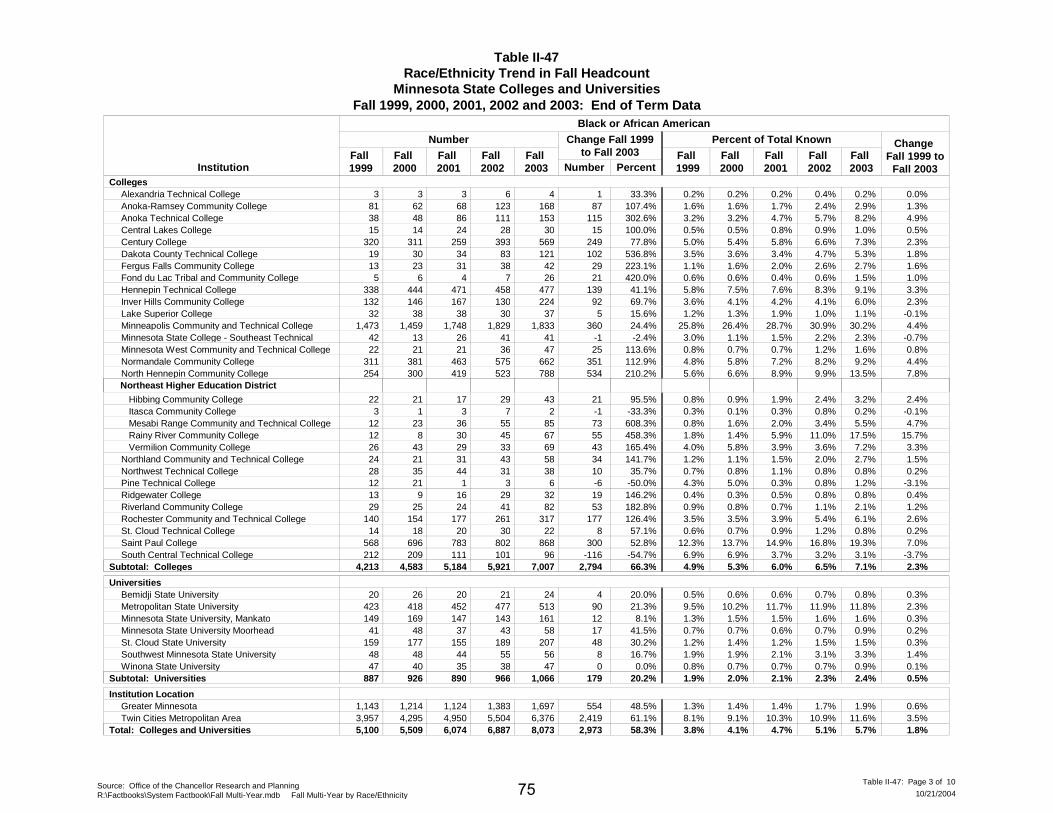
Table II-47Race/Ethnicity Trend in Fall Headcount
Minnesota State Colleges and UniversitiesFall 1999, 2000, 2001, 2002 and 2003: End of Term Data
InstitutionFall 1999
Fall 2000
Fall 2001
Fall 2002
Number
Fall 1999
Fall 2000
Fall 2001
Fall 2003
Change Fall 1999 to
Fall 2003
Change Fall 1999to Fall 2003
Number Percent
Black or African American
Percent of Total Known
Fall 2003
Fall 2002
CollegesAlexandria Technical College 3 3 3 6 1 33.3% 0.0%0.2% 0.2% 0.2% 0.2%4 0.4%Anoka-Ramsey Community College 81 62 68 123 87 107.4% 1.3%1.6% 1.6% 1.7% 2.9%168 2.4%Anoka Technical College 38 48 86 111 115 302.6% 4.9%3.2% 3.2% 4.7% 8.2%153 5.7%Central Lakes College 15 14 24 28 15 100.0% 0.5%0.5% 0.5% 0.8% 1.0%30 0.9%Century College 320 311 259 393 249 77.8% 2.3%5.0% 5.4% 5.8% 7.3%569 6.6%Dakota County Technical College 19 30 34 83 102 536.8% 1.8%3.5% 3.6% 3.4% 5.3%121 4.7%Fergus Falls Community College 13 23 31 38 29 223.1% 1.6%1.1% 1.6% 2.0% 2.7%42 2.6%Fond du Lac Tribal and Community College 5 6 4 7 21 420.0% 1.0%0.6% 0.6% 0.4% 1.5%26 0.6%Hennepin Technical College 338 444 471 458 139 41.1% 3.3%5.8% 7.5% 7.6% 9.1%477 8.3%Inver Hills Community College 132 146 167 130 92 69.7% 2.3%3.6% 4.1% 4.2% 6.0%224 4.1%Lake Superior College 32 38 38 30 5 15.6% -0.1%1.2% 1.3% 1.9% 1.1%37 1.0%Minneapolis Community and Technical College 1,473 1,459 1,748 1,829 360 24.4% 4.4%25.8% 26.4% 28.7% 30.2%1,833 30.9%Minnesota State College - Southeast Technical 42 13 26 41 -1 -2.4% -0.7%3.0% 1.1% 1.5% 2.3%41 2.2%Minnesota West Community and Technical College 22 21 21 36 25 113.6% 0.8%0.8% 0.7% 0.7% 1.6%47 1.2%Normandale Community College 311 381 463 575 351 112.9% 4.4%4.8% 5.8% 7.2% 9.2%662 8.2%North Hennepin Community College 254 300 419 523 534 210.2% 7.8%5.6% 6.6% 8.9% 13.5%788 9.9%
Hibbing Community College 22 21 17 29 21 95.5% 2.4%0.8% 0.9% 1.9% 3.2%43 2.4%
Northeast Higher Education District
Itasca Community College 3 1 3 7 -1 -33.3% -0.1%0.3% 0.1% 0.3% 0.2%2 0.8% Mesabi Range Community and Technical College 12 23 36 55 73 608.3% 4.7%0.8% 1.6% 2.0% 5.5%85 3.4% Rainy River Community College 12 8 30 45 55 458.3% 15.7%1.8% 1.4% 5.9% 17.5%67 11.0% Vermilion Community College 26 43 29 33 43 165.4% 3.3%4.0% 5.8% 3.9% 7.2%69 3.6%Northland Community and Technical College 24 21 31 43 34 141.7% 1.5%1.2% 1.1% 1.5% 2.7%58 2.0%Northwest Technical College 28 35 44 31 10 35.7% 0.2%0.7% 0.8% 1.1% 0.8%38 0.8%Pine Technical College 12 21 1 3 -6 -50.0% -3.1%4.3% 5.0% 0.3% 1.2%6 0.8%Ridgewater College 13 9 16 29 19 146.2% 0.4%0.4% 0.3% 0.5% 0.8%32 0.8%Riverland Community College 29 25 24 41 53 182.8% 1.2%0.9% 0.8% 0.7% 2.1%82 1.1%Rochester Community and Technical College 140 154 177 261 177 126.4% 2.6%3.5% 3.5% 3.9% 6.1%317 5.4%St. Cloud Technical College 14 18 20 30 8 57.1% 0.2%0.6% 0.7% 0.9% 0.8%22 1.2%Saint Paul College 568 696 783 802 300 52.8% 7.0%12.3% 13.7% 14.9% 19.3%868 16.8%South Central Technical College 212 209 111 101 -116 -54.7% -3.7%6.9% 6.9% 3.7% 3.1%96 3.2%
Subtotal: Colleges 4,213 4,583 5,184 5,921 2,794 66.3% 4.9% 5.3% 6.0% 7.1% 2.3%7,007 6.5%
UniversitiesBemidji State University 20 26 20 21 4 20.0% 0.3%0.5% 0.6% 0.6% 0.8%24 0.7%Metropolitan State University 423 418 452 477 90 21.3% 2.3%9.5% 10.2% 11.7% 11.8%513 11.9%Minnesota State University, Mankato 149 169 147 143 12 8.1% 0.3%1.3% 1.5% 1.5% 1.6%161 1.6%Minnesota State University Moorhead 41 48 37 43 17 41.5% 0.2%0.7% 0.7% 0.6% 0.9%58 0.7%St. Cloud State University 159 177 155 189 48 30.2% 0.3%1.2% 1.4% 1.2% 1.5%207 1.5%Southwest Minnesota State University 48 48 44 55 8 16.7% 1.4%1.9% 1.9% 2.1% 3.3%56 3.1%Winona State University 47 40 35 38 0 0.0% 0.1%0.8% 0.7% 0.7% 0.9%47 0.7%
Subtotal: Universities 887 926 890 966 179 20.2% 1.9% 2.0% 2.1% 2.4% 0.5%1,066 2.3%
Institution LocationGreater Minnesota 1,143 1,214 1,124 1,383 554 48.5% 0.6%1.3% 1.4% 1.4% 1.9%1,697 1.7%Twin Cities Metropolitan Area 3,957 4,295 4,950 5,504 2,419 61.1% 3.5%8.1% 9.1% 10.3% 11.6%6,376 10.9%
Total: Colleges and Universities 5,100 5,509 6,074 6,887 2,973 58.3% 3.8% 4.1% 4.7% 5.7% 1.8%8,073 5.1%
Source: Office of the Chancellor Research and PlanningR:\Factbooks\System Factbook\Fall Multi-Year.mdb Fall Multi-Year by Race/Ethnicity 10/21/2004
Table II-47: Page 3 of 1075

Table II-47Race/Ethnicity Trend in Fall Headcount
Minnesota State Colleges and UniversitiesFall 1999, 2000, 2001, 2002 and 2003: End of Term Data
InstitutionFall 1999
Fall 2000
Fall 2001
Fall 2002
Number
Fall 1999
Fall 2000
Fall 2001
Fall 2003
Change Fall 1999 to
Fall 2003
Change Fall 1999to Fall 2003
Number Percent
Hispanic or Latino
Percent of Total Known
Fall 2003
Fall 2002
CollegesAlexandria Technical College 9 7 7 9 1 11.1% 0.0%0.6% 0.5% 0.4% 0.5%10 0.5%Anoka-Ramsey Community College 42 49 57 57 11 26.2% 0.1%0.8% 1.2% 1.4% 0.9%53 1.1%Anoka Technical College 15 17 20 15 -1 -6.7% -0.5%1.3% 1.1% 1.1% 0.7%14 0.8%Central Lakes College 14 9 20 20 11 78.6% 0.4%0.4% 0.3% 0.6% 0.8%25 0.6%Century College 134 106 87 102 2 1.5% -0.3%2.1% 1.8% 1.9% 1.7%136 1.7%Dakota County Technical College 7 22 21 40 42 600.0% 0.9%1.3% 2.6% 2.1% 2.1%49 2.3%Fergus Falls Community College 4 8 11 11 18 450.0% 1.1%0.3% 0.6% 0.7% 1.4%22 0.7%Fond du Lac Tribal and Community College 3 5 10 9 0.0% 0.5%0.0% 0.3% 0.5% 0.5%9 0.8%Hennepin Technical College 67 67 63 61 4 6.0% 0.2%1.1% 1.1% 1.0% 1.4%71 1.1%Inver Hills Community College 105 106 142 84 -12 -11.4% -0.4%2.9% 2.9% 3.6% 2.5%93 2.7%Lake Superior College 12 24 13 16 2 16.7% 0.0%0.5% 0.8% 0.6% 0.4%14 0.5%Minneapolis Community and Technical College 150 168 193 190 19 12.7% 0.2%2.6% 3.0% 3.2% 2.8%169 3.2%Minnesota State College - Southeast Technical 6 8 12 21 5 83.3% 0.2%0.4% 0.7% 0.7% 0.6%11 1.1%Minnesota West Community and Technical College 33 32 50 62 14 42.4% 0.4%1.1% 1.0% 1.7% 1.6%47 2.0%Normandale Community College 108 128 105 130 19 17.6% 0.1%1.7% 2.0% 1.6% 1.8%127 1.9%North Hennepin Community College 60 53 80 85 35 58.3% 0.3%1.3% 1.2% 1.7% 1.6%95 1.6%
Hibbing Community College 7 6 4 8 3 42.9% 0.5%0.3% 0.3% 0.4% 0.7%10 0.7%
Northeast Higher Education District
Itasca Community College 8 6 8 11 -3 -37.5% -0.2%0.8% 0.7% 0.8% 0.6%5 1.2% Mesabi Range Community and Technical College 6 6 5 6 -3 -50.0% -0.2%0.4% 0.4% 0.3% 0.2%3 0.4% Rainy River Community College 3 4 11 12 2 66.7% 0.9%0.5% 0.7% 2.2% 1.3%5 2.9% Vermilion Community College 4 2 2 3 -2 -50.0% -0.4%0.6% 0.3% 0.3% 0.2%2 0.3%Northland Community and Technical College 12 13 11 15 5 41.7% 0.2%0.6% 0.7% 0.5% 0.8%17 0.7%Northwest Technical College 65 60 62 50 -5 -7.7% -0.3%1.5% 1.4% 1.5% 1.3%60 1.3%Pine Technical College 4 12 2 3 -2 -50.0% -1.0%1.4% 2.9% 0.6% 0.4%2 0.8%Ridgewater College 55 79 82 96 37 67.3% 0.5%1.8% 2.5% 2.6% 2.3%92 2.7%Riverland Community College 45 58 67 67 68 151.1% 1.4%1.4% 1.8% 2.0% 2.8%113 1.8%Rochester Community and Technical College 62 54 71 82 22 35.5% 0.1%1.5% 1.2% 1.6% 1.6%84 1.7%St. Cloud Technical College 14 16 9 23 6 42.9% 0.1%0.6% 0.7% 0.4% 0.7%20 0.9%Saint Paul College 134 166 180 174 12 9.0% 0.3%2.9% 3.3% 3.4% 3.2%146 3.6%South Central Technical College 119 91 55 57 -68 -57.1% -2.2%3.9% 3.0% 1.8% 1.7%51 1.8%
Subtotal: Colleges 1,304 1,380 1,455 1,520 251 19.2% 1.5% 1.6% 1.7% 1.6% 0.1%1,555 1.7%
UniversitiesBemidji State University 27 31 22 19 -8 -29.6% -0.1%0.7% 0.8% 0.7% 0.6%19 0.6%Metropolitan State University 86 83 80 76 6 7.0% 0.2%1.9% 2.0% 2.1% 2.1%92 1.9%Minnesota State University, Mankato 115 104 90 90 -28 -24.3% -0.1%1.0% 0.9% 0.9% 0.9%87 1.0%Minnesota State University Moorhead 80 82 82 76 -6 -7.5% -0.1%1.3% 1.3% 1.3% 1.2%74 1.2%St. Cloud State University 118 106 105 109 -26 -22.0% -0.2%0.9% 0.8% 0.8% 0.7%92 0.8%Southwest Minnesota State University 14 19 16 24 6 42.9% 0.6%0.5% 0.8% 0.8% 1.2%20 1.3%Winona State University 51 62 57 52 11 21.6% 0.3%0.9% 1.0% 1.1% 1.1%62 1.0%
Subtotal: Universities 491 487 452 446 -45 -9.2% 1.0% 1.0% 1.0% 1.0% 0.0%446 1.1%
Institution LocationGreater Minnesota 887 902 879 952 69 7.8% 0.0%1.0% 1.0% 1.1% 1.1%956 1.1%Twin Cities Metropolitan Area 908 965 1,028 1,014 137 15.1% 0.0%1.9% 2.0% 2.1% 1.9%1,045 2.0%
Total: Colleges and Universities 1,795 1,867 1,907 1,966 206 11.5% 1.3% 1.4% 1.5% 1.4% 0.1%2,001 1.5%
Source: Office of the Chancellor Research and PlanningR:\Factbooks\System Factbook\Fall Multi-Year.mdb Fall Multi-Year by Race/Ethnicity 10/21/2004
Table II-47: Page 4 of 1076

Table II-47Race/Ethnicity Trend in Fall Headcount
Minnesota State Colleges and UniversitiesFall 1999, 2000, 2001, 2002 and 2003: End of Term Data
InstitutionFall 1999
Fall 2000
Fall 2001
Fall 2002
Number
Fall 1999
Fall 2000
Fall 2001
Fall 2003
Change Fall 1999 to
Fall 2003
Change Fall 1999to Fall 2003
Number Percent
Students of Color
Percent of Total Known
Fall 2003
Fall 2002
CollegesAlexandria Technical College 24 25 25 35 14 58.3% 0.5%1.6% 1.7% 1.6% 2.1%38 2.1%Anoka-Ramsey Community College 232 220 259 343 168 72.4% 2.3%4.5% 5.6% 6.3% 6.8%400 6.6%Anoka Technical College 75 113 159 177 138 184.0% 5.0%6.3% 7.6% 8.6% 11.4%213 9.1%Central Lakes College 59 53 98 121 68 115.3% 2.3%1.9% 1.7% 3.2% 4.2%127 3.7%Century College 874 835 715 1,058 613 70.1% 5.5%13.5% 14.5% 16.0% 19.0%1,487 17.9%Dakota County Technical College 48 85 90 189 203 422.9% 2.2%8.8% 10.2% 9.0% 11.0%251 10.7%Fergus Falls Community College 33 49 57 67 67 203.0% 3.7%2.7% 3.4% 3.6% 6.4%100 4.5%Fond du Lac Tribal and Community College 222 233 278 331 181 81.5% -0.9%24.9% 24.0% 28.7% 24.0%403 26.4%Hennepin Technical College 766 901 867 861 101 13.2% 3.5%13.1% 15.2% 13.9% 16.5%867 15.6%Inver Hills Community College 380 387 479 342 143 37.6% 3.4%10.5% 10.7% 12.2% 13.9%523 10.9%Lake Superior College 194 179 166 190 5 2.6% -1.4%7.4% 6.1% 8.1% 6.0%199 6.5%Minneapolis Community and Technical College 2,158 2,177 2,485 2,532 388 18.0% 4.2%37.7% 39.4% 40.8% 41.9%2,546 42.8%Minnesota State College - Southeast Technical 97 45 70 99 -2 -2.1% -1.7%6.9% 3.7% 4.1% 5.3%95 5.3%Minnesota West Community and Technical College 100 105 127 167 62 62.0% 1.9%3.4% 3.3% 4.3% 5.4%162 5.5%Normandale Community College 784 955 1,024 1,256 568 72.4% 6.7%12.2% 14.6% 15.9% 18.8%1,352 17.9%North Hennepin Community College 506 588 783 961 822 162.5% 11.5%11.2% 13.0% 16.6% 22.7%1,328 18.3%
Hibbing Community College 63 50 43 64 14 22.2% 3.4%2.3% 2.2% 4.8% 5.8%77 5.2%
Northeast Higher Education District
Itasca Community College 46 37 44 57 -1 -2.2% 0.7%4.5% 4.1% 4.6% 5.2%45 6.2% Mesabi Range Community and Technical College 78 76 82 88 32 41.0% 1.7%5.4% 5.3% 4.6% 7.1%110 5.4% Rainy River Community College 58 43 64 70 24 41.4% 12.6%8.9% 7.5% 12.5% 21.5%82 17.2% Vermilion Community College 41 51 36 47 38 92.7% 2.0%6.3% 6.9% 4.8% 8.3%79 5.1%Northland Community and Technical College 94 68 90 120 27 28.7% 0.9%4.7% 3.4% 4.2% 5.6%121 5.6%Northwest Technical College 400 351 343 317 22 5.5% -0.4%9.4% 8.4% 8.5% 9.0%422 7.9%Pine Technical College 27 50 9 11 -6 -22.2% -5.6%9.7% 11.9% 2.8% 4.1%21 2.9%Ridgewater College 91 116 121 163 69 75.8% 1.0%3.0% 3.6% 3.8% 4.0%160 4.6%Riverland Community College 121 112 114 132 119 98.3% 2.3%3.8% 3.5% 3.3% 6.0%240 3.5%Rochester Community and Technical College 378 395 471 584 281 74.3% 3.3%9.4% 8.9% 10.4% 12.7%659 12.2%St. Cloud Technical College 79 85 81 112 19 24.1% 0.0%3.4% 3.5% 3.6% 3.5%98 4.3%Saint Paul College 1,144 1,350 1,461 1,466 322 28.1% 7.9%24.7% 26.5% 27.9% 32.6%1,466 30.7%South Central Technical College 397 374 211 207 -203 -51.1% -6.5%12.8% 12.4% 7.1% 6.3%194 6.6%
Subtotal: Colleges 9,569 10,108 10,852 12,167 4,296 44.9% 11.1% 11.7% 12.7% 14.1% 3.1%13,865 13.3%
UniversitiesBemidji State University 244 242 212 199 -33 -13.5% 0.6%6.2% 5.9% 6.5% 6.8%211 6.5%Metropolitan State University 834 857 895 918 217 26.0% 5.4%18.8% 20.9% 23.1% 24.2%1,051 23.0%Minnesota State University, Mankato 533 534 447 447 -77 -14.4% -0.2%4.8% 4.8% 4.7% 4.6%456 4.9%Minnesota State University Moorhead 260 281 271 283 52 20.0% 0.7%4.3% 4.3% 4.3% 4.9%312 4.5%St. Cloud State University 572 593 593 650 67 11.7% 0.3%4.5% 4.6% 4.6% 4.8%639 5.0%Southwest Minnesota State University 115 129 107 122 -1 -0.9% 2.3%4.5% 5.2% 5.1% 6.7%114 6.8%Winona State University 236 213 207 191 -4 -1.7% 0.2%4.0% 3.5% 3.9% 4.2%232 3.8%
Subtotal: Universities 2,794 2,849 2,732 2,810 221 7.9% 6.0% 6.0% 6.3% 6.8% 0.9%3,015 6.6%
Institution LocationGreater Minnesota 4,562 4,489 4,367 4,874 834 18.3% 0.8%5.4% 5.2% 5.4% 6.2%5,396 5.9%Twin Cities Metropolitan Area 7,801 8,468 9,217 10,103 3,683 47.2% 4.9%16.1% 17.9% 19.2% 20.9%11,484 20.0%
Total: Colleges and Universities 12,363 12,957 13,584 14,977 4,517 36.5% 9.3% 9.7% 10.5% 11.9% 2.6%16,880 11.2%
Source: Office of the Chancellor Research and PlanningR:\Factbooks\System Factbook\Fall Multi-Year.mdb Fall Multi-Year by Race/Ethnicity 10/21/2004
Table II-47: Page 5 of 1077
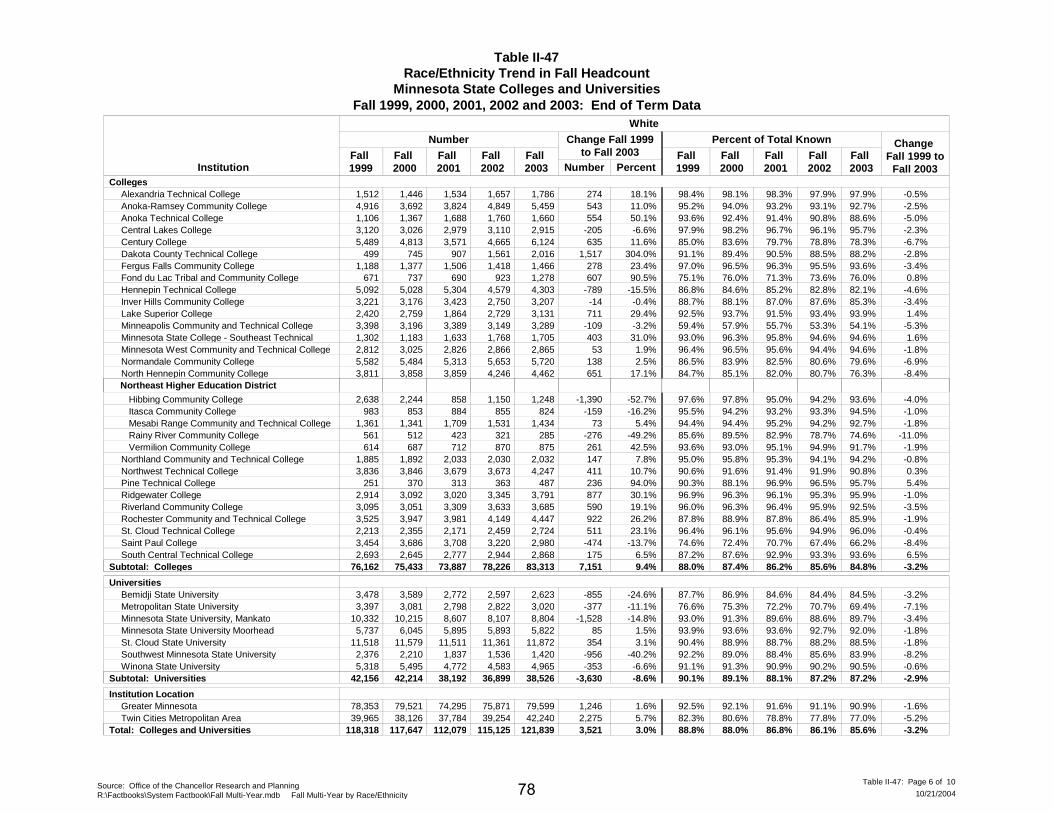
Table II-47Race/Ethnicity Trend in Fall Headcount
Minnesota State Colleges and UniversitiesFall 1999, 2000, 2001, 2002 and 2003: End of Term Data
InstitutionFall 1999
Fall 2000
Fall 2001
Fall 2002
Number
Fall 1999
Fall 2000
Fall 2001
Fall 2003
Change Fall 1999 to
Fall 2003
Change Fall 1999to Fall 2003
Number Percent
White
Percent of Total Known
Fall 2003
Fall 2002
CollegesAlexandria Technical College 1,512 1,446 1,534 1,657 274 18.1% -0.5%98.4% 98.1% 98.3% 97.9%1,786 97.9%Anoka-Ramsey Community College 4,916 3,692 3,824 4,849 543 11.0% -2.5%95.2% 94.0% 93.2% 92.7%5,459 93.1%Anoka Technical College 1,106 1,367 1,688 1,760 554 50.1% -5.0%93.6% 92.4% 91.4% 88.6%1,660 90.8%Central Lakes College 3,120 3,026 2,979 3,110 -205 -6.6% -2.3%97.9% 98.2% 96.7% 95.7%2,915 96.1%Century College 5,489 4,813 3,571 4,665 635 11.6% -6.7%85.0% 83.6% 79.7% 78.3%6,124 78.8%Dakota County Technical College 499 745 907 1,561 1,517 304.0% -2.8%91.1% 89.4% 90.5% 88.2%2,016 88.5%Fergus Falls Community College 1,188 1,377 1,506 1,418 278 23.4% -3.4%97.0% 96.5% 96.3% 93.6%1,466 95.5%Fond du Lac Tribal and Community College 671 737 690 923 607 90.5% 0.8%75.1% 76.0% 71.3% 76.0%1,278 73.6%Hennepin Technical College 5,092 5,028 5,304 4,579 -789 -15.5% -4.6%86.8% 84.6% 85.2% 82.1%4,303 82.8%Inver Hills Community College 3,221 3,176 3,423 2,750 -14 -0.4% -3.4%88.7% 88.1% 87.0% 85.3%3,207 87.6%Lake Superior College 2,420 2,759 1,864 2,729 711 29.4% 1.4%92.5% 93.7% 91.5% 93.9%3,131 93.4%Minneapolis Community and Technical College 3,398 3,196 3,389 3,149 -109 -3.2% -5.3%59.4% 57.9% 55.7% 54.1%3,289 53.3%Minnesota State College - Southeast Technical 1,302 1,183 1,633 1,768 403 31.0% 1.6%93.0% 96.3% 95.8% 94.6%1,705 94.6%Minnesota West Community and Technical College 2,812 3,025 2,826 2,866 53 1.9% -1.8%96.4% 96.5% 95.6% 94.6%2,865 94.4%Normandale Community College 5,582 5,484 5,313 5,653 138 2.5% -6.9%86.5% 83.9% 82.5% 79.6%5,720 80.6%North Hennepin Community College 3,811 3,858 3,859 4,246 651 17.1% -8.4%84.7% 85.1% 82.0% 76.3%4,462 80.7%
Hibbing Community College 2,638 2,244 858 1,150 -1,390 -52.7% -4.0%97.6% 97.8% 95.0% 93.6%1,248 94.2%
Northeast Higher Education District
Itasca Community College 983 853 884 855 -159 -16.2% -1.0%95.5% 94.2% 93.2% 94.5%824 93.3% Mesabi Range Community and Technical College 1,361 1,341 1,709 1,531 73 5.4% -1.8%94.4% 94.4% 95.2% 92.7%1,434 94.2% Rainy River Community College 561 512 423 321 -276 -49.2% -11.0%85.6% 89.5% 82.9% 74.6%285 78.7% Vermilion Community College 614 687 712 870 261 42.5% -1.9%93.6% 93.0% 95.1% 91.7%875 94.9%Northland Community and Technical College 1,885 1,892 2,033 2,030 147 7.8% -0.8%95.0% 95.8% 95.3% 94.2%2,032 94.1%Northwest Technical College 3,836 3,846 3,679 3,673 411 10.7% 0.3%90.6% 91.6% 91.4% 90.8%4,247 91.9%Pine Technical College 251 370 313 363 236 94.0% 5.4%90.3% 88.1% 96.9% 95.7%487 96.5%Ridgewater College 2,914 3,092 3,020 3,345 877 30.1% -1.0%96.9% 96.3% 96.1% 95.9%3,791 95.3%Riverland Community College 3,095 3,051 3,309 3,633 590 19.1% -3.5%96.0% 96.3% 96.4% 92.5%3,685 95.9%Rochester Community and Technical College 3,525 3,947 3,981 4,149 922 26.2% -1.9%87.8% 88.9% 87.8% 85.9%4,447 86.4%St. Cloud Technical College 2,213 2,355 2,171 2,459 511 23.1% -0.4%96.4% 96.1% 95.6% 96.0%2,724 94.9%Saint Paul College 3,454 3,686 3,708 3,220 -474 -13.7% -8.4%74.6% 72.4% 70.7% 66.2%2,980 67.4%South Central Technical College 2,693 2,645 2,777 2,944 175 6.5% 6.5%87.2% 87.6% 92.9% 93.6%2,868 93.3%
Subtotal: Colleges 76,162 75,433 73,887 78,226 7,151 9.4% 88.0% 87.4% 86.2% 84.8% -3.2%83,313 85.6%
UniversitiesBemidji State University 3,478 3,589 2,772 2,597 -855 -24.6% -3.2%87.7% 86.9% 84.6% 84.5%2,623 84.4%Metropolitan State University 3,397 3,081 2,798 2,822 -377 -11.1% -7.1%76.6% 75.3% 72.2% 69.4%3,020 70.7%Minnesota State University, Mankato 10,332 10,215 8,607 8,107 -1,528 -14.8% -3.4%93.0% 91.3% 89.6% 89.7%8,804 88.6%Minnesota State University Moorhead 5,737 6,045 5,895 5,893 85 1.5% -1.8%93.9% 93.6% 93.6% 92.0%5,822 92.7%St. Cloud State University 11,518 11,579 11,511 11,361 354 3.1% -1.8%90.4% 88.9% 88.7% 88.5%11,872 88.2%Southwest Minnesota State University 2,376 2,210 1,837 1,536 -956 -40.2% -8.2%92.2% 89.0% 88.4% 83.9%1,420 85.6%Winona State University 5,318 5,495 4,772 4,583 -353 -6.6% -0.6%91.1% 91.3% 90.9% 90.5%4,965 90.2%
Subtotal: Universities 42,156 42,214 38,192 36,899 -3,630 -8.6% 90.1% 89.1% 88.1% 87.2% -2.9%38,526 87.2%
Institution LocationGreater Minnesota 78,353 79,521 74,295 75,871 1,246 1.6% -1.6%92.5% 92.1% 91.6% 90.9%79,599 91.1%Twin Cities Metropolitan Area 39,965 38,126 37,784 39,254 2,275 5.7% -5.2%82.3% 80.6% 78.8% 77.0%42,240 77.8%
Total: Colleges and Universities 118,318 117,647 112,079 115,125 3,521 3.0% 88.8% 88.0% 86.8% 85.6% -3.2%121,839 86.1%
Source: Office of the Chancellor Research and PlanningR:\Factbooks\System Factbook\Fall Multi-Year.mdb Fall Multi-Year by Race/Ethnicity 10/21/2004
Table II-47: Page 6 of 1078

Table II-47Race/Ethnicity Trend in Fall Headcount
Minnesota State Colleges and UniversitiesFall 1999, 2000, 2001, 2002 and 2003: End of Term Data
InstitutionFall 1999
Fall 2000
Fall 2001
Fall 2002
Number
Fall 1999
Fall 2000
Fall 2001
Fall 2003
Change Fall 1999 to
Fall 2003
Change Fall 1999to Fall 2003
Number Percent
Foreign National
Percent of Total Known
Fall 2003
Fall 2002
CollegesAlexandria Technical College 3 1 0 0.0% 0.0%0.0% 0.2% 0.1% 0.0%0.0%Anoka-Ramsey Community College 16 14 19 19 14 87.5% 0.2%0.3% 0.4% 0.5% 0.5%30 0.4%Anoka Technical College 1 1 0 0.0% 0.0%0.1% 0.0% 0.0% 0.1%1 0.1%Central Lakes College 7 4 4 5 -2 -28.6% -0.1%0.2% 0.1% 0.1% 0.2%5 0.2%Century College 92 110 195 199 116 126.1% 1.2%1.4% 1.9% 4.4% 2.7%208 3.4%Dakota County Technical College 1 3 5 14 17 1700.0% 0.6%0.2% 0.4% 0.5% 0.8%18 0.8%Fergus Falls Community College 4 1 1 -4 0.0% -0.3%0.3% 0.1% 0.1% 0.0%0.0%Fond du Lac Tribal and Community College 1 0.0% 0.1%0.0% 0.0% 0.0% 0.1%1 0.0%Hennepin Technical College 11 16 54 87 58 527.3% 1.1%0.2% 0.3% 0.9% 1.3%69 1.6%Inver Hills Community College 29 41 33 46 0 0.0% 0.0%0.8% 1.1% 0.8% 0.8%29 1.5%Lake Superior College 2 5 7 3 1 50.0% 0.0%0.1% 0.2% 0.3% 0.1%3 0.1%Minneapolis Community and Technical College 161 147 214 230 80 49.7% 1.2%2.8% 2.7% 3.5% 4.0%241 3.9%Minnesota State College - Southeast Technical 1 1 1 2 1 100.0% 0.0%0.1% 0.1% 0.1% 0.1%2 0.1%Minnesota West Community and Technical College 6 5 3 3 -5 -83.3% -0.2%0.2% 0.2% 0.1% 0.0%1 0.1%Normandale Community College 86 97 101 106 30 34.9% 0.3%1.3% 1.5% 1.6% 1.6%116 1.5%North Hennepin Community College 182 90 65 55 -124 -68.1% -3.1%4.0% 2.0% 1.4% 1.0%58 1.0%
Hibbing Community College 2 2 7 7 350.0% 0.6%0.1% 0.0% 0.2% 0.7%9 0.6%
Northeast Higher Education District
Itasca Community College 16 21 4 3 0.0% 0.3%0.0% 1.8% 2.2% 0.3%3 0.4% Mesabi Range Community and Technical College 2 4 5 6 1 50.0% 0.1%0.1% 0.3% 0.3% 0.2%3 0.4% Rainy River Community College 36 17 23 17 -21 -58.3% -1.6%5.5% 3.0% 4.5% 3.9%15 4.2% Vermilion Community College 1 1 1 -1 0.0% -0.2%0.2% 0.1% 0.1% 0.0%0.0%Northland Community and Technical College 5 14 11 8 -1 -20.0% -0.1%0.3% 0.7% 0.5% 0.2%4 0.4%Northwest Technical College 2 5 6 0.0% 0.1%0.0% 0.0% 0.0% 0.1%6 0.1%Pine Technical College 1 2 1 0.0% 0.2%0.0% 0.0% 0.3% 0.2%1 0.5%Ridgewater College 2 2 2 1 1 50.0% 0.0%0.1% 0.1% 0.1% 0.1%3 0.0%Riverland Community College 7 5 9 24 52 742.9% 1.3%0.2% 0.2% 0.3% 1.5%59 0.6%Rochester Community and Technical College 112 99 84 68 -40 -35.7% -1.4%2.8% 2.2% 1.9% 1.4%72 1.4%St. Cloud Technical College 3 10 19 19 13 433.3% 0.4%0.1% 0.4% 0.8% 0.6%16 0.7%Saint Paul College 29 58 72 93 24 82.8% 0.6%0.6% 1.1% 1.4% 1.2%53 1.9%South Central Technical College 1 3 2 0.0% 0.1%0.0% 0.0% 0.0% 0.1%2 0.1%
Subtotal: Colleges 798 763 956 1,027 230 28.8% 0.9% 0.9% 1.1% 1.0% 0.1%1,028 1.1%
UniversitiesBemidji State University 242 298 294 281 27 11.2% 2.6%6.1% 7.2% 9.0% 8.7%269 9.1%Metropolitan State University 205 156 183 252 73 35.6% 1.8%4.6% 3.8% 4.7% 6.4%278 6.3%Minnesota State University, Mankato 240 437 548 592 318 132.5% 3.5%2.2% 3.9% 5.7% 5.7%558 6.5%Minnesota State University Moorhead 114 134 132 179 78 68.4% 1.2%1.9% 2.1% 2.1% 3.0%192 2.8%St. Cloud State University 658 849 880 875 241 36.6% 1.5%5.2% 6.5% 6.8% 6.7%899 6.8%Southwest Minnesota State University 87 145 135 137 71 81.6% 6.0%3.4% 5.8% 6.5% 9.3%158 7.6%Winona State University 283 310 272 306 8 2.8% 0.5%4.8% 5.2% 5.2% 5.3%291 6.0%
Subtotal: Universities 1,829 2,329 2,444 2,622 816 44.6% 3.9% 4.9% 5.6% 6.0% 2.1%2,645 6.2%
Institution LocationGreater Minnesota 1,814 2,360 2,459 2,547 758 41.8% 0.8%2.1% 2.7% 3.0% 2.9%2,572 3.1%Twin Cities Metropolitan Area 813 732 941 1,102 288 35.4% 0.3%1.7% 1.5% 2.0% 2.0%1,101 2.2%
Total: Colleges and Universities 2,627 3,092 3,400 3,649 1,046 39.8% 2.0% 2.3% 2.6% 2.6% 0.6%3,673 2.7%
Source: Office of the Chancellor Research and PlanningR:\Factbooks\System Factbook\Fall Multi-Year.mdb Fall Multi-Year by Race/Ethnicity 10/21/2004
Table II-47: Page 7 of 1079
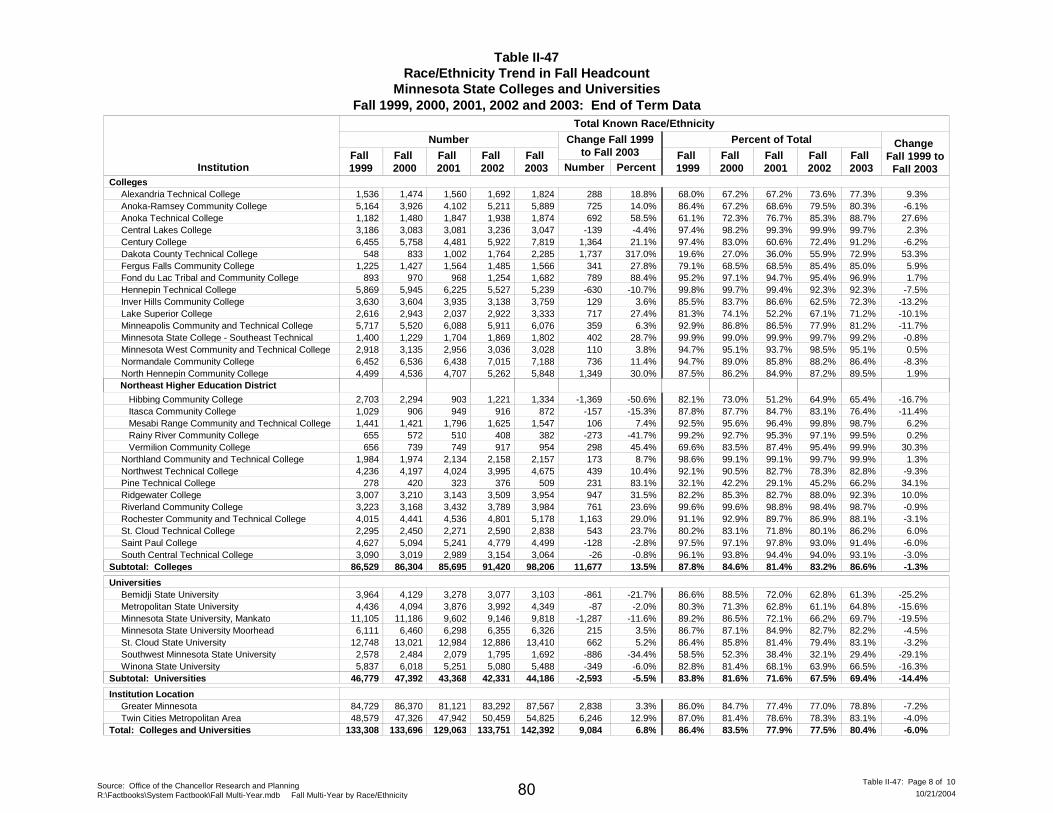
Table II-47Race/Ethnicity Trend in Fall Headcount
Minnesota State Colleges and UniversitiesFall 1999, 2000, 2001, 2002 and 2003: End of Term Data
InstitutionFall 1999
Fall 2000
Fall 2001
Fall 2002
Number
Fall 1999
Fall 2000
Fall 2001
Fall 2003
Change Fall 1999 to
Fall 2003
Change Fall 1999to Fall 2003
Number Percent
Total Known Race/Ethnicity
Percent of Total
Fall 2003
Fall 2002
CollegesAlexandria Technical College 1,536 1,474 1,560 1,692 288 18.8% 9.3%68.0% 67.2% 67.2% 77.3%1,824 73.6%Anoka-Ramsey Community College 5,164 3,926 4,102 5,211 725 14.0% -6.1%86.4% 67.2% 68.6% 80.3%5,889 79.5%Anoka Technical College 1,182 1,480 1,847 1,938 692 58.5% 27.6%61.1% 72.3% 76.7% 88.7%1,874 85.3%Central Lakes College 3,186 3,083 3,081 3,236 -139 -4.4% 2.3%97.4% 98.2% 99.3% 99.7%3,047 99.9%Century College 6,455 5,758 4,481 5,922 1,364 21.1% -6.2%97.4% 83.0% 60.6% 91.2%7,819 72.4%Dakota County Technical College 548 833 1,002 1,764 1,737 317.0% 53.3%19.6% 27.0% 36.0% 72.9%2,285 55.9%Fergus Falls Community College 1,225 1,427 1,564 1,485 341 27.8% 5.9%79.1% 68.5% 68.5% 85.0%1,566 85.4%Fond du Lac Tribal and Community College 893 970 968 1,254 789 88.4% 1.7%95.2% 97.1% 94.7% 96.9%1,682 95.4%Hennepin Technical College 5,869 5,945 6,225 5,527 -630 -10.7% -7.5%99.8% 99.7% 99.4% 92.3%5,239 92.3%Inver Hills Community College 3,630 3,604 3,935 3,138 129 3.6% -13.2%85.5% 83.7% 86.6% 72.3%3,759 62.5%Lake Superior College 2,616 2,943 2,037 2,922 717 27.4% -10.1%81.3% 74.1% 52.2% 71.2%3,333 67.1%Minneapolis Community and Technical College 5,717 5,520 6,088 5,911 359 6.3% -11.7%92.9% 86.8% 86.5% 81.2%6,076 77.9%Minnesota State College - Southeast Technical 1,400 1,229 1,704 1,869 402 28.7% -0.8%99.9% 99.0% 99.9% 99.2%1,802 99.7%Minnesota West Community and Technical College 2,918 3,135 2,956 3,036 110 3.8% 0.5%94.7% 95.1% 93.7% 95.1%3,028 98.5%Normandale Community College 6,452 6,536 6,438 7,015 736 11.4% -8.3%94.7% 89.0% 85.8% 86.4%7,188 88.2%North Hennepin Community College 4,499 4,536 4,707 5,262 1,349 30.0% 1.9%87.5% 86.2% 84.9% 89.5%5,848 87.2%
Hibbing Community College 2,703 2,294 903 1,221 -1,369 -50.6% -16.7%82.1% 73.0% 51.2% 65.4%1,334 64.9%
Northeast Higher Education District
Itasca Community College 1,029 906 949 916 -157 -15.3% -11.4%87.8% 87.7% 84.7% 76.4%872 83.1% Mesabi Range Community and Technical College 1,441 1,421 1,796 1,625 106 7.4% 6.2%92.5% 95.6% 96.4% 98.7%1,547 99.8% Rainy River Community College 655 572 510 408 -273 -41.7% 0.2%99.2% 92.7% 95.3% 99.5%382 97.1% Vermilion Community College 656 739 749 917 298 45.4% 30.3%69.6% 83.5% 87.4% 99.9%954 95.4%Northland Community and Technical College 1,984 1,974 2,134 2,158 173 8.7% 1.3%98.6% 99.1% 99.1% 99.9%2,157 99.7%Northwest Technical College 4,236 4,197 4,024 3,995 439 10.4% -9.3%92.1% 90.5% 82.7% 82.8%4,675 78.3%Pine Technical College 278 420 323 376 231 83.1% 34.1%32.1% 42.2% 29.1% 66.2%509 45.2%Ridgewater College 3,007 3,210 3,143 3,509 947 31.5% 10.0%82.2% 85.3% 82.7% 92.3%3,954 88.0%Riverland Community College 3,223 3,168 3,432 3,789 761 23.6% -0.9%99.6% 99.6% 98.8% 98.7%3,984 98.4%Rochester Community and Technical College 4,015 4,441 4,536 4,801 1,163 29.0% -3.1%91.1% 92.9% 89.7% 88.1%5,178 86.9%St. Cloud Technical College 2,295 2,450 2,271 2,590 543 23.7% 6.0%80.2% 83.1% 71.8% 86.2%2,838 80.1%Saint Paul College 4,627 5,094 5,241 4,779 -128 -2.8% -6.0%97.5% 97.1% 97.8% 91.4%4,499 93.0%South Central Technical College 3,090 3,019 2,989 3,154 -26 -0.8% -3.0%96.1% 93.8% 94.4% 93.1%3,064 94.0%
Subtotal: Colleges 86,529 86,304 85,695 91,420 11,677 13.5% 87.8% 84.6% 81.4% 86.6% -1.3%98,206 83.2%
UniversitiesBemidji State University 3,964 4,129 3,278 3,077 -861 -21.7% -25.2%86.6% 88.5% 72.0% 61.3%3,103 62.8%Metropolitan State University 4,436 4,094 3,876 3,992 -87 -2.0% -15.6%80.3% 71.3% 62.8% 64.8%4,349 61.1%Minnesota State University, Mankato 11,105 11,186 9,602 9,146 -1,287 -11.6% -19.5%89.2% 86.5% 72.1% 69.7%9,818 66.2%Minnesota State University Moorhead 6,111 6,460 6,298 6,355 215 3.5% -4.5%86.7% 87.1% 84.9% 82.2%6,326 82.7%St. Cloud State University 12,748 13,021 12,984 12,886 662 5.2% -3.2%86.4% 85.8% 81.4% 83.1%13,410 79.4%Southwest Minnesota State University 2,578 2,484 2,079 1,795 -886 -34.4% -29.1%58.5% 52.3% 38.4% 29.4%1,692 32.1%Winona State University 5,837 6,018 5,251 5,080 -349 -6.0% -16.3%82.8% 81.4% 68.1% 66.5%5,488 63.9%
Subtotal: Universities 46,779 47,392 43,368 42,331 -2,593 -5.5% 83.8% 81.6% 71.6% 69.4% -14.4%44,186 67.5%
Institution LocationGreater Minnesota 84,729 86,370 81,121 83,292 2,838 3.3% -7.2%86.0% 84.7% 77.4% 78.8%87,567 77.0%Twin Cities Metropolitan Area 48,579 47,326 47,942 50,459 6,246 12.9% -4.0%87.0% 81.4% 78.6% 83.1%54,825 78.3%
Total: Colleges and Universities 133,308 133,696 129,063 133,751 9,084 6.8% 86.4% 83.5% 77.9% 80.4% -6.0%142,392 77.5%
Source: Office of the Chancellor Research and PlanningR:\Factbooks\System Factbook\Fall Multi-Year.mdb Fall Multi-Year by Race/Ethnicity 10/21/2004
Table II-47: Page 8 of 1080
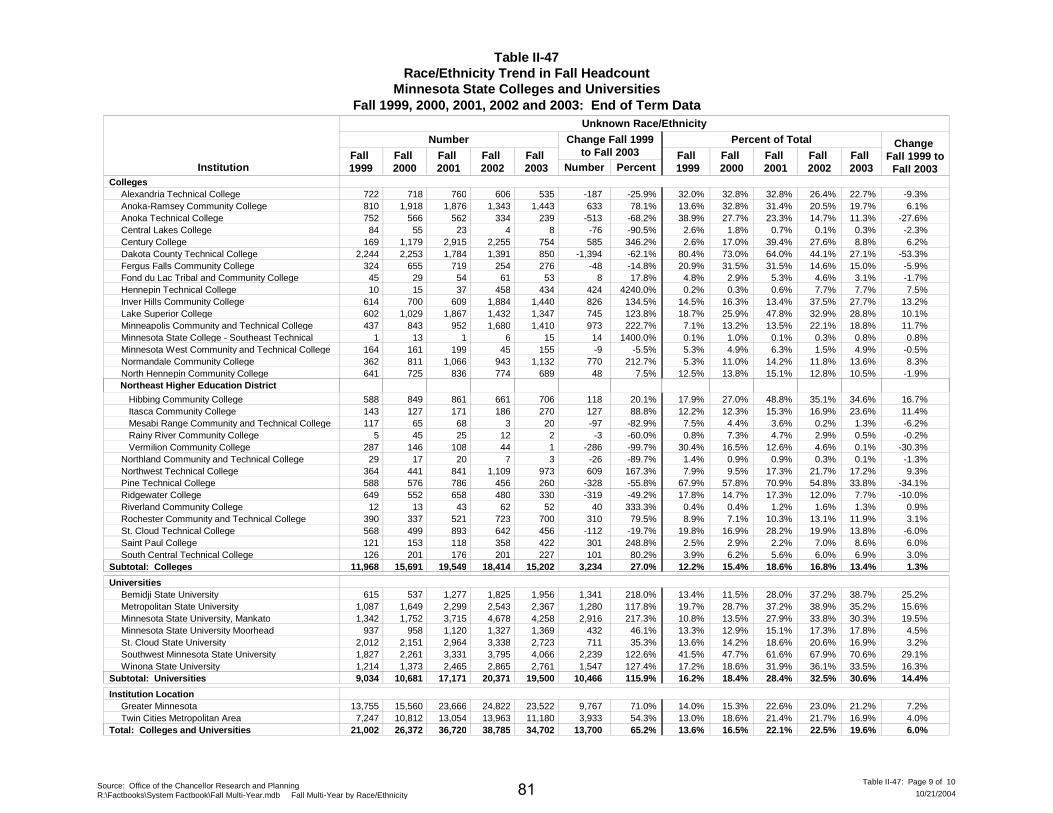
Table II-47Race/Ethnicity Trend in Fall Headcount
Minnesota State Colleges and UniversitiesFall 1999, 2000, 2001, 2002 and 2003: End of Term Data
InstitutionFall 1999
Fall 2000
Fall 2001
Fall 2002
Number
Fall 1999
Fall 2000
Fall 2001
Fall 2003
Change Fall 1999 to
Fall 2003
Change Fall 1999to Fall 2003
Number Percent
Unknown Race/Ethnicity
Percent of Total
Fall 2003
Fall 2002
CollegesAlexandria Technical College 722 718 760 606 -187 -25.9% -9.3%32.0% 32.8% 32.8% 22.7%535 26.4%Anoka-Ramsey Community College 810 1,918 1,876 1,343 633 78.1% 6.1%13.6% 32.8% 31.4% 19.7%1,443 20.5%Anoka Technical College 752 566 562 334 -513 -68.2% -27.6%38.9% 27.7% 23.3% 11.3%239 14.7%Central Lakes College 84 55 23 4 -76 -90.5% -2.3%2.6% 1.8% 0.7% 0.3%8 0.1%Century College 169 1,179 2,915 2,255 585 346.2% 6.2%2.6% 17.0% 39.4% 8.8%754 27.6%Dakota County Technical College 2,244 2,253 1,784 1,391 -1,394 -62.1% -53.3%80.4% 73.0% 64.0% 27.1%850 44.1%Fergus Falls Community College 324 655 719 254 -48 -14.8% -5.9%20.9% 31.5% 31.5% 15.0%276 14.6%Fond du Lac Tribal and Community College 45 29 54 61 8 17.8% -1.7%4.8% 2.9% 5.3% 3.1%53 4.6%Hennepin Technical College 10 15 37 458 424 4240.0% 7.5%0.2% 0.3% 0.6% 7.7%434 7.7%Inver Hills Community College 614 700 609 1,884 826 134.5% 13.2%14.5% 16.3% 13.4% 27.7%1,440 37.5%Lake Superior College 602 1,029 1,867 1,432 745 123.8% 10.1%18.7% 25.9% 47.8% 28.8%1,347 32.9%Minneapolis Community and Technical College 437 843 952 1,680 973 222.7% 11.7%7.1% 13.2% 13.5% 18.8%1,410 22.1%Minnesota State College - Southeast Technical 1 13 1 6 14 1400.0% 0.8%0.1% 1.0% 0.1% 0.8%15 0.3%Minnesota West Community and Technical College 164 161 199 45 -9 -5.5% -0.5%5.3% 4.9% 6.3% 4.9%155 1.5%Normandale Community College 362 811 1,066 943 770 212.7% 8.3%5.3% 11.0% 14.2% 13.6%1,132 11.8%North Hennepin Community College 641 725 836 774 48 7.5% -1.9%12.5% 13.8% 15.1% 10.5%689 12.8%
Hibbing Community College 588 849 861 661 118 20.1% 16.7%17.9% 27.0% 48.8% 34.6%706 35.1%
Northeast Higher Education District
Itasca Community College 143 127 171 186 127 88.8% 11.4%12.2% 12.3% 15.3% 23.6%270 16.9% Mesabi Range Community and Technical College 117 65 68 3 -97 -82.9% -6.2%7.5% 4.4% 3.6% 1.3%20 0.2% Rainy River Community College 5 45 25 12 -3 -60.0% -0.2%0.8% 7.3% 4.7% 0.5%2 2.9% Vermilion Community College 287 146 108 44 -286 -99.7% -30.3%30.4% 16.5% 12.6% 0.1%1 4.6%Northland Community and Technical College 29 17 20 7 -26 -89.7% -1.3%1.4% 0.9% 0.9% 0.1%3 0.3%Northwest Technical College 364 441 841 1,109 609 167.3% 9.3%7.9% 9.5% 17.3% 17.2%973 21.7%Pine Technical College 588 576 786 456 -328 -55.8% -34.1%67.9% 57.8% 70.9% 33.8%260 54.8%Ridgewater College 649 552 658 480 -319 -49.2% -10.0%17.8% 14.7% 17.3% 7.7%330 12.0%Riverland Community College 12 13 43 62 40 333.3% 0.9%0.4% 0.4% 1.2% 1.3%52 1.6%Rochester Community and Technical College 390 337 521 723 310 79.5% 3.1%8.9% 7.1% 10.3% 11.9%700 13.1%St. Cloud Technical College 568 499 893 642 -112 -19.7% -6.0%19.8% 16.9% 28.2% 13.8%456 19.9%Saint Paul College 121 153 118 358 301 248.8% 6.0%2.5% 2.9% 2.2% 8.6%422 7.0%South Central Technical College 126 201 176 201 101 80.2% 3.0%3.9% 6.2% 5.6% 6.9%227 6.0%
Subtotal: Colleges 11,968 15,691 19,549 18,414 3,234 27.0% 12.2% 15.4% 18.6% 13.4% 1.3%15,202 16.8%
UniversitiesBemidji State University 615 537 1,277 1,825 1,341 218.0% 25.2%13.4% 11.5% 28.0% 38.7%1,956 37.2%Metropolitan State University 1,087 1,649 2,299 2,543 1,280 117.8% 15.6%19.7% 28.7% 37.2% 35.2%2,367 38.9%Minnesota State University, Mankato 1,342 1,752 3,715 4,678 2,916 217.3% 19.5%10.8% 13.5% 27.9% 30.3%4,258 33.8%Minnesota State University Moorhead 937 958 1,120 1,327 432 46.1% 4.5%13.3% 12.9% 15.1% 17.8%1,369 17.3%St. Cloud State University 2,012 2,151 2,964 3,338 711 35.3% 3.2%13.6% 14.2% 18.6% 16.9%2,723 20.6%Southwest Minnesota State University 1,827 2,261 3,331 3,795 2,239 122.6% 29.1%41.5% 47.7% 61.6% 70.6%4,066 67.9%Winona State University 1,214 1,373 2,465 2,865 1,547 127.4% 16.3%17.2% 18.6% 31.9% 33.5%2,761 36.1%
Subtotal: Universities 9,034 10,681 17,171 20,371 10,466 115.9% 16.2% 18.4% 28.4% 30.6% 14.4%19,500 32.5%
Institution LocationGreater Minnesota 13,755 15,560 23,666 24,822 9,767 71.0% 7.2%14.0% 15.3% 22.6% 21.2%23,522 23.0%Twin Cities Metropolitan Area 7,247 10,812 13,054 13,963 3,933 54.3% 4.0%13.0% 18.6% 21.4% 16.9%11,180 21.7%
Total: Colleges and Universities 21,002 26,372 36,720 38,785 13,700 65.2% 13.6% 16.5% 22.1% 19.6% 6.0%34,702 22.5%
Source: Office of the Chancellor Research and PlanningR:\Factbooks\System Factbook\Fall Multi-Year.mdb Fall Multi-Year by Race/Ethnicity 10/21/2004
Table II-47: Page 9 of 1081
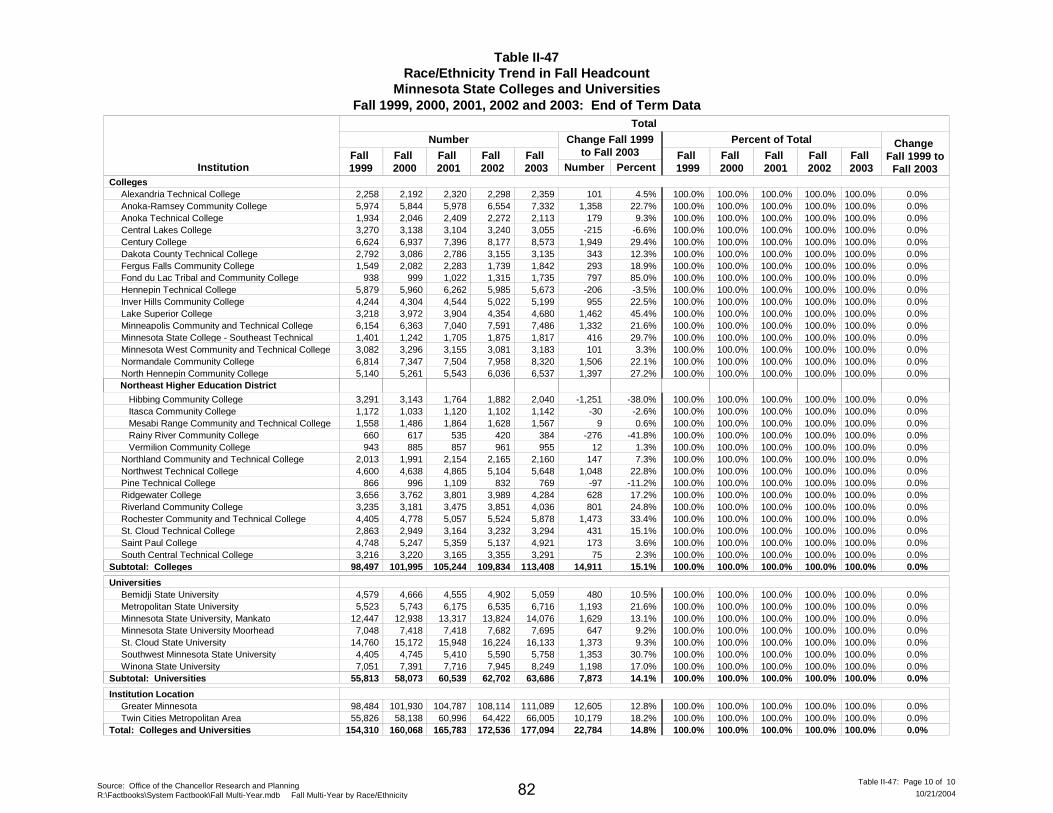
Table II-47Race/Ethnicity Trend in Fall Headcount
Minnesota State Colleges and UniversitiesFall 1999, 2000, 2001, 2002 and 2003: End of Term Data
InstitutionFall 1999
Fall 2000
Fall 2001
Fall 2002
Number
Fall 1999
Fall 2000
Fall 2001
Fall 2003
Change Fall 1999 to
Fall 2003
Change Fall 1999to Fall 2003
Number Percent
Total
Percent of Total
Fall 2003
Fall 2002
CollegesAlexandria Technical College 2,258 2,192 2,320 2,298 101 4.5% 0.0%100.0% 100.0% 100.0% 100.0%2,359 100.0%Anoka-Ramsey Community College 5,974 5,844 5,978 6,554 1,358 22.7% 0.0%100.0% 100.0% 100.0% 100.0%7,332 100.0%Anoka Technical College 1,934 2,046 2,409 2,272 179 9.3% 0.0%100.0% 100.0% 100.0% 100.0%2,113 100.0%Central Lakes College 3,270 3,138 3,104 3,240 -215 -6.6% 0.0%100.0% 100.0% 100.0% 100.0%3,055 100.0%Century College 6,624 6,937 7,396 8,177 1,949 29.4% 0.0%100.0% 100.0% 100.0% 100.0%8,573 100.0%Dakota County Technical College 2,792 3,086 2,786 3,155 343 12.3% 0.0%100.0% 100.0% 100.0% 100.0%3,135 100.0%Fergus Falls Community College 1,549 2,082 2,283 1,739 293 18.9% 0.0%100.0% 100.0% 100.0% 100.0%1,842 100.0%Fond du Lac Tribal and Community College 938 999 1,022 1,315 797 85.0% 0.0%100.0% 100.0% 100.0% 100.0%1,735 100.0%Hennepin Technical College 5,879 5,960 6,262 5,985 -206 -3.5% 0.0%100.0% 100.0% 100.0% 100.0%5,673 100.0%Inver Hills Community College 4,244 4,304 4,544 5,022 955 22.5% 0.0%100.0% 100.0% 100.0% 100.0%5,199 100.0%Lake Superior College 3,218 3,972 3,904 4,354 1,462 45.4% 0.0%100.0% 100.0% 100.0% 100.0%4,680 100.0%Minneapolis Community and Technical College 6,154 6,363 7,040 7,591 1,332 21.6% 0.0%100.0% 100.0% 100.0% 100.0%7,486 100.0%Minnesota State College - Southeast Technical 1,401 1,242 1,705 1,875 416 29.7% 0.0%100.0% 100.0% 100.0% 100.0%1,817 100.0%Minnesota West Community and Technical College 3,082 3,296 3,155 3,081 101 3.3% 0.0%100.0% 100.0% 100.0% 100.0%3,183 100.0%Normandale Community College 6,814 7,347 7,504 7,958 1,506 22.1% 0.0%100.0% 100.0% 100.0% 100.0%8,320 100.0%North Hennepin Community College 5,140 5,261 5,543 6,036 1,397 27.2% 0.0%100.0% 100.0% 100.0% 100.0%6,537 100.0%
Hibbing Community College 3,291 3,143 1,764 1,882 -1,251 -38.0% 0.0%100.0% 100.0% 100.0% 100.0%2,040 100.0%
Northeast Higher Education District
Itasca Community College 1,172 1,033 1,120 1,102 -30 -2.6% 0.0%100.0% 100.0% 100.0% 100.0%1,142 100.0% Mesabi Range Community and Technical College 1,558 1,486 1,864 1,628 9 0.6% 0.0%100.0% 100.0% 100.0% 100.0%1,567 100.0% Rainy River Community College 660 617 535 420 -276 -41.8% 0.0%100.0% 100.0% 100.0% 100.0%384 100.0% Vermilion Community College 943 885 857 961 12 1.3% 0.0%100.0% 100.0% 100.0% 100.0%955 100.0%Northland Community and Technical College 2,013 1,991 2,154 2,165 147 7.3% 0.0%100.0% 100.0% 100.0% 100.0%2,160 100.0%Northwest Technical College 4,600 4,638 4,865 5,104 1,048 22.8% 0.0%100.0% 100.0% 100.0% 100.0%5,648 100.0%Pine Technical College 866 996 1,109 832 -97 -11.2% 0.0%100.0% 100.0% 100.0% 100.0%769 100.0%Ridgewater College 3,656 3,762 3,801 3,989 628 17.2% 0.0%100.0% 100.0% 100.0% 100.0%4,284 100.0%Riverland Community College 3,235 3,181 3,475 3,851 801 24.8% 0.0%100.0% 100.0% 100.0% 100.0%4,036 100.0%Rochester Community and Technical College 4,405 4,778 5,057 5,524 1,473 33.4% 0.0%100.0% 100.0% 100.0% 100.0%5,878 100.0%St. Cloud Technical College 2,863 2,949 3,164 3,232 431 15.1% 0.0%100.0% 100.0% 100.0% 100.0%3,294 100.0%Saint Paul College 4,748 5,247 5,359 5,137 173 3.6% 0.0%100.0% 100.0% 100.0% 100.0%4,921 100.0%South Central Technical College 3,216 3,220 3,165 3,355 75 2.3% 0.0%100.0% 100.0% 100.0% 100.0%3,291 100.0%
Subtotal: Colleges 98,497 101,995 105,244 109,834 14,911 15.1% 100.0% 100.0% 100.0% 100.0% 0.0%113,408 100.0%
UniversitiesBemidji State University 4,579 4,666 4,555 4,902 480 10.5% 0.0%100.0% 100.0% 100.0% 100.0%5,059 100.0%Metropolitan State University 5,523 5,743 6,175 6,535 1,193 21.6% 0.0%100.0% 100.0% 100.0% 100.0%6,716 100.0%Minnesota State University, Mankato 12,447 12,938 13,317 13,824 1,629 13.1% 0.0%100.0% 100.0% 100.0% 100.0%14,076 100.0%Minnesota State University Moorhead 7,048 7,418 7,418 7,682 647 9.2% 0.0%100.0% 100.0% 100.0% 100.0%7,695 100.0%St. Cloud State University 14,760 15,172 15,948 16,224 1,373 9.3% 0.0%100.0% 100.0% 100.0% 100.0%16,133 100.0%Southwest Minnesota State University 4,405 4,745 5,410 5,590 1,353 30.7% 0.0%100.0% 100.0% 100.0% 100.0%5,758 100.0%Winona State University 7,051 7,391 7,716 7,945 1,198 17.0% 0.0%100.0% 100.0% 100.0% 100.0%8,249 100.0%
Subtotal: Universities 55,813 58,073 60,539 62,702 7,873 14.1% 100.0% 100.0% 100.0% 100.0% 0.0%63,686 100.0%
Institution LocationGreater Minnesota 98,484 101,930 104,787 108,114 12,605 12.8% 0.0%100.0% 100.0% 100.0% 100.0%111,089 100.0%Twin Cities Metropolitan Area 55,826 58,138 60,996 64,422 10,179 18.2% 0.0%100.0% 100.0% 100.0% 100.0%66,005 100.0%
Total: Colleges and Universities 154,310 160,068 165,783 172,536 22,784 14.8% 100.0% 100.0% 100.0% 100.0% 0.0%177,094 100.0%
Source: Office of the Chancellor Research and PlanningR:\Factbooks\System Factbook\Fall Multi-Year.mdb Fall Multi-Year by Race/Ethnicity 10/21/2004
Table II-47: Page 10 of 1082
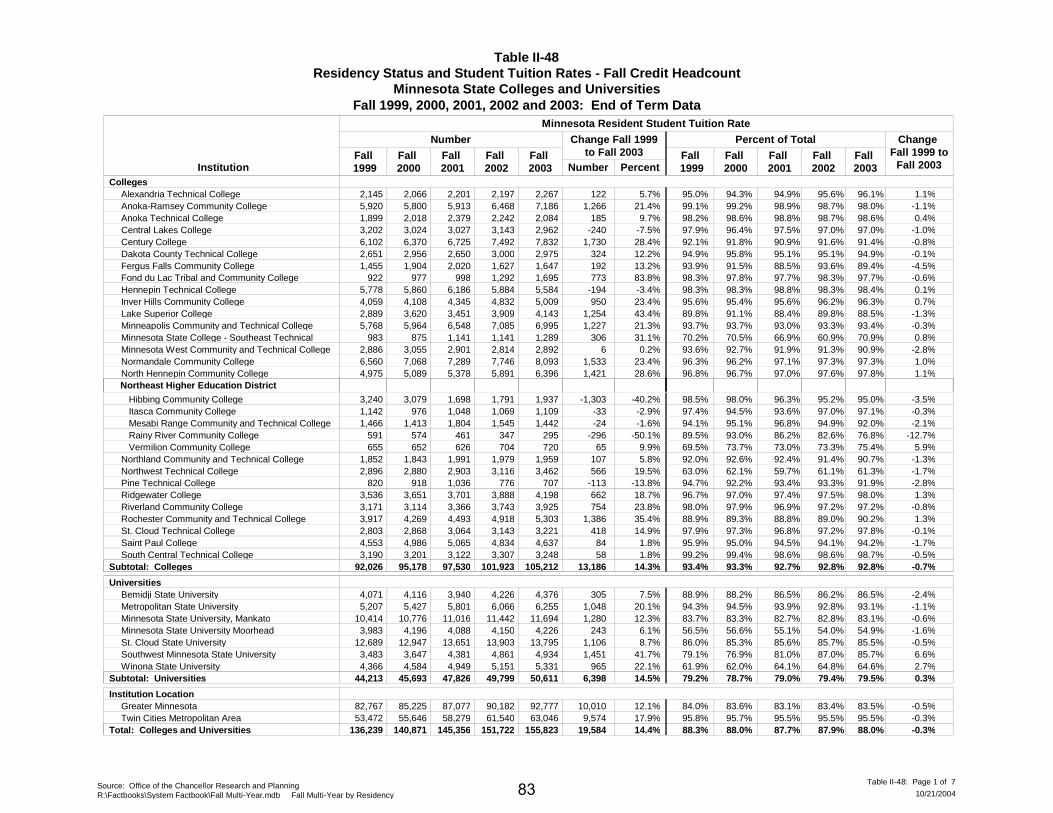
Table II-48Residency Status and Student Tuition Rates - Fall Credit Headcount
Minnesota State Colleges and UniversitiesFall 1999, 2000, 2001, 2002 and 2003: End of Term Data
InstitutionFall 1999
Fall 2000
Fall 2001
Fall 2002
Number
Fall 1999
Fall 2000
Fall 2001
Fall 2003
Change Fall 1999 to
Fall 2003
Change Fall 1999to Fall 2003
Number Percent
Minnesota Resident Student Tuition Rate
Fall 2003
Fall 2002
Percent of Total
CollegesAlexandria Technical College 2,145 2,066 2,201 2,197 122 5.7%2,267 95.0% 94.3% 94.9% 95.6% 96.1% 1.1%Anoka-Ramsey Community College 5,920 5,800 5,913 6,468 1,266 21.4%7,186 99.1% 99.2% 98.9% 98.7% 98.0% -1.1%Anoka Technical College 1,899 2,018 2,379 2,242 185 9.7%2,084 98.2% 98.6% 98.8% 98.7% 98.6% 0.4%Central Lakes College 3,202 3,024 3,027 3,143 -240 -7.5%2,962 97.9% 96.4% 97.5% 97.0% 97.0% -1.0%Century College 6,102 6,370 6,725 7,492 1,730 28.4%7,832 92.1% 91.8% 90.9% 91.6% 91.4% -0.8%Dakota County Technical College 2,651 2,956 2,650 3,000 324 12.2%2,975 94.9% 95.8% 95.1% 95.1% 94.9% -0.1%Fergus Falls Community College 1,455 1,904 2,020 1,627 192 13.2%1,647 93.9% 91.5% 88.5% 93.6% 89.4% -4.5%Fond du Lac Tribal and Community College 922 977 998 1,292 773 83.8%1,695 98.3% 97.8% 97.7% 98.3% 97.7% -0.6%Hennepin Technical College 5,778 5,860 6,186 5,884 -194 -3.4%5,584 98.3% 98.3% 98.8% 98.3% 98.4% 0.1%Inver Hills Community College 4,059 4,108 4,345 4,832 950 23.4%5,009 95.6% 95.4% 95.6% 96.2% 96.3% 0.7%Lake Superior College 2,889 3,620 3,451 3,909 1,254 43.4%4,143 89.8% 91.1% 88.4% 89.8% 88.5% -1.3%Minneapolis Community and Technical College 5,768 5,964 6,548 7,085 1,227 21.3%6,995 93.7% 93.7% 93.0% 93.3% 93.4% -0.3%Minnesota State College - Southeast Technical 983 875 1,141 1,141 306 31.1%1,289 70.2% 70.5% 66.9% 60.9% 70.9% 0.8%Minnesota West Community and Technical College 2,886 3,055 2,901 2,814 6 0.2%2,892 93.6% 92.7% 91.9% 91.3% 90.9% -2.8%Normandale Community College 6,560 7,068 7,289 7,746 1,533 23.4%8,093 96.3% 96.2% 97.1% 97.3% 97.3% 1.0%North Hennepin Community College 4,975 5,089 5,378 5,891 1,421 28.6%6,396 96.8% 96.7% 97.0% 97.6% 97.8% 1.1%
Hibbing Community College 3,240 3,079 1,698 1,791 -1,303 -40.2%1,937
Northeast Higher Education District
98.5% 98.0% 96.3% 95.2% 95.0% -3.5% Itasca Community College 1,142 976 1,048 1,069 -33 -2.9%1,109 97.4% 94.5% 93.6% 97.0% 97.1% -0.3% Mesabi Range Community and Technical College 1,466 1,413 1,804 1,545 -24 -1.6%1,442 94.1% 95.1% 96.8% 94.9% 92.0% -2.1% Rainy River Community College 591 574 461 347 -296 -50.1%295 89.5% 93.0% 86.2% 82.6% 76.8% -12.7% Vermilion Community College 655 652 626 704 65 9.9%720 69.5% 73.7% 73.0% 73.3% 75.4% 5.9%Northland Community and Technical College 1,852 1,843 1,991 1,979 107 5.8%1,959 92.0% 92.6% 92.4% 91.4% 90.7% -1.3%Northwest Technical College 2,896 2,880 2,903 3,116 566 19.5%3,462 63.0% 62.1% 59.7% 61.1% 61.3% -1.7%Pine Technical College 820 918 1,036 776 -113 -13.8%707 94.7% 92.2% 93.4% 93.3% 91.9% -2.8%Ridgewater College 3,536 3,651 3,701 3,888 662 18.7%4,198 96.7% 97.0% 97.4% 97.5% 98.0% 1.3%Riverland Community College 3,171 3,114 3,366 3,743 754 23.8%3,925 98.0% 97.9% 96.9% 97.2% 97.2% -0.8%Rochester Community and Technical College 3,917 4,269 4,493 4,918 1,386 35.4%5,303 88.9% 89.3% 88.8% 89.0% 90.2% 1.3%St. Cloud Technical College 2,803 2,868 3,064 3,143 418 14.9%3,221 97.9% 97.3% 96.8% 97.2% 97.8% -0.1%Saint Paul College 4,553 4,986 5,065 4,834 84 1.8%4,637 95.9% 95.0% 94.5% 94.1% 94.2% -1.7%South Central Technical College 3,190 3,201 3,122 3,307 58 1.8%3,248 99.2% 99.4% 98.6% 98.6% 98.7% -0.5%
Subtotal: Colleges 92,026 95,178 97,530 101,923 13,186 14.3%105,212 93.4% 93.3% 92.7% 92.8% 92.8% -0.7%
UniversitiesBemidji State University 4,071 4,116 3,940 4,226 305 7.5%4,376 88.9% 88.2% 86.5% 86.2% 86.5% -2.4%Metropolitan State University 5,207 5,427 5,801 6,066 1,048 20.1%6,255 94.3% 94.5% 93.9% 92.8% 93.1% -1.1%Minnesota State University, Mankato 10,414 10,776 11,016 11,442 1,280 12.3%11,694 83.7% 83.3% 82.7% 82.8% 83.1% -0.6%Minnesota State University Moorhead 3,983 4,196 4,088 4,150 243 6.1%4,226 56.5% 56.6% 55.1% 54.0% 54.9% -1.6%St. Cloud State University 12,689 12,947 13,651 13,903 1,106 8.7%13,795 86.0% 85.3% 85.6% 85.7% 85.5% -0.5%Southwest Minnesota State University 3,483 3,647 4,381 4,861 1,451 41.7%4,934 79.1% 76.9% 81.0% 87.0% 85.7% 6.6%Winona State University 4,366 4,584 4,949 5,151 965 22.1%5,331 61.9% 62.0% 64.1% 64.8% 64.6% 2.7%
Subtotal: Universities 44,213 45,693 47,826 49,799 6,398 14.5%50,611 79.2% 78.7% 79.0% 79.4% 79.5% 0.3%
Institution LocationGreater Minnesota 82,767 85,225 87,077 90,182 10,010 12.1%92,777 84.0% 83.6% 83.1% 83.4% 83.5% -0.5%Twin Cities Metropolitan Area 53,472 55,646 58,279 61,540 9,574 17.9%63,046 95.8% 95.7% 95.5% 95.5% 95.5% -0.3%
Total: Colleges and Universities 136,239 140,871 145,356 151,722 19,584 14.4%155,823 88.3% 88.0% 87.7% 87.9% 88.0% -0.3%
Source: Office of the Chancellor Research and PlanningR:\Factbooks\System Factbook\Fall Multi-Year.mdb Fall Multi-Year by Residency 10/21/2004
Table II-48: Page 1 of 783

Table II-48Residency Status and Student Tuition Rates - Fall Credit Headcount
Minnesota State Colleges and UniversitiesFall 1999, 2000, 2001, 2002 and 2003: End of Term Data
InstitutionFall 1999
Fall 2000
Fall 2001
Fall 2002
Number
Fall 1999
Fall 2000
Fall 2001
Fall 2003
Change Fall 1999 to
Fall 2003
Change Fall 1999to Fall 2003
Number Percent
Non-Resident Student Tuition Rate: Reciprocity
Fall 2003
Fall 2002
Percent of Total
CollegesAlexandria Technical College 92 108 84 80 -20 -21.7%72 4.1% 4.9% 3.6% 3.5% 3.1% -1.0%Anoka-Ramsey Community College 22 22 28 41 66 300.0%88 0.4% 0.4% 0.5% 0.6% 1.2% 0.8%Anoka Technical College 20 20 20 10 -7 -35.0%13 1.0% 1.0% 0.8% 0.4% 0.6% -0.4%Central Lakes College 50 53 54 69 24 48.0%74 1.5% 1.7% 1.7% 2.1% 2.4% 0.9%Century College 358 386 447 455 140 39.1%498 5.4% 5.6% 6.0% 5.6% 5.8% 0.4%Dakota County Technical College 124 117 126 132 8 6.5%132 4.4% 3.8% 4.5% 4.2% 4.2% -0.2%Fergus Falls Community College 83 166 237 91 91 109.6%174 5.4% 8.0% 10.4% 5.2% 9.4% 4.1%Fond du Lac Tribal and Community College 11 14 12 14 13 118.2%24 1.2% 1.4% 1.2% 1.1% 1.4% 0.2%Hennepin Technical College 26 22 12 26 12 46.2%38 0.4% 0.4% 0.2% 0.4% 0.7% 0.2%Inver Hills Community College 98 90 116 116 43 43.9%141 2.3% 2.1% 2.6% 2.3% 2.7% 0.4%Lake Superior College 271 286 337 368 131 48.3%402 8.4% 7.2% 8.6% 8.5% 8.6% 0.2%Minneapolis Community and Technical College 109 109 133 142 30 27.5%139 1.8% 1.7% 1.9% 1.9% 1.9% 0.1%Minnesota State College - Southeast Technical 365 324 430 494 113 31.0%478 26.1% 26.1% 25.2% 26.3% 26.3% 0.3%Minnesota West Community and Technical College 127 152 162 151 10 7.9%137 4.1% 4.6% 5.1% 4.9% 4.3% 0.2%Normandale Community College 70 68 55 67 -7 -10.0%63 1.0% 0.9% 0.7% 0.8% 0.8% -0.3%North Hennepin Community College 33 26 22 21 5 15.2%38 0.6% 0.5% 0.4% 0.3% 0.6% -0.1%
Hibbing Community College 29 24 23 11 -21 -72.4%8
Northeast Higher Education District
0.9% 0.8% 1.3% 0.6% 0.4% -0.5% Itasca Community College 24 34 30 17 -3 -12.5%21 2.0% 3.3% 2.7% 1.5% 1.8% -0.2% Mesabi Range Community and Technical College 28 29 19 21 -5 -17.9%23 1.8% 2.0% 1.0% 1.3% 1.5% -0.3% Rainy River Community College 15 19 9 7 -4 -26.7%11 2.3% 3.1% 1.7% 1.7% 2.9% 0.6% Vermilion Community College 139 149 130 135 -18 -12.9%121 14.7% 16.8% 15.2% 14.0% 12.7% -2.1%Northland Community and Technical College 149 135 139 145 -33 -22.1%116 7.4% 6.8% 6.5% 6.7% 5.4% -2.0%Northwest Technical College 1,628 1,689 1,888 1,895 444 27.3%2,072 35.4% 36.4% 38.8% 37.1% 36.7% 1.3%Pine Technical College 42 73 63 54 17 40.5%59 4.8% 7.3% 5.7% 6.5% 7.7% 2.8%Ridgewater College 86 80 69 76 -18 -20.9%68 2.4% 2.1% 1.8% 1.9% 1.6% -0.8%Riverland Community College 8 2 10 11 5 62.5%13 0.2% 0.1% 0.3% 0.3% 0.3% 0.1%Rochester Community and Technical College 126 151 133 143 26 20.6%152 2.9% 3.2% 2.6% 2.6% 2.6% -0.3%St. Cloud Technical College 35 56 64 55 18 51.4%53 1.2% 1.9% 2.0% 1.7% 1.6% 0.4%Saint Paul College 122 167 193 191 80 65.6%202 2.6% 3.2% 3.6% 3.7% 4.1% 1.5%South Central Technical College 7 9 17 21 13 185.7%20 0.2% 0.3% 0.5% 0.6% 0.6% 0.4%
Subtotal: Colleges 4,297 4,580 5,062 5,059 1,153 26.8%5,450 4.4% 4.5% 4.8% 4.6% 4.8% 0.4%
UniversitiesBemidji State University 153 148 166 174 3 2.0%156 3.3% 3.2% 3.6% 3.5% 3.1% -0.3%Metropolitan State University 78 93 111 135 48 61.5%126 1.4% 1.6% 1.8% 2.1% 1.9% 0.5%Minnesota State University, Mankato 889 971 1,009 1,063 186 20.9%1,075 7.1% 7.5% 7.6% 7.7% 7.6% 0.5%Minnesota State University Moorhead 2,699 2,850 2,991 3,142 365 13.5%3,064 38.3% 38.4% 40.3% 40.9% 39.8% 1.5%St. Cloud State University 1,080 1,039 1,133 1,144 141 13.1%1,221 7.3% 6.8% 7.1% 7.1% 7.6% 0.3%Southwest Minnesota State University 305 691 618 354 61 20.0%366 6.9% 14.6% 11.4% 6.3% 6.4% -0.6%Winona State University 1,803 1,909 1,931 1,963 295 16.4%2,098 25.6% 25.8% 25.0% 24.7% 25.4% -0.1%
Subtotal: Universities 7,007 7,701 7,959 7,975 1,099 15.7%8,106 12.6% 13.3% 13.1% 12.7% 12.7% 0.2%
Institution LocationGreater Minnesota 10,244 11,161 11,758 11,698 1,834 17.9%12,078 10.4% 10.9% 11.2% 10.8% 10.9% 0.5%Twin Cities Metropolitan Area 1,060 1,120 1,263 1,336 418 39.4%1,478 1.9% 1.9% 2.1% 2.1% 2.2% 0.3%
Total: Colleges and Universities 11,304 12,281 13,021 13,034 2,252 19.9%13,556 7.3% 7.7% 7.9% 7.6% 7.7% 0.3%
Source: Office of the Chancellor Research and PlanningR:\Factbooks\System Factbook\Fall Multi-Year.mdb Fall Multi-Year by Residency 10/21/2004
Table II-48: Page 2 of 784
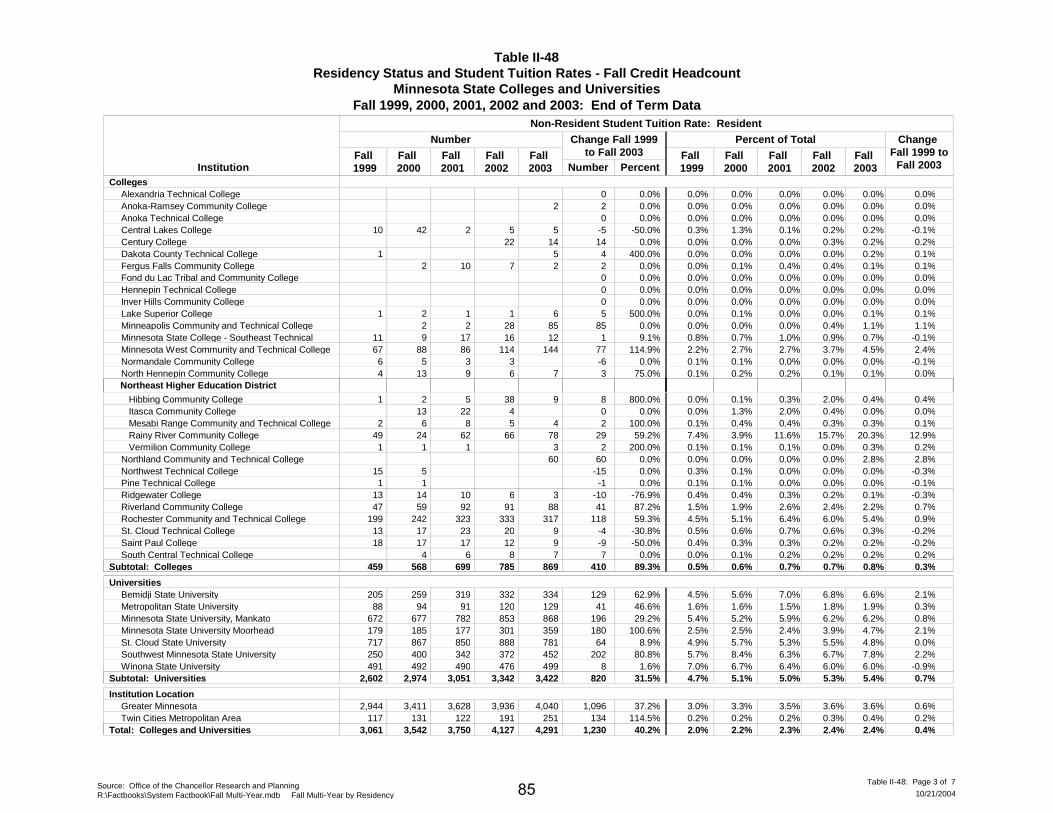
Table II-48Residency Status and Student Tuition Rates - Fall Credit Headcount
Minnesota State Colleges and UniversitiesFall 1999, 2000, 2001, 2002 and 2003: End of Term Data
InstitutionFall 1999
Fall 2000
Fall 2001
Fall 2002
Number
Fall 1999
Fall 2000
Fall 2001
Fall 2003
Change Fall 1999 to
Fall 2003
Change Fall 1999to Fall 2003
Number Percent
Non-Resident Student Tuition Rate: Resident
Fall 2003
Fall 2002
Percent of Total
CollegesAlexandria Technical College 0 0.0% 0.0% 0.0% 0.0% 0.0% 0.0% 0.0%Anoka-Ramsey Community College 2 0.0%2 0.0% 0.0% 0.0% 0.0% 0.0% 0.0%Anoka Technical College 0 0.0% 0.0% 0.0% 0.0% 0.0% 0.0% 0.0%Central Lakes College 10 42 2 5 -5 -50.0%5 0.3% 1.3% 0.1% 0.2% 0.2% -0.1%Century College 22 14 0.0%14 0.0% 0.0% 0.0% 0.3% 0.2% 0.2%Dakota County Technical College 1 4 400.0%5 0.0% 0.0% 0.0% 0.0% 0.2% 0.1%Fergus Falls Community College 2 10 7 2 0.0%2 0.0% 0.1% 0.4% 0.4% 0.1% 0.1%Fond du Lac Tribal and Community College 0 0.0% 0.0% 0.0% 0.0% 0.0% 0.0% 0.0%Hennepin Technical College 0 0.0% 0.0% 0.0% 0.0% 0.0% 0.0% 0.0%Inver Hills Community College 0 0.0% 0.0% 0.0% 0.0% 0.0% 0.0% 0.0%Lake Superior College 1 2 1 1 5 500.0%6 0.0% 0.1% 0.0% 0.0% 0.1% 0.1%Minneapolis Community and Technical College 2 2 28 85 0.0%85 0.0% 0.0% 0.0% 0.4% 1.1% 1.1%Minnesota State College - Southeast Technical 11 9 17 16 1 9.1%12 0.8% 0.7% 1.0% 0.9% 0.7% -0.1%Minnesota West Community and Technical College 67 88 86 114 77 114.9%144 2.2% 2.7% 2.7% 3.7% 4.5% 2.4%Normandale Community College 6 5 3 3 -6 0.0% 0.1% 0.1% 0.0% 0.0% 0.0% -0.1%North Hennepin Community College 4 13 9 6 3 75.0%7 0.1% 0.2% 0.2% 0.1% 0.1% 0.0%
Hibbing Community College 1 2 5 38 8 800.0%9
Northeast Higher Education District
0.0% 0.1% 0.3% 2.0% 0.4% 0.4% Itasca Community College 13 22 4 0 0.0% 0.0% 1.3% 2.0% 0.4% 0.0% 0.0% Mesabi Range Community and Technical College 2 6 8 5 2 100.0%4 0.1% 0.4% 0.4% 0.3% 0.3% 0.1% Rainy River Community College 49 24 62 66 29 59.2%78 7.4% 3.9% 11.6% 15.7% 20.3% 12.9% Vermilion Community College 1 1 1 2 200.0%3 0.1% 0.1% 0.1% 0.0% 0.3% 0.2%Northland Community and Technical College 60 0.0%60 0.0% 0.0% 0.0% 0.0% 2.8% 2.8%Northwest Technical College 15 5 -15 0.0% 0.3% 0.1% 0.0% 0.0% 0.0% -0.3%Pine Technical College 1 1 -1 0.0% 0.1% 0.1% 0.0% 0.0% 0.0% -0.1%Ridgewater College 13 14 10 6 -10 -76.9%3 0.4% 0.4% 0.3% 0.2% 0.1% -0.3%Riverland Community College 47 59 92 91 41 87.2%88 1.5% 1.9% 2.6% 2.4% 2.2% 0.7%Rochester Community and Technical College 199 242 323 333 118 59.3%317 4.5% 5.1% 6.4% 6.0% 5.4% 0.9%St. Cloud Technical College 13 17 23 20 -4 -30.8%9 0.5% 0.6% 0.7% 0.6% 0.3% -0.2%Saint Paul College 18 17 17 12 -9 -50.0%9 0.4% 0.3% 0.3% 0.2% 0.2% -0.2%South Central Technical College 4 6 8 7 0.0%7 0.0% 0.1% 0.2% 0.2% 0.2% 0.2%
Subtotal: Colleges 459 568 699 785 410 89.3%869 0.5% 0.6% 0.7% 0.7% 0.8% 0.3%
UniversitiesBemidji State University 205 259 319 332 129 62.9%334 4.5% 5.6% 7.0% 6.8% 6.6% 2.1%Metropolitan State University 88 94 91 120 41 46.6%129 1.6% 1.6% 1.5% 1.8% 1.9% 0.3%Minnesota State University, Mankato 672 677 782 853 196 29.2%868 5.4% 5.2% 5.9% 6.2% 6.2% 0.8%Minnesota State University Moorhead 179 185 177 301 180 100.6%359 2.5% 2.5% 2.4% 3.9% 4.7% 2.1%St. Cloud State University 717 867 850 888 64 8.9%781 4.9% 5.7% 5.3% 5.5% 4.8% 0.0%Southwest Minnesota State University 250 400 342 372 202 80.8%452 5.7% 8.4% 6.3% 6.7% 7.8% 2.2%Winona State University 491 492 490 476 8 1.6%499 7.0% 6.7% 6.4% 6.0% 6.0% -0.9%
Subtotal: Universities 2,602 2,974 3,051 3,342 820 31.5%3,422 4.7% 5.1% 5.0% 5.3% 5.4% 0.7%
Institution LocationGreater Minnesota 2,944 3,411 3,628 3,936 1,096 37.2%4,040 3.0% 3.3% 3.5% 3.6% 3.6% 0.6%Twin Cities Metropolitan Area 117 131 122 191 134 114.5%251 0.2% 0.2% 0.2% 0.3% 0.4% 0.2%
Total: Colleges and Universities 3,061 3,542 3,750 4,127 1,230 40.2%4,291 2.0% 2.2% 2.3% 2.4% 2.4% 0.4%
Source: Office of the Chancellor Research and PlanningR:\Factbooks\System Factbook\Fall Multi-Year.mdb Fall Multi-Year by Residency 10/21/2004
Table II-48: Page 3 of 785

Table II-48Residency Status and Student Tuition Rates - Fall Credit Headcount
Minnesota State Colleges and UniversitiesFall 1999, 2000, 2001, 2002 and 2003: End of Term Data
InstitutionFall 1999
Fall 2000
Fall 2001
Fall 2002
Number
Fall 1999
Fall 2000
Fall 2001
Fall 2003
Change Fall 1999 to
Fall 2003
Change Fall 1999to Fall 2003
Number Percent
Non-Resident Student Tuition Rate: Non-Resident
Fall 2003
Fall 2002
Percent of Total
CollegesAlexandria Technical College 20 16 34 21 0 0.0%20 0.9% 0.7% 1.5% 0.9% 0.8% 0.0%Anoka-Ramsey Community College 30 22 36 45 25 83.3%55 0.5% 0.4% 0.6% 0.7% 0.8% 0.2%Anoka Technical College 15 8 10 20 1 6.7%16 0.8% 0.4% 0.4% 0.9% 0.8% 0.0%Central Lakes College 8 19 21 23 5 62.5%13 0.2% 0.6% 0.7% 0.7% 0.4% 0.2%Century College 164 180 220 202 65 39.6%229 2.5% 2.6% 3.0% 2.5% 2.7% 0.2%Dakota County Technical College 15 13 10 21 3 20.0%18 0.5% 0.4% 0.4% 0.7% 0.6% 0.0%Fergus Falls Community College 10 10 15 14 9 90.0%19 0.6% 0.5% 0.7% 0.8% 1.0% 0.4%Fond du Lac Tribal and Community College 5 7 9 9 4 80.0%9 0.5% 0.7% 0.9% 0.7% 0.5% 0.0%Hennepin Technical College 71 71 63 67 -23 -32.4%48 1.2% 1.2% 1.0% 1.1% 0.8% -0.4%Inver Hills Community College 85 103 82 74 -37 -43.5%48 2.0% 2.4% 1.8% 1.5% 0.9% -1.1%Lake Superior College 35 49 102 58 78 222.9%113 1.1% 1.2% 2.6% 1.3% 2.4% 1.3%Minneapolis Community and Technical College 277 287 356 336 -14 -5.1%263 4.5% 4.5% 5.1% 4.4% 3.5% -1.0%Minnesota State College - Southeast Technical 42 34 115 224 -4 -9.5%38 3.0% 2.7% 6.7% 11.9% 2.1% -0.9%Minnesota West Community and Technical College 1 5 2 7 700.0%8 0.0% 0.0% 0.2% 0.1% 0.3% 0.2%Normandale Community College 178 206 156 141 -14 -7.9%164 2.6% 2.8% 2.1% 1.8% 2.0% -0.6%North Hennepin Community College 128 133 133 117 -32 -25.0%96 2.5% 2.5% 2.4% 1.9% 1.5% -1.0%
Hibbing Community College 21 36 35 22 56 266.7%77
Northeast Higher Education District
0.6% 1.1% 2.0% 1.2% 3.8% 3.1% Itasca Community College 6 9 20 12 6 100.0%12 0.5% 0.9% 1.8% 1.1% 1.1% 0.5% Mesabi Range Community and Technical College 62 38 32 57 35 56.5%97 4.0% 2.6% 1.7% 3.5% 6.2% 2.2% Rainy River Community College 5 3 -5 0.0% 0.8% 0.0% 0.6% 0.0% 0.0% -0.8% Vermilion Community College 148 83 100 122 -37 -25.0%111 15.7% 9.4% 11.7% 12.7% 11.6% -4.1%Northland Community and Technical College 12 8 24 41 13 108.3%25 0.6% 0.4% 1.1% 1.9% 1.2% 0.6%Northwest Technical College 59 60 66 89 55 93.2%114 1.3% 1.3% 1.4% 1.7% 2.0% 0.7%Pine Technical College 2 3 10 2 1 50.0%3 0.2% 0.3% 0.9% 0.2% 0.4% 0.2%Ridgewater College 20 17 19 18 -5 -25.0%15 0.5% 0.5% 0.5% 0.5% 0.4% -0.2%Riverland Community College 7 2 7 6 2 28.6%9 0.2% 0.1% 0.2% 0.2% 0.2% 0.0%Rochester Community and Technical College 162 116 108 130 -56 -34.6%106 3.7% 2.4% 2.1% 2.4% 1.8% -1.9%St. Cloud Technical College 11 7 13 13 0 0.0%11 0.4% 0.2% 0.4% 0.4% 0.3% -0.1%Saint Paul College 55 74 84 100 18 32.7%73 1.2% 1.4% 1.6% 1.9% 1.5% 0.3%South Central Technical College 19 6 20 18 -4 -21.1%15 0.6% 0.2% 0.6% 0.5% 0.5% -0.1%
Subtotal: Colleges 1,673 1,617 1,908 2,004 152 9.1%1,825 1.7% 1.6% 1.8% 1.8% 1.6% -0.1%
UniversitiesBemidji State University 150 143 130 169 42 28.0%192 3.3% 3.1% 2.9% 3.4% 3.8% 0.5%Metropolitan State University 130 125 169 207 76 58.5%206 2.4% 2.2% 2.7% 3.2% 3.1% 0.7%Minnesota State University, Mankato 468 506 507 460 -32 -6.8%436 3.8% 3.9% 3.8% 3.3% 3.1% -0.7%Minnesota State University Moorhead 187 186 162 89 -141 -75.4%46 2.7% 2.5% 2.2% 1.2% 0.6% -2.1%St. Cloud State University 273 314 312 286 56 20.5%329 1.8% 2.1% 2.0% 1.8% 2.0% 0.2%Southwest Minnesota State University 365 6 64 3 -359 -98.4%6 8.3% 0.1% 1.2% 0.1% 0.1% -8.2%Winona State University 391 406 346 355 -70 -17.9%321 5.5% 5.5% 4.5% 4.5% 3.9% -1.7%
Subtotal: Universities 1,964 1,686 1,690 1,569 -428 -21.8%1,536 3.5% 2.9% 2.8% 2.5% 2.4% -1.1%
Institution LocationGreater Minnesota 2,489 2,081 2,279 2,243 -344 -13.8%2,145 2.5% 2.0% 2.2% 2.1% 1.9% -0.6%Twin Cities Metropolitan Area 1,148 1,222 1,319 1,330 68 5.9%1,216 2.1% 2.1% 2.2% 2.1% 1.8% -0.2%
Total: Colleges and Universities 3,637 3,303 3,598 3,573 -276 -7.6%3,361 2.4% 2.1% 2.2% 2.1% 1.9% -0.5%
Source: Office of the Chancellor Research and PlanningR:\Factbooks\System Factbook\Fall Multi-Year.mdb Fall Multi-Year by Residency 10/21/2004
Table II-48: Page 4 of 786
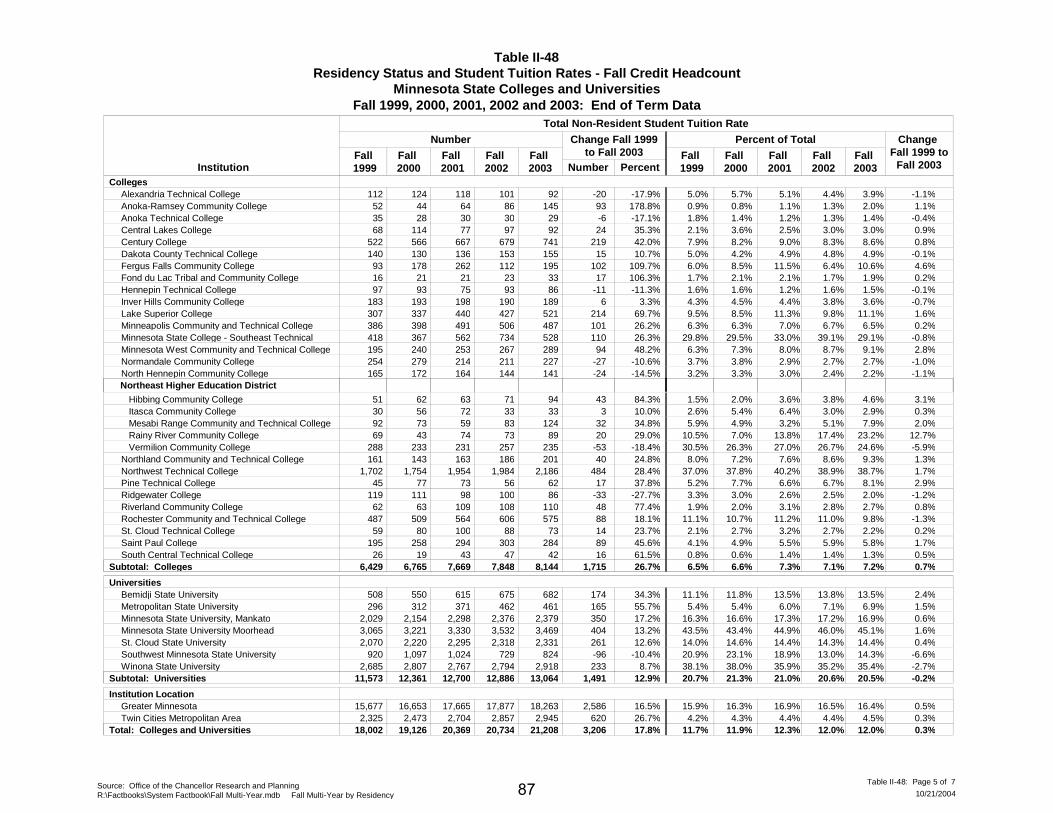
Table II-48Residency Status and Student Tuition Rates - Fall Credit Headcount
Minnesota State Colleges and UniversitiesFall 1999, 2000, 2001, 2002 and 2003: End of Term Data
InstitutionFall 1999
Fall 2000
Fall 2001
Fall 2002
Number
Fall 1999
Fall 2000
Fall 2001
Fall 2003
Change Fall 1999 to
Fall 2003
Change Fall 1999to Fall 2003
Number Percent
Total Non-Resident Student Tuition Rate
Fall 2003
Fall 2002
Percent of Total
CollegesAlexandria Technical College 112 124 118 101 -20 -17.9%92 5.0% 5.7% 5.1% 4.4% 3.9% -1.1%Anoka-Ramsey Community College 52 44 64 86 93 178.8%145 0.9% 0.8% 1.1% 1.3% 2.0% 1.1%Anoka Technical College 35 28 30 30 -6 -17.1%29 1.8% 1.4% 1.2% 1.3% 1.4% -0.4%Central Lakes College 68 114 77 97 24 35.3%92 2.1% 3.6% 2.5% 3.0% 3.0% 0.9%Century College 522 566 667 679 219 42.0%741 7.9% 8.2% 9.0% 8.3% 8.6% 0.8%Dakota County Technical College 140 130 136 153 15 10.7%155 5.0% 4.2% 4.9% 4.8% 4.9% -0.1%Fergus Falls Community College 93 178 262 112 102 109.7%195 6.0% 8.5% 11.5% 6.4% 10.6% 4.6%Fond du Lac Tribal and Community College 16 21 21 23 17 106.3%33 1.7% 2.1% 2.1% 1.7% 1.9% 0.2%Hennepin Technical College 97 93 75 93 -11 -11.3%86 1.6% 1.6% 1.2% 1.6% 1.5% -0.1%Inver Hills Community College 183 193 198 190 6 3.3%189 4.3% 4.5% 4.4% 3.8% 3.6% -0.7%Lake Superior College 307 337 440 427 214 69.7%521 9.5% 8.5% 11.3% 9.8% 11.1% 1.6%Minneapolis Community and Technical College 386 398 491 506 101 26.2%487 6.3% 6.3% 7.0% 6.7% 6.5% 0.2%Minnesota State College - Southeast Technical 418 367 562 734 110 26.3%528 29.8% 29.5% 33.0% 39.1% 29.1% -0.8%Minnesota West Community and Technical College 195 240 253 267 94 48.2%289 6.3% 7.3% 8.0% 8.7% 9.1% 2.8%Normandale Community College 254 279 214 211 -27 -10.6%227 3.7% 3.8% 2.9% 2.7% 2.7% -1.0%North Hennepin Community College 165 172 164 144 -24 -14.5%141 3.2% 3.3% 3.0% 2.4% 2.2% -1.1%
Hibbing Community College 51 62 63 71 43 84.3%94
Northeast Higher Education District
1.5% 2.0% 3.6% 3.8% 4.6% 3.1% Itasca Community College 30 56 72 33 3 10.0%33 2.6% 5.4% 6.4% 3.0% 2.9% 0.3% Mesabi Range Community and Technical College 92 73 59 83 32 34.8%124 5.9% 4.9% 3.2% 5.1% 7.9% 2.0% Rainy River Community College 69 43 74 73 20 29.0%89 10.5% 7.0% 13.8% 17.4% 23.2% 12.7% Vermilion Community College 288 233 231 257 -53 -18.4%235 30.5% 26.3% 27.0% 26.7% 24.6% -5.9%Northland Community and Technical College 161 143 163 186 40 24.8%201 8.0% 7.2% 7.6% 8.6% 9.3% 1.3%Northwest Technical College 1,702 1,754 1,954 1,984 484 28.4%2,186 37.0% 37.8% 40.2% 38.9% 38.7% 1.7%Pine Technical College 45 77 73 56 17 37.8%62 5.2% 7.7% 6.6% 6.7% 8.1% 2.9%Ridgewater College 119 111 98 100 -33 -27.7%86 3.3% 3.0% 2.6% 2.5% 2.0% -1.2%Riverland Community College 62 63 109 108 48 77.4%110 1.9% 2.0% 3.1% 2.8% 2.7% 0.8%Rochester Community and Technical College 487 509 564 606 88 18.1%575 11.1% 10.7% 11.2% 11.0% 9.8% -1.3%St. Cloud Technical College 59 80 100 88 14 23.7%73 2.1% 2.7% 3.2% 2.7% 2.2% 0.2%Saint Paul College 195 258 294 303 89 45.6%284 4.1% 4.9% 5.5% 5.9% 5.8% 1.7%South Central Technical College 26 19 43 47 16 61.5%42 0.8% 0.6% 1.4% 1.4% 1.3% 0.5%
Subtotal: Colleges 6,429 6,765 7,669 7,848 1,715 26.7%8,144 6.5% 6.6% 7.3% 7.1% 7.2% 0.7%
UniversitiesBemidji State University 508 550 615 675 174 34.3%682 11.1% 11.8% 13.5% 13.8% 13.5% 2.4%Metropolitan State University 296 312 371 462 165 55.7%461 5.4% 5.4% 6.0% 7.1% 6.9% 1.5%Minnesota State University, Mankato 2,029 2,154 2,298 2,376 350 17.2%2,379 16.3% 16.6% 17.3% 17.2% 16.9% 0.6%Minnesota State University Moorhead 3,065 3,221 3,330 3,532 404 13.2%3,469 43.5% 43.4% 44.9% 46.0% 45.1% 1.6%St. Cloud State University 2,070 2,220 2,295 2,318 261 12.6%2,331 14.0% 14.6% 14.4% 14.3% 14.4% 0.4%Southwest Minnesota State University 920 1,097 1,024 729 -96 -10.4%824 20.9% 23.1% 18.9% 13.0% 14.3% -6.6%Winona State University 2,685 2,807 2,767 2,794 233 8.7%2,918 38.1% 38.0% 35.9% 35.2% 35.4% -2.7%
Subtotal: Universities 11,573 12,361 12,700 12,886 1,491 12.9%13,064 20.7% 21.3% 21.0% 20.6% 20.5% -0.2%
Institution LocationGreater Minnesota 15,677 16,653 17,665 17,877 2,586 16.5%18,263 15.9% 16.3% 16.9% 16.5% 16.4% 0.5%Twin Cities Metropolitan Area 2,325 2,473 2,704 2,857 620 26.7%2,945 4.2% 4.3% 4.4% 4.4% 4.5% 0.3%
Total: Colleges and Universities 18,002 19,126 20,369 20,734 3,206 17.8%21,208 11.7% 11.9% 12.3% 12.0% 12.0% 0.3%
Source: Office of the Chancellor Research and PlanningR:\Factbooks\System Factbook\Fall Multi-Year.mdb Fall Multi-Year by Residency 10/21/2004
Table II-48: Page 5 of 787
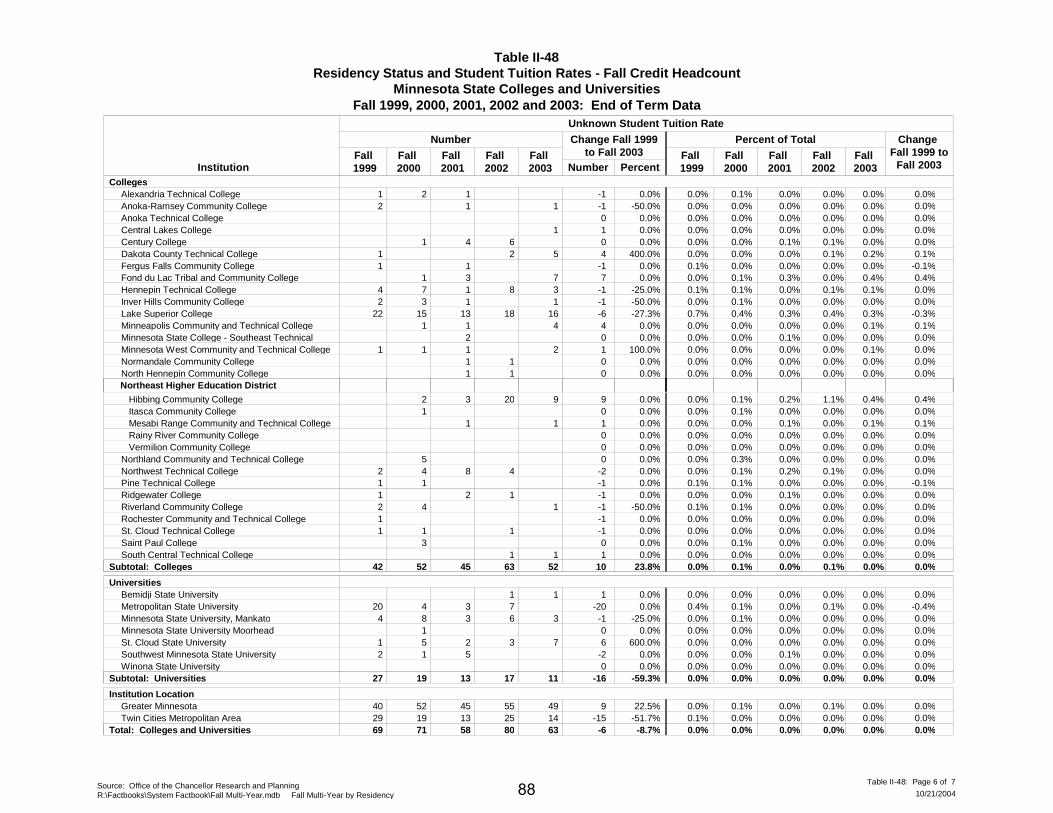
Table II-48Residency Status and Student Tuition Rates - Fall Credit Headcount
Minnesota State Colleges and UniversitiesFall 1999, 2000, 2001, 2002 and 2003: End of Term Data
InstitutionFall 1999
Fall 2000
Fall 2001
Fall 2002
Number
Fall 1999
Fall 2000
Fall 2001
Fall 2003
Change Fall 1999 to
Fall 2003
Change Fall 1999to Fall 2003
Number Percent
Unknown Student Tuition Rate
Fall 2003
Fall 2002
Percent of Total
CollegesAlexandria Technical College 1 2 1 -1 0.0% 0.0% 0.1% 0.0% 0.0% 0.0% 0.0%Anoka-Ramsey Community College 2 1 -1 -50.0%1 0.0% 0.0% 0.0% 0.0% 0.0% 0.0%Anoka Technical College 0 0.0% 0.0% 0.0% 0.0% 0.0% 0.0% 0.0%Central Lakes College 1 0.0%1 0.0% 0.0% 0.0% 0.0% 0.0% 0.0%Century College 1 4 6 0 0.0% 0.0% 0.0% 0.1% 0.1% 0.0% 0.0%Dakota County Technical College 1 2 4 400.0%5 0.0% 0.0% 0.0% 0.1% 0.2% 0.1%Fergus Falls Community College 1 1 -1 0.0% 0.1% 0.0% 0.0% 0.0% 0.0% -0.1%Fond du Lac Tribal and Community College 1 3 7 0.0%7 0.0% 0.1% 0.3% 0.0% 0.4% 0.4%Hennepin Technical College 4 7 1 8 -1 -25.0%3 0.1% 0.1% 0.0% 0.1% 0.1% 0.0%Inver Hills Community College 2 3 1 -1 -50.0%1 0.0% 0.1% 0.0% 0.0% 0.0% 0.0%Lake Superior College 22 15 13 18 -6 -27.3%16 0.7% 0.4% 0.3% 0.4% 0.3% -0.3%Minneapolis Community and Technical College 1 1 4 0.0%4 0.0% 0.0% 0.0% 0.0% 0.1% 0.1%Minnesota State College - Southeast Technical 2 0 0.0% 0.0% 0.0% 0.1% 0.0% 0.0% 0.0%Minnesota West Community and Technical College 1 1 1 1 100.0%2 0.0% 0.0% 0.0% 0.0% 0.1% 0.0%Normandale Community College 1 1 0 0.0% 0.0% 0.0% 0.0% 0.0% 0.0% 0.0%North Hennepin Community College 1 1 0 0.0% 0.0% 0.0% 0.0% 0.0% 0.0% 0.0%
Hibbing Community College 2 3 20 9 0.0%9
Northeast Higher Education District
0.0% 0.1% 0.2% 1.1% 0.4% 0.4% Itasca Community College 1 0 0.0% 0.0% 0.1% 0.0% 0.0% 0.0% 0.0% Mesabi Range Community and Technical College 1 1 0.0%1 0.0% 0.0% 0.1% 0.0% 0.1% 0.1% Rainy River Community College 0 0.0% 0.0% 0.0% 0.0% 0.0% 0.0% 0.0% Vermilion Community College 0 0.0% 0.0% 0.0% 0.0% 0.0% 0.0% 0.0%Northland Community and Technical College 5 0 0.0% 0.0% 0.3% 0.0% 0.0% 0.0% 0.0%Northwest Technical College 2 4 8 4 -2 0.0% 0.0% 0.1% 0.2% 0.1% 0.0% 0.0%Pine Technical College 1 1 -1 0.0% 0.1% 0.1% 0.0% 0.0% 0.0% -0.1%Ridgewater College 1 2 1 -1 0.0% 0.0% 0.0% 0.1% 0.0% 0.0% 0.0%Riverland Community College 2 4 -1 -50.0%1 0.1% 0.1% 0.0% 0.0% 0.0% 0.0%Rochester Community and Technical College 1 -1 0.0% 0.0% 0.0% 0.0% 0.0% 0.0% 0.0%St. Cloud Technical College 1 1 1 -1 0.0% 0.0% 0.0% 0.0% 0.0% 0.0% 0.0%Saint Paul College 3 0 0.0% 0.0% 0.1% 0.0% 0.0% 0.0% 0.0%South Central Technical College 1 1 0.0%1 0.0% 0.0% 0.0% 0.0% 0.0% 0.0%
Subtotal: Colleges 42 52 45 63 10 23.8%52 0.0% 0.1% 0.0% 0.1% 0.0% 0.0%
UniversitiesBemidji State University 1 1 0.0%1 0.0% 0.0% 0.0% 0.0% 0.0% 0.0%Metropolitan State University 20 4 3 7 -20 0.0% 0.4% 0.1% 0.0% 0.1% 0.0% -0.4%Minnesota State University, Mankato 4 8 3 6 -1 -25.0%3 0.0% 0.1% 0.0% 0.0% 0.0% 0.0%Minnesota State University Moorhead 1 0 0.0% 0.0% 0.0% 0.0% 0.0% 0.0% 0.0%St. Cloud State University 1 5 2 3 6 600.0%7 0.0% 0.0% 0.0% 0.0% 0.0% 0.0%Southwest Minnesota State University 2 1 5 -2 0.0% 0.0% 0.0% 0.1% 0.0% 0.0% 0.0%Winona State University 0 0.0% 0.0% 0.0% 0.0% 0.0% 0.0% 0.0%
Subtotal: Universities 27 19 13 17 -16 -59.3%11 0.0% 0.0% 0.0% 0.0% 0.0% 0.0%
Institution LocationGreater Minnesota 40 52 45 55 9 22.5%49 0.0% 0.1% 0.0% 0.1% 0.0% 0.0%Twin Cities Metropolitan Area 29 19 13 25 -15 -51.7%14 0.1% 0.0% 0.0% 0.0% 0.0% 0.0%
Total: Colleges and Universities 69 71 58 80 -6 -8.7%63 0.0% 0.0% 0.0% 0.0% 0.0% 0.0%
Source: Office of the Chancellor Research and PlanningR:\Factbooks\System Factbook\Fall Multi-Year.mdb Fall Multi-Year by Residency 10/21/2004
Table II-48: Page 6 of 788
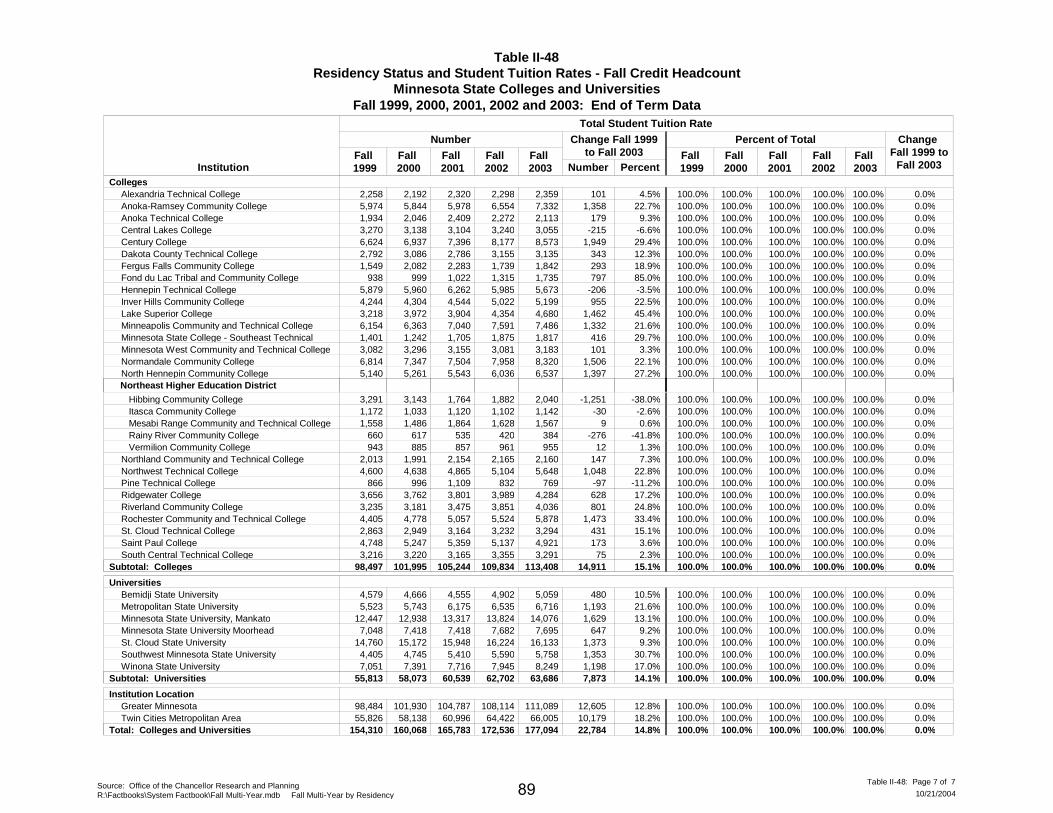
Table II-48Residency Status and Student Tuition Rates - Fall Credit Headcount
Minnesota State Colleges and UniversitiesFall 1999, 2000, 2001, 2002 and 2003: End of Term Data
InstitutionFall 1999
Fall 2000
Fall 2001
Fall 2002
Number
Fall 1999
Fall 2000
Fall 2001
Fall 2003
Change Fall 1999 to
Fall 2003
Change Fall 1999to Fall 2003
Number Percent
Total Student Tuition Rate
Fall 2003
Fall 2002
Percent of Total
CollegesAlexandria Technical College 2,258 2,192 2,320 2,298 101 4.5%2,359 100.0% 100.0% 100.0% 100.0% 100.0% 0.0%Anoka-Ramsey Community College 5,974 5,844 5,978 6,554 1,358 22.7%7,332 100.0% 100.0% 100.0% 100.0% 100.0% 0.0%Anoka Technical College 1,934 2,046 2,409 2,272 179 9.3%2,113 100.0% 100.0% 100.0% 100.0% 100.0% 0.0%Central Lakes College 3,270 3,138 3,104 3,240 -215 -6.6%3,055 100.0% 100.0% 100.0% 100.0% 100.0% 0.0%Century College 6,624 6,937 7,396 8,177 1,949 29.4%8,573 100.0% 100.0% 100.0% 100.0% 100.0% 0.0%Dakota County Technical College 2,792 3,086 2,786 3,155 343 12.3%3,135 100.0% 100.0% 100.0% 100.0% 100.0% 0.0%Fergus Falls Community College 1,549 2,082 2,283 1,739 293 18.9%1,842 100.0% 100.0% 100.0% 100.0% 100.0% 0.0%Fond du Lac Tribal and Community College 938 999 1,022 1,315 797 85.0%1,735 100.0% 100.0% 100.0% 100.0% 100.0% 0.0%Hennepin Technical College 5,879 5,960 6,262 5,985 -206 -3.5%5,673 100.0% 100.0% 100.0% 100.0% 100.0% 0.0%Inver Hills Community College 4,244 4,304 4,544 5,022 955 22.5%5,199 100.0% 100.0% 100.0% 100.0% 100.0% 0.0%Lake Superior College 3,218 3,972 3,904 4,354 1,462 45.4%4,680 100.0% 100.0% 100.0% 100.0% 100.0% 0.0%Minneapolis Community and Technical College 6,154 6,363 7,040 7,591 1,332 21.6%7,486 100.0% 100.0% 100.0% 100.0% 100.0% 0.0%Minnesota State College - Southeast Technical 1,401 1,242 1,705 1,875 416 29.7%1,817 100.0% 100.0% 100.0% 100.0% 100.0% 0.0%Minnesota West Community and Technical College 3,082 3,296 3,155 3,081 101 3.3%3,183 100.0% 100.0% 100.0% 100.0% 100.0% 0.0%Normandale Community College 6,814 7,347 7,504 7,958 1,506 22.1%8,320 100.0% 100.0% 100.0% 100.0% 100.0% 0.0%North Hennepin Community College 5,140 5,261 5,543 6,036 1,397 27.2%6,537 100.0% 100.0% 100.0% 100.0% 100.0% 0.0%
Hibbing Community College 3,291 3,143 1,764 1,882 -1,251 -38.0%2,040
Northeast Higher Education District
100.0% 100.0% 100.0% 100.0% 100.0% 0.0% Itasca Community College 1,172 1,033 1,120 1,102 -30 -2.6%1,142 100.0% 100.0% 100.0% 100.0% 100.0% 0.0% Mesabi Range Community and Technical College 1,558 1,486 1,864 1,628 9 0.6%1,567 100.0% 100.0% 100.0% 100.0% 100.0% 0.0% Rainy River Community College 660 617 535 420 -276 -41.8%384 100.0% 100.0% 100.0% 100.0% 100.0% 0.0% Vermilion Community College 943 885 857 961 12 1.3%955 100.0% 100.0% 100.0% 100.0% 100.0% 0.0%Northland Community and Technical College 2,013 1,991 2,154 2,165 147 7.3%2,160 100.0% 100.0% 100.0% 100.0% 100.0% 0.0%Northwest Technical College 4,600 4,638 4,865 5,104 1,048 22.8%5,648 100.0% 100.0% 100.0% 100.0% 100.0% 0.0%Pine Technical College 866 996 1,109 832 -97 -11.2%769 100.0% 100.0% 100.0% 100.0% 100.0% 0.0%Ridgewater College 3,656 3,762 3,801 3,989 628 17.2%4,284 100.0% 100.0% 100.0% 100.0% 100.0% 0.0%Riverland Community College 3,235 3,181 3,475 3,851 801 24.8%4,036 100.0% 100.0% 100.0% 100.0% 100.0% 0.0%Rochester Community and Technical College 4,405 4,778 5,057 5,524 1,473 33.4%5,878 100.0% 100.0% 100.0% 100.0% 100.0% 0.0%St. Cloud Technical College 2,863 2,949 3,164 3,232 431 15.1%3,294 100.0% 100.0% 100.0% 100.0% 100.0% 0.0%Saint Paul College 4,748 5,247 5,359 5,137 173 3.6%4,921 100.0% 100.0% 100.0% 100.0% 100.0% 0.0%South Central Technical College 3,216 3,220 3,165 3,355 75 2.3%3,291 100.0% 100.0% 100.0% 100.0% 100.0% 0.0%
Subtotal: Colleges 98,497 101,995 105,244 109,834 14,911 15.1%113,408 100.0% 100.0% 100.0% 100.0% 100.0% 0.0%
UniversitiesBemidji State University 4,579 4,666 4,555 4,902 480 10.5%5,059 100.0% 100.0% 100.0% 100.0% 100.0% 0.0%Metropolitan State University 5,523 5,743 6,175 6,535 1,193 21.6%6,716 100.0% 100.0% 100.0% 100.0% 100.0% 0.0%Minnesota State University, Mankato 12,447 12,938 13,317 13,824 1,629 13.1%14,076 100.0% 100.0% 100.0% 100.0% 100.0% 0.0%Minnesota State University Moorhead 7,048 7,418 7,418 7,682 647 9.2%7,695 100.0% 100.0% 100.0% 100.0% 100.0% 0.0%St. Cloud State University 14,760 15,172 15,948 16,224 1,373 9.3%16,133 100.0% 100.0% 100.0% 100.0% 100.0% 0.0%Southwest Minnesota State University 4,405 4,745 5,410 5,590 1,353 30.7%5,758 100.0% 100.0% 100.0% 100.0% 100.0% 0.0%Winona State University 7,051 7,391 7,716 7,945 1,198 17.0%8,249 100.0% 100.0% 100.0% 100.0% 100.0% 0.0%
Subtotal: Universities 55,813 58,073 60,539 62,702 7,873 14.1%63,686 100.0% 100.0% 100.0% 100.0% 100.0% 0.0%
Institution LocationGreater Minnesota 98,484 101,930 104,787 108,114 12,605 12.8%111,089 100.0% 100.0% 100.0% 100.0% 100.0% 0.0%Twin Cities Metropolitan Area 55,826 58,138 60,996 64,422 10,179 18.2%66,005 100.0% 100.0% 100.0% 100.0% 100.0% 0.0%
Total: Colleges and Universities 154,310 160,068 165,783 172,536 22,784 14.8%177,094 100.0% 100.0% 100.0% 100.0% 100.0% 0.0%
Source: Office of the Chancellor Research and PlanningR:\Factbooks\System Factbook\Fall Multi-Year.mdb Fall Multi-Year by Residency 10/21/2004
Table II-48: Page 7 of 789

This Page is Intentionally Left Blank
90
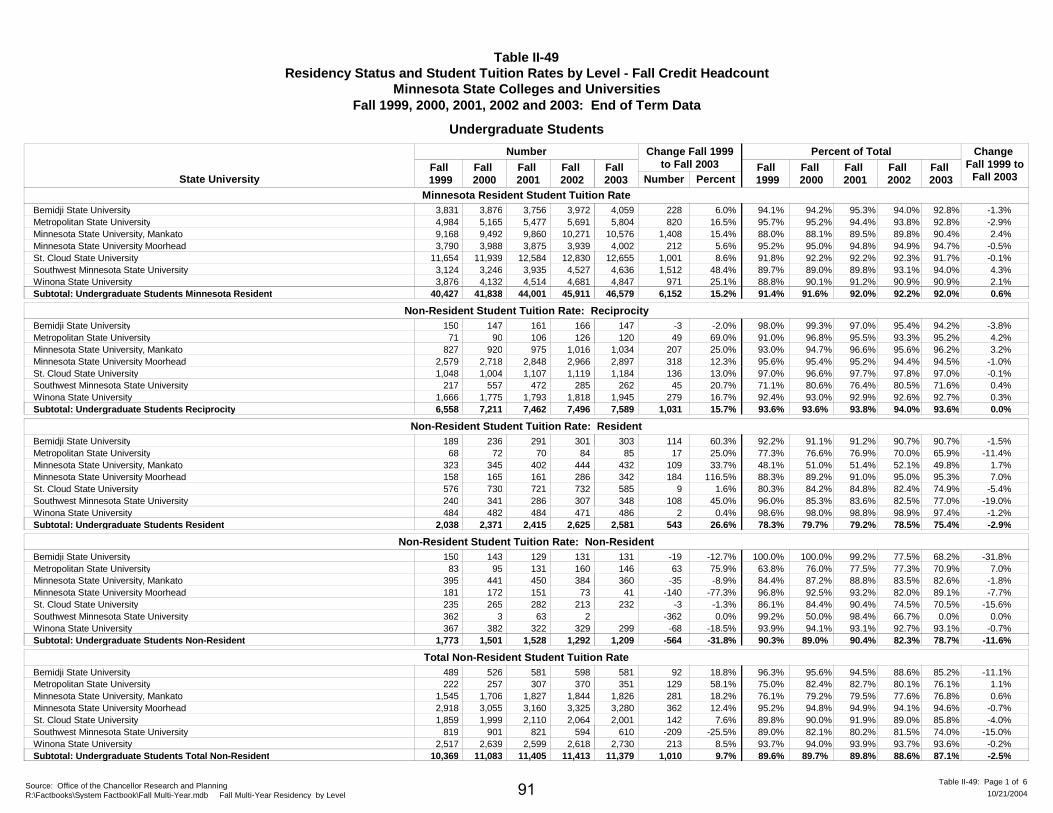
Table II-49Residency Status and Student Tuition Rates by Level - Fall Credit Headcount
Minnesota State Colleges and UniversitiesFall 1999, 2000, 2001, 2002 and 2003: End of Term Data
Undergraduate Students
State UniversityFall 1999
Fall 2000
Fall 2001
Fall 2002
Number
Fall 1999
Fall 2000
Fall 2001
Fall 2003
Change Fall 1999 to
Fall 2003
Change Fall 1999to Fall 2003
Number PercentFall 2003
Fall 2002
Percent of Total
Minnesota Resident Student Tuition RateBemidji State University 3,831 3,876 3,756 3,972 228 6.0%4,059 94.1% -1.3%94.2% 95.3% 94.0% 92.8%Metropolitan State University 4,984 5,165 5,477 5,691 820 16.5%5,804 95.7% -2.9%95.2% 94.4% 93.8% 92.8%Minnesota State University, Mankato 9,168 9,492 9,860 10,271 1,408 15.4%10,576 88.0% 2.4%88.1% 89.5% 89.8% 90.4%Minnesota State University Moorhead 3,790 3,988 3,875 3,939 212 5.6%4,002 95.2% -0.5%95.0% 94.8% 94.9% 94.7%St. Cloud State University 11,654 11,939 12,584 12,830 1,001 8.6%12,655 91.8% -0.1%92.2% 92.2% 92.3% 91.7%Southwest Minnesota State University 3,124 3,246 3,935 4,527 1,512 48.4%4,636 89.7% 4.3%89.0% 89.8% 93.1% 94.0%Winona State University 3,876 4,132 4,514 4,681 971 25.1%4,847 88.8% 2.1%90.1% 91.2% 90.9% 90.9%Subtotal: Undergraduate Students Minnesota Resident 40,427 41,838 44,001 45,911 6,152 15.2%46,579 91.4% 91.6% 92.0% 92.2% 92.0% 0.6%
Non-Resident Student Tuition Rate: ReciprocityBemidji State University 150 147 161 166 -3 -2.0%147 98.0% -3.8%99.3% 97.0% 95.4% 94.2%Metropolitan State University 71 90 106 126 49 69.0%120 91.0% 4.2%96.8% 95.5% 93.3% 95.2%Minnesota State University, Mankato 827 920 975 1,016 207 25.0%1,034 93.0% 3.2%94.7% 96.6% 95.6% 96.2%Minnesota State University Moorhead 2,579 2,718 2,848 2,966 318 12.3%2,897 95.6% -1.0%95.4% 95.2% 94.4% 94.5%St. Cloud State University 1,048 1,004 1,107 1,119 136 13.0%1,184 97.0% -0.1%96.6% 97.7% 97.8% 97.0%Southwest Minnesota State University 217 557 472 285 45 20.7%262 71.1% 0.4%80.6% 76.4% 80.5% 71.6%Winona State University 1,666 1,775 1,793 1,818 279 16.7%1,945 92.4% 0.3%93.0% 92.9% 92.6% 92.7%Subtotal: Undergraduate Students Reciprocity 6,558 7,211 7,462 7,496 1,031 15.7%7,589 93.6% 93.6% 93.8% 94.0% 93.6% 0.0%
Non-Resident Student Tuition Rate: ResidentBemidji State University 189 236 291 301 114 60.3%303 92.2% -1.5%91.1% 91.2% 90.7% 90.7%Metropolitan State University 68 72 70 84 17 25.0%85 77.3% -11.4%76.6% 76.9% 70.0% 65.9%Minnesota State University, Mankato 323 345 402 444 109 33.7%432 48.1% 1.7%51.0% 51.4% 52.1% 49.8%Minnesota State University Moorhead 158 165 161 286 184 116.5%342 88.3% 7.0%89.2% 91.0% 95.0% 95.3%St. Cloud State University 576 730 721 732 9 1.6%585 80.3% -5.4%84.2% 84.8% 82.4% 74.9%Southwest Minnesota State University 240 341 286 307 108 45.0%348 96.0% -19.0%85.3% 83.6% 82.5% 77.0%Winona State University 484 482 484 471 2 0.4%486 98.6% -1.2%98.0% 98.8% 98.9% 97.4%Subtotal: Undergraduate Students Resident 2,038 2,371 2,415 2,625 543 26.6%2,581 78.3% 79.7% 79.2% 78.5% 75.4% -2.9%
Non-Resident Student Tuition Rate: Non-ResidentBemidji State University 150 143 129 131 -19 -12.7%131 100.0% -31.8%100.0% 99.2% 77.5% 68.2%Metropolitan State University 83 95 131 160 63 75.9%146 63.8% 7.0%76.0% 77.5% 77.3% 70.9%Minnesota State University, Mankato 395 441 450 384 -35 -8.9%360 84.4% -1.8%87.2% 88.8% 83.5% 82.6%Minnesota State University Moorhead 181 172 151 73 -140 -77.3%41 96.8% -7.7%92.5% 93.2% 82.0% 89.1%St. Cloud State University 235 265 282 213 -3 -1.3%232 86.1% -15.6%84.4% 90.4% 74.5% 70.5%Southwest Minnesota State University 362 3 63 2 -362 0.0% 99.2% 0.0%50.0% 98.4% 66.7% 0.0%Winona State University 367 382 322 329 -68 -18.5%299 93.9% -0.7%94.1% 93.1% 92.7% 93.1%Subtotal: Undergraduate Students Non-Resident 1,773 1,501 1,528 1,292 -564 -31.8%1,209 90.3% 89.0% 90.4% 82.3% 78.7% -11.6%
Total Non-Resident Student Tuition RateBemidji State University 489 526 581 598 92 18.8%581 96.3% -11.1%95.6% 94.5% 88.6% 85.2%Metropolitan State University 222 257 307 370 129 58.1%351 75.0% 1.1%82.4% 82.7% 80.1% 76.1%Minnesota State University, Mankato 1,545 1,706 1,827 1,844 281 18.2%1,826 76.1% 0.6%79.2% 79.5% 77.6% 76.8%Minnesota State University Moorhead 2,918 3,055 3,160 3,325 362 12.4%3,280 95.2% -0.7%94.8% 94.9% 94.1% 94.6%St. Cloud State University 1,859 1,999 2,110 2,064 142 7.6%2,001 89.8% -4.0%90.0% 91.9% 89.0% 85.8%Southwest Minnesota State University 819 901 821 594 -209 -25.5%610 89.0% -15.0%82.1% 80.2% 81.5% 74.0%Winona State University 2,517 2,639 2,599 2,618 213 8.5%2,730 93.7% -0.2%94.0% 93.9% 93.7% 93.6%Subtotal: Undergraduate Students Total Non-Resident 10,369 11,083 11,405 11,413 1,010 9.7%11,379 89.6% 89.7% 89.8% 88.6% 87.1% -2.5%
Source: Office of the Chancellor Research and PlanningR:\Factbooks\System Factbook\Fall Multi-Year.mdb Fall Multi-Year Residency by Level 10/21/2004
Table II-49: Page 1 of 691
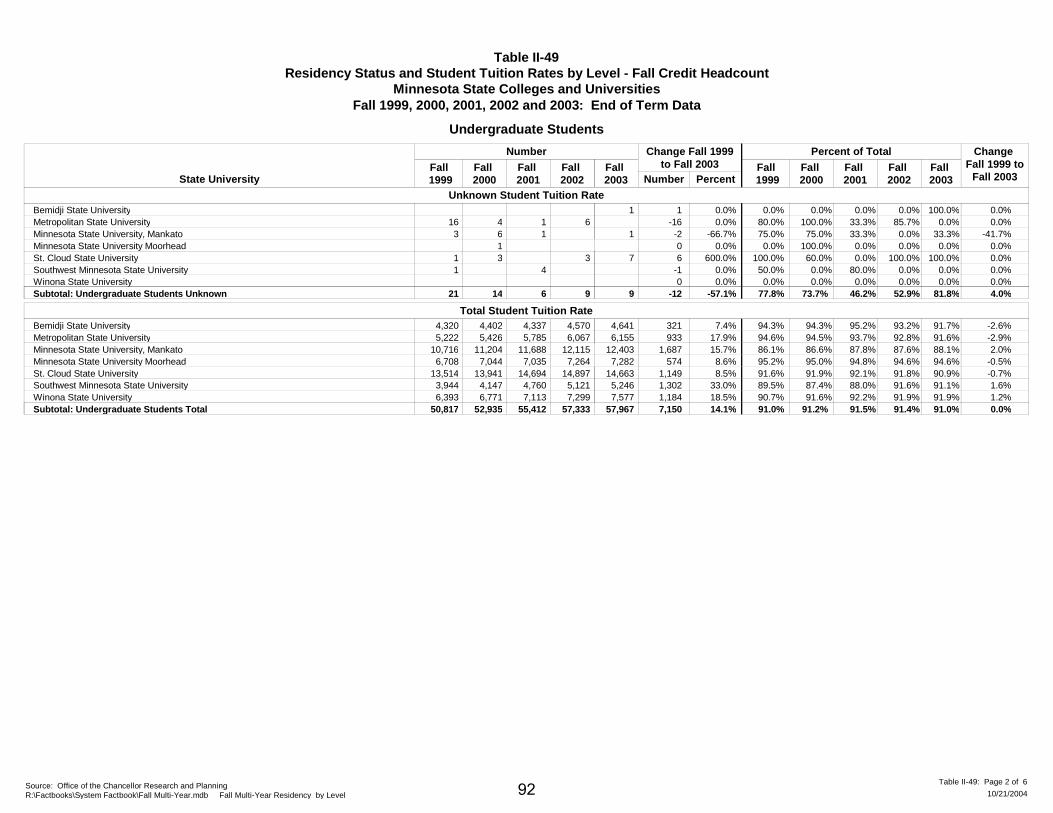
Table II-49Residency Status and Student Tuition Rates by Level - Fall Credit Headcount
Minnesota State Colleges and UniversitiesFall 1999, 2000, 2001, 2002 and 2003: End of Term Data
Undergraduate Students
State UniversityFall 1999
Fall 2000
Fall 2001
Fall 2002
Number
Fall 1999
Fall 2000
Fall 2001
Fall 2003
Change Fall 1999 to
Fall 2003
Change Fall 1999to Fall 2003
Number PercentFall 2003
Fall 2002
Percent of Total
Unknown Student Tuition RateBemidji State University 1 0.0%1 0.0% 0.0%0.0% 0.0% 0.0% 100.0%Metropolitan State University 16 4 1 6 -16 0.0% 80.0% 0.0%100.0% 33.3% 85.7% 0.0%Minnesota State University, Mankato 3 6 1 -2 -66.7%1 75.0% -41.7%75.0% 33.3% 0.0% 33.3%Minnesota State University Moorhead 1 0 0.0% 0.0% 0.0%100.0% 0.0% 0.0% 0.0%St. Cloud State University 1 3 3 6 600.0%7 100.0% 0.0%60.0% 0.0% 100.0% 100.0%Southwest Minnesota State University 1 4 -1 0.0% 50.0% 0.0%0.0% 80.0% 0.0% 0.0%Winona State University 0 0.0% 0.0% 0.0%0.0% 0.0% 0.0% 0.0%Subtotal: Undergraduate Students Unknown 21 14 6 9 -12 -57.1%9 77.8% 73.7% 46.2% 52.9% 81.8% 4.0%
Total Student Tuition RateBemidji State University 4,320 4,402 4,337 4,570 321 7.4%4,641 94.3% -2.6%94.3% 95.2% 93.2% 91.7%Metropolitan State University 5,222 5,426 5,785 6,067 933 17.9%6,155 94.6% -2.9%94.5% 93.7% 92.8% 91.6%Minnesota State University, Mankato 10,716 11,204 11,688 12,115 1,687 15.7%12,403 86.1% 2.0%86.6% 87.8% 87.6% 88.1%Minnesota State University Moorhead 6,708 7,044 7,035 7,264 574 8.6%7,282 95.2% -0.5%95.0% 94.8% 94.6% 94.6%St. Cloud State University 13,514 13,941 14,694 14,897 1,149 8.5%14,663 91.6% -0.7%91.9% 92.1% 91.8% 90.9%Southwest Minnesota State University 3,944 4,147 4,760 5,121 1,302 33.0%5,246 89.5% 1.6%87.4% 88.0% 91.6% 91.1%Winona State University 6,393 6,771 7,113 7,299 1,184 18.5%7,577 90.7% 1.2%91.6% 92.2% 91.9% 91.9%Subtotal: Undergraduate Students Total 50,817 52,935 55,412 57,333 7,150 14.1%57,967 91.0% 91.2% 91.5% 91.4% 91.0% 0.0%
Source: Office of the Chancellor Research and PlanningR:\Factbooks\System Factbook\Fall Multi-Year.mdb Fall Multi-Year Residency by Level 10/21/2004
Table II-49: Page 2 of 692
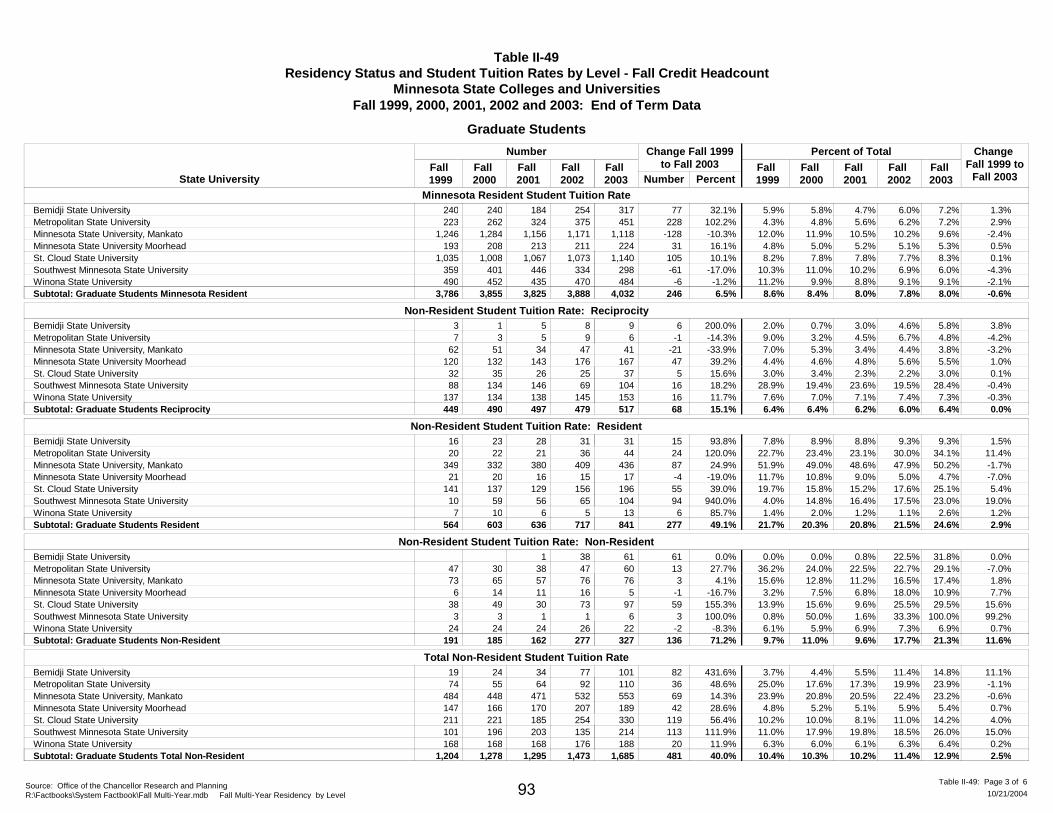
Table II-49Residency Status and Student Tuition Rates by Level - Fall Credit Headcount
Minnesota State Colleges and UniversitiesFall 1999, 2000, 2001, 2002 and 2003: End of Term Data
Graduate Students
State UniversityFall 1999
Fall 2000
Fall 2001
Fall 2002
Number
Fall 1999
Fall 2000
Fall 2001
Fall 2003
Change Fall 1999 to
Fall 2003
Change Fall 1999to Fall 2003
Number PercentFall 2003
Fall 2002
Percent of Total
Minnesota Resident Student Tuition RateBemidji State University 240 240 184 254 77 32.1%317 5.9% 1.3%5.8% 4.7% 6.0% 7.2%Metropolitan State University 223 262 324 375 228 102.2%451 4.3% 2.9%4.8% 5.6% 6.2% 7.2%Minnesota State University, Mankato 1,246 1,284 1,156 1,171 -128 -10.3%1,118 12.0% -2.4%11.9% 10.5% 10.2% 9.6%Minnesota State University Moorhead 193 208 213 211 31 16.1%224 4.8% 0.5%5.0% 5.2% 5.1% 5.3%St. Cloud State University 1,035 1,008 1,067 1,073 105 10.1%1,140 8.2% 0.1%7.8% 7.8% 7.7% 8.3%Southwest Minnesota State University 359 401 446 334 -61 -17.0%298 10.3% -4.3%11.0% 10.2% 6.9% 6.0%Winona State University 490 452 435 470 -6 -1.2%484 11.2% -2.1%9.9% 8.8% 9.1% 9.1%Subtotal: Graduate Students Minnesota Resident 3,786 3,855 3,825 3,888 246 6.5%4,032 8.6% 8.4% 8.0% 7.8% 8.0% -0.6%
Non-Resident Student Tuition Rate: ReciprocityBemidji State University 3 1 5 8 6 200.0%9 2.0% 3.8%0.7% 3.0% 4.6% 5.8%Metropolitan State University 7 3 5 9 -1 -14.3%6 9.0% -4.2%3.2% 4.5% 6.7% 4.8%Minnesota State University, Mankato 62 51 34 47 -21 -33.9%41 7.0% -3.2%5.3% 3.4% 4.4% 3.8%Minnesota State University Moorhead 120 132 143 176 47 39.2%167 4.4% 1.0%4.6% 4.8% 5.6% 5.5%St. Cloud State University 32 35 26 25 5 15.6%37 3.0% 0.1%3.4% 2.3% 2.2% 3.0%Southwest Minnesota State University 88 134 146 69 16 18.2%104 28.9% -0.4%19.4% 23.6% 19.5% 28.4%Winona State University 137 134 138 145 16 11.7%153 7.6% -0.3%7.0% 7.1% 7.4% 7.3%Subtotal: Graduate Students Reciprocity 449 490 497 479 68 15.1%517 6.4% 6.4% 6.2% 6.0% 6.4% 0.0%
Non-Resident Student Tuition Rate: ResidentBemidji State University 16 23 28 31 15 93.8%31 7.8% 1.5%8.9% 8.8% 9.3% 9.3%Metropolitan State University 20 22 21 36 24 120.0%44 22.7% 11.4%23.4% 23.1% 30.0% 34.1%Minnesota State University, Mankato 349 332 380 409 87 24.9%436 51.9% -1.7%49.0% 48.6% 47.9% 50.2%Minnesota State University Moorhead 21 20 16 15 -4 -19.0%17 11.7% -7.0%10.8% 9.0% 5.0% 4.7%St. Cloud State University 141 137 129 156 55 39.0%196 19.7% 5.4%15.8% 15.2% 17.6% 25.1%Southwest Minnesota State University 10 59 56 65 94 940.0%104 4.0% 19.0%14.8% 16.4% 17.5% 23.0%Winona State University 7 10 6 5 6 85.7%13 1.4% 1.2%2.0% 1.2% 1.1% 2.6%Subtotal: Graduate Students Resident 564 603 636 717 277 49.1%841 21.7% 20.3% 20.8% 21.5% 24.6% 2.9%
Non-Resident Student Tuition Rate: Non-ResidentBemidji State University 1 38 61 0.0%61 0.0% 0.0%0.0% 0.8% 22.5% 31.8%Metropolitan State University 47 30 38 47 13 27.7%60 36.2% -7.0%24.0% 22.5% 22.7% 29.1%Minnesota State University, Mankato 73 65 57 76 3 4.1%76 15.6% 1.8%12.8% 11.2% 16.5% 17.4%Minnesota State University Moorhead 6 14 11 16 -1 -16.7%5 3.2% 7.7%7.5% 6.8% 18.0% 10.9%St. Cloud State University 38 49 30 73 59 155.3%97 13.9% 15.6%15.6% 9.6% 25.5% 29.5%Southwest Minnesota State University 3 3 1 1 3 100.0%6 0.8% 99.2%50.0% 1.6% 33.3% 100.0%Winona State University 24 24 24 26 -2 -8.3%22 6.1% 0.7%5.9% 6.9% 7.3% 6.9%Subtotal: Graduate Students Non-Resident 191 185 162 277 136 71.2%327 9.7% 11.0% 9.6% 17.7% 21.3% 11.6%
Total Non-Resident Student Tuition RateBemidji State University 19 24 34 77 82 431.6%101 3.7% 11.1%4.4% 5.5% 11.4% 14.8%Metropolitan State University 74 55 64 92 36 48.6%110 25.0% -1.1%17.6% 17.3% 19.9% 23.9%Minnesota State University, Mankato 484 448 471 532 69 14.3%553 23.9% -0.6%20.8% 20.5% 22.4% 23.2%Minnesota State University Moorhead 147 166 170 207 42 28.6%189 4.8% 0.7%5.2% 5.1% 5.9% 5.4%St. Cloud State University 211 221 185 254 119 56.4%330 10.2% 4.0%10.0% 8.1% 11.0% 14.2%Southwest Minnesota State University 101 196 203 135 113 111.9%214 11.0% 15.0%17.9% 19.8% 18.5% 26.0%Winona State University 168 168 168 176 20 11.9%188 6.3% 0.2%6.0% 6.1% 6.3% 6.4%Subtotal: Graduate Students Total Non-Resident 1,204 1,278 1,295 1,473 481 40.0%1,685 10.4% 10.3% 10.2% 11.4% 12.9% 2.5%
Source: Office of the Chancellor Research and PlanningR:\Factbooks\System Factbook\Fall Multi-Year.mdb Fall Multi-Year Residency by Level 10/21/2004
Table II-49: Page 3 of 693
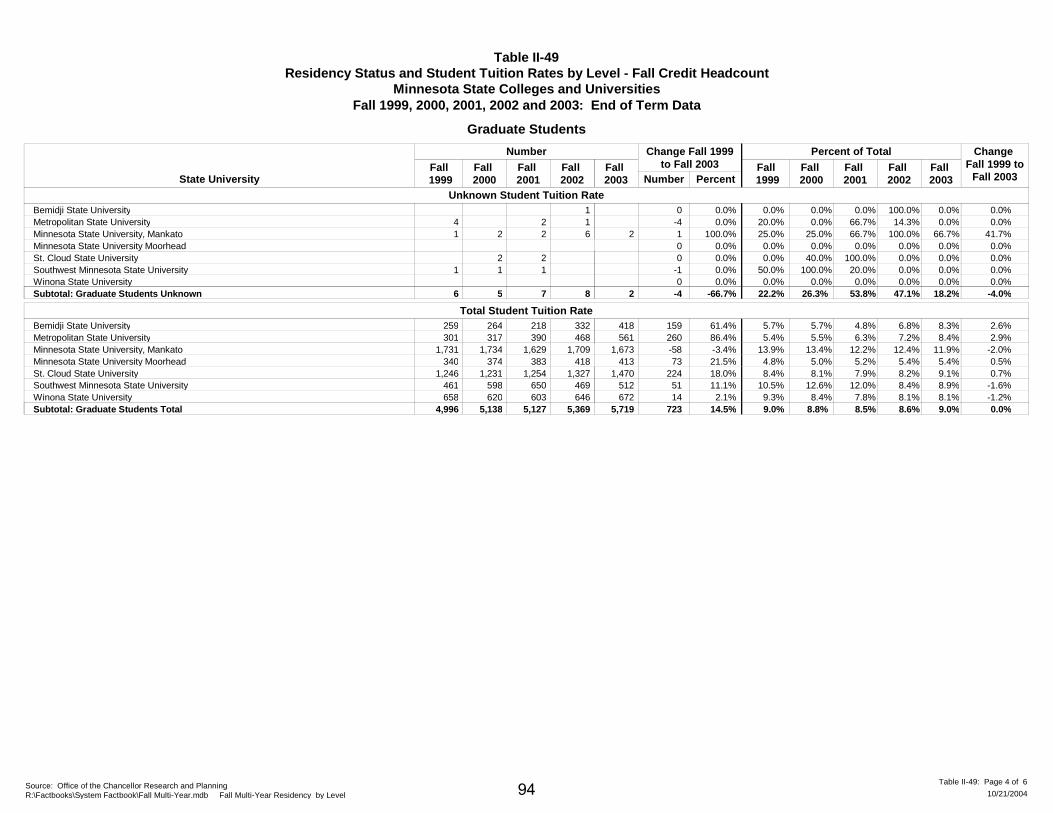
Table II-49Residency Status and Student Tuition Rates by Level - Fall Credit Headcount
Minnesota State Colleges and UniversitiesFall 1999, 2000, 2001, 2002 and 2003: End of Term Data
Graduate Students
State UniversityFall 1999
Fall 2000
Fall 2001
Fall 2002
Number
Fall 1999
Fall 2000
Fall 2001
Fall 2003
Change Fall 1999 to
Fall 2003
Change Fall 1999to Fall 2003
Number PercentFall 2003
Fall 2002
Percent of Total
Unknown Student Tuition RateBemidji State University 1 0 0.0% 0.0% 0.0%0.0% 0.0% 100.0% 0.0%Metropolitan State University 4 2 1 -4 0.0% 20.0% 0.0%0.0% 66.7% 14.3% 0.0%Minnesota State University, Mankato 1 2 2 6 1 100.0%2 25.0% 41.7%25.0% 66.7% 100.0% 66.7%Minnesota State University Moorhead 0 0.0% 0.0% 0.0%0.0% 0.0% 0.0% 0.0%St. Cloud State University 2 2 0 0.0% 0.0% 0.0%40.0% 100.0% 0.0% 0.0%Southwest Minnesota State University 1 1 1 -1 0.0% 50.0% 0.0%100.0% 20.0% 0.0% 0.0%Winona State University 0 0.0% 0.0% 0.0%0.0% 0.0% 0.0% 0.0%Subtotal: Graduate Students Unknown 6 5 7 8 -4 -66.7%2 22.2% 26.3% 53.8% 47.1% 18.2% -4.0%
Total Student Tuition RateBemidji State University 259 264 218 332 159 61.4%418 5.7% 2.6%5.7% 4.8% 6.8% 8.3%Metropolitan State University 301 317 390 468 260 86.4%561 5.4% 2.9%5.5% 6.3% 7.2% 8.4%Minnesota State University, Mankato 1,731 1,734 1,629 1,709 -58 -3.4%1,673 13.9% -2.0%13.4% 12.2% 12.4% 11.9%Minnesota State University Moorhead 340 374 383 418 73 21.5%413 4.8% 0.5%5.0% 5.2% 5.4% 5.4%St. Cloud State University 1,246 1,231 1,254 1,327 224 18.0%1,470 8.4% 0.7%8.1% 7.9% 8.2% 9.1%Southwest Minnesota State University 461 598 650 469 51 11.1%512 10.5% -1.6%12.6% 12.0% 8.4% 8.9%Winona State University 658 620 603 646 14 2.1%672 9.3% -1.2%8.4% 7.8% 8.1% 8.1%Subtotal: Graduate Students Total 4,996 5,138 5,127 5,369 723 14.5%5,719 9.0% 8.8% 8.5% 8.6% 9.0% 0.0%
Source: Office of the Chancellor Research and PlanningR:\Factbooks\System Factbook\Fall Multi-Year.mdb Fall Multi-Year Residency by Level 10/21/2004
Table II-49: Page 4 of 694
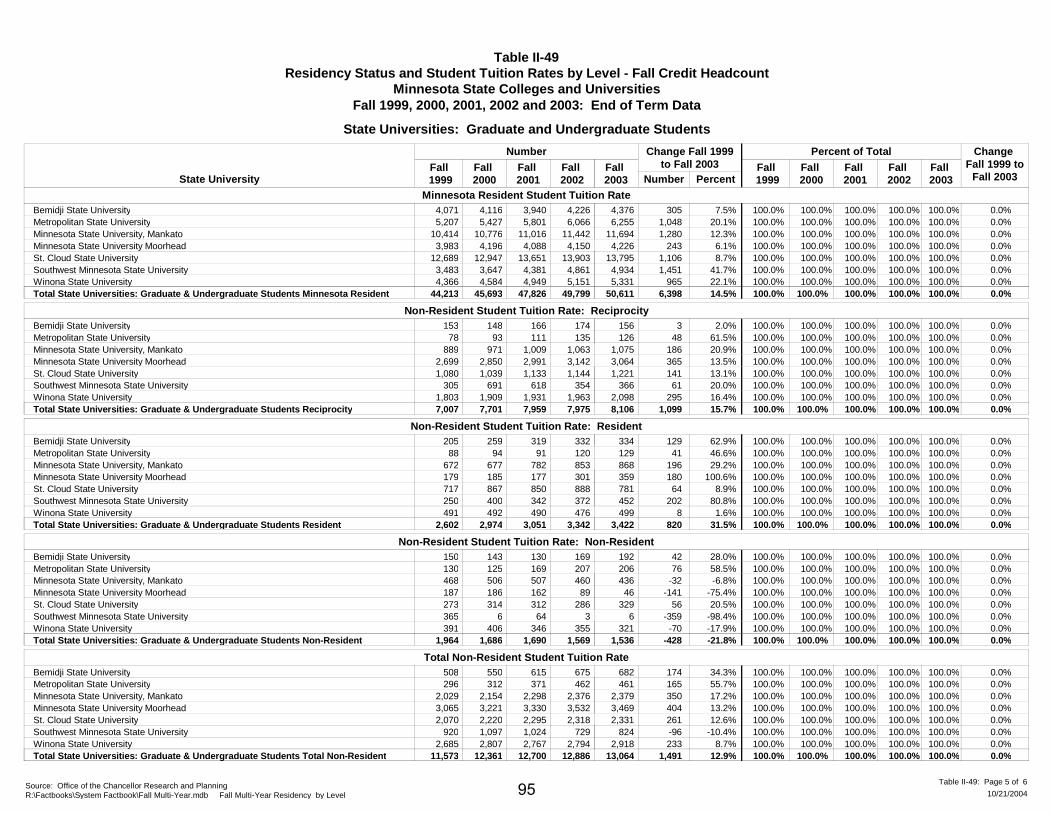
Table II-49Residency Status and Student Tuition Rates by Level - Fall Credit Headcount
Minnesota State Colleges and UniversitiesFall 1999, 2000, 2001, 2002 and 2003: End of Term Data
State Universities: Graduate and Undergraduate Students
State UniversityFall 1999
Fall 2000
Fall 2001
Fall 2002
Number
Fall 1999
Fall 2000
Fall 2001
Fall 2003
Change Fall 1999 to
Fall 2003
Change Fall 1999to Fall 2003
Number PercentFall 2003
Fall 2002
Percent of Total
Minnesota Resident Student Tuition RateBemidji State University 4,071 4,116 3,940 4,226 305 7.5%4,376 100.0% 0.0%100.0% 100.0% 100.0% 100.0%Metropolitan State University 5,207 5,427 5,801 6,066 1,048 20.1%6,255 100.0% 0.0%100.0% 100.0% 100.0% 100.0%Minnesota State University, Mankato 10,414 10,776 11,016 11,442 1,280 12.3%11,694 100.0% 0.0%100.0% 100.0% 100.0% 100.0%Minnesota State University Moorhead 3,983 4,196 4,088 4,150 243 6.1%4,226 100.0% 0.0%100.0% 100.0% 100.0% 100.0%St. Cloud State University 12,689 12,947 13,651 13,903 1,106 8.7%13,795 100.0% 0.0%100.0% 100.0% 100.0% 100.0%Southwest Minnesota State University 3,483 3,647 4,381 4,861 1,451 41.7%4,934 100.0% 0.0%100.0% 100.0% 100.0% 100.0%Winona State University 4,366 4,584 4,949 5,151 965 22.1%5,331 100.0% 0.0%100.0% 100.0% 100.0% 100.0%Total State Universities: Graduate & Undergraduate Students Minnesota Resident 44,213 45,693 47,826 49,799 6,398 14.5%50,611 100.0% 100.0% 100.0% 100.0% 100.0% 0.0%
Non-Resident Student Tuition Rate: ReciprocityBemidji State University 153 148 166 174 3 2.0%156 100.0% 0.0%100.0% 100.0% 100.0% 100.0%Metropolitan State University 78 93 111 135 48 61.5%126 100.0% 0.0%100.0% 100.0% 100.0% 100.0%Minnesota State University, Mankato 889 971 1,009 1,063 186 20.9%1,075 100.0% 0.0%100.0% 100.0% 100.0% 100.0%Minnesota State University Moorhead 2,699 2,850 2,991 3,142 365 13.5%3,064 100.0% 0.0%100.0% 100.0% 100.0% 100.0%St. Cloud State University 1,080 1,039 1,133 1,144 141 13.1%1,221 100.0% 0.0%100.0% 100.0% 100.0% 100.0%Southwest Minnesota State University 305 691 618 354 61 20.0%366 100.0% 0.0%100.0% 100.0% 100.0% 100.0%Winona State University 1,803 1,909 1,931 1,963 295 16.4%2,098 100.0% 0.0%100.0% 100.0% 100.0% 100.0%Total State Universities: Graduate & Undergraduate Students Reciprocity 7,007 7,701 7,959 7,975 1,099 15.7%8,106 100.0% 100.0% 100.0% 100.0% 100.0% 0.0%
Non-Resident Student Tuition Rate: ResidentBemidji State University 205 259 319 332 129 62.9%334 100.0% 0.0%100.0% 100.0% 100.0% 100.0%Metropolitan State University 88 94 91 120 41 46.6%129 100.0% 0.0%100.0% 100.0% 100.0% 100.0%Minnesota State University, Mankato 672 677 782 853 196 29.2%868 100.0% 0.0%100.0% 100.0% 100.0% 100.0%Minnesota State University Moorhead 179 185 177 301 180 100.6%359 100.0% 0.0%100.0% 100.0% 100.0% 100.0%St. Cloud State University 717 867 850 888 64 8.9%781 100.0% 0.0%100.0% 100.0% 100.0% 100.0%Southwest Minnesota State University 250 400 342 372 202 80.8%452 100.0% 0.0%100.0% 100.0% 100.0% 100.0%Winona State University 491 492 490 476 8 1.6%499 100.0% 0.0%100.0% 100.0% 100.0% 100.0%Total State Universities: Graduate & Undergraduate Students Resident 2,602 2,974 3,051 3,342 820 31.5%3,422 100.0% 100.0% 100.0% 100.0% 100.0% 0.0%
Non-Resident Student Tuition Rate: Non-ResidentBemidji State University 150 143 130 169 42 28.0%192 100.0% 0.0%100.0% 100.0% 100.0% 100.0%Metropolitan State University 130 125 169 207 76 58.5%206 100.0% 0.0%100.0% 100.0% 100.0% 100.0%Minnesota State University, Mankato 468 506 507 460 -32 -6.8%436 100.0% 0.0%100.0% 100.0% 100.0% 100.0%Minnesota State University Moorhead 187 186 162 89 -141 -75.4%46 100.0% 0.0%100.0% 100.0% 100.0% 100.0%St. Cloud State University 273 314 312 286 56 20.5%329 100.0% 0.0%100.0% 100.0% 100.0% 100.0%Southwest Minnesota State University 365 6 64 3 -359 -98.4%6 100.0% 0.0%100.0% 100.0% 100.0% 100.0%Winona State University 391 406 346 355 -70 -17.9%321 100.0% 0.0%100.0% 100.0% 100.0% 100.0%Total State Universities: Graduate & Undergraduate Students Non-Resident 1,964 1,686 1,690 1,569 -428 -21.8%1,536 100.0% 100.0% 100.0% 100.0% 100.0% 0.0%
Total Non-Resident Student Tuition RateBemidji State University 508 550 615 675 174 34.3%682 100.0% 0.0%100.0% 100.0% 100.0% 100.0%Metropolitan State University 296 312 371 462 165 55.7%461 100.0% 0.0%100.0% 100.0% 100.0% 100.0%Minnesota State University, Mankato 2,029 2,154 2,298 2,376 350 17.2%2,379 100.0% 0.0%100.0% 100.0% 100.0% 100.0%Minnesota State University Moorhead 3,065 3,221 3,330 3,532 404 13.2%3,469 100.0% 0.0%100.0% 100.0% 100.0% 100.0%St. Cloud State University 2,070 2,220 2,295 2,318 261 12.6%2,331 100.0% 0.0%100.0% 100.0% 100.0% 100.0%Southwest Minnesota State University 920 1,097 1,024 729 -96 -10.4%824 100.0% 0.0%100.0% 100.0% 100.0% 100.0%Winona State University 2,685 2,807 2,767 2,794 233 8.7%2,918 100.0% 0.0%100.0% 100.0% 100.0% 100.0%Total State Universities: Graduate & Undergraduate Students Total Non-Resident 11,573 12,361 12,700 12,886 1,491 12.9%13,064 100.0% 100.0% 100.0% 100.0% 100.0% 0.0%
Source: Office of the Chancellor Research and PlanningR:\Factbooks\System Factbook\Fall Multi-Year.mdb Fall Multi-Year Residency by Level 10/21/2004
Table II-49: Page 5 of 695
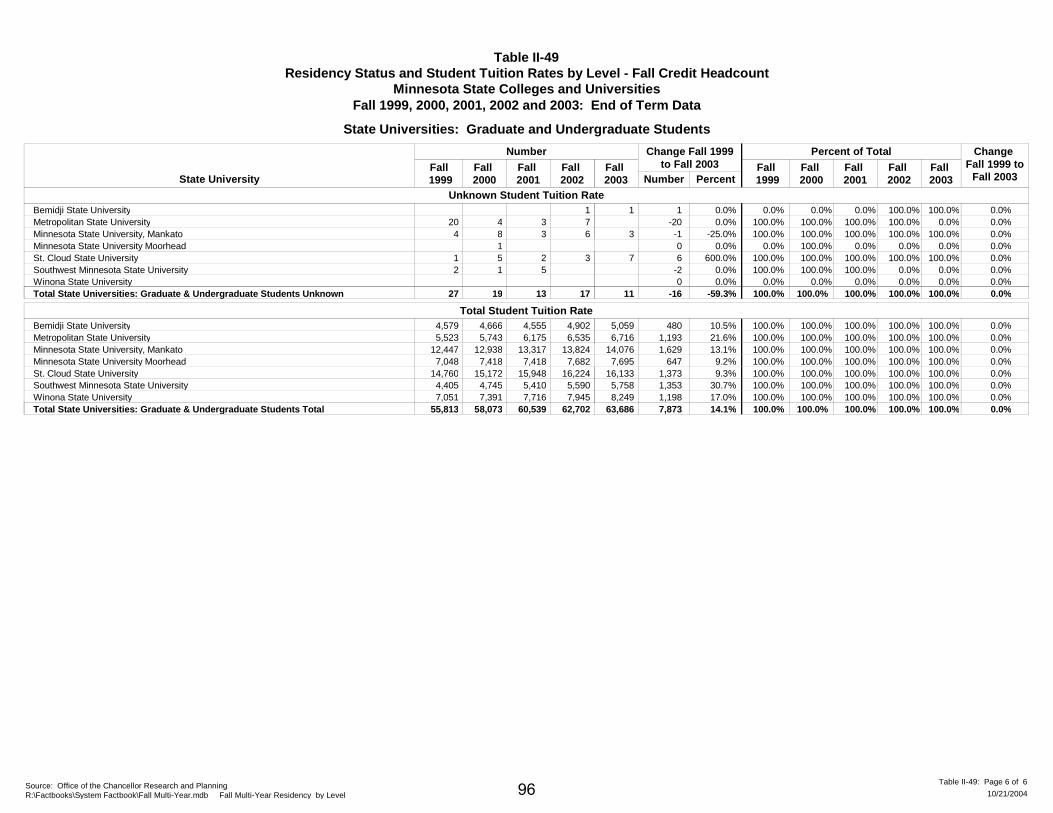
Table II-49Residency Status and Student Tuition Rates by Level - Fall Credit Headcount
Minnesota State Colleges and UniversitiesFall 1999, 2000, 2001, 2002 and 2003: End of Term Data
State Universities: Graduate and Undergraduate Students
State UniversityFall 1999
Fall 2000
Fall 2001
Fall 2002
Number
Fall 1999
Fall 2000
Fall 2001
Fall 2003
Change Fall 1999 to
Fall 2003
Change Fall 1999to Fall 2003
Number PercentFall 2003
Fall 2002
Percent of Total
Unknown Student Tuition RateBemidji State University 1 1 0.0%1 0.0% 0.0%0.0% 0.0% 100.0% 100.0%Metropolitan State University 20 4 3 7 -20 0.0% 100.0% 0.0%100.0% 100.0% 100.0% 0.0%Minnesota State University, Mankato 4 8 3 6 -1 -25.0%3 100.0% 0.0%100.0% 100.0% 100.0% 100.0%Minnesota State University Moorhead 1 0 0.0% 0.0% 0.0%100.0% 0.0% 0.0% 0.0%St. Cloud State University 1 5 2 3 6 600.0%7 100.0% 0.0%100.0% 100.0% 100.0% 100.0%Southwest Minnesota State University 2 1 5 -2 0.0% 100.0% 0.0%100.0% 100.0% 0.0% 0.0%Winona State University 0 0.0% 0.0% 0.0%0.0% 0.0% 0.0% 0.0%Total State Universities: Graduate & Undergraduate Students Unknown 27 19 13 17 -16 -59.3%11 100.0% 100.0% 100.0% 100.0% 100.0% 0.0%
Total Student Tuition RateBemidji State University 4,579 4,666 4,555 4,902 480 10.5%5,059 100.0% 0.0%100.0% 100.0% 100.0% 100.0%Metropolitan State University 5,523 5,743 6,175 6,535 1,193 21.6%6,716 100.0% 0.0%100.0% 100.0% 100.0% 100.0%Minnesota State University, Mankato 12,447 12,938 13,317 13,824 1,629 13.1%14,076 100.0% 0.0%100.0% 100.0% 100.0% 100.0%Minnesota State University Moorhead 7,048 7,418 7,418 7,682 647 9.2%7,695 100.0% 0.0%100.0% 100.0% 100.0% 100.0%St. Cloud State University 14,760 15,172 15,948 16,224 1,373 9.3%16,133 100.0% 0.0%100.0% 100.0% 100.0% 100.0%Southwest Minnesota State University 4,405 4,745 5,410 5,590 1,353 30.7%5,758 100.0% 0.0%100.0% 100.0% 100.0% 100.0%Winona State University 7,051 7,391 7,716 7,945 1,198 17.0%8,249 100.0% 0.0%100.0% 100.0% 100.0% 100.0%Total State Universities: Graduate & Undergraduate Students Total 55,813 58,073 60,539 62,702 7,873 14.1%63,686 100.0% 100.0% 100.0% 100.0% 100.0% 0.0%
Source: Office of the Chancellor Research and PlanningR:\Factbooks\System Factbook\Fall Multi-Year.mdb Fall Multi-Year Residency by Level 10/21/2004
Table II-49: Page 6 of 696
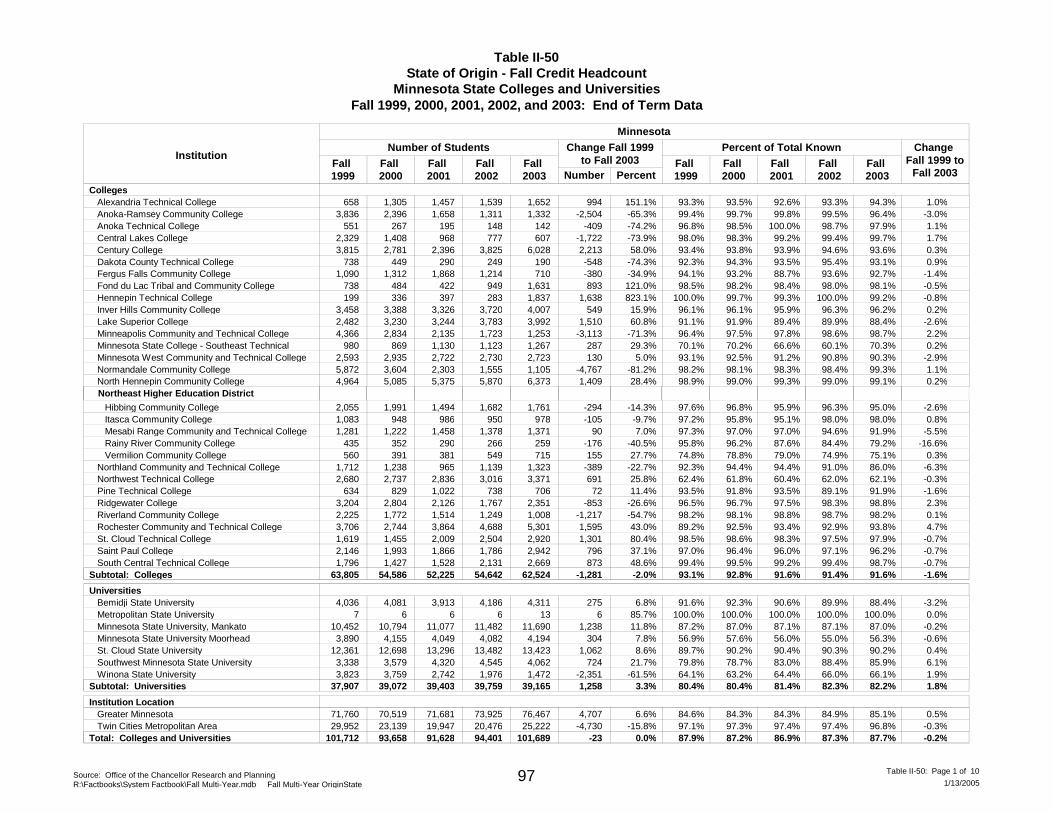
Table II-50State of Origin - Fall Credit Headcount
Minnesota State Colleges and UniversitiesFall 1999, 2000, 2001, 2002, and 2003: End of Term Data
InstitutionFall 1999
Fall 2000
Fall 2001
Fall 2002
Fall 2003
Change Fall 1999to Fall 2003
Number PercentFall 1999
Fall 2000
Fall 2001
Fall 2002
Fall 2003
Change Fall 1999 to
Fall 2003
Minnesota
Percent of Total KnownNumber of Students
CollegesAlexandria Technical College 658 1,305 1,457 1,539 1,652 994 151.1% 93.3% 93.5% 92.6% 93.3% 94.3% 1.0%Anoka-Ramsey Community College 3,836 2,396 1,658 1,311 1,332 -2,504 -65.3% 99.4% 99.7% 99.8% 99.5% 96.4% -3.0%Anoka Technical College 551 267 195 148 142 -409 -74.2% 96.8% 98.5% 100.0% 98.7% 97.9% 1.1%Central Lakes College 2,329 1,408 968 777 607 -1,722 -73.9% 98.0% 98.3% 99.2% 99.4% 99.7% 1.7%Century College 3,815 2,781 2,396 3,825 6,028 2,213 58.0% 93.4% 93.8% 93.9% 94.6% 93.6% 0.3%Dakota County Technical College 738 449 290 249 190 -548 -74.3% 92.3% 94.3% 93.5% 95.4% 93.1% 0.9%Fergus Falls Community College 1,090 1,312 1,868 1,214 710 -380 -34.9% 94.1% 93.2% 88.7% 93.6% 92.7% -1.4%Fond du Lac Tribal and Community College 738 484 422 949 1,631 893 121.0% 98.5% 98.2% 98.4% 98.0% 98.1% -0.5%Hennepin Technical College 199 336 397 283 1,837 1,638 823.1% 100.0% 99.7% 99.3% 100.0% 99.2% -0.8%Inver Hills Community College 3,458 3,388 3,326 3,720 4,007 549 15.9% 96.1% 96.1% 95.9% 96.3% 96.2% 0.2%Lake Superior College 2,482 3,230 3,244 3,783 3,992 1,510 60.8% 91.1% 91.9% 89.4% 89.9% 88.4% -2.6%Minneapolis Community and Technical College 4,366 2,834 2,135 1,723 1,253 -3,113 -71.3% 96.4% 97.5% 97.8% 98.6% 98.7% 2.2%Minnesota State College - Southeast Technical 980 869 1,130 1,123 1,267 287 29.3% 70.1% 70.2% 66.6% 60.1% 70.3% 0.2%Minnesota West Community and Technical College 2,593 2,935 2,722 2,730 2,723 130 5.0% 93.1% 92.5% 91.2% 90.8% 90.3% -2.9%Normandale Community College 5,872 3,604 2,303 1,555 1,105 -4,767 -81.2% 98.2% 98.1% 98.3% 98.4% 99.3% 1.1%North Hennepin Community College 4,964 5,085 5,375 5,870 6,373 1,409 28.4% 98.9% 99.0% 99.3% 99.0% 99.1% 0.2%
Hibbing Community College 2,055 1,991 1,494 1,682 1,761 -294 -14.3% 97.6% 96.8% 95.9% 96.3% 95.0% -2.6%
Northeast Higher Education District
Itasca Community College 1,083 948 986 950 978 -105 -9.7% 97.2% 95.8% 95.1% 98.0% 98.0% 0.8% Mesabi Range Community and Technical College 1,281 1,222 1,458 1,378 1,371 90 7.0% 97.3% 97.0% 97.0% 94.6% 91.9% -5.5% Rainy River Community College 435 352 290 266 259 -176 -40.5% 95.8% 96.2% 87.6% 84.4% 79.2% -16.6% Vermilion Community College 560 391 381 549 715 155 27.7% 74.8% 78.8% 79.0% 74.9% 75.1% 0.3%Northland Community and Technical College 1,712 1,238 965 1,139 1,323 -389 -22.7% 92.3% 94.4% 94.4% 91.0% 86.0% -6.3%Northwest Technical College 2,680 2,737 2,836 3,016 3,371 691 25.8% 62.4% 61.8% 60.4% 62.0% 62.1% -0.3%Pine Technical College 634 829 1,022 738 706 72 11.4% 93.5% 91.8% 93.5% 89.1% 91.9% -1.6%Ridgewater College 3,204 2,804 2,126 1,767 2,351 -853 -26.6% 96.5% 96.7% 97.5% 98.3% 98.8% 2.3%Riverland Community College 2,225 1,772 1,514 1,249 1,008 -1,217 -54.7% 98.2% 98.1% 98.8% 98.7% 98.2% 0.1%Rochester Community and Technical College 3,706 2,744 3,864 4,688 5,301 1,595 43.0% 89.2% 92.5% 93.4% 92.9% 93.8% 4.7%St. Cloud Technical College 1,619 1,455 2,009 2,504 2,920 1,301 80.4% 98.5% 98.6% 98.3% 97.5% 97.9% -0.7%Saint Paul College 2,146 1,993 1,866 1,786 2,942 796 37.1% 97.0% 96.4% 96.0% 97.1% 96.2% -0.7%South Central Technical College 1,796 1,427 1,528 2,131 2,669 873 48.6% 99.4% 99.5% 99.2% 99.4% 98.7% -0.7%
Subtotal: Colleges 63,805 54,586 52,225 54,642 62,524 -1,281 -2.0% 93.1% 92.8% 91.6% 91.4% 91.6% -1.6%
UniversitiesBemidji State University 4,036 4,081 3,913 4,186 4,311 275 6.8% 91.6% 92.3% 90.6% 89.9% 88.4% -3.2%Metropolitan State University 7 6 6 6 13 6 85.7% 100.0% 100.0% 100.0% 100.0% 100.0% 0.0%Minnesota State University, Mankato 10,452 10,794 11,077 11,482 11,690 1,238 11.8% 87.2% 87.0% 87.1% 87.1% 87.0% -0.2%Minnesota State University Moorhead 3,890 4,155 4,049 4,082 4,194 304 7.8% 56.9% 57.6% 56.0% 55.0% 56.3% -0.6%St. Cloud State University 12,361 12,698 13,296 13,482 13,423 1,062 8.6% 89.7% 90.2% 90.4% 90.3% 90.2% 0.4%Southwest Minnesota State University 3,338 3,579 4,320 4,545 4,062 724 21.7% 79.8% 78.7% 83.0% 88.4% 85.9% 6.1%Winona State University 3,823 3,759 2,742 1,976 1,472 -2,351 -61.5% 64.1% 63.2% 64.4% 66.0% 66.1% 1.9%
Subtotal: Universities 37,907 39,072 39,403 39,759 39,165 1,258 3.3% 80.4% 80.4% 81.4% 82.3% 82.2% 1.8%
Institution LocationGreater Minnesota 71,760 70,519 71,681 73,925 76,467 4,707 6.6% 84.6% 84.3% 84.3% 84.9% 85.1% 0.5%Twin Cities Metropolitan Area 29,952 23,139 19,947 20,476 25,222 -4,730 -15.8% 97.1% 97.3% 97.4% 97.4% 96.8% -0.3%
Total: Colleges and Universities 101,712 93,658 91,628 94,401 101,689 -23 0.0% 87.9% 87.2% 86.9% 87.3% 87.7% -0.2%
Source: Office of the Chancellor Research and PlanningR:\Factbooks\System Factbook\Fall Multi-Year.mdb Fall Multi-Year OriginState 1/13/2005
Table II-50: Page 1 of 1097

Table II-50State of Origin - Fall Credit Headcount
Minnesota State Colleges and UniversitiesFall 1999, 2000, 2001, 2002, and 2003: End of Term Data
InstitutionFall 1999
Fall 2000
Fall 2001
Fall 2002
Fall 2003
Change Fall 1999to Fall 2003
Number PercentFall 1999
Fall 2000
Fall 2001
Fall 2002
Fall 2003
Change Fall 1999 to
Fall 2003
Iowa
Percent of Total KnownNumber of Students
CollegesAlexandria Technical College 3 3 2 5 4 1 33.3% 0.4% 0.2% 0.1% 0.3% 0.2% -0.2%Anoka-Ramsey Community College 1 1 0 0.0% 0.0% 0.0% 0.0% 0.0% 0.1% 0.0%Anoka Technical College 0 0.0% 0.0% 0.0% 0.0% 0.0% 0.0% 0.0%Central Lakes College 2 -2 0.0% 0.1% 0.0% 0.0% 0.0% 0.0% -0.1%Century College 4 3 1 3 7 3 75.0% 0.1% 0.1% 0.0% 0.1% 0.1% 0.0%Dakota County Technical College 0 0.0% 0.0% 0.0% 0.0% 0.0% 0.0% 0.0%Fergus Falls Community College 0 0.0% 0.0% 0.0% 0.0% 0.0% 0.0% 0.0%Fond du Lac Tribal and Community College 0 0.0% 0.0% 0.0% 0.0% 0.0% 0.0% 0.0%Hennepin Technical College 0 0.0% 0.0% 0.0% 0.0% 0.0% 0.0% 0.0%Inver Hills Community College 4 3 2 4 2 -2 -50.0% 0.1% 0.1% 0.1% 0.1% 0.0% -0.1%Lake Superior College 2 2 2 2 0.0% 0.0% 0.1% 0.1% 0.0% 0.0% 0.0%Minneapolis Community and Technical College 1 1 1 0 0.0% 0.0% 0.0% 0.0% 0.1% 0.1% 0.1%Minnesota State College - Southeast Technical 11 9 17 17 10 -1 -9.1% 0.8% 0.7% 1.0% 0.9% 0.6% -0.2%Minnesota West Community and Technical College 74 87 107 102 91 17 23.0% 2.7% 2.7% 3.6% 3.4% 3.0% 0.4%Normandale Community College 10 3 1 1 -10 0.0% 0.2% 0.1% 0.0% 0.1% 0.0% -0.2%North Hennepin Community College 2 4 2 3 3 1 50.0% 0.0% 0.1% 0.0% 0.1% 0.0% 0.0%
Hibbing Community College 2 2 2 0.0% 0.0% 0.0% 0.0% 0.1% 0.1% 0.1%
Northeast Higher Education District
Itasca Community College 1 1 1 1 1 0 0.0% 0.1% 0.1% 0.1% 0.1% 0.1% 0.0% Mesabi Range Community and Technical College 1 1 1 0.0% 0.0% 0.0% 0.0% 0.1% 0.1% 0.1% Rainy River Community College 1 0 0.0% 0.0% 0.0% 0.0% 0.3% 0.0% 0.0% Vermilion Community College 8 5 3 3 4 -4 -50.0% 1.1% 1.0% 0.6% 0.4% 0.4% -0.6%Northland Community and Technical College 1 1 2 1 0 0.0% 0.1% 0.0% 0.1% 0.2% 0.1% 0.0%Northwest Technical College 1 2 4 2 5 4 400.0% 0.0% 0.0% 0.1% 0.0% 0.1% 0.1%Pine Technical College 1 1 0 0.0% 0.0% 0.0% 0.1% 0.1% 0.0% 0.0%Ridgewater College 7 6 4 2 -7 0.0% 0.2% 0.2% 0.2% 0.1% 0.0% -0.2%Riverland Community College 24 25 12 10 9 -15 -62.5% 1.1% 1.4% 0.8% 0.8% 0.9% -0.2%Rochester Community and Technical College 69 41 65 99 97 28 40.6% 1.7% 1.4% 1.6% 2.0% 1.7% 0.1%St. Cloud Technical College 1 0 0.0% 0.0% 0.0% 0.0% 0.0% 0.0% 0.0%Saint Paul College 1 5 4 400.0% 0.0% 0.0% 0.0% 0.0% 0.2% 0.1%South Central Technical College 4 11 11 0.0% 0.0% 0.0% 0.0% 0.2% 0.4% 0.4%
Subtotal: Colleges 224 194 225 265 257 33 14.7% 0.3% 0.3% 0.4% 0.4% 0.4% 0.0%
UniversitiesBemidji State University 11 19 24 28 32 21 190.9% 0.2% 0.4% 0.6% 0.6% 0.7% 0.4%Metropolitan State University 0 0.0% 0.0% 0.0% 0.0% 0.0% 0.0% 0.0%Minnesota State University, Mankato 333 354 314 318 329 -4 -1.2% 2.8% 2.9% 2.5% 2.4% 2.4% -0.3%Minnesota State University Moorhead 10 10 14 15 16 6 60.0% 0.1% 0.1% 0.2% 0.2% 0.2% 0.1%St. Cloud State University 48 53 50 51 40 -8 -16.7% 0.3% 0.4% 0.3% 0.3% 0.3% -0.1%Southwest Minnesota State University 134 151 131 149 185 51 38.1% 3.2% 3.3% 2.5% 2.9% 3.9% 0.7%Winona State University 133 137 91 64 46 -87 -65.4% 2.2% 2.3% 2.1% 2.1% 2.1% -0.2%
Subtotal: Universities 669 724 624 625 648 -21 -3.1% 1.4% 1.5% 1.3% 1.3% 1.4% -0.1%
Institution LocationGreater Minnesota 870 905 843 878 886 16 1.8% 1.0% 1.1% 1.0% 1.0% 1.0% 0.0%Twin Cities Metropolitan Area 23 13 6 12 19 -4 -17.4% 0.1% 0.1% 0.0% 0.1% 0.1% 0.0%
Total: Colleges and Universities 893 918 849 890 905 12 1.3% 0.8% 0.9% 0.8% 0.8% 0.8% 0.0%
Source: Office of the Chancellor Research and PlanningR:\Factbooks\System Factbook\Fall Multi-Year.mdb Fall Multi-Year OriginState 1/13/2005
Table II-50: Page 2 of 1098

Table II-50State of Origin - Fall Credit Headcount
Minnesota State Colleges and UniversitiesFall 1999, 2000, 2001, 2002, and 2003: End of Term Data
InstitutionFall 1999
Fall 2000
Fall 2001
Fall 2002
Fall 2003
Change Fall 1999to Fall 2003
Number PercentFall 1999
Fall 2000
Fall 2001
Fall 2002
Fall 2003
Change Fall 1999 to
Fall 2003
North Dakota
Percent of Total KnownNumber of Students
CollegesAlexandria Technical College 21 38 45 51 44 23 109.5% 3.0% 2.7% 2.9% 3.1% 2.5% -0.5%Anoka-Ramsey Community College 3 1 1 10 7 233.3% 0.1% 0.0% 0.1% 0.0% 0.7% 0.6%Anoka Technical College 2 -2 0.0% 0.4% 0.0% 0.0% 0.0% 0.0% -0.4%Central Lakes College 16 9 4 3 1 -15 -93.8% 0.7% 0.6% 0.4% 0.4% 0.2% -0.5%Century College 4 2 1 3 6 2 50.0% 0.1% 0.1% 0.0% 0.1% 0.1% 0.0%Dakota County Technical College 2 -2 0.0% 0.3% 0.0% 0.0% 0.0% 0.0% -0.3%Fergus Falls Community College 49 75 209 54 31 -18 -36.7% 4.2% 5.3% 9.9% 4.2% 4.0% -0.2%Fond du Lac Tribal and Community College 1 5 5 0.0% 0.0% 0.0% 0.0% 0.1% 0.3% 0.3%Hennepin Technical College 1 2 2 2 0.0% 0.0% 0.3% 0.5% 0.0% 0.1% 0.1%Inver Hills Community College 5 3 5 5 4 -1 -20.0% 0.1% 0.1% 0.1% 0.1% 0.1% 0.0%Lake Superior College 4 12 14 32 24 20 500.0% 0.1% 0.3% 0.4% 0.8% 0.5% 0.4%Minneapolis Community and Technical College 12 11 7 3 1 -11 -91.7% 0.3% 0.4% 0.3% 0.2% 0.1% -0.2%Minnesota State College - Southeast Technical 3 2 1 4 5 2 66.7% 0.2% 0.2% 0.1% 0.2% 0.3% 0.1%Minnesota West Community and Technical College 3 5 9 11 13 10 333.3% 0.1% 0.2% 0.3% 0.4% 0.4% 0.3%Normandale Community College 13 9 4 1 1 -12 -92.3% 0.2% 0.2% 0.2% 0.1% 0.1% -0.1%North Hennepin Community College 5 4 7 8 5 0 0.0% 0.1% 0.1% 0.1% 0.1% 0.1% 0.0%
Hibbing Community College 1 2 2 2 0.0% 0.0% 0.0% 0.1% 0.1% 0.1% 0.1%
Northeast Higher Education District
Itasca Community College 5 6 0 0.0% 0.0% 0.5% 0.6% 0.0% 0.0% 0.0% Mesabi Range Community and Technical College 1 1 0.0% 0.0% 0.0% 0.0% 0.0% 0.1% 0.1% Rainy River Community College 1 1 1 1 1 0 0.0% 0.2% 0.3% 0.3% 0.3% 0.3% 0.1% Vermilion Community College 3 2 3 6 5 2 66.7% 0.4% 0.4% 0.6% 0.8% 0.5% 0.1%Northland Community and Technical College 120 63 38 74 135 15 12.5% 6.5% 4.8% 3.7% 5.9% 8.8% 2.3%Northwest Technical College 1,553 1,629 1,789 1,768 1,967 414 26.7% 36.2% 36.8% 38.1% 36.4% 36.2% 0.1%Pine Technical College 1 2 4 2 2 0.0% 0.0% 0.1% 0.2% 0.5% 0.3% 0.3%Ridgewater College 25 22 8 8 7 -18 -72.0% 0.8% 0.8% 0.4% 0.4% 0.3% -0.5%Riverland Community College 1 -1 0.0% 0.0% 0.0% 0.0% 0.0% 0.0% 0.0%Rochester Community and Technical College 13 4 16 15 14 1 7.7% 0.3% 0.1% 0.4% 0.3% 0.2% -0.1%St. Cloud Technical College 5 6 5 14 13 8 160.0% 0.3% 0.4% 0.2% 0.5% 0.4% 0.1%Saint Paul College 2 2 4 2 3 1 50.0% 0.1% 0.1% 0.2% 0.1% 0.1% 0.0%South Central Technical College 2 2 0.0% 0.0% 0.0% 0.0% 0.0% 0.1% 0.1%
Subtotal: Colleges 1,865 1,907 2,182 2,070 2,304 439 23.5% 2.7% 3.2% 3.8% 3.5% 3.4% 0.7%
UniversitiesBemidji State University 86 65 86 97 99 13 15.1% 2.0% 1.5% 2.0% 2.1% 2.0% 0.1%Metropolitan State University 0 0.0% 0.0% 0.0% 0.0% 0.0% 0.0% 0.0%Minnesota State University, Mankato 66 77 76 91 80 14 21.2% 0.6% 0.6% 0.6% 0.7% 0.6% 0.0%Minnesota State University Moorhead 2,455 2,569 2,672 2,789 2,668 213 8.7% 35.9% 35.6% 37.0% 37.6% 35.8% -0.1%St. Cloud State University 156 159 170 187 203 47 30.1% 1.1% 1.1% 1.2% 1.3% 1.4% 0.2%Southwest Minnesota State University 13 11 13 17 14 1 7.7% 0.3% 0.2% 0.2% 0.3% 0.3% 0.0%Winona State University 8 8 7 7 5 -3 -37.5% 0.1% 0.1% 0.2% 0.2% 0.2% 0.1%
Subtotal: Universities 2,784 2,889 3,024 3,188 3,069 285 10.2% 5.9% 5.9% 6.2% 6.6% 6.4% 0.5%
Institution LocationGreater Minnesota 4,601 4,763 5,175 5,236 5,341 740 16.1% 5.4% 5.7% 6.1% 6.0% 5.9% 0.5%Twin Cities Metropolitan Area 48 33 31 22 32 -16 -33.3% 0.2% 0.1% 0.2% 0.1% 0.1% 0.0%
Total: Colleges and Universities 4,649 4,796 5,206 5,258 5,373 724 15.6% 4.0% 4.5% 4.9% 4.9% 4.6% 0.6%
Source: Office of the Chancellor Research and PlanningR:\Factbooks\System Factbook\Fall Multi-Year.mdb Fall Multi-Year OriginState 1/13/2005
Table II-50: Page 3 of 1099
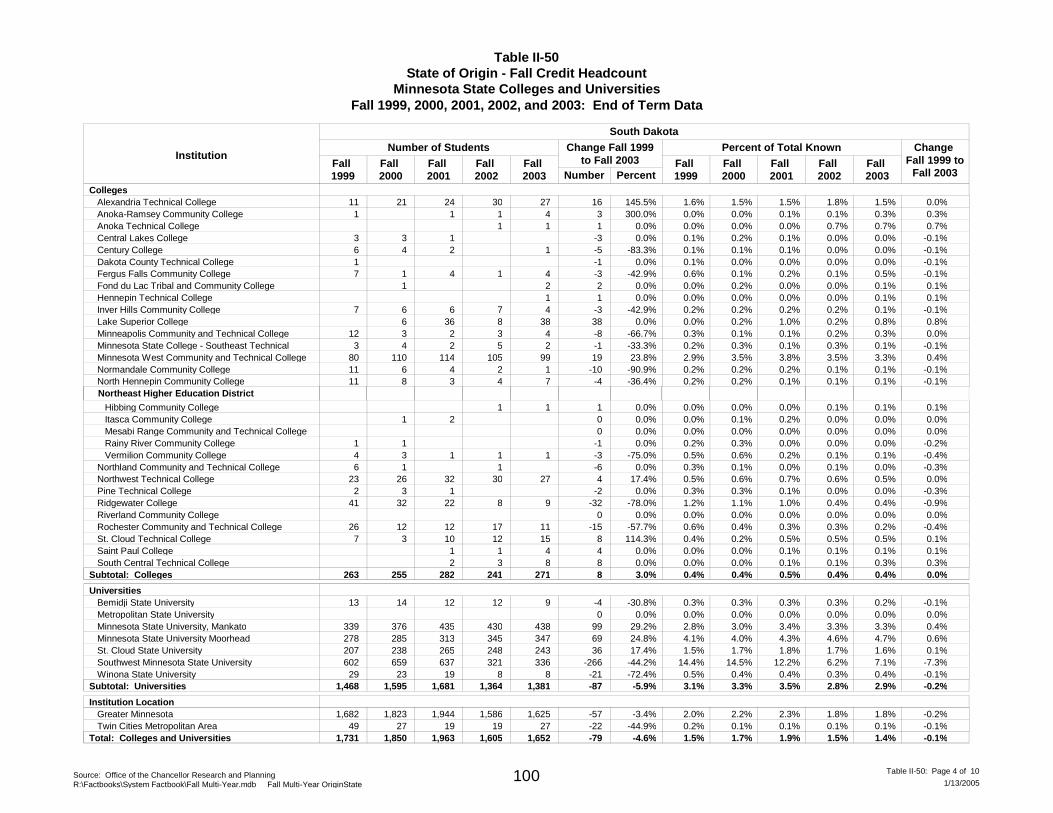
Table II-50State of Origin - Fall Credit Headcount
Minnesota State Colleges and UniversitiesFall 1999, 2000, 2001, 2002, and 2003: End of Term Data
InstitutionFall 1999
Fall 2000
Fall 2001
Fall 2002
Fall 2003
Change Fall 1999to Fall 2003
Number PercentFall 1999
Fall 2000
Fall 2001
Fall 2002
Fall 2003
Change Fall 1999 to
Fall 2003
South Dakota
Percent of Total KnownNumber of Students
CollegesAlexandria Technical College 11 21 24 30 27 16 145.5% 1.6% 1.5% 1.5% 1.8% 1.5% 0.0%Anoka-Ramsey Community College 1 1 1 4 3 300.0% 0.0% 0.0% 0.1% 0.1% 0.3% 0.3%Anoka Technical College 1 1 1 0.0% 0.0% 0.0% 0.0% 0.7% 0.7% 0.7%Central Lakes College 3 3 1 -3 0.0% 0.1% 0.2% 0.1% 0.0% 0.0% -0.1%Century College 6 4 2 1 -5 -83.3% 0.1% 0.1% 0.1% 0.0% 0.0% -0.1%Dakota County Technical College 1 -1 0.0% 0.1% 0.0% 0.0% 0.0% 0.0% -0.1%Fergus Falls Community College 7 1 4 1 4 -3 -42.9% 0.6% 0.1% 0.2% 0.1% 0.5% -0.1%Fond du Lac Tribal and Community College 1 2 2 0.0% 0.0% 0.2% 0.0% 0.0% 0.1% 0.1%Hennepin Technical College 1 1 0.0% 0.0% 0.0% 0.0% 0.0% 0.1% 0.1%Inver Hills Community College 7 6 6 7 4 -3 -42.9% 0.2% 0.2% 0.2% 0.2% 0.1% -0.1%Lake Superior College 6 36 8 38 38 0.0% 0.0% 0.2% 1.0% 0.2% 0.8% 0.8%Minneapolis Community and Technical College 12 3 2 3 4 -8 -66.7% 0.3% 0.1% 0.1% 0.2% 0.3% 0.0%Minnesota State College - Southeast Technical 3 4 2 5 2 -1 -33.3% 0.2% 0.3% 0.1% 0.3% 0.1% -0.1%Minnesota West Community and Technical College 80 110 114 105 99 19 23.8% 2.9% 3.5% 3.8% 3.5% 3.3% 0.4%Normandale Community College 11 6 4 2 1 -10 -90.9% 0.2% 0.2% 0.2% 0.1% 0.1% -0.1%North Hennepin Community College 11 8 3 4 7 -4 -36.4% 0.2% 0.2% 0.1% 0.1% 0.1% -0.1%
Hibbing Community College 1 1 1 0.0% 0.0% 0.0% 0.0% 0.1% 0.1% 0.1%
Northeast Higher Education District
Itasca Community College 1 2 0 0.0% 0.0% 0.1% 0.2% 0.0% 0.0% 0.0% Mesabi Range Community and Technical College 0 0.0% 0.0% 0.0% 0.0% 0.0% 0.0% 0.0% Rainy River Community College 1 1 -1 0.0% 0.2% 0.3% 0.0% 0.0% 0.0% -0.2% Vermilion Community College 4 3 1 1 1 -3 -75.0% 0.5% 0.6% 0.2% 0.1% 0.1% -0.4%Northland Community and Technical College 6 1 1 -6 0.0% 0.3% 0.1% 0.0% 0.1% 0.0% -0.3%Northwest Technical College 23 26 32 30 27 4 17.4% 0.5% 0.6% 0.7% 0.6% 0.5% 0.0%Pine Technical College 2 3 1 -2 0.0% 0.3% 0.3% 0.1% 0.0% 0.0% -0.3%Ridgewater College 41 32 22 8 9 -32 -78.0% 1.2% 1.1% 1.0% 0.4% 0.4% -0.9%Riverland Community College 0 0.0% 0.0% 0.0% 0.0% 0.0% 0.0% 0.0%Rochester Community and Technical College 26 12 12 17 11 -15 -57.7% 0.6% 0.4% 0.3% 0.3% 0.2% -0.4%St. Cloud Technical College 7 3 10 12 15 8 114.3% 0.4% 0.2% 0.5% 0.5% 0.5% 0.1%Saint Paul College 1 1 4 4 0.0% 0.0% 0.0% 0.1% 0.1% 0.1% 0.1%South Central Technical College 2 3 8 8 0.0% 0.0% 0.0% 0.1% 0.1% 0.3% 0.3%
Subtotal: Colleges 263 255 282 241 271 8 3.0% 0.4% 0.4% 0.5% 0.4% 0.4% 0.0%
UniversitiesBemidji State University 13 14 12 12 9 -4 -30.8% 0.3% 0.3% 0.3% 0.3% 0.2% -0.1%Metropolitan State University 0 0.0% 0.0% 0.0% 0.0% 0.0% 0.0% 0.0%Minnesota State University, Mankato 339 376 435 430 438 99 29.2% 2.8% 3.0% 3.4% 3.3% 3.3% 0.4%Minnesota State University Moorhead 278 285 313 345 347 69 24.8% 4.1% 4.0% 4.3% 4.6% 4.7% 0.6%St. Cloud State University 207 238 265 248 243 36 17.4% 1.5% 1.7% 1.8% 1.7% 1.6% 0.1%Southwest Minnesota State University 602 659 637 321 336 -266 -44.2% 14.4% 14.5% 12.2% 6.2% 7.1% -7.3%Winona State University 29 23 19 8 8 -21 -72.4% 0.5% 0.4% 0.4% 0.3% 0.4% -0.1%
Subtotal: Universities 1,468 1,595 1,681 1,364 1,381 -87 -5.9% 3.1% 3.3% 3.5% 2.8% 2.9% -0.2%
Institution LocationGreater Minnesota 1,682 1,823 1,944 1,586 1,625 -57 -3.4% 2.0% 2.2% 2.3% 1.8% 1.8% -0.2%Twin Cities Metropolitan Area 49 27 19 19 27 -22 -44.9% 0.2% 0.1% 0.1% 0.1% 0.1% -0.1%
Total: Colleges and Universities 1,731 1,850 1,963 1,605 1,652 -79 -4.6% 1.5% 1.7% 1.9% 1.5% 1.4% -0.1%
Source: Office of the Chancellor Research and PlanningR:\Factbooks\System Factbook\Fall Multi-Year.mdb Fall Multi-Year OriginState 1/13/2005
Table II-50: Page 4 of 10100

Table II-50State of Origin - Fall Credit Headcount
Minnesota State Colleges and UniversitiesFall 1999, 2000, 2001, 2002, and 2003: End of Term Data
InstitutionFall 1999
Fall 2000
Fall 2001
Fall 2002
Fall 2003
Change Fall 1999to Fall 2003
Number PercentFall 1999
Fall 2000
Fall 2001
Fall 2002
Fall 2003
Change Fall 1999 to
Fall 2003
Wisconsin
Percent of Total KnownNumber of Students
CollegesAlexandria Technical College 7 13 10 6 10 3 42.9% 1.0% 0.9% 0.6% 0.4% 0.6% -0.4%Anoka-Ramsey Community College 15 5 1 6 29 14 93.3% 0.4% 0.2% 0.1% 0.5% 2.1% 1.7%Anoka Technical College 16 4 1 2 -14 -87.5% 2.8% 1.5% 0.0% 0.7% 1.4% -1.4%Central Lakes College 18 7 2 -18 0.0% 0.8% 0.5% 0.2% 0.0% 0.0% -0.8%Century College 225 153 141 198 366 141 62.7% 5.5% 5.2% 5.5% 4.9% 5.7% 0.2%Dakota County Technical College 57 26 19 12 13 -44 -77.2% 7.1% 5.5% 6.1% 4.6% 6.4% -0.8%Fergus Falls Community College 1 2 2 5 5 4 400.0% 0.1% 0.1% 0.1% 0.4% 0.7% 0.6%Fond du Lac Tribal and Community College 9 7 7 12 22 13 144.4% 1.2% 1.4% 1.6% 1.2% 1.3% 0.1%Hennepin Technical College 5 5 0.0% 0.0% 0.0% 0.0% 0.0% 0.3% 0.3%Inver Hills Community College 108 107 107 113 131 23 21.3% 3.0% 3.0% 3.1% 2.9% 3.1% 0.1%Lake Superior College 225 244 310 364 409 184 81.8% 8.3% 6.9% 8.5% 8.6% 9.1% 0.8%Minneapolis Community and Technical College 66 34 26 13 8 -58 -87.9% 1.5% 1.2% 1.2% 0.7% 0.6% -0.8%Minnesota State College - Southeast Technical 356 318 429 488 470 114 32.0% 25.5% 25.7% 25.3% 26.1% 26.1% 0.6%Minnesota West Community and Technical College 3 8 8 6 22 19 633.3% 0.1% 0.3% 0.3% 0.2% 0.7% 0.6%Normandale Community College 46 33 21 10 2 -44 -95.7% 0.8% 0.9% 0.9% 0.6% 0.2% -0.6%North Hennepin Community College 22 16 11 19 25 3 13.6% 0.4% 0.3% 0.2% 0.3% 0.4% 0.0%
Hibbing Community College 27 19 20 15 20 -7 -25.9% 1.3% 0.9% 1.3% 0.9% 1.1% -0.2%
Northeast Higher Education District
Itasca Community College 22 27 24 7 6 -16 -72.7% 2.0% 2.7% 2.3% 0.7% 0.6% -1.4% Mesabi Range Community and Technical College 23 20 19 17 25 2 8.7% 1.7% 1.6% 1.3% 1.2% 1.7% -0.1% Rainy River Community College 4 5 5 3 8 4 100.0% 0.9% 1.4% 1.5% 1.0% 2.4% 1.6% Vermilion Community College 114 67 68 105 106 -8 -7.0% 15.2% 13.5% 14.1% 14.3% 11.1% -4.1%Northland Community and Technical College 6 3 4 8 2 33.3% 0.3% 0.0% 0.3% 0.3% 0.5% 0.2%Northwest Technical College 5 4 5 4 10 5 100.0% 0.1% 0.1% 0.1% 0.1% 0.2% 0.1%Pine Technical College 40 67 66 82 57 17 42.5% 5.9% 7.4% 6.0% 9.9% 7.4% 1.5%Ridgewater College 12 9 7 4 5 -7 -58.3% 0.4% 0.3% 0.3% 0.2% 0.2% -0.2%Riverland Community College 7 2 1 1 2 -5 -71.4% 0.3% 0.1% 0.1% 0.1% 0.2% -0.1%Rochester Community and Technical College 134 62 82 119 143 9 6.7% 3.2% 2.1% 2.0% 2.4% 2.5% -0.7%St. Cloud Technical College 9 9 18 17 27 18 200.0% 0.5% 0.6% 0.9% 0.7% 0.9% 0.4%Saint Paul College 60 61 58 45 87 27 45.0% 2.7% 3.0% 3.0% 2.4% 2.8% 0.1%South Central Technical College 1 2 4 5 5 0.0% 0.0% 0.1% 0.1% 0.2% 0.2% 0.2%
Subtotal: Colleges 1,637 1,330 1,472 1,680 2,028 391 23.9% 2.4% 2.3% 2.6% 2.8% 3.0% 0.6%
UniversitiesBemidji State University 63 69 74 85 81 18 28.6% 1.4% 1.6% 1.7% 1.8% 1.7% 0.2%Metropolitan State University 0 0.0% 0.0% 0.0% 0.0% 0.0% 0.0% 0.0%Minnesota State University, Mankato 481 515 511 544 571 90 18.7% 4.0% 4.2% 4.0% 4.1% 4.2% 0.2%Minnesota State University Moorhead 43 40 35 37 42 -1 -2.3% 0.6% 0.6% 0.5% 0.5% 0.6% -0.1%St. Cloud State University 687 611 631 654 694 7 1.0% 5.0% 4.3% 4.3% 4.4% 4.7% -0.3%Southwest Minnesota State University 26 31 28 24 32 6 23.1% 0.6% 0.7% 0.5% 0.5% 0.7% 0.1%Winona State University 1,542 1,596 1,110 736 547 -995 -64.5% 25.9% 26.8% 26.1% 24.6% 24.6% -1.3%
Subtotal: Universities 2,842 2,862 2,389 2,080 1,967 -875 -30.8% 6.0% 5.9% 4.9% 4.3% 4.1% -1.9%
Institution LocationGreater Minnesota 3,864 3,753 3,477 3,343 3,327 -537 -13.9% 4.6% 4.5% 4.1% 3.8% 3.7% -0.9%Twin Cities Metropolitan Area 615 439 384 417 668 53 8.6% 2.0% 1.8% 1.9% 2.0% 2.6% 0.6%
Total: Colleges and Universities 4,479 4,192 3,861 3,760 3,995 -484 -10.8% 3.9% 3.9% 3.7% 3.5% 3.4% -0.4%
Source: Office of the Chancellor Research and PlanningR:\Factbooks\System Factbook\Fall Multi-Year.mdb Fall Multi-Year OriginState 1/13/2005
Table II-50: Page 5 of 10101

Table II-50State of Origin - Fall Credit Headcount
Minnesota State Colleges and UniversitiesFall 1999, 2000, 2001, 2002, and 2003: End of Term Data
InstitutionFall 1999
Fall 2000
Fall 2001
Fall 2002
Fall 2003
Change Fall 1999to Fall 2003
Number PercentFall 1999
Fall 2000
Fall 2001
Fall 2002
Fall 2003
Change Fall 1999 to
Fall 2003
Border States
Percent of Total KnownNumber of Students
CollegesAlexandria Technical College 42 75 81 92 85 43 102.4% 6.0% 5.4% 5.1% 5.6% 4.9% -1.1%Anoka-Ramsey Community College 20 6 3 7 44 24 120.0% 0.5% 0.2% 0.2% 0.5% 3.2% 2.7%Anoka Technical College 18 4 2 3 -15 -83.3% 3.2% 1.5% 0.0% 1.3% 2.1% -1.1%Central Lakes College 39 19 7 3 1 -38 -97.4% 1.6% 1.3% 0.7% 0.4% 0.2% -1.5%Century College 239 162 145 204 380 141 59.0% 5.8% 5.5% 5.7% 5.0% 5.9% 0.1%Dakota County Technical College 60 26 19 12 13 -47 -78.3% 7.5% 5.5% 6.1% 4.6% 6.4% -1.1%Fergus Falls Community College 57 78 215 60 40 -17 -29.8% 4.9% 5.5% 10.2% 4.6% 5.2% 0.3%Fond du Lac Tribal and Community College 9 8 7 13 29 20 222.2% 1.2% 1.6% 1.6% 1.3% 1.7% 0.5%Hennepin Technical College 1 2 8 8 0.0% 0.0% 0.3% 0.5% 0.0% 0.4% 0.4%Inver Hills Community College 124 119 120 129 141 17 13.7% 3.4% 3.4% 3.5% 3.3% 3.4% -0.1%Lake Superior College 229 264 362 404 473 244 106.6% 8.4% 7.5% 10.0% 9.6% 10.5% 2.1%Minneapolis Community and Technical College 91 48 35 20 14 -77 -84.6% 2.0% 1.7% 1.6% 1.1% 1.1% -0.9%Minnesota State College - Southeast Technical 373 333 449 514 487 114 30.6% 26.7% 26.9% 26.5% 27.5% 27.0% 0.3%Minnesota West Community and Technical College 160 210 238 224 225 65 40.6% 5.7% 6.6% 8.0% 7.4% 7.5% 1.7%Normandale Community College 80 51 30 14 4 -76 -95.0% 1.3% 1.4% 1.3% 0.9% 0.4% -1.0%North Hennepin Community College 40 32 23 34 40 0 0.0% 0.8% 0.6% 0.4% 0.6% 0.6% -0.2%
Hibbing Community College 27 19 21 20 25 -2 -7.4% 1.3% 0.9% 1.3% 1.1% 1.3% 0.1%
Northeast Higher Education District
Itasca Community College 23 34 33 8 7 -16 -69.6% 2.1% 3.4% 3.2% 0.8% 0.7% -1.4% Mesabi Range Community and Technical College 23 20 19 18 27 4 17.4% 1.7% 1.6% 1.3% 1.2% 1.8% 0.1% Rainy River Community College 6 7 6 5 9 3 50.0% 1.3% 1.9% 1.8% 1.6% 2.8% 1.4% Vermilion Community College 129 77 75 115 116 -13 -10.1% 17.2% 15.5% 15.6% 15.7% 12.2% -5.0%Northland Community and Technical College 133 64 42 81 144 11 8.3% 7.2% 4.9% 4.1% 6.5% 9.4% 2.2%Northwest Technical College 1,582 1,661 1,830 1,804 2,009 427 27.0% 36.8% 37.5% 39.0% 37.1% 37.0% 0.2%Pine Technical College 42 71 70 87 59 17 40.5% 6.2% 7.9% 6.4% 10.5% 7.7% 1.5%Ridgewater College 85 69 41 22 21 -64 -75.3% 2.6% 2.4% 1.9% 1.2% 0.9% -1.7%Riverland Community College 32 27 13 11 11 -21 -65.6% 1.4% 1.5% 0.8% 0.9% 1.1% -0.3%Rochester Community and Technical College 242 119 175 250 265 23 9.5% 5.8% 4.0% 4.2% 5.0% 4.7% -1.1%St. Cloud Technical College 21 18 33 44 55 34 161.9% 1.3% 1.2% 1.6% 1.7% 1.8% 0.6%Saint Paul College 63 63 63 48 99 36 57.1% 2.8% 3.0% 3.2% 2.6% 3.2% 0.4%South Central Technical College 1 4 11 26 26 0.0% 0.0% 0.1% 0.3% 0.5% 1.0% 1.0%
Subtotal: Colleges 3,989 3,686 4,161 4,256 4,860 871 21.8% 5.8% 6.3% 7.3% 7.1% 7.1% 1.3%
UniversitiesBemidji State University 173 167 196 222 221 48 27.7% 3.9% 3.8% 4.5% 4.8% 4.5% 0.6%Metropolitan State University 0 0.0% 0.0% 0.0% 0.0% 0.0% 0.0% 0.0%Minnesota State University, Mankato 1,219 1,322 1,336 1,383 1,418 199 16.3% 10.2% 10.7% 10.5% 10.5% 10.5% 0.4%Minnesota State University Moorhead 2,786 2,904 3,034 3,186 3,073 287 10.3% 40.8% 40.3% 42.0% 42.9% 41.2% 0.5%St. Cloud State University 1,098 1,061 1,116 1,140 1,180 82 7.5% 8.0% 7.5% 7.6% 7.6% 7.9% 0.0%Southwest Minnesota State University 775 852 809 511 567 -208 -26.8% 18.5% 18.7% 15.5% 9.9% 12.0% -6.5%Winona State University 1,712 1,764 1,227 815 606 -1,106 -64.6% 28.7% 29.7% 28.8% 27.2% 27.2% -1.5%
Subtotal: Universities 7,763 8,070 7,718 7,257 7,065 -698 -9.0% 16.5% 16.6% 15.9% 15.0% 14.8% -1.6%
Institution LocationGreater Minnesota 11,017 11,244 11,439 11,043 11,179 162 1.5% 13.0% 13.4% 13.5% 12.7% 12.4% -0.5%Twin Cities Metropolitan Area 735 512 440 470 746 11 1.5% 2.4% 2.2% 2.1% 2.2% 2.9% 0.5%
Total: Colleges and Universities 11,752 11,756 11,879 11,513 11,925 173 1.5% 10.2% 10.9% 11.3% 10.7% 10.3% 0.1%
Source: Office of the Chancellor Research and PlanningR:\Factbooks\System Factbook\Fall Multi-Year.mdb Fall Multi-Year OriginState 1/13/2005
Table II-50: Page 6 of 10102
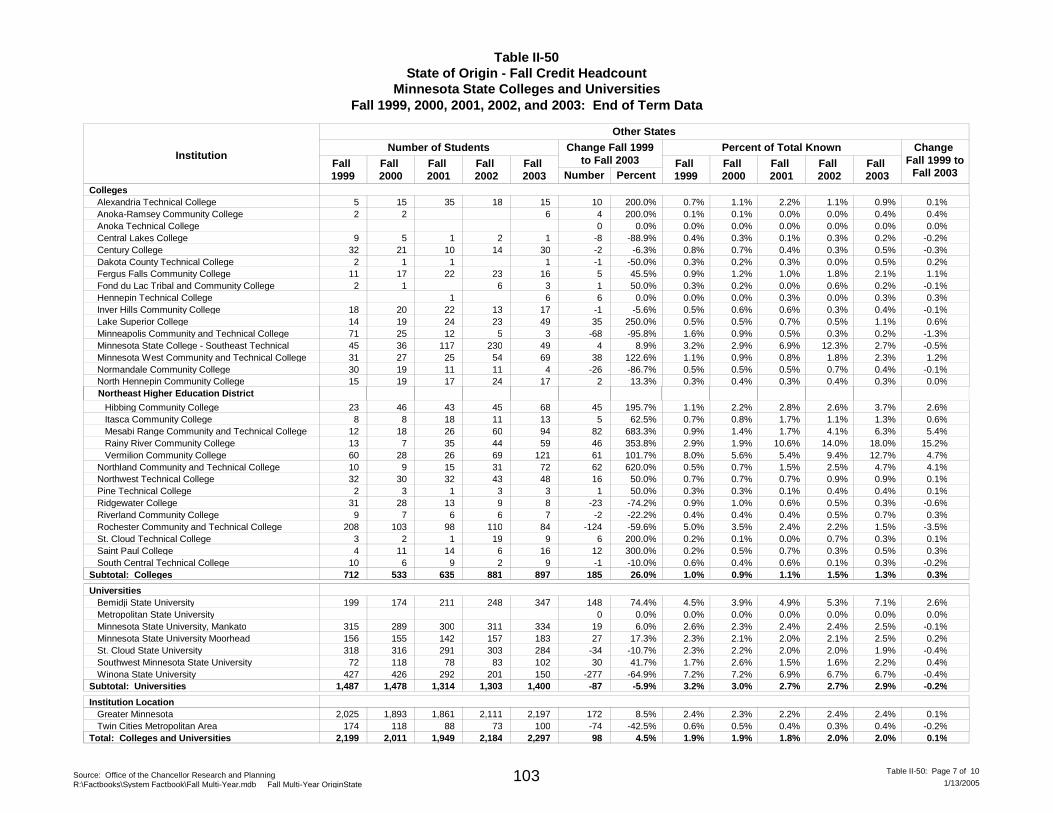
Table II-50State of Origin - Fall Credit Headcount
Minnesota State Colleges and UniversitiesFall 1999, 2000, 2001, 2002, and 2003: End of Term Data
InstitutionFall 1999
Fall 2000
Fall 2001
Fall 2002
Fall 2003
Change Fall 1999to Fall 2003
Number PercentFall 1999
Fall 2000
Fall 2001
Fall 2002
Fall 2003
Change Fall 1999 to
Fall 2003
Other States
Percent of Total KnownNumber of Students
CollegesAlexandria Technical College 5 15 35 18 15 10 200.0% 0.7% 1.1% 2.2% 1.1% 0.9% 0.1%Anoka-Ramsey Community College 2 2 6 4 200.0% 0.1% 0.1% 0.0% 0.0% 0.4% 0.4%Anoka Technical College 0 0.0% 0.0% 0.0% 0.0% 0.0% 0.0% 0.0%Central Lakes College 9 5 1 2 1 -8 -88.9% 0.4% 0.3% 0.1% 0.3% 0.2% -0.2%Century College 32 21 10 14 30 -2 -6.3% 0.8% 0.7% 0.4% 0.3% 0.5% -0.3%Dakota County Technical College 2 1 1 1 -1 -50.0% 0.3% 0.2% 0.3% 0.0% 0.5% 0.2%Fergus Falls Community College 11 17 22 23 16 5 45.5% 0.9% 1.2% 1.0% 1.8% 2.1% 1.1%Fond du Lac Tribal and Community College 2 1 6 3 1 50.0% 0.3% 0.2% 0.0% 0.6% 0.2% -0.1%Hennepin Technical College 1 6 6 0.0% 0.0% 0.0% 0.3% 0.0% 0.3% 0.3%Inver Hills Community College 18 20 22 13 17 -1 -5.6% 0.5% 0.6% 0.6% 0.3% 0.4% -0.1%Lake Superior College 14 19 24 23 49 35 250.0% 0.5% 0.5% 0.7% 0.5% 1.1% 0.6%Minneapolis Community and Technical College 71 25 12 5 3 -68 -95.8% 1.6% 0.9% 0.5% 0.3% 0.2% -1.3%Minnesota State College - Southeast Technical 45 36 117 230 49 4 8.9% 3.2% 2.9% 6.9% 12.3% 2.7% -0.5%Minnesota West Community and Technical College 31 27 25 54 69 38 122.6% 1.1% 0.9% 0.8% 1.8% 2.3% 1.2%Normandale Community College 30 19 11 11 4 -26 -86.7% 0.5% 0.5% 0.5% 0.7% 0.4% -0.1%North Hennepin Community College 15 19 17 24 17 2 13.3% 0.3% 0.4% 0.3% 0.4% 0.3% 0.0%
Hibbing Community College 23 46 43 45 68 45 195.7% 1.1% 2.2% 2.8% 2.6% 3.7% 2.6%
Northeast Higher Education District
Itasca Community College 8 8 18 11 13 5 62.5% 0.7% 0.8% 1.7% 1.1% 1.3% 0.6% Mesabi Range Community and Technical College 12 18 26 60 94 82 683.3% 0.9% 1.4% 1.7% 4.1% 6.3% 5.4% Rainy River Community College 13 7 35 44 59 46 353.8% 2.9% 1.9% 10.6% 14.0% 18.0% 15.2% Vermilion Community College 60 28 26 69 121 61 101.7% 8.0% 5.6% 5.4% 9.4% 12.7% 4.7%Northland Community and Technical College 10 9 15 31 72 62 620.0% 0.5% 0.7% 1.5% 2.5% 4.7% 4.1%Northwest Technical College 32 30 32 43 48 16 50.0% 0.7% 0.7% 0.7% 0.9% 0.9% 0.1%Pine Technical College 2 3 1 3 3 1 50.0% 0.3% 0.3% 0.1% 0.4% 0.4% 0.1%Ridgewater College 31 28 13 9 8 -23 -74.2% 0.9% 1.0% 0.6% 0.5% 0.3% -0.6%Riverland Community College 9 7 6 6 7 -2 -22.2% 0.4% 0.4% 0.4% 0.5% 0.7% 0.3%Rochester Community and Technical College 208 103 98 110 84 -124 -59.6% 5.0% 3.5% 2.4% 2.2% 1.5% -3.5%St. Cloud Technical College 3 2 1 19 9 6 200.0% 0.2% 0.1% 0.0% 0.7% 0.3% 0.1%Saint Paul College 4 11 14 6 16 12 300.0% 0.2% 0.5% 0.7% 0.3% 0.5% 0.3%South Central Technical College 10 6 9 2 9 -1 -10.0% 0.6% 0.4% 0.6% 0.1% 0.3% -0.2%
Subtotal: Colleges 712 533 635 881 897 185 26.0% 1.0% 0.9% 1.1% 1.5% 1.3% 0.3%
UniversitiesBemidji State University 199 174 211 248 347 148 74.4% 4.5% 3.9% 4.9% 5.3% 7.1% 2.6%Metropolitan State University 0 0.0% 0.0% 0.0% 0.0% 0.0% 0.0% 0.0%Minnesota State University, Mankato 315 289 300 311 334 19 6.0% 2.6% 2.3% 2.4% 2.4% 2.5% -0.1%Minnesota State University Moorhead 156 155 142 157 183 27 17.3% 2.3% 2.1% 2.0% 2.1% 2.5% 0.2%St. Cloud State University 318 316 291 303 284 -34 -10.7% 2.3% 2.2% 2.0% 2.0% 1.9% -0.4%Southwest Minnesota State University 72 118 78 83 102 30 41.7% 1.7% 2.6% 1.5% 1.6% 2.2% 0.4%Winona State University 427 426 292 201 150 -277 -64.9% 7.2% 7.2% 6.9% 6.7% 6.7% -0.4%
Subtotal: Universities 1,487 1,478 1,314 1,303 1,400 -87 -5.9% 3.2% 3.0% 2.7% 2.7% 2.9% -0.2%
Institution LocationGreater Minnesota 2,025 1,893 1,861 2,111 2,197 172 8.5% 2.4% 2.3% 2.2% 2.4% 2.4% 0.1%Twin Cities Metropolitan Area 174 118 88 73 100 -74 -42.5% 0.6% 0.5% 0.4% 0.3% 0.4% -0.2%
Total: Colleges and Universities 2,199 2,011 1,949 2,184 2,297 98 4.5% 1.9% 1.9% 1.8% 2.0% 2.0% 0.1%
Source: Office of the Chancellor Research and PlanningR:\Factbooks\System Factbook\Fall Multi-Year.mdb Fall Multi-Year OriginState 1/13/2005
Table II-50: Page 7 of 10103
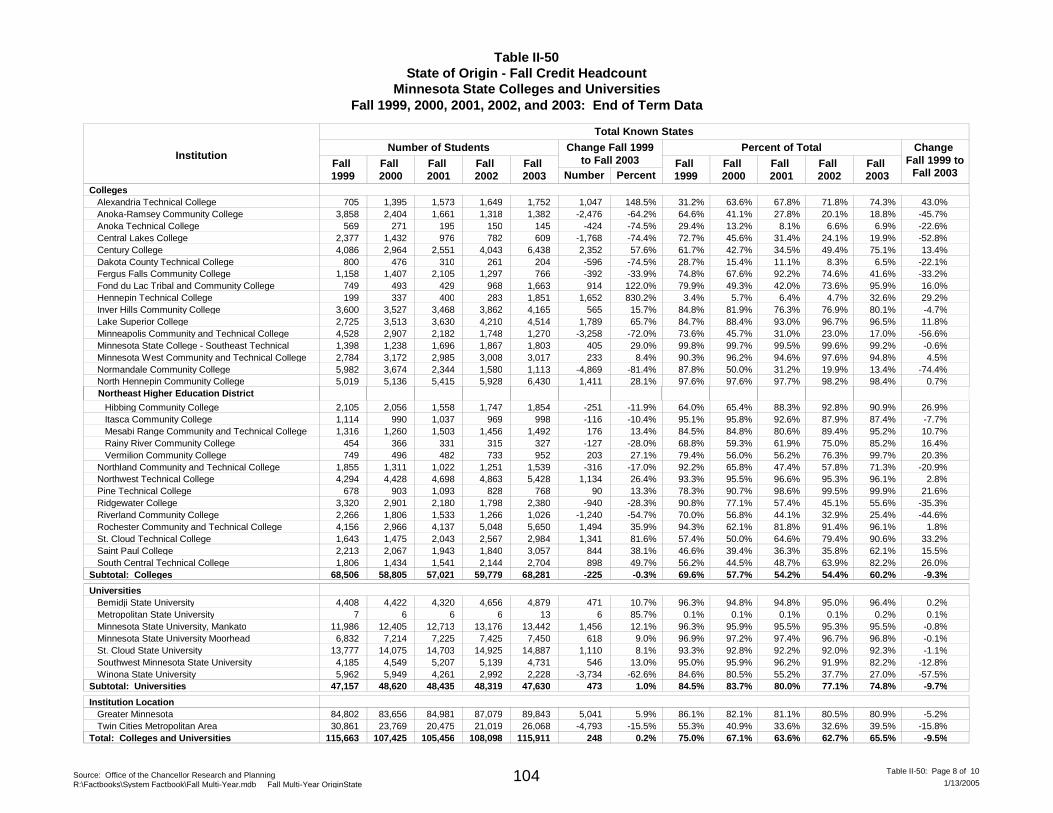
Table II-50State of Origin - Fall Credit Headcount
Minnesota State Colleges and UniversitiesFall 1999, 2000, 2001, 2002, and 2003: End of Term Data
InstitutionFall 1999
Fall 2000
Fall 2001
Fall 2002
Fall 2003
Change Fall 1999to Fall 2003
Number PercentFall 1999
Fall 2000
Fall 2001
Fall 2002
Fall 2003
Change Fall 1999 to
Fall 2003
Total Known States
Percent of TotalNumber of Students
CollegesAlexandria Technical College 705 1,395 1,573 1,649 1,752 1,047 148.5% 31.2% 63.6% 67.8% 71.8% 74.3% 43.0%Anoka-Ramsey Community College 3,858 2,404 1,661 1,318 1,382 -2,476 -64.2% 64.6% 41.1% 27.8% 20.1% 18.8% -45.7%Anoka Technical College 569 271 195 150 145 -424 -74.5% 29.4% 13.2% 8.1% 6.6% 6.9% -22.6%Central Lakes College 2,377 1,432 976 782 609 -1,768 -74.4% 72.7% 45.6% 31.4% 24.1% 19.9% -52.8%Century College 4,086 2,964 2,551 4,043 6,438 2,352 57.6% 61.7% 42.7% 34.5% 49.4% 75.1% 13.4%Dakota County Technical College 800 476 310 261 204 -596 -74.5% 28.7% 15.4% 11.1% 8.3% 6.5% -22.1%Fergus Falls Community College 1,158 1,407 2,105 1,297 766 -392 -33.9% 74.8% 67.6% 92.2% 74.6% 41.6% -33.2%Fond du Lac Tribal and Community College 749 493 429 968 1,663 914 122.0% 79.9% 49.3% 42.0% 73.6% 95.9% 16.0%Hennepin Technical College 199 337 400 283 1,851 1,652 830.2% 3.4% 5.7% 6.4% 4.7% 32.6% 29.2%Inver Hills Community College 3,600 3,527 3,468 3,862 4,165 565 15.7% 84.8% 81.9% 76.3% 76.9% 80.1% -4.7%Lake Superior College 2,725 3,513 3,630 4,210 4,514 1,789 65.7% 84.7% 88.4% 93.0% 96.7% 96.5% 11.8%Minneapolis Community and Technical College 4,528 2,907 2,182 1,748 1,270 -3,258 -72.0% 73.6% 45.7% 31.0% 23.0% 17.0% -56.6%Minnesota State College - Southeast Technical 1,398 1,238 1,696 1,867 1,803 405 29.0% 99.8% 99.7% 99.5% 99.6% 99.2% -0.6%Minnesota West Community and Technical College 2,784 3,172 2,985 3,008 3,017 233 8.4% 90.3% 96.2% 94.6% 97.6% 94.8% 4.5%Normandale Community College 5,982 3,674 2,344 1,580 1,113 -4,869 -81.4% 87.8% 50.0% 31.2% 19.9% 13.4% -74.4%North Hennepin Community College 5,019 5,136 5,415 5,928 6,430 1,411 28.1% 97.6% 97.6% 97.7% 98.2% 98.4% 0.7%
Hibbing Community College 2,105 2,056 1,558 1,747 1,854 -251 -11.9% 64.0% 65.4% 88.3% 92.8% 90.9% 26.9%
Northeast Higher Education District
Itasca Community College 1,114 990 1,037 969 998 -116 -10.4% 95.1% 95.8% 92.6% 87.9% 87.4% -7.7% Mesabi Range Community and Technical College 1,316 1,260 1,503 1,456 1,492 176 13.4% 84.5% 84.8% 80.6% 89.4% 95.2% 10.7% Rainy River Community College 454 366 331 315 327 -127 -28.0% 68.8% 59.3% 61.9% 75.0% 85.2% 16.4% Vermilion Community College 749 496 482 733 952 203 27.1% 79.4% 56.0% 56.2% 76.3% 99.7% 20.3%Northland Community and Technical College 1,855 1,311 1,022 1,251 1,539 -316 -17.0% 92.2% 65.8% 47.4% 57.8% 71.3% -20.9%Northwest Technical College 4,294 4,428 4,698 4,863 5,428 1,134 26.4% 93.3% 95.5% 96.6% 95.3% 96.1% 2.8%Pine Technical College 678 903 1,093 828 768 90 13.3% 78.3% 90.7% 98.6% 99.5% 99.9% 21.6%Ridgewater College 3,320 2,901 2,180 1,798 2,380 -940 -28.3% 90.8% 77.1% 57.4% 45.1% 55.6% -35.3%Riverland Community College 2,266 1,806 1,533 1,266 1,026 -1,240 -54.7% 70.0% 56.8% 44.1% 32.9% 25.4% -44.6%Rochester Community and Technical College 4,156 2,966 4,137 5,048 5,650 1,494 35.9% 94.3% 62.1% 81.8% 91.4% 96.1% 1.8%St. Cloud Technical College 1,643 1,475 2,043 2,567 2,984 1,341 81.6% 57.4% 50.0% 64.6% 79.4% 90.6% 33.2%Saint Paul College 2,213 2,067 1,943 1,840 3,057 844 38.1% 46.6% 39.4% 36.3% 35.8% 62.1% 15.5%South Central Technical College 1,806 1,434 1,541 2,144 2,704 898 49.7% 56.2% 44.5% 48.7% 63.9% 82.2% 26.0%
Subtotal: Colleges 68,506 58,805 57,021 59,779 68,281 -225 -0.3% 69.6% 57.7% 54.2% 54.4% 60.2% -9.3%
UniversitiesBemidji State University 4,408 4,422 4,320 4,656 4,879 471 10.7% 96.3% 94.8% 94.8% 95.0% 96.4% 0.2%Metropolitan State University 7 6 6 6 13 6 85.7% 0.1% 0.1% 0.1% 0.1% 0.2% 0.1%Minnesota State University, Mankato 11,986 12,405 12,713 13,176 13,442 1,456 12.1% 96.3% 95.9% 95.5% 95.3% 95.5% -0.8%Minnesota State University Moorhead 6,832 7,214 7,225 7,425 7,450 618 9.0% 96.9% 97.2% 97.4% 96.7% 96.8% -0.1%St. Cloud State University 13,777 14,075 14,703 14,925 14,887 1,110 8.1% 93.3% 92.8% 92.2% 92.0% 92.3% -1.1%Southwest Minnesota State University 4,185 4,549 5,207 5,139 4,731 546 13.0% 95.0% 95.9% 96.2% 91.9% 82.2% -12.8%Winona State University 5,962 5,949 4,261 2,992 2,228 -3,734 -62.6% 84.6% 80.5% 55.2% 37.7% 27.0% -57.5%
Subtotal: Universities 47,157 48,620 48,435 48,319 47,630 473 1.0% 84.5% 83.7% 80.0% 77.1% 74.8% -9.7%
Institution LocationGreater Minnesota 84,802 83,656 84,981 87,079 89,843 5,041 5.9% 86.1% 82.1% 81.1% 80.5% 80.9% -5.2%Twin Cities Metropolitan Area 30,861 23,769 20,475 21,019 26,068 -4,793 -15.5% 55.3% 40.9% 33.6% 32.6% 39.5% -15.8%
Total: Colleges and Universities 115,663 107,425 105,456 108,098 115,911 248 0.2% 75.0% 67.1% 63.6% 62.7% 65.5% -9.5%
Source: Office of the Chancellor Research and PlanningR:\Factbooks\System Factbook\Fall Multi-Year.mdb Fall Multi-Year OriginState 1/13/2005
Table II-50: Page 8 of 10104
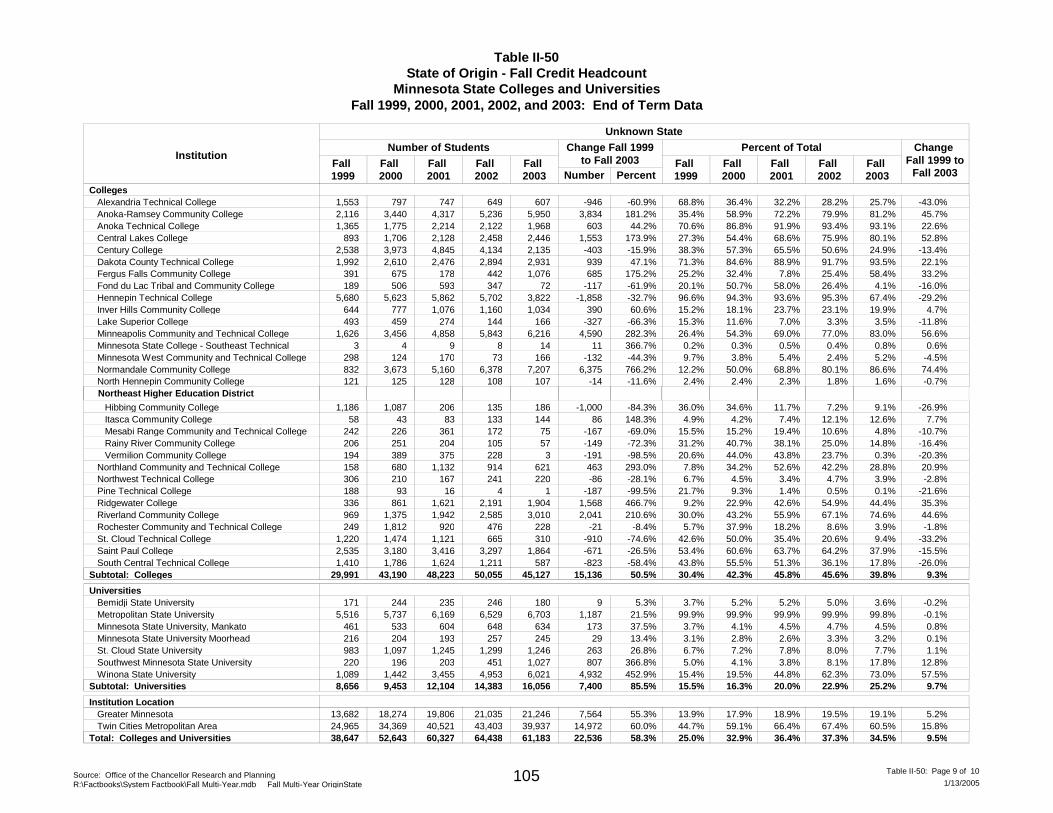
Table II-50State of Origin - Fall Credit Headcount
Minnesota State Colleges and UniversitiesFall 1999, 2000, 2001, 2002, and 2003: End of Term Data
InstitutionFall 1999
Fall 2000
Fall 2001
Fall 2002
Fall 2003
Change Fall 1999to Fall 2003
Number PercentFall 1999
Fall 2000
Fall 2001
Fall 2002
Fall 2003
Change Fall 1999 to
Fall 2003
Unknown State
Percent of TotalNumber of Students
CollegesAlexandria Technical College 1,553 797 747 649 607 -946 -60.9% 68.8% 36.4% 32.2% 28.2% 25.7% -43.0%Anoka-Ramsey Community College 2,116 3,440 4,317 5,236 5,950 3,834 181.2% 35.4% 58.9% 72.2% 79.9% 81.2% 45.7%Anoka Technical College 1,365 1,775 2,214 2,122 1,968 603 44.2% 70.6% 86.8% 91.9% 93.4% 93.1% 22.6%Central Lakes College 893 1,706 2,128 2,458 2,446 1,553 173.9% 27.3% 54.4% 68.6% 75.9% 80.1% 52.8%Century College 2,538 3,973 4,845 4,134 2,135 -403 -15.9% 38.3% 57.3% 65.5% 50.6% 24.9% -13.4%Dakota County Technical College 1,992 2,610 2,476 2,894 2,931 939 47.1% 71.3% 84.6% 88.9% 91.7% 93.5% 22.1%Fergus Falls Community College 391 675 178 442 1,076 685 175.2% 25.2% 32.4% 7.8% 25.4% 58.4% 33.2%Fond du Lac Tribal and Community College 189 506 593 347 72 -117 -61.9% 20.1% 50.7% 58.0% 26.4% 4.1% -16.0%Hennepin Technical College 5,680 5,623 5,862 5,702 3,822 -1,858 -32.7% 96.6% 94.3% 93.6% 95.3% 67.4% -29.2%Inver Hills Community College 644 777 1,076 1,160 1,034 390 60.6% 15.2% 18.1% 23.7% 23.1% 19.9% 4.7%Lake Superior College 493 459 274 144 166 -327 -66.3% 15.3% 11.6% 7.0% 3.3% 3.5% -11.8%Minneapolis Community and Technical College 1,626 3,456 4,858 5,843 6,216 4,590 282.3% 26.4% 54.3% 69.0% 77.0% 83.0% 56.6%Minnesota State College - Southeast Technical 3 4 9 8 14 11 366.7% 0.2% 0.3% 0.5% 0.4% 0.8% 0.6%Minnesota West Community and Technical College 298 124 170 73 166 -132 -44.3% 9.7% 3.8% 5.4% 2.4% 5.2% -4.5%Normandale Community College 832 3,673 5,160 6,378 7,207 6,375 766.2% 12.2% 50.0% 68.8% 80.1% 86.6% 74.4%North Hennepin Community College 121 125 128 108 107 -14 -11.6% 2.4% 2.4% 2.3% 1.8% 1.6% -0.7%
Hibbing Community College 1,186 1,087 206 135 186 -1,000 -84.3% 36.0% 34.6% 11.7% 7.2% 9.1% -26.9%
Northeast Higher Education District
Itasca Community College 58 43 83 133 144 86 148.3% 4.9% 4.2% 7.4% 12.1% 12.6% 7.7% Mesabi Range Community and Technical College 242 226 361 172 75 -167 -69.0% 15.5% 15.2% 19.4% 10.6% 4.8% -10.7% Rainy River Community College 206 251 204 105 57 -149 -72.3% 31.2% 40.7% 38.1% 25.0% 14.8% -16.4% Vermilion Community College 194 389 375 228 3 -191 -98.5% 20.6% 44.0% 43.8% 23.7% 0.3% -20.3%Northland Community and Technical College 158 680 1,132 914 621 463 293.0% 7.8% 34.2% 52.6% 42.2% 28.8% 20.9%Northwest Technical College 306 210 167 241 220 -86 -28.1% 6.7% 4.5% 3.4% 4.7% 3.9% -2.8%Pine Technical College 188 93 16 4 1 -187 -99.5% 21.7% 9.3% 1.4% 0.5% 0.1% -21.6%Ridgewater College 336 861 1,621 2,191 1,904 1,568 466.7% 9.2% 22.9% 42.6% 54.9% 44.4% 35.3%Riverland Community College 969 1,375 1,942 2,585 3,010 2,041 210.6% 30.0% 43.2% 55.9% 67.1% 74.6% 44.6%Rochester Community and Technical College 249 1,812 920 476 228 -21 -8.4% 5.7% 37.9% 18.2% 8.6% 3.9% -1.8%St. Cloud Technical College 1,220 1,474 1,121 665 310 -910 -74.6% 42.6% 50.0% 35.4% 20.6% 9.4% -33.2%Saint Paul College 2,535 3,180 3,416 3,297 1,864 -671 -26.5% 53.4% 60.6% 63.7% 64.2% 37.9% -15.5%South Central Technical College 1,410 1,786 1,624 1,211 587 -823 -58.4% 43.8% 55.5% 51.3% 36.1% 17.8% -26.0%
Subtotal: Colleges 29,991 43,190 48,223 50,055 45,127 15,136 50.5% 30.4% 42.3% 45.8% 45.6% 39.8% 9.3%
UniversitiesBemidji State University 171 244 235 246 180 9 5.3% 3.7% 5.2% 5.2% 5.0% 3.6% -0.2%Metropolitan State University 5,516 5,737 6,169 6,529 6,703 1,187 21.5% 99.9% 99.9% 99.9% 99.9% 99.8% -0.1%Minnesota State University, Mankato 461 533 604 648 634 173 37.5% 3.7% 4.1% 4.5% 4.7% 4.5% 0.8%Minnesota State University Moorhead 216 204 193 257 245 29 13.4% 3.1% 2.8% 2.6% 3.3% 3.2% 0.1%St. Cloud State University 983 1,097 1,245 1,299 1,246 263 26.8% 6.7% 7.2% 7.8% 8.0% 7.7% 1.1%Southwest Minnesota State University 220 196 203 451 1,027 807 366.8% 5.0% 4.1% 3.8% 8.1% 17.8% 12.8%Winona State University 1,089 1,442 3,455 4,953 6,021 4,932 452.9% 15.4% 19.5% 44.8% 62.3% 73.0% 57.5%
Subtotal: Universities 8,656 9,453 12,104 14,383 16,056 7,400 85.5% 15.5% 16.3% 20.0% 22.9% 25.2% 9.7%
Institution LocationGreater Minnesota 13,682 18,274 19,806 21,035 21,246 7,564 55.3% 13.9% 17.9% 18.9% 19.5% 19.1% 5.2%Twin Cities Metropolitan Area 24,965 34,369 40,521 43,403 39,937 14,972 60.0% 44.7% 59.1% 66.4% 67.4% 60.5% 15.8%
Total: Colleges and Universities 38,647 52,643 60,327 64,438 61,183 22,536 58.3% 25.0% 32.9% 36.4% 37.3% 34.5% 9.5%
Source: Office of the Chancellor Research and PlanningR:\Factbooks\System Factbook\Fall Multi-Year.mdb Fall Multi-Year OriginState 1/13/2005
Table II-50: Page 9 of 10105

Table II-50State of Origin - Fall Credit Headcount
Minnesota State Colleges and UniversitiesFall 1999, 2000, 2001, 2002, and 2003: End of Term Data
InstitutionFall 1999
Fall 2000
Fall 2001
Fall 2002
Fall 2003
Change Fall 1999to Fall 2003
Number PercentFall 1999
Fall 2000
Fall 2001
Fall 2002
Fall 2003
Change Fall 1999 to
Fall 2003
Total
Percent of TotalNumber of Students
CollegesAlexandria Technical College 2,258 2,192 2,320 2,298 2,359 101 4.5% 100.0% 100.0% 100.0% 100.0% 100.0% 0.0%Anoka-Ramsey Community College 5,974 5,844 5,978 6,554 7,332 1,358 22.7% 100.0% 100.0% 100.0% 100.0% 100.0% 0.0%Anoka Technical College 1,934 2,046 2,409 2,272 2,113 179 9.3% 100.0% 100.0% 100.0% 100.0% 100.0% 0.0%Central Lakes College 3,270 3,138 3,104 3,240 3,055 -215 -6.6% 100.0% 100.0% 100.0% 100.0% 100.0% 0.0%Century College 6,624 6,937 7,396 8,177 8,573 1,949 29.4% 100.0% 100.0% 100.0% 100.0% 100.0% 0.0%Dakota County Technical College 2,792 3,086 2,786 3,155 3,135 343 12.3% 100.0% 100.0% 100.0% 100.0% 100.0% 0.0%Fergus Falls Community College 1,549 2,082 2,283 1,739 1,842 293 18.9% 100.0% 100.0% 100.0% 100.0% 100.0% 0.0%Fond du Lac Tribal and Community College 938 999 1,022 1,315 1,735 797 85.0% 100.0% 100.0% 100.0% 100.0% 100.0% 0.0%Hennepin Technical College 5,879 5,960 6,262 5,985 5,673 -206 -3.5% 100.0% 100.0% 100.0% 100.0% 100.0% 0.0%Inver Hills Community College 4,244 4,304 4,544 5,022 5,199 955 22.5% 100.0% 100.0% 100.0% 100.0% 100.0% 0.0%Lake Superior College 3,218 3,972 3,904 4,354 4,680 1,462 45.4% 100.0% 100.0% 100.0% 100.0% 100.0% 0.0%Minneapolis Community and Technical College 6,154 6,363 7,040 7,591 7,486 1,332 21.6% 100.0% 100.0% 100.0% 100.0% 100.0% 0.0%Minnesota State College - Southeast Technical 1,401 1,242 1,705 1,875 1,817 416 29.7% 100.0% 100.0% 100.0% 100.0% 100.0% 0.0%Minnesota West Community and Technical College 3,082 3,296 3,155 3,081 3,183 101 3.3% 100.0% 100.0% 100.0% 100.0% 100.0% 0.0%Normandale Community College 6,814 7,347 7,504 7,958 8,320 1,506 22.1% 100.0% 100.0% 100.0% 100.0% 100.0% 0.0%North Hennepin Community College 5,140 5,261 5,543 6,036 6,537 1,397 27.2% 100.0% 100.0% 100.0% 100.0% 100.0% 0.0%
Hibbing Community College 3,291 3,143 1,764 1,882 2,040 -1,251 -38.0% 100.0% 100.0% 100.0% 100.0% 100.0% 0.0%
Northeast Higher Education District
Itasca Community College 1,172 1,033 1,120 1,102 1,142 -30 -2.6% 100.0% 100.0% 100.0% 100.0% 100.0% 0.0% Mesabi Range Community and Technical College 1,558 1,486 1,864 1,628 1,567 9 0.6% 100.0% 100.0% 100.0% 100.0% 100.0% 0.0% Rainy River Community College 660 617 535 420 384 -276 -41.8% 100.0% 100.0% 100.0% 100.0% 100.0% 0.0% Vermilion Community College 943 885 857 961 955 12 1.3% 100.0% 100.0% 100.0% 100.0% 100.0% 0.0%Northland Community and Technical College 2,013 1,991 2,154 2,165 2,160 147 7.3% 100.0% 100.0% 100.0% 100.0% 100.0% 0.0%Northwest Technical College 4,600 4,638 4,865 5,104 5,648 1,048 22.8% 100.0% 100.0% 100.0% 100.0% 100.0% 0.0%Pine Technical College 866 996 1,109 832 769 -97 -11.2% 100.0% 100.0% 100.0% 100.0% 100.0% 0.0%Ridgewater College 3,656 3,762 3,801 3,989 4,284 628 17.2% 100.0% 100.0% 100.0% 100.0% 100.0% 0.0%Riverland Community College 3,235 3,181 3,475 3,851 4,036 801 24.8% 100.0% 100.0% 100.0% 100.0% 100.0% 0.0%Rochester Community and Technical College 4,405 4,778 5,057 5,524 5,878 1,473 33.4% 100.0% 100.0% 100.0% 100.0% 100.0% 0.0%St. Cloud Technical College 2,863 2,949 3,164 3,232 3,294 431 15.1% 100.0% 100.0% 100.0% 100.0% 100.0% 0.0%Saint Paul College 4,748 5,247 5,359 5,137 4,921 173 3.6% 100.0% 100.0% 100.0% 100.0% 100.0% 0.0%South Central Technical College 3,216 3,220 3,165 3,355 3,291 75 2.3% 100.0% 100.0% 100.0% 100.0% 100.0% 0.0%
Subtotal: Colleges 98,497 101,995 105,244 109,834 113,408 14,911 15.1% 100.0% 100.0% 100.0% 100.0% 100.0% 0.0%
UniversitiesBemidji State University 4,579 4,666 4,555 4,902 5,059 480 10.5% 100.0% 100.0% 100.0% 100.0% 100.0% 0.0%Metropolitan State University 5,523 5,743 6,175 6,535 6,716 1,193 21.6% 100.0% 100.0% 100.0% 100.0% 100.0% 0.0%Minnesota State University, Mankato 12,447 12,938 13,317 13,824 14,076 1,629 13.1% 100.0% 100.0% 100.0% 100.0% 100.0% 0.0%Minnesota State University Moorhead 7,048 7,418 7,418 7,682 7,695 647 9.2% 100.0% 100.0% 100.0% 100.0% 100.0% 0.0%St. Cloud State University 14,760 15,172 15,948 16,224 16,133 1,373 9.3% 100.0% 100.0% 100.0% 100.0% 100.0% 0.0%Southwest Minnesota State University 4,405 4,745 5,410 5,590 5,758 1,353 30.7% 100.0% 100.0% 100.0% 100.0% 100.0% 0.0%Winona State University 7,051 7,391 7,716 7,945 8,249 1,198 17.0% 100.0% 100.0% 100.0% 100.0% 100.0% 0.0%
Subtotal: Universities 55,813 58,073 60,539 62,702 63,686 7,873 14.1% 100.0% 100.0% 100.0% 100.0% 100.0% 0.0%
Institution LocationGreater Minnesota 98,484 101,930 104,787 108,114 111,089 12,605 12.8% 100.0% 100.0% 100.0% 100.0% 100.0% 0.0%Twin Cities Metropolitan Area 55,826 58,138 60,996 64,422 66,005 10,179 18.2% 100.0% 100.0% 100.0% 100.0% 100.0% 0.0%
Total: Colleges and Universities 154,310 160,068 165,783 172,536 177,094 22,784 14.8% 100.0% 100.0% 100.0% 100.0% 100.0% 0.0%
Source: Office of the Chancellor Research and PlanningR:\Factbooks\System Factbook\Fall Multi-Year.mdb Fall Multi-Year OriginState 1/13/2005
Table II-50: Page 10 of 10106
Chapter III: Graduate Information Introduction The Graduate Information chapter of the Fact Book contains four tables that provide current and trend information on graduates from the Minnesota State Colleges and Universities. The information in this chapter describes the: • Race/ethnicity of graduates; • Majors, degrees, diplomas and certificates awarded to graduates; and • Related employment rate of graduates.
107

This Page is Intentionally Left Blank
108
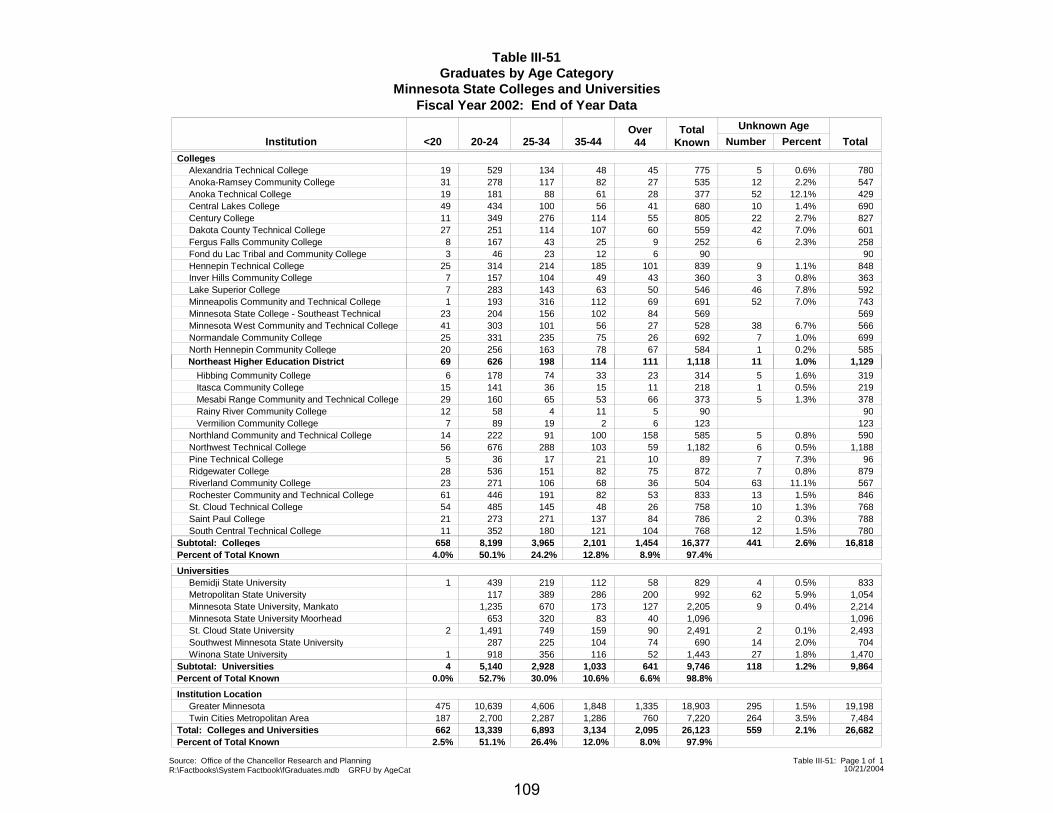
Table III-51Graduates by Age Category
Minnesota State Colleges and Universities
<20 20-24Total
Known Over
44 PercentInstitution
Fiscal Year 2002: End of Year Data
Total25-34 35-44 Number
Unknown Age
Colleges19Alexandria Technical College 529 7800.6%134 48 545 77531Anoka-Ramsey Community College 278 5472.2%117 82 1227 53519Anoka Technical College 181 42912.1%88 61 5228 37749Central Lakes College 434 6901.4%100 56 1041 68011Century College 349 8272.7%276 114 2255 80527Dakota County Technical College 251 6017.0%114 107 4260 5598Fergus Falls Community College 167 2582.3%43 25 69 2523Fond du Lac Tribal and Community College 46 9023 12 6 90
25Hennepin Technical College 314 8481.1%214 185 9101 8397Inver Hills Community College 157 3630.8%104 49 343 3607Lake Superior College 283 5927.8%143 63 4650 5461Minneapolis Community and Technical College 193 7437.0%316 112 5269 691
23Minnesota State College - Southeast Technical 204 569156 102 84 56941Minnesota West Community and Technical College 303 5666.7%101 56 3827 52825Normandale Community College 331 6991.0%235 75 726 69220North Hennepin Community College 256 5850.2%163 78 167 584
Northeast Higher Education District
6 Hibbing Community College 178
69 626
3191.6%
1.0% 1,129
74
198
33
114
5
11
23
111
314
1,118
15 Itasca Community College 141 2190.5%36 15 111 21829 Mesabi Range Community and Technical College 160 3781.3%65 53 566 37312 Rainy River Community College 58 904 11 5 907 Vermilion Community College 89 12319 2 6 123
14Northland Community and Technical College 222 5900.8%91 100 5158 58556Northwest Technical College 676 1,1880.5%288 103 659 1,1825Pine Technical College 36 967.3%17 21 710 89
28Ridgewater College 536 8790.8%151 82 775 87223Riverland Community College 271 56711.1%106 68 6336 50461Rochester Community and Technical College 446 8461.5%191 82 1353 83354St. Cloud Technical College 485 7681.3%145 48 1026 75821Saint Paul College 273 7880.3%271 137 284 78611South Central Technical College 352 7801.5%180 121 12104 768
Subtotal: Colleges 658 8,199 16,8182.6%3,965 2,101 4414.0%Percent of Total Known 50.1% 24.2% 12.8% 8.9%
1,45497.4%
16,377
Universities1Bemidji State University 439 8330.5%219 112 458 829
Metropolitan State University 117 1,0545.9%389 286 62200 992Minnesota State University, Mankato 1,235 2,2140.4%670 173 9127 2,205Minnesota State University Moorhead 653 1,096320 83 40 1,096
2St. Cloud State University 1,491 2,4930.1%749 159 290 2,491Southwest Minnesota State University 287 7042.0%225 104 1474 690
1Winona State University 918 1,4701.8%356 116 2752 1,443Subtotal: Universities 4 5,140 9,8641.2%2,928 1,033 118
0.0%Percent of Total Known 52.7% 30.0% 10.6% 6.6%641
98.8%9,746
Institution Location475Greater Minnesota 10,639 19,1981.5%4,606 1,848 2951,335 18,903187Twin Cities Metropolitan Area 2,700 7,4843.5%2,287 1,286 264760 7,220
Total: Colleges and Universities 662 13,339 26,6822.1%6,893 3,134 5592.5%Percent of Total Known 51.1% 26.4% 12.0% 8.0%
2,09597.9%
26,123
Source: Office of the Chancellor Research and PlanningR:\Factbooks\System Factbook\fGraduates.mdb GRFU by AgeCat 10/21/2004
Table III-51: Page 1 of 1
109
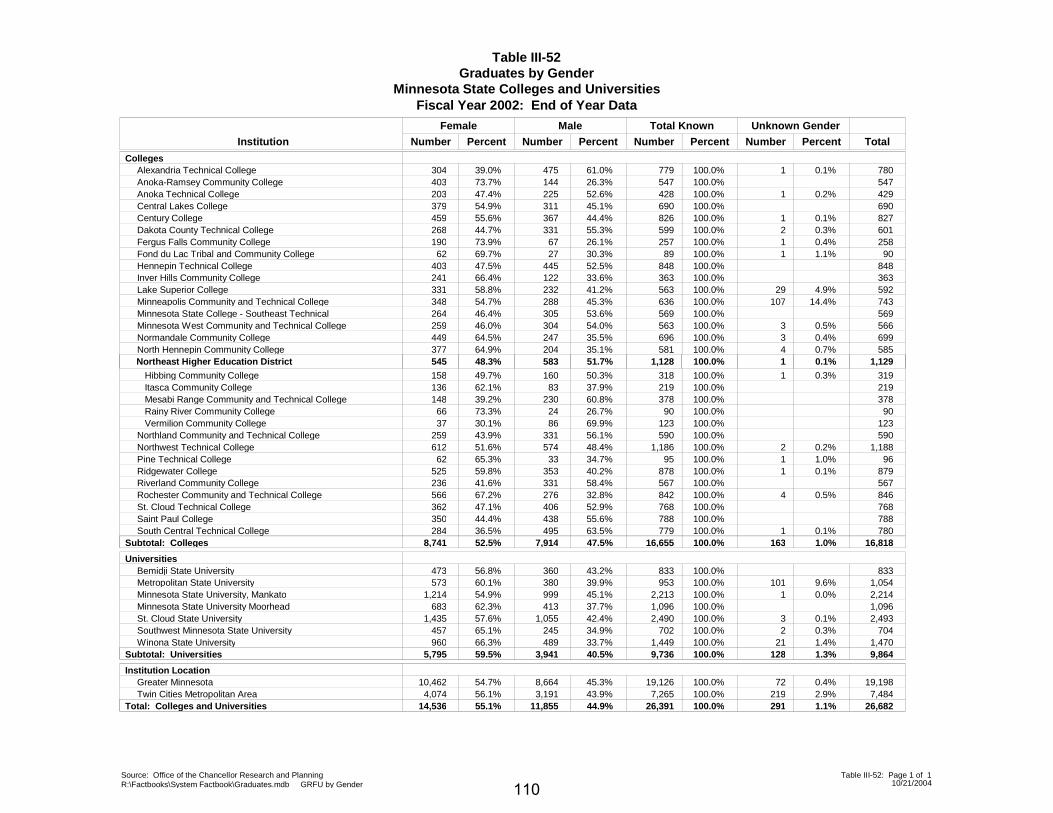
Table III-52Graduates by Gender
Minnesota State Colleges and UniversitiesFiscal Year 2002: End of Year Data
Female Unknown Gender
Institution Total
Total Known
Number Percent Number Percent
Male
Number PercentNumber Percent
Colleges304Alexandria Technical College 475 77939.0% 61.0% 7800.1%1100.0%403Anoka-Ramsey Community College 144 54773.7% 26.3% 547100.0%203Anoka Technical College 225 42847.4% 52.6% 4290.2%1100.0%379Central Lakes College 311 69054.9% 45.1% 690100.0%459Century College 367 82655.6% 44.4% 8270.1%1100.0%268Dakota County Technical College 331 59944.7% 55.3% 6010.3%2100.0%190Fergus Falls Community College 67 25773.9% 26.1% 2580.4%1100.0%62Fond du Lac Tribal and Community College 27 8969.7% 30.3% 901.1%1100.0%
403Hennepin Technical College 445 84847.5% 52.5% 848100.0%241Inver Hills Community College 122 36366.4% 33.6% 363100.0%331Lake Superior College 232 56358.8% 41.2% 5924.9%29100.0%348Minneapolis Community and Technical College 288 63654.7% 45.3% 74314.4%107100.0%264Minnesota State College - Southeast Technical 305 56946.4% 53.6% 569100.0%259Minnesota West Community and Technical College 304 56346.0% 54.0% 5660.5%3100.0%449Normandale Community College 247 69664.5% 35.5% 6990.4%3100.0%377North Hennepin Community College 204 58164.9% 35.1% 5850.7%4100.0%
Northeast Higher Education District
158 Hibbing Community College 160
545 583 1
318
1,128
49.7%
48.3%
50.3%
51.7%
3190.3%
0.1% 1,129
1100.0%
100.0%
136 Itasca Community College 83 21962.1% 37.9% 219100.0%148 Mesabi Range Community and Technical College 230 37839.2% 60.8% 378100.0%66 Rainy River Community College 24 9073.3% 26.7% 90100.0%37 Vermilion Community College 86 12330.1% 69.9% 123100.0%
259Northland Community and Technical College 331 59043.9% 56.1% 590100.0%612Northwest Technical College 574 1,18651.6% 48.4% 1,1880.2%2100.0%62Pine Technical College 33 9565.3% 34.7% 961.0%1100.0%
525Ridgewater College 353 87859.8% 40.2% 8790.1%1100.0%236Riverland Community College 331 56741.6% 58.4% 567100.0%566Rochester Community and Technical College 276 84267.2% 32.8% 8460.5%4100.0%362St. Cloud Technical College 406 76847.1% 52.9% 768100.0%350Saint Paul College 438 78844.4% 55.6% 788100.0%284South Central Technical College 495 77936.5% 63.5% 7800.1%1100.0%
Subtotal: Colleges 8,741 7,914 16316,65552.5% 47.5% 16,8181.0%100.0%
Universities473Bemidji State University 360 83356.8% 43.2% 833100.0%573Metropolitan State University 380 95360.1% 39.9% 1,0549.6%101100.0%
1,214Minnesota State University, Mankato 999 2,21354.9% 45.1% 2,2140.0%1100.0%683Minnesota State University Moorhead 413 1,09662.3% 37.7% 1,096100.0%
1,435St. Cloud State University 1,055 2,49057.6% 42.4% 2,4930.1%3100.0%457Southwest Minnesota State University 245 70265.1% 34.9% 7040.3%2100.0%960Winona State University 489 1,44966.3% 33.7% 1,4701.4%21100.0%
Subtotal: Universities 5,795 3,941 1289,73659.5% 40.5% 9,8641.3%100.0%
Institution Location10,462Greater Minnesota 8,664 19,12654.7% 45.3% 19,1980.4%72100.0%4,074Twin Cities Metropolitan Area 3,191 7,26556.1% 43.9% 7,4842.9%219100.0%
Total: Colleges and Universities 14,536 11,855 29126,39155.1% 44.9% 26,6821.1%100.0%
Source: Office of the Chancellor Research and PlanningR:\Factbooks\System Factbook\Graduates.mdb GRFU by Gender 10/21/2004
Table III-52: Page 1 of 1
110
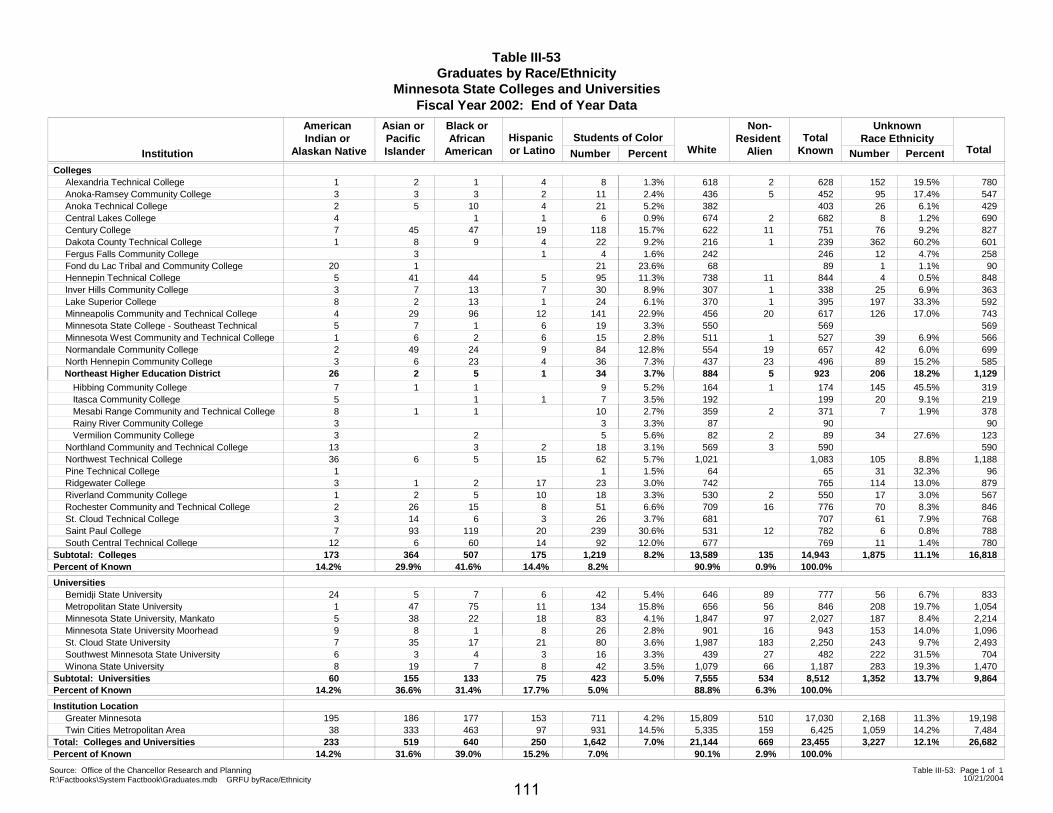
Table III-53Graduates by Race/Ethnicity
Minnesota State Colleges and Universities
American Indian or
Alaskan Native
Asian or Pacific Islander
TotalKnown Percent PercentInstitution
Fiscal Year 2002: End of Year Data
TotalNumber
Black or African
AmericanHispanic or Latino White
Non-Resident
Alien Number
UnknownRace EthnicityStudents of Color
Colleges1Alexandria Technical College 2 1.3% 78019.5%1 4 618 2 1528 6283Anoka-Ramsey Community College 3 2.4% 54717.4%3 2 436 5 9511 4522Anoka Technical College 5 5.2% 4296.1%10 4 382 2621 4034Central Lakes College 0.9% 6901.2%1 1 674 2 86 6827Century College 45 15.7% 8279.2%47 19 622 11 76118 7511Dakota County Technical College 8 9.2% 60160.2%9 4 216 1 36222 239
Fergus Falls Community College 3 1.6% 2584.7%1 242 124 24620Fond du Lac Tribal and Community College 1 23.6% 901.1%68 121 895Hennepin Technical College 41 11.3% 8480.5%44 5 738 11 495 8443Inver Hills Community College 7 8.9% 3636.9%13 7 307 1 2530 3388Lake Superior College 2 6.1% 59233.3%13 1 370 1 19724 3954Minneapolis Community and Technical College 29 22.9% 74317.0%96 12 456 20 126141 6175Minnesota State College - Southeast Technical 7 3.3% 5691 6 55019 5691Minnesota West Community and Technical College 6 2.8% 5666.9%2 6 511 1 3915 5272Normandale Community College 49 12.8% 6996.0%24 9 554 19 4284 6573North Hennepin Community College 6 7.3% 58515.2%23 4 437 23 8936 496
Northeast Higher Education District
7 Hibbing Community College 1
26 2 92334
5.2%
3.7%
31945.5%
18.2% 1,129
1
5 1
164
884
1
5
145
206
9 1745 Itasca Community College 3.5% 2199.1%1 1 192 207 1998 Mesabi Range Community and Technical College 1 2.7% 3781.9%1 359 2 710 3713 Rainy River Community College 3.3% 90873 903 Vermilion Community College 5.6% 12327.6%2 82 2 345 89
13Northland Community and Technical College 3.1% 5903 2 569 318 59036Northwest Technical College 6 5.7% 1,1888.8%5 15 1,021 10562 1,0831Pine Technical College 1.5% 9632.3%64 311 653Ridgewater College 1 3.0% 87913.0%2 17 742 11423 7651Riverland Community College 2 3.3% 5673.0%5 10 530 2 1718 5502Rochester Community and Technical College 26 6.6% 8468.3%15 8 709 16 7051 7763St. Cloud Technical College 14 3.7% 7687.9%6 3 681 6126 7077Saint Paul College 93 30.6% 7880.8%119 20 531 12 6239 782
12South Central Technical College 6 12.0% 7801.4%60 14 677 1192 769Subtotal: Colleges 173 364 14,9431,219 8.2% 16,81811.1%507 175 13,589 135 1,875
14.2%Percent of Known 29.9% 41.6% 14.4% 8.2% 90.9% 0.9% 100.0%
Universities24Bemidji State University 5 5.4% 8336.7%7 6 646 89 5642 7771Metropolitan State University 47 15.8% 1,05419.7%75 11 656 56 208134 8465Minnesota State University, Mankato 38 4.1% 2,2148.4%22 18 1,847 97 18783 2,0279Minnesota State University Moorhead 8 2.8% 1,09614.0%1 8 901 16 15326 9437St. Cloud State University 35 3.6% 2,4939.7%17 21 1,987 183 24380 2,2506Southwest Minnesota State University 3 3.3% 70431.5%4 3 439 27 22216 4828Winona State University 19 3.5% 1,47019.3%7 8 1,079 66 28342 1,187
Subtotal: Universities 60 155 8,512423 5.0% 9,86413.7%133 75 7,555 534 1,35214.2%Percent of Known 36.6% 31.4% 17.7% 5.0% 88.8% 6.3% 100.0%
Institution Location195Greater Minnesota 186 4.2% 19,19811.3%177 153 15,809 510 2,168711 17,03038Twin Cities Metropolitan Area 333 14.5% 7,48414.2%463 97 5,335 159 1,059931 6,425
Total: Colleges and Universities 233 519 23,4551,642 7.0% 26,68212.1%640 250 21,144 669 3,22714.2%Percent of Known 31.6% 39.0% 15.2% 7.0% 90.1% 2.9% 100.0%
Source: Office of the Chancellor Research and PlanningR:\Factbooks\System Factbook\Graduates.mdb GRFU byRace/Ethnicity 10/21/2004
Table III-53: Page 1 of 1
111
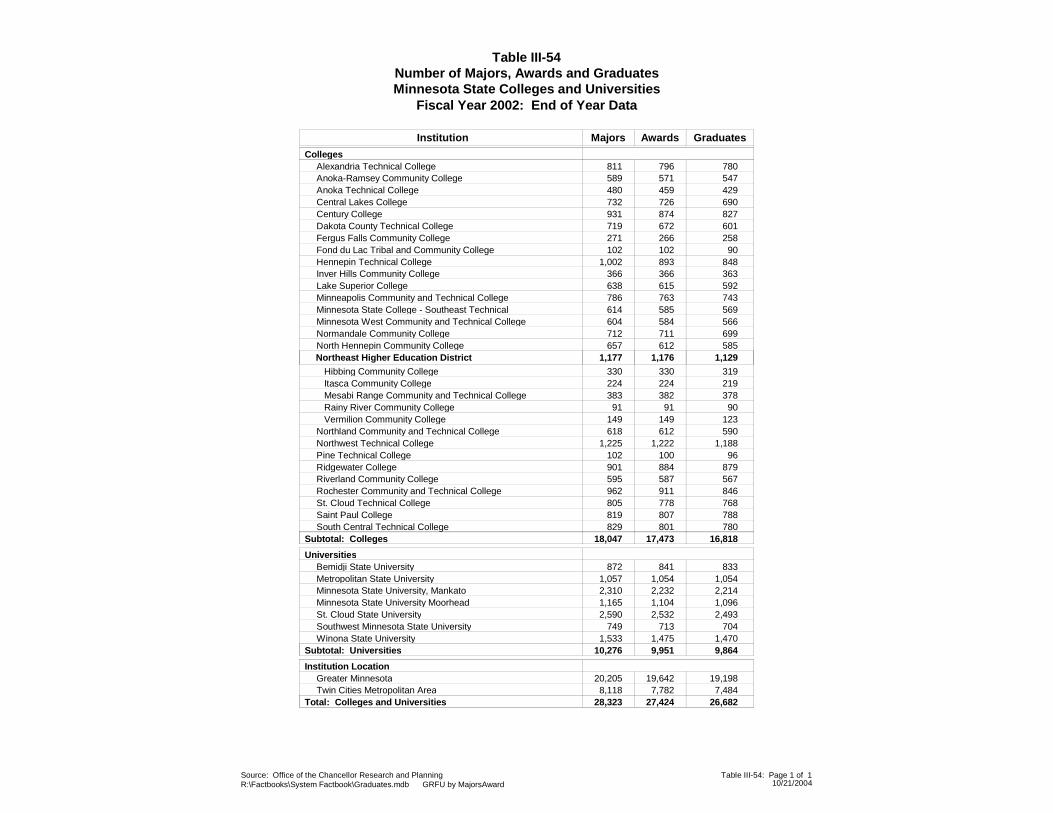
Table III-54Number of Majors, Awards and GraduatesMinnesota State Colleges and Universities
Majors Awards GraduatesInstitution
Fiscal Year 2002: End of Year Data
Colleges811Alexandria Technical College 796 780589Anoka-Ramsey Community College 571 547480Anoka Technical College 459 429732Central Lakes College 726 690931Century College 874 827719Dakota County Technical College 672 601271Fergus Falls Community College 266 258102Fond du Lac Tribal and Community College 102 90
1,002Hennepin Technical College 893 848366Inver Hills Community College 366 363638Lake Superior College 615 592786Minneapolis Community and Technical College 763 743614Minnesota State College - Southeast Technical 585 569604Minnesota West Community and Technical College 584 566712Normandale Community College 711 699657North Hennepin Community College 612 585
Northeast Higher Education District
330 Hibbing Community College 330
1,177 1,176 1,129
319224 Itasca Community College 224 219383 Mesabi Range Community and Technical College 382 37891 Rainy River Community College 91 90
149 Vermilion Community College 149 123618Northland Community and Technical College 612 590
1,225Northwest Technical College 1,222 1,188102Pine Technical College 100 96901Ridgewater College 884 879595Riverland Community College 587 567962Rochester Community and Technical College 911 846805St. Cloud Technical College 778 768819Saint Paul College 807 788829South Central Technical College 801 780
Subtotal: Colleges 17,473 16,81818,047
Universities872Bemidji State University 841 833
1,057Metropolitan State University 1,054 1,0542,310Minnesota State University, Mankato 2,232 2,2141,165Minnesota State University Moorhead 1,104 1,0962,590St. Cloud State University 2,532 2,493
749Southwest Minnesota State University 713 7041,533Winona State University 1,475 1,470
Subtotal: Universities 9,951 9,86410,276
Institution Location20,205Greater Minnesota 19,642 19,1988,118Twin Cities Metropolitan Area 7,782 7,484
Total: Colleges and Universities 27,424 26,68228,323
Source: Office of the Chancellor Research and PlanningR:\Factbooks\System Factbook\Graduates.mdb GRFU by MajorsAward 10/21/2004
Table III-54: Page 1 of 1
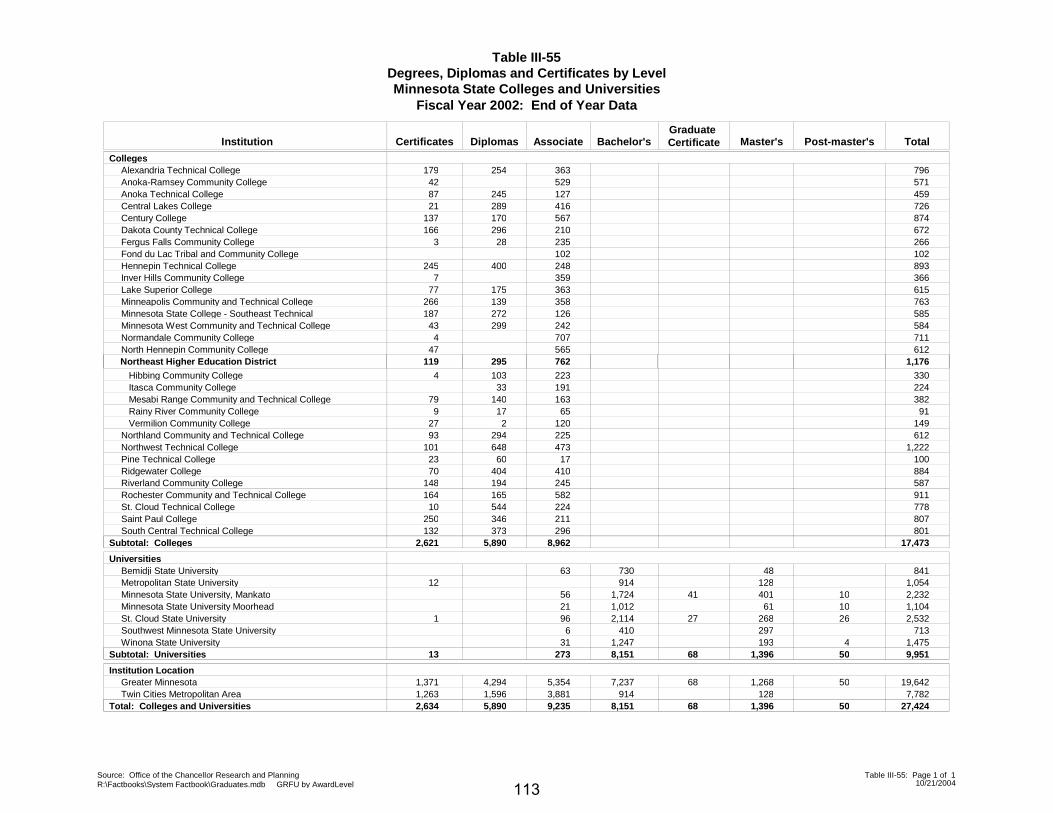
Table III-55Degrees, Diplomas and Certificates by LevelMinnesota State Colleges and Universities
Certificates DiplomasGraduate CertificateInstitution
Fiscal Year 2002: End of Year Data
Associate Bachelor's Master's Post-master's Total
Colleges179Alexandria Technical College 254 363 79642Anoka-Ramsey Community College 529 57187Anoka Technical College 245 127 45921Central Lakes College 289 416 726
137Century College 170 567 874166Dakota County Technical College 296 210 672
3Fergus Falls Community College 28 235 266Fond du Lac Tribal and Community College 102 102
245Hennepin Technical College 400 248 8937Inver Hills Community College 359 366
77Lake Superior College 175 363 615266Minneapolis Community and Technical College 139 358 763187Minnesota State College - Southeast Technical 272 126 58543Minnesota West Community and Technical College 299 242 5844Normandale Community College 707 711
47North Hennepin Community College 565 612 Northeast Higher Education District
4 Hibbing Community College 103
119 295
223
762
330
1,176
Itasca Community College 33 191 22479 Mesabi Range Community and Technical College 140 163 3829 Rainy River Community College 17 65 91
27 Vermilion Community College 2 120 14993Northland Community and Technical College 294 225 612
101Northwest Technical College 648 473 1,22223Pine Technical College 60 17 10070Ridgewater College 404 410 884
148Riverland Community College 194 245 587164Rochester Community and Technical College 165 582 91110St. Cloud Technical College 544 224 778
250Saint Paul College 346 211 807132South Central Technical College 373 296 801
Subtotal: Colleges 2,621 5,890 8,962 17,473
UniversitiesBemidji State University 63 730 48 841
12Metropolitan State University 914 128 1,054Minnesota State University, Mankato 4156 1,724 401 10 2,232Minnesota State University Moorhead 21 1,012 61 10 1,104
1St. Cloud State University 2796 2,114 268 26 2,532Southwest Minnesota State University 6 410 297 713Winona State University 31 1,247 193 4 1,475
Subtotal: Universities 13 68273 8,151 1,396 50 9,951
Institution Location1,371Greater Minnesota 4,294 685,354 7,237 1,268 50 19,6421,263Twin Cities Metropolitan Area 1,596 3,881 914 128 7,782
Total: Colleges and Universities 2,634 5,890 689,235 8,151 1,396 50 27,424
Source: Office of the Chancellor Research and PlanningR:\Factbooks\System Factbook\Graduates.mdb GRFU by AwardLevel 10/21/2004
Table III-55: Page 1 of 1
113

This Page is Intentionally Left Blank
114
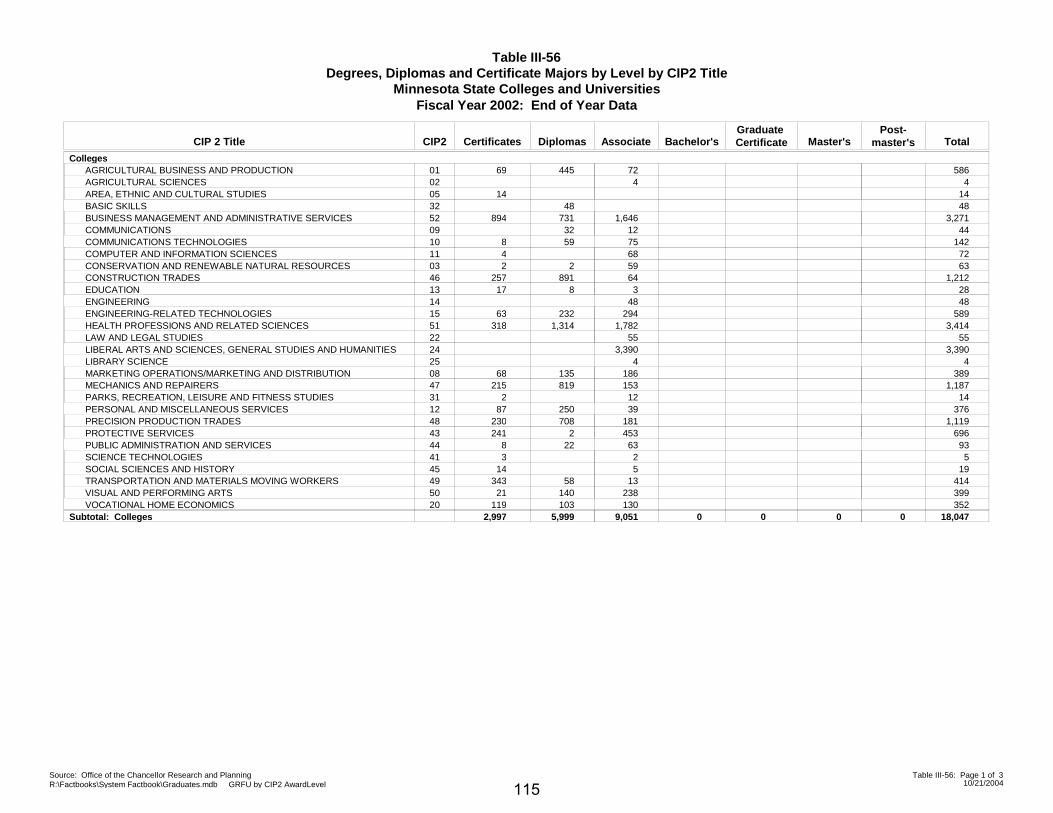
Table III-56Degrees, Diplomas and Certificate Majors by Level by CIP2 Title
Minnesota State Colleges and Universities
Certificates DiplomasGraduate CertificateCIP 2 Title
Fiscal Year 2002: End of Year Data
Associate Bachelor's Master'sPost-
master's TotalCIP2
Colleges69 445 72 586AGRICULTURAL BUSINESS AND PRODUCTION 01
4 4AGRICULTURAL SCIENCES 0214 14AREA, ETHNIC AND CULTURAL STUDIES 05
48 48BASIC SKILLS 32894 731 1,646 3,271BUSINESS MANAGEMENT AND ADMINISTRATIVE SERVICES 52
32 12 44COMMUNICATIONS 098 59 75 142COMMUNICATIONS TECHNOLOGIES 104 68 72COMPUTER AND INFORMATION SCIENCES 112 2 59 63CONSERVATION AND RENEWABLE NATURAL RESOURCES 03
257 891 64 1,212CONSTRUCTION TRADES 4617 8 3 28EDUCATION 13
48 48ENGINEERING 1463 232 294 589ENGINEERING-RELATED TECHNOLOGIES 15
318 1,314 1,782 3,414HEALTH PROFESSIONS AND RELATED SCIENCES 5155 55LAW AND LEGAL STUDIES 22
3,390 3,390LIBERAL ARTS AND SCIENCES, GENERAL STUDIES AND HUMANITIES 244 4LIBRARY SCIENCE 25
68 135 186 389MARKETING OPERATIONS/MARKETING AND DISTRIBUTION 08215 819 153 1,187MECHANICS AND REPAIRERS 47
2 12 14PARKS, RECREATION, LEISURE AND FITNESS STUDIES 3187 250 39 376PERSONAL AND MISCELLANEOUS SERVICES 12
230 708 181 1,119PRECISION PRODUCTION TRADES 48241 2 453 696PROTECTIVE SERVICES 43
8 22 63 93PUBLIC ADMINISTRATION AND SERVICES 443 2 5SCIENCE TECHNOLOGIES 41
14 5 19SOCIAL SCIENCES AND HISTORY 45343 58 13 414TRANSPORTATION AND MATERIALS MOVING WORKERS 4921 140 238 399VISUAL AND PERFORMING ARTS 50
119 103 130 352VOCATIONAL HOME ECONOMICS 20Subtotal: Colleges 5,999 02,997 9,051 0 0 0 18,047
Source: Office of the Chancellor Research and PlanningR:\Factbooks\System Factbook\Graduates.mdb GRFU by CIP2 AwardLevel 10/21/2004
Table III-56: Page 1 of 3
115
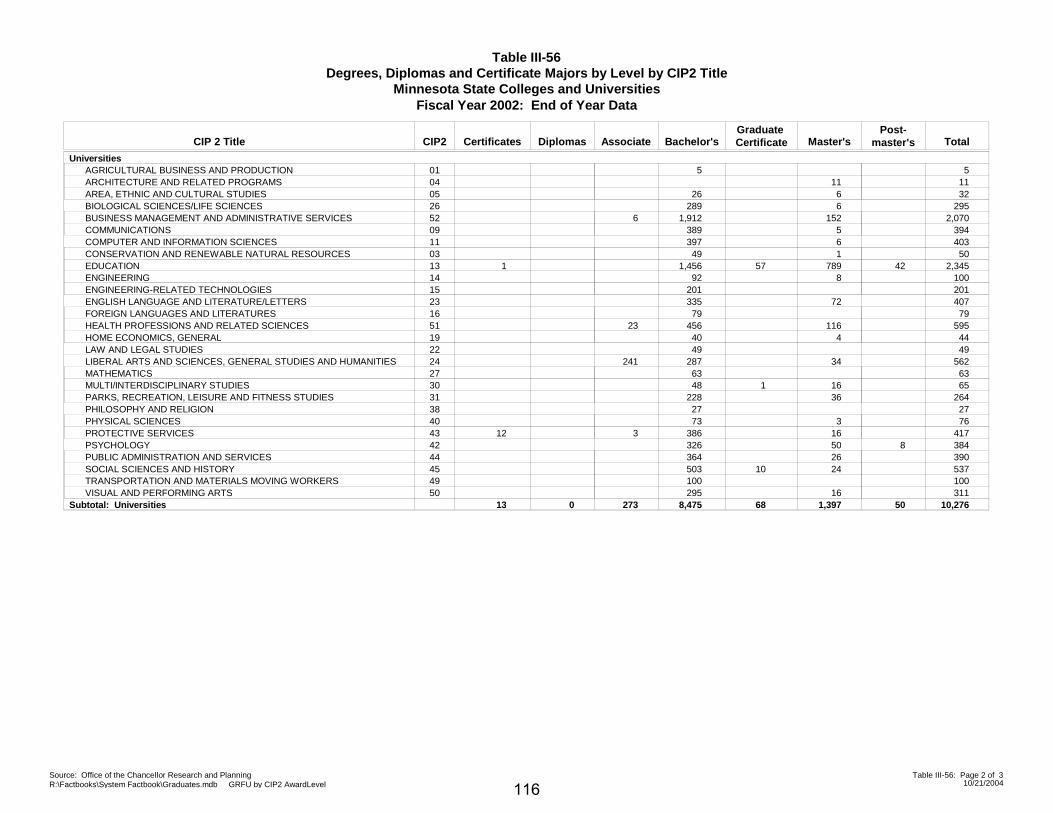
Table III-56Degrees, Diplomas and Certificate Majors by Level by CIP2 Title
Minnesota State Colleges and Universities
Certificates DiplomasGraduate CertificateCIP 2 Title
Fiscal Year 2002: End of Year Data
Associate Bachelor's Master'sPost-
master's TotalCIP2
Universities5 5AGRICULTURAL BUSINESS AND PRODUCTION 01
11 11ARCHITECTURE AND RELATED PROGRAMS 0426 6 32AREA, ETHNIC AND CULTURAL STUDIES 05
289 6 295BIOLOGICAL SCIENCES/LIFE SCIENCES 266 1,912 152 2,070BUSINESS MANAGEMENT AND ADMINISTRATIVE SERVICES 52
389 5 394COMMUNICATIONS 09397 6 403COMPUTER AND INFORMATION SCIENCES 1149 1 50CONSERVATION AND RENEWABLE NATURAL RESOURCES 03
1 571,456 789 42 2,345EDUCATION 1392 8 100ENGINEERING 14
201 201ENGINEERING-RELATED TECHNOLOGIES 15335 72 407ENGLISH LANGUAGE AND LITERATURE/LETTERS 2379 79FOREIGN LANGUAGES AND LITERATURES 16
23 456 116 595HEALTH PROFESSIONS AND RELATED SCIENCES 5140 4 44HOME ECONOMICS, GENERAL 1949 49LAW AND LEGAL STUDIES 22
241 287 34 562LIBERAL ARTS AND SCIENCES, GENERAL STUDIES AND HUMANITIES 2463 63MATHEMATICS 27
148 16 65MULTI/INTERDISCIPLINARY STUDIES 30228 36 264PARKS, RECREATION, LEISURE AND FITNESS STUDIES 3127 27PHILOSOPHY AND RELIGION 3873 3 76PHYSICAL SCIENCES 40
12 3 386 16 417PROTECTIVE SERVICES 43326 50 8 384PSYCHOLOGY 42364 26 390PUBLIC ADMINISTRATION AND SERVICES 44
10503 24 537SOCIAL SCIENCES AND HISTORY 45100 100TRANSPORTATION AND MATERIALS MOVING WORKERS 49295 16 311VISUAL AND PERFORMING ARTS 50
Subtotal: Universities 0 6813 273 8,475 1,397 50 10,276
Source: Office of the Chancellor Research and PlanningR:\Factbooks\System Factbook\Graduates.mdb GRFU by CIP2 AwardLevel 10/21/2004
Table III-56: Page 2 of 3
116
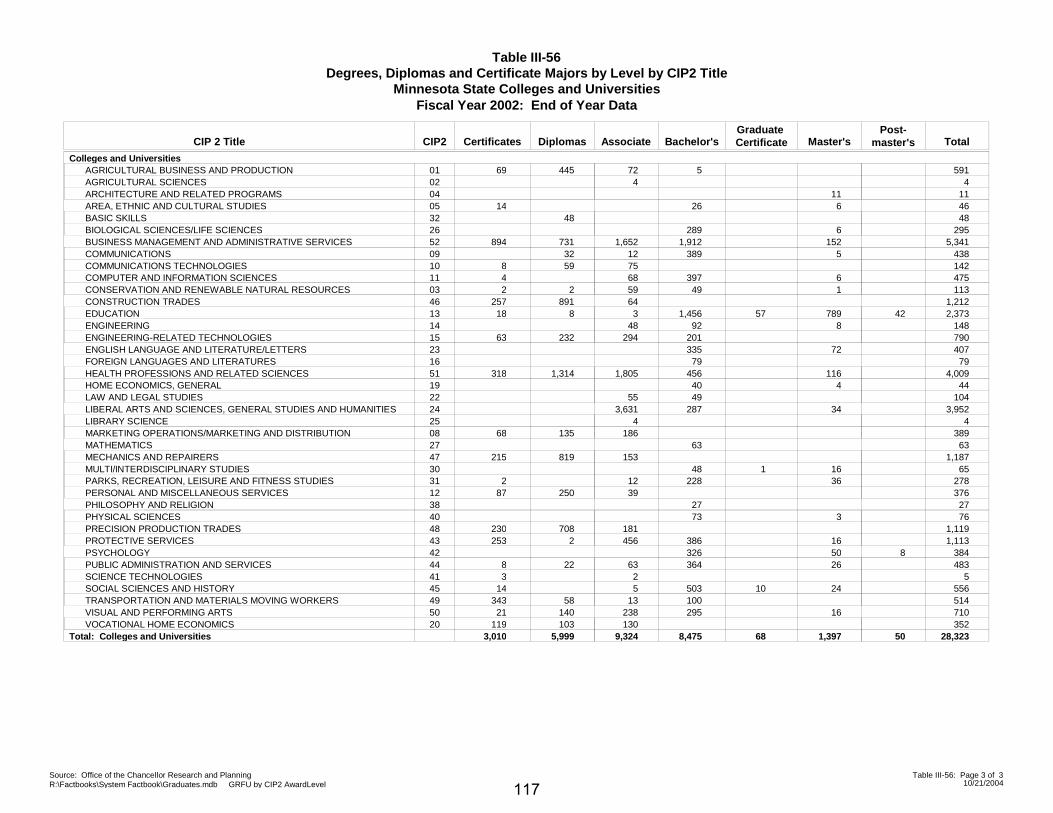
Table III-56Degrees, Diplomas and Certificate Majors by Level by CIP2 Title
Minnesota State Colleges and Universities
Certificates DiplomasGraduate CertificateCIP 2 Title
Fiscal Year 2002: End of Year Data
Associate Bachelor's Master'sPost-
master's TotalCIP2
Colleges and Universities69 445 72 5 591AGRICULTURAL BUSINESS AND PRODUCTION 01
4 4AGRICULTURAL SCIENCES 0211 11ARCHITECTURE AND RELATED PROGRAMS 04
14 26 6 46AREA, ETHNIC AND CULTURAL STUDIES 0548 48BASIC SKILLS 32
289 6 295BIOLOGICAL SCIENCES/LIFE SCIENCES 26894 731 1,652 1,912 152 5,341BUSINESS MANAGEMENT AND ADMINISTRATIVE SERVICES 52
32 12 389 5 438COMMUNICATIONS 098 59 75 142COMMUNICATIONS TECHNOLOGIES 104 68 397 6 475COMPUTER AND INFORMATION SCIENCES 112 2 59 49 1 113CONSERVATION AND RENEWABLE NATURAL RESOURCES 03
257 891 64 1,212CONSTRUCTION TRADES 4618 8 573 1,456 789 42 2,373EDUCATION 13
48 92 8 148ENGINEERING 1463 232 294 201 790ENGINEERING-RELATED TECHNOLOGIES 15
335 72 407ENGLISH LANGUAGE AND LITERATURE/LETTERS 2379 79FOREIGN LANGUAGES AND LITERATURES 16
318 1,314 1,805 456 116 4,009HEALTH PROFESSIONS AND RELATED SCIENCES 5140 4 44HOME ECONOMICS, GENERAL 19
55 49 104LAW AND LEGAL STUDIES 223,631 287 34 3,952LIBERAL ARTS AND SCIENCES, GENERAL STUDIES AND HUMANITIES 24
4 4LIBRARY SCIENCE 2568 135 186 389MARKETING OPERATIONS/MARKETING AND DISTRIBUTION 08
63 63MATHEMATICS 27215 819 153 1,187MECHANICS AND REPAIRERS 47
148 16 65MULTI/INTERDISCIPLINARY STUDIES 302 12 228 36 278PARKS, RECREATION, LEISURE AND FITNESS STUDIES 31
87 250 39 376PERSONAL AND MISCELLANEOUS SERVICES 1227 27PHILOSOPHY AND RELIGION 3873 3 76PHYSICAL SCIENCES 40
230 708 181 1,119PRECISION PRODUCTION TRADES 48253 2 456 386 16 1,113PROTECTIVE SERVICES 43
326 50 8 384PSYCHOLOGY 428 22 63 364 26 483PUBLIC ADMINISTRATION AND SERVICES 443 2 5SCIENCE TECHNOLOGIES 41
14 105 503 24 556SOCIAL SCIENCES AND HISTORY 45343 58 13 100 514TRANSPORTATION AND MATERIALS MOVING WORKERS 4921 140 238 295 16 710VISUAL AND PERFORMING ARTS 50
119 103 130 352VOCATIONAL HOME ECONOMICS 20Total: Colleges and Universities 5,999 683,010 9,324 8,475 1,397 50 28,323
Source: Office of the Chancellor Research and PlanningR:\Factbooks\System Factbook\Graduates.mdb GRFU by CIP2 AwardLevel 10/21/2004
Table III-56: Page 3 of 3
117

This Page is Intentionally Left Blank
118
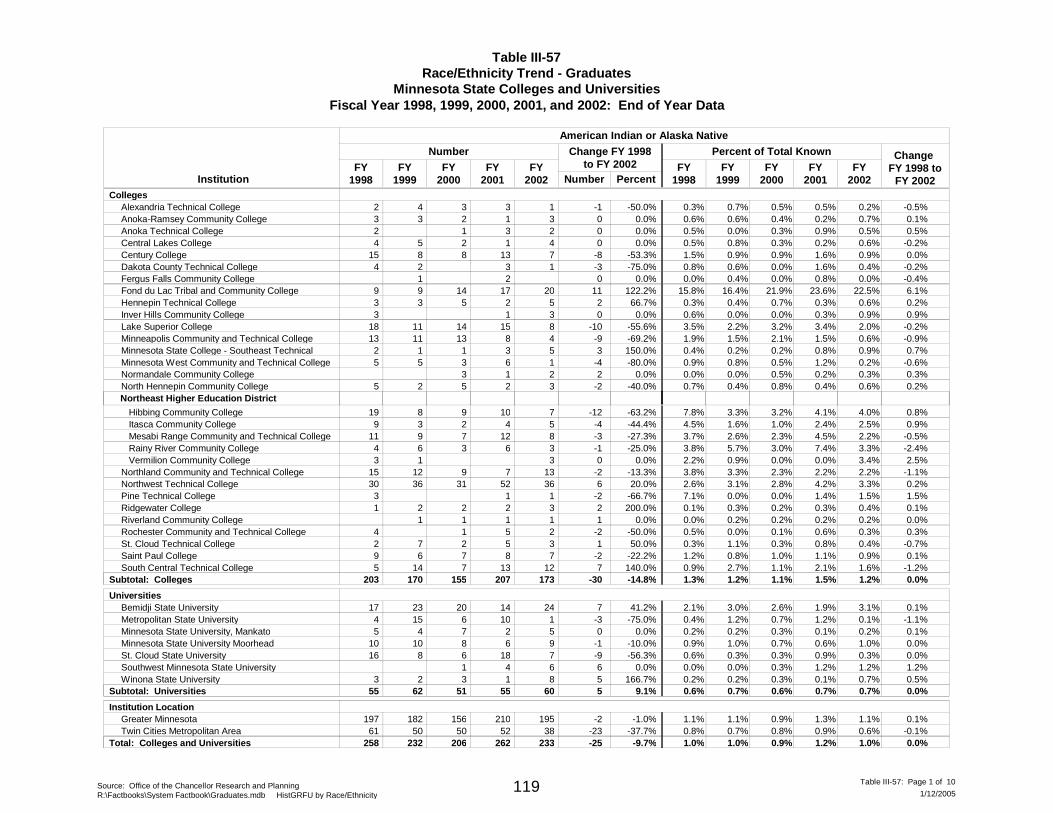
Table III-57Race/Ethnicity Trend - Graduates
Minnesota State Colleges and UniversitiesFiscal Year 1998, 1999, 2000, 2001, and 2002: End of Year Data
InstitutionFY
1998FY
1999FY
2000FY
2001
Number Change FY 1998 to
FY 2002
Change FY 1998to FY 2002
Number Percent
American Indian or Alaska Native
Percent of Total Known
FY2002
FY1998
FY1999
FY2000
FY2001
FY2002
CollegesAlexandria Technical College 2 3 3 1 -1 -50.0% -0.5%0.7% 0.5% 0.5% 0.2%0.3%4Anoka-Ramsey Community College 3 2 1 3 0 0.0% 0.1%0.6% 0.4% 0.2% 0.7%0.6%3Anoka Technical College 2 1 3 2 0 0.0% 0.5%0.0% 0.3% 0.9% 0.5%0.5%Central Lakes College 4 2 1 4 0 0.0% -0.2%0.8% 0.3% 0.2% 0.6%0.5%5Century College 15 8 13 7 -8 -53.3% 0.0%0.9% 0.9% 1.6% 0.9%1.5%8Dakota County Technical College 4 3 1 -3 -75.0% -0.2%0.6% 0.0% 1.6% 0.4%0.8%2Fergus Falls Community College 2 0 0.0% -0.4%0.4% 0.0% 0.8% 0.0%0.0%1Fond du Lac Tribal and Community College 9 14 17 20 11 122.2% 6.1%16.4% 21.9% 23.6% 22.5%15.8%9Hennepin Technical College 3 5 2 5 2 66.7% 0.2%0.4% 0.7% 0.3% 0.6%0.3%3Inver Hills Community College 3 1 3 0 0.0% 0.9%0.0% 0.0% 0.3% 0.9%0.6%Lake Superior College 18 14 15 8 -10 -55.6% -0.2%2.2% 3.2% 3.4% 2.0%3.5%11Minneapolis Community and Technical College 13 13 8 4 -9 -69.2% -0.9%1.5% 2.1% 1.5% 0.6%1.9%11Minnesota State College - Southeast Technical 2 1 3 5 3 150.0% 0.7%0.2% 0.2% 0.8% 0.9%0.4%1Minnesota West Community and Technical College 5 3 6 1 -4 -80.0% -0.6%0.8% 0.5% 1.2% 0.2%0.9%5Normandale Community College 3 1 2 2 0.0% 0.3%0.0% 0.5% 0.2% 0.3%0.0%North Hennepin Community College 5 5 2 3 -2 -40.0% 0.2%0.4% 0.8% 0.4% 0.6%0.7%2
Hibbing Community College 19 9 10 7 -12 -63.2% 0.8%3.3% 3.2% 4.1% 4.0%7.8%8
Northeast Higher Education District
Itasca Community College 9 2 4 5 -4 -44.4% 0.9%1.6% 1.0% 2.4% 2.5%4.5%3 Mesabi Range Community and Technical College 11 7 12 8 -3 -27.3% -0.5%2.6% 2.3% 4.5% 2.2%3.7%9 Rainy River Community College 4 3 6 3 -1 -25.0% -2.4%5.7% 3.0% 7.4% 3.3%3.8%6 Vermilion Community College 3 3 0 0.0% 2.5%0.9% 0.0% 0.0% 3.4%2.2%1Northland Community and Technical College 15 9 7 13 -2 -13.3% -1.1%3.3% 2.3% 2.2% 2.2%3.8%12Northwest Technical College 30 31 52 36 6 20.0% 0.2%3.1% 2.8% 4.2% 3.3%2.6%36Pine Technical College 3 1 1 -2 -66.7% 1.5%0.0% 0.0% 1.4% 1.5%7.1%Ridgewater College 1 2 2 3 2 200.0% 0.1%0.3% 0.2% 0.3% 0.4%0.1%2Riverland Community College 1 1 1 1 0.0% 0.0%0.2% 0.2% 0.2% 0.2%0.0%1Rochester Community and Technical College 4 1 5 2 -2 -50.0% 0.3%0.0% 0.1% 0.6% 0.3%0.5%St. Cloud Technical College 2 2 5 3 1 50.0% -0.7%1.1% 0.3% 0.8% 0.4%0.3%7Saint Paul College 9 7 8 7 -2 -22.2% 0.1%0.8% 1.0% 1.1% 0.9%1.2%6South Central Technical College 5 7 13 12 7 140.0% -1.2%2.7% 1.1% 2.1% 1.6%0.9%14
Subtotal: Colleges 170 155 207 173 -30 -14.8% 1.2% 1.1% 1.5% 0.0%1.2%1.3%203
UniversitiesBemidji State University 17 20 14 24 7 41.2% 0.1%3.0% 2.6% 1.9% 3.1%2.1%23Metropolitan State University 4 6 10 1 -3 -75.0% -1.1%1.2% 0.7% 1.2% 0.1%0.4%15Minnesota State University, Mankato 5 7 2 5 0 0.0% 0.1%0.2% 0.3% 0.1% 0.2%0.2%4Minnesota State University Moorhead 10 8 6 9 -1 -10.0% 0.0%1.0% 0.7% 0.6% 1.0%0.9%10St. Cloud State University 16 6 18 7 -9 -56.3% 0.0%0.3% 0.3% 0.9% 0.3%0.6%8Southwest Minnesota State University 1 4 6 6 0.0% 1.2%0.0% 0.3% 1.2% 1.2%0.0%Winona State University 3 3 1 8 5 166.7% 0.5%0.2% 0.3% 0.1% 0.7%0.2%2
Subtotal: Universities 62 51 55 60 5 9.1% 0.7% 0.6% 0.7% 0.0%0.7%0.6%55
Institution LocationGreater Minnesota 197 156 210 195 -2 -1.0% 0.1%1.1% 0.9% 1.3% 1.1%1.1%182Twin Cities Metropolitan Area 61 50 52 38 -23 -37.7% -0.1%0.7% 0.8% 0.9% 0.6%0.8%50
Total: Colleges and Universities 232 206 262 233 -25 -9.7% 1.0% 0.9% 1.2% 0.0%1.0%1.0%258
Source: Office of the Chancellor Research and PlanningR:\Factbooks\System Factbook\Graduates.mdb HistGRFU by Race/Ethnicity 1/12/2005
Table III-57: Page 1 of 10119
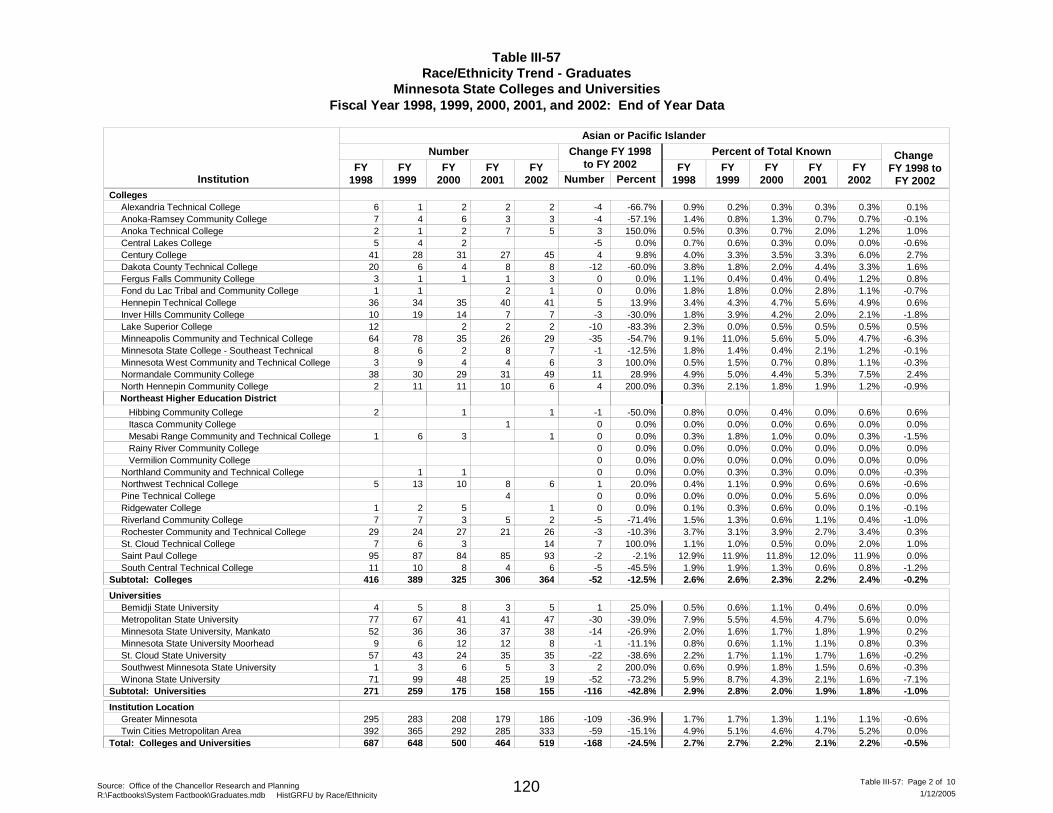
Table III-57Race/Ethnicity Trend - Graduates
Minnesota State Colleges and UniversitiesFiscal Year 1998, 1999, 2000, 2001, and 2002: End of Year Data
InstitutionFY
1998FY
1999FY
2000FY
2001
Number Change FY 1998 to
FY 2002
Change FY 1998to FY 2002
Number Percent
Asian or Pacific Islander
Percent of Total Known
FY2002
FY1998
FY1999
FY2000
FY2001
FY2002
CollegesAlexandria Technical College 6 2 2 2 -4 -66.7% 0.1%0.2% 0.3% 0.3% 0.3%0.9%1Anoka-Ramsey Community College 7 6 3 3 -4 -57.1% -0.1%0.8% 1.3% 0.7% 0.7%1.4%4Anoka Technical College 2 2 7 5 3 150.0% 1.0%0.3% 0.7% 2.0% 1.2%0.5%1Central Lakes College 5 2 -5 0.0% -0.6%0.6% 0.3% 0.0% 0.0%0.7%4Century College 41 31 27 45 4 9.8% 2.7%3.3% 3.5% 3.3% 6.0%4.0%28Dakota County Technical College 20 4 8 8 -12 -60.0% 1.6%1.8% 2.0% 4.4% 3.3%3.8%6Fergus Falls Community College 3 1 1 3 0 0.0% 0.8%0.4% 0.4% 0.4% 1.2%1.1%1Fond du Lac Tribal and Community College 1 2 1 0 0.0% -0.7%1.8% 0.0% 2.8% 1.1%1.8%1Hennepin Technical College 36 35 40 41 5 13.9% 0.6%4.3% 4.7% 5.6% 4.9%3.4%34Inver Hills Community College 10 14 7 7 -3 -30.0% -1.8%3.9% 4.2% 2.0% 2.1%1.8%19Lake Superior College 12 2 2 2 -10 -83.3% 0.5%0.0% 0.5% 0.5% 0.5%2.3%Minneapolis Community and Technical College 64 35 26 29 -35 -54.7% -6.3%11.0% 5.6% 5.0% 4.7%9.1%78Minnesota State College - Southeast Technical 8 2 8 7 -1 -12.5% -0.1%1.4% 0.4% 2.1% 1.2%1.8%6Minnesota West Community and Technical College 3 4 4 6 3 100.0% -0.3%1.5% 0.7% 0.8% 1.1%0.5%9Normandale Community College 38 29 31 49 11 28.9% 2.4%5.0% 4.4% 5.3% 7.5%4.9%30North Hennepin Community College 2 11 10 6 4 200.0% -0.9%2.1% 1.8% 1.9% 1.2%0.3%11
Hibbing Community College 2 1 1 -1 -50.0% 0.6%0.0% 0.4% 0.0% 0.6%0.8%
Northeast Higher Education District
Itasca Community College 1 0 0.0% 0.0%0.0% 0.0% 0.6% 0.0%0.0% Mesabi Range Community and Technical College 1 3 1 0 0.0% -1.5%1.8% 1.0% 0.0% 0.3%0.3%6 Rainy River Community College 0 0.0% 0.0%0.0% 0.0% 0.0% 0.0%0.0% Vermilion Community College 0 0.0% 0.0%0.0% 0.0% 0.0% 0.0%0.0%Northland Community and Technical College 1 0 0.0% -0.3%0.3% 0.3% 0.0% 0.0%0.0%1Northwest Technical College 5 10 8 6 1 20.0% -0.6%1.1% 0.9% 0.6% 0.6%0.4%13Pine Technical College 4 0 0.0% 0.0%0.0% 0.0% 5.6% 0.0%0.0%Ridgewater College 1 5 1 0 0.0% -0.1%0.3% 0.6% 0.0% 0.1%0.1%2Riverland Community College 7 3 5 2 -5 -71.4% -1.0%1.3% 0.6% 1.1% 0.4%1.5%7Rochester Community and Technical College 29 27 21 26 -3 -10.3% 0.3%3.1% 3.9% 2.7% 3.4%3.7%24St. Cloud Technical College 7 3 14 7 100.0% 1.0%1.0% 0.5% 0.0% 2.0%1.1%6Saint Paul College 95 84 85 93 -2 -2.1% 0.0%11.9% 11.8% 12.0% 11.9%12.9%87South Central Technical College 11 8 4 6 -5 -45.5% -1.2%1.9% 1.3% 0.6% 0.8%1.9%10
Subtotal: Colleges 389 325 306 364 -52 -12.5% 2.6% 2.3% 2.2% -0.2%2.4%2.6%416
UniversitiesBemidji State University 4 8 3 5 1 25.0% 0.0%0.6% 1.1% 0.4% 0.6%0.5%5Metropolitan State University 77 41 41 47 -30 -39.0% 0.0%5.5% 4.5% 4.7% 5.6%7.9%67Minnesota State University, Mankato 52 36 37 38 -14 -26.9% 0.2%1.6% 1.7% 1.8% 1.9%2.0%36Minnesota State University Moorhead 9 12 12 8 -1 -11.1% 0.3%0.6% 1.1% 1.1% 0.8%0.8%6St. Cloud State University 57 24 35 35 -22 -38.6% -0.2%1.7% 1.1% 1.7% 1.6%2.2%43Southwest Minnesota State University 1 6 5 3 2 200.0% -0.3%0.9% 1.8% 1.5% 0.6%0.6%3Winona State University 71 48 25 19 -52 -73.2% -7.1%8.7% 4.3% 2.1% 1.6%5.9%99
Subtotal: Universities 259 175 158 155 -116 -42.8% 2.8% 2.0% 1.9% -1.0%1.8%2.9%271
Institution LocationGreater Minnesota 295 208 179 186 -109 -36.9% -0.6%1.7% 1.3% 1.1% 1.1%1.7%283Twin Cities Metropolitan Area 392 292 285 333 -59 -15.1% 0.0%5.1% 4.6% 4.7% 5.2%4.9%365
Total: Colleges and Universities 648 500 464 519 -168 -24.5% 2.7% 2.2% 2.1% -0.5%2.2%2.7%687
Source: Office of the Chancellor Research and PlanningR:\Factbooks\System Factbook\Graduates.mdb HistGRFU by Race/Ethnicity 1/12/2005
Table III-57: Page 2 of 10120
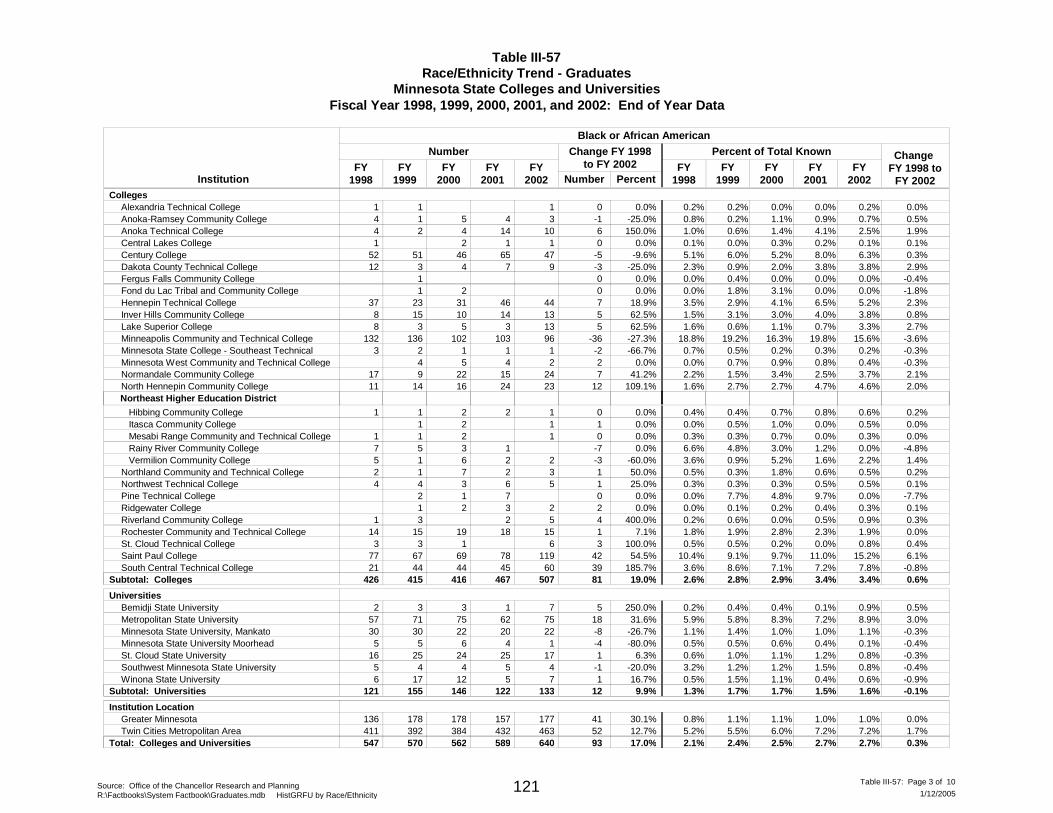
Table III-57Race/Ethnicity Trend - Graduates
Minnesota State Colleges and UniversitiesFiscal Year 1998, 1999, 2000, 2001, and 2002: End of Year Data
InstitutionFY
1998FY
1999FY
2000FY
2001
Number Change FY 1998 to
FY 2002
Change FY 1998to FY 2002
Number Percent
Black or African American
Percent of Total Known
FY2002
FY1998
FY1999
FY2000
FY2001
FY2002
CollegesAlexandria Technical College 1 1 0 0.0% 0.0%0.2% 0.0% 0.0% 0.2%0.2%1Anoka-Ramsey Community College 4 5 4 3 -1 -25.0% 0.5%0.2% 1.1% 0.9% 0.7%0.8%1Anoka Technical College 4 4 14 10 6 150.0% 1.9%0.6% 1.4% 4.1% 2.5%1.0%2Central Lakes College 1 2 1 1 0 0.0% 0.1%0.0% 0.3% 0.2% 0.1%0.1%Century College 52 46 65 47 -5 -9.6% 0.3%6.0% 5.2% 8.0% 6.3%5.1%51Dakota County Technical College 12 4 7 9 -3 -25.0% 2.9%0.9% 2.0% 3.8% 3.8%2.3%3Fergus Falls Community College 0 0.0% -0.4%0.4% 0.0% 0.0% 0.0%0.0%1Fond du Lac Tribal and Community College 2 0 0.0% -1.8%1.8% 3.1% 0.0% 0.0%0.0%1Hennepin Technical College 37 31 46 44 7 18.9% 2.3%2.9% 4.1% 6.5% 5.2%3.5%23Inver Hills Community College 8 10 14 13 5 62.5% 0.8%3.1% 3.0% 4.0% 3.8%1.5%15Lake Superior College 8 5 3 13 5 62.5% 2.7%0.6% 1.1% 0.7% 3.3%1.6%3Minneapolis Community and Technical College 132 102 103 96 -36 -27.3% -3.6%19.2% 16.3% 19.8% 15.6%18.8%136Minnesota State College - Southeast Technical 3 1 1 1 -2 -66.7% -0.3%0.5% 0.2% 0.3% 0.2%0.7%2Minnesota West Community and Technical College 5 4 2 2 0.0% -0.3%0.7% 0.9% 0.8% 0.4%0.0%4Normandale Community College 17 22 15 24 7 41.2% 2.1%1.5% 3.4% 2.5% 3.7%2.2%9North Hennepin Community College 11 16 24 23 12 109.1% 2.0%2.7% 2.7% 4.7% 4.6%1.6%14
Hibbing Community College 1 2 2 1 0 0.0% 0.2%0.4% 0.7% 0.8% 0.6%0.4%1
Northeast Higher Education District
Itasca Community College 2 1 1 0.0% 0.0%0.5% 1.0% 0.0% 0.5%0.0%1 Mesabi Range Community and Technical College 1 2 1 0 0.0% 0.0%0.3% 0.7% 0.0% 0.3%0.3%1 Rainy River Community College 7 3 1 -7 0.0% -4.8%4.8% 3.0% 1.2% 0.0%6.6%5 Vermilion Community College 5 6 2 2 -3 -60.0% 1.4%0.9% 5.2% 1.6% 2.2%3.6%1Northland Community and Technical College 2 7 2 3 1 50.0% 0.2%0.3% 1.8% 0.6% 0.5%0.5%1Northwest Technical College 4 3 6 5 1 25.0% 0.1%0.3% 0.3% 0.5% 0.5%0.3%4Pine Technical College 1 7 0 0.0% -7.7%7.7% 4.8% 9.7% 0.0%0.0%2Ridgewater College 2 3 2 2 0.0% 0.1%0.1% 0.2% 0.4% 0.3%0.0%1Riverland Community College 1 2 5 4 400.0% 0.3%0.6% 0.0% 0.5% 0.9%0.2%3Rochester Community and Technical College 14 19 18 15 1 7.1% 0.0%1.9% 2.8% 2.3% 1.9%1.8%15St. Cloud Technical College 3 1 6 3 100.0% 0.4%0.5% 0.2% 0.0% 0.8%0.5%3Saint Paul College 77 69 78 119 42 54.5% 6.1%9.1% 9.7% 11.0% 15.2%10.4%67South Central Technical College 21 44 45 60 39 185.7% -0.8%8.6% 7.1% 7.2% 7.8%3.6%44
Subtotal: Colleges 415 416 467 507 81 19.0% 2.8% 2.9% 3.4% 0.6%3.4%2.6%426
UniversitiesBemidji State University 2 3 1 7 5 250.0% 0.5%0.4% 0.4% 0.1% 0.9%0.2%3Metropolitan State University 57 75 62 75 18 31.6% 3.0%5.8% 8.3% 7.2% 8.9%5.9%71Minnesota State University, Mankato 30 22 20 22 -8 -26.7% -0.3%1.4% 1.0% 1.0% 1.1%1.1%30Minnesota State University Moorhead 5 6 4 1 -4 -80.0% -0.4%0.5% 0.6% 0.4% 0.1%0.5%5St. Cloud State University 16 24 25 17 1 6.3% -0.3%1.0% 1.1% 1.2% 0.8%0.6%25Southwest Minnesota State University 5 4 5 4 -1 -20.0% -0.4%1.2% 1.2% 1.5% 0.8%3.2%4Winona State University 6 12 5 7 1 16.7% -0.9%1.5% 1.1% 0.4% 0.6%0.5%17
Subtotal: Universities 155 146 122 133 12 9.9% 1.7% 1.7% 1.5% -0.1%1.6%1.3%121
Institution LocationGreater Minnesota 136 178 157 177 41 30.1% 0.0%1.1% 1.1% 1.0% 1.0%0.8%178Twin Cities Metropolitan Area 411 384 432 463 52 12.7% 1.7%5.5% 6.0% 7.2% 7.2%5.2%392
Total: Colleges and Universities 570 562 589 640 93 17.0% 2.4% 2.5% 2.7% 0.3%2.7%2.1%547
Source: Office of the Chancellor Research and PlanningR:\Factbooks\System Factbook\Graduates.mdb HistGRFU by Race/Ethnicity 1/12/2005
Table III-57: Page 3 of 10121
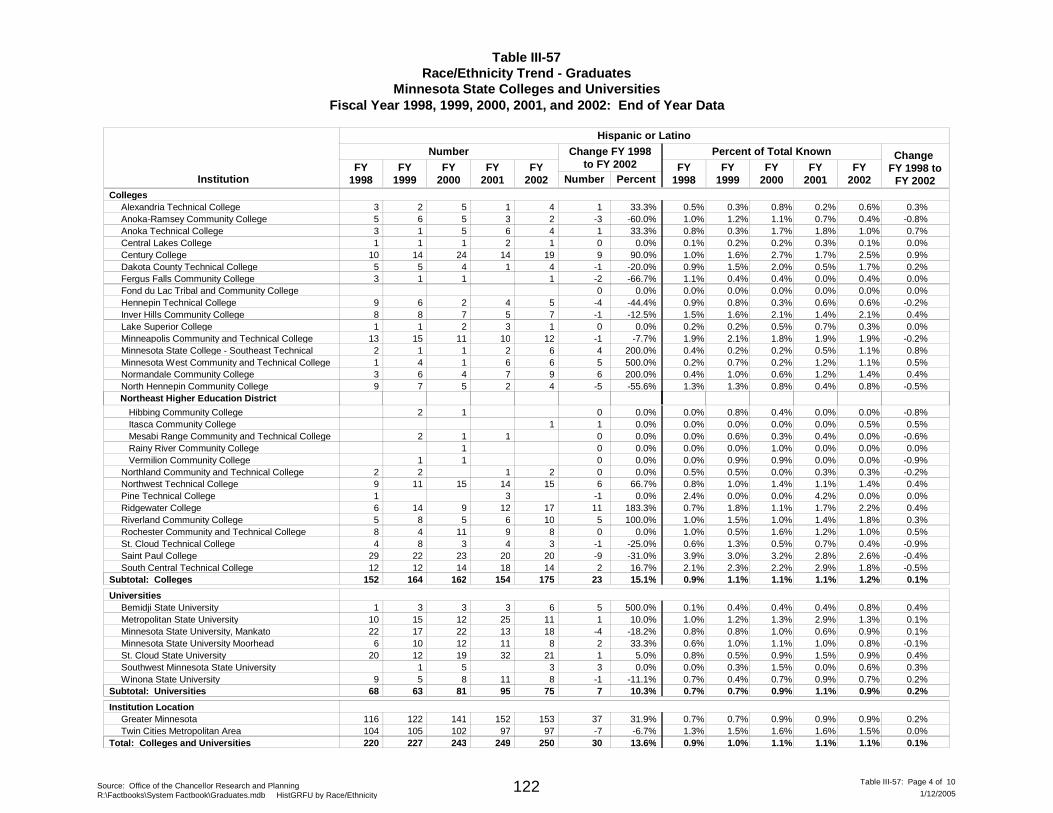
Table III-57Race/Ethnicity Trend - Graduates
Minnesota State Colleges and UniversitiesFiscal Year 1998, 1999, 2000, 2001, and 2002: End of Year Data
InstitutionFY
1998FY
1999FY
2000FY
2001
Number Change FY 1998 to
FY 2002
Change FY 1998to FY 2002
Number Percent
Hispanic or Latino
Percent of Total Known
FY2002
FY1998
FY1999
FY2000
FY2001
FY2002
CollegesAlexandria Technical College 3 5 1 4 1 33.3% 0.3%0.3% 0.8% 0.2% 0.6%0.5%2Anoka-Ramsey Community College 5 5 3 2 -3 -60.0% -0.8%1.2% 1.1% 0.7% 0.4%1.0%6Anoka Technical College 3 5 6 4 1 33.3% 0.7%0.3% 1.7% 1.8% 1.0%0.8%1Central Lakes College 1 1 2 1 0 0.0% 0.0%0.2% 0.2% 0.3% 0.1%0.1%1Century College 10 24 14 19 9 90.0% 0.9%1.6% 2.7% 1.7% 2.5%1.0%14Dakota County Technical College 5 4 1 4 -1 -20.0% 0.2%1.5% 2.0% 0.5% 1.7%0.9%5Fergus Falls Community College 3 1 1 -2 -66.7% 0.0%0.4% 0.4% 0.0% 0.4%1.1%1Fond du Lac Tribal and Community College 0 0.0% 0.0%0.0% 0.0% 0.0% 0.0%0.0%Hennepin Technical College 9 2 4 5 -4 -44.4% -0.2%0.8% 0.3% 0.6% 0.6%0.9%6Inver Hills Community College 8 7 5 7 -1 -12.5% 0.4%1.6% 2.1% 1.4% 2.1%1.5%8Lake Superior College 1 2 3 1 0 0.0% 0.0%0.2% 0.5% 0.7% 0.3%0.2%1Minneapolis Community and Technical College 13 11 10 12 -1 -7.7% -0.2%2.1% 1.8% 1.9% 1.9%1.9%15Minnesota State College - Southeast Technical 2 1 2 6 4 200.0% 0.8%0.2% 0.2% 0.5% 1.1%0.4%1Minnesota West Community and Technical College 1 1 6 6 5 500.0% 0.5%0.7% 0.2% 1.2% 1.1%0.2%4Normandale Community College 3 4 7 9 6 200.0% 0.4%1.0% 0.6% 1.2% 1.4%0.4%6North Hennepin Community College 9 5 2 4 -5 -55.6% -0.5%1.3% 0.8% 0.4% 0.8%1.3%7
Hibbing Community College 1 0 0.0% -0.8%0.8% 0.4% 0.0% 0.0%0.0%2
Northeast Higher Education District
Itasca Community College 1 1 0.0% 0.5%0.0% 0.0% 0.0% 0.5%0.0% Mesabi Range Community and Technical College 1 1 0 0.0% -0.6%0.6% 0.3% 0.4% 0.0%0.0%2 Rainy River Community College 1 0 0.0% 0.0%0.0% 1.0% 0.0% 0.0%0.0% Vermilion Community College 1 0 0.0% -0.9%0.9% 0.9% 0.0% 0.0%0.0%1Northland Community and Technical College 2 1 2 0 0.0% -0.2%0.5% 0.0% 0.3% 0.3%0.5%2Northwest Technical College 9 15 14 15 6 66.7% 0.4%1.0% 1.4% 1.1% 1.4%0.8%11Pine Technical College 1 3 -1 0.0% 0.0%0.0% 0.0% 4.2% 0.0%2.4%Ridgewater College 6 9 12 17 11 183.3% 0.4%1.8% 1.1% 1.7% 2.2%0.7%14Riverland Community College 5 5 6 10 5 100.0% 0.3%1.5% 1.0% 1.4% 1.8%1.0%8Rochester Community and Technical College 8 11 9 8 0 0.0% 0.5%0.5% 1.6% 1.2% 1.0%1.0%4St. Cloud Technical College 4 3 4 3 -1 -25.0% -0.9%1.3% 0.5% 0.7% 0.4%0.6%8Saint Paul College 29 23 20 20 -9 -31.0% -0.4%3.0% 3.2% 2.8% 2.6%3.9%22South Central Technical College 12 14 18 14 2 16.7% -0.5%2.3% 2.2% 2.9% 1.8%2.1%12
Subtotal: Colleges 164 162 154 175 23 15.1% 1.1% 1.1% 1.1% 0.1%1.2%0.9%152
UniversitiesBemidji State University 1 3 3 6 5 500.0% 0.4%0.4% 0.4% 0.4% 0.8%0.1%3Metropolitan State University 10 12 25 11 1 10.0% 0.1%1.2% 1.3% 2.9% 1.3%1.0%15Minnesota State University, Mankato 22 22 13 18 -4 -18.2% 0.1%0.8% 1.0% 0.6% 0.9%0.8%17Minnesota State University Moorhead 6 12 11 8 2 33.3% -0.1%1.0% 1.1% 1.0% 0.8%0.6%10St. Cloud State University 20 19 32 21 1 5.0% 0.4%0.5% 0.9% 1.5% 0.9%0.8%12Southwest Minnesota State University 5 3 3 0.0% 0.3%0.3% 1.5% 0.0% 0.6%0.0%1Winona State University 9 8 11 8 -1 -11.1% 0.2%0.4% 0.7% 0.9% 0.7%0.7%5
Subtotal: Universities 63 81 95 75 7 10.3% 0.7% 0.9% 1.1% 0.2%0.9%0.7%68
Institution LocationGreater Minnesota 116 141 152 153 37 31.9% 0.2%0.7% 0.9% 0.9% 0.9%0.7%122Twin Cities Metropolitan Area 104 102 97 97 -7 -6.7% 0.0%1.5% 1.6% 1.6% 1.5%1.3%105
Total: Colleges and Universities 227 243 249 250 30 13.6% 1.0% 1.1% 1.1% 0.1%1.1%0.9%220
Source: Office of the Chancellor Research and PlanningR:\Factbooks\System Factbook\Graduates.mdb HistGRFU by Race/Ethnicity 1/12/2005
Table III-57: Page 4 of 10122
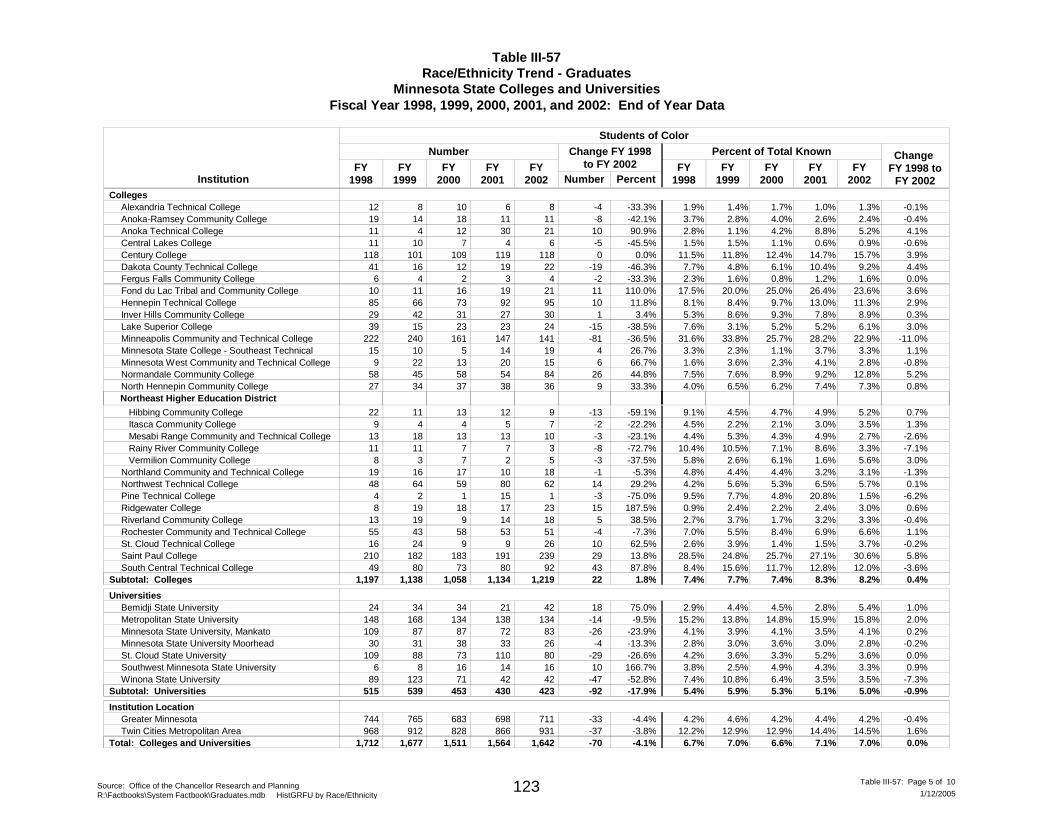
Table III-57Race/Ethnicity Trend - Graduates
Minnesota State Colleges and UniversitiesFiscal Year 1998, 1999, 2000, 2001, and 2002: End of Year Data
InstitutionFY
1998FY
1999FY
2000FY
2001
Number Change FY 1998 to
FY 2002
Change FY 1998to FY 2002
Number Percent
Students of Color
Percent of Total Known
FY2002
FY1998
FY1999
FY2000
FY2001
FY2002
CollegesAlexandria Technical College 12 10 6 8 -4 -33.3% -0.1%1.4% 1.7% 1.0% 1.3%1.9%8Anoka-Ramsey Community College 19 18 11 11 -8 -42.1% -0.4%2.8% 4.0% 2.6% 2.4%3.7%14Anoka Technical College 11 12 30 21 10 90.9% 4.1%1.1% 4.2% 8.8% 5.2%2.8%4Central Lakes College 11 7 4 6 -5 -45.5% -0.6%1.5% 1.1% 0.6% 0.9%1.5%10Century College 118 109 119 118 0 0.0% 3.9%11.8% 12.4% 14.7% 15.7%11.5%101Dakota County Technical College 41 12 19 22 -19 -46.3% 4.4%4.8% 6.1% 10.4% 9.2%7.7%16Fergus Falls Community College 6 2 3 4 -2 -33.3% 0.0%1.6% 0.8% 1.2% 1.6%2.3%4Fond du Lac Tribal and Community College 10 16 19 21 11 110.0% 3.6%20.0% 25.0% 26.4% 23.6%17.5%11Hennepin Technical College 85 73 92 95 10 11.8% 2.9%8.4% 9.7% 13.0% 11.3%8.1%66Inver Hills Community College 29 31 27 30 1 3.4% 0.3%8.6% 9.3% 7.8% 8.9%5.3%42Lake Superior College 39 23 23 24 -15 -38.5% 3.0%3.1% 5.2% 5.2% 6.1%7.6%15Minneapolis Community and Technical College 222 161 147 141 -81 -36.5% -11.0%33.8% 25.7% 28.2% 22.9%31.6%240Minnesota State College - Southeast Technical 15 5 14 19 4 26.7% 1.1%2.3% 1.1% 3.7% 3.3%3.3%10Minnesota West Community and Technical College 9 13 20 15 6 66.7% -0.8%3.6% 2.3% 4.1% 2.8%1.6%22Normandale Community College 58 58 54 84 26 44.8% 5.2%7.6% 8.9% 9.2% 12.8%7.5%45North Hennepin Community College 27 37 38 36 9 33.3% 0.8%6.5% 6.2% 7.4% 7.3%4.0%34
Hibbing Community College 22 13 12 9 -13 -59.1% 0.7%4.5% 4.7% 4.9% 5.2%9.1%11
Northeast Higher Education District
Itasca Community College 9 4 5 7 -2 -22.2% 1.3%2.2% 2.1% 3.0% 3.5%4.5%4 Mesabi Range Community and Technical College 13 13 13 10 -3 -23.1% -2.6%5.3% 4.3% 4.9% 2.7%4.4%18 Rainy River Community College 11 7 7 3 -8 -72.7% -7.1%10.5% 7.1% 8.6% 3.3%10.4%11 Vermilion Community College 8 7 2 5 -3 -37.5% 3.0%2.6% 6.1% 1.6% 5.6%5.8%3Northland Community and Technical College 19 17 10 18 -1 -5.3% -1.3%4.4% 4.4% 3.2% 3.1%4.8%16Northwest Technical College 48 59 80 62 14 29.2% 0.1%5.6% 5.3% 6.5% 5.7%4.2%64Pine Technical College 4 1 15 1 -3 -75.0% -6.2%7.7% 4.8% 20.8% 1.5%9.5%2Ridgewater College 8 18 17 23 15 187.5% 0.6%2.4% 2.2% 2.4% 3.0%0.9%19Riverland Community College 13 9 14 18 5 38.5% -0.4%3.7% 1.7% 3.2% 3.3%2.7%19Rochester Community and Technical College 55 58 53 51 -4 -7.3% 1.1%5.5% 8.4% 6.9% 6.6%7.0%43St. Cloud Technical College 16 9 9 26 10 62.5% -0.2%3.9% 1.4% 1.5% 3.7%2.6%24Saint Paul College 210 183 191 239 29 13.8% 5.8%24.8% 25.7% 27.1% 30.6%28.5%182South Central Technical College 49 73 80 92 43 87.8% -3.6%15.6% 11.7% 12.8% 12.0%8.4%80
Subtotal: Colleges 1,138 1,058 1,134 1,219 22 1.8% 7.7% 7.4% 8.3% 0.4%8.2%7.4%1,197
UniversitiesBemidji State University 24 34 21 42 18 75.0% 1.0%4.4% 4.5% 2.8% 5.4%2.9%34Metropolitan State University 148 134 138 134 -14 -9.5% 2.0%13.8% 14.8% 15.9% 15.8%15.2%168Minnesota State University, Mankato 109 87 72 83 -26 -23.9% 0.2%3.9% 4.1% 3.5% 4.1%4.1%87Minnesota State University Moorhead 30 38 33 26 -4 -13.3% -0.2%3.0% 3.6% 3.0% 2.8%2.8%31St. Cloud State University 109 73 110 80 -29 -26.6% 0.0%3.6% 3.3% 5.2% 3.6%4.2%88Southwest Minnesota State University 6 16 14 16 10 166.7% 0.9%2.5% 4.9% 4.3% 3.3%3.8%8Winona State University 89 71 42 42 -47 -52.8% -7.3%10.8% 6.4% 3.5% 3.5%7.4%123
Subtotal: Universities 539 453 430 423 -92 -17.9% 5.9% 5.3% 5.1% -0.9%5.0%5.4%515
Institution LocationGreater Minnesota 744 683 698 711 -33 -4.4% -0.4%4.6% 4.2% 4.4% 4.2%4.2%765Twin Cities Metropolitan Area 968 828 866 931 -37 -3.8% 1.6%12.9% 12.9% 14.4% 14.5%12.2%912
Total: Colleges and Universities 1,677 1,511 1,564 1,642 -70 -4.1% 7.0% 6.6% 7.1% 0.0%7.0%6.7%1,712
Source: Office of the Chancellor Research and PlanningR:\Factbooks\System Factbook\Graduates.mdb HistGRFU by Race/Ethnicity 1/12/2005
Table III-57: Page 5 of 10123

Table III-57Race/Ethnicity Trend - Graduates
Minnesota State Colleges and UniversitiesFiscal Year 1998, 1999, 2000, 2001, and 2002: End of Year Data
InstitutionFY
1998FY
1999FY
2000FY
2001
Number Change FY 1998 to
FY 2002
Change FY 1998to FY 2002
Number Percent
White
Percent of Total Known
FY2002
FY1998
FY1999
FY2000
FY2001
FY2002
CollegesAlexandria Technical College 632 586 570 618 -14 -2.2% -0.2%98.6% 98.3% 99.0% 98.4%98.1%575Anoka-Ramsey Community College 494 428 411 436 -58 -11.7% 0.3%96.2% 96.0% 96.5% 96.5%95.6%476Anoka Technical College 379 276 312 382 3 0.8% -4.1%98.9% 95.5% 91.2% 94.8%97.2%344Central Lakes College 732 632 628 674 -58 -7.9% 0.5%98.3% 98.4% 99.2% 98.8%98.3%651Century College 899 752 678 622 -277 -30.8% -4.3%87.1% 85.6% 83.5% 82.8%87.5%743Dakota County Technical College 490 186 163 216 -274 -55.9% -4.8%95.2% 93.9% 89.6% 90.4%92.3%319Fergus Falls Community College 257 238 238 242 -15 -5.8% 1.2%97.1% 98.8% 98.8% 98.4%97.3%238Fond du Lac Tribal and Community College 47 48 53 68 21 44.7% -3.6%80.0% 75.0% 73.6% 76.4%82.5%44Hennepin Technical College 961 679 614 738 -223 -23.2% -4.2%91.6% 90.3% 86.6% 87.4%91.9%724Inver Hills Community College 513 301 316 307 -206 -40.2% -0.4%91.2% 90.4% 91.1% 90.8%94.1%447Lake Superior College 474 417 420 370 -104 -21.9% -3.1%96.7% 94.6% 94.8% 93.7%92.2%473Minneapolis Community and Technical College 459 442 351 456 -3 -0.7% 11.4%62.5% 70.5% 67.4% 73.9%65.4%444Minnesota State College - Southeast Technical 436 445 367 550 114 26.1% -0.8%97.5% 98.9% 96.3% 96.7%96.7%429Minnesota West Community and Technical College 552 557 470 511 -41 -7.4% 0.9%96.1% 97.7% 95.5% 97.0%98.2%587Normandale Community College 717 584 525 554 -163 -22.7% -5.3%89.6% 89.2% 89.1% 84.3%92.2%533North Hennepin Community College 639 548 459 437 -202 -31.6% -3.5%91.6% 91.2% 89.1% 88.1%93.8%480
Hibbing Community College 219 262 232 164 -55 -25.1% -1.3%95.5% 94.6% 94.3% 94.3%90.1%234
Northeast Higher Education District
Itasca Community College 190 191 161 192 2 1.1% -1.3%97.8% 97.9% 97.0% 96.5%95.5%179 Mesabi Range Community and Technical College 280 289 252 359 79 28.2% 2.1%94.7% 95.7% 94.7% 96.8%95.2%322 Rainy River Community College 95 91 71 87 -8 -8.4% 7.1%89.5% 91.9% 87.7% 96.7%89.6%94 Vermilion Community College 129 108 124 82 -47 -36.4% -5.2%97.4% 93.9% 98.4% 92.1%93.5%111Northland Community and Technical College 372 366 301 569 197 53.0% 1.1%95.3% 95.6% 95.9% 96.4%94.9%347Northwest Technical College 1,098 1,048 1,160 1,021 -77 -7.0% -0.1%94.4% 94.7% 93.5% 94.3%95.8%1,083Pine Technical College 38 20 57 64 26 68.4% 6.2%92.3% 95.2% 79.2% 98.5%90.5%24Ridgewater College 843 791 698 742 -101 -12.0% -0.6%97.6% 97.8% 97.6% 97.0%99.1%763Riverland Community College 466 513 422 530 64 13.7% 0.4%96.0% 98.1% 96.6% 96.4%96.9%498Rochester Community and Technical College 732 617 711 709 -23 -3.1% -2.1%93.5% 89.4% 92.1% 91.4%92.5%729St. Cloud Technical College 601 623 587 681 80 13.3% 0.2%96.1% 98.6% 98.3% 96.3%97.4%595Saint Paul College 528 524 510 531 3 0.6% -6.6%74.5% 73.6% 72.2% 67.9%71.5%547South Central Technical College 536 550 546 677 141 26.3% 3.6%84.4% 88.3% 87.2% 88.0%91.6%433
Subtotal: Colleges 13,466 13,112 12,407 13,589 -1,219 -8.2% 91.6% 91.9% 90.9% -0.7%90.9%92.1%14,808
UniversitiesBemidji State University 748 640 682 646 -102 -13.6% -3.8%86.9% 84.7% 91.2% 83.1%90.2%670Metropolitan State University 797 670 679 656 -141 -17.7% -1.5%79.0% 74.2% 78.4% 77.5%81.8%960Minnesota State University, Mankato 2,381 1,936 1,923 1,847 -534 -22.4% 1.2%89.9% 90.2% 92.6% 91.1%90.2%1,989Minnesota State University Moorhead 1,038 1,014 1,030 901 -137 -13.2% 0.5%95.0% 94.8% 95.0% 95.5%95.4%988St. Cloud State University 2,347 2,053 1,858 1,987 -360 -15.3% -1.8%90.1% 91.9% 88.0% 88.3%89.9%2,220Southwest Minnesota State University 151 312 290 439 288 190.7% -6.5%97.5% 94.8% 89.5% 91.1%96.2%318Winona State University 1,118 996 1,065 1,079 -39 -3.5% 2.0%88.9% 89.6% 89.0% 90.9%92.5%1,013
Subtotal: Universities 8,158 7,621 7,527 7,555 -1,025 -11.9% 89.0% 89.1% 89.5% -0.2%88.8%90.2%8,580
Institution LocationGreater Minnesota 16,512 15,343 14,916 15,809 -703 -4.3% -0.2%93.0% 93.4% 93.0% 92.8%93.5%15,607Twin Cities Metropolitan Area 6,876 5,390 5,018 5,335 -1,541 -22.4% -1.8%84.9% 84.3% 83.4% 83.0%86.7%6,017
Total: Colleges and Universities 21,624 20,733 19,934 21,144 -2,244 -9.6% 90.6% 90.8% 90.4% -0.5%90.1%91.4%23,388
Source: Office of the Chancellor Research and PlanningR:\Factbooks\System Factbook\Graduates.mdb HistGRFU by Race/Ethnicity 1/12/2005
Table III-57: Page 6 of 10124
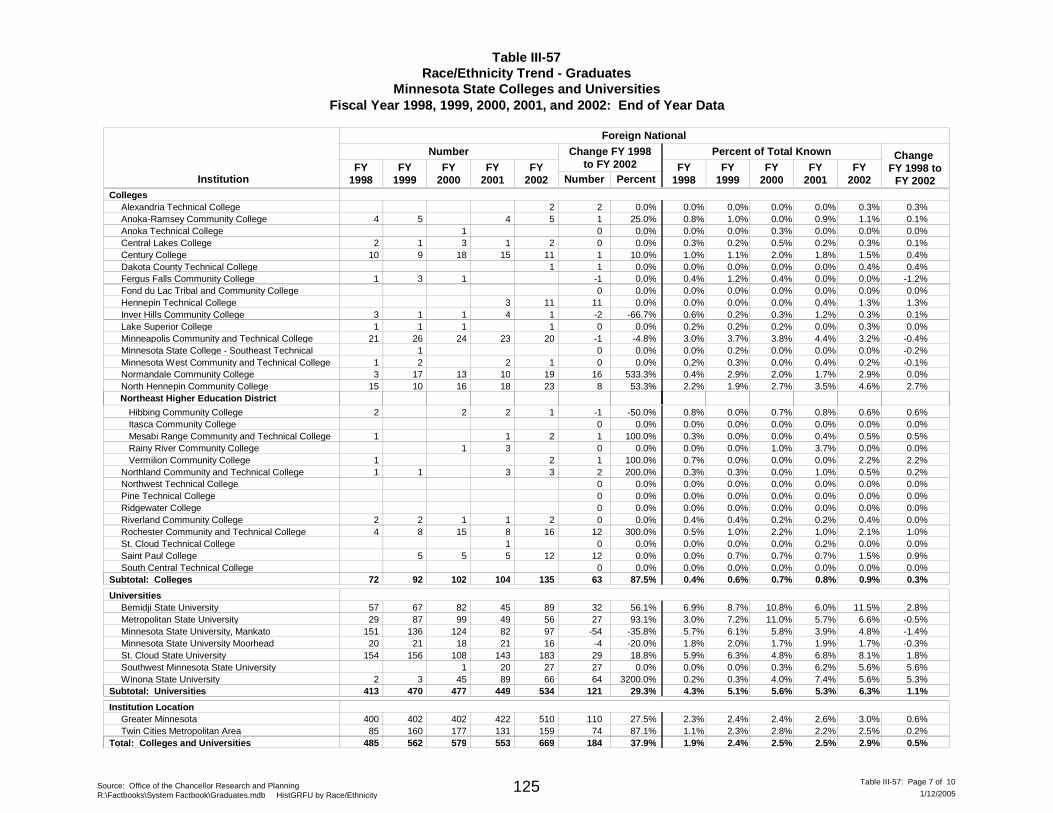
Table III-57Race/Ethnicity Trend - Graduates
Minnesota State Colleges and UniversitiesFiscal Year 1998, 1999, 2000, 2001, and 2002: End of Year Data
InstitutionFY
1998FY
1999FY
2000FY
2001
Number Change FY 1998 to
FY 2002
Change FY 1998to FY 2002
Number Percent
Foreign National
Percent of Total Known
FY2002
FY1998
FY1999
FY2000
FY2001
FY2002
CollegesAlexandria Technical College 2 2 0.0% 0.3%0.0% 0.0% 0.0% 0.3%0.0%Anoka-Ramsey Community College 4 4 5 1 25.0% 0.1%1.0% 0.0% 0.9% 1.1%0.8%5Anoka Technical College 1 0 0.0% 0.0%0.0% 0.3% 0.0% 0.0%0.0%Central Lakes College 2 3 1 2 0 0.0% 0.1%0.2% 0.5% 0.2% 0.3%0.3%1Century College 10 18 15 11 1 10.0% 0.4%1.1% 2.0% 1.8% 1.5%1.0%9Dakota County Technical College 1 1 0.0% 0.4%0.0% 0.0% 0.0% 0.4%0.0%Fergus Falls Community College 1 1 -1 0.0% -1.2%1.2% 0.4% 0.0% 0.0%0.4%3Fond du Lac Tribal and Community College 0 0.0% 0.0%0.0% 0.0% 0.0% 0.0%0.0%Hennepin Technical College 3 11 11 0.0% 1.3%0.0% 0.0% 0.4% 1.3%0.0%Inver Hills Community College 3 1 4 1 -2 -66.7% 0.1%0.2% 0.3% 1.2% 0.3%0.6%1Lake Superior College 1 1 1 0 0.0% 0.0%0.2% 0.2% 0.0% 0.3%0.2%1Minneapolis Community and Technical College 21 24 23 20 -1 -4.8% -0.4%3.7% 3.8% 4.4% 3.2%3.0%26Minnesota State College - Southeast Technical 0 0.0% -0.2%0.2% 0.0% 0.0% 0.0%0.0%1Minnesota West Community and Technical College 1 2 1 0 0.0% -0.1%0.3% 0.0% 0.4% 0.2%0.2%2Normandale Community College 3 13 10 19 16 533.3% 0.0%2.9% 2.0% 1.7% 2.9%0.4%17North Hennepin Community College 15 16 18 23 8 53.3% 2.7%1.9% 2.7% 3.5% 4.6%2.2%10
Hibbing Community College 2 2 2 1 -1 -50.0% 0.6%0.0% 0.7% 0.8% 0.6%0.8%
Northeast Higher Education District
Itasca Community College 0 0.0% 0.0%0.0% 0.0% 0.0% 0.0%0.0% Mesabi Range Community and Technical College 1 1 2 1 100.0% 0.5%0.0% 0.0% 0.4% 0.5%0.3% Rainy River Community College 1 3 0 0.0% 0.0%0.0% 1.0% 3.7% 0.0%0.0% Vermilion Community College 1 2 1 100.0% 2.2%0.0% 0.0% 0.0% 2.2%0.7%Northland Community and Technical College 1 3 3 2 200.0% 0.2%0.3% 0.0% 1.0% 0.5%0.3%1Northwest Technical College 0 0.0% 0.0%0.0% 0.0% 0.0% 0.0%0.0%Pine Technical College 0 0.0% 0.0%0.0% 0.0% 0.0% 0.0%0.0%Ridgewater College 0 0.0% 0.0%0.0% 0.0% 0.0% 0.0%0.0%Riverland Community College 2 1 1 2 0 0.0% 0.0%0.4% 0.2% 0.2% 0.4%0.4%2Rochester Community and Technical College 4 15 8 16 12 300.0% 1.0%1.0% 2.2% 1.0% 2.1%0.5%8St. Cloud Technical College 1 0 0.0% 0.0%0.0% 0.0% 0.2% 0.0%0.0%Saint Paul College 5 5 12 12 0.0% 0.9%0.7% 0.7% 0.7% 1.5%0.0%5South Central Technical College 0 0.0% 0.0%0.0% 0.0% 0.0% 0.0%0.0%
Subtotal: Colleges 92 102 104 135 63 87.5% 0.6% 0.7% 0.8% 0.3%0.9%0.4%72
UniversitiesBemidji State University 57 82 45 89 32 56.1% 2.8%8.7% 10.8% 6.0% 11.5%6.9%67Metropolitan State University 29 99 49 56 27 93.1% -0.5%7.2% 11.0% 5.7% 6.6%3.0%87Minnesota State University, Mankato 151 124 82 97 -54 -35.8% -1.4%6.1% 5.8% 3.9% 4.8%5.7%136Minnesota State University Moorhead 20 18 21 16 -4 -20.0% -0.3%2.0% 1.7% 1.9% 1.7%1.8%21St. Cloud State University 154 108 143 183 29 18.8% 1.8%6.3% 4.8% 6.8% 8.1%5.9%156Southwest Minnesota State University 1 20 27 27 0.0% 5.6%0.0% 0.3% 6.2% 5.6%0.0%Winona State University 2 45 89 66 64 3200.0% 5.3%0.3% 4.0% 7.4% 5.6%0.2%3
Subtotal: Universities 470 477 449 534 121 29.3% 5.1% 5.6% 5.3% 1.1%6.3%4.3%413
Institution LocationGreater Minnesota 400 402 422 510 110 27.5% 0.6%2.4% 2.4% 2.6% 3.0%2.3%402Twin Cities Metropolitan Area 85 177 131 159 74 87.1% 0.2%2.3% 2.8% 2.2% 2.5%1.1%160
Total: Colleges and Universities 562 579 553 669 184 37.9% 2.4% 2.5% 2.5% 0.5%2.9%1.9%485
Source: Office of the Chancellor Research and PlanningR:\Factbooks\System Factbook\Graduates.mdb HistGRFU by Race/Ethnicity 1/12/2005
Table III-57: Page 7 of 10125
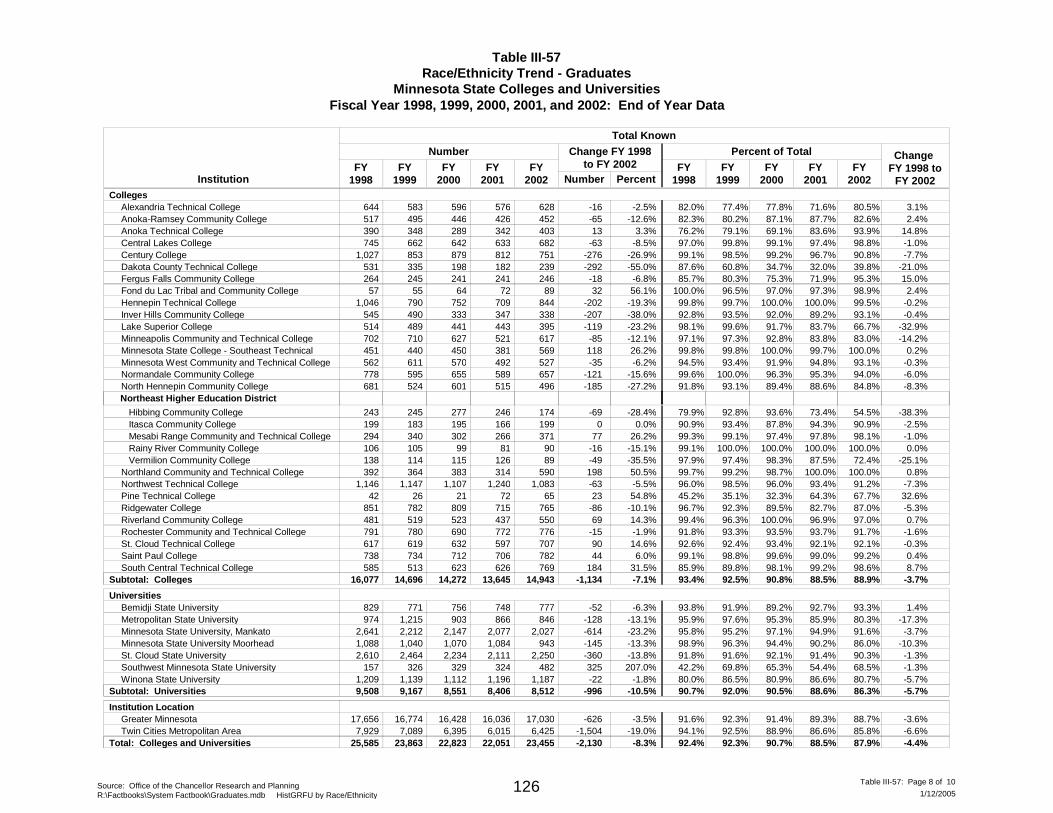
Table III-57Race/Ethnicity Trend - Graduates
Minnesota State Colleges and UniversitiesFiscal Year 1998, 1999, 2000, 2001, and 2002: End of Year Data
InstitutionFY
1998FY
1999FY
2000FY
2001
Number Change FY 1998 to
FY 2002
Change FY 1998to FY 2002
Number Percent
Total Known
Percent of Total
FY2002
FY1998
FY1999
FY2000
FY2001
FY2002
CollegesAlexandria Technical College 644 596 576 628 -16 -2.5% 3.1%77.4% 77.8% 71.6% 80.5%82.0%583Anoka-Ramsey Community College 517 446 426 452 -65 -12.6% 2.4%80.2% 87.1% 87.7% 82.6%82.3%495Anoka Technical College 390 289 342 403 13 3.3% 14.8%79.1% 69.1% 83.6% 93.9%76.2%348Central Lakes College 745 642 633 682 -63 -8.5% -1.0%99.8% 99.1% 97.4% 98.8%97.0%662Century College 1,027 879 812 751 -276 -26.9% -7.7%98.5% 99.2% 96.7% 90.8%99.1%853Dakota County Technical College 531 198 182 239 -292 -55.0% -21.0%60.8% 34.7% 32.0% 39.8%87.6%335Fergus Falls Community College 264 241 241 246 -18 -6.8% 15.0%80.3% 75.3% 71.9% 95.3%85.7%245Fond du Lac Tribal and Community College 57 64 72 89 32 56.1% 2.4%96.5% 97.0% 97.3% 98.9%100.0%55Hennepin Technical College 1,046 752 709 844 -202 -19.3% -0.2%99.7% 100.0% 100.0% 99.5%99.8%790Inver Hills Community College 545 333 347 338 -207 -38.0% -0.4%93.5% 92.0% 89.2% 93.1%92.8%490Lake Superior College 514 441 443 395 -119 -23.2% -32.9%99.6% 91.7% 83.7% 66.7%98.1%489Minneapolis Community and Technical College 702 627 521 617 -85 -12.1% -14.2%97.3% 92.8% 83.8% 83.0%97.1%710Minnesota State College - Southeast Technical 451 450 381 569 118 26.2% 0.2%99.8% 100.0% 99.7% 100.0%99.8%440Minnesota West Community and Technical College 562 570 492 527 -35 -6.2% -0.3%93.4% 91.9% 94.8% 93.1%94.5%611Normandale Community College 778 655 589 657 -121 -15.6% -6.0%100.0% 96.3% 95.3% 94.0%99.6%595North Hennepin Community College 681 601 515 496 -185 -27.2% -8.3%93.1% 89.4% 88.6% 84.8%91.8%524
Hibbing Community College 243 277 246 174 -69 -28.4% -38.3%92.8% 93.6% 73.4% 54.5%79.9%245
Northeast Higher Education District
Itasca Community College 199 195 166 199 0 0.0% -2.5%93.4% 87.8% 94.3% 90.9%90.9%183 Mesabi Range Community and Technical College 294 302 266 371 77 26.2% -1.0%99.1% 97.4% 97.8% 98.1%99.3%340 Rainy River Community College 106 99 81 90 -16 -15.1% 0.0%100.0% 100.0% 100.0% 100.0%99.1%105 Vermilion Community College 138 115 126 89 -49 -35.5% -25.1%97.4% 98.3% 87.5% 72.4%97.9%114Northland Community and Technical College 392 383 314 590 198 50.5% 0.8%99.2% 98.7% 100.0% 100.0%99.7%364Northwest Technical College 1,146 1,107 1,240 1,083 -63 -5.5% -7.3%98.5% 96.0% 93.4% 91.2%96.0%1,147Pine Technical College 42 21 72 65 23 54.8% 32.6%35.1% 32.3% 64.3% 67.7%45.2%26Ridgewater College 851 809 715 765 -86 -10.1% -5.3%92.3% 89.5% 82.7% 87.0%96.7%782Riverland Community College 481 523 437 550 69 14.3% 0.7%96.3% 100.0% 96.9% 97.0%99.4%519Rochester Community and Technical College 791 690 772 776 -15 -1.9% -1.6%93.3% 93.5% 93.7% 91.7%91.8%780St. Cloud Technical College 617 632 597 707 90 14.6% -0.3%92.4% 93.4% 92.1% 92.1%92.6%619Saint Paul College 738 712 706 782 44 6.0% 0.4%98.8% 99.6% 99.0% 99.2%99.1%734South Central Technical College 585 623 626 769 184 31.5% 8.7%89.8% 98.1% 99.2% 98.6%85.9%513
Subtotal: Colleges 14,696 14,272 13,645 14,943 -1,134 -7.1% 92.5% 90.8% 88.5% -3.7%88.9%93.4%16,077
UniversitiesBemidji State University 829 756 748 777 -52 -6.3% 1.4%91.9% 89.2% 92.7% 93.3%93.8%771Metropolitan State University 974 903 866 846 -128 -13.1% -17.3%97.6% 95.3% 85.9% 80.3%95.9%1,215Minnesota State University, Mankato 2,641 2,147 2,077 2,027 -614 -23.2% -3.7%95.2% 97.1% 94.9% 91.6%95.8%2,212Minnesota State University Moorhead 1,088 1,070 1,084 943 -145 -13.3% -10.3%96.3% 94.4% 90.2% 86.0%98.9%1,040St. Cloud State University 2,610 2,234 2,111 2,250 -360 -13.8% -1.3%91.6% 92.1% 91.4% 90.3%91.8%2,464Southwest Minnesota State University 157 329 324 482 325 207.0% -1.3%69.8% 65.3% 54.4% 68.5%42.2%326Winona State University 1,209 1,112 1,196 1,187 -22 -1.8% -5.7%86.5% 80.9% 86.6% 80.7%80.0%1,139
Subtotal: Universities 9,167 8,551 8,406 8,512 -996 -10.5% 92.0% 90.5% 88.6% -5.7%86.3%90.7%9,508
Institution LocationGreater Minnesota 17,656 16,428 16,036 17,030 -626 -3.5% -3.6%92.3% 91.4% 89.3% 88.7%91.6%16,774Twin Cities Metropolitan Area 7,929 6,395 6,015 6,425 -1,504 -19.0% -6.6%92.5% 88.9% 86.6% 85.8%94.1%7,089
Total: Colleges and Universities 23,863 22,823 22,051 23,455 -2,130 -8.3% 92.3% 90.7% 88.5% -4.4%87.9%92.4%25,585
Source: Office of the Chancellor Research and PlanningR:\Factbooks\System Factbook\Graduates.mdb HistGRFU by Race/Ethnicity 1/12/2005
Table III-57: Page 8 of 10126
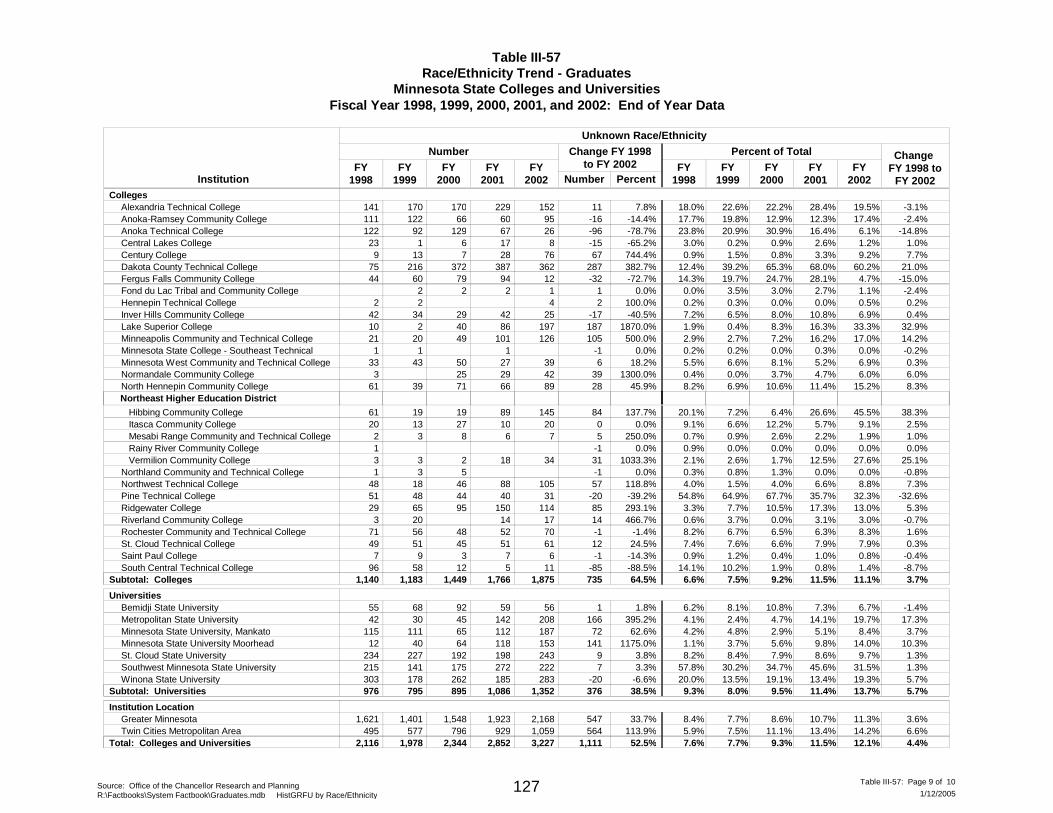
Table III-57Race/Ethnicity Trend - Graduates
Minnesota State Colleges and UniversitiesFiscal Year 1998, 1999, 2000, 2001, and 2002: End of Year Data
InstitutionFY
1998FY
1999FY
2000FY
2001
Number Change FY 1998 to
FY 2002
Change FY 1998to FY 2002
Number Percent
Unknown Race/Ethnicity
Percent of Total
FY2002
FY1998
FY1999
FY2000
FY2001
FY2002
CollegesAlexandria Technical College 141 170 229 152 11 7.8% -3.1%22.6% 22.2% 28.4% 19.5%18.0%170Anoka-Ramsey Community College 111 66 60 95 -16 -14.4% -2.4%19.8% 12.9% 12.3% 17.4%17.7%122Anoka Technical College 122 129 67 26 -96 -78.7% -14.8%20.9% 30.9% 16.4% 6.1%23.8%92Central Lakes College 23 6 17 8 -15 -65.2% 1.0%0.2% 0.9% 2.6% 1.2%3.0%1Century College 9 7 28 76 67 744.4% 7.7%1.5% 0.8% 3.3% 9.2%0.9%13Dakota County Technical College 75 372 387 362 287 382.7% 21.0%39.2% 65.3% 68.0% 60.2%12.4%216Fergus Falls Community College 44 79 94 12 -32 -72.7% -15.0%19.7% 24.7% 28.1% 4.7%14.3%60Fond du Lac Tribal and Community College 2 2 1 1 0.0% -2.4%3.5% 3.0% 2.7% 1.1%0.0%2Hennepin Technical College 2 4 2 100.0% 0.2%0.3% 0.0% 0.0% 0.5%0.2%2Inver Hills Community College 42 29 42 25 -17 -40.5% 0.4%6.5% 8.0% 10.8% 6.9%7.2%34Lake Superior College 10 40 86 197 187 1870.0% 32.9%0.4% 8.3% 16.3% 33.3%1.9%2Minneapolis Community and Technical College 21 49 101 126 105 500.0% 14.2%2.7% 7.2% 16.2% 17.0%2.9%20Minnesota State College - Southeast Technical 1 1 -1 0.0% -0.2%0.2% 0.0% 0.3% 0.0%0.2%1Minnesota West Community and Technical College 33 50 27 39 6 18.2% 0.3%6.6% 8.1% 5.2% 6.9%5.5%43Normandale Community College 3 25 29 42 39 1300.0% 6.0%0.0% 3.7% 4.7% 6.0%0.4%North Hennepin Community College 61 71 66 89 28 45.9% 8.3%6.9% 10.6% 11.4% 15.2%8.2%39
Hibbing Community College 61 19 89 145 84 137.7% 38.3%7.2% 6.4% 26.6% 45.5%20.1%19
Northeast Higher Education District
Itasca Community College 20 27 10 20 0 0.0% 2.5%6.6% 12.2% 5.7% 9.1%9.1%13 Mesabi Range Community and Technical College 2 8 6 7 5 250.0% 1.0%0.9% 2.6% 2.2% 1.9%0.7%3 Rainy River Community College 1 -1 0.0% 0.0%0.0% 0.0% 0.0% 0.0%0.9% Vermilion Community College 3 2 18 34 31 1033.3% 25.1%2.6% 1.7% 12.5% 27.6%2.1%3Northland Community and Technical College 1 5 -1 0.0% -0.8%0.8% 1.3% 0.0% 0.0%0.3%3Northwest Technical College 48 46 88 105 57 118.8% 7.3%1.5% 4.0% 6.6% 8.8%4.0%18Pine Technical College 51 44 40 31 -20 -39.2% -32.6%64.9% 67.7% 35.7% 32.3%54.8%48Ridgewater College 29 95 150 114 85 293.1% 5.3%7.7% 10.5% 17.3% 13.0%3.3%65Riverland Community College 3 14 17 14 466.7% -0.7%3.7% 0.0% 3.1% 3.0%0.6%20Rochester Community and Technical College 71 48 52 70 -1 -1.4% 1.6%6.7% 6.5% 6.3% 8.3%8.2%56St. Cloud Technical College 49 45 51 61 12 24.5% 0.3%7.6% 6.6% 7.9% 7.9%7.4%51Saint Paul College 7 3 7 6 -1 -14.3% -0.4%1.2% 0.4% 1.0% 0.8%0.9%9South Central Technical College 96 12 5 11 -85 -88.5% -8.7%10.2% 1.9% 0.8% 1.4%14.1%58
Subtotal: Colleges 1,183 1,449 1,766 1,875 735 64.5% 7.5% 9.2% 11.5% 3.7%11.1%6.6%1,140
UniversitiesBemidji State University 55 92 59 56 1 1.8% -1.4%8.1% 10.8% 7.3% 6.7%6.2%68Metropolitan State University 42 45 142 208 166 395.2% 17.3%2.4% 4.7% 14.1% 19.7%4.1%30Minnesota State University, Mankato 115 65 112 187 72 62.6% 3.7%4.8% 2.9% 5.1% 8.4%4.2%111Minnesota State University Moorhead 12 64 118 153 141 1175.0% 10.3%3.7% 5.6% 9.8% 14.0%1.1%40St. Cloud State University 234 192 198 243 9 3.8% 1.3%8.4% 7.9% 8.6% 9.7%8.2%227Southwest Minnesota State University 215 175 272 222 7 3.3% 1.3%30.2% 34.7% 45.6% 31.5%57.8%141Winona State University 303 262 185 283 -20 -6.6% 5.7%13.5% 19.1% 13.4% 19.3%20.0%178
Subtotal: Universities 795 895 1,086 1,352 376 38.5% 8.0% 9.5% 11.4% 5.7%13.7%9.3%976
Institution LocationGreater Minnesota 1,621 1,548 1,923 2,168 547 33.7% 3.6%7.7% 8.6% 10.7% 11.3%8.4%1,401Twin Cities Metropolitan Area 495 796 929 1,059 564 113.9% 6.6%7.5% 11.1% 13.4% 14.2%5.9%577
Total: Colleges and Universities 1,978 2,344 2,852 3,227 1,111 52.5% 7.7% 9.3% 11.5% 4.4%12.1%7.6%2,116
Source: Office of the Chancellor Research and PlanningR:\Factbooks\System Factbook\Graduates.mdb HistGRFU by Race/Ethnicity 1/12/2005
Table III-57: Page 9 of 10127
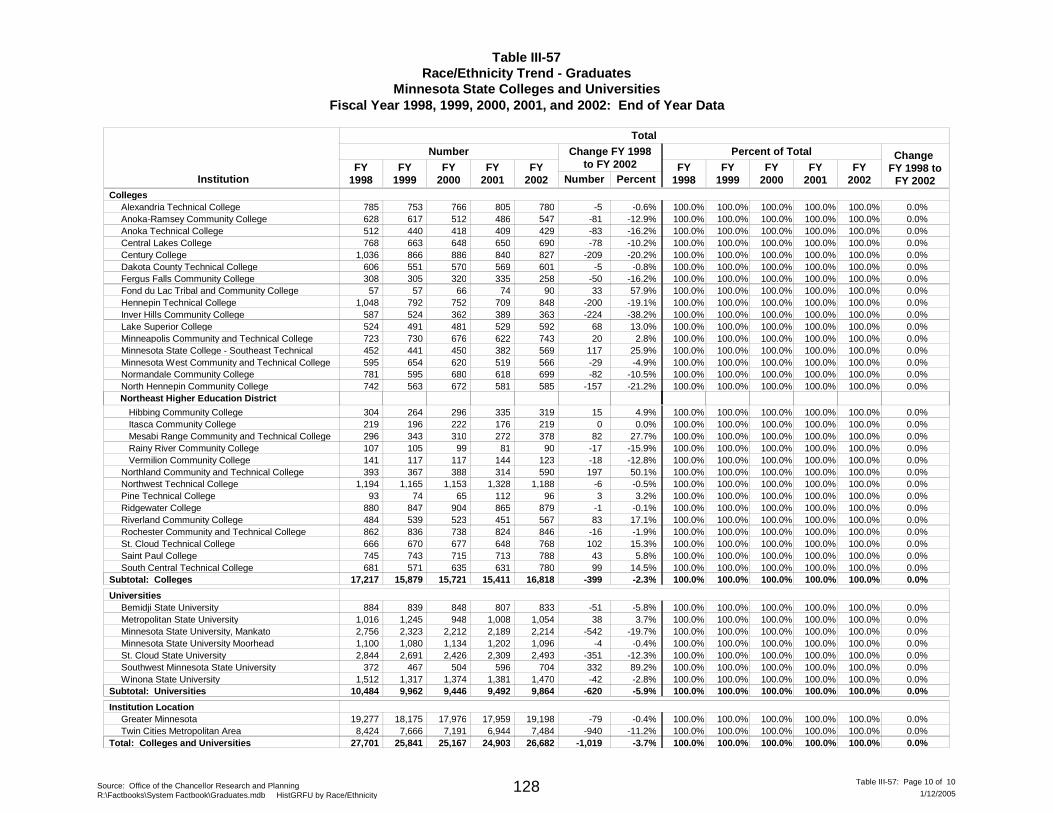
Table III-57Race/Ethnicity Trend - Graduates
Minnesota State Colleges and UniversitiesFiscal Year 1998, 1999, 2000, 2001, and 2002: End of Year Data
InstitutionFY
1998FY
1999FY
2000FY
2001
Number Change FY 1998 to
FY 2002
Change FY 1998to FY 2002
Number Percent
Total
Percent of Total
FY2002
FY1998
FY1999
FY2000
FY2001
FY2002
CollegesAlexandria Technical College 785 766 805 780 -5 -0.6% 0.0%100.0% 100.0% 100.0% 100.0%100.0%753Anoka-Ramsey Community College 628 512 486 547 -81 -12.9% 0.0%100.0% 100.0% 100.0% 100.0%100.0%617Anoka Technical College 512 418 409 429 -83 -16.2% 0.0%100.0% 100.0% 100.0% 100.0%100.0%440Central Lakes College 768 648 650 690 -78 -10.2% 0.0%100.0% 100.0% 100.0% 100.0%100.0%663Century College 1,036 886 840 827 -209 -20.2% 0.0%100.0% 100.0% 100.0% 100.0%100.0%866Dakota County Technical College 606 570 569 601 -5 -0.8% 0.0%100.0% 100.0% 100.0% 100.0%100.0%551Fergus Falls Community College 308 320 335 258 -50 -16.2% 0.0%100.0% 100.0% 100.0% 100.0%100.0%305Fond du Lac Tribal and Community College 57 66 74 90 33 57.9% 0.0%100.0% 100.0% 100.0% 100.0%100.0%57Hennepin Technical College 1,048 752 709 848 -200 -19.1% 0.0%100.0% 100.0% 100.0% 100.0%100.0%792Inver Hills Community College 587 362 389 363 -224 -38.2% 0.0%100.0% 100.0% 100.0% 100.0%100.0%524Lake Superior College 524 481 529 592 68 13.0% 0.0%100.0% 100.0% 100.0% 100.0%100.0%491Minneapolis Community and Technical College 723 676 622 743 20 2.8% 0.0%100.0% 100.0% 100.0% 100.0%100.0%730Minnesota State College - Southeast Technical 452 450 382 569 117 25.9% 0.0%100.0% 100.0% 100.0% 100.0%100.0%441Minnesota West Community and Technical College 595 620 519 566 -29 -4.9% 0.0%100.0% 100.0% 100.0% 100.0%100.0%654Normandale Community College 781 680 618 699 -82 -10.5% 0.0%100.0% 100.0% 100.0% 100.0%100.0%595North Hennepin Community College 742 672 581 585 -157 -21.2% 0.0%100.0% 100.0% 100.0% 100.0%100.0%563
Hibbing Community College 304 296 335 319 15 4.9% 0.0%100.0% 100.0% 100.0% 100.0%100.0%264
Northeast Higher Education District
Itasca Community College 219 222 176 219 0 0.0% 0.0%100.0% 100.0% 100.0% 100.0%100.0%196 Mesabi Range Community and Technical College 296 310 272 378 82 27.7% 0.0%100.0% 100.0% 100.0% 100.0%100.0%343 Rainy River Community College 107 99 81 90 -17 -15.9% 0.0%100.0% 100.0% 100.0% 100.0%100.0%105 Vermilion Community College 141 117 144 123 -18 -12.8% 0.0%100.0% 100.0% 100.0% 100.0%100.0%117Northland Community and Technical College 393 388 314 590 197 50.1% 0.0%100.0% 100.0% 100.0% 100.0%100.0%367Northwest Technical College 1,194 1,153 1,328 1,188 -6 -0.5% 0.0%100.0% 100.0% 100.0% 100.0%100.0%1,165Pine Technical College 93 65 112 96 3 3.2% 0.0%100.0% 100.0% 100.0% 100.0%100.0%74Ridgewater College 880 904 865 879 -1 -0.1% 0.0%100.0% 100.0% 100.0% 100.0%100.0%847Riverland Community College 484 523 451 567 83 17.1% 0.0%100.0% 100.0% 100.0% 100.0%100.0%539Rochester Community and Technical College 862 738 824 846 -16 -1.9% 0.0%100.0% 100.0% 100.0% 100.0%100.0%836St. Cloud Technical College 666 677 648 768 102 15.3% 0.0%100.0% 100.0% 100.0% 100.0%100.0%670Saint Paul College 745 715 713 788 43 5.8% 0.0%100.0% 100.0% 100.0% 100.0%100.0%743South Central Technical College 681 635 631 780 99 14.5% 0.0%100.0% 100.0% 100.0% 100.0%100.0%571
Subtotal: Colleges 15,879 15,721 15,411 16,818 -399 -2.3% 100.0% 100.0% 100.0% 0.0%100.0%100.0%17,217
UniversitiesBemidji State University 884 848 807 833 -51 -5.8% 0.0%100.0% 100.0% 100.0% 100.0%100.0%839Metropolitan State University 1,016 948 1,008 1,054 38 3.7% 0.0%100.0% 100.0% 100.0% 100.0%100.0%1,245Minnesota State University, Mankato 2,756 2,212 2,189 2,214 -542 -19.7% 0.0%100.0% 100.0% 100.0% 100.0%100.0%2,323Minnesota State University Moorhead 1,100 1,134 1,202 1,096 -4 -0.4% 0.0%100.0% 100.0% 100.0% 100.0%100.0%1,080St. Cloud State University 2,844 2,426 2,309 2,493 -351 -12.3% 0.0%100.0% 100.0% 100.0% 100.0%100.0%2,691Southwest Minnesota State University 372 504 596 704 332 89.2% 0.0%100.0% 100.0% 100.0% 100.0%100.0%467Winona State University 1,512 1,374 1,381 1,470 -42 -2.8% 0.0%100.0% 100.0% 100.0% 100.0%100.0%1,317
Subtotal: Universities 9,962 9,446 9,492 9,864 -620 -5.9% 100.0% 100.0% 100.0% 0.0%100.0%100.0%10,484
Institution LocationGreater Minnesota 19,277 17,976 17,959 19,198 -79 -0.4% 0.0%100.0% 100.0% 100.0% 100.0%100.0%18,175Twin Cities Metropolitan Area 8,424 7,191 6,944 7,484 -940 -11.2% 0.0%100.0% 100.0% 100.0% 100.0%100.0%7,666
Total: Colleges and Universities 25,841 25,167 24,903 26,682 -1,019 -3.7% 100.0% 100.0% 100.0% 0.0%100.0%100.0%27,701
Source: Office of the Chancellor Research and PlanningR:\Factbooks\System Factbook\Graduates.mdb HistGRFU by Race/Ethnicity 1/12/2005
Table III-57: Page 10 of 10128
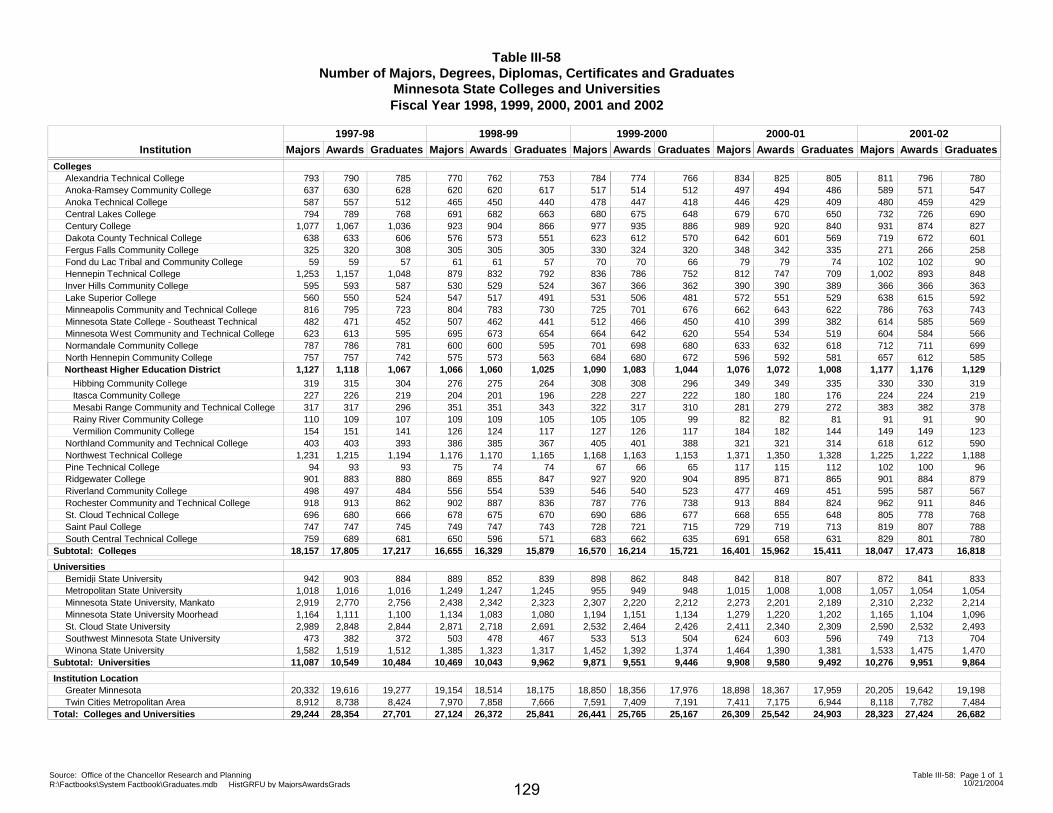
Table III-58Number of Majors, Degrees, Diplomas, Certificates and Graduates
Minnesota State Colleges and Universities
Majors Awards GraduatesInstitution
Fiscal Year 1998, 1999, 2000, 2001 and 2002
1997-98
Majors Awards Graduates
1998-99
Majors Awards Graduates
1999-2000
Majors Awards Graduates
2000-01
Majors Awards Graduates
2001-02
Colleges793Alexandria Technical College 790 785 770 762 753 784 774 766 834 825 805 811 796 780637Anoka-Ramsey Community College 630 628 620 620 617 517 514 512 497 494 486 589 571 547587Anoka Technical College 557 512 465 450 440 478 447 418 446 429 409 480 459 429794Central Lakes College 789 768 691 682 663 680 675 648 679 670 650 732 726 690
1,077Century College 1,067 1,036 923 904 866 977 935 886 989 920 840 931 874 827638Dakota County Technical College 633 606 576 573 551 623 612 570 642 601 569 719 672 601325Fergus Falls Community College 320 308 305 305 305 330 324 320 348 342 335 271 266 25859Fond du Lac Tribal and Community College 59 57 61 61 57 70 70 66 79 79 74 102 102 90
1,253Hennepin Technical College 1,157 1,048 879 832 792 836 786 752 812 747 709 1,002 893 848595Inver Hills Community College 593 587 530 529 524 367 366 362 390 390 389 366 366 363560Lake Superior College 550 524 547 517 491 531 506 481 572 551 529 638 615 592816Minneapolis Community and Technical College 795 723 804 783 730 725 701 676 662 643 622 786 763 743482Minnesota State College - Southeast Technical 471 452 507 462 441 512 466 450 410 399 382 614 585 569623Minnesota West Community and Technical College 613 595 695 673 654 664 642 620 554 534 519 604 584 566787Normandale Community College 786 781 600 600 595 701 698 680 633 632 618 712 711 699757North Hennepin Community College 757 742 575 573 563 684 680 672 596 592 581 657 612 585
Northeast Higher Education District
319 Hibbing Community College 315
1,127 1,118 1,067
304 276 275
1,066 1,060 1,025
264 308 308
1,090 1,083 1,044
296 349 349
1,076 1,072 1,008
335 330 330
1,177 1,176 1,129
319227 Itasca Community College 226 219 204 201 196 228 227 222 180 180 176 224 224 219317 Mesabi Range Community and Technical College 317 296 351 351 343 322 317 310 281 279 272 383 382 378110 Rainy River Community College 109 107 109 109 105 105 105 99 82 82 81 91 91 90154 Vermilion Community College 151 141 126 124 117 127 126 117 184 182 144 149 149 123403Northland Community and Technical College 403 393 386 385 367 405 401 388 321 321 314 618 612 590
1,231Northwest Technical College 1,215 1,194 1,176 1,170 1,165 1,168 1,163 1,153 1,371 1,350 1,328 1,225 1,222 1,18894Pine Technical College 93 93 75 74 74 67 66 65 117 115 112 102 100 96
901Ridgewater College 883 880 869 855 847 927 920 904 895 871 865 901 884 879498Riverland Community College 497 484 556 554 539 546 540 523 477 469 451 595 587 567918Rochester Community and Technical College 913 862 902 887 836 787 776 738 913 884 824 962 911 846696St. Cloud Technical College 680 666 678 675 670 690 686 677 668 655 648 805 778 768747Saint Paul College 747 745 749 747 743 728 721 715 729 719 713 819 807 788759South Central Technical College 689 681 650 596 571 683 662 635 691 658 631 829 801 780
Subtotal: Colleges 17,805 17,21718,157 16,329 15,87916,655 16,214 15,72116,570 15,962 15,41116,401 17,473 16,81818,047
Universities942Bemidji State University 903 884 889 852 839 898 862 848 842 818 807 872 841 833
1,018Metropolitan State University 1,016 1,016 1,249 1,247 1,245 955 949 948 1,015 1,008 1,008 1,057 1,054 1,0542,919Minnesota State University, Mankato 2,770 2,756 2,438 2,342 2,323 2,307 2,220 2,212 2,273 2,201 2,189 2,310 2,232 2,2141,164Minnesota State University Moorhead 1,111 1,100 1,134 1,083 1,080 1,194 1,151 1,134 1,279 1,220 1,202 1,165 1,104 1,0962,989St. Cloud State University 2,848 2,844 2,871 2,718 2,691 2,532 2,464 2,426 2,411 2,340 2,309 2,590 2,532 2,493
473Southwest Minnesota State University 382 372 503 478 467 533 513 504 624 603 596 749 713 7041,582Winona State University 1,519 1,512 1,385 1,323 1,317 1,452 1,392 1,374 1,464 1,390 1,381 1,533 1,475 1,470
Subtotal: Universities 10,549 10,48411,087 10,043 9,96210,469 9,551 9,4469,871 9,580 9,4929,908 9,951 9,86410,276
Institution Location20,332Greater Minnesota 19,616 19,277 19,154 18,514 18,175 18,850 18,356 17,976 18,898 18,367 17,959 20,205 19,642 19,1988,912Twin Cities Metropolitan Area 8,738 8,424 7,970 7,858 7,666 7,591 7,409 7,191 7,411 7,175 6,944 8,118 7,782 7,484
Total: Colleges and Universities 28,354 27,70129,244 26,372 25,84127,124 25,765 25,16726,441 25,542 24,90326,309 27,424 26,68228,323
Source: Office of the Chancellor Research and PlanningR:\Factbooks\System Factbook\Graduates.mdb HistGRFU by MajorsAwardsGrads 10/21/2004
Table III-58: Page 1 of 1
129

This Page is Intentionally Left Blank
130
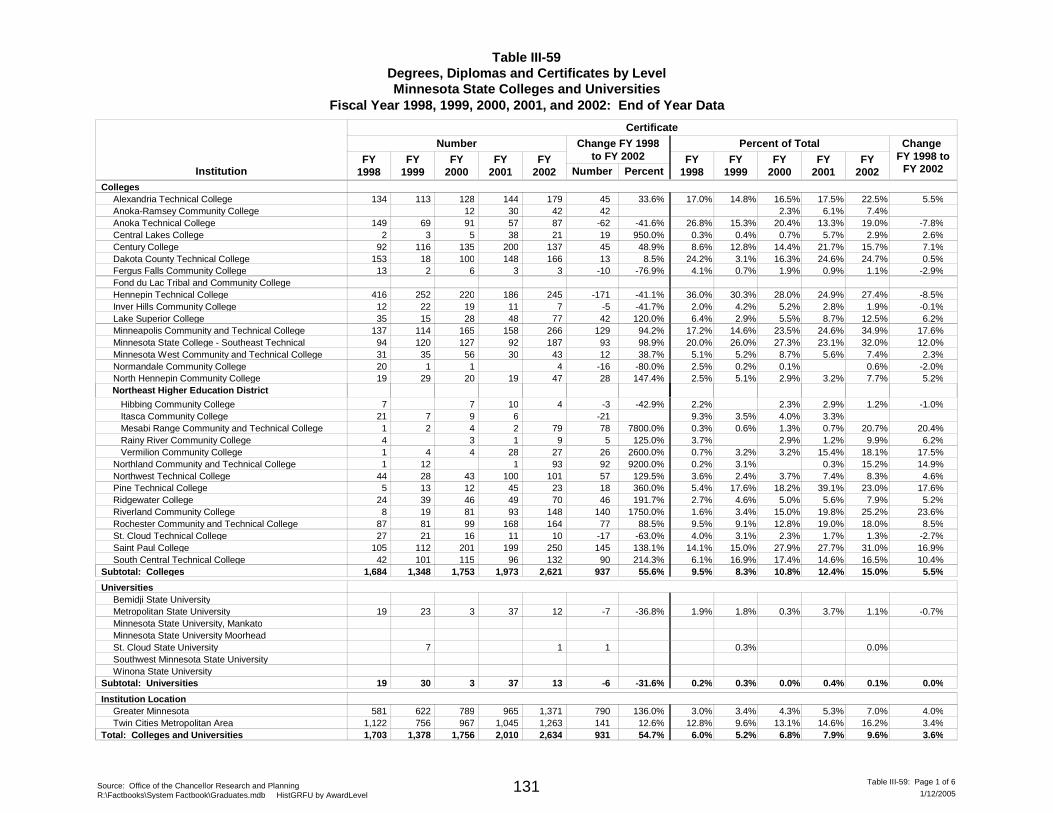
Table III-59Degrees, Diplomas and Certificates by LevelMinnesota State Colleges and Universities
Fiscal Year 1998, 1999, 2000, 2001, and 2002: End of Year Data
InstitutionFY
1998FY
1999FY
2000FY
2001
Number Change FY 1998 to
FY 2002
Change FY 1998to FY 2002
Number Percent
Percent of Total
FY2002
FY1998
FY1999
FY2000
FY2001
FY2002
Certificate
Colleges134 128 144 179 45 33.6% 17.0%113 14.8% 16.5% 17.5% 22.5% 5.5%Alexandria Technical College
12 30 42 42 2.3% 6.1% 7.4%Anoka-Ramsey Community College149 91 57 87 -62 -41.6% 26.8%69 15.3% 20.4% 13.3% 19.0% -7.8%Anoka Technical College
2 5 38 21 19 950.0% 0.3%3 0.4% 0.7% 5.7% 2.9% 2.6%Central Lakes College92 135 200 137 45 48.9% 8.6%116 12.8% 14.4% 21.7% 15.7% 7.1%Century College
153 100 148 166 13 8.5% 24.2%18 3.1% 16.3% 24.6% 24.7% 0.5%Dakota County Technical College13 6 3 3 -10 -76.9% 4.1%2 0.7% 1.9% 0.9% 1.1% -2.9%Fergus Falls Community College
Fond du Lac Tribal and Community College416 220 186 245 -171 -41.1% 36.0%252 30.3% 28.0% 24.9% 27.4% -8.5%Hennepin Technical College12 19 11 7 -5 -41.7% 2.0%22 4.2% 5.2% 2.8% 1.9% -0.1%Inver Hills Community College35 28 48 77 42 120.0% 6.4%15 2.9% 5.5% 8.7% 12.5% 6.2%Lake Superior College
137 165 158 266 129 94.2% 17.2%114 14.6% 23.5% 24.6% 34.9% 17.6%Minneapolis Community and Technical College94 127 92 187 93 98.9% 20.0%120 26.0% 27.3% 23.1% 32.0% 12.0%Minnesota State College - Southeast Technical31 56 30 43 12 38.7% 5.1%35 5.2% 8.7% 5.6% 7.4% 2.3%Minnesota West Community and Technical College20 1 4 -16 -80.0% 2.5%1 0.2% 0.1% 0.6% -2.0%Normandale Community College19 20 19 47 28 147.4% 2.5%29 5.1% 2.9% 3.2% 7.7% 5.2%North Hennepin Community College
7 7 10 4 -3 -42.9% 2.2% 2.3% 2.9% 1.2% -1.0%
Northeast Higher Education District
Hibbing Community College21 9 6 -21 9.3%7 3.5% 4.0% 3.3% Itasca Community College1 4 2 79 78 7800.0% 0.3%2 0.6% 1.3% 0.7% 20.7% 20.4% Mesabi Range Community and Technical College4 3 1 9 5 125.0% 3.7% 2.9% 1.2% 9.9% 6.2% Rainy River Community College1 4 28 27 26 2600.0% 0.7%4 3.2% 3.2% 15.4% 18.1% 17.5% Vermilion Community College1 1 93 92 9200.0% 0.2%12 3.1% 0.3% 15.2% 14.9%Northland Community and Technical College
44 43 100 101 57 129.5% 3.6%28 2.4% 3.7% 7.4% 8.3% 4.6%Northwest Technical College5 12 45 23 18 360.0% 5.4%13 17.6% 18.2% 39.1% 23.0% 17.6%Pine Technical College
24 46 49 70 46 191.7% 2.7%39 4.6% 5.0% 5.6% 7.9% 5.2%Ridgewater College8 81 93 148 140 1750.0% 1.6%19 3.4% 15.0% 19.8% 25.2% 23.6%Riverland Community College
87 99 168 164 77 88.5% 9.5%81 9.1% 12.8% 19.0% 18.0% 8.5%Rochester Community and Technical College27 16 11 10 -17 -63.0% 4.0%21 3.1% 2.3% 1.7% 1.3% -2.7%St. Cloud Technical College
105 201 199 250 145 138.1% 14.1%112 15.0% 27.9% 27.7% 31.0% 16.9%Saint Paul College42 115 96 132 90 214.3% 6.1%101 16.9% 17.4% 14.6% 16.5% 10.4%South Central Technical College
Subtotal: Colleges 1,348 1,753 1,973 2,621 937 55.6% 9.5%1,684 8.3% 10.8% 12.4% 15.0% 5.5%
UniversitiesBemidji State University
19 3 37 12 -7 -36.8% 1.9%23 1.8% 0.3% 3.7% 1.1% -0.7%Metropolitan State UniversityMinnesota State University, MankatoMinnesota State University Moorhead
1 17 0.3% 0.0%St. Cloud State UniversitySouthwest Minnesota State UniversityWinona State University
Subtotal: Universities 30 3 37 13 -6 -31.6% 0.2%19 0.3% 0.0% 0.4% 0.1% 0.0%
Institution Location581 789 965 1,371 790 136.0% 3.0%622 3.4% 4.3% 5.3% 7.0% 4.0%Greater Minnesota
1,122 967 1,045 1,263 141 12.6% 12.8%756 9.6% 13.1% 14.6% 16.2% 3.4%Twin Cities Metropolitan AreaTotal: Colleges and Universities 1,378 1,756 2,010 2,634 931 54.7% 6.0%1,703 5.2% 6.8% 7.9% 9.6% 3.6%
Source: Office of the Chancellor Research and PlanningR:\Factbooks\System Factbook\Graduates.mdb HistGRFU by AwardLevel 1/12/2005
Table III-59: Page 1 of 6131
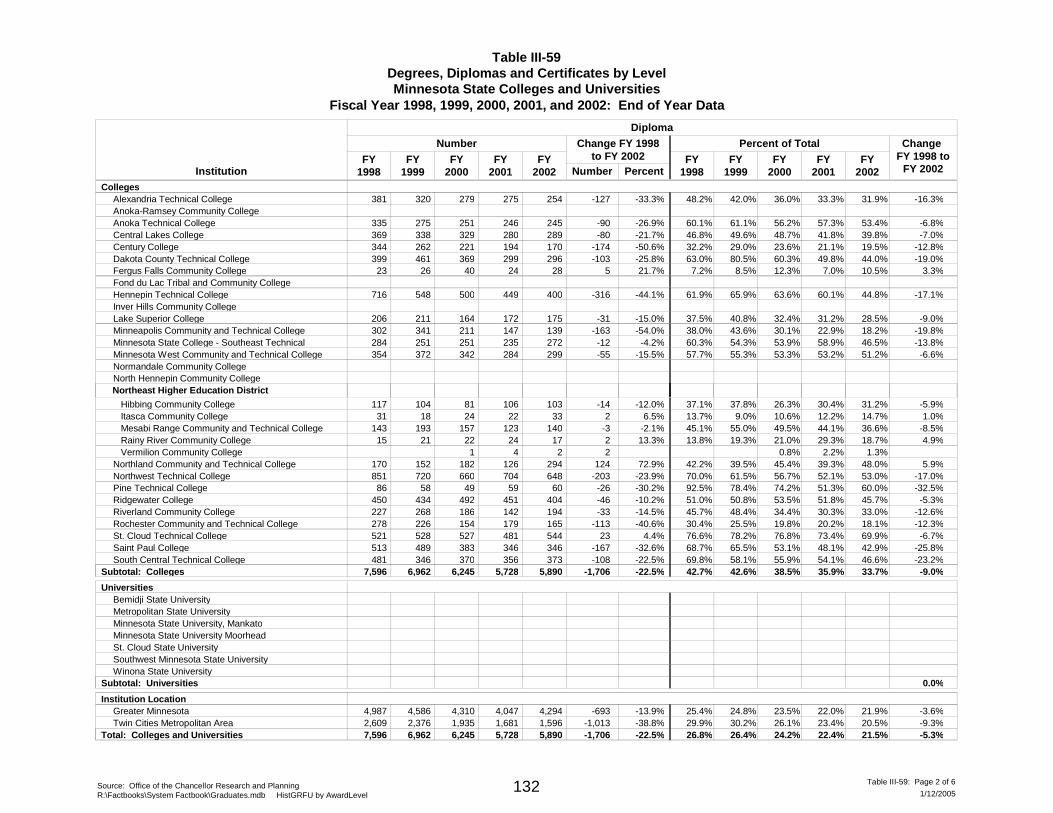
Table III-59Degrees, Diplomas and Certificates by LevelMinnesota State Colleges and Universities
Fiscal Year 1998, 1999, 2000, 2001, and 2002: End of Year Data
InstitutionFY
1998FY
1999FY
2000FY
2001
Number Change FY 1998 to
FY 2002
Change FY 1998to FY 2002
Number Percent
Percent of Total
FY2002
FY1998
FY1999
FY2000
FY2001
FY2002
Diploma
Colleges381 279 275 254 -127 -33.3% 48.2%320 42.0% 36.0% 33.3% 31.9% -16.3%Alexandria Technical College
Anoka-Ramsey Community College335 251 246 245 -90 -26.9% 60.1%275 61.1% 56.2% 57.3% 53.4% -6.8%Anoka Technical College369 329 280 289 -80 -21.7% 46.8%338 49.6% 48.7% 41.8% 39.8% -7.0%Central Lakes College344 221 194 170 -174 -50.6% 32.2%262 29.0% 23.6% 21.1% 19.5% -12.8%Century College399 369 299 296 -103 -25.8% 63.0%461 80.5% 60.3% 49.8% 44.0% -19.0%Dakota County Technical College23 40 24 28 5 21.7% 7.2%26 8.5% 12.3% 7.0% 10.5% 3.3%Fergus Falls Community College
Fond du Lac Tribal and Community College716 500 449 400 -316 -44.1% 61.9%548 65.9% 63.6% 60.1% 44.8% -17.1%Hennepin Technical College
Inver Hills Community College206 164 172 175 -31 -15.0% 37.5%211 40.8% 32.4% 31.2% 28.5% -9.0%Lake Superior College302 211 147 139 -163 -54.0% 38.0%341 43.6% 30.1% 22.9% 18.2% -19.8%Minneapolis Community and Technical College284 251 235 272 -12 -4.2% 60.3%251 54.3% 53.9% 58.9% 46.5% -13.8%Minnesota State College - Southeast Technical354 342 284 299 -55 -15.5% 57.7%372 55.3% 53.3% 53.2% 51.2% -6.6%Minnesota West Community and Technical College
Normandale Community CollegeNorth Hennepin Community College
117 81 106 103 -14 -12.0% 37.1%104 37.8% 26.3% 30.4% 31.2% -5.9%
Northeast Higher Education District
Hibbing Community College31 24 22 33 2 6.5% 13.7%18 9.0% 10.6% 12.2% 14.7% 1.0% Itasca Community College
143 157 123 140 -3 -2.1% 45.1%193 55.0% 49.5% 44.1% 36.6% -8.5% Mesabi Range Community and Technical College15 22 24 17 2 13.3% 13.8%21 19.3% 21.0% 29.3% 18.7% 4.9% Rainy River Community College
1 4 2 2 0.8% 2.2% 1.3% Vermilion Community College170 182 126 294 124 72.9% 42.2%152 39.5% 45.4% 39.3% 48.0% 5.9%Northland Community and Technical College851 660 704 648 -203 -23.9% 70.0%720 61.5% 56.7% 52.1% 53.0% -17.0%Northwest Technical College86 49 59 60 -26 -30.2% 92.5%58 78.4% 74.2% 51.3% 60.0% -32.5%Pine Technical College
450 492 451 404 -46 -10.2% 51.0%434 50.8% 53.5% 51.8% 45.7% -5.3%Ridgewater College227 186 142 194 -33 -14.5% 45.7%268 48.4% 34.4% 30.3% 33.0% -12.6%Riverland Community College278 154 179 165 -113 -40.6% 30.4%226 25.5% 19.8% 20.2% 18.1% -12.3%Rochester Community and Technical College521 527 481 544 23 4.4% 76.6%528 78.2% 76.8% 73.4% 69.9% -6.7%St. Cloud Technical College513 383 346 346 -167 -32.6% 68.7%489 65.5% 53.1% 48.1% 42.9% -25.8%Saint Paul College481 370 356 373 -108 -22.5% 69.8%346 58.1% 55.9% 54.1% 46.6% -23.2%South Central Technical College
Subtotal: Colleges 6,962 6,245 5,728 5,890 -1,706 -22.5% 42.7%7,596 42.6% 38.5% 35.9% 33.7% -9.0%
UniversitiesBemidji State UniversityMetropolitan State UniversityMinnesota State University, MankatoMinnesota State University MoorheadSt. Cloud State UniversitySouthwest Minnesota State UniversityWinona State University
Subtotal: Universities 0.0%
Institution Location4,987 4,310 4,047 4,294 -693 -13.9% 25.4%4,586 24.8% 23.5% 22.0% 21.9% -3.6%Greater Minnesota2,609 1,935 1,681 1,596 -1,013 -38.8% 29.9%2,376 30.2% 26.1% 23.4% 20.5% -9.3%Twin Cities Metropolitan Area
Total: Colleges and Universities 6,962 6,245 5,728 5,890 -1,706 -22.5% 26.8%7,596 26.4% 24.2% 22.4% 21.5% -5.3%
Source: Office of the Chancellor Research and PlanningR:\Factbooks\System Factbook\Graduates.mdb HistGRFU by AwardLevel 1/12/2005
Table III-59: Page 2 of 6132
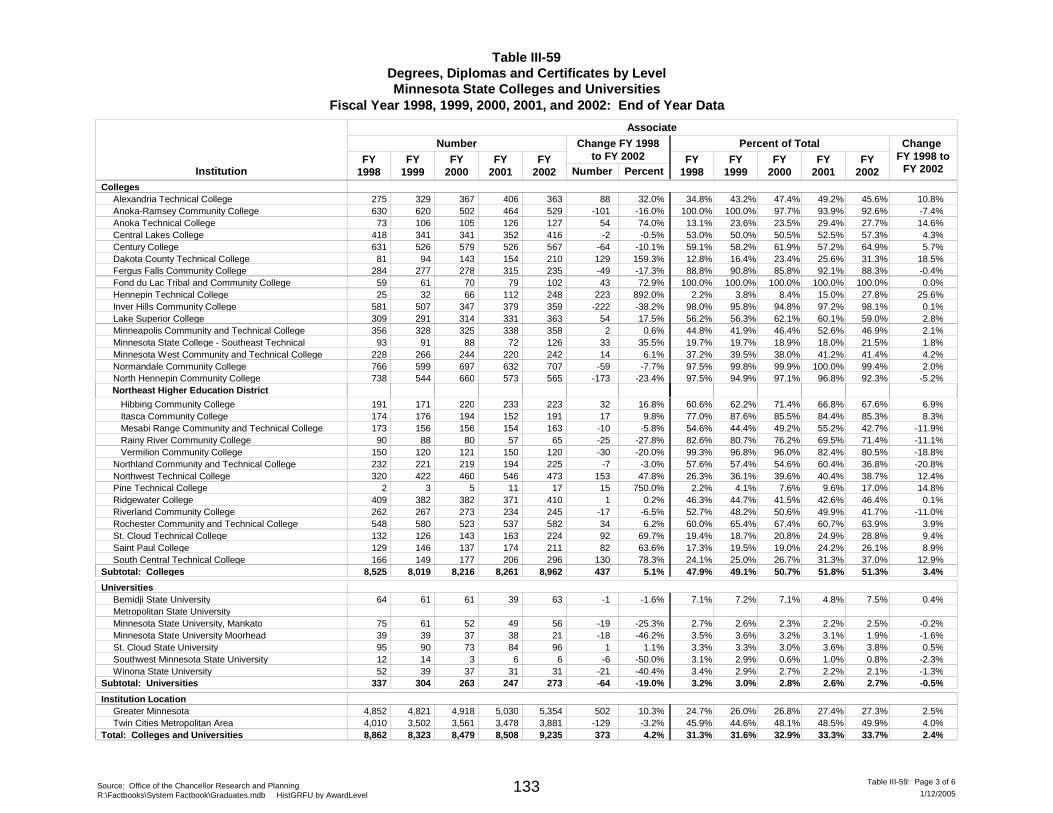
Table III-59Degrees, Diplomas and Certificates by LevelMinnesota State Colleges and Universities
Fiscal Year 1998, 1999, 2000, 2001, and 2002: End of Year Data
InstitutionFY
1998FY
1999FY
2000FY
2001
Number Change FY 1998 to
FY 2002
Change FY 1998to FY 2002
Number Percent
Percent of Total
FY2002
FY1998
FY1999
FY2000
FY2001
FY2002
Associate
Colleges275 367 406 363 88 32.0% 34.8%329 43.2% 47.4% 49.2% 45.6% 10.8%Alexandria Technical College630 502 464 529 -101 -16.0% 100.0%620 100.0% 97.7% 93.9% 92.6% -7.4%Anoka-Ramsey Community College73 105 126 127 54 74.0% 13.1%106 23.6% 23.5% 29.4% 27.7% 14.6%Anoka Technical College
418 341 352 416 -2 -0.5% 53.0%341 50.0% 50.5% 52.5% 57.3% 4.3%Central Lakes College631 579 526 567 -64 -10.1% 59.1%526 58.2% 61.9% 57.2% 64.9% 5.7%Century College81 143 154 210 129 159.3% 12.8%94 16.4% 23.4% 25.6% 31.3% 18.5%Dakota County Technical College
284 278 315 235 -49 -17.3% 88.8%277 90.8% 85.8% 92.1% 88.3% -0.4%Fergus Falls Community College59 70 79 102 43 72.9% 100.0%61 100.0% 100.0% 100.0% 100.0% 0.0%Fond du Lac Tribal and Community College25 66 112 248 223 892.0% 2.2%32 3.8% 8.4% 15.0% 27.8% 25.6%Hennepin Technical College
581 347 379 359 -222 -38.2% 98.0%507 95.8% 94.8% 97.2% 98.1% 0.1%Inver Hills Community College309 314 331 363 54 17.5% 56.2%291 56.3% 62.1% 60.1% 59.0% 2.8%Lake Superior College356 325 338 358 2 0.6% 44.8%328 41.9% 46.4% 52.6% 46.9% 2.1%Minneapolis Community and Technical College93 88 72 126 33 35.5% 19.7%91 19.7% 18.9% 18.0% 21.5% 1.8%Minnesota State College - Southeast Technical
228 244 220 242 14 6.1% 37.2%266 39.5% 38.0% 41.2% 41.4% 4.2%Minnesota West Community and Technical College766 697 632 707 -59 -7.7% 97.5%599 99.8% 99.9% 100.0% 99.4% 2.0%Normandale Community College738 660 573 565 -173 -23.4% 97.5%544 94.9% 97.1% 96.8% 92.3% -5.2%North Hennepin Community College
191 220 233 223 32 16.8% 60.6%171 62.2% 71.4% 66.8% 67.6% 6.9%
Northeast Higher Education District
Hibbing Community College174 194 152 191 17 9.8% 77.0%176 87.6% 85.5% 84.4% 85.3% 8.3% Itasca Community College173 156 154 163 -10 -5.8% 54.6%156 44.4% 49.2% 55.2% 42.7% -11.9% Mesabi Range Community and Technical College90 80 57 65 -25 -27.8% 82.6%88 80.7% 76.2% 69.5% 71.4% -11.1% Rainy River Community College
150 121 150 120 -30 -20.0% 99.3%120 96.8% 96.0% 82.4% 80.5% -18.8% Vermilion Community College232 219 194 225 -7 -3.0% 57.6%221 57.4% 54.6% 60.4% 36.8% -20.8%Northland Community and Technical College320 460 546 473 153 47.8% 26.3%422 36.1% 39.6% 40.4% 38.7% 12.4%Northwest Technical College
2 5 11 17 15 750.0% 2.2%3 4.1% 7.6% 9.6% 17.0% 14.8%Pine Technical College409 382 371 410 1 0.2% 46.3%382 44.7% 41.5% 42.6% 46.4% 0.1%Ridgewater College262 273 234 245 -17 -6.5% 52.7%267 48.2% 50.6% 49.9% 41.7% -11.0%Riverland Community College548 523 537 582 34 6.2% 60.0%580 65.4% 67.4% 60.7% 63.9% 3.9%Rochester Community and Technical College132 143 163 224 92 69.7% 19.4%126 18.7% 20.8% 24.9% 28.8% 9.4%St. Cloud Technical College129 137 174 211 82 63.6% 17.3%146 19.5% 19.0% 24.2% 26.1% 8.9%Saint Paul College166 177 206 296 130 78.3% 24.1%149 25.0% 26.7% 31.3% 37.0% 12.9%South Central Technical College
Subtotal: Colleges 8,019 8,216 8,261 8,962 437 5.1% 47.9%8,525 49.1% 50.7% 51.8% 51.3% 3.4%
Universities64 61 39 63 -1 -1.6% 7.1%61 7.2% 7.1% 4.8% 7.5% 0.4%Bemidji State University
Metropolitan State University75 52 49 56 -19 -25.3% 2.7%61 2.6% 2.3% 2.2% 2.5% -0.2%Minnesota State University, Mankato39 37 38 21 -18 -46.2% 3.5%39 3.6% 3.2% 3.1% 1.9% -1.6%Minnesota State University Moorhead95 73 84 96 1 1.1% 3.3%90 3.3% 3.0% 3.6% 3.8% 0.5%St. Cloud State University12 3 6 6 -6 -50.0% 3.1%14 2.9% 0.6% 1.0% 0.8% -2.3%Southwest Minnesota State University52 37 31 31 -21 -40.4% 3.4%39 2.9% 2.7% 2.2% 2.1% -1.3%Winona State University
Subtotal: Universities 304 263 247 273 -64 -19.0% 3.2%337 3.0% 2.8% 2.6% 2.7% -0.5%
Institution Location4,852 4,918 5,030 5,354 502 10.3% 24.7%4,821 26.0% 26.8% 27.4% 27.3% 2.5%Greater Minnesota4,010 3,561 3,478 3,881 -129 -3.2% 45.9%3,502 44.6% 48.1% 48.5% 49.9% 4.0%Twin Cities Metropolitan Area
Total: Colleges and Universities 8,323 8,479 8,508 9,235 373 4.2% 31.3%8,862 31.6% 32.9% 33.3% 33.7% 2.4%
Source: Office of the Chancellor Research and PlanningR:\Factbooks\System Factbook\Graduates.mdb HistGRFU by AwardLevel 1/12/2005
Table III-59: Page 3 of 6133
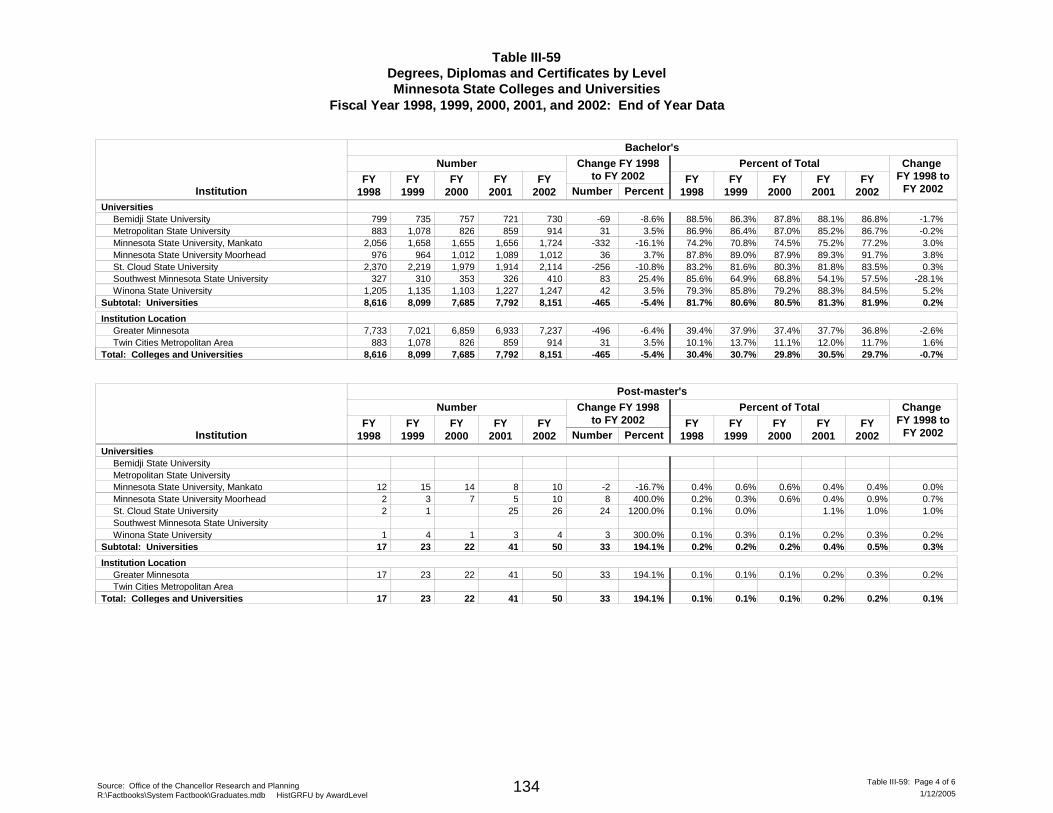
Table III-59Degrees, Diplomas and Certificates by LevelMinnesota State Colleges and Universities
Fiscal Year 1998, 1999, 2000, 2001, and 2002: End of Year Data
Institution
Number
Number Percent
Percent of Total
Bachelor's
FY1998
FY1999
FY2000
FY2001
Change FY 1998 to
FY 2002
Change FY 1998to FY 2002FY
2002FY
1998FY
1999FY
2000FY
2001FY
2002Universities
799 757 721 730 -69 -8.6% 88.5%735 86.3% 87.8% 88.1% 86.8% -1.7%Bemidji State University883 826 859 914 31 3.5% 86.9%1,078 86.4% 87.0% 85.2% 86.7% -0.2%Metropolitan State University
2,056 1,655 1,656 1,724 -332 -16.1% 74.2%1,658 70.8% 74.5% 75.2% 77.2% 3.0%Minnesota State University, Mankato976 1,012 1,089 1,012 36 3.7% 87.8%964 89.0% 87.9% 89.3% 91.7% 3.8%Minnesota State University Moorhead
2,370 1,979 1,914 2,114 -256 -10.8% 83.2%2,219 81.6% 80.3% 81.8% 83.5% 0.3%St. Cloud State University327 353 326 410 83 25.4% 85.6%310 64.9% 68.8% 54.1% 57.5% -28.1%Southwest Minnesota State University
1,205 1,103 1,227 1,247 42 3.5% 79.3%1,135 85.8% 79.2% 88.3% 84.5% 5.2%Winona State UniversitySubtotal: Universities 8,099 7,685 7,792 8,151 -465 -5.4% 81.7%8,616 80.6% 80.5% 81.3% 81.9% 0.2%
Institution Location7,733 6,859 6,933 7,237 -496 -6.4% 39.4%7,021 37.9% 37.4% 37.7% 36.8% -2.6%Greater Minnesota
883 826 859 914 31 3.5% 10.1%1,078 13.7% 11.1% 12.0% 11.7% 1.6%Twin Cities Metropolitan AreaTotal: Colleges and Universities 8,099 7,685 7,792 8,151 -465 -5.4% 30.4%8,616 30.7% 29.8% 30.5% 29.7% -0.7%
Institution
Number
Number Percent
Percent of Total
Post-master's
FY1998
FY1999
FY2000
FY2001
Change FY 1998 to
FY 2002
Change FY 1998to FY 2002FY
2002FY
1998FY
1999FY
2000FY
2001FY
2002Universities
Bemidji State UniversityMetropolitan State University
12 14 8 10 -2 -16.7% 0.4%15 0.6% 0.6% 0.4% 0.4% 0.0%Minnesota State University, Mankato2 7 5 10 8 400.0% 0.2%3 0.3% 0.6% 0.4% 0.9% 0.7%Minnesota State University Moorhead2 25 26 24 1200.0% 0.1%1 0.0% 1.1% 1.0% 1.0%St. Cloud State University
Southwest Minnesota State University1 1 3 4 3 300.0% 0.1%4 0.3% 0.1% 0.2% 0.3% 0.2%Winona State University
Subtotal: Universities 23 22 41 50 33 194.1% 0.2%17 0.2% 0.2% 0.4% 0.5% 0.3%
Institution Location17 22 41 50 33 194.1% 0.1%23 0.1% 0.1% 0.2% 0.3% 0.2%Greater Minnesota
Twin Cities Metropolitan AreaTotal: Colleges and Universities 23 22 41 50 33 194.1% 0.1%17 0.1% 0.1% 0.2% 0.2% 0.1%
Source: Office of the Chancellor Research and PlanningR:\Factbooks\System Factbook\Graduates.mdb HistGRFU by AwardLevel 1/12/2005
Table III-59: Page 4 of 6134
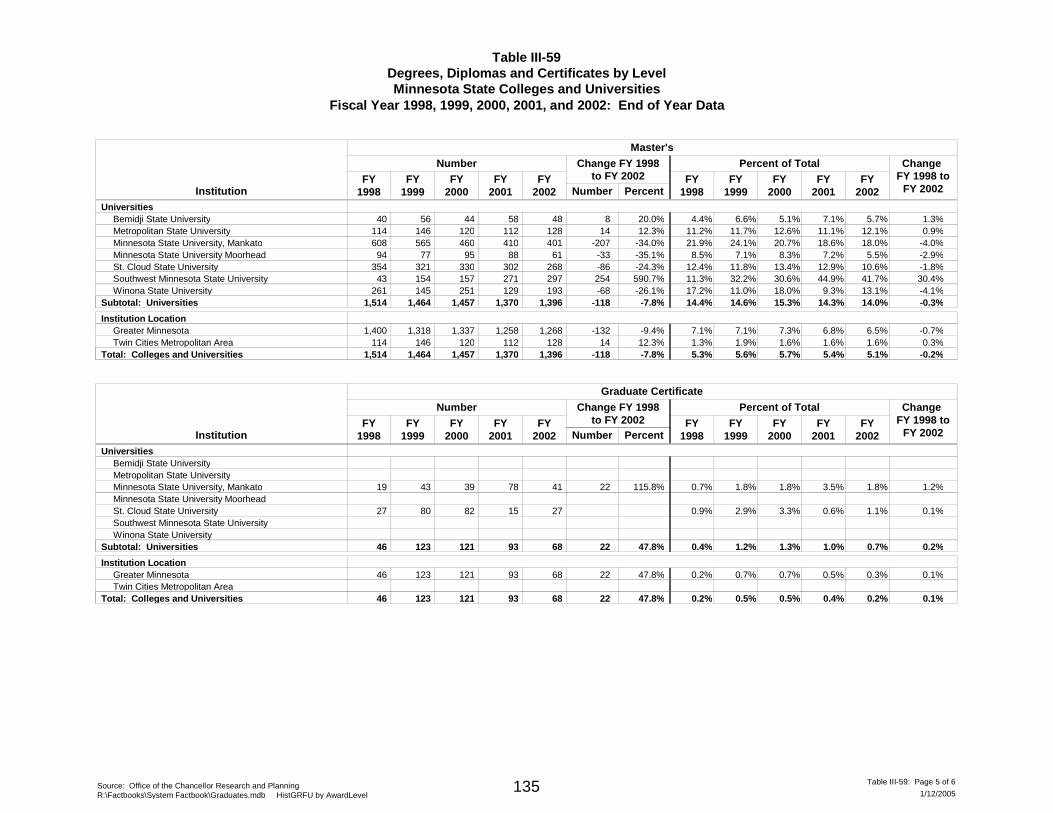
Table III-59Degrees, Diplomas and Certificates by LevelMinnesota State Colleges and Universities
Fiscal Year 1998, 1999, 2000, 2001, and 2002: End of Year Data
Institution
Number
Number Percent
Percent of Total
Master's
FY1998
FY1999
FY2000
FY2001
Change FY 1998 to
FY 2002
Change FY 1998to FY 2002FY
2002FY
1998FY
1999FY
2000FY
2001FY
2002Universities
40 44 58 48 8 20.0% 4.4%56 6.6% 5.1% 7.1% 5.7% 1.3%Bemidji State University114 120 112 128 14 12.3% 11.2%146 11.7% 12.6% 11.1% 12.1% 0.9%Metropolitan State University608 460 410 401 -207 -34.0% 21.9%565 24.1% 20.7% 18.6% 18.0% -4.0%Minnesota State University, Mankato94 95 88 61 -33 -35.1% 8.5%77 7.1% 8.3% 7.2% 5.5% -2.9%Minnesota State University Moorhead
354 330 302 268 -86 -24.3% 12.4%321 11.8% 13.4% 12.9% 10.6% -1.8%St. Cloud State University43 157 271 297 254 590.7% 11.3%154 32.2% 30.6% 44.9% 41.7% 30.4%Southwest Minnesota State University
261 251 129 193 -68 -26.1% 17.2%145 11.0% 18.0% 9.3% 13.1% -4.1%Winona State UniversitySubtotal: Universities 1,464 1,457 1,370 1,396 -118 -7.8% 14.4%1,514 14.6% 15.3% 14.3% 14.0% -0.3%
Institution Location1,400 1,337 1,258 1,268 -132 -9.4% 7.1%1,318 7.1% 7.3% 6.8% 6.5% -0.7%Greater Minnesota
114 120 112 128 14 12.3% 1.3%146 1.9% 1.6% 1.6% 1.6% 0.3%Twin Cities Metropolitan AreaTotal: Colleges and Universities 1,464 1,457 1,370 1,396 -118 -7.8% 5.3%1,514 5.6% 5.7% 5.4% 5.1% -0.2%
Institution
Number
Number Percent
Percent of Total
Graduate Certificate
FY1998
FY1999
FY2000
FY2001
Change FY 1998 to
FY 2002
Change FY 1998to FY 2002FY
2002FY
1998FY
1999FY
2000FY
2001FY
2002Universities
Bemidji State UniversityMetropolitan State University
19 39 78 41 22 115.8% 0.7%43 1.8% 1.8% 3.5% 1.8% 1.2%Minnesota State University, MankatoMinnesota State University Moorhead
27 82 15 27 0.9%80 2.9% 3.3% 0.6% 1.1% 0.1%St. Cloud State UniversitySouthwest Minnesota State UniversityWinona State University
Subtotal: Universities 123 121 93 68 22 47.8% 0.4%46 1.2% 1.3% 1.0% 0.7% 0.2%
Institution Location46 121 93 68 22 47.8% 0.2%123 0.7% 0.7% 0.5% 0.3% 0.1%Greater Minnesota
Twin Cities Metropolitan AreaTotal: Colleges and Universities 123 121 93 68 22 47.8% 0.2%46 0.5% 0.5% 0.4% 0.2% 0.1%
Source: Office of the Chancellor Research and PlanningR:\Factbooks\System Factbook\Graduates.mdb HistGRFU by AwardLevel 1/12/2005
Table III-59: Page 5 of 6135
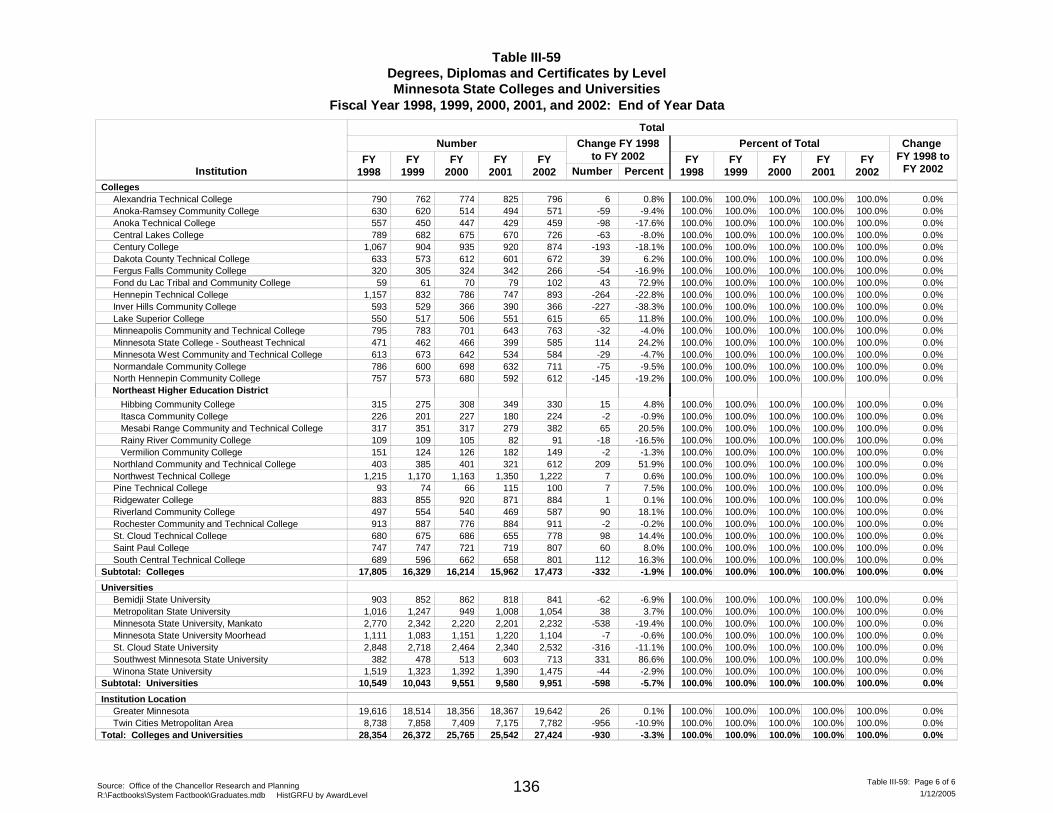
Table III-59Degrees, Diplomas and Certificates by LevelMinnesota State Colleges and Universities
Fiscal Year 1998, 1999, 2000, 2001, and 2002: End of Year Data
Institution
Number
Number Percent
Percent of Total
Total
FY1998
FY1999
FY2000
FY2001
Change FY 1998 to
FY 2002
Change FY 1998to FY 2002FY
2002FY
1998FY
1999FY
2000FY
2001FY
2002Colleges
790 774 825 796 6 0.8% 100.0%762 100.0% 100.0% 100.0% 100.0% 0.0%Alexandria Technical College630 514 494 571 -59 -9.4% 100.0%620 100.0% 100.0% 100.0% 100.0% 0.0%Anoka-Ramsey Community College557 447 429 459 -98 -17.6% 100.0%450 100.0% 100.0% 100.0% 100.0% 0.0%Anoka Technical College789 675 670 726 -63 -8.0% 100.0%682 100.0% 100.0% 100.0% 100.0% 0.0%Central Lakes College
1,067 935 920 874 -193 -18.1% 100.0%904 100.0% 100.0% 100.0% 100.0% 0.0%Century College633 612 601 672 39 6.2% 100.0%573 100.0% 100.0% 100.0% 100.0% 0.0%Dakota County Technical College320 324 342 266 -54 -16.9% 100.0%305 100.0% 100.0% 100.0% 100.0% 0.0%Fergus Falls Community College59 70 79 102 43 72.9% 100.0%61 100.0% 100.0% 100.0% 100.0% 0.0%Fond du Lac Tribal and Community College
1,157 786 747 893 -264 -22.8% 100.0%832 100.0% 100.0% 100.0% 100.0% 0.0%Hennepin Technical College593 366 390 366 -227 -38.3% 100.0%529 100.0% 100.0% 100.0% 100.0% 0.0%Inver Hills Community College550 506 551 615 65 11.8% 100.0%517 100.0% 100.0% 100.0% 100.0% 0.0%Lake Superior College795 701 643 763 -32 -4.0% 100.0%783 100.0% 100.0% 100.0% 100.0% 0.0%Minneapolis Community and Technical College471 466 399 585 114 24.2% 100.0%462 100.0% 100.0% 100.0% 100.0% 0.0%Minnesota State College - Southeast Technical613 642 534 584 -29 -4.7% 100.0%673 100.0% 100.0% 100.0% 100.0% 0.0%Minnesota West Community and Technical College786 698 632 711 -75 -9.5% 100.0%600 100.0% 100.0% 100.0% 100.0% 0.0%Normandale Community College757 680 592 612 -145 -19.2% 100.0%573 100.0% 100.0% 100.0% 100.0% 0.0%North Hennepin Community College
315 308 349 330 15 4.8% 100.0%275 100.0% 100.0% 100.0% 100.0% 0.0%
Northeast Higher Education District
Hibbing Community College226 227 180 224 -2 -0.9% 100.0%201 100.0% 100.0% 100.0% 100.0% 0.0% Itasca Community College317 317 279 382 65 20.5% 100.0%351 100.0% 100.0% 100.0% 100.0% 0.0% Mesabi Range Community and Technical College109 105 82 91 -18 -16.5% 100.0%109 100.0% 100.0% 100.0% 100.0% 0.0% Rainy River Community College151 126 182 149 -2 -1.3% 100.0%124 100.0% 100.0% 100.0% 100.0% 0.0% Vermilion Community College403 401 321 612 209 51.9% 100.0%385 100.0% 100.0% 100.0% 100.0% 0.0%Northland Community and Technical College
1,215 1,163 1,350 1,222 7 0.6% 100.0%1,170 100.0% 100.0% 100.0% 100.0% 0.0%Northwest Technical College93 66 115 100 7 7.5% 100.0%74 100.0% 100.0% 100.0% 100.0% 0.0%Pine Technical College
883 920 871 884 1 0.1% 100.0%855 100.0% 100.0% 100.0% 100.0% 0.0%Ridgewater College497 540 469 587 90 18.1% 100.0%554 100.0% 100.0% 100.0% 100.0% 0.0%Riverland Community College913 776 884 911 -2 -0.2% 100.0%887 100.0% 100.0% 100.0% 100.0% 0.0%Rochester Community and Technical College680 686 655 778 98 14.4% 100.0%675 100.0% 100.0% 100.0% 100.0% 0.0%St. Cloud Technical College747 721 719 807 60 8.0% 100.0%747 100.0% 100.0% 100.0% 100.0% 0.0%Saint Paul College689 662 658 801 112 16.3% 100.0%596 100.0% 100.0% 100.0% 100.0% 0.0%South Central Technical College
Subtotal: Colleges 16,329 16,214 15,962 17,473 -332 -1.9% 100.0%17,805 100.0% 100.0% 100.0% 100.0% 0.0%
Universities903 862 818 841 -62 -6.9% 100.0%852 100.0% 100.0% 100.0% 100.0% 0.0%Bemidji State University
1,016 949 1,008 1,054 38 3.7% 100.0%1,247 100.0% 100.0% 100.0% 100.0% 0.0%Metropolitan State University2,770 2,220 2,201 2,232 -538 -19.4% 100.0%2,342 100.0% 100.0% 100.0% 100.0% 0.0%Minnesota State University, Mankato1,111 1,151 1,220 1,104 -7 -0.6% 100.0%1,083 100.0% 100.0% 100.0% 100.0% 0.0%Minnesota State University Moorhead2,848 2,464 2,340 2,532 -316 -11.1% 100.0%2,718 100.0% 100.0% 100.0% 100.0% 0.0%St. Cloud State University
382 513 603 713 331 86.6% 100.0%478 100.0% 100.0% 100.0% 100.0% 0.0%Southwest Minnesota State University1,519 1,392 1,390 1,475 -44 -2.9% 100.0%1,323 100.0% 100.0% 100.0% 100.0% 0.0%Winona State University
Subtotal: Universities 10,043 9,551 9,580 9,951 -598 -5.7% 100.0%10,549 100.0% 100.0% 100.0% 100.0% 0.0%
Institution Location19,616 18,356 18,367 19,642 26 0.1% 100.0%18,514 100.0% 100.0% 100.0% 100.0% 0.0%Greater Minnesota8,738 7,409 7,175 7,782 -956 -10.9% 100.0%7,858 100.0% 100.0% 100.0% 100.0% 0.0%Twin Cities Metropolitan Area
Total: Colleges and Universities 26,372 25,765 25,542 27,424 -930 -3.3% 100.0%28,354 100.0% 100.0% 100.0% 100.0% 0.0%
Source: Office of the Chancellor Research and PlanningR:\Factbooks\System Factbook\Graduates.mdb HistGRFU by AwardLevel 1/12/2005
Table III-59: Page 6 of 6136
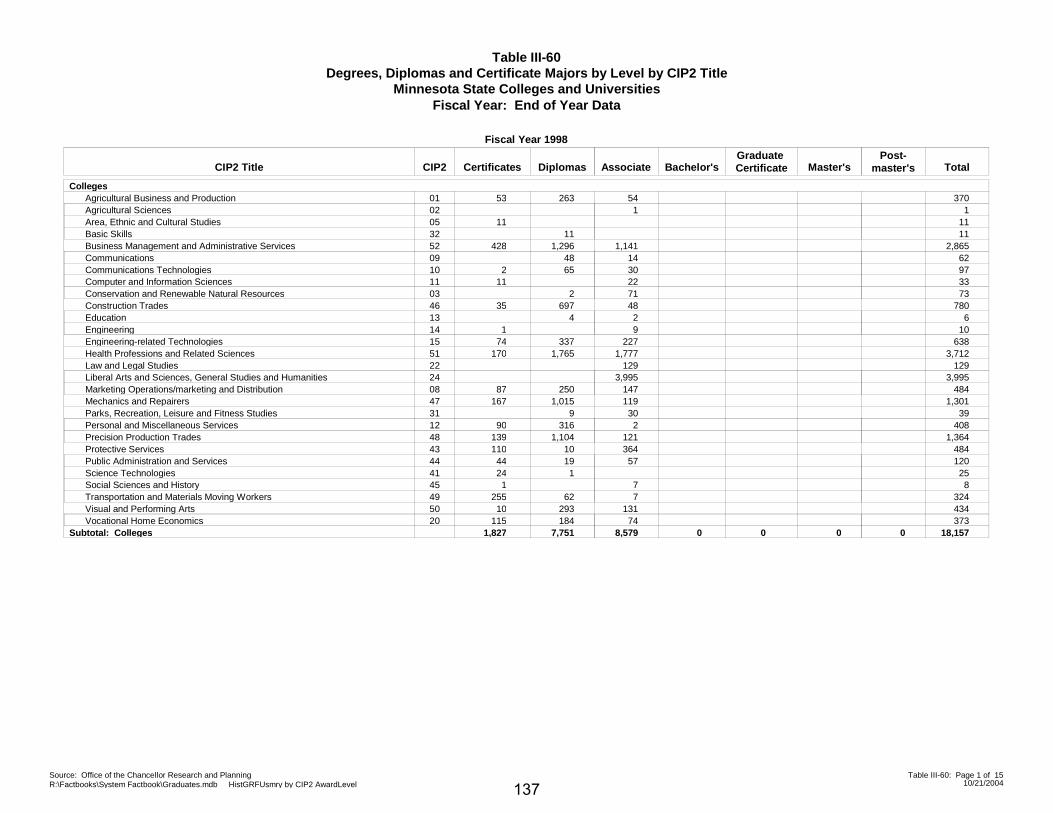
Table III-60Degrees, Diplomas and Certificate Majors by Level by CIP2 Title
Minnesota State Colleges and UniversitiesFiscal Year: End of Year Data
Colleges
Certificates DiplomasGraduate CertificateAssociate Bachelor's Master's
Post-master's TotalCIP2
Fiscal Year 1998
CIP2 Title
53 263 54 370Agricultural Business and Production 011 1Agricultural Sciences 02
11 11Area, Ethnic and Cultural Studies 0511 11Basic Skills 32
428 1,296 1,141 2,865Business Management and Administrative Services 5248 14 62Communications 09
2 65 30 97Communications Technologies 1011 22 33Computer and Information Sciences 11
2 71 73Conservation and Renewable Natural Resources 0335 697 48 780Construction Trades 46
4 2 6Education 131 9 10Engineering 14
74 337 227 638Engineering-related Technologies 15170 1,765 1,777 3,712Health Professions and Related Sciences 51
129 129Law and Legal Studies 223,995 3,995Liberal Arts and Sciences, General Studies and Humanities 24
87 250 147 484Marketing Operations/marketing and Distribution 08167 1,015 119 1,301Mechanics and Repairers 47
9 30 39Parks, Recreation, Leisure and Fitness Studies 3190 316 2 408Personal and Miscellaneous Services 12
139 1,104 121 1,364Precision Production Trades 48110 10 364 484Protective Services 4344 19 57 120Public Administration and Services 4424 1 25Science Technologies 411 7 8Social Sciences and History 45
255 62 7 324Transportation and Materials Moving Workers 4910 293 131 434Visual and Performing Arts 50
115 184 74 373Vocational Home Economics 20Subtotal: Colleges 7,751 01,827 8,579 0 0 0 18,157
Source: Office of the Chancellor Research and PlanningR:\Factbooks\System Factbook\Graduates.mdb HistGRFUsmry by CIP2 AwardLevel 10/21/2004
Table III-60: Page 1 of 15
137
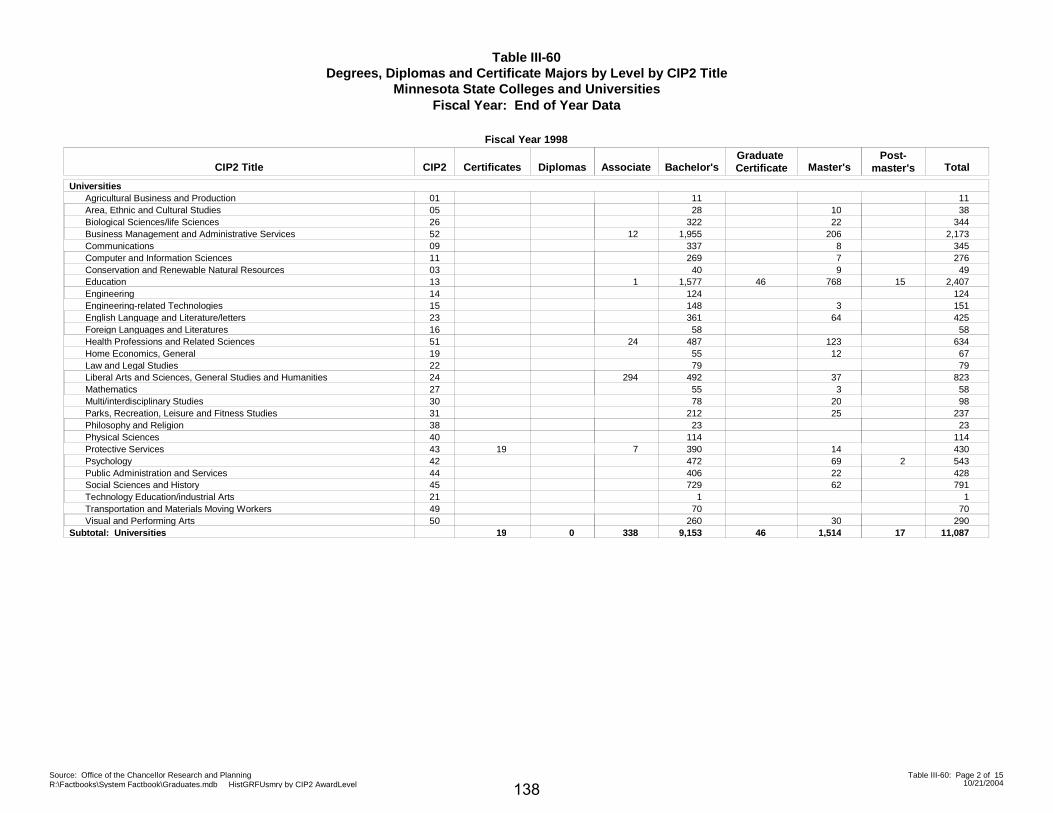
Table III-60Degrees, Diplomas and Certificate Majors by Level by CIP2 Title
Minnesota State Colleges and UniversitiesFiscal Year: End of Year Data
Universities
Certificates DiplomasGraduate CertificateAssociate Bachelor's Master's
Post-master's TotalCIP2
Fiscal Year 1998
CIP2 Title
11 11Agricultural Business and Production 0128 10 38Area, Ethnic and Cultural Studies 05
322 22 344Biological Sciences/life Sciences 2612 1,955 206 2,173Business Management and Administrative Services 52
337 8 345Communications 09269 7 276Computer and Information Sciences 1140 9 49Conservation and Renewable Natural Resources 03
461 1,577 768 15 2,407Education 13124 124Engineering 14148 3 151Engineering-related Technologies 15361 64 425English Language and Literature/letters 2358 58Foreign Languages and Literatures 16
24 487 123 634Health Professions and Related Sciences 5155 12 67Home Economics, General 1979 79Law and Legal Studies 22
294 492 37 823Liberal Arts and Sciences, General Studies and Humanities 2455 3 58Mathematics 2778 20 98Multi/interdisciplinary Studies 30
212 25 237Parks, Recreation, Leisure and Fitness Studies 3123 23Philosophy and Religion 38
114 114Physical Sciences 4019 7 390 14 430Protective Services 43
472 69 2 543Psychology 42406 22 428Public Administration and Services 44729 62 791Social Sciences and History 45
1 1Technology Education/industrial Arts 2170 70Transportation and Materials Moving Workers 49
260 30 290Visual and Performing Arts 50Subtotal: Universities 0 4619 338 9,153 1,514 17 11,087
Source: Office of the Chancellor Research and PlanningR:\Factbooks\System Factbook\Graduates.mdb HistGRFUsmry by CIP2 AwardLevel 10/21/2004
Table III-60: Page 2 of 15
138
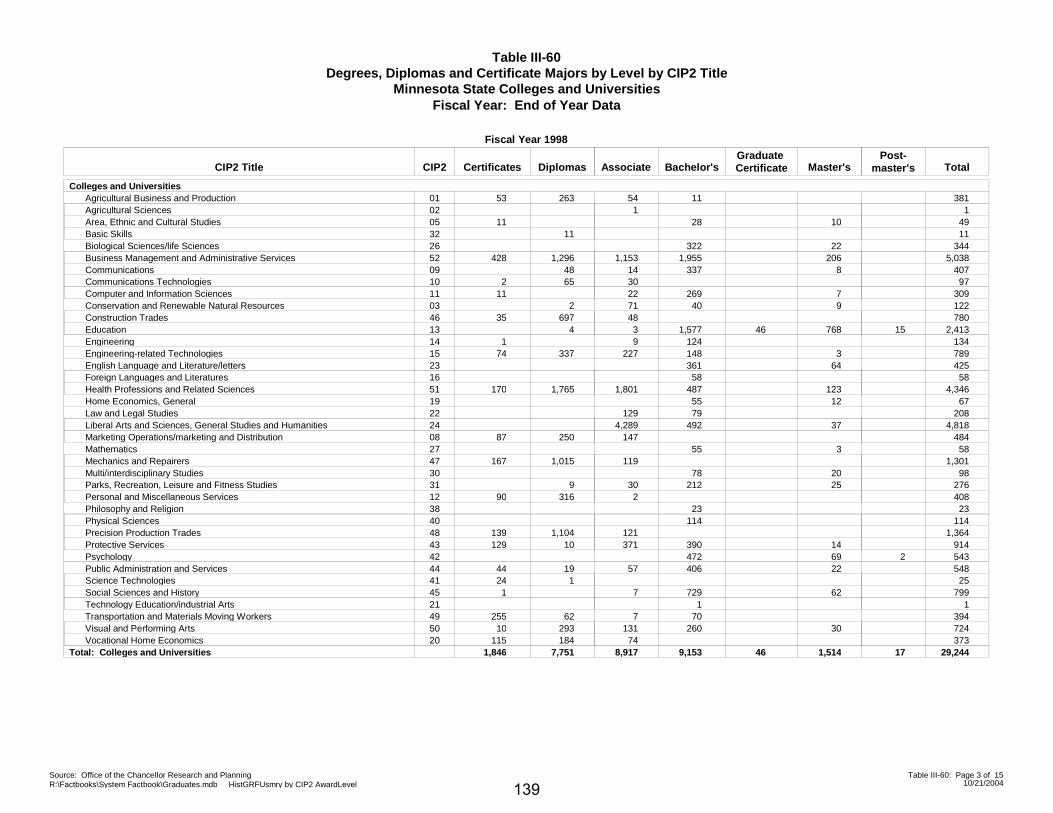
Table III-60Degrees, Diplomas and Certificate Majors by Level by CIP2 Title
Minnesota State Colleges and UniversitiesFiscal Year: End of Year Data
Colleges and Universities
Certificates DiplomasGraduate CertificateAssociate Bachelor's Master's
Post-master's TotalCIP2
Fiscal Year 1998
CIP2 Title
53 263 54 11 381Agricultural Business and Production 011 1Agricultural Sciences 02
11 28 10 49Area, Ethnic and Cultural Studies 0511 11Basic Skills 32
322 22 344Biological Sciences/life Sciences 26428 1,296 1,153 1,955 206 5,038Business Management and Administrative Services 52
48 14 337 8 407Communications 092 65 30 97Communications Technologies 10
11 22 269 7 309Computer and Information Sciences 112 71 40 9 122Conservation and Renewable Natural Resources 03
35 697 48 780Construction Trades 464 463 1,577 768 15 2,413Education 13
1 9 124 134Engineering 1474 337 227 148 3 789Engineering-related Technologies 15
361 64 425English Language and Literature/letters 2358 58Foreign Languages and Literatures 16
170 1,765 1,801 487 123 4,346Health Professions and Related Sciences 5155 12 67Home Economics, General 19
129 79 208Law and Legal Studies 224,289 492 37 4,818Liberal Arts and Sciences, General Studies and Humanities 24
87 250 147 484Marketing Operations/marketing and Distribution 0855 3 58Mathematics 27
167 1,015 119 1,301Mechanics and Repairers 4778 20 98Multi/interdisciplinary Studies 30
9 30 212 25 276Parks, Recreation, Leisure and Fitness Studies 3190 316 2 408Personal and Miscellaneous Services 12
23 23Philosophy and Religion 38114 114Physical Sciences 40
139 1,104 121 1,364Precision Production Trades 48129 10 371 390 14 914Protective Services 43
472 69 2 543Psychology 4244 19 57 406 22 548Public Administration and Services 4424 1 25Science Technologies 411 7 729 62 799Social Sciences and History 45
1 1Technology Education/industrial Arts 21255 62 7 70 394Transportation and Materials Moving Workers 4910 293 131 260 30 724Visual and Performing Arts 50
115 184 74 373Vocational Home Economics 20Total: Colleges and Universities 7,751 461,846 8,917 9,153 1,514 17 29,244
Source: Office of the Chancellor Research and PlanningR:\Factbooks\System Factbook\Graduates.mdb HistGRFUsmry by CIP2 AwardLevel 10/21/2004
Table III-60: Page 3 of 15
139

Table III-60Degrees, Diplomas and Certificate Majors by Level by CIP2 Title
Minnesota State Colleges and UniversitiesFiscal Year: End of Year Data
Colleges
Certificates DiplomasGraduate CertificateAssociate Bachelor's Master's
Post-master's TotalCIP2
Fiscal Year 1999
CIP2 Title
36 279 72 387Agricultural Business and Production 011 2 3Agricultural Sciences 02
6 6Area, Ethnic and Cultural Studies 053 3Basic Skills 32
445 918 1,179 2,542Business Management and Administrative Services 5245 18 63Communications 09
3 84 39 126Communications Technologies 1021 15 36Computer and Information Sciences 113 56 59Conservation and Renewable Natural Resources 03
39 736 29 804Construction Trades 468 6 4 18Education 131 4 5Engineering 14
54 257 230 541Engineering-related Technologies 15138 1,695 1,767 3,600Health Professions and Related Sciences 51
89 89Law and Legal Studies 223,433 3,433Liberal Arts and Sciences, General Studies and Humanities 24
6 6Library Science 2555 222 134 411Marketing Operations/marketing and Distribution 08
166 915 117 1,198Mechanics and Repairers 472 2Multi/interdisciplinary Studies 30
10 10Parks, Recreation, Leisure and Fitness Studies 3165 276 5 346Personal and Miscellaneous Services 12
107 1,020 135 1,262Precision Production Trades 48103 6 377 486Protective Services 43
5 18 61 84Public Administration and Services 444 4Science Technologies 41
5 7 12Social Sciences and History 45152 152 16 320Transportation and Materials Moving Workers 49
8 246 145 399Visual and Performing Arts 5096 194 110 400Vocational Home Economics 20
Subtotal: Colleges 7,077 01,516 8,062 0 0 0 16,655
Source: Office of the Chancellor Research and PlanningR:\Factbooks\System Factbook\Graduates.mdb HistGRFUsmry by CIP2 AwardLevel 10/21/2004
Table III-60: Page 4 of 15
140
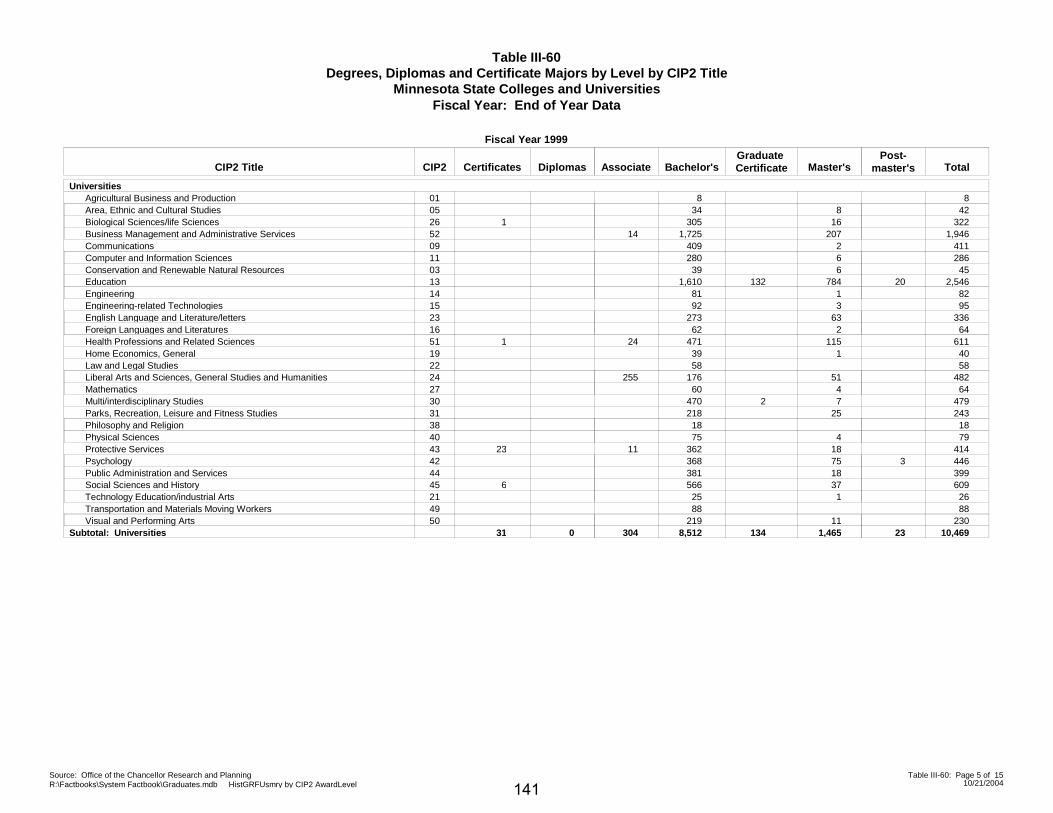
Table III-60Degrees, Diplomas and Certificate Majors by Level by CIP2 Title
Minnesota State Colleges and UniversitiesFiscal Year: End of Year Data
Universities
Certificates DiplomasGraduate CertificateAssociate Bachelor's Master's
Post-master's TotalCIP2
Fiscal Year 1999
CIP2 Title
8 8Agricultural Business and Production 0134 8 42Area, Ethnic and Cultural Studies 05
1 305 16 322Biological Sciences/life Sciences 2614 1,725 207 1,946Business Management and Administrative Services 52
409 2 411Communications 09280 6 286Computer and Information Sciences 1139 6 45Conservation and Renewable Natural Resources 03
1321,610 784 20 2,546Education 1381 1 82Engineering 1492 3 95Engineering-related Technologies 15
273 63 336English Language and Literature/letters 2362 2 64Foreign Languages and Literatures 16
1 24 471 115 611Health Professions and Related Sciences 5139 1 40Home Economics, General 1958 58Law and Legal Studies 22
255 176 51 482Liberal Arts and Sciences, General Studies and Humanities 2460 4 64Mathematics 27
2470 7 479Multi/interdisciplinary Studies 30218 25 243Parks, Recreation, Leisure and Fitness Studies 3118 18Philosophy and Religion 3875 4 79Physical Sciences 40
23 11 362 18 414Protective Services 43368 75 3 446Psychology 42381 18 399Public Administration and Services 44
6 566 37 609Social Sciences and History 4525 1 26Technology Education/industrial Arts 2188 88Transportation and Materials Moving Workers 49
219 11 230Visual and Performing Arts 50Subtotal: Universities 0 13431 304 8,512 1,465 23 10,469
Source: Office of the Chancellor Research and PlanningR:\Factbooks\System Factbook\Graduates.mdb HistGRFUsmry by CIP2 AwardLevel 10/21/2004
Table III-60: Page 5 of 15
141
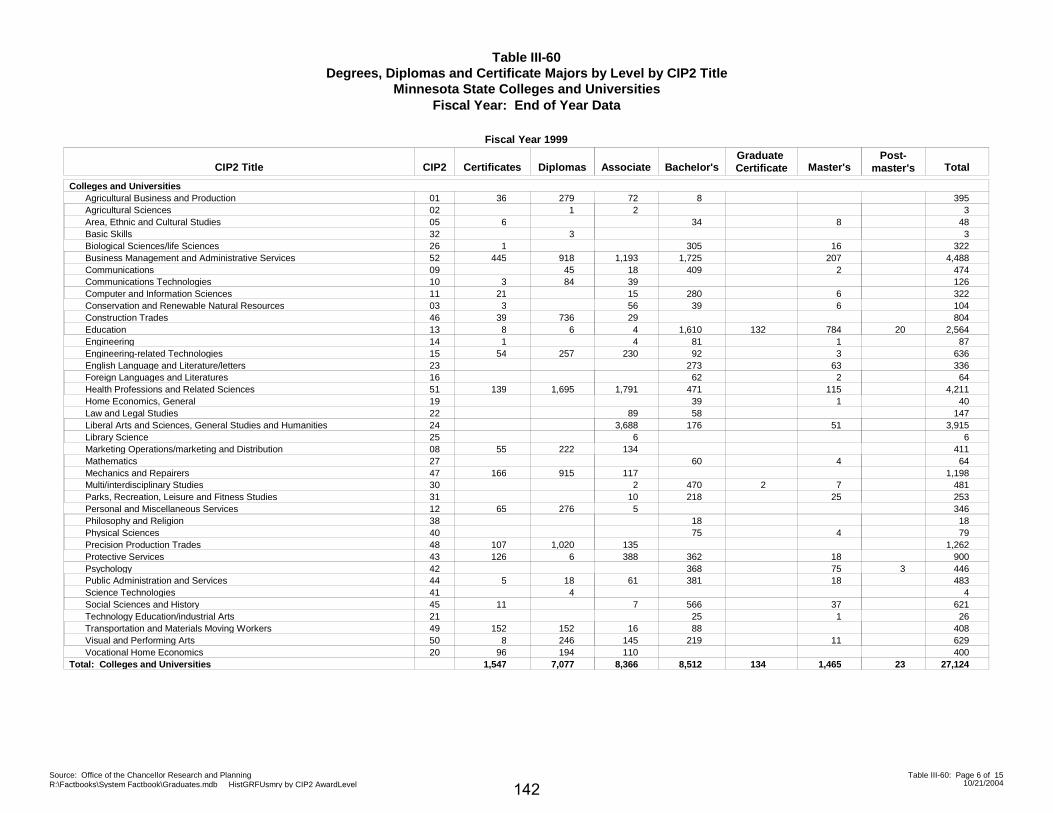
Table III-60Degrees, Diplomas and Certificate Majors by Level by CIP2 Title
Minnesota State Colleges and UniversitiesFiscal Year: End of Year Data
Colleges and Universities
Certificates DiplomasGraduate CertificateAssociate Bachelor's Master's
Post-master's TotalCIP2
Fiscal Year 1999
CIP2 Title
36 279 72 8 395Agricultural Business and Production 011 2 3Agricultural Sciences 02
6 34 8 48Area, Ethnic and Cultural Studies 053 3Basic Skills 32
1 305 16 322Biological Sciences/life Sciences 26445 918 1,193 1,725 207 4,488Business Management and Administrative Services 52
45 18 409 2 474Communications 093 84 39 126Communications Technologies 10
21 15 280 6 322Computer and Information Sciences 113 56 39 6 104Conservation and Renewable Natural Resources 03
39 736 29 804Construction Trades 468 6 1324 1,610 784 20 2,564Education 131 4 81 1 87Engineering 14
54 257 230 92 3 636Engineering-related Technologies 15273 63 336English Language and Literature/letters 2362 2 64Foreign Languages and Literatures 16
139 1,695 1,791 471 115 4,211Health Professions and Related Sciences 5139 1 40Home Economics, General 19
89 58 147Law and Legal Studies 223,688 176 51 3,915Liberal Arts and Sciences, General Studies and Humanities 24
6 6Library Science 2555 222 134 411Marketing Operations/marketing and Distribution 08
60 4 64Mathematics 27166 915 117 1,198Mechanics and Repairers 47
22 470 7 481Multi/interdisciplinary Studies 3010 218 25 253Parks, Recreation, Leisure and Fitness Studies 31
65 276 5 346Personal and Miscellaneous Services 1218 18Philosophy and Religion 3875 4 79Physical Sciences 40
107 1,020 135 1,262Precision Production Trades 48126 6 388 362 18 900Protective Services 43
368 75 3 446Psychology 425 18 61 381 18 483Public Administration and Services 44
4 4Science Technologies 4111 7 566 37 621Social Sciences and History 45
25 1 26Technology Education/industrial Arts 21152 152 16 88 408Transportation and Materials Moving Workers 49
8 246 145 219 11 629Visual and Performing Arts 5096 194 110 400Vocational Home Economics 20
Total: Colleges and Universities 7,077 1341,547 8,366 8,512 1,465 23 27,124
Source: Office of the Chancellor Research and PlanningR:\Factbooks\System Factbook\Graduates.mdb HistGRFUsmry by CIP2 AwardLevel 10/21/2004
Table III-60: Page 6 of 15
142

Table III-60Degrees, Diplomas and Certificate Majors by Level by CIP2 Title
Minnesota State Colleges and UniversitiesFiscal Year: End of Year Data
Colleges
Certificates DiplomasGraduate CertificateAssociate Bachelor's Master's
Post-master's TotalCIP2
Fiscal Year 2000
CIP2 Title
17 251 75 343Agricultural Business and Production 018 8Agricultural Sciences 02
19 19Area, Ethnic and Cultural Studies 056 6Basic Skills 32
598 796 1,361 2,755Business Management and Administrative Services 524 35 17 56Communications 092 52 41 95Communications Technologies 104 37 41Computer and Information Sciences 114 59 63Conservation and Renewable Natural Resources 03
92 734 35 861Construction Trades 463 8 4 15Education 13
16 16Engineering 1429 248 256 533Engineering-related Technologies 15
202 1,496 1,692 3,390Health Professions and Related Sciences 5177 77Law and Legal Studies 22
3,350 3,350Liberal Arts and Sciences, General Studies and Humanities 246 6Library Science 25
45 165 171 381Marketing Operations/marketing and Distribution 08157 978 161 1,296Mechanics and Repairers 47
2 6 8Parks, Recreation, Leisure and Fitness Studies 3146 209 9 264Personal and Miscellaneous Services 12
170 926 182 1,278Precision Production Trades 4886 10 397 493Protective Services 4322 18 57 97Public Administration and Services 44
1 1Science Technologies 4111 4 15Social Sciences and History 45
308 72 21 401Transportation and Materials Moving Workers 496 157 158 321Visual and Performing Arts 50
132 166 83 381Vocational Home Economics 20Subtotal: Colleges 6,328 01,959 8,283 0 0 0 16,570
Source: Office of the Chancellor Research and PlanningR:\Factbooks\System Factbook\Graduates.mdb HistGRFUsmry by CIP2 AwardLevel 10/21/2004
Table III-60: Page 7 of 15
143

Table III-60Degrees, Diplomas and Certificate Majors by Level by CIP2 Title
Minnesota State Colleges and UniversitiesFiscal Year: End of Year Data
Universities
Certificates DiplomasGraduate CertificateAssociate Bachelor's Master's
Post-master's TotalCIP2
Fiscal Year 2000
CIP2 Title
4 4Agricultural Business and Production 0123 7 30Area, Ethnic and Cultural Studies 05
282 9 291Biological Sciences/life Sciences 263 1,697 176 1,876Business Management and Administrative Services 52
367 1 368Communications 09334 5 339Computer and Information Sciences 1145 4 49Conservation and Renewable Natural Resources 03
1101,576 837 16 2,539Education 1374 3 77Engineering 14
162 6 168Engineering-related Technologies 15251 55 306English Language and Literature/letters 2350 1 51Foreign Languages and Literatures 16
724 401 128 560Health Professions and Related Sciences 51138 1 40Home Economics, General 19
60 60Law and Legal Studies 22227 382 6 615Liberal Arts and Sciences, General Studies and Humanities 24
38 4 42Mathematics 27105 42 147Multi/interdisciplinary Studies 30216 24 240Parks, Recreation, Leisure and Fitness Studies 3115 15Philosophy and Religion 3871 71Physical Sciences 40
3 9 351 19 382Protective Services 43319 61 6 386Psychology 42309 7 316Public Administration and Services 44
3538 48 589Social Sciences and History 4512 1 13Technology Education/industrial Arts 2166 66Transportation and Materials Moving Workers 49
219 12 231Visual and Performing Arts 50Subtotal: Universities 0 1213 263 8,005 1,457 22 9,871
Source: Office of the Chancellor Research and PlanningR:\Factbooks\System Factbook\Graduates.mdb HistGRFUsmry by CIP2 AwardLevel 10/21/2004
Table III-60: Page 8 of 15
144

Table III-60Degrees, Diplomas and Certificate Majors by Level by CIP2 Title
Minnesota State Colleges and UniversitiesFiscal Year: End of Year Data
Colleges and Universities
Certificates DiplomasGraduate CertificateAssociate Bachelor's Master's
Post-master's TotalCIP2
Fiscal Year 2000
CIP2 Title
17 251 75 4 347Agricultural Business and Production 018 8Agricultural Sciences 02
19 23 7 49Area, Ethnic and Cultural Studies 056 6Basic Skills 32
282 9 291Biological Sciences/life Sciences 26598 796 1,364 1,697 176 4,631Business Management and Administrative Services 52
4 35 17 367 1 424Communications 092 52 41 95Communications Technologies 104 37 334 5 380Computer and Information Sciences 114 59 45 4 112Conservation and Renewable Natural Resources 03
92 734 35 861Construction Trades 463 8 1104 1,576 837 16 2,554Education 13
16 74 3 93Engineering 1429 248 256 162 6 701Engineering-related Technologies 15
251 55 306English Language and Literature/letters 2350 1 51Foreign Languages and Literatures 16
202 1,496 71,716 401 128 3,950Health Professions and Related Sciences 51138 1 40Home Economics, General 19
77 60 137Law and Legal Studies 223,577 382 6 3,965Liberal Arts and Sciences, General Studies and Humanities 24
6 6Library Science 2545 165 171 381Marketing Operations/marketing and Distribution 08
38 4 42Mathematics 27157 978 161 1,296Mechanics and Repairers 47
105 42 147Multi/interdisciplinary Studies 302 6 216 24 248Parks, Recreation, Leisure and Fitness Studies 31
46 209 9 264Personal and Miscellaneous Services 1215 15Philosophy and Religion 3871 71Physical Sciences 40
170 926 182 1,278Precision Production Trades 4889 10 406 351 19 875Protective Services 43
319 61 6 386Psychology 4222 18 57 309 7 413Public Administration and Services 44
1 1Science Technologies 4111 34 538 48 604Social Sciences and History 45
12 1 13Technology Education/industrial Arts 21308 72 21 66 467Transportation and Materials Moving Workers 49
6 157 158 219 12 552Visual and Performing Arts 50132 166 83 381Vocational Home Economics 20
Total: Colleges and Universities 6,328 1211,962 8,546 8,005 1,457 22 26,441
Source: Office of the Chancellor Research and PlanningR:\Factbooks\System Factbook\Graduates.mdb HistGRFUsmry by CIP2 AwardLevel 10/21/2004
Table III-60: Page 9 of 15
145
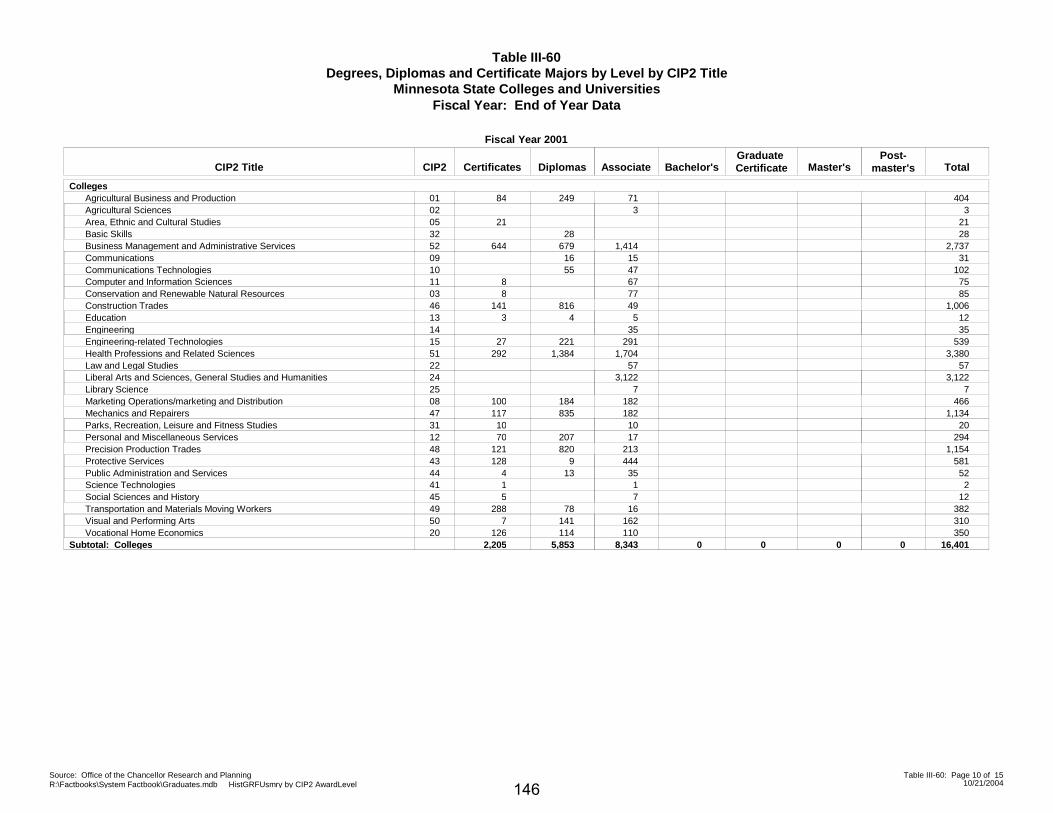
Table III-60Degrees, Diplomas and Certificate Majors by Level by CIP2 Title
Minnesota State Colleges and UniversitiesFiscal Year: End of Year Data
Colleges
Certificates DiplomasGraduate CertificateAssociate Bachelor's Master's
Post-master's TotalCIP2
Fiscal Year 2001
CIP2 Title
84 249 71 404Agricultural Business and Production 013 3Agricultural Sciences 02
21 21Area, Ethnic and Cultural Studies 0528 28Basic Skills 32
644 679 1,414 2,737Business Management and Administrative Services 5216 15 31Communications 0955 47 102Communications Technologies 10
8 67 75Computer and Information Sciences 118 77 85Conservation and Renewable Natural Resources 03
141 816 49 1,006Construction Trades 463 4 5 12Education 13
35 35Engineering 1427 221 291 539Engineering-related Technologies 15
292 1,384 1,704 3,380Health Professions and Related Sciences 5157 57Law and Legal Studies 22
3,122 3,122Liberal Arts and Sciences, General Studies and Humanities 247 7Library Science 25
100 184 182 466Marketing Operations/marketing and Distribution 08117 835 182 1,134Mechanics and Repairers 4710 10 20Parks, Recreation, Leisure and Fitness Studies 3170 207 17 294Personal and Miscellaneous Services 12
121 820 213 1,154Precision Production Trades 48128 9 444 581Protective Services 43
4 13 35 52Public Administration and Services 441 1 2Science Technologies 415 7 12Social Sciences and History 45
288 78 16 382Transportation and Materials Moving Workers 497 141 162 310Visual and Performing Arts 50
126 114 110 350Vocational Home Economics 20Subtotal: Colleges 5,853 02,205 8,343 0 0 0 16,401
Source: Office of the Chancellor Research and PlanningR:\Factbooks\System Factbook\Graduates.mdb HistGRFUsmry by CIP2 AwardLevel 10/21/2004
Table III-60: Page 10 of 15
146
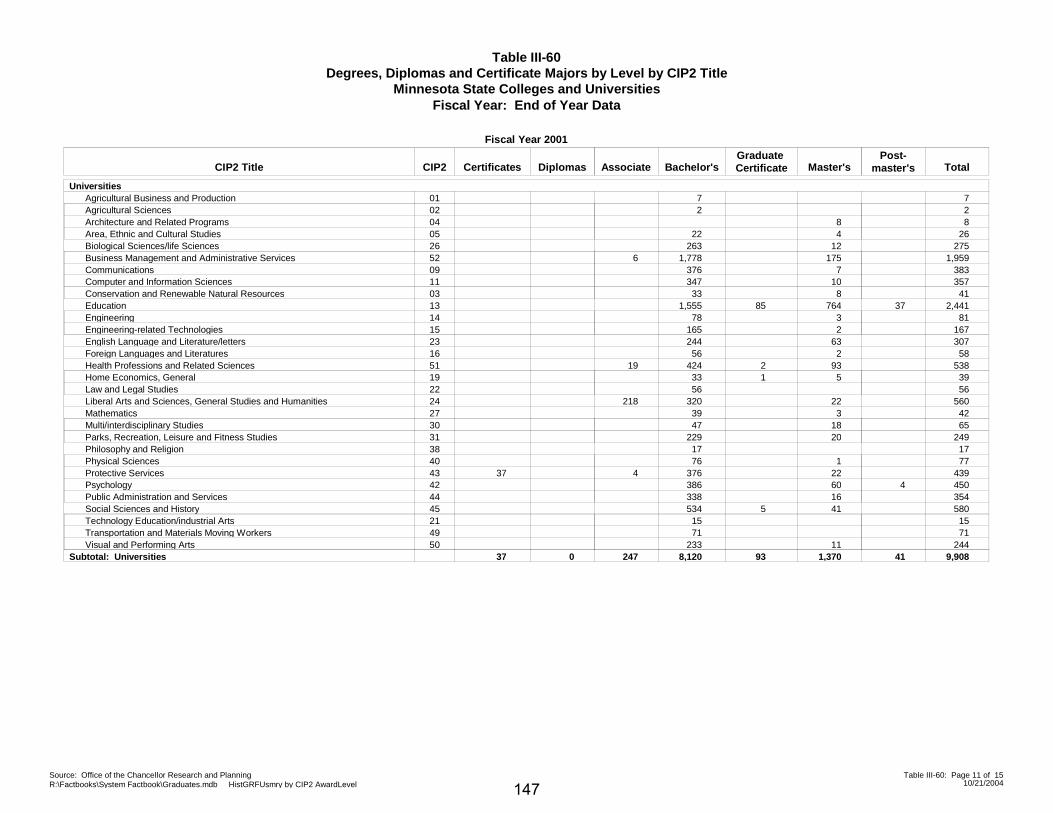
Table III-60Degrees, Diplomas and Certificate Majors by Level by CIP2 Title
Minnesota State Colleges and UniversitiesFiscal Year: End of Year Data
Universities
Certificates DiplomasGraduate CertificateAssociate Bachelor's Master's
Post-master's TotalCIP2
Fiscal Year 2001
CIP2 Title
7 7Agricultural Business and Production 012 2Agricultural Sciences 02
8 8Architecture and Related Programs 0422 4 26Area, Ethnic and Cultural Studies 05
263 12 275Biological Sciences/life Sciences 266 1,778 175 1,959Business Management and Administrative Services 52
376 7 383Communications 09347 10 357Computer and Information Sciences 1133 8 41Conservation and Renewable Natural Resources 03
851,555 764 37 2,441Education 1378 3 81Engineering 14
165 2 167Engineering-related Technologies 15244 63 307English Language and Literature/letters 2356 2 58Foreign Languages and Literatures 16
219 424 93 538Health Professions and Related Sciences 51133 5 39Home Economics, General 19
56 56Law and Legal Studies 22218 320 22 560Liberal Arts and Sciences, General Studies and Humanities 24
39 3 42Mathematics 2747 18 65Multi/interdisciplinary Studies 30
229 20 249Parks, Recreation, Leisure and Fitness Studies 3117 17Philosophy and Religion 3876 1 77Physical Sciences 40
37 4 376 22 439Protective Services 43386 60 4 450Psychology 42338 16 354Public Administration and Services 44
5534 41 580Social Sciences and History 4515 15Technology Education/industrial Arts 2171 71Transportation and Materials Moving Workers 49
233 11 244Visual and Performing Arts 50Subtotal: Universities 0 9337 247 8,120 1,370 41 9,908
Source: Office of the Chancellor Research and PlanningR:\Factbooks\System Factbook\Graduates.mdb HistGRFUsmry by CIP2 AwardLevel 10/21/2004
Table III-60: Page 11 of 15
147
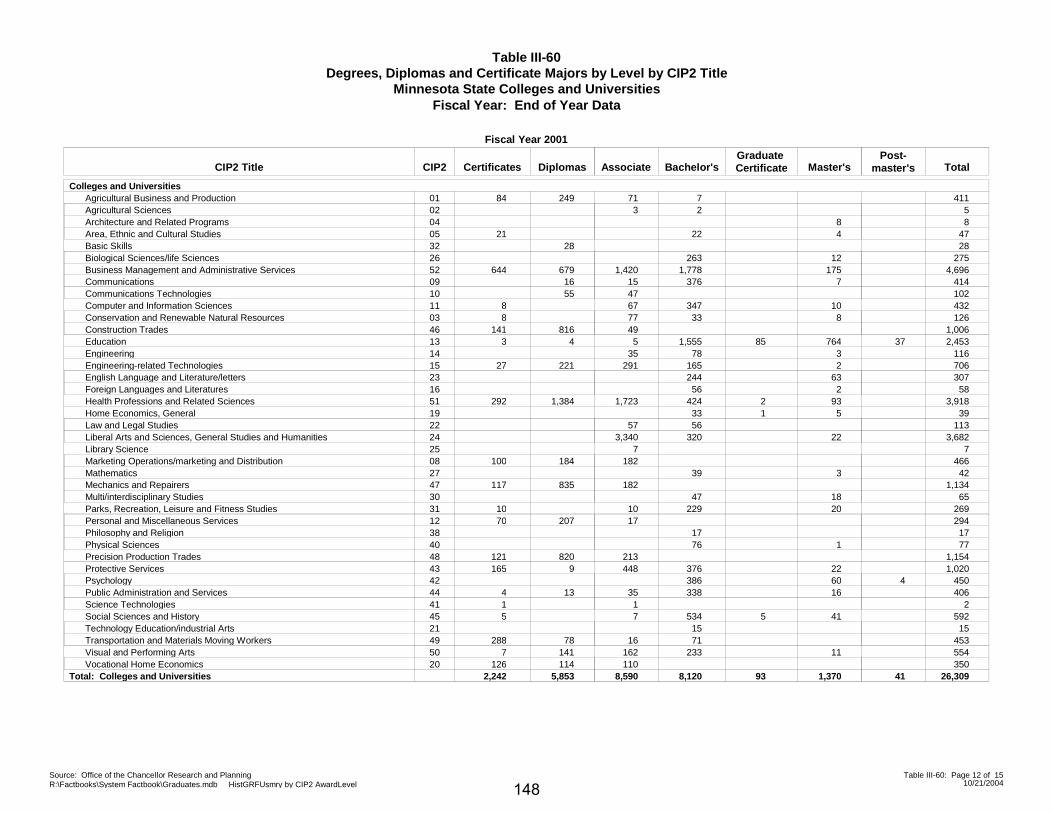
Table III-60Degrees, Diplomas and Certificate Majors by Level by CIP2 Title
Minnesota State Colleges and UniversitiesFiscal Year: End of Year Data
Colleges and Universities
Certificates DiplomasGraduate CertificateAssociate Bachelor's Master's
Post-master's TotalCIP2
Fiscal Year 2001
CIP2 Title
84 249 71 7 411Agricultural Business and Production 013 2 5Agricultural Sciences 02
8 8Architecture and Related Programs 0421 22 4 47Area, Ethnic and Cultural Studies 05
28 28Basic Skills 32263 12 275Biological Sciences/life Sciences 26
644 679 1,420 1,778 175 4,696Business Management and Administrative Services 5216 15 376 7 414Communications 0955 47 102Communications Technologies 10
8 67 347 10 432Computer and Information Sciences 118 77 33 8 126Conservation and Renewable Natural Resources 03
141 816 49 1,006Construction Trades 463 4 855 1,555 764 37 2,453Education 13
35 78 3 116Engineering 1427 221 291 165 2 706Engineering-related Technologies 15
244 63 307English Language and Literature/letters 2356 2 58Foreign Languages and Literatures 16
292 1,384 21,723 424 93 3,918Health Professions and Related Sciences 51133 5 39Home Economics, General 19
57 56 113Law and Legal Studies 223,340 320 22 3,682Liberal Arts and Sciences, General Studies and Humanities 24
7 7Library Science 25100 184 182 466Marketing Operations/marketing and Distribution 08
39 3 42Mathematics 27117 835 182 1,134Mechanics and Repairers 47
47 18 65Multi/interdisciplinary Studies 3010 10 229 20 269Parks, Recreation, Leisure and Fitness Studies 3170 207 17 294Personal and Miscellaneous Services 12
17 17Philosophy and Religion 3876 1 77Physical Sciences 40
121 820 213 1,154Precision Production Trades 48165 9 448 376 22 1,020Protective Services 43
386 60 4 450Psychology 424 13 35 338 16 406Public Administration and Services 441 1 2Science Technologies 415 57 534 41 592Social Sciences and History 45
15 15Technology Education/industrial Arts 21288 78 16 71 453Transportation and Materials Moving Workers 49
7 141 162 233 11 554Visual and Performing Arts 50126 114 110 350Vocational Home Economics 20
Total: Colleges and Universities 5,853 932,242 8,590 8,120 1,370 41 26,309
Source: Office of the Chancellor Research and PlanningR:\Factbooks\System Factbook\Graduates.mdb HistGRFUsmry by CIP2 AwardLevel 10/21/2004
Table III-60: Page 12 of 15
148

Table III-60Degrees, Diplomas and Certificate Majors by Level by CIP2 Title
Minnesota State Colleges and UniversitiesFiscal Year: End of Year Data
Colleges
Certificates DiplomasGraduate CertificateAssociate Bachelor's Master's
Post-master's TotalCIP2
Fiscal Year 2002
CIP2 Title
69 445 72 586Agricultural Business and Production 014 4Agricultural Sciences 02
14 14Area, Ethnic and Cultural Studies 0548 48Basic Skills 32
894 731 1,646 3,271Business Management and Administrative Services 5232 12 44Communications 09
8 59 75 142Communications Technologies 104 68 72Computer and Information Sciences 112 2 59 63Conservation and Renewable Natural Resources 03
257 891 64 1,212Construction Trades 4617 8 3 28Education 13
48 48Engineering 1463 232 294 589Engineering-related Technologies 15
318 1,314 1,782 3,414Health Professions and Related Sciences 5155 55Law and Legal Studies 22
3,390 3,390Liberal Arts and Sciences, General Studies and Humanities 244 4Library Science 25
68 135 186 389Marketing Operations/marketing and Distribution 08215 819 153 1,187Mechanics and Repairers 47
2 12 14Parks, Recreation, Leisure and Fitness Studies 3187 250 39 376Personal and Miscellaneous Services 12
230 708 181 1,119Precision Production Trades 48241 2 453 696Protective Services 43
8 22 63 93Public Administration and Services 443 2 5Science Technologies 41
14 5 19Social Sciences and History 45343 58 13 414Transportation and Materials Moving Workers 4921 140 238 399Visual and Performing Arts 50
119 103 130 352Vocational Home Economics 20Subtotal: Colleges 5,999 02,997 9,051 0 0 0 18,047
Source: Office of the Chancellor Research and PlanningR:\Factbooks\System Factbook\Graduates.mdb HistGRFUsmry by CIP2 AwardLevel 10/21/2004
Table III-60: Page 13 of 15
149

Table III-60Degrees, Diplomas and Certificate Majors by Level by CIP2 Title
Minnesota State Colleges and UniversitiesFiscal Year: End of Year Data
Universities
Certificates DiplomasGraduate CertificateAssociate Bachelor's Master's
Post-master's TotalCIP2
Fiscal Year 2002
CIP2 Title
5 5Agricultural Business and Production 0111 11Architecture and Related Programs 04
26 6 32Area, Ethnic and Cultural Studies 05289 6 295Biological Sciences/life Sciences 26
6 1,912 152 2,070Business Management and Administrative Services 52389 5 394Communications 09397 6 403Computer and Information Sciences 1149 1 50Conservation and Renewable Natural Resources 03
1 571,456 789 42 2,345Education 1392 8 100Engineering 14
201 201Engineering-related Technologies 15335 72 407English Language and Literature/letters 2379 79Foreign Languages and Literatures 16
23 456 116 595Health Professions and Related Sciences 5140 4 44Home Economics, General 1949 49Law and Legal Studies 22
241 287 34 562Liberal Arts and Sciences, General Studies and Humanities 2463 63Mathematics 27
148 16 65Multi/interdisciplinary Studies 30228 36 264Parks, Recreation, Leisure and Fitness Studies 3127 27Philosophy and Religion 3873 3 76Physical Sciences 40
12 3 386 16 417Protective Services 43326 50 8 384Psychology 42364 26 390Public Administration and Services 44
10503 24 537Social Sciences and History 45100 100Transportation and Materials Moving Workers 49295 16 311Visual and Performing Arts 50
Subtotal: Universities 0 6813 273 8,475 1,397 50 10,276
Source: Office of the Chancellor Research and PlanningR:\Factbooks\System Factbook\Graduates.mdb HistGRFUsmry by CIP2 AwardLevel 10/21/2004
Table III-60: Page 14 of 15
150

Table III-60Degrees, Diplomas and Certificate Majors by Level by CIP2 Title
Minnesota State Colleges and UniversitiesFiscal Year: End of Year Data
Colleges and Universities
Certificates DiplomasGraduate CertificateAssociate Bachelor's Master's
Post-master's TotalCIP2
Fiscal Year 2002
CIP2 Title
69 445 72 5 591Agricultural Business and Production 014 4Agricultural Sciences 02
11 11Architecture and Related Programs 0414 26 6 46Area, Ethnic and Cultural Studies 05
48 48Basic Skills 32289 6 295Biological Sciences/life Sciences 26
894 731 1,652 1,912 152 5,341Business Management and Administrative Services 5232 12 389 5 438Communications 09
8 59 75 142Communications Technologies 104 68 397 6 475Computer and Information Sciences 112 2 59 49 1 113Conservation and Renewable Natural Resources 03
257 891 64 1,212Construction Trades 4618 8 573 1,456 789 42 2,373Education 13
48 92 8 148Engineering 1463 232 294 201 790Engineering-related Technologies 15
335 72 407English Language and Literature/letters 2379 79Foreign Languages and Literatures 16
318 1,314 1,805 456 116 4,009Health Professions and Related Sciences 5140 4 44Home Economics, General 19
55 49 104Law and Legal Studies 223,631 287 34 3,952Liberal Arts and Sciences, General Studies and Humanities 24
4 4Library Science 2568 135 186 389Marketing Operations/marketing and Distribution 08
63 63Mathematics 27215 819 153 1,187Mechanics and Repairers 47
148 16 65Multi/interdisciplinary Studies 302 12 228 36 278Parks, Recreation, Leisure and Fitness Studies 31
87 250 39 376Personal and Miscellaneous Services 1227 27Philosophy and Religion 3873 3 76Physical Sciences 40
230 708 181 1,119Precision Production Trades 48253 2 456 386 16 1,113Protective Services 43
326 50 8 384Psychology 428 22 63 364 26 483Public Administration and Services 443 2 5Science Technologies 41
14 105 503 24 556Social Sciences and History 45343 58 13 100 514Transportation and Materials Moving Workers 4921 140 238 295 16 710Visual and Performing Arts 50
119 103 130 352Vocational Home Economics 20Total: Colleges and Universities 5,999 683,010 9,324 8,475 1,397 50 28,323
Source: Office of the Chancellor Research and PlanningR:\Factbooks\System Factbook\Graduates.mdb HistGRFUsmry by CIP2 AwardLevel 10/21/2004
Table III-60: Page 15 of 15
151

This Page is Intentionally Left Blank
152
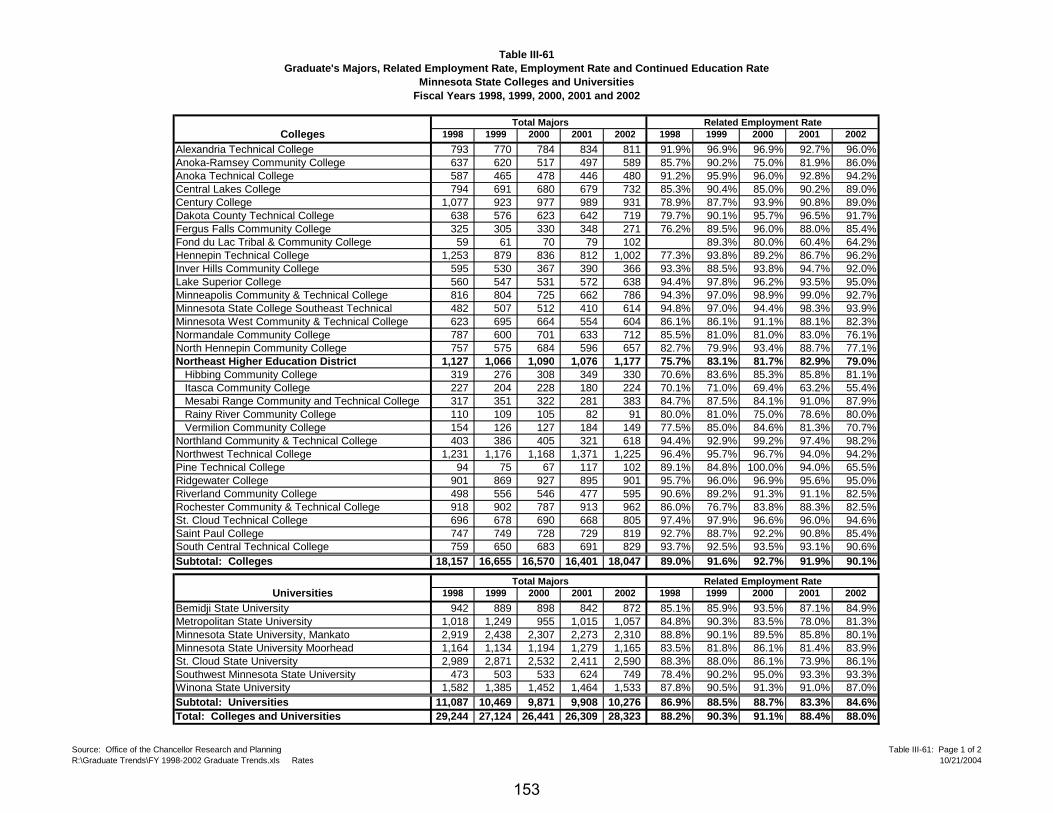
Table III-61Graduate's Majors, Related Employment Rate, Employment Rate and Continued Education Rate
Minnesota State Colleges and UniversitiesFiscal Years 1998, 1999, 2000, 2001 and 2002
Colleges 1998 1999 2000 2001 2002 1998 1999 2000 2001 2002
Alexandria Technical College 793 770 784 834 811 91.9% 96.9% 96.9% 92.7% 96.0%Anoka-Ramsey Community College 637 620 517 497 589 85.7% 90.2% 75.0% 81.9% 86.0%Anoka Technical College 587 465 478 446 480 91.2% 95.9% 96.0% 92.8% 94.2%Central Lakes College 794 691 680 679 732 85.3% 90.4% 85.0% 90.2% 89.0%Century College 1,077 923 977 989 931 78.9% 87.7% 93.9% 90.8% 89.0%Dakota County Technical College 638 576 623 642 719 79.7% 90.1% 95.7% 96.5% 91.7%Fergus Falls Community College 325 305 330 348 271 76.2% 89.5% 96.0% 88.0% 85.4%Fond du Lac Tribal & Community College 59 61 70 79 102 89.3% 80.0% 60.4% 64.2%Hennepin Technical College 1,253 879 836 812 1,002 77.3% 93.8% 89.2% 86.7% 96.2%Inver Hills Community College 595 530 367 390 366 93.3% 88.5% 93.8% 94.7% 92.0%Lake Superior College 560 547 531 572 638 94.4% 97.8% 96.2% 93.5% 95.0%Minneapolis Community & Technical College 816 804 725 662 786 94.3% 97.0% 98.9% 99.0% 92.7%Minnesota State College Southeast Technical 482 507 512 410 614 94.8% 97.0% 94.4% 98.3% 93.9%Minnesota West Community & Technical College 623 695 664 554 604 86.1% 86.1% 91.1% 88.1% 82.3%Normandale Community College 787 600 701 633 712 85.5% 81.0% 81.0% 83.0% 76.1%North Hennepin Community College 757 575 684 596 657 82.7% 79.9% 93.4% 88.7% 77.1%Northeast Higher Education District 1,127 1,066 1,090 1,076 1,177 75.7% 83.1% 81.7% 82.9% 79.0% Hibbing Community College 319 276 308 349 330 70.6% 83.6% 85.3% 85.8% 81.1% Itasca Community College 227 204 228 180 224 70.1% 71.0% 69.4% 63.2% 55.4% Mesabi Range Community and Technical College 317 351 322 281 383 84.7% 87.5% 84.1% 91.0% 87.9% Rainy River Community College 110 109 105 82 91 80.0% 81.0% 75.0% 78.6% 80.0% Vermilion Community College 154 126 127 184 149 77.5% 85.0% 84.6% 81.3% 70.7%Northland Community & Technical College 403 386 405 321 618 94.4% 92.9% 99.2% 97.4% 98.2%Northwest Technical College 1,231 1,176 1,168 1,371 1,225 96.4% 95.7% 96.7% 94.0% 94.2%Pine Technical College 94 75 67 117 102 89.1% 84.8% 100.0% 94.0% 65.5%Ridgewater College 901 869 927 895 901 95.7% 96.0% 96.9% 95.6% 95.0%Riverland Community College 498 556 546 477 595 90.6% 89.2% 91.3% 91.1% 82.5%Rochester Community & Technical College 918 902 787 913 962 86.0% 76.7% 83.8% 88.3% 82.5%St. Cloud Technical College 696 678 690 668 805 97.4% 97.9% 96.6% 96.0% 94.6%Saint Paul College 747 749 728 729 819 92.7% 88.7% 92.2% 90.8% 85.4%South Central Technical College 759 650 683 691 829 93.7% 92.5% 93.5% 93.1% 90.6%Subtotal: Colleges 18,157 16,655 16,570 16,401 18,047 89.0% 91.6% 92.7% 91.9% 90.1%
Universities 1998 1999 2000 2001 2002 1998 1999 2000 2001 2002
Bemidji State University 942 889 898 842 872 85.1% 85.9% 93.5% 87.1% 84.9%Metropolitan State University 1,018 1,249 955 1,015 1,057 84.8% 90.3% 83.5% 78.0% 81.3%Minnesota State University, Mankato 2,919 2,438 2,307 2,273 2,310 88.8% 90.1% 89.5% 85.8% 80.1%Minnesota State University Moorhead 1,164 1,134 1,194 1,279 1,165 83.5% 81.8% 86.1% 81.4% 83.9%St. Cloud State University 2,989 2,871 2,532 2,411 2,590 88.3% 88.0% 86.1% 73.9% 86.1%Southwest Minnesota State University 473 503 533 624 749 78.4% 90.2% 95.0% 93.3% 93.3%Winona State University 1,582 1,385 1,452 1,464 1,533 87.8% 90.5% 91.3% 91.0% 87.0%Subtotal: Universities 11,087 10,469 9,871 9,908 10,276 86.9% 88.5% 88.7% 83.3% 84.6%Total: Colleges and Universities 29,244 27,124 26,441 26,309 28,323 88.2% 90.3% 91.1% 88.4% 88.0%
Total Majors Related Employment Rate
Total Majors Related Employment Rate
Source: Office of the Chancellor Research and PlanningR:\Graduate Trends\FY 1998-2002 Graduate Trends.xls Rates
Table III-61: Page 1 of 210/21/2004
153
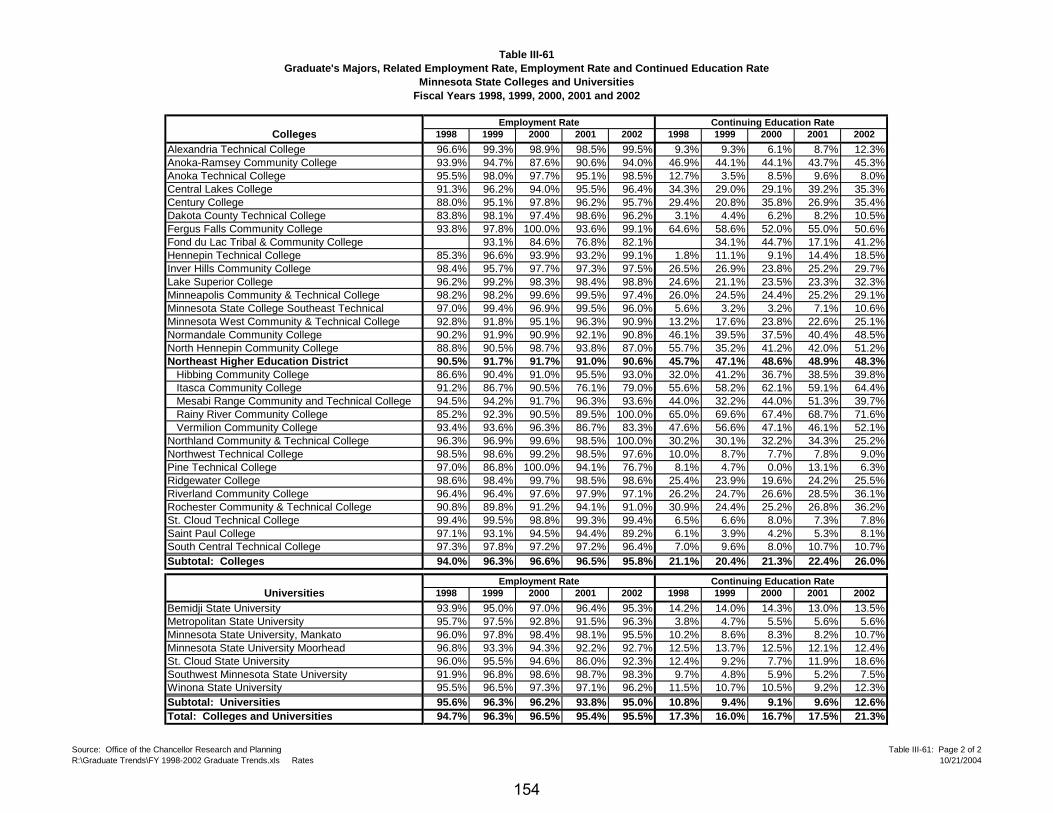
Table III-61Graduate's Majors, Related Employment Rate, Employment Rate and Continued Education Rate
Minnesota State Colleges and UniversitiesFiscal Years 1998, 1999, 2000, 2001 and 2002
CollegesAlexandria Technical CollegeAnoka-Ramsey Community CollegeAnoka Technical CollegeCentral Lakes CollegeCentury CollegeDakota County Technical CollegeFergus Falls Community CollegeFond du Lac Tribal & Community CollegeHennepin Technical CollegeInver Hills Community CollegeLake Superior CollegeMinneapolis Community & Technical CollegeMinnesota State College Southeast TechnicalMinnesota West Community & Technical CollegeNormandale Community CollegeNorth Hennepin Community CollegeNortheast Higher Education District Hibbing Community College Itasca Community College Mesabi Range Community and Technical College Rainy River Community College Vermilion Community CollegeNorthland Community & Technical CollegeNorthwest Technical CollegePine Technical CollegeRidgewater CollegeRiverland Community CollegeRochester Community & Technical CollegeSt. Cloud Technical CollegeSaint Paul CollegeSouth Central Technical CollegeSubtotal: Colleges
UniversitiesBemidji State UniversityMetropolitan State UniversityMinnesota State University, MankatoMinnesota State University MoorheadSt. Cloud State UniversitySouthwest Minnesota State UniversityWinona State UniversitySubtotal: UniversitiesTotal: Colleges and Universities
1998 1999 2000 2001 2002 1998 1999 2000 2001 2002
96.6% 99.3% 98.9% 98.5% 99.5% 9.3% 9.3% 6.1% 8.7% 12.3%93.9% 94.7% 87.6% 90.6% 94.0% 46.9% 44.1% 44.1% 43.7% 45.3%95.5% 98.0% 97.7% 95.1% 98.5% 12.7% 3.5% 8.5% 9.6% 8.0%91.3% 96.2% 94.0% 95.5% 96.4% 34.3% 29.0% 29.1% 39.2% 35.3%88.0% 95.1% 97.8% 96.2% 95.7% 29.4% 20.8% 35.8% 26.9% 35.4%83.8% 98.1% 97.4% 98.6% 96.2% 3.1% 4.4% 6.2% 8.2% 10.5%93.8% 97.8% 100.0% 93.6% 99.1% 64.6% 58.6% 52.0% 55.0% 50.6%
93.1% 84.6% 76.8% 82.1% 34.1% 44.7% 17.1% 41.2%85.3% 96.6% 93.9% 93.2% 99.1% 1.8% 11.1% 9.1% 14.4% 18.5%98.4% 95.7% 97.7% 97.3% 97.5% 26.5% 26.9% 23.8% 25.2% 29.7%96.2% 99.2% 98.3% 98.4% 98.8% 24.6% 21.1% 23.5% 23.3% 32.3%98.2% 98.2% 99.6% 99.5% 97.4% 26.0% 24.5% 24.4% 25.2% 29.1%97.0% 99.4% 96.9% 99.5% 96.0% 5.6% 3.2% 3.2% 7.1% 10.6%92.8% 91.8% 95.1% 96.3% 90.9% 13.2% 17.6% 23.8% 22.6% 25.1%90.2% 91.9% 90.9% 92.1% 90.8% 46.1% 39.5% 37.5% 40.4% 48.5%88.8% 90.5% 98.7% 93.8% 87.0% 55.7% 35.2% 41.2% 42.0% 51.2%90.5% 91.7% 91.7% 91.0% 90.6% 45.7% 47.1% 48.6% 48.9% 48.3%86.6% 90.4% 91.0% 95.5% 93.0% 32.0% 41.2% 36.7% 38.5% 39.8%91.2% 86.7% 90.5% 76.1% 79.0% 55.6% 58.2% 62.1% 59.1% 64.4%94.5% 94.2% 91.7% 96.3% 93.6% 44.0% 32.2% 44.0% 51.3% 39.7%85.2% 92.3% 90.5% 89.5% 100.0% 65.0% 69.6% 67.4% 68.7% 71.6%93.4% 93.6% 96.3% 86.7% 83.3% 47.6% 56.6% 47.1% 46.1% 52.1%96.3% 96.9% 99.6% 98.5% 100.0% 30.2% 30.1% 32.2% 34.3% 25.2%98.5% 98.6% 99.2% 98.5% 97.6% 10.0% 8.7% 7.7% 7.8% 9.0%97.0% 86.8% 100.0% 94.1% 76.7% 8.1% 4.7% 0.0% 13.1% 6.3%98.6% 98.4% 99.7% 98.5% 98.6% 25.4% 23.9% 19.6% 24.2% 25.5%96.4% 96.4% 97.6% 97.9% 97.1% 26.2% 24.7% 26.6% 28.5% 36.1%90.8% 89.8% 91.2% 94.1% 91.0% 30.9% 24.4% 25.2% 26.8% 36.2%99.4% 99.5% 98.8% 99.3% 99.4% 6.5% 6.6% 8.0% 7.3% 7.8%97.1% 93.1% 94.5% 94.4% 89.2% 6.1% 3.9% 4.2% 5.3% 8.1%97.3% 97.8% 97.2% 97.2% 96.4% 7.0% 9.6% 8.0% 10.7% 10.7%94.0% 96.3% 96.6% 96.5% 95.8% 21.1% 20.4% 21.3% 22.4% 26.0%
1998 1999 2000 2001 2002 1998 1999 2000 2001 2002
93.9% 95.0% 97.0% 96.4% 95.3% 14.2% 14.0% 14.3% 13.0% 13.5%95.7% 97.5% 92.8% 91.5% 96.3% 3.8% 4.7% 5.5% 5.6% 5.6%96.0% 97.8% 98.4% 98.1% 95.5% 10.2% 8.6% 8.3% 8.2% 10.7%96.8% 93.3% 94.3% 92.2% 92.7% 12.5% 13.7% 12.5% 12.1% 12.4%96.0% 95.5% 94.6% 86.0% 92.3% 12.4% 9.2% 7.7% 11.9% 18.6%91.9% 96.8% 98.6% 98.7% 98.3% 9.7% 4.8% 5.9% 5.2% 7.5%95.5% 96.5% 97.3% 97.1% 96.2% 11.5% 10.7% 10.5% 9.2% 12.3%95.6% 96.3% 96.2% 93.8% 95.0% 10.8% 9.4% 9.1% 9.6% 12.6%94.7% 96.3% 96.5% 95.4% 95.5% 17.3% 16.0% 16.7% 17.5% 21.3%
Employment Rate Continuing Education Rate
Employment Rate Continuing Education Rate
Source: Office of the Chancellor Research and PlanningR:\Graduate Trends\FY 1998-2002 Graduate Trends.xls Rates
Table III-61: Page 2 of 210/21/2004
154
IS THE NAME
SPONSO G ORGANIZATIO
OS ITALS & C INICS,
FOR OUR
• AL INA
NOT~FO
PR FIT EALT CARE SYSTEM.
~~,,-y,,.,.,_" care for greater
twenty years. The clinic enjoys a rich
and in areas of preventive health,
homeless care, sliding scale
visits,
program wide
was highlighted on national
television.
UFPC, in partnership
West Seventh Community Center,
has addressing the issue access
to quality health care in the community
by forging relationships ~~,.,,,,.,...,,,_,,hT leaders, local churches,
alternative care providers.
this way, UFPC hopes to remain
central in addressing the community
health needs now and in the future.
Our unique faculty bring active clinical
practices and enthusiasm for teaching
and working with residents. this
atmosphere we offer a richness of
collegial sharing and active mentoring.
envision the residents as partners,
as well as students.
is an American
lS lS
( 6 ,; 6 ,; 6.) residency achieves its
residents
At United Hospital's only residency
program you will find a large and varied
patient population and an excellent,
enthusiastic faculty who are dedicated
to Allina's United Family Medicine
Residency Program. Children's
Health Care ~ St. Paul, family medicine
residents are working with University
Minnesota pediatric/family medicine
-~sidents in one of the most highly
regarded inpatient pediatric training
centers in the Twin Cities.
United Hospital delivers over 4,300
babies per year at the well~established
Birth Center. The residency is
committed to excellent training in
family~centered perinatal health,
emphasizing the unique role that the
family physician plays as a provider
of prenatal, birth, and postnatal care.
Some of our faculty have 20 years
of experience in this area and are
passionately committed to this concept.
-'The perinatal consulting service at
e hospitals is dedicated to each of
'~cs patients being available for
residency education.
resources
site,
working
a
a
organizations,
The rural settings that are part of the
core rotation in the second year and
elective rotations in the third year are
viable, vital components of their
respective communities with well~
trained family physicians who serve
both as teachers and mentors.
In our formative years and beyond, it is
our experience and expectation that our
residents help shape the many aspects
of the program and are actively
involved in evaluation of its growth
and development.
to
component is
care
The quality of the resident's life and
respect for the whole person is part of
our commitment. Our program provides
benefits (e.g. child care, wellness center
membership, and progressive maternity
and paternity leave) and makes
available support services that respect
the special family needs of residents.
We invite you to review our program and
to contact our office with questions or
concerns you may have ( 651) 29 3;0069 or e;mail us at [email protected].
-eKally Macken, M.<JJ., <JJirector
-
lS
MOD Clinic began in 1968,
sponsored by four local hospitals:
St. Luke's, Riverview, and
St. Joseph's Hospitals. The MOD Clinic
had a two~fold purpose: to provide
primary health care for adult medically
indigent persons, and to provide
student/physician education.
In 1992, MOD Clinic merged with
United Family Practice and Helping
Hand Health Center to form the
United Family Practice Center.
Helping Hand Health Center,
established in 1970, was the second
major element to eventually develop
into the present UFPC. Helping
Hand Health Center was designed on a
free clinic model by the West Seventh
neighborhood planners and St. Luke's
Hospital. It was a nationally recognized
leader in community health and in
1978 was featured on CBS "Sixty
Minutes" for its innovative lifestyle
programs for the medically indigent.
IN 985, UNITED FAMILY PRACTICE (UFP)
WAS FORMED, JOINING WITH
DR. TIM RUMSEY, A LOCAL PRIVATE
PRACTITIONER, BOTH SOCIALLY COMMITTED TO
SERVING THE COMMUNITY. IN 99 , UFP AND
HHHC MERGED, FORMING THE UNITED FAMILY
PRACTICE/ HELPING HAND CENTER.
]N 992 UFP/HHHC MERGED WITH THE MOD
CLINIC TO FORM THE CURRENT UNITED
FAMILY HEALTH CENTER. THIS MERGED
CLINIC CONTINUES TO SERVE
THE COMMUNITY WITH ACCESS TO
AFFORDABLE, QUALITY HEAL TH CARE.
THE CLINIC TEACHING SITE OFFERS
CONTINUITY OF CARE, AFTER-HOURS
ON-CALL AVAILABILITY, HOSPITALIZATION
UNITED HOSPITAL, A SLIDING FEE SCALE
PAYMENT PROGRAM, COUNSELING, AS WELL
AS A VARIETY OF SOCIAL SERVICES.
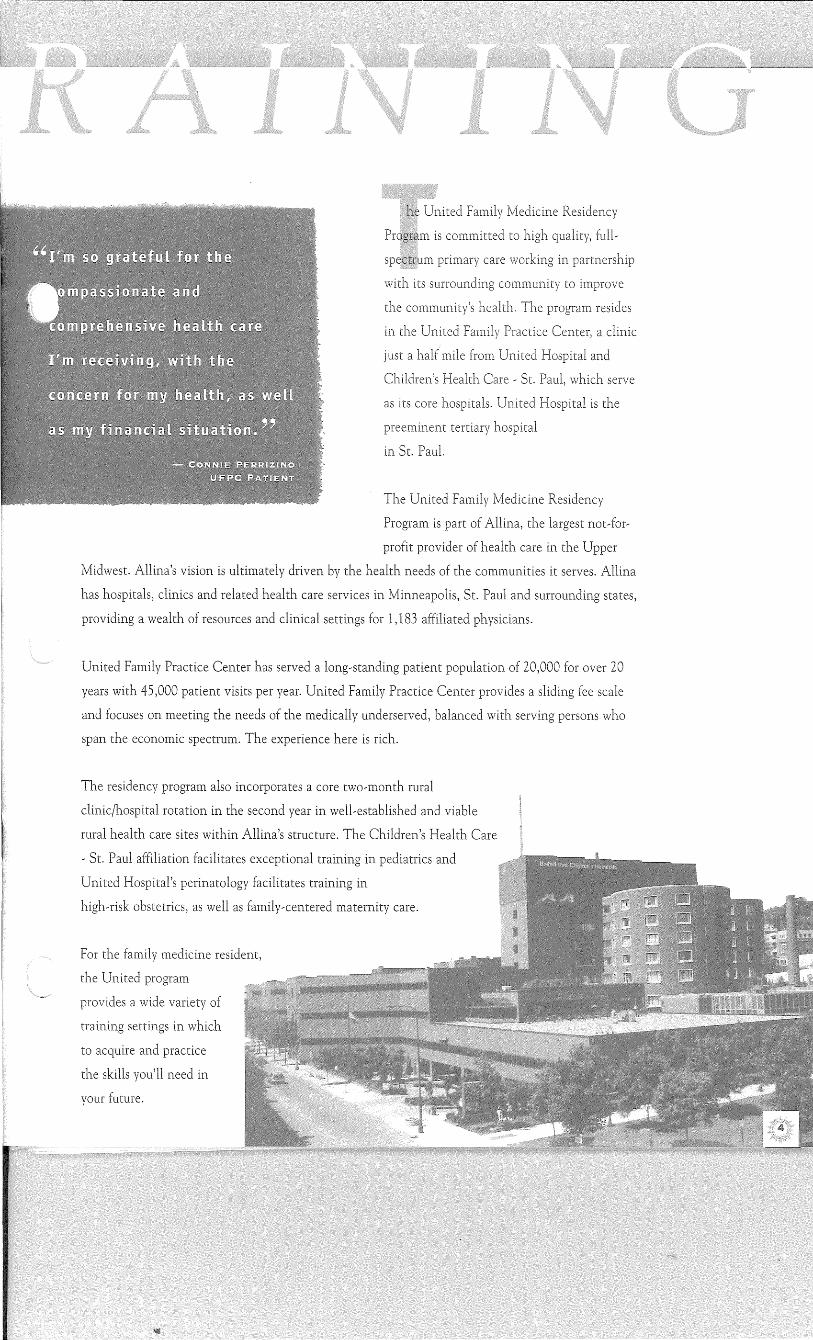
in the
just a
program resides
serve
as its core hospitals. is the
'-'-L.LHH'-LLL ;-a,-;-,,-,.,.." hospital
in St.
The United Family Medicine Residency
Program is part of Allina, the largest nodor,
profit provider of health care in the Upper
Midwest. Allina's vision is ultimately driven by the health needs of the communities it serves. Allina
has hospitals, clinics and related health care services in Minneapolis, St. Paul and surrounding states,
providing a wealth of resources and clinical settings for 1,183 affiliated physicians.
United Family Practice Center has served a long,standing patient population of 20,000 over 20
years with 45,000 patient visits per year. United Family Practice Center provides a sliding fee scale
and focuses on meeting the needs of the medically underserved, balanced with serving persons who
span the economic spectrum. The experience here is rich.
The residency program also incorporates a core two,month rural
clinic/hospital rotation in the second year in well,established and viable
rural health care sites within Allina's structure. The Children's Health Care
, St. Paul affiliation facilitates exceptional training in pediatrics and
United Hospital's perinatology facilitates training in
high,risk obstetrics, as well as family,centered maternity care.
For the family medicine resident,
the United program
provides a wide variety of
training settings in which
to acquire practice
the skills you'll need in
your future.
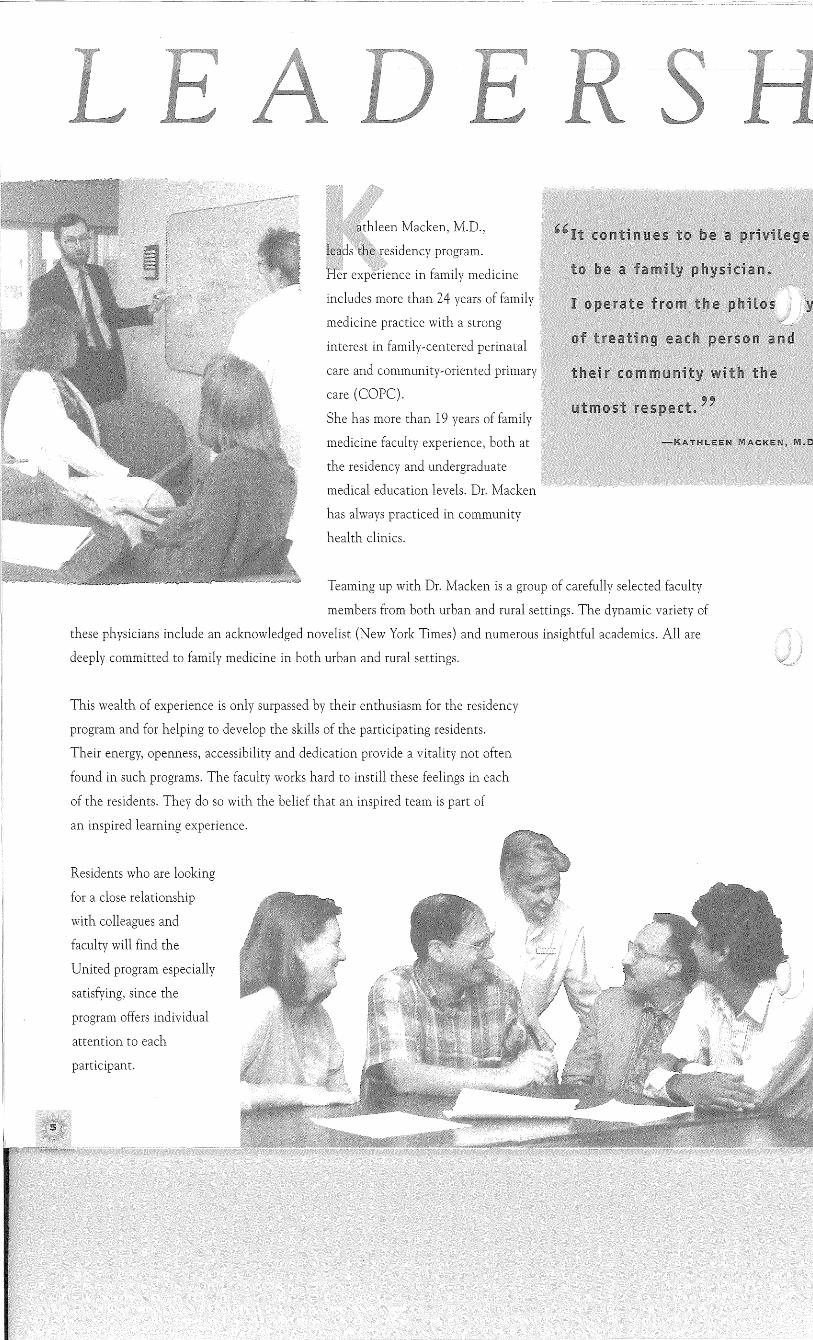
a.thleen Macken, M.D.,
leads the residency program.
Her expedence in family medicine
includes more than 24 years of family I
medicine practice with a strong
interest in family~centered perinatal
care and community~oriented primary
care (COPC).
She has more than 19 years of family
medicine faculty experience, both at
the residency and undergraduate
medical education levels. Dr. Macken
has always practiced in community
health clinics.
-KATHLEEN MACKEN, M.D
Teaming up with Dr. Macken is a group of carefully selected faculty
members from both urban and rural settings. The dynamic variety of
these physicians include an acknowledged novelist (New York Times) and numerous insightful academics. All are
deeply committed to family medicine in both urban and rural settings.
This wealth of experience is only surpassed by their enthusiasm for the residency
program and for helping to develop the skills of the participating residents.
Their energy, openness, accessibility and dedication provide a vitality not often
found in such programs. The faculty works hard to instill these feelings in each
of the residents. They do so with the belief that an inspired team is part of
an inspired learning experience.
Residents who are looking
for a close relationship
with colleagues and
faculty will find the
United program especially
satisfying, since the
program offers individual
attention to each
participant.
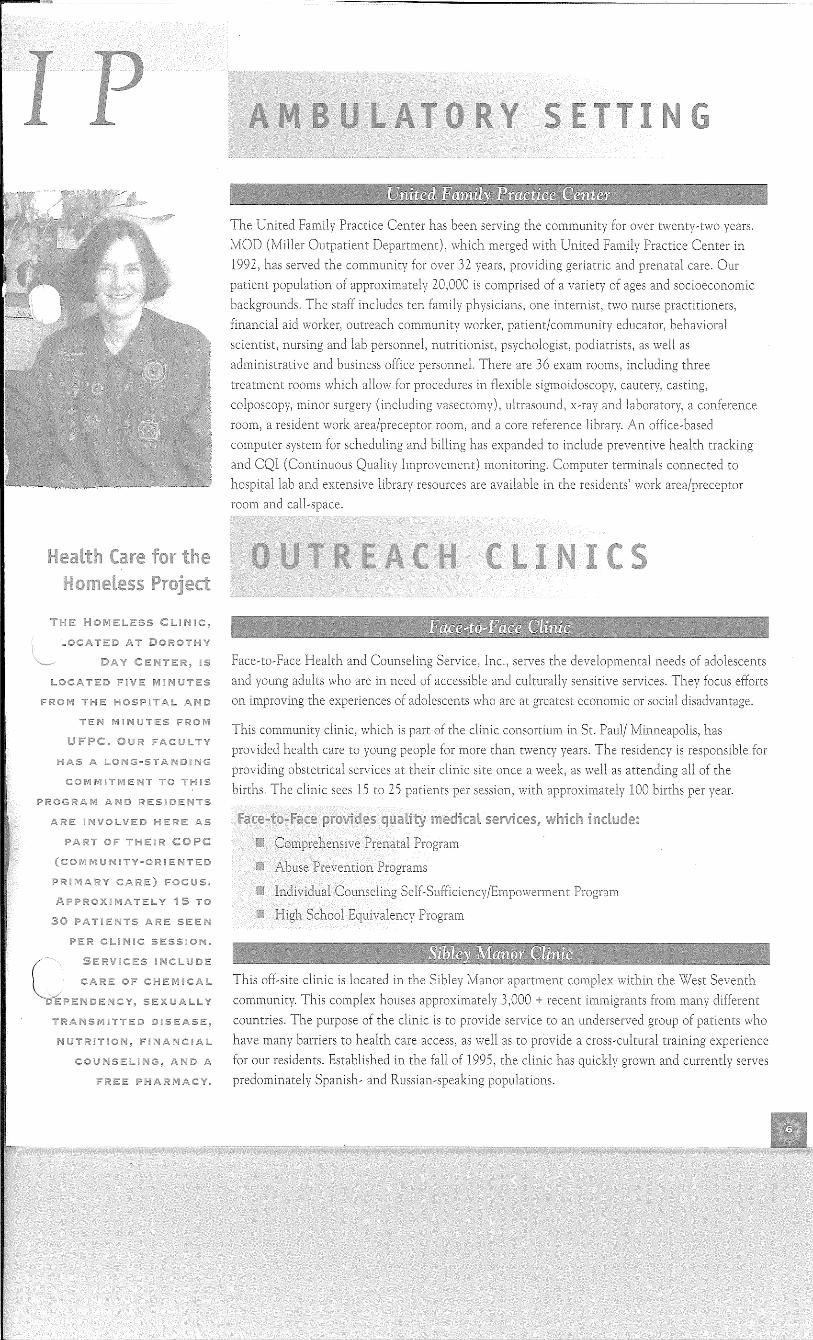
second year is
a
a
concert
to
care to
Preceptors, in both family medicine, behavioral science,
and
are
faculty staff, as well as other family physicians
the Allina
preceptor reviews
social--ethical model,
of care, the bio--psycho-
health care, and quality
family medicine practice issues. Patients are fallowed
by their own resident physician, in conjunction with the
Family Medicine staff, when hospitalized. Each
resident is teamed with other residents to ensure
continuity of care during vacation or off--site rotations.
Home and nursing home visits are an integral part of
ambulatory care training.
Face--to--Face
and to
of one
two weeks
progresses.
disease
as STD or
ect
worker facilitates significant resident
COPC process.
areas
Practice
visits,
we are to bio~psycho~social~
~~~~4~4~~4· United Family
long~standing
the West
sponsorship context is
medicine resident.
one to two
as a
is to learn interaction.
core a to teach patient~physician relationship.
Behavioral science concepts are a cornerstone of case presentations, conferences, grand rounds,
The psychiatry component of the family medicine residency is taught
in a longitudinal fashion at the family medicine center and on the
family medicine inpatient service with psychiatric input.
A consulting psychiatrist is available for Balint Group at the
family practice center.
block rotation in mental health and chemical dependency occurs in
year two, which collaborates with United Hospital's crisis
intervention assessment team, counseling with our behavioral
scientist and a local C .D. treatment center.
times.
is a HH..-'-LH..-HL"- rotation in
year rotation class together to become in family medicine concepts, ·~~-~·u,, •• ,._,
the bio,psycho,social,ethical in an outpatient setting. This allows faculty to highlight tenets of family medicine, as well as outpatient procedure, and systems and therapy issues.
more intervention patients are of higher risk.
Occurring in the second year, this rotation is largely outpatient, and includes family planning, as well as infertility evaluation/treatment, colposcopy and other women's health issues from menarche through menopause.
N
These components are all one,half month, offsite location, core,required rotations in PGY2 year, in which the resident works in a one,on,one basis with a consultant in the given area. Goals and objectives are geared toward recognition and treatment of common problems in each of the areas. During the half months of training, the rotations are supplemented with additional educational materials such as videotapes.
This onMnonth rotation occurs in the PGY2 year in a variety of locations which cover mental health issues, from crisis intervention and evaluation to hal£,way house care for the chronically, mentally ill to chemical dependency (both detoxification and treatment). It includes a segment with our on,site psychologist evaluating patients from a psychologist's perspective, including testing. Two half days of ambulatory care clinic at the family practice center are included.
This one,month block occurs in the PGYl year largely in an outpatient setting with a group of orthopedics in a one,on,one relationship with the resident. Emphasis is placed on ambulatory problems, including musculoskeletal inflammation, overuse, fracture, sprain, and allowing for hands,on evaluation, casting, and injection experience. A supplement to this rotation is an every fourth evening four,hour block in the emergency room to become familiar with as much ER presentation of orthopedic problems, as well as other ER problems. One,half day per ~eek residents participate in continuity of care clinic.
onMnonth rotation occurs at an outside clinic site with two family physicians who are CAQ in sports medicine, exercise physiologists, physical therapists, and nutritionists. There also are opportunities to participate at school athletic events.
one,month block occurs in the PGY3 year with a neurologist who practices both pediatrics and adult neurology. This component occurs at an outside clinic site and allows for discussion, evaluation, diagnosis, and treatment modality discussion of multiple common patient presentations. The neurologist is keenly aware of the types of problems that family physicians see within multiple one,on,one teaching sessions, with the opportunity to do consults in the hospital as time and pertinent diagnoses allows.
rotation is a PGY3 one,month block which includes working in a seniors' clinic with a CAQ geriatricians /internist, as well as in our own family practice center. There are on,going longitudinal nursing home rounds with our family physicians and internists, which occur in the third year. Two of our faculty have Certificates of Added Qualification (CAQ).
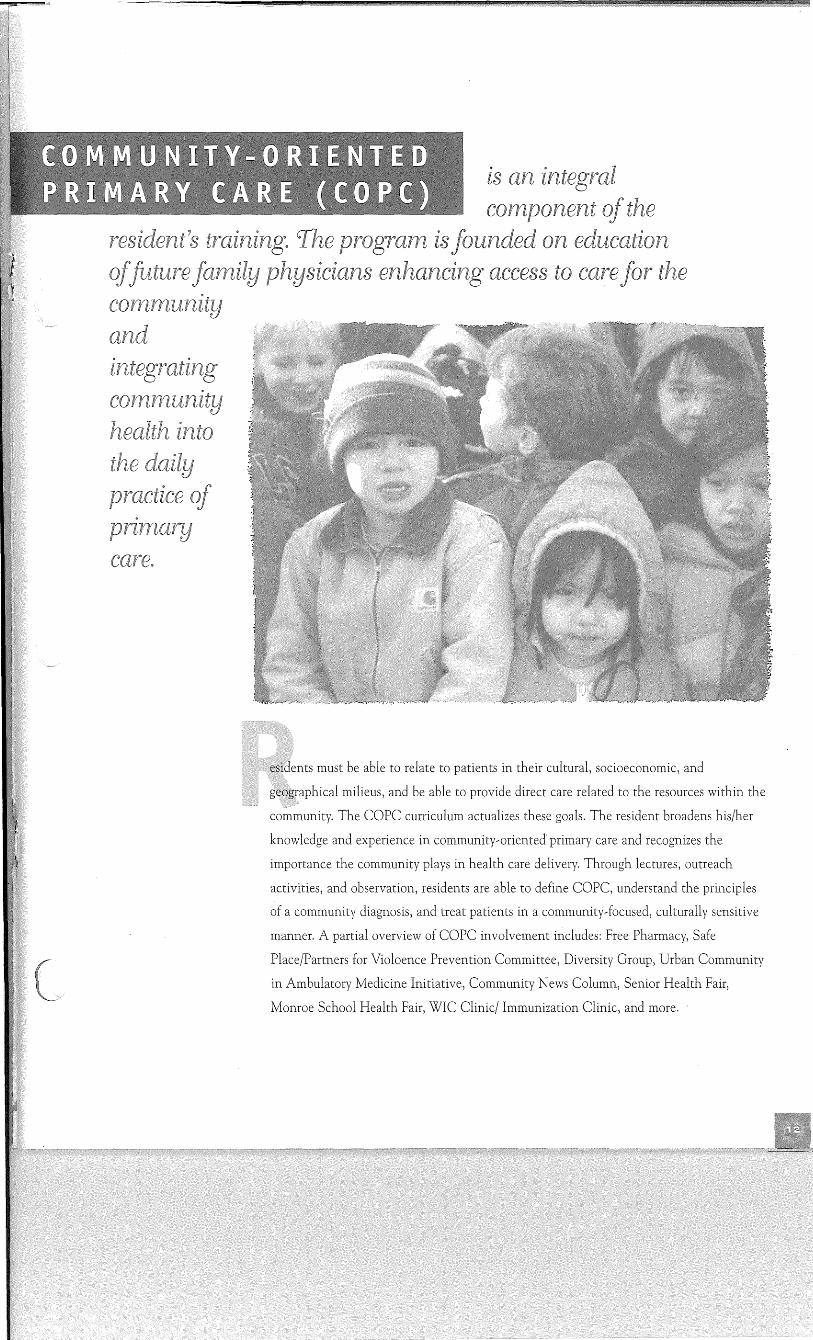
esidents must be able to relate to patients in their cultural, socioeconomic, and
geographical milieus, and be able to provide direct care related to the resources within the
community. The COPC curriculum actualizes these goals. The resident broadens his/her
knowledge and experience in community,oriented primary care and recognizes the
importance the community plays in health care delivery. Through lectures, outreach
activities, and observation, residents are able to define COPC, understand the principles
of a community diagnosis, and treat patients in a community,focused, culturally sensitive
manner. A partial overview of COPC involvement includes: Free Pharmacy, Safe
Place/Partners for Violoence Prevention Committee, Diversity Group, Urban Community
in Ambulatory Medicine Initiative, Community News Column, Senior Health Fair,
Monroe School Health Fair, WIC Clinic/ Immunization Clinic, and more.
All are available through Allina Medical Education and Research and are part of the resident's
education. All residents are certified in these areas.
A monthly one hour conference conducted by an ER physician to review cardiac arrest situations with the residents.
The review focuses on cases in which the residents have had participation.
This conference occurs bimonthly, incorporating principles of COPC,
Public Health and cross-cultural medicine.
It is rotated among departments and includes family medicine
pertain to clinic systems issues, clinic diagnoses, and treatment plans.
An every-other-month meeting conducted with all faculty and residents to review, update, and refine curriculum.
The family medicine conference topics rotate within the structure of the family life cycle,
i11,c;111i,c:,1Jcc111"' biologic issues. These are scheduled in one one-hour blocks per week. Cycling ensures that each resident in the three-year period hears
and participates and reparticipates in each critical area.
Care - St. Paul.
The internal medicine coordinates daily conferences while residents rotate on the internal medicine teaching
also has bivveekly internal medicine grand rounds.
A journal club convenes once a month and is coordinated by designated
A monthly meeting, co-presented by a PGY3 and a staff pathologist, centering
medicine service. This is a CFC clinic pathology conference model.
These occur on a five day per week basis. are coordinated by the Pediatric Department at Children's Health
A meeting which encompasses women's health - both child-bearing related, as
well as the life-cycle from adolescence through menopause. The conference is conducted by family physicians, OB/GYN and perinatal staff persons.
An pupn 1-r., 1·n,a1·- 1-nr-,n 1• 1• conference conducted by \'arious presenters
practice management topics. There are also scheduled all-day ,,,,..,.,,.,,.,,,,n,-
This conference is around actual
patient cases and directed by the behavioral scientist one hour per week. This highlights common
medicine problems, DSM-IV and psychopharmacology.
This conference occurs in the Radiology Conference Room one hour per
month. This is conductedby a from the United service and covers primary care radiology.
A monthly resident, and staff meeting
"''"""""'-"'·" to review pertinent administrative issues around residency training. Residents also have a monthly
rneeting of their own to discuss issues prior to the business meeting. ~"·~·c•CC'-" .. '' to contribute to
is available to all residents, and staff
This is a monthly meeting which is by resident training year
to promote resident support and well-being around personal and professional issues and is conducted by
the behavioral scientist, psychiatrist and outside family physician facilitators. The PGY2 - 3 format is a
Balint format.
This is attended weekly while on surgery service and coordinated by surgical staff
You will note, reading
the diagrammatic
description of years one, two, and three, that
electives are listed in year three to a total of five
months. We highly encourage flexibility in this area.
Advanced training is available in OB, procedural
skill building (sigmoidoscopy, colposcopy, stress
·sting, vasectomies, ultrasound, casting),
·community/environmental medicine, emergency
medicine, ICU/CCU/hospice/etc. An additional
orthopedics rotation is available in Colorado,
specifically Copper Mountain through a group of
family physicians. This orthopedics elective
highlights sportHelated injuries, initial management
and stabilization. This well,established elective has
been working with family medicine residencies in
Colorado and nationally for the past several years.
There is the opportunity in the third year to return
to a rural site for two months of electives without
commitment at the residency site clinic. Other
electives include international health experiences,
'.sidency,developed electives in Indian Health
... oervice, HIV and OB training.
I s Get up 15 niinutes <Prepare for the moniing the night before
fivoid tight .fitting clothes fivoid relying on chernical aids Set
appointments ahead </Jon 't rely on your memory ... write it down
<Practice preventive maintenance Make duplicate keys Say no more
often Set priorities in your life fivoid negative people Vse time
wisely Sirnplify meal make copies of irnportant papers
finticipate your needs <l(epair anything that doesn't work properly
help with the jobs you <l:3reak large tasks into bite size
portions [Qok at problerns as challenges [Qok at challenges
differently Vnclutter your life @e prepared for rain
'fickle a <Pet a friendly </Jon 't know all the nJ'lC'11,D1''(' 'I' l\
fgok for the Say something nice to 'leach a kid
to fly a kite Walk in the rain Schedule playtime into eve1y day
'lake a bubble bath @e aware of the decisions you niake @elieve in
Stop saying negative things to 1?isualize yourself
u~n·1nn1n·~·"' </Jevelop your sense Stop thinking tom01TOW will
be a better today goals for </Janee a jig Say hello
to a a friendfor a fgok up at the stars <Practice
breathing sloivly /garn to whistle a <l(ead a poern fjf.;ten to a
syrnphony Watch a ballet <l(ead a st01y mrled up in bed </Jo a
brand ne1,v thing Stop a bad habit <1:3uy yourself a flower 01;~~' 'lake
time to srnell the flower $ind support frorn others Jf'lsk sorneone to
be your "i:>ent-partrier" <fJo it today Work at being cheerful and
optimistic <Put safety first <Do ei:>e1ythi11g in moderation <Pay
attention to your appearance Strive for e.xcellence cNb'l pe1fection
&retch your limits a little each day [gok at a work a
jingle Maintain your weight <Plant a tree !Peed the birds
<Practice grace Stand up and stretch filways hai'e a
/garn to meet your oMm @ecome a better listener
eXnow your lirnitations and let others know thern too 'fell som.eone
to have a good day in pig latin 'Throw a paper airplane exercise
every
out one
/gam the words to a new Clean
<Play patty cake with a+,.,.,.,,.,,,..,,.//'' Go on a ,~,r.»·>U·'''" 'lake
a different route to
.freshener in your
to afar
[gave i.vork early (with pennission) <Put air
Watch a moi,ie and eat popcorn Write a note
Go to a ball game and Cook: a meal and
eat it by r:/{gcognize the importance of unconditional love
<l(e1nernber that stress is an attitude JCeep a journal <Practice a
monster <l(emen1.ber you always have nntc,nnc:•'" a support
network of people, places and Q!:;dt nying to
Get enough 'lalk less and liBten $reely praise other people
<P.S. <l(elax, take each day at a ti1ne ... you hai:>e the rest of youi· life to live.
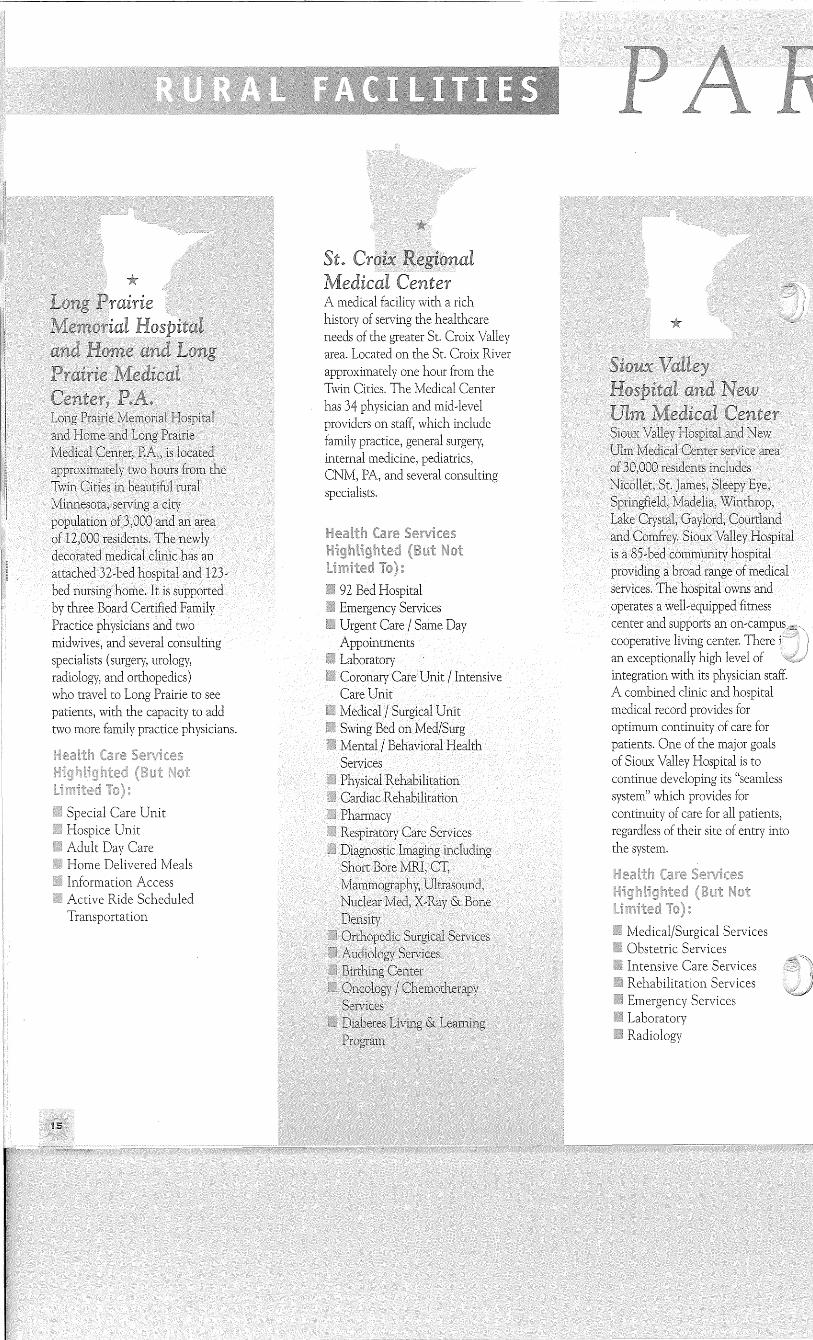
.LUJ.JlL'--U'V\.U., serving a population of 3,000 and an area of 12,000 residents. The newly decorated medical clinic has an attached 32~bed hospital and 123~ bed nursing home. It is supported by three Board Certified Family Practice physicians and two midwives, and several consulting specialists (surgery, urology, radiology, and mthopedics) who travel to Long Prairie to see patients, with the capacity to add two more family practice physicians.
Special Care Unit Hospice Unit Adult Day Care Home Delivered Meals Information Access Active Ride Scheduled Transportation
A medical facility with a rich history of serving the healthcare needs of the greater St. Croix Valley area. Located on the St. Croix River approximately one hour from the Twin Cities. The Medical Center has 34 physician and mid~level providers on staff, which include family practice, general surgery, internal medicine, pediatrics, CNM, PA, and several consulting specialists.
92 Bed Hospital Emergency Services Urgent Care / Same Day Appointments Laboratory Coronary Care Unit / Intensive Care Unit Medical / Surgical Unit Swing Bed on Med/Surg Mental / Behavioral Health Services Physical Rehabilitation Cardiac Rehabilitation Pharmacy Respiratory Care Services Diagnostic Imaging including Short Bore CT,
Springfield, Lake Crystal, Gaylord, Comtland and Comfrey. Sioux Hospital is a 85~bed community hospital providing a range of medical services. hospital owns and operates a well~equipped fitness center and supports an cooperative living center. There an exceptionally high level of integration with its physician staff. A combined clinic and hospital medical record provides for optimum continuity of care for patients. One of the rnaj or goals of Sioux Valley Hospital is to continue developing its "seamless system" which provides for continuity of care for all patients, regardless of their site of entry into the system.
Medical/Surgical Services Obstetric Services Intensive Care Services Rehabilitation Services Emergency Services Laboratory Radiology
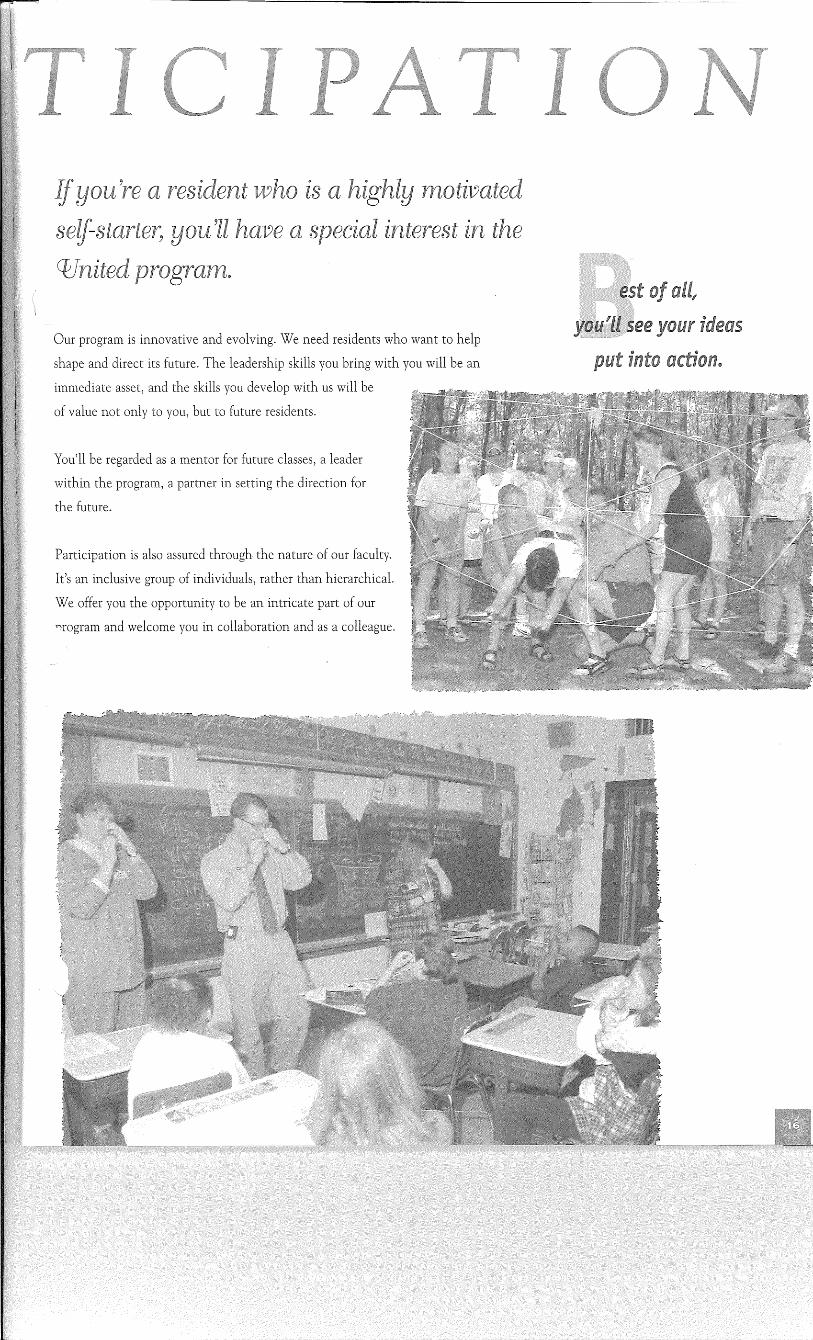
Our program is innovative and evolving. We need residents who want to help
shape and direct its future. The leadership skills you bring with you will be an
immediate asset, and the skills you develop with us will be
of value not only to you, but to future residents.
You'll be regarded as a mentor for future classes, a leader
within the program, a partner in setting the direction for
the future.
Participation is also assured through the nature of our faculty.
It's an inclusive group of individuals, rather than hierarchical.
We offer you the opportunity to be an intricate part of our
11rogram and welcome you in collaboration and as a colleague.
The program, the people, place. are top quality. invite participation. need you to make a
difference for the better. Combine
you haven't heard about the high
quality of life in Minneapolis/St. Paul
and Minnesota, you've been working
too hard. Lakes, rivers, trees, the Twins, Vikings, hockey,
several colleges, an incredible variety of community theaters -
ranging from a hearing-impaired theater to the Guthrie and
Children's Theaters - hundreds of restaurants, great night life
(even Prince lives here) ... these just begin the list of what
Minnesota has to offer. We even have the world's largest fully
enclosed shopping complex, The Mall of America,
you need to run out and buy something. Everything you
would ever want and everything your family want is here.
All that's missing is you.
Kathleen Macken, M.D. Family Medicine Residency Progra 545 West 7th Street
them and you have one of the highest quality living and learning experiences anywhere.
St. Paul, MN 55102
Phone: (651) 293-0069 FAX: (651) 293-5889 e-mail: [email protected]
© 2003 Allina Health System
® A registered trademark of Allina
Health System
03-1(
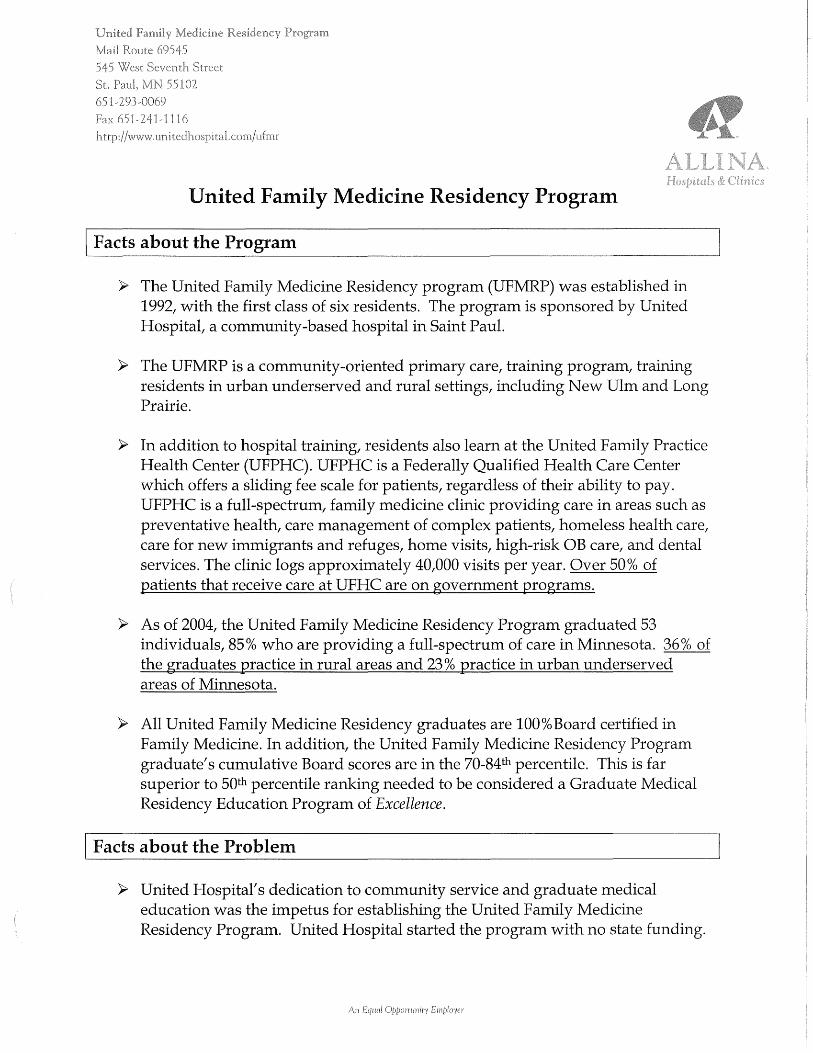
United Family Medicine Residency Program
\ Facts about the Program
? The United Family Medicine Residency program (UFMRP) was established in 1992, with the first class of six residents. The program is sponsored by United Hospital, a community-based hospital in Saint Paul.
? The UFMRP is a community-oriented primary care, training program, training residents in urban underserved and rural settings, including New Ulm and Long Prairie.
? In addition to hospital training, residents also learn at the United Family Practice Health Center (UFPHC). UFPHC is a Federally Qualified Health Care Center which offers a sliding fee scale for patients, regardless of their ability to pay. UFPH C is a full-spectrum, family medicine clinic providing care in areas such as preventative health, care management of complex patients, homeless health care, care for new immigrants and refuges, home visits, high-risk OB care, and dental services. The clinic logs approximately 40,000 visits per year. Over 50% of patients that receive care at UFHC are on government programs.
? As of 2004, the United Family Medicine Residency Program graduated 53 individuals, 85% who are providing a full-spectrum of care in Minnesota. 36% of the graduates practice in rural areas and 23 % practice in urban underserved areas of Minnesota.
? All United Family Medicine Residency graduates are 100%Board certified in Family Medicine. In addition, the United Family Medicine Residency Program graduate's cumulative Board scores are in the 70-84th percentile. This is far superior to 50th percentile ranking needed to be considered a Graduate Medical Residency Education Program of Excellence.
I Facts about the Problem
? United Hospital's dedication to community service and graduate medical education was the impetus for establishing the United Family Medicine Residency Program. United Hospital started the program with no state funding.
Eqrwl Employer
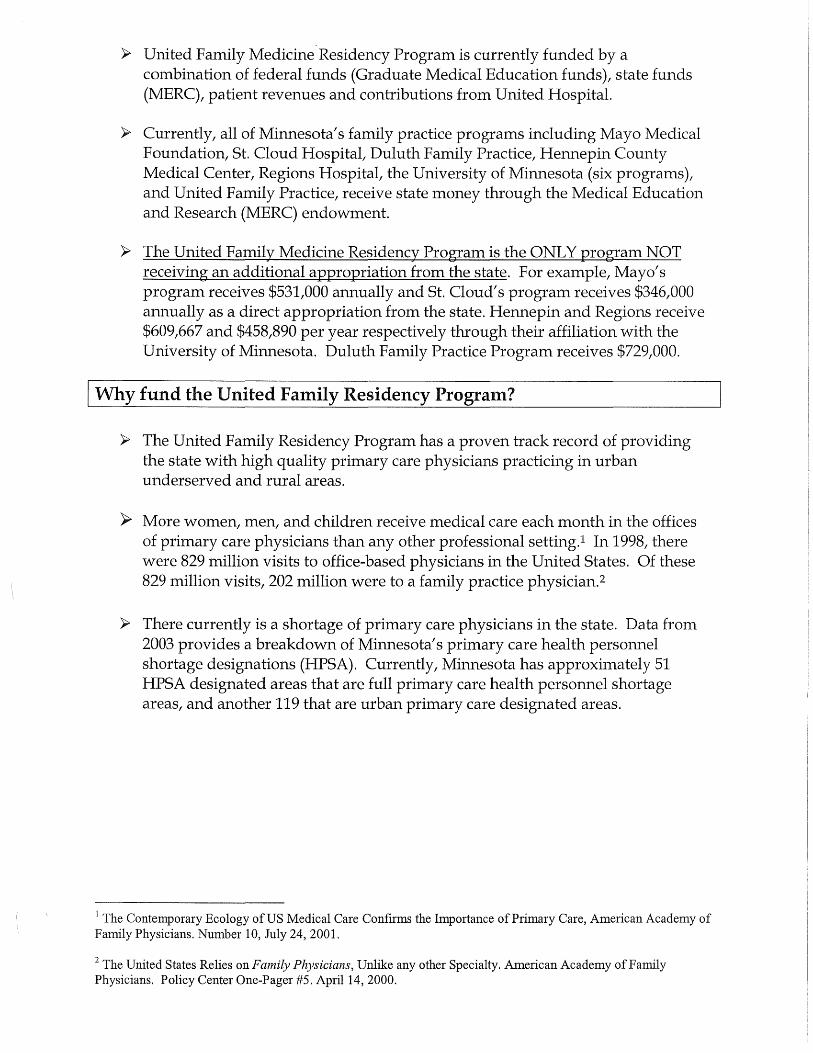
>- United Family Medicine.Residency Program is currently funded by a combination of federal funds (Graduate Medical Education funds), state funds (MERC), patient revenues and contributions from United Hospital.
>- Currently, all of Minnesota's family practice programs including Mayo Medical Foundation, St. Cloud Hospital, Duluth Family Practice, Hennepin County Medical Center, Regions Hospital, the University of Minnesota (six programs), and United Family Practice, receive state money through the Medical Education and Research (MERC) endowment.
>- The United Family Medicine Residency Program is the ONLY program NOT receiving an additional appropriation from the state. For example, Mayo's program receives $531,000 annually and St. Cloud's program receives $346,000 annually as a direct appropriation from the state. Hennepin and Regions receive $609,667 and $458,890 per year respectively through their affiliation with the University of Minnesota. Duluth Family Practice Program receives $729,000.
I Why fund the United Family Residency Program?
>- The United Family Residency Program has a proven track record of providing the state with high quality primary care physicians practicing in urban underserved and rural areas.
~ More women, men, and children receive medical care each month in the offices of primary care physicians than any other professional setting.1 In 1998, there were 829 million visits to office-based physicians in the United States. Of these 829 million visits, 202 million were to a family practice physician.2
>- There currently is a shortage of primary care physicians in the state. Data from 2003 provides a breakdown of Minnesota's primary care health personnel shortage designations (HPSA). Currently, Minnesota has approximately 51 HPSA designated areas that are full primary care health personnel shortage areas, and another 119 that are urban primary care designated areas.
1 The Contemporary Ecology of US Medical Care Confirms the Importance of Primary Care, American Academy of Family Physicians. Number 10, July 24, 2001.
2 The United States Relies on Family Physicians, Unlike any other Specialty. American Academy of Family Physicians. Policy Center One-Pager #5. April 14, 2000.
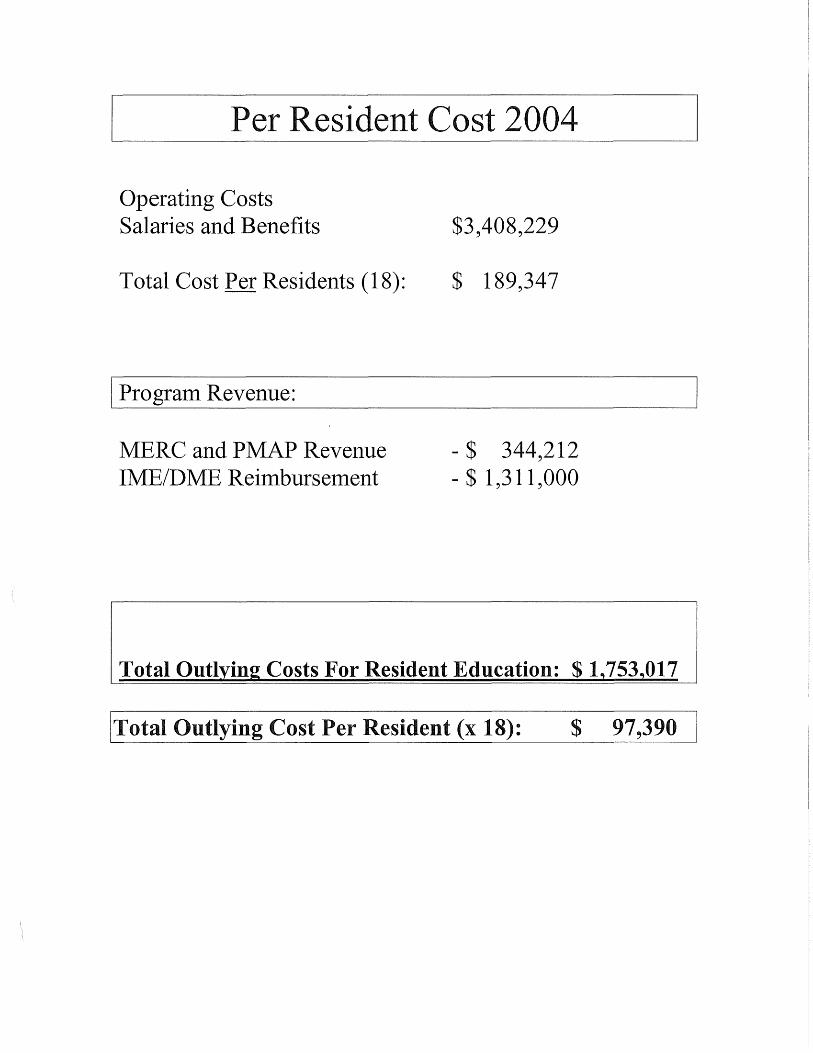
[ Per Resident Cost 2004 I
Operating Costs Salaries and Benefits
Total Cost Per Residents (18):
$3,408,229
$ 189,347
I Program Revenue: I
MERC and PMAP Revenue IME/DME Reimbursement
- $ 344,212 - $ 1,311,000
Total Outlying Costs For Resident Education: $ 1, 753,017
ITotal Out1Yhig Cost ]>~;-Resident (x 18): $ 97,390 I
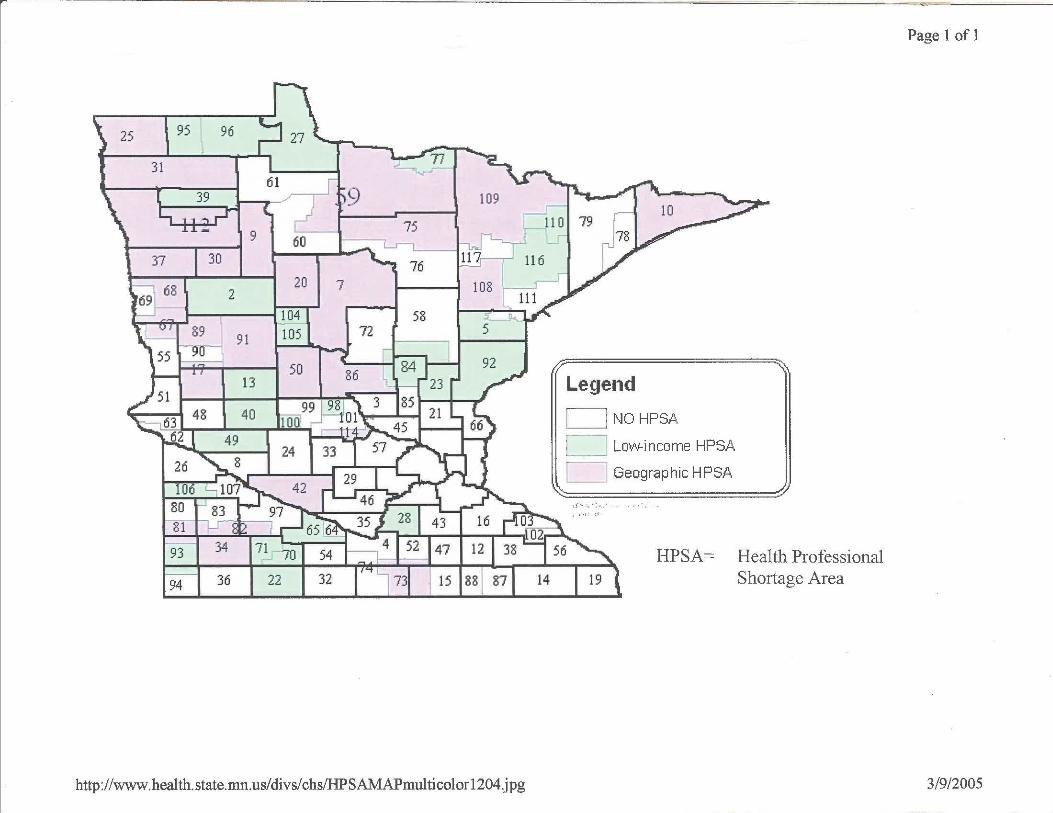
l 95 96
31 I 61 rl
9 __r-
3019
~ 75
2 L0 1 7 ~ 108
104 l ' -- j 58
9~ 13 50
-40
36 22 32
http://www.health.state.mn.us/divs/chs/HPSAMAPmulticolor1204.jpg
Legend
C] NOHPSA
II Lowi ncome HPSA ____,
I Geographic HPSA
;f·- .... . : '· . . •'·; · ,_.
HPSA= Health Professional Shortage Area
Page 1of1
3/9/2005
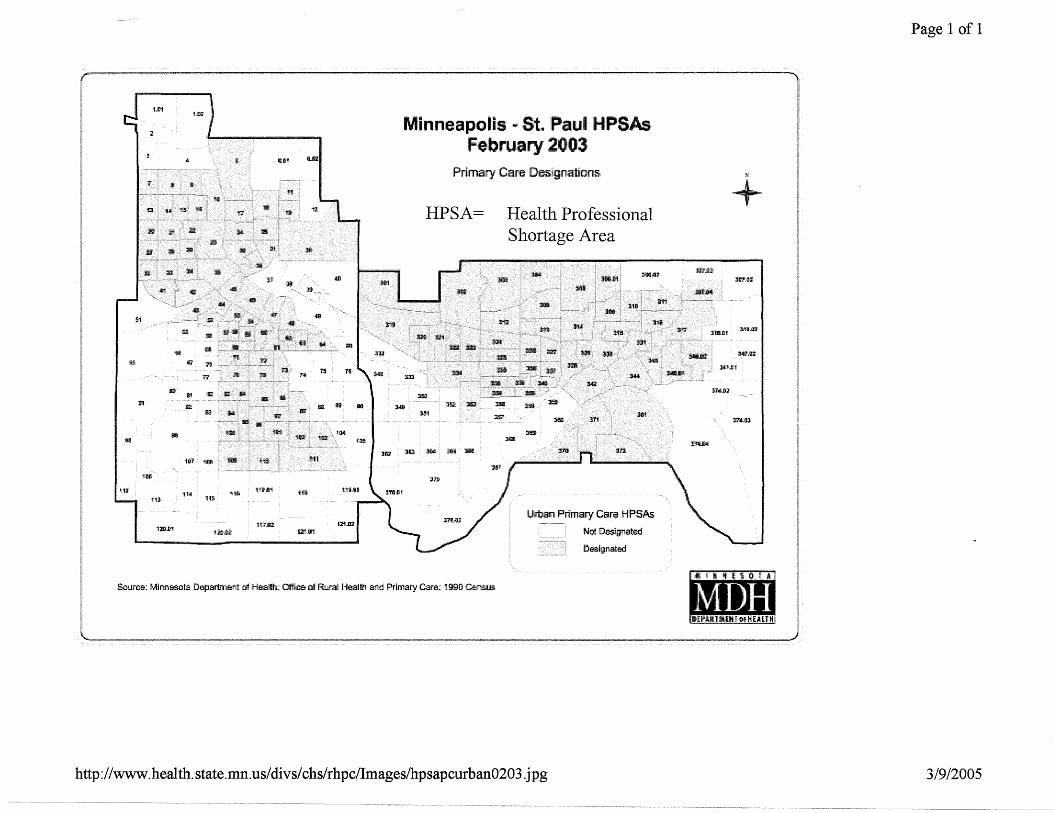
IUH IS.Iii'!
lm'
Minneapolis .. St. iPaul HPSAs Februarry 2003
lMI
JU
Primary Care Designabons
HPSA=
-Jl1
-H-' -:m
351'
Health Professional Shortage Area
:!m
3!!G· :m -::IGI
:m
Urban Primary Care HP'SAs
Nte Dosiptod
DEl!lllgnat'!d
http://www.health.state.mn.us/divs/chs/rhpc/Images/hpsapcurban0203.jpg
Page 1of1
:-.;
+
~
~lllJ)li
3/9/2005
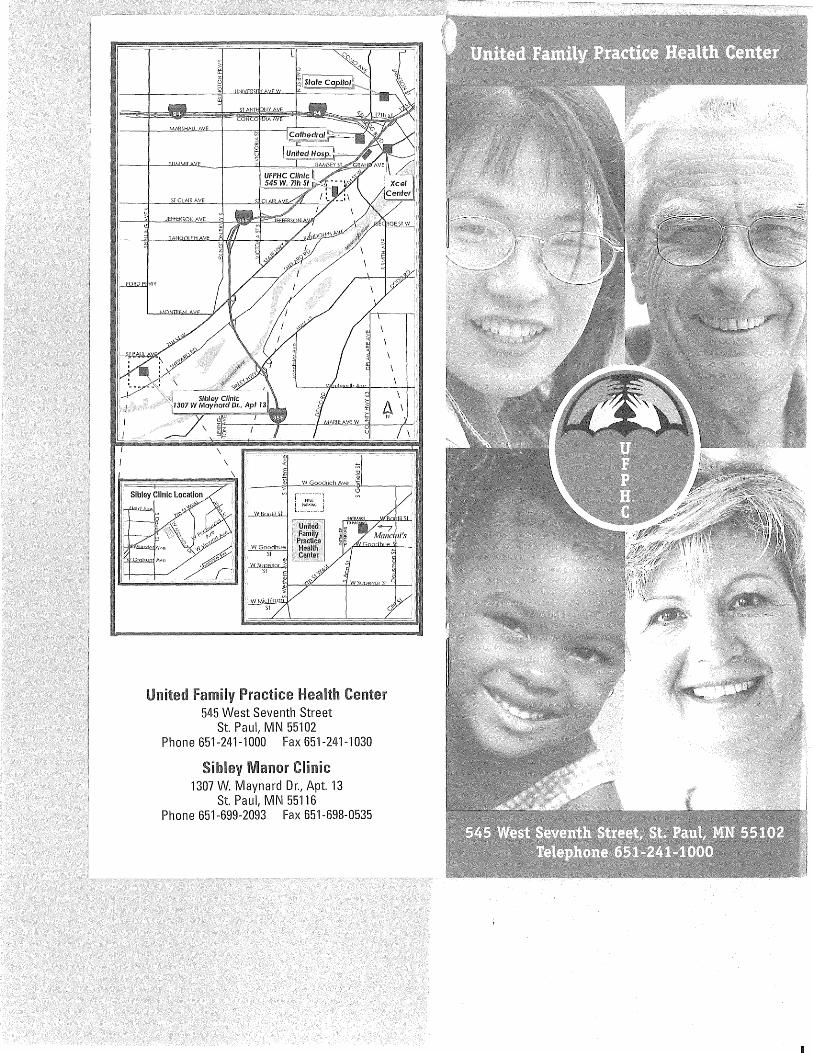
545 West Seventh Street St. Paul, MN 55102
Phone 651-241-1000 Fax 651-241-1030
1307 W. Maynard Dr., Apt. 13 St. Paul, MN 55116
Phone 651-699-2093 Fax 651-698-0535
United Family Practice Health Center is a primary care medical clinic with long standing ties to the West Seventh Street community of St. Paul. In March 2004, UFPHC became an independent community clinic, led by a board of directors comprised of patients and community leaders. We are dedicated to providing comprehensive primary care services to our community and to teaching resident physicians the art and science of family medicine.
Please bring the following to each clinic appointment:
Current insurance card
Address and phone number
Current list of medications or the bottles of medications you are taking
Any forms you need completed by your provider
Same day appointments are available for patients with an illness or injury that requires immediate medical attention. If possible, you will be seen by your primary medical provider. However, if your provider is not available, another provider will see you.
UFPHC assures that medical services to all patients are in accordance with its Patient Bill of Rights, which includes an emphasis on provision of care that is respectful and courteous, and in compliance with all Federal and State laws establishing patient rights including the confidentiality of patient information as required by HIPAA. You may request a copy of our patient information privacy policy at any time.
We strive to provide our patients with the most current medical information and treatment available. Our physicians are Board Certified and actively involved in ongoing education and teaching of family medicine.
Unless otherwise requested, you will be informed of your lab results by mail. We will contact you by phone with any significant abnormal results. Some results may take up to four weeks to receive.
When you are in need of a refill of your routine medications, please contact your pharmacy. They will contact us for a refill authorization. The refill process can take 2-3 days to complete, so please call your pharmacy while you still have enough medication to last at least 3 days. You may also request refills at the time of your office visit.
United Family Practice Health Center has a preferred network of specialty providers, and we strive to work within this group of carefully selected healthcare providers. Referrals outside of this network may not be authorized or may require special approval. Details of our referral network are available upon request.
Our clinic will make efforts to assist you if your primary language is not English. Please notify us if you need assistance in scheduling an appointment, require an interpreter at your visit, or if you wish to see a provider who is bilingual.
UFPHC is actively engaged in community activity that goes far beyond the doctor's office. Services that extend throughout the community include a continuum of health education, social service and outreach programs.
United Family Practice Health Center is a training site for 18 family medicine residents. Each year, we graduate six family medicine physicians, many of whom continue to practice in Minnesota, in both urban and rural locations.
UFPHC accepts most insurance plans, including:
Medical Assistance (MA)
Medicare
Minnesota Care
Hea Ith Pa rtnersCare
UC are
BlueCross BlueShield/BluePlus Preferred One
Metropolitan Health Plan
Medica Choice
And other private insurances
Our office will provide courtesy billing to all private insurance companies. For patients with no health insurance or high insurance deductibles, a sliding fee scale is available. The sliding fee scale is a discount program to provide assistance to pay for medical services. Sliding fees are based on family size and income. To apply for this program you must provide us with copies of your paystubs for the last month, W-2 form or 1040 Income Tax Form. A patient services staff member is available to meet with you to determine eligibility and set-up a payment plan.
Medical Emergencies
Main UFPHC Switchboard
Ap poi ntm e nts/ Ca nc ell ati ans
Referrals
Billing/I nsu ranee/ Sliding Fee Scale Questions
Family Medicine Residency
Sibley Manor Clinic
United Hospital Emergency Room
911
651-241-1000
651-241-1000
651-241-1040
651-241-1090
651-293-0069
651-699-2093
651-241-8755
Children's Hospital Emergency Room 651-220-6911
Dental Appointments (UCare Mobile) 651-455-1555 (UCare Patients only) Toll Free 1-866-451-1555
Interpreter Services
Kim Tong 612-724-5962
Jewish Community Center 651-698-0751
AA 651-227-5502
Al-ANON 651-771-2208
ALATEEN (Teen Line) 952-920-3961
Battered Women's Crisis Line 651-645-2824
First Call For Help 211
Portico Health Net 651-603-5100
Salvation Army 651-224-6946
Senior Linkage Line 1-800-333-2433
West 7th Community Center 651-298-5493
l
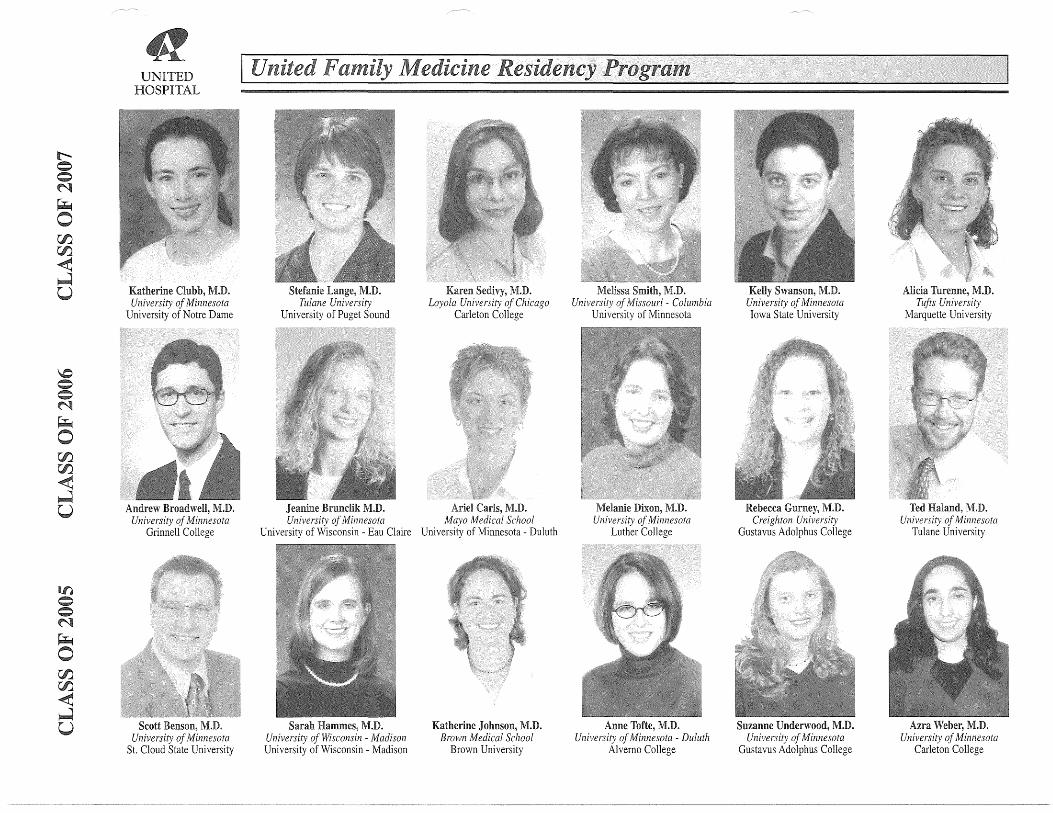
UNITED HOSPITAL
Katherine Clubb, M.D. University of Minnesota
University of Notre Dame
Andrew Broadwell, M.D. University of Minnesota
Grinnell College
Scott Benson, M.D. University of Minnesota
St. Cloud State University
Stefanie Lange, M.D. Tulane University
University of Puget Sound
Karen Sedivy, M.D. Loyola University of Chicago
Carleton College
Jeanine Brunclik M.D. Ariel Carls, M.D. University of Minnesota Mayo Medical School
University of Wisconsin - Eau Claire University of Minnesota - Duluth
Sarah Hammes, M.D. University of Wisconsin - Madison University of Wisconsin - Madison
Katherine Johnson, M.D. Brown Medical School
Brown University
Melissa Smith, M.D. University of Missouri - Columbia
University of Minnesota
Melanie Dixon, M.D. University of Minnesota
Luther College
Anne Tofte, M.D. University of Minnesota - Duluth
Alvemo College
Kelly Swanson, M.D. University of Minnesota Iowa State University
Rebecca Gurney, M.D. Creighton University
Gustavus Adolphus College
Suzanne Underwood, M.D. University of Minnesota
Gustavus Adolphus College
Alicia Turenne, M.D. Tufts University
Marquette University
Ted Haland, M.D. University of Minnesota
Tulane University
Azra Weber, M.D. University of Minnesota
Carleton College
~ = = ~
~ 0 00. 00. < ~ u
Laura Clay, M.D. David Olson, M.D. Timothy Roberts, M.D. Chris Stuart, M.D. Daniel Sullivan, M.D. Michael Tacheny, M.D. University of Wisconsin - Madison University of Minnesota Hahnemann University University of Minnesota University of Minnesota University of Minnesota Trinity University - San Antonio Gustavus Adolphus College University of California, Berkeley St. John's University University of Notre Dame University of Minnesota
Practice: Allina Medical Clinic Practice: University Physicians - North Practice: Siski-you Community Health Practice: Northwest Family Physicians Practice: St. Croix Falls Medical Center Practice: Allina Medical Clinic West St. Paul, MN Minneapolis, MN Grants Pass, OR Rogers, MN St. Croix, WI Hastings, MN
= = = ~
~ 0 00. 00. < ~ u
Noelle Dowling, M.D. Samuel Timothy Ko, M.D. Stephanie (Hansen) Kray, M.D. Elise (Brodin) Larson, M.D. Garrick Olsen, M.D. Jennifer Smith-Kristensen, M.D. University of Wisconsin - Madison University of Minnesota University of Minnesota - Duluth University of Minnesota New York Medical College University of Minnesota
_. St. Norbert College University of Michigan - Ann Arbor Valparaiso University St. Olaf College St. Olaf College Beloit College
Practice: Theda Care Practice: Fairview Northland Clinic Practice: Family Medical Center Practice: Allina Medical Clinic - Champlin Practice: Regina Medical Center Practice: Camden Physicians Waupaca, WI St. Michael, MN Little Falls, MN Champlin, MN Hastings, MN Plymouth, MN
~
~ ~ ~ ~
~ ~
~ 0 .. ,.... 00.
00. < ~ u
Kathleen Abrahamson, M.D. Rory Gwin, M.D. Michael Mercer, M.D. Marilou (Johnson) Sollom, M.D. Naomi Tetzlaff, M.D. Kimberly Haycraft-Williams, M.D. Cl ...l Mayo Medical School University of Minnesota University of Minnesota University of Minnesota - Duluth Mayo Medical School University of Minnesota
'~b Hamline University Colorado State University St. Olaf College Moorhead State University St. Olaf College College of St. Catherine ..... i::i.. ZCZJ ~@ Practice: Camden Physicians Practice: International Medicine Practice: United Family Practice Center Former Practice: International Falls, MN Practice: Allina Medical Clinic Practice: Allina Medical Clinic
Plymouth, MN Uzbekistan St. Paul, MN Passed away April 26, 2003 Cottage Grove, MN Ham Lake, MN
~ ~ ~ ·~
~
o.....i . ~~ E-< ....... ....... il< zw o@
~ = = N
00. 00. < ~ u
N = = N ~ 0 00. 00. < ~ u
Kelle Anderson, MD Creighton University
Gustavus Adolphus College
Sonia Chadha, MD University of Wisconsin - Madison
University of Wisconsin - Eau Clare
Practice: Western WI Medical Assoc. Practice: HealthEast Woodbury Clinic River Falls, WI Woodbury, MN
Lori Bethke, M.D. R. Marie Langer, M.D. University of Minnesota - Duluth University of Minnesota
University of Minnesota St. Cloud State University
Practice: MinnHealth Practice: Allina Medical Clinic Vadnais Heights, MN Hastings, MN
Johnna Charbonneau, M.D. Christopher Luhman, M.D. Medical University of South Carolina University of Minnesota
University of Colorado U.S. Military Academy
Practice: Santa Clara Medical Clinic Practice: MultiCare Associates Eugene, OR Roseville, MN
Michelle Chestovich, MD University of Minnesota
St. Mary's College
Practice: Gorman Clinic West St. Paul
Lara Lunde, M.D. Oregon Health Sciences University
Drake University
Practice: MeritCare Fargo, North Dakota
Stephanie Rosener, M.D. U. of Pittsburgh School of Medicine
Pennsylvania State University
Practice: United Family Practice Center St. Paul, MN
Christopher Foss, MD James Letts, MD Benjamin Pofahl, MD University of Minnesota University of Minnesota University of Wisconsin - Madison
University of Minnesota - Morris University of Wisconsin - Eau Clare University of Wisconsin - Madison
Practice: Allina Medical Clinic Woodbury, MN
Anne-Marie Mischel, M.D. University of Minnesota - Duluth
Creighton University
Practice: North Suburban FP Roseville, MN
Roopa Shah, M.D. Michigan State University Michigan State University
Practice: Dean West Clinic Madison, WI
Practice: Roselawn Clinic St. Paul, MN
Danielle Montague, M.D. Mayo Medical School
University of Wisconsin - Madison
Practice: Allina Medical Clinic Woodbury, MN
Philip Stoyke, M.D. Medical College of Wisconsin
St. Olaf College
Practice: CentraCare Clinic Long Prairie, MN
Practice: Alaska
Michelle Swiglo, M.D. University of Minnesota - Duluth
St. Olaf College
·Practice: MinnHealth Vadnais Heights, MN
Heather Tacheny, M.D. University of Minnesota
Wheaton College
Practice: Allina Medical Clinic Hastings, MN
·~ ~
~ ~ ·~ =:
] ·~ s
.....i
'~~ ,....i:i,.. ZCI) ::i@
00 00 < ~ u
t-... ~ ~ ~
~ 0 00 00 < ~ u
\C ~ ~ ~
~ o· 00 00
< ~ u
Patty Carlin-Janssen, M.D. University of Minnesota
University of Notre Dame
Practice: Grand Rapids Medical Grand Rapids, MN
Ann (Barry) Freking, M.D. University of Minnesota - Duluth
University of Minnesota
Practice: Fairview Lakes Wyoming, MN
Neil Golan, M.D. University of Minnesota
University of California - Irvine
Practice: Doctor's Clinic of Auburn Auburn, WA
Greg DeFor, M.D.
David Haugland, M.D. University of Minnesota-Duluth
Luther College
Practice: Lakeview Clinic Chaska, MN
Daniel Keeley, M.D. University of Minnesota University of Minnesota
Practice: Lakeview Clinic Chaska, MN
Molly Feely, M.D. University of Minnesota - Duluth
University of Minnesota Mayo Medical School
St. Olaf College
Practice: Allina Medical Clinic West St. Paul, MN
Practice: Duluth Internal Medicine Assoc. Duluth, MN
Nedira Haik, M.D. Jennifer (Ray) Mader, M.D . Peggy (Sullivan)Murtaugh, M.D. Mary (Frenz) Paquette, M.D. U of Texas Health Science Ctr- San Antonio Ohio State University of Medicine University of Minnesota-Duluth
College of St. Thomas University of Minnesota College of St. Thomas Texas Womens' University Ohio State University
Practice: Allina Medical Clinic Cottage Grove, MN
Practice: Consultation Practice: Allina Medical Clinic Cottage Grove, MN
Practice: AALFA Practice White Bear Lake, MN
Steve Lawler, M.D. University of Iowa Drake University
Practice: Allina Medical Clinic Northfield, MN
Paula Rehder, M.D. University of Minnesota
Lawrence University
Practice: Fairview Lakes North Branch, MN
James Sayovitz, M.D. University of Minnesota-Duluth
Concordia College
Practice: Lakeview Medical Clinic Sauk Centre, MN
Nancy Struthers, M.D. University of Minnesota
Stanford University
Practice: Allina Medical Clinic Cottage Grove, MN
David Rossmiller, M.D. University of Wisconsin - Madison University of Wisconsin - Madison
Practice: MinnHealth Vadnais Heights, MN
Alison Wagenknecht, M.D. University of Minnesota University of Minnesota
Practice: Columbia Park Fridley, MN
St. Paul's premier tertiary
hospital, had approximately 134,903
admissions in 2002, 3/4 of them on an outpatient basis. More than 16,386 surgenes were
performed last year. United Hospital currently has a medical staff of 1 ,082. Close to 140 of those
physicians are in family practice. Last year 4,300 babies were born at United Hospital, which
provides perinatal services to mothers and babies through United and Children's.
is one of the busiest pediatric hospitals in the area
with 7,462 inpatient admissions in 2002.
ICU had 1,097 admits in 1997 for a total of 3,307 patient days. The environment
at Unity encourages family medicine physicians to directly address the intensive care needs of
their patients.
part of the core rotation in the second year of the program - utilizes vital, rwr.nlti'\rl
practices in the Allina system. The rural faculty are eager to teach with many of the
faculty being residency and fellowship trained.
long been involved in community medicine, and the residents are involved in
the community. It's a primary goal of the residency program to teach Community-Oriented
Primary Care ( COPC) in the urban site where the clinic is located and at rural sites.
is staffed with both family medicine physicians and an internal medicine physician actively
practicing geriatric medicine, including physicians with Certificates of Added Qualification
in Geriatrics.
your interest in
Family Medicine Program and look
forward to the opportunity to
meet you and your family members and to provide you
with a more thorough look at
our program. unique
interview allows for
to know
, and on a more personal, as well as
professional
Our formal interview process (mid-October - mid-January) will ensure access to our residents, program director, faculty, and facilities. We ask for your direction
in customizing an interview day that meets your individual needs so you may
walk away with the information necessary to help in your future decision-making
process. We invite you to spend an informal evening with our residents and
family members, and to explore housing and job placement opportunities for your
spouse or significant other during your visit. For our traveling applicants, we are
pleased to provide the cost of an overnight accommodation for all applicants and family members during your visit. We also encourage you to become more
acquainted with our program by taking time to visit for a more laid-back,
informal look at our program at any time during the year, as well. (However,
a formal interview must be scheduled for consideration in the Match process.)
Applicants are encouraged to schedule and second-look visits as meets
their in finalizing decision-making process. If you are in any of these invitations, Dlease to g:ive us a call.
Applications submitted for the formal interview process will by our
Admissions Committee and, upon approval, applicants will be notified \vhen
they have selected to in the interview process. Incomplete
applications will be only upon receipt of all required documentation.
A complete ERAS Application.
A recent photograph to accompany application. Dean's and medical school r.-.~n··r·,.,·~
letters of recommendation - one of which is from a family physician. Applicable Board Scores.
if applicable.
If you are a applicant, please include a from the director
of your most recent program.
Contact program for criteria.
Joy Gray, United
w. 102
We are committed to helping
\-01uu1L0 continue to balance their
lives 1 which include
commitment to their profession 1
as well as commitment to
well-being. To this end 1 we
developed the following areas
support :
Quarterly with faculty
advisors (mentors); may
held more frequently based
on need
Monthly support group 1 facilitated
by a professional
Availability of wellness facility
membership
Periodic faculty/resident retreats
and social gatherings
Residents are three
of vacation per academic year.
Year one one week taken within
the family medicine rotation.
additional are allowed
during other rotations.
We are unable to part,time
positions. We do family leave
consistent with federal guidelines.
'--'"'-'UH'-' Year:
Third
$39)956
$4omo
Second and third year residents may moonlight> providing it
with their primary work in the residency. In the and third year1
moonlighting is encouraged in a hospital or clinic in which the resident hopes
to affiliate with upon graduation. Moonlighting is available through the Allina
system 1 allowing for persons to become familiar with post-training
opportunities. It is also our intentiop that this allows for some supervision
which enh8nces the educational component of the process and allows
feedback to occL1r. Moonlighting outside of the organization is not covered by
Allina1s malpractice insurance.
Each resident vvill receive full coverage in the following areas:
Family coverage to zero deductible in Allina's health care system
Family coverage within a dental maintenance organization
3x yearly salary for self with option to purchase extra for self, spouse,
and dependent
60% of salary
May participate after one year of employment
May participate after one year of employment
Full coverage within Allina system
Provided as required by law
Dependent child day care allowance to $5,000 per resident family per year
CME
Time: one week per year
Funds: $900
Pre;tax Reimbursement Program
Dues paid: Minnesota Academy of Family Practice and American Academy
of Family Practice
Three monogrammed lab coats per resident
Heptavax vaccination at no charge
Parking at clinics and hospitals at no charge
Rural rotation mileage reimbursement
BLS/ACLS/ATLS/PALS/NRP/ALSO at no charge
Comfortable call quarters
Meals while on;call and at noon conferences
Research facility and search service through Boeckmann Library
at United Hospital
Discounted event tickets
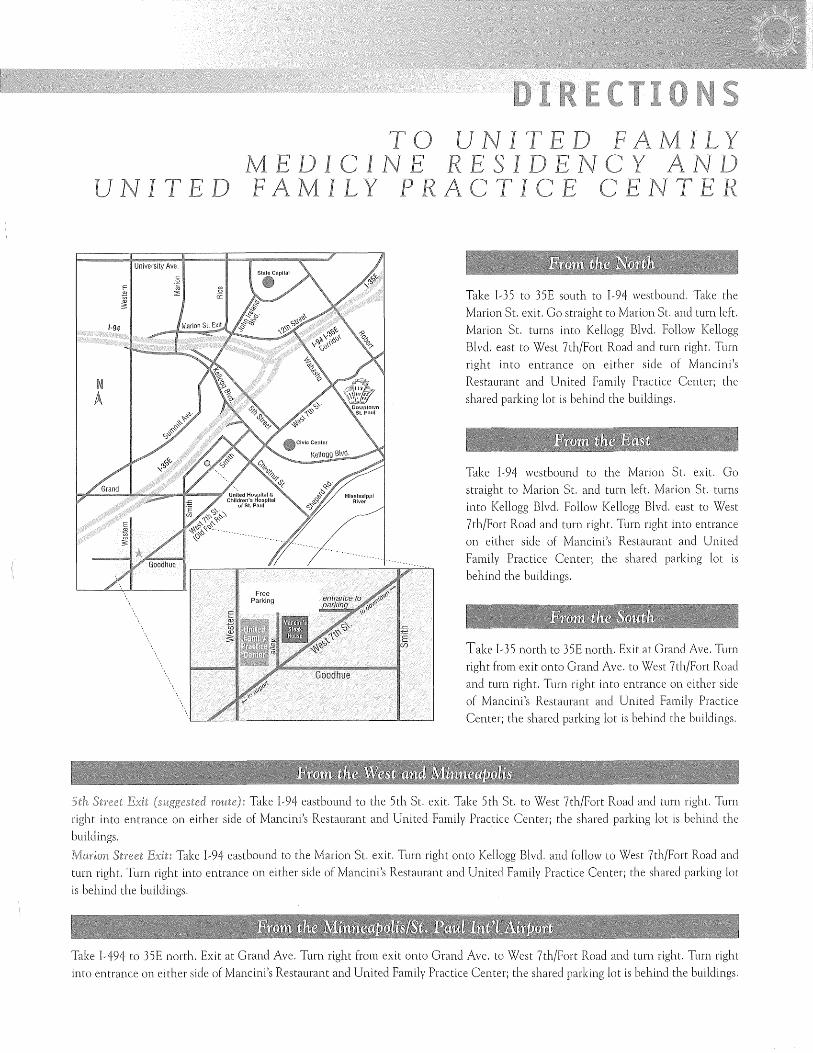
I I I
Take l,35 to 35E south to l,94 westbound. Take the
Marion St. exit. Go straight to Marion St. and tum left.
Marion St. turns into Kellogg Blvd. Follow Kellogg
Blvd. east to West 7th/Fort Road and tum right. Turn
right into entrance on either side of Mancini's
Restaurant and United Family Practice Center; the
shared parking lot is behind the buildings.
Take l,94 westbound to the Marion St. exit. Go
straight to Marion St. and turn left. Marion St. turns
into Kellogg Blvd. Follow Kellogg Blvd. east to West
7th/Fort Road and turn right. Turn right into entrance
on either side of Mancini's Restaurant and United
Family Practice Center; the shared parking lot is
behind the buildings.
Take 1,35 north to 35E north. Exit at Grand Ave. Turn
right from exit onto Grand Ave. to West 7th/Fort Road
and turn right. Turn right into entrance on either side
of Mancini's Restaurant and United Family Practice
Center; the shared parking lot is behind the buildings.
Take 1,94 eastbound to the 5th St. exit. Take 5th St. to West 7th/Fort Road and turn right. Turn
right into entrance on either side of Mancini's Restaurant and United Family Practice Center; the shared parking lot is behind the
buildings.
Take 1,94 eastbound to the Marion St. exit. Turn right onto Kellogg Blvd. and follow to West 7th/Fort Road and
Turn right into entrance on either side of Mancini's Restaurant and United Family Practice Center; the shared parking lot
is behind the buildings.
Take 1,494 to 35E north. Exit at Grand Ave. Turn right from exit onto Grand Ave. to West 7th/Fort Road and turn right. Turn right
into entrance on either side of Mancini's Restaurant and United Family Practice Center; the shared parking lot is behind the buildings.
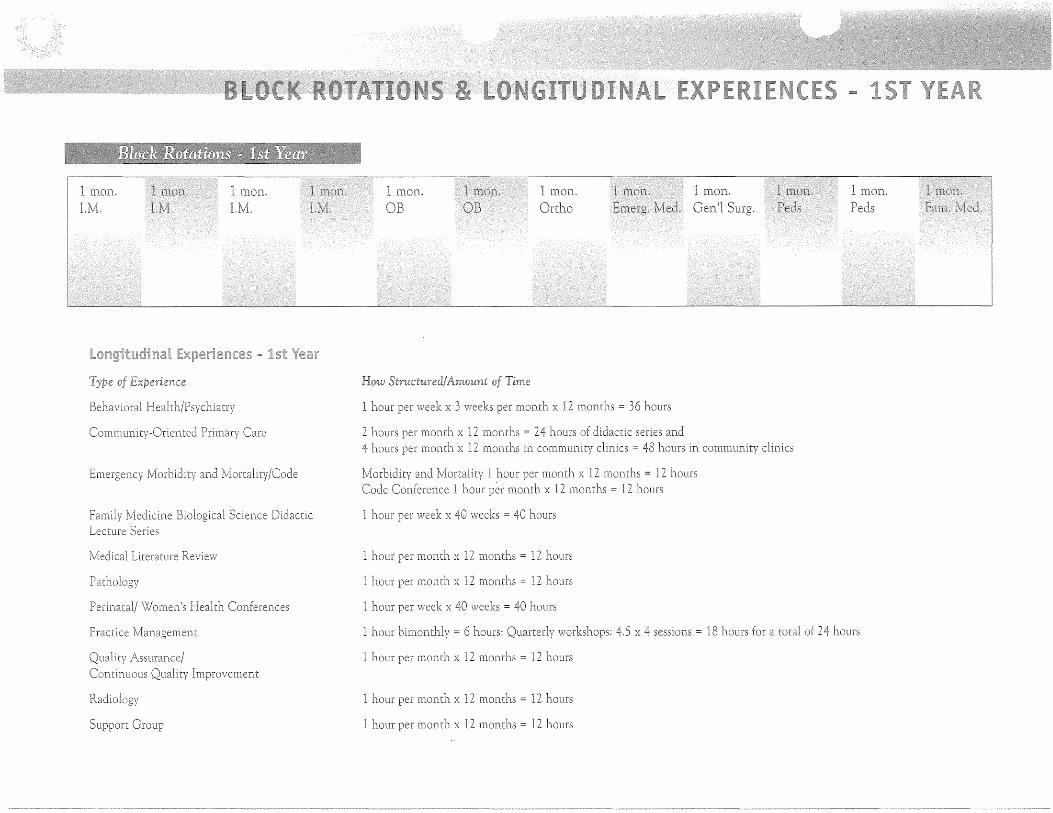
mon. LM.
Behavioral
1 mon. LM.
Care
Medicine ,._'L,JCVC:.CvLU Science Didactic Lecture Series
Medical Literature Review
Women's Health Conferences
Practice
Assurance/ Continuous
1 mon.
1 hour per week x 3 weeks per month x 12 months = 36 hours
2 hours per month x 12 months = 24 hours of didactic series and 4 hours per month x 12 months in clinics = 48 hours in ~~ ....... c.u.cc
and 1 hour per month x 12 months = 12 hours Code Conference 1 hour per month x 12 months = 12 hours
1 hour per week x 40 weeks = 40 hours
1 hour per month x 12 months = 12 hours
1 hour per month x 12 months = 12 hours
hour per week x 40 weeks = 40 hours
clinics
,,,n,-.rc•nn.nc'- 4.5 x 4 sessions = 18 hours for a total of 24 hours
1 hour per month x 12 months = 12 hours
1 hour per month x 12 months = 12 hours
l hour per month x 12 months = 12 hours
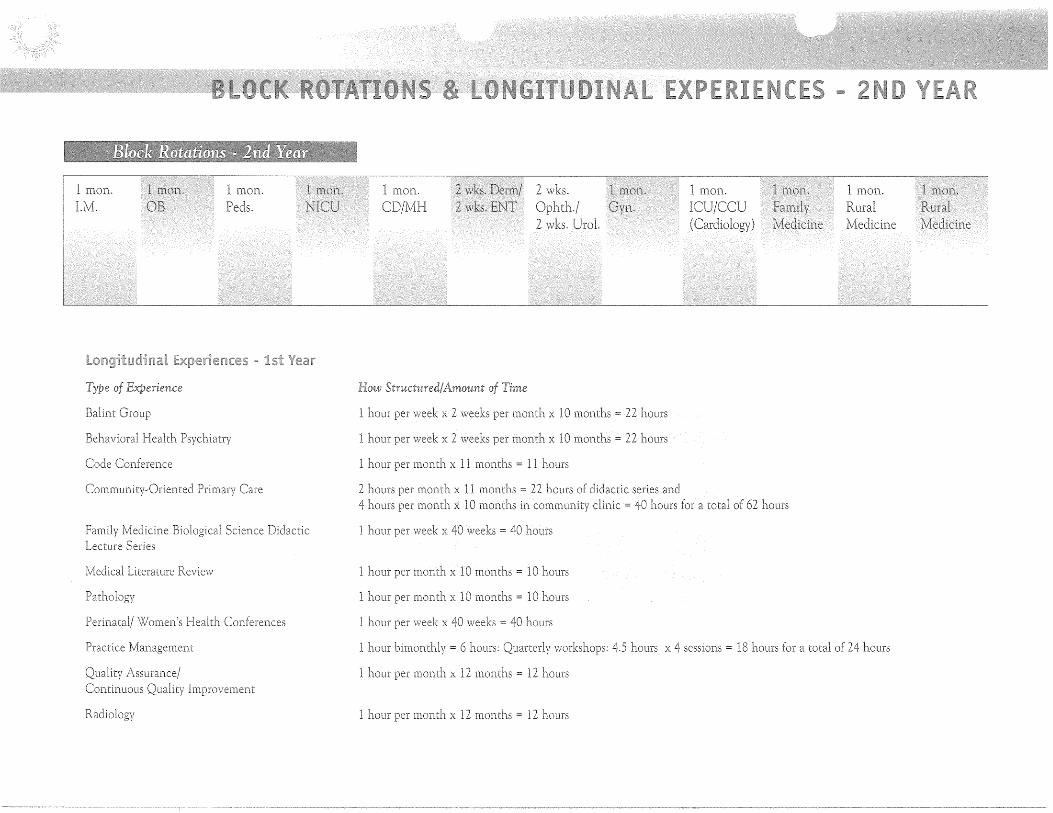
mon. I.M.
Balint
Code Conference
Care
Medicine JLll,JLVj:'.,l'-'"u Science Didactic Lecture Series
Medical Literature Review
Women's Health Conferences
Practice
Radiology
1 mon.
of Time
1 hour per week x 2 weeks per month x 10 months 22 hours
1 hour per week x 2 weeks per month x 10 = 22 hours
1 hour per month x 11 months = 1 hours
2 hours per month x months = 22 hours of didactic series and
mon. ICU/CCU
4 hours per month x 10 months in clinic = 40 hours for a total of 62 hours
1 hour per week x 40 weeks = 40 hours
hour month x 10 months = 10 hours
1 hour per month x 10 months = 10 hours
1 hour per week x 40 weeks = 40 hours
per month x 12 months = 12 hours
1 hour per month x 12 months = 12 hours
1 mon.
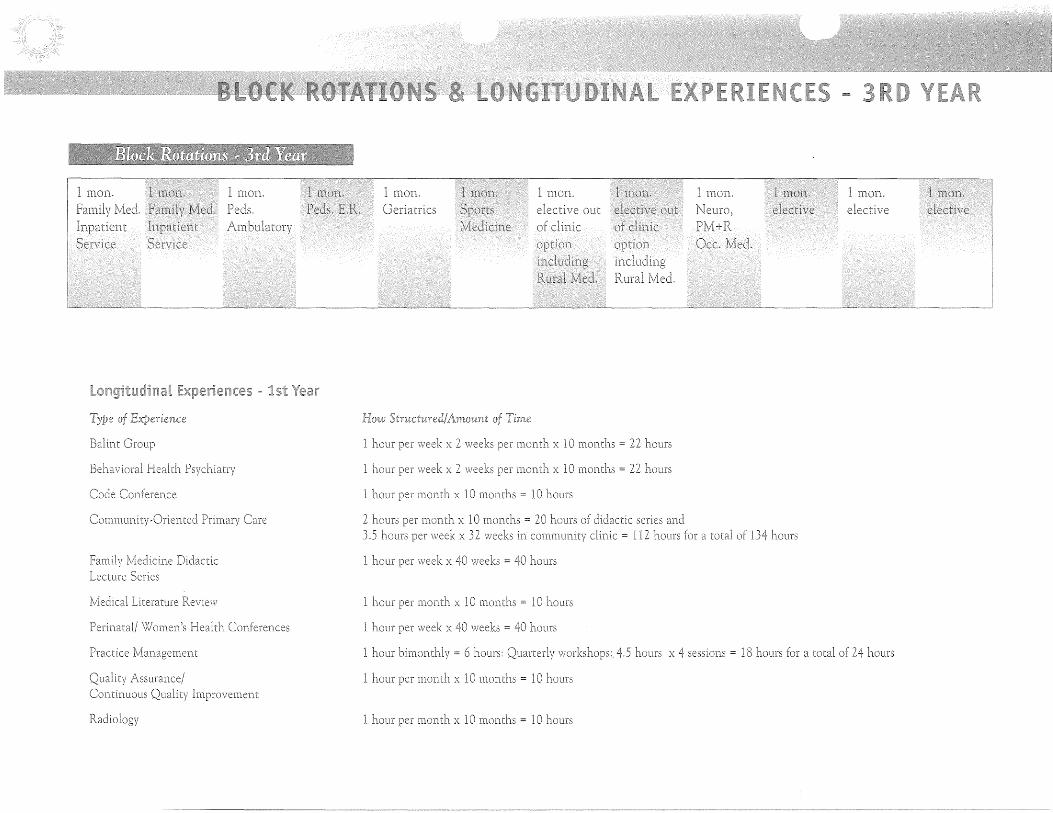
Balint
Behavioral
Code Conference
Medicine Didactic Lecture Series
Medical Literature Review
vVomen's
Practice
1 mon.
Care
Conferences
PM+R
1 hour per week x 2 weeks per month x 10 months = 22 hours
1 hour per week x 2 weeks per month x 10 months = 22 hours
hour per month x 10 months = 10 hours
2 hours per x 10 months = 20 hours of didactic series and 3 .5 hours per week x 3 2 weeks
week x 40 weeks = 40 hours
1 hour per month x 10 months = 10 hours
1 hour per week x 40 weeks = 40 hours
= 6 hours: 4.5 hours x 4 sessions = 18 hours for a total of 24 hours
1 hour per month x l 0 months = 10 hours
hour per x 10 months = 10 hours
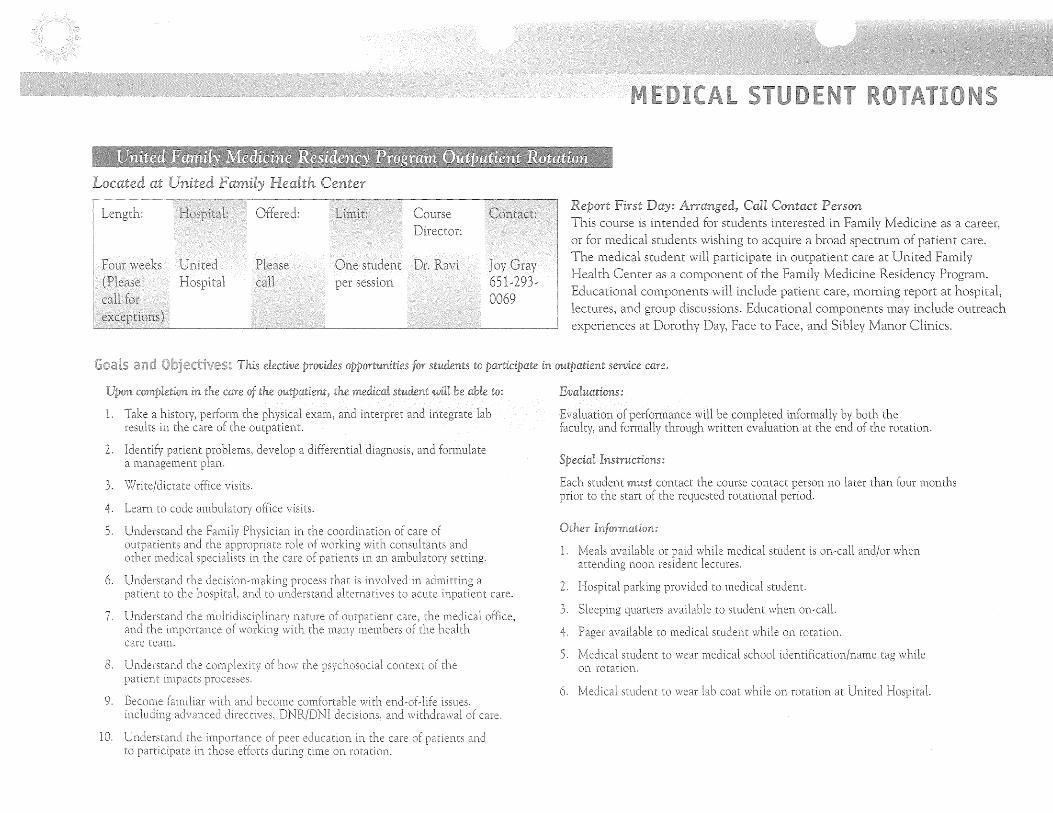
l.
2.
3.
5.
6.
7.
care team.
session
This elective
office visits.
office visits.
in the coordination of care of 0
,..,,..,,.,..,,..,,.,0
,.." role of vvith consultants and
processes.
the care of in an ""H'J'-""""v
that is involved in U~U.HH.LH•.-. L"'"L'~''' LL•"~' alternatives to acute H•t--·~LLLHL care.
the medical the health
9. Become familiar with and become comfortable with end-of-life issues, UC'.LL'L'"'·"' advanced and withdrawal of care.
10. Understand the of to those efforts
education in the care of time on rotation.
and
First Call Contact Person This course is intended for students interested in Medicine as a career, or for medical students a broad spectrum of The medical will care at United
Evaluations:
])ertorma1nce will be by both the written evaluation at the end of the rotation.
Instructions:
Each student must contact the course contact no later than four months to the start of the rotational
while medical student is on-call and/or when
2.
3.
4.
re>CHi~>nr lectures.
cJt\...L.lll l I,~ quarters available to student when on-call.
available to medical student while on rotation.
5. Medical student to wear medical school '"c'~''"'"'" on rotation.
6. Medical student to wear lab coat while on rotation at
tag while
1. Take a results
2.
3. Write
4.
5.
6.
orders and progress notes.
7. Understand the ,,,,, . .,..,.,...1°",.,_"
context of the
0069
wiU able to:
d12Lr::nos1s, and formulate
in the coordination of care of with consultants and in the HVOULLCU.
8. become comfortable with end-of-life uc1_1CJi.vuci, and withdrawal care.
9. Understand the of and to in those efforts
10.
First Call Contact Person
This course is intended for students interested in Medicine as a career,
or
component of the
components will include
discussions.
Evaluations:
Evaluation of JJertonrLar:tce
group
both the and written evaluation at the end
of the rotation.
Instructions:
Each student must contact the course contact person no later than four months
2. , ).
LL I•
to the start of the rotational ·
while medical student is on-call lectures.
~'-'"'"""'c." to medical student.
quarters available to studem when on-call.
available to medical student while on rotation.
5. Medical student to wear medical school LU. .... HLHL'-·""-VH/
on rotation.
when
tag while
6. Medical student to wear lab coat while on rotation at United
as a
LP.; Ravi vct1a.;:,uu1a.11111ct11
to right) Kathleen 1\11.,r1no.n · Connie Walsh
Dana Sue '--''-'HH'c.-HH):;, Brad Toso, M.D.
grew up in the northeastern St. Paul suburb of Mahtomedi. Mahtomedi High School activities included playing flute in the band, singing in the choir, student council and acting in just about every school play offered. She also met her future husband, Shane, during her high school years.
After she completed technical school, she worked as a certified medical assistant in a Rheumatology office for about a year, then moved on to a Family Practice clinic, where she truly fell in love with medicine and caring for families. She decided to pursue her childhood dream of becoming a physician.
To help finance her education, Lori joined the Minnesota Army National Guard as a combat medic. She is now an officer in the Guard and loves to put on her fatigues and combat boots once a month to participate in and learn about soldiering and survival. Activities in the Guard include navigation, repelling, and weapons qualifications, in addition to taking care of soldiers. She is even licensed to drive an armored personnel carrier (a large, tracked vehicle, which she has learned through experimentation will go through just about anything!).
Lori and Shane live in St. Paul and enjoy outdoor activities such as biking, running, and snowmobiling in the winter. Lori also is an avid reader and enjoys indoor and outdoor planting, and crochet. They also love to spend time with their eight nieces and nephews. They are very excited that Lori is starting her residency at the United Family Medicine Residency Program, and hope to move to a smaller Minnesota community when she is done, to practice community-oriented primary care.
is the second oldest of nine children raised on a farm in rural Minnesota. Deciding not to follow in her mother's footsteps, she called it quits after two children, Andrew and Amanda. She spent a decade doing the modem '\vorking mom marathon", PTA, Girl Scouts, Tiger Cubs, Little League, Dance Lessons, etc., before attending college at St. Cloud State University (go Husky's!).
Her husband, James, a chemist who also attended St. Cloud State University as a non-traditional student, introduced Marie to her three favorite pastimes: golf, fishing, and weekends at his parents' lake home near Long Prairie, Minnesota. She is still working on getting her golf score under 100, and catching that illusive five-pound bass, but has become a master at the "lake weekend" ... morning coffee on the dock, followed by a good book on the deck for the rest of the day.
She attended medical school at the University of Minnesota with incredible support from her husband and children. House rules rapidly developed ... "don't enter mom's study room without coffee or chocolate," and "the kitchen is self-serve." The kids found the only down side to having a mom as a student was that they received no sympathy when they com
-plained about having too much homework.
Family Practice was an easy decision for Marie. She loves preventative medicine, obstetrics, and pediatrics, and is excited about a field of medicine that offers all three and then some! Having spent six weeks as a fourth-year medicine student on the United Family Medicine Residency Program Inpatient Service, she felt completely at home with the staff, residents, and the hospital, and is very excited about begilming her residency in the wonde1ful world of Family Medicine!
grew up in the now infamous town of Fargo, North Dakota. Coming from a family which stressed the importance of "trying everything at least once", you can understand how much of her childhood was spent participating in a variety of activities, including basketball, volleyball, gymnastics, ballet, and guitar lessons. This philosophy, combined with the Midwest ethics of hard work and compassion, have helped Lara get where she is today. She attended Drake University in Des Moines, Iowa for her undergraduate years, earning a BA in Biology, and then moved out to ; Portland, Oregon to eam her medical degree at Oregon J:-:Iealth Sciences University.
Medical school was both an adventure and a joumey for Lara. She learned very
quickly that it was the continuity and partnerships with patients that she craved. Family Medicine was her calling in life, so she immediately began volunteering at local neighborhood clinics to refine her skills. She continued to pursue an active lifestyle, spending time giving lectures to high school and elementary students, participating in the training of first year medical students, and finding time to hike around the Oregon countryside.
Although traveling has always been a hobby for Lara, she is now excited to be returning to the Midwest to complete her medical training and settle down permanently, closer to her family. She recalls many summers spent on Lake Sallie in Mi1mesota, near Detroit Lakes, where her family owns a lake cabin, and she would like to continue this tradition when she decides to have a family of her own. Much of her free time is spent in the company of friends and family. She also enjoys writing poet1y, reading, biking, outdoor activities, and baking. Lara's goal is to become an effective, compassionate family doctor who makes a difference in the lives of her patients, while maintaining a healthy, balanced personal life.
was bom and raised in the town of Two Harbors, MN (home of the THHS Agates and the birthplace of 3M) on the North Shore of Lake Superior. She grew up roaming trails in the woods, reading at the local library, swimming in Gitchee Gurnee, building igloos in the backyard, playing piano, fishing with her dad, collecting agates, and having the occasional mud fight with her three sisters in the clay pit near Burlington Bay (one of the two harbors).
Exotic Omaha lured her away from the North Shore for college, where she studied biology, philosophy, and French at Creighton University. Living in the heartland opened her eyes to the beauty of com and soybean fields. However, after four years, Nebraska's unicameral legislature and the desire for progressive politics called her back to Minnesota, where she attended the U of M-Duluth for the first two years of medical school.
<I
There, she started running, snmvshoeing, and singing jazz to balance her studies. She moved to Crosby, Minnesota, to participate in RAP (Rural Physicians Associate Program) for nine months during her third year, where she was able to cross-count1y ski, bike along the lakes to work, and experience c01mmmity medicine as practiced in a small, but vibrant community. A medical mission trip to Haiti was a life-changing experience.
Following RPAP, Anne-Marie moved to St. Paul to complete her last nine rnonths of medical school. She was ve1y excited to live in a larger city after several years of being in smaller towns. She was especially pleased to be closer to family members and friends living nearby.
Anne-Marie is truly delighted to begin Family Practice residency training at United. She is thrilled to stay in St. Paul and hopes to become a fine Family Physician over the next three years and beyond. Undecided whether her future practice will be in a rural or urban (or international!) setting, she hopes to be a physician in a vital, diverse community. She looks forward to balancing her career with a family of her own someday. AnneMarie also anticipates filling her free time with singing, music composition, painting, cooking, running, reading, snowshoelng, and especially travel!
born in Minneapolis, MN, grew up in a suburb west of the city. After spending my first year of college at the University of Michigan (and becoming very poor after paying out-of-state tuition), I moved to Madison, WI, to finish my degree at the University of Wisconsin. I thrived amongst the diversity and liberal spirit in Madison, and took full advantage of the outdoor recreation opportunities. I had worked throughout college as a preschool teacher, and couldn't resist an offer to work fulltime after I graduated. After playing for a year, I moved on to Mayo Medical School in Rochester, MN. I survived a honendous case of culture shock, and eventually grew to like Rochester and the ninety miles of highway that cmmected it to the Twin Cities.
My husband, Tim, and I met in Madison, after growing up five miles away from each other. He is a cartographer (mapmaker), and works for the State of Minnesota -Board of Water and Soil Resources. After living in separate cities for four years, \Ve are thrilled to be moving into our new home. We don't have any children or pets yet, but we do have a small stuffed Piglet (goes by "Pig") who keeps us company. Tim and I share a love of the outdoors, and are working on our goal of camping in eve1y national park in North America. We also spend a great deal of time rela,'<ing with friends and family, cooking and taking long walks. Four years in Rochester inspired me to develop my own hobbies, and I am now an avid quilter.
A commitment to community-based medicine, along with a love of Pediatrics, Geriatrics, and Obstetrics led me to Medicine. I am eager to continue my training in an environment that supports Prirnaty Care. I plan to practice in an underserved, urban area (hopefully in the Twin Cities). I was able to spend some time in Panama during medical school, and enjoy working with Spanish-speaking populations. I have no doubt that residency at the United Family Medicine Residency Program will prepare me well for this demanding profession, and give me the tools to continue learning throughout my career.
grew up in Rochester, MN, with her parents and younger brother. All of their neighbors had a connection to either IBM (like Michelle's family), or to the Mayo Clinic. Not really aware of other career options, her brother chose electrical engineering, and Michelle chose medicine. She spent one summer during high school shadowing a Family Practice physician, and has loved Family Medicine ever since.
Michelle spent her undergraduate years at St. Olaf College, where she met wonde1ful people (including her husband, Brian!) and had many interesting new experiences. Some of her favorite memories of college were when she was actually off-campus, i
however! She'll never forget the time she spent living inside .the Old City walls of Jerusalem or volunteering at the
Christian Medical College Hospital in Vellore, India.
Michelle spent her first two years of medical school at the University of Milmesota - Duluth, where she loved being so close to Spirit Mountain, the North Shore, and the Portland Malt Shop. After finishing her second year of medical school and taking her Boards, Michelle married Brian and moved to the Twin Cities, excited to start married life and her third year of medical school. She spent 16 weeks during her fourth year at the United Family Medicine Residency Program's Urban Community Ambulatory Medicine (UCAM) Elective Rotation. During this time, she really grew to love Family Medicine, community-oriented primary care, and many of the wonde1ful faculty in the Residency Program. She is thrilled to be able to return to the United program as a Family Medicine Resident. She sees herself eventually practicing in an urban, underserved environment.
Michelle and Brian now live in an old house in NE Minneapolis with their amazing and loving cat, Flouvers. In their free time, they enjoy t1ying new restaurants, working on their house and garden, sailing on area lakes in their Laser sailboat, or playing tennis or racquetball. They also en.ioy lots of weekends filled with more saili11g, water-skiing, and card games at "the cabin" with Michelle's extended family. When Brian (a med student) is either studying or at the hospital, Michelle likes to read, play the piano, make quilts, and plan fondue parties.
grevv up in Anoka, Minnesota, where she earned her first set of crutches when the garage door came clown on her foot at age five. She managed a fairly injm-y-free childhood as she tagged along with her big brother. Seasons of tennis, basketball, and softball were filled with friends and fun, until she earned her next pair of crutches in school when she tore ligaments in her knee.
After high school, Kelle headed to St. Peter, Minnesota, to attend college at Gustavus Adolphus. She loved the charming St. Peter town so much that she spent her summers there teaching at Tennis and Life Camps. Kelle had a wonderful time at Gustavus and had some opportunities to travel. She managed to spend J anuai-ys away from the Minnesota cold, visiting Australia and Europe. Also at college and camp with her was her best friend and future husband, Chris. But before she realized she had met the man she would spend the rest of her life with, Kelle followed her big brother one more time down to Omaha, Nebraska to attend Creighton University School of Medicine. Kelle lived with her brother for the first two years and benefited from his guidance. She was inspired to become a family medicine doctor after spending a summer in Staples, Minnesota, learning from an experienced, caring family doctor there. The only traveling she did while at Creighton was the six-hour commute to St. Paul to visit Chris eve1-y other weekend. In her last year at Creighton, Kelle was able to marry the man of her dreams and also earned her (hopefully!) last set of crutches, by tearing the ligaments in her other lmee. She hopes to be nursing back to health before at United.
Kelle is very excited to be doing her family medicine training at United, and to be moving back to Minnesota. Her parents and in-laws are also joyfully anticipating the move. She looks forward to her training and to lrnow the West Seventh Community.
was born in New Delhi, India, where she lived for a few years with her parents and extended
family. She then, as a baby, moved to Papua, New Guinea, as a result of her parents' jobs. After a few years clown under, she moved to Kingston, Jamaica. Fortunately, she was old enough to remember those times - the glass bottom boats, friendly people, reggae music, and delicious mangos. Then, seeking a change and colder weather, her family settled down in Eau Claire, WI, where both her parents ''profess'' Mathematics. Sonia has one younger sister who is a source of much confusion, since they both resemble each other quite a bit.
She attended the University of WI-Eau Claire for four years, followed by medical school at the University of WI-Madison. Prior to medical school, she spent a summer in India and returned to Madison with a deep appreciation for medicine and the barriers that it can overcome. Between her third and fourth year of medical school, she completed a year long fellowship in Pathology. As a Pathology fellow, having held an emphysematous lung in her hands, black and withered, she witnessed the ways in which medicine involves much more than simply repairing a damaged organ or body.
Sonia's main goal in life is to successfully balance her family life with a career in medicine. She is excited about being a part of the Untied Family Medicine Residency Program and is looking forward to the next three years as being both a learning and growing experience. Aside from medicine, her interests include spending time with
friends, with the Ab Roller, cooking, and gardening.
grew up in Cold Springs, MN, the second of four children. She had a great childhood playing with her siblings and "exploring" the great outdoors where she grew up. While playing in the woods near her home, she was known to gather acorns and berries in preparation for "the winters". Maybe she will be the next winner on "Survivor"! She has fond memories and loves to escape back home to see family, water ski, and enjoy the fall colors.
\IVhile in college, Michelle continued to
"explore", which led her to study in Madras, India for a semester. She also traveled around Southeast Asia for a month. She has great memories of the things she saw, the people she met, and the delicious food she ate! She now enjoys trying to recreate some of the meals at home. She looks forward to more traveling someday, with a return to India being at the top of the list.
Time spent with family has always been very important to Michelle. Her family joyously expanded last May when she married her best friend, Paul. She and her husband enjoy camping (they survived rattlers in Texas), cooking for friends and family, and spending time outdoors. Running is another of their favorite pastimes. After years of being a "distance" runner in high school and college, Michelle decided to see what "real" distance rLmning was all about. She completed her first marathon this past and despite feeling delirious the last six miles, vows she will do it again and run even better! She can't believe that years ago, while training for the 1600m, she called herself a distance runner!
Michelle is very eager to begin her Family Medicine residency at United. She looks forward to getting to know her patients and her colleagues in the exciting years ahead.
was raised in the semi-suburban hamlet of Forest MN. Much of his childhood was spent in or on the lake. He often had the coveted job of being the "spotter" for his brother's gang of water-skiers. In the winters, he was repaid for his services by being whipped around in a sled behind the family snowmobile by his ever-loving big brother. In high school, Chris became enamored with speech and acting, and participated in a variety of productions. Sadly, most of them seemed to necessitate the of revealing tights. Save for the endless ridicule, Chris found many great friends in the theater and continues to find immense enjoyment in being taken away by an engaging story.
Despite the cosmopolitan air that the third-ring suburb had inspired in Chris, he
/(
decided to follow his brother to the west central Minnesota prairie for college at the Morris campus of the U of MN. It was in Morris that Chris became involved in a peer health education group. The group gave presentations to dorms, classes, and the Morris community on a variety of health related topics. It seemed that Chris had finally found his niche in a place where he could do some public speaking, teaching, and occasionally use a bit of the dramatic flare (yet, not have to wear any tights!). The group also promoted Chris to consider a career in medicine.
Throughout college, Chris worked as a nursing assistant in a nursing home, which further spurred his interest in medicine. Though the job lacked some of the benefits of his previous job at Subway ( i.e free food), he took away a great satisfaction from helping people in their day,to,day activities. There was a great amount of perspective to be gained from assisting the residents with activities that most take for granted.
Three weeks after graduation at MmTis, Chris returned to the Twin Cities and started medical school. Here he found an amazing group of classmates that challenged his ideas of both medicine and life. He also found a great interest in community,oriented medicine while on a medical student rotation at the United Program, and was able to expand his knowledge and experience in it. Chris looks forward to learning about his new found community in St. Paul and within the United Family Medicine Residency Program.
, was born in Wisconsin but don't hold that against him, he moved to Minnesota at the age of three. In St. Peter, he and his older sister and younger brother grew up with the guidance of two teachers as parents. Several times each summer the whole family packed up the station wagon and headed back to the Nicolet National Forest in Wisconsin for camping trips. By the encl of each summer, the countless hours of S\~imming and playing in the sun had turned all three of the kids' hair white and their skin bronze. In the fall, it was back to
the great public schools of St. Peter for another nine months.
Needless to say, education was greatly valued in the family. When graduation from high school came, Jim decided to venture back to Wisconsin for college. At UW,Eau Claire, he survived four years of living with rabid Packer fans as his best friends. He was with those guys at a house party during his sophomore year, when he met his wife Erin. Erin and Jim exchanged their first words in a dirty basement, right next to the keg (but for the record, it was at the library). When he was actually in that library, Jim was falling in love with science, as well. He truly enjoyed studying genetics, physiology, and physics and the
~ >ing to medical school entered his mind. Always the activist, he joined Amnesty International and was the campus chapter president in his senior year. By that time, he had come to view health care as a human
It was this view that led Jim to participate a 16,week Urban Community Ambulatory Medicine rotation during the early part of the fourth year of medical school. He was lucky enough to be placed at the United
Medicine Residency Program, where he decided on a career in Family Practice based on his great experiences with the patients, staff, and residents there. Jim, Erin, and their cats, Percy and Alli, are very excited about Jim spending the next three years becoming a Family Physician in such a great environment.
spent his earliest years in a home in the country where his closest friends included his sister, his clog, the trees, and a spunky goat named Eddy. The clays were carefree as he learned to be independent and find his way
through the woods. When the drives into town became too long and the goat became sausage, the parents decided to move the family to the bustling metropolis of Onalaska, WI, the Sunfish Capital of the World. Here, Ben attended high school, which provided memories of sports and as well as ample motivation to explore the world of college. He moved to the great city of Madison, WI, where he would become a Badger fan of such magnitude that he would bleed red. Meanwhile, he pledged his free time to the University of Wisconsin rowing team. The sport provided a woncle1ful opportunity for travel and competition, but cut into his precious morning time.
Not fully appreciating that entering medical school would severely reduce the changes of becoming an urban planner, a park ranger, or a circus clown, he stayed in Madison for four more years of study. School kept him busy and stressed, but without rowing, he was able to spend more time traveling on his own terms to destinations such as Glacier National Park and Poland. Ben is quite pleased to have completed these challenging years and to
begin his next adventure in St. Paul. He hopes to leam a lot about medicine, the Twin Cities, and his colleagues while
any opportunities to become a fan of any team that calls the Metrodome home. He also hopes to continue to pursue his interests that, besides writing in the third person, include biking, basketball, music, and enjoying all St. Paul and Minneapolis have to offer. He also reserves the right to become a park ranger at any time in the future.
""'I I
I
\Vas raised
in the Rochester, MN, suburb of Mantorville - the subject of numerous calendar photographs and home of the historic Hubbell House. He spent days exploring the local limestone brewery ruins, shooting off fireworks, building things in his father's woodworking shop, and partaking in various forms of mischief. Shortly after graduation from high school, Scott met the woman (Katie) with whom he would fall in love and live happily ever after.
Being generally indecisive, traveled to St. Cloud, MN, where he began the first of a short 6-year plan to a Bachelor's Degree. Kate moved to St. Cloud shortly thereafter, and the two were manied at the mature age of 20. While an undergrad, Scott became interested in biochemical and genetic research, working as a research assistant at St. Cloud during the academic year and summers at various research facilities in the U.S.
Again, being generally indecisive, Scott
entered the combined MD/PhD program at the University of Minnesota after earning his B.S. After two years of medical school, the plight of the chicken farmer came to Scott's attention and spent several years after a Ph.D. doing chicken research. During this time, Scott found time to continue his hobbies of woodworking and politics. Scott and Katie are also the very proud parents of Katie and Seth.
Scott is very excited to begin residency at the United Family lV[edicine Residency Program. He has a great desire to _join a community-oriented practice after residency, with United as an ideal match for this next phase of education.
grew up
exploring the bluffs and shorelines of the Mississippi River in La Crosse, Wisconsin, with her parents and three younger siblings. She participated in the performing arts in a wide variety of ways including playing piano, singing in choirs, and pe1forming homemade plays in a makeshift
basement theater. While Sarah was in school, her mom took a job as a nurse-
midwife at a small rural hospital in Sparta, Wisconsin, and subsequently the Hammes family moved. It was there, in Sparta, that Sarah experienced the many delights of a small to\vn, even spending a summer disc jockeying at a local country music radio station without any previous experience as a DJ or with country music! On the evenings and weekends that Sarah wasn't involved with school sporting events, she worked as a C.N .A at a local nursing home.
For college, Sarah left the West Coast of her home state and moved inland to the University of Wisconsin in Madison. A semester abroad in Indonesia sparked an interest in tropical medicine, international health, and Indonesian After college, Sarah didn't have far to go, as she continued on to medical school at UW. (Go Badgers!) In medical school Sarah was able to get involved in many different school sponsored projects and to pursue her interest in community service. She was able to leave the university setting for most of her clinical years, and enjoyed experiencing community-based medicine all over the state of Wisconsin. To maintain a balance in her life, Sarah en_joys many hobbies including quilting, running, reading, biking, and ballroom dancing.
Sarah is excited to head up the Mississippi River to St. Paul for her Family Practice residency at United. She is looking forward to joining and serving the West 7th
Community as a Family Practice Resident.
was born on the island of Hawaii. Family lore recalls that my labor was provoked by the sting of a jellyfish.
I consider myself a North Dakotan, moving to Devils Lake as I was starting the fourth
home create a flood of memories - walks in the wood with mom, learning to get up on one water-ski, crosscountry skiing under a full moon, Sunday lunches with grandma and summer com
theater productions at Fort Totteti.
school, I was attracted to the i
emphasis of independent learning and the diverse community at Brown University in Providence, Rhode Island. I took a varied
course load - focusing on Biology and Developmental Studies and enjoyed teaching English as a second language. The supportive environment, and of course the coffee milk, Dell's frozen lemonade, and crab cakes kept me at Brown for four more years. I loved med school. Highlights in the past two years have included volunteering at the Rhode Island Free Clinic, a rural rotation at the Alaska Native Health Center in Sitka, Alaska, and two months on the Internal Medicine wards in Eldoret,
Kenya.
I am excited to be in St. Paul and thrilled with my residency selection, and am looking forward to becoming part of the
West Seventh Community.
on working in a variety of settings during my career, focusing on cross-cultural medicine, with an emphasis on patienteducation and disease prevention. When I'm not in the clinic or hospital, you'll find me hiking a trail, my bike, reading a book, dancing - or maybe you won't even find me - because I'll be in Africa~ Central America, or Asia exchanging ideas and care.
grew up on the North Shore of Lake Superior in Two Harbors. You may recognize the town of Tofte (a little further up the shore) as her family's namesake. This is the town her
,,.,,.,,,..,,,J-,,1-h,~ 1 • and his twin brother
founded after they immigrated from Norway.
She attending a small, private, all girls college in Milwaukee. Most people have yet to discover this up-and-coming institution, Alvemo College, where grades and traditional tests are non-existent and students are on a first-name basis with professors.
During college she continued dating her high-school sweetheart, Cory Jackson (he was in college when they started dating and maintains he never had a high-school sweetheart). Looking back, they're not sure how they did it, but they managed to maintain a thriving relationship despite
never living in the same town.
She returned to northern Minnesota for her first two years of medical school where she moved in with her grandfather "just
up." Anne and Cury married between first and second year. Her parents were often volunteered to
cater class or to provide that "home,cooked" meal that everyone needs once in awhile.
It was the United part in
closer to home for , That and the fact that
out of channeled her energy
into countless hours of dance softball and
school musicals.
Suzanne attended college and studied at Gustavus Adolphus College in
MN - a lovely town, which 1"""'""""""-' to be a littlenatur,11,disaster
her
1cu16 une;'-- 8l1Cl lv1exican Mexico. Her flrst
care came while ~· a nursmg assistant at Bethesda
Rehabditation in St. Paul, MN her breaks and summers off.
Suzanne attended the U of MN Twin Cities for her four years of medical school.
her third year, she n•H·J-U'ln•>l«o,-J
the Rural Physictan Associates (RPAP), and spent nine months in
grevv up in a teeny rural lv1innesota town named \Villow
1-''-'1-'Ll"-'L"-"' 350 three and four bars (no, Laura
Wilder cllcl not play a role in the town!). Her childhood heroes included The Incredible Hulk, The Dukes of
and Wonder
down country roads. One of her when she wowed the entire
students from all over the country, and countless ultimate Frisbee teams. Her at Carleton were a wonderful time of
and fllled with many late ""'"'" i no of life and even more
cups of coffee.
Azra ventured into the medical school at the
to attend of
Minnesota - 'Evin Cities campus. During that time, she a love for the incredible of the human and discovered many new interests,
UWC<_•vc~V) and neonatal
HIV She i-10pes to some medicine in an umlerserved '--'-''''u'urnL
forwmd to the part of the
Medicine
I
e
I
was born in Calcutta, India (City of
Joy). He was an aspiring cricketer until the age of six, when he was transported to
an alien land where his native Tamil was never heard and cricket was an insect.
Once here he had a perpetual identity crisis, as no American could pronounce his
name or look at it without going weak at the knees, until one kindly old
gentleman bestowed upon him the name of Bowl of Soup and Onions
(Balasubrahmanyan.) With this new title, he went on to medical school. In typical
third year turmoil, he tried his hand at the monastic life. After one summer
decided family practice was the life for him.
After medical school he left Baltimore and his beloved Orioles to begin
residency in Michigan. Internship began with a bang July 1st, being on call for
the entire hospital. During residency he discovered there was a world outside of
medical life through his involvement in Physicians for Social Responsibility and
being a board member of the Local Peace and Justice Committee.
Ravi finished residency with the dubious honor of being the worst dressed and
having the most cluttered desk in the history of the program. Ravi joined a
three-person practice in a small coastal town in Massachusetts, where patient
visits occurred as often in the local grocery store as in the office. For 1 '/2 years his
car could be heard puttering around town on house calls. Eight years ago,
following the northern lights and the allure of his "ole" wife, he came to the
Twin Cities. Now a family man with two energetic boys, he enjoys running,
baseball, tennis, and ... cricket anyone?
was born and raised in a rural area of Oklahoma
(a redundant phrase - there's no such thing as urban Oklahoma), in a family of
working cowboys, displaced Native Americans (Cherokee and Creek), and various
dust-bowl survivors. I was considered a certified genius, mostly because I could read,
and when I finally read all the books in the local library, I got to leave town. From
there it's been pretty much all downhill. Residency was completed at Cook County
Hospital in Chicago, epidemiologic training at CDC in Atlanta, research at Mayo
Clinic, adolescent clinic in Baltimore, and general family practice in St. Paul.
My favorite 13-year-old says I should describe myself as ... "like, you know, really retro." I suppose that means someone who knows "I Heard It Through the Grapevine" did not originate with the California Raisins and "SOS" are not the initials for a fuel additive. Anyway, my current interests include: women and adolescent health care issues, clinical research, psychiatry and addiction medicine in family practice, routine plumbing and mastering the art of dovetail joints. Actually, what I think I'd most like to do is ethnobotany, but it's hard to. grow Aztec corn and tepary beans this far North. But then ... it's hard to do
anything this far North.
Medical School: University of Maryland
Internship: Michigan State University Hospital
Residency: Michigan State University Hospital
Family Practice, Geriat1ic Medicine
Medical School: Universit;1 of Ol<lahoma
Internship: Cook County Hospitctl
Cook Coimty HosjJital
li/11/ ii
the third of four children and as the first name implies, is from the south. My parents were both children of sharecroppers on. cotton farms - one from Mississippi and one from south Texas. My father's career was as a cook in the Army. My father couldn't read or write, but my mother got to fourth grade and was, therefore, the family "administrator". When I was 10, my father bought a set of Encyclopedia Britannia's and said, "There it is, Jim, all you vvant to know."
Growing up a "military brat", I traveled a lot, half of my early years were spent in Texas near my mother's family. I grew up on country and western music and dedication to military service. So the obvious step in the late 1960's for those of us with no money and no pull with the local draft board, was the service.
I served nearly three years with the U.S. Marine Corps, then used the GI Bill and the Marine Corps Reserves to get through college. From the first day of medical school, I was always interested in Family Practice and small-town medicine. In residency, I joined the Army Reserves as a physician. I have a firm belief that if we as a nation send our young men in harms way, we must provide the best medical care possible for them. This part time dedication has resulted in two active duty call-ups; one for Desert Storm and the other for support of the U.N. involvement in Bosnia. I am still a colonel in the Army and I still hope, someday, to see the residents march to and from United Hospital for daily hospital rounds.
My clinical practice started as the only doctor in the county in the ranch-lands of central Kansas, twenty-five miles from the hospital. After five years with only ten total days off, I decided to move to a farm community 100 miles north. I then spent 13 years in a farm community loving the closeness I experienced with my patients. My patients were my friends, and I cried, I laughed, and I celebrated with them as I had the honor of sharing their life as their physician.
I have four sons, one daughter-in-law and two granddaughters. Moving to Minnesota alone was a major change in my life, but the joy of caring for patients, sharing knowledge and experience with the residents, and a new relationship in my life has filled the gaps.
debuted on the West Coast as the oldest of five oil company brats, migrating between the Midwest and New England. After finishing medical school in Washington, D.C., during the heat of Watergate, she developed significant heat intolerance and moved to the cooler climate of St. Paul, where she completed a family practice residency at St. Paul Ramsey in 1979. There she met, and eventually married, her intern. After a rural rotation in Long Prairie, MN, she opened her suburban New York eyes to the joys of rural private practice, she and husband John, moved North to Deer River, MN, and worked together in a Northern Exposure practice for 14 years. She migrated back to suburbia in 1994.
In her other lifetime, she contemplated marine biology, having been voted the person most likely to "grow gills" on an Earthwatch project, and dance/choreography, galley wench, and is one of the fluting faculty. Instead, she has been cultivating an Auntie Mame in medicine approach, with on-going experimentation on the effects of bright colors on patients and colleagues.
Practice interests include: women's health care, zebra hunting, community health education, cardiovascular risk reduction, and healing ministry. Long term goals include: early childhood parenting and practice-based research.
Medical School: University of Kansas
Residency: \Vesley Medical Center
Family Practice
Medical School: Georgetown University
Residency: St. Paul Ramsey Medical Center
Family Practice
ui1lli1u11·{{
•
e
•
technically a Hoosier, grew up in a Japanese; American household in the South suburbs of Chicago in a predominantly white, working class neighborhood. When the neighborhood bullies found my flatter profile just reason for torment, I, with all the wisdom of my seven years of life, advised my father to adopt a German shepherd, the bigger the better. He appeared to be listening, but then promptly purchased an eighty;year;old upright piano, assuring me that this was the more effective weapon. Although dubious of my father's judgement, I agreed to lessons. Music has since warded off a number of enemies.
I attended college on the South side of Chicago, where I was a volunteer in the Pediatric Emergency Room. I saw children turned away from this rich, private institution because of lack of insurance, and my determination to provide care to the underserved was born.
I took a couple of detours, including a five;month stint in Japan, hanging out with my grandmother, a hipper version of my mother. After medical school, I moved to Austria to do a little research, preferring the cafe' culture of Vienna to the rigors of residency.
I packed up my cat named "Cat", and returned to the Twin Cities. I did, in fact, do a residency in between nursing recurrent bilateral tendinitis, secondary to com; pulsive knitting and foot numbness from rum1ing. After finishing a Maternal;Child Fellowship in Chicago, the cat and I, again, returned to the Twin Cities to join the faculty at the United Family Medicine Residency Program ... happily ever after.
Yes, I am the eldest of eight children in an lrish;French;German family with a typical penchant for perfectionism that reached its pinnacle at age 14, when my 13;year;old sister had to fight for me by telling people I really wasn't a "weirdo" because I only had time to break from studying to wash my hair every two weeks. I think what I have matured to is a person with a passion for life, from my family to the high school girl's basketball tournament to women's marathon running (of which I've only run one. But, from all the stories I tell, you would think it was more) to traveling with my family.
Included and very important in my passions is a love for family medicine. I truly have never regretted the choice and find it to be forever stimulating, rewarding, challenging, and a privilege. Within its confines, I particularly love continuity of care 1 family;centered perinatal care, women and children's care, and the behavioral aspects of medicine. In case you're wondering, I've definitely lost my perfectionism.
was born, raised and educated in Minnesota, but by no means has he remained confined to the state borders. He most enjoys adventure and travel, and having visited all fifty states, now prefers international trips. Among his favorite adventures are sea kayaking in Thailand and New Zealand, and mountain biking in rural Haiti. During the warm Minnesota summer months, Mike looks forward to camping trips to the Boundary Waters Canoe Area, and is always ready to introduce a newcomer to the fantastic beauty and tranquility of the North Woods. The international culture at United Family Practice satisfies the travel bug while at work, but at any given time, Mike will likely have two, if not three upcoming trips on the planning docket.
Mike is a fan of all sports, Nascar excluded, with favoritism toward Minnesota teams. He considers athletics a key to physical and emotional health, and encourages all of his patients to develop a fitness plan. When not traveling or working, Mike might be found golfing, biking, or playing a pick; up game of basket; ball. He also enjoys working on his older St. Paul home, where he resides with his two female companions, Sport and Zoe (cats).
Medical School: University of Minnesota
Residency:
St. Paul Ramsey Medical Center
Family Practice
Medical School: Mayo Clinic
Residency:
St. Paul Ramsay Medical Center
Family Practice
Medical School: University of Minnesota
School of Medicine Ke:sta<mcv: United Family Medicine
Residency Program
Family Practice
a self;described Pacific Northwest native, was born and raised in Wisconsin. During high school he was more often seen playing drums in local nightclubs than his 8 a.m. calculus class. Jerry's obsession with music has continued through the years. His experience ranges from many gigs in smoke;filled nightclubs to playing in a baclMlp band for Rodney Dange1field. Most recently, he concentrates on writing and recording music in an effort to discover and document his musical brain. Should he find anything worthwhile, he'll be releasing a CD of original music in the future.
After deciding that it might be difficult to make a living as a professional free; style skier, Jerry decided on a career in family medicine. He feels privileged to have such a great job.
Aside from being a doc and a musician, Jerry also enjoys spending time with family and friends, mountain biking, cross;country skiing, and other outdoor activities.
In the future, Jerry hopes to discourage increasing commercialism and promote more sustainable lifestyles for everyone.
"You might say I'm a dreamer, but I'm not the only one ... "
Growing up as a chubby redheaded halr Jewish American in Venezuela, I learned firsthand what is like to be a "stranger in a strange land." This experience would have colored my approach to any career, but has been especially influential in medicine, in which the minority, the marginalized and the disenfranchised fall through the cracks without advocacy and support.
I attended Hampshire College in Massachusetts, a hippie wanna be who was intimidated by pre;med curriculum. I was interested in alternative medicine, but in those days in this country there was only sloppy empiricism to support its use. I went to San Francisco to find myself and ended up working for the arch; establishmentarian California Medical Association. There I met physicians I could respect, and learned that I didn't have to sacrifice my humanity to obtain a medical degree. I also met doctors who were so dense that I knew that I too could get through medical school. I headed back east to Boston University, where Family Practice was considered on par with witch doctorism. Always the rebel, I followed my heart to the Maine; Dartmouth Family Practice Residency, the eastern equivalent of United Family. After a disastrous attempt at solo private practice in rural Maine, my family and I packed up and headed to Wisconsin. I practiced there five years before we decided we needed to be around more Jews, and here we are.
Still a hippie wanna be and rabblM·ouser, my professional interests are women's health care, cross cultural medicine, alternative medicine (which is now more evidence; based), and the interface between psyche and soma. A disciple of Patch Adams, the doctor clown and citizen diplomat, I seek a professional niche in which having a sense of humor is considered a healing skill.
One of my main goals as a physician is to set an example for patients of physical and mental health. Therefore, I cultivate n01Hnedical interests such as cooking, sewing, singing, reading and playing Scrabble. Some people have pets; I have a compost pit. However, the thing that really keeps me honest is my family: my husband Geoff and my kids Ilana (7) and Jonah (3 ). My goal is to create a balance that allows me to work hard as a physician and have time to live the rest of life to its fullest.
Medical School: Washington University School of lvledicine
Residency: Valley Medical Center, Renton, WA
Family Practice
Medical School: Boston University School of Medicine
Residency: Maine;Dartmouth Family Practice Residency
Family Practice
111 I/(
grew up in Hershey, PA, where the world's finest chocolate is made. She went to Penn State University, vvhere she majored in Music Education, Nursing, and being a football fan. After college, she worked both as a nurse and a professional musician, but decided she wasn't in quite enough debt, so she headed to medical school at the University of Pittsburgh. Residency brought her to the United Family Medicine Program, where she fell in love with Minnesota, and all the folks at the Residency Program, Clinic, and in the Community. She joined the program's Residency faculty in 2002, and has made St. Paul her home. In her spare time, she can be found singing and playing keyboards at her church, walking around a lake, or knitting furiously while cheering for Penn State's Nittany Lions. (Editor's Note: "What's a Nittany?")
is a failed rock mus1c1an, would-be dmosaur hLmter, and hockey geek. His wife and three children are the main focus of his life, followed by a continued belief that being a family doctor is a job that matters and, after 21 years, can still say
is glad to be doing what he is doing. He is the author of a novel, ''Pictures From A Trip," about two brothers in love with the world who take a trip with a blind friend to the Dakotas
''I met him in a little cafe on West Seventh Street ... Elvis lives."
and Montana to look for dinosaurbones. Five CME credits are automatically given to anyone reading this book.
His main goals in life are to be a good dad and husband, to be a good family doc, and to play rhythm guitar with the Rolling Stones.
I bought flippers and a used wet suit and began college in Boston to follow in the footsteps of Jacques Cousteau. My Norwegian ethos found empathy with the Chinese student community, where I was gifted with my Chinese name. I had imagined for myself a career in a scientific research lab. As there could be only one Cousteau, I completed my degree in chemistry and enrolled in medical school at the University of Minnesota. I earned some honors along the way, but found greater Joy in volunteer work and the sports team on which I participated.
I developed a special interest in infectious diseases and spent some time studying tropical diseases in the Philippines. I returned to finish my residency in internal medicine, added two months of peels and started work in community medicine in a bicultural clinic. I became fluent in Spanish, and a novice at classical guitar and folk dancing. Then I began my protest years (later than most). I moved to MOD Clinic to involve myself more in medical education and geriatric medicine, while continuing in a community service-oriented practice.
Medical School: Uni,versity of Pittsbwgh
Internship:
United Family Medicine Residency
Family Practice
Medical School: University of Minnesota
Internship:
Hennepin County Medical Center
Famil:y Practice
Medical School: Unii1ersity of Minnesota
Abbott Northwestern Hospital
Lneuu:me. Medicine
Behavioral Scientist, has a master's degree in counseling psychology and a master's in theater. Mary tries to
combine these two disciplines in everything she does at United Family Practice Center. From theater, Mary has learned how to be playful
while at work, and from psychology, she has learned how to motivate others to have a playful attitude at work. She thoroughly loves coming
to work each morning, knowing that she will be interacting with the residents and teaching them evetything she knows about mental health,
and that she will be interacting with patients - helping them to discover that they can change and heal from the pain in their lives. When
not at the clinic, you can find Mary at home with her life partner, Mary'n, concocting numerous ways to spend massive amounts of money
creating artistic statements throughout the house and garden.
Community Outreach Specialist, was born in St. Paul and spent the first four years of life within two blocks of
United Family Health Center. There are still some of the Walsh relatives living in the area, although her family moved to the East Side of St.
Paul. She currently lives on Lake Phalen, home of the lee Palace.
Connie comes to United Family Health Center with over 20 years of experience in community health both in residential and clinic settings.
As a nurse and patient advocate, her specialty has been working with low-income and uninsured patients. She is excited about the
opportunity to return to her "roots" in the West 7th area.
When asked about her greatest challenge, there was no hesitation. "The day I organized and cooked a benefit turkey di1mer for 1,100 guests."
So what was the challenge? "I never had even cooked a frozen turkey TV dinner before that day." Two things that are her joys in life are her
Irish family and traditions and volunteering with her church. Goals for the future: Visit the Holy Land a.lea. Ireland.
Administrative Assistant, although born in Cumberland, Wisconsin, in a family of seven brothers and
sisters, I've called South St. Paul, MN, home since the age of three. I married my high school sweetheart and we have two sons.
After 40+ years in Minnesota, my husband and I moved back to Wisconsin after our youngest son graduated from high school,
living in a rural area just south of Baldwin. We love the peace and quiet that the country provides, but stay connected to the
Twin Cities through family and our work, still feeling like we belong to Minnesota.
My family is the most enjoyable thing in my life, and I spend as much time as I can with them. My husband and I are old car
enthusiasts. We have a '56 Oldsmobile that is "almost" ready for the street. We recently purchased a 1930 Ford Model A Tudor
body, with the dream to build a car to race on the Bonneville Salt Flats. We spend our summers at car shows, S\:vap meets, and
try to get out to the Bonneville Salt Flats for Speed Week in August. Aside from cars, I like to read, listen to music, and \Vatch
the Minnesota Twins play baseball.
Program Manager, grew up on a farm outside Iowa City, Iowa, and still enjoys singing the Hawkeyes Iowa Fight song after
those peanuts at the football games as a kid. Enjoys fondly remembering her home state and what it meant growing up there ...
detassling com, watching heat lighting and storms roll in across the fields, 4-H, the county and state fairs, casseroles (not "hot dishes"), and
the ever present jello at every special event and holiday. After all these years, excitement continues to build each July and August in
preparation for entries into the Dakota County Fair and the Minnesota State Fair.
Working in administration since 1979, with a short stint in court reporting, she enjoys keeping systems organized. Described best as ve1y
perky with a fun sense of humor and a love of laughter, she loves to work with people and likes to chat to keep up with people's lives.
With a passion for family, people, travel (old-fashioned drive trips), landscaping, state fairs, and jello, you'll no doubt see her around her other
hobby the camera. Also acting as the program historian ... smile! You'll no doubt be a part of our histmy!
Scheduling Coordinator, was raised in Hutchinson, MN. With Hutchinson being located only 60 minutes from
the Twin Cities, some would say that I was fortunate to have the opportunity to grow up in a rural community and still had access to all the
experiences of a metropolitan area. Although I did not live on a fann, I have experienced most of the lifestyle of a farmkid. (Yes, I have
helped with chores, bailed hay, and been on a tractor or two.)
My previous employment experience includes anything from being an administrative .assistant for an independent medical clinic, a librarian,
church office manager, coroner's assistant, secret shopper, and independent movie auditor. Following high school, I received my AAS degree
from Ridgewater College. After a few years of employment and being somewhat of a nontraditionalist, I decided to return to college for a BA
by enrolling part-time at Augsburg College.
In my freetime, I find enjoyment/frustration in being an armchair coach for most sports (football, basketball, hockey, and Nascar). Tennis,
racquetball, in-line skating, canoeing, walkir'tg, reading, movie viewing, want-to-be wine connoisseur, and music are also a part of my life. The
local church choir has graciously accepted me into membership, but 1 find more pleasure in listening to more polished artists and/or attending
concerts, plays, and musicals.
Printed on papers with 50% recycled fiber including at least 10% post-consumer waste.
-------------·------·