Embed Size (px)
Citation preview

ABSTRACTThe aim of this experiment was to analyze the octane number (both RON and MON)
from petrol sample using NIR spectroscopy.
Octane number (ON) is very important performance measure of the fuel oil in resisting
fuel to auto ignition and knock. Normally the (ON) of a fuel can be determined through
two test, one method is done by using CFRE (Cooperative Fuel Research Engine) in
which the ant-knock performance of a fuel of measured in a standardized cylinder
engine with variable compression ratio. This is very expensive and time consuming
method.
The second method is by using Near- Infrared (NIR) spectroscopy. This is very suitable
for gasoline analysis because of the absorption band observed in the NIR region and
direct associated with carbon-hydrogen stretching vibration found in hydrocarbon.
In this experiment the gasoline pure sample was taken about 150mL and its RON and
MON was measured by using Near- Infrared (NIR) spectroscopy. It follows the
addition of some chemical additives include Methanol, Ethanol, Isobutanol and Tetra-
butanol alcohol TBA to increase the octane number of the gasoline.
The additives were added successively at the amount of 5%, 10% and 15%. In each
addition step, the RON and MON of the gasoline were determined by placing the
sample on the Near- Infrared (NIR) spectroscopy.
The reading data for MON and RON were recorded in tabular form, and later the
graphs of (RON + MON)/2 against percentage volume for each additive were drawn.
From the graphs, the conclusion was reached that, ethanol as an octane booster will
have Maximum performance since it has the variable values closer to the Tanzania
standards than any other additive which have higher octane numbers(both MON and
RON).
i
TABLE OF CONTENTS
ABSTRACT.................................................................................................................................................. i
TABLE OF CONTENTS................................................................................................................................ ii
LIST OF FIGURES...................................................................................................................................... iii
LIST OF TABLES........................................................................................................................................ iv
INTRODUCTION........................................................................................................................................1
Research Octane Number (RON)..............................................................................................................1
Motor Octane Number (MON).................................................................................................................2
THEORY.................................................................................................................................................4
MATERIAL AND METHODS.......................................................................................................................6
RESULTS AND DISCUSION.................................................................................................................9
CONCLUSION......................................................................................................................................16
RECOMMENDATIONS.............................................................................................................................17
REFERENCES...........................................................................................................................................18
ii
LIST OF FIGURESFigure 1: The Graph of %volume against Average (MON and RON).......................................................10Figure 2: The Graph of Octane Number (RON) against %Volume Increased..........................................11Figure 3: The Graph of Octane Number (RON) against %Volume Increased..........................................12Figure 4: The Graph Of % Volume Against Vapor Pressure....................................................................13Figure 5: The Graph Of %Volume Against Oxygen Content In (%Wt).....................................................14
iii

LIST OF TABLESTable 1.....................................................................................................................................................9Table 2.....................................................................................................................................................9Table 3...................................................................................................................................................10Table 4...................................................................................................................................................10
iv
INTRODUCTIONOctane number is a standard measure of the performance of an engine or aviation fuel.
The higher the octane number, the more compression the fuel can withstand before
detonating (igniting). In broad terms, fuels with a higher octane rating are used in high
performance gasoline engines that require higher compression ratios. In contrast, fuels
with lower octane numbers are ideal for diesel engines, because diesel engines do not
compress the fuel but rather compress only air and then inject the fuel into the air heated
up by compression. Gasoline engines rely on ignition of air and fuel compressed
together as a mixture without ignition, which is then ignited at the end of the
compression stroke using spark plugs. Therefore, high compressibility of the fuel
matters mainly for gasoline engines. Use of gasoline with lower octane numbers may
lead to the problem of engine knocking.
In a normal spark-ignition engine, the air-fuel mixture is heated due to being compressed
and is then triggered to burn rapidly by the spark plug and ignition system. If it is heated
or compressed too much, then it will explode when triggered, or even self-ignite before
the ignition system sparks. This causes much higher pressures than engine components
are designed for and can cause a "knocking" or "pinging" sound. Octane numbers can
be:-
1. Research Octane Number (RON) and
2. Motor Octane Number (MON).
Research Octane Number (RON)This is the most common type of octane rating worldwide. RON is determined by
running the fuel in a test engine with a variable compression ratio under controlled
conditions, and comparing the results with those for mixtures of iso-octane and n-
heptane.
1
Motor Octane Number (MON)Motor Octane Number (MON) is determined at 900 rpm engine speed instead of the 600
rpm for RON. MON testing uses a similar test engine to that used in RON testing, but
with a preheated fuel mixture, higher engine speed, and variable ignition timing to
further stress the fuel's knock resistance. Depending on the composition of the fuel, the
MON of a modern pump gasoline will be about 8 to 12 octane lower than the RON, but
the point to note is that, there is no direct link between RON and MON. Pump gasoline
specifications typically require both a minimum RON and a minimum MON.
In most countries, including Australia, New Zealand and all of those in Europe, the
"headline" octane rating shown on the pump is the RON, but in Canada, the United
States, Brazil, and some other countries, the headline number is the average of the RON
and the MON, called the Anti-Knock Index (AKI), and often written on pumps as
(R+M)/2). It may also sometimes be called the Posted Octane Number (PON).
The RON/MON values of n-heptane and iso-octane are exactly 0 and 100, respectively,
by the definition of octane rating. These are used as the references. It is possible for a
fuel to have a Research Octane Number (RON) more than 100, because iso-octane is not
the most knock-resistant substance available. Racing fuels, avgas, LPG and alcohol fuels
such as methanol may have octane ratings of 110 or significantly higher. Typical "octane
booster" gasoline additives include ETBE, isooctane and toluene. Lead in the form of
tetraethyllead was once a common additive, but its use for fuels for road vehicles has
been progressively phased-out worldwide, beginning in the 1970s. in Tanzania the
standard octane number for our unleaded gasoline is of maximum Research Octane
Number (RON) 95.
The evaluation of the octane number by the two laboratory methods requires a standard
engine and the test procedure can be both expensive and time-consuming. The standard
engine required for the test may not always be available, especially in out-of-the-way
places or in small or mobile laboratories. These and other considerations led to the
search for a rapid method for the evaluation of the anti-knock quality of gasoline. Such
2

methods include FTIR, near infrared on-line analyzers (ASTM D-2885) and others.
Deriving an equation that can be used for calculating the octane quality would also serve
the same purpose with added advantages. The term Octane Index is often used to refer to
the calculated octane quality in contradistinction to the (measured) research or motor
octane numbers. The octane index can be of great service in the blending of gasoline.
Motor gasoline, as marketed, is usually a blend of several types of refinery grades that
are derived from different processes such as straight-run gasoline, reformate, cracked
gasoline etc. These different grades are considered as one group when blending to meet
final product specifications. Most refiners produce and market more than one grade of
motor gasoline, differing principally in their anti-knock quality.
3
THEORY
Octane number is very important performance measure of the fuel oil in resisting fuel
auto ignition and knock. Knock which is the abnormal combustion, occur in spark
ignition engine when the fuel/air mixture explodes on the compression stroke of the
engine cycle ie. Before the application of the spark. The higher the octane number, the
more compression the fuel can withstand before detonating (igniting). Erick show thesis
about exploring the use of a higher octane gasoline for the U.S light-duty cited from
Heywood, 1988 on effect of abnormal increases in temperature and pressure in fuel
engines and say “if the pressure and temperature of unburned air fuel mixture (ahead of
the propagation flame front) reach high enough levels, spontaneous auto ignition may
occur in certain spots. This auto – ignition causes an extremely rapid release of much of
the chemical energy stored in unburned mixture, resulting in large pressure oscillation in
the cylinder. In turn these oscillations produce an audible metallic “pinging” sound if
survive enough, they can cause major damage to engine components.
Raising the octane number will reduce the tendency of the fuel to auto ignite and knock
by influencing the design of the engines with greater compression ratios and boost levels
which signifies better fuel efficiency”
Gasoline engines rely on ignition of air and fuel compressed together as a mixture
without ignition, which is then ignited at the end of the compression stroke using spark
plugs. Therefore, high compressibility of the fuel matters mainly for gasoline engines.
Octanes are a family of hydrocarbon that are typical components of gasoline. They are
colorless liquids that boil around 125 °C (260 °F). One member of the octane family,
iso-octane, is used as a reference standard to benchmark the tendency of gasoline or
LPG fuels to resist self-ignition.
The octane rating of gasoline is measured in a test engine and is defined by comparison
with the mixture of 2,2,4-trimethylpentane (iso-octane) and heptane that would have the
same anti-knocking capacity as the fuel under test: the percentage, by volume, of 2,2,4-
4

trimethylpentane in that mixture is the octane number of the fuel. For example, gasoline
with the same knocking characteristics as a mixture of 90% iso-octane and 10% heptane
would have an octane rating of 90. A rating of 90 does not mean that the gasoline
contains just iso-octane and heptane in these proportions but that it has the same
detonation resistance properties (generally, gasoline sold for common use never consists
solely of iso-octane and heptane; it is a mixture of many hydrocarbons and often other
additives). Because some fuels are more knock-resistant than pure iso-octane, the
definition has been extended to allow for octane numbers greater than 100.
5

MATERIAL AND METHODSMATERIALS AND APPARATUS
We were provided with unleaded
1. Gasoline,
2. Methanol,
3. Ethanol,
4. TBA and
5. Butan-2-ol.
The apparatus used was potable octane analyzer (ZX 101XL)
FIGURE FOR ZX 101XL OCTANE ANALYZER.
6
Sample Holder
Display
Measure button
MEASUREMENT OF THE SAMPLE
1. We were required to measure 150mL of unleaded Gasoline and put it into the
sample holder.
2. We obtained RON, MON and (RON+MON)/2 of a given unleaded gasoline using
potable ZX-101XL. We used interpolation to obtain the vapor pressure and
oxygen content of gasoline from the given table.
3. Also we measured 5%v of methanol and add it to the unleaded gasoline in the
sample holder.
4. The vapor pressure and oxygen content of each measurement was calculated by
interpolation using given table.
5. Continue adding 5%v of the methanol to 15%v while analyzing RON MON and
its average, vapor pressure and oxygen content.
6. Repeat the above procedure for ethanol, TBA and Butan-2-ol.
PROCIDURES
MEASURING A SAMPLE USING Zeltex, Inc,. 2007
1. The first step was to switch power to on. The display will show the version
number followed by the 15-second count down after which “Clear chamber and
press measure” will appear.
2. We make sure there is no sample holder in the sample chamber and Cover the
chamber with a light shield.
3. After we covered the chamber with a light shield, the MEASURE key was
pressed to standardize the instrument. After the reading takes place, “Put in
sample” appeared on the display. This indicates that the instrument has been
standardized; it is now ready to measure the sample.
7
4. Then we remove the light shield from the sample chamber and place the filled
sample in the sample chamber by being carefully to align the alignment stripe on
the sample holder with the left alignment stripe on the instrument.
5. Carefully we replaced the light shield over the sample holder. This shield must
always be used when measuring the fuel sample or a standard; otherwise the
result will be incorrect.
6. We pressed the MEASURE button. After the “reading” takes place “remove and
replace” displayed.
7. Now the sample holder was removed and rotated to align the stripe on the sample
holder with the right alignment stripe in the instrument and again Carefully the
light shield was replaced over the sample holder.
8. Again we pressed MEASURE button to take reading. After the “Reading” takes
place. “Remove & Press M” displayed.
9. We removed the sample holder and cover the empty chamber with the light shield
and pressed measure button again.
10. After the measurement is complete, we repeated step 3-11 to measure another
fuel sample.
8

RESULTS AND DISCUSION
A quantitative calibration model was created using the NIR spectra and laboratory
octane data was used to predict the Octane number of gasoline (RON and MON) by
increasing the volume of the of different additives in real time.
The results for this are shown in Table 1, Table 2, Table 3 and Table 4 for RON,MON
and their Average ie. (MON+RON)/2. Both parameters are in good agreement with the
accepted laboratory method. Both models (RON and MON) in this example are set up to
operate with multiple grades of blended gasoline. The method easily distinguishes
between low, middle, and high Octane samples.
TABLES OF RESULTS
TBAGasoline Volume Used 150mL
%Volume RON MON (ROM+MON)/2 V. Pressure
O2 Content
0 96.3 85.6 91.0 66.5 3.3755 95.8 89.7 92.8 74.6 4.5910 96.9 91.9 94.4 81.8 5.6715 97.6 93.9 95.8 88.1 6.615
Table 1
BUTAN-2-OLGasoline Volume Used 150mL
%Volume RON MON (ROM+MON)/2 V. Pressure
O2 Content
0 96.3 85.6 91.0 66.5 3.3755 96.3 89.3 92.8 74.6 4.5910 96.5 91.2 93.9 79.55 5.332515 96.9 92.7 94.8 83.6 5.93
Table 2
9

METHANOLGasoline Volume Used 150mL
%Volume RON MON (ROM+MON)/2 V. Pressure
O2 Content
0 96.3 85.6 91.0 66.5 3.3755 99.6 84.9 92.3 72.35 4.25310 97.8 89.8 93.8 79.1 5.26515 98.4 90.7 94.6 82.7 5.805
Table 3
ETHANOLGasoline Volume Used 150mL
%Volume RON MON (ROM+MON)/2 V. Pressure
O2 Content
0 96.3 85.6 91.0 66.5 3.3755 96.3 88.5 92.4 72.8 4.3210 96.2 89.6 92.9 72.05 4.6615 96.1 90.3 93.2 76.4 4.86
Table 4
The graph of average value of RON and MON against the increase in the volume of each additive is drawn in the figure below.
0 2 4 6 8 10 12 14 1688.0
89.0
90.0
91.0
92.0
93.0
94.0
95.0
96.0
97.0 THE GRAPH OF %VOLUME AGAINST AVERAGE (MON AND RON)
TBABUTAN-2-OLMETHANOLETHANOL
% By Volume
(RO
N+M
ON
)/2
Figure 1: The Graph of %volume against Average (MON and RON).
10
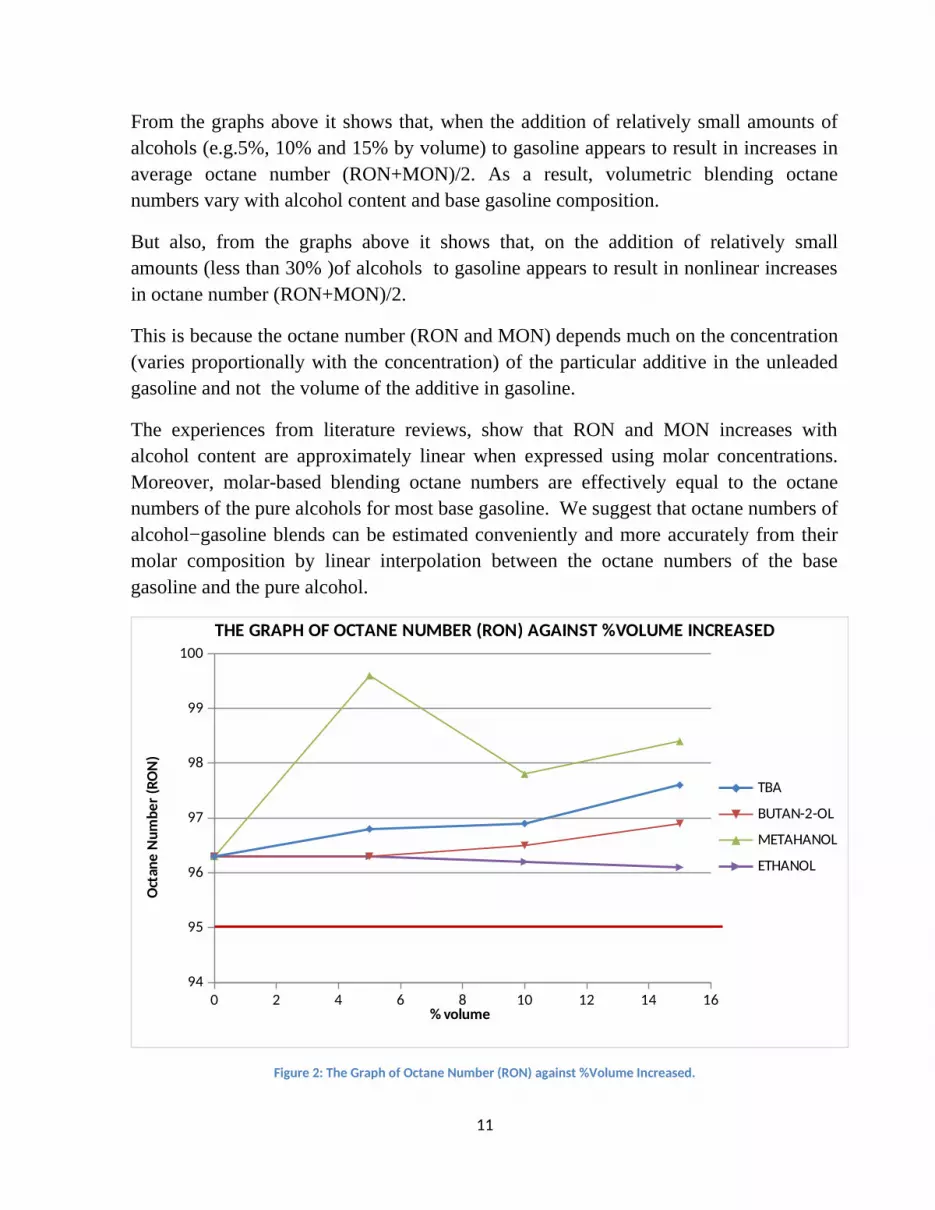
From the graphs above it shows that, when the addition of relatively small amounts of alcohols (e.g.5%, 10% and 15% by volume) to gasoline appears to result in increases in average octane number (RON+MON)/2. As a result, volumetric blending octane numbers vary with alcohol content and base gasoline composition.
But also, from the graphs above it shows that, on the addition of relatively small amounts (less than 30% )of alcohols to gasoline appears to result in nonlinear increases in octane number (RON+MON)/2.
This is because the octane number (RON and MON) depends much on the concentration (varies proportionally with the concentration) of the particular additive in the unleaded gasoline and not the volume of the additive in gasoline.
The experiences from literature reviews, show that RON and MON increases with alcohol content are approximately linear when expressed using molar concentrations. Moreover, molar-based blending octane numbers are effectively equal to the octane numbers of the pure alcohols for most base gasoline. We suggest that octane numbers of alcohol−gasoline blends can be estimated conveniently and more accurately from their molar composition by linear interpolation between the octane numbers of the base gasoline and the pure alcohol.
0 2 4 6 8 10 12 14 1694
95
96
97
98
99
100THE GRAPH OF OCTANE NUMBER (RON) AGAINST %VOLUME INCREASED
TBA
BUTAN-2-OL
METAHANOL
ETHANOL
% volume
Oct
ane
Num
ber (
RON
)
Figure 2: The Graph of Octane Number (RON) against %Volume Increased.
11

0 2 4 6 8 10 12 14 1680
82
84
86
88
90
92
94
96The Graph of Octane Number (MON) against %Volume Increased
TBABUTAN-2-OLMETHANOLETHANOL
%Volume
Oct
ane
Num
ber (
MO
N)
Figure 3: The Graph of Octane Number (RON) against %Volume Increased.
By considering the graphs above (Figure 2 and Figure 3)
The distribution of Octane numbers for these samples is shown in Figure 2. The RON values range from 96.1 to 99.6 and the MON values in figure 3 range from 84.9 to 93.9. These are ranges results from given additives alcohol - blended gasoline by adding 5%v, 10%v and 15%v of each additive successively. A quantitative calibration model was created using the NIR spectra and laboratory octane data.
The second data for both RON and MON for methanol are seen to deviate from the normal trend. In the RON against %volume the value of RON is seem to be higher about 99.6 when the %volume is 5%v and after the addition of methanol to 10%v the value of RON decreases. Normally, it is impossible to have this kind of graph since it has no any logical meaning since if the additive have the tendency of boosting octane number when added in small amount, it must increase more when added in large amount.
In other way, the value of MON is seem to be lower about 84.9 when the %volume is 5%v and after the addition of methanol to 10%v the value of RON decreases. This also it has no any logical meaning since if the additive has the tendency of lower octane
12
number when added in small amount, it must lower more when added in large amount and not increase.
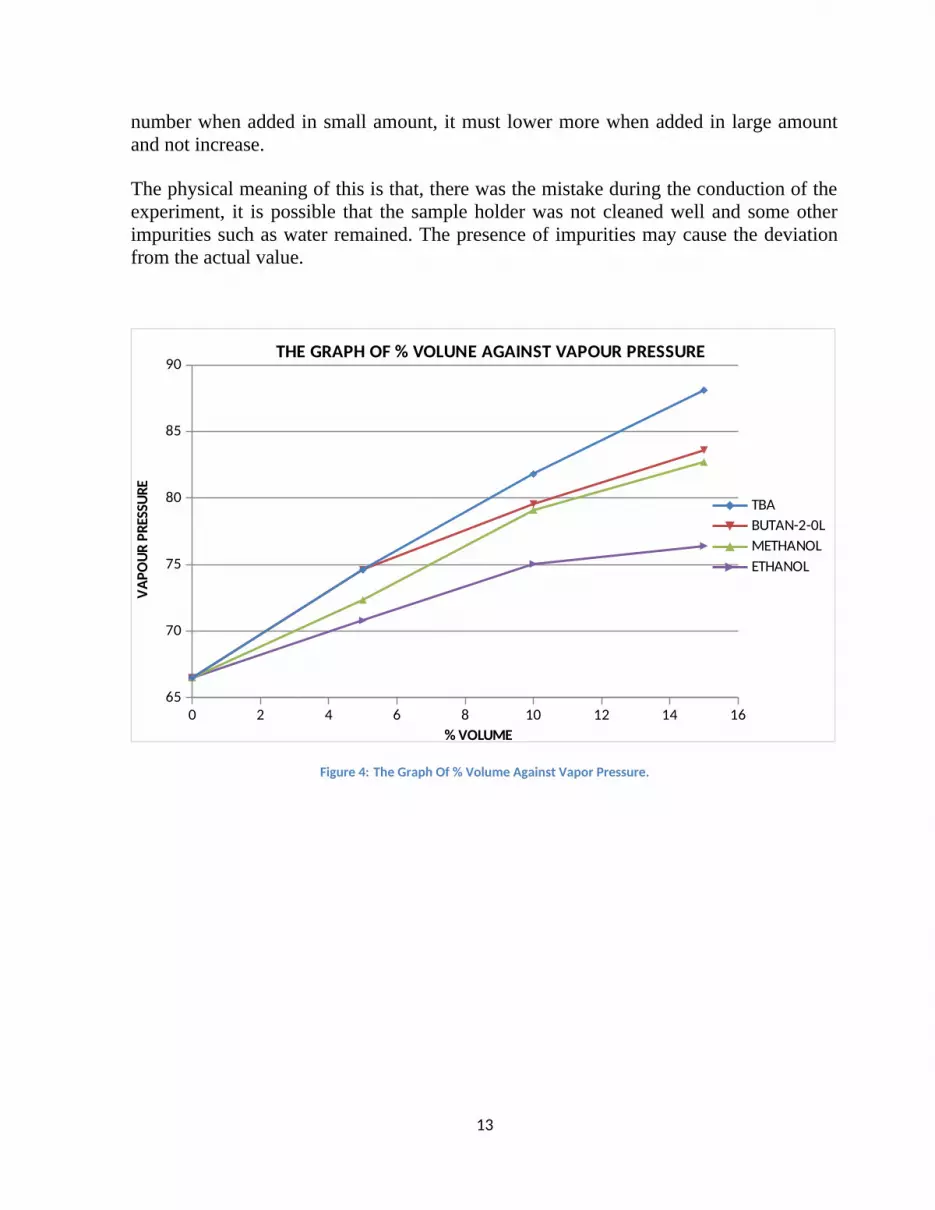
The physical meaning of this is that, there was the mistake during the conduction of the experiment, it is possible that the sample holder was not cleaned well and some other impurities such as water remained. The presence of impurities may cause the deviation from the actual value.
0 2 4 6 8 10 12 14 1665
70
75
80
85
90THE GRAPH OF % VOLUNE AGAINST VAPOUR PRESSURE
TBABUTAN-2-0LMETHANOLETHANOL
% VOLUME
VAPO
UR P
RESS
URE
Figure 4: The Graph Of % Volume Against Vapor Pressure.
13
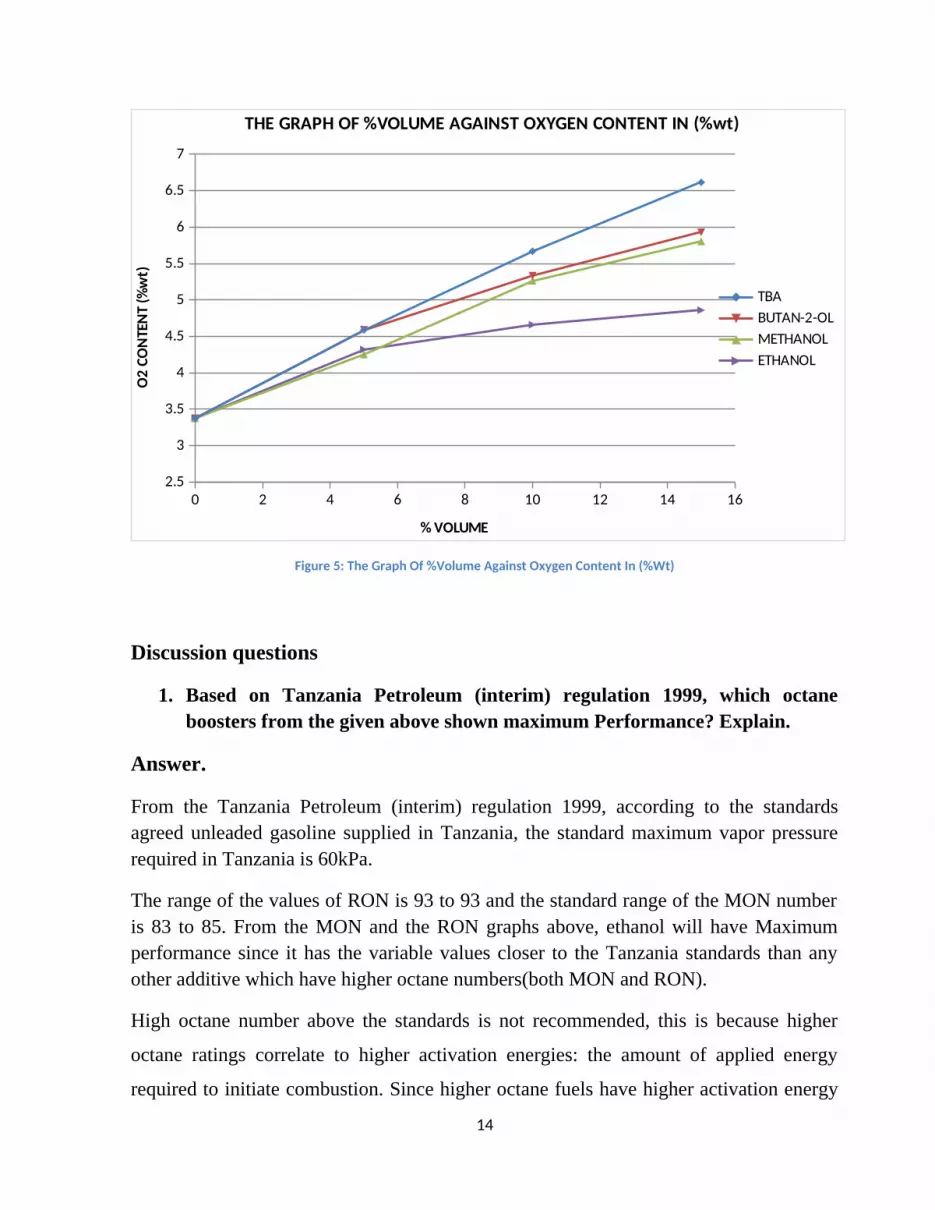
0 2 4 6 8 10 12 14 162.5
3
3.5
4
4.5
5
5.5
6
6.5
7
THE GRAPH OF %VOLUME AGAINST OXYGEN CONTENT IN (%wt)
TBABUTAN-2-OLMETHANOLETHANOL
% VOLUME
O2
CON
TEN
T (%
wt)
Figure 5: The Graph Of %Volume Against Oxygen Content In (%Wt)
Discussion questions
1. Based on Tanzania Petroleum (interim) regulation 1999, which octane boosters from the given above shown maximum Performance? Explain.
Answer.
From the Tanzania Petroleum (interim) regulation 1999, according to the standards agreed unleaded gasoline supplied in Tanzania, the standard maximum vapor pressure required in Tanzania is 60kPa.
The range of the values of RON is 93 to 93 and the standard range of the MON number is 83 to 85. From the MON and the RON graphs above, ethanol will have Maximum performance since it has the variable values closer to the Tanzania standards than any other additive which have higher octane numbers(both MON and RON).
High octane number above the standards is not recommended, this is because higher
octane ratings correlate to higher activation energies: the amount of applied energy
required to initiate combustion. Since higher octane fuels have higher activation energy
14

requirements, it is less likely that a given compression will cause uncontrolled ignition,
otherwise known as auto-ignition or detonation
2. What are the factors to consider when inspecting unleaded gasoline? Why do we inspect?
Answer.
In a normal spark-ignition engine, the air-fuel mixture is heated due to being compressed and is then triggered to burn rapidly by the spark plug and ignition system. If it is heated or compressed too much, then it will explode when triggered, or even self-ignite before the ignition system sparks. This causes much higher pressures than engine components are designed for and can cause a "knocking" or "pinging" sound. Knocking can cause major engine damage if severe. This is the reason for why we should inspect unleaded gasoline.
The ability of an engine to account for the use of lower octane fuel by retarding spark timing and enriching air-fuel ratio to reduce knock is limited, and engine efficiency is directly and adversely impacted when the use of lower octane gasoline is accommodated, resulting in higher fuel consumption.
Results demonstrated that the use of high octane gasoline consistently enabled advanced gasoline engines to achieve maximum energy savings in the form of approximately 1% better fuel economy per octane number increase.
Not that since there is that much benzene in gasoline. It is regulated, since it is known to cause cancer. So, this may be a bad example, but it is just to illustrate that aromatics in general are probably denser than "regular" hydrocarbons
Higher-octane gasoline resists knock by igniting less readily than lower-octane gasoline
15
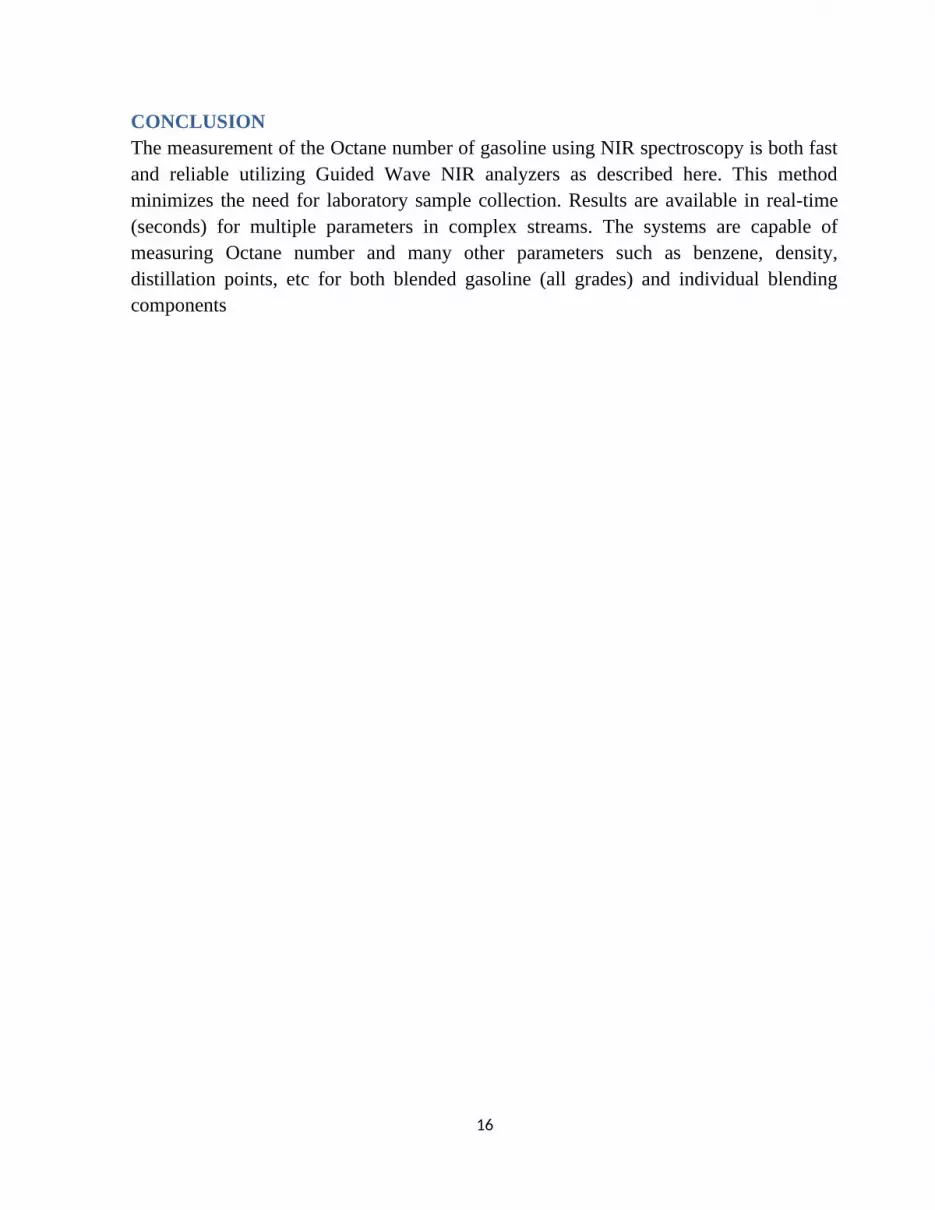
CONCLUSIONThe measurement of the Octane number of gasoline using NIR spectroscopy is both fast and reliable utilizing Guided Wave NIR analyzers as described here. This method minimizes the need for laboratory sample collection. Results are available in real-time (seconds) for multiple parameters in complex streams. The systems are capable of measuring Octane number and many other parameters such as benzene, density, distillation points, etc for both blended gasoline (all grades) and individual blending components
16

RECOMMENDATIONSThe Octane number rating of a gasoline is an indication of how the gasoline will perform under various engine conditions. Two different ratings are included, Research Octane Number (RON) and Motor Octane Number (MON). Finished gasoline must meet certain Octane number specifications. Thus refineries control this parameter during production and must certify that a gasoline meets specification before it is released. In addition, the Octane number of gasoline blending components (reformate, etc) is an important parameter in unit production.
17
REFERENCESBodle, E.S (May,2007). Multivariate pattern recognition of petroleum based accelerants
and fuels.
D. Burns, E. Ciurczak. Handbook of Near-Infrared Analysis. Marcel Dekker,Inc., 1992.
E1655, ASTM. “Standard Practices for Infrared, Multivariate, Quantitative
Analysis.”n.d.
H. Martens, T. Naes. Multivariate Calibration. John Wiley & Sons, 1989.
Kelly, Jeffrey J., et al. “Prediction of gasoline octane numbers from near-infrared
spectral features in the range 660-1215 nm.” Analytical Chemistry (1989): 313-320.
Institute for Internal Combustion Engines and Automotive Engineering, Vienna
University of Technology, Karlsplatz 13, 1040 Vienna, Austria
Department of Mechanical and Aerospace Engineering, University of California−San
Diego, La Jolla, California 92093, United States
18
![Dehalogenation of 1,3-Diiodotricyclo[3.3.0.03,7]octane: Generation of 1,3-Dehydrotricyclo[3.3.0.03,7]octane, a 2,5-Methano-Bridged [2.2.1]Propellane](https://img.pdfslide.net/doc/110x75/6335b14cb5f91cb18a0b83bb/dehalogenation-of-13-diiodotricyclo330037octane-generation-of-13-dehydrotricyclo330037octane.jpg)