Embed Size (px)
Citation preview
An Experimental Investigation of Iso-octane Ignition Phenomena
S. M. Walton, X. He, B. T. Zigler, M. S. Wooldridge and A. Atreya Department of Mechanical Engineering, University of Michigan, 2350 Hayward St.,
Ann Arbor, MI, USA 48109-2125.
Submitted as a Full-Length Article to Combustion and Flame January 27, 2006
Corresponding Author: Stephen M. Walton University of Michigan Department of Mechanical Engineering 2350 Hayward St. Ann Arbor, MI 48109-2125 U.S.A. Phone Number: (734) 647-7387 FAX Number: (734) 647-3170 e-mail Address: [email protected]
1
An Experimental Investigation of Iso-octane Ignition Phenomena
S. M. Walton, X. He, B. T. Zigler, M. S. Wooldridge, and A. Atreya Department of Mechanical Engineering
University of Michigan Ann Arbor, Michigan 48109
Abstract
High-speed digital imaging has been used in rapid compression facility (RCF) studies to
investigate ignition phenomena of iso-octane/air mixtures. Sequential images were captured for
each experiment. The results indicate the existence of two ignition regimes. In one domain,
ignition is rapid, typically less than 76 μsec, and ignition occurs simultaneously throughout the
test volume. In the other domain, reaction fronts form and propagate within the test volume prior
to volumetric ignition. The data span equivalence ratios from φ = 0.20 to 1.98, with inert/O2 gas
ratios from 1.38 to 5.89, pressures from 8.7-16.6 atm and temperatures from 903-1020 K. The
transition between the two regimes is discussed in the context of the mixture composition and
experimental conditions. The analysis shows that the fuel mole fraction is a key parameter
dictating the boundary between the modes of ignition. Below a critical mole fraction limit,
volumetric ignition is observed; above the critical limit, reaction fronts are consistently present
prior to volumetric ignition. The ignition delay times for both ignition regimes are well
reproduced using a homogenous simulation with detailed reaction chemistry, when the state
conditions are modified to account for the presence of the reaction fronts. The results are also
discussed in terms of theory proposed for modes of ignition.
Keywords: ignition, ignition delay time, iso-octane, reaction front, rapid compression facility
2
1. Introduction
Intermediate-temperature, premixed, lean fuel conditions are of considerable importance in
many advanced combustion strategies which focus on simultaneously reducing pollutant
emissions and increasing combustion efficiencies, such as homogeneous charge compression
ignition (HCCI) engines [1] and integrated gasification combined cycle (IGCC) power plants [2].
The reaction kinetics often play a significant role on the combustion characteristics that control
performance of the devices based on lean premixed technologies. As a consequence, there have
been significant efforts to investigate the chemical kinetics of fuel/air mixtures at conditions
relevant to these combustion applications (e.g. [3,4,5,6,7,8,9]). The uniform high-temperature,
high-pressure conditions created by shock tubes and rapid compression facilities (RCF) make
these apparatuses ideal for isolating the reaction chemistry and quantifying the ignition behavior
of the fuel/air mixtures over a broad parametric space, including equivalence ratio and dilution.
Ignition data are also critical as a means to validate and refine detailed, skeletal, and reduced
chemical reaction mechanisms.
During the course of several fundamental experimental [10,11,12,13,14,15] and
computational [16,17] ignition studies of hydrocarbon and hydrogen fuels, spatially-resolved
phenomena have been observed that indicate the existence of multiple ignition regimes in
addition to volumetric ignition. For example, during recent RCF ignition studies of iso-octane
mixtures [3,4], the presence of reaction fronts prior to volumetric ignition was observed at
certain conditions, while volumetric ignition with no spatially-resolved features occurred at other
conditions. Gu et al proposed 5 regimes of ignition or propagation modes in computational
ignition studies when hot-spots were introduced into otherwise homogeneous mixtures of
hydrogen and hydrogen and carbon monoxide with air [16]. Gu et al. proposed that the regimes

3
are delineated by the local temperature gradient, the critical temperature gradient, and the
acoustic velocity of the test gas mixture. Similarly, Sankaran et al. identified two ignition
regimes (spontaneous explosion and flame-like deflagration) in their computational study of
ignition of hydrogen/air mixtures in turbulent scalar fields of temperature gradients [17].
Studies of engines operating in HCCI mode have also indicated the presence of reaction
fronts at conditions below the lean flammability limit, where flames are not considered self-
sustaining [18,19,20,21]. The presence of reaction fronts at lean conditions can have critical
effects on ignition timing and pollutant emissions [18,19] and on safety considerations if
traditional flammability limits, such as the trends developed by Zabetakis [22], are applied.
The objective of the current work was to identify and quantify the characteristics and modes
of ignition of lean, intermediate-temperature iso-octane/air mixtures and to provide a quantitative
understanding of the chemical and physical mechanisms that are important in the ignition
regimes. The technical approach used was to measure the ignition delay times for iso-octane
mixtures over a broad experimental domain using a rapid compression facility and
simultaneously use high-speed digital imaging to capture the ignition phenomena. The results
are discussed in terms of proposed reaction chemistry and ignition theory.
2. Experimental Approach
The rapid compression facility
All experiments were conducted in the well-controlled and well-characterized environment of
the University of Michigan Rapid Compression Facility (UM RCF). The ignition behavior of
iso-octane/air mixtures was investigated in terms of several parameters including: equivalence
ratio, oxygen concentration, fuel concentration, temperature, and pressure. High-speed digital

4
imaging, and pressure and emission time-histories were used to characterize the ignition
experiments. A detailed description of the UM RCF, the operating procedure, and the results of
benchmark experimental studies characterizing performance can be found in Donovan et al. [23],
He et al. [3,4] and Donovan [24].
Briefly, the UM RCF consists of five major components: the driver section, the driven section,
the test manifold, the sabot (free piston), and the hydraulic control valve assembly. The driver
section (154 mm i.d.) contains pressurized air and is separated from the driven section (2.74 m
long, 101.2 mm i.d.) via the fast-acting hydraulic globe valve assembly and a scored sheet of
plastic (0.05 mm, Mylar®). The driven section is a long stainless steel tube with a honed and
chromed interior surface which is connected to the test manifold. The sabot has a replaceable
nosecone which is made of ultra-high molecular weight polyethylene. The body of the sabot is
solid (Delrin®) and contains a copper counterweight to balance the nosecone. U-ring seals
(virgin Teflon® with stainless steel radial springs) eliminate gas blow-by past the sabot.
A schematic of the test manifold and imaging system is shown in Fig. 1. The four main
components of the test manifold are the convergent section, the extension section, the
instrumented test section, and a transparent end wall. The stainless steel convergent section
bridges the 101.2 mm bore of the driven section to the 50.8 mm bore of the remainder of the test
manifold components. The total length of the extension section is variable by design (through
combinations of subcomponents) to yield different compression ratios. The test section has a
length of 50.6 mm, and is equipped with two optical ports for laser access, a pressure transducer
port, and two additional instrumentation ports. For the current study, the test section was
instrumented with a piezoelectric transducer (Kistler 6041AX4) and charge amplifier (Kistler
5010B) for pressure measurements. The end wall seals the test manifold and allows optical
5
access to the test volume.
Two end walls, quartz or polycarbonate, were used to provide optical access to the test
manifold. The quartz end wall (with a diameter of 78 mm and a thickness of 45.25 mm) has a
double layer anti-reflective coating on both faces. The coatings are optimized for transmission
of visible wavelengths and the window has excellent reflection- and glare-reduction properties.
The polycarbonate (Lexan®) end walls are polished (140 × 140 mm square with a thickness of
12.5 mm) and have no coatings. Peak transmission for the polycarbonate end walls occurs at
visible wavelengths. When the polycarbonate windows were used, the windows were replaced
regularly (every 5-10 experiments) in order to maintain high image quality.
The test gas mixtures were made in a dedicated mixing tank, and the mixture composition was
determined by measurement of the relative partial pressures of the gas-phase reactants. The
specific heats of the mixtures were controlled through the balance of argon, carbon dioxide, and
nitrogen as inert gas diluents. The specific heat of the mixture was adjusted and the
experimental compression ratios were varied to achieve the targeted temperatures and pressures.
Prior to each experiment, the sabot is placed at the upstream end of the driven section,
downstream of the hydraulic valve assembly and the scored plastic sheet. The RCF is evacuated.
The driven section and test manifold are then charged with the test gas mixture, and the driver
section is charged with high-pressure air. The hydraulic valve is opened, breaking the plastic
sheet, and launching the sabot down the length of the driven section. The test gas mixture is
compressed ahead of the sabot. The sabot comes to rest in the test manifold when the nosecone
seals (via an annular interference fit) with the extension section. The core region of the test
gases is sealed in the test manifold while the cooler gases near the walls are sealed in the
shoulder region of the convergent section.
6
High-speed imaging details
The large size of the quartz and polycarbonate end walls allows the entire test volume to be
imaged using a high-speed color digital video camera (Vision Research, Phantom V7.1, 800 ×
600 pixel SR-CMOS 48 bit color array, capable of 150 kHz at reduced spatial resolution). A fast
50 mm lens (f/0.95 Navitar TV Lens) and c-mount extension tube were used with the camera to
optimize the capture of available light emission.
Each time the camera settings were changed (e.g. different experimental conditions, frame
rate or spatial resolution), the camera sensor array was recalibrated. The camera was first
aligned with the test manifold approximately 40 cm from end wall, and the camera was focused
on a plane inside the test section, 2 cm from the end wall. To maximize the capture of the
emission from the test section and limit the depth of field, the wide aperture lens was used in the
fully open position. The camera frame rate and spatial resolution were selected at this time. The
camera sensor was then calibrated using a black reference (where the camera lens was covered)
and the zero signal level of each pixel in the CMOS array was assigned.
For this study, the high-speed digital camera was used to acquire continuous full-frame video
sequences of the ignition experiments at speeds from 10,000 to 60,000 frames per second (fps).
The frame rate has an inverse relation to the total spatial resolution, and at 26,000 fps (the typical
frame rate used), the spatial resolution was maintained at the maximum allowable setting of 256
× 256 pixels. These settings resulted in each frame corresponding to 38 µsec, and each pixel in
the CMOS array imaging focused light from a volume with a height × width × depth of
approximately 198 µm × 198 µm × 2 mm.
The camera was triggered by a circuit designed to output a pulse to the trigger input of the
7
camera. The signal to the triggering circuit was supplied by an unamplified photo-detector
(Hamamatsu S1787-12) located on the driven section of the RCF. Emission from a laser diode
(TIM-201-3, 3 mW, 650 nm) was directed onto the active element of the photo-detector such that
the laser emission was orthogonal to the path of the sabot. When the sabot passed the laser
diode, the change in signal from the photo-detector triggered the camera. Using this
arrangement, images were acquired throughout the compression and ignition processes.
3. Results
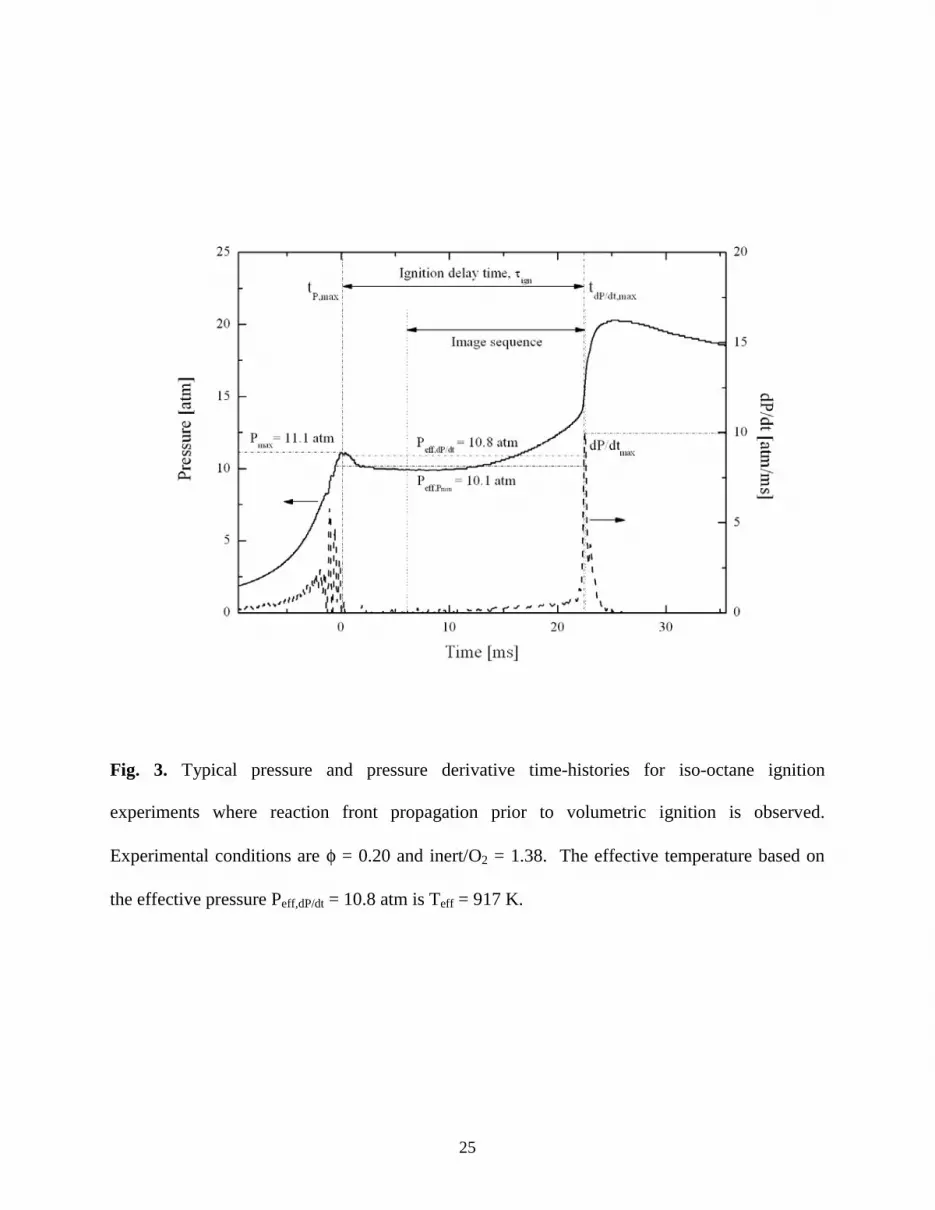
Typical pressure and pressure derivative data for RCF iso-octane ignition experiments are
shown in Figs. 2 and 3. Results for conditions where volumetric ignition occurred and where
reaction fronts preceded volumetric ignition are presented in each figure, respectively. In both
data sets, the initial pressure rise is due to compression of the test gas mixture ahead of the sabot.
At the end of compression, the pressure reaches the first maximum. This time is set as t = 0 sec
and is labeled Pmax in the figures. The pressure then decreases slightly due to cooling losses to
the test volume walls. After a delay period, the mixture auto-ignites resulting in a rapid increase
in pressure.
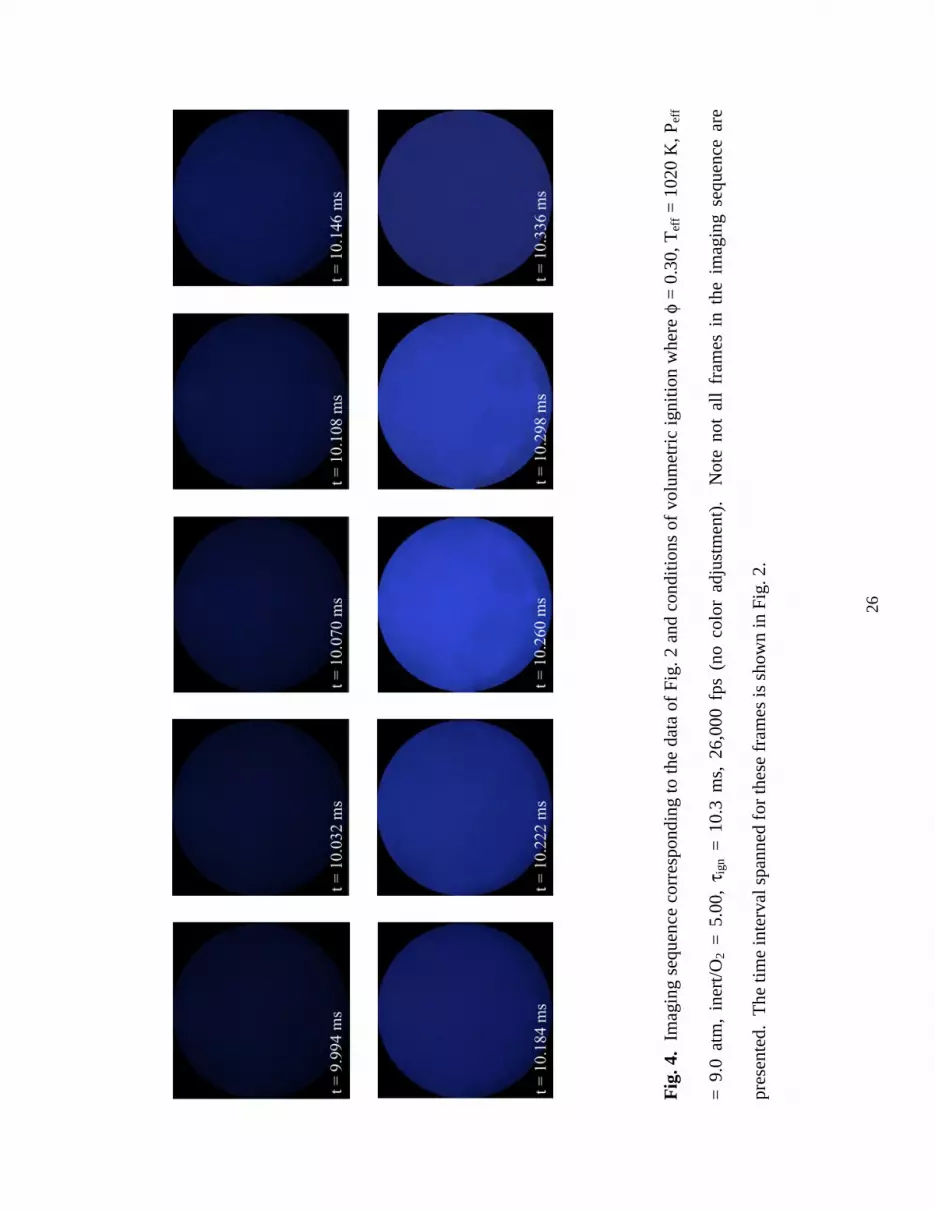
Figure 4 presents a selection of the frames from the imaging sequence corresponding to the
volumetric ignition data of Fig. 2. As seen in Fig. 4, blue emission occurred uniformly
throughout the test volume with increasing intensity until maximum emission levels were
observed at t =10.260 ms. No structures or spatial non-uniformities were observed in the
emission images for this condition, and ignition occurred simultaneously throughout the test
volume. The peak in the emission intensity occurred at the same time as the peak in the pressure
derivative.

8
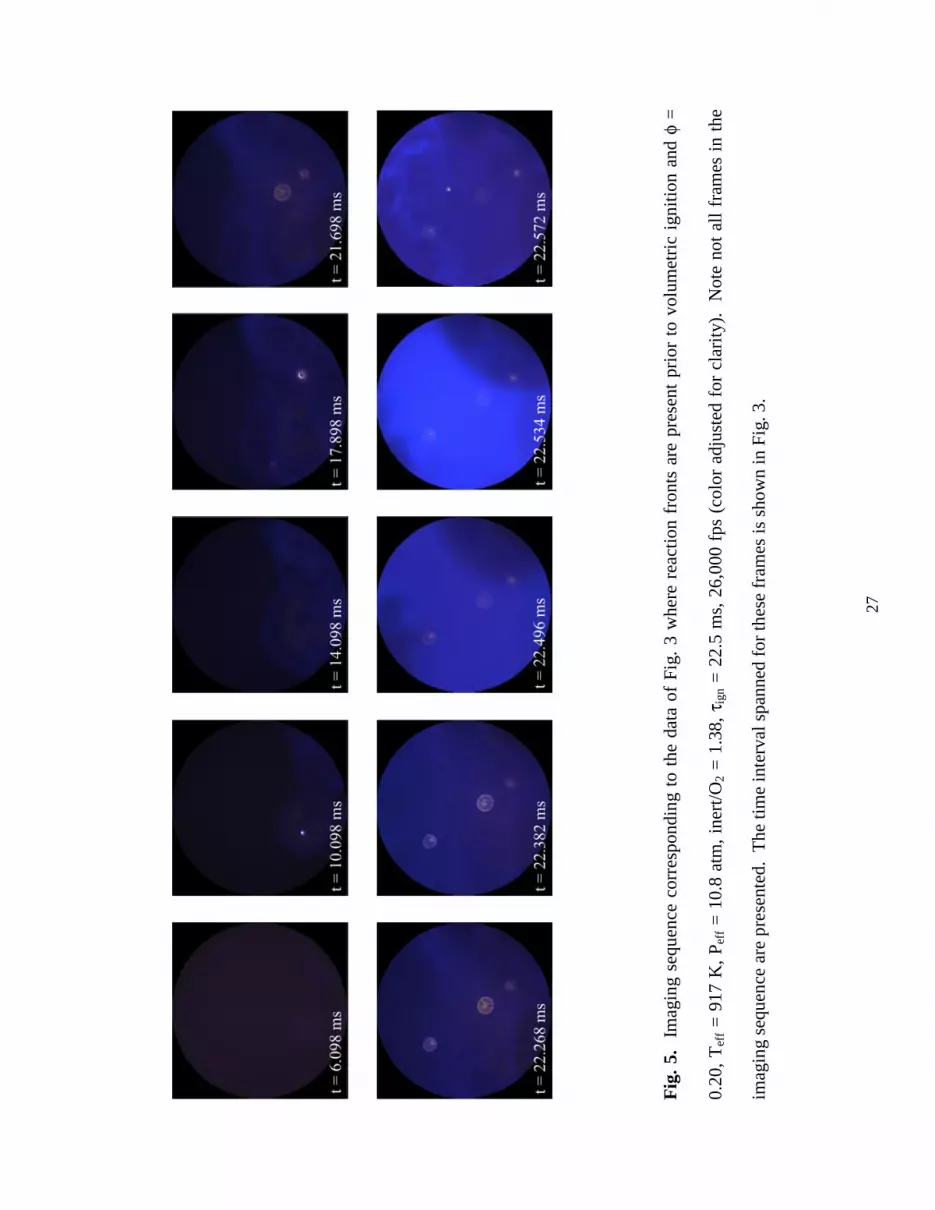
Frames from the imaging sequence corresponding to the pressure data of Fig. 3 are shown in
Fig. 5. The images show the presence of discrete regions of reaction in the test volume. The
reaction fronts are observed early in the image sequence (t = 6.098 ms), and they propagate
throughout the test volume until volumetric ignition is recorded at t = 22.5 ms. The effect of the
propagation of the discrete zones of reaction is apparent in the pressure time history. The
pressure data show a slow increase at times consistent with the formation and propagation of the
reaction fronts, prior to the rapid increase in pressure associated with volumetric ignition (see
Fig. 3). The expansion of the reaction fronts serves to further compress the unignited test gas
mixture and consequently the pressure and temperature in the test section gradually increase
prior to volumetric ignition. On the contrary, the pressure data corresponding to volumetric
ignition (Fig. 2) show little pressure rise during the delay period prior to the ignition.
In previous UM RCF studies of iso-octane ignition [3,4], the effective pressure (Peff) for each
experiment was defined as the time-integrated average pressure from the maximum pressure
(Pmax) due to compression to the minimum pressure (Pmin) due to cooling after compression, but
before ignition, i.e.
∫ ⋅−
= minp
maxP
t t
maxPminPmin,eff dtP
)tt(
1P (1)
If this definition is applied to the conditions where reaction fronts were present, the pressure at
the time of volumetric ignition is underestimated. In order to account for the effects of the
reaction fronts, the effective pressure was defined for each experiment in this work as the time-
integrated pressure between the point of maximum pressure due to compression (Pmax) and the
point of maximum rate of pressure rise (dP/dtmax), or
∫ ⋅−
= maxdt/dP
maxP
tt
maxPmaxdt/dPdt/dP,eff dtP
)tt(
1P (2)
9
Equation (2) has little effect versus Eq. (1) on Peff determined for the conditions where only
volumetric ignition was observed. For example, for the data presented in Fig. 2, Peff,Pmin is equal
to Peff,dP,dt. More generally, the average difference between Peff defined using Eqs. (1) and (2)
was less than 0.5% for experiments where no reaction fronts were observed. The average
difference in Peff using Eqs. (1) and (2) for conditions where reaction fronts were present was
less than 7%.
The effective temperature for each experiment was determined as in previous UM RCF
studies [3] using the effective pressure and by numerical integration of the isentropic relation:
∫ ⎟⎟⎠
⎞⎜⎜⎝
⎛=
−γγ
eff
o
T T
o
eff
P
PlnTlnd
1 (3)
where Po is the charge pressure, To is the initial temperature (typically 298 K), and γ is the
temperature-dependent ratio of the specific heats of the unreacted test gas mixture, which is
determined using the NASA thermodynamic data base [25]. The average difference in Teff due
to the definitions of Eqs. (1) and (2) for Peff is 0.1% when reaction fronts were not present and
1.5% when reaction fronts were present.
For each experiment, the ignition delay time (τign) was determined using the pressure time-
history. In previous UM RCF studies of iso-octane mixtures [3,4], the ignition delay time was
defined as follows. The end of compression was designated as the first time the pressure reached
Peff due to compression, using Peff defined by Eq. (1). The portion of the pressure trace which
corresponded to the sharp pressure rise due to ignition was linearly extrapolated. The relatively
constant portion of the pressure trace prior to ignition was also linearly extrapolated. The
intersection of the two linear fits was designated the start of ignition. The ignition delay time
was defined as the difference between the end of compression and the start of ignition.
10
When reaction fronts are present, this definition for τign is not feasible. The gradual pressure
rise during the ignition delay period complicates linear extrapolation of the pressure data.
Additionally, Peff defined using Eq. (2) leads to pressures higher than Pmax for some conditions.
Consequently, in this work the ignition delay time was defined as the time between Pmax and
dP/dtmax. The definition for τign is illustrated in Figs. 2 and 3. When compared with the previous
data for τign, the new definition for τign yields an average difference of ±2%.
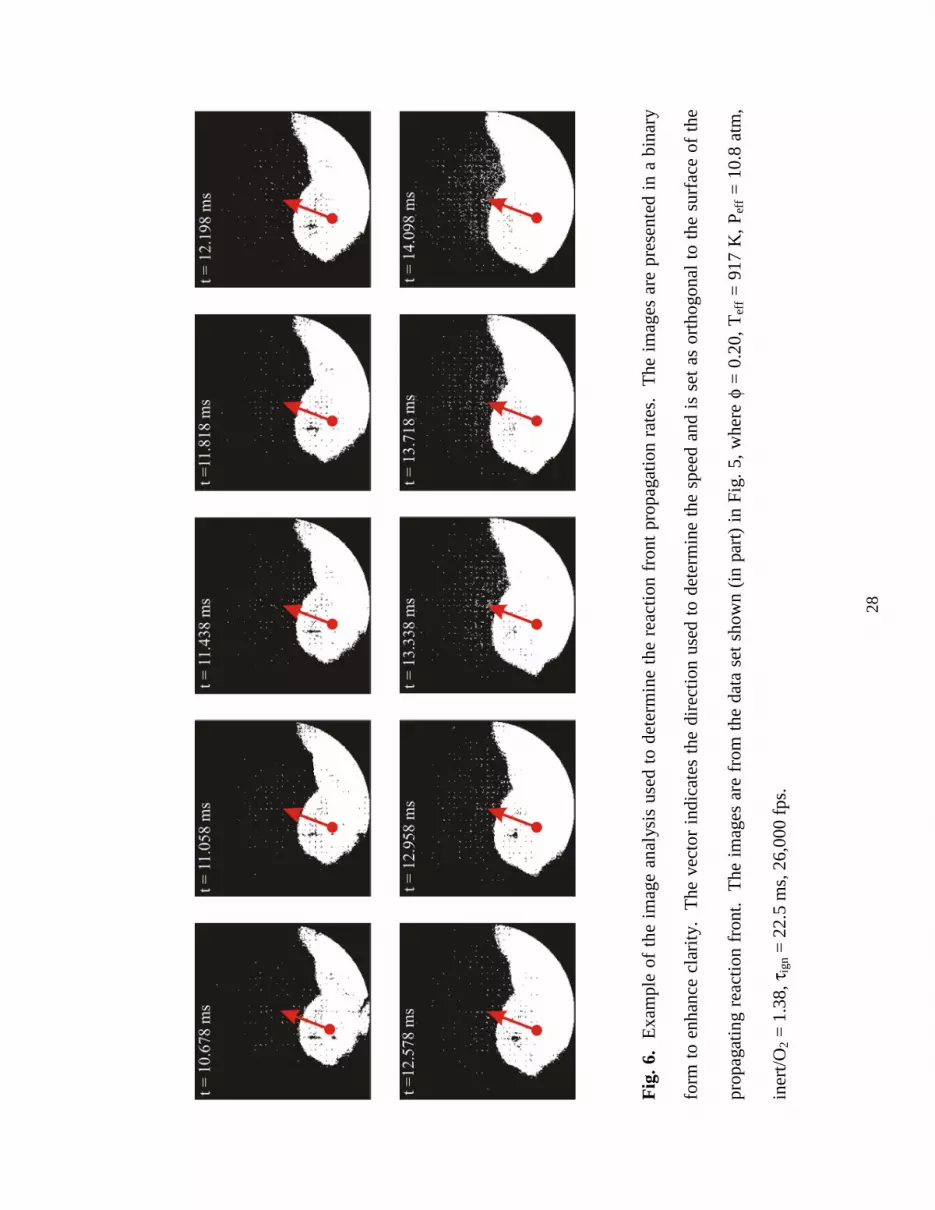
For each experiment where reaction fronts were observed, the rate of propagation of the
reaction fronts, U [m/s], was determined from the image sequences, as shown schematically in
Fig. 6. Note that in order to make the presence and propagation of the reaction fronts clearer,
Fig. 6 presents data from the same imaging file as that of Fig. 5 where a threshold filter has been
applied to create binary images. The propagation rates were determined by tracking features on
the reaction surface through time. The result is an estimate for the propagation rate in the
direction normal to the surface of the reaction front. The image analysis indicated that the
highest propagation rates of the reaction fronts were associated with propagation into the
unconstrained environment towards the center of the test volume (as opposed to propagation into
gases bounded by the test chamber walls). Only the maximum velocities are reported here.
The general features were the same for each of the categories of ignition. For conditions
where reaction fronts were observed, more than one reaction front was typically present.
Reaction fronts did not consistently initiate in the same location of the test volume, i.e. in some
cases the fronts started in the center or top of the test volume as compared to the data of Fig. 5.
For conditions where only volumetric ignition was observed, ignition (as indicated by
homogeneous blue emission) was rapid and typically occurred in less than 76 μsec.
A summary of the iso-octane ignition data is presented in Table 1. The table shows the range

11
of conditions and mixture compositions examined, with equivalence ratios varying from φ = 0.2
to 1.98, inert gas/O2 ratios varying from 1.38 to 5.89, pressures varying from Peff = 8.7-16.6 atm
(determined using Eq. (2)), and temperatures varying from Teff = 903-1020 K. The imaging and
pressure data for each experiment were designated as one of the two categories of ignition
described above: volumetric ignition or reaction front propagation/volumetric ignition. The
volumetric ignition data are identified by a “V” designation in the table.
The ignition delay time determined for each experiment is also provided in Table 1, along
with the maximum propagation rate for each experiment where reaction fronts were present.
Calculated reaction front velocities ranged from 0.5 to 13.7 m/s, much faster than laminar flame
speeds for iso-octane at elevated temperatures and pressures, and far below the speed of sound
(a, based on the unreacted gas composition at Teff and Peff) for the mixtures, which are provided
in Table 1.
In order to identify trends in the τign data, regression analysis is required to isolate the effects
of each parameter of interest, e.g. temperature. In a previous UM RCF study of (only)
volumetric ignition of iso-octane mixtures [3], regression analysis yielded the following best-fit
(R2 value of 0.98) correlation for the ignition delay time data:
)TR/33700exp(P103.1 ]K/mol/cal[41.1
O77.005.14
ign 2
−−−− χφ×=τ (4)
where P is pressure [atm], T is temperature [K], φ is the equivalence ratio, χO2 is the oxygen
mole percent, and τign is the ignition delay time [ms]. Using Eq. (4) to normalize the data as
necessary, a summary of the ignition delay time measurements from the current study is
presented in Fig. 7 as a function of inverse temperature.
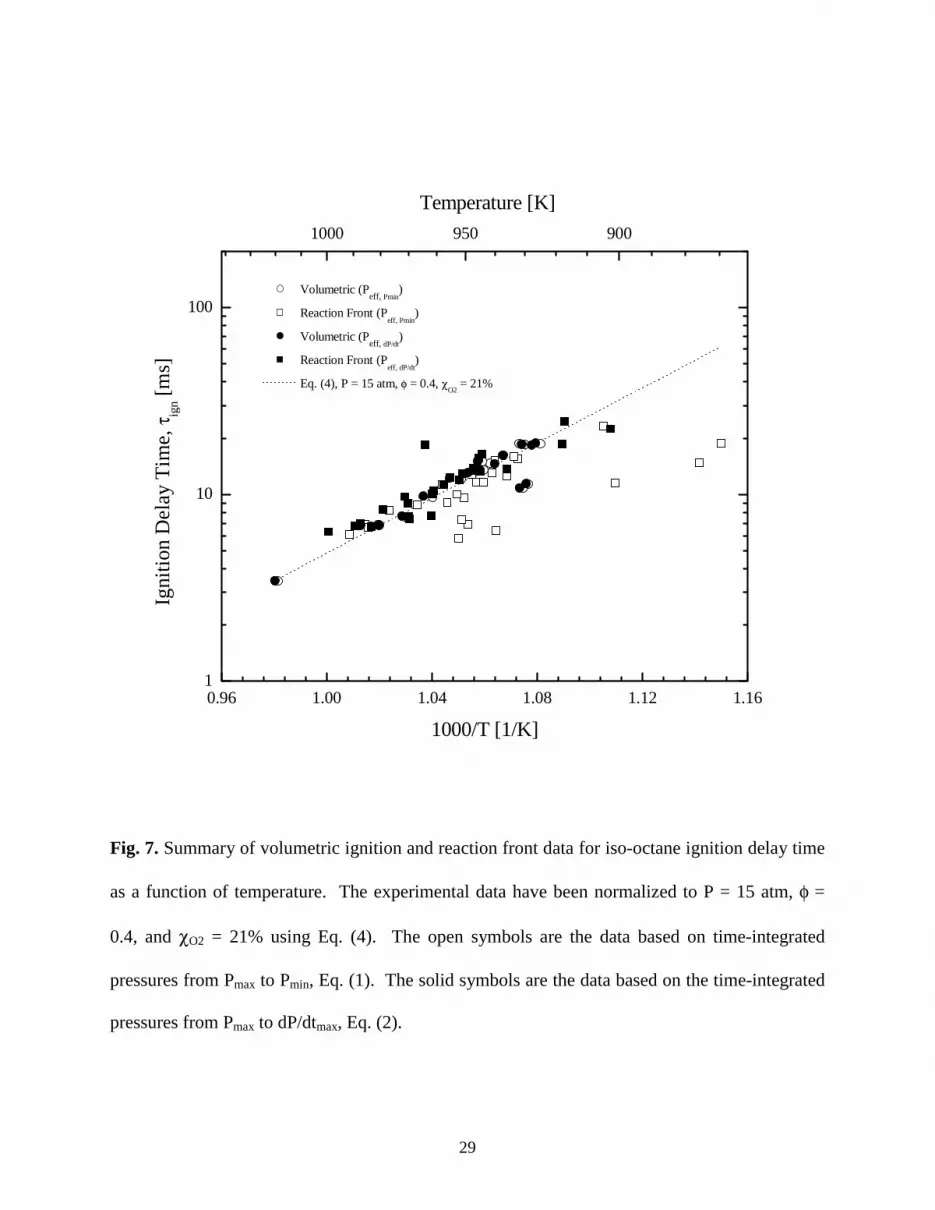
Figure 7 provides a comparison of the data using the definitions for effective pressure based
on Eqs. (1) and (2). As noted earlier and demonstrated in Fig. 7, the data where only volumetric
12
ignition was observed are relatively unaffected by the definition for Peff. However, when Eq. (1)
is used to define Peff for the reaction front data, the data are highly scattered and show poor
agreement with the volumetric ignition correlation. When the effects of the reaction fronts on
Peff are considered, using the larger integrated time domain of Eq. (2), there is excellent
agreement between the data from the two ignition regimes, as seen in Fig. 7.
Due to the revised definitions for τign and Peff, differences in the range of conditions studied in
the work by He et al. [3] and the current work, and the two modes of ignition considered here,
the need for a new correlation for τign was investigated. Regression analysis was conducted on
the complete τign data set of Table 1, using exclusively Peff based on Eq. (2). Multiple forms to
the expression were considered yielding similar qualities of fit. For consistency, the same form
as Eq. (4) is presented here, with a best-fit R2 value of 0.92.
)TR/27300exp(P108.2 ]K/mol/cal[14.1
O79.025.13
ign 2
−−−− χφ×=τ (5)
Although the fit parameters differ from those of Eq. (4), the new correlation yields only slight
changes in the predicted values for τign, as seen in Figs. 8-11.
Summaries of the effects of temperature, pressure, equivalence ratio, and oxygen mole
fraction on τign are presented in Figs. 8-11, respectively, using Peff defined based on Eq. (2), and
where the data have been normalized as necessary using Eq. (5). Equation (5) is provided for
reference in each of the figures as the solid line. The volumetric and reaction front τign data are
in excellent agreement with each other for each of the parameters considered, and there are no
systematic deviations in the trends indicated by the two ignition regimes. The recommended
uncertainty in the ignition delay time measurements (presented as the error bars in Fig. 8) is
±13% and is based on the standard deviation of τign relative to the correlation provided in Eq. (5).
13
Trends in the rate of propagation of the reaction fronts as a function of the state conditions and
the mixture properties were also investigated. The analysis indicated no strong correlation with
temperature, pressure, equivalence ratio, or oxygen mole fraction, and even extremely fuel lean
mixtures were capable of sustaining a reaction front. However, there was a strong dependence of
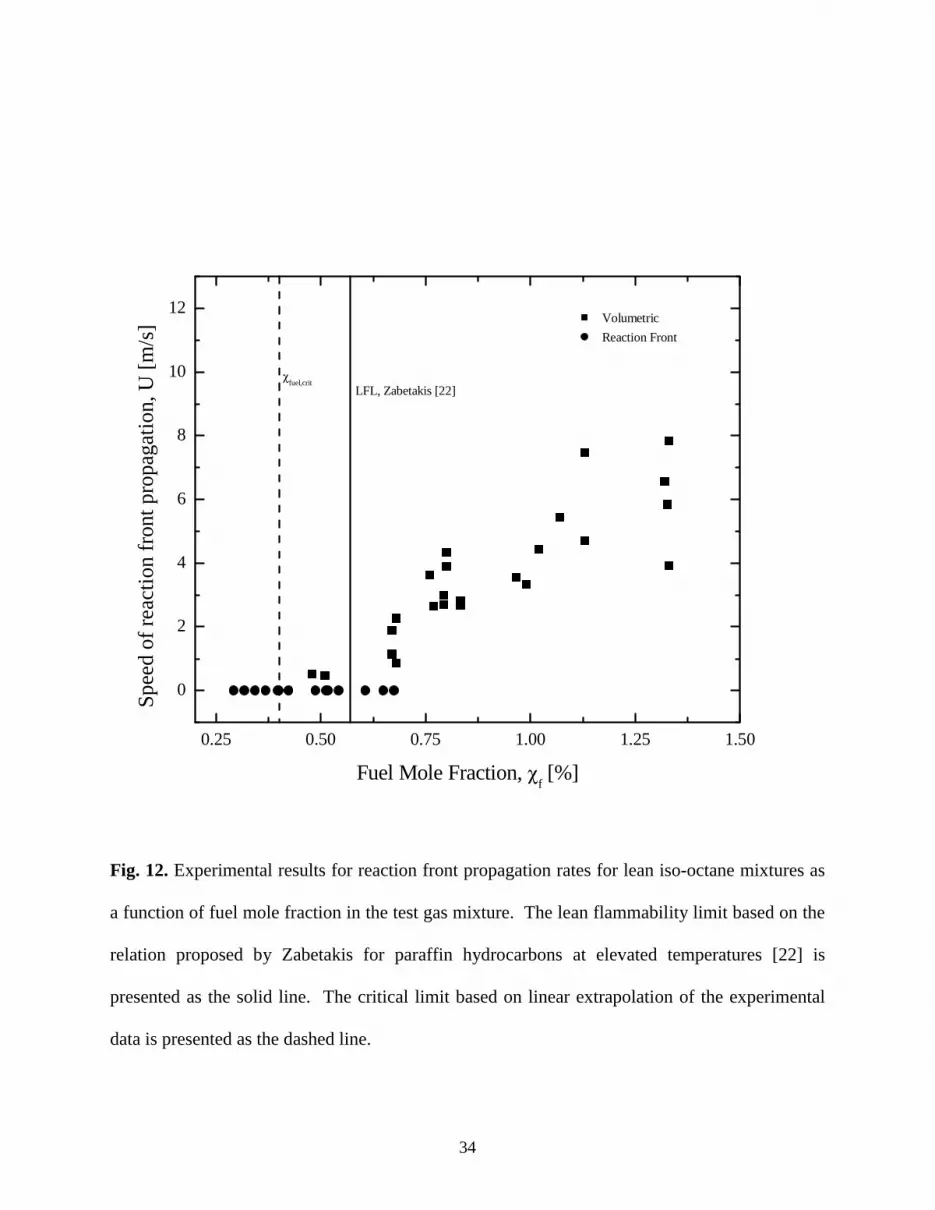
U on fuel mole fraction (χfuel) as seen in Fig. 12, where U increases nearly linearly with
increasing χfuel. When compared with conditions where only volumetric ignition was observed,
the data of Fig. 12 imply the existence of a critical fuel mole fraction limit, χfuel,crit, above which
reaction fronts are self-sustaining, and below which only volumetric ignition is observed. Using
a linear fit to the U data and extrapolating to U = 0 m/s, yields a value for χfuel,crit of 0.4.
4. Discussion
The experimental data for τign were compared with predictions using a single-zone model and
the detailed chemical reaction mechanism developed for iso-octane by Curran et al. [26]. For the
modeling, the AURORA™/CHEMKIN™ 4.0 suite of programs [27] was used assuming a
homogeneous, adiabatic, constant volume system. Using the initial conditions of the unreacted
mixture composition, Peff, and Teff, the corresponding predictions for ignition delay time are
provided in Table 1 as τpred. The trends based on the mechanism by Curran et al. are also
provided for comparison in Figs. 8-11. As seen in Table 1 and Figs. 8-11, the predictions for τign
are in excellent agreement with the experimental data (within an average of 11% for the
volumetric ignition data, and within an average of 15% for the reaction front data). The ability
to accurately reproduce τign for the conditions where reaction fronts were observed using a
homogeneous model is an important finding, which indicates the primary effects of the reaction
fronts on the unignited reactants is compression. Transport effects, which are localized and are
14
not captured by the single-zone model used, do not appear to significantly influence τign.
Ignition theory supports the existence of regimes where reaction fronts can be sustained prior
to volumetric ignition. The classification of ignition regimes between thermal explosion and
detonations in the presence of non-uniform initial conditions was first proposed by Zeldovich
[28]. He describes the regimes based on the relative values of the laminar flame speed (ul), the
rate of spontaneous propagation of the reaction fronts (U in the current work, usp in [28]), the
speed of sound, and the rate of normal detonation (uJ). The results of the current work are in the
3rd category described by Zeldovich, where ul < U << a < uJ. Zeldovich stated that in this
regime, the propagation of reaction fronts is slow such that “the pressure has sufficient time to
equalize,” and the reaction fronts do not depend on the “heat conductivity” of the mixture, which
is consistent with the observations made here.
It is important to note the formation of the reaction fronts are not due to cool flame or
negative-temperature coefficient (NTC) chemistry. Iso-octane does not exhibit NTC behavior at
the pressures and temperatures considered here [4]. Additionally, when NTC behavior is
observed, the effect on the ignition delay time for iso-octane is weak. Lastly, model studies
using the reaction mechanism by Curran et al. [26] confirm that accelerated ignition due to low
temperature chemistry does not occur at the range of conditions encountered during the RCF
experiments conducted in this study.
The initiation of the reaction fronts is likely due to small thermal non-uniformities in the test
section, as proposed by Zeldovich [28]. Characterization studies of the UM RCF indicate the
variability in the temperature field in the core region is typically less than 10 K [23]. The extent
of the thermal inhomogeneities is primarily determined by the motion of the fluid off the nose-
cone of the sabot and the mixing of the cooler fluid near the wall. Consequently, the temperature
15
gradients that exist in each experiment are expected to be of the same magnitude when the sabot
velocity profiles are similar, as they were in this study. However, the reaction fronts are only
self-sustaining at specific compositions. Thus, the thermal gradients may be necessary for
initiation, but they are not sufficient to sustain the propagation of the reaction fronts.
Gu et al. [16] have shown in studies of reaction front propagation in H2 and CO mixtures that
very small temperature gradients, e.g. ΔT = 0.17 – 1.7 K, from hot spots ranging from 1 to 3 mm
in diameter are sufficient to have marked impact on the mode of reaction front propagation. The
authors defined the dimensionless temperature gradient, ξ:
ξ = a (∂To/∂r) (∂τign/∂To) (6)
as a means to quantify the boundaries between ignition regimes. In Eq. (6), To is the temperature
of the surroundings of the hot spot and r is radius of the hot spot. Values for ξ for the current
work were estimated using the data of Table 1, the temperature derivative for τign based on Eq.
(5) and assuming a 10 K gradient associated with a 3 mm hot spot. The values for ξ did not
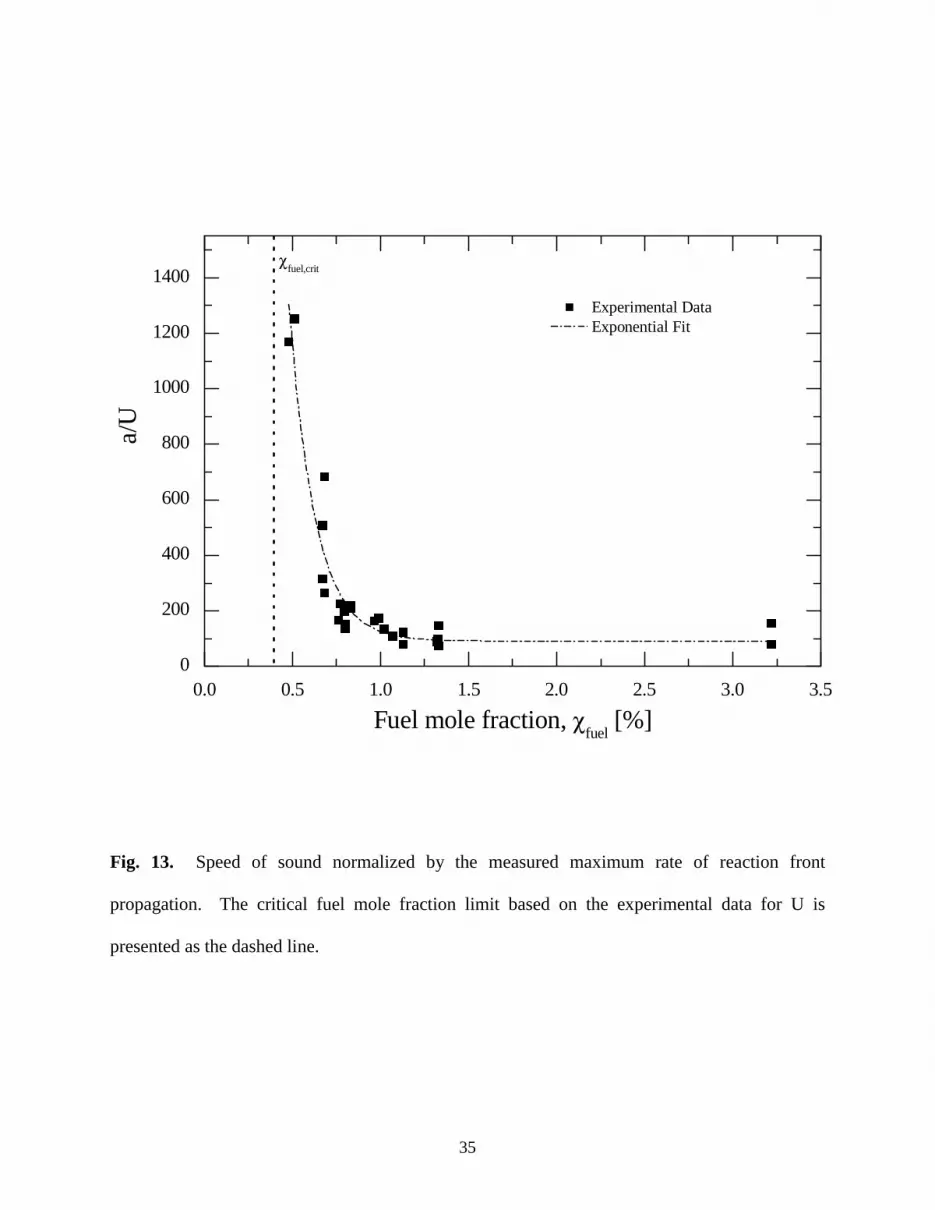
indicate a clear limit between the ignition regimes. However, the dimensionless ratio of the
speed of sound to the measured maximum rate of propagation (a/U) supports the proposition of a
limit based on fuel mole fraction. Figure 13 presents a/U as a function of χfuel for the
experiments where reaction fronts were observed. At low values of χfuel, the ratio exponentially
approaches a limit consistent with the value χfuel,crit = 0.4 that was estimated based on the data of
Fig. 12.
It is interesting to compare the critical limit for fuel mole fraction determined in this work
with the correlations for flammability limits developed by Zabetakis [22]. Zabatakis surveyed a
large body of experimental flammability data and compiled the results as a function of fuel type.
For paraffin hydrocarbon fuels such as iso-octane, he proposed that the lean flammability limit
16
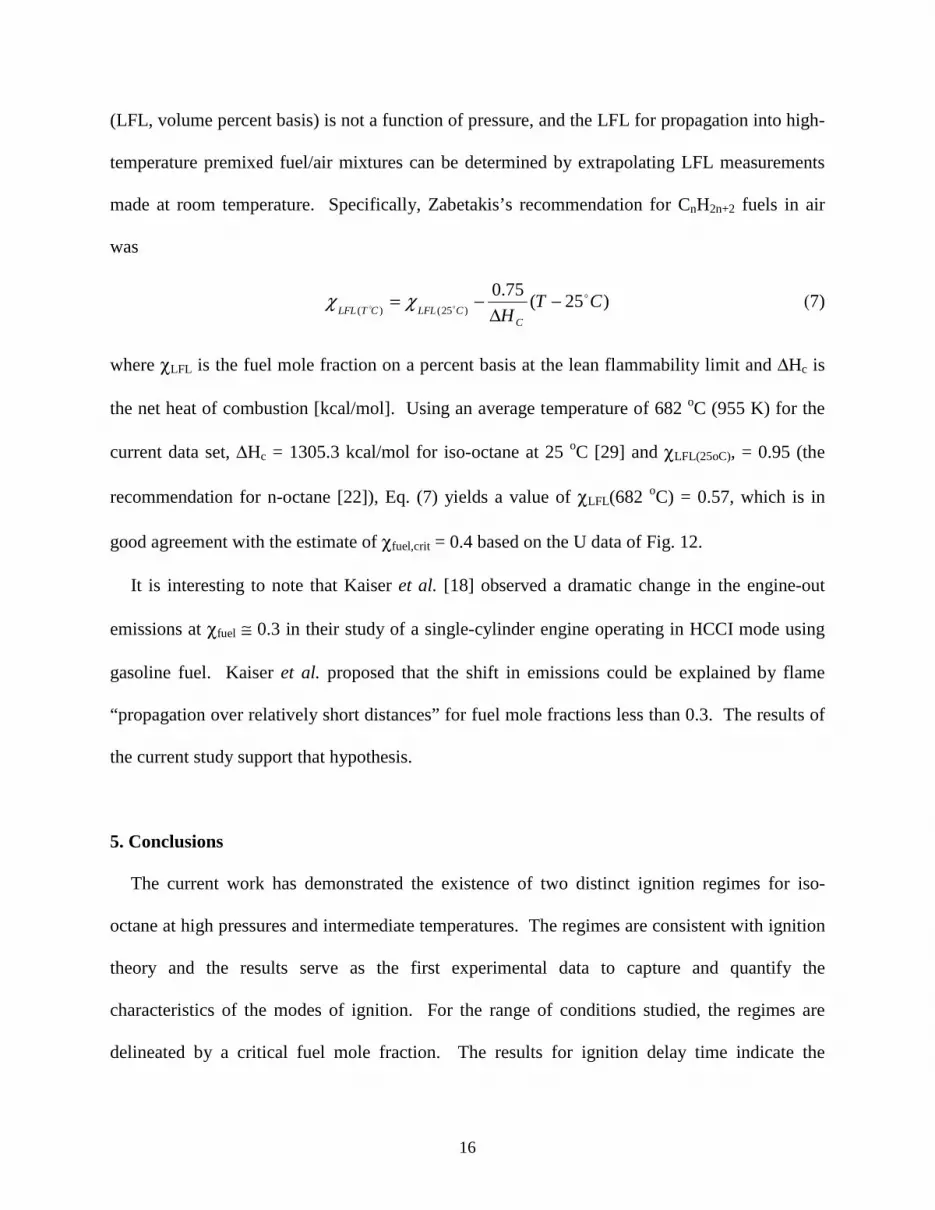
(LFL, volume percent basis) is not a function of pressure, and the LFL for propagation into high-
temperature premixed fuel/air mixtures can be determined by extrapolating LFL measurements
made at room temperature. Specifically, Zabetakis’s recommendation for CnH2n+2 fuels in air
was
)25(75.0
)25()(CT
H CCLFLCTLFL
ooo −
Δ−= χχ (7)
where χLFL is the fuel mole fraction on a percent basis at the lean flammability limit and ΔHc is
the net heat of combustion [kcal/mol]. Using an average temperature of 682 oC (955 K) for the
current data set, ΔHc = 1305.3 kcal/mol for iso-octane at 25 oC [29] and χLFL(25oC), = 0.95 (the
recommendation for n-octane [22]), Eq. (7) yields a value of χLFL(682 oC) = 0.57, which is in
good agreement with the estimate of χfuel,crit = 0.4 based on the U data of Fig. 12.
It is interesting to note that Kaiser et al. [18] observed a dramatic change in the engine-out
emissions at χfuel ≅ 0.3 in their study of a single-cylinder engine operating in HCCI mode using
gasoline fuel. Kaiser et al. proposed that the shift in emissions could be explained by flame
“propagation over relatively short distances” for fuel mole fractions less than 0.3. The results of
the current study support that hypothesis.
5. Conclusions
The current work has demonstrated the existence of two distinct ignition regimes for iso-
octane at high pressures and intermediate temperatures. The regimes are consistent with ignition
theory and the results serve as the first experimental data to capture and quantify the
characteristics of the modes of ignition. For the range of conditions studied, the regimes are
delineated by a critical fuel mole fraction. The results for ignition delay time indicate the
17
primary effect of the reaction fronts is to increase the pressure in the test chamber and thereby
accelerate volumetric ignition. A homogeneous model and the reaction mechanism for iso-
octane by Curran et al. [26] yields predictions for τign that are in excellent agreement with the
experimental data. As many advanced combustion methods utilize lean, low-temperature
premixed strategies at similar conditions to those studied in the current work, the data provide
both valuable insight into anticipated ignition performance as well as quantitative data critical to
validating and refining ignition theory.
Acknowledgements
The authors would like to acknowledge the generous support of the Department of Energy
through the University of Michigan HCCI Consortium.

18
Table 1. Summary of experimental conditions and results. The mixture composition is provided on a mole basis. The equivalence ratio is based on iso-octane to O2 molar ratios. Experiments where only volumetric ignition was observed are denoted V.
Test gas compositiona Ignition delay time [ms] φ
Inert /O2 C8H18% O2% N2% Ar%
Peff b
[atm] Teff [K]
U [m/s]
ac [m/s]
τign τregd τpred
e
0.20 1.38 0.7 41.8 57.5 0.0 10.8 917 1.1 578 22.5 20.6 26.2
0.30 4.00 0.5 19.9 70.8 8.8 10.7 958 0.5 597 21.6 19.7 17.8
0.30 3.65 0.5 21.4 75.2 2.8 10.8 947 0.5 596 23.9 21.7 20.3
0.30 1.39 1.0 41.4 51.2 6.4 12.1 936 3.3 576 8.3 9.4 11.7
0.40 3.76 0.7 20.9 71.2 7.3 11.0 951 1.9 593 17.9 16.2 15.0
0.40 3.01 0.8 24.8 62.7 11.7 10.9 945 2.7 585 17.3 14.4 13.9
0.40 3.01 0.8 24.8 62.7 11.7 11.8 971 3.0 592 9.9 8.2 8.1
0.40 2.28 1.0 30.2 51.0 17.8 11.8 964 3.6 582 14.2 7.0 7.4
0.50 3.76 0.8 20.8 66.1 12.3 10.3 944 2.7 586 20.8 16.7 14.8
0.50 3.76 0.8 20.8 66.1 12.3 11.0 955 2.8 589 14.5 12.6 11.5
0.50 2.50 1.1 28.2 48.3 22.4 11.2 947 4.7 572 10.1 9.5 9.4
0.50 2.50 1.1 28.2 48.3 22.4 12.1 969 7.5 579 5.1 5.8 5.9
0.51 5.01 0.7 16.5 69.0 13.8 11.3 970 0.9 596 13.9 12.7 11.0
0.51 5.01 0.7 16.5 69.0 13.8 11.7 979 2.3 599 12.4 10.5 9.2
0.57 4.99 0.8 16.6 64.9 17.8 8.7 988 3.6 597 13.1 11.3 8.8
0.58 5.03 0.8 16.5 65.1 17.7 12.0 989 2.7 598 9.1 7.7 7.0
0.60 4.95 0.8 16.7 71.9 10.6 11.4 952 3.9 591 16.1 15.5 13.0
0.60 4.95 0.8 16.7 71.9 10.6 11.1 945 4.3 589 18.5 18.3 15.1
0.77 5.00 1.0 16.5 56.8 25.7 9.1 999 4.4 592 9.0 7.0 6.7
0.80 3.76 1.3 20.7 50.8 27.2 11.4 961 3.9 574 8.3 7.7 6.8
0.80 4.94 1.1 16.7 63.7 18.6 11.9 961 5.4 585 10.4 9.9 8.4
0.80 3.76 1.3 20.7 50.9 27.1 11.6 962 5.8 574 6.0 7.5 6.5
0.80 3.76 1.3 20.7 50.8 27.2 12.8 983 7.8 580 4.7 4.6 4.3
0.99 4.92 1.3 16.7 55.5 26.5 12.3 970 6.6 579 6.5 7.0 6.1
1.98 3.75 3.2 20.4 19.1 57.3 16.6 903 3.3 515 6.2 8.3 4.4
1.98 3.75 3.2 20.4 19.1 57.3 13.5 918 6.5 519 6.4 7.6 4.4
0.20 3.78 0.3 20.9 78.8 0.0 10.3 940 V 598 37.8 37.2 35.4
0.20 3.78 0.3 20.9 78.8 0.0 9.7 928 V 595 50.8 50.3 47.4
0.25 5.00 0.3 16.6 79.2 3.9 14.0 965 V 605 21.2 19.6 18.3
0.25 5.00 0.3 16.6 79.2 3.9 15.4 987 V 612 13.4 11.8 11.4
0.30 5.00 0.4 16.6 77.2 5.8 9.0 1020 V 619 10.3 10.3 8.1
0.30 3.76 0.5 20.9 76.3 2.3 10.9 945 V 596 24.0 22.9 21.4
19
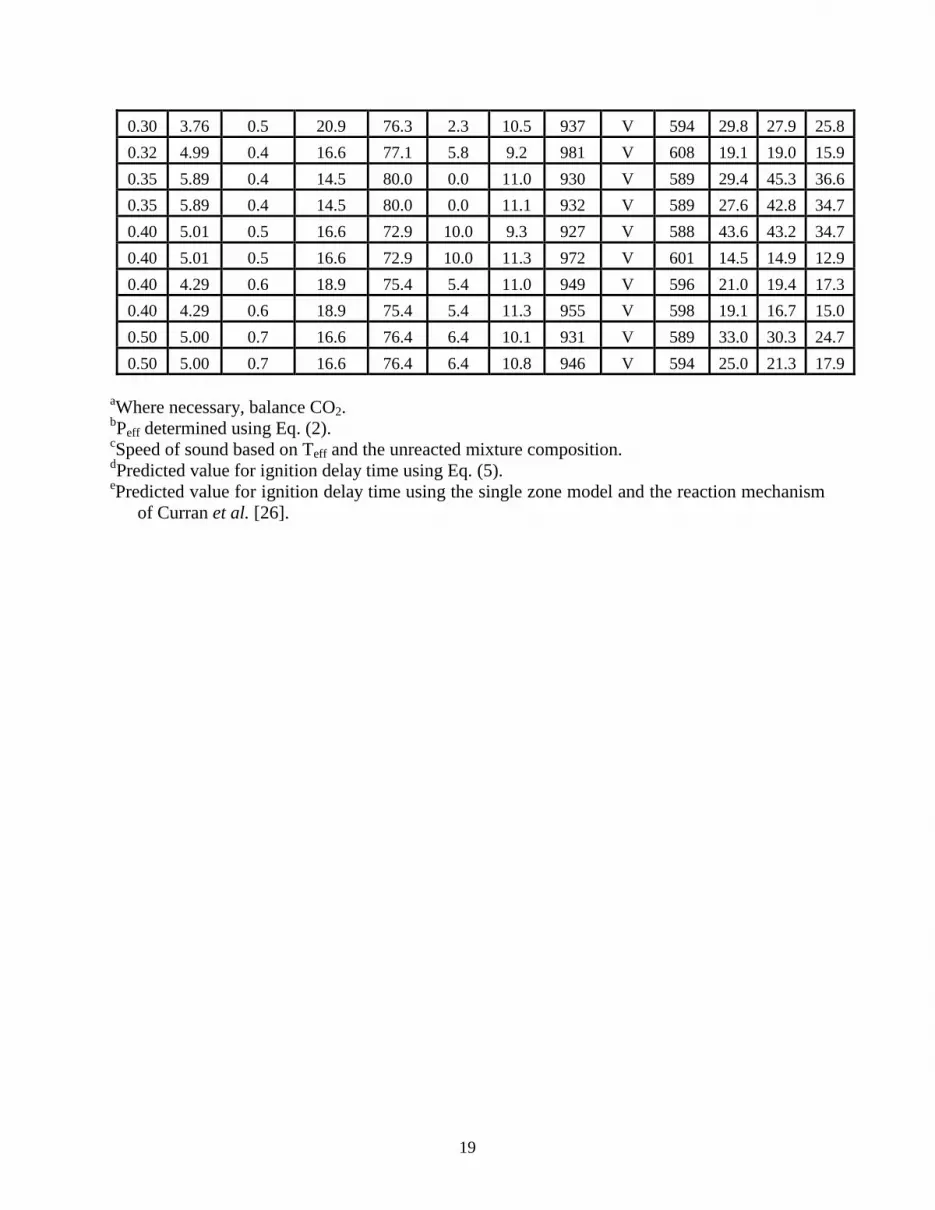
0.30 3.76 0.5 20.9 76.3 2.3 10.5 937 V 594 29.8 27.9 25.8
0.32 4.99 0.4 16.6 77.1 5.8 9.2 981 V 608 19.1 19.0 15.9
0.35 5.89 0.4 14.5 80.0 0.0 11.0 930 V 589 29.4 45.3 36.6
0.35 5.89 0.4 14.5 80.0 0.0 11.1 932 V 589 27.6 42.8 34.7
0.40 5.01 0.5 16.6 72.9 10.0 9.3 927 V 588 43.6 43.2 34.7
0.40 5.01 0.5 16.6 72.9 10.0 11.3 972 V 601 14.5 14.9 12.9
0.40 4.29 0.6 18.9 75.4 5.4 11.0 949 V 596 21.0 19.4 17.3
0.40 4.29 0.6 18.9 75.4 5.4 11.3 955 V 598 19.1 16.7 15.0
0.50 5.00 0.7 16.6 76.4 6.4 10.1 931 V 589 33.0 30.3 24.7
0.50 5.00 0.7 16.6 76.4 6.4 10.8 946 V 594 25.0 21.3 17.9
aWhere necessary, balance CO2. bPeff determined using Eq. (2). cSpeed of sound based on Teff and the unreacted mixture composition. dPredicted value for ignition delay time using Eq. (5). ePredicted value for ignition delay time using the single zone model and the reaction mechanism
of Curran et al. [26].
20
List of Figures
Fig. 1. Experimental schematic of the test section of the UM-RCF, demonstrating the camera
perspective for high-speed imaging. The sabot nose cone is shown in the final seated position.
Fig. 2. Typical pressure and pressure derivative time-histories for iso-octane ignition
experiments where no indications of reaction fronts are observed prior to volumetric ignition.
Experimental conditions are φ = 0.30, and inert/O2 = 5.00. The effective temperature based on
the effective pressure Peff,dP/dt = 9.0 atm is Teff = 1020 K.
Fig. 3. Typical pressure and pressure derivative time-histories for iso-octane ignition
experiments where reaction front propagation prior to volumetric ignition is observed.
Experimental conditions are φ = 0.20 and inert/O2 = 1.38. The effective temperature based on
the effective pressure Peff,dP/dt = 10.8 atm is Teff = 917 K.
Fig. 4. Imaging sequence corresponding to the data of Fig. 2 and conditions of volumetric
ignition where φ = 0.30, Teff = 1020 K, Peff = 9.0 atm, inert/O2 = 5.00, τign = 10.3 ms, 26,000 fps
(no color adjustment). Note not all frames in the imaging sequence are presented. The time
interval spanned for these frames is shown in Fig. 2.
Fig. 5. Imaging sequence corresponding to the data of Fig. 3 where reaction fronts are present
prior to volumetric ignition and φ = 0.20, Teff = 917 K, Peff = 10.8 atm, inert/O2 = 1.38, τign =
22.5 ms, 26,000 fps (color adjusted for clarity). Note not all frames in the imaging sequence are
presented. The time interval spanned for these frames is shown in Fig. 3.
Fig. 6. Example of the image analysis used to determine the reaction front propagation rates.
The images are presented in a binary form to enhance clarity. The vector indicates the direction
used to determine the speed and is set as orthogonal to the surface of the propagating reaction
front. The images are from the data set shown (in part) in Fig. 5, where φ = 0.20, Teff = 917 K,

21
Peff = 10.8 atm, inert/O2 = 1.38, τign = 22.5 ms, 26,000 fps.
Fig. 7. Summary of volumetric ignition and reaction front data for iso-octane ignition delay time
as a function of temperature. The experimental data have been normalized to P = 15 atm, φ =
0.4, and χO2 = 21% using Eq. (4). The open symbols are the data based on time-integrated
pressures from Pmax to Pmin, Eq. (1). The solid symbols are the data based on the time-integrated
pressures from Pmax to dP/dtmax, Eq. (2).
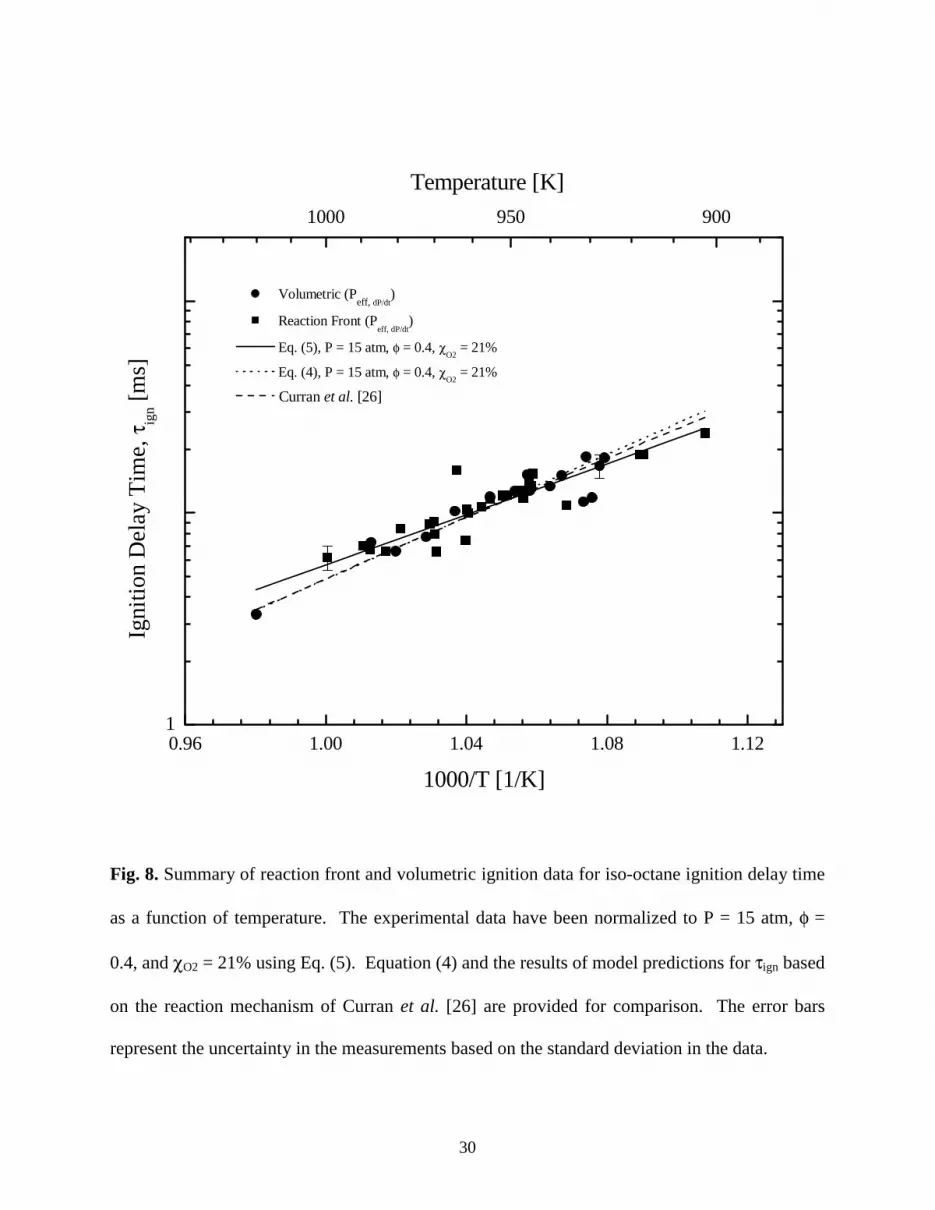
Fig. 8. Summary of reaction front and volumetric ignition data for iso-octane ignition delay time
as a function of temperature. The experimental data have been normalized to P = 15 atm, φ =
0.4, and χO2 = 21% using Eq. (5). Equation (4) and the results of model predictions for τign based
on the reaction mechanism of Curran et al. [26] are provided for comparison. The error bars
represent the uncertainty in the measurements based on the standard deviation in the data.
Fig. 9. Summary of reaction front and homogeneous ignition data for iso-octane ignition delay
time as a function of pressure. The experimental data have been normalized to T = 980 K, φ =
0.4, and χO2 = 21% using Eq. (5). Equation (4) and the results of model predictions for τign based
on the reaction mechanism of Curran et al. [26] are provided for comparison.
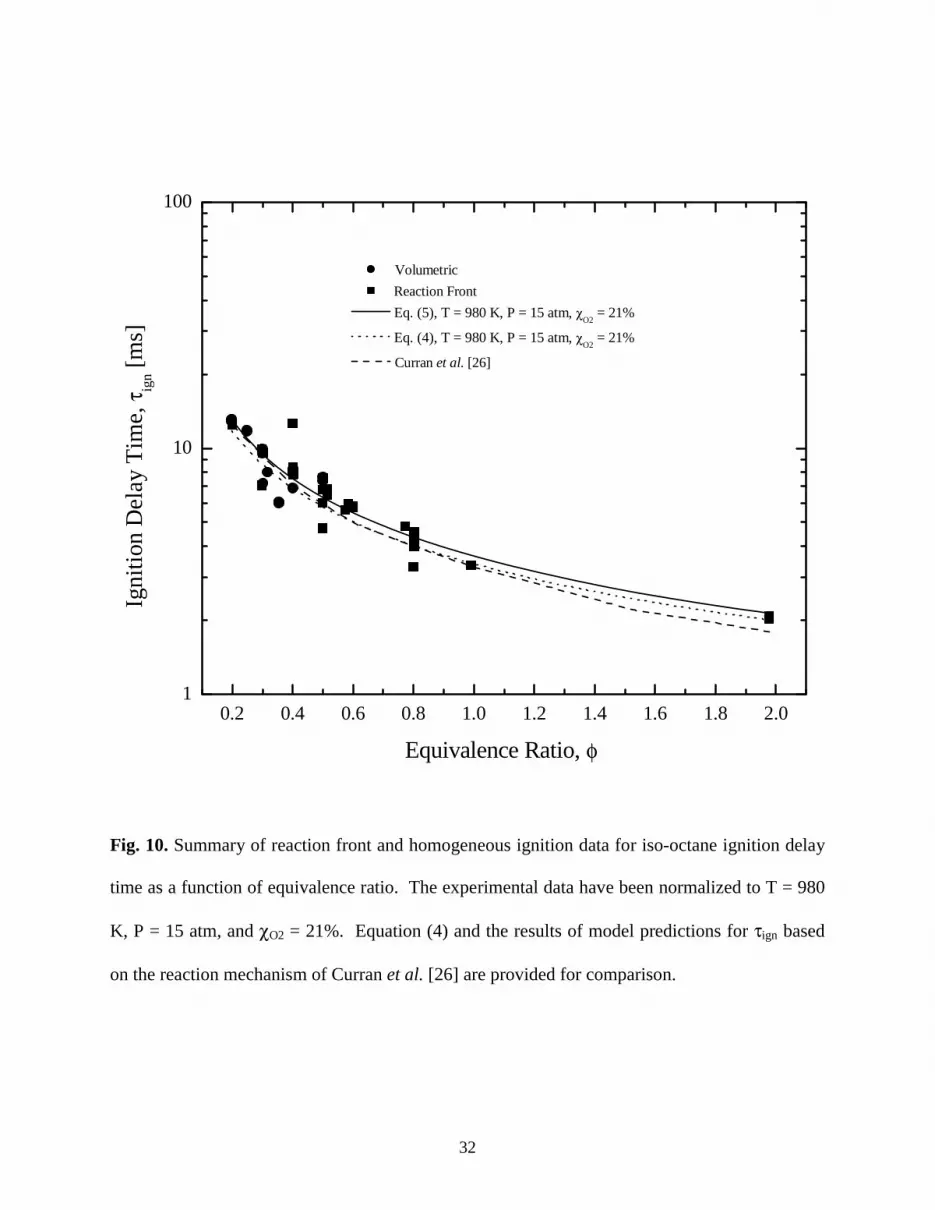
Fig. 10. Summary of reaction front and homogeneous ignition data for iso-octane ignition delay
time as a function of equivalence ratio. The experimental data have been normalized to T = 980
K, P = 15 atm, and χO2 = 21%. Equation (4) and the results of model predictions for τign based
on the reaction mechanism of Curran et al. [26] are provided for comparison.
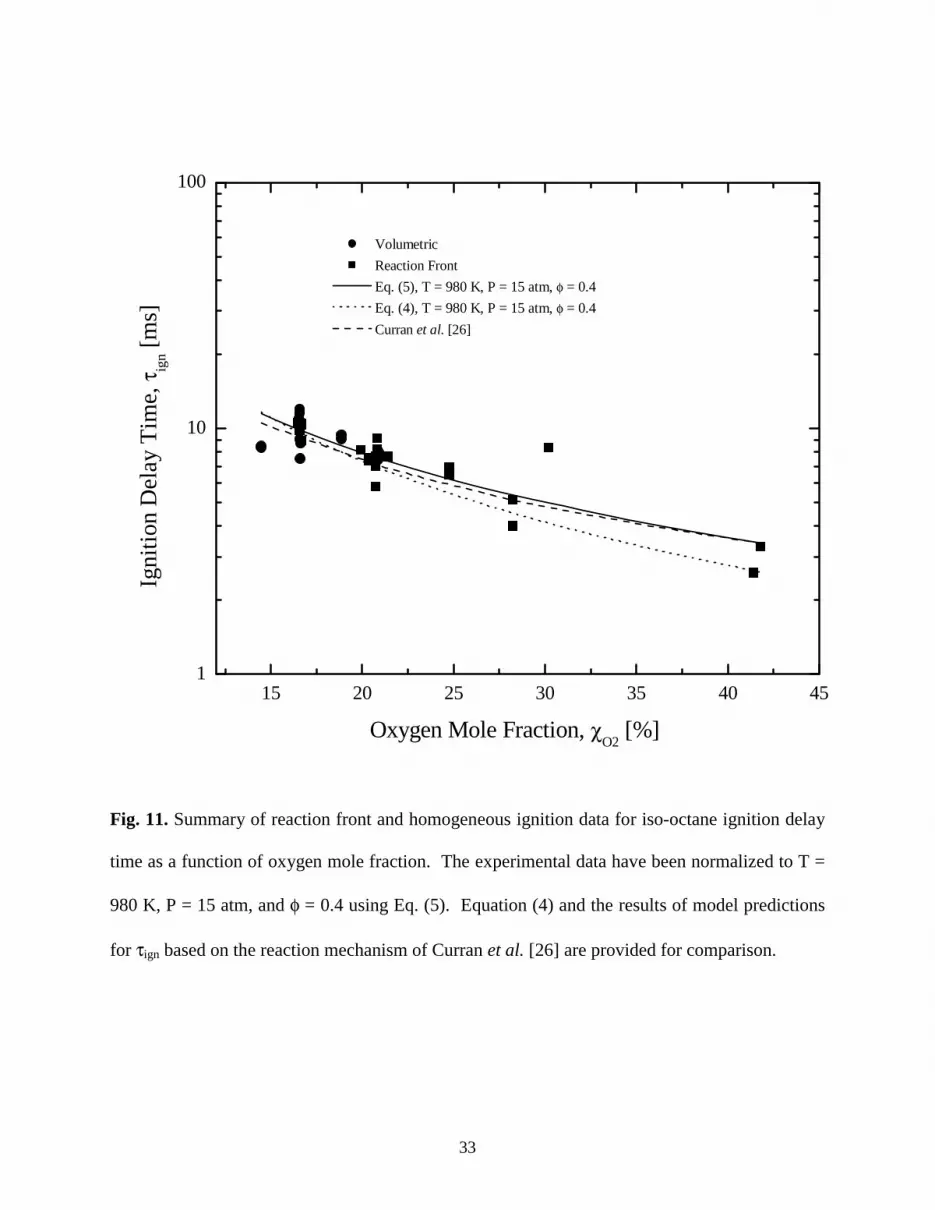
Fig. 11. Summary of reaction front and homogeneous ignition data for iso-octane ignition delay
time as a function of oxygen mole fraction. The experimental data have been normalized to T =
980 K, P = 15 atm, and φ = 0.4 using Eq. (5). Equation (4) and the results of model predictions
for τign based on the reaction mechanism of Curran et al. [26] are provided for comparison.

22
Fig. 12. Experimental results for reaction front propagation rates for lean iso-octane mixtures as
a function of fuel mole fraction in the test gas mixture. The lean flammability limit based on the
relation proposed by Zabetakis for paraffin hydrocarbons at elevated temperatures [22] is
presented as the solid line. The critical limit based on linear extrapolation of the experimental
data is presented as the dashed line.
Fig. 13. Speed of sound normalized by the measured maximum rate of reaction front
propagation. The critical fuel mole fraction limit based on the experimental data for U is
presented as the dashed line.

23
a) Isometric cross-section view
b) Cross-section view
Fig. 1. Experimental schematic of the test section of the UM-RCF, demonstrating the camera
perspective for high-speed imaging. The sabot nose cone is shown in the final seated position.

24
Fig. 2. Typical pressure and pressure derivative time-histories for iso-octane ignition
experiments where no indications of reaction fronts are observed prior to volumetric ignition.
Experimental conditions are φ = 0.30, and inert/O2 = 5.00. The effective temperature based on
the effective pressure Peff,dP/dt = 9.0 atm is Teff = 1020 K.
25
Fig. 3. Typical pressure and pressure derivative time-histories for iso-octane ignition
experiments where reaction front propagation prior to volumetric ignition is observed.
Experimental conditions are φ = 0.20 and inert/O2 = 1.38. The effective temperature based on
the effective pressure Peff,dP/dt = 10.8 atm is Teff = 917 K.
26
Fig
. 4.
Imag
ing
sequ
ence
cor
resp
ondi
ng to
the
data
of
Fig.
2 a
nd c
ondi
tions
of
volu
met
ric
igni
tion
whe
re φ
= 0
.30,
Tef
f = 1
020
K, P
eff
= 9
.0 a
tm,
iner
t/O2
= 5
.00,
τig
n =
10.
3 m
s, 2
6,00
0 fp
s (n
o co
lor
adju
stm
ent)
. N
ote
not
all
fram
es i
n th
e im
agin
g se
quen
ce a
re
pres
ente
d. T
he ti
me
inte
rval
spa
nned
for
thes
e fr
ames
is s
how
n in
Fig
. 2.
27
Fig
. 5.
Im
agin
g se
quen
ce c
orre
spon
ding
to
the
data
of
Fig.
3 w
here
rea
ctio
n fr
onts
are
pre
sent
pri
or t
o vo
lum
etri
c ig
nitio
n an
d φ
=
0.20
, T
eff =
917
K, P
eff =
10.
8 at
m,
iner
t/O2
= 1
.38,
τig
n =
22.
5 m
s, 2
6,00
0 fp
s (c
olor
adj
uste
d fo
r cl
arit
y).
Not
e no
t al
l fr
ames
in
the
imag
ing
sequ
ence
are
pre
sent
ed.
The
tim
e in
terv
al s
pann
ed f
or th
ese
fram
es is
sho
wn
in F
ig. 3
.
28
Fig
. 6.
Exa
mpl
e of
the
im
age
anal
ysis
use
d to
det
erm
ine
the
reac
tion
fro
nt p
ropa
gati
on r
ates
. T
he i
mag
es a
re p
rese
nted
in
a bi
nary
form
to
enha
nce
clar
ity.
T
he v
ecto
r in
dica
tes
the
dire
ctio
n us
ed t
o de
term
ine
the
spee
d an
d is
set
as
orth
ogon
al t
o th
e su
rfac
e of
the
prop
agat
ing
reac
tion
fron
t. T
he i
mag
es a
re f
rom
the
dat
a se
t sh
own
(in
part
) in
Fig
. 5, w
here
φ =
0.2
0, T
eff =
917
K, P
eff =
10.
8 at
m,
iner
t/O
2 =
1.3
8, τ
ign
= 2
2.5
ms,
26,
000
fps.
29
0.96 1.00 1.04 1.08 1.12 1.161
10
100
1000 950 900
Volumetric (Peff, Pmin
)
Reaction Front (Peff, Pmin
)
Volumetric (Peff, dP/dt
)
Reaction Front (Peff, dP/dt
)
Eq. (4), P = 15 atm, φ = 0.4, χO2
= 21%
Igni
tion
Del
ay T
ime,
τig
n [m
s]
1000/T [1/K]
Temperature [K]
Fig. 7. Summary of volumetric ignition and reaction front data for iso-octane ignition delay time
as a function of temperature. The experimental data have been normalized to P = 15 atm, φ =
0.4, and χO2 = 21% using Eq. (4). The open symbols are the data based on time-integrated
pressures from Pmax to Pmin, Eq. (1). The solid symbols are the data based on the time-integrated
pressures from Pmax to dP/dtmax, Eq. (2).
30
0.96 1.00 1.04 1.08 1.121
1000 950 900
Volumetric (Peff, dP/dt
)
Reaction Front (Peff, dP/dt
)
Eq. (5), P = 15 atm, φ = 0.4, χO2
= 21%
Eq. (4), P = 15 atm, φ = 0.4, χO2
= 21%
Curran et al. [26]
Igni
tion
Del
ay T
ime,
τig
n [m
s]
1000/T [1/K]
Temperature [K]
Fig. 8. Summary of reaction front and volumetric ignition data for iso-octane ignition delay time
as a function of temperature. The experimental data have been normalized to P = 15 atm, φ =
0.4, and χO2 = 21% using Eq. (5). Equation (4) and the results of model predictions for τign based
on the reaction mechanism of Curran et al. [26] are provided for comparison. The error bars
represent the uncertainty in the measurements based on the standard deviation in the data.

31
8 10 12 14 161
10
100
Volumetric
Reaction Front
Eq. (5), T = 980 K, φ = 0.4, χO2 = 21%
Eq. (4), T = 980 K, φ = 0.4, χO2 = 21%
Curran et al. [26]
Ig
niti
on D
elay
Tim
e, τ
ign [
ms]
Pressure [atm]
Fig. 9. Summary of reaction front and homogeneous ignition data for iso-octane ignition delay
time as a function of pressure. The experimental data have been normalized to T = 980 K, φ =
0.4, and χO2 = 21% using Eq. (5). Equation (4) and the results of model predictions for τign based
on the reaction mechanism of Curran et al. [26] are provided for comparison.
32
0.2 0.4 0.6 0.8 1.0 1.2 1.4 1.6 1.8 2.01
10
100
Volumetric
Reaction Front
Eq. (5), T = 980 K, P = 15 atm, χO2
= 21%
Eq. (4), T = 980 K, P = 15 atm, χO2
= 21%
Curran et al. [26]
Igni
tion
Del
ay T
ime,
τig
n [m
s]
Equivalence Ratio, φ
Fig. 10. Summary of reaction front and homogeneous ignition data for iso-octane ignition delay
time as a function of equivalence ratio. The experimental data have been normalized to T = 980
K, P = 15 atm, and χO2 = 21%. Equation (4) and the results of model predictions for τign based
on the reaction mechanism of Curran et al. [26] are provided for comparison.
33
15 20 25 30 35 40 451
10
100
Volumetric
Reaction Front
Eq. (5), T = 980 K, P = 15 atm, φ = 0.4
Eq. (4), T = 980 K, P = 15 atm, φ = 0.4
Curran et al. [26]
Ig
niti
on D
elay
Tim
e, τ
ign [
ms]
Oxygen Mole Fraction, χO2
[%]
Fig. 11. Summary of reaction front and homogeneous ignition data for iso-octane ignition delay
time as a function of oxygen mole fraction. The experimental data have been normalized to T =
980 K, P = 15 atm, and φ = 0.4 using Eq. (5). Equation (4) and the results of model predictions
for τign based on the reaction mechanism of Curran et al. [26] are provided for comparison.
34
0.25 0.50 0.75 1.00 1.25 1.50
0
2
4
6
8
10
12
χfuel,crit
Spee
d of
rea
ctio
n fr
ont p
ropa
gati
on, U
[m
/s]
Fuel Mole Fraction, χf [%]
Volumetric
Reaction Front
LFL, Zabetakis [22]
Fig. 12. Experimental results for reaction front propagation rates for lean iso-octane mixtures as
a function of fuel mole fraction in the test gas mixture. The lean flammability limit based on the
relation proposed by Zabetakis for paraffin hydrocarbons at elevated temperatures [22] is
presented as the solid line. The critical limit based on linear extrapolation of the experimental
data is presented as the dashed line.
35
0.0 0.5 1.0 1.5 2.0 2.5 3.0 3.50
200
400
600
800
1000
1200
1400
a/U
Fuel mole fraction, χfuel
[%]
Experimental Data Exponential Fit
χfuel,crit
Fig. 13. Speed of sound normalized by the measured maximum rate of reaction front
propagation. The critical fuel mole fraction limit based on the experimental data for U is
presented as the dashed line.
36
References
1. K. Epping, S. Aceves, R. Bechtold, J. Dec, SAE Paper No. 2002-02-1923 (2002).
2. J. Neathery, D. Gray, D. Challman, F. Derbyshire, Fuel 78 (7) (1999) 815-823.
3. X. He, M.T. Donovan, B.T. Zigler, T.R. Palmer, S.M. Walton, M.S. Wooldridge, A. Atreya,
Combust. Flame 142 (2005) 266-275.
4. X. He, B.T. Zigler, S.M. Walton, M.S. Wooldridge, A. Atreya, “A Rapid Compression
Facility Study of OH Time Histories During Iso-octane Ignition,” Combust. Flame, in press
December 2005.
5. S.M. Walton, X. He, B.T. Zigler, M.S. Wooldridge, “An Experimental Investigation of the
Ignition Properties of Hydrogen and Carbon Monoxide Mixtures for Syngas Turbine
Applications,” submitted to the 31st International Symposium on Combustion, December
2005.
6. D.F. Davidson, B.M. Gauthier, R.K. Hanson, Proc. Combust. Inst. 30 (2005) 1175-1182.
7. K. Fieweger, R. Blumenthal, G. Adomeit, Combust. Flame 109 (4) (1997) 599–619.
8. R. Minetti, M. Carlier, M. Ribaucour, E. Therssen, L.R. Sochet, Proc. Combust. Inst. 26
(1996) 747-753.
9. S. Tanaka, F. Ayala, J. C. Keck, J.B. Heywood, Combust. Flame 132 (2) (2003) 219-239.
10. J.E. Elsworth, W.W. Haskell, I.A. Read, Combust. Flame 13 (4) (1969) 437-438.
11. D.J. Vermeer, J.W. Meyer, A.K. Oppenheim, Combust Flame 18 (3) (1972) 327-336.
12. K. Fieweger, R. Blumenthal, G. Adomeit, Combust. Flame 109 (4) (1997) 599-619.
13. S.M. Walton, X. He, B.T. Zigler, M.S. Wooldridge, A. Atreya, (2005) “Demonstration of
Distinct Ignition Regimes using High-Speed Digital Imaging of Iso-octane Mixtures” Proc.
Fourth Joint Meeting of the U.S. Sections of The Combust. Inst., March 20-23, 2005.
37
14. J.F. Griffiths, J.P. MacNamara, C.G.W. Sheppard, D.A. Turton, B.J. Whitaker, Fuel 81
(2002) 2219-2225.
15. E. Murase, K. Hanada, T. Miyaura, J. Ikeda, Combust. Sci. Tech. 177 (2005) 1699-1723.
16. X.J. Gu, D.R. Emerson, D. Bradley, Combust. Flame 133 (2003) 63-74.
17. R. Sankaran, H.G. Im, E.R. Hawkes, J.H. Chen, Proc. Combust. Inst. 30 (2004) 875-882.
18. E.W. Kaiser, J. Yang, T. Culp, N. Xu, M.M. Maricq, Int. J. Eng. Res. 3 (2002) 185-195.
19. E.W. Kaiser, M.M. Maricq, N. Xu, J. Yang, SAE Paper No. 2005-01-3749 (2005).
20. Y. Ishibashi, M. Asai, K. Nishida, SAE Paper No. 972077 (1997) (also JSAE Paper No.
9734106).
21. A. Hultqvist, M. Christensen, B. Johansson, M. Richter, J. Nygren, J. Hult, M. Aldjn, SAE
Paper No. 2002-01-0424 (2002).
22. M.G. Zabetakis, “Flammability characteristics of combustible gases and vapors,” Bulletin
627, U.S. Bureau of Mines, U.S. Department of the Interior, 1965.
23. M.T. Donovan, X. He, B.T. Zigler, T.R. Palmer, M.S. Wooldridge, A. Atreya,
“Demonstration of a Free-Piston Rapid Compression Facility for the Study of High
Temperature Combustion Phenomena,” Combust. Flame 137 (2004) 351-365.
24. M.T. Donovan, Ph.D. Dissertation, Department of Mechanical Engineering, University of
Michigan (2003).
25. B.J. McBride, S Gordon, M.A. Reno, NASA Thermodynamic Data Base, NASA Technical
Memorandum 4513, October 1993.
26. H.J. Curran, P. Gaffuri, W.J. Pitz, C.K. Westbrook, Combust. Flame 129 (3) (2002) 253-280.
27. R.J. Kee, F.M. Rupley, J.A. Miller, M.E. Coltrin, J.F. Grcar, E. Meeks, H.K. Moffat, A.E.
Lutz, G. Dixon-Lewis, M.D. Smooke, J. Warnatz, G.H. Evans, R.S. Larson, R.E. Mitchell,
38
L.R. Petzold, W.C. Reynolds, M. Caracotsios, W.E. Stewart, P. Glarborg, C. Wang, O.
Adigun, W.G. Houf, C.P. Chou, S.F. Miller, Chemkin Collection, Release 3.7.1, Reaction
Design, Inc., San Diego, CA (2003).
28. Ya.B. Zeldovich, Comb. Flame 39 (1980) 211-214.
29. NIST Chemistry Webbook, NIST Standard Reference Database Number 69 (2005).


![Molecular reorientations of bicyclo [2, 2, 2] octane in its plastic](https://img.pdfslide.net/doc/110x75/631b22ce209fbf85b505abc8/molecular-reorientations-of-bicyclo-2-2-2-octane-in-its-plastic-.jpg)


