Embed Size (px)
Citation preview
Pleasant HillCommunity Food System Assessment
A city wide scan of food systems and their connection with community development opportunities in Pleasant Hill, Iowa
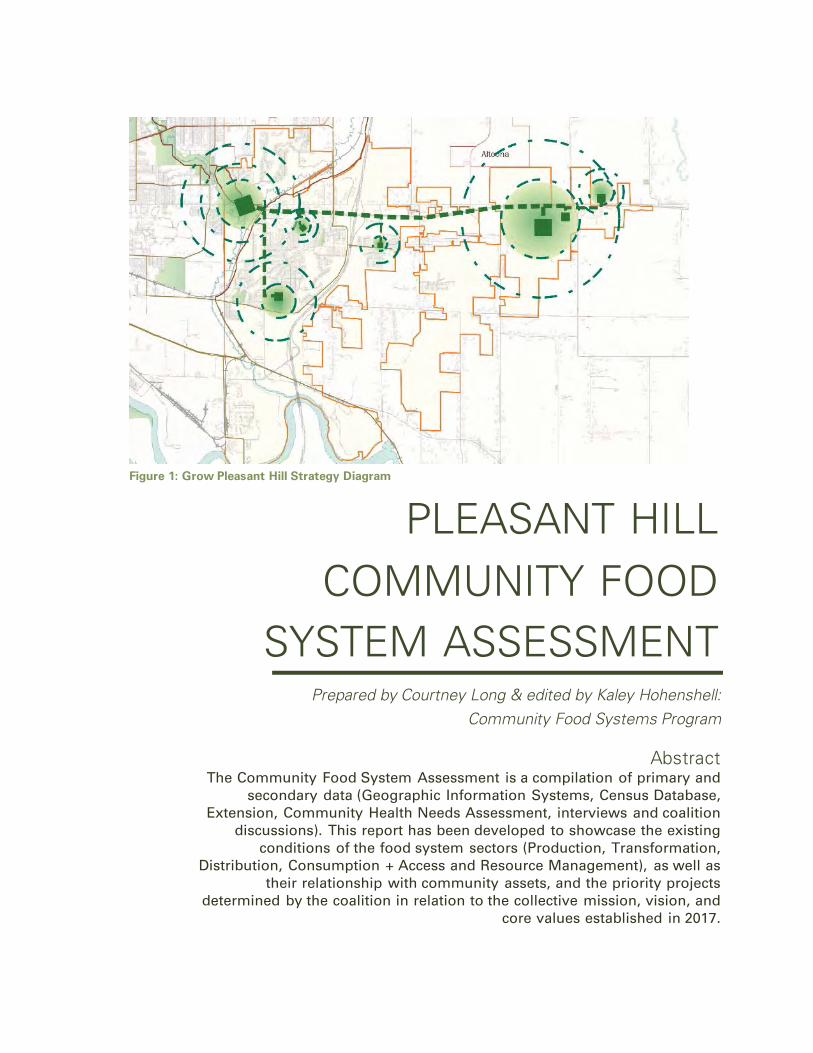
Figure 1: Grow Pleasant Hill Strategy Diagram
PLEASANT HILL COMMUNITY FOOD
SYSTEM ASSESSMENT
Abstract The Community Food System Assessment is a compilation of primary and
secondary data (Geographic Information Systems, Census Database, Extension, Community Health Needs Assessment, interviews and coalition
discussions). This report has been developed to showcase the existing conditions of the food system sectors (Production, Transformation,
Distribution, Consumption + Access and Resource Management), as well as their relationship with community assets, and the priority projects
determined by the coalition in relation to the collective mission, vision, and core values established in 2017.
Prepared by Courtney Long & edited by Kaley Hohenshell: Community Food Systems Program
1
Assessment Process
The assessment is formatted to give an in-depth analysis of food system tactics that exist, or are needed within Pleasant Hill. Each section starts with the sector and then dives into details of the sector tactics. Where appropriate, maps are developed to give a visual demonstration of the information discussed.
Coalition Development and Engagement: 5/16-5/17
o 29 unique organizations and businesses were interviewed regarding food systems development and collaboration
o 4 coalition meetings were facilitated at the City of Pleasant Hill o 18 unique members of the coalition o Average attendance of 12 individuals
o 2 public input sessions hosted o Caribou Coffee o Riley Resource Group
o 3 versions of an input survey offered o Pleasant Hill website: received over 60 responses o Pleasant Hill Facebook o Fareway discussions
o 1 Snapshot completed to determine priority projects o 5 priority projects determined for collective development
o 2 projects being led by individuals outside of City Staff o Total participation in projects: 25 individuals o 1 project collaboration leading to state wide recognition and collaboration
o 1 Evaluation plan will be developed in 2018
2
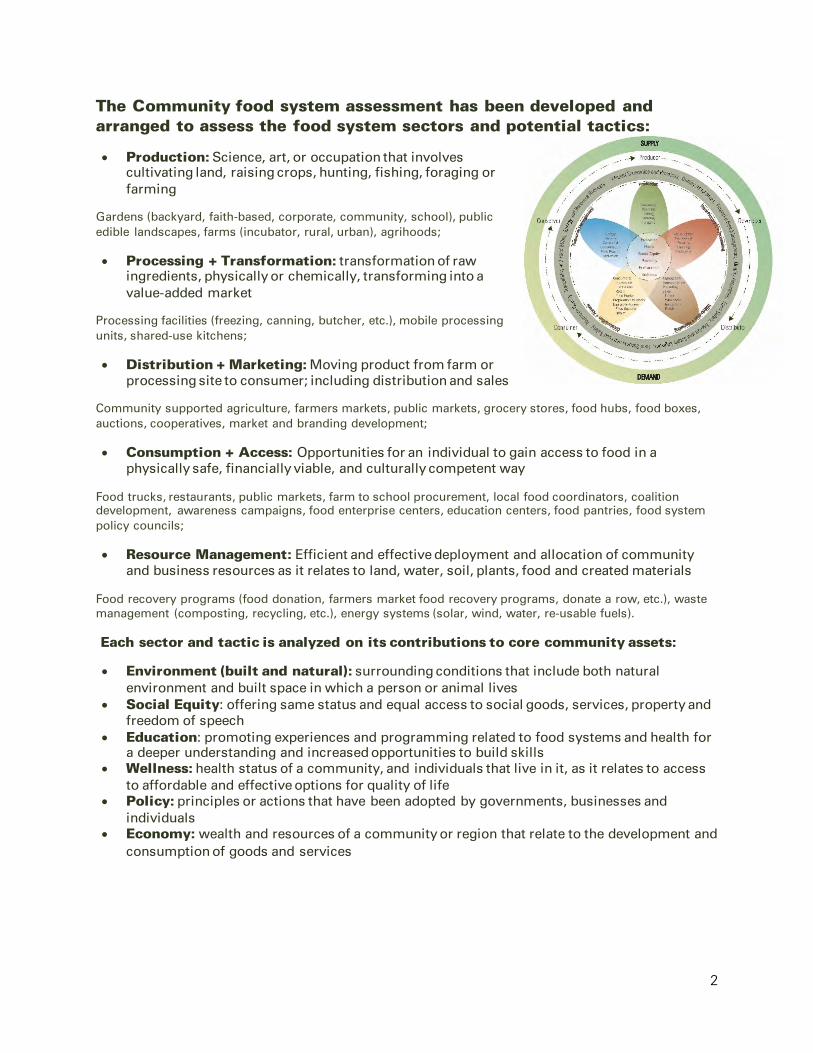
The Community food system assessment has been developed and arranged to assess the food system sectors and potential tactics:
• Production: Science, art, or occupation that involves cultivating land, raising crops, hunting, fishing, foraging or farming
Gardens (backyard, faith-based, corporate, community, school), public edible landscapes, farms (incubator, rural, urban), agrihoods;
• Processing + Transformation: transformation of raw ingredients, physically or chemically, transforming into a value-added market
Processing facilities (freezing, canning, butcher, etc.), mobile processing units, shared-use kitchens;
• Distribution + Marketing: Moving product from farm or processing site to consumer; including distribution and sales
Community supported agriculture, farmers markets, public markets, grocery stores, food hubs, food boxes, auctions, cooperatives, market and branding development;
• Consumption + Access: Opportunities for an individual to gain access to food in a physically safe, financially viable, and culturally competent way
Food trucks, restaurants, public markets, farm to school procurement, local food coordinators, coalition development, awareness campaigns, food enterprise centers, education centers, food pantries, food system policy councils;
• Resource Management: Efficient and effective deployment and allocation of community and business resources as it relates to land, water, soil, plants, food and created materials
Food recovery programs (food donation, farmers market food recovery programs, donate a row, etc.), waste management (composting, recycling, etc.), energy systems (solar, wind, water, re-usable fuels).
Each sector and tactic is analyzed on its contributions to core community assets:
• Environment (built and natural): surrounding conditions that include both natural environment and built space in which a person or animal lives
• Social Equity: offering same status and equal access to social goods, services, property and freedom of speech
• Education: promoting experiences and programming related to food systems and health for a deeper understanding and increased opportunities to build skills
• Wellness: health status of a community, and individuals that live in it, as it relates to access to affordable and effective options for quality of life
• Policy: principles or actions that have been adopted by governments, businesses and individuals
• Economy: wealth and resources of a community or region that relate to the development and consumption of goods and services
3
Contents
Grow Pleasant Hill: ....................................................................................................................... 5
Mission: .................................................................................................................................... 5
Vision: ....................................................................................................................................... 5
Core Values: .............................................................................................................................. 5
Grow Pleasant Hill Partners: ...................................................................................................... 6
Priority projects ......................................................................................................................... 7
City of Pleasant Hill: ...................................................................................................................... 8
Population ................................................................................................................................. 8
Infrastructure........................................................................................................................... 12
Wellness ................................................................................................................................. 15
Policy ...................................................................................................................................... 15
Production: ................................................................................................................................. 17
Residential Gardens ................................................................................................................ 18
Faith Gardens .......................................................................................................................... 19
Corporate Gardens .................................................................................................................. 20
Community Gardens................................................................................................................ 21
Farm to School: School Gardens.............................................................................................. 23
Public Edible Landscape .......................................................................................................... 26
Incubator Farms: ..................................................................................................................... 28
Urban Farms............................................................................................................................ 30
Rural Farms ............................................................................................................................. 32
Agrihood.................................................................................................................................. 37
Transformation:........................................................................................................................... 39
Processing Facilities ................................................................................................................ 40
Mobile Processing Units.......................................................................................................... 40
Shared-Use Kitchens ............................................................................................................... 41
Distribution + Marketing: ............................................................................................................ 42
Community Supported Agriculture........................................................................................... 43
Farmers Markets ..................................................................................................................... 46
Public Markets ........................................................................................................................ 49
Grocery Stores ........................................................................................................................ 50
4
Cooperatives ........................................................................................................................... 52
Awareness Campaign:............................................................................................................. 54
Farm to School Procurement ................................................................................................... 55
Food Access and Consumption:.................................................................................................. 57
Restaurants: ............................................................................................................................ 58
Food Trucks............................................................................................................................. 59
Farm to School (Nutrition Education) ....................................................................................... 60
Local Food Coordinators and Coalitions: .................................................................................. 62
Food Pantries & Meal Programs: ............................................................................................. 63
Food System Policy Councils: .................................................................................................. 65
Resource Management .............................................................................................................. 66
Food Recovery ........................................................................................................................ 66
Bibliography.................................................................................................................................... 67
Appendix……………………………………………………………………………………………………….80
5
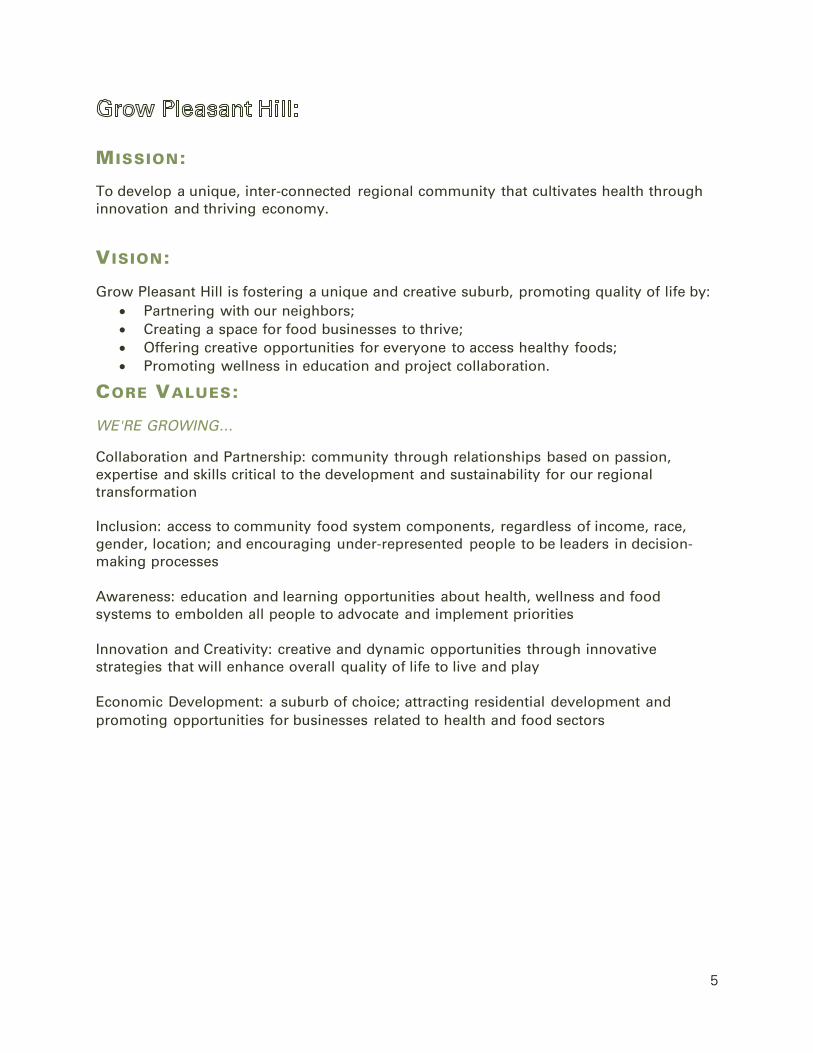
MISSION:
To develop a unique, inter-connected regional community that cultivates health through innovation and thriving economy.
VISION:
Grow Pleasant Hill is fostering a unique and creative suburb, promoting quality of life by: • Partnering with our neighbors; • Creating a space for food businesses to thrive; • Offering creative opportunities for everyone to access healthy foods; • Promoting wellness in education and project collaboration.
CORE VALUES:
WE'RE GROWING…
Collaboration and Partnership: community through relationships based on passion, expertise and skills critical to the development and sustainability for our regional transformation Inclusion: access to community food system components, regardless of income, race, gender, location; and encouraging under-represented people to be leaders in decision-making processes Awareness: education and learning opportunities about health, wellness and food systems to embolden all people to advocate and implement priorities Innovation and Creativity: creative and dynamic opportunities through innovative strategies that will enhance overall quality of life to live and play Economic Development: a suburb of choice; attracting residential development and promoting opportunities for businesses related to health and food sectors
6
GROW PLEASANT HILL PARTNERS: City of Pleasant Hill -- Ben Champ, Madeline Sturms, Rick Courcier, Candace Bell Parks and Rec Board and volunteer -- Penny Thompson Berean Church and Pleasant Hill Farmers Market -- Kevin Umphress Drake University and Agrihood -- Trent Grundmeyer Dinner Delights -- Andrea Love Happe Homes -- Chris Peterson, Jake Happe Veterans in Agriculture -- Beth Grabau Eastern Polk County Economic Development -- Alex Lynch Pleasant Hill Chamber-- Wendy Martinez The Homestead -- Robbie Morris Riley, Ashley Bernel Riley Resource Group -- Bob Riley MidAmerican Energy -- Deb Calvert Planning and Zoning Commission -- Mark Ackelson Pleasant Hill Library -- John Lardall Southeast Polk High School -- Matt Eddy
7
PRIORITY PROJECTS
Priority projects were determined by the Grow Pleasant Hill coalition in May 2017 based on the community snapshot and evaluation of potential project impact, feasibility, and coalition core values. Each priority project has a local team chair and project team. Within phase 2 of the Community Food Systems (CFS) program, partners will collaborate with the CFS program for research, technical assistance, design, and implementation. In addition to the priority project, the coalition and City of Pleasant Hill determined that there are potentials for additional community gardens and edible landscapes developed by the City of Pleasant Hill and their Parks Department. City staff will dedicate time and resources to establishing different pubic opportunities to offer access to healthy foods.
Occupation and Workforce Development Chair: Alex Lynch and Beth Grabau Promote partnerships with organizations and businesses that need agriculture and landscape skills. This will include two components: first, a hands-on training strategy for landscape and agriculture, and second, collaboration with Veterans in Agriculture in their pursuit to develop a farming apprenticeship program.
Promotion and Education Chair: Candace Bell and Rick Courcier Build awareness about existing food related resources and business in the city and region while also creating educational opportunities for residents such as cooking demonstrations and classes on topics such as gardening, preserving, and composting. Agrihood Development Chair: Trent Grundmeyer Create a new neighborhood development strategy centered on agriculture and open space. The development will support beginning farmer programs, provide connections to natural resources and the food system, promote community gathering space, and provide opportunities for education and events. Farmers Market Expansion Chair: Kevin Umphress Expand the existing farmers market to encourage more vendors and consumers to attend. This will include development of marketing and promotion material as well as an assessment of the location, time, program, and feasibility to enhance the market to be a place that draws attendees from the East Polk County area. Food Center Design an activity hub for food related business development that includes a shared-use kitchen and culinary business offerings while also showcasing outdoor amenities and creative solutions for healthy living, gardening, and community collaboration.
8
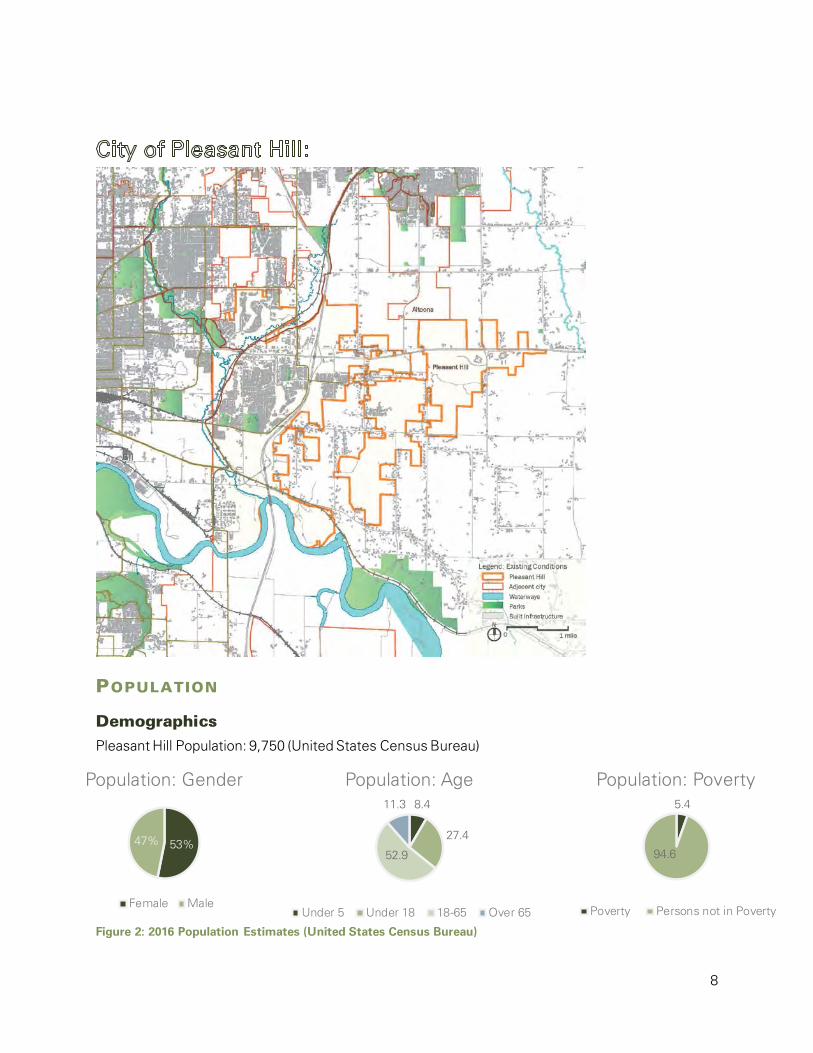
8.4
27.4
52.9
11.3
Population: Age
Under 5 Under 18 18-65 Over 65
53%47%
Population: Gender
Female Male
5.4
94.6
Population: Poverty
Poverty Persons not in Poverty
POPULATION
Demographics Pleasant Hill Population: 9,750 (United States Census Bureau)
Figure 2: 2016 Population Estimates (United States Census Bureau)
9
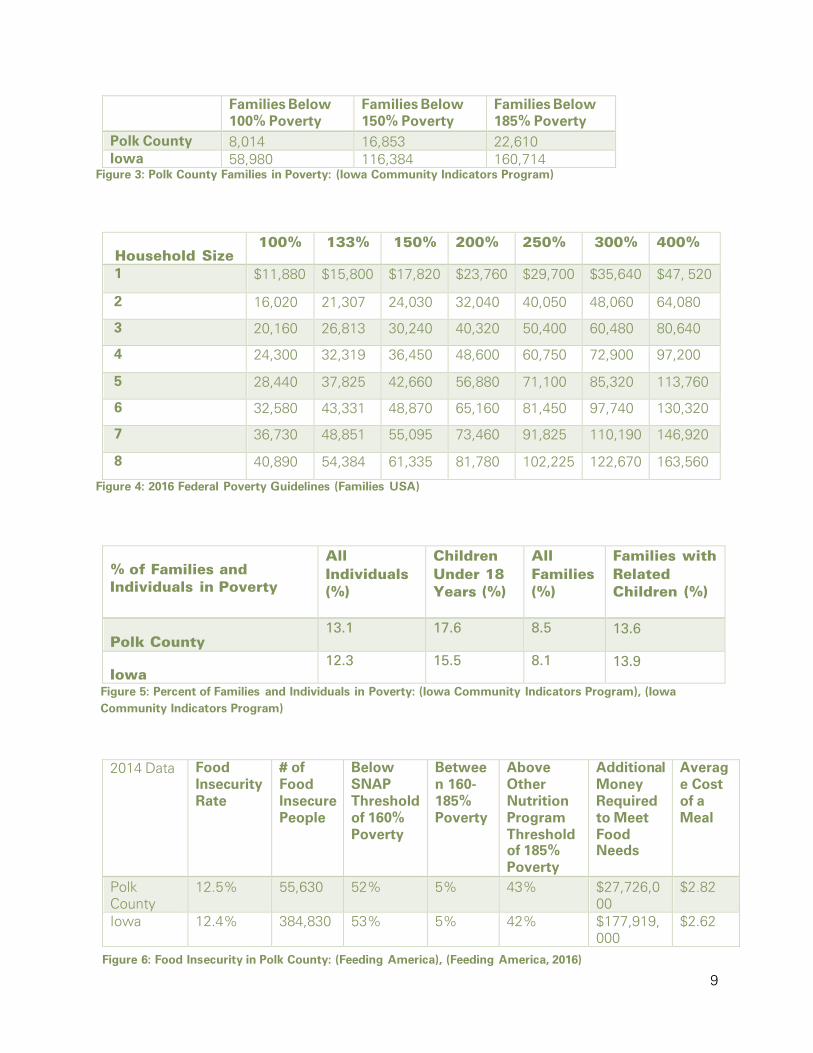
Families Below 100% Poverty
Families Below 150% Poverty
Families Below 185% Poverty
Polk County 8,014 16,853 22,610 Iowa 58,980 116,384 160,714
Figure 3: Polk County Families in Poverty: (Iowa Community Indicators Program)
Household Size 100% 133% 150% 200% 250% 300% 400%
1 $11,880 $15,800 $17,820 $23,760 $29,700 $35,640 $47, 520
2 16,020 21,307 24,030 32,040 40,050 48,060 64,080
3 20,160 26,813 30,240 40,320 50,400 60,480 80,640
4 24,300 32,319 36,450 48,600 60,750 72,900 97,200
5 28,440 37,825 42,660 56,880 71,100 85,320 113,760
6 32,580 43,331 48,870 65,160 81,450 97,740 130,320
7 36,730 48,851 55,095 73,460 91,825 110,190 146,920
8 40,890 54,384 61,335 81,780 102,225 122,670 163,560
Figure 4: 2016 Federal Poverty Guidelines (Families USA)
% of Families and Individuals in Poverty
All Individuals (%)
Children Under 18 Years (%)
All Families (%)
Families with Related Children (%)
Polk County 13.1 17.6 8.5 13.6
Iowa 12.3 15.5 8.1 13.9
Figure 5: Percent of Families and Individuals in Poverty: (Iowa Community Indicators Program), (Iowa Community Indicators Program)
2014 Data Food Insecurity Rate
# of Food Insecure People
Below SNAP Threshold of 160% Poverty
Between 160-185% Poverty
Above Other Nutrition Program Threshold of 185% Poverty
Additional Money Required to Meet Food Needs
Average Cost of a Meal
Polk County
12.5% 55,630 52% 5% 43% $27,726,000
$2.82
Iowa 12.4% 384,830 53% 5% 42% $177,919,000
$2.62
Figure 6: Food Insecurity in Polk County: (Feeding America), (Feeding America, 2016)
10
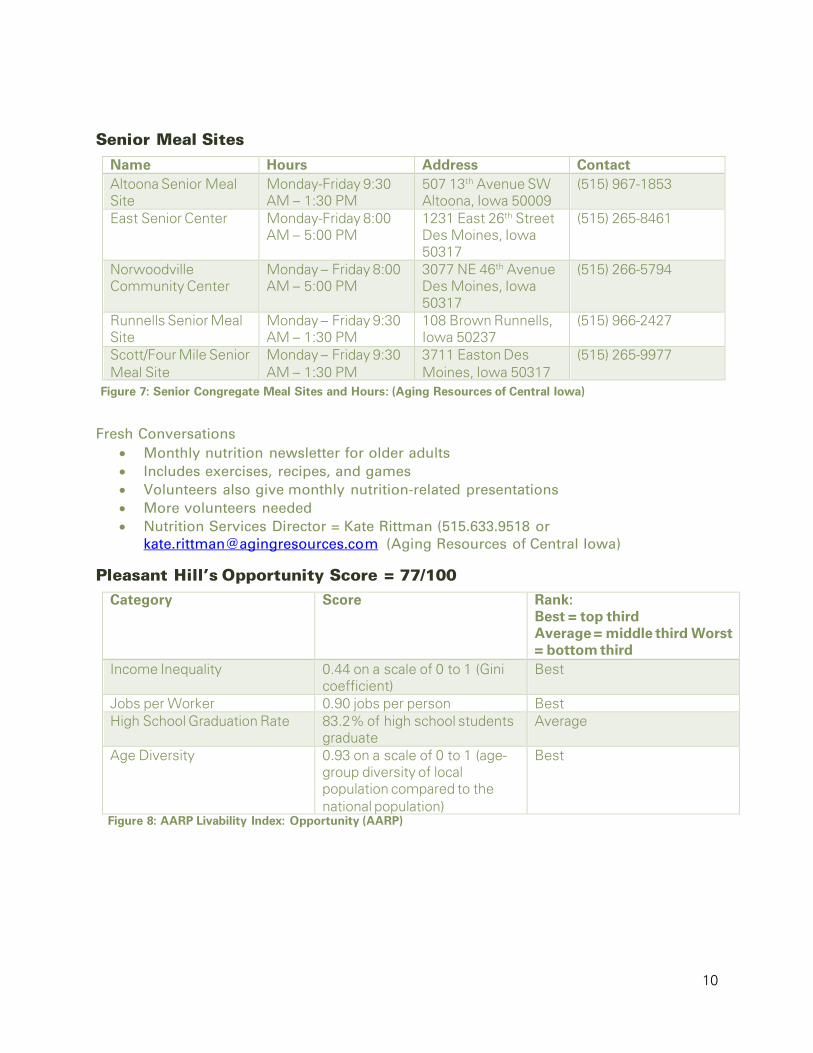
Senior Meal Sites
Fresh Conversations • Monthly nutrition newsletter for older adults • Includes exercises, recipes, and games • Volunteers also give monthly nutrition-related presentations • More volunteers needed • Nutrition Services Director = Kate Rittman (515.633.9518 or
[email protected] (Aging Resources of Central Iowa)
Pleasant Hill’s Opportunity Score = 77/100
Name Hours Address Contact Altoona Senior Meal Site
Monday-Friday 9:30 AM – 1:30 PM
507 13th Avenue SW Altoona, Iowa 50009
(515) 967-1853
East Senior Center Monday-Friday 8:00 AM – 5:00 PM
1231 East 26th Street Des Moines, Iowa 50317
(515) 265-8461
Norwoodville Community Center
Monday – Friday 8:00 AM – 5:00 PM
3077 NE 46th Avenue Des Moines, Iowa 50317
(515) 266-5794
Runnells Senior Meal Site
Monday – Friday 9:30 AM – 1:30 PM
108 Brown Runnells, Iowa 50237
(515) 966-2427
Scott/Four Mile Senior Meal Site
Monday – Friday 9:30 AM – 1:30 PM
3711 Easton Des Moines, Iowa 50317
(515) 265-9977
Figure 7: Senior Congregate Meal Sites and Hours: (Aging Resources of Central Iowa)
Category Score Rank: Best = top third Average = middle third Worst = bottom third
Income Inequality 0.44 on a scale of 0 to 1 (Gini coefficient)
Best
Jobs per Worker 0.90 jobs per person Best High School Graduation Rate 83.2% of high school students
graduate Average
Age Diversity 0.93 on a scale of 0 to 1 (age-group diversity of local population compared to the national population)
Best
Figure 8: AARP Livability Index: Opportunity (AARP)
11
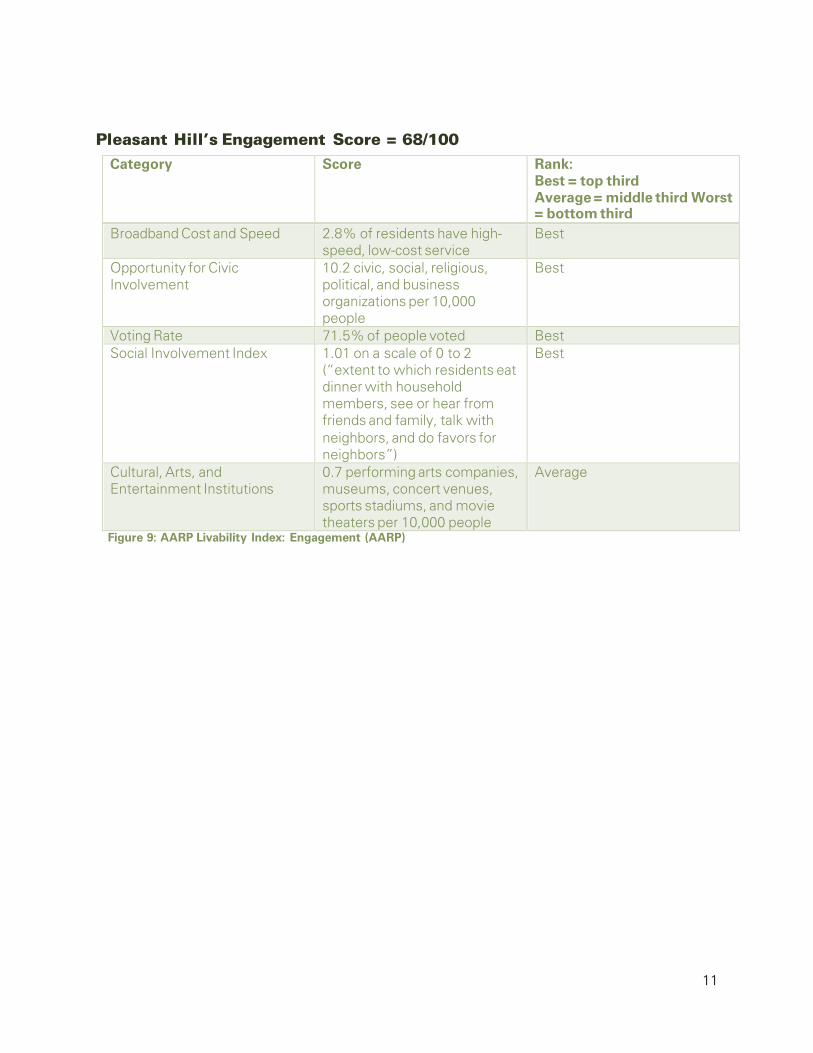
Pleasant Hill’s Engagement Score = 68/100
Category Score Rank: Best = top third Average = middle third Worst = bottom third
Broadband Cost and Speed 2.8% of residents have high-speed, low-cost service
Best
Opportunity for Civic Involvement
10.2 civic, social, religious, political, and business organizations per 10,000 people
Best
Voting Rate 71.5% of people voted Best Social Involvement Index 1.01 on a scale of 0 to 2
(“extent to which residents eat dinner with household members, see or hear from friends and family, talk with neighbors, and do favors for neighbors”)
Best
Cultural, Arts, and Entertainment Institutions
0.7 performing arts companies, museums, concert venues, sports stadiums, and movie theaters per 10,000 people
Average
Figure 9: AARP Livability Index: Engagement (AARP)
12
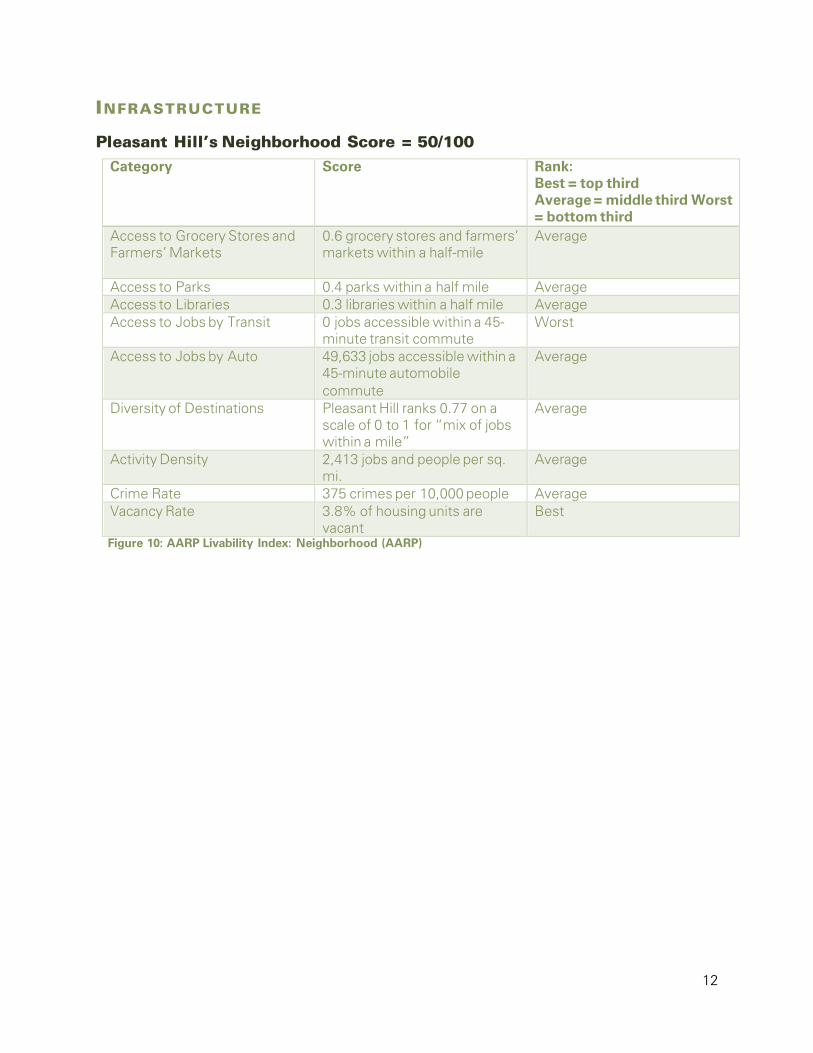
INFRASTRUCTURE
Pleasant Hill’s Neighborhood Score = 50/100
Category Score Rank: Best = top third Average = middle third Worst = bottom third
Access to Grocery Stores and Farmers’ Markets
0.6 grocery stores and farmers’ markets within a half-mile
Average
Access to Parks 0.4 parks within a half mile Average Access to Libraries 0.3 libraries within a half mile Average Access to Jobs by Transit 0 jobs accessible within a 45-
minute transit commute Worst
Access to Jobs by Auto 49,633 jobs accessible within a 45-minute automobile commute
Average
Diversity of Destinations Pleasant Hill ranks 0.77 on a scale of 0 to 1 for “mix of jobs within a mile”
Average
Activity Density 2,413 jobs and people per sq. mi.
Average
Crime Rate 375 crimes per 10,000 people Average Vacancy Rate 3.8% of housing units are
vacant Best
Figure 10: AARP Livability Index: Neighborhood (AARP)
13
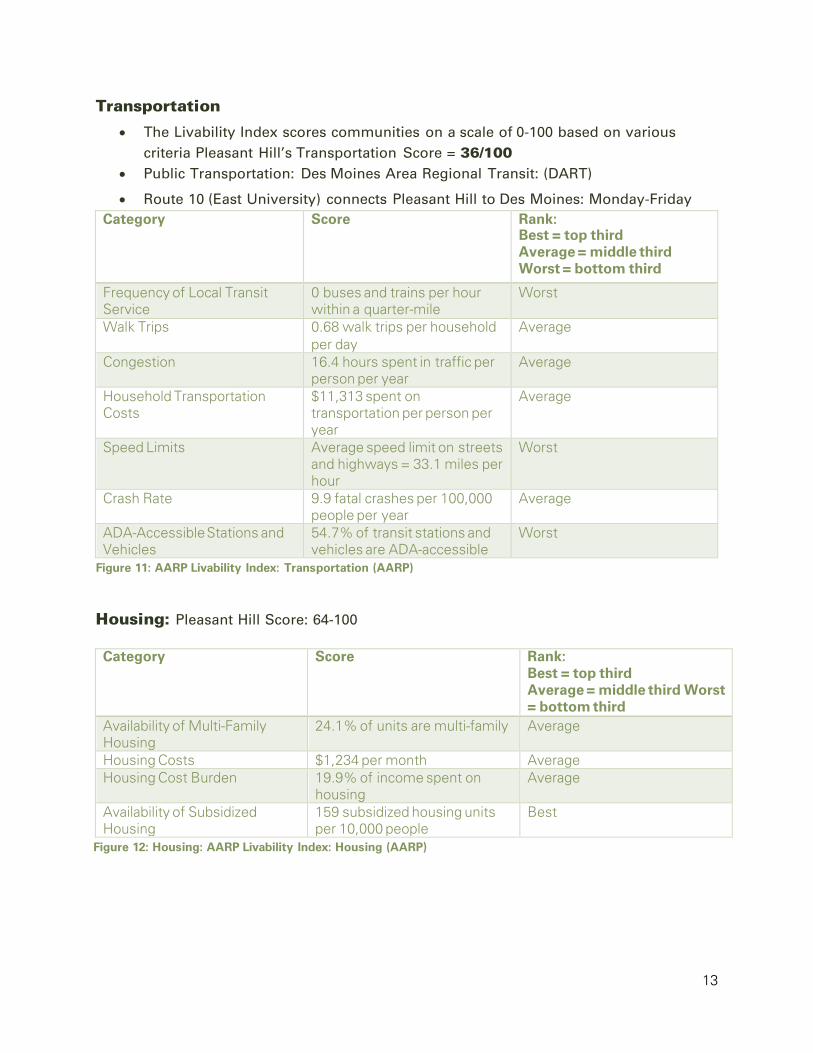
Transportation
• The Livability Index scores communities on a scale of 0-100 based on various criteria Pleasant Hill’s Transportation Score = 36/100
• Public Transportation: Des Moines Area Regional Transit: (DART)
• Route 10 (East University) connects Pleasant Hill to Des Moines: Monday-Friday
Housing: Pleasant Hill Score: 64-100
Category Score Rank: Best = top third Average = middle third Worst = bottom third
Frequency of Local Transit Service
0 buses and trains per hour within a quarter-mile
Worst
Walk Trips 0.68 walk trips per household per day
Average
Congestion 16.4 hours spent in traffic per person per year
Average
Household Transportation Costs
$11,313 spent on transportation per person per year
Average
Speed Limits Average speed limit on streets and highways = 33.1 miles per hour
Worst
Crash Rate 9.9 fatal crashes per 100,000 people per year
Average
ADA-Accessible Stations and Vehicles
54.7% of transit stations and vehicles are ADA-accessible
Worst
Figure 11: AARP Livability Index: Transportation (AARP)
Category Score Rank: Best = top third Average = middle third Worst = bottom third
Availability of Multi-Family Housing
24.1% of units are multi-family Average
Housing Costs $1,234 per month Average Housing Cost Burden 19.9% of income spent on
housing Average
Availability of Subsidized Housing
159 subsidized housing units per 10,000 people
Best
Figure 12: Housing: AARP Livability Index: Housing (AARP)
14
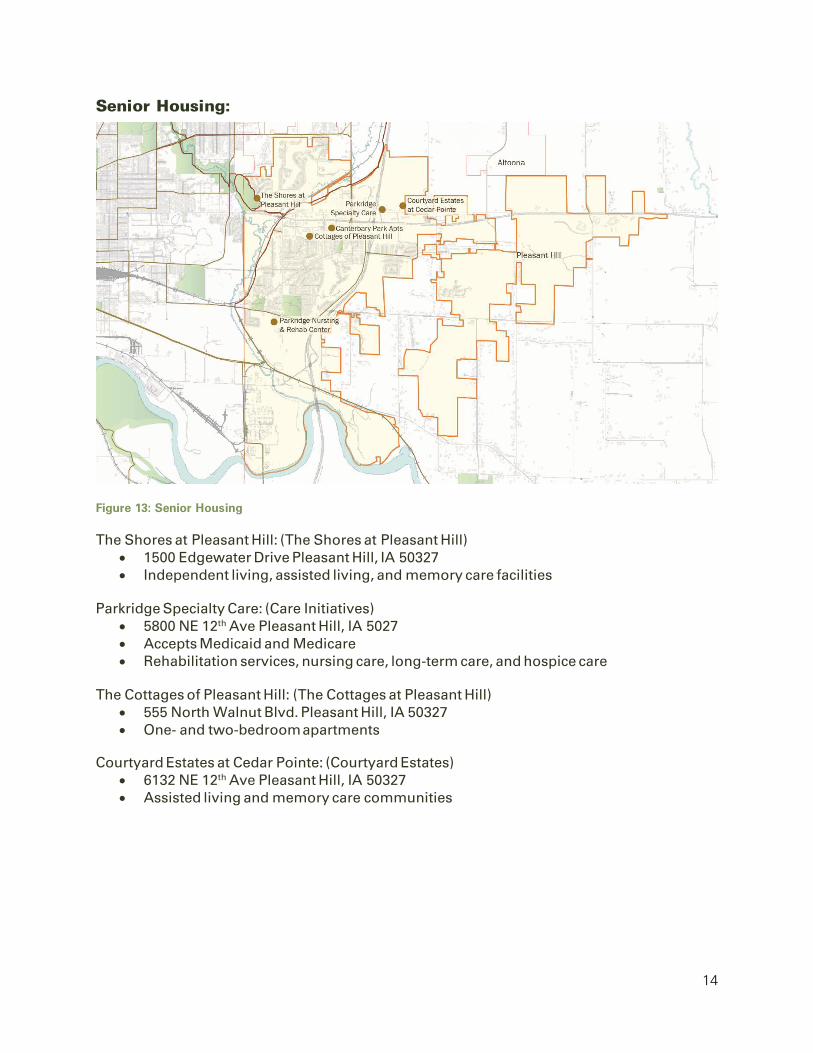
Senior Housing:
Figure 13: Senior Housing
The Shores at Pleasant Hill: (The Shores at Pleasant Hill) • 1500 Edgewater Drive Pleasant Hill, IA 50327 • Independent living, assisted living, and memory care facilities
Parkridge Specialty Care: (Care Initiatives)
• 5800 NE 12th Ave Pleasant Hill, IA 5027 • Accepts Medicaid and Medicare • Rehabilitation services, nursing care, long-term care, and hospice care
The Cottages of Pleasant Hill: (The Cottages at Pleasant Hill)
• 555 North Walnut Blvd. Pleasant Hill, IA 50327 • One- and two-bedroom apartments
Courtyard Estates at Cedar Pointe: (Courtyard Estates)
• 6132 NE 12th Ave Pleasant Hill, IA 50327 • Assisted living and memory care communities
15
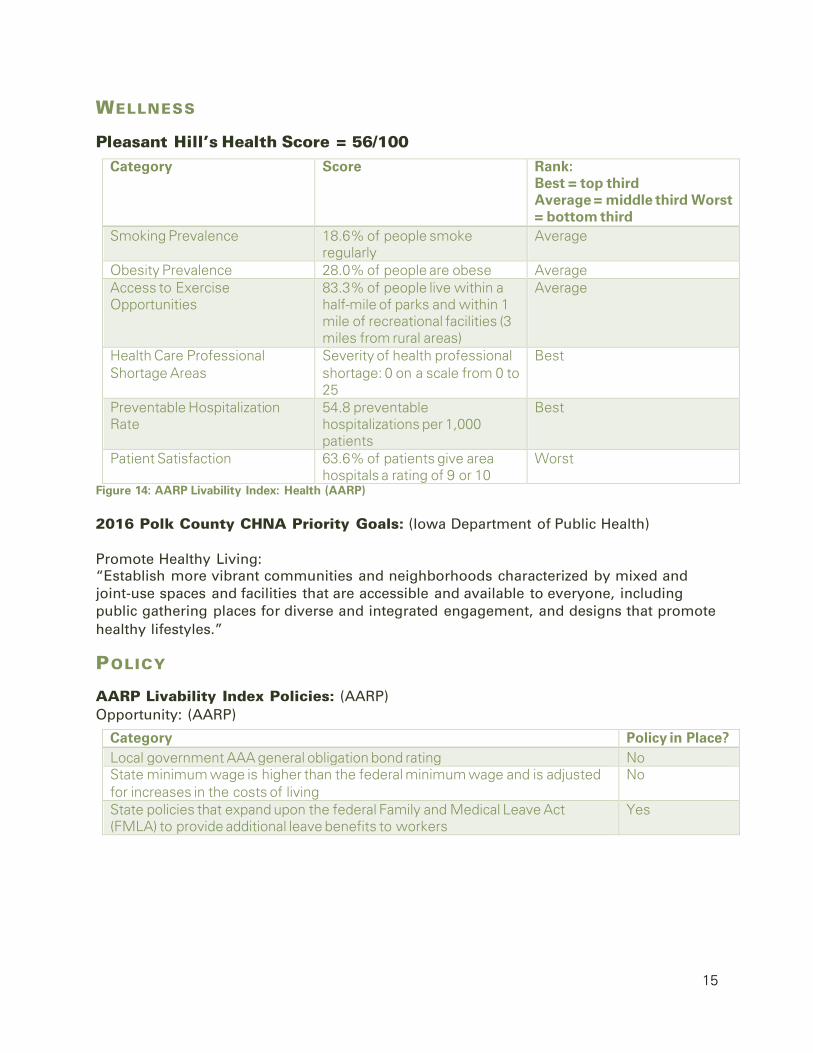
WELLNESS
Pleasant Hill’s Health Score = 56/100 Category Score Rank:
Best = top third Average = middle third Worst = bottom third
Smoking Prevalence 18.6% of people smoke regularly
Average
Obesity Prevalence 28.0% of people are obese Average Access to Exercise Opportunities
83.3% of people live within a half-mile of parks and within 1 mile of recreational facilities (3 miles from rural areas)
Average
Health Care Professional Shortage Areas
Severity of health professional shortage: 0 on a scale from 0 to 25
Best
Preventable Hospitalization Rate
54.8 preventable hospitalizations per 1,000 patients
Best
Patient Satisfaction 63.6% of patients give area hospitals a rating of 9 or 10
Worst
Figure 14: AARP Livability Index: Health (AARP)
2016 Polk County CHNA Priority Goals: (Iowa Department of Public Health) Promote Healthy Living: “Establish more vibrant communities and neighborhoods characterized by mixed and joint-use spaces and facilities that are accessible and available to everyone, including public gathering places for diverse and integrated engagement, and designs that promote healthy lifestyles.”
POLICY
AARP Livability Index Policies: (AARP) Opportunity: (AARP)
Category Policy in Place? Local government AAA general obligation bond rating No State minimum wage is higher than the federal minimum wage and is adjusted for increases in the costs of living
No
State policies that expand upon the federal Family and Medical Leave Act (FMLA) to provide additional leave benefits to workers
Yes
16
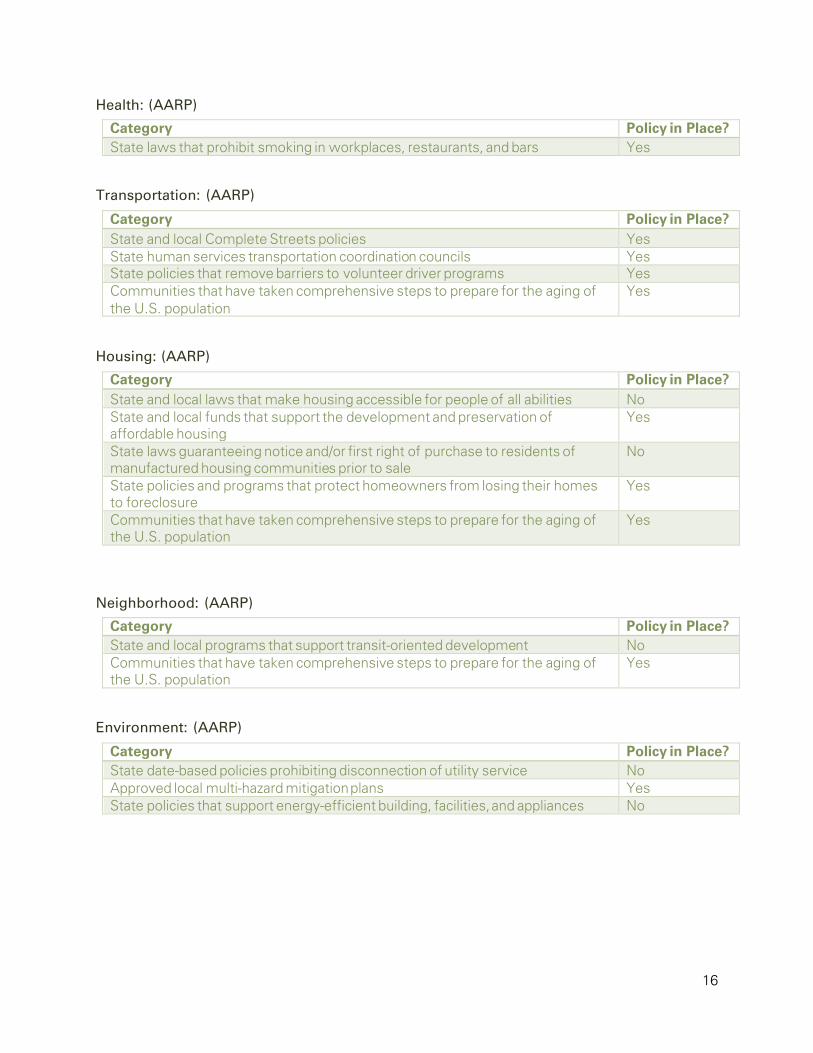
Health: (AARP)
Category Policy in Place? State laws that prohibit smoking in workplaces, restaurants, and bars Yes
Transportation: (AARP)
Category Policy in Place? State and local Complete Streets policies Yes State human services transportation coordination councils Yes State policies that remove barriers to volunteer driver programs Yes Communities that have taken comprehensive steps to prepare for the aging of the U.S. population
Yes
Housing: (AARP)
Category Policy in Place? State and local laws that make housing accessible for people of all abilities No State and local funds that support the development and preservation of affordable housing
Yes
State laws guaranteeing notice and/or first right of purchase to residents of manufactured housing communities prior to sale
No
State policies and programs that protect homeowners from losing their homes to foreclosure
Yes
Communities that have taken comprehensive steps to prepare for the aging of the U.S. population
Yes
Neighborhood: (AARP)
Category Policy in Place? State and local programs that support transit-oriented development No Communities that have taken comprehensive steps to prepare for the aging of the U.S. population
Yes
Environment: (AARP)
Category Policy in Place? State date-based policies prohibiting disconnection of utility service No Approved local multi-hazard mitigation plans Yes State policies that support energy-efficient building, facilities, and appliances No
17
This section provides an overview of community projects, programs, businesses, etc. that involve the science, art, or occupation that involves cultivating land, raising crops, hunting, fishing, foraging or farming.
Community Conclusions/ priority project development:
• Occupation and Workforce Development
Promote partnerships with organizations and businesses that need agriculture and landscape skills. This will include two components: first, a hands on training strategy for landscape and agriculture, and second, collaboration with Veterans in Agriculture in their pursuit to develop a farming apprenticeship program.
• Agrihood Development
Create a new neighborhood development strategy centered on agriculture and open space. The development will support beginning farmer programs, provide connections to natural resources and the food system, promote community gathering space, and provide opportunities for education and events.
While many production opportunities exist in surrounding communities, this assessment focuses on capacity and existing production options within the city of Pleasant Hill. In addition to priority projects, the City of Pleasant Hill determined that there are potentials for additional community gardens and edible landscapes. Due to capacity and investment from the city, a future priority is to dedicate time and resources to establishing different pubic opportunities to offer access to healthy foods. These additional resources will help build momentum for both priority projects that the coalition has determined as well as potential collaborations in the future with new organizations. The public expressed a high value in having both educational programs as well as land to garden, and these efforts will help promote those interests and concerns.
Next steps to incorporate production capacity for both priority projects are to assess potential sites for an agrihood development and begin to create a strategic plan and dynamic team to work through a unique and place-based design opportunity. Similarly, a team will be established to work towards educational opportunities for mentorship, certification and potential apprenticeship programs to support individuals that desire to farm.
18
RESIDENTIAL GARDENS Backyard gardening allows for the integration of food plants with ornamental plants for an aesthetic setting. By incorporating both types of plants, a garden becomes productive as well as beautiful; leading to added health benefits, stress reduction, and personal financial stability. With the incorporation of fruits, vegetables, herbs and beautiful perennials and annuals, your space is sure to have practical and flavorful results. There are numerous types of gardening that can be used at any scale from the backyard to city streets. Gardening is a great way to introduce healthy, fresh plants into family lifestyle at home as well as grow food for those in need. Community Discussion:
• Education on how and where to start gardens in my yard • Community compost- I have lots of food scraps and would like to not throw away • Of course, everywhere: Victory gardens ReDUX- make it fashionable and
affordable • How to garden topics
Education:
Master Gardener programs are offered through Polk County Extension and are available for Pleasant Hill residents. There is interest from the community to develop additional city education programs that involve how-to topics of gardening and composting.
o DNR’s “Edible Outdoors” Program: (Edible Outdoors) Group learning about foraging, hunting, and fishing Offered in Des Moines Events such as “Foraging for Mushrooms”, “River Fishing”, or
“Becoming an Outdoors-Woman Workshop” Contact: [email protected]
Wellness:
Safe food, exercise, and gardens are shown to assist with stress reduction; children who eat homegrown fruits and vegetables eat twice the amount of these foods than kids who seldom get fresh fruits and vegetables.
Policy:
The city has been considering options for policy change to include opportunities in areas of the city for chickens and backyard/urban agriculture components. Limitations can be set for front yard and forms of residential gardening to help with aesthetics or safety concerns (Taylor and Vaage, Municipal Zoning for Local Foods in Iowa: A Guidebook for Reducing Local Regulatory Barriers to Local Foods). Additionally, chickens, bees, and other small livestock are growing in popularity and desire in residential neighborhoods. Noise concerns, odors, and safety come into concern with neighbors for these reasons. Options for permitting include involving departments of animal safety, or requiring certain restrictions within zoning code. (Taylor and Vaage, Municipal Zoning for Local Foods in Iowa: A Guidebook for Reducing Local Regulatory Barriers to Local Foods)
19
FAITH GARDENS Faith-Based Gardens are similar to community gardens, with particular faith-based affiliations. Common motivations include feeding the hungry, building community, and creating multi-generational and cultural connections. Many gardens offer produce to their volunteers or congregation members in need, and several also donate produce to food pantries in the community. These gardens typically are focused on creating therapeutic spaces for individuals to relax and contemplate life, allowing for people to feel a part of something larger than themselves. Often, faith-based affiliations will connect with businesses outside of the church for participation and or training opportunities such as refugee farming, high-school internships, master-gardeners volunteers, etc. Environment:
Environmental diversity and awareness, promotes therapeutic space
Equity:
Faith gardens can help promote food security for individuals within the congregation or general community. Many gardens donate produce to those that are in need, or provide space for individuals to grow for themselves.
Wellness:
Therapeutic space can help relieve stress; faith gardens create opportunities for volunteerism, volunteering has been shown to develop community capacity and ownership in the community as well as increase social and relationship skills and benefit the mind.
20
CORPORATE GARDENS
Corporate gardens can assist and help establish healthy habits for employees and administration within a company and promote sustainable wellness for the community. Many corporate gardens allow for employees to take home product. Large corporations like PepsiCo to small town neighborhood businesses incorporate gardens for various reasons: lunchtime getaway, health benefits, or fashionable perks. Several employee wellness opportunities can occur such as nutritional awareness, mental health, and physical health. Corporate gardens are options to give back to employees and improve quality of life. Gardens can take on many different looks like any community garden- rent for space, corporate giving gardens, or community space to grow and work together free of charge.
Equity:
Corporate gardens can assist in providing access to land for growing personal food
Education:
Promotion of nutritional, mental and physical health (Corporate Garden Coach)
Wellness:
Best practices on employee betterment programs – also identified opportunities for employees to get involved in wellness programs. Assists in providing emotional and beneficial mental peace. Gardens have been shown to improve health by decreasing blood pressure, reducing hear rate, relieving muscle tension, decreasing patients’ perception of pain, and improving mood. (Cass County Health System Foundation)
Economy:
Hy-Vee One Step Community Produce Garden- gives back to the community through donations of everyday foods to charitable causes. They also have grant awards for up to $1,000, typically grant applications close in late January or early February.
21
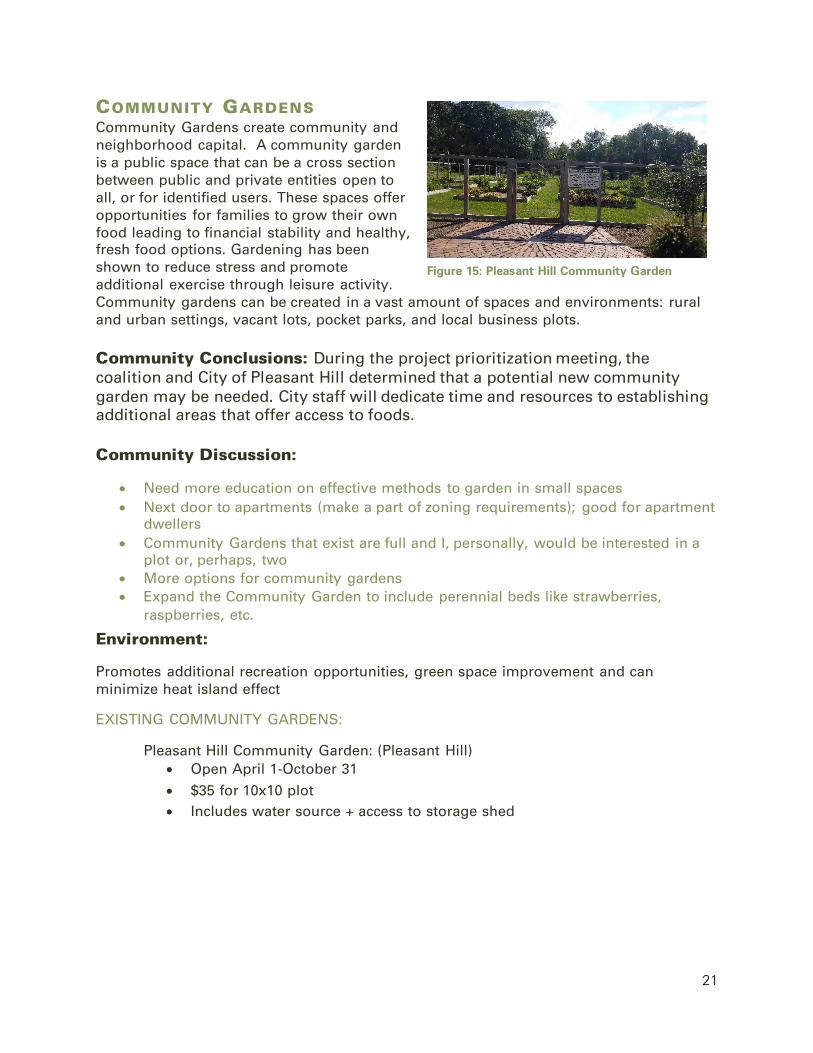
COMMUNITY GARDENS Community Gardens create community and neighborhood capital. A community garden is a public space that can be a cross section between public and private entities open to all, or for identified users. These spaces offer opportunities for families to grow their own food leading to financial stability and healthy, fresh food options. Gardening has been shown to reduce stress and promote additional exercise through leisure activity. Community gardens can be created in a vast amount of spaces and environments: rural and urban settings, vacant lots, pocket parks, and local business plots. Community Conclusions: During the project prioritization meeting, the coalition and City of Pleasant Hill determined that a potential new community garden may be needed. City staff will dedicate time and resources to establishing additional areas that offer access to foods. Community Discussion:
• Need more education on effective methods to garden in small spaces • Next door to apartments (make a part of zoning requirements); good for apartment
dwellers • Community Gardens that exist are full and I, personally, would be interested in a
plot or, perhaps, two • More options for community gardens • Expand the Community Garden to include perennial beds like strawberries,
raspberries, etc.
Environment:
Promotes additional recreation opportunities, green space improvement and can minimize heat island effect
EXISTING COMMUNITY GARDENS:
Pleasant Hill Community Garden: (Pleasant Hill) • Open April 1-October 31
• $35 for 10x10 plot • Includes water source + access to storage shed
Figure 15: Pleasant Hill Community Garden
22
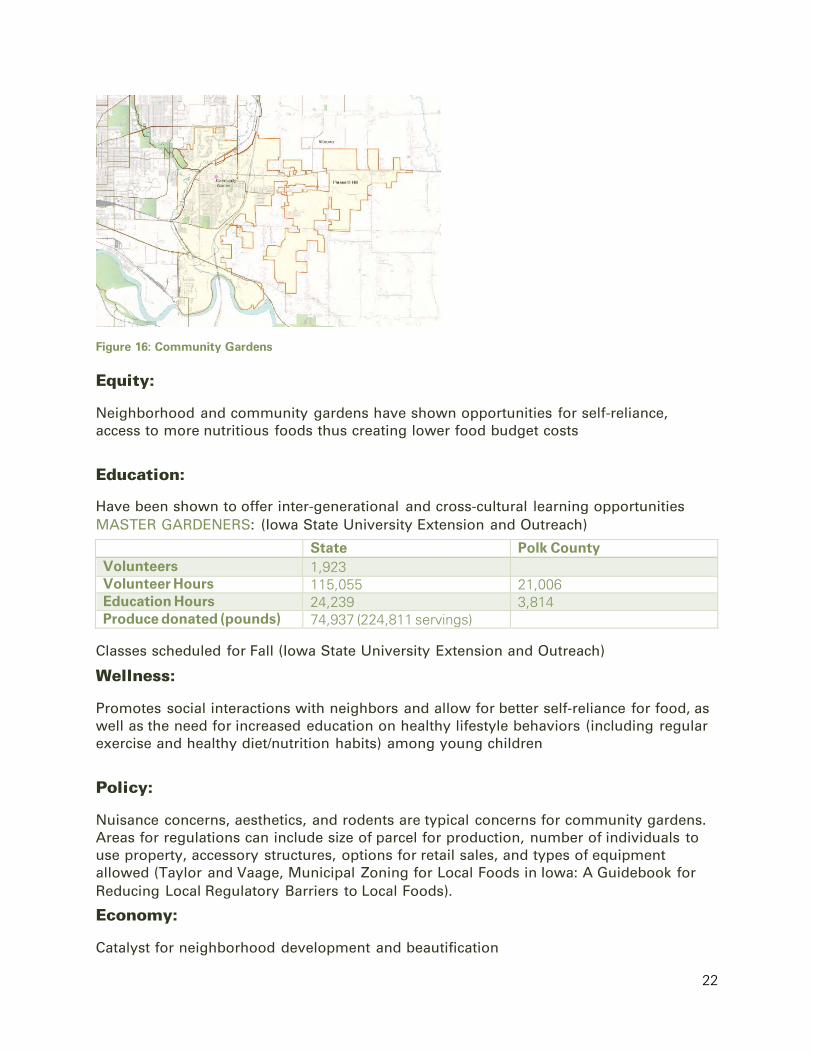
Figure 16: Community Gardens
Equity:
Neighborhood and community gardens have shown opportunities for self-reliance, access to more nutritious foods thus creating lower food budget costs
Education:
Have been shown to offer inter-generational and cross-cultural learning opportunities MASTER GARDENERS: (Iowa State University Extension and Outreach)
State Polk County Volunteers 1,923 Volunteer Hours 115,055 21,006 Education Hours 24,239 3,814 Produce donated (pounds) 74,937 (224,811 servings)
Classes scheduled for Fall (Iowa State University Extension and Outreach)
Wellness:
Promotes social interactions with neighbors and allow for better self-reliance for food, as well as the need for increased education on healthy lifestyle behaviors (including regular exercise and healthy diet/nutrition habits) among young children
Policy:
Nuisance concerns, aesthetics, and rodents are typical concerns for community gardens. Areas for regulations can include size of parcel for production, number of individuals to use property, accessory structures, options for retail sales, and types of equipment allowed (Taylor and Vaage, Municipal Zoning for Local Foods in Iowa: A Guidebook for Reducing Local Regulatory Barriers to Local Foods).
Economy:
Catalyst for neighborhood development and beautification
23
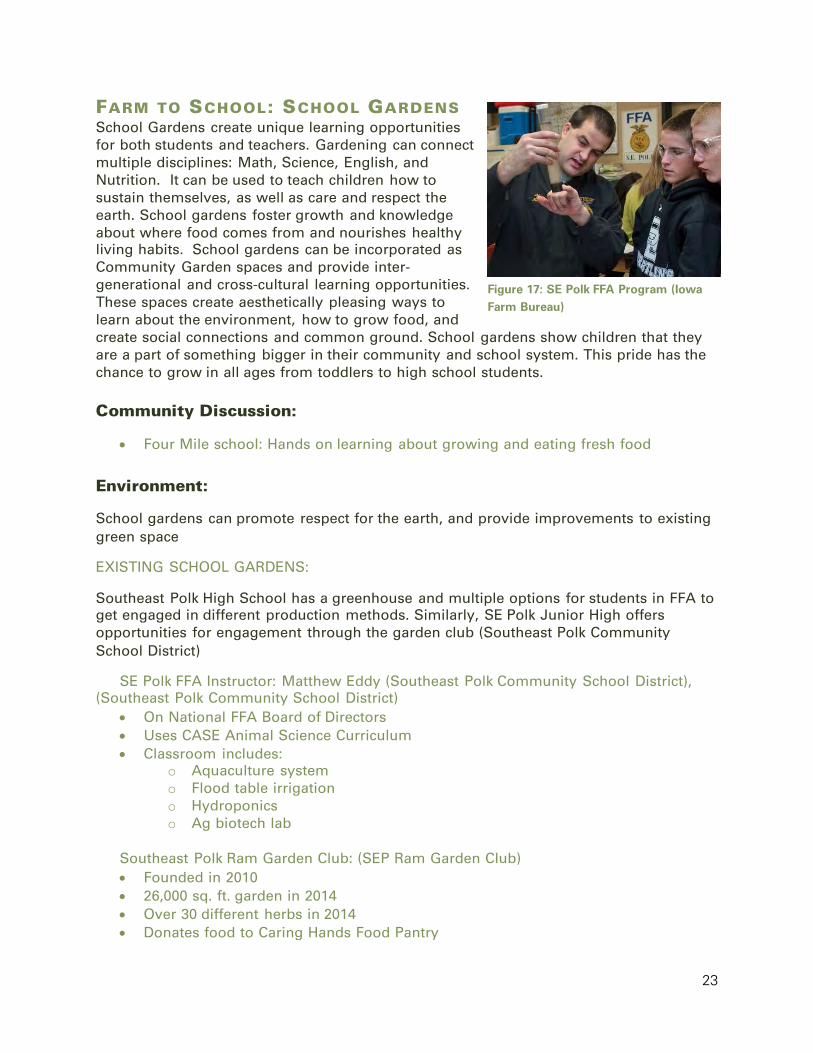
FARM TO SCHOOL: SCHOOL GARDENS School Gardens create unique learning opportunities for both students and teachers. Gardening can connect multiple disciplines: Math, Science, English, and Nutrition. It can be used to teach children how to sustain themselves, as well as care and respect the earth. School gardens foster growth and knowledge about where food comes from and nourishes healthy living habits. School gardens can be incorporated as Community Garden spaces and provide inter-generational and cross-cultural learning opportunities. These spaces create aesthetically pleasing ways to learn about the environment, how to grow food, and create social connections and common ground. School gardens show children that they are a part of something bigger in their community and school system. This pride has the chance to grow in all ages from toddlers to high school students. Community Discussion:
• Four Mile school: Hands on learning about growing and eating fresh food
Environment:
School gardens can promote respect for the earth, and provide improvements to existing green space
EXISTING SCHOOL GARDENS:
Southeast Polk High School has a greenhouse and multiple options for students in FFA to get engaged in different production methods. Similarly, SE Polk Junior High offers opportunities for engagement through the garden club (Southeast Polk Community School District)
SE Polk FFA Instructor: Matthew Eddy (Southeast Polk Community School District), (Southeast Polk Community School District)
• On National FFA Board of Directors • Uses CASE Animal Science Curriculum • Classroom includes:
o Aquaculture system o Flood table irrigation o Hydroponics o Ag biotech lab
Southeast Polk Ram Garden Club: (SEP Ram Garden Club) • Founded in 2010 • 26,000 sq. ft. garden in 2014 • Over 30 different herbs in 2014 • Donates food to Caring Hands Food Pantry
Figure 17: SE Polk FFA Program (Iowa Farm Bureau)
24
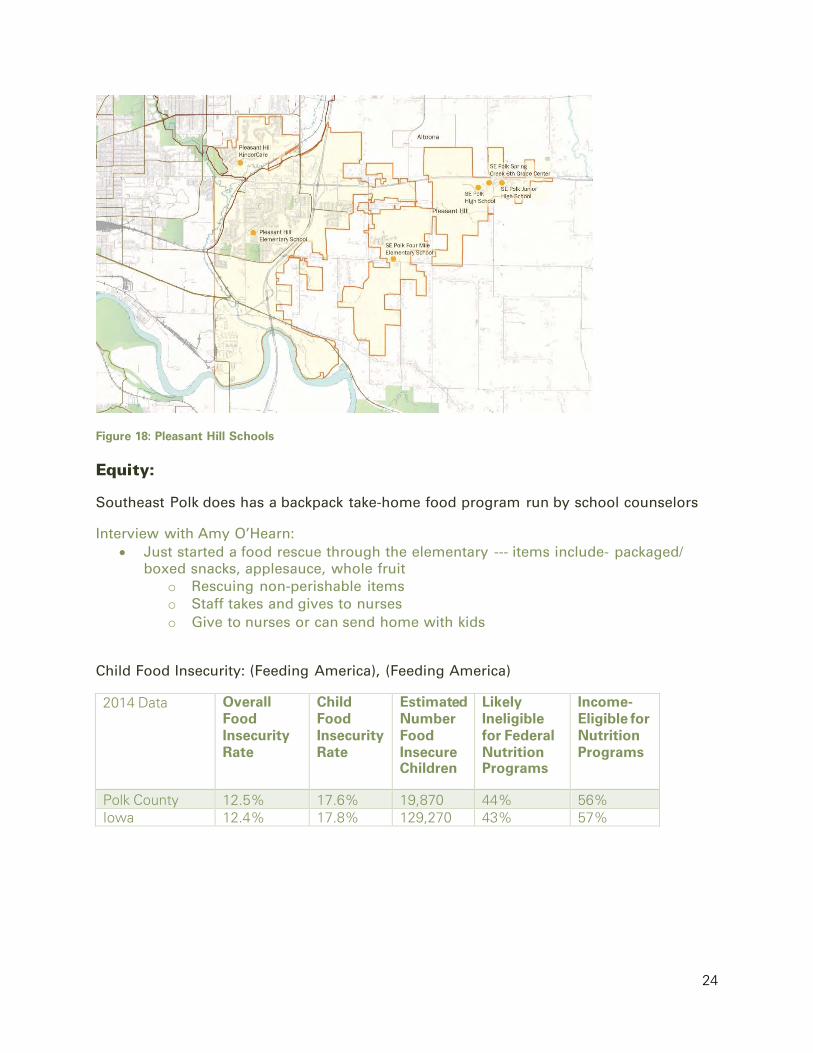
Figure 18: Pleasant Hill Schools
Equity:
Southeast Polk does has a backpack take-home food program run by school counselors
Interview with Amy O’Hearn: • Just started a food rescue through the elementary --- items include- packaged/
boxed snacks, applesauce, whole fruit o Rescuing non-perishable items o Staff takes and gives to nurses o Give to nurses or can send home with kids
Child Food Insecurity: (Feeding America), (Feeding America)
2014 Data Overall Food Insecurity Rate
Child Food Insecurity Rate
Estimated Number Food Insecure Children
Likely Ineligible for Federal Nutrition Programs
Income-Eligible for Nutrition Programs
Polk County 12.5% 17.6% 19,870 44% 56% Iowa 12.4% 17.8% 129,270 43% 57%
25
Education:
Provides numerous learning opportunities for children in schools including learning where food comes from; they also help develop responsibility and nurturing skills. Working in the garden can also build pride in individuals. Evidence has shown that students who participate in school gardens score higher on standardized tests.
o Southeast Polk FFA o SEP Junior High Garden Club: Garden Flex Class - garden and greenhouse o Altoona Kids Café: (Altoona Kids Cafe)
o Serves lunch to Southeast Polk Elementary kids during summers o Provides enrichment and fun activities for kids o Partners with local food bank, Caring Hands Outreach
A Garden is the Way to Grow is a two-year Initiative offers schools $400 to purchase composting supplies along with educational materials to teach lessons on science, math and reading in their gardens. (Hohenshell, Local Foods Program )
Wellness:
Opportunities to try new fruits and vegetables with unique curriculum. Youth Consuming at Least 5 Fruits/Day (The University of Iowa)
Units: Percentage 6th Grade 8th Grade 11th Grade All Grades County Males 9% 6% 7% 8% County Females 8% 5% 4% 6% State Males 9% 7% 5% 7% State Females 7% 5% 4% 6%
Youth Consuming at Least 5 Vegetables/Day (The University of Iowa)
Units: Percentage 6th Grade 8th Grade 11th Grade All Grades County Results Males 7% 5% 5% 6% County Results Females 5% 3% 3% 4% State of Iowa Results Males 5% 5% 4% 5% State of Iowa Results Females 5% 4% 3% 4%
Policy:
A new mandate for all schools with federally funded meal programs went into effect June 30, 2017 for school wellness policies. School wellness policies guide educational agencies in their efforts to support nutrition and physical activity requirements (Hohenshell and Long, Iowa State University Local Foods Program). Policies can include connection to curriculum for school gardens and the environment.
26
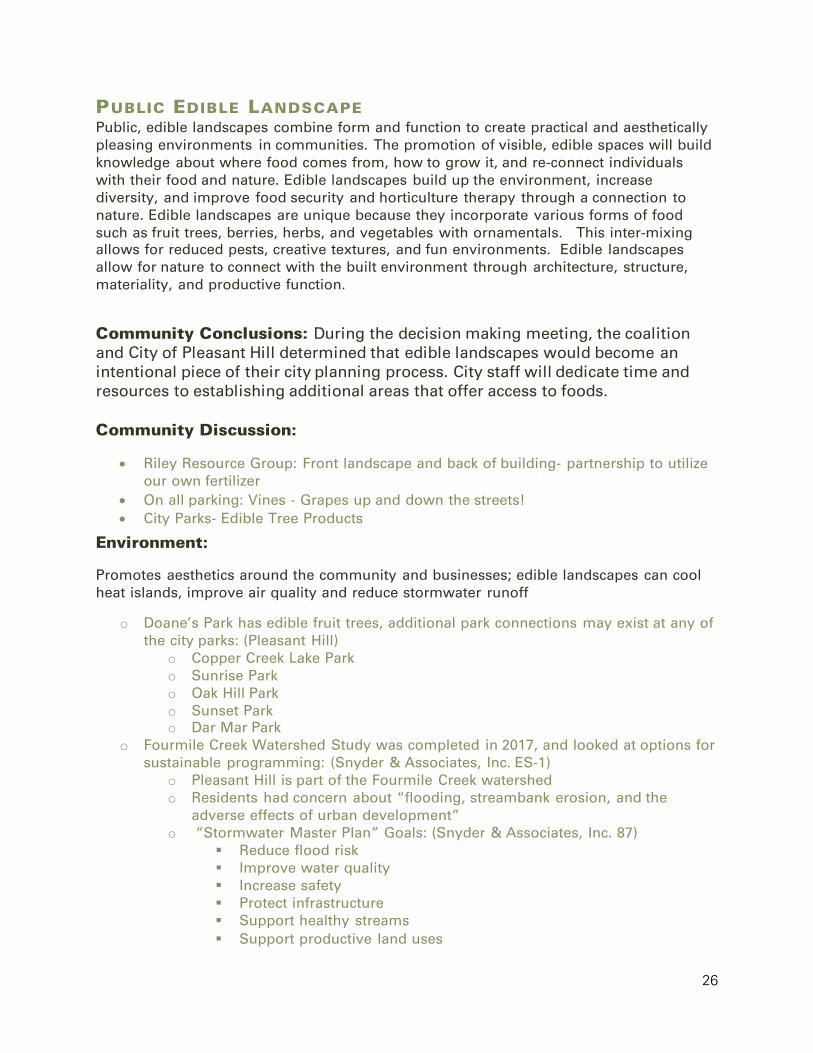
PUBLIC EDIBLE LANDSCAPE Public, edible landscapes combine form and function to create practical and aesthetically pleasing environments in communities. The promotion of visible, edible spaces will build knowledge about where food comes from, how to grow it, and re-connect individuals with their food and nature. Edible landscapes build up the environment, increase diversity, and improve food security and horticulture therapy through a connection to nature. Edible landscapes are unique because they incorporate various forms of food such as fruit trees, berries, herbs, and vegetables with ornamentals. This inter-mixing allows for reduced pests, creative textures, and fun environments. Edible landscapes allow for nature to connect with the built environment through architecture, structure, materiality, and productive function.
Community Conclusions: During the decision making meeting, the coalition and City of Pleasant Hill determined that edible landscapes would become an intentional piece of their city planning process. City staff will dedicate time and resources to establishing additional areas that offer access to foods. Community Discussion:
• Riley Resource Group: Front landscape and back of building- partnership to utilize our own fertilizer
• On all parking: Vines - Grapes up and down the streets! • City Parks- Edible Tree Products
Environment:
Promotes aesthetics around the community and businesses; edible landscapes can cool heat islands, improve air quality and reduce stormwater runoff
o Doane’s Park has edible fruit trees, additional park connections may exist at any of the city parks: (Pleasant Hill)
o Copper Creek Lake Park o Sunrise Park o Oak Hill Park o Sunset Park o Dar Mar Park
o Fourmile Creek Watershed Study was completed in 2017, and looked at options for sustainable programming: (Snyder & Associates, Inc. ES-1)
o Pleasant Hill is part of the Fourmile Creek watershed o Residents had concern about “flooding, streambank erosion, and the
adverse effects of urban development” o “Stormwater Master Plan” Goals: (Snyder & Associates, Inc. 87)
Reduce flood risk Improve water quality Increase safety Protect infrastructure Support healthy streams Support productive land uses
27
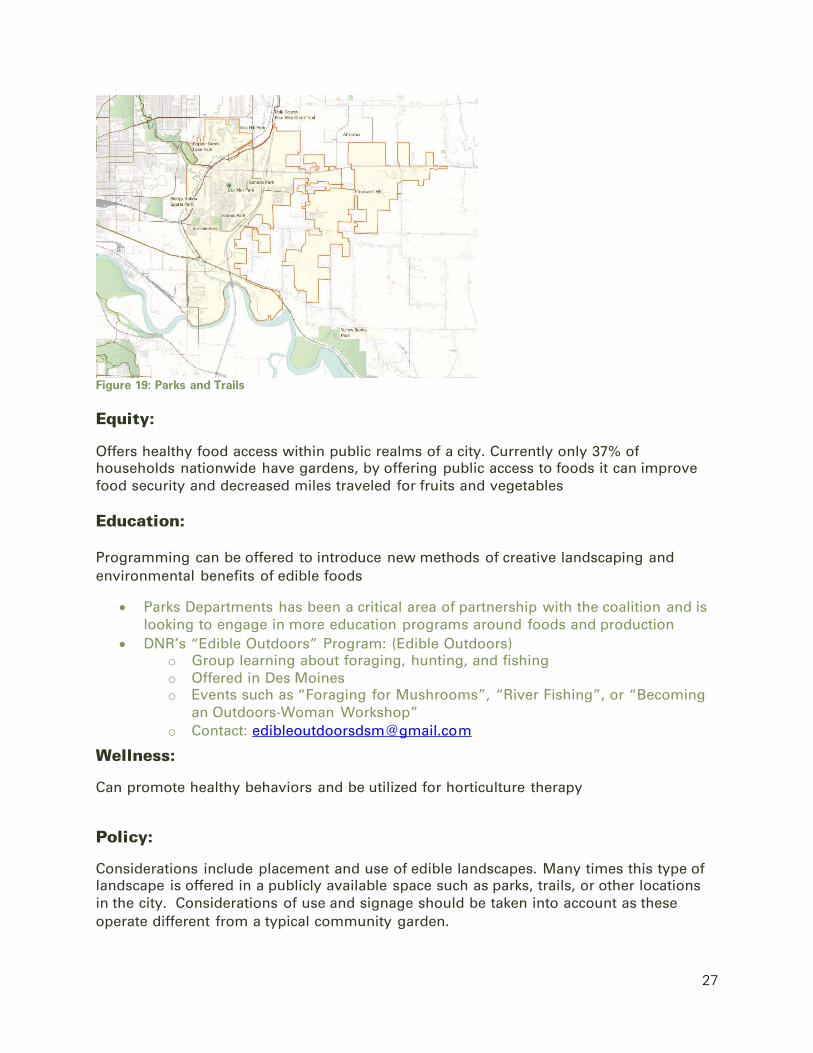
Figure 19: Parks and Trails
Equity:
Offers healthy food access within public realms of a city. Currently only 37% of households nationwide have gardens, by offering public access to foods it can improve food security and decreased miles traveled for fruits and vegetables Education: Programming can be offered to introduce new methods of creative landscaping and environmental benefits of edible foods
• Parks Departments has been a critical area of partnership with the coalition and is looking to engage in more education programs around foods and production
• DNR’s “Edible Outdoors” Program: (Edible Outdoors) o Group learning about foraging, hunting, and fishing o Offered in Des Moines o Events such as “Foraging for Mushrooms”, “River Fishing”, or “Becoming
an Outdoors-Woman Workshop” o Contact: [email protected]
Wellness:
Can promote healthy behaviors and be utilized for horticulture therapy
Policy:
Considerations include placement and use of edible landscapes. Many times this type of landscape is offered in a publicly available space such as parks, trails, or other locations in the city. Considerations of use and signage should be taken into account as these operate different from a typical community garden.
28
INCUBATOR FARMS:
Incubator farms aim to assist new and beginning farmer entrepreneurs in establishing their own successful business. Incubator farms typically train on successful business tactics and provide resources and services that are typically expensive or difficult to come by for start-up entrepreneurs on their own. Many forms of incubator farms exist, but all rely on land-based areas for training, and include multiple-growers on site. Additionally, trainers and experts can be housed or consulted to teach various technical practices of farming.
Community Conclusions: During the prioritization meeting, the coalition determined that having an agrihood (neighborhood development, discussed in the next section), would be an appropriate place-making project for the community. Within this development, the goal includes an incubator farm that offers certification or apprenticeship for diversified farming. This apprenticeship program is being developed within the workforce development team.
Community Discussion:
• Since we have open areas not developed this would be the first one • New developments: zoning changes • Mandate: butterfly, bugs, open spaces, gardens-- in new development • Agrihoods
Interviews with topic:
Cherry Glen Learning Farm- Ray Meylor: Owns urban farm in Ankeny Iowa and operates as a For-Profit/ Non-profit. There are potentials for collaboration
• Goal to teach other farmers how to develop land under water-mitigation design • Interested in purchasing and then give opportunity to beginning farmers to have
option to buy or lease to own • Goal to be in the watershed/ not necessarily flood plain • Stay away from stream bed-- hardwoods start with, then go through to perennials/
vines, then have gardens on higher ground • 3 acres/ 6 acres--- or an existing farmer that has site • Have visited with other sites -- $90,000 per acre; has offered $20-30,000; but
because at commercial tax rate; would need to change to agricultural tax rate o No input cost to grow-- saving $1600 just in terms of water value o High product cost
Equity:
Options to partner with Veterans in Agriculture has been discussed as a potential way to build new ways for Veterans to have access to land and training for farm management
29
Education:
Veterans in Agriculture and the Workforce Development project team are working to create a new apprenticeship program that will be the first of its kind in Iowa. This will allow for on-the-job training and curriculum to be taught in partnership with state community colleges.
Policy:
Apprenticeship programs must be authorized and registered with the Department of Labor for Veterans to use their GI Bill for educational credit. Additionally, by having a registered apprenticeship program, there are many options for funding and additional incentives for organizing agencies. Additional policies that may need to be considered are land use codes and ordinances depending on the location and ownership of the incubator farm.
Economy:
Incubator farms are typically established to help start new farming businesses. They may assist in developing new business markets such as food hubs or distribution potential, or they may offer business development training for individuals enrolled in the programs offered.
30
URBAN FARMS Urban farms use urban land to maximize local food outputs and assists in meeting needs for local food production and community food security. This contributes to the safety, health, and diversity of environments, and also promotes economic growth by keeping local dollars within the community. Urban farming enhances the community by providing a sustainable food source within city limits develops community capacity; and improves health through access to nutritious food and exercise opportunities. Farming in the city enhances the built environment through the incorporation of soft and open spaces and also benefits the air quality, bio-diversity, soil quality and overall enhancement of city aesthetics. Community Discussion:
• Preparing for a crisis, with neighborhood greenhouse • Altoona's Facebook Development Area; use all the heat that comes off those
buildings to heat greenhouses and grow winter veggies!
Environment:
Urban farms can assist in mitigating soil erosion in urban centers; they also assist in decreasing the carbon footprint by lowering the amount of miles traveled to market. Food related emissions account for 21% of total emissions: consumer activity (traveling to grocery store/ dining out) accounts for 46%- connecting to urban food systems reduce these percentages. (Long, Agricultural Urbanism Toolkit)
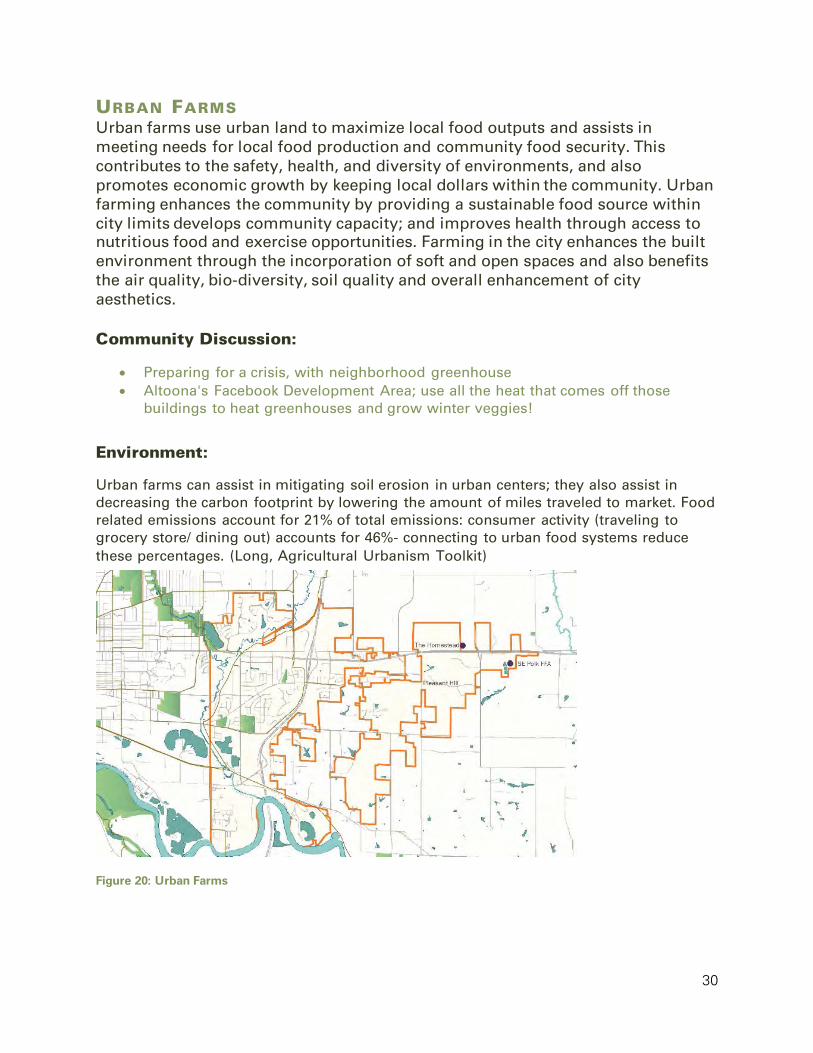
Figure 20: Urban Farms
31
“Stormwater Master Plan” Components and Strategies: (Snyder & Associates, Inc. 89)
Sustainable Urban Land Management: • Rain gardens, bioretention systems, + rainscaping • Tree + shrub plantings • Native plantings • Rain barrels
Equity:
Improving the physical space in communities allow for the community parcels to be re-used and creates safe places for community members
Wellness:
2016 Polk County CHNA Priority Goals: (Iowa Department of Public Health)
Promote Healthy Living: “Establish more vibrant communities and neighborhoods characterized by mixed and joint-use spaces and facilities that are accessible and available to everyone, including public gathering places for diverse and integrated engagement, and designs that promote healthy lifestyles.”
Policy:
Most urban farms are typically a market farm and are run by a business or organization. They typically have more intensive practices than a community garden or public edible landscape; chemicals and equipment will need to be specified for use in code language.
Economy:
Promotion of jobs in food in an unexpected location, in the middle of a city; with every $1 invested in an urban farm or garden, $6 are generated in worth of vegetables. (Long, Agricultural Urbanism Toolkit)
32
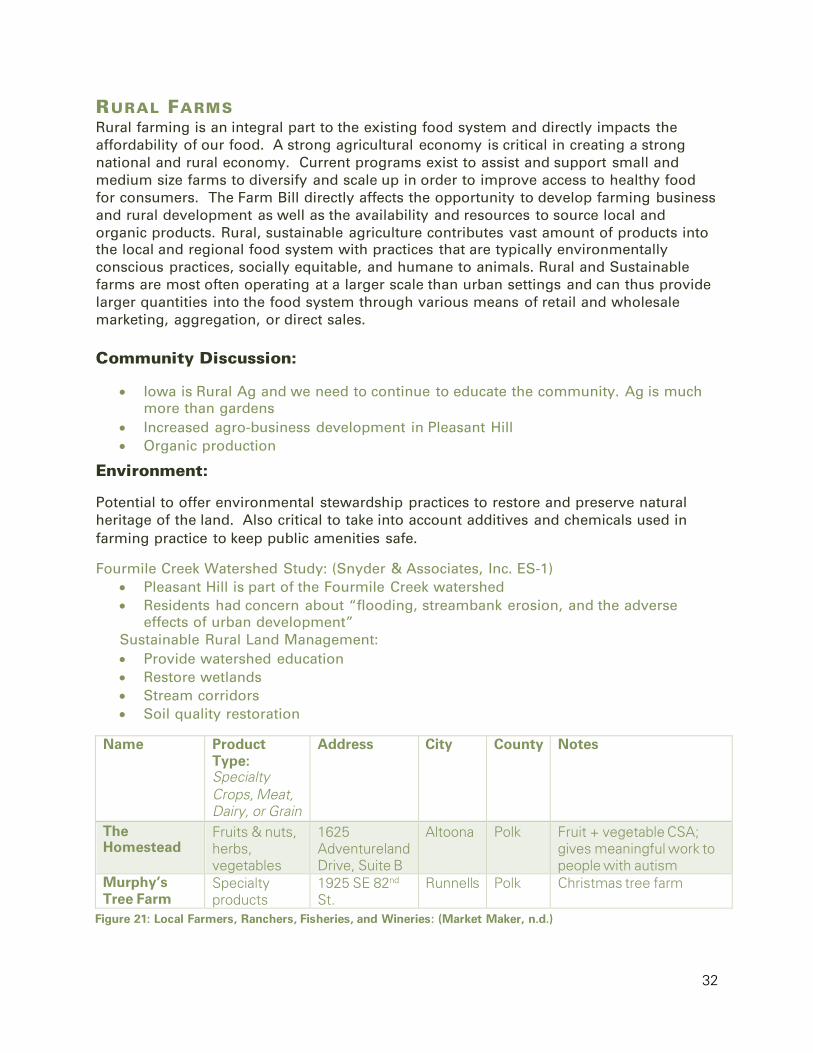
RURAL FARMS Rural farming is an integral part to the existing food system and directly impacts the affordability of our food. A strong agricultural economy is critical in creating a strong national and rural economy. Current programs exist to assist and support small and medium size farms to diversify and scale up in order to improve access to healthy food for consumers. The Farm Bill directly affects the opportunity to develop farming business and rural development as well as the availability and resources to source local and organic products. Rural, sustainable agriculture contributes vast amount of products into the local and regional food system with practices that are typically environmentally conscious practices, socially equitable, and humane to animals. Rural and Sustainable farms are most often operating at a larger scale than urban settings and can thus provide larger quantities into the food system through various means of retail and wholesale marketing, aggregation, or direct sales. Community Discussion:
• Iowa is Rural Ag and we need to continue to educate the community. Ag is much more than gardens
• Increased agro-business development in Pleasant Hill • Organic production
Environment:
Potential to offer environmental stewardship practices to restore and preserve natural heritage of the land. Also critical to take into account additives and chemicals used in farming practice to keep public amenities safe.
Fourmile Creek Watershed Study: (Snyder & Associates, Inc. ES-1) • Pleasant Hill is part of the Fourmile Creek watershed • Residents had concern about “flooding, streambank erosion, and the adverse
effects of urban development” Sustainable Rural Land Management: • Provide watershed education • Restore wetlands • Stream corridors • Soil quality restoration
Name Product Type: Specialty Crops, Meat, Dairy, or Grain
Address City County Notes
The Homestead
Fruits & nuts, herbs, vegetables
1625 Adventureland Drive, Suite B
Altoona Polk Fruit + vegetable CSA; gives meaningful work to people with autism
Murphy’s Tree Farm
Specialty products
1925 SE 82nd St.
Runnells Polk Christmas tree farm
Figure 21: Local Farmers, Ranchers, Fisheries, and Wineries: (Market Maker, n.d.)
33
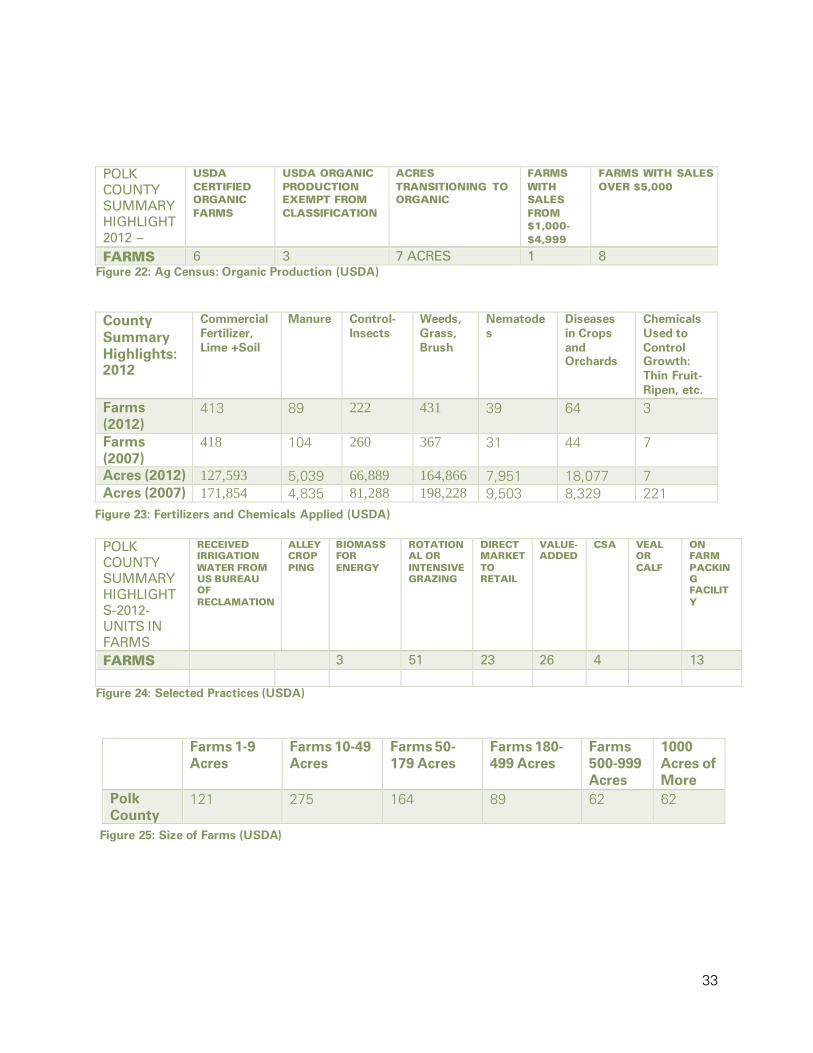
Figure 22: Ag Census: Organic Production (USDA)
POLK COUNTY SUMMARY HIGHLIGHTS-2012- UNITS IN FARMS
RECEIVED IRRIGATION WATER FROM US BUREAU OF RECLAMATION
ALLEY CROPPING
BIOMASS FOR ENERGY
ROTATIONAL OR INTENSIVE GRAZING
DIRECT MARKET TO RETAIL
VALUE-ADDED
CSA VEAL OR CALF
ON FARM PACKING FACILITY
FARMS
3 51 23 26 4
13
Figure 24: Selected Practices (USDA)
POLK COUNTY SUMMARY HIGHLIGHT 2012 –
USDA CERTIFIED ORGANIC FARMS
USDA ORGANIC PRODUCTION EXEMPT FROM CLASSIFICATION
ACRES TRANSITIONING TO ORGANIC
FARMS WITH SALES FROM $1,000-$4,999
FARMS WITH SALES OVER $5,000
FARMS 6 3 7 ACRES 1 8
Figure 23: Fertilizers and Chemicals Applied (USDA)
County Summary Highlights: 2012
Commercial Fertilizer, Lime +Soil
Manure Control-Insects
Weeds, Grass, Brush
Nematodes
Diseases in Crops and Orchards
Chemicals Used to Control Growth: Thin Fruit-Ripen, etc.
Farms (2012)
413 89 222 431 39 64 3
Farms (2007)
418 104 260 367 31 44 7
Acres (2012) 127,593 5,039 66,889 164,866 7,951 18,077 7 Acres (2007) 171,854 4,835 81,288 198,228 9,503 8,329 221
Farms 1-9 Acres
Farms 10-49 Acres
Farms 50-179 Acres
Farms 180-499 Acres
Farms 500-999 Acres
1000 Acres of More
Polk County
121 275 164 89 62 62
Figure 25: Size of Farms (USDA)
34
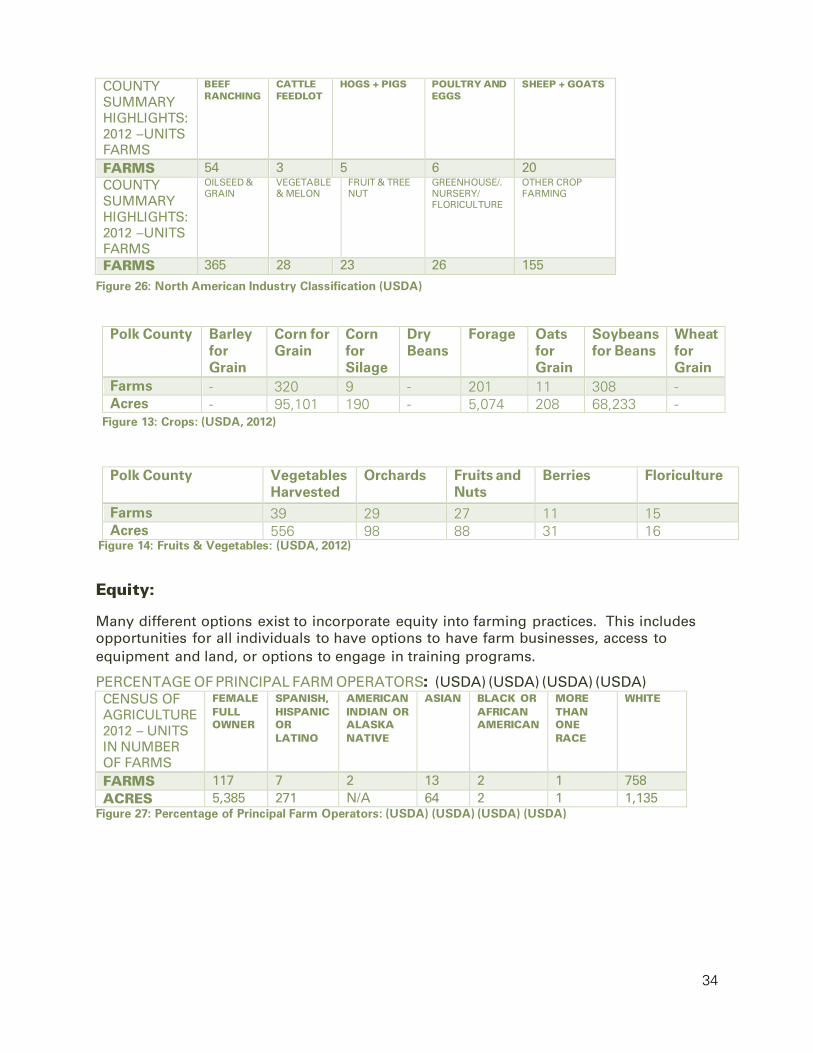
Equity:
Many different options exist to incorporate equity into farming practices. This includes opportunities for all individuals to have options to have farm businesses, access to equipment and land, or options to engage in training programs.
PERCENTAGE OF PRINCIPAL FARM OPERATORS: (USDA) (USDA) (USDA) (USDA) CENSUS OF AGRICULTURE 2012 – UNITS IN NUMBER OF FARMS
FEMALE FULL OWNER
SPANISH, HISPANIC OR LATINO
AMERICAN INDIAN OR ALASKA NATIVE
ASIAN BLACK OR AFRICAN AMERICAN
MORE THAN ONE RACE
WHITE
FARMS 117 7 2 13 2 1 758 ACRES 5,385 271 N/A 64 2 1 1,135
Figure 27: Percentage of Principal Farm Operators: (USDA) (USDA) (USDA) (USDA)
COUNTY SUMMARY HIGHLIGHTS: 2012 –UNITS FARMS
BEEF RANCHING
CATTLE FEEDLOT
HOGS + PIGS POULTRY AND EGGS
SHEEP + GOATS
FARMS 54 3 5 6 20 COUNTY SUMMARY HIGHLIGHTS: 2012 –UNITS FARMS
OILSEED & GRAIN
VEGETABLE & MELON
FRUIT & TREE NUT
GREENHOUSE/. NURSERY/ FLORICULTURE
OTHER CROP FARMING
FARMS 365 28 23 26 155
Figure 26: North American Industry Classification (USDA)
Polk County Barley for Grain
Corn for Grain
Corn for Silage
Dry Beans
Forage Oats for Grain
Soybeans for Beans
Wheat for Grain
Farms - 320 9 - 201 11 308 - Acres - 95,101 190 - 5,074 208 68,233 -
Figure 13: Crops: (USDA, 2012)
Polk County
Vegetables Harvested
Orchards Fruits and Nuts
Berries Floriculture
Farms 39 29 27 11 15 Acres 556 98 88 31 16
Figure 14: Fruits & Vegetables: (USDA, 2012)
35
Education:
Options for education can occur from consumer awareness of local production, best practices for farming businesses, and technical support for business partners.
FARMERS:
Food Safety Training
• Iowa State University: GAP training several times per year • Market Ready Program
Cost Support:
• GAP Audits have an average cost of around $900.00 (source: NSAC) • Group GAP cost-share grant opportunities are also available to offset costs of GAP
certification. Producers working with Organic Valley are provided with complementary GAP certification services.
Management and Logistics Mentorship & Internship Opportunities:
• PFI - Practical Farmers of Iowa Savings Incentive Program offers mentorship opportunities to beginning farmers
• Veterans in Agriculture: Apprenticeship and Certification programs
Record Keeping & Third Party Audits
• FSA programs
WORKING GROUPS/ TRAININGS:
• Practical Farmers of Iowa - Field Days, Webinars, Beginning Farmer Development Program
• WFAN Women Farming & Agriculture Network - Harvesting our Potential program • Veterans in Agriculture: Apprenticeship and Certification programs
GOVERNMENT CONSERVATION PROGRAMS
The federal government, the State of Iowa, and Dubuque County have several different conservation programs in which landowners and/or cities can participate. These programs often provide financial assistance for conservation practices, and are listed below. Dubuque Soil and Water Conservation District (SWCD) office, located in Epworth, IA, has more information on the following programs:
STATE PROGRAMS
• Conservation Cost-Sharing • State Revolving Fund (SRF) • Water Quality Projects • Stormwater Best Management Practices Loan • Resource Enhancement & Protection (REAP)
36
FEDERAL PROGRAMS
• Conservation Reserve Program (CRP) • Wetlands Reserve Program (WRP) • Environmental Quality Incentives Program (EQIP) • Mississippi River Basin Initiative (MRBI) • Wildlife Habitat Incentive Program (WHIP)
Economy:
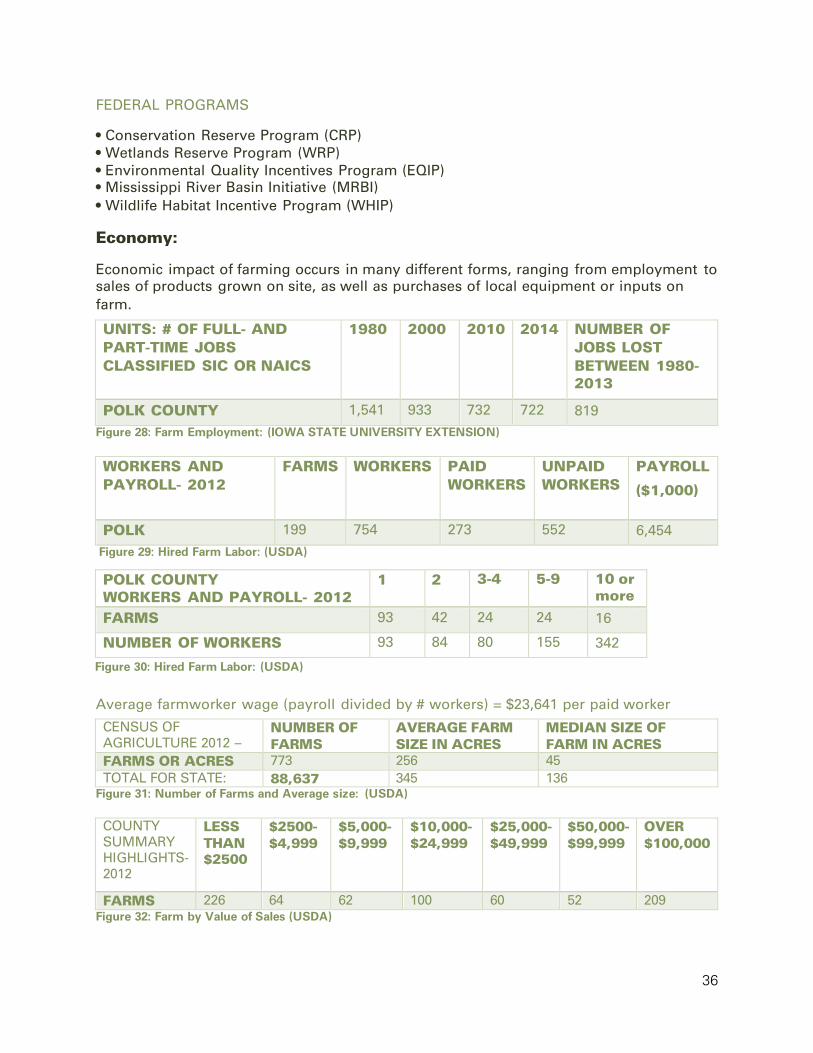
Economic impact of farming occurs in many different forms, ranging from employment to sales of products grown on site, as well as purchases of local equipment or inputs on farm.
UNITS: # OF FULL- AND PART-TIME JOBS CLASSIFIED SIC OR NAICS
1980 2000 2010 2014 NUMBER OF JOBS LOST BETWEEN 1980-2013
POLK COUNTY 1,541 933 732 722 819 Figure 28: Farm Employment: (IOWA STATE UNIVERSITY EXTENSION)
WORKERS AND PAYROLL- 2012
FARMS WORKERS PAID WORKERS
UNPAID WORKERS
PAYROLL
($1,000)
POLK 199 754 273 552 6,454 Figure 29: Hired Farm Labor: (USDA)
Average farmworker wage (payroll divided by # workers) = $23,641 per paid worker
CENSUS OF AGRICULTURE 2012 –
NUMBER OF FARMS
AVERAGE FARM SIZE IN ACRES
MEDIAN SIZE OF FARM IN ACRES
FARMS OR ACRES 773 256 45 TOTAL FOR STATE: 88,637 345 136
Figure 31: Number of Farms and Average size: (USDA)
COUNTY SUMMARY HIGHLIGHTS-2012
LESS THAN $2500
$2500-$4,999
$5,000-$9,999
$10,000-$24,999
$25,000-$49,999
$50,000-$99,999
OVER $100,000
FARMS 226 64 62 100 60 52 209 Figure 32: Farm by Value of Sales (USDA)
POLK COUNTY WORKERS AND PAYROLL- 2012
1 2 3-4 5-9 10 or more
FARMS 93 42 24 24 16
NUMBER OF WORKERS 93 84 80 155 342
Figure 30: Hired Farm Labor: (USDA)
37
AGRIHOOD
An agrihood is a large scale farm that produces fresh food for the local community. The development also incorporates residential living built to help enhance the community and promote connections and awareness about where food comes from. Agrihoods allow for fresh food to be brought straight from farm to table, encouraging residents to live a healthy lifestyle and partake in the helping tend the land. While most agrihoods have a central farm that is operated by a farm manager and staff, residents also have options to grow food in public areas or backyards.
Community Conclusions:
An Agrihood was determined as one of the priority projects in Pleasant Hill to help establish unique, place-based development with a focus on local foods. The goal of the Pleasant Hill Agrihood is to create a new neighborhood development strategy centered on agriculture and open space. The development will support beginning farmer programs, provide connections to natural resources and the food system, promote community gathering space, and provide opportunities for education and events. Interview: Trent Grundmeyer and Happe Homes: Interested in helping develop a dream for a concept with development centered on agriculture. A series of precedent studies have been explored ranging from 80 acres to over 1000 acres. The team will help determine the appropriate scale and site location for this development in Pleasant Hill. Happe Homes expressed interest in being involved in a unique development that offers variety. Environment: Agrihoods offer unique options for incorporating sustainable development considerations. Conservation practices, native habitat, and stomwater management plans can be incorporated into both the residential design as well as the agricultural programming to enhance environmental stewardship practices.
“Stormwater Master Plan” Components and Strategies: (Snyder & Associates, Inc. 89) Sustainable Land Development: • Consider stormwater management early in the design process • Utilize low impact development strategies • Maintain hydrologic function of prairie potholes • Prepare for extreme flood events
Equity:
Opportunities for mixed-income housing, as well as land access for minority audiences should be considered in the development of agrihoods.
38
Education:
Awareness of where food comes from is encourages with residents living in agrihoods. School partnerships, apprenticeship or mentor programs are also offered in many agrihoods across the nation to incorporate production education offerings.
Wellness:
Environmental wellness is encouraged through sustainable development practices. Individual health and wellness is also offered with intentional design of trails, public parks, as well as access to leisure recreation such as community gardens.
Policy:
Unique Planned Unit Developments (PUD) are one strategy to incorporate an agrihood into community development projects. This allows for unique and creative options for land-use to be included. Homeowners Associations are typically utilized with PUD to manage and create a consistent aesthetic to the neighborhood. Additional policies to consider with an agrihood are the types of livestock (noise ordinance), fences, structures, etc. that can be utilized within the farmland on site.
Economy:
Agrihoods incorporate many different options for new business development from farm managers and laborers, to new retail businesses. In addition, the new development inputs that are brought to the community engage in economic development considerations community wide.
39
To include all community projects, businesses, etc. that involve transformation (processing, packaging, labeling and marketing) of food
Community Conclusions/ Priority Project Development Food Center Design an activity hub for food related business development that includes a shared use kitchen and culinary business offerings while also showcasing outdoor amenities and creative solutions for healthy living, gardening, and community collaboration.
Transformation and processing within Pleasant Hill is limited, and while there were some concerns and ideas about future projects and potentials, the larger goal is to establish business development opportunities for individuals seek food preparation location. There is currently a gap in licensed kitchen spaces for beginning food entrepreneurs to pilot new products, begin catering jobs, or consider starting a new retail or restaurant food business. Next steps to assess potentials for a food center project includes assessing locations available with city limits, understanding if existing kitchen space may be available through partnerships with food businesses, and addressing a general business model to offer such a center.
40
PROCESSING FACILITIES Allow for raw food products to be physically or chemically altered into value-added forms. Processing facilities work with everything from produce to dairy to meat and array of activities from mincing to emulsifying to cooking and preserving. This is a way for farmers to add-value to their product, but can be a large investment to process individually and typically involves several forms of certifications or licenses. Over the past several decades, the US has had a rapid consolidation of its meat industry. In 2007, four companies controlled over 80% of the country’s beef processing, and three controlled over 60% of the pork processing. Businesses are required to obtain a retail food license or food processing plant license to make or sell food to the public. Independent processing centers and slaughterhouses can help establish economic growth and opportunities for individual producers and farmers to access a means to process smaller quantities of product at a reasonable cost. Community Discussion:
• Brewery: would really like to see a local brewery on the trail system • Bakery
Environment:
No processing units exist currently in Pleasant Hill.
Interview: Sara Rural area connection, there is potential and need for processing for animals from hunting. Currently hunters travel to Otley or Perry.
Economy:
Processing facilities assist in increasing product value and offer niche products. There are also opportunities for multiple scales of businesses and incubator opportunities. Typically there are limited slaughter and processing capacity in states, and this is a key barrier for meat and poultry, as well as value-added produce producers. The number of slaughter plants has decreased significantly in the past 10 years (Long, Agricultural Urbanism Toolkit 54).
MOBILE PROCESSING UNITS
Mobile slaughter units (MSUs) go directly to farms and can generate creative, niche markets for both animal and produce. Since Mobile Processing Units go directly to farm or specific locations, they offer locally processed, locally raised products (Long, Agricultural Urbanism Toolkit 54).
Economy:
Processing facilities assist in increasing product value and offer niche products. There are also opportunities for multiple scales of businesses and incubator opportunities. Typically there are limited slaughter and processing capacity in states, and this is a key barrier for meat and poultry, as well as value-added produce producers. The number of slaughter plants has decreased significantly in the past 10 years (Long, Agricultural Urbanism Toolkit 54).
41
SHARED-USE KITCHENS
Enhance local and regional food businesses by offering commercial kitchens for public use. Shared-use kitchens have the opportunity to bridge a full range of issues in the local food system, including access to healthy foods. Shared-use kitchens provide comprehensive and diverse approaches to offering opportunities to value-added product, and cook from a shared-location to create a self-financed, sustainable business model. Many of these programs work hard to include shareholder loyalty by including options to purchase memberships or rent out space. This strategy builds a market base and assists in community capacity and financial sustainability. In addition, many shared-use kitchens also offer community support through processing food donations.
Community Conclusions:
A shard-use kitchen and food center was determined as a priority project in Pleasant Hill to support food entrepreneurs. Based on public input and coalition meetings, this development will begin with networking and design of an activity hub for food related businesses. Depending on site location, the design will incorporate landscape design improvements as well as unique business offering for food entrepreneurs.
Community Discussion:
• Personal chef looking for space to expand business • So CSA users can share and put it together • Shared-Use Kitchen Space • Create a food hub near Copper Creek Lake that serves many purposes- shared-use
kitchen, edible landscape, community gathering space, an attractive place for people to hang out
Environment:
Shared-use kitchens support the local food system; creating a space for both farmers, culinary providers, and entrepreneurs to develop holistic partnerships that support the local food system from start to finish.
Education:
Can promote educational programs for food business development
Policy
Food safety regulations will need to be closely followed and maintained as part of the management plan. It is suggested to meat with a food safety and health inspector. (Topaloff)
Economy:
Offer a broad public purpose and celebrate regional culture through food and local business opportunities. They can also be utilized as business incubators.
42
To include all community projects, businesses, etc. that involve distribution and retail (wholesaling, distribution, warehousing, transportation, restaurants, and retail markets) of food
Farmers Market Expansion
Expand the existing farmers market to encourage more vendors and consumers to attend. This will include development of marketing and promotion material as well as an assessment of the location, time, program, and feasibility to enhance the market to be a place that draws attendees from the East Polk County area.
Promotion and Education
Build awareness about existing food related resources and business in the city and region, while also creating educational opportunities for residents such as cooking demonstrations, and classes on topics such as gardening, preserving, and composting. Within the first six months of collaboration in Pleasant Hill, the Iowa Food Cooperative began distributing Pleasant Hill as a new drop site. This connection assisted in meeting community demand for increased local and healthy foods. Additional steps to assist in distribution and marketing efforts of food in Pleasant Hill are to increase capacity for the farmers market located at Berean Church. In 2017, Berean revitalized the efforts for a Pleasant Hill Farmers Market and are working to increase the number of farmers and consumers that utilize the market. Additionally, promotion of both a newly branded coalition: Grow Pleasant Hill, and a directory that highlights supporting local businesses and organizations will be available. This effort will help bridge connections throughout the community for those looking to support local and network for innovative and unique projects.
43
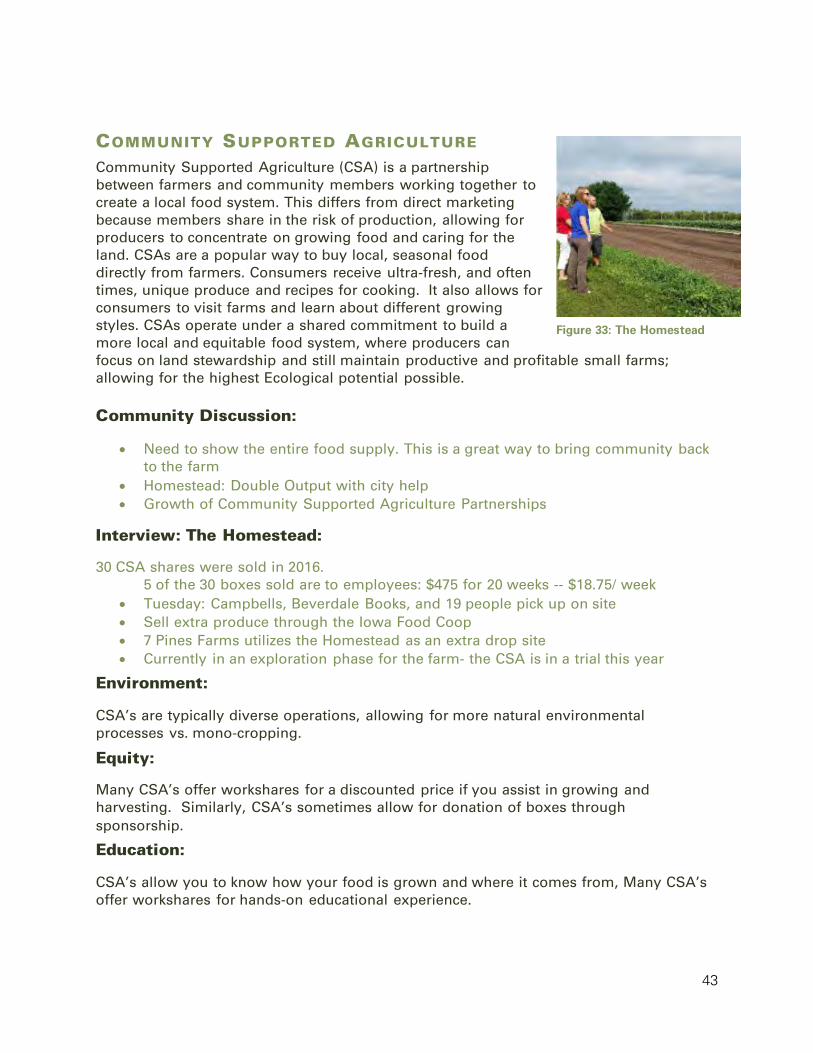
COMMUNITY SUPPORTED AGRICULTURE Community Supported Agriculture (CSA) is a partnership between farmers and community members working together to create a local food system. This differs from direct marketing because members share in the risk of production, allowing for producers to concentrate on growing food and caring for the land. CSAs are a popular way to buy local, seasonal food directly from farmers. Consumers receive ultra-fresh, and often times, unique produce and recipes for cooking. It also allows for consumers to visit farms and learn about different growing styles. CSAs operate under a shared commitment to build a more local and equitable food system, where producers can focus on land stewardship and still maintain productive and profitable small farms; allowing for the highest Ecological potential possible. Community Discussion:
• Need to show the entire food supply. This is a great way to bring community back to the farm
• Homestead: Double Output with city help • Growth of Community Supported Agriculture Partnerships
Interview: The Homestead:
30 CSA shares were sold in 2016. 5 of the 30 boxes sold are to employees: $475 for 20 weeks -- $18.75/ week
• Tuesday: Campbells, Beverdale Books, and 19 people pick up on site • Sell extra produce through the Iowa Food Coop • 7 Pines Farms utilizes the Homestead as an extra drop site • Currently in an exploration phase for the farm- the CSA is in a trial this year
Environment:
CSA’s are typically diverse operations, allowing for more natural environmental processes vs. mono-cropping.
Equity:
Many CSA’s offer workshares for a discounted price if you assist in growing and harvesting. Similarly, CSA’s sometimes allow for donation of boxes through sponsorship.
Education:
CSA’s allow you to know how your food is grown and where it comes from, Many CSA’s offer workshares for hands-on educational experience.
Figure 33: The Homestead
44
Wellness:
Community members who participate in CSA’s have said they increased the variety of produce eaten, and have increased the quantity of vegetables eaten.
Economy:
CSA’s promote local and regional production as well as local businesses; direct economic benefit is seen- consumers can save up to %39 by purchasing from CSA vs. supermarkets, and the sale goes to a member in the community, with a high likelihood that those dollars will also stay within the community.
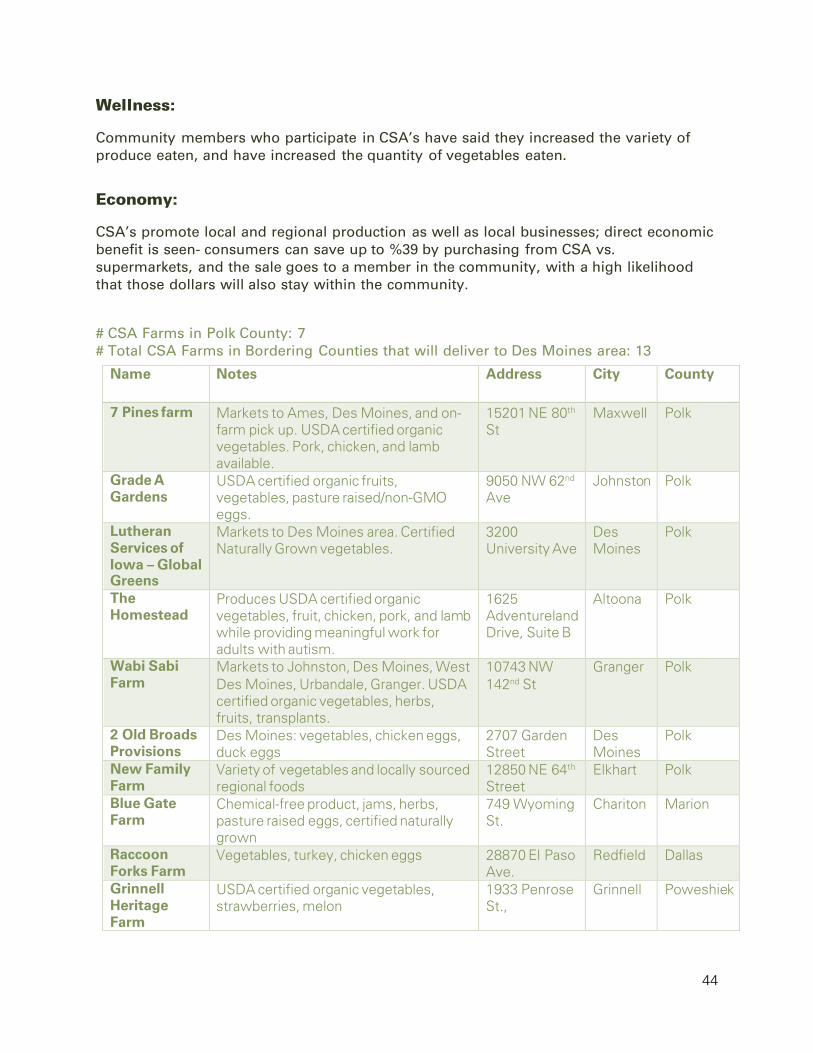
# CSA Farms in Polk County: 7 # Total CSA Farms in Bordering Counties that will deliver to Des Moines area: 13
Name Notes Address City County
7 Pines farm Markets to Ames, Des Moines, and on-farm pick up. USDA certified organic vegetables. Pork, chicken, and lamb available.
15201 NE 80th St
Maxwell Polk
Grade A Gardens
USDA certified organic fruits, vegetables, pasture raised/non-GMO eggs.
9050 NW 62nd Ave
Johnston Polk
Lutheran Services of Iowa – Global Greens
Markets to Des Moines area. Certified Naturally Grown vegetables.
3200 University Ave
Des Moines
Polk
The Homestead
Produces USDA certified organic vegetables, fruit, chicken, pork, and lamb while providing meaningful work for adults with autism.
1625 Adventureland Drive, Suite B
Altoona Polk
Wabi Sabi Farm
Markets to Johnston, Des Moines, West Des Moines, Urbandale, Granger. USDA certified organic vegetables, herbs, fruits, transplants.
10743 NW 142nd St
Granger Polk
2 Old Broads Provisions
Des Moines: vegetables, chicken eggs, duck eggs
2707 Garden Street
Des Moines
Polk
New Family Farm
Variety of vegetables and locally sourced regional foods
12850 NE 64th Street
Elkhart Polk
Blue Gate Farm
Chemical-free product, jams, herbs, pasture raised eggs, certified naturally grown
749 Wyoming St.
Chariton Marion
Raccoon Forks Farm
Vegetables, turkey, chicken eggs 28870 El Paso Ave.
Redfield Dallas
Grinnell Heritage Farm
USDA certified organic vegetables, strawberries, melon
1933 Penrose St.,
Grinnell Poweshiek

45
Daystar Harvest
Vegetables and herbs 1206 68th Street
Windsor Heights
Boone
Nature Road Farm
Produce 908 Idaho Ave Ames Boone
Heritage Hill Farm
Vegetables, herbs, fruits 53278 265 Street
Kelley Boone
Figure 34: CSA Farms in Polk County: (Rigby-Adcock, 2017)
46
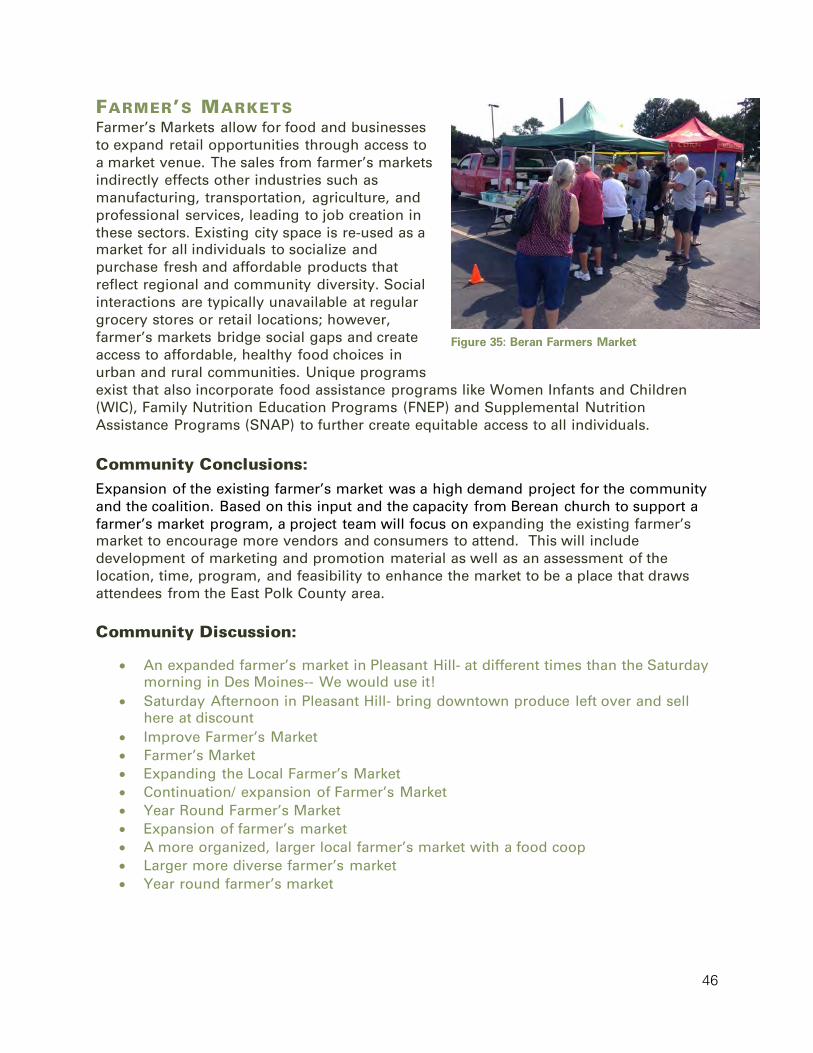
FARMER’S MARKETS Farmer’s Markets allow for food and businesses to expand retail opportunities through access to a market venue. The sales from farmer’s markets indirectly effects other industries such as manufacturing, transportation, agriculture, and professional services, leading to job creation in these sectors. Existing city space is re-used as a market for all individuals to socialize and purchase fresh and affordable products that reflect regional and community diversity. Social interactions are typically unavailable at regular grocery stores or retail locations; however, farmer’s markets bridge social gaps and create access to affordable, healthy food choices in urban and rural communities. Unique programs exist that also incorporate food assistance programs like Women Infants and Children (WIC), Family Nutrition Education Programs (FNEP) and Supplemental Nutrition Assistance Programs (SNAP) to further create equitable access to all individuals. Community Conclusions: Expansion of the existing farmer’s market was a high demand project for the community and the coalition. Based on this input and the capacity from Berean church to support a farmer’s market program, a project team will focus on expanding the existing farmer’s market to encourage more vendors and consumers to attend. This will include development of marketing and promotion material as well as an assessment of the location, time, program, and feasibility to enhance the market to be a place that draws attendees from the East Polk County area. Community Discussion:
• An expanded farmer’s market in Pleasant Hill- at different times than the Saturday morning in Des Moines-- We would use it!
• Saturday Afternoon in Pleasant Hill- bring downtown produce left over and sell here at discount
• Improve Farmer’s Market • Farmer’s Market • Expanding the Local Farmer’s Market • Continuation/ expansion of Farmer’s Market • Year Round Farmer’s Market • Expansion of farmer’s market • A more organized, larger local farmer’s market with a food coop • Larger more diverse farmer’s market • Year round farmer’s market
Figure 35: Beran Farmers Market
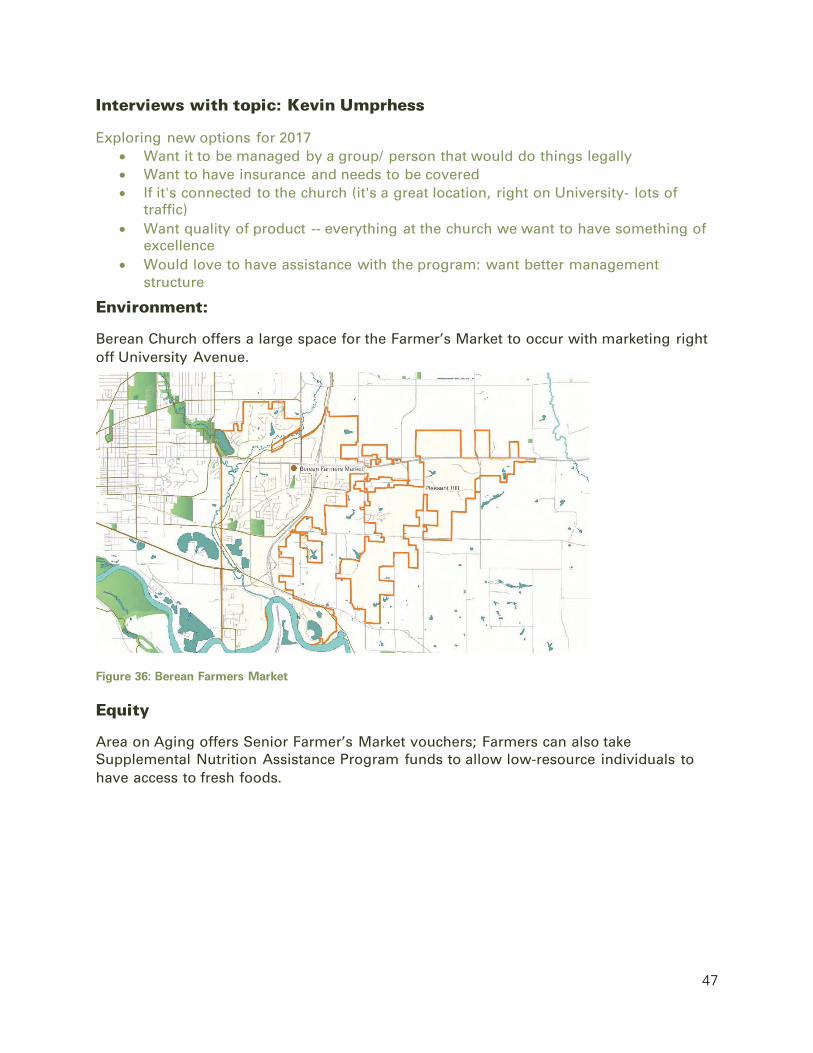
47
Interviews with topic: Kevin Umprhess
Exploring new options for 2017 • Want it to be managed by a group/ person that would do things legally • Want to have insurance and needs to be covered • If it's connected to the church (it's a great location, right on University- lots of
traffic) • Want quality of product -- everything at the church we want to have something of
excellence • Would love to have assistance with the program: want better management
structure
Environment:
Berean Church offers a large space for the Farmer’s Market to occur with marketing right off University Avenue.
Figure 36: Berean Farmers Market
Equity
Area on Aging offers Senior Farmer’s Market vouchers; Farmers can also take Supplemental Nutrition Assistance Program funds to allow low-resource individuals to have access to fresh foods.
48
Senior Farmers’ Market Nutrition Program (SFMNP): (Aging Resources of Central Iowa) • Benefits distributed by Area Agencies on Aging • Low-income seniors receive checks (worth $30) to use at farmers’ markets • Distributed “first come, first served” • Coupons can be used June 1st-October 31st • Eligibility requirements:
o ≥60 years old o Income of ≤$21,978 for single adults o Combined income of ≤$29,637 for married adults
Education
Many farmer’s markets offer nutrition of meal preparation classes during summer market season. Other ways of incorporating education includes farmer workshops for marketing and general market best practices.
Wellness:
Farmer’s markets have an opportunity to provide fresh, local product and contribute to overall health for individuals.
Policy:
Depending on where farmer’s markets exist within the city, there are different restrictions through city code that must be enforced. This can include permitting requirements, allowable use of infrastructure, etc.
Economy:
Many markets operate as incubators for local food businesses to explore additional market opportunities. This venture can help to establish new bricks and mortar businesses in the future by allowing for businesses to develop and maintain clientele.
49
PUBLIC MARKETS
Public Markets build grocers and retailers that benefit the local economy and deliver seasonal and assorted product, improve their carbon footprint and increase options for natural and organic production. The demand for local food is rising as grocery shoppers are embracing the need for increased local food options. Customers are demanding locally sourced protein and produce, environmentally sustainable options, and healthy meals. Offering retail products allows for an additional benefit of consumers being able to celebrate regional and cultural food from their home. The use of local foods is mutually beneficial among producers, consumers and business owners because it increases profits, provides customers with high quality products, and builds the infrastructure for an effective local food shed.
Community Discussion:
• As Pleasant Hill grows and develops more of a community center, this would be a great idea
• Health Food Market • Health food type of market • Create a food hub near Copper Creek Lake that serves many purposes- shared-use
kitchen, edible landscape, community gathering space, an attractive place for people to hang out
This tactic coincides with the Shared-Use Kitchen opportunity and the development of a Food Center. Public market is focused more on the opportunity to buy prepared foods or operate as a retail outlet for producers and food businesses. Throughout the Food Center project development, analysis of additional retail markets, such as this, will be taken into consideration.
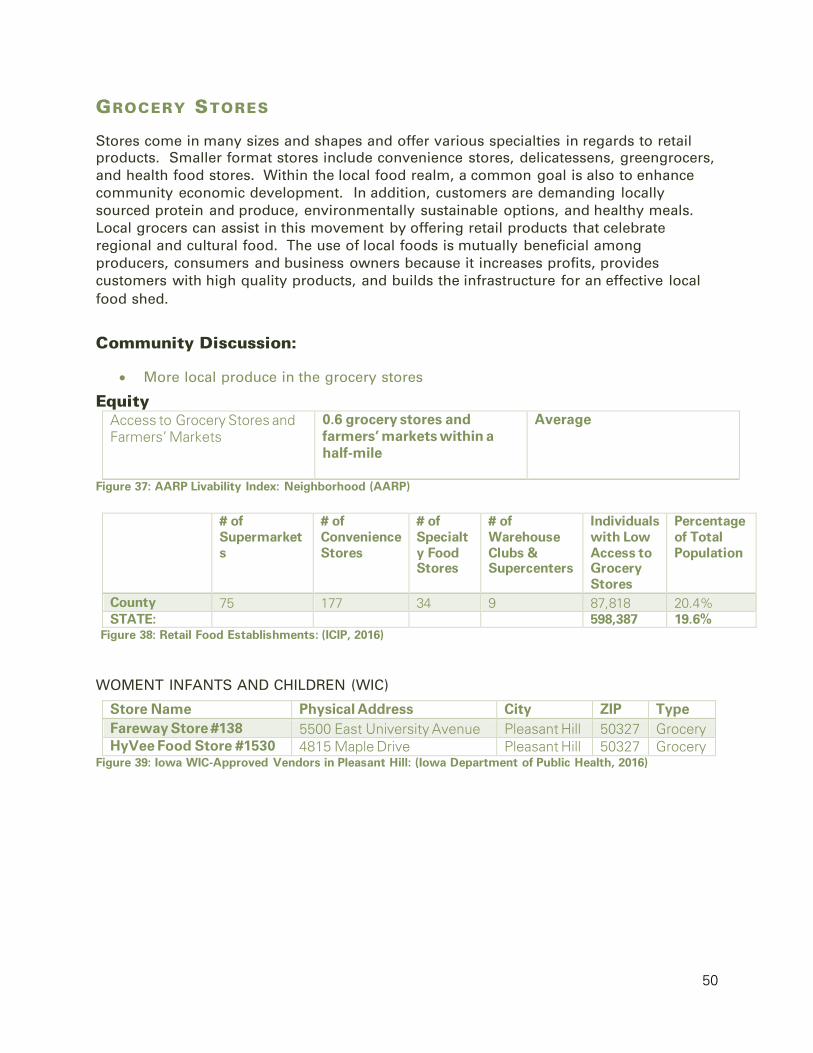
50
GROCERY STORES
Stores come in many sizes and shapes and offer various specialties in regards to retail products. Smaller format stores include convenience stores, delicatessens, greengrocers, and health food stores. Within the local food realm, a common goal is also to enhance community economic development. In addition, customers are demanding locally sourced protein and produce, environmentally sustainable options, and healthy meals. Local grocers can assist in this movement by offering retail products that celebrate regional and cultural food. The use of local foods is mutually beneficial among producers, consumers and business owners because it increases profits, provides customers with high quality products, and builds the infrastructure for an effective local food shed.
Community Discussion:
• More local produce in the grocery stores
Equity Access to Grocery Stores and Farmers’ Markets
0.6 grocery stores and farmers’ markets within a half-mile
Average
Figure 37: AARP Livability Index: Neighborhood (AARP)
WOMENT INFANTS AND CHILDREN (WIC)
Store Name Physical Address City ZIP Type Fareway Store #138 5500 East University Avenue Pleasant Hill 50327 Grocery HyVee Food Store #1530 4815 Maple Drive Pleasant Hill 50327 Grocery
Figure 39: Iowa WIC-Approved Vendors in Pleasant Hill: (Iowa Department of Public Health, 2016)
# of Supermarkets
# of Convenience Stores
# of Specialty Food Stores
# of Warehouse Clubs & Supercenters
Individuals with Low Access to Grocery Stores
Percentage of Total Population
County 75 177 34 9 87,818 20.4% STATE: 598,387 19.6%
Figure 38: Retail Food Establishments: (ICIP, 2016)
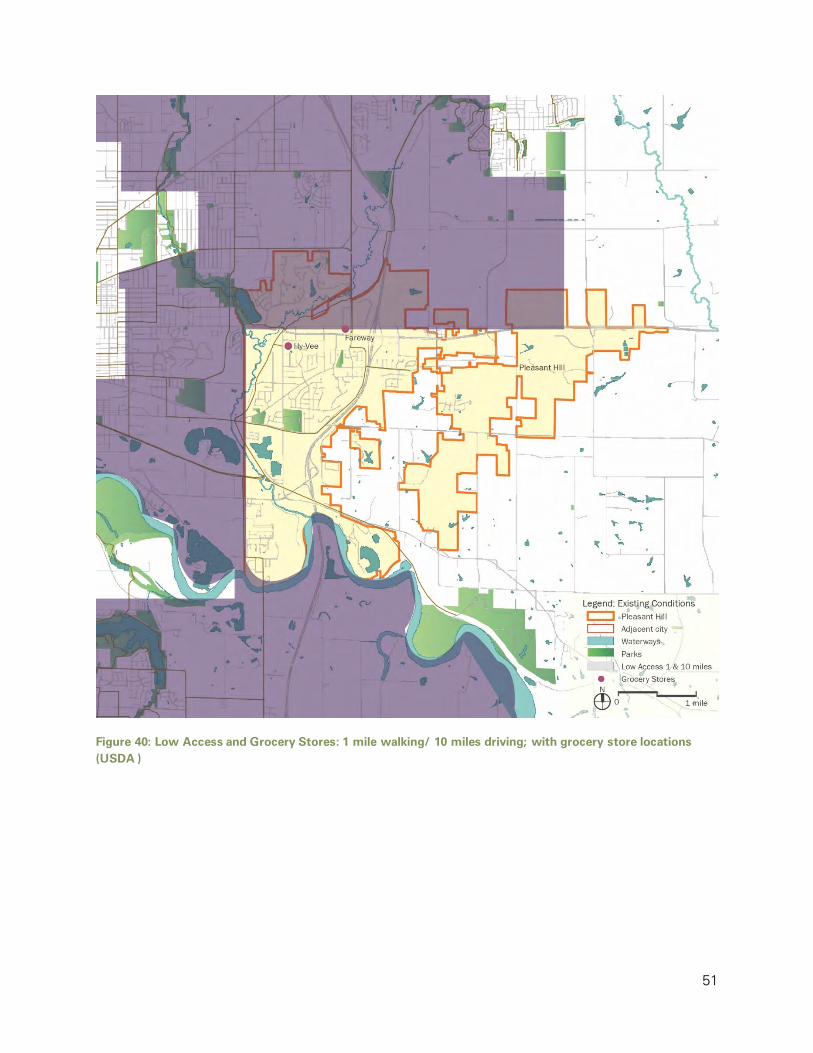
51
Figure 40: Low Access and Grocery Stores: 1 mile walking/ 10 miles driving; with grocery store locations (USDA )
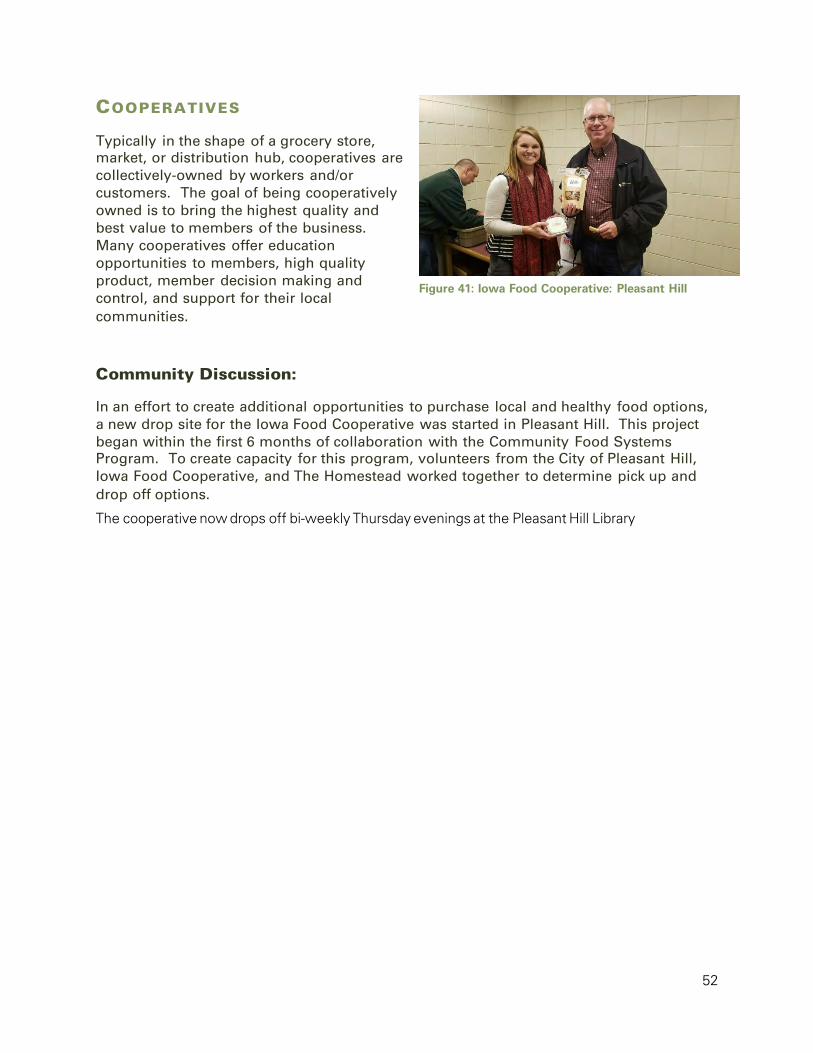
52
COOPERATIVES
Typically in the shape of a grocery store, market, or distribution hub, cooperatives are collectively-owned by workers and/or customers. The goal of being cooperatively owned is to bring the highest quality and best value to members of the business. Many cooperatives offer education opportunities to members, high quality product, member decision making and control, and support for their local communities.
Community Discussion:
In an effort to create additional opportunities to purchase local and healthy food options, a new drop site for the Iowa Food Cooperative was started in Pleasant Hill. This project began within the first 6 months of collaboration with the Community Food Systems Program. To create capacity for this program, volunteers from the City of Pleasant Hill, Iowa Food Cooperative, and The Homestead worked together to determine pick up and drop off options.
The cooperative now drops off bi-weekly Thursday evenings at the Pleasant Hill Library
Figure 41: Iowa Food Cooperative: Pleasant Hill
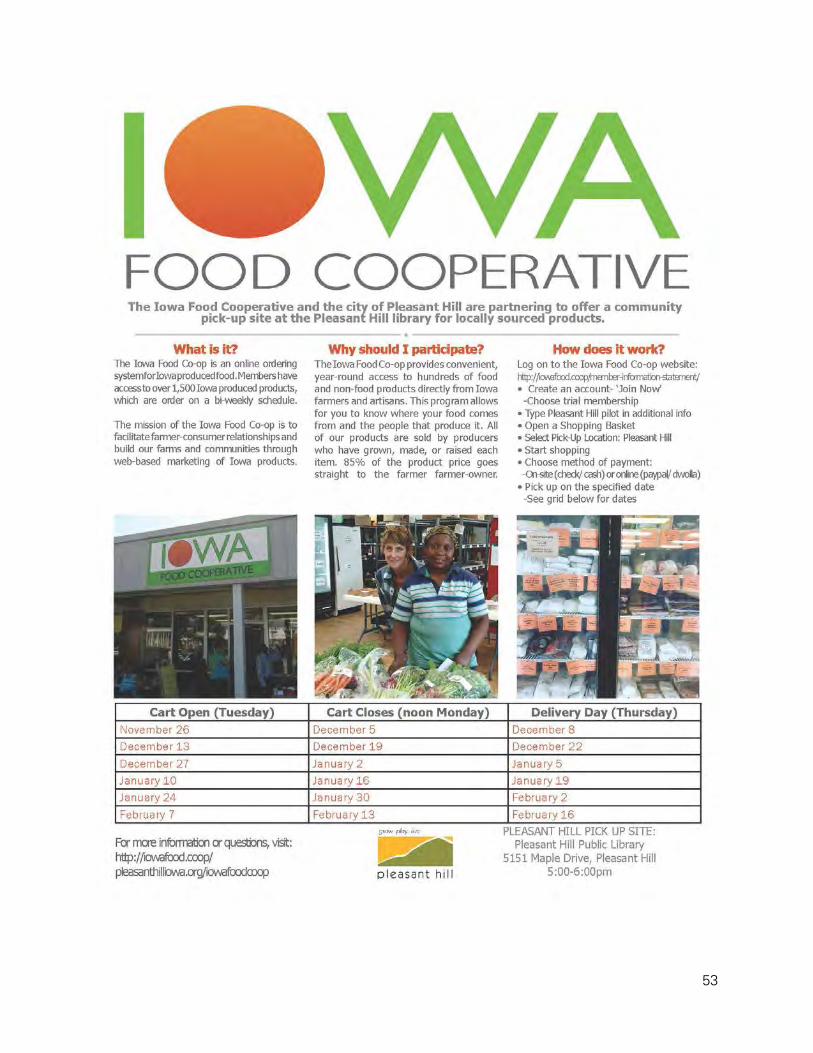
53
54
AWARENESS CAMPAIGN:
Marketing campaigns build public support for a particular issue that an organization seeks to resolve or get behind. Typically, the campaign is a comprehensive effort between multiple partners and includes many different forms of outreach through organizations, public and social media, branding, and overall mission of a particular group or organization. A campaign should speak to a targeted audience and seek out a particular action. Awareness campaigns have the opportunity to support community and organizational identity and assist in bringing visibility, and attention to a specific cause; if used as a call to action, it can assist in behavior change and make significant strides for social behavior improvements.
Community Conclusions: An effort of the coalition is to build general awareness of existing food businesses in the city of Pleasant Hill. These efforts will include new events and collaboration to highlight existing programs, and well as developing a new Grow Pleasant Hill directory. The directory will highlight businesses that support health and wellness, local food procurement or gardening, community engagement and volunteerism, and environmental stewardship. Community Discussion:
• Sweet corn feed • Food Festival • Festival for locals and their food recipes • Discover Iowa Commodities Day
Environment:
This strategy connects with the 2016 Polk County CHNA Priority Goals: (Iowa Department of Public Health) to Promote Healthy Living: “Establish more vibrant communities and neighborhoods characterized by mixed and joint-use spaces and facilities that are accessible and available to everyone, including public gathering places for diverse and integrated engagement, and designs that promote healthy lifestyles.”
Education:
Promotion of existing engagement and learning opportunities throughout the community.
Economy:
Provide options to showcase businesses that are supporting common goals for community betterment. By offering directories, this creates awareness and support for residents and visitors to shop local.
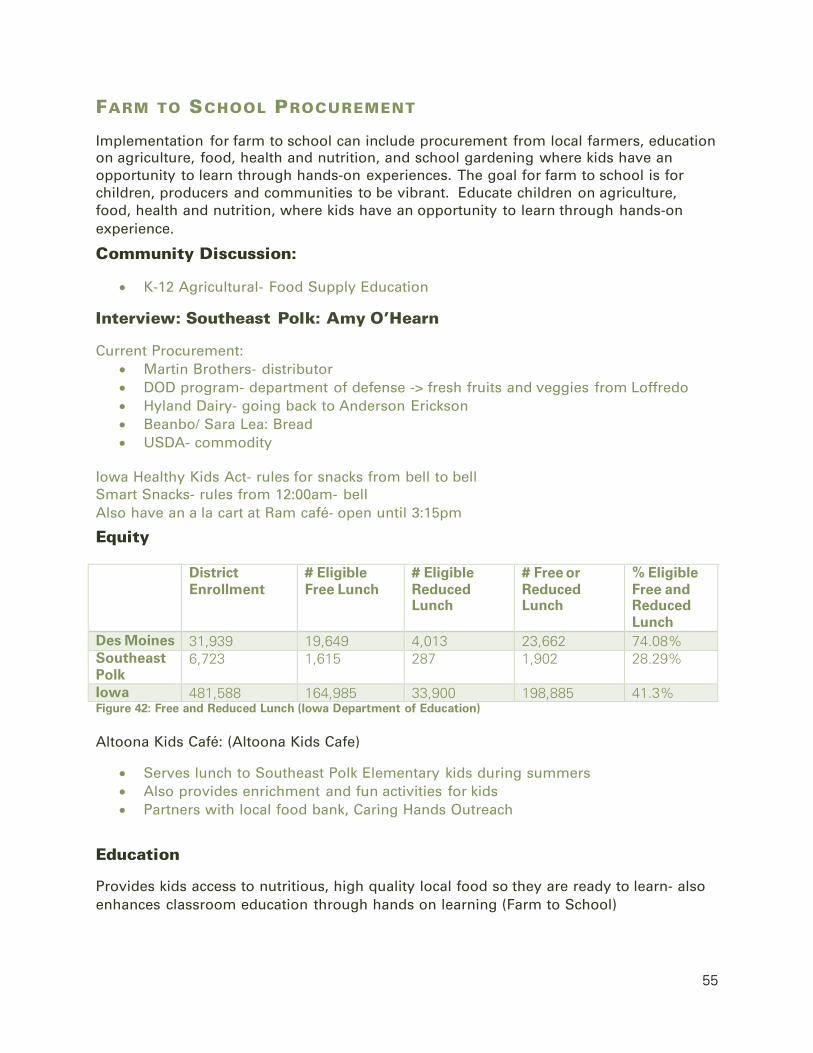
55
FARM TO SCHOOL PROCUREMENT
Implementation for farm to school can include procurement from local farmers, education on agriculture, food, health and nutrition, and school gardening where kids have an opportunity to learn through hands-on experiences. The goal for farm to school is for children, producers and communities to be vibrant. Educate children on agriculture, food, health and nutrition, where kids have an opportunity to learn through hands-on experience.
Community Discussion:
• K-12 Agricultural- Food Supply Education
Interview: Southeast Polk: Amy O’Hearn
Current Procurement: • Martin Brothers- distributor • DOD program- department of defense -> fresh fruits and veggies from Loffredo • Hyland Dairy- going back to Anderson Erickson • Beanbo/ Sara Lea: Bread • USDA- commodity
Iowa Healthy Kids Act- rules for snacks from bell to bell Smart Snacks- rules from 12:00am- bell Also have an a la cart at Ram café- open until 3:15pm
Equity District
Enrollment # Eligible Free Lunch
# Eligible Reduced Lunch
# Free or Reduced Lunch
% Eligible Free and Reduced Lunch
Des Moines 31,939 19,649 4,013 23,662 74.08% Southeast Polk
6,723 1,615 287 1,902 28.29%
Iowa 481,588 164,985 33,900 198,885 41.3% Figure 42: Free and Reduced Lunch (Iowa Department of Education)
Altoona Kids Café: (Altoona Kids Cafe)
• Serves lunch to Southeast Polk Elementary kids during summers • Also provides enrichment and fun activities for kids • Partners with local food bank, Caring Hands Outreach
Education
Provides kids access to nutritious, high quality local food so they are ready to learn- also enhances classroom education through hands on learning (Farm to School)
56
Wellness:
Buying local reduces carbon footprint- school gardens and composting also create a healthier environment around the school community.
Policy:
A new mandate for all schools with federally funded meal programs went into effect June 30, 2017 for school wellness policies. School wellness policies guide educational agencies in their efforts to support nutrition and physical activity requirements (Hohenshell and Long, Iowa State University Local Foods Program).
Economy:
Significant financial opportunity for producers and processors by opening door for institutional market; average 5 percent increase in income from farm to school sales for individual farmers.
57
To include all community projects, businesses, etc. that involve production (gleaning, food assistance, preparing, preserving, and awareness) of food
Community Conclusions/ priority project development:
• City Support: Edible Landscapes/ Public Access to Food
In addition to the priority project, the coalition and City of Pleasant Hill determined that there are potentials for additional community gardens and edible landscapes developed by the City of Pleasant Hill and their Parks Department. City staff will dedicate time and resources to establishing different pubic opportunities to offer access to healthy foods. Pleasant Hill offers several eating establishments and options for people to access prepared meals. However, many of these options have limited hours or are not viewed as healthy options by residents. Many of the surveys and input sessions shared desire for diversification and more lunch options within the community. However, this effort was not determined as a priority project. There are still many ways the city can engage and promote local business development and retail establishments. Through the development and collaboration amongst the other sectors, it is possible that new consumption and access considerations may appear. For example, through the Promotion project team, there may be ways to highlight existing restaurants and showcase ways of building more health conscious menus or local procurement. Other solutions may be through event development for food trucks, or “pop-up” style restaurants.
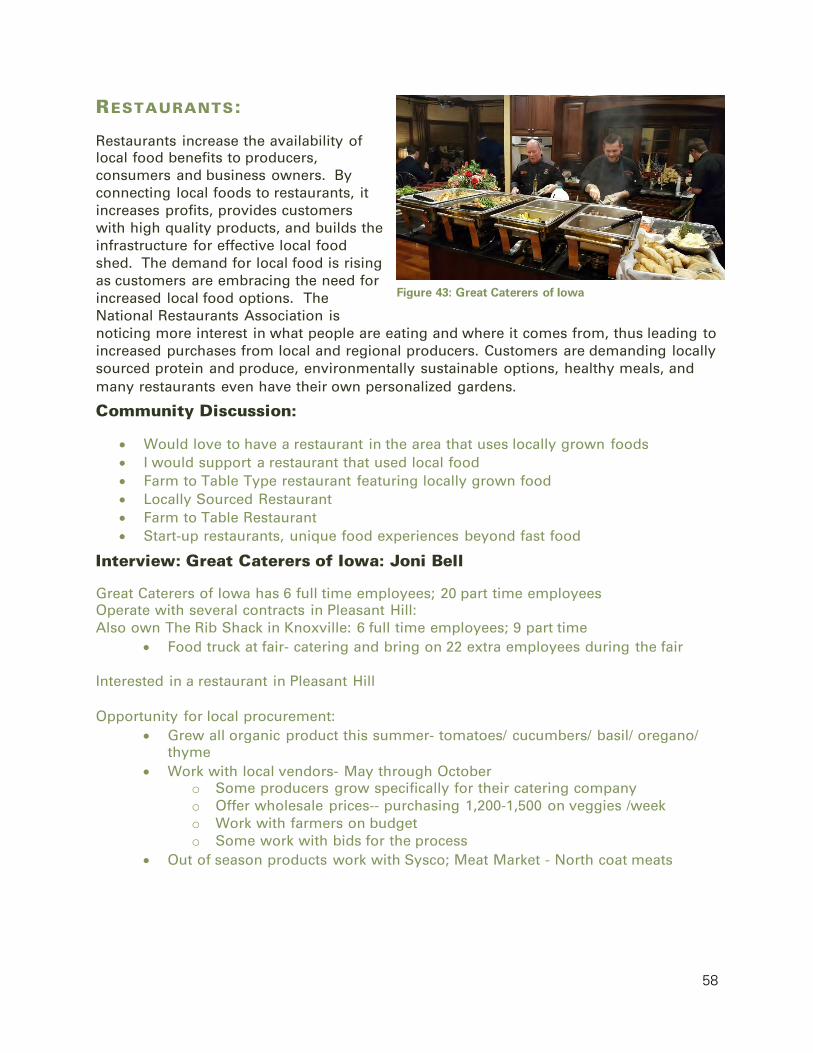
58
RESTAURANTS:
Restaurants increase the availability of local food benefits to producers, consumers and business owners. By connecting local foods to restaurants, it increases profits, provides customers with high quality products, and builds the infrastructure for effective local food shed. The demand for local food is rising as customers are embracing the need for increased local food options. The National Restaurants Association is noticing more interest in what people are eating and where it comes from, thus leading to increased purchases from local and regional producers. Customers are demanding locally sourced protein and produce, environmentally sustainable options, healthy meals, and many restaurants even have their own personalized gardens.
Community Discussion:
• Would love to have a restaurant in the area that uses locally grown foods • I would support a restaurant that used local food • Farm to Table Type restaurant featuring locally grown food • Locally Sourced Restaurant • Farm to Table Restaurant • Start-up restaurants, unique food experiences beyond fast food
Interview: Great Caterers of Iowa: Joni Bell
Great Caterers of Iowa has 6 full time employees; 20 part time employees Operate with several contracts in Pleasant Hill: Also own The Rib Shack in Knoxville: 6 full time employees; 9 part time
• Food truck at fair- catering and bring on 22 extra employees during the fair Interested in a restaurant in Pleasant Hill Opportunity for local procurement:
• Grew all organic product this summer- tomatoes/ cucumbers/ basil/ oregano/ thyme
• Work with local vendors- May through October o Some producers grow specifically for their catering company o Offer wholesale prices-- purchasing 1,200-1,500 on veggies /week o Work with farmers on budget o Some work with bids for the process
• Out of season products work with Sysco; Meat Market - North coat meats
Figure 43: Great Caterers of Iowa
59
FOOD TRUCKS
Food trucks promote food access through creative ways-like restaurants on wheels; they also provide a strong cultural identity for the community. Food trucks offer unique ways of incorporating economic development into the food system through incorporation of mobile food vending for diverse backgrounds and cultural experiences. Food trucks offer a business model with relatively low start-up cost that assists persons with diverse backgrounds and socioeconomic status. They also offer opportunities to connect with local food production and community businesses as a means to offer exceptional food in unique locations around the city. City infrastructure lends itself in creative ways to promote food access through public easements, mobile truck parks, and city blocks. These ventures allow under-utilized space to connect residents and business owners alike to support local businesses.
Community Discussion:
• We lived in OKC, watched them grow a food truck park over the past 3 years. Great sport for family entertainment and supporting local small businesses
• Food Truck Events • Food Trucks and ethnic food options • Food truck-park
Food trucks have an opportunity to be involved in the promotion project team in relation to developing capacity for new businesses and the development of events.
Economy
The average food truck start-up requires between $55,000-75,000: about $200,000- 400,000 less than bricks and mortar. Economic Development Generation: In 2012 $650 million in revenue was generated from food trucks-approximately 1 percent of the total U.S. restaurant sales. It is expected that by 2017, food trucks will generate 3-4 percent of the revenue, or about $2.7 billion
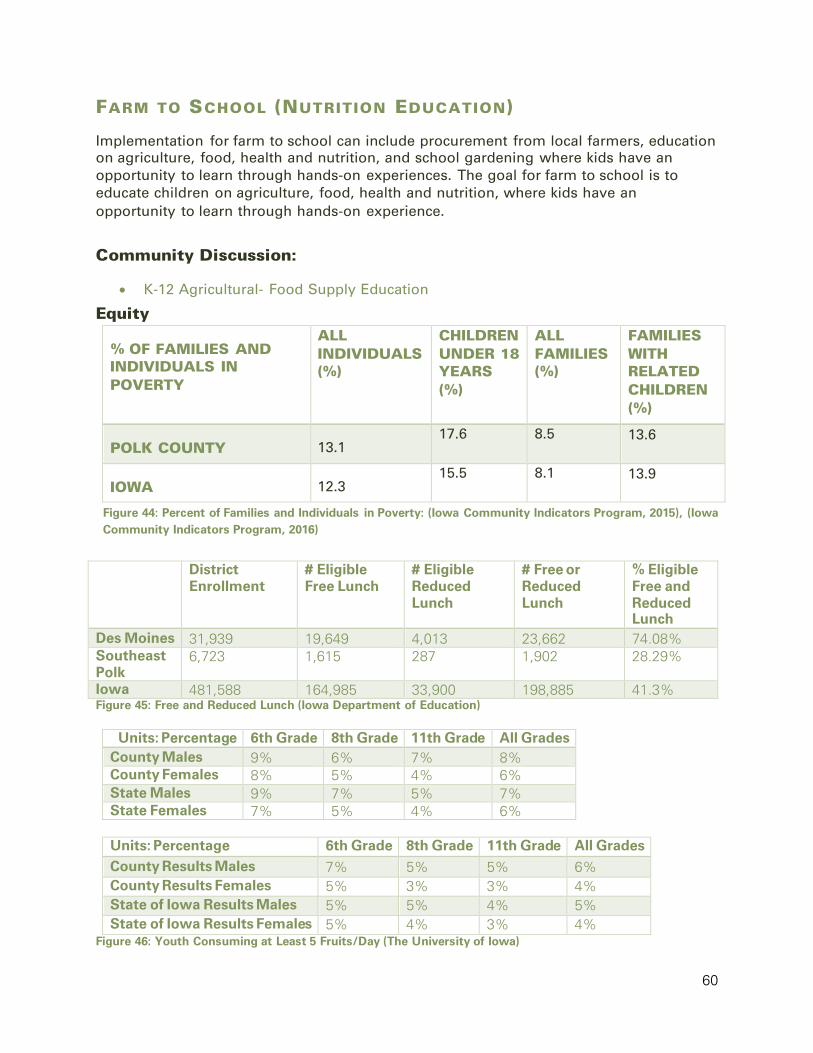
60
FARM TO SCHOOL (NUTRITION EDUCATION)
Implementation for farm to school can include procurement from local farmers, education on agriculture, food, health and nutrition, and school gardening where kids have an opportunity to learn through hands-on experiences. The goal for farm to school is to educate children on agriculture, food, health and nutrition, where kids have an opportunity to learn through hands-on experience.
Community Discussion:
• K-12 Agricultural- Food Supply Education
Equity
District
Enrollment # Eligible Free Lunch
# Eligible Reduced Lunch
# Free or Reduced Lunch
% Eligible Free and Reduced Lunch
Des Moines 31,939 19,649 4,013 23,662 74.08% Southeast Polk
6,723 1,615 287 1,902 28.29%
Iowa 481,588 164,985 33,900 198,885 41.3% Figure 45: Free and Reduced Lunch (Iowa Department of Education)
Units: Percentage 6th Grade 8th Grade 11th Grade All Grades County Males 9% 6% 7% 8% County Females 8% 5% 4% 6% State Males 9% 7% 5% 7% State Females 7% 5% 4% 6%
Units: Percentage 6th Grade 8th Grade 11th Grade All Grades County Results Males 7% 5% 5% 6% County Results Females 5% 3% 3% 4% State of Iowa Results Males 5% 5% 4% 5% State of Iowa Results Females 5% 4% 3% 4%
Figure 46: Youth Consuming at Least 5 Fruits/Day (The University of Iowa)
% OF FAMILIES AND INDIVIDUALS IN POVERTY
ALL INDIVIDUALS (%)
CHILDREN UNDER 18 YEARS (%)
ALL FAMILIES (%)
FAMILIES WITH RELATED CHILDREN (%)
POLK COUNTY 13.1 17.6 8.5 13.6
IOWA 12.3 15.5 8.1 13.9
Figure 44: Percent of Families and Individuals in Poverty: (Iowa Community Indicators Program, 2015), (Iowa Community Indicators Program, 2016)
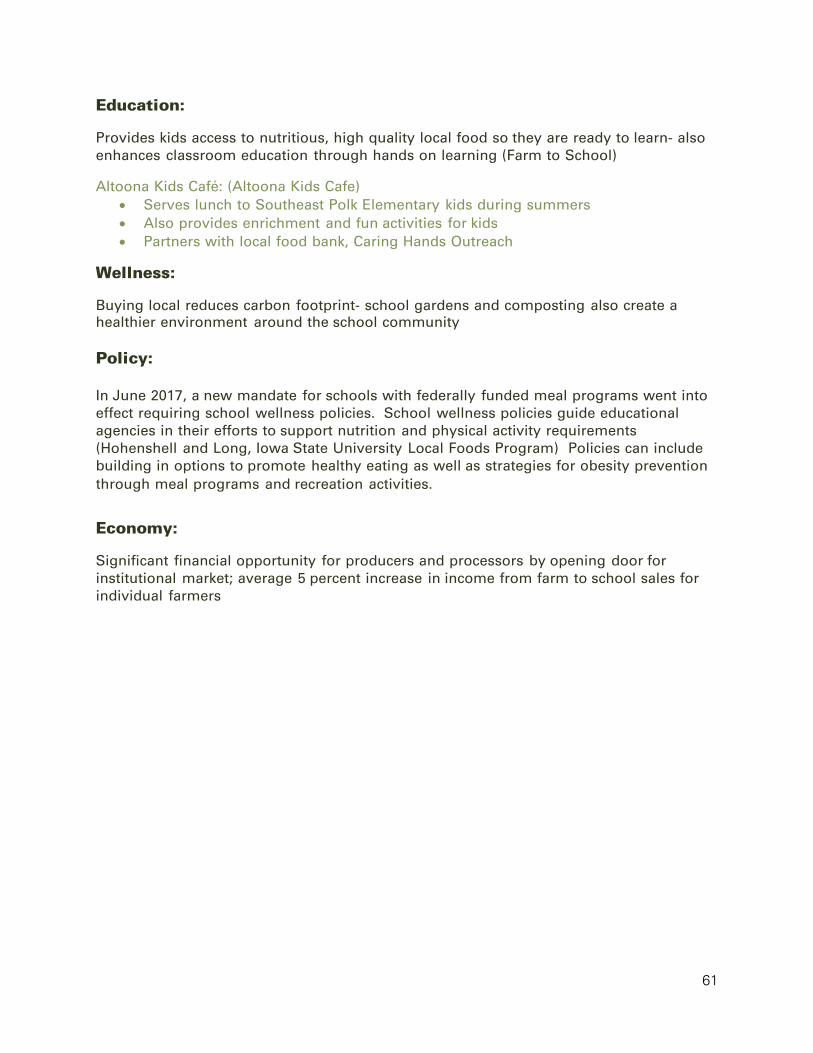
61
Education:
Provides kids access to nutritious, high quality local food so they are ready to learn- also enhances classroom education through hands on learning (Farm to School)
Altoona Kids Café: (Altoona Kids Cafe) • Serves lunch to Southeast Polk Elementary kids during summers • Also provides enrichment and fun activities for kids • Partners with local food bank, Caring Hands Outreach
Wellness:
Buying local reduces carbon footprint- school gardens and composting also create a healthier environment around the school community Policy: In June 2017, a new mandate for schools with federally funded meal programs went into effect requiring school wellness policies. School wellness policies guide educational agencies in their efforts to support nutrition and physical activity requirements (Hohenshell and Long, Iowa State University Local Foods Program) Policies can include building in options to promote healthy eating as well as strategies for obesity prevention through meal programs and recreation activities.
Economy:
Significant financial opportunity for producers and processors by opening door for institutional market; average 5 percent increase in income from farm to school sales for individual farmers
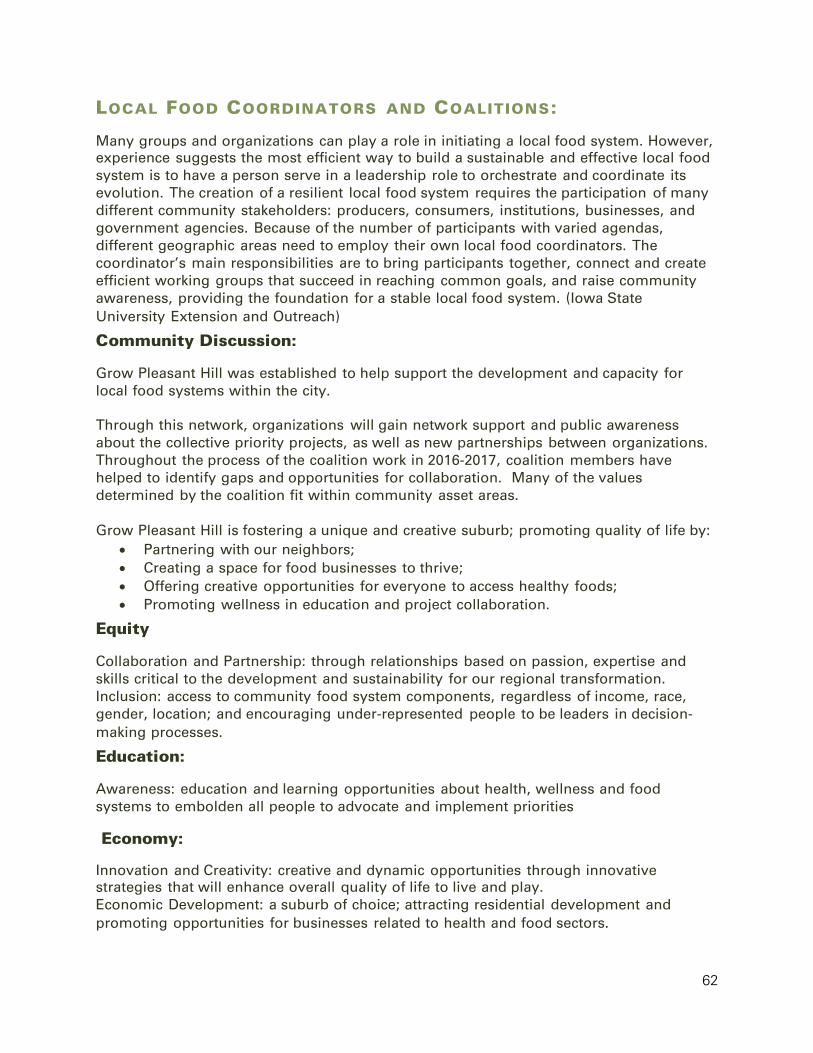
62
LOCAL FOOD COORDINATORS AND COALITIONS:
Many groups and organizations can play a role in initiating a local food system. However, experience suggests the most efficient way to build a sustainable and effective local food system is to have a person serve in a leadership role to orchestrate and coordinate its evolution. The creation of a resilient local food system requires the participation of many different community stakeholders: producers, consumers, institutions, businesses, and government agencies. Because of the number of participants with varied agendas, different geographic areas need to employ their own local food coordinators. The coordinator’s main responsibilities are to bring participants together, connect and create efficient working groups that succeed in reaching common goals, and raise community awareness, providing the foundation for a stable local food system. (Iowa State University Extension and Outreach)
Community Discussion:
Grow Pleasant Hill was established to help support the development and capacity for local food systems within the city. Through this network, organizations will gain network support and public awareness about the collective priority projects, as well as new partnerships between organizations. Throughout the process of the coalition work in 2016-2017, coalition members have helped to identify gaps and opportunities for collaboration. Many of the values determined by the coalition fit within community asset areas. Grow Pleasant Hill is fostering a unique and creative suburb; promoting quality of life by:
• Partnering with our neighbors; • Creating a space for food businesses to thrive; • Offering creative opportunities for everyone to access healthy foods; • Promoting wellness in education and project collaboration.
Equity
Collaboration and Partnership: through relationships based on passion, expertise and skills critical to the development and sustainability for our regional transformation. Inclusion: access to community food system components, regardless of income, race, gender, location; and encouraging under-represented people to be leaders in decision-making processes.
Education:
Awareness: education and learning opportunities about health, wellness and food systems to embolden all people to advocate and implement priorities
Economy:
Innovation and Creativity: creative and dynamic opportunities through innovative strategies that will enhance overall quality of life to live and play. Economic Development: a suburb of choice; attracting residential development and promoting opportunities for businesses related to health and food sectors.
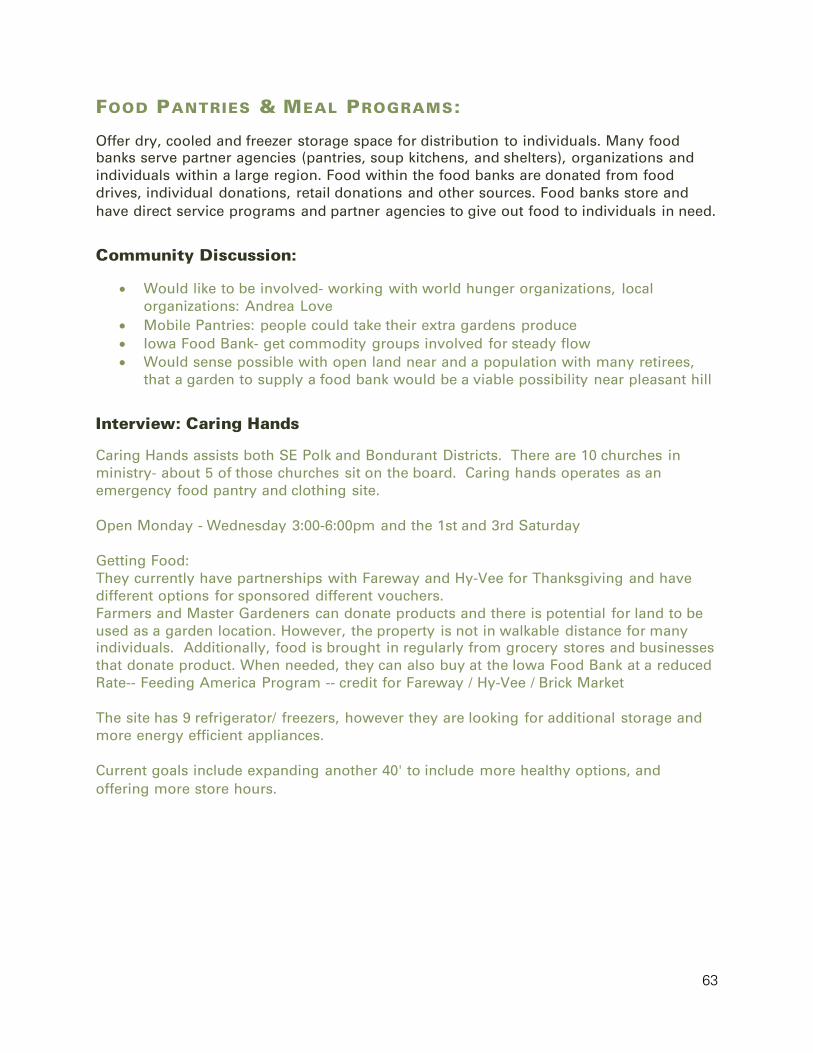
63
FOOD PANTRIES & MEAL PROGRAMS:
Offer dry, cooled and freezer storage space for distribution to individuals. Many food banks serve partner agencies (pantries, soup kitchens, and shelters), organizations and individuals within a large region. Food within the food banks are donated from food drives, individual donations, retail donations and other sources. Food banks store and have direct service programs and partner agencies to give out food to individuals in need.
Community Discussion:
• Would like to be involved- working with world hunger organizations, local organizations: Andrea Love
• Mobile Pantries: people could take their extra gardens produce • Iowa Food Bank- get commodity groups involved for steady flow • Would sense possible with open land near and a population with many retirees,
that a garden to supply a food bank would be a viable possibility near pleasant hill
Interview: Caring Hands
Caring Hands assists both SE Polk and Bondurant Districts. There are 10 churches in ministry- about 5 of those churches sit on the board. Caring hands operates as an emergency food pantry and clothing site. Open Monday - Wednesday 3:00-6:00pm and the 1st and 3rd Saturday Getting Food: They currently have partnerships with Fareway and Hy-Vee for Thanksgiving and have different options for sponsored different vouchers. Farmers and Master Gardeners can donate products and there is potential for land to be used as a garden location. However, the property is not in walkable distance for many individuals. Additionally, food is brought in regularly from grocery stores and businesses that donate product. When needed, they can also buy at the Iowa Food Bank at a reduced Rate-- Feeding America Program -- credit for Fareway / Hy-Vee / Brick Market The site has 9 refrigerator/ freezers, however they are looking for additional storage and more energy efficient appliances. Current goals include expanding another 40' to include more healthy options, and offering more store hours.
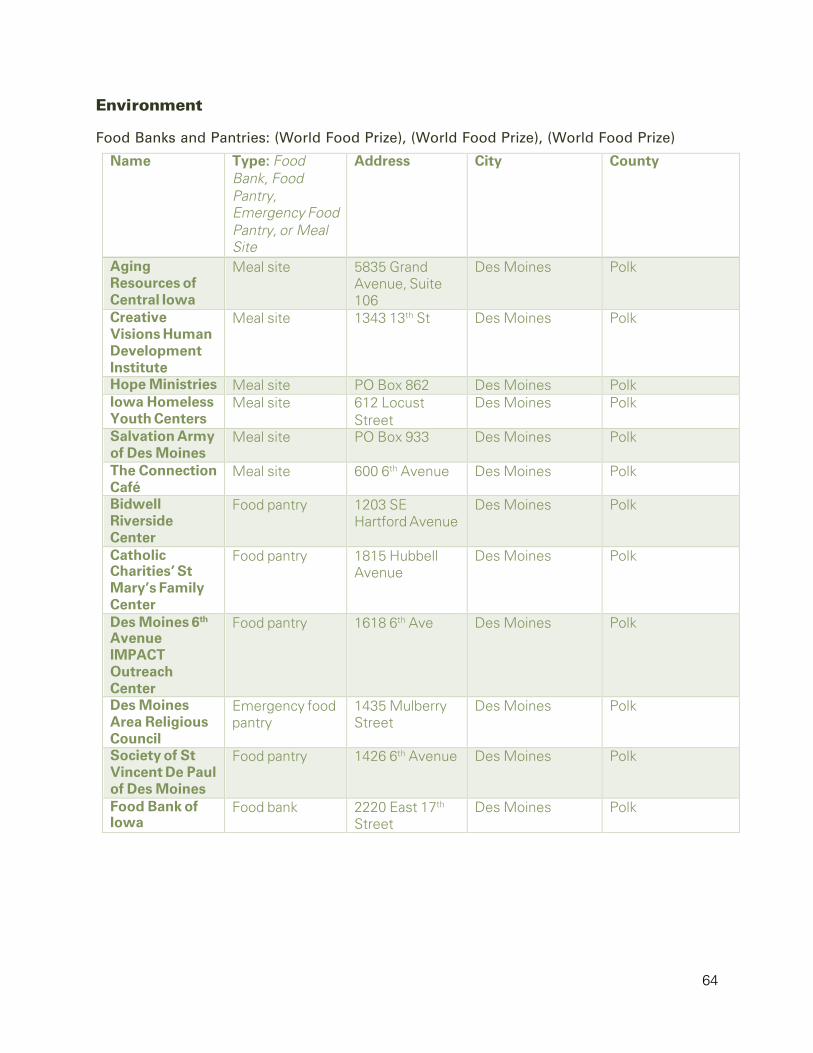
64
Environment
Food Banks and Pantries: (World Food Prize), (World Food Prize), (World Food Prize)
Name Type: Food Bank, Food Pantry, Emergency Food Pantry, or Meal Site
Address City County
Aging Resources of Central Iowa
Meal site 5835 Grand Avenue, Suite 106
Des Moines Polk
Creative Visions Human Development Institute
Meal site 1343 13th St Des Moines Polk
Hope Ministries Meal site PO Box 862 Des Moines Polk Iowa Homeless Youth Centers
Meal site 612 Locust Street
Des Moines Polk
Salvation Army of Des Moines
Meal site PO Box 933 Des Moines Polk
The Connection Café
Meal site 600 6th Avenue Des Moines Polk
Bidwell Riverside Center
Food pantry 1203 SE Hartford Avenue
Des Moines Polk
Catholic Charities’ St Mary’s Family Center
Food pantry 1815 Hubbell Avenue
Des Moines Polk
Des Moines 6th Avenue IMPACT Outreach Center
Food pantry 1618 6th Ave Des Moines Polk
Des Moines Area Religious Council
Emergency food pantry
1435 Mulberry Street
Des Moines Polk
Society of St Vincent De Paul of Des Moines
Food pantry 1426 6th Avenue Des Moines Polk
Food Bank of Iowa
Food bank 2220 East 17th Street
Des Moines Polk
65
FOOD SYSTEM POLICY COUNCILS:
Food Policy Councils bring together food activists, community members, urban and rural planners, and local, municipal and state governments as partners in creating local food initiatives. Food policy councils support communities in their efforts to rebuild, with existing community assets, local and regional food systems. This collaboration assists partners within various scales of communities to move forward in food system change through coordinated efforts for policy change. These coalitions of leaders give a voice to numerous, compassionate individuals and organizations within the community. Food policy councils defend and articulate the priorities of the community that inform local and regional policies to continue to enhance the opportunity for implementation of local food systems.
Community Discussion:
• Interested in good policy and access • As Pleasant Hill grows, it is important to lay the framework to have educated
leaders • Create a policy that all new residential development set aside 1/4 acre for
community gardening with deer fence and maintained by homeowners association
Environment
Assist in state and local food system assessments: analysis of food supply chain data collected identifies gaps and assets within the food system to inform decision making on programs and policies
Education
Number of food policy councils nearly doubled from 111 councils in 2010 to 193 councils in 2012: representing and advocating for health, environmental sustainability, economic viability and socially just food systems. (Long, Agricultural Urbanism Toolkit)
Wellness
Potential to address public health through improvements to food access, food insecurity, and quality of available food
Policy
Food policy councils can work on a range of policy in local and state jurisdictions. They are typically appointed by a city, county or state and are an elected group of individuals tasked to improve policies that impact the food system. (Harper, Alkon and Shattuck)
66
To include all community projects, businesses, etc. that involve production (recycling, reducing, recovering, reusing, composting) of food or other natural resources
Community Conclusions:
While no priority project was determined in the sector or resource management, there were several suggestions of incorporating educational programs around composting and general conservation programs. One solution discussed during coalition meetings was offering composting courses through the City Parks and Recreation summer classes. Food recovery and food donation also connect well with the interest of Caring Hands pantry. A next step could be to incorporate a food donation component to the directory and suggest options for individuals looking to donate food from their farm or garden.
Community Discussion:
Compost Programs • Community compost- I have lots of food scraps and would like to not throw away • Community Compost
Conservation Program:
• Create conservation nursery
FOOD RECOVERY
Bridge between food waste and fighting hunger. Food recovery works to offer opportunities for individuals, organizations, and farmers to donate food that is not used rather than throwing it away. This can be done through gleaning programs at farms or supermarkets where non-sold goods are donated to food banks, or can be offered through new programs like phone applications where individuals and businesses can link up with food banks and food pantries for needed donations of food.
67
Bibliography
AARP. "AARP Livability Index." n.d. AARP. 15 December 2016. <https://livabilityindex.aarp.org/search#Pleasant+Hill+IA+USA>.
Aging Resources of Central Iowa. "Nutrition & Healthy Living." n.d. Aging Resources of Central Iowa. 15 December 2016. <http://www.agingresources.com/programs-services/nutrition-healthy-living>.
—. "Senior Farmers Market (SFMNP)." 29 July 2016. Aging Resources of Central Iowa. 15 December 2016. <http://www.agingresources.com/programs-services/senior-farmers-market-nutrition-program>.
Altoona Kids Cafe. "Kids Cafe." n.d. Altoona Kids Cafe. 7 December 2016. <http://www.altoonakidscafe.com/>.
Care Initiatives. "Parkridge Specialty Care." 2016. Care Initiatives. 7 December 2016. <http://www.careinitiatives.org/parkridge-specialty-care>.
Caring Hands. "Caring Hands." n.d. Caring Hands Iowa. 7 December 2016. <http://caringhandsiowa.org/>.
Cass County Health System Foundation. "Plant a Garden Heal a Soul." n.d. <http://www.casshealth.org/static/uploads/healinggarden.pdf>.
Catfish Creek Watershed. Mission Statement. 2015. 26 October 2015. <http://www.catfishcreekwatershed.org/AboutUs/MissionStatement.aspx>.
Centers for Disease Control and Prevention. "Behavioral Risk Factor Surveillance System." 15 September 2015. Centers for Disease Control and Prevention. 30 September 2015. <http://www.cdc.gov/brfss/>.
Corporate Garden Coach. Why Start a Corporate Garden. 4 November 2016. <http://corporategardencoach.com/why>.
County Health Rankings. "Polk County Snapshot." 2016. County Health Rankings. 25 October 2016. <http://www.countyhealthrankings.org/app/iowa/2016/rankings/polk/county/outcomes/overall/snapshot>.
Courtyard Estates. "Courtyard Estates." 2015. Courtyard Estates. 7 December 2016. <http://www.courtyard-estates.net/>.
DART. "Local Route 10 - East University." 2016. Des Moines Regional Transit Authority. 30 November 2016. <https://www.ridedart.com/content/local-route-10-east-university>.
68
Edible Outdoors. "Edible Outdoors - Des Moines." 2016. Edible Outdoors - Des Moines Facebook. 30 November 2016. <https://www.facebook.com/edibleoutdoorsdsm/>.
EPIC. "Major Employers." n.d. East Polk Innovation Collaborative. 30 November 2016. <http://epictomorrow.org/#>.
eXtension. Mobile Slaughter/ processing units currently in operation. 20 March 2016. <http://articles.extension.org/pages/19781/mobile-slaughterprocessing-units-currently-in-operation>.
Families USA. Federal Poverty Guidelines. February 2015. 25 October 2015. <http://familiesusa.org/product/federal-poverty-guidelines>.
—. Federal Poverty Guidelines. February 2016. 28 November 2016. <http://familiesusa.org/product/federal-poverty-guidelines>.
Farm to School. "Farm to School." n.d. The Benefits of Farm to Schools. http://www.farmtoschool.org/Resources/BenefitsFactSheet.pdf.
Feeding America. "Child Food Insecurity in Iowa." 2016. Feeding America. 30 November 2016. <http://map.feedingamerica.org/county/2014/child/iowa>.
—. "Child Food Insecurity in Polk County." 2016. Feeing America. 30 November 2016. <http://map.feedingamerica.org/county/2014/child/iowa/county/polk>.
—. "Food Insecurity in Iowa." 2016. Feeding America. 28 November 2016. <http://map.feedingamerica.org/county/2014/overall/iowa>.
—. "Food Insecurity in Polk County." 2016. Feeding America. 28 November 2016. <http://map.feedingamerica.org/county/2014/overall/iowa/county/polk>.
—. "Map the Meal Gap 2015." 2015. Feeding America. 25 October 2015. <http://www.feedingamerica.org/hunger-in-america/our-research/map-the-meal-gap/2013/IA_AllCounties_CDs_CFI_2013.pdf>.
—. Map the Meal Gap: Child Food Insecurity in Iowa by County in 2013. 2013. 23 September 2015. <http://map.feedingamerica.org/county/2013/overall/iowa/county/dubuque>.
Gary Taylor, Andrea Vaage. "Municipal Zoning for Local Foods in Iowa: A Guidebook for Reducing Local Regulatory Barriers to Local Foods." Iowa State University Extension and Outreach, 2012. <https://blogs.extension.iastate.edu/planningBLUZ/files/2012/01/ZONING-FOR-LOCAL-FOODS-GUIDEBOOK.pdf>.
Harper, Alethea, et al. Food Policy Councils: Lessons Learned. 01 December 2009. https://foodfirst.org/publication/food-policy-councils-lessons-learned/. 2018.
69
Hohenshell, Kaley and Courtney Long. "Iowa State University Local Foods Program." 2017. School Wellness Policies: Overview and Resources. https://www.extension.iastate.edu/localfoods/school-wellness-policies-overview-resources/. 2018.
Hohenshell, Kaley. "Local Foods Program ." 2017. Farm to School 101. https://www.extension.iastate.edu/localfoods/farm-school-101-overview-resources/. 2018.
ICIP. "Poverty and Food Needs: Polk County, Iowa." March 2016. Iowa Community Indicators Program (ICIP). 23 November 2016. <http://www.icip.iastate.edu/sites/default/files/poverty/poverty_19153.pdf>.
IDPH. CHNA & HIP. 29 September 2016. 19 December 2016. <http://idph.iowa.gov/chnahip/health-improvement-plans>.
Iowa Community Indicators Program. Farm Employment. November 2015. 28 November 2016. <http://www.icip.iastate.edu/tables/employment/farm-jobs>.
—. Number of families at selected ratios of income to poverty level. 2016. 28 November 2016. <http://www.icip.iastate.edu/tables/income/poverty-ratios>.
—. Poverty rates for families. 2016. 28 November 2016. <http://www.icip.iastate.edu/tables/income/family-poverty>.
—. Poverty rates for individuals and children. 2015. 28 November 2016. <http://www.icip.iastate.edu/tables/income/individual-poverty>.
Iowa Department of Education. "2014-15 Iowa Public School K-12 Students Eligible for Free and Reduced-Price Lunch by District, w/CEP designation." 2014. Iowa Department of Education. 23 September 2015. <https://www.educateiowa.gov/documents/district-level/2015/06/2014-15-iowa-public-school-k-12-students-eligible-free-and-reduced>.
—. "2014-15 Iowa Public School K-12 Students Eligible for Free and Reduced-Price Lunch by District, w/CEP designation." 2017. Iowa Department of Education. 23 September 2015. <https://www.educateiowa.gov/documents/district-level/2017/01/2016-17-iowa-public-school-k-12-students-eligible-free-and-reduced>.
—. "eWIC Ready List." 9 August 2016. Iowa Department of Public Health. 7 November 2016. <https://idph.iowa.gov/Portals/1/userfiles/48/eWIC%20Ready%20List%208_2016.pdf>.
—. "FY2015 CHNA&HIP Progress Report." 2015. Iowa Department of Public Health. 25 October 2016. <http://idph.iowa.gov/Portals/1/userfiles/91/CHNA%26HIP/HIP%20Progress%20Reports/Polk%20County.pdf>.
70
—. Polk County CHNA. n.d. 13 October 2015. <http://idph.iowa.gov/Portals/1/userfiles/91/CHNA%26HIP/2016%20CHNA%26HIPs/Polk%20County%20CHNA%202-9-16.pdf>.
Iowa Farm Bureau. Iowa Rise Up. n.d. http://programs.iowafarmbureau.com/iowariseup/invest.html. January 2018.
Iowa Food Cooperative. "How It Works & FAQ." n.d. Iowa Food Cooperative. 30 November 2016. <http://iowafood.coop/how-it-works-faq/>.
Iowa Food Hub. About the Iowa Food Hub. 2015. 26 October 2015. <http://www.iowafoodhub.com/public/pageedit.aspx?pageid=1>.
Iowa State University . Iowa Community Indicators Program. 2009-2013. 25 October 2015. <http://www.icip.iastate.edu/tables/income/family-poverty >.
Iowa State University Extension and Outreach. "Local Food Coordinators: who are they, and why are they important?" 2014.
—. "Master Gardener Volunteer Reporting System." 2017. Iowa State University Extension and Outreach. https://www.extension.iastate.edu/mastergardener/files/page/files/2017%20MG%20report_0.pdf. 28 January 2018. <http://mastergardenerhours.hort.iastate.edu/index.php>.
Iowa State University Extension. Iowa Community Indicators Program: Farm Employment. n.d. 25 October 2015. <http://www.icip.iastate.edu/tables/employment/farm-jobs>.
—. Iowa Community Indicators Program: Number of families at selected ratios of income to poverty level. 2009-2013. 25 October 2015. <http://www.icip.iastate.edu/tables/income/poverty-ratios>.
—. Iowa Community Indicators Program: Number of Farms by County. 2015. 25 October 2015. <http://www.icip.iastate.edu/tables/agriculture/farms-by-county>.
—. Iowa Community Indicators Program: Personal Income by Source. n.d. 25 October 2015. <http://www.icip.iastate.edu/tables/income/sources>.
Iowa State University. Iowa Community Indicators Program: Poverty rates for individuals and children. 2013. 25 October 2015. <http://www.icip.iastate.edu/tables/income/individual-poverty>.
Iowa WIC . "Attachment C- Iowa WIC Authorized Vendors ." 2013.
ISU Extension. Iowa community Indicators Program: Average Farm Size in Acres. 2015. October 25 2015. <http://www.icip.iastate.edu/tables/agriculture/avg-farm-size>.
71
—. Iowa Community Indicators Program: Selected Characteristics of Principal Farm Operators. 2015. 25 October 2015. <http://www.icip.iastate.edu/tables/agriculture/operators >.
Leopold Center for Sustainable Agriculture. "Regional Food Systems Working Group - Iowa." n.d. Leopold Center for Sustainable Agriculture. 12 October 2015. <http://www.leopold.iastate.edu/regional-food-systems-working-group>.
Long, Courtney. "Agricultural Urbanism Toolkit." July 2015. ISU E&O Local Foods. Community Design Lab. 29 August 2016. <https://www.extension.iastate.edu/localfoods/new-publication-ag-urbanism-toolkit/>.
—. "Notes from Dubuque Meeting." 2015.
—. "Pleasant Hill Residents, Iowa Food Cooperative Increase Access to Local Foods." 23 November 2016. Iowa State University Extension and Outreach. 30 November 2016. <http://www.extension.iastate.edu/article/pleasant-hill-residents-iowa-food-cooperative-increase-access-local-foods>.
Market Maker. Market Maker Iowa. 2016. https://ia.foodmarketmaker.com/. 2016.
—. Polk County Farmers Market. n.d. 27 December 2016. <https://foodmarketmaker.com/search/directory/?pos=%7B%22city%22%3A%22Cedar+Rapids%22%2C%22state%22%3A%22IA%22%2C%22lat%22%3A41.9778795%2C%22lng%22%3A-91.66562320000003%2C%22address%22%3A%22Cedar+Rapids%2C+IA%22%7D&search=submit&state=IA&profile%5B%5D=1734&county=Polk&search=SEARCH>.
—. Polk County Food Retailers. n.d. 27 December 2016. <https://foodmarketmaker.com/search/directory/?pos=%7B%22city%22%3A%22Cedar+Rapids%22%2C%22state%22%3A%22IA%22%2C%22lat%22%3A41.9778795%2C%22lng%22%3A-91.66562320000003%2C%22address%22%3A%22Cedar+Rapids%2C+IA%22%7D&search=submit&state=IA&profile%5B%5D=15035&county=Polk&search=SEARCH>.
—. Polk County Processor/Packing Shed. n.d. 27 December 2016. <https://foodmarketmaker.com/search/directory/?pos=%7B%22city%22%3A%22Cedar+Rapids%22%2C%22state%22%3A%22IA%22%2C%22lat%22%3A41.9778795%2C%22lng%22%3A-91.66562320000003%2C%22address%22%3A%22Cedar+Rapids%2C+IA%22%7D&search=submit&state=IA&profile%5B%5D=19069&county=Polk&search=SEARCH>.
—. Polk County Wholesalers. n.d. 27 December 2016. <https://foodmarketmaker.com/search/directory/?pos=%7B%22city%22%3A%22Cedar+Rapids%22%2C%22state%22%3A%22IA%22%2C%22lat%22%3A41.9778795%2C%22lng%22%3A-
72
91.66562320000003%2C%22address%22%3A%22Cedar+Rapids%2C+IA%22%7D&search=submit&state=IA&profile%5B%5D=20357&county=Polk&search=SEARCH>.
—. Polk Farmer/Rancher. n.d. 22 December 2016. <https://foodmarketmaker.com/search/directory/?pos=%7B%22city%22%3A%22Ames%22%2C%22state%22%3A%22IA%22%2C%22lat%22%3A42.0307812%2C%22lng%22%3A-93.63191310000002%2C%22address%22%3A%22Ames%2C+IA%22%7D&search=submit&state=IA&profile%5B%5D=1742&search=SEARCH>.
Pleasant Hill. "City Parks." n.d. Pleasant Hill. 30 November 2016. <http://www.pleasanthilliowa.org/233/City-Parks>.
—. "Community Garden." n.d. Pleasant Hill. 6 December 2016. <http://www.pleasanthilliowa.org/235/Community-Garden>.
—. "Resources." n.d. Pleasant Hill. 6 December 2016. <http://www.ci.pleasant-hill.ia.us/187/Resources>.
Program, North Iowa Community Action Organization WIC. "Feed Your Family's Future." 1 June 2015.
Rigby-Adcock, Leigh. "Iowa CSA Farms: 2017 Statewide List of Iowa CSA Farms and Organizers Serving Iowa." May 2017. Iowa State University Extension and Outreach. 28 November 2016. <https://store.extension.iastate.edu/product/5235>.
River Bend Buy Fresh Buy Local. Directory. 2012. 26 October 2015. <http://www.riverbendbfbl.org/directory>.
SEP Ram Garden Club. "Southeast Polk Ram Garden Club." 2014. SEP Ram Garden Club. 6 December 2016. <https://sites.google.com/a/southeastpolk.org/jhramgardens/>.
Snyder & Associates, Inc. "Final Report Fourmile Creek Watershed Study." December 2013. Fourmile Creek Watershed. Inc. Snyder & Associates. 22 November 2016. <http://www.fourmilecreekwatershed.org/FourmileCreek/FMCW_1_Report_Final-Web.pdf>.
Southeast Polk Community School District. "Eddy Named State Outstanding Agriculture Teacher." 2013. Southeast Polk Community School District. 7 November 2016. <http://www.southeastpolk.org/vnews/display.v/ART/51dac6b1be898>.
—. "Find Your School." 20 October 2014. Southeast Polk. 8 December 2016. <http://www.southeastpolk.org/vnews/display.v/SEC/District%7CDistrict%20Map>.
—. "Matthew Eddy Named to the National FFA Board of Directors." 30 June 2016. Southeast Polk Community School District. 7 November 2016. <http://www.southeastpolk.org/vnews/display.v/ART/57751fac809b1>.
73
—. Southeast Polk Community School District. 21 September 2017. https://www.southeastpolk.org/news/2017/09/sep-junior-high-rocking-garden-club/. 28 January 2018.
Southeast Polk. "Elementary Schools." n.d. Map My Schools. 8 December 2016. <http://mapmyschools.com/sep_ia.schoolsearch/>.
Sustainable Dubuque. Coalition Vision, Mission, and Goals. 2014. 26 October 2015. <http://www.sustainabledubuque.org/en/social__cultural_vibrancy/community_health__safety/dubuque_county_wellness_coalition/>.
Taylor, Gary and Andrea Vaage. Municipal Zoning for Local Foods in Iowa: A Guidebook for Reducing Local Regulatory Barriers to Local Foods. Ames: Leopold Center for Sustainable Agriculture, 2016.
Taylor, Gary. The Midwest Planning BLUZ. 15 December 2016. 16 December 2016. <https://blogs.extension.iastate.edu/planningBLUZ/>.
The Cottages at Pleasant Hill. "The Cottages of Pleasant Hill." 2014. The Cottages of Pleasant Hill. 7 December 2016. <http://www.cottages-pleasanthill.com/>.
The Shores at Pleasant Hill. "The Shores at Pleasant Hill." 2016. The Shores at Pleasant Hill. 7 December 2016. <http://www.theshoreslife.com/>.
The University of Iowa. "2012 Iowa Youth Survey: Dubuque County Results." 2013. Iowa Youth Survey. 30 September 2015. <http://www.iowayouthsurvey.iowa.gov/>.
—. "2014 Iowa Youth Survey: Polk County Results." 2017. Iowa Youth Survey. 30 September 2017. <http://www.iowayouthsurvey.iowa.gov/images/2012_County_reports/31.Dubuque.pdf>.
Topaloff, Alice. Shared Use Kitchen Planning Toolkit . Ames: Leopold Center for Sustainable Agriculture, 2014. https://www.leopold.iastate.edu/files/pubs-and-papers/2014-09-shared-use-kitchen-planning-toolkit.pdf.
United States Census Bureau. United States Census Bureau. n.d. https://www.census.gov/quickfacts/fact/table/pleasanthillcityiowa/PST045217#viewtop. 28 January 2018.
USDA . Food Access Research Atlas. 2016. https://www.ers.usda.gov/data-products/food-access-research-atlas/go-to-the-atlas.aspx. 2016.
USDA. "Asian and Black or African American Operators." Data Report. 2012. http://www.agcensus.usda.gov/Publications/2012/Full_Report/Volume_1,_Chapter_2_County_Level/Iowa/st19_2_051_052.pdf.
74
—. "County Summary Highlights." 2012. https://www.agcensus.usda.gov/Publications/2012/Full_Report/Volume_1,_Chapter_2_County_Level/Iowa/st19_2_001_001.pdf.
—. ERS. n.d. 2015. <http://www.ers.usda.gov/data-products/county-level-data-sets/poverty.aspx?reportPath=/State_Fact_Sheets/PovertyReport&fips_st=19>.
USDA ERS. Food Data Atlas. 2016. https://www.ers.usda.gov/data-products/food-environment-atlas/go-to-the-atlas/.
—. Food Environment Atlas. 2010. 4 January 2017. <https://www.ers.usda.gov/data-products/food-environment-atlas/go-to-the-atlas/>.
USDA. "Farms, Land in Farms, Value of Land and Buildings, and Land Use: 2012 and 2007." Data Report. 2012. http://www.agcensus.usda.gov/Publications/2012/Full_Report/Volume_1,_Chapter_2_County_Level/Iowa/st19_2_008_008.pdf.
—. "Fertilizers and Chemicals Applied." 2012. (USDA)https://www.agcensus.usda.gov/Publications/2012/Full_Report/Volume_1,_Chapter_2_County_Level/Iowa/st19_2_041_041.pdf.
—. "Hired Farm Labor- Workers and Payroll." 2012.
—. "Net Cash Farm Income of the Operations and Operators: 2012 and 2007." 2012.
—. "North American Industry Classification." 2012. https://www.agcensus.usda.gov/Publications/2012/Full_Report/Volume_1,_Chapter_2_County_Level/Iowa/st19_2_044_044.pdf.
—. "Organic Agriculture." 2012. https://www.agcensus.usda.gov/Publications/2012/Full_Report/Volume_1,_Chapter_2_County_Level/Iowa/st19_2_042_042.pdf.
—. "Publications." 30 March 2015. USDA Census of Agriculture. 25 October 2015. <http://www.agcensus.usda.gov/Publications/2012/Full_Report/Volume_1,_Chapter_2_County_Level/Iowa/st19_2_001_001.pdf>.
—. "Publications." 25 October 2015. USDA Census of Agriculture. http://www.agcensus.usda.gov/Publications/2012/Full_Report/Volume_1,_Chapter_2_County_Level/Iowa/st19_2_041_041.pdf. 25 October 2015. <http://www.agcensus.usda.gov/Publications/2012/Full_Report/Volume_1,_Chapter_2_County_Level/Iowa/>.
—. "Publications." 30 March 2015. USDA Census of Agriculture. 1 October 2015. <http://www.agcensus.usda.gov/Publications/>.
75
—. "Selected Practices." 2012. file:///C:/Users/court7/Desktop/PleasantHill/Assessment/practices.pdf.
—. "Spanish, Hispanic, or Latino Operators: 2012." Data Report. 2012. http://www.agcensus.usda.gov/Publications/2012/Full_Report/Volume_1,_Chapter_2_County_Level/Iowa/st19_2_049_050.pdf.
—. "Table 1. County Summary Highlights: 2012." 2012. USDA Census of Agriculture. 23 November 2016. <http://www.agcensus.usda.gov/Publications/2012/Full_Report/Volume_1,_Chapter_2_County_Level/Iowa/st19_2_001_001.pdf>.
—. Table 11. Cattle and Calves- Inventory and Sales: 2012 and 2007. 2012. 22 November 2016. <https://www.agcensus.usda.gov/Publications/2012/Full_Report/Volume_1,_Chapter_2_County_Level/Iowa/st19_2_011_011.pdf>.
—. Table 12. Hogs and Pigs - Inventory and Sales: 2012 and 2007. 2012. 22 November 2016. <https://www.agcensus.usda.gov/Publications/2012/Full_Report/Volume_1,_Chapter_2_County_Level/Iowa/st19_2_012_012.pdf>.
—. "Table 13. Sheep and Lambs - Inventory, Wool Production, and Sales: 2012 and 2007." 2012. USDA Census of Agriculture. 23 November 2016. <https://www.agcensus.usda.gov/Publications/2012/Full_Report/Volume_1,_Chapter_2_County_Level/Iowa/st19_2_013_013.pdf>.
—. "Table 14. All Goats - Inventory and Sales: 2012 and 2007." 2012. USDA Census of Agriculture. 23 November 2016. <https://www.agcensus.usda.gov/Publications/2012/Full_Report/Volume_1,_Chapter_2_County_Level/Iowa/st19_2_014_014.pdf>.
—. "Table 19. Poultry - Inventory and Sales: 2012 and 2007." 2012. USDA Census of Agriculture. 23 November 2016. <https://www.agcensus.usda.gov/Publications/2012/Full_Report/Volume_1,_Chapter_2_County_Level/Iowa/st19_2_019_019.pdf>.
—. "Table 2. Land Use: 1974." 1974. USDA Economics, Statistics, and Market Information System. 28 November 2016. <http://usda.mannlib.cornell.edu/usda/AgCensusImages/1974/01/15/306/Table-02.pdf>.
—. "Table 21. Colonies of Bees - Inventory and Honey Sales: 2012 and 2007." 2012. USDA Census of Agriculture. 23 November 2016. <https://www.agcensus.usda.gov/Publications/2012/Full_Report/Volume_1,_Chapter_2_County_Level/Iowa/st19_2_021_022.pdf>.
76
—. "Table 25. Field Crops: 2012 and 2007." 2012. USDA Census of Agriculture. 28 November 2016. <https://www.agcensus.usda.gov/Publications/2012/Full_Report/Volume_1,_Chapter_2_County_Level/Iowa/st19_2_025_025.pdf>.
—. "Table 26. Field Seeds, Grass Seeds, Hay, Forage, and Silage: 2012 and 2007." 2012. USDA Census of Agriculture. 28 November 2016. <https://www.agcensus.usda.gov/Publications/2012/Full_Report/Volume_1,_Chapter_2_County_Level/Iowa/st19_2_026_027.pdf>.
—. "Table 29. Vegetables, Potatoes, and Melons Harvested for Sale: 2012 and 2007." 2012. USDA Census of Agriculture. 23 November 2016. <https://www.agcensus.usda.gov/Publications/2012/Full_Report/Volume_1,_Chapter_2_County_Level/Iowa/st19_2_029_029.pdf>.
—. "Table 30. Land in Orchards: 2012 and 2007." 2012. USDA Census of Agriculture. 23 November 2016. <https://www.agcensus.usda.gov/Publications/2012/Full_Report/Volume_1,_Chapter_2_County_Level/Iowa/st19_2_030_030.pdf>.
—. "Table 31. Fruits and Nuts: 2012 and 2007." 2012. USDA Census of Agriculture. 23 November 2016. <https://www.agcensus.usda.gov/Publications/2012/Full_Report/Volume_1,_Chapter_2_County_Level/Iowa/st19_2_031_031.pdf>.
—. "Table 32. Land in Berries: 2012 and 2007." 2012. USDA Census of Agriculture. 23 November 2016. <https://www.agcensus.usda.gov/Publications/2012/Full_Report/Volume_1,_Chapter_2_County_Level/Iowa/st19_2_032_032.pdf>.
—. "Table 34. Nursery, Greenhouse, Floriculture, Sod, Mushroom, Vegetable Seeds, and Propagative Materials Grown For Sale: 2012 and 2007." 2012. USDA Census of Agriculture. 23 November 2016. <https://www.agcensus.usda.gov/Publications/2012/Full_Report/Volume_1,_Chapter_2_County_Level/Iowa/st19_2_034_034.pdf>.
—. Table 41. Fertilizers and Chemicals Applied: 2012 and 2007. 2012. 22 November 2016. <https://www.agcensus.usda.gov/Publications/2012/Full_Report/Volume_1,_Chapter_2_County_Level/Iowa/st19_2_041_041.pdf>.
—. "Table 42. Organic Agriculture: 2012." 2012. USDA Census of Agriculture. 23 November 2016. <https://www.agcensus.usda.gov/Publications/2012/Full_Report/Volume_1,_Chapter_2_County_Level/Iowa/st19_2_042_042.pdf>.
77
—. Table 43. Selected Practices: 2012. 2012. 22 November 2016. <https://www.agcensus.usda.gov/Publications/2012/Full_Report/Volume_1,_Chapter_2_County_Level/Iowa/st19_2_043_043.pdf>.
—. "Table 48. Women Principal Operators - Tenure: 2012." 2012. USDA Census of Agriculture. 28 November 2016. <https://www.agcensus.usda.gov/Publications/2012/Full_Report/Volume_1,_Chapter_2_County_Level/Iowa/st19_2_048_048.pdf>.
—. "Table 49. Spanish, Hispanic, or Latino Origin Operators: 2012." 2012. USDA Census of Agriculture. 28 November 2016. <https://www.agcensus.usda.gov/Publications/2012/Full_Report/Volume_1,_Chapter_2_County_Level/Iowa/st19_2_049_050.pdf>.
—. "Table 51. Asian Operators: 2012." 2012. USDA Census of Agriculture. 28 November 2016. <https://www.agcensus.usda.gov/Publications/2012/Full_Report/Volume_1,_Chapter_2_County_Level/Iowa/st19_2_051_052.pdf>.
—. "Table 54: White Operators: 2012." 2012. USDA Census of Agriculture. 28 November 2016. <https://www.agcensus.usda.gov/Publications/2012/Full_Report/Volume_1,_Chapter_2_County_Level/Iowa/st19_2_054_054.pdf>.
—. Table 8. Farms, Land in Farms, Value of Land and Buildings, and Land Use: 2012 and 2007. 2012. 22 November 2016. <https://www.agcensus.usda.gov/Publications/2012/Full_Report/Volume_1,_Chapter_2_County_Level/Iowa/st19_2_008_008.pdf>.
—. "Table 8. Farms, Land in Farms, Value of Land and Buildings, and Land Use: 2012 and 2007." 2012. USDA Census of Agriculture. 28 November 2016. <https://www.agcensus.usda.gov/Publications/2012/Full_Report/Volume_1,_Chapter_2_County_Level/Iowa/st19_2_008_008.pdf>.
—. "White Operators." Data Report. 2012. http://www.agcensus.usda.gov/Publications/2012/Full_Report/Volume_1,_Chapter_2_County_Level/Iowa/st19_2_054_054.pdf.
—. "Women Principal Operators." Data Report. 2012. http://www.agcensus.usda.gov/Publications/2012/Full_Report/Volume_1,_Chapter_2_County_Level/Iowa/st19_2_048_048.pdf.
World Food Prize. Polk County Food Bank. n.d. 27 December 2016. <https://www.worldfoodprize.org/en/events/iowa_hunger_summit/the_iowa_hunger_directory/organizations_fighting_hunger/?action=list&letter=&name=&c_1=2734&c_2=2648>.

78
—. Polk County Food Pantry. n.d. 27 December 2016. <https://www.worldfoodprize.org/en/events/iowa_hunger_summit/the_iowa_hunger_directory/organizations_fighting_hunger/?action=list&letter=&name=&c_1=2734&c_2=2655>.
—. Polk County Meal Site. n.d. 27 December 2016. <https://www.worldfoodprize.org/en/events/iowa_hunger_summit/the_iowa_hunger_directory/organizations_fighting_hunger/?action=list&letter=&name=&c_1=2734&c_2=2656>.

Appendix: -Assessment Maps-Snapshot -Polk County Demographics-Polk County Food and Poverty Report-Retail Trade Analysis Report -Des Moines Independent and Southeast Polk District Profiles
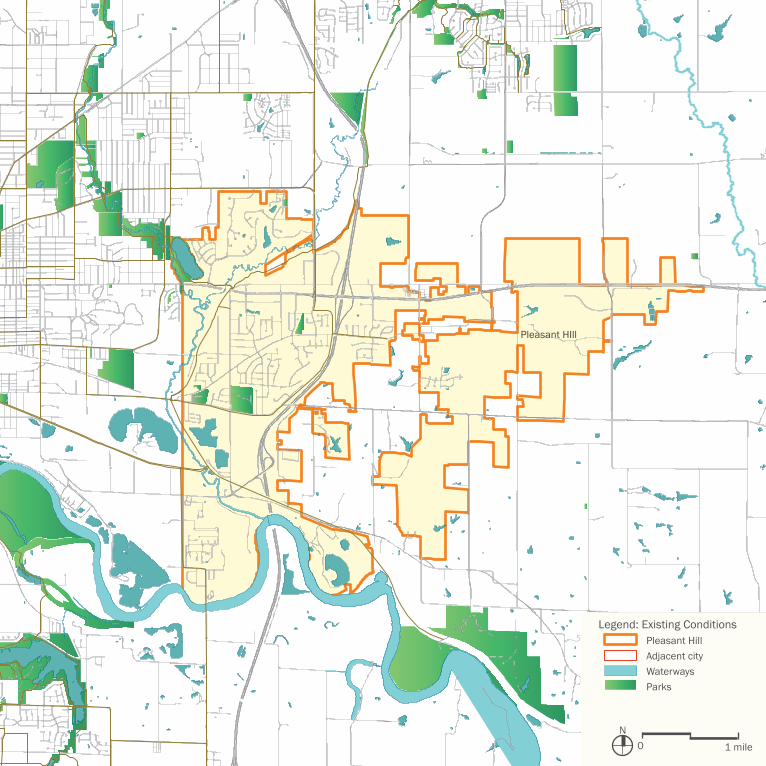
Pleasant HIll
Altoona
The Homestead
SE Polk FFA
N0 1 mile
Legend: Existing Conditions Pleasant Hill Adjacent city Waterways Parks
Hy-VeeFareway
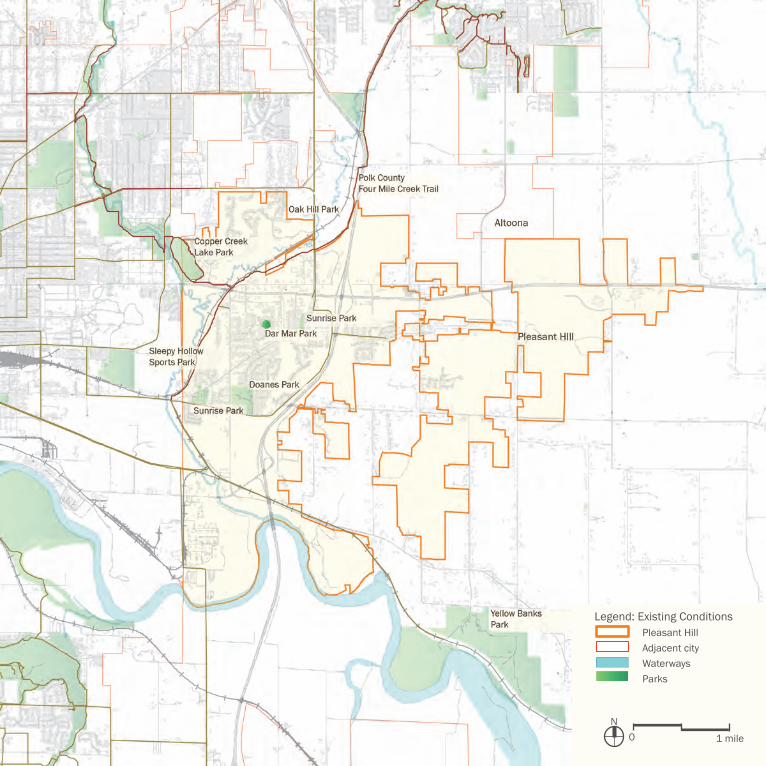
N0 1 mile
Legend: Existing Conditions Pleasant Hill Adjacent city Waterways Parks
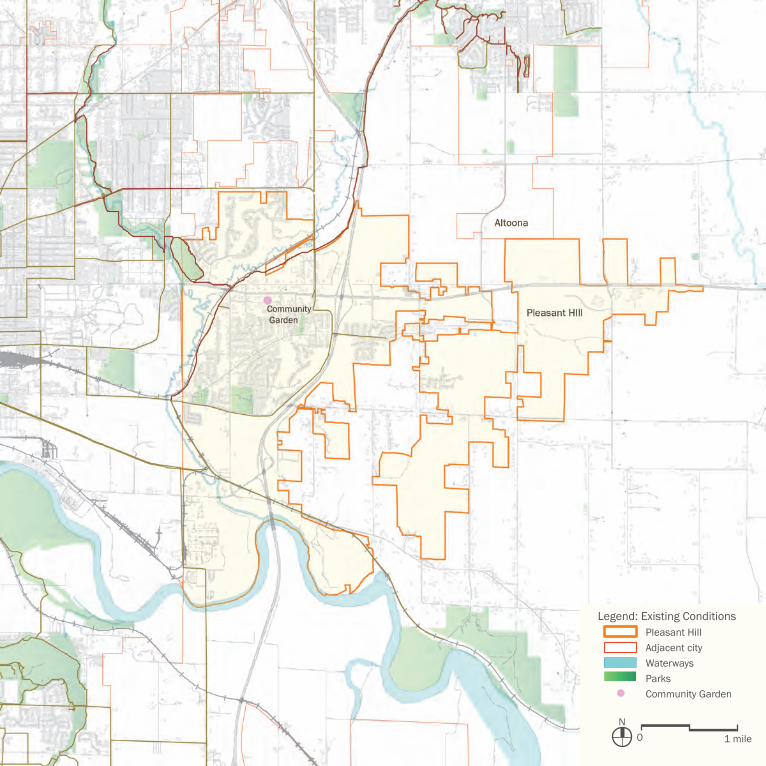
N0 1 mile
Legend: Existing Conditions Pleasant Hill Adjacent city Waterways Parks Community Garden
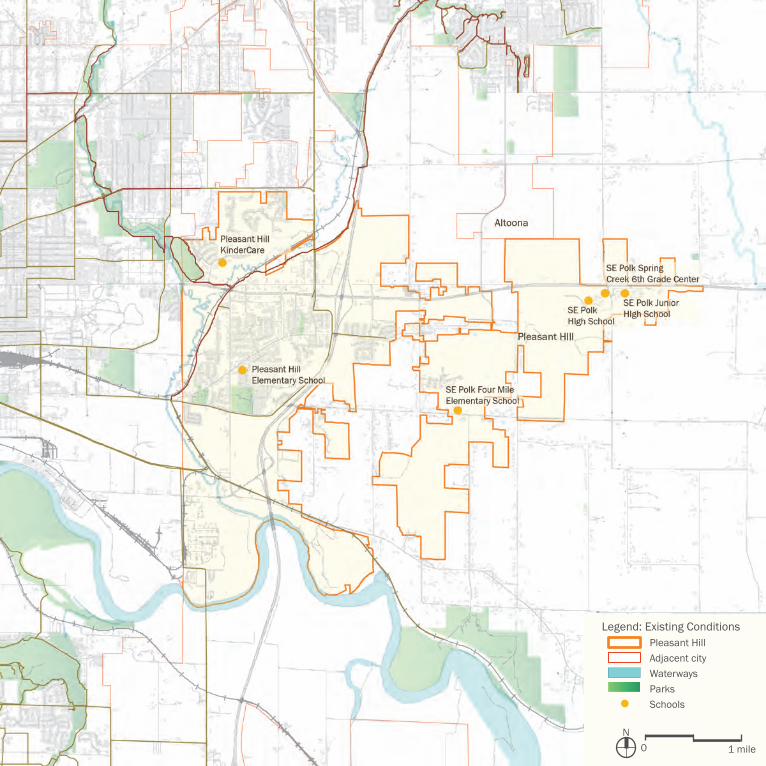
N0 1 mile
Legend: Existing Conditions Pleasant Hill Adjacent city Waterways Parks Schools
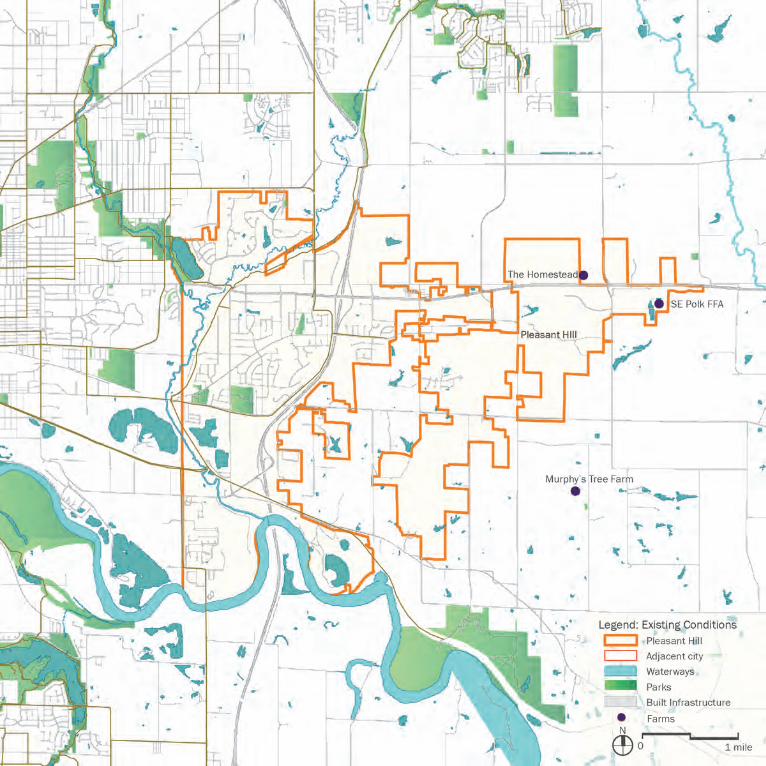
Farms
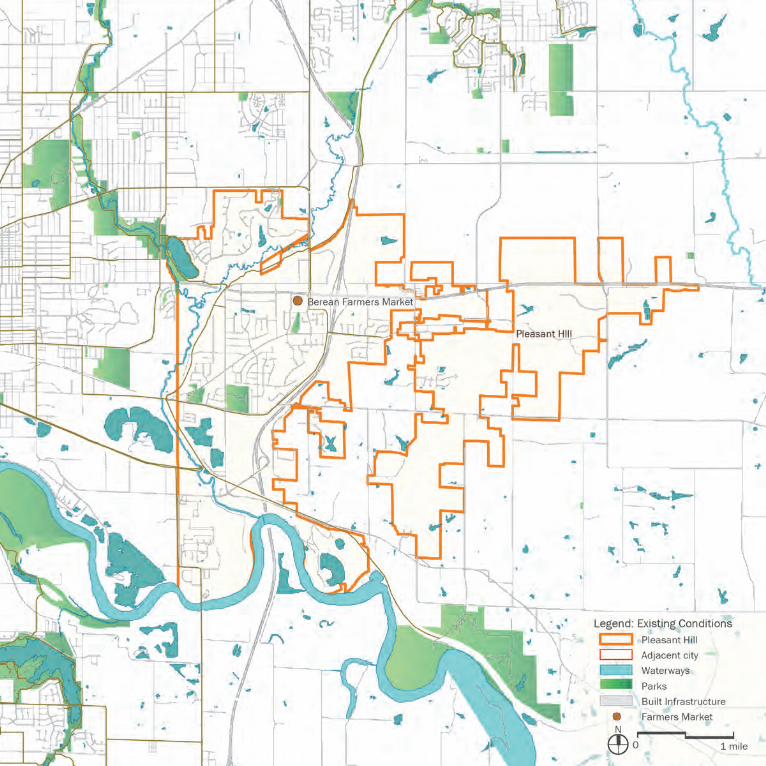
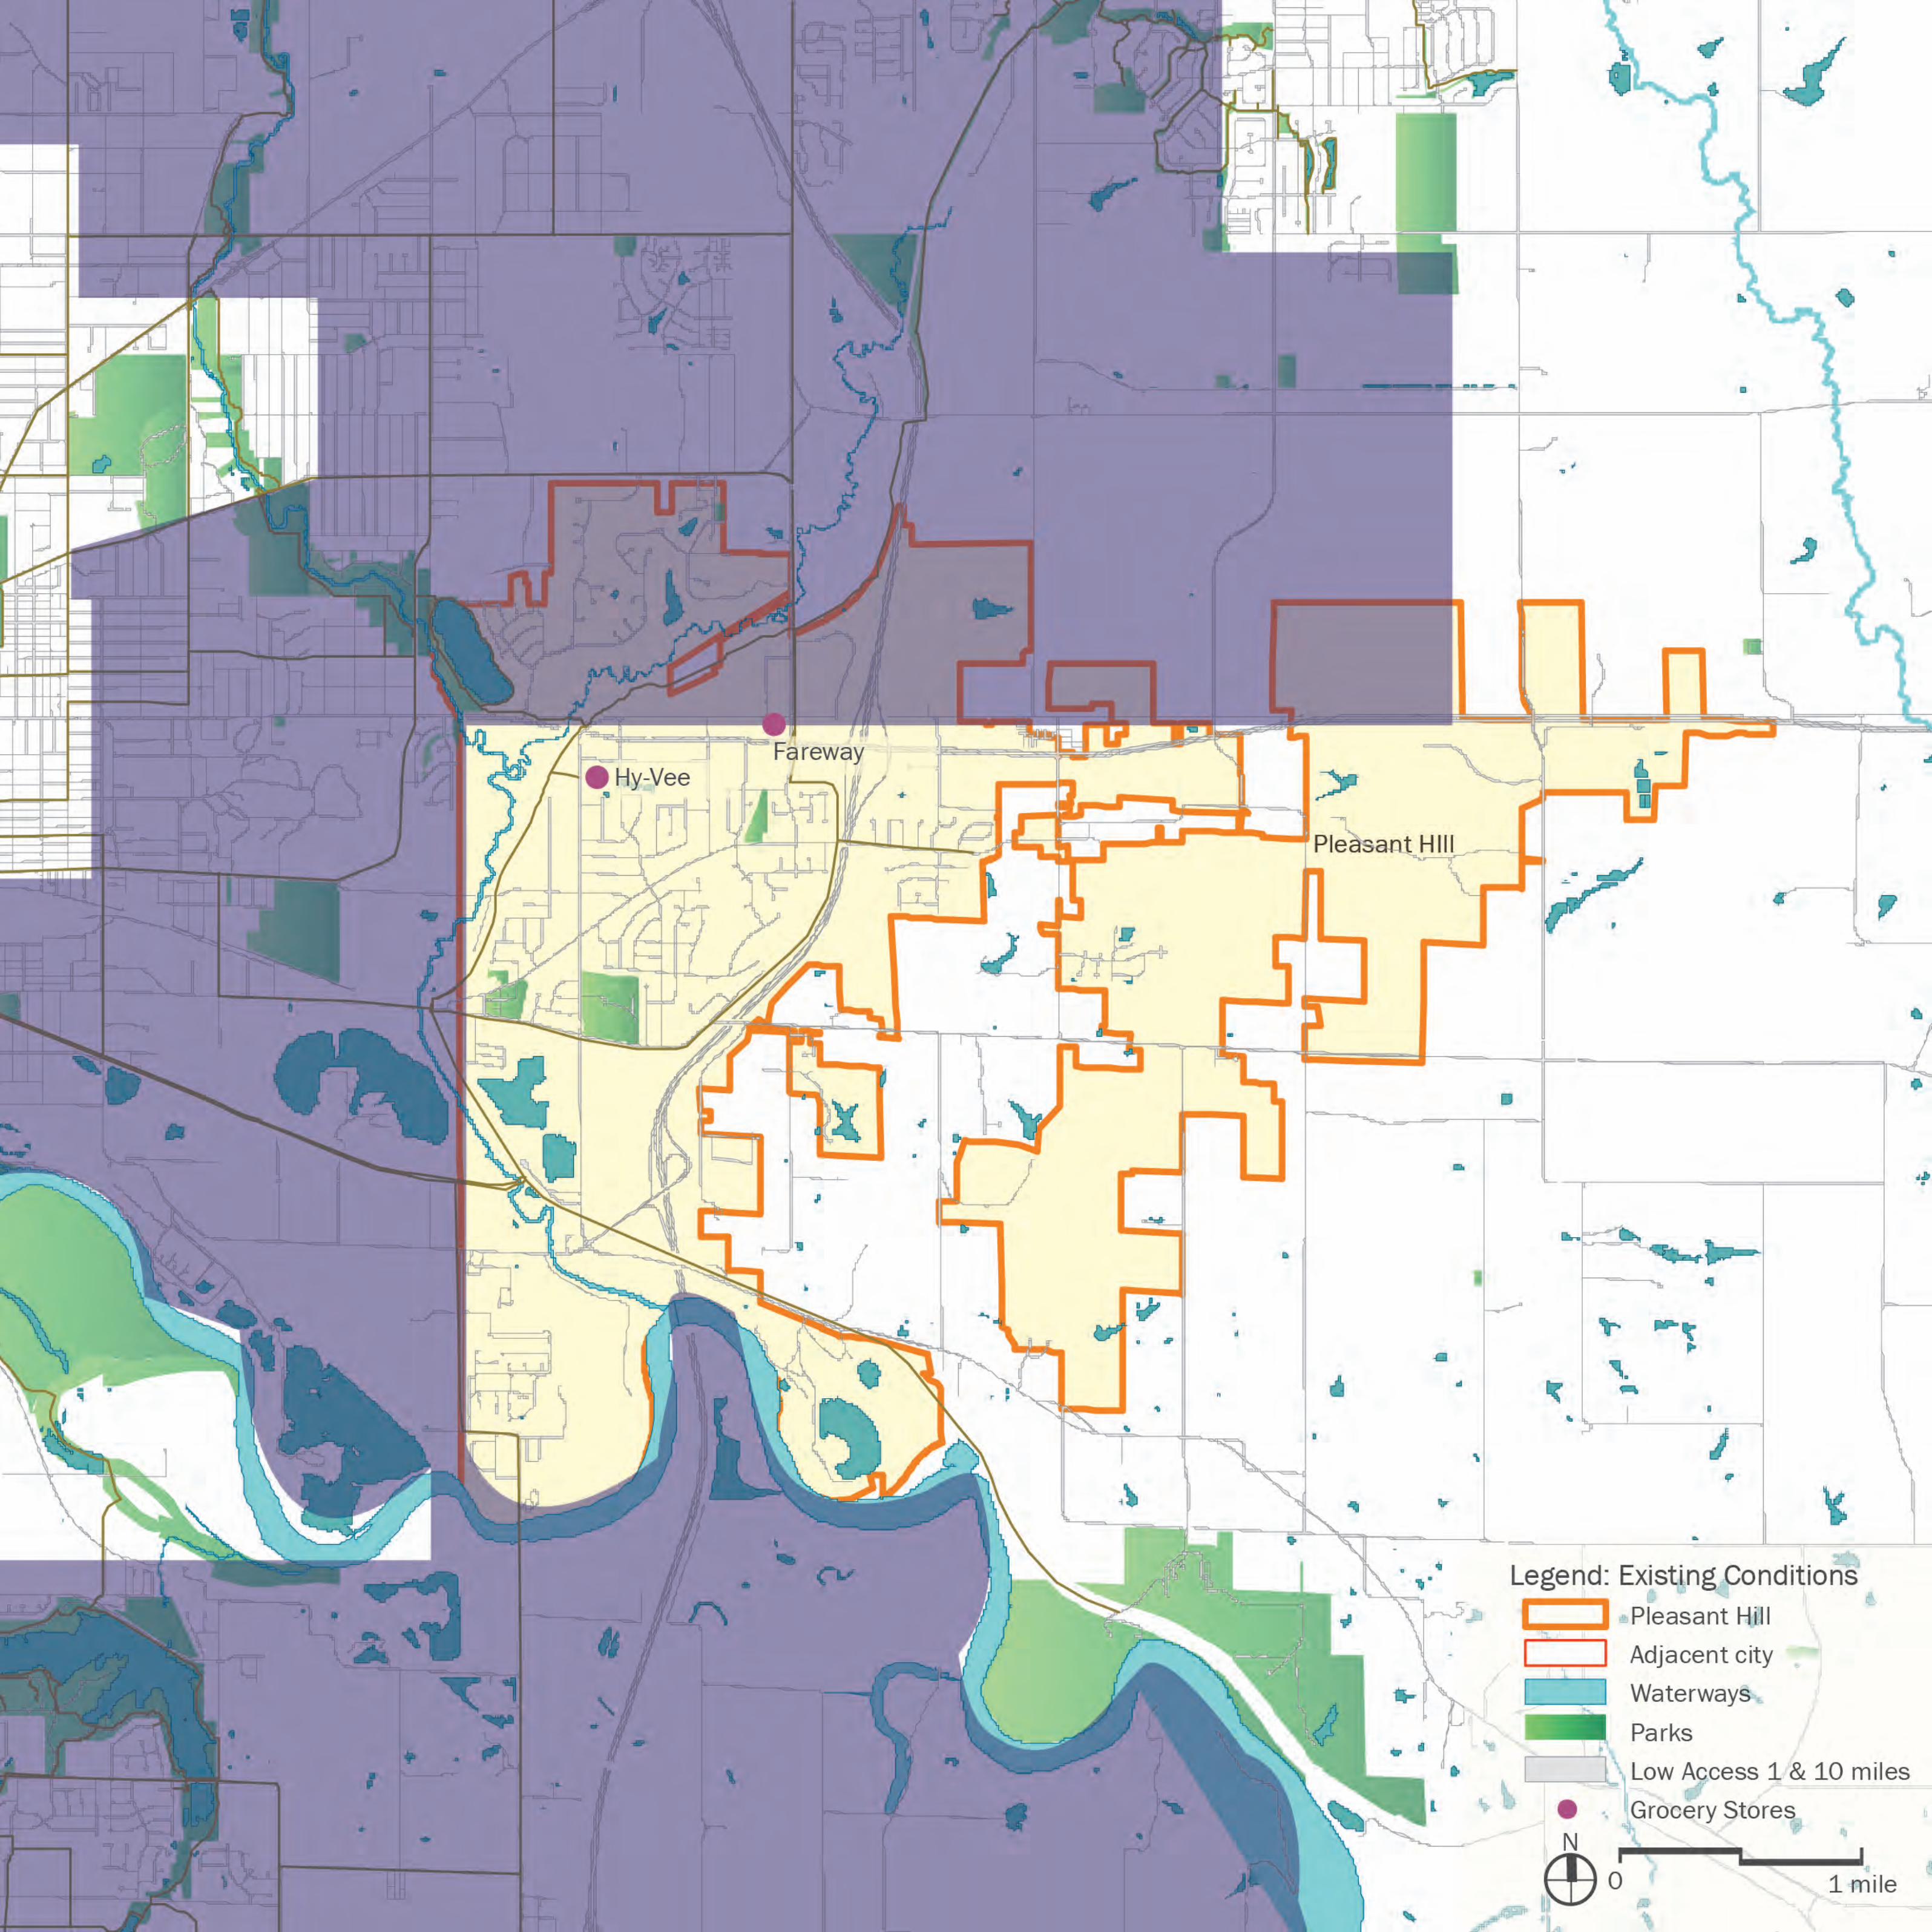
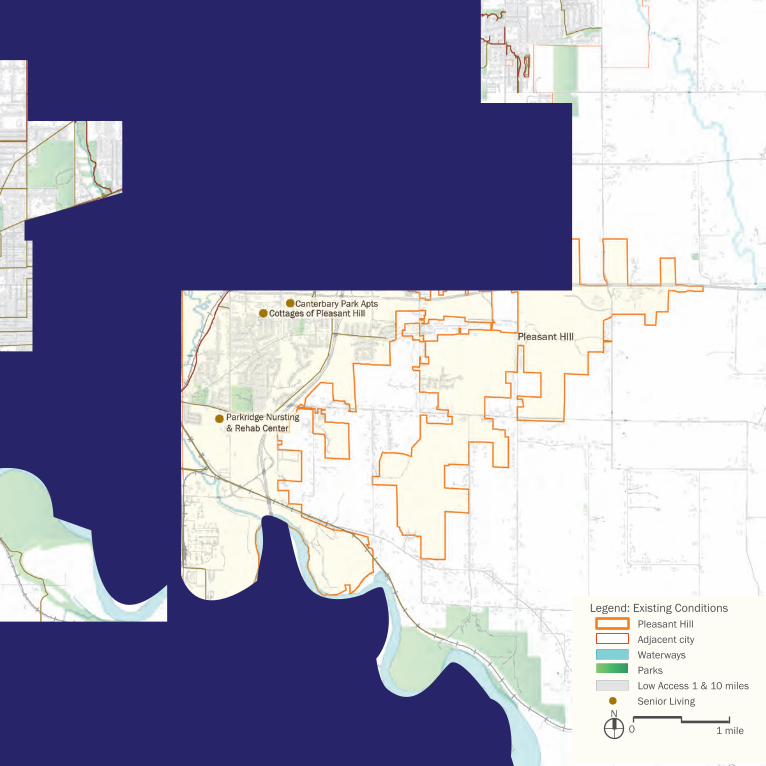
N0 1 mile
Legend: Existing Conditions Pleasant Hill Adjacent city Waterways Parks Low Access 1 & 10 miles Senior Living
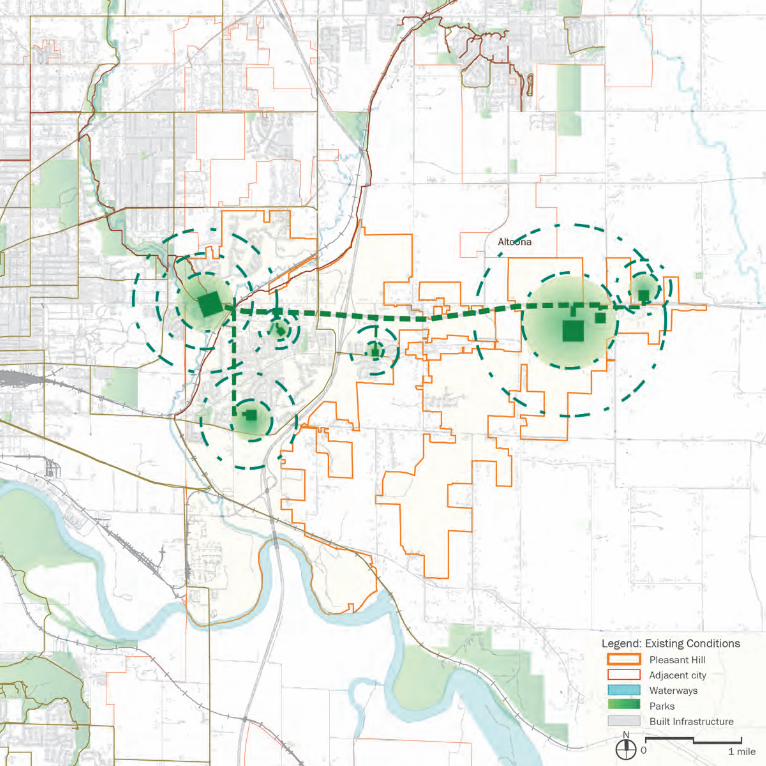
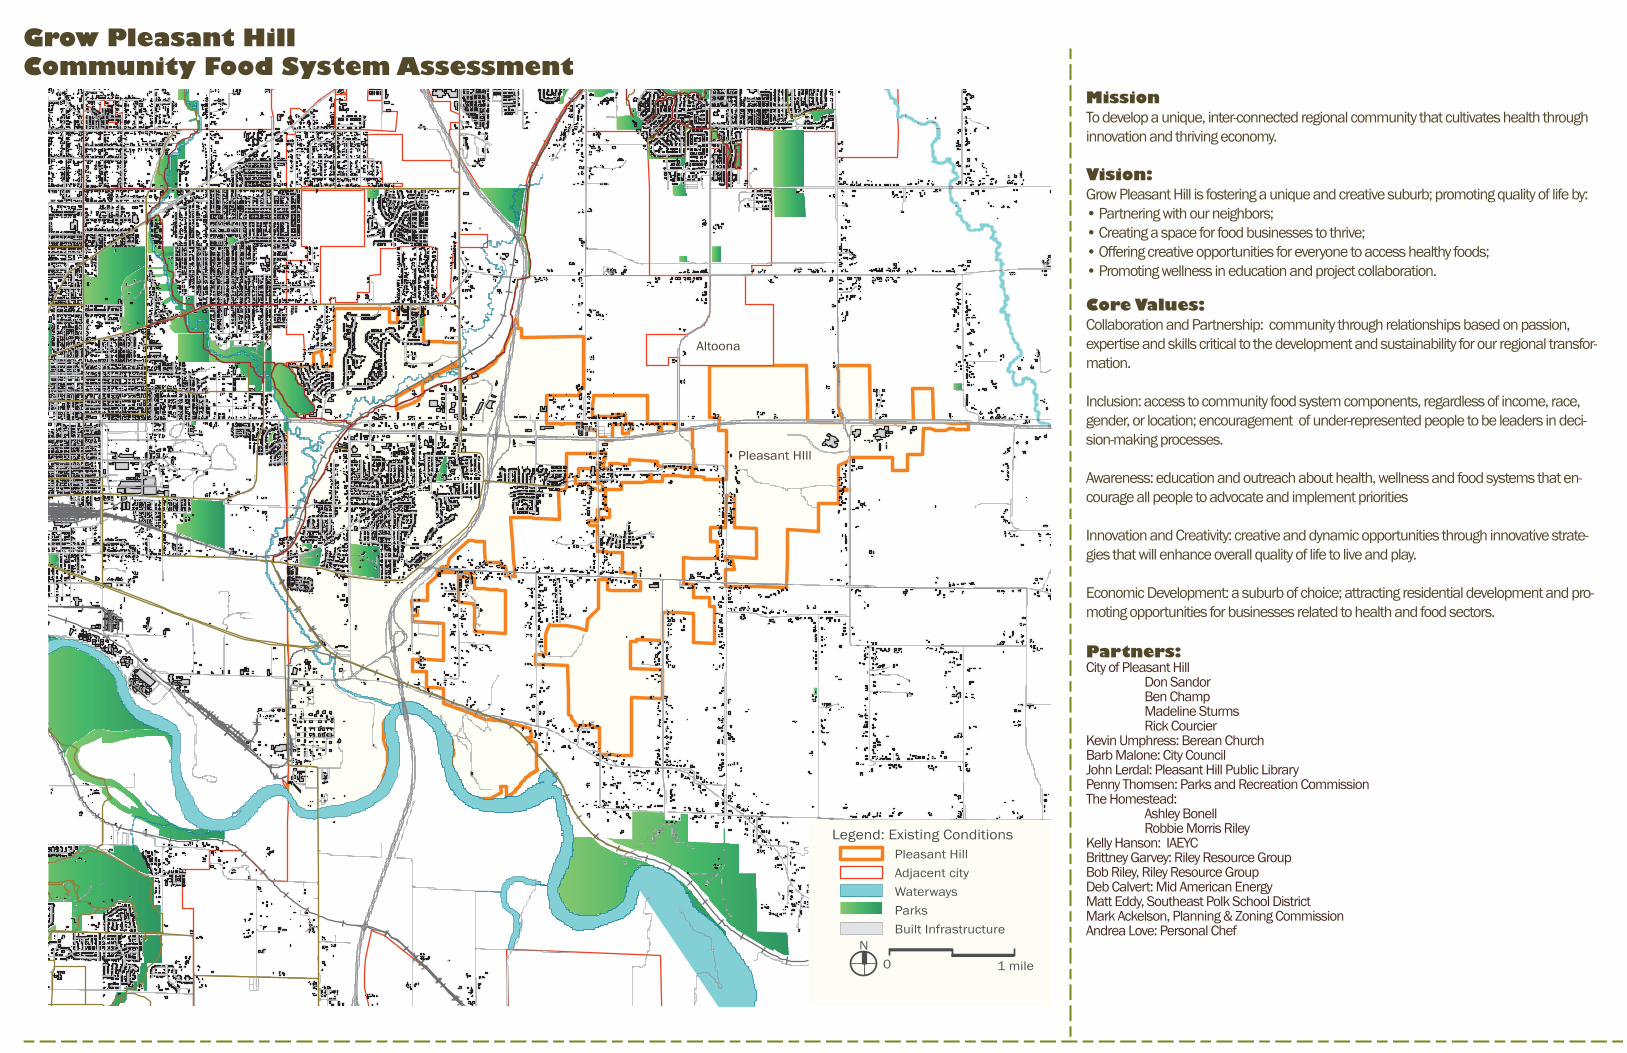
Partners:City of Pleasant Hill
Don Sandor Ben ChampMadeline SturmsRick Courcier
Kevin Umphress: Berean ChurchBarb Malone: City Council John Lerdal: Pleasant Hill Public Library Penny Thomsen: Parks and Recreation CommissionThe Homestead:
Ashley Bonell Robbie Morris RileyKelly Hanson: IAEYCBrittney Garvey: Riley Resource GroupBob Riley, Riley Resource GroupDeb Calvert: Mid American Energy Matt Eddy, Southeast Polk School DistrictMark Ackelson, Planning & Zoning CommissionAndrea Love: Personal Chef
Pleasant HIll
Altoona
N0 1 mile
Legend: Existing ConditionsPleasant HillAdjacent cityWaterwaysParksBuilt Infrastructure
Core Values:Collaboration and Partnership: community through relationships based on passion, expertise and skills critical to the development and sustainability for our regional transfor-mation.
Inclusion: access to community food system components, regardless of income, race, gender, or location; encouragement of under-represented people to be leaders in deci-sion-making processes.
Awareness: education and outreach about health, wellness and food systems that en-courage all people to advocate and implement priorities
Innovation and Creativity: creative and dynamic opportunities through innovative strate-gies that will enhance overall quality of life to live and play.
Economic Development: a suburb of choice; attracting residential development and pro-moting opportunities for businesses related to health and food sectors.
MissionTo develop a unique, inter-connected regional community that cultivates health through innovation and thriving economy.
Vision:Grow Pleasant Hill is fostering a unique and creative suburb; promoting quality of life by:• Partnering with our neighbors;• Creating a space for food businesses to thrive;• Offering creative opportunities for everyone to access healthy foods;• Promoting wellness in education and project collaboration.
Grow Pleasant HillCommunity Food System Assessment
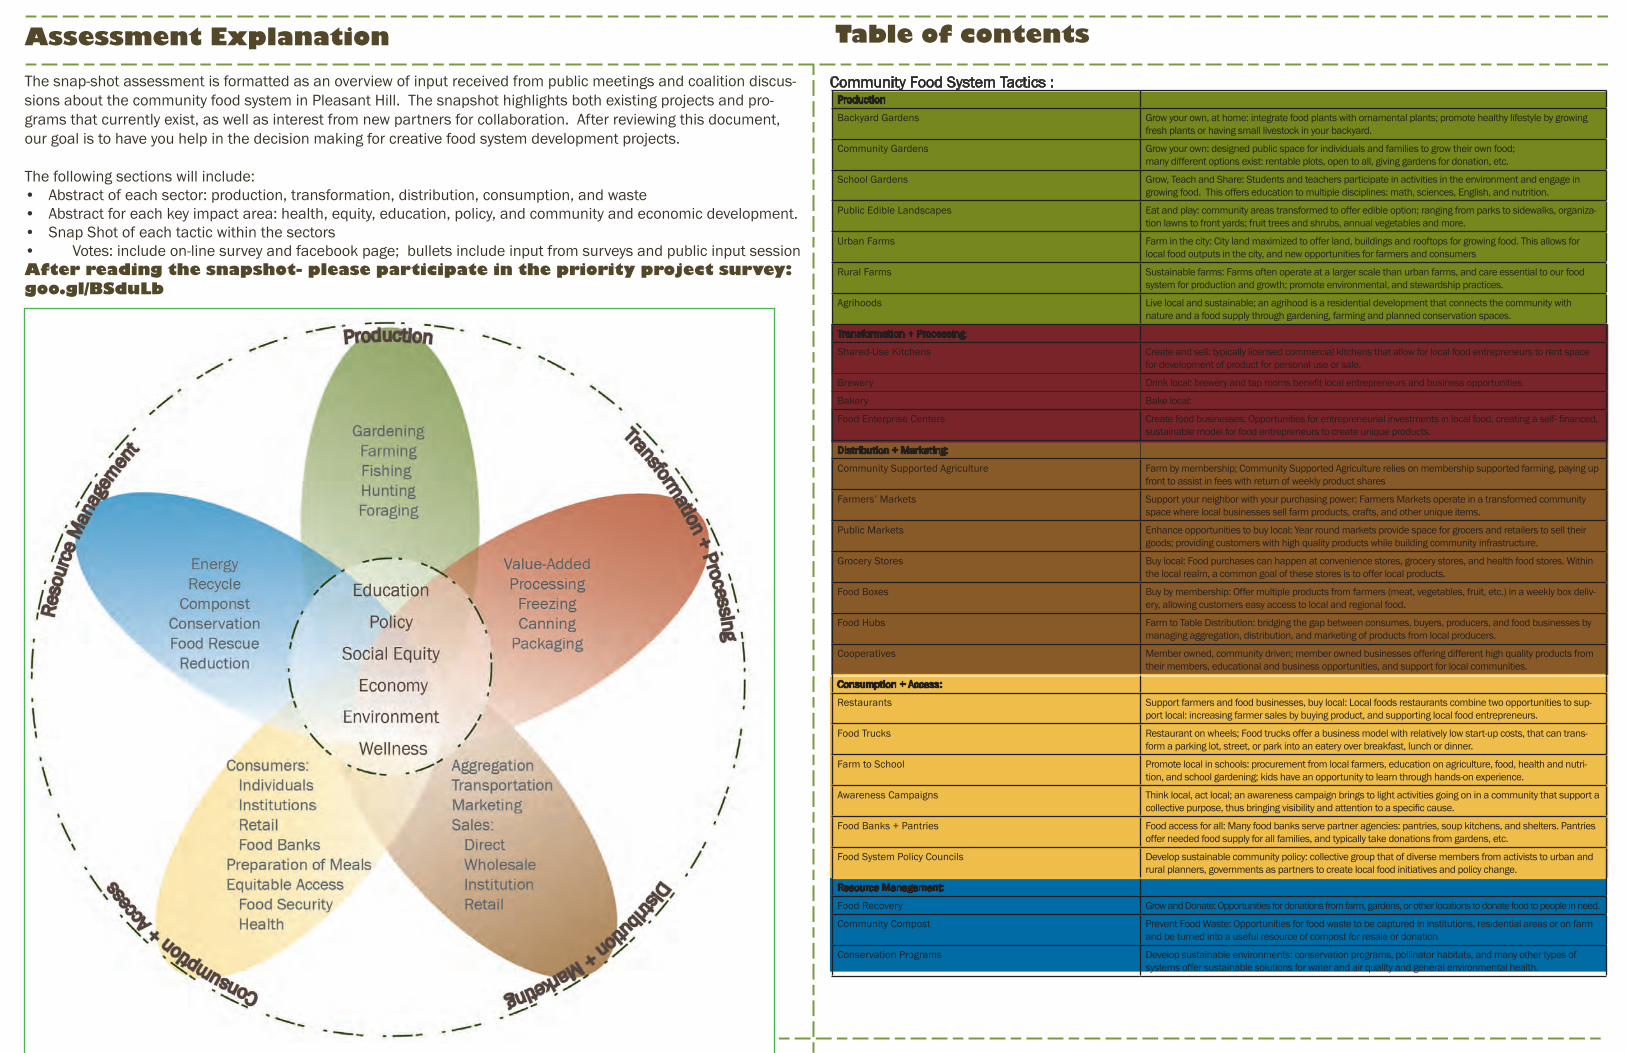
The snap-shot assessment is formatted as an overview of input received from public meetings and coalition discus-sions about the community food system in Pleasant Hill. The snapshot highlights both existing projects and pro-grams that currently exist, as well as interest from new partners for collaboration. After reviewing this document, our goal is to have you help in the decision making for creative food system development projects.
The following sections will include:• Abstract of each sector: production, transformation, distribution, consumption, and waste• Abstract for each key impact area: health, equity, education, policy, and community and economic development.• Snap Shot of each tactic within the sectors • Votes: include on-line survey and facebook page; bullets include input from surveys and public input sessionAfter reading the snapshot- please participate in the priority project survey: goo.gl/BSduLb
Community Food System Tactics :
Assessment Explanation Table of contents
Production
Backyard Gardens Grow your own, at home: integrate food plants with ornamental plants; promote healthy lifestyle by growing fresh plants or having small livestock in your backyard.
Community Gardens Grow your own: designed public space for individuals and families to grow their own food; many different options exist: rentable plots, open to all, giving gardens for donation, etc.
School Gardens Grow, Teach and Share: Students and teachers participate in activities in the environment and engage in growing food. This offers education to multiple disciplines: math, sciences, English, and nutrition.
Public Edible Landscapes Eat and play: community areas transformed to offer edible option; ranging from parks to sidewalks, organiza-tion lawns to front yards; fruit trees and shrubs, annual vegetables and more.
Urban Farms Farm in the city: City land maximized to offer land, buildings and rooftops for growing food. This allows for local food outputs in the city, and new opportunities for farmers and consumers
Rural Farms Sustainable farms: Farms often operate at a larger scale than urban farms, and care essential to our food system for production and growth; promote environmental, and stewardship practices.
Agrihoods Live local and sustainable; an agrihood is a residential development that connects the community with nature and a food supply through gardening, farming and planned conservation spaces.
Transformation + Processing:
Shared-Use Kitchens Create and sell: typically licensed commercial kitchens that allow for local food entrepreneurs to rent space for development of product for personal use or sale.
Brewery Drink local: brewery and tap rooms benefit local entrepreneurs and business opportunities
Bakery Bake local:
Food Enterprise Centers Create food businesses: Opportunities for entrepreneurial investments in local food, creating a self- financed, sustainable model for food entrepreneurs to create unique products.
Distribution + Marketing:
Community Supported Agriculture Farm by membership; Community Supported Agriculture relies on membership supported farming, paying up front to assist in fees with return of weekly product shares
Farmers’ Markets Support your neighbor with your purchasing power; Farmers Markets operate in a transformed community space where local businesses sell farm products, crafts, and other unique items.
Public Markets Enhance opportunities to buy local: Year round markets provide space for grocers and retailers to sell their goods; providing customers with high quality products while building community infrastructure.
Grocery Stores Buy local: Food purchases can happen at convenience stores, grocery stores, and health food stores. Within the local realm, a common goal of these stores is to offer local products.
Food Boxes Buy by membership: Offer multiple products from farmers (meat, vegetables, fruit, etc.) in a weekly box deliv-ery, allowing customers easy access to local and regional food.
Food Hubs Farm to Table Distribution: bridging the gap between consumes, buyers, producers, and food businesses by managing aggregation, distribution, and marketing of products from local producers.
Cooperatives Member owned, community driven; member owned businesses offering different high quality products from their members, educational and business opportunities, and support for local communities.
Consumption + Access:
Restaurants Support farmers and food businesses, buy local: Local foods restaurants combine two opportunities to sup-port local: increasing farmer sales by buying product, and supporting local food entrepreneurs.
Food Trucks Restaurant on wheels; Food trucks offer a business model with relatively low start-up costs, that can trans-form a parking lot, street, or park into an eatery over breakfast, lunch or dinner.
Farm to School Promote local in schools: procurement from local farmers, education on agriculture, food, health and nutri-tion, and school gardening; kids have an opportunity to learn through hands-on experience.
Awareness Campaigns Think local, act local; an awareness campaign brings to light activities going on in a community that support a collective purpose, thus bringing visibility and attention to a specific cause.
Food Banks + Pantries Food access for all: Many food banks serve partner agencies: pantries, soup kitchens, and shelters. Pantries offer needed food supply for all families, and typically take donations from gardens, etc.
Food System Policy Councils Develop sustainable community policy: collective group that of diverse members from activists to urban and rural planners, governments as partners to create local food initiatives and policy change.
Resource Management:
Food Recovery Grow and Donate: Opportunities for donations from farm, gardens, or other locations to donate food to people in need.
Community Compost Prevent Food Waste: Opportunities for food waste to be captured in institutions, residential areas or on farm and be turned into a useful resource of compost for resale or donation
Conservation Programs Develop sustainable environments: conservation programs, pollinator habitats, and many other types of systems offer sustainable solutions for water and air quality and general environmental health.
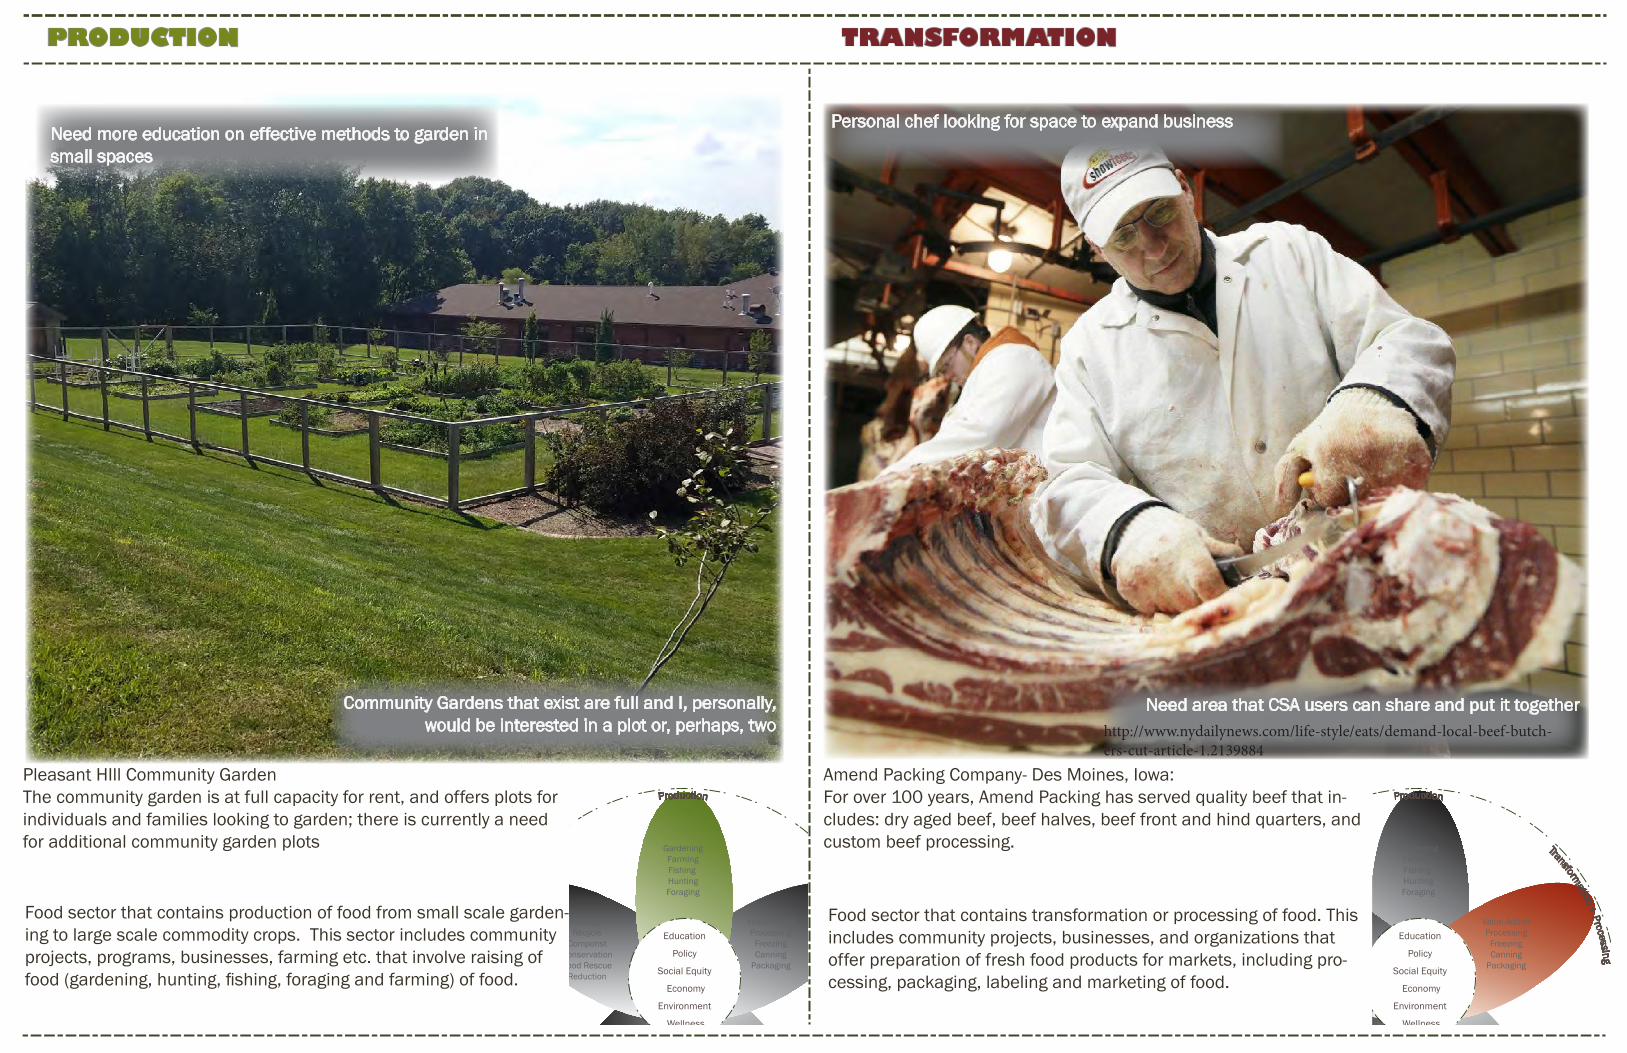
Food sector that contains transformation or processing of food. This includes community projects, businesses, and organizations that offer preparation of fresh food products for markets, including pro-cessing, packaging, labeling and marketing of food.
Food sector that contains production of food from small scale garden-ing to large scale commodity crops. This sector includes community projects, programs, businesses, farming etc. that involve raising of food (gardening, hunting, fishing, foraging and farming) of food.
Pleasant HIll Community GardenThe community garden is at full capacity for rent, and offers plots for individuals and families looking to garden; there is currently a need for additional community garden plots
Amend Packing Company- Des Moines, Iowa: For over 100 years, Amend Packing has served quality beef that in-cludes: dry aged beef, beef halves, beef front and hind quarters, and custom beef processing.
Production
Transformation + Processing
Distribution + Marketing Consumption + Ac
cess
Re
sour
ce M
anag
emen
t
GardeningFarmingFishing HuntingForaging
EnergyRecycle
ComponstConservationFood Rescue
Reduction
Value-AddedProcessing
FreezingCanning
Packaging
AggregationTransportationMarketingSales: Direct Wholesale Institution Retail
Consumers: Individuals Institutions Retail Food BanksPreparation of MealsEquitable Access Food Security Health
Education
Wellness
Social Equity
Economy
Environment
Policy
TRANSFORMATIONPRODUCTION
Need more education on effective methods to garden in small spaces
Community Gardens that exist are full and I, personally, would be interested in a plot or, perhaps, two
Personal chef looking for space to expand business
Need area that CSA users can share and put it together http://www.nydailynews.com/life-style/eats/demand-local-beef-butch-ers-cut-article-1.2139884
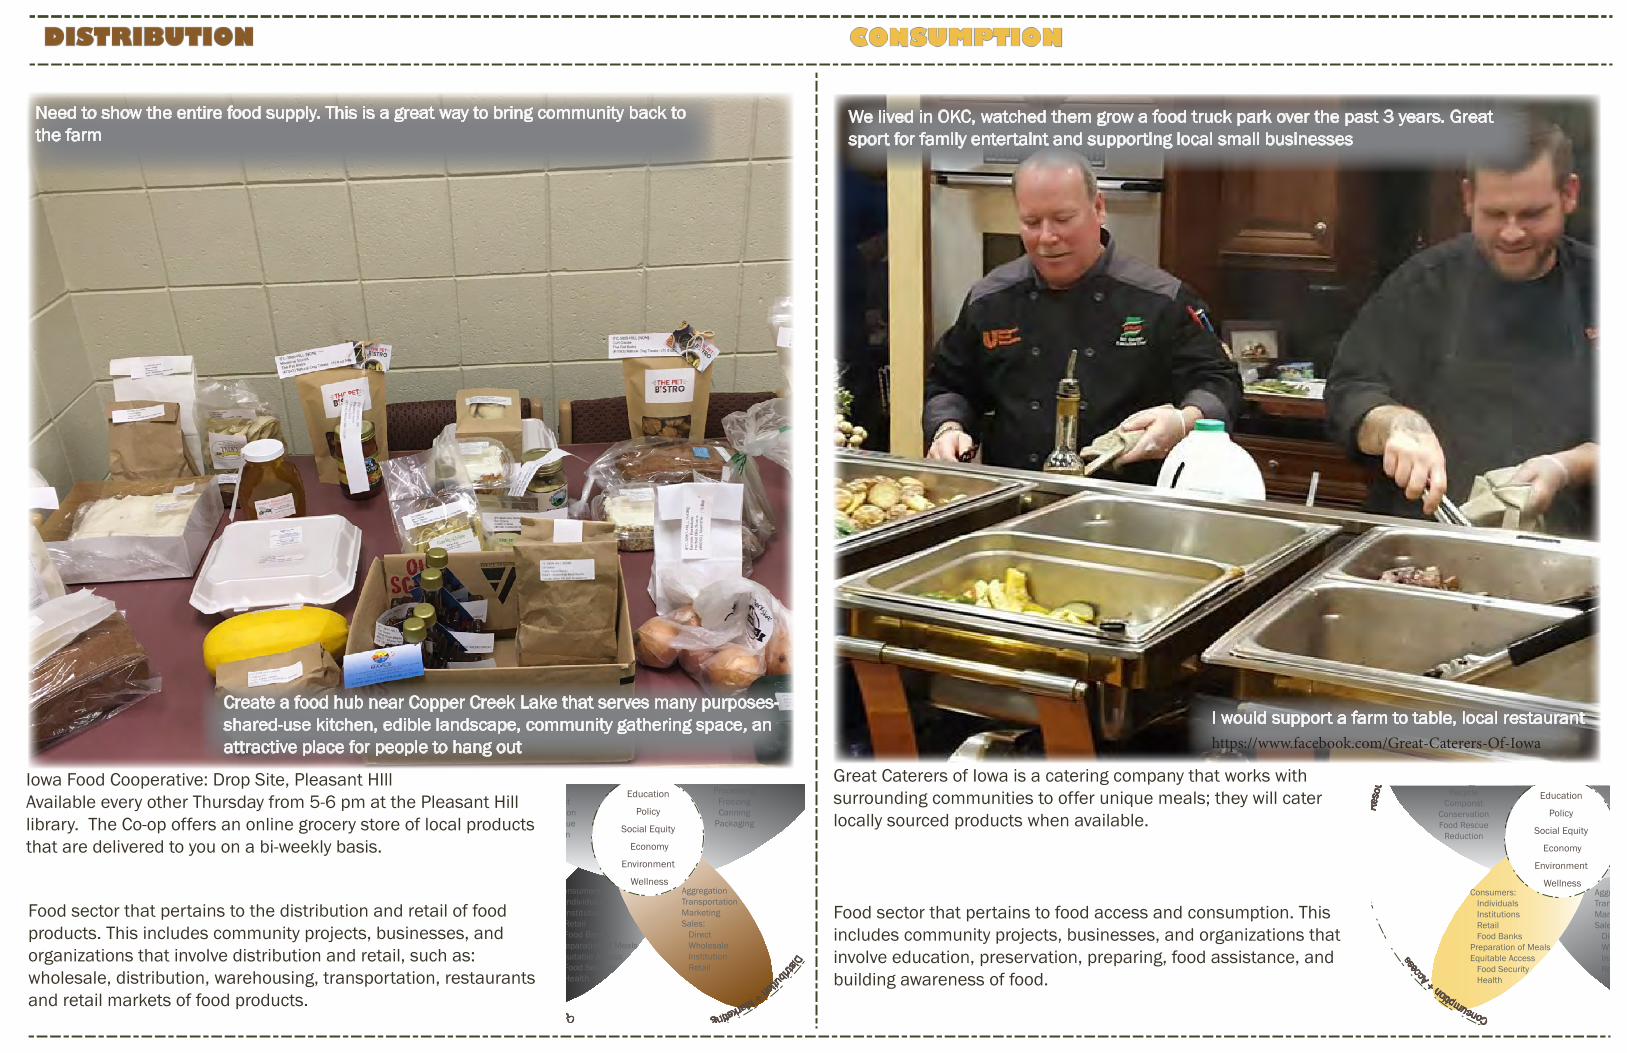
Create a food hub near Copper Creek Lake that serves many purposes- shared-use kitchen, edible landscape, community gathering space, an attractive place for people to hang out
Great Caterers of Iowa is a catering company that works with surrounding communities to offer unique meals; they will cater locally sourced products when available.
Iowa Food Cooperative: Drop Site, Pleasant HIll Available every other Thursday from 5-6 pm at the Pleasant Hill library. The Co-op offers an online grocery store of local products that are delivered to you on a bi-weekly basis.
Food sector that pertains to food access and consumption. This includes community projects, businesses, and organizations that involve education, preservation, preparing, food assistance, and building awareness of food.
Food sector that pertains to the distribution and retail of food products. This includes community projects, businesses, and organizations that involve distribution and retail, such as: wholesale, distribution, warehousing, transportation, restaurants and retail markets of food products.
Production
Transformation + Processing
Distribution + Marketing Consumption + Ac
cess
Re
sour
ce M
anag
emen
t
GardeningFarmingFishing HuntingForaging
EnergyRecycle
ComponstConservationFood Rescue
Reduction
Value-AddedProcessing
FreezingCanning
Packaging
AggregationTransportationMarketingSales: Direct Wholesale Institution Retail
Consumers: Individuals Institutions Retail Food BanksPreparation of MealsEquitable Access Food Security Health
Education
Wellness
Social Equity
Economy
Environment
Policy
CONSUMPTIONDISTRIBUTION
We lived in OKC, watched them grow a food truck park over the past 3 years. Great sport for family entertaint and supporting local small businesses
I would support a farm to table, local restaurant
Need to show the entire food supply. This is a great way to bring community back to the farm
https://www.facebook.com/Great-Caterers-Of-Iowa
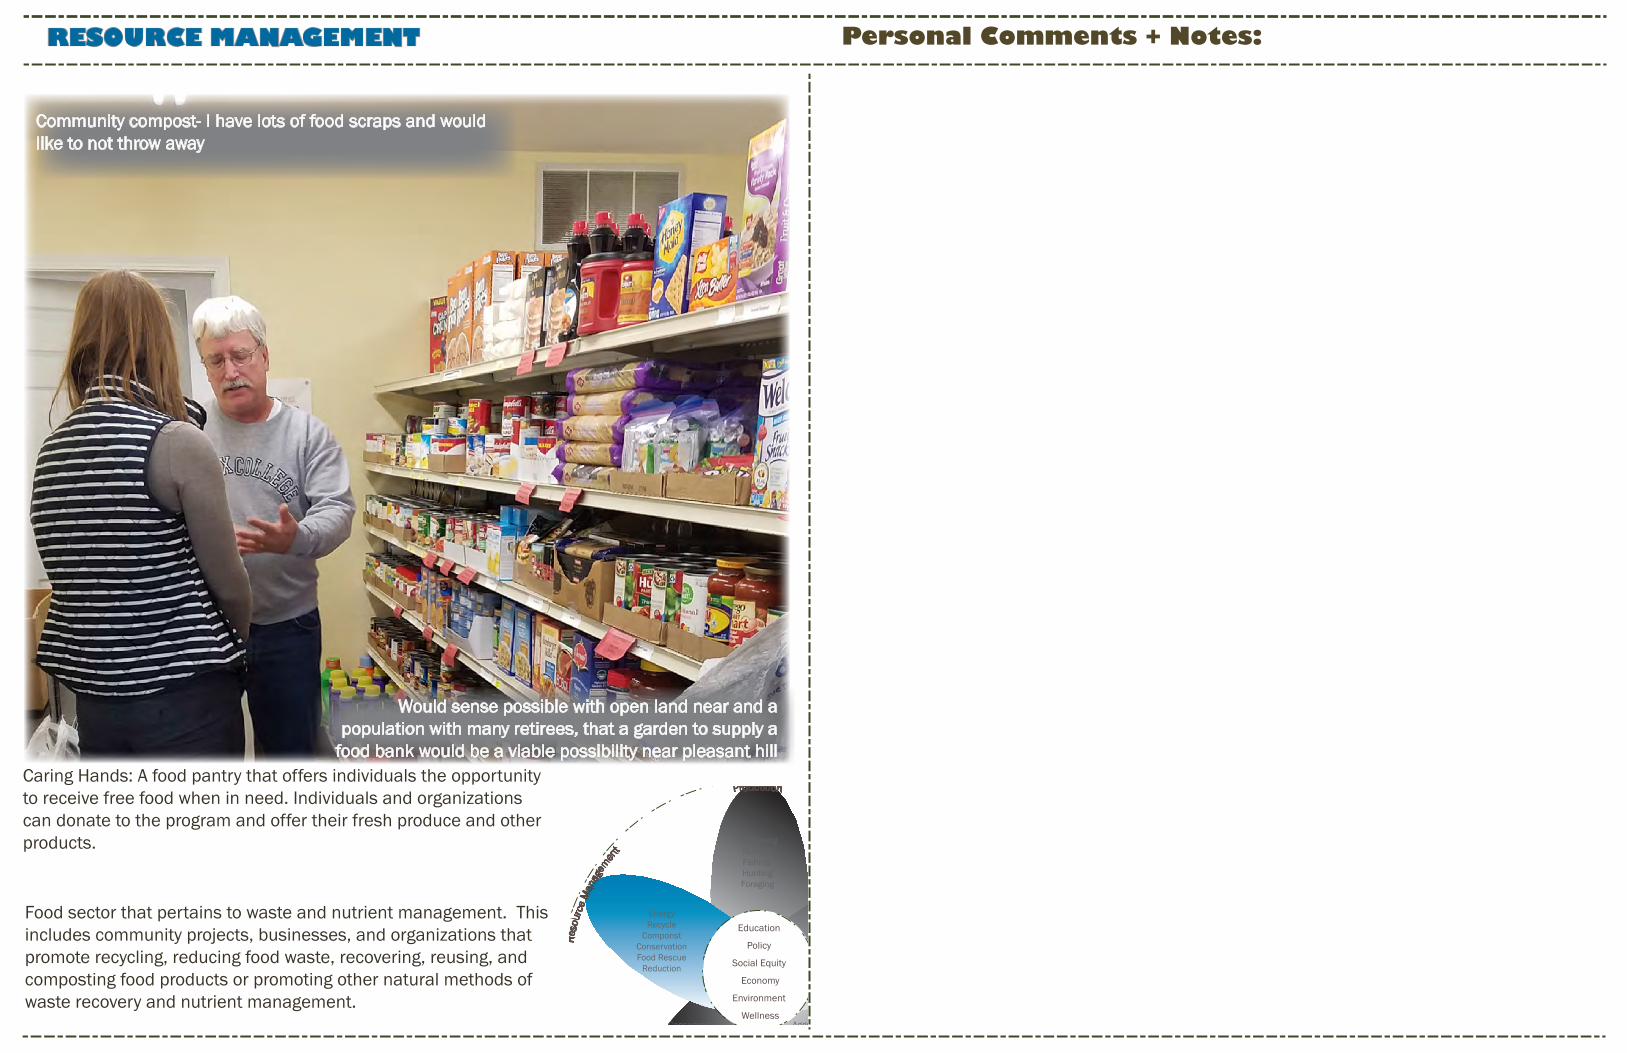
Production
Transformation + Processing
Distribution + Marketing Consumption + Ac
cess
Re
sour
ce M
anag
emen
t
GardeningFarmingFishing HuntingForaging
EnergyRecycle
ComponstConservationFood Rescue
Reduction
Value-AddedProcessing
FreezingCanning
Packaging
AggregationTransportationMarketingSales: Direct Wholesale Institution Retail
Consumers: Individuals Institutions Retail Food BanksPreparation of MealsEquitable Access Food Security Health
Education
Wellness
Social Equity
Economy
Environment
Policy
Food sector that pertains to waste and nutrient management. This includes community projects, businesses, and organizations that promote recycling, reducing food waste, recovering, reusing, and composting food products or promoting other natural methods of waste recovery and nutrient management.
Caring Hands: A food pantry that offers individuals the opportunity to receive free food when in need. Individuals and organizations can donate to the program and offer their fresh produce and other products.
Personal Comments + Notes:RESOURCE MANAGEMENT
Would sense possible with open land near and a population with many retirees, that a garden to supply a
food bank would be a viable possibility near pleasant hill
Community compost- I have lots of food scraps and would like to not throw away
I would support a farm to table, local restaurant
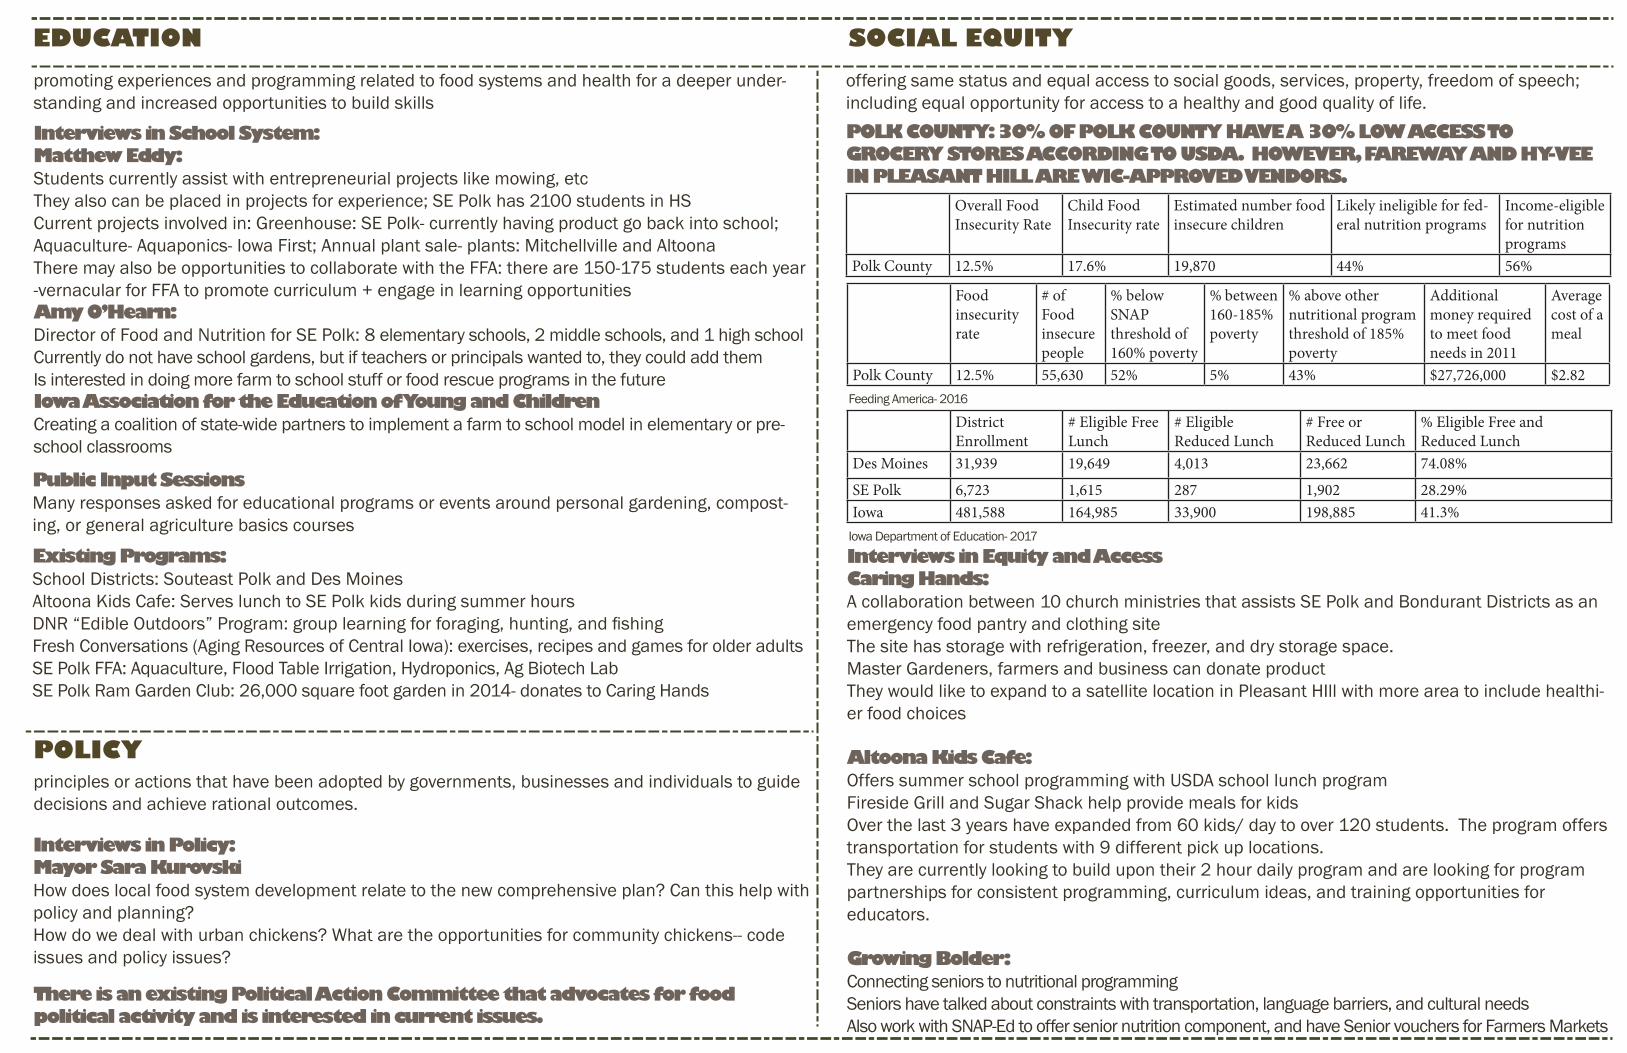
Overall Food Insecurity Rate
Child Food Insecurity rate
Estimated number food insecure children
Likely ineligible for fed-eral nutrition programs
Income-eligible for nutrition programs
Polk County 12.5% 17.6% 19,870 44% 56%
District Enrollment
# Eligible Free Lunch
# Eligible Reduced Lunch
# Free or Reduced Lunch
% Eligible Free and Reduced Lunch
Des Moines 31,939 19,649 4,013 23,662 74.08%
SE Polk 6,723 1,615 287 1,902 28.29%Iowa 481,588 164,985 33,900 198,885 41.3%
Foodinsecurity rate
# of Food insecurepeople
% below SNAP threshold of160% poverty
% between 160-185% poverty
% above other nutritional program threshold of 185% poverty
Additionalmoney required to meet food needs in 2011
Average cost of a meal
Polk County 12.5% 55,630 52% 5% 43% $27,726,000 $2.82
promoting experiences and programming related to food systems and health for a deeper under-standing and increased opportunities to build skills
offering same status and equal access to social goods, services, property, freedom of speech; including equal opportunity for access to a healthy and good quality of life.
principles or actions that have been adopted by governments, businesses and individuals to guide decisions and achieve rational outcomes.
POLICY
SOCIAL EQUITY EDUCATION
Interviews in School System: Matthew Eddy: Students currently assist with entrepreneurial projects like mowing, etcThey also can be placed in projects for experience; SE Polk has 2100 students in HS Current projects involved in: Greenhouse: SE Polk- currently having product go back into school; Aquaculture- Aquaponics- Iowa First; Annual plant sale- plants: Mitchellville and AltoonaThere may also be opportunities to collaborate with the FFA: there are 150-175 students each year -vernacular for FFA to promote curriculum + engage in learning opportunities Amy O’Hearn:Director of Food and Nutrition for SE Polk: 8 elementary schools, 2 middle schools, and 1 high schoolCurrently do not have school gardens, but if teachers or principals wanted to, they could add them Is interested in doing more farm to school stuff or food rescue programs in the future Iowa Association for the Education of Young and ChildrenCreating a coalition of state-wide partners to implement a farm to school model in elementary or pre-school classrooms
POLK COUNTY: 30% OF POLK COUNTY HAVE A 30% LOW ACCESS TO GROCERY STORES ACCORDING TO USDA. HOWEVER, FAREWAY AND HY-VEE IN PLEASANT HILL ARE WIC-APPROVED VENDORS.
Interviews in Equity and Access Caring Hands:A collaboration between 10 church ministries that assists SE Polk and Bondurant Districts as an emergency food pantry and clothing siteThe site has storage with refrigeration, freezer, and dry storage space. Master Gardeners, farmers and business can donate product They would like to expand to a satellite location in Pleasant HIll with more area to include healthi-er food choices
Altoona Kids Cafe: Offers summer school programming with USDA school lunch program Fireside Grill and Sugar Shack help provide meals for kids Over the last 3 years have expanded from 60 kids/ day to over 120 students. The program offers transportation for students with 9 different pick up locations. They are currently looking to build upon their 2 hour daily program and are looking for program partnerships for consistent programming, curriculum ideas, and training opportunities for educators.
Growing Bolder:Connecting seniors to nutritional programming Seniors have talked about constraints with transportation, language barriers, and cultural needsAlso work with SNAP-Ed to offer senior nutrition component, and have Senior vouchers for Farmers Markets
There is an existing Political Action Committee that advocates for food political activity and is interested in current issues.
Public Input SessionsMany responses asked for educational programs or events around personal gardening, compost-ing, or general agriculture basics courses
Existing Programs: School Districts: Souteast Polk and Des MoinesAltoona Kids Cafe: Serves lunch to SE Polk kids during summer hours DNR “Edible Outdoors” Program: group learning for foraging, hunting, and fishingFresh Conversations (Aging Resources of Central Iowa): exercises, recipes and games for older adultsSE Polk FFA: Aquaculture, Flood Table Irrigation, Hydroponics, Ag Biotech LabSE Polk Ram Garden Club: 26,000 square foot garden in 2014- donates to Caring Hands
Interviews in Policy:Mayor Sara KurovskiHow does local food system development relate to the new comprehensive plan? Can this help with policy and planning? How do we deal with urban chickens? What are the opportunities for community chickens-- code issues and policy issues?
Iowa Department of Education- 2017
Feeding America- 2016
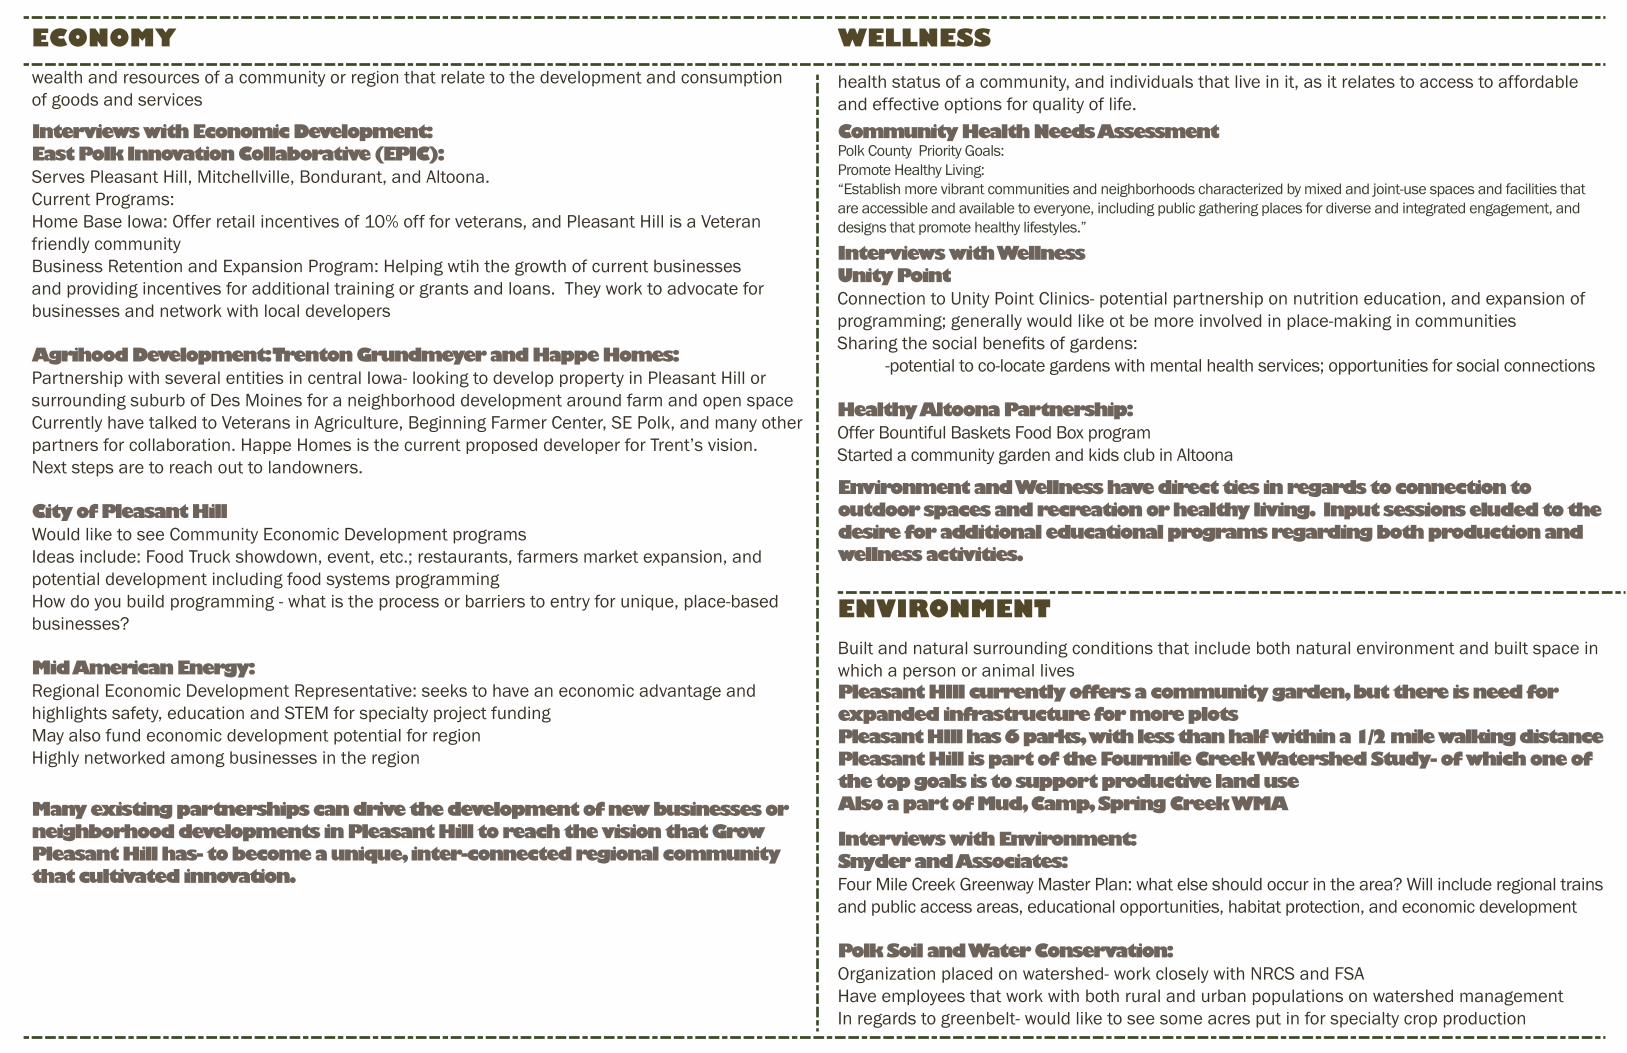
Polk County Priority Goals:Promote Healthy Living: “Establish more vibrant communities and neighborhoods characterized by mixed and joint-use spaces and facilities that are accessible and available to everyone, including public gathering places for diverse and integrated engagement, and designs that promote healthy lifestyles.”
Community Health Needs Assessment
wealth and resources of a community or region that relate to the development and consumption of goods and services
health status of a community, and individuals that live in it, as it relates to access to affordable and effective options for quality of life.
Built and natural surrounding conditions that include both natural environment and built space in which a person or animal lives
ECONOMY
ENVIRONMENT
Interviews with Economic Development: East Polk Innovation Collaborative (EPIC): Serves Pleasant Hill, Mitchellville, Bondurant, and Altoona.Current Programs: Home Base Iowa: Offer retail incentives of 10% off for veterans, and Pleasant Hill is a Veteran friendly community Business Retention and Expansion Program: Helping wtih the growth of current businesses and providing incentives for additional training or grants and loans. They work to advocate for businesses and network with local developers
Agrihood Development: Trenton Grundmeyer and Happe Homes: Partnership with several entities in central Iowa- looking to develop property in Pleasant Hill or surrounding suburb of Des Moines for a neighborhood development around farm and open space Currently have talked to Veterans in Agriculture, Beginning Farmer Center, SE Polk, and many other partners for collaboration. Happe Homes is the current proposed developer for Trent’s vision. Next steps are to reach out to landowners.
City of Pleasant Hill Would like to see Community Economic Development programs Ideas include: Food Truck showdown, event, etc.; restaurants, farmers market expansion, and potential development including food systems programming How do you build programming - what is the process or barriers to entry for unique, place-based businesses?
Mid American Energy: Regional Economic Development Representative: seeks to have an economic advantage and highlights safety, education and STEM for specialty project funding May also fund economic development potential for regionHighly networked among businesses in the region
Pleasant HIll currently offers a community garden, but there is need for expanded infrastructure for more plots Pleasant HIll has 6 parks, with less than half within a 1/2 mile walking distancePleasant Hill is part of the Fourmile Creek Watershed Study- of which one of the top goals is to support productive land useAlso a part of Mud, Camp, Spring Creek WMA
WELLNESS
Many existing partnerships can drive the development of new businesses or neighborhood developments in Pleasant Hill to reach the vision that Grow Pleasant Hill has- to become a unique, inter-connected regional community that cultivated innovation.
Interviews with Environment: Snyder and Associates:Four Mile Creek Greenway Master Plan: what else should occur in the area? Will include regional trains and public access areas, educational opportunities, habitat protection, and economic development
Polk Soil and Water Conservation: Organization placed on watershed- work closely with NRCS and FSAHave employees that work with both rural and urban populations on watershed managementIn regards to greenbelt- would like to see some acres put in for specialty crop production
Interviews with Wellness Unity PointConnection to Unity Point Clinics- potential partnership on nutrition education, and expansion of programming; generally would like ot be more involved in place-making in communities Sharing the social benefits of gardens: -potential to co-locate gardens with mental health services; opportunities for social connections
Healthy Altoona Partnership: Offer Bountiful Baskets Food Box programStarted a community garden and kids club in Altoona
Environment and Wellness have direct ties in regards to connection to outdoor spaces and recreation or healthy living. Input sessions eluded to the desire for additional educational programs regarding both production and wellness activities.
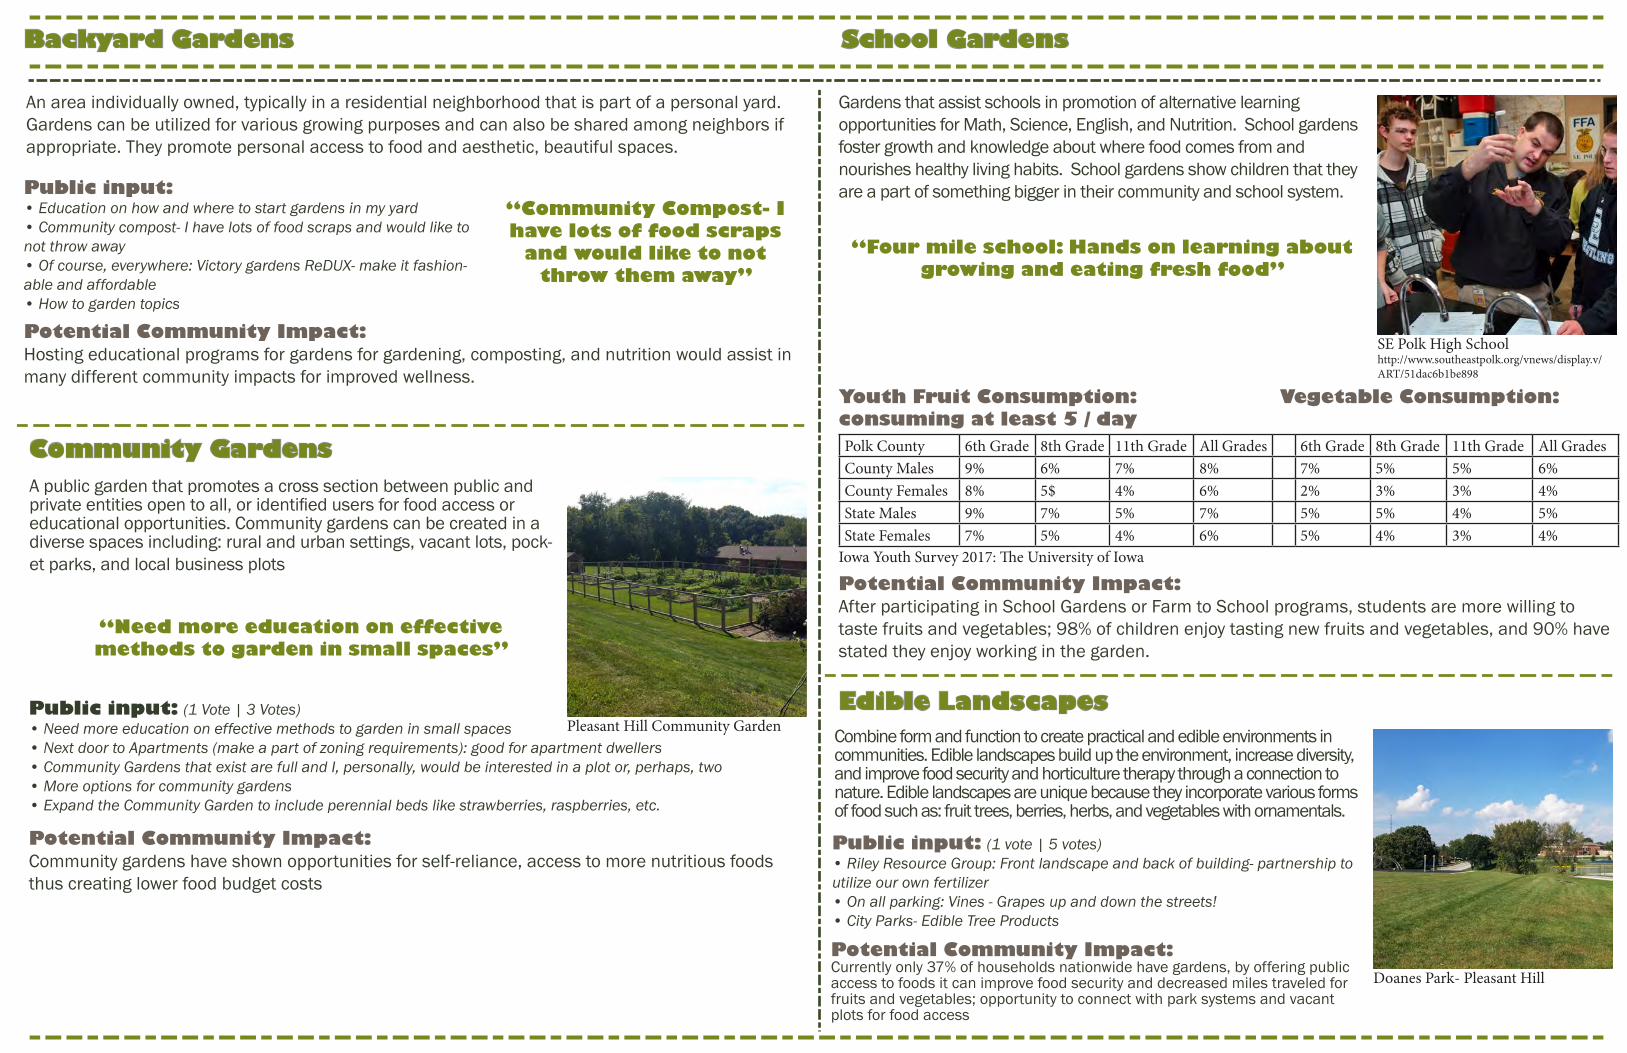
Public input: (1 vote | 5 votes)• Riley Resource Group: Front landscape and back of building- partnership to utilize our own fertilizer • On all parking: Vines - Grapes up and down the streets!• City Parks- Edible Tree Products
Community Gardens
School Gardens
Potential Community Impact: Hosting educational programs for gardens for gardening, composting, and nutrition would assist in many different community impacts for improved wellness.
“Community Compost- I have lots of food scraps
and would like to not throw them away”
Public input:• Education on how and where to start gardens in my yard• Community compost- I have lots of food scraps and would like to not throw away • Of course, everywhere: Victory gardens ReDUX- make it fashion-able and affordable • How to garden topics
An area individually owned, typically in a residential neighborhood that is part of a personal yard. Gardens can be utilized for various growing purposes and can also be shared among neighbors if appropriate. They promote personal access to food and aesthetic, beautiful spaces.
Backyard Gardens
“Four mile school: Hands on learning about growing and eating fresh food”
Gardens that assist schools in promotion of alternative learning opportunities for Math, Science, English, and Nutrition. School gardens foster growth and knowledge about where food comes from and nourishes healthy living habits. School gardens show children that they are a part of something bigger in their community and school system.
A public garden that promotes a cross section between public and private entities open to all, or identified users for food access or educational opportunities. Community gardens can be created in a diverse spaces including: rural and urban settings, vacant lots, pock-et parks, and local business plots
Potential Community Impact: Community gardens have shown opportunities for self-reliance, access to more nutritious foods thus creating lower food budget costs
Public input: (1 Vote | 3 Votes)• Need more education on effective methods to garden in small spaces• Next door to Apartments (make a part of zoning requirements): good for apartment dwellers • Community Gardens that exist are full and I, personally, would be interested in a plot or, perhaps, two• More options for community gardens • Expand the Community Garden to include perennial beds like strawberries, raspberries, etc.
“Need more education on effective methods to garden in small spaces”
Pleasant Hill Community Garden
SE Polk High Schoolhttp://www.southeastpolk.org/vnews/display.v/ART/51dac6b1be898
Polk County 6th Grade 8th Grade 11th Grade All Grades 6th Grade 8th Grade 11th Grade All GradesCounty Males 9% 6% 7% 8% 7% 5% 5% 6%County Females 8% 5$ 4% 6% 2% 3% 3% 4%State Males 9% 7% 5% 7% 5% 5% 4% 5%State Females 7% 5% 4% 6% 5% 4% 3% 4%
Youth Fruit Consumption:consuming at least 5 / day
Vegetable Consumption:
Iowa Youth Survey 2017: The University of Iowa
Potential Community Impact: After participating in School Gardens or Farm to School programs, students are more willing to taste fruits and vegetables; 98% of children enjoy tasting new fruits and vegetables, and 90% have stated they enjoy working in the garden.
Edible LandscapesCombine form and function to create practical and edible environments in communities. Edible landscapes build up the environment, increase diversity, and improve food security and horticulture therapy through a connection to nature. Edible landscapes are unique because they incorporate various forms of food such as: fruit trees, berries, herbs, and vegetables with ornamentals.
Doanes Park- Pleasant Hill
Potential Community Impact: Currently only 37% of households nationwide have gardens, by offering public access to foods it can improve food security and decreased miles traveled for fruits and vegetables; opportunity to connect with park systems and vacant plots for food access
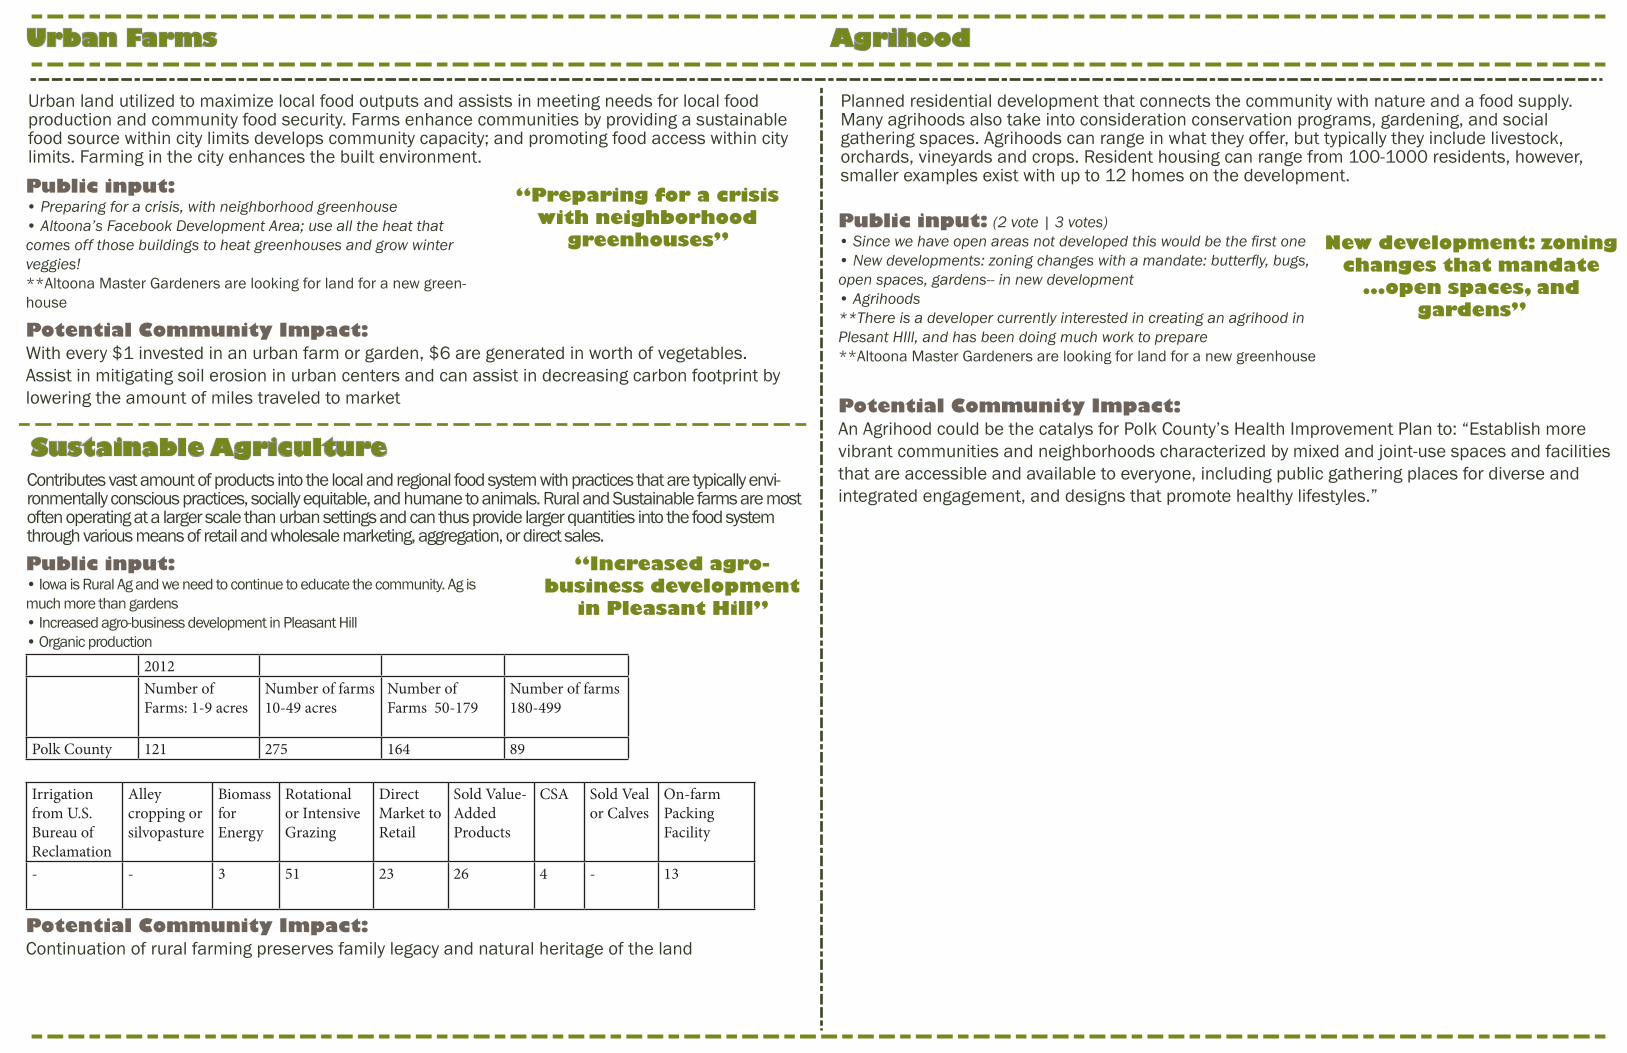
Sustainable Agriculture
Agrihood
Potential Community Impact: Continuation of rural farming preserves family legacy and natural heritage of the land
Public input:• Iowa is Rural Ag and we need to continue to educate the community. Ag is much more than gardens • Increased agro-business development in Pleasant Hill • Organic production
“Increased agro-business development
in Pleasant Hill”
Contributes vast amount of products into the local and regional food system with practices that are typically envi-ronmentally conscious practices, socially equitable, and humane to animals. Rural and Sustainable farms are most often operating at a larger scale than urban settings and can thus provide larger quantities into the food system through various means of retail and wholesale marketing, aggregation, or direct sales.
Potential Community Impact: With every $1 invested in an urban farm or garden, $6 are generated in worth of vegetables.Assist in mitigating soil erosion in urban centers and can assist in decreasing carbon footprint by lowering the amount of miles traveled to market
“Preparing for a crisis with neighborhood
greenhouses”
Public input:• Preparing for a crisis, with neighborhood greenhouse• Altoona’s Facebook Development Area; use all the heat that comes off those buildings to heat greenhouses and grow winter veggies! **Altoona Master Gardeners are looking for land for a new green-house
Urban land utilized to maximize local food outputs and assists in meeting needs for local food production and community food security. Farms enhance communities by providing a sustainable food source within city limits develops community capacity; and promoting food access within city limits. Farming in the city enhances the built environment.
Urban Farms
2012Number of Farms: 1-9 acres
Number of farms 10-49 acres
Number of Farms 50-179
Number of farms 180-499
Polk County 121 275 164 89
Potential Community Impact: An Agrihood could be the catalys for Polk County’s Health Improvement Plan to: “Establish more vibrant communities and neighborhoods characterized by mixed and joint-use spaces and facilities that are accessible and available to everyone, including public gathering places for diverse and integrated engagement, and designs that promote healthy lifestyles.”
New development: zoning changes that mandate
...open spaces, and gardens”
Public input: (2 vote | 3 votes)• Since we have open areas not developed this would be the first one • New developments: zoning changes with a mandate: butterfly, bugs, open spaces, gardens-- in new development• Agrihoods**There is a developer currently interested in creating an agrihood in Plesant HIll, and has been doing much work to prepare **Altoona Master Gardeners are looking for land for a new greenhouse
Planned residential development that connects the community with nature and a food supply. Many agrihoods also take into consideration conservation programs, gardening, and social gathering spaces. Agrihoods can range in what they offer, but typically they include livestock, orchards, vineyards and crops. Resident housing can range from 100-1000 residents, however, smaller examples exist with up to 12 homes on the development.
Irrigation from U.S. Bureau of Reclamation
Alley cropping or silvopasture
Biomass forEnergy
Rotational or Intensive Grazing
Direct Market to Retail
Sold Value-Added Products
CSA Sold Veal or Calves
On-farm Packing Facility
- - 3 51 23 26 4 - 13
Vegetable Consumption:
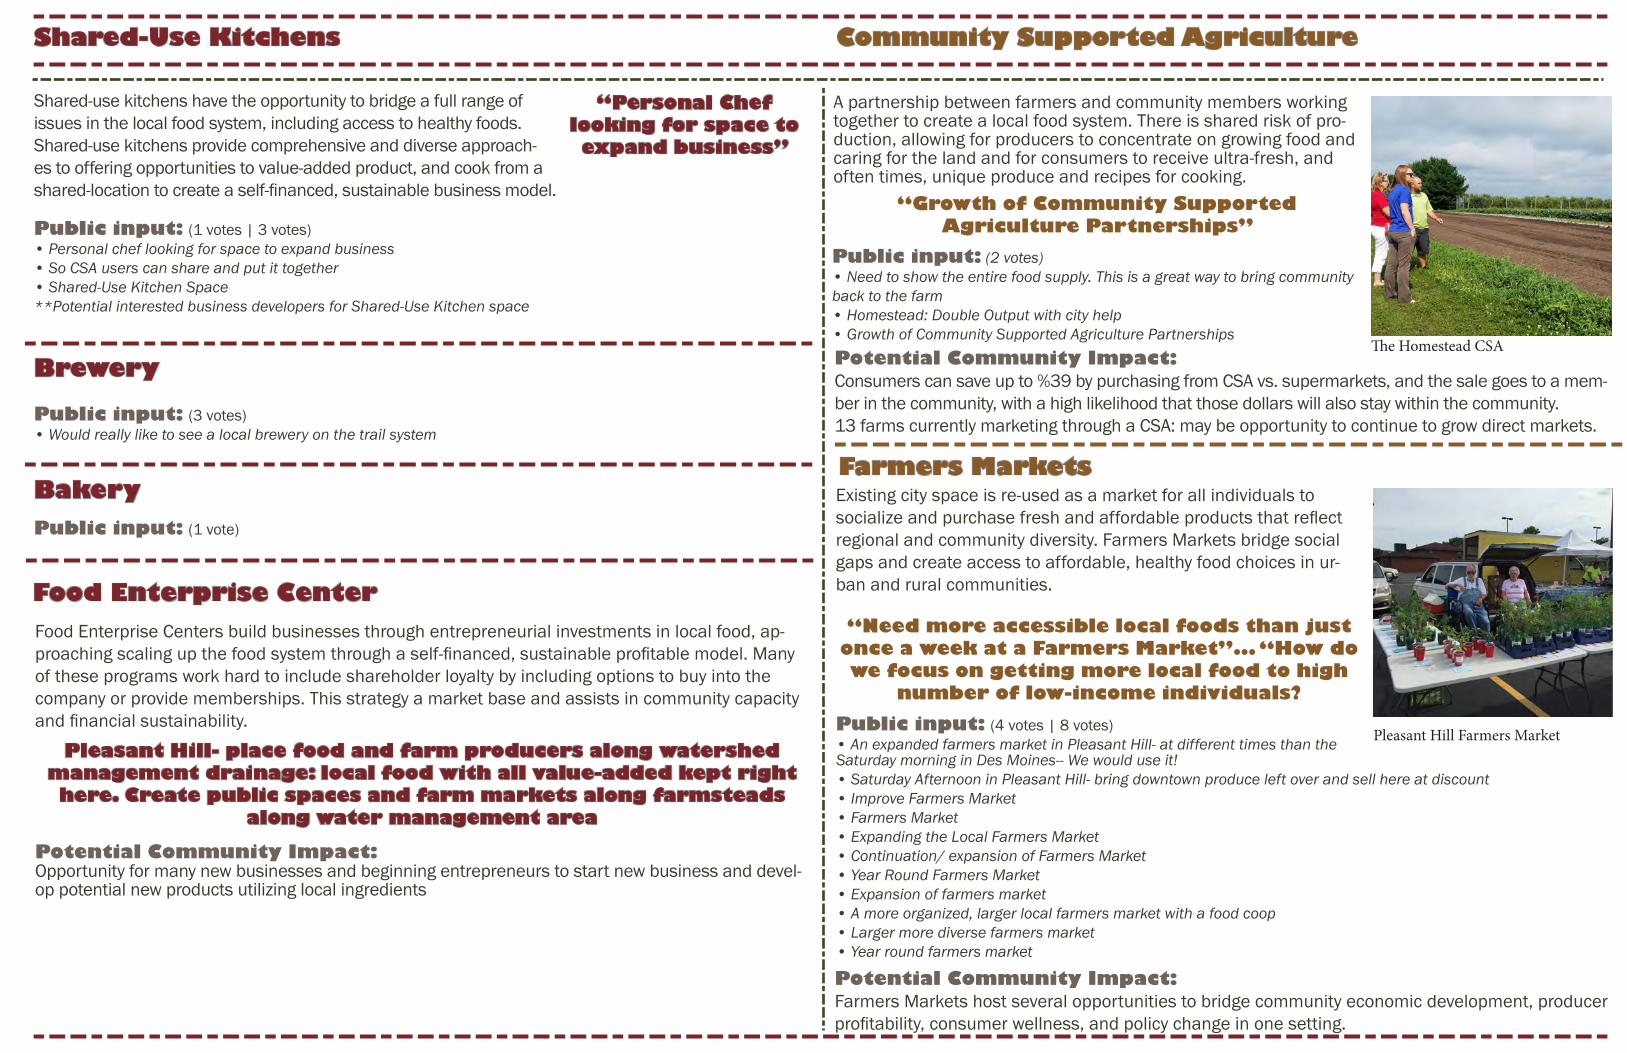
Public input: (2 votes)• Need to show the entire food supply. This is a great way to bring community back to the farm • Homestead: Double Output with city help• Growth of Community Supported Agriculture Partnerships
A partnership between farmers and community members working together to create a local food system. There is shared risk of pro-duction, allowing for producers to concentrate on growing food and caring for the land and for consumers to receive ultra-fresh, and often times, unique produce and recipes for cooking.
Potential Community Impact: Consumers can save up to %39 by purchasing from CSA vs. supermarkets, and the sale goes to a mem-ber in the community, with a high likelihood that those dollars will also stay within the community. 13 farms currently marketing through a CSA: may be opportunity to continue to grow direct markets.
“Growth of Community Supported Agriculture Partnerships”
Community Supported Agriculture
The Homestead CSA
Public input: (1 votes | 3 votes)• Personal chef looking for space to expand business • So CSA users can share and put it together • Shared-Use Kitchen Space**Potential interested business developers for Shared-Use Kitchen space
Public input: (3 votes)• Would really like to see a local brewery on the trail system
Public input: (1 vote)
“Personal Chef looking for space to expand business”
Shared-use kitchens have the opportunity to bridge a full range of issues in the local food system, including access to healthy foods. Shared-use kitchens provide comprehensive and diverse approach-es to offering opportunities to value-added product, and cook from a shared-location to create a self-financed, sustainable business model.
Shared-Use Kitchens
Food Enterprise Centers build businesses through entrepreneurial investments in local food, ap-proaching scaling up the food system through a self-financed, sustainable profitable model. Many of these programs work hard to include shareholder loyalty by including options to buy into the company or provide memberships. This strategy a market base and assists in community capacity and financial sustainability.
Potential Community Impact: Opportunity for many new businesses and beginning entrepreneurs to start new business and devel-op potential new products utilizing local ingredients
Pleasant Hill- place food and farm producers along watershed management drainage: local food with all value-added kept right here. Create public spaces and farm markets along farmsteads
along water management area
Food Enterprise Center
Brewery
Bakery
“Need more accessible local foods than just once a week at a Farmers Market”... “How do we focus on getting more local food to high
number of low-income individuals? Public input: (4 votes | 8 votes)• An expanded farmers market in Pleasant Hill- at different times than the Saturday morning in Des Moines-- We would use it! • Saturday Afternoon in Pleasant Hill- bring downtown produce left over and sell here at discount • Improve Farmers Market• Farmers Market • Expanding the Local Farmers Market • Continuation/ expansion of Farmers Market• Year Round Farmers Market • Expansion of farmers market • A more organized, larger local farmers market with a food coop• Larger more diverse farmers market • Year round farmers market
Potential Community Impact: Farmers Markets host several opportunities to bridge community economic development, producer profitability, consumer wellness, and policy change in one setting.
Existing city space is re-used as a market for all individuals to socialize and purchase fresh and affordable products that reflect regional and community diversity. Farmers Markets bridge social gaps and create access to affordable, healthy food choices in ur-ban and rural communities.
Farmers Markets
Pleasant Hill Farmers Market
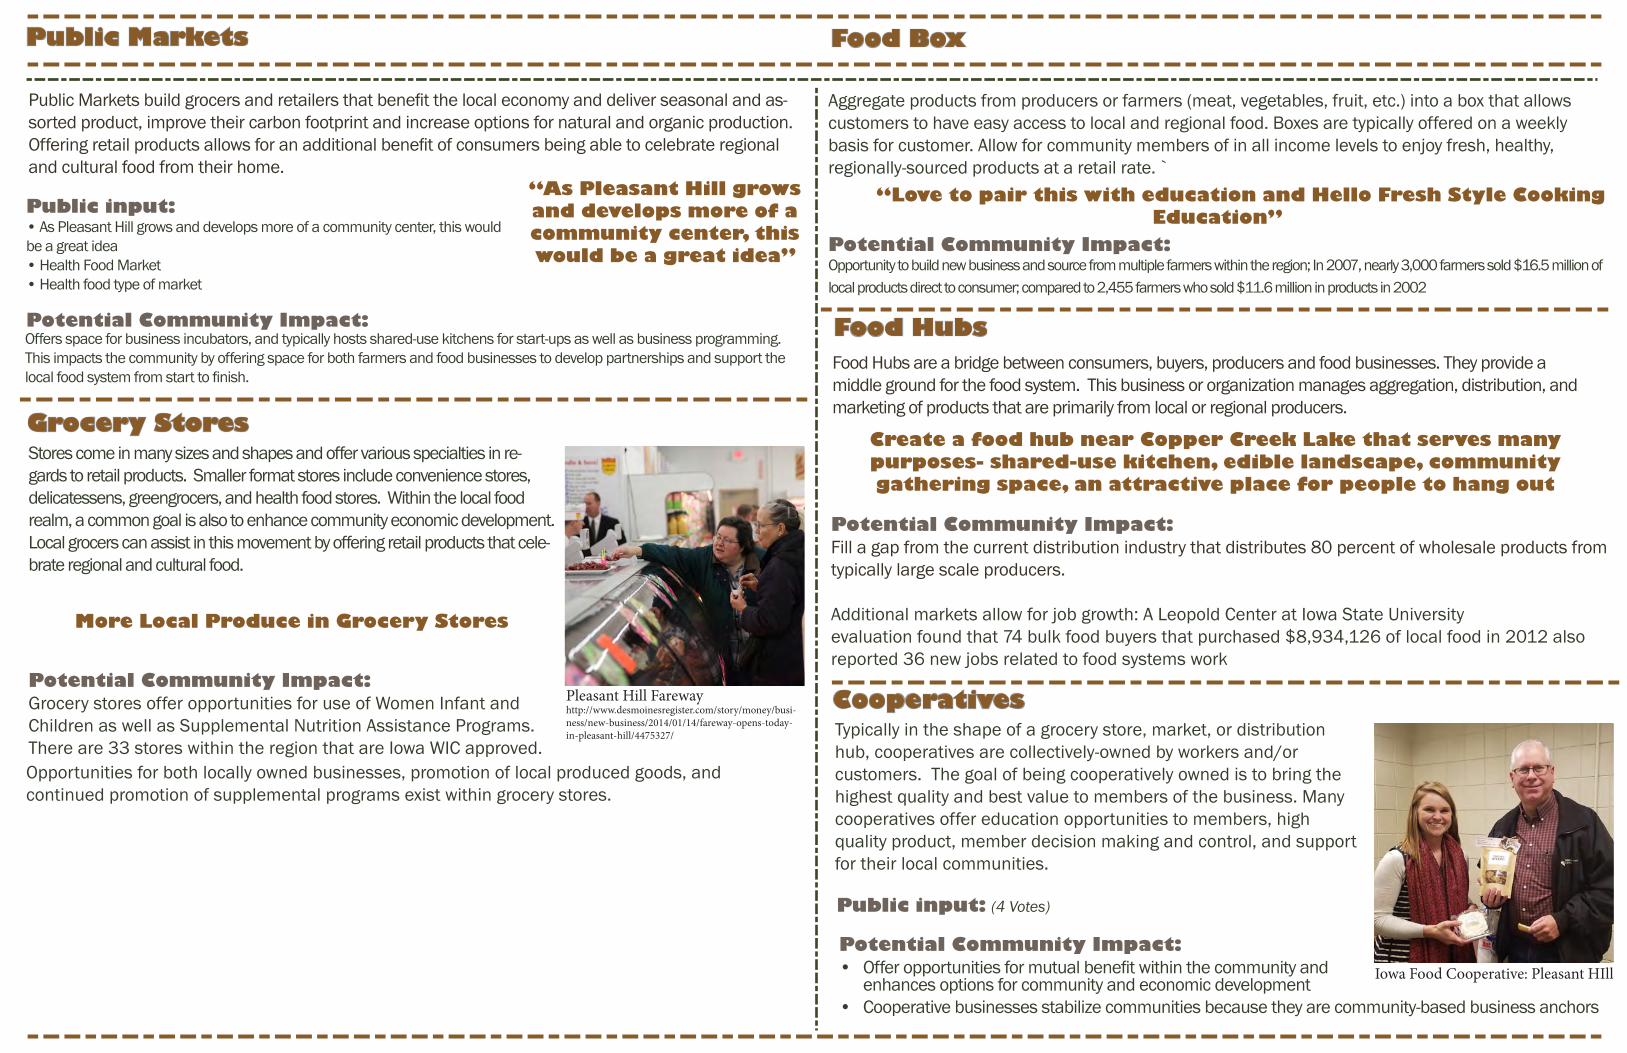
Potential Community Impact: Grocery stores offer opportunities for use of Women Infant and Children as well as Supplemental Nutrition Assistance Programs. There are 33 stores within the region that are Iowa WIC approved. Opportunities for both locally owned businesses, promotion of local produced goods, and continued promotion of supplemental programs exist within grocery stores.
Potential Community Impact:
Stores come in many sizes and shapes and offer various specialties in re-gards to retail products. Smaller format stores include convenience stores, delicatessens, greengrocers, and health food stores. Within the local food realm, a common goal is also to enhance community economic development. Local grocers can assist in this movement by offering retail products that cele-brate regional and cultural food.
More Local Produce in Grocery Stores
Public input:• As Pleasant Hill grows and develops more of a community center, this would be a great idea • Health Food Market • Health food type of market
Offers space for business incubators, and typically hosts shared-use kitchens for start-ups as well as business programming. This impacts the community by offering space for both farmers and food businesses to develop partnerships and support the local food system from start to finish.
Public Markets build grocers and retailers that benefit the local economy and deliver seasonal and as-sorted product, improve their carbon footprint and increase options for natural and organic production. Offering retail products allows for an additional benefit of consumers being able to celebrate regional and cultural food from their home.
“As Pleasant Hill grows and develops more of a community center, this would be a great idea”
Public Markets
Pleasant Hill Farewayhttp://www.desmoinesregister.com/story/money/busi-ness/new-business/2014/01/14/fareway-opens-today-in-pleasant-hill/4475327/
Iowa Food Cooperative: Pleasant HIll
Grocery Stores
Potential Community Impact: Opportunity to build new business and source from multiple farmers within the region; In 2007, nearly 3,000 farmers sold $16.5 million of local products direct to consumer; compared to 2,455 farmers who sold $11.6 million in products in 2002
“Love to pair this with education and Hello Fresh Style Cooking Education”
Aggregate products from producers or farmers (meat, vegetables, fruit, etc.) into a box that allows customers to have easy access to local and regional food. Boxes are typically offered on a weekly basis for customer. Allow for community members of in all income levels to enjoy fresh, healthy, regionally-sourced products at a retail rate. `
Food Box
Potential Community Impact: Fill a gap from the current distribution industry that distributes 80 percent of wholesale products from typically large scale producers.
Additional markets allow for job growth: A Leopold Center at Iowa State Universityevaluation found that 74 bulk food buyers that purchased $8,934,126 of local food in 2012 also reported 36 new jobs related to food systems work
Create a food hub near Copper Creek Lake that serves many purposes- shared-use kitchen, edible landscape, community gathering space, an attractive place for people to hang out
Food Hubs are a bridge between consumers, buyers, producers and food businesses. They provide a middle ground for the food system. This business or organization manages aggregation, distribution, and marketing of products that are primarily from local or regional producers.
Food Hubs
Potential Community Impact: • Offer opportunities for mutual benefit within the community and
enhances options for community and economic development• Cooperative businesses stabilize communities because they are community-based business anchors
Public input: (4 Votes)
Typically in the shape of a grocery store, market, or distribution hub, cooperatives are collectively-owned by workers and/or customers. The goal of being cooperatively owned is to bring the highest quality and best value to members of the business. Many cooperatives offer education opportunities to members, high quality product, member decision making and control, and support for their local communities.
Cooperatives
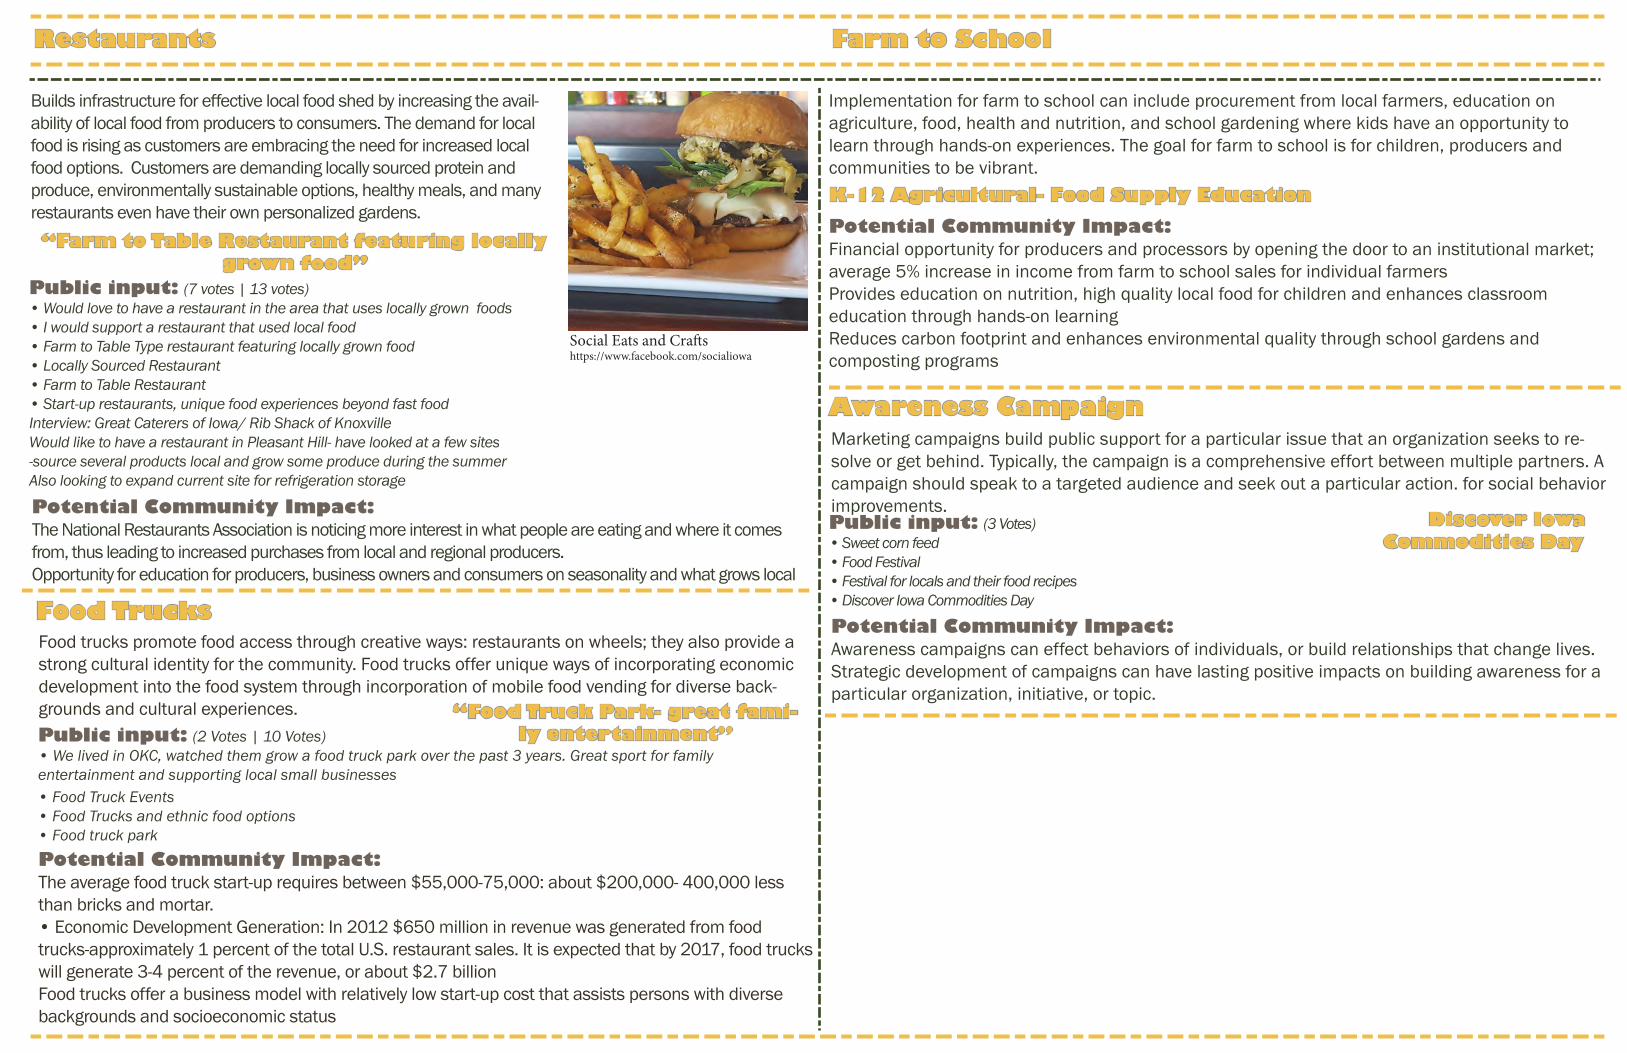
Public input: (7 votes | 13 votes)• Would love to have a restaurant in the area that uses locally grown foods • I would support a restaurant that used local food • Farm to Table Type restaurant featuring locally grown food • Locally Sourced Restaurant • Farm to Table Restaurant • Start-up restaurants, unique food experiences beyond fast foodInterview: Great Caterers of Iowa/ Rib Shack of Knoxville Would like to have a restaurant in Pleasant Hill- have looked at a few sites-source several products local and grow some produce during the summer Also looking to expand current site for refrigeration storage
Potential Community Impact: The National Restaurants Association is noticing more interest in what people are eating and where it comes from, thus leading to increased purchases from local and regional producers. Opportunity for education for producers, business owners and consumers on seasonality and what grows local
“Farm to Table Restaurant featuring locally grown food”
Builds infrastructure for effective local food shed by increasing the avail-ability of local food from producers to consumers. The demand for local food is rising as customers are embracing the need for increased local food options. Customers are demanding locally sourced protein and produce, environmentally sustainable options, healthy meals, and many restaurants even have their own personalized gardens.
Restaurants
Potential Community Impact: The average food truck start-up requires between $55,000-75,000: about $200,000- 400,000 less than bricks and mortar.• Economic Development Generation: In 2012 $650 million in revenue was generated from food trucks-approximately 1 percent of the total U.S. restaurant sales. It is expected that by 2017, food trucks will generate 3-4 percent of the revenue, or about $2.7 billionFood trucks offer a business model with relatively low start-up cost that assists persons with diverse backgrounds and socioeconomic status
Public input: (2 Votes | 10 Votes)• We lived in OKC, watched them grow a food truck park over the past 3 years. Great sport for family entertainment and supporting local small businesses• Food Truck Events• Food Trucks and ethnic food options• Food truck park
Food trucks promote food access through creative ways: restaurants on wheels; they also provide a strong cultural identity for the community. Food trucks offer unique ways of incorporating economic development into the food system through incorporation of mobile food vending for diverse back-grounds and cultural experiences. “Food Truck Park- great fami-
ly entertainment”
Food Trucks
Social Eats and Craftshttps://www.facebook.com/socialiowa
Potential Community Impact: Financial opportunity for producers and processors by opening the door to an institutional market; average 5% increase in income from farm to school sales for individual farmersProvides education on nutrition, high quality local food for children and enhances classroom education through hands-on learningReduces carbon footprint and enhances environmental quality through school gardens and composting programs
K-12 Agricultural- Food Supply Education
Implementation for farm to school can include procurement from local farmers, education on agriculture, food, health and nutrition, and school gardening where kids have an opportunity to learn through hands-on experiences. The goal for farm to school is for children, producers and communities to be vibrant.
Farm to School
Potential Community Impact: Awareness campaigns can effect behaviors of individuals, or build relationships that change lives. Strategic development of campaigns can have lasting positive impacts on building awareness for a particular organization, initiative, or topic.
Public input: (3 Votes)• Sweet corn feed • Food Festival • Festival for locals and their food recipes• Discover Iowa Commodities Day
Marketing campaigns build public support for a particular issue that an organization seeks to re-solve or get behind. Typically, the campaign is a comprehensive effort between multiple partners. A campaign should speak to a targeted audience and seek out a particular action. for social behavior improvements.
Discover Iowa Commodities Day
Awareness Campaign
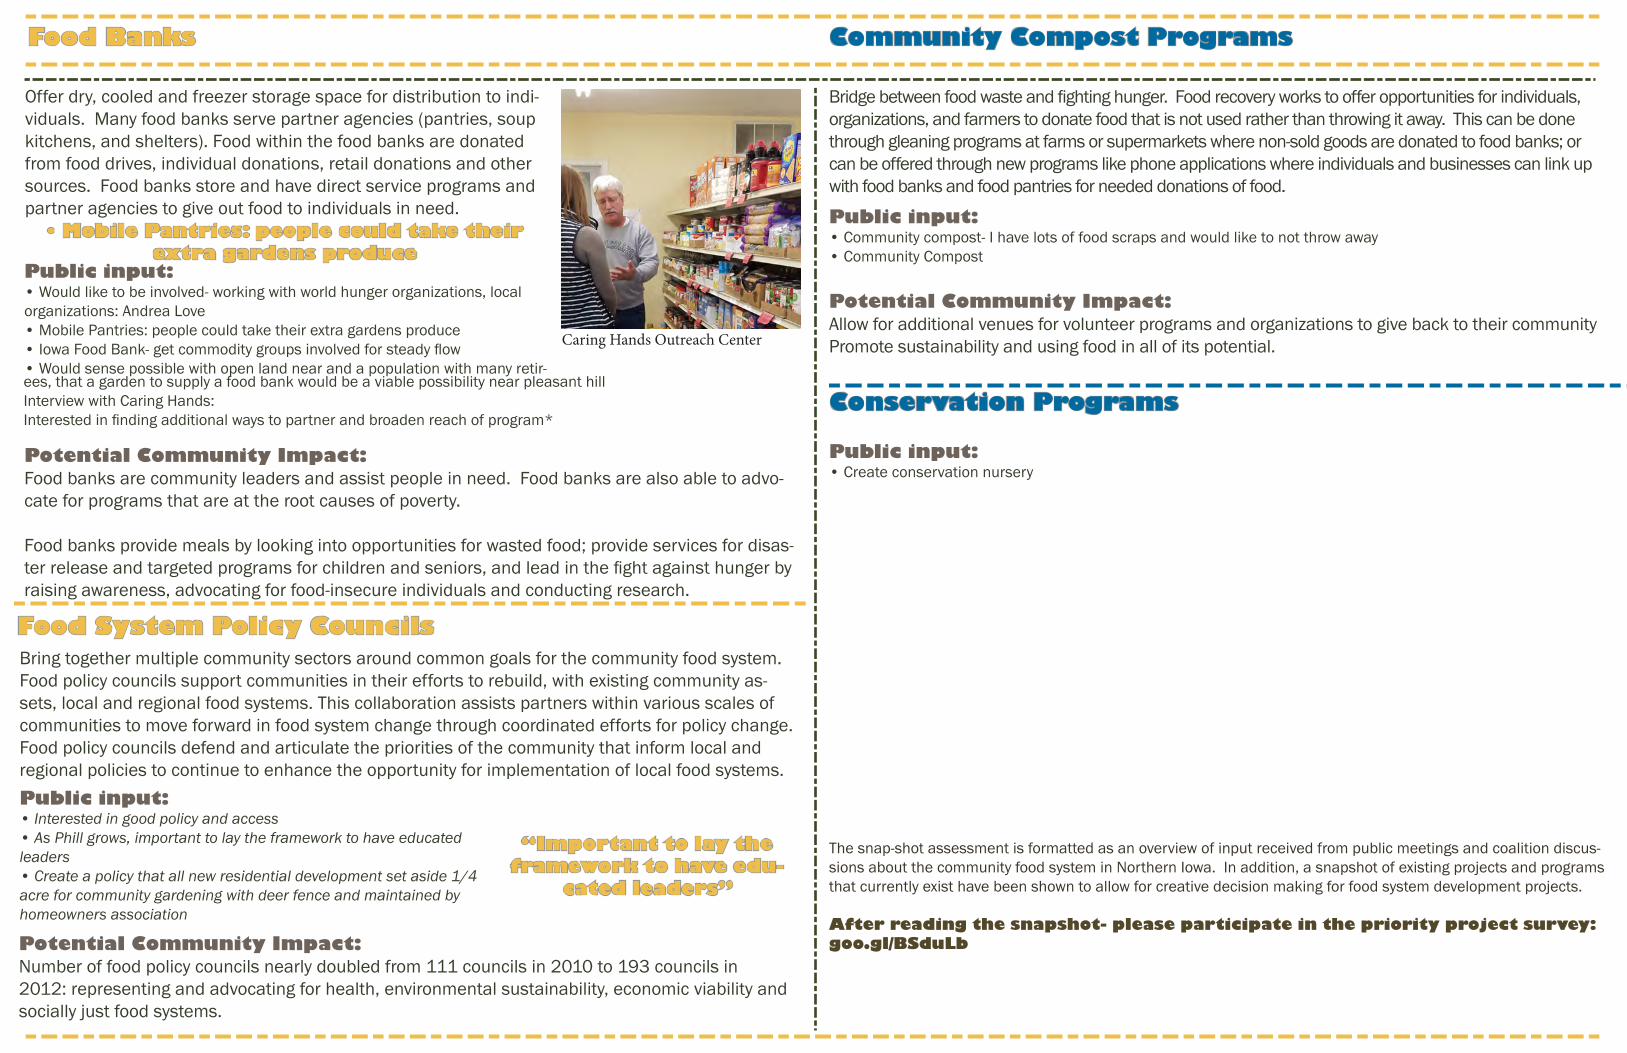
Potential Community Impact: Food banks are community leaders and assist people in need. Food banks are also able to advo-cate for programs that are at the root causes of poverty. Food banks provide meals by looking into opportunities for wasted food; provide services for disas-ter release and targeted programs for children and seniors, and lead in the fight against hunger by raising awareness, advocating for food-insecure individuals and conducting research.
Public input:• Would like to be involved- working with world hunger organizations, local organizations: Andrea Love • Mobile Pantries: people could take their extra gardens produce • Iowa Food Bank- get commodity groups involved for steady flow • Would sense possible with open land near and a population with many retir-ees, that a garden to supply a food bank would be a viable possibility near pleasant hill Interview with Caring Hands: Interested in finding additional ways to partner and broaden reach of program*
Offer dry, cooled and freezer storage space for distribution to indi-viduals. Many food banks serve partner agencies (pantries, soup kitchens, and shelters). Food within the food banks are donated from food drives, individual donations, retail donations and other sources. Food banks store and have direct service programs and partner agencies to give out food to individuals in need.
Food Banks
Caring Hands Outreach Center
Potential Community Impact: Number of food policy councils nearly doubled from 111 councils in 2010 to 193 councils in 2012: representing and advocating for health, environmental sustainability, economic viability and socially just food systems.
Public input:• Interested in good policy and access• As Phill grows, important to lay the framework to have educated leaders• Create a policy that all new residential development set aside 1/4 acre for community gardening with deer fence and maintained by homeowners association
“Important to lay the framework to have edu-
cated leaders”
Bring together multiple community sectors around common goals for the community food system. Food policy councils support communities in their efforts to rebuild, with existing community as-sets, local and regional food systems. This collaboration assists partners within various scales of communities to move forward in food system change through coordinated efforts for policy change. Food policy councils defend and articulate the priorities of the community that inform local and regional policies to continue to enhance the opportunity for implementation of local food systems.
Food System Policy Councils
• Mobile Pantries: people could take their extra gardens produce
Bridge between food waste and fighting hunger. Food recovery works to offer opportunities for individuals, organizations, and farmers to donate food that is not used rather than throwing it away. This can be done through gleaning programs at farms or supermarkets where non-sold goods are donated to food banks; or can be offered through new programs like phone applications where individuals and businesses can link up with food banks and food pantries for needed donations of food.
Potential Community Impact: Allow for additional venues for volunteer programs and organizations to give back to their communityPromote sustainability and using food in all of its potential.
Community Compost Programs
Conservation Programs
Public input:• Community compost- I have lots of food scraps and would like to not throw away • Community Compost
Public input:• Create conservation nursery
The snap-shot assessment is formatted as an overview of input received from public meetings and coalition discus-sions about the community food system in Northern Iowa. In addition, a snapshot of existing projects and programs that currently exist have been shown to allow for creative decision making for food system development projects.
After reading the snapshot- please participate in the priority project survey: goo.gl/BSduLb
Iowa’s official population count on April 1, 2010, was 3,046,355 residents. The state’s total population grew by 4.1 percent between 2000 and 2010, although the growth was unevenly distributed across the state. Two-thirds of Iowa’s 99 counties and 600 of its 947 incorporated cities experienced population losses for the decade.
Iowa’s population reflects a slightly older age distribution compared to a decade ago. The state’s median age has increased to 38.1 years compared to 36.6 years in 2000. Elderly residents, ages 65 years and older, now account for nearly 15 percent of the total population.
Children under the age of 18 years represent about 24 percent of the population.
The racial and ethnic composition of Iowa’s population reflects growing minority group shares. Residents who report any race other than white alone now comprise nearly 9 percent of Iowa’s population. Hispanic/Latino residents, who may be of any race, are now 5 percent of the total population.
The average size of an Iowa household in 2010 was 2.4 persons, only slightly smaller than the average in 2000.
The total number of housing units in Iowa grew by 8.4 percent from 2000 to 2010.
May 2011
Census 2010 Demographic Profile Pleasant Hill
Overview and Statewide Trends 1
Population Change 2000-2010 2
Historical Population 1900-2010 2
Racial Composition 3
Hispanic/Latino Origin 3
5-Year Age Groups 4
Median Age 5
Selected Age Groups 5
Households and Families 6
Changes in Households 7
Average Household Size 7
Total Housing Units 8
Housing Occupancy and Tenure 8
Vacancy and Ownership Rates 8
Other Census Data Sources 9
CONTENTS:
Overview
IOWA STATE UNIVERSITY Department of Economics
This demographic profile describes characteristics of the local and state population based on results from the 2010 Census.
The decennial census is an official enumeration, or count, of all residents on April 1st of the census year. The results of the census provide us with information about basic demographic characteristics of the population, including age, race, ethnicity, household composition, housing occupancy, and housing tenure.
Statewide Demographic Trends
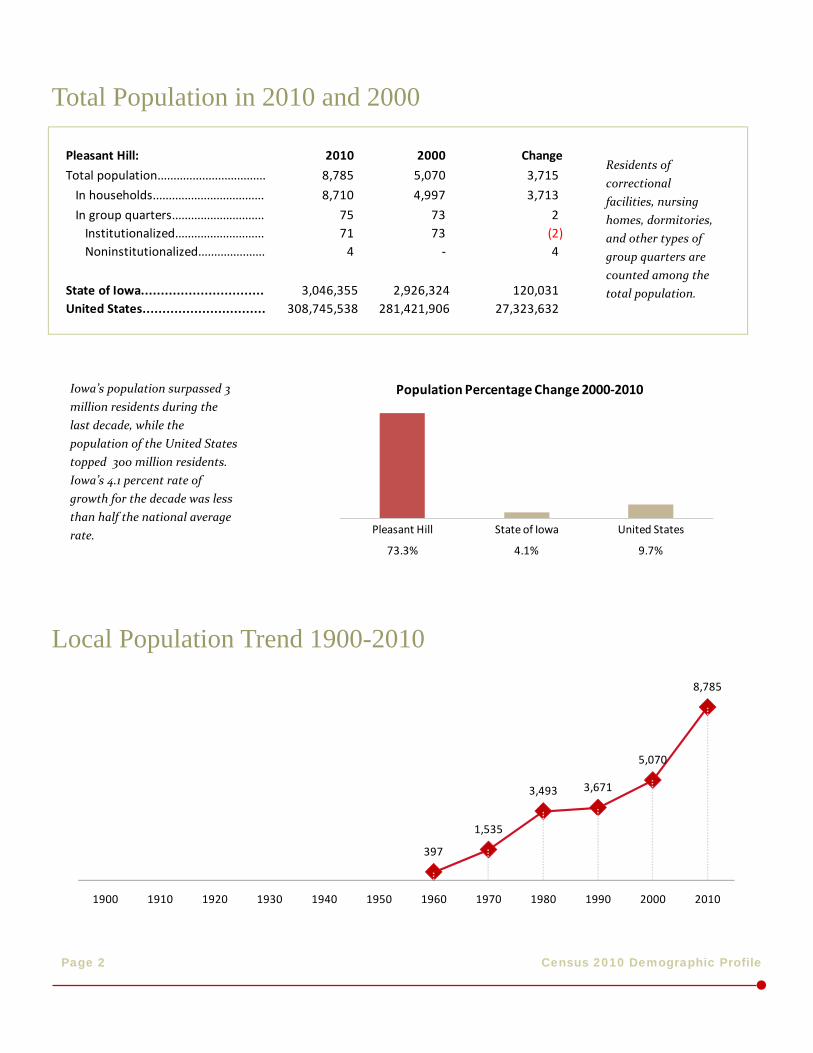
Census 2010 Demographic Profile Page 2
Total Population in 2010 and 2000
Local Population Trend 1900-2010
397
1,535
3,493 3,671
5,070
8,785
1900 1910 1920 1930 1940 1950 1960 1970 1980 1990 2000 2010
Iowa’s population surpassed 3 million residents during the last decade, while the population of the United States topped 300 million residents. Iowa’s 4.1 percent rate of growth for the decade was less than half the national average rate.
Pleasant Hill: 2010 2000 Change
Total population.................................. 8,785 5,070 3,715
In households................................... 8,710 4,997 3,713
In group quarters............................. 75 73 2 Institutionalized............................ 71 73 (2) Noninstitutionalized..................... 4 - 4
State of Iowa............................... 3,046,355 2,926,324 120,031 United States............................... 308,745,538 281,421,906 27,323,632
Residents of correctional facilities, nursing homes, dormitories, and other types of group quarters are counted among the total population.
Pleasant Hill State of Iowa United States
73.3% 4.1% 9.7%
Population Percentage Change 2000-2010
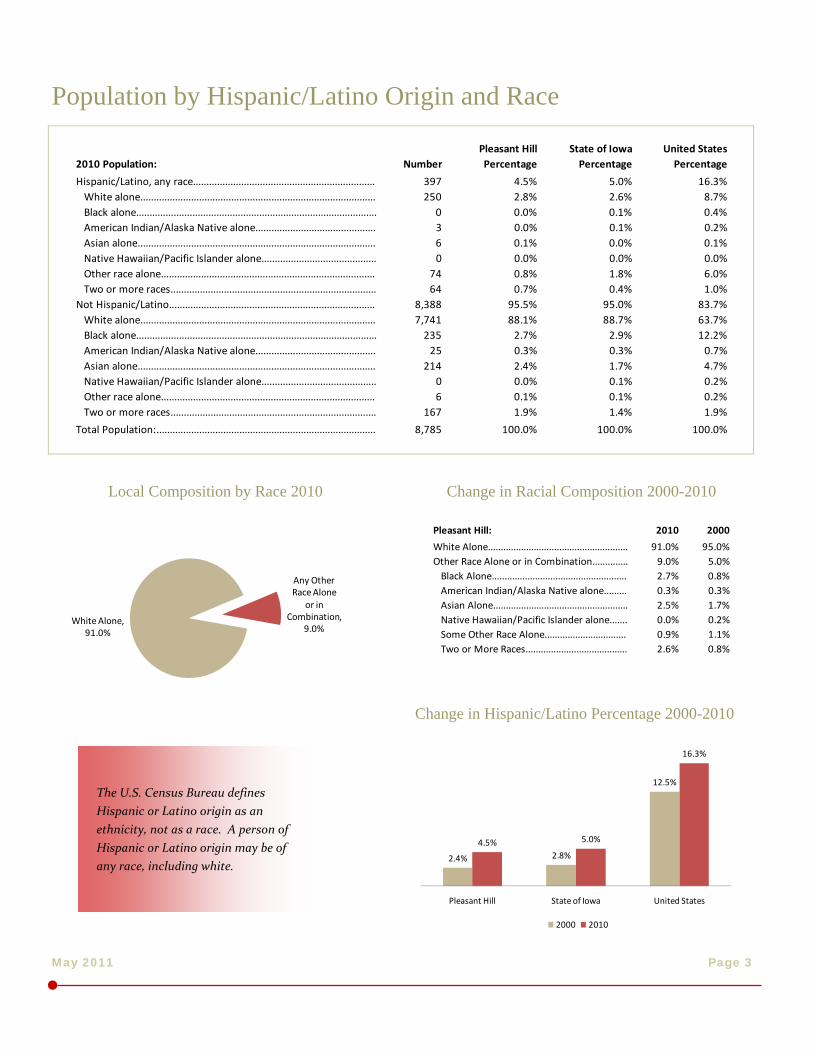
May 2011 Page 3
Population by Hispanic/Latino Origin and Race
The U.S. Census Bureau defines Hispanic or Latino origin as an ethnicity, not as a race. A person of Hispanic or Latino origin may be of any race, including white.
White Alone, 91.0%
Any Other Race Alone
or in Combination,
9.0%
Change in Racial Composition 2000-2010
Change in Hispanic/Latino Percentage 2000-2010
2.4% 2.8%
12.5%
4.5% 5.0%
16.3%
Pleasant Hill State of Iowa United States
2000 2010
State of Iowa United States2010 Population: Number Percentage Percentage Percentage
Hispanic/Latino, any race.................................................................... 397 4.5% 5.0% 16.3%White alone........................................................................................ 250 2.8% 2.6% 8.7%Black alone.......................................................................................... 0 0.0% 0.1% 0.4%American Indian/Alaska Native alone............................................. 3 0.0% 0.1% 0.2%Asian alone......................................................................................... 6 0.1% 0.0% 0.1%Native Hawaiian/Pacific Islander alone........................................... 0 0.0% 0.0% 0.0%Other race alone................................................................................ 74 0.8% 1.8% 6.0%Two or more races............................................................................. 64 0.7% 0.4% 1.0%
Not Hispanic/Latino............................................................................. 8,388 95.5% 95.0% 83.7%White alone........................................................................................ 7,741 88.1% 88.7% 63.7%Black alone.......................................................................................... 235 2.7% 2.9% 12.2%American Indian/Alaska Native alone............................................. 25 0.3% 0.3% 0.7%Asian alone......................................................................................... 214 2.4% 1.7% 4.7%Native Hawaiian/Pacific Islander alone........................................... 0 0.0% 0.1% 0.2%Other race alone................................................................................ 6 0.1% 0.1% 0.2%Two or more races............................................................................. 167 1.9% 1.4% 1.9%
Total Population:.................................................................................. 8,785 100.0% 100.0% 100.0%
Pleasant Hill
Local Composition by Race 2010
Pleasant Hill: 2010 2000
White Alone....................................................... 91.0% 95.0%Other Race Alone or in Combination.............. 9.0% 5.0%
Black Alone..................................................... 2.7% 0.8%American Indian/Alaska Native alone......... 0.3% 0.3%Asian Alone..................................................... 2.5% 1.7%Native Hawaiian/Pacific Islander alone....... 0.0% 0.2%Some Other Race Alone................................ 0.9% 1.1%Two or More Races........................................ 2.6% 0.8%
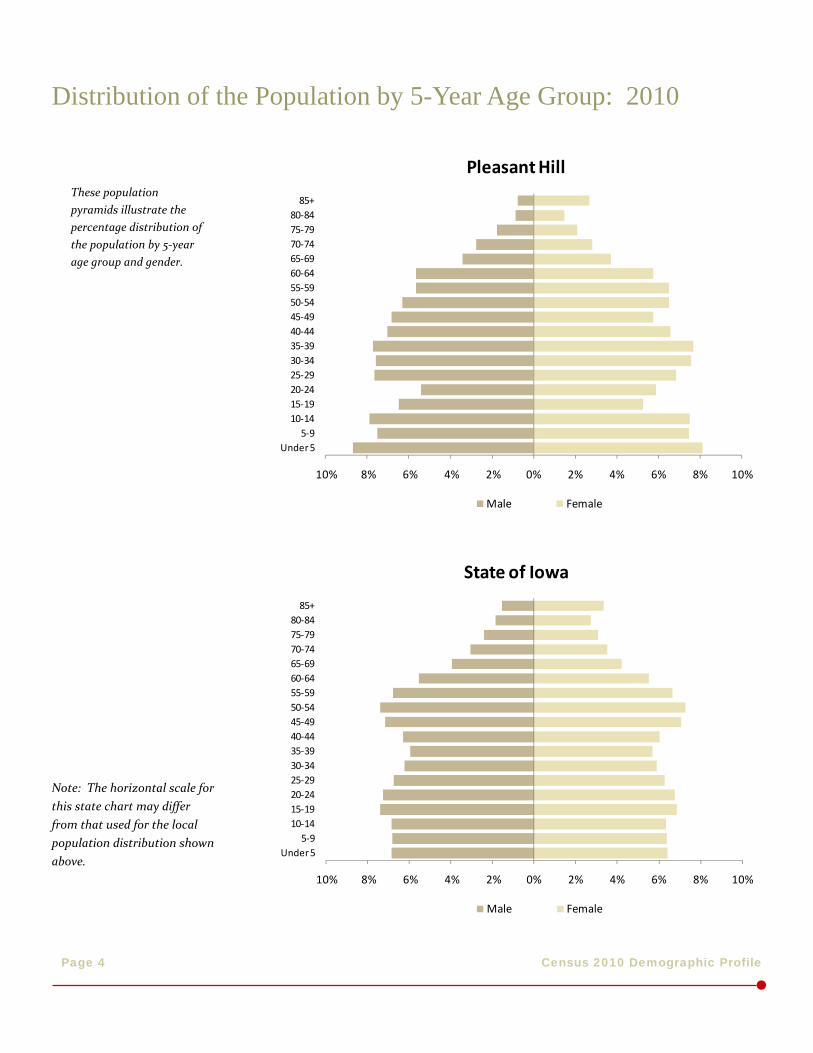
Census 2010 Demographic Profile Page 4
Note: The horizontal scale for this state chart may differ from that used for the local population distribution shown above.
Distribution of the Population by 5-Year Age Group: 2010
10% 8% 6% 4% 2% 0% 2% 4% 6% 8% 10%
Under 55-9
10-1415-1920-2425-2930-3435-3940-4445-4950-5455-5960-6465-6970-7475-7980-84
85+
Pleasant Hill
Male Female
10% 8% 6% 4% 2% 0% 2% 4% 6% 8% 10%
Under 55-9
10-1415-1920-2425-2930-3435-3940-4445-4950-5455-5960-6465-6970-7475-7980-84
85+
State of Iowa
Male Female
These population pyramids illustrate the percentage distribution of the population by 5-year age group and gender.
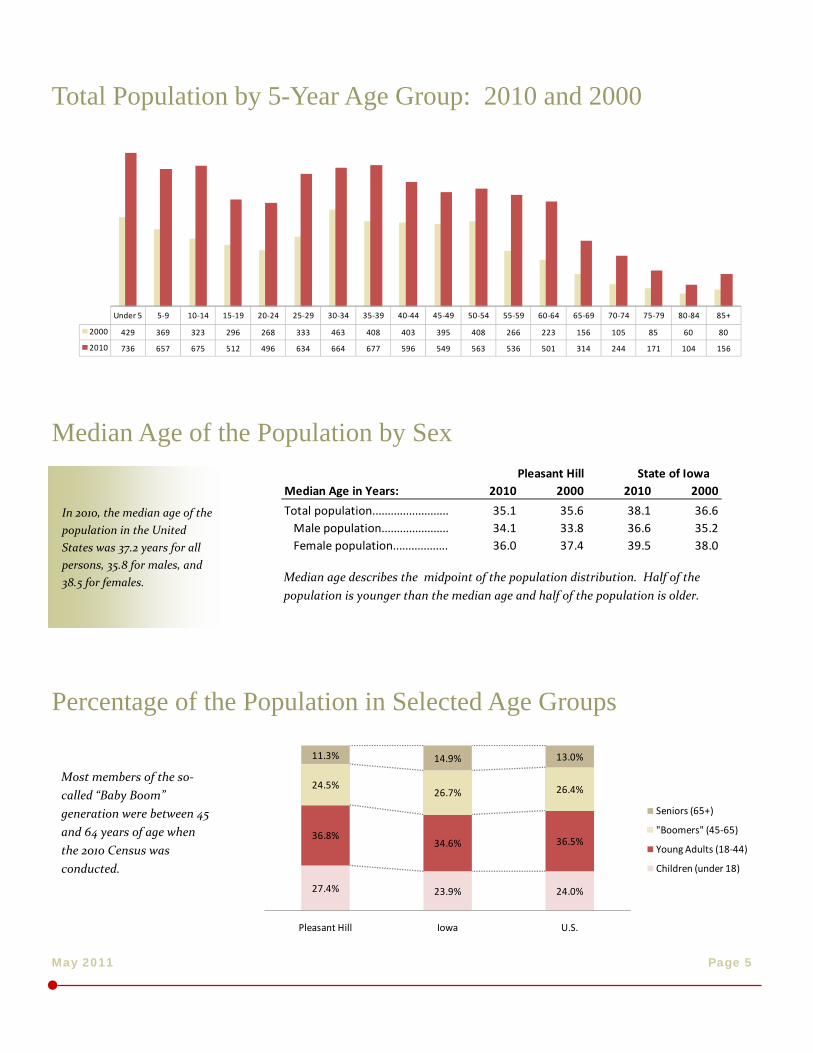
May 2011 Page 5
Percentage of the Population in Selected Age Groups
Total Population by 5-Year Age Group: 2010 and 2000
Median age describes the midpoint of the population distribution. Half of the population is younger than the median age and half of the population is older.
Median Age of the Population by Sex
Under 5 5-9 10-14 15-19 20-24 25-29 30-34 35-39 40-44 45-49 50-54 55-59 60-64 65-69 70-74 75-79 80-84 85+
2000 429 369 323 296 268 333 463 408 403 395 408 266 223 156 105 85 60 80
2010 736 657 675 512 496 634 664 677 596 549 563 536 501 314 244 171 104 156
Median Age in Years: 2010 2000 2010 2000
Total population......................... 35.1 35.6 38.1 36.6Male population...................... 34.1 33.8 36.6 35.2Female population.................. 36.0 37.4 39.5 38.0
Pleasant Hill State of Iowa
In 2010, the median age of the population in the United States was 37.2 years for all persons, 35.8 for males, and 38.5 for females.
27.4% 23.9% 24.0%
36.8%34.6% 36.5%
24.5%26.7% 26.4%
11.3% 14.9% 13.0%
Pleasant Hill Iowa U.S.
Seniors (65+)
"Boomers" (45-65)
Young Adults (18-44)
Children (under 18)
Most members of the so-called “Baby Boom” generation were between 45 and 64 years of age when the 2010 Census was conducted.
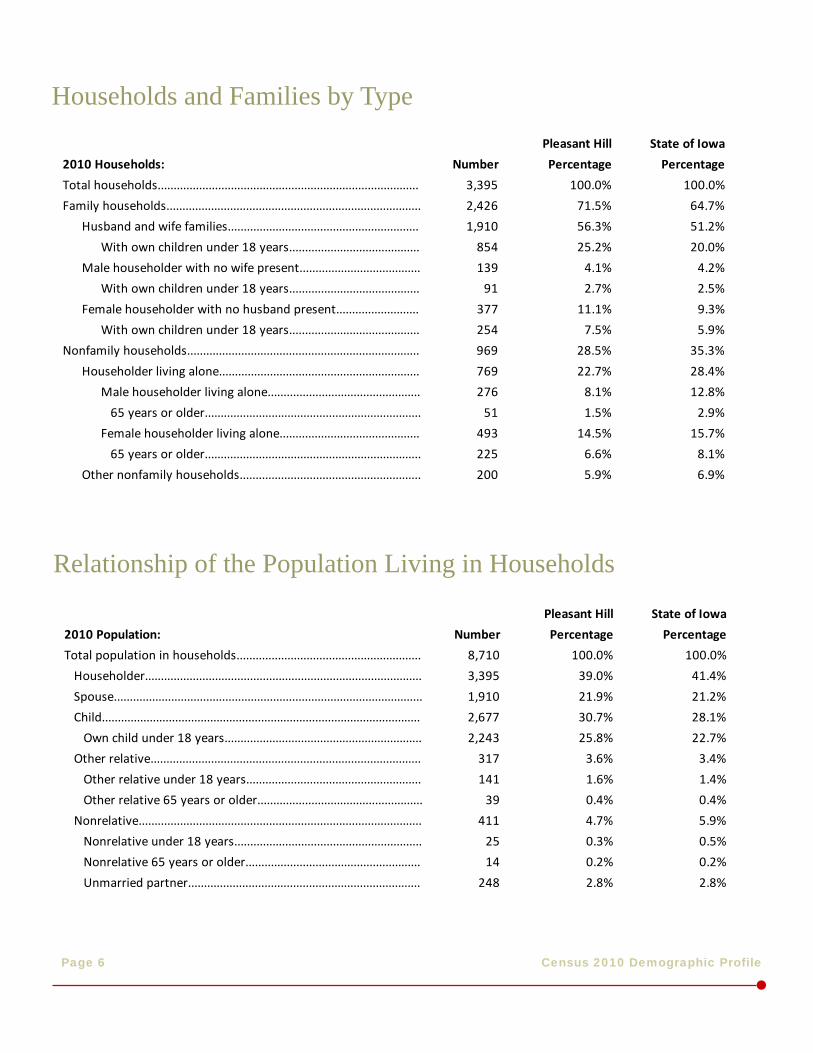
Census 2010 Demographic Profile Page 6
Households and Families by Type
Relationship of the Population Living in Households
State of Iowa
2010 Population: Number Percentage Percentage
Total population in households.......................................................... 8,710 100.0% 100.0%
Householder....................................................................................... 3,395 39.0% 41.4%
Spouse................................................................................................. 1,910 21.9% 21.2%
Child.................................................................................................... 2,677 30.7% 28.1%
Own child under 18 years.............................................................. 2,243 25.8% 22.7%
Other relative..................................................................................... 317 3.6% 3.4%
Other relative under 18 years....................................................... 141 1.6% 1.4%
Other relative 65 years or older.................................................... 39 0.4% 0.4%
Nonrelative......................................................................................... 411 4.7% 5.9%
Nonrelative under 18 years........................................................... 25 0.3% 0.5%
Nonrelative 65 years or older....................................................... 14 0.2% 0.2%
Unmarried partner......................................................................... 248 2.8% 2.8%
Pleasant Hill
State of Iowa
2010 Households: Number Percentage Percentage
Total households.................................................................................. 3,395 100.0% 100.0%
Family households................................................................................ 2,426 71.5% 64.7%
Husband and wife families............................................................ 1,910 56.3% 51.2%
With own children under 18 years......................................... 854 25.2% 20.0%
Male householder with no wife present...................................... 139 4.1% 4.2%
With own children under 18 years......................................... 91 2.7% 2.5%
Female householder with no husband present.......................... 377 11.1% 9.3%
With own children under 18 years......................................... 254 7.5% 5.9%
Nonfamily households......................................................................... 969 28.5% 35.3%
Householder living alone............................................................... 769 22.7% 28.4%
Male householder living alone................................................ 276 8.1% 12.8%
65 years or older.................................................................... 51 1.5% 2.9%
Female householder living alone............................................ 493 14.5% 15.7%
65 years or older.................................................................... 225 6.6% 8.1%
Other nonfamily households......................................................... 200 5.9% 6.9%
Pleasant Hill
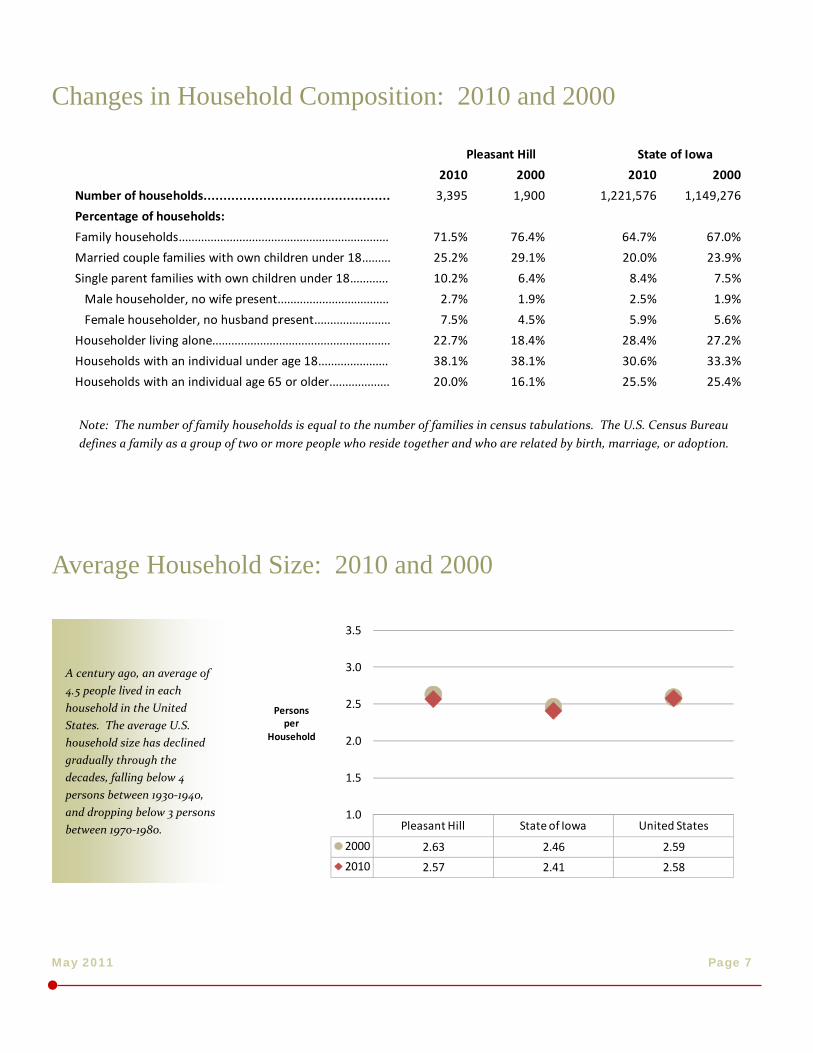
Average Household Size: 2010 and 2000
May 2011 Page 7
Changes in Household Composition: 2010 and 2000
A century ago, an average of 4.5 people lived in each household in the United States. The average U.S. household size has declined gradually through the decades, falling below 4 persons between 1930-1940, and dropping below 3 persons between 1970-1980.
2010 2000 2010 2000
Number of households............................................... 3,395 1,900 1,221,576 1,149,276
Percentage of households:
Family households.................................................................. 71.5% 76.4% 64.7% 67.0%
Married couple families with own children under 18......... 25.2% 29.1% 20.0% 23.9%
Single parent families with own children under 18............ 10.2% 6.4% 8.4% 7.5%
Male householder, no wife present................................... 2.7% 1.9% 2.5% 1.9%
Female householder, no husband present........................ 7.5% 4.5% 5.9% 5.6%
Householder living alone........................................................ 22.7% 18.4% 28.4% 27.2%
Households with an individual under age 18...................... 38.1% 38.1% 30.6% 33.3%
Households with an individual age 65 or older................... 20.0% 16.1% 25.5% 25.4%
State of IowaPleasant Hill
Note: The number of family households is equal to the number of families in census tabulations. The U.S. Census Bureau defines a family as a group of two or more people who reside together and who are related by birth, marriage, or adoption.
Pleasant Hill State of Iowa United States
2000 2.63 2.46 2.59
2010 2.57 2.41 2.58
1.0
1.5
2.0
2.5
3.0
3.5
Personsper
Household
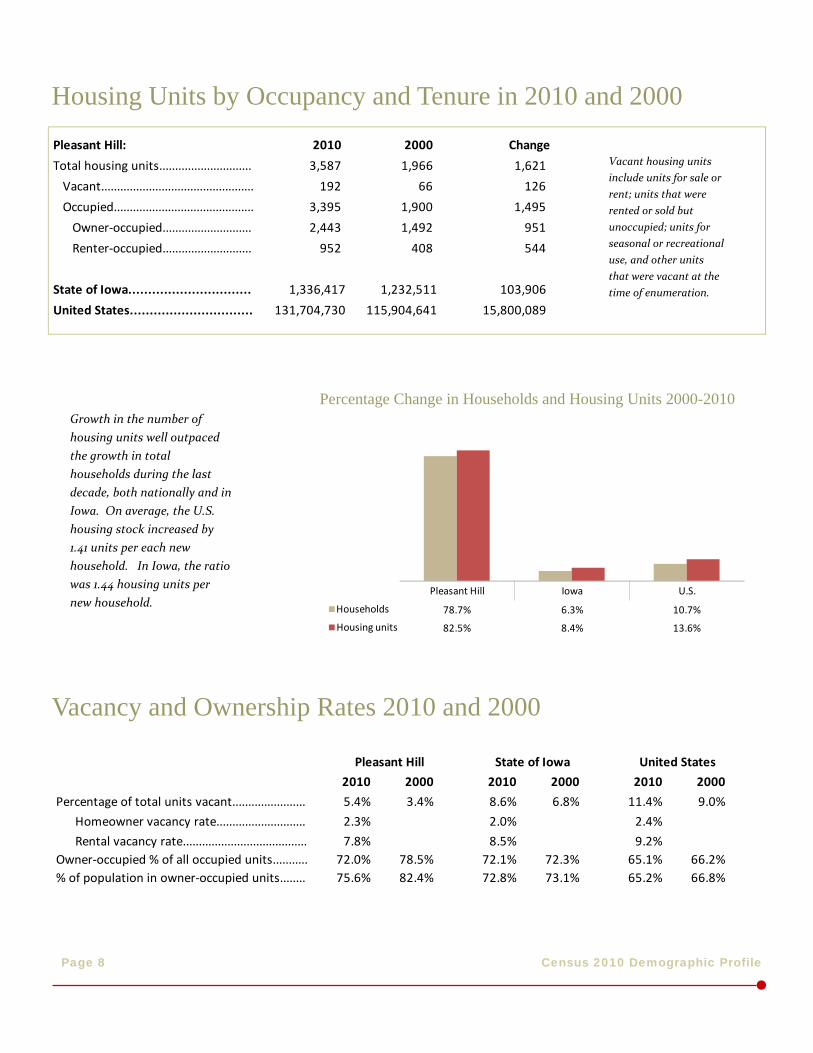
Census 2010 Demographic Profile Page 8
Housing Units by Occupancy and Tenure in 2010 and 2000
Pleasant Hill: 2010 2000 Change
Total housing units............................. 3,587 1,966 1,621
Vacant................................................ 192 66 126
Occupied............................................ 3,395 1,900 1,495
Owner-occupied............................ 2,443 1,492 951
Renter-occupied............................ 952 408 544
State of Iowa............................... 1,336,417 1,232,511 103,906
United States............................... 131,704,730 115,904,641 15,800,089
Vacancy and Ownership Rates 2010 and 2000
2010 2000 2010 2000 2010 2000
Percentage of total units vacant....................... 5.4% 3.4% 8.6% 6.8% 11.4% 9.0%
Homeowner vacancy rate............................ 2.3% 2.0% 2.4%
Rental vacancy rate....................................... 7.8% 8.5% 9.2%Owner-occupied % of all occupied units........... 72.0% 78.5% 72.1% 72.3% 65.1% 66.2%% of population in owner-occupied units........ 75.6% 82.4% 72.8% 73.1% 65.2% 66.8%
United StatesPleasant Hill State of Iowa
Vacant housing units include units for sale or rent; units that were rented or sold but unoccupied; units for seasonal or recreational use, and other units that were vacant at the time of enumeration.
Growth in the number of housing units well outpaced the growth in total households during the last decade, both nationally and in Iowa. On average, the U.S. housing stock increased by 1.41 units per each new household. In Iowa, the ratio was 1.44 housing units per new household.
Percentage Change in Households and Housing Units 2000-2010
Pleasant Hill Iowa U.S.
Households 78.7% 6.3% 10.7%
Housing units 82.5% 8.4% 13.6%
May 2011 Page 9
Other Sources for Detailed Census Data
… and justice for all
The U.S. Department of Agriculture (USDA) prohibits discrimination in all its programs and activities on the basis of race, color, national origin, age, disability, and where applicable, sex, marital status, familial status, parental status, religion, sexual orientation, genetic information, political beliefs, reprisal, or because all or part of an individual’s income is derived from any public assistance program. (Not all prohibited bases apply to all programs.) Persons with disabilities who require alternative means for communication of program information (Braille, large print, audiotape, etc.) should contact USDA's TARGET Center at 202-720-2600 (voice and TDD). To file a complaint of discrimination, write to USDA, Director, Office of Civil Rights, 1400 Independence Avenue SW, Washington, DC 20250-9410, or call 800-795-3272 (voice) or 202-720-6382 (TDD). USDA is an equal opportunity provider and employer.
Issued in furtherance of Cooperative Extension work, Acts of May 8 and June 30, 1914, in cooperation with the U.S. Department of Agriculture. Gerald A. Miller, interim director, Cooperative Extension Service, Iowa State University of Science and Technology, Ames, Iowa.
The decennial census has traditionally been a rich source for socio-economic data far more detailed than the basic demographic characteristics presented in this report. The detailed information was collected via a “long form” survey that was administered to a sampled subset of the total population. The long form sample provided the basis for detailed portraits of income, educational attainment, employment, housing, and many other characteristics of the population in our communities.
The 2010 Census was the first since 1940 not to include the detailed long form data sample. The U.S. Census Bureau has replaced the long form sample with a new, rolling sample of U.S. households that is administered on a continuous basis rather than once every 10 years. This new survey, called the American Community Survey (ACS), will now serve as the primary source of socio-economic data for our neighborhoods, cities, and counties.
ACS data for all census geographies down to the block group level are currently available for the period covering 2005-2009. The next release of small-area ACS data will describe the 5-year period from 2006-2010.
Iowa State University will continue to release new reports based on future data releases from the 2010 Census, the ACS, and other Census data programs. Data may also be obtained directly via the World Wide Web from the U.S. Census Bureau and the State Data Center of Iowa.
Regional Economics & Community Analysis
Program
Phone: 515-294-7458 Fax: 515-294-0592 E-mail: [email protected]
175 Heady Hall Iowa State University Ames, Iowa 50011
For questions about this profile or other Census-related questions, please contact the author:
Liesl Eathington
(515) 294-2954
American FactFinder U.S. Census Bureau www.factfinder.census.gov
State Data Center of Iowa State Library of Iowa www.iowadatacenter.org
Poverty And Food Needs
Poverty
Issued March, 2016
Poverty and food insecurity impact the welfare of individuals, families, and communities. This profile describes several indicators of poverty and food insecurity and related measures of general economic well-being in Polk County, Iowa.
Polk County, Iowa
Poverty Rates 2
Food Insecurity 3
Food Accessibility 4
Nutrition 5
Health Status 7
Program Participation Levels 9
Local Income 12
Household Economic Stress 13
Demographic Profile 14
Other Data Sources 15
Contents People living in poverty have annual incomes insufficient to meet their basic needs. The Federal government determines the poverty status of individuals and families using money income thresholds that vary by family size. The thresholds are based on three times the cost of the official USDA Low-Cost Food Plan that includes a nutritious diet of meals and snacks prepared at home. See Page 15 for current Federal poverty guidelines.
The incidence of poverty varies among individuals and families with different socio-economic characteristics. Table 1 (following page) displays poverty rates by age, race and ethnicity, work experience, and family type in Polk County and the state. The data describe average poverty characteristics during a five-year survey measurement period.
For each poverty measure, Table 1 includes a point estimate and a margin of error (MOE) value associated with that estimate. Adding and subtracting the margin of error to the point estimate yields a confidence interval that is 90% likely to contain the actual number or percentage of individuals or families in poverty.
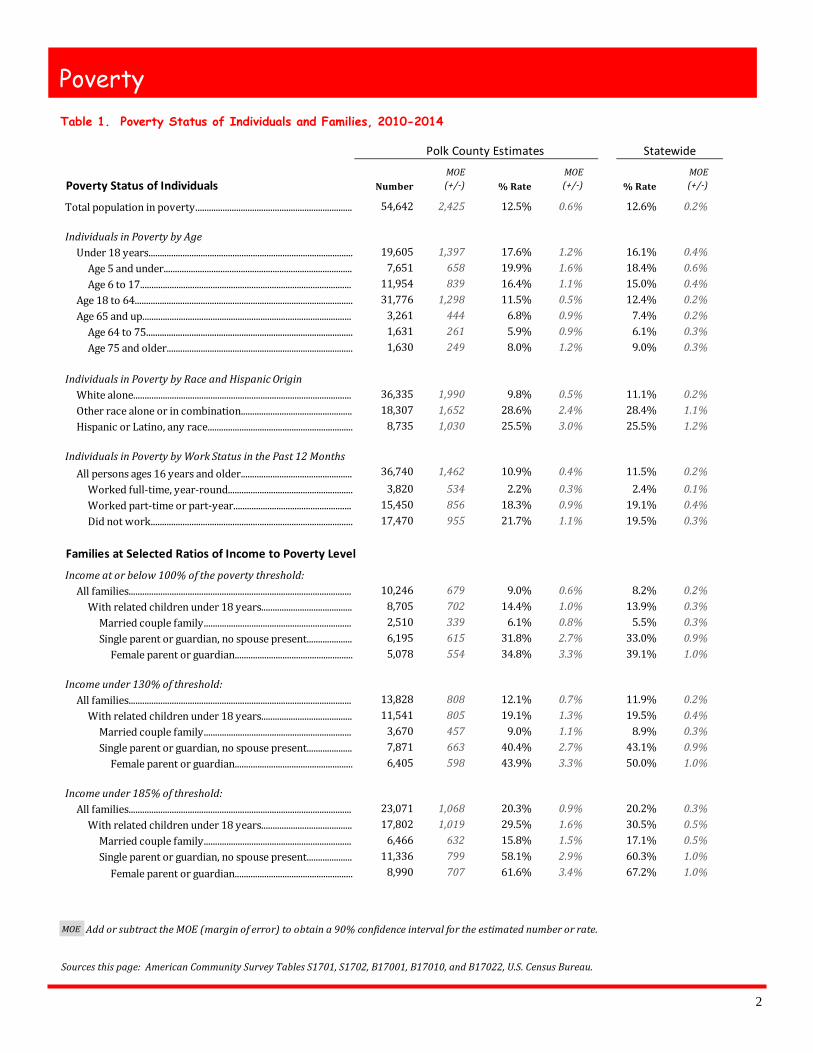
2
Poverty
Sourcesthispage:AmericanCommunitySurveyTablesS1701,S1702,B17001,B17010,andB17022,U.S.CensusBureau.
Table 1. Poverty Status of Individuals and Families, 2010-2014
Poverty Status of Individuals NumberMOE(+/-) % Rate
MOE(+/-) % Rate
MOE(+/-)Total population in poverty..................................................................... 54,642 2,425 12.5% 0.6% 12.6% 0.2%
IndividualsinPovertybyAgeUnder 18 years.......................................................................................... 19,605 1,397 17.6% 1.2% 16.1% 0.4%Age 5 and under................................................................................... 7,651 658 19.9% 1.6% 18.4% 0.6%Age 6 to 17............................................................................................. 11,954 839 16.4% 1.1% 15.0% 0.4%Age 18 to 64................................................................................................ 31,776 1,298 11.5% 0.5% 12.4% 0.2%Age 65 and up............................................................................................ 3,261 444 6.8% 0.9% 7.4% 0.2%Age 64 to 75........................................................................................... 1,631 261 5.9% 0.9% 6.1% 0.3%Age 75 and older.................................................................................. 1,630 249 8.0% 1.2% 9.0% 0.3%
IndividualsinPovertybyRaceandHispanicOriginWhite alone................................................................................................ 36,335 1,990 9.8% 0.5% 11.1% 0.2%Other race alone or in combination................................................. 18,307 1,652 28.6% 2.4% 28.4% 1.1%Hispanic or Latino, any race................................................................ 8,735 1,030 25.5% 3.0% 25.5% 1.2%
IndividualsinPovertybyWorkStatusinthePast12MonthsAll persons ages 16 years and older................................................. 36,740 1,462 10.9% 0.4% 11.5% 0.2%Worked full-time, year-round....................................................... 3,820 534 2.2% 0.3% 2.4% 0.1%Worked part-time or part-year.................................................... 15,450 856 18.3% 0.9% 19.1% 0.4%Did not work......................................................................................... 17,470 955 21.7% 1.1% 19.5% 0.3%
Families at Selected Ratios of Income to Poverty Level
Incomeatorbelow100%ofthepovertythreshold:All families.................................................................................................. 10,246 679 9.0% 0.6% 8.2% 0.2%With related children under 18 years........................................ 8,705 702 14.4% 1.0% 13.9% 0.3%Married couple family................................................................. 2,510 339 6.1% 0.8% 5.5% 0.3%Single parent or guardian, no spouse present.................... 6,195 615 31.8% 2.7% 33.0% 0.9%Female parent or guardian.................................................... 5,078 554 34.8% 3.3% 39.1% 1.0%
Incomeunder130%ofthreshold:All families.................................................................................................. 13,828 808 12.1% 0.7% 11.9% 0.2%With related children under 18 years........................................ 11,541 805 19.1% 1.3% 19.5% 0.4%Married couple family................................................................. 3,670 457 9.0% 1.1% 8.9% 0.3%Single parent or guardian, no spouse present.................... 7,871 663 40.4% 2.7% 43.1% 0.9%Female parent or guardian.................................................... 6,405 598 43.9% 3.3% 50.0% 1.0%
Incomeunder185%ofthreshold:All families.................................................................................................. 23,071 1,068 20.3% 0.9% 20.2% 0.3%With related children under 18 years........................................ 17,802 1,019 29.5% 1.6% 30.5% 0.5%Married couple family................................................................. 6,466 632 15.8% 1.5% 17.1% 0.5%Single parent or guardian, no spouse present.................... 11,336 799 58.1% 2.9% 60.3% 1.0%Female parent or guardian.................................................... 8,990 707 61.6% 3.4% 67.2% 1.0%
StatewidePolk County Estimates
MOE AddorsubtracttheMOE(marginoferror)toobtaina90%confidenceintervalfortheestimatednumberorrate.
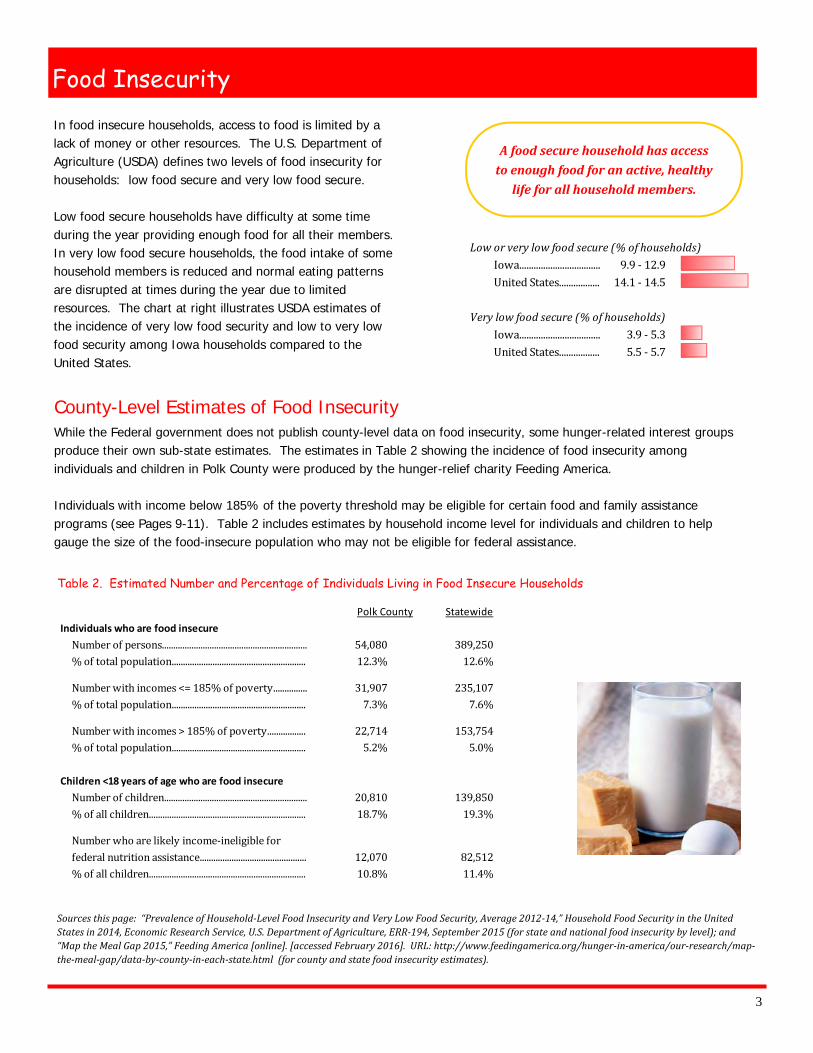
3
Food Insecurity In food insecure households, access to food is limited by a lack of money or other resources. The U.S. Department of Agriculture (USDA) defines two levels of food insecurity for households: low food secure and very low food secure. Low food secure households have difficulty at some time during the year providing enough food for all their members. In very low food secure households, the food intake of some household members is reduced and normal eating patterns are disrupted at times during the year due to limited resources. The chart at right illustrates USDA estimates of the incidence of very low food security and low to very low food security among Iowa households compared to the United States.
Afoodsecurehouseholdhasaccesstoenoughfoodforanactive,healthylifeforallhouseholdmembers.
County-Level Estimates of Food Insecurity While the Federal government does not publish county-level data on food insecurity, some hunger-related interest groups produce their own sub-state estimates. The estimates in Table 2 showing the incidence of food insecurity among individuals and children in Polk County were produced by the hunger-relief charity Feeding America. Individuals with income below 185% of the poverty threshold may be eligible for certain food and family assistance programs (see Pages 9-11). Table 2 includes estimates by household income level for individuals and children to help gauge the size of the food-insecure population who may not be eligible for federal assistance.
Table 2. Estimated Number and Percentage of Individuals Living in Food Insecure Households
Sourcesthispage:“PrevalenceofHousehold-LevelFoodInsecurityandVeryLowFoodSecurity,Average2012-14,”HouseholdFoodSecurityintheUnitedStatesin2014,EconomicResearchService,U.S.DepartmentofAgriculture,ERR-194,September2015(forstateandnationalfoodinsecuritybylevel);and“MaptheMealGap2015,”FeedingAmerica[online].[accessedFebruary2016].URL:http://www.feedingamerica.org/hunger-in-america/our-research/map-the-meal-gap/data-by-county-in-each-state.html(forcountyandstatefoodinsecurityestimates).
StatewideIndividuals who are food insecureNumber of persons................................................................ 54,080 389,250% of total population........................................................... 12.3% 12.6%Number with incomes <= 185% of poverty............... 31,907 235,107% of total population........................................................... 7.3% 7.6%Number with incomes > 185% of poverty................. 22,714 153,754% of total population........................................................... 5.2% 5.0%Children <18 years of age who are food insecureNumber of children............................................................... 20,810 139,850% of all children..................................................................... 18.7% 19.3%Number who are likely income-ineligible forfederal nutrition assistance............................................... 12,070 82,512% of all children..................................................................... 10.8% 11.4%
Polk County
Loworverylowfoodsecure(%ofhouseholds)Iowa.................................. 9.9 - 12.9United States................. 14.1 - 14.5Verylowfoodsecure(%ofhouseholds)Iowa.................................. 3.9 - 5.3United States................. 5.5 - 5.7
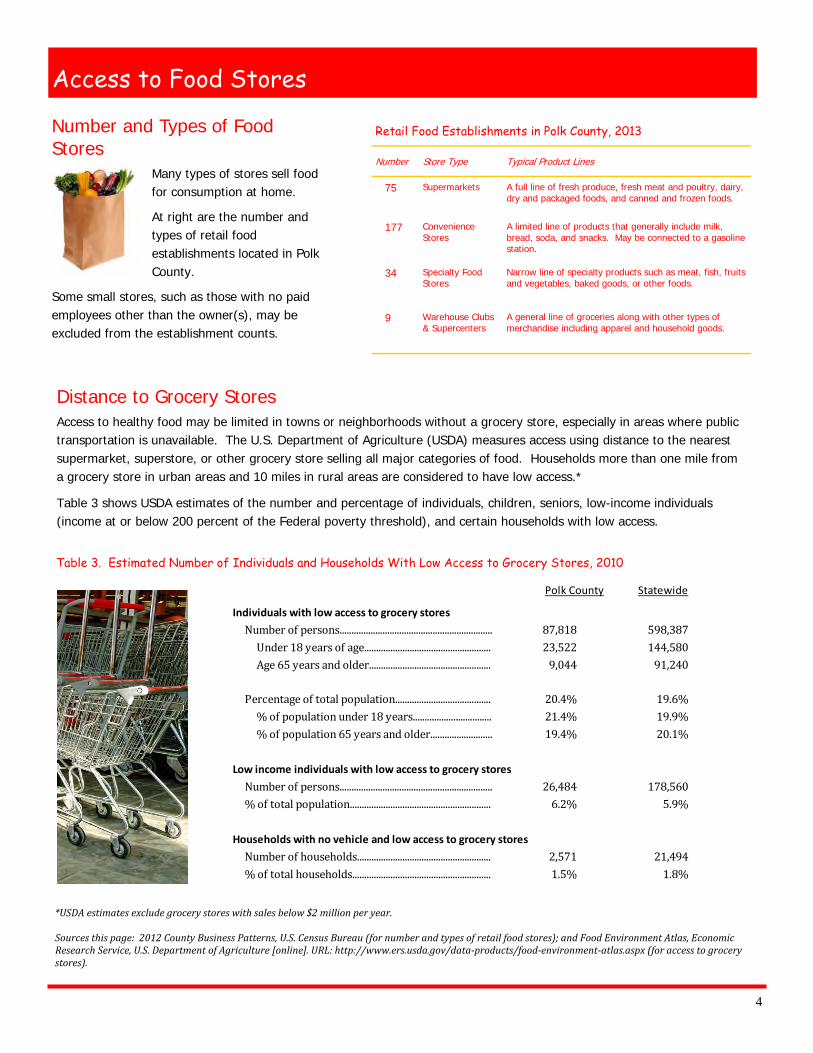
4
Access to Food Stores
Distance to Grocery Stores Access to healthy food may be limited in towns or neighborhoods without a grocery store, especially in areas where public transportation is unavailable. The U.S. Department of Agriculture (USDA) measures access using distance to the nearest supermarket, superstore, or other grocery store selling all major categories of food. Households more than one mile from a grocery store in urban areas and 10 miles in rural areas are considered to have low access.*
Table 3 shows USDA estimates of the number and percentage of individuals, children, seniors, low-income individuals (income at or below 200 percent of the Federal poverty threshold), and certain households with low access.
Number and Types of Food Stores
Many types of stores sell food for consumption at home.
At right are the number and types of retail food establishments located in Polk County.
Some small stores, such as those with no paid employees other than the owner(s), may be excluded from the establishment counts.
Table 3. Estimated Number of Individuals and Households With Low Access to Grocery Stores, 2010
*USDAestimatesexcludegrocerystoreswithsalesbelow$2millionperyear.Sourcesthispage:2012CountyBusinessPatterns,U.S.CensusBureau(fornumberandtypesofretailfoodstores);andFoodEnvironmentAtlas,EconomicResearchService,U.S.DepartmentofAgriculture[online].URL:http://www.ers.usda.gov/data-products/food-environment-atlas.aspx(foraccesstogrocerystores).
Number Store Type Typical Product Lines
75 Supermarkets A full line of fresh produce, fresh meat and poultry, dairy, dry and packaged foods, and canned and frozen foods.
177 Convenience Stores
A limited line of products that generally include milk, bread, soda, and snacks. May be connected to a gasoline station.
34 Specialty Food Stores
Narrow line of specialty products such as meat, fish, fruits and vegetables, baked goods, or other foods.
9 Warehouse Clubs & Supercenters
A general line of groceries along with other types of merchandise including apparel and household goods.
Retail Food Establishments in Polk County, 2013
Statewide
Individuals with low access to grocery storesNumber of persons................................................................ 87,818 598,387Under 18 years of age..................................................... 23,522 144,580Age 65 years and older................................................... 9,044 91,240Percentage of total population........................................ 20.4% 19.6%% of population under 18 years................................. 21.4% 19.9%% of population 65 years and older.......................... 19.4% 20.1%
Low income individuals with low access to grocery storesNumber of persons................................................................ 26,484 178,560% of total population........................................................... 6.2% 5.9%Households with no vehicle and low access to grocery storesNumber of households........................................................ 2,571 21,494% of total households.......................................................... 1.5% 1.8%
Polk County
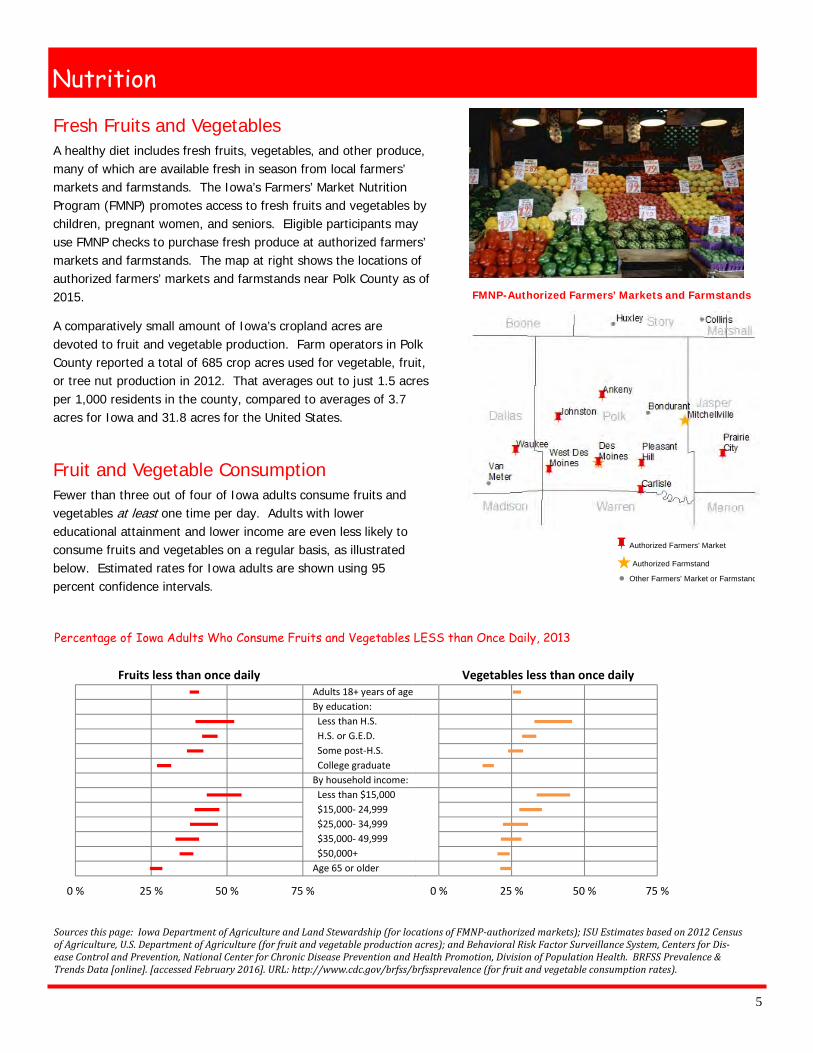
5
Nutrition
Fresh Fruits and Vegetables A healthy diet includes fresh fruits, vegetables, and other produce, many of which are available fresh in season from local farmers’ markets and farmstands. The Iowa’s Farmers’ Market Nutrition Program (FMNP) promotes access to fresh fruits and vegetables by children, pregnant women, and seniors. Eligible participants may use FMNP checks to purchase fresh produce at authorized farmers’ markets and farmstands. The map at right shows the locations of authorized farmers’ markets and farmstands near Polk County as of 2015.
A comparatively small amount of Iowa’s cropland acres are devoted to fruit and vegetable production. Farm operators in Polk County reported a total of 685 crop acres used for vegetable, fruit, or tree nut production in 2012. That averages out to just 1.5 acres per 1,000 residents in the county, compared to averages of 3.7 acres for Iowa and 31.8 acres for the United States.
cAuthorized Farmers' Market
^Authorized Farmstand
! Other Farmers' Market or Farmstand
FMNP-Authorized Farmers’ Markets and Farmstands
Fruit and Vegetable Consumption Fewer than three out of four of Iowa adults consume fruits and vegetables at least one time per day. Adults with lower educational attainment and lower income are even less likely to consume fruits and vegetables on a regular basis, as illustrated below. Estimated rates for Iowa adults are shown using 95 percent confidence intervals.
Sourcesthispage:IowaDepartmentofAgricultureandLandStewardship(forlocationsofFMNP-authorizedmarkets);ISUEstimatesbasedon2012CensusofAgriculture,U.S.DepartmentofAgriculture(forfruitandvegetableproductionacres);andBehavioralRiskFactorSurveillanceSystem,CentersforDis-easeControlandPrevention,NationalCenterforChronicDiseasePreventionandHealthPromotion,DivisionofPopulationHealth.BRFSSPrevalence&TrendsData[online].[accessedFebruary2016].URL:http://www.cdc.gov/brfss/brfssprevalence(forfruitandvegetableconsumptionrates).
Percentage of Iowa Adults Who Consume Fruits and Vegetables LESS than Once Daily, 2013
0 % 25 % 50 % 75 %
Adults 18+ years of ageBy education: Less than H.S. H.S. or G.E.D. Some post-H.S. College graduateBy household income: Less than $15,000 $15,000- 24,999 $25,000- 34,999 $35,000- 49,999 $50,000+Age 65 or older
Fruits less than once daily
0 % 25 % 50 % 75 %
Vegetables less than once daily
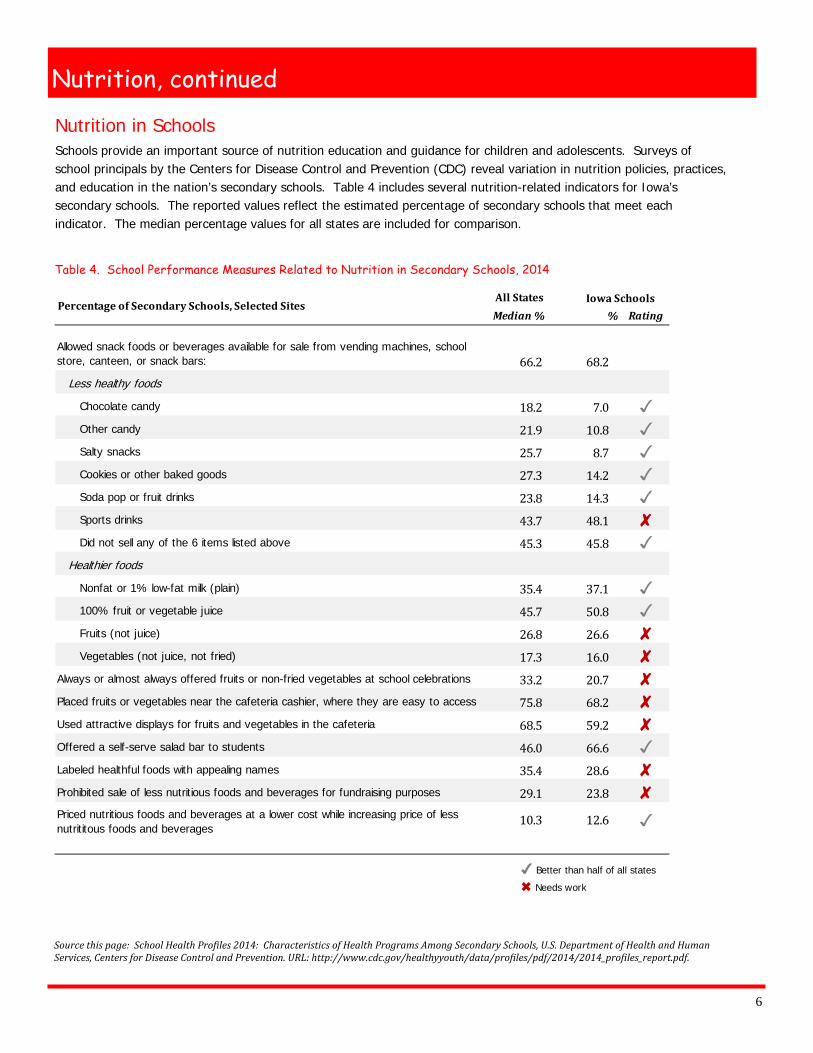
6
Nutrition, continued
Nutrition in Schools Schools provide an important source of nutrition education and guidance for children and adolescents. Surveys of school principals by the Centers for Disease Control and Prevention (CDC) reveal variation in nutrition policies, practices, and education in the nation’s secondary schools. Table 4 includes several nutrition-related indicators for Iowa’s secondary schools. The reported values reflect the estimated percentage of secondary schools that meet each indicator. The median percentage values for all states are included for comparison.
Sourcethispage:SchoolHealthPro iles2014:CharacteristicsofHealthProgramsAmongSecondarySchools,U.S.DepartmentofHealthandHumanServices,CentersforDiseaseControlandPrevention.URL:http://www.cdc.gov/healthyyouth/data/pro iles/pdf/2014/2014_pro iles_report.pdf.
Table 4. School Performance Measures Related to Nutrition in Secondary Schools, 2014
All StatesMedian% % Rating
Allowed snack foods or beverages available for sale from vending machines, school store, canteen, or snack bars: 66.2 68.2
Less healthy foods
Chocolate candy 18.2 7.0 Other candy 21.9 10.8 Salty snacks 25.7 8.7 Cookies or other baked goods 27.3 14.2 Soda pop or fruit drinks 23.8 14.3 Sports drinks 43.7 48.1 Did not sell any of the 6 items listed above 45.3 45.8
Healthier foods
Nonfat or 1% low-fat milk (plain) 35.4 37.1 100% fruit or vegetable juice 45.7 50.8 Fruits (not juice) 26.8 26.6 Vegetables (not juice, not fried) 17.3 16.0
Always or almost always offered fruits or non-fried vegetables at school celebrations 33.2 20.7 Placed fruits or vegetables near the cafeteria cashier, where they are easy to access 75.8 68.2 Used attractive displays for fruits and vegetables in the cafeteria 68.5 59.2 Offered a self-serve salad bar to students 46.0 66.6 Labeled healthful foods with appealing names 35.4 28.6 Prohibited sale of less nutritious foods and beverages for fundraising purposes 29.1 23.8 Priced nutritious foods and beverages at a lower cost while increasing price of less nutrititous foods and beverages
10.3 12.6
Better than half of all states
Needs work
Iowa SchoolsPercentage of Secondary Schools, Selected Sites
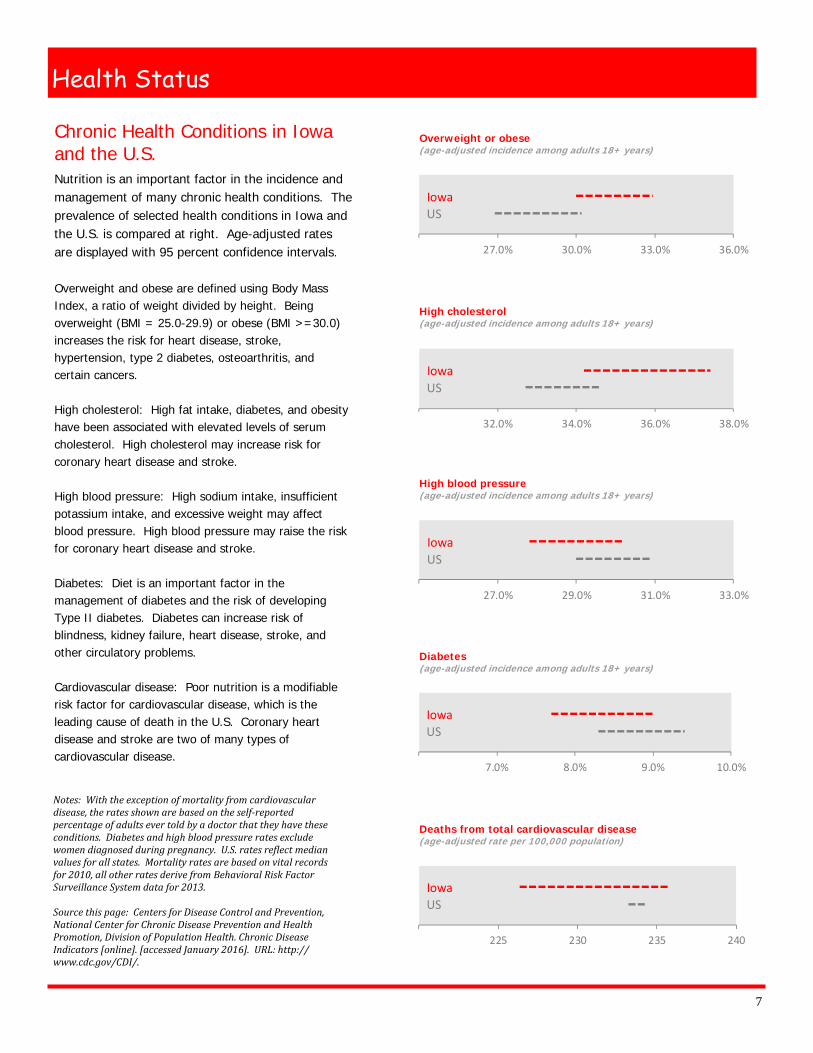
7
Health Status
Chronic Health Conditions in Iowa and the U.S. Nutrition is an important factor in the incidence and management of many chronic health conditions. The prevalence of selected health conditions in Iowa and the U.S. is compared at right. Age-adjusted rates are displayed with 95 percent confidence intervals. Overweight and obese are defined using Body Mass Index, a ratio of weight divided by height. Being overweight (BMI = 25.0-29.9) or obese (BMI >=30.0) increases the risk for heart disease, stroke, hypertension, type 2 diabetes, osteoarthritis, and certain cancers. High cholesterol: High fat intake, diabetes, and obesity have been associated with elevated levels of serum cholesterol. High cholesterol may increase risk for coronary heart disease and stroke. High blood pressure: High sodium intake, insufficient potassium intake, and excessive weight may affect blood pressure. High blood pressure may raise the risk for coronary heart disease and stroke. Diabetes: Diet is an important factor in the management of diabetes and the risk of developing Type II diabetes. Diabetes can increase risk of blindness, kidney failure, heart disease, stroke, and other circulatory problems. Cardiovascular disease: Poor nutrition is a modifiable risk factor for cardiovascular disease, which is the leading cause of death in the U.S. Coronary heart disease and stroke are two of many types of cardiovascular disease.
Notes:Withtheexceptionofmortalityfromcardiovasculardisease,theratesshownarebasedontheself-reportedpercentageofadultsevertoldbyadoctorthattheyhavetheseconditions.Diabetesandhighbloodpressureratesexcludewomendiagnosedduringpregnancy.U.S.ratesre lectmedianvaluesforallstates.Mortalityratesarebasedonvitalrecordsfor2010,allotherratesderivefromBehavioralRiskFactorSurveillanceSystemdatafor2013.Sourcethispage:CentersforDiseaseControlandPrevention,NationalCenterforChronicDiseasePreventionandHealthPromotion,DivisionofPopulationHealth.ChronicDiseaseIndicators[online].[accessedJanuary2016].URL:http://www.cdc.gov/CDI/.
Overweight or obese (age-adjusted incidence among adults 18+ years)
Diabetes (age-adjusted incidence among adults 18+ years)
High cholesterol (age-adjusted incidence among adults 18+ years)
Deaths from total cardiovascular disease (age-adjusted rate per 100,000 population)
High blood pressure (age-adjusted incidence among adults 18+ years)
USIowa
27.0% 30.0% 33.0% 36.0%
USIowa
32.0% 34.0% 36.0% 38.0%
USIowa
27.0% 29.0% 31.0% 33.0%
USIowa
225 230 235 240
USIowa
7.0% 8.0% 9.0% 10.0%
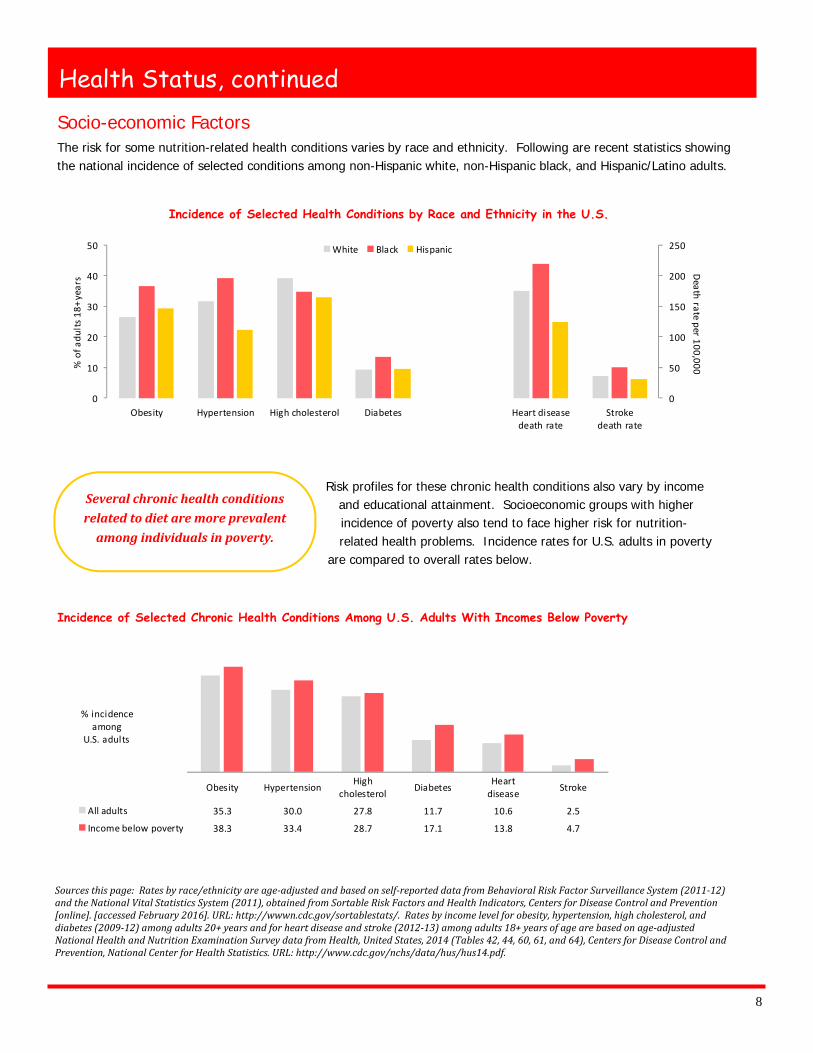
8
Health Status, continued Socio-economic Factors The risk for some nutrition-related health conditions varies by race and ethnicity. Following are recent statistics showing the national incidence of selected conditions among non-Hispanic white, non-Hispanic black, and Hispanic/Latino adults.
Sourcesthispage:Ratesbyrace/ethnicityareage-adjustedandbasedonself-reporteddatafromBehavioralRiskFactorSurveillanceSystem(2011-12)andtheNationalVitalStatisticsSystem(2011),obtainedfromSortableRiskFactorsandHealthIndicators,CentersforDiseaseControlandPrevention[online].[accessedFebruary2016].URL:http://wwwn.cdc.gov/sortablestats/.Ratesbyincomelevelforobesity,hypertension,highcholesterol,anddiabetes(2009-12)amongadults20+yearsandforheartdiseaseandstroke(2012-13)amongadults18+yearsofagearebasedonage-adjustedNationalHealthandNutritionExaminationSurveydatafromHealth,UnitedStates,2014(Tables42,44,60,61,and64),CentersforDiseaseControlandPrevention,NationalCenterforHealthStatistics.URL:http://www.cdc.gov/nchs/data/hus/hus14.pdf.
Risk profiles for these chronic health conditions also vary by income and educational attainment. Socioeconomic groups with higher incidence of poverty also tend to face higher risk for nutrition-related health problems. Incidence rates for U.S. adults in poverty
are compared to overall rates below.
Severalchronichealthconditionsrelatedtodietaremoreprevalentamongindividualsinpoverty.
Incidence of Selected Health Conditions by Race and Ethnicity in the U.S.
Incidence of Selected Chronic Health Conditions Among U.S. Adults With Incomes Below Poverty
0
50
100
150
200
250
0
10
20
30
40
50
Obesity Hypertension High cholesterol Diabetes Heart diseasedeath rate
Strokedeath rate
Death rate per 100,000% o
f adu
lts 1
8+ ye
ars
White Black Hispanic
Obesity Hypertension Highcholesterol Diabetes Heart
disease Stroke
All adults 35.3 30.0 27.8 11.7 10.6 2.5
Income below poverty 38.3 33.4 28.7 17.1 13.8 4.7
% incidenceamong
U.S. adults
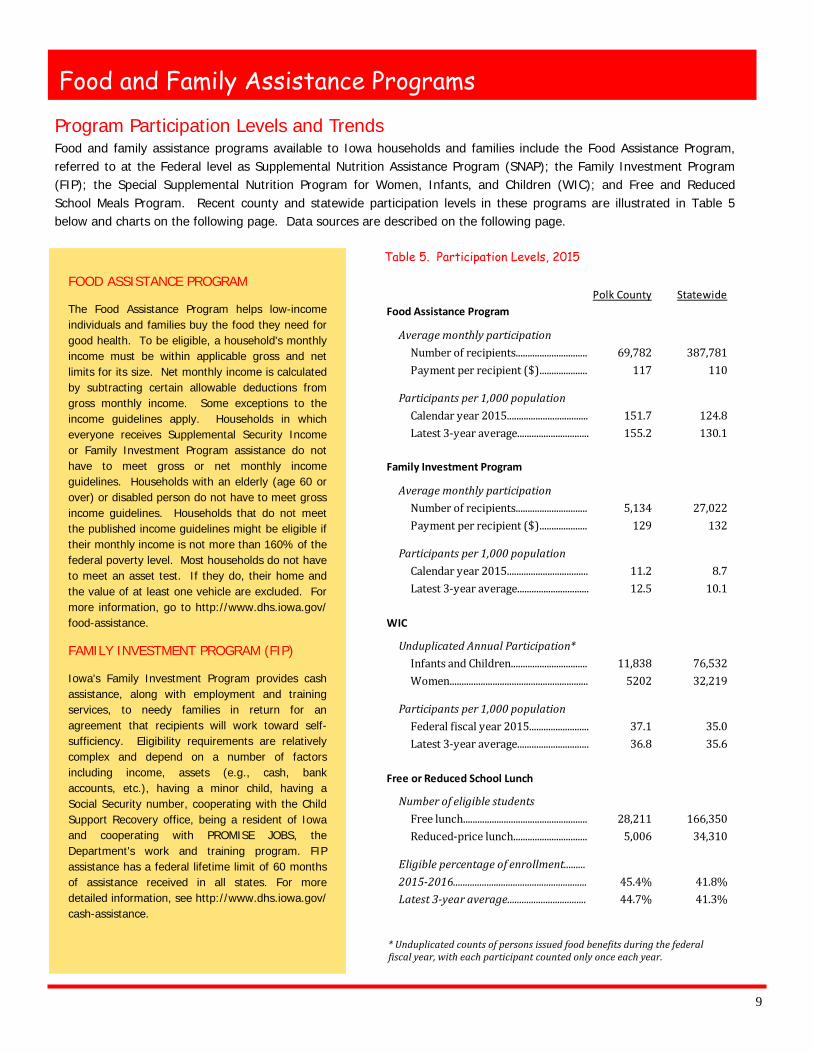
9
Food and Family Assistance Programs
FOOD ASSISTANCE PROGRAM
The Food Assistance Program helps low-income individuals and families buy the food they need for good health. To be eligible, a household's monthly income must be within applicable gross and net limits for its size. Net monthly income is calculated by subtracting certain allowable deductions from gross monthly income. Some exceptions to the income guidelines apply. Households in which everyone receives Supplemental Security Income or Family Investment Program assistance do not have to meet gross or net monthly income guidelines. Households with an elderly (age 60 or over) or disabled person do not have to meet gross income guidelines. Households that do not meet the published income guidelines might be eligible if their monthly income is not more than 160% of the federal poverty level. Most households do not have to meet an asset test. If they do, their home and the value of at least one vehicle are excluded. For more information, go to http://www.dhs.iowa.gov/food-assistance.
FAMILY INVESTMENT PROGRAM (FIP)
Iowa's Family Investment Program provides cash assistance, along with employment and training services, to needy families in return for an agreement that recipients will work toward self-sufficiency. Eligibility requirements are relatively complex and depend on a number of factors including income, assets (e.g., cash, bank accounts, etc.), having a minor child, having a Social Security number, cooperating with the Child Support Recovery office, being a resident of Iowa and cooperating with PROMISE JOBS, the Department's work and training program. FIP assistance has a federal lifetime limit of 60 months of assistance received in all states. For more detailed information, see http://www.dhs.iowa.gov/cash-assistance.
Program Participation Levels and Trends Food and family assistance programs available to Iowa households and families include the Food Assistance Program, referred to at the Federal level as Supplemental Nutrition Assistance Program (SNAP); the Family Investment Program (FIP); the Special Supplemental Nutrition Program for Women, Infants, and Children (WIC); and Free and Reduced School Meals Program. Recent county and statewide participation levels in these programs are illustrated in Table 5 below and charts on the following page. Data sources are described on the following page.
Table 5. Participation Levels, 2015
*Unduplicatedcountsofpersonsissuedfoodbene itsduringthefederaliscalyear,witheachparticipantcountedonlyonceeachyear.
StatewideFood Assistance Program
AveragemonthlyparticipationNumber of recipients.............................. 69,782 387,781Payment per recipient ($).................... 117 110Participantsper1,000populationCalendar year 2015.................................. 151.7 124.8Latest 3-year average.............................. 155.2 130.1
Family Investment Program
AveragemonthlyparticipationNumber of recipients.............................. 5,134 27,022Payment per recipient ($).................... 129 132Participantsper1,000populationCalendar year 2015.................................. 11.2 8.7Latest 3-year average.............................. 12.5 10.1
WIC
UnduplicatedAnnualParticipation*Infants and Children................................ 11,838 76,532Women.......................................................... 5202 32,219Participantsper1,000populationFederal fiscal year 2015......................... 37.1 35.0Latest 3-year average.............................. 36.8 35.6
Free or Reduced School Lunch
NumberofeligiblestudentsFree lunch.................................................... 28,211 166,350Reduced-price lunch............................... 5,006 34,310Eligiblepercentageofenrollment.........2015-2016........................................................ 45.4% 41.8%Latest3-yearaverage................................. 44.7% 41.3%
Polk County
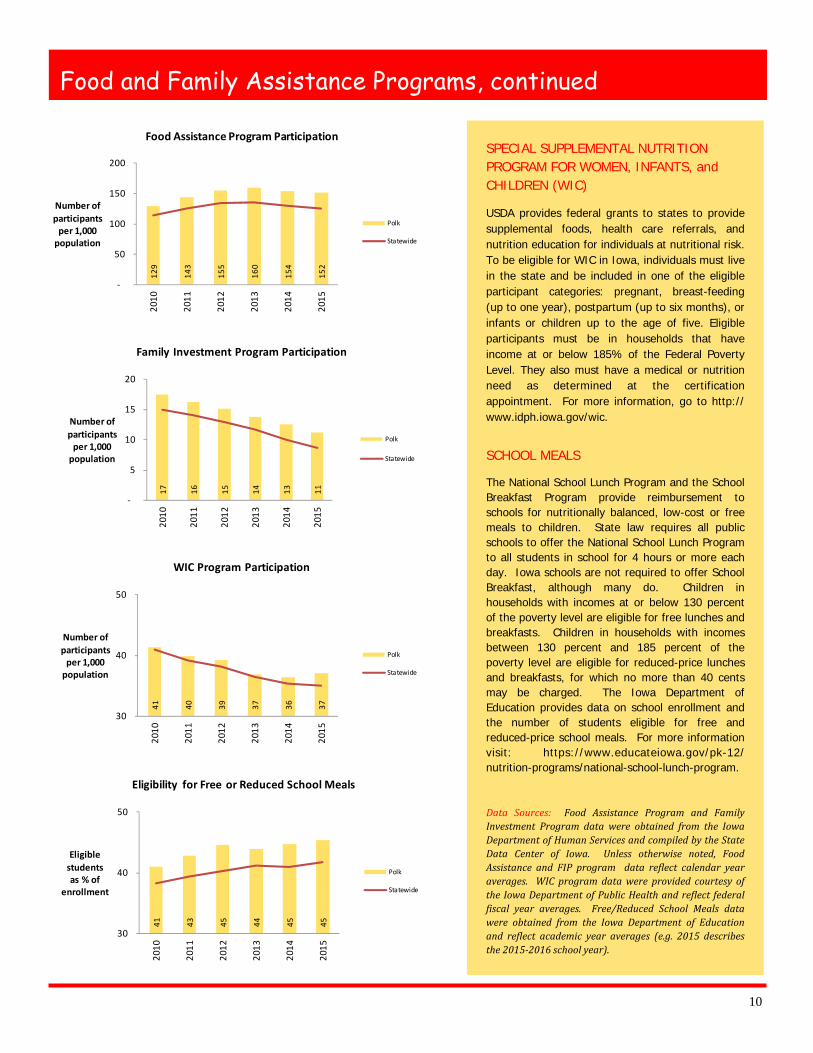
10
Food and Family Assistance Programs, continued
129
143
155
160
154
152
-
50
100
150
20020
10
2011
2012
2013
2014
2015
Number ofparticipants
per 1,000population
Food Assistance Program Participation
Polk
Statewide
17 16 15 14 13 11
-
5
10
15
20
2010
2011
2012
2013
2014
2015
Number of participants
per 1,000population
Family Investment Program Participation
Polk
Statewide
41 43 45 44 45 45
30
40
50
2010
2011
2012
2013
2014
2015
Eligiblestudentsas % of
enrollment
Eligibility for Free or Reduced School Meals
Polk
Statewide
SPECIAL SUPPLEMENTAL NUTRITION PROGRAM FOR WOMEN, INFANTS, and CHILDREN (WIC)
USDA provides federal grants to states to provide supplemental foods, health care referrals, and nutrition education for individuals at nutritional risk. To be eligible for WIC in Iowa, individuals must live in the state and be included in one of the eligible participant categories: pregnant, breast-feeding (up to one year), postpartum (up to six months), or infants or children up to the age of five. Eligible participants must be in households that have income at or below 185% of the Federal Poverty Level. They also must have a medical or nutrition need as determined at the certification appointment. For more information, go to http://www.idph.iowa.gov/wic.
SCHOOL MEALS
The National School Lunch Program and the School Breakfast Program provide reimbursement to schools for nutritionally balanced, low-cost or free meals to children. State law requires all public schools to offer the National School Lunch Program to all students in school for 4 hours or more each day. Iowa schools are not required to offer School Breakfast, although many do. Children in households with incomes at or below 130 percent of the poverty level are eligible for free lunches and breakfasts. Children in households with incomes between 130 percent and 185 percent of the poverty level are eligible for reduced-price lunches and breakfasts, for which no more than 40 cents may be charged. The Iowa Department of Education provides data on school enrollment and the number of students eligible for free and reduced-price school meals. For more information visit: https://www.educateiowa.gov/pk-12/nutrition-programs/national-school-lunch-program.
Data Sources: Food Assistance Program and FamilyInvestment Program datawere obtained from the IowaDepartmentofHumanServicesandcompiledbytheStateData Center of Iowa. Unless otherwise noted, FoodAssistance and FIP program data re lect calendar yearaverages. WICprogramdatawereprovided courtesyoftheIowaDepartmentofPublicHealthandre lect federaliscal year averages. Free/Reduced School Meals datawere obtained from the Iowa Department of Educationand re lect academic year averages (e.g. 2015 describesthe2015-2016schoolyear).
41 40 39 37 36 37
30
40
50
2010
2011
2012
2013
2014
2015
Number of participants
per 1,000 population
WIC Program Participation
Polk
Statewide
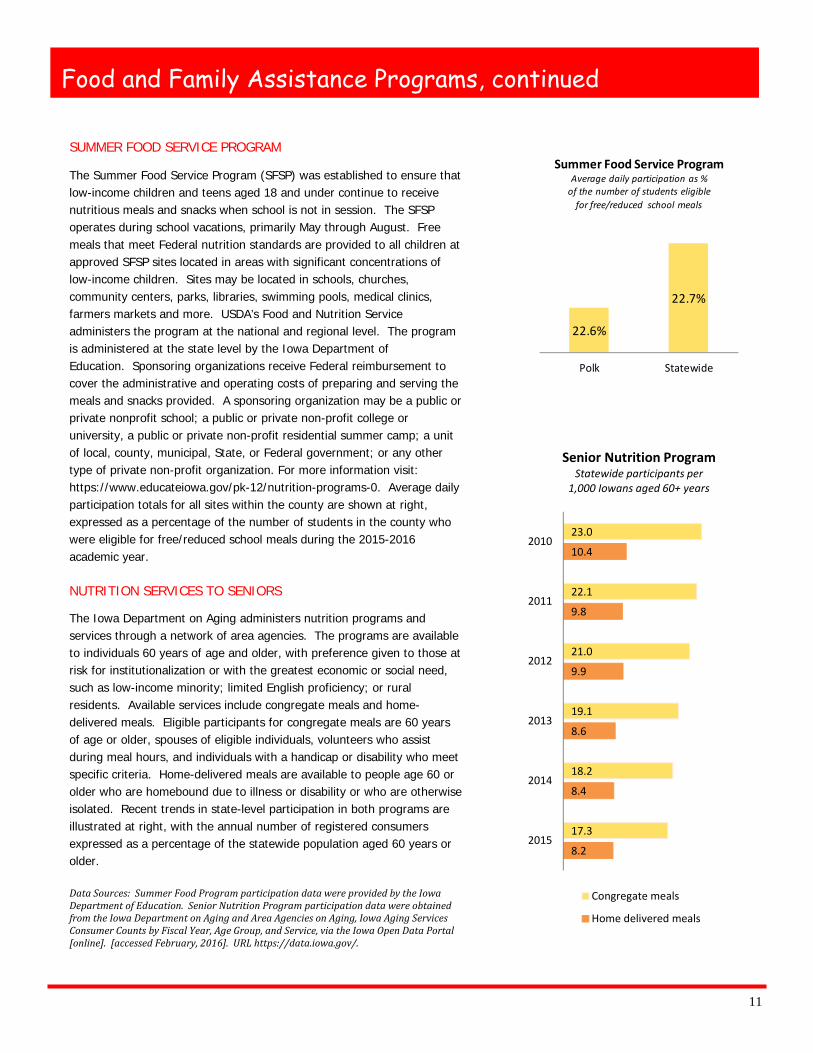
11
Food and Family Assistance Programs, continued
SUMMER FOOD SERVICE PROGRAM
The Summer Food Service Program (SFSP) was established to ensure that low-income children and teens aged 18 and under continue to receive nutritious meals and snacks when school is not in session. The SFSP operates during school vacations, primarily May through August. Free meals that meet Federal nutrition standards are provided to all children at approved SFSP sites located in areas with significant concentrations of low-income children. Sites may be located in schools, churches, community centers, parks, libraries, swimming pools, medical clinics, farmers markets and more. USDA’s Food and Nutrition Service administers the program at the national and regional level. The program is administered at the state level by the Iowa Department of Education. Sponsoring organizations receive Federal reimbursement to cover the administrative and operating costs of preparing and serving the meals and snacks provided. A sponsoring organization may be a public or private nonprofit school; a public or private non-profit college or university, a public or private non-profit residential summer camp; a unit of local, county, municipal, State, or Federal government; or any other type of private non-profit organization. For more information visit: https://www.educateiowa.gov/pk-12/nutrition-programs-0. Average daily participation totals for all sites within the county are shown at right, expressed as a percentage of the number of students in the county who were eligible for free/reduced school meals during the 2015-2016 academic year.
NUTRITION SERVICES TO SENIORS
The Iowa Department on Aging administers nutrition programs and services through a network of area agencies. The programs are available to individuals 60 years of age and older, with preference given to those at risk for institutionalization or with the greatest economic or social need, such as low-income minority; limited English proficiency; or rural residents. Available services include congregate meals and home-delivered meals. Eligible participants for congregate meals are 60 years of age or older, spouses of eligible individuals, volunteers who assist during meal hours, and individuals with a handicap or disability who meet specific criteria. Home-delivered meals are available to people age 60 or older who are homebound due to illness or disability or who are otherwise isolated. Recent trends in state-level participation in both programs are illustrated at right, with the annual number of registered consumers expressed as a percentage of the statewide population aged 60 years or older. DataSources:SummerFoodProgramparticipationdatawereprovidedbytheIowaDepartmentofEducation.SeniorNutritionProgramparticipationdatawereobtainedfromtheIowaDepartmentonAgingandAreaAgenciesonAging,IowaAgingServicesConsumerCountsbyFiscalYear,AgeGroup,andService,viatheIowaOpenDataPortal[online].[accessedFebruary,2016].URLhttps://data.iowa.gov/.
22.6%
22.7%
Polk Statewide
Summer Food Service Program Average daily participation as %
of the number of students eligible for free/reduced school meals
23.0
22.1
21.0
19.1
18.2
17.3
10.4
9.8
9.9
8.6
8.4
8.2
2010
2011
2012
2013
2014
2015
Senior Nutrition Program Statewide participants per
1,000 Iowans aged 60+ years
Congregate meals
Home delivered meals
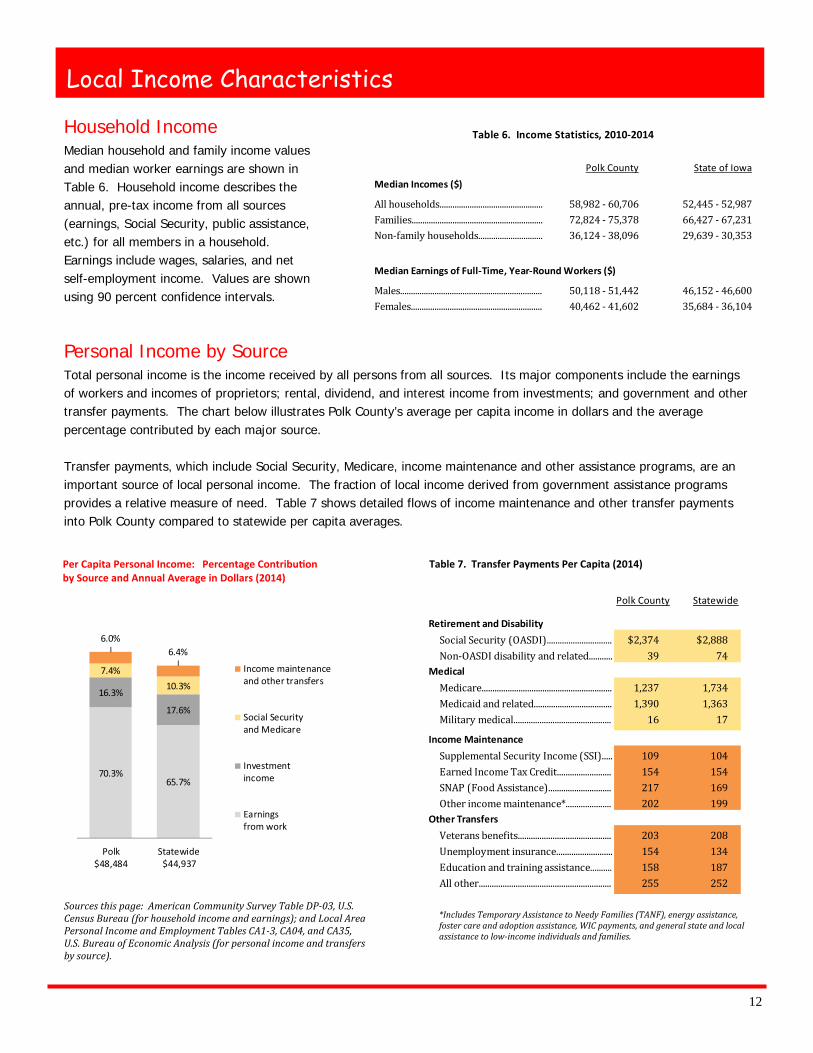
12
Household Income Median household and family income values and median worker earnings are shown in Table 6. Household income describes the annual, pre-tax income from all sources (earnings, Social Security, public assistance, etc.) for all members in a household. Earnings include wages, salaries, and net self-employment income. Values are shown using 90 percent confidence intervals.
Local Income Characteristics
Personal Income by Source Total personal income is the income received by all persons from all sources. Its major components include the earnings of workers and incomes of proprietors; rental, dividend, and interest income from investments; and government and other transfer payments. The chart below illustrates Polk County’s average per capita income in dollars and the average percentage contributed by each major source. Transfer payments, which include Social Security, Medicare, income maintenance and other assistance programs, are an important source of local personal income. The fraction of local income derived from government assistance programs provides a relative measure of need. Table 7 shows detailed flows of income maintenance and other transfer payments into Polk County compared to statewide per capita averages.
Sourcesthispage:AmericanCommunitySurveyTableDP-03,U.S.CensusBureau(forhouseholdincomeandearnings);andLocalAreaPersonalIncomeandEmploymentTablesCA1-3,CA04,andCA35,U.S.BureauofEconomicAnalysis(forpersonalincomeandtransfersbysource).
Statewide
Retirement and DisabilitySocial Security (OASDI).............................. $2,374 $2,888Non-OASDI disability and related........... 39 74MedicalMedicare............................................................ 1,237 1,734Medicaid and related.................................... 1,390 1,363Military medical............................................. 16 17Income MaintenanceSupplemental Security Income (SSI)..... 109 104Earned Income Tax Credit......................... 154 154SNAP (Food Assistance)............................. 217 169Other income maintenance*..................... 202 199Other TransfersVeterans benefits........................................... 203 208Unemployment insurance.......................... 154 134Education and training assistance.......... 158 187All other............................................................. 255 252
Polk County
Per Capita Personal Income: Percentage Contribu on by Source and Annual Average in Dollars (2014)
State of Iowa
All households................................................ 58,982 - 60,706 52,445 - 52,987Families............................................................. 72,824 - 75,378 66,427 - 67,231Non-family households.............................. 36,124 - 38,096 29,639 - 30,353Males.................................................................. 50,118 - 51,442 46,152 - 46,600Females............................................................. 40,462 - 41,602 35,684 - 36,104Median Earnings of Full-Time, Year-Round Workers ($)
Table 6. Income Statistics, 2010-2014
Polk CountyMedian Incomes ($)
Table 7. Transfer Payments Per Capita (2014)
*IncludesTemporaryAssistancetoNeedyFamilies(TANF),energyassistance,fostercareandadoptionassistance,WICpayments,andgeneralstateandlocalassistancetolow-incomeindividualsandfamilies.
70.3%65.7%
16.3%
17.6%
7.4%10.3%
6.0%6.4%
Polk$48,484
Statewide $44,937
Income maintenanceand other transfers
Social Securityand Medicare
Investmentincome
Earningsfrom work
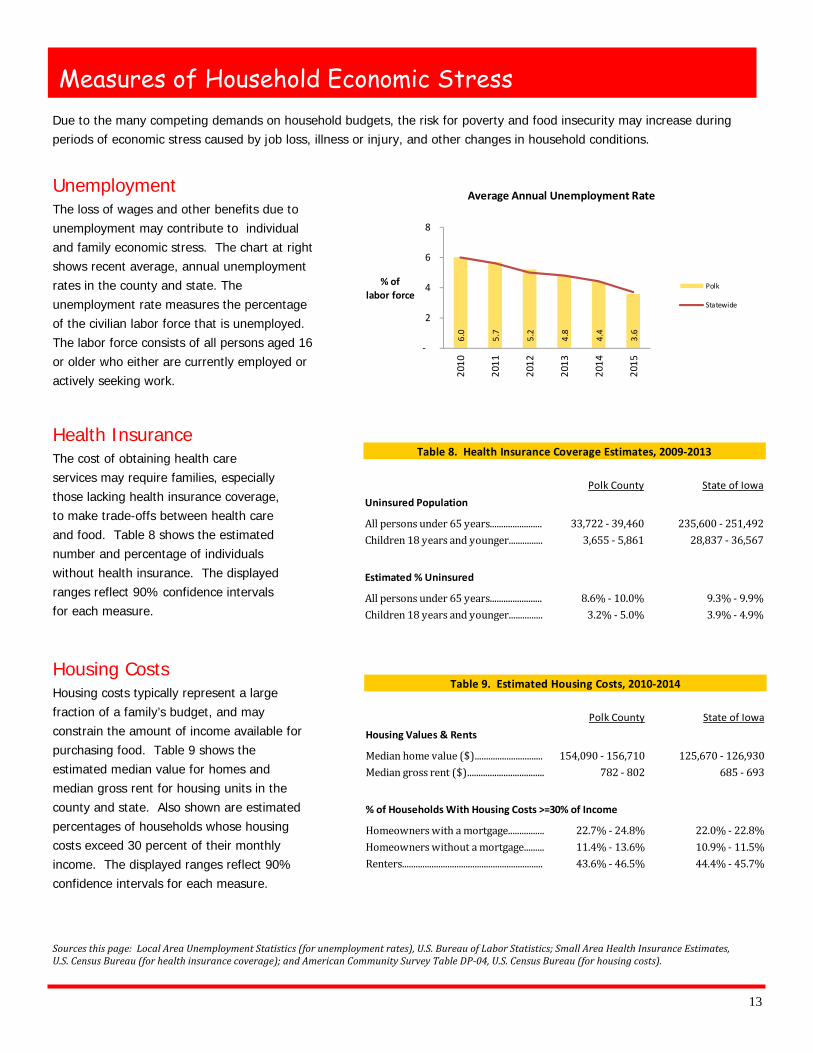
13
Measures of Household Economic Stress
Unemployment The loss of wages and other benefits due to unemployment may contribute to individual and family economic stress. The chart at right shows recent average, annual unemployment rates in the county and state. The unemployment rate measures the percentage of the civilian labor force that is unemployed. The labor force consists of all persons aged 16 or older who either are currently employed or actively seeking work.
Health Insurance The cost of obtaining health care services may require families, especially those lacking health insurance coverage, to make trade-offs between health care and food. Table 8 shows the estimated number and percentage of individuals without health insurance. The displayed ranges reflect 90% confidence intervals for each measure.
Housing Costs Housing costs typically represent a large fraction of a family’s budget, and may constrain the amount of income available for purchasing food. Table 9 shows the estimated median value for homes and median gross rent for housing units in the county and state. Also shown are estimated percentages of households whose housing costs exceed 30 percent of their monthly income. The displayed ranges reflect 90% confidence intervals for each measure.
6.0
5.7
5.2
4.8
4.4
3.6
-
2
4
6
8
2010
2011
2012
2013
2014
2015
% of labor force
Average Annual Unemployment Rate
Polk
Statewide
Sourcesthispage:LocalAreaUnemploymentStatistics(forunemploymentrates),U.S.BureauofLaborStatistics;SmallAreaHealthInsuranceEstimates,U.S.CensusBureau(forhealthinsurancecoverage);andAmericanCommunitySurveyTableDP-04,U.S.CensusBureau(forhousingcosts).
State of IowaHousing Values & RentsMedian home value ($).............................. 154,090 - 156,710 125,670 - 126,930Median gross rent ($).................................. 782 - 802 685 - 693Homeowners with a mortgage................ 22.7% - 24.8% 22.0% - 22.8%Homeowners without a mortgage......... 11.4% - 13.6% 10.9% - 11.5%Renters.............................................................. 43.6% - 46.5% 44.4% - 45.7%% of Households With Housing Costs >=30% of Income
Table 9. Estimated Housing Costs, 2010-2014
Polk County
State of IowaUninsured PopulationAll persons under 65 years....................... 33,722 - 39,460 235,600 - 251,492Children 18 years and younger............... 3,655 - 5,861 28,837 - 36,567Estimated % UninsuredAll persons under 65 years....................... 8.6% - 10.0% 9.3% - 9.9%Children 18 years and younger............... 3.2% - 5.0% 3.9% - 4.9%
Table 8. Health Insurance Coverage Estimates, 2009-2013
Polk County
Due to the many competing demands on household budgets, the risk for poverty and food insecurity may increase during periods of economic stress caused by job loss, illness or injury, and other changes in household conditions.
14
Educational Attainment and English Language Ability Individuals with lower educational attainment may have limited employment and earnings opportunities that contribute to household economic stress. Table 11 displays the percentage of the adult population by their highest degree attained. Educational attainment is reported for the adult aged population after their education is largely complete (25 years of age or older). Values are displayed using 90% confidence intervals. Language barriers may hinder programming and other local efforts to assist area families and individuals in need. Table 10 below shows the number and percentage of individuals ages 5 years and older who report speaking English less than “very well.”
Age Distribution by Race and Ethnicity Recent U.S. Census Bureau population estimates by age, race, and Hispanic origin for Polk County are shown in Table 10 below. The Census Bureau defines Hispanic as an ethnicity, not a race. Individuals of Hispanic origin may be of any race.
Population Profile
State of Iowa
% Less than 9th grade................................. 2.9% - 3.5% 3.4% - 3.6%% High school diploma............................... 91.6% - 92.2% 91.2% - 91.4%% Bachelor's degree or higher................ 34.7% - 36.1% 26.2% - 26.6%Number of persons....................................... 22,290 - 24,794 85,647 - 90,125Percentage of population.......................... 5.4% - 6.0% 3.0% - 3.2%
Adults by Highest Degree Attained
Population with Limited English-Speaking Ability (Age 5 and Older)
Table 11. Education and English Language Ability, 2010-2014
Polk County
Sourcesthispage:2014AnnualPopulationEstimates,U.S.CensusBureau(foragedistributionbyrace,andethnicity);andAmericanCommunitySurveyTableDP-02,U.S.CensusBureau(foreducationalattainmentandEnglishlanguageability).
Table 10. Population Estimates, 2014
Group Under20 20to44 45to64 65years AllAges Polk StatewideTotal Population....................................................... 126,989 164,582 114,566 53,725 459,862 100.0 100.0 White alone............................................................ 102,411 140,658 104,095 50,577 397,741 86.5 92.1 Black alone............................................................. 11,440 11,794 5,680 1,741 30,655 6.7 3.4 American Indian/Alaska Native alone........ 738 740 353 69 1,900 0.4 0.5 Asian alone.............................................................. 5,761 8,523 3,671 1,141 19,096 4.2 2.2 Any other race or combination...................... 6,639 2,867 767 197 10,470 2.3 0.1 Hispanic (of any race)....................................... 16,420 14,539 5,004 1,031 36,994 8.0 5.6
Polk County Population by AgeRacial/Ethnic Group
% of Population
15
Iowa State University Extension programs are available to all without regard to race, color, age, religion, national origin, sexual orientation, gender identity, genetic information, sex, marital status, disability, or status as a U.S. veteran. Inquiries can be directed to the Director of Equal Opportunity and Compliance, 3280 Beardshear Hall, (515) 294-7612. Issued in furtherance of Cooperative Extension work, Acts of May 8 and June 30, 1914, in cooperation with the U.S. Department of Agriculture. Cathann A. Kress, director, Cooperative Extension Service, Iowa State University of Science and Technology, Ames, Iowa.
Data Notes
Publication prepared by:
Liesl Eathington Assistant Scientist
Department of Economics 515-294-2954
For more information, please contact:
Kimberly Greder Associate Professor and
Human Sciences Extension and Outreach Specialist Human Development & Family Studies
515-294-5906 [email protected]
Family Size 100% 130% 185%1 11,880 15,444 21,978 2 16,020 20,826 29,637 3 20,160 26,208 37,296 4 24,300 31,590 44,955 5 28,440 36,972 52,614 6 32,580 42,354 60,273 7 36,730 47,749 67,951 8 40,890 53,157 75,647
Annual Family Income ($)
PercentageofPovertyThreshold
Federal HHS Poverty Guidelines, 2016 Federal Poverty Guidelines The U.S. Census Bureau determines the poverty status of the non-institutionalized population based on family size and income level. If a family’s total annual income is below the threshold level appropriate for that family size, every member of the family is considered poor. The U.S. Department of Health and Human Services (HHS) annually publishes poverty guidelines by family size that are based on Census Bureau poverty thresholds. At right are recent HHS poverty guidelines as published in the Federal Register.
Source:FederalRegister,DocumentNumber2016-01450,January25,2016[online].[accessedFebruary2016].URL:https://www.federalregister.gov/articles/2016/01/25/2016-01450/annual-update-of-the-hhs-poverty-guidelines.
Other Information Sources • Poverty: Poverty rate data in this report were obtained from the U.S. Census Bureau’s American Community Survey.
Other sources for poverty data include the Small Area Income and Poverty Estimates Program and the Current Population Survey, both of which are administered by the U.S. Census Bureau.
• Food insecurity: The U.S. Department of Agriculture (USDA) publishes estimates of food insecurity at the national and state levels using data collected from a special annual supplement to the Current Population Survey. The county-level data in this report were obtained from Map the Meal Gap, Feeding America (http://feedingamerica.org/). Readers are encouraged to visit their web site for more information about their methodology and data sources.
• Access to food stores: This report utilized county-level statistics from the Food Access Research Atlas, Economic Research Service, USDA. The Centers for Disease Control and Prevention provides an alternative source with data at the census tract level. For more information, see the publication, “Access to Healthier Food Retailers — United States, 2011,” available at http://www.cdc.gov/mmwr/preview/mmwrhtml/su6203a4.htm.
• Resources for families and communities: Please visit the ISUEO Families and Communities Web page at: http://www.extension.iastate.edu/humansciences/reducing-poverty-families-communities.
This report examines local retail sales and related economic trends in Pleasant Hill, Iowa, using a variety of comparative performance measures.
The retail analysis is based on state-reported sales of goods and services that are subject to Iowa’s statewide sales tax. Please refer to the Data Notes section for detailed information about the types of retail activity included in taxable sales. The data notes also include definitions and guidelines for interpreting retail measures and other indicators in this report.
Except where otherwise noted, retail sales data for preceding years have been adjusted for inflation and are stated in Fiscal Year 2016 dollar equivalents. The 2016 fiscal year began on July 1, 2015, and ended on June 30, 2016.
Overview
Key Retail Indicators for Pleasant Hill
Contents:
10-Year Sales Summary 2
Local Economic Conditions 3-4
Peer Group Analysis 5-6
Pull Factor Analysis 7-8
Regional Competition 9-11
Historical Trends 12
Sales by Business Group 13-15
Consumer Characteristics 16-17
Data Notes 18-22
Frequently-Asked Questions 23
About Pleasant Hill:
• Pleasant Hill is located within Polk County, Iowa.
• Pleasant Hill is part of the Des Moines-West Des Moines, IA Metropolitan Sta s cal Area.
• Pleasant Hill recorded a total popula on of 8,785 residents in the 2010 Census , including 75 residents in group quarters such as skilled nursing facili es and group homes.
Iowa State University Department of Economics
Pleasant Hill
Retail Trade Analysis Report Fiscal Year 2016
Issued April, 2017
No distinctions are made between households and group quarters residents in the calculation of per capita sales and related indicators.
Pleasant Hill FY2015 FY2016
Real total taxable sales ($) 66,559,867 68,478,665 2.9%
Number of reporting firms (annualized) 176 187 6.3%
Population 9,247 9,383 1.5%
Average sales per capita ($) 7,198 7,298 1.4%
Average sales per firm ($) 378,181 366,686 -3.0%
% Change
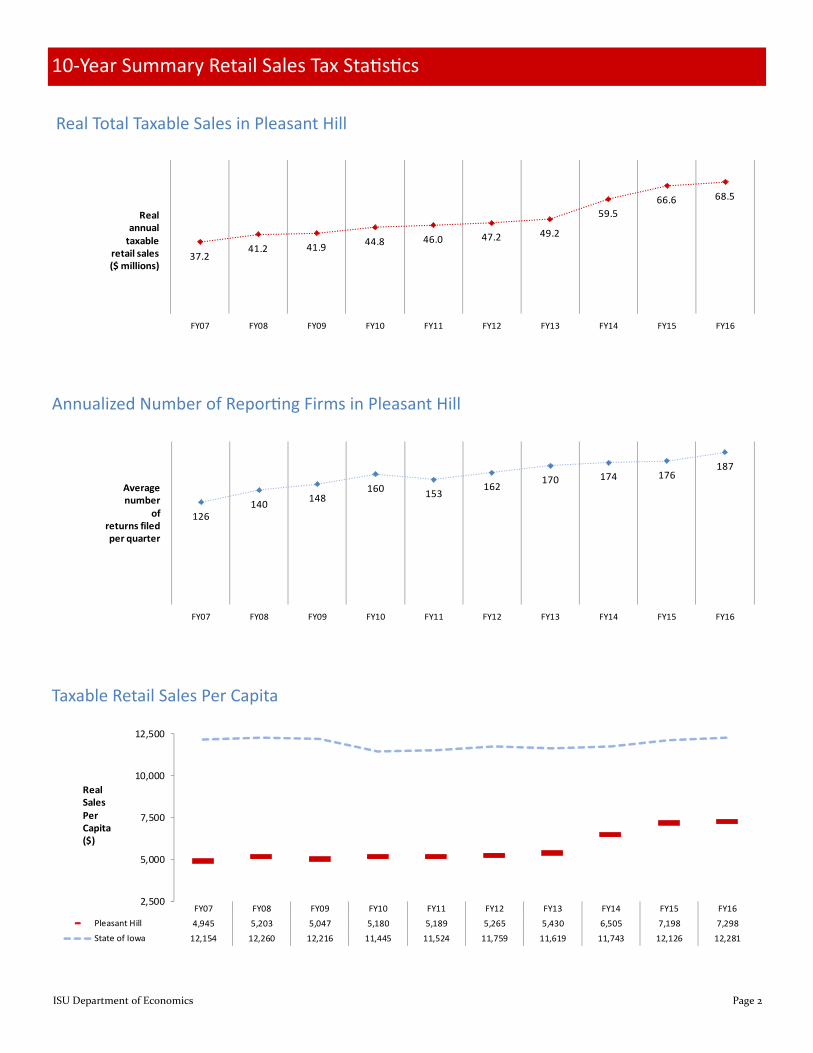
ISU Department of Economics Page 2
Taxable Retail Sales Per Capita
10-Year Summary Retail Sales Tax Sta s cs
Real Total Taxable Sales in Pleasant Hill
Annualized Number of Repor ng Firms in Pleasant Hill
2,500
5,000
7,500
10,000
12,500
FY07 FY08 FY09 FY10 FY11 FY12 FY13 FY14 FY15 FY16Pleasant Hill 4,945 5,203 5,047 5,180 5,189 5,265 5,430 6,505 7,198 7,298State of Iowa 12,154 12,260 12,216 11,445 11,524 11,759 11,619 11,743 12,126 12,281
RealSalesPerCapita($)
126140 148
160 153162
170 174 176187
FY07 FY08 FY09 FY10 FY11 FY12 FY13 FY14 FY15 FY16
Average number
of returns filedper quarter
37.241.2 41.9 44.8 46.0 47.2 49.2
59.566.6 68.5
FY07 FY08 FY09 FY10 FY11 FY12 FY13 FY14 FY15 FY16
Realannual
taxableretail sales($ millions)
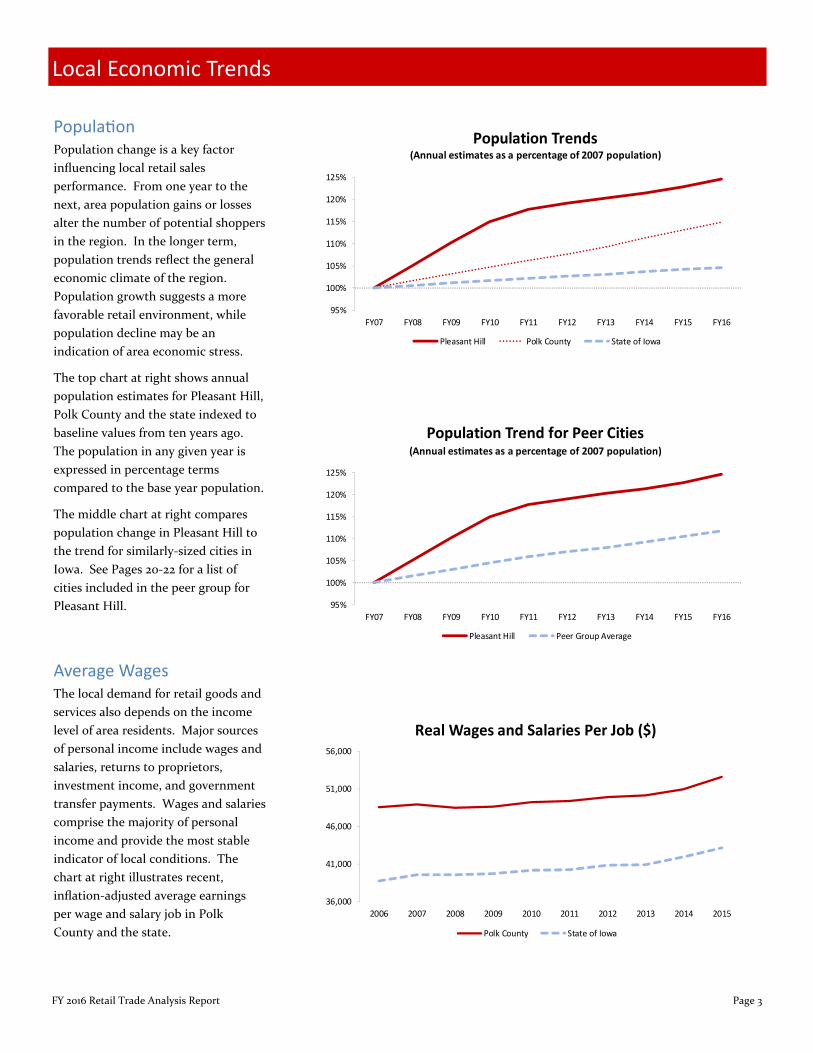
FY 2016 Retail Trade Analysis Report Page 3
Local Economic Trends
Popula on Population change is a key factor influencing local retail sales performance. From one year to the next, area population gains or losses alter the number of potential shoppers in the region. In the longer term, population trends reflect the general economic climate of the region. Population growth suggests a more favorable retail environment, while population decline may be an indication of area economic stress.
The top chart at right shows annual population estimates for Pleasant Hill, Polk County and the state indexed to baseline values from ten years ago. The population in any given year is expressed in percentage terms compared to the base year population.
The middle chart at right compares population change in Pleasant Hill to the trend for similarly-sized cities in Iowa. See Pages 20-22 for a list of cities included in the peer group for Pleasant Hill.
Average Wages The local demand for retail goods and services also depends on the income level of area residents. Major sources of personal income include wages and salaries, returns to proprietors, investment income, and government transfer payments. Wages and salaries comprise the majority of personal income and provide the most stable indicator of local conditions. The chart at right illustrates recent, inflation-adjusted average earnings per wage and salary job in Polk County and the state.
95%
100%
105%
110%
115%
120%
125%
FY07 FY08 FY09 FY10 FY11 FY12 FY13 FY14 FY15 FY16
Population Trends(Annual estimates as a percentage of 2007 population)
Pleasant Hill Polk County State of Iowa
95%
100%
105%
110%
115%
120%
125%
FY07 FY08 FY09 FY10 FY11 FY12 FY13 FY14 FY15 FY16
Population Trend for Peer Cities
Pleasant Hill Peer Group Average
(Annual estimates as a percentage of 2007 population)
36,000
41,000
46,000
51,000
56,000
2006 2007 2008 2009 2010 2011 2012 2013 2014 2015
Real Wages and Salaries Per Job ($)
Polk County State of Iowa
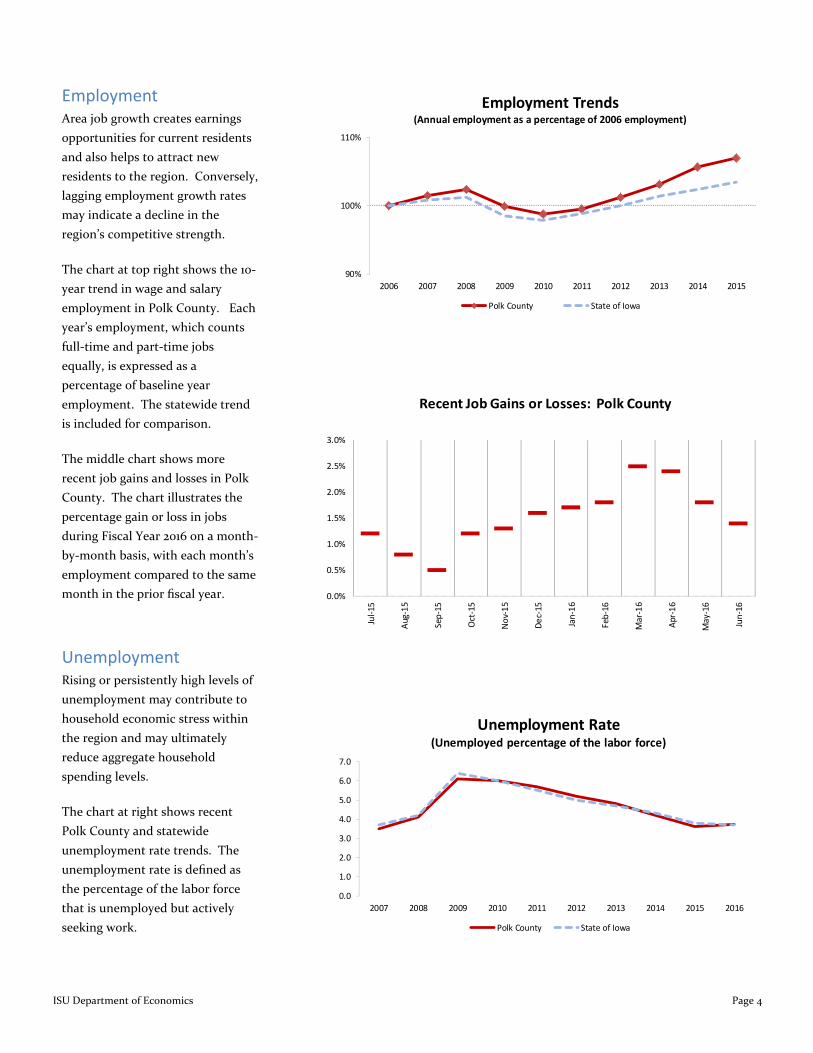
ISU Department of Economics Page 4
Employment
Area job growth creates earnings opportunities for current residents and also helps to attract new residents to the region. Conversely, lagging employment growth rates may indicate a decline in the region’s competitive strength.
The chart at top right shows the 10-year trend in wage and salary employment in Polk County. Each year’s employment, which counts full-time and part-time jobs equally, is expressed as a percentage of baseline year employment. The statewide trend is included for comparison.
The middle chart shows more recent job gains and losses in Polk County. The chart illustrates the percentage gain or loss in jobs during Fiscal Year 2016 on a month-by-month basis, with each month’s employment compared to the same month in the prior fiscal year.
Unemployment Rising or persistently high levels of unemployment may contribute to household economic stress within the region and may ultimately reduce aggregate household spending levels.
The chart at right shows recent Polk County and statewide unemployment rate trends. The unemployment rate is defined as the percentage of the labor force that is unemployed but actively seeking work.
90%
100%
110%
2006 2007 2008 2009 2010 2011 2012 2013 2014 2015
Employment Trends(Annual employment as a percentage of 2006 employment)
Polk County State of Iowa
0.0
1.0
2.0
3.0
4.0
5.0
6.0
7.0
2007 2008 2009 2010 2011 2012 2013 2014 2015 2016
Unemployment Rate(Unemployed percentage of the labor force)
Polk County State of Iowa
0.0%
0.5%
1.0%
1.5%
2.0%
2.5%
3.0%
Jul-1
5
Aug-
15
Sep-
15
Oct
-15
Nov-
15
Dec-
15
Jan-
16
Feb-
16
Mar
-16
Apr-1
6
May
-16
Jun-
16
Recent Job Gains or Losses: Polk County
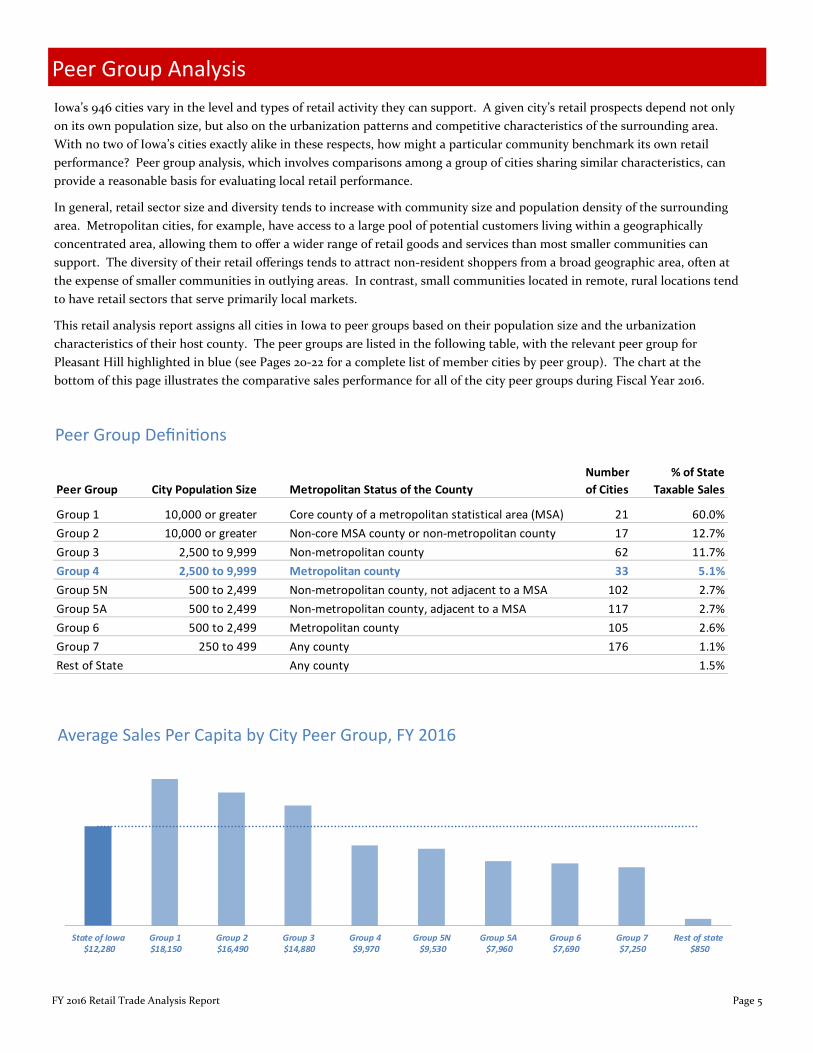
FY 2016 Retail Trade Analysis Report Page 5
Iowa’s 946 cities vary in the level and types of retail activity they can support. A given city’s retail prospects depend not only on its own population size, but also on the urbanization patterns and competitive characteristics of the surrounding area. With no two of Iowa’s cities exactly alike in these respects, how might a particular community benchmark its own retail performance? Peer group analysis, which involves comparisons among a group of cities sharing similar characteristics, can provide a reasonable basis for evaluating local retail performance.
In general, retail sector size and diversity tends to increase with community size and population density of the surrounding area. Metropolitan cities, for example, have access to a large pool of potential customers living within a geographically concentrated area, allowing them to offer a wider range of retail goods and services than most smaller communities can support. The diversity of their retail offerings tends to attract non-resident shoppers from a broad geographic area, often at the expense of smaller communities in outlying areas. In contrast, small communities located in remote, rural locations tend to have retail sectors that serve primarily local markets.
This retail analysis report assigns all cities in Iowa to peer groups based on their population size and the urbanization characteristics of their host county. The peer groups are listed in the following table, with the relevant peer group for Pleasant Hill highlighted in blue (see Pages 20-22 for a complete list of member cities by peer group). The chart at the bottom of this page illustrates the comparative sales performance for all of the city peer groups during Fiscal Year 2016.
Peer Group Analysis
Peer Group Defini ons
Average Sales Per Capita by City Peer Group, FY 2016
Peer Group City Population Size Metropolitan Status of the CountyNumberof Cities
% of State Taxable Sales
Group 1 10,000 or greater Core county of a metropolitan statistical area (MSA) 21 60.0%Group 2 10,000 or greater Non-core MSA county or non-metropolitan county 17 12.7%Group 3 2,500 to 9,999 Non-metropolitan county 62 11.7%Group 4 2,500 to 9,999 Metropolitan county 33 5.1%Group 5N 500 to 2,499 Non-metropolitan county, not adjacent to a MSA 102 2.7%Group 5A 500 to 2,499 Non-metropolitan county, adjacent to a MSA 117 2.7%Group 6 500 to 2,499 Metropolitan county 105 2.6%Group 7 250 to 499 Any county 176 1.1%Rest of State Any county 1.5%
State of Iowa $12,280
Group 1 $18,150
Group 2 $16,490
Group 3 $14,880
Group 4 $9,970
Group 5N $9,530
Group 5A $7,960
Group 6 $7,690
Group 7 $7,250
Rest of state $850
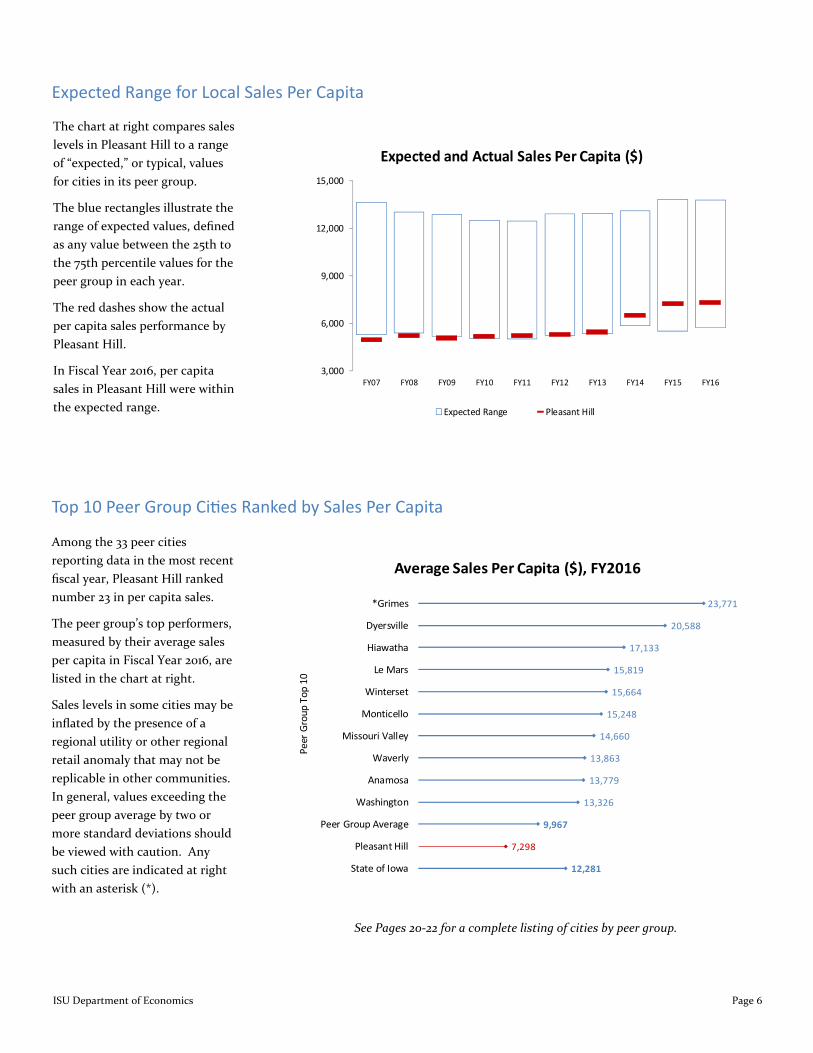
ISU Department of Economics Page 6
The chart at right compares sales levels in Pleasant Hill to a range of “expected,” or typical, values for cities in its peer group.
The blue rectangles illustrate the range of expected values, defined as any value between the 25th to the 75th percentile values for the peer group in each year.
The red dashes show the actual per capita sales performance by Pleasant Hill.
In Fiscal Year 2016, per capita sales in Pleasant Hill were within the expected range.
Expected Range for Local Sales Per Capita
Among the 33 peer cities reporting data in the most recent fiscal year, Pleasant Hill ranked number 23 in per capita sales.
The peer group’s top performers, measured by their average sales per capita in Fiscal Year 2016, are listed in the chart at right.
Sales levels in some cities may be inflated by the presence of a regional utility or other regional retail anomaly that may not be replicable in other communities. In general, values exceeding the peer group average by two or more standard deviations should be viewed with caution. Any such cities are indicated at right with an asterisk (*).
Top 10 Peer Group Ci es Ranked by Sales Per Capita
See Pages 20-22 for a complete listing of cities by peer group.
3,000
6,000
9,000
12,000
15,000
FY07 FY08 FY09 FY10 FY11 FY12 FY13 FY14 FY15 FY16
Expected and Actual Sales Per Capita ($)
Expected Range Pleasant Hill
23,771
20,588
17,133
15,819
15,664
15,248
14,660
13,863
13,779
13,326
9,967
12,281
7,298
*Grimes
Dyersville
Hiawatha
Le Mars
Winterset
Monticello
Missouri Valley
Waverly
Anamosa
Washington
Peer Group Average
Pleasant Hill
State of Iowa
Peer
Gro
up T
op 1
0
Average Sales Per Capita ($), FY2016
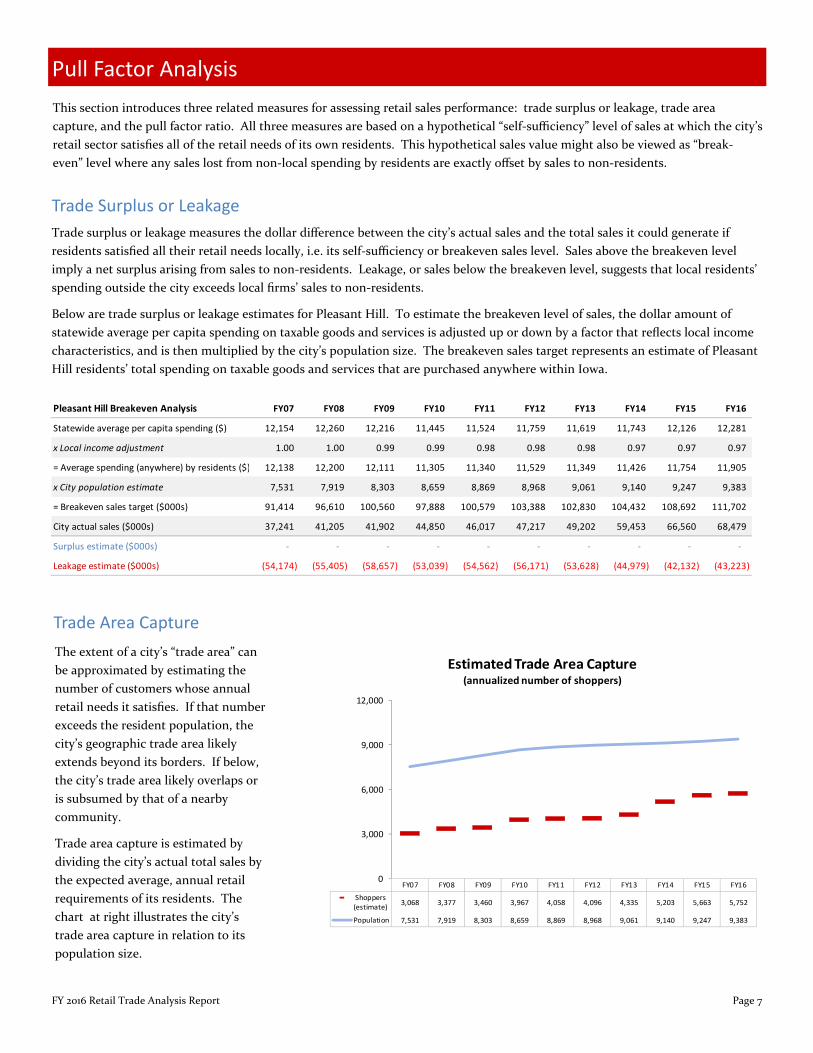
FY 2016 Retail Trade Analysis Report Page 7
Trade Area Capture
Trade surplus or leakage measures the dollar difference between the city’s actual sales and the total sales it could generate if residents satisfied all their retail needs locally, i.e. its self-sufficiency or breakeven sales level. Sales above the breakeven level imply a net surplus arising from sales to non-residents. Leakage, or sales below the breakeven level, suggests that local residents’ spending outside the city exceeds local firms’ sales to non-residents.
Below are trade surplus or leakage estimates for Pleasant Hill. To estimate the breakeven level of sales, the dollar amount of statewide average per capita spending on taxable goods and services is adjusted up or down by a factor that reflects local income characteristics, and is then multiplied by the city’s population size. The breakeven sales target represents an estimate of Pleasant Hill residents’ total spending on taxable goods and services that are purchased anywhere within Iowa.
Trade Surplus or Leakage
The extent of a city’s “trade area” can be approximated by estimating the number of customers whose annual retail needs it satisfies. If that number exceeds the resident population, the city’s geographic trade area likely extends beyond its borders. If below, the city’s trade area likely overlaps or is subsumed by that of a nearby community.
Trade area capture is estimated by dividing the city’s actual total sales by the expected average, annual retail requirements of its residents. The chart at right illustrates the city’s trade area capture in relation to its population size.
This section introduces three related measures for assessing retail sales performance: trade surplus or leakage, trade area capture, and the pull factor ratio. All three measures are based on a hypothetical “self-sufficiency” level of sales at which the city’s retail sector satisfies all of the retail needs of its own residents. This hypothetical sales value might also be viewed as “break-even” level where any sales lost from non-local spending by residents are exactly offset by sales to non-residents.
Pull Factor Analysis
Pleasant Hill Breakeven Analysis FY07 FY08 FY09 FY10 FY11 FY12 FY13 FY14 FY15 FY16
Statewide average per capita spending ($) 12,154 12,260 12,216 11,445 11,524 11,759 11,619 11,743 12,126 12,281
x Local income adjustment 1.00 1.00 0.99 0.99 0.98 0.98 0.98 0.97 0.97 0.97
= Average spending (anywhere) by residents ($) 12,138 12,200 12,111 11,305 11,340 11,529 11,349 11,426 11,754 11,905
x City population estimate 7,531 7,919 8,303 8,659 8,869 8,968 9,061 9,140 9,247 9,383
= Breakeven sales target ($000s) 91,414 96,610 100,560 97,888 100,579 103,388 102,830 104,432 108,692 111,702
City actual sales ($000s) 37,241 41,205 41,902 44,850 46,017 47,217 49,202 59,453 66,560 68,479
Surplus estimate ($000s) - - - - - - - - - -
Leakage estimate ($000s) (54,174) (55,405) (58,657) (53,039) (54,562) (56,171) (53,628) (44,979) (42,132) (43,223)
FY07 FY08 FY09 FY10 FY11 FY12 FY13 FY14 FY15 FY16
Shoppers(estimate) 3,068 3,377 3,460 3,967 4,058 4,096 4,335 5,203 5,663 5,752
Population 7,531 7,919 8,303 8,659 8,869 8,968 9,061 9,140 9,247 9,383
0
3,000
6,000
9,000
12,000
Estimated Trade Area Capture(annualized number of shoppers)
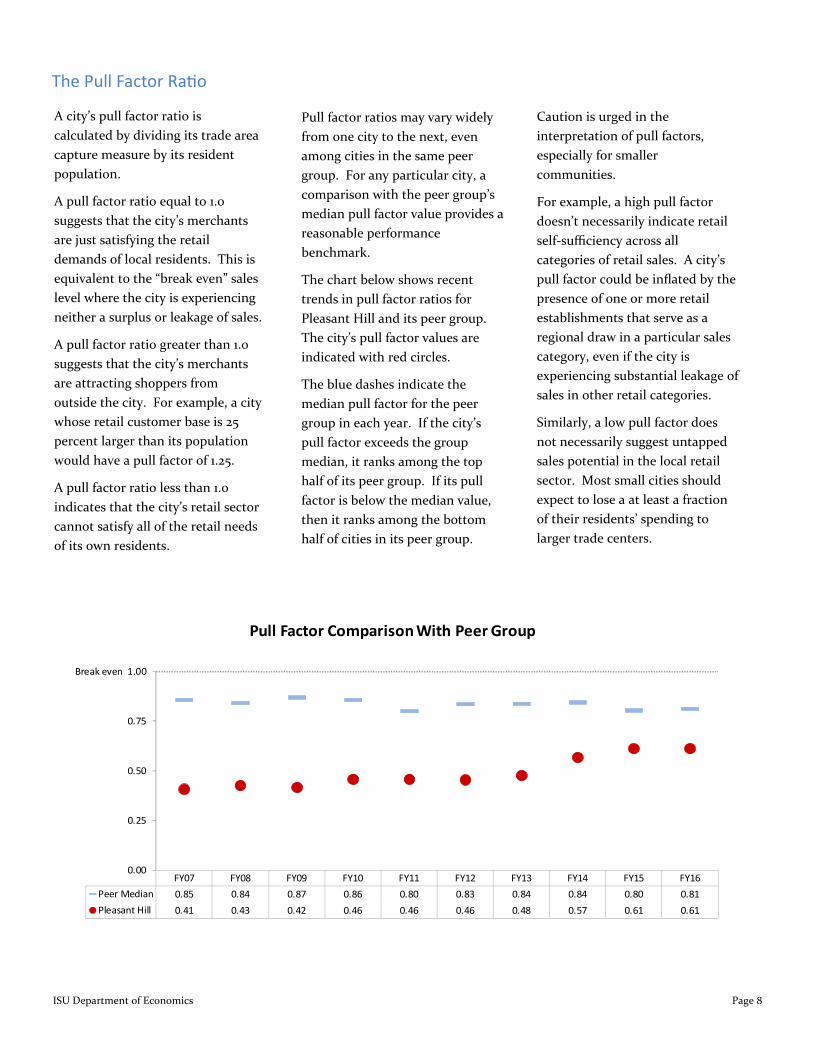
ISU Department of Economics Page 8
The Pull Factor Ra o
A city’s pull factor ratio is calculated by dividing its trade area capture measure by its resident population.
A pull factor ratio equal to 1.0 suggests that the city’s merchants are just satisfying the retail demands of local residents. This is equivalent to the “break even” sales level where the city is experiencing neither a surplus or leakage of sales.
A pull factor ratio greater than 1.0 suggests that the city’s merchants are attracting shoppers from outside the city. For example, a city whose retail customer base is 25 percent larger than its population would have a pull factor of 1.25.
A pull factor ratio less than 1.0 indicates that the city’s retail sector cannot satisfy all of the retail needs of its own residents.
Pull factor ratios may vary widely from one city to the next, even among cities in the same peer group. For any particular city, a comparison with the peer group’s median pull factor value provides a reasonable performance benchmark.
The chart below shows recent trends in pull factor ratios for Pleasant Hill and its peer group. The city’s pull factor values are indicated with red circles.
The blue dashes indicate the median pull factor for the peer group in each year. If the city’s pull factor exceeds the group median, it ranks among the top half of its peer group. If its pull factor is below the median value, then it ranks among the bottom half of cities in its peer group.
Caution is urged in the interpretation of pull factors, especially for smaller communities.
For example, a high pull factor doesn’t necessarily indicate retail self-sufficiency across all categories of retail sales. A city’s pull factor could be inflated by the presence of one or more retail establishments that serve as a regional draw in a particular sales category, even if the city is experiencing substantial leakage of sales in other retail categories.
Similarly, a low pull factor does not necessarily suggest untapped sales potential in the local retail sector. Most small cities should expect to lose a at least a fraction of their residents’ spending to larger trade centers.
FY07 FY08 FY09 FY10 FY11 FY12 FY13 FY14 FY15 FY16Peer Median 0.85 0.84 0.87 0.86 0.80 0.83 0.84 0.84 0.80 0.81Pleasant Hill 0.41 0.43 0.42 0.46 0.46 0.46 0.48 0.57 0.61 0.61
0.00
0.25
0.50
0.75
Break even 1.00
Pull Factor Comparison With Peer Group
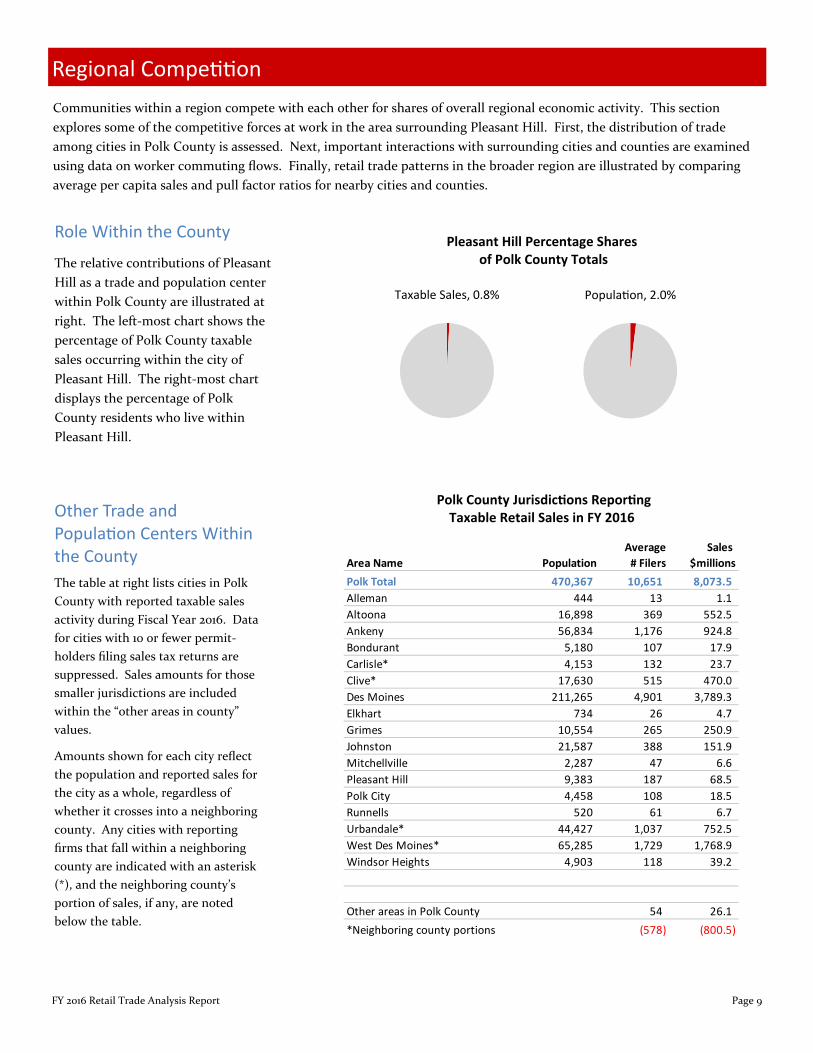
FY 2016 Retail Trade Analysis Report Page 9
Regional Compe on Communities within a region compete with each other for shares of overall regional economic activity. This section explores some of the competitive forces at work in the area surrounding Pleasant Hill. First, the distribution of trade among cities in Polk County is assessed. Next, important interactions with surrounding cities and counties are examined using data on worker commuting flows. Finally, retail trade patterns in the broader region are illustrated by comparing average per capita sales and pull factor ratios for nearby cities and counties.
Role Within the County
The relative contributions of Pleasant Hill as a trade and population center within Polk County are illustrated at right. The left-most chart shows the percentage of Polk County taxable sales occurring within the city of Pleasant Hill. The right-most chart displays the percentage of Polk County residents who live within Pleasant Hill.
Taxable Sales, 0.8% Popula on, 2.0%
Pleasant Hill Percentage Shares of Polk County Totals
Polk County Jurisdic ons Repor ng Taxable Retail Sales in FY 2016
Average Sales Area Name Population # Filers $millionsPolk Total 470,367 10,651 8,073.5Alleman 444 13 1.1Altoona 16,898 369 552.5Ankeny 56,834 1,176 924.8Bondurant 5,180 107 17.9Carlisle* 4,153 132 23.7Clive* 17,630 515 470.0Des Moines 211,265 4,901 3,789.3Elkhart 734 26 4.7Grimes 10,554 265 250.9Johnston 21,587 388 151.9Mitchellville 2,287 47 6.6Pleasant Hill 9,383 187 68.5Polk City 4,458 108 18.5Runnells 520 61 6.7Urbandale* 44,427 1,037 752.5West Des Moines* 65,285 1,729 1,768.9Windsor Heights 4,903 118 39.2
Other areas in Polk County 54 26.1(578) (800.5)*Neighboring county portions
Other Trade and Popula on Centers Within the County The table at right lists cities in Polk County with reported taxable sales activity during Fiscal Year 2016. Data for cities with 10 or fewer permit-holders filing sales tax returns are suppressed. Sales amounts for those smaller jurisdictions are included within the “other areas in county” values.
Amounts shown for each city reflect the population and reported sales for the city as a whole, regardless of whether it crosses into a neighboring county. Any cities with reporting firms that fall within a neighboring county are indicated with an asterisk (*), and the neighboring county’s portion of sales, if any, are noted below the table.
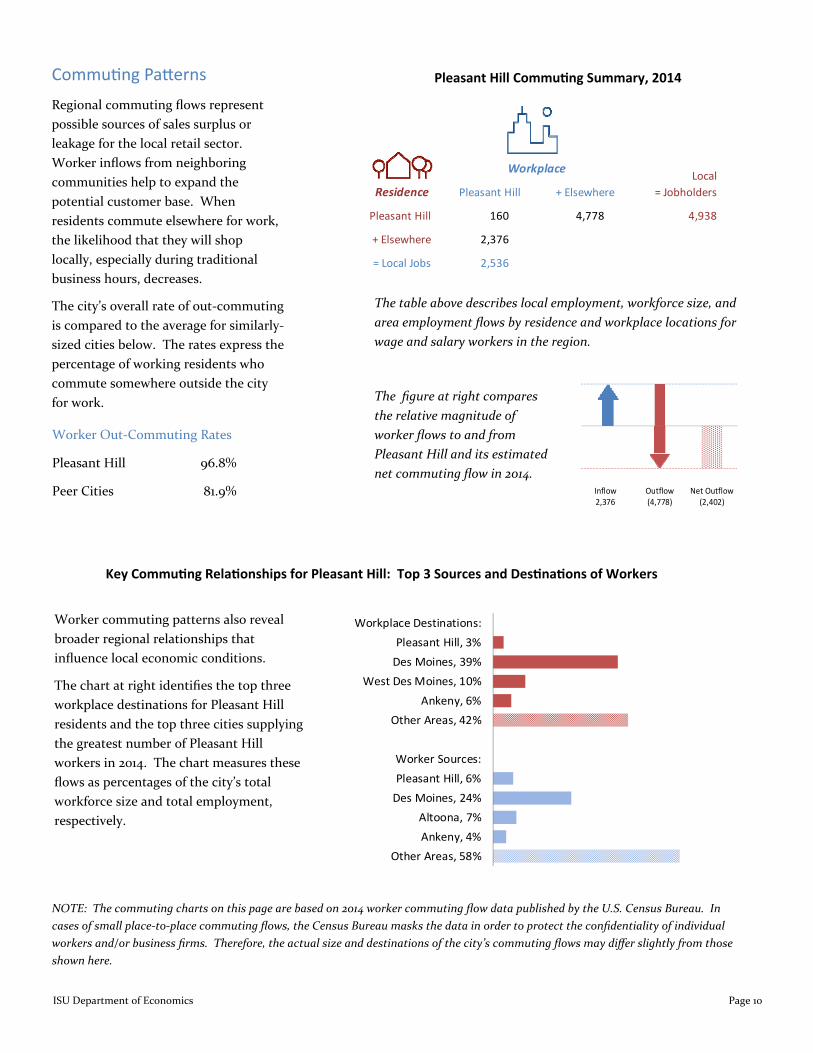
ISU Department of Economics Page 10
Regional commuting flows represent possible sources of sales surplus or leakage for the local retail sector. Worker inflows from neighboring communities help to expand the potential customer base. When residents commute elsewhere for work, the likelihood that they will shop locally, especially during traditional business hours, decreases.
The city’s overall rate of out-commuting is compared to the average for similarly-sized cities below. The rates express the percentage of working residents who commute somewhere outside the city for work.
Commu ng Pa erns
Key Commu ng Rela onships for Pleasant Hill: Top 3 Sources and Des na ons of Workers
Pleasant Hill Commu ng Summary, 2014
NOTE: The commuting charts on this page are based on 2014 worker commuting flow data published by the U.S. Census Bureau. In cases of small place-to-place commuting flows, the Census Bureau masks the data in order to protect the confidentiality of individual workers and/or business firms. Therefore, the actual size and destinations of the city’s commuting flows may differ slightly from those shown here.
Workplace Destinations:Pleasant Hill, 3%
Des Moines, 39%West Des Moines, 10%
Ankeny, 6%Other Areas, 42%
Worker Sources:Pleasant Hill, 6%
Des Moines, 24%Altoona, 7%Ankeny, 4%
Other Areas, 58%
Pleasant Hill 96.8%
Peer Cities 81.9%
Worker Out-Commuting Rates
Worker commuting patterns also reveal broader regional relationships that influence local economic conditions.
The chart at right identifies the top three workplace destinations for Pleasant Hill residents and the top three cities supplying the greatest number of Pleasant Hill workers in 2014. The chart measures these flows as percentages of the city’s total workforce size and total employment, respectively.
The table above describes local employment, workforce size, and area employment flows by residence and workplace locations for wage and salary workers in the region.
The figure at right compares the relative magnitude of worker flows to and from Pleasant Hill and its estimated net commuting flow in 2014.
Inflow2,376
Outflow(4,778)
Net Outflow(2,402)
Residence Pleasant Hill + Elsewhere
Pleasant Hill 160 4,778 4,938
+ Elsewhere 2,376
= Local Jobs 2,536
Local = Jobholders
Workplace
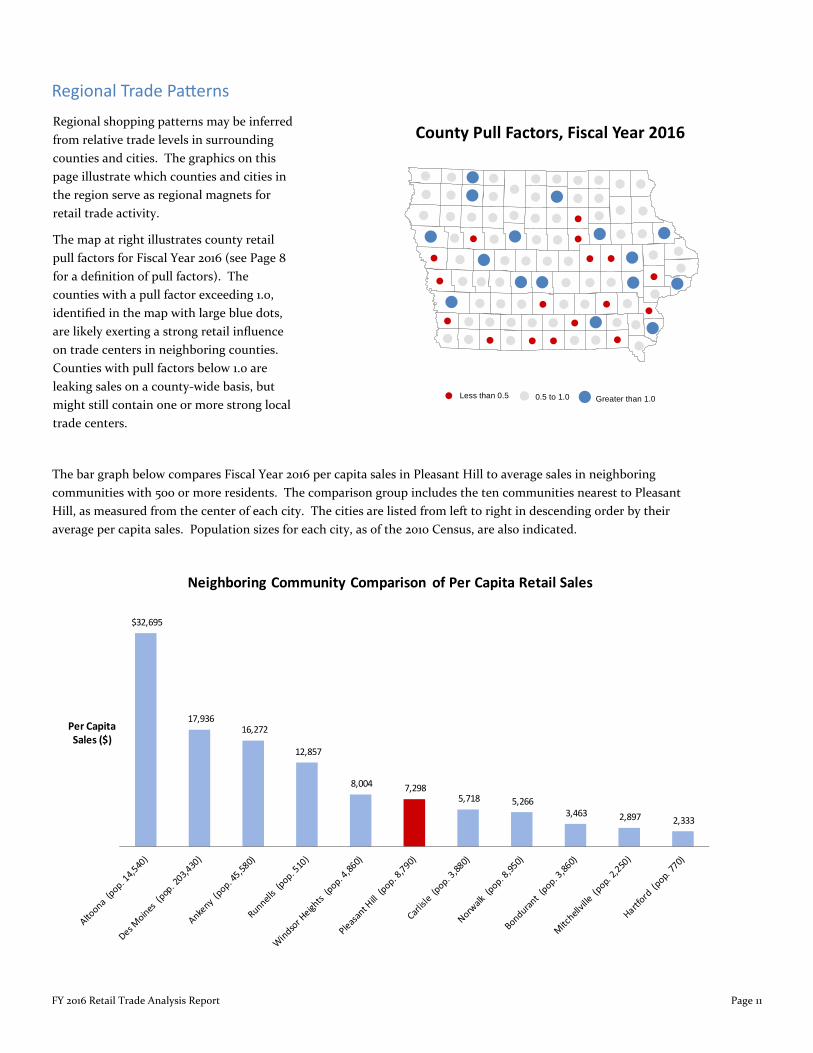
FY 2016 Retail Trade Analysis Report Page 11
Regional Trade Pa erns Regional shopping patterns may be inferred from relative trade levels in surrounding counties and cities. The graphics on this page illustrate which counties and cities in the region serve as regional magnets for retail trade activity.
The map at right illustrates county retail pull factors for Fiscal Year 2016 (see Page 8 for a definition of pull factors). The counties with a pull factor exceeding 1.0, identified in the map with large blue dots, are likely exerting a strong retail influence on trade centers in neighboring counties. Counties with pull factors below 1.0 are leaking sales on a county-wide basis, but might still contain one or more strong local trade centers.
$32,695
17,93616,272
12,857
8,004 7,2985,718 5,266
3,463 2,897 2,333
Per CapitaSales ($)
Neighboring Community Comparison of Per Capita Retail Sales
The bar graph below compares Fiscal Year 2016 per capita sales in Pleasant Hill to average sales in neighboring communities with 500 or more residents. The comparison group includes the ten communities nearest to Pleasant Hill, as measured from the center of each city. The cities are listed from left to right in descending order by their average per capita sales. Population sizes for each city, as of the 2010 Census, are also indicated.
!
!
! !
!
!
!
!
!
!
!
!!
!
!
!!!
!
!
!
!!
!
!
!
!
!
!
!
!
!
!
!
!
!
!
!
!
!
!
!
!
!
!!
!
!
!
!
!
! !
!
! !!
!
!
!
!!
!
!
!
!
! !
!
!
!
! !
!
!
!
!
!
!
!
!
!
!
!
!
!
!
!
!
!
!
!
! !
! !
!
! !
! Less than 0.5 ! 0.5 to 1.0 ! Greater than 1.0
County Pull Factors, Fiscal Year 2016
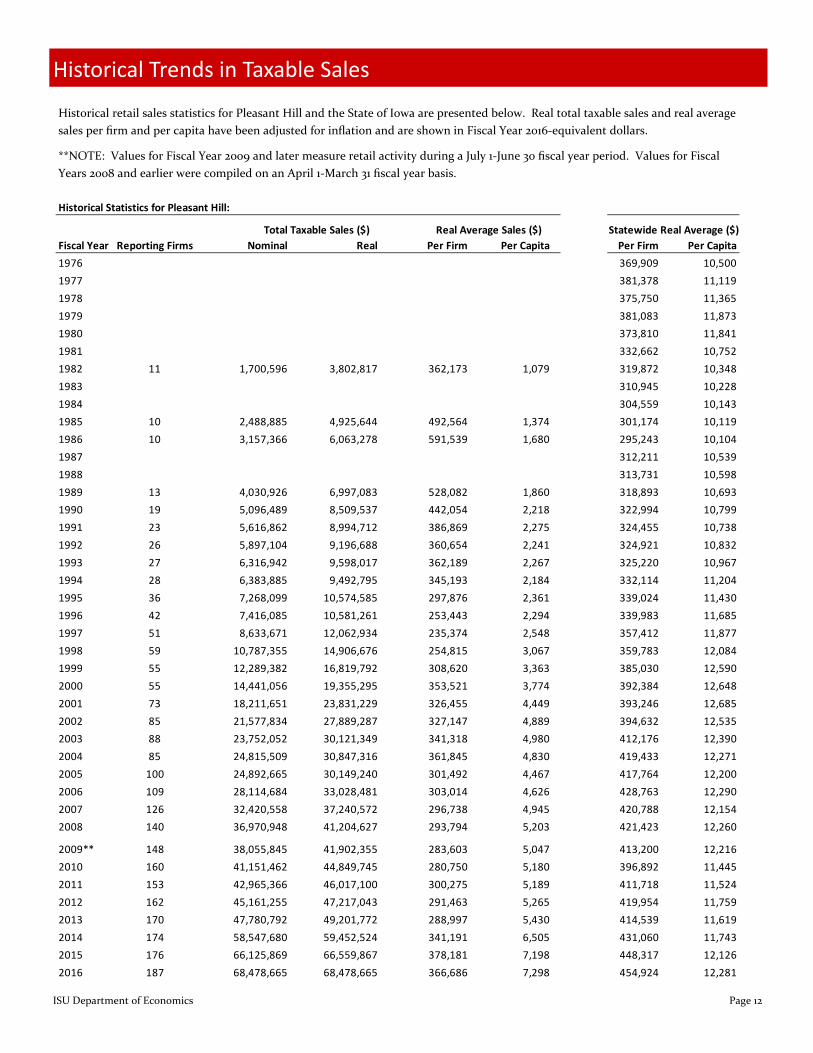
ISU Department of Economics Page 12
Historical Trends in Taxable Sales
Historical retail sales statistics for Pleasant Hill and the State of Iowa are presented below. Real total taxable sales and real average sales per firm and per capita have been adjusted for inflation and are shown in Fiscal Year 2016-equivalent dollars.
**NOTE: Values for Fiscal Year 2009 and later measure retail activity during a July 1-June 30 fiscal year period. Values for Fiscal Years 2008 and earlier were compiled on an April 1-March 31 fiscal year basis.
Historical Statistics for Pleasant Hill:
Fiscal Year Reporting Firms Nominal Real Per Firm Per Capita Per Firm Per Capita1976 #N/A #N/A #N/A #N/A #N/A 369,909 10,5001977 #N/A #N/A #N/A #N/A #N/A 381,378 11,1191978 #N/A #N/A #N/A #N/A #N/A 375,750 11,3651979 #N/A #N/A #N/A #N/A #N/A 381,083 11,8731980 #N/A #N/A #N/A #N/A #N/A 373,810 11,8411981 #N/A #N/A #N/A #N/A #N/A 332,662 10,7521982 11 1,700,596 3,802,817 362,173 1,079 319,872 10,3481983 #N/A #N/A #N/A #N/A #N/A 310,945 10,2281984 #N/A #N/A #N/A #N/A #N/A 304,559 10,1431985 10 2,488,885 4,925,644 492,564 1,374 301,174 10,1191986 10 3,157,366 6,063,278 591,539 1,680 295,243 10,1041987 #N/A #N/A #N/A #N/A #N/A 312,211 10,5391988 #N/A #N/A #N/A #N/A #N/A 313,731 10,5981989 13 4,030,926 6,997,083 528,082 1,860 318,893 10,6931990 19 5,096,489 8,509,537 442,054 2,218 322,994 10,7991991 23 5,616,862 8,994,712 386,869 2,275 324,455 10,7381992 26 5,897,104 9,196,688 360,654 2,241 324,921 10,8321993 27 6,316,942 9,598,017 362,189 2,267 325,220 10,9671994 28 6,383,885 9,492,795 345,193 2,184 332,114 11,2041995 36 7,268,099 10,574,585 297,876 2,361 339,024 11,4301996 42 7,416,085 10,581,261 253,443 2,294 339,983 11,6851997 51 8,633,671 12,062,934 235,374 2,548 357,412 11,8771998 59 10,787,355 14,906,676 254,815 3,067 359,783 12,0841999 55 12,289,382 16,819,792 308,620 3,363 385,030 12,5902000 55 14,441,056 19,355,295 353,521 3,774 392,384 12,6482001 73 18,211,651 23,831,229 326,455 4,449 393,246 12,6852002 85 21,577,834 27,889,287 327,147 4,889 394,632 12,5352003 88 23,752,052 30,121,349 341,318 4,980 412,176 12,3902004 85 24,815,509 30,847,316 361,845 4,830 419,433 12,2712005 100 24,892,665 30,149,240 301,492 4,467 417,764 12,2002006 109 28,114,684 33,028,481 303,014 4,626 428,763 12,2902007 126 32,420,558 37,240,572 296,738 4,945 420,788 12,1542008 140 36,970,948 41,204,627 293,794 5,203 421,423 12,260
2009** 148 38,055,845 41,902,355 283,603 5,047 413,200 12,2162010 160 41,151,462 44,849,745 280,750 5,180 396,892 11,4452011 153 42,965,366 46,017,100 300,275 5,189 411,718 11,5242012 162 45,161,255 47,217,043 291,463 5,265 419,954 11,7592013 170 47,780,792 49,201,772 288,997 5,430 414,539 11,6192014 174 58,547,680 59,452,524 341,191 6,505 431,060 11,7432015 176 66,125,869 66,559,867 378,181 7,198 448,317 12,1262016 187 68,478,665 68,478,665 366,686 7,298 454,924 12,281
Total Taxable Sales ($) Real Average Sales ($) Statewide Real Average ($)
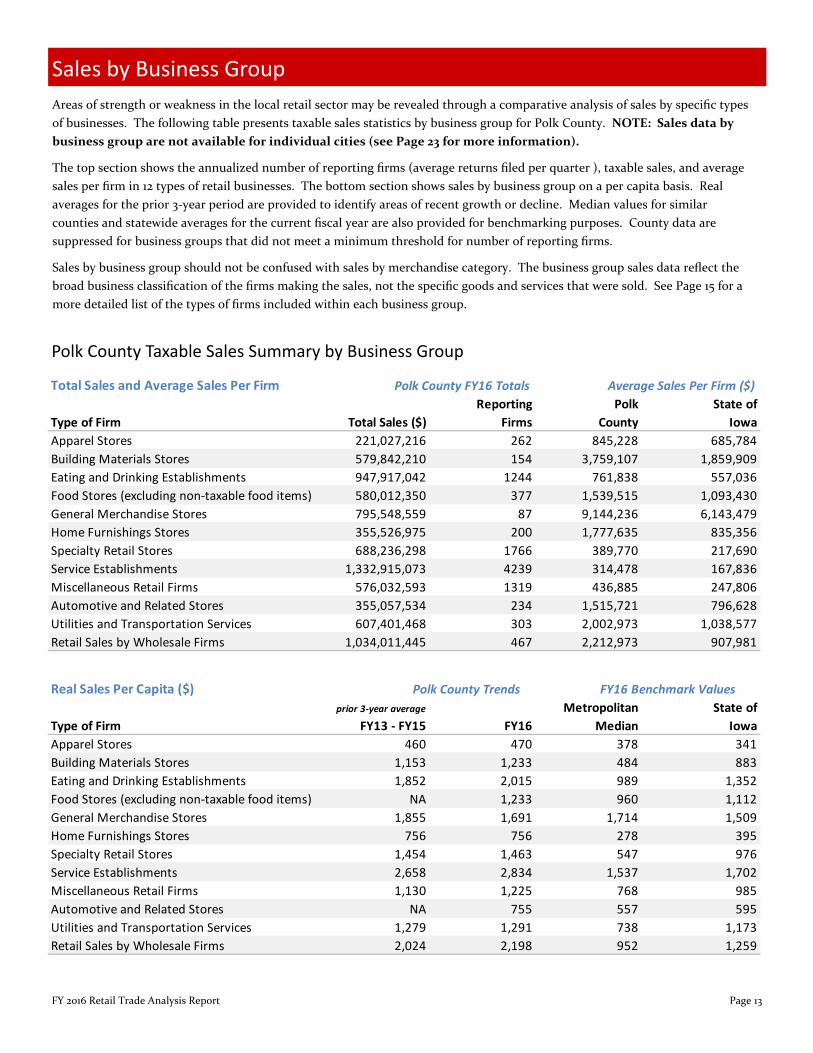
FY 2016 Retail Trade Analysis Report Page 13
Areas of strength or weakness in the local retail sector may be revealed through a comparative analysis of sales by specific types of businesses. The following table presents taxable sales statistics by business group for Polk County. NOTE: Sales data by business group are not available for individual cities (see Page 23 for more information).
The top section shows the annualized number of reporting firms (average returns filed per quarter ), taxable sales, and average sales per firm in 12 types of retail businesses. The bottom section shows sales by business group on a per capita basis. Real averages for the prior 3-year period are provided to identify areas of recent growth or decline. Median values for similar counties and statewide averages for the current fiscal year are also provided for benchmarking purposes. County data are suppressed for business groups that did not meet a minimum threshold for number of reporting firms.
Sales by business group should not be confused with sales by merchandise category. The business group sales data reflect the broad business classification of the firms making the sales, not the specific goods and services that were sold. See Page 15 for a more detailed list of the types of firms included within each business group.
Sales by Business Group
Reporting Polk State ofType of Firm Total Sales ($) Firms County Iowa
221,027,216 262 845,228 685,784579,842,210 154 3,759,107 1,859,909947,917,042 1244 761,838 557,036580,012,350 377 1,539,515 1,093,430795,548,559 87 9,144,236 6,143,479355,526,975 200 1,777,635 835,356688,236,298 1766 389,770 217,690
1,332,915,073 4239 314,478 167,836576,032,593 1319 436,885 247,806355,057,534 234 1,515,721 796,628607,401,468 303 2,002,973 1,038,577
1,034,011,445 467 2,212,973 907,981
Real Sales Per Capita ($)prior 3-year average Metropolitan State of
Type of Firm FY13 - FY15 FY16 Median Iowa460 470 378 341
1,153 1,233 484 8831,852 2,015 989 1,352
NA 1,233 960 1,1121,855 1,691 1,714 1,509
756 756 278 3951,454 1,463 547 9762,658 2,834 1,537 1,7021,130 1,225 768 985
NA 755 557 5951,279 1,291 738 1,1732,024 2,198 952 1,259
Home Furnishings StoresSpecialty Retail StoresService Establishments
Retail Sales by Wholesale Firms
Apparel StoresBuilding Materials StoresEating and Drinking Establishments
Miscellaneous Retail FirmsAutomotive and Related Stores
Food Stores (excluding non-taxable food items)General Merchandise Stores
Total Sales and Average Sales Per Firm Polk County FY16 Totals Average Sales Per Firm ($)
Utilities and Transportation Services
FY16 Benchmark Values
Apparel StoresBuilding Materials Stores
Polk County Trends
Eating and Drinking EstablishmentsFood Stores (excluding non-taxable food items)General Merchandise StoresHome Furnishings StoresSpecialty Retail StoresService EstablishmentsMiscellaneous Retail FirmsAutomotive and Related StoresUtilities and Transportation ServicesRetail Sales by Wholesale Firms
Polk County Taxable Sales Summary by Business Group
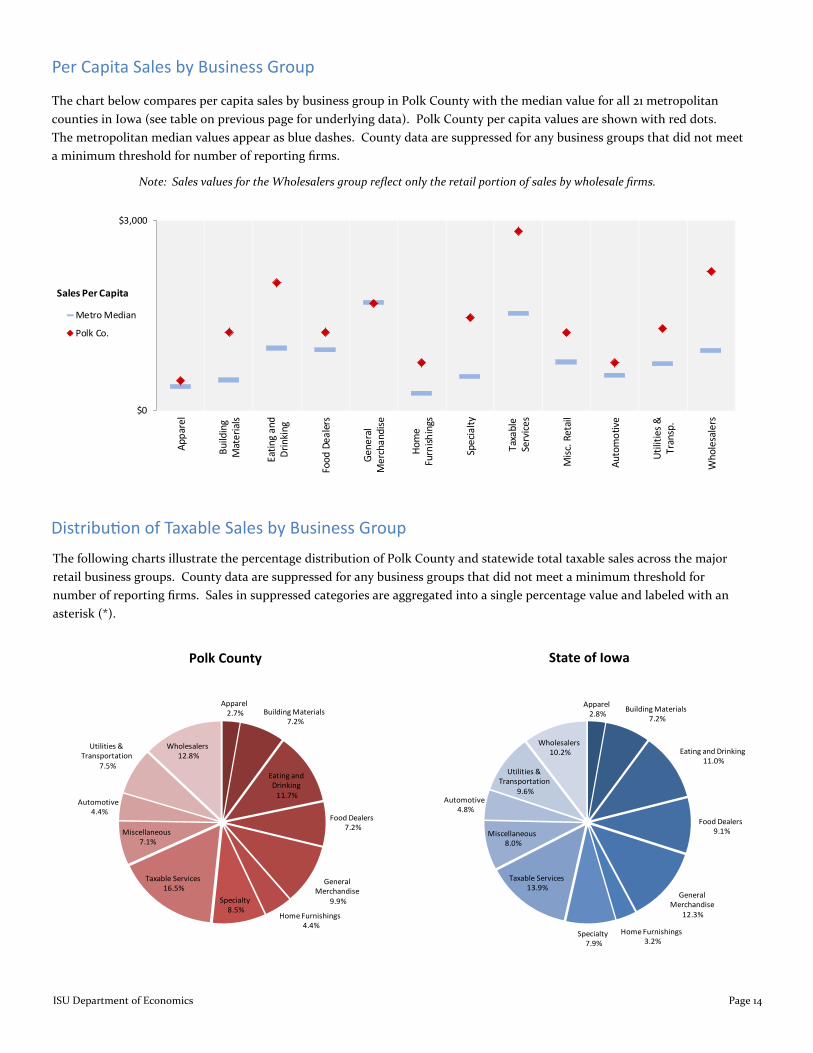
ISU Department of Economics Page 14
Per Capita Sales by Business Group
The chart below compares per capita sales by business group in Polk County with the median value for all 21 metropolitan counties in Iowa (see table on previous page for underlying data). Polk County per capita values are shown with red dots. The metropolitan median values appear as blue dashes. County data are suppressed for any business groups that did not meet a minimum threshold for number of reporting firms.
Note: Sales values for the Wholesalers group reflect only the retail portion of sales by wholesale firms.
Distribu on of Taxable Sales by Business Group The following charts illustrate the percentage distribution of Polk County and statewide total taxable sales across the major retail business groups. County data are suppressed for any business groups that did not meet a minimum threshold for number of reporting firms. Sales in suppressed categories are aggregated into a single percentage value and labeled with an asterisk (*).
$0
$3,000
Appa
rel
Build
ing
Mat
eria
ls
Eatin
g an
dDr
inki
ng
Food
Dea
lers
Gene
ral
Mer
chan
dise
Hom
eFu
rnish
ings
Spec
ialty
Taxa
ble
Serv
ices
Misc
. Ret
ail
Auto
mot
ive
Utili
ties &
Tran
sp.
Who
lesa
lers
Sales Per Capita
Metro Median
Polk Co.
Apparel2.7% Building Materials
7.2%
Eating and Drinking
11.7%
Food Dealers7.2%
General Merchandise
9.9%
Home Furnishings4.4%
Specialty8.5%
Taxable Services16.5%
Miscellaneous7.1%
Automotive4.4%
Utilities & Transportation
7.5%
Wholesalers12.8%
Apparel2.8% Building Materials
7.2%
Eating and Drinking11.0%
Food Dealers9.1%
General Merchandise
12.3%
Home Furnishings3.2%
Specialty7.9%
Taxable Services13.9%
Miscellaneous8.0%
Automotive4.8%
Utilities & Transportation
9.6%
Wholesalers10.2%
Polk County State of Iowa
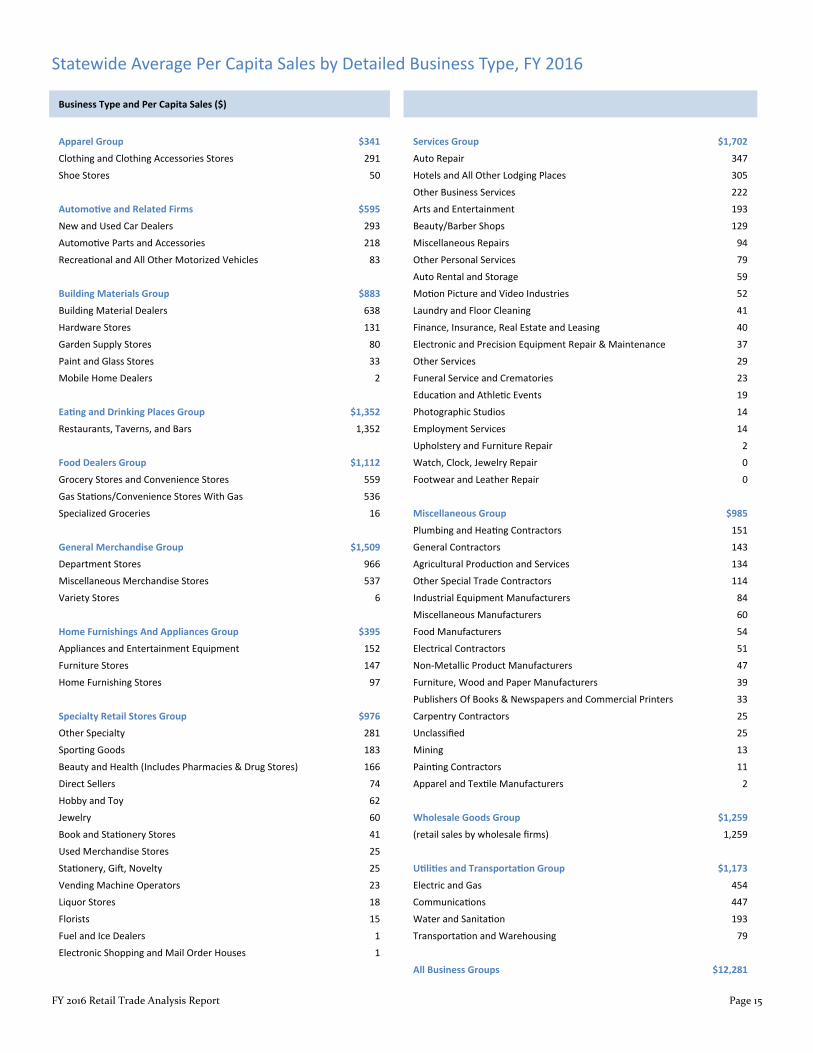
FY 2016 Retail Trade Analysis Report Page 15
Statewide Average Per Capita Sales by Detailed Business Type, FY 2016
Apparel Group $341 Services Group $1,702 Clothing and Clothing Accessories Stores 291 Auto Repair 347
Shoe Stores 50 Hotels and All Other Lodging Places 305
Other Business Services 222 Automo ve and Related Firms $595 Arts and Entertainment 193
New and Used Car Dealers 293 Beauty/Barber Shops 129
Automo ve Parts and Accessories 218 Miscellaneous Repairs 94
Recrea onal and All Other Motorized Vehicles 83 Other Personal Services 79
Auto Rental and Storage 59 Building Materials Group $883 Mo on Picture and Video Industries 52
Building Material Dealers 638 Laundry and Floor Cleaning 41
Hardware Stores 131 Finance, Insurance, Real Estate and Leasing 40
Garden Supply Stores 80 Electronic and Precision Equipment Repair & Maintenance 37
Paint and Glass Stores 33 Other Services 29 Mobile Home Dealers 2 Funeral Service and Crematories 23
Educa on and Athle c Events 19
Ea ng and Drinking Places Group $1,352 Photographic Studios 14
Restaurants, Taverns, and Bars 1,352 Employment Services 14
Upholstery and Furniture Repair 2 Food Dealers Group $1,112 Watch, Clock, Jewelry Repair 0
Grocery Stores and Convenience Stores 559 Footwear and Leather Repair 0
Gas Sta ons/Convenience Stores With Gas 536
Specialized Groceries 16 Miscellaneous Group $985 Plumbing and Hea ng Contractors 151
General Merchandise Group $1,509 General Contractors 143 Department Stores 966 Agricultural Produc on and Services 134
Miscellaneous Merchandise Stores 537 Other Special Trade Contractors 114
Variety Stores 6 Industrial Equipment Manufacturers 84
Miscellaneous Manufacturers 60
Home Furnishings And Appliances Group $395 Food Manufacturers 54 Appliances and Entertainment Equipment 152 Electrical Contractors 51
Furniture Stores 147 Non-Metallic Product Manufacturers 47
Home Furnishing Stores 97 Furniture, Wood and Paper Manufacturers 39
Publishers Of Books & Newspapers and Commercial Printers 33
Specialty Retail Stores Group $976 Carpentry Contractors 25 Other Specialty 281 Unclassified 25
Spor ng Goods 183 Mining 13
Beauty and Health (Includes Pharmacies & Drug Stores) 166 Pain ng Contractors 11
Direct Sellers 74 Apparel and Tex le Manufacturers 2
Hobby and Toy 62 Jewelry 60 Wholesale Goods Group $1,259 Book and Sta onery Stores 41 (retail sales by wholesale firms) 1,259
Used Merchandise Stores 25
Sta onery, Gi , Novelty 25 U li es and Transporta on Group $1,173 Vending Machine Operators 23 Electric and Gas 454 Liquor Stores 18 Communica ons 447
Florists 15 Water and Sanita on 193
Fuel and Ice Dealers 1 Transporta on and Warehousing 79
Electronic Shopping and Mail Order Houses 1
All Business Groups $12,281
Business Type and Per Capita Sales ($)
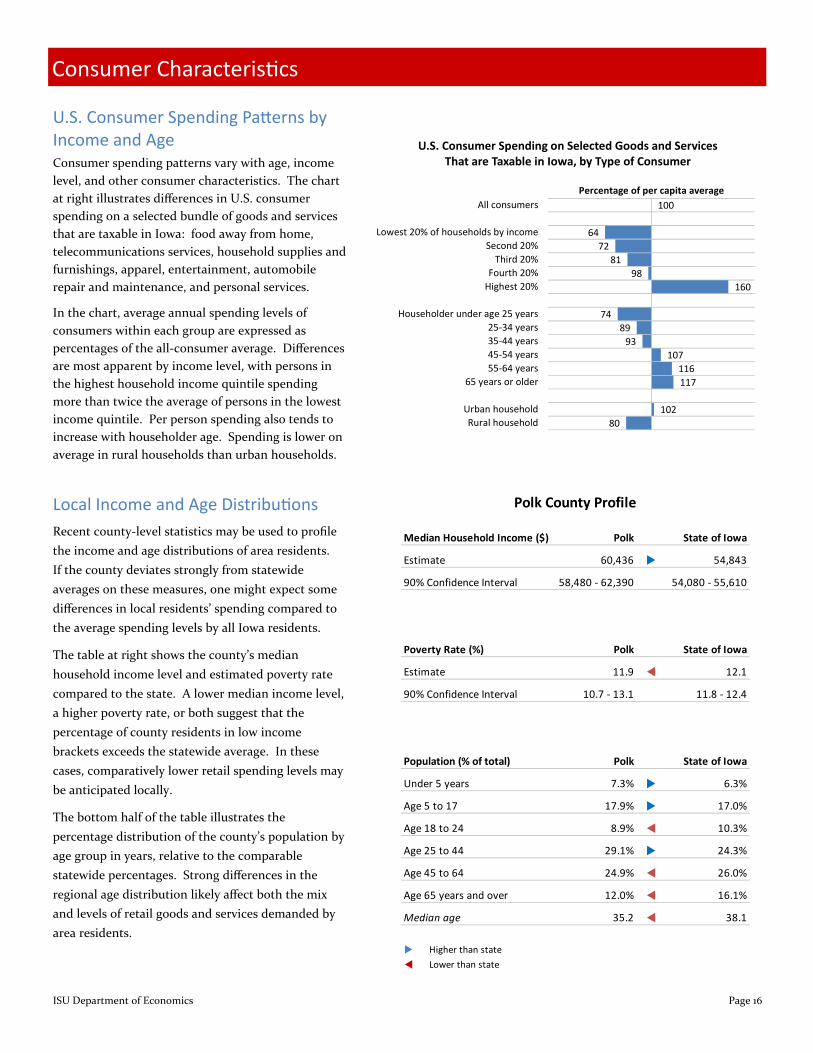
ISU Department of Economics Page 16
U.S. Consumer Spending Pa erns by Income and Age Consumer spending patterns vary with age, income level, and other consumer characteristics. The chart at right illustrates differences in U.S. consumer spending on a selected bundle of goods and services that are taxable in Iowa: food away from home, telecommunications services, household supplies and furnishings, apparel, entertainment, automobile repair and maintenance, and personal services.
In the chart, average annual spending levels of consumers within each group are expressed as percentages of the all-consumer average. Differences are most apparent by income level, with persons in the highest household income quintile spending more than twice the average of persons in the lowest income quintile. Per person spending also tends to increase with householder age. Spending is lower on average in rural households than urban households.
Local Income and Age Distribu ons Recent county-level statistics may be used to profile the income and age distributions of area residents. If the county deviates strongly from statewide averages on these measures, one might expect some differences in local residents’ spending compared to the average spending levels by all Iowa residents.
The table at right shows the county’s median household income level and estimated poverty rate compared to the state. A lower median income level, a higher poverty rate, or both suggest that the percentage of county residents in low income brackets exceeds the statewide average. In these cases, comparatively lower retail spending levels may be anticipated locally.
The bottom half of the table illustrates the percentage distribution of the county’s population by age group in years, relative to the comparable statewide percentages. Strong differences in the regional age distribution likely affect both the mix and levels of retail goods and services demanded by area residents.
Consumer Characteris cs
Higher than state Lower than state
Median Household Income ($) Polk State of Iowa
Estimate 60,436 54,843
90% Confidence Interval 58,480 - 62,390 54,080 - 55,610
Poverty Rate (%) Polk State of Iowa
Estimate 11.9 12.1
90% Confidence Interval 10.7 - 13.1 11.8 - 12.4
Population (% of total) Polk State of Iowa
Under 5 years 7.3% 6.3%
Age 5 to 17 17.9% 17.0%
Age 18 to 24 8.9% 10.3%
Age 25 to 44 29.1% 24.3%
Age 45 to 64 24.9% 26.0%
Age 65 years and over 12.0% 16.1%
Median age 35.2 38.1
Polk County Profile
100
6472
8198
160
7489
93107
116117
10280
All consumers
Lowest 20% of households by incomeSecond 20%
Third 20%Fourth 20%
Highest 20%
Householder under age 25 years25-34 years35-44 years45-54 years55-64 years
65 years or older
Urban householdRural household
Percentage of per capita average
U.S. Consumer Spending on Selected Goods and Services That are Taxable in Iowa, by Type of Consumer
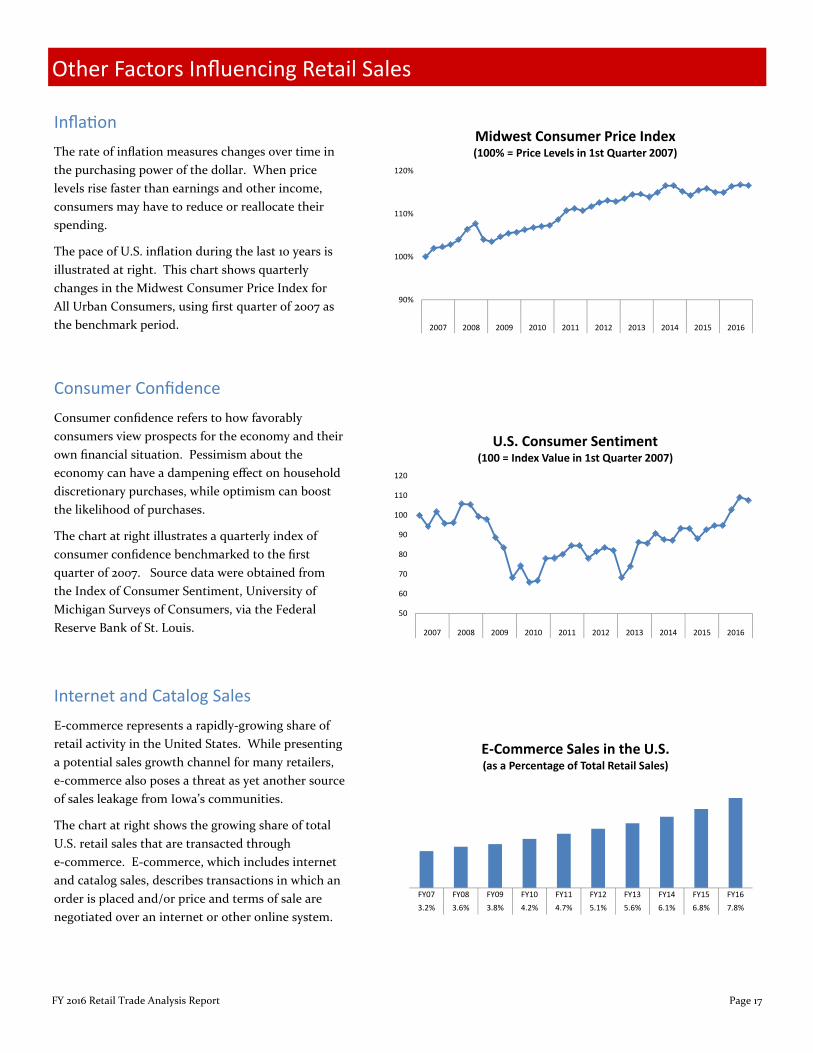
FY 2016 Retail Trade Analysis Report Page 17
Consumer Confidence
Infla on
Consumer confidence refers to how favorably consumers view prospects for the economy and their own financial situation. Pessimism about the economy can have a dampening effect on household discretionary purchases, while optimism can boost the likelihood of purchases.
The chart at right illustrates a quarterly index of consumer confidence benchmarked to the first quarter of 2007. Source data were obtained from the Index of Consumer Sentiment, University of Michigan Surveys of Consumers, via the Federal Reserve Bank of St. Louis.
Internet and Catalog Sales E-commerce represents a rapidly-growing share of retail activity in the United States. While presenting a potential sales growth channel for many retailers, e-commerce also poses a threat as yet another source of sales leakage from Iowa’s communities.
The chart at right shows the growing share of total U.S. retail sales that are transacted through e-commerce. E-commerce, which includes internet and catalog sales, describes transactions in which an order is placed and/or price and terms of sale are negotiated over an internet or other online system.
The rate of inflation measures changes over time in the purchasing power of the dollar. When price levels rise faster than earnings and other income, consumers may have to reduce or reallocate their spending.
The pace of U.S. inflation during the last 10 years is illustrated at right. This chart shows quarterly changes in the Midwest Consumer Price Index for All Urban Consumers, using first quarter of 2007 as the benchmark period.
Other Factors Influencing Retail Sales
FY07 FY08 FY09 FY10 FY11 FY12 FY13 FY14 FY15 FY163.2% 3.6% 3.8% 4.2% 4.7% 5.1% 5.6% 6.1% 6.8% 7.8%
E-Commerce Sales in the U.S.(as a Percentage of Total Retail Sales)
50
60
70
80
90
100
110
120
2007 2008 2009 2010 2011 2012 2013 2014 2015 2016
U.S. Consumer Sentiment(100 = Index Value in 1st Quarter 2007)
90%
100%
110%
120%
2007 2008 2009 2010 2011 2012 2013 2014 2015 2016
Midwest Consumer Price Index(100% = Price Levels in 1st Quarter 2007)
ISU Department of Economics Page 18
Notable Exemp ons and Exclusions from Iowa’s Retail Sales Tax Many retail transactions, because they are exempt or otherwise excluded from the state’s sales tax, are not included in the taxable sales values reported in this report. Following are some notable exemptions from Iowa’s sales tax. More detailed documentation is available from the Iowa Department of Revenue.
Exempt or Excluded Goods. Goods that are exempt from the sales tax include certain foods used for home consumption, prescription drugs, and medical devices. Sales of gasoline, subject to a separate fuel tax, are excluded from taxable retail sales. Taxable retail sales also exclude the sale or lease of new or used vehicles that are subject to registration. Vehicle purchases are taxed separately under the state’s one-time registration fee.
Exempt Services. Unlike tangible goods, services are exempt from tax unless specifically enumerated. Professional
services such as medical and legal services are not subject to the sales tax.
Utilities. The state has phased out taxes on sales of metered gas, electricity, and fuel used as energy in residential dwellings, apartment units and condominiums. Specific exemptions may also apply to certain businesses and industries.
Sales to Agriculture, Manufacturing, and Other Industries. The state exempts sales of many goods and services that are used as inputs to agriculture and other industrial processes.
Sales tax exemptions for agriculture apply to the purchase of feed, seed, fertilizer, farm machinery and equipment, fuels and utilities, and some services.
Exemptions to manufacturing include purchases of tangible inputs that become an integral part of manufactured goods ultimately sold at retail; fuels, chemicals,
and other inputs that are consumed during production processes; industrial machinery, equipment, and some computer equipment; and many services.
The state has created additional exemptions targeted toward specific industries such as wind energy and information technology. See the Department of Revenue Web site for more detailed information about exempt sales to industry and business.
Sales to Tax-Exempt Organizations. Local and state government entities are exempt from the sales tax. Sales to private nonprofit educational institutions for educational purposes are also exempt. Sales from fund-raising activities are exempt from sales tax if the proceeds are used for educational, religious, or charitable purposes.
The state of Iowa imposes a tax on the gross receipts from sales of taxable tangible personal property and taxable services. In general, merchandise goods are taxable unless specifically exempted and services are taxable if specifically enumerated by the state.
Retailers file sales tax returns to the Iowa Department of Revenue on a semi-monthly, monthly, quarterly, or annual basis depending on their amount of sales.
The Department of Revenue compiles the data from sales tax returns and publishes quarterly and annual retail sales tax reports that provide the primary source of data for this report.
Iowa’s sales tax reporting process may lead to occasional anomalies in retail sales data reported at the local level. The state compiles these data primarily for fiscal management purposes, and only secondarily for analytical purposes.
Certain accounting and other administrative constraints may result in the under-reporting or no reporting of sales activity for individual communities.
Confidentiality. In order to protect the confidentiality of individual filers, the Iowa Department of Revenue only reports data from localities with a minimum of 10 tax returns filed for a quarter or 40 returns per year. Sales data for localities not meeting this threshold level are reported for the county in which they are located.
Recent changes in the administration of Iowa’s sales tax include the following:
• July 1, 2004. Iowa revised its sales tax laws to meet Streamlined Sales Tax Project (SSTP) requirements. SSTP improves uniformity in sales tax laws across states, thereby encouraging businesses to collect and remit sales tax in every state in which they make taxable sales.
• January 1, 2006. The tax on certain types of energy was reduced to 0% after a 4-year phased decline.
• July 1, 2008. Iowa’s sales tax rate increased from 5% to 6%.
• July 1, 2008. The Iowa Department of Revenue adopted a new fiscal year reporting period to align with the state fiscal year that runs from July 1 through June 30 of each year.
• July 1, 2013. The Iowa Department of Revenue changed the business class assignment for approximately 12 percent of Iowa’s retailers.
• July 1, 2013. Taxable sales in the Convenience Stores and Gas Stations business class were reclassified from the Automotive and Related Group to the Food Dealers Group.
Iowa’s Retail Sales Tax Repor ng
Data Notes and Defini ons
FY 2016 Retail Trade Analysis Report Page 19
Defini ons of Retail Measures Retail Sales. This term refers to the reported sales of goods and services that are subject to Iowa’s retail sales tax.
Reporting Firms. This value reflects the average number of tax returns filed each quarter during the year, and it serves as a proxy for the number of local retail firms.
Real Sales. "Real" dollar values have been standardized to reflect the purchasing power of a dollar in the current fiscal year, thus removing the effects of price inflation.
Nominal Sales. Nominal sales are the dollar amounts reported in the year the transactions actually took place. These values have not been adjusted for inflation.
Sales Per Firm. Per firm sales are calculated by dividing the annual dollar value of sales by the average number of reporting firms in that year.
Sales Per Capita. Per capita (or “per person”) sales are calculated by dividing the dollar value of sales by the estimated population for the subject place, including group quarters residents.
Expected Per Capita Spending. An expected value for residents’ average spending on taxable retail goods and services is used in the calculation of trade surplus and leakage, trade area capture, and pull factor values. This measure is sensitive to local income levels. For more information on the derivation of this measure, please contact the author.
Sales by Business Group. Sales tabulations by business group describe the types of firms where retail transactions occurred. They do not describe the type of merchandise that was sold.
Cau ons for Interpre ng Reported Sales Data Non-Taxable Goods & Services. The sales information presented in this report provides only a partial picture of retail and service sector activity in Iowa’s communities, due in part to the data reporting practices and sales tax exemptions listed on the previous page.
Large Public Institutions. The presence of large public institutions such as correctional facilities or universities may distort local sales measures, as their institutional purchases are excluded from taxable sales but their residents are included in local population estimates.
Sales or Service Territories. Some cities’ reported sales values may appear inflated if they are home to the business office or headquarters of a firm with a broad, geographically-defined service territory such as a rural telecommunications or cable television provider.
Other Data Notes City-to-County Assignments: The incorporated territory of many Iowa cities crosses the boundaries of two or more counties. For this report, all cities are assigned to the county that contained the greatest percentage of its population in the 2010 Census.
Commuting Flows: Local Employment Dynamics Program, U.S. Census Bureau. These commuting flows describe the place of work and place of residence of wage and salary workers in 2014. Self-employed individuals such as sole proprietors and partners are excluded from these data.
Consumer Spending Patterns: Consumer Expenditure Survey, U.S. Bureau of Labor Statistics.
Consumer Sentiment: Surveys of Consumers, University of Michigan, University of Michigan: Consumer Sentiment©, retrieved from FRED, Federal Reserve Bank of St. Louis https://research.stlouisfed.org/fred2/series/UMCSENT, 04/12/17.
E-commerce Sales: US. Bureau of the Census, E-Commerce Retail Sales as a Percent of Total Sales, retrieved from FRED, Federal Reserve Bank of St. Louis https://research.stlouisfed.org/fred2/series/ECOMPCTSA, 04/12/17.
Employment: U.S. Bureau of Economic Analysis (annual) and U.S. Bureau of Labor Statistics (monthly). Employment includes full-time and part-time wage and salary jobs, with all jobs counted equally.
Household Income and Poverty: Small Area Income and Poverty Estimates, U.S. Census Bureau.
Inflation Rate: Midwest Region Consumer Price Index for All Urban Consumers, All Items, U.S. Bureau of Labor Statistics.
Average Wages and Salaries per Job: U.S. Bureau of Economic Analysis.
Population: Iowa State University estimates, based on data released through the Population Estimates Program, U.S. Census Bureau. With each annual data release, the U.S. Census Bureau may revise its estimates from prior years. This report incorporates the most recently available estimates and revisions. Population-based statistics published in this report may not reconcile with those appearing in earlier retail trade analysis reports. In most cases, the discrepancies are minor.
Price Deflators: Except where otherwise noted in this report, the dollar values for all retail sales and personal income data have been adjusted for inflation using the Implicit Price Deflator for Personal Consumption Expenditures published by the U.S. Bureau of Economic Analysis.
Unemployment: Local Area Unemployment Statistics, U.S. Bureau of Labor Statistics.
ISU Department of Economics Page 20
Peer Group 1-4 Ci es and Their 2010 Census Popula on Size
1 Altoona................... 14,541 Coralville................ 18,907 Marion.................... 34,768 Ames....................... 58,965 Council Bluffs......... 62,230 North Liberty........... 13,374
Bettendorf.............. 33,217 Des Moines............ 203,433 Urbandale............... 39,463 Cedar Falls.............. 39,260 Dubuque................. 57,637 Waterloo................. 68,406 Cedar Rapids.......... 126,326 Iowa City................. 67,862 Waukee.................. 13,790 Clive........................ 15,447 Johnston................. 17,278 West Des Moines... 56,609
2 Boone..................... 12,661 Indianola................. 14,782 Oskaloosa............... 11,463 Burlington............... 25,663 Keokuk.................... 10,780 Ottumwa................. 25,023 Carroll..................... 10,103 Marshalltown......... 27,552 Pella........................ 10,352 Clinton.................... 26,885 Mason City............. 28,079 Spencer................... 11,233 Fort Dodge.............. 25,206 Muscatine............... 22,886 Storm Lake.............. 10,600 Fort Madison.......... 11,051 Newton................... 15,254
3
Albia....................... 3,766 Fairfield.................. 9,464 Onawa.................... 2,998 Algona.................... 5,560 Forest City.............. 4,151 Orange City............ 6,004 Atlantic................... 7,112 Garner..................... 3,129 Osage..................... 3,619 Bloomfield.............. 2,640 Grinnell................... 9,218 Osceola.................. 4,929 Camanche............... 4,448 Hampton................. 4,461 Red Oak.................. 5,742 Centerville.............. 5,528 Harlan..................... 5,106 Rock Rapids............ 2,549 Chariton.................. 4,321 Hawarden............... 2,546 Rock Valley............. 3,354 Charles City............ 7,652 Humboldt................ 4,690 Sheldon................... 5,188 Cherokee................ 5,253 Independence......... 5,966 Shenandoah............ 5,150 Clarinda.................. 5,572 Iowa Falls............... 5,238 Sibley...................... 2,798 Clarion.................... 2,850 Jefferson................. 4,345 Sioux Center........... 7,048 Clear Lake............... 7,777 Jesup....................... 2,520 Spirit Lake............... 4,840 Cresco..................... 3,868 Knoxville................. 7,313 Tama....................... 2,877 Creston................... 7,834 Madrid.................... 2,543 Tipton..................... 3,221 Decorah.................. 8,127 Manchester............ 5,179 Waukon.................. 3,897 Denison.................. 8,298 Maquoketa............. 6,141 Webster City........... 8,070 De Witt................... 5,322 Marengo................. 2,528 West Burlington..... 2,968 Eagle Grove............ 3,583 Milford.................... 2,898 West Liberty........... 3,736 Eldora..................... 2,732 Mount Pleasant...... 8,668 Williamsburg.......... 3,068 Emmetsburg........... 3,904 New Hampton........ 3,571 Wilton..................... 2,802 Estherville............... 6,360 Oelwein.................. 6,415
4
Adel........................ 3,682 Grimes.................... 8,246 Perry....................... 7,702
Asbury..................... 4,170 Hiawatha................ 7,024 Polk City.................. 3,418 Belle Plaine............ 2,534 Huxley..................... 3,317 Robins..................... 3,142 Bondurant............... 3,860 Le Claire................. 3,765 Sergeant Bluff......... 4,227 Carlisle................... 3,876 Le Mars................... 9,826 Story City................ 3,431 Carter Lake............. 3,785 Missouri Valley....... 2,838 Vinton..................... 5,257 Dyersville................ 4,058 Monticello.............. 3,796 Washington............ 7,266 Eldridge.................. 5,651 Mount Vernon....... 4,506 Waverly.................. 9,874 Evansdale............... 4,751 Nevada................... 6,798 Windsor Heights..... 4,860 Glenwood............... 5,269 Norwalk.................. 8,945 Winterset................ 5,190
Ankeny.................... 45,582 Davenport............... 99,685 Sioux City................ 82,684
Anamosa................. 5,533 Grundy Center........ 2,706 Pleasant Hill........... 8,785
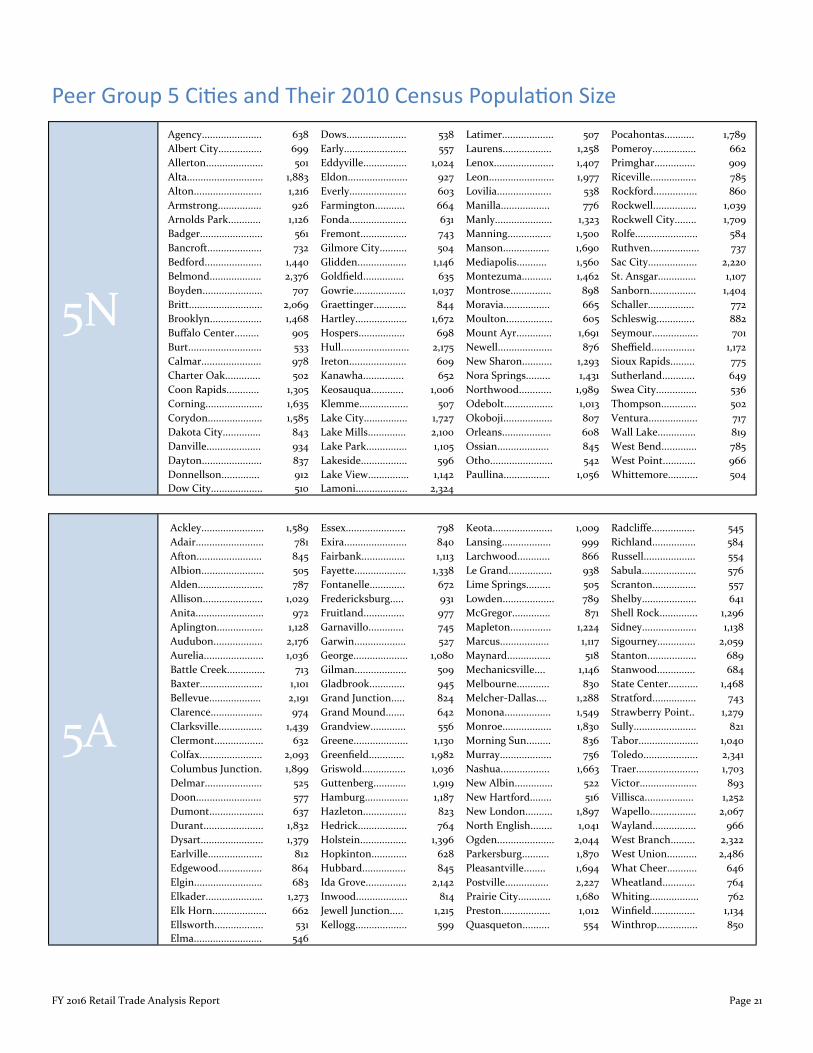
FY 2016 Retail Trade Analysis Report Page 21
Peer Group 5 Ci es and Their 2010 Census Popula on Size
5N
Agency...................... 638 Dows...................... 538 Latimer................... 507 Pocahontas........... 1,789 Albert City................ 699 Early....................... 557 Laurens.................. 1,258 Pomeroy................ 662 Allerton..................... 501 Eddyville................ 1,024 Lenox...................... 1,407 Primghar............... 909 Alta............................ 1,883 Eldon...................... 927 Leon........................ 1,977 Riceville................. 785 Alton......................... 1,216 Everly..................... 603 Lovilia.................... 538 Rockford................ 860 Armstrong................ 926 Farmington........... 664 Manilla.................. 776 Rockwell................ 1,039 Arnolds Park............ 1,126 Fonda..................... 631 Manly..................... 1,323 Rockwell City........ 1,709 Badger....................... 561 Fremont................. 743 Manning................ 1,500 Rolfe....................... 584 Bancroft.................... 732 Gilmore City.......... 504 Manson................. 1,690 Ruthven.................. 737 Bedford..................... 1,440 Glidden.................. 1,146 Mediapolis........... 1,560 Sac City.................. 2,220 Belmond................... 2,376 Goldfield............... 635 Montezuma........... 1,462 St. Ansgar.............. 1,107 Boyden...................... 707 Gowrie................... 1,037 Montrose............... 898 Sanborn................. 1,404 Britt........................... 2,069 Graettinger............ 844 Moravia................. 665 Schaller................. 772 Brooklyn................... 1,468 Hartley................... 1,672 Moulton................. 605 Schleswig.............. 882 Buffalo Center......... 905 Hospers................. 698 Mount Ayr............. 1,691 Seymour................. 701 Burt........................... 533 Hull......................... 2,175 Newell.................... 876 Sheffield................ 1,172 Calmar...................... 978 Ireton..................... 609 New Sharon........... 1,293 Sioux Rapids......... 775 Charter Oak............. 502 Kanawha............... 652 Nora Springs......... 1,431 Sutherland............ 649 Coon Rapids............ 1,305 Keosauqua............ 1,006 Northwood............ 1,989 Swea City............... 536 Corning..................... 1,635 Klemme.................. 507 Odebolt.................. 1,013 Thompson............. 502 Corydon.................... 1,585 Lake City................ 1,727 Okoboji.................. 807 Ventura.................. 717 Dakota City.............. 843 Lake Mills.............. 2,100 Orleans.................. 608 Wall Lake.............. 819 Danville.................... 934 Lake Park............... 1,105 Ossian................... 845 West Bend............. 785 Dayton...................... 837 Lakeside................. 596 Otho....................... 542 West Point............ 966 Donnellson.............. 912 Lake View............... 1,142 Paullina................. 1,056 Whittemore........... 504 Dow City................... 510 Lamoni................... 2,324
5A
Ackley....................... 1,589 Essex...................... 798 Keota...................... 1,009 Radcliffe................ 545 Adair......................... 781 Exira....................... 840 Lansing.................. 999 Richland................ 584 Afton........................ 845 Fairbank................ 1,113 Larchwood............ 866 Russell................... 554 Albion....................... 505 Fayette................... 1,338 Le Grand................ 938 Sabula.................... 576 Alden........................ 787 Fontanelle............. 672 Lime Springs......... 505 Scranton................ 557 Allison...................... 1,029 Fredericksburg..... 931 Lowden................... 789 Shelby.................... 641 Anita......................... 972 Fruitland............... 977 McGregor.............. 871 Shell Rock.............. 1,296 Aplington................. 1,128 Garnavillo............. 745 Mapleton............... 1,224 Sidney.................... 1,138 Audubon.................. 2,176 Garwin................... 527 Marcus.................. 1,117 Sigourney.............. 2,059 Aurelia...................... 1,036 George.................... 1,080 Maynard................ 518 Stanton.................. 689 Battle Creek.............. 713 Gilman................... 509 Mechanicsville.... 1,146 Stanwood.............. 684 Baxter....................... 1,101 Gladbrook............. 945 Melbourne............ 830 State Center........... 1,468 Bellevue................... 2,191 Grand Junction..... 824 Melcher-Dallas.... 1,288 Stratford................ 743 Clarence................... 974 Grand Mound....... 642 Monona................. 1,549 Strawberry Point.. 1,279
Colfax....................... 2,093 Greenfield............. 1,982 Murray................... 756 Toledo.................... 2,341 Columbus Junction. 1,899 Griswold................ 1,036 Nashua.................. 1,663 Traer....................... 1,703 Delmar..................... 525 Guttenberg............ 1,919 New Albin.............. 522 Victor..................... 893 Doon........................ 577 Hamburg................ 1,187 New Hartford........ 516 Villisca.................. 1,252 Dumont.................... 637 Hazleton................ 823 New London.......... 1,897 Wapello................. 2,067 Durant...................... 1,832 Hedrick.................. 764 North English........ 1,041 Wayland................ 966 Dysart....................... 1,379 Holstein................. 1,396 Ogden..................... 2,044 West Branch......... 2,322 Earlville.................... 812 Hopkinton............. 628 Parkersburg.......... 1,870 West Union........... 2,486 Edgewood................ 864 Hubbard................ 845 Pleasantville........ 1,694 What Cheer........... 646 Elgin......................... 683 Ida Grove............... 2,142 Postville................ 2,227 Wheatland............ 764 Elkader..................... 1,273 Inwood................... 814 Prairie City............ 1,680 Whiting.................. 762 Elk Horn.................... 662 Jewell Junction..... 1,215 Preston.................. 1,012 Winfield................ 1,134 Ellsworth.................. 531 Kellogg................... 599 Quasqueton.......... 554 Winthrop............... 850 Elma......................... 546
Clermont.................. 632 Greene.................... 1,130 Morning Sun......... 836 Tabor...................... 1,040 Clarksville................ 1,439 Grandview............. 556 Monroe.................. 1,830 Sully....................... 821
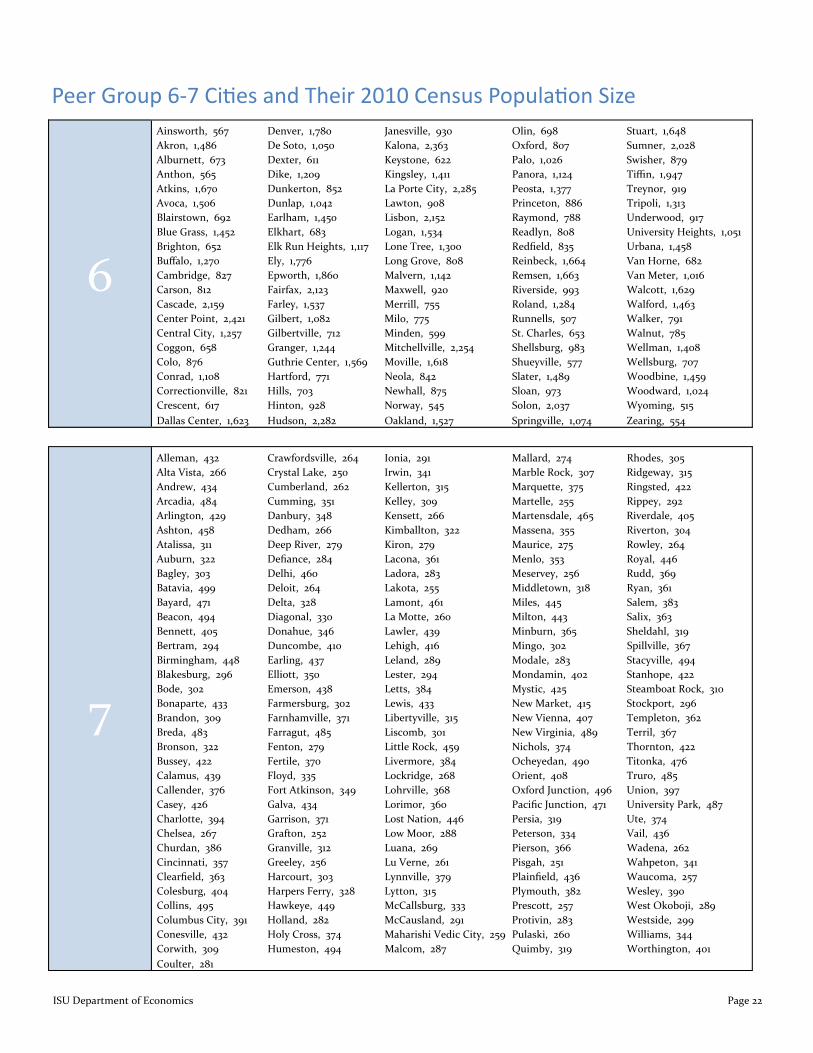
ISU Department of Economics Page 22
Peer Group 6-7 Ci es and Their 2010 Census Popula on Size
6
Ainsworth, 567 Denver, 1,780 Janesville, 930 Olin, 698 Stuart, 1,648 Akron, 1,486 De Soto, 1,050 Kalona, 2,363 Oxford, 807 Sumner, 2,028 Alburnett, 673 Dexter, 611 Keystone, 622 Palo, 1,026 Swisher, 879 Anthon, 565 Dike, 1,209 Kingsley, 1,411 Panora, 1,124 Tiffin, 1,947 Atkins, 1,670 Dunkerton, 852 La Porte City, 2,285 Peosta, 1,377 Treynor, 919 Avoca, 1,506 Dunlap, 1,042 Lawton, 908 Princeton, 886 Tripoli, 1,313 Blairstown, 692 Earlham, 1,450 Lisbon, 2,152 Raymond, 788 Underwood, 917 Blue Grass, 1,452 Elkhart, 683 Logan, 1,534 Readlyn, 808 University Heights, 1,051 Brighton, 652 Elk Run Heights, 1,117 Lone Tree, 1,300 Redfield, 835 Urbana, 1,458 Buffalo, 1,270 Ely, 1,776 Long Grove, 808 Reinbeck, 1,664 Van Horne, 682 Cambridge, 827 Epworth, 1,860 Malvern, 1,142 Remsen, 1,663 Van Meter, 1,016 Carson, 812 Fairfax, 2,123 Maxwell, 920 Riverside, 993 Walcott, 1,629
Center Point, 2,421 Gilbert, 1,082 Milo, 775 Runnells, 507 Walker, 791 Central City, 1,257 Gilbertville, 712 Minden, 599 St. Charles, 653 Walnut, 785 Coggon, 658 Granger, 1,244 Mitchellville, 2,254 Shellsburg, 983 Wellman, 1,408 Colo, 876 Guthrie Center, 1,569 Moville, 1,618 Shueyville, 577 Wellsburg, 707 Conrad, 1,108 Hartford, 771 Neola, 842 Slater, 1,489 Woodbine, 1,459 Correctionville, 821 Hills, 703 Newhall, 875 Sloan, 973 Woodward, 1,024 Crescent, 617 Hinton, 928 Norway, 545 Solon, 2,037 Wyoming, 515 Dallas Center, 1,623 Hudson, 2,282 Oakland, 1,527 Springville, 1,074 Zearing, 554
7
Alleman, 432 Crawfordsville, 264 Ionia, 291 Mallard, 274 Rhodes, 305 Alta Vista, 266 Crystal Lake, 250 Irwin, 341 Marble Rock, 307 Ridgeway, 315 Andrew, 434 Cumberland, 262 Kellerton, 315 Marquette, 375 Ringsted, 422 Arcadia, 484 Cumming, 351 Kelley, 309 Martelle, 255 Rippey, 292 Arlington, 429 Danbury, 348 Kensett, 266 Martensdale, 465 Riverdale, 405 Ashton, 458 Dedham, 266 Kimballton, 322 Massena, 355 Riverton, 304 Atalissa, 311 Deep River, 279 Kiron, 279 Maurice, 275 Rowley, 264 Auburn, 322 Defiance, 284 Lacona, 361 Menlo, 353 Royal, 446 Bagley, 303 Delhi, 460 Ladora, 283 Meservey, 256 Rudd, 369 Batavia, 499 Deloit, 264 Lakota, 255 Middletown, 318 Ryan, 361 Bayard, 471 Delta, 328 Lamont, 461 Miles, 445 Salem, 383 Beacon, 494 Diagonal, 330 La Motte, 260 Milton, 443 Salix, 363 Bennett, 405 Donahue, 346 Lawler, 439 Minburn, 365 Sheldahl, 319 Bertram, 294 Duncombe, 410 Lehigh, 416 Mingo, 302 Spillville, 367 Birmingham, 448 Earling, 437 Leland, 289 Modale, 283 Stacyville, 494 Blakesburg, 296 Elliott, 350 Lester, 294 Mondamin, 402 Stanhope, 422 Bode, 302 Emerson, 438 Letts, 384 Mystic, 425 Steamboat Rock, 310 Bonaparte, 433 Farmersburg, 302 Lewis, 433 New Market, 415 Stockport, 296 Brandon, 309 Farnhamville, 371 Libertyville, 315 New Vienna, 407 Templeton, 362 Breda, 483 Farragut, 485 Liscomb, 301 New Virginia, 489 Terril, 367 Bronson, 322 Fenton, 279 Little Rock, 459 Nichols, 374 Thornton, 422 Bussey, 422 Fertile, 370 Livermore, 384 Ocheyedan, 490 Titonka, 476 Calamus, 439 Floyd, 335 Lockridge, 268 Orient, 408 Truro, 485 Callender, 376 Fort Atkinson, 349 Lohrville, 368 Oxford Junction, 496 Union, 397 Casey, 426 Galva, 434 Lorimor, 360 Pacific Junction, 471 University Park, 487 Charlotte, 394 Garrison, 371 Lost Nation, 446 Persia, 319 Ute, 374 Chelsea, 267 Grafton, 252 Low Moor, 288 Peterson, 334 Vail, 436 Churdan, 386 Granville, 312 Luana, 269 Pierson, 366 Wadena, 262 Cincinnati, 357 Greeley, 256 Lu Verne, 261 Pisgah, 251 Wahpeton, 341 Clearfield, 363 Harcourt, 303 Lynnville, 379 Plainfield, 436 Waucoma, 257 Colesburg, 404 Harpers Ferry, 328 Lytton, 315 Plymouth, 382 Wesley, 390 Collins, 495 Hawkeye, 449 McCallsburg, 333 Prescott, 257 West Okoboji, 289 Columbus City, 391 Holland, 282 McCausland, 291 Protivin, 283 Westside, 299 Conesville, 432 Holy Cross, 374 Maharishi Vedic City, 259 Pulaski, 260 Williams, 344 Corwith, 309 Humeston, 494 Malcom, 287 Quimby, 319 Worthington, 401 Coulter, 281
Cascade, 2,159 Farley, 1,537 Merrill, 755 Roland, 1,284 Walford, 1,463
FY 2016 Retail Trade Analysis Report Page 23
175 Heady Hall Iowa State University
Ames, Iowa 50011
For more information about this report, please contact:
Liesl Eathington
Phone: 515-294-2954 Fax: 515-294-0221
E-mail: [email protected]
Iowa State University Department of Economics
For more than three decades, Iowa State University has provided analysis and outreach services to describe retail trade patterns in Iowa’s cities and counties. In producing this report, we acknowledge the pioneering work of Kenneth E. Stone, now Professor Emeritus, in applied community retail trade analysis.
This project was supported with funding from the Iowa Agriculture and Home Economics Experiment Station, the research program directed by the College of Agriculture and Life Sciences at Iowa State University.
Acknowledgements
Frequently-Asked Ques ons
Find these retail reports, along with
other economic and demographic
profiles for Iowa’s communities,
online at:
www.icip.iastate.edu
Iowa State University does not discriminate on the basis of race, color, age, religion, national origin, sexual orientation, gender identity, sex, marital status, disability, or status as a U.S. veteran. Inquiries can be directed to the Director of Equal Opportunity and Diversity, 3680 Beardshear Hall, (515) 294-7612.
Following are some of the most frequently-asked questions about the content of this report:
What happened to the detailed business group sales data for cities? Long-time users of the Iowa State University (ISU) Retail Trade Analysis reports may notice the absence of city-level sales data by type of business. Beginning in Fiscal Year 2009, the Iowa Department of Revenue ceased publication of detailed business group data at the individual city level in its Annual Retail Sales and Use Tax Report. As a consequence, the ISU Retail Trade Analysis reports now provide analysis of business group sales at the county and state levels only. Subject to strict disclosure limitations, the Iowa Department of Revenue may provide detailed categorical sales data for individual cities upon request.
Why do historical data in this report differ from previously-published ISU retail reports? The underlying population and income data used in this report are subject to backward revision by the U.S. Census Bureau and sister agencies, meaning that historical data are revised as new information becomes available. Any revisions to population and income estimates may result in re-statement of per capita retail sales, pull factors, and related measures for prior years. This report incorporates the most recently-revised statistics, and no effort is made to reconcile the historical data with prior versions of the ISU Retail Trade Analysis reports.
Are the retail sales statistics fully comparable over time? Users should note that retail statistics in this report describe only taxable, not total, retail sales. Changes to Iowa’s sales tax laws have redefined the mix of goods and services included within taxable sales transactions over time. Changes in sales tax reporting practices may also complicate analysis of historical trends at the local or statewide level. Notable recent changes include the following:
• Iowa Department of Revenue reassigned more than 10 percent of Iowa’s retailers to different business class codes that better reflect their business focus (FY 2014).
• Iowa Department of Revenue reclassified gasoline stations with convenience stores from the automotive and related group to the food dealers group (FY 2014).
These reclassifications should be noted when comparing sales by business group before and after FY 2014.
Are the pull factors and other retail measures adjusted for differences in local income? Yes. In calculating local pull factor ratios and estimating trade surplus/leakage values, this report incorporates small area income data available from the American Community Survey (ACS), U.S. Census Bureau. The ACS income estimates are spatially-smoothed, then used to derive pull factor and related retail measures that account for variations in local income levels.
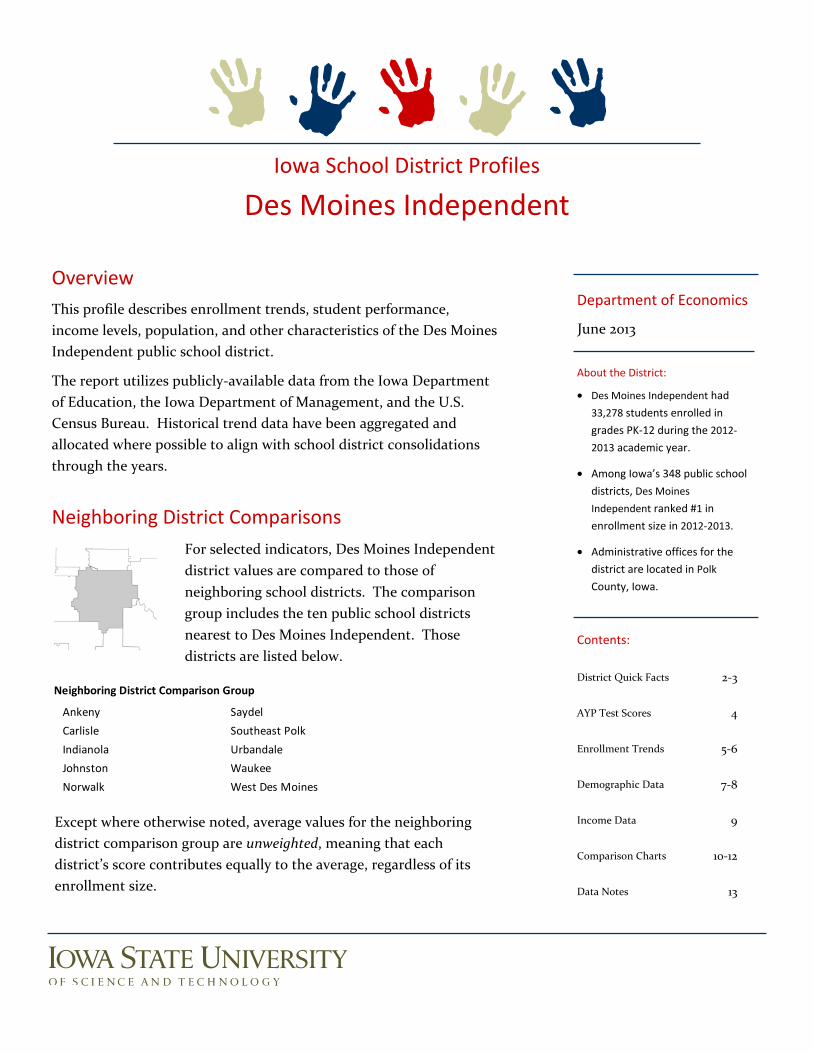
This profile describes enrollment trends, student performance, income levels, population, and other characteristics of the Des Moines Independent public school district.
The report utilizes publicly-available data from the Iowa Department of Education, the Iowa Department of Management, and the U.S. Census Bureau. Historical trend data have been aggregated and allocated where possible to align with school district consolidations through the years.
For selected indicators, Des Moines Independent district values are compared to those of neighboring school districts. The comparison group includes the ten public school districts nearest to Des Moines Independent. Those districts are listed below.
Neighboring District Comparisons
Overview
Iowa School District Profiles
Des Moines Independent
Contents:
District Quick Facts 2-3
AYP Test Scores 4
Enrollment Trends 5-6
Demographic Data 7-8
Income Data 9
Comparison Charts 10-12
Data Notes 13
June 2013
Department of Economics
About the District:
• Des Moines Independent had
33,278 students enrolled in
grades PK-12 during the 2012-
2013 academic year.
• Among Iowa’s 348 public school
districts, Des Moines
Independent ranked #1 in
enrollment size in 2012-2013.
• Administrative offices for the
district are located in Polk
County, Iowa.
Except where otherwise noted, average values for the neighboring district comparison group are unweighted, meaning that each district’s score contributes equally to the average, regardless of its enrollment size.
Ankeny Saydel
Carlisle Southeast Polk
Indianola Urbandale
Johnston Waukee
Norwalk West Des Moines
Neighboring District Comparison Group
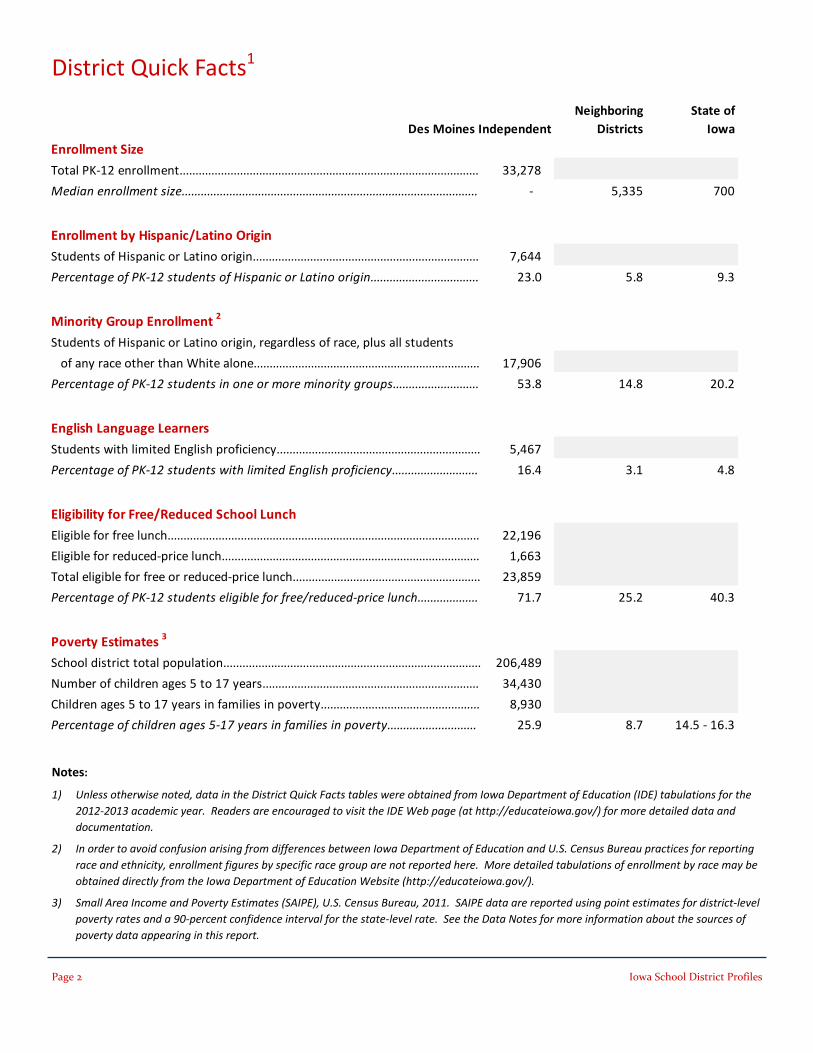
Page 2 Iowa School District Profiles
District Quick Facts1
Notes:
1) Unless otherwise noted, data in the District Quick Facts tables were obtained from Iowa Department of Education (IDE) tabulations for the 2012-2013 academic year. Readers are encouraged to visit the IDE Web page (at http://educateiowa.gov/) for more detailed data and documentation.
2) In order to avoid confusion arising from differences between Iowa Department of Education and U.S. Census Bureau practices for reporting race and ethnicity, enrollment figures by specific race group are not reported here. More detailed tabulations of enrollment by race may be obtained directly from the Iowa Department of Education Website (http://educateiowa.gov/).
3) Small Area Income and Poverty Estimates (SAIPE), U.S. Census Bureau, 2011. SAIPE data are reported using point estimates for district-level poverty rates and a 90-percent confidence interval for the state-level rate. See the Data Notes for more information about the sources of poverty data appearing in this report.
Enrollment Size
Total PK-12 enrollment.............................................................................................. 33,278
Median enrollment size............................................................................................. - 5,335 700
Enrollment by Hispanic/Latino Origin
Students of Hispanic or Latino origin....................................................................... 7,644
Percentage of PK-12 students of Hispanic or Latino origin.................................. 23.0 5.8 9.3
Minority Group Enrollment 2
Students of Hispanic or Latino origin, regardless of race, plus all students
of any race other than White alone....................................................................... 17,906
Percentage of PK-12 students in one or more minority groups........................... 53.8 14.8 20.2
English Language Learners
Students with limited English proficiency................................................................ 5,467
Percentage of PK-12 students with limited English proficiency........................... 16.4 3.1 4.8
Eligibility for Free/Reduced School Lunch
Eligible for free lunch.................................................................................................. 22,196
Eligible for reduced-price lunch................................................................................. 1,663
Total eligible for free or reduced-price lunch........................................................... 23,859
Percentage of PK-12 students eligible for free/reduced-price lunch................... 71.7 25.2 40.3
Poverty Estimates 3
School district total population................................................................................. 206,489
Number of children ages 5 to 17 years.................................................................... 34,430
Children ages 5 to 17 years in families in poverty.................................................. 8,930
Percentage of children ages 5-17 years in families in poverty............................ 25.9 8.7 14.5 - 16.3
Des Moines IndependentNeighboring
DistrictsState of
Iowa
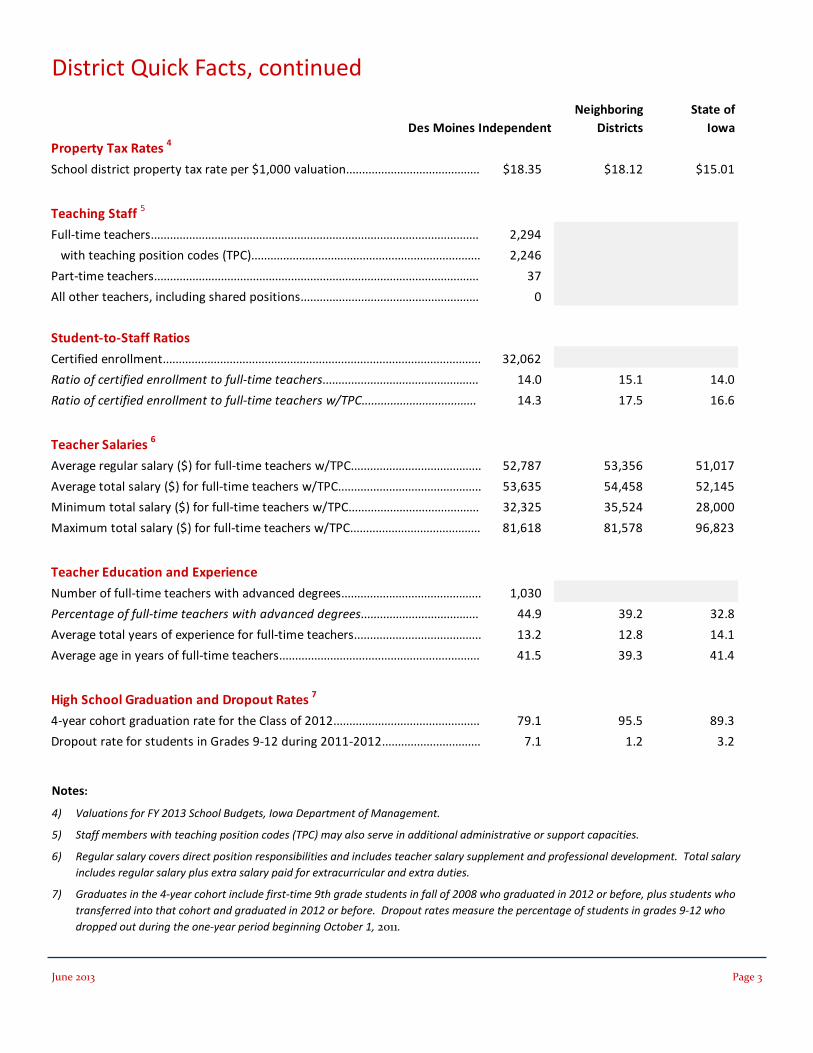
June 2013 Page 3
District Quick Facts, continued
Notes:
4) Valuations for FY 2013 School Budgets, Iowa Department of Management.
5) Staff members with teaching position codes (TPC) may also serve in additional administrative or support capacities.
6) Regular salary covers direct position responsibilities and includes teacher salary supplement and professional development. Total salary includes regular salary plus extra salary paid for extracurricular and extra duties.
7) Graduates in the 4-year cohort include first-time 9th grade students in fall of 2008 who graduated in 2012 or before, plus students who transferred into that cohort and graduated in 2012 or before. Dropout rates measure the percentage of students in grades 9-12 who dropped out during the one-year period beginning October 1, 2011.
Property Tax Rates 4
School district property tax rate per $1,000 valuation.......................................... $18.35 $18.12 $15.01
Teaching Staff 5
Full-time teachers....................................................................................................... 2,294
with teaching position codes (TPC)........................................................................ 2,246
Part-time teachers...................................................................................................... 37
All other teachers, including shared positions........................................................ 0
Student-to-Staff Ratios
Certified enrollment.................................................................................................... 32,062
Ratio of certified enrollment to full-time teachers................................................. 14.0 15.1 14.0
Ratio of certified enrollment to full-time teachers w/TPC.................................... 14.3 17.5 16.6
Teacher Salaries 6
Average regular salary ($) for full-time teachers w/TPC......................................... 52,787 53,356 51,017
Average total salary ($) for full-time teachers w/TPC............................................. 53,635 54,458 52,145
Minimum total salary ($) for full-time teachers w/TPC......................................... 32,325 35,524 28,000
Maximum total salary ($) for full-time teachers w/TPC......................................... 81,618 81,578 96,823
Teacher Education and Experience
Number of full-time teachers with advanced degrees............................................ 1,030
Percentage of full-time teachers with advanced degrees..................................... 44.9 39.2 32.8
Average total years of experience for full-time teachers........................................ 13.2 12.8 14.1
Average age in years of full-time teachers............................................................... 41.5 39.3 41.4
High School Graduation and Dropout Rates 7
4-year cohort graduation rate for the Class of 2012.............................................. 79.1 95.5 89.3
Dropout rate for students in Grades 9-12 during 2011-2012............................... 7.1 1.2 3.2
Des Moines IndependentNeighboring
DistrictsState of
Iowa
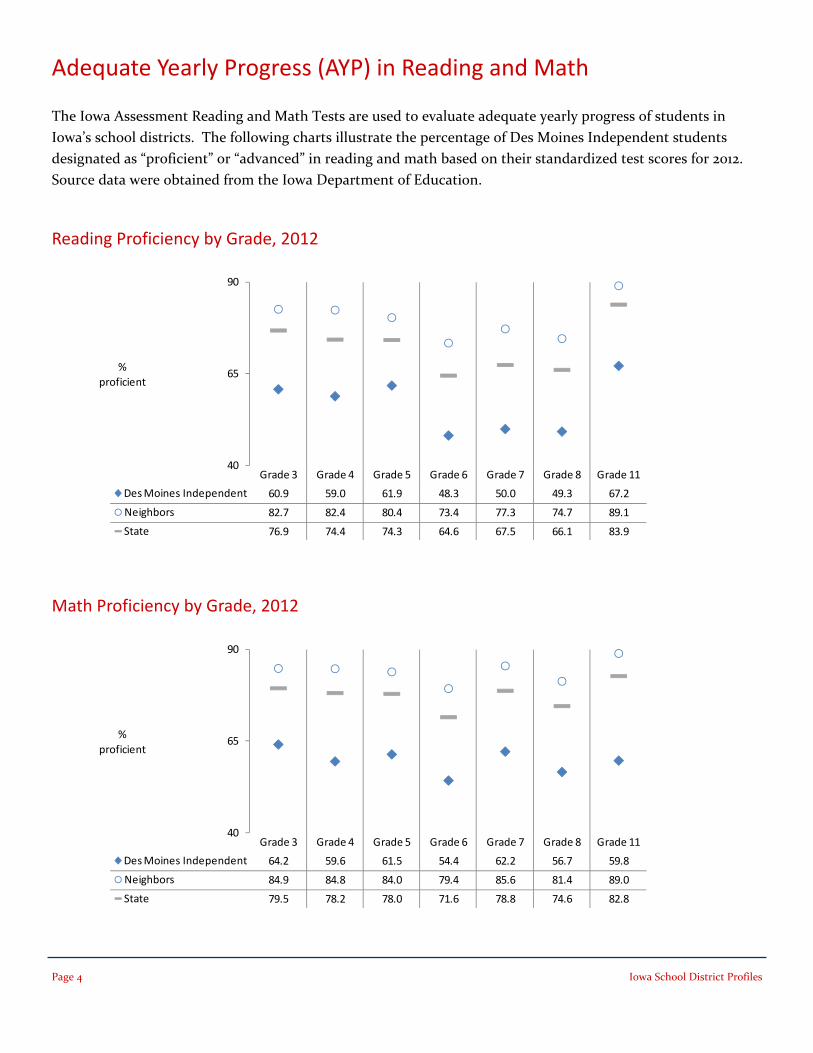
Page 4 Iowa School District Profiles
Math Proficiency by Grade, 2012
The Iowa Assessment Reading and Math Tests are used to evaluate adequate yearly progress of students in Iowa’s school districts. The following charts illustrate the percentage of Des Moines Independent students designated as “proficient” or “advanced” in reading and math based on their standardized test scores for 2012. Source data were obtained from the Iowa Department of Education.
Adequate Yearly Progress (AYP) in Reading and Math
Reading Proficiency by Grade, 2012
40
65
90
Grade 3 Grade 4 Grade 5 Grade 6 Grade 7 Grade 8 Grade 11
Des Moines Independent 60.9 59.0 61.9 48.3 50.0 49.3 67.2
Neighbors 82.7 82.4 80.4 73.4 77.3 74.7 89.1
State 76.9 74.4 74.3 64.6 67.5 66.1 83.9
%proficient
40
65
90
Grade 3 Grade 4 Grade 5 Grade 6 Grade 7 Grade 8 Grade 11
Des Moines Independent 64.2 59.6 61.5 54.4 62.2 56.7 59.8
Neighbors 84.9 84.8 84.0 79.4 85.6 81.4 89.0
State 79.5 78.2 78.0 71.6 78.8 74.6 82.8
%proficient
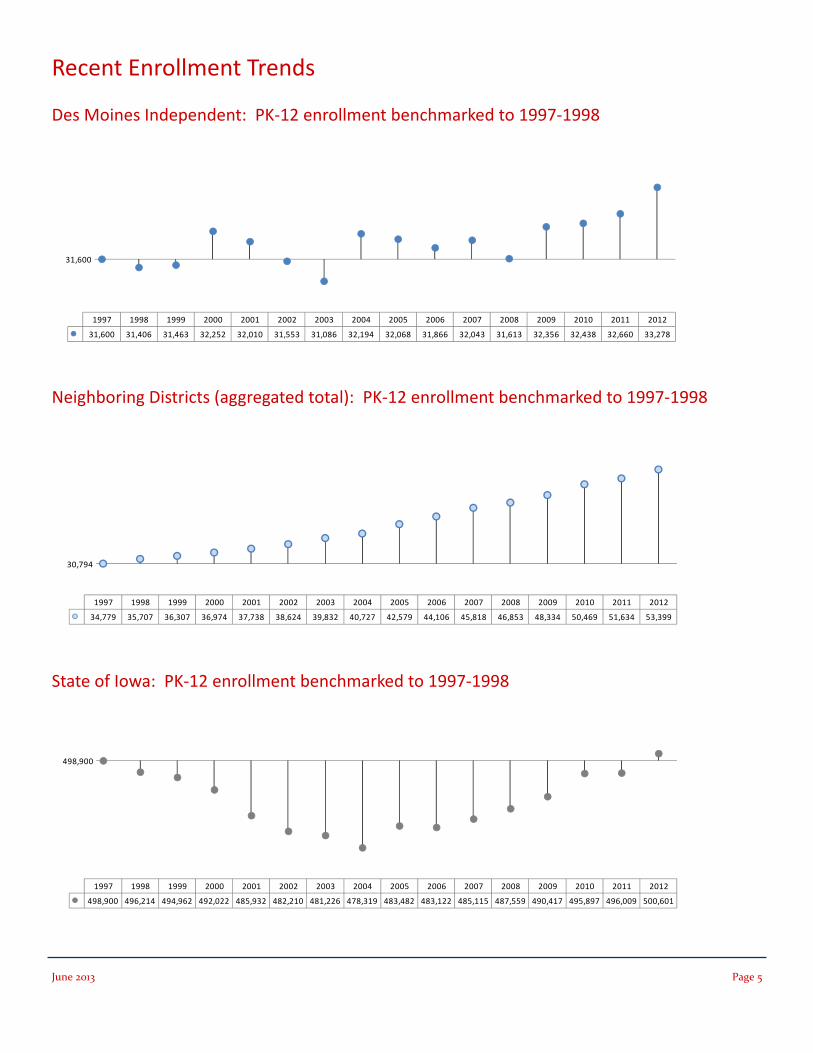
State of Iowa: PK-12 enrollment benchmarked to 1997-1998
Des Moines Independent: PK-12 enrollment benchmarked to 1997-1998
Neighboring Districts (aggregated total): PK-12 enrollment benchmarked to 1997-1998
1997 1998 1999 2000 2001 2002 2003 2004 2005 2006 2007 2008 2009 2010 2011 2012
31,600 31,406 31,463 32,252 32,010 31,553 31,086 32,194 32,068 31,866 32,043 31,613 32,356 32,438 32,660 33,278
31,600
1997 1998 1999 2000 2001 2002 2003 2004 2005 2006 2007 2008 2009 2010 2011 2012
34,779 35,707 36,307 36,974 37,738 38,624 39,832 40,727 42,579 44,106 45,818 46,853 48,334 50,469 51,634 53,399
30,794
1997 1998 1999 2000 2001 2002 2003 2004 2005 2006 2007 2008 2009 2010 2011 2012
498,900 496,214 494,962 492,022 485,932 482,210 481,226 478,319 483,482 483,122 485,115 487,559 490,417 495,897 496,009 500,601
498,900
Recent Enrollment Trends
June 2013 Page 5
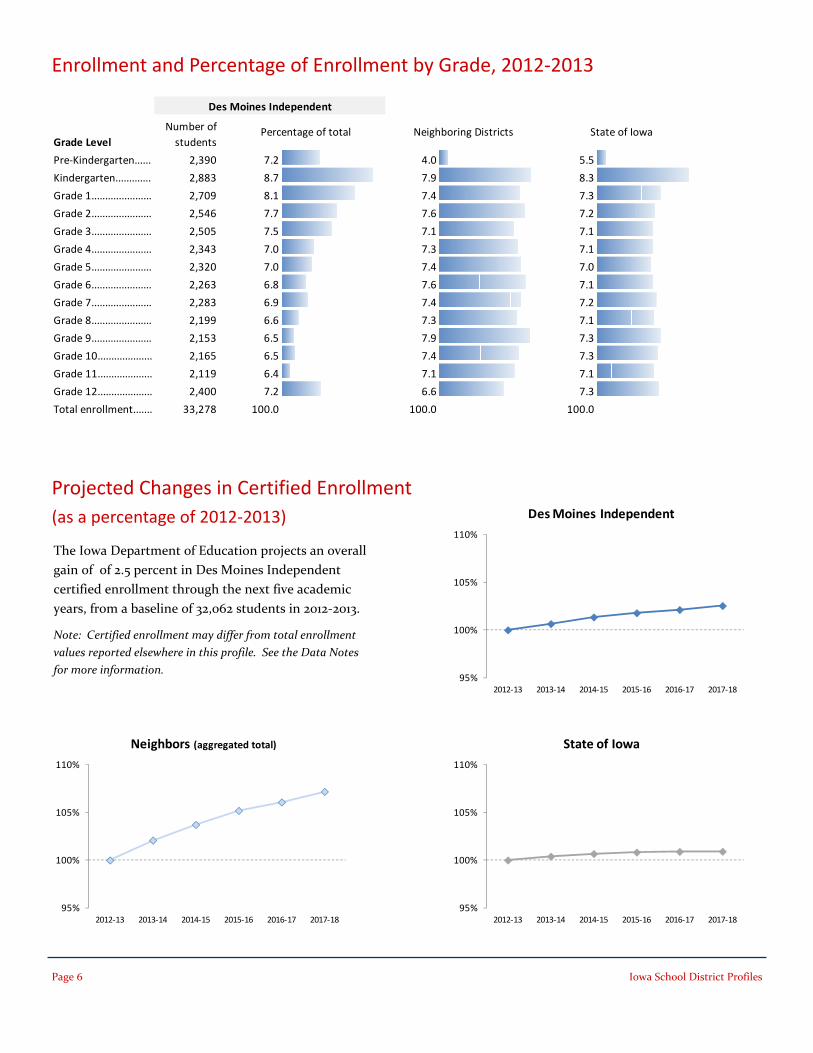
Page 6 Iowa School District Profiles
Projected Changes in Certified Enrollment (as a percentage of 2012-2013)
Enrollment and Percentage of Enrollment by Grade, 2012-2013
Grade Level
Pre-Kindergarten...... 2,390 7.2 4.0 5.5
Kindergarten............. 2,883 8.7 7.9 8.3
Grade 1...................... 2,709 8.1 7.4 7.3
Grade 2...................... 2,546 7.7 7.6 7.2
Grade 3...................... 2,505 7.5 7.1 7.1
Grade 4...................... 2,343 7.0 7.3 7.1
Grade 5...................... 2,320 7.0 7.4 7.0
Grade 6...................... 2,263 6.8 7.6 7.1
Grade 7...................... 2,283 6.9 7.4 7.2
Grade 8...................... 2,199 6.6 7.3 7.1
Grade 9...................... 2,153 6.5 7.9 7.3
Grade 10.................... 2,165 6.5 7.4 7.3
Grade 11.................... 2,119 6.4 7.1 7.1
Grade 12.................... 2,400 7.2 6.6 7.3
Total enrollment....... 33,278 100.0 100.0 100.0
Des Moines Independent
Number of students
Percentage of total Neighboring Districts State of Iowa
95%
100%
105%
110%
2012-13 2013-14 2014-15 2015-16 2016-17 2017-18
Des Moines Independent
95%
100%
105%
110%
2012-13 2013-14 2014-15 2015-16 2016-17 2017-18
Neighbors (aggregated total)
95%
100%
105%
110%
2012-13 2013-14 2014-15 2015-16 2016-17 2017-18
State of Iowa
The Iowa Department of Education projects an overall gain of of 2.5 percent in Des Moines Independent certified enrollment through the next five academic years, from a baseline of 32,062 students in 2012-2013.
Note: Certified enrollment may differ from total enrollment values reported elsewhere in this profile. See the Data Notes for more information.
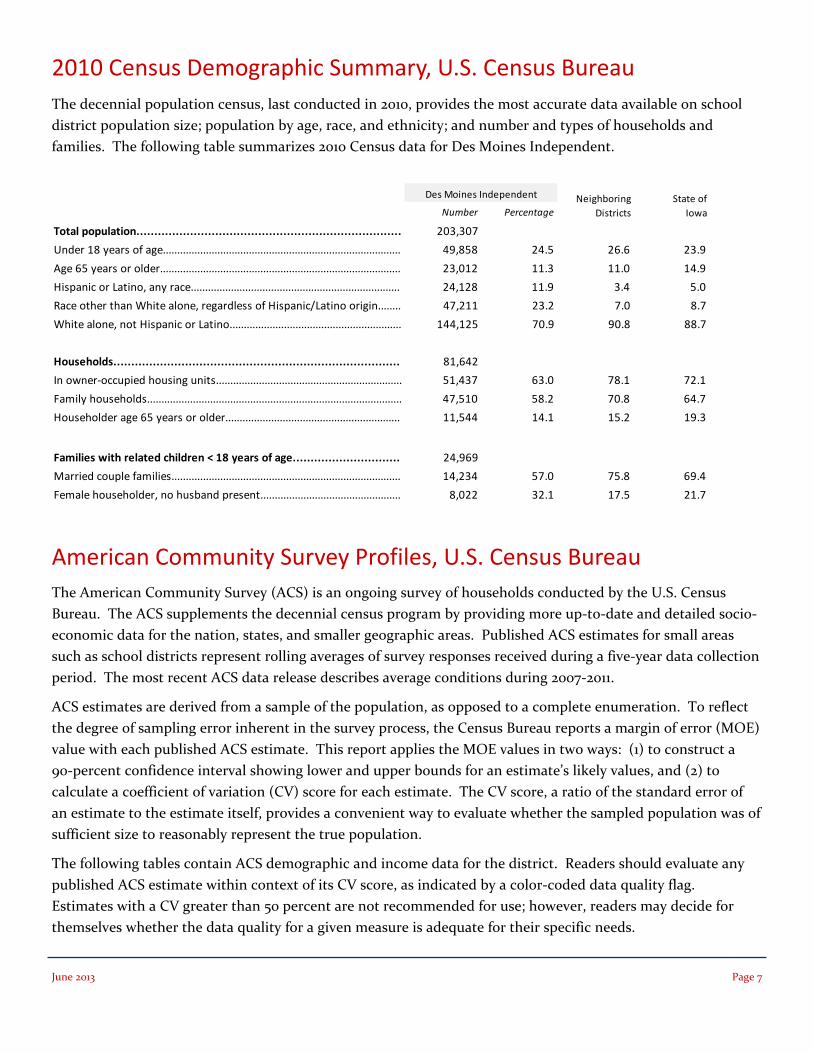
The decennial population census, last conducted in 2010, provides the most accurate data available on school district population size; population by age, race, and ethnicity; and number and types of households and families. The following table summarizes 2010 Census data for Des Moines Independent.
American Community Survey Profiles, U.S. Census Bureau
2010 Census Demographic Summary, U.S. Census Bureau
The American Community Survey (ACS) is an ongoing survey of households conducted by the U.S. Census Bureau. The ACS supplements the decennial census program by providing more up-to-date and detailed socio-economic data for the nation, states, and smaller geographic areas. Published ACS estimates for small areas such as school districts represent rolling averages of survey responses received during a five-year data collection period. The most recent ACS data release describes average conditions during 2007-2011.
ACS estimates are derived from a sample of the population, as opposed to a complete enumeration. To reflect the degree of sampling error inherent in the survey process, the Census Bureau reports a margin of error (MOE) value with each published ACS estimate. This report applies the MOE values in two ways: (1) to construct a 90-percent confidence interval showing lower and upper bounds for an estimate’s likely values, and (2) to calculate a coefficient of variation (CV) score for each estimate. The CV score, a ratio of the standard error of an estimate to the estimate itself, provides a convenient way to evaluate whether the sampled population was of sufficient size to reasonably represent the true population.
The following tables contain ACS demographic and income data for the district. Readers should evaluate any published ACS estimate within context of its CV score, as indicated by a color-coded data quality flag. Estimates with a CV greater than 50 percent are not recommended for use; however, readers may decide for themselves whether the data quality for a given measure is adequate for their specific needs.
Number Percentage
Total population.......................................................................... 203,307
Under 18 years of age................................................................................... 49,858 24.5 26.6 23.9
Age 65 years or older.................................................................................... 23,012 11.3 11.0 14.9
Hispanic or Latino, any race......................................................................... 24,128 11.9 3.4 5.0
Race other than White alone, regardless of Hispanic/Latino origin........ 47,211 23.2 7.0 8.7
White alone, not Hispanic or Latino............................................................ 144,125 70.9 90.8 88.7
Households................................................................................ 81,642
In owner-occupied housing units................................................................. 51,437 63.0 78.1 72.1
Family households......................................................................................... 47,510 58.2 70.8 64.7
Householder age 65 years or older............................................................. 11,544 14.1 15.2 19.3
Families with related children < 18 years of age.............................. 24,969
Married couple families................................................................................ 14,234 57.0 75.8 69.4
Female householder, no husband present................................................. 8,022 32.1 17.5 21.7
State ofIowa
Neighboring Districts
Des Moines Independent
June 2013 Page 7
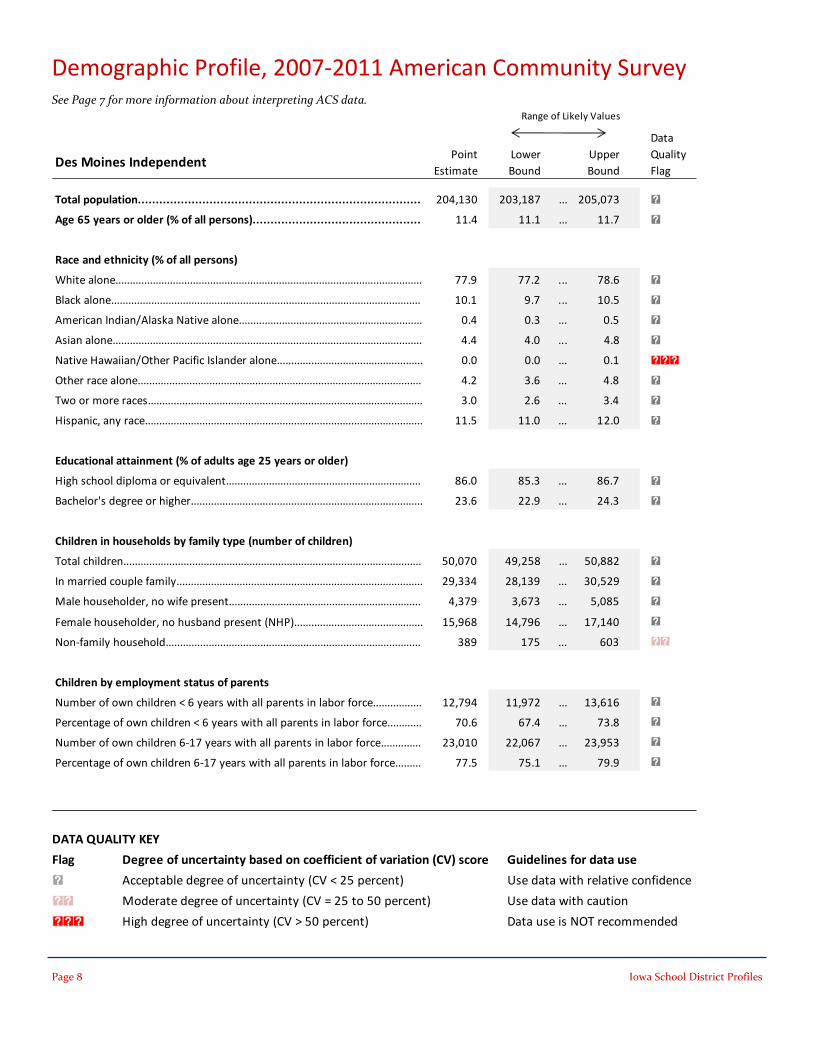
Demographic Profile, 2007-2011 American Community Survey
Des Moines IndependentPoint
EstimateLower Bound
Upper Bound
Total population............................................................................... 204,130 203,187 ... 205,073 c
Age 65 years or older (% of all persons)............................................... 11.4 11.1 ... 11.7 c
Race and ethnicity (% of all persons)
White alone........................................................................................................... 77.9 77.2 ... 78.6 c
Black alone............................................................................................................ 10.1 9.7 ... 10.5 c
American Indian/Alaska Native alone................................................................ 0.4 0.3 ... 0.5 c
Asian alone............................................................................................................ 4.4 4.0 ... 4.8 c
Native Hawaiian/Other Pacific Islander alone................................................... 0.0 0.0 ... 0.1 ccc
Other race alone................................................................................................... 4.2 3.6 ... 4.8 c
Two or more races................................................................................................ 3.0 2.6 ... 3.4 c
Hispanic, any race................................................................................................. 11.5 11.0 ... 12.0 c
Educational attainment (% of adults age 25 years or older)
High school diploma or equivalent.................................................................... 86.0 85.3 ... 86.7 c
Bachelor's degree or higher................................................................................. 23.6 22.9 ... 24.3 c
Children in households by family type (number of children)
Total children........................................................................................................ 50,070 49,258 ... 50,882 c
In married couple family...................................................................................... 29,334 28,139 ... 30,529 c
Male householder, no wife present................................................................... 4,379 3,673 ... 5,085 c
Female householder, no husband present (NHP)............................................. 15,968 14,796 ... 17,140 c
Non-family household......................................................................................... 389 175 ... 603 cc
Children by employment status of parents
Number of own children < 6 years with all parents in labor force................. 12,794 11,972 ... 13,616 c
Percentage of own children < 6 years with all parents in labor force............ 70.6 67.4 ... 73.8 c
Number of own children 6-17 years with all parents in labor force.............. 23,010 22,067 ... 23,953 c
Percentage of own children 6-17 years with all parents in labor force......... 77.5 75.1 ... 79.9 c
Range of Likely Values
Data Quality Flag
See Page 7 for more information about interpreting ACS data.
Page 8 Iowa School District Profiles
DATA QUALITY KEY
Flag Degree of uncertainty based on coefficient of variation (CV) score Guidelines for data use
c Acceptable degree of uncertainty (CV < 25 percent) Use data with relative confidence
cc Moderate degree of uncertainty (CV = 25 to 50 percent) Use data with caution
ccc High degree of uncertainty (CV > 50 percent) Data use is NOT recommended
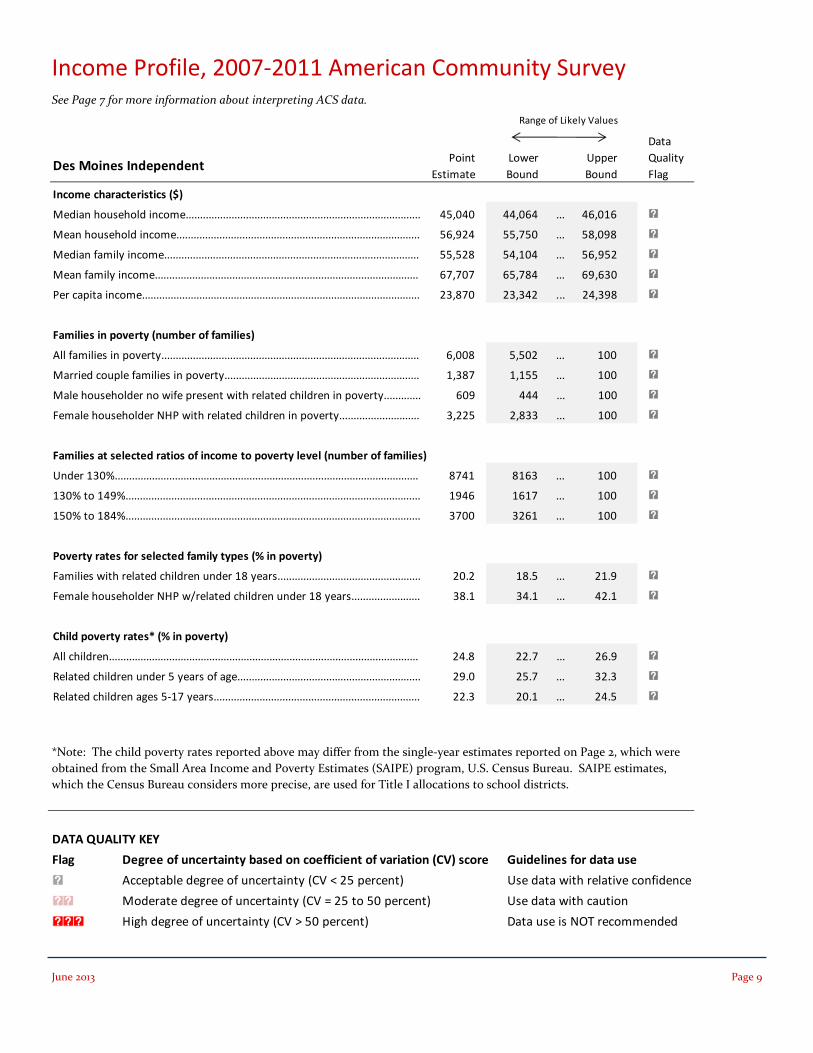
Income Profile, 2007-2011 American Community Survey
*Note: The child poverty rates reported above may differ from the single-year estimates reported on Page 2, which were obtained from the Small Area Income and Poverty Estimates (SAIPE) program, U.S. Census Bureau. SAIPE estimates, which the Census Bureau considers more precise, are used for Title I allocations to school districts.
See Page 7 for more information about interpreting ACS data.
Des Moines IndependentPoint
EstimateLower Bound
Upper Bound
Income characteristics ($)
Median household income.................................................................................. 45,040 44,064 ... 46,016 c
Mean household income..................................................................................... 56,924 55,750 ... 58,098 c
Median family income......................................................................................... 55,528 54,104 ... 56,952 c
Mean family income............................................................................................ 67,707 65,784 ... 69,630 c
Per capita income................................................................................................. 23,870 23,342 ... 24,398 c
Families in poverty (number of families)
All families in poverty.......................................................................................... 6,008 5,502 ... 100 c
Married couple families in poverty.................................................................... 1,387 1,155 ... 100 c
Male householder no wife present with related children in poverty............. 609 444 ... 100 c
Female householder NHP with related children in poverty............................ 3,225 2,833 ... 100 c
Families at selected ratios of income to poverty level (number of families)
Under 130%.......................................................................................................... 8741 8163 ... 100 c
130% to 149%....................................................................................................... 1946 1617 ... 100 c
150% to 184%....................................................................................................... 3700 3261 ... 100 c
Poverty rates for selected family types (% in poverty)
Families with related children under 18 years.................................................. 20.2 18.5 ... 21.9 c
Female householder NHP w/related children under 18 years........................ 38.1 34.1 ... 42.1 c
Child poverty rates* (% in poverty)
All children............................................................................................................ 24.8 22.7 ... 26.9 c
Related children under 5 years of age................................................................ 29.0 25.7 ... 32.3 c
Related children ages 5-17 years........................................................................ 22.3 20.1 ... 24.5 c
Range of Likely Values
Data Quality Flag
June 2013 Page 9
DATA QUALITY KEY
Flag Degree of uncertainty based on coefficient of variation (CV) score Guidelines for data use
c Acceptable degree of uncertainty (CV < 25 percent) Use data with relative confidence
cc Moderate degree of uncertainty (CV = 25 to 50 percent) Use data with caution
ccc High degree of uncertainty (CV > 50 percent) Data use is NOT recommended
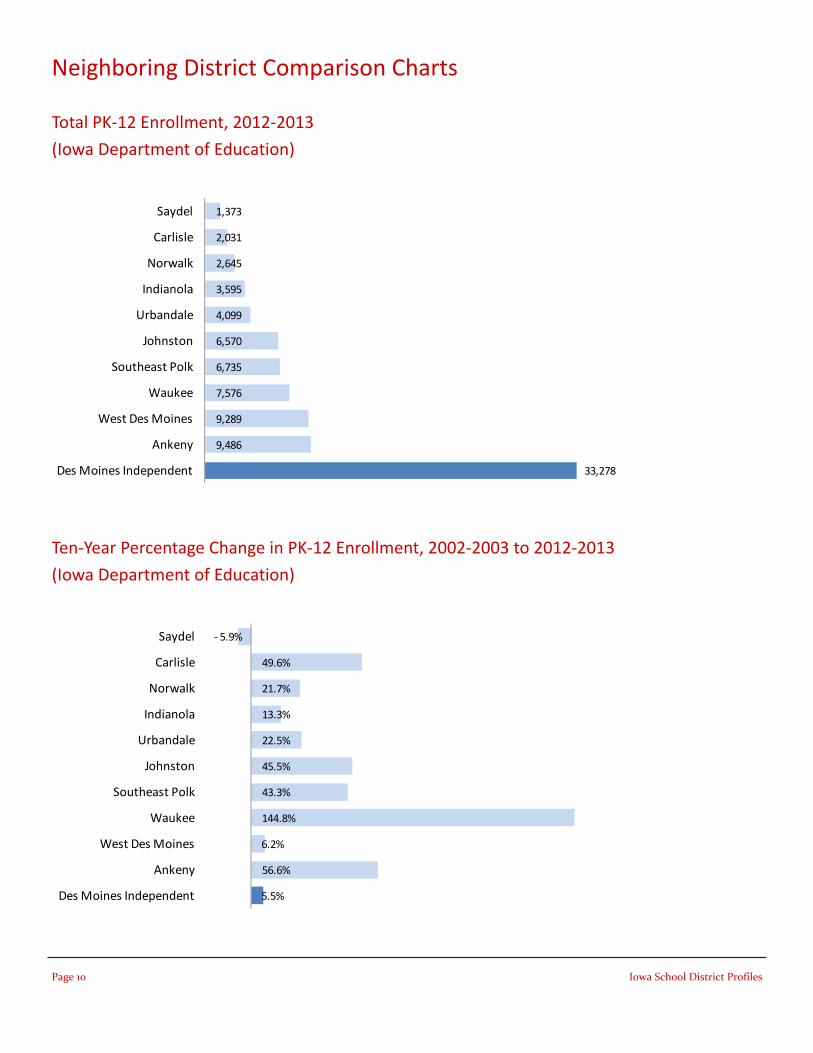
Ten-Year Percentage Change in PK-12 Enrollment, 2002-2003 to 2012-2013
(Iowa Department of Education)
Total PK-12 Enrollment, 2012-2013
(Iowa Department of Education)
Neighboring District Comparison Charts
33,278
9,486
9,289
7,576
6,735
6,570
4,099
3,595
2,645
2,031
1,373
Des Moines Independent
Ankeny
West Des Moines
Waukee
Southeast Polk
Johnston
Urbandale
Indianola
Norwalk
Carlisle
Saydel
5.5%
56.6%
6.2%
144.8%
43.3%
45.5%
22.5%
13.3%
21.7%
49.6%
- 5.9%
Des Moines Independent
Ankeny
West Des Moines
Waukee
Southeast Polk
Johnston
Urbandale
Indianola
Norwalk
Carlisle
Saydel
Page 10 Iowa School District Profiles
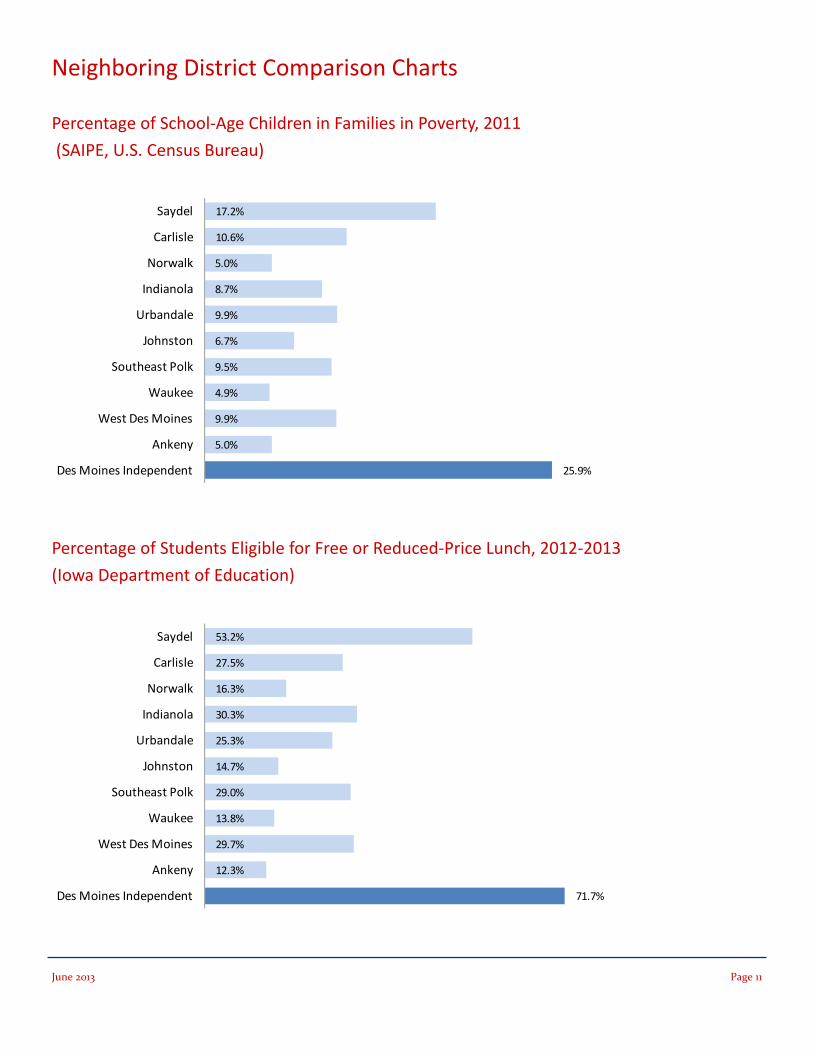
Neighboring District Comparison Charts
25.9%
5.0%
9.9%
4.9%
9.5%
6.7%
9.9%
8.7%
5.0%
10.6%
17.2%
Des Moines Independent
Ankeny
West Des Moines
Waukee
Southeast Polk
Johnston
Urbandale
Indianola
Norwalk
Carlisle
Saydel
71.7%
12.3%
29.7%
13.8%
29.0%
14.7%
25.3%
30.3%
16.3%
27.5%
53.2%
Des Moines Independent
Ankeny
West Des Moines
Waukee
Southeast Polk
Johnston
Urbandale
Indianola
Norwalk
Carlisle
Saydel
Percentage of School-Age Children in Families in Poverty, 2011
(SAIPE, U.S. Census Bureau)
Percentage of Students Eligible for Free or Reduced-Price Lunch, 2012-2013
(Iowa Department of Education)
June 2013 Page 11
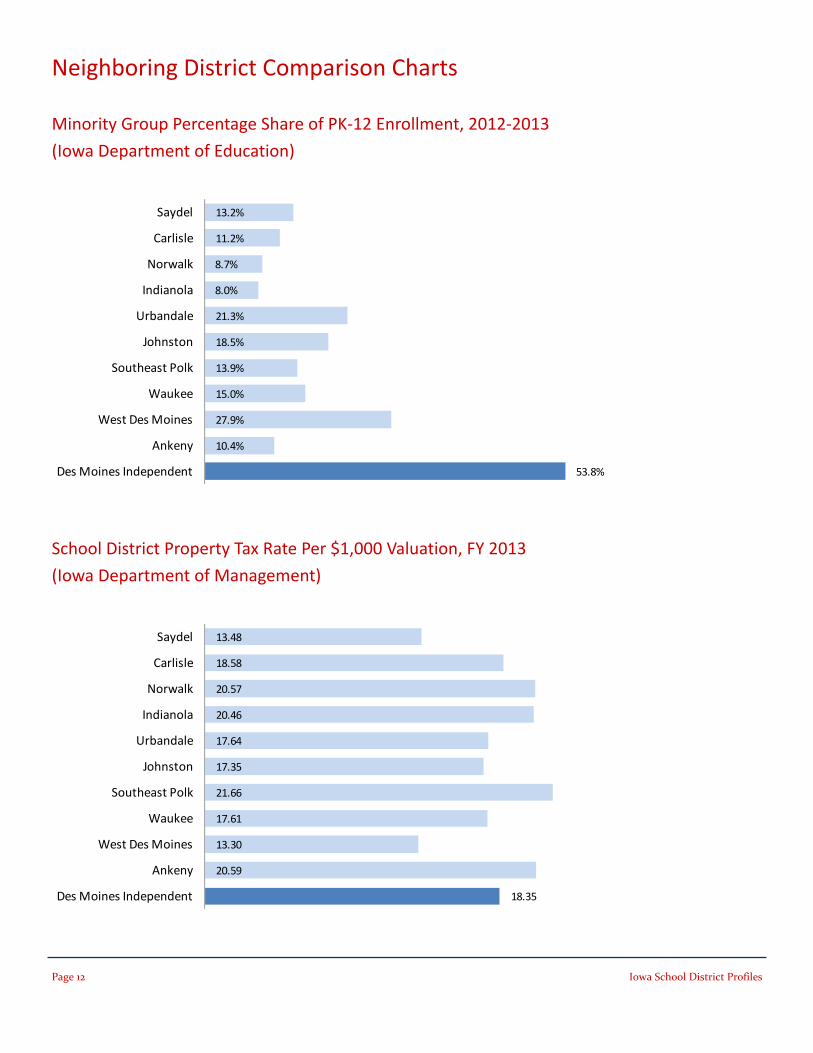
Neighboring District Comparison Charts
School District Property Tax Rate Per $1,000 Valuation, FY 2013
(Iowa Department of Management)
Minority Group Percentage Share of PK-12 Enrollment, 2012-2013
(Iowa Department of Education)
18.35
20.59
13.30
17.61
21.66
17.35
17.64
20.46
20.57
18.58
13.48
Des Moines Independent
Ankeny
West Des Moines
Waukee
Southeast Polk
Johnston
Urbandale
Indianola
Norwalk
Carlisle
Saydel
53.8%
10.4%
27.9%
15.0%
13.9%
18.5%
21.3%
8.0%
8.7%
11.2%
13.2%
Des Moines Independent
Ankeny
West Des Moines
Waukee
Southeast Polk
Johnston
Urbandale
Indianola
Norwalk
Carlisle
Saydel
Page 12 Iowa School District Profiles

Iowa State University does not discriminate on the basis of race, color, age, religion, national origin, sexual orientation, gender identity, sex, marital status, disability, or status as a U.S. veteran. Inquiries can be directed to the Director of Equal Opportunity and Diversity, 3680 Beardshear Hall, (515) 294-7612.
Iowa Community Indicators Program Liesl Eathington 175 Heady Hall Ames, Iowa 50011
• Adequate Yearly Progress (AYP), teaching staff, and student data such as eligibility for Free or Reduced School Lunch and English language proficiency were obtained from the Iowa Department of Education.
• Property tax rates were obtained from the Iowa Department of Management.
• Poverty data were obtained from the Small Area Income and Poverty Estimates (SAIPE) and American Community Survey programs, both
• Current and historical enrollment data were obtained from the Iowa Department of Education’s Basic Educational Data Survey (BEDS) tabulations. These values may differ from certified enrollment totals, which are used for allocation of state funding and other administrative purposes.
• Projected enrollment data, describing expected short-term changes in certified enrollment, were obtained from the Iowa Department of Education.
Phone: 515-294-2954 Fax: 515-294-0592 E-mail: [email protected]
Data Notes and Sources
www.icip.iastate.edu
Iowa State University
Department of Economics
administered by the U.S. Census Bureau. The SAIPE estimates are preferred for official reporting of student poverty rates and for allocation of Title I funding. The ACS data provide additional detail to help characterize poverty levels among individuals and families within the district.
• Other population and income data were obtained from the 2010 Census and the American Community Survey, U.S. Census Bureau.
This profile describes enrollment trends, student performance, income levels, population, and other characteristics of the Southeast Polk public school district.
The report utilizes publicly-available data from the Iowa Department of Education, the Iowa Department of Management, and the U.S. Census Bureau. Historical trend data have been aggregated and allocated where possible to align with school district consolidations through the years.
For selected indicators, Southeast Polk district values are compared to those of neighboring school districts. The comparison group includes the ten public school districts nearest to Southeast Polk. Those districts are listed below.
Neighboring District Comparisons
Overview
Iowa School District Profiles
Southeast Polk
Contents:
District Quick Facts 2-3
AYP Test Scores 4
Enrollment Trends 5-6
Demographic Data 7-8
Income Data 9
Comparison Charts 10-12
Data Notes 13
June 2013
Department of Economics
About the District:
• Southeast Polk had 6,735
students enrolled in grades PK-
12 during the 2012-2013
academic year.
• Among Iowa’s 348 public school
districts, Southeast Polk ranked
#13 in enrollment size in 2012-
2013.
• Administrative offices for the
district are located in Polk
County, Iowa.
Except where otherwise noted, average values for the neighboring district comparison group are unweighted, meaning that each district’s score contributes equally to the average, regardless of its enrollment size.
Ankeny Norwalk
Bondurant-Farrar PCM
Carlisle Pleasantville
Colfax-Mingo Saydel
Des Moines Independent West Des Moines
Neighboring District Comparison Group
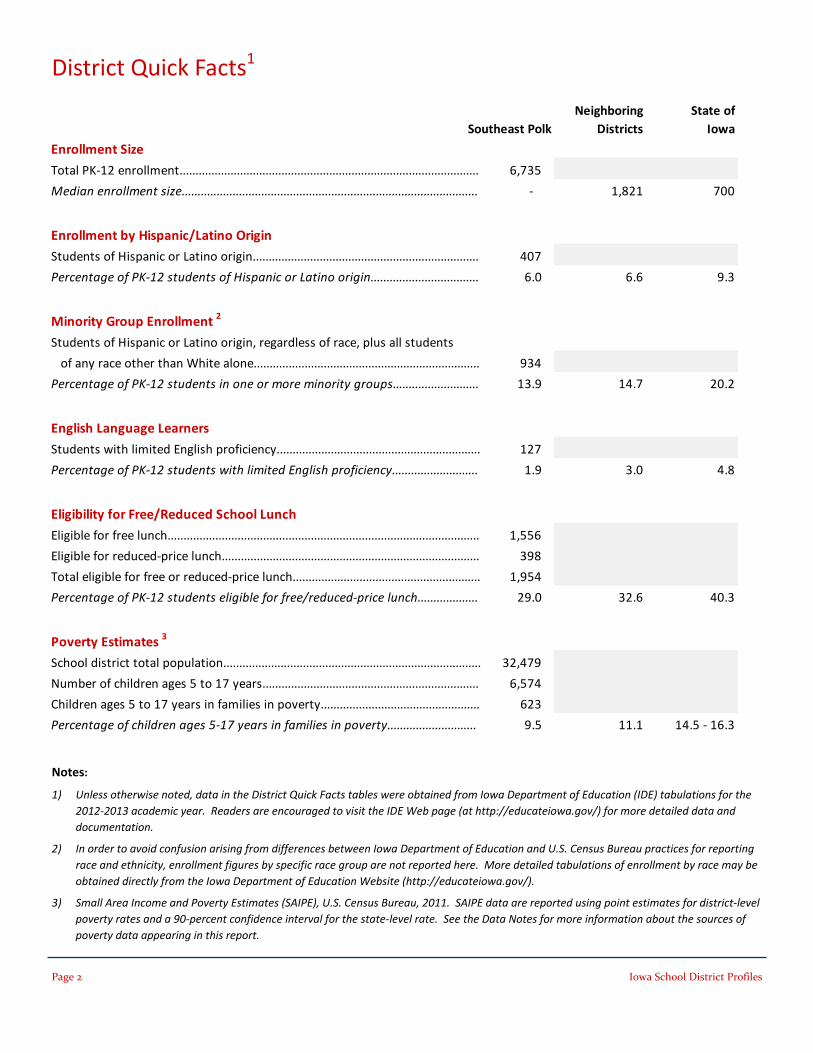
Page 2 Iowa School District Profiles
District Quick Facts1
Notes:
1) Unless otherwise noted, data in the District Quick Facts tables were obtained from Iowa Department of Education (IDE) tabulations for the 2012-2013 academic year. Readers are encouraged to visit the IDE Web page (at http://educateiowa.gov/) for more detailed data and documentation.
2) In order to avoid confusion arising from differences between Iowa Department of Education and U.S. Census Bureau practices for reporting race and ethnicity, enrollment figures by specific race group are not reported here. More detailed tabulations of enrollment by race may be obtained directly from the Iowa Department of Education Website (http://educateiowa.gov/).
3) Small Area Income and Poverty Estimates (SAIPE), U.S. Census Bureau, 2011. SAIPE data are reported using point estimates for district-level poverty rates and a 90-percent confidence interval for the state-level rate. See the Data Notes for more information about the sources of poverty data appearing in this report.
Enrollment Size
Total PK-12 enrollment.............................................................................................. 6,735
Median enrollment size............................................................................................. - 1,821 700
Enrollment by Hispanic/Latino Origin
Students of Hispanic or Latino origin....................................................................... 407
Percentage of PK-12 students of Hispanic or Latino origin.................................. 6.0 6.6 9.3
Minority Group Enrollment 2
Students of Hispanic or Latino origin, regardless of race, plus all students
of any race other than White alone....................................................................... 934
Percentage of PK-12 students in one or more minority groups........................... 13.9 14.7 20.2
English Language Learners
Students with limited English proficiency................................................................ 127
Percentage of PK-12 students with limited English proficiency........................... 1.9 3.0 4.8
Eligibility for Free/Reduced School Lunch
Eligible for free lunch.................................................................................................. 1,556
Eligible for reduced-price lunch................................................................................. 398
Total eligible for free or reduced-price lunch........................................................... 1,954
Percentage of PK-12 students eligible for free/reduced-price lunch................... 29.0 32.6 40.3
Poverty Estimates 3
School district total population................................................................................. 32,479
Number of children ages 5 to 17 years.................................................................... 6,574
Children ages 5 to 17 years in families in poverty.................................................. 623
Percentage of children ages 5-17 years in families in poverty............................ 9.5 11.1 14.5 - 16.3
Southeast PolkNeighboring
DistrictsState of
Iowa

June 2013 Page 3
District Quick Facts, continued
Notes:
4) Valuations for FY 2013 School Budgets, Iowa Department of Management.
5) Staff members with teaching position codes (TPC) may also serve in additional administrative or support capacities.
6) Regular salary covers direct position responsibilities and includes teacher salary supplement and professional development. Total salary includes regular salary plus extra salary paid for extracurricular and extra duties.
7) Graduates in the 4-year cohort include first-time 9th grade students in fall of 2008 who graduated in 2012 or before, plus students who transferred into that cohort and graduated in 2012 or before. Dropout rates measure the percentage of students in grades 9-12 who dropped out during the one-year period beginning October 1, 2011.
Property Tax Rates 4
School district property tax rate per $1,000 valuation.......................................... $21.66 $17.18 $15.01
Teaching Staff 5
Full-time teachers....................................................................................................... 396
with teaching position codes (TPC)........................................................................ 359
Part-time teachers...................................................................................................... 10
All other teachers, including shared positions........................................................ 2
Student-to-Staff Ratios
Certified enrollment.................................................................................................... 6,400
Ratio of certified enrollment to full-time teachers................................................. 16.2 14.2 14.0
Ratio of certified enrollment to full-time teachers w/TPC.................................... 17.8 16.5 16.6
Teacher Salaries 6
Average regular salary ($) for full-time teachers w/TPC......................................... 58,306 48,707 51,017
Average total salary ($) for full-time teachers w/TPC............................................. 58,836 49,368 52,145
Minimum total salary ($) for full-time teachers w/TPC......................................... 32,767 33,927 28,000
Maximum total salary ($) for full-time teachers w/TPC......................................... 87,764 71,868 96,823
Teacher Education and Experience
Number of full-time teachers with advanced degrees............................................ 121
Percentage of full-time teachers with advanced degrees..................................... 30.6 28.7 32.8
Average total years of experience for full-time teachers........................................ 13.1 13.0 14.1
Average age in years of full-time teachers............................................................... 39.9 39.8 41.4
High School Graduation and Dropout Rates 7
4-year cohort graduation rate for the Class of 2012.............................................. 96.2 94.9 89.3
Dropout rate for students in Grades 9-12 during 2011-2012............................... 1.2 1.6 3.2
Southeast PolkNeighboring
DistrictsState of
Iowa
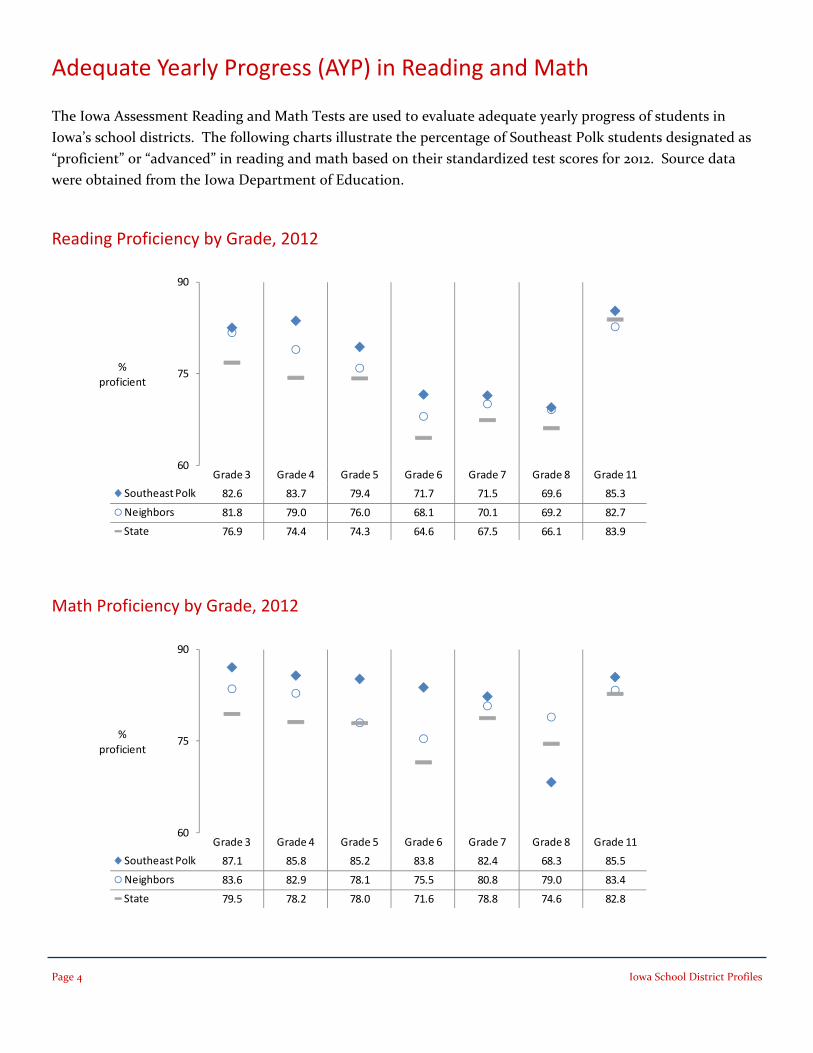
Page 4 Iowa School District Profiles
Math Proficiency by Grade, 2012
The Iowa Assessment Reading and Math Tests are used to evaluate adequate yearly progress of students in Iowa’s school districts. The following charts illustrate the percentage of Southeast Polk students designated as “proficient” or “advanced” in reading and math based on their standardized test scores for 2012. Source data were obtained from the Iowa Department of Education.
Adequate Yearly Progress (AYP) in Reading and Math
Reading Proficiency by Grade, 2012
60
75
90
Grade 3 Grade 4 Grade 5 Grade 6 Grade 7 Grade 8 Grade 11
Southeast Polk 82.6 83.7 79.4 71.7 71.5 69.6 85.3
Neighbors 81.8 79.0 76.0 68.1 70.1 69.2 82.7
State 76.9 74.4 74.3 64.6 67.5 66.1 83.9
%proficient
60
75
90
Grade 3 Grade 4 Grade 5 Grade 6 Grade 7 Grade 8 Grade 11
Southeast Polk 87.1 85.8 85.2 83.8 82.4 68.3 85.5
Neighbors 83.6 82.9 78.1 75.5 80.8 79.0 83.4
State 79.5 78.2 78.0 71.6 78.8 74.6 82.8
%proficient
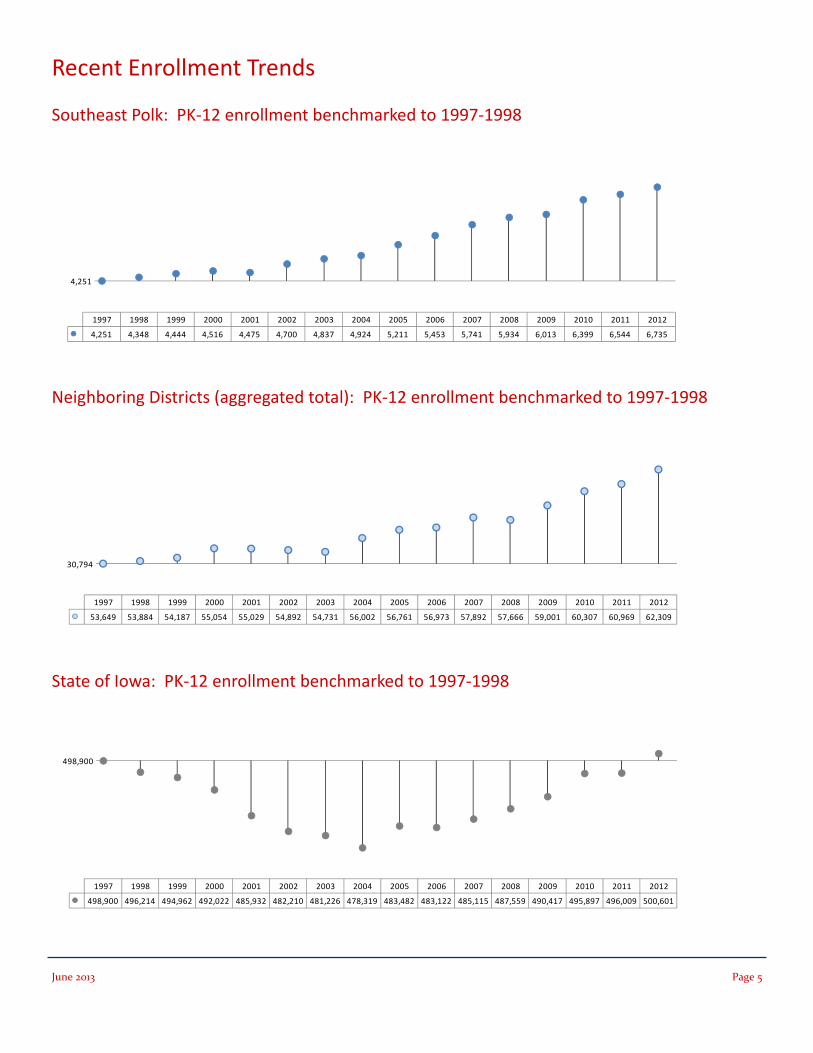
State of Iowa: PK-12 enrollment benchmarked to 1997-1998
Southeast Polk: PK-12 enrollment benchmarked to 1997-1998
Neighboring Districts (aggregated total): PK-12 enrollment benchmarked to 1997-1998
1997 1998 1999 2000 2001 2002 2003 2004 2005 2006 2007 2008 2009 2010 2011 2012
4,251 4,348 4,444 4,516 4,475 4,700 4,837 4,924 5,211 5,453 5,741 5,934 6,013 6,399 6,544 6,735
4,251
1997 1998 1999 2000 2001 2002 2003 2004 2005 2006 2007 2008 2009 2010 2011 2012
53,649 53,884 54,187 55,054 55,029 54,892 54,731 56,002 56,761 56,973 57,892 57,666 59,001 60,307 60,969 62,309
30,794
1997 1998 1999 2000 2001 2002 2003 2004 2005 2006 2007 2008 2009 2010 2011 2012
498,900 496,214 494,962 492,022 485,932 482,210 481,226 478,319 483,482 483,122 485,115 487,559 490,417 495,897 496,009 500,601
498,900
Recent Enrollment Trends
June 2013 Page 5
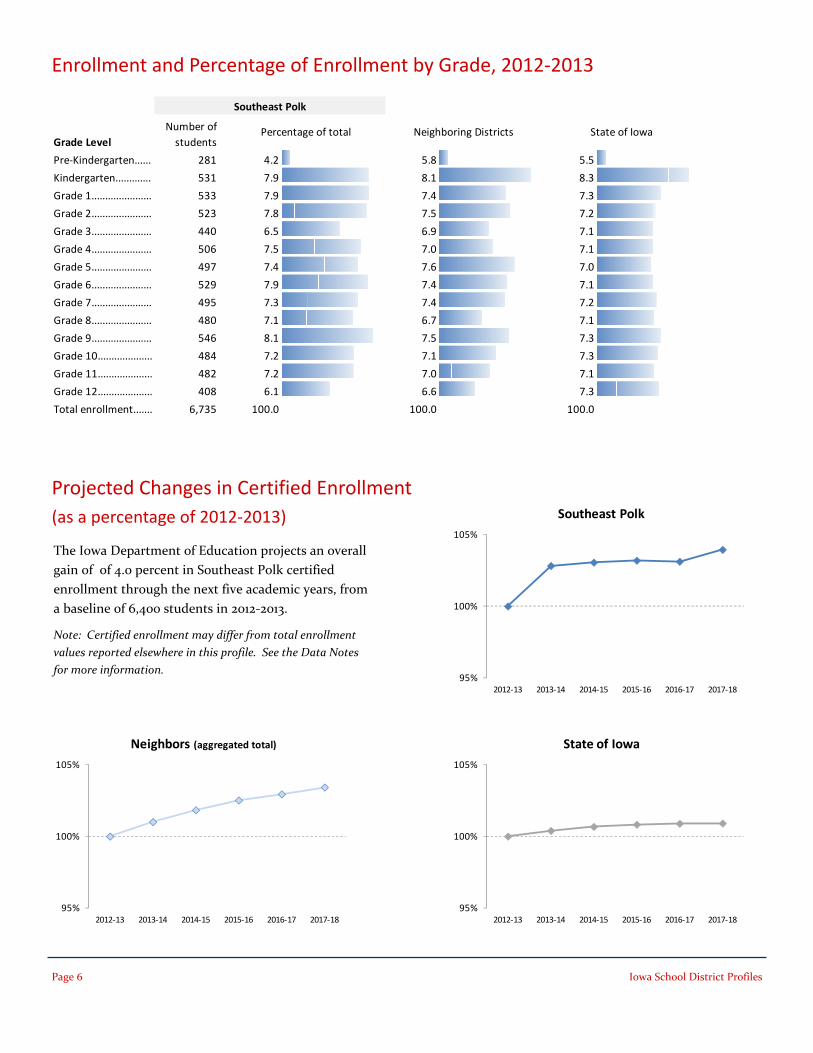
Page 6 Iowa School District Profiles
Projected Changes in Certified Enrollment (as a percentage of 2012-2013)
Enrollment and Percentage of Enrollment by Grade, 2012-2013
Grade Level
Pre-Kindergarten...... 281 4.2 5.8 5.5
Kindergarten............. 531 7.9 8.1 8.3
Grade 1...................... 533 7.9 7.4 7.3
Grade 2...................... 523 7.8 7.5 7.2
Grade 3...................... 440 6.5 6.9 7.1
Grade 4...................... 506 7.5 7.0 7.1
Grade 5...................... 497 7.4 7.6 7.0
Grade 6...................... 529 7.9 7.4 7.1
Grade 7...................... 495 7.3 7.4 7.2
Grade 8...................... 480 7.1 6.7 7.1
Grade 9...................... 546 8.1 7.5 7.3
Grade 10.................... 484 7.2 7.1 7.3
Grade 11.................... 482 7.2 7.0 7.1
Grade 12.................... 408 6.1 6.6 7.3
Total enrollment....... 6,735 100.0 100.0 100.0
Southeast Polk
Number of students
Percentage of total Neighboring Districts State of Iowa
95%
100%
105%
2012-13 2013-14 2014-15 2015-16 2016-17 2017-18
Southeast Polk
95%
100%
105%
2012-13 2013-14 2014-15 2015-16 2016-17 2017-18
Neighbors (aggregated total)
95%
100%
105%
2012-13 2013-14 2014-15 2015-16 2016-17 2017-18
State of Iowa
The Iowa Department of Education projects an overall gain of of 4.0 percent in Southeast Polk certified enrollment through the next five academic years, from a baseline of 6,400 students in 2012-2013.
Note: Certified enrollment may differ from total enrollment values reported elsewhere in this profile. See the Data Notes for more information.
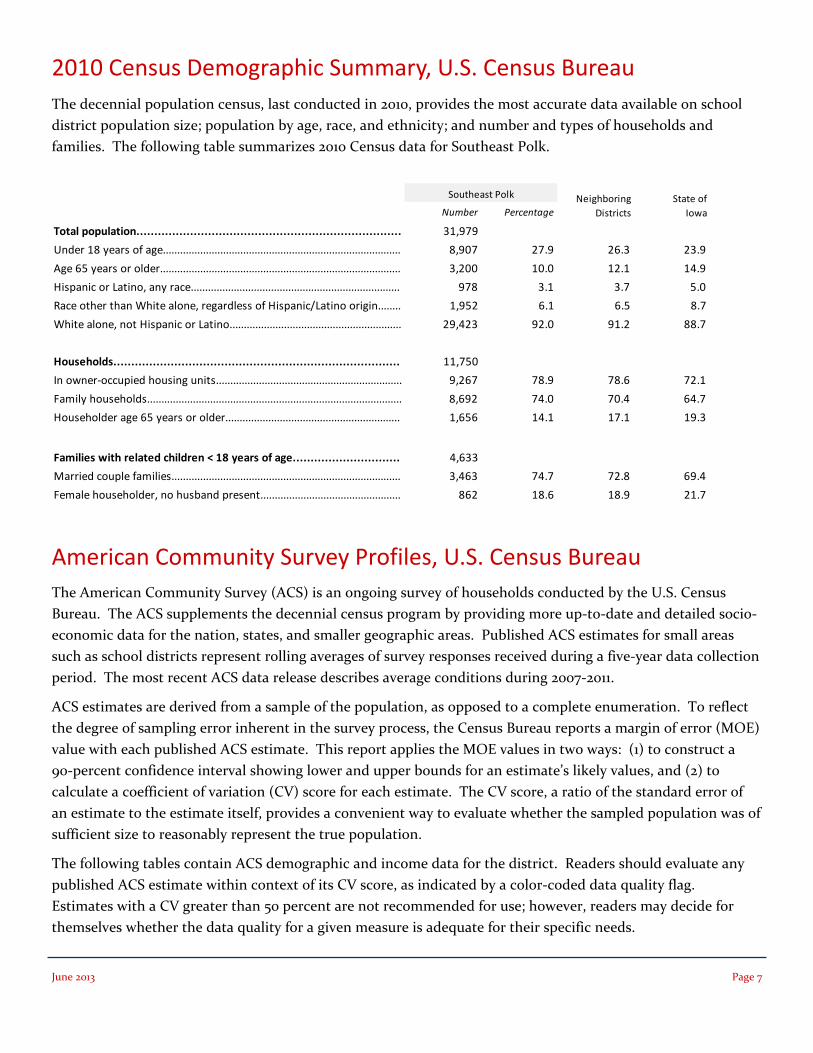
The decennial population census, last conducted in 2010, provides the most accurate data available on school district population size; population by age, race, and ethnicity; and number and types of households and families. The following table summarizes 2010 Census data for Southeast Polk.
American Community Survey Profiles, U.S. Census Bureau
2010 Census Demographic Summary, U.S. Census Bureau
The American Community Survey (ACS) is an ongoing survey of households conducted by the U.S. Census Bureau. The ACS supplements the decennial census program by providing more up-to-date and detailed socio-economic data for the nation, states, and smaller geographic areas. Published ACS estimates for small areas such as school districts represent rolling averages of survey responses received during a five-year data collection period. The most recent ACS data release describes average conditions during 2007-2011.
ACS estimates are derived from a sample of the population, as opposed to a complete enumeration. To reflect the degree of sampling error inherent in the survey process, the Census Bureau reports a margin of error (MOE) value with each published ACS estimate. This report applies the MOE values in two ways: (1) to construct a 90-percent confidence interval showing lower and upper bounds for an estimate’s likely values, and (2) to calculate a coefficient of variation (CV) score for each estimate. The CV score, a ratio of the standard error of an estimate to the estimate itself, provides a convenient way to evaluate whether the sampled population was of sufficient size to reasonably represent the true population.
The following tables contain ACS demographic and income data for the district. Readers should evaluate any published ACS estimate within context of its CV score, as indicated by a color-coded data quality flag. Estimates with a CV greater than 50 percent are not recommended for use; however, readers may decide for themselves whether the data quality for a given measure is adequate for their specific needs.
Number Percentage
Total population.......................................................................... 31,979
Under 18 years of age................................................................................... 8,907 27.9 26.3 23.9
Age 65 years or older.................................................................................... 3,200 10.0 12.1 14.9
Hispanic or Latino, any race......................................................................... 978 3.1 3.7 5.0
Race other than White alone, regardless of Hispanic/Latino origin........ 1,952 6.1 6.5 8.7
White alone, not Hispanic or Latino............................................................ 29,423 92.0 91.2 88.7
Households................................................................................ 11,750
In owner-occupied housing units................................................................. 9,267 78.9 78.6 72.1
Family households......................................................................................... 8,692 74.0 70.4 64.7
Householder age 65 years or older............................................................. 1,656 14.1 17.1 19.3
Families with related children < 18 years of age.............................. 4,633
Married couple families................................................................................ 3,463 74.7 72.8 69.4
Female householder, no husband present................................................. 862 18.6 18.9 21.7
State ofIowa
Neighboring Districts
Southeast Polk
June 2013 Page 7
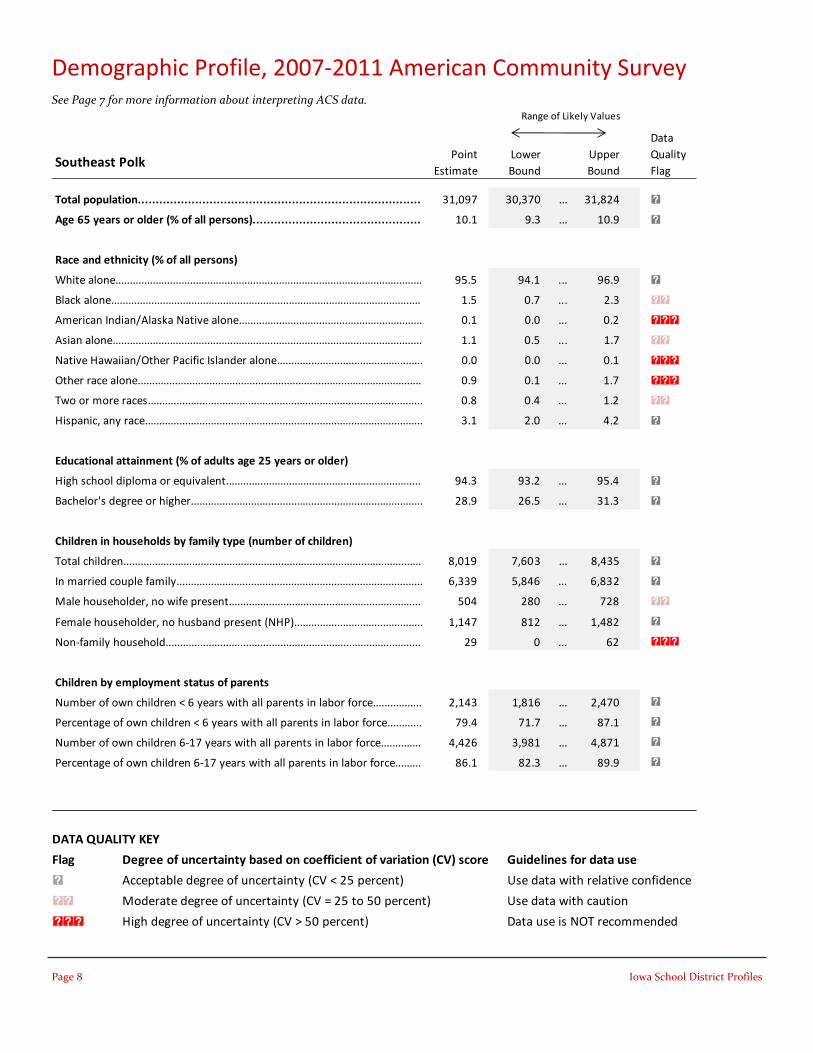
Demographic Profile, 2007-2011 American Community Survey
Southeast PolkPoint
EstimateLower Bound
Upper Bound
Total population............................................................................... 31,097 30,370 ... 31,824 c
Age 65 years or older (% of all persons)............................................... 10.1 9.3 ... 10.9 c
Race and ethnicity (% of all persons)
White alone........................................................................................................... 95.5 94.1 ... 96.9 c
Black alone............................................................................................................ 1.5 0.7 ... 2.3 cc
American Indian/Alaska Native alone................................................................ 0.1 0.0 ... 0.2 ccc
Asian alone............................................................................................................ 1.1 0.5 ... 1.7 cc
Native Hawaiian/Other Pacific Islander alone................................................... 0.0 0.0 ... 0.1 ccc
Other race alone................................................................................................... 0.9 0.1 ... 1.7 ccc
Two or more races................................................................................................ 0.8 0.4 ... 1.2 cc
Hispanic, any race................................................................................................. 3.1 2.0 ... 4.2 c
Educational attainment (% of adults age 25 years or older)
High school diploma or equivalent.................................................................... 94.3 93.2 ... 95.4 c
Bachelor's degree or higher................................................................................. 28.9 26.5 ... 31.3 c
Children in households by family type (number of children)
Total children........................................................................................................ 8,019 7,603 ... 8,435 c
In married couple family...................................................................................... 6,339 5,846 ... 6,832 c
Male householder, no wife present................................................................... 504 280 ... 728 cc
Female householder, no husband present (NHP)............................................. 1,147 812 ... 1,482 c
Non-family household......................................................................................... 29 0 ... 62 ccc
Children by employment status of parents
Number of own children < 6 years with all parents in labor force................. 2,143 1,816 ... 2,470 c
Percentage of own children < 6 years with all parents in labor force............ 79.4 71.7 ... 87.1 c
Number of own children 6-17 years with all parents in labor force.............. 4,426 3,981 ... 4,871 c
Percentage of own children 6-17 years with all parents in labor force......... 86.1 82.3 ... 89.9 c
Range of Likely Values
Data Quality Flag
See Page 7 for more information about interpreting ACS data.
Page 8 Iowa School District Profiles
DATA QUALITY KEY
Flag Degree of uncertainty based on coefficient of variation (CV) score Guidelines for data use
c Acceptable degree of uncertainty (CV < 25 percent) Use data with relative confidence
cc Moderate degree of uncertainty (CV = 25 to 50 percent) Use data with caution
ccc High degree of uncertainty (CV > 50 percent) Data use is NOT recommended
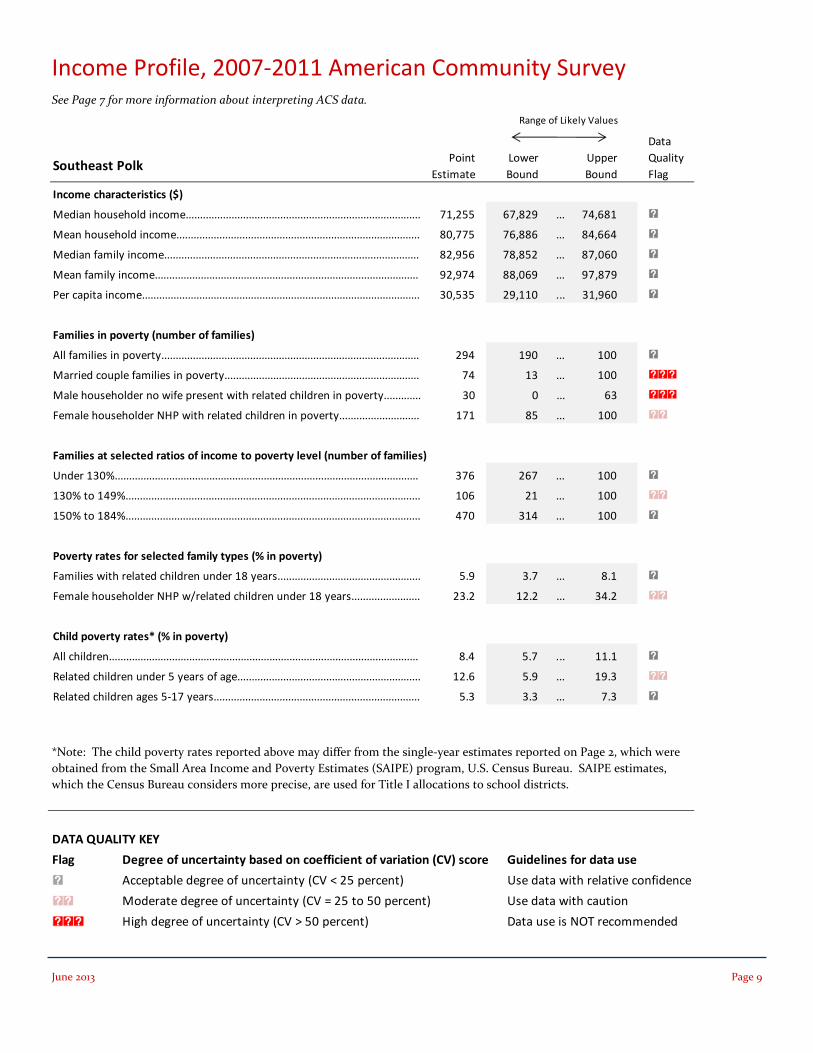
Income Profile, 2007-2011 American Community Survey
*Note: The child poverty rates reported above may differ from the single-year estimates reported on Page 2, which were obtained from the Small Area Income and Poverty Estimates (SAIPE) program, U.S. Census Bureau. SAIPE estimates, which the Census Bureau considers more precise, are used for Title I allocations to school districts.
See Page 7 for more information about interpreting ACS data.
Southeast PolkPoint
EstimateLower Bound
Upper Bound
Income characteristics ($)
Median household income.................................................................................. 71,255 67,829 ... 74,681 c
Mean household income..................................................................................... 80,775 76,886 ... 84,664 c
Median family income......................................................................................... 82,956 78,852 ... 87,060 c
Mean family income............................................................................................ 92,974 88,069 ... 97,879 c
Per capita income................................................................................................. 30,535 29,110 ... 31,960 c
Families in poverty (number of families)
All families in poverty.......................................................................................... 294 190 ... 100 c
Married couple families in poverty.................................................................... 74 13 ... 100 ccc
Male householder no wife present with related children in poverty............. 30 0 ... 63 ccc
Female householder NHP with related children in poverty............................ 171 85 ... 100 cc
Families at selected ratios of income to poverty level (number of families)
Under 130%.......................................................................................................... 376 267 ... 100 c
130% to 149%....................................................................................................... 106 21 ... 100 cc
150% to 184%....................................................................................................... 470 314 ... 100 c
Poverty rates for selected family types (% in poverty)
Families with related children under 18 years.................................................. 5.9 3.7 ... 8.1 c
Female householder NHP w/related children under 18 years........................ 23.2 12.2 ... 34.2 cc
Child poverty rates* (% in poverty)
All children............................................................................................................ 8.4 5.7 ... 11.1 c
Related children under 5 years of age................................................................ 12.6 5.9 ... 19.3 cc
Related children ages 5-17 years........................................................................ 5.3 3.3 ... 7.3 c
Range of Likely Values
Data Quality Flag
June 2013 Page 9
DATA QUALITY KEY
Flag Degree of uncertainty based on coefficient of variation (CV) score Guidelines for data use
c Acceptable degree of uncertainty (CV < 25 percent) Use data with relative confidence
cc Moderate degree of uncertainty (CV = 25 to 50 percent) Use data with caution
ccc High degree of uncertainty (CV > 50 percent) Data use is NOT recommended
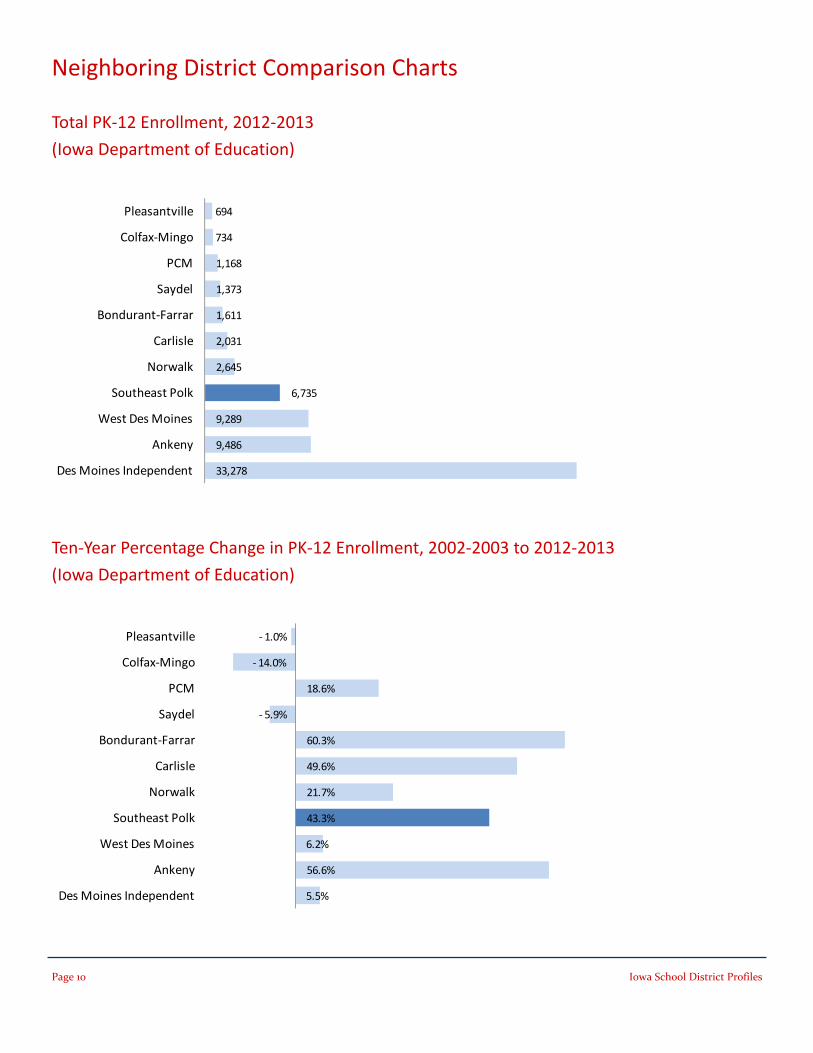
Ten-Year Percentage Change in PK-12 Enrollment, 2002-2003 to 2012-2013
(Iowa Department of Education)
Total PK-12 Enrollment, 2012-2013
(Iowa Department of Education)
Neighboring District Comparison Charts
6,735
33,278
9,486
9,289
2,645
2,031
1,611
1,373
1,168
734
694
Des Moines Independent
Ankeny
West Des Moines
Southeast Polk
Norwalk
Carlisle
Bondurant-Farrar
Saydel
PCM
Colfax-Mingo
Pleasantville
43.3%
5.5%
56.6%
6.2%
21.7%
49.6%
60.3%
- 5.9%
18.6%
- 14.0%
- 1.0%
Des Moines Independent
Ankeny
West Des Moines
Southeast Polk
Norwalk
Carlisle
Bondurant-Farrar
Saydel
PCM
Colfax-Mingo
Pleasantville
Page 10 Iowa School District Profiles
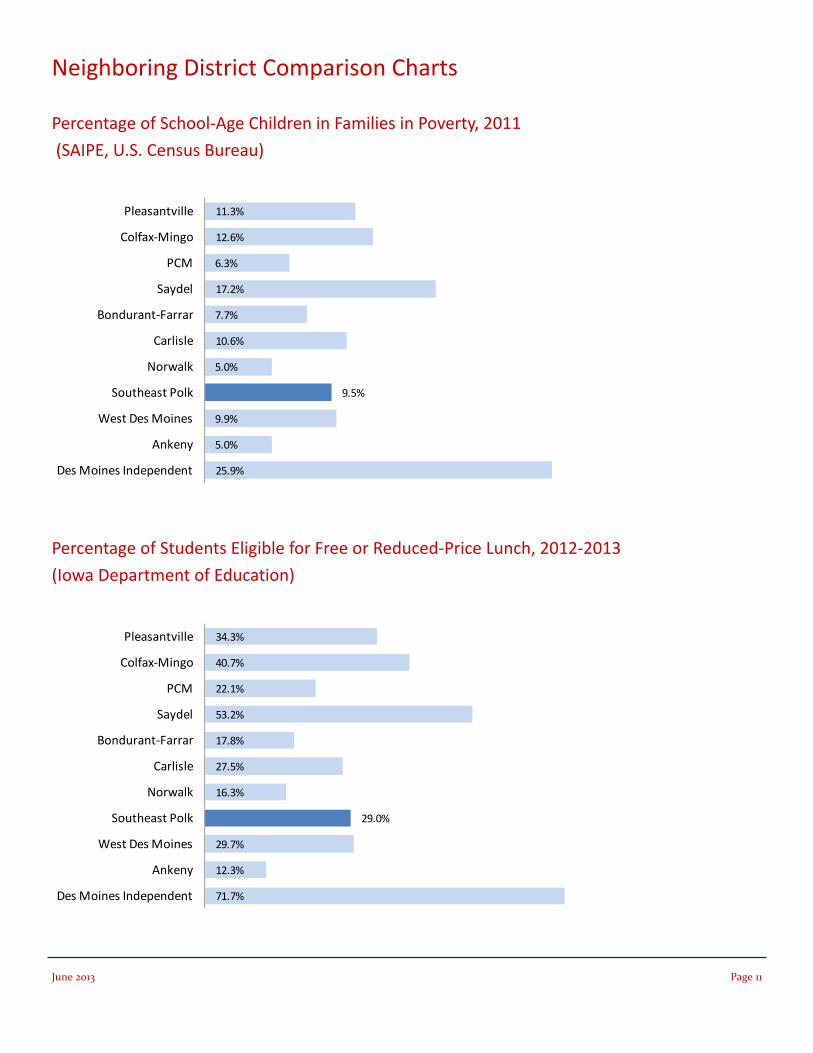
Neighboring District Comparison Charts
9.5%
25.9%
5.0%
9.9%
5.0%
10.6%
7.7%
17.2%
6.3%
12.6%
11.3%
Des Moines Independent
Ankeny
West Des Moines
Southeast Polk
Norwalk
Carlisle
Bondurant-Farrar
Saydel
PCM
Colfax-Mingo
Pleasantville
29.0%
71.7%
12.3%
29.7%
16.3%
27.5%
17.8%
53.2%
22.1%
40.7%
34.3%
Des Moines Independent
Ankeny
West Des Moines
Southeast Polk
Norwalk
Carlisle
Bondurant-Farrar
Saydel
PCM
Colfax-Mingo
Pleasantville
Percentage of School-Age Children in Families in Poverty, 2011
(SAIPE, U.S. Census Bureau)
Percentage of Students Eligible for Free or Reduced-Price Lunch, 2012-2013
(Iowa Department of Education)
June 2013 Page 11
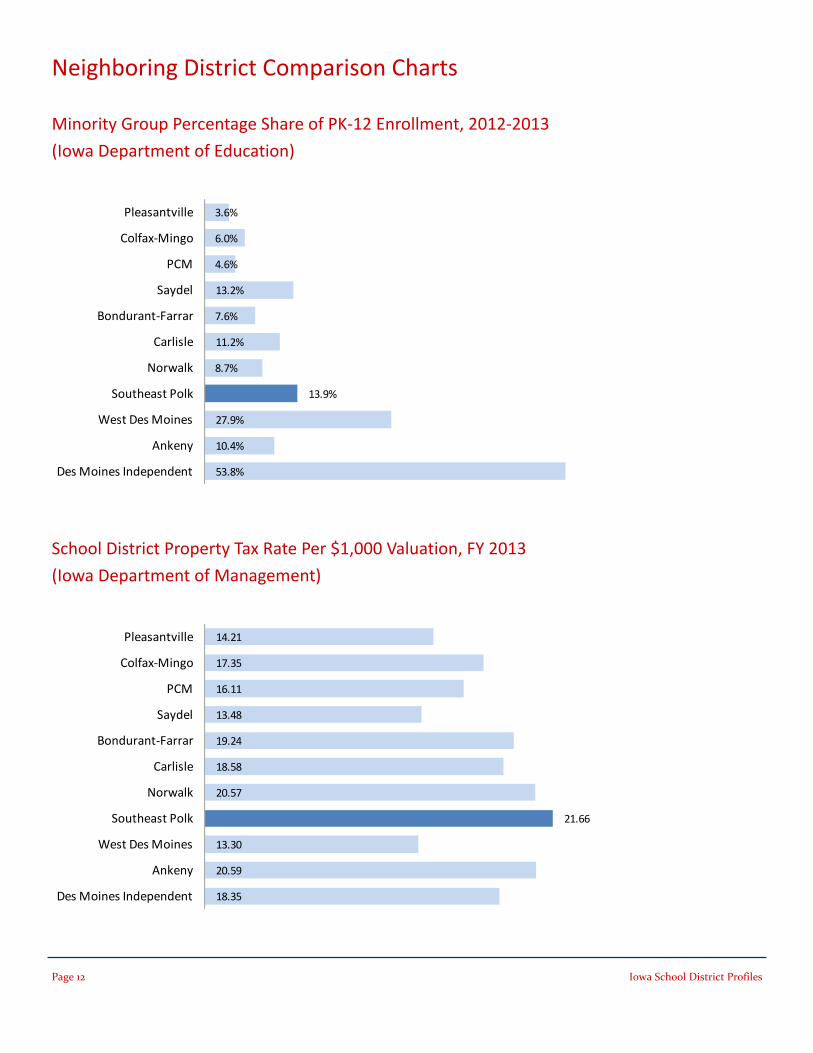
Neighboring District Comparison Charts
School District Property Tax Rate Per $1,000 Valuation, FY 2013
(Iowa Department of Management)
Minority Group Percentage Share of PK-12 Enrollment, 2012-2013
(Iowa Department of Education)
21.66
18.35
20.59
13.30
20.57
18.58
19.24
13.48
16.11
17.35
14.21
Des Moines Independent
Ankeny
West Des Moines
Southeast Polk
Norwalk
Carlisle
Bondurant-Farrar
Saydel
PCM
Colfax-Mingo
Pleasantville
13.9%
53.8%
10.4%
27.9%
8.7%
11.2%
7.6%
13.2%
4.6%
6.0%
3.6%
Des Moines Independent
Ankeny
West Des Moines
Southeast Polk
Norwalk
Carlisle
Bondurant-Farrar
Saydel
PCM
Colfax-Mingo
Pleasantville
Page 12 Iowa School District Profiles
Iowa State University does not discriminate on the basis of race, color, age, religion, national origin, sexual orientation, gender identity, sex, marital status, disability, or status as a U.S. veteran. Inquiries can be directed to the Director of Equal Opportunity and Diversity, 3680 Beardshear Hall, (515) 294-7612.
Iowa Community Indicators Program Liesl Eathington 175 Heady Hall Ames, Iowa 50011
• Adequate Yearly Progress (AYP), teaching staff, and student data such as eligibility for Free or Reduced School Lunch and English language proficiency were obtained from the Iowa Department of Education.
• Property tax rates were obtained from the Iowa Department of Management.
• Poverty data were obtained from the Small Area Income and Poverty Estimates (SAIPE) and American Community Survey programs, both
• Current and historical enrollment data were obtained from the Iowa Department of Education’s Basic Educational Data Survey (BEDS) tabulations. These values may differ from certified enrollment totals, which are used for allocation of state funding and other administrative purposes.
• Projected enrollment data, describing expected short-term changes in certified enrollment, were obtained from the Iowa Department of Education.
Phone: 515-294-2954 Fax: 515-294-0592 E-mail: [email protected]
Data Notes and Sources
www.icip.iastate.edu
Iowa State University
Department of Economics
administered by the U.S. Census Bureau. The SAIPE estimates are preferred for official reporting of student poverty rates and for allocation of Title I funding. The ACS data provide additional detail to help characterize poverty levels among individuals and families within the district.
• Other population and income data were obtained from the 2010 Census and the American Community Survey, U.S. Census Bureau.