Embed Size (px)
Citation preview

CapitalMarketsDay 2019
4 June 2019Bangkok, Thailand
ticker symbol: DTAC

Alexandra ReichCEO
Prathet TankuranumCTO
Dilip PalCFO
Rajiv BawaCCAO, CBO
Nardrerdee Arj-harnwongseCPO
HowLih RenCMO
Tipayarat KaewsringarmCSO

/agenda
Welcome, dtac’s TurnaroundAlexandra ReichCEO
13:30 Financial UpdateDilip PalCFO
15:30
Customer Centric NetworkPrathet TankuranumCTO
14:00 Final RemarksAlexandra ReichCEO
15:50
Win Back B2CHow Lih Ren & Tipayarat KaewsringarmCMO, CSO
14:30 Q&A16:00
Address B2B OpportunityRajiv BawaCBO
15:00
Registration13:00 Break15:15

Welcome, dtac’sturnaround
Alexandra Reich Chief Executive Officer

0
2
4
6
8
10
2018 OECD average dtac 2018 dtac Q1'19
Data
cons
umpt
ion
(GB/
mon
th)
/contextThais are some of the world’s heaviest data users…
Smartphone penetration 81%
Average 9hrs per day using internet
Bangkok #1 city in the world for Facebook users
Thailand is among the top 10 countries in for Youtube watch hours
Increasing willingness to pay for convenience and reliability
5

20142013 2015 20172016 Q118 Q218 Q119
End of concession
/context…but dtac failed to capture market growth
22.5%
31.5% Reduction of spectrum
End of concession
Remedy
9002x5MHz
18002x5MHz
2300MHz
Revenue market share (Service rev ex. IC)
Alexandra starts
Q318 Q41815 Sep 15 DecApr Aug Oct
Network issues & competitive pressure
6

\
/responseGet things done
Manage the crisis
Build the fundamentals
open, transparent communication
Turn crisis into an opportunity
New sites and spectrum acquisition
Customer-focused
Hypothesis Quantitative data Behavioral Research
crisis
!
7

/responseNever Stop Improving…
Complex
NonTransparent
Technology Driven
Trust
Individual appreciation
Simple
Honest
Human
Customers want
dtac needs to be
Marketis
Convenience
8Em
otio
nal p
ositi
onin
g
Functional positioning
Consistent network &
competitive price
Simple,Honest, Human
Best coverage &premium price
Fast network &attractive
promotions
Lifestyle
Best & biggest

/responseBuilding the platform for growth in the middle of the crisis
Removed involuntary CPA
Transparent promo-end renewal
No discrimination of existing vs. new
customers
Q3’18 Q4’18 Q1’19
Billing & pricing complaints
Jan-18
Oct-18
Apr-18
Jan-19
Jul-18
Apr-19
Monthly CPA revenues
Recall of the “We Will Never Stop” campaign across users from all
operators
92 94123
Q1’19Q3’18 Q4’18
Postpaid net adds (‘000)
79%-22%
+16%
Transparent communication
Complaints: -75%
Q1’19 vs 2018
Postpaid churn: -3%
Q1’19 vs Q3’18
9

/peopleGain trust, mobilize, empower
PHASE IListen and Gain Trust• Openly share challenges• Clarify want to stand for • Set expected behavior
PHASE IIMobilize
• Own the challenges• Create a common belief in success• Give proof points• Set the right incentives
PHASE IIIEmpower• Change the way we work• Design end to end experiences• Frontline empowerment
We’re here!
10

20212017 2018 2019 2020
/ambitionGet back to growth!
Turnaround pillars
dtac service rev ex. IC
Consistent Customer Centric Network Experience
Win Back B2C
Address B2B Opportunity
Stop the bleeding Stabilize
Change the trend
11

Customer Centric Network
Prathet TankuranunChief Technology Officer

/spectrumIncreased spectrum holdings by 10% Largest download bandwidth in Thailand
dtac spectrum position vs. competition (2018)
* based on 45MHz D/L bandwidth on 2300MHz network
dtac spectrum portfolio evolution (in MHz by band)
Q1 2018
850/900
110
Q1 2019
1800
2300
2100
100
+10%
3.3
1.51.9
Operator Xdtac* Operator Y
70.060.0 55.0
Operator Ydtac* Operator X
Total download bandwidth (in MHz)
Download bandwidth / mn. customers (in MHz)
13

/networkIncreased number of sites by over 50% in 3 years
2016
91
71
20182017 Q1 2019
61
94
Number of sites by band (in thousands)
4G 2300MHz 4G 2100MHz 2G 1800MHz4G 1800MHz 3G 2100MHz 3G 850MHz
• Massive densification of 2100 network ->18k additional 2100MHz base stations installed in since 2016
• Launch of first TD-LTE network in Thailand in 2018
15.4k 2300MHz base stations installed at end of Q119
Deployment of 64T64R Massive MIMO with 3.5x capacity enhancement in terms of user throughput
8.0m subs on 2300MHz network
+55%
14
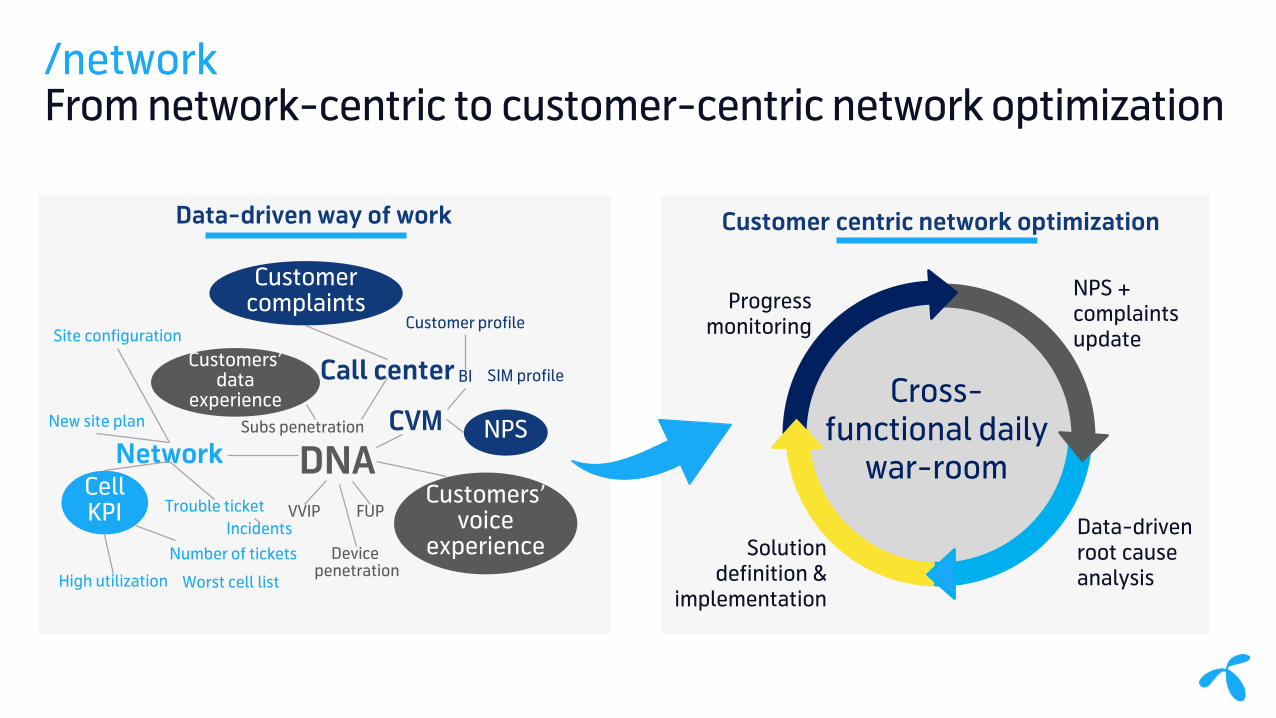
/networkFrom network-centric to customer-centric network optimization
Customer centric network optimizationData-driven way of work
Progressmonitoring
Solution definition &
implementation
NPS + complaints update
Cross-functional daily
war-roomData-driven root causeanalysisHigh utilization Worst cell list
Cell KPI
Network DNA
Site configuration
New site plan
Trouble ticket
Number of ticketsIncidents
Customers’ data
experienceSubs penetration
VVIP
Device penetration
FUPCustomers’
voice experience
CVMBI
Customer profile
SIM profileCall center
Customercomplaints
NPS
15

/networkVery encouraging signs that we are on the right track
Average daily network complaints
#1 Operator in Thailand for download speed and video
experience(2)
(1) excl. AOU <30 Days(2) Source: Manager Online, Prachachat Turakij quoting “OpenSignal”
Jan-17 Jan-18 Jul-18Jul-17 Jan-19 Apr-19
-28%
Network NPS(1)
Jul-18Jan-17 Jul-17 Jan-18 Jan-19 Apr-19
x2
16
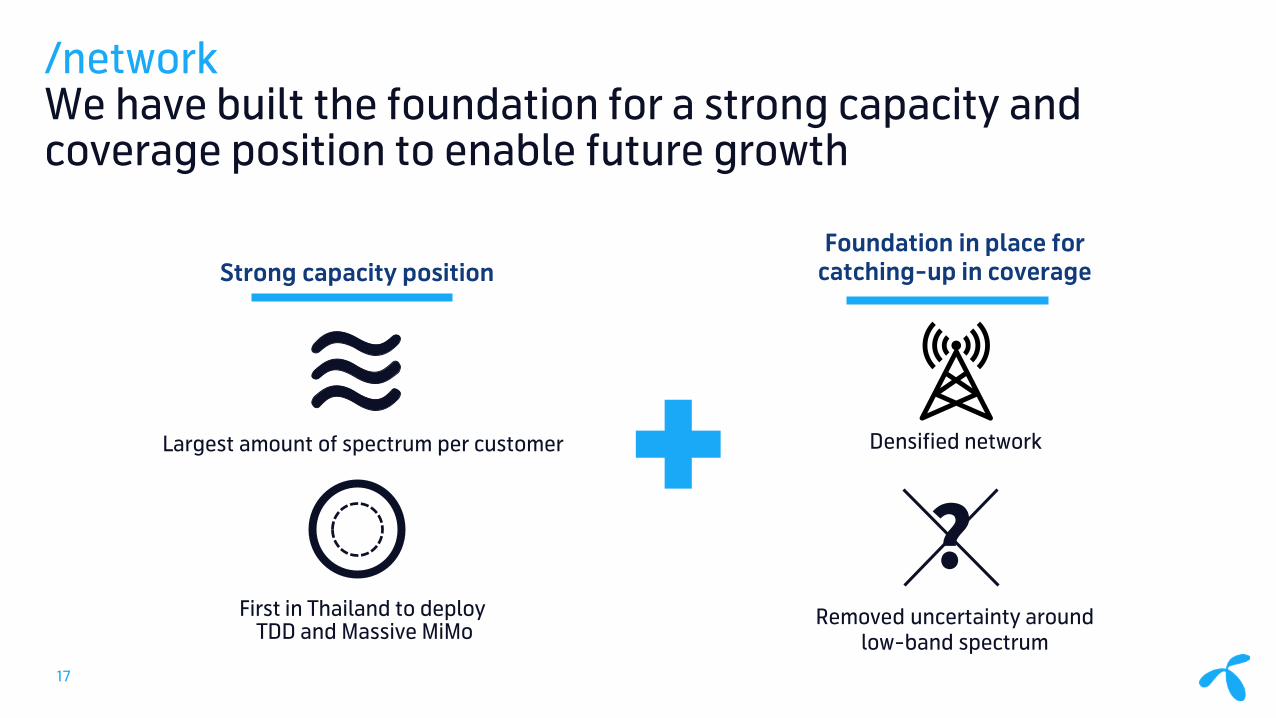
/networkWe have built the foundation for a strong capacity and coverage position to enable future growth
?
Strong capacity positionFoundation in place for
catching-up in coverage
Densified network
Removed uncertainty around low-band spectrum
Largest amount of spectrum per customer
First in Thailand to deployTDD and Massive MiMo
17

/network visionConsistent customer-centric network experience
Unbuffered video experience nationwide
Competitive capacityHD video
Consistent coverage nationwide, indoor & outdoor
Leading technology position, enabling customer-centric
innovations
18

/networkClear roadmap to execute against this vision
Q2-19 Q3-19 H2-20H1-20Q4-19 2020+
Expand TDD footprint
Fix coverage in existing footprint
Sunset 2G
Continue to drive 5G readiness
IT transformation
Upgrade capacity to improve quality
Fix quality in existing footprint Increase coverage
Swap 850-900 MHz spectrum and increase coverage
19
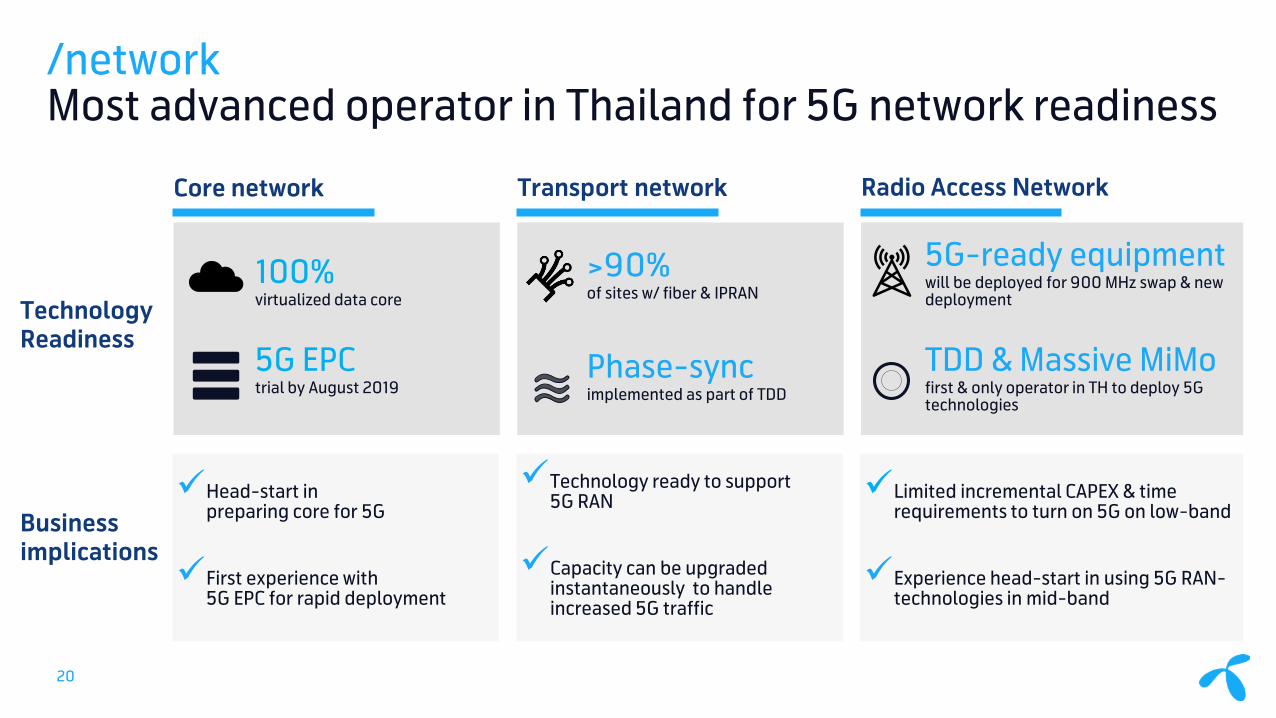
/networkMost advanced operator in Thailand for 5G network readiness
Head-start in preparing core for 5G
First experience with 5G EPC for rapid deployment
Technology ready to support 5G RAN
Capacity can be upgraded instantaneously to handle increased 5G traffic
Limited incremental CAPEX & time requirements to turn on 5G on low-band
Experience head-start in using 5G RAN-technologies in mid-band
100% virtualized data core
5G EPC trial by August 2019
>90% of sites w/ fiber & IPRAN
Phase-sync implemented as part of TDD
5G-ready equipmentwill be deployed for 900 MHz swap & new deployment
TDD & Massive MiMofirst & only operator in TH to deploy 5G technologies
TechnologyReadiness
Business implications
Core network Transport network Radio Access Network
20

/ITConstant progress in our IT transformation to support business, with clear focus areas for 2019-2020
Digitization of our core
Competency & people
Business security
Agile transformation
& business model
Data-driven company
21

Win Back B2C
Tipayarat KaewsringarmChief Sales Officer
How Lih RenChief Marketing Officer

Market slowing down but still growing…
…driven by strong customer demand for data consumption
2017 2018 2019 2020
5.7%
2.6%
48% 52%
52% 48%
2017 Q1’19
prepaid
postpaid
Quarterly reports - dtac, AIS, True, and others.
…and migration from prepaid to postpaid…
Market Revenue MixMarket Revenue Growth (est.)
6
910
20182017 Q1’19Data consumption / user / month (GB)
Source: dtac internal
+29%
/mobile consumer marketStill a growing market driven by strong demand for data and shift to postpaid
23
Revenue market growth includes AIS, True, dtac.2019 and 2020 figure is based on IFRS15 accounting standard which lead to negative impact on YoY comparison as 2018 was based on IAS18 accounting standard.
ARPU(THB)
155
538
147
502

/mobile consumer marketIn a complex market, dtac will be simple, honest and human
Add-on
144
Operator X Operator Y
131
Operator Z
85
Main plan
Add-on
SIM
149177
120
Postpaid
Prepaid
Source: Company websites; lit search - Mar 2018
Emot
iona
l pos
ition
ing
Functional positioning
Consistent network &
competitive price
Simple,Honest, Human
Best coverage &premium price
Fast network &attractive
promotions
Lifestyle
Best & biggest
Operator X Operator Y Operator Z
24

/win backOur 2019 priorities
Enhance customer experience across touch points
Stabilize prepaid
Keep momentum on postpaid
25

/prepaidSigns of stabilization
After a long struggle we see signs of stabilization
Heavy handsets subsidies from competition
NW issues
Sales execution issues
Market mostly pulled back from prepaid device subsidies
Revitalize distribution
Key drivers of decline Current situation
68 67 6864 65 65
55
60
65
70
Oct-18 Jan-19Nov-18 Feb-19Dec-18 Mar-19
Prepaid Daily Revenue (THB mln)
Distribution challenges
Network issues
Distribution challenges
Network NPS doubled since Jan’19
Revitalize distribution
inte
rnal
fact
ors
Heavy handsets subsidies from competition
“Race to the bottom” on pricing
Market mostly pulled back from prepaid device subsidies
Market pulled back from unlimited in 2019
exte
rnal
fact
ors
26

/prepaidPull back from unlimited offer for acquisition topping
Market is pulling back from unlimited offers
Unlimited internet with low price
May’19 Stopped unlimited acquisition toppingIntroduced fixed speed with fair-use policy (FUP)
2018
Unlimited data at flat speed, without fair-use policy (FUP)
New! Fixed quota at flat speed, with FUP
27
Launched bite-size fixed speed with FUP2019

/prepaidRevitalize distribution
Revitalize distribution… …while focusing on quality… …and keep expanding our footprint
Q4’18 Q1’19
# prepaid GA at retailer
Q1’19Q4’18
Survival rate at month 3
• Re-activate retailers and new retailer expansion
• Onboarding distributors in selected provinces
• Introduction of mini distributor/hub in rural areas
+14%
+14%
28

/prepaidHyperlocal approach to fix distribution holes
Leveraging direct sales to penetrate key areas
New commission and incentives Re-engaging customers in areas with network improvements
Q4’19 Q1’19
Prepaid inflow revenues by direct sales
+7%% increase in inflow revenues
Q119 vs Q418Localized marketing & sales activities
+24%
29
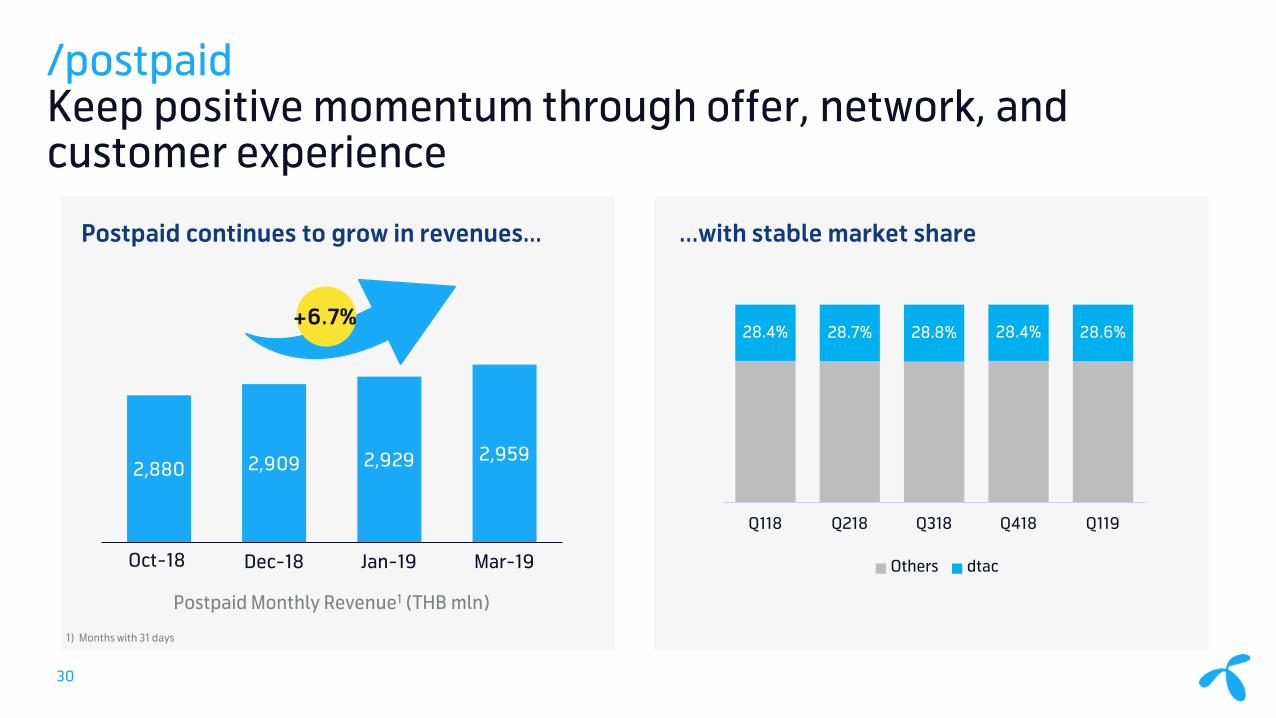
28.4% 28.7% 28.8% 28.4% 28.6%
Q118 Q218 Q318 Q418 Q119
Others dtac
2,880 2,909 2,929 2,959
Jan-19Dec-18 Mar-19
Postpaid Monthly Revenue1 (THB mln)
...with stable market sharePostpaid continues to grow in revenues…
1) Months with 31 days
/postpaidKeep positive momentum through offer, network, and customer experience
+6.7%
30
Oct-18

Take a position not to discriminate existing vs new customers
… Capture additional value through TDD migration
Individual:
Migration to TDD
Gain back trust in service through network experience improvement
Postpaid NPS
Non TDD TDDAverage ARPU TDD vs
non-TDD 4G active callers
+7pp
in 3 months
+15%
/postpaidRetain customers through trust and caring while monetizing higher data usage
31

/postpaidWin customers through clear proposition and strong sale executionBuild trust on our network through honest communication
…
• Churn stabilization
Strong focus on sales execution and service quality
Clear position on competitive offers and taking care of customers
32
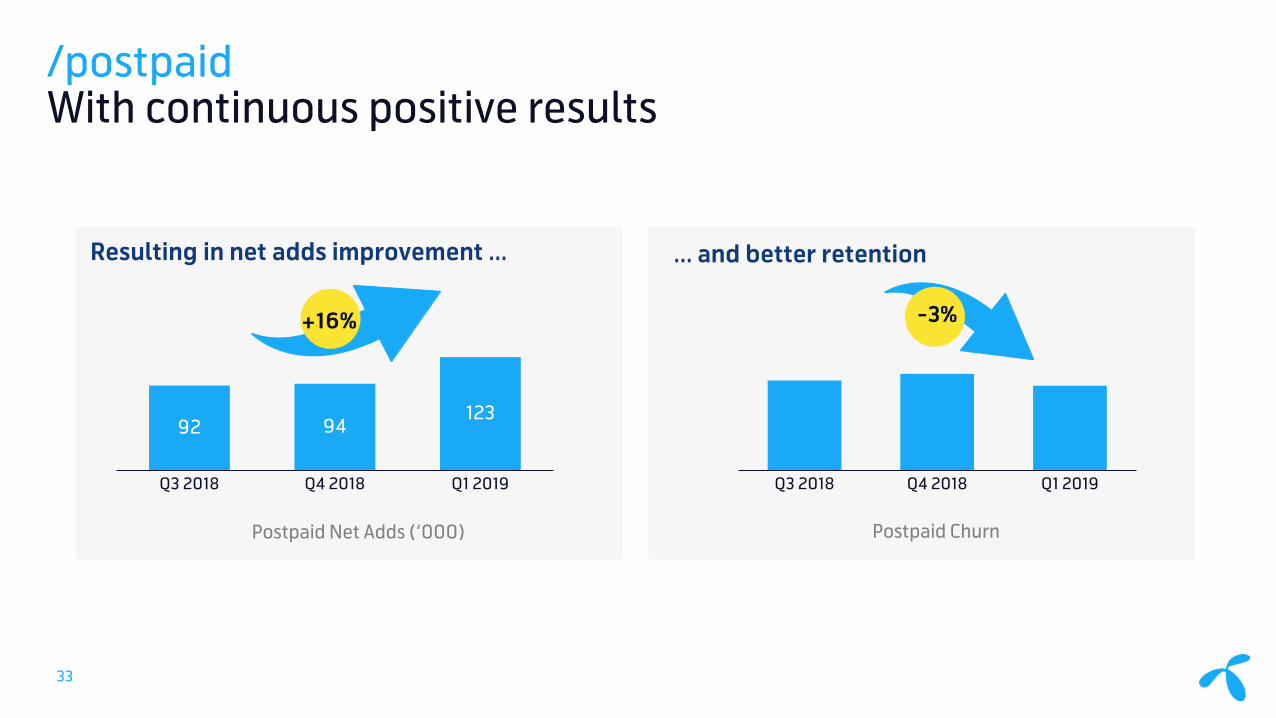
/postpaidWith continuous positive results
92 94123
Q3 2018 Q4 2018 Q1 2019 Q4 2018Q3 2018 Q1 2019
Resulting in net adds improvement … … and better retention
Postpaid ChurnPostpaid Net Adds (‘000)
+16% -3%
33

Digitize to amplify best
service at dtac
Best experience in digital channels
Personalize by being data-
driven
Embrace omni-channel
approach
/enhance customer experienceCombine digital and human touch
34
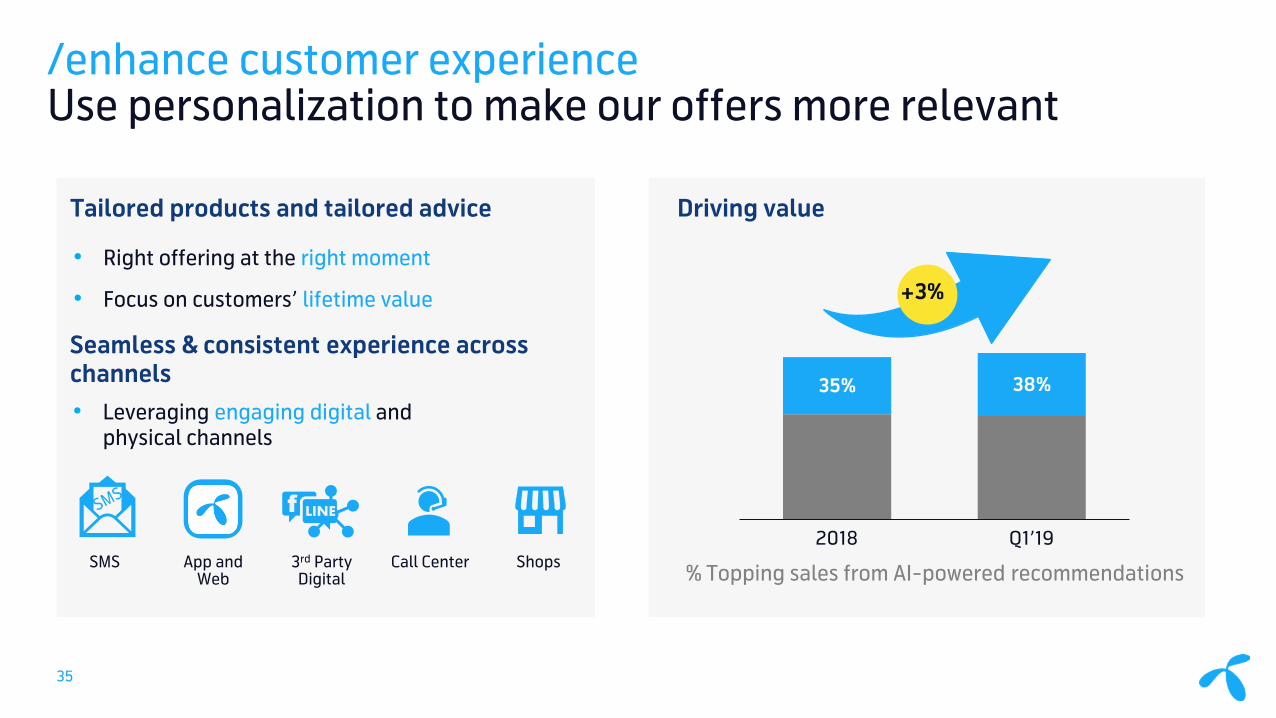
/enhance customer experienceUse personalization to make our offers more relevant
Driving value
Q1’19
35%
2018
38%
% Topping sales from AI-powered recommendations
+3%
35
Tailored products and tailored advice
• Right offering at the right moment
• Focus on customers’ lifetime value
App and Web
3rd Party Digital
ShopsCall CenterSMS
Seamless & consistent experience across channels• Leveraging engaging digital and
physical channels
f LINE

/enhance customer experienceMeet customer needs of simplicity and convenience
-23%
In our shops…. …and in our retailers
• Digitize payment through kiosk
• Prepaid / Postpaid registration on mobile devices through mobile application
• Start Mobility in store
Average waiting time in shops
• Simplify sales process through mobile application for retailers
• Engage and communicate with retailers through retailer application
Active retailers who perform transactions on our retailer app
Q4'18 Q1'19
Q1’19 vs. Q4’18
Time to register a new SIM on retailer app
+20%
<30s
36

/enhance customer experienceResulting in more satisfied customers
• One Stop Service: First-time resolution rate increased
• Feedback call and visit customers: Follow up and feedback all complaint cases to customer
• Uplift agent skills & Knowledge
• Never stop caring campaign
• Regular localized customer activities
Q4/2018 Q1/2019 Q4/2018 Q1/2019
CSAT at Call Center Number of customer complaints
Q4/2018 Q1/2019 Q4/2018 Q1/2019 Q4/2018 Q1/2019
CSAT at Service Hall
CSAT at dtac Center - FOFO
CSAT at dtac Center - COCO
Call center excellence Branded shops
+2% +3% +1% +4%-26%
37

AddressB2B Opportunity
Rajiv BawaChief Business Officer

/mobile B2B marketA virtually untapped opportunity for dtac – especially in the mid-market segment
dtac<10%THB ~22bn
Total addressable mobile B2B market in Thailand Current market offerings
?Mid-Market
SoHo
Large Enterprises
Source: Analysys Mason
Complex customized solutionsbought by IT-departments
Consumer postpaid plans39

/dtac positioningSimple, modular services with consistent experience & competitive prices
Startup Medium EnterpriseTraditional small Business
Our key target segment needs Our value proposition
Flexibility,long-term, no fixed cost & contract lock-in
Smooth connectivityto keep business running
Manage employeemobile usage and contain costs
We help our customers run their businesses more efficiently & effectively by offering simple & honest, worry-free, standardized & best value products.
40

/building capabilitiesWe are focusing on fundamentals in four key areas
Organization Portfolio Customer Journey Distribution
• End-to-end accountability
• Streamlined processes & operations
• Ongoing capability uplift
• Simplified core portfolios + add-ons
• New services together with partners (incl. IoT & IPLC)
• Digitalized sales & service channels
• Enhancement of in-store visibility (own + partner)
• Increased distribution reach (own + dealers)
• New innovative partnerships
1 2 3 41 2 3 4
41

/portfolioWe have launched a simplified core portfolio with simple & easy add-on services
42
Simplified core portfolio… …and simple & easy add-on services
+

/customer journey & distributionDigitalizing sales and service channels to enhance customer experience, improve sales and streamline operations
New salesUpsell
VASTop-ups
Manage own acc & subsProactive AdvisoryBilling/usage info
Customer careMigrate/renew
Acquisition Farming Self-care / CC
Tele Hunters
KAMsTele Farmers E-care Customer
Care
Direct Sales
Dealers
Digital sales (Web)
Branded Retail
Account Managers43

/portfolioWe are working with partners to expand our product portfolio and capture further growth opportunities
International Private Leased Circuit (IPLC)Smart Industry – MDB Care IoT
dtac• Project Management• Mobile & Web App• Marketing• Billing & Collection
• Embedded Software• IoT Devices
• Bundling of solution with MDB• Sale to end customer
44

/resultsWe see early signs of success
+200%
Monthly customer acquisition(1)
+17%
Avg. inflow pack fee(1)
+25%
Customer base(1)
Note: (1) SME segment, May ’19 vs. May ‘18
45

FinancialUpdate
Dilip PalChief Financial Officer

Top line growth has been a challenge
64.7 64.863.0
2016 2017 2018
Service revenues ex. IC (THB bln)
Despite the revenue challenge, dtac delivered strong financial results
27.9 30.4 28.4
33.8%
38.9% 38.6%
2016 2017 2018
EBITDA (THB billion) EBITDA margin
/financials Financial discipline is a core tenet of dtac’s corporate strategy
47

Revenue development was affected by prepaid sub loss, CPA cleanup, and unlimited data price plans
/financials Underlying reasons of revenue challenge are improving
Dec-17
21,8
6,15,6
15,7
6,25,9
17,0 16,1
5,7
Mar-18 Jun-18
6,0
15,3
Sep-18
15,1
Dec-18
14,5
Mar-19
22,7 21,6 21,3 21,2 20,7
Postpaid
PrepaidSubscribers (mln)
237 240248 247 243 242
Mar-19Dec-17 Jun-18Mar-18 Sep-18 Dec-18
ARPU Exc. IC
Q117 Q217 Q317 Q417 Q118 Q218 Q318 Q418 Q119
CPA revenues
What Happened Where are we now
Prepaid sub loss
• Network issues• Device subsidies• High S&M spending
• dtac Network is improving significantly
• Competition subsidy and offers getting rational
Loss of high value customer
• Concession related issues
• Concession related uncertainties are over
• Improvement in Port out and churn from high value
CPA cleanup • High no. of complaints related to CPA services
• Significant reduction in no. of complaints
• CPA loss has bottomed out
Aggressive acquisition price plans
• Unlimited fixed-speed data price plans on both prepaid and postpaid
• Unlimited acquisition plans have been pulled out
Drivers
48

2016 2017 2018 Q119
24.015 21.702
3.642
17.889
-26%
20182016 2017 Q119
16.804 14.404 13.993
3.514
-17%
2016 2017 2018
26.498
Q119
23.137 25.061
3.738
• Regulatory costs dropped to approx. 4% of service revenues ex. IC
• Net CAT lease and TOT roaming costs take full year impact in 2019. YoY net cost increase in Q1’19 is THB 1.9bn for CAT lease and TOT deal combined
• D&A charges dropped sharply after end of the concession
Cost of Service (Excl. CAT, TOT & D&A)
SG&A (Excl. D&A)
D&A
/financials 2018 initiatives delivered on efficiency ambition, 2019 starts with a reset of cost baseline
49
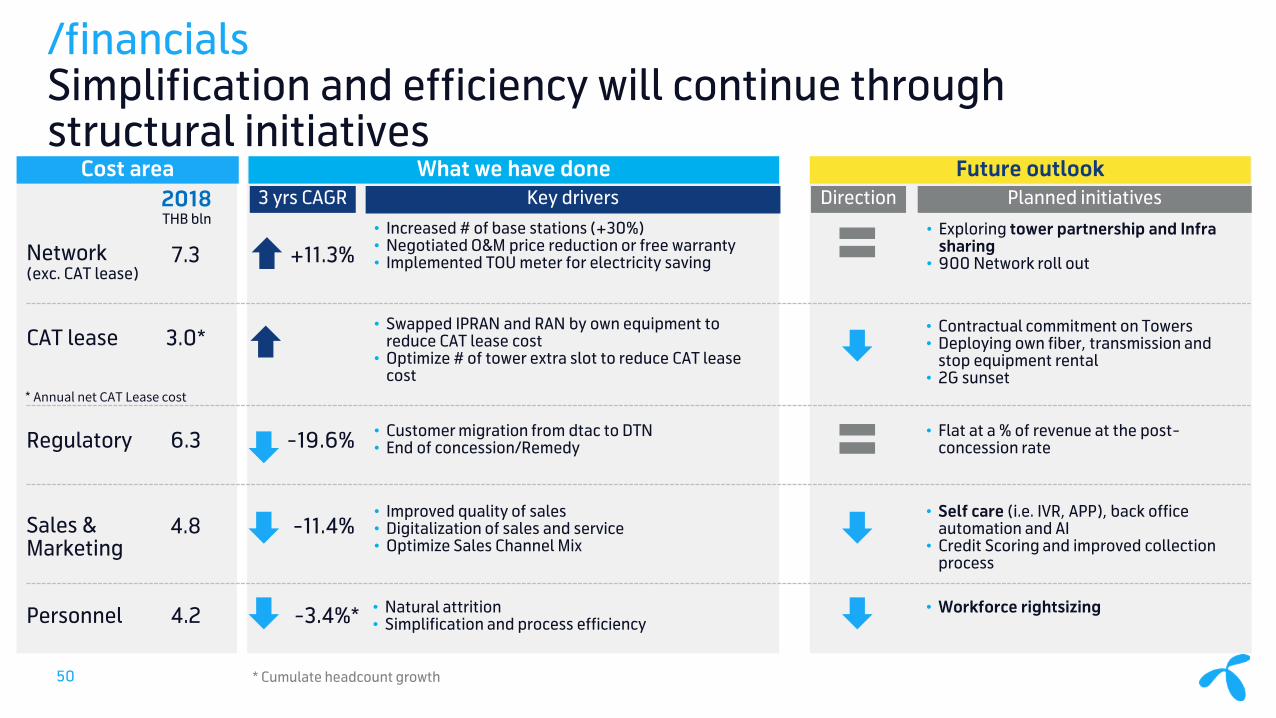
/financials Simplification and efficiency will continue through structural initiatives
Cost area3 yrs CAGR Key drivers
What we have done Future outlook
Network (exc. CAT lease)
CAT lease
Regulatory
Sales & Marketing
Personnel
• Increased # of base stations (+30%)• Negotiated O&M price reduction or free warranty • Implemented TOU meter for electricity saving
6.3
4.2
2018THB bln
7.3
4.8
-19.6%
-3.4%*
+11.3%
-11.4%
• Customer migration from dtac to DTN• End of concession/Remedy
• Improved quality of sales • Digitalization of sales and service• Optimize Sales Channel Mix
• Natural attrition• Simplification and process efficiency
• Exploring tower partnership and Infra sharing
• 900 Network roll out
• Contractual commitment on Towers• Deploying own fiber, transmission and
stop equipment rental• 2G sunset
• Flat at a % of revenue at the post-concession rate
• Self care (i.e. IVR, APP), back office automation and AI
• Credit Scoring and improved collection process
• Workforce rightsizing
Planned initiativesDirection
3.0*• Swapped IPRAN and RAN by own equipment to
reduce CAT lease cost • Optimize # of tower extra slot to reduce CAT lease
cost* Annual net CAT Lease cost
* Cumulate headcount growth50

Financial RatiosNet Debt
30.7 23.0
32.9 34.2
2016 2017 2018 Q1-19
1.1
0.8
1.5 1.4
1.1
0.8
1.2 1.3
2016 2017 2018 Q1-19Net Debt : Equity Net Debt : EBITDA
Interest Bearing Debt by Maturity
11.5
6.0
1.5
4.0
13.0 10.0
2.5 3.0 1.5
0.5
6.0
1.0
7.0
2.5
2019 2020 2021 2022 2023 2024 2025 2026 2027 2028 2029
Loan Debenture
Note: as of 31 Mar. 19, the loan includes Revolving Credit Facilities for THB 5.5 billion
THB billion
THB billion
Operating Cash FlowTHB billion
7.613.9
8.91.7
20.416.5
19.6
4.4
27.9 30.4 28.5
6.1
2016 2017 2018 Q1-19Operating CF (EBITDA - CAPEX) CAPEX
Capex
20.3 16.5 19.5 4.4
24.6% 21.1%26.5% 24.9%
2016 2017 2018 Q119
CAPEX (THB billion)
/financials A well-managed debt profile will support flexibility for necessary investment
51

Debt Funding Dividend Leverage
• Continue to deliver positive operating cash flow which will support building liquidity cushion over time
• Expected increase in net debt/EBITDA level in 2019-2020 due to one-off CAT settlement and payment for spectrum licenses
• Manage net debt/EBITDA to be below 3x
• Access to both bank loan and bondto diversify funding source as well tooptimize the funding cost
• Affirmed credit rating at AA withstable outlook by TRIS at 5th April2019
• Secure long term funding to matchlong term investment
• Ensure well spread debt maturityprofile to manage refinancing risk
• Policy takes into consideration both the financial positions and investment required
• Maintain current dividend policy i.e. not less than 50% of company’s net profit
• Aiming for semi-annual dividend payment
/financialsMaintain necessary financial flexibility to support long-term strategic ambitious and offer good shareholder remuneration
52

Guidance RationaleService revenueexcl. IC
Low single-digit decline • Impact from end of the concession still persisted in Q1-19• Efforts to ensure best customer experience have some short
term adverse impact on revenue development• Expect sequential service revenue growth
EBITDA THB 24 – 25 billion • 2019 is the first full year of new cost base after end of the concession
• Dynamic and competitive S&M expenses• Ongoing implementation of operational efficiency
measuresCAPEX THB 13 – 15 billion • Mainly for the expansion of 2300MHz network
• Capacity expansion to address data usage
/2019 guidance Reflects concession-end revenue impact and new cost baseline for 2019
53

Ambition Rationale
Service revenues excl. IC
Low single digit growth • In line with market growth
EBITDA growth Above service revenue growth • Ongoing implementation of operational efficiency measures
CAPEX* In line with 2019 level • Coverage on par with peers
* Excluding spectrum payment.
/medium-term ambitionConfident to get back to growth in both Revenue and EBITDA
54

Final Remarks
Alexandra Reich Chief Executive Officer
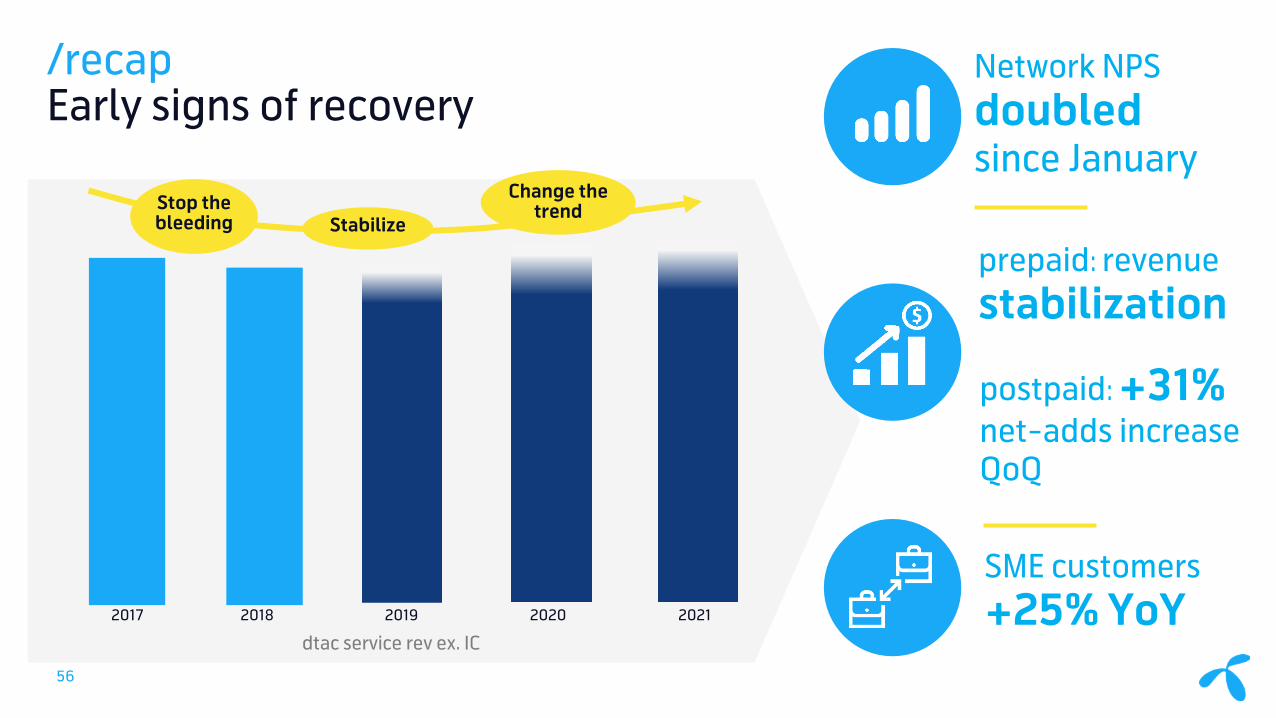
20212017 2018 2019 2020
dtac service rev ex. IC
Stop the bleeding Stabilize
Change the trend
56
/recapEarly signs of recovery
Network NPS doubled since January
prepaid: revenue stabilization
postpaid: +31% net-adds increase QoQ
SME customers +25% YoY

/innovationWe will never stop…
Electric VehiclePlatform
5G57 dtac@home
57

/disclaimer
Certain forward looking statements may be made in the course of the presentation. These forward-looking statements generally can be identified by use of statements that include words or phrases such as dtac or its management “believes”, “expects”, “anticipates”, “intends”, “plans”, “foresees”, or other words or phrases of similar import. Similarly, statements that describe dtac’s objectives, plans or goals also are forward-looking statements.
All such forward-looking statements are subject to certain risks and uncertainties that could cause actual results to differ materially from those contemplated by the relevant forward-looking statement. The forward-looking statements contained in the slides are not and should not be constructed as representations of the future performance of dtac and that such statements are an expression of the Company’s reviews based on its current view and certain assumptions including, but not limited to, prevailing economic and market conditions and currently available information.
Investor RelationsE: [email protected] T: +662 202 8882


![[ppt] Powerpoint Template - Kansas Healthcare Collaborative](https://img.pdfslide.net/doc/110x75/63178f13c72bc2f2dd0584e1/ppt-powerpoint-template-kansas-healthcare-collaborative.jpg)

![[ PowerPoint Template ]](https://img.pdfslide.net/doc/110x75/631afe995d5809cabd0fa04b/-powerpoint-template-.jpg)