Embed Size (px)
Citation preview
Integrated Resource
Plan and Transmission
Analysis
PSAT Meeting
September 16, 2019
siemens.com/paceglobal Restricted © Siemens AG 2019
Unrestricted © Siemens AG 2019
Page 2 Siemens Energy Business Advisory
Agenda
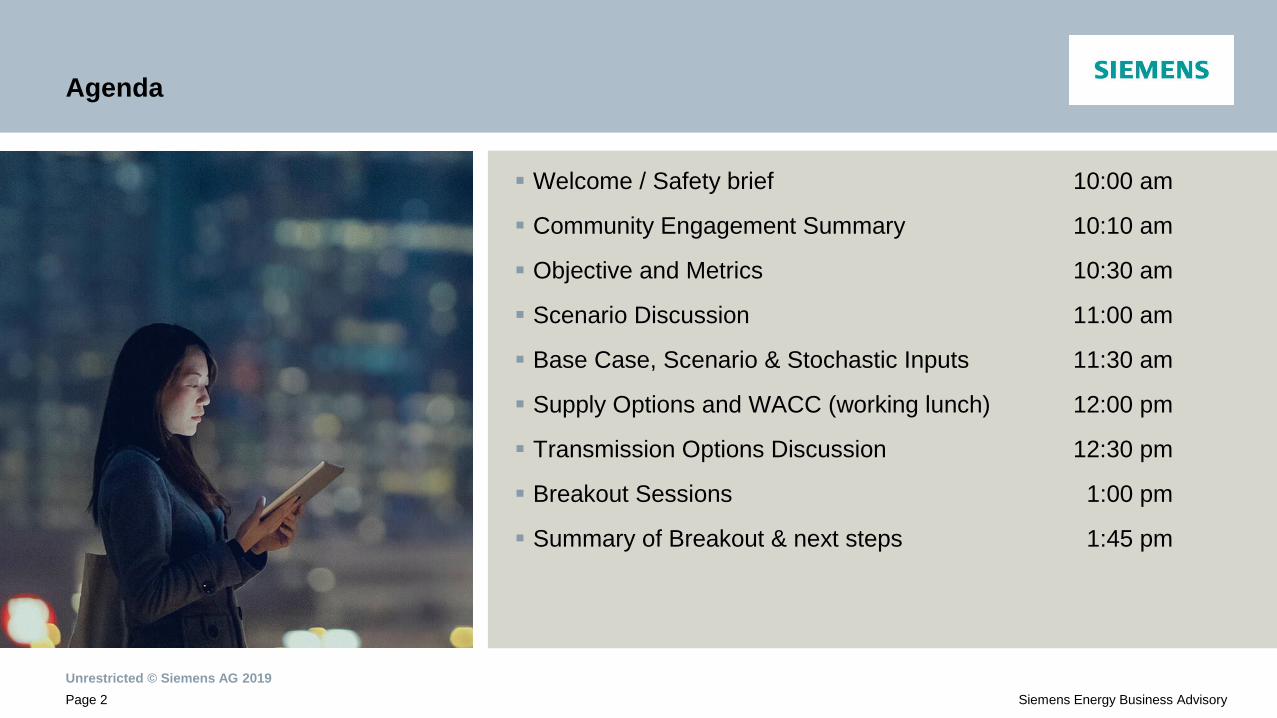
Welcome / Safety brief 10:00 am
Community Engagement Summary 10:10 am
Objective and Metrics 10:30 am
Scenario Discussion 11:00 am
Base Case, Scenario & Stochastic Inputs 11:30 am
Supply Options and WACC (working lunch) 12:00 pm
Transmission Options Discussion 12:30 pm
Breakout Sessions 1:00 pm
Summary of Breakout & next steps 1:45 pm

Recap of the Community Meeting
Unrestricted © Siemens AG 2019
Page 4 Siemens Energy Business Advisory
Community Engagement Meeting Summary
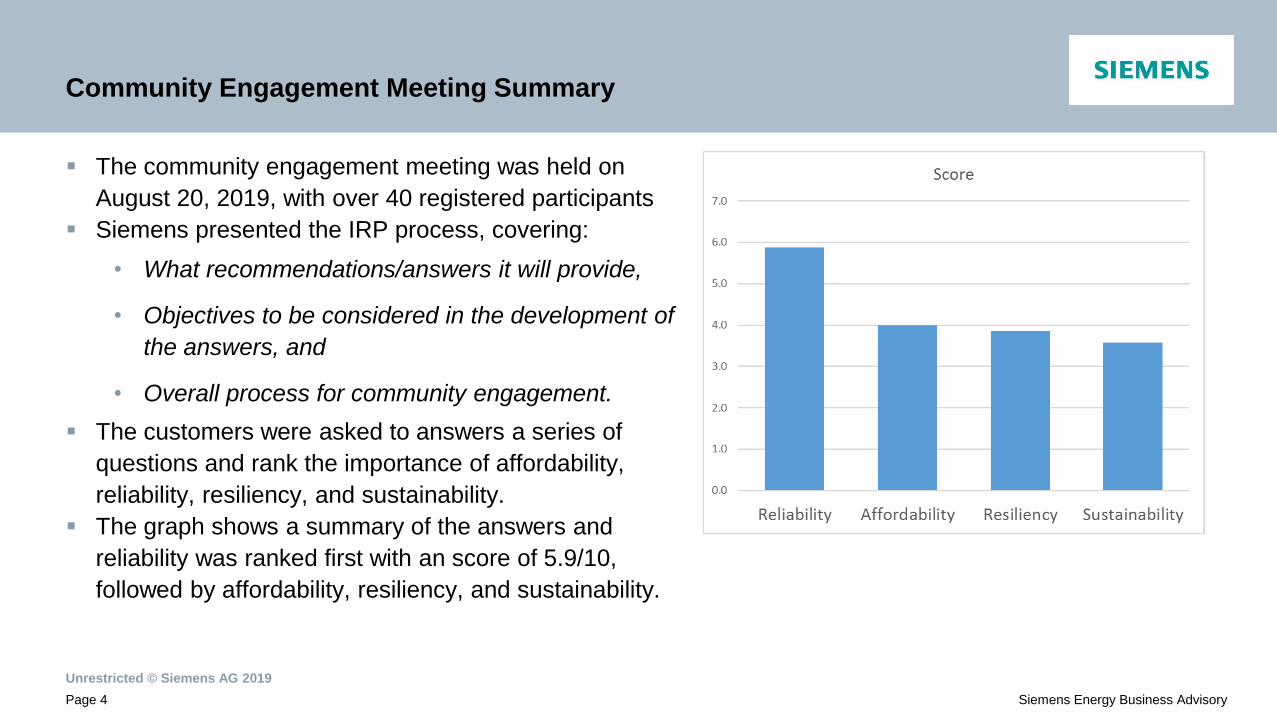
The community engagement meeting was held on
August 20, 2019, with over 40 registered participants
Siemens presented the IRP process, covering:
• What recommendations/answers it will provide,
• Objectives to be considered in the development of
the answers, and
• Overall process for community engagement.
The customers were asked to answers a series of
questions and rank the importance of affordability,
reliability, resiliency, and sustainability.
The graph shows a summary of the answers and
reliability was ranked first with an score of 5.9/10,
followed by affordability, resiliency, and sustainability.
Unrestricted © Siemens AG 2019
Page 5 Siemens Energy Business Advisory
Community Engagement Meeting Summary
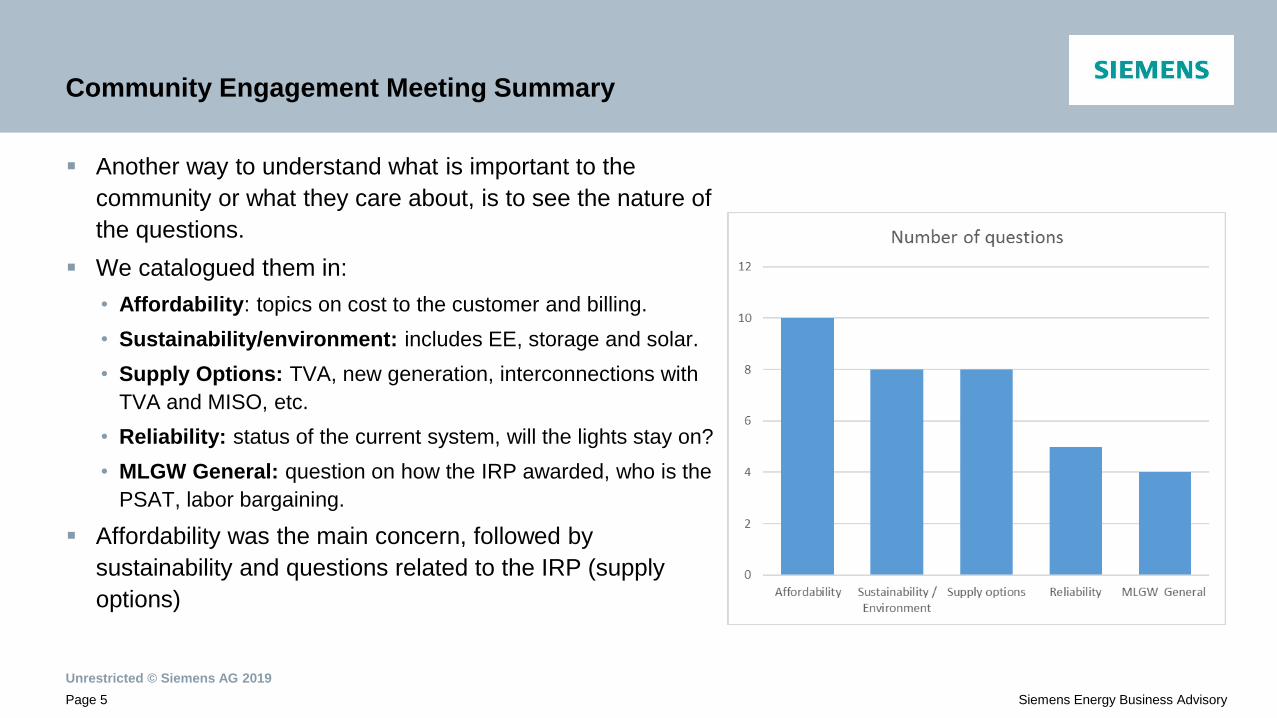
Another way to understand what is important to the
community or what they care about, is to see the nature of
the questions.
We catalogued them in:
• Affordability: topics on cost to the customer and billing.
• Sustainability/environment: includes EE, storage and solar.
• Supply Options: TVA, new generation, interconnections with
TVA and MISO, etc.
• Reliability: status of the current system, will the lights stay on?
• MLGW General: question on how the IRP awarded, who is the
PSAT, labor bargaining.
Affordability was the main concern, followed by
sustainability and questions related to the IRP (supply
options)
Objectives and Metrics
Unrestricted © Siemens AG 2019
Page 7 Siemens Energy Business Advisory
IRP Objectives & Metrics
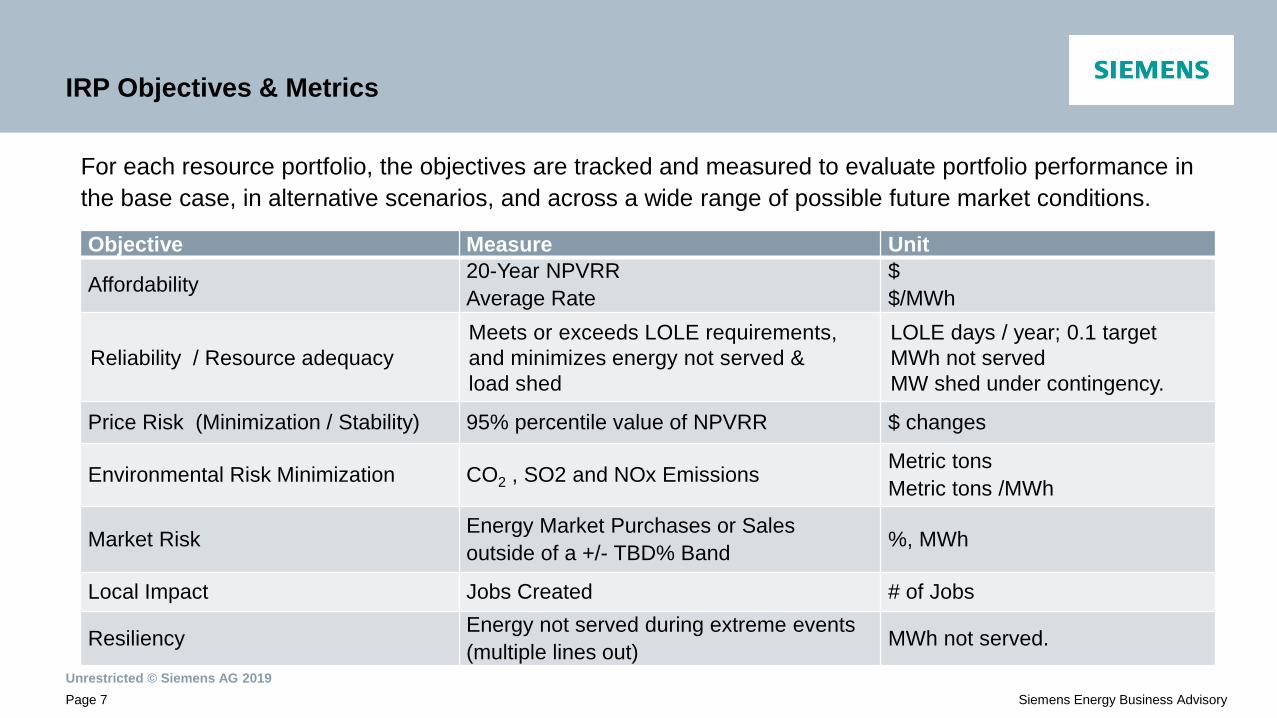
For each resource portfolio, the objectives are tracked and measured to evaluate portfolio performance in
the base case, in alternative scenarios, and across a wide range of possible future market conditions.
Objective Measure Unit
Affordability 20-Year NPVRR
Average Rate
$
$/MWh
Reliability / Resource adequacy
Meets or exceeds LOLE requirements,
and minimizes energy not served &
load shed
LOLE days / year; 0.1 target
MWh not served
MW shed under contingency.
Price Risk (Minimization / Stability) 95% percentile value of NPVRR $ changes
Environmental Risk Minimization CO2 , SO2 and NOx Emissions Metric tons
Metric tons /MWh
Market Risk Energy Market Purchases or Sales
outside of a +/- TBD% Band %, MWh
Local Impact Jobs Created # of Jobs
Resiliency Energy not served during extreme events
(multiple lines out) MWh not served.

Scenarios
Unrestricted © Siemens AG 2019
Page 9 Siemens Energy Business Advisory
Scenarios
9
Incre
asin
g
Regula
tion
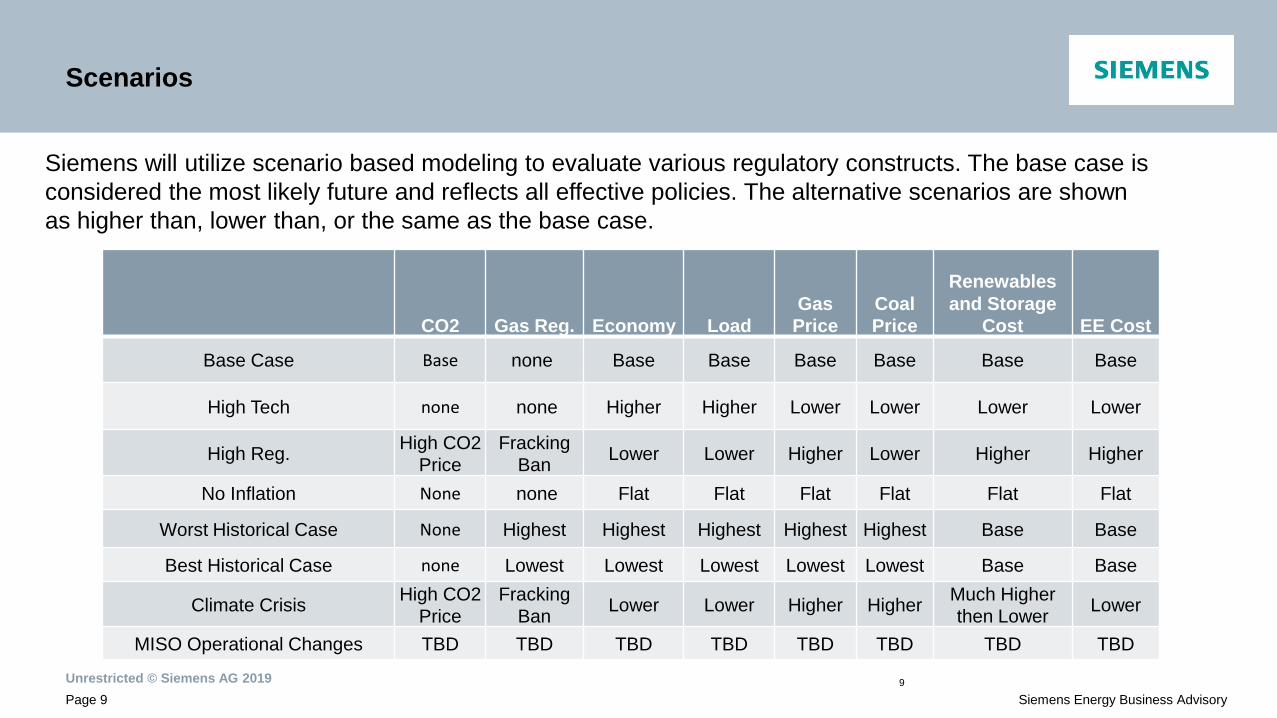
Siemens will utilize scenario based modeling to evaluate various regulatory constructs. The base case is
considered the most likely future and reflects all effective policies. The alternative scenarios are shown
as higher than, lower than, or the same as the base case.
CO2 Gas Reg. Economy Load Gas
Price Coal
Price
Renewables
and Storage
Cost EE Cost
Base Case Base none Base Base Base Base Base Base
High Tech none none Higher Higher Lower Lower Lower Lower
High Reg. High CO2
Price Fracking
Ban Lower Lower Higher Lower Higher Higher
No Inflation None none Flat Flat Flat Flat Flat Flat
Worst Historical Case None Highest Highest Highest Highest Highest Base Base
Best Historical Case none Lowest Lowest Lowest Lowest Lowest Base Base
Climate Crisis High CO2
Price Fracking
Ban Lower Lower Higher Higher
Much Higher
then Lower Lower
MISO Operational Changes TBD TBD TBD TBD TBD TBD TBD TBD
Unrestricted © Siemens AG 2019
Page 10 Siemens Energy Business Advisory
Scenario Narratives
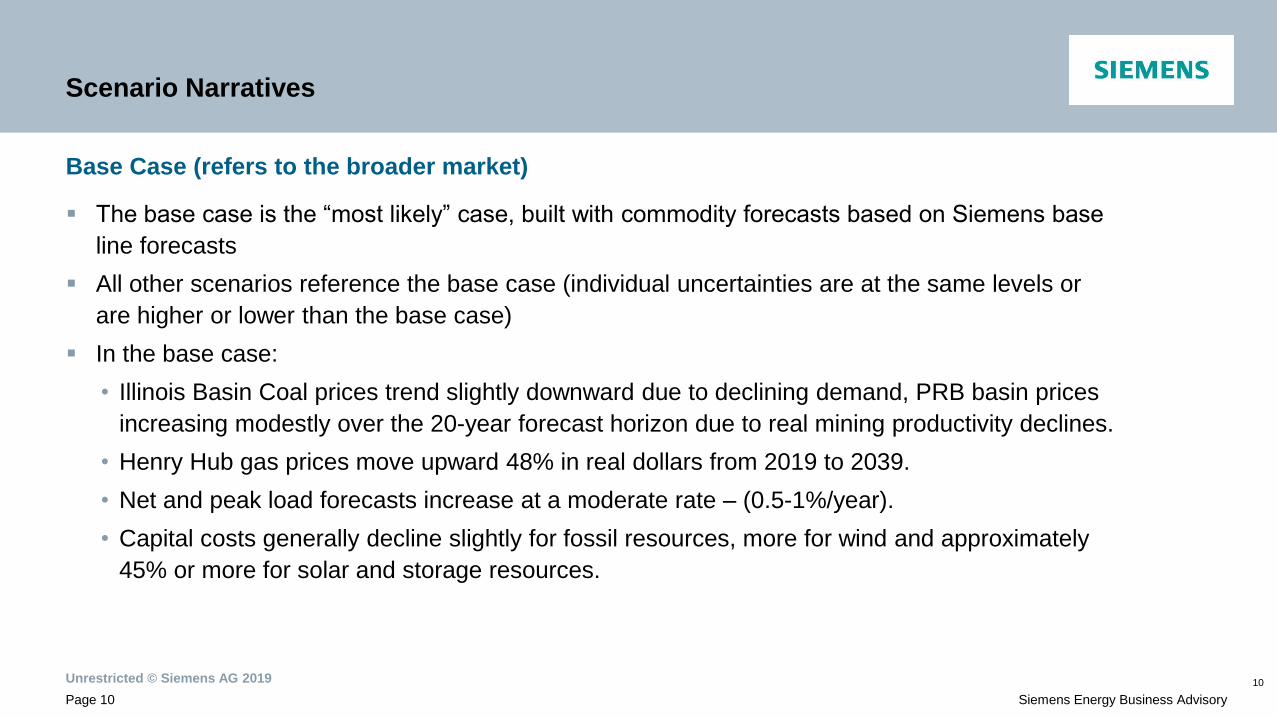
Base Case (refers to the broader market)
The base case is the “most likely” case, built with commodity forecasts based on Siemens base
line forecasts
All other scenarios reference the base case (individual uncertainties are at the same levels or
are higher or lower than the base case)
In the base case:
• Illinois Basin Coal prices trend slightly downward due to declining demand, PRB basin prices
increasing modestly over the 20-year forecast horizon due to real mining productivity declines.
• Henry Hub gas prices move upward 48% in real dollars from 2019 to 2039.
• Net and peak load forecasts increase at a moderate rate – (0.5-1%/year).
• Capital costs generally decline slightly for fossil resources, more for wind and approximately
45% or more for solar and storage resources.
10
Unrestricted © Siemens AG 2019
Page 11 Siemens Energy Business Advisory
Scenario Narratives
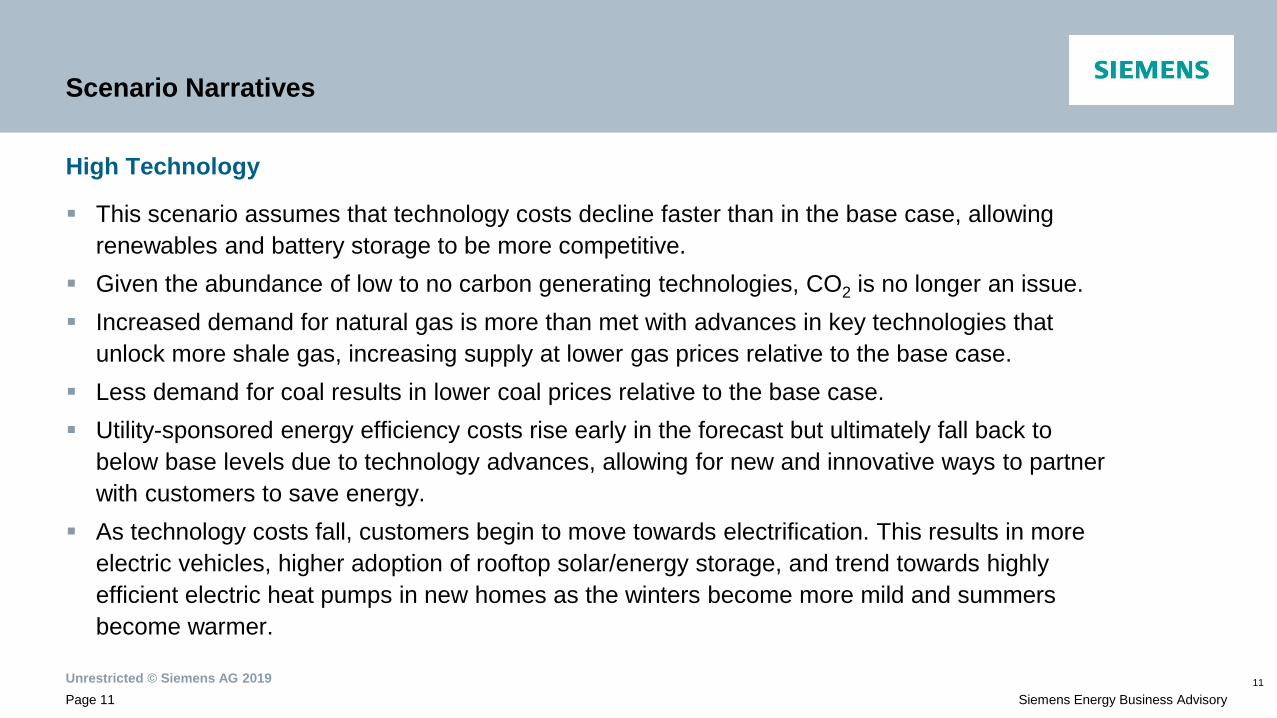
High Technology
This scenario assumes that technology costs decline faster than in the base case, allowing
renewables and battery storage to be more competitive.
Given the abundance of low to no carbon generating technologies, CO2 is no longer an issue.
Increased demand for natural gas is more than met with advances in key technologies that
unlock more shale gas, increasing supply at lower gas prices relative to the base case.
Less demand for coal results in lower coal prices relative to the base case.
Utility-sponsored energy efficiency costs rise early in the forecast but ultimately fall back to
below base levels due to technology advances, allowing for new and innovative ways to partner
with customers to save energy.
As technology costs fall, customers begin to move towards electrification. This results in more
electric vehicles, higher adoption of rooftop solar/energy storage, and trend towards highly
efficient electric heat pumps in new homes as the winters become more mild and summers
become warmer.
11
Unrestricted © Siemens AG 2019
Page 12 Siemens Energy Business Advisory
Scenario Narratives
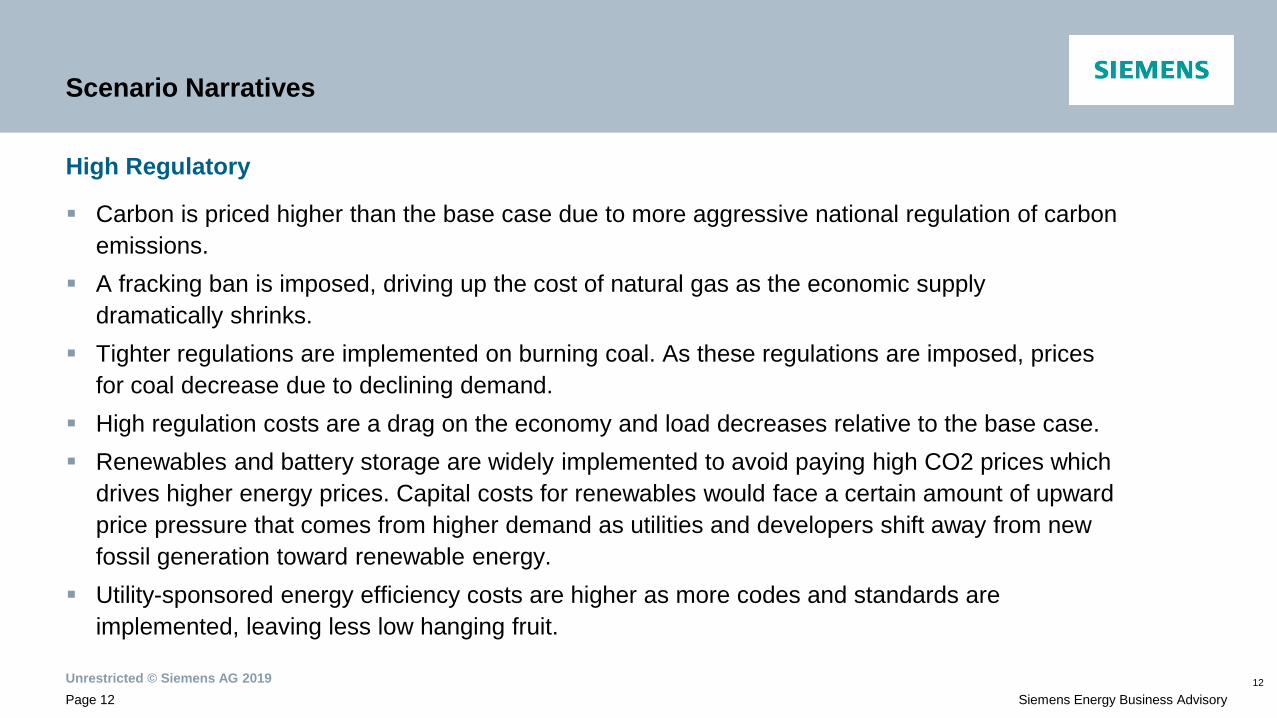
High Regulatory
Carbon is priced higher than the base case due to more aggressive national regulation of carbon
emissions.
A fracking ban is imposed, driving up the cost of natural gas as the economic supply
dramatically shrinks.
Tighter regulations are implemented on burning coal. As these regulations are imposed, prices
for coal decrease due to declining demand.
High regulation costs are a drag on the economy and load decreases relative to the base case.
Renewables and battery storage are widely implemented to avoid paying high CO2 prices which
drives higher energy prices. Capital costs for renewables would face a certain amount of upward
price pressure that comes from higher demand as utilities and developers shift away from new
fossil generation toward renewable energy.
Utility-sponsored energy efficiency costs are higher as more codes and standards are
implemented, leaving less low hanging fruit.
12
Unrestricted © Siemens AG 2019
Page 13 Siemens Energy Business Advisory
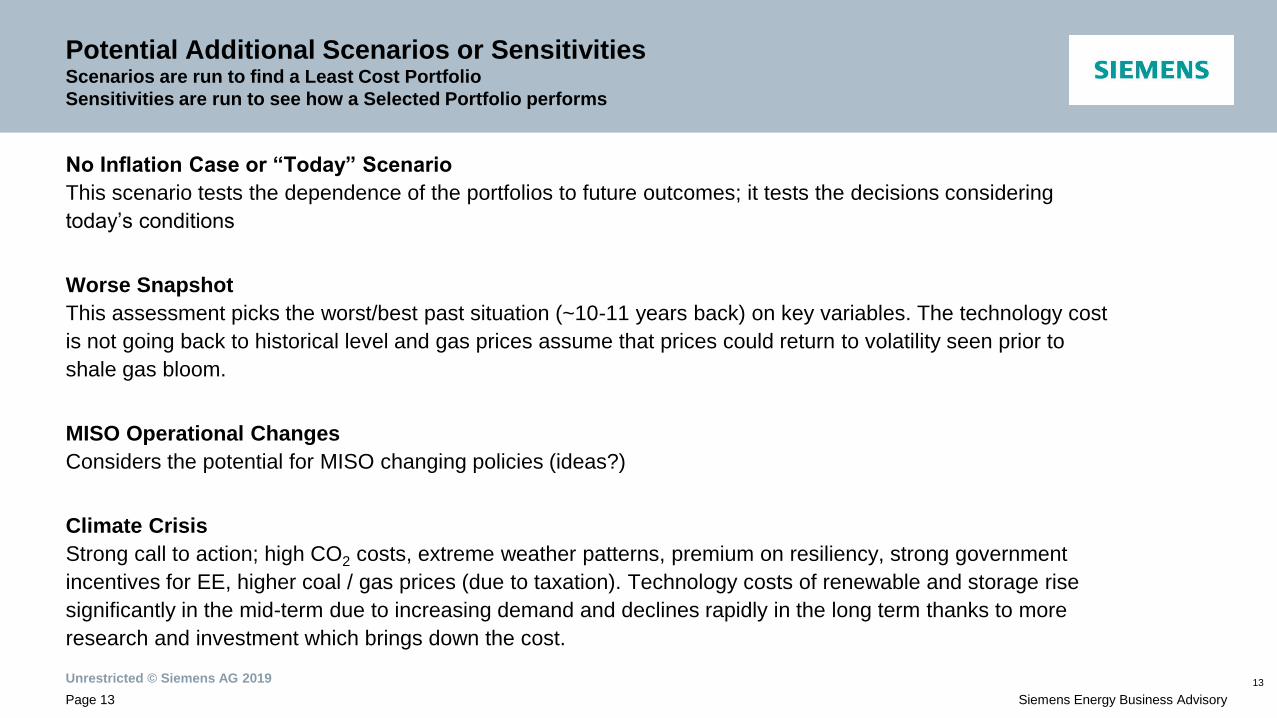
Potential Additional Scenarios or Sensitivities Scenarios are run to find a Least Cost Portfolio
Sensitivities are run to see how a Selected Portfolio performs
No Inflation Case or “Today” Scenario
This scenario tests the dependence of the portfolios to future outcomes; it tests the decisions considering
today’s conditions
Worse Snapshot
This assessment picks the worst/best past situation (~10-11 years back) on key variables. The technology cost
is not going back to historical level and gas prices assume that prices could return to volatility seen prior to
shale gas bloom.
MISO Operational Changes
Considers the potential for MISO changing policies (ideas?)
Climate Crisis
Strong call to action; high CO2 costs, extreme weather patterns, premium on resiliency, strong government
incentives for EE, higher coal / gas prices (due to taxation). Technology costs of renewable and storage rise
significantly in the mid-term due to increasing demand and declines rapidly in the long term thanks to more
research and investment which brings down the cost.
13
Base, Scenario and Stochastic Inputs
Unrestricted © Siemens AG 2019
Page 15 Siemens Energy Business Advisory
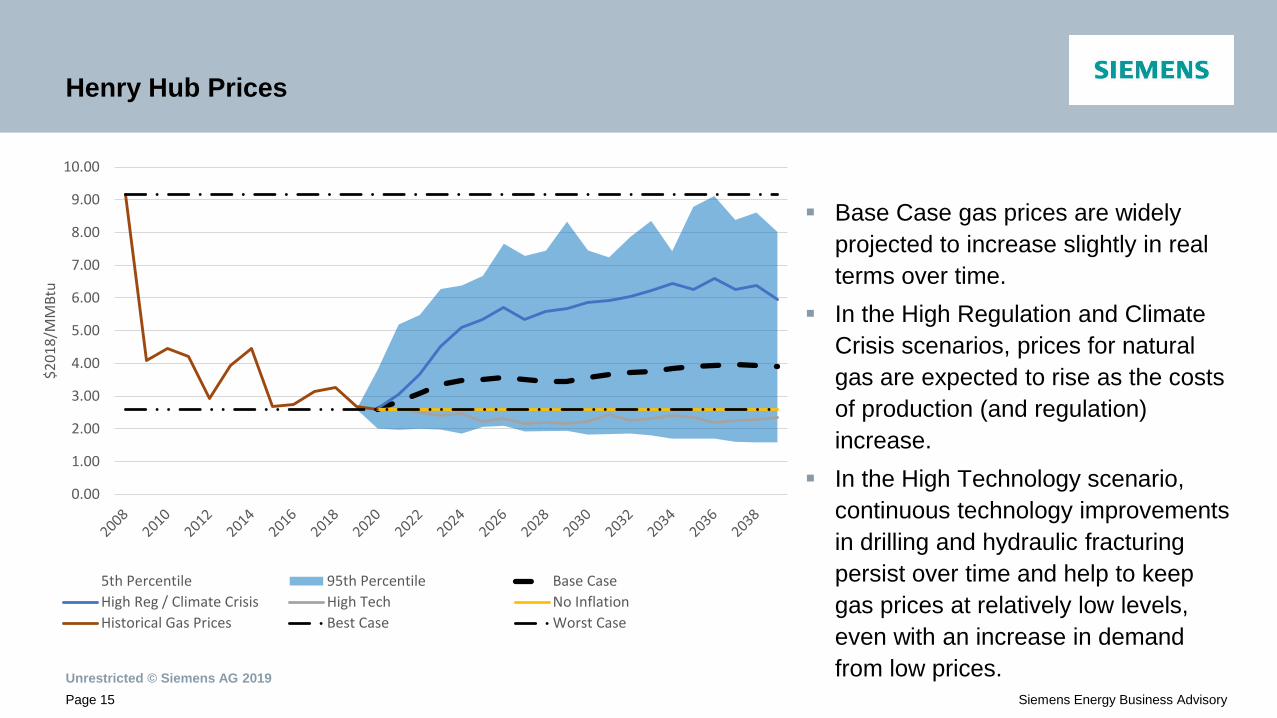
Henry Hub Prices
Base Case gas prices are widely
projected to increase slightly in real
terms over time.
In the High Regulation and Climate
Crisis scenarios, prices for natural
gas are expected to rise as the costs
of production (and regulation)
increase.
In the High Technology scenario,
continuous technology improvements
in drilling and hydraulic fracturing
persist over time and help to keep
gas prices at relatively low levels,
even with an increase in demand
from low prices.
0.00
1.00
2.00
3.00
4.00
5.00
6.00
7.00
8.00
9.00
10.00
$2
01
8/M
MB
tu
5th Percentile 95th Percentile Base Case
High Reg / Climate Crisis High Tech No Inflation
Historical Gas Prices Best Case Worst Case
Unrestricted © Siemens AG 2019
Page 16 Siemens Energy Business Advisory
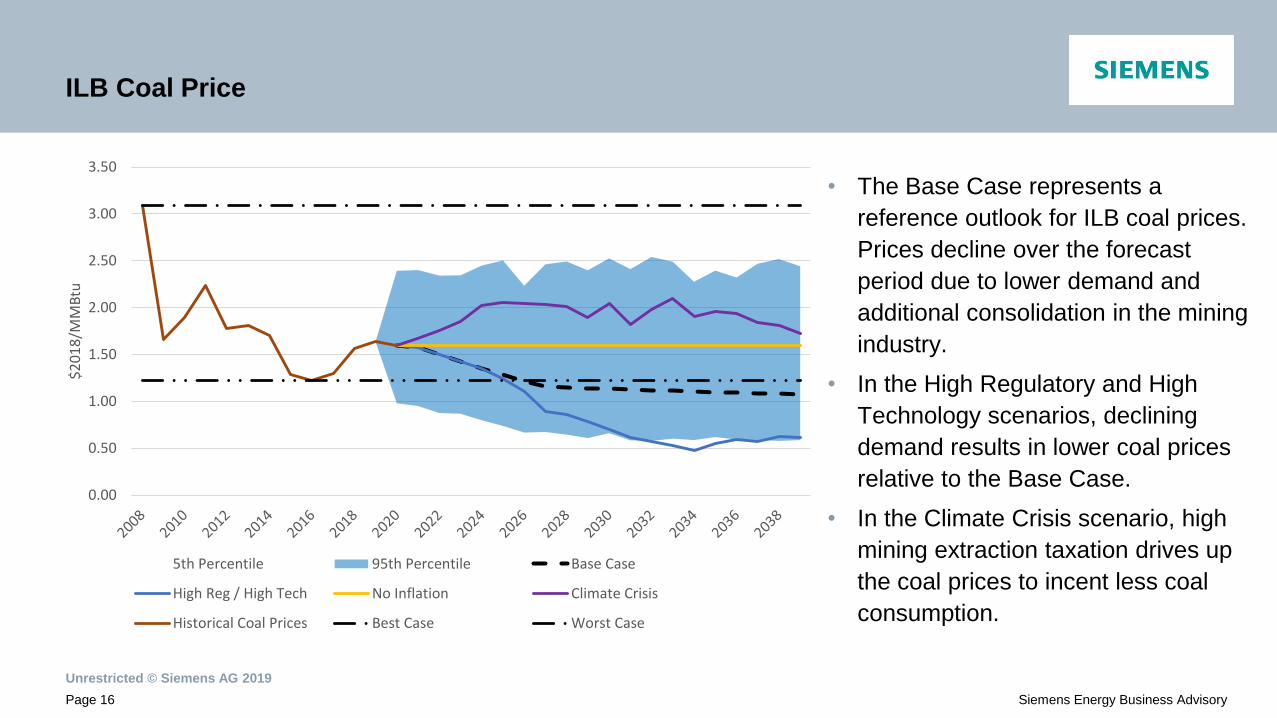
ILB Coal Price
• The Base Case represents a
reference outlook for ILB coal prices.
Prices decline over the forecast
period due to lower demand and
additional consolidation in the mining
industry.
• In the High Regulatory and High
Technology scenarios, declining
demand results in lower coal prices
relative to the Base Case.
• In the Climate Crisis scenario, high
mining extraction taxation drives up
the coal prices to incent less coal
consumption.
0.00
0.50
1.00
1.50
2.00
2.50
3.00
3.50
$2
01
8/M
MB
tu
5th Percentile 95th Percentile Base Case
High Reg / High Tech No Inflation Climate Crisis
Historical Coal Prices Best Case Worst Case
Unrestricted © Siemens AG 2019
Page 17 Siemens Energy Business Advisory
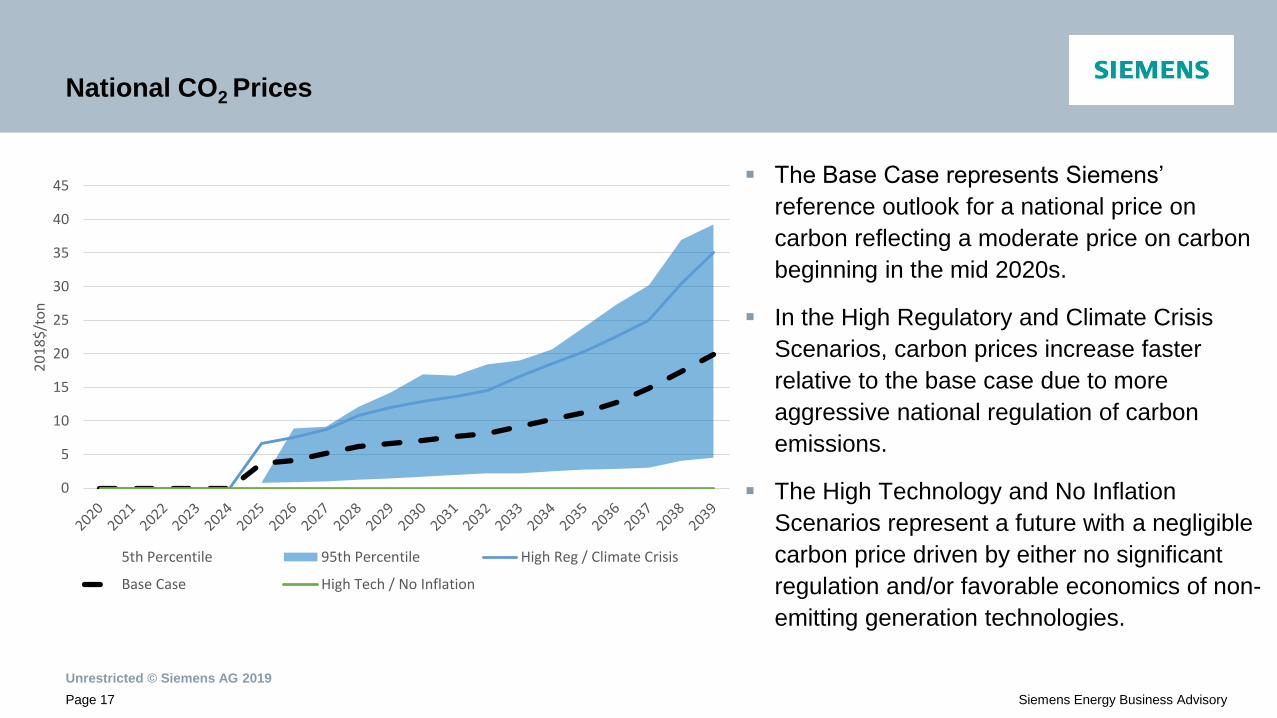
National CO2 Prices
The Base Case represents Siemens’
reference outlook for a national price on
carbon reflecting a moderate price on carbon
beginning in the mid 2020s.
In the High Regulatory and Climate Crisis
Scenarios, carbon prices increase faster
relative to the base case due to more
aggressive national regulation of carbon
emissions.
The High Technology and No Inflation
Scenarios represent a future with a negligible
carbon price driven by either no significant
regulation and/or favorable economics of non-
emitting generation technologies.
0
5
10
15
20
25
30
35
40
45
20
18
$/t
on
5th Percentile 95th Percentile High Reg / Climate Crisis
Base Case High Tech / No Inflation
Unrestricted © Siemens AG 2019
Page 18 Siemens Energy Business Advisory
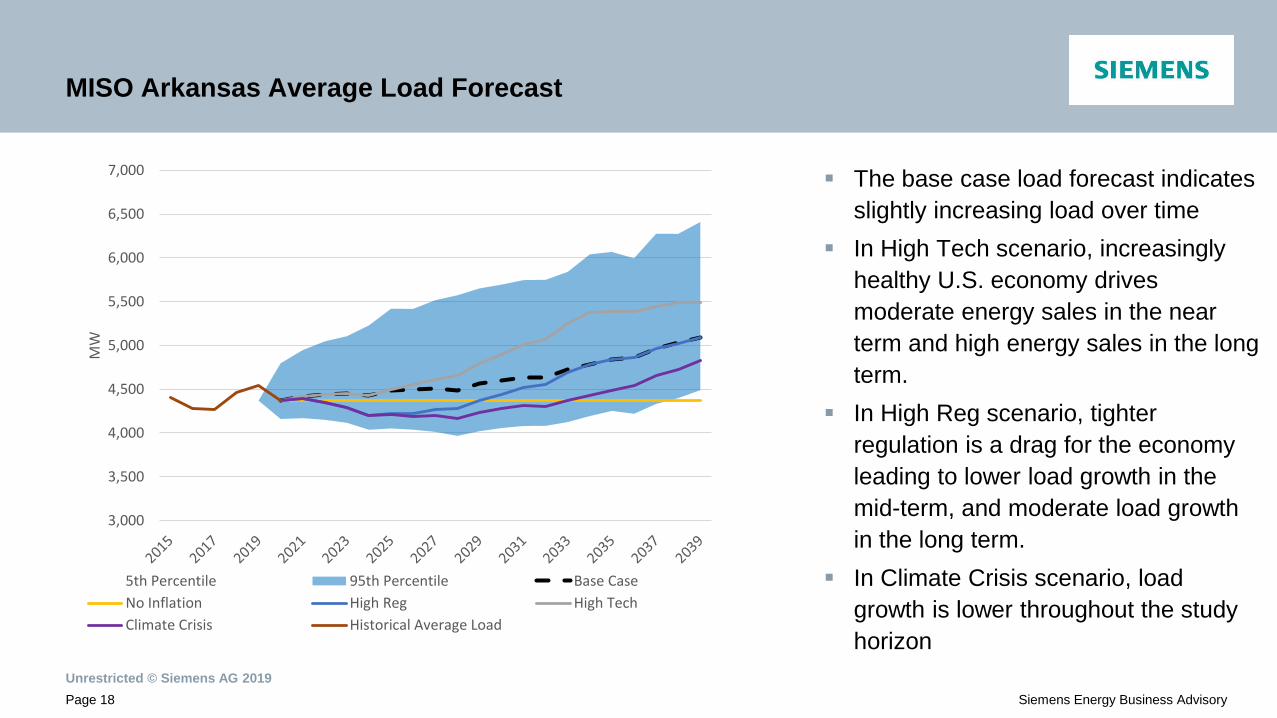
MISO Arkansas Average Load Forecast
The base case load forecast indicates
slightly increasing load over time
In High Tech scenario, increasingly
healthy U.S. economy drives
moderate energy sales in the near
term and high energy sales in the long
term.
In High Reg scenario, tighter
regulation is a drag for the economy
leading to lower load growth in the
mid-term, and moderate load growth
in the long term.
In Climate Crisis scenario, load
growth is lower throughout the study
horizon
3,000
3,500
4,000
4,500
5,000
5,500
6,000
6,500
7,000
MW
5th Percentile 95th Percentile Base Case
No Inflation High Reg High Tech
Climate Crisis Historical Average Load
Unrestricted © Siemens AG 2019
Page 19 Siemens Energy Business Advisory
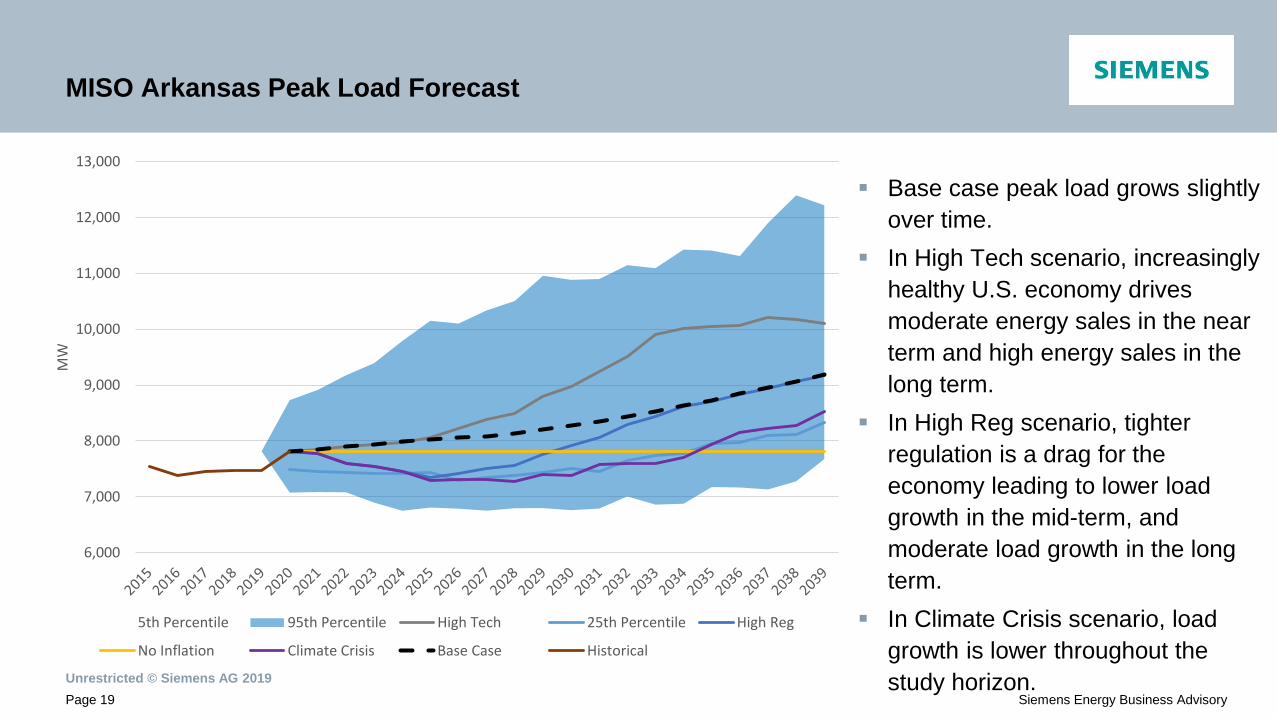
MISO Arkansas Peak Load Forecast
Base case peak load grows slightly
over time.
In High Tech scenario, increasingly
healthy U.S. economy drives
moderate energy sales in the near
term and high energy sales in the
long term.
In High Reg scenario, tighter
regulation is a drag for the
economy leading to lower load
growth in the mid-term, and
moderate load growth in the long
term.
In Climate Crisis scenario, load
growth is lower throughout the
study horizon.
6,000
7,000
8,000
9,000
10,000
11,000
12,000
13,000
MW
5th Percentile 95th Percentile High Tech 25th Percentile High Reg
No Inflation Climate Crisis Base Case Historical
Unrestricted © Siemens AG 2019
Page 20 Siemens Energy Business Advisory
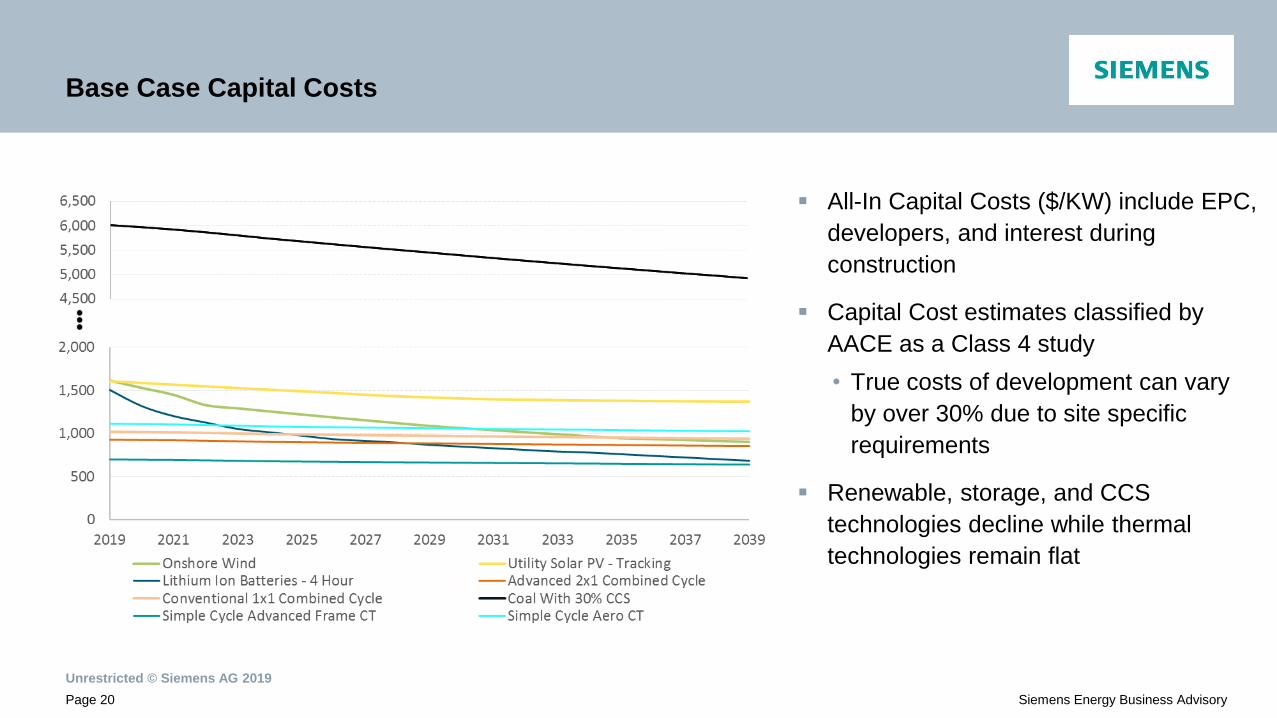
Base Case Capital Costs
All-In Capital Costs ($/KW) include EPC,
developers, and interest during
construction
Capital Cost estimates classified by
AACE as a Class 4 study
• True costs of development can vary
by over 30% due to site specific
requirements
Renewable, storage, and CCS
technologies decline while thermal
technologies remain flat
Unrestricted © Siemens AG 2019
Page 21 Siemens Energy Business Advisory
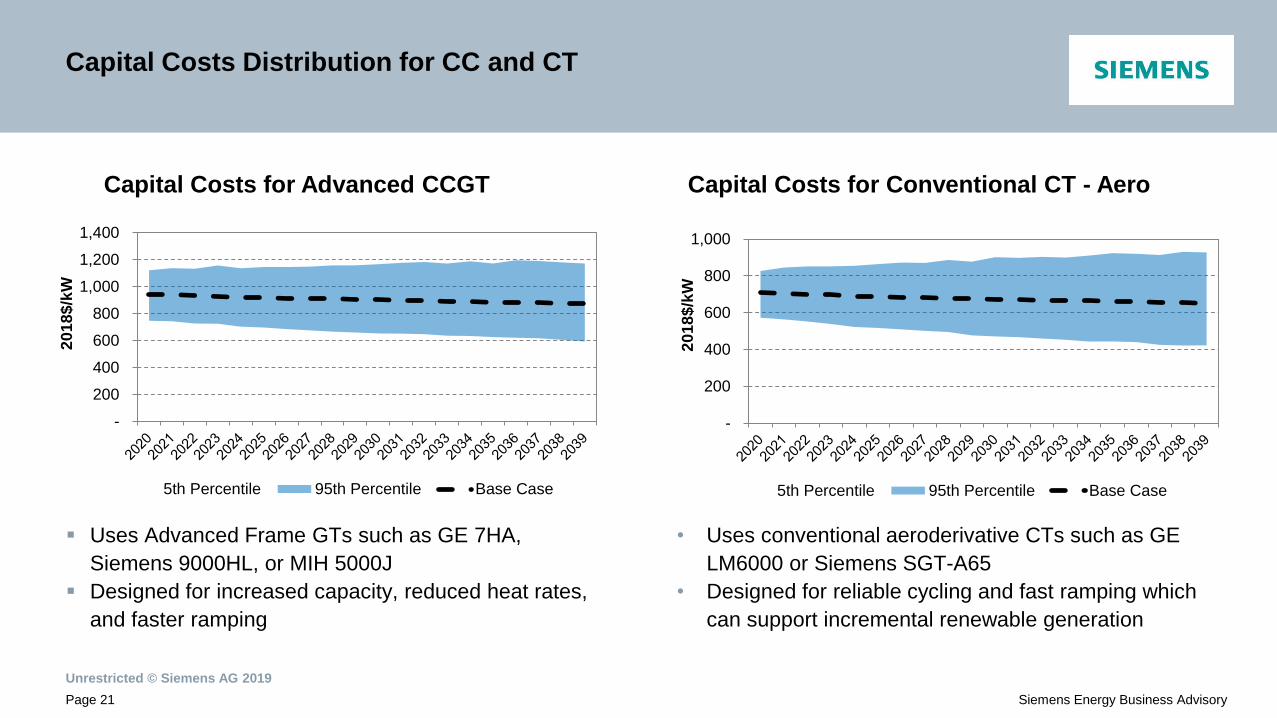
Capital Costs Distribution for CC and CT
Uses Advanced Frame GTs such as GE 7HA,
Siemens 9000HL, or MIH 5000J
Designed for increased capacity, reduced heat rates,
and faster ramping
• Uses conventional aeroderivative CTs such as GE
LM6000 or Siemens SGT-A65
• Designed for reliable cycling and fast ramping which
can support incremental renewable generation
Capital Costs for Advanced CCGT Capital Costs for Conventional CT - Aero
-
200
400
600
800
1,000
1,200
1,400
20
18
$/k
W
5th Percentile 95th Percentile Base Case
-
200
400
600
800
1,000
20
18
$/k
W
5th Percentile 95th Percentile Base Case
Unrestricted © Siemens AG 2019
Page 22 Siemens Energy Business Advisory
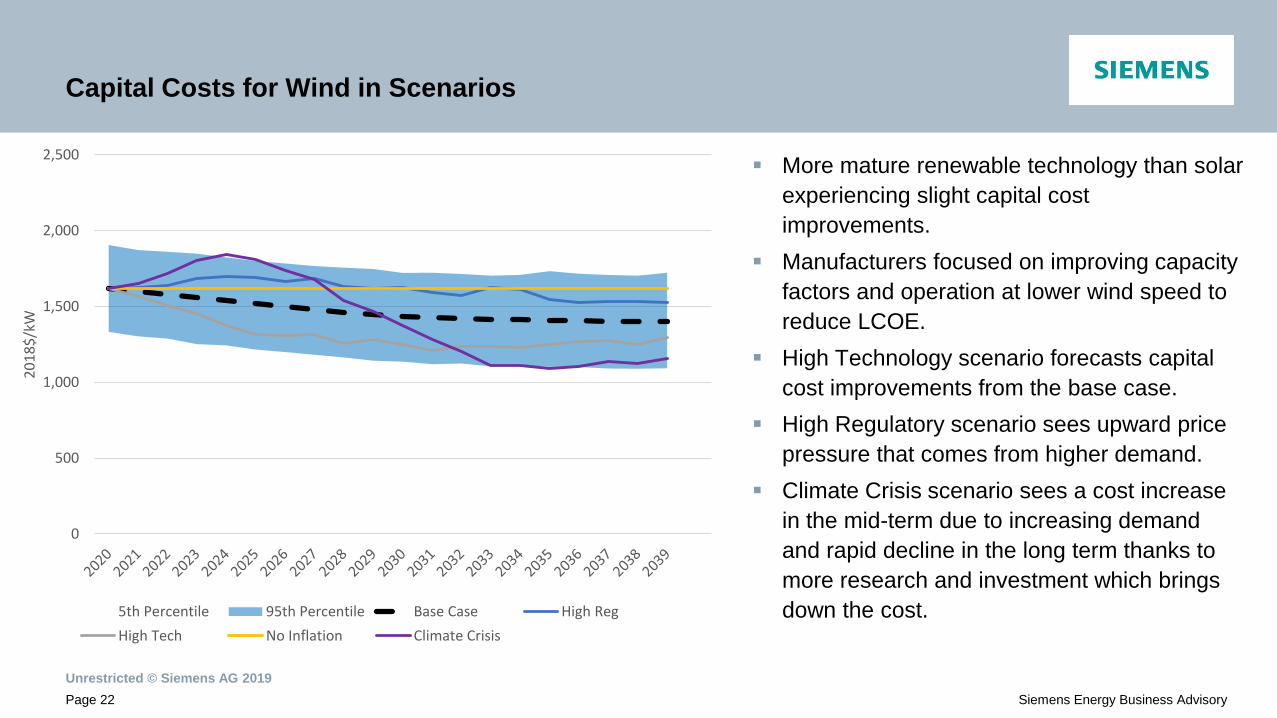
Capital Costs for Wind in Scenarios
More mature renewable technology than solar
experiencing slight capital cost
improvements.
Manufacturers focused on improving capacity
factors and operation at lower wind speed to
reduce LCOE.
High Technology scenario forecasts capital
cost improvements from the base case.
High Regulatory scenario sees upward price
pressure that comes from higher demand.
Climate Crisis scenario sees a cost increase
in the mid-term due to increasing demand
and rapid decline in the long term thanks to
more research and investment which brings
down the cost.
0
500
1,000
1,500
2,000
2,500
20
18
$/k
W
5th Percentile 95th Percentile Base Case High Reg
High Tech No Inflation Climate Crisis
Unrestricted © Siemens AG 2019
Page 23 Siemens Energy Business Advisory
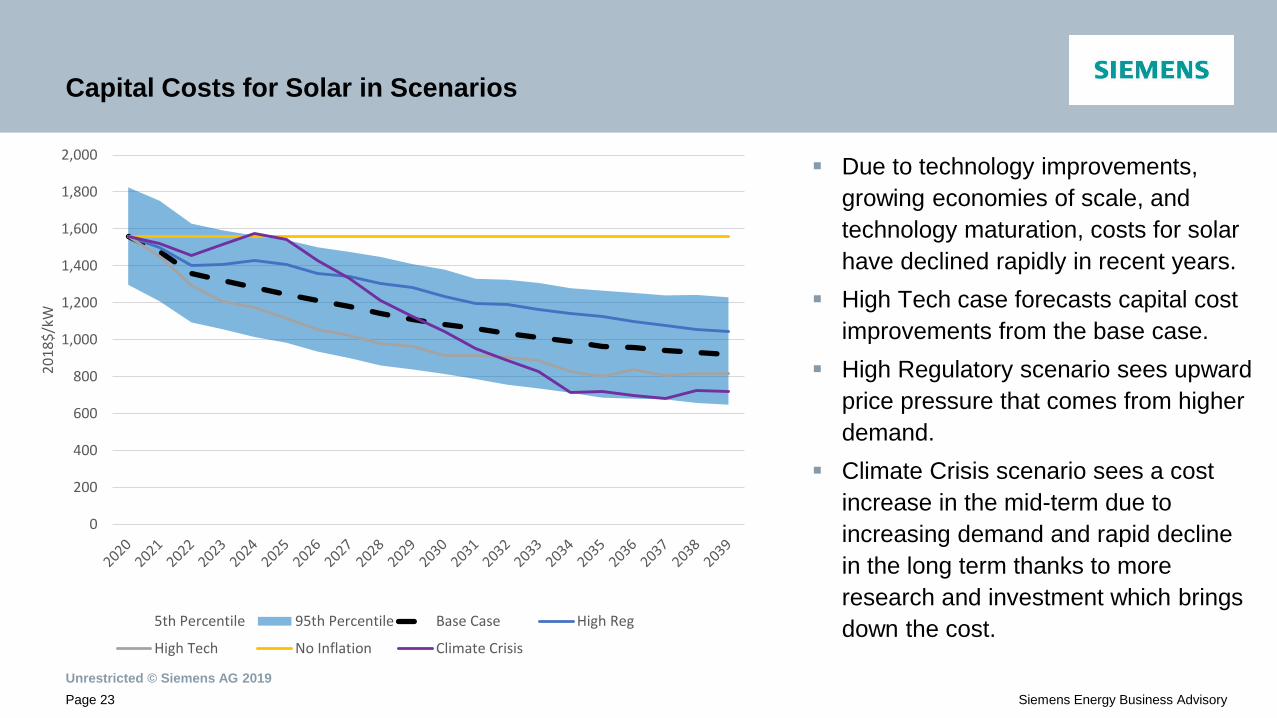
Capital Costs for Solar in Scenarios
Due to technology improvements,
growing economies of scale, and
technology maturation, costs for solar
have declined rapidly in recent years.
High Tech case forecasts capital cost
improvements from the base case.
High Regulatory scenario sees upward
price pressure that comes from higher
demand.
Climate Crisis scenario sees a cost
increase in the mid-term due to
increasing demand and rapid decline
in the long term thanks to more
research and investment which brings
down the cost.
0
200
400
600
800
1,000
1,200
1,400
1,600
1,800
2,000
20
18
$/k
W
5th Percentile 95th Percentile Base Case High Reg
High Tech No Inflation Climate Crisis
Unrestricted © Siemens AG 2019
Page 24 Siemens Energy Business Advisory
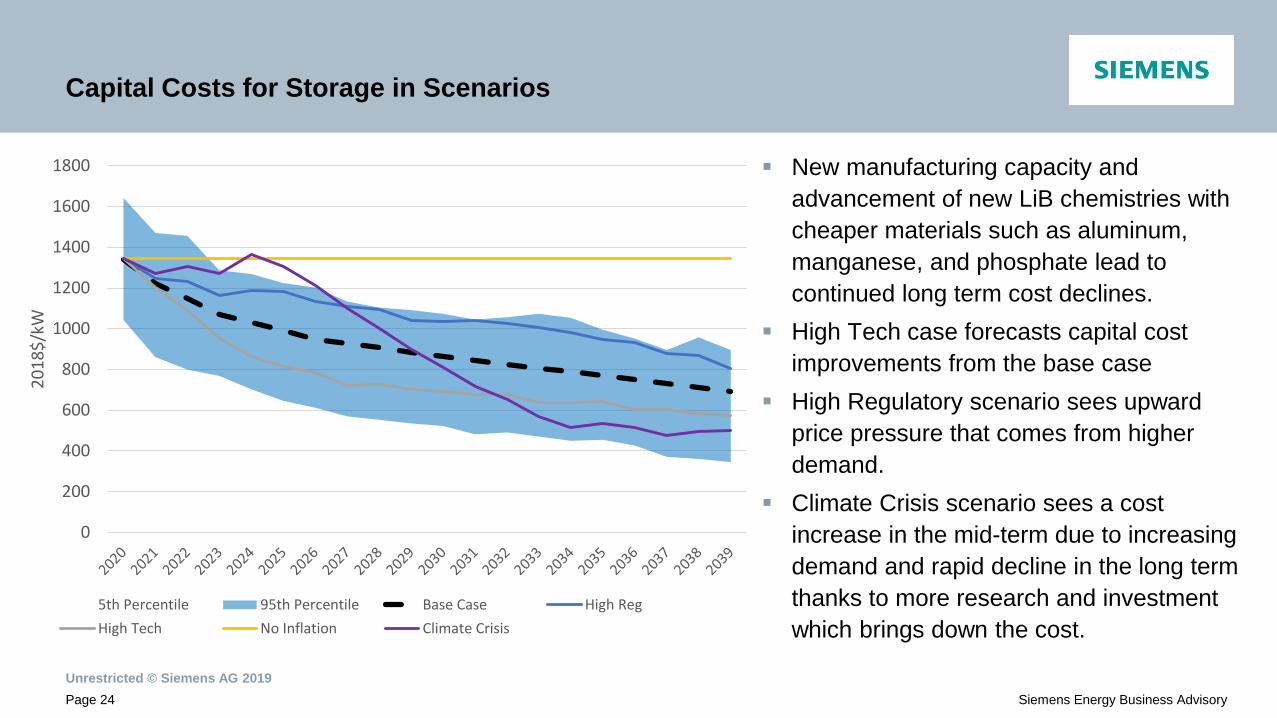
Capital Costs for Storage in Scenarios
New manufacturing capacity and
advancement of new LiB chemistries with
cheaper materials such as aluminum,
manganese, and phosphate lead to
continued long term cost declines.
High Tech case forecasts capital cost
improvements from the base case
High Regulatory scenario sees upward
price pressure that comes from higher
demand.
Climate Crisis scenario sees a cost
increase in the mid-term due to increasing
demand and rapid decline in the long term
thanks to more research and investment
which brings down the cost.
0
200
400
600
800
1000
1200
1400
1600
1800
20
18
$/k
W
5th Percentile 95th Percentile Base Case High Reg
High Tech No Inflation Climate Crisis
Resource Options and WACC
Unrestricted © Siemens AG 2019
Page 26 Siemens Energy Business Advisory
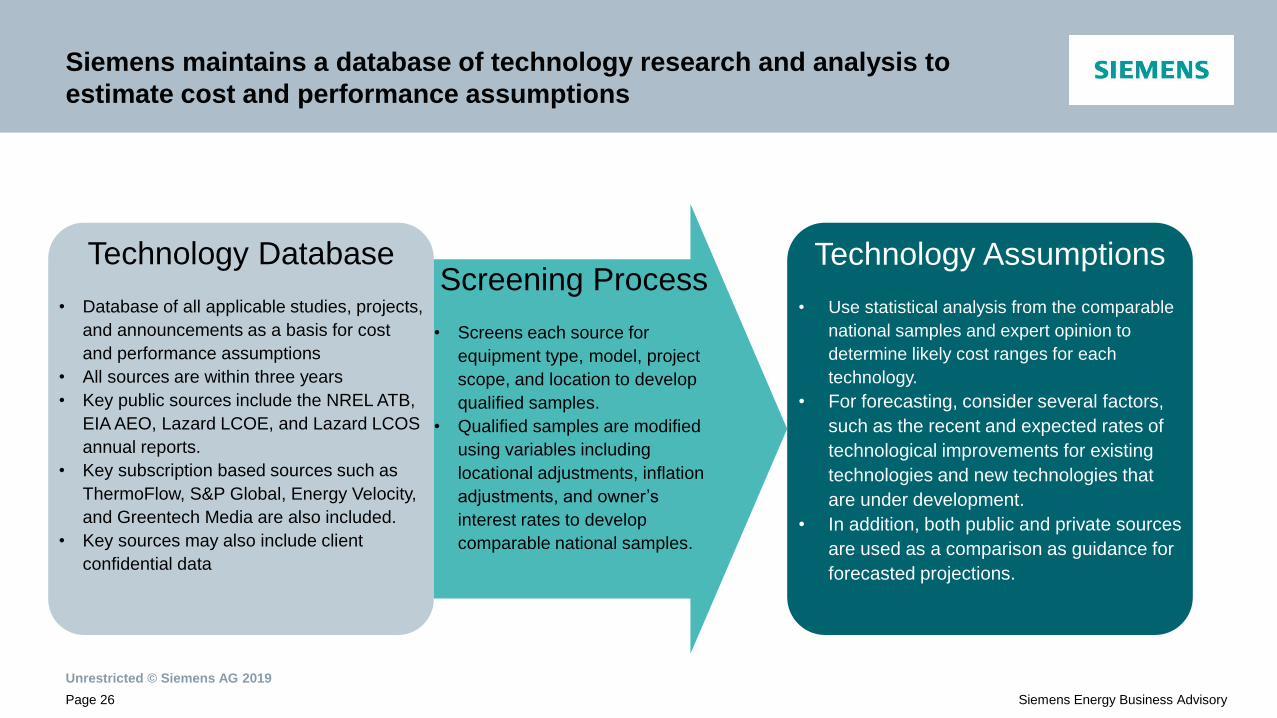
Technology Database
• Database of all applicable studies, projects,
and announcements as a basis for cost
and performance assumptions
• All sources are within three years
• Key public sources include the NREL ATB,
EIA AEO, Lazard LCOE, and Lazard LCOS
annual reports.
• Key subscription based sources such as
ThermoFlow, S&P Global, Energy Velocity,
and Greentech Media are also included.
• Key sources may also include client
confidential data
Screening Process
• Screens each source for
equipment type, model, project
scope, and location to develop
qualified samples.
• Qualified samples are modified
using variables including
locational adjustments, inflation
adjustments, and owner’s
interest rates to develop
comparable national samples.
Technology Assumptions
• Use statistical analysis from the comparable
national samples and expert opinion to
determine likely cost ranges for each
technology.
• For forecasting, consider several factors,
such as the recent and expected rates of
technological improvements for existing
technologies and new technologies that
are under development.
• In addition, both public and private sources
are used as a comparison as guidance for
forecasted projections.
Siemens maintains a database of technology research and analysis to
estimate cost and performance assumptions
Unrestricted © Siemens AG 2019
Page 27 Siemens Energy Business Advisory
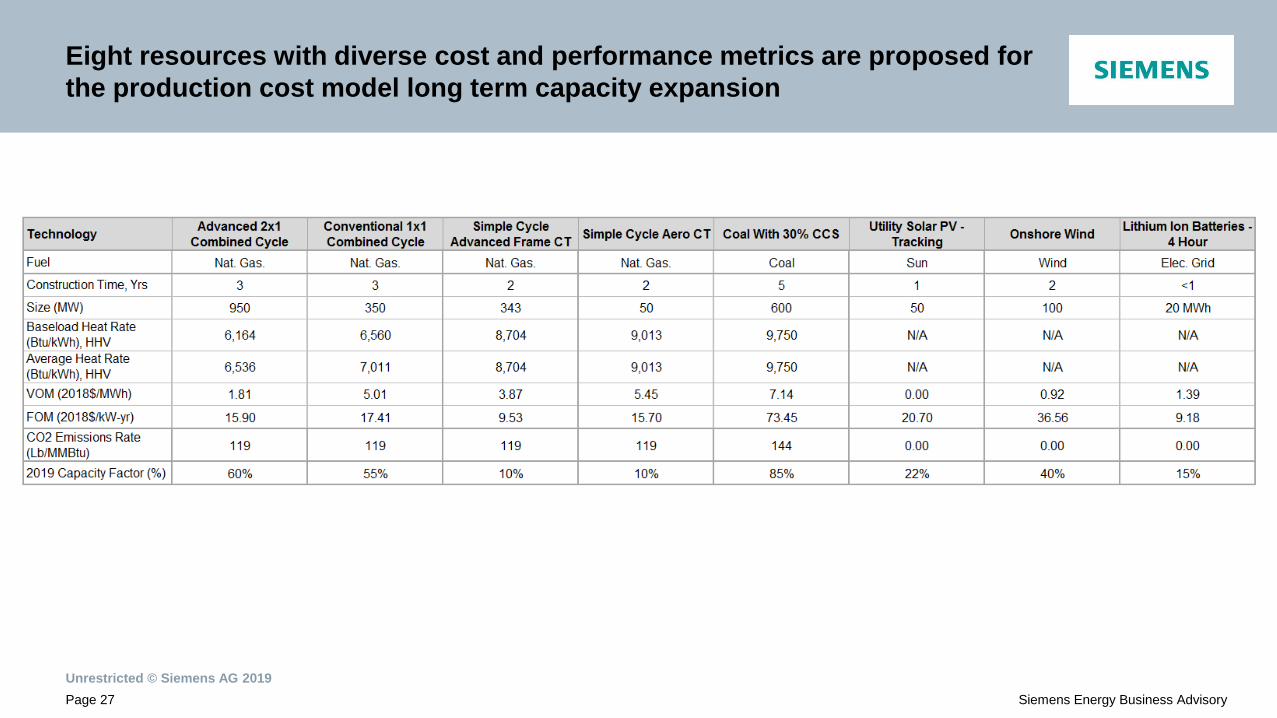
Eight resources with diverse cost and performance metrics are proposed for
the production cost model long term capacity expansion
Unrestricted © Siemens AG 2019
Page 28 Siemens Energy Business Advisory
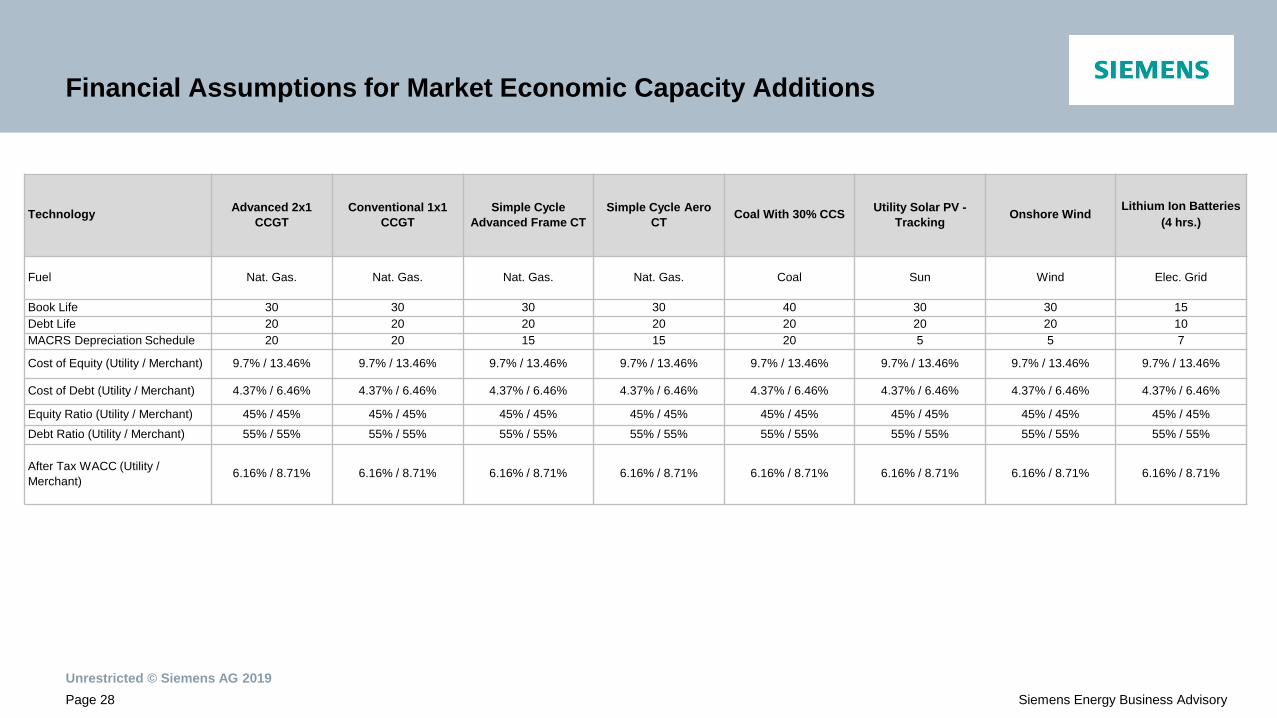
Financial Assumptions for Market Economic Capacity Additions
Technology Advanced 2x1
CCGT Conventional 1x1
CCGT Simple Cycle
Advanced Frame CT Simple Cycle Aero
CT Coal With 30% CCS Utility Solar PV -
Tracking Onshore Wind
Lithium Ion Batteries (4 hrs.)
Fuel Nat. Gas. Nat. Gas. Nat. Gas. Nat. Gas. Coal Sun Wind Elec. Grid
Book Life 30 30 30 30 40 30 30 15 Debt Life 20 20 20 20 20 20 20 10 MACRS Depreciation Schedule 20 20 15 15 20 5 5 7
Cost of Equity (Utility / Merchant) 9.7% / 13.46% 9.7% / 13.46% 9.7% / 13.46% 9.7% / 13.46% 9.7% / 13.46% 9.7% / 13.46% 9.7% / 13.46% 9.7% / 13.46%
Cost of Debt (Utility / Merchant) 4.37% / 6.46% 4.37% / 6.46% 4.37% / 6.46% 4.37% / 6.46% 4.37% / 6.46% 4.37% / 6.46% 4.37% / 6.46% 4.37% / 6.46%
Equity Ratio (Utility / Merchant) 45% / 45% 45% / 45% 45% / 45% 45% / 45% 45% / 45% 45% / 45% 45% / 45% 45% / 45% Debt Ratio (Utility / Merchant) 55% / 55% 55% / 55% 55% / 55% 55% / 55% 55% / 55% 55% / 55% 55% / 55% 55% / 55%
After Tax WACC (Utility /
Merchant) 6.16% / 8.71% 6.16% / 8.71% 6.16% / 8.71% 6.16% / 8.71% 6.16% / 8.71% 6.16% / 8.71% 6.16% / 8.71% 6.16% / 8.71%
Unrestricted © Siemens AG 2019
Page 29 Siemens Energy Business Advisory
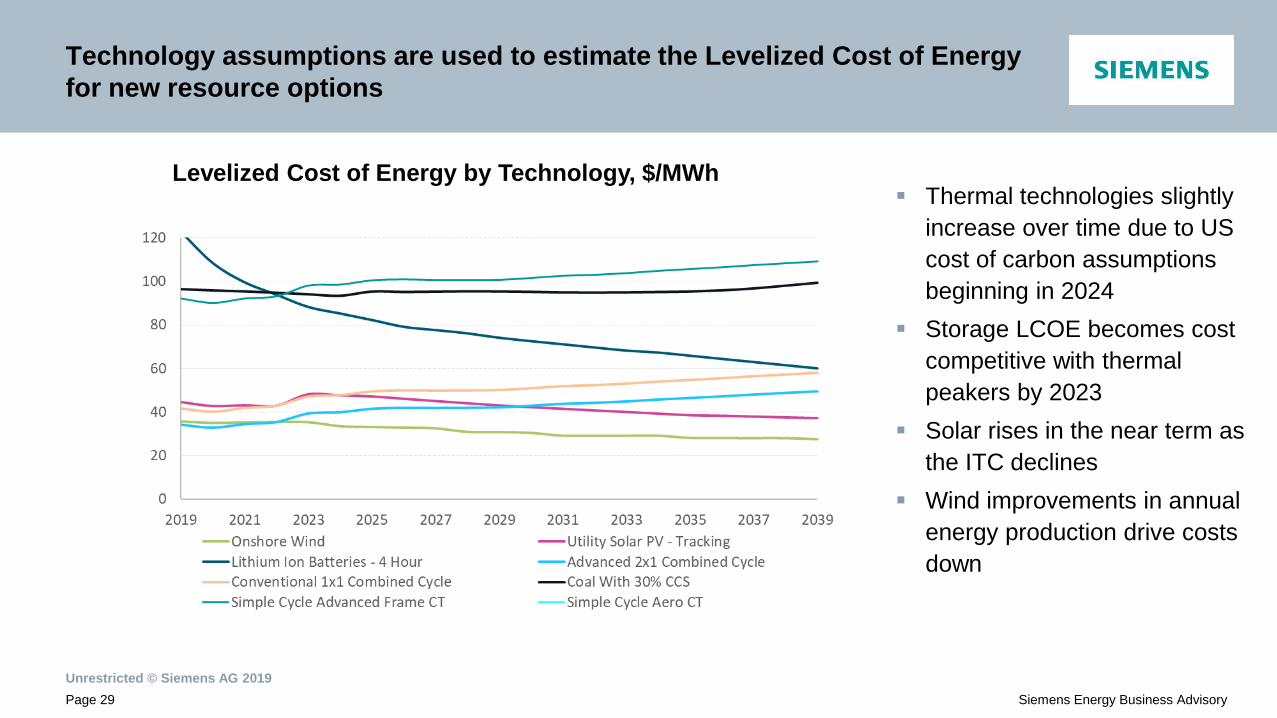
Technology assumptions are used to estimate the Levelized Cost of Energy
for new resource options
Thermal technologies slightly
increase over time due to US
cost of carbon assumptions
beginning in 2024
Storage LCOE becomes cost
competitive with thermal
peakers by 2023
Solar rises in the near term as
the ITC declines
Wind improvements in annual
energy production drive costs
down
Levelized Cost of Energy by Technology, $/MWh
Unrestricted © Siemens AG 2019
Page 30 Siemens Energy Business Advisory
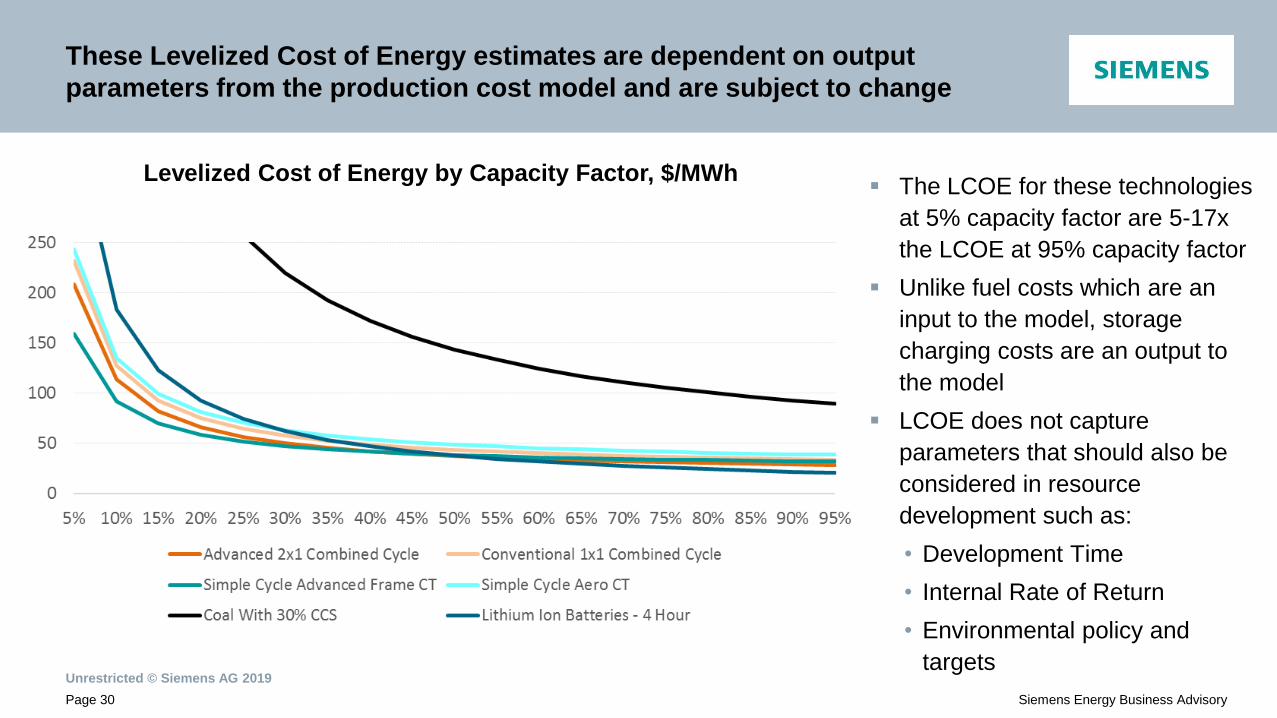
These Levelized Cost of Energy estimates are dependent on output
parameters from the production cost model and are subject to change
The LCOE for these technologies
at 5% capacity factor are 5-17x
the LCOE at 95% capacity factor
Unlike fuel costs which are an
input to the model, storage
charging costs are an output to
the model
LCOE does not capture
parameters that should also be
considered in resource
development such as:
• Development Time
• Internal Rate of Return
• Environmental policy and
targets
Levelized Cost of Energy by Capacity Factor, $/MWh
Transmission
Unrestricted © Siemens AG 2019
Page 32 Siemens Energy Business Advisory
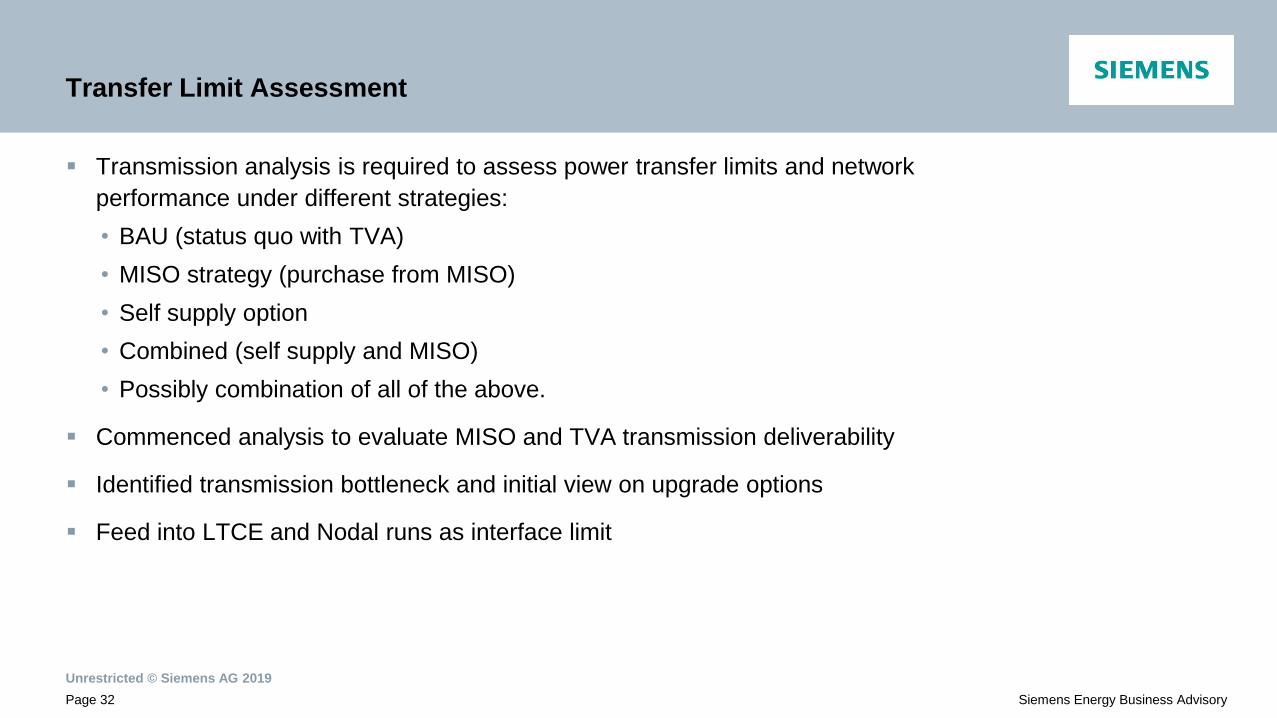
Transfer Limit Assessment
Transmission analysis is required to assess power transfer limits and network
performance under different strategies:
• BAU (status quo with TVA)
• MISO strategy (purchase from MISO)
• Self supply option
• Combined (self supply and MISO)
• Possibly combination of all of the above.
Commenced analysis to evaluate MISO and TVA transmission deliverability
Identified transmission bottleneck and initial view on upgrade options
Feed into LTCE and Nodal runs as interface limit
Unrestricted © Siemens AG 2019
Page 33 Siemens Energy Business Advisory
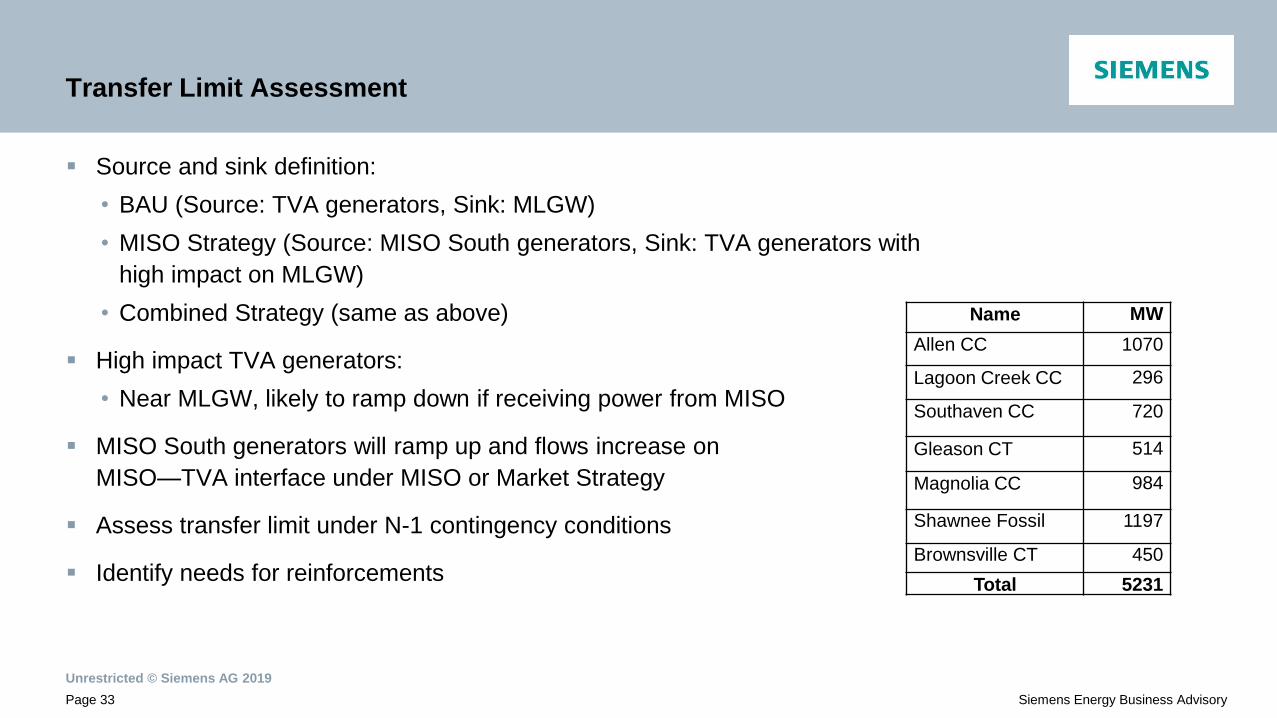
Transfer Limit Assessment
Source and sink definition:
• BAU (Source: TVA generators, Sink: MLGW)
• MISO Strategy (Source: MISO South generators, Sink: TVA generators with
high impact on MLGW)
• Combined Strategy (same as above)
High impact TVA generators:
• Near MLGW, likely to ramp down if receiving power from MISO
MISO South generators will ramp up and flows increase on
MISO—TVA interface under MISO or Market Strategy
Assess transfer limit under N-1 contingency conditions
Identify needs for reinforcements
Name MW
Allen CC 1070
Lagoon Creek CC 296
Southaven CC 720
Gleason CT 514
Magnolia CC 984
Shawnee Fossil 1197
Brownsville CT 450
Total 5231
Unrestricted © Siemens AG 2019
Page 34 Siemens Energy Business Advisory
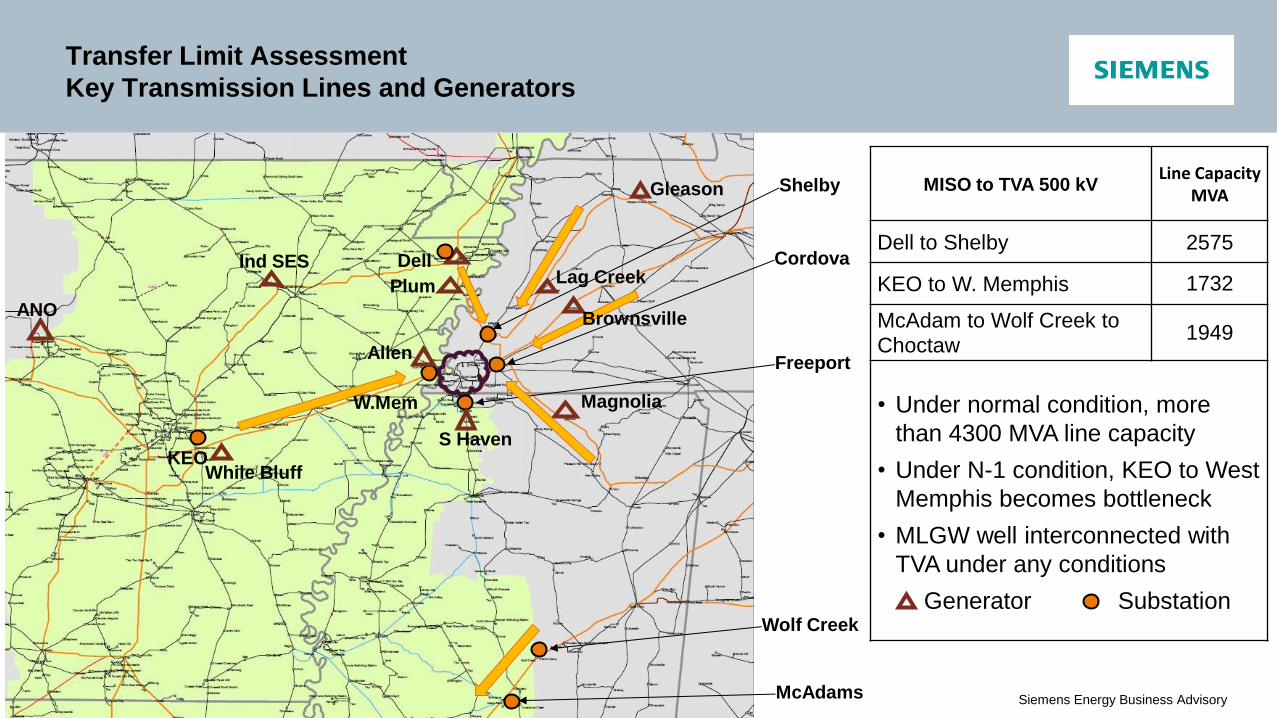
Transfer Limit Assessment
Key Transmission Lines and Generators
Dell
KEO
Shelby
Cordova
Allen Freeport
W.Mem
McAdams
Wolf Creek
Lag Creek
Gleason
Magnolia
S Haven
Brownsville
While Bluff
ANO
Plum
Ind SES
MISO to TVA 500 kV Line Capacity
MVA
Dell to Shelby 2575
KEO to W. Memphis 1732
McAdam to Wolf Creek to
Choctaw 1949
• Under normal condition, more
than 4300 MVA line capacity
• Under N-1 condition, KEO to West
Memphis becomes bottleneck
• MLGW well interconnected with
TVA under any conditions
Generator Substation
Unrestricted © Siemens AG 2019
Page 35 Siemens Energy Business Advisory
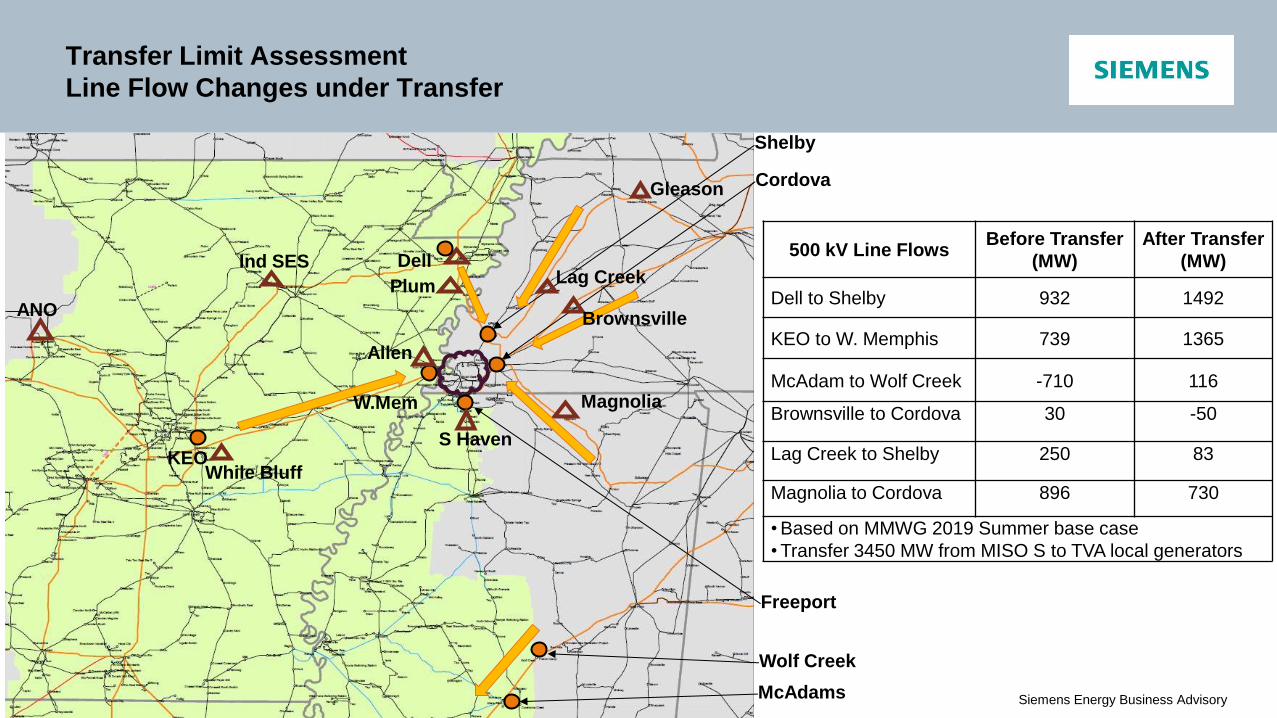
Transfer Limit Assessment
Line Flow Changes under Transfer
Dell
KEO
Shelby
Cordova
Allen
Freeport
W.Mem
McAdams
Wolf Creek
Lag Creek
Gleason
Magnolia
S Haven
Brownsville
While Bluff
ANO
Plum
Ind SES
500 kV Line Flows Before Transfer
(MW)
After Transfer
(MW)
Dell to Shelby 932 1492
KEO to W. Memphis 739 1365
McAdam to Wolf Creek -710 116
Brownsville to Cordova 30 -50
Lag Creek to Shelby 250 83
Magnolia to Cordova 896 730
• Based on MMWG 2019 Summer base case
• Transfer 3450 MW from MISO S to TVA local generators
Unrestricted © Siemens AG 2019
Page 36 Siemens Energy Business Advisory
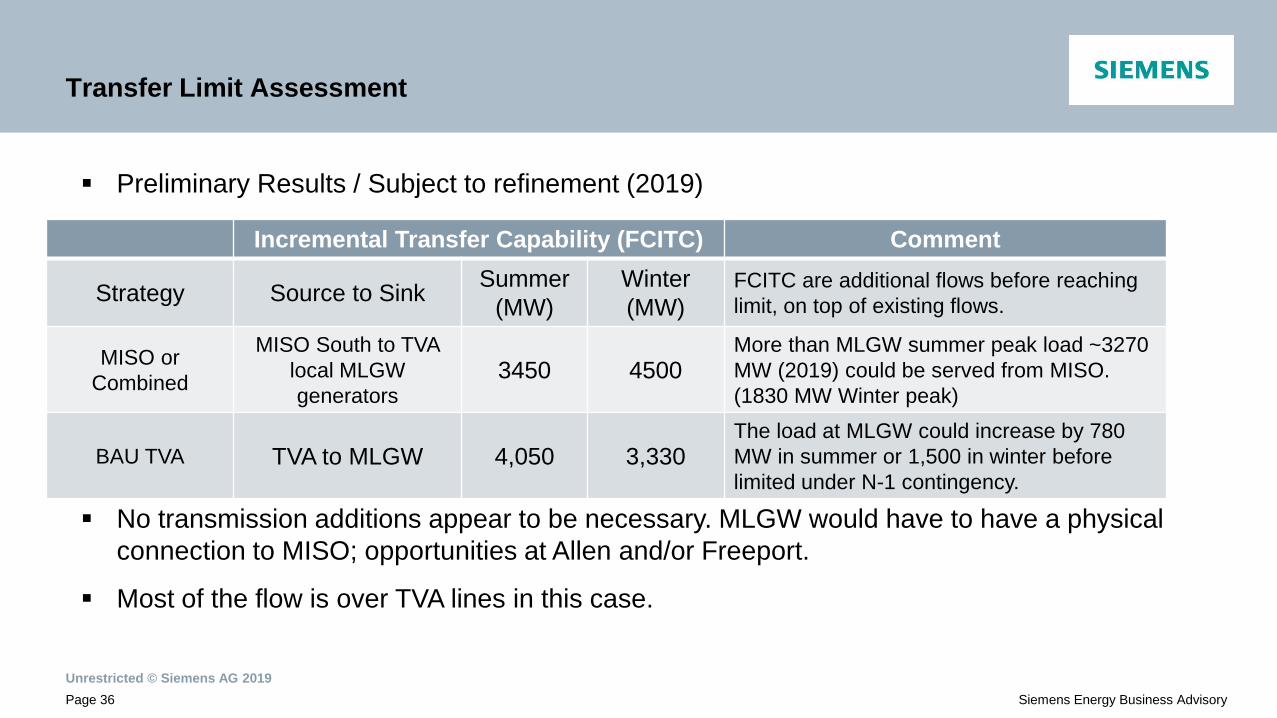
Transfer Limit Assessment
Preliminary Results / Subject to refinement (2019)
No transmission additions appear to be necessary. MLGW would have to have a physical
connection to MISO; opportunities at Allen and/or Freeport.
Most of the flow is over TVA lines in this case.
Incremental Transfer Capability (FCITC) Comment
Strategy Source to Sink Summer
(MW)
Winter
(MW)
FCITC are additional flows before reaching
limit, on top of existing flows.
MISO or
Combined
MISO South to TVA
local MLGW
generators 3450 4500
More than MLGW summer peak load ~3270
MW (2019) could be served from MISO.
(1830 MW Winter peak)
BAU TVA TVA to MLGW 4,050 3,330 The load at MLGW could increase by 780
MW in summer or 1,500 in winter before
limited under N-1 contingency.

Breakout section
Unrestricted © Siemens AG 2019
Page 38 Siemens Energy Business Advisory
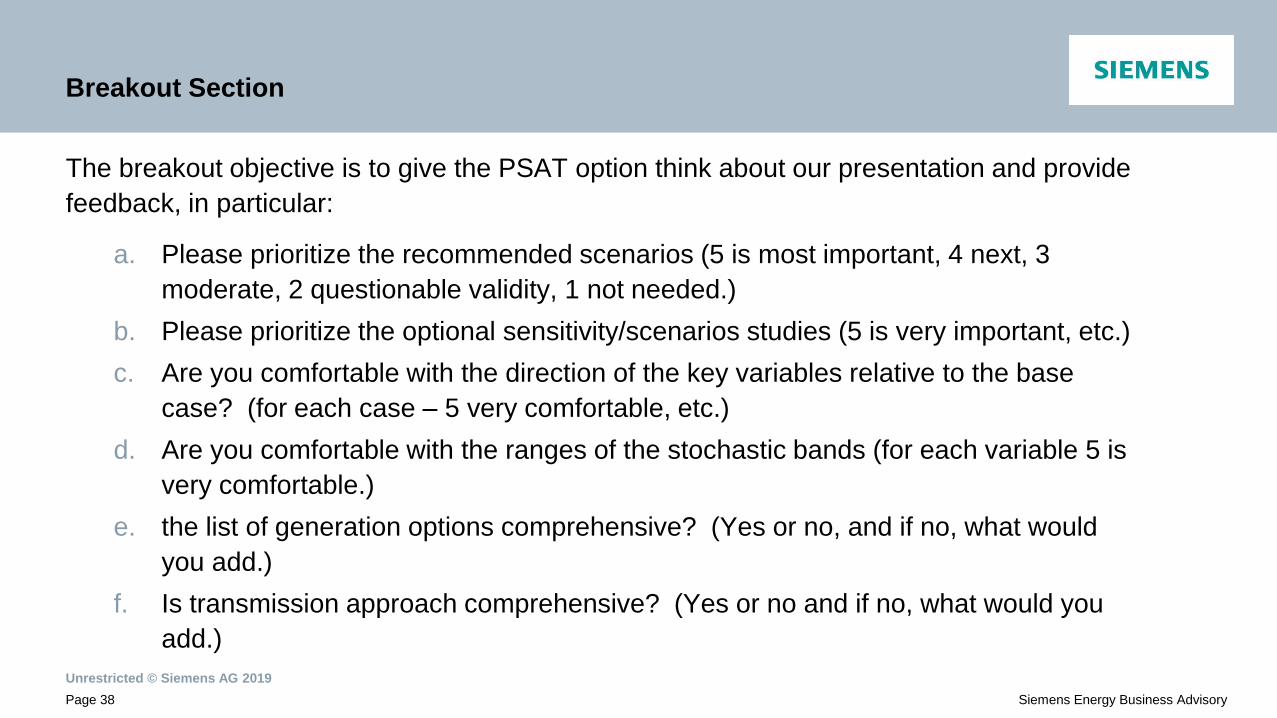
Breakout Section
The breakout objective is to give the PSAT option think about our presentation and provide
feedback, in particular:
a. Please prioritize the recommended scenarios (5 is most important, 4 next, 3
moderate, 2 questionable validity, 1 not needed.)
b. Please prioritize the optional sensitivity/scenarios studies (5 is very important, etc.)
c. Are you comfortable with the direction of the key variables relative to the base
case? (for each case – 5 very comfortable, etc.)
d. Are you comfortable with the ranges of the stochastic bands (for each variable 5 is
very comfortable.)
e. the list of generation options comprehensive? (Yes or no, and if no, what would
you add.)
f. Is transmission approach comprehensive? (Yes or no and if no, what would you
add.)