Embed Size (px)
Citation preview

1 PSI Immunology Meeting
17th June 2016
Predicting Responders & Non Responders
Jacquie Christie
GSK

For the more prevalent Immunology diseases there are multiple
treatment options

Which patient will gain most benefit from which compound?
• Baseline variables?
– Demographics
– Disease severity
– Conmeds
– Biomarkers
– PGx
– Etc.
– Methodology: subgroup analyses, covariate effects
– Frequently carried out, but not conclusive and very few H2H studies

Give it a try?
• Working Hypothesis – If the medicine doesn’t work well in the first few weeks, it probably won’t work well in the
longer term.
– How do we best assess that?
• How well does it need to work in the first weeks?
• How long do you need to try for?
• What’s the risk?
–Of stopping when you should have continued.
–Of continuing when you should have stopped.

Example Background
• Rheumatoid Arthritis
– Inflammation of joints
• DAS28 Endpoint • Continuous score made up of joint counts, inflammatory markers, patient assessment.
• ≥5.1 indicates active disease
• ≤3.2 indicates low disease activity (LDA)
• ≤2.6 remission.

Methodology
• Consider early response like a ‘diagnostic’ test for longer term
response/remission.
– Sensitivity
– Specificity
– Positive Predictive Values.
– Negative Predictive Values
– False Positive Rate
– False Negative Rate

Terminology
• Sensitivity
– Pr(correctly identified as positive).
– Also called TPR (True Positive Rate)
• Specificity
– Pr(correctly identified as negative)
– Equal to 1-FPR (False Positive Rate)
• Positive Predictive Value (PPV)
– Pr (Being positive if identified as positive)
• Negative Predictive Value (NPV)
– Pr (Being negative if identified as negative)

Outcome
Positive Negative
Prediction Positive
True Positive (TP)
False Positive (FP)
PPV TP/(TP+FP)
Prediction Negative
False Negative (FN) True Negative (TN)
NPV TN/(FN+TN)
Sensitivity TP/(TP+FN)
Specificity TN/(FP+TN)
Earl
y P
red
icti
on
% of predicted positives who actually were positives
% of predicted negatives who actually were negatives
% of actual positives who were predicted to be positives
% of actual negatives who were predicted negatives

In example RA endpoint terms
Low Disease Activity at week 52
Yes No
>=0.6 True Positive (TP)
False Positive (FP)
PPV TP/(TP+FP)
<0.6 False Negative (FN) True Negative (TN)
NPV TN/(FN+TN)
Sensitivity TP/(TP+FN)
Specificity TN/(FP+TN)
Ch
ange
s in
DA
S28
at
wee
k 4

Baricitinib *
Low Disease Activity at week 24
Yes No
>=0.6 62 (TP)
97 (FP)
159 PPV
TP/(TP+FP) = 39%
<0.6 5 (FN)
31 (TN)
36 NPV
TN/FN+TN) =86%
67 Sensitivity TP/(TP+FN)
=93%
128 Specificity
TN/(FP+TN) =24%
195
Ch
ange
s in
DA
S28
at
wee
k 4
*Kremer et al (2015 ACR abstract) http://acrabstracts.org/abstract/response-to-baricitinib-at-4-weeks-predicts-response-at-12-and-24-weeks-in-patients-with-rheumatoid-arthritis-results-from-two-phase-3-studies/

Interpretation
• NPV = 86%
– Exact 95% CI=[70%, 95%]
• PPV = 39%
– Exact 95% CI= [31%, 47%]
• Misclassification rate = 52%.
• NPV high
Few patients with minimal early response(<0.6 improvement in DAS28 at week 4) would reach LDA at week 24.
• Using this rule, relatively low risk of stopping incorrectly.
• PPV low many patients with early response (≥0.6 improvement in DAS28 at week 4) do not reach LDA at week
24.
• Using this rule, high risk of continuing incorrectly.
• Only 24% of non-responders would stop treatment

Are different endpoints better?
Kremer et al (2015 ACR abstract)
http://acrabstracts.org/abstract/response-to-baricitinib-at-4-weeks-predicts-response-at-12-and-24-weeks-in-patients-with-rheumatoid-arthritis-results-from-two-
phase-3-studies/

Are different cut points better?
• Receiver Operating Characteristic Curve (ROC curve.)
– Plot of the TPR (sensitivity) vs the FPR (1-specifity) for all different possible cutpoints of the ‘diagnostic’.
– Shows the trade-off (increase in one is accompanied by decrease in the other)

Simulated Example Low Disease Activity at week 24
Yes No
>=0.6 57 (TP)
58 (FP)
115 PPV
TP/(TP+FP) = 50%
<0.6 11 (FN)
74 (TN)
85 NPV
TN/FN+TN) = 87%
68 Sensitivity TP/(TP+FN)
=84%
132 Specificity
TN/(FP+TN) =56%
200
Ch
ange
s in
DA
S28
at
wee
k 4

Simulated Example RoC Curve The perfect score
No value in test 50:50
chance
‘Best Point’ assuming equal weight of FPR/TPR, gives DAS28 cut of 0.64
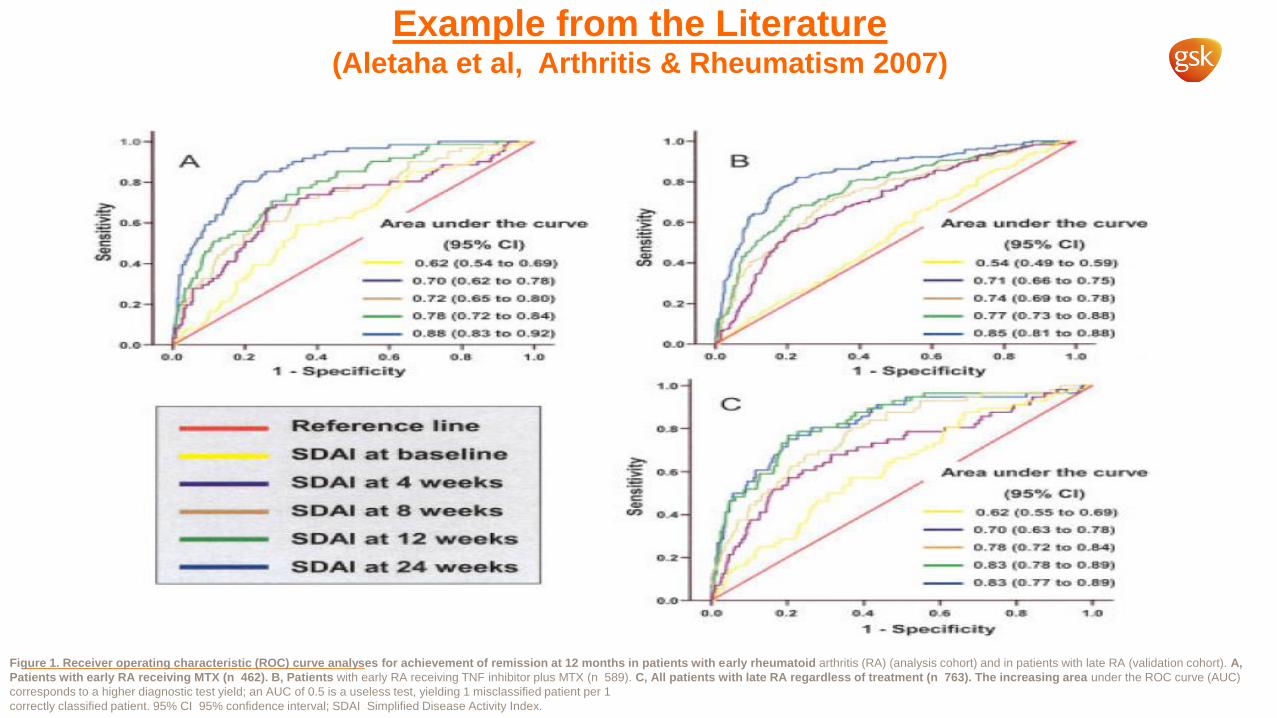
Example from the Literature (Aletaha et al, Arthritis & Rheumatism 2007)
Figure 1. Receiver operating characteristic (ROC) curve analyses for achievement of remission at 12 months in patients with early rheumatoid arthritis (RA) (analysis cohort) and in patients with late RA (validation cohort). A,
Patients with early RA receiving MTX (n 462). B, Patients with early RA receiving TNF inhibitor plus MTX (n 589). C, All patients with late RA regardless of treatment (n 763). The increasing area under the ROC curve (AUC)
corresponds to a higher diagnostic test yield; an AUC of 0.5 is a useless test, yielding 1 misclassified patient per 1
correctly classified patient. 95% CI 95% confidence interval; SDAI Simplified Disease Activity Index.

Logistic model
Predicted probabilities for LDA at week 24 by 4 week DAS improvement
DAS28 improvement by week 4

Logistic model
Predicted probabilities for NO LDA at week 24 by DAS improvement
DAS28 improvement by week 4

NPV vs PPV
NOTE: 11 obs had missing values. Lines represent the 0.6 DAS cut point used.

One Step Further
• CART analysis
– Classification and Regression Trees
– Optimal recursive splitting of patients into subgroups based on maximum predictive accuracy
• At each level the patients are split into two group that are most different with respect to the outcome.
• Can consider multiple endpoints, baseline characteristics and timepoints.
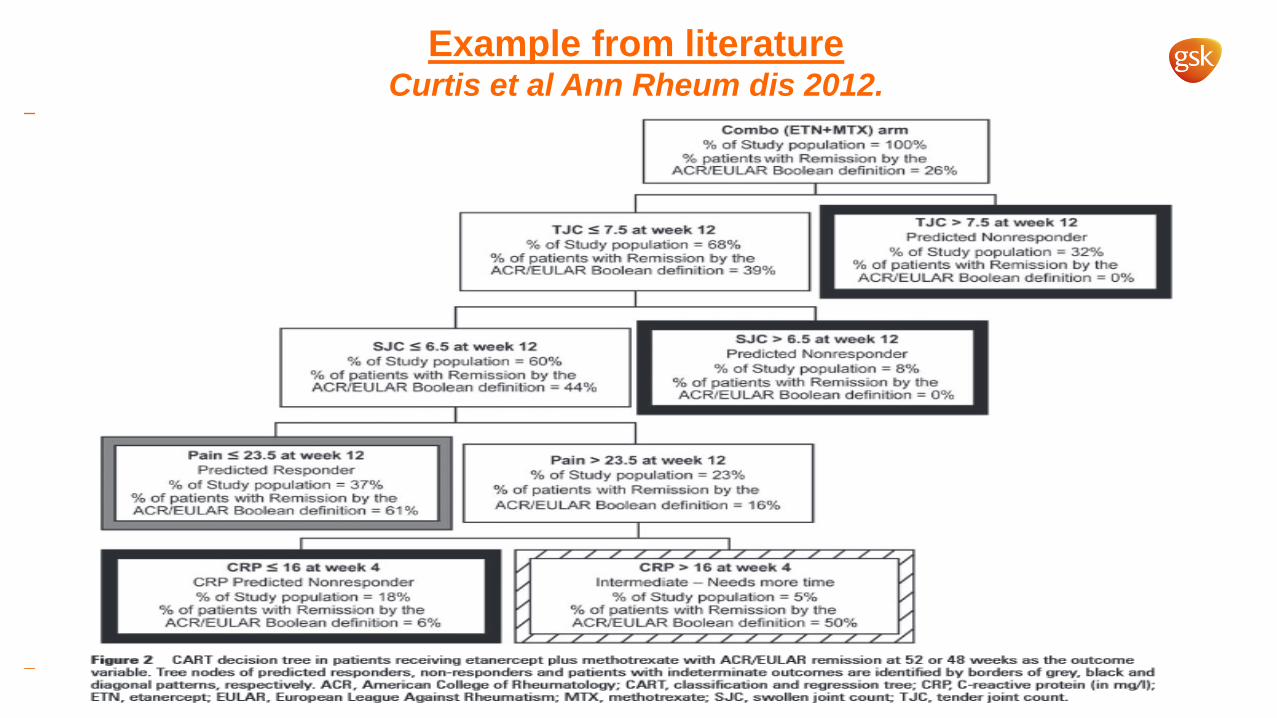
Example from literature Curtis et al Ann Rheum dis 2012.

Overall summary of CART output* Remission at week 48-52
Yes No
Carry on 48 (TP)
34 (FP)
81 PPV
TP/(TP+FP) = 59%
Stop (black boxes)
2 (FN)
110 (TN)
112 NPV
TN/FN+TN)= 98%
50 Sensitivity TP/(TP+FN)
=96%
143 Specificity
TN/(FP+TN) =77%
193
Pre
dic
tio
n f
rom
C
AR
T an
alys
is
*calculated numbers are based on %’s given in paper, so may be slightly out due to rounding.

Compare to 2 level tree only?* Remission at week 48-52
Yes No
Carry on 50 (TP)
66 (FP)
116 PPV
TP/(TP+FP) = 43%
Stop (black boxes)
0 (FN)
77 (TN)
77 NPV
TN/FN+TN)= 100%
50 Sensitivity TP/(TP+FN)
=100%
143 Specificity
TN/(FP+TN) =54%
193
Pre
dic
tio
n f
rom
C
AR
T an
alys
is
*calculated numbers are based on %’s given in paper, so may be slightly out due to rounding.

CART approach
• Improvement in accuracy over single DAS28 approach.
• However, complex to generate and to use
– Especially across multiple time points
– Consider whether extra steps are worthwhile

• E.g. Probability of future
Remission conditioned on non-
response at all timepoints
before?
Consider Conditional Probabilities to Optimise Duration?
0
5
10
15
20
25
30
0 4 8 12 16 20 24 28 32 36 40 44 48 52%
Week
Start of plateau?
About a 1 in 4 chance
About a 1 in 6 chance
About a 1 in 10 chance

Discussion Points
• The trade off
– should false positive and false negatives be considered equally?
• Handling missing data
• Different endpoints and timepoints for different compounds.
• Lower hurdles endpoints
– And therefore higher overall response rates
• Different rules for different patient populations.
• Utility for dose escalation/reduction designs.
• Replication, and potential for labelling.