Embed Size (px)
Citation preview

lable at ScienceDirect
Renewable Energy 80 (2015) 674e681
Contents lists avai
Renewable Energy
journal homepage: www.elsevier .com/locate/renene
Preliminary investigation to characterize deposits forming duringcombustion of biogas from anaerobic digesters and landfills
Sharon C. Surita*, Berrin TanselDepartment of Civil and Environmental Engineering, Florida International University, College of Engineering and Computing, 10155 West Flagler St, Miami,FL 33174, USA
a r t i c l e i n f o
Article history:Received 24 April 2014Accepted 24 February 2015Available online
Keywords:Silicate-depositsLandfill gasBiogasMunicipal solid wasteDigesterCombustion engine
* Corresponding author. Tel.: þ1 (305) 766 1312.E-mail address: [email protected] (S.C. Surita).
http://dx.doi.org/10.1016/j.renene.2015.02.0600960-1481/© 2015 Elsevier Ltd. All rights reserved.
a b s t r a c t
The objectives of this study were to compare composition and morphological characteristics of thedeposits forming in engines operated with biogas from anaerobic digesters and from landfills. Enginedeposit samples were collected from biogas to energy facilities in Florida, USA. The deposit samples wereanalyzed by scanning electron microscopy (SEM) and energy dispersive spectroscopy (EDS). Similaritiesand differences between the deposit samples collected from the engines operated with biogas fromanaerobic digesters and biogas from landfills were analyzed in terms of chemical composition andmorphology. The sample obtained from the anaerobic digester gas did not contain potassium whilecalcium and zinc were present at a higher ratio. Relatively high levels of carbon were present in thecrystalline deposits forming during the combustion of biogas. C:O:Si ratios were about 5:7:1 in thedeposits obtained from the engines operated with biogas from the anaerobic digesters and 2:3.5:1 in thedeposits from the engines operated with landfill gas. In general, the silicon content from deposits foundin facilities utilizing biogas from anaerobic digesters was lower than those operated with landfills gas.The difference was made up with higher phosphorus, sulfur and calcium content in the deposits from theengines operated with digester gas.
© 2015 Elsevier Ltd. All rights reserved.
1. Introduction
The increasing demand for energy and dependency on fossilfuels has created opportunities for renewable energy sources. Re-gions with high potential for bioenergy production (i.e., fromwastematerials) have implemented programs and facilities to utilize thebioenergy [4]. It has been estimated that by the year 2050, half ofthe world energy demand in developing countries will stem fromimproved biomass energy [7]. The United States accounts for theconsumption of approximately 19 percent of theworld's energy butonly accounts for a population of 4.5 percent of the world.Approximately 84 percent of the energy supply comes from fossilfuels [3]. According to the International Energy Agency (IEA), biogasprovides an estimated the gross electricity generation of 9281 GWhand heat production of 999 TJ [15]. Additionally gross electricitygeneration from municipal waste and industrial wastes was esti-mated at 16,900 and 5500 GWh. Gross heat production for thesefacilities was estimated at 11,700 and 3800 TJ, respectively.
Biogas is generated from landfills and wastewater treatmentplants (WWTPs) during the step-wise degradation process whenmicroorganisms decompose the organic material under anaerobicconditions [7]. The gas produced is typically used as fuel for energyproduction, pumps and boilers [34]. Although utilization of biogasis more costly than energy derived from fossil fuels, the reuse ofbiogas eliminates much of the greenhouse gas emissions fromlandfills and can be further upgraded for pipeline use. The potentialenergy of biomass from waste in the United States has been esti-mated to be 1.5 EJ/yr for the municipal solid waste industry, 0.8 EJ/yr for sewage sludge bio-solids, and 0.4 EJ/yr for industrial wastebiodegradation [6]. In 2005, Demirbas et al. [8] reported the top fiveof ten bio-electricity producers to be USA (30.7%), Germany (7.33%),Brazil (7.31%), Japan (5.13%) and Finland (4.85%). The composition ofbiogas is variable, but ranges between 40 and 60 percent methane,40 to 55 percent carbon dioxide and the remainder consists of tracecompounds such as nitrogen, oxygen, halogenated compounds,hydrogen sulphide and siloxanes.
Siloxanes in the wastewater stream originate from discardedconsumer products (i.e. cosmetics, cleaning products, deodorants,and hair/skin care products, landfill leachate). Landfill origins canbe traced to a multitude of consumer products including paper,

S.C. Surita, B. Tansel / Renewable Energy 80 (2015) 674e681 675
construction debris, treated woods, and wastewater treatmentsludge. With the increase of siloxanes found in consumer products,concentrations of siloxane compounds are intensifying in the wastestream. It was projected that the world demand for silicone hasincreased by 6.3 percent per year [27,35]. Siloxanes typically sorbonto solids due to their low solubilities or volatilize due to theirinherent vapor pressures. Table 1 provides mean siloxane concen-trations found at different locations. Fig. 1 provides the levels of thevolatile methyl siloxanes in biogas from landfills and wastewaterfacilities which take only municipal discharges.
The comparison of the types and levels of siloxanes in biogasshows that volatile methyl siloxanes (VMS) presents in landfill gasare primarily TMSOH, D4 and D5 as well as small concentrations ofL2 and L3. The VMS in biogas from anaerobic digesters are mainlyD5, D4 and D3. It is interesting to note that the landfill conditionspromote formation of TMSOH and D4 is present at higher con-centrations than D5. On the other hand, in the biogas forming inanaerobic digesters, D5 levels are significantly higher than thosefor D4. Lack of significant levels of linear siloxanes (L2eL4) andTMSOH in the biogas from anaerobic digesters in comparison tothose in the biogas from landfills indicate that the reduction po-tential in the anaerobic digesters are significantly lower in com-parison to those present in the landfills or formation of TMSOH, L2and L3 occur through slow reduction processes.Siloxanes arereleased from the solid phase (biomass) during anaerobicdecomposition processes which result in release of the bound si-loxanes through volatilizing when temperatures reach 60 �C [21].When biogas is combusted, the siloxanes are oxidized leavingwhite deposits on heated metal surfaces. Siloxane combustionyields silicon dioxide (SiO2) or silicates, which is visible on engine
Table 1Siloxane concentrations (mg/m3) in landfill gas and biogas at different locations.
Facility Concentration of Si containing compounds (mg/m3)
TMSOH L2 L3 L4
LF-1a e 6.07 0.32 e
LF-2b 6.08 1.65 0.03 0.04LF-3c 0.30 0.33 0.01 e
LF-4d e 0.34 e e
LF-5e,o 35.7 e e e
LF-6f 10.10 0.10 e e
LF-7g 6.70 0.10 e e
LF-8h 12.70 1.50 e e
LF-9i 7.25 0.72 0.10 e
Averagen 7.19 1.35 0.12 0.04WW-1a e 0.02 0.02 e
WW-2b 0.11 0.05 0.03 0.10WW-3c 0.04 0.01 0.20 0.04WW-4j e e e e
WW-5k,o e 3.40 e 0.70WW-6l e e e e
WW-7m,o e e e e
WW-9i 0.08 0.05 0.05 0.29Averagen 0.08 0.03 0.08 0.14
a Asten, Austria [39].b Germany [39].c Finland [39].d Canada [39].e Poland [32].f Poland e Woj. Podlaskie [32].g Germany-Baden-Wurttemberg [32].h Germany-Sachsen-Anhalt [32].j Germany-Niedersachsen [32].i Miami (this study).k Germany-Hessen [32].l Germany-Hessen [32].
m Poland-Woj. Pomorskie [32].n Facilities which accept only municipal was.o Not included in the average.
components, pistons, cylinder heads, turbine blades, and sparkplugs among others [24,37]. Deposits formed, contain mostly SiO2or silicates; however may contain calcium, zinc, phosphorus, sulfurand other trace elements.
Deposits on spark plugs often cause premature engine failure,excessive fouling of heated surfaces, misfiring and noise. Pistonswith excessive deposit accumulation may limit the expansion ofpiston rings thereby leading to higher oil consumption. Whensiloxane present in gas phase are burned, they form nanoparticleswhich accumulate when proper maintenance technologies andprocedures are not employed [25,29,31]. Additional compoundspresent in engine deposits include metals in solid form ([9,20,14])(i.e., calcium, copper, sodium, sulfur and zinc) [25,36].
At energy facilities operated with biogas, the presence of VMSsreduce the engine performance and increase maintenance activ-ities. Operation and maintenance costs can become increasinglyhigh due to silicate deposition [1]. No state, federal or regionalmandates have been implemented for siloxane quantification andcontrol; however several methodologies for sampling and analyt-ical procedures have been developed [2,17,23,28]. Consequently,manufacturers have adapted equipment warranties for inclusion ofdeficiency due to these deposits.
Objectives of this study were to compare the composition ofdeposits forming in engines operated with biogas from anaerobicdigesters and biogas from landfills. In the literature review con-ducted by the authors, no additional studies have aimed to spe-cifically characterize siloxane deposits. Engine deposit sampleswere collected from the facilities in Florida, USA. Themorphologicalcharacteristics and elemental composition of the deposit sampleswere analyzed by scanning electron microscopy (SEM) which was
L5 D3 D4 D5 D6
NR 0.49 12.53 4.73 NRe 0.42 7.70 1.26 e
e 0.10 0.67 0.30 e
e 0.58 2.80 1.26 e
NR 2.80 29.1 11.80 1.50NR 0.10 3.60 6.40 0.40NR 0.50 11.80 6.00 0.50NR 0.40 5.00 0.90 e
NR 0.52 2.16 e 0.090.00 0.39 5.78 2.98 0.33e 0.04 0.93 6.03 e
e 0.25 6.12 9.05 e
e 0.04 0.45 0.69 e
NR 1.60 0.50 5.30 0.10NR e 8.10 340.7 8.70NR 2.80 0.90 11.90 0.20NR 0.10 1.00 48.40 2.501.80 0.26 0.05 4.15 0.090.05 0.83 1.49 6.19 0.13

Fig. 1. Comparison of the siloxanes in biogas from landfills and wastewater treatmentfacilities. a. Biogas from landfills, b. Biogas from wastewater treatment facilities.
S.C. Surita, B. Tansel / Renewable Energy 80 (2015) 674e681676
used in conjunction with energy dispersive spectroscopy (EDS).Similarities and differences between the deposits collected fromthe engines operated with biogas from anaerobic digesters werecompared with those operated with biogas from landfills.
2. Background
The facilities used in this study are located in three differentgeographic areas of the state of Florida. Each of the facilities im-plements reciprocating engines of varying capacity. Many facilitieshave reported similar issues due to the emerging problem associ-ated with increased siloxane use; however only three facilitiesprovided usable and transportable deposits for subsequent anal-ysis. Site 1 is a wastewater treatment plant implementing digesterrecovered gas for cogeneration or combined heat and power. Effi-ciency gains are evident in the capture of both thermal energy andgeneration of electricity [12]. Sites 2 and 3 utilize the landfill gas(LFG) for electricity generation versus direct use.
2.1. Facility 1
Samples were obtained from engine head and spark plug com-ponents of the combustion chamber at a wastewater treatmentplant located in Facility 1 during a complete engine overhaul. Thefacility serves a population of approximately 2.3 million residentsand includes conventional treatment including physical separation,neutralization, biological treatment and wet scrubbing forhydrogen sulfide removal [10]. The treated wastewater is dis-infected prior to disposal via deep well injection or reuse. Thebiogas from 12 on-site digesters receives pre-treatment from awater-based scrubbing system at a rate of 17 cubic feet per hourprior to cogeneration.
2.2. Facility 2
Facility 2 was opened in 1978 [12] and serves municipal, resi-dential, industrial and commercial customers in the County andsurrounding areas. The site is permitted by FDEP for Class I landfilling,yard waste mulching, tire collection and solidification processes anddoesnot accepthazardouswaste.Approximately 1700 tonsofwaste isreceived daily on a 700 acre site. Gas is collected through a series ofgas extractionwells and is used to as fuel for electricity generation ofapproximately 4.8 MW [11]. At the facility, 6 caterpillar engines areutilized, each being 4.9 mW. Approximately 11e12 scfm of LFG isutilized. Siloxane monitoring is conducted quarterly by a third partycontractor. Engine depositionhas been notedwithin engine head andoperations and maintenance impacts have been noted, specificallyfrom build-up on pistons which cause detonation.
2.3. Facility 3
Facility 3 is a Type I landfill, opened in 1999 [12] for disposal ofMSW with designation of special-use areas for processing, storageand disposal. According to the EJ View Census 2010 SummaryReport, the population density at a 1 mile radius from location isapproximately 2300. Samples were scraped from engine compo-nents replaced during a full-engine overall conducted in lateFebruary 2014. The facility is fitted with 2 caterpillar 3520'srunning at 1.6 mW and 1 smaller caterpillar 3516 running at800 kW. Approximately 1100 scfm. LFG is utilized. Siloxane moni-toring is not regularly conducted at this site; however depositionhas been noted with minor impacts to routine maintenance.
3. Methods
When scanning electronmicroscopy (SEM) is used in conjunctionwith Energy Dispersive Spectroscopy (EDS), qualitative analysis ofsilicates can be determined. Because SEM uses wavelengths shorterthan that of light, material observation can be conducted down to thenanometer scale. The electron images in the SEM display composi-tional contrast resulting frommass and distributions, while EDS willidentify the specific elements and their comparative proportions. EDSis used for elemental analysis and functions as a spectrum of theenergy intensity of Xerayswhen Li-doped Si semiconductor detectorand spectrum analyzer are combined. The JEOL 6330F Field EmissionSEM with Energy Dispersive Spectroscopy was utilized for the char-acterization of siloxane deposition and microanalyses in this study.
Samples to be analyzed were scraped from engine componentsat three facilities and collected for future analyses (Fig. 2). Sample 1was extracted from engine components utilizing digester gaswhereas samples 2 and 3 were collected from landfills processingbiogas for energy use. Samples were then processed for analysis inlaboratory. The sample sizes were limited to less than 8 mm in sizeand were mounted on a metallic sample holder. Double sidedconductive tape was used to affix samples to holder. The workingdistance was decreased and samples were aligned consecutively(one through three) for SEM followed by EDS microanalysis.Because the three samples lost resolution when magnified, due topoor conductivity, a thin coating of gold was applied to the samplesusing the PELCO SC-7 Auto Sputter Coater. This amendmentimproved the quality of the images and ensured reduced chargeeffect. However, because of the roughness of material, the chargeeffect could not completely be eliminated.
4. Results
Impurities in LFG include hydrogen sulfide, siloxanes, hydro-chlorofluorocarbons, volatile halogenated hydrocarbons, benzene,

Fig. 2. Samples collected from facilities 1 through 3, respectively, a) scrapings from engine head operated with anaerobic digester gas, b) scrapings from engine head operated withlandfill gas, and c) coated spark plug from engine operated with landfill gas.
S.C. Surita, B. Tansel / Renewable Energy 80 (2015) 674e681 677
toluene and xylene [18,26]; however the most problematic of theseare siloxanes due to their residues which develop on engine com-ponents during combustion. Samples collected from spark plugsand engine heads at WWTP and LFs were analyzed for elementalcomposition. Figs. 3e5 provide the SEM images for the threesamples collected (Samples 1 through 3 respectively) to illustratevarying particle morphology. The magnifications and scales areindicated in each figure and vary depending on availability of highresolution image. Sample 1 as shown in Fig. 3 was consistentthroughout producing an image of agglomerated dust-like parti-cles. Deposits for sample 2 were affixed to scrapings from enginehead that may have contained additional materials and roughnesswas more apparent. Sample 3 magnifications of 20,000 were
Fig. 3. Morphological characteristics of the deposits obtained from Facility 1 (scrapings frocations. a) X250, 100 mm; b) X600, 10 mm; c) X1,900, 10 mm; d) X10,000, 1 mm.
reached, whereas samples 1 and 2, magnification of only 10,000times were obtained due to clarity of image. In sample 3, obser-vations of some irregularity in structure were made (Fig. 6). Theseirregularities may be a result of sample extraction from the sparkplug containing deposition.
Characteristic X-ray peaks for Facilities 1 through 3 respectivelyare provided in Fig. 7. Numerical comparison between net counts ofsamples indicated the following: Net counts for carbon in sample 1were approximately four times higher than samples 2 and 3.Phosphorus and sulfur net counts were approximately thirteen andten times higher in sample 1 when compared to samples 2 and 3respectively. Calcium and zinc similarly presented higher ratios insample 1. When compared with sample 2, calcium and zinc were
m engine head operated with anaerobic digester gas) observed at different magnifi-

Fig. 4. Morphological characteristics of the deposits obtained from Facility 2 (scrapings from engine head of landfill gas engine), observed at different magnifications. a) X20, 1 mm;b) X1,000, 10 mm; c) X2,500, 10 mm; d) X10,000, 1 mm.
Fig. 5. Morphological characteristics of the deposits obtained from Facility 3 (scrapings from spark plug from landfill gas engine) observed at different magnifications. a) X20, 1 mm;b) X2,500, 10 mm; c) X5,000, 1 mm; d) X20,000, 1 mm.
S.C. Surita, B. Tansel / Renewable Energy 80 (2015) 674e681678

Fig. 6. Morphological characteristics of the deposits with irregularity in structure obtained from Facility 3 (sparkplug from landfill gas engine) observed at different magnifications.a) X1,000, 10 mm; b) X2,000, 10 mm; c) X5,000, 1 mm; d) X20,000, 1 mm.
S.C. Surita, B. Tansel / Renewable Energy 80 (2015) 674e681 679
five and eight times higher. Sample 1 comparison with sample 3demonstrated eight and four times higher net counts for calciumand zinc respectively.
Elemental characterization of silicate deposits, formed duringbiogas combustion, is provided in Table 2. A graphical representa-tion of the elemental characterization at each facility is depicted inFig. 8. The prevalent compounds encountered at all three locationsinclude carbon, oxygen, silicon, calcium, sulfur, phosphorus andzinc. Facility 2 indicated the highest elemental composition of ox-ygen and no potassium presence. Facility 1 and 3 were similar inboth carbon and silicon compositions, however carbon ratios werenot comparable. Misinterpretation of calcium and potassiumoverlap in sample 3 was not considered as two of the three samplesindicated similar compositions. However, the overlap was consid-ered negligible due to the quantitative comparison of elementalcomposition (w/w).
Similarity of elements in all three sample sites was evident;however, samples collected from engines operatedwith LFG did notindicate the presence of potassium and lesser quantities of calcium,sulfur and phosphorus. The differencewasmade upwith the highersilicon content in comparison to those operated with anaerobicdigester gas. In anaerobic digesters, the chemical form of somenutrients will be changed. Some potassium and phosphorus arereleased by decomposing material and mostly settle as sludge.Phosphorus, from zinc/phosphorus engine oil additives, separatesfrom zinc at high temperatures as indicated in throttle depositstudies and confirmed by a manufacturer of the additive [13]. Astudy by Tansel [24] demonstrated the presence of similar elementsincluding potassium, calcium, zinc, sulfur, and silicon on depositsamples collected from spark plugs and engine heads.
Calcium is commonly found in wastewater treatment systems,contributing to water hardness and has been noted to be essentialfor the growth of certain methanogens; however excess amountslead to scaling on reactors and loss of buffering capacity [5].Moreover, calcium composition in deposits may be attributed to itsuse as a detergent additive commonly used in engine oil. Deter-gent additives aid in keeping contaminants suspended so they canlater be removed by filtration. They can also act as a neutralizingagent, functioning as corrosion inhibitors. Although high calciumlevels may be beneficial for these reasons, too much detergent maycause high ash content, contributing to the presence of impurities[33]. Residence time and release mechanisms (volatilization, sol-ubilization and sorption) impact the conversion process and pro-duction of methane and other gas-phase constituents. For thesereasons, the relatively larger counts of potassium and calcium areexpected in silicate deposits forming from digester producedbiogas.
Large concentrations of zinc oxides, which enter the wastestream from the personal care products, inhibit methanogenesis[22]. Delays in speciation/transformation process may contribute toZnO stability and may be influenced by surface coating of formu-lations [16]. Additionally, the relatively small elemental composi-tion of zinc presented likely results from metallic elements withinengine oils specifically used as friction modifier, antioxidant, anti-wear or corrosion inhibitor (i.e. zinc dithiophosphate). Weatherednanoparticles present in biological treatment have undergonetransformation, including coating loss and reactivity before endingin sewage sludge [19]. Some landfills are co-disposal facilities,accepting biosolids produced during anaerobic digestion. Organiccomplexes of zinc oxide may react with siloxanes, and because of

Fig. 7. Characteristic X-ray peaks observed in the deposit samples obtained from fa-cilities 1, 2, and 3, respectively.
Table 2Composition of deposits forming in engines during combustion of biogas.
Element Symbol Facility 1 (WWTP)
Weight (%) Elementala (%)
Carbon C 24.64 34.98Oxygen O 47.51 50.63Silicon Si 11.49 6.97Phosphorus P 1.85 1.02Sulfur S 4.96 2.64Potassium K 0.10 0.04Calcium Ca 7.56 3.22Zinc Zn 1.88 0.49Total 100.00 100.00
a Elemental composition was calculated by dividing the weight percent by the corres
Fig. 8. Elemental composition of the deposits forming during biogas combustion.
Table 3Comparison of the deposit compositions for the three elements with the highestconcentrations relative to Si content.
Sample C:O:Si Atomic composition
Facility 1 (ADa) 5.0:7.3:1.0 C34.3O49.7Si6.9PS2.6Ca3.2Zn0.5
Facility 2 (LFb) 1.4:3.7:1.0 C111.1O292.1Si76.5PS2.7Ca7.1Zn0.7
Facility 3 (LF) 2.7:3.3:1.0 C174.9O213.3Si63PS2Ca9.2Zn2.9
a AD e anaerobic digester gas.b LF e landfill gas.
S.C. Surita, B. Tansel / Renewable Energy 80 (2015) 674e681680
volatility, may be released in biogas or LFG. Future studies shouldaim to understand the interaction of various nanoparticles betweenenvironmental compartments during various phases of treatmentand with respect to degradation time.
A comparison of carboneoxygenesilicon ratios are presented inTable 3. A correlation between silicate-based deposition on enginecomponents and increasing CO emissions has been noted by Tower[30]. Because carbon exists in deposits sampled, it is indicative thatthe carbon bond with silicon and oxygen is too complex to breakthus preventing carbon combustion. Furthermore, there is insuffi-cient oxygen remaining to form bicarbonate. As a result, the si-loxanes initially present in biogas may form other siloxanecompounds in addition to varying crystalline, more complexstructures. Atomic compositions have been estimated based on themolecular weights and elemental mass compositions. A studyconducted by Yang et al. [38] demonstrated that relative carboncontent and porosity are significant factors of bonding. Bondingstructures of SiOC have demonstrated caged siliconecarbon bondswith porosity enhancement.
The relatively high levels of carbon present in the crystallinedeposits were found in ratios of 5C:7O:1Si in the deposits obtainedfrom the engines operated with biogas from the anaerobic
Facility 2 (LF) Facility 3 (LF)
Weight (%) Elemental (%) Weight (%) Elemental (%)
15.51 22.62 26.46 37.5054.33 59.47 42.98 45.7324.96 15.57 22.29 13.510.36 0.21 0.39 0.221.01 0.55 0.81 0.43
e e 0.00 0.003.32 1.45 4.65 1.980.51 0.14 2.41 0.63
100.00 100.00 100.00 100.00
ponding atomic weight normalized. Composition was adjusted to percentage.
S.C. Surita, B. Tansel / Renewable Energy 80 (2015) 674e681 681
digesters. The ratios were substantially different in engines oper-ated with LFG at 2:3.5:1 establishing a lower silicon presence inengines operated with biogas.
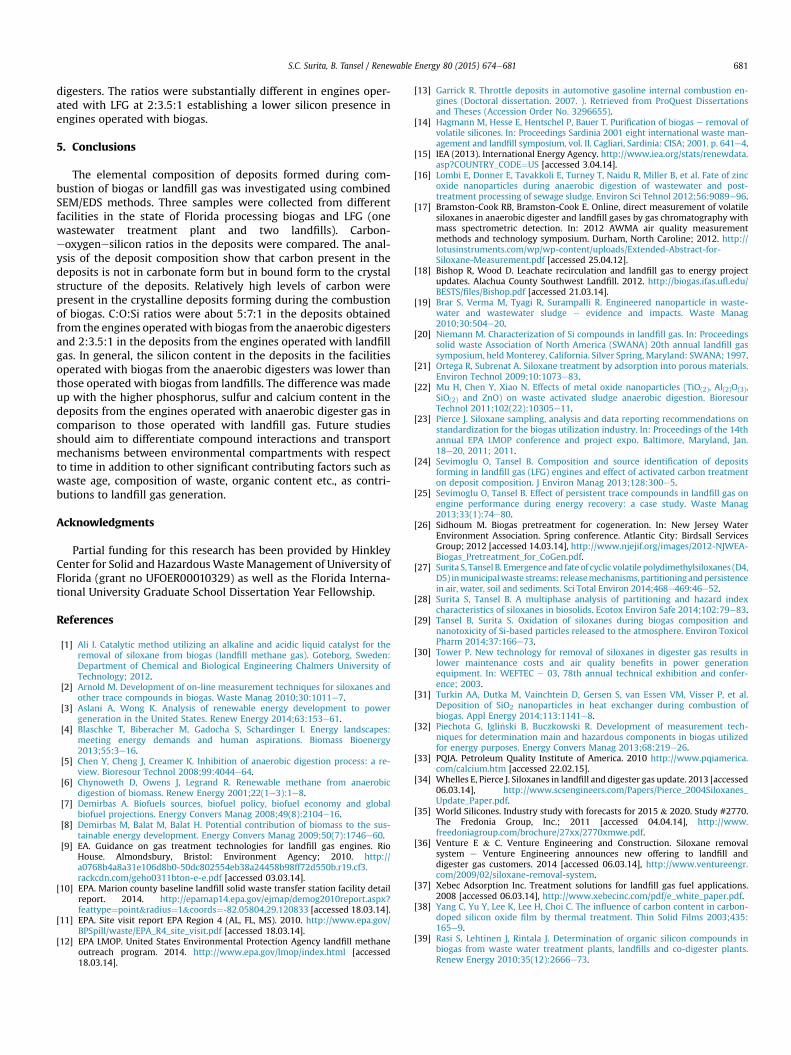
5. Conclusions
The elemental composition of deposits formed during com-bustion of biogas or landfill gas was investigated using combinedSEM/EDS methods. Three samples were collected from differentfacilities in the state of Florida processing biogas and LFG (onewastewater treatment plant and two landfills). Carbon-eoxygenesilicon ratios in the deposits were compared. The anal-ysis of the deposit composition show that carbon present in thedeposits is not in carbonate form but in bound form to the crystalstructure of the deposits. Relatively high levels of carbon werepresent in the crystalline deposits forming during the combustionof biogas. C:O:Si ratios were about 5:7:1 in the deposits obtainedfrom the engines operatedwith biogas from the anaerobic digestersand 2:3.5:1 in the deposits from the engines operated with landfillgas. In general, the silicon content in the deposits in the facilitiesoperated with biogas from the anaerobic digesters was lower thanthose operated with biogas from landfills. The difference was madeup with the higher phosphorus, sulfur and calcium content in thedeposits from the engines operated with anaerobic digester gas incomparison to those operated with landfill gas. Future studiesshould aim to differentiate compound interactions and transportmechanisms between environmental compartments with respectto time in addition to other significant contributing factors such aswaste age, composition of waste, organic content etc., as contri-butions to landfill gas generation.
Acknowledgments
Partial funding for this research has been provided by HinkleyCenter for Solid and HazardousWasteManagement of University ofFlorida (grant no UFOER00010329) as well as the Florida Interna-tional University Graduate School Dissertation Year Fellowship.
References
[1] Ali I. Catalytic method utilizing an alkaline and acidic liquid catalyst for theremoval of siloxane from biogas (landfill methane gas). Goteborg, Sweden:Department of Chemical and Biological Engineering Chalmers University ofTechnology; 2012.
[2] Arnold M. Development of on-line measurement techniques for siloxanes andother trace compounds in biogas. Waste Manag 2010;30:1011e7.
[3] Aslani A, Wong K. Analysis of renewable energy development to powergeneration in the United States. Renew Energy 2014;63:153e61.
[4] Blaschke T, Biberacher M, Gadocha S, Schardinger I. Energy landscapes:meeting energy demands and human aspirations. Biomass Bioenergy2013;55:3e16.
[5] Chen Y, Cheng J, Creamer K. Inhibition of anaerobic digestion process: a re-view. Bioresour Technol 2008;99:4044e64.
[6] Chynoweth D, Owens J, Legrand R. Renewable methane from anaerobicdigestion of biomass. Renew Energy 2001;22(1e3):1e8.
[7] Demirbas A. Biofuels sources, biofuel policy, biofuel economy and globalbiofuel projections. Energy Convers Manag 2008;49(8):2104e16.
[8] Demirbas M, Balat M, Balat H. Potential contribution of biomass to the sus-tainable energy development. Energy Convers Manag 2009;50(7):1746e60.
[9] EA. Guidance on gas treatment technologies for landfill gas engines. RioHouse. Almondsbury, Bristol: Environment Agency; 2010. http://a0768b4a8a31e106d8b0-50dc802554eb38a24458b98ff72d550b.r19.cf3.rackcdn.com/geho0311bton-e-e.pdf [accessed 03.03.14].
[10] EPA. Marion county baseline landfill solid waste transfer station facility detailreport. 2014. http://epamap14.epa.gov/ejmap/demog2010report.aspx?feattype¼point&radius¼1&coords¼-82.05804,29.120833 [accessed 18.03.14].
[11] EPA. Site visit report EPA Region 4 (AL, FL, MS). 2010. http://www.epa.gov/BPSpill/waste/EPA_R4_site_visit.pdf [accessed 18.03.14].
[12] EPA LMOP. United States Environmental Protection Agency landfill methaneoutreach program. 2014. http://www.epa.gov/lmop/index.html [accessed18.03.14].
[13] Garrick R. Throttle deposits in automotive gasoline internal combustion en-gines (Doctoral dissertation. 2007. ). Retrieved from ProQuest Dissertationsand Theses (Accession Order No. 3296655).
[14] Hagmann M, Hesse E, Hentschel P, Bauer T. Purification of biogas e removal ofvolatile silicones. In: Proceedings Sardinia 2001 eight international waste man-agement and landfill symposium, vol. II. Cagliari, Sardinia: CISA; 2001. p. 641e4.
[15] IEA (2013). International Energy Agency. http://www.iea.org/stats/renewdata.asp?COUNTRY_CODE¼US [accessed 3.04.14].
[16] Lombi E, Donner E, Tavakkoli E, Turney T, Naidu R, Miller B, et al. Fate of zincoxide nanoparticles during anaerobic digestion of wastewater and post-treatment processing of sewage sludge. Environ Sci Tehnol 2012;56:9089e96.
[17] Bramston-Cook RB, Bramston-Cook E. Online, direct measurement of volatilesiloxanes in anaerobic digester and landfill gases by gas chromatography withmass spectrometric detection. In: 2012 AWMA air quality measurementmethods and technology symposium. Durham, North Caroline; 2012. http://lotusinstruments.com/wp/wp-content/uploads/Extended-Abstract-for-Siloxane-Measurement.pdf [accessed 25.04.12].
[18] Bishop R, Wood D. Leachate recirculation and landfill gas to energy projectupdates. Alachua County Southwest Landfill. 2012. http://biogas.ifas.ufl.edu/BESTS/files/Bishop.pdf [accessed 21.03.14].
[19] Brar S, Verma M, Tyagi R, Surampalli R. Engineered nanoparticle in waste-water and wastewater sludge e evidence and impacts. Waste Manag2010;30:504e20.
[20] Niemann M. Characterization of Si compounds in landfill gas. In: Proceedingssolid waste Association of North America (SWANA) 20th annual landfill gassymposium, heldMonterey, California. Silver Spring, Maryland: SWANA; 1997.
[21] Ortega R, Subrenat A. Siloxane treatment by adsorption into porous materials.Environ Technol 2009;10:1073e83.
[22] Mu H, Chen Y, Xiao N. Effects of metal oxide nanoparticles (TiO(2), Al(2)O(3),SiO(2) and ZnO) on waste activated sludge anaerobic digestion. BioresourTechnol 2011;102(22):10305e11.
[23] Pierce J. Siloxane sampling, analysis and data reporting recommendations onstandardization for the biogas utilization industry. In: Proceedings of the 14thannual EPA LMOP conference and project expo. Baltimore, Maryland, Jan.18e20, 2011; 2011.
[24] Sevimoglu O, Tansel B. Composition and source identification of depositsforming in landfill gas (LFG) engines and effect of activated carbon treatmenton deposit composition. J Environ Manag 2013;128:300e5.
[25] Sevimoglu O, Tansel B. Effect of persistent trace compounds in landfill gas onengine performance during energy recovery: a case study. Waste Manag2013;33(1):74e80.
[26] Sidhoum M. Biogas pretreatment for cogeneration. In: New Jersey WaterEnvironment Association. Spring conference. Atlantic City: Birdsall ServicesGroup; 2012 [accessed 14.03.14], http://www.njejif.org/images/2012-NJWEA-Biogas_Pretreatment_for_CoGen.pdf.
[27] Surita S, Tansel B. Emergence and fate of cyclic volatile polydimethylsiloxanes (D4,D5) inmunicipalwaste streams: releasemechanisms,partitioningandpersistencein air, water, soil and sediments. Sci Total Environ 2014;468e469:46e52.
[28] Surita S, Tansel B. A multiphase analysis of partitioning and hazard indexcharacteristics of siloxanes in biosolids. Ecotox Environ Safe 2014;102:79e83.
[29] Tansel B, Surita S. Oxidation of siloxanes during biogas composition andnanotoxicity of Si-based particles released to the atmosphere. Environ ToxicolPharm 2014;37:166e73.
[30] Tower P. New technology for removal of siloxanes in digester gas results inlower maintenance costs and air quality benefits in power generationequipment. In: WEFTEC e 03, 78th annual technical exhibition and confer-ence; 2003.
[31] Turkin AA, Dutka M, Vainchtein D, Gersen S, van Essen VM, Visser P, et al.Deposition of SiO2 nanoparticles in heat exchanger during combustion ofbiogas. Appl Energy 2014;113:1141e8.
[32] Piechota G, Igli�nski B, Buczkowski R. Development of measurement tech-niques for determination main and hazardous components in biogas utilizedfor energy purposes. Energy Convers Manag 2013;68:219e26.
[33] PQIA. Petroleum Quality Institute of America. 2010 http://www.pqiamerica.com/calcium.htm [accessed 22.02.15].
[34] Whelles E, Pierce J. Siloxanes in landfill and digester gas update. 2013 [accessed06.03.14], http://www.scsengineers.com/Papers/Pierce_2004Siloxanes_Update_Paper.pdf.
[35] World Silicones. Industry study with forecasts for 2015 & 2020. Study #2770.The Fredonia Group, Inc.; 2011 [accessed 04.04.14], http://www.freedoniagroup.com/brochure/27xx/2770xmwe.pdf.
[36] Venture E & C. Venture Engineering and Construction. Siloxane removalsystem e Venture Engineering announces new offering to landfill anddigester gas customers. 2014 [accessed 06.03.14], http://www.ventureengr.com/2009/02/siloxane-removal-system.
[37] Xebec Adsorption Inc. Treatment solutions for landfill gas fuel applications.2008 [accessed 06.03.14], http://www.xebecinc.com/pdf/e_white_paper.pdf.
[38] Yang C, Yu Y, Lee K, Lee H, Choi C. The influence of carbon content in carbon-doped silicon oxide film by thermal treatment. Thin Solid Films 2003;435:165e9.
[39] Rasi S, Lehtinen J, Rintala J. Determination of organic silicon compounds inbiogas from waste water treatment plants, landfills and co-digester plants.Renew Energy 2010;35(12):2666e73.