Embed Size (px)
Citation preview

Page 1
Current Trade Issues in the Literature: Focus on Trade Issues/Developments between China & the U.S., including the Implication of China & United States Trade Volumes on
Worldwide Trade
Hans E. Alagoa
MONARCH UNIVERSITY
14 September, 2015
Abstract:
According to UNCTADstat (2014a), the United States of America, with a Federal
Presidential Constitutional Republic government, has a population in the order of 326.4
million, a land area of 9,156,640 sq. km, a Nominal Gross Domestic Product (GDPNominal) of
$17.53 trillion in 2014 (with a year on year growth rate of 2.38%), and a Nominal Gross
Domestic Product per Capita (GDPNominal per Capita) of $53,702 in 2014; is the largest
economy in the world. The United States boasts of Total Exports in 2014 of $1,621 billion,
Total Imports in 2014 of $2,413 billion, and a Human Development Index (HDI) of 0.914,
considered ‘Very High’.
The People's Republic of China, as shown on Table 1, with an Authoritarian Socialist
government, has a population in the order of 1,393.8 million, a land area of 9,388,211 sq. km,
a Nominal Gross Domestic Product (GDPNominal) of $10.07 trillion in 2014 (with a year on
year growth rate of 7.4%), and a Nominal Gross Domestic Product per Capita (GDPNominal per
Capita) of $8,193 in 2014; is the second largest economy in the world. The People's Republic
of China’s Total Exports in 2014 was $2,342 billion, Total Imports in 2014 was $1,959

Page 2
billion, and China has a Human Development Index (HDI) of 0.719, considered ‘High’.
(UNCTADstat, 2014b).
China and the United States of America have extensive and trade and economic ties.
(Morrison, 2015). China is currently the second-largest trading partner of the United States;
its third-largest export market; and its biggest source of import. (Morrison, 2015; UNCTAD
stat, 2014a; UNCTAD stat, 2014b).
Current trade issues, with focus on the issues and developments between China and the
United States, is discussed in this essay. In the process, such topics as the worldwide
implications of the Import and Export trade volumes, into and out of both China and the
United States, and the balance of trade of the China-U.S. trade are also discussed.

Page 3
LIST OF FIGURES & TABLES
FIGURES
1 Exports: Worldwide, China, and U.S.; 2007-2014 1a Export Percentages: All Others, China, and U.S.; 2007-2014 2. Imports: Worldwide, China, and U.S.; 2007-2014 2a Import Percentages: All Others, China, and U.S.; 2007-2014
3 China’s Exports to, Americas, Asia, and Europe 2007-2014
4 China’s Exports to, Africa, and Oceania 2007-2014 5 %ages of China’s Exports to Africa, Americas, Asia, Europe, and Oceania, 2007-2014 6 China’s Exports to Africa, Americas, Asia, Europe, and Oceania, 2014 7 China’s Imports from, America, Asia, and Europe, 2007-2014 8 China’s Imports from, Africa, and Oceania, 2007-2014 9 %ages of China’s Imports frm Africa, Americas, Asia, Europe, & Oceania, 2007-2014 10 China’s Imports from, Africa, Americas, Asia, Europe, and Oceania, 2014 11 U.S.’s Exports to, to America, Asia, and Europe, 2007-2014 12 U.S.’s Exports to, Africa, and Oceania, 2007-2014 13 %ages of U.S.’s Exports to, Africa, Americas, Asia, Europe, and Oceania, 2007-2014 14 U.S.’s Exports to, Africa, Americas, Asia, Europe, and Oceania, 2014 15 U.S.’s Imports from America, Asia, and Europe, 2007-2014 16 U.S.’s Imports from Africa, and Oceania, 2007-2014 17 %ages of U.S. Imports frm Africa, Americas, Asia, Europe, and Oceania, 2007-2014 18 U.S.’s Imports from Africa, Americas, Asia, Europe, and Oceania, 2007-2014 19 U.S.’s Imports from Africa, Americas, Asia, Europe, and Oceania, 2007-2014 19a %ages of Product Group Classes in U.S. Exports to China, 2007-2014 20 Percentages of U.S. Exports to China, 2007-2014

Page 4
21 U.S.’s Imports, and U.S. Imports from China, 2007-2014 21a Percentage of U.S. Imports to China, 2007-2014 22 China’s Exports, and China’s Exports to U.S., 2007-2014 22a Percentages of China’s Exports to U.S., 2007-2014 22b Percentages of Product Group Classes in China’s Exports to U.S., 2007-2014 23 China’s Imports, and China’s Imports from the U.S., 2007-2014 23a Percentages of China’s Imports to U.S., 2007-2014 23b Percentages of Product Group Classes in China’s Imports to U.S., 2007-2014 24a U.S. Exports to and Imports frm China, and Trade Deficit, 2007-2014 24b China’s Exports to and Imports frm U.S., and Trade Surplus, 2007-2014
TABLES
1 Country Comparison: China vs. United States
2 Worldwide Exports, Exports from China, and Exports from the U.S., 2007-2014
3 Worldwide Imports, Imports to China, and Imports to the U.S., 2007-2014
4 China’s Exports to Africa, America, Asia, Europe, and Oceania, 2007-2014
5 China’s Imports from Africa, America, Asia, Europe, and Oceania, 2007-2014 6 United States’ Exports to Africa, America, Asia, Europe, and Oceania, 2007-2014 7 United States’ Imports from Africa, America, Asia, Europe, and Oceania, 2007-2014 8 United States’ Exports, and United States’ Exports to China , 2007-2014 8a U.S. Exports to China, & Export Structure by Product Group Classes, 2007-2014 9 United States’ Imports, and United States’ Imports from China, 2007-2014 9a U.S. Imports to China, & Import Structure by Product Group Classes, 2007-2014 10 China’s Exports, and China’s Exports to the United States, 2007-2014
10a China Exports to U.S., & Export Structure by Product Group Classes, 2007-2014

Page 5
11 China’s Imports, and China’s Imports from the United States, 2007-2014
11a China Imports frm U.S., & Import Structure by Product Group Classes, 2007-2014
12 China-U.S. Imports, Exports, and Trade Balance, 2007-2014
Page 6
Table 1 Country Comparison: China vs. United States
Category
People's Republic of China
United States of America
Population 1,393,800,000 326,415,000
Government Authoritarian Socialist State Federal Presidential
Constitutional Republic
Currency Renminbi (yuan) (¥) United States dollar ($)
GDP (nominal) 2014 $10.07 trillion $17.53 trillion
GDP (nominal) per capita 2014
$8,193 $53,702
GDP (PPP) 2014 $18.97 trillion $17.53 trillion
GDP (PPP) per capita 2014
$13,801 $53,702
Real GDP Growth Rate 2014 7.4% 2.38%
Total Exports (2014) $2,342 billion $1,621 billion
Total Imports (2014) $1,959 billion $2,413 billion
HDI 0.719 (High) 0.914 (Very High)
Source: UNCTADstat, International Monetary Fund, given in U.S. Dollars

Page 7
2.0 Implications of China & U.S. Trade Volumes on Worldwide Trade
The United States and China being the first and second largest economies in the world, each
with very large trade volumes, as shown in Table 1, have the potential of influencing trade
and other issues in the world. This is, at least in part, due to their large trade volumes, with
one another, and with the rest of the world. The extent to which the trade volumes of China
and the United States with the rest of the world, influences the rest of the world, is therefore
worth discussing. This will be done in the following sections by comparing China’s trade
volumes and the trade volumes of the U.S. with the volume of trade worldwide; and by
determining where in the world the trade volumes of China and the trade volumes of the U.S.
come from and go to.
Determining what percentages of the world’s total export and imports that constitute the total
exports and imports of China and the U.S., gives an indication of the possible extent that a
change in policy or other factor in China or the U.S., may negatively or otherwise, affect
trade between either of the economies and the rest of the world. In the same manner
determining what percentages (and by extraction what volumes) of the total trade of China or
the U.S. that originates or are sent to various parts of the world, gives an indication of where
in the world may be impacted by such factors as just mentioned.
China being an Emerging market is, as discussed in Alagoa (2015), highly sought after by
investors for the prospect of high returns, but such investments are fraught with risks when
compared with investments in more advanced economies such as the United States. As such
between China and the U.S., China is the more likely source of policy changes or other
factors that may negatively or otherwise affect trade between it and the rest of the world.
During the week of 9th to 15th of August 2015, such a change in policy resulted in the
devaluation of the Renminbi (yuan), the currency of China, three days in a row and, as Inman
(2015) and Gough (2015) noted, the most obvious effect it could have on global trade is that,

Page 8
with a less valuable currency, the prices of exports from China will cost less thus increasing
the demand for them; imports into China will cost more to the Chinese and other users of the
Reminbi (Yuan) and drive down the demand for imports into China from other parts of the
world. Such is the possible impact on global trade of a change in policy, and thus the
importance of determining the possible locations in the world that may be impacted, and to
what degree they may be impacted, by such changes in policy or other factors.
While trade is most directly related to the economic factors that are considered in a PEST
analysis, usually the first step in a Country risk analysis; Alagoa (2015) and Rugman &
Collinson (2006) suggest that developments in economic factors have strong influences over
political, social, and technological factors, as espoused by the PEST framework. As such
trade issues, with their associated developments in economic factors, can potentially have far
reaching implications to the life of an economy that is being affected by such economic
developments.
2.1 Worldwide Trade Volumes, China and U.S. Trade Volumes
Here a comparison will be made between worldwide trade volumes and the trade volumes of
China and the United States, between 2007 and 2014.
2.1.1 Worldwide Exports, and China and U.S. Exports
As indicated on Table 2 and Figure 1a, which show the total export volumes from all of the
world’s economies, the total exports of China, and the total exports of the U.S, from 2007 to
2014; China’s total exports as a percentage of the Worldwide total exports, ranged from a low
of 8.71% in 2007, to a high of 12.41% in 2014. Table 2 and Figure 1 show China’s Total and
the Worldwide Total Exports to be 1,220,059,668 thousand U.S. dollars and 14,003,700,791
thousand U.S. dollars, respectively in 2007; and 2,342, 342,011 thousand U.S. dollars and
18,882,143,567 thousand U.S. dollars respectively, in 2014. China’s export trade volumes, at
least between 2007 and 2014, did not exceeded 12.41% of worldwide export volumes, and
Page 9
any impact on worldwide trade, caused by policy or other changes or factors in China, on
worldwide export volumes, can be expected to be limited to this order of magnitude. In
addition, when compared with worldwide export trade volumes, 8.7% may appear small;
however the change in policy that resulted in the devaluation of the Yuan, the currency of
China, and the resulting demand for the exports of China, may drastically increase 8.7% of
worldwide export volumes to potentially much more.
Table 2 and Figure 1a, show that the total exports of the U.S. as a percentage of the
worldwide total exports, between 2007 and 2014, ranged from a low of 8.06% in 2008 to a
high of 8.59% in 2014. Table 2 and Figure 1 show the Total Exports of the U.S. and the
Worldwide Total Exports to be 1,299,898,877 thousand U.S. dollars and 16,136,419,252
thousand U.S. dollars, respectively in 2008; and 1,622,657,461 thousand U.S. dollars and
18,882,143,567 thousand U.S. dollars respectively, in 2014. The export trade volumes of the
U.S., at least between 2007 and 2014, did not exceeded 8.59% of worldwide export volumes,
and any impact on worldwide trade caused by policy changes or other factors in the U.S., on
worldwide export volumes, can be expected to be limited to this order of magnitude.
Except for a Year-on-Year decrease between 2008 and 2009 for worldwide Total Exports,
China’s Total Exports, and Total Exports for the U.S., there has been Year-on-Year increases
in all three between 2007 and 2014.
2.1.2 Worldwide Imports, and China and U.S. Imports
As indicated on Table 3 and Figure 2a, which shows the total import volumes of all of the
world’s economies, the total imports of China, and the total imports from the U.S, from 2007
to 2014; China’s total imports as a percentage of the Worldwide total imports, ranged from a
low of 6.75% in 2007, to a high of 10.41% in 2014. Table 3 and Figure 2 show China’s Total
and the Worldwide Total Imports to be 956,115,448 thousand U.S. dollars and
14,162,512,557 thousand U.S. dollars, respectively in 2007; and 1,958, 021,301 thousand

���� ���� ���� ���� ���� ���� ���� ��������������� ��������� ���������� ������� ���� ����������� ����������� ����������� ��� �������
���� ���� ���� ���� ���� ���� ���� ����
�� ����� ������ ����� ����� ���� ��� ����
�������� ������� �������� ��������� ���������� ���������� ���������� ����������
����� ����� ���� ������ ����� ������ ������ ������
�� ����� ����� ����� ����� ���� ���� ���
��������� ���������� ��������� ��������� ��������� �������� ��������� �������
����� ���� ����� ����� ����� ����� ����� �����
�� ����� ������ ����� ����� ���� ���� ����
������������������������ � ��� !�"#�$�%����� �� ��
&����� �&������� '�
($����� !���)�"��%������*
&����
+���!, !�
�� ��$�����-./����
" ��!��������$�����-./����
$�0������-./��������������
�+���!, !���� ��� !�" ��!�������
1���� ��'�
1���� ��'�
1���� ��'�
&����� �&������� '�
&����� �&������� '�

� � � � � � � �
�� � � � � � � � � � �� � �� � �� � ��
�������� ��� ��� ���� �������������� �������������� �������������� �������� ���� �������������� �������������� ��������������
����� ���� � ������ ���� ����� �� ��� ��������� ������������� ������������� �� ���������� ��� �� ���� ���������� ��
����������� ������������ ������������� �� ������� �� ������� ����� �������� ���� ������������� ������ ����� �������������
� � �
�� � �
��� � �
�� � �
��� � �
��� ���� ���� ���� �����
� ���� � ���� � ���� � ����
����
������
����� ���������
��������������������������� ��!�"�����#� ���� ��������������$!����

� � � � � � � �
� ���� ������ ������ ������ ������ ������ ������ ������ ������
��� �� � � �� ����� ����� ����� ����� ����� ����� ����� �����
����� ����� ����� ����� ������ ������ ������ ������ ������
�����
������
������
������
������
�������
�������
��
��
��
�
��
!��
� "
#$�
� �
����������� ���������������������������������������������� ! �"!���#$����%

Page 10
U.S. dollars and 18,809,926,692 thousand U.S. dollars respectively, in 2014. The import
trade volumes of China, at least between 2007 and 2014, did not exceeded 10.41% of
worldwide import volumes, and any impact on worldwide trade caused by policy changes or
other factors in China, on worldwide export volumes, can be expected to be limited to this
order of magnitude.
Table 3 and Figure 2a indicate that the total imports of the U.S. as a percentage of the
worldwide total imports between 2007 and 2014, ranged from a low of 12.33% in 2011 to a
high of 14.24% in 2007. Table 3 and Figure 2 show the Total Imports of the U.S. and the
Worldwide Total Imports to be 2,017,120,776 thousand U.S. dollars and 14,162,512,557
thousand U.S. dollars, respectively in 2007; and 2,408,098,712 thousand U.S. dollars and
18,809,926,692 thousand U.S. dollars respectively, in 2014. The import trade volumes of the
U.S., at least between 2007 and 2014, has not exceeded 14.24% of worldwide export
volumes, and any impact on worldwide trade caused by policy changes or other factors in the
U.S, on worldwide export volumes, can be expected to be limited to this order of magnitude.
Except for a Year-on-Year decrease between 2008 and 2009 for worldwide Total Imports,
China’s Total Imports, and Total Imports for the U.S., there has been Year-on-Year increases
in all three between 2007 and 2014.
2.2 Destinations and Origins of China and U.S. Trade
Continuing the discussion of the possible impacts on the rest of the world of the large Trade
Volumes of both China and the U.S., the destinations of the Exports from China and the U.S.,
as well as the origins of the Imports into China and the U.S. will now be determined. To
cover the trade between China and the U.S. with the rest of the world, the world has been
subdivided into; Africa, Americas, Asia, Europe, and Oceania.

���� ���� ���� ���� ���� ���� ���� ����
���������� ��������� ��������� ����������� ���������� ����������� ����������� ���������
���� ���� ���� ���� ���� ���� ���� ����
�� ���� ������ ����� ����� ���� ���� ����
�������� �������� ���������� �������� �������� ���������� ���������� ����������
���� ���� ����� ����� ����� ���� ������ ������
�� ����� ������ ����� ����� ���� ���� ����
��������� ��������� ��������� ������� �������� ���������� ��������� ����������
������ ����� ����� ������ ������ ���� ������ ������
�� ���� ����� ����� ����� ���� ����� ����
� ���������������������� ��
!� "� ��#�
��$����%����� ������������
�&� ��'����()� ��� ��� �����������
*�)�+�� ����,����-���� �.
/�� �
&� ��'���
!� "� ��#�
/�� �� �/�� �()� #�
/�� �� �/�� �()� #�
()� ������������ ��
!� "� ��#�
/�� �� �/�� �()� #�
��+ "�%�0+�)� ��(��"+����� ��� ���1(�0-���������"�

� � � � � � � �
�� � � � � � � � � � �� � �� � �� � ��
�������� �������������� �������������� �������� ���� ��������� ��� �������������� ������������ � ����� �������� ���� ���������
����� ����������� ������������� �� ��������� ������ ����� ������������� ������������� ������������� ������ ���� �
����������� �� ����� ���� ���������� �� ��� ��������� ������������ ������������� ������� ����� ������������� ��� �� ������
� � �
�� � �
��� � �
�� � �
��� � �
�� � �
��� ���� ���� ���� �����
� ���� � ���� � ���� � ����
����
������
����� ���������
��������������������������� ��!�"�����#� ���� ��������������$!��%�

� � � � � � � �
� ���� ������ ������ ������ ������ ������ ������ ������ ������
��� ���� � �� ������ ������ ������ ������ ������ ������ ������ ������
����� ����� ����� ����� ����� ����� ����� ������ ������
�����
������
������
������
������
�������
�������
������������ ���������
� ������������������������������������ �!����"! ��������#$%$�&%���'�(��)*

Page 11
2.2.1 China’s Exports to Africa, Americas, Asia, Europe, and Oceania
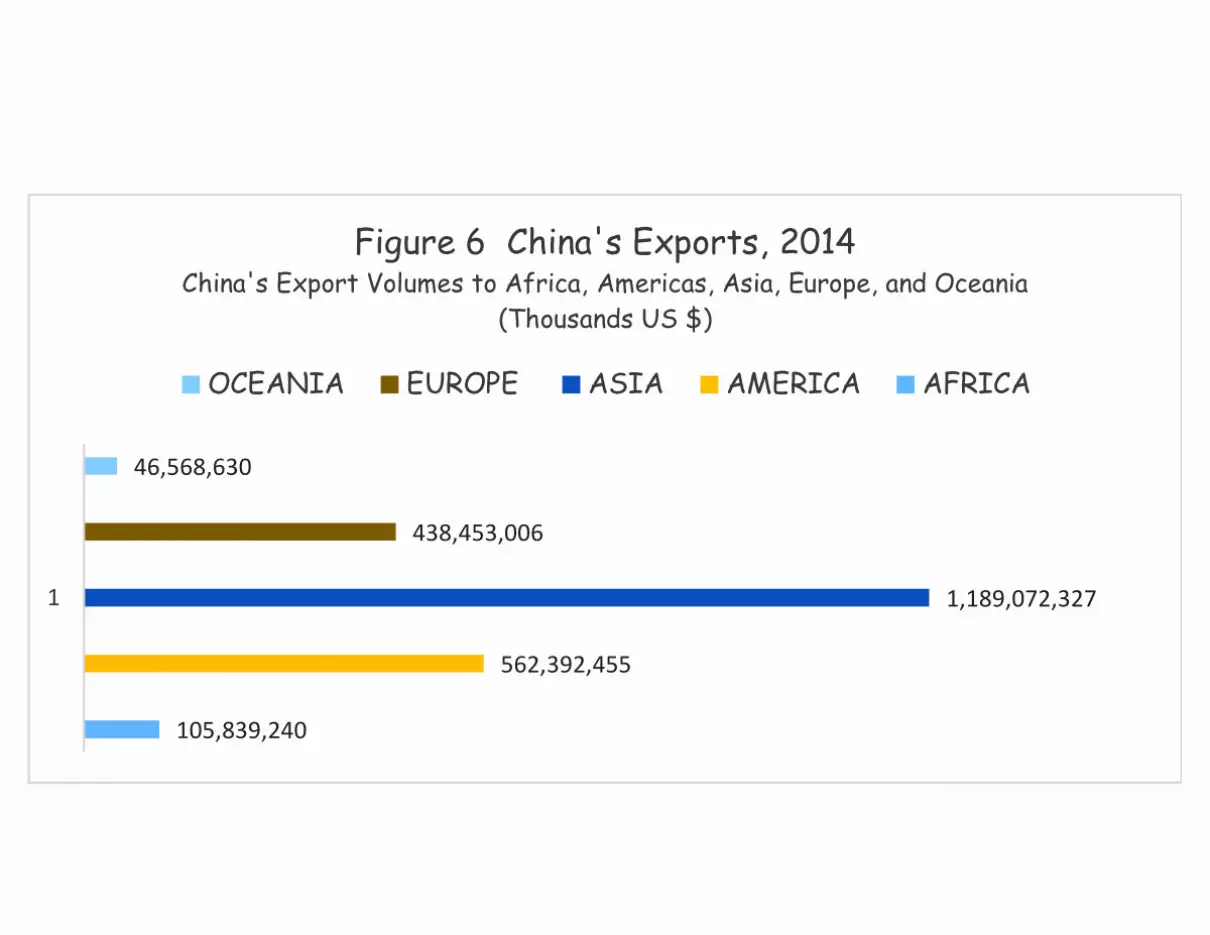
Table 4 and Figure 5, which show China’s exports and the percentages of its exports to
Africa, the Americas, Asia, Europe, and Oceana, from 2007 to 2014; indicates that the
percentage of the China’s exports to Africa, ranged from a low of 3.06% in 2007, to a high of
4.52% in 2014. Table 4 and Figure 4 show China’s Total exports and China’s exports to
Africa to be 1,220,059,668 thousand U.S. dollars and 37,375,142 thousand U.S. dollars,
respectively in 2007; and 2,342, 342,011 thousand U.S. dollars and 105,839,240 thousand
U.S. dollars respectively, in 2014. China’s export trade volumes to Africa, at least between
2007 and 2014, was never been above 4.52% of China’s Total export volumes, as such any
impact on Africa caused by policy changes or other factors in China that directly affect
China’s trade exports, can be expected to be limited to this order of magnitude.
Table 4 and Figure 5 indicates that the percentage of the China’s exports to the Americas,
ranged from a low of 24.01% in 2014, to a high of 25.20% in 2010. Table 4 and Figure 3
show China’s Total exports and China’s exports to the Americas to be 2,342,343,011
thousand U.S. dollars and 562,392,455 thousand U.S. dollars, respectively in 2014; and
1,577, 763,751 thousand U.S. dollars and 397,584,823 thousand U.S. dollars respectively, in
2010. China’s export trade volumes to the Americas, at least between 2007 and 2014, was
never been above 25.20% of China’s Total export volumes, as such any impact on the
Americas caused by policy changes or other factors in China that directly affect China’s trade
exports, can be expected to be limited to this order of magnitude.
Table 4 and Figure 5 indicates that the percentage of the China’s exports to Asia, ranged
from a low of 46.38% in 2010, to a high of 51.38% in 2013. Table 4 and Figure 3 show
China’s Total exports and China’s exports to Asia to be 1,577,763,751 thousand U.S. dollars
and 731,845,646 thousand U.S. dollars, respectively in 2010; and 2,209, 007,280 thousand
U.S. dollars and 1,134,951,525 thousand U.S. dollars respectively, in 2013. China’s export

Page 12
trade volumes to Asia, at least between 2007 and 2014, was never been above 51.38% of
China’s Total export volumes, as such any impact on Asia caused by policy changes or other
factors in China that directly affect China’s trade exports, can be expected to be limited to
this order of magnitude.
Table 4 and Figure 5 indicates that the percentage of the China’s exports to Europe, ranged
from a low of 18.34% in 2013, to a high of 24.02% in 2008. Table 4 and Figure 3 show
China’s Total exports and China’s exports to Europe to be 2,209,007,280 thousand U.S.
dollars and 405,073,972 thousand U.S. dollars, respectively in 2013; and 1,430,693,066
thousand U.S. dollars and 343,695,842 thousand U.S. dollars respectively, in 2008. China’s
export trade volumes to Europe, at least between 2007 and 2014, was never been above
24.02% of China’s Total export volumes, as such any impact on Europe caused by policy
changes or other factors in China that directly affect China’s trade exports, can be expected to
be limited to this order of magnitude.
Table 4 and Figure 5 indicates that the percentage of the China’s exports to Oceania, ranged
from a low of 1.73% in 2007, to a high of 2.19% in 2012. Table 4 and Figure 4 show China’s
Total exports and China’s exports to Oceania to be 1,220,059,668 thousand U.S. dollars and
21,103,724 thousand U.S. dollars, respectively in 2007; and 2,048, 782,233 thousand U.S.
dollars and 44,872,025 thousand U.S. dollars respectively, in 2012. China’s export trade
volumes to Oceania, at least between 2007 and 2014, was never been above 2.19% of China’s
Total export volumes, as such any impact on Oceania caused by policy changes or other
factors in China that directly affect China’s trade exports, can be expected to be limited to
this order of magnitude.
As Figure 5 shows most clearly, between 2007 and 2014, China’s Exports were distributed
approximately thus; 50% to Asia, 25% to the Americas, 20% to Europe, 3% to Africa, and
2% to Oceania.

���� ���� ���� ���� ���� ���� ���� ���� ����
������� ��� ��������� ���������� ��������� �������� ��������� ���������� ���������� ����������
���� ���� ���� ���� ���� ���� ���� ����
�� ����� ������ ����� ����� ���� ���� ����
� ������ ������� ������� �������� ������ �������� ������ ������ ��������
����� ���� ����� ����� ����� ����� ����� ����
�� ����� ����� ���� ����� ����� ���� �����
� �������� ��������� ������ �������� �������� ��������� ����� ������� ������
������ ������ ������ ����� ����� ���� ������ ������
�� ����� ������ ���� ����� ���� ���� ���
� ���� ������� �������� ������ �������� ��������� ���������� ������� ����������
������ ������ ������ ������ ������ ������ ����� �����
�� ����� ������ ����� ����� ����� ����� ����
� ������ �������� �������� ������ ������� ��������� �������� �������� ��������
������ ������ ������ ����� ������ ������ ������ ������
�� ����� ������ ����� ����� ����� ���� ����
� ���� �� �������� ������� ������� �������� �������� ������� �������� �������
����� ����� ����� ����� ���� ����� ����� �����
�� ����� ����� ����� ����� ���� ����� ����
������������ ������� !"�����������
��� ����� !"��" �#$!�%��#&�!�%��#�����'! ���� (�)%�� �
*�� '�� (�� $�+�,��- ���!�.
/��!�
0�!%� "�1�
/��!� �/��!���� 1�
0�!%� "�1�
/��!� �/��!���� 1�
0�!%� "�1�
/��!� �/��!���� 1�
0�!%� "�1�
/��!� �/��!���� 1�
0�!%� "�1�
/��!� �/��!���� 1�
0�!%� "�1�
/��!� �/��!���� 1�
, '!%���#'"� !�����%'��"� ��� (�+2��#-�,"�"��"�%�

� � � � � � � �
�� � � � � � � � � � �� � �� � �� � ��
������������ ���� � �� ���� ���� ��� ����� ��������� ��������� �� ������ ��� �� � ���������
���������� � ���� �� �������� ����� ��� ��������� ��������� ��������� ����� ��� ���������
������� ������ �� ���� ���� ����� ��� ��������� ����� �� �� ����� ��������� ������ ��
��� �!" ��������� ��������� ��������� ��������� ��������� ��������� � �� ���� ��������
� � � � � � � � � � � � �� � � ��� � � ��� � �
�
�# �
�$�# �
�# �
�$�# �
��������
��
����
���
����
����
��������������� ����� ������ ��!"������ ����� ���#$���%� ��# ��������������������&'��"�

� � � � � � � �
�� � � � � � � � � � �� � �� � �� � ��
������������ ���� � ���� � ��� �� ������ ������ �� ��� ��� �� ������
��������� ������ ��� � ������ ���� � ������ ������ ������ � ����
������ �� ���� � ������ ������ ��� �� � ���� ������ ������ ������
� � �
� � �
� � �
� � �
� � �
�� � �
�
�! �
�"�! �
�! �
�"�! �
�������
���
�����
���
��
���
�������������������������� ��!�����������������"#��$�%&$������ ����'(���

� � � � � � � �
�� ����� ����� ����� ����� ����� ����� ����� ����� �����
������� ������ ������ ������ ������ ������ ������ ������ ������
����� ������ ������ ������ ������ ������ ������ ������ ������
������ � ������ ������ ������ ������ ������ ������ ������ ������
����� � ����� ����� ����� ����� ����� ����� ����� �����
���������������������������������
������������ ������� ������������ ������� �����������
������������ ������� ����������������� ��� ����������� �!�����
����������
���������
�������������
��������
������
�
������������� ������������������ �������������������������������������������������������� �������
!"��������#$�%&
��'(� �#) *� �$(� �+�)(� ��)(�

Page 13
2.2.2 China’s Imports from Africa, Americas, Asia, Europe, and Oceania
Table 5 and Figure 9, which show China’s imports and the percentages of its imports from
Africa, the Americas, Asia, Europe, and Oceana, from 2007 to 2014; indicates that the
percentage of China’s imports from Africa, ranged from a low of 3.80% in 2007, to a high of
6.23% in 2012. Table 5 and Figure 8 show China’s Total imports and China’s imports from
Africa to be 956,115,448 thousand U.S. dollars and 36,359,944 thousand U.S. dollars,
respectively in 2007; and 1,949,992,315 thousand U.S. dollars and 115,658,756 thousand
U.S. dollars respectively, in 2013 the year with the highest trade imports into China from
Africa between 2007 and 2014. The percentage of China’s import trade volumes from Africa,
at least between 2007 and 2014, never exceeded 6.23% of China’s Total import volumes, as
such any impact on Africa caused by policy changes or other factors in China that directly
affect China’s trade imports, can be expected to be limited to this order of magnitude.
Table 5 and Figure 9 indicate that the percentage of China’s imports from the Americas,
ranged from a low of 13.76% in 2007, to a high of 15.89% in 2014. Table 5 and Figure 7
show China’s Total imports and China’s imports from the Americas to be 956,115,448
thousand U.S. dollars and 131,569,799 thousand U.S. dollars, respectively in 2007; and
1,958,021,301 thousand U.S. dollars and 311,221,554 thousand U.S. dollars respectively, in
2014 the year with the highest trade imports into China from the Americas between 2007 and
2014. The percentage of China’s import trade volumes from the Americas, at least between
2007 and 2014, never exceeded 15.89% of China’s Total import volumes, as such any impact
on the Americas caused by policy changes or other factors in China that directly affect
China’s trade imports, can be expected to be limited to this order of magnitude.
Table 5 and Figure 9 indicate that the percentage of China’s imports from the Asia, ranged
from a low of 55.43% in 2014, to a high of 64.86% in 2007. Table 5 and Figure 7 show
China’s Total imports and China’s imports from the Asia to be 1, 958,021,301 thousand U.S.

Page 14
dollars and 1,085,293,801 thousand U.S. dollars, respectively in 2014; and 956,115,448
thousand U.S. dollars and 620,103,539 thousand U.S. dollars respectively, in 2007 the year
with the highest trade imports into China from the Asia between 2007 and 2014. The
percentage of China’s import trade volumes from Asia, at least between 2007 and 2014,
never exceeded 64.86% of China’s Total import volumes, as such any impact on Asia caused
by policy changes or other factors in China that directly affect China’s trade imports, can be
expected to be limited to this order of magnitude.
Table 5 and Figure 9 indicate that the percentage of China’s imports from the Europe, ranged
from a low of 14.61% in 2007, to a high of 17.10% in 2014. Table 5 and Figure 7 show
China’s Total imports and China’s imports from Europe to be 956,115,448 thousand U.S.
dollars and 139,649,033 thousand U.S. dollars, respectively in 2007; and 1,958,021,301
thousand U.S. dollars and 334,790,195 thousand U.S. dollars respectively, in 2014 the year
with the highest trade imports into China from Europe between 2007 and 2014. The
percentage of China’s import trade volumes from Europe, at least between 2007 and 2014,
never exceeded 17.10% of China’s Total import volumes, as such any impact on the
Americas caused by policy changes or other factors in China that directly affect China’s trade
imports, can be expected to be limited to this order of magnitude.
Table 5 and Figure 9 indicate that the percentage of China’s imports from Oceania, ranged
from a low of 2.97% in 2007, to a high of 5.59% in 2014. Table 5 and Figure 8 show China’s
Total imports and China’s imports from Oceania to be 956,115,448 thousand U.S. dollars and
28,376,169 thousand U.S. dollars, respectively in 2007; and 1,958,021,301 thousand U.S.
dollars and 109,509,465 thousand U.S. dollars respectively, in 2014 the year with the highest
trade imports into China from Oceania between 2007 and 2014. The percentage of China’s
import trade volumes from Oceania, at least between 2007 and 2014, never exceeded 5.59%
of China’s Total import volumes, as such any impact on Oceania caused by policy changes or

���� ���� ���� ���� ���� ���� ���� ���� ����
������ ���� �������� ���������� �������� ��������� ����������� ������������� ������������ ������������
���� ���� ���� ���� ���� ���� ���� ����
�� ���� ������ ����� ����� ���� ���� ����
��������� �������� ����� ��������� ������� �������� ����������� ���������� ������
����� ����� ����� ����� ��� ���� ���� ����
�� ���� ����� ���� ����� ���� ���� ����
����������� ��������� ��������� ������� �������� ���������� ���������� ���������� ���������
����� ����� ����� ����� ����� ���� ��� �����
�� ���� ����� ��� ���� ��� ���� ����
������� ��������� ���������� �������� ���������� ������������ ������������ ������������� ������������
���� ���� ����� ����� ���� ����� ���� ����
�� ����� ������ ����� ����� ���� ��� ����
��������� ��������� ���������� ���������� ���������� ��������� �������� ��������� ����������
����� ������ ����� ���� ���� ���� ���� ������
�� ����� ���� ����� ����� ����� ����� ����
���������� �������� ��������� �������� ������� ���������� �������� ���������� ��������
����� ��� ����� ����� ���� ���� ��� ���
�� ���� ��� ���� ����� ���� ���� ����
����� ����
������ ��������� ��
������ ���! �"#�$%&���#�����������
��! ��$%&���#�'��%��('�!����(%��!����(#!���)*��&���� +�,��� �
-���*#� +#��'�.�/��0�����#1
����#
����� ����
������ ��������� ��
����� ����
������ ��������� ��
����� ����
������ ��������� ��
����� ����
������ ��������� ��
����� ����
������ ��������� ��
/�*��� �(*����#�����*���!� #��� +�.2��(0�/���!#�!�#

� � � � � � � �
�� � � � � � � � � � �� � �� � �� � ��
������������� ��������� ��������� �� ����� ������ � ��������� ��������� ��������� ������ ��
����������� ��������� ��������� ��������� � ������� ��������� ��������� � �� ���� ���������
�������� �� �� ��� � ��� ��� � ��� ��� ���� ���� �� ���� �� ����� �� � ���� �� ������
���� �!" �������� ��������� ���� ���� ��������� ��������� �������� �������� ������ ��
� � �
� � �
� � �
� � �
�� � �
��� � �
�
�# �
�$�# �
�# �
�$�# �
��������
��
���� �����������
������������������� ���������� �����! ����� �"���#����$�! ��# ��������%����������&'�(�

� � � � � � � �
�� � � � � � � � � � �� � �� � �� � ��
������������� ������ ������ �� �� ������ ������ ������ ������ ������
���������� ������ ������ ����� ��� �� ������ ������ ������ ������
���������� ������ � ���� ������ ��� � ������ ������ � ���� � ���
� � �
� � �
� � �
� � �
� � �
�� � �
�� � �
�
� �
�!� �
� �
�!� �
������
��
�� �
���
���
����
����
����
���� �������������� �������� ��!"���������� ���# ��$# �%�������&%�������������'(��)�

� � � � � � � �
�� ������ ����� ����� ����� ����� ����� ����� ����� �����
����� �� ������ ������ ������ ������ ������ ������ ������ ������
������ ������ ������ ������ ������ ������ ������ ������ ������
��������� ������ ������ ������ ������ ������ ������ ������ ������
�������� ����� ����� ����� ����� ����� ����� ����� �����
�����������������������������
����
����
�������� �����
�� ������������ ��������������������
������ ��!"#�$%���&�'%�'��� "(�)����"(�%)��%"�)��*�&�)�+� (��#"�

�����������
����������
�����������
���������
��������
�
������������ ������������������ ������������������� �������� ������ ��������������� �� ������� � ��!"#"�$%
���&�� �!'�(� �#�� �)�'�� ��'��

Page 15
other factors in China that directly affect China’s trade imports, can be expected to be limited
to this order of magnitude.
As Figure 9 shows most clearly, between 2007 and 2014, the percentage distribution of the
Imports of China was thus; 55% to Asia, 16% to the Americas, 17% to Europe, 6% to Africa,
and 6% to Oceania.
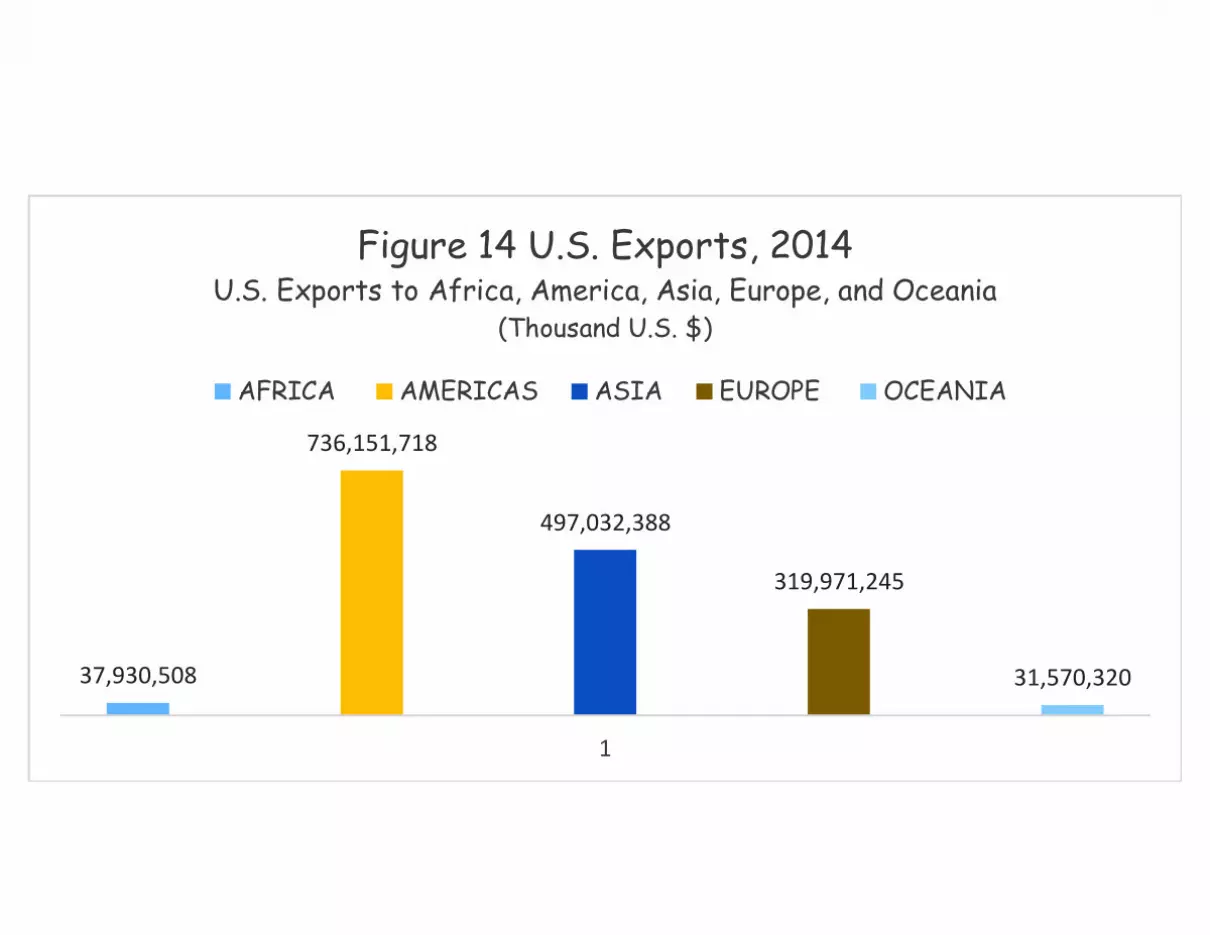
2.2.3 United States’ Exports to Africa, Americas, Asia, Europe, and Oceania
Table 6 and Figure 13, which show the exports of the U.S. and the percentages of the exports
of the U.S. to Africa, the Americas, Asia, Europe, and Oceana, from 2007 to 2014; indicates
that the percentage of the exports of the U.S. to Africa, ranged from a low of 2.03% in 2007
to a high of 2.34% in 2014. Table 6 and Figure 12 show the Total Exports of the U.S. and the
exports of the U.S. to Africa to be 1,162,538,150 thousand U.S. dollars and 23,657,162
thousand U.S. dollars, respectively in 2007; and 1,622,657,461 thousand U.S. dollars and
37,930,508 thousand U.S. dollars respectively, in 2014. U.S. export trade volumes to Africa,
did not exceeded 2.34% of the Total U.S. Export Trade volume, for any year between 2007
and 2014, as such any impact on Africa caused by policy changes or other factors in the U.S.
that directly affect the trade exports of the U.S., can be expected to be limited to this order of
magnitude.
Table 6 and Figure 13 indicates that the percentage of the exports of the U.S. to the
Americas, ranged from a low of 41.93% in 2009 to a high of 45.37% in 2014. Table 6 and
Figure 11 show the Total Exports of the U.S. and the exports of the U.S. to the Americas to
be 1,056,712,078 thousand U.S. dollars and 443,073,545 thousand U.S. dollars, respectively
in 2009; and 1,622,657,461 thousand U.S. dollars and 736,151,718 thousand U.S. dollars
respectively, in 2014. U.S. export trade volumes to the Americas, did not exceeded 45.37% of
the Total U.S. Export Trade volume, for any year between 2007 and 2014, as such any impact

Page 16
on the Americas caused by policy changes or other factors in the U.S. that directly affect the
trade exports of the U.S., can be expected to be limited to this order of magnitude.
Table 6 and Figure 13 indicates that the percentage of the exports of the U.S. to Asia, ranged
from a low of 29.23% in 2008 to a high of 31.28% in 2010. Table 6 and Figure 11 show the
Total Exports of the U.S. and the exports of the U.S. to Asia to be 1,299,898,877 thousand
U.S. dollars and 379,897,640 thousand U.S. dollars, respectively in 2008; and 1,277,109,162
thousand U.S. dollars and 399,527,393 thousand U.S. dollars respectively, in 2010. U.S.
export trade volumes to Asia, did not exceeded 31.28% of the Total U.S. Export Trade
volume, for any year between 2007 and 2014, as such any impact on Asia caused by policy
changes or other factors in the U.S. that directly affect the trade exports of the U.S., can be
expected to be limited to this order of magnitude.
Table 6 and Figure 13 indicates that the percentage of the exports of the U.S. to Europe,
ranged from a low of 19.72% in 2014 to a high of 24.31% in 2008. Table 6 and Figure 11
show the Total Exports of the U.S. and the exports of the U.S. to Europe to be 1,622,657,461
thousand U.S. dollars and 319,971,245 thousand U.S. dollars, respectively in 2014; and
1,299,898,877 thousand U.S. dollars and 315,993,806 thousand U.S. dollars respectively, in
2008. U.S. export trade volumes to Europe, did not exceeded 20.58% of the Total U.S.
Export Trade volume, for any year between 2007 and 2014, as such any impact on Europe
caused by policy changes or other factors in the U.S. that directly affect the trade exports of
the U.S., can be expected to be limited to this order of magnitude.
Table 6 and Figure 13 indicates that the percentage of the exports of the U.S. to Oceania,
ranged from a low of 1.90% in 2013 to a high of 2.29% in 2012. Table 6 and Figure 12 show
the Total Exports of the U.S. and the exports of the U.S. to Oceania to be 1,587,001,360
thousand U.S. dollars and 29,945,401 thousand U.S. dollars, respectively in 2013; and
1,545,565,186 thousand U.S. dollars and 35,348,555 thousand U.S. dollars respectively, in

���� ���� ���� ���� ���� ���� ���� ���� ����
������� �� ��������� ���������� ��������� ��������� ��������� �������� ��������� �������
���� ���� ���� ���� ���� ���� ���� ����
�� ����� ������ ����� ����� ���� ���� ����
��������� ������ ������� �������� �������� ������ �������� �������� ��������
����� ����� ����� ����� ����� ����� ����� �����
�� ����� ������ ���� ����� ���� �� ����
��������� �������� �������� ��������� ��������� ������� ������� �������� ��������
������ ������ ������ ������ ���� ����� ������ ������
�� ����� ������ ����� ���� ��� ��� ����
������� �������� �������� ������ ��������� ������� ������� ��������� ���������
������ ������ ������ ������ ������ ����� ������ �����
�� ����� ����� ���� ����� ���� ���� ����
����� � ��������� �������� ��������� �������� �������� �������� ��������� ���������
������ ������ ����� ������ ������ ������ ������ ������
�� ����� ������ ��� ����� ��� ����� ����
��� ����� �������� ������� �������� ������� ������� �������� �������� ��������
����� ����� ����� ����� ���� ����� ����� �����
�� ����� ������ ����� ����� ����� ������ ����
����� ����
����� ����
����� ����
����� ����
����� ����
������ ��������� ��
������ ��������� ��
�����
����� ����
������ ��������� ��
������ ��������� ��
������ ��������� ��
������ ��������� ��
������ �!���������"��"��#� ��� $�%&�'!(�����#��#��
'�)"�� �% #��$��������*+,��������������
% #��$��������*+,��������!-�#���!.��#���!�#��*���,��� $�/��� �
0'����� $���-�%����(�""���1

� � � � � � � �
�� � � � � � � � � � �� � �� � �� � ��
������������ ��������� ��������� �� ������ ������� � �������� ��������� ������ � ���������
���������� ���� ���� ��������� ���� ���� ��������� ��������� �� ������ � ������� ���������
������� ��������� ��������� ��������� ��������� �������� ��������� �� ������ ���� ����
������� ����� ��� ��������� �� ������ ��������� ������ � ��������� ����� ��� ���������
� � �
� � �
� � �
� � �
� � �
� � �
� � � �
� ���� ���� ���� ���� �
������
����� ���������
������������������������������������������������ !���"���� �����#��������������$%��&�

� � � � � � � �
�� � � � � � � � � � �� � �� � �� � ��
������������ ������ ������ �� ��� ������ ������ ������ ������ ������
��������� ������ ������ ������ ������ ���� � ����� ��� �� �����
��������� ���� � ������ ������ ������ ������ ������ ������ �����
�� �
� � �
��� �
� � �
��� �
� � �
��� �
� � �
� � � �
� �
��� ���� ���� ���� �
������
����
��
�������
�
����������������������������������������������� ��!���"�#!�����������$�%&��'�

� � � � � � � �
��� ��� ���� ��� ���� ��� ��� ���
���� ����� ����� ����� ����� ����� ���� ����
���� ���� ��� ����� ����� ����� ����� �����
����� ����� ���� ����� ����� ���� ���� �����
���� ���� ���� ���� ���� ���� ���� ����
��������������������������������
������������ ����
�������������� ��������������������������� ������������������������������������ ����� ���!��
����������
��������
����������
��������
���������
������������� ��������������� ��������������������������������� �������������������
�� �����������!"
��#$%� �& #$%�� ��$� #�' �% �($�

Page 17
2012. U.S. export trade volumes to Oceania, did not exceeded 2.29% of the Total U.S. Export
Trade volume, for any year between 2007 and 2014, as such any impact on Oceania caused
by policy changes or other factors in the U.S. that directly affect the trade exports of the U.S.,
can be expected to be limited to this order of magnitude.
As Figure 13 shows most clearly, between 2007 and 2014, the Exports of the United States
were distributed approximately thus; 30% to Asia, 45% to the Americas, 20% to Europe, 3%
to Africa, and 2% to Oceania.
2.2.4 United States’ Imports from Africa, Americas, Asia, Europe, and Oceania
Table 7 and Figure 17, which show the total imports of the U.S., and the import volumes to
the U.S. from Africa, the Americas, Asia, Europe, and Oceana, from 2007 to 2014; indicates
that the percentage of the imports of the U.S. from Africa, ranged from a low of 1.48% in
2014 to a high of 5.41% in 2008. Table 7 and Figure 16 show the Total Imports of the U.S.
and the imports of the U.S. from Africa to be 2,408,098,712 thousand U.S. dollars and
35,522,664 thousand U.S. dollars, respectively in 2014; and 2,164,834,031 thousand U.S.
dollars and 117,220,100 thousand U.S. dollars respectively, in 2008. U.S. import trade
volumes from Africa, did not exceeded 5.41% of the Total U.S. Import Trade volume, for any
year between 2007 and 2014, as such any impact on Africa caused by policy changes or other
factors in the U.S. that directly affect the trade imports of the U.S., can be expected to be
limited to this order of magnitude.
Table 7 and Figure 17 indicates that the percentage of the imports of the U.S. from the
Americas, ranged from a low of 32.41% in 2009 to a high of 33.66% in 2013. Table 7 and
Figure 15 show the Total Imports to the U.S. and the imports to the U.S. from the Americas
to be 1,601,895,815 thousand U.S. dollars and 519,116,915 thousand U.S. dollars,
respectively in 2009; and 2,328,328,633 thousand U.S. dollars and 783,658,302 thousand
U.S. dollars respectively, in 2013. U.S. import trade volumes from Africa, did not exceeded

Page 18
33.66% of the Total U.S. Import Trade volume, for any year between 2007 and 2014, as such
any impact on Africa caused by policy changes or other factors in the U.S. that directly affect
the trade imports of the U.S., can be expected to be limited to this order of magnitude.
Table 7 and Figure 17 indicates that the percentage of the imports of the U.S. from Asia,
ranged from a low of 40.36% in 2008 to a high of 44.07% in 2014. Table 7 and Figure 15
show the Total Imports to the U.S. and the imports to the U.S. from Asia to be 2,164,834,031
thousand U.S. dollars and 873,704,160 thousand U.S. dollars, respectively in 2008; and
2,408,098,712 thousand U.S. dollars and 1,061,254,339 thousand U.S. dollars respectively, in
2014. U.S. import trade volumes from Asia, did not exceeded 44.07% of the Total U.S.
Import Trade volume, for any year between 2007 and 2014, as such any impact on Asia
caused by policy changes or other factors in the U.S. that directly affect the trade imports of
the U.S., can be expected to be limited to this order of magnitude.
Table 7 and Figure 17 indicates that the percentage of the imports of the U.S. from Europe,
ranged from a low of 19.42% in 2010 to a high of 20.58% in 2009. Table 7 and Figure 15
show the Total Imports to the U.S. and the imports to the U.S. from Europe to be
1,601,895,815 thousand U.S. dollars and 329,719,481 thousand U.S. dollars, respectively in
2009; and 1,966,496,750 thousand U.S. dollars and 381,802,586 thousand U.S. dollars
respectively, in 2010. U.S. import trade volumes from Europe, did not exceeded 20.58% of
the Total U.S. Import Trade volume, for any year between 2007 and 2014, as such any impact
on Europe caused by policy changes or other factors in the U.S. that directly affect the trade
imports of the U.S., can be expected to be limited to this order of magnitude.
Table 7 and Figure 17 indicates that the percentage of the imports of the U.S. from Oceania,
ranged from a low of 0.58% in 2013 to a high of 0.71% in 2009. Table 7 and Figure 16 show
the Total Imports to the U.S. and the imports to the U.S. from Oceania to be 2,328,328,633
thousand U.S. dollars and 13,400,211 thousand U.S. dollars, respectively in 2013; and

Page 19
1,601,895,815 thousand U.S. dollars and 11,333,257 thousand U.S. dollars respectively, in
2009. U.S. import trade volumes from Oceania, did not exceeded 0.71% of the Total U.S.
Import Trade volume, for any year between 2007 and 2014, as such any impact on Oceania
caused by policy changes or other factors in the U.S. that directly affect the trade imports of
the U.S., can be expected to be limited to this order of magnitude.
As Figure 17 shows most clearly, between 2007 and 2014, the percentage distribution of the
Imports of the United States was thus; 45% to Asia, 30% to the Americas, 20% to Europe,
3% to Africa, and 2% to Oceania.
3.0 China and U.S. Trade with One Another
U.S.-China trade rose rapidly after the two economies reestablished diplomatic relations, and
signed a bilateral trade agreement (which happened in January and July respectively of 1979)
and provided mutual most-favored-nation (MFN) treatment beginning in 1980. (Shitan, 2012;
and USGPO, 1998). Tisdall (2008) and Morrison (2006) believe that China’s economic
reforms began in the same year, that is, in 1979; when total U.S.-China trade (exports plus
imports) was $2 billion, China ranked as the United States’ 23rd largest export market, and its
45th-largest source of imports. (USITC DataWeb, 2014). In 2014, total bilateral trade
(exports plus imports) reached $592 billion; China is currently the second-largest U.S. trading
partner (after Canada), the third-largest U.S. export market (after Canada and Mexico).
(UNCTAD Stats, 2015). Over the past 10 years of so, China has been one of the fastest-
growing U.S. export markets and the largest source of U.S. imports. (UNCTAD Stats, 2015).
According to the U.S.-China Business Council, USCBC (2014), China was a $350 billion
market (2013) for U.S. firms, if direct and indirect U.S. exports to China, and sales by U.S. -
invested firms in China, are counted.
Trade between China and the U.S. is covered in greater detail by discussing such topics as

���� ���� ���� ���� ���� ���� ���� ���� ����
������� �� ��������� ��������� ��������� ������� �������� ���������� ��������� ����������
���� ���� ���� ���� ���� ���� ���� ����
�� ���� ����� ����� ����� ���� ����� ����
���������� �������� ��������� ����� ������� ������� ������� �������� ������
����� ����� ����� ����� ����� ����� ����� �����
�� ����� ������ ����� ���� ������ ������ ������
���������� �������� �������� �������� ������� ������� ��������� �������� ���������
������ ����� ������ ������ ������ ����� ���� ������
�� ���� ������ ����� ����� ���� ����� ����
�������� �������� �������� �������� ������� ������� ��������� ���������� ���������
������ ����� ������ ������ ����� ������ ����� ������
�� ���� ������ ����� ���� ���� ���� ����
�������� ��������� ��������� ��������� �������� ��������� �������� �������� ���������
������ ������ ������ ������ ������ ������ ������ ������
�� ��� ������ ����� ����� ���� ���� ���
���������� ������� �������� �������� �������� �������� �������� �������� �������
���� ���� ����� ���� ���� ����� ����� ����
�� ���� ������ ���� ���� ����� ����� �����
����� ����
����� ����
����� ����
���������� ����� ����!�"#$%��!����������&
� ����� ����!�"#$%��!�'�%#�('�����(#������(!���)*�%$��� ��+��� �
,����% �,����-.� ��
/�.%*!� �!�%'��� ��0%����!&
,����% �,����-.� ��
,����% �,����-.� ��
%*�����(*�.%�!�-���*����% !�� ���1-�(0� ����!���!
,���!
����� ����
,����% �,����-.� ��
,����% �,����-.� ��
����� ����
����� ����
,����% �,����-.� ��

� � � � � � � �
�� � � � � � � � � � �� � �� � �� � ��
������������ �� ����� ��������� ��� ����� ��������� ��������� ������� � ��������� ��� �� ��
����������� ��������� �������� ��������� ����� ��� ���� ��� ��������� ��������� � �� ����
�������� ��������� ����� ��� ����� ��� ����� ��� ���� ���� �� ������ �� ����� �� ������
�������� �� ������ ��������� ��������� ����� ��� ��������� ��������� �� ��� �� �� ��� ��
� � �
� � �
� � �
� � �
�� � �
��� � �
�
� �
��� �
� �
��� �
� �
������
������ ���������
��������������������������������� �������������!���"����#����"������ ��$�����������%&����

� � � � � � � �
�� � � � � � � � � � �� � �� � �� � ��
������������ �� ��� ������ ��� �� ������ ������ ������ ������ ��� ��
���������� ������ ������ ������ ������ ������ ������ ������ ������
���������� ������ ����� ������ ������ ���� � ������ ���� ������
� � �
� � �
� � �
� � �
� � �
�� � �
�� � �
�
�� �
���� �
�� �
���� �
�� �
������
������ ���������
�������������������������������� �������������!���"!��#���� ��$#�� ��������%&����

� � � � � � � �
��� ��� ��� ��� ��� ��� ��� ���
���� ��� ���� ����� ����� ����� ���� ����
���� ���� ����� ����� ����� ����� ����� ����
����� ����� ����� ����� ����� ����� ����� �����
���� ���� ��� ���� ���� ���� ��� ����
�������������������
��
������������ ����
��������������� ��������������������������� �������������������������������������� ��������� ��

����������
��������
������������
���������
���������
�
� ������������������������������������������������ �������� ������� ��� ��������!"�#���!��$%&����!"������'(
��)�*� �+ )�*�� ���� �)#, #* �-��

Page 20
China’s Exports, Imports, and Structure of the Trade with the U.S.; and U.S.’s Exports,
Imports, and Structure of the Trade with China, in the following sections.
3.1. United States’ Trade with China
3.1.1 United States’ Exports to China; Volumes & %ages of Total U.S. Exports
Table 8 and Figures 19 and 20, which are based on the author’s calculations and data from
United Nations Conference on Trade and Development (UNCTAD stat, 2014), show Total
Exports from the U.S. and U.S. Exports to China, from 2007 to 2014. Exports of the United
States to China, as a percentage of U.S. Total exports, from 2007 to 2014, ranges from a low
of 5.50% in 2008, to a high of 7.64% in 2014. (Table 8, and Figure 20). Total exports from
the U.S. and exports of the United States to China, in 2008 were 1,299,898,877 thousand U.S.
dollars and 71,456,412 thousand U.S. dollars, respectively. (Table 8, and Figure 19).
Alternatively the Total exports from the U.S. and U.S. exports to China, in 2014 were
1,622,657,461 thousand U.S. dollars and 124,023,905 thousand U.S. dollars, respectively.
(Table 8, and Figure 19).
3.1.2 United States’ Exports to China; Structure by Product Group Classes
Table 8a and Figures 19a, based on the author’s calculations and data from United Nations
Conference on Trade and Development (UNCTAD stat, 2014), show U.S. Exports to China
and the Structure by Product Group Classes of the U.S. Exports to China from 2007 to 2014.
The percentage of Product Group Class 0, Food and Live Animals, ranges from 2.99% in
2007 to 7.23% in 2013, of U.S. Exports to China; Product Group Class 1, Beverages and
Tobacco, ranges from 0.14% in 2007 to 0.27% in 2014, of U.S. Exports to China; Product
Group Class 2, Crude Materials-Inedible-Except Fuels, ranges from 4.04% in 2014 to
6.89% in 2011, of U.S. Exports to China; Product group Class 3, Mineral Fuels-Lubricants-
Related Materials, ranges from 0.46% in 2007 to 2.28% in 2012, of U.S. Exports to China;
Product group Class 4, Animal & Vegetable Oils-Fats & Waxes, ranges from 0.10% in

���� ���� ���� ���� ���� ���� ���� ������������� ���������� ��������� ��������� ��������� �������� ��������� �������
���� ���� ���� ���� ���� ���� ���� ����
�� ����� ������ ����� ����� ���� ���� ����
������� ������� ������ ������� ��������� ��������� �������� ���������
���� ����� ���� ����� ����� ���� ����� ����
�� ���� ���� ����� ����� ��� ����� ���
����� ����
������������ ��!����������
" #��$�%����!���� ��!�� $�"�%����� ��!�� �&'# �
(�' )!� $!� *�"%�+ ����!,
-���!
-���� �-����&'� ��
% )�����.)�' �!�&���)���# !�� $�"/&�.+�%���#!�#�!
� ����"�%����� ��!
����� ����
-���� �-����&'� ��
" #��$�%����!�� �&'# �

� � � � � � � �
�� � � � � � � � � � �� � �� � �� � ��
������������ ���������� ���������� �� ������� ������� �� �������� � ���������� ������ �� ����������
������������� ���������� ���������� ���������� ��������� � �������� �� ��� � � ���� ����� ���� ����
� � �
� � �
� � �
� � �
� � �
�� � �
�� � �
�
�
�
�
��� �
����� �
����� �
����� �
����� �
�������
� ��!���"������#$
����������� �������������������������� ��������������� ������������ �!����" #���$%

� � � � � � � �
� ���� ����� ����� ����� ����� ����� ����� ����� �����
����� � ����� ����� ����� ����� ����� ����� ����� ����� �����
�����
������
������
������
������
�������
�������
������������ ��
���� ������������� ��������������� ������������������ �!""�#��� ������ ����$����%�&"��'(

���� ���� ���� ���� ���� ���� ���� ����
�������� �������� ������ ��������� ����������� ��������� ��������� ����������
���� ���� ���� ���� ���� ���� ���� ����
��������� �������� �������� ��������� ������� �������� �������� ���������
���������� ��� � � � �� ���� ���� ��� ��� ���
���� ������ ������ ������� ������ ������� ������� �����
���������� ���� ��� ��� ��� ���� ��� ��� ���
������� �������� ������ �������� �������� �������� ������ ��������
���������� ���� � � ���� �� ���� ��� ���� ����
������ ������ ���� �������� ������� �������� �������� ��������
���������� ���� ��� ���� �� � ���� �� � ����
���� ����� ������ ����� ������ ����� ������� ����
���������� ��� ��� ���� ���� ���� ��� �� � ����
������� ��������� ���������� �������� ���������� �������� �������� �������
���������� ���� ����� �� �� ���� ����� ���� ����� �����
�������� �������� ������� ������ ������ ������ �������� ��������
���������� ���� ���� ��� ��� � ��� ���� ���
���������� ��������� ������� ���������� ���������� ���������� ��������� ���������
���������� ��� � ���� ���� ����� ��� � �� ���� �� �
������ �������� ��������� ������ �������� �������� ��������� ��������
���������� ���� � �� ���� ���� ���� ���� ���� ����
����� ����� ����� ���� ������ ���� ��� �������
���������� ���� ���� ���� ���� ���� ���� ���� ���
�������
�������
������
�������
�������
������
������������� �������� ������������
�������������������������� ���
��������������������
�������������������
�����������������������������
������������ �!"�������#����
$��"���%"�"����� �!"��"��&'���������%"!()"(!���*�+!��()"�,!�( �&��������-�$.%.��� �!"��"��&'���
/�'�(�������-�$%�0����!�1
2��!�
3���!�4�����������))�
��������������������� �������
������������������� �� ���� �!�"����
�������������#������$������ �������
����%�������&����
������������ �'������� �!�#�����������
�������
�������
�������
�������

��
���
���
���
���
���
���
��
��
���
����
� � � � � �
�������������� �
������������ �����
��� �������������������� �������� �!"#"�$%���������&� �'����������
� �����
� ����
� ����
� �����
� �����
� �����
� �����
� �����
� �����
� �����

Page 21
2009 to 0.47% in 2010, of U.S. Exports to China; Product group Class 5, Chemicals and
Related Products, n.e.s., ranges from 11.01% in 2013 to 14.51% in 2009, of U.S. Exports to
China; Product group Class 6, Manufactured Goods, ranges from 4.91% in 2013 to 7.04%
in 2008, of U.S. Exports to China; Product group Class 7, Machinery & Transport
Equipment, ranges from 26.54% in 2012 to 44.45% in 2007, of U.S. Exports to China;
Product group Class 8, Miscellaneous Articles, ranges from 6.19% in 2007 to 7.31% in
2012, of U.S. Exports to China; and Product group Class 9, Commodities and Transport
n.e.s., ranges from 0.00% in 2007 to 0.47% in 2013, of U.S. Exports to China.
For the period under consideration, that is 2007 to 2014, U.S. Exports to China was
dominated by Product Group Class 7 items, which are Machinery and Transport Equipment;
followed by Product Group Class 5 items, which are Chemicals and Related Products.
3.1.3 United States’ Imports from China; Volumes & %ages of Total U.S. Imports
Table 9 and Figures 21 and 21a, which are based on the author’s calculations and data from
United Nations Conference on Trade and Development (UNCTAD stat, 2014), show Total
Imports of the U.S. and U.S. Imports from China, from 2007 to 2014. U.S. Imports from
China, as a percentage of U.S. Total Imports, from 2007 to 2014, ranges from a low of
16.46% in 2008, to a high of 20.19% in 2014. (Table 9, and Figure 21a). Total Imports of the
U.S. and U.S. Imports from China, in 2008 were 2,164,834,031 thousand U.S. dollars and
356,304,561 thousand U.S. dollars, respectively. (Table 9, and Figure 21). Alternatively the
Total Imports of the U.S. and U.S. Imports from China, in 2014 were 2,408,098,712 thousand
U.S. dollars and 486,196,055 thousand U.S. dollars, respectively. (Table 9, and Figure 21).

���� ���� ���� ���� ���� ���� ���� ������������� ��������� ��������� ������� �������� ���������� ��������� ����������
���� ���� ���� ���� ���� ���� ���� ����
�� ���� ����� ����� ����� ���� ����� ����
������ ������� ��������� ��������� ��������� ��������� ������� �������
���� ���� ������ ������ ������ ������ ����� ������
�� ���� ������ ����� ���� ��� ���� ����
����� ����
������ ��������� ��
������� �!"#���$����������
% &��'�(����$�!"#���$�� '�% &��'�(����$�!"#���$�)��"���& �
*���+$� '$��)�%(�,�����$-
����$
������%�(��!"#���$
% &��'�(����$�)��"���& �
����� ����
������ ��������� ��
(�+��� �.+����$�����+���&� $�� '�%/��.,�(���&$�&�$

� � � � � � � �
�� � � � � � � � � � �� � �� � �� � ��
������������ �� ����� ���� ���������� �� ��� ��������� ������������ ������������� ������� ����� ������������� ��� �� ������
������������� �� �� ����� ����� ����� � ���� ���� ����������� ����� ����� ����� ���� �� � ����� �������� ��
� � �
� � �
� � �
� � �
� � �
� � �
�
�� �
���� �
�� �
���� �
�� �
������
������ ��������
�
���������������������������
� �������������!�"��������������#���$� ��������% ��&�

� � � � � � � �
� ���� ����� ����� ����� ����� ����� ����� ����� �����
���� ��� ����� ������ ������ ������ ������ ������ ������ ������ ������
��
���
���
���
���
���
���
���
���
���
����
������������
����
����������� �������������������������������� ���������������������������������

Page 22
3.1.4 United States’ Imports from China; Structure by Product Group Classes
Table 9a and Figures 19a, based on the author’s calculations and data from United Nations
Conference on Trade and Development (UNCTAD stat, 2014), show U.S. Imports from
China and the Structure by Product Group Classes of the U.S. Imports from China from 2007
to 2014. The percentage of Product Group Class 0, Food and Live Animals, ranges from
1.26% in 2014 to 1.46% in 2008, of U.S. Imports from China; Product Group Class 1,
Beverages and Tobacco, ranges from 0.01% in 2007 to 0.02% in 2014, of U.S. Imports from
China; Product Group Class 2, Crude Materials-Inedible-Except Fuels, ranges from 0.43%
in 2009 to 0.55% in 2008, of U.S. Imports from China; Product group Class 3, Mineral
Fuels-Lubricants-Related Materials, ranges from 0.07% in 2012 to 0.61% in 2008, of U.S.
Imports from China; Product group Class 4, Animal & Vegetable Oils-Fats & Waxes,
ranges from 0.01% for every year to 0.02% in 2009, of U.S. Imports from China; Product
group Class 5, Chemicals and Related Products, n.e.s., ranges from 2.31% in 2007 to
3.49% in 2011, of U.S. Imports from China; Product group Class 6, Manufactured Goods,
ranges from 10.69% in 2010 to 13.36% in 2008, of U.S. Imports from China; Product group
Class 7, Machinery & Transport Equipment, ranges from 43.92% in 2008 to 51.35% in
2014, of U.S. Imports from China; Product group Class 8, Miscellaneous Articles, ranges
from 30.78% in 2014 to 36.99% in 2007, of U.S. Imports from China; and Product group
Class 9, Commodities and Transport n.e.s., were negligible among U.S. Imports from
China, between 2007 and 2014.
For the period under consideration, that is 2007 to 2014, U.S. Imports from China was
dominated by Product Group Class 7 items, which is Machinery and Transport Equipment;
followed by Product Group Class 8 items, which is Miscellaneous Articles; and then Product
group Class 6 items, which is Manufactured Goods.

���� ���� ���� ���� ���� ���� ���� ���������� ������� ��������� ��������� ��������� ��������� ������� �������
���� ���� ���� ���� ���� ���� ���� ����
������� ������� ���� ������ ������� ���� ������ ������
������� ��� ��� � ����� ���� ���� ����� ���� ��� �
����� ����� ���� ����� ����� ����� ���� �����
������� ����� ����� ����� ����� ����� ����� ����� �����
������ ������ ������� ����� ������� ������ ������� �������
������� ��� ��� ���� ���� ����� ���� ����� �����
����� ������� ������ ����� ���� ������ ������ �����
������ ����� �� �� ����� ���� ����� ����� ����� �����
���� ���� ���� ����� ���� ����� ���� ����
������� ����� ����� ����� ����� ����� ����� ����� �����
������� ������� ������� �������� ������� ������� ������� �����
������ ���� ���� ����� ����� ���� � � ��� ����
�������� ������ ������� �������� ������ ������� �������� �������
������ ����� �� � ����� ��� �� ������ ������ ������ ��� ��
��������� �������� ��������� ��������� ��������� ��������� �������� �������
������� ������ ����� � �� ��� � ������ ���� ���� ���
������� ��������� ��������� ��������� �������� �������� ��������� ��������
������� ���� � �� ���� ����� �� � ����� ���� �����
���� ���� ��� ���� ���� ���� ��� ���
������� ����� �� ����� � �������� ������� ������� �������� ��� ���� �������
�������������������������
�������������������������
�������������������������
�������������������������
�������������������������
�������������������������
�������������������������
�������������������������
�������������������������
�������������������������
������������� �������� ������������
������� ������������������������
�������������������
�������������������
�����������������������������
��������������������������
������� ��������������!����"#�������� ��$%�$����&�'���$%��(��$��"��������!��) )���������!����"#���
* #�$�������!�� �+������,
-����
������ ��������������
��������������������� ��!�!�!
�$�%���.$�#����"��%$�������������/" .+� �������%�
����������"� ������#�� ���� �$�%����
�������������&������'������ ��!�!�!
����(�������)����
������������ ��������� �$�&����������!

��
���
���
���
���
����
� � � � � �
��������������� ���������
��
���������
����������������
������������������ �!�"�� ����������#$%$������������ &���'����������
�� ���� �� ���� �� ���� �� ���� �� ����
�� ��� �� ���� �� ��� �� ���� �� ����

Page 23
3.2 China’s Trade with the United States
3.2.1 China’s Exports to the U.S.; Volumes & %ages of Total China Exports
Table 10 and Figures 22 and 22a, which are based on the author’s calculations and data from
United Nations Conference on Trade and Development (UNCTAD stat, 2014), show Total
Exports of China and China’s Exports to the U.S., from 2007 to 2014. Exports of China to the
United States, as a percentage of China’s Total exports, from 2007 to 2014, ranges from a
low of 16.71% in 2013, to a high of 19.11% in 2007. (Table 10, and Figure 22a). Total
exports of China and exports of China to the U.S., in 2013 were 2,209,007,280 thousand U.S.
dollars and 369,063,859 thousand U.S. dollars, respectively. (Table 10, and Figure 22).
Alternatively the Total exports from China and China’s exports to U.S., in 2007 were
1,220,059,668 thousand U.S. dollars and 233,168,790 thousand U.S. dollars, respectively.
(Table 10, and Figure 22).
Between 2007 and 2014, there was a general decrease in the percentage of China’s exports to
the U.S. when compare to China’s total exports.
3.2.2 China’s Exports to the U.S.; Structure by Product Group Classes
Table 10a and Figures 22b, based on the author’s calculations and data from United Nations
Conference on Trade and Development (UNCTAD stat, 2014), show China’s Exports to the
U.S. and the Structure by Product Group Classes of the China’s Exports to the U.S. from
2007 to 2014. The percentage of Product Group Class 0, Food and Live Animals, ranges
from 1.61% in 2014 to 1.91% in 2009, of China’s Exports to the U.S.; Product Group Class
1, Beverages and Tobacco, ranges from 0.0098% in 2010 to 0.0172% in 2007, of China’s
Exports to the U.S.; Product Group Class 2, Crude Materials-Inedible-Except Fuels,
ranges from 0.42% in 2009 to 0.57% in 2008, of China’s Exports to the U.S.; Product group
Class 3, Mineral Fuels-Lubricants-Related Materials, ranges from 0.31% in 2009 to
0.93% in 2008, of China’s Exports to the U.S.; Product group Class 4, Animal & Vegetable

Page 24
Oils-Fats & Waxes, ranges from 0.01% in 2007 to 0.03% in 2013, of China’s Exports to the
U.S.; Product group Class 5, Chemicals and Related Products, n.e.s., ranges from 2.90% in
2007 to 4.04% in 2011, of China’s Exports to the U.S.; Product group Class 6,
Manufactured Goods, ranges from 11.94% in 2010 to 14.45% in 2008, of China’s Exports
to the U.S.; Product group Class 7, Machinery & Transport Equipment, ranges from
48.01% in 2008 to 50.34% in 2014, of China’s Exports to the U.S.; Product group Class 8,
Miscellaneous Articles, ranges from 30.27% in 2008 to 32.24% in 2009, of China’s Exports
to the U.S.; and Product group Class 9, Commodities and Transport n.e.s., ranges from
0.00% in 2007 to 0.00% in 2014, of China’s Exports to the U.S.
For the period under consideration, that is 2007 to 2014, China’s Exports to the U.S. was
dominated by Product Group Class 7 items, which are Machinery and Transport Equipment;
followed by Product Group Class 8 items, which are Miscellaneous Articles items; and
Product group Class 6 items, which are Manufactured Goods.
3.2.3 China’s Imports from the U.S.; Volumes & %ages of Total China Imports
Table 11 and Figure 23, which are based on the author’s calculations and data from United
Nations Conference on Trade and Development (UNCTAD stat, 2014), show Total Imports
of China and China’s Imports from the U.S., from 2007 to 2014. China’s Imports from the
U.S., as a percentage of China’s Total Imports, from 2007 to 2014, ranges from a low of
7.06% in 2011, to a high of 8.16% in 2014. (Table 11, and Figure 23a). Total Imports of
China and China’s Imports from the U.S. in 2011 were 1,743,394,866 thousand U.S. dollars
and 123,124,010 thousand U.S. dollars, respectively. (Table 11, and Figure 23). Alternatively
the Total Imports of China and China’s Imports from the U.S., in 2014 were 1,958,021,301
thousand U.S. dollars and 159,481,403 thousand U.S. dollars, respectively. (Table 11, and
Figure 23).

���� ���� ���� ���� ���� ���� ���� ������������� ���������� ��������� �������� ��������� ���������� ���������� ����������
���� ���� ���� ���� ���� ���� ���� ����
�� ����� ������ ����� ����� ���� ���� ����
��������� ������� �������� ��������� �������� �������� �������� ���������
������ ������ ������ ������ ������ ������ ������ �����
�� ���� ����� ����� ���� ���� ���� ����
��� ������������� ����� ������������������� �����!�����
"#��$�� ����%� !�&�''���(
)����
#�*'����+������������������
#���'���� ���������
,��-� ��.�
)����� �)������� .�
��� ������������� �!�
,��-� ��.�
)����� �)������� .�
!�$�-�+�/$��������'-$'���� ��� �� 0�#/&�!�������-�

� � � � � � � �
�� � � � � � � � � � �� � �� � �� � ��
������������� ���� � ������ ���� ����� �� ��� ��������� ������������� ������������� �� ���������� ��� �� ���� ���������� ��
������������� ���������� ����������� �������� � ������ ���� ���� � ���� ����������� ���� ������ ����� ��� �
� � �
� � �
�� � �
� � �
�� � �
� � �
�� � �
� � �
�� � �
�
��� �
����� �
��� �
����� �
����
���
���
�� �
����
����
����������������������������������������� ���������������� ������������������������

� � � � � � � �
� ���� ����� ����� ����� ����� ����� ����� ����� �����
����� � ���� ������ ������ ������ ������ ������ ������ ������ ������
��
���
���
���
���
���
���
���
���
���
����
����
���������
��
���
�������������� ��������������������������������������� �!��������������"����#$ ����%

���� ���� ���� ���� ���� ���� ���� ������������ ��������� ��������� ��������� ��������� ��������� ������� ��������
���� ���� ���� ���� ���� ���� ���� ����
������� ������� ������� ������� ������ ����� ����� �����
������� ��� ����� ���� ��� � ����� ����� ����� ����
���� ��� ����� ����� ��� ����� ���� ����
������� ������� ������� ������� ������ ����� � ������� ������� ���� �
������� ������� ������ ������� ������ ������� ������� �������
������� ����� ����� ����� ����� ����� ����� ����� �����
����� ������ ����� ���� ������ ������� ������� �������
������ ����� �� � �� �� �� �� �� � �� �� �� �� �� �
����� ����� ���� ����� ���� ����� ������ ���
������� ����� ����� ����� ����� ��� � ��� � ��� � �����
������ ������� ����� ������� ������ �������� �������� ��������
������� ���� ���� ��� ��� ����� ���� ���� ����
������� ������� ������ ������� �������� ������� ������� �������
������ ��� �� ������ ����� ����� ������ ������ ����� �����
��������� ��������� ������� ��������� �������� �������� ��������� ���������
������� ����� ������ ���� ������ ����� ���� ���� ��� ��
������� ������� �������� ������� ��������� �������� ������� ���������
������� ����� ����� ����� ���� ���� ����� ���� �����
� � � � � � � �
������ �������� �������� �������� �������� �������� �������� �������� ��������
��������������������������������� �!�"� ���������
A������������� ��������������������
����������������������������������
������������ ����
�������������!� �����������������������
���������������������������
���������!�"��������
�������������������
�������#�����$����%����&'��%���
!�#��������$%&���������'����
�����(��$%&������������������� ���������� ���������#)�*�������+���&����������,������(��$%&�������������- -
.!����������,�� �"������/
0����
("���������$� ����
���������������)��� ���&��%������
������ ��������������������
������ ��������������������
������ ��������������������
������ ��������������������
������ ��������������������
������ ��������������������
������ ��������������������
������ ��������������������
������ ��������������������
������ ��������������������
���������������$����%����������

��
���
���
���
���
����
� � � � � �
�������������� �
��������
��
����������������
��� ���������������� ��! "����������#���$�����������%&'&(����������
�� ���� �� ���� �� ���� �� ���� �� ���� �� ��� �� ���� �� ��� �� ���� �� ����

��
���
���
���
���
����
� � � � � �
�������������� �
��������
��
����������������
��� ���������������� ��! "����������#���$�����������%&'&(����������
�� ���� �� ���� �� ���� �� ���� �� ���� �� ��� �� ���� �� ��� �� ���� �� ����

Page 25
3.2.4 China’s Imports from the U.S.; Structure by Product Group Classes
Table 11a and Figures 23b, based on the author’s calculations and data from United Nations
Conference on Trade and Development (UNCTAD stat, 2014), show China’s Imports from
the U.S. and the Structure by Product Group Classes of the China’s Imports from the U.S.
from 2007 to 2014. The percentage of Product Group Class 0, Food and Live Animals,
ranges from 2.78% in 2007 to 5.48% in 2012, of China’s Imports from the U.S.; Product
Group Class 1, Beverages and Tobacco, ranges from 0.131% in 2007 to 0.217% in 2014, of
China’s Imports from the U.S.; Product Group Class 2, Crude Materials-Inedible-Except
Fuels, ranges from 20.15% in 2007 to 26.42% in 2011, of China’s Imports from the U.S.;
Product group Class 3, Mineral Fuels-Lubricants-Related Materials, ranges from 0.59%
in 2007 to 2.09% in 2012, of China’s Imports from the U.S.; Product group Class 4, Animal
& Vegetable Oils-Fats & Waxes, ranges from 0.08% in 2009 to 0.28% in 2010, of China’s
Imports from the U.S.; Product group Class 5, Chemicals and Related Products, ranges
from 12.02% in 2014 to 16.38% in 2007, of China’s Imports from the U.S.; Product group
Class 6, Manufactured Goods, ranges from 4.83% in 2013 to 7.23% in 2008, of China’s
Imports from the U.S.; Product group Class 7, Machinery & Transport Equipment, ranges
from 34.13% in 2012 to 44.44% in 2007, of China’s Imports from the U.S.; Product group
Class 8, Miscellaneous Articles, ranges from 7.80% in 2011 to 8.69% in 2009, of China’s
Imports from the U.S.; and Product group Class 9, Commodities and Transport n.e.s.,
ranges from 0.00% in 2007 to 0.00% in 2014, of China’s Imports from the U.S.
For the period under consideration, that is 2007 to 2014, China’s Imports from the U.S. was
dominated by Product Group Class 7 items, which are Machinery and Transport Equipment;
followed by Product Group Class 2 items, which are Crude Materials-Inedible-Except Fuels;
and Product group Class 5 items, which are Chemicals and Related Products. There were no

���� ���� ���� ���� ���� ���� ���� ������������ ���������� �������� ��������� ����������� ������������� ������������ ������������
���� ���� ���� ���� ���� ���� ���� ����
�� ���� ������ ����� ����� ���� ���� ����
������ ����� �������� ���������� ����������� ��������� ��������� ����������
����� ����� ����� ���� ���� ���� ����� ����
�� ����� ����� ����� ����� ��� ����� ���������� ��������� ��
������������ ��!"�����������
��# �$"��� ��!"��� %���# ���� ��!"�&����!���' #!�%�(!�!�"
)���*"� %"��&�'(�+�����",
����"
(�*�-���.*!���"����-*��!#� "��� %�'/��.+�(!�!#"!#-"
��!�����# ���� ��!"
0��-� !���
������ ��������� ��
��# ���� ��!"�&����'�(�
0��-� !���

� � � � � � � �
�� � � � � � � � � � �� � �� � �� � ��
������������� ����������� ������������� �� ��������� ������ ����� ������������� ������������� ������������� ������ ���� �
�������������� ���������� ���������� �������� � � ��������� �������� � ����������� ����������� ��������� �
� � �
� � �
� � �
� � �
� � �
�� � �
�� � �
�� � �
�� � �
�
�� �
���� �
�� �
���� �
����
���
�����
���
��
���
���� �� ������� ������������������������������������������ �� ����������
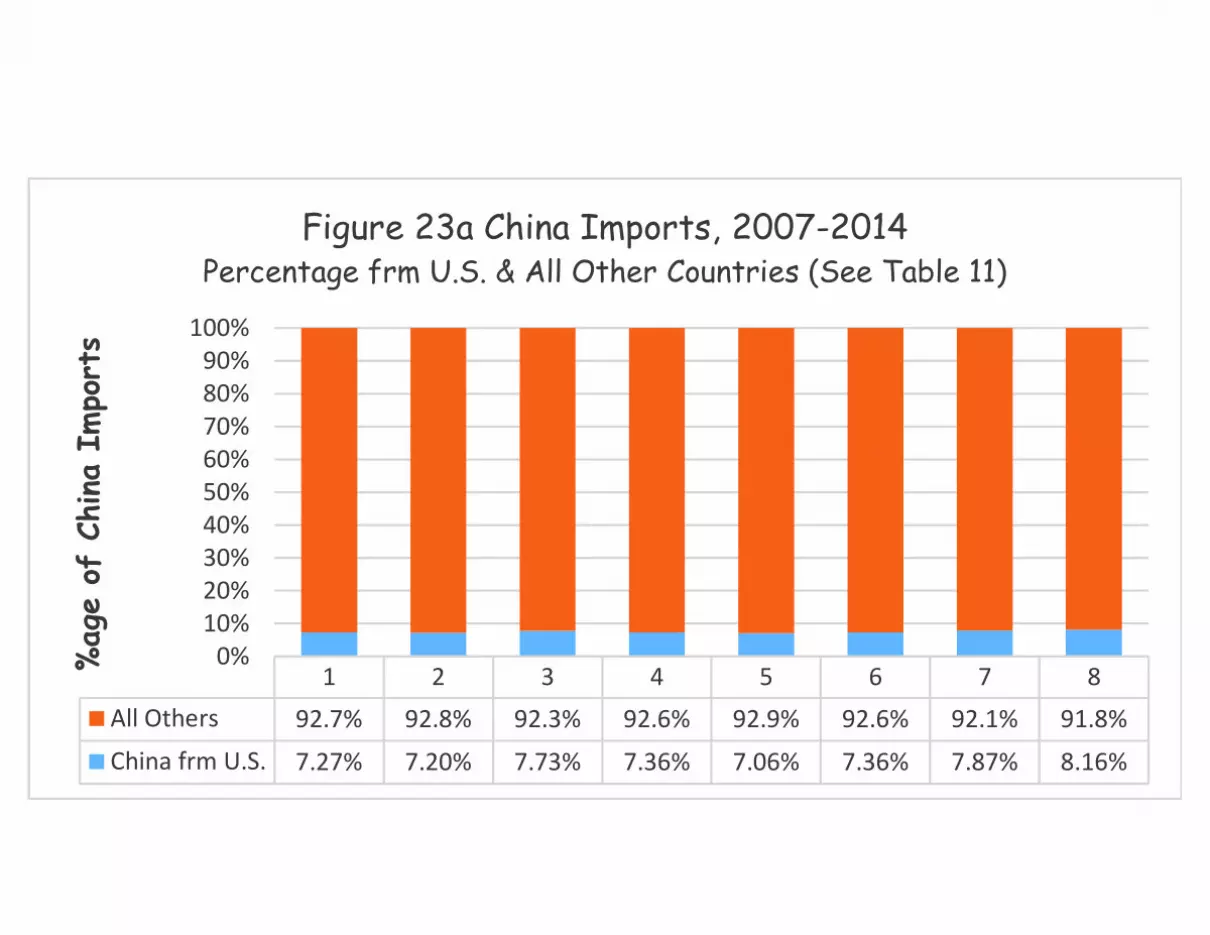
� � � � � � � �
� ���� ����� ����� ����� ����� ����� ����� ����� �����
����� ��� ���� ����� ����� ����� ����� ����� ����� ����� �����
��
���
���
���
���
���
���
���
���
���
����
����
��������� ��
���
������������ ������������������������ ������������� �!""�#�������� ������$����%&"����'

���� ���� ���� ���� ���� ���� ���� ���������� ������� �������� ��������� ��������� �������� �������� ���������
���� ���� ���� ���� ���� ���� ���� ����
������ ������� ������ ������� ������ ������� ������� ������
����� ����� ����� ����� ���� ���� ���� ����
����� ������ ������ ������ ������ ����� ������ ������
����� ����� ������ ������ ���� ���� ������ ������
������� �������� �������� ������ �������� ������� �������� �������
���� ������ ����� ������ ������ ����� ������ �����
������ ����� ������ ���� ������ ������� ������� �����
��� ���� ���� ���� ����� ���� ���� ����
������ ����� ����� ������ ������ ����� ����� ������
���� ���� ��� ���� ���� ���� ���� ����
�������� ������ �������� ����� ������ ������� ������ ��������
������ ����� ����� ������ ����� ������ ������ �����
������ ������ ������ ������ ������ ������ ����� ������
���� ����� ����� ��� ��� ���� ����� �����
�������� ������� �������� ������ ������� ������� ������� ������
������ ����� ��� ����� ����� ������ ������ ������
������ ������ ���� ������� ������� ������� ������ ��������
����� ����� ����� ���� ���� ���� ����� ����
� � � � � � � �
�� �� �� �� �� �� �� ��
������������� �����������������������
������������� �����������������������
�������������� ���� ��������
������������ �����������������������
���������������������� �����
����������������
������������� ������
������ ���� ���� ����������
���������������������������
����� ����������!��������"����#�$��������#�$��%&�%����'�(��#%&��)��%�����������!������ ����������!��������"*$*
+ ��%���#���!�"$�,������-
.����
���� �����������
���� ���������� ������ !����������
� ������ ����"���������#���������
������������� �����������������������
������������� �����������������������
������������� �����������������������
$�%�&���/%���������&%����������#�"0� /,�$�������&�
�������$�������%�������� &#��
����������!�����' �������������
���(��� ��)����
������������� �����������������������
������������ �����������������������
������������� �����������������������
������������� �����������������������

��
���
���
���
���
���
���
��
��
���
����
� � � � � � ����������
���
� ����
���
������
������
����
����
���
���
������������� !"
#����$%&���������'�(�)�� ��������� ��������������������*�������� !

Page 26
items in product Group Class 9, which are Commodities and Transport, or Class 9 items they
were not reported separately.
4.0 Major China-U.S. Trade Issues
Most of the topics that fall under this category have been discussed extensively by many
authors, and include such topics as Chinese ‘State Capitalism’, Intellectual Property issues,
China and U.S. Obligations in the WTO, and China’s Currency Policy. (Hitt, Black, and
Porter, 2012; Morrison, 2015; Russell, 2014; White House, 2011; and USTR, 2015). The
remainder of this essay will instead discuss the trade balance of the China-U.S. trade, both
from the perspective of the United States and from the perspective of China.
4.1 China-U.S. Balance of Trade
The China-United States balance of trade, like the other major issues regarding China-U.S.
trade, has been covered extensively. (Morrison, 2015). This topic is, none the less, covered
here due to the Author’s access to reliable sources of trade data between China and the U.S.
In the course of this essay, this data has been used to establish such facts about the China-
U.S. trade as, the percentage of Worldwide trade that consists of the China-U.S. trade; the
percentages of China and U.S. Exports and Imports that are sent to and arrive from the
various continents of the world; and the percentages of the various standard product group
classes that make up China and U.S. Exports and Imports; over the period 2007 to 2014. The
quality of such information will now be used to establish the trade balance in the China-U.S.
trade, both with respect to China and with respect to the U.S.
Simply defined, a country's trade balance, also called balance of trade, is the calculation of its
exports minus imports; a balance of trade surplus happens when the value of all exports
exceeds the value of all imports, and a balance of trade deficit is when the value of all
imports exceeds the value of all exports. (Abel, Bernanke, and Croushore, 2008).

Page 27
4.1.1 China-U.S. Balance of Trade, with respect to the United States
Table 12 and Figures 24a, based on the author’s calculations and data from United Nations
Conference on Trade and Development (UNCTAD stat, 2014), show that for the years 2007
to 2014, the balance of trade deficit, with respect to the United States in the China-U.S. trade,
has grown steadily from 274,868,762 Thousand U.S. dollars in 2007, to 362,172,149
Thousand U.S. dollars in 2014. The size of the U.S. trade deficit with China is a major
concern among some U.S. policymakers. (Hufbauer, Wong, and Sheth, 2006). Some analysts
contend that the large U.S. trade deficit is an indicator that the trade relationship is
unbalanced, unfair, and damaging to the U.S. economy. (Brown, Crowley, McCulloch, and
Nakajima, 2005). Others argue the large trade deficit with China is more of a reflection of
global supply chains, where China is often the final point of assembly for export oriented
multinational firms. (World Bank, 2015).
4.1.2 China-U.S. Balance of Trade, with respect to China
Table 12 and Figures 24b, based on the author’s calculations and data from United Nations
Conference on Trade and Development (UNCTAD stat, 2014), show that for the years 2007
to 2014, the balance of trade surplus, with respect to China in the China-U.S. trade, has
grown steadily from 163,620,826 Thousand U.S. dollars in 2007, to 237,263,503 Thousand
U.S. dollars in 2014. The World Bank attributes the trade surplus to such factors as the global
supply chain distribution patterns, where China is often the final point of assembly for export
oriented multinational firms.

���� ���� ���� ���� ���� ���� ���� ������������ �������� ������ ��������� ����������� ��������� ��������� ����������
�������� ������� ���������� ���������� ���������� ���������� ��������� �������
��������� ����������� ��������� ��������� ���������� ����������� ����������� ����������
���������� ��������� ���������� ����������� ���������� ���������� �������� ����������
������ ����� �������� ���������� ����������� ��������� ��������� ����������
�������� ���������� ���������� ���������� ���������� ���������� �������� ���������
� ������������ ���������� �������������
�������� �!"�! ����� �������#$� �!"�%� $����� &����� '"���� �!"�! ����������� '"�#$� �!"�%� $�����
(�� )" ��"� %����* �� �"+
���� '"���� �!"�! �!������!����! !�"
���� '"�#$� �!"�%� $����!����! !�"
, � �-�� %��� ����)���)"
� )�-���.)!� �"�� �-)� !� �"�� ����/��.*��! !�"!�-"
0� �"0� �
���!����! !�"���� �!"�! �����
���!����! !�"�#$� �!"�%� $�����
, � �-�� %��� ���*�%�-�!

�
���������
���������
���������
���������
���������
���������
���� ���� ��� ��� ���� ���� ���� ���� ���� ����
����������� ��������������������������������������� ���������� ������!� �� ����"������#$�%��&�!�%��
�� ������������������������ �� �� �������������������������� ��
�� ��!�����"�����#�� ! �

�
���������
���������
���������
���������
���������
���� ���� ��� ��� ���� ���� ���� ���� ���� ����
����������� ������������������������� ����������� �� ��������� ������!"��� ��#�"�������$�������%�&��'������&��
�� ���������������������� ���������� �� �������������������� ����������
�!��"�����#������$��!$�

Page 28
5.0 Last Word
In the course of this essay it has been established that, between 2007 and 2014, the exports of
China, as a percentage of Worldwide exports, was less than 12.5%; the exports of the U.S., as
a percentage of Worldwide exports, was in the order of 8.6%; the imports of China, as a
percentage of Worldwide imports, was less than 10.5%; and the imports of the U.S., as a
percentage of Worldwide imports, was less than 14.5%. This means that the impact on
worldwide trade caused by policy changes or other factors in China or the U.S. is likely to be
limited to the magnitudes of the aforementioned China and U.S. Import and Export
percentages of worldwide imports and exports.
It has been established that, between 2007 and 2014, China’s exports to Africa, the Americas,
Asia, Europe, and Oceania, never exceeded 4.5%, 25%, 51.4%, 24%, or 2.2% respectively, of
China’s total exports; and that, during the same period, China’s imports from Africa, the
Americas, Asia, Europe, and Oceania, never exceeded 6.25%, 15.9%, 65%, 17%, and 5.6%
respectively, of China’s total imports. This implies that the impact on the various continents,
caused by policy changes or other factors in China, is likely to be limited to the magnitudes
of the aforementioned continent’s import and export percentages of China’s total imports and
exports.
It has been established that, between 2007 and 2014, the exports of the U.S. to Africa, the
Americas, Asia, Europe, and Oceania, never exceeded 2.4%, 45.4%, 3.3%, 24.4%, or 2.3%
respectively, of the total exports of the U.S.; and that, during the same period, the imports of
the U.S. from Africa, the Americas, Asia, Europe, and Oceania, never exceeded 5.5%, 33.7%,
44.1%, 20.6%, and 0.8% respectively, of the total imports of the U.S. This implies that the
impact on the various continents, caused by policy changes or other factors in the U.S., is
likely to be limited to the magnitudes of the aforementioned continent’s import and export
percentages of the total imports and exports of the U.S.

Page 29
It has been established that, between 2007 and 2014, the exports of the U.S. to China, as a
percentage of the total exports of the U.S. never exceeded 7.7%; and these exports were
dominated by Product Group Class 7 items, Machinery and Transport (26.5% to 44.5%) of
U.S. exports to China; and Product Group Class 5 items, Chemicals and Related products
(11% to 14.5%) of U.S. exports to China. Between 2007 and 2014, the imports of the U.S.
from China, as a percentage of the total imports of the U.S. never exceeded 20.2%; and these
imports were dominated by Product Group Class 7 items, Machinery and Transport (43.9% to
51.4%) of U.S. imports from China; Product Group Class 8 items, Miscellaneous Articles
(30.8% to 37%) of U.S. imports from China; and Product Group Class 6 items, Manufactured
Goods (11.9% to 14.5%) of U.S. imports from China.
It has been established that, between 2007 and 2014, the exports of China to the U.S., as a
percentage of the total exports of China never exceeded 19.2%; and these exports were
dominated by Product Group Class 7 items, Machinery and Transport (48% to 50.3%) of the
exports of China to the U.S.; Product Group Class 8 items, Miscellaneous Articles (30.3% to
32.2%) of the exports of China to the U.S.; and Product Group Class 6 items, Manufactured
Goods (11.9% to 14.5%) of China’s exports to the U.S.. Between 2007 and 2014, the imports
of China from the U.S. as a percentage of the total imports of the U.S. never exceeded 8.2 %;
and these imports were dominated by Product Group Class 7 items, Machinery and Transport
(34.1% to 44.4%) of China’s imports from the U.S.); Product Group Class 2 items, Crude
Materials-Inedible-except Fuels (20.2% to 26.4%); and Product Group Class 5 items,
Chemicals and Related Products (12% to 16.4%) of China’s imports from the U.S..
Finally it has also been established that, the trade deficit, to the United States, in China-U.S.
trade has grown steadily from the order of magnitude of 274,870,000 thousand U.S. dollars in
2007 to 362,170,000 thousand U.S. dollars in 2014; and the trade surplus, to China, in China-

Page 30
U.S. trade has grown steadily from the order of magnitude of 163,621,000 thousand U.S.
dollars in 2007, to 237,264,000 thousand U.S. dollars in 2014.
6.0 REFERENCES
1. Abel, A.B., Bernanke, B.S., and Croushore, D. (2008). Macroeconomics, 6th Edition.
Boston, MA: Pearson Addison Wesley.
2. Alagoa, H.E. (2015). Management Decision-Making in International Business:
Corporate Governance Issues in Emerging Markets. Social Science Research
Network, abstract=2641005. Retrieved from http://ssrn.com/abstract=2641005
3. Brown, C.P, Crowley, M.A., McCulloch, R., and Nakajima, D.J. (2005).
The U.S. Trade Deficit: Made in China? Federal Reserve Bank of Chicago,
4Q Economic Perspectives
4. Gough, N. (2015). China Seeks to Calm Markets as it Devalues Currency for 3rd
Consecutive Day. The New York Times. Retrieved from
www.nytimes.com/2015/08/14/business/international/china-devalues-its-
currency-renminbi-for-a-third-consecutive-day.html
5. Hitt, M.A., Black, J.S., Porter, L.W. (2012). Management. Upper saddle River, NJ:
Pearson Education Prentice Hall
6. Hufbauer, G. Wong, Y. and Sheth, K. (2006). U.S.-China Trade Disputes: Rising
Tide, Rising Stakes. Washington, D.C.: Institute for International Economics
7. Inman, P. (2015). China Ends Three Days of Yuan Devaluation. The Guardian.
Retrieved from www.theguatdian.com/business/2015/aug/14/china-halts-yuan-
devaluation-with-slight-official-rise-against-us-dollar

Page 31
8. Lau, L.J. (2000). The Chinese Economy: Past, Present, and Future.
Stanford University. Retrieved from
www.stanford.edu/~ljlau/Presentations/Presentations/022800.pdf
9. Morrison, W.M. (2015). China-U.S. Trade Issues. Congressional Research Service,
March 17, 5700 RL 33536.
Retrieved from https://www.fas.org/sgp/crs/row/RL33536.pdf
10. Morrison, W.M. (2006). China’s Economic Conditions. CRS Issue Brief for Congress,
OC IB98014. Retrieved from www.fas.org/sgp/crs/row/IB98014.pdf
11. Rugman, A.M. and Collinson, S. (2006). International Business, 4th Edition.
New NY: FT Prentice Hall.
12. Shijian, Z. (2012). China-U.S. Economic Relations: Accords and Discords.
China.org.cn Retrieved from
www.China.org.cn/opinion/2012-02/27/content_24744473_2.htm
13. Tisdell, C. (2008). Thirty Years of Economic Reform and Openness in China:
Retrospect and Prospect. The University of Queensland, Economic Theory
Application and Issues, ISSN: 1444-8890, Working Paper 51.
Retrieved from www.uq.edu.au/rsmg/doc/ClemWPapers/ETA/WP%2051.pdf
14. United States Government Printing Office (USGPO). (1998). U.S.-China Trade
Relations and Renewal of China’s Most-Favoured-Nation status.
Hearing before the Subcommittee on Trade of the Committee on ways and
Means, House of Representatives, Serial 105-59. Retrieved from
www. gpo.gov/fdsys/pkg/CHRG-105hhrg51705/html/CHRG-105hhrg51705.htm

Page 32
15. United Nations Conference on Trade and Development (UNCTADstat). (2014a).
General Profile: United States. Retrieved from
http://unctadstat.unctad.org/CountryProfile/842/en842GeneralProfile.html
16. United Nations Conference on Trade and Development (UNCTADstat). (2014b).
General Profile: China. Retrieved from
http://unctadstat.unctad.org/CountryProfile/156/en156GeneralProfile.html
17. United Nations Conference on Trade and Development (UNCTADstat). (2015).
U.S.-China Trade. Retrieved from
http://unctadstat.unctad.org/wds/TableViewer/tableView.aspx
18. U.S.-China Business Council (USCBC). (2014). USCBC China Economic Reform
Scorecard. Retrieved from
https://www.uschina.org/sites/default/files/2014%20USCBCEconomic%20Ec
onomic%20Scorecard_October.pdf
19. United States International Trade Commission DataWeb (USITC DataWeb) 2014.
U.S.-China Trade. Retrieved from
https://dataweb.usitc.gov/scripts/cy_m3_run.asp
20. World Bank (2015). China’s Integration in Global Supply Chains: Review and
Implications. Retrieved from www.worldbank.org/en/publication/global-
economic-prospectus-old/regional-outlooks/chinas-integration-in-global-
supply-chains