Embed Size (px)
Citation preview
Ž .The Science of the Total Environment 286 2002 167�179
Residual pollution load of soils impacted by thež /Aznalcollar Spain mining spill after clean-up´
operations
E. Galana, I. Gonzaleza, J.C. Fernandez-Calianib,�´ ´ ´a ´Dpto. Cristalografia y Mineralogıa, Facultad de Quımica, Uni�. Se�illa, 41071-Se�illa, Spain´ ´
bDpto. Geologıa, Facultad de Ciencias Experimentales, Uni�. Huel�a, 21819-Huel�a, Spain´
Received 21 February 2001; accepted 12 July 2001
Abstract
By comparing total concentrations of potentially toxic elements in soils affected by the Aznalcollar mining spill´with those of the adjacent unaffected soils, it can be inferred that after the sludge removal, there still exists aconsiderable amount of residual pollution. This exceeds the suitable levels for cultivation, especially in the case ofarsenic for which total concentrations are in the range of values above which eco-toxicity is considered to be possible.
ŽElemental distribution in the soil seems to be determined by two distinctive associations As�Pb�Hg�Sb and.Cu�Zn�Cd with different geochemical behaviours. � 2002 Elsevier Science B.V. All rights reserved.
Keywords: Soil pollution; Heavy metals; Pyrite sludge; Aznalcollar mining accident; Guadiamar river; Spain´
1. Introduction
On April 1998 probably the worst ecologicaldisaster recorded in Spain took place as a conse-
� Corresponding author.
quence of the mine tailings accident atŽ .Aznalcollar, near Seville Andalusia . The failure´
of the tailings dam wall released out approxi-mately 2 000 000 m3 of pyrite sludge and 4 000 000m3 of acidic water into the Agrio-Guadiamarriver system, flooding more than 4000 ha of river-banks and adjacent fertile landfarms, and threat-ening ecologically sensitive areas of the Donana˜
0048-9697�02�$ - see front matter � 2002 Elsevier Science B.V. All rights reserved.Ž .PII: S 0 0 4 8 - 9 6 9 7 0 1 0 0 9 7 4 - 3
( )E. Galan et al. � The Science of the Total En�ironment 286 2002 167�179´168
Ž .National Park Pain et al., 1998 , the largest re-serve of bird species in Europe. Because of themining spill, the agricultural soils and sedimentsalong the river course were severely impacted bypotentially highly toxic elements such as Cu, Pb,Zn, Cd, As and other sulphide-related trace ele-ments. A general overview of the accident can be
Ž .found in Grimalt et al. 1999 , Gallart et al.
Ž . Ž .1999 , Alastuey et al. 1999 and Lopez-Pamo et´Ž .al. 1999 , and preliminary data on soil pollution
Ž .were provided by Simon et al. 1999 , Cabrera etŽ . Ž .al. 1999 and Vidal et al. 1999 , among other
papers compiled in a special issue of The ScienceŽof the Total En�ironment vol. 242, nos. 1�3, De-
.cember 1999 .Immediately after the mining accident, the An-
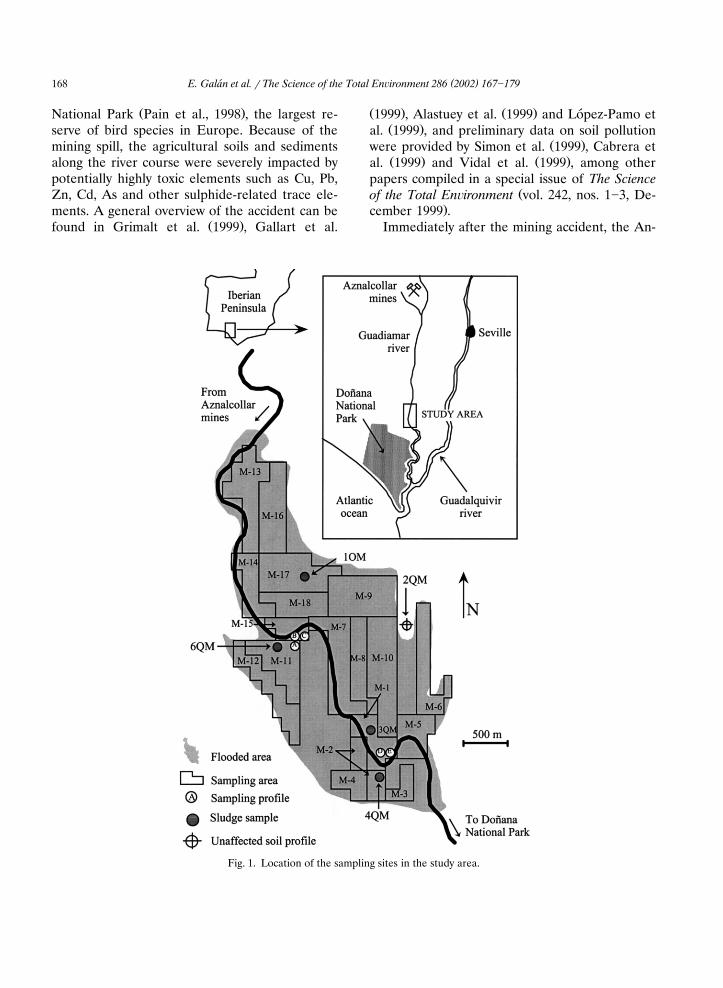
Fig. 1. Location of the sampling sites in the study area.
( )E. Galan et al. � The Science of the Total En�ironment 286 2002 167�179´ 169
dalusian Regional Government established anEmergency Actions Plan whose purpose was at-tenuation of the environmental and socio-eco-nomic effects and prevention of potential health
Ž .risks Junta de Andalucıa, 1999 . Soil remediation´activities included intensive clean-up works in-volving removal of the pyrite slurry by bulldozing,and soil treatments by the addition of calciumcarbonate and iron oxy-hydroxides to preventmetal solubilization, adsorption and dispersal ofpollutants, among other emergency measures.Other long-term actions were implemented laterin the framework of the Green Corridor Project,an ecological bridge connecting the Donana Park˜and the Sierra Morena through the Guadiamarriver basin.
This paper deals with the determination of
trace element concentrations in the soils affectedby the toxic spill once clean-up works and pre-liminary soil-reclamation activities were over, aswell as an assessment of soil environmental qual-ity, including recommendations for management.
2. Sample collection and methodology
Ž .Nine months after the accident February 1999when the removal of the sludge and the prelimi-nary soil treatments had been concluded, a syste-matic sampling was conducted for a typical agri-cultural area affected by the spill around to theQuema ford, approximately 30 km downstream of
Ž .the mine tailings Fig. 1 .ŽA collection of 149 samples one sample per
Table 1Chemical composition of the pyrite sludge samples
Pyrite sludge Detection 1QM 3QM 4QM 6QMsamples limits
( )Major elements %Ca 0.01 0.32 0.42 0.40 0.65Mg 0.01 0.46 0.85 0.83 0.68K 0.01 0.25 0.30 0.29 0.33Na 0.01 0.09 0.06 0.07 0.11Fe 0.01 33.6 30.8 32.4 30.8Ti 0.01 0.04 0.03 0.04 0.05Al 0.01 1.50 2.22 2.16 2.01S 0.01 37.5 34.2 34.3 34.2
( )Trace elements mg�kgCu 1 1438 1720 1920 2095Pb 3 8389 10493 10298 9031Zn 1 5546 6172 6245 7880Ag 0.3 42 44.9 44.2 41Ni 1 14 16 15 18Mn 1 696 844 849 896Sr 1 21 27 25 25Ba 50 710 670 620 610Cr 2 70 69 78 73As 0.5 4400 4400 4500 4300Co 1 42 40 41 41Au 0.002 0.752 0.739 0.781 0.665Cd 0.3 20.4 22.8 21.9 28.8Bi 2 42 59 57 58V 2 27 37 37 35Hg 0.005 16.90 16.41 16.88 15.38Sb 0.1 570 580 640 560Se 3 19 15 16 11
( )E. Galan et al. � The Science of the Total En�ironment 286 2002 167�179´170
Table 2Chemical composition of the unaffected profile samples
Unaffected Detection 2QM1 2QM2 2QM3soil profile limits
( )Major elements %P 0.001 0.03 0.02 0.02Ca 0.01 0.84 0.74 0.92Mg 0.01 0.37 0.46 0.61K 0.01 1.37 1.45 1.49Na 0.01 0.06 0.10 0.99Fe 0.01 2.54 3.75 4.19Ti 0.01 0.29 0.37 0.39Al 0.01 5.01 7.02 7.80
( )Trace elements mg�kgCu 1 40 24 24Pb 3 34 30 24Zn 1 81 60 70Ni 1 21 31 34Mn 1 591 671 795Sr 1 65 69 81Ba 50 320 370 320Cr 2 53 73 81As 0.5 17 21 20Co 1 10 12 14
a aCd 0.3 n.d. 0.5 n.d.V 2 70 102 116Hg 0.005 0.03 0.017 0.016Sb 0.1 1.4 1.4 1.6
a n.d: not detected.
.hectare of the top 25 cm of soil profile weretaken to prepare, by mixing and homogenising, 18compounded samples for laboratory analysis.Thus, each compounded sample represents a plotcontaining up to 16 sampling points located atdistances approximately the same as the riverbed. Moreover, some sites close to the riverbedŽ .A, B, C, D and E were sampled at 25 and 50 cmbelow the surface, in order to compare elementconcentrations in top and sub-soils, and to iden-tify possible trends of metal distribution withdepth. Previously, before the sludge removal, foursamples of the pyrite slurry covering the soilsŽ .1QM, 3QM, 4QM and 6QM were collected forchemical and mineralogical characterisation, andone profile representative of the unaffected soilŽ .2QM was also sampled to determine someparameters of interest such as pH and grain-sizedistribution, and to estimate the trace metalsbackground of the alluvial soils in the study area.
Quantitative assessment of the residual soilpollution was based on the Pollution Load IndexŽ .Tomlinson et al., 1980 taking into consideration
Ž .the Concentration Factor CF , which is the ratiobetween each trace element in the soil and itsbackground value. Thus, the Pollution Load In-
Table 3Total concentration of selected potentially toxic elements in the unaffected soils of the study area and the Guadiamar valley incomparison with the normal range in soils and the critical soil total concentrations
Trace Study Normal CriticalGuadiamar soilsaelement area range in soil totalb c
d eŽ .mg�kg soils concentrationsAs 20 18.9 �31 0.1�40 20�50Cd �0.5 0.33 � 0.01�2.0 3�8Cu 40 30.9 36 2�250 60�125Hg 0.03 � � 0.01�0.5 0.3�5Pb 34 38.2 47 2�300 100�400Sb 1.5 1.8 � 0.2�10 5�10Co 12 12.4 11 0.5�65 25�50Zn 81 109 109 1�900 70�400
a This study.b Ž .Cabrera et al. 1999 .c Ž .Lopez-Pamo et al. 1999 .´d Ž .Bowen 1979 .e Ž .Kabata-Pendias and Pendias 1992 .
( )E. Galan et al. � The Science of the Total En�ironment 286 2002 167�179´ 171
Ž .dex PLI of each soil sample can be calculated byŽderiving the n-th root of the n factors CF �CF1 2
.�CF � ...CF . A statistical study of the chemi-3 ncal dataset was accomplished by principal compo-nent analysis in order to determine significantinter-elemental relationships, and to evaluate theinfluence of the related element associations onthe variance of the whole sample chemistry.
Mineral identification and characterisation ofthe pyrite sludge and soil samples was performed
Ž .by powder X-ray diffraction XRD and by usingŽ .a scanning electron microscope SEM equipped
with an energy dispersive X-ray spectrometerŽ .EDS , and with a backscattered electron detec-tor. Major and trace element concentrations weredetermined at Activation Laboratories Ltd.
Ž .Ontario, Canada by inductively coupledŽ .plasma-atomic emission spectrometry ICP-AES
Ž .and neutron activation analysis NAA , except theHg content, which was obtained by cold-vapour
Ž .atomic absorption spectrometry CVAAS . Thequality of data were verified by use of certifiedreference materials MRG-1, CT-3, G2 and GXN-1. Particle-size distribution was carried out byX-ray absorption with a Sedigraph equipment.
3. Results and discussion
3.1. Sludge and soil characteristics
The sludge formed a fine-grained layer several
Table 4Chemical composition of the compounded soil samples
Compounded M1 M2 M3 M4 M5 M6 M7 M8 M9samples
( )Major elements %P 0.06 0.08 0.05 0.07 0.06 0.06 0.06 0.05 0.07Ca 6.04 4.87 4.36 5.15 4.80 4.17 4.66 4.95 5.05Mg 0.81 0.80 0.81 0.86 0.90 0.80 0.84 0.70 0.91K 1.34 1.39 1.35 1.43 1.43 1.62 1.33 1.26 1.48Na 0.59 0.79 0.75 0.71 0.68 0.60 0.84 0.76 0.76Fe 3.60 3.53 3.59 3.45 4.12 4.13 4.30 2.94 3.57Ti 0.30 0.34 0.32 0.34 0.32 0.32 0.32 0.28 0.33Al 5.03 5.22 5.40 5.51 5.92 6.03 5.24 4.48 5.83
( )Trace elements mg�kgMn 578 647 655 676 690 664 669 505 693Ba 290 320 230 240 360 390 270 260 310Sr 134 122 117 124 127 116 127 121 136Rb 71 75 91 75 88 98 70 71 85Cr 74 81 76 81 90 86 77 75 76Ni 24 25 27 26 26 27 23 21 27V 76 80 83 86 90 87 79 66 88Sc 10.5 12.4 11.7 12.4 13.2 13.0 11.7 10.4 12.6Y 13 13 13 14 14 14 13 11 14Th 8.7 10.3 8.3 10.1 9.6 12.3 8.2 8.8 8.5U 2.4 2.4 2.3 2.4 2.0 2.2 2.3 2.2 2.2S 0.82 0.28 0.19 0.07 0.27 0.33 1.32 0.17 0.22Cu 133 93 186 115 165 137 180 73 119Pb 286 125 113 84 159 156 416 94 127Zn 692 477 668 446 571 551 867 417 670As 136 60 68 44 87 91 230 52 59Cd 2.4 1.7 2.5 1.7 2.2 2.0 3.0 1.3 1.6Hg 0.463 0.189 0.206 0.128 0.264 0.256 0.673 0.155 0.199Sb 17.9 7.7 7.1 5.1 9.2 10.1 27 6.5 7.8Co 13 17 15 16 17 18 18 16 17
( )E. Galan et al. � The Science of the Total En�ironment 286 2002 167�179´172
Ž .Table 4 Continued
Compounded M10 M11 M12 M13 M14 M15 M16 M17 M18samples
( )Major elements %P 0.05 0.05 0.05 0.06 0.04 0.06 0.05 0.06 0.05Ca 5.70 3.85 4.75 5.75 5.01 5.83 4.57 5.20 3.47Mg 0.90 0.60 0.63 0.87 0.66 0.89 0.81 0.84 0.77K 1.39 1.35 1.32 1.40 1.28 1.43 1.35 1.38 1.31Na 0.76 0.63 0.57 0.65 0.60 1.00 0.72 0.78 0.99Fe 3.59 2.93 2.96 3.63 3.05 3.56 2.90 3.26 3.88Ti 0.31 0.29 0.26 0.30 0.26 0.30 0.32 0.31 0.33Al 5.54 4.82 4.63 5.58 4.48 5.72 5.31 5.44 5.32
( )Trace elements mg�kgMn 647 505 449 651 463 657 595 619 635Ba 290 340 310 280 370 250 280 220 350Sr 133 98 111 138 118 142 128 132 112Rb 70 76 80 80 70 86 71 75 81Cr 78 74 73 75 66 74 78 77 70Ni 24 21 21 27 19 26 22 23 21V 84 71 70 86 64 88 80 82 81Sc 12.5 10.3 10.3 11.8 9.8 12.7 10.6 11.9 12.1Y 13 11 11 13 11 13 12 13 12Th 8.4 8.2 8.6 8.9 7.8 8.3 7.3 8.9 8.0U 2.1 2.0 1.8 2.3 2.4 2.1 1.9 2.1 2.1S 0.23 0.31 0.09 0.30 0.53 0.30 0.13 0.13 0.69Cu 126 50 52 95 83 97 84 81 97Pb 128 112 58 110 174 112 74 77 251Zn 589 293 274 707 474 696 404 452 444As 65 56 32 60 91 81 35 37 133Cd 2.3 1.1 1.3 2.5 1.4 2.2 1.4 1.6 1.3Hg 0.222 0.189 0.91 0.209 0.291 0.258 0.125 0.143 0.410Sb 7.7 6.7 3.9 7.1 11 9.5 4.4 4.8 16.4Co 18 12 14 17 13 16 13 13 15
centimetres thick covering the soil, which wasŽ .composed largely of pyrite 75�80 wt.% and
sub-ordinate amounts of other metallic sulphidesŽ .galena, chalcopyrite, sphalerite and arsenopyrite ,quartz, and rarely chlorite and illite. Most ofthese mineral components ranged between 2 and60 �m in crystal size, but it must be emphasised
Žthat a significant amount of the slurry more than.50 wt.% of the 1QM1 and 3QM1 whole samples
was characterised by a particle-size distributionŽ .within the inhalable range �10 �m . The pyrite
sludge had a pH as low as 1.8 and a specificgravity between 3.30 and 3.74. Over time, thesludge waste showed a white salty crust made upof neophormed phases, mainly gypsum and a vari-
ety of soluble iron-sulphate minerals, togetherwith poorly crystalline iron oxy-hydroxides, sug-gesting high rates of sulphide oxidation triggeredby chemical weathering.
The pyrite sludge contained very high levels ofŽ . Ž .Pb 8389�10 492 mg�kg , Zn 5546�7880 mg�kg ,Ž . Ž .As 4300�4500 mg�kg , Cu 1438�2095 mg�kg ,Ž . ŽCd 20.4�28.8 mg�kg and Hg 15.38�16.90.mg�kg , together with other potentially toxic
Ž .chalcophilic elements Table 1 . The mineralogi-cal and geochemical evolution of the pyritic sludgeand its long-term effects on soils was determined
Ž .in a preliminary study by Galan et al. 2000 .´The alluvial soils impacted by the toxic spill are
neutral or slightly alkaline with predominantly
( )E. Galan et al. � The Science of the Total En�ironment 286 2002 167�179´ 173
Table 5Ž .Concentration of selected potentially toxic elements in the profile samples and pollution load index PLI
Ž .Element mg�kg Cu Pb Zn As Cd Hg Sb Co PLI
Profile A0�25 cm 41 154 176 75.7 0.5 0.287 9.7 10 2.5825�50 cm 92 71 213 26 1.1 0.117 2.9 9 1.94
Profile B0�25 cm 117 96 284 56.8 1.1 0.350 6.7 16 3.2525�50 cm 114 67 236 41 1.1 0.110 4.6 16 2.40
Profile C0�25 cm 82 85 231 37.7 1.2 0.098 4.8 17 2.3725�50 cm 75 87 197 37.2 1.2 0.083 4.2 14 2.16
Profile D0�25 cm 196 655 1041 271 4.0 0.959 39.8 17 10.5925�50 cm 143 103 606 53.7 2.2 0.153 5.9 16 3.56
Profile E0�25 cm 109 179 478 99.3 1.5 0.224 12.3 16 4.23
a25�50 cm 39 48 113 21.8 n.d. 0.057 3.2 12 1.31
a n.d: not detected.
sandy loam textures, and relatively low amountsŽ .of organic-carbon 0.22�1.36% and carbonate
Ž .�10% CaCO contents according to Simon et3Ž .al. 1999 . They are typically composed of quartz,
phyllosilicates, feldspars, calcite, amorphous ironand manganese oxy-hydroxides, and accessory
Žheavy minerals ilmenite, rutile, zircon, baryte.and monazite . Major phyllosilicates identified by
XRD are illite and smectite, with minor kaolinite,Žvermiculite and mixed-layered clay minerals il-
.lite-smectite, illite-vermiculite . Chemical compo-sition of the soils unaffected by the spill, as de-
Ž .termined from the 2QM soil profile Table 2 , hasbeen used as a reference to better understand thesoil inorganic chemistry before the accident, andfor establishing the local geochemical background
Table 6Pearson correlation matrix for selected potentially toxic elements in the compounded soil samples
Cu Pb Zn S Ni Mn Cr As Co Cd V Hg Sb
Cu 1Pb 0.58 1Zn 0.76 0.67 1S 0.41 0.93 0.56 1Ni 0.37 0.05 0.49 0.16 1Mn 0.68 0.18 0.63 0.08 0.59 1Cr 0.46 0.01 0.12 0.23 0.20 0.60 1As 0.56 0.93 0.63 0.97 0.11 0.23 0.08 1Co 0.53 0.24 0.55 0.12 0.28 0.67 0.53 0.27 1Cd 0.81 0.63 0.90 0.48 0.47 0.58 0.29 0.57 0.54 1V 0.53 0.04 0.49 0.14 0.58 0.93 0.62 0.01 0.57 0.49 1Hg 0.54 0.93 0.65 0.98 0.08 0.22 0.13 0.99 0.21 0.57 0.01 1Sb 0.51 0.93 0.61 0.98 0.11 0.20 0.14 0.99 0.22 0.53 0.03 1.00 1
( )E. Galan et al. � The Science of the Total En�ironment 286 2002 167�179´174
Table 7Pearson correlation matrix for selected potentially toxic elements in the profile samples
Cu Pb Zn S As Co Cd Hg Sb
Cu 1Pb 0.71 1Zn 0.90 0.88 1S 0.64 0.99 0.84 1As 0.71 0.99 0.89 0.99 1Co 0.60 0.29 0.49 0.25 0.33 1Cd 0.91 0.88 0.97 0.82 0.86 0.49 1Hg 0.70 0.96 0.83 0.97 0.96 0.27 0.81 1Sb 0.71 1.00 0.88 0.99 1.00 0.32 0.86 0.97 1
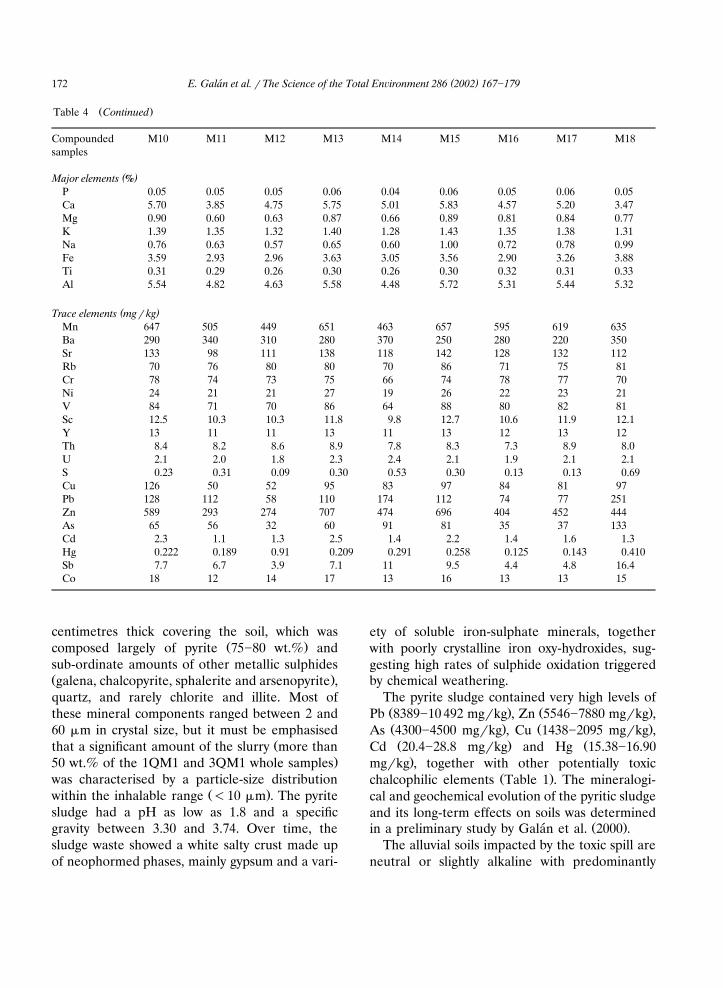
Fig. 2. Plot of the principal component analysis showing vari-able loadings of the first two factors for selected trace ele-
Ž .ments on surficial compounded samples a , and for selectedŽ .trace elements on profile samples b .
Ž .level Table 3 . The elemental concentration lev-els in the study area fall within the normal rangesfor unpolluted soils of the Guadiamar valleyŽ .Cabrera et al., 1999; Lopez-Pamo et al., 1999 ,´where there are relatively elevated heavy metallevels due to mining activities and the use of
Ž .agrochemicals Arambarri et al., 1984 .
3.2. Soil en�ironmental quality after the sludgeremo�al
Soil quality for environmental purposes can beŽmeasured in many different ways e.g. Pierzynski
.et al., 1994; Sims et al., 1997 . In this paper, theconcentration of potentially hazardous trace ele-ments and extent of the residual pollution loadhave been quantified and related to soil environ-mental quality after the sludge removal, on thebasis of chemical dataset from both the surficial
Ž .compounded soil samples Table 4 and the soilŽ .profile samples Table 5 .
3.2.1. Concentration and distribution of potentiallytoxic elements
The total As content in the compounded soilsamples varies between 32 and 230 mg�kg withan average of 78.8�47.9 mg�kg, depending onthe location of the samples with respect to theriverbed. These concentrations exceed by far the
Žnormal levels of As in soils Bowen, 1979; Al-.loway, 1995 , and the majority of samples are in
the range of values above which toxicity is con-Žsidered to be possible Kabata-Pendias and Pen-
.dias, 1992 . This is particularly true for the sam-
( )E. Galan et al. � The Science of the Total En�ironment 286 2002 167�179´ 175
ple M7 in which the As concentration is 11.5times above the baseline value. The total Zncontent in the compounded soil samples rangesbetween 274 and 867 mg�kg with an average of538.4�156.9 mg�kg, which is well above thenatural concentration in the study area. The totalCd content in the compounded soil samples rangesfrom 1.1 to 3.0 mg�kg, with 1.86�0.54 mg�kg asan average. Thus, locally, the soils remain en-riched in Cd as much as six times with respect tothe background level. The total Cu content in thecompounded soil samples lies in the range from50 to 186 mg�kg with an average of 109.2�39.7mg�kg. The concentration factor of Cu in thesoils varies between 1.25 and 4.65 indicating soilpollution because of the mining spill. The totalcontent of Pb ranges fairly in the compounded
Žsoil samples between 58 and 416 mg�kg with an.average of 140.6�85.2 mg�kg , involving concen-
tration factors up to 12.2 in the most pollutedŽ .sample M7 . The total Hg concentration in the
Žcompounded soil samples from 0.09 to 0.67.mg�kg with an average of 0.25�0.14 appears to
Ž .be much greater up to 22 times than the naturalcontent in the soil before the accident. The totalSb content in the compounded soil samples range
between 3.9 and 27 mg�kg with an average of9.44�5.76 mg�kg.
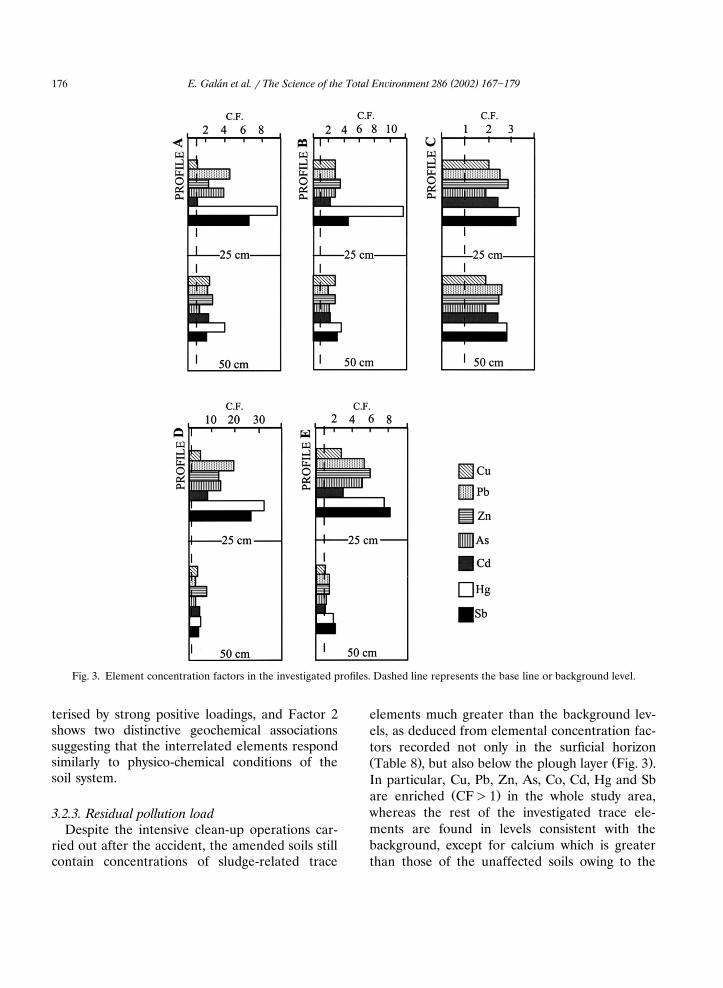
Concerning the vertical distribution inferredŽ .from the investigated profiles Table 5 , it seems
that As, Pb, Hg and Sb were preferentially re-tained in the top soil, whereas concentration fac-tors of Zn, Cd and Cu in the subsoil suggest thatthe removal of these metals down the profilescould have been significant.
3.2.2. Statistical geochemical associationsThe interelemental relationships in the surficial
compounded soil samples as well as in the profilesamples, are shown by the Pearson correlation
Ž .matrix Tables 6 and 7, respectively , and theinfluence of the interrelated elements is quanti-fied from principal component analysis, whichattributes to two factors; 73.5% of the total vari-
Ž .ance explained in the surficial samples Fig. 2aand 94.25% of the variance in the soil profile
Ž .samples Fig. 2b .Thus, in both types of samples a very high
degree of correlation among S, Pb, As, Hg and Sbis evident and, on the other hand, Cu, Zn and Cdalso seem to be significantly correlated. In fact,Factor 1 is statistically dominant and it is charac-
Table 8Ž .Concentration factors of the sludge-related trace elements in the compounded soil samples and pollution load index PLI
Sample Cu Pb Zn As Co Cd Hg Sb PLI
M1 3.32 8.41 8.54 6.80 1.08 4.80 15.43 11.93 5.94M2 2.32 3.68 5.89 3.00 1.42 3.40 6.30 5.13 3.52M3 4.65 3.32 8.25 3.40 1.25 5.00 6.87 4.73 4.15M4 2.87 2.47 5.51 2.18 1.33 3.40 4.27 3.40 2.94M5 4.12 4.68 7.05 4.35 1.42 4.40 8.80 6.13 4.60M6 3.42 4.59 6.80 4.56 1.50 4.00 8.53 6.73 4.50M7 4.50 12.23 10.70 11.50 1.50 6.00 22.43 18.00 8.39M8 1.82 2.76 5.15 2.61 1.33 2.60 5.17 4.33 2.92M9 2.97 3.73 8.27 2.96 1.42 3.20 6.63 5.20 3.79M10 3.15 3.76 7.27 3.26 1.50 4.60 7.40 5.13 4.06M11 1.25 3.29 3.62 2.78 1.00 2.20 6.30 4.47 2.67M12 1.30 1.71 3.38 1.62 1.17 2.60 3.03 2.60 2.03M13 2.37 3.23 8.73 3.00 1.42 5.00 6.97 4.73 3.84M14 2.07 5.12 5.85 4.57 1.08 2.80 9.70 7.33 3.97M15 2.42 3.29 8.59 4.05 1.33 4.40 8.60 8.47 4.31M16 2.10 2.18 4.99 1.77 1.08 2.80 4.17 2.93 2.49M17 2.02 2.26 5.58 1.85 1.08 3.20 4.77 3.20 2.66M18 2.42 7.38 5.48 6.65 1.25 2.60 13.67 10.93 4.87
( )E. Galan et al. � The Science of the Total En�ironment 286 2002 167�179´176
Fig. 3. Element concentration factors in the investigated profiles. Dashed line represents the base line or background level.
terised by strong positive loadings, and Factor 2shows two distinctive geochemical associationssuggesting that the interrelated elements respondsimilarly to physico-chemical conditions of thesoil system.
3.2.3. Residual pollution loadDespite the intensive clean-up operations car-
ried out after the accident, the amended soils stillcontain concentrations of sludge-related trace
elements much greater than the background lev-els, as deduced from elemental concentration fac-tors recorded not only in the surficial horizonŽ . Ž .Table 8 , but also below the plough layer Fig. 3 .In particular, Cu, Pb, Zn, As, Co, Cd, Hg and Sb
Ž .are enriched CF�1 in the whole study area,whereas the rest of the investigated trace ele-ments are found in levels consistent with thebackground, except for calcium which is greaterthan those of the unaffected soils owing to the
( )E. Galan et al. � The Science of the Total En�ironment 286 2002 167�179´ 177
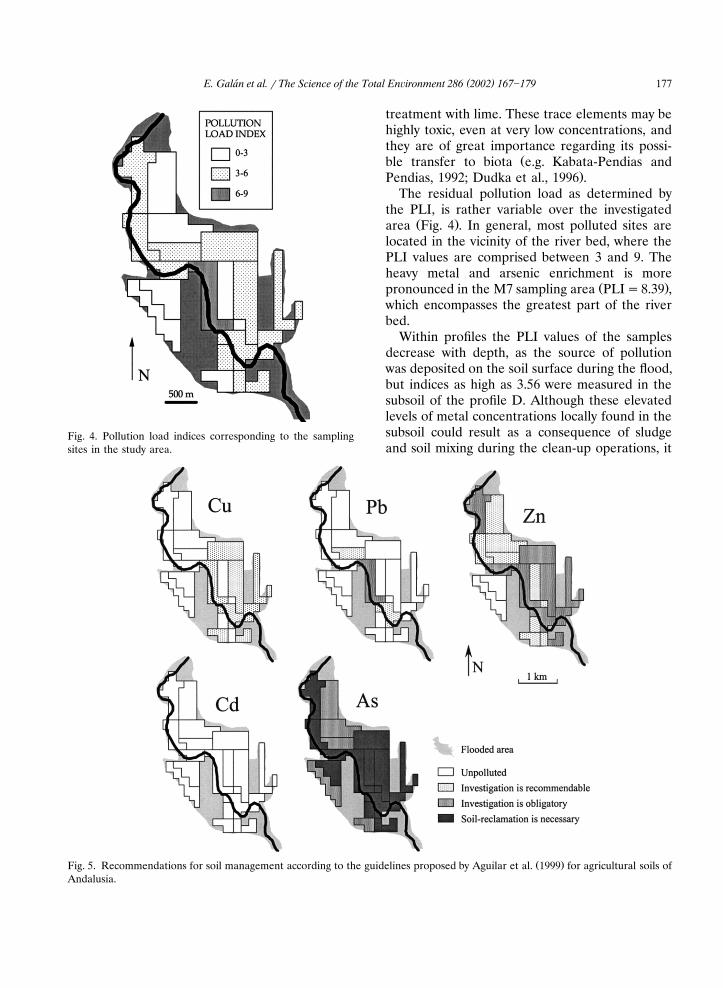
Fig. 4. Pollution load indices corresponding to the samplingsites in the study area.
treatment with lime. These trace elements may behighly toxic, even at very low concentrations, andthey are of great importance regarding its possi-
Žble transfer to biota e.g. Kabata-Pendias and.Pendias, 1992; Dudka et al., 1996 .
The residual pollution load as determined bythe PLI, is rather variable over the investigated
Ž .area Fig. 4 . In general, most polluted sites arelocated in the vicinity of the river bed, where thePLI values are comprised between 3 and 9. Theheavy metal and arsenic enrichment is more
Ž .pronounced in the M7 sampling area PLI�8.39 ,which encompasses the greatest part of the riverbed.
Within profiles the PLI values of the samplesdecrease with depth, as the source of pollutionwas deposited on the soil surface during the flood,but indices as high as 3.56 were measured in thesubsoil of the profile D. Although these elevatedlevels of metal concentrations locally found in thesubsoil could result as a consequence of sludgeand soil mixing during the clean-up operations, it
Ž .Fig. 5. Recommendations for soil management according to the guidelines proposed by Aguilar et al. 1999 for agricultural soils ofAndalusia.
( )E. Galan et al. � The Science of the Total En�ironment 286 2002 167�179´178
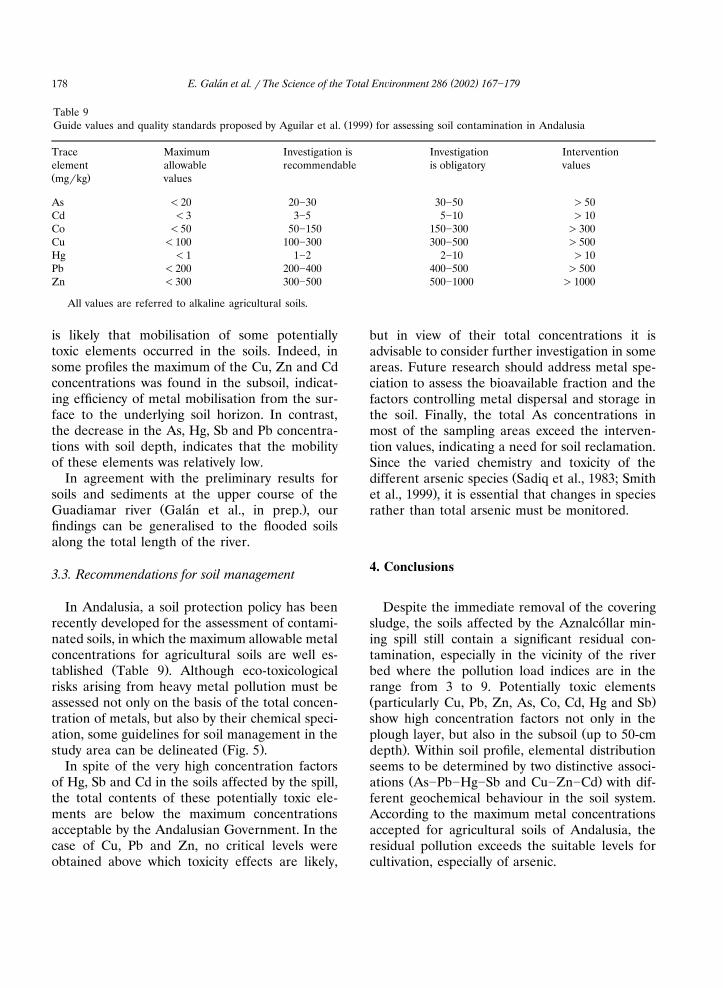
Table 9Ž .Guide values and quality standards proposed by Aguilar et al. 1999 for assessing soil contamination in Andalusia
Trace Maximum Investigation is Investigation Interventionelement allowable recommendable is obligatory valuesŽ .mg�kg values
As �20 20�30 30�50 �50Cd �3 3�5 5�10 �10Co �50 50�150 150�300 �300Cu �100 100�300 300�500 �500Hg �1 1�2 2�10 �10Pb �200 200�400 400�500 �500Zn �300 300�500 500�1000 �1000
All values are referred to alkaline agricultural soils.
is likely that mobilisation of some potentiallytoxic elements occurred in the soils. Indeed, insome profiles the maximum of the Cu, Zn and Cdconcentrations was found in the subsoil, indicat-ing efficiency of metal mobilisation from the sur-face to the underlying soil horizon. In contrast,the decrease in the As, Hg, Sb and Pb concentra-tions with soil depth, indicates that the mobilityof these elements was relatively low.
In agreement with the preliminary results forsoils and sediments at the upper course of the
Ž .Guadiamar river Galan et al., in prep. , our´findings can be generalised to the flooded soilsalong the total length of the river.
3.3. Recommendations for soil management
In Andalusia, a soil protection policy has beenrecently developed for the assessment of contami-nated soils, in which the maximum allowable metalconcentrations for agricultural soils are well es-
Ž .tablished Table 9 . Although eco-toxicologicalrisks arising from heavy metal pollution must beassessed not only on the basis of the total concen-tration of metals, but also by their chemical speci-ation, some guidelines for soil management in the
Ž .study area can be delineated Fig. 5 .In spite of the very high concentration factors
of Hg, Sb and Cd in the soils affected by the spill,the total contents of these potentially toxic ele-ments are below the maximum concentrationsacceptable by the Andalusian Government. In thecase of Cu, Pb and Zn, no critical levels wereobtained above which toxicity effects are likely,
but in view of their total concentrations it isadvisable to consider further investigation in someareas. Future research should address metal spe-ciation to assess the bioavailable fraction and thefactors controlling metal dispersal and storage inthe soil. Finally, the total As concentrations inmost of the sampling areas exceed the interven-tion values, indicating a need for soil reclamation.Since the varied chemistry and toxicity of the
Ždifferent arsenic species Sadiq et al., 1983; Smith.et al., 1999 , it is essential that changes in species
rather than total arsenic must be monitored.
4. Conclusions
Despite the immediate removal of the coveringsludge, the soils affected by the Aznalcollar min-´ing spill still contain a significant residual con-tamination, especially in the vicinity of the riverbed where the pollution load indices are in therange from 3 to 9. Potentially toxic elementsŽ .particularly Cu, Pb, Zn, As, Co, Cd, Hg and Sbshow high concentration factors not only in the
Žplough layer, but also in the subsoil up to 50-cm.depth . Within soil profile, elemental distribution
seems to be determined by two distinctive associ-Ž .ations As�Pb�Hg�Sb and Cu�Zn�Cd with dif-
ferent geochemical behaviour in the soil system.According to the maximum metal concentrationsaccepted for agricultural soils of Andalusia, theresidual pollution exceeds the suitable levels forcultivation, especially of arsenic.
( )E. Galan et al. � The Science of the Total En�ironment 286 2002 167�179´ 179
Acknowledgements
We thank the AFREXPORT Company forpermission to take soil samples and for providingtechnical field assistance. Robert Readman andYolanda Fernandez-Caliani kindly helped with´the translation of the manuscript.
References
Aguilar J, Dorronsoro C, Gomez-Ariza JL, Galan E. Los´ ´criterios y estandares para declarar un suelo contaminado´en Andalucıa y la metodologıa y tecnicas de toma de´ ´ ´muestras y analisis para su investigacion. Investigacion y´ ´ ´Desarrollo Medioambiental en Andalucıa. Sevilla: Univ.´Sevilla, 1999:45�59.
Alastuey A, Garcıa-Sanchez A, Lopez F, Querol X. Evolution´ ´ ´of pyrite mud weathering and mobility of heavy metals inthe Guadiamar valley after the Aznalcollar spill, southwest´Spain. Sci Total Environ 1999;242:41�55.
Alloway BJ. In: Alloway BJ, editor. Heavy Metals in Soils.London: Blackie, 1995.
Arambarri P, Cabrera F, Toca C. La Contaminacion del Rıo´ ´Guadiamar y su Zona de Influencia, Marismas delGuadalquivir y Coto Donana, por Resıduos de Industrias˜ ´Mineras y Agrıcolas. Madrid: Consejo Superior de Investi-´gaciones Cientıficas, 1984.´
Bowen HJM. Environmental Chemistry of Elements. London:Academic Press, 1979.
Cabrera F, Clemente L, Dıaz-Barrientos E, Lopez R, Murillo´ ´JM. Heavy metal pollution of soils affected by the Guadia-mar toxic flood. Sci Total Environ 1999;242:117�129.
Dudka S, Piotrowska M, Terelak H. Transfer of Cd, Pb andZn from industrially contaminated soil to crop plants: afield study. Environ Pollut 1996;94:181�188.
Galan E, Gonzalez I, Alvarez MA, Fernandez-Caliani JC.´ ´ ´Mineralogical and geochemical effects of the Aznalcollar´mining spill on soils and sediments of the Guadiamarvalley, SW Spain. In: Rammlmair D, Mederer J, Oberthur¨T, Heimann RB, Pentinghaus H, editors. Applied Miner-alogy in Research, Economy, Technology, Ecology andCulture. Rotterdam: Balkema, 2000:543�546.
Gallart F, Benito G, Martın-Vide JP, Benito A, Prio JM,´ ´
Regues D. Fluvial geomorphology and hydrology in the¨´dispersal and fate of pyrite mud particles released by theAznalcollar mine tailings spill. Sci Total Environ 1999;´242:13�26.
Grimalt JO, Ferrer M, Macpherson E. The mine tailing acci-dent in Aznalcollar. Sci Total Environ 1999;242:3�11.´
Junta de Andalucıa. The Guadiamar a year later. Result of´Actions for Correcting the Effects of the Mining Spill atAznalcollar. Junta de Andalucıa: Consejerıa de Medio Am-´ ´ ´biente, 1999.
Kabata-Pendias A, Pendias H. Trace Elements in Soils andPlants. Boca Raton: CRC Press, 1992.´
Lopez-Pamo E, Barettino D, Anton-Pacheco C, Ortiz G,´ ´Arranz JC, Gumiel JC, Martınez-Pledel B, Aparicio M,´Montouto O. The extent of the Aznalcollar pyritic sludge´spill and its effects on soils. Sci Total Environ 1999;242:57�88.
Pain DJ, Sanchez A, Meharg AA. The Donana ecological´ ˜disaster: contamination of a world heritage estuarine marshecosystem with acidified pyrite mine waste. Sci Total Envi-ron 1998;222:4554.
Pierzynski GM, Vance GF, Sims JT. Soils and EnvironmentalQuality. Boca Raton: CRC Press, 1994.
Sadiq M, Zaidi TH, Miann AA. Environmental behaviour ofarsenic in soils. Water Air Soil Pollut 1983;20:369�377.
Simon M, Ortiz I, Garcıa I, Fenandez E, Fernandez J, Dor-´ ´ ´ronsoro C, Aguilar J. Pollution of soils by the toxic spill of
Ž .a pyrite mine Aznalcollar, Spain . Sci Total Environ´1999;242:105�115.
Sims JT, Cunningham SA, Summer ME. Assessing soil qualityfor environmental purposes: roles and challenges for soilscientists. J Environ Qual 1997;26:20�25.
Smith E, Naidu R, Alston AM. Chemistry of arsenic in soils:sorption of arsenate and arsenite by four Australian soils. JEnviron Qual 1999;28:1719�1726.
Tomlinson DL, Wilson JG, Harris CR, Jeffrey DW. Problemsin the assessments of heavy metal levels in estuaries andformation of a pollution index. Helgol Meeresunters1980;33:566�575.
Vidal M, Lopez-Sanchez JF, Sastre J, Jimenez G, Dagnac T,´ ´ ´Rubio R, Rauret G. Prediction of the impact of the Az-nalcollar toxic spill on the trace element concentration of´agricultural soils. Sci Total Environ 1999;242:131�148.