Embed Size (px)
Citation preview
www.idosr.org Mgbakor
75
©IDOSR PUBLICATIONS
International Digital Organization for Scientific Research ISSN:2579-082X
IDOSR JOURNAL OF BANKING, ECONOMICS AND SOCIAL SCIENCES 2(1): 75-92, 2017.
Socio-economic characteristics of cassava producers and
processors in Enugu State, Nigeria.
Mgbakor Miriam N.
Department of Agricultural Economics and Extension, Faculty of Agriculture and Natural
Resources Management Enugu State University of Science and Technology (ESUT).
ABSTRACT
Cassava production in Nigeria is by far the largest output in the world; a third more
than the production in Brazil and almost double the production in Indonesia and
Thailand. Results of socio economic characteristics established that the mean age and
mean household size of the study farmers were 50 years and 8 persons respectively.
More than half (57.9%) of the cassava producers and processors were males, with about
83.5% of them having some form of formal education and 78.5% of them married. The
mean farm size and mean farming/processing experience of the cassava producers and
processors were 1.6 hectares and 22 years respectively. Mean annual farm income and
mean annual non-farm income of the respondents were N171, 963.82 and N77649.25,
with 62.6% of them not having access to farm credit. As much as 72.4% of the cassava
producers and processors used both improved cassava production and processing
technologies. About 51 percent of the cassava producers/processors employed use of
both family and hired labour on their cassava production and processing enterprises.
Also, 53.2% of the study farmers did not belong to any cooperative associations. In
conclusion, the cassava farmers/processors engaged primarily in farming, although
majority of them operated small farm sizes whose output are small. Consequently,
these farmers engage in other off-farm income generating activities whose returns are
smaller compared to returns generated from farming.
Keywords: Cassava, Socio-economic, farm credit and farm income
INTRODUCTION
Cassava is important, not only as a food crop but even more so as a major source of
income for rural households [1,2,3]. Nigeria is currently the largest producer of cassava
in the world with an annual production of over 34 million tonnes of tuberous roots
[4,6]. Cassava is largely consumed in many processed forms in Nigeria. Its use in the
industry and livestock feed, is well known, but is gradually increasing, especially as
import substitution becomes prominent in the industrial sector of the economy [7,8]. As
a cash crop, cassava generates cash income for the largest number of households in
comparison with other staples [9,10]. It is produced with relevant purchased inputs as
frequently as and in some cases more frequently than other staples. A large proportion
of total production, probably larger than that of most staples, is planted annually for
sale [11,12]. As a food crop, cassava has some inherent characteristics which make it
attractive, especially to the smallholder farmers in Nigeria [13]. First, it is rich in
carbohydrates especially starch and consequently has a multiplicity of end uses [14].
Secondly, it is available all year round, making it preferable to other, more seasonal
crops such as grains, peas and beans and other crops for food security. Compared to
grains, cassava is more tolerant of low soil fertility and more resistant to drought, pests
and diseases. Furthermore, its roots are storable in the ground for months after they
mature [15]. These attributes combined with other socioeconomic considerations are
therefore what IFAD has recognized in the crop as lending itself to a commodity-based
approach to poverty alleviation [16].
An ever increasing world population, which some estimates put at about 11.2 billion in
2050, places a good deal of pressure on the supply of staples like rice, corn, wheat, and
www.idosr.org Mgbakor
76
barley [17]. To meet these food requirements, existing food production must be set to
double [18]. Cassava root tubers (CRT) have the potential to contribute to the
achievement of this target [19]. In turn, this has put pressure on levels of productivity
of cassava in tropical countries such as Nigeria [20]. The main area of CRT utilization is
as a traditional staple food, and processing is done at home. It is estimated that 88
percent of cassava produced in African countries including Nigeria is consumed as
staple food in the form of gari, fufu, akpu among others [21]. The demand for cassava
chips, flour and pellets, especially for animal feeds is just emerging and undeveloped
research is in for the possible uses of CRT and its leaves for biofuel [22]. However, there
is already existing high demand for other products such as starch for the textile
industry, pharmaceutical products, pulp and paper, adhesives for packaging industries
and flour for bakeries and confectionery industries. It is estimated that more than 40
million tonnes of cassava would be needed to meet current industrial demand in Nigeria
[23]. [24], argue that, beside local demand, there is a high demand for cassava-based
products in foreign countries, such as an urgent demand for 400,000 tonnes of cassava
chips (about 1.6 million tonnes of CRT) for animal feeds in South Africa and Botswana.
However, the current supply may not be enough even to satisfy local demand. The main
reasons for this are low pricing, which is discouraging farmers from expanding their
output, the use of low yielding seed varieties and low efficiency in productivity [25].
Objectives of the Study
The broad objective of this study was to describe socio-economic characteristics of
cassava producers and processors in the study area. The following null hypothesis was
tested in the course of this research
Ho1
: Mean gross margins does not differ significantly among sole cropping,
intercropping and mixed cropping systems.
RESEARCH METHODOLOGY
The Study Area
The study was carried out in Enugu state of Nigeria. The state is one of the five states in
South Eastern Nigeria and is purposively selected for this study because of its
agricultural potential, high proportion of farmers as well as concentration of
agricultural institutions. The study covered major cassava producing and processing
communities in Enugu state. Enugu State is bounded to the Northwest and Northeast by
Kogi State and Benue State respectively, to the East by Ebonyi State, to the South by Abia
State and Imo State and to the West by Anambra State. The state is located between
latitudes 58° 50´ and 78° 01´ N of the Equator and longitudes 68° 50´ and 78° 55´ E of
the Greenwich Meridian. The state comprises of 17 Local Government Areas (LGAs)
namely; Aninri, Awgu, Enugu East, Enugu North, Enugu South, Ezeagu, Igbo Etiti, Igbo
Eze North, Igbo Eze South, Isi Uzo, Nkanu East, Nkanu West, Nsukka, Oji River, Udenu,
Udi and Uzo Uwani which form the three agricultural/senatorial zones (Enugu North,
Enugu East and Enugu West) of the state. It comprises four hundred and seventy three
(473) communities. The state is made up of two tiers of government, the state
government and the local government. The State Government is responsible for
economic development policy including implementation of development projects in the
state while the Local Governments have jurisdiction over activities confined within their
boundaries. Enugu state has an estimated population of 3.891,339 million persons
comprising 1,990,773 females and 1,900,566 males, with an annual projected
percentage increase of 2.6% from base year (National Population Commission, (NPC)
2006). Average population density of the State is 780 persons/km2
.Enugu state has a
tropical savannah climate. Its climate is humid and this humidity is at its peak between
March and November. For the whole of Enugu State, the mean daily temperature is 26.7
°C (80.1 °F) with an average annual rainfall of 2,000 mm, which arrives intermittently
and becomes very heavy during the rainy season. The State is characterised by two
prominent seasons, namely; rainy season which usually occur from April to October and
dry season which occurs from November to March. Other weather conditions affecting
the city include Harmattan, a dusty trade wind lasting a few weeks in December and
January. Like the rest of Nigeria, Enugu is hot all year round. The land is 223 metres
above sea level and because of its topography; the soil is naturally well drained during
its rainy seasons. Erosion is one of the problems of some places due to the sloppy
nature of its terrain and incidence of land slide. Economically, the state is
www.idosr.org Mgbakor
77
predominantly rural and agrarian, with a substantial proportion of its working
population engaged in farming, mining, transportation, although trading (18.8%) and
civil services (12.9%) are also important. In the urban areas trading is the dominant
occupation, followed by public and private services. A small proportion of the
population is also engaged in manufacturing activities, with the most pronounced
among them located in Enugu, Oji, Ohebedim and Nsukka (Nigerian National Bureau of
Statistic, 2008). The Profile of Major Mineral Resources in Enugu State are; Coal,
Limestone, Gypsum, Glass sand, Copper, Bauxite, Calcite, Bentonite, Dolorite, Iron-
Stone, Clay, Fire-clay, Brine. There are also traces of Petroleum and Natural gas in
Ugwuoba in Oji-River Local Government area and Uzo-Uwani in Enugu state.Enugu state
is located in a tropical rain forest zone with a derived savannah. Enugu has rich fertile
soil conditions over a wide range of agro-ecological zone which allow for a very diverse
crop production such as cassava Tree crop: cashew (Anacardium occidentale), kola nut
(Cola nitida), oil palm (Elaesis guineensis), cocoa (Theobroma cacoa), mango (Mangifera
indica), breadfruit (Treculia africana), guava(Psidium guajava), pawpaw (Carica papaya),
Plant sucker: plantain (Musa paradisiaca), banana (Musa sapientum), Fruit crop:
pineapple (Ananas comosus), maize (Zea mays), Root crop: cassava (Manihot esculenta),
yam (Dioscorea spp), coco-yam( Esculenta spp), sweet potato (Ipomoea batatas),
Legume/vegetables: Bambara groundnut (Voandzeia subterranea), pigeon pea (Cajanus
cajan), black bean (Phaseolus vulgaris), melon(Cucumis melo), groundnut (Arachis
hypogaea), okra, (Abelmoschus esculentus), red pepper(Capsicum annuum), fluted
pumpkin (Telfairia occidentalis), spinach(Spinacia oleracea), bitter-leaf( Venonia
amygdalina), low-lying and seasonally flooded areas are being used for rice (Oryza
sativum) production.
Sampling Procedure
In an empirical investigation, it is very difficult to collect information from the whole
population. Therefore, researchers are often forced to make inferences based on
information derived from a representative sample of the population. The size of the
sample and amount of variation usually affect the quantity and quality of information
obtained from the survey. Both factors can be controlled using appropriate sampling
methods.
Population of the Study
Population in research could be described as a full set of numbers of objects or people.
Classification of the population is the first step in the sampling procedure, namely, the
sector or element under investigation, the sampling unit and the area of investigation.
The population for this study are cassava farmers in Enugu State, Nigeria that are
registered with Enugu State Agricultural Development Programme (ENADEP). They
comprised registered cassava producers and processors from the 17 LGAs of Enugu
State as presented in Table 1. It is worthy to note that in Enugu state, all cassava
producers also process cassava at least for self and family consumption as against
buying processed cassava products from the market. In this scenario and in the concept
of study, qualifies the farmers as producers/ processors. This also ensures that there is
no duplication in the sampling.
www.idosr.org Mgbakor
78
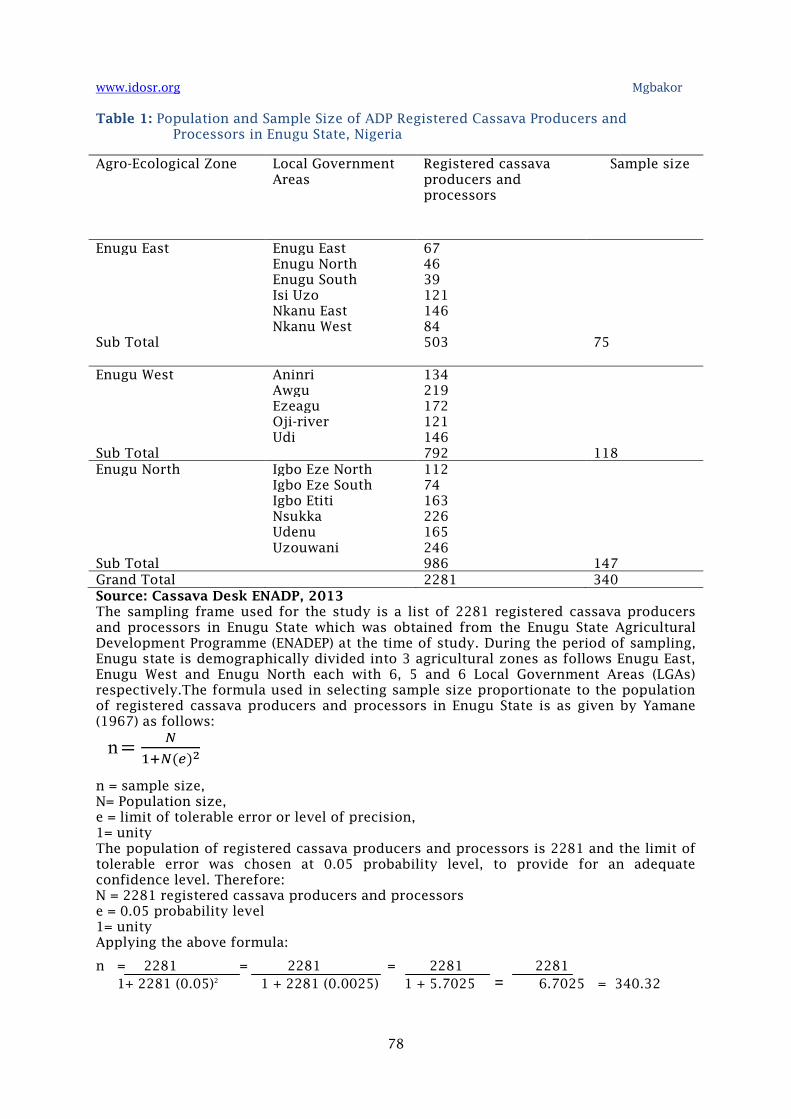
Table 1: Population and Sample Size of ADP Registered Cassava Producers and
Processors in Enugu State, Nigeria
Agro-Ecological Zone Local Government
Areas
Registered cassava
producers and
processors
Sample size
Enugu East Enugu East 67
Enugu North 46
Enugu South 39
Isi Uzo 121
Nkanu East 146
Nkanu West 84
Sub Total 503 75
Enugu West Aninri 134
Awgu 219
Ezeagu 172
Oji-river 121
Udi 146
Sub Total 792 118
Enugu North Igbo Eze North 112
Igbo Eze South 74
Igbo Etiti 163
Nsukka 226
Udenu 165
Uzouwani 246
Sub Total 986 147
Grand Total 2281 340
Source: Cassava Desk ENADP, 2013
The sampling frame used for the study is a list of 2281 registered cassava producers
and processors in Enugu State which was obtained from the Enugu State Agricultural
Development Programme (ENADEP) at the time of study. During the period of sampling,
Enugu state is demographically divided into 3 agricultural zones as follows Enugu East,
Enugu West and Enugu North each with 6, 5 and 6 Local Government Areas (LGAs)
respectively.The formula used in selecting sample size proportionate to the population
of registered cassava producers and processors in Enugu State is as given by Yamane
(1967) as follows:
n = sample size,
N= Population size,
e = limit of tolerable error or level of precision,
1= unity
The population of registered cassava producers and processors is 2281 and the limit of
tolerable error was chosen at 0.05 probability level, to provide for an adequate
confidence level. Therefore:
N = 2281 registered cassava producers and processors
e = 0.05 probability level
1= unity
Applying the above formula:
n = 2281 = 2281 = 2281 2281
1+ 2281 (0.05)2
1 + 2281 (0.0025) 1 + 5.7025 6.7025 = 340.32 =
www.idosr.org Mgbakor
79
Therefore a sample size of 340 cassava producers and processors is statistically
adequate for the study. Multi-stage random sampling technique was used to select
sampling location and respondents for the study. In the first stage, 4 LGAs were
selected randomly from each of the 3 agro-ecological zones in the study area, giving a
total of 12 LGAs out of the 17 LGAs in the study area. The selected LGAs are Enugu East,
Nkanu East, Nkanu West, Isi Uzo, Aninri, Awgu, Ezeagu, Oji-river, Igbo Etiti, Nsukka,
Udenu and Uzouwani. In the second stage, proportionate random sampling technique
was applied to determine 75, 147 and 118 registered cassava producers and processors
that were selected from Enugu East (Enugu East, Nkanu West, Isi Uzo and Nkanu East
LGAs), Enugu North (Igbo Etiti, Nsukka, Udenu and Uzouwani LGAs) and Enugu West
(Aninri, Awgu, Ezeagu and Oji-river LGAs) agro-ecological zones respectively to give a
sample size of 340 cassava producers and processors for the study as follows:
Enugu East = 503
2281 𝑥
340
1= 75
Enugu North = 986
2281 𝑥
340
1 = 147
Enugu West = 792
2281 𝑥
340
1= 118
In the third stage, simple random sampling technique was applied in each stratum to
select the already determined sample size. As a result of inadequate information
pertaining to accurate population of all the cassava producers and processors in the
state, the law of large samples or numbers was applied in choosing the size of sample.
According to [16,19] the law states that the sample mean converges to the distribution
mean as the sample size increases. It also stated in the mathematical premise that the
greater the number of exposures: (1) the more accurate the prediction, (2) the less the
deviation of actual losses from the expected losses (X-x approaches zero) and (3) the
greater the credibility of the prediction. [5,9] further asserted that for any given study
area without accurate population size, the chosen size of sample should be greater than
300, thus the sample size of this study is adequate since more than 300 respondents
were selected.
Data Collection
Data for this study was gathered from primary source. Primary data were collected from
the selected sample following a field survey conducted with a pre-tested semi-
structured questionnaire in Enugu East local government area. The researcher employed
services of twelve trained enumerators (one for each local government area) who are
indigenes and familiar with the areas to assist in data collection. One set of
questionnaire was administered to the selected cassava producers and processors. The
questionnaires were carefully structured to elicit responses on socio-economic
characteristics such as age, sex, level of education, marital status, household size, farm
size, farming experience, non-farm occupation, annual income, sources of finance,
access to extension and membership of farmers organization and other relevant
variables such as costs and returns from cassava production and processing,
technologies available for cassava production and processing, production systems of
cassava, products of cassava processed in the area, perceived effect of cassava
production and processing by the respondents. In addition data on their farm income
and household consumption expenditure details were collected.The secondary sources
of information were journals, magazine, textbooks, publications and annual reports
form World Bank, Food and Agricultural Organization (FAO), USAID, International
Institute for Tropical Agriculture (IITA), National Root Crops Research Institute (NRCRI),
and National Special Programme for Food Security (NSPFS), Agricultural Development
Programme (ADP), FADAMA, CMP and other relevant reports.
Model Specification
The models were specified for this study as follows:
Poverty Indicators
The measurement of household welfare or standard of living is a question which has not
been resolved completely. There are many ways one could go about addressing this
issue depending on the context, need and availability of information. Since quality of
www.idosr.org Mgbakor
80
life has to take into consideration all direct and indirect consumption, both tangible and
intangible items, measuring welfare has become a daunting task. Poverty can be
measured mostly on two scales- the relative scale measurement of poverty and the
absolute scale measurement of poverty. However, the most common single indicator of
welfare in the literature is to generate value of consumption basket both market
purchases and consumption of own production, using appropriate price measures. In
the present case, since expenditure is expressed only in terms of value, there is no need
to construct a vector of prices which then can be used to convert the quantity
information into a value. To determine the poverty status of households in the study
area, a poverty line was constructed, using two-thirds of the mean per adult equivalent
expenditure, below which a household was classified as being poor and above which a
household was classified as being non-poor. The use of consumption to identify and
measure poverty has a long tradition, right from the study of Rowntree. The World Bank
has also been assessing global poverty by using expenditure data collected through
household surveys. This is because consumption level, which is reflected in
consumption expenditure, has been conventionally viewed as a preferred welfare
indicator. Also, for practical reasons of reliability, consumption expenditure levels are
thought to better capture long-run welfare levels than current income levels.
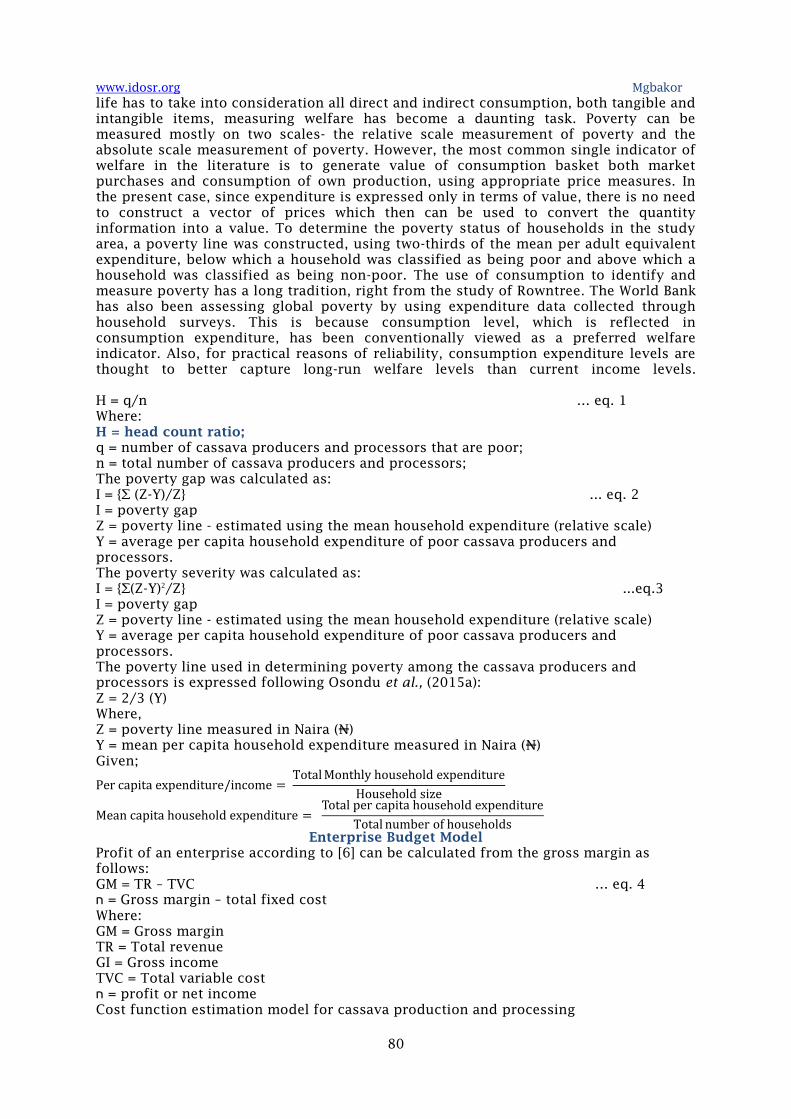
H = q/n … eq. 1
Where:
H = head count ratio;
q = number of cassava producers and processors that are poor;
n = total number of cassava producers and processors;
The poverty gap was calculated as:
I = {∑ (Z-Y)/Z} ... eq. 2
I = poverty gap
Z = poverty line - estimated using the mean household expenditure (relative scale)
Y = average per capita household expenditure of poor cassava producers and
processors.
The poverty severity was calculated as:
I = {∑(Z-Y)2
/Z} ...eq.3
I = poverty gap
Z = poverty line - estimated using the mean household expenditure (relative scale)
Y = average per capita household expenditure of poor cassava producers and
processors.
The poverty line used in determining poverty among the cassava producers and
processors is expressed following Osondu et al., (2015a):
Z = 2/3 (Y)
Where,
Z = poverty line measured in Naira (N)
Y = mean per capita household expenditure measured in Naira (N)
Given;
Per capita expenditure/income = Total Monthly household expenditure
Household size
Mean capita household expenditure = Total per capita household expenditure
Total number of households
Enterprise Budget Model
Profit of an enterprise according to [6] can be calculated from the gross margin as
follows:
GM = TR – TVC … eq. 4
Gross margin – total fixed cost = ח
Where:
GM = Gross margin
TR = Total revenue
GI = Gross income
TVC = Total variable cost
profit or net income = ח
Cost function estimation model for cassava production and processing
www.idosr.org Mgbakor
81
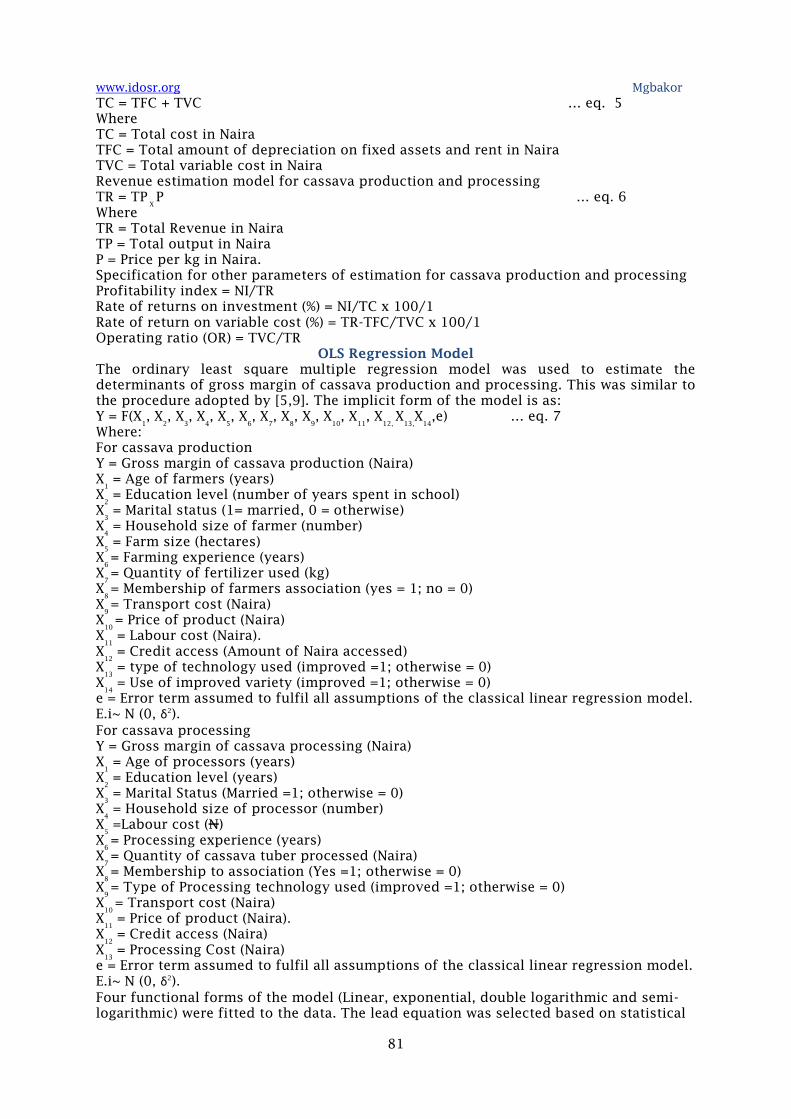
TC = TFC + TVC … eq. 5
Where
TC = Total cost in Naira
TFC = Total amount of depreciation on fixed assets and rent in Naira
TVC = Total variable cost in Naira
Revenue estimation model for cassava production and processing
TR = TP X
P … eq. 6
Where
TR = Total Revenue in Naira
TP = Total output in Naira
P = Price per kg in Naira.
Specification for other parameters of estimation for cassava production and processing
Profitability index = NI/TR
Rate of returns on investment (%) = NI/TC x 100/1
Rate of return on variable cost (%) = TR-TFC/TVC x 100/1
Operating ratio (OR) = TVC/TR
OLS Regression Model
The ordinary least square multiple regression model was used to estimate the
determinants of gross margin of cassava production and processing. This was similar to
the procedure adopted by [5,9]. The implicit form of the model is as:
Y = F(X1
, X2
, X3
, X4
, X5
, X6
, X7
, X8
, X9
, X10
, X11
, X12,
X13,
X14
,e) … eq. 7
Where:
For cassava production
Y = Gross margin of cassava production (Naira)
X1
= Age of farmers (years)
X2
= Education level (number of years spent in school)
X3
= Marital status (1= married, 0 = otherwise)
X4
= Household size of farmer (number)
X5
= Farm size (hectares)
X6
= Farming experience (years)
X7
= Quantity of fertilizer used (kg)
X8
= Membership of farmers association (yes = 1; no = 0)
X9
= Transport cost (Naira)
X10
= Price of product (Naira)
X11
= Labour cost (Naira).
X12
= Credit access (Amount of Naira accessed)
X13
= type of technology used (improved =1; otherwise = 0)
X14
= Use of improved variety (improved =1; otherwise = 0)
e = Error term assumed to fulfil all assumptions of the classical linear regression model.
E.i~ N (0, δ2
).
For cassava processing
Y = Gross margin of cassava processing (Naira)
X1
= Age of processors (years)
X2
= Education level (years)
X3
= Marital Status (Married =1; otherwise = 0)
X4
= Household size of processor (number)
X5
=Labour cost (N)
X6
= Processing experience (years)
X7
= Quantity of cassava tuber processed (Naira)
X8
= Membership to association (Yes =1; otherwise = 0)
X9
= Type of Processing technology used (improved =1; otherwise = 0)
X10
= Transport cost (Naira)
X11
= Price of product (Naira).
X12
= Credit access (Naira)
X13
= Processing Cost (Naira)
e = Error term assumed to fulfil all assumptions of the classical linear regression model.
E.i~ N (0, δ2
).
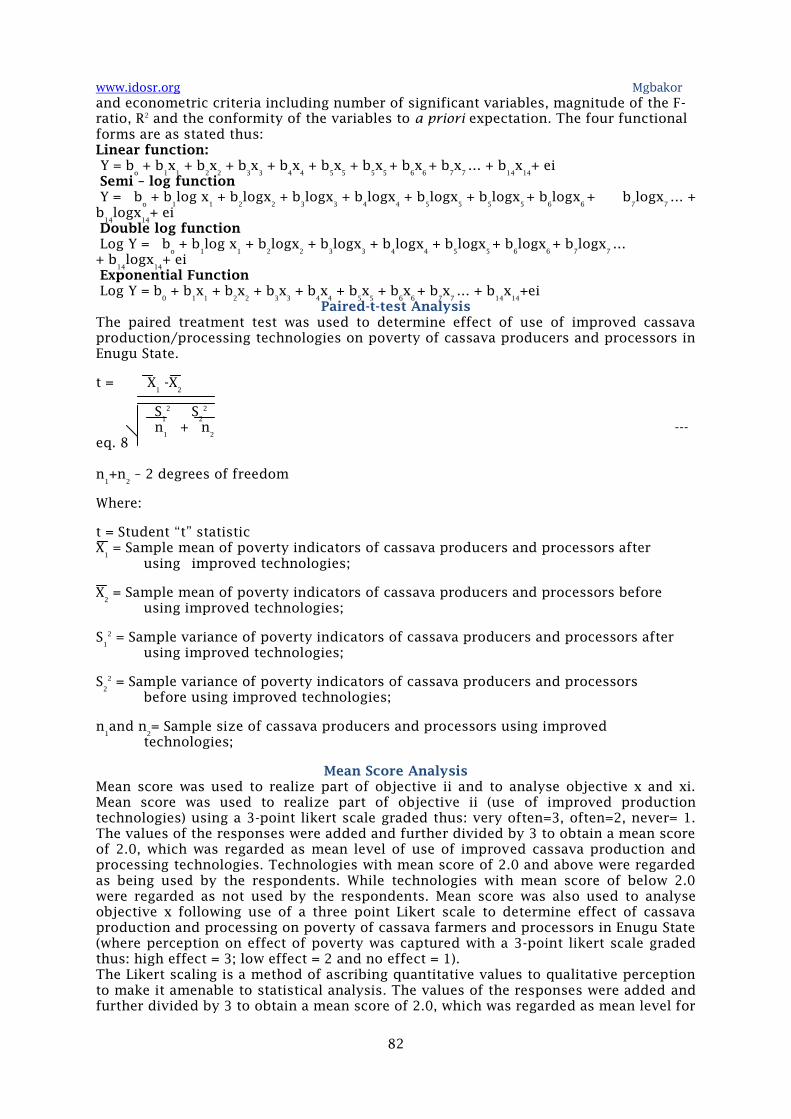
Four functional forms of the model (Linear, exponential, double logarithmic and semi-
logarithmic) were fitted to the data. The lead equation was selected based on statistical
www.idosr.org Mgbakor
82
and econometric criteria including number of significant variables, magnitude of the F-
ratio, R2
and the conformity of the variables to a priori expectation. The four functional
forms are as stated thus:
Linear function:
Y = bo
+ b1
x1
+ b2
x2
+ b3
x3
+ b4
x4
+ b5
x5
+ b5
x5
+ b6
x6
+ b7
x7
… + b14
x14
+ ei
Semi – log function
Y = bo
+ b1
log x1
+ b2
logx2
+ b3
logx3
+ b4
logx4
+ b5
logx5
+ b5
logx5
+ b6
logx6
+ b7
logx7
… +
b14
logx14
+ ei
Double log function
Log Y = bo
+ b1
log x1
+ b2
logx2
+ b3
logx3
+ b4
logx4
+ b5
logx5
+ b6
logx6
+ b7
logx7
…
+ b14
logx14
+ ei
Exponential Function
Log Y = b0
+ b1
x1
+ b2
x2
+ b3
x3
+ b4
x4
+ b5
x5
+ b6
x6
+ b7
x7
… + b14
x14
+ei
Paired-t-test Analysis
The paired treatment test was used to determine effect of use of improved cassava
production/processing technologies on poverty of cassava producers and processors in
Enugu State.
t = X1
-X2
S1
2
S2
2
n1
+ n2
---
eq. 8
n1
+n2
– 2 degrees of freedom
Where:
t = Student “t” statistic
X1
= Sample mean of poverty indicators of cassava producers and processors after
using improved technologies;
X2
= Sample mean of poverty indicators of cassava producers and processors before
using improved technologies;
S1
2
= Sample variance of poverty indicators of cassava producers and processors after
using improved technologies;
S2
2
= Sample variance of poverty indicators of cassava producers and processors
before using improved technologies;
n1
and n2
= Sample size of cassava producers and processors using improved
technologies;
Mean Score Analysis
Mean score was used to realize part of objective ii and to analyse objective x and xi.
Mean score was used to realize part of objective ii (use of improved production
technologies) using a 3-point likert scale graded thus: very often=3, often=2, never= 1.
The values of the responses were added and further divided by 3 to obtain a mean score
of 2.0, which was regarded as mean level of use of improved cassava production and
processing technologies. Technologies with mean score of 2.0 and above were regarded
as being used by the respondents. While technologies with mean score of below 2.0
were regarded as not used by the respondents. Mean score was also used to analyse
objective x following use of a three point Likert scale to determine effect of cassava
production and processing on poverty of cassava farmers and processors in Enugu State
(where perception on effect of poverty was captured with a 3-point likert scale graded
thus: high effect = 3; low effect = 2 and no effect = 1).
The Likert scaling is a method of ascribing quantitative values to qualitative perception
to make it amenable to statistical analysis. The values of the responses were added and
further divided by 3 to obtain a mean score of 2.0, which was regarded as mean level for
www.idosr.org Mgbakor
83
effect of cassava production and processing on poverty. Responses with mean score of
2.0 and above were regarded as being influenced by cassava production and processing
while responses with mean score of less than 2.0 were regarded as not being influenced
by cassava production and processing.
Thus, mean effect of cassava production and processing = X
X = ∑fx/N, (the mean score).
Mean (X) of each item was computed by multiplying the frequency of positive response
to each question with its appropriate likert nominal value and the sum was divided by
the sum of the number of the respondent to the items. This is summarized with the
equation below:
X = ∑fn/N.
Where
X = mean score;
∑ = summation sign;
F = frequency or number of respondents who responded positively;
n = Likert nominal value;
N = Number of respondents.
To determine the problems constraining cassava production and processing, a three
point likert type scale with three response options (very serious = 3; serious = 2; and
not serious =1) were used. The values on the likert type scale were summated to 6 and
were divided by 3 to give 2.0. The respondents mean score were obtained for each
response item such that any one higher or equal to 2.0 was regarded as a major problem
and any one less than 2.0 was regarded as a minor problem.
Tests for Validity and Reliability of Research Instrument
This is an essential part of the research procedure. These tests were used to determine
the adequacy and accuracy of the content of the measuring instrument.
Validity of Research Instrument
Validity is the extent a measuring instrument measures what is expected to measure.
Validity is the most important attribute of the research procedure. It is always specific
to the particular situation and purpose. An instrument that is valid in one situation may
not be in different situation because of the differences in objectives or environment. For
the purpose of this study, content and face validity were used to determine the
adequacy of the content of the measuring instrument. The instrument was developed on
the basis of the study objective, scrutinized and was validated via peer review
mechanism. The questionnaire was given to my supervisor, professors in the
department and experts in the field of Agricultural Economics for their constructive
criticism and necessary input to improve its’ content and face validity. Thereafter the
necessary modifications were made; ambiguous items were amended while those
considered irrelevant were removed.
Reliability of Research Instrument
Reliability of research instrument refers to the degree of consistency and precision
(accuracy) with which an instrument measures what it is supposed to measure. That is,
the degree to which the instrument measures the same thing time after time. It is the
ability of an instrument to consistently produce the same result provided no real
change has occurred in the respondent’s characteristics. The three methods used to
determine reliability include test – retest method, multiple form method and split–half
method. The reliability test for the instrument used in this study was conducted using
test–retest method involving a sample of 20 respondents randomly from the sample
frame. After a period of 12 weeks, the exercise was repeated on the same set of the
respondents. Scores were assigned to the items relating to socio economic
characteristics, poverty and gross margin. The total scores for each exercise was
computed and later subjected to Pearson Product Moment Correlation (PPMCC) analysis
was used to test the reliability of the instrument. A reliability coefficient of 0.824
obtained. This was considered high enough to accept the instrument as reliable as the
reliability coefficient exceeded the minimum threshold of 0.7.
RESULTS AND DISCUSSION
Socio-Economic Characteristics of the Respondents
The Socio economic variables of the respondents that were examined in this sub-section
include, sex, age, level of educational qualification, marital status, household size, size
www.idosr.org Mgbakor
84
of farm holdings, farming experience, primary occupation, household annual income
from the farm, and household annual income from off-farm activities, credit access, use
of improved production and processing technology, sources of labour and membership
of farmers’ organisation.
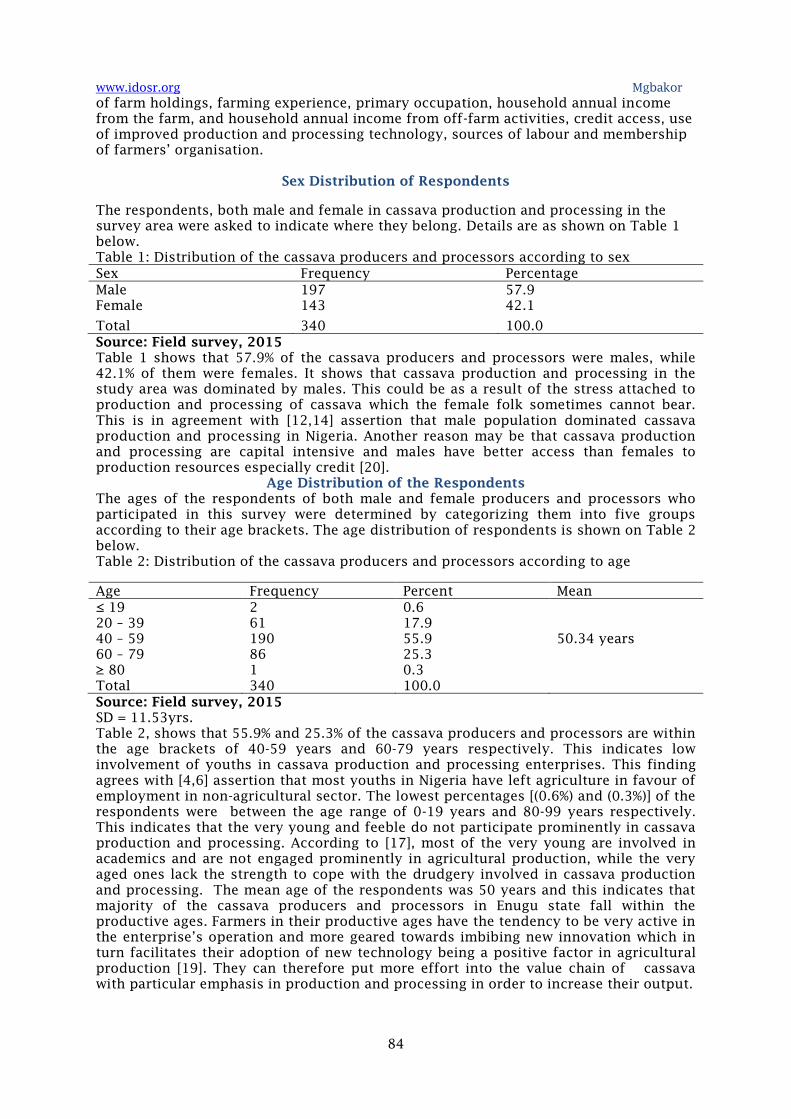
Sex Distribution of Respondents
The respondents, both male and female in cassava production and processing in the
survey area were asked to indicate where they belong. Details are as shown on Table 1
below.
Table 1: Distribution of the cassava producers and processors according to sex
Sex Frequency Percentage
Male 197 57.9
Female 143 42.1
Total 340 100.0
Source: Field survey, 2015
Table 1 shows that 57.9% of the cassava producers and processors were males, while
42.1% of them were females. It shows that cassava production and processing in the
study area was dominated by males. This could be as a result of the stress attached to
production and processing of cassava which the female folk sometimes cannot bear.
This is in agreement with [12,14] assertion that male population dominated cassava
production and processing in Nigeria. Another reason may be that cassava production
and processing are capital intensive and males have better access than females to
production resources especially credit [20].
Age Distribution of the Respondents
The ages of the respondents of both male and female producers and processors who
participated in this survey were determined by categorizing them into five groups
according to their age brackets. The age distribution of respondents is shown on Table 2
below.
Table 2: Distribution of the cassava producers and processors according to age
Age Frequency Percent Mean
≤ 19 2 0.6
20 – 39 61 17.9
40 – 59 190 55.9 50.34 years
60 – 79 86 25.3
≥ 80 1 0.3
Total 340 100.0
Source: Field survey, 2015
SD = 11.53yrs.
Table 2, shows that 55.9% and 25.3% of the cassava producers and processors are within
the age brackets of 40-59 years and 60-79 years respectively. This indicates low
involvement of youths in cassava production and processing enterprises. This finding
agrees with [4,6] assertion that most youths in Nigeria have left agriculture in favour of
employment in non-agricultural sector. The lowest percentages [(0.6%) and (0.3%)] of the
respondents were between the age range of 0-19 years and 80-99 years respectively.
This indicates that the very young and feeble do not participate prominently in cassava
production and processing. According to [17], most of the very young are involved in
academics and are not engaged prominently in agricultural production, while the very
aged ones lack the strength to cope with the drudgery involved in cassava production
and processing. The mean age of the respondents was 50 years and this indicates that
majority of the cassava producers and processors in Enugu state fall within the
productive ages. Farmers in their productive ages have the tendency to be very active in
the enterprise’s operation and more geared towards imbibing new innovation which in
turn facilitates their adoption of new technology being a positive factor in agricultural
production [19]. They can therefore put more effort into the value chain of cassava
with particular emphasis in production and processing in order to increase their output.
www.idosr.org Mgbakor
85
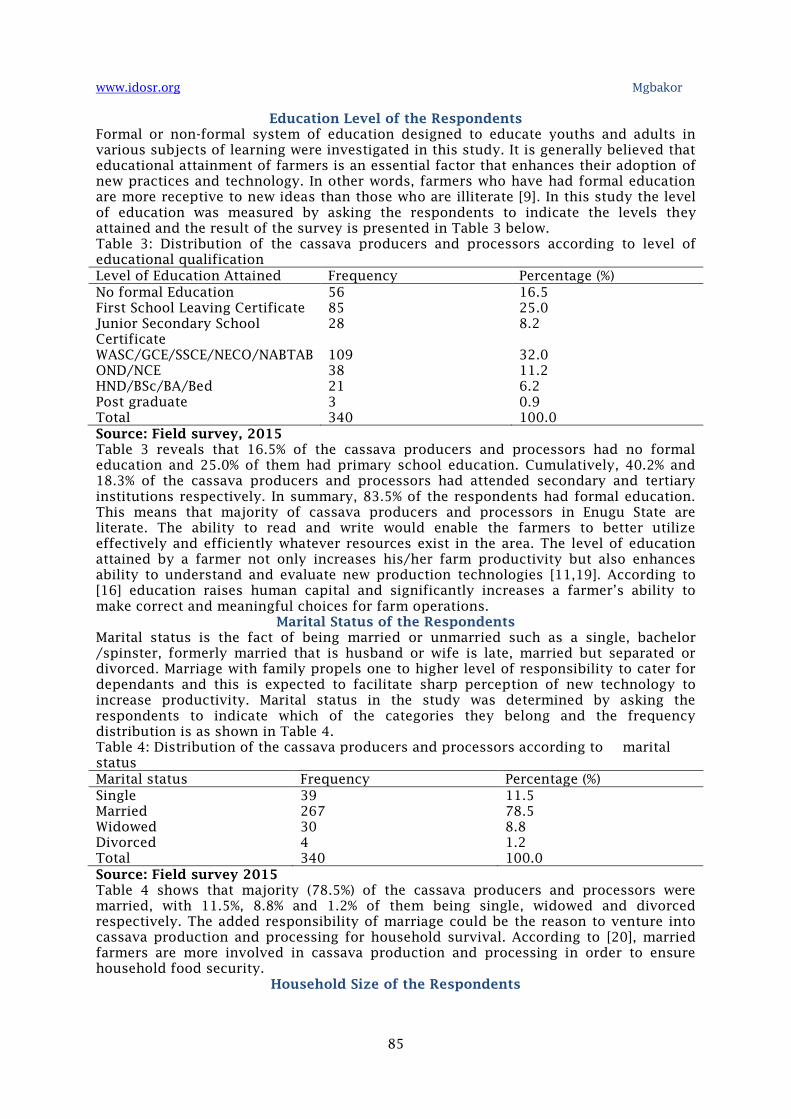
Education Level of the Respondents
Formal or non-formal system of education designed to educate youths and adults in
various subjects of learning were investigated in this study. It is generally believed that
educational attainment of farmers is an essential factor that enhances their adoption of
new practices and technology. In other words, farmers who have had formal education
are more receptive to new ideas than those who are illiterate [9]. In this study the level
of education was measured by asking the respondents to indicate the levels they
attained and the result of the survey is presented in Table 3 below.
Table 3: Distribution of the cassava producers and processors according to level of
educational qualification
Level of Education Attained Frequency Percentage (%)
No formal Education 56 16.5
First School Leaving Certificate 85 25.0
Junior Secondary School
Certificate
28 8.2
WASC/GCE/SSCE/NECO/NABTAB 109 32.0
OND/NCE 38 11.2
HND/BSc/BA/Bed 21 6.2
Post graduate 3 0.9
Total 340 100.0
Source: Field survey, 2015
Table 3 reveals that 16.5% of the cassava producers and processors had no formal
education and 25.0% of them had primary school education. Cumulatively, 40.2% and
18.3% of the cassava producers and processors had attended secondary and tertiary
institutions respectively. In summary, 83.5% of the respondents had formal education.
This means that majority of cassava producers and processors in Enugu State are
literate. The ability to read and write would enable the farmers to better utilize
effectively and efficiently whatever resources exist in the area. The level of education
attained by a farmer not only increases his/her farm productivity but also enhances
ability to understand and evaluate new production technologies [11,19]. According to
[16] education raises human capital and significantly increases a farmer’s ability to
make correct and meaningful choices for farm operations.
Marital Status of the Respondents
Marital status is the fact of being married or unmarried such as a single, bachelor
/spinster, formerly married that is husband or wife is late, married but separated or
divorced. Marriage with family propels one to higher level of responsibility to cater for
dependants and this is expected to facilitate sharp perception of new technology to
increase productivity. Marital status in the study was determined by asking the
respondents to indicate which of the categories they belong and the frequency
distribution is as shown in Table 4.
Table 4: Distribution of the cassava producers and processors according to marital
status
Marital status Frequency Percentage (%)
Single 39 11.5
Married 267 78.5
Widowed 30 8.8
Divorced 4 1.2
Total 340 100.0
Source: Field survey 2015
Table 4 shows that majority (78.5%) of the cassava producers and processors were
married, with 11.5%, 8.8% and 1.2% of them being single, widowed and divorced
respectively. The added responsibility of marriage could be the reason to venture into
cassava production and processing for household survival. According to [20], married
farmers are more involved in cassava production and processing in order to ensure
household food security.
Household Size of the Respondents
www.idosr.org Mgbakor
86
A household is defined in English dictionary as people who live together in a single
home. A household unit according to [21], is defined in dejure terms, which relies on
the concept of normal residence whether or not an individual member of the household
was present at time of interview. There are other criteria that are vital in classifying the
household members. According to [21]; and Federal Office of Statistics (FOS) [22] a
household refers to a group of related or unrelated people, living in a dwelling unit or
its equivalent, eating from the same pot and sharing a common housekeeping
arrangement who take or are subject to others taking financial decisions. According to
the concept of this survey, a household is recognized as people who live and eat
together in a dwelling in the study area. This section describes the distribution of
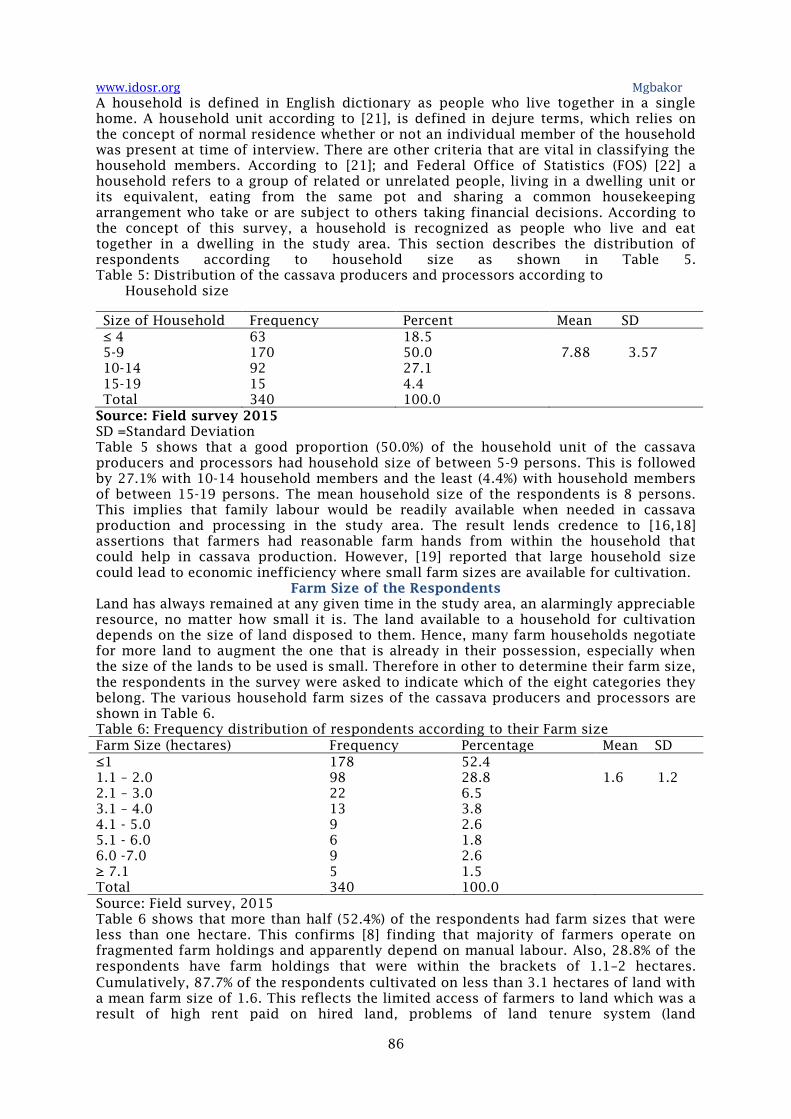
respondents according to household size as shown in Table 5.
Table 5: Distribution of the cassava producers and processors according to
Household size
Size of Household Frequency Percent Mean SD
≤ 4 63 18.5
5-9 170 50.0 7.88 3.57
10-14 92 27.1
15-19 15 4.4
Total 340 100.0
Source: Field survey 2015
SD =Standard Deviation
Table 5 shows that a good proportion (50.0%) of the household unit of the cassava
producers and processors had household size of between 5-9 persons. This is followed
by 27.1% with 10-14 household members and the least (4.4%) with household members
of between 15-19 persons. The mean household size of the respondents is 8 persons.
This implies that family labour would be readily available when needed in cassava
production and processing in the study area. The result lends credence to [16,18]
assertions that farmers had reasonable farm hands from within the household that
could help in cassava production. However, [19] reported that large household size
could lead to economic inefficiency where small farm sizes are available for cultivation.
Farm Size of the Respondents
Land has always remained at any given time in the study area, an alarmingly appreciable
resource, no matter how small it is. The land available to a household for cultivation
depends on the size of land disposed to them. Hence, many farm households negotiate
for more land to augment the one that is already in their possession, especially when
the size of the lands to be used is small. Therefore in other to determine their farm size,
the respondents in the survey were asked to indicate which of the eight categories they
belong. The various household farm sizes of the cassava producers and processors are
shown in Table 6.
Table 6: Frequency distribution of respondents according to their Farm size
Farm Size (hectares) Frequency Percentage Mean SD
≤1 178 52.4
1.1 – 2.0 98 28.8 1.6 1.2
2.1 – 3.0 22 6.5
3.1 – 4.0 13 3.8
4.1 - 5.0 9 2.6
5.1 - 6.0 6 1.8
6.0 -7.0 9 2.6
≥ 7.1 5 1.5
Total 340 100.0
Source: Field survey, 2015
Table 6 shows that more than half (52.4%) of the respondents had farm sizes that were
less than one hectare. This confirms [8] finding that majority of farmers operate on
fragmented farm holdings and apparently depend on manual labour. Also, 28.8% of the
respondents have farm holdings that were within the brackets of 1.1−2 hectares.
Cumulatively, 87.7% of the respondents cultivated on less than 3.1 hectares of land with
a mean farm size of 1.6. This reflects the limited access of farmers to land which was a
result of high rent paid on hired land, problems of land tenure system (land
www.idosr.org Mgbakor
87
fragmentation) that are prevalent in the study area. This is in accordance to [9,13,17]
assertion that in Nigeria, cassava is generally cultivated by small holder farmers with
low resources. Although Smallholder farmers control a vast proportion of the
productive agricultural resources in Nigeria, they are characterized by low level of
resource utilization, low levels of productivity, low returns to labour and low level of
capital investment which limits their production potentials [20].
Farming/Processing Experience of the Respondents
Experience is an increased knowledge or skill gained through being actively involved in
an enterprise over a period of time. The cassava producers and processors need to have
skills and practical competence, to strengthen their ability in allocating scarce resources
as well as making sound production decisions to increase productivity. It is this wealth
of knowledge and skills acquired by the cassava producing and processing household in
repeated performance over a number of years in an enterprise that is called farm
enterprise experience. The production and processing experience of the cassava
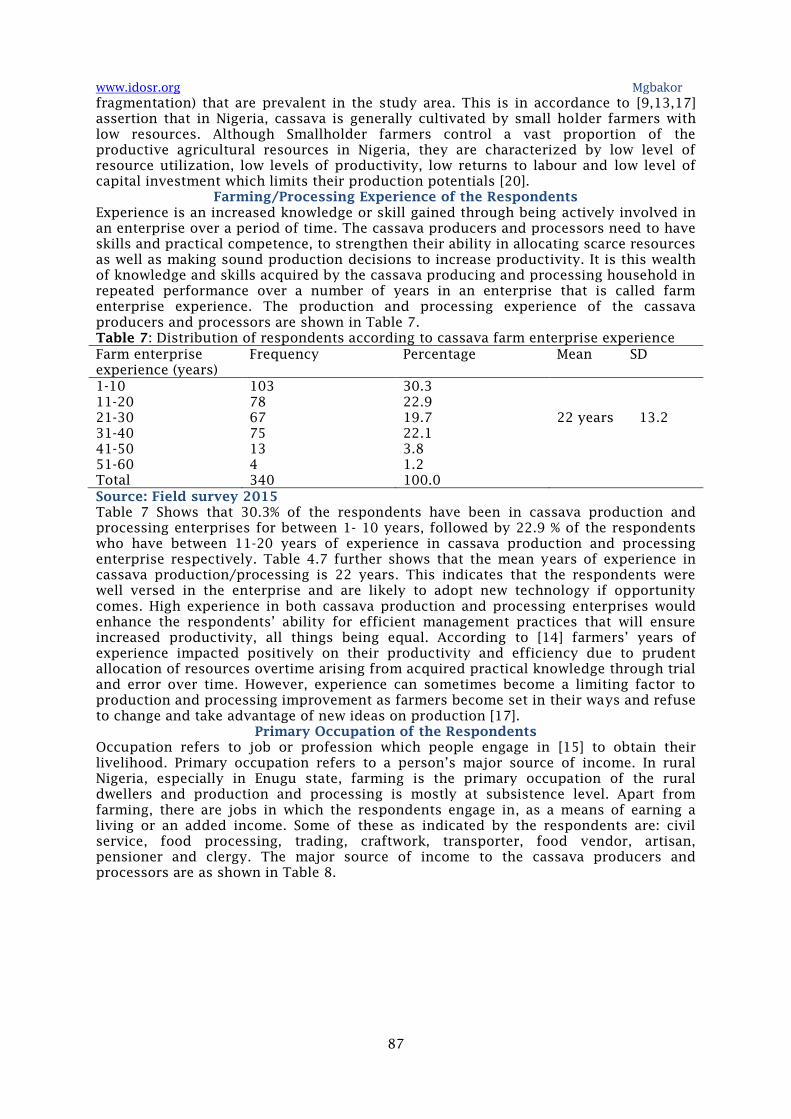
producers and processors are shown in Table 7.
Table 7: Distribution of respondents according to cassava farm enterprise experience
Farm enterprise
experience (years)
Frequency Percentage Mean SD
1-10 103 30.3
11-20 78 22.9
21-30 67 19.7 22 years 13.2
31-40 75 22.1
41-50 13 3.8
51-60 4 1.2
Total 340 100.0
Source: Field survey 2015
Table 7 Shows that 30.3% of the respondents have been in cassava production and
processing enterprises for between 1- 10 years, followed by 22.9 % of the respondents
who have between 11-20 years of experience in cassava production and processing
enterprise respectively. Table 4.7 further shows that the mean years of experience in
cassava production/processing is 22 years. This indicates that the respondents were
well versed in the enterprise and are likely to adopt new technology if opportunity
comes. High experience in both cassava production and processing enterprises would
enhance the respondents’ ability for efficient management practices that will ensure
increased productivity, all things being equal. According to [14] farmers’ years of
experience impacted positively on their productivity and efficiency due to prudent
allocation of resources overtime arising from acquired practical knowledge through trial
and error over time. However, experience can sometimes become a limiting factor to
production and processing improvement as farmers become set in their ways and refuse
to change and take advantage of new ideas on production [17].
Primary Occupation of the Respondents
Occupation refers to job or profession which people engage in [15] to obtain their
livelihood. Primary occupation refers to a person’s major source of income. In rural
Nigeria, especially in Enugu state, farming is the primary occupation of the rural
dwellers and production and processing is mostly at subsistence level. Apart from
farming, there are jobs in which the respondents engage in, as a means of earning a
living or an added income. Some of these as indicated by the respondents are: civil
service, food processing, trading, craftwork, transporter, food vendor, artisan,
pensioner and clergy. The major source of income to the cassava producers and
processors are as shown in Table 8.
www.idosr.org Mgbakor
88
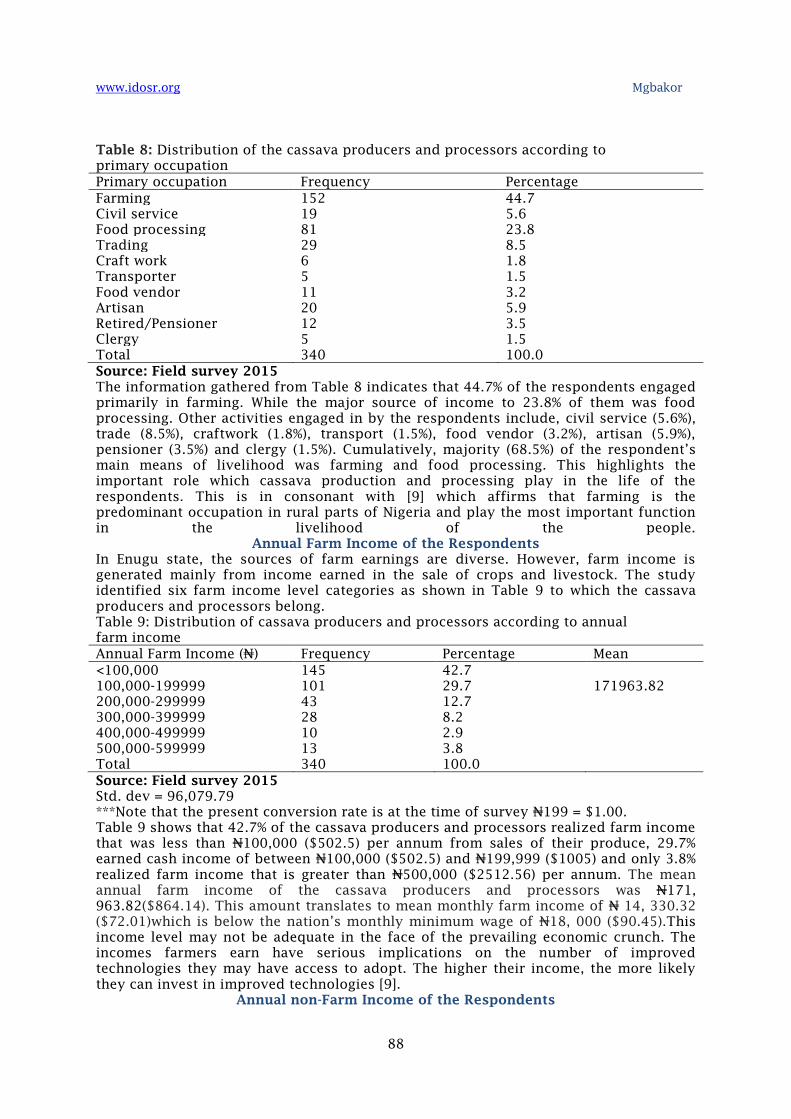
Table 8: Distribution of the cassava producers and processors according to
primary occupation
Primary occupation Frequency Percentage
Farming 152 44.7
Civil service 19 5.6
Food processing 81 23.8
Trading 29 8.5
Craft work 6 1.8
Transporter 5 1.5
Food vendor 11 3.2
Artisan 20 5.9
Retired/Pensioner 12 3.5
Clergy 5 1.5
Total 340 100.0
Source: Field survey 2015
The information gathered from Table 8 indicates that 44.7% of the respondents engaged
primarily in farming. While the major source of income to 23.8% of them was food
processing. Other activities engaged in by the respondents include, civil service (5.6%),
trade (8.5%), craftwork (1.8%), transport (1.5%), food vendor (3.2%), artisan (5.9%),
pensioner (3.5%) and clergy (1.5%). Cumulatively, majority (68.5%) of the respondent’s
main means of livelihood was farming and food processing. This highlights the
important role which cassava production and processing play in the life of the
respondents. This is in consonant with [9] which affirms that farming is the
predominant occupation in rural parts of Nigeria and play the most important function
in the livelihood of the people.
Annual Farm Income of the Respondents
In Enugu state, the sources of farm earnings are diverse. However, farm income is
generated mainly from income earned in the sale of crops and livestock. The study
identified six farm income level categories as shown in Table 9 to which the cassava
producers and processors belong.
Table 9: Distribution of cassava producers and processors according to annual
farm income
Annual Farm Income (N) Frequency Percentage Mean
<100,000 145 42.7
100,000-199999 101 29.7 171963.82
200,000-299999 43 12.7
300,000-399999 28 8.2
400,000-499999 10 2.9
500,000-599999 13 3.8
Total 340 100.0
Source: Field survey 2015
Std. dev = 96,079.79
***Note that the present conversion rate is at the time of survey N199 = $1.00.
Table 9 shows that 42.7% of the cassava producers and processors realized farm income
that was less than N100,000 ($502.5) per annum from sales of their produce, 29.7%
earned cash income of between N100,000 ($502.5) and N199,999 ($1005) and only 3.8%
realized farm income that is greater than N500,000 ($2512.56) per annum. The mean
annual farm income of the cassava producers and processors was N171,
963.82($864.14). This amount translates to mean monthly farm income of N 14, 330.32
($72.01)which is below the nation’s monthly minimum wage of N18, 000 ($90.45).This
income level may not be adequate in the face of the prevailing economic crunch. The
incomes farmers earn have serious implications on the number of improved
technologies they may have access to adopt. The higher their income, the more likely
they can invest in improved technologies [9].
Annual non-Farm Income of the Respondents
www.idosr.org Mgbakor
89
Non-farm income is generated from diverse sources by the respondents, namely;
trading, civil service, food processing, artisan, retirement benefit, transportation, food
vendor, craft work and clergy. During the survey, respondents were asked to indicate in
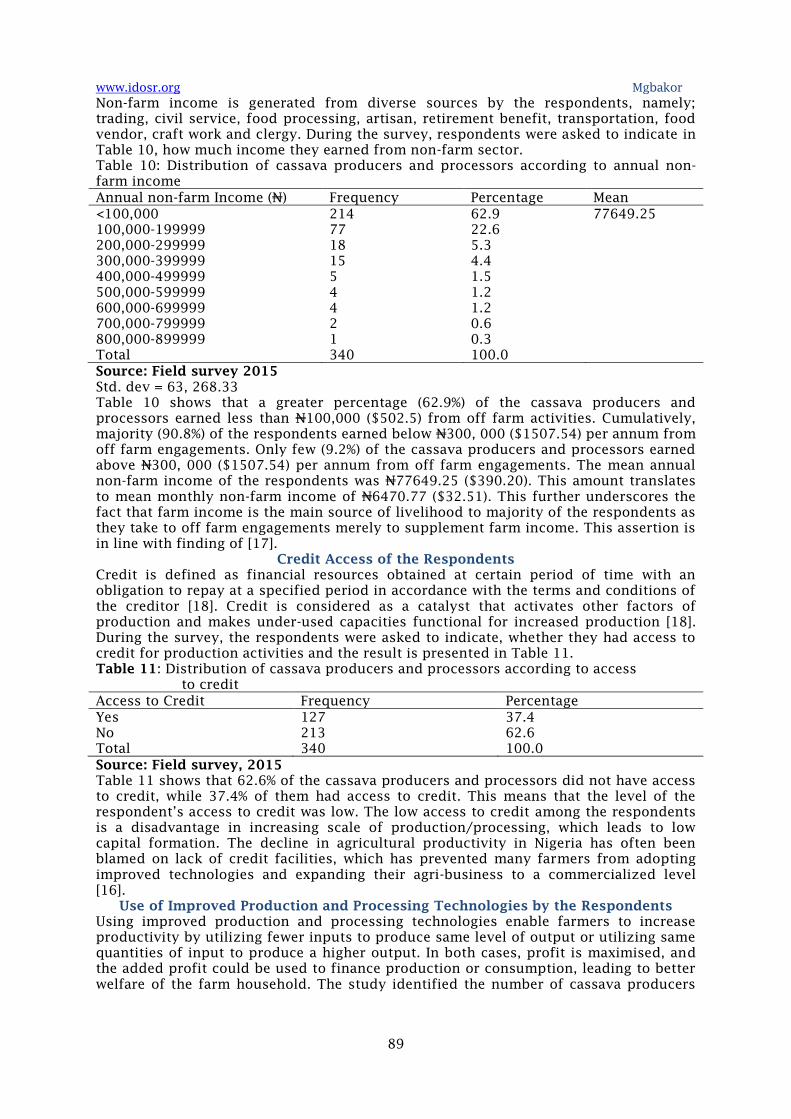
Table 10, how much income they earned from non-farm sector.
Table 10: Distribution of cassava producers and processors according to annual non-
farm income
Annual non-farm Income (N) Frequency Percentage Mean
<100,000 214 62.9 77649.25
100,000-199999 77 22.6
200,000-299999 18 5.3
300,000-399999 15 4.4
400,000-499999 5 1.5
500,000-599999 4 1.2
600,000-699999 4 1.2
700,000-799999 2 0.6
800,000-899999 1 0.3
Total 340 100.0
Source: Field survey 2015
Std. dev = 63, 268.33
Table 10 shows that a greater percentage (62.9%) of the cassava producers and
processors earned less than N100,000 ($502.5) from off farm activities. Cumulatively,
majority (90.8%) of the respondents earned below N300, 000 ($1507.54) per annum from
off farm engagements. Only few (9.2%) of the cassava producers and processors earned
above N300, 000 ($1507.54) per annum from off farm engagements. The mean annual
non-farm income of the respondents was N77649.25 ($390.20). This amount translates
to mean monthly non-farm income of N6470.77 ($32.51). This further underscores the
fact that farm income is the main source of livelihood to majority of the respondents as
they take to off farm engagements merely to supplement farm income. This assertion is
in line with finding of [17].
Credit Access of the Respondents
Credit is defined as financial resources obtained at certain period of time with an
obligation to repay at a specified period in accordance with the terms and conditions of
the creditor [18]. Credit is considered as a catalyst that activates other factors of
production and makes under-used capacities functional for increased production [18].
During the survey, the respondents were asked to indicate, whether they had access to
credit for production activities and the result is presented in Table 11.
Table 11: Distribution of cassava producers and processors according to access
to credit
Access to Credit Frequency Percentage
Yes 127 37.4
No 213 62.6
Total 340 100.0
Source: Field survey, 2015
Table 11 shows that 62.6% of the cassava producers and processors did not have access
to credit, while 37.4% of them had access to credit. This means that the level of the
respondent’s access to credit was low. The low access to credit among the respondents
is a disadvantage in increasing scale of production/processing, which leads to low
capital formation. The decline in agricultural productivity in Nigeria has often been
blamed on lack of credit facilities, which has prevented many farmers from adopting
improved technologies and expanding their agri-business to a commercialized level
[16].
Use of Improved Production and Processing Technologies by the Respondents
Using improved production and processing technologies enable farmers to increase
productivity by utilizing fewer inputs to produce same level of output or utilizing same
quantities of input to produce a higher output. In both cases, profit is maximised, and
the added profit could be used to finance production or consumption, leading to better
welfare of the farm household. The study identified the number of cassava producers
www.idosr.org Mgbakor
90
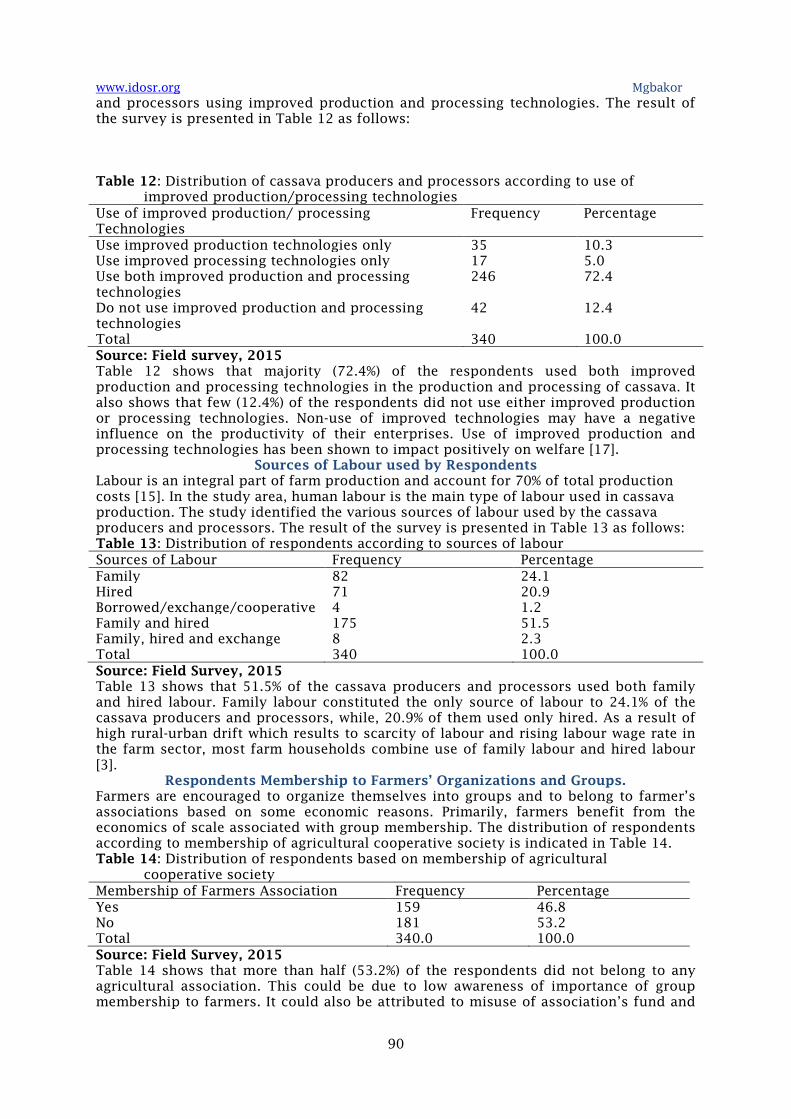
and processors using improved production and processing technologies. The result of
the survey is presented in Table 12 as follows:
Table 12: Distribution of cassava producers and processors according to use of
improved production/processing technologies
Use of improved production/ processing
Technologies
Frequency Percentage
Use improved production technologies only 35 10.3
Use improved processing technologies only 17 5.0
Use both improved production and processing
technologies
246 72.4
Do not use improved production and processing
technologies
42 12.4
Total 340 100.0
Source: Field survey, 2015
Table 12 shows that majority (72.4%) of the respondents used both improved
production and processing technologies in the production and processing of cassava. It
also shows that few (12.4%) of the respondents did not use either improved production
or processing technologies. Non-use of improved technologies may have a negative
influence on the productivity of their enterprises. Use of improved production and
processing technologies has been shown to impact positively on welfare [17].
Sources of Labour used by Respondents
Labour is an integral part of farm production and account for 70% of total production
costs [15]. In the study area, human labour is the main type of labour used in cassava
production. The study identified the various sources of labour used by the cassava
producers and processors. The result of the survey is presented in Table 13 as follows:
Table 13: Distribution of respondents according to sources of labour
Sources of Labour Frequency Percentage
Family 82 24.1
Hired 71 20.9
Borrowed/exchange/cooperative 4 1.2
Family and hired 175 51.5
Family, hired and exchange 8 2.3
Total 340 100.0
Source: Field Survey, 2015
Table 13 shows that 51.5% of the cassava producers and processors used both family
and hired labour. Family labour constituted the only source of labour to 24.1% of the
cassava producers and processors, while, 20.9% of them used only hired. As a result of
high rural-urban drift which results to scarcity of labour and rising labour wage rate in
the farm sector, most farm households combine use of family labour and hired labour
[3].
Respondents Membership to Farmers’ Organizations and Groups.
Farmers are encouraged to organize themselves into groups and to belong to farmer’s
associations based on some economic reasons. Primarily, farmers benefit from the
economics of scale associated with group membership. The distribution of respondents
according to membership of agricultural cooperative society is indicated in Table 14.
Table 14: Distribution of respondents based on membership of agricultural
cooperative society
Membership of Farmers Association Frequency Percentage
Yes 159 46.8
No 181 53.2
Total 340.0 100.0
Source: Field Survey, 2015
Table 14 shows that more than half (53.2%) of the respondents did not belong to any
agricultural association. This could be due to low awareness of importance of group
membership to farmers. It could also be attributed to misuse of association’s fund and
www.idosr.org Mgbakor
91
lack of trust on the leaders of farmer’s association [11]. According to [6] membership to
farmers association improves a farmer’s social capital. Collective endeavour make
necessary arrangements for better inputs supply, extension support, credit facilities,
collection of produce, processing and marketing facilities [2].
CONCLUSION
In conclusion, the cassava farmers/processors engaged primarily in farming, although
majority of them operated small farm sizes whose output are small. Consequently,
these farmers engage in other off-farm income generating activities whose returns are
smaller compared to returns generated from farming.
REFERENCES
1. Abalu, G. I. (2008). Agricultural self-sufficiency by Year 2020: From the Frying
Pan into the Fire
2. . Nigerian Association of Agricultural Economists. NAAEEconomic and Policy
Series, Vol. 1. No. 1, October.
3. Abang, S.O. and Agom, D.I. (2004). Resource use efficiency of small-holder
cassava farmers: The case of cassava producers in cross River State,
Nigeria. Journal of Food, Agriculture and Environment, 2 (3): 87-90.
4. Abdullahi, A. (2003). Employment creation and opportunities in the agro- allied
sub-sector: the case of cassava production. Central Bank of Nigeria Bullion, 27(4):
1-9.
5. Abdullahi, S. A. (2009). Entrepreneurship Skills Development as an
EconomicEmpowerment and Poverty education Strategy in Nigeria.Nigerian
Academy of Management Journal,3 (1): 42 - 47.
6. Abolaji, D., Willie, D., Siyabola, O., Oladele, O.F. and Isiaka, A. (2007).Capacity
Innovations in Cassava Production, Harvesting and Processing in Nigeria.
7. Achem, B. A. (2011). Assessment of Constraints to Cassava Value-Added
Enterprises in Kwara State, Nigeria. Journal of Agricultural Extension, 15,
(1):124-34.
8. Achem, B.A. et al., (2013): A Comparative Assessment of the Profitability of
Cassava Processing Enterprises in Kwara State, Nigeria. Global Journal of Current
Research Vol. 1 No. 2. 2013. Pp. 57-61.
9. Addy, P. S., Kashaija, I.N., Moyo, M.T., Quynh, N.K., Singh, S. and Awalekhwa, P.N.
(2004). Constraints and Opportunities for Small and Medium Scale Processing
of Cassava in the Ashati and Brong Ahafoa Regions of Ghana:
International Centre for Development oriented Research in Agriculture (ICRA).
10. Adebayo, A. (2009). Theoretical Perspectives on Poverty Reduction: Challenges
forPolicy in Nigeria. International Journal of Economic and Development Issues,8
(1): 34- 41.
11. Adebayo, E. (2005). Modelling the uptake of Agricultural knowledge and
information among small scale farmers in Ogun State.Nigeria Journal of
Agricultural Extension, 9: 116 125.
12. Adegbite, D. A., Oluruntoba, O.A., Adubi, K.O. and Shobanke S. B. (2008). Impact
of National Fadama Development Project II on Small Scale Farmers’ Income in
Ogun State. Implications for Agricultural Financing in Nigeria. Journal
of Sustainable Development in Africa, Vol 10, No. 3, 2008
13. Adeola R.G, Ayoade A.R (2009): Effect of gender discrimination in access to
technologies among farmers in Ibadan/Ibarapa Agricultural zone of Oyo state
Nigeria. Ozean Journal of social sciences, Vol. 2, No. 2, page 66
14. Adeolu, B.A. and Taiwo, A. (2004).The Impact of National Fadama Facility in
Alleviating Rural Poverty and Enhancing Agricultural Development in South
Minister of Agriculture Federal Republic of Nigeria at the International Institute
of Tropical Agriculture (IITA), Ibadan –Nigeria.
15. Adetunji, M.O., Oladejo, J.A., Oladiran, J.O. and Ojedokun, I.K. (2015). Factors
associated with Poverty Status among Women Cassava Processors in
www.idosr.org Mgbakor
92
Ogbomoso Agricultural Zone of Oyo State, Nigeria. International Journalof
conomics and BusinessManagement, 1 (5): 1-12.
16. Afolabi J.A. (2009): An Assessment of Garri Marketing in South –West Nigeria,
Journal of Social Sciences 21(10):33 –38
17. Ahmadu J. And Egbodion (2013) Effect of Oil Spillage on Cassava Production in
Niger Delta Region of Nigeria: American Journal of Experimental Agriculture 3(4):
914-926, 2013 Science domain international www.sciencedomain.org
18. Aigbokhan, B. E. (2000). Poverty, Growth and Inequality in Nigeria: A Case
Study.Nairobi: African Research Consortium.
19. Ajani, E.N. and Onwubuya, E.A. (2013).Analysis of use of improved cassava
production technologies among farmers in Anambra state, Nigeria.Journal of
Agricultural Research, 2(12): 335 – 341.
20. Ajani E.N, Mgbenka R. N., Onah O. (2015) “Empowerment of Youths in Rural Areas
through Agricultural Development Programmes: Implications for Poverty
Reduction in Nigeria” Journal of Research in Agriculture and Forestry, 212)
February 2015 36
21. Ajayi, M.T., Banmeke T.O.A., Omoregbee, F. E. and Edeoghon C.O.(2007)
Extension guide for growing cassava and rapid production of quality cassava
planting material.
22. Akeredolu – Ale, E.O. (1975) “Poverty as a Social Issue: A Theoretical Note”
In:Poverty inNigeria, Nigeria Economic Society (NES) Annual Conference,Ibadan
UniversityPress, Ibadan, PP: 43-61.
23. Akorede, M. A. (2004). Cassava industrial revolution in Nigeria: the potential for a
newindustrial agriculture, Ibadan 40-43.
24. Akinnagbe, O.M. (2010). Constraints and strategies towards improving
cassavaproduction and processing in Enugu North Agricultural Zone of Enugu
State,Nigeria.Bangladesh Journal of Agricultural Research, 35(3): 387-394.
25. Akinpelu, A.O. * L. E.F. Amamgbo*, A.O. Olojede,* A.S. Oyekale (2011). “Health
implications of cassava production and consumption”, Journal of Agriculture and
Social Research (JASR) Vol. 11, No. 1, 2011