Embed Size (px)
Citation preview

67
ANNALS OF GEOPHYSICS, VOL. 51, N. 1, February 2008
Key words time gravity changes – gravity record –volcanic processes – air pressure admittance
1. Introduction
A wide set of dynamic phenomena (i.e. ge-odynamics, seismicity, volcanic activity) canproduce temporal gravity changes, with a spec-
trum varying from short (1-10 s) to longer(more than 1 year) periods. An impending erup-tion, for instance, is generally associated withthe ascent of magma producing changes in thedensity distribution at depth, and leading toground deformation and gravity changes ob-served at surface. The amplitude of such gravi-ty variations is often quite small, on the order of10−9-10-8 g (10-102 nms−2; 1-10 µGal), so theirdetection requires high quality data and a rigor-ous procedure to split up from the records thoseweak gravity signals coming from differentsources. What exactly would Time-VariableGravity (TVG) tell us about mass redistributionbelow a volcano? The detected TVG is the sum
Strategies in the processing and analysisof continuous gravity record in active
volcanic areas: the case of Mt. Vesuvius
Umberto Riccardi (1), Giovanna Berrino (2), Gennaro Corrado (1) and Jacques Hinderer (3)(1) Dipartimento di Scienze della Terra, Università degli Studi di Napoli «Federico II», Napoli, Italy
(2) Istituto Nazionale di Geofisica e Vulcanologia, Osservatorio Vesuviano, Napoli, Italy(3) Ecole et Observatoire des Sciences de la Terre (EOST), Institut de Physique du Globe de Strasbourg,
Université Louis Pasteur (UMR 7516 CNRS-ULP), Strasbourg (France)
AbstractThis research is intended to describe new strategies in the processing and analysis of continuous gravity recordscollected in active volcanic areas and to assess how permanent gravity stations can improve the geophysicalmonitoring of a volcano. The experience of 15 years in continuous gravity monitoring on Mt. Vesuvius is dis-cussed. Several geodynamic phenomena can produce temporal gravity changes. An eruption, for instance, is as-sociated with the ascent of magma producing changes in the density distribution at depth, and leading to grounddeformation and gravity changes The amplitude of such gravity variations is often quite small, in the order of10-102 nms-2, so their detection requires high quality data and a rigorous procedure to isolate from the recordsthose weak gravity signals coming from different sources. Ideally we need gravity signals free of all effectswhich are not of volcanic origin. Therefore solid Earth tide, ocean and atmospheric loading, instrumental driftor any kind of disturbances other than due to the volcano dynamics have to be removed. The state of the art onthe modelling of the solid Earth tide is reviewed. The atmospheric dynamics is one of the main sources preclud-ing the detection of small gravity signals. The most advanced methods to reduce the atmospheric effects on grav-ity are presented. As the variations of the calibration factors can prevent the repeatability of high-precision meas-urements, new approaches to model the instrumental response of mechanical gravimeters are proposed too.Moreover, a strategy for an accurate modelling of the instrumental drift and to distinguish it from longterm grav-ity changes is suggested.
Mailing address: Dr. Umberto Riccardi, Dipartimentodi Scienze della Terra, Università degli Studi di Napoli «Fe-derico II», Largo S. Marcellino 10, 80138 Napoli, Italy; e-mail: [email protected]
Vol51,1,2008_DelNegro 16-02-2009 21:27 Pagina 67

68
U. Riccardi, G. Berrino, G. Corrado and J. Hinderer
could be useful to characterize the deformation-al behaviour in some geodynamic contexts.Several investigations (e.g., Melchior andDucarme, 1991; Melchior, 1995; Robinson,1989, 1991) carried out to date show for in-stance that a correlation exists at «regional»scale between heat flow and the gravity tide. Atvery local scale Arnoso et al. (2001) suggestthat the tidal response can be strongly influ-enced by the structure and mechanical proper-ties of the Crust. Those anomalies are associat-ed, respectively, with areas of thin crust, highheat flow values, and recent basaltic-type vol-canic activity, and with stable structures thathave a deeper Moho discontinuity and lowerheat flow. Robinson (1989, 1991) relates thecorrelation found in his studies to features inthe upper crust, suggesting a measurable uppercrustal tidal response. Arnoso et al. (2001) ob-tained interesting results from the analysis ofthe gravity tide collected in two continuous sta-tions in Lanzarote island (Canary islands-Spain). After a suitable reduction of the OTLeffect by means of global ocean charts comple-mented with regional and local ones, they ob-tained anomalous M2 and O1 delta factors andphases consistent with a body tide effect. Theseresults were interpreted as the response of aporous or cavity-filled, local, upper crust underthe influence of tidal strain.
Moreover, knowledge of the specific tidalparameters for an area is required to calculatethe luni-solar effect, which has to be removedfrom the gravity record to obtain gravity resid-uals.
As we are interested in modelling the trans-fer function between the observed gravity andthe underground mass redistribution due to vol-canic activity, ideally we need residual gravitysignals free of all effects which are not of vol-canic origin. In fact, natural (mainly bodytides), man-made and instrumental sources af-fect the signal to noise ratio and hide the subtlevolcanic signals. Therefore solid Earth tide,ocean and atmospheric loading, instrumentaldrift, hydrological effects or any kind of distur-bances other than due to the volcano dynamicshave to be modelled to be reduced in the gravi-ty signal. The atmospheric dynamics is one ofthe main sources precluding the detection of
of the gravitational signals originating from allgeophysical sources at work at any given time.Sorting out different geophysical signals in thedata is a challenge, but in principle can be facil-itated by recognizing the different temporal andspatial characteristics of different geophysicalphenomena (e.g., Chao, 1994).
Unlike the repeated relative gravity meas-urements on network, there are limited data oncontinuous gravity observations at active volca-noes (e.g., Imbò et al., 1965a; Davis, 1981;Vieira et al., 1991; Goodkind and Young, 1991;Berrino et al., 1997; Budetta and Carbone,1997; Bonvalot et al., 1998; Arnoso et al.,2001, Carbone et al., 2003, 2006).
Two different approaches may be adopted toextract from the gravity records some insightsrelated with the volcano dynamics, i.e., theanalysis of the tidal gravimetric factor (delta: δ)and the analysis of gravity residuals.
According to the recommendations of theWorking Group on the Theoretical Tidal Model(SSG of the Earth Tide Commission Sec. V ofthe IAG), the delta factor (δ) is defined as theEarth’s transfer function between the body tidesignal (∆gn(r)) measured at the station by agravimeter and the amplitude of the verticalcomponent of the gradient of the external tidalpotential (Vn) at the station.
where
r is the radius of the Earth and , ,are volumeLove numbers of degree n (complex value),which characterize the spherical elasticity of theEarth. Thus delta factor is the ratio between theobserved gravity tide and the luni-solar gravita-tional attraction. As it defines the Earth transferfunction of the external tidal potential, the deltafactor is frequency-dependent and is related tothe elastic property of the Earth. Because of theviscoelastic behaviour of the Earth, its reactionto the external perturbation due to the luni-solargravitational attraction is characterized by acertain phase shift. So the study of the tidal pa-rameters (delta factor and phase) for the maintidal waves and eventually their time evolution
knuhn
u
n h nn
k12 1
n n nδ = + - +u u u
( )nr
g r Vn n nδ∆- =u u
Vol51,1,2008_DelNegro 16-02-2009 21:27 Pagina 68

69
Strategies in the processing and analysis of continuous gravity record in active volcanic areas: the case of Mt. Vesuvius
small amplitude gravity signals. Pressurechanges can reach several tens of hecto-Pascal(say 50 hPa) in specific locations, so the ampli-tude of the atmospheric contribution to gravityis as large as 200 nms-2, then it could be higherthan volcanic signal. This is why a large part ofthis paper have been devoted to illustrating themost advanced developments in that field of re-search and the experience of the authors is pre-sented.
The goal of this paper is to describe newstrategies in the processing and analyses of con-tinuous gravity record collected in active vol-canic areas. The experience of about 15 years atMt. Vesuvius (Southern Italy) is reported. Thetime dependent behaviour of the tidal gravimet-ric factors is compared with the results fromrelative and absolute gravity surveys and seis-mic activity. The results are interpreted in theframework of the present-day dynamics of Mt.Vesuvius.
Mt. Vesuvius is a quiescent volcano whoselast eruption occurred in March 1944. Current-ly, its activity consists of a low level of seismic-ity, sometimes increasing in numbers of quakesand energy (hereafter called seismic crises),small ground deformation, gravity changes andmoderate gas emission.
2. The Mt. Vesuvius permanent gravity station
The Mt. Vesuvius recording gravity station(fig. 1) is located at the Osservatorio Vesuviano(fig. 1), where a recording gravity station hasbeen operating since 1987 (Berrino et al.,1993b) and where a first experiment of contin-uous gravity measurements dates back to 1960s(Imbò et al., 1964, 1965a). The permanent sta-tion is assembled on a concrete pillar located inan artificial cave, 20 m deep (ϕ: 40.828N, λ:14.408E; h: 608 m) (Berrino et al., 1997),where the daily temperature variations areabout 0.1°C and the annual ones are within2°C. The gravity sensor is the LaCoste andRomberg model D, number 126 (LR-D126),equipped with a feedback system (van Ruym-beke, 1991), with a range equivalent to 3⋅104
nm/s2 (implemented at the ROB, Royal Obser-
vatory of Belgium in Brussels and upgraded in1994). The data acquisition is provided by DASor mDAS systems developed at the ROB (vanRuymbeke et al., 1995) at a sampling rate of 1data/min (0.01667 Hz). Here we focus on theresults of gravity records since 1994 (fig. 2),when the instrument and siting of the stationwere improved. The station belongs to a rela-tive gravity network, spanning the Vesuvianarea, periodically surveyed since 1982. It isclose to an absolute gravity station establishedon the volcano in 1986. The absolute value of gwas measured in 1994, 1996, 1998 and 2003(Berrino, 1995; Berrino, 2000).
In order to check the reliability of the grav-ity signals, the instrumentation is periodicallycalibrated and the background noise level at thestation is analyzed. In fact, instrumental sensi-tivity can change, not always linearly, as a con-sequence of mechanical perturbations and thenoise level at the gravity station. To character-ize the background noise level, which could af-fect the instrumental response, the 1 min sam-pled residual gravity was analyzed to detect any
Fig. 1. Location of the recording gravity station andgravity network on Mt. Vesuvius.
Vol51,1,2008_DelNegro 16-02-2009 21:27 Pagina 69

70
U. Riccardi, G. Berrino, G. Corrado and J. Hinderer
Fig. 3. Power spectra of the background noise level computed in each seasons at the Mt. Vesuvius gravity sta-tion, with the indication of the standard New Low Noise Model (NLNM) as reference.
Fig. 2a,b. Hourly values of gravity records (a), drift corrected gravity residuals (b). Anomalous record with ab-normal drift and very large residuals are highlighted in circles.
possible seasonal dependence or the presenceof spectral components which could hide ormask geophysical signals. Several time win-dows lasting about 1 week were selected in
each season. The amplitude and spectral con-tent of the noise (Berrino and Riccardi, 2004)show a flat trend in the analyzed spectral band(fig. 3), according to the standard New Low
a
b
Vol51,1,2008_DelNegro 16-02-2009 21:27 Pagina 70

71
Strategies in the processing and analysis of continuous gravity record in active volcanic areas: the case of Mt. Vesuvius
Noise Model [NLNM] (Peterson, 1993). Thehigh noise level during the autumn is a conse-quence of the meteorological condition (mainlywind) at Mt. Vesuvius during that season.
Changes through time of the calibration fac-tors for different kinds of mechanical gravime-ters have been detected by several authors (e.g.,Bonvalot et al., 1998; Budetta and Carbone,1997; Riccardi et al., 2002). However, a com-plete understanding of the physical processesaffecting the instrumental sensitivity is still farfrom being achieved. As changes in instrumen-tal sensitivity can prevent the repeatability ofmeasurements and affect the phase and ampli-
tude of the recorded gravity signals, the accu-rate calibration of gravimeters plays a key rolein high precision gravity measurements (Ric-cardi et al., 2002). The calibration of a gravime-ter at an accuracy level of 10−8 to 10−9 g, is dif-ficult to attain because of the many problems inpursuing a known gravity change («standard»)at such a level of accuracy. The stability of thecalibration factors of LR-D126 has been peri-odically investigated on site. This kind of cali-bration is obtained by inducing changes in thespring length through a known «dial» turningand fitting this, by least-squares, against the in-strumental output. This is the most frequently
Table I. Comparison between LR-D126 and superconducting SG-TT70-T015 meters: results (delta factor andphase) of the tidal analysis for the main tidal waves. In the last column the ratio (SG/D) of delta factors obtainedby the records from the superconducting and D meters is listed. The tidal waves nomenclature is: O1-Diurnal lu-nar; P1-Diurnal lunar; K1-Diurnal luni-solar; S1-Diurnal solar; M2 Semi-diurnal lunar; S2 semi-diurnal solar.
LR-D126 SG-TT70-T015
Wave Delta Phase (°) Delta Phase (°) LR/SG
O1 1.147 ± 0.003 -0.2 ± 0.1 1.14 ± 0.01 -0.1 ± 0.6 1.006 ± 0.009P1S1K1 1.137 ± 0.002 0.0 ± 0.09 1.130 ± 0.009 0.1 ± 0.6 1.006 ± 0.007
M2 1.184 ± 0.001 1.14 ± 0.06 1.176 ± 0.003 0.9 ± 0.2 1.007 ± 0.004
Fig. 4. Calibration factors obtained with on-site and absolute calibration for LR-D126 gravity meter; units ofvertical axis (ndiv) are number of scale divisions.
Vol51,1,2008_DelNegro 16-02-2009 21:27 Pagina 71
72
U. Riccardi, G. Berrino, G. Corrado and J. Hinderer
adopted calibration procedure for continuousgravity station equipped with relative mechani-cal instruments. Various schemes of dial turn-ing have been tested at Mt. Vesuvius station(Riccardi et al., 2002). Hereafter, such calibra-tions are referred to as «on-site» calibrations.Moreover, two additional calibrations of thefeedback were carried out in June 1994 and No-vember 1997 in Sèvres, at the Bureau Interna-tional des Poids et Mesures (BIPM) during theInternational Comparison of AbsoluteGravimeters (Becker et al., 1995, 2000). A cal-ibration of the instrumentation was also ob-tained in 1997 by means of a joint intercompar-ison with the superconducting gravimeter SG-TT70-T015 (table I) and the absolute FG5-206gravimeter (Riccardi et al., 2002). The inter-comparison between spring and superconduct-ing gravimeters is the most suitable way to de-termine the transfer function of spring gravime-ters in the tidal band. Detailed information onthe different calibrations and operational proce-dures carried out at this station are given in Ric-cardi et al. (2002). The time distribution of thecalibration factor is shown in fig. 4. In this plotthe value from the intercomparison with theFG5-206 absolute gravimeter is shown and thesuitable range of repeatability of the calibrationfactor at 1% level is also drawn. A large scatter-ing of the calibration factor occurs from 1999 to2001, when some anomalous signals were de-tected. The anomalous signals (highlighted in
fig. 2a) were characterized by an abnormal driftand then very large gravity residuals.
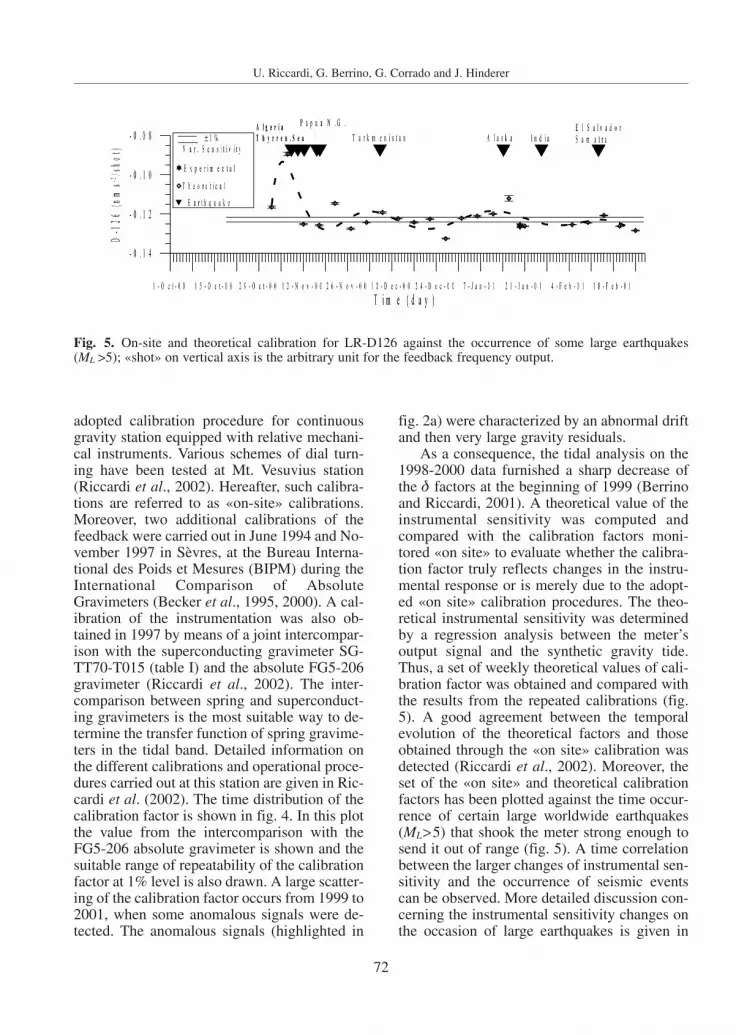
As a consequence, the tidal analysis on the1998-2000 data furnished a sharp decrease ofthe δ factors at the beginning of 1999 (Berrinoand Riccardi, 2001). A theoretical value of theinstrumental sensitivity was computed andcompared with the calibration factors moni-tored «on site» to evaluate whether the calibra-tion factor truly reflects changes in the instru-mental response or is merely due to the adopt-ed «on site» calibration procedures. The theo-retical instrumental sensitivity was determinedby a regression analysis between the meter’soutput signal and the synthetic gravity tide.Thus, a set of weekly theoretical values of cali-bration factor was obtained and compared withthe results from the repeated calibrations (fig.5). A good agreement between the temporalevolution of the theoretical factors and thoseobtained through the «on site» calibration wasdetected (Riccardi et al., 2002). Moreover, theset of the «on site» and theoretical calibrationfactors has been plotted against the time occur-rence of certain large worldwide earthquakes(ML>5) that shook the meter strong enough tosend it out of range (fig. 5). A time correlationbetween the larger changes of instrumental sen-sitivity and the occurrence of seismic eventscan be observed. More detailed discussion con-cerning the instrumental sensitivity changes onthe occasion of large earthquakes is given in
Fig. 5. On-site and theoretical calibration for LR-D126 against the occurrence of some large earthquakes(ML >5); «shot» on vertical axis is the arbitrary unit for the feedback frequency output.
Vol51,1,2008_DelNegro 16-02-2009 21:27 Pagina 72

73
Strategies in the processing and analysis of continuous gravity record in active volcanic areas: the case of Mt. Vesuvius
Riccardi et al. (2002) and Berrino and Riccardi(2004). They suggest a mechanical perturbationof the sensor, due to some dominant frequen-cies of the noise at the station on the occasionof large earthquakes. In fact the higher frequen-cy of the seismic free oscillation excited bylarge earthquakes includes the fundamentalmode of oscillation (T0: 15 to 20 s) of the La-Coste and Romberg spring gravimeters (Torge,1989). These instrumental disturbances due tolarge earthquakes can last several weeks.
3. Ocean loading and atmospheric reduction
The state of the art of the modelling of theocean loading effect on local gravity data ishereafter reviewed and the most advancedmethods in pursuing the reductions of the at-mospheric effects are presented. To focus onthe methodological upgrades, we present ourattempt to model the barometric «local» effecton gravity data in a stable non-volcanic area bymeans of a barometric array. However, by theway of the methodological approaches, theseresults can be fruitfully applied to fix the prob-lem of air pressure effect on local TVG in vol-canic areas.
In a very general sense, Ocean Tide Loading(OTL) is the deformation of the Earth due to theweight of the ocean tides. The ocean tides in-duces water mass redistributions causing peri-odic loading of the ocean bottom. The Earth’sdeformation (vertical and horizontal displace-ment, TVG, tilt and strain) under this load iscalled ocean tide loading. The ocean tides aswell as the body tides have more than one peri-odicity, so they can be described as the sum ofseveral harmonic components having their ownperiod. Problem areas are mostly islands andshallow seas with large tidal amplitude and fastvarying phase lag. These include among theothers in Europe: the Mediterranean Sea andthe North Sea.
To compute the ocean tide loading the oceantides are integrated with a weighting function G
(3.1)
Here L is the loading phenomenon (displace-ment, gravity, tilt or strain) at the station locat-ed at distance r. The ocean tide at r’ is given inits complex form Z=Aeiϕ, where ϕ is the phase;ρ is the mean density of sea water and G isGreen’s function for the distance |r−rl|. The in-tegral is taken over all global water masses A.
( ) ( )L r Z r G r r dAA
ρ= -l l#
Table II. Amplitude (L; in nm s-2) and phase (ϕ in degrees) of the main harmonics of the OTL computed forMt. Vesuvius station by means of different models.
SCW80 CSR 3.0 FES 95.2 TPXO 6.2 TPXO 7.0
Wave L ϕ L ϕ L ϕ L ϕ L ϕ
M2 11.5 -85.4 9.2 -68.0 10.6 -69.1 9.5 -67.8 9.6 -66.9S2 4.0 -58.8 3.1 -58.6 4.0 -58.1 4.6 -57.7 3.3 -49.6N2 2.3 -100.3 1.7 -82.4 2.2 -84.9 2.1 -66.7 2.2 -80.5K2 1.1 -58.9 0.8 -59.1 1.1 -63.4 0.9 -33.9 1.1 -37.6K1 1.1 -131.8 2.0 -84.1 2.8 -76.6 1.5 -83.9 1.5 -81.1O1 1.2 169.0 1.3 -131.7 2.0 -145.3 1.3 -147.4 1.3 -153.0P1 0.4 -136.8 0.7 -90.0 0.9 -84.4 0.6 -100.3 0.4 -121.8Q1 0.3 116.2 0.1 167.7 0.3 168.2 0.4 129.9 0.4 131.4MF 0.4 -16.8 0.5 27.1 0.5 27.1 0.4 33.8 0.3 32.2MM 0.2 -109.7 0.3 23.2 0.1 22.9 0.3 30.3 0.2 21.0SSA 0.3 -93.1 0.3 4.5 0.2 3.9 0.3 4.5 0.3 4.5
Vol51,1,2008_DelNegro 16-02-2009 21:27 Pagina 73

74
U. Riccardi, G. Berrino, G. Corrado and J. Hinderer
Green’s function determines how much theEarth deforms due to the point load (a generalsolution of this problem is given in Farrel,1972). The next step is to replace the convolu-tion integral by a summation. Most ocean mod-els are given on a 0.5° by 0.5° grid, which jus-tifies direct summation over these ocean gridcells if the station is more than 10 km from thecoast. Otherwise some re-gridding is necessary.Some local solutions (models) are obtained bymeans of a re-gridding the model gradually to-wards the station.
Table II lists the amplitude (L) and phase(ϕ) of the main 11 harmonics of the OTL com-puted for Mt. Vesuvius station. These 11 har-monics are the largest in amplitude and repre-sent most of the total tidal signal. These havebeen computed by means of a free OTLprovider developed at the Onsala Space Obser-vatory and maintained by M.S. Bos and H.-G.Scherneck (http://www.oso.chalmers.se/~load-ing/). Solutions coming from classical(SCW80) (Schwiderski, 1980) and most recentmodels (CSR 3.0; FES95.2, TPXO6.2,TPXO7.0) (Eanes, 1994; Le Provost et al.,1998; Egbert and Erofeeva, 2002) have beenobtained. If the stations are close to the coast,like the Mt. Vesuvius one, an automatic interpo-lation is applied using a mask having a coast-line resolution of 0.6 km. Schwiderski’s model(SCW80) is one of the oldest and it has beenconsidered the standard for many years. It is ahydrodynamic model, given on a 1° by 1° gridand uses an interpolation scheme to fit the tidegauges; SCW80 model does not account for theMediterranean sea tide. FES95.2 is an upgradeof the FES94.1 model, a pure hydrodynamictide model tuned to fit tide gauges globally,which includes the Mediterranean Sea tide. InFES95.2 the tides in the Arctic were improvedand TOPEX/Poseidon satellite altimeter datahas been used to adjust the long wavelength be-haviour of FES94.1. It has been calculated on afinite element grid with very fine resolutionnear the coast. The version used at Mt. Vesu-vius station is given on a 0.5° by 0.5° grid. TheCSR3.0 models are nothing other than a longwavelength adjustment of FES94.1 model byusing TOPEX/Poseidon data and are given on a0.5° by 0.5° grid. TPXO.6.2 and 7.0 have been
computed using inverse theory using tide gaugeand TOPEX/Poseidon data. These models havea resolution of a 0.25° by 0.25° grid.
The results lead to a maximum OTL effect atMt. Vesuvius of about 10 nm/s2 (1 mGal) with aslightly lower amplitude obtained by means ofmodels accounting for Mediterranean Sea tides.
The amplitude and phase of such effect hasto be accounted for to avoid a tidal modulation(diurnal and semi-diurnal) in the residual grav-ity signals.
Besides solid Earth and ocean tides, atmos-pheric pressure variations are one of the majorsources of surface gravity perturbations pre-venting a highly accurate detection of smallamplitude gravity signals (see e.g., Hindererand Crossley, 2000, 2004). The continual redis-tribution of air mass in the Earth’s atmospherecauses periodic variations in local gravity at thesolar tidal frequencies as well as random varia-tions (Warburton and Goodkind, 1977; Spratt,1982). Gravity (measured positive down) andlocal atmospheric pressure correlate with an ad-mittance of about −3.0÷−3.5 nms−2/hPa (e.g.,Warburton and Goodkind, 1977; Müller andZürn, 1983; Merriam, 1992). Knowing thatpressure changes can reach 50 hPa in specificlocations, the amplitude of atmospheric contri-bution to gravity may be as large as 200 nms−2,which is typically only 10 times less than thesolid Earth tides. Moreover, because this effectvaries both in time and with frequency (Richteret al., 1995), the contribution is spread over awide spectral domain and may inhibit the ob-servation of small signals of non-tidal origin.The global atmosphere acts on surface gravitythrough two competing effects: a direct «New-tonian» attraction by air masses and an elasticcontribution due to the Earth’s surface loading.The amplitude and polarity of these two effectsvary with distance, so the net contribution ofthe atmosphere coming from different distancesfrom the gravity station is variable (e.g., Spratt1982; Merriam, 1992; Mukai et al. 1995; Boyet al. 1998). The coherence scale of pressurefluctuations and some considerations on the hy-drostatic approximation of the atmosphere, ledsome authors to suggest a division of the globeinto «local» (within 50 km), «regional» (50-1000 km) and «global» zones (>1000 km)
Vol51,1,2008_DelNegro 16-02-2009 21:27 Pagina 74

75
Strategies in the processing and analysis of continuous gravity record in active volcanic areas: the case of Mt. Vesuvius
(Atkinson, 1981; Merriam, 1992). In the localzone (<50 km) pressure can change rapidly intime, but is spatially coherent, so that pressureobservations collected at the gravity site aresufficient to obtain an accurate reduction with-in a few tenths of nm/s2 except when a front ispassing through the local zone (Rabbel andZschau, 1985). When a pressure front movesthrough or larger horizontal gradients affect thelocal zone, the band from 1 to 10 km from thegravity station becomes a critical area for whichmore detailed pressure data are needed.
Atmospheric effects on gravity are routine-ly reduced using a barometric admittance,which is a simple transfer function adjusted byleast square fitting between pressure and gravi-ty, both measured locally. The use of a singlescalar admittance has been well established(e.g., Warburton and Goodkind, 1977; Crossleyet al. 1995). When atmospheric pressure p(hPa) is recorded jointly with gravity g (nms−2)at a single station, the gravity can be reduced(gr) by using the relation
(3.2)
where pn is a reference pressure at the station andα is either a nominal value of −3.0 nms-2/hPa ordetermined by a least squares fit of p to g.
The effectiveness and simplicity of thismethod has led to its widespread use in gravitystudies for many purposes. This reduction typi-cally accounts for some 90% of the total atmos-pheric effect. The drawback of this method isthat the admittance shows some variation withtime (e.g., Richter, 1987; Van Dam and Francis,1998), usually on seasonal time scales, whereasthe atmosphere is certainly variable on shorttime scales and local weather systems can moverapidly over a station in a few hours (Müllerand Zürn, 1983; Rabbel and Zschau, 1985). Sothere is no guarantee that the correlation im-plied by eq. (3.2) is satisfied over all length andtime scales. Furthermore Crossley et al. (2002)found that the admittance is sensitive to thetime averaging windows applied on data, name-ly a higher admittance is found for shorter win-dowing. Moreover, the simple reduction usingonly the local pressure measurements cannottake into account either the global scale or re-
( )g g p pr nα= - -
gional (1000 km around the gravimeter) atmos-pheric effects.
Several approaches using the local pressuremore effectively have been attempted, particu-larly with a frequency dependent admittance(e.g., Warburton and Goodkind, 1977; Crossleyet al. 1995; Neumeyer, 1995; Neumeyer et al.,1998; Kroner and Jentzsch, 1998; Van Dam andFrancis, 1998). The method represents a trans-formation of the eq. (3.2) from the time domainto the frequency (ω) domain and allowing theadmittance (α) to be frequency dependent
(3.3)
Minimising ⎮Gr(w)⎮2 over the whole frequen-cy range leads to
(3.4)
which is equivalent to the complex admittancedefined by Warburton and Goodkind (1977).Crossley et al. (1995) demonstrated that thecomplex admittance, as expressed in eq. (3.4),is a powerful and versatile tool to model bothlocal atmospheric effect and contribution due tothe solar harmonics Sn and allows to select thefrequency ranges of the air pressure reduction.
3.1. Atmospheric reduction by means of a barometric array
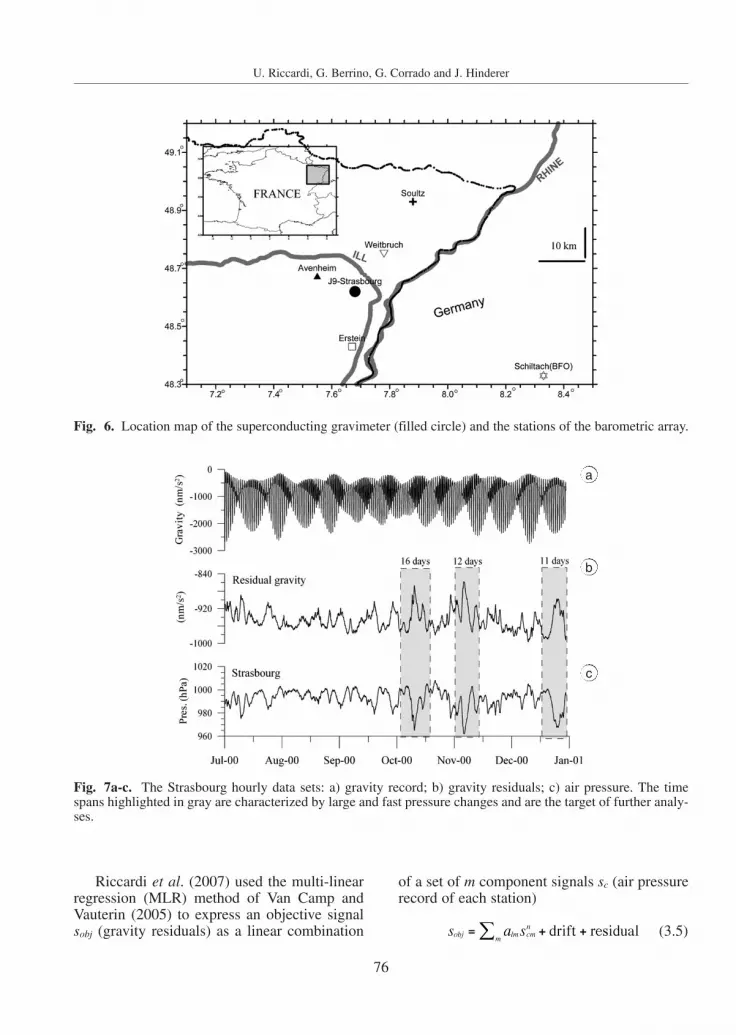
Riccardi et al. (2007) investigated the effi-ciency of a barometric array (fig. 6) to improvethe reduction of the «local» atmospheric effectson gravity data in normal weather conditionsand also under extreme weather conditions.This research has been developed by using Su-perconducting Gravity (SG) data collected inStrasbourg and barometric records in five sitesaround the SG station at distances ranging be-tween 10 and 60 km (fig. 6). Six months ofgravity and air pressure records (fig. 7) havebeen analyzed both in the time and frequencydomains. Some further analyses have been ad-dressed on three time intervals (highlighted infig. 7) characterized by large and fast air pres-sure changes.
( )( )
( ) ( )
P
G P2α ω
ωω ω
= //
( ) ( ) ( ) ( )G G Pr ω ω α ω ω= -
Vol51,1,2008_DelNegro 16-02-2009 21:27 Pagina 75
76
U. Riccardi, G. Berrino, G. Corrado and J. Hinderer
Riccardi et al. (2007) used the multi-linearregression (MLR) method of Van Camp andVauterin (2005) to express an objective signalsobj (gravity residuals) as a linear combination
of a set of m component signals sc (air pressurerecord of each station)
(3.5)drift residuals a sobj lm cmn
m= + +/
Fig. 6. Location map of the superconducting gravimeter (filled circle) and the stations of the barometric array.
Fig. 7a-c. The Strasbourg hourly data sets: a) gravity record; b) gravity residuals; c) air pressure. The timespans highlighted in gray are characterized by large and fast pressure changes and are the target of further analy-ses.
b
c
a
Vol51,1,2008_DelNegro 16-02-2009 21:27 Pagina 76

77
Strategies in the processing and analysis of continuous gravity record in active volcanic areas: the case of Mt. Vesuvius
In this study we set n=1 (a linear regression).The drift term, which is used to model the long-term instrumental behaviour in the gravityrecord consists of a polynomial of degree k (t isthe time)
(3.6)
The parameters a1 ... an, b1 ... bn, were estimat-ed by least squares adjustment.
b t$+fb b t b t b t$ $ $+ + + +=( )drift a pk
0 1 22
33
Fig. 8a-f. Residual gravity obtained for a time span 11 days long during December 2000 (ref. fig. 7a-c). Com-parison of different kinds of reduction: a) by means of: a single admittance coefficient; b) a fit to pressure datafrom Strasbourg only; c) a fit to pressure data from the whole array; d) a frequency dependent admittance; e) airloading computed with the hybrid model; f) fourier spectrum of the reduced residual gravity.
a
b
c
d
e
f
Vol51,1,2008_DelNegro 16-02-2009 21:27 Pagina 77

78
U. Riccardi, G. Berrino, G. Corrado and J. Hinderer
The MLR approach allows us to jointly ac-count for the atmospheric effect as it can beprobed trough the barometric array. A similarmethodology has also been applied by Dittfeld(1995) and Kroner and Jentzsch (1998).
The results obtained on the whole data set(6 months) demonstrated that negligible im-provement in the «local» atmospheric reductionderives from the use of an array, as also shownby Dittfeld (1995). Moreover the short length ofour study did not permit us to investigate sea-sonal variations in the pressure reduction togravity.
We further compared the efficiency of theatmospheric reduction by means of the baro-metric array with the one performed throughglobal loading computation (Boy et al., 2002;Petrov and Boy, 2004). We use ECMWF (Euro-pean Centre for Medium-range Weather Fore-casts) surface pressure fields from the 4Dvarmodel as they have the highest temporal (3 h)and spatial (0.5°) resolution. A more detaileddescription of the global loading computation isgiven in Riccardi et al. (2007) and Petrov andBoy (2004). The results showed that gravityresiduals reduced by means of the atmosphericloading using the 4Dvar surface pressure areslightly worse than those obtained by applyinga single admittance coefficient. This is likelydue to the low resolution of the loading model,which is unable to reconstruct high frequencylocal barometric changes.
These considerations could be extendedwhen the mean atmospheric conditions are notfar from the hydrostatic equilibrium. So we de-cided to analyze data during shorter time inter-vals, mainly characterized by abnormal weath-er conditions like when an atmospheric front ispassing. Here the results for 11 days during De-cember 2000 are shown (figs. 7 and 8).
In order to improve the time and spatial res-olution of the computed global atmosphericloading, we tested a hybrid method which con-sists in the following steps:
– a global loading reduction using the 3 hand 0.5°×0.5° grided surface pressure fieldseverywhere except in the local zone. The glob-al contribution has been recomputed from the4Dvar model and oversampled to 60 s withspline interpolating functions;
– a local loading reduction obtained by di-viding the local zone into a smaller grid usinginterpolated data and the 60 s pressure samplesfrom the closest stations of the barometric ar-ray, except the central zone;
– a central zone reduction using the J9 sta-tion pressure.
All three contributions have been addedleading to a hybrid time series of the atmos-pheric loading. The effect of the hybrid modelin the load computation is clear, the increase inthe model resolution has led to improve the ef-ficiency of the global loading reduction givingresults similar to those obtained through thebarometric array (fig. 8c,e). To evaluate the po-tentiality of each aforesaid method of reductionRiccardi et al. (2007) considered the standarddeviation (σ) of the reduced gravity residuals asan estimator of the efficiency of the applied airpressure reduction. The standard deviations ofgravity residuals reduced by means of the baro-metric array have been better than to those re-duced by using an air pressure record collectedin a single station. The use of the barometer ar-ray lowers the standard deviation of the gravityresiduals by about 30%. The improvement isessentially due to a removal of an almost quad-ratic background trend by using the array (seefig. 8a-c). The trend could be related to somecoherent features of the barometric field at localscale sensed by the array. Moreover an im-provement in the atmospheric reduction hasbeen achieved with a frequency dependent ad-mittance (fig. 8d); as demonstrated by severalauthors (Crossley et al., 1995), the reduction issignificantly better mainly at high frequency(>2 cpd), because large-scale pressure fluctua-tions are less correlated with gravity than arelocal pressure fluctuations. In only one of the 3periods of rapid changes we investigated did thearray improve on standard methods, and even inthat case the improvement was noticeable onlyin the low frequencies, but actually worse athigh frequencies. The spectra of the unreducedand reduced gravity residuals according to allthe reduction methods are also drawn (fig. 8f).They clearly show that a single admittance co-efficient is enough to reduce the energy in allthe spectral bands. Data from the barometernetwork improve the reduction at low frequen-
Vol51,1,2008_DelNegro 16-02-2009 21:27 Pagina 78

79
Strategies in the processing and analysis of continuous gravity record in active volcanic areas: the case of Mt. Vesuvius
cies (<2.5 cpd) while at higher frequencies theresults are worse. In fact, comparing the gravi-ty residuals reduced by a single admittance co-efficient with those reduced through data fromthe barometric array (fig. 8a,c), an increase inhigh-frequency (>3 cpd) noise is quite evident.These features could be due to the summationof correlated high-frequency noise in the pres-sure data series. Hence the use of pressure dataacquired by an array to improve the gravity re-duction requires special care, because theycould introduce an artificial high-frequencynoise. The application of the hybrid method im-proves the air pressure reduction in almost theentire spectral band except for the 2.0 cpd band(fig. 8e). This would be the result of two modeldefaults i.e. an inefficient tidal fitting in theresidual gravity computation and an inadequatemodelling of the air loading due to the thermalS2 component (see Ponte and Ray, 2002).
Finally we note that during normal atmos-pheric conditions, when the atmosphere is in ap-parent hydrostatic equilibrium, the use of our lo-cal array of barometers gave no improvementover the use of the pressure at the station itself.Accounting for the geometry of the availablebarometric array and the typical amplitude (10−2
hPa) of the pressure signal in the «local» zone,we could expect some improvement with a more
dense array of higher quality sensors using themethods described in this paper.
A more general consideration arises fromthis experience: the highest level of develop-ment in air pressure reduction of local gravitydata make sense only for gravity signals col-lected by superconducting gravimeters. Other-wise a single barometer can be enough to ac-count for the main part of the pressure effectoriginating in the local zone. However it isnoteworthy that a significant progress in model-ling atmospheric effects, as demonstrated byseveral authors, can be pursued by using a fre-quency dependent admittance, which allows usto model the weather contribution at differentfrequency ranges. The reduction is significantlyimproved mainly at high frequency (>2 cpd)and consequently the reduced gravity residualsare much smoother than the others obtained byapplying different kind of reductions.
4. Analysis of gravity record at Mt. Vesuvius and results
This section reports the most remarkable re-sults coming from the experience of about 15years of gravity recording at Mt. Vesuvius(Southern Italy). The time dependent behaviour
Fig. 9. Calibration functions (dotted and continuous lines) interpolating the factors obtained with the on-sitecalibrations (points with error bars) and polynomial fitting (dashed line). The thickest line is the calibration func-tion adopted to convert gravity records in nm/s2.
Vol51,1,2008_DelNegro 16-02-2009 21:27 Pagina 79
80
U. Riccardi, G. Berrino, G. Corrado and J. Hinderer
of the tidal gravimetric factors is comparedwith the results from relative and absolute grav-ity surveys and seismic activity. The results areinterpreted in the framework of the present-daydynamics of Mt. Vesuvius.
To reduce the instrumental effect on tidalparameters (δ factors and phases) computed atMt. Vesvius gravity station, a calibration func-tion has been computed to convert the recordedsignal into nm/s2 (fig. 9); this function derivesfrom the available data-set of the calibrationfactors periodically checked at the gravity sta-tion. In detail, two calibration functions havebeen computed respectively by including or ex-cluding the highest outlier of the calibrationfactors data-set obtained in 1999.
The harmonic tidal analyses were repeatedon the gravity record calibrated by means of thetwo functions to rule out any dependence of δfactors and phases from instrumental effects,namely the temporal changes of the calibrationfactors. Thus, taking into account these results,the first calibration function (dotted line in fig.9) was rejected and we adopted the secondfunction (bold continuous line in fig. 9) to cali-brate the gravity record (fig. 2) spanning 1999-2001 interval.
All of the gravity records were analysed toobtain tidal parameters and gravity residuals(fig. 2). The latter have been computed by sub-tracting the luni-solar effect (body tide), ac-cording to Tamura’s gravity potential catalogue(Tamura, 1987) from the gravity record, as wellas a first order correction for the atmosphericeffect and instrumental drift. The mean coeffi-cient, −3.5 nms−2/hPa, has been adopted to re-duce the atmospheric effect in gravity record(Berrino et al., 1997, 2000). The Wahr-Dehant-
Zschau (WDZ) Earth model (Wahr, 1981; De-hant, 1987; Zschau and Wang, 1987) has beenadopted to compute tidal parameters, while forthe computation of gravity residuals a synthetictide was calculated using tidal parameters com-puted from the local gravity records since 1994.As regards the reduction of the drift, accuratemodelling is necessary to remove the instru-mental drift and to distinguish it from longtermgravity changes due to volcanic sources. This ismainly required in quiescent volcanic areas,where «slow» and small temporal gravitychanges are expected. Otherwise in the case oflarge short-lasting (few hours or days) gravityvariations, as observed in open-conduit volca-noes (Carbone et al., 2006), the instrumentaldrift can be easily modelled.
Here, drift has been constrained by takinginto account the temporal gravity changes ob-tained by both relative and absolute measure-ments periodically performed at Mt. Vesuvius.The latter show a negligible contribution on thetrend observable in fig. 2b; thus, the long termcomponent of the gravity record can be consid-ered instrumental drift. The drift correctedgravity residuals are shown in fig. 2b.
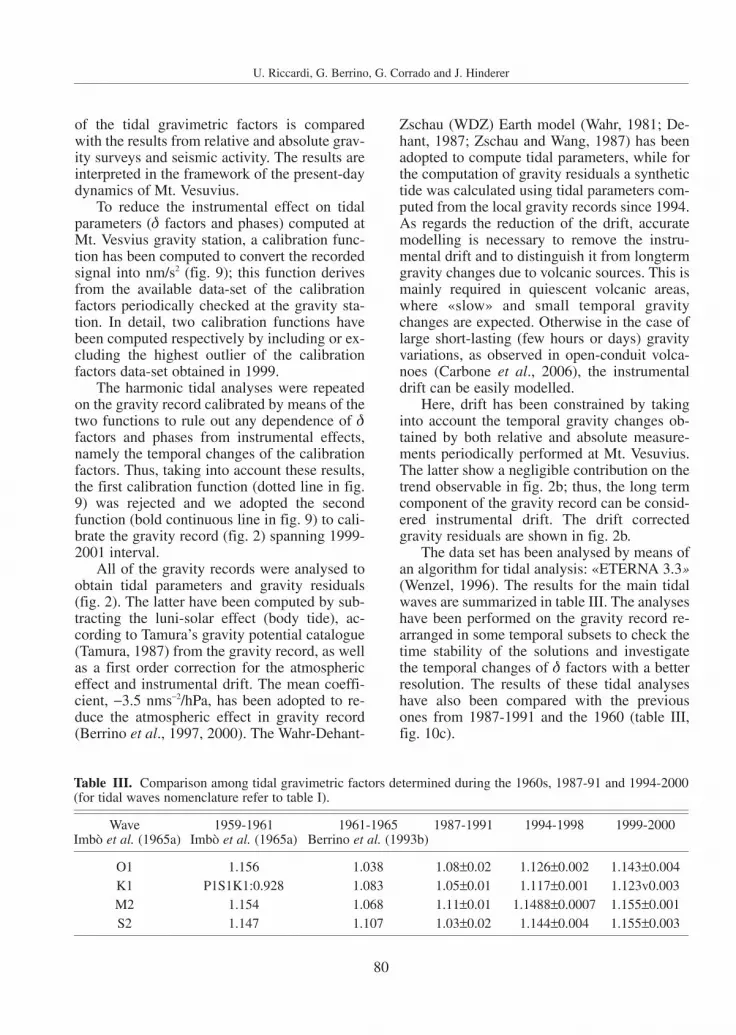
The data set has been analysed by means ofan algorithm for tidal analysis: «ETERNA 3.3»(Wenzel, 1996). The results for the main tidalwaves are summarized in table III. The analyseshave been performed on the gravity record re-arranged in some temporal subsets to check thetime stability of the solutions and investigatethe temporal changes of δ factors with a betterresolution. The results of these tidal analyseshave also been compared with the previousones from 1987-1991 and the 1960 (table III,fig. 10c).
Table III. Comparison among tidal gravimetric factors determined during the 1960s, 1987-91 and 1994-2000(for tidal waves nomenclature refer to table I).
Wave 1959-1961 1961-1965 1987-1991 1994-1998 1999-2000Imbò et al. (1965a) Imbò et al. (1965a) Berrino et al. (1993b)
O1 1.156 1.038 1.08±0.02 1.126±0.002 1.143±0.004K1 P1S1K1:0.928 1.083 1.05±0.01 1.117±0.001 1.123v0.003M2 1.154 1.068 1.11±0.01 1.1488±0.0007 1.155±0.001S2 1.147 1.107 1.03±0.02 1.144±0.004 1.155±0.003
Vol51,1,2008_DelNegro 16-02-2009 21:27 Pagina 80
81
Strategies in the processing and analysis of continuous gravity record in active volcanic areas: the case of Mt. Vesuvius
Although a calibration function has beenadopted, aimed at eliminating or at least reduc-ing the instrumental effects, the results of thetidal analyses (table III) show an increase in theδ factor in the period 1999-2000. Anyway the as-sumption of a calibration function and all the ef-forts aimed at achieve a rigorous calibration ofthe LCR D126 do not rule out bona fide some in-strumental effects on the observed delta tempo-ral changes at Mt. Vesuvius gravity station.
It is noteworthy that these variations arewell correlated with some changes in the activ-
ity of Mt. Vesuvius. In fact a seismic crisis be-gan in October 1999 (Iannaccone et al., 2001)and a significant inversion of the trend of thegravity changes occurred in 1994 as deduced byboth relative and absolute measurements.
In order to better understand the relation-ship, if any, between the results of tidal analy-ses and volcano dynamics, δ factor and gravitychanges have been reconstructed by the avail-able data for the last forty years and interpretedin the context of the activity of Mt. Vesuvius(fig. 10a-c).
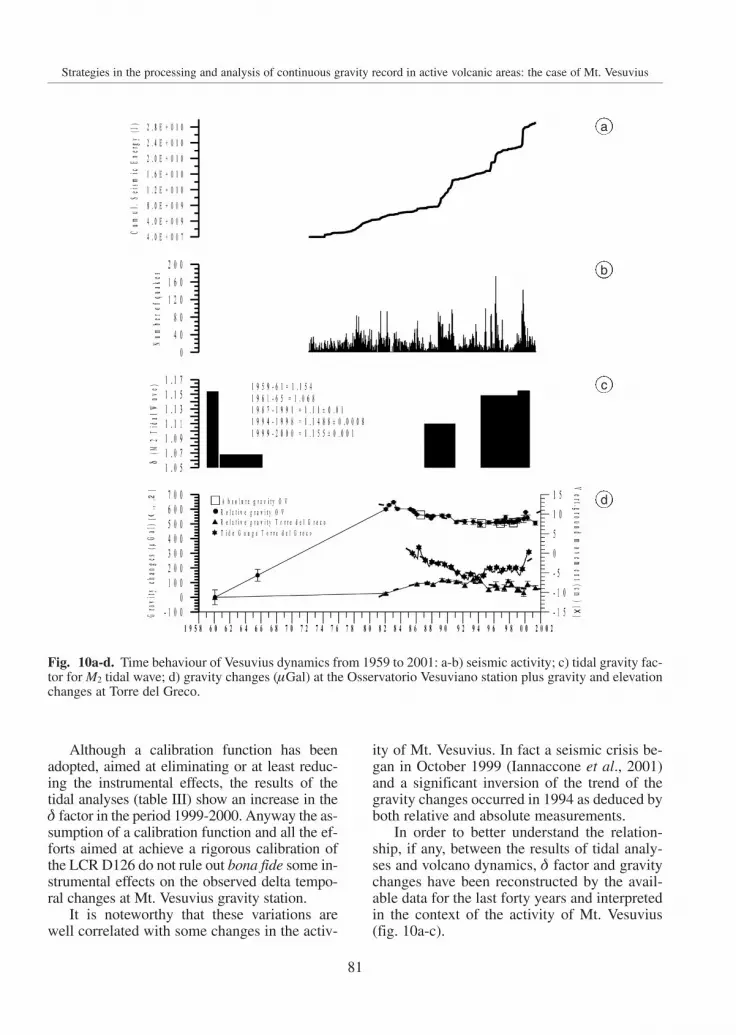
Fig. 10a-d. Time behaviour of Vesuvius dynamics from 1959 to 2001: a-b) seismic activity; c) tidal gravity fac-tor for M2 tidal wave; d) gravity changes (µGal) at the Osservatorio Vesuviano station plus gravity and elevationchanges at Torre del Greco.
a
b
c
d
Vol51,1,2008_DelNegro 16-02-2009 21:27 Pagina 81

82
U. Riccardi, G. Berrino, G. Corrado and J. Hinderer
Figure 10d shows the observed TVG at theOsservatorio Vesuviano station. The reliabilityof this gravity change may be strongly con-strained by taking into account data from othersstations of the Mt. Vesuvius relative gravity net-work. As an example, fig. 10d shows the gravi-ty changes at Torre del Greco, about 5 km SWof the Mt. Vesuvius crater, and the verticalground movement continuously obtained bytide gauge data. Tide gauge data were collectedvery close to the Torre del Greco gravity sta-tion. An inversion of the trend, detected in1993-1994, is also evident in the ground move-ment. A high degree of similarity in the changesobserved at both stations is clear.
The results of these tidal analyses have alsobeen compared with the previous ones from1987-1991 and the 1960s (table III, fig. 10c).An increasing trend from 1961 to the present inthe amplitude of the tidal waves is clearly de-tectable. Taking into account the logistic and in-strumental differences between the 1959-1965(Askania meter Gs9, Gs11) and 1987-2001recording stations, a rough comparison amongthe different data can be made. From 1961-1965 to 1987-1991, changes in the tidal param-eters cannot be considered significant, while anincrease can be noted from 1991 to 1994 and, aspreviously discussed, in 1999-2000. The lattershows tidal parameters similar to the values de-termined in the 1959-61 time interval.
It is noteworthy that the main changes intidal parameters again seem well correlatedwith the temporal behaviour of the activity ofMt. Vesuvius (Berrino et al., 2006). At leastthree crises (1989-1991, 1996, 1999-2000)(figs. 10a-b) are reported (Berrino et al., 1993a;Vilardo et al., 1996; Iannaccone et al., 2001).Moreover, an increase in seismicity was alsowell documented in 1963-1964 (Imbò et al.,1965b). Concerning gravity changes, here wefocus on the results of the episodic gravitymeasurements since 1982 collected on Mt.Vesuvius relative gravity network (Berrino,2000; Berrino and Riccardi, 2000). The ob-served temporal gravity change at the Osserva-torio Vesuviano station (fig. 10d) shows an in-crease (more then 20 µGal/year) in the 1959-1983 time interval (Berrino and Riccardi, 2000;2001), as inferred by reviewing data collected
during 1959-1960 (Tribalto and Maino, 1962)and 1965 (Bonasia, unpublished data) gravitysurveys. This trend fits the gravity data collect-ed during the 1980s, when a continuous gravityincrease affected the whole area (Berrino,2000).
Focusing on the most recent data (fig. 10), itis interesting to note that the increase of the dfactor from 1991 to 1994 (fig. 10c) occurredduring or soon after the 1989-91 seismic crisis.A gravity decrease of about 60 µGal (fig. 10d)(Berrino et al., 1993a) was also detected be-tween 1989 and 1991 at the Osservatorio Vesu-viano gravity station by both relative and ab-solute gravity measurements.
The tidal response of the investigated areacould indicate a variation in the deformationalbehaviour probably due to the change in themean mechanical properties of Mt. Vesuvius, asalready suggested by Berrino et al. (1997).
Up to now any additional information onvolcanic sources may be inferred by the gravityresiduals. Although their time distributionclearly shows an increase in amplitude andscattering during 1998-2001, coinciding withthe increasing seismicity, there are not enoughclear gravity signals to detect or hypothesizethe presence of volcanic input.
5. Conclusions
The above described results show how thecontinuous gravity record on active volcanoescould be a useful investigative tool to detectvolcanic inputs, but much care must be taken toremove from the recorded signals the effectsdue to the instrumental response and non-vol-canic sources. As changes in instrument sensi-tivity can reduce the repeatability of measure-ments and affect the phase and amplitude ofrecorded gravity signals, the accurate calibra-tion of gravimeters in high-precision gravime-try is topical. The stability of the calibrationfactors has to be deeply investigated throughdifferent calibration methods (e.g., inter-com-parison with AG and SG).
Concerning the modelling of the non-vol-canic contribution to TVG, currently the tidegenerating potential is at a suitable level of ac-
Vol51,1,2008_DelNegro 16-02-2009 21:27 Pagina 82

83
Strategies in the processing and analysis of continuous gravity record in active volcanic areas: the case of Mt. Vesuvius
curacy (1 nm/s2), so highly accurate cataloguesof tide potential are available. Even the OTLmodelling is highly accurate. The TOPEX/Po-seidon satellite altimeter data deeply improvedthe studies on the OTL effects. Neverthelesssome local solutions are needed for instance forvolcanic islands.
Moreover the state of the art demonstratesthat the gravity record could be able to charac-terize the deformational behaviour of the vol-cano through the time evolution of the δ factor.However, as mentioned by several authors (e.g.,Arnoso et al., 2001; Robinson, 1991; Melchior,1995), this points out the existing necessity oftheoretical studies and observations of the high-est quality to answer the different questions re-garding the significance of the tidal gravityanomaly and how it relates to mechanical prop-erties of the upper crust. On the other hand, thecapability of gravity residuals at least in the vol-canic area characterized by a low level dynam-ics, requires a significant improvement in mod-elling mainly instrumental drift. However, thejoint application of relative, absolute and con-tinuous gravimetry is strongly recommended,to better remove the longterm instrumentaldrift. Thus the recognition of real gravitychanges from apparent ones, due to instrumen-tal behaviour, becomes more reliable. Current-ly, no additional information on volcanicsources may be inferred from the gravity resid-uals at Mt. Vesuvius permanent station. An im-provement in the study of the mass redistribu-tion due to volcanic processes by means ofgravity residuals could derive from the use of atleast a reference station outside the volcano,which would make it possible to model and ex-clude long-term and non-volcanic «regional»effects (Berrino et al., 1997).
In quiescent volcanic areas, undertaken by«slow» and small temporal gravity changes, itis hard to recover signals (residual gravity) re-lated to volcanic activity by means of mechani-cal gravimeters. This is mainly due to the strongand non-linear instrumental drift affecting thesignals acquired by such sensors. The availabil-ity of SGs in active volcanic areas is hoped forbecause of their very small instrumental drift,high and stable sensitivity. SGs would allow todetect very slow and small TVGs often related
with re-filling process of magma chamber.The reduction of the air pressure effects on
local gravity through the most advanced meth-ods, such as global loading computation or ar-ray application, is redundant for TVG collectedby means of mechanical gravimeters.
Acknowledgements
The authors are very grateful to J.-P. Boyfrom EOST for the computation of the globalloading air pressure effect on local gravity. Theauthors are deeply indebted to the anonymousreferee who greatly improved the paper withhis/her comments and suggestions. For the finalform of this manuscript the comments of D.Carbone have also been considered. The au-thors thank C. Del Negro from INGV for hiseditorial work.
REFERENCES
ARNOSO, J., J. FERNANDEZ and R. VIEIRA (2001): Interpreta-tion of tidal gravity anomalies in Lanzarote, Canary Is-lands, J. Geodyn., 31, 341-354.
ATKINSON, B. W. (1981): Meso-Scale Atmospheric Circula-tions (Academic Press, London), pp. 495.
BECKER, M., L. BALESTRI , L. BARTELL, G. BERRINO, S. BON-VALOT, G. CSAPÒ, M. DIAMENT, V. D’ERRICO , C. GAGNON,C. GERSTENECKER, P. ,JOUSSET, A. KOPAEV, J. LIARD, I.MARSON, B. MEURES, I. NOWAK, S. NAKAI, F. REHREN, B.RICHTER, M. SCHNÜLL, A. SOMERHAUSEN, W. SPITA, G.SZATMARI, M. VAN RUYMBEKE,H-G. WENZEL, H. WILMES,M. ZUCCHI and W. ZÜRN (1995): Microgravimetric meas-urements at the 1994 international comparison of ab-solute gravimeters, Metrologia, 32, 145-152.
BECKER, M., G. BERRINO, A.G. CAMACHO, R. FALK, O.FRANCIS, J.E. FRIEDERICH, C. GAGNON, C. GERSTE-NECKER, G. LÄUFER, J. LIARD, B. MEURES, F.-J. NAVAR-RO, I. NOWAK, F. REHREN, U. RICCARDI, B. RICHTER, M.SCHNÜLL, D. STIZZA, M. VAN RUYMBEKE, P. VAUTERIN
and H. WILMES (2000): Results of relative gravimetermeasurements at the ICAG97 intercomparison, BureauGravim. Int. Bull. Inf., 85, 61-72.
BERRINO, G. (1995): Absolute gravimetry and gradiometryon active volcanoes of Southern Italy, Boll. Geofis.Teor. Appl., 37 (146), 131-144.
BERRINO, G. (2000): Combined gravimetry in the observa-tion of volcanic processes in Southern Italy, J. Geody-namics, 30, 371-388.
BERRINO, G. and U. RICCARDI (2000): Non-statyonary compo-nents of the gravity field at Mt. Vesuvius (Southern Italy):correlations with different aspects of its present-day dy-namics, Comptes Rendus of 88th Journées Luxembour-geoises de Géodynamique (JLG), Munsbach 32-37.
Vol51,1,2008_DelNegro 16-02-2009 21:27 Pagina 83
84
U. Riccardi, G. Berrino, G. Corrado and J. Hinderer
BERRINO, G. and U. RICCARDI (2001): Gravity tide at Mt.Vesuvius (Southern Italy): correlations with differentgeophysical data and volcanological implications, J.Geod. Soc. Japan, 47 (1), 121-127.
BERRINO, G. and U. RICCARDI (2004): Far-field gravity andtilt signals by large earthquakes: real or instrumentaleffects?, Pure Appl. Geophys., 161, 1379-1397. dyn.,30, 371-388.
BERRINO, G., U. COPPA, G. DE NATALE and F. PINGUE
(1993a): Recent geophysical investigation at Somma-Vesuvius volcanic complex, J. Volcanol. Geotherm.Res., 53, 11-26.
BERRINO, G., G. CORRADO, R. MAGLIULO and U. RICCARDI
(1997): Continuous record of the gravity changes atMt. Vesuvius, Ann. Geofis., 40 (5), 1019-1028.
BERRINO, G., G. CORRADO, R. MAGLIULO and U. RICCARDI
(2000): Continuous gravity record at Mount Vesuvius:a tool to monitor its dynamics, Phys. Chem. Earth A,25 (9-11), 713-717.
BERRINO, G., G. CORRADO, U. RICCARDI (2006): On the ca-pability of recording gravity stations to detect signalscoming from volcanic activity: The case of Vesuvius, J.Volcanol. Geotherm. Res., 150, 270-282.
BERRINO, G., B. DUCARME and R. MAGLIULO (1993b):Gravity tide and volcanic activity in Southern Italy, inProceedings of the XII National Meeting GruppoNazionale Geofisica della Terra Solida, 997-1001.
BONVALOT, S., M. DIAMENT and G. GABALDA (1998): Con-tinuous gravity recording with Scintrex CG-3M me-ters: a promising tool for monitoring active zones, Geo-phys. J. Int., 135, 470-494.
BOY, J.-P., P. GEGOUT and J. HINDERER (2002): Reduction ofsurface gravity data from global atmospheric pressureloading, Geophys. J. Int., 149, 534-545.
BOY, J.-P., J. HINDERER and P. GEGOUT (1998): Global at-mospheric pressure loading and gravity, Phys. EarthPlanet. Int., 109, 161-177.
BUDETTA, G. and D. CARBONE (1997): Potential applicationof the Scintrex CG-3M gravimeter for monitoring vol-canic activity: results of field trials on Mt. Etna, Sicily,J. Volcanol. Geotherm. Res., 76, 199-214.
CARBONE, D., G. BUDETTA, F. GRECO and H. RYMER (2003):Combined discrete and continuous gravity observationsat Mt. Etna, J. Volcanol. Geotherm. Res., 123, 123-135.
CARBONE, D., L. ZUCCARELLO, G. SACCOROTTI and F. GRE-CO (2006): Analysis of simultaneous gravity andtremor anomalies observed during the 2002-2003 Etnaeruption, Earth Planet. Sci. Lett., 245, 616-629.
CHAO, B.F. (1994): The geoid and Earth rotation, in Geo-physical Interpretations of Geoid, edited by P. VANICEK
and N. CHRISTOU ( CRC Press, Boca Raton), 285-298.CROSSLEY, D. and J. HINDERER (1995): Global Geodynam-
ics Project – GGP, Cahiers du Centre Europeen deGéodynamique et de Séismologie, 11, 244-271.
CROSSLEY, D.J., O.G. JENSEN and J. HINDERER (1995): Ef-fective barometric admittance and gravity residuals,Phys. Earth Planet. Int., 90, 221-241.
CROSSLEY, D.J., J. HINDERER and S. ROSAT (2002): Using at-mosphere-gravity correlation to derive a time-depend-ent admittance, Bull. Inf. Marées Terrestres, 136,10809-10820.
DAVIS, P.M. (1981): Gravity and Earth tides measured on anactive volcano, Mt Etna, Sicily, J. Volcanol. Geotherm.
Res., 11, 213-223.DEHANT, V. (1987): Tidal parameters for an inelastic Earth,
Phys. Earth Planet. Int., 49, 97-116.DITTFELD, H.-J. (1995): Non-tidal features in the SG-record
at Potsdam, Cahiers du Centre Européen de Géody-namique et de Séismologie, 11, 79-88.
EANES, R.J. (1994): Diurnal and semidiurnal tides fromTOPEX/POSEIDON altimetry, Eos, 75, 108.
EGBERT, G.D. and L. EROFEEVA (2002): Efficient inversemodeling of barotropic ocean tides, J. Atmos. OceanicTechnol., 19, 183-204.
FARRELL, W. E. (1972): Deformation of the Earth by SurfaceLoads, Rev. Geophys. Space Phys., 10 (3), 761-797.
GOODKIND, J.M. and C. YOUNG (1991): Gravity and hydrol-ogy at Kilauea volcano, the Geysers and Miami,Cahiers du Centre Européen de Géodynamique et deSéismologie, 3, 163-167.
HINDERER, J. and D. CROSSLEY (2000): Time variations andinferences on the Earth’s structure and dynamics, Surv.Geophys., 21, 1-45.
HINDERER, J. and D. CROSSLEY (2004): Scientific achieve-ments from the first phase (1997-2003) of the GlobalGeodynamics Project using a worldwide network ofsuperconducting gravimeters, J. Geodyn., 38, 237-262.
IANNACCONE, G., G. ALESSIO, G. BORRIELLO, P. CUSANO, S.PETROSINO, P. RICCIOLINO, G. TALARICO and V. TOREL-LO (2001): Characteristics of the seismicity of Vesuviusand Campi Flegrei during the year 2000, Ann. Geofis.,44 (5-6), 1075-1091.
IMBÒ, G., V. BONASIA and A. LO BASCIO (1964): Mareagravimetrica all’Osservatorio Vesuviano, Ann. Osser-vatorio Vesuviano, 5 (S6), 161-184.
IMBÒ, G., V. BONASIA and A. LO BASCIO (1965a): Variazionidella marea della crosta all’Osservatorio Vesuviano.Ann. Osservatorio Vesuviano, 7 (S6), 181-198.
IMBÒ, G., L. CASERTANO and V. BONASIA (1965b): Consid-erazioni sismo-gravimetriche sulle manifestazionivesuviane del Maggio 1964, in Proceedings of the XIVConvegno nazionale Associazione Geofisica Italiana,291-300.
KRONER, C. and G. JENTZSCH (1998): Comparison of airpressure reducing methods and discussion of other in-fluences on gravity, in Proceedings of the 13th EarthTide Symposium, Brussels, 423-430,.
LE PROVOST, C., F. LYARD, J.M. MOLINES, M.L. GENCO andF. RABILLOUD (1998): A hydrodynamic ocean tidemodel improved by assimilating a satellite altimeter-derived data set, J. Geophys. Res., 103 (C3), 5513-5529.
MELCHIOR, P. (1995): A continuing discussion about thecorrelation of tidal gravity anomalies and heat flowdensities, Phys. Earth Planet. Int., 88, 223-256.
MELCHIOR, P. and B. DUCARME (1991): Tidal gravity anom-alies and tectonics, in Proceedings of the 11th Inter.Symp. Earth Tides, Helsinki, edited by J. KAKKURI,445-454.
MERRIAM, J. B. (1992): Atmospheric pressure and gravity,Geophys. J. Int., 109, 488-500.
MUKAI, A., T. HIGASHI, S. TAKEMOTO, I. NAKAGAWA and I.NAITO (1995): Accurate estimation of atmospheric ef-fects on gravity observations made with a supercon-ducting gravity meter at Kyoto, Phys. Earth Planet.Int., 91, 149-159.
Vol51,1,2008_DelNegro 16-02-2009 21:27 Pagina 84

85
Strategies in the processing and analysis of continuous gravity record in active volcanic areas: the case of Mt. Vesuvius
MÜLLER, T. and W. ZÜRN (1983): Observation of the gravi-ty changes during the passage of cold fronts, J. Geo-phys., 53, 155-162.
NEUMEYER, J. (1995): Frequency dependent atmosphericpressure corrections on gravity variations by means ofcross spectral analysis, Bull. Inf. Marées Terrestres,122, 9212-9220.
NEUMEYER, J., F. BARTHELMES and D. WOLF (1998): Atmos-pheric pressure correction for gravity data using differ-ent methods, in Proceedings of the 13th Earth TideSymposium, Brussels, 431-438,.
PETERSON, J. (1993): Observations and modelling of seis-mic background noise, Open File Report 93-322 (U.S.Department of Interior Geological Survey, Albu-querque, New Mexico).
PETROV, L. and J.-P. BOY (2004): Study of the atmosphericpressure loading signal in VLBI observations, J. Geo-phys. Res., 109, B03405, 10.1029/2003JB002500.
PONTE, R.M. and R.D. RAY (2002): Atmospheric pressurecorrections in geodesy and oceanography: a strategyfor handling air tides, Geophys. Res. Lett., 29, 2153,doi: 10.1029/2002GL016340.
RABBEL, W. and J. ZSCHAU (1985): Static deformations andgravity changes at the Earth’s surface due to atmos-pheric loading, J. Geophys., 56, 81-99.
RICCARDI, U., G. BERRINO and G. CORRADO (2002):Changes in the instrumental sensitivity for same feed-back equipping LaCoste and Romberg gravity meters,Metrologia, 39, 509-515.
RICCARDI, U., J. HINDERER and J.-P. BOY (2007): On the ef-ficiency of barometric arrays to improve the correc-tions of atmospheric effects on gravity data, Phys.Earth Planet. Int., 161, 224-242.
RICHTER, B. (1987): Das supraleitende Gravimeter, Ph.D.Thesis (Deutsche Geodät. Komm., C 329, Frankfurt amMain), pp. 124.
RICHTER, B., H.G. WENZEL, W. ZÜRN and F. KLOPPING
(1995): From Chandler wobble to free oscillations: com-parison of cryogenic and other instruments in a wide pe-riod range, Phys. Earth Planet. Int., 91, 131-148.
ROBINSON, E.S. (1989): Tidal gravity, heat flow, and the up-per crust, Phys. Earth Planet. Int., 56, 181-185.
ROBINSON, E.S. (1991): Correlation of tidal gravity and heatflow in eastern North America, Phys. Earth Planet.Int., 67, 231-236.
SCHWIDERSKI, E.W. (1980): On charting global ocean tides.Rev. Geophys. Space. Physics., 18 (1), 243-268.
SPRATT, R.S. (1982): Modelling the effect of atmosphericpressure variations on gravity, Geophys. J.R. Astron.Soc., 71, 173-186.
TAMURA, Y. (1987): A harmonic development of the tide-generating potential, Bull. Inf. Marées Terrestres, 99,6813-6855.
TORGE, W. (1989): Gravimetry (de Gruyter, Berlin, NewYork), pp. 465.
TRIBALTO, G. and A. MAINO (1962): Rilevamento gravimet-rico della zona circumvesuviana, Ann. OsservatorioVesuviano, 6 (S4), 134-172.
VAN CAMP, M. and P. VAUTERIN (2005): Tsoft: graphical andinteractive software for the analysis of time series andEarth tides, Comput. Geosci., 31 (5), 631-640.
VAN DAM, T. and O. FRANCIS (1998): Two years of continu-ous gravity measurements of tidal and non-tidal varia-tions of gravity in Boulder, Colorado, Geophys. Res.Lett., 25, 393-396.
VAN RUYMBEKE, M. (1991): New Feedback Electronics for La-Coste & Romberg Gravimeters, Cahiers du Centre Eu-ropéen de Géodynamique et de Séismologie, 4, 333-337.
VAN RUYMBEKE, M., R. VIEIRA, N. D'OREYE, A. SOMER-HAUSEN and N. GRAMMATIKA (1995): TechnologicalApproach from Walferdange to Lanzarote: the EDASConcept, in Proceeding 12th Int. Symp. on Earth tides,(Science press, Beijing, China), 53-62.
VIEIRA, R., M. VAN RUYMBEKE, J. FERNANDEZ, J. ARNOSO
and C. DE TORO (1991): The Lanzarote undergroundlaboratory, Cahiers du Centre Européen de Géody-namique et de Séismologie, 4, 71-86.
VILARDO, G., G. DE NATALE, G. MILANO and U. COPPA
(1996): The seismicity of Mt. Vesuvius, Tectono-physics, 261, 127-138.
WAHR, J.M. (1981): Body tides on an elliptical, rotating,elastic and oceanless Earth, Geophys. J. R. Astr. Soc.,64, 677-703.
WARBURTON, R.J. and J.M. GOODKIND (1977): The influ-ence of barometric-pressure variations on gravity, Geo-phys. J. R. Astr. Soc., 48, 281-292.
WENZEL, H.G. (1996): The nanoGal software: Earth tidedata processing package ETERNA 3.30, Bull. Inf.Marées Terrestres, Bruxelles, 9425-9438.
ZSCHAU, J. and R. WANG (1987): Imperfect elasticity inthe Earth’s mantle. Implication for Earth tides andlong period deformation, in Proceedings of the 9th In-ternational Symposium on Earth Tides, New York,605-629.
Vol51,1,2008_DelNegro 16-02-2009 21:27 Pagina 85


