Embed Size (px)
Citation preview
ELSEVIER
Fire Safety Journal 27 (19%) 249-259 ~) 1997 Elsevier Science Limited
Printed in Northern Ireland. All rights reserved 0379-7112/%[$15.(KI
P l l : S 0 3 7 9 - 7 1 1 2 ( 9 6 ) 0 0 0 4 6 - X
Surface Temperature at Ignition of Wooden Based Slabs
Jadwiga Fangrat, ° Yuji H a s e m i f Masashi Yoshida h & Toshimi Hirata c
" Fire Research Division, Building Research Institute, Filtrowa 1, 00-950 Warsaw, Poland h Building Research Institute, Ministry of Construction, 1 Tatehara, Tsukuba,
Ibaraki 305, Japan ' Forestry and Forest Products Research Institute, Ministry of Agriculture,
Forestry and Fisheries, Tsukuba Norin Kenkyu, Danchi-nai, Ibaraki 305, Japan
(Received 4 June 1995; revised version received 29 February 1996; accepted 18 March 1996)
A B S T R A C T
Up to now, a sufficiently developed ignition theory is not available for wood slabs and other combustible building materials in the form of layers. Very often, the concept of surface ignition temperature as a material characteristic is used, especially when related to fire modelling. Measurements of surface temperature at ignition during cone calori- meter tests for several plywoods and particle board in the horizontal and vertical configurations are presented here. It was found that the surface temperature at ignition depends not only on the material properties but also strongly on the experimental conditions (irradiation, sample configuration). There is evidence that two different mechanisms control ignition in the horizontal and vertical orientations of the samples. ~) 1997 Elsevier Science Ltd. All rights reserved.
1 I N T R O D U C T I O N
Woods and wood-based products, like coals, undergo only partial pyroly- sis; ignition therefore may occur in one of two possible modes:
exothermic gasification due to heterogeneous oxidation (regime I); endothermic pyrolysis and subsequent oxidation of the combustible products of pyrolysis in the gas phase (regime II).
In contrast to that for coal in the form of particles, ignition theory is not sufficiently developed for wood slabs and other combustible building materials in the form of layers.
Up to now, for fire modell ing purposes, the so-called ignition tempera- ture, also called the temperature to ignition, surface ignition temperature,
249
250 J. Fangrat et al.
surface temperature at ignition or pyrolysis temperature (in the case of pyrolysing materials), is often used, but it is still not certain how to obtain this value, although this quantity is essential for fire-related calculations. The literature ~,2 refers to this quantity as a material property; however, Tran and White 2 described the surface ignition temperature as 'a very elusive quantity and difficult to measure accurately'. Several methods have so far been proposed for estimation of this value. Some of them, used in this work, are presented in the next sections.
2 T H E O R E T I C A L ANALYSIS
The first method used for the calculations presented in this work was developed by Janssens 3 on the basis of the Quintiere and Harkleroad theory for the LIFT test, 4'5 and is essentially based on the following procedure:
plotting (l/tig) t~'s47 on the y-axis, as a function of external radiation q~; determination of critical irradiance qcr as the intercept with the abscissa of a straight-line fit through the data; solving for T~g using:
q . = hc(Tig- T,,)+ o-(T4g- -/,4) (1)
where the value of hc to be used depends on the apparatus used, but 15 kW/(m2K) for the horizontal orientation is recommended; solving for hig using the formula:
h~g = q . / ( T i g - T,,) (2)
computing the apparent k p c as:
kpc = h i ~ [ 1 / ( 0 . 7 3 • {slope} * q.)] ~2~ (3)
where:
q~ external heat flux, kW/m 2 qcr critical heat flux for ignition, k W / m 2 k thermal conductivity, W/(m K) p density, kg/m 3 c heat capacity, kJ/(kg K) hc convective heat transfer coefficient from the surface, kW/(m2K) hig total heat transfer coefficient from the surface at ignition,
kW/(m2K)
The second method, used for further calculations and referred to as the
Ignition of wooden based slabs 251
Swedish method, 6 is based on a set of ignitability data from the cone calorimeter. At least two sets of ignition times (tig) at different irradiance levels (qo) are required. The least-squares me thod is used with these data.
The following equations, based on the work of Alpert and de Ris, 7 are used to obtain T~g and kpc:
Assuming that qe = Y,
C
C2
1 X X/~ig (4)
V~kpc (Tig - To) (5) t = 2
= 0.64eo-(T~g - T, 4) (6)
Y = CIX + C2 (7)
Nomenclature here is as given above. For the experimentally measured 'ignition temperatures ' , the kpc values
were calculated using eqn (5):
CI = 2 (T~g- To)
where C~ is the slope as before.
3 E X P E R I M E N T S
As well as the theoretical analysis, experimental measurements were conducted. The first experimental method was thermogravimetry (TG) and derivative thermogravimetry (DTG) at a heating rate of 5 K/rain in an air flow of 100mL/min. This is a standard method and will not be described here.
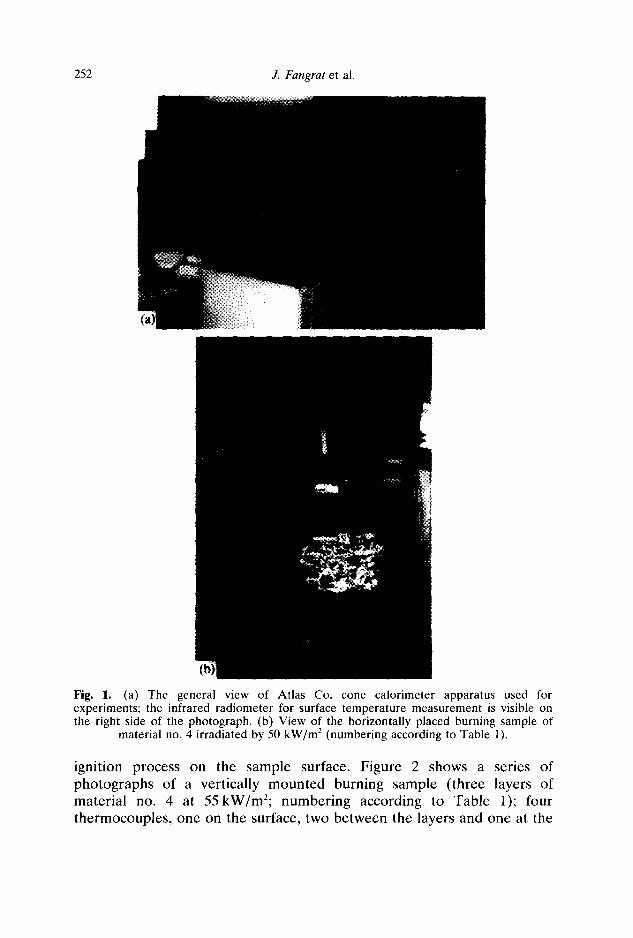
Next, two series of tests were conducted on the group of cellulose-based materials (plywood and particleboard) by means of the cone calorimeter (Atlas Co., see Fig. 1). A list of the materials and their characteristics is presented in Table 1. In the course of the experiments these materials were tested at three irradiance levels: 25, 33 and 5 0 k W / m 2 in the horizontal orientation, and two external heat fluxes: 35 and 55 k W / m 2 in the vertical orientation.
Besides the routine cone calorimeter procedure, the surface tempera- ture of the samples was measured by means of both thermocouples (AI-CrAI 0.2 mm in diameter) and a Chino radiation pyrometer , Model IR-AHOT. A heat flux meter was also located in the centre of the sample in the case of vertical orientation. The outputs were scanned at 2 s intervals. The tests were recorded using video and conventional cameras. These films and photographs were used for detailed analysis of the
252 J. Fangrat et al.
Fig. 1. (a) The general view of Atlas Co. cone calorimeter apparatus used for experiments; the infrared radiometer for surface temperature measurement is visible on the right side of the photograph. (b) View of the horizontally placed burning sample of
material no. 4 irradiated by 50 kW/m 2 (numbering according to Table 1).
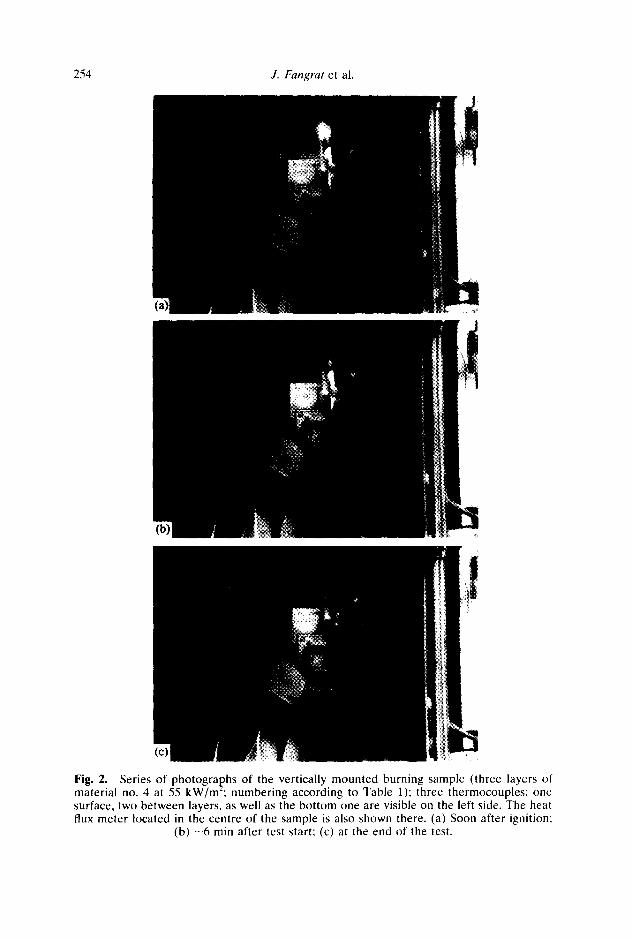
igni t ion p rocess on the sample surface . F igure 2 shows a ser ies o f p h o t o g r a p h s of a ver t ica l ly m o u n t e d bu rn ing sample ( t h r ee layers o f ma te r i a l no. 4 at 5 5 k W / m 2 ; n u m b e r i n g accord ing to Tab l e 1); four t h e r m o c o u p l e s , o n e on the surface , two b e t w e e n the layers and o n e at the
Ignition of wooden based slabs
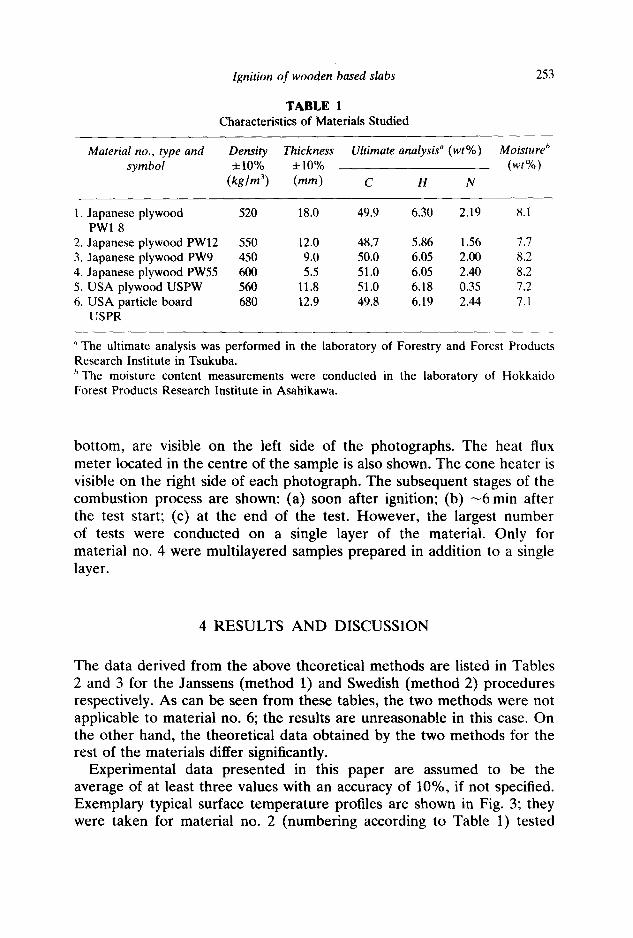
TABLE 1 Characteristics of Materials Studied
253
Material no., type and Density Thickness Ultimate analysis" (wt% ) Moisture h symbol +10% i10% (wt%)
(kg/m 3) (ram) C H N
1. Japanese plywood 520 18.0 49.9 6.30 2.19 8.1 PW1 8
2. Japanese plywood PWl2 550 12.0 48.7 5.86 1.56 7.7 3. Japanese plywood PW9 450 9.0 50.0 6.05 2.00 8.2 4. Japanese plywood PW55 600 5.5 51.0 6.05 2.40 8.2 5. USA plywood USPW 560 11.8 51.0 6.18 0.35 7.2 6. USA particle board 680 12.9 49.8 6.19 2.44 7.1
USPR
"The ultimate analysis was performed in the laboratory of Forestry and Forest Products Research Institute in Tsukuba. b The moisture content measurements were conducted in the laboratory of Hokkaido Forest Products Research Institute in Asahikawa.
bottom, are visible on the left side of the photographs. The heat flux meter located in the centre of the sample is also shown. The cone heater is visible on the right side of each photograph. The subsequent stages of the combustion process are shown: (a) soon after ignition; (b) - 6 min after the test start; (c) at the end of the test. However, the largest number of tests were conducted on a single layer of the material. Only for material no. 4 were multilayered samples prepared in addition to a single layer.
4 RESULTS AND DISCUSSION
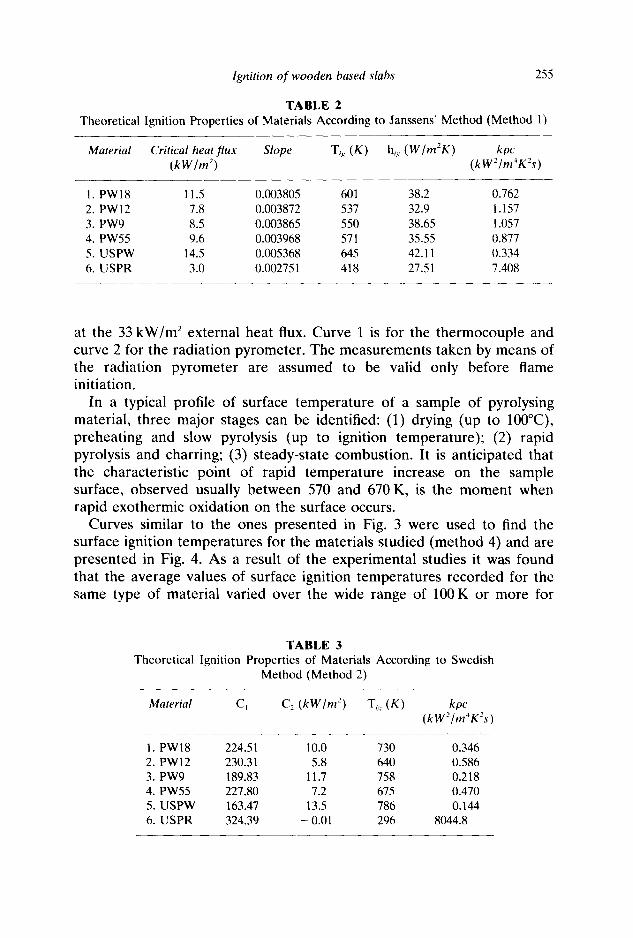
The data derived from the above theoretical methods are listed in Tables 2 and 3 for the Janssens (method 1) and Swedish (method 2) procedures respectively. As can be seen from these tables, the two methods were not applicable to material no. 6; the results are unreasonable in this case. On the other hand, the theoretical data obtained by the two methods for the rest of the materials differ significantly.
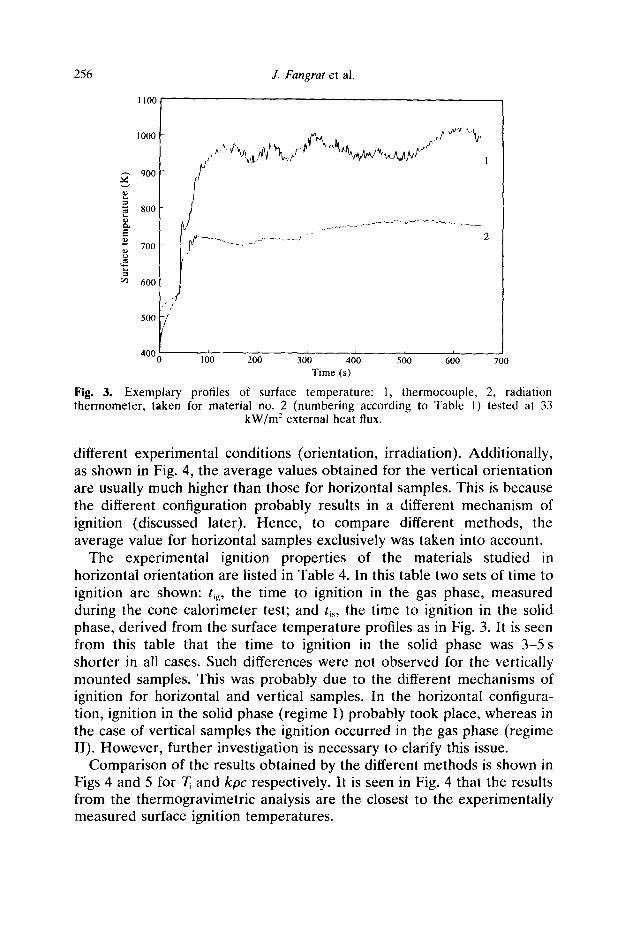
Experimental data presented in this paper are assumed to be the average of at least three values with an accuracy of 10%, if not specified. Exemplary typical surface temperature profiles are shown in Fig. 3; they were taken for material no. 2 (numbering according to Table 1) tested
254 J. Fangrat et al.
Fig. 2. Series of photographs of the vertically mounted burning sample (three layers of material no. 4 at 55 kW/m'~; numbering according to Table 1): three thermocouples: one surface, two between layers, as well as the bottom one are visible on the left side. The heat flux meter located in the centre of the sample is also shown there. (a) Soon after ignition:
(b) - 6 rain after test start: (c) at the end of the test.
Ignition of wooden based slabs 255
TABLE 2 Theoretical Ignition Properties of Materials According to Janssens' Method (Method 1)
Material Critical heat flux Slope T~, (K) h~, (W/m:K) kpc (kW /m ~) (kWZ/m4K2s)
1. PW18 11.5 0.003805 601 38.2 0.762 2. PWI2 7.8 0.003872 537 32.9 1.157 3. PW9 8.5 0.003865 550 38.65 1.057 4. PW55 9.6 0.003968 571 35.55 0.877 5. USPW 14.5 0.005368 645 42.11 0.334 6. USPR 3.0 0.002751 418 27.51 7.408
at the 33 k W / m 2 external heat flux. Curve 1 is for the thermocouple and curve 2 for the radiation pyrometer. The measurements taken by means of the radiation pyrometer are assumed to be valid only before flame initiation.
In a typical profile of surface temperature of a sample of pyrolysing material, three major stages can be identified: (1) drying (up to 100°C), preheating and slow pyrolysis (up to ignition temperature); (2) rapid pyrolysis and charring; (3) steady-state combustion. It is anticipated that the characteristic point of rapid temperature increase on the sample surface, observed usually between 570 and 670 K, is the moment when rapid exothermic oxidation on the surface occurs.
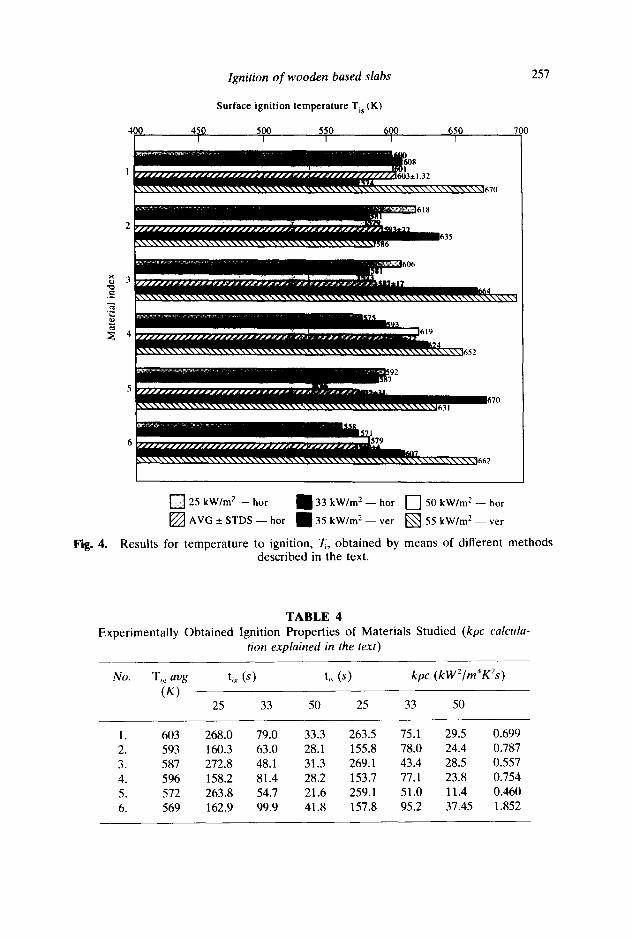
Curves similar to the ones presented in Fig. 3 were used to find the surface ignition temperatures for the materials studied (method 4) and are presented in Fig. 4. As a result of the experimental studies it was found that the average values of surface ignition temperatures recorded for the same type of material varied over the wide range of 100 K or more for
TABLE 3 Theoretical Ignition Properties of Materials According to Swedish
Method (Method 2)
Material C, C2 (kW/m 2) T~. (K) kpc (kW~/mZK2s)
1. PW18 224.51 10.0 730 0.346 2. PW12 230.31 5.8 640 0.586 3. PW9 189.83 11.7 758 0,218 4. PW55 227.80 7.2 675 0.470 5. USPW 163.47 13.5 786 0.144 6. USPR 324.39 - 0.01 296 8044.8
256 J. Fangrat et al.
I 1 0 0
1000
900
800
E 700
t~ 600
500
I.
~~"¢~v, ~.,~% r"~ "%& ..... ~ , - - I ' j ,~,~ v ' ~ . t ,,~¢~.,v ~-'d',...AN
J /
4000 1()0 20() 3010 4010 500 600 700 Time (s)
Fig. 3. Exemplary profiles of surface temperature : 1, thermocouple , 2, radiation thermometer , taken for mater ial no. 2 (number ing according to Table 1) tested at 33
k W / m 2 external heat flux.
different experimental conditions (orientation, irradiation). Additionally, as shown in Fig. 4, the average values obtained for the vertical orientation are usually much higher than those for horizontal samples. This is because the different configuration probably results in a different mechanism of ignition (discussed later). Hence, to compare different methods, the average value for horizontal samples exclusively was taken into account.
The experimental ignition properties of the materials studied in horizontal orientation are listed in Table 4. In this table two sets of time to ignition are shown: t~g, the time to ignition in the gas phase, measured during the cone calorimeter test; and/is, the time to ignition in the solid phase, derived from the surface temperature profiles as in Fig. 3. It is seen from this table that the time to ignition in the solid phase was 3-5s shorter in all cases. Such differences were not observed for the vertically mounted samples. This was probably due to the different mechanisms of ignition for horizontal and vertical samples. In the horizontal configura- tion, ignition in the solid phase (regime I) probably took place, whereas in the case of vertical samples the ignition occurred in the gas phase (regime II). However, further investigation is necessary to clarify this issue.
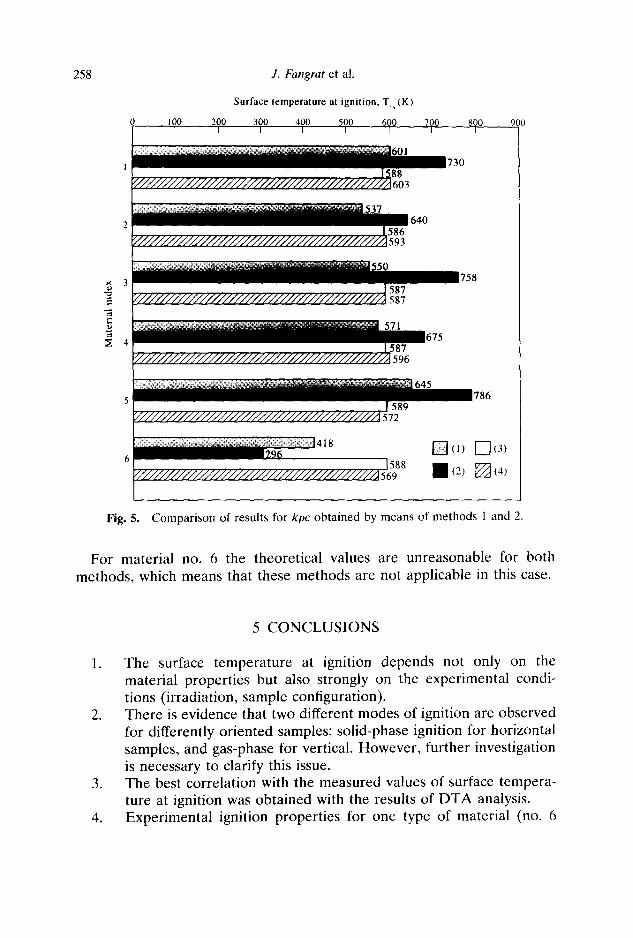
Comparison of the results obtained by the different methods is shown in Figs 4 and 5 for T~ and kpc respectively. It is seen in Fig. 4 that the results from the thermogravimetric analysis are the closest to the experimentally measured surface ignition temperatures.
Ignition of wooden based slabs 257
Surface ignition temperature Tis (K)
400 450 500 550 600 650 700
~J
Fig. 4.
[ ] 2 5 k W / m 2 - h o r 1 3 3 k W / m 2 - h o t [ ] 50kW/m 2 - h o t
[ ] A V G _ + S T D S - - h o r 1 3 5 k W / r n 2 - v e t [ ] 5 5 k W / m 2 - v e r
Results for temperature to ignition, T~, obtained by means of different methods described in the text.
TABLE 4 Experimentally Obtained Ignition Properties of Materials Studied (kpc calcula-
tion explained in the text)
No. T,~ avg t,~ (s) ti, (s) kpc (kW2/m4K2s) (K)
25 33 50 25 33 50
1. 603 268.0 79.0 33.3 263.5 75.1 29.5 0.699 2. 593 160.3 63.0 28.1 155.8 78.0 24.4 0.787 3. 587 272.8 48.1 31.3 269.1 43.4 28.5 0.557 4. 596 158.2 81.4 28.2 153.7 77.1 23.8 0.754 5. 572 263.8 54.7 21.6 259.1 51.0 11.4 0.460 6. 569 162.9 99.9 41.8 157.8 95.2 37.45 1.852
258
100 200
J. Fangrat et al.
Surface temperature at ignition, Tis (K)
300 400 500 600 700 800 [
900
730
640
29~ / / / / / / / / / / / / / / / / / / / A I s 8 8
758
675
[ ] ( 1 ) ~ ] (3)
m,2,
Fig. 5. Compar ison of results for kpc obtained by means of methods 1 and 2.
For material no. 6 the theoretical values are unreasonable for both methods, which means that these methods are not applicable in this case.
5 CONCLUSIONS
1. The surface temperature at ignition depends not only on the material properties but also strongly on the experimental condi- tions (irradiation, sample configuration).
2. There is evidence that two different modes of ignition are observed for differently oriented samples: solid-phase ignition for horizontal samples, and gas-phase for vertical. However, further investigation is necessary to clarify this issue.
3. The best correlation with the measured values of surface tempera- ture at ignition was obtained with the results of DTA analysis.
4. Experimental ignition properties for one type of material (no. 6
Ignition of wooden based slabs 259
according to Table 1) were found to be outside the applicability of the two theoretical procedures considered in this work.
A C K N O W L E D G E M E N T
The present work was performed at the Fire Laboratory of Building Research Institute (BRI) in Tsukuba. J. Fangrat is very grateful to the Science and Technology Agency for granting an STA Fellowship for her stay in Japan, and to her host Dr Yuji Hasemi and her colleagues Masashi Yoshida and Ichiroh Nakaya for their kindness and hospitality.
R E F E R E N C E S
1. Babrauskas, V. & Grayson, S. J. (eds), Heat Release in Fires. Elsevier Applied Science, London and New York, 1992.
2. Tran, H. C. & White, R. H., Burning rate of solid wood measured in a heat release rate calorimeter. Fire and Materials, 16 (1992) 197-206.
3. Janssens, M. L., In Heat Release in Fires, ed. V. Babrauskas and S. J. Grayson. Elsevier Applied Science, London and New York, 1992, pp. 267-70.
4. Quintiere, J. G. & Harkleroad, M., New concepts for measuring flame spread properties. NBS IR 84-2943, National Bureau of Standards, Gaithersburg, MD, 1984.
5. American Society for Testing and Materials, E 1321-90: Standard test method for determining material ignition and flame spread properties. ASTM, Philadelphia, 1990.
6. Jianmin, Q., Prediction of flame spread test results from the test data of the Cone Calorimeter. Report SP 1990:38, Statens Provningsanstalt, Boras, Sweden, 1990. Also in Heat Release in Fires, ed. V. Babrauskas, V. and S. J. Grayson. Elsevier Applied Science, London and New York, 1992, pp. 293 -306.
7. Alpert, R. L. & de Ris, J., In Summaries of Centre for Fire Research in-house projects and grants--1989. NIST IR 89-4188, National Institute For Standards and Technology, Gaithersburg, MD, 1989, p. 81.