Embed Size (px)
Citation preview

Tax reforms in EU Member States Tax policy challenges for economic growth and fiscal sustainability 2012 Report
WORKING PAPER N.34 - 2012Directorate General for Taxation and Customs Union Directorate General for Economic and Financial Affairs
Taxation Papers are written by the staff of the European Commission's Directorate-General for Taxation and Customs Union, or by experts working in association with them. Taxation Papers are intended to increase awareness of the work being done by the staff and to seek comments and suggestions for further analyses. The views expressed in the Taxation Papers are solely those of the authors and do not necessarily reflect the views of the European Commission. Comments and inquiries should be addressed to: TAXUD [email protected] Cover photo made by Milan Pein
Despite all our efforts, we have not yet succeeded in identifying the authors and rights holders for some of the images. If you believe that you may be a rights holder, we invite you to contact the Central Audiovisual Library of the European Commission.
This paper is available in English only. This paper is also published as European Economy No 6 from Directorate-General Economic and Financial Affairs. Europe Direct is a service to help you find answers to your questions about the European Union Freephone number:
00 800 6 7 8 9 10 11 A great deal of additional information on the European Union is available on the Internet. It can be accessed through EUROPA at: http://europa.eu. For information on EU tax policy visit the European Commission's website at: http://ec.europa.eu/taxation_customs/taxation/index_en.htm Do you want to remain informed of EU tax and customs initiatives? Subscribe now to the Commission's e-mail newsflash at: http://ec.europa.eu/taxation_customs/common/newsflash/index_en.htm Cataloguing data can be found at the end of this publication. Luxembourg: Office for Official Publications of the European Communities, 2012 DOI 10.2778/30527 ISBN 978-92-79-26383-5 © European Union, 2012 Reproduction is authorised provided the source is acknowledged. PRINTED ON WHITE CHLORINE-FREE PAPER

Tax reforms in EU Member States
Tax policy challenges for economic growth and fiscal sustainability
2012 Report
6/2012

ACKNOWLEDGEMENTS
2
This report was prepared under the direction of Marco Buti (Director-General of DG ECFIN), Heinz
Zourek (Director-General of DG TAXUD), Servaas Deroose (Deputy Director-General of DG ECFIN),
Lucio Pench (Director of DG ECFIN) and Philip Kermode (Director of DG TAXUD).
The report was coordinated by Florian Wöhlbier (DG ECFIN) and Doris Prammer (DG TAXUD) under
the supervision of Gilles Mourre (Head of Unit, DG ECFIN) and Jean-Pierre De Laet (Head of Unit, DG
TAXUD). The main contributors were Serena Fatica, Jonas Jensen, Asa Johannesson-Linden, Gilles
Mourre, Florian Wöhlbier (DG ECFIN) and Marco Fantini, Mayya Hristova, Zornitsa Kutlina-Dimitrova,
Gaetan Nicodeme and Doris Prammer (DG TAXUD).
Special contributions were provided by George-Marian Isbasoiu, Savina Princen, Dario Paternoster (DG
ECFIN), Katri Kosonen (DG TAXUD), Salvador Barrios, Jonathan Pycroft and Bert Saveyn (JRC
Seville).
George-Marian Isbasoiu (DG ECFIN) was responsible for layout and IT support. Tamas Gabor Szin (DG
ECFIN) kindly provided layout support. Secretarial support was provided by Patricia Tuite (DG ECFIN).
Comments and suggestions by members of the Economic Policy Committee (EPC) and the Working
Group 'Structures of Taxation Systems' are gratefully acknowledged. The report benefitted from
comments and suggestions by colleagues in the Directorates-General for Economic and Financial Affairs
and Taxation and Customs Union as well as by other services of the Commission.
Comments on the report would be gratefully received and should be sent, by mail or e-mail to:
Gilles Mourre
European Commission
Directorate-General for Economic and Financial Affairs
Directorate for Fiscal Policy
Office BU-1 00-147
B-1049 Brussels
e-mail: Functional Mailbox [email protected]
or
Gaetan Nicodeme
European Commission
Directorate-General Taxation and Customs Union
Directorate for Direct taxation, Tax Coordination, Economic Analysis and Evaluation
Office SPA3 6/017
B-1049 Brussels
e-mail: Functional Mailbox [email protected]

ABBREVIATIONS
3
AETR Average effective tax rate
AEFC Alternates of the Economic and Financial Committee
AGS Annual Growth Survey
AW Average wage
CGE Computable General Equilibrium
CIT Corporate income tax
CCCTB Common Consolidated Corporate Tax Base
DG ECFIN Directorate-General Economic and Financial Affairs
DG TAXUD Directorate-General Taxation and Customs Union
EA Euro area
EC European Commission
ECB European Central Bank
ECOFIN Economic and Financial Affairs (Council)
EPC Economic Policy Committee
EPP Euro Plus Pact
ESA79 European System of Accounts 1979
ESA95 European System of Accounts 1995
EU European Union
EMU European Monetary Union
FAT Financial activity tax
FTT Financial transaction tax
GDP Gross domestic product
GHG Greenhouse gas
GNI Gross national income
ITR Implicit tax rate
JRC-IPTS Institute for Prospective Technological Studies of the European Commission's Joint
Research Centre
METR Marginal effective tax rate
MCPF Marginal cost of public funds
MTO Medium-term budgetary objective
NMS New Member States
NRP National Reform Programme
OECD Organisation for Economic Cooperation and Development
PIT Personal income tax
pp percentage points
SCP Stability and Convergence Programme
SSC Social security contributions
TFP Total factor productivity
VAT Value added tax


CONTENTS
5
Editorial 9
Summary and conclusions 10
1. Introduction 13
2. Level, structure and trends of tax revenue in the EU 17
2.1. Level and development of the overall tax burden 17
2.2. Tax composition 18
3. Recent reforms of tax systems in the EU 23
3.1. General trends in tax reforms 23
3.1.1. Overall tax policy direction 23
3.1.2. The overall structure of taxation 23
3.2. Main tax reforms in member states 25
3.2.1. Direct taxation 25
3.2.2. Social security contributions 28
3.2.3. Indirect taxation 28
3.2.4. Taxation of property 29
3.2.5. Tax administration and tax compliance 31
3.3. Concluding remarks 31
4. The EU VAT system: economic implications and policy challenges 47
4.1. Choosing between an ‘origin’ and a ‘destination’ system 47
4.1.1. Issues related with the origin system and merits of the destination system 47
4.1.2. Dealing with VAT fraud in the current destination system 49
4.2. General implications of the current vat system on trade 50
4.2.1. The current VAT system: strengths and weaknesses 50
4.2.2. Theoretical impacts on the current systems on trade 50
4.3. Estimating the impact of cross-border compliance costs 51
4.4. Estimating the impact of VAT exemptions on trade neutrality 53
4.5. Estimating the cost of exemptions and reduced rates and its distributional benefits 54
4.6. Policy conclusions 55
5. Tax policy challenges in EU Member States 57
5.1. Fiscal consolidation and growth-friendly tax structures 58
5.1.1. Consolidation on the revenue side 58
5.1.2. Promoting growth-enhancing tax structures 60

6
5.2. Broadening tax bases 66
5.2.1. Reviewing tax expenditures in personal and corporate income taxation 67
5.2.2. Increasing VAT efficiency 71
5.3. Improving tax governance 73
5.3.1. Tax compliance issues: Reviewing available indicators 74
5.3.2. Quality of tax administration 78
5.4. Specific issues 80
5.4.1. Housing taxation 81
5.4.2. Environmental taxation 87
5.4.3. Some redistribution aspects 92
5.5. Overview of tax policy challenges 97
References 100
Glossary 107
Statistical annex 111
LIST OF TABLES
3.1. Tax changes in 2011 and 2012 24
3.2. Excise duty changes in 2011 and 2012 29
3.3. Overview of tax reforms in Member States 36
5.1. Sustainability gap and primary balance 58
5.2. Assessment of 'tax space' 60
5.3. Overview: fiscal consolidation challenges 60
5.4. Tax burden on labour and overall labour market situation 61
5.5. Labour market situation of and tax burden on specific groups 62
5.6. Indirect and consumption taxes 63
5.7. Tax burden on the environment 65
5.8. Overview: tax structure indicators 66
5.9. Reduced corporate income tax rate for small businesses 67
5.10. Reduced corporate income tax rates and special tax regimes for specific regions and
sectors 68
5.11. Issues in the area of corporate tax expenditures in EU Member States 69
5.12. ACE, CBIT, thin-capitalisation and earnings-stripping rules in EU Member States 70
5.13. VAT ‘compliance’ gap 73
5.14. Size of the shadow economy and undeclared work in the EU Member States 75
5.15. Use of third party information in Member States 79
5.16. Overview table of tax administration challenges 80
5.17. Tax rates on real estate transactions in EU Member States 81

7
5.18. Rules for mortgage interest deductibility for owner-occupied properties in EU Member States 86
5.19. Summary of challenges in area of environmental taxation 91
5.20. Overview table: Tax policy challenges in Member States 97
A.1. Total taxes (including social security contributions) and tax structure 111
A.2. Total taxes (including social security contributions) and tax structure 112
A.3. Development of implicit tax rates 113
A.4. Statutory tax rates 114
A.5. Energy tax revenues in relation to final energy consumption 115
A.6. The composition of tax wedge in 2011, single average income worker 116
A.7. Standard and reduced VAT rates in the EU 117
A.8. Measures of tax progressivity 118
LIST OF GRAPHS
2.1. Development of overall tax ratio 17
2.2. Overall tax-to-GDP ratio (incl. SSC) in the EU 17
2.3. Dispersion (coefficient of variation) of total taxes 18
2.4. Tax composition 18
2.5. Tax revenue by type of tax 19
2.6. Implicit tax rates 19
2.7. Decomposition of the implicit tax rate consumption 19
2.8. Decomposition of the implicit tax rate on labour 20
2.9. Implicit tax rate on capital 20
2.10. Environmental tax revenue 20
2.11. Breakdown of environmental tax revenue 21
2.12. Energy tax revenue in relation to final energy consumption (real ITR on energy) 21
4.1. Standard VAT rate in EU-27 49
5.1. Effective marginal tax rates on debt- and equity-financed new corporate investment 70
5.2. Actual VAT revenues as a percentage of theoretical revenues at standard rates in 2009 and
2010 72
5.3. Administrative cost per net revenue collection 78
5.4. Size of tax administrations (total staffing) and number of local branches 78
5.5. Use of electronic filing for PIT, CIT and VAT 80
5.6. Administrative burden of tax systems for a medium-sized company 80
5.7. Revenues from property taxes 84
5.8. Diesel/petrol ratio 89
5.9. Concentration of market income and disposable income measured by the Gini-coefficient 92
5.10. Index of progressivity at the 100% and 167% level of the wage of the average worker (single
no children) 96
5.11. Ratio of tax wedge 167% / 67% of the average worker (single, no children) 97
8
LIST OF BOXES
1.1. Importance of taxation in main policy processes 15
3.1. Determinants of tax reforms 30
3.2. Assessing the efficiency losses of tax increase in the EU: the case of labour and energy
taxation 32
4.1. Commission's Communication on the future of VAT 56
5.1. Benchmarking approach to identifying Member States that face a challenge in a particular
tax policy area 57
5.2. Screening principles to identify a potential need for tax-based consolidation 59
5.3. Screening principles when identifying a potential need, and room, for a tax shift 64
5.4. Selected measures to improve tax compliance and promote efficient tax administration 76
5.5. Distributional effects of environmental taxation 95
EDITORIAL
9
Reforming the European economy to ensure that it generates sustainable growth and creates jobs remains
a key challenge. At present, many Member States face substantial consolidation needs while at the same
time have to support ailing economic activity and employment. Tax policies contribute to the
consolidation of public finances. They also have an important influence on the growth and job potential of
the EU economy, while promoting social inclusiveness. Given their dual functions, tax policy issues have
been comprehensively covered in the 2012 cycle of economic policy coordination, commonly referred to
as the 'European Semester'.
The 2012 edition of the report ‘Tax reforms in EU Member States’ intends to contribute to the tax policy
debate in the EU. Following the successful 2011 edition, the report consists of two parts: i) a short
analysis of tax revenue data and an overview of recent tax reforms in Member States, and ii) a discussion
of selected up-to-date tax policy topics in the form of two analytical chapters.
The first analytical chapter focuses on the economic implications and policy challenges of the EU VAT
system, of which it provides an overview of the history and possible future. It analyses welfare gains and
economic benefits from simplifying VAT procedures and reviews options to reduce VAT fraud and
evasion. This chapter is particularly topical in light of two recent Commission Communications on ‘the
future of VAT’ and on ‘concrete ways to reinforce the fight against tax fraud and tax evasion including in
relation to third countries’.
The second analytical chapter deals with economic challenges that EU Member States are facing in the
field of taxation and tax policy in times of slow growth and high fiscal consolidation needs. Applying an
indicator-based approach, the report identifies horizontal challenges related to (i) fiscal consolidation on
the revenue side and growth-friendly tax structures, (ii) broadness of tax bases in both direct and indirect
taxation, with a particular focus on corporate tax expenditure, (iii) the need to improve tax governance
and (iv) specific tax issues, namely housing taxation, environmental taxation and some redistributive
aspects of taxation.
We trust that the analysis in this year's report will again contribute to the tax policy debate in the
European Union. In particular, the cross-country consistent identification of tax challenges for all EU
Member States, based on indicators, may serve as technical background for the analysis of necessary tax
policy measures. In line with last years' practice, the tax challenges identified in this report require further
scrutiny in the framework of the 'European Semester'.
Marco Buti Heinz Zourek
Director-General Director-General
Economic and Financial Affairs Taxation and Customs Union

SUMMARY AND CONCLUSIONS
10
The first effects of the global financial and economic crisis on revenue were felt in 2008. Due to the
strong contraction of GDP and expansionary cuts in labour taxes and capital taxation, the overall
tax-to-GDP ratio reached its lowest value since the beginning of the decade in 2009. Consolidation-
oriented tax increases and a modest recovery of the economy stabilised tax revenue in 2010. Given the
deterioration of public finances and strong turbulence in sovereign debt markets, fiscal policies in 2011
and 2012 were generally driven by the need to restore the sustainability of public finances. As far as tax
policy is concerned, for most Member States the need for more revenue to support the overall
consolidation effort was compounded by other difficulties stemming from the need to support recovery
and restore sustained growth over the medium and long term. Tax revenue in the EU increased in 2011
and this upward trend is expected to continue until 2013 at least.
In the period 2011–12, many Member States increased personal income tax, mainly by increasing
statutory rates. This was often done on a temporary basis in the form of general surcharges or solidarity
contributions for high-income earners. Measures to reduce tax on labour aimed mainly to increase work
incentives for specific groups. Social security contributions were also increased in many countries, by
increasing the standard rate and the rates applicable to specific groups. Several Member States reduced
their headline tax rate on corporate income, while in a few others marginal tax rates were increased by
means of surcharges or levies applicable only to the largest companies. Changes in corporate tax bases
were slightly more common. They consisted mostly of generous tax relief on investment in physical
capital or R&D, whilst restricting the deductibility of other items (e.g. operating losses). In about half of
the Member States standard and reduced VAT rates were increased. Targeted increases in the VAT rates
applicable to specific categories of goods and/or services were quite common. Excise duties were
increased in most Member States, mostly by changing the statutory rates for environment and energy
products and for alcohol and tobacco. These reforms resulted in a slight change in the composition of
total tax revenues for 2011 and 2012 compared to 2010, with the share of indirect taxes forecast to rise by
almost one percentage point of GDP.
Despite these reforms, structural features of European tax systems remain entrenched. For example,
differences in the tax-to-GDP ratio across the EU are still quite pronounced, with the cross-country range
standing at twenty points and a higher overall tax-to-GDP ratio in the euro area than in the EU. Following
a period of cross-country convergence, marked by tax reductions in countries with high taxes, tax-to-GDP
ratios diverged again between 2008 and 2010. This was due to the different degree to which the recession
affected Member States and the difference in policy reactions to the crisis. There are differences between
EU Member States both in terms of the overall tax burden and in terms of its composition. While most
‘old’ Member States raise roughly equal amounts of revenue from direct taxes, indirect taxes and social
security contributions, the share of direct taxes in total revenue is lower for Member States that joined the
EU in or after 2004. This is mostly because they have adopted flat-rate systems.
Some key economic issues related to the legal and institutional features of VAT in the EU, as well as new
analytical evidence, are presented, broadly based on a recent study by the Institute for Fiscal Studies. This
study served as input into the Commission’s Communication on the future of VAT issued in December
2011. The first important policy conclusion is that the long-standing plan of moving to VAT taxation at
origin, where the goods are produced instead of consumed, is no longer feasible. It may not even be
economically desirable, on account of the loss of flexibility it entails, the risk of trade diversion and
distortion in the single market and its incompatibility with heterogeneous VAT systems. This disparity is
seen in terms not only of standard rates but also of reduced rates and exemptions (on different goods and
with very different rates). The confirmation of the destination principle reinforces the need to tackle VAT
fraud, in particular VAT carousels fraud. This requires better coordination between Member States and
reflects the general objective of combating tax fraud in the Annual Growth Survey 2012. Simplifying
VAT procedures would also bring economic benefits. Recent research shows that trade and GDP would
increase in the EU if the number and complexity of VAT procedures were reduced. The second important
policy conclusion concerns the use of reduced VAT rates and exemptions. These largely account for why
different VAT regimes may have an impact on trade, despite the use of the less distortionary destination

Summary and conclusions
11
system. The use of reduced VAT rates and exemptions mostly reflects policy choices made in the past.
These were often linked to distributional objectives. They are, however, debatable from an economic
viewpoint, because consumption taxes are poor instruments for redistribution. While the part reduced
VAT rates play in boosting employment or the consumption of merit goods is not supported by empirical
evidence, reduced rates and exemptions generally have a significant budgetary cost and increase the
complexity of the system. The latter increases administrative and compliance costs. The third important
conclusion is that new evidence suggests that the differences in VAT regimes, exemptions and reduced
rates generate high costs in terms of the distortion and fragmentation of the internal market. These costs
are probably higher than previously believed. This confirms the potential welfare gains from increasing
the efficiency of VAT systems by limiting exemptions and phasing out most reduced rates, subject to a
careful cost-benefit analysis, and making use of alternative policy instruments, as recommended in the
Annual Growth Survey 2012.
This report also analyses economic challenges that EU Member States are facing in terms of taxation and
tax policy in these times of slow growth and great fiscal consolidation needs. This analysis may be
relevant for the 2013 European Semester, underpinning sound national tax policies to support growth and
fiscal sustainability and avoid macroeconomic imbalances. This analysis is consistent across Member
States and based on indicator-based evidence. It should be completed with country-specific evidence
before drawing firm policy conclusions.
The analysis found that several EU Member States could, albeit to a different extent, consider using
revenue measures in addition to expenditure measures to consolidate their public finances and make them
more sustainable. Around a third of Member States appear to have both need and room for a tax shift.
They could benefit from shifting labour taxes to taxes considered less detrimental to growth (consumption
taxes, recurrent property taxes, environmental taxes). With a view to broadening tax bases, many Member
States need to review and possibly reduce tax expenditure in direct taxation, especially in corporate
income tax. The debt bias in corporate tax is an issue for almost a third of Member States. Despite recent
measures to improve VAT efficiency, there is still a compliance gap in this area in many Member States,
often combined with the large use of exemptions and reduced rates (i.e. VAT ‘policy’ gap).
A number of Member States face the challenge of improving tax governance. This relates to a large
shadow economy and/or high levels of potential VAT fraud and evasion in some countries, or the
efficiency of tax administration in others. Better tax administration is a challenge in a third of Member
States due to various factors. They are high administrative costs per net revenue collected, not using
third-party information to prefill tax returns, the little use made of e-filing and the heavy administrative
burden of tax systems for medium-sized companies.
Housing taxation in EU Member States is often based too much on transaction taxes relative to recurrent
taxes on immovable property. Due to such a situation, in particular a third of Member States should
consider a shift within property taxes. Moreover, several Member States face the challenges to reduce the
debt bias in housing taxation.
Finally, there are several tax-related challenges related to environmental policy. Firstly, it is important to
ensure that the policy instruments in place, including taxes, are sufficient to achieve the agreed
environmental objectives. If more policy measures are needed, environmental taxes should play a role.
Secondly, energy taxes and other environmental taxes should be designed so that they provide appropriate
incentives to reduce emissions over time. Various measures could be implemented at national level to
improve the tax system, in particular by i) adjusting tax rates on fossil fuels according to their carbon and
energy content, ii) indexing environmental taxes, iii) reconsidering reduced VAT rates on energy, iv)
reducing tax subsidies for company cars and v) introducing CO2-related vehicle taxation. Overall, there
appears to be scope for improving the design of their environmental taxes in a third of Member States.

European Commission
Tax reforms in EU Member States
12
While this report mainly focuses on the potential to improve the efficiency of national tax systems, the
redistributive effects of the tax system can be equally important. Redistribution can occur in several ways,
including through taxation, notably the progressive taxation of labour income. It can also take the form of
income-replacing transfers, targeted benefits, public consumption spending and the provision of public
goods. Redistribution through the tax-benefit system is the prerogative of Member States, which have
different perceptions of social equity and different collective preferences for balancing efficiency and
equality. However, a Member State that has substantial challenges with efficiency in the tax-benefit
system (e.g. a large amount of tax expenditure) and does not do well in terms of mitigating income
inequalities, may be able to improve efficiency without compromising redistribution policies or increase
redistribution without hampering efficiency. Member States also need to take the sustainability of public
finances into account when deciding on their redistributive policy.

1. INTRODUCTION
13
Initial mandate and overall purpose
In 2009, the first edition of the report entitled
‘Monitoring revenue trends and tax reforms in EU
Member States’ was published. In the 2011
edition, the title was shortened to ‘Tax reforms in
EU Member States’ for ease of communication
and to better reflect the content of the report.
The report is prepared jointly by DG ECFIN and
DG TAXUD of the European Commission under
its own initiative. It includes comments provided
by Member States in the context of the Economic
Policy Committee attached to the ECOFIN
Council and DG TAXUD's working group
'Structures of Taxation Systems'. It builds on a
substantial body of work done by the Commission
services, including numerous assessments of the
budgetary implications of tax reforms, analyses of
their effects on employment, growth and equity
and of their contribution to meeting environmental
policy objectives. (1) Given its focus on policy-
relevant aspects of taxation and on recent tax
reforms having direct bearing on fiscal
sustainability, growth and jobs, this report
complements the annual report entitled ‘Taxation
Trends in the European Union’ prepared by DG
TAXUD and Eurostat. That report is more
descriptive and statistical and gives a
comprehensive overview of the level and structure
of revenue systems in the EU. (2)
This report has several purposes. First, it identifies
how tax revenues in EU Member States have been
evolving, as a result of past reforms and other
factors, such as the business cycle or the slowdown
in potential growth. Second, it takes stock of tax
reforms that have been implemented in the
Member States. Third, it reviews various policy
issues relevant for future reforms, which are
presently considered in the policy debate, such as
broadening the tax base of certain taxes and thus
increasing revenue or reducing harmful high tax
rates. Other topical issues are shifting taxation
away from labour towards revenue sources both
more innovative and less detrimental to growth
and improving the efficiency of tax collection and
tackling tax evasion.
(1) See, e.g. European Commission (2008a, 2010a, 2010b).
(2) European Commission (2012a).
As a first attempt to identify relevant tax policy
challenges, e.g. by using indicator-based
screenings, the report also represents an analytical
input to the economic integrated surveillance
carried out in the context of the European
Semester, which is presented in the next section
and in Box 1.1. This report may in particular feed
into or analytically underpin the 2013 European
Semester, starting with the formulation of the
cross-cutting issues reported in the 2013 Annual
Growth Survey. Member States should take these
issues into account when designing future reforms
of their national tax systems.
The report is also intended to stimulate a
structured, multi-faceted tax dialogue between the
Commission and Member States. This has been
stressed as particularly important in Annex IV of
the 2012 Annual Growth Survey on 'Growth-
friendly tax policies in Member States and better
tax coordination in the EU' This will stimulate the
exchange of best practice on tax reforms among
Member States and foster debates on the role of
efficient tax policies for growth, employment and
social equity. Lastly, the report aims to contribute
to more effective communication with the civil
society on this topic.
Greater relevance of tax policies under the
European Semester
Taxation is particularly important in the current
economic context in which Member States need to
speed up consolidation. Many Member States have
to consider revenue-raising measures, while at the
same time trying to maintain still fragile European
economic growth.
To tackle these glaring challenges, a new
framework of integrated economic policy
coordination, the European Semester, was set up in
the EU. This process looks at economic policies,
including tax reforms, at Member State level with
a view to supporting economic growth and fiscal
sustainability (see Box 1.1 for a more detailed
description of the European Semester and related
processes). It also enables the exchange of best
practices and the definition of some common
challenges, e.g. in the area of tax policies, which
may benefit all Member States. It provides helpful
guidance on how to take common steps towards

European Commission
Tax reforms in EU Member States
14
more sustainable, growth-and job-friendly tax
systems, while meeting the need for substantial
fiscal consolidation, removing distortions that
contribute to macroeconomic imbalances and
keeping their (re)distributional abilities.
At country level, the European Semester agenda is
distinct but complementary to the need for
strengthened tax coordination, especially when
cross-border issues are involved. On the one hand,
well-coordinated taxation will help to improve the
efficiency of the Internal Market, given that some
remaining obstacles stem from the uncoordinated
tax policies of Member States. On the other hand,
tax coordination can also support the
implementation of national growth-friendly tax
policy strategies, for example when it leads to the
elimination of harmful tax practices and
strengthens national tax governance.
Main trends in tax revenue and tax policy that
emerge from the European Semester
The Country Specific Recommendations endorsed
by the European Council on 28/29 June 2012,
adopted by the ECOFIN Council on 10 July and
closing the second European Semester highlight
the importance of further tax reforms that give
priority to growth-friendly sources of taxation
while maintaining or raising total tax revenues to
help the consolidation process.
A review of the Stability and Convergence
Programmes shows that the revenue-to-GDP ratio
is expected to increase in nearly all Member States
of the euro area in 2012. It is expected to remain
stable in the rest of the euro area. The picture is
more mixed for the non-euro area, where higher
and lower revenue ratios are expected in 2012. All
tax categories, indirect taxation, direct taxation,
and social security contributions are expected to
increase as a percentage of GDP in the EU in the
coming years.
With regard to tax policy as outlined in the
Stability and Convergence Programmes, Member
States tend to increase taxes considered less
detrimental to growth, i.e. consumption taxes,
including environmental taxes, and property taxes.
VAT revenue is increased by raising tax rates and
broadening the tax base. Increased excise duties
and other indirect taxes, including environmental
taxes, are also used frequently to raise additional
revenue. If a lot of consolidation is needed, tax
increases tend to be applied also on labour and
capital incomes, although Member States usually
do not increase the corporate income tax in line
with a growth-friendly tax policy and possibly to
avoid an adverse impact on a mobile tax base.
Distributional concerns appear to often play a role
in tax measures, as new measures often target
high-value properties or high-income earners.
Many Member States are trying to improve tax
governance, in particular by fighting tax evasion
more efficiently and improving tax administration.
Outline of the report
The report is structured as follows.
Chapter 2 summarises the major developments in
tax revenues and revenue composition (by type of
tax and economic function). It focuses on
developments before and since the beginning of
the economic and financial crisis.
Chapter 3 gives an overview of recent tax reforms
implemented in Member States, driven in many
cases by short-term consolidation needs. Whilst
relevant for the European Semester, this keeps the
promise made in the 2012 Annual Growth Survey
to give information 'on the main features of
national tax reforms'. On the basis of individual
country information, it identifies common trends
across countries, identifying the types of reforms
implemented since the financial crisis began.
Chapter 4 focuses on how the VAT system works,
reviewing reform needs and options. In most
Member States, consumption taxes, notably VAT,
have greatly contributed to consolidation on the
revenue side. At the same time, the importance of
a well-designed VAT system, with a view to
generating revenues in the most efficient way and
minimising compliance costs for businesses, has
been recognised in the Communication on the
future of VAT. This section recalls the main
economic aspects of VAT, and reports on the main
results of the evaluation of the VAT system.
Chapter 5 looks at tax policy challenges in EU
Member States. To foster a better understanding of
Member States' tax systems, it updates last year's
analysis of challenges linked to the contribution of

1. Introduction
15
(Continued on the next page)
Box 1.1: Importance of taxation in main policy processes
The European Semester (I): horizontal recommendation including Annual Growth Survey
The Annual Growth Survey for 2012 launched the 2012 European Semester of economic governance. It is
the basis for a common understanding about the priorities for action at national and EU level for the next
twelve months. It should feed into national economic and budgetary decisions putting the EU country-
specific recommendations and the commitments made under the Euro Plus Pact (EPP) into practice.
To take better account of the need to integrate tax policy, this year’s Annual Growth Survey contains a new
annex on growth-friendly tax policies in Member States and better tax coordination in the EU. It is also
relevant to the EPP. It underlines that to improve the contribution of revenue to fiscal consolidation, tax
systems should be better designed and structured to make them more effective, efficient and fair, taking into
account that Member States may need to increase taxes. Tax reforms are already under way in many Member States. They should take account of the following:
There is scope for broadening the tax base of certain taxes, thus increasing revenue or reducing
distortively high tax rates. For example, deductions and exemptions from the standard tax base often
create economic distortions and make the tax system less efficient. This is particularly the case with
VAT exemptions and reduced rates but it also applies to corporate and personal income tax. Phasing out
some hidden tax subsidies could help to widen the tax base. In particular, environmentally harmful subsidies should be eliminated.
Greater efforts should be made to shift taxation away from labour towards taxation that is less
detrimental to growth. For example, increasing consumption, environmental, wealth (including high
value property) taxation can help alleviate the tax burden on labour. This makes it more attractive to hire people. Particular attention should be paid to the needs of the most vulnerable groups in any tax shifts.
In several Member States, making tax collection more efficient and tackling tax evasion can increase
government revenue. Applying tax rules in all areas of taxation more effectively will help in this respect.
Measures to encourage moves from informal or undeclared work to regular employment should be reinforced.
New sources of national revenue such as the auctioning of CO2 emission allowances and spectrum
auctioning will start to become available. They could be used to support expenditure in growth-friendly
areas, including green growth, given the commitment to devote a substantial share of these new resources to combating climate change.
To maximise the impact of their tax reforms, Member States should coordinate their efforts through
enhanced dialogue at EU level. Progress should be made on the proposals announced by the
Commission in its last Annual Growth Survey for a common consolidated corporate tax base, for a financial transaction tax and for energy taxation – which are now on the table of the European legislator.
The macro-annex of the Annual Growth Survey also said that while expenditure-based consolidation is more
likely to succeed, the structure and design of taxation should be developed to better spur growth. In this
respect, tax reforms can serve two purposes. Firstly, they can support the consolidation of public finances in
those Member States where there is room for tax revenue increases and they can be used as a complement to
expenditure control. Secondly, they can support growth by changing the structure of taxation or better
designing individual types of tax, such as taxes designed to improve the incentives to work, produce or invest or to improve resource efficiency.
The European Semester (II): assessment of national reform strategies by the Commission and the
Council
The European Semester is closed in June each year with the endorsement of the Country Specific
Recommendations (CSRs) by the Council. The national policy strategy of each Member State is set out in its
Stability and Convergence Programme (SCP) and in its National Reform Programme (NRP). The SCP sets

European Commission
Tax reforms in EU Member States
16
taxation to fiscal consolidation and more growth-
friendly tax structures as well as the design of
individual taxes and tax administration. All
Member States are covered, unlike last year, when
only Member States in the euro area were covered.
Moreover, the chapter deepens the analysis on
housing taxation and tax governance further. It
also provides a first analysis of challenges related
to additional areas of taxation, including tax
expenditure in corporate taxation, environmental
taxation and the redistributive effects of taxation.
The chapter concludes with a synoptic overview of
EU Member States that may need to consider tax
policy measures in the different areas analysed.
Box (continued)
out measures to ensure sound public finances, while the NRP sets out the measures planned to boost growth
and jobs and address potential macroeconomic imbalances. The Commission assesses the EPP commitments
of the participating Member States to the extent that they are included in the NRPs. It provides a detailed
assessment of the implementation by Member States of the CSRs and the EPP commitments in the country-
by-country analysis it presents to the June European Council each year and proposes changes or amendments to CSRs based on that analysis.
The Commission’s assessment of EU Member States’ SCPs and NRPs suggests that tax structures should be
adapted to support growth, while tax increases may complement the control of government expenditure to
help meet the sizeable consolidation challenges in some Member States. Growth-friendly tax policies should
aim to broaden tax bases and raise indirect taxation if necessary, while not increasing direct taxation. The
SCPs and NRPs show that Member States who have problems with debt sustainability intend to increase
taxes in addition to curbing public spending. Although in general all taxes were increased, including SSC
and personal income tax, the emphasis was on indirect taxes, resulting in a relative shift towards indirect
taxation. This often takes the form of narrowing the scope of reduced VAT rates and increasing excise
duties, including energy taxes. New special provisions have been introduced generally to support R&D,
green innovation or SMEs. Reducing tax loopholes also seems to be a priority in order to broaden tax bases
and lower tax rates, thus supporting growth and fiscal sustainability. New tax expenditure should be rigorously reviewed and assessed ex ante and ex post.
Euro Plus Pact
The Euro Plus Pact has been agreed by the Heads of State and Government of the euro area countries and of
Bulgaria, Denmark, Latvia, Lithuania, Poland and Romania. Hungary, the Czech Republic, Sweden and the
United Kingdom decided not to take part, partly to retain their tax independence. The EPP is embedded in
the institutional set-up of the EU and consistent with the European Semester. It adds a political impetus to the Europe 2020 growth strategy and steps taken to reinforce economic governance in EMU.
It stipulates that labour tax reforms will be instrumental in increasing employment and highlights the
importance of pragmatic tax coordination in the form of structured discussions on tax issues, the exchange
of good practice and the adoption of the Commission’s proposal for a common consolidated corporate tax
base. In this context, Member States undertake ‘to engage in structured discussions on tax policy issues,
notably to ensure the exchange of best practices, avoidance of harmful practices and proposals to fight against fraud and tax evasion’.
2. LEVEL, STRUCTURE AND TRENDS OF TAX REVENUE IN THE
EU
17
This chapter presents the trends in tax revenue and
the latest available detailed data for the 27 EU
Member States. It provides an overview of tax
revenue levels across the EU (Section 2.1) and
information about their composition (Section
2.2). (3)
2.1. LEVEL AND DEVELOPMENT OF THE
OVERALL TAX BURDEN
Revenue stabilised in 2010 but picked up in
2011
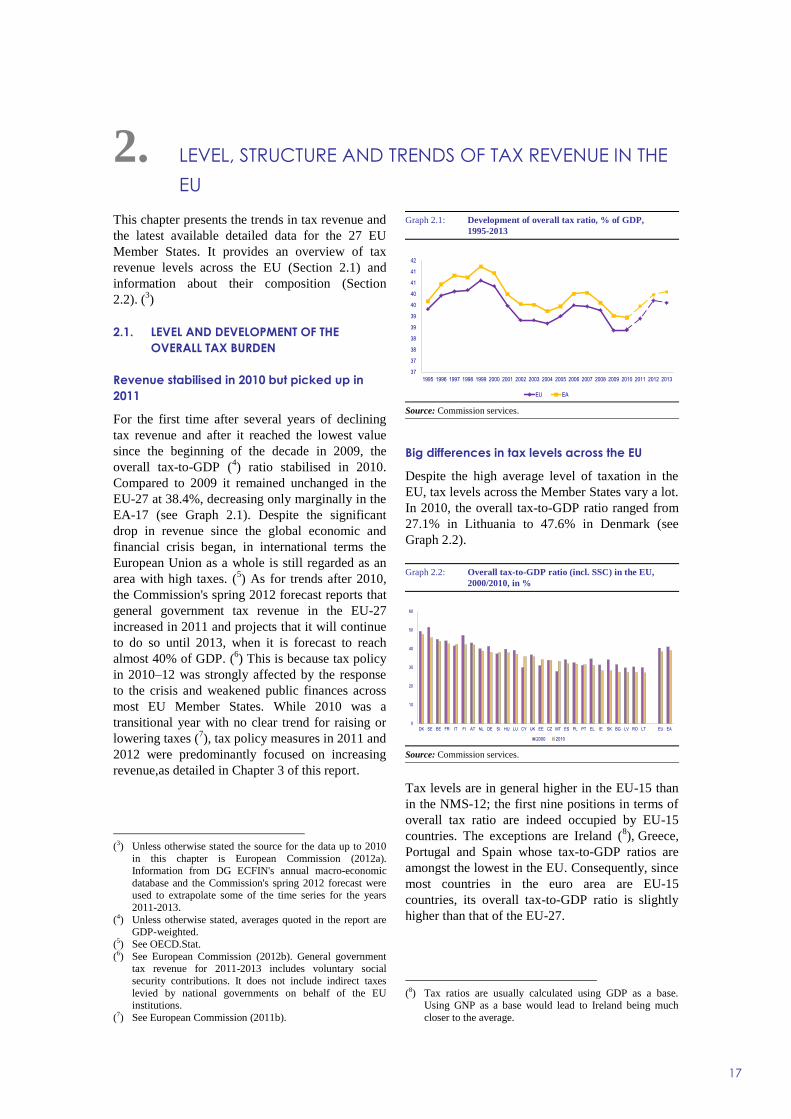
For the first time after several years of declining
tax revenue and after it reached the lowest value
since the beginning of the decade in 2009, the
overall tax-to-GDP (4) ratio stabilised in 2010.
Compared to 2009 it remained unchanged in the
EU-27 at 38.4%, decreasing only marginally in the
EA-17 (see Graph 2.1). Despite the significant
drop in revenue since the global economic and
financial crisis began, in international terms the
European Union as a whole is still regarded as an
area with high taxes. (5) As for trends after 2010,
the Commission's spring 2012 forecast reports that
general government tax revenue in the EU-27
increased in 2011 and projects that it will continue
to do so until 2013, when it is forecast to reach
almost 40% of GDP. (6) This is because tax policy
in 2010–12 was strongly affected by the response
to the crisis and weakened public finances across
most EU Member States. While 2010 was a
transitional year with no clear trend for raising or
lowering taxes (7), tax policy measures in 2011 and
2012 were predominantly focused on increasing
revenue,as detailed in Chapter 3 of this report.
(3) Unless otherwise stated the source for the data up to 2010
in this chapter is European Commission (2012a). Information from DG ECFIN's annual macro-economic
database and the Commission's spring 2012 forecast were used to extrapolate some of the time series for the years
2011-2013.
(4) Unless otherwise stated, averages quoted in the report are GDP-weighted.
(5) See OECD.Stat.
(6) See European Commission (2012b). General government tax revenue for 2011-2013 includes voluntary social
security contributions. It does not include indirect taxes
levied by national governments on behalf of the EU institutions.
(7) See European Commission (2011b).
Graph 2.1: Development of overall tax ratio, % of GDP,
1995-2013
Source: Commission services.
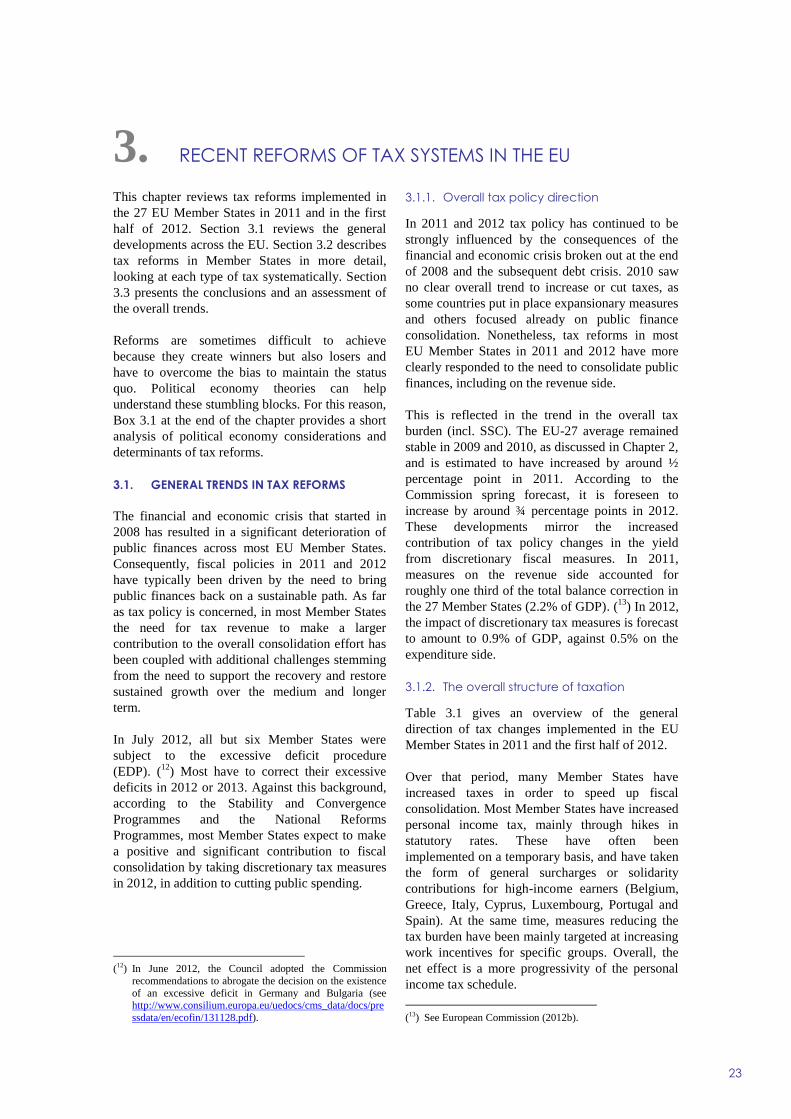
Big differences in tax levels across the EU
Despite the high average level of taxation in the
EU, tax levels across the Member States vary a lot.
In 2010, the overall tax-to-GDP ratio ranged from
27.1% in Lithuania to 47.6% in Denmark (see
Graph 2.2).
Graph 2.2: Overall tax-to-GDP ratio (incl. SSC) in the EU,
2000/2010, in %
Source: Commission services.
Tax levels are in general higher in the EU-15 than
in the NMS-12; the first nine positions in terms of
overall tax ratio are indeed occupied by EU-15
countries. The exceptions are Ireland (8), Greece,
Portugal and Spain whose tax-to-GDP ratios are
amongst the lowest in the EU. Consequently, since
most countries in the euro area are EU-15
countries, its overall tax-to-GDP ratio is slightly
higher than that of the EU-27.
(8) Tax ratios are usually calculated using GDP as a base.
Using GNP as a base would lead to Ireland being much
closer to the average.
37
37
38
38
39
39
40
40
41
41
42
1995 1996 1997 1998 1999 2000 2001 2002 2003 2004 2005 2006 2007 2008 2009 2010 2011 2012 2013
EU EA
0
10
20
30
40
50
60
DK SE BE FR IT FI AT NL DE SI HU LU CY UK EE CZ MT ES PL PT EL IE SK BG LV RO LT EU EA
2000 2010

European Commission
Tax reforms in EU Member States
18
Convergence of tax-to-GDP ratios since 2000
interrupted during the crisis
Big differences between national tax levels are not
new. In 2000, the gap between the tax-to-GDP
ratio in the Member State with the highest tax and
the Member State with the lowest tax was almost
24 points. However, there were signs of
convergence from 2000 until 2007, as shown by
the falling ratio of the standard deviation and the
mean (see Graph 2.3). The trend came to a halt in
2007/2008 when tax-to-GDP ratios diverged. This
could be due to the difference in the depth of the
recession across the EU and to the various policy
reactions to the crisis.
Graph 2.3: Dispersion (coefficient of variation) of total taxes,
1995-2010
Source: Commission services.
Note: The coefficient of variation is a normalised dispersion measure. It
is calculated as the standard deviation divided by the mean (both un-
weighted).
All countries, except Italy, whose tax-to-GDP ratio
was above average in 2000, reduced it between
2000 and 2010. Sweden and Finland, two of the
countries with the highest tax-to-GDP ratio in
2000 have cut the tax burden since then by more
than 5 points (see Graph 2.3). The trend is less
uniform for the group of countries whose tax-to-
GDP ratios were below average tax ratios in 2000.
Only four of them had higher revenues in 2010
than in 2000.
2.2. TAX COMPOSITION
Diverging tax composition in the EU
There are differences across the EU not only in the
overall tax level, but also in its composition. While
most EU-15 Member States raise roughly the same
amount of revenue from direct taxes, indirect
taxes, and social security contributions, NMS-12
countries, except Malta, usually have fewer direct
taxes in the total (see Graph 2.4). The lowest
shares of direct taxes are recorded in Lithuania
(only 17.4%), Bulgaria (18.8%), Slovakia (19.1%)
and Estonia (19.9%). All of these countries have
adopted flat rate systems, which usually greatly
reduce direct tax rates.
Graph 2.4: Tax composition, 2010
Source: Commission services.
At the other extreme, the Nordic countries and the
United Kingdom have relatively high shares of
direct taxes in total tax revenues. In Denmark and,
to a lesser extent in Sweden and the United
Kingdom the share of social security contributions
(SSCs) is low. The extremely low share in
Denmark is due to the fact that most welfare
spending is financed out of general taxation. This
requires high direct tax levels. Indeed the share of
direct taxation in total tax revenues in Denmark is
by far the highest in the EU. With a high share of
SSCs and a relatively low share of direct taxes, the
German and French tax systems are the opposite of
Denmark’s.
Revenue raised from the three major tax bases -
consumption, labour and capital- also varies
greatly (see Graph 2.5). On average, taxes on
labour income amount to almost 50% of overall
revenue, followed by consumption at roughly one
third and capital at around one fifth. However,
NMS-12 countries tend to have a high share of
consumption taxes. Apart from the fact that in
general a large share of GDP in the NMS-12 is
final domestic consumption, the lower taxation of
labour in these countries tends to increase the share
of consumption taxation. Also, the economy of
these countries is generally more energy-intensive
and mineral oil taxes are an important part of
consumption taxes. Revenue from taxation of
capital and business income varies even more.
Some smaller revenue sources, such as the taxation
of stocks of capital/wealth and the taxation of non-
employed labour (essentially pensions and social
0
5
10
15
20
25
1995 1996 1997 1998 1999 2000 2001 2002 2003 2004 2005 2006 2007 2008 2009 2010
EU EA
0%
10%
20%
30%
40%
50%
60%
70%
80%
90%
100%
BE BG CZ DK DE EE IE EL ES FR IT CY LV LT LU HU MT NL AT PL PT RO SI SK FI SE UK EU EA
Indirect taxes Direct taxes SSC

2. Level, structure and trends of tax revenue in the EU
19
security benefits) range from significant to
negligible. The latter primarily reflects the choice
made in the different Member States to provide
social benefits and pensions on a gross or a net
basis.
Graph 2.5: Tax revenue by type of tax, 2010, % of GDP
Source: Commission services.
Consumption taxation
One area strongly affected by the response to the
economic and financial crisis has been
consumption taxation. The implicit tax rate (ITR)
on consumption increased sharply in 2010 (19.7%
in the EU-27) interrupting the downward trend
since 2007 and almost reaching pre-crisis level
(see Graph 2.6).
Graph 2.6: Implicit tax rates, EU-27, 1995-2010
Note: ITR on capital: due to data availability the EU average does not
include BG, LU, MT and RO.
Source: Commission services.
The increase was quite broad across the EU. It can
be largely attributed to an increase in VAT rates.
Stagnant since 2002, standard VAT rates have
often increased since 2009. (9) The arithmetic EU-
(9) Only in two cases did the VAT rate decrease. In the United
Kingdom the rate was temporarily cut by two points in
2009 to support consumption. In Ireland the rate was
decreased by half a point in 2010 after a temporary increase in 2009. Both countries are currently applying
higher rates.
27 average having risen strongly by 1.5 points in
only four years, stands at around 21% in 2012 (see
Table A.7 in Annex 1).
The decomposition of the ITR shows that the VAT
component is the largest, accounting for more than
half of the overall indicator's value (see Graph
2.7).
Graph 2.7: Decomposition of the implicit tax rate consumption,
2010, in %
Source: Commission services.
However, non-VAT consumption taxes are not
negligible; their share in the ITR ranges from
26.6 % in Sweden to 41.4 % in the United
Kingdom. On average, taxes on energy (typically
excise duties on mineral oils), tobacco and alcohol
make up around one quarter of the revenue from
consumption taxes. Differences in the consumption
of excisable goods are such that their revenue
effects go well beyond the spread in tax rates: For
example in percent of GDP Bulgaria raises about
five times as much revenue as the Netherlands
from excise duties on alcohol and tobacco.
Labour taxation
Despite a wide consensus on the desirability of
lower taxes on labour, the high ITR on labour (10
)
confirms the widespread difficulty of achieving
this aim. Although the ratio decreased by half a
percentage point in 2009 and is below the peaks
reached in the late 1990s, it remained stable in
2010 at 36% (see Graph 2.6). More than half of the
Member States' ratio increased, but the increase
was higher than one point in only six of them (see
Table A.3 in Annex 1).
(10) The ITR on labour (employed) is calculated as the ratio of
taxes and social contributions on employed labour income
to the total compensation of employees and payroll taxes.
0
5
10
15
20
25
30
35
40
45
50
DK SE BE FR IT FI AT NL DE SI HU LU CY UK EE CZ MT ES PL PT EL IE SK BG LV RO LT EU EA
Consumption Labour employed Labour non-employed Capital and business income Stocks of capital
18
20
22
24
26
28
30
32
34
36
38
1995 1996 1997 1998 1999 2000 2001 2002 2003 2004 2005 2006 2007 2008 2009 2010
ITR consumption ITR labour ITR capital
0%
5%
10%
15%
20%
25%
30%
35%
DK SE LU HU NL EE FI SI BG IE AT BE CZ PL DE FR RO MT CY UK LT SK PT LV IT EL ES EU
VAT component Energy component Tobacco and alcohol component Residual

European Commission
Tax reforms in EU Member States
20
Graph 2.8: Decomposition of the implicit tax rate on labour,
2010, in %
Source: Commission services.
The tax burden on labour is essentially consists of
personal income taxes and social security
contributions. In most Member States, SSC
account for a much greater share of labour taxes
than personal income tax. On average, about two
thirds of the overall ITR on labour consists of non-
wage labour costs paid by employees and
employers (see Graph 2.8). Only in Denmark,
Ireland and the United Kingdom is personal
income tax a relatively large part of the total
charges paid on labour income. In countries such
as Poland, Greece and Slovakia less than 20% of
the ITR on labour consists of personal income tax.
Capital taxation
The ITR on capital (11
) has decreased considerably
since 2007. However it stabilised in 2010 when it
reached 28.8 %, only half a percentage point less
than what it was in 2009 (see Graph 2.9). Cyclical
effects and big cuts in corporate income tax (CIT)
rates affected the ITR. However, it seems likely
that tax-base broadening measures which
frequently accompanied the rate cuts sustained the
ITR.
The indicator’s levels differ widely in the EU,
ranging from 39 % in Denmark (based on 2009
data) to a mere 9.1 % in Estonia (see Graph 2.9). A
breakdown of the ITR shows that in most cases,
the difference in the tax burden on capital is due to
wide differences in the taxation of capital
stocks/wealth, while the ITRs on capital and
business income cluster around 20 % (see Graph
(11) The ITR on capital is the ratio between taxes on capital and
aggregate capital and savings income. It includes taxes on
the income earned from savings and investments by households and corporations and taxes on stocks of capital
from savings and investment in previous periods. The
denominator of the ITR is an approximation of the worldwide capital and business income of residents for
domestic tax purposes.
2.5. For a more detailed discussion see European
Commission (2012a)).
Graph 2.9: Implicit tax rate on capital, 2010, in %
Note: No data for BG, LU, MT, RO and IS; data for DK, ES and UK
refer to 2009.
Source: Commission services.
Environmental taxation
Roughly one euro out of every 16 in revenue is
raised from environmental taxes. After declining
between 2003 and 2008, the EU-27 average picked
up in 2009 and remained stable in 2010 at 2.4 % of
GDP (see Graph 2.10). At 4.0 % of GDP in 2010,
Denmark and the Netherlands had the highest level
of ‘green’ taxes followed by Slovenia at 3.6 %.
Graph 2.10: Environmental tax revenue, 2000-2010, % of GDP
Source: Commission services.
Environmental taxes are a sub-category of indirect
taxes, in general consumption taxes. They also
sometimes include taxes on capital stock. Energy
taxes, mainly levied on transport fuels,
predominate in most Member States. In some,
however, the contribution of taxes on transport,
other than on fuels, is also significant. For
example, in Denmark, Ireland, Cyprus and Malta
they account for between 36% and 44% of
environmental taxes. In 2010, revenue from these
0%
5%
10%
15%
20%
25%
30%
35%
40%
45%
IT BE FR AT HU FI CZ SE DE EE NL SI DK ES LV SK LU LT EL PL RO CY IE UK BG PT MT EU EA
Personal income tax Employees' SSC Employers' SSC and payroll taxes
3937 37
35 35
31 3130
28 28
2422
21 20
18 1717 16
1413
0907 07
2829
0
10
20
30
40
DK FR UK SE IT CY PT BE ES FI AT SI DE PL EL HU CZ SK IE NL EE LV LT EA EU
2.1%
2.2%
2.3%
2.4%
2.5%
2.6%
2.7%
2000 2001 2002 2003 2004 2005 2006 2007 2008 2009 2010
EA EU

2. Level, structure and trends of tax revenue in the EU
21
taxes amounted to 0.5 % of GDP in the EU-27,
while taxes on pollution/resources raised only
0.1 % of GDP (see Graph 2.11).
Graph 2.11: Breakdown of environmental tax revenue, 2010,
in % of GDP
Source: Commission services.
A high ratio of environmental tax revenue to total
taxation or a high level in % of GDP do not
necessarily mean that environmental protection is a
high priority. Originally, taxes on energy (incl.
fuel) and transport were often used to raise
revenue, without environmental purposes. Tax
revenues are a product of tax rates and the tax
base. Hence the high level of the indicator can be
the result not only of high level of tax rates, but
also of a high tax base in relation to GDP. This is
an indication of the inefficient use of resources in a
country or of a very energy-intensive economy.
The indicator can therefore give a misleading view
of a country’s environmental policy goals if the tax
base is not thoroughly assessed.
In contrast, the indicator ‘ITR on energy’ is not
affected by the size of the tax base. It therefore
provides a more reliable measure of the effective
level of environmental (or energy) taxation.
However, this indicator also has some
peculiarities. The ITR treats all kinds of energy
consumption in the same way, regardless of their
environmental impact. An energy unit produced
from hydroelectric power has the same weight as
one produced from coal. In many countries,
however, renewable energy sources are taxed at a
lower tax rate than exhaustible ones, or they are
exempted to provide incentives to switch from
fossil fuels to more environmentally-friendly
sources of energy. Thus, paradoxically, a country
with a large share of renewable energy may have a
lower ITR on energy than a country that relies
heavily on carbon-based energy sources.
Graph 2.12: Energy tax revenue in relation to final energy
consumption (real ITR on energy), Euro per tonne
of oil equivalent, deflated with cumulative % change
in final demand deflator, 2000-2009
Source: Commission services.
Data show that in real terms taxation on energy
increased sharply in 2009, breaking the downward
trend from 2002 to 2008 (see Graph 2.12).
Moreover, the EU-27 base-weighted average in
2009 was just above its highest level in 2002. The
real ITR on energy increased in nearly all EU
Member States, except in Luxemburg, Hungary,
Bulgaria and Slovakia where it remained almost
unchanged (see Table A.5 in Annex 1). The rise is
probably due to the discretionary increase in the
rates of excise duties on energy products and other
environmental taxes across the EU over the last
few years.
0.0
0.5
1.0
1.5
2.0
2.5
3.0
3.5
4.0
4.5
DK NL SI MT EE CY BG FI SE UK HU IT PL PT EL LV CZ LU AT IE DE BE RO SK LT FR ES EU EA
Energy Transport Pollution/Resources
150
155
160
165
170
175
2000 2001 2002 2003 2004 2005 2006 2007 2008 2009
EA average EU average

3. RECENT REFORMS OF TAX SYSTEMS IN THE EU
23
This chapter reviews tax reforms implemented in
the 27 EU Member States in 2011 and in the first
half of 2012. Section 3.1 reviews the general
developments across the EU. Section 3.2 describes
tax reforms in Member States in more detail,
looking at each type of tax systematically. Section
3.3 presents the conclusions and an assessment of
the overall trends.
Reforms are sometimes difficult to achieve
because they create winners but also losers and
have to overcome the bias to maintain the status
quo. Political economy theories can help
understand these stumbling blocks. For this reason,
Box 3.1 at the end of the chapter provides a short
analysis of political economy considerations and
determinants of tax reforms.
3.1. GENERAL TRENDS IN TAX REFORMS
The financial and economic crisis that started in
2008 has resulted in a significant deterioration of
public finances across most EU Member States.
Consequently, fiscal policies in 2011 and 2012
have typically been driven by the need to bring
public finances back on a sustainable path. As far
as tax policy is concerned, in most Member States
the need for tax revenue to make a larger
contribution to the overall consolidation effort has
been coupled with additional challenges stemming
from the need to support the recovery and restore
sustained growth over the medium and longer
term.
In July 2012, all but six Member States were
subject to the excessive deficit procedure
(EDP). (12
) Most have to correct their excessive
deficits in 2012 or 2013. Against this background,
according to the Stability and Convergence
Programmes and the National Reforms
Programmes, most Member States expect to make
a positive and significant contribution to fiscal
consolidation by taking discretionary tax measures
in 2012, in addition to cutting public spending.
(12) In June 2012, the Council adopted the Commission
recommendations to abrogate the decision on the existence
of an excessive deficit in Germany and Bulgaria (see http://www.consilium.europa.eu/uedocs/cms_data/docs/pre
ssdata/en/ecofin/131128.pdf).
3.1.1. Overall tax policy direction
In 2011 and 2012 tax policy has continued to be
strongly influenced by the consequences of the
financial and economic crisis broken out at the end
of 2008 and the subsequent debt crisis. 2010 saw
no clear overall trend to increase or cut taxes, as
some countries put in place expansionary measures
and others focused already on public finance
consolidation. Nonetheless, tax reforms in most
EU Member States in 2011 and 2012 have more
clearly responded to the need to consolidate public
finances, including on the revenue side.
This is reflected in the trend in the overall tax
burden (incl. SSC). The EU-27 average remained
stable in 2009 and 2010, as discussed in Chapter 2,
and is estimated to have increased by around ½
percentage point in 2011. According to the
Commission spring forecast, it is foreseen to
increase by around ¾ percentage points in 2012.
These developments mirror the increased
contribution of tax policy changes in the yield
from discretionary fiscal measures. In 2011,
measures on the revenue side accounted for
roughly one third of the total balance correction in
the 27 Member States (2.2% of GDP). (13
) In 2012,
the impact of discretionary tax measures is forecast
to amount to 0.9% of GDP, against 0.5% on the
expenditure side.
3.1.2. The overall structure of taxation
Table 3.1 gives an overview of the general
direction of tax changes implemented in the EU
Member States in 2011 and the first half of 2012.
Over that period, many Member States have
increased taxes in order to speed up fiscal
consolidation. Most Member States have increased
personal income tax, mainly through hikes in
statutory rates. These have often been
implemented on a temporary basis, and have taken
the form of general surcharges or solidarity
contributions for high-income earners (Belgium,
Greece, Italy, Cyprus, Luxembourg, Portugal and
Spain). At the same time, measures reducing the
tax burden have been mainly targeted at increasing
work incentives for specific groups. Overall, the
net effect is a more progressivity of the personal
income tax schedule.
(13) See European Commission (2012b).

European Commission
Tax reforms in EU Member States
24
Social security contributions have also been
increased in many countries, through hikes both in
the standard rates (Greece, Latvia, Poland and the
United Kingdom) and in the rates applicable to
specific groups (Bulgaria, France, Hungary,
Austria and Portugal). Only Germany has cut the
general contribution rate to the pension insurance,
albeit modestly.
Roughly half of the Member States have raised
VAT rates, both the standard rate (Portugal, the
United Kingdom, Cyprus, Ireland, Hungary,
Poland, Slovakia and Italy) and the reduced rate
(Latvia, Poland, France, Bulgaria, Greece and the
Czech Republic). (14
) Targeted increases in the
VAT rate for specific categories of goods and/or
services have also been relatively frequent. These
have been achieved by repealing exemptions (e.g.,
in Cyprus, Belgium, Denmark, Finland) and by
narrowing the application of the reduced rates
(e.g., in Greece, Latvia, Portugal and Finland).
Excises duties have been increased in most
Member States, mostly through changes in the
statutory rates, both for environment and energy
products and for alcohol and tobacco.
Several Member States have reduced their headline
tax rates on corporate income (United Kingdom,
Finland, Slovenia, Greece and the Netherlands). At
the same time, however, marginal tax rates have
increased in France, Greece and Portugal by means
of surcharges or levies applicable only to the
largest companies. Changes in the bases have been
slightly more frequent, mostly focused on more
generous treatment of investment expenditure on
physical capital or R&D, and on restrictions to the
deductibility of other items, such as losses.
All in all, 2011 and 2012 have seen a slight change
in the composition of total revenue compared to
2010. While 2009 saw a marked drop in the yield
from direct taxes (from 33.3% to 31.4%) and only
a small increase in that from indirect taxation
(from 31.8% to 32.1%), more recently, increases in
the indirect tax burden have been coupled with
increased revenue from direct taxation in the EU as
(14) Spain raised its reduced and standard VAT rates,
broadening at the same time the scope of application of the latter, in the context of the tax reform approved in July
2012, i.e. after the cut-off date.
a whole, although of moderate magnitude. In
particular, in 2012, the share of indirect taxes over
the total tax burden is forecast to rise by 1
percentage point from 32.1% in 2009. At the same
time, the share of direct taxes in the total tax
revenue is set to increase from 31.5% in 2009 to
32.1% in 2012. (15
)
The change in the structure of taxation is generally
associated with strong economic effects, notably,
in terms of the reduction of economic distortions.
As an analytical illustration, Box 3.2 at the end of
the chapter provides results of recent simulations
for the efficiency loss of tax increases in the EU in
the area of labour and energy taxation. This
analysis uses the concept of 'marginal costs of
public funds' (MCPF) and is conducted by the
European Commission's Joint Research Centre
(JRC-ITPS) using a CGE model. Generally the
cost is found to be higher for labour tax increases
than for energy tax increases.
Table 3.1: Tax changes in 2011 and 2012
Note: The table encompasses tax changes implemented in 2011 and the
first half of 2012 including temporary but significant changes. Minor
changes are not included. Tax measures are reported individually, and
not consolidated on the basis of their budgetary impacts. Introduction of
new taxes is listed as an increase in statutory rate. Changes in tax
brackets (thresholds) are considered as base changes.
Solidarity charges levied in: BE on financial income, CY on SSC, EL on
high income, IT on high income, LU temporary, PT and ES all of which
are classified as increases in statutory rate. PIT: In FI and NL labour
income taxation has been decreased while capital income taxation has
been increased.
* temporary increase in 2011. ** measure introduced after the cut-off
date.
Source: Commission services.
(15) The composition of tax revenue can change not only
because of exogenous tax reforms but also for endogenous
factors, e.g. business cycle developments.
Statutory rates Base or special regimes
IncreaseBE, DK,CY, FI, EL, ES, IE, IT,
LU*, NL, PT
AT, BE, CZ*, DK, ES**, FI, FR,
EL, HU, IE, PL, PT, SK, UK
Decrease FI, HU, LV, NLCZ, DK, EE, FI, DE, ES, HU, IE,
LV, MT, NL, SE, UK
Increase FR, PT CZ, AT, BE, DK, ES**, HU
Decrease UK, FI, EL, SI, NL, ES, HU, IT, LT, LU, UK
IncreaseAT, BG, CY, FR, EL, HU, LV,
PL, PT, UKIE, SK
Decrease DE, IE CZ
IncreasePT, UK, CY, ES**, IE, HU, LV,
PL, SK, IT, FR, BG, EL, CZ
AT, BE, BG, CY, DK, EL, ES**,
FI, LV, NL, PL, PT,
Decrease CY, EL, ES, IE, LT, PL
Increase
AT, BE, BG, CY, CZ, DE, EL,
ES, FI, FR, HU, IE, IT, LT, LU,
LV, MT, NL, PL, PT, RO, SE,
SK, SI, UK
DK, EE, LV, PL
Decrease SI
Increase CY, EL, ES, IE, PT, UK CY, IT, LT, LV
Decrease NL
Taxation of
Property
Excise Duties
Personal
Income Tax
Corporate
Income Tax
Social Security
Contributions
Value Added
Tax

3. Recent reforms of tax systems in the EU
25
3.2. MAIN TAX REFORMS IN MEMBER STATES
This section presents the main measures taken on
direct taxation (personal income tax and corporate
income tax), and social security contributions. It
then details the reforms in indirect tax (VAT and
excise duties). Measures on housing taxation and
to combat tax evasion are reviewed in turn. Further
details on tax reforms in each of the 27 Member
States are outlined in Table 3.3 at the end of this
chapter.
3.2.1. Direct taxation
Personal Income Tax
Around half of the Member States have
implemented substantial, albeit in many cases
temporary, changes to personal income tax in 2011
and 2012. The need for budget consolidation has
resulted in marked increases in personal income
tax in many Member States, with tax cuts mainly
targeting special groups.
Most Member States have increased personal
income tax (Belgium, Denmark, Cyprus, Finland,
Greece, Ireland, France, Italy, Luxembourg,
Netherlands, Portugal, Spain, Slovakia, and the
United Kingdom), often by increasing statutory tax
rates. In contrast to 2010, many tax rate increases
are temporary and often represent surcharges on
high income, both from capital and labour.
Belgium, Greece, Italy, Cyprus, Luxembourg,
Portugal and Spain introduced solidarity levies, all
temporary measures, except in Belgium. Austria
announced that it will bring in a temporary
progressive solidarity contribution on high
incomes in 2013 (and lower tax allowances for the
self-employed). Similar measures are planned in
the Czech Republic.
As solidarity contributions are levied on high
incomes or increase with the level of income, these
countries' personal income tax systems have
become more progressive. While Italy and
Portugal levy surcharges on high incomes, at rates
of 3% and 2.5% respectively (16
), Greece, Cyprus
and Spain have increased taxes for all income
brackets, but progressively. For 2011 only,
Portugal applied a surcharge of 3.5% to the income
above the minimum wage. Luxembourg levied a
0.8% crisis tax on all income except minimum
(16) The 3% levy in Italy is deductible from PIT base.
wage salary in 2011, and Belgium brought in a 4%
solidarity charge on financial income above a
threshold. The Spanish progressive tax schedule on
savings and capital gains in three brackets is a
temporary measure for two years.
For Member States that have shifted the tax burden
away from personal income tax, most tax reforms
have aimed to increase work incentives. The focus
has been mostly on participation incentives for
vulnerable groups and generally involved changes
in the tax base. Austria and the Netherlands,
however, have cut the tax/social security
advantages for older workers. Only Finland and
Germany’s tax base measures lowered the tax
burden for the entire working population.
Germany, the Czech Republic, Hungary and Malta
have introduced tax measures supporting parents.
Germany facilitated tax deductibility for childcare
costs, the Czech Republic and Hungary increased
tax allowances for families with children and tax
credits for families with three or more children,
respectively, and Malta increased the tax brackets
for parents with children under 18.
Tax reliefs were also granted to low and medium
income earners by increasing tax credits and basic
allowances in Belgium, Finland and Hungary. The
Netherlands decreased the tax rate in the lowest tax
bracket in 2011. Other targeted tax base reliefs
were given in Denmark, Sweden and Spain.
Denmark introduced a temporary deduction for
wage expenses for household services and
refurbishment expiring at the end of 2012. Sweden
raised basic income tax allowances for labour
income of people older than 65 and Spain
reintroduced the general 15% tax credit for buying
or restoring a taxpayer's primary residence.
Clearly, the Spanish tax measures are intended to
increase consumption and investment, and the
Swedish initiative aims to increase life spent in
work (since retirement age can be voluntarily
postponed from 65 to the age of 67).
Some measures in Italy and Ireland aim to improve
tax compliance and enhance human capital,
respectively. In Italy, a lower proportional tax rate
of between 19-21% was introduced on rental
income from buildings for residential purposes,
replacing the inclusion of 85% of rental income in
the personal income tax base (with a marginal tax
rate of around 30% on average). To attract key

European Commission
Tax reforms in EU Member States
26
individuals, Ireland grants qualifying individuals
from abroad an exemption from income tax on
30% of their annual salary between €75000 and
€500000 if they are employed for a minimum of
one year to a maximum of five years.
The 2011 Hungarian tax reform brought the
highest marginal tax rate down from 32% to a 16%
flat rate. However, as the tax base rose to 127% of
gross earnings (in 2010), the tax rate actually
corresponds to 20.3%. In 2012, the 27% base-
increasing component was phased out for low to
medium earnings below HUF 202000 (€653),
roughly the average wage, leading to a system with
two rates, 16% and 20.3%. Latvia lowered the
general PIT rate from 26 to 25%, partly
compensating for the increase in social security
contributions. In Finland there has been a slight
reduction in progressivity: the top marginal tax
rate was cut by 0.25 pp in 2012. The United
Kingdom announced that it would cut its highest
PIT rate from 50% to 45% in 2013.
The overall trend towards steeper progression in
personal income tax could reflect the fact that
personal income tax is the only tax that is well
suited to redistribute consumption power among
different income groups. The increase in other
taxes in response to the need for consolidation
tends to be flat or even regressive.
The EU-27 (arithmetic) average top personal
income tax rate increased slightly, by 0.2 pp, in the
period 2010-2012 from 37.9% to 38.1% (see Table
A.4 in Annex 1). This development has not been
steady as the PIT top rate fell in 2011 by 0.3 pp to
37.6%, and then returned to 38.1%, the highest
level since the crisis began in 2008. While the
decrease in 2011 was mainly the result of the
reform in Hungary, where the rate was halved to
20.3% in 2011, the 2012 increase is driven by the
(temporary) tax increases in Cyprus and Spain. In
comparison to 2010, six Member States – France,
Spain, Italy, Cyprus, Luxembourg and Portugal –
increased top rates levied on personal income. The
largest increase, by more than 28%, from 30 in
2011 to 38.5 in 2012 was in Cyprus, due to the
introduction of an additional tax bracket with a tax
rate of 35% and a temporary surcharge. The top
rate on personal income increased significantly in
Spain from 43% in 2010 to 52% in 2012. In 2011
the Spanish government introduced two additional
tax rates on income above €120000 and €175000
of 44% and 45% respectively. In 2012, a
temporary supplementary progressive levy was
brought in, raising the top personal income tax to
52%.
Concerning the taxation of capital income, recent
measures have typically increased the tax burden
on capital. In Austria, as from 1 April 2012 a
withholding tax of 25%, independent of the
holding period, applies to capital gains from
financial assets. Measures taken in other countries
mostly comprise increases in tax rates, namely in
Belgium, Cyprus, Finland, France, Ireland,
Portugal and Spain. In Belgium, the withholding
tax rate on interest and dividends increased from
15% to 21%, and in Cyprus the rate increased
permanently from 10% to 15% for interest and
temporarily for 2 years from 17% to 20% for
dividends. In France, the optional final levy on
dividends and interest was increased from 18% to
19% in 2011, and 21% and 24% respectively in
2012, whereas the mandatory final levy was
increased from 18% to 19% on capital gains. In
Ireland taxes on capital and interest were aligned at
30% in 2012. In Portugal, the tax rate applicable to
capital gains on the sale of shares and other
securities was increased from 21.5% in 2011 to
25% in 2012. Portugal also adopted an increase in
withholding tax from 21.5% to 25% on income
from dividends, interest and other forms of
remuneration on shareholders’ loans and share
capital.
Two countries, Finland and Spain rendered their
capital taxation more progressive. In Finland, the
tax rate on capital income increased from 28% to
30% and for income exceeding €50000 to 32%
from 2012. As of 2012, Spain taxes savings and
capital gains separately under a progressive tax
schedule with three brackets of 21% on the first
€6000, 25% up to €24000, and 27% on income
above that (in 2011, they were taxed at 19% on the
first €6000, and 21% on income above) from
2012-2013.
Several countries introduced measures to broaden
the tax base, often by reducing tax expenditures. In
particular, this was done through measures related
to housing taxation (although on personal capital

3. Recent reforms of tax systems in the EU
27
income). In the Netherlands, a new top bracket was
introduced in the imputed income for owner-
occupied housing, increasing the imputed income
for the share of the value in excess of €1 million
from 0.55% in 2009 to 1.05% in 2011 As a result,
it is slightly closer to the 4% imputed income that
applies to other assets. In Finland, the tax
deductibility of mortgage interest rate payments
will be gradually cut to 85% in 2012, 80% in 2013
and 75% in 2014. In Spain, the housing investment
deduction in personal income tax, which was
removed for incomes above €24 170, was
reintroduced for all primary residences in 2012.
Corporate Income Tax
The long-term trend to cut the statutory rates
across the EU has continued, albeit at a slower
pace, as most Member States have left the headline
rates unchanged in 2011-2012, with some
exceptions.
The United Kingdom cut the small profits
corporate tax rate by 1 point to 20%, and the
headline rate in two steps to 24%, 4 points below
the 2010 level. Further reductions in the rate are
planned to bring it to 23% in 2013 and 22% in
2014. Finland also cut its corporate income tax rate
from 26 to 24.5%. In Greece, the statutory rate was
cut from 25% in 2009 to 24% in 2010 and 20% for
income earned as of 2011. At the same time, as
from 2009 and until 2014, Greece applies a
temporary special contribution at progressive rates
for enterprises with a net income above €100000.
Slovenia cut the statutory rate from 20% to 18%,
and plans to cut it further progressively to 15% in
2015. In the Netherlands, the rate applicable to
profit in excess of €200000 was cut by half a
percentage point to 25%.
France and Portugal introduced surcharges to the
corporate income tax rate in 2012. France
introduced a temporary 5% surcharge on
companies with (group) gross income exceeding
€250 million, while in Portugal the surcharge on
the state corporate income tax (IRC) is levied at
3% on income between €1.5 and 10 million and at
5% above that. At the same time, the reduced CIT
rate of 12.5% was abolished.
Overall, the average top corporate income tax fell
in the EU-27 in the period 2010-2012 by 0.2 pp
from 23.7% in 2010 to 23.5% in 2012. In this
period only two Member States – France and
Portugal – increased the top CIT through
surcharges while four countries – Greece, Finland,
Netherlands and the United Kingdom cut the top
rate (Table A.4 in Annex 1 provides an overview
of the statutory top corporate income tax rates in
2012 compared to previous years).
Several Member States have made changes to their
tax base. The United Kingdom and Slovenia
introduced measures to incentivise corporate
investment. Slovenia increased the allowance for
investment in equipment and intangible assets to
40% (previously 30%) and raised the relief for
investment in research and development from 40
to 100%. Similarly, in the United Kingdom the
SME tax relief rate for investment was increased in
stages to 225% as of April 2012. In addition, a
special regime introducing a reduced 10% rate on
corporate profits attributed to patents and other
types of intellectual property (Patent Box) will be
phased in over five years as from April 2013. At
the same time, an 'Above the Line' (ATL) credit
for R&D with a minimum rate of 9.1% before tax
will be introduced. In March 2012, Spain
introduced several base-broadening measures such
as the deferral of tax benefits for goodwill arising
from acquisitions and business restructuring
operations, a permanent limit to the deductibility
of interest expenses, lower limits to the deductions
aimed at promoting certain activities (e.g. R&D),
limits to the ‘free depreciation’ regime (introduced
in 2010).
Restrictions to the favourable tax treatment of
losses have been introduced in Austria (limited to
cross-border losses), Denmark and France, where
upper limits were set to the amount that can be
overall carried forward, or utilised annually,
respectively. Similar limitations were introduced in
Spain for larger companies in 2012, while in the
previous year the carry-forward period had been
extended from 15 to 18 years.
Some countries have reduced the tax burden on
corporate profits by enlarging the scope of special
regimes. In Hungary, the threshold for the reduced
10% rate was increased tenfold to HUF 500
million (€1.8 million). Lithuania and Spain also
increased the maximum annual threshold to qualify
for the simplified taxation regime for small
companies.

European Commission
Tax reforms in EU Member States
28
3.2.2. Social security contributions
In contrast with 2010, when social security
contributions remained virtually unchanged in
most Member States - only Bulgaria and Hungary
implemented cuts – significant changes were made
in 2011 and even more in 2012. The changes
mainly take the form of increases. Almost always,
the increase was achieved by rate hikes, both for
general and for targeted groups. The standard rate
increased in Greece, Latvia, and the United
Kingdom. Special items of the social security
contributions, which effectively also increase the
overall social security contribution rate, were
raised in Bulgaria for pension contributions, in
France for passive (investment) income, in
Hungary for health insurance, and in Poland for
disability contributions. Increases for special types
of employees were brought in in Austria for
farmers, the self-employed and old-age
unemployed and in Portugal for civil servants.
Cyprus and Slovakia brought in increases via
amendments to the tax base. In Cyprus a
contribution of 3% on gross earnings of current
government employees to the government pension
schemes was introduced, and in Slovakia, taxable
non-monetary benefits provided to employees
were also made subject to social security and
health insurance contributions. In most of the
Member States where social security contributions
were increased, this increased the tax burden on
labour as they were not compensated by decreases
in the PIT, except in Latvia.
The only exception was Germany, which reduced
the contribution to pension insurance from 19.9%
to 19.6% from 1 January 2012. France plans to
increase SSC on passive income. Belgium brought
in tax relief in the employer social security
contribution for the first three employees hired by
medium-sized enterprises in order to address the
rigid labour market.
3.2.3. Indirect taxation
VAT
In line with the trends over the previous biennium,
between 2011 and 2012, many Member States
increased the standard VAT rate. In Portugal, as of
January 2011 the standard rate was increased by a
two-step hike to 23%, 3 points above its level in
June 2010. Following the temporary reduction to
15% in 2009, the United Kingdom raised the
standard rate from 17.5% to 20% in January 2011.
In 2012 Cyprus and Ireland increased their
standard rates by 2 percentage points to 17% and
23%, respectively. The two-point hike in January
2012 brought the standard rate to 27% in Hungary,
the highest level in the EU, and 7 points above the
level before the July 2009 increase. Increases by 1
point were also made in Latvia, Poland, Slovakia
and Italy in 2011. (17
) In Italy an additional two-
point hike to 23% will take effect in October
2012. (18
) (19
)
This implies a progressive increase in the average
standard VAT in EU-27 from 19.8% in 2009 to
21% in 2012 (See Table A.7 in Annex 1). Over
2010-2012, almost half the Member States raised
the standard and/or reduced rate to raise revenue.
Reduced rates were increased in several countries,
such as Latvia, Poland, France (excluding some
goods and services still taxed at the previous
level), Bulgaria (where reduced rates apply only to
tourist services) and Greece, with a parallel sizable
increase in the standard rate made in 2010. In
2012, the reduced rate in the Czech Republic was
raised from 10 to 14%.
Increases in the VAT base were achieved by
repealing exemptions (for instance, in Cyprus,
Belgium, Denmark, Finland) and by reducing the
scope of application of existing reduced rates
(notably, in Greece Latvia and Portugal).
Interestingly, in Finland, the application of the
reduced rate to labour-intensive services was
abolished.
In Hungary and Denmark, the increase in the
statutory VAT rate and base broadening measures
were adopted in the context of broader reforms that
aim to shift the fiscal burden away from labour and
capital towards consumption. In the other Member
States, the increases were brought in to increase
overall tax revenue.
(17) Latvia brought the standard rate back to 21% from July
2012. (18) This measure is approved unless the general Spending
Review reform makes it unnecessary by generating
expenditures saving. (19) In July 2012, Spain increased the standard rate by 3 pp to
21% as of September 2012.

3. Recent reforms of tax systems in the EU
29
Several Member States have implemented targeted
– and in some cases temporary – reductions in the
tax burden to specific goods and services by
moving them to the lowest rates (Belgium, Cyprus,
Greece, Spain and Sweden). These changes were,
in most of these Member States, justified not only
on distributional grounds (reduced rates on
necessities such as food or on merit goods thought
to be under consumed), but also by concerns on the
economic developments in specific sectors (e.g.
construction). (20
)
Excise duties
In 2011 and 2012, a number of excise duty rates
were significantly increased in most Member
States, with the only decrease in fuel excises
implemented in Slovenia. In several of the new
Member States, excise duties on transport fuels,
electricity, tobacco and alcohol have been raised
considerably, although in many instances from a
low level close to the EU minimum before the
hikes implemented in 2010.
Excise duties on energy and other environmental
taxes were increased in many Member States.
Germany introduced a tax on nuclear fuel. Austria
and Germany introduced a duty on airline tickets
for planes leaving from domestic airports. Air
passenger duty was also increased in the United
Kingdom. In Finland, energy taxation has been
restructured to take into account the energy content
and CO2-emissions of energy products. Ireland
introduced a tax on CO2-emissions and Slovakia
introduced a tax on ETS quotas allocated free of
charge. In line with the Energy Directive, Poland
abolished the exemption on coal, lignite and coke.
Latvia re-introduced excises on natural gas in 2011
and widened the tax base by including certain
lubricating oil groups in 2012.
Several countries have implemented changes to the
taxation of cars. Austria, Belgium and the
Netherlands have increased the CO2-incentives in
car registration tax. In 2011 Latvia changed the
structure of the vehicle operation tax, at the same
time increasing the tax burden on luxury,
environmentally unfriendly and powerful cars. In
Romania, a pollution tax was introduced on both
(20) Reduced VAT rates are generally not the most efficient
way of redistributing income.
new and second-hand vehicles produced locally or
abroad on their first registration.
Excise duties on tobacco and/or alcohol were
increased in Belgium, Cyprus, Czech Republic,
Estonia, France, Finland, Hungary, Latvia,
Lithuania, Luxembourg, Malta, the Netherlands,
Poland, Portugal, Romania, Slovenia, Spain and
the United Kingdom. Concerning other health-
related products, Finland introduced an excise duty
on sweets and ice cream, while in France a specific
contribution was introduced on suppliers of
beverages (sodas) with added sugar or sweeteners.
Latvia’s excise duty rate on sweetened non-
alcoholic drinks was increased by 30%.
Table 3.2 summarises the tax changes in excise
duties across Member States and breaks down the
overview from Table 3.1 into two main excise duty
categories.
Table 3.2: Excise duty changes in 2011 and 2012
Note: See note to Table 3.1.
Source: Commission services.
3.2.4. Taxation of property
Only a few Member States implemented tax
reforms in the domain of property taxation. In
particular, increases in recurrent taxes were
brought in in Greece, Italy, Latvia, Lithuania,
Portugal and Spain. Greece introduced a special
real estate duty on residential property, calculated
on the surface area of buildings, also taking into
account its age and location. The duty is collected
through the payment of electricity bills. In
addition, the tax-free bracket of the progressive
real estate tax introduced in 2010 was halved to
€200000. Italy abolished the exemption on main
residences granted by the property tax and raised
cadastral values by 60%. This is expected to yield
0.7% of GDP in extra revenue. Latvia doubled its
progressive rates for residential buildings and
Statutory ratesBase or special
regimes
Increase
AT, BG, FI, DE, EL,
ES, HU, IE, IT, LV,
LT, MT, NL, PT, RO,
SK, UK
DK, EE, LV, PL
Decrease SI
Increase
AT, BE, CY, CZ, DE,
EE, ES, FI, FR, HU,
LV, LT, LU, NL, PL,
PT, RO, SE, SK, SI,
UK
Decrease
Energy &
Environment
Tobacco, Alcohol
and Sugar etc.

European Commission
Tax reforms in EU Member States
30
broadened the base of the real estate tax by
including auxiliary buildings, parking slots and
houses and lands owned by religious organisations
but not used for a religious purpose. Base-
broadening measures were also introduced in
Lithuania, where the annual tax now applies to
immovable property owned by individuals and not
used for commercial purposes (previously exempt)
at a 1% rate on values above LTL 1000000
(€290000). Portugal increased the minimum and
the maximum rates of the real estate tax on urban
property by 0.1 pp. Spain introduced for 2012 and
2013 a temporary surcharge in the Real Estate
Tax (municipal tax) for immovable properties with
an updated cadastral value over the average value
in each municipality.
The Netherlands and the United Kingdom
amended their property transaction taxes. The
Dutch cut the property transfer tax for owner-
occupied dwellings from 6% to 2%. The United
Kingdom introduced a 7% rate of the Stamp Duty
Land Tax (increased to 15% if the buyer is a non-
natural person) applicable to the purchase of
residential property with a value above GBP 2
million (€2.5 million).
Box 3.1: Determinants of tax reforms
Tax systems are amended relatively frequently. While the recent reforms are clearly influenced by the
general economic conditions, one interesting question is whether political or social factors also play a role in
tax policy.
The political economy of tax policy has investigated why tax systems are as they are and why they are going
towards specific structures. For instance, reviewing the UK, Alt et al. (2011) highlight a decline in
preferences for redistribution that materialised in cuts in statutory rates. They also identify hysteresis
features in terms of favourable tax treatments (e.g. R&D tax credits, mortgage interest tax relief, married
couple allowances, etc.),even if these measures do not tend to be lobbied for in the first place. The authors
also note a low level of information in the electorate on the effects of tax and interaction between different
types of tax. These features are echoed by Castanheira and Valenduc (2006). They find that many features of
the Belgian tax system (e.g. reduced corporate tax rates, the favourable taxation of financial instruments or
the financial sector, or the tax treatment of couples) benefit from the status quo due to political
considerations. A third example is Profeta (2007), who argues that the 2007 reform of bequest taxes in Italy
was driven by political considerations.
A second strand of the economic literature focuses on the levels of various taxes, in particular those on
corporations. By estimating tax reaction functions, the seminal work of Devereux, Lockwood and Redoano
(2008) shows interdependence in the setting of corporate tax rates in Europe. However, the empirical
approach does not allow one to distinguish between reasons relating to tax competition (defined as the wish
to attract a mobile tax base) or other reasons. In fact, Slemrod (2004) finds that tax systems tend to converge
because the features of economies tend to converge. Alternatively, according to the yardstick competition
argument (Besley and Case, 1995), countries would actually mimic each other for political reasons. The
influence of political and institutional factors seems to be particularly relevant as they appear to be strong
determinants of corporate tax rates (Gérard and Ruiz, 2009).
This feature is also strong in a third strand of the literature that tries to identify the determinants of tax
reforms. In a recent article, Castanheira et al. (2012) take the political economy arguments to the data. They
find that political competition (expressed for example as a large number of parties in the governing
coalition) increase the likelihood of tax reforms, that targeted reforms tend to gradually overcome the status
quo bias and that reforms may be easier to implement for governments that are perceived less as pro-reform.
In their empirical test, economic variables, unlike political ones, have little predictive power — besides the
finding that governments tend to reform more in good than in bad times. The time period covered in their
study (2000–2007) may however not reflect the current policy stance. It is an open question whether crisis
periods produce more, and better, reforms.

3. Recent reforms of tax systems in the EU
31
3.2.5. Tax administration and tax compliance
Improving the efficiency of tax collection and
tackling tax evasion can increase government
revenue and ensure that the redistributive
properties of the tax system functions. This is
particularly relevant in times of fiscal
consolidation, also with a view to enhancing the
social acceptability of tax hikes by creating a
perception of a fairer distribution of the adjustment
burden. Measures to combat tax evasion and
improve revenue collection were introduced in
several Member States.
At the end of 2011, the Czech Republic passed a
bill aimed at introducing gradually a one-stop-shop
for all taxes, duties, and social security and health
insurance contributions (Integrated Revenue
Agency). The first stage envisaged the creation of
a Financial Office administered by the newly
established General Financial Directorate, and
action to reduce the layers of the tax
administration. Other measures already
implemented include the introduction of a stricter
penalty system, and measures to combat VAT
fraud and evasion.
Between the end of 2011 and 2012, Latvia
introduced new measures to fight VAT fraud in the
fields of construction and scrap metal, and several
legislative measures in 2012 under the Action Plan
to Combat the Shadow Economy and Promote Fair
Competition. Moreover, the Law on Individual
Declaration of Property and Reporting of
Undeclared Income, effective from March 2012,
makes it possible to legalise previously undeclared
taxable income and aims to improve oversight over
an individual’s financial position, in particular the
accuracy of expenses incurred and the payment of
taxes and the legality of derived income.
As part of their adjustment programmes, Greece
and Portugal have planned a number of initiatives
aimed at strengthening revenue administration and
fighting tax evasion. Among those already
implemented in Greece are: merging of smaller tax
offices and consolidation of key functions,
introduction of performance-based contracts for
auditors, establishment of a large taxpayer unit.
Portugal is proceeding with a merge of the Tax and
Customs Authority, putting in place a large
taxpayer office, improving the procedure for
handling tax appeals in the judicial system and
implementing a strategic plan to combat fraud and
evasion.
Italy implemented reforms addressing tax evasion,
such as lowering of the threshold for electronic
payments and the so–called ‘income-meter’
estimating individuals’ income based on the
expenses. In January 2012, Slovakia launched the
project UNITAS project, which aims to unify
revenue collection (taxes and customs) into a
single institution, the Financial Administration
(FA). The reform ultimately aims to reduce
administrative and compliance costs and tackle
fraud and tax avoidance. Measures to combat tax
evasion have also been implemented in Hungary.
These include allowing unannounced audits and
increasing penalties.
Denmark has locked further fields on the tax return
for editing by the taxpayer where the coverage and
quality of third party information is high.
3.3. CONCLUDING REMARKS
Reforms undertaken in 2011 and 2012 have clearly
been influenced by the need for fiscal
consolidation, more so than in 2010. Overall, this
has led to an increase in personal income taxes in
many Member States. Social security contributions
have also been frequently increased, while
reductions typically target specific groups. In the
taxation of corporate income, rate changes have
not been frequent: while headline rates have been
cut in some countries, a few Member States have
introduced surcharges on large companies. In the
domain of indirect taxation, there has been a clear
generalised trend towards increasing the tax
burden, in the form both of higher rates
(particularly for excise duties) and broader tax
bases. Only a minority of countries has increased
property tax to secure additional revenue in a
growth-friendly manner. Action to combat tax
evasion and enhance the functioning of the tax
administration is being taken in an increasing
number of Member States. Overall, 2011 and 2012
have seen a slight change in the composition of
total tax revenue, with an increase of the share of
both indirect and direct taxes over total revenue,
albeit only slightly for direct taxation.

European Commission
Tax reforms in EU Member States
32
(Continued on the next page)
Box 3.2: Assessing the efficiency losses of tax increase in the EU: the case of labour and
energy taxation
Introduction
The appropriateness of a given tax increase must be gauged on the efficiency loss associated with it, i.e. its
deadweight loss (Feldstein, 1997). Minimising the economic distortions caused by tax measures, given the
extra revenues generated, is particularly important at a time when both fiscal consolidation and long-term
growth are pressing policy issues in most EU Member States.
The efficiency loss associated with tax increases depends on the behavioural responses of economic agents
which affect the tax bases. An appropriate metric for gauging such loss should compare the economic cost
and the extra revenue for a given tax increase. One such metric is the so-called marginal cost of public funds
(MCF), which is defined as the ratio between the change in consumer surplus and the extra tax revenue
obtained from a given (marginal) tax rate increase. This indicator is widely used in the public economics
literature for the evaluation of tax reforms and public spending programmes (Dahlby, 2008). The available
evidence based on this measure suggests that the efficiency loss of tax hikes varies widely across tax
categories and countries, increasing with the level of the total tax burden in the economy (Devarajan and
Robinson, 2002; Dahlby and Ferede, 2011). In addition, structural rigidities in the labour market may
magnify the distortionary effect of tax reforms via the behavioural response of economic agents (Nickell,
1997).
The results presented hereinafter are drawn from Saveyn et al. (2012), who measured the marginal cost of tax
increases in the EU with the computable general equilibrium model GEM-E3. The model is calibrated using
social accounting matrices derived from Eurostat national account data. Thus, the tax rates used in the
simulations reflect the actual effective tax rates in each Member State, which could be seen as a good
description of national tax systems. (1) The simulations focus on labour and energy taxes. The results support
the well-established view that a revenue-neutral shift from labour to environmental taxes would increase
consumer welfare (particularly by reducing GHG emissions) and favour job creation. Moreover, the success
of such tax shifting policy crucially depends on the starting level of the tax burden, the actual tax structure
and rigidities in the labour market, which ultimately affect behavioural responses.(2)
The efficiency losses of tax increases in the EU: results for energy and labour taxes
Using a CGE model it is possible to capture the overall effects of a given tax increase and interactions
between agents and markets in the economy. The MCF can be calculated using the following formula:
i
ki
kiTR
WMCF
,
, (1)
where ΔWi,k is the welfare loss due to the increase of tax k in country i and is calculated as the change in
consumer utility. (3) It could be seen as the reduction in consumption relative to a benchmark of no-policy
change, with prices and incomes remaining fixed at their ‘no-policy-change’ benchmark level after the tax
increase under consideration. This technically corresponds to the ‘equivalent variation’. The term ΔTRi in
equation (1) represents the corresponding change in tax collection in country i (including all tax revenues).
The MCF therefore provides a metric for the loss in welfare (the efficiency loss) per unit of tax revenue gain.
If the MCF equals one, then the tax is merely a lump-sum transfer from households to government with no
distortion. Typically, however, the MCF is greater than one, so that MCF =1+α, with α>0 representing the
(1) For more details on the GEM-E3 model see European Commission (2011b) and www.GEM-E3.net.
(2) Other conditioning factors discussed in Saveyn et al. (2012) include the degree of substitutability between domestic and foreign goods (i.e. representing the degree of foreign competition) and the potential cross-country spillovers
associated with tax increases. These additional results are not discussed here, however.
(3) The indirect utility function is used in order to give a monetary value.

3. Recent reforms of tax systems in the EU
33
Box (continued)
(Continued on the next page)
cost of the distortion. This means that for every euro that goes into the government’s purse, the economy pays
an efficiency cost of α euros. The higher the MCF, the larger the distortive cost vs the tax revenue gains. The
results presented here provide estimations of the MCF for a marginal increase (0.05 pp) of the effective tax
rate in 2005. In the case of labour, the tax increase affects total social security contribution. Personal income
taxation remains unchanged. The energy tax considered is energy tax for households per petajoule of energy
(which is the measure commonly used to express energy consumption by large customer groups, such as
countries). It is important to note that the environmental benefits of lower CO2-emissions (which are
modelled in GEM-E3) following higher energy taxes are not taken into account in the utility functions, so that
the results are driven by the traditional price and income effects for the bundle of goods consumed by the
representative consumer. Likewise, it is assumed that the additional tax revenues generated are allocated to
the rest of the world (i.e. outside the EU), instead of being used to finance policy objectives such as an
increase in public expenditure, a subsidy or repayment of public debt.
Table 1: The Marginal cost of public funds in the EU: labour and energy taxation
Labour tax Energy tax
EU average 1.9 1.08
Standard deviation / average 17.38% 22.21% Note: EU averages are calculated using GDP level in 2005 as weight.
Source: Saveyn et al. (2012).
Table 1 provides the results of the value of the MCF for the EU (using the weighted average of individual
country figures) for labour and energy taxes respectively. It shows that the efficiency loss related to a labour
tax increase is 1.9. This means that for each euro of extra labour tax revenue raised, the efficiency loss for the
economy as a whole is 90 cents. In this case the efficiency loss is therefore more or less the same as the extra
tax revenue raised. Energy taxation appears to be much less distortionary. The efficiency loss associated with
one extra euro of revenues obtained using this tax instrument amounts to 8 cents on average for the EU, i.e.
roughly ten times lower than for labour tax. These first results would suggest that for a given target of extra
tax revenue, an increase in the tax rate on energy is more desirable than an increase in labour taxation. This
implies that, from a revenue neutral perspective, shifting the tax burden from labour to energy would
minimise the resulting economic distortions, as already found in the literature (OECD, 2006; Aldy et al.,
2008).
Looking more closely at country-specific results, the general message still holds: energy tax hikes potentially
have a lower efficiency cost than labour tax increases. Figure 1 shows the cross-country dispersion of results
for labour and energy taxes respectively (it should be noted that the two graphs have very different scales,
which reflects the systematically higher value of the MCF for labour taxation). Graph 1 also shows that
countries where the relevant tax burden is already high tend to have higher MCF, independently of the tax
category considered, a result which is also in line with the literature on MCF, see Dahlby (2008).

European Commission
Tax reforms in EU Member States
34
Box (continued)
(Continued on the next page)
Graph 1: The marginal cost of public funds vs tax burden in the EU: the cross-country dispersion
0.00
0.50
1.00
1.50
2.00
2.50
3.00
0.00 0.05 0.10 0.15 0.20
Ma
rgin
al
of
Pu
bli
c F
un
ds
Social security contribution (% GDP)
MCF Labour vs. Labour tax (SSC) in % GDP
0.00
0.20
0.40
0.60
0.80
1.00
1.20
1.40
1.60
0 0.005 0.01 0.015 0.02 0.025 0.03Ma
rgin
al
Co
st
of
Pu
bli
c F
un
ds
Energy tax (consumption) in % GDP
MCF Energy vs. Energy tax revenues in % GDP
Source: Saveyn et al. (2012).
A comparison of the level of distortion for energy and labour tax and their weights as a share of GDP shows
that, generally speaking, lower MCF for energy taxes combined with a lower tax burden offers greater
potential for further tax increases in order to minimise related distortionary effects (see Graph 2). It should
also be borne in mind that the extra tax revenue obtained from a given increase might differ, depending on
existing levels of taxation according to the traditional Laffer-curve argument.
Graph 2: The marginal cost of public funds vs. tax burden for labour and energy taxes in the EU (% of GDP)
0.00
0.50
1.00
1.50
2.00
2.50
3.00
0.00 0.02 0.04 0.06 0.08 0.10 0.12 0.14 0.16 0.18 0.20
Marg
inal co
st
of
pu
bli
c f
un
ds o
f la
bo
ur
taxes a
nd
en
erg
y t
axes
Labour taxes (SSC) and energy taxes (households consumption) in % GDP
Labour taxes ▲Energy taxes ●
Source: Saveyn et al. (2012).
Structural rigidities tend to magnify the efficiency losses of tax increases
Beyond the existing level of tax burden, the impact of tax increases can also depend on the underlying
economic structure, and on market rigidities in particular. The latter are especially relevant when considering
labour markets in view of wide-ranging regulation and institutional arrangements (Pissarides, 1998). The
degree of labour market flexibility reflects the extent to which a change in prices resulting from a tax increase
affects the wage setting. In the model used here, the labour market is modelled as in Shapiro/Stiglitz (1984),
where workers benefit from a wage premium which firms are obliged to pay to induce employees not to shirk.
As a result, effective labour supply is determined by efficiency wages. The balancing of labour demand with
the effective, rather than the potential, labour supply implies that the equilibrium rate of unemployment is
determined as the difference between potential and effective labour. These assumptions are validated
empirically by the observed negative correlation between wages and unemployment levels, see Blanchflower
and Oswald (1994).

3. Recent reforms of tax systems in the EU
35
Box (continued)
In principle a high degree of labour market flexibility (i.e. low wage premium) should lead workers to
experience a lower level of welfare loss as a result of a change of a specific tax rate. A low degree of
flexibility would instead result in higher welfare loss as wages adjust less to the lower labour demand. The
results presented are therefore intended more to illustrate the change in the value of the MCF on average
across EU countries rather than to show whether the country-specific degrees of ‘flexibility’ are correctly
reflected in the model. Table 2 below provides the EU average estimates of the MCF for the two tax
categories considered here and for the cases of relatively high and low labour market flexibility (vs. a
benchmark case where the degree of flexibility in the labour market lies between these two opposite
scenarios).
The results show that the degree of labour market rigidities can have a non-trivial impact on the marginal cost
of public funds. The MCF increases by 33.7 % (from 1.90 to 2.54) and 4.7 % (from 1.08 to 1.13) for labour
and energy tax respectively when labour markets are less flexible, and decrease by 13.7 % and 3.7 %
respectively when labour market flexibility is high. Although these results should be interpreted with caution,
given the highly stylised assumption regarding the magnitude of the change in the degree of labour market
rigidities, they are indicative of the direction of the changes in the efficiency losses related to a given tax
increase when labour market rigidities are altered. This result illustrates the potential complementarity
between structural reforms aimed at lowering market rigidities and fiscal objectives.
Table 2: The Marginal cost of public funds and labour market flexibility in the EU
Labour tax Energy tax
Low flexibility of labour market 2.54 1.13
High flexibility of labour market 1.64 1.04
Benchmark case 1.9 1.08 Source: Saveyn et al. (2012).

European Commission
Tax reforms in EU Member States
36
Table 3.3: Overview of tax reforms in Member States
(Continued on the next page)
Austria
Personal income tax increase. From 2011, capital income tax rates and rates for private trusts were harmonised at 25% and the holding period, after which realised speculative capital gains were tax exempt, was abolished. Capital gains on shares, bonds and deposits are now
subject to a final 25% withholding tax [0.08% of GDP]. The single earner's allowance is only granted if child support has been received.
The stability law from April 2012 contains several revenue-raising measures. They include a temporary progressive solidarity contribution
for high income earners (from approximately € 186 000) on their holiday and Christmas pay (in force from 1 January 2013), and reducing
the state premium on building saving and (third pillar) pension saving (in force from April 2012). To reflect PIT changes tax free earnings
(Gewinnfreibetrag) have also been reduced.
VAT increase. From September 2012, there are restrictions to deductibility and reclaiming of input VAT for premises.
Corporate income tax increase. From 2013 the deductibility for losses made in foreign subsidiaries is restricted in group taxation.
Excise duty increase. In 2011, the excise duty on petrol was increased by € 40 /1000 litres and on diesel by € 50 /1000 litres (€ 20/tonne
of CO2) [0.16% of GDP]. Other environmental tax measures include a flight tax and a higher car registration tax depending on the CO2 emissions of the vehicles. Excise duties on tobacco were significantly increased in three stages, in January and June 2011 and in January
2012. From 1 January 2013 mineral oil tax reimbursement for agriculture and public transport is abolished.
Social security contribution increase. From May 2012, social security contribution rates for farmers and the self-employed were increased. The ceiling for the SSC base will again be increased in 2013. Unemployment contributions will be levied on formerly exempt
older workers (from 59 onwards) until they reach the legal minimum retirement age. Employers terminating an employment contract will
be subject to a processing fee.
Other tax increases. A bank levy based on the balance sheet total (excluding own capital and secured deposits) was introduced in 2011. it
ranges from 0% for banks with balance sheets of up to € 1 billion to 0,055% up to € 20 billion and 0.085% above that [0.1% of GDP].
Derivatives trading will be taxed on 0.013% of its volume. Under the stability law, capital gains from rezoning of land property will be taxed and the 10-year holding period, after which realised gains from real estate sales are tax exempt, is abolished. An additional stability
surcharge on banks and an advance tax payment on certain company pensions have been introduced in 2012.
Belgium
Personal income tax increase. With effect from 1 January 2012, the withholding tax on interest and dividends rose from 15% to 21%. An
additional levy of 4% was introduced on the share of qualifying financial income exceeding € 20020 [0.2% of GDP]. PIT tax expenditure cuts include the abolishment of federal subsidies for environmentally-friendly cars and most of energy saving investments, which might
only partly be replaced by regional subsidies. The base for taxation of company cars (catalogue value) was broadened for the user of the
car. Moreover, company car taxation takes into account car-specific CO2 emission levels. From January 2012, the taxable benefit in kind for non-quoted stock options was increased from 15% to 18%.
Corporate income tax increase. In line with the 2012 budget the cap for the notional interest deduction is reduced to 3% from tax year
2013 [0.4% of GDP]. The new base for company car taxation (catalogue value) also affects the company (with a new component in the tax base). Stricter thin capitalisation rules, lowering the maximum threshold for the tax deductibility of interest expenses, were introduced.
The possibility of carrying forward the excess notional interest deduction will be abolished from tax year 2013.
VAT increase. From 1 January 2012 the VAT on digital television was increased from 12% to 21%. Notary and bailiff fees were made subject to the standard VAT rate [0.5% of GDP].
Excise duty increase. From January 2012, excises on tobacco were increased [0.04% of GDP].
Other tax increase. From 1 January 2012, stock exchange stamp duty rose by 30% and another increase is scheduled from mid-2012.
Bulgaria
Social security contribution increase. The state pension contribution rate was increased from 16% to 17.8% in 2011. VAT increase. From April 2011 the reduced VAT rate on travel services was increased from 7% to 9%.
Excise duty increase. From 1 January 2012 the excise duties on diesel, natural gas (used for transport purposes) and kerosene were increased. In June 2012, an excise duty on natural heating gas used by the businesses was introduced. [0.1% of GDP]
Cyprus
Personal income tax increases. In August 2011, an additional tax bracket with a top rate of 35% for personal income over € 60000 was
introduced, with effect from 1 January 2011. The tax rate on deemed and accrued dividend distribution was increased from 17% to 20% for a period of two years [0.1% of GDP]. The defence contribution on interest payments on deposits in local banks was also increased
from 10% to 15%. In August 2011 a temporary special contribution to strengthen public finances was introduced. It is levied on gross
wages at progressive rates for 24 months, starting on 1 September 2011 for public sector employees. This special contribution was extended to private sector employees and pensioners. The rates for public and private sector employees were set at 2.5% for income
between € 2 501 to € 3 500, 3% for income between € 3 501 and € 4 500 and 3.5% for income above that.
Social security contribution increase. A permanent contribution of 3% of the gross earnings of current government employees towards government pension schemes was introduced. The contribution to the widows and orphans fund was increased by 1.25 pp to 2% of gross
earnings [0.3% of GDP].
VAT increase. From 10 January 2011, 5% VAT on food and medicines, that were previously exempt, was introduced [0.4% GDP]. In line with the austerity package adopted in December 2011 the standard VAT rate was increased from 15% to 17% from 1 March 2012 [0.7%
of GDP].
VAT decrease. From 1 November 2011 the reduced 5% VAT rate applies to the construction or purchase of first residences by eligible individuals.

3. Recent reforms of tax systems in the EU
37
Table (continued)
(Continued on the next page)
Excise duty increase. Excise duties on tobacco were increased by 20% for cigarettes and by 30% for loose tobacco in 2011 [0.2% of
GDP]. Other tax increases. In line with the austerity package of August 2011, an annual levy of € 350 on registered companies was introduced.
A bank levy was introduced only for two years in 2011. It is 0.095% of the deposits held in banks on 31 December 2010 and 2011,
payable in four instalments in 2011 and 2012, with a maximum of 20% of the total taxable profits of the financial institution [0.4% of GDP]. Real estate tax rates were increased. They now range from 0% to 0.8%, depending on the property value (previously 0% to 0.4%)
[0.1% of GDP].
Czech Republic
Personal income tax changes. The basic personal income tax credit was reduced for 2011 on account of the unexpected floods
expenditure [0.1% of GDP]. In 2012, the tax allowance for families with children was increased [0.1% of GDP]. A comprehensive direct
tax reform was adopted on 27 December 2011. It is planned to implement it in 2014. It introduces a personal income tax of 19% of the gross salary (instead of 15% of the 'supergross' salary) and replaces social and health insurance employers have to pay with a 32.5%
payroll tax (currently 34% of the contribution base). The maximum amount of mortgage interest payments deductible for a main residence have been reduced from CZK 300000 to CZK 80000 per year. A temporary consolidation package approved by the government in April
2012 to respond to current consolidation needs due to the crisis contains tax measures that should remain in force only from 2013 to 2015.
The main ones include removing the basic tax allowance for employees, introducing a temporary 7 pp additional PIT surcharge for high-income earners, limiting tax deductibles for the self-employed and a temporarily increasing in the PIT rate from 19% to 20%.
Corporate income tax increase. From January 2012, a new tax on lottery companies was introduced [0.1% of GDP]. Until then lottery
companies had not had to pay corporate income tax. General CIT is now applicable to these companies and the revenue from the tax will be divided between the state budget and municipalities.
Social security contribution decrease. Contribution ceilings were reduced from six times to four times the average wage in 2011 [0.1% of
GDP]. Social security contribution increase. under the reform mentioned above, social security and health insurance contributions paid by
employees and self-employed people will be taxed at 6.5% in each case. Currently, the rate for health insurance is 4.5%, while the rate for
social security contributions is 6.5%. VAT increase. From 1 January 2012 the reduced VAT rate was increased from 10% to 14% [0.7% of GDP]. This rate will be in force for
the fiscal year 2012. Under the temporary consolidation package, from 2013, a 1 pp increase will bring the standard rate to 21% and the
reduced rate to 15%. The previous plan to set the two VAT rates at 17.5% was postponed to 2016. Excise duty increase. Excise duties on tobacco were increased from 1 January 2012. Under the consolidation package, it is planned to
introduce a carbon tax and a wine tax, to further increase excises on tobacco and to reduce the number of exemptions from excise duties
on certain commodities. Other tax issues: At the end of 2011 a bill created a one-stop-shop for all taxes, duties, and social security and health insurance
contributions. This Integrated Revenue Agency for public revenue is being set up gradually. At first, a Czech Financial Office
administered by the newly established General Financial Directorate was set up with effect from January 2011. From 2012, Regional Tax Directorates will be abolished, so that tax administration will consist of two layers (the Financial Directorate and local tax offices). From
2013, social and health insurance services, and from 2014 customs administration, which currently administers the collection of excises,
will be integrated. The creation of the one-stop-shop for all taxes is accompanied by recent tax administration measures, such as a
disciplinary fine of up to CZK 50000 for not fulfilling certain procedural duties and a fine for not filing a tax return on time. Measures
against VAT fraud and evasion have also been adopted. They relate to optional provisions of the VAT Directive on suppliers' and
customers' joint liability for VAT payments.
Denmark
Personal income tax decreases. From 1 June 2011, Denmark introduced a temporary deduction for wage expenses for household services
and refurbishment. It will expire by the end of 2012. Personal income tax increases. From 2011, there is a 6% tax on payments from pension schemes exceeding DKK 362 800 (€ 48 370)
(part of the 2010 Spring Package). A Fiscal Consolidation Agreement was reached in May 2010. It includes measures such as the
suspension from 2011 to 2013 of automatic adjustments to various tax thresholds (including personal allowances), and the postponement from 2011 to 2014 of the planned increase in the threshold for the top income tax rate. The tax deductibility of trade union membership
fees is limited to DKK 3 000 (€ 403) from 2011. Child allowances are gradually being reduced by 5% from 2011 to 2013. In the 2012
budget, the limit for deductible contributions to individual pension insurance schemes with less than lifelong coverage was decreased from DKK 100000 to 55 000 with effect from income year 2012 [0.08% of GDP in 2012; 1/5th of that in the long run]. The tax exemption for
employer-paid health insurance is abolished as of 2012 [0.03% of GDP].
Corporate income tax increase. From 2012, limitations to loss carry-forward were introduced. Losses can still be carried forward indefinitely, but may be set off against current year income only up to € 1 million without restriction. Amounts over € 1 million may be
offset only by 60% of the remaining income (similar to the rules in Germany) [0.02% of GDP]. VAT increase. VAT exemptions were removed for travel agencies, property management and the supply of buildings and building land
[0.07% of GDP in 2011].
Excise duty increase. In February 2012 the government put forward a bill attempting to close a loophole in the car registration tax that gives leased cars preferential treatment and to reduce evasion by car dealers related to demonstration cars [0.05% of GDP].
Other tax increase. In 2012 the taxes/duties on unhealthy products such as sweets, soft and alcoholic drinks and cigarettes were increased.
From 2011, financial activities tax (FAT) was increased from 9.13% to 10.5% (part of the 2010 Spring Package). FAT is a tax on wage and salary costs for businesses engaged in financial services.

European Commission
Tax reforms in EU Member States
38
Table (continued)
(Continued on the next page)
Estonia
Excise duty increase. In 2011 excises on tobacco were increased by 10% [0.1% of GDP] and in 2012 by 10% [0.1% of GDP]. The Estonian parliament increased the excise duty on alcohol by 5% from February 2012 [0.04% of GDP]. Tax benefits of using specially
marked fuel in mining, building and forestry were abolished in 2012 [0.1% of GDP].
Personal income tax decrease. At the end of 2011, the Income Tax Act was amended abolishing the cap for the reimbursement of tax-free accommodation expenses from 1 January 2012. Previously, the reimbursement of accommodation expenses for business trips was exempt
from tax up to € 77 for domestic trips and € 128 for foreign trips.
Finland
Personal income tax decrease. Tax on earned income was slightly reduced in 2012. This was due to a 3.3% inflation adjustment to state income tax scales and a slight increase in the labour income tax credit. The basic income tax allowance was increased in municipal
income taxation to ease the tax burden for low incomes. As a result, the top marginal tax rate fell by 0.25 pp and the earned income tax
credit and tax allowances in state and municipal taxation increased [0.3% of GDP].
Personal income tax increase. From 2012 the tax rate on capital income was increased from 28% to 30% and to 32% for income
exceeding € 50000. Tax deductibility of mortgage interest rate payments is gradually decreased by 2014, so that the share of deductible interest payments will decrease from 100% to 85% in 2012, to 80% in 2013 and to 75% in 2014. The threshold for tax-exempt dividends
of non-listed companies was reduced from € 90000 to € 60000 from 2012. From 2012, the maximum amount of the tax credit for the cost
of domestic help decreased from € 3 000 to € 2 000 per person per year. The creditable amount of labour costs decreased from 60% to 45%, including VAT that has been paid out, if the party that did the work was a tax-registered firm or an entrepreneur. The creditable
amount of the total costs incurred for hiring a worker, including his wages and social costs, decreased from 30% to 15%.
Corporate income tax decrease. The corporate income tax rate was decreased from 26% to 24.5% from 2012 [0.2% of GDP]. VAT increase. From 2012, the VAT rate on newspapers and magazine subscriptions was increased from 0% to 9% and the application of
reduced VAT rates on labour-intensive services abolished.
Excise duty increase. From January 2011 a tax on sweets and ice cream was introduced and the current tax on soft drinks was increased.
The excise duty on heating fuels and electricity were increased and energy taxation was restructured to take the energy content, CO2-
emissions and local emissions of energy products into account. From 2012 the excise duty rates on alcohol, tobacco, sweets, ice cream and
soft drinks were increased. The tax rates on transport fuels will increase by 10% in 2012 and 2014, in addition to the previously agreed increase in the diesel rate, implemented in 2012 [0.2% of GDP]. The rates of vehicle taxes (registration tax and annual circulation tax) and
the CO2 dependence of tax rates were also increased.
Other tax increase. From 2011 the waste tax was increased and the tax base was broadened to include private landfill sites.
France
Personal income tax increase. The 2011 Finance Law increased the top PIT rate from 40% to 41%. The allowance that reduces the
amount of employment income subject to the generalized social contribution (CSG) and the social security deficit contribution (CRDS)
was reduced from 3% to 1.75% from January 2012. From January 2012, the overall amount of tax incentives (niches fiscales) that a
taxpayer may obtain during a fiscal year for individual income tax purposes was further capped for households (foyer fiscal) at € 18 000 (2011: € 18 000; 2010: € 20000) plus 4% (2011: 6%; 2010: 8%) of net taxable income. Many tax credits, including the deductibility of
mortgage interest payments, were abolished or reduced as part of a government plan to reduce the budget deficit. From January 2011, the
optional levy on dividends and interests was increased from 18% to 19%, and the mandatory final levy on capital gains was increased from 18% to 19%. From January 2012, the optional final levy on dividends was increased from 19% to 21% , and the optional levy on
interest was increased from 19% to 24%.The tax shield will be fully abolished in 2013. From 2012, a temporary progressive contribution
on top incomes (more than 250000€ a year) was introduced. From August 2012, the exemption of personal income tax and the reduction in social contributions for overtime earnings was abolished. However, the reduction in employers’ social contributions for overtime was
maintained for small companies (less than 20 employees).
Corporate income tax increase. A temporary CIT surcharge of 5% on companies with (group) gross income over € 250 million was introduced in 2012. In 2011, the carry-back of losses was reduced from three years to one and the carry-forward of losses limited to 60%
over € 1 million of taxable profits. The R&D reimbursable tax credit (credit d’impôt recherche) has been reduced. The worldwide tax
consolidation regime was abolished. An additional contribution of 3% on distributed earnings was introduced in 2012. VAT increase. From 2012, a new reduced rate of 7% was introduced. It covers all products and services previously taxed at 5.5%
(including restaurants), bar those for disabled people, food and gas and electricity subscriptions . these are still taxed at 5.5%.
Excise duty increase. A specific contribution of € 7.16 per hectolitre was introduced for suppliers of beverages (sodas) with added sugar or sweeteners. The tax base for spirits was broadened and the tax schedule revised, leading to a 10% price increase.
Social security contribution increase. From July 2012 the overall rate of social taxes (i.e. social levies, CSG and CRDS) applicable to
passive income will be increased to 15.5% (from the current 13.5%). This is due to the increase in the social contribution from 3.4% to 5.4% for certain types of income (prélèvement social sur les revenus du patrimoine et produits de placement).
Other tax increases. France also announced the introduction of a Financial Transaction Tax with effect from August 2012. Its rate will be
0.2% on the transaction of shares of publicly traded resident companies whose capital exceeds € 1 billion and 0.01% on high frequency and automated trading and on 'naked' credit default swaps for European sovereign debt. From January 2012, a temporary contribution on
wealth was also introduced doubling current revenue from tax on wealth (the so called “impôt sur la fortune (ISF)”). In 2012, the
allowance for descendants in the direct line that reduces taxation on inheritance and gifts was reduced from € 150000 to € 100000. The time allowed to lapse between two exempt gifts was increased from 10 years (6 years in 2010) to 15 years in 2012.

3. Recent reforms of tax systems in the EU
39
Table (continued)
(Continued on the next page)
Germany
Personal income tax decrease. Tax simplification measures that took effects on 1 January 2012 include better deductibility of child care costs and an increase in the employee allowance (Arbeitnehmer-Pauschbetrag) from €920 to €1,000 [0.022% of GDP].
Social security contribution decrease. At the end of 2011, the German government decreased the pension insurance contribution from
19.9% to 19.6% with effect from 1 January 2012. Excise duty increases. A tax on nuclear fuel (Kernbrennstoffsteuergesetz) was introduced from 2011. The supplementary Budget Bill
2011 introduced from 2011 a duty on all airline tickets booked after 1 September 2010 for flights departing from Germany. The rates
depend on the flight distance (€ 8 for short-distance flights, € 25 for medium- distance flights and € 45 for long- distance flights).
Greece
Personal income tax increase. A new solidarity contribution was introduced for individuals in July 2011. It applies to income earned from
2010 to 2014. The rates range from 1% for income above € 12 000 to 4% for income above € 100000. The rate for high-ranking state officers is 5%. The maximum PIT exemption was reduced from € 12 000 to € 8 000 in July 2011, and to € 5 000 in October 2011
(applicable since January 2011). The number of tax brackets was also reduced from 9 to 8. Law 4024, enacted in October 2011, amended
the provisions of the Income Tax Code on tax credits. Tax credits are still granted for medical expenses, home rent, annual educational expenses, the conversion or installation of environmentally friendly heating systems and other environmentally friendly interventions in
buildings, for the annual mortgage interest on the taxpayer's principal home and for life insurance premiums. The ceiling was reduced
from 20% to 10% of the cost, subject to certain thresholds depending on the type of cost. The new system also applies to social security contributions, previously fully deductible.
Corporate income tax decrease. The tax law of March 2011 reduced the CIT rate to 20% for income earned in 2011 and abandoned the
split system introduced in 2010 for retained and distributed profits. Corporate income tax increase. The extra contribution charged on large profitable corporations (at progressive rates, initially, of 5, 7 and
10% and since 2010, for income earned in 2009, at progressive rates of 4, 6, 8 and 10%) was previously extended until 2014. From 2012,
a 25% withholding tax is levied on profits distributed by corporations, limited liability companies and cooperatives; for the year 2011 the withholding tax rate was 21%.
VAT decrease. From 1 January 2011 the reduced rate on hotels, medicines and picture books for children was decreased from 13% to
6.5%. VAT increase. From January 2011, reduced VAT rates were set at 13% (up from 11%) and 6.5% (up from 5.5%). The VAT rate on non-
alcoholic drinks and restaurant services was increased from 13% to 23% from September 2011. The VAT exemption on the supply of
water by public bodies was abolished on 22 August 2011. Excise duty increase. An excise duty was introduced on electricity in January 2011 and on natural gas in September 2011.
Social security contribution increase. With effect from August 2011, social security contributions were increased by 0.5% both for
employers and employees, paid to the unemployment fund of the Workforce Employment Organisation. This change brought the
contribution rate to 16.5% for white-collar workers and to 19.5% for blue-collar workers.
Other tax increases. In September 2011 a special real estate duty on residential property was introduced. It is calculated in terms of the
surface area of buildings, taking into account also their age and location. It is collected through the payment of electricity bills. Since 2011, the tax-free bracket of the progressive real estate tax introduced in 2010 is reduced from € 400000 to 200000. Until 2012 inclusive,
real estate worth more than € 5 million is subject to tax at the rate of 2% (rather than the 1% rate applicable above € 800000). Several
measures of the comprehensive reform plan to combat tax evasion were implemented, such as merging smaller tax offices and consolidating key functions, introducing performance-based contracts for auditors and establishing a 'large taxpayer' unit.
Hungary
Personal income tax decrease. A flat personal income tax rate of 16% was introduced in January 2011 [1.8% of GDP]. It means that one
tax rate applies to income from wages, rent and capital. In 2011, as in 2010, employers' SSC were still fully included in the tax base, so
that the tax base amounts to 127% of the gross wage and the effective tax rate is 20.3%. Also in 2011, the amount of the employment tax credit, benefiting low to medium earners, was reduced by 20% and the income threshold for its application was increased. Substantial tax
credits for families with children were also introduced. They are particularly favourable for families with three or more children (HUF
10000 per child per month for one to two children, HUF 33000 per child per month for three or more, with no negative tax possible) [overall, 1.8% of GDP].With effect from 2012, the tax base of tax payers earning less than HUF 202 000 (€ 653) does not include the
employers' social security contributions. The result is a two rate system with rates of 16% and 20.3%. The family tax credit introduced in
2011 was maintained in 2012. Personal income tax increase. From 2012 the employment tax credit was fully phased out, leading to a net tax increase to low earners
with no children..
Corporate income tax decrease. In 2011, the threshold for the lower 10% rate was increased tenfold to HUF 500 million (€ 1.8 million). Accordingly, in 2013 the reduced rate will be 10% and the regular rate 19%. The introduction of a higher 30% rate applicable only to
energy and utilities companies was announced. The sectoral surcharges will be phased out (only halved for banks). [0.7% of GDP].
Corporate income tax increase. In 2012, the simplified corporate income tax rate was increased to 37% (from 30%). The eligibility threshold was increased to HUF 30 million (€ 97 000) of annual turnover (from HUF 25 million).
Social security contribution increase. In 2012 the health care contribution was increased to 7% (from 6%). This led to an increase in
employees total SSC from 17.5% to 18.5% [0.45% of GDP]. VAT increase. From 1 January 2012 the standard VAT rate was increased from 25% to 27% [0.5% of GDP].
Excise duty increase. Alcohol, tobacco and fuel excise duties were increased in 2012.

European Commission
Tax reforms in EU Member States
40
Table (continued)
(Continued on the next page)
Other tax increases. A "cultural tax" on pornographic material was introduced on 1 January 2012. A new tax on unhealthy packaged food
came into force in September 2011. A levy on phone usage was introduced with effect from July 2012. It amounts to HUF 2 per minute of call or sms [0.1% of GDP]. The introduction of a financial transaction tax in 2013 was announced. Measures to fight tax evasion have
been implemented. They include allowing unannounced audits and increasing penalties.
Ireland
Personal income tax increase. Income tax measures contributed around € 1 billion to fiscal consolidation in 2011 mainly through the
reduction of tax credits (€ 435 million) and changes in the rate band (€ 395 million). From 2012 the taxes on capital and interest earned are aligned at 30%, in particular tha capital acquisitions tax and the capital gains tax were increased were increased from 25% to 30%, and the
deposit interest retention tax (DIRT) from 27% to 30%. . For certain windfall gains the windfall gains tax rate is 80%.
Personal income tax decrease. Under the Finance Bill 2012, it is planned to increase the lower exemption threshold of the Universal Social Charge, exempting around 330000 people, and the mortage interest relief for first-time buyers during the property boom of 2004-
2008. The same Bill also plans to create tax incentives to attract key employees that are currently foreign-based. Under the Special Assignee Relief Programme (SARP) individuals from abroad who are eligible can receive an exemption from income tax on 30% of their
annual salary between €75 000 and €500000 if they are assigned for a minimum of one year to a maximum of five years. Furthermore, a
deduction for foreign earnings (FED) is granted for employees assigned from Ireland to work in certain emerging market countries in order to increase trade with those countries. In addition, it is also planned to amend the Research and Development Tax Credit, where the
first € 100000 expenditure will be allowable on a volume basis.
VAT increase. The standard VAT rate was increased from 21% to 23% from January 2012. VAT decrease. The Jobs Initiative temporarily introduced a new reduced VAT rate of 9% on tourism services until end-2013 [0.2% GDP].
Excise duty increase. The mineral oil tax on petrol and auto-diesel was increased first by four cent and then by two cent in 2011 [0.07%
of GDP]. Social security contribution increase. Base-broadening measures for Pay Related Social Insurance (PRSI) contributed to fiscal adjustment
in 2011, in particular removing ceiling on employee PRSI contributions [0.2% GDP].
Social security contribution decrease. As part of the Jobs Initiative, until end of 2013, the lower rate of PRSI was halved from 8% to 4.25% on jobs that that pay up to €356 per week [0.1% GDP].
Other tax increases. A household charge of €100 was introduced in 2012, as an interim measure before implementation of the valuation-
based property tax [0.1% GDP]. The temporary measures of the Jobs Initiative are financed by a levy on the pension funds (yielding € 460 million annually in 2011-2014).
Italy
Personal income tax decrease. Changes to the municipal fiscal system were made in 2011 (Law n. 42/2009). Among other things they involve: i) taxing rental income from buildings for residential purposes at a separate, flat rate from 19% to 21%, rather than including it in
the personal income tax base (average rates around 30%), with around 20% of the revenue accruing to municipalities; and ii) removing the
‘tax rate freeze’ on the increase in additional personal income tax (between 0.2% and 0.4%) to be levied by town councils [0.1% of GDP]. Personal income tax increase. The regional PIT surcharge was increased by 0.3% and a temporary 3% solidarity contribution on high
incomes was introduced. The 3% levy is deductible from the PIT base.
Corporate income tax decrease. A new allowance for corporate equity (Aiuto alla Crescita Economica, ACE), similar to the Belgian notional interest deduction, was introduced. The ACE is retroactively applied to 2011. It covers capital increases of corporations and even
unincorporated businesses. The IRAP, a business tax with a different base than the CIT, saw an increase in deductions for labour costs,
notably for women and for employees under 35. Companies can also deduct from their CIT taxable income an amount equal to the part of
IRAP paid with reference to tha tax base allocated to their share of labour costs [Overall, 0.15% of GDP].
VAT increase. The standard VAT rate was increased by 1 pp on 17 September 2011 (from 20%) [0.3% of GDP]. An additional 2% rise
planned for October 2012, unless a general spending review reform makes it unnecessary by generating expenditures saving. Excise duty increase. From 1 January 2012 fuel excises were increased by about 10 cent per litre [0.5% of GDP].
Other tax increases. A new tax on high-powered automobiles, private boats and aircraft was introduced in 2012. Property taxes were
increased by abolishing the exemption on main residences and increasing cadastral values by 60%, although some reductions are granted depending on household composition; properties held abroad, too, were made subject to a 0.76% tax on their value [0.7% of GDP]. Stamp
duties on cash, deposit and security accounts were increased and extended to all financial instruments. The withholding tax on both
interest (except interest from government bonds) and dividends was set at 20% [0.1% of GDP]. Other reforms addressed tax evasion, e.g. lowering the threshold for electronic payments and the 'income-meter', that estimates the income of individuals based on expenses [0.1%
of GDP in 2011; 0.5% in 2012].
Latvia
Personal income tax decrease. In 2011 the general PIT rate was lowered from 26% to 25%. Non-taxable allowances and allowances for
dependent persons were increased. Social security contribution increase. The SSC rate was increased by two percentage points from January 2011 to compensate for the
lowering of the general PIT rate.
VAT increase. With effect from January 2011, the standard VAT rate was increased from 21% to 22% and the reduced rate from 10% to 12%. From 1 July 2012 the standard rate of VAT was reduced from 22% to 21%. The reduced rate on electricity was abolished in January,
the one on natural gas in July, thereby increasing the rate from 10% to 22%. The reduced VAT rate for medical equipment was amended
from 1 June 2011. A VAT on real estate auctions within insolvency process was amended in January 2011 (0.1% of GDP). The usage of reverse VAT was broadened by applying reverse VAT on scrap metal supplies and related services form 1 October 2011 and construction
services form 1 January 2012.
3. Recent reforms of tax systems in the EU
41
Table (continued)
(Continued on the next page)
Excise duty increase. From June 2011 excises on petrol and on ethyl alcohol were increased; the reduced excise tax rate on fuel with bio
fuel admixture 5% of volume was abolished from 1 January 2011. From July 2011 excises on tobacco products were increased and the allowance of excises on natural gas for producing electricity was abolished. The excise tax on sweetened non-alcoholic drinks was also
increased by 30% from 1 January 2011. From July 2011, allowances for excise duty for diesel fuel used in agriculture were reduced.
From 1 February 2012 excise tax base has been widened by including certain lubricating oil groups. From 1 July 2011 an excise tax on natural gas was re-introduced with a reduced rate.
Other tax increases. In 2011 the structure of the vehicle use tax was changed, providing for three components to be taken into account by
tax calculation - vehicle gross weight, engine capacity and maximum engine power, thus increasing the tax on luxury, environmentally unfriendly and powerful cars (0.1% of GDP). In 2011 the progressive property taxation of residential buildings was doubled, now ranging
from 0.2%-0.6% (0.1% of GDP). From 2012 the tax on gambling, slot machines and gambling tables was increased by 15%. The annual
financial stability duty rate was increased from 0.036% to 0.072%. In addition, the base of real estate tax was broadened to include auxiliary buildings, parking slots and houses and lands owned by religious organisations but not used for religious purpose [0.03% of
GDP]. The natural recource tax was increased. Lottery and gambling tax rates were increased and reformed in July 2011 and Janurary
2012. Several fees and licences and state duties have been review and increased. Several legislative measures under the Action Plan to Combat the Shadow Economy and Promote Fair Competition entered into force in 2012. Law on Individual Declaration of Property and
Reporting of Undeclared Income was adopted with effect from June 2012. It introduces the possibility to legalise previously undeclared
taxable income and aims to improve oversight over an individual’s financial position, in particular the accuracy of expenses incurred and the payment of taxes and the legality of income derived. [0.25% of GDP].
Lithuania
Corporate income tax decrease. The threshold of the maximum annual income of small companies with up to 10 employees subject to a
lower rate of 5% was increased from LTL 500000 (€ 145000) to LTL 1 000000 (€ 290000).
VAT decrease. From 1 January 2012 the VAT registration threshold was increased from 100000 LTL (€ 29 000) to 155 000 LTL (€ 45 000). The application of a 5% reduced VAT rate on medicines was extended until the end of 2012. The application of the 9% reduced rate
for residential heating was also extended until 31 December 2012. The 9% reduced rate on accommodation services introduced as a
temporary measure in 2011was abolished from 1 January 2012 [0.02% of GDP].
Excise duty increase. The excise duty on gas oil used as motor fuel was increased by more than 10% from € 274.27 to € 302.07 per 1000
litres with effect from 1 January 2011 [0.1% of GDP]. From 1 March 2012 the excise duty on cigarettes was increased from € 64 to €
67.19 per 1000 cigarettes. It was increased from € 23.16 to € 24.32 per kilogram of cigars and cigarillos [0.02%]. Other tax increase. From 1 January 2012 Lithuania broadened the immovable property tax base to include the immovable property
intended for dwelling purposes, gardens and garages etc owned by individuals. Until now these were exempt unless they were used for
commercial purposes. The value of previously tax exempt immovable property of natural persons exceeding LTL one million (€ 290000) will be subject to a tax rate of 1% [0,02%].
Other changes: At the end of 2010 the government adopted 'Consolidated strategies of the state tax inspectorate of taxpayers' compliance
with tax obligations and assurance of tax collection for the year 2011-2012. Cash registers have been installed in all indoor marketplaces and border control has been strengthened.
Luxembourg
Personal income tax decrease. The temporary crisis tax of 0.8% levied on total income except minimum wage salaries introduced for the year 2011 was abolished from January 2012.
Personal income tax increase. From January 2011, the top income tax rate was increased from 38% to 39%. The surcharge for the
employment fund (solidarity tax) was also increased from 2.5% to 4% for income up to € 150000 and to 6% for income above € 150000 [0.20% of GDP].
Corporate income tax decrease. The 2012 budget grants a tax credit to employers hiring workers from the unemployed pool until 2014.
Corporate income tax increase. The 2012 budget introduces a new table with revaluation coefficients for the valuation of business assets and participations.
Excise duty increase. From January 2012 the excise duty rates on manufactured tobacco was increased to 10% of the purchase price with
a maximum of € 10 per kilogram.
Malta
Personal income tax decrease. From 2012, new income tax brackets apply to income earned by parents of children under 18 years. Income up to € 9 300 is tax-free. From € 9 301 to € 15 800 a tax rate of 15% applies. From € 15 801 to € 21 200 a rate of 25% applies and a rate
of 35% applies to income above € 21 200. Parents who qualify for these tax rates should benefit from an annual tax saving of between € 75
and € 420 per parent [0.2% of GDP]. To help women return to the labour market the current tax credit of up to € 5 000 was extended to include self-employed mothers.
Excise duty increase. From 15 November 2011, excise duty rates on cigarettes was increased by 5.8% and excise duty on tobacco was
increased by 8.5% [0.1% of GDP]. Excise duty on cement was increased by € 3 on every 1000 kg. Bunkering tax on fuel for ships outside Maltese territorial waters was set to €1.86 per metric ton or part thereof.
Other tax increases. The registration tax on motor vehicles with Euro 1 to Euro 3 emissions (or worse) increased on 1 January 2012 [0.1%
of GDP]. Measures have been introduced to improve the efficiency of the revenue collection, notably pecuniary incentives to reduce tax arrears. Several other initiatives are being implemented to combat tax evasion and avoidance, including reforms aimed at increasing the
effectiveness of VAT tax audits [0.6% of GDP].

European Commission
Tax reforms in EU Member States
42
Table (continued)
(Continued on the next page)
The Netherlands
Personal income tax decrease. The rate in the first two brackets consists of two elements: income tax and social security contributions. In January 2011, the combined tax and SSC rate in the first bracket of personal income tax and wages tax was reduced from 33.45% to 33%.
From 2012, the tax deduction for R&D activities for self-employed was increased to € 12 310 for entrepreneurs and can be increased by
another € 6 157 for starting entrepreneurs. Since 2012 there is a 40% tax deduction for R&D expenses. Personal income tax increase. From January 2012, the imputed income for the owner-occupied dwellings was increased from 1.05% to
1.3% for the part of the value that exceeds € 1040000. From January 2012, the combined rate for the first bracket increased to 33.10%.
From January 2012 two tax credits on labour participation by workers of 65 years and older were decreased. The amount of the cut varies depending on income and age.
Corporate income tax decrease. From January 2011, the corporate income tax rate is reduced to 25% from 25.5% for profits in excess of
€ 200000 [0.07% GDP]. Since 2012 a new tax facility provides for 40% deduction for R&D expenses.
VAT increase. From 1 July 2011, performing arts were transferred temporarily to the standard VAT rate of 19%. Excise duty increase. Excise duties on cigarettes and tobacco are increased from 1 March 2011. The yearly adjustment for tobacco and
cigarettes took place in April 2012 increasing the minimum excise duty to € 157.28 per 1 000 cigarettes and to € 66.50 per 1000 grams for smoking tobacco. For mineral oils there is an increase of € 0.01 per litre (only for LPG per kilogram) from January 2012 to adjust for
inflation.
Other tax decreases. The property transfer tax for owner-occupied dwellings was temporarily reduced from 6% to 2% from 15 June 2011 to July 2012. In July 2012, the reduction was made permanent. From July 2012 the CO2 limits of the car registration tax (BPM) is
tightened each year to ensure stable tax revenue. At the same time the fixed surcharge for diesel cars is replaced by a surcharge depending
on the amount of CO2 emission. The taxes on groundwater and waste materials were abolished in 2012.
Poland
Personal income tax increase. PIT thresholds were frozen at their 2009 level in 2011 and 2012 [0.1% of GDP].
Social security contribution increase. From 1 February 2012, non-wage labour costs were increased by increasing the disability pension
contribution paid by employers from 4.5% to 6.5% of gross wages. The total rate of disability pension contribution therefore increased from 6% to 8% of gross wages [0.3% of GDP].
VAT increase. A series of measures came into force in 2011 [0.41% of GDP]. The VAT rates were temporarily increased for the years
2011-13 by 1 pp, from 7% to 8% and from 22% to 23%. A new reduced rate of 5% was introduced for, amongst others, basic foodstuffs. VAT reimbursement for company cars and fuels was abolished in 2011 [0.08% of GDP]. From 2012 the VAT rates for certain products,
including some medical devices, clothing and clothing accessories for infants and children's' footwear, were increased from 8% to 23%. The 23% rate also applies to the previously exempt services related to the conservation and restoration of registered historical monuments
and archive materials and to the services delivered by public institutions.
Excise duty increase. The government is gradually increasing the excise duties rates on tobacco products (8% for cigarettes, 13% for smoking tobacco, 4% for cigars) and for fuels (3% for jet engine fuels, 14% for diesel and intrinsic bio-components). In line with the
Energy Directive, from 2012 the excise tax applies to coal, lignite and coke, so far exempted (due to the transition period).
Other tax increases. On 18 April 2012, a new tax on extraction of certain minerals, targeted at copper and silver extraction, came into force. The applicable tax rate is determined based on the exchange rate of American dollar to Polish zloty and copper and silver prices on
stock exchanges’ quotations in London [0.1% of GDP].
Portugal
Personal income tax increase. From 2011, expense-related tax credits were reduced by imposing an overall ceiling for the two highest
income tax brackets. To comply with the MoU targets, a new annual surtax on individual income was introduced on 3 August 2011. It is
levied at a rate of 3.5% and applies only to income earned in 2011 that is above the minimum wage income. In 2012 and 2013 a surtax of 2.5% applies to the highest income bracket. The tax rate applicable to capital gains on the sale of shares and other securities was increased
from 21.5% in 2011 to 25% with effect from 1 January 2012. An increase from 21.5% to 25% in withholding taxes on income from
dividends, interest and other forms of remuneration on shareholders' loans and on share capital derived by resident and non-resident individuals was adopted in 2011.
Corporate income tax increase. From 1 January 2012 the reduced CIT rate of 12.5% was abolished. A State surtax of 3% is levied on
corporate income between € 1.5 and € 10 million and a 5% rate is levied on taxable profits over € 10 million with effect from 1 January 2012. The withholding tax on investment income earned by legal entities without a permanent establishment in Portugal was increased
from 21.5% to 25%.
Social security contribution increase. To align the rates with those of the general social security scheme, employees' contribution rates to the civil service social security scheme were increased by 1 pp from January 2011.
VAT increase. The standard VAT rate was increased from 21 to 23% from January 2011. From October 2011, the VAT rate on electricity
and natural gas was increased from the reduced rate of 6% to the standard rate of 23%. A set of categories of goods and services were moved from the reduced and intermediate VAT rates to higher ones in 2011.
Excise duty increase. With effect from 1 January 2012 Portugal introduced an excise duty on electricity consumption by consumer,
producers, traders and self-producer. The maximum rates of excise duties on petrol, spirit drinks, heating diesel and tobacco were also increased.
Other tax increases. With effect from 1 January 2012 the minimum and the maximum rates of the real estate tax on urban property were
increased by 0.1 percentage points.

3. Recent reforms of tax systems in the EU
43
Table (continued)
(Continued on the next page)
Romania
Excise duty increase. With effect from 1 July 2012, the excise duty on cigarettes was increased from € 51.49 per 1 000 cigarettes to € 53.18 per 1 000 cigarettes. The total excise duty on cigarettes (i.e. sum of the specific excise duty and the ad-valorem excise duty), is
increased from € 76.60 per 1 000 cigarettes to € 79.19 per 1 000 cigarettes for the period from 1 July 2012 until 30 June 2013. Excise
duties on unleaded petrol and diesel were increased in January 2011. This was followed by a further increase of excise duties on diesel in
January 2012. They currently stand at € 467 per tonne for petrol and € 374 per tonne for diesel.
Other tax increases. Under the legislation that entered into force in mid-January 2012, a pollution tax applies to both new and second-
hand vehicles produced in Romania or abroad on their first registration in Romania.
Slovakia
Personal income increase. From 1 January 2011, basic personal allowances can only be claimed on aggregate income from employment, business activities and independent professional activities. The amount of the basic personal allowance and the relevant ceilings are
generally based on the amount of the living minimum applicable on 1 January of the tax year. This was € 185 in 2011 and it is € 189 for 2012.
Social security contribution increase. From 1 January 2011, non-monetary benefits given to an employee, regarded as taxable
employment income, are also subject to social security and health insurance contributions
Excise duty increase. With effect from January 2011, a tax on CO2 emission quotas was introduced on the emission allowances allocated
free of charge to the taxpayer in the period 2011-12. The tax rate is 80%. The tax base made up of transferred emission quota (valued at
market price for the calendar month preceding the transfer), and non-consumed emission quotas (valued at the average market price for the calendar year in question). The calculated amount of tax on emission quotas is not considered a tax deductible expense. From 2011, excise
duties on tobacco products were increased.
Other tax increases. With effect from 1 January 2012, Slovak banks and branches of foreign banks operating in the Slovak Republic, established under special legislation on banks, are subject to a bank levy. The levy is 0.1%. It is due on the 20th day of every calendar
quarter. It is calculated on the basis of the bank’s liabilities at the end of the previous calendar quarter (adjusted by certain items defined
by law) [0.1% of GDP]. The UNITAS project was launched in January 2012. It aims to merge revenue collection bodies (taxes and customs) into a single institution – Financial Administration (FA) – to reduce administrative and compliance costs and tackle fraud and tax
avoidance.
Slovenia
Corporate income tax decrease. With the amendments to the Corporate Income Tax Law approved in April 2012 and applicable with
effect from 1 January 2012, the statutory rate was reduced to 18% (from 20%) for the year 2012. Further decreases to 17% in 2013 16% in
2014, and 15% in 2015 are envisaged. The allowance for investments in equipment and intangible assets was increased from 30% to 40% ,
and the cap of € 30000 was abolished. Tax relief for investment in research and development was increased from 40% to 100%. Sspecial
regional tax relief for investment in research and development was therefore abolished [overall, 0.3% of GDP]. Excise duty decrease. After the 7% increase in 2010, excises on fuel were reduced by 15% in 2011.
Excise duty increase. Excise duties on tobacco were increased in 2011 and 2012. Excise duties on alcohol were increased by around 10%
in April 2012 [0.2% of GDP]. Other tax increases. Under the Bank Balance Sheet Tax Act adopted in July 2011 a new bank tax was introduced on 1 August 2011. The
new tax is applicable to domestic banks, banks from EU Member State and banks from third countries that operate in Slovenia. The tax
rate is set at 0.1% of the tax base. The tax base is the average amount of the total assets of the bank within the tax year. Under certain conditions, the amount of the tax may be reduced up to 0.167% of the loans provided to non-financial companies or private entrepreneurs.
Spain
Personal income tax increase. In January 2011, the government introduced two additional tax bands/rates for taxpayers over € 120000
and € 175 000 raising the former top marginal personal income tax rate to 44% and 45%, respectively). From January 2012 the
government introduced a temporary supplementary progressive levy (covering years 2012 and 2013) applied to each tax band of the general government tax base, which implies now the existence of seven brackets (24.75%, 30%, 40%, 47%, 49%, 51% and 52%). During
2012 and 2013, savings and capital gains are taxed under a progressive tax schedule with three brackets of 21% on the first € 6 000, 25%
up to € 24 000, and 27% on income above (in 2011, they were taxed at 19% on the first € 6 000, and 21% on income above). [Overall, 0.4% of GDP]. (*) The withholding tax rate applied to some types of employment income and to income from professional activities is
increased to 21% from 1 September 2012 to 31 December 2013. The mortgage interest deductibility for new mortgages taken for house
purchases is abolished from 1 January 2013. Personal income tax decrease. From January 2012, (and with effect from 1 January 2011), the government re-introduced the 15% tax
credit for the acquisition or restoration of the taxpayer's primary residence for all taxpayers, regardless on their tax base.

European Commission
Tax reforms in EU Member States
44
Table (continued)
(Continued on the next page)
Corporate income tax increase. In March 2012 measures were introduced intended to increase the effective taxation of corporate
(including hidden) income, such as: the deferral of tax benefits for goodwill arising from acquisitions and business restructuring operations (for which the annual deductibility limit is one hundredth of the amount), a permanent limit to the deductibility of interest
expenses (30% of the operating profits), reduction to 25% (from 35%) of the limits to the deductions aimed at promoting certain activities
(e.g. R&D); permanent limits to the "free depreciation" regime (introduced in 2010) for large companies, while for small and medium business "free depreciation" is linked to job creation (for assets acquired before 31 March 2012 the incentive applies with certain
limitations); a special 8% tax on qualifying foreign dividends and income derived from the transfer of foreign companies operating in tax
havens or similar jurisdictions. (*) Following the measures introduced with Royal Decree-Law 12/2012 of 30 March 2012, further important reforms have been introduced with Royal Decree – Law 20/2012 of 13 July 2012, such as: a new special tax of 10% applicable
to dividends and capital gains that do not qualify for participation exemption; limits to the loss carry forward applicable in 2012 and 2013
(50% - instead of 75% - for companies with net turnover between € 20 and 60 million; 25% - instead of 50% - above € 60 million). Rates for the payment on account are increased to 23% (from 21%) if net turnover is between € 10 and 20 million; to 26% (from 24%) if
turnover is between € 20 and 60 million; to 29% (from 27%) if turnover is at least € 60 million. In the calculation of the payment on
account 25% of the dividends and capital gains accrued should be included. The minimum payment on account rate for companies with turnover above € 20 million is set at 12% (previously 8%).
Corporate income tax decrease. In Spain several measures took place for encouraging investment and employment from 1 January 2011.
The annual turnover threshold to be included within the scope of the special regime for small and medium sized enterprises (SMEs) increases from € 8 million to € 10 million. Moreover, the taxable amount taxed at the reduced tax rate has been increased from € 120 202
to € 300000. Companies that have less than 25 employees and a turnover below € 5 million are taxed on their annual profits below
€ 300000 at 20%; annual profits above this threshold are taxed at 25%. As part of additional measures taken in the course of 2011, the loss carry forward period was increased from 15 to 18 years for all companies. At the same time, the amount of losses to be carried forward
was limited for big companies for the tax years 2011-2013 (to 75% for companies with turnover between € 20 million and 60 million and
50% for companies with higher turnover. VAT decrease. At the end of 2011, the application of the super-reduced 4% VAT to the acquisition of new dwellings was extended by one
year. VAT increase. (*) From 1 September 2012 the standard and reduced VAT rates are increased to 21% and 10% (from 18% and 8%,
respectively). In addition, the standard rate applies also to some goods and services (e.g. combined hotel and catering, entertainment,
discotheque and night-club services, cinema and theatre tickets, supply and receipt of digital radio broadcasting and digital television services) previously taxed at the reduced rate.
Excise duty increase. From January 2012 the tax on diesel for professional use was increased, reducing the amount for partial refunds. (*)
Tobacco excises are increased and their structure is modified by reducing the proportional rate and raising the specific one. The minimum tax rate for cigarettes has been fixed at € 119.1 per 1000 units.
Other tax increase. From January 2012 a temporary surcharge (up to 2013) applies in the Real Estate Tax (municipal tax) for immovable
properties with an updated cadastral value over the average value in each municipality. In September 2011, the net wealth tax (impuesto sobre el patrimonio) was temporarily restored for the years 2011 and 2012. The exemption for dwelling houses was nearly doubled to €
300000 (previously € 150 253.03) and the tax-free amount (after application of specific tax exemptions) was substantially increased to €
700000 (previously: € 108 182.18). A special programme was approved to encourage regularisation of the tax status concenring personal
and corporate income.
Note: Measures indicated with (*) were taken after the cut-off date.
Sweden
Personal income tax decrease. From January 2011 the basic income tax allowance was increased for people over 65 [0.2% of GDP]. VAT decrease. From 2012 the VAT on restaurant and catering services was reduced by 13 pp to 12% [0.2% of GDP].
Excise duty increase. In 2012 the excise duty on tobacco was increased and annual indexation was introduced, corresponding to a total tax
increase of roughly 10%.
United Kingdom
Personal income tax increase. For the fiscal year 2012-13 the basic rate limit was lowered to GBP 34 370 (from GBP 35 000 in 2011-2012). The personal tax allowance was increased to GBP 8 105. Since the 2010-11 tax year, this personal allowance is reduced for income
over GBP 100000 - by GBP one for every GBP two of income over GBP 100000. This reduction applies irrespective of age. From April
2011 the annual allowance for tax-privileged pension saving was reduced from GBP 255 000 to GBP 50000. From April 2013 the availability of the income tax age-related allowances will be restricted for current recipients and a cap on all unlimited income tax reliefs
will be introduced through a ceiling of GBP 50000 or 25% per cent of income, whichever is higher. From January 2013 the child benefit
will be withdrawn through an income tax charge applicable only to households with someone earning over GBP 50000 a year; the withdrawal will be gradual for households with someone earning between GBP 50000 and GBP 60000.
Personal income tax decrease. From April 2013, the personal tax allowance will increase to GBP 9 205, and the additional rate of income
tax (applicable above GBP 150000 since 2010) will decrease from 50% to 45% [-0.23% of GDP]. Corporate income tax decrease. From April 2011 the headline and small profits rates were reduced from 28% to 26% and from 21% to
20% From April 2012 the standard CIT rate was reduced further to 24% [0.03% of GDP]. The SME tax relief rate for investment was
increased to 200% in April 2011, and further to 225% in April 2012. A special regime introducing a reduced 10% rate on corporate profits from patents and other types of intellectual property (Patent Box) will be phased in over five years from April 2013. An 'Above the Line'
(ATL) credit for R&D with a minimum rate of 9.1% before tax will be introduced.
VAT increase. From 2011 the standard VAT rate was increased from 17.5% to 20%.

3. Recent reforms of tax systems in the EU
45
Table (continued)
Note: Cut-off date is June 2012.
Source: Commission services.
Excise duty increase. The general duty rates on alcohol and tobacco were increased by 2% above inflation in March 2011. They were
increased by a further 2% (alcohol) and 5% (tobacco) above inflation in March 2012. The fuel duty escalator was abolished and replaced
by a fair fuel stabiliser. this means that fuel duty now increases in line with inflation when oil prices are high. When the price of oil falls
below a certain level, fuel duty increases by inflation plus GBP 0.01 per litre.
Social security contribution increase. In April 2011 the main and additional rates of National Insurance Contributions (NICs) were increased by one percentage point.
Other tax increases. With effect from January 2012 the bank levy full rate was increased from 0.078% to 0.088% Another increase to
0.105% is scheduled for January 2013. Since 22 March 2012, a new 7% rate of the stamp duty land tax (increased to 15% if the buyer is a
non-natural person) applies to the purchase of residential property worth over GBP two million. The government set up an independent
Office of Tax Simplification and in Budget 2012 it announced a consultation on a new general anti-abuse rule (GAAR) to tackle artificial
and abusive tax avoidance.


4. THE EU VAT SYSTEM: ECONOMIC IMPLICATIONS AND
POLICY CHALLENGES
47
Value-Added Tax has been at the core of the
Country Specific Recommendations (CSRs) on
taxation resulting from the European Semester.
The CSRs stress the potential of Member States to
make their tax structure more growth-friendly and
improve the design of their individual taxes. For
VAT, this mainly means using it as a substitute for
taxing income but also improving its efficiency as
reduced VAT rates (21
) lower tax collection
without always achieving their economic or social
objectives.
At EU-level, the European Commission has
recently started a wide-ranging review of the EU
VAT system. This process began with the
presentation of a Green Paper on the future of
VAT in December 2010. (22
) Then an ex-post
evaluation of the system was carried out through a
study produced by the Institute for Fiscal Studies
and published in December 2011. (23
) Combined
with the numerous contributions received from
stakeholders in response to the public consultation
launched with the Green Paper, its findings
provided the analytical input for the Commission’s
Communication on the future of VAT adopted in
December 2011(24
). The main points of the
Communication are summarised in Box 4.1, at the
end of the chapter.
This chapter presents some key economic issues
related to the legal and institutional features of
VAT in the EU and provides new analytical
evidence, largely based on the IFS study. The first
section will consider the cause and consequence of
abandoning the ‘origin principle’ in favour of the
‘destination principle’. Section 4.2 discusses the
general economic implications of the current VAT
systems on trade. Sections 4.3 and 4.4 give
estimations of cross-border VAT compliance costs
and the economic impact of VAT exemptions on
trade neutrality. Lastly, Section 4.5 assesses the
welfare economic cost of exemptions and reduced
(21) Throughout this report, the term ‘reduced VAT rates’
covers all VAT rates applied in the EU other than the
standard rate.
(22) COM(2010) 695 final, 1 December 2010. (23) IFS et al. (2011).
(24) COM(2011) 851 final, 6 December 2011.
rates and their distributional effects. Section 4.6 is
the conclusion. (25
)
4.1. CHOOSING BETWEEN AN ‘ORIGIN’ AND A
‘DESTINATION’ SYSTEM
4.1.1. Issues related with the origin system and
merits of the destination system
Although the review of the VAT system has only
recently begun, a significant change is already
apparent: the Commission no longer aims to
change over to a VAT origin system in the
foreseeable future. This is important as, ever since
the 1992 Single Market Programme, the current
destination system was supposed to be just a
temporary solution before switching to the
permanent origin system. The Council has decided
to abandon the objective of switching to the origin
principle, although it should be noted that this is
justified on the basis of political feasibility rather
than on the economic desirability per se of this
objective. (26
)
The difference between the two systems lies in
how imports and exports are treated. Under the
origin system, the country of the seller levies tax at
its domestic rate, and the importing country does
not levy any VAT. Under the destination system,
the importing country levies tax at its domestic rate
and conditions. In the current EU system, which is
a variant of a destination system, goods for export
are zero-rated, that is to say they are free of VAT,
and the seller can claim back the VAT paid on the
inputs. VAT is levied on imported goods at the rate
and according to the rules applicable in the
importing country, with the customer paying VAT
to the Treasury. In the destination country, VAT is
levied at the same rate on imported goods as on
domestic goods and there is thus no direct effect of
VAT on relative prices. Thus, the benefit of the
destination system is that it allows Member States
to have different VAT rates according to their
(25) Due to space restrictions, this chapter does not assess the
effects of broader VAT bases on inflation or as a
possibility for fiscal devaluation. (26) See Conclusions of the 3167 meeting of the Council of
Economic and Finance Ministers, 15 May 2012.

European Commission
Tax reforms in EU Member States
48
revenue needs and preferences. Under the origin
system, by contrast, any rate difference will result
in a corresponding impact on the relative terms of
trade. (27
) For this reason, use of the destination
principle was never really challenged until the
Single Market programme of 1992 led to the
abolition of border controls, which had been
identified by the Cecchini report as costing intra-
community traders 2 % of their turnover. (28
) The
problem, as far as VAT was concerned, was that
abolishing border controls removed one crucial
element of the destination system, i.e. certification
that the goods that were zero-rated for export
actually left the country and were taxed on
importation in the destination country.
The solution initially proposed in 1987 by the
Commission (29
) involved a shift to the ‘origin
principle’. Instead of being zero-rated, transactions
between Member States liable to VAT would be
subject to the tax already charged in the country of
origin, which traders could then deduct as input tax
in the normal way. Hence, the origin system is by
design not exposed to types of fraud such as
carrousel fraud that exploit the zero-rating of
exports. The system would have resulted in goods
moving between, say, England and France, or
France and Germany, treated in exactly the same
way as those moving between England and
Scotland or Bavaria and Baden-Württemberg.
There would have remained, however, one obvious
difference: VAT paid in England and Scotland
goes into the same Treasury; that paid in England
and France does not. Estimates showed that there
would have been substantial transfers of tax
revenues, notably to Germany and Benelux from
the rest. Accordingly, the Commission proposed a
clearing system (30
) to re-allocate the VAT
collected in the countries of origin to the countries
(27) It is theoretically possible that, in an origin system in which
two countries have different VAT rates, trade will not be
distorted in the long-term, if there is a free trade environment and flexible exchange rates because these will
adjust (Genser and Schulze, 1997). However, the
conditions required seem unlikely to apply to a real-world situation. Furthermore, trade neutrality would presumably
take even longer to be achieved in a multi-country setting
with a fixed exchange rate regime, i.e. the euro zone. (28) The following discussion on the origin and destination
principle is largely based on the report from the European
Parliament (2000). (29) COM(87) 322 final/2, 21 August 1987.
(30) COM(87) 323 final/2 25 August 1987.
of destination. This might have been based on
VAT returns or on macro-economic statistics. (31
)
The Commission proposals, however, were not
accepted by the Council. In the second half of
1989, a high-level working party convened by the
Council outlined an alternative which retained the
destination principle for transactions involving
VAT-registered traders. (32
) This became the basis
of the transitional system proposed by the
Commission in the following year, and which
came into effect at the beginning of 1993. (33
)
However, for sales to private individuals other than
distance sales exceeding a significant threshold
and sales of new means of transport, the principle
of taxation in the Member State of origin was
accepted. The system was originally intended to
apply until the end of 1996 and was known as the
‘transitional VAT system’. However, after a
second set of simplification measures (34
) and
numerous other modifications, it has remained in
force until today.
Therefore the destination principle continues to
apply to most transactions between registered
traders. However, as tax controls at frontiers have
been abolished, traders are required to keep
detailed records of purchases from, and sales to,
other countries, and the system is policed by
administrative cooperation between Member State
tax authorities. In practice, goods supplied between
taxable persons (or VAT registered traders) are
exempted with a right to deduct the input VAT
(zero-rated) on dispatch if they are sent to another
Member State. This is known as an ‘intra-
Community supply’. The customer can establish
his status by providing his VAT number, which the
supplier can check using the VAT Information
Exchange System (VIES).
Three main reasons explain the reluctance of
Member States to change over to the origin
(31) COM(89) 260, 14 June 1989.
(32) The origin system applies to most sales made directly to
final consumers, except those by mail order companies and similar entities, which, over a certain threshold, must apply
the rate at destination. Sales of new means of transport, too,
constitute an exception, as they are taxed at the rate of the country of destination.
(33) Directive 91/680/EEC of 16 December 1991 together with
Directive 92/111/EEC of 14 December 1992, which introduced a first set of simplification measures.
(34) Directive 95/7/EC of 10 April 1995.

4. The EU VAT system: economic implications and policy challenges
49
system. The first was that Member States had
some doubts that the proposed clearing house
system would offer all the necessary guarantees
and incentives regarding fiscal controls and ensure
a fair distribution between Member States of the
VAT collected.
Second, shifting to an origin-based VAT would
have required substantial convergence of the VAT
rates between Member States, as the origin system
can tolerate only very small differences in rates,
owing to its immediate implications on trade
distortion. This would mean a significant reduction
in Member States’ room for manoeuvre. Today,
the difference between the highest (HU) and the
lowest (LU) rate in the Union is 12 percentage
points, which is very high. Overall, there has been
only a very gradual and limited closing of the gap
between standard rates, even partly reversed in
recent years (see Graph 2.1).
Third, the differences in the tax base may be (for
tradable goods, of course) even greater than for
standard VAT rates. Although EU legislation has
limited the right of Member States to grant a more
favourable VAT treatment to a specific set of
goods, major differences in the base for VAT
remain. (35
)
Graph 4.1: Standard VAT rate in EU-27
Source: Commission services.
(35) The VAT revenue ratio can give a rough measure of this.
The indicator is the ratio between actual VAT revenue and
the theoretical amount that could be obtained by taxing all consumption at the standard VAT rate. The low value of
the indicator for most countries highlights that actual VAT
revenue is only a small fraction of the theoretical total. While this is likely to be to some extent due to differences
in rates of tax evasion, the large variation in the levels of
the indicator seems to confirm that Member States differ substantially in the degree by which they exempt, or tax
more favourably, certain goods and services.
It appears highly unlikely that there will be
convergence in VAT (standard and reduced) rates
in the future. VAT is one of the main tax policy
variables left for Member States to adjust their
revenue in the short term, but only a VAT system
based on taxation at destination provides the
necessary flexibility for this, as it allows
differentiated levels of VAT between Member
States and changes in rates. The room for increases
in taxes other than VAT has been gradually
eroded, either because they have already reached
high levels, or due to increased competition for
mobile tax bases. In addition, recourse to the main
alternative revenue raiser in all Member States, i.e.
labour taxation, has been made more and more
problematic by the need to boost the EU’s
unsatisfactory employment levels. (36
) VAT hikes
have predominated as the preferred tax revenue
raiser since the beginning of the crisis (see
European Commission, 2012a). This also reflects
policy suggestions by the European Commission to
shift tax away from labour towards less
distortionary tax bases (European Commission,
2012b).
4.1.2. Dealing with VAT fraud in the current
destination system
A consequence of abandoning the origin system is
that it removes a promising systemic solution to
deal with VAT carousel fraud in the current
destination-based system. ‘Carousel fraud’ is a
type of fraud that exploits the zero-rating of
exports combined with the deferred payment of
VAT on imported goods to disappear before
paying the VAT charged on the subsequent
domestic sale with the customer claiming its
refunds. Although, given the nature of fraud, it is
difficult to quantify its extent, all estimates put the
level of fraud at extremely high levels (Baldwin
(2007) quotes estimates ranging from € 60 to € 250
billion annually EU wide). Carousel fraud is linked
to the design of the current VAT system, which
provides for an exemption of exports from VAT—
this is the step targeted by fraudsters. So far, two
types of solutions have been put forward to tackle
this problem: one relies on better cooperation
within national tax administrations, aiming at
facilitating and speeding up detection and
repression; the other relies on system reforms of
various kinds. One proposal, put forward in the
(36) See also Chapters 2 and 3 of this report.
0.00
0.02
0.04
0.06
0.08
0.10
0.12
0.14
0.16
0.18
19
19
20
20
21
21
22
2000 2001 2002 2003 2004 2005 2006 2007 2008 2009 2010 2011 2012
average (lhs) coefficient dispersion (rhs)

European Commission
Tax reforms in EU Member States
50
past notably by Germany and Austria, involves the
‘domestic reverse charge mechanism’, where VAT
on products and services delivered in the same
Member State is owed by the recipient and not by
supplier. Other solutions, such as the VIVAT
system proposed by Keen and Smith (1999),
centres on reducing the financial incentives for
fraud, essentially by preventing the VAT chain
from being broken by levying a low common rate
of VAT on trade between registered traders,
including intra-EU trade. (37
)
4.2. GENERAL IMPLICATIONS OF THE CURRENT
VAT SYSTEM ON TRADE
The focus of this section is on the general
implications of the current VAT system on trade.
If the destination principle is to be used
permanently, it is even more important to examine
critically the weaknesses of the current VAT
system, which is a variant of a destination system,
and to reflect on alternative solutions to achieve a
properly functioning destination system.
4.2.1. The current VAT system: strengths and
weaknesses
VAT was first introduced in the EU and has been a
very successful tax since its inception. Its success
is measured by the fact that it has been introduced
in at least 145 countries so far (38
), including many
developing countries where it was initially deemed
to be too complicated (Bird, 2005: ‘VAT has
swept the world’). In the EU, the long-term growth
of VAT rates, compared with the trend for lower
taxation of labour and capital income, is testimony
to the robustness of this. Furthermore, according to
recent research, VAT is considered to be one of the
taxes that have the least negative effect on
economic growth. (39
) VAT also has, at a first
approximation, by and large a neutral effect on
international trade, a factor that was instrumental
in its adoption in the EU, as the previous old-style
sales tax ran the risk of generating trade distortions
among Member States due to the difficulty in
exempting taxes on inputs.
(37) The main advantage of VIVAT is that it enables neutrality
for international trade and subsidiarity for domestic
taxation at the same time.
(38) See PwC (2011). (39) European Commission (2011b) gives a good overview of
this literature.
The basis of the EU system dates back to the 1st
and 2nd Directives, originally adopted in 1967.
Although the Directives on VAT – in particular the
6th Directive (40
) have been amended over time,
the changes have been adaptive, rather than
systemic reforms. A number of initial choices have
not been reassessed, despite their negative
consequences. The main characteristics of the
current VAT system are as follows.
Although the legal form of the tax must conform to
the EU VAT Directive (41
), Member States have
considerable leeway to define their rates.
Member States can even amend the base for VAT.
Reduced rates and exemptions differ strongly, in
practice, from one Member State to another. This
is because overall, the current VAT system in the
European Union gives considerable operational
and administrative freedom to national
governments. The main limit to Member States is
that goods or services cannot be freely moved from
the standard rate to a reduced rate, as only those
listed in Annex III of the VAT Directive can be
taxed at a reduced rate.
Despite some safeguards to guarantee an equal
playing field, the system exempts most of the
output of the public sector, creating a number of
distortions wherever public and private producers
of a good or service compete or could compete one
with another. Other newer systems have limited
the public sector exemption.
The system excludes most of the financial sector
from taxation due to technical difficulties in
determining the value added in margin-based
activities, creating distortions and probably
contributing to overconsumption of financial
services. (42
)
4.2.2. Theoretical impacts on the current
systems on trade
These fundamental choices have a number of
consequences for trade. First, the patchwork of
legal rules on VAT, the differences in procedures
and in the definition of the base create an implicit
tax barrier for intra-EU trade, even though VAT is,
in principle, neutral with regard to trade due to the
(40) 77/388/EEC of 17 May 1977. (41) 2006/112/EC of 28 November 2006.
(42) See Section 4.4 for further details.

4. The EU VAT system: economic implications and policy challenges
51
application of the destination system to most
transactions. A number of elements support the
view that the different VAT regimes do have an
impact on trade.
IFS et al. (2011) (43
) identifies four potential types
of impacts. First, the higher cross-border costs and
the sizeable one-off learning costs needed to start
exporting, due to the need to learn about the
destination country’s VAT rules. Second,
differences in VAT regimes may also affect the
choice of exporting vs setting up a local
subsidiary, particularly for firms that organise
complex trade networks in intermediary goods.
Third, they may also have an impact on the
structure of demand. VAT rates, VAT exemptions
and the compliance cost burden associated with a
national VAT regime may have domestic price and
volume effects that affect the structure of a
country’s foreign trade. This is because multiple
VAT rates and exemptions influence the structure
of relative prices in a country. This may push up
the demand for low-rated or exempted goods and
services, while putting a brake on the demand for
other items. This may well affect a country’s
specialisation in international trade.
The fourth impact of VAT regimes on trade is
immediate and relates, of course, to cross-border
purchases of goods by final consumers, (44
)
particularly between Schengen area members, as
the abolition of cross-border identity checks
facilitates shopping. The main impact of
differences in tax regimes is on excisable goods.
Cnossen (2002) notes that the impact of different
VAT rates was found to be relatively limited in
Denmark, despite a significant difference in rates
vis-à-vis neighbouring Germany. However, the
strong recent increases of VAT standard rates,
which still diverge, may increase the scale of
cross-border shopping. The distance-selling
arrangements laid down in the VAT Directive
ensure taxation at destination and therefore
neutralise the differences in VAT rates, but only
for those supplies for which the supplier takes care
of the transport of the goods. (45
)
(43) See p. 159-160. (44) Most of them are subject to the origin principle.
(45) The rise in the use of the internet by the population may
increase cross-border shopping, as shoppers in neighbouring countries find it easier to shop for goods and
services on the other side of the border and modern GPS
Therefore, cross-country differences in VAT
regimes are likely to result in a sub-optimal
international division of labour. These are not only
limited to compliance costs and the effects of rate
and base differences. In an early, well-known
discussion of the impact of VAT on international
trade, Feldstein and Krugman (1990), while
starting from the well-known theoretical result that
in the first approximation that VAT is neutral on
trade, also demonstrate that exemptions and
reduced rates may well have an impact on the
international division of labour, notably on the
financial sector. (46
)
4.3. ESTIMATING THE IMPACT OF CROSS-
BORDER COMPLIANCE COSTS
The compliance costs of VAT are not trivial. IFS
et al. (2011) reports that past estimates for
compliance costs have ranged from 0.3 % of
turnover to as high as 8 or even 25 % of VAT
collected in countries such as Croatia or Slovenia.
Compliance costs are known to differ substantially
between Member States, even though the general
principles of VAT are common. Data from World
Bank / PwC (2011) ‘Paying Taxes’ (47
) show that
for a model company, the time required to comply
with VAT obligations varies very greatly amongst
EU Member States. For a fictional model
company, they range from 22 hours in Finland to
288 in Bulgaria (PwC, 2010). This suggests a high
level of inconsistency. Furthermore, the estimates
of ‘Paying Taxes’ assume that companies carry out
solely domestic transactions.
There are good reasons to believe that the
compliance costs linked to cross-border trade are
even higher. This is because cross-border trade
requires applying complex rules and fulfilling
additional obligations. Very often it also requires
acquiring knowledge of the foreign legislation and
technology facilitates driving to new destinations in neighbouring countries.
(46) Anecdotal evidence suggests, for example, that cross-
border trade in personal services like hairdressing or dentistry has grown, notably in the border regions of
Austria or Germany. While the main driver of these trends
probably lies in strong differences in the cost of labour, VAT factors may either amplify or artificially restrict this
trend. This explains the attention of Member States to
issues such as granting reduced rates to labour-intensive services in neighbouring countries.
(47) See PwC et al. (2011).

European Commission
Tax reforms in EU Member States
52
VAT practice. These costs are proportionately
much higher for SMEs, as the profit to be obtained
from foreign sales may be uncertain and limited at
the beginning, whereas the costs sunk into setting
up a system for dealing with foreign VAT are up-
front and certain. But there are other, more subtle
effects.
It has been known for a long time that the cross-
border VAT compliance costs are well above those
for domestic transactions. In general, VAT-related
obligations have been identified as a major source
of the compliance costs for European firms, due to
their pervasive role in everyday transactions. A
European Commission survey in 2000 showed that
26 % of businesses found difficulties related to the
VAT system and VAT procedures to be an
obstacle to doing business in the Internal Market.
A further survey (48
) in 2001 showed that VAT
payments and refunds were the third most costly
regulatory burden for companies. The multiplicity
and complexity of VAT requirements in the EU-15
Member States, i.e. the ‘old’ EU Member States,
combined with difficulties for businesses in
obtaining VAT refunds from other Member States
leads to substantial costs and represents a real
barrier to cross-border activities. (49
) Out of 25
priority areas identified in the VAT legislation by
their contribution to the compliance cost burden of
European companies, eight specifically pertain to
cross-border activities. (50
)
The impact of this on trade has always been
difficult to quantify due to a lack of estimates of
the scale of cross-border compliance costs,
compared with domestic costs. However, IFS et al.
(2011) sheds some new light on the issue. It
suggests that the distortionary effect on trade is
strong. It found many differences across Member
States in VAT-related administrative procedures:
on average, a firm trading in two EU-15 Member
States would have to deal with eleven
differences (51
). These intra-EU differences are a
(48) European Commission (2001).
(49) An overview of these results is given in IFS et al. (2011),
pp. 157-158. (50) See the report by the High Level Group of Independent
Stakeholders on Administrative Burdens (2009), and
http://ec.europa.eu/enterprise/policies/better-regulation/administrative-burdens/priorityareas/
tax/index_en.htm; Ministry of Finance, et al. (2005);
Diemer (2010); Skatteverket (2006), Verwaal and Cnossen (2002).
(51) IFS et al. (2011), p. 15.
source of trade costs that hamper the development
of the internal market and discourage cross-border
trade.
The results confirm that there are considerable
differences, not only in the structures and levels of
VAT but also in the administrative procedures. An
interesting finding is that administrative
procedures in the EU-15 have not tended to
converge appreciably, although several decades
have gone by since the VAT system was set up.
The VAT dissimilarity indicator (52
) for the EU-15
shows that on average, more than 11 out of the 30
aspects of the administrative and procedural VAT
regime differ between each EU-15 country pair.
By contrast, the ten member states that joined the
EU in 2004 have fewer administrative differences
in their VAT regimes than the EU-15 countries
have among each other. This may be because these
countries were able to start a VAT tax system from
scratch and have chosen to adapt best-practice
procedures from the EU-15 countries. (53
) Rates
also differ less between the new Member States
than among the EU-15 Members. This suggests
that convergence is not a natural phenomenon over
time, but the result of deliberate policy alignment.
IFS et al. (2011) uses an innovative indirect
approach to simulate, in the absence of data on
cross-border compliance costs, the order of
magnitude of the possible impact on the
economy. (54
) The estimates suggest that a 10 %
reduction in differences in VAT procedures could
boost intra-EU trade by up to 3.7 % and GDP by
up to 0.4 %. The simulation results also suggest
that removing national VAT obligations that go
beyond EU requirements would yield a growth in
(52) The VAT-regime dissimilarity indicator compares across
countries various aspects and functional domains in national VAT regimes. The aspects include rate structures,
the heterogeneity of administrative procedures, and the
compliance cost burdens created by national VAT regimes. Dissimilarity indicators are calculated for all 676 (=26x26)
bilateral country pairs in the EU in order to allow maximum accuracy in detecting the VAT influences on
bilateral trade between Member States.
(53) IFS et al. (2011), p. 168. (54) The method is an econometric approach based on
comparing the trade structure of each country with the
above-mentioned estimates for the dissimilarity of VAT regimes. The results capture the direct (partial equilibrium)
effects of VAT policy on trade only and do not take into
account trade diversion or other indirect effects. For trade in services, the study distinguishes three types of trade
flows: total services, travel, and other business services.

4. The EU VAT system: economic implications and policy challenges
53
intra-EU trade volumes by 2.6 % and GDP by
0.2 %.
Overall, although the authors of the study consider
these estimates, owing to methodological
limitations, to be clearly the upper bounds of the
range of possible impacts, the effects of this
magnitude clearly highlight that simplifying and
harmonising procedures and converging tax rates
and bases are an important policy issue. This is
confirmed by the robustness check performed by
the study. It simulates the impact on trade of
abolishing all VAT compliance costs, on the basis
of the assumption that it may raise firm turnover
by 1 %. The estimated increase in intra-EU trade is
4.3 % and the estimated impact on GDP is 0.4 %.
4.4. ESTIMATING THE IMPACT OF VAT
EXEMPTIONS ON TRADE NEUTRALITY
The basic result that VAT has a neutral effect on
vertical integration and world trade is no longer
strictly true when there are exemptions and
reduced rates.
Exemptions apply in a significant number of areas
and sectors: examples include many financial
services (given the difficulty of identifying
economic value added in a financial transaction)
and certain services of public interest (e.g. health
services). The distortion affects both the input and
the output side. On the input side, it is due to the
fact that exempted sectors do not have to add VAT
to the sale price and are also not allowed to deduct
the VAT they pay on their inputs. (55
) As a result,
exempted sectors have a financial incentive to
internalise production inputs, because internal
value added goes untaxed, but VAT paid on inputs
acquired from other sectors is irrecoverable and
increases production costs. This may lead the
public or the financial sector to engage in activities
which could be outsourced at a lower total running
cost. A recent study (56
) on VAT in the public
sector and exemptions in the public interest found
that in the EU public sector alone, thus excluding
the financial and charity sector, eliminating this
distortion would results in gains of up to 0.3 % of
consumption.
(55) This situation is different from ‘zero rating’ where turnover
is not taxed and the producer is allowed to deduct VAT
paid on inputs, resulting in zero effective taxation. Exports, for example, are zero rated.
(56) Copenhagen Economics et al. (2011).
There is also a distortion on the output side: when
an exempted sector, i.e. financial services, sells to
a business, the sale cost must include a component
to compensate for the VAT on inputs, which the
banking sector cannot recover. The business will
be unable to recover this amount, departing from
the normal case whereby VAT paid on inputs is
wholly recovered and therefore indifferent to the
business. Therefore the output of the exempted
sector is overtaxed when it makes a sale to an
ordinary business. On the other hand, not taxing
value added results in under-taxation of the output
whenever the financial service industry sells to
households or exempt entities. This may skew the
composition of sectoral demand. Copenhagen
Economics (2011) found that a full taxation
solution, which would eliminate both distortions,
would create potential economic gains from 0.04
up to 0.19 % of EU GDP, which is significant.
Furthermore, there are frequent situations in which
businesses trade in both exempt and non-exempt
goods. This creates substantial extra compliance
costs.
As recognised by the seminal Feldstein and
Krugman (1990) contribution, having exempt
sectors weakens the neutrality properties of VAT
with regards to international trade. The authors
argue that generally, the fact that exemptions are in
practice mostly found in the non-traded sector
means that they will reduce the size of the tradable
sector. In addition, there is a competitiveness issue,
which may affect the financial sector in particular.
Financial sector exports are harmed by the
inability to deduct input VAT and this creates a
competitiveness distortion whenever there are
different rates. The effect is significant: IFS et al
2011 reports that if financial services firms could
reclaim VAT on their inputs, the cost of financial
services to businesses would be reduced by around
3–5 % in the four biggest euro-area countries
(France, Germany, Italy and Spain), leading to an
increase in their international price
competitiveness of 0.16 %, on average. For the EU,
financial institutions may well be handicapped by
this effect when competing with US institutions (as
the US levies no VAT). Overall, this may result in
barriers to trade in financial services. Several
authors consider comprehensive VAT rates as one
of the most important advantages of more modern
VAT systems like the New Zealand system, which

European Commission
Tax reforms in EU Member States
54
gives no exemption for the public sector (Aujean et
al., 1999).
4.5. ESTIMATING THE COST OF EXEMPTIONS
AND REDUCED RATES AND ITS
DISTRIBUTIONAL BENEFITS
Last year’s Tax Reforms Report discussed the issue
of VAT efficiency and called for coordination of
policies on VAT rates among Member States. This
section adds to this discussion by highlighting the
theoretical arguments in favour of using uniform
VAT rates and presenting some new empirical
results on their effects.
According to Ramsey (1927), an efficient indirect
tax system should in theory reduce the
consumption of any good in the same proportion.
However, this is not possible in reality. The design
of such a rate structure would require knowledge
of cross-price demand elasticities, which are very
difficult to measure. A similar theoretical approach
is followed by Corlett and Hague (1953), who
showed that efficiency could be enhanced by
increasing the tax burden on goods that are
complementary to leisure. However, this policy
suffers from the same drawback that price
elasticities between leisure and those goods are not
discernible. (57
) These difficulties have led
economists to pragmatically favour uniform VAT
taxation.
This is reinforced by the fact that consumption
taxes are poor instruments for redistribution. (58
)
Historically, the main argument for introducing
reduced VAT rates was the attempt to counteract
the regressive properties of VAT. IFS et al. (2011)
relativises this problem, arguing that, while zero
and reduced rates can be progressive and can be
used to encourage the consumption of socially
desirable goods and services, they are costly
instruments, as the benefit is by nature spread
between all consumers, regardless of income.
Indeed, their estimates indicate that it would be
possible, in principle, to abolish zero and reduced
rates of VAT, compensate low income households
(57) For an in-depth discussion of VAT differentiation applied
to environmental policy, see Kosonen and Nicodeme
(2010), on which we draw.
(58) See Atkinson and Stiglitz (1976) for the theoretical argument and Copenhagen Economics (2007, 2008) for the
empirical evidence.
and still have revenue left over. (59
) In addition, it
is not certain that reduced rates or exemptions
effectively result in lower prices for consumers as
traders may not pass the gains on to consumer
prices. Although one might expect that in
competitive markets, tax savings should be largely
passed on to consumers in the long run, it appears
that only 30 % of the 2009 cut in VAT on
restaurant and catering services in France from
19.6 % to 5.5 % was passed on to consumers. A
similar effect was reported for a 2010 VAT cut in
hotel services in Germany and in South Africa on
paraffin (Owens et al, 2011). (60
)
The effects of reduced VAT rates to promote
employment or the consumption of merit goods are
not supported by empirical evidence either (see
Copenhagen Economics, 2007). For employment,
although there may be some positive effects in the
short-term, the long-term impact appears at best
low. In addition, the cost of the jobs created appear
high. (61
) As for the promotion of merit goods, the
concept does not tally with the purpose of
redistribution as many of these goods ultimately
benefit high-income earners (e.g. cultural goods).
Reduced rates and exemptions generally tend to
have a significant budgetary cost. Mathis (2004)
found that in the EU-15, only about 69 % of VAT-
taxable transactions were taxed at the standard rate
in 2000, with the share falling to about 50 % in
some Member States. Besides reducing revenue,
reduced rates and exemptions also distort
households’ spending patterns.
Furthermore, reduced rates and exemptions
increase the complexity of the system — thereby
increasing administrative costs, litigation costs and
compliance costs. Because a large proportion of
compliance costs are generated by differences in
rates between different products, or between the
same products in different countries, this creates a
risk of a gradual increase in system complexity and
(59) Additional details on this are given in European
Commission (2011a).
(60) Preliminary reports on the VAT cut on restaurant services in Sweden in 2012 suggests that around 30 % of the tax
reduction affected prices while at the same time the
employment level in the restaurant sector has increased. (61) See the report by the French Senate on the effects of
reduced VAT rates in restaurants, which estimates that the
measure created 20 000 jobs for a net cost of € 2.4 billion, representing a cost of € 120 000 per job created
(http://www.senat.fr/rap/r10-042/r10-042_mono.html).

4. The EU VAT system: economic implications and policy challenges
55
in the degree of fragmentation of the internal
market. Indeed, the countries that have adopted
VAT more recently seem to have preferred single-
rate regimes to avoid these problems. Australia,
Canada, Korea, New Zealand, Singapore and
South Africa have broader bases for VAT than the
EU. In Africa, two thirds of the 21 countries that
adopted the VAT in the 1990s and all but one of
the nine that did so in the 2000s have chosen
single-rate systems. Current proposals for VAT
reform in Switzerland also plan to replace the
current three rates of VAT with a single rate. Some
studies suggest this may reduce compliance costs
by 20-30 % and add 0.1-0.7 % to growth (Owens et
al., 2011). Moreover, avoiding the cost associated
with reduced rates and exemptions allows
governments to set a lower standard VAT rate.
This may also partly explain why the OECD
countries that have adopted VAT more recently
also have, on average, lower standard VAT rates
(although this may also be due to lower overall tax
levels than in the EU in general).
Granting exemptions and reduced rates tends to
generate constant demand to extend the favourable
treatment to other sectors. Uniform VAT is more
stable and less prone to lobbyism and
manipulation. Experience in operating the EU
VAT system does not lead to excessive optimism
that the prevalence of reduced rates may diminish
over the longer term. On the contrary, events over
the past years have tended to highlight that under
normal circumstances, reduced rates or exemptions
are very difficult to roll back for political reasons.
Fundamentally, the constituency that would benefit
from the reform, i.e. the general public, would
derive from the reform only a limited advantage in
per capita terms, whereas the affected sectors stand
to lose much more from the withdrawal of special
tax treatment and are generally much better
organised politically.
Overall, Copenhagen Economics (2007) concludes
that there is a strong overall argument for a (more)
uniform VAT rate structure in the EU. Although in
a few cases (like sectors whose services can be
easily substituted by shadow economy activity)
there is a convincing case for a lower VAT rate, in
general the arguments for reduced VAT rates or
exemptions are limited and contingent and the
policy aims of reduced rates or exemptions can
often be equally well or better achieved by other
means. In particular, the case for granting
exemptions on equity grounds is substantially
weakened by the fact that the same
objectives can be reached at a lower budgetary cost
and without distorting the consumption decision
through direct payments to needy households (on
this point see also IFS et al., 2011).
4.6. POLICY CONCLUSIONS
The first policy conclusion of the ongoing review
of the EU VAT system is that the long-standing
plan to change to a VAT system based on taxation
at origin is no longer feasible. Maybe, due to the
loss of flexibility that the origin system entails, it is
not even economically desirable under the present
circumstances.
Confirming the destination principle reinforces the
need to tackle VAT fraud (in particular VAT
carousel fraud), as it results in part from the
endemic weaknesses of the destination regime and
from the high VAT compliance costs for cross-
border trade. This will require substantial work to
devise alternative concepts for a more robust and
simpler destination-based system tailored to the
Single Market. This, as well as coordination
between Member States, should be the priority,
under the general objective set in the Annual
Growth Survey 2012 of combating tax fraud and in
the Single Market Act. (62
)
There would be economic benefits from
simplifying and standardising VAT procedures as
recent research shows that there is a potential
increase in trade and GDP in the EU if the number
and mismatches of procedures are reduced. The
high VAT compliance costs for cross-border trade
must also be addressed when seeking solutions to
cross-border VAT fraud.
The second important policy conclusion concerns
the use of reduced VAT rates and exemptions.
Reduced VAT rates and exemptions largely
explain why different VAT regimes can impact
trade, despite the use of the destination system.
Their use mostly reflects policy choices made in
the past, often linked to distributional objectives.
(62) COM(2011) 206, 13 April 2011.
European Commission
Tax reforms in EU Member States
56
Using reduced VAT rates and exemptions is,
however, debatable from an economic perspective,
since consumption taxes are poor instruments for
redistribution. The effect of reduced VAT rates to
promote employment or the consumption of merit
goods is not supported by empirical evidence, but
reduced rates and exemptions generally tend to
have a significant budgetary cost and increase the
complexity of the system, thereby increasing
administrative and compliance costs.
Third, the study has found new evidence
suggesting that differences in VAT regimes,
exemptions and reduced rates generate high costs
in terms of distortion and fragmentation of the
internal market, probably higher than previously
believed. This confirms the recommendations
made under the Annual Growth Survey 2012,
which stressed that there are potential welfare
gains to be made by increasing the efficiency of
VAT systems by limiting VAT exemptions,
phasing out most VAT reduced rates and using
alternative policy instruments to achieve their
aims.
The findings of the study and the outcome of the
public consultation have provided the input for the
Commission’s Communication on the future of
VAT presented in December 2011 (see Box 4.1).
Box 4.1: Commission's Communication on the future of VAT
This Communication, which was first presented in December 2011, had a dual purpose. First, it set out the
fundamental characteristics that must underlie a new VAT regime (long-term objectives). Secondly, it
defined the priority actions that were needed for the coming years in order to create a simpler, more efficient
and more robust VAT system in the EU, tailored to the single market (short- and medium-term).
First, VAT needs to be simplified in order to make it more workable for businesses. A simpler, more
transparent VAT system would relieve businesses of considerable administrative burdens and encourage
greater cross-border trade. Second, VAT must be made more efficient in supporting Member States' fiscal
consolidation efforts and sustainable economic growth. Broadening tax bases and limiting the use of reduced
rates could generate new revenue for Member States without the need for rate increases. Third, the current
huge revenue losses, that are due to uncollected VAT and fraud, need to be stopped. It is estimated that
around 12% of the total VAT which should be collected is not (the so-called VAT Gap).
Finally, the Commission has concluded that the long-standing issue of changing to a VAT system based on
taxation at origin is no longer relevant. VAT will continue to be collected in the country of destination, and
the Commission will work on creating a modern EU VAT system based on this principle.
In its Conclusions adopted on 15 May 2012, the Council expressed its support for an EU VAT system which
should be simpler, more efficient and neutral, as well as robust and fraud-proof. The Council also
emphasized that the current financial and economic situation is difficult and complex, and requires strong
fiscal consolidation of national budgets. This should be taken into account at EU level when implementing
the objectives of the Communication on the future of VAT. The Council conclusions also invite the
European Commission to continue its in-depth analytical work and to set directions for legislative works,
and thus are important for the future reform of VAT.

5. TAX POLICY CHALLENGES IN EU MEMBER STATES
Box 5.1: Benchmarking approach to identifying Member States that face a challenge in a
particular tax policy area
In the horizontal screening applied in this Chapter, the GDP-weighted average of the EU-27 Member States is used as a
reference point for benchmarking. A Member State is considered to have performed badly in a particular area if the indicator under consideration is significantly lower than the EU average after normalising, so that a high indicator
corresponds to a good performance. This normalisation – not displayed in the tables – is key to calculate the two
performance thresholds: ‘LAF plus’ and ‘LAF minus’, indicating a good and a poor performance respectively. The direction of performance needs to be indicated, and this is always a delicate normative exercise: is the high value of the
original indicator indicative of a bad or a good performance? Each indicator may point to several different concepts and
its interpretation depends on its purpose. For example, the tax-to-GDP ratio may indicate either the overall tax burden or the existence of ‘overall tax space’.
A Member State is considered to have performed badly in a particular area, if the indicator is significantly worse than this
average. Technically, being significantly worse means that the indicator is at least 0.4 standard deviations below the
weighted EU average (after normalising). This approach captures the bottom third of total distribution under the normality assumption (i.e. the worst performers). It is applied in the LIME Assessment Framework – LAF (see European
Commission, 2008). For the sake of simplicity, the wording ‘LAF plus’ and ‘LAF minus’ or ‘very high’ and ‘very low’ are used in the Chapter. If a high value of a – normally distributed – indicator refers to a good (bad) performance, the
values above (below) ‘LAF plus’ capture the third best performers. The values below (above) ‘LAF minus’ capture the
third worst performers. The values between ‘LAF plus’ and ‘LAF minus’ capture the third of the distribution which is not significantly different from the EU average.
A more elaborate approach is applied if several indicators are used to assess whether a Member State faces a challenge in
a particular policy area. In that case, the general approach is to consider that a country faces a challenge if at least one of
the indicators is significantly below the average. Different rules are applied in the various policy areas concerning the required minimum level for the other indicator(s). A more detailed explanation is provided in the different sections of the
chapter and in Boxes 5.2 and 5.3.
While this mechanical screening is consistent across countries, it does not take country specificities into account. This also
implies that Member States coming out as better than ‘LAF minus’ for a specific policy area could still face a challenge in that area. Hence, before firm policy conclusions can be drawn, an in-depth analysis would have to be carried out.
However, such detailed country-specific scrutiny clearly lies outside the scope of this report. Moreover, countries not
displaying a strong tax challenge may still require subtle policy adjustments, which would require a more detailed analysis
of best practices than EU-27 average performances. Nevertheless, the ‘LAF plus’ value might be a first – and rough –
screening device for identifying countries with good practices.
57
This chapter provides an analysis of
macroeconomic challenges that individual EU
Member States are facing in the field of taxation
and tax policy. The purpose of this chapter serves
to supplement understanding of Member States'
tax systems, rather than to prescribe
recommendations. The coverage is extended to all
Member States, while last year's Tax Reforms
Report only covered euro-area Members. It should
be borne in mind that all EU Member States are
covered by the European Semester, which also
recommends sound national tax policies to favour
growth and fiscal sustainability, while avoiding
and correcting macroeconomic imbalances. This
cross-country analysis is a first screening and
needs to be qualified to take relevant country-
specific features into account.
Member States are benchmarked using the so-
called Lisbon Assessment Framework (LAF)
approach (as explained in more detail in Box 5.1).
In short, a Member State is considered to face a
challenge in a particular area of tax policy if it is
amongst the worst performers, that is, the bottom
third of the distribution (under normality
assumption). (63
) This approach is more restrictive
than the one applied last year when the GDP-
weighted average (for the euro-area Member States
only) was used as a benchmark. Certainly
assessing countries against best practices would be
also very useful but requires in-depth country
specific examination, which is outside the scope of
this report. In some limited cases, mainly for
sustainability indicators, alternative well-
established benchmarks are used (instead of LAF).
While revisions of challenges compared to last
year's report are often due to recent reform efforts,
they may also relate to the more restrictive
screening approach, the revision of (backward-
looking) data and the improvement of the analysis,
which has been dug deeper on various dimensions.
(63) Based on the sign of the indicator value, a high value
corresponds to a good performance. All averages are GDP-
weighted unless otherwise indicated.

European Commission
Tax reforms in EU Member States
58
This chapter first of all updates and refines the
analysis carried out in last year's report on the
broad challenges linked to the contribution of
taxation to fiscal consolidation or related to the
need of growth-friendly tax structures (Section
5.1). The chapter then identifies challenges linked
to the broadening of tax bases in direct taxation
and VAT (Section 5.2). Tax governance is the
subject of Section 5.3. Specific issues are
addressed in Section 5.4, namely challenges
related to housing taxation and environmental
taxation. In addition, this section also touches upon
some redistributive aspects of the tax system in a
non-normative way. Finally, Section 5.5
summarises the results of the analysis and provides
in a synoptic table an overview of the tax policy
challenges faced by individual EU Member States.
5.1. FISCAL CONSOLIDATION AND GROWTH-
FRIENDLY TAX STRUCTURES
Last year's edition of the report analysed two
macroeconomic dimensions of taxation in detail:
the sustainability of public finances and the
growth-friendliness of tax structures. This section
updates and refines the analysis aimed at
identifying Member States that face overarching
macroeconomic challenges relating to fiscal
consolidation and growth-enhancing tax structures.
As last year, Member States are subject to
preliminary quantitative screening. Before drawing
firm policy conclusions, it would, of course, be
necessary to complement this with an in-depth
country analysis, which is outside the scope of this
first horizontal analysis.
5.1.1. Consolidation on the revenue side
In the current economic context, many Member
States need to undertake significant consolidation
efforts. This sub-section identifies those Member
States that face sizeable consolidation needs and
could consider increasing their tax revenues.
Member States that are currently following an
economic adjustment programme (Greece, Ireland
and Portugal) are excluded from the analysis in
this sub-section. The fiscal sustainability indicators
used in this sub-section cannot replace detailed and
frequent monitoring of debt sustainability carried
out by the European Commission, the IMF and the
ECB in the context of the adjustment programme.
There is considered to be potential for using tax
increases to help consolidation if: (i) tax-to-GDP
ratio is relatively low, and (ii) at the same time
there is scope for increasing the least distortionary
taxes and/or the overall tax burden has not
increased substantially (unless warranted by large
consolidation needs). The section is based on the
approach set out last year, which has been
amended this year to take medium-term fiscal
sustainability into account. The approach is
summarised in Box 5.2 and is explained in more
detail in Wöhlbier et al. (2012). Finally, the
screening results are presented in Table 5.3.
Table 5.1: Sustainability gap and primary balance
Source: Commission services.
As regards the fiscal sustainability of Member
States, the values for the main indicator for long-
term fiscal sustainability, referred to as ‘S2’, were
revised substantially in spring 2012, following the
publication of the new age-related expenditures
projections by the Commission and the Ageing
Working Group. The S2 indicator (64
) shows the
adjustment to the current structural primary
(64) Last year's edition of the report includes a Box with an
explanation of the concept of fiscal sustainability and of the
S2 indicator (see European Commission, 2011b, p. 77). S2
indicators used in this year's report have been calculated on the basis of the Commission services' 2012 Spring Forecast
and the new age-related expenditures projections by the
Commission and the Ageing Working Group of the Economic Policy Committee (EPC).
Total
Initial Budgetary
position
Ageing
component
BE 6.2 7.5 0.5 7.0DE 0.6 1.8 -0.5 2.3EE -2.1 2.1 1.2 0.8ES 3.7 4.3 2.3 2.0FR 3.0 2.2 1.3 0.9IT -0.9 -2.8 -3.4 0.5CY 2.3 5.5 -0.2 5.7LU 0.3 9.8 1.2 8.7MT 2.9 6.1 1.3 4.8NL 4.1 7.9 2.4 5.4AT 2.3 3.7 0.2 3.5SI 2.2 7.5 0.6 6.8SK 4.4 8.6 3.5 5.1FI 1.2 4.9 -0.3 5.1BG -1.7 2.6 0.4 2.2CZ 0.4 4.9 1.1 3.8DK -0.6 3.3 0.5 2.9LV -1.9 -0.7 0.9 -1.6LT -0.1 4.3 0.8 3.5HU -0.7 0.5 -0.5 1.0PL -0.1 1.5 0.5 1.0RO -1.5 3.6 0.1 3.5SE -2.9 1.8 -1.1 2.9UK 5.1 5.2 2.6 2.5EU-27 2.2 2.9 0.7 2.3EA-17 2.1 2.4 0.3 2.2
S2 - "long-term"
Country of which:
Sustainability gap indicators (2012)
S1 - "medium-
term"

5. Tax policy challenges in EU Member States
59
balance which is required to fulfil the infinite
horizon inter-temporal budget constraint, including
paying for any additional expenditures arising
from an ageing population. It, therefore, considers
the projected changes in age-related expenditures
over a very long time horizon (to 2060). Moreover,
unlike last year, an indicator of medium-term fiscal
sustainability has been used, referred to later on as
‘S1’.(65
) S1 corresponds to the required adjustment
(65) The values of S1 and S2 are published in the Commission
Staff Working Papers published for each Member States by
the European Commission on 30 May 2012 to underpin the Country-specific Recommendations 2012-2013 for
Stability, Growth and Jobs under the European Semester.
of the primary balance until 2020 to reach a public
debt of 60% of GDP – the debt threshold in the
Treaty – by 2030. For the sake of a prudent
assessment and as explained in Box 5.2, the
analysis in this report considers that Member
States need a strong fiscal adjustment to make their
public finance sustainable if either the indicator of
medium-term sustainability (S1) or that of long-
term sustainability (S2) is high according to the
http://ec.europa.eu/europe2020/making-it-happen/country-
specific-recommendations/index_en.htm.
Box 5.2: Screening principles to identify a potential need for tax-based consolidation
Quantitative screening on the basis of selected indicators is applied to Member States with a view to
identifying countries that might consider using taxation – in addition to expenditure control – to consolidate
their public finances and steer them onto a more sustainable path. Such screening should identify both a
strong need for consolidation and the availability of tax space. The following screening criteria are
considered:
Fiscal sustainability problems
1) Fiscal sustainability is considered problematic, if:
(i) The indicator of fiscal sustainability gap in the medium-term, "S1", is high (more than 3, which
corresponds to the very top of the indicator distribution).
OR
(ii) The indicator of fiscal sustainability gap in the long-term, "S2", is high (more than 6, which
corresponds to the very top of the indicator distribution). This generally means that both the initial
budgetary position component of the sustainability gap (i.e. the initial deficit) and the long-term
budgetary projections of age-related expenditure are very unfavourable.
Availability of tax space
AND: 2) There is ‘overall tax space’ currently available (relatively low tax-to-GDP ratio). This main
criterion needs to be met in conjunction with one of the two qualifying criteria below:
AND EITHER: 2(a) There is still scope for increasing the least distortionary taxes (i.e. the share of
consumption and/or recurrent property taxes in GDP is not (significantly) above average or there is scope for
increasing environmental taxation; see Box 5.3 for details).
OR: 2(b) The tax burden has not increased substantially in the recent past (i.e. no marked increase in
tax-to-GDP ratios in the period 2009-2012). The distance between the structural deficit and its medium-term
budgetary objective (MTO) is used as a supplementary indicator to check the magnitude of the tax increase in
relative terms, i.e. compared with the current consolidation need. Thus, a country is considered not to have
experienced a strong rise in its tax burden if the tax-to-GDP ratio increase is above LAF minus and the
distance to the MTO is below average.
A low current tax-to-GDP ratio in conjunction with a high fiscal sustainability gap does not necessarily point
to a need to change the tax code by increasing tax rates or broadening tax bases. Higher tax revenues might
also be achieved by improving tax compliance/administration and fighting tax evasion, without changing tax
rules. Similarly, tax increases implemented in the recent past may not lead to equivalent increases in tax-to-
GDP ratios due to (higher) tax evasion and Laffer-Curve effects (negative feedback of higher taxes on output
and employment, i.e. tax bases).
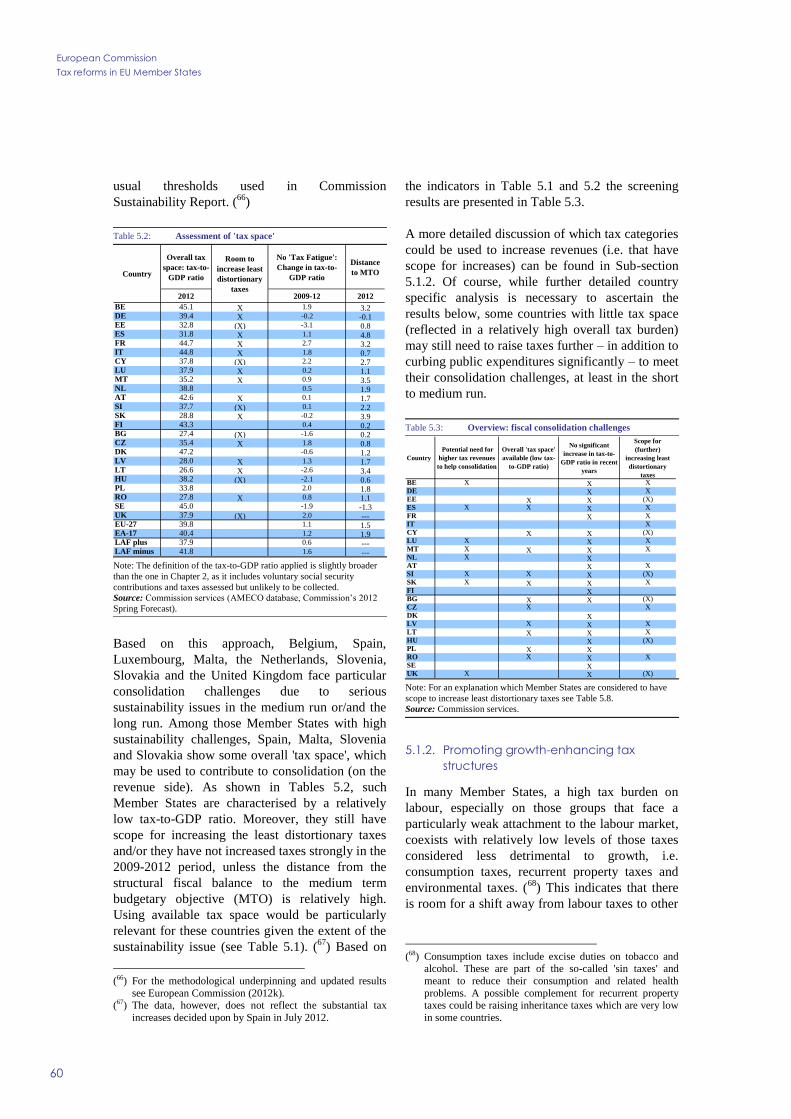
European Commission
Tax reforms in EU Member States
60
usual thresholds used in Commission
Sustainability Report. (66
)
Table 5.2: Assessment of 'tax space'
Note: The definition of the tax-to-GDP ratio applied is slightly broader
than the one in Chapter 2, as it includes voluntary social security
contributions and taxes assessed but unlikely to be collected.
Source: Commission services (AMECO database, Commission’s 2012
Spring Forecast).
Based on this approach, Belgium, Spain,
Luxembourg, Malta, the Netherlands, Slovenia,
Slovakia and the United Kingdom face particular
consolidation challenges due to serious
sustainability issues in the medium run or/and the
long run. Among those Member States with high
sustainability challenges, Spain, Malta, Slovenia
and Slovakia show some overall 'tax space', which
may be used to contribute to consolidation (on the
revenue side). As shown in Tables 5.2, such
Member States are characterised by a relatively
low tax-to-GDP ratio. Moreover, they still have
scope for increasing the least distortionary taxes
and/or they have not increased taxes strongly in the
2009-2012 period, unless the distance from the
structural fiscal balance to the medium term
budgetary objective (MTO) is relatively high.
Using available tax space would be particularly
relevant for these countries given the extent of the
sustainability issue (see Table 5.1). (67
) Based on
(66) For the methodological underpinning and updated results
see European Commission (2012k). (67) The data, however, does not reflect the substantial tax
increases decided upon by Spain in July 2012.
the indicators in Table 5.1 and 5.2 the screening
results are presented in Table 5.3.
A more detailed discussion of which tax categories
could be used to increase revenues (i.e. that have
scope for increases) can be found in Sub-section
5.1.2. Of course, while further detailed country
specific analysis is necessary to ascertain the
results below, some countries with little tax space
(reflected in a relatively high overall tax burden)
may still need to raise taxes further – in addition to
curbing public expenditures significantly – to meet
their consolidation challenges, at least in the short
to medium run.
Table 5.3: Overview: fiscal consolidation challenges
Note: For an explanation which Member States are considered to have
scope to increase least distortionary taxes see Table 5.8.
Source: Commission services.
5.1.2. Promoting growth-enhancing tax
structures
In many Member States, a high tax burden on
labour, especially on those groups that face a
particularly weak attachment to the labour market,
coexists with relatively low levels of those taxes
considered less detrimental to growth, i.e.
consumption taxes, recurrent property taxes and
environmental taxes. (68
) This indicates that there
is room for a shift away from labour taxes to other
(68) Consumption taxes include excise duties on tobacco and
alcohol. These are part of the so-called 'sin taxes' and
meant to reduce their consumption and related health
problems. A possible complement for recurrent property taxes could be raising inheritance taxes which are very low
in some countries.
Overall tax
space: tax-to-
GDP ratio
No 'Tax Fatigue':
Change in tax-to-
GDP ratio
Distance
to MTO
2012 2009-12 2012
BE 45.1 X 1.9 3.2DE 39.4 X -0.2 -0.1EE 32.8 (X) -3.1 0.8ES 31.8 X 1.1 4.8FR 44.7 X 2.7 3.2IT 44.8 X 1.8 0.7CY 37.8 (X) 2.2 2.7LU 37.9 X 0.2 1.1MT 35.2 X 0.9 3.5NL 38.8 0.5 1.9AT 42.6 X 0.1 1.7SI 37.7 (X) 0.1 2.2SK 28.8 X -0.2 3.9FI 43.3 0.4 0.2BG 27.4 (X) -1.6 0.2CZ 35.4 X 1.8 0.8DK 47.2 -0.6 1.2LV 28.0 X 1.3 1.7LT 26.6 X -2.6 3.4HU 38.2 (X) -2.1 0.6PL 33.8 2.0 1.8RO 27.8 X 0.8 1.1SE 45.0 -1.9 -1.3UK 37.9 (X) 2.0 ---EU-27 39.8 1.1 1.5EA-17 40.4 1.2 1.9LAF plus 37.9 0.6 ---LAF minus 41.8 1.6 ---
Country
Room to
increase least
distortionary
taxes
Country
Potential need for
higher tax revenues
to help consolidation
Overall 'tax space'
available (low tax-
to-GDP ratio)
No significant
increase in tax-to-
GDP ratio in recent
years
Scope for
(further)
increasing least
distortionary
taxes
BE X X XDE X XEE X X (X)ES X X X XFR X XIT XCY X X (X)LU X X XMT X X X XNL X XAT X XSI X X X (X)SK X X X XFI XBG X X (X)CZ X XDK XLV X X XLT X X XHU X (X)PL X XRO X X XSE XUK X X (X)

5. Tax policy challenges in EU Member States
61
tax bases. Certainly, in some Member States the
fiscal consolidation constraints are so demanding
that a reduction in labour taxes becomes very
difficult. However, even those Member States that
need to increase revenues to contribute to fiscal
consolidation should consider a shift within the
overall tax burden in order to limit the detrimental
effect of the overall higher tax burden on the
economy. Shifting the tax burden towards indirect
taxation might require accompanying policies to
strengthen tax compliance, which may be more
problematic for consumption taxes. (69
)
Box 5.3 outlines the horizontal quantitative
screening principles used to identify countries that
have both a need and room for improving the
structure of taxation to enhance growth. This sub-
section first identifies Member States that have a
particular need to reduce (overall or group-
specific) labour taxation and then highlights those
countries that appear to have particular scope for
increasing taxes which are the least detrimental for
growth. (70
)
High tax burden on labour – need for a shift
The overall tax burden on labour, as measured by
the implicit tax rate on labour and the tax wedge at
average earnings, is considered to be particularly
high in Belgium, Germany, France, Italy, Austria,
Finland, the Czech Republic, Hungary and Sweden
(see Table 5.4). However, it is necessary to look
also at output indicators to assess the importance
of a labour tax reduction. Of the abovementioned
countries, Germany, Austria, Finland, and Sweden
have an employment rate significantly above the
EU-27 average (above LAF plus), and with the
exception of Finland, also above the Europe 2020
employment target of 75%. For these countries, the
issue of high labour costs still remains but is
considered to be less problematic in the screening
analysis when analysing the overall tax burden.
It is, however, important to place a special
emphasis on specific labour market groups that
face particular employment problems and are at
the same time considered to be rather responsive to
labour supply disincentives created by a higher
(69) See, e.g., Watrin and Ullman (2008).
(70) This sub-section focuses on the main results, whereas a more detailed analysis can be found in Wöhlbier et al.
(2012).
after-tax wage: low-skilled workers (71
) and second
earners.
Table 5.4: Tax burden on labour and overall labour market
situation
Notes: Employment rate and unemployment rate (20 to 64 years),
tax wedge of single earner without children at 100 % of the average
wage for full-time work (AW), implicit tax rate on employed labour;
* data for the tax wedge refer to 2010 in the case of Bulgaria, Greece,
Lithuania, Latvia, Malta and Romania, and 2007 in the case of Cyprus.
Source: Commission services, OECD.
Low-skilled workers also face difficulties with
employability given their supposedly high labour
costs (including labour taxes) compared with their
productivity. Other groups that are often seen to be
facing particular labour market problems, in
particular young workers and older workers will
not be discussed here. It is generally considered
that the tax burden is not one of the key drivers of
these problems. (72
) Table 5.5 nevertheless also
(71) In this document, low-skilled and low wage earners are
used as synonyms although it is well understood that low
wage earners are not necessarily the same as low-skilled workers, partly due to a trend towards over-qualification.
(72) Reducing the tax burden is not the best way to address the
problems faced by young and older workers. Older workers' disincentives to work may be due to their wage
career rather than the supposedly declining age-
productivity profile and encouragement to retire earlier. Unemployment among young workers is the result of a
wealth of complex factors, ranging from labour protection
Country
Employment
rate (2011)
Unemployment
rate (2011)
Implicit tax
rate on labour
(2010)
Tax wedge
(100%
AW, 2011)
BE 67.3 6.9 42.5 55.5DE 76.3 5.9 37.4 49.8EE 70.4 12.3 37.0 40.1IE 64.1 14.1 26.1 26.8EL 59.9 17.6 31.3 38.0ES 61.6 21.1 33.0 39.9FR 69.1 8.9 41.0 49.4IT 61.2 8.1 42.6 47.6CY 73.8 7.7 27.0 13.9*LU 70.1 4.8 32.0 36.0MT 61.5 5.7 21.7 22.4*NL 77.0 4.0 36.9 37.8AT 75.2 3.9 40.5 48.4PT 69.1 12.8 23.4 39.0SI 68.4 8.2 35.0 42.5SK 65.1 13.1 32.0 38.9FI 73.8 7.1 39.3 42.7BG 63.9 10.9 24.4 32.5*CZ 70.9 6.5 39.0 42.5DK 75.7 7.0 34.8 38.4LV 67.2 15.3 32.5 44.2*LT 67.2 15.4 31.7 40.7*HU 60.7 10.9 39.4 49.4PL 64.8 9.5 30.1 34.3RO 62.8 7.4 27.4 44.3*SE 80.0 6.6 39.0 42.8UK 73.6 7.0 25.7 32.5EU-27 70.1 8.7 36.0 43.7EA-17 69.3 9.1 38.1 46.4LAF plus 72.5 6.9 33.7 40.9LAF minus 67.6 10.5 38.3 46.6

European Commission
Tax reforms in EU Member States
62
presents data on the unemployment rate of young
workers whose labour market situation has
deteriorated dramatically in several Member States
since the beginning of the crisis.
On the basis of the indicators presented in Table
5.5, in particular Belgium, Germany, France, Italy,
Austria, Latvia, Hungary, Romania, and Sweden
are faced with the challenge of reducing the tax
burden on low-skilled workers. (73
) Austria and
legislation to wage gaps for a supposedly inexperienced
segment of the population and labour market mismatches. Thus, these two groups are not referred to in the taxation
annex of the 2012 AGS, although they are stressed in the
2012 AGS itself. (73) Given that the indicators look at specific wage levels, they
do not reflect potential measures aimed at reducing labour
Sweden, however, show relatively high
employment rates for low-skilled workers, which
is again reflected in the screening. (74
)
Turning to second earners, the data in Table 5.5
show that in Belgium and Germany there are
specific disincentives to return to work from
inactivity and to increase the number of hours
worked, whereas in the Netherlands and Latvia the
tax disincentives to return to the labour market
supply disincentives and/or labour costs at lower wage
levels, as, e.g., in place in Belgium and France. (74) For a discussion of which components of the tax burden
should be reduced – which of course depends on the
specific Member State – see last year's report. Generally, a reduction of employers' social security contributions has a
direct impact on labour costs, at least in the short term.
Table 5.5: Labour market situation of and tax burden on specific groups
Notes: (1) Employment rate and unemployment rate of low-skilled workers (25-54 years, pre-primary, primary and lower secondary education -
levels 0-2, ISCED 1997), long-term unemployment in % of active population. Tax wedge, inactivity trap and unemployment trap for single worker
with no children at 67 % of average earnings. *Tax wedge data for the indicators measuring the disincentives to work refer to 2010 in the case of
Bulgaria, Greece, Lithuania, Latvia, Malta, and Romania and 2007 in the case of Cyprus. (2) Unemployment rate of young workers (15-24) (3)
Employment rate for age group 25-54. Inactivity trap for second earner in two-earner couple with two children, principal earner with 67% of average
wage, second earner with 67%, low-wage trap for second earner in two-earner couple with two children, principal earner with 67% of average wage,
second earner moving from 33% to 67% of average wage. Data for the traps refer to 2009 in the case of Bulgaria, Lithuania, Latvia, Malta, and
Romania. No detailed breakdown of the contribution from labour taxes to the low-wage trap is available. 'Contribution from labour taxes' refers to the
contribution to the respective trap in percentage points. Inactivity includes household work.
Source: Commission services, OECD.
Labour market
performance
Tax wedge
(67% AW)
2011 2011 2011 2011
BE 59.3 49.7 66.8 35.5 92.7 35.5 18.7 73.8 84.9 46.5 46.5 58.5
DE 62.0 45.6 65.6 34.4 74.7 34.4 8.6 77.8 87.7 47.8 43.8 45.8
EE 55.1 38.8 46.3 17.6 62.7 12.7 22.3 74.8 81.5 23.2 23.2 23.2
IE 48.8 21.3 78.5 7.9 78.2 7.5 29.4 64.8 74.1 40.6 11.0 23.7
EL 62.4 35.6 5.9 16.0 60.8 16.0 44.4 57.7 80.0 30.4 16.0 16.0
ES 57.9 36.6 44.7 17.5 83.2 13.2 46.4 62.7 74.5 23.1 23.1 22.9
FR 68.2 46.5 61.2 26.1 77.0 19.3 22.1 76.2 86.7 38.8 25.4 30.1
IT 61.2 44.5 24.5 24.5 78.3 21.7 29.1 58.9 83.4 39.7 30.7 47.5
CY 74.9 11.9* --- --- --- --- 22.4 76.6 86.5 --- --- ---
LU 73.9 29.2 69.7 16.6 85.7 5.7 16.8 72.9 90.8 32.9 22.5 29.0
MT 59.9 18.1* 59.1 12.0 58.6 12.0 13.7 50.6 89.7 32.9 16.2 22.5
NL 71.5 33.1 82.0 32.7 83.7 8.7 7.6 79.0 89.4 45.7 38.2 39.3
AT 69.2 43.7 65.2 26.3 66.8 26.3 8.3 80.2 89.6 28.8 28.8 37.8
PT 73.4 33.1 36.3 16.8 79.2 16.8 30.1 74.1 81.6 21.3 19.2 28.2
SI 62.9 38.5 60.2 28.7 83.2 13.2 15.7 81.3 84.8 52.4 28.7 37.5
SK 36.9 36.1 40.3 17.6 67.6 17.6 33.2 70.4 82.6 21.8 21.8 34.8
FI 65.8 37.2 68.6 25.3 72.2 13.9 20.1 79.6 84.8 27.6 25.3 32.9
BG 43.5 32.5* 37.7 20.9 80.9 20.9 26.6 73.0 75.0 20.9 20.9 20.9
CZ 54.8 39.5 62.2 18.2 80.0 18.2 18.0 74.3 90.9 33.2 25.4 25.2
DK 69.9 36.8 86.8 26.3 89.2 11.6 14.2 78.9 85.7 79.0 27.4 64.3
LV 55.7 43.5* 59.5 29.9 89.9 29.9 29.1 75.4 76.2 34.9 34.9 32.7
LT 41.0 38.8* 44.0 19.7 69.8 19.7 32.9 78.3 76.3 49.4 19.7 29.0
HU 46.0 45.2 49.9 27.8 82.1 22.1 26.1 66.6 79.6 31.0 27.8 38.3
PL 52.7 33.4 51.5 27.0 81.9 21.4 25.8 71.4 83.0 42.2 23.4 32.4
RO 57.2 43.1* 36.9 27.1 70.6 27.1 23.7 67.4 80.7 32.9 28.2 33.7
SE 69.2 40.7 69.8 28.8 74.7 9.8 22.9 83.2 88.8 22.5 28.8 28.5
UK 62.5 28.5 50.0 22.6 50.0 22.6 21.1 74.5 85.9 46.8 22.6 31.0
EU-27 62.8 40.2 54.6 26.3 74.0 22.1 21.6 72.6 84.9 40.4 30.2 36.9
EA-17 63.4 42.6 54.4 27.0 77.6 22.7 21.6 71.8 84.7 39.2 32.1 38.0
LAF plus 65.1 35.9 47.6 23.8 69.4 18.8 17.2 75.4 86.5 36.8 26.6 32.7
LAF minus 60.6 43.0 61.4 28.7 78.4 25.3 26.0 69.6 83.3 44.7 33.7 40.9
Disincentives to work
Employment
rate (low-skilled)
Unemployment
rate (youth)
Employment
rate - female
Employment
rate - male
Inactivity trap (67%
AW)
Country
Tax burden on low-wage earners and labour market situation of low-skilled
(1) Youth labour
market
performance (2)
Tax burden on second earners and female labour market situation
(3)
Disincentives to work Labour market performance
Low-wage
trap (33% to
67% AW,
2010) 2011 2010
of which
contribution
from labour
tax
2010
of which
contribution
from labour
tax
2010
of which
contribution
from labour
tax
Inactivity trap (67%
AW)
Unemployment trap
(67% AW)

5. Tax policy challenges in EU Member States
63
from inactivity are high. The labour market
situation of second earners, taking the female
employment rate as a proxy, is, however,
significantly better than the EU-27 average in
Germany, the Netherlands and Latvia. Again this
is reflected in the screening. The employment rate,
however, does not capture the number of hours
worked, which is another important indicator of
labour underutilisation. In particular, the average
number of hours worked is low for second-earners
in the Netherlands, while the share of women
working full-time is low in Germany.
Room for manoeuvre– potential to increase
consumption, property or environmental taxes
Member States are considered to have room to
shift taxes away from labour if their tax burden is
relatively low in at least one of the following three
areas: consumption taxes, recurrent property taxes
or environmental taxes. All of these tax categories
have been found to be among those which are the
least detrimental to growth.
By far the broadest tax base to which a tax shift
could be considered is consumption. As measured
by the share of consumption taxes in GDP in 2010,
revenues from consumption taxes are particularly
low in Ireland (75
), Spain, Italy, Luxembourg and
Slovakia and are also below the EU-27 average in
Belgium, Germany, France, the Czech Republic
and Latvia (see Table 5.6). In addition to those
countries, Greece, Portugal, Lithuania and the UK
as well as Cyprus, Malta and Romania had a tax
burden on consumption below the EU-27 average
in 2010, as measured by the implicit tax rate on
consumption. (76
) Moreover, in France there is a
large gap between the tax burden on labour and
consumption, as measured by the two implicit tax
rates, clearly above the EU-27 average. Hence,
there appears to be potential room for shifting
taxation from labour to consumption.
However, as the data used in the screening stop in
2010, there is a need to take into account the often
substantial tax reforms implemented in 2011 and
early 2012 and presented in Chapter 3. As a rough
(75) The rather low value is also due to a high share of
multinational companies in the Irish economy and a
comparison of consumption taxes to GNI would provide a
more favourable picture. (76) For an explanation of the concept of implicit tax rates see
Glossary and Chapter 2.
proxy for the impact of these changes on revenues
from consumption taxes, the change in revenues
from indirect taxes over the 2010-2012 period is
used. (77
) Among those countries found to have the
potential to increase consumption taxes, revenues
from indirect taxes are forecast to increase by more
than one percentage point in Italy, Malta and
Portugal and by more than 0.5 percentage points in
Greece, France, the Czech Republic, Romania and
the United Kingdom. (78
) Assuming that these
increases are confirmed and indeed linked to
higher consumption taxes, they would tend to limit
the actual scope for future increases. This points to
the need for further country-specific analysis, as
this dimension is not factored into the screening.
When considering increases in consumption taxes
it is important to see in which sub-category (VAT,
excise duties on alcohol and tobacco or energy)
Member States have a particular scope for
increasing revenues, as was done in last year's
report.(79
)
Table 5.6: Indirect and consumption taxes
Note: The last column shows the difference between the ITR on labour
and the ITR on consumption.
Source: Commission services.
(77) Indirect taxes are broader than consumption taxes as they
also include revenues from other taxes, in particular large
parts of property tax revenues, some additional smaller
environmental taxes, stamp taxes and payroll taxes. (78) The data does not include the increase in VAT in Spain
applicable since 1 September 2012.
(79) The scope for increases in environmental taxes is discussed below. For a detailed discussion on which consumption
taxes could be increased, see Wöhlbier et al. (2013).
Share of
consumption
taxes in total
taxation
Consumptio
n taxes as %
of GDP
ITR on
consumption
Gap: ITR on
labour and
consumption
2012change
2008-122012
change
2010-122010
BE 28.7 0.4 12.9 0.1 24.7 10.9 21.4 21.1
DE 28.9 1.1 11.4 0.3 28.4 10.8 19.8 17.6
EE 42.4 4.8 13.9 0.0 39.8 13.6 25.6 11.4
IE 39.5 -2.2 11.5 0.1 35.5 10.0 21.6 4.5
EL 39.1 0.4 12.8 0.8 38.9 12.1 15.8 15.5
ES 30.8 1.1 9.8 -0.6 27.2 8.7 14.6 18.4
FR 35.0 0.4 15.6 0.8 25.6 10.9 19.3 21.7
IT 34.5 2.4 15.5 1.4 24.2 10.2 16.8 25.8
CY 39.9 -6.7 15.1 -0.4 37.8 13.5 18.8 8.1
LU 31.6 -1.5 12.0 0.2 26.8 9.9 27.3 4.7
MT 43.4 1.2 15.3 1.6 39.5 13.2 18.9 2.8
NL 29.6 -1.5 11.5 -0.6 31.0 12.0 27.0 9.9
AT 33.9 0.9 14.5 0.0 28.1 11.8 21.4 19.1
PT 43.6 0.7 14.8 1.4 37.1 11.7 17.4 6.1
SI 38.3 0.7 14.4 0.1 37.5 14.2 24.1 10.9
SK 36.5 1.0 10.5 0.3 36.1 10.1 17.7 14.4
FI 33.0 3.1 14.3 1.0 31.2 13.1 25.2 14.0
BG 53.3 -0.7 14.6 -0.2 53.0 14.5 22.8 1.6
CZ 34.2 3.6 12.1 0.9 32.3 10.9 21.1 17.9
DK 36.1 0.5 17.0 0.3 31.5 15.0 31.5 3.3
LV 42.1 4.9 11.8 0.5 39.5 10.8 17.3 15.2
LT 44.8 6.9 11.9 0.1 42.5 11.5 18.2 13.5
HU 45.6 6.9 17.4 0.5 39.2 14.8 27.2 12.2
PL 41.4 0.2 14.0 0.4 38.6 12.3 20.2 9.9
RO 45.6 4.0 12.7 0.8 42.4 11.5 18.9 8.5
SE 41.3 2.9 18.6 0.7 29.0 13.3 28.1 10.9
UK 35.4 4.3 13.4 0.7 31.5 11.2 18.4 7.3
EU-27 33.9 1.6 13.5 0.5 29.1 11.0 19.7 16.3
EA-17 32.5 0.9 13.1 0.4 27.7 10.7 19.2 18.9
LAF plus 35.6 2.3 14.3 0.7 30.7 11.5 21.0 13.4
LAF minus 32.2 0.9 12.6 0.3 27.4 10.5 18.2 18.7
Country
2010
Share of indirect taxes
in total taxation
Indirect taxes as % of
GDP

European Commission
Tax reforms in EU Member States
64
Box 5.3: Screening principles when identifying a potential need, and room, for a tax shift
Quantitative screening on the basis of selected indicators is applied to Member States with a view to
identifying countries that might consider shifting taxation away from labour. Such screening should identify
both a need for a reduction in labour taxation and the availability of tax space for specific tax categories. The
following screening criteria are considered:
Need to reduce labour taxation
Labour taxation is problematically high if:
1(a) The ‘overall tax burden on labour’ is very high (significantly above the average, i.e. above LAF
minus). This is considered the case if either the implicit tax rate (ITR) on labour or the tax wedge at average
earnings are significantly above the average, with the other indicator not being significantly below this
average.
OR: 1(b) The tax burden on specific labour market groups is very high (low-skilled workers and/or
second earners). The assessment is based on different tax wedge and trap indicators.
The tax burden on low-skilled workers is considered very high if
(i) the tax wedge on low-skilled workers is very high (significantly above the average)
AND/OR
(ii) labour taxes contribute to a high inactivity trap and/or a high unemployment trap (with the
contribution from labour taxes to the other trap not being significantly below the average).
The tax burden on second-earners is considered very high if
(i) the contribution from labour taxation to the inactivity trap is very high
AND/OR
(ii) the low-wage trap is very high (with the contribution from labour taxes to the inactivity trap not being
very low. The low-wage trap acts as a disincentive for the second-earner to work full-time, instead of
part-time).
If the employment level is very high (either overall or for specific groups), a very high tax burden is still an
issue, but less problematic.
Scope for increasing the least distortionary taxes
There is still scope for increasing the least distortionary taxes. Increasing taxes does not necessarily point to a
need to increase tax rates. The result could also be achieved by a broadening of tax bases, while paying
attention to enhance tax compliance effectively in the short- to medium-term.
AND EITHER: 2(a) There is scope for increasing consumption taxes. This means that:
(i) the share of consumption taxes in % of GDP is (significantly) below the EU average,
OR
(ii) the ITR on consumption is (significantly) below the EU average
OR
(iii) the gap between the ITR rate on labour and consumption is very high and the ITR on consumption
not yet very high.
OR: 2(b) There is scope for increasing recurrent taxes on housing (i.e. the share of revenues from
recurrent tax on housing in GDP is significantly below average).
OR: 2(c) There is scope for increasing environmental taxation (i.e. either the share of revenues from
environmental taxes or the ITR on energy are significantly below average with the other indicator not being
significantly above it).

5. Tax policy challenges in EU Member States
65
The rise of consumption taxes might lead to a rise
in price levels, translating into higher inflation in
the short run. This may (partly) counteract the cut
in labour costs from the tax shift, depending on the
response of wages to prices.
A second category of less growth-harmful taxation
is recurrent property taxes, although substantially
smaller in revenue terms than consumption taxes.
In terms of revenues, those are particularly low in
Malta, Luxembourg, Austria, the Czech Republic,
Greece, Bulgaria, Hungary, Estonia, Lithuania,
Slovakia, Germany and Slovenia (see Graph 5.7 in
Sub-section 5.4.1). Those Member States could
raise revenues by 0.4% of GDP or more by
bringing revenue in line with the EU-27
average. (80
) However, taxes on imputed rent, the
revenue from which are not included in the data,
are applied in the Netherlands and Luxembourg
and could explain the very low revenue from
recurrent taxes on immovable property in these
countries. As discussed in Sub-section 5.4.2,
revenue from recurrent housing taxes should, first
of all, be increased by bringing the cadastral values
of housing in line with market values. Tax rates
should only be increased as a second step.
The third tax category which has been found to be
less detrimental to growth is that of environmental
taxes, in particular those falling on consumption.
Moreover, as discussed in more detail in Sub-
section 5.4.2 they can help to reach environmental
targets. There is potential to raise revenue both
through tax increases as well as through reducing
tax expenditure in this area, i.e. by reforming
environmentally harmful subsidies. Revenue
expectations should not be too high, however.
Based on the criteria outlined in Box 5.3 and the
data provided in Table 5.7, Belgium, Greece,
Spain, France, Austria, Slovakia, the Czech
Republic, Latvia, Lithuania and Romania seem
particularly apt to increase revenues from
environmental taxes. (81
)
(80) Countries that are below, but not significantly below, the
EU-27 average are not looked into here as the EU-27 average is partly driven by the United Kingdom. The
EU-27 average excluding the UK would be rather in line
with LAF minus. (81) The two indicators shown in Table 5.7 are both used for the
assessment. Each one has its own weaknesses.
Environmental (or energy) tax revenue as a % of GDP does not take into account the level of energy consumption in a
country and, therefore, does not measure a 'true' tax burden.
Table 5.7: Tax burden on the environment
Source: Commission services.
Summary findings on the need and potential
for tax shifting
Based on the screening summarised in Table 5.8,
Belgium, France, Italy, the Czech Republic, Latvia
and Romania in particular and, to a lesser extent,
Germany, Austria, and Hungary face the challenge
of reducing the tax burden on labour (either overall
or for specific groups) and at the same time appear
to have room to increase taxes which are less
detrimental to growth. Thus, these Member States
should analyse in greater detail whether to shift the
tax burden away from labour and if so, how.
In this analysis, Member States need also to take
into account the effect of such a shift on tax
compliance, which, in some countries, might be
more difficult to ensure in the area of indirect
taxation than direct taxation. Therefore, tax shifts
should go hand in hand with measures to improve
tax compliance, namely in the area of VAT and
In the case of the implicit tax rate on energy, it is not the
whole base (level of energy consumption) that is actually taxed: i.e. transport is heavily taxed in most countries,
while energy use for heating and industrial production is
taxed much less or exempt. Therefore, Member States with, in relative terms, a large low taxed industrial sector and
low, or not taxed, heating use appear 'bad'. Moreover, an
increased use of (untaxed) renewable energy over time (as set out in the energy/climate policy) leads to a lower
indicator and hence a weaker performance.
CountryEnvironmental taxes as % of
GDP, 2010
Implicit tax rates on energy,
2009
BE 2.1 125.2DE 2.2 215.4EE 3.0 127.5IE 2.4 198.3EL 2.4 135.5ES 1.6 154.2FR 1.8 178.8IT 2.6 259.4CY 2.9 142.1LU 2.4 210.1MT 3.1 195.5NL 4.0 231.9AT 2.4 169.5PT 2.5 175.3SI 3.6 226.8SK 1.9 100.7FI 2.8 129.1BG 2.9 108.6CZ 2.4 130.6DK 4.0 330.9LV 2.4 97.1LT 1.9 116.4HU 2.6 112.6PL 2.6 106.8RO 2.1 86.1SE 2.8 210.0UK 2.6 220.9EU-27 2.4 198.5EA-17 2.3 198.3LAF plus 2.6 217.0LAF minus 2.1 179.9

European Commission
Tax reforms in EU Member States
66
other indirect taxes. The effect on income
redistribution – discussed in more detail in Sub-
section 5.4.3 – also needs to be taken into
consideration.
Table 5.8: Overview: tax structure indicators
Note: High tax burden on specific labour market groups in a Member
State either refers to low-skilled workers or second earners in couples or
both. (X) depicts borderline cases. Member States are considered to
have a room to shift if consumption tax indicators are very low (below
LAF minus), if they are low (below average) combined with a very low
burden on at least one of the two other potential bases for tax shifts, or if
the burden on at least one of the other bases is very low with the burden
on the other one being low. Member States are considered to have
limited room for a tax shift if at least one of the indicators signals some
potential to shift.
Source: Commission services.
5.2. BROADENING TAX BASES
There is wide agreement that broader tax bases
allow for lower tax rates and, therefore, help to
reduce the distortionary effects of taxation. (82
) As
discussed in Chapter 3, in recent years many
Member States have implemented measures aimed
at broadening tax bases via a reduction in tax
expenditures. Tax expenditures not only reduce the
amount of revenues collected and tend to lower the
efficiency of the tax system; they also increase
compliance costs and the costs of tax collection
(see Section 5.3). However, a reduction is often
difficult, notably for political reasons.
(82) See, e.g. OECD (2010b).
Tax expenditures can be defined as ‘…provisions
of tax law, regulation or practices that reduce or
postpone revenue for a comparatively narrow
population of taxpayers relative to a benchmark
tax.’ (Anderson, 2008). As stressed in last year's
edition of the report and in OECD (2010a), it is
difficult to distinguish unambiguously tax
expenditures from what is considered to be a norm,
as the latter is loosely defined. This makes
international comparisons very difficult. (83
)
Moreover, estimates of tax expenditures, based on
micro studies, are not available for all Member
States and not consistent across countries.
It is important that Member States regularly inform
the public about the cost of tax expenditures in
terms of revenues foregone and that they assess to
what extent the original objectives are still being
met or if they could be met via other means at a
lower cost. The redistributive effects (84
) of tax
expenditures are also important as several of these
items tend to benefit high-income households and
therefore have a regressive effect. It also needs to
be ensured that such tax expenditures do not
constitute illegal state aid under Art. 107
TFEU. (85
) Tax measures meeting the cumulative
criteria of Art. 107 TFEU are subject to a system
of prior Commission authorisation and Member
States may not put the proposed aid measures into
effect until the Commission has approved them.
When designing their tax measures and especially
differential tax treatments, Member States
therefore have to assess the need to notify the
Commission, in particular where such tax
measures introduce favourable tax treatment for
certain categories of undertakings or for the
production of certain goods.
This section analyses tax expenditure in
personal and corporate income taxation, looks into
the debt bias in corporate taxation, and assesses the
efficiency of the VAT system in Member States.
(83) See OECD (2010a and 2010b) for a discussion of the
difficulties of measuring tax expenditure.
(84) For an analysis of redistributive aspects of the tax system see Sub-section 5.4.3.
(85) Article 107(1) TFEU state that 'any aid granted by a
Member State or through state resources in any form whatsoever which distorts or threatens to distort
competition by favouring certain undertakings or the
production of certain goods shall, in so far as it affects trade between Member States, be incompatible with the
Internal Market'.
OverallSpecific
groups
Low
consumption
taxes
Low
recurrent
taxes on
housing
Low tax
burden on the
environment
BE X X (X) X X
DE (X) (X) (X) X (X)
EE X
IE X
EL X X X
ES X X
FR X X X X X
IT X X X X
CY (X)
LU X
MT (X) X
NL (X)
AT (X) (X) X X (X)
PT X
SI X
SK X X X
FI (X)
BG X
CZ X (X) X X X
DK
LV X (X) X X
LT X X X
HU X X X (X)
PL
RO X (X) X X
SE (X) (X)
UK (X)
Country
High tax burden on
labourNeed and
room for
tax shift
Potential to shift

5. Tax policy challenges in EU Member States
67
5.2.1. Reviewing tax expenditures in personal
and corporate income taxation
This sub-section restates the main findings of last
year's report on tax expenditure in personal income
taxation (86
) and analyses in more detail tax
expenditure in corporate income taxation.
Personal income tax expenditures
The analysis contained in last year's report
highlighted those euro-area countries for which
OECD data or other specific information on levels
of tax expenditure in the area of personal income
taxation are available. According to this
analysis (87
), Greece, Spain, Italy, Portugal, France
and Austria as well as Belgium need to review
their tax expenditure in personal income taxation
given their scale and the overall revenue foregone
(as a % of total revenue from personal income
taxes). In general, several Member States have
implemented base-broadening measures in recent
years but no updated data on tax expenditure levels
have been published by the OECD since. (88
) In
addition to the above mentioned euro-area Member
States, OECD data points to high levels of tax
expenditure in two non-euro-area Member States,
namely the United Kingdom and, to a lesser extent,
Poland. In both these countries, tax expenditures
amounted to around 20% (in 2007-08) and around
11% (in 2007) of revenues from personal income
taxation, respectively. Given the lack of
(comparable) data it is important that those
Member States that have not published data yet,
step up their efforts to do so. Moreover, it is
important that individual tax expenditure items are
assessed regularly.
Corporate tax expenditures
Tax expenditures are also widely used for
corporate tax purposes. An important distinction
should be drawn between those affecting the tax
rate and those impacting the tax base.
(86) Tax expenditure items related to housing taxation are
discussed in more detail in Sub-section 5.4.1.
(87) The data does not take into account all the specific features of the national tax system.
(88) Portugal has, e.g. in line with the Memorandum of
Understanding started to substantially reduce tax expenditure in personal income taxation (see European
Commission, 2012l).
Reduced tax rates and special regimes
Many Member States favour specific companies
by granting them reduced corporate income tax
rates or special regimes. Table 5.9 and Table 5.10
show which Member States make use of reduced
tax rates to support particular types of companies,
regions or sectors. In most cases, these reduced
rates are provided for small and medium-sized
enterprises (SMEs), for companies operating in
economically-distressed regions or for companies
operating in specific economic sectors.
Table 5.9: Reduced corporate income tax rate for small
businesses (2012)
Notes: (1) As of 2011, companies in Spain that grow above the limits
applicable for small companies can benefit from the lower rate for three
years after losing their small-business status.
Source: Commission services, national authorities.
CountryStandard
rate
Reduced
rates for
SMEs
Eligibility criteria for reduced rates /
thresholds for lower rates
Companies that fulfil a number of
conditions relating to the activities of
the company, the shareholding of the
company, the rate of return of
distributed profits and the remuneration
of their managers benefit from reduced
rates.
24.25% profits of up to €25,000
31% profits between €25,000 and €90,000
34.50% profits between €90,000 and €322,500
25%
Companies with a turnover below €10
million. Only on a taxable base of up to
€300,000.(1)
20%
In 2009-2012: micro-enterprises with a
turnover less than €5 million,
employing fewer than 25 employees and
maintaining or increasing employment.
Only on a taxable base of up to
€300,000.
FR 33.33% 15%
Largely independent businesses with an
annual turnover no greater than €7.63
million. Only on the first €38,120 of
profit.
21% 20% Taxable base up to €15,000
NL 25% 20% On the first €200,000 of profits
LV 15% 9%
Micro-enterprises with a turnover less
than LVL 70,000, employing up to 5
employees (if turnover above, excess
taxed at 20%)
LT 15% 5%
Companies with a taxable profit less
than LTL 1 million, employing up to 10
employees
HU 19% 10%On the first HUF 500 million of profits
per annum
RO 16% 3%
Privately-owned companies with a
turnover less than €100,000, employing
up to 9 employees (optional)
UK 24% 20%
Companies with profit under GBP
300,000. Marginal relief is available on
profits between GBP 300 000 and GBP
1.5 million
LU
ES 30%
+ 5% solidarity tax
BE33%
+ 3% austerity surcharge on income tax rate

European Commission
Tax reforms in EU Member States
68
As discussed in last year’s report, the preferential
treatment of SMEs may find its roots in the general
perception that corporate taxation could be
regressive, in the wish to make up for possible
market imperfections — such as difficulties in
accessing credit, the absence of large economies of
scale for SMEs or their lack of resources to
optimise their tax burden. However, using the tax
system to correct these possible distortions does
not seem to be the first-best solution. (89
) Instead,
considerations of political economy may lie behind
the choice to provide SMEs with reduced
corporate income tax rates, even though the latter
encourage entrepreneurs to incorporate for tax
purposes (90
) and discourage companies to grow.
As shown in Table 5.9, ten Member States
currently make use of reduced corporate tax rates
to support SMEs.
In some Member States companies operating in
specific, often economically-distressed, regions
may also benefit from reduced tax rates. Table
5.10 indicates those Member States which grant
tax relief to companies solely on the basis of their
location, (often) independently of their economic
activity.
Moreover, specific sectors of activity are
sometimes granted a favourable tax regime, which
affects the general tax rate to which those sectors
are in principle subject. (91
) Many EU Member
States (see Table 5.10), for instance, provide a
specific corporate tax regime for the shipping
sector (‘tonnage tax’) under which the taxable
income is determined based on the volume
transported (tonnage of vessels) rather than the
income generated.
In the past, regional and sector-specific incentives
used to be more numerous but as a consequence of
the OECD work on harmful tax practices, of the
EU Code of Conduct on Business Taxation and the
rules on State Aids, as well as the supervisory role
performed by the European Commission as the
guardian of the Treaties (92
), many of these
(89) An alternative solution could be to impose a minimum
corporate tax as some Member States already do. (90) See de Mooij and Nicodeme (2008).
(91) Some Member States, like Hungary, also apply surcharges
to specific sectors. (92) http://ec.europa.eu/taxation_customs/taxation/
company_tax/harmful_tax_practices/index_en.htm
specific measures have been put on standstill and
rolled back.
Table 5.10: Reduced corporate income tax rates and special tax
regimes for specific regions and sectors
Note: The list of economic sectors is non-exhaustive. ‘Sh’ refers to the
shipping sector (tonnage tax), ‘Ag’ refers to the agricultural sector, ‘In’
refers to investment companies, and ‘Tr’ refers to trusts.
Source: Commission services.
Reduced tax bases
Tax provisions impacting the computation of the
tax base are common in almost all Member States.
By deviating from the domestic tax norm, those
provisions grant a favourable tax treatment for
specific items. These tax provisions often serve
economic purposes, but their extended use may
make corporate taxation more distortive. This
section focuses on the most common tax
expenditures used across Member States. (93
)
Most EU Member States allow the taxable base to
be reduced by the economic depreciation of assets
according to a straight-line method or a declining-
(93) Tax expenditures related to company cars are discussed in
Sub-section 5.4.2. Although many Member States offer the
possibility to carry-forward (or back) unused losses for tax
purposes, this feature of the tax system is not analysed here. For information on this item see European
Commission (2010d) and 'Taxes in Europe' Database.
CountryStandard
Rate
Reduced rates for
economically-distressed
regions
Special tax
regimes for
specific sectors
BE
33% +
austerity
surcharge
Sh
DE 31% Sh
IE 12.5% Sh
EL 20% Some Aegean islands (12%) Sh
Canary Islands (4%)
Ceuta and Melilla (15%)
Basque country (28%)
Navarre (20%-27%)
FR 33.3%Overseas departments (0%
for newly-created companies)Sh
IT 31.1% Sh
CY 10% Sh
MT 35% Sh, In
NL 25.5% Sh
Azores (17.5%)
Madeira (20%)
SI 20% Koper and Maribor (10%) Sh, In (0%)
FI 26% Sh
CZ 19% In (5%)
DK 25% Sh
LV 15% Free Economic Zones (3%) Sh
LT 15% Free Economic Zones (0%) Sh
HU 19% Tr (0%)
PL 19% Sh
UK 24% Sh, Tr (0%)
BG 10%High unemployment regions
(0%)
PT 25%
ES 30% Sh
Sh, Ag

5. Tax policy challenges in EU Member States
69
balance method. (94
) In all, 15 of them allow
accelerated depreciation or immediate expensing
for small-value items (95
) (see Table 5.11), which
not only narrows the tax base but also distorts
investment choices. That said, going closer to a
cash-flow tax where investment is immediately
expensed has interesting economic properties, in
particular a zero marginal effective tax rate on
investment.
The corporate tax system of most EU Member
States also includes provisions aiming at
promoting R&D or spurring investment. A
majority of Member States has R&D or investment
incentives (see Table 5.11), which are given in the
form of a tax credit or a tax allowance. Obviously,
fine-tuning the focus of these measures is
important to avoid distortions in investment and
R&D choices. Some Member States also direct
their investment incentives to specific economic
activities, such as audio-visual activities (e.g.
Luxembourg), the sponsoring of sport (e.g.
Hungary), venture capital (e.g. Luxembourg),
urban renovation (e.g. Portugal) or new industrial
activities (e.g. Luxembourg).
A number of Member States also try to boost
employment through the use of specific tax
expenditures. These employment incentives take
the form of a tax credit for disabled workers in the
Czech Republic and tax deductions for newly
created jobs in Bulgaria, Portugal (young or long-
term unemployed) and Slovenia (young or older
unemployed).
Table 5.11 indicates for each EU Member State the
corporate tax expenditure items that may be worth
assessing and points to which Member States are
(94) Depreciation based on declined-balance does not
necessarily provide a more accelerated system than straight-line. It all depends on how many years straight-line
depreciation is given for (e.g. a 4-year straight-line
depreciation for PCs allows faster depreciation than a 25% declined-balance system).
(95) For more information on the items for which accelerated depreciation is available, see the 'Taxes in Europe'
Database. This report lists Member States with available
accelerated depreciation. An assessment of the budgetary impact, which might be relatively low for some schemes,
is, however out of the scope of the report and for example,
the impact of the depreciation at will for environmentally friendly assets (VAMIL) in the Netherlands is estimated at
€ 40 million per year. For Belgium, accelerated
depreciation is almost limited to newly launched sea ships. In Spain, a recent decree from March 2012 limits the
choice of depreciation by large companies.
particularly suitable for such a tax expenditure
review. Although some of the tax expenditure
items may find their rationale in the achievement
of specific policy objectives (growth, employment,
innovation, etc.), the question remains whether
they are effective and whether they are the best
instruments for achieving their goals.
Table 5.11: Issues in the area of corporate tax expenditures in
EU Member States
Note: Member States are considered to have a room for a tax
expenditure review if they have an 'x' in at least three categories in
columns 2-6.
Source: Commission services, IBFD and Taxes in Europe Database.
In the light of this overview and on the basis of a
cost-benefit analysis, some countries may review
their tax systems and consider making use of other
channels to accomplish their policy objectives.
Based on available information, a regular (partial
or complete) assessment of tax expenditures is
carried out in a limited number of Member States
only (Austria, Belgium, Finland, France, Germany,
Greece, Italy, Netherlands, Poland, Portugal,
Spain, Sweden and the United Kingdom (96
)). Such
regular assessment by Member States should be
(96) See OECD (2010b) for an overview and IGF (2011) for the
full French review. No information is currently available
for non-OECD EU Member States. So far a review of tax
expenditures in Poland has only been carried out once (in 2010). According to national authorities, Sweden also
carries out a regular review.
Reduced
rates for
SMEs
Reduced
rates for
regions /
sectors
Accelerated
Depreciation
R&D
Incentives
Investment
Incentives
BE X X X X X X
DE X X
EE
IE X X
EL X X
ES X X X X X X
FR X X X X X
IT X X
CY X
LU X X X X
MT X X X X
NL X X X X X X
AT X
PT X X
SI X X X X X
SK X X
FI X X
BG X
CZ X X X X
DK X X
LV X X X X X
LT X X X X X X
HU X X
PL X X
RO X X X X
SE
UK X X X X X
Corporate tax expenditures
Country
Room for
tax
expenditure
review

European Commission
Tax reforms in EU Member States
70
the norm as it provides relevant information to
policy-makers and taxpayers.
Debt bias in corporate taxation
The corporate tax system of almost all EU Member
States allows interest payments on corporate debt
to reduce the taxable base. This type of tax
expenditure, however, considerably favours the
use of debt over equity as a financing mode. The
issue of tax-induced debt-bias in corporate taxation
was developed in last year’s report. (97
) Graph 5.1
shows the effective marginal tax rates (EMTR) on
debt- and equity-financed new corporate
investment. It highlights the gap between the tax
treatment of debt and equity in all Member States.
As in 2010, Malta, Greece, Luxembourg and
France stood out as the countries with the highest
gap in 2011. Although clearly lower, the gap was
also significantly above the EU average gap, in
Portugal and Italy and above the EU average in
Belgium, Spain, Germany and Sweden in 2011.
Graph 5.1: Effective marginal tax rates on debt- and equity-
financed new corporate investment, 2011
Source: ZEW (2012), unpublished, partly provisional data.
To counter this debt-bias, some Member States,
have introduced some type of Allowance for
Corporate Equity (ACE) making it possible to
deduct equity costs for corporate tax purposes.
Belgium has an ACE in place since 2006 and
Latvia since 2009. (98
) Italy introduced it for new
(97) Fatica et al. (2012) also review the topic and possible
solutions to address the bias. (98) For Belgium, the notional interest rate used in the EMTR
computation is the 10-year state interest rate (OLO).
Because this rate is relatively low (3.425% for 2011), there remains a gap between the EMTR on debt-financing (-
28.2%) and on equity financing (13.2%). A sensitivity
analysis shows that increasing this rate reduces and eventually nullifies this gap. Note that the European
Commission has officially asked Belgium to amend its
legislation on the notional interest deduction. Current Belgian rules provide that a notional interest deduction is
granted for Belgian real estate and permanent
equity in 2011 (99
) - after a previous episode
between 1997 and 2003. (100
) Although an ACE
further narrows the corporate income tax base and
would, at least ex ante, lead to a revenue shortfall
at unchanged tax rates, it seems an appropriate
way of limiting the debt bias.
On the other hand, some Member States have
developed alternatives to limit the interest
deductibility. One alternative involves thin-
capitalisation rules, which disallow the tax
deductibility of interest costs related to debt
exceeding a given ratio of total (or alternatively
internal) debt to equity.
Table 5.12: ACE, CBIT, thin-capitalisation and earnings-
stripping rules in EU Member States, 2012
Source: Commission services and Blouin et al. (2012).
In 2012, 16 Member States are using some kind of
thin-capitalisation rule for corporate tax purposes,
although their details vary dramatically from one
country to another. Another possibility involves
earnings stripping rules, which disallow the tax
deductibility of interest costs exceeding a
percentage of a company’s taxable profit (often
measured as the earnings before interest, taxes,
establishments, while no deduction is granted for foreign
real estate and permanent establishments. (99) This recent reform is not reflected in the data in Graph 5.1.
(100) Portugal has applied a form of ACE for SMEs since 2010.
Austria had an ACE in place between 2000 and 2004. See Klemm (2007) for an overview of ACE systems in
practice.
-30
-20
-10
0
10
20
30
40
50
60
MT EL LU FR PT IT BE ES DE SE NL DK AT FI CZ SI SK UK PL EE HU LT RO IE CY BG LV EU
in %
EMTR new equity EMTR debt LAF minus LAF plus Debt bias
CountrySome form of
ACE/CBIT
Thin capitalisation
rule
Earnings-stripping
rule
BE X X
DE X
EE
IE
EL X
ES X
FR X X
IT X X
CY
LU
MT
NL X
AT
PT X X
SI X
SK
FI
BG X X
CZ X
DK X
LV X X
LT X
HU X
PL X
RO X
SE
UK X
5. Tax policy challenges in EU Member States
71
depreciation and amortisation — EBITDA). (101
)
Table 5.12 provides an overview of rules which
reduce the debt-bias in EU Member States. Estonia
only taxes distributed earnings. (102
)
5.2.2. Increasing VAT efficiency
As discussed in detail in Section 4.5, results from
the economic literature, confirmed by recent
econometric estimations, underline the benefits in
terms of efficiency of a uniform VAT system.
Deviations from uniformity even though justifiable
from a theoretical point of view, seem to lack
practicability (e.g. updating cross price elasticity in
real time), not to fulfil their primary objective (e.g.
redistribution) or to lead to substantial economic
costs (including compliance costs). Regarding the
latter, VAT should in general be levied to the
extent possible on a broad base minimising
revenue losses from exemptions and reduced rates.
When designing their VAT systems Member
States are bound by the VAT Directive. In this
respect they are not free to transfer goods or
services from the standard to the reduced rate, as
only those listed in Annex III to the Directive can
be taxed at a reduced rate. However, within this
legal framework national governments retain
significant operational and administrative freedom
as to the possibility of amending the base for VAT.
In practice, VAT is heterogeneously designed
across Member States and reduced rates and
exemptions differ strongly. (103
)
Broadness of VAT base
To give an idea of the share of consumption
expenditure spared from taxation at the standard
VAT rate, Graph 5.2 compares actual VAT
revenue with the revenue that would accrue if all
private consumption (104
) were taxed at the
(101) Germany and Italy introduced this kind of rule in 2008.
Finland and Spain are in the process of adopting similar rules.
(102) Estonia applies an S-base cash flow tax. (103) Denmark is the only Member State that does not apply any
reduced rates. However, Denmark applies zero rates to
supplies such as newspapers and exempts supplies such as education and passenger transport.
(104) Note that, although this is a reasonable approximation,
private consumption is in some respects narrower than the VAT base (as the latter includes some construction work,
which is classified as investment in the national accounts)
and in some respects wider than it (some items belonging to personal consumption are exempt from VAT, such as
spending on financial services or on public services).
standard rate and revenue effectively
collected. (105
) This share gives a good first
indication of the impact of exemptions and
reduced rates, i.e. of ‘policy efficiency’. However,
it is also affected by the share of tax evasion or tax
non-compliance (‘collection efficiency’), which
also diminishes the ratio. (106
)
Graph 5.2 suggests that the impact of reduced
rates, exemptions and/or VAT fraud and evasion is
indeed significant, as actual VAT revenue in the
EU-27 is less than 50 % of the theoretical total in
2010. It should be mentioned, however, that these
figures might be overestimated as the indicator
includes (untaxed) imputed rents in the base. This
leaves the country ranking largely unchanged. (107
)
Compared to the previous year the indicator
increased by 1.5 percentage points, reversing a
backward trend since 2007. The same development
can be seen for the euro-area, where the indicator
rose even more markedly, by 1.9 percentage
points. This indicates that old EU Members States
have increased reduced rates and/or broadened the
base more strongly.
Although quite high on average, the impact of
reduced rates, exemptions and tax fraud varies
significantly across Member States. In fact the
difference between the highest VAT revenue ratio
in Luxemburg (108
) and the lowest one in Greece is
substantial: 56 percentage points. Next to
(105) This measure is analogous to the ‘C-efficiency’ or the
‘VAT revenue ratio’ computed by the OECD, see OECD
(2011c).
(106) Unless, due to the existence of the informal sector, private consumption is understated by national accounts in an
equal proportion to the share of VAT evasion, which seems
unlikely. (107) The consumption of housing services by owner-occupiers,
an item on which VAT cannot be levied, on average
accounts for slightly less than 12 % of final consumption, which is used as a proxy for the potential tax base. On the
other hand, while this results in a downward bias in the
ratio, other items tend to boost it, one example being sales of residential housing, which yield VAT revenues but are
not part of final consumption. Overall, the exclusion of consumption of housing services by owner-occupiers does
not have a major impact on the ranking of countries in
terms of the ratio. An alternative calculation, e.g. the one made in the OECD review of France, identifies the same
countries as having the narrowest VAT base (see OECD,
2011a, page 17). (108) However, the high value of Luxemburg might be affected
by cross-border shopping, as VAT revenues are included in
the nominator of the indicator while the denominator excludes consumption expenditure of non-resident
households.

European Commission
Tax reforms in EU Member States
72
Luxemburg only five countries – Cyprus, Estonia,
Bulgaria, Slovenia and Austria – gather more than
60% of the theoretical amounts.
The two dotted lines shown in Graph 5.2 indicate
an indicator's value significantly below the EU-27
average (LAF minus) and significantly above the
average (LAF plus). According to this assessment,
six Member States – Greece, Italy, Spain, Latvia,
Romania and United Kingdom – exhibit a VAT
revenue ratio significantly below the EU-27
average (LAF minus). This means that these
countries could substantially improve the design of
VAT in order to increase its efficiency. In addition,
the ratio is below the EU average in Slovakia,
Portugal, France, Belgium, Ireland, Poland and
Lithuania, signalling scope for increasing VAT
efficiency.
From a comparison of 2010 to 2009 it is clear that
the increase in the EU-27 VAT revenue ratio is
driven by an augmentation in fifteen Member
States. The strongest increase was in Spain where
the indicator's value rose by almost a fifth from
35% to 41.7%. This development could to a large
extent be due to the increase of the two reduced
rates by 1 percentage point as of July 2010. Latvia
exhibited the second and Italy the third strongest
increase of 13% (from 37.9% to 42.8%) and 10%
(from 37.6 to 41.3%) respectively. The
improvement of the ratio in Latvia may have been
driven by an augmentation of the reduced rate by
100% (from 5% to 10%) which was effective in
2009 but came fully into effect in 2010 most likely
due to the crisis.
There are a number of reasons why the indicator
could have been affected negatively by the crisis
and the economic cycle in general, even though
VAT is a proportional tax. First, the recession is
likely to have shifted consumption patterns
towards primary goods, which are more frequently
subject to lower VAT rates. Second, the share
calculated here is affected (109
) by the decline in
construction activity, which was particularly
marked in this recession. Third, rising bankruptcies
reduce the amount of VAT paid, as do inventories
(109) This is because VAT paid on construction is counted in the
numerator of the ratio, but is excluded from the
denominator (not being consumption expenditure). This
statistical bias implies that any decline in construction activity will tend to have an over-proportional impact on
the share.
involuntarily accumulated by businesses during the
recession. (110
) Finally, many countries have
introduced measures aimed at making it possible
for companies to defer tax payments, including
VAT.
Graph 5.2: Actual VAT revenues as a percentage of theoretical
revenues at standard rates in 2009 and 2010
Note: The ratio consists of actual VAT revenues divided by the product
of the VAT standard rate and net final consumption expenditure, i.e.
final consumption expenditure minus VAT receipts. A low value of the
ratio suggests that exemptions, reduced rates, or tax evasion have a
significant impact.
Source: Commission services.
The increase of the revenue ratio in Italy was
partly due to measures taken by the government to
combat VAT fraud and evasion. The outlook for
future development with respect to improvement
of the VAT efficiency in Member States may be
favourable. As shown in Chapter 3 quite a number
of Member States increased recently reduced rates
and/or broadened the VAT base. This will help
reduce the significant cost created by deviation
from uniformity – not only in budgetary terms, but
also in terms of administrative and compliance
costs.
VAT compliance gap
As mentioned above, the difference between
theoretical and actual tax revenue is also due to
VAT fraud and evasion, which is already included
as one element in the VAT revenue ratio discussed
above. It is certainly very difficult to quantify this
variable. The 2009 study by Reckon is the most
comprehensive recent report attempting to do so. It
quantifies and analyses the VAT ‘compliance’ gap
in the EU-25 Member States over the period 2000-
2006.
(110) National accounts data indicate, however, that a destocking
of inventories took place in 2009.
00
10
20
30
40
50
60
70
80
90
100
LU CY EE BG SI AT SE DK MT NL DE CZ HU FI LT PL IE BE FR PT SK UK RO LV ES IT EL EU EA
2009 2010
LAF minus
LAF plus

5. Tax policy challenges in EU Member States
73
Table 5.13: VAT ‘compliance’ gap, EU-25, in %
Note: The study covers the EU-25 Member States. No data is available
for Cyprus. The VAT gap compares VAT receipts with a theoretical net
VAT liability. The latter is calculated by identifying the categories of
expenditure that give rise to irrecoverable VAT and combining them
with appropriate VAT rates.
Source: Reckon (2009).
As explained in last year’s report, the aggregate
VAT gap for the EU-25 (excluding Cyprus)
amounted to € 106.7 billion in 2006, which
constituted 11 per cent of theoretical liability.
On the basis of the 2006 results of the Reckon
Study (111
), in particular the following Member
States, faced in this year the challenge of
addressing a high VAT compliance gap: Greece,
Slovakia, Italy, the Czech Republic, Latvia,
Lithuania, Hungary and the United Kingdom. All
these countries have an indicator value higher than
LAF minus, which points to a need to improve
VAT compliance.
5.3. IMPROVING TAX GOVERNANCE
Efficient tax collection is a prerequisite for
financing European welfare states with a relatively
high level of public services and redistributive tax
and transfer systems. Tax evasion, which results
from shadow economic activities (undeclared
work) and underreporting of income in tax returns,
undermines the revenue-raising and redistributive
(111) The European Commission is in the process of updating
this study because of possibly significant changes in VAT
compliance.
objectives of the tax system. It leads to unintended
redistribution from those who do respect the rules
to those who do not. Moreover, it creates unfair
competition between formal and informal actors.
Finally, it further weakens tax morale and can lead
to more evasion. This is a risk at a time when tax
increases are necessary to meet severe
consolidation challenges. Reducing tax evasion
and improving tax compliance is, therefore, of
particular importance at this juncture and, as
discussed in Chapter 3, several Member States are
seeking to step up efforts to improve tax
collection.
In the conventional view of economic models of
taxpayer behaviour, taxpayers comply with tax
laws if the expected value of the penalty where
evasion is detected exceeds the tax to be paid.
However, a host of other factors such as social
values, public morality, and people’s perception of
the efficiency of the public sector and the fairness
of the tax system also matter in shaping attitudes to
tax laws. (112
)
The goal for revenue authorities is to collect the
full amount of taxes and duties payable in
accordance with the law. Tax authorities should
aim at reducing the tax compliance gap while at
the same time minimising the administrative costs
of collecting taxes for the government (collection
costs) and of paying taxes for taxpayers, i.e.
businesses and individuals (compliance costs).
Tax authorities apply policies to facilitate and
stimulate ‘voluntary’ compliance, to prevent and
deter evasion, to detect and combat tax fraud, to
enforce compliance, as well as to collect
effectively taxes which are due and in arrears.
These policies are interlinked: facilitating
voluntary compliance decreases the need for
enforcement, while an effective enforcement
policy will contribute to more voluntary
compliance. In general, policies aimed at
enhancing voluntary compliance will have a
positive impact on administrative burdens, while
the opposite might be the case for enforcement
policies. However, a tax administration policy
needs to include both. The challenge is to strike a
proper balance between these two elements. This
(112) See e.g. Dell'Anno (2009) and Slemrod (2007).
Country 2000 2002 2004 2006
BE 10 13 12 11
DE 12 13 14 10
EE 12 15 21 8
IE 5 3 4 2
EL 24 20 29 30
ES 9 12 8 2
FR 5 7 7 7
IT 22 24 27 22
CY --- --- --- ---
LU 12 5 2 1
MT 17 4 14 11
NL 7 9 6 3
AT 13 10 13 14
PT 5 7 8 4
SI 16 13 8 4
SK 27 27 24 28
FI 2 4 5 5
CZ 15 16 13 18
DK 9 8 7 4
LV 31 32 31 22
LT 15 18 28 22
HU 15 25 24 23
PL 22 20 19 7
SE 6 4 4 3
UK 16 17 15 17
EU-25 12 14 14 11
EA-17 12 13 13 10
LAF plus 10 11 11 8
LAF minus 15 16 16 14
European Commission
Tax reforms in EU Member States
74
section extends the analysis of tax governance
contained in last year's report. (113
)
5.3.1. Tax compliance issues: Reviewing
available indicators
The size of the shadow economy gives an initial
idea of the extent of tax non-compliance.
According to Dell’Anno (2003), the shadow
economy includes those economic activities and
the income derived thereof that circumvent or
avoid government regulation or taxation. The
avoidance of tax and social security contribution
(SSC) payments, but also the avoidance of labour
protection legislation and consumer rights
protection laws can contribute to a large share of
the shadow economy in official GDP.
By definition, the size of the shadow economy is
difficult to ascertain. Reflecting these difficulties,
different studies, which apply different methods,
come to rather different results for some Member
States. (114
) One of these approaches, applied by
Schneider (2012), uses the Multiple Indicators
Multiple Causes (MIMIC) model which examines
the relationship between the unobserved shadow
economy and a set of observable variables.
Although the methodology faces strong criticism
and should not be taken as producing uncontested
values, the results have the advantage of coming
from the consistent application of a methodology
across Member States and time, allowing for a
basis for comparisons between countries and
identifying trends in the phenomenon. (115
)
However, the available results only provide an
indication of the extent of the problem and the
development over time, so that the levels should
(113) It is also partly based on Jensen and Wöhlbier (2012). See
also Gayer and Mourre (2012).
(114) Available methods include direct approaches (based on audits and taxpayers' surveys), indirect approaches (using
the gap between declared income and income in national
accounts; the currency demand approach based on the relationship between the quantity and the velocity of
money; the estimated gap between official income and that estimated from an assumed relationship between income
and the observed consumption of specific goods and
services (e.g. energy); the rate of non-filing; and experiments using behavioural economics approaches. See
Alm (2012) for a survey.
(115) It is an indirect measure based on statistical relationships, notably the currency demand, which can partly capture
home production. It might not take country specific
characteristics and differences sufficiently into account as the parameters of the model are estimated jointly for a
large group of countries.
not be taken as an absolute measure of the
phenomenon. (116
)
According to Schneider (2012), shadow economic
activity varies considerably across Member States.
In 2012, Bulgaria is estimated to have the largest
shadow economy in the EU, followed by Romania,
Lithuania, and Estonia (see Table 5.14). According
to Schneider (2012), the size of the shadow
economy increased steadily between 2008 and
2010, but dropped again in 2011 and 2012.
Another important source is the European
Employment Observatory, which collected
national data in 2004 and 2007 for the share of
undeclared work. Depending on availability, these
figures are based on micro surveys, labour-force
survey studies, macro studies or other available
information. (117
) Hence, the reported national data
for undeclared work are not fully comparable
across countries but appear to complement usefully
the indicator scheme, given its methodological
drawbacks. In some cases, divergences between
the two indicators stress the need for cautious
assessment based on this set of indicators. The data
for undeclared work points to a great deal of
heterogeneity with estimates ranging from 2% to
30%. The estimated size of undeclared work is
usually significantly lower in the reported national
data than in the Schneider (2012) estimates for the
size of the shadow economy. For most Member
States, the difference between figures in Schneider
(2012) and national estimates amounts to around
6-8 percentage points. For Greece, Slovakia, Malta
and Hungary, the discrepancy is lower or even
absent, while national estimates are more than 10
percentage points lower for Cyprus, Estonia (in
both cases around 21 pp), Portugal, Lithuania,
Poland, Romania, Denmark and Italy. (118
)
(116) Arguably, they overestimate the true measure of the
shadow economy. (117) In micro surveys individuals are asked if they have
performed (or acquired) activities in the shadow economy during the previous year. One reason for the lower results
is that micro surveys usually apply a more narrow
definition of the shadow economy, focusing on households' supply of black labour, whereas the macro studies tend to
include also other types of tax evasion. Another possible
reason might be biased reporting. Nevertheless, it is likely that the size of the shadow economy is overestimated, at
least for some countries, in macro estimations like
Schneider (2012). (118) In the case of Cyprus, information included in the 2012
National Reform Programme points to a high level of

5. Tax policy challenges in EU Member States
75
Comparable micro surveys are only available for a
few Member States (see right-hand side column of
Table 5.14).
There seem to be some common characteristics in
the prevalence of undeclared work: it is most
prevalent among men, singles, people with short or
craft education as well as workers employed in the
construction sector and in the hospitality sector. It
is more common in sparsely populated areas.
In addition to the shadow economy, which is not
necessarily driven only by tax reasons but has a
large impact on tax revenues, a sizeable part of tax
evasion consists of underreporting in the formal
sector. The ability to misreport and the will to
exploit opportunities to do so – tax morale – seem
to be decisive explanatory variables for the size of
the shadow economy and the total amount of tax
evasion. (119
)
As discussed in Sub-section 5.2.3, Reckon (2009)
provides estimates for the VAT gap in 25 Member
States, which includes fraud, legal avoidance (120
)
and unpaid VAT liability due to insolvencies (see
Table 5.13). Although the exact amount involved
in VAT fraud is difficult to quantify, filing of false
returns and unauthorised deductions of VAT are
believed to be a key factor in explaining revenue
loss. For this reason, some Member States have
tightened their measures to combat VAT fraud, by
imposing new obligations on taxpayers in the
chain of production and distribution to submit
additional information to the tax authorities.
Member States are considered to have a particular
need and scope for improving tax compliance if:
(i) the size of the shadow economy as estimated by
Schneider (2012) is significantly above the EU-27
average and other national sources indicate that the
extend of undeclared work is above the EU-27
average, or, (ii) the VAT gap is significantly above
the EU-27 average. According to these criteria,
Belgium, Bulgaria, Greece, Hungary, Italy,
undeclared work and confirms the high figures in Schneider (2012).
(119) See, e.g., Robinson and Slemrod (2011) and Kleven et al.
(2011). (120) Although legal, tax avoidance involves the abusive
exploitation of ‘loopholes’ in national or international laws,
allowing companies to shift profits from one country to another with the intention of reducing the amount of taxes
they pay.
Lithuania, Malta, Poland, Portugal, Romania,
Slovenia and Spain as well as Cyprus (121
), face a
particular challenge in this area.
Table 5.14: Size of the shadow economy and undeclared work in
the EU Member States
Note: The size and development of the shadow economy is calculated
with the MIMIC estimation procedure. The currency demand approach
was used for Austria, Germany and Poland. Averages are GDP-
weighted. For undeclared work, national data is collected by European
Employment Observatory, Spring Review 2004 and 2007 (figures for
Belgium, Italy and Lithuania are based on the articles on undeclared
work from national SYSDEM correspondents).
Source: Schneider (2012), European Commission (2004, 2007) and
Pedersen (2003).
Various policy instruments can be used to increase
tax compliance. Box 5.4 provides an overview of
practical measures which are crucial for improving
tax compliance. The effectiveness of each measure
depends on the underlying cause of non-
compliance. Moreover, reform priorities differ
across Member States, reflecting differences in tax
systems, stages of development, administrative
capacity, and the extent and type of tax evasion.
Thus, reforms need to be tailored to each Member
State's circumstances. The relatively wider tax
compliance gaps and lower revenue productivity of
the less developed Member States generally
(121) Based on the national source referred to in footnote 118.
2005 2010 2012
BE 20.1 17.4 16.8 6-10
DE 15.4 13.9 13.3 7 4.1
EE 30.2 29.3 28.2 7-8
IE 14.8 13 12.7 NA
EL 27.6 25.4 25.0 25
ES 21.3 19.4 19.2 12
FR 13.8 11.3 10.8 4-6.5
IT 24.4 21.8 21.6 12
CY 28.1 26.2 25.6 4.2
LU 9.9 8.4 8.2 NA
MT 26.9 26 25.3 25
NL 12 10 9.5 2
AT 10.3 8.2 7.6 2
PT 21.2 19.2 19.4 5
SI 26 24.3 23.6 17
SK 17.6 16.4 15.5 13-15
FI 16.6 14 13.3 4.2
BG 34.4 32.6 31.9 22-30
CZ 18.5 16.7 16 9-10
DK 16.5 14 13.4 3 3.8
LV 29.5 27.3 26.1 18
LT 31.1 29.7 28.5 16-18
HU 24.5 23.3 22.5 15-20
PL 27.1 25.4 24.4 12-15
RO 32.2 29.8 29.1 16-21
SE 17.5 15 14.3 5 2.3
UK 12 10.7 10.1 2 1.2
EU-27 17.4 15.4 14.9 7.2
EA-17 17.6 15.5 15 8
LAF plus 15.1 13.4 12.8 5.3
LAF minus 19.1 17.4 16.8 9.1
Undeclared work
(share of GDP or
employment, 1995-
2006)
Micro survey,
Undeclared work
(working hours in
% of hours in
formal economy)
Country
Size of shadow economy
(in % of GDP)

European Commission
Tax reforms in EU Member States
76
(Continued on the next page)
Box 5.4: Selected measures to improve tax compliance and promote efficient tax
administration*
Developing a compliance strategy and targeting efforts against tax evasion
Developing an overall compliance strategy is critical for tax authorities’ ability to improve taxpayer compliance and
enhance revenue collection.(1) The purpose of a compliance strategy is to identify and respond to the most
significant risks in the tax collection system and achieve the widest possible impact on voluntary compliance.
Revenue agencies following this approach have moved away from administrative assessment systems, where all or
most tax returns are examined, to a system which relies on limiting standard taxpayers’ ability to evade and on
taxpayers' voluntary compliance with their obligations without the intervention of a tax official. Voluntary
compliance is encouraged through an appropriate balance of targeted audits, taxpayer education and assistance, to
help taxpayers and their advisors understand and fulfil their obligations and entitlements (see European
Commission, 2010c).
Taxpayers are more likely to comply if they perceive the likelihood of detection as high and see blatant non-
compliers being brought to account. The use of risk-management approaches improves compliance behaviour by
deterring non-compliance through targeting of audits. Segmenting taxpayers into four compliance categories
(compliant; attempt to comply but fail; general non-compliant; deliberate fraud) in the so-called compliance
pyramid can help tax authorities differentiate in their approach towards the taxpayer between service and control (or
even criminal investigation in the event of fraud). Moving beyond segmentation to determine whether a taxpayer
should generally be approached with service or control, the building up of databases with information on taxpayers’
income and assets can lead to better targeting of tax authorities' audits, through a system of flags for instance. Flag
systems use available data to pinpoint which tax returns of individuals and businesses can be expected to have the
largest deviations and which it would be most beneficial to examine more closely. The flag system could build on
data relating to sources of income, size of taxpayers’ reported changes to the preliminary assessment of income,
income levels, any mismatch between income and consumption levels, and perhaps socio-economic factors as
well.(2)
Third-Party Information
Third-party reporting of income is a crucial element in an efficient tax administration. It limits a normal taxpayer’s
possibilities of under-declaring income and makes tax evasion considerably more difficult. For example, it is
mandatory for employers to report the taxable wages of their employees directly to the revenue authorities together
with the payee details. The relevant fields on the tax return containing third-party information can then be locked, so
that the taxpayer cannot change the information. This is in contrast to self-declaring, where individual citizens are
responsible for reporting their incomes and deductions themselves. In a detailed study on Danish data, Kleven et al.
(2011) found a significant negative correlation between the share of an income type reported by third parties and the
proportion of tax evasion for the income type.
In most Member States, employers are obliged to report to the tax authorities the taxable wages and royalties they
pay their employees (including non-monetary wage components). Some Member States have extended the
obligation to conduct third-party reporting to financial institutions regarding each account holder's interest payments
(positive and negative), dividends and yields on bonds, as well as the purchase and selling prices of shares and
bonds. This means that large parts of the taxpayer’s capital income, including capital gains, can be calculated
automatically by the tax authorities. In some Member States, deductible expenses such as union fees and child-care
expenses are third-party reported directly to the tax authorities.
The better the coverage of third-party information, the more resources are freed up to be targeted, for example, at
revenue sources reliant on self-reporting and at combating the shadow economy.(3)
* This box is based on Jensen and Wöhlbier (2012). 1) Kleven et al. (2001) found that the presence of types of income difficult to detect (e.g. self-employed income and
other income not reported by a third party) is the most important factor in predicting evasion, whereas the
socio-economic characteristics of the individual have little explanatory power.
(2) See, e.g., Russell (2010). (3) It should, however, be kept in mind that in small companies with only a few employees, it could be relatively easy for
the employee and the employer to collaborate on under-declaring, and thus third-party reporting conducted by small
businesses should not be totally excluded from scrutiny.

5. Tax policy challenges in EU Member States
77
Box (continued)
Pre-filled tax returns
Pre-filling appears to be a successful formula for improving the efficiency of tax collection for personal income tax.
Pre-populated tax returns have become a significant component of e-government strategies by revenue bodies in
many countries. While not removing the possibility of under-declaration, pre-filled tax returns with third-party
information have a significant impact on tax compliance and make it easier for the taxpayer to comply and pay
taxes.
In pre-filling, revenue bodies use information already held by them (e.g. taxpayer identity information, elements of
taxpayer history, and third-party reports of income and deductions) to populate fields within tax returns that are
made available to taxpayers for their examination. In its most advanced form, tax return preparation has been fully
automated for the vast majority of the taxpayer population. In the Nordic countries, at the end of the year tax
administrations generate a fully completed personal income tax return in electronic and/or paper form for the vast
majority of taxpayers required to file tax returns. The remaining share of taxpayers receives a partly pre-filled tax
return (see OECD, 2011).
When taxpayers receive the pre-filled return, they have the option of making adjustments and submitting a new
return. Taxpayers’ access for adjusting the final tax return should be limited technically to those types of income
and deductions for which the tax authorities do not possess hard and reliable information from third parties.
Measures to contain the shadow economy
In most Member States, the shadow economy (undeclared work) accounts for the vast majority of tax evasion.
Increasing the probability that working in the shadow economy will be exposed, or increasing the penalties, reduces
the expected gains from shadow-economy activities and can have a deterrent effect. However, simply to increase
control measures could prove relatively costly in relation to the direct revenue gains. Unlike under-reporting of
income or over-reporting of tax deductions, it is difficult for tax authorities to detect undeclared work when auditing
annual tax returns, as it is not possible to obtain third-party reports on income from the shadow economy and the
activity is typically concealed both by the person performing the work and by the customer.
One potentially powerful option would be to criminalise the purchaser of undeclared work if the seller does not pay
the appropriate tax on the transaction, unless the purchaser pays by electronic means. Some studies have shown that
the buyer of undeclared work reaps a large part of the evaded taxes through a lower price.(4) Thus, there is currently
a lack of proportionality between buyers’ gain and their potential punishment.
In Italy it is illegal to purchase undeclared work. However, to avoid criminal liability it is sufficient for the buyer to
show a receipt for the work performed. In other Member States it is mandatory to keep invoices for work carried out
for some time (e.g. for two years in Germany). However, these systems create an administrative cost for the buyer,
who must keep track of receipts. It would be preferable to require the purchaser to pay by electronic means in order
to avoid criminal liability for purchases of undeclared services. This system has, e.g., been implemented in Norway
and is due to be implemented in Denmark.
A common measure in the fight against the shadow economy is the use of mandatory electronic payments for
purchases over a certain threshold, as they leave a trace. The obligation to pay for purchases over a certain amount
by electronic means exists, e.g., in Italy (€ 1 000) and Greece (€ 1 500).
A related measure to detect tax evaders is to exploit data relating to an individual's electronic transactions and
compare them with that individual's declared income. If a person has a low reported income and at the same time a
high level of private consumption, it could be an indication that the taxpayer requires a closer audit. Italy pursues
this strategy fairly systematically with the so-called ‘income meter’. Denmark and Sweden also exploit data on
electronic purchases for audits of taxpayers.
Introducing tax deductions for certain activities and sectors (such as the construction sector and household services)
with a high prevalence of undeclared work, i.e. monetary incentives (‘carrot approach’), could be effective although
very costly. This approach, which is applied in Belgium, Denmark, France, Germany and Sweden for example,
tends to be very costly.(5) It involves a high deadweight loss and implies an undermining of the fairness of the tax
system.
Tax morale is considered to be a key factor for tax compliance. Low tax morale can be contagious. If an individual
justifies his evasion by the fact that everyone else does it, existing tax evasion becomes a motive for further
cheating. Hence, it is important that governments protect and nurse the tax morale of the population. This can be
achieved by highlighting the risk of being detected. In combination with a high likelihood of detection, an active
communication strategy drawing attention to successful control measures and detection of evaders can prove a cost-
effective way of underpinning tax morale and increasing the perceived probability of being detected.
(4) See Danish Economic Council (2011).
(5) This, for example, concerns the titre service in Belgium, the Servicefradraget in Denmark, mini-jobs and tax deductions for services close to home in Germany, and the RUT deduction in Sweden.

European Commission
Tax reforms in EU Member States
78
suggest potential for bigger revenue increases
based on initiatives to improve compliance. For
these countries, taxpayer service operations and
effective audit and enforcement should be the first
step.
5.3.2. Quality of tax administration
In the area of tax governance, an important
question is the cost of tax collection for the
administration. According to OECD (2011a), the
average costs of tax collection in the EU-27
amounted to € 1.1 per 100 units of revenue (see
Graph 5.3). No clear trend is discernible for the
period 2005-2009. (122
) In 2009, Poland, the Czech
Republic, Portugal, Belgium, Bulgaria and France
faced a challenge in the high costs of tax
collection. Slovakia's costs were high in 2007, the
latest year for which data are available.
In general, it is difficult to construct indicators that
give an exhaustive description of the quality of tax
administration. However, comparative data do
exist for a few specific areas which are of
particular relevance for efficient tax
administration: i) number of employees and local
branches per capita; ii) use of third-party
information to obtain information on taxpayers'
taxable activities; and iii) the use of pre-filling of
tax returns.
Graph 5.3: Administrative cost per net revenue collection (costs
per 100 units of revenue, 2009)
Note: No data available for Greece. Data for Slovakia refers to 2007.
Data for Cyprus is currently under revision following a request by the
Cypriot authorities for the year 2009 and over.
Source: OECD (2011a).
(122) The trend in the ‘cost of collection’ ratio is influenced by a
series of factors: (i) changes in tax rates over time; (ii)
macro-economic changes; (iii) abnormal expenditure by
tax administrations; and (iv) changes in the scope of taxes. Thus, its value as an indicator of effectiveness is rather
limited.
Size and organisation of tax administrations
The size and organisation of tax administrations
vary considerably between Member States. Some
of these disparities can be attributed to different
ways of organising the administration of SSC,
customs and excises which may or may not be part
of the tax agency. Setting up an integrated tax and
SSC collection agency could improve efficiency
and effectiveness, and reduce the compliance
burden for businesses. (123
) First of all, the
differences concern the total staffing of tax
authorities. This is rather low in Italy, Spain and
Estonia, while it is relatively high in the
Netherlands and Latvia. Although there are no
norms in terms of the ideal size of a tax
administration, the examples of Austria, Finland,
Sweden and the United Kingdom show that it
appears possible to run an efficient tax
administration with staff of slightly above 1 000
per 1 million inhabitants (see Graph 5.4).
Graph 5.4: Size of tax administrations (total staffing) and
number of local branches
Note: Averages are unweighted.
Source: OECD (2011a).
To ensure cost efficiency and specialisation of
staff, field offices should not be too widely
dispersed geographically. In smaller Member
States, local tax centres might not contain the
whole range of functions. Some specialised
functions such as corporate income tax, large
corporations or frontier taxpayers (taxpayers who
derive income in one Member State but reside in
another), may be concentrated at one physical
address.
The number of local and regional tax offices or
branches varies considerably between Member
(123) See Kidd (2010).
0.0
0.5
1.0
1.5
2.0
2.5
0.0
0.5
1.0
1.5
2.0
2.5
SK PL CZ PT BE BG FR IT HU LT LV UK LU NL IE ES SI FI AT DE RO DK MT EE SE EA EU
LAF minus
LAF plus
50.8 132.1
0
10
20
30
40
0
500
1000
1500
2000
IT ES EE AT MT PT BG FI SK CY SE FR LT UK RO SI DE IE BE DK CZ HU PL NL LV EU27
EA17
Total staffing per 1m inhabitants (left axis) Regional and local offices per 1m inhabitants (right axis)

5. Tax policy challenges in EU Member States
79
States: from 35 in the United Kingdom to 3,271 in
France (124
) and 1,421 in Belgium. At a time when
information technology is playing an ever
increasing role in connecting taxpayers and
administrations, a relatively small number of local
tax offices (less than 10 per 1 million inhabitants),
could support professional competency, ensure
quality of service and improve administrative cost
effectiveness. (125
)
Third-party information and easy tax reporting
An overview of the use of third party information
in the EU by the Fiscalis Risk Management
Platform (European Commission, 2012e), shows
that third-party information regarding individual
income is widely used (see Table 5.15). According
to this source, ten Member States (Belgium,
Denmark, Finland, Lithuania, Malta, Netherlands,
Portugal, Romania, Spain and Sweden) use the
information to pre-fill tax returns. Other sources
(124) The two main fiscal administrations in France were merged
in 2008. The process should end in 2012 and aims at a
reducing administrative costs.
(125) There is no doubt that political factors and aspects such as the federalist structure of a country have an impact on the
organisation of tax administrations.
show that additional countries including France
use pre-filling. (126
) Pre-filling appears to be a
successful formula for improving the efficiency of
tax collection for personal income tax. Pre-filled
tax returns containing third-party information
make it easy for taxpayers to comply and pay
taxes. At the same time, pre-filling more or less
eliminates taxpayers' ability to misreport and
evade taxes if the third-party reported fields on the
tax return are locked for editing. Many Member
States also make use of third party information for
audit or control and for assessment, while the
majority of countries use the information for risk
analysis. Third-party information is also an
important source for debt collection.
It should be as easy as possible for taxpayers to fill
in and file their tax returns, even if they are not
pre-filled. While in some cases complicated tax
rules cannot be avoided, appropriate IT solutions
should simplify the filling-in process. As shown in
(126) According to the OECD, substantial use of pre-filling to
complete tax returns (fully or partly) for a significant share
of taxpayers takes place in Belgium, Denmark, Estonia, Finland, France, Lithuania, the Netherlands, Portugal,
Slovenia, Spain and Sweden (see OECD, 2011a).
Table 5.15: Use of third party information in Member States
Note: 'P's for pre-filled returns are put in bold to emphasise the importance of this dimension. A missing 'P' for financial information in European
Commission (2012e) is added for Denmark.
Source: European Commission (2012e).
Interest payments DividendsSales and purchase of
financial assetsSuspicious transactions
BE P, A, R A, RDE NA NA NA NA NA NA
EE A, R R
IE R R A, R
EL A A
ES P, R P, R R
FR NA NA NA NA NA NA
IT A, R A, R A, R
CY A, R A, R
LU NA NA NA NA NA NA
MT P, R P, R P, R
NL P, R P, R P, R A R
AT R
PT P, R A
SI A, R A R
SK A, R A, R
FI P, A, R P, R P, R P, R
BG
CZ NA NA NA NA NA
DK P P P P P
LV R R R
LT P, R P, A A
HU A, R A, R A, R A, R
PL A, R A
RO P A A A
SE P P P P P, R
UK R R
Wages and salaries (reported
by employer, entity paying the
income)
Financial information (reported by financial institution and insurance companies)
P (Pre-filled Returns); A (Audit / Control); R (Risk Analysis)
RoyaltiesCountry

European Commission
Tax reforms in EU Member States
80
Graph 5.5, the use of electronic filing varies
widely across Member States. (127
)
Graph 5.5: Use of electronic filing for PIT, CIT and VAT, 2009
Note: No data is available for Slovakia, Czech Republic (for CIT and
VAT) and Cyprus (for CIT). 'Weighted use of e-filing' is calculated with
a weight of 50% of PIT and 25% of CIT and VAT respectively.
Source: OECD (2011a).
Costs of compliance
Compliance costs are an important variable often
associated with non-compliance. A widely used
indicator for measuring tax compliance costs for
small and medium-sized enterprises is the ‘paying
taxes’ indicator. (128
)
Graph 5.6: Administrative burden of tax systems for a medium-
sized company
Note: Total hours to comply across the EU include: corporate income
tax time, labour income tax time, and consumption tax time. Data for
Malta are not available.
Source: PwC et al. (2011).
In 2011 the Czech Republic and Bulgaria in
particular but also ten other Member States
(127) Several Member States have implemented measures
recently to increase the share of electronic filing. In Cyprus, for example, e-filing is compulsory for legal
persons in PIT and CIT who submit audited accounts in
since 2010. (128) It measures the time required to prepare, file and pay (or
withhold) corporate income tax, value added or sales tax
and labour taxes, including payroll taxes and SSC for a case study company. The indicator is calculated annually
by PwC, the World Bank and IFC; see PwC et al. (2011).
showed high tax compliance costs (above LAF
high, see Graph 5.6). Overall, however,
compliance costs have trended downwards in the
EU recently (2005 average: 212 hours, 2011: 189
hours).
Overall results for quality of tax administration
When assessing whether Member States are
considered to have a particular need and scope for
improving the administrative system, the following
four criteria are applied: (i) administrative costs
per net revenue collection is significantly above
the EU-27 average; (ii) the administrative burden
of tax systems for mid-sized companies are
significantly above the EU average; (iii) third party
information is not used for pre-filling tax returns;
and (iv) the extend of e-filing is significantly
below the EU average. Table 5.16 presents an
overview of these four indicators. Member States
that fulfil either the first two criteria or three of the
four criteria are considered to face a particular
challenge to review their tax administration. This
applies to Bulgaria, the Czech Republic, Greece,
Portugal, Poland and Slovakia.
Table 5.16: Overview table of tax administration challenges
Note: An ‘X’ in columns four and five indicate that third party
information and e-filing, respectively, are not used in the Member State.
Source: Commission services.
5.4. SPECIFIC ISSUES
This section addresses three specific issues in more
detail: housing taxation, environmental taxation
and redistributive aspects of taxation. Whereas the
discussion in the first two sub-sections is an
0
10
20
30
40
50
60
70
80
90
100
0
10
20
30
40
50
60
70
80
90
100
AT BE CZ DK EE FI FR DE EL HU IE IT LU NL PL PT SK SI ES SE UK BG CY LV LT MT RO EA17
EU27
Personal income tax Corporate profits/income tax Value added tax Weighted use of e-filling
LAF plus
LAF minus
0
100
200
300
400
500
600
0
100
200
300
400
500
600
CZ BG PL LV IT HU PT SI SK EL RO DE ES LT AT BE CY DK FR NL SE UK FI EE IE LU EU27
EA17
LAF minus
LAF plus
CountryCost of revenue
collection
Cost of paying
taxes
Use of third
party
information
Use of e-fillingOverall
Challenge
BE X
DE X NA X
EE X
IE X
EL NA X X X X
ES
FR X NA
IT X XCY NA X XLU X XMT NA XNLAT X
PT X X X
SI X X
SK X X X X X
FI X
BG X X X X X
CZ X X NA X X
DK
LV X X
LT
HU X X
PL X X X X X
RO X X
SE
UK X

5. Tax policy challenges in EU Member States
81
extension of the analysis in last year's report, the
discussion of the redistributive aspects of taxation
is an innovation which has been included in this
report because of its increasing importance in
policy discussions.
5.4.1. Housing taxation
Various studies have shown that property taxes,
and in particular recurrent taxes on immovable
property, are among the taxes least detrimental to
growth. Taxes on immovable property or housing
take various forms and include both recurrent and
transaction taxes. (129
) Moreover, taxes on capital
gains also affect investment decisions in residential
housing. As these taxes affect incentives to invest,
rent and build residential housing, the design and
structure of housing taxes matters for the overall
functioning of the economy. (130
)
Transaction vs recurrent taxes on housing
Transaction taxes tend to discourage transactions
that would allocate properties more efficiently.
The market will be thinner and the price discovery
process, which is already slow in the housing
market, could be hampered. These taxes would
also have a negative impact on labour mobility
given the high transaction costs incurred by
changing property. Theoretically, it is always
possible to replace a transaction tax with a
recurrent tax, which would entail less distortion on
the housing market. (131
) Moreover, revenues from
transaction taxes are often very volatile as revenue
development in the crisis has recently shown, with
tax windfalls in housing market booms and tax
shortfalls in busts.
On the positive side, a tax on real property
transactions could theoretically deter speculation
and thus possibly help reduce the risk of housing
market bubbles. However, this relationship
(129) European Commission (2010c) provides an overview of the
literature on this topic. The analysis here is limited to
residential property because commercial buildings, along with other physical capital used as an input in the
production process, should ideally not be taxed due to
efficiency considerations. (130) This section draws on last year's report. A more elaborate
analysis is available in Johannesson Linden and Gayer
(2012). See also Gayer and Mourre (2012). For a discussion of other structural features of the housing
market, e.g. regulations that are important for the stability
of market itself and of the broader economy, see European Commission (2011g).
(131) See, e.g., Johansson et al. (2008).
remains empirically ambiguous. It could also
prove to be politically difficult to use the
transaction tax as a timely policy response to
mitigate price increases in the housing market.
Moreover, other policies are available that can deal
more effectively with housing market bubbles. (132
)
Current systems for taxing immovable property
that rely heavily on transaction taxes provide scope
for improving tax design. A shift from taxes on
transactions to recurrent taxes on real estate would
reduce the distortions introduced by taxation and
improve economic efficiency. The latter is
warranted by the fact that this type of tax has a
limited negative impact on the overall allocation of
resources in the economy compared to other
sources of revenue.
Property taxes generally play a relatively small
role in the EU Member States in terms of revenue
(1.4% of GDP), and around a third of that refers to
taxes on transactions (0.5% of GDP). (133
)
Variations between Member States are significant,
and transaction tax revenues were estimated to be
close or higher than 1% of GDP in Belgium,
Spain, France, Italy, Luxembourg and Malta in
2010. However, these data include revenue from
other capital and financial transactions. (134
) The
tax rates applied also provide an indication of the
importance and the distortive impact of the tax.
Belgium, Italy and Greece apply a tax on real
estate transactions at a rate above or equal to 10 %
(see Table 5.17), even if reductions and
exemptions apply in some cases (e.g. for first-time
buyers).
Table 5.17: Tax rates on real estate transactions in EU Member
States, 2012
Note: * indicates a progressive or multiple rate structure; no rate
indicated for Romania; the top rate in the UK of 7% applies to properties
above GBP 2million. In Italy some rates are levied on cadastral values
rather than transaction values.
Source: Commission services.
(132) Crowe et al. (2011). (133) For country data, see Graph 5.7.
(134) No further disaggregation of data is currently available.
Tax level Member State
≥10% BE, EL*, IT*
5-8% FR, ES, LU, CY*, PT*, UK*
<5% AT, DE, IE, MT, NL, SI, FI, CZ, DK, LV, SE, HU*
None EE, SK, BG, LT, PL

European Commission
Tax reforms in EU Member States
82
A second set of countries (Portugal (135
), Spain,
Luxembourg, France and Cyprus (136
)) currently
apply rates in the 5-8 % range, while nearly half of
the Member States apply tax rates below or at 5 %
on real estate transactions. Ireland reduced its
stamp duty to 1-2% (from 7-9%) in 2011, while
the Netherlands first temporarily and then
permanently reduced the real estate transaction tax
from 6% to 2% as from July 2011. Moreover,
Cyprus has suspended the application of the tax on
real estate transactions until the end of 2012.
Several Member States do not levy taxes on real
estate transactions. A gradual shift from a tax on
real estate transactions to a recurrent tax on real
estate could potentially improve the functioning of
the housing market in Belgium, Italy and Greece,
but also in Spain, Luxembourg, France, Cyprus,
and Portugal. (137
)
The design of recurrent taxes on housing
Several approaches to designing taxes on
residential property have been discussed in the
literature and are applied in different countries.
One difficulty lies in the fact that ownership of a
house involves both a consumption decision and
an investment decision, which potentially has an
impact on the design of the tax. In most cases, the
taxation of immovable property is related to the
capital taxation rules. Alternative approaches are
to consider the real estate tax as a tax on the
consumption of housing services or as a payment
for local public services.
Capital-based housing taxation
An ideal tax system aims at neutrality, which
implies that returns from residential property
should be taxed as other capital income.
Accordingly, the return from the house, less
depreciation allowances and interest payments (i.e.
(135) In Portugal the transaction for first residences ranges from
0% to 8%.
(136) The rate in Cyprus varies between 4 and 8 %, with lower rates and reduced valuations for transactions within the
extended family.
(137) Under the financial assistance programmes, Greece has committed to updating property values and raising more
revenue, while Portugal has committed to rebalancing
property taxation towards recurrent real estate taxes and away from the transaction tax while protecting vulnerable
households. Moreover, incentives to rent and own should
be equalised by removing mortgage interest deductibility. Italy recently increased recurrent taxes on real estate with
the introduction of the so-called IMU.
the net return), should be subject to personal
income tax or capital income tax at the personal
level. (138
) In the case of owner-occupied housing,
this principle of neutrality translates into taxing an
imputed return, while at the same time allowing
for mortgage interest deductibility and
depreciation. Consistent with the treatment of
other financial assets, capital gains from housing
transactions should also be taxed in order to
achieve neutrality vis-à-vis other assets. (139
) A tax
on imputed rental income could be approximated
through a recurrent annual tax on the
property. (140
) In both cases, it is important that the
value of the tax base is regularly updated.
A tax on imputed rents and/or a recurrent property
tax are essential to balance the tax subsidy
provided through interest rate deductibility. The
tax is needed to achieve a neutral tax treatment of
various investment possibilities. If interest
deductibility is provided to house-owners while
imputed rental income is either (i) not taxed or
taxed too low or (ii) approximated with recurrent
property tax which is too low, a tax subsidy is
provided which favours investments in owner-
occupied housing and household indebtedness
through mortgage loans. A neutral tax treatment
will depend on the taxation of other financial
investment, which implies that a recurrent property
tax or a tax on imputed rents can be motivated by
the taxation of other financial returns/returns on
savings. (141
)
Favourable tax treatment of home ownership is
based on the assumption that it generates positive
externalities for society (e.g. in the form of better
social outcomes for the children of homeowners
and more commitment to the local community).
However, there are several drawbacks of such tax
subsidies to home ownership and of interest rate
deductibility. Home ownership tends to reduce
labour mobility. (142
) There is a risk that interest
(138) In a comprehensive income tax system, it would be taxed
as part of the (progressive) personal income tax, while in a
dual-income tax system the tax rate on capital income at
the personal level would apply. (139) OECD (2010c).
(140) A tax on imputed income is a direct tax levied on the
income. A recurrent property tax is generally classified as an indirect tax as the tax burden is typically independent of
the taxpayer’s income situation.
(141) See, e.g., Keen et al. (2010) and Andrews et al. (2011). (142) See Andrews and Caldera Sanchez (2011) for an overview
of the benefits and costs of homeownership (box 1).

5. Tax policy challenges in EU Member States
83
deductibility encourage households to invest too
much in housing in relation to other assets, which
could contribute to higher private-sector debt and
an over-allocation of capital to the housing
sector. (143
) Empirical studies also indicate that
reduced interest costs are capitalised into higher
house prices, implying that the policy does not
achieve its aim of lowering costs for
homebuyers. (144
) Tax subsidies for mortgage
interest payments have also been found to be
correlated with price volatility on the housing
market. (145
)
In this context, a second-best design of the taxation
of owner-occupied housing could be: (i) not to
allow mortgage interest deductibility and (ii) to
levy a (lower) recurrent tax on real estate
properties. In this way, housing investments would
be taxed in line with other capital assets and the
tax system would not favour debt. In order to relate
the tax to the return from the house, it is important
for the tax base to be closely linked to properly
updated market values. Moreover, the tax level
should broadly take account of the tax treatment of
interests (i.e. the absence of mortgage interest
deductibility in relation to other assets) and capital
gains (possibly favourable). (146
)
Consumption-based housing taxation
One way to tax the consumption of housing
services is to levy VAT on the first sale of all new
houses. The tax would then be regarded as a levy
on the present value of the stream of services that
the house will generate in the future. (147
) This
would be in line with the treatment of other
durable goods, e.g. cars or refrigerators.
(143) European Commission (2010d).
(144) Capozza et al. (1996), Harris (2010) and Agell et al.
(1995). Moreover, recent results indicate that demand shocks (e.g. through financial deregulation) have a greater
likelihood of being capitalised into real house prices when
the country provides interest deductibility. (Andrews 2010).
(145) Van den Noord (2005), Andrews (2010). (146) To ensure neutral tax treatment vis-à-vis other assets,
capital gains from housing transactions should be taxed as
other capital gains are. In practice, many countries reduce, exempt or defer the tax on the capital gains made on the
primary residence. Capital gains tax on housing
transactions generally suffers from the same set of drawbacks as a transaction tax, i.e. it creates lock-in effects
and risks reducing labour mobility.
(147) It would also imply that subsequent sales should not be taxed, nor should the yearly consumption service, as the
first application of VAT covers all future services.
An alternative approach to taxing housing services
would be to tax the consumption value of the
housing service, i.e. imputed rents, every year with
VAT, in the same way as for other services. A
practical problem in this context is the difficulty of
properly and fairly estimating the housing service
for owner-occupied housing. Thus, most countries
do not apply this approach, and with a view to
achieving equal treatment, do not levy VAT on
rental payments either. (148
)
In line with the tax treatment of other durable
goods, the financial return of a house should
normally not be taxed with a consumption-based
approach, as the VAT is levied on the rent (i.e. the
service provided). To achieve consistency between
the tax treatment of the consumption and
investment aspects of housing, Mirrlees et al.
(2011) propose levying a tax on housing services
as a substitute for VAT, which ideally could be
combined with a capital tax on above normal
returns on owner-occupied and rental housing.
At present, most Member States apply VAT on
some housing-related consumption, namely the
construction, alteration and maintenance of
immovable property. Moreover, several Member
States levy reduced rates on renovation and repair
works of private dwellings. The rental of
residential properties is normally exempt or zero-
rated. VAT is levied on the sale of new buildings
in about 2/3 of the Member States and exempted in
the others, while construction work on new
buildings is normally covered by VAT. This
implies that VAT is generally levied on the
construction of a residential property, but not
always on the final sale of it (European
Commission, 2012f and OECD, 2010c).
A charge for local service
Property taxation has also been regarded as a
payment for the local provision of public service,
i.e. as a user charge. Tiebout (1956) and Hamilton
(1976) model local government in order to analyse
(148) In the case of the UK, the Mirrlees review proposes a
Housing Service Tax to approximate a VAT on housing
services. It reflects the fact that the UK applies a zero
VAT-rate on the construction and sale of residential property, and the difficulties of covering both new and old
houses. The proposal is a tax on the flow of housing
service consumed, which is based on the rental value of each property, both owner-occupied and rented. (Mirrlees
et al., 2011)

European Commission
Tax reforms in EU Member States
84
the conditions which ensure efficiency of resource
allocation in the local public sector. In this field of
work, a property tax is regarded as a payment in
exchange for benefits of local public service, and
thus is considered to be non-distortive. Moreover,
it should not affect capital intensity or aggregate
land or property values as the tax only reflects the
level of local public service. However, most
empirical work indicates that local property taxes
should rather be regarded as a capital (or
consumption) tax which does have an impact on
house prices and the allocation of housing
investments. (149
) In terms of their practical
implementation, recurrent taxes on immovable
property are usually levied at the municipal level
to finance the local community. In many cases
central government sets specific bands in order to
limit municipalities' discretion in determining the
tax rates.
Increasing tax revenue on housing: revaluation of
the tax base and increasing rates
As the available data indicate, reliance on recurrent
property taxes varies considerably between
Member States. Recurrent taxes on immovable
property range from nearly 3.4 % of GDP to nil
(there is no recurrent property tax in Malta) with
an average of 0.9% of GDP (see Graph 5.7). In
some cases very low shares can partly be explained
by the taxation of imputed rents, whose proceeds
fall within the personal income tax and are
therefore not included in the data. Generally
revenues from recurrent real estate taxes should
first be increased by bringing the tax base in line
with the market value of the property. This is
important if the tax is to function properly, that is
to reflect the return on the investment or the rental
value. The rents charged for the housing will
reflect the value of the property in well-
functioning markets. Hence, the quality of the
service received will depend on the building's
location and its condition, which will be reflected
in its value. If the tax is part of an overall tax on
capital, it should be levied on the market value of
the house in order to tax correctly the various types
of assets and not distort the allocation of capital.
Rising house prices result in higher tax liabilities if
the tax base properly reflects the market valuation.
In a rising market, this tends to result in political
(149) See Zodrow (2007) for an overview.
pressures to freeze the valuation (or reduce tax
rates). Once the tax base is frozen, however, it
becomes politically very difficult to update the tax
base as reflected by the actual practice across the
EU. Any property revaluation creates losers and
winners, with losers often being very vocal. (150
)
As market prices diverge from the valuation used
for taxation purpose, both the economic
implications and the political difficulties of a
revaluation grow. As failures to increase the tax
base support rising prices, it is important to
maintain a regular revaluation of the cadastral
values used as the tax base. Failure to update
regularly risks leading to erosion of the tax base
and of revenues over time.
Graph 5.7: Revenues from property taxes, 2010 (in % of GDP)
Note: Ordered by revenues from recurrent property taxes. ‘Other taxes
on property’ includes taxes on net wealth, inheritance, gifts and other
property items as well as financial and capital transactions. Data does
not include PIT on imputed rents. * Data for Greece is provisional.
Source: Commission services.
Many Member States have not updated property
values for many years. Examples include Austria,
which applies cadastral values from 1973, Cyprus
(1980), and the UK (1991). (151
) Belgium (values
from 1975) and Germany (generally from 1964)
update cadastral values with inflation or a
corrective factor respectively, but do not link them
to house-price developments. A few Member
States show examples of good practice and
undertake regular updates. The Netherlands does
so annually, Denmark biannually and Sweden
every third year. According to the information
available, at least ten Member States (Belgium,
Germany, Estonia, Greece, Spain, France, Italy,
Cyprus, Luxembourg, and Austria) apply out-dated
property values. A few Member States (e.g.
Greece, Portugal and Italy) are currently
reassessing real estate values with a view to
(150) See Mirrlees et al. (2011)
(151) Cadastral values in Wales refer to 2003.
0.0
0.5
1.0
1.5
2.0
2.5
3.0
3.5
4.0
4.5
UK FR DK BE PL ES IE SE LV RO FI CY PT IT NL SI DE SK LT EE HU BG EL* CZ AT LU MT EU EA
Recurrent property tax Rest
LAF plus
LAF minus

5. Tax policy challenges in EU Member States
85
bringing them into line with market values and
some others (e.g. Germany) are considering doing
so. (152
) However, Denmark and Sweden, which
regularly update cadastral values, do not use these
updated values as a general basis for the recurrent
property tax. (153
)
One alternative is simply to increase the tax rates
for the recurrent property tax. However, to adjust
the rate without updating the tax base implies that
the increased tax burden reflects the valuation of
properties at some specific time in the past.
Moreover, as the tax burden is not proportionate to
current house values, the tax increase could not
properly help to dampen the price increase by
increasing the costs of owning a house.
Measures addressing distributional aspects might
need to accompany housing taxation reforms to
facilitate their implementation. As property taxes
often accrue to the local level of government,
inter-governmental transfer systems might also
need to be adjusted accordingly.
Reducing the debt-bias in housing taxation
The tax deductibility of mortgage interest
payments (or even capital (re)payments) in many
Member States favours debt creation and leads to a
debt bias in the taxation of housing. Even if
account is taken of recurrent property taxes, the
taxation of housing appears debt-biased in many
Member States as recurrent tax rates or cadastral
values are low compared to proper taxation of the
rental return. This type of tax relief is considered
to have contributed to the increase in housing
prices, debt leverage and household over-
indebtedness. (154
)
An indicator that measures the wedge introduced
by tax relief (reflecting tax systems in 2010) is
presented in Andrews et al. (2011). These
empirical results indicate that the Dutch and Czech
tax rules are the most generous ones and the most
favourable to debt-financed housing investments
within the European Union. The systems in the
Nordic countries appear generous, but Belgium
(152) See Chapter 3 for countries that are currently carrying out
reassessments.
(153) In Sweden the cadastral value is used to calculate the tax burden for low-value properties.
(154) See Keen et al. (2010).
and Spain also provide a sizeable tax subsidy to
mortgage interest payments. (155
) This ranking is
based on an indicator that takes into account the
deductibility of mortgage interest payments
(including potential time limits or ceilings) and tax
credits for loans, but does not include taxation of
imputed rents or recurrent property taxes. The
indicator applies the value of zero to those
countries that do not subsidise mortgage interest
payments via a tax deduction.
Several Member States are in the process of
changing their rules on the tax deductibility of
mortgage interest payments, thereby reducing the
debt bias in the tax system. In 2011, France
stopped providing five years of tax deductibility of
mortgage interest rates. Ireland is in the process of
phasing out interest deductibility by 2017, while
Estonia has decided to reduce both the personal
income tax (as of 2015) and the ceiling for tax
deductibility (in 2012). Finland is reducing the
share of mortgage interest rate payments that are
deductible. The share is 85% in 2012 and will be
80% in 2013 and 75% in 2014. In line with the
Memorandum of Understanding, Portugal will
eliminate the deductibility of payments of principal
and interests for new mortgages in 2012 and will
be phasing out the deductibility of mortgage
interest payments for owner-occupied housing.
Following several reforms in the recent past, Spain
decided in July 2012 to eliminate the income tax
deduction for mortgage interest payments on house
purchases from 1 January 2013.
As Table 5.18 shows, around half of the Member
States’ tax systems continue to favour mortgage
debt financing of homeowners. In all, 12 Member
States (Belgium, Estonia, Greece, Spain, Italy,
Luxembourg, the Netherlands, Portugal, Finland,
the Czech Republic, Denmark and Sweden) face
the challenge of a debt-biased tax system
favouring housing investments, although to a
different degree. It is noteworthy that nine of these
countries were singled out in the context of the
macro-economic imbalance procedure as having a
private debt above 160% of GDP in 2010. (156
) As
mentioned above, Ireland, Portugal and Spain are
(155) Hemmelgarn et al. (2011) confirm the generosity of the
Dutch system when calculating an effective personal
income tax rate on housing covering eight EU Member States.
(156) European Commission (2012g).
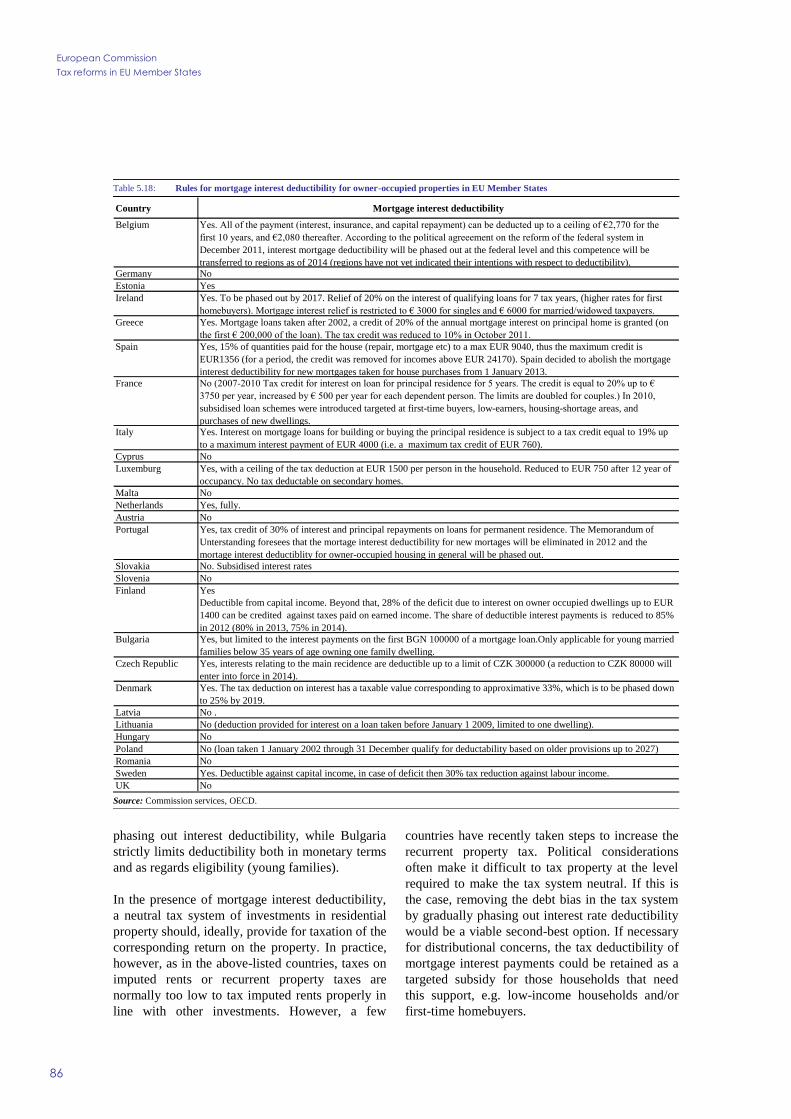
European Commission
Tax reforms in EU Member States
86
phasing out interest deductibility, while Bulgaria
strictly limits deductibility both in monetary terms
and as regards eligibility (young families).
In the presence of mortgage interest deductibility,
a neutral tax system of investments in residential
property should, ideally, provide for taxation of the
corresponding return on the property. In practice,
however, as in the above-listed countries, taxes on
imputed rents or recurrent property taxes are
normally too low to tax imputed rents properly in
line with other investments. However, a few
countries have recently taken steps to increase the
recurrent property tax. Political considerations
often make it difficult to tax property at the level
required to make the tax system neutral. If this is
the case, removing the debt bias in the tax system
by gradually phasing out interest rate deductibility
would be a viable second-best option. If necessary
for distributional concerns, the tax deductibility of
mortgage interest payments could be retained as a
targeted subsidy for those households that need
this support, e.g. low-income households and/or
first-time homebuyers.
Table 5.18: Rules for mortgage interest deductibility for owner-occupied properties in EU Member States
Source: Commission services, OECD.
Country Mortgage interest deductibility
Belgium Yes. All of the payment (interest, insurance, and capital repayment) can be deducted up to a ceiling of €2,770 for the
first 10 years, and €2,080 thereafter. According to the political agreeement on the reform of the federal system in
December 2011, interest mortgage deductibility will be phased out at the federal level and this competence will be
transferred to regions as of 2014 (regions have not yet indicated their intentions with respect to deductibility).Germany No
Estonia Yes
Ireland Yes. To be phased out by 2017. Relief of 20% on the interest of qualifying loans for 7 tax years, (higher rates for first
homebuyers). Mortgage interest relief is restricted to € 3000 for singles and € 6000 for married/widowed taxpayers.
Greece Yes. Mortgage loans taken after 2002, a credit of 20% of the annual mortgage interest on principal home is granted (on
the first € 200,000 of the loan). The tax credit was reduced to 10% in October 2011.
Spain Yes, 15% of quantities paid for the house (repair, mortgage etc) to a max EUR 9040, thus the maximum credit is
EUR1356 (for a period, the credit was removed for incomes above EUR 24170). Spain decided to abolish the mortgage
interest deductibility for new mortgages taken for house purchases from 1 January 2013.
France No (2007-2010 Tax credit for interest on loan for principal residence for 5 years. The credit is equal to 20% up to €
3750 per year, increased by € 500 per year for each dependent person. The limits are doubled for couples.) In 2010,
subsidised loan schemes were introduced targeted at first-time buyers, low-earners, housing-shortage areas, and
purchases of new dwellings.Italy Yes. Interest on mortgage loans for building or buying the principal residence is subject to a tax credit equal to 19% up
to a maximum interest payment of EUR 4000 (i.e. a maximum tax credit of EUR 760).
Cyprus No
Luxemburg Yes, with a ceiling of the tax deduction at EUR 1500 per person in the household. Reduced to EUR 750 after 12 year of
occupancy. No tax deductable on secondary homes.
Malta No
Netherlands Yes, fully.
Austria No
Portugal Yes, tax credit of 30% of interest and principal repayments on loans for permanent residence. The Memorandum of
Unterstanding foresees that the mortage interest deductibility for new mortages will be eliminated in 2012 and the
mortage interest deductiblity for owner-occupied housing in general will be phased out.
Slovakia No. Subsidised interest rates
Slovenia No
Finland Yes
Deductible from capital income. Beyond that, 28% of the deficit due to interest on owner occupied dwellings up to EUR
1400 can be credited against taxes paid on earned income. The share of deductible interest payments is reduced to 85%
in 2012 (80% in 2013, 75% in 2014).
Bulgaria Yes, but limited to the interest payments on the first BGN 100000 of a mortgage loan.Only applicable for young married
families below 35 years of age owning one family dwelling.
Czech Republic Yes, interests relating to the main recidence are deductible up to a limit of CZK 300000 (a reduction to CZK 80000 will
enter into force in 2014).
Denmark Yes. The tax deduction on interest has a taxable value corresponding to approximative 33%, which is to be phased down
to 25% by 2019.
Latvia No .
Lithuania No (deduction provided for interest on a loan taken before January 1 2009, limited to one dwelling).
Hungary No
Poland No (loan taken 1 January 2002 through 31 December qualify for deductability based on older provisions up to 2027)
Romania No
Sweden Yes. Deductible against capital income, in case of deficit then 30% tax reduction against labour income.
UK No

5. Tax policy challenges in EU Member States
87
5.4.2. Environmental taxation
Environmentally related taxes primarily serve an
environmental purpose, but also provide fiscal
revenue. Fiscal consolidation, which reduces the
scope for environmental policy measures on the
expenditure side of the budget, strengthens the
need to use taxes as well as other
market-based (157
) policy instruments in
environmental policy. A uniform tax, i.e. price on
emissions or other negative environmental
externalities, has the advantage of providing an
incentive to change behaviour as well as allocating
emission reduction efforts in a cost-efficient way.
Market-based instruments also provide incentives
for further technology developments which will
reduce the environmental impact.
In terms of environmental policy, there are several
tax-related challenges. First, it is important to
ensure that the policy instruments in place,
including taxes, other market-based instruments
and regulation (158
), are sufficient to meet the
agreed policy objectives. If there is a need for
further policy measures, environmental taxes (or
other market-based instruments) should play a role
in the policy mix to achieve cost-efficiency.
Secondly, energy taxes and other environmental
taxes should be designed in such a way that they
provide appropriate incentives to reduce emissions
over time and improve resource efficiency,
including through environmentally consistent tax
rates across various energy carriers and emissions
(e.g. across fuels). Finally, environmentally
harmful subsidies in the tax systems should be
phased out. (159
) Various measures, outlined below,
could be taken at national level to improve on
existing tax systems.
Fulfilment of the agreed limitation targets for
green-house gas emissions
Energy taxes, together with the EU Emission
Trading System (ETS), are two of the main
instruments in climate and energy policy. In this
(157) The importance of market-based instruments is underlined
in the Europe 2020 Strategy, which refers to the use of these policy instruments as well as the work to phase out
environmentally harmful subsidies as essential elements of
the climate and energy policy. (158) Which can be substitutes or complements.
(159) This concerns preferential tax treatment of specific sectors,
uses and goods. See e.g. the Inventory of Estimated Budgetary Support and Tax Expenditure for Fossil Fuels
(OECD (2011d)).
context, the Member States have undertaken to
reach legally binding national targets concerning
greenhouse gas emissions by 2020. (160
) The
overall EU-wide target is to reduce greenhouse gas
emissions by 20% as compared to 1990 levels,
which is equivalent to a 14% reduction in relation
to 2005 emission levels. (161
) National targets,
which cover emissions in the sectors outside the
ETS, range from limiting the increase in emissions
by 20% to implementing a 20% emission reduction
(vis-à-vis 2005 emission levels). According to the
latest projections, the EU-wide target is expected
to be reached in 2020. However, several Member
States will still need to adopt and effectively
implement additional policy measures to achieve
their individual targets for non-ETS emissions.
The level of ambition relating to these targets
varies considerably between Member States.
One sub-set of these countries is expected to
achieve their reduction targets provided they
implement those additional measures that have so
far only been planned. These countries include
Austria, Finland, Italy, Slovenia, Cyprus and
Denmark. For another sub-set of countries, the
measures that are planned but not yet implemented
are judged as insufficient. Projections regarding
greenhouse gas emissions indicate that
Luxembourg, Malta, Ireland, Lithuania, Belgium,
Greece, and Slovakia risk not to achieve their
targets in 2020 unless they implement new policy
measures. (162
) (163
)
All those countries that need to undertake further
policy measures to achieve the targeted emission
reduction should work primarily with market-
based measures, i.e. taxes, charges, or emission
quotas. Taxes have the advantage of providing
fiscal revenue while at the same time allowing for
a cost-efficient allocation of abatement efforts. All
those Member States should allow carbon and
(160) The national targets are defined in the Effort Sharing
Decision (406/2009/EC, 23.4.2009).
(161) This effort will be divided between the EU ETS and non-ETS sectors as follows: a 21% reduction in EU ETS sector
emissions by 2020 and a reduction of approximately 10%
for sectors that are not covered by the EU ETS. (162) COM(2011)624 final.
(163) Note that a few countries (i.e. France, Germany, Spain and
Sweden) have projected emission gaps close to 0% and have, therefore, not been included in this list. As the
emission gaps are based on projections, the future policy
might need to be reviewed to take account of changing conditions in order to ensure fulfilment of the emission
targets.

European Commission
Tax reforms in EU Member States
88
energy taxation to play an important role when
designing the policy mix to fulfil their
commitments according to the Effort Sharing
Decision.
However, the projected distance to 2020 emission
limitation targets per se is not specific and targeted
enough to assess the extent to which
environmental taxation reforms are needed. Even
Member States that are projected to meet their
targets easily should consider such reforms. The
role of environmental taxes in fiscal consolidation
policies and tax shifts to more growth friendly tax
structures is analysed in Section 5.1. The following
sub-sections consider the need to improve the
design of energy taxes and other environmental
taxes so that they do not contain any implicit
environmentally-harmful subsidies and provide
appropriate incentives to reduce emissions over
time and improve resource efficiency. (164
)
Structure of excise duty rates on fossil fuels
In the current fiscal context, and faced with the
serious challenge of climate change, it becomes
crucial to use energy taxes to their full extent in
climate and energy policy in order to minimise the
overall cost of the policy. However, the current
structures of excise duty rates in Member States do
not normally reflect the environmental and energy
properties of the various fuels. In fact, the current
structures implicitly promote fuels that are
relatively more detrimental to the environment
and/or are less energy-efficient. It is important that
the relative tax rates reflect the environmental and
energy properties of the fuels correctly. Proper
ranking of fuels could be achieved by a carbon or
an energy tax, or through a combination of the
two. (165
)
The Energy Tax Directive currently provides for
lower EU minimum levels of taxation (expressed
in € per 1000 litre) for diesel than for petrol. In fact
all Members States apply lower tax rates on diesel
(164) The need to achieve resource efficiency is captured by the
2020 renewable energy targets and the 2020 energy efficiency targets.
(165) A carbon tax would be based on the carbon content of the
fuel and would thereby rank the various fuels according to their carbon content. A neutral energy tax, in terms of
promoting energy efficiency equally across energy
products, would tax fuels according to their energy content. The Commission proposal to revise the Energy Tax
Directive (COM(2011) 169/3) addresses these issues.
given the higher energy and CO2 content of this
fuel. This results in preferential treatment
favouring the road transport sector. It reflects a
different tax treatment of fuels mainly used for
commercial versus private use, also partly
motivated by tax competition. As a result, the
market share of diesel cars has increased
substantially in the EU since 1995 to around 60%.
Tax rates determined according to carbon or
energy content would result in a higher tax rate per
volume on diesel than on petrol. A carbon tax on
motor fuels would imply a tax rate on diesel which
is around 15% higher than the tax on petrol in
terms of litres. A tax based on energy content
would only translate into a tax rate which is around
8% higher for diesel. A combination of these two
types of taxes would result in a relative rate
differential within this range of 9%-15%. In
contrast, Member States tend to promote strongly
the use of diesel through their relative tax rates
(see Graph 5.8). The EU average for the diesel vs
petrol tax ratio has increased slightly in 2012
compared to last year. Several Member States have
increased their tax on diesel more than their tax on
petrol, namely Belgium, Bulgaria, Denmark,
Hungary, Poland and Finland. In a few other cases
(Latvia and Slovenia) the ratio has fallen,
potentially pointing towards a larger tax subsidy to
diesel. Overall, substantial progress still needs to
be made and the preferential tax treatment of
diesel, particularly in Belgium, Germany, Greece,
France, Lithuania, Luxembourg, the Netherlands,
Portugal, Slovenia, Slovakia, and Finland, to be
reviewed. (166
) Some countries offset this
advantage for diesel by levying a higher annual
circulation tax. Such a tax adds to the overall cost
of owning the car. However, it has the drawback
that it does not impact on the marginal cost of
additional driving in the same way as a fuel tax
does. Consistent and neutral taxation of all
transport fuels is important with a view of
providing proper incentives for the development of
carbon- and energy efficient fuel technologies
without favouring specific fuels or technologies.
There are similar inconsistencies in the taxation of
fossil-based heating fuels in many Member States.
Normally, heating oil is taxed heavily, while rates
on natural gas and coal are relatively low. This rate
(166) Some of these countries are already taxing diesel at
relatively high rates in level terms.

5. Tax policy challenges in EU Member States
89
structure is based on the tradition of taxing oil
rather heavily, while coal and natural gas have
been brought into the energy tax framework more
recently at lower rates. Thus, coal – but also
natural gas – is normally given a tax advantage as
a heating fuel. The situation is rather complex as
conditions vary considerably between Member
States according to industrial structure and fuel
mix. The issue mainly concerns households and
businesses falling outside the scope of the ETS.
Several countries also exempt household
consumption of heating fuels. It is important to
ensure that energy tax rates become more
consistent across both fuels and uses, and that the
tax system does not unduly favour fossil-based
solutions. Consistent tax rates are also important in
order to provide correct framework incentives for
technology development.
Graph 5.8: Diesel/petrol ratio, 2012
Note: The ratio compares the excise duty rates per 1000 litres of fuel.
Source: Commission services.
Indexation of environmental taxes
Neither the current EU Energy Tax Directive nor
the majority of the Members States' current tax
frameworks require automatic indexation of
energy and other environmental taxes. (167
)
Indexing excise duty levels to inflation has two
advantages: (i) it helps maintain the real value of
taxes over time and thereby also prevent an erosion
of government tax revenues and - more
importantly for the functioning of the tax - (ii) it
helps maintain the impact of the tax on relative
prices and thereby on agents' behaviour. (168
) The
fact that revenue from environmental taxation fell
in relation to GDP in the 1999 – 2008 period is
(167) Indexation is relevant for all excise duties that are levied on
the quantity of the product (i.e. not ad valorem).
(168) Indexing EU minimum level excise rates could also help to
reduce (or at least maintain the current degree of) price divergence across Member States and hence the potential
for downward tax competition.
partly attributed to the fact that these excise duties
are normally not adjusted to changes in the general
price level. Only few Member States currently
apply indexation (e.g. Denmark, the Netherlands
and Sweden). It is noteworthy that Sweden
introduced indexation of major excise duties,
including the energy tax, in 1994 (169
) as part of
fiscal consolidation efforts. The introduction of
indexation of excise duties to core inflation in
2012 is included in the Memorandum of
Understanding for Portugal. (170
)
However, indexing environmental taxes does have
a few disadvantages that need to be taken into
consideration. The major drawback is that it can
potentially influence inflation expectations. Hence,
there is a risk of damaging feedbacks to inflation
and inflation expectations dynamics, in particular
if the indexation is endogenised by economic
agents. Nevertheless, this effect can be expected to
be rather limited as energy accounts for a relatively
low share of overall consumption (around 11% of
the Harmonised Index of Consumer Prices
(HICP)). Moreover, the adjustment should
preferably be based on an index of consumer
prices that excludes energy and unprocessed food.
Using this measure of core inflation (rather than
headline inflation (HICP)) diminishes volatility
stemming from energy and food prices, which are
not included in this core inflation measure. As
such, this would lead to a smoother adjustment
and, most importantly, it avoids a situation in
which the indexation of energy taxes feeds into the
same index which is used for the indexation. This
is an important aspect in relation to energy price
developments.
Indexation also entails some minor administrative
costs related to the decision mechanism and the
adjustment of tax rates. However, these costs are
no higher than the transaction costs incurred by a
discretionary increase of energy taxes. Such costs
could also be reduced by adjusting the frequency
of the indexation, e.g. by adjusting the rates every
second or third year and by setting a minimum
HICP change threshold for this indexation.
However, at the same time it is vital to maintain
regular adjustments in order to secure the real
value of the tax rate and of the revenue.
(169) Svensk Författningssamling (SFS) 1993:1508; 1512-1513.
(170) See European Commission (2012i).
0.0
0.2
0.4
0.6
0.8
1.0
UK EE HU CY BGRO PL CZ IT SE AT IE MT LV ES DK SI FI DE LU FR BE LT SK PT EL NL EU EA
LAF minus
LAF plus

European Commission
Tax reforms in EU Member States
90
Reduced VAT on energy
As discussed in Chapter 4 and Sub-section 5.2.2, a
broadening of the VAT base (i.e. removing
reduced rates, zero rates and exemptions) would
improve efficiency by reducing the distortions
generated by differential treatment while at the
same time generating more revenue. At present,
Member States have the possibility to levy lower
VAT rates on electricity and natural gas, as well as
district heating. However, these reduced rates
conflict with overall ambitions in energy and
climate policy and constitute environmentally
harmful subsidies. Moreover, targeted support can
be provided more efficiently to vulnerable
households through general welfare payments,
which would also avoid windfall gains for more
affluent households.
According to the European Commission (2012f),
at the beginning of 2012 Greece, France, Ireland,
Italy, Luxembourg, Malta and the UK were
reported to tax natural gas and electricity at a
reduced VAT rate. Moreover, Belgium, Ireland,
Luxembourg, Portugal and the UK apply reduced
VAT rates on fuel oil and/or solid fuels (European
Commission, 2011h). These Member States face a
challenge in phasing out these subsidies. However,
it should be acknowledged that since 2011,
Portugal has removed the reduced VAT rate on
electricity and natural gas (171
), while Latvia has
removed the reduced rate on natural gas for private
consumers.
Taxation of company cars
Company cars are defined as passenger light-duty
vehicles leased or owned by companies, but used
by their employees for business or personal travel.
Copenhagen Economics (2009) conclude that the
favourable taxation of company cars in many EU
Member States is distortionary and imposes
welfare costs on society. Tax treatment depends on
how the ownership and use of the car are taxed in
corporate taxation for the employer and in income
tax as a benefit for the employee. The rules tend to
encourage car ownership and affect the choice of
car model, as well as driving habits. Company car
schemes in particular mitigate and counteract
incentives to reduce fuel consumption provided
(171) In line with the Memorandum of Understanding, see
European Commission (2011h).
through energy and vehicle taxation. Moreover, tax
regimes often provide incentives to buy relatively
larger cars, which have a detrimental impact on the
environment through increased overall fuel
consumption. Roughly 50 per cent of all new cars
sold in the EU in 2008 were company cars, which
imply that these schemes have a large and long-
term impact on the overall composition of the car
fleet.
At present, the taxation regime for company cars
in most Member States promotes the use of such
cars beyond merits. According to Copenhagen
Economics (2009) private use of company cars has
been heavily subsidised in several Member States.
The subsidy (measured as the percentage gap in
the imputed tax base) is particularly large –
according to the LAF-criteria – in Belgium, the
Czech Republic, Germany, Greece, Hungary, Italy,
Portugal and Slovakia. Against this background, r
these countries in particular should consider
reviewing the tax treatment of company cars. (172
)
It would be beneficial to reduce these subsidies
and thereby favour the deployment of cleaner
vehicles. Belgium is reviewing its company car
regime with a view to reducing the incentive to
choose large cars, while Hungary and Portugal
have increased the tax on company cars.
Vehicle taxation
Transport taxes are an important category of
environmentally-related taxes in the EU,
accounting on average for 0.5% of GDP and 21%
of environmental tax revenues. The two main
forms of transport taxes are registration taxes
levied on acquisition of the car and circulation
taxes levied annually on car ownership.
Today the transport sector accounts for close to
one quarter of all the CO2 emissions in the EU
Member States, the share of road transport being
close to 70%. Moreover, the share of CO2
emissions of the transport sector in the EU is
projected to rise rapidly over the next 30 years in
spite of the fact that the fuel efficiency and CO2
intensity of new cars sold in the EU have
constantly improved due to regulatory and other
(172) Note, however, that there is missing data for Bulgaria,
Cyprus, Estonia, Ireland, Latvia, Lithuania, Malta, and
Romania.

5. Tax policy challenges in EU Member States
91
measures taken. (173
) It is essential to address
transport sector emissions to achieve the ambitious
EU climate policy targets. In this context, vehicle
taxes have recently started to be used as an
environmental policy instrument. (174
) They are
increasingly designed in such a way that the tax
burden depends on the car's CO2-emissions.
CO2-based vehicle taxation can be regarded as a
complement to transport fuel taxes, which also
induces consumers to purchase fuel-efficient and
hence low-emitting cars. Fuel taxation has the
added advantage that it also affects driving habits.
Several studies (175
) suggest that when consumers
make decisions to purchase cars they are more
affected by retail prices than by future fuel costs.
One explanation could be that consumers are
short-sighted and hence apply very high discount
rates on future fuel costs. Another possible
explanation is that new cars are sold after a few
years of use, and hence fuel costs in the more
distant future are not taken into account by the
buyer or the initial user of the car. This would
(173) European Commission (2012i). (174) Vehicle taxes were originally introduced for fiscal purposes
and to finance road infrastructure. Moreover, private cars
were seen as luxury goods that could be taxed higher than normal goods.
(175) See the Impact Assessment accompanying the Commission
proposal for a Council Directive on passenger related taxes (SEC(2005) 809), Kågeson (2005) and the report for the
Commission by TNO, IEEP and LAT (2006).
apply, in particular, to company cars, which are
generally sold after 2-3 years of use. There are also
indications of very high own-price elasticities (in
absolute terms) of car demand. (176
) Such evidence
implies that registration taxes, which affect the
retail price, could have a strong influence on the
fuel-efficiency of cars. There is not yet much
evidence relating to the efficiency of the recently
introduced CO2-based vehicle taxes in reducing
transport-related CO2 emissions. (177
)
The number of countries applying CO2-based
vehicle taxation has increased rapidly in recent
years. In 2010, 17 countries applied CO2-based
registration taxes, circulation tax or both, while in
2006 only 9 countries had done so. (178
) (179
)
(176) See Adamou et al. (2010). On the other hand, Vance and
Mehlin (2009) present econometric evidence according to
which circulation taxes and fuel costs also have a
significantly negative impact on car demand, in addition to retail prices.
(177) Giblin and McNabola (2009) studied the Irish reform in 2008 which introduced both CO2-based registration and
circulation taxes. The reform would bring about a 3 %
reduction in CO2 emissions from private transport, which reflects a 3.8% reduction of emission intensity for petrol
cars and a 3.6% reduction for diesel cars, as well as a shift
of 6% from petrol to diesel car ownership. (178) ACEA (2012); European Commission, Taxes in Europe
Database.
(179) In 2005, a Commission proposal (COM(2005) 261final) aimed at removing cross-border obstacles to trade in cars
and improving the functioning of the internal market by
Table 5.19: Summary of challenges in area of environmental taxation
Source: Commission services.
SummaryDiesel vs. petrol
ratio
No indexation of
evironmental taxes
Reduced VAT on
energy
Low taxation of
company cars
Scope for CO2-
related vehicle
taxation
BE X X X X X XDE X X X XEE X XIE X X XEL X X X X X XES XFR X X X XIT (X) X X X XCY (X) XLU X X X X XMT X X XNL XAT (X) XPT X X X XSI (X) X XSK X X X X XFI (X) X XBG X XCZ X XDK (X)LV XLT X X X X XHU X XPL X XRO XSEUK X X
Scope to improve environmental tax designAdditional measures to
achieve national
greenhouse gas emission
target
Country

European Commission
Tax reforms in EU Member States
92
At present, 18 EU countries apply a registration
tax. In 14 of them the tax is based on CO2
emissions, often in addition to other characteristics
of the car. In all, 23 Member States currently apply
a circulation tax, and in half of these countries the
tax rate is determined, partly or entirely, by CO2
emissions. However, the design of the CO2-
component varies considerably between countries.
Tax rates usually increase with CO2 emissions, but
may also depend on many other of the car's
characteristics.
Some countries use ‘bonus-malus’ systems
(Austria, Belgium (Wallonia), France), in which a
‘bonus’ is granted for very low-emitting cars,
while high-emitting cars pay a penalty. In a
number of countries (seven) electric (and hybrid)
vehicles are exempt from vehicle taxes, while in
some countries they receive a subsidy (bonus).
Estonia and Lithuania are the only two countries
that do not apply any vehicle taxes. Bulgaria and
Poland apply one of these taxes, but without CO2
or fuel-efficiency differentiation. Thus, these four
countries could benefit from reviewing whether a
CO2-based vehicle tax could help them to reduce
transport-related CO2 emissions more efficiently.
first making the registration taxes refundable and then
phasing them out. A further aim was to transform vehicle taxation into a more efficient environmental policy
instrument by introducing differentiation according to CO2
emissions. The proposal has not been adopted by the Council, but as shown above, Member States have
integrated parts of the proposal into their tax systems.
Summary of challenges in the area of
environmental taxation
The challenges discussed in this section can be
divided into: (i) the need to make more use of the
taxation tool to achieve environmental objectives;
and (ii) tax design issues in the area of
environmental taxation. There are of course links
between these two dimensions. For example,
indexation of environmental taxes has an impact
on incentives and hence the achievement of the
objectives, in particular over time. The various
measures that could be taken at a national level to
improve the existing design of the tax system in
this area include: (a) adjusting the structure of tax
rates on fossil fuels according to their carbon and
energy content; (b) indexing environmental taxes;
(c) considering the abolition of reduced VAT rates
on energy; (d) reducing tax subsidies for company
cars; and (e) introducing CO2-related vehicle
taxation. Individual Member States are considered
to face an overall challenge regarding tax design
issues if challenges have been defined in three out
of the five areas discussed. On this basis, nine
Member States have particular scope for
improving the design of their environmental taxes:
Belgium, Germany, Greece, France, Italy,
Luxembourg, Portugal, Slovakia, and Lithuania.
Table 5.19 provides an overview of the challenges
Member States face in the area of environmental
taxation.
5.4.3. Some redistribution aspects
The previous sections have focused on improving
the efficiency of the tax systems in EU Member
Graph 5.9: Concentration of market income and disposable income measured by the Gini-coefficient
Note: Member States are ranked in increasing order of disposable income inequality according to Eurostat. Eurostat data is available only for
disposable income and cover the entire population, while OECD data refer to the working-age population (18-65 years old). Late 2000s refers to a year
between 2006 and 2009. Income data are adjusted for household size (equivalation). Averages are arithmetic and refer to the Member States for which
the respective data is available. EU-21 refers to those 21 OECD member countries that are also EU Member States.
Source: Eurostat and OECD.
0
5
10
15
20
25
30
35
40
45
50
0
5
10
15
20
25
30
35
40
45
50
SI HU SE CZ FI NL SK AT BE DK LU MT CY DE FR PL IT EE EL UK BG IE RO PT ES LV LT EU-27
EU-21
EA-17
Disposable income, 2010 (Eurostat) Disposable income, late 2000s (OECD) Market income, late 2000s (OECD)

5. Tax policy challenges in EU Member States
93
States. However, the redistributive effects of a tax
system can be just as important as its efficiency.
There is often – although not always – a trade-off
between efficiency and equity. Assuming that
there is a social preference against inequality,
social welfare is greater when consumption
possibilities are more equally distributed, but
redistribution may reduce the incentives to work
and earn income in the first place. Therefore, when
efficiency is scrutinised it is relevant to consider
redistributive outcomes as well.
Furthermore, income redistribution is one of the
three objectives of taxation, alongside
macroeconomic stabilisation, and resource
allocation. (180
) Redistribution can take place
through several instruments, including taxation –
in particular progressive taxation of labour income
– but also through income replacing transfers,
targeted benefits and public consumption
expenditures (transfers in kind). Redistribution
through the tax and transfer system is the
prerogative of Member States, which – depending
on their citizens' preferences – have different
perceptions of social equity and different collective
preferences for the balancing of efficiency and
equality. However, a Member State which faces
substantial efficiency challenges in the tax-benefit
system (e.g. measured by a large share of tax
expenditures) and at the same time achieves an
inferior outcome in terms of mitigating market
income inequalities, may have scope for improving
efficiency without compromising redistribution
policies or for increasing redistribution without
hampering efficiency. (181
) Redistributive policies
should also take account of the need to ensure the
sustainability of public finances.
Comparing the distribution of market and
disposable income
The distribution of market income, obtained either
from labour or capital, is a prior determinant of the
distribution of household disposable income. (182
)
(180) See Musgrave (1959).
(181) In formal economic terms, this means that a government could enhance one dimension without harming the other
until the optimal Pareto frontier is reached. The position on
this ‘trade-off’ frontier, once reached, depends on collective choice.
(182) Market incomes are wages, self-employed income, and
personal capital income before deduction of taxes and social security contributions. Disposable income is market
income plus social transfers less income taxes.
The more unequally market income is distributed,
the greater the amount of redistribution required to
achieve a given degree of equality in disposable
income.
The distribution of market income is more unequal
than the distribution of disposable income in the
EU. (183
) On average, the Gini-coefficient (184
) for
market income for working-age population in the
EU-21 (0.41) is about 35% higher than for
disposable income (see Graph 5.9). This reflects
the significant role of (country-specific) tax-
benefit systems to smooth out market-income
inequality. However, inequality patterns are less
dispersed across countries in terms of market
income than in terms of disposable income,
suggesting differences in national preferences for
redistribution. Member States with low inequality
in market income for the working-age population
also tend to redistribute the most (i.e. they are the
ones with the highest difference between the two
Gini coefficients). According to OECD data for 21
EU countries, the range of the Gini-coefficient is
about 10 points for market income (from 0.36 to
0.46) and around 12 points for disposable income
(from 0.23 to 0.35).
Lithuania and Latvia display the highest levels of
inequality for disposable income of the entire
population in 2010, followed by Spain, Portugal,
Romania, Ireland, Bulgaria, the United Kingdom
and Greece. Disposable income is most equally
distributed in Slovenia, followed by Hungary,
Sweden, the Czech Republic, the Netherlands and
Belgium. (185
)
(183) Redistribution is expressed by the difference between the
Gini-coefficient for market income and disposable income.
Working-age population (rather than total population) is
used to compare redistribution across Member States because it avoids the influence of differences in pension
systems and different demographic patterns.
(184) The Gini-coefficient is the most used inequality measure. It varies between 0, when everyone receives an identical
amount of income, and 1, when a single individual receives all the income. Higher values of the Gini-coefficient thus
indicate higher inequality in the income distribution.
Besides the Gini-coefficient, several other indicators are available to describe inequality and the redistributive
impact of tax-and benefit systems; see, e.g., European
Commission (2009b). (185) However, there is a significant difference between the
Eurostat figures and the OECD figures for the Gini-
coefficient for disposable income. This is in particular the case for Hungary, Ireland and the Netherlands, which all
have a Gini-coefficient close to the EU-21 average

European Commission
Tax reforms in EU Member States
94
Turning to the difference between market income
and disposable income, Slovakia, Denmark and
Sweden show the lowest levels of market income
inequality of the working-age population but not of
disposable income inequality. On the other hand,
Luxembourg, Germany and France have market
income inequality at or above the (un-weighted)
EU-average, but the tax-benefit system reduces the
inequality to a level below the average. A strong
redistributive effect is also visible in Italy, Poland,
the United Kingdom and Portugal, although the
inequality of disposable income remains above the
EU average in these countries. In Spain and
Estonia, by contrast, the redistributive effect is
rather modest, as the Gini-coefficient for
disposable income is close to the one for market
income.
From a long-term perspective, inequality has
generally been rising in the EU since the 1970', 80'
and 90', although there are several exceptions,
particularly in southern Europe. (186
) Since the
mid-2000s, however, inequality in disposable
income has hardly changed in the EU.
Tax policy instruments for redistribution
Different types of taxes have different distributive
properties. Personal income taxes are in most cases
progressive, but the degree of progressivity and,
therefore, the redistributive power varies
considerably among Member States. Social
security contributions are often proportional or
even regressive (if they are capped). As they are
largely equivalent, economically speaking, to
personal income taxes on labour income, their
distributional impact should be evaluated jointly
with personal income tax. VAT is often thought to
be regressive because of the higher propensity to
consume at low income levels. However, all
income is going to be spent at some point.
Theoretically, from a life-time perspective with no
bequests, uniform VAT without reduced rates is
proportional. (187
) (188
) In general, excise duties are
regressive as they are set as a fixed amount per
quantity, but the redistributive properties also
according to OECD figures, and for Denmark, which
would rank as having the second lowest Gini-coefficient. (186) See OECD (2011b).
(187) In a closed economy, a uniform commodity tax is
equivalent to a proportional tax on wage income, both in terms of distortions and (absence of) distributional impact.
(188) See Caspersen and Metcalf (1995).
depend on which income groups consume the
commodity in question.
It is well established that the most efficient policy
instrument for redistributing income is progressive
taxation of labour income along with income-
replacing transfers and targeted benefits. (189
) It is
possible to introduce progressive elements in taxes
other than labour income taxes, such as personal
capital income taxes, corporate income taxes and
consumption taxes. However, these instruments
are less efficient than progressive labour income
taxation and subsidies.
Personal capital income taxes adversely affect
savings/consumption as well as portfolio decisions
and capital is far more mobile than labour. (190
)
However, a counter argument for taxing personal
capital income at progressive rates, despite
additional distortionary effects compared to labour
taxes, is that capital income is more unevenly
distributed than labour income. (191
) Corporate
income taxes do not directly affect the income
distribution of individuals (192
), but they do
adversely affect capital formation and, therefore,
reduce labour productivity and wages.
With regard to consumptions taxes, most EU
Member States apply different VAT rates
apparently for redistributive reasons (e.g. reduced
rates on food, housing, medicine, children’s
clothing etc.). However, as discussed in Chapter 4,
differential commodity taxation is an ill-targeted
and costly instrument for the pursuit of equity
objectives. While it is true that the less well-off
spend a higher proportion of their income on
consumption items taxed at reduced rates than the
better off do, high-income individuals spend a
larger absolute amount on such items. Crawford et
al. (2010) show for the United Kingdom (which
has a zero rate for certain consumption items) that
it is possible to unify VAT rates, while at the same
time compensating the losers with direct transfers
(189) See e.g. Mirrlees et al. (2010), Sørensen (2007) or
Boadway and Keen (2000). (190) See Sørensen (2006).
(191) Furthermore, property taxes could be made progressive
through a basic allowance. Inheritance taxes could also be made progressive on the same grounds as capital income
taxation.
(192) Profits of corporations net of corporate income tax are eventually taxed as dividends or capital gains under
personal income tax.

5. Tax policy challenges in EU Member States
95
(Continued on the next page)
Box 5.5: Distributional effects of environmental taxation
Environmental taxes can be cost-effective instruments for achieving environmental policy goals. They
increase the relative price of consumption with a negative environmental impact, thereby encouraging
consumers to switch to more sustainable patterns of consumption and providing incentives for producers to
invest in clean technologies. However, the distributional consequences of such taxes are debated and could
be an obstacle for implementing environmental tax reforms. In fact, environmental tax reform does not
necessarily have a negative impact on the distribution of consumption possibilities.
The commonest forms of environmental taxes, and the most important ones from the fiscal point of view,
are taxes on energy. Energy products, such as electricity and fuels for heating and transport, are considered,
like food, to be necessary goods to the extent that the share of income devoted to these goods typically
declines with the level of income. Hence, poorer households bear a larger burden of the taxes imposed on
these products than richer households do, relative to their income.
Most empirical evidence indicates that taxing domestic heating and electricity does tend to be regressive. At
the EU-27 level, Cambridge Econometrics (2008) show that a 10 % increase in gas and electricity prices will
have a regressive impact across five income quintiles of real household disposable income (see Table 1A).
Table 1A: Changes in real household incomes (per cent) as a result of a 10 per cent increase in
electricity and gas prices for five income quintiles, EU-27
All households 1st quintile 2nd quintile 3rd quintile 4th quintile 5th quintile
-0.54 -0.69 -0.65 -0.59 -0.53 -0.43
Source: Cambridge Econometrics (2008), reproduced in European Commission (2011).
Similar evidence is found in studies concerning individual Member States. (1) Evidence in Tuuli (2009)
indicates that electricity taxes are at least mildly regressive in Finland. In Denmark, the Danish Ministry of
Taxation (2005) shows that the excise duties on electricity and on fuels for heating purposes are clearly
regressive, both measured in relation to consumption and total household income. A recent study by Vivid
Economics (2012) concludes that taxes on residential energy are regressive in Spain, Hungary and Poland.
There is also evidence indicating that countries may differ with respect to the regressive nature of energy
taxes. For instance, energy taxes appear to be more regressive in the UK and Ireland than in other European
countries (see EEA, 2011 and Kosonen, 2012). Differences in the levels of consumption of energy for
heating in northern and southern Europe and differences in the design of vehicle taxation also affect the
overall distributional effects of environmental taxes across Member States.
However, not all environmental taxes are regressive. Taxes on transport fuels and other transport-related
taxes tend to be somewhat progressive.(2) This is because car ownership increases heavily with income, so
that taxes affecting the cost of fuel or the purchase and ownership of cars are paid more by middle- or high-
income households than by those with the lowest incomes.(3) Several empirical studies from individual
countries indicate that the shares of income paid on transport-related taxes or expenses also tend to rise with
income up to a relatively high-income level. Jacobsen et al. (2003) conclude that in Denmark the share of
disposable income paid on transport-related taxes (car registration tax, annual ownership tax, tax on
insurance premiums and excise duty on petrol) increase up to the 9th decile. Thus, these taxes are
progressive as a whole.(4) Tuuli (2009) studies the incidence of motor fuel taxes in Finland using total
expenditure as the income concept. The findings show that the share of total expenditure spent on motor
fuels increases up to the 6th-8th expenditure decile and declines slightly thereafter and thus would be
progressive for a large share of the income scale. Ahola-Carlsson-Sterner (2009) present similar evidence
(1) See EEA (2011) for an overview of the literature.
(2) Taxes on transport fuels represent about 78 % of energy tax revenues in the EU-27. (3) While car ownership and purchase increases with income all the way throughout the income distribution, annual
driving per household is flat in the upper half of the income distribution.
(4) See also Danish Ministry of Taxation (2005).

European Commission
Tax reforms in EU Member States
96
in a way that improves both the progressivity and
the efficiency of the overall tax system and also
increases overall revenues to finance desirable
reforms. A number of indirect taxes other than
VAT may also have non-negligible effects on the
distribution of consumption possibilities. The
distributional impact of environmental taxes is
reviewed in Box 5.5.
Personal income tax and social security
contribution progressivity
A tax schedule can be considered to be progressive
if the average tax rate rises with income, i.e. the
marginal tax rate at a given level of income
exceeds the average tax rate. (193
) (194
) An index of
progressivity (IP) can be defined as follows:
IP = 1 – (1-MTR)/(1-ATR)
where MTR = marginal tax rate and
ATR = average tax rate. For a progressive tax
system, i.e. MTR higher than ATR, the index of
progressivity is bounded between 0 and 1. Higher
(193) The marginal tax rate is the amount of personal income tax
and social security contributions paid on an additional unit of income. The average tax rate is the ratio of the total
amount of personal income tax and social security
contributions to total gross income. (194) See Jakobsson (1976) for an overview of different
measures of tax progression.
values of the index imply higher
progressivity. (195
)
This index varies substantially between Member
States (see Graph 5.10 and Table A.8 in the
Annex). At the average wage (AW) level,
progressivity is by far the highest in Ireland (0.41),
followed by Luxembourg and Hungary. Italy,
Germany, and France, rank approximately in the
middle with a mean comprised between 0.13 and
0.17.
Graph 5.10: Index of progressivity at the 100% and 167% level
of the wage of the average worker (single no
children), 2010
Note: Data not available for Bulgaria, Cyprus, Latvia, Lithuania, Malta
and Romania.
Source: OECD.
(195) For MTR=100% and ATR <100%, IP=1. For ATR=MTR,
i.e. a purely flat tax system, IP=0.
-0.2
-0.1
0
0.1
0.2
0.3
0.4
-0.2
-0.1
0
0.1
0.2
0.3
0.4
IE LU HU FI BE AT DE PT NL SI EL ES IT UK CZ SK SE DK EE FR PL OECD EU
Index of Progressivity (Single no ch 100% of AW) Index of Progressivity (Single no ch 167% of AW)
Box (continued)
from Sweden: taking total expenditure, the tax burden would increase from the lowest up to the 8th decile.
Evidence from the UK also indicates that middle-income households would be more affected by fuel tax
increases than low- or high-income households (5), while if only car-owning households are considered, fuel
taxes would be regressive. Several studies also point out that rural households are more affected by transport
fuel taxes than urban households are.
This evidence implies that transport-related taxes can significantly mitigate the regressive impact of other
energy taxes, or even completely offset that impact. In this respect, however, there is variation across
countries, and this needs to be taken into account when a tax reform is designed. The Cambridge
Econometrics (2008) study for the Commission investigates the impacts of various energy tax reform
packages at EU level. The results indicate that the inclusion of transport fuel taxes in the reform package
more or less neutralises the regressive overall impact of other energy taxes. However, the distributional
effect of tax reforms also depends on how the extra revenue from excise duties is used. If distributional
neutrality is a reform objective, such as in a reform increasing environmental taxes and reducing taxes on
labour income, low-income and non-labour-income households could be compensated through a higher
basic allowance or a targeted income transfer.
As with many environmental taxes, excise duties on health-related products such as tobacco, alcohol,
confectionary and saturated fat (sin taxes) tend to be regressive. Again, it is possible to mitigate the impact
on low-income households via personal income taxation or direct transfers.
(5) Blow-Crawford (1997) and Johnstone-Alavapati (1998).
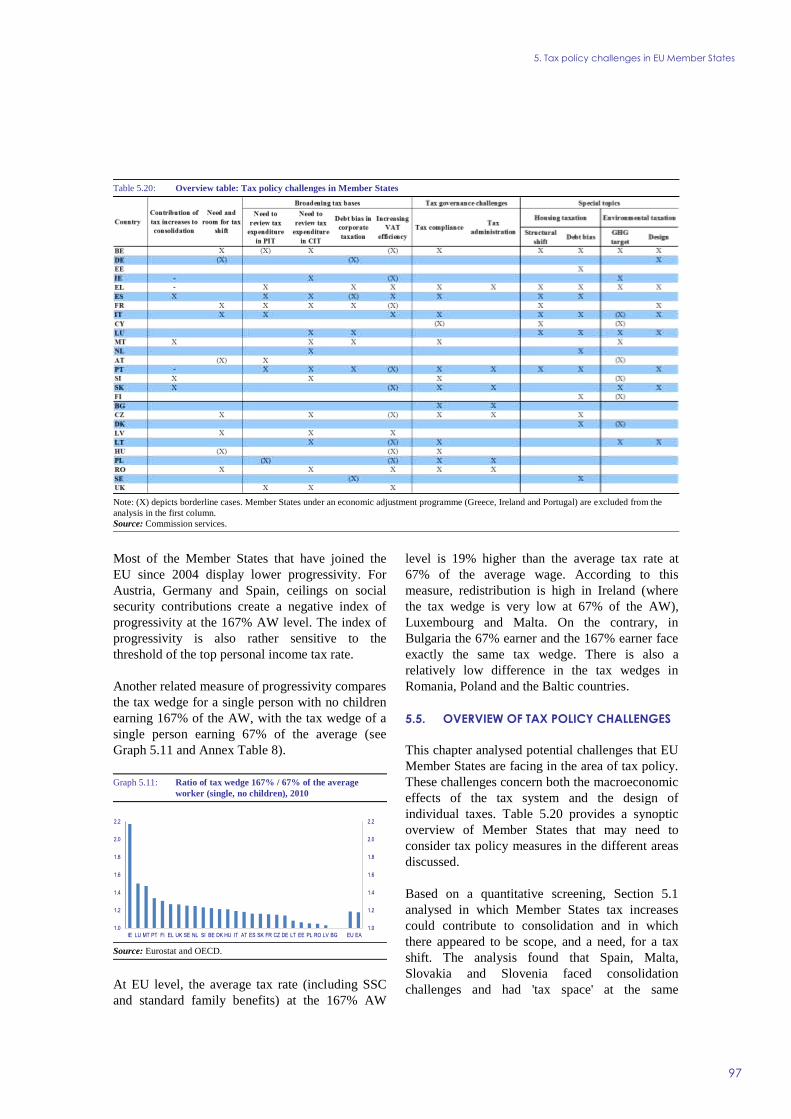
5. Tax policy challenges in EU Member States
97
Most of the Member States that have joined the
EU since 2004 display lower progressivity. For
Austria, Germany and Spain, ceilings on social
security contributions create a negative index of
progressivity at the 167% AW level. The index of
progressivity is also rather sensitive to the
threshold of the top personal income tax rate.
Another related measure of progressivity compares
the tax wedge for a single person with no children
earning 167% of the AW, with the tax wedge of a
single person earning 67% of the average (see
Graph 5.11 and Annex Table 8).
Graph 5.11: Ratio of tax wedge 167% / 67% of the average
worker (single, no children), 2010
Source: Eurostat and OECD.
At EU level, the average tax rate (including SSC
and standard family benefits) at the 167% AW
level is 19% higher than the average tax rate at
67% of the average wage. According to this
measure, redistribution is high in Ireland (where
the tax wedge is very low at 67% of the AW),
Luxembourg and Malta. On the contrary, in
Bulgaria the 67% earner and the 167% earner face
exactly the same tax wedge. There is also a
relatively low difference in the tax wedges in
Romania, Poland and the Baltic countries.
5.5. OVERVIEW OF TAX POLICY CHALLENGES
This chapter analysed potential challenges that EU
Member States are facing in the area of tax policy.
These challenges concern both the macroeconomic
effects of the tax system and the design of
individual taxes. Table 5.20 provides a synoptic
overview of Member States that may need to
consider tax policy measures in the different areas
discussed.
Based on a quantitative screening, Section 5.1
analysed in which Member States tax increases
could contribute to consolidation and in which
there appeared to be scope, and a need, for a tax
shift. The analysis found that Spain, Malta,
Slovakia and Slovenia faced consolidation
challenges and had 'tax space' at the same
1.0
1.2
1.4
1.6
1.8
2.0
2.2
1.0
1.2
1.4
1.6
1.8
2.0
2.2
IE LU MT PT FI EL UK SE NL SI BE DK HU IT AT ES SK FR CZ DE LT EE PL RO LV BG EU EA
Table 5.20: Overview table: Tax policy challenges in Member States
Note: (X) depicts borderline cases. Member States under an economic adjustment programme (Greece, Ireland and Portugal) are excluded from the
analysis in the first column.
Source: Commission services.

European Commission
Tax reforms in EU Member States
98
time. (196
) They could, therefore, consider using
measures on the revenue side of the budget – in
addition to those on the expenditure side – to
consolidate their public finances and make them
more sustainable. Such revenue raising measures
have been taken recently in Spain but are not
reflected in the data yet.
Around one third of Member States could benefit
from a tax shift from labour taxes to taxes
considered less detrimental to growth
(consumption taxes, recurrent property taxes,
environmental taxes). In particular Belgium,
France, Italy, the Czech Republic, Latvia, Romania
and – to a lesser extent – also Germany, Austria
and Hungary were found to have both a need to
reduce labour taxation and scope for increasing
less detrimental taxes.
Section 5.2 analysed which countries might benefit
from a broadening of tax bases in direct and
indirect taxation. As shown in Table 5.20 many
Member States face the challenge of reviewing and
potentially reducing tax expenditure in personal
and corporate income taxation. Concerning such a
review in the area of corporate income taxation,
Member States should, where appropriate, assess
reduced rates for SMEs, special regions or sectors,
accelerated depreciation schemes as well as R&D
and investment incentives. Moreover, several
Member States should consider addressing the debt
bias in corporate taxation (in particular Greece,
France, Luxembourg, Malta, Portugal, but also
Germany, Spain and Sweden). Despite recent
measures to improve VAT efficiency, many
Member States still need to address the often very
high policy and/or compliance gaps in the area of
VAT.
A number of Member States face the challenge of
improving tax governance as analysed in Section
5.3. Challenges can be related to either (i) the need
to improve tax compliance as a consequence of a
large shadow economy and/or high levels of
potential VAT fraud and evasion, or (ii) a specific
potential to improve their tax administration as
indicated by high costs of paying and/or collecting
taxes and little use of pre-filling or third-party
information.
(196) In that analysis programme countries Greece, Ireland and
Portugal were not included.
Housing taxation in EU Member States is often
based too much on rather distortive transaction
taxes as opposed to recurrent taxes on immovable
property, which are considered less detrimental to
growth. In particular Belgium, Greece, Spain,
France, Italy, Cyprus, Luxembourg and Portugal
should consider a shift within property taxes in
favour of recurrent taxes and/or continue with the
measures recently implemented or discussed. (197
)
Moreover, nearly half of the Member States face
the challenges of reducing the debt bias in housing
taxation created by the (partial) deductibility of
mortgage interest, although to differing degrees. In
these countries, either imputed rents or recurrent
property taxes on owner-occupied housing are too
low to tax immovable property returns at a level
consistent with alternative investment items. Given
the political difficulty of raising property taxes, a
second-best option might be the gradual phasing
out of interest-rate deductibility in order to remove
this debt bias in the tax system and make the tax
treatment of different capital goods more neutral.
Sub-section 5.4.2 analysed tax-related challenges
in terms of environmental policy. First, it is
important to ensure that the policy instruments in
place, including taxes, are sufficient to meet the
agreed environmental objectives concerning GHG
emissions. If there is a need for further policy
measures, environmental taxes should play a role
in the policy mix. Secondly, energy taxes and other
environmental taxes should be designed so that
they provide appropriate incentives to reduce
emissions over time. Various measures could be
taken at the national level to improve the existing
design of tax systems, in particular by: i) adjusting
the structure of tax rates on fossil fuels according
to their carbon and energy content; ii) indexing
environmental taxes; iii) considering the abolition
of reduced VAT rates on energy; iv) reducing tax
subsidies for company cars and v) introducing
CO2-related vehicle taxation. Overall, a third of
Member States appear to have specific scope for
improving the design of their environmental taxes.
The challenges identified in this chapter relate to
improving the efficiency of national tax systems.
However, the redistributive effects of the tax
system can be equally important. Redistribution
(197) For instance Italy recently increased recurrent taxes on real
estate with the introduction of IMU.

5. Tax policy challenges in EU Member States
99
can occur via several instruments, including
taxation, and progressive taxation of labour
income in particular. Redistribution through the
tax-benefit system is the prerogative of Member
States, which have different perceptions of social
equity and different collective preferences for
balancing efficiency versus equality. Therefore, it
is difficult to come up with prescriptive policy
recommendations in this complex and sensitive
area and the identification of clear policy
challenges at national level. However, a Member
State which faces substantial efficiency challenges
in the tax-benefit system and at the same time
achieves an inferior outcome in terms of mitigating
income inequalities, may have some scope for
increasing either redistribution or efficiency
without harming the other dimension. When
deciding on their redistributive policy, Member
States also need to ensure that the sustainability of
public finance is not jeoparised.

REFERENCES
100
ACEA (European Automobile Manufacturers'
Association), Tax Guide 2012.
Adamou, A, Clerides, S. and T. Zachariadis
(2010), An empirical evaluation of the
effectiveness of the CO2-related vehicle taxation in
Europe, Department of Economics, University of
Cyprus.
Agell, J. Englund, P. and J. Södersten (1995),
Svensk skattepolitik i teori och praktik, Statens
offentliga utredningar 104, Stockholm, Sweden.
Ahola, H., E. Carlsson and T. Sterner (2009), Är
bensinskatten regressiv? (Is the gasoline tax
regressive?) Ekonomisk Debatt 2, pp. 71- 77.
Alm, J. (2012), Measuring, explaining, and
controlling tax evasion: lessons from theory,
experiments, and field studies, International Tax
and Public Finance 19, pp. 54-77.
Alt, J., Preston, I. and L. Sibieta (2011), The
Political Economy of Tax Policy, in: Tax by
Design: The Mirrlees Review, Chapter 16: The
Taxation of Land and Property, Oxford: Oxford
University Press for Institute for Fiscal Studies.
Anderson, B. (2008), presentation at the Asian
Senior Budget Officials meeting, 10-11 January
2008, Bangkok, Thailand.
Andrews, D. (2010), Real House Prices in OECD
Countries: The Role of Demand Shocks and
Structural and Policy Factors, OECD Economics
Department Working Papers 831, OECD
Publishing.
Andrews, D. and A. Caldera Sánchez (2011),
Drivers of Homeownership rates in Selected
OECD Countries, OECD Economics Department
Working Papers 849, OECD Publishing.
Andrews, D., Caldera Sánchez, A. and Å.
Johansson (2011), Housing Markets and Structural
Policies in OECD Countries, OECD Economics
Department Working Papers 836, OECD
Publishing.
Arnold, J.M., Brys, B, Heady, C., Johansson, A.,
Schwellnus, C. and L. Vartia, (2011), Tax policy
for economic recovery and growth, Economic
Journal 121(550), FF59-FF80.
Atkinson, A.B. and J.E. Stiglitz, (1976), The
Design of Tax Structure: Direct versus indirect
taxation, Journal of Public Economics 6, pp. 55-
75.
Aujean, M. (2010), Le système de TVA et le
marché unique européen, Reflets et perspectives de
la vie économique 2/3, Tome XLIX, pp. 91-104.
Aujean, M., Jenkins, P. and S. Poddar (1999), A
new approach to public sector bodies,
International VAT Monitor 10, pp. 144-199.
Baldwin, R., VAT fraud, (2007), available at
http://www.voxeu.org
Barrios, S., Langedijk, S. and L. Pench (2010), EU
fiscal consolidation after the financial crisis.
Lessons from past experiences, European
Economy - Economic Papers 418, Directorate
General Economic and Monetary Affairs,
European Commission.
Besley, T., and A. Case, (1995), Incumbent
behaviour: vote seeking, tax setting and yardstick
competition, American Economic Review 85(1),
pp. 25–45.
Bird, R. (2005), Value Added Taxes in Developing
and Transitional Countries: Lessons and
Questions, paper prepared for the First Global
International Tax Dialogue Conference on VAT,
Rome, March 15-16.
Blouin, J., Huizinga, H., Laeven, L. and G.
Nicodeme (2012), Thin Capitalization Rules and
Multinational Firm Capital Structure, mimeo.
Blow, L. and I. Crawford (1997), The
Distributional Effects of taxes on Private
Motoring, The Institute of Fiscal Studies, London.
Boadway, R. and M. Keen (2000), Redistribution,
in A. B. Atkinson and F. Bourguignon (eds),
Handbook of Income Distribution Volume 1,
Amsterdam, North-Holland.
Cambridge Econometrics (2008), Review of the
Energy Taxation Directive: final modeling results,
A report for DG TAXUD, European Commission.
Capozza, D. R., Green, R. K. and P. H.
Hendershott (1996), Taxes, Mortgage Borrowing,

References
101
and Residential Land Prices, In Economic Effects
of Fundamental Tax Reform, ed. Aaron, H. and W.
Gale, Brookings Institution, pp. 171-198.
Caspersen, E. and G. Metcalf (1995), Is A Value
Added Tax Progressive? Annual Versus Lifetime
Incidence Measures, NBER Working Paper 4387,
Feb. 1995.
Castanheira, M. and C. Valenduc (2006),
Economie Politique de la Taxation, Reflets et
Perspectives de la Vie Economique 45(3), pp. 19-
37.
Castanheira, M., Nicodeme, G. and P. Profeta
(2012), On the political economics of tax reforms:
survey and empirical assessment, International
Tax and Public Finance, Forthcoming.
Cnoossen, S. (2002), Tax Policy in the European
Union, CESifo Working Paper Series 758.
Copenhagen Economics (2007), Study on reduced
VAT applied to goods and services in the Member
States of the European Union, Taxation Papers13.
Copenhagen Economics (2008), Reduced VAT for
Environmentally Friendly Products. Final report,
December 2008.
Copenhagen Economics (2009), Company car
taxation – subsidies, welfare, and environment,
Taxation Papers 22.
Copenhahen Economics and KPMG AG (2011),
VAT in the public sector and exemptions in the
public interest.
Corlett, W.J. and D.C. Hague (1953),
Complementarity and the Excess Burden of
Taxation. Review of Economic Studies 21, pp. 21-
30.
Crawford, I., Keen, M. and S. Smith (2010), Value
added tax and excises, in: Dimensions of Tax
Design: the Mirrlees Review, J. Mirrlees, S. Adam,
T. Besley, R. Blundell, S. Bond, R. Chote, M.
Gammie, P. Johnson, G. Myles and J. Poterba
(eds), Oxford University Press.
Crowe, C., Dell'Ariccia, G., Igan, D. and P.
Rabanal (2011), How to Deal with Real Estate
Booms: Lessons from Country Experiences, IMF
Working Papers 11/91.
Cyprus National Reform Programme (2012),
National Reform Programme: Europe 2020
Strategy for: Smart, Sustainable and Inclusive
Growth, pp.84.
Dahlby, B. and E. Ferede, (2011), What Does it
Cost Society to Raise a Dollar of Tax Revenue?,
C.D. Howe Institute Commentary on Fiscal and
Tax Competitiveness 324, C.D. Howe Institute,
Toronto.
Dahlby, B., (2008), The Marginal Cost of Public
Funds, Theory and applications, M.I.T. Press,
Cambridge, Mass.
Danish Ministry of Taxation (2005), Afgifternes
fordelingsmæssige virkninger i forhold til
husholdningernes samlede forbrug,
Skatteministeriet, available at http://www.skm.dk/
tal_statistik/afgiftsberegning/4208.html
De Mooij, R. and G. Nicodeme (2008), Corporate
tax policy and incorporation in the EU,
International Tax and Public Finance 15(4), pp.
478-498.
Dell’Anno, R. (2003), Estimating the Shadow
Economy in Italy: a Structural Equation Approach.
Working Paper 2003-7, Dept. of Economics,
University of Aarhus.
Dell'Anno, R. (2009), Tax evasion, tax morale and
policy maker's effectiveness. Journal of Socio-
Economics 38 (6), pp. 988-997.
Devarajan, S. and S. Robinson, (2002), The
influence of Computable General Equilibrium
Models on Policy, TMD Discussion Paper 98,
Trade and Macroeconomics Division, International
Food Policy Research Institute, Washington.
Devereux, M. P., Lockwood, B. and M. Redoano
(2008), Do countries compete over corporate tax
rates?, Journal of Public Economics 92(5-6), pp.
1210-1235.
European Commission (1987) COM (87) 322
final/2, 21 August 1987. Proposal for a Council
Directive completing and amending Directive
77/388/EEC - Removal of fiscal frontiers.

European Commission
Tax reforms in EU Member States
102
European Commission (2004), European
Employment Observatory Review, Spring 2004.
European Commission (2005a), Impact
Assessment accompanying the proposal for a
Council Directive on passenger car related taxes,
SEC (2005) 809.
European Commission (2005b), Proposal for a
Council Directive on passenger car related taxes,
COM (2005) 261 final.
European Commission (2007), European
Employment Observatory Review: Spring 2007.
European Commission (2008a), The LIME
assessment framework (LAF): a methodological
tool to compare, in the context of the Lisbon
Strategy, the performance of EU Member States in
terms of GDP and in terms of twenty policy areas
affecting growth, European Economy Occasional
Paper 41.
European Commission (2008b), European
competitiveness report, Luxembourg.
European Commission (2009a), Monitoring
revenue trends and tax reforms in EU Member
States, European Economy 4.
European Commission (2009b), Social Situation
Observatory, Income Distribution and Living
Conditions, Annual Monitoring Report 2009.
European Commission (2010a), Public Finances in
the EMU 2010, European Economy 4.
European Commission (2010b), Effective levels of
company taxation within an enlarged EU.
European Commission (2010c), Compliance risk
management guide for tax administrations, Fiscalis
Risk Management Platform Group, DG TAXUD.
European Commission (2010d), Monitoring tax
revenues and tax reforms in EU Member States
2010, European Economy 6 and Taxation
Papers 24.
European Commission (2011a), Taxation Trends
in the European Union 2011, Luxembourg.
European Commission (2011b), Tax reforms in
EU: Tax policy challenges for economic growth
and fiscal sustainability, European Economy 5 and
Taxation Papers 28.
European Commission (2011c), Impact
Assessment Accompanying the document
‘Proposal for a Council Directive on a common
system of financial transaction tax and amending
Directive 2008/7/EC’, (SEC/2011/1102).
European Commission (2011d), Proposal of
Council Directive, amending Directive
2003/96/EC restructuring the Community
framework for the taxation of energy products and
electricity, COM(2011)169/3.
European Commission (2011e), Impact assessment
SEC (2011) 409. Accompanying document to the
proposal for a Council Directive amending
Directive 2003/96/EC restructuring the
Community framework for the taxation of energy
products and electricity.
European Commission (2011f), Commission staff
working paper: Impact Assessment accompanying
document to the Proposal of Council Directive,
amending Directive 2003/96/EC restructuring the
Community framework for the taxation of energy
products and electricity, SEC(2011)409.
European Commission (2011g), House price
imbalances and structural features of housing
markets, Quarterly Report on the Euro Area,
October 2011.
European Commission (2011h), Memorandum of
understanding between Portugal and the EC, the
ECB and the IMF on Specific Economic Policy
Conditionality.
European Commission (2012a), Taxation Trends
in the European Union 2012, Luxembourg.
European Commission (2012b), European
Economic Forecast, European Economy 1, Spring
2012.
European Commission (2012c), Annual Growth
Survey 2012, Annex IV, Growth-Friendly Tax
Policies in Member States and Better Tax
Coordination in the EU, available at

References
103
http://ec.europa.eu/europe2020/pdf/ags2012_annex
4_en.pdf.
European Commission (2012d), Conclusions of the
3167 meeting of the Council of Economic and
Finance Ministers, 15 May 2012.
European Commission (2012e), An Overview of
the use of Third Party Information in the European
Union, Fiscalis Risk Management Platform Group,
DG TAXUD.
European Commission (2012f), VAT Rates
applied in the Member States of the European
Union, DG Taxation and Customs Union, situation
at 1 January 2012.
European Commission (2012g), Alert Mechanism
Report, Report prepared in accordance with Article
3 and 4 of Regulation on the prevention and
correction of macro-economic imbalances,
COM(2012)68 final.
European Commission (2012h), Excise duty
tables, part II – Energy products and electricity, by
DG Taxation and Customs Union, situation at 1
January 2012.
European Commission (2012i), Towards low
carbon transport in Europe, Communicating
transport research and innovation.
European Commission (2012j), The Economic
Adjustment Programme for Portugal, Third
Review – Winter 2011/2012, European Economy,
Occasional Papers 95, April 2012.
European Commission (2012k), Sustainability
Report 2012, European Economy, Forthcoming.
European Commission (2012l), The Economic
Adjustment Programme for Portugal, Fourth
Review – Spring 2012, European Economy,
Occasional Papers 111, July 2012.
European Commission (2012m), Taxes in Europe
Database, available at http://ec.europa.eu/taxation
_customs/taxation/gen_info/info_docs/tax_invento
ry/index_en.htm
European Commission COM (2011) 851 final, 6
December 2011. On the future of VAT: Towards a
simpler, more robust and efficient VAT system
tailored to the single market.
European Commission COM(2010) 695 final, 1
December 2010. Green Paper on the future of
VAT: Towards a simpler, more robust and
efficient VAT system.
European Environmental Agency (2011),
Environmental tax reform in Europe: implications
for income distribution, EEA Technical Report 16.
European Parliament (2000),European Parliament
Fact Sheets – 3.4.5 Value Added Tax (VAT),
European Parliament.
Fatica, S., Hemmelgarn, T. and G. Nicodeme
(2012), The Debt-Equity Tax Bias – Consequences
and Solutions, Taxation Papers, Working Paper
33, Forthcoming.
Feldstein, M. (1997), How big should government
be?, National Tax Journal 50(2), pp. 197-213.
Feldstein, M. and P. Krugman (1990),
International Trade Effects of Value-Added
Taxation, In E. Assaf Razin and Joel Slemrod,
Taxation in the Global Economy (pp. 263-282),
University of Chicago Press.
Gayer, C. and G. Mourre (2012), Property taxation
and enhanced tax administration in challenging
times. Proceedings of ECFIN workshop on 24
November 2011, Commission Economic Paper
463.
Genser, B. and G. Schulze (1997), Transfer Pricing
under an Origin-based VAT System, Finanzarchiv
54 (1), pp. 51-67.
Gérard, M. and F. Ruiz (2009), Corporate Taxation
and the Impact of Governance, Political and
Economic Factors, CESifo Working paper 2904.
Gibin, S. and A. McNabola (2009), Modelling the
impacts of a carbon emission-differentiated vehicle
tax system on CO2 emission intensity from new
vehicle purchases in Ireland, Energy Policy 37(4),
pp. 1404-1411.
Hamilton, B.W. (1976), Capitalization of
Intrajurisdictional Differences in Local Tax Prices,
American Economic Review 66:5, pp. 743-753.

European Commission
Tax reforms in EU Member States
104
Harris, B. (2010), The Effect of Proposed Tax
Reforms on Metropolitan Housing Prices, Tax
Policy Center, Urban Institute and Brookings
Institution.
Hemmelgarn, T., Nicodeme, G. and E. Zangari
(2011), The Role of Housing Tax Provisions in the
2008 Financial Crisis, Taxation Papers, Working
Paper No 27.
IFS in consortium with: CPB, CAPP, CASE,
CEPII, ETLA, IFO and IHS (2011), The
retrospective evaluation of elements of the VAT
system, report for the European Commission.
IGF (2011), Rapport du comité d’évaluation des
dépenses fiscales et des niches sociales.
Jacobsen, H. K., Birr-Pedersen, K. and Wier, M.
(2003), Distributional implications of
environmental taxation in Denmark, Fiscal Studies
24, pp. 477-499.
Jakobsson, U. (1976), On the Measurement of the
Degree of Progression, Journal of Public
Economics 5, pp. 161-168.
Jensen, J. and F. Wöhlbier (2012), Improving tax
governance in EU Member States: Criteria for
successful policies, European Economy,
Occasional Papers 114, European Commission.
Johannesson Lindén, Å. and C. Gayer (2012),
Possible reforms of real estate taxation: Criteria for
successful policies, European Economy,
Occasional Papers 119.
Johansson, Å., Heady, C., Arnold. J., Brys, B. and
L. Vartia (2008), Tax and Economic Growth,
OECD Economics Department Working Papers
620, OECD Publishing.
Johnstone, N. and J. Alavalapati (1998), The
distributional effects of environmental tax reform,
International Institute for Environment and
Development Discussion Paper 98-01.
Kågeson, P. (2005), Reducing CO2 emissions from
new cars, T&E European Federation for Transport
and Environment.
Keen, M. (2007), VAT attacks!, IMF Working
Paper 07/142, June 2007.
Keen, M. and S. Smith (1999), Viva VIVAT!,
International Tax and Public Finance 6(2), pp.
741-751.
Keen, M., Klemm, A. and V. Perry (2010), Tax
and the Crisis, Fiscal Studies 31(1), pp.43-79.
Kidd, M. (2010), Revenue Administration:
Functionally Organized Tax Administration, IMF,
Fiscal Affairs Department, June 2010.
Klemm, A. (2006), Allowances for Corporate
Equity in Practice, IMF Working Papers 06/259.
Kleven, H.J., Knudsen, M.B., Kreiner, C.T.,
Pedersen, S., and E. Saez (2011), Unwilling or
Unable to Cheat? Evidence from a Tax Audit
Experiment in Denmark, Econometrica 79, pp.
651-692.
Kosonen, K. (2012), Regressivity of environmental
taxation: myth or reality?, Taxation Papers 32.
Kosonen, K. and G. Nicodeme (2010), The Role of
Fiscal Instruments in Environmental Policy, in C.
Soares, J. Milne, H. Ashiabor, L. Kreiser and K.
Deketelaere (eds), Critical Issues in Environmental
Taxation, Vol. VIII, chapter 1, Oxford University
Press, pp. 3-20.
Mathis, A., (2004), VAT indicators. Taxation
Papers, European Commission, Directorate-
General for Taxation and Customs, Issue 2.
Mirrlees, J., Adam, S., Besley, T., Blundell, R.,
Bond, S., Chote, R., Gammie, M., Johnson, P.,
Myles, G. and J. Poterba (2011), Tax by Design:
The Mirrlees Review, Chapter 16: The Taxation of
Land and Property, Oxford: Oxford University
Press for Institute for Fiscal Studies.
Musgrave, R. A. (1959), The Theory of Public
Finance: A Study in Public Economy.
Nickell, S. (1997) Unemployment and Labor
Market Rigidities: Europe versus North America.
Journal of Economic Perspectives 11 (3),
pp. 55-74.
Nicodeme, G. (2007), Do Large Companies Have
Lower Effective Corporate Tax Rates? A European
Survey, Working Papers CEB 07-001, Solvay
Brussels School of Economics and Management.

References
105
OECD (2006), The Political Economy of
Environmentally Related Taxes, Organisation for
Economic Cooperation and Development, Paris.
OECD (2010a), Tax Expenditures in OECD
Countries, Paris.
OECD (2010b), Choosing a broad base – low rate
approach to taxation, Tax Policy Studies 19,
OECD publishing.
OECD (2010c), Tax Policy Reform and Economic
Growth, Tax Policy Studies 20, OECD publishing.
OECD (2011a), Forum on tax administration – tax
administration in OECD and selected non-OECD
countries: comparative information series, OECD
Publishing.
OECD (2011b), Divided We Stand: Why
Inequality Keeps Rising, OECD Publishing.
OECD (2011c), Consumption tax trends 2010:
VAT/GST and excise rates, trends and
administration issues, OECD publishing.
OECD (2011d), Inventory of Estimated Budgetary
Support and Tax Expenditures for Fossil Fuels,
OECD Publishing.
Owens J., Battiau, P. and Charlet A. (2011), VAT's
next half century: Towards a single-rate system?,
OECD Observer 284.
Pedersen, S. (2003), The Shadow Economy in
Germany, Great Britain and Scandinavia. A
measurement based on questionnaire surveys,
Rockwool Foundation Research Unit Study 10.
Pissarides, C. (1998), The impact of employment
tax cuts on unemployment and wages; the role of
unemployment benefits and tax structures,
European Economic Review 42, pp. 55- 83.
Profeta, P. (2007), Political Support and tax
reforms with an application to Italy, Public Choice
131, pp. 141–155.
PwC (2010), The impact of VAT compliance on
business, available at: http://www.pwc.com/gx/
en/tax/indirect-taxes/impact-vat-compliance-
business.jhtml
PwC, World Bank and IFC (2011), Paying Taxes
2012 – The Global Picture.
Ramsey, F.P. (1927), A Contribution to the Theory
of Taxation. Economic Journal 37, pp. 47-61.
Reckon LLP (2009), Study to quantify and analyse
the VAT gap in the EU-25 member states, Report
for DG Taxation and Customs Union, September
2009.
Renooy, P., Ivarsson, S., van der Wusten-Gritsai,
O. and E. Meijer (2004), Undeclared Work in an
enlarged Union – An analysis of undeclared work:
an in-depth study of specific items. European
Commission.
Russell, B. (2010), Revenue Administration:
Developing a Taxpayer Compliance Program,
Technical Notes and Manuals.
Saveyn, B., Pycroft, J. and S. Barrios, (2012), The
cost of tax increase in the EU, paper presented at
the 2012 Banca d´Italia workshop on Public
Finance, Perugia.
Schneider, F. (2012), Size and Development of the
shadow economy of 31 European and 5 other
OECD Countries from 2003 to 2012, March 2012,
http://www.econ.jku.at/members/Schneider/files/p
ublications/2012/ShadEcEurope31_March%20201
2.pdf.
Shapiro, C. and J.E. Stiglitz, (1987), Equilibrium
Unemployment as a Worker Discipline Device,
American Economic Review 74 (3), pp. 433-444.
Slemrod, J. (2004), Are corporate tax rates, or
countries, converging?, Journal of Public
Economics 88(6), pp. 1169-1186.
Slemrod, J. (2007), Cheating Ourselves: The
Economics of Tax Evasion, Journal of Economic
Perspectives 21 (1), pp. 25-48.
Sørensen, P. B. (2006), Can Capital Income Taxes
Survive? And Should They?, CESifo Working
Paper 1793, August 2006.
Sørensen, P. B. (2007), The theory of optimal
taxation: what is the policy relevance?,
International Tax and Public Finance 14, pp. 383–
406.

European Commission
Tax reforms in EU Member States
106
Svensk Författningssamling (SFS), pp. 1993:1508;
pp. 1512-1513.
Tiebout, C. (1956) A Pure Theory of Local
Expenditures, Journal of Political Economy 64:5,
pp. 416-424.
TNO Science and Industry, IEEP (Institute for
European Environmental Policy) and LAT
(Laboratory of Applied Thermodynamics), Review
and analysis of the reduction potential and costs of
technological and other measures to reduce CO2
emissions from passenger cars, Final report,
October 2006.
Tuuli, J. (2009), Polttoaineverojen ja muiden
ympäristöverojen tulonjakovaikutukset.
(Distributional effects of fuel and other
environmental taxes), VATT muistiot, Valtion
taloudellinen tutkimuskeskus. Helsinki 2009.
Van den Noord, P. (2005), Tax Incentives and
House Price Volatility in the Euro Area: Theory
and Evidence, Économie internationale 101, pp.
29-45.
Vance, C and M. Mehlin (2009), Tax policy and
CO2 emissions, An Econometric Analysis of the
German Automobile Market. Ruhr Economic
Papers, RWI Essen.
Vivid Economics (2012), Carbon taxation and
fiscal consolidation: The potential of carbon
pricing to reduce Europe's fiscal deficits. Report
prepared for the European Climate Foundation and
Green Budget Europe. May 2012.
Watrin, C. and R. Ullmann (2008), Comparing
Direct and Indirect Taxation: The Influence of
Framing on Tax Compliance, The European
Journal of Comparative Economics 5(1), pp. 33-
56.
Wöhlbier, F., Gayer, C., Isbasoiu, G. and G.
Mourre (2012), Fiscal consolidation and growth-
friendly tax structures, mimeo.
Zentrum fuer Europaeische Wirtschaftsforschung
(ZEW) (2012), Effective Tax Levels using the
Devereux/Griffith methodology, Project for the
European Commission. Forthcoming.
Zodrow G.R. (2007), The Property Tax as a
Capital Tax: A Room with Three Views, mimeo,
The James Baker III Institute for Public Policy,
Rice University, January.

GLOSSARY
107
ACE (Allowance for Corporate Equity) allows for
a deduction for the return on equity from the
corporate income tax base (taxable profits).
Coupled with a deduction for interest payments, it
would equalise the tax treatment of debt and equity
finance.
CBIT (Comprehensive Business Income Tax)
Interest payments can no longer be deducted from
corporate profits, and are thus fully taxed at the
corporate income tax rate, similarly to the return
on equity.
Convergence programmes Medium-term
budgetary and monetary strategies presented by
Member States that have not yet adopted the euro.
They are updated annually, according to the
provisions of the Stability and Growth Pact. Prior
to the third phase of EMU, convergence
programmes were issued on a voluntary basis and
used by the Commission in its assessment of the
progress made in preparing for the euro. See also
stability programmes.
Direct taxes Taxes that are levied on income,
wealth and capital, at the personal or corporate
level.
Discretionary fiscal policy Change in the budget
balance and in its components under government
control. It is usually measured as the residual of
the change in the balance after the exclusion of the
budgetary impact of automatic stabilisers. See also
fiscal stance.
Economic Policy Committee (EPC) Group of
senior government officials whose main task is to
prepare the discussions of the (ECOFIN) Council
on structural policies. It plays an important role in
the preparation of the Broad Economic Policy
Guidelines. It is also deals with policies related to
labour markets, methods to calculate cyclically-
adjusted budget balances and ageing populations.
Effective tax rate The ratio of broad categories of
tax revenue (labour income, capital income,
consumption) to their respective tax bases.
Effectiveness The same concept as efficiency
except that it links input to outcomes rather than
outputs.
Efficiency Can be defined in several ways, either
as the ratio of outputs to inputs or as the distance
to a production possibility frontier. Cost efficiency
measures the link between monetary inputs (funds)
and outputs; technical efficiency measures the link
between technical inputs and outputs. Output
efficiency indicates by how much the output can be
increased for a given input; input efficiency
indicates by how much the input can be reduced
for a given input.
Environmental taxes These include taxes on
energy, transport, pollution and resources
(excluding value added types of taxes because they
are levied on all products). Energy taxes include
taxes on energy products used for both transport
(e.g. petrol and diesel) and stationary purposes
(e.g. fuel oils, natural gas, coal and electricity).
Transport taxes include taxes related to the
ownership and use of motor vehicles. They also
include taxes on other transport equipment such as
planes and related transport services such as duties
on charter or scheduled flights. Pollution taxes
include taxes on measured or estimated emissions
to air (except CO2 taxes) and water, on the
management of waste, and on noise. Resource
taxes include any taxes linked to extraction or use
of a natural resource (e.g. extraction of gas and oil,
licences paid for hunting, fishing and the like).
Euro-Plus Pact Agreed in spring 2011 by the 17
Member States of the euro area, joined by
Bulgaria, Denmark, Latvia, Lithuania, Poland and
Romania. The Pact commits signatories to
economic coordination for competitiveness and
convergence, also in areas of national competence,
with concrete goals agreed on and reviewed on a
yearly basis by Heads of State or Government. It is
integrated into the European semester and the
Commission monitors the implementation of the
commitments.
ESA95 / ESA79 European accounting standards
for the reporting of economic data by the Member
States to the EU. As of 2000, ESA95 replaced the
earlier ESA79 standard with respect to the
comparison and analysis of national public finance
data.
European semester New governance architecture
approved by the Member States in September
2010. It means that the EU and the euro zone will
coordinate their budgetary and economic policies

European Commission
Tax reforms in EU Member States
108
ex ante, in line with the Europe 2020 strategy, the
Stability and Growth Pact and the Macroeconomic
Imbalances Procedure. On the basis of previous
discussions on the Commission’s Annual Growth
Survey, each summer the European Council and
the Council of Ministers provide policy advice
before Member States finalise their draft budgets.
Excessive Deficit Procedure (EDP) A procedure
according to which the Commission and the
Council monitor the development of national
budget balances and public debt in order to assess
and/or correct the risk of an excessive deficit in
each Member State. Its application has been
further clarified in the Stability and Growth Pact.
See also stability programmes.
Implicit tax rates General measure for the
effective average tax burden on different types of
economic income or activities, i.e. on labour,
consumption and capital, as the ratio between
revenue from the tax type under consideration and
its (maximum possible) base.
Implicit tax rate on consumption Ratio between
the revenue from all consumption taxes and the
final consumption expenditure of households.
Implicit tax rate on labour The sum of all direct
and indirect taxes and social contributions levied
on employed labour income as a percentage of
total compensation of employees from national
accounts.
Implicit tax rate on capital Ratio between taxes
on capital and aggregate capital and savings
income. Specifically, it includes taxes levied on
the income earned from savings and investments
by households and corporations as well as taxes,
related to stocks of capital, stemming from savings
and investment in previous periods. The
denominator is an approximation of world-wide
capital and business income of residents for
domestic tax purposes
(Real) implicit tax rate on energy Ratio between
total energy tax revenues and final energy
consumption, deflated with the cumulative %
change in the final demand deflator.
Fiscal consolidation An improvement in the
budget balance through measures of discretionary
fiscal policy, specified either by the amount of the
improvement or the period over which the
improvement continues.
General government As used by the EU in its
process of budgetary surveillance under the
Stability and Growth Pact and the excessive deficit
procedure, the general government sector covers
national government, regional and local
government, as well as social security funds.
Public enterprises are excluded, as are transfers to
and from the EU Budget.
Inactivity trap Measure for the disincentive to
return to employment from inactivity. The
inactivity trap is also often referred to as the
participation tax rate. The inactivity trap measures
the part of additional gross wage that is taxed away
in the form of increased taxes (personal income tax
and employee social security contributions (SSC)
and withdrawn benefits such as unemployment
benefits, social assistance, and housing benefits in
the event of an inactive person taking up a job.
Indirect taxation Taxes that are levied during the
production stage, and not on the income and
property arising from economic production
processes. Prominent examples of indirect taxation
are value added tax (VAT), excise duties, import
levies, energy and other environmental taxes.
Integrated guidelines A general policy instrument
for coordinating EU-wide and Member States'
economic structural reforms embedded in the
Lisbon strategy, whose main aim is to boost
economic growth and job creation in the EU.
Lisbon Strategy for Growth and Jobs
Partnership between the EU and Member States
for growth and more and better jobs. Originally
approved in 2000, the Lisbon Strategy was
revamped in 2005. On the basis of the Integrated
Guidelines (merger of the broad economic policy
guidelines and the employment guidelines, dealing
with macro-economic, micro-economic and
employment issues) for the period 2005-2008,
Member States drew up three-year national reform
programmes at the end of 2005. They reported on
the implementation of the national reform
programmes for the first time in autumn 2006. The
Commission analyses and summarises these
reports in an EU Annual Progress Report each year
in time for the Spring European Council.

Glossary
109
Low-wage trap Effective marginal tax rate
defined as the rate at which taxes are increased and
benefits withdrawn as earnings rise due to an
increase in work productivity. This kind of trap is
most likely to occur at relatively low wage levels
due to the fact that the withdrawal of social
transfers (mainly social assistance, in-work
benefits and housing benefits), which are usually
available only to persons with a low income, adds
to the marginal rate of income taxes and social
security contributions.
Medium-term budgetary framework An
institutional fiscal device that lets policy-makers
extend the horizon for fiscal policy-making beyond
the annual budgetary calendar (typically 3-5
years). Targets can be adjusted under medium-
term budgetary frameworks (MTBF) either on an
annual basis (flexible frameworks) or only at the
end of the MTBF horizon (fixed frameworks).
Medium-term objective (MTO) Represents a
budgetary position that safeguards against the risk
of breaching the 3% of GDP threshold of the
Treaty and ensures the long-term sustainability of
public finances.
One-off and temporary measures Government
transactions having a transitory budgetary effect
that does not lead to a sustained change in the
budgetary position. See also structural balance.
Policy-mix The overall stance of fiscal and
monetary policy. The policy-mix may consist of
various combinations of expansionary and
restrictive policies, with a given fiscal stance either
supported or offset by monetary policy.
Pro-cyclical fiscal policy A fiscal stance which
amplifies the economic cycle by increasing the
structural primary deficit during an economic
upturn, or by decreasing it in a downturn. A
neutral fiscal policy keeps the cyclically-adjusted
budget balance unchanged throughout the
economic cycle but allows the automatic
stabilisers to work. See also tax-smoothing.
QUEST The macroeconomic model of the EU
Member States plus the US and Japan developed
by the Directorate-General for Economic and
Financial Affairs of the European Commission.
Recently acceded Member States The countries
that became members of the EU in May 2004
include Cyprus, the Czech Republic, Estonia,
Hungary, Latvia, Lithuania, Malta, Poland,
Slovakia and Slovenia. Two additional countries,
Romania and Bulgaria joined in January 2007.
Social security contributions (SSC) Mandatory
contributions paid by employers and employees to
a social insurance scheme to cover pensions, health
care and other welfare provisions.
Stability and Growth Pact (SGP) Approved in
1997 and reformed in 2005, the SGP clarifies the
provisions of the Maastricht Treaty regarding the
surveillance of Member States' budgetary policies
and the monitoring of budget deficits during the
third phase of the EMU. The SGP consists of two
Council Regulations setting out legally binding
provisions to be followed by the European
Institutions and the Member States and two
Resolutions of the Amsterdam European Council
in (June 1997). See also Excessive Deficit
Procedure.
Stability programmes Medium-term budgetary
strategies presented by those Member States that
have already adopted the euro. They are updated
annually, according to the provisions of the
Stability and Growth Pact. See also Convergence
programmes.
Statutory tax rate on corporate income Taxation
of corporate income is not only conducted through
CIT (corporate income tax), but, in some Member
States, also through surcharges or even additional
taxes levied on tax bases that are similar, but often
not identical, to the CIT. In order to take these
features into account, the simple CIT rate has been
adjusted for comparison purposes. If several rates
exist, only the ‘basic’ (non-targeted) top rate is
presented; existing surcharges and averages of
local taxes are added to the standard rate.
Tax elasticity A parameter measuring the relative
change in tax revenues with respect to a relative
change in GDP. Tax elasticity is an input to
budgetary sensitivity.
Tax expenditure Public expenditure implemented
through the tax system by way of a special tax
concession — such as an exclusion, an exemption,
an allowance, a credit, a preferential rate or tax
European Commission
Tax reforms in EU Member States
110
deferral — that results in reduced tax liability for
certain subsets of taxpayers.
Tax gaps Measure used in the assessment of the
sustainability of public finances. They measure the
difference between the current tax ratio and the
constant tax ratio over a given projection period to
achieve a predetermined level of debt at the end of
that projection period.
Tax smoothing The idea that tax rates should be
kept stable in order to minimise the distortionary
effects of taxation, while leaving it up to automatic
stabilisers to smooth the economic cycle. It is also
referred to as neutral discretionary fiscal policy.
See also cyclical component of fiscal policy.
Tax wedge Difference between the wage costs of
an average worker for his/her employer and the
amount of net income that the worker receives in
return. That difference is represented by taxes,
including personal income taxes and compulsory
social security contributions.
Unemployment trap Measure for the disincentive
to return to employment from unemployment. It
measures the part of the additional gross wage that
is taxed away when a person returns to work from
unemployment. It takes into account the reduction
in benefits payments following the return to the
labour market, as well as higher taxes and
employee social security contributions.
VAT revenue ratio (VRR) The VRR is defined as
the ratio between the actual VAT revenue
collected and the revenue that would theoretically
be raised if VAT was applied at the standard rate
to all final consumption. In theory, the closer the
VAT system of a country is to the ‘pure’ VAT
regime (i.e. where all consumption is taxed at a
uniform rate), the closer its VRR is to 1. A low
VRR can indicate a reduction of the tax base due
to large exemptions or reduced rates (‘policy gap’)
or a failure to collect all tax as a result of fraud, for
instance (‘collection gap’).
VAT ‘collection gap’ The VAT gap is the
difference between accrued VAT receipts and the
theoretical net VAT liability for the economy as a
whole given the country's VAT system. The
theoretical net liability is estimated by identifying
the categories of expenditure that give rise to
irrecoverable VAT and combining these with
appropriate VAT rates.

Statistical annex
111
Table A.1: Total taxes (including social security contributions) and tax structure, % of GDP, 2000-2010, EU-27
Note: GDP-weighted EU-27 averages. Totals may be affected by rounding.
Source: Commission services.
2000 2001 2002 2003 2004 2005 2006 2007 2008 2009 2010
Structure by type of tax
Indirect taxes 13.7 13.4 13.3 13.3 13.3 13.4 13.5 13.5 13.1 12.9 13.2
VAT 7.0 6.9 6.8 6.8 6.8 6.9 7.0 7.0 6.9 6.7 7.0
Excise duties and consumption taxes 3.0 2.9 3.0 3.0 2.9 2.8 2.7 2.6 2.6 2.6 2.7
Other taxes on products (incl. import duties) 1.7 1.6 1.6 1.6 1.7 1.7 1.8 1.8 1.6 1.5 1.5
Other taxes on production 2.0 2.0 2.0 2.0 2.0 2.0 2.0 2.0 2.0 2.1 2.0
Direct taxes 14.1 13.6 13.1 12.9 12.8 13.2 13.7 13.9 13.8 12.8 12.6
Personal income 9.8 9.6 9.4 9.2 8.9 9.1 9.2 9.4 9.4 9.3 9.1
Corporate income 3.1 2.9 2.6 2.4 2.7 2.9 3.3 3.3 3.0 2.2 2.4
Other 1.1 1.1 1.1 1.3 1.2 1.2 1.2 1.2 1.3 1.2 1.2
Social contributions 12.7 12.6 12.5 12.7 12.6 12.5 12.4 12.2 12.5 12.9 12.7
Employers´ 7.2 7.2 7.2 7.3 7.2 7.2 7.1 7.1 7.2 7.4 7.3
Employees´ 4.1 4.0 3.9 3.9 3.9 3.8 3.8 3.7 3.8 3.9 3.8
Self- and non-employed 1.4 1.4 1.4 1.4 1.5 1.5 1.5 1.4 1.5 1.6 1.5
Total taxes (including SSC) 40.4 39.5 38.8 38.8 38.7 39.0 39.5 39.4 39.3 38.4 38.4
Structure by economic function
Consumption 11.4 11.1 11.1 11.1 11.1 11.1 11.1 11.0 10.8 10.7 11.0
Labour 20.2 20.1 19.8 19.8 19.5 19.5 19.3 19.2 19.6 20.0 19.6
Employed 18.6 18.5 18.2 18.2 17.9 17.8 17.7 17.7 18.1 18.4 18.1
Paid by employers 7.8 7.8 7.7 7.9 7.8 7.7 7.7 7.7 7.9 8.0 8.0
Paid by employees 10.9 10.7 10.5 10.4 10.1 10.1 10.1 10.0 10.2 10.3 10.1
Non-employed 1.6 1.6 1.6 1.6 1.6 1.6 1.6 1.5 1.5 1.6 1.5
Capital 8.9 8.4 8.0 8.0 8.2 8.5 9.2 9.3 8.9 7.8 7.8
Capital and business income 6.1 5.7 5.3 5.3 5.4 5.7 6.3 6.5 6.1 5.2 5.3
Income of corporations 3.2 2.9 2.7 2.6 2.8 3.0 3.4 3.4 3.1 2.3 2.4
Income of households 0.9 0.7 0.7 0.7 0.7 0.8 0.9 0.9 0.9 0.8 0.8
Income of self-employed (incl. SSC) 2.1 2.0 1.9 2.0 1.9 1.9 2.0 2.1 2.1 2.1 2.0
Stocks of capital / wealth 2.8 2.7 2.7 2.7 2.8 2.8 2.9 2.9 2.8 2.6 2.5
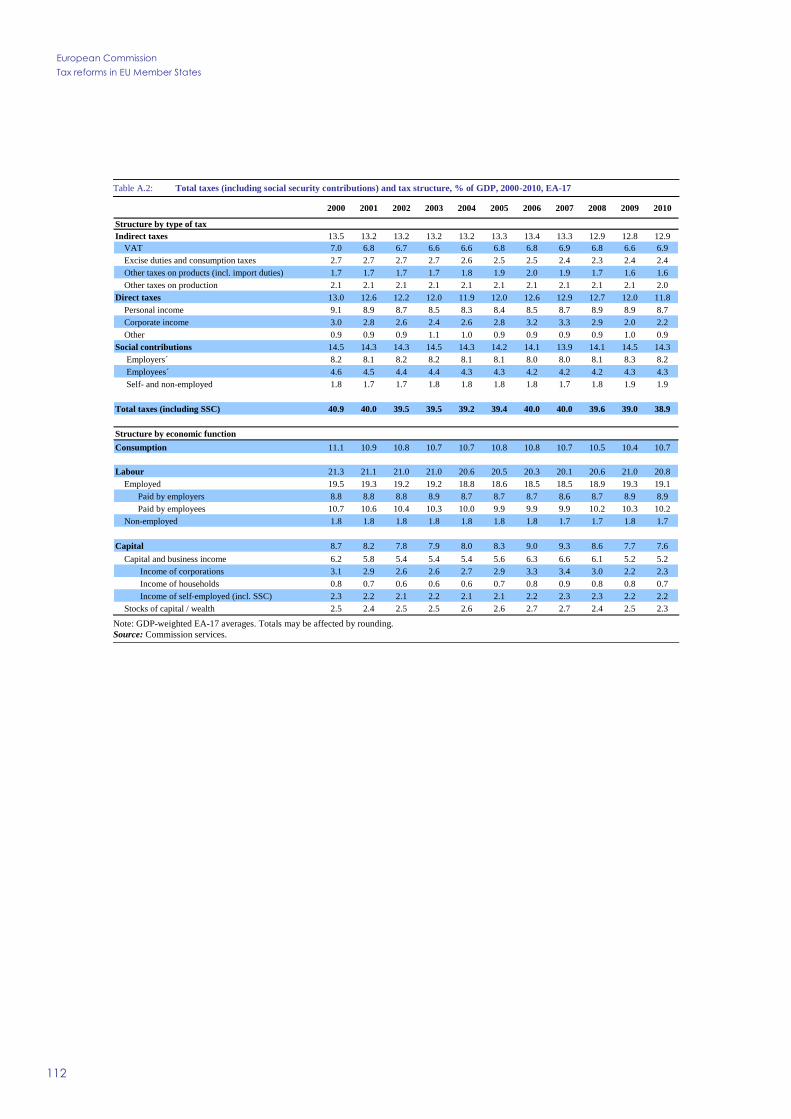
European Commission
Tax reforms in EU Member States
112
Table A.2: Total taxes (including social security contributions) and tax structure, % of GDP, 2000-2010, EA-17
Note: GDP-weighted EA-17 averages. Totals may be affected by rounding.
Source: Commission services.
2000 2001 2002 2003 2004 2005 2006 2007 2008 2009 2010
Structure by type of tax
Indirect taxes 13.5 13.2 13.2 13.2 13.2 13.3 13.4 13.3 12.9 12.8 12.9
VAT 7.0 6.8 6.7 6.6 6.6 6.8 6.8 6.9 6.8 6.6 6.9
Excise duties and consumption taxes 2.7 2.7 2.7 2.7 2.6 2.5 2.5 2.4 2.3 2.4 2.4
Other taxes on products (incl. import duties) 1.7 1.7 1.7 1.7 1.8 1.9 2.0 1.9 1.7 1.6 1.6
Other taxes on production 2.1 2.1 2.1 2.1 2.1 2.1 2.1 2.1 2.1 2.1 2.0
Direct taxes 13.0 12.6 12.2 12.0 11.9 12.0 12.6 12.9 12.7 12.0 11.8
Personal income 9.1 8.9 8.7 8.5 8.3 8.4 8.5 8.7 8.9 8.9 8.7
Corporate income 3.0 2.8 2.6 2.4 2.6 2.8 3.2 3.3 2.9 2.0 2.2
Other 0.9 0.9 0.9 1.1 1.0 0.9 0.9 0.9 0.9 1.0 0.9
Social contributions 14.5 14.3 14.3 14.5 14.3 14.2 14.1 13.9 14.1 14.5 14.3
Employers´ 8.2 8.1 8.2 8.2 8.1 8.1 8.0 8.0 8.1 8.3 8.2
Employees´ 4.6 4.5 4.4 4.4 4.3 4.3 4.2 4.2 4.2 4.3 4.3
Self- and non-employed 1.8 1.7 1.7 1.8 1.8 1.8 1.8 1.7 1.8 1.9 1.9
Total taxes (including SSC) 40.9 40.0 39.5 39.5 39.2 39.4 40.0 40.0 39.6 39.0 38.9
Structure by economic function
Consumption 11.1 10.9 10.8 10.7 10.7 10.8 10.8 10.7 10.5 10.4 10.7
Labour 21.3 21.1 21.0 21.0 20.6 20.5 20.3 20.1 20.6 21.0 20.8
Employed 19.5 19.3 19.2 19.2 18.8 18.6 18.5 18.5 18.9 19.3 19.1
Paid by employers 8.8 8.8 8.8 8.9 8.7 8.7 8.7 8.6 8.7 8.9 8.9
Paid by employees 10.7 10.6 10.4 10.3 10.0 9.9 9.9 9.9 10.2 10.3 10.2
Non-employed 1.8 1.8 1.8 1.8 1.8 1.8 1.8 1.7 1.7 1.8 1.7
Capital 8.7 8.2 7.8 7.9 8.0 8.3 9.0 9.3 8.6 7.7 7.6
Capital and business income 6.2 5.8 5.4 5.4 5.4 5.6 6.3 6.6 6.1 5.2 5.2
Income of corporations 3.1 2.9 2.6 2.6 2.7 2.9 3.3 3.4 3.0 2.2 2.3
Income of households 0.8 0.7 0.6 0.6 0.6 0.7 0.8 0.9 0.8 0.8 0.7
Income of self-employed (incl. SSC) 2.3 2.2 2.1 2.2 2.1 2.1 2.2 2.3 2.3 2.2 2.2
Stocks of capital / wealth 2.5 2.4 2.5 2.5 2.6 2.6 2.7 2.7 2.4 2.5 2.3

1. Statistical annex
113
Table A.3: Development of implicit tax rates, in %
Note: EU and EA averages are adjusted for missing data.
Source: Commission services.
1995 2000 2010 1995 2000 2010 1995 2000 2010
BE 43.6 43.6 42.5 20.4 21.8 21.4 25.5 29.5 29.5
BG 30.8 38.1 24.4 17.3 18.5 22.8 : : :
CZ 41.4 41.2 39.0 20.9 18.8 21.1 22.4 18.7 16.7
DK 40.2 41.0 34.8 30.5 33.4 31.5 29.9 36.0 :
DE 38.8 39.1 37.4 18.8 19.2 19.8 21.3 27.0 20.7
EE 38.6 37.8 37.0 21.2 19.5 25.6 : 5.8 9.1
IE 29.7 28.5 26.1 24.7 25.5 21.6 : : 14.0
EL : 34.5 31.3 : 16.5 15.8 : : 16.5
ES 31.0 30.5 33.0 14.2 15.8 14.6 : 30.8 :
FR 41.1 41.9 41.0 21.7 21.1 19.3 32.2 37.8 37.2
IT 37.8 41.8 42.6 17.4 17.8 16.8 27.3 29.5 34.9
CY 22.1 21.6 27.0 13.0 12.6 18.8 18.0 24.7 31.1
LV 39.2 36.7 32.5 19.4 18.7 17.3 20.5 11.5 7.4
LT 34.5 41.2 31.7 17.7 18.0 18.2 12.7 7.1 6.8
LU 29.3 29.9 32.0 21.0 23.0 27.3 : : :
HU 42.3 41.4 39.4 29.6 27.2 27.2 14.9 18.5 17.5
MT 20.1 21.8 21.7 14.8 15.6 18.9 : : :
NL 34.8 35.0 36.9 23.3 23.8 27.0 21.0 20.0 12.5
AT 38.5 40.1 40.5 20.6 22.2 21.4 26.6 27.2 24.1
PL 36.8 33.6 30.1 20.7 17.8 20.2 20.9 20.5 20.5
PT 22.3 22.3 23.4 18.1 18.2 17.4 21.5 31.6 30.7
RO 31.6 33.6 27.4 12.6 17.0 18.9 : : :
SI 38.5 37.6 35.0 24.4 23.3 24.1 13.3 17.2 22.5
SK 38.5 36.3 32.0 26.4 21.7 17.7 35.0 22.9 15.9
FI 44.2 44.0 39.3 27.6 28.5 25.2 31.1 38.1 28.4
SE 46.8 46.8 39.0 27.9 26.3 28.1 19.9 42.7 34.9
UK 25.9 25.9 25.7 19.6 18.9 18.4 34.3 43.3 :
EU-27 average
GDP-weighted 36.8 36.7 36.0 19.9 20.0 19.7 : : :
arithmetic 35.3 35.8 33.4 20.8 20.8 21.3 : : :
EA-17 average
GDP-weighted 38.1 38.8 38.1 19.4 19.7 19.2 25.7 29.6 27.5
arithmetic 34.3 34.5 34.0 20.2 20.3 20.7 22.8 25.0 23.7
EU-25 average
GDP-weighted 36.8 36.7 36.1 20.0 20.0 19.7 26.6 32.1 28.8
arithmetic 35.6 35.8 34.0 21.2 21.0 21.4 22.5 24.9 23.3
Implicit tax rate on labour Implicit tax rate on consumption Implicit tax rate on capital

European Commission
Tax reforms in EU Member States
114
Table A.4: Statutory tax rates, in %
Note: The top PIT rates reflect the statutory tax rate for the highest income bracket. The rates include surcharges, state and local taxes. Only the 'basic'
(non-targeted) top CIT rate is presented here. Existing surcharges and averages of local taxes are included. For details of the calculation of the top PIT
rates and CIT rates see European Commission (2012a).
Source: Commission services.
1995 2000 2005 2010 2011 2012 1995 2000 2005 2010 2011 2012
BE 60.6 60.6 53.7 53.7 53.7 53.7 40.2 40.2 34.0 34.0 34.0 34.0
BG 50.0 40.0 24.0 10.0 10.0 10.0 40.0 32.5 15.0 10.0 10.0 10.0
CZ 43.0 32.0 32.0 15.0 15.0 15.0 41.0 31.0 26.0 19.0 19.0 19.0
DK 65.7 62.9 62.3 55.4 55.4 55.4 34.0 32.0 28.0 25.0 25.0 25.0
DE 57.0 53.8 44.3 47.5 47.5 47.5 56.8 51.6 38.7 29.8 29.8 29.8
EE 26.0 26.0 24.0 21.0 21.0 21.0 26.0 26.0 24.0 21.0 21.0 21.0
IE 48.0 44.0 42.0 41.0 41.0 41.0 40.0 24.0 12.5 12.5 12.5 12.5
EL 45.0 45.0 40.0 49.0 49.0 49.0 40.0 40.0 32.0 34.0 30.0 30.0
ES 56.0 48.0 45.0 43.0 45.0 52.0 35.0 35.0 35.0 30.0 30.0 30.0
FR 59.1 59.0 53.5 45.8 46.7 46.8 36.7 37.8 35.0 34.4 34.4 36.1
IT 51.0 45.9 44.1 45.2 47.3 47.3 52.2 41.3 37.3 31.4 31.4 31.4
CY 40.0 40.0 30.0 30.0 30.0 38.5 25.0 29.0 10.0 10.0 10.0 10.0
LV 25.0 25.0 25.0 26.0 25.0 25.0 25.0 25.0 15.0 15.0 15.0 15.0
LT 33.0 33.0 33.0 15.0 15.0 15.0 29.0 24.0 15.0 15.0 15.0 15.0
LU 51.3 47.2 39.0 39.0 42.1 41.3 40.9 37.5 30.4 28.6 28.8 28.8
HU 44.0 44.0 38.0 40.6 20.3 20.3 19.6 19.6 17.5 20.6 20.6 20.6
MT 35.0 35.0 35.0 35.0 35.0 35.0 35.0 35.0 35.0 35.0 35.0 35.0
NL 60.0 60.0 52.0 52.0 52.0 52.0 35.0 35.0 31.5 25.5 25.0 25.0
AT 50.0 50.0 50.0 50.0 50.0 50.0 34.0 34.0 25.0 25.0 25.0 25.0
PL 45.0 40.0 40.0 32.0 32.0 32.0 40.0 30.0 19.0 19.0 19.0 19.0
PT 40.0 40.0 40.0 45.9 50.0 49.0 39.6 35.2 27.5 29.0 29.0 31.5
RO 40.0 40.0 16.0 16.0 16.0 16.0 38.0 25.0 16.0 16.0 16.0 16.0
SI 50.0 50.0 50.0 41.0 41.0 41.0 25.0 25.0 25.0 20.0 20.0 20.0
SK 42.0 42.0 19.0 19.0 19.0 19.0 40.0 29.0 19.0 19.0 19.0 19.0
FI 62.2 54.0 51.0 49.0 49.2 49.0 25.0 29.0 26.0 26.0 26.0 24.5
SE 61.3 51.5 56.6 56.6 56.6 56.6 28.0 28.0 28.0 26.3 26.3 26.3
UK 40.0 40.0 40.0 50.0 50.0 50.0 33.0 30.0 30.0 28.0 26.0 24.0
EU-27 arithmetic 47.4 44.8 40.0 37.9 37.6 38.1 35.3 31.9 25.5 23.7 23.4 23.5
EA-17 arithmetic 49.0 47.1 41.9 41.6 42.3 43.1 36.8 34.4 28.1 26.2 25.9 26.1
Adjusted top corporate income tax rateTop personal income tax rate

1. Statistical annex
115
Table A.5: Energy tax revenues in relation to final energy consumption
Note: Nominal: EUR per tonne of oil equivalent; Real: EUR per tonne of equivalent, deflated with cumulative % change in final demand deflator
(2000 = 100). 2009 are provisional data.
Source: Commission services.
2000 2008 2009 2000 2008 2009
BE 96.7 114.9 125.2 BE 96.7 95.6 105.2
BG 39.8 107.6 108.6 BG 39.8 73.7 73.3
CZ 53.4 132.0 130.6 CZ 53.4 77.2 80.7
DK 299.2 317.5 330.9 DK 299.2 275.7 283.2
DE 191.8 203.8 215.4 DE 191.8 181.6 191.8
EE 31.4 104.0 127.5 EE 31.4 71.7 88.7
IE 140.4 174.5 198.3 IE 140.4 134.4 159.7
EL 117.3 126.1 135.5 EL 117.3 98.7 105.4
ES 138.0 147.9 154.2 ES 138.0 113.5 119.7
FR 166.5 173.5 178.8 FR 166.5 148.2 153.6
IT 245.3 232.6 259.4 IT 245.3 189.1 210.9
CY 43.2 137.8 142.1 CY 43.2 111.5 114.8
LV 48.2 92.2 97.1 LV 48.2 67.9 69.6
LT 57.9 101.6 116.4 LT 57.9 75.3 82.6
LU 167.5 210.2 210.1 LU 167.5 176.9 175.0
HU 77.2 121.4 112.6 HU 77.2 76.4 76.2
MT 161.4 176.0 195.5 MT 161.4 157.1 171.4
NL 153.5 224.8 231.9 NL 153.5 188.4 195.3
AT 138.8 166.8 169.5 AT 138.8 143.4 144.9
PL 58.7 127.6 106.8 PL 58.7 91.4 91.9
PT 111.4 173.4 175.3 PT 111.4 138.0 143.0
RO 58.2 80.1 86.1 RO 58.2 54.2 64.7
SI 118.5 167.7 226.8 SI 118.5 135.1 183.5
SK 39.7 100.7 100.7 SK 39.7 51.5 49.6
FI 109.8 124.2 129.1 FI 109.8 110.0 112.5
SE 179.9 220.8 210.0 SE 179.9 221.3 228.3
UK 249.2 220.3 220.9 UK 249.2 244.3 270.2
EU-27 averages EU-27 averages
GDP-weighted 187.0 190.3 198.5 GDP-weighted 187.0 168.4 179.3
base-weighted 170.1 183.0 190.0 base-weighted 170.1 160.0 170.9
EA-17 averages EA-17 averages
GDP-weighted 176.8 186.8 198.3 GDP-weighted 176.8 157.2 167.3
base-weighted 171.0 184.2 195.7 base-weighted 171.0 154.9 165.1
Nominal Real (2000 deflator)

European Commission
Tax reforms in EU Member States
116
Table A.6: The composition of tax wedge in 2011, single average income worker
Note: *Data for non-OECD-EU countries (BG, LV, LT, MT and RO) are only available for 2010; ** CY data for 2007. For these countries, changes in
tax wedge refer to period 2009-2010 (for CY to period 2006-2007).
Source: Commission services.
Country Tax wedge Income tax Employee SSC Employer SSC Tax wedge Income tax Employee SSC Employer SSC
(1) (2) (3) (4) (1) (2) (3) (4)
BE 55.5 21.7 10.8 23.1 0.2 0.0 0.0 0.1
BG* 32.5 7.4 11.0 15.5 -1.3 0.1 0.2 -1.6
CZ 42.5 8.9 8.2 25.4 0.4 0.4 0.0 0.0
DK 38.4 28.0 10.7 0.0 0.1 0.1 0.0 0.0
DE 49.8 15.9 17.4 16.5 0.6 0.0 0.3 0.3
EE 40.1 12.5 2.1 25.6 0.1 0.1 0.0 0.0
IE 26.8 13.5 3.6 9.7 0.9 3.8 -2.9 0.0
EL 38.0 3.0 12.8 22.2 -0.2 -0.8 0.3 0.3
ES 39.9 12.0 4.9 23.0 0.1 0.1 0.0 0.0
FR 49.4 10.0 9.6 29.7 0.0 0.0 0.0 0.0
IT 47.6 16.1 7.2 24.3 0.4 0.4 0.0 0.0
CY** 13.9 2.1 5.9 5.9 --- --- --- ---
LV* 44.2 14.9 7.3 19.4 -0.8 -0.8 0.0 0.0
LT* 40.7 10.1 6.9 23.8 -0.9 -5.5 4.6 0.0
LU 36.0 13.3 11.7 11.0 1.7 0.3 0.7 0.6
HU 49.4 13.6 13.6 22.2 2.8 2.4 0.4 0.0
MT* 22.4 8.5 6.9 6.9 -0.5 -0.3 -0.1 -0.1
NL 37.8 14.5 14.0 9.2 -0.3 -0.1 0.0 -0.2
AT 48.4 11.9 14.0 22.6 0.2 0.2 0.0 0.0
PL 34.3 5.9 15.5 12.9 0.1 0.1 0.0 0.0
PT 39.0 10.9 8.9 19.2 1.4 1.4 0.0 0.0
RO* 44.3 9.3 12.8 22.3 2.0 -0.2 0.5 1.7
SI 42.5 9.6 19.0 13.9 0.0 0.0 0.0 0.0
SK 38.9 7.5 10.6 20.8 1.0 1.0 0.0 0.0
FI 42.7 18.5 5.8 18.4 0.2 0.1 0.0 0.1
SE 42.8 13.6 5.3 23.9 0.0 0.0 0.0 0.0
UK 32.5 14.1 8.5 9.9 -0.1 -0.6 0.3 0.2
EU-27 weighted average 43.7 13.7 10.7 19.3 0.3 0.1 0.1 0.1
EU-17 weighted average 46.4 13.8 11.2 21.4 0.3 0.2 0.0 0.1
Income tax plus employees' and employers' social security
contributions (as % of labour costs, 2011)Annual change 2011/10 (in percentage points)
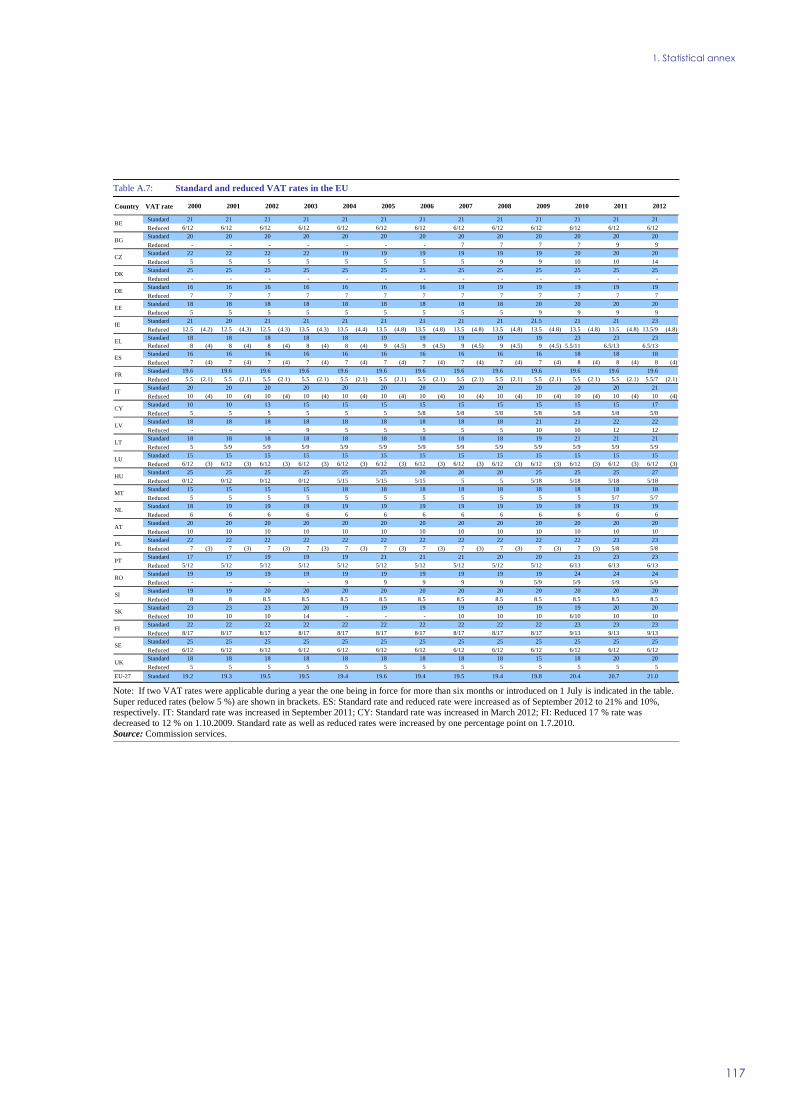
1. Statistical annex
117
Table A.7: Standard and reduced VAT rates in the EU
Note: If two VAT rates were applicable during a year the one being in force for more than six months or introduced on 1 July is indicated in the table.
Super reduced rates (below 5 %) are shown in brackets. ES: Standard rate and reduced rate were increased as of September 2012 to 21% and 10%,
respectively. IT: Standard rate was increased in September 2011; CY: Standard rate was increased in March 2012; FI: Reduced 17 % rate was
decreased to 12 % on 1.10.2009. Standard rate as well as reduced rates were increased by one percentage point on 1.7.2010.
Source: Commission services.
Country VAT rate
Standard 21 21 21 21 21 21 21 21 21 21 21 21 21
Reduced 6/12 6/12 6/12 6/12 6/12 6/12 6/12 6/12 6/12 6/12 6/12 6/12 6/12
Standard 20 20 20 20 20 20 20 20 20 20 20 20 20
Reduced - - - - - - - 7 7 7 7 9 9
Standard 22 22 22 22 19 19 19 19 19 19 20 20 20
Reduced 5 5 5 5 5 5 5 5 9 9 10 10 14
Standard 25 25 25 25 25 25 25 25 25 25 25 25 25
Reduced - - - - - - - - - - - - -
Standard 16 16 16 16 16 16 16 19 19 19 19 19 19
Reduced 7 7 7 7 7 7 7 7 7 7 7 7 7
Standard 18 18 18 18 18 18 18 18 18 20 20 20 20
Reduced 5 5 5 5 5 5 5 5 5 9 9 9 9
Standard 21 20 21 21 21 21 21 21 21 21.5 21 21 23
Reduced 12.5 (4.2) 12.5 (4.3) 12.5 (4.3) 13.5 (4.3) 13.5 (4.4) 13.5 (4.8) 13.5 (4.8) 13.5 (4.8) 13.5 (4.8) 13.5 (4.8) 13.5 (4.8) 13.5 (4.8) 13.5/9 (4.8)
Standard 18 18 18 18 18 19 19 19 19 19 23 23 23
Reduced 8 (4) 8 (4) 8 (4) 8 (4) 8 (4) 9 (4.5) 9 (4.5) 9 (4.5) 9 (4.5) 9 (4.5) 5.5/11 6.5/13 6.5/13
Standard 16 16 16 16 16 16 16 16 16 16 18 18 18
Reduced 7 (4) 7 (4) 7 (4) 7 (4) 7 (4) 7 (4) 7 (4) 7 (4) 7 (4) 7 (4) 8 (4) 8 (4) 8 (4)
Standard 19.6 19.6 19.6 19.6 19.6 19.6 19.6 19.6 19.6 19.6 19.6 19.6 19.6
Reduced 5.5 (2.1) 5.5 (2.1) 5.5 (2.1) 5.5 (2.1) 5.5 (2.1) 5.5 (2.1) 5.5 (2.1) 5.5 (2.1) 5.5 (2.1) 5.5 (2.1) 5.5 (2.1) 5.5 (2.1) 5.5/7 (2.1)
Standard 20 20 20 20 20 20 20 20 20 20 20 20 21
Reduced 10 (4) 10 (4) 10 (4) 10 (4) 10 (4) 10 (4) 10 (4) 10 (4) 10 (4) 10 (4) 10 (4) 10 (4) 10 (4)
Standard 10 10 13 15 15 15 15 15 15 15 15 15 17
Reduced 5 5 5 5 5 5 5/8 5/8 5/8 5/8 5/8 5/8 5/8
Standard 18 18 18 18 18 18 18 18 18 21 21 22 22
Reduced - - - 9 5 5 5 5 5 10 10 12 12
Standard 18 18 18 18 18 18 18 18 18 19 21 21 21
Reduced 5 5/9 5/9 5/9 5/9 5/9 5/9 5/9 5/9 5/9 5/9 5/9 5/9
Standard 15 15 15 15 15 15 15 15 15 15 15 15 15
Reduced 6/12 (3) 6/12 (3) 6/12 (3) 6/12 (3) 6/12 (3) 6/12 (3) 6/12 (3) 6/12 (3) 6/12 (3) 6/12 (3) 6/12 (3) 6/12 (3) 6/12 (3)
Standard 25 25 25 25 25 25 20 20 20 25 25 25 27
Reduced 0/12 0/12 0/12 0/12 5/15 5/15 5/15 5 5 5/18 5/18 5/18 5/18
Standard 15 15 15 15 18 18 18 18 18 18 18 18 18
Reduced 5 5 5 5 5 5 5 5 5 5 5 5/7 5/7
Standard 18 19 19 19 19 19 19 19 19 19 19 19 19
Reduced 6 6 6 6 6 6 6 6 6 6 6 6 6
Standard 20 20 20 20 20 20 20 20 20 20 20 20 20
Reduced 10 10 10 10 10 10 10 10 10 10 10 10 10
Standard 22 22 22 22 22 22 22 22 22 22 22 23 23
Reduced 7 (3) 7 (3) 7 (3) 7 (3) 7 (3) 7 (3) 7 (3) 7 (3) 7 (3) 7 (3) 7 (3) 5/8 5/8
Standard 17 17 19 19 19 21 21 21 20 20 21 23 23
Reduced 5/12 5/12 5/12 5/12 5/12 5/12 5/12 5/12 5/12 5/12 6/13 6/13 6/13
Standard 19 19 19 19 19 19 19 19 19 19 24 24 24
Reduced - - - - 9 9 9 9 9 5/9 5/9 5/9 5/9
Standard 19 19 20 20 20 20 20 20 20 20 20 20 20
Reduced 8 8 8.5 8.5 8.5 8.5 8.5 8.5 8.5 8.5 8.5 8.5 8.5
Standard 23 23 23 20 19 19 19 19 19 19 19 20 20
Reduced 10 10 10 14 - - - 10 10 10 6/10 10 10
Standard 22 22 22 22 22 22 22 22 22 22 23 23 23
Reduced 8/17 8/17 8/17 8/17 8/17 8/17 8/17 8/17 8/17 8/17 9/13 9/13 9/13
Standard 25 25 25 25 25 25 25 25 25 25 25 25 25
Reduced 6/12 6/12 6/12 6/12 6/12 6/12 6/12 6/12 6/12 6/12 6/12 6/12 6/12
Standard 18 18 18 18 18 18 18 18 18 15 18 20 20
Reduced 5 5 5 5 5 5 5 5 5 5 5 5 5
EU-27 Standard 19.2 19.3 19.5 19.5 19.4 19.6 19.4 19.5 19.4 19.8 20.4 20.7 21.0
SK
FI
SE
UK
NL
AT
PL
PT
RO
SI
CY
LV
LT
LU
HU
MT
EE
IE
EL
ES
FR
IT
2012
BE
BG
CZ
DK
DE
2006 2007 2008 2009 2010 20112000 2001 2002 2003 2004 2005

European Commission
Tax reforms in EU Member States
118
Table A.8: Measures of tax progressivity
Source: Commission services.
Index of Progressivity
(Single no ch 100% of
AW)
Index of Progressivity
(Single no ch 167% of
AW)
Tax wedge 167% /
67% (single no ch.)
BE 0.24 0.22 1.22
BG NA NA 1.00
CZ 0.11 0.07 1.15
DK 0.06 0.20 1.21
DE 0.21 -0.14 1.14
EE 0.05 0.03 1.07
IE 0.41 0.29 2.17
EL 0.14 0.14 1.27
ES 0.14 -0.10 1.16
FR 0.04 0.13 1.16
IT 0.12 0.19 1.19
CY NA NA NA
LV NA NA 1.03
LT NA NA 1.08
LU 0.30 0.20 1.50
HU 0.28 0.00 1.21
MT NA NA 1.47
NL 0.15 0.13 1.25
AT 0.24 -0.19 1.18
PL 0.03 0.02 1.05
PT 0.19 0.26 1.34
RO NA N/A 1.05
SI 0.15 0.24 1.23
SK 0.09 0.03 1.16
FI 0.25 0.17 1.31
SE 0.09 0.33 1.25
UK 0.11 0.18 1.27
EU-21/27 0.16 0.11 1.19
EA --- --- 1.18
Unweighted average:

TAXATION PAPERS Taxation Papers can be accessed and downloaded free of charge at the following address: http://ec.europa.eu/taxation_customs/taxation/gen_info/economic_analysis/tax_papers/index_en.htm The following papers have been issued. Taxation Paper No 34 (2012): Tax reforms in EU Member States: Tax policy challenges for economic growth and fiscal sustainability. Written by Directorate-General for Taxation and Customs Union and Directorate-General for Economic and Financial Affairs, European Commission. Taxation Paper No 33 (2012): The Debt-Equity Tax Bias: consequences and solutions. Written by Serena Fatica, Thomas Hemmelgarn and Gaëtan Nicodème Taxation Paper No 32 (2012): Regressivity of environmental taxation: myth or reality? Written by Katri Kosonen Taxation Paper No 31 (2012): Review of Current Practices for Taxation of Financial Instruments, Profits and Remuneration of the Financial Sector. Written by PWC Taxation Paper No 30 (2012): Tax Elasticities of Financial Instruments, Profits and Remuneration. Written by Copenhagen Economics. Taxation Paper No 29 (2011): Quality of Taxation and the Crisis: Tax shifts from a growth perspective. Written by Doris Prammer. Taxation Paper No 28 (2011): Tax reforms in EU Member States. Written by European Commission Taxation Paper No 27 (2011): The Role of Housing Tax Provisions in the 2008 Financial Crisis. Written by Thomas Hemmelgarn, Gaetan Nicodeme, and Ernesto Zangari Taxation Paper No 26 (2010): Financing Bologna Students' Mobility. Written by Marcel Gérard. Taxation Paper No 25 (2010): Financial Sector Taxation. Written by European Commission. Taxation Paper No 24 (2010): Tax Policy after the Crisis – Monitoring Tax Revenues and Tax Reforms in EU Member States – 2010 Report. Written by European Commission. Taxation Paper No 23 (2010): Innovative Financing at a Global Level. Written by European Commission. Taxation Paper No 22 (2010): Company Car Taxation. Written by Copenhagen Economics. Taxation Paper No 21 (2010): Taxation and the Quality of Institutions: Asymmetric Effects on FDI. Written by Serena Fatica. Taxation Paper No 20 (2010): The 2008 Financial Crisis and Taxation Policy. Written by Thomas Hemmelgarn and Gaëtan Nicodème. Taxation Paper No 19 (2009): The role of fiscal instruments in environmental policy.' Written by Katri Kosonen and Gaëtan Nicodème. Taxation Paper No 18 (2009): Tax Co-ordination in Europe: Assessing the First Years of the EU-Savings Taxation Directive. Written by Thomas Hemmelgarn and Gaëtan Nicodème. Taxation Paper No 17 (2009): Alternative Systems of Business Tax in Europe: An applied analysis of ACE and CBIT Reforms. Written by Ruud A. de Mooij and Michael P. Devereux.

Taxation Paper No 16 (2009): International Taxation and multinational firm location decisions. Written by Salvador Barrios, Harry Huizinga, Luc Laeven and Gaëtan Nicodème. Taxation Paper No 15 (2009): Corporate income tax and economic distortions. Written by Gaëtan Nicodème. Taxation Paper No 14 (2009): Corporate tax rates in an enlarged European Union. Written by Christina Elschner and Werner Vanborren. Taxation Paper No 13 (2008): Study on reduced VAT applied to goods and services in the Member States of the European Union. Final report written by Copenhagen Economics. Taxation Paper No 12 (2008): The corporate income tax rate-revenue paradox: evidence in the EU. Written by Joanna Piotrowska and Werner Vanborren. Taxation Paper No 11 (2007): Corporate tax policy and incorporation in the EU. Written by Ruud A. de Mooij and Gaëtan Nicodème. Taxation Paper No 10 (2007): A history of the 'Tax Package': The principles and issues underlying the Community approach. Written by Philippe Cattoir. Taxation Paper No 9 (2006): The Delineation and Apportionment of an EU Consolidated Tax Base for Multi-jurisdictional Corporate Income Taxation: a Review of Issues and Options. Written by Ana Agúndez-García. Taxation Paper No 8 (2005): Formulary Apportionment and Group Taxation in the European Union: Insights from the United States and Canada. Written by Joann Martens Weiner. Taxation Paper No 7 (2005): Measuring the effective levels of company taxation in the new member States : A quantitative analysis. Written by Martin Finkenzeller and Christoph Spengel. Taxation Paper No 6 (2005): Corporate income tax and the taxation of income from capital. Some evidence from the past reforms and the present debate on corporate income taxation in Belgium. Written by Christian Valenduc. Taxation Paper No 5 (2005): An implicit tax rate for non-financial corporations: Definition and comparison with other tax indicators. Written by Claudius Schmidt-Faber. Taxation Paper No 4 (2005): Examination of the macroeconomic implicit tax rate on labour derived by the European Commission. Written by Peter Heijmans and Paolo Acciari. Taxation Paper No 3 (2005): European Commission Staff Working Paper. Taxation Paper No 2 (2004): VAT indicators. Written by Alexandre Mathis. Taxation Paper No 1 (2004): Tax-based EU own resources: an assessment. Written by Philippe Cattoir.

European Commission
Taxation papers – Tax reforms in EU Member States: Tax policy challenges for economic growth and fiscal sustainability
Luxembourg: Publications Office of the European Union
2012 — 118 pp. — 21 x 29.7 cm
ISBN 978-92-79-26383-5
DOI: 10.2778/30527
HOW TO OBTAIN EU PUBLICATIONS
Free publications:
• via EU Bookshop (http://bookshop.europa.eu);
• at the European Commission’s representations or delegations. You can obtain their contact details on the Internet (http://ec.europa.eu) or by sending a fax to +352 2929-42758.
Priced publications:
• via EU Bookshop (http://bookshop.europa.eu).
Priced subscriptions (e.g. annual series of the Official Journal of the European Union and reports of cases before the Court of Justice of the European Union):
• via one of the sales agents of the Publications Office of the European Union (http://publications.europa.eu/others/agents/index_en.htm).

CATALOGUE
KP-AC
-12-034-EN-C