Embed Size (px)
Citation preview
National ResearchCouncil Canada
Institute forInformation Technology
Conseil nationalde recherches Canada
Institut de Technologiede l’information
The Application of SubjectiveEstimates of Effectiveness toControlling SoftwareInspections
Khaled El Emam, Oliver Laitenberger,and Thomas HarbichOctober 1999
ERB-1060
Canada NRC 43604
National ResearchCouncil Canada
Institute forInformation Technology
Conseil nationalde recherches Canada
Institut de Technologiede l’information
The Application of Subjective Estimates ofEffectiveness to Controlling Software Inspections
Khaled El Emam, Oliver Laitenberger,and Thomas HarbichOctober 1999
Copyright 1999 byNational Research Council of Canada
Permission is granted to quote short excerpts and to reproduce figures and tables from this report,provided that the source of such material is fully acknowledged.
1
The Application of Subjective Estimates of Effectiveness toControlling Software Inspections
Khaled El Emam1 Oliver Laitenberger Thomas HarbichNational Research Council,
CanadaInstitute for Information
TechnologyBuilding M-50, Montreal Road
Ottawa, OntarioCanada K1A OR6
Fraunhofer Institute forExperimental Software Engineering
Sauerwiesen 6D-67661 Kaiserslautern
Germany+49 (0)6301 [email protected]
Bosch Telecom GmbHGerberstrasse 33
D-71520 BacknangGermany
+49 (0)7191 13 [email protected]
AbstractOne of the recently proposed tools for controlling software inspections is capture-recapture models.
These are models that can be used to estimate the number of remaining defects in a software document
after an inspection. Based on this information one can decide whether to reinspect a document to ensure
that it is below a prespecified defect density threshold, and that the inspection process itself has attained
a minimal level of effectiveness. This line of work has also recently been extended with other techniques,
such as the Detection Profile Method. In this paper we investigate an alternative approach: the use of
subjective estimates of effectiveness by the inspectors for making the reinspection decision. We
performed a study with 30 professional software engineers and found that the median relative error of the
engineers’ subjective estimates of defect content to be zero, and that the reinspection decision based on
that estimate is consistently more correct than the default decision of never reinspecting. This means that
subjective estimates provide a good basis for ensuring product quality and inspection process
effectiveness during software inspections. Since a subjective estimation procedure can be easily
integrated into existing inspection processes, it represents a good starting point for practitioners before
introducing more objective decision making criteria by means of capture-recapture models or the Defect
Detection Profile Method.
1 IntroductionIn the recent past, there has been a mushrooming of research activity in developing and improving defect
content estimation techniques (DCETs) for software inspections. All of these techniques use quantitative
models for estimating the number of defects in a software document from data collected after a software
inspection has been carried out. The logic behind applying DCETs is that by estimating the number of
defects in a document, the remaining defects can be calculated, and subsequently an objective decision
can be made on whether to reinspect the software document or to let it pass to the next phase. In this
2
manner, the document quality (defined in terms of defect density) and the inspection process quality
(defined in terms of its effectiveness) can be controlled. Objectivity refers to the fact that the decision
making process does not depend on human judgment.
Two classes of DCETs have been studied: capture-recapture (CR) models and the Detection Profile
Method (DPM). CR models originate from wildlife research. These models have been applied in biology to
the estimation of the size of animal populations, and epidemiology to estimate the size of diseased
populations and birth and death rates. The same models can be applied in the context of a software
inspection to estimate the number of defects in a software document.
The DPM (Wohlin and Runeson, 1998) involves fitting a curve to the data obtained from an inspection,
and using that for predicting the total number of defects in a document. Further investigations have
resulted in improvements to DPM and the proposal of a procedure for selection between CR and DPM
(Briand et al., 1998a).
Because the major focus of this line of work was the development of objective decision criteria, another,
much simpler approach has not been investigated in this context thus far: the use of subjective estimates
of inspection effectiveness for making the reinspection decision. The basic concept behind this approach
is to ask inspectors after an inspection to estimate the percentage of defects in a document they believe
they have actually found. Using this information, one can estimate the total number of defects in a
document and the remaining number of defects. In addition to its simplicity, this approach would be
appealing for practitioners because, first, it requires only one inspector, perhaps the most experienced
one, to make the estimate, and therefore would be applicable irrespective of the total number of
inspectors. And second, it neither requires significant changes to an existing inspection implementation,
such as collecting more detailed data on defects, nor any extra effort for inspection participants.
The motivation for investigating subjective estimates of effectiveness comes from the earlier work of
Selby (Selby, 1985). In a study comparing code reading, functional testing, and structural testing, he
noted that readers could estimate quite accurately their own effectiveness: "This estimation of the number
of faults uncovered correlated reasonably well with the actual percentage of faults detected (R = .57,
alpha < .0001). Investigating further, individuals using the different techniques were able to give better
estimates: code readers gave the best estimates (R =.79, alpha < .0001).... This last observation
suggests that the code readers were more certain of the effectiveness they had in revealing faults in the
programs." Although subjective, if further corroborative evidence suggests that those effectiveness
estimates are accurate, then this can provide another approach for controlling software inspections and a
good starting point for practitioners before introducing more objective DCETs, such as CR and DPM.
In this paper we show how subjective estimates of effectiveness can be applied to making the
reinspection decision for code documents, and report on a study that empirically evaluated the usefulness
1 This work was partially done while El Emam was at the Fraunhofer Institute for Experimental Software Engineering, Germany.
3
of the estimates. The study was conducted with 30 professional software engineers at Bosch Telecom
GmbH, Germany. The reading technique that the subjects used for defect detection was checklist-based
reading (CBR) (Laitenberger et al., 1999). The reason for focusing on CBR is that in a recent literature
survey checklist-based reading was found to be the de-facto standard approach for defect detection in
many industrial inspection implementations (Laitenberger and DeBaud, 1998). After the defect detection
step, the subjects estimated their own effectiveness, i.e., the percentage of defects they thought they
have found. The subjective estimates were used in our analysis. Briefly, our results indicate that
estimates of defect content based on subjective estimates of effectiveness have a median relative error of
zero, and that they provide consistently better document and inspection process quality control than the
current default practice of not reinspecting a document.
This paper is organized as follows. In Section 2 we present an overview of empirical work on evaluating
DCETs in software engineering, and current uses of subjective estimates in software engineering.
Section 3 describes how subjective estimates of effectiveness can be evaluated. Our research method is
described in detail in Section 4, and our results in Section 5. We conclude the paper in Section 6 with a
summary and suggestions for future work.
2 Background2.1 Definition of ReinspectionsA recent literature review found that, on average, inspections find 57% of defects in code and design
documents (Briand et al., 1998c). Given the substantial defect detection cost savings that can be
accrued by increasing the effectiveness of inspections (Briand et al., 1998c), contemporary research has
primarily focused on improved reading techniques, for example, (Laitenberger et al., 1999), and on
reinspections, for example, (Eick et al., 1992), for maximizing inspection effectiveness. Our focus here is
on reinspections.
A reinspection, as referred to in this paper, is intended to scrutinize an already inspected document anew.
The purpose is to identify defects that have been missed during the initial inspection. It is not to focus on
the changes made due to the initial inspection.
Some inspection implementations involve a follow-up phase at the end of the inspection process. Fagan
(Fagan, 1976) reports that this inspection phase aims at verifying whether the author has taken some
remedial action for each issue, problem, and concern detected. He also states that the follow-up phase is
an optional one in the inspection process and that it cannot be considered a reinspection.
In their book on software inspections, Strauss and Ebenau (Strauss and Ebenau, 1994) describe the
reinspection stage. However, the focus of this is to concentrate on the changes made after the initial
inspection, their interfaces and dependencies. This is different from performing a reinspection to identify
defects that have been missed.
4
Adams (Adams, 1999) notes that the occurrence of a reinspection should be a trigger for preventive
action since excessive use of reinspections is likely to be inefficient. He suggests improved entrance
criteria for inspections, use of preliminary informal inspections, and some form of root cause analysis.
The criteria for making the reinspection decision should be formulated to control:
• The quality of the document. By ensuring that the documents that pass the inspection attain a
minimal quality level. A document quality level would be the remaining defect density.
• The quality of the inspection. By ensuring that the inspection process has achieved a minimal
quality level. The process quality level would be defined as the proportion of defects in the
document that have been identified by the inspection.
Most organizations have not institutionalized reinspections as a technique for ensuring the quality of the
document and the inspection process. Those that do have utilized, for example, historical norms for
making the reinspection decision: if too many defects are found compared to the norm then this is taken
as evidence of a poor document, while too few are taken as evidence of a poor inspection (Eick et al.,
1992). However, this approach assumes that variations among reviews are larger than variations among
documents. If this is not the case then this can lead to reinspections of high quality documents, and low
quality documents may easily pass. Other companies have followed a rule of thumb to determine whether
to perform a reinspection. One is that the number of defects remaining is roughly equal to the number of
defects found per page (Gilb and Graham, 1993). This rule of thumb, however, does neither consider the
quality level of the document nor the quality of the inspection. Moreover, there is no systematic evidence
on the validity or accuracy of this rule.
Work in the DCET area has aimed at providing a better means for making the reinspection decision. We
review this work below.
2.2 An Overview of DCETs in Software EngineeringOne can use capture-recapture (CR) models to decide on an objective basis whether or not to perform a
reinspection. CR models were initially developed to estimate the size of animal populations (Seber, 1982;
Otis et al., 1978; White et al., 1982). In doing so, animals are captured, marked, and then released on
several trapping occasions. The number of marked animals that are recaptured allows one to estimate
the total population size based on the samples’ overlap. CR models are also applied in epidemiology to
estimate the size of a diseased population (Stephen, 1996) and for the estimation of birth and death rates
(Chandra Sekar and Deming, 1949) where, instead of multiple trapping occasions, multiple registration
systems are used.
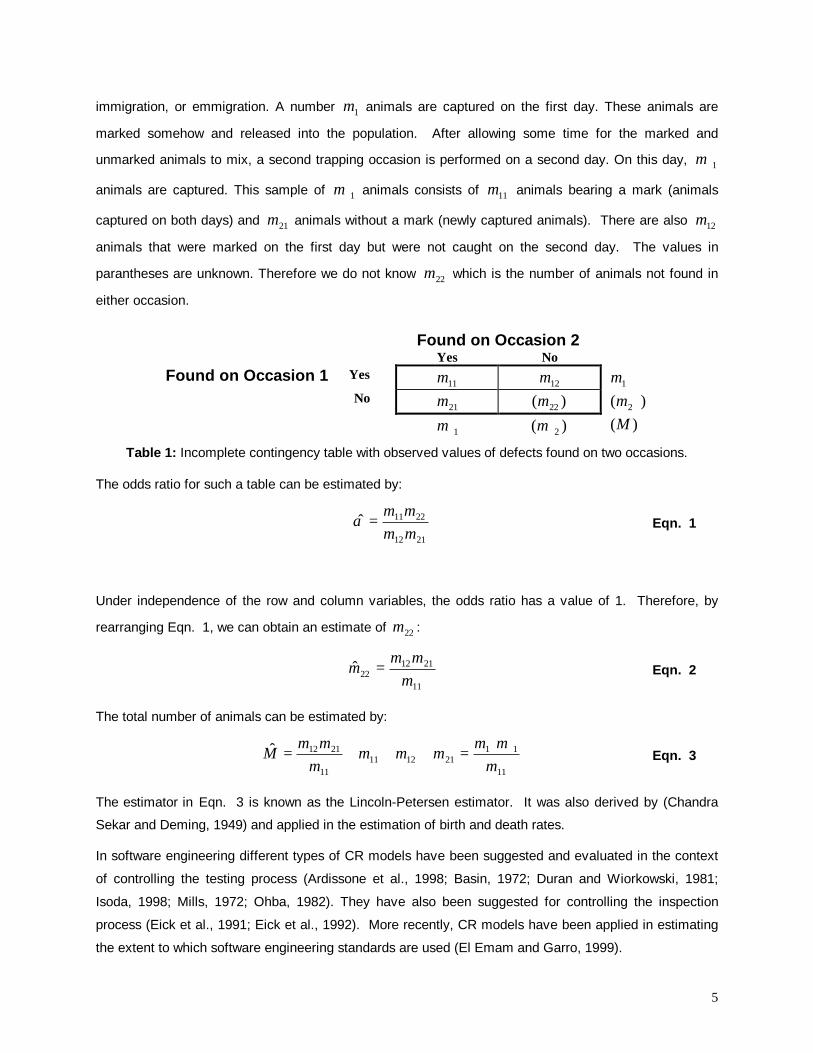
The basic idea behind a CR model can be illustrated for the case of two occasions with reference to
Table 1 (see (Wickens, 1989)). Suppose one wants to estimate the size M of an animal population that
does not change over time, i.e., no animals enter or leave the population through birth, death,
5
immigration, or emmigration. A number +1m animals are captured on the first day. These animals are
marked somehow and released into the population. After allowing some time for the marked and
unmarked animals to mix, a second trapping occasion is performed on a second day. On this day, 1+m
animals are captured. This sample of 1+m animals consists of 11m animals bearing a mark (animals
captured on both days) and 21m animals without a mark (newly captured animals). There are also 12m
animals that were marked on the first day but were not caught on the second day. The values in
parantheses are unknown. Therefore we do not know 22m which is the number of animals not found in
either occasion.
Found on Occasion 2Yes No
Found on Occasion 1 Yes11m 12m +1m
No21m )( 22m )( 2+m
1+m )( 2+m )(M
Table 1: Incomplete contingency table with observed values of defects found on two occasions.
The odds ratio for such a table can be estimated by:
2112
2211ˆmmmm=α Eqn. 1
Under independence of the row and column variables, the odds ratio has a value of 1. Therefore, by
rearranging Eqn. 1, we can obtain an estimate of 22m :
11
211222ˆ
mmm
m = Eqn. 2
The total number of animals can be estimated by:
11
11211211
11
2112ˆm
mmmmm
mmm
M ++=+++= Eqn. 3
The estimator in Eqn. 3 is known as the Lincoln-Petersen estimator. It was also derived by (Chandra
Sekar and Deming, 1949) and applied in the estimation of birth and death rates.
In software engineering different types of CR models have been suggested and evaluated in the context
of controlling the testing process (Ardissone et al., 1998; Basin, 1972; Duran and Wiorkowski, 1981;
Isoda, 1998; Mills, 1972; Ohba, 1982). They have also been suggested for controlling the inspection
process (Eick et al., 1991; Eick et al., 1992). More recently, CR models have been applied in estimating
the extent to which software engineering standards are used (El Emam and Garro, 1999).
6
The idea behind using capture-recapture models for software engineering inspections is to let several
inspectors draw samples from the population of defects (by identifying defects during the preparation
stage of the inspection). The different inspectors reflect the various occasions depicted in Table 1. Based
on the overlap of defects amongst inspectors, one can estimate the number of defects remaining in a
software document using, for example, the Lincoln-Peterson estimator. Using this estimate and the
known number of defects found in the inspection, it is possible to estimate the number of remaining
defects in the inspected document (i.e., estimating 22m in the above table). Subsequently, armed with
this information, the inspection team can make an objective decision as to whether the document should
be reinspected to reduce its defect content before passing it on to the next phase of the development life
cycle.
Researchers at Bell Labs first applied CR models for requirements and design inspections (Eick et al.,
1991; Eick et al., 1992; Eick et al., 1993). However, in these studies the true number of defects was
unknown and therefore an evaluation of their true efficacy was not possible. Later work consisted of a
Monte Carlo simulation to evaluate the robustness of different CR estimators to violations of their
assumptions (Vander Wiel and Votta, 1993).
Objective empirical evaluation of CR models started with the study of Wohlin et al. (Wohlin et al., 1995).
However, this study was conducted with non-software engineering documents. Subsequent work used
software engineering documents (Briand et al., 1997; Briand et al., 1998e; Miller, 1998; Runeson and
Wohlin, 1998). All of the above work utilized models that were originally developed in wildlife research.
Other researchers considered the incorporation of Bayesian methods to estimate defect content and for
model selection (Basu and Ebrahimi, 1998), performed further evaluations of assumption violations when
using the estimation models (Thelin and Runeson, 1999a), evaluated the incorporation of previous
experiences in the estimate (Runeson and Wohlin, 1998), evaluated the applicability of CR models to
perspective-based reading (Thelin and Runeson, 1999b), and proposed new estimators for the case
when the independence assumption is violated (Embrahimi, 1997).
An alternative approach was proposed in (Wohlin and Runeson, 1998), the Detection Profile Method
(DPM). The DPM is an intuitively appealing approach that can be easily explained graphically to
nonspecialists. A later study suggested a method for selecting between a CR model and the DPM
(Briand et al., 1998a), and this was subsequently further evaluated in (Petersson and Wohlin, 1999).
In addition to the experiences reported by the researchers at Bell Labs, the use of the DPM at an
insurance company in Germany was reported in (Briand et al., 1998d), and the application of CR models
in telecommunications projects (Ardissone et al., 1998).
Thus far there has been no evaluation of subjective approaches for directly controlling software
inspections. The only exception is one mention that the document quality (expressed as the number of
7
defects not yet found) as estimated from a CR model matches the intuition of inspectors (Eick et al.,
1991; Eick et al., 1993).
2.3 Definition of Subjective Estimates of EffectivenessA subjective estimate of effectiveness, as used in this paper, is defined as an individual inspector’s
perception of the percentage of defects in a document that s/he has found. This estimate is produced
after reading the document and logging the defects that s/he has found. For example, let’s say that an
inspector found 15 defects in a code document, and s/he estimates that 75% of the defects have been
found (i.e., the 15 defects represent only 75% of the total defects in the document). It follows that the
inspector estimates that there were 20 defects in total in the document, and that 5 defects remain in the
document. As we shall see later in the paper, an individual inspector’s estimate can be generalized to an
inspection team of arbitrary size.
Of course, the precision of this subjective estimate is expected to be affected by many different variables.
One of them may be, for example, the method that the inspector uses to read and understand the
inspected document (Laitenberger et al., 1999). It is expected that a more systematic reading method
results in a more precise estimate.
2.4 The Use of Subjective Estimates in Software EngineeringSince, to our knowledge, there is no extensive literature on the behavioral and application aspects of
subjective estimates of inspection effectiveness, we can at least inform our endeavors by considering the
work done in the area of subjective cost estimation.2
Despite the predominant use of subjective cost estimation practices in industry (Heemstra, 1992; Hihn
and Habib-Agahi, 1991; Lederer and Prasad, 1992), there exists a strong bias against their use in
software engineering. This is exemplified by statements such as “researchers can make a contribution by
finding practices that can discourage the use of the informal basis [for cost estimation … ], the
employment of an informal basis should probably be discouraged [… ], managers should make diligent
efforts to eschew them”3 (Lederer and Prasad, 1998). While such perceptions may be supported by some
empirical studies (e.g., see (Lederer and Prasad, 1992; Lederer and Prasad, 1998)), there also does exist
a body of empirical evidence showing that subjective cost estimates can outperform more objective
techniques (such as parametric models) (Vicinanza et al., 1991), or that they perform at least as well as
the objective techniques (Kusters et al., 1990). Furthermore, cost estimation methods based on
substantial subjective information have been shown to perform impressively well (Briand et al., 1998b),
and contemporary cost estimation models are currently explicitly taking into account subjective expert
2 This is also sometimes refered to as informal or intuitive cost estimation.3 In this particular article, an informal basis is defined as intuition, comparison to similar, past projects based on personal memory,and guessing.
8
opinion through the use of Bayesian statistics to improve their predictive performance (Devnani-Chulani,
1997).
Perhaps the strongest statement that we have found in support of subjective estimates of cost, or at least
of their utility, was made by Hughes (Hughes, 1996). There, he chides the negative perception that
subjective cost estimates have in the research community, and attempts to partially balance this by
providing a clarification of how subjective cost estimation is performed in practice.
Thus, despite the negative perceptions of subjective estimates in some quarters of software engineering,
this perception is certainly neither universal nor strongly justifiable.
Subjective cost estimation is arguably a more difficult problem than subjective estimation of inspection
effectiveness. The reason being that for the former the software system to be developed is barely
conceptualized and the estimate is for a task that will be performed in the future, while for the latter the
document is completed and the estimate is for a task that has already been performed. However, if
subjective estimates have been shown to work well in a more difficult context, such as cost estimation,
then they have the potential of working well in an inspection effectiveness context. This assertion is
further reenforced by the encouraging results of Selby (Selby, 1985) on the performance of subjective
estimates of inspection effectiveness with code documents. The objective of the current study is
therefore to test this assertion, and evaluate the utility of subjective estimates of effectiveness for making
the reinspection decision.
3 Evaluating Subjective Estimates of InspectionEffectiveness
3.1 Evaluation of DCETsThe goal of any DCET is to provide an estimate of the number of defects that existed in a document
before the inspection was performed and, thus, a characterization of the document quality. We will denote
this estimate as AD . Therefore, if an inspection finds FD defects, then the estimated remaining number
of defects in the document after the inspection is FAR DDD −= ˆˆ .
A commonly used criterion for evaluating a DCET in general is to compute the relative error, defined as:
A
AA
DDD
RE−=
ˆEqn. 4
9
where AD is the true number of defects in the document. In Appendix A (Section 9) we show that the
relative error, as defined above, only makes sense as an evaluative measure if the following two criteria
are used to make the reinspection decision.
To control the quality of a document, the document should be reinspected if the following inequality is not
satisfied:
( ) FDA DLOCQD +×<ˆEqn. 5
where LOC is the size of the document that was inspected (we use LOC as a measure of size since
our study is on code documents; other size measures could be used as well), and DQ is the minimal
defect density that a document should have before it passes the inspection. In addition, to control the
quality of the process, the document should be reinspected if the following inequality is not satisfied:
P
FA Q
DD <ˆ Eqn. 6
where PQ is the minimal permissible effectiveness of the inspection.
3.2 Evaluating Subjective Estimates of EffectivenessBelow we describe how subjective estimates of effectiveness can be evaluated, and also demonstrate
how the individual estimates of effectiveness can be applied to teams of inspectors.
An inspector provides a subjective estimate of his/her effectiveness, which we shall denote as E .
Therefore, if the inspector estimates that 75% of the defects in a document were found, the value of Ewould be 0.75.
Let us define 1FD as the number of defects found by the first inspector, and it is this inspector who
provides the subjective estimate of his/her individual effectiveness. Let FkD be the sum of all other
unique defects found by the remaining k members of the inspection team that were not also found by the
first inspector (i.e., remaining unique defects). The total unique defects found by the inspection team are
given by:
FkFF DDD += 1 Eqn. 7
Now we let:
10
ED
D FA ˆ
ˆ 1= Eqn. 8
which is the estimate of defect content using the subjective estimate of effectiveness from the first
inspector.
We can define DQ as:
LOCDDd
Q FkFDD
−−= 1 Eqn. 9
where Dd is a threshold defect content of the document. The logic of the above formulation is that a
threshold defect density, DQ , depends on the document’s size, the number of defects found, and a
threshold quality of the document. This means that, given the document and the inspection that was
performed, Dd is the maximum defect content of the document allowable to achieve the desired quality
level. By substituting Eqn. 9 and Eqn. 7 into Eqn. 5, we get:
DA dD <ˆEqn. 10
where:
( ) FkFDD DDLOCQd ++×= 1 Eqn. 11
Therefore, the decision criterion in Eqn. 10 will be applicable whether an inspection is conducted by one
person or a team of inspectors. The only modification that is necessary, depending on the team size, is in
the threshold.
We can also define PQ as:
P
FkFP d
DDQ
+= 1 Eqn. 12
where Pd is a threshold defect content of the document. The logic of the above formulation is that a
threshold effectiveness, PQ , depends on the number of defects found, and a threshold quality of the
document. This means that, given the document and the inspection that was performed, Pd is the
maximum defect content of the document allowable to achieve the desired effectiveness level. By
substituting Eqn. 12 and Eqn. 7 into Eqn. 6, we get:
PA dD <ˆEqn. 13
where:
11
P
FkFP Q
DDd
+= 1 Eqn. 14
Therefore, the decision criterion in Eqn. 13 will be applicable whether an inspection is conducted by one
person or a team of inspectors. The only modification that is necessary, depending on the team size, is in
the threshold.
The above formulations have demonstrated that a defect content estimate based on an individual
inspector’s subjective estimate of his/her effectiveness can be used for making the reinspection decision
irrespective of the inspection team size. We have also defined two decision criteria for controlling
document quality and inspection effectiveness that directly use the estimated defect content.
3.3 Evaluating Decision AccuracyEvaluating a DCET using the relative error criterion can provide a good indication of its bias. However,
the sole reliance on relative error in studies that evaluate DCETs is not congruent with the manner in
which DCETs are used. The reason is that the decision that needs to be made is binary: pass or
reinspect. Therefore, a necessary complementary evaluation criterion would be the decision accuracy.
The decision that needs to be made for controlling document quality is:
≥<=
DA
DAD dD
dDˆ,0
ˆ,1λ Eqn. 15
where Dλ is the decision based on the DCET estimate, and is one (pass) if estimated defect density after
the inspection is below a certain threshold, and zero (reinspect) if the defect density is equal to or greater
than the threshold. In the above case, if AD is only slightly lower than the threshold or much lower than
the threshold, it does not matter because the same decision will be made (pass).
Similarly, one can define the decision for controlling inspection process quality:
≥<=
PA
PAP dD
dDˆ,0
ˆ,1λ Eqn. 16
where Pλ is the decision based on the DCET estimate, and is one (pass) if the estimated effectiveness is
higher than a certain threshold, and zero (reinspect) if it is lower than or equal to the threshold.
In evaluating decision accuracy, one can compare the decision based on the estimates, Dλ and Pλ , with
the decision that would be made if the DCET was perfectly accurate, which we will denote as Dλ and Pλrespectively:
12
≥<
=DA
DAD dD
dD,0,1
λ Eqn. 17
and:
≥<
=PA
PAP dD
dD,0,1
λ Eqn. 18
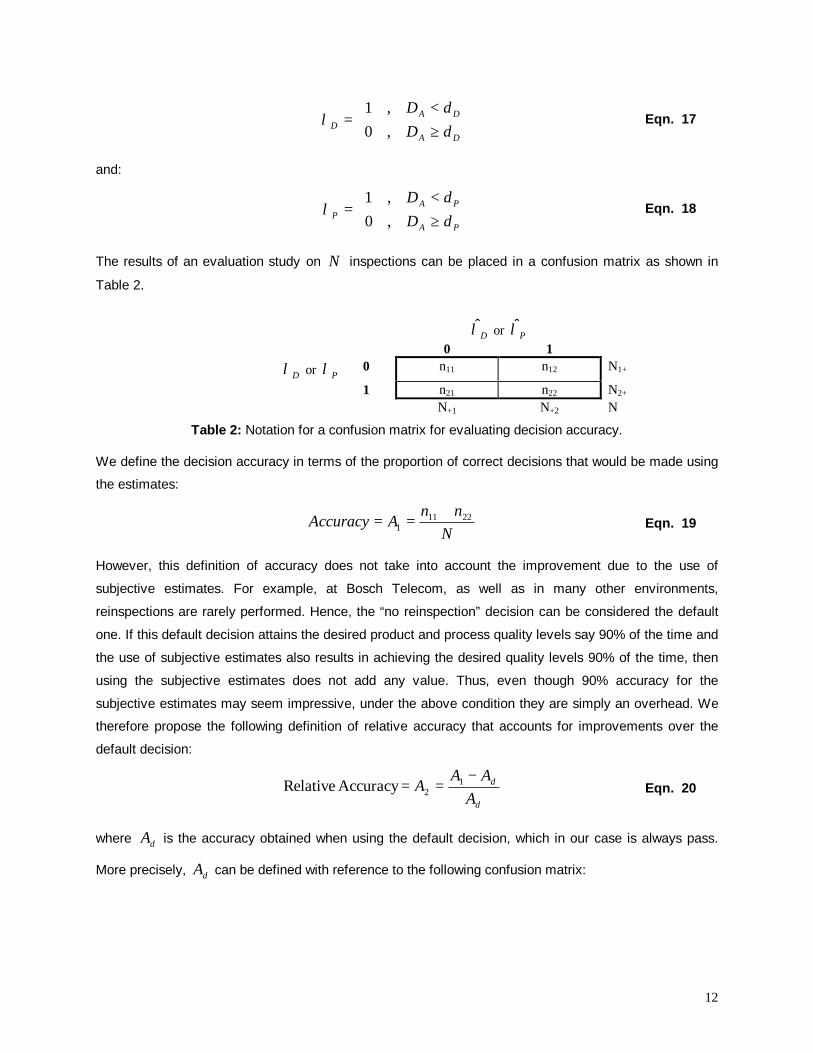
The results of an evaluation study on N inspections can be placed in a confusion matrix as shown in
Table 2.
Dλ or Pλ0 1
Dλ or Pλ 0 n11 n12 N1+
1 n21 n22 N2+
N+1 N+2 N
Table 2: Notation for a confusion matrix for evaluating decision accuracy.
We define the decision accuracy in terms of the proportion of correct decisions that would be made using
the estimates:
Nnn
AAccuracy 22111
+== Eqn. 19
However, this definition of accuracy does not take into account the improvement due to the use of
subjective estimates. For example, at Bosch Telecom, as well as in many other environments,
reinspections are rarely performed. Hence, the “no reinspection” decision can be considered the default
one. If this default decision attains the desired product and process quality levels say 90% of the time and
the use of subjective estimates also results in achieving the desired quality levels 90% of the time, then
using the subjective estimates does not add any value. Thus, even though 90% accuracy for the
subjective estimates may seem impressive, under the above condition they are simply an overhead. We
therefore propose the following definition of relative accuracy that accounts for improvements over the
default decision:
d
d
AAA
A−== 1
2AccuracyRelative Eqn. 20
where dA is the accuracy obtained when using the default decision, which in our case is always pass.
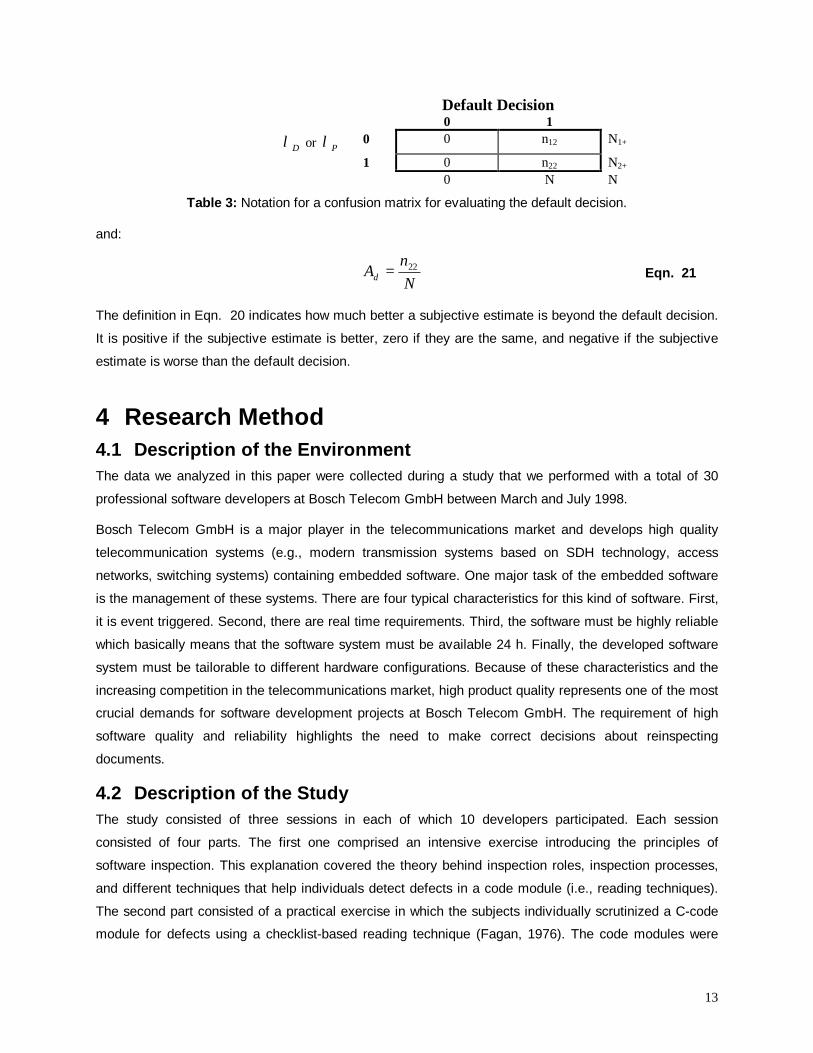
More precisely, dA can be defined with reference to the following confusion matrix:
13
Default Decision0 1
Dλ or Pλ 0 0 n12 N1+
1 0 n22 N2+
0 N N
Table 3: Notation for a confusion matrix for evaluating the default decision.
and:
Nn
Ad22= Eqn. 21
The definition in Eqn. 20 indicates how much better a subjective estimate is beyond the default decision.
It is positive if the subjective estimate is better, zero if they are the same, and negative if the subjective
estimate is worse than the default decision.
4 Research Method4.1 Description of the EnvironmentThe data we analyzed in this paper were collected during a study that we performed with a total of 30
professional software developers at Bosch Telecom GmbH between March and July 1998.
Bosch Telecom GmbH is a major player in the telecommunications market and develops high quality
telecommunication systems (e.g., modern transmission systems based on SDH technology, access
networks, switching systems) containing embedded software. One major task of the embedded software
is the management of these systems. There are four typical characteristics for this kind of software. First,
it is event triggered. Second, there are real time requirements. Third, the software must be highly reliable
which basically means that the software system must be available 24 h. Finally, the developed software
system must be tailorable to different hardware configurations. Because of these characteristics and the
increasing competition in the telecommunications market, high product quality represents one of the most
crucial demands for software development projects at Bosch Telecom GmbH. The requirement of high
software quality and reliability highlights the need to make correct decisions about reinspecting
documents.
4.2 Description of the StudyThe study consisted of three sessions in each of which 10 developers participated. Each session
consisted of four parts. The first one comprised an intensive exercise introducing the principles of
software inspection. This explanation covered the theory behind inspection roles, inspection processes,
and different techniques that help individuals detect defects in a code module (i.e., reading techniques).
The second part consisted of a practical exercise in which the subjects individually scrutinized a C-code
module for defects using a checklist-based reading technique (Fagan, 1976). The code modules were
14
part of running software systems of Bosch Telecom GmbH and, defects were seeded in them
beforehand. We changed the code modules after each training session. This was to avoid that an
exchange of information between participants of different sessions would bias their performance. While
inspecting the code module, the subjects were asked to log all detected defects on a defect report form.
After this exercise we asked the subjects to fill out a debriefing questionnaire which required them to
make the subjective estimate of the percentage of defects they found in the code module (i.e., 100ˆ×E ).
The third part of a session consisted of a two-person inspection meeting in which its participants could
discuss the defects found in the reading exercises. The inspection team was formed by randomly
assigning each inspector to a team. The inspection team was asked to log all defects upon which both
agreed. The final part of each session consisted of a feedback session. For this, we then did an initial
analysis of all collected data by cross-checking the defect report forms with the known defect list and
presented the results to the subjects.
During the reading of the code documents, the participants did not communicate with each other.
Therefore, there are no effects due to collusion amongst participants by the nature of the study design.
The trainer for all three sessions was the same individual, therefore we do not expect trainer effects as
the study progressed.
4.3 Description of SubjectsAll subjects participating in this study were professional software developers at Bosch Telecom GmbH.
Thus, we can consider our subject pool a representative sample of the population of professional
software developers. Although Bosch Telecom GmbH performs desk checks and reviews at various
stages of the development process to ensure that the quality goals are met, formal software inspection
and defect content estimation was a new activity for developers. For this, they could only rely on their own
heuristics from their development experience to come up with an estimate. In order to capture their
experiences we used the debriefing questionnaire. We captured the subjects' experience in the C-
Programming language and in the application domain on a six-point scale as the most prevalent types of
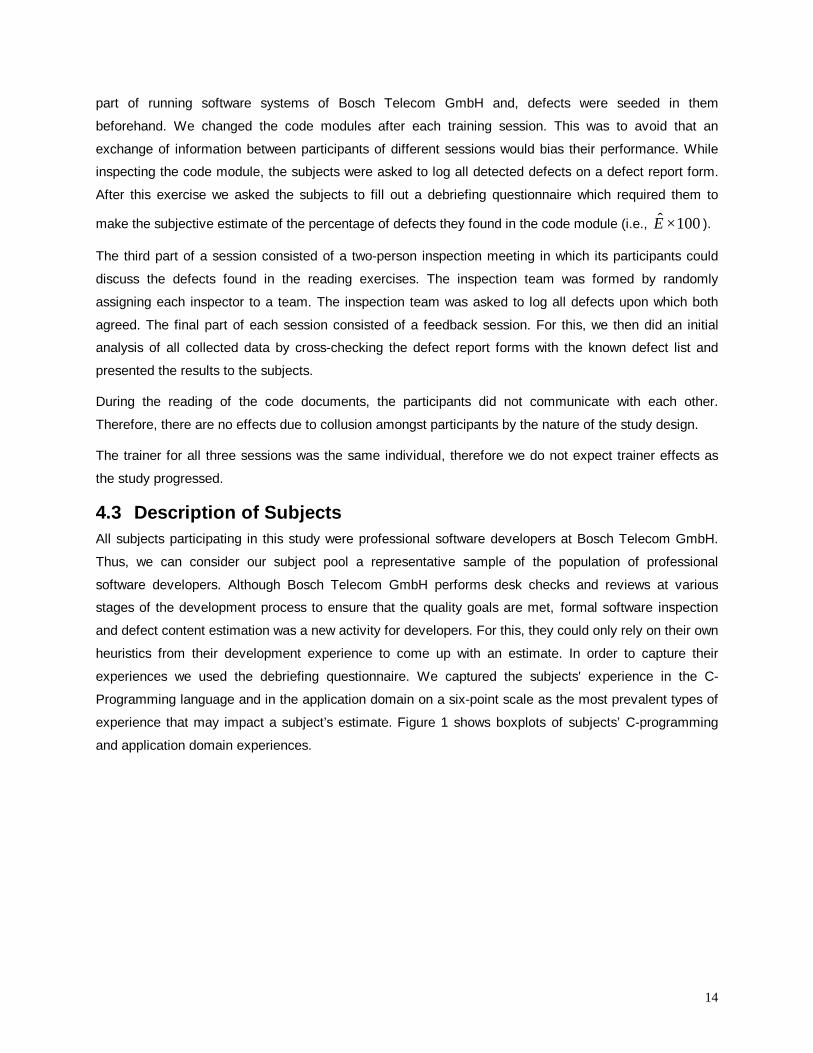
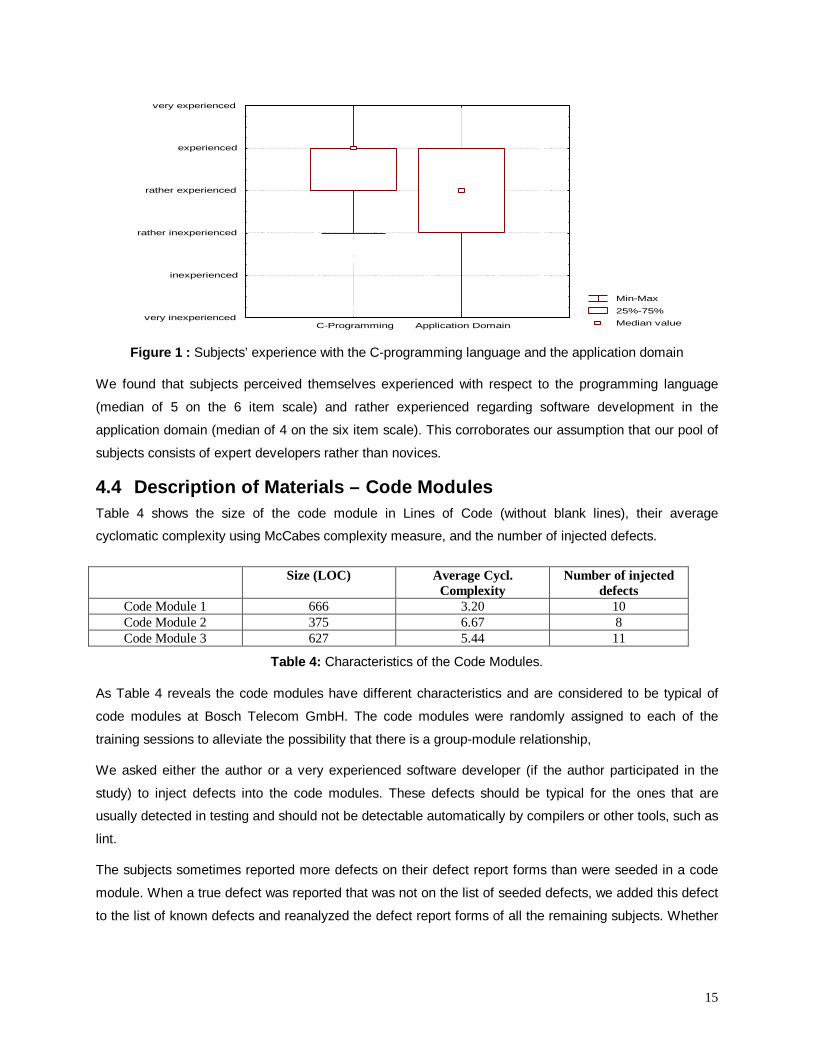
experience that may impact a subject’s estimate. Figure 1 shows boxplots of subjects’ C-programming
and application domain experiences.
15
Min-Max
25%-75%
Median valuevery inexperienced
inexperienced
rather inexperienced
rather experienced
experienced
very experienced
C-Programming Application Domain
Figure 1 : Subjects’ experience with the C-programming language and the application domain
We found that subjects perceived themselves experienced with respect to the programming language
(median of 5 on the 6 item scale) and rather experienced regarding software development in the
application domain (median of 4 on the six item scale). This corroborates our assumption that our pool of
subjects consists of expert developers rather than novices.
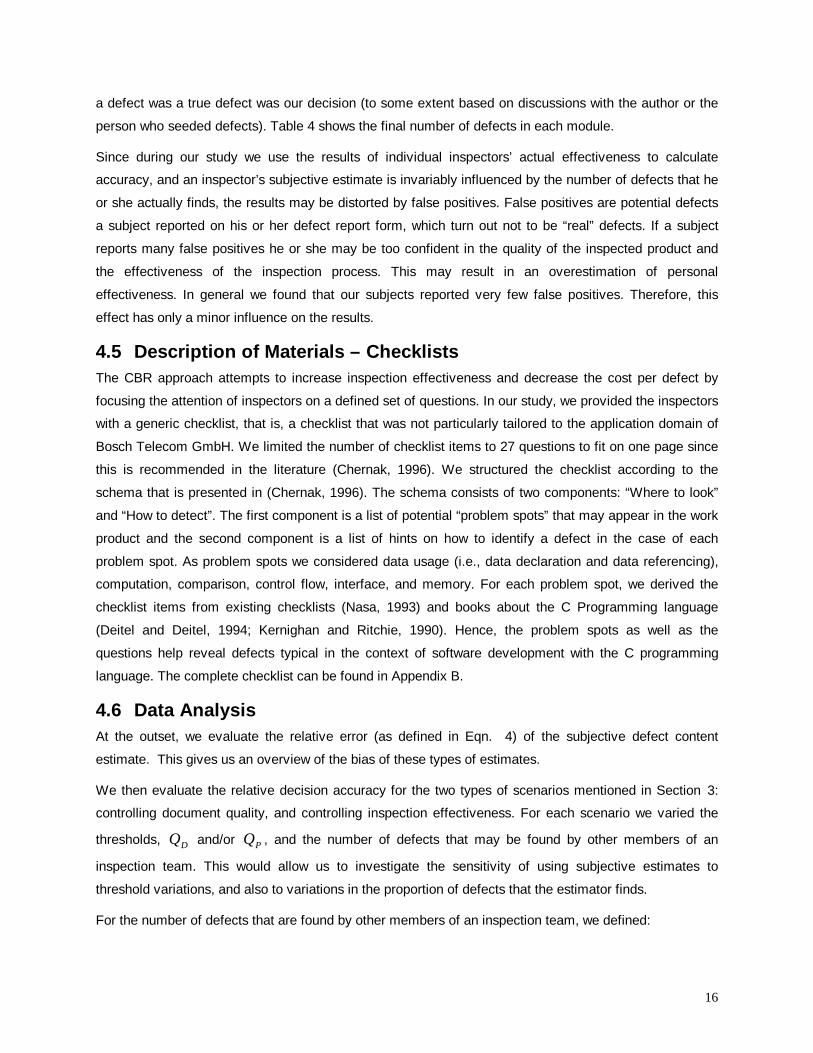
4.4 Description of Materials – Code ModulesTable 4 shows the size of the code module in Lines of Code (without blank lines), their average
cyclomatic complexity using McCabes complexity measure, and the number of injected defects.
Size (LOC) Average Cycl.Complexity
Number of injecteddefects
Code Module 1 666 3.20 10Code Module 2 375 6.67 8Code Module 3 627 5.44 11
Table 4: Characteristics of the Code Modules.
As Table 4 reveals the code modules have different characteristics and are considered to be typical of
code modules at Bosch Telecom GmbH. The code modules were randomly assigned to each of the
training sessions to alleviate the possibility that there is a group-module relationship,
We asked either the author or a very experienced software developer (if the author participated in the
study) to inject defects into the code modules. These defects should be typical for the ones that are
usually detected in testing and should not be detectable automatically by compilers or other tools, such as
lint.
The subjects sometimes reported more defects on their defect report forms than were seeded in a code
module. When a true defect was reported that was not on the list of seeded defects, we added this defect
to the list of known defects and reanalyzed the defect report forms of all the remaining subjects. Whether
16
a defect was a true defect was our decision (to some extent based on discussions with the author or the
person who seeded defects). Table 4 shows the final number of defects in each module.
Since during our study we use the results of individual inspectors’ actual effectiveness to calculate
accuracy, and an inspector’s subjective estimate is invariably influenced by the number of defects that he
or she actually finds, the results may be distorted by false positives. False positives are potential defects
a subject reported on his or her defect report form, which turn out not to be “real” defects. If a subject
reports many false positives he or she may be too confident in the quality of the inspected product and
the effectiveness of the inspection process. This may result in an overestimation of personal
effectiveness. In general we found that our subjects reported very few false positives. Therefore, this
effect has only a minor influence on the results.
4.5 Description of Materials – ChecklistsThe CBR approach attempts to increase inspection effectiveness and decrease the cost per defect by
focusing the attention of inspectors on a defined set of questions. In our study, we provided the inspectors
with a generic checklist, that is, a checklist that was not particularly tailored to the application domain of
Bosch Telecom GmbH. We limited the number of checklist items to 27 questions to fit on one page since
this is recommended in the literature (Chernak, 1996). We structured the checklist according to the
schema that is presented in (Chernak, 1996). The schema consists of two components: “Where to look”
and “How to detect”. The first component is a list of potential “problem spots” that may appear in the work
product and the second component is a list of hints on how to identify a defect in the case of each
problem spot. As problem spots we considered data usage (i.e., data declaration and data referencing),
computation, comparison, control flow, interface, and memory. For each problem spot, we derived the
checklist items from existing checklists (Nasa, 1993) and books about the C Programming language
(Deitel and Deitel, 1994; Kernighan and Ritchie, 1990). Hence, the problem spots as well as the
questions help reveal defects typical in the context of software development with the C programming
language. The complete checklist can be found in Appendix B.
4.6 Data AnalysisAt the outset, we evaluate the relative error (as defined in Eqn. 4) of the subjective defect content
estimate. This gives us an overview of the bias of these types of estimates.
We then evaluate the relative decision accuracy for the two types of scenarios mentioned in Section 3:
controlling document quality, and controlling inspection effectiveness. For each scenario we varied the
thresholds, DQ and/or PQ , and the number of defects that may be found by other members of an
inspection team. This would allow us to investigate the sensitivity of using subjective estimates to
threshold variations, and also to variations in the proportion of defects that the estimator finds.
For the number of defects that are found by other members of an inspection team, we defined:
17
( ) ω×−= 1FAFk DDD Eqn. 22
where ω is a proportion defined to be 0, 0.25, 0.5, and 0.75.4 We present our results in the form of plots
of the relative accuracy (see Eqn. 20) to evaluate how well subjective estimates perform.
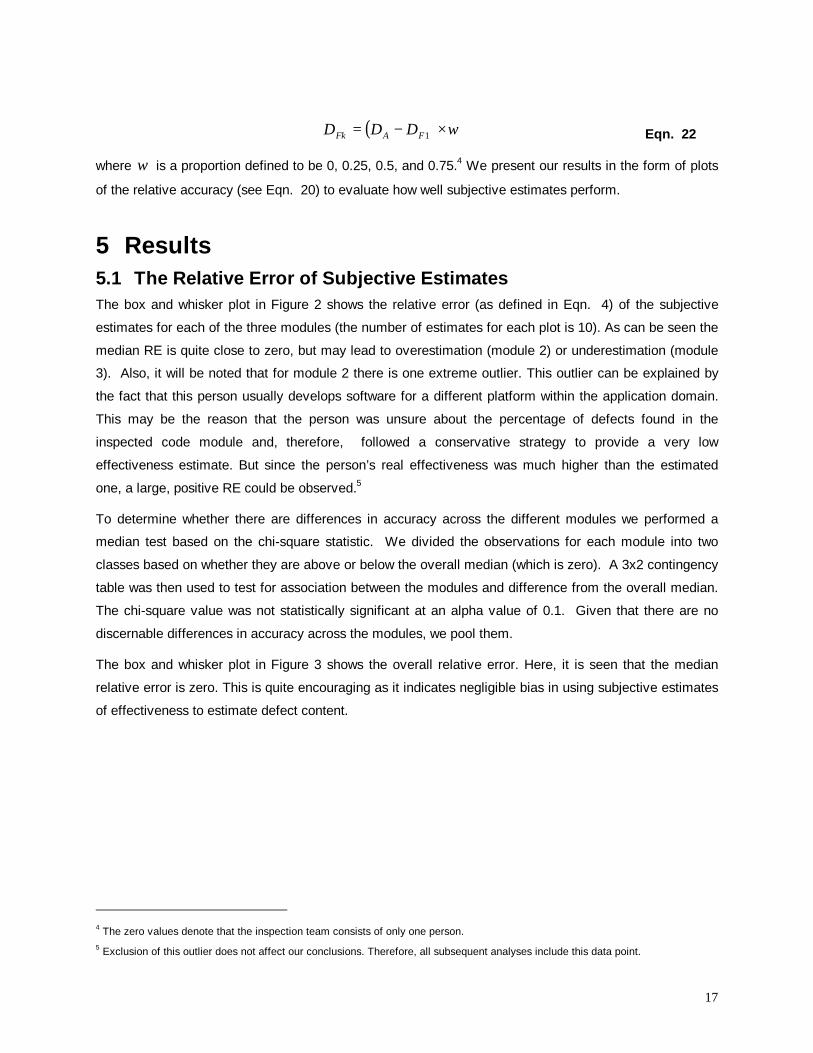
5 Results5.1 The Relative Error of Subjective EstimatesThe box and whisker plot in Figure 2 shows the relative error (as defined in Eqn. 4) of the subjective
estimates for each of the three modules (the number of estimates for each plot is 10). As can be seen the
median RE is quite close to zero, but may lead to overestimation (module 2) or underestimation (module
3). Also, it will be noted that for module 2 there is one extreme outlier. This outlier can be explained by
the fact that this person usually develops software for a different platform within the application domain.
This may be the reason that the person was unsure about the percentage of defects found in the
inspected code module and, therefore, followed a conservative strategy to provide a very low
effectiveness estimate. But since the person’s real effectiveness was much higher than the estimated
one, a large, positive RE could be observed.5
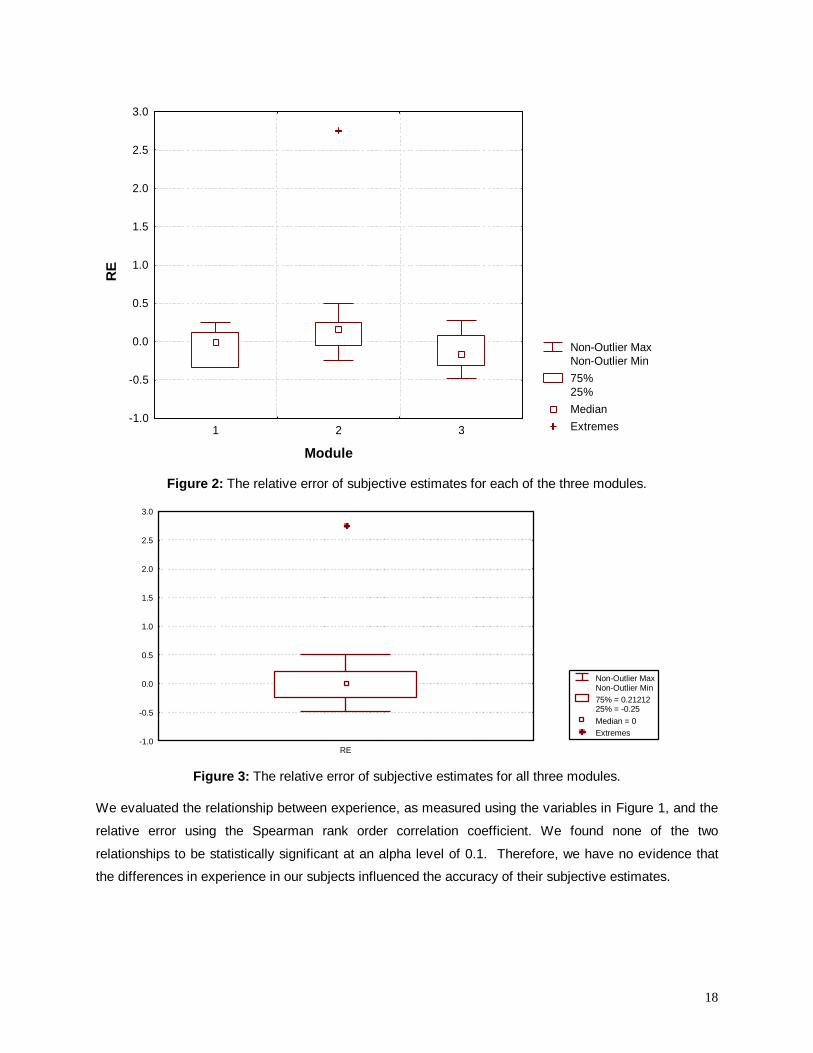
To determine whether there are differences in accuracy across the different modules we performed a
median test based on the chi-square statistic. We divided the observations for each module into two
classes based on whether they are above or below the overall median (which is zero). A 3x2 contingency
table was then used to test for association between the modules and difference from the overall median.
The chi-square value was not statistically significant at an alpha value of 0.1. Given that there are no
discernable differences in accuracy across the modules, we pool them.
The box and whisker plot in Figure 3 shows the overall relative error. Here, it is seen that the median
relative error is zero. This is quite encouraging as it indicates negligible bias in using subjective estimates
of effectiveness to estimate defect content.
4 The zero values denote that the inspection team consists of only one person.5 Exclusion of this outlier does not affect our conclusions. Therefore, all subsequent analyses include this data point.
18
Non-Outlier MaxNon-Outlier Min75%25%MedianExtremes
Module
RE
-1.0
-0.5
0.0
0.5
1.0
1.5
2.0
2.5
3.0
1 2 3
Figure 2: The relative error of subjective estimates for each of the three modules.
-1.0
-0.5
0.0
0.5
1.0
1.5
2.0
2.5
3.0
RE
Non-Outlier MaxNon-Outlier Min75% = 0.2121225% = -0.25Median = 0Extremes
Figure 3: The relative error of subjective estimates for all three modules.
We evaluated the relationship between experience, as measured using the variables in Figure 1, and the
relative error using the Spearman rank order correlation coefficient. We found none of the two
relationships to be statistically significant at an alpha level of 0.1. Therefore, we have no evidence that
the differences in experience in our subjects influenced the accuracy of their subjective estimates.
19
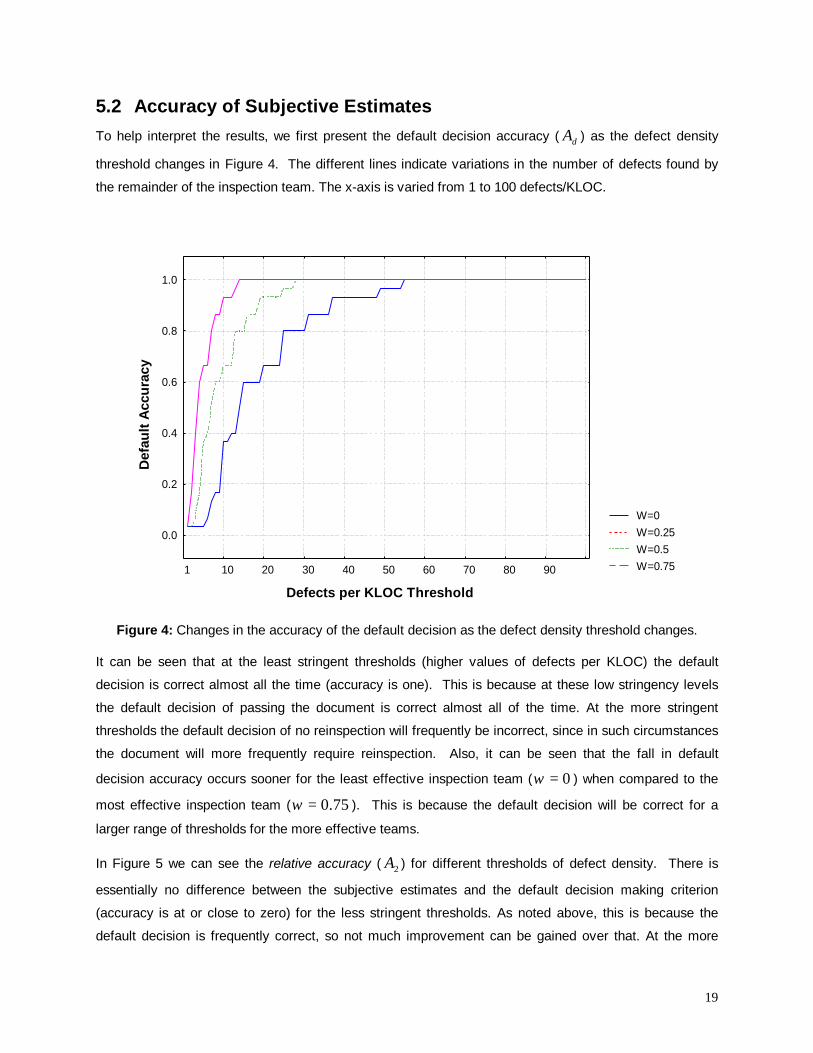
5.2 Accuracy of Subjective EstimatesTo help interpret the results, we first present the default decision accuracy ( dA ) as the defect density
threshold changes in Figure 4. The different lines indicate variations in the number of defects found by
the remainder of the inspection team. The x-axis is varied from 1 to 100 defects/KLOC.
W=0 W=0.25W=0.5 W=0.75
Defects per KLOC Threshold
Def
ault
Acc
urac
y
0.0
0.2
0.4
0.6
0.8
1.0
1 10 20 30 40 50 60 70 80 90
Figure 4: Changes in the accuracy of the default decision as the defect density threshold changes.
It can be seen that at the least stringent thresholds (higher values of defects per KLOC) the default
decision is correct almost all the time (accuracy is one). This is because at these low stringency levels
the default decision of passing the document is correct almost all of the time. At the more stringent
thresholds the default decision of no reinspection will frequently be incorrect, since in such circumstances
the document will more frequently require reinspection. Also, it can be seen that the fall in default
decision accuracy occurs sooner for the least effective inspection team ( 0=ω ) when compared to the
most effective inspection team ( 75.0=ω ). This is because the default decision will be correct for a
larger range of thresholds for the more effective teams.
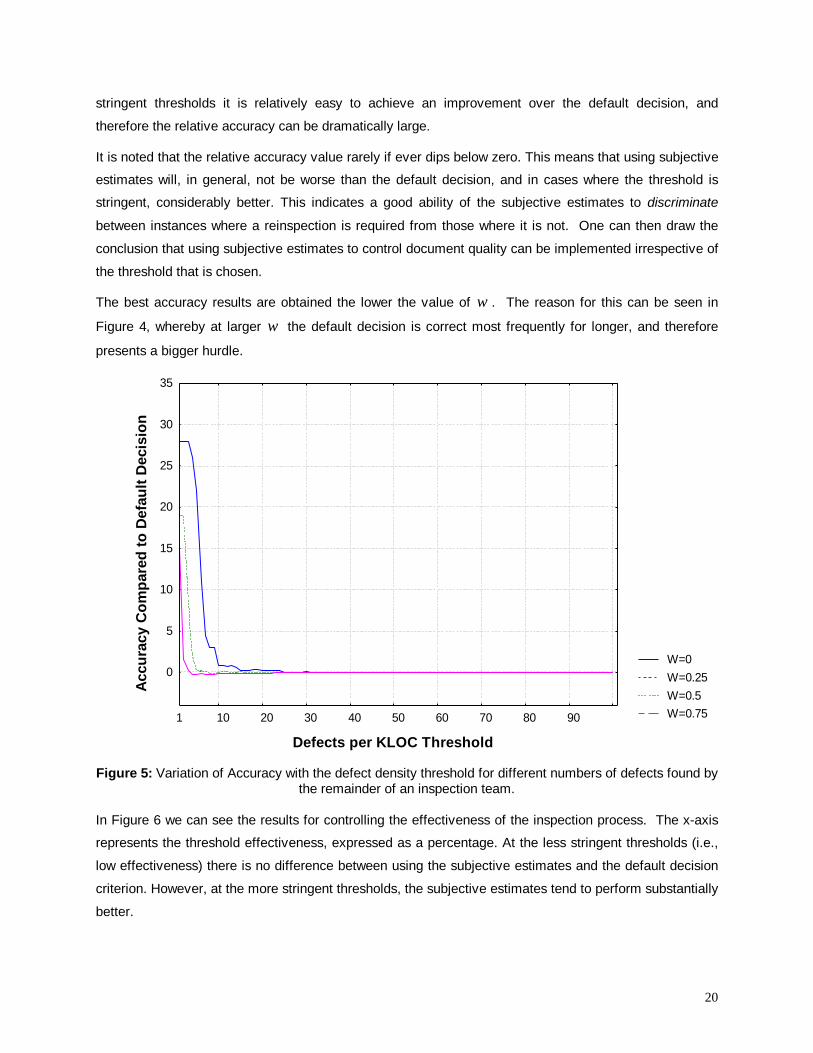
In Figure 5 we can see the relative accuracy ( 2A ) for different thresholds of defect density. There is
essentially no difference between the subjective estimates and the default decision making criterion
(accuracy is at or close to zero) for the less stringent thresholds. As noted above, this is because the
default decision is frequently correct, so not much improvement can be gained over that. At the more
20
stringent thresholds it is relatively easy to achieve an improvement over the default decision, and
therefore the relative accuracy can be dramatically large.
It is noted that the relative accuracy value rarely if ever dips below zero. This means that using subjective
estimates will, in general, not be worse than the default decision, and in cases where the threshold is
stringent, considerably better. This indicates a good ability of the subjective estimates to discriminate
between instances where a reinspection is required from those where it is not. One can then draw the
conclusion that using subjective estimates to control document quality can be implemented irrespective of
the threshold that is chosen.
The best accuracy results are obtained the lower the value of ω . The reason for this can be seen in
Figure 4, whereby at larger ω the default decision is correct most frequently for longer, and therefore
presents a bigger hurdle.
W=0 W=0.25W=0.5 W=0.75
Defects per KLOC Threshold
Acc
urac
y C
ompa
red
to D
efau
lt D
ecis
ion
0
5
10
15
20
25
30
35
1 10 20 30 40 50 60 70 80 90
Figure 5: Variation of Accuracy with the defect density threshold for different numbers of defects found bythe remainder of an inspection team.
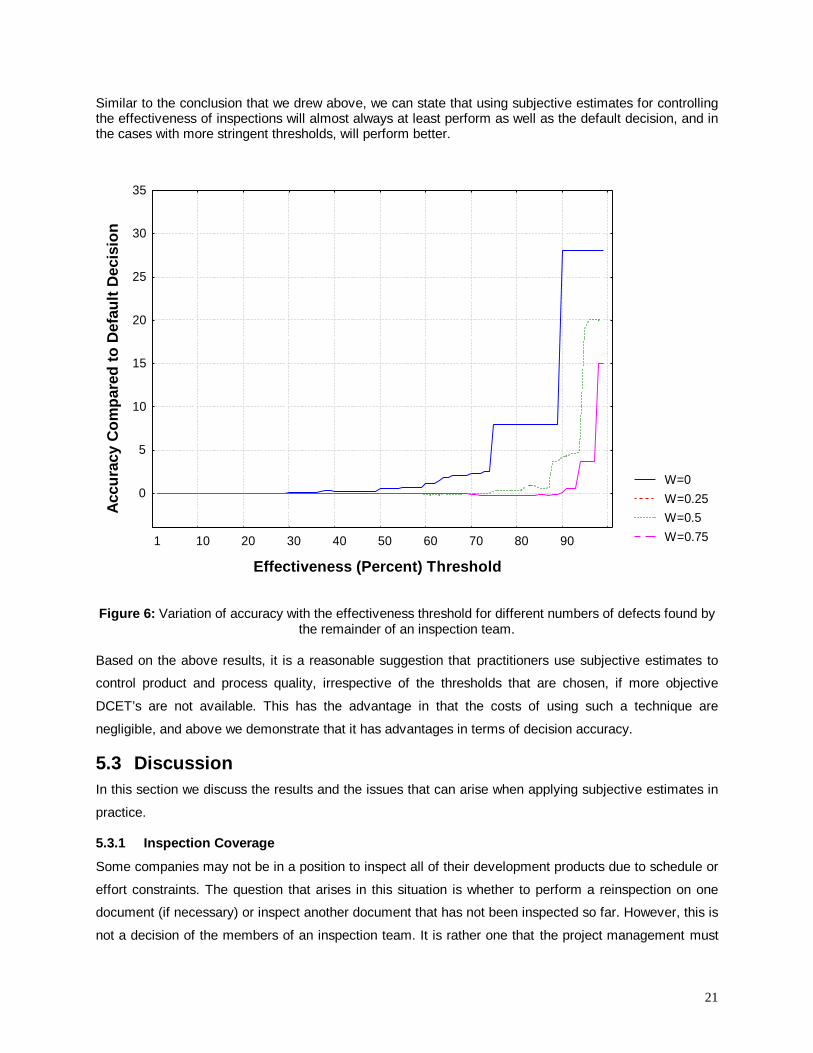
In Figure 6 we can see the results for controlling the effectiveness of the inspection process. The x-axis
represents the threshold effectiveness, expressed as a percentage. At the less stringent thresholds (i.e.,
low effectiveness) there is no difference between using the subjective estimates and the default decision
criterion. However, at the more stringent thresholds, the subjective estimates tend to perform substantially
better.
21
Similar to the conclusion that we drew above, we can state that using subjective estimates for controllingthe effectiveness of inspections will almost always at least perform as well as the default decision, and inthe cases with more stringent thresholds, will perform better.
W=0 W=0.25W=0.5 W=0.75
Effectiveness (Percent) Threshold
Acc
urac
y C
ompa
red
to D
efau
lt D
ecis
ion
0
5
10
15
20
25
30
35
1 10 20 30 40 50 60 70 80 90
Figure 6: Variation of accuracy with the effectiveness threshold for different numbers of defects found bythe remainder of an inspection team.
Based on the above results, it is a reasonable suggestion that practitioners use subjective estimates to
control product and process quality, irrespective of the thresholds that are chosen, if more objective
DCET’s are not available. This has the advantage in that the costs of using such a technique are
negligible, and above we demonstrate that it has advantages in terms of decision accuracy.
5.3 DiscussionIn this section we discuss the results and the issues that can arise when applying subjective estimates in
practice.
5.3.1 Inspection Coverage
Some companies may not be in a position to inspect all of their development products due to schedule or
effort constraints. The question that arises in this situation is whether to perform a reinspection on one
document (if necessary) or inspect another document that has not been inspected so far. However, this is
not a decision of the members of an inspection team. It is rather one that the project management must
22
make . If the management committs itself to developing high quality software, it must spend the effort for
a reinspection once the inspection team has decided on it. The subjective estimates of the inspection
team members therefore should not be biased by the question of whether to perform reinspections at all.
5.3.2 Personal Bias and Political Pressure
An obvious danger with subjective estimates is that they are liable to personal bias and political pressure.
For example, consider the situation where a team is behind schedule and is under very high pressure to
pass a document to the next phase. This may tempt the exaggeration of subjective effectiveness to pass
the document. However, actions that defeat the purpose of a quality assurance technique, such as
inspection, can be performed whether the reinspection decision is subjective or based on objective
information. This argument is further supported by Hughes (Hughes, 1996) who states that, in the realm
of cost estimation, “all estimating methods may be liable to personal bias and political pressure”. For
instance, when using a parametric estimation model, the estimator may be pressured to modify the input
subjective cost drivers if the estimated cost is unacceptable (say, it is too high and the project manager is
very eager to have his/her project approved by senior management).
Nevertheless, below we discuss managerial actions that may discourage such biases.
5.3.3 Estimate Accountability
A recent study on cost estimation practices found evidence supporting the claim that when estimators are
held accountable for their estimates, the accuracy of the estimates increases (Lederer and Prasad, 1998).
It would therefore seem reasonable that, should subjective estimates of effectiveness be introduced into
an organization, the estimators ought to be held accountable for document quality and inspection process
quality. Such a practice would likely dilute the negative impact of personal bias and political pressure.
5.3.4 Collusion Amongst Inspectors
Collusion amongst inspectors occurs if inspectors discuss their defects or work jointly during the
preparation phase of the inspection. Dealing with collusion has been a concern in the DCET literature
(Basu and Ebrahimi, 1998; Ebrahimi, 1997; Eick et al., 1993).
If there is collusion where the subjective estimator is involved then we can consider two cases:
• If the other inspector(s) find many defects that s/he did not find, then this may push the estimator
to reduce his/her estimate of personal effectiveness.
• If the other inspector(s) find few defects that s/he did not find, then this may prompt the estimator
to raise his/her estimate of personal effectiveness.
Should collusion of the former type exist, we would expect an underestimation of subjective effectiveness.
Collusion of the latter type would result in overestimation of subjective effectiveness. The evaluation of
the impact of collusion on relative accuracy ought to be an item for future research. It should be noted
that during our study the design precluded collusion.
23
5.3.5 Subjective Estimates vs. Objective DCETs
Do we suggest that one do away with objective DCETs and simply use expert judgement in making the
reinspection decision? Certainly the case seems attractive. Subjective estimates are low cost and do not
require additional data collection to operationalise.
Such a suggestion, however, would not be corroborated by the results of this study since we did not
compare the decision accuracy of subjective estimates with those from objective DCETs. Given the
encouraging performance of subjective estimates as indicated in the current study, it would certainly be of
value to perform this comparison in future research.
5.3.6 Subjective Estimates and Decision Transparency
A recent study (Lederer and Prasad, 1998) found a positive relationship between user commitment and
participation in IS development and the use of more objective methods for cost estimation. This may be
interpreted that the use of objective methods provides visibility and transparency in the estimation
process, and may also provide justification for decisions that are made. It is expected that such benefits
would be dampened with subjective estimates.
This finding and its interpretation would suggest some inherent disadvantages when using subjective
estimates of effectiveness as the sole basis for making the reinspection decision, even if accountability is
enforced. It is therefore recommended that subjective estimates of effectiveness be applied primarily in
three contexts:
• As a starting point for controlling software inspections. The ease with which such a practice can
be institutionalized and the evidence we present as to its efficacy supports this recommendation.
• Evaluating objective DCETs. In many practical situations the real number of defects or the real
decision is unknown. This makes it difficult to evaluate an objective DCET in a particular
environment. However, given the good decision accuracy performance of subjective estimates,
they can be used to evaluate objective DCETs.
• Bayesian DCETs. Our results would certainly recommend the use of subjective estimates as
informative priors to Bayesian capture-recapture models. This is likely to result in improved
decisions when compared to the more common (non-Bayesian) models.
5.3.7 Relevance of Thresholds
Another point that should be emphasized as a consequence of this study is that the performance of any
method for making the reinspection decision, whether subjective or objective, is inherently linked to the
threshold that is used for controlling document and inspection process quality. Therefore, future studies
should either evaluate the methods across all reasonable thresholds, or select a number of thresholds as
the basis for the evaluation.
24
5.4 Threats to validityIt is the nature of any empirical study that assumptions are made that later on may restrict the validity of
the results. Here, we list these assumptions that impose threats to internal and external validity.
5.4.1 Threats to Internal Validity
One important potential threat to the internal validity of our study concerns defect severity. Similar to
previous studies that evaluate DCETs, we do not consider the characteristics of the defects that are
found. With characteristics we mean, for example, the severity or the criticality of defects. An inspection
that reveals few extremely critical defects is different from an inspection that detects many uncritical
defects. When only looking at some thresholds one may decide not to reinspect in the first case while
making a reinspection in the second one. However, from a purely subjective point of view, it would be
better to reinspect the first one to be sure that there are no other major defects and that the defects are
corrected without introducing other or even more major defects (in some existing inspection
implementations, a follow-up phase is performed as part of the inspection for checking this (Gilb and
Graham, 1993)). However, it is more difficult to model the characteristics of the defects in a decision
criterion. One approach might be to just consider critical or severe defects for decision making.
A second potential threat to the internal validity of our study is related to the fact that seeded defects were
used. Despite us taking special care to alleviate this (for example, by reinjecting previously detected
defects rather than making up new defects), there is always the danger that seeded defects are not the
same as actual defects. Specifically, they may be easier to detect than actual defects. If an inspector
realizes that the defects found are easy, then s/he may be suspicious that the defects are too easy and
that the difficult defects were not found yet, hence deflating the effectiveness estimate. However, we did
not observe this effect in our data, therefore this potential threat may not be severe.
5.4.2 Threats to External Validity
Our study was performed with subjects and code documents from a single organization. While this enjoys
greater external validity than doing studies with students in a "laboratory" setting, it is uncertain the extent
to which the results can be generalized to other organizations. However, our result are in line with
previous findings (Selby, 1985).
6 ConclusionKnowing the number of defects in an inspected document can provide the basis for deciding whether to
reinspect a document. Making the correct reinspection decision provides a means for ensuring that
inspected documents have a defect density below a prespecified threshold, and that the inspection
process has attained a minimal level of effectiveness.
25
Thus far, software engineers have proposed capture-recapture models and the Detection Profile Method
as objective means for estimating the number of defects in a document. Both of these approaches utilize
data collected during an inspection to make an estimate.
In this paper we evaluated subjective estimates of effectiveness by the inspectors as a basis for making
that decision. We showed how subjective estimates can be used for such a purpose and detailed an
empirical evaluation of subjective estimates. The empirical study was performed with 30 professional
software engineers. Our results indicate that subjective estimates of defect content have a median
relative error of zero, and do indeed consistently outperform the default decision of not reinspecting a
document.
Given that subjective estimates are easy to perform, they can provide a cost effective way for making the
reinspection decision. This is especially true since we have shown that the subjective estimate of only a
single inspector is necessary to make the decision for a team-based inspection.
These results are encouraging for organizations contemplating the use of reinspections for controlling
their product and process quality. It can be recommended that subjective estimates be used as a starting
point for controlling inspections and for evaluating more objective decision models. From a research
perspective, our results suggest that future studies ought to compare the performance of subjective
estimates with more objective techniques such as capture-recapture models and the Detection Profile
Method, evaluate the use of Bayesian capture-recapture models, and ought to consider the effects of
collusion among inspectors. In addition, in our study the estimates did not take into account the
confidence of the inspectors in their estimates. Future work ought to consider the inspectors expressing
a distribution of their effectiveness rather than a point estimate, much in the same manner as recent
studies of subjective estimates of cost (Connolly and Dean, 1997; Hihn and Habib-Agahi, 1991; Host and
Wohlin, 1997; Host and Wohlin, 1998).
7 AcknowledgementsWe thank both the managers and developers at Bosch Telecom GmbH for their dedicated efforts in
making this study possible as well as for their participation.
8 ReferencesAdams, T., 1999. A Formula for the Re-Inspection Decision. Software Engineering Notes, 24(3), p. 80.
Ardissone, M., Spolverini, M., Valentini, M., 1998. Statistical Decision Support Method for In-ProcessInspections. Proceedings of the 4th International Conference on Achieving Quality in Software, p. 135-143.
Basin, S., 1972. Estimation of Software Error Rates via Capture-Recapture Sampling. Technical Report,Science Applications Inc..
26
Basu, S., Ebrahimi, N., 1998. Estimating the Number of Undetected Errors: Bayesian Model Selection.Proceedings of the 9th International Symposium on Software Reliability Engineering, p. 22-31.
Briand, L., El Emam, K., Freimut, B., Laitenberger, O., 1997. Quantitative Evaluation of CaptureRecapture Models to Control Software Inspections. Proceedings of the 8th International Symposiumon Software Reliability Engineering, p. 234-244.
Briand, L., El Emam, K., Freimut, B., 1998a. A Comparison and Integration of Capture-Recapture Modelsand the Detection Profile Method. Proceedings of the 9th International Symposium on SoftwareReliability Engineering, p. 32-41.
Briand, L., El Emam, K., Bomarius, F., 1998b. COBRA: A Hybrid Method for Software Cost Estimation,Benchmarking, and Risk Assessment. Proceedings of the 20th International Conference on SoftwareEngineering, p. 390-399.
Briand, L., El Emam, K., Laitenberger, O., Fussbroich, T., 1998c. Using Simulation to Build InspectionEfficiency Benchmarks for Development Projects. Proceedings of the 20th International Conferenceon Software Engineering, p. 340-349.
Briand, L., Freimut, B., Laitenberger, O., Ruhe, G., Klein, B., 1998d. Quality Assurance Technologies forthe EURO Conversion – Industrial Experience at Allianz Life Assurance. Proceedings of the QualityWeek Europe.
Briand, L., El Emam, K., Freimut, B., Laitenberger, O., 1998e. A Comprehensive Evaluation of Capture-Recapture Models for Estimating Software Defect Content. IEEE Transactions on SoftwareEngineering (to appear).
Chandra Sekar, C., Deming, W., 1949. On a Method of Estimating Birth and Death Rates and the Extentof Registration. Journal of the American Statistical Association, 44(245-248), p. 101-115.
Chernak, Y., 1996. A Statistical Approach to the Inspection Checklist Formal Synthesis and Improvement.IEEE Transactions on Software Engineering, 22(12), p. 866–874.
Connolly, T., Dean, D., 1997. Decomposed Versus Holistic Estimates of Effort Required for SoftwareWriting Tasks. Management Science, 43(7), p. 1029-1045.
Deitel, H., Deitel, P., 1994. C How to program, 2nd ed.. Prentice Hall.
Devnani-Chulani, S., 1997. Incorporating Bayesian Analysis to Improve the Accuracy of COCOMO II andIts Quality Model Extension. Technical Report, University of Southern California, Computer ScienceDepartment.
Duran, J., Wiorkowski, J., 1981. Capture-Recapture Sampling for Estimating Software Error Content.IEEE Transactions on Software Engineering, 7(1), p. 147-148.
Ebrahimi, N., 1997. On the Statistical Analysis of the Number of Errors Remaining in a Software DesignAfter Inspection. IEEE Transactions on Software Engineering, 23(8), p. 529-532.
Eick, S., Loader, C., Long, M., Votta, L., Vander Wiel, S., 1991. Investigating the Application of Capture-Recapture Techniques to Requirements and Design Reviews. Proceedings of the SEL SoftwareEngineering Workshop, p. 97-102.
Eick, S., Loader, C., Long, M., Votta, L., Vander Wiel, S., 1992. Estimating Software Fault Content BeforeCoding. Proceedings of the 14th International Conference on Software Engineering, p. 59-65.
27
Eick, S., Loader, C., Vander Weil. S., Votta, L., 1993. How Many Errors Remain in a Software DesignAfter Inspection ?. Proceedings of the 25th Symposium on the Interface, Interface Foundation of NorthAmerica, p. 195-202.
El Emam, K., Garro, I., 1999. Estimating the Extent of Standards Use: The Case of ISO/IEC 15504.Submitted for Publication.
Fagan, M.E., 1976. Design and Code Inspections to Reduce Errors in Program Development. IBMSystems Journal, vol. 15, no. 3, p. 182-211.
Gilb, T., Graham, D., 1993. Software Inspection. Addison-Wesley Publishing Company.
Heemstra, F., 1992. Software Cost Estimation. Information and Software Technology, 34(10), p. 627-639.
Hihn, J., Habib-Agahi, H., 1991. Cost Estimation of Software Intensive Projects: A Survey of CurrentPractices. Proceedings of the 13th International Conference on Software Engineering, p. 276-287.
Host, M., Wohlin, C., 1997. A Subjective Effort Estimation Experiment. Proceedings of the Conference onEmpirical Assessment in Software Engineering.
Host, M., Wohlin, C., 1998. An Experimental Study of Individual Subjective Effort Estimations andCombinations of Estimates. Proceedings of the 20th International Conference on SoftwareEngineering, p. 332-339.
Hughes, R., 1996. Expert Judgement As An Estimating Method. Information and Software Technology,38, p. 67-75.
Isoda, S., 1998. A Criticism on the Capture and Recapture Method for Software Reliability Assurance.Journal of Systems and Software, 43, p. 3-10.
Kernighan, B.W., Ritchie, D.M., 1990. Programming in C. Hanser Verlag.
Kusters, R., van Genuchten, M., Heemstra, F., 1990. Are Software Cost Estimation Models Accurate?.Information and Software Technology, 32(3):187-190, 1990.
Laitenberger, O., DeBaud, J.M., 1998. An Encompassing Life-Cycle Centric Survey of SoftwareInspection. International Software Engineering Research Network (ISERN) Technical Report ISERN-98-14, Fraunhofer Institute for Experimental Software Engineering. To appear in the Journal ofSystems and Software, 2000.
Laitenberger, O., El Emam, K., Harbich, T., 1999. An Internally Replicated Quasi-ExperimentalComparison of Checklist and Perspective-based Reading of Code Documents. International SoftwareEngineering Research Network, Technical Report ISERN-99-01.
Lederer, A., Prasad, J., 1992. Nine Management Guidelines for Better Cost Estimating. Communicationsof the ACM, 35(2), p. 51-59.
Lederer, A., Prasad, J., 1998. A Causal Model of Software Cost Estimating Error. IEEE Transactions onSoftware Engineering, 24(2), p. 137-148.
Miller, J., 1998. Estimating the Number of Remaining Defects After Inspection. International SoftwareEngineering Research Network Technical Report ISERN-98-24.
Mills, H., On the Statistical Validation of Computer Programs. Technical Report FSC-72-6015, IBMFederal Systems Division.
28
National Aeronautics and Space Administration, 1993. Software Formal Inspection Guidebook. TechnicalReport NASA-GB-A302, National Aeronautics and Space Administration.http://satc.gsfc.nasa.gov/fi/fipage.html.
Ohba, M., 1982. Software Quality = Test Accuracy X Test Coverage. Proceedings of the 6th InternationalConference on Software Engineering, p. 287-293.
Otis, D., Burnham, K., White, G., Anderson, D. 1978. Statistical Inference from Capture Data on ClosedAnimal Populations. Wildlife Monographs, 62, p. 1-135.
Petersson, H., Wohlin, C., 1999. Evaluation of Using Capture-Recapture Methods on Software ReviewData. Proceedings of the Conference on Empirical Assessment in Software Engineering.
Runeson, P., Wohlin, C., 1998, An Experimental Evaluation of an Experience-Based Capture-RecaptureMethod in Software Code Inspections. Empirical Software Engineering, 3, p. 381-406.
Seber, G., 1982, The Estimation of Animal Abundance and Related Parameters. Charles Griffin &Company Ltd., 2nd. edition.
Selby, R.W., 1985. Evaluations of Software Technologies: Testing, Cleanroom, and Metrics. PhD-Thesis,Department of Computer Science, University of Maryland.
Stephen, C., 1996. Capture-Recapture Methods in Epidemiological Studies. Infection Control andHospital Epidemiology, 17(4), p. 262-266.
Strauss, S., Ebenau, R., 1994. Software Inspection Process. McGraw Hill.
Thelin, T., Runeson, P., 1999a. Robust Estimations of Fault Content with Capture-Recapture andDetection Profile Estimators. Proceedings of the Conference on Empirical Assessment in SoftwareEngineering.
Thelin, T., Runeson, P., 1999b. Capture-Recapture Estimations for Perspective-Based Reading – ASimulated Experiment. Submitted for Publication.
Vicinanza, S., Mukhopadhyay, T., Prietula, M., 1991. Software-Effort Estimation: An Exploratory Study ofExpert Performance. Information Systems Research, 2(4), p.243-262.
Vander Wiel, S., Votta, L., 1993. Assessing Software Designs Using Capture-Recapture Methods, IEEETransactions on Software Engineering, 19(11), p.1045-1054.
White, G., Anderson, D., Burnham, K., Otis, D., 1982. Capture-Recapture and Removal Methods forSampling Closed Populations. Technical Report LA-8787-NERP, Los Alamos National Laboratory.
Wickens, T., 1989. Multiway Contingency Tables Analysis for the Social Sciences. Lawrence ErlbaumAssociates.
Wohlin, C., Runeson, P., Brantestam, J., 1995. An Experimental Evaluation of Capture-Recapture inSoftware Inspections. Software Testing, Verification and Reliability, 5, p.213-232.
Wohlin. C., Runeson, P., 1998, Defect Content Estimations from Review Data. Proceedings of the 20th
International Conference on Software Engineering, p. 400-409.
29
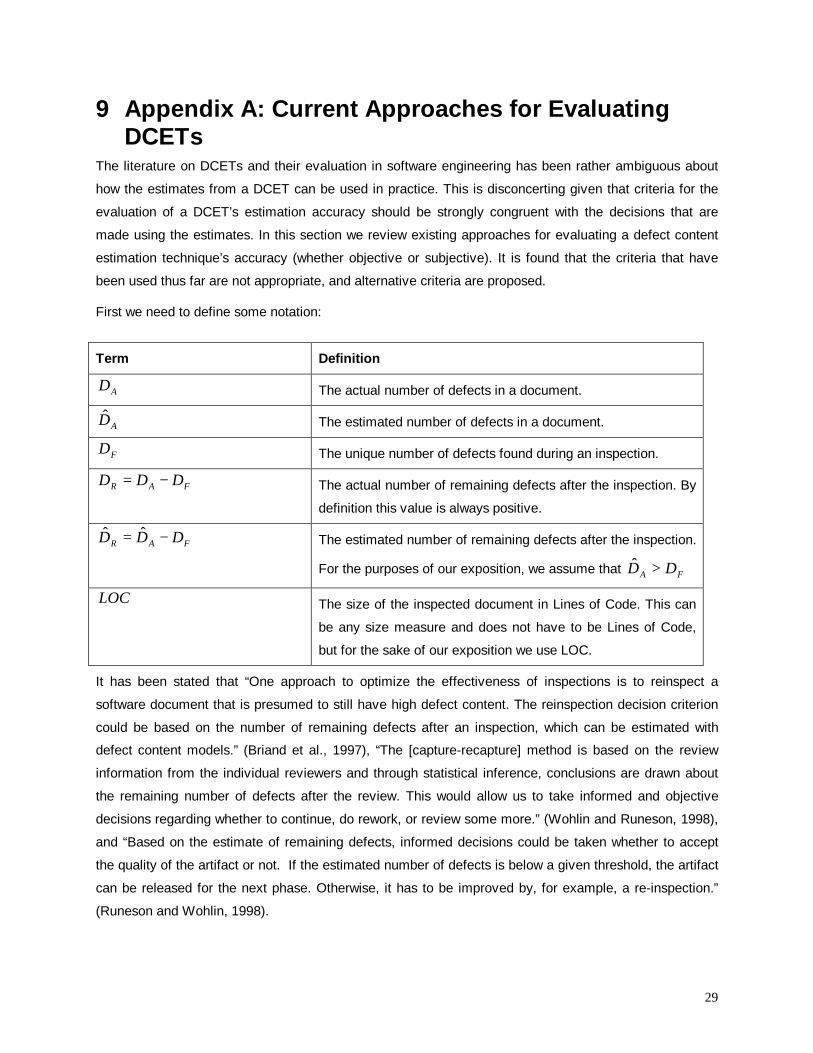
9 Appendix A: Current Approaches for EvaluatingDCETs
The literature on DCETs and their evaluation in software engineering has been rather ambiguous about
how the estimates from a DCET can be used in practice. This is disconcerting given that criteria for the
evaluation of a DCET’s estimation accuracy should be strongly congruent with the decisions that are
made using the estimates. In this section we review existing approaches for evaluating a defect content
estimation technique’s accuracy (whether objective or subjective). It is found that the criteria that have
been used thus far are not appropriate, and alternative criteria are proposed.
First we need to define some notation:
Term Definition
AD The actual number of defects in a document.
AD The estimated number of defects in a document.
FD The unique number of defects found during an inspection.
FAR DDD −= The actual number of remaining defects after the inspection. By
definition this value is always positive.
FAR DDD −= ˆˆ The estimated number of remaining defects after the inspection.
For the purposes of our exposition, we assume that FA DD >ˆ
LOC The size of the inspected document in Lines of Code. This can
be any size measure and does not have to be Lines of Code,
but for the sake of our exposition we use LOC.
It has been stated that “One approach to optimize the effectiveness of inspections is to reinspect a
software document that is presumed to still have high defect content. The reinspection decision criterion
could be based on the number of remaining defects after an inspection, which can be estimated with
defect content models.” (Briand et al., 1997), “The [capture-recapture] method is based on the review
information from the individual reviewers and through statistical inference, conclusions are drawn about
the remaining number of defects after the review. This would allow us to take informed and objective
decisions regarding whether to continue, do rework, or review some more.” (Wohlin and Runeson, 1998),
and “Based on the estimate of remaining defects, informed decisions could be taken whether to accept
the quality of the artifact or not. If the estimated number of defects is below a given threshold, the artifact
can be released for the next phase. Otherwise, it has to be improved by, for example, a re-inspection.”
(Runeson and Wohlin, 1998).
30
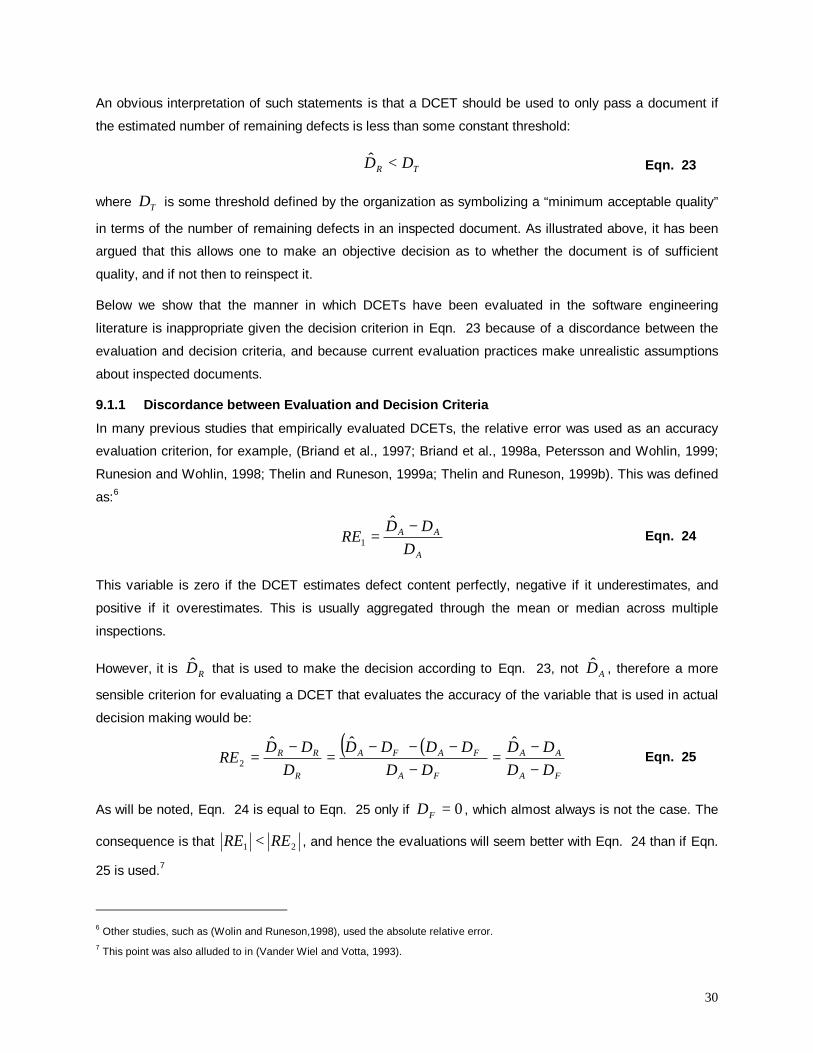
An obvious interpretation of such statements is that a DCET should be used to only pass a document if
the estimated number of remaining defects is less than some constant threshold:
TR DD <ˆ Eqn. 23
where TD is some threshold defined by the organization as symbolizing a “minimum acceptable quality”
in terms of the number of remaining defects in an inspected document. As illustrated above, it has been
argued that this allows one to make an objective decision as to whether the document is of sufficient
quality, and if not then to reinspect it.
Below we show that the manner in which DCETs have been evaluated in the software engineering
literature is inappropriate given the decision criterion in Eqn. 23 because of a discordance between the
evaluation and decision criteria, and because current evaluation practices make unrealistic assumptions
about inspected documents.
9.1.1 Discordance between Evaluation and Decision Criteria
In many previous studies that empirically evaluated DCETs, the relative error was used as an accuracy
evaluation criterion, for example, (Briand et al., 1997; Briand et al., 1998a, Petersson and Wohlin, 1999;
Runesion and Wohlin, 1998; Thelin and Runeson, 1999a; Thelin and Runeson, 1999b). This was defined
as:6
A
AA
DDD
RE−=
ˆ1 Eqn. 24
This variable is zero if the DCET estimates defect content perfectly, negative if it underestimates, and
positive if it overestimates. This is usually aggregated through the mean or median across multiple
inspections.
However, it is RD that is used to make the decision according to Eqn. 23, not AD , therefore a more
sensible criterion for evaluating a DCET that evaluates the accuracy of the variable that is used in actual
decision making would be:
( ) ( )FA
AA
FA
FAFA
R
RR
DDDD
DDDDDD
DDD
RE−−=
−−−−=−=
ˆˆˆ2 Eqn. 25
As will be noted, Eqn. 24 is equal to Eqn. 25 only if 0=FD , which almost always is not the case. The
consequence is that 21 RERE < , and hence the evaluations will seem better with Eqn. 24 than if Eqn.
25 is used.7
6 Other studies, such as (Wolin and Runeson,1998), used the absolute relative error.7 This point was also alluded to in (Vander Wiel and Votta, 1993).
31
9.1.2 Unrealistic Assumptions About Inspected Documents and Estimation Models
As noted in the body of the paper, in making the reinspection decision, one wishes to control two aspects
of quality:
• The quality of the document. By ensuring that the documents that pass the inspection attain a
minimal quality level.
• The quality of the inspection. By ensuring that the inspection process has achieved a minimal
quality level.
It is shown below that following the decision criterion in Eqn. 23 achieves neither of these objectives.
The decision criterion to control the quality of the document can be based on estimated residual defect
density:
DR Q
LOCD <ˆ
Eqn. 26
where DQ is some threshold document quality level. The above decision criterion stipulates that a
document must have a residual defect density that is lower than some accepted level. This accepted level
would be defined as a constant for a project or an organization. This way, an organization can ensure that
a document that passes inspection will be of a certain quality. For this purpose, the estimated residual
defect density, LOCDR , is used. The question then is what is the difference between the decision criterion
in Eqn. 23 and the criterion that controls document quality defined in Eqn. 26 ?
It can be seen that Eqn. 23 is equal to Eqn. 26 only if LOCQD DT ×= . If TD is a constant, then
LOC would also have to be a constant. The implication is that using the decision criterion in Eqn. 23 will
consistently result in the same decisions as Eqn. 26 only if all documents that are inspected are of the
same size. This is unlikely to be true in many cases as the documents that go through an inspection will
not be of a uniform size.
The problematic aspect can be illustrated through an example. Let us assume that we have two
documents, A and B. A is 600 LOC and B is 50 LOC. Further, let us assume that after an inspection, the
DCET is used to predict 5 remaining defects in both documents, and that our threshold quality level, DQ ,
is 0.01 defects per LOC. In the former, the estimated defect density is approximately 0.008 while for the
latter it is 0.1. According to the decision criterion in Eqn. 23 both documents would either pass or be
reinspected. However, to control document quality, we should pass document A but reinspect document
B.
32
The skeptic can argue that it may be clear, in an intuitive sense, that 5 remaining defects in a 50 LOC
document would seem problematic to the inspection participants. While this may be true, it indicates that
the decision is no longer objective, which defeats the whole point of using an objective DCET.
To control the quality of the inspection process, one can use its estimated effectiveness as follows:
PA
F QDD >ˆ Eqn. 27
where PQ is some threshold inspection process quality level that is constant for the project or
organization. The above decision criterion stipulates that an inspection must achieve an effectiveness that
is larger than some minimal accepted level. This way, an organization can ensure that its inspections
achieve a certain quality. We can then write the decision criterion of Eqn. 27 as:
PA
RA
A
F QD
DDDD >−= ˆ
ˆˆˆ
Eqn. 28
It can be seen that Eqn. 23 is equal to Eqn. 28 only if )1(ˆPAT QDD −= . If TD is a constant, then AD
would also have to be a constant. The implication is that decisions made using Eqn. 23 will be
consistently the same as using Eqn. 28 only if DCETs always predict the same number of defects in all
documents, which will not be the case, and if it was the case then the DCETs would be useless. Further,
let’s say we achieve the ultimate outcome of devising a DCET that has 100% accuracy (i.e., AA DD =ˆ ),
then the assumption that would need to be made is that all documents that go through inspections have
the same defect content before the inspection (i.e., are of the same quality). This is unlikely to be true in
many cases as the documents that go through an inspection will not be of a uniform quality beforehand.
The problematic aspect can be illustrated through an example. Consider a stipulation that all inspections
should attain at least 0.6 effectiveness. This means that 60% of the defects in a document are found
during the inspection. Let’s assume we have two documents, A and B. Document A has 30 defects in it
before the inspection, and document B has 20 defects. During the inspections, 20 defects were found in
document A, and 10 defects in document B. In both cases the number of remaining defects is 10. If we
have a perfect DCET, we will know that the number of remaining defects is 10, and so we will make the
same decision for both documents as to whether they should be reinspected using the criterion in Eqn.
23. However, the effectiveness of the inspection of document A is approximately 0.66, and for document
B is 0.5. So, to control inspection process quality, we would reinspect document B to attain our threshold
level of effectiveness. Therefore, using the criterion in Eqn. 23 does not actually control the effectiveness
of the inspection process.
The above exposition has shown that the most obvious decision criterion as implied from the literature
does not necessarily control document quality nor inspection process quality. In order to do so, all
33
documents that are inspected would have to be of the same size and of the same quality, or that DCETs
always make the same prediction. Clearly, then the criterion in Eqn. 23 is not a good one. Below we
consider some alternatives.
9.1.3 Possible Alternatives to Relative Error
We can propose that DCETs should be used to explicitly control one or both of the qualities in practice by
using the criteria in Eqn. 26 and Eqn. 28. From the perspective of the previous literature that evaluates
DCETs, we can consider alternative definitions of relative error that are congruent with the decision
criteria in Eqn. 26 and Eqn. 28. For controlling document quality, we can define:
23
ˆ
ˆ
RED
DD
LOCD
LOCD
LOCD
RER
RR
R
RR
=−=
−
=Eqn. 29
Therefore, the previously used definition of relative error (Eqn. 24) provides accuracy results that are not
congruent with the decision criterion in Eqn. 26.
For controlling process quality, we can define:
1
14 1ˆ
ˆˆ
RERE
DDD
DD
DD
DD
REA
AA
A
F
A
F
A
F
+=−=
−
=Eqn. 30
This then would be the appropriate definition of relative error when one applies DCETs for making the
decision as defined in Eqn. 28. As can be seen, this is inconsistent with the definition of relative error in
Eqn. 24.
The above formulation indicates that the commonly used definition of relative error (defined in Eqn. 24)
does not actually indicate an accuracy that is useful for controlling document quality and inspection
process effectiveness when used with the alternative decision criteria in Eqn. 26 and Eqn. 27.
9.1.4 Summary
We have shown that the commonly used criterion for evaluating DCETs, the relative error (as defined in
Eqn. 24), does not actually give you an indication of whether the DCET can be used for controlling
document quality nor inspection process quality when used in conjunction with the decision criterion of
Eqn. 23. Furthermore, alternative decision criteria that do control document and process quality, given in
Eqn. 26 and Eqn. 27, are incongruent with the decision criterion of Eqn. 23, and so is relative error as
defined in Eqn. 24.
34
9.2 Appropriate Criteria for Evaluating AccuracyTo resolve the difficulties unearthed above with the commonly used evaluation criterion, one can use
variable thresholds for decision making. A variable threshold combines the specifics of a particular
inspection with the fixed expected product quality level DQ or process quality level PQ .
We reformulate Eqn. 26 as:
DFA Q
LOCDD <−ˆ
Eqn. 31
( ) FDA DLOCQD +×<ˆEqn. 32
Therefore, the estimated number of defects in the document can be applied directly in the decision
criterion. Also, the decision criterion maintains the desired document quality level by defining a different
threshold depending on the document size. Similarly for inspection effectiveness, we can reformulate
Eqn. 27 as:
P
FA Q
DD <ˆ Eqn. 33
The above results also indicate that the currently used relative error criterion (Eqn. 24) is congruent with
the manner in which DCETs are used in practice for controlling document quality and process
effectiveness only if the decision criteria defined in Eqn. 32 and Eqn. 33 are used.
10 Appendix B: The Checklist
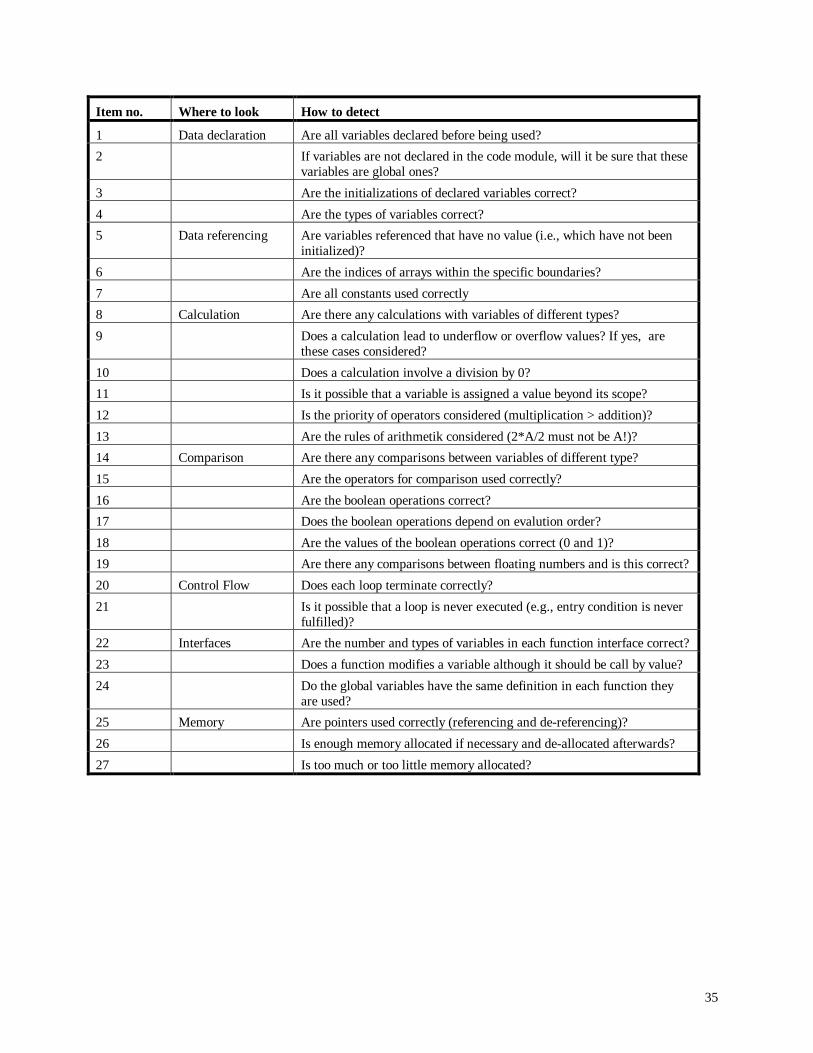
35
Item no. Where to look How to detect
1 Data declaration Are all variables declared before being used?
2 If variables are not declared in the code module, will it be sure that thesevariables are global ones?
3 Are the initializations of declared variables correct?
4 Are the types of variables correct?
5 Data referencing Are variables referenced that have no value (i.e., which have not beeninitialized)?
6 Are the indices of arrays within the specific boundaries?
7 Are all constants used correctly
8 Calculation Are there any calculations with variables of different types?
9 Does a calculation lead to underflow or overflow values? If yes, arethese cases considered?
10 Does a calculation involve a division by 0?
11 Is it possible that a variable is assigned a value beyond its scope?
12 Is the priority of operators considered (multiplication > addition)?
13 Are the rules of arithmetik considered (2*A/2 must not be A!)?
14 Comparison Are there any comparisons between variables of different type?
15 Are the operators for comparison used correctly?
16 Are the boolean operations correct?
17 Does the boolean operations depend on evalution order?
18 Are the values of the boolean operations correct (0 and 1)?
19 Are there any comparisons between floating numbers and is this correct?
20 Control Flow Does each loop terminate correctly?
21 Is it possible that a loop is never executed (e.g., entry condition is neverfulfilled)?
22 Interfaces Are the number and types of variables in each function interface correct?
23 Does a function modifies a variable although it should be call by value?
24 Do the global variables have the same definition in each function theyare used?
25 Memory Are pointers used correctly (referencing and de-referencing)?
26 Is enough memory allocated if necessary and de-allocated afterwards?
27 Is too much or too little memory allocated?

36
Khaled El Emam is currently at the National Research Council in Ottawa. He is the current editor of the
IEEE TCSE Software Process Newsletter, the current International Trials Coordinator for the SPICE
Trials, which is empirically evaluating the emerging ISO/IEC 15504 International Standard world-wide,
and co-editor of ISO's project to develop an international standard defining the software measurement
process. Previously, he worked in both small and large software research and development projects for
organizations such as Toshiba International Company, Yokogawa Electric, and Honeywell Control
Systems. Khaled El Emam obtained his Ph.D. from the Department of Electrical and Electronics
Engineering, King’s College, the University of London (UK) in 1994. He was previously the head of the
Quantitative Methods Group at the Fraunhofer Institute for Experimental Software Engineering in
Germany, a research scientist at the Centre de recherche informatique de Montreal (CRIM), and a
research assistant in the Software Engineering Laboratory at McGill University.
Oliver Laitenberger is a researcher and consultant at the the Fraunhofer Institute for Experimental
Software Engineering (IESE) in Kaiserslautern. Laitenberger has been working for several years in the
development and evaluation of inspection technology. His main interests therefore concern software
quality assurance with software inspections, inspection measurement, and inspection improvement. As a
consultant, he has worked with several international companies in introducing and improving inspection
technology.Oliver Laitenberger has received the degree Diplom-Informatiker (M.S.) in computer science
and economics from the University of Kaiserslautern, Germany, in 1996.
Thomas G. Harbich received his diploma degree in physics at the University of Regensburg, Germany in
1977 and his Ph.D. degree in theoretical solid state physics at the University of Stuttgart in 1982. He
joined ANT-Nachrichtentechnik GmbH, Backnang Germany (now BOSCH Telecom GmbH) in 1983
where he held different engineering positions in the field of telecommunications systems. Currently he is
leading a department for software development with the main focus on embedded software for
transmission systems and access networks.


