Embed Size (px)
Citation preview

1
World Internet Project Cyprus
The Internet in Cyprus 2009 Final Report
Nicolas Demertzis
Vassilis Gialamas Christopher Kyriakides
Helena Kyza Lambros Lambrinos
Dimitra Milioni Dionysis Panos
Nicolas Tsapatsoulis
Cyprus University of Technology (CUT) Department of Communication and Internet Studies

2

3
Credits
Representative of WIP in Cyprus and Principal Investigator
Professor Nicolas Demertzis, University of Athens
Project director
Dr Dimitra Milioni, Lecturer, Cyprus University of Technology
CUT Research team and contributing writers
Vassilis Gialamas, Associate Professor, University of Athens Dr Christopher Kyriakides, Assistant Professor Dr Helena Kyza, Lecturer Dr Lambros Lambrinos, Lecturer Dr Dionysis Panos, Lecturer Dr Nicolas Tsapatsoulis, Assistant Professor
Research Consultants
Dr Angeliki Gazi, University of Athens Dr Michalis Vryonides, Symmetron MRCI Ltd, Limassol
Promotion and Public Relations
Giannos Afrodises, CUT
Design and Layout
Isidoros Kolotas, Consulo Integrated Strategic Communications, Limassol
Administration and Secretarial Support
Charalambos Chrisostomou & Rosita Pavlidou, Research, International and Public Relations, CUT Dr Angeliki Gazi

4
General Information ADDITIONAL COPIES Readers are welcome to download additional copies of the Internet in Cyprus 2009 Final Report for non-commercial or individual use only. The full text and graphs of this report may be downloaded from http://www.cut.ac.cy/cis/ REPRINTING Reprinting of this report in any form other than brief excerpts requires the express written permission of the World Internet Project Cyprus. ATTRIBUTION Excerpted material from this report may be cited in media coverage and institutional publications. Text excerpts and use should be attributed as follows: Demertzis, Nicolas et al. The Internet in Cyprus 2009. Final Report. Limassol: Cyprus University of Technology, 2009. © 2009. Department of Communication and Internet Studies, Cyprus University of Technology QUESTIONS E-mail: [email protected] [email protected]

5
Contents
Executive summary __________________________________________ 6 Introduction _________________________________________________ 9 Methodology ________________________________________________ 11 I Profiles of Internet Users and Non-users ________________________ 13
II Internet impressions ________________________________________ 27 IIΙ Internet access hours _______________________________________ 31 IV. Media Use ______________________________________________ 34 V. Online purchasing _________________________________________ 39 VI. Social Networking and communication _______________________ 42 VII. The range of Internet use …………………………………………….. 55 VIII. The Internet at Work …………… 64 ………………………………. IX. Internet and political efficacy …….. 67 __________ Χ. Overall evaluation of the Internet ….71 71_____________________ Appendix …………………….. 73 __

6
Executive summary The Cyprus World Internet Project survey was conducted in late 2008. A sample of 1000 Cypriots were interviewed regarding their use of and attitudes to the Internet. ICT Usage Currently, the majority of Cypriots own a personal computer (63%). Overall, Cypriots are not very dependent on their computers in their everyday life. Computer dependence is higher among urban residents, younger age groups and the more highly educated. The duration of computer ownership varies from 1 to 10 years (87%). Internet use has increased dramatically since 2000, but is not a routine part of everyday life. 48% of Cypriots use the Internet; currently, 52% are non users among which 13% are ex-users. The overwhelming majority of users (83%) say they have access to the Internet at home; most of them (69%) have broadband connection. Educational and work-related needs are the most significant factors which motivate an individual in Cyprus to start using the Internet. It is unlikely that the majority of non-users will start using the Internet in the near future.
Digital divide In Cyprus there are digital divides across socio-demographic variables. Among Internet users, 54% are men and 42% are women. Young people and the highly educated are more likely to use the Internet. High family income is systematically related to Internet use. . The majority of non-users seem to be immune to technological progress as they say that they are unlikely to start using the Internet within the next year. Internet access hours Overall, most online time is spent at schools and universities. Time spent on the Internet at home decreases linearly with age. Males, students and residents in rural areas spend more time on the Internet at home. Rural residents and university graduates spend more time using the Internet at work than lyceum graduates. Internet impressions By and large, the Internet is regarded as an important but not very reliable source of information. The Internet is a more important information-source for young people than for older age groups.

7
On average, television is more important as an entertainment medium than the Internet. Media use Average TV-viewing time for Internet users’ is 15.4 hours per week. Viewing time increases dramatically for retired people and housewives/househusbands, and decreases among the more highly educated. Nearly half of Internet users in Cyprus listen to the radio up to 7 hours per week (44%). Radio enthusiasts (more than 21 hours per week) amount to 16% of Internet users, but one out of ten (11%) do not listen to the radio at all.
The majority of Internet users spend up to 7 hours per week reading newspapers, but a full one third (34%) do not read newspapers at all. Online purchasing Online purchasing is limited in Cyprus. Among Internet users, 62% never purchase online, and 19% only purchase online on average less than once per month. Most Internet users are concerned about the security of their credit card information during online transactions. Socializing Most Cypriot users do not think that access to the Internet has had any major impact on their social networks.
Most respondents say that the Internet has not affected face-to-face contact with family and friends. Increased Internet use does not decrease time spent socializing with friends. The opposite is true: more frequent Internet use positively correlates with more time spent with friends. By contrast, Internet use at home negatively correlates with familial socializing: the more frequent the Internet use at home, the less time is devoted to social activities within the family. Identity and relationships Internet use does not sufficiently engage at an emotional level so as to warrant classification as a significant life style choice for Cypriots; this is an additional sign that in Cyprus the Internet is not a deeply integrated presence in people’s lives and identities. Overall affect of the net 80% of the Cypriot users declare that the overall impact of the Internet on their lives is ‘positive’ and that a possible disconnection would be highly unwelcome (69%). Activities when online Most users (69%) engage in more than one online activity simultaneously. This is a more frequent habit of young people who tend to have many programs running at the same time. The two most concurrent activities are surfing the web and instant messaging / chat room participation.

8
Useful information Information searches related to local, national or international news are very common via the web. Tourism and travel, especially for the purpose of booking, and health information searches are also popular. Everyday transactions To a limited extent Cypriot Internet users do engage in online banking and shopping transactions. The most frequent users are the college educated and those on higher incomes. Entertainment Surfing the web, listening to music and digital radio, playing games online, and downloading videos are the most popular entertainment activities performed by Internet users, especially by young people. Online learning Online educational practices are not widely utilized in Cyprus.
72% and 38% of those aged 15-17 and 18-24 respectively, use the web weekly, daily, or several times a day in search of information related to school work. . The Internet at work In Cyprus, the Internet is highly integrated in the workplace and is a widely applied and effective business tool. Generally, the Internet enhances productivity. In a typical week the average work place Internet use time is 17 hours and 28 minutes. Workplace online activity is higher for males than for females. Political orientation and efficacy Most respondents place themselves in the “Centre” of the right-left political axis. Most users do not think that the Internet either enhances their political efficacy, or renders the political system more responsive to its citizenry.

9
Introduction
The Republic of Cyprus is the third largest island in the Mediterranean Sea and has a
population of approximately 800,000 1 . Located at the north-eastern end of the
Mediterranean basin at a distance of 240 miles north of Egypt, 64 miles west of Syria,
and 44 miles south of Turkey, Cyprus represents the most easterly border of the
European Union. Over the course of the last twenty five years the island’s economy
has been transformed into a successful free market service-based economy with
dynamic industrial, agricultural and construction sub-sectors. The population as a
whole enjoys a high level of literacy and education. The service sector, where tourism
occupies a substantial position, contributes 76% of GDP and employs 71% of the
labour force. The World Bank classifies Cyprus2
among the high income countries;
GDP per capita amounts to EUR 18 500, which is about 80 % of the EU average,
ranking it in first place among all Candidate Countries. Per capita income among
Cypriots is higher than in Greece or Portugal. Cyprus has a significant macro-
economic potential due to the introduction of high technology, expertise and know-
how which facilitate foreign capital investments. As a consequence, development of
knowledge-intensive industries (machinery, audiovisuals, pharmaceuticals, education,
social work, etc) is progressing at a steady pace. In addition, expenditure in consumer
goods is quite extensive; if not a fully fledged network society, Cyprus is
unquestionably a consumer society.
On 1 May 2004 Cyprus joined the EU together with nine other countries. Cyprus and
Malta were the only ‘new member states’ that did not formerly belong to the Soviet
Bloc. As compared with most of the new member states Cyprus was wealthier and
faced less immediate regional, financial, social, and human capital divides and
inequalities. In 2004 the average level of productivity was the second highest among
the new member states, corresponding to around 78% of the EU average. In addition,
Cyprus had the highest rate of employment among the ten new member states and the
fifth highest among the EU25.
1 http://www.cia.gov/cia/publications/factbook/geos/cy.html#Intro 2 In this paper ‘Cyprus’ does not refer to the part of the country occupied by Turkish troops since 1974..

10
The improvement of Cyprus’ position in the EU depends on the upgrading of key
infrastructures and the development of human capital. This is contingent upon the
taking up of opportunities offered by the Information Society (access to ICTs, online
public and private services and so on). Despite increased spending in R&D over the
last ten years or so, both in public and private sectors, Cyprus still lags behind the EU
average as far as ICT expenditure is concerned; the latter represents only 0.1% of total
European spending. Nevertheless, high investment in state-of-the-art
telecommunications technologies has made Cyprus into one of the most important
telecommunications hubs for the Middle East, a position enhanced by the vigorous
implementation of eGovernment programmes and the provision of broadband services
countrywide.
Cyprus is a ‘late-starter’ in terms of IS policy. In 1987 the Cypriot government
inaugurated the ‘Information Systems Strategy,’ (ISS) which in one form or another
still exists. Under this strategy a number of projects were implemented, albeit not
speedily, in specific target areas in both public and private sectors. The majority of
theses projects commenced after 1996, when EU accession, being a viable goal,
required greater harmonization. Since then, ICT services have increased dramatically.
Given that Cyprus was already a modernized society, tightly incorporated into the
world economic system, one cannot claim that its late start in the digital era has been
a leap-frog process, i.e. an opportunity for reducing an economic development gap.
The leap-frog metaphor fits better for less developed countries where
telecommunications policies are adopted in order to catalyze speedy transition to a
knowledge economy.

11
Methodology Introduction
The survey comprised 1000 interviews conducted face-to-face, and selected door-to-
door, with people who were able to express themselves either in Greek or English.
The research methodology was designed by CUT and fieldwork was carried out by
Symmetron MRC Institute, a full service research agency and member of ESOMAR.
A pilot stage with 43 first and second year CUT students was conducted prior to the
survey in order to test the format, questions and interview length. In addition, through
reverse translation, a cultural adaptation of the WIP questionnaire ensured ‘linguistic
equivalence’.
Geographical Coverage
The Survey covered all of the five districts of the Cyprus Republic
Statistical Units
Households with at least one member aged 15+ years old
Individuals aged 15+ years old
Data Collection Period
1 – 17 December 2008
Sampling Method
A multistage stratified random sample design was applied. At the first stage, the
sampling frame was stratified into urban and rural strata by district. Households were
allocated proportionally in each stratum according to the Population Census of the
Statistical Service of the Republic of Cyprus. Selection of households in urban areas
was implemented through simple systematic random sample. A random start was
selected and by using the sampling interval N/n urban households for each district
were selected. The selection in rural areas was conducted in two stages: villages of
each district were the Primary Sampling Units and households the Ultimate Sampling
Units. The villages sample was drawn with probability proportional to size.

12
At the second stage, respondents were selected in each household using age and
gender quotas proportionate to the total population according to the Population
Census of 2001. In each household only one interview was conducted. If the
randomly selected individual was between 15 and 17 years of age, the interviewer
asked a parent for permission to interview the young person.
Response Rate
The response rate was 84%. Specifically, 1186 households were visited and 1000
effective interviews were obtained. Refusal by the person who answered the door
accounts for 10%, the corresponding rate for refusal by the selected respondent was
3%. A further 3% represents repeated unsuccessful efforts to contact the selected
households.
Data Collection Method
Data was collected face-to-face using a structured questionnaire. The questionnaire
was formulated based on the World Internet Project guidelines. The average length of
interview was 37 minutes for Internet users and 16 minutes for non users.
Organization of Fieldwork
In total, 58 trained and experienced interviewers were employed. The fieldwork team
was organized and monitored on a daily basis by 5 supervisors, one in each of the five
districts.
Confidence Interval
The sample error is +/- 3, 1 at the 95% confidence interval.

13
I. Profiles of Internet Users and Non-users General access and use Computer ownership in Cyprus has increased significantly in the last three years, ranging from 46% in 2005 to 63% in 2008. However, a significant number of citizens say that they do not own a computer at home, whilst most of those who do are long term owners (= more than six years).
Q1(b) : Home computer historyN=1000
2%6%
15%
40%37%
0%
10%
20%
30%
40%
50%
Less than a year One to two years Three to six years More than six years I don't have acomputer at home
Respondents were asked to estimate the personal cost of a possible loss or damage of their computer, using a scale of 1 to 10, where 1 indicates that he/she would not care at all because his/her life would nevertheless continue as normal, and where 10 means that he/she would be extremely distraught, its absence costing dearly. A mean value of 6.46 entails that Cypriots are not very dependent on their computers in their everyday lives. Most dependent on their computers are urban residents, young people, and the more highly educated.
Q1C. Computer dependency N=630
12%
5% 5% 5%
10%
5%7%
15%13%
21%
0%
5%
10%
15%
20%
25%
(1.0) (2.0) (3.0) (4.0) (5.0) (6.0) (7.0) (8.0) (9.0) (10.0)

14
Q1C. Computer dependency N=630
12%
5%
5%
5%
10%
5%
7%
15%
13%
21%
(1.0)
(2.0)
(3.0)
(4.0)
(5.0)
(6.0)
(7.0)
(8.0)
(9.0)
(10.0)
Likewise, Internet use increased dramatically from 2000 to 2008. Yet, for Cypriots the Internet has not become an indispensable part of their everyday lives as
Table 1. Internet Use in Cyprus

15
Cyprus lags behind other western and European countries with regards to Internet diffusion among the general population. User profile Graph Q5 below illustrates that as gross family income increases,
Q5. Years of Internet use(N= 475)
0
2
4
6
8
10
Nic
osia
Lim
asso
l
Larn
aca
Paph
os
Amm
ocho
stos
Urb
an
Rur
al
Mal
e
Fem
ale
15-1
7
18-2
4
25-3
4
35-4
4
45-5
4
55+
Hig
h Sc
hool
Stud
ents
Lyce
umG
radu
ates
Uni
vers
itySt
uden
tsU
nive
rsity
Gra
duat
es
Up
to 1
200
1201
-200
0
2001
-300
0
3001
-400
0
4001
+
YES
NO
DISTRICT AREA GENDER AGE EDUCATION GROSS FAMILYINCOME (Euros)
Childrenunder18 athome

16
number of years of Internet usage also increases. In Cyprus this is quite logical because, apart from any socially-related issues, the cost of Internet access has been and remains high compared with other European countries. It is interesting to note differences in use by district – Internet access appears to have commenced in Nicosia at least two years prior to that in any other district. Also, households with young children have connected to the Internet more recently than households without children. Cypriot Internet users also fall into two significant categories: early and late users, a well known typology in the web literature. However, due to the increasing period of Internet use in Cyprus we added two further categories that tap into that prolonged time span: long term users who have accessed the Internet for more than a decade, and novices, for whom use amounts to less than one year. The mean duration of Internet use is 6.45 years. It should be noted that ‘novices’ are virtually non-existent.
Q5. Internet use history Current users. N=475
1%
46%41%
11%
0%
10%
20%
30%
40%
50%
60%
novices (<1 year) late users (1 to 5 years) early users (5 to 10years)
long term users (>10years)
Internet use history is significantly correlated with region, education, income, and children under 18 years living in the household. Cypriots living in an urban location tend to be more highly educated, and affluent, and where at least one child is resident, Internet use in such households is likely to be early and/or long term. Unsurprisingly, the ‘late users’ category is dominated by the youngest age group, 15-17, whereas the “early users” group reflects use by those who are more actively involved in the labor market.

17
E.5: Inetrnet use by ageCurrent users: N=475
0%
20%
40%
60%
80%
100%
120%
1 2 3 4
15-17
18-24
25-34
35-44
45-54
55-64
65+
<1 year(novices
1 to 5 years(late users )
5+ to 10 years(early users )
>10 years(long term users )
Q2b: Main reasons for starting using the InternetCurrent users: N=475
29,05%
26,32%
8,42% 8,21% 7,79%
4,84%4,00% 3,79% 3,37%
1,68% 1,47%
0%
5%
10%
15%
20%
25%
30%
35%
1
Needed it for school
Needed it for work
Entertaintment
Learn more about myinterestsGather informationquicklyMy friends are on the net
Seemed new andinterestingWanted to buy things
Receive emails
Purchase stocks
Other
By far, education and work related needs provide the strongest motives for initial Internet use. Entertainment, personal interests, and search for information, count much less as motives. This is evidenced by the fact that there are virtually only two sorts of users with

18
E.5: Internet use by employment statusCurrent users N=475
0
50
100
150
200
250
300
350
1
Employed
Housewife
Student
Unemployed
Retired
Other
respect to employment status: employed and students. Contrary to use in other affluent countries, the unemployed, retired people and housewives/househusbands in Cyprus do not readily engage with the Internet. Access location The majority of Internet users access from home. Internet access from school is limited because it applies only to a limited proportion of the population. The same holds, partially, for Internet access at work. Wireless Internet connection reaches 38% while Internet access from places other than home, work, school and through wireless connection (i.e. Internet café) is rather low (15%), although it applies to the whole population of Internet users.
Q4(1)-(5) Location of Internet Access(N= 475)
82,95%
43,16%
14,95% 18,32%36,63%
0%
20%
40%
60%
80%
100%
AT HOME AT WORK AT SCHOOL OTHER PLACES WIRELESSCONNECTION

19
Type of Internet connection at home In this sample 69% of users with a connection at home have broadband, compared to 13% with dial-up. This should be expected due to the wide dissemination of broadband infrastructure of-late. Those who use mobile phone devices to access the Internet are few; also, a considerable number of users do not have access at home. .
Q19. Types of internet connection Current users. N= 475
13%
69%
1%
17%
1%0%
10%
20%
30%
40%
50%
60%
70%
80%
Phone modem Broadband/Always on
Cell phones No connection athome
DK
As is the case globally, Internet users in Cyprus rate their own digital literacy as quite high. Those with wireless devices for Internet access (cell phone, wireless computer etc), those with a university education, and those in the 18-24 and 25-34 age groups rate their digital literacy higher in comparison with the other cohorts in our sample.
Q2A. Self-rating of ability to use the internet N=475
3%
25%
42%
31%
Poor
Fair
Good
Excellent

20
Digital divide In Cyprus there are persistent digital divides along age, income, education, province, citizenship, and employment status i.e. along almost all our independent variables. Although Internet use in relation to gender does not seem to present significant variations, there is a clear indication that the Internet is still generally a male pursuit in Cyprus.
E.2: Internet use by gender(N: 1000)
53,77%
41,76%
46,23%
58,24%
0%
10%
20%
30%
40%
50%
60%
70%
1 2
YesNo
Male Femaie
The younger the respondent the more likelihood he/she is to use the Internet; similarly, higher family income is systematically related to Internet use.
Q.2: Internet use by age
77,78%70,77%
56,45%
66,29%
75,76%
95,76%93,22%
4,24%
24,24%
33,71%
43,55%
6,78%
22,22%29,23%
0%
20%
40%
60%
80%
100%
120%
1 2 3 4 5 6 7
Yes
No
15- 18-24 25-34 35-44 45-54 55-64 65+

21
Q.2: Internet use by gross family income
25,26%
35,03%
53,00%56,44%
67,04%
74,74%
64,97%
47,00%43,56%
32,96%
0%
10%
20%
30%
40%
50%
60%
70%
80%
1 2 3 4 5
Yes
No
UP TO 1.200 1.201-2.000 2.001-3.000 3.001-4.000 4.000+
Of course the same holds true with education: the likelihood is that the more highly educated use the Internet more.
Q.2: Internet use by education
2,10%
40,74% 40,12%
91,43%
97,90%
59,26% 59,88%
8,57%
24,02%
75,98%
0%
20%
40%
60%
80%
100%
120%
1 2 3 4 5
Yes
No
Primary or less High School (at) Lyceum (grad) Col lege / Univers i ty (at)
Col lege / Univers i ty or higher

22
Q.2: Internet use by province
55,16%
47,55%44,85%
28,87%
32,73%
44,84%
52,45%55,15%
71,13%
67,27%
0%
10%
20%
30%
40%
50%
60%
70%
80%
1 2 3 4 5
Yes
No
NICOSIA LARNACALIMASSOL PAPHOS FAMAGUSTA
It should be noted that relatively low Internet access in Paphos and Famagusta can be explained by the fact that these two areas are composed by a great number of widely dispersed, small villages with relatively poor telecoms infrastructure. Differential access is also clearly demonstrated along the urban – rural dimension.
Q.2: Internet use by region
51,24%
39,30%
48,76%
60,70%
0%
10%
20%
30%
40%
50%
60%
70%
1 2
Yes
No
URBAN RURAL
Respondents of citizenship other than Cypriot are using the Internet more than Cypriots themselves. This might be due to more urgent needs for business and family contacts.

23
Q.2: Internet use by citizenship
0,467793031
0,603773585
0,532206969
0,396226415
0%
10%
20%
30%
40%
50%
60%
70%
1 2
Yes
No
CYPRIOT OTHER
Since the Internet is a new medium and has content familiar to young people, households with young people under 18 years of age are likely to use the Internet more than the rest.
Q2: Internet use by children under 18 at household
55,48%
40,81%
44,52%
59,19%
0%
10%
20%
30%
40%
50%
60%
70%
1 2
Yes
No
WITH WITHOUT
Cyprus has a significant student population, especially among the lower age groups, and use is much higher for them than is the case among other employment categories.

24
Q.2: Internet Use by employment status
53%
7%
93%
33%
6%
56%
93%
7%
67%
94%
44%47%
0%
10%
20%
30%
40%
50%
60%
70%
80%
90%
100%
1 2 3 4 5 6
Yes
No
Employed Housewife Student Unemployed Retiered Other
An overall picture of the Cypriot digital divide is depicted in the following two Graphs (Q2):
Q2. Internet use in Cyprus across demographics(N= 1000)
0%
20%
40%
60%
80%
100%
Prim
ary
or le
ss
Lyce
um
Col
lege
/Uni
vers
ityor
Hig
her
Em
ploy
ed
Hou
sew
ife /
Hou
sehu
sban
d
Stu
dent
Ret
ired
Up
to 1
200
1201
-200
0
2001
-300
0
3001
-400
0
4001
+
YE
S
NO
EDUCATION EMPLOYMENT STATUS GROSS FAMILY INCOME (Euros) Childrenunder 18 athousehold
Perc
enta
ge
non usersusers

25
Q2. Internet use in Cyprus across demographics(N= 1000)
0%10%20%30%40%50%60%70%80%90%
100%
NIC
OS
IA
LIM
AS
SO
L
LAR
NA
CA
PA
PH
OS
AM
MO
CH
OS
TOS
UR
BA
N
RU
RA
L
MA
LE
FEM
ALE
15-1
7
18-2
4
25-3
4
35-4
4
45-5
4
55-6
4
65+
DISTRICT AREA GENDER AGE
Perc
enta
ge
non-usersusers
• Percentage of Internet users decreases linearly with age and increases linearly with gross family income.
• Nearly 100% of students use the Internet
• Female Internet users are less than male Internet users. The same holds for rural residents compared to urban residents.
Haves and have-nots Despite developments in telecommunications infrastructure, Cyprus is not yet a network society. The majority of Cypriots do not use the Internet, and a large proportion are ex-users.
Q2 & Q3(a). Users & non-users of the internet N=1000
Non-users: 53%
Users: 48%
Ex-users: 13%
Non-users: 40%
Users
Non-users
Ex-users
The above finding is reinforced by the reasons given for non-use. The majority said that they are not interested in using the Internet and consider it “not useful”, while other reasons related to lack of knowledge, time, non-possession of a computer and lack of an Internet connection. These statements indicate that perhaps a “culture of

26
use” related to New Technologies of Communication is not yet sufficiently developed in Cyprus.
E.3: Reasons for not using the Internet
55,24%
21,71%
10,10%
0,76%
11,24%
0,95%
0%
10%
20%
30%
40%
50%
60%
1
No interest / NotusefulDon't know how to useitNo computer/InternetconnectionToo expensive/cannotaffort itNo time/Too busy
Other
The main reason why ex-users stopped using the Internet was “insufficient time”, “lack of interest” and “not enough usage”. Generally speaking, these reasons point to the existence of a specific segment of the Cypriot population, who have already at some time used the Internet but who are rather unwilling to continue or keep up with the latest developments in the field.
Q3b: Main reasons for stopped using the Internet
24,24%
18,18%
15,15%
7,58%
6,06%
4,55% 4,55%
3,03% 3,03% 3,03%
0%
5%
10%
15%
20%
25%
30%
1
Consumes time
No interest
Didn't use it enough
Changed work - No Internet access
No computer available
Finished University - No Internet access
Changed home - Didn't install Internet access
Don't know how to use it
It's not usefull
Broke/lost computer
Reasons
It is important to note that the majority of non-users seem to be immune to technological progress as they say that they are unlikely to start using the Internet within the next year. If one takes into consideration that 22% say it is somewhat likely,

27
we may predict that there will be little diffusion of the Internet in Cyprus in the next couple of years.
Q3c. Likelihood for using the internet within the next yearNon-users. N=525
62%22%
10%5%
Not likely at all
Somewhat likely
Very likely
DK
The elderly, housewives/househusbands, less well educated, and the less affluent are least likely to foresee themselves commencing Internet use in the next year.
Q3c. Posibility of using the Internet within next year
0%
10%
20%
30%
40%
50%
60%
70%
80%
90%
100%
1 2 3 4 5 6 7 8 9 10 11 12 13 14 15 16 17 18 19 20 21 22 23
NotLikelyAt AllSomewhatLikelyVeryLikely
15-17 28-24 25-34 35-44 45-54 55-64 65+ Primary High School
LyceumUn/sity Higher Employed
Housewife
Student
Unemployed
Retired Other Up to1.200
1.201-2.000
2.001-3.000
3.001-4.000
4.000+
EDUCATIONAGE EMPLOYMENT STATUS FAMILY INCOME

28
II Internet impressions Regardless of gender, almost half of Cypriot Internet users (48.63%) believe that most of the information they find on the Internet is reliable. This belief is higher among Cypriots between the ages of 25-34 (62.32%). That 43% express doubts as to the reliability of the information disseminated by the Internet is an indication of polarization of the medium’s users.
Q12. How much of the information on the internet do you think is reliable? (N=475)
0,63%
13,89%
28,84%
48,63%
4,00% 3,79%0,21%
0%
10%
20%
30%
40%
50%
60%
None A smal lportion
Abouthal f
Most Al l Don'tknow
Noresponse
Most Internet users believe that the Internet is an important (30.74%) or very important (40.21%) source for their information. Sixty percent of the users 65 years old or older are undecided; whereas the remaining 40% state that the Internet is a very important source of information for them.
Q13a. How important source of information is the internet? (N=475)
0%5%
10%15%20%25%30%35%40%45%
Not importa
nt at a
ll
Not importa
nt
Neutral/U
ndecided
Importa
nt
Very im
portant

29
Most users favor the Internet to other sources of information. For most of the respondents (71%) the Internet is regarded as a very important or important source of information, as many as is the case for television (71.4%), which is still the most popular information medium worldwide. It should be noted, however, that more respondents (40%) indicate that the Internet is a ‘very important’ source of information, compared to those choosing the same statement for television (32.6%).
Interestingly, over 36% of the respondents indicate that newspapers (36.63%) or radio (36.21%) is not an important source of information. More respondents between the ages 35-44 believe that television is an important source of information (mean score=4.11); respondents of the same age range also rate radio and newspaper sources higher than the other age ranges. Younger ages (15-24) indicate that they consider the Internet and television as important sources of information but do not believe that newspapers or radio are important information sources. Respondents aged 15-17 rank the Internet and interpersonal sources as the two most important sources of information; considering the online and off-line socialization patterns of youngsters of this age, this finding reflects the influence of peers on young persons’ behavior.
Q13c-Q13e How do the different sources of information compare? (N=475)
0%
10%
20%
30%
40%
50%
Not important at a l l 3,58% 4,84% 24,21% 18,53% 5,89%
Not important 6,95% 8,21% 12,42% 17,68% 8,00%
Neutra l/Undecided 18,32% 15,37% 16,84% 22,11% 18,95%
Important 30,74% 38,74% 28,21% 29,26% 38,95%
Very important 40,21% 32,63% 18,11% 12,00% 25,89%
Internet Televis ion Newspaper RadioInterpersonal
Sources
Overall, the data above demonstrates an ambivalent and reluctant attitude of Cypriot’ Internet users towards the medium: just less than the half (43%) say that the information conveyed via the Internet is unreliable while at the same time they admit that the Internet is important (31%) or even very important (40%) for their own information.
The Internet is somewhat less important for user’ entertainment; five out of ten of the respondents indicate that the Internet is either a very important source (30%) or an important source (23.8%). This percentage is higher for respondents between the ages of 15-24. Overwhelmingly (65.6%) most respondents between the ages of 55-64 believe that the Internet is not important as a source of entertainment.

30
Q14a. How important is the internet as a source of entertainment? ( N=475)
16,42%13,05%
16,63%23,79%
29,89%
0,21%0%5%
10%15%20%25%30%35%
Not importa
nt at a
ll
Not importa
nt
Neutral/U
ndecided
Importa
nt
Very im
portant
Don't know
Respondents have a higher regard for television as an important source of entertainment; almost seven out of ten say that television is a very important (36.84%) or an important source of entertainment (37.26%). The percentage of respondents aged 15-17 who indicated that the television is a very important source of information was the highest (49.09%).
Q14b. How important is the television as a source of entertainment? (N=475)
3,37% 5,26%
17,05%
37,26% 36,84%
0,21%0%5%
10%15%20%25%30%35%40%
Not importa
nt at a
ll
Not importa
nt
Neutral/U
ndecided
Importa
nt
Very im
portant
Don't know
Most respondents indicate that radio is not an important source entertainment, with 39.16% of them indicating that radio is not important at all.

31
Q14c. How important is the radio as a source of entertainment? (N=475)
39,16%
23,79%18,11% 14,74%
4,21%
0%5%
10%15%20%25%30%35%40%45%
Not importa
nt at a
ll
Not importa
nt
Neutral/U
ndecided
Importa
nt
Very im
portant
Most respondents (50.53%) indicate that newspapers are an important or a very important source of entertainment.

32
IIΙ Internet access hours Respondents were asked how many hours per week, on average, they access the Internet using a personal computer in their home, work, school or other place. They were also asked how many hours they use the Internet via wireless devices. The following graph gives an overall picture of Internet access hours.
Q4(1)-(5) Time of internet access per location and wirelles devices(N= 475)
02468
101214161820
AT HOME AT WORK AT SCHOOL OTHER PLACES WIRELESSCONNECTION
Hou
rs p
er w
eek
(ave
rage
)
Clearly, more Internet use time is spent in schools and universities while the least time is spent in the work place. This can be explained by the provision of free Internet access in all Cypriot universities and almost all high-schools, whilst, in some professions computers are not used or are not available. Furthermore, Internet access is prohibited by some employers. Graph Q4(1) shows that total hours spent online at home decreases linearly with age.
Q4(1). Time of internet access at home (hours per week)(N= 394)
02468
1012141618
Nic
osia
Lim
asso
l
Larn
aca
Pap
hos
Am
moc
host
os
Urb
an
Rur
al
Mal
e
Fem
al
15-1
7
18-2
4
25-3
4
35-4
4
45-5
4
Sec
onda
ryle
vel s
tude
nts
Lyce
umG
radu
ates
Uni
vers
ity /
colle
geU
nive
rsity
/co
llege
Em
ploy
ed
Stu
dent
Cyp
riot
Oth
er
UP
TO
120
0
1201
-200
0
2001
-300
0
3001
-400
0E
uro
4001
+
YE
S
NO
DISTRICT AREA GENDER AGE EDUCATION EMPLOYMENTSTATUS
CITIZENSHIP GROSS FAMILY INCOME (Euros) Childrenunder 18
athousehold
This is probably due to young people having more familiarity with the technology, the availability of free time, the age-specific allure of online games and a greater general interest in exploring online leisure opportunities. Males spend more time online than females and the same holds for rural residents compared to urban ones. The latter can be attributed to fewer opportunities for leisure provided in rural areas. Students (both high school and university) also spend more time online than non-students. On the other hand, time spent on the Internet from home by university graduates is not much higher than that of lyceum graduates.

33
Finally, families with children under 18 at home spend somewhat less time on the Internet than families with no children.
Q4(2) Time of internet access at work (hours per week)(N= 205)
05
10152025
Urb
an
Rur
al
Mal
e
Fem
ale
Lyce
umG
radu
ate
Uni
vers
ityG
radu
ates
UP
TO
1200
1201
-200
0
2001
-300
0
3001
-400
0
4001
+
YE
S
NO
AREA GENDER EDUCATION GROSS FAMILY INCOME (Euros) Childrenunder 18 at
home
Hou
rs p
er w
eek
(ave
rage
)
Graph Q4(2) indicates time spent online at work via a wired PC for various categories. Rural residents spent more time online at work than urban residents. This might be attributed to lack of online home access prompting them to spend more time online at work. Also evident is a difference in time spent online by males and females and by university and lyceum graduates. Graph Q4(5) illustrates the distribution of Internet use through wireless devices along various categories. The majority of users are young (age 18-24), and university students. These categories are more familiar with information technology and tend to be more prolific consumers of modern electronic products including handheld mobile devices.
Q4(5). Internet use through wireless devices (among internet users)(N= 174)
0%10%20%30%40%50%60%70%80%90%100%
Nic
osia
Lim
asso
l
Larn
aca
Pap
hos
Am
moc
host
os
Urb
an
Rur
al
Mal
e
Fem
ale
15-1
7
18-2
4
25-3
4
35-4
4
45-5
4
55+
Hig
h S
choo
lS
tude
nts
Lyce
umG
radu
ates
Uni
vers
ityS
tude
nts
Uni
vers
ityG
radu
ates
Up
to 1
200
1201
-200
0
2001
-300
0
3001
-400
0
4001
+
YE
S
NO
DISTRICT AREA GENDER AGE EDUCATION GROSS FAMILY INCOME(Euros)
Childrenunder 18at home
Graph Q4(5)a shows the distribution of Internet use via wireless connections for various categories across the whole population (Internet users and non-users). The basic conclusion is the same as above. Furthermore, it is depicted that Internet access via a wireless connection decreases linearly with age for people aged 17 years and over.

34
Q 4(5)a Internet use through wireless devices (whole population)(N= 1000)
0%20%40%60%80%
100%
Nic
osia
Lim
asso
l
Larn
aca
Pap
hos
Am
moc
host
os
Urb
an
Rur
al
Mal
e
Fem
ale
15-1
7
18-2
4
25-3
4
35-4
4
45-5
4
55+
Hig
h S
choo
lS
tude
nts
Lyce
umG
radu
ates
Uni
vers
ityS
tude
nts
Uni
vers
ityG
radu
ates
Up
to 1
200
1201
-200
0
2001
-300
0
3001
-400
0
4001
+
YE
S
NO
DISTRICT AREA GENDER AGE EDUCATION GROSS FAMILYINCOME (Euros)
Childrenunder18 at
non-usersusers
Graph Q4(5)a & 4(5)b clearly show that online time spent via mobile devices is far less than time spent via wireless computer. This comes as little surprise given the usability issues characterizing mobile devices (small screen and mainly used for accessing e-mails or dedicated web-cites).
Q 4(5)a & 4(5)b. Time spent online through wireless devices(N= 174)
048
121620
Nic
osia
Lim
asso
l
Larn
aca
Pap
hos
Am
moc
host
os
Urb
an
Rur
al
Mal
e
Fem
ale
15-1
7
18-2
4
25-3
4
35-4
4
45-5
4
Hig
h S
choo
lS
tude
nts
Lyce
umG
radu
ates
Uni
vers
ityS
tude
nts
Uni
vers
ityG
radu
ates
Up
to 1
200
1201
-200
0
2001
-300
0
3001
-400
0
4001
+
YE
S
NO
DISTRICT AREA GENDER AGE EDUCATION GROSS FAMILY INCOME(Euros)
Childrenunder 18at home
wireless computerhandheld device
35
IV. Media Use
TELEVISION
The impact of the Internet on the use of traditional media, such as television, radio and newspapers, is a common concern among researchers and media professionals alike.
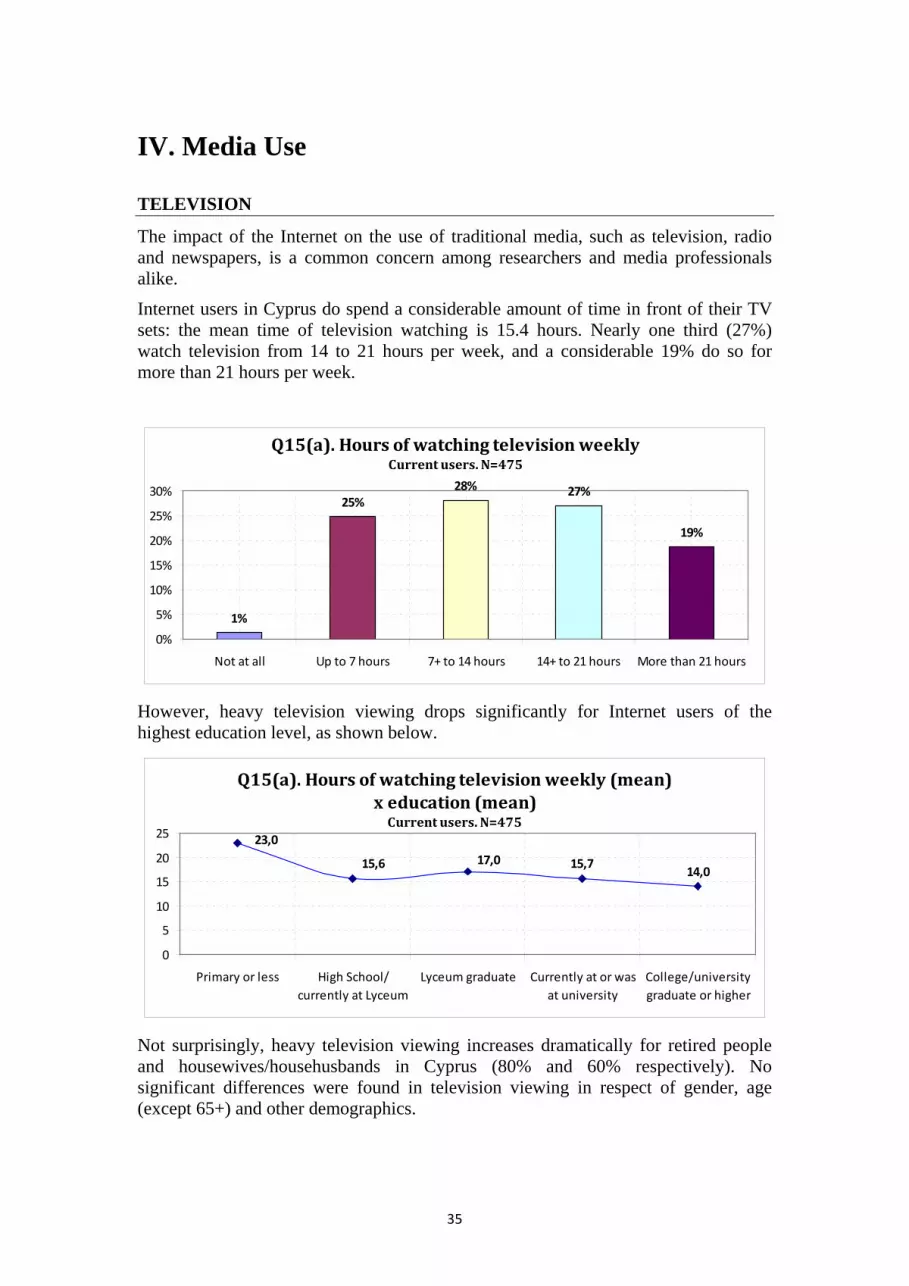
Internet users in Cyprus do spend a considerable amount of time in front of their TV sets: the mean time of television watching is 15.4 hours. Nearly one third (27%) watch television from 14 to 21 hours per week, and a considerable 19% do so for more than 21 hours per week.
Q15(a). Hours of watching television weeklyCurrent users. N=475
1%
25%28% 27%
19%
0%
5%
10%
15%
20%
25%
30%
Not at all Up to 7 hours 7+ to 14 hours 14+ to 21 hours More than 21 hours
However, heavy television viewing drops significantly for Internet users of the highest education level, as shown below.
Q15(a). Hours of watching television weekly (mean)x education (mean)
Current users. N=475
14,015,7
23,0
15,6 17,0
0
5
10
15
20
25
Primary or less High School/currently at Lyceum
Lyceum graduate Currently at or wasat university
College/universitygraduate or higher
Not surprisingly, heavy television viewing increases dramatically for retired people and housewives/househusbands in Cyprus (80% and 60% respectively). No significant differences were found in television viewing in respect of gender, age (except 65+) and other demographics.

36
Q15(a). Hours of watching television weekly x employment
Current users. N=475
0%
20%
40%
60%
80%
100%
Employed Housewife/Househusband
Student Unemployed Retired Other
Not at all Up to 7 hours 7+ to 14 hours 14+ to 21 hours More than 21 hours
RADIO
Nearly half of Internet users in Cyprus listen to the radio up to 7 hours per week (44%). Radio enthusiasts (more than 21 hours per week) amount to 16% of Internet users, but one out of ten (11%) do not listen to the radio at all.
Q15(b). Hours of listening to radio per weekCurrent users. N=475
11%
44%
18%11%
16%
0%
10%
20%
30%
40%
50%
Not at all Up to 7 hours 7+ to 14 hours 14+ to 21 hours More than 21 hours
Significant differences are found only in regard to education; lyceum graduates value radio the most, as shown by the mean scores of radio listening (mean=17.2, n=138).

37
Q15(b). Hours of listening to radio per week (mean) x education
Current users. N=475
24,3
11,2
17,2
10,9 12,4
0
10
20
30
Primary or less High School/currently at
Lyceum
Lyceum graduate Currently at or wasat university
College/universitygraduate or higher
NEWSPAPERS
Newspaper circulation is low in Cyprus, although it has increased markedly since 20033
Q15(c). Hours of reading newspaper per weekCurrent users. N=475
34%
58%
5%2% 1%
0%
10%
20%
30%
40%
50%
60%
Not at all Up to 7 hours 7+ to 14 hours 14+ to 21 hours More than 21 hours
. The majority of Internet users spend up to 7 hours per week reading newspaper, but a full one third of them (34%) do not read newspapers at all.
There are notable gender and age differences regarding newspaper reading. Four out of ten women who use the Internet do not read newspapers and those who do, devote to it less time than men (data not shown). Newspaper reading is markedly age-graded: the higher the age, the more time is spent in newspaper reading, whereas non-readers decrease as age increases. Three out of four Internet users in their teens do not read newspapers at all, and the same is true for half of young Internet users (aged 18-24).
3 World Association of Newspapers, “World Press Trends: Newspapers Are A Growth Business”, Göteborg, Sweden, 2 June 2008, http://www.wan-press.org/article17377.html, last accessed: 14.3.2009.

38
Q15(c). Hours of reading newspaper per weekx gender, age
Current users. N=475
27%42%
76%
52%
24%15% 13%
63%
53%
24%
43%
72%67%
69% 69%
14%13%
21%
40%
40%
20%
0%
20%
40%
60%
80%
100%
Male Female 15-17 18-24 25-34 35-44 45-54 55-64 65+
More than 21 hours
14+ to 21 hours
7+ to 14 hours
Up to 7 hours
Not at all

39
In regard to education, newspaper reading is higher among Internet users with university degree or higher (69%) and lyceum graduates (64%). It is also worth noting that more than half of the students going online (60%) do not read newspapers at all. Not surprisingly, all retired Internet users read newspapers and devote more time to it than any other employment group (mean=11.2, n=5). More than half of Internet users with the lowest gross family income (53%) do not read newspapers; those who do, spend less time to it than higher income groups.
Q15(c). Hours of reading newspaper x education, employment, incomeCurrent users. N=475
28%
55%
20% 24%
60%
29% 22%
53%37%
26%39%
24%
45%
17%
67%
35%
64%
42%
69% 66%
37%
71% 78%
43%
56%63%
54%55%
83%
33%
61%50%
40%
50%
65%20%
40%
0%
20%
40%
60%
80%
100%
Prim
ary
or le
ss
Hig
h Sc
hool
/cu
rren
tly a
t Lyc
eum
Lyce
um g
radu
ate
Curr
ently
at o
r w
as a
t uni
vers
ity
Colle
ge/
Uni
vers
ity g
radu
ate
orhi
gher
Empl
oyed
Hou
sew
ife/
Hou
sehu
sban
d
Stud
ent
Une
mpl
oyed
Retir
ed
Oth
er
Up
to 1
200
Euro
1201
-200
0 Eu
ro
2001
-300
0 Eu
ro
3001
-400
0 Eu
ro
4001
+ Εu
ro DK RF
More than 21 hours
14+ to 21 hours
7+ to 14 hours
Up to 7 hours
Not at all
Employment Education Income
40
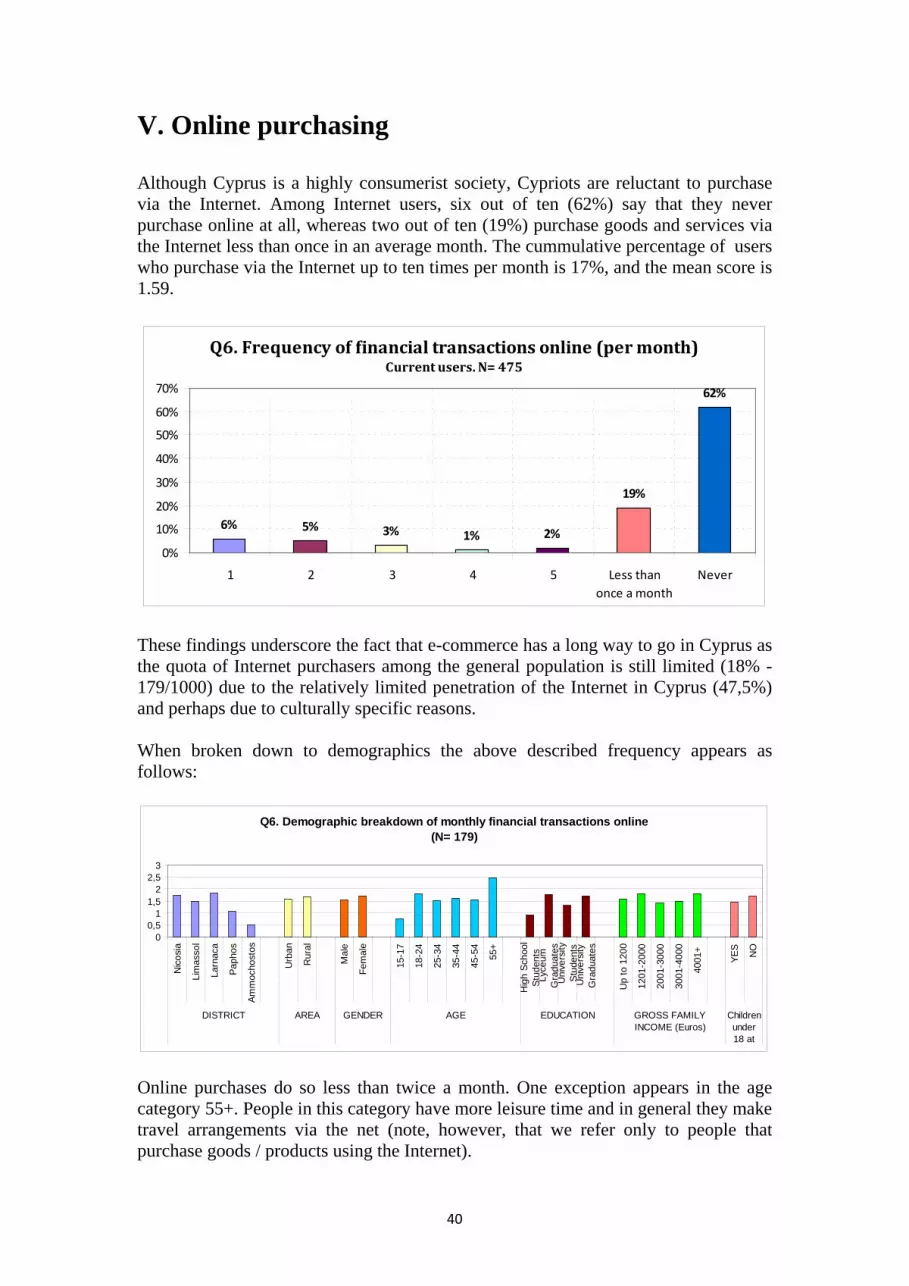
V. Online purchasing Although Cyprus is a highly consumerist society, Cypriots are reluctant to purchase via the Internet. Among Internet users, six out of ten (62%) say that they never purchase online at all, whereas two out of ten (19%) purchase goods and services via the Internet less than once in an average month. The cummulative percentage of users who purchase via the Internet up to ten times per month is 17%, and the mean score is 1.59.
Q6. Frequency of financial transactions online (per month) Current users. N= 475
6% 5% 3% 1% 2%
19%
62%
0%
10%
20%
30%
40%
50%
60%
70%
1 2 3 4 5 Less thanonce a month
Never
These findings underscore the fact that e-commerce has a long way to go in Cyprus as the quota of Internet purchasers among the general population is still limited (18% - 179/1000) due to the relatively limited penetration of the Internet in Cyprus (47,5%) and perhaps due to culturally specific reasons. When broken down to demographics the above described frequency appears as follows:
Q6. Demographic breakdown of monthly financial transactions online(N= 179)
00,5
11,5
22,5
3
Nic
osia
Lim
asso
l
Larn
aca
Paph
os
Amm
ocho
stos
Urb
an
Rur
al
Mal
e
Fem
ale
15-1
7
18-2
4
25-3
4
35-4
4
45-5
4
55+
Hig
h Sc
hool
Stud
ents
Lyce
umG
radu
ates
Uni
vers
itySt
uden
tsU
nive
rsity
Gra
duat
es
Up
to 1
200
1201
-200
0
2001
-300
0
3001
-400
0
4001
+
YES
NO
DISTRICT AREA GENDER AGE EDUCATION GROSS FAMILYINCOME (Euros)
Childrenunder18 at
Online purchases do so less than twice a month. One exception appears in the age category 55+. People in this category have more leisure time and in general they make travel arrangements via the net (note, however, that we refer only to people that purchase goods / products using the Internet).

41
Products and services purchased online are mainly tourist/travel services, clothing, electronic appliances, and books.
Q6A. Products and services purchased on the internetCurrent users. N= 179
44%
31%28%
21%17%
13% 12% 11% 10% 9%7%
5%3% 2% 1%
0%
10%
20%
30%
40%
50%
Trav
el arr
angemen
ts
Clothes
Electr
onicsBooks
Products
for h
obbies
Softw
are/
Computer ga
mesOth
erGift
sCDs
Computers &
peripher
als
Jewelr
y/ W
atches
Sporti
ng goods
Insura
nce
Food an
d cosm
etics
Videos/
DVDs
Internet s
ite su
bscriptio
ns
Stock
s and bo
nds
Children
Goods/T
oys
News/
Mag
azine
s (onlin
e)
Collecto
rs's i
tems
Flower
sDru
gs
Automob
iles
Furn
iture
By counting those users who purchase online monthly or less frequently, we are able to construct a profile of the Cypriot online buyer, as depicted in the following graph.
Q6. Profile of online buyers (N= 179)
0,0%20,0%40,0%60,0%80,0%
Nic
osia
Lim
asso
l
Larn
aca
Pap
hos
Am
moc
host
os
Urb
an
Rur
al
Mal
e
Fem
ale
15-1
7
18-2
4
25-3
4
35-4
4
45-5
4
55+
Hig
h S
choo
lS
tude
nts
Lyce
umG
radu
ates
Uni
vers
ityS
tude
nts
Uni
vers
ityG
radu
ates
Up
to 1
200
1201
-200
0
2001
-300
0
3001
-400
0
4001
+
YE
S
NO
DISTRICT AREA GENDER AGE EDUCATION GROSS FAMILY INCOME(Euros)
Childrenunder 18at home
All in all, the profile of the typical Cypriot Internet buyer is male, between 25 and 34 years of age, holds a university degree, with gross monthly (family) salary higher than 2000€. Prospects for increased online purchasing are highly dependent upon customer’ confidence that e-commerce is a safe and reliable process of transaction.

42
Q7. Concern about security of credit card in online transactions Current users. N= 475
25%24%
19%
12%13%
4%3%
0%
5%
10%
15%
20%
25%
30%
Not at allconcerned
Somewhatconcerned
Very concerned Extremelyconcerned
Do not havecredit/bank card
DK RF
In Cyprus, only one out of four Internet users feels no concern about the online security of their credit card information. Most users (55%) seem to be quite worried when it comes to online credit card transactions. Hackers (42%), news media stories (27%), personal experience (21%) and complexity (21%) are some of the principal reasons given as concerns.
Q7A. Reasons for concern about security in credit cards online transactions
Current users. N= 262
42%
27%
21%16%
6% 6% 5%2% 2%
0%
10%
20%
30%
40%
50%
I amconcerned
abour hackers
I've heardabout thedangers
through themedia
Too manystrangers are
involved
I knowsomeone whowas swindled
Other I have aspecial secure
credit card
Personalexperiencewith creditcard fraud
I use personaltechnology for
safety
I understandthe
possibil itiesfor safe
internet usageand I only usesafe websites
Obviously, these concerns have to be met so that new online markets develop in the near future.

43
VI. Social Networking and communication Social relations Most Cypriot users do not think that access to the Internet influences the contact they have with other people, including their family members and friends. Using a scale of 1 to 5 where “1” means a large decrease, “5” means a large increase and “3” means contact remaining the same, respondents self-placement indicates that the Internet has not precipitated
Table 2: Contact with people (Ε8. Has your use of the Internet increased or decreased your contact with the following groups?)
Mean A People who have similar hobbies or participate in similar activities
for entertainment 3.11 B People who have similar political interests 2.72 C People who share similar religious beliefs 2.61 D Your family 2.89 E Your friends 3.14
F People from your workplace or colleagues
3.08 major changes in their social networks. The likelihood is that this is due to the inter -connaisance character of the Cypriot society, i.e. a small island society where personal acquaintance is the norm in social relationships, the endurance of which cannot easily be affected by the Internet. Family and friends With regards to intimate relationships with family members and friends most respondents say that the Internet has not affected face-to-face contact with them. Nevertheless, 18% say that it has decreased the time for face-to-face contact with family members and 13% with friends. After controlling our demographic variables,

44
Q9A. Time spend with family since being connected at home Current users. N= 475
18%
74%
5%
0%
10%
20%
30%
40%
50%
60%
70%
80%
Less time together About the same amount oftime
More time together
it was found that only the 15-17 age group showed a significant difference in the decrease of time spent with family (38%). As to the time spent with friends on a face-to-face basis no significant difference was found across our demographic variables.
Q9B. Time spent with friends since being connectedCurrent users. N= 475
13%
78%
6%3%
0%
10%
20%
30%
40%
50%
60%
70%
80%
90%
Less time together About the sameamount of time
More time together Refused

45
TIME SPENT WITH FRIENDS
The findings of this survey, in accord with recent research on the relation of the Internet to sociality, alleviate earlier fears of the first generation of the Internet research literature – fears that the use of the Internet drives its users to social isolation, especially the young.
Half of Internet users spend up to 7 hours weekly with their friends and a considerable 28% do so for up to 15 hours weekly.
Q16. Hours spent socializing with friends weeklyCurrent users. N=475
4%
49%
28%
9% 7%3%
0%
10%
20%
30%
40%
50%
60%
Not at all Up to 7 7-15 16-21 22-30 31+
Exploring more closely the socializing habits of users who use the Internet at home, the results are revealing: not only socializing with friends is not decreasing as Internet use increases, but the opposite is true: the more frequent the Internet use, the more time is spent with friends (one-way ANOVA, p<0,036).
Men tend to spend more time with their friends than women (mean=11.4 and 9.5 respectively). Contrary to gender differences, age differences in socializing are statistically significant.

46
Q16. Hours spent socializing with friends weeklyx gender, age
Current users. N=475
44%55%
40%27%
53%59% 75%
50%
40%
32%
23%
20%33%
29%
26%17%
38%60%
0%
20%
40%
60%
80%
100%
Male Female 15-17 18-24 25-34 35-44 45-54 55-64 65+
31+
22-30
16-21
7-15
Up to 7
Not at all
Looking at the mean time spent with friends, teenager and young Internet users are clearly socializing more with their friends, compared to older groups.
Q16.Hours spent socializing with friends weekly (mean) x age
Current users. N=475
6,68,36,57,99,2
15,613,5
0
4
8
12
16
20
15-17 18-24 25-34 35-44 45-54 55-64 65+
After controlling for other demographic variables, more statistically significant differences are found. Internet users who currently are or have been university students are more likely to spend more time with friends (mean=15, n=64), whereas university graduates or higher are more likely to spend less time with friends (mean=8.4, n=193), compared to other education level groups.
Gender Age

47
Q16.Hours spent socializing with friends weekly (mean) x education
Current users. N=475
9,0
12,910,0
15,0
8,4
0
5
10
15
20
Primary or less High School/currently at
Lyceum
Lyceum graduate Currently at or wasat university
College/universitygraduate or higher
In terms of employment status, students spend more time, on average, with their friends than other groups (mean=15.8, n=119); employed Internet users are not big socializers, as they spend, on average, only 8.7 hours with friends per week.
Q16.Hours spent socializing with friends weekly (mean) x employment
Current users. N=475
10,210,212,3
15,8
5,58,7
0
5
10
15
20
Employed Housewife/Househusband
Student Unemployed Retired Other
Regarding gross family income, it is worth noting that Internet users with the lowest income (up to 1200 €) are more likely to spend more time with friends (mean=14.5, n=49), compared to other income groups.
Q16. Hours spent socializing with friends weekly x incomeCurrent users. N=475
31%43%
52% 54% 54%
35%
29%27% 26% 27%
14%12%
9% 5% 9%10% 7%7% 9%
0%
20%
40%
60%
80%
100%
Up to 1200 € 1201-2000 € 2001-3000 € 3001-4000 € 4001+ €
Not at all
31+
22-30
16-21
7-15
Up to 7

48
Q16. Hours spent socializing with friends weekly (mean)x income
Current users. N=475
10,19,49,510,9
14,5
0
5
10
15
20
Up to 1200 € 1201-2000 € 2001-3000 € 3001-4000 € 4001+ €

49
TIME SPENT WITH FAMILY
In general, strong traditional family ties are characteristic of the Cypriot society. Internet users seem to highly value sharing time with members of the family. Nearly one fourth of Internet users devote 11-20 hours to socializing with family, but almost 60% (cumulative percentage) spend from 21 to 41 or more hours weekly with their family. Apparently, this reflects the strong familial ties which mark many
Q17. Hours spent socializing with family weeklyCurrent users. N=464
1%
19%
23%
19% 19% 19%
0%
5%
10%
15%
20%
25%
Not at all Up to 10 11-20 21-30 31-40 41+
Mediterranean countries in general.
However, and contrary to socializing habits with friends, it seems that Internet and family compete for users’ time. The frequency of Internet use at home is negatively correlated with socializing with family: the more frequent the Internet use at home, the less time is devoted to social activities within the family (one-way ANOVA, p<0,001).

50
Quite surprisingly, Internet users in urban Cyprus tend to spend slightly more time with family (mean=31.2, n=352) than Internet users in rural areas (mean=26.4, n=123). Small gender differences are also found: women socialize more with family (mean=32, n=218) than men (mean=28.2, n=257). Of greater statistical significance are differences found regarding age, education, employment, citizenship, Internet access location and children at household. Non-Cypriots are more likely to spend more time in family activities than Cypriots (mean=41.8 and 29.2, n=32 and 443 respectively). Also, in households with children under 18 users are more likely to engage in more family activities than those in households without children (mean=32.6 and 26.8, n=253 and 222 respectively).
Q17. Hours spent socializing with family weeklyCurrent users. N=464
0%
20%
40%
60%
80%
100%
Urb
an
Rura
l
Mal
e
Fem
ale
15-1
7
18-2
4
25-3
4
35-4
4
45-5
4
55-6
4
65+
Prim
ary
or le
ss
Hig
h Sc
hool
/cur
rent
ly a
t Lyc
eum
Lyce
um g
radu
ate
Curr
ently
at o
r was
at u
nive
rsity
Colle
ge/ U
nive
rsity
gra
duat
e or
hig
her
Empl
oyed
Hou
sew
ife/ H
ouse
husb
and
Stud
ent
Une
mpl
oyed
Retir
ed
Oth
er
Cypr
iot
Oth
er
At h
ome
At w
ork
At s
choo
l
Oth
er p
lace
s
Wire
less
con
nect
ion
Yes
No
41+
31-40
21-30
11-20
Up to 10
Not at all
Employment Education Age Area Gender Citizen-
chip Internet access
Children at home

51
Socializing with family among Internet users is notably age-graded: as expected, time spent in social activities with family members increases with age. Teenagers spend on average 26 hours weekly with family; sharing time with family slightly decreases as young Internet users reach the age of 18-24, when they begin their adult life, usually studying or working. Socializing with family keeps rising during the main parenting years (35-54) and reaches its peak at the age of retirement (65+).
Q17. Hours spent socializing with family weekly (mean)x age
Current users. N=475
59,0
36,637,636,928,1
21,825,7
0
20
40
60
80
15-17 18-24 25-34 35-44 45-54 55-64 65+
Activities when online As with TV watching, being connected to the Internet means that users occupy themselves with more than one activity; when online, usually people listen to music, read, eat, and so on. This is exactly the case with our sample; as much as 69% of the respondents say that they do more than one thing when they are online.
Q18. Other activities while online(listening to music, watching TV, talking on the phone)
Current users. N=475
31.4%
30.7%
37.3%
No Yes, sometimes Yes, most of the time
This can be attributed to the fact that many activities performed on the computer are asynchronous (e.g. email) or take plenty of time (e.g. downloads) allowing users to shift their attention elsewhere. This is a more frequent habit of young people who tend to have many programs running simultaneously; perhaps the two most concurrent activities are surfing the web and instant messaging / chat room participation. Another

52
potential concurrent application is the downloading of music / videos which can be easily left running in the background. Another potential reason is listening to online radio.
Multiple activities while online
84% 84%75%
52% 49% 53%
0%10%20%30%40%50%60%70%80%90%
15-17 18-24 25-34 35-44 45-54 55+
Age group
Perc
enta
ge
Unsurprisingly, young people are more prone to engage in these kind of activities than older users. Communication with other people Respondents were asked how often and in what way they communicate with other people through the net. Graphs Q20 below indicate different kinds of communication through the Internet, and the frequency in which they occur. It was found that checking email is a popular activity while more advanced methods of communication (e.g. chatting, Internet telephony) are not yet very popular.
Q20. Usage of communication applications (%) Current users. N=475
90%
71% 67%
37%29% 26%
0%
20%
40%
60%
80%
100%
Check your e-mail
Do instantmessaging
Sendattachmentswith your e-
Make or receiveinternet calls
Work on yourblog
Participate inchat rooms

53
Q20. Internet usage for communication (1) Current users. N=475
0%
10%
20%
30%
40%
Never Less thanmonthly
Monthly Weekly Daily Several times aday
Check your e-mail Send attachments with your e-mail Do instant messaging
Q20. Internet usage for communication (1) Current users. N=475
0%
10%
20%
30%
40%
Never Less thanmonthly
Monthly Weekly Daily Several times aday
Check your e-mail Send attachments with your e-mail Do instant messaging
It seems that Cypriot users seem to either like checking their email very often or checking it rarely or even not checking it at all. Also, apart from the 45-54 age group, it seems that there are no great differences in this activity across age groups.
Q20a. Check email at least once a dayCurrent users. N=475
62%69% 70% 68%
54%
72%
0%
20%
40%
60%
80%
15-17 18-24 25-34 35-44 45-54 55+
Age group

54
Instant Messaging is mainly a young person’s activity but again the 45-54 age range is below 55-64. It is important also to note that as shown in the graph above, middle range income has lower use.
Q20b. Use instant messaging at least once a dayCurrent users. N=475
53%49%
34% 37%
49%
0%
10%
20%
30%
40%
50%
60%
<1200 1201-2000 2001-3000 3001-4000 4001+
Income range (euros)
As for sending attachments, it was found that recent graduates and those nearing retirement are the most frequent users. The popularity in these age groups indicates that perhaps the most popular type of attachments is pictures.
Q20d. Sending email attachmentsCurrent users. N=475
62%70%
76%67%
47%
72%
0%
20%
40%
60%
80%
15-17 18-24 25-34 35-44 45-54 55+
Age group
Other ways of communicating with people on the net are calls, participating in chat rooms and blogging. Generally, these activities are not popular among Cypriot Internet users. This is another indication that Cyprus is a midway information society.
55
Q20. Internet usage for communication (1) Current users. N=475
0%
20%
40%
60%
80%
Never Less thanmonthly
Monthly Weekly Daily Several times aday
Participate in chat rooms Make or receive internet calls Work on your blog
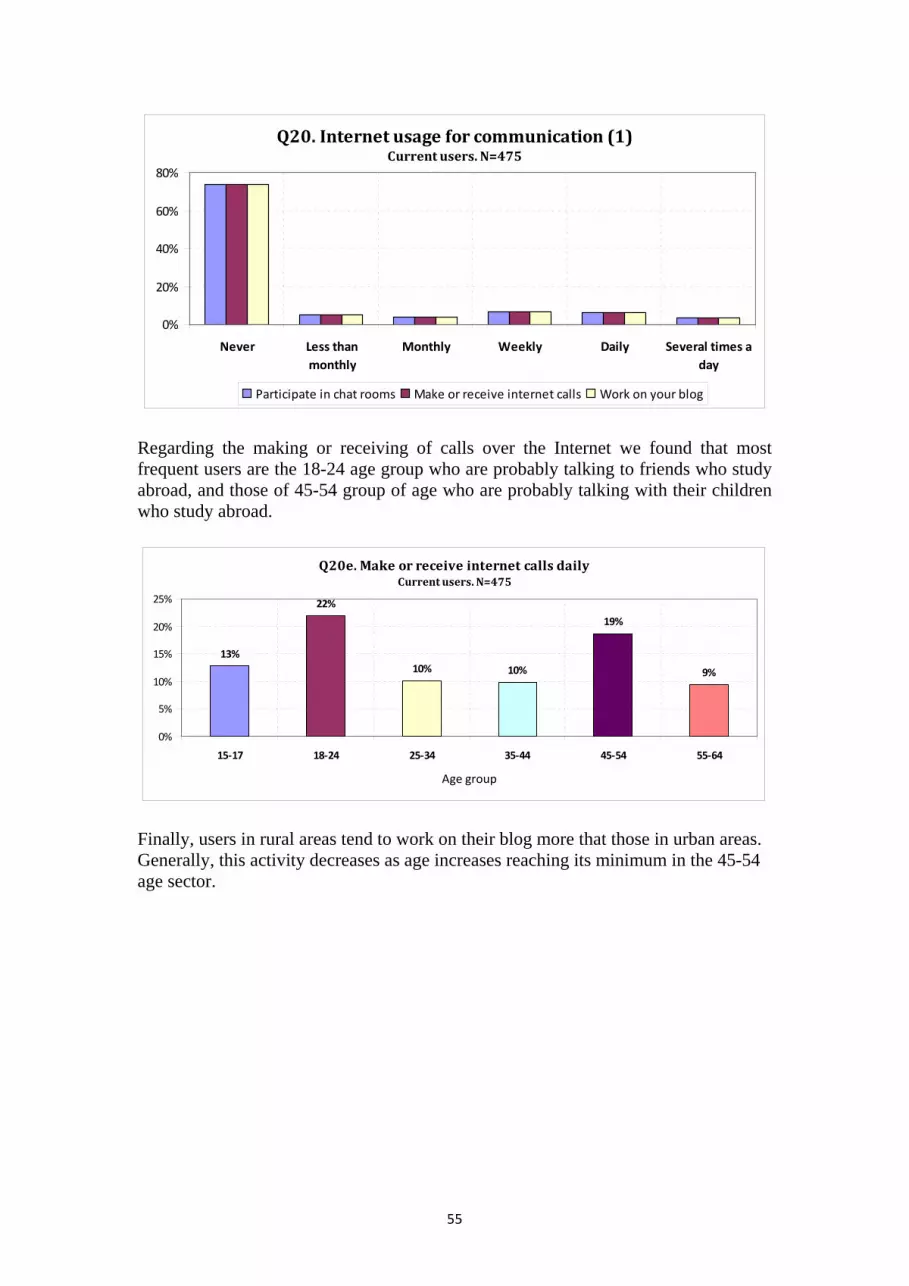
Regarding the making or receiving of calls over the Internet we found that most frequent users are the 18-24 age group who are probably talking to friends who study abroad, and those of 45-54 group of age who are probably talking with their children who study abroad.
Q20e. Make or receive internet calls dailyCurrent users. N=475
13%
22%
10% 10%
19%
9%
0%
5%
10%
15%
20%
25%
15-17 18-24 25-34 35-44 45-54 55-64
Age group
Finally, users in rural areas tend to work on their blog more that those in urban areas. Generally, this activity decreases as age increases reaching its minimum in the 45-54 age sector.

56
VII. The range of Internet use Useful information for everyday life Respondents were asked about the types of information they seek via the Internet. In the graphs below, different types of information are indicated according to search frequency.
Q21. Internet usage for information (%) Current users. N=475
75%
61%71%
50%39%
22%
0%
20%
40%
60%
80%
Look for news Look for healthinfo
Look for travelinfo
Look forhumorous
content
Read blogs Look for jobs,work
Q21. Internet usage for information (1) Current users. N=475
0%
20%
40%
60%
80%
100%
Never Less thanmonthly
Monthly Weekly Daily Several times aday
Look for news Look for travel info Look for jobs, work Look for health info

57
Q21. Internet usage for information (2) Current users. N=475
0%
20%
40%
60%
80%
Never Less thanmonthly
Monthly Weekly Daily Several times aday
Read blogs Look for jokes, cartoons, or other humorous content
The most common information search relates to local, national or international news. Users nearing retirement / retired and users who recently graduated / started work are the most frequent news seekers. It was also found that news seeking via the net is more popular among males. This may be attributed to the search for sports-related information.
Q21a. Looking for news at least once a dayCurrent users. N=475
13%
24%
40%
27% 29%
44%
0%
10%
20%
30%
40%
50%
15-17 18-24 25-34 35-44 45-54 55+
age group
Information about travel is also popular and it is highly related to Q23 with regards to the transactions users perform via the net. Health information searching is common due to the fact that the elderly show more interest in health related information. Health information searches are most frequent in Paphos, which is heavily populated by non-Cypriot retirees. However, there is lower interest among the less educated and the less affluent. Unsurprisingly, searching for information related to employment, not popular at all among high-school-only graduates, is popular among users who have just finished school / college and who live in rural areas; it is. People with young children also tend to look for jobs online.

58
Everyday transactions Although buying products via the Internet is not a widespread activity, getting information about a product is by far the most popular online transaction among Cypriot users.
Q23. Internet usage for banking/shopping (%) Current users. N=475
80%
36% 38%45%
30%
5%
0%
20%
40%
60%
80%
100%
Get informationabout a product
Use bank onlineservices
Buy things online Make travelbookings
Pay bills Invest instocks/funds/bonds
Searching for product information is a more common practice for those respondents living in rural areas, those who actually buy things through the Internet more often
Q23a. Looking for product informationCurrent users. N=475
71%
86% 90%
69%75% 72%
0%
20%
40%
60%
80%
100%
15-17 18-24 25-34 35-44 45-54 55-64
Age group
are recent college graduates. Although middle-aged people tend to get information on products (see Graph Q23a) they tend to avoid making online purchases. The less affluent also use the service less. Making travel reservations online is a popular practice particularly of those nearing retirement and those who have just graduated/got a job. However, this is a frequent practice of the more affluent, perhaps because they travel more (see Graphs Q23c).

59
Q23c. Make travel reservations/bookingsCurrent users. N=475
5%
35%
58%
49% 53%
66%
0%
10%
20%
30%
40%
50%
60%
70%
15-17 18-24 25-34 35-44 45-54 55+
Age group
Q23c. Make travel reservations/bookingsCurrent users. N=475
27% 30%
49%41%
62%
0%
20%
40%
60%
80%
<1200 Euro 1201-2000 Euro 2001-3000 Euro 3001-4000 Euro 4001+ Εuro
Income range
Online banking and shopping practices are moderately popular among Cypriot Internet user. The most frequent users for such purposes are the college educated and those on higher incomes.
Q23. Internet usage for banking/shopping (1)Current users. N=475
0%
20%
40%
60%
80%
Never Less thanmonthly
Monthly Weekly Daily Several times aday
Get information about a product Buy things online Make travel bookings

60
Q23. Internet usage for banking/shopping (2)Current users. N=475
0%
20%
40%
60%
80%
100%
Never Less thanmonthly
Monthly Weekly Daily Several times aday
Pay bills Use bank online services Invest in stocks/funds/bonds
Q23b. Buying things online
Current users. N=475
20%
32%
54%
38%
29%34%
0%
10%
20%
30%
40%
50%
60%
15-17 18-24 25-34 35-44 45-54 55+
Age group
The more affluent are more likely to pay bills via the Internet than the less affluent
Q23d. Pay bills onlineCurrent users. N=475
18%
23%
35% 33% 35%
0%
10%
20%
30%
40%
<1200 Euro 1201-2000 Euro 2001-3000 Euro 3001-4000 Euro 4001+ Εuro
Income range
(Graph Q23d). In addition, people living in the capital use their bank’s online service more often.

61
Q23e. Use bank's online servicesCurrent users. N=475
42%
34%
26%
36%
22%
0%
10%
20%
30%
40%
50%
Nicosia Limassol Larnaca Paphos Ammochostos
District
Entertainment Respondents were asked to state which entertainment sources they access online. Surfing, downloading music, playing games and downloading or watching videos
Q22. Internet usage for entertainment (%) Current users. N=475
87%
66%56% 55%
46%
16% 12% 8%
0%
20%
40%
60%
80%
100%
Surf orbrowse the
web
Download orlisten to
music
Play games Download orwatch videos
Listen to theradio online
Look at siteswith sexual
content
Look atreligious or
spiritual sites
Bet, gambleor enter
sweepstakes
are the more popular entertainment activities engaged (Graph Q22). By far, surfing or browsing the web is the most popular activity with more than 50% of users doing so at least once a day. Those in the 35-44 age group tend to surf the web less frequently than other age groups. Online gaming from home is frequent for those aged 24 or lower. This activity tends to decrease as income increases. As to downloading or listening to music it was found that students and the less affluent engage most frequently in this activity. The same holds true with regards to downloading or watching videos.

62
Download or listen to music
86%71%
59%67%
58%
0%
20%
40%
60%
80%
100%
<1200 Euro 1201-2000 Euro 2001-3000 Euro 3001-4000 Euro 4001+ Εuro
Income range
Perc
enta
ge
It is interesting to note that the less affluent engage more in betting, gambling and entering sweepstakes than the rest. The less affluent are likely to look at sites with sexual content more than any other demographic category. Learning Given that Cyprus is not yet a fully fledged information society, it comes as little surprise that online educational practices are not widely utilized by Internet users. 91% of our respondents ‘never’ use the net in order to participate in distance learning for an academic degree or for job training. Distance learners are more readily found in the 25-34 age group, although at 14% this is still quite low. From Graph Q24a we can see that only 29% of our respondents use the web for distance learning or job training activities, and even less, 21%, seek information related to school work; however, in this instance usage increases to 87% of those aged 15-17. It should be noted, however, that a more casual style of learning is habitual for Internet users as usage is significantly higher for word definition searches and fact-checking: approximately 70% of our respondents use the web for either purpose.

63
E24a. Frequency by Type of UseCurrent users. N = 475
70%70%
29%
21%
87%
0
10
20
30
40
50
60
70
80
90
100
Dist. Learn/Job Train.
Schoolwork
Schoolwork 15-17yrs.
Fact Search
Word Def.
InternetUse
The majority of our educational users do so on a weekly rather than on a daily or monthly basis. Approximately 20% search for/check a fact or look up word definitions weekly. However, 72% and 38% of those aged 15-17 and 18-24 respectively, use the web weekly, daily, or several times a day in search of information related to school work. Here, the older of the two age cohorts may have interpreted ‘schoolwork’ to mean college or university related work: 51% of those currently attending or who have attended university are weekly, daily or more frequent seekers of ‘schoolwork’ related information. There were no obvious distinctions in patterns or frequency of educational and learning use across all our independent variables. Identity and online relationships Respondents were asked whether they agree or disagree with statements regarding identity issues on the net using a scale of 1 to 5 where “1” means that they absolutely disagree and “5” means they absolutely agree. A rather reluctant stance towards

64
Table 3. Identity issues on the net (Q11a)
Mean value DK NR
A On the Internet I share personal details that I am unable to reveal in face to face contact 1.90 9 1
B It’s easier for me to meet people on the Internet than face to face 1.88 9 2
C I have many names in cyberspace and each one has its own value 1.51 18 13
D The Internet allows me to have relationships that I would be afraid to create in real life 1.59 9 3
personal identity issues and online relations is indicated in Table 3. The mean value in all four statements is much lower than the mid point (3) of the scale. It seems that Internet use does not sufficiently engage at an emotional level so as to warrant classification as a significant life style choice for Cypriots; this is an additional sign that in Cyprus the Internet is not a deeply integrated presence in people’s lives and identities.

65
VIII. The Internet at Work Worldwide, the Internet has become a more than crucial tool both for work and a as place of work. Unsurprisingly, this is the case in Cyprus as well. Almost half of users (205/475 - 43%) say they use the Internet at work. During a typical week the average time they are connected with the Internet at work is 17 hours and 28 minutes. By grouping the values of the time usage from less than an hour up to more than twenty hours per week, we constructed a threefold typology of users:
Q4(2). Internet use at work Current users. N= 205
23%
38% 39%
0%
10%
20%
30%
40%
50%
Occasional users < 5 hours Regular users 5 -15 hours Heavy users 16+ hours
After controlling for all demographic variables, we found that there is a reverse statistical difference between men and women in the categories of ‘regular’ and ‘heavy user’.
Q4(2)b. Gender difference in internet use at work Current users. N=205
23%
31%
45%
24%
44%
32%
0%
10%
20%
30%
40%
50%
Occasional users < 5 hours Regular users 5 -15 hours Heavy users 16+ hours
Men
Women

66
Respondents were asked whether, due to Internet access, they feel that their work performance has improved. Clearly, half of them say it has been improved much or somewhat.
Q10. Changes in productivity because of internet accessCurrent users. N= 475
25%
18%
24%
0%
31%
1%
0%
5%
10%
15%
20%
25%
30%
35%
Improved a lot Improvedsomewhat
Stayed thesame
Worsenedsomewhat
Worsened a lot DK
Differences were found as to the place of usage and the income category: Those who use it in work places say the Internet has enhanced their productivity twice as much in comparison to those who use it at home. This indicates that the Internet in
Q10. Differences in productivity per place of internet usage
Current users. N=326
0%
10%
20%
30%
40%
50%
60%
At home At work At school Other places
Improved a lot
Improved somewhat
Stayed the same
Worsened
Cyprus like other western countries is effectively engaged in business making and work performance. In addition, it seems that it enhances productivity far more extensively for those users who belong to higher income categories. This correlation might mean that class differences are not alleviated by the Internet usage at work places.

67
Q10. Differences in productivity per income category (monthly in Euros)
Current users. N= 326
0%
5%
10%
15%
20%
25%
30%
35%
40%
Up to 1200 € 1201-2000 € 2001-3000 € 3001-4000 € 4001+ €
Improved a lot
Improved somewhat
Stayed the same
Worsened

68
IX. Internet and political efficacy When asked about political affiliation, most respondents place themselves in the “Centre” (with a mean score 5.33 in the “left – right” axis where 1 stands for extreme left and 10 for extreme right), but it is also worth mentioning that 17,75% reject the “left-right" political distinction.
Q.24c. Political Self Placement
6,38%
3,93% 4,04%
2,76%2,13%
3,61%
5,84%
4,46%
17,32%
0%
2%
4%
6%
8%
10%
12%
14%
16%
18%
20%
1 2 3 4 5 6 7 8 9
Left - Right Axis
Sel f Placement
The large majority of Cypriot Internet users do not appear to be convinced of the political effectiveness of the Internet.
Q.11a : AGREEMENT - DISAGREEMENT:Internet use can increase personal political power
8,21%
18,11%
14,11%
6,53%
42,95%
0%
5%
10%
15%
20%
25%
30%
35%
40%
45%
50%
1 2 3 4 5
Agreement Level
Strongly Disagree Strongly Agree

69
However, they appear to be somewhat informed and they demonstrate a general awareness of the Internet’s affect on the political process. More specifically:
• They don’t agree that the use of the Internet can enhance one’s personal
political leverage.
Q.11b: AGREEMENT - DISAGREEMENT: Internet use can increase personal influence on governmental actions
50,95%
8,84%
14,74%12,63%
4,63%
0%
10%
20%
30%
40%
50%
60%
1 2 3 4 5
Agreement Level
Strongly Disagree Strongly Agree
• They don’t agree that the Internet can increase one’s personal impact on governmental decisions and actions
• Almost one out of three tend to recognize that the Internet may enhance their understanding of political affairs.
Q.11c: AGREEMENT-DISAGREEMENT: Internet use can help to better understand of politics
10,74%
16,63%14,74%
8,00%
42,74%
0%
5%
10%
15%
20%
25%
30%
35%
40%
45%
1 2 3 4 5
Agreement Level
Strongly Disagree Strongly Agree

70
• They think that the Internet does not increase system responsiveness and
hence it does not limit political alienation.
Q.11d: AGREEMENT-DISAGREEMENT: Internet use will increase public officials interesting about what people think
53,26%
10,11%
15,58%
9,26%
2,95%
0%
10%
20%
30%
40%
50%
60%
1 2 3 4 5
Agreement Level
Strongly Disagree Strongly Agree
These opinions about the political impact of the Internet are concomitant with the over-politicized public life in Cyprus and the strong political selectivity of citizens. Strong partisanship tends to obscure the relatively independent role of the Internet on political culture. Yet the Internet has already been utilized in Cypriot political scene and the respondents, despite their reluctance to admit its overall impact, concede to its increasing importance in the making of political campaigns.
Q.11e: Agreement - Disagreement:Internet has become important for the political campaign process
0%
5%
10%
15%
20%
25%
30%
1 2 3 4 5
Agreement Level
Strongly Disagree Strongly Agree
The findings above indicate that a respondents’ perception of the Internet’s impact on politics may operate on two levels: a “personal/practical” and a “general/theoretical” level. On the first level, the Internet use appears not to enhance political efficacy.

71
However, on the second level, it is recognized that the Internet is an important part of critical political procedures. This difference might be based on a ‘third person effect’ syndrome.

72
Χ. Overall evaluation of the Internet Internet dependence Respondents were asked to rate their expected affect on a 1-10 scale where 1 = “I wouldn’t care at all” and 10 = “I would be extremely distraught” in case their Internet connection was demolished. For the purpose of this analysis respondents indicating a 6-10 affect are understood to be signaling a negative affect, those who answered 1-5 are not considered to self-evaluate a high degree of negative affect. In total 69% felt that the absence of their Internet connection would have a negative affect. This did not manifest in any significant urban/rural divide, nor were males more or less positively/negatively disposed than females. However, whilst 68% of Cypriot respondents self-evaluated a high degree of negative affect, this was even higher for non-Cypriots, 86% of whom indicated that absence of an Internet connection would have a highly negative affect. Obviously, for these people Internet an important means for communication to their families abroad or a platform for making business. As Graph Q24b indicates, of our seven age groups the degree of negative affect signaled by those under the age of 34 was stronger than indicated by those aged 35 and over. For example, a prospective disconnection would negatively affect 75% of 18-24’s, 76% of 25-34’s, 64% of 35-44’s and 53% of 45-54’s.
Q24b. -VE Affect of Internet Disconnection by AgeCurrent users. N = 475
0
10
20
30
40
50
60
70
80
15-17 18-24 25-34 35-44 45-54 55-64 65+
-ve affect
A high degree of negative affect was also indicated by High school/Lyceum students, 70%; those currently at, or who were once at university, 75%; and college/university graduates, 72%. Overall affect of the Internet Using a 5-point scale, 1 being ‘very positive’, respondents were asked to indicate the general affect that the Internet has on their lives. 80% indicated a ‘very positive’ or ‘somewhat positive’ affect. 1% indicated a ‘very negative’ or ‘somewhat negative’ affect, and 19% felt neither negatively nor positively affected.

73
Q24c. Affect on LifeCurrent users. N = 475
80%
1%
19%
0%
10%
20%
30%
40%
50%
60%
70%
80%
90%
Positve Affect
Negative Affect
No affect
Of the 1% who expressed a negative affect this was largely from the 65+ age group and retirees: 20% or 1 respondent out of a total of 5 for each group respectively. However, 60% of retirees also felt ‘somewhat positive’. Again, there was no significant rural/urban or gender divide, although 60% of housewives/househusbands felt neither positive nor negative. By contrast the unemployed felt that the Internet had a high degree of positive influence on their lives. 71% were ‘very positive’ compared with 42% of those in employment.

74
Appendix

75
Demographics
Sample size: 1000 individuals.
1 2 3 4 50
5
10
15
20
25
30
35
40
45
50
District
Perc
enta
ge (%
)
Sample Distribution per District
NicosiaLimassolLarnacaPaphosFamagusta
1 20
10
20
30
40
50
60
70
Perc
enta
ge (%
)
Area
Urban-Rural Distribution
RuralUrban

76
1 20
10
20
30
40
50
60
70Gender Distribution
Per
cent
age
(%)
Gender
MaleFemale
1 2 3 4 5 6 70
5
10
15
20
25Age Distribution
Per
cent
age
(%)
Age Category
15-1718-2425-3435-4445-5455-6465+

77
1 2 3 4 50
5
10
15
20
25
30
35
40
45
50
55P
erce
ntag
e (%
)
Education Level
Sample Distribution per Education level
Primary or lessHigh School (at)Lyceum (grad)College/University (at)College/University or higher
1 2 3 4 5 60
10
20
30
40
50
60
Employment status of sample population
Employment Status
Per
cent
age
(%)
EmployedHousewifeStudentUnemployedRetiredOther

78
Employment (Ν=1000)
61,10%
38,90%
YESNO