Embed Size (px)
Citation preview
JOHN MOLSON SCHOOL OF BUSINESS
CONCORDIA UNIVERSITY
MONTREAL, QUEBEC, CANADA
TRADE CLASSIFICATION ACCURACY FOR THE BIST
by
Osman Ulas Aktas * and Lawrence Kryzanowski**
Current Version: July 2014
* Ph. D. student, Department of Finance, John Molson School of Business, Concordia University, 1455
de Maisonneuve Blvd. West, Montreal, P.Q., Canada, H3G 1M8. E-mail: [email protected].
**Senior Concordia University Research Chair in Finance, Department of Finance, MB12.229, John
Molson School of Business, Concordia University, 1455 de Maisonneuve Blvd. West, Montreal, P.Q.,
Canada, H3G 1M8. Telephone: 514-848-2424, local 2782. E-mail: [email protected]
The authors thank Coskun Gunduz for his extensive assistance in the reconstruction of the limit order
book, Trang P. Tran for her research assistance, and George Constantinides (Chair) and Kangwoo Park
(discussant) at the 2013 MFS Conference (Izmir, Turkey) for helpful comments and suggestions.
Kryzanowski gratefully acknowledges financial support from the Senior Concordia University Research
Chair in Finance, IFM2 and SSHRC (Social Sciences and Humanities Research Council of Canada). The
usual disclaimer applies.
Please do not quote without the authors’ permission.
Comments are welcomed.
ABSTRACT
The accuracy of five algorithms for classifying trades as buyer- or seller-initiated is assessed for BIST-30
index constituents over a period including the Lehman collapse. The highest classification accuracy rate
(over 95%) is for the one-second lagged Lee & Ready (LR) algorithm. The LR’s classification accuracy
is highest (lowest) for trades representing mixed agency and principal (pure principal) relations between
clients and executing brokers. Unlike for U.S. markets, almost all trades are classifiable with accuracy
rates of 90-plus percent for both long and short trades. As for U.S. markets, higher misclassification rates
occur for trades in the first versus last 30 minutes of the trading day, as the time between consecutive
trades decreases, and for decreasing trade sizes.
Keywords: trade classification algorithms; market microstructure; developing stock market; short sales;
time between trades; agency relations.
JEL classification: G10; C52.
1
TRADE CLASSIFICATION ACCURACY FOR THE BIST
1. INTRODUCTION
Much of the microstructure literature and applications thereof require a determination of whether a
trade is initiated by the buyer or the seller (commonly referred to as trade signing or trade direction).
Some early examples include the asymmetric-information and inventory-control theories of specialist
behaviour (e.g., Hasbrouck, 1988), the effect of order imbalances and returns on NYSE stocks during the
crash of October 1987 (Blume, MacKinlay and Terker, 1989), and the price impact of large trades (briefly
reviewed in section two herein). Commonly used trade classification algorithms include the tick test, the
Lee and Ready (1991) (hereafter LR) algorithm and the Ellis, Michaely and O`Hara (2000) or EMO
algorithm (see table 1 for a description of the ones used herein).
[Please place table 1 about here]
Various papers illustrate the consequences of inaccurate trade classification in empirical finance. For
example, Boehmer, Grammig and Theissen (2007) show analytically and empirically that inaccurate
classification of trades leads to downward-biased PIN (probability of informed trade) estimates and that
the magnitude of the bias is related to a security’s trading intensity. Using two separate periods around the
NYSE’s change to a tick size of $1/16 in June 1997, Peterson and Sirri (2003) report that actual execution
costs are overstated by up to 17% using effective spread estimates that incorporate errors in trade
direction and benchmark quote assignments, and that the highest biases occur for small trades and for
trades of larger firms.
To the best of our knowledge, the only study that examines trade classification accuracy for a
developing market is by Lu and Wei (2009) for the Taiwan Stock Exchange. Thus, the primary purpose of
this paper is to test the accuracy of five trade classification algorithms described in table 1 for an
important, active and representative market in a developing country, namely, the Borsa Istanbul (BIST).
The BIST was the eighth most active market in equity trading out of 26 exchanges ranked in the category
‘Europe /Africa /Middle East’ by the World Federation of Exchanges for 2008.1 We argue that a study of
this market can provide some methodological support for the use of trade classification algorithms and the
credibility of the resulting research for the BIST and other similar markets (i.e., fully-computerized
1 The BIST with 46.0 million equity trades in 2008 placed between the SIX Swiss Exchange and Saudi Stock
Market (Tadawul) with 42.0 and 52.1 million trades, respectively. The BIST with 114,307.7 million shares traded in
2008 placed between the Johannesburg Stock Exchange and the BME Spanish Exchanges with 82,580.6 and
119,701.2 million shares traded, respectively. For greater details, see: http://www.world-
exchanges.org/statistics/annual/2009/equity-markets/total-number-trades-equity-shares-and-number-shares-traded
2
markets with an order-driven mechanism via continuous auction, no official market maker and a small
representation of short sales in total trading) when the data set available to the researcher requires that the
order book be constructed or does not allow for the use of the more accurate chronological approach
(defined later) to determine the true initiator of a trade.
We examine stocks in the BIST-30 because these stocks account for about 70% of total trades on the
BIST during our chosen time period. This choice was also dictated by the extensive time need to clean the
raw data provided by the BIST using 20-minute intervals for each company before constructing the limit
order book in order to obtain the BBO (best bid and offer) for each second during each trading day for
each of the 35 stocks in our sample due to quarterly index revisions. The accuracies of the trade
classification algorithms are examined over the seven months of June through December 2008 which
includes two quarterly index revisions. The test period is also centered on the month of the collapse of
Lehman Brothers (namely, September 2008) to provide a first test of the accuracy of the five trade
classification algorithms during a period including the effects of a financial crisis and the Great
Recession.2 Our choice of time period extends the work of Asquith, Oman and Safaya (2010) and
Chakrabarty, Moulton and Shkilko (2012) who use two months in 2005 that the former authors (page
472) characterize as: “These two months also offer the advantage of capturing a recent, relatively
“normal’’ time in the markets — after decimalization, but before the financial crisis and the scrutiny of
short sellers that followed …”
Since the times and IDs of each order and trade are available for our propriety dataset from the BIST,
we use the more accurate chronological approach as the benchmark for the true initiator of a trade.3 We
find that the one-second lagged version of the LR algorithm outperforms the other four trade
classification algorithms that we assess. To the best of our knowledge and despite the period examined,
we document the highest accuracy rates for the LR algorithm (lagged one second) in the market
microstructure literature of above 95%.4 Like Odders-White (2000), we find that the highest
misclassification rates occur for trades that occur at the quote mid-spread. We find significant differences
in classification accuracy for buyer- versus seller-initiated trades among the five classification algorithms.
For the four quote-based algorithms, the EMO algorithm exhibits the highest accuracy rate (over 95%) in
2 Turkey and the following countries/territories went into economic recession in the third quarter of 2008: Euro-
using nations in the European Union as a whole, Germany, Hong Kong, Japan, Italy, Singapore, Sweden, and the
United Kingdom. They were followed into technical recession in the fourth quarter of 2008 by Spain, Switzerland,
Taiwan and the United States. http://en.wikipedia.org/wiki/Great_Recession 3 When trader IDs are not available (Lee and Ready, 1991), the immediacy approach defines the trade initiator as the
trader who demands immediate execution (i.e., places a market order) and the non-initiator as the trader who is a
liquidity provider but does not require immediate execution (i.e., places a limit order). 4 According to Asquith, Oman and Safaya (2010, p. 158), the degree of accuracy of the LR algorithm ranges from
72% to 93% depending on the study.
3
classifying seller-initiated trades and lowest accuracy rate (<77%) in classifying buyer-initiated trades. In
contrast, the LR algorithm places second in classification accuracy for seller-initiated trades and first for
buyer-initiated trades (over 92% except for the use of contemporaneous quotes).
To the best of our knowledge, this is the first paper to examine classification accuracy for trades
differentiated by whether the trader has an agency or principal relationship with the brokerage firm
executing the trade. To this end, we use the BIST’s three-way trader classification that is included in our
proprietary data set. We document that the trade classification algorithms show significantly inferior
accuracy in classifying trades that take place in the portfolios of the brokerage firms (pure principal)
compared to the trades that take place in the institutional and retail clients’ accounts of the brokerage
firms (pure agency), and the trades that take place at the investment funds managed by the brokerage
firms (mixed). This has important implications for the use of trade classification algorithms for the
determination of the probability of informed trading when the proportion of pure principal trades is
material.
Our findings have implications for the ongoing debate on whether short trades are seller-initiated, and
whether they consume liquidity more often than they provide it. We find significant differences in the
accuracy rates of the trade classification algorithms that generally are higher for long versus short trades.
Unlike Asquith, Oman and Safaya (2010) and Chakrabarty, Moulton and Shkilko (2012) who examine
US data for June and December 2005 provided under the SEC’s Reg SHO initiative,5 we find accuracy
rates of at least 90% using one-second lagged quotes for both long and short trades for the quote, at-the-
quote and LR algorithms. Like these authors, we find that long sellers appear to consume liquidity more
often than they provide it while short sellers appear to provide liquidity more often than they consume it.
Like these studies, we find that short sales are predominantly buyer-initiated which is consistent with the
expectation advanced by Chakrabarty, Moulton and Shkilko (2012) but not Asquith, Oman and Safaya
(2010) whose prior is that short sales should be predominantly seller-initiated. This interpretation depends
on the somewhat strong implicit assumption that any differential immediacy costs associated with the
short-side of a trade are not material. To further illustrate the importance of this implicit assumption, we
note that Asquith, Oman and Safaya (2010) report that the proportion of buyer-initiated trades involving
short sellers is significantly lower in the absence of short-selling restrictions like an uptick rule on the
NYSE or a bid price test on NASDAQ.6
5 Asquith, Oman and Safaya (2010) also examine data for March 2005.
6 Chakrabarty, Moulton and Shkilko (2012) could not provide a totally clean test of the effect of short selling
restrictions on trade classification since they note that INET (their data source) did not enforce NASDAQ’s bid price
test.
4
Our findings also have implications for tests of informed or manipulative trading at the close of a
trading session. We find that a relationship exists between the misclassification of trade initiator and the
time of the trade day. We find that misclassifications tend to be higher in the first 30 minutes compared to
the last 30 minutes of the morning and afternoon trading sessions for our sample. As the time between the
trades decreases, the misclassification rates increase with the exception of the tick algorithm.
The remainder of this paper is organized as follows. In the next section, we provide a brief review of
the literature that examines the performance of trade classification algorithms. In the third section, some
descriptive information on trade execution on the BIST is presented. In the fourth section, the sample and
data are discussed. In the fifth section, we deal with the conceptual question of who is the trade initiator
especially when the trade includes a short-sale side. In the sixth section, the hypotheses to be tested are
specified and our results for the tests of these hypotheses are presented and discussed. We conclude with
section seven.
2. BRIEF REVIEW OF THE RELEVANT LITERATURE
In this section, we discuss the studies summarized in table 2 that test the accuracy of various trade
classification (or signing) algorithms. Lee and Ready (1991) use the immediacy approach and the
available BBO to obtain a benchmark for assessing trade classification accuracy of their individual trade
classification or LR algorithm against the tick and the quote algorithms for 150 NYSE firms for 1988.
They identify a delay between the reporting of quotes and their respective trades that should be reflected
when classifying trades, and that classification performance deteriorates for trades inside the quoted
spreads (i.e., when trade improvement occurs).
[Please place table 2 about here]
Two studies use unique data sets with more complete data on quotes and trades (including some trader
identities and/or trade direction indicators) for NASDAQ firms.7 Ellis, Michaely and O’Hara (2000)
document accuracy rates of 77%, 76% and 81% (lower for trades within the bid-ask quotes) for the tick,
quote and LR algorithms, respectively, for a sample of 313 Nasdaq stocks over the 12 months starting
with September 1996. Chakrabarty et al. (2007) present a new algorithm that first divides the spread into
7 The data set used by Ellis, Michaely and O’Hara (2000) identifies whether a trade is by market makers, brokers
and customers but only provides the names of market makers and brokers since this field is blank for customers.
Chakrabarty et al. (2007) use data from the two largest ECNs, INET and ArcaEx, which provide buy and sell
indicators. Using a proprietary dataset from the Chicago Board Options Exchange (CBOE) that reports trade
direction, Savickas and Wilson (2003) report accuracy rates of 59%, 83%, 80% and 77% for the tick, quote, LR and
EMO algorithms, respectively.
5
ten incremental deciles and then uses the quote rule when transaction prices are closer to the ask or bid
and the tick rule when transaction prices are closer to the mid-spread. Their classification algorithm
outperforms the tick, LR and EMO algorithms by 1.12%, 2.10% and 0.72%, respectively, for a sample of
750 NASDAQ firms over the three-month period of April-June 2005.
Various studies use the TORQ database. Since TORQ provides details on the parties to a trade, order
submission times and the prior-to-execution handling of orders electronically routed (SuperDot) at the
NYSE, information about the trader's identity (e.g., individuals versus institutional traders) and order
characteristics (e.g., whether seller- or buyer-initiated) are directly observable for 144 NYSE stocks for
the three months starting with November 1990. Lee and Radhakrishna (2000) report a 93% accuracy rate
for the LR algorithm for a sub-sample of 15 stocks from the TORQ dataset after eliminating
approximately 40% of the trades in TORQ that could not be unambiguously classified as being either
buyer- or seller-initiated because they were market “crosses”, stopped market orders, and pairings of
market with executable limit orders. Odders-White (2000) reports an 85% classification success rate for
the LR algorithm with systematic misclassifications of the transactions at the mid-spread, small
transactions, and for large or frequently traded stocks. Based only on an analysis of signing accuracy for
the LR algorithm by trade size, time between trades, number of transactions, and firm size, Odders-White
(2000) finds that classification accuracy increases with the omission of trades at the mid-spread. She also
reports overestimation of the number of buys and underestimation of the number of sells for small trades,
and that the use of incorrectly signed trades leads to the overestimation of order processing costs.
Including only those trades with a market order on one or both sides of the trade, Finucane (2000) reports
a similar performance for the tick and LR algorithms that is superior to that for the reverse tick test. He
also reports that the accuracy rate for the tick test is below that reported by Lee and Ready (1991) but
better than that reported by Aitken and Frino (1996) and Ellis, Michaely and O’Hara (2000).
Based on the assumption that their algorithm correctly assigns trades, Blais and Protter (2012) report
that the signing accuracy of the LR algorithm for trades is around 56% for both 30 liquid and 30 illiquid
stocks drawn from the Morgan Stanley Order Book for stocks listed on the NYSE, AMEX, NASDAQ
and LSE over the period of July 1 to December 19, 2003. Using a modeling approach that considers
information strengths, microstructure effects and classification correlations for 2800 US stocks, Rosenthal
(2012) reports 1 to 2% higher accuracy rates compared to other classification algorithms across dates,
sectors and spreads for the ArcaTrade dataset that provides the non-initiating (first arriving) trade
classification for all trades on the Archipelago ECN for December 2004. Using clean data unlike previous
studies, he attributes the improvements in forecast accuracy to the use of information strengths (1 to
1.3%) and from estimating quotes (0.9% and 0.7% for Nasdaq and NYSE stocks, respectively).
6
Some studies test the accuracy of the trade classification methods for non-US, developed markets.
Aitken and Frino (1996) report a 74% and 90% accuracy rate when using a tick algorithm to determine
actual trade direction for about 1100 stocks in the Australian Stock Exchange when zero ticks are
included and excluded, respectively. The tick algorithm outperforms the LR algorithm for their data
sample except for seller–initiated and small buyer-initiated trades. Using the definition of true
classification based on whether the Makler (the equivalent of the specialist on the Frankfurt Stock
Exchange) bought or sold shares, Theissen (2001) documents accuracy rates of 72.2% and 72.8% for the
tick and LR algorithms, respectively, for 15 stocks from 26 September to 25 October 1996.
For a developing market, Lu and Wei (2009) conclude that their adjusted version of the LR algorithm
is the most appropriate algorithm examined for 684 stocks traded on the Taiwan Stock Exchange for the
six-months ending June 30, 2006.8 Due to the existing price limits and the absence of designated market
makers on this exchange, Lu and Wei suggest that the lack of bid or ask quotes can be solved by first
classifying trades using the quote and then the tick algorithm.
Findings on the trade classification accuracy of the LR algorithm are less supportive for short sales.
Asquith, Oman and Safaya (2010) find that the tick, quote and LR algorithms often misclassify short sales
as buyer-initiated based on a sample of 100 stocks from each of NASDAQ and NYSE during the three
months of March, June and December 2005. The LR algorithm performs the best with a 33.4% accuracy
rate for short sales when measured against a prior that short sales should be seller-initiated. In the absence
of trader IDs, Chakrabarty, Moulton and Shkilko (2012) use a modified chronological approach for
determining the true trade initiator that should be highly reliable. Using a prior that short sales should be
buyer-initiated, Chakrabarty, Moulton and Shkilko (2012) report that the misclassification rate is higher
than 30% for individual short sales and is reduced to 21% using one-second lagged instead of
contemporaneous quotes for a sample of 100 Reg SHO pilot stocks from NASDAQ for June and
December 2005. Since the misclassifications of buyer- and seller-initiated trades are almost evenly
distributed, they report that the LR algorithm correctly identifies most short sales as buyer-initiated and
most long sales as seller-initiated at the aggregate daily level. The generalizability of their results are
based on how representative trades in the accounts of the electronic trading platform INET were of the
wider market given that it only represented around one-quarter of total and total short-sale volume for the
two months they studied, on the effect of INET not enforcing NASDAQ’s bid price test for short sales
during their sample period (Diether et al., 2009b), and of the acquisition of Instinet by NASDAQ which
was announced in April 2005 and closed in December 2005 (Morcroft, 2005).
8 Their revised quote rule classifies a trade as a buy (sell) if there is only a bid-side (ask-side) quote available.
7
3. THE BORSA ISTANBUL (BIST)9
National Market firms require daily average trading volumes (number of trades) of >1% (≥ 4%) of
the total for all National Market listings.10
National Market listings have increased from 325 (December
31, 2008) to 397 (November 14, 2012). Other markets on the BIST during our studied time period
include: the Second National Market for small- and medium-sized firms that are temporarily or
permanently delisted from the National Market; the New Economy Market for telecommunication,
electronic, internet and computer manufacturing firms considered as fast growing and in need of
financing; the Exchange Traded Funds Market for ETF transactions; and the Watchlist Market for
companies under special surveillance and investigation due to extraordinary stock transactions.
Trading for BIST-30 (and BIST-100) constituents is fully computerized and order-driven with buy and
sell order matching based on price and time priority.11
The opening of a session for BIST-30 (and BIST-
100) constituents is designed as a call market. During the opening of a session, trades in the limit-order
book are executed at the price that provides the maximum executable amount of trade for each stock.
However, this opening price is not used to generate a new base price and price limits in the continuous
auction market phase. If an opening price for a particular stock is not obtained, all the orders entered into
the system are carried over to the continuous auction session where market makers have no role.12
Up to October 13, 2008, the time period for order collection, order matching and continuous trading
are 9:30 to 9:40, 9:40 to 9:45 and 9:45 to 12:00, respectively, for the first daily trading session.
Thereafter, the time periods for each of the three functions are 9:30 to 9:45, 9:45 to 9:50 and 9:50 to
12:30, respectively. The second daily session for our sample time period is from 14:00 to 17:00 where the
first five-minute period consists of electronic order transmission. All of these changes are reflected in our
subsequently reported results.
4. SAMPLE AND DATA
4.1 Sample
Our sample consists of all the firms in the BIST-30 Index which in the aggregate accounts for about
70% of the total trading volume on the BIST for the seven-month period ending in December 2008 and
9 A more extensive description of the BIST listing categories and trading mechanics is available from the authors.
10 The listing requirements are given in detail in the BIST Operations Manual 2008 and 2009 available at
www.ise.org The daily average trading volume and number of trades of all companies are reviewed quarterly. If a
company fails to meet the minimum circulation criteria during one of these reviews, it is transferred to the Second
National Market. 11
The exchange was founded on December 26, 1985 and became fully automated from October 21, 1994. 12
Based on communications with the BIST.
8
centered on September 2008 (the month of Lehman’s collapse). The BIST-30 index is updated quarterly
and consists of the 30 most frequently traded firms on the BIST chosen from National Market listings and
the stocks of real estate investment trusts and venture capital investment trusts listed on the Collective
Products Market. Since the sample period covers two (at the end of June and September) of these
quarterly index revisions when five firms were replaced, our sample consists of 35 firms. The aggregate
market capitalization and total value of shares traded for the BIST-30 Index in 2008 was $11 billion and
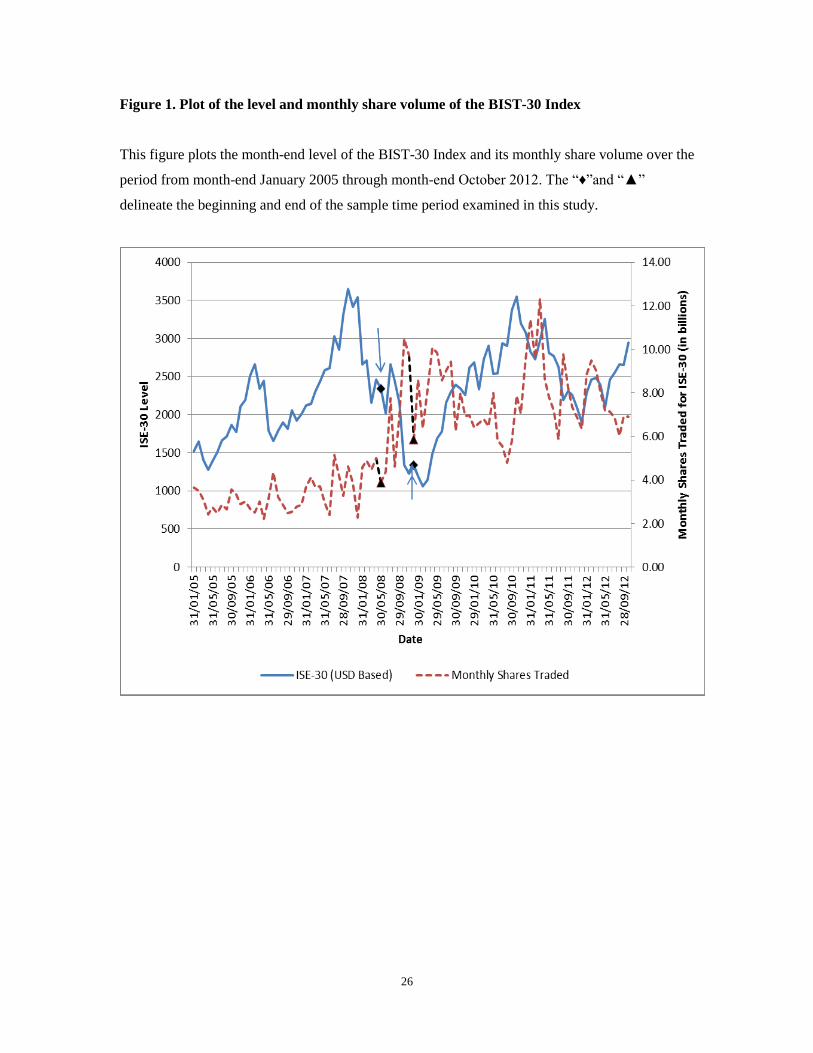
$248 billion US, respectively. Figure 1 plots the monthly closing levels and aggregate number of shares
traded for the BIST-30 Index for our seven-month sample period. This is a period of generally increasing
trade activity and decreasing index levels.
[Please place figure 1 about here.]
4.2 Data Manipulation
The raw data provided by the BIST consists of incoming order and trade files that provide the date,
time (up to the closest second), order number, order type, quantity, and price information. The uncleaned
order file contains some entry errors due to, for example, the inclusion of orders cancelled by phone,
altered orders (by order type or quantity) and multiple order entries. Using a search over 20-minute
increments for each stock (i.e., 2499 20-minute intervals for the seven-month period examined herein),
we identify order file errors as those orders that appear in the order but not trade book and cause the
spread to be non-positive. We eliminate any identified order errors, and then recheck each 20-minute time
interval until no additional errors are identified.
We construct the limit order book consisting of the ten best different bids and ten best different offers
and their corresponding volumes for each second of the trading day based on price and then time priority
by using the order flow and trade data. Our second-by-second limit order book for each stock is updated
when new orders are added, existing orders are canceled or existing or new orders are executed. A new
buy (sell) order is placed in the buy queue after (before) all orders to buy (sell) at the same price or after
(before) all orders to buy (sell) at a higher (lower) price if the queue does not already include an order to
buy (sell) at the same price. A trade removes an order from the inside of the book (oldest buy order at the
highest buying price or the oldest sell order at the lowest selling price). The unique 15 or 16-digit ID
number and timestamp up to the closest second attached to each order allows us to perfectly match orders
between the order-flow and trade data sets. This makes it possible to obtain the chronological ranking of
the orders and trades and the trade initiator using the chronological method as in Odders-White (2000).
Our initial “cleaned” sample consists of 8,375,672 trades of which we can classify 99.5% or
8,332,218 trades using the chronological method since the chronological method cannot classify executed
9
orders that arrive at the same time (i.e., have the same time stamp). The sample of trades is further
reduced to 7,894,420 trades with the deletion of the first five minutes of continuous trading of the trading
day,13
and to 7,889,985 trades after deleting trades that could not be classified using the five classification
algorithms used herein. A total of 46.1 billion shares were traded for our final sample of trades over the
seven months examined herein.
Thus, our final sample of the number of trades represents 94.2% of all the trades in the original
sample. This elimination rate of 5.8% is much lower than that reported in the literature for other markets.
Some elimination rates for studies using TORQ trades are 25% in Finucane (2000), 25.1% in Odders-
White (2000) and about 40% in Lee and Radhakrishna (2000). Elimination rates using other datasets
include 24.6% in Ellis, Michaely and O’Hara (2000).
5. WHO IS THE TRADE INITIATOR?
Before proceeding to our examination of the performance of the various trade classification algorithms
for the BIST, we need to discuss how the identity of the actual initiator of each trade or comparison
benchmark is determined. In the absence of short sales and given full information on trades and quotes
(such as time and trader identification), the actual trade initiator is the party to the trade that pays the
largest “immediacy premium’’ that reflects both a time and cost dimension.
The two common approaches for determining the trade initiator are based on the implicit assumption
that all trades are long-long. When trade IDs are not available, a trade is assumed to be initiated by the
trader whose market order has been executed against a standing limit order. The advantage of this
immediacy approach is that it considers both dimensions of liquidity for trades that match a market with a
limit order that are on opposite sides of the market. However, as noted by Odders-White (2000), this
approach cannot identify the actual trade initiator for crossed market orders, limit-limit order matches and
stopped market orders. Odders-White reports that crossed market orders and limit-limit order matches
account for about 12% and 17%, respectively, of the transactions in the TORQ data set. When trade IDs
are available, the chronological approach is used where the trade initiator is identified as being the trader
who places an order last chronologically. The two-part rationale behind this approach is that: (i) the first-
in party to the trade acts as the liquidity provider at its chosen price; and (ii) the last-in party pays the
“immediacy premium” for the rapid execution of the trade. The advantage of this approach is that it
considers both dimensions of liquidity for a wider set of order type pairings.
13
Continuous trades began at 9:45 am for trades up to October 13, 2008, and from 9:50 thereafter. Thus, we use
trades from 9:50am and 9:55am, respectively.
10
There is a divergence of opinion in the literature on who is the trade initiator when one side of the
trade includes a short sale. While Asquith, Oman and Safaya (2010) argue conceptually that short sales
should be predominantly seller-initiated, Chakrabarty, Moulton and Shkilko (2012) argue that by using
INET order data they can correctly identify the true trade initiator for short sales as being predominantly
buyer-initiated. Given different conceptual benchmarks, it is not surprising that they arrive at different
conclusions about the reliability of using the LR algorithm for classifying trades when the LR algorithm
classifies most (majority of) trades involving short sales as being buyer-initiated for stocks (not) subject
to either the uptick or inside bid rule depending upon the trading venue examined.
We argue that it is not possible to obtain an unambiguous determination of the true trade initiator for
trades that involve short sales even if the researcher has access to trader IDs. We argue that it is not
reasonable to assume that other trade immediacy costs are symmetrical for both trade sides for a trade that
involves a short sale, since the short side incurs various additional immediacy-related trade costs
(Lesmond, Schill and Zhou, 2004) that are not incurred by the long side even in the absence of an uptick
rule. As noted by Asquith, Oman and Safaya (2010), these include at a minimum the need to locate a
security to borrow and to accept a below-market rebate rate (i.e., the equivalent of the overnight repo rate
minus the lending fee on a daily basis).14
The existence of these additional trade costs only for the short
seller means that both parties pay an “immediacy premium” for rapid execution of the trade. Thus, the
competing actual trade initiator benchmarks differ based on the assumption made in terms of the relative
importance of these additional trade costs. If they are not material, one arrives at a benchmark that trades
involving short sales should be predominantly buyer-initiated as advocated by Chakrabarty, Moulton and
Shkilko (2012). If they are material and sufficiently large, one arrives at a benchmark that trades
involving short sales should be predominantly seller-initiated as advocated by Asquith, Oman and Safaya
(2010).
The empirical evidence finds that lending fees (rebate rates) are material but not sufficiently large for
most stocks to either conclude that the actual initiator of a trade involving a short sale should be
predominantly buyer- or predominantly seller-initiated. Two examples are the studies by D’Avolio (2002)
and Cohen, Diether and Malloy (2007) both of which use proprietary databases of stock lending activity
from a large (different) institutional investor. For the period of April 2000 through September 2001,
D’Avolio (2002) reports that for the 91% of the firms not “on special” (defined as a loan fee greater than
1% per annum), the typical loan fees are around 20 basis points per annum. For the period of September
1999 to August 2003, Cohen, Diether and Malloy (2007) report mean (median) annual loan fees of 0.39%
14
Other indirect costs associated with the short side are recall risk, and the short term adverse consequence of the
marking to market of collateral when the price moves against the borrower (short seller).
11
(0.13%) and 3.94% (3.93%) for firms above and below the median value of market equity of firms listed
on the NYSE. They also note that the loan fee for retail borrowers is typically equal to the interest rate on
cash funds since retail investors typically receive no interest on their proceeds from the short sale. For the
rebate rates based on the small proportion of short sales collected by Takasbank,15
we observe that almost
all rebate rates exceed one percent annually.
Thus, given that lending fees are firm-specific and time-varying and not available for most traded
stocks (especially over the longer time periods examined in many microstructure studies), no
unambiguous benchmark of the identities of the actual trade initiators is possible for trades involving
short sales. However, if such data became available, a researcher could adjust the mid-spreads used in the
LR algorithm upwards to account for estimates of these differentials.
6. HYPOTHESES AND FINDINGS
Before proceeding to a presentation of the hypotheses to be tested and the test results, our primary test
for goodness-of-fit is the chi-square test, . We also use the G-test, which is also known as a (log-)
likelihood ratio test, as an alternative test since the chi-square test is simply an approximation to the G-
test for convenient manual computation and the G-test is based on the multinomial distribution without
using the normal distribution approximation. The chi-square and G- test statistics are computed as:16
, and ,
where and are the observed and expected frequencies for cell i, j, respectively, in the contingency
table; ln is the natural logarithm; and the sum is taken over all non-empty cells.
6.1 Total Sample (not) Differentiated by Time of the Trading Day
6.1.1 Hypotheses
Since many studies that were reviewed earlier find that the LR algorithm tends to have the highest
accuracy rate for markets in developed countries, we expect that such will also be the case for the BIST
even though it is situated in a developing country. Therefore, our first hypothesis in its alternate form is:
15
The major purpose and activity of the Takasbank is to provide clearing, settlement and custody services within the
capital market and related exchange regulations of Turkey as well as rendering investment banking services within
the scope of the Banking Law and other banking regulations. As the central clearing and settlement institution to
Borsa Istanbul, Takasbank is authorized to provide cash and securities settlements for transactions for equities, debt
securities, foreign securities, derivatives and precious metals. 16
The two statistics will converge for large sample size n since the two measures differ by terms of the order of
. For greater details, see: http://www.statsref.com/HTML/index.html?g_contingency_table_test.html
12
: The LR algorithm has a better rate of accuracy for the total sample not differentiated by time-
of-day than the tick, quote, at-the-quote and EMO algorithms for trade classification.
Researchers generally exclude trades for short periods after the opening and near the closing of a
trading day. For example, Odders-White (2000) excludes the first fifteen minutes of trading from her
analysis based on the argument that the concept of an initiator is not applicable for this period of time due
to the opening auction. Petersen and Fialkowski (1994) exclude the orders entered prior to the market
opening when they document a significant difference between the posted and effective spreads paid by
investors. In the spirit of Odders-White while minimizing the loss of trades, we only exclude the first five
minutes of continuous trading for the first trading session of each trading day when examining the rates of
accuracy of the five classification algorithms for the first and last 30 minutes of both the morning and
afternoon trading sessions. We also account for the change of trading times on October 13, 2008 that was
discussed earlier. Therefore, our second hypothesis in its alternate form is:
: The accuracies of the trade classification algorithms differ during the first and last 30 minutes
of each trading session.
The first potential determinant of trade misclassifications examined in the literature is the lag length of
the quote used in some of the trade classification algorithms. According to Lee and Ready (1991),
misclassifications are reduced significantly by comparing a trade to the quote in effect five seconds
earlier. Although her highest misclassification rate of 20.1% occurs for trades that are less than five
seconds apart, Odders-White (2000) finds that the five-second rule only affects 4% of her data sample and
that the rule changes the classification for only 1,218 out of 318,364 transactions. Since the elimination of
the five-second rule causes more misclassifications, she concludes that the increased misclassification of
trades that are less than five seconds apart is not due to the failure of the five-second rule. Chakrabarty,
Moulton and Shkilko (2012) report that the misclassification rate drops by one third when one-second
lagged quotes are used in the LR algorithm instead of contemporaneous quotes. We also expect to have
better results using one- versus five-second lagged quotes given the fully computerized nature of the
order-driven market on the BIST. Therefore, our third null hypothesis is:
: The classification accuracy of the various trade classification algorithms for trades on the BIST
is the same for quote lag lengths of zero, one and five seconds that are commonly used in the
microstructure literature.
6.1.2 Results
We report the average accuracy rates for the full trading day and for the first and last 30 minutes of the
morning and afternoon trading sessions in panels A and B of table 3, respectively. The results are based
13
on 7,889,985 transactions for the whole sample over the full seven months examined herein. For the
undifferentiated sample, we find that the one-second version of each of the four trade classification
algorithms that use quotes have the highest classification accuracies, and that this version of the LR
algorithm has the best performance with an average accuracy rate of 96.38%.17
The use of zero-second
lagged quotes results in the lowest classification accuracies for all quote-based algorithms. For one-
second lagged quotes, the average trade classification accuracy rate for the LR algorithm is followed by
the quote, at-the-quote, tick and EMO algorithms with average accuracy rates of 95.00%, 93.05%,
90.38%, and 86.93%, respectively. These results support the findings of Chakrabarty, Moulton and
Shkilko (2012) that the use of quotes lagged one second lead to higher classification accuracies than the
use of contemporaneous quotes.
[Please place table 3 about here]
As for the undifferentiated sample, we find that the one-second version of each of the four trade
classification algorithms that use quotes have the highest trade classification accuracies for the
differentiated samples. Furthermore, this version of the LR algorithm has the best performance with an
average accuracy rate of 96.52% and 96.32% for the first and last 30 minutes of the morning trading
session, respectively, and 95.89% and 96.99% for the first and last 30 minutes of the afternoon trading
session, respectively. As for the undifferentiated sample, this average trade accuracy rate for the LR
algorithm is followed by the quote and at-the-quote algorithms. The tick (EMO) followed by the EMO
(tick) algorithm come next for the morning (afternoon) session.18
Based on the chi-square and G- tests and
one-second lagged BBO, the accuracy rates are significantly higher (lower) for the last 30 versus the first
30 minutes for the at-the-quote and EMO (quote and LR) algorithms in the morning session and for all
four classification algorithms in the afternoon session. They are also significantly higher using the tick
algorithm for both sessions. Thus, we reject our third null hypothesis at the 0.001% level that
classification accuracy is independent of whether trades occur near the beginning or end of the morning or
afternoon sessions for all trade classification algorithms and all lag lengths.
6.2 Total Sample Differentiated by Trade Positioning within the BBO
6.2.1 Hypothesis
It is well documented that trade classification algorithms perform significantly better for the trades at
the BBO quotes. Since the LR algorithm compares the transaction price to the posted quotes, Chakrabarty
17
Since the tick algorithm does not use quotes, its classification accuracy is invariant to whether a zero, one or five
second lagged quote is used. 18
Based on untabulated results, the average classification accuracies are materially inferior for the reverse tick
classification algorithm.
14
et al. (2007) find that its accuracy is higher for the trades that occur at either BBO quote. Odders-White
(2000) documents an 89.6% accuracy rate for the trades at or outside the quotes using the LR algorithm.
However, the LR algorithm for her sample only correctly classifies 78.23% and 62.63% of the trades that
are inside the spread but not at the spread midpoint and at the spread midpoint, respectively. Similarly,
Rosenthal (2012) documents that the LR algorithm using one second lagged quotes has the best
classification accuracy of 79% of the trades that take place at the ask quote for his sample of Nasdaq and
NYSE stocks for December 1 and 2, 2004. Thus, our fourth hypothesis in its alternate form is:
: The accuracy rate for classifying trades using the LR algorithm is higher when trades take
place at the BBO quotes compared to when they occur at the mid-spread or inside the quotes
but not at the mid-spread.
6.2.2 Results
The accuracy rates of the trade classification algorithms based on the trade price positioning against
the BBO quotes and their mid-spreads are reported in table 4. Once again, the LR algorithm with one-
second lagged quotes exhibits the best performance with accuracy rates of 96.18%, 93.30% and 95.42%
for the trades that occur at or outside the BBO spread, at the BBO mid-spread, and within the BBO spread
but not at the mid-spread, respectively.19
Interestingly, the other three classification algorithms that use
quotes have the highest accuracies for trades at the mid-spread when their lag length is five seconds.
Among the three trade positions relative to the BBO, the tick algorithm performs best with an accuracy
rate of 90.17% when the trades occur at or outside the BBO spread. Our results for lagged versions of the
LR algorithm are consistent with those of Odders-White (2000) in that the highest rates of
misclassifications occur for the trades that take place at the quote mid-spread. Furthermore, based on the
chi-square and G-test statistics and their associated p-values, we reject our fourth null hypothesis at the
0.001% level that classification accuracy is independent of the positioning of the trade relative to the
BBO for all trade classification algorithms and all lag lengths.
[Please place table 4 about here]
6.3 Total Sample Differentiated by Time between Trades
6.3.1 Hypothesis
19
The results are similar when locked trades are removed from the sample. One difference is that the quote
algorithm using a one-second lagged BBO has the highest accuracy rate of 95.40% versus 94.60% for its LR
algorithm counterpart for trades within the BBO spread but not at the mid-spread. Not surprisingly, the accuracy
rates increase substantially for all classification algorithms and BBO lag lengths for trades at the mid-spread.
15
Easley and O’Hara (1992) show that the time between trades plays a role in price behavior in that
trade provides a signal of the direction of any new information and the lack of trade indicates the absence
of any news and provides an indicator of event uncertainty. Since the time between trades cannot be
isolated from the information content and the price process, we analyze the effect of the time difference
between trades when assessing the performances of the trade classification algorithms. In other words, we
investigate if a relationship exists between the misclassification of trades and trade frequency. This will
provide an indirect test of whether trade classification accuracy has a relationship with the frequency of
informed trading. Odders-White (2000) investigates this hypothesis by applying two different measures:
time between trades and the total number of transactions during her sample period. Therefore, in order to
provide further evidence on the effect of this trade characteristic for our market, our fifth hypothesis in its
alternate form is:
: Trade classification accuracy is inversely related with the time between trades.
6.3.2 Results
To conduct this test, we divide our sample into three categories: trades occurring less than or equal to
five seconds apart (76.2% of the total), trades occurring more than five and less than or equal to 30
seconds apart (15.8% of the total), and trades occurring more than 30 seconds apart (8.0% of the total).
The accuracy rates of the trade classification algorithms based on the time between trades are reported in
table 5. Based on the chi-square and G-test statistics, the rates of trade classification accuracy are
significantly different for each classification algorithm for each lag quote length. Thus, our results do not
support our fifth null hypothesis at the 0.001% level that classification accuracy is independent of the
elapsed time between trades for all trade classification algorithms and all lag lengths.
[Please place table 5 about here]
The one-second lagged version of the LR algorithm continues to have the best performance for three
time-between-trades categories with a classification accuracy range of 96.19% to 97.50%. Holding the lag
to one-second, the accuracy rates in descending order are the quote, at-the-quote, and the EMO algorithms
for all three categories. The tick algorithm consistently outperforms the EMO algorithm for all BBO lag
lengths and time-between-trades categories. The rate of trade accuracy tends to deteriorate as the time
between trades decreases for all but the EMO trade classification algorithm. Except for the tick algorithm
and the one- and five-second lagged quote versions of the EMO algorithm, all trade direction algorithms
exhibit the lowest performances for successive trades occurring within five seconds or less. This result is
consistent with the findings of Odders-White (2000) although she finds that 20.07% of the transactions
occurring within five seconds or less of each other are misclassified using the LR algorithm. We find that
16
the accuracy rate for the LR algorithm changes marginally when moving from five to one-second lagged
quotes, except for a five-second or less period between trades where it increases from 93.77% to 96.29%.
This result is also consistent with the finding of Oders-White (2000) for developed markets who notes
that the increased misclassification for consecutive trades occurring within five seconds or less is not
caused by the failure of the use of five-second lagged quotes. As further support, we find that the LR
algorithm only successfully classifies 81.20% of the trades in this trade-time category using
contemporaneous quotes. The misclassification rate increases from 6.23% to 18.80% when we move from
five- to zero-second quotes, where the latter percentage represents the highest misclassification rate for
the LR algorithm for all categories and for all lag lengths. These results are consistent with the conjecture
that frequently traded stocks exhibit higher trade misclassification rates which may be attributed to the
increased number of informed trades taking place when the time between consecutive trades is shorter.
6.4 Total Sample Differentiated by Trade Size
6.4.1 Hypothesis
There is reason to expect that trade classification accuracy may be lower for larger-sized trades.
Various studies use either trade size categorization in dollars traded or shares traded to identify trades by
retail investors (e.g., Brandt et al., 2010) or informed traders (e.g., Kryzanowski and Zhang, 1996;
Schultz, 2000). Petersen and Fialkowski (1994) document greater price improvement for smaller trades,
which may be caused by a greater proportion of small trades taking place inside the bid-ask spread.
Odders-White (2000) reports that 16.85% of the transactions with 300 or fewer shares that she examined
are misclassified by the LR algorithm, whereas 13.65% of the transactions consisting of more than 300
shares are misclassified. Aitken and Frino (1996) document similar results for the Australian market using
the tick algorithm. In contrast, Chakrabarty, Moulton and Shkilko (2012) document higher
misclassification rates for trades larger than their mean trade size of 300 shares and median of 100 shares.
Given these mixed results, the sixth hypothesis in its alternate form is:
: Smaller trades are more likely to be misclassified compared to larger trades, since they occur
more frequently inside the bid ask spread.
6.4.2 Results
There are three main metrics used in the microstructure literature to determine trade sizes: number of
shares transacted, dollar value of shares transacted, or number of board lots transacted. Kryzanowski and
Zhang (1996) use the dollar value of shares transacted in the Canadian Market and designate four
17
categories: odd lot,20
small board lot (value of less than $10,000), middle board lot (value equal to or
greater than $10,000 and less than $100,000), and large board lot (value equal to or greater than
$100,000) in their analysis of the trading patterns of small and large trades around stock split ex-dates
using intraday data for the Toronto Stock Exchange between 1983 and 1989. In exploring the competition
between ECNs and NASDAQ market makers, Barclay, Hendershott and McCormick (2003) use the
number of shares transacted on these trade venues when grouped into three categories: one to 1000
shares; 1001 to 9999 shares; and ≥ 10000 shares. Using the board lots size (considered as the generally
accepted unit of trading), Ahn and Cheung (1999) analyze the behavior of bid and ask spreads and depths
for 471 stocks listed on the Hong Kong Stock Exchange.
To be consistent with Odders-White (2000), we divide our trades into six categories based on the
number of shares traded. The resulting trade size groupings are: fewer than or equal to 500 shares,
between 501 and 1,000 shares, between 1001 and 5000 shares, between 5001 and 15,000 shares, between
15,001 and 45,000 shares, and more than 45,000 shares. Based on the accuracy rates for these trade size
groupings reported in table 6, we observe that almost half of the trades (41.6%) are in the smallest trade
size category of 500 or fewer shares, whereas the largest trade size grouping with trades of more than
45,000 shares represent only 3.1% of all trades. The LR algorithm once gain outperforms the other four
trade classification algorithms for each trade-size grouping using one-second lagged quotes with accuracy
rates of 96.77% and 96.79% for the smallest (fewer than or equal to 500 shares) and largest (more than
45,000 shares) trade size groupings, respectively. Based on the chi-square and G-test statistics and their
associated p-values, we reject our sixth null hypothesis at the 0.001% level that classification accuracy is
independent of trade size for all trade classification algorithms and all lag lengths.
[Please place table 6 about here]
Our findings are consistent with Chakrabarty, Moulton and Shkilko (2012) but not Odders-White
(2000) and Aitken and Frino (1996). The misclassification rates for our smallest trade size category
(between 501 and 1,000 shares) are (significantly) higher than that for the largest trade size category
(greater than 45,000 shares) for the tick algorithm and the other four classification algorithms using zero
and five-second lagged BBO. In contrast, they are smaller for the four classification algorithms that use a
one-second lagged BBO, and significantly so for all but the LR algorithm. The misclassification rates for
the second smallest trade size category (greater than 1000 shares but less than or equal to 5000 shares) are
generally significantly larger than those for the second largest trade size category (greater than 15,000
shares but less than or equal to 45,000 shares). The rates are significantly higher for the second largest
20
A board lot is defined as 100 shares for a stock with a price of $1 or higher (definition Canadian Securities
Institute). An Odd Lot corresponds to the number of shares that are less than a board lot.
18
versus second smallest trade size category for the at-the-quote and EMO algorithms using one-second
lagged BBO. Based on our results, our evidence supports the hypothesis that the smallest trades are more
frequently misclassified than the largest trades.
6.5 Total Sample Differentiated by Long versus Short Trades
Short sales are allowed on the BIST using a conventional uptick rule after the opening price is
determined by the system or against the previous session’s closing trade price in cases where the system
does not determine an opening price.
6.5.1 Hypothesis
Examining differences between short and long trades has attracted increasing research interest as more
sophisticated data has become available. As discussed in section two, researchers report lower accuracy
rates for trade classification algorithms for short versus long trades although they differ on whether short
sales are expected to be buyer-initiated (Chakrabarty, Moulton and Shkilko, 2012) or seller-initiated
(Asquith, Oman and Safaya, 2010). We also expect the classification accuracy of the LR algorithm for
short sales to be best using one-second lagged quotes when benchmarked against the actual trade
classification from the chronological approach. However, as we discussed in section five, the reliability of
using the chronological approach for identifying the actual trade initiator is dependent upon the relative
importance of the additional trade (immediacy) costs associated with the short and not the long side of a
trade involving a short sale. We invoke the assumption in this section of the paper that these additional
costs are not material so that our benchmark is that trades involving short sales are predominantly buyer-
initiated.21
We do this for presentation purposes and because the tick rule on the BIST may be a constraint
for short sales. Therefore, our seventh hypothesis in its alternative form is:
: The LR algorithm using one second lagged quotes performs better than the other classification
algorithms for both long and short trades.
6.5.2 Results
The results for trade classification accuracy differentiated by long versus short trades are reported in
table 7. For the four trade classification algorithms that use quotes (quote, at the quote, LR and EMO), the
rate of “misclassification” is higher for the short trades than for the long trades using one second lagged
quotes, consistent with the results reported by Asquith, Oman and Safaya (2010) and Chakrabarty,
21
When we classify our samples of long and short trades using the chronological method, we find that 92.2% and
only 51.2% of the short and long trades, respectively, are classified as being buyer-initiated.
19
Moulton and Shkilko (2012).22
While the differences in classification accuracies for the same algorithm
are statistical significant based on the chi-square and G-test statistics, the magnitudes are not that
different. For instance, the “misclassification” rates for the LR algorithm for short and long trades are
respectively 16.18% and 16.12% using contemporaneous quotes, 5.07% and 3.57% using one-second
lagged quotes, and 8.05% and 3.57% using five-second lagged quotes. Although the corresponding
“misclassification” rate magnitudes are higher in Chakrabarty, Moulton and Shkilko (2012), they report a
similar ordering based on the quote lag length for the LR algorithm. Specifically, they report for short and
long trades respective “misclassification” rates of 32% and 31% using contemporaneous quotes, 21.4%
and 21.8% using one-second lagged quotes, and 23.7% and 23.4% using five-second lagged quotes. For
the four trade classification algorithms that use quotes, the rate of “misclassification” is lowest (highest)
when one second (contemporaneous) quotes are used for both the short and long trades. Thus, our results
support the seventh hypothesis that the LR algorithm using one-second lagged quotes outperforms the
other trade direction algorithms for both long and short trades.
[Please place table 7 about here]
6.6 Total Sample Differentiated by Seller-or-Buyer-Initiated Trades
6.6.1 Hypothesis
While informed traders buy upon good information and sell upon bad information, uninformed
(liquidity) traders are considered, on average, to buy or sell at similar levels. This distinction between
informed and uninformed traders has been analyzed by many researchers for various purposes, such as the
PIN of Easley et al. (1996) and the spread decomposition models of Madhavan, Richardson and Roomans
(1997) and Glosten and Harris (1988). Since the PIN estimate depends on the probability of information
events and on the arrival rates of both informed and uninformed traders, where the LR algorithm is
generally used to determine the number of buys and sells for each period of time (such as a day).
Similarly, the trade indicator variables in these spread decomposition models generally rely on the LR
algorithm to determine if a trade is buyer- or seller-initiated. Thus, we now examine whether the
accuracy rates of the five trade classification algorithms differ for buyer- and seller-initiated trades.
Therefore, our eighth hypothesis is:
22
This is the case even though the participation rate of short sales in our sample is lower than that reported in the
U.S. For example, short sales account for 3.7% and 5.3% of the total number of trades and total number of shares
traded, respectively, in our sample based on the last seven months of 2008. In contrast, Asquith et al. (2010, table 1,
page 162) report respective corresponding average values of 29.7% and 27.9% for their sample for the three months
examined in 2005.
20
: There is no significant difference in the accuracies of the trade classification algorithms
between buyer- and seller-initiated trades.
6.6.2 Results
The trade classification accuracy results differentiated by buyer- or seller-initiated trades are reported
in panel A of table 8. Based on the chi-square and G-test values, the null hypothesis that trade
classification accuracy is independent of whether the trade is buyer or seller-initiated is rejected at greater
than the 0.01 level for all but the quote classification algorithm for a zero lag (p-value = 0.06). For the
buyer-initiated trades which represent 52.8% of all trades, the LR algorithm using one-second lagged
quotes has the best accuracy rate at 94.81%. In contrast, for the seller-initiated trades which represent
47.2% of all the trades, the EMO algorithm with a one-second lag has the best accuracy rate at 99.07%,
followed by the LR algorithm with a one-second lag at 98.12%. While the EMO algorithm is also best for
the other two lag lengths for seller-initiated trades, its performance is far inferior to the tick and other
three quote-based trade classification algorithms for the buyer-initiated trades.23
[Please place table 8 about here]
6.7 Total Sample Differentiated by BIST`s trader classifications
6.7.1 Hypothesis
To the best of our knowledge, we are the first to conduct a more complete test of the classification
accuracy of trades differentiated by whether the trader has an agency or principal relationship with the
brokerage firm executing the trade.24
To this end, we use the following three-way trader classification that
is included in our proprietary dataset from the BIST: institutional and retail clients of the brokerage firms
[M(Ins. & Retail)], portfolios of the brokerage firms [P(portfolio)], and the investment funds managed by
the brokerage firms [F(fund)]. For testing purposes, we consider these three categories as representing
pure agency, pure principal and most likely mixed agency and principal relations between client and
executing broker, respectively. Thus, our ninth null hypothesis, which examines whether the accuracy of
the trade classification algorithms is independent of the BIST’s trader classifications, is:
: The accuracy of the trade classification algorithms is independent of the BIST`s classification
of traders.
6.7.1 Results
23
Consistent with the findings of Funicane (2000) and untabulated results, the reverse tick rule displays the poorest
classification accuracy for buyer- and seller-initiated trades. 24
Since they could not determine who initiated trades between market makers and between brokers, Ellis, Michaely
and O`Hara (2000) examine the 75.4% of their sample that involves trades between market makers or brokers and
customers.
21
The average trade classification accuracies in percent for each of the five trade classification
algorithms based on the BIST`s classification of traders are reported in panel B of table 8. Based on the
chi-squares and G-test statistics, the null hypothesis that trade classification accuracy is independent of
the BIST’s trader classification is rejected at greater than the 0.01 level. Consistent with previously
reported results, the LR algorithm using one-second lagged quotes has the best classification accuracy at
96.38%, 95.72% and 96.89% for the M, P and F trader classifications, respectively. Trades for the
investment funds managed by the brokerage firms (mixed agency and principal relations) exhibit the
highest accuracy rates with the exception of the LR algorithm using contemporaneous quotes. Trades for
the portfolios of the brokerage firms (pure principal relations) exhibit the lowest accuracy rates. When
compared to the undifferentiated results reported earlier in table 3, we find lower accuracy rates for this
grouping for all classification algorithms and lag lengths. Therefore, our results do not support our null
hypothesis that the accuracies of the trade classification algorithms are independent of the BIST`s three-
way classification of traders.
7. CONCLUSION
We examine the accuracy rates of five trade classification algorithms for a trade venue in a developing
market for the seven months ending with December 2008 that is centered on the month of Lehman
Brothers’ collapse. The order book data from the BIST is extensively cleaned to remove human errors
prior to determining the BBO for each second for each trading day for each stock in the primary BIST
index (the BIST-30).
We find that the one-second lagged version of the LR algorithm with over 95% classification accuracy
not only outperforms the other four trade classification algorithms analyzed herein but is also higher than
that previously reported for other markets including the U.S. This is consistent with the guidance that the
five-second rule needs to be replaced by its one-second counterpart for trade classifications for US
markets (Chakrabarty, Moulton and Shkilko, 2012). It is also consistent with the observation of Peterson
and Sirri (2003) that trade misclassifications for the LR algorithm based on the NBBO trade-
contemporaneous instead of the order-submission NBBO depend on how long an order takes to execute.
We find that the LR algorithm using one-second lagged quotes is generally the best for seven
differentiated samples, and that the highest rates of misclassifications occur for trades at the quote mid-
spread and as the time between consecutive trades decreases (Odders-White, 2000). Misclassifications
also tend to be lowest for agency trades and higher in the first versus the last 30 minutes of both daily
trading sessions which may be due to more informed trading during these periods. Unlike Odders-White
22
(2000) and Aitken and Frino (1996), we find that larger transactions generally are more frequently
misclassified but only for the classification algorithms using one-second lagged BBO.
Unlike Asquith, Oman and Safaya (2010) and Chakrabarty, Moulton and Shkilko (2012), we find
accuracy rates of at least 90% using one-second lagged quotes for both long and short trades for the
quote, at-the-quote and LR (but not EMO) algorithms. While the EMO algorithm is best for correctly
classifying seller-initiated trades with over 95% accuracy rates and worst for correctly classifying buyer-
initiated trades, the LR algorithm using a one-second lagged BBO is second best for correctly classifying
seller-initiated trades and best for correctly classifying buyer-initiated trades.
23
REFERENCES
Ahn, Hee-Joon and Yan-Leung Cheung, 1999. The intraday patterns of the spread and depth in a market
without makers: The Stock Exchange of Hong Kong, Pacific-Basin Finance Journal 7, 539-556.
Aitken, M. and A. Frino, 1996. The accuracy of the tick test: Evidence from the Australian stock
exchange, Journal of Banking & Finance 20, 1715-1729.
Asquith, Paul, Rebecca Oman and Christopher Safaya, 2010. Short sales and trade classification
algorithms, Journal of Financial Markets 13, 157-173.
Barclay, Michael J., Terrence Hendershott and D. Timothy McCormick, 2003. Competition among
trading venues: Information and trading on electronic communications networks, The Journal of Finance
58: 6 (December), 2637-2665.
Bessembinder, Hendrik, 2003. Issues in assessing trade execution costs, Journal of Financial Markets 6,
233-257.
Blais, Marcel and Philip Protter, 2012. Signing trades and an evaluation of the Lee-Ready algorithm,
Annals of Finance 8: 1 (February), 1-13.
Blume, M. E., A. C. MacKinlay and B. Terker, 1989. Order imbalances and stock price movements on
October 19 and 20, 1987, Journal of Finance 44, 827-848.
Boehmer, Ekkehart, Joachim Grammig and Erik Theissen, 2007. Estimating the probability of informed
trading – does trade misclassification matter, Journal of Financial Markets 10: 1 (February), 26-47.
Brandt, Michael W., Alon Brav, John R. Graham and Alok Kumar, 2010. The idiosyncratic volatility
puzzle: Time trend or speculative episodes?, The Review of Financial Studies 23: 2, 863-899.
Chakrabarty, Bidisha, Bingguang Lee, Vanthuan Nguyen and Robert A. Van Ness, 2007. Trade
classification algorithms for electronic communications network trades, Journal of Banking and Finance
31, 3806-3821.
Chakrabarty, Bidisha, Pamela C. Moulton and Andriy Shkilko, 2012. Short sales, long sales, and the Lee-
Ready classification algorithm revisited, Journal of Financial Markets 15: 4 (November), 361-492.
Cohen, Lauren, Karl B. Diether and Christopher J. Malloy, 2007. Supply and demand shifts in the
shorting market, The Journal of Finance 62: 5 (October), 2061-2096.
D’Avolio, Gene, 2002. The market for borrowing stock, Journal of Financial Economics 66, 271–306.
Diether, Karl B., Kuan-Hui Lee and Ingrid Werner, 2009a. Short-sale strategies and return predictability,
Review of Financial Studies 22, 575–607.
Diether, Karl B., Kuan-Hui Lee and Ingrid Werner, 2009b. It’s SHO time! Short-sale price-tests and
market quality, Journal of Finance 64: 1, 37–73.

24
Easley, David and Maureen O’Hara, 1992. Time and the process of security price adjustment, The
Journal of Finance 47: 2 (June), 577-605.
Easley, D., N. Kiefer, M. O’Hara and J. Paperman, 1996. Liquidity, information and infrequently traded
stocks, Journal of Finance 51, 1405-1436.
Easley, David and Maureen O’Hara, 2004. Information and the cost of capital, Journal of Finance 19: 4
(August), 1553-1583.
Ellis, K., R. Michaely and M. O’Hara, 2000. The accuracy of trade classification rules: Evidence from
NASDAQ, Journal of Financial and Quantitative Analysis 35, 529-551.
Finucane, T. J., 2000. A direct test for methods for inferring trade direction from intra-day data, Journal
of Financial and Quantitative Analysis 35, 553-576.
Glosten, L. and L. Harris, 1988. Estimating the components of the bid-ask spread, Journal of Financial
Economics 21, 123–142.
Hasbrouck, J., 1988. Trades, quotes, inventories, and information, Journal of Financial Economics 22,
229-252.
Istanbul Stock Exchange. Operations Manuals, 2010, 2011.
Kryzanowski, Lawrence and Hao Zhang, 1996. Trading patterns of small and large traders around stock
split ex-dates, Journal of Financial Research 19: 1, 75-90.
Lee, C. M. C. and M. J. Ready, 1991. Inferring trade direction from intraday data, Journal of Finance 46,
733-746.
Lee, C. M. C. and B. Radhakrishna, 2000. Inferring investor behavior: Evidence from TORQ data,
Journal of Financial Markets 3 (May), 83-111.
Lesmond, David A., Michael J. Schill and Chunsheng Zhou, 2004. The illusory nature of momentum
profits, Journal of Financial Economics 71, 349–380.
Lu, Yang-Cheng and Yu-Chen Wei, 2009. Classification of trade direction for an equity market with price
limit and order match: Evidence from the Taiwan stock market, Investment Management and Financial
Innovations 6: 3, 135-147.
Madhavan, Ananth, Matthew Richardson and Mark Roomans, 1997. Why do security prices change? A
transaction-level analysis of NYSE stocks, Review of Financial Studies 10, 1035–1064.
Morcroft, Greg, 2005. Nasdaq closes Instinet acquisition, MarketWatch, December 08. Available at:
http://articles.marketwatch.com/2005-12-08/news/30683338_1_instinet-acquisition-instinet-group-ingp
Odders-White, Elizabeth R., 2000. On the occurence and consequences of inaccurate trade classification,
Journal of Financial Markets 3, 259-286.
Petersen, Mitchell A. and David Fialkowski, 1994. Posted vs. effective spreads, Journal of Financial
Economics 35, 169-292.

25
Peterson, Mark and Erik Sirri, 2003. Evaluation of the biases in execution cost estimation using trade and
quote data, Journal of Financial Markets 6, 259-280.
Rosenthal, Dale W. R., 2012. Modeling trade direction, Journal of Financial Econometrics 10: 2, 390-
415.
Savickas, Robert and Arthur J. Wilson, 2003. On inferring the direction of option trades, Journal of
Financial and Quantitative Analysis 38: 4 (December), 881-902.
Schultz, Paul, 2000. Stock splits, tick size, and sponsorship, The Journal of Finance 55: 1 (February),
429-450.
Theissen, Erik, 2001. A test of the accuracy of the Lee/Ready trade classification algorithm, Journal of
International Financial Markets, Institutions and Money 11, 147-165.
26
Figure 1. Plot of the level and monthly share volume of the BIST-30 Index
This figure plots the month-end level of the BIST-30 Index and its monthly share volume over the
period from month-end January 2005 through month-end October 2012. The “♦”and “▲”
delineate the beginning and end of the sample time period examined in this study.
27
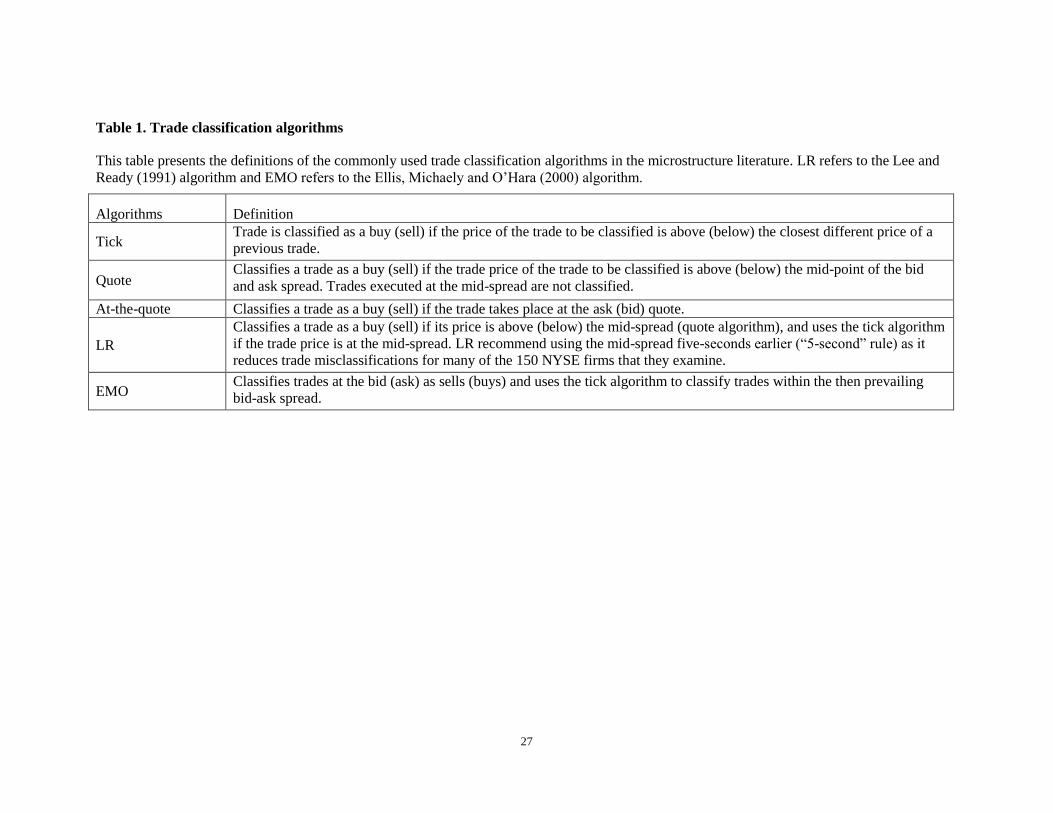
Table 1. Trade classification algorithms
This table presents the definitions of the commonly used trade classification algorithms in the microstructure literature. LR refers to the Lee and
Ready (1991) algorithm and EMO refers to the Ellis, Michaely and O’Hara (2000) algorithm.
Algorithms Definition
Tick Trade is classified as a buy (sell) if the price of the trade to be classified is above (below) the closest different price of a
previous trade.
Quote Classifies a trade as a buy (sell) if the trade price of the trade to be classified is above (below) the mid-point of the bid
and ask spread. Trades executed at the mid-spread are not classified.
At-the-quote Classifies a trade as a buy (sell) if the trade takes place at the ask (bid) quote.
LR
Classifies a trade as a buy (sell) if its price is above (below) the mid-spread (quote algorithm), and uses the tick algorithm
if the trade price is at the mid-spread. LR recommend using the mid-spread five-seconds earlier (“5-second” rule) as it
reduces trade misclassifications for many of the 150 NYSE firms that they examine.
EMO Classifies trades at the bid (ask) as sells (buys) and uses the tick algorithm to classify trades within the then prevailing
bid-ask spread.
28
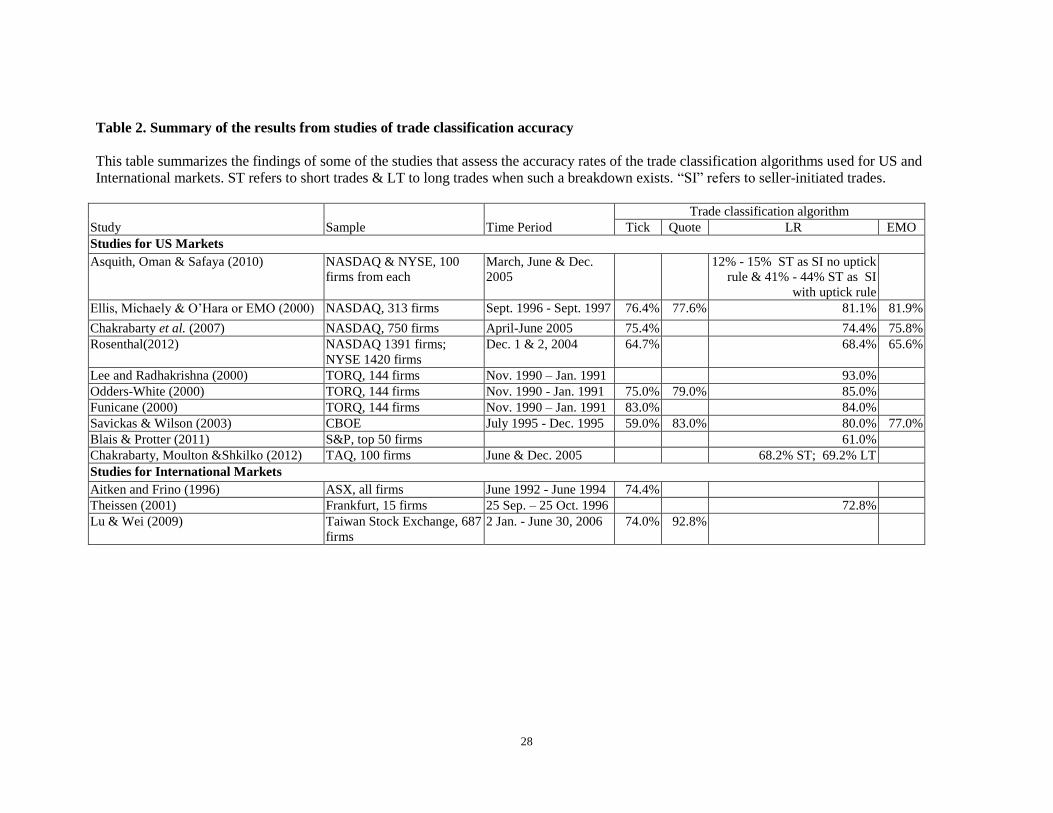
Table 2. Summary of the results from studies of trade classification accuracy
This table summarizes the findings of some of the studies that assess the accuracy rates of the trade classification algorithms used for US and
International markets. ST refers to short trades & LT to long trades when such a breakdown exists. “SI” refers to seller-initiated trades.
Study Sample Time Period
Trade classification algorithm
Tick Quote LR EMO
Studies for US Markets
Asquith, Oman & Safaya (2010) NASDAQ & NYSE, 100
firms from each
March, June & Dec.
2005
12% - 15% ST as SI no uptick
rule & 41% - 44% ST as SI
with uptick rule
Ellis, Michaely & O’Hara or EMO (2000) NASDAQ, 313 firms Sept. 1996 - Sept. 1997 76.4% 77.6% 81.1% 81.9%
Chakrabarty et al. (2007) NASDAQ, 750 firms April-June 2005 75.4% 74.4% 75.8%
Rosenthal(2012) NASDAQ 1391 firms;
NYSE 1420 firms
Dec. 1 & 2, 2004 64.7% 68.4% 65.6%
Lee and Radhakrishna (2000) TORQ, 144 firms Nov. 1990 – Jan. 1991 93.0%
Odders-White (2000) TORQ, 144 firms Nov. 1990 - Jan. 1991 75.0% 79.0% 85.0%
Funicane (2000) TORQ, 144 firms Nov. 1990 – Jan. 1991 83.0% 84.0%
Savickas & Wilson (2003) CBOE July 1995 - Dec. 1995 59.0% 83.0% 80.0% 77.0%
Blais & Protter (2011) S&P, top 50 firms 61.0%
Chakrabarty, Moulton &Shkilko (2012) TAQ, 100 firms June & Dec. 2005 68.2% ST; 69.2% LT
Studies for International Markets
Aitken and Frino (1996) ASX, all firms June 1992 - June 1994 74.4%
Theissen (2001) Frankfurt, 15 firms 25 Sep. – 25 Oct. 1996 72.8%
Lu & Wei (2009) Taiwan Stock Exchange, 687
firms
2 Jan. - June 30, 2006 74.0% 92.8%
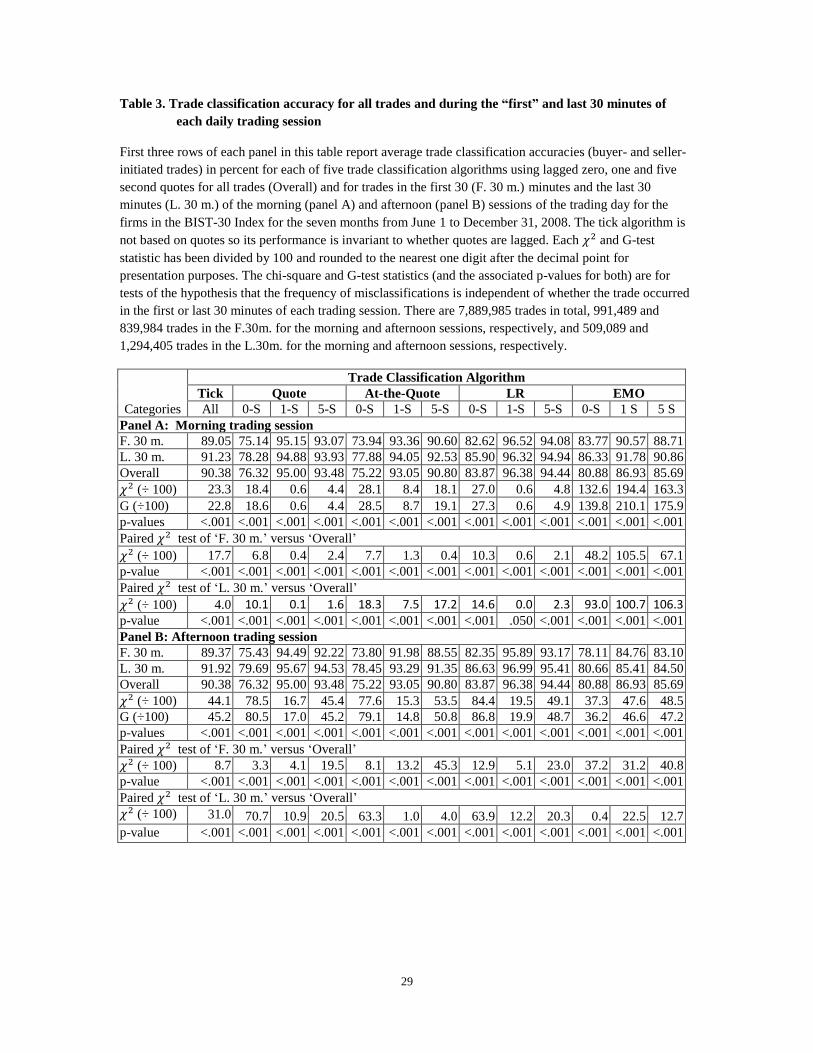
29
Table 3. Trade classification accuracy for all trades and during the “first” and last 30 minutes of
each daily trading session
First three rows of each panel in this table report average trade classification accuracies (buyer- and seller-
initiated trades) in percent for each of five trade classification algorithms using lagged zero, one and five
second quotes for all trades (Overall) and for trades in the first 30 (F. 30 m.) minutes and the last 30
minutes (L. 30 m.) of the morning (panel A) and afternoon (panel B) sessions of the trading day for the
firms in the BIST-30 Index for the seven months from June 1 to December 31, 2008. The tick algorithm is
not based on quotes so its performance is invariant to whether quotes are lagged. Each and G-test
statistic has been divided by 100 and rounded to the nearest one digit after the decimal point for
presentation purposes. The chi-square and G-test statistics (and the associated p-values for both) are for
tests of the hypothesis that the frequency of misclassifications is independent of whether the trade occurred
in the first or last 30 minutes of each trading session. There are 7,889,985 trades in total, 991,489 and
839,984 trades in the F.30m. for the morning and afternoon sessions, respectively, and 509,089 and
1,294,405 trades in the L.30m. for the morning and afternoon sessions, respectively.
Categories
Trade Classification Algorithm
Tick Quote At-the-Quote LR EMO
All 0-S 1-S 5-S 0-S 1-S 5-S 0-S 1-S 5-S 0-S 1 S 5 S
Panel A: Morning trading session
F. 30 m. 89.05 75.14 95.15 93.07 73.94 93.36 90.60 82.62 96.52 94.08 83.77 90.57 88.71
L. 30 m. 91.23 78.28 94.88 93.93 77.88 94.05 92.53 85.90 96.32 94.94 86.33 91.78 90.86
Overall 90.38 76.32 95.00 93.48 75.22 93.05 90.80 83.87 96.38 94.44 80.88 86.93 85.69
(÷ 100) 23.3 18.4 0.6 4.4 28.1 8.4 18.1 27.0 0.6 4.8 132.6 194.4 163.3
G (÷100) 22.8 18.6 0.6 4.4 28.5 8.7 19.1 27.3 0.6 4.9 139.8 210.1 175.9
p-values <.001 <.001 <.001 <.001 <.001 <.001 <.001 <.001 <.001 <.001 <.001 <.001 <.001
Paired test of ‘F. 30 m.’ versus ‘Overall’
(÷ 100) 17.7 6.8 0.4 2.4 7.7 1.3 0.4 10.3 0.6 2.1 48.2 105.5 67.1
p-value <.001 <.001 <.001 <.001 <.001 <.001 <.001 <.001 <.001 <.001 <.001 <.001 <.001
Paired test of ‘L. 30 m.’ versus ‘Overall’
(÷ 100) 4.0 10.1 0.1 1.6 18.3 7.5 17.2 14.6 0.0 2.3 93.0 100.7 106.3 p-value <.001 <.001 <.001 <.001 <.001 <.001 <.001 <.001 .050 <.001 <.001 <.001 <.001
Panel B: Afternoon trading session
F. 30 m. 89.37 75.43 94.49 92.22 73.80 91.98 88.55 82.35 95.89 93.17 78.11 84.76 83.10
L. 30 m. 91.92 79.69 95.67 94.53 78.45 93.29 91.35 86.63 96.99 95.41 80.66 85.41 84.50
Overall 90.38 76.32 95.00 93.48 75.22 93.05 90.80 83.87 96.38 94.44 80.88 86.93 85.69
(÷ 100) 44.1 78.5 16.7 45.4 77.6 15.3 53.5 84.4 19.5 49.1 37.3 47.6 48.5
G (÷100) 45.2 80.5 17.0 45.2 79.1 14.8 50.8 86.8 19.9 48.7 36.2 46.6 47.2
p-values <.001 <.001 <.001 <.001 <.001 <.001 <.001 <.001 <.001 <.001 <.001 <.001 <.001
Paired test of ‘F. 30 m.’ versus ‘Overall’
(÷ 100) 8.7 3.3 4.1 19.5 8.1 13.2 45.3 12.9 5.1 23.0 37.2 31.2 40.8
p-value <.001 <.001 <.001 <.001 <.001 <.001 <.001 <.001 <.001 <.001 <.001 <.001 <.001
Paired test of ‘L. 30 m.’ versus ‘Overall’
(÷ 100) 31.0 70.7 10.9 20.5 63.3 1.0 4.0 63.9 12.2 20.3 0.4 22.5 12.7
p-value <.001 <.001 <.001 <.001 <.001 <.001 <.001 <.001 <.001 <.001 <.001 <.001 <.001
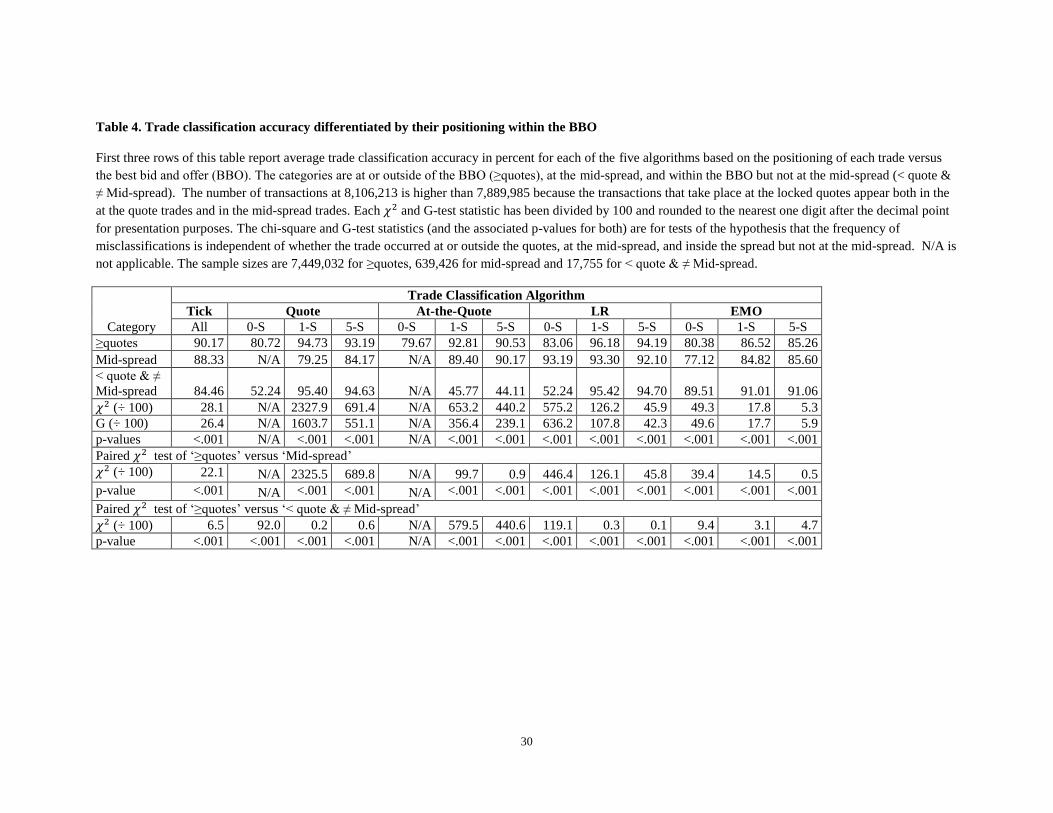
30
Table 4. Trade classification accuracy differentiated by their positioning within the BBO
First three rows of this table report average trade classification accuracy in percent for each of the five algorithms based on the positioning of each trade versus
the best bid and offer (BBO). The categories are at or outside of the BBO (≥quotes), at the mid-spread, and within the BBO but not at the mid-spread (< quote &
≠ Mid-spread). The number of transactions at 8,106,213 is higher than 7,889,985 because the transactions that take place at the locked quotes appear both in the
at the quote trades and in the mid-spread trades. Each and G-test statistic has been divided by 100 and rounded to the nearest one digit after the decimal point
for presentation purposes. The chi-square and G-test statistics (and the associated p-values for both) are for tests of the hypothesis that the frequency of
misclassifications is independent of whether the trade occurred at or outside the quotes, at the mid-spread, and inside the spread but not at the mid-spread. N/A is
not applicable. The sample sizes are 7,449,032 for ≥quotes, 639,426 for mid-spread and 17,755 for < quote & ≠ Mid-spread.
Category
Trade Classification Algorithm
Tick Quote At-the-Quote LR EMO
All 0-S 1-S 5-S 0-S 1-S 5-S 0-S 1-S 5-S 0-S 1-S 5-S
≥quotes 90.17 80.72 94.73 93.19 79.67 92.81 90.53 83.06 96.18 94.19 80.38 86.52 85.26
Mid-spread 88.33 N/A 79.25 84.17 N/A 89.40 90.17 93.19 93.30 92.10 77.12 84.82 85.60
< quote & ≠
Mid-spread 84.46 52.24 95.40 94.63 N/A 45.77 44.11 52.24 95.42 94.70 89.51 91.01 91.06
(÷ 100) 28.1 N/A 2327.9 691.4 N/A 653.2 440.2 575.2 126.2 45.9 49.3 17.8 5.3
G (÷ 100) 26.4 N/A 1603.7 551.1 N/A 356.4 239.1 636.2 107.8 42.3 49.6 17.7 5.9
p-values <.001 N/A <.001 <.001 N/A <.001 <.001 <.001 <.001 <.001 <.001 <.001 <.001
Paired test of ‘≥quotes’ versus ‘Mid-spread’
(÷ 100) 22.1 N/A 2325.5 689.8 N/A 99.7 0.9 446.4 126.1 45.8 39.4 14.5 0.5
p-value <.001 N/A <.001 <.001 N/A <.001 <.001 <.001 <.001 <.001 <.001 <.001 <.001
Paired test of ‘≥quotes’ versus ‘< quote & ≠ Mid-spread’
(÷ 100) 6.5 92.0 0.2 0.6 N/A 579.5 440.6 119.1 0.3 0.1 9.4 3.1 4.7
p-value <.001 <.001 <.001 <.001 N/A <.001 <.001 <.001 <.001 <.001 <.001 <.001 <.001
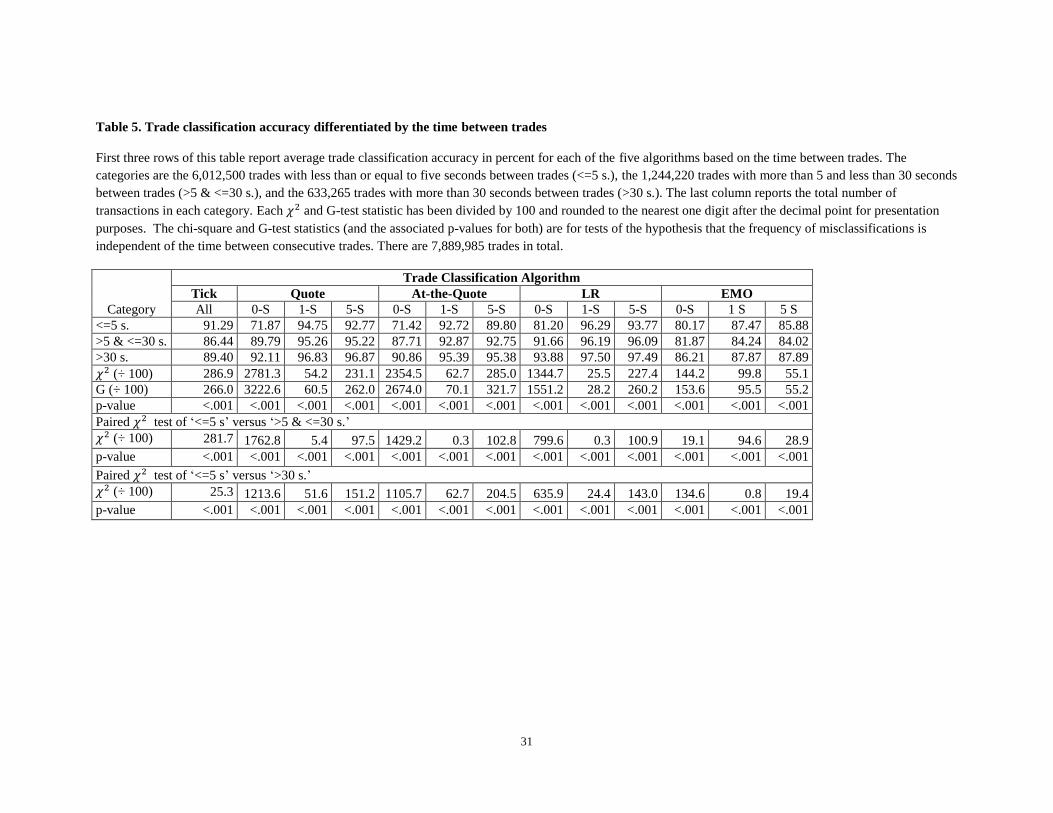
31
Table 5. Trade classification accuracy differentiated by the time between trades
First three rows of this table report average trade classification accuracy in percent for each of the five algorithms based on the time between trades. The
categories are the 6,012,500 trades with less than or equal to five seconds between trades (<=5 s.), the 1,244,220 trades with more than 5 and less than 30 seconds
between trades (>5 & <=30 s.), and the 633,265 trades with more than 30 seconds between trades (>30 s.). The last column reports the total number of
transactions in each category. Each and G-test statistic has been divided by 100 and rounded to the nearest one digit after the decimal point for presentation
purposes. The chi-square and G-test statistics (and the associated p-values for both) are for tests of the hypothesis that the frequency of misclassifications is
independent of the time between consecutive trades. There are 7,889,985 trades in total.
Category
Trade Classification Algorithm
Tick Quote At-the-Quote LR EMO
All 0-S 1-S 5-S 0-S 1-S 5-S 0-S 1-S 5-S 0-S 1 S 5 S
<=5 s. 91.29 71.87 94.75 92.77 71.42 92.72 89.80 81.20 96.29 93.77 80.17 87.47 85.88
>5 & <=30 s. 86.44 89.79 95.26 95.22 87.71 92.87 92.75 91.66 96.19 96.09 81.87 84.24 84.02
>30 s. 89.40 92.11 96.83 96.87 90.86 95.39 95.38 93.88 97.50 97.49 86.21 87.87 87.89
(÷ 100) 286.9 2781.3 54.2 231.1 2354.5 62.7 285.0 1344.7 25.5 227.4 144.2 99.8 55.1
G (÷ 100) 266.0 3222.6 60.5 262.0 2674.0 70.1 321.7 1551.2 28.2 260.2 153.6 95.5 55.2
p-value <.001 <.001 <.001 <.001 <.001 <.001 <.001 <.001 <.001 <.001 <.001 <.001 <.001
Paired test of ‘<=5 s’ versus ‘>5 & <=30 s.’
(÷ 100) 281.7 1762.8 5.4 97.5 1429.2 0.3 102.8 799.6 0.3 100.9 19.1 94.6 28.9
p-value <.001 <.001 <.001 <.001 <.001 <.001 <.001 <.001 <.001 <.001 <.001 <.001 <.001
Paired test of ‘<=5 s’ versus ‘>30 s.’
(÷ 100) 25.3 1213.6 51.6 151.2 1105.7 62.7 204.5 635.9 24.4 143.0 134.6 0.8 19.4
p-value <.001 <.001 <.001 <.001 <.001 <.001 <.001 <.001 <.001 <.001 <.001 <.001 <.001
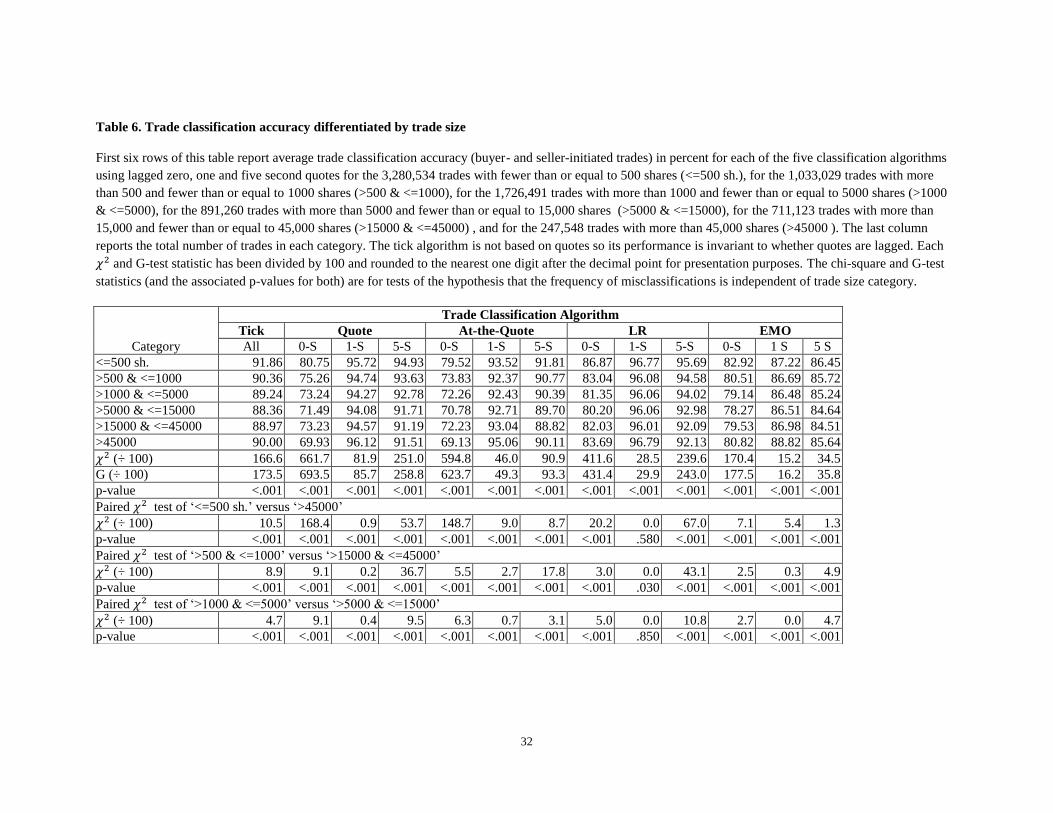
32
Table 6. Trade classification accuracy differentiated by trade size
First six rows of this table report average trade classification accuracy (buyer- and seller-initiated trades) in percent for each of the five classification algorithms
using lagged zero, one and five second quotes for the 3,280,534 trades with fewer than or equal to 500 shares (<=500 sh.), for the 1,033,029 trades with more
than 500 and fewer than or equal to 1000 shares (>500 & <=1000), for the 1,726,491 trades with more than 1000 and fewer than or equal to 5000 shares (>1000
& <=5000), for the 891,260 trades with more than 5000 and fewer than or equal to 15,000 shares (>5000 & <=15000), for the 711,123 trades with more than
15,000 and fewer than or equal to 45,000 shares (>15000 & <=45000) , and for the 247,548 trades with more than 45,000 shares (>45000 ). The last column
reports the total number of trades in each category. The tick algorithm is not based on quotes so its performance is invariant to whether quotes are lagged. Each
and G-test statistic has been divided by 100 and rounded to the nearest one digit after the decimal point for presentation purposes. The chi-square and G-test
statistics (and the associated p-values for both) are for tests of the hypothesis that the frequency of misclassifications is independent of trade size category.
Category
Trade Classification Algorithm
Tick Quote At-the-Quote LR EMO
All 0-S 1-S 5-S 0-S 1-S 5-S 0-S 1-S 5-S 0-S 1 S 5 S
<=500 sh. 91.86 80.75 95.72 94.93 79.52 93.52 91.81 86.87 96.77 95.69 82.92 87.22 86.45
>500 & <=1000 90.36 75.26 94.74 93.63 73.83 92.37 90.77 83.04 96.08 94.58 80.51 86.69 85.72
>1000 & <=5000 89.24 73.24 94.27 92.78 72.26 92.43 90.39 81.35 96.06 94.02 79.14 86.48 85.24
>5000 & <=15000 88.36 71.49 94.08 91.71 70.78 92.71 89.70 80.20 96.06 92.98 78.27 86.51 84.64
>15000 & <=45000 88.97 73.23 94.57 91.19 72.23 93.04 88.82 82.03 96.01 92.09 79.53 86.98 84.51
>45000 90.00 69.93 96.12 91.51 69.13 95.06 90.11 83.69 96.79 92.13 80.82 88.82 85.64
(÷ 100) 166.6 661.7 81.9 251.0 594.8 46.0 90.9 411.6 28.5 239.6 170.4 15.2 34.5
G (÷ 100) 173.5 693.5 85.7 258.8 623.7 49.3 93.3 431.4 29.9 243.0 177.5 16.2 35.8
p-value <.001 <.001 <.001 <.001 <.001 <.001 <.001 <.001 <.001 <.001 <.001 <.001 <.001
Paired test of ‘<=500 sh.’ versus ‘>45000’
(÷ 100) 10.5 168.4 0.9 53.7 148.7 9.0 8.7 20.2 0.0 67.0 7.1 5.4 1.3
p-value <.001 <.001 <.001 <.001 <.001 <.001 <.001 <.001 .580 <.001 <.001 <.001 <.001
Paired test of ‘>500 & <=1000’ versus ‘>15000 & <=45000’
(÷ 100) 8.9 9.1 0.2 36.7 5.5 2.7 17.8 3.0 0.0 43.1 2.5 0.3 4.9
p-value <.001 <.001 <.001 <.001 <.001 <.001 <.001 <.001 .030 <.001 <.001 <.001 <.001
Paired test of ‘>1000 & <=5000’ versus ‘>5000 & <=15000’
(÷ 100) 4.7 9.1 0.4 9.5 6.3 0.7 3.1 5.0 0.0 10.8 2.7 0.0 4.7
p-value <.001 <.001 <.001 <.001 <.001 <.001 <.001 <.001 .850 <.001 <.001 <.001 <.001
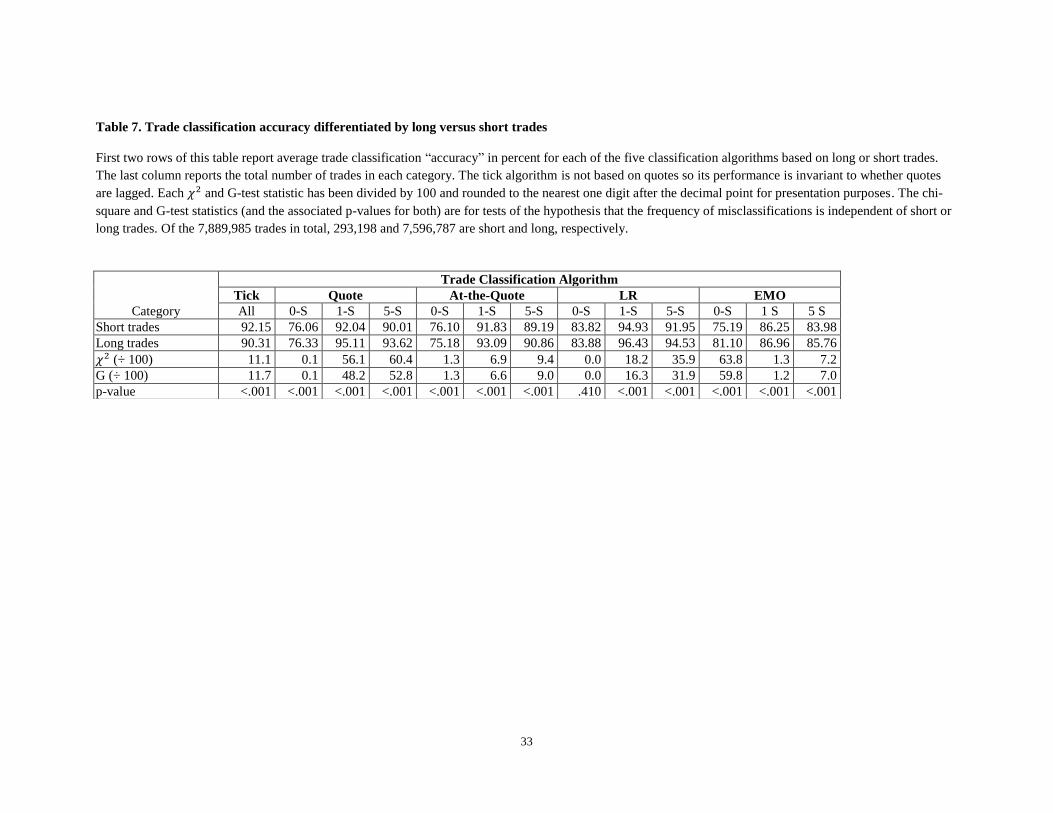
33
Table 7. Trade classification accuracy differentiated by long versus short trades
First two rows of this table report average trade classification “accuracy” in percent for each of the five classification algorithms based on long or short trades.
The last column reports the total number of trades in each category. The tick algorithm is not based on quotes so its performance is invariant to whether quotes
are lagged. Each and G-test statistic has been divided by 100 and rounded to the nearest one digit after the decimal point for presentation purposes. The chi-
square and G-test statistics (and the associated p-values for both) are for tests of the hypothesis that the frequency of misclassifications is independent of short or
long trades. Of the 7,889,985 trades in total, 293,198 and 7,596,787 are short and long, respectively.
Category
Trade Classification Algorithm
Tick Quote At-the-Quote LR EMO
All 0-S 1-S 5-S 0-S 1-S 5-S 0-S 1-S 5-S 0-S 1 S 5 S
Short trades 92.15 76.06 92.04 90.01 76.10 91.83 89.19 83.82 94.93 91.95 75.19 86.25 83.98
Long trades 90.31 76.33 95.11 93.62 75.18 93.09 90.86 83.88 96.43 94.53 81.10 86.96 85.76
(÷ 100) 11.1 0.1 56.1 60.4 1.3 6.9 9.4 0.0 18.2 35.9 63.8 1.3 7.2
G (÷ 100) 11.7 0.1 48.2 52.8 1.3 6.6 9.0 0.0 16.3 31.9 59.8 1.2 7.0
p-value <.001 <.001 <.001 <.001 <.001 <.001 <.001 .410 <.001 <.001 <.001 <.001 <.001
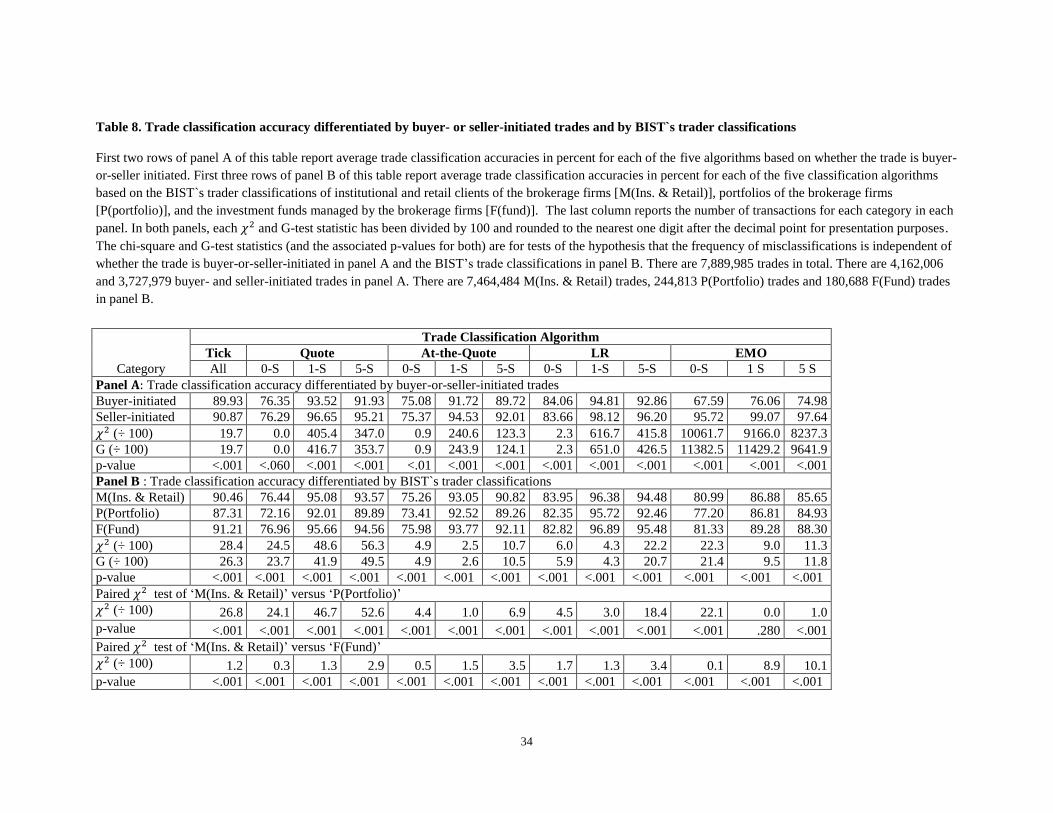
34
Table 8. Trade classification accuracy differentiated by buyer- or seller-initiated trades and by BIST`s trader classifications
First two rows of panel A of this table report average trade classification accuracies in percent for each of the five algorithms based on whether the trade is buyer-
or-seller initiated. First three rows of panel B of this table report average trade classification accuracies in percent for each of the five classification algorithms
based on the BIST`s trader classifications of institutional and retail clients of the brokerage firms [M(Ins. & Retail)], portfolios of the brokerage firms
[P(portfolio)], and the investment funds managed by the brokerage firms [F(fund)]. The last column reports the number of transactions for each category in each
panel. In both panels, each and G-test statistic has been divided by 100 and rounded to the nearest one digit after the decimal point for presentation purposes.
The chi-square and G-test statistics (and the associated p-values for both) are for tests of the hypothesis that the frequency of misclassifications is independent of
whether the trade is buyer-or-seller-initiated in panel A and the BIST’s trade classifications in panel B. There are 7,889,985 trades in total. There are 4,162,006
and 3,727,979 buyer- and seller-initiated trades in panel A. There are 7,464,484 M(Ins. & Retail) trades, 244,813 P(Portfolio) trades and 180,688 F(Fund) trades
in panel B.
Category
Trade Classification Algorithm
Tick Quote At-the-Quote LR EMO
All 0-S 1-S 5-S 0-S 1-S 5-S 0-S 1-S 5-S 0-S 1 S 5 S
Panel Trade classification accuracy differentiated by buyer-or-seller-initiated trades
Buyer-initiated 89.93 76.35 93.52 91.93 75.08 91.72 89.72 84.06 94.81 92.86 67.59 76.06 74.98
Seller-initiated 90.87 76.29 96.65 95.21 75.37 94.53 92.01 83.66 98.12 96.20 95.72 99.07 97.64
(÷ 100) 19.7 0.0 405.4 347.0 0.9 240.6 123.3 2.3 616.7 415.8 10061.7 9166.0 8237.3
G (÷ 100) 19.7 0.0 416.7 353.7 0.9 243.9 124.1 2.3 651.0 426.5 11382.5 11429.2 9641.9
p-value <.001 <.060 <.001 <.001 <.01 <.001 <.001 <.001 <.001 <.001 <.001 <.001 <.001
Panel B : Trade classification accuracy differentiated by BIST`s trader classifications
M(Ins. & Retail) 90.46 76.44 95.08 93.57 75.26 93.05 90.82 83.95 96.38 94.48 80.99 86.88 85.65
P(Portfolio) 87.31 72.16 92.01 89.89 73.41 92.52 89.26 82.35 95.72 92.46 77.20 86.81 84.93
F(Fund) 91.21 76.96 95.66 94.56 75.98 93.77 92.11 82.82 96.89 95.48 81.33 89.28 88.30
(÷ 100) 28.4 24.5 48.6 56.3 4.9 2.5 10.7 6.0 4.3 22.2 22.3 9.0 11.3
G (÷ 100) 26.3 23.7 41.9 49.5 4.9 2.6 10.5 5.9 4.3 20.7 21.4 9.5 11.8
p-value <.001 <.001 <.001 <.001 <.001 <.001 <.001 <.001 <.001 <.001 <.001 <.001 <.001
Paired test of ‘M(Ins. & Retail)’ versus ‘P(Portfolio)’
(÷ 100) 26.8 24.1 46.7 52.6 4.4 1.0 6.9 4.5 3.0 18.4 22.1 0.0 1.0
p-value <.001 <.001 <.001 <.001 <.001 <.001 <.001 <.001 <.001 <.001 <.001 .280 <.001
Paired test of ‘M(Ins. & Retail)’ versus ‘F(Fund)’
(÷ 100) 1.2 0.3 1.3 2.9 0.5 1.5 3.5 1.7 1.3 3.4 0.1 8.9 10.1
p-value <.001 <.001 <.001 <.001 <.001 <.001 <.001 <.001 <.001 <.001 <.001 <.001 <.001