Embed Size (px)
Citation preview
Hindawi Publishing CorporationComputational and Mathematical Methods in MedicineVolume 2013 Article ID 395071 15 pageshttpdxdoiorg1011552013395071
Research ArticleWhite Blood Cell Segmentation by Circle Detection UsingElectromagnetism-Like Optimization
Erik Cuevas1 Diego Oliva2 Margarita Diacuteaz1 Daniel Zaldivar1
Marco Peacuterez-Cisneros1 and Gonzalo Pajares2
1 Departamento de Electronica Universidad de Guadalajara CUCEI Avenida Revolucion 1500 44430 Guadalajara JAL Mexico2Departamento de Ingenierıa del Software e Inteligencia Artificial Facultad Informatica Universidad Complutense AvenidaComplutense SN 28040 Madrid Spain
Correspondence should be addressed to Erik Cuevas erikcuevascuceiudgmx
Received 21 October 2012 Revised 21 December 2012 Accepted 29 December 2012
Academic Editor Yoram Louzoun
Copyright copy 2013 Erik Cuevas et al This is an open access article distributed under the Creative Commons Attribution Licensewhich permits unrestricted use distribution and reproduction in any medium provided the original work is properly cited
Medical imaging is a relevant field of application of image processing algorithms In particular the analysis of white blood cell(WBC) images has engaged researchers from fields of medicine and computer vision alike Since WBCs can be approximated by aquasicircular form a circular detector algorithm may be successfully applied This paper presents an algorithm for the automaticdetection of white blood cells embedded into complicated and cluttered smear images that considers the complete process as a circledetection problem The approach is based on a nature-inspired technique called the electromagnetism-like optimization (EMO)algorithm which is a heuristic method that follows electromagnetism principles for solving complex optimization problems Theproposed approach uses an objective function which measures the resemblance of a candidate circle to an actual WBC Guidedby the values of such objective function the set of encoded candidate circles are evolved by using EMO so that they can fit intothe actual blood cells contained in the edge map of the image Experimental results from blood cell images with a varying range ofcomplexity are included to validate the efficiency of the proposed technique regarding detection robustness and stability
1 Introduction
Nature-inspired computing is a field of research that isconcerned with both the use of biology as an inspirationfor solving computational problems and the use of thenatural physical phenomena to solve real world problemsMoreover nature-inspired computing has proved to be usefulin several application areas [1] with relevant contributionsto optimization pattern recognition shape detection andmachine learning In particular it has gained considerableresearch interest from the computer vision community asnature-based algorithms have successfully contributed tosolve challenging computer vision problems
On the other hand white blood cells (WBCs) also knownas leukocytes play a significant role in the diagnosis of dif-ferent diseases Although digital image processing techniqueshave successfully contributed to generate new methods forcell analysis which in turn have lead into more accurateand reliable systems for disease diagnosis however high vari-ability on cell shape size edge and localization complicates
the data extraction process Moreover the contrast betweencell boundaries and the imagersquos background may vary due tounstable lighting conditions during the capturing process
Many works have been conducted in the area of bloodcell detection In [2] a method based on boundary supportvectors is proposed to identify WBC In such approach theintensity of each pixel is used to construct feature vectorswhereas a support vector machine (SVM) is used for classi-fication and segmentation By using a different approach in[3]Wu et al developed an iterativeOtsumethod based on thecircular histogram for leukocyte segmentation According tosuch technique the smear images are processed in the Hue-Saturation-Intensity (HSI) space by considering that the Huecomponent contains most of the WBC information One ofthe latest advances in white blood cell detection research isthe algorithm proposed by Wang et al [4] which is basedon the fuzzy cellular neural network (FCNN) Although suchmethod has proved successful in detecting only one leukocytein the image it has not been tested over images containing
2 Computational and Mathematical Methods in Medicine
several white cells Moreover its performance commonlydecays when the iteration number is not properly definedyielding a challenging problem itself with no clear clues onhow to make the best choice
Since blood cells can be approximated with a quasi-circular form a circular detector algorithm may be handyThe problem of detecting circular features holds paramountimportance for image analysis in particular for medicalimage analysis [5] The circle detection in digital images iscommonly performed by the circular Hough transform [6]A typical Hough-based approach employs an edge detectorwhose information guides the inference for circle locationsand radius values Peak detection is then performed byaveraging filtering and histogramming the transform spaceHowever such approach requires a large storage space givenby the required 3D cells to cover all parameters (119909 119910 119903) Italso implies a high computational complexity yielding a lowprocessing speed The accuracy of the extracted parametersfor the detected circle is poor particularly in presence ofnoise [7] For a digital image holding a significant widthand height and a densely populated edge pixel map therequired processing time for circularHough transformmakesit prohibitive to be deployed in real time applications In orderto overcome such a problem some other researchers haveproposed new approaches based on the Hough transformfor instance the probabilistic Hough transform [8 9] therandomized Hough transform (RHT) [10] and the fuzzyHough transform [11] Alternative transformations have alsobeen presented in the literature as the one proposed by Beckeret al in [12] Although those new approaches demonstratedbetter processing speeds in comparison to the originalHoughtransform they are still very sensitive to noise
As an alternative to Hough transform-based techniquesthe circle detection problem has also been handled throughoptimization methods In general they have demonstratedto deliver better results than those based on HT consider-ing accuracy speed and robustness [13] Such approacheshave produced several robust circle detectors using differentoptimization algorithms such as genetic algorithms (GAs)[13] harmony search (HS) [14] differential evolution (DE)[15] and the electromagnetism-like optimization algorithm(EMO) [16]
Although detection algorithms based on the optimiza-tion approaches present several advantages in comparisonto those based on the Hough transform they have beenscarcely applied toWBCdetection One exception is theworkpresented by Karkavitsas and Rangoussi [17] that solves theWBC detection problem through the use of GA Howeversince the evaluation function which assesses the qualityof each solution considers the number of pixels containedinside of a circle with fixed radius the method is prone toproduce misdetections particularly for images that containedoverlapped or irregular WBC
In this paper the WBC detection task is approachedas an optimization problem and the EMO-based circledetector [16] is used to build the circular approximationThe EMO algorithm [18] is a stochastic evolutionary com-putation technique based on the electromagnetism theory Itconsiders each solution to be a charged particle The charge
of each particle is determined by an objective functionThereby EMO moves each particle according to its chargewithin an attraction or repulsion field among the popula-tion using Coulombrsquos law and the superposition principleThis attraction-repulsion mechanism of the EMO algorithmcorresponds to the reproduction crossover and mutation inGA [19] In general the EMO algorithm can be consideredas a fast and robust algorithm representing an alternative tosolve complex nonlinear nondifferentiable and nonconvexoptimization problemsThe principal advantages of the EMOalgorithm lie on several facts it has no gradient operation itcan be used directly on a decimal system it needs only fewparticles to converge and the convergence existence has beenalready verified [20]
TheEMO-based circle detector uses the encoding of threeedge points that represent candidate circles in the edge mapof the scene The quality of each individual is calculated byusing an objective function which evaluates if such candidatecircles are really present in the edge map of the image Thebetter a candidate circle approximates the actual edge circlethe more the objective function value decreases Thereforethe detection performance depends on the quality of the edgemap as it is obtained from the original images Howeversince smear images present different imaging conditionsand staining intensities they produce edge maps partiallydamaged by noisy pixels Under such conditions the use ofthe EMO-based circle detector cannot be directly applied toWBC detection
This paper presents an algorithm for the automatic detec-tion of blood cell images based on the EMO algorithm Theproposedmethodmodifies the EMO-based circle detector byincorporating a new objective function Such function allowsto accurately measure the resemblance of a candidate circlewith an actualWBCon the imagewhich is based on the infor-mation not only from the edgemap but also from the segmen-tation results Guided by the values of the new objective func-tion the set of encoded candidate circles are evolved using theEMO algorithm so that they can fit into actual WBC on theimageThe approach generates a subpixel detector which caneffectively identify leukocytes in real images Experimentalevidence shows the effectiveness of such method in detectingleukocytes despite complex conditions Comparison to thestate-of-the-art WBC detectors on multiple images demon-strates a better performance of the proposed method
The main contribution of this study is the proposal ofa new WBC detector algorithm that efficiently recognizesWBC under different complex conditions while consideringthe whole process as a circle detection problem Althoughcircle detectors based on optimization present several inter-esting properties to the best of our knowledge they havenot yet been applied to any medical image processing up todate
This paper is organized as follows Section 2 provides adescription of the EMO algorithm while in Section 3 thecircle detection task is fully explained from an optimizationperspective within the context of the EMO approach Thecomplete WBC detector is presented in Section 4 Section 5reports the obtained experimental results whereas Section 6conducts a comparison between the state-of-the-art WBC
Computational and Mathematical Methods in Medicine 3
(1) Input parameters the maximum number of iterationsMAXITER the values for the localsearch parameters such as 119868
119897and 120575 and the size119873 of the population are all defined
(2) Initialize set the iteration counter 119896 = 1 initialize the members of 119878119896 uniformly in119883and identify the best point in 119878119896
(3) while 119896 lt 119872119860119883119868119879119864119877 do(4) 119865119896119894larr Calc119865(119878119896)
(5) 119910119894119896 = Move (119909119894119896 119865119896
119894)
(6) 119911119894119896= Local (119868119897 120575 119910119894119896)(7) 119909119894119896+1 = Select (119878119896+1 119910119894119896 119911119894119896)(8) End while
Algorithm 1 [EMO (119873119872119860119883119868119879119864119877 119868119897 120575)]
detectors and the proposed approach Finally in Section 7some conclusions are drawn
2 Electromagnetism-Like OptimizationAlgorithm (EMO)
Initially designed for bound constrained optimization prob-lems the EMOmethod [18] utilizes119873 119899-dimensional points119909119894119896 119894 = 1 2 119873 as a population for searching the feasibleset 119883 = 119909 isin 119877119899 | 119897119894 le 119909 le 119906119894 where the index 119896 denotes theiteration (or generation) number of the algorithm while thelower and upper parameter limits are represented by 119897119894 and 119906119894respectively The initial population 119878119896 = 1199091119896 1199092119896 119909119873119896
(being 119896 = 1) is taken from uniformly distributed samplesof the search region 119883 We also denote the population set atthe 119896th iteration by 119878119896 It does contain the members of theset 119878119896 that have changed with 119896 After the initialization of 119878119896EMOcontinues its iterative process until a stopping condition(eg themaximumnumber of iterations) is met An iterationof EMO consists of two steps In the first step each pointin 119878119896 moves to a different location by using the attraction-repulsion mechanism of the electromagnetism theory [21]In the second step points that have been moved by theelectromagnetism theory are further moved locally by a localsearch and then become the members of 119878119896+1 in the (119896 + 1)thiteration Both the attraction-repulsion mechanism and thelocal search in EMO are responsible for driving themembers119909119894119896 of 119878119896 to the close proximity of the global minimizer
Similar to the electromagnetism theory for charged par-ticles each point 119909119894119896 isin 119878119896 in the search space119883 is assumed tobe a charged particle where the charge of a point relates to itsobjective function value Points holding better objective func-tion values possess higher EMO charges than other points
The attraction-repulsion mechanism in EMO states thatpoints holding more charge attract other points in 119878119896 whilepoints showing less charge repel other points Finally a totalforce vector 119865119896
119894 exerted over a point for example the 119894th
point 119909119894119896 is calculated by adding the resultant attraction-repulsion forces and each 119909119894119896 isin 119878119896 is moved in the directionof its total force denoting its location by 119910119894119896
A local search is used to explore the neighborhood of each119910119894119896 Considering a determined number of steps known as 119868119897and a fixed neighbourhood search 120575 the procedure iteratesas follows Point 119910119894119896 is assigned to a temporary point 119911119894119896 to
store the initial information Next for a given coordinate 119894 (isin1 119899) a random number is selected and combined with 120575
as a step length which in turns moves the point 119911119894119896 along thedirection 119889 If point 119911119894119896 observes a better performance withina set of 119868119897 repetitions point 119910119894119896 is replaced by 119911119894119896 otherwise119910119894119896 is held Therefore the members 119909119894119896+1 isin 119878119896+1 of the (119896 +1)th iteration are defined through the following equation
119909119894119896+1 = 119911119894119896 if 119891 (119911119894119896) lt 119891 (119910119894119896)
119910119894119896 otherwise(1)
Algorithm 1 shows the general scheme of EMO We alsoprovide the description of each step as follows
Input Parameter Values (Line 1) The EMO algorithm is runfor MAXITER iterations In the local search phase 119899 times 119868119897 isthe maximum number of locations 119911119894119896 within a 120575 distance of119910119894119896 for each 119894
Initialize (Line 2) The points 119909119894119896 119896 = 1 are selecteduniformly distributed in119883 considering lower 119897119894 and upper 119906119894parameter limits where 119894 = 1 2 119899The objective functionvalues 119891(119909119894119896) are computed and the best point
119909119861
119896= arg min
119909119894119896isin119878119896
119891 (119909119894119896) (2)
is also identified
Calculate Force (Line 4) In this step a charged-like value(119902119894119896) is assigned to each point (119909119894119896) The charge 119902119894119896 of 119909119894119896is dependent on 119891(119909119894119896) and points holding better objectivefunction have more charge than others The charges arecomputed as follows
119902119894119896 = exp(minus119899119891 (119909119894119896) minus 119891 (119909119861
119896)
sum119873
119895=1119891 (119909119895119896) minus 119891 (119909119861
119896)) (3)
where 119909119861119896represents the best particle in the population (see
(2)) Then the force 119865119896119894119895 between two points 119909119894119896 and 119909119895119896 is
calculated by using
119865119896
119894119895=
(119909119895119896 minus 119909119894119896)119902119894119896 sdot 119902119895119896
10038171003817100381710038171003817119909119895119896 minus 119909119894119896
10038171003817100381710038171003817
2if 119891 (119909119894119896) gt 119891 (119909119895119896)
(119909119894119896 minus 119909119895119896)119902119894119896 sdot 119902119895119896
10038171003817100381710038171003817119909119895119896 minus 119909119894119896
10038171003817100381710038171003817
2if 119891 (119909119894119896) le 119891 (119909119895119896)
(4)
4 Computational and Mathematical Methods in Medicine
The total force 119865119896119894 corresponding to 119909119894119896 is now calculated as
119865119896
119894=
119873
sum119895=1119895 = 119894
119865119896
119894119895 (5)
Moving Point 119909119894119896 along 119865119896119894(Line 5) In this step each point
119909119894119896 except for 119909119861
119896 is moved along the total force vector 119865119896
119894by
considering
119909119894119896 = 119909119894119896 + 120582119865119896
119894
1003817100381710038171003817119865119896
119894
1003817100381710038171003817(RNG) 119894 = 1 2 119873 119894 = 119861 (6)
where 120582 is a random number between 0 and 1 and RNGdenotes the allowed range of movement towards the lower 119897119894or upper 119906119894 bound for the corresponding dimension
Local Search (Line 6) For each 119910119894119896 a maximum of 119868119897points are generated at each coordinate direction in 120575 theneighborhood of 119910119894119896 The process of generating local pointsis continued for each 119910119894119896 until either a better 119911119894119896 is found orthe 119868119897 trial is reached
Selection for the Next Iteration (Line 7) In this step members119909119894119896+1 isin 119878119896+1 are selected from 119910119894119896 and 119911119894119896 using (1) and thebest point is identified using (2)
3 Circle Detection Using EMO
31 Data Preprocessing In order to detect circle shapescandidate images must be preprocessed first by the well-known Canny algorithm which yields a single-pixel edge-only image Then the (119909119894 119910119894) coordinates for each edge pixel119901119894 are stored inside the edge vector119875 = 1199011 1199012 119901119873119901 with119873119901 being the total number of edge pixels
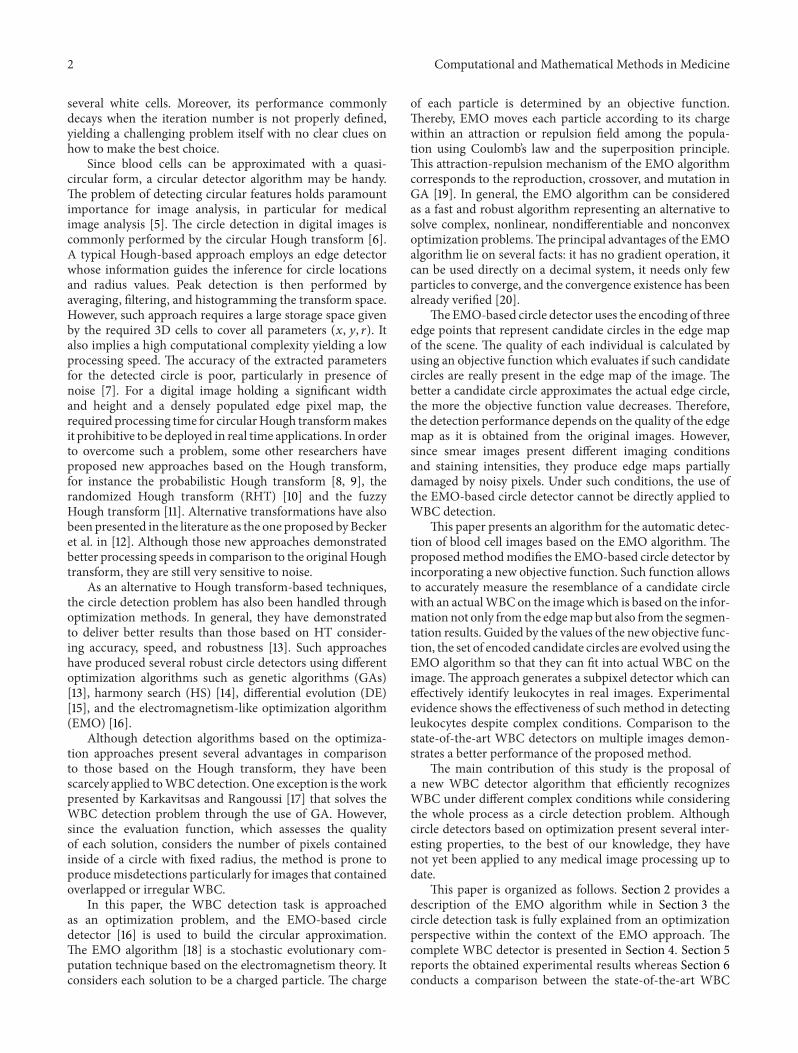
32 Particle Representation In order to construct each par-ticle 119862 (circle candidate) the indexes 1198901 1198902 and 1198903 whichrepresent three edge points previously stored inside the vector119875 must be grouped assuming that the circlersquos contour con-nects them Therefore the circle 119862 = 1199011198901 1199011198902 1199011198903 passingover such points may be considered as a potential solutionfor the detection problem Considering the configuration ofthe edge points shown in Figure 1 the circle center (1199090 1199100)and the radius 119903 of 119862 can be characterized as follows
(119909 minus 1199090)2+ (119910 minus 1199100)
2= 1199032 (7)
where 1199090 and 1199100 are computed through the following equa-tions
1199090 =det (A)
4 ((1199091198902 minus 1199091198901) (1199101198903 minus 1199101198901) minus (1199091198903 minus 1199091198901) (1199101198902 minus 1199101198901))
1199100 =det (B)
4 ((1199091198902 minus 1199091198901) (1199101198903 minus 1199101198901) minus (1199091198903 minus 1199091198901) (1199101198902 minus 1199101198901))
(8)
Figure 1 Circle candidate (charged particle) built from the combi-nation of points 1199011198901 1199011198902 and 1199011198903
with det(A) anddet(B) representing determinants ofmatricesA and B respectively considering
A = [11990921198902+ 11991021198902minus (11990921198901+ 11991021198901) 2 sdot (1199101198901 minus 1199101198901)
11990921198903+ 11991021198903minus (11990921198901+ 11991021198901) 2 sdot (1199101198903 minus 1199101198901)
]
B = [2 sdot (1199091198902 minus 1199091198901) 1199092
1198902+ 11991021198902minus (11990921198901+ 11991021198901)
2 sdot (1199091198903 minus 1199091198901) 11990921198903+ 11991021198903minus (11990921198901+ 11991021198901)]
(9)
the radius 119903 can therefore be calculated using
119903 = radic(1199090 minus 119909119890119889)2
+ (1199100 minus 119910119890119889)2
(10)
where 119889 isin 1 2 3 and (119909119890119889 119910119890119889) are the coordinates ofany of the three selected points which define the particle119862 Figure 1 illustrates main parameters defined by (7)ndash(10)Therefore the shaping parameters for the circle [11990901199100 119903]can be represented as a transformation 119879 of the edge vectorindexes 1198901 1198902 and 1198903
[1199090 1199100 119903] = 119879 (1198901 1198902 1198903) (11)
By exploring each index as a particle it is possible to sweepthe continuous space while looking for shape parameters bymeans of the EMO algorithm This approach reduces thesearch space by eliminating unfeasible solutions
33 Objective Function In order to model the fitness func-tion the circumference coordinates of the circle candidate119862 are calculated as a virtual shape which in turn must bevalidated that is if it really exists in the edge image Thecircumference coordinates are grouped within the test set119867 = ℎ1 ℎ2 ℎ119873119904 with 119873119904 representing the numberof points over which the existence of an edge point whichcorresponds to 119862 must be verified
The test 119867 is generated by the midpoint circle algorithm(MCA) [22] which is a well-known algorithm to determinethe required points for drawing a circle MCA requires
Computational and Mathematical Methods in Medicine 5
as inputs only the radius 119903 and the center point (1199090 1199100)
considering only the first octant over the circle equation 1199092 +
1199102 = 1199032 It draws a curve starting at point (119903 0) and proceedsupwards left by using integer additions and subtractionsThe MCA aims to calculate the required points 119867 in orderto represent a circle candidate Although the algorithm isconsidered as the quickest providing a subpixel precision it isimportant to assure that points lying outside the image planemust not be considered in119867
The objective function 119869(119862) represents thematching errorproduced between the pixels 119867 of the circle candidate 119862
(particle) and the pixels that actually exist in the edge-onlyimage yielding
119869 (119862) = 1 minussum119873119904
119907=1119864 (ℎ119907)
119873119904 (12)
where 119864(ℎ119907) is a function that verifies the pixel existence inℎ119907 where ℎ119907 isin 119867 and 119873119904 is the number of elements of 119867Hence the function 119864(ℎ119907) is defined as
119864 (ℎ119907) = 1 if the test pixel ℎ119907 is an edge point0 otherwise
(13)
A value of 119869(119862) near to zero implies a better responsefrom the ldquocircularityrdquo operator Figure 2 shows the procedureto evaluate a candidate solution 119862 with its representation asa virtual shape 119867 Figure 2(a) shows the original edge mapwhile Figure 2(b) presents the virtual shape 119867 representingthe particle 119862 = 1199011198901 1199011198902 1199011198903 In Figure 2(c) the virtualshape119867 is compared to the original image point by point inorder to find coincidences between virtual and edge pointsThe 119901 individual has been built from points 1199011198901 1199011198902 and1199011198903 which are shown in Figure 2(a) The virtual shape 119867obtained by MCA gathers 56 points (119873119904 = 56) with only18 of them existing in both images (shown as blue pointsplus red points in Figure 2(c)) and yieldingsum119873119904
ℎ=1119864(ℎ119907) = 18
therefore 119869(119862) asymp 067
34 EMO Implementation The implementation of the pro-posed algorithm can be summarized into the following steps
Step 1 The Canny filter is applied to find the edges and storethem in the 119875 = 1199011 1199012 119901119873119901 vector The index 119896 is set to1
Step 2 119898 initial particles are generated (1198621198861 119886 isin [1119898])Particles belonging to a seriously small or to a quite big radiusare eliminated (collinear points are discarded)
Step 3 The objective function 119869(119862119886119896) is evaluated to deter-mine the best particle 119862119861 (where 119862119861 larr arg min119869(119862119886119896))
Step 4 The charge between particles is calculated usingexpression (3) and its vector force is calculated through (4)and (5) The particle with a better objective function holds abigger charge and therefore a bigger attraction force
(a)
(b)
(c)
Figure 2 Procedure to evaluate the objective function 119869(119862) Theimage shown by (a) presents the original edge image while (b)portraits the virtual shape 119867 corresponding to 119862 The image in (c)shows coincidences between both images through blue or red pixelswhile the virtual shape is also depicted in green
Step 5 The particles are moved according to their forcemagnitude The new particlersquos position 119862119910
119886is calculated by
expression (6) 119862119861 is not moved because it has the biggestforce and it attracts other particles to itself
Step 6 For each 119862119910119886 a maximum of 119868119897 points are generated at
each coordinate direction in the 120575 neighborhood of 119862119910119886 The
process of generating local points is continued for each 119862119910119886
until either a better 119862119911119886is found or the 119899 times 119868119897 trial is reached
Step 7 The new particles 119862119886119896+1 are selected from 119862119910119886and 119862119911
119886
using (1)
6 Computational and Mathematical Methods in Medicine
Repelled
Attracted
Figure 3 An analogy to the Coulombrsquos law
Step 8 The 119896 index is increased If 119896 = 119872119860119883119868119879119864119877 or if119869(119862119886119896) value is as smaller as the predefined threshold valuethen the algorithm is stopped and the flow jumps to Step 9Otherwise it jumps to Step 3
Step 9 The best 119862119861 particle is selected from the last iteration
Step 10 From the original edge map the algorithm markspoints corresponding to 119862119861 In case of multicircle detectionit jumps to Step 2
Step 11 Finally the best particle 119862119861119873119888
from each circle isused to draw (over the original image) the detected circlesconsidering119873119888 as the number of detected circles
Figure 3 shows an analogy to Coulombrsquos lawThe originalfigures to be detected are represented by a solid black linewhile the shapes with discontinuous gray lines represent thecandidate circles Since the candidate circles 1198621119896 and 1198623119896present a high value in the fitness function 119869(119862119886119896) they arerepelled (blue lines) moving away the shapes In contrastthe circle candidate 1198622119896 that holds a small value of 119869(119862119886119896)is attracted (red line) to the circular shape contained in theimage
4 The White Blood Cell Detector
In order to detect WBC the proposed detector combines theEMO-based circle detector presented in Section 3 with a newobjective function
41 Image Preprocessing To employ the proposed detectorsmear images must be preprocessed to obtain two newimages the segmented image and its corresponding edgemapThe segmented image is produced by using a segmenta-tion strategy whereas the edge map is generated by a borderextractor algorithm Both images are considered by the newobjective function to measure the resemblance of a candidatecircle with an actual WBC
The goal of the segmentation strategy is to isolate thewhite blood cells (WBCs) from other structures such as
red blood cells and background pixels Information of colorbrightness and gradients is commonly used within a thresh-olding scheme to generate the labels to classify each pixelAlthough a simple histogram thresholding can be used tosegment the WBCs in this work the diffused expectation-maximization (DEM) has been used to assure better results[23]
DEM is an expectation-maximization- (EM-) based algo-rithm which has been used to segment complex medicalimages [24] In contrast to classical EM algorithms DEMconsiders the spatial correlations among pixels as a part ofthe minimization criteria Such adaptation allows to segmentobjects in spite of noisy and complex conditions
For the WBCs segmentation the DEM has been config-ured considering three different classes (119870 = 3) 119892(nablaℎ119894119896) =
|nablaℎ119894119896|minus95 120582 = 01 and 119898 = 10 iterations These values
have been found as the best configuration set according to[23] As a final result of the DEM operation three differentthresholding points are obtained the first corresponds to theWBCs the second to the red blood cells whereas the thirdrepresents the pixels classified as background Figure 4(b)presents the segmentation results obtained by the DEMapproach employed at this work considering Figure 4(a) asthe original image
Once the segmented image has been produced the edgemap is computed The purpose of the edge map is to obtain asimple image representation that preserves object structuresOptimization-based circle detectors [17ndash20] operate directlyover the edge map in order to recognize circular shapesSeveral algorithms can be used to extract the edge maphowever in this work the morphological edge detectionprocedure [25] has been used to accomplish such a taskMorphological edge detection is a traditional method toextract borders from binary images in which original images(119868119861) are eroded by a simple structure element (119868119864) Then theeroded image is inverted (119868119864) and compared with the originalimage (119868119864 and 119868119861) in order to detect pixels which are present inboth images Such pixels compose the computed edge mapfrom 119868119861 Figure 4(c) shows the edge map obtained by usingthe morphological edge detection procedure
Other example is presented in Figure 8 It represents acomplex example with an image showing seriously deformedcells Despite such imperfections the proposed approach caneffectively detect the cells as it is shown in Figure 8(d)
42 The Modified EMO-Based Circle Detector The circledetection approach uses the encoding of three edge pointsthat represent candidate circles in the image In the originalEMO-based circle detector the quality of each individual iscalculated by using an objective function which evaluates theexistence of a candidate circle considering only informationfrom the edge map (shape structures) The better a candidatecircle approximates the actual edge-circle themore the objec-tive function value decreasesTherefore the detection perfor-mance depends on the quality of the edgemap that is obtainedfrom the original images However since smear imagespresent different imaging conditions and staining intensitiesthey produce edge maps partially damaged by noisy pixels
Computational and Mathematical Methods in Medicine 7
(a) (b)
(c)
Figure 4 Preprocessing process (a) original smear image (b) segmented image obtained by DEM and (c) the edge map obtained by usingthe morphological edge detection procedure
Under such conditions the use of the EMO-based circledetector cannot be directly applied to WBC detection
In order to use the EMO-based circle detector withinthe context of WBC detection it is necessary to change thefitness function presented in (11) In thiswork a newobjectivefunction has been derived to measure the resemblance of acandidate circle to an actual WBC based on the informationfrom the edge map and the segmented image Such newobjective function takes into consideration not only the infor-mation provided by the edge map but also the relationshipamong the pixels falling inside the candidate circle which iscontained in the segmented image validating the existenceof the WBC This new function 119869(119862) is thus calculated asfollows
119869New (119862) = 2 minussum119873119904
119907=1119864 (ℎ119907)
119873119904minus119882119901
119861119901 (14)
where ℎ119907 and 119873119904 keep the same meaning than (11) and 119882119901
is the amount of white pixel falling inside the candidatecircle represented by 119862 Likewise 119861119901 corresponds to the totalnumber of black pixels falling inside 119862
To illustrate the functionality of the new objective func-tion Figure 5 presents a detection procedure which considersa complex image Figure 5(a) shows the original smear imagecontaining a WBC and a stain produced by the coloringprocess Figures 5(b) and 5(c) represent the segmented imageand the edge map respectively Since the stain containedin the smear image (Figure 5(a)) possesses similar proper-ties than a WBC it remains as a part of the segmented
image (Figure 5(b)) and the edge map (Figure 5(c)) Suchan inconsistency produces big detection errors in case theEMO-based circle detector is used without modificationFigure 5(d) presents detection results obtained by the originalEMO-based circle detector As the original objective functionconsiders only the number of coincidences between thecandidate circle and the edge map circle candidates thatmatch with a higher number of edge pixels are chosen asthe best circle instances In Figure 5(d) the detected circlepresents a coincidence of 37 different pixels in the edge mapSuch coincidence is considered as the best possible underthe restrictions of the original objective function On theother hand when the modified objective function is used inthe recognition procedure the accuracy and the robustnessof the detection are both significantly improved By usingthe new objective function information from the segmentedimage is employed to refine the solution that is providedby coincidences with the edge map Figure 5(e) presents thedetection result that has been produced by the modifiedEMO-based circle detector In the figure the detected circlematches with only 32 pixels of the edge map However it isconsidered as the best instance due to the relationship of itsinternal pixels (the white pixels aremuchmore than the blackpixels) Finally Figure 5(f) shows final detection results overthe original smear image
Table 1 presents the parameters for the EMO algorithmused in this workThey have been kept for all test images afterbeing experimentally defined
8 Computational and Mathematical Methods in Medicine
(a) (b) (c)
(d) (e) (f)
Figure 5WBC detection procedure (a) Smear image (b) Segmented image (c) Edge map (d) Detected circle by using the original objectivefunction Red points show the coincidences between the candidate circle and the edge map (e) Detected circle by using the new objectivefunction Yellow points represent the edge pixels without coincidence (f) Final result
Table 1 EMO parameters used for leukocytes detection in medicalimages119898 119899 119872119860119883119868119879119864119877 120575 119871119868119878119879119864119877
50 3 5 4 4
Under such assumptions the complete process to detectWBCs is implemented as follows
Step 1 Segment the WBCs using the DEM algorithm
Step 2 Get the edge map from the segmented image by usingthe morphological edge detection method
Step 3 Start the circle detector based on EMO over the edgemap while saving best circles (Section 33)
Step 4 Define parameter values for each circle that identifythe WBCs
43 Numerical Example In order to present the algorithmrsquosstep-by-step operation a numerical example has been set byapplying the proposed method to detect a single leukocytelying inside of a simple image Figure 6(a) shows the imageused in the example After applying the threshold operationtheWBC is located besides few other pixels which are merelynoise (see Figure 6(b)) Then the edge map is subsequentlycomputed and stored pixel by pixel inside the vector 119875Figure 6(c) shows the resulting image after such procedure
The EMO-based circle detector is executed using infor-mation of the edge map and the segmented image (for thesake of easiness it only considers a population of three parti-cles) Like all evolutionary approaches EMO is a population-based optimizer that attacks the starting point problem by
sampling the search space at multiple randomly choseninitial particles By taking three random pixels from vector 119875three different particles are constructed Figure 6(d) depictsthe initial particle distribution Since the particle 11986220 holdsthe best fitness value 119869New(11986220) (it does possess a bettercoincidence with the edge map and a god pixel relationship)it is considered as the best particle 119862119861 Then the charge ofeach particle is calculated through (3) and the forces exertedover each particle are computed Figure 6(e) shows the forcesexerted over the 11986230 particle Since the 11986230 particle is theworst particle in terms of fitness value it is attracted byparticles 11986210 and 11986220 11986531 and 11986532 represent the existentattracting forces of 11986230 with respect to 11986210 and 11986220 whereas1198653 corresponds to the resultant force Considering 1198653 as thefinal force exerted over 11986230 the position of 11986230 is modifiedusing (6) Figure 6(f) depicts the new position11986231 of particle11986230 (the second subindex means the iteration number) Ifthe same procedure is applied over all the particles (exceptfor 11986220 which is the best particle) it yields positions shownin Figure 6(g) Therefore after 20 iterations all particlesconverge to the same position presented in Figure 6(h)whereas Figure 6(i) depicts the final result
5 Experimental Results
Experimental tests have been developed in order to evaluatethe performance of the WBC detector It was tested overmicroscope images from blood smears holding a 600 times 500
pixel resolution They correspond to supporting images onthe leukemia diagnosis The images show several complexconditions such as deformed cells and overlapping withpartial occlusions The robustness of the algorithm has beentested under such demanding conditions
Computational and Mathematical Methods in Medicine 9
(a) (b) (c)
(d) (e) (f)
(g) (h) (i)
Figure 6 Detection numerical example (a) The image used as example (b) Segmented image (c) Edge map (d) Initial particles (e) Forcesexerted over 11986230 (f) New position of 11986230 (g) Positions of all particles after the first generation (h) Final particle configuration after 20generations (i) Final result overlapped the original image
Figure 7(a) shows an example image employed in thetest It was used as input image for the WBC detectorFigure 7(b) presents the segmented WBCs obtained by theDEM algorithm Figures 7(c) and 7(d) present the edgemap and the white blood cells after detection respectivelyThe results show that the proposed algorithm can effec-tively detect and mark blood cells despite cell occlusiondeformation or overlapping Other parameters may also becalculated through the algorithm the total area coveredby white blood cells and relationships between several cellsizes
6 Comparisons to Other Methods
Acomprehensive set of smear-blood test images is used to testthe performance of the proposed approach We have appliedthe proposed EMO-based detector to test images in order tocompare its performance to otherWBC detection algorithmssuch as the boundary support vectors (BSVs) approach [2]the iterative Otsu (IO) method [3] the Wang algorithm [4]and the Genetic algorithm-based (GAB) detector [17] In allcases the algorithms are tuned according to the value setwhich is originally proposed by their own references
61 Detection Comparison To evaluate the detection per-formance of the proposed detection method Table 2 tab-ulates the comparative leukocyte detection performance ofthe BSV approach the IO method the Wang algorithmthe BGA detector and the proposed method in terms ofdetection rates and false alarms The experimental data setincludes 30 images which are collected from the Cellavisionreference library (httpwwwcellavisioncom) Such imagescontain 426 leukocytes (222 bright leukocytes and 204 darkleukocytes according to smear conditions) which have beendetected and counted by a human expert Such values act asground truth for all the experiments For the comparisonthe detection rate (DR) is defined as the ratio between thenumber of leukocytes correctly detected and the numberof leukocytes determined by the expert The false alarmrate (FAR) is defined as the ratio between the number ofnonleukocyte objects that have been wrongly identified asleukocytes and the number leukocytes which have beenactually determined by the expert
Experimental results show that the proposed EMOmethod which achieves 9648 leukocyte detection accu-racy with 375 false alarm rate is compared favorablyagainst other WBC detection algorithms such as the BSV
10 Computational and Mathematical Methods in Medicine
(a) (b)
(c) (d)
Figure 7 Resulting images of the first test after applying the WBC detector (a) original image (b) image segmented by the DEM algorithm(c) edge map and (d) the white detected blood cells
approach the IO method the Wang algorithm and the BGAdetector
62 Robustness Comparison Images of blood smear are oftendeteriorated by noise due to various sources of interferenceand other phenomena that affect the measurement processesin imaging and data acquisition systems Therefore thedetection results depend on the algorithmrsquos ability to copewith different kinds of noises In order to demonstratethe robustness in the WBC detection the proposed EMOapproach is compared to the BSV approach the IO methodthe Wang algorithm and the BGA detector under noisyenvironments In the test two different experiments havebeen studied The first inquest explores the performanceof each algorithm when the detection task is accomplishedover images corrupted by salt and pepper noise The secondexperiment considers images polluted by Gaussian noise Saltand Pepper andGaussian noise are selected for the robustnessanalysis because they represent the most compatible noisetypes commonly found in images of blood smear [26]The comparison considers the complete set of 30 imagespresented in Section 61 containing 426 leukocytes whichhave been detected and counted by a human expert Theadded noise is produced by MatLab considering two noiselevels of 5 and 10 for salt and pepper noise whereas 120590 = 5
and 120590 = 10 are used for the case of Gaussian noiseFigure 9 shows only two images with different noise types asexample The outcomes in terms of the detection rate (DR)and the false alarm rate (FAR) are reported for each noisetype in Tables 3 and 4 The results show that the proposedEMO algorithm presents the best detection performanceachieving in the worst case a DR of 8779 and 8920 undercontaminated conditions of salt and pepper and Gaussiannoise respectively On the other hand the EMO detectorpossesses the least degradation performance presenting aFAR value of 821 and 751
63 Stability Comparison In order to compare the stabilityperformance of the proposed method its results are com-pared to those reported by Wang et al in [4] which isconsidered as an accurate technique for the detection ofWBC
The Wang algorithm is an energy-minimizing methodwhich is guided by internal constraint elements and influ-enced by external image forces producing the segmentationof WBCs at a closed contour As external forces the Wangapproach uses edge information which is usually representedby the gradient magnitude of the image Therefore thecontour is attracted to pixels with large image gradients thatis strong edges At each iteration the Wang method finds
Computational and Mathematical Methods in Medicine 11
(a) (b)
(c) (d)
Figure 8 Resulting images of the second test after applying theWBCdetector (a) original image (b) image segmented by theDEMalgorithm(c) edge map and (d) the white detected blood cells
(a) (b)
Figure 9 Examples of images included in the experimental set for robustness comparison (a) Image contaminated with 10 of salt andpepper noise and (b) image polluted with 120590 = 10 of Gaussian noise
a new contour configurationwhichminimizes the energy thatcorresponds to external forces and constraint elements
In the comparison the net structure and its operationalparameters corresponding to theWang algorithm follow theconfiguration suggested in [4] while the parameters for theEMO algorithm are taken from Table 1
Figure 10 shows the performance of both methods con-sidering a test image with only two white blood cells Sincethe Wang method uses gradient information in order toappropriately find a new contour configuration it needs to beexecuted iteratively in order to detect each structure (WBC)Figure 10(b) shows the results after the Wang approach has
12 Computational and Mathematical Methods in Medicine
Table 2 Comparative leukocyte detection performance of the BSV approach the IO method the Wang algorithm the BGA detector andthe proposed EMOmethod over the data set which contains 30 images and 426 leukocytes
Leukocyte type Method Leukocytes detected Missing False alarms DR FAR
Bright leukocytes (222)
BSV 104 118 67 4685 3018IO 175 47 55 7883 2477
Wang 186 36 42 8378 1892BGA 177 45 22 7973 991EMO 211 11 10 9504 450
Dark leukocytes (204)
BSV 98 106 54 4804 2647IO 166 38 49 8137 2402
Wang 181 23 38 8872 1863BGA 170 34 19 8333 931EMO 200 4 6 9804 294
Overall (426)
BSV 202 224 121 4742 2840IO 341 85 104 8005 2441
Wang 367 59 80 8615 1878BGA 347 79 41 8145 962EMO 411 15 16 9648 375
Table 3 Comparative WBC detection among methods that considers the complete data set of 30 images corrupted by different levels of saltand pepper noise
Noise level Method Leukocytes detected Missing False alarms DR FAR
5 salt and peppernoise426 leukocytes
BSV 148 278 114 3474 2676IO 270 156 106 6338 2488
Wang 250 176 118 5868 2770BGA 306 120 103 7183 2418EMO 390 36 30 9155 704
10 salt and peppernoise426 leukocytes
BSV 101 325 120 2371 2817IO 240 186 78 5634 1831
Wang 184 242 123 4319 2887BGA 294 132 83 6901 1948EMO 374 52 35 8779 821
been applied considering only 200 iterations FurthermoreFigure 10(c) shows results after applying the EMO methodwhich has been proposed in this paper
The Wang algorithm uses the fuzzy cellular neuralnetwork (FCNN) as an optimization approach It employsgradient information and internal states in order to find abetter contour configuration In each iteration the FCNNtries as contour points different new pixel positions whichmust be located nearby the original contour position Suchfact might cause the contour solution to remain trapped intoa local minimum In order to avoid such a problem theWangmethod applies a considerable number of iterations so that anear optimal contour configuration can be found Howeverwhen the number of iterations increases the possibility tocover other structures increases too Thus if the image hasa complex background (as smear images) the method getsconfused so that finding the correct contour configurationfrom the gradient magnitude is not easy Therefore a draw-back of Wangrsquos method is related to its optimal iterationnumber (instability) Such number must be determinedexperimentally as it depends on the image context and its
complexity Figure 11(a) shows the result of applying 400cycles of Wangrsquos algorithm while Figure 11(b) presents thedetection of the same cell shapes after 1000 iterations usingthe proposed algorithm From Figure 11(a) it can be seen thatthe contour produced byWangrsquos algorithm degenerates as theiteration process continues wrongly covering other shapeslying nearby
In order to compare the accuracy of both methods theestimated WBC area which has been approximated by bothapproaches is compared to the actual WBC size consideringdifferent degrees of evolution that is the cycle numberfor each algorithm The comparison acknowledges only oneWBC because it is the only detected shape inWangrsquos methodTable 5 shows the averaged results over twenty repetitions foreach experiment
7 Conclusions
This paper has presented an algorithm for the automaticdetection of white blood cells that are embedded into compli-cated and cluttered smear images by considering the complete
Computational and Mathematical Methods in Medicine 13
Table 4 Comparative WBC detection among methods that considers the complete data set of 30 images corrupted by different levels ofGaussian noise
Noise level Method Leukocytes detected Missing False alarms DR FAR
120590 = 5 Gaussian noise426 Leukocytes
BSV 172 254 77 4037 1807IO 309 117 71 7253 1667
Wang 301 125 65 7066 1526BGA 345 81 61 8098 1432EMO 397 29 21 9319 493
120590 = 10 Gaussian noise426 Leukocytes
BSV 143 283 106 3357 2488IO 281 145 89 6596 2089
Wang 264 162 102 6197 2394BGA 308 118 85 7230 1995EMO 380 46 32 8920 751
(a) (b)
(c)
Figure 10 Comparison of the EMO and Wangrsquos method for white blood cell detection in medical images (a) Original image (b) Detectionusing the Wangrsquos method (c) Detection after applying the EMOmethod
process as a circle detection problem The approach is basedon a nature-inspired technique called the electromagnetism-like optimization (EMO) which is a heuristic method thatfollows electromagnetism principles for solving complexoptimization problemsThe EMO algorithm is based on elec-tromagnetic attraction and repulsion forces among chargedparticles whose charge represents the fitness solution for eachparticle (a given solution) The algorithm uses the encodingof three noncollinear edge points as candidate circles overan edge map A new objective function has been derived to
measure the resemblance of a candidate circle to an actualWBC based on the information from the edge map andsegmentation results Guided by the values of such objectivefunction the set of encoded candidate circles (chargedparticles) are evolved by using the EMO algorithm so thatthey can fit into the actual blood cells that are contained inthe edge map
The performance of the EMO-method has been com-pared to other existingWBCdetectors (the boundary supportvectors (BSV) approach [2] the iterative Otsu (IO) method
14 Computational and Mathematical Methods in Medicine
(a) (b)
Figure 11 Result comparison for the white blood cells detection showing (a)Wangrsquos algorithm after 400 cycles and (b) EMOdetector methodconsidering 1000 cycles
Table 5 Error in cellrsquos size estimation after applying the EMOalgorithm and theWangrsquos method to detect one leukocite embeddedinto a blood-smear image The error is averaged over twentyexperiments
Algorithm Iterations Error
Wang60 70200 1400 121
EMO proposed60 822200 101400 108
[3] the Wang algorithm [4] and the Genetic algorithm-based (GAB) detector [19]) considering several images whichexhibit different complexity levels Experimental resultsdemonstrate the high performance of the proposed methodin terms of detection accuracy robustness and stability
Acknowledgments
The second author acknowledges The National Council ofScience and Technology of Mexico (CONACyT) for partiallysupport this research under the doctoral grant number215517
References
[1] J Liu and K C Tsui ldquoToward nature-inspired computingrdquoCommunications of the ACM vol 49 no 10 pp 59ndash64 2006
[2] M Wang and R Chu ldquoA novel white blood cell detectionmethod based on boundary support vectorsrdquo in Proceedings ofIEEE International Conference on Systems Man and Cybernetics(SMC rsquo09) pp 2595ndash2598 San Antonio Tex USA October2009
[3] J Wu P Zeng Y Zhou and C Olivier ldquoA novel colorimage segmentation method and its application to white bloodcell image analysisrdquo in Proceedings of the 8th InternationalConference on Signal Processing (ICSP rsquo06) November 2006
[4] S Wang F L Korris and D Fu ldquoApplying the improved fuzzycellular neural network IFCNN to white blood cell detectionrdquoNeurocomputing vol 70 no 7ndash9 pp 1348ndash1359 2007
[5] G Karkavitsas and M Rangoussi ldquoObject localization in medi-cal images using genetic algorithmsrdquoWorld Academy of ScienceEngineering and Technology vol 2 pp 499ndash502 2007
[6] H Muammar and M Nixon ldquoApproaches to extending theHough transformrdquo in Proceedings of the International Confer-ence on Acoustics Speech and Signal Processing (ICASSP rsquo89)vol 3 pp 1556ndash1559 May 1989
[7] T Atherton and D Kerbyson ldquoUsing phase to represent radiusin the coherent circle Hough transformrdquo in Proceedings of IEEColloquium on the Hough Transform pp 1ndash4 May 1993
[8] M A Fischler and R C Bolles ldquoRandom sample consensus aparadigm for model fitting with applications to image analysisand automated cartographyrdquo Communications of the ACM vol24 no 6 pp 381ndash395 1981
[9] D Shaked O Yaron and N Kiryati ldquoDeriving stopping rulesfor the probabilistic Hough transform by sequential analysisrdquoComputer Vision and Image Understanding vol 63 no 3 pp512ndash526 1996
[10] L Xu E Oja and P Kultanen ldquoA new curve detection methodrandomized Hough transform (RHT)rdquo Pattern RecognitionLetters vol 11 no 5 pp 331ndash338 1990
[11] J H Han L T Koczy and T Poston ldquoFuzzy Hough transformrdquoinProceedings of the 2nd IEEE International Conference on FuzzySystems vol 2 pp 803ndash808 April 1993
[12] J M Becker S Grousson and D Coltuc ldquoFrom Hough trans-form to integral geometryrdquo in Proceedings of IEEE InternationalGeoscience and Remote Sensing Symposium (IGARSS rsquo02) vol 3pp 1444ndash1446 June 2002
[13] V Ayala-Ramirez C H Garcia-Capulin A Perez-Garcia andR E Sanchez-Yanez ldquoCircle detection on images using geneticalgorithmsrdquo Pattern Recognition Letters vol 27 no 6 pp 652ndash657 2006
[14] E Cuevas N Ortega-Sanchez D Zaldivar and M Perez-Cisneros ldquoCircle detection by harmony search optimizationrdquoJournal of Intelligent amp Robotic Systems vol 66 no 3 pp 359ndash376 2012
[15] E Cuevas D Zaldivar M Perez-Cisneros and M Ramırez-Ortegon ldquoCircle detection using discrete differential evolution
Computational and Mathematical Methods in Medicine 15
optimizationrdquo Pattern Analysis amp Applications vol 14 no 1 pp93ndash107 2011
[16] E Cuevas D Oliva D Zaldivar M Perez-Cisneros and HSossa ldquoCircle detection using electro-magnetismoptimizationrdquoInformation Sciences vol 182 no 1 pp 40ndash55 2012
[17] G Karkavitsas and M Rangoussi ldquoObject localization in med-ical images using genetic algorithmsrdquo International Journal ofInformation and Communication Engineering vol 1 no 4 pp204ndash207 2005
[18] S Birbil and S C Fang ldquoAn electromagnetism-like mechanismfor global optimizationrdquo Journal of Global Optimization vol 25no 3 pp 263ndash282 2003
[19] A M A C Rocha and E M G P Fernandes ldquoHybridizingthe electromagnetism-like algorithm with descent search forsolving engineering design problemsrdquo International Journal ofComputer Mathematics vol 86 no 10-11 pp 1932ndash1946 2009
[20] S Birbil S C Fang and R L Sheu ldquoOn the convergence ofa population-based global optimization algorithmrdquo Journal ofGlobal Optimization vol 30 no 2-3 pp 301ndash318 2004
[21] E W Cowan Basic Electromagnetism Academic Press NewYork NY USA 1968
[22] J Bresenham ldquoLinear algorithm for incremental digital displayof circular arcsrdquo Communications of the ACM vol 20 no 2 pp100ndash106 1977
[23] G Boccignone M Ferraro and P Napoletano ldquoDiffusedexpectation maximisation for image segmentationrdquo ElectronicsLetters vol 40 no 18 pp 1107ndash1108 2004
[24] G Boccignone P Napoletano V Caggiano and M Ferraro ldquoAmultiresolution diffused expectation-maximization algorithmfor medical image segmentationrdquo Computers in Biology andMedicine vol 37 no 1 pp 83ndash96 2007
[25] R C Gonzalez and R E Woods Digital Image ProcessingAddison Wesley Reading Mass USA 1992
[26] G Landi and E L Piccolomini ldquoAn efficient method fornonnegatively constrained Total Variation-based denoising ofmedical images corrupted by Poisson noiserdquo ComputerizedMedical Imaging and Graphics vol 36 no 1 pp 38ndash46 2012
Submit your manuscripts athttpwwwhindawicom
Hindawi Publishing Corporationhttpwwwhindawicom Volume 2013
Oxidative Medicine and Cellular Longevity
Hindawi Publishing Corporation httpwwwhindawicom Volume 2013Hindawi Publishing Corporation httpwwwhindawicom Volume 2013
The Scientific World Journal
International Journal of
EndocrinologyHindawi Publishing Corporationhttpwwwhindawicom
Volume 2013
ISRN Anesthesiology
Hindawi Publishing Corporationhttpwwwhindawicom Volume 2013
OncologyJournal of
Hindawi Publishing Corporationhttpwwwhindawicom Volume 2013
PPARRe sea rch
Hindawi Publishing Corporationhttpwwwhindawicom Volume 2013
OphthalmologyJournal of
Hindawi Publishing Corporationhttpwwwhindawicom Volume 2013
ISRN Allergy
Hindawi Publishing Corporationhttpwwwhindawicom Volume 2013
BioMed Research International
Hindawi Publishing Corporationhttpwwwhindawicom Volume 2013
ObesityJournal of
Hindawi Publishing Corporationhttpwwwhindawicom Volume 2013
ISRN Addiction
Hindawi Publishing Corporationhttpwwwhindawicom Volume 2013
Hindawi Publishing Corporationhttpwwwhindawicom Volume 2013
Computational and Mathematical Methods in Medicine
ISRN AIDS
Hindawi Publishing Corporationhttpwwwhindawicom Volume 2013
Clinical ampDevelopmentalImmunology
Hindawi Publishing Corporationhttpwwwhindawicom
Volume 2013
Diabetes ResearchJournal of
Hindawi Publishing Corporationhttpwwwhindawicom Volume 2013
Evidence-Based Complementary and Alternative Medicine
Volume 2013Hindawi Publishing Corporationhttpwwwhindawicom
Hindawi Publishing Corporationhttpwwwhindawicom Volume 2013
Gastroenterology Research and Practice
Hindawi Publishing Corporationhttpwwwhindawicom Volume 2013
ISRN Biomarkers
Hindawi Publishing Corporationhttpwwwhindawicom Volume 2013
MEDIATORSINFLAMMATION
of
2 Computational and Mathematical Methods in Medicine
several white cells Moreover its performance commonlydecays when the iteration number is not properly definedyielding a challenging problem itself with no clear clues onhow to make the best choice
Since blood cells can be approximated with a quasi-circular form a circular detector algorithm may be handyThe problem of detecting circular features holds paramountimportance for image analysis in particular for medicalimage analysis [5] The circle detection in digital images iscommonly performed by the circular Hough transform [6]A typical Hough-based approach employs an edge detectorwhose information guides the inference for circle locationsand radius values Peak detection is then performed byaveraging filtering and histogramming the transform spaceHowever such approach requires a large storage space givenby the required 3D cells to cover all parameters (119909 119910 119903) Italso implies a high computational complexity yielding a lowprocessing speed The accuracy of the extracted parametersfor the detected circle is poor particularly in presence ofnoise [7] For a digital image holding a significant widthand height and a densely populated edge pixel map therequired processing time for circularHough transformmakesit prohibitive to be deployed in real time applications In orderto overcome such a problem some other researchers haveproposed new approaches based on the Hough transformfor instance the probabilistic Hough transform [8 9] therandomized Hough transform (RHT) [10] and the fuzzyHough transform [11] Alternative transformations have alsobeen presented in the literature as the one proposed by Beckeret al in [12] Although those new approaches demonstratedbetter processing speeds in comparison to the originalHoughtransform they are still very sensitive to noise
As an alternative to Hough transform-based techniquesthe circle detection problem has also been handled throughoptimization methods In general they have demonstratedto deliver better results than those based on HT consider-ing accuracy speed and robustness [13] Such approacheshave produced several robust circle detectors using differentoptimization algorithms such as genetic algorithms (GAs)[13] harmony search (HS) [14] differential evolution (DE)[15] and the electromagnetism-like optimization algorithm(EMO) [16]
Although detection algorithms based on the optimiza-tion approaches present several advantages in comparisonto those based on the Hough transform they have beenscarcely applied toWBCdetection One exception is theworkpresented by Karkavitsas and Rangoussi [17] that solves theWBC detection problem through the use of GA Howeversince the evaluation function which assesses the qualityof each solution considers the number of pixels containedinside of a circle with fixed radius the method is prone toproduce misdetections particularly for images that containedoverlapped or irregular WBC
In this paper the WBC detection task is approachedas an optimization problem and the EMO-based circledetector [16] is used to build the circular approximationThe EMO algorithm [18] is a stochastic evolutionary com-putation technique based on the electromagnetism theory Itconsiders each solution to be a charged particle The charge
of each particle is determined by an objective functionThereby EMO moves each particle according to its chargewithin an attraction or repulsion field among the popula-tion using Coulombrsquos law and the superposition principleThis attraction-repulsion mechanism of the EMO algorithmcorresponds to the reproduction crossover and mutation inGA [19] In general the EMO algorithm can be consideredas a fast and robust algorithm representing an alternative tosolve complex nonlinear nondifferentiable and nonconvexoptimization problemsThe principal advantages of the EMOalgorithm lie on several facts it has no gradient operation itcan be used directly on a decimal system it needs only fewparticles to converge and the convergence existence has beenalready verified [20]
TheEMO-based circle detector uses the encoding of threeedge points that represent candidate circles in the edge mapof the scene The quality of each individual is calculated byusing an objective function which evaluates if such candidatecircles are really present in the edge map of the image Thebetter a candidate circle approximates the actual edge circlethe more the objective function value decreases Thereforethe detection performance depends on the quality of the edgemap as it is obtained from the original images Howeversince smear images present different imaging conditionsand staining intensities they produce edge maps partiallydamaged by noisy pixels Under such conditions the use ofthe EMO-based circle detector cannot be directly applied toWBC detection
This paper presents an algorithm for the automatic detec-tion of blood cell images based on the EMO algorithm Theproposedmethodmodifies the EMO-based circle detector byincorporating a new objective function Such function allowsto accurately measure the resemblance of a candidate circlewith an actualWBCon the imagewhich is based on the infor-mation not only from the edgemap but also from the segmen-tation results Guided by the values of the new objective func-tion the set of encoded candidate circles are evolved using theEMO algorithm so that they can fit into actual WBC on theimageThe approach generates a subpixel detector which caneffectively identify leukocytes in real images Experimentalevidence shows the effectiveness of such method in detectingleukocytes despite complex conditions Comparison to thestate-of-the-art WBC detectors on multiple images demon-strates a better performance of the proposed method
The main contribution of this study is the proposal ofa new WBC detector algorithm that efficiently recognizesWBC under different complex conditions while consideringthe whole process as a circle detection problem Althoughcircle detectors based on optimization present several inter-esting properties to the best of our knowledge they havenot yet been applied to any medical image processing up todate
This paper is organized as follows Section 2 provides adescription of the EMO algorithm while in Section 3 thecircle detection task is fully explained from an optimizationperspective within the context of the EMO approach Thecomplete WBC detector is presented in Section 4 Section 5reports the obtained experimental results whereas Section 6conducts a comparison between the state-of-the-art WBC
Computational and Mathematical Methods in Medicine 3
(1) Input parameters the maximum number of iterationsMAXITER the values for the localsearch parameters such as 119868
119897and 120575 and the size119873 of the population are all defined
(2) Initialize set the iteration counter 119896 = 1 initialize the members of 119878119896 uniformly in119883and identify the best point in 119878119896
(3) while 119896 lt 119872119860119883119868119879119864119877 do(4) 119865119896119894larr Calc119865(119878119896)
(5) 119910119894119896 = Move (119909119894119896 119865119896
119894)
(6) 119911119894119896= Local (119868119897 120575 119910119894119896)(7) 119909119894119896+1 = Select (119878119896+1 119910119894119896 119911119894119896)(8) End while
Algorithm 1 [EMO (119873119872119860119883119868119879119864119877 119868119897 120575)]
detectors and the proposed approach Finally in Section 7some conclusions are drawn
2 Electromagnetism-Like OptimizationAlgorithm (EMO)
Initially designed for bound constrained optimization prob-lems the EMOmethod [18] utilizes119873 119899-dimensional points119909119894119896 119894 = 1 2 119873 as a population for searching the feasibleset 119883 = 119909 isin 119877119899 | 119897119894 le 119909 le 119906119894 where the index 119896 denotes theiteration (or generation) number of the algorithm while thelower and upper parameter limits are represented by 119897119894 and 119906119894respectively The initial population 119878119896 = 1199091119896 1199092119896 119909119873119896
(being 119896 = 1) is taken from uniformly distributed samplesof the search region 119883 We also denote the population set atthe 119896th iteration by 119878119896 It does contain the members of theset 119878119896 that have changed with 119896 After the initialization of 119878119896EMOcontinues its iterative process until a stopping condition(eg themaximumnumber of iterations) is met An iterationof EMO consists of two steps In the first step each pointin 119878119896 moves to a different location by using the attraction-repulsion mechanism of the electromagnetism theory [21]In the second step points that have been moved by theelectromagnetism theory are further moved locally by a localsearch and then become the members of 119878119896+1 in the (119896 + 1)thiteration Both the attraction-repulsion mechanism and thelocal search in EMO are responsible for driving themembers119909119894119896 of 119878119896 to the close proximity of the global minimizer
Similar to the electromagnetism theory for charged par-ticles each point 119909119894119896 isin 119878119896 in the search space119883 is assumed tobe a charged particle where the charge of a point relates to itsobjective function value Points holding better objective func-tion values possess higher EMO charges than other points
The attraction-repulsion mechanism in EMO states thatpoints holding more charge attract other points in 119878119896 whilepoints showing less charge repel other points Finally a totalforce vector 119865119896
119894 exerted over a point for example the 119894th
point 119909119894119896 is calculated by adding the resultant attraction-repulsion forces and each 119909119894119896 isin 119878119896 is moved in the directionof its total force denoting its location by 119910119894119896
A local search is used to explore the neighborhood of each119910119894119896 Considering a determined number of steps known as 119868119897and a fixed neighbourhood search 120575 the procedure iteratesas follows Point 119910119894119896 is assigned to a temporary point 119911119894119896 to
store the initial information Next for a given coordinate 119894 (isin1 119899) a random number is selected and combined with 120575
as a step length which in turns moves the point 119911119894119896 along thedirection 119889 If point 119911119894119896 observes a better performance withina set of 119868119897 repetitions point 119910119894119896 is replaced by 119911119894119896 otherwise119910119894119896 is held Therefore the members 119909119894119896+1 isin 119878119896+1 of the (119896 +1)th iteration are defined through the following equation
119909119894119896+1 = 119911119894119896 if 119891 (119911119894119896) lt 119891 (119910119894119896)
119910119894119896 otherwise(1)
Algorithm 1 shows the general scheme of EMO We alsoprovide the description of each step as follows
Input Parameter Values (Line 1) The EMO algorithm is runfor MAXITER iterations In the local search phase 119899 times 119868119897 isthe maximum number of locations 119911119894119896 within a 120575 distance of119910119894119896 for each 119894
Initialize (Line 2) The points 119909119894119896 119896 = 1 are selecteduniformly distributed in119883 considering lower 119897119894 and upper 119906119894parameter limits where 119894 = 1 2 119899The objective functionvalues 119891(119909119894119896) are computed and the best point
119909119861
119896= arg min
119909119894119896isin119878119896
119891 (119909119894119896) (2)
is also identified
Calculate Force (Line 4) In this step a charged-like value(119902119894119896) is assigned to each point (119909119894119896) The charge 119902119894119896 of 119909119894119896is dependent on 119891(119909119894119896) and points holding better objectivefunction have more charge than others The charges arecomputed as follows
119902119894119896 = exp(minus119899119891 (119909119894119896) minus 119891 (119909119861
119896)
sum119873
119895=1119891 (119909119895119896) minus 119891 (119909119861
119896)) (3)
where 119909119861119896represents the best particle in the population (see
(2)) Then the force 119865119896119894119895 between two points 119909119894119896 and 119909119895119896 is
calculated by using
119865119896
119894119895=
(119909119895119896 minus 119909119894119896)119902119894119896 sdot 119902119895119896
10038171003817100381710038171003817119909119895119896 minus 119909119894119896
10038171003817100381710038171003817
2if 119891 (119909119894119896) gt 119891 (119909119895119896)
(119909119894119896 minus 119909119895119896)119902119894119896 sdot 119902119895119896
10038171003817100381710038171003817119909119895119896 minus 119909119894119896
10038171003817100381710038171003817
2if 119891 (119909119894119896) le 119891 (119909119895119896)
(4)
4 Computational and Mathematical Methods in Medicine
The total force 119865119896119894 corresponding to 119909119894119896 is now calculated as
119865119896
119894=
119873
sum119895=1119895 = 119894
119865119896
119894119895 (5)
Moving Point 119909119894119896 along 119865119896119894(Line 5) In this step each point
119909119894119896 except for 119909119861
119896 is moved along the total force vector 119865119896
119894by
considering
119909119894119896 = 119909119894119896 + 120582119865119896
119894
1003817100381710038171003817119865119896
119894
1003817100381710038171003817(RNG) 119894 = 1 2 119873 119894 = 119861 (6)
where 120582 is a random number between 0 and 1 and RNGdenotes the allowed range of movement towards the lower 119897119894or upper 119906119894 bound for the corresponding dimension
Local Search (Line 6) For each 119910119894119896 a maximum of 119868119897points are generated at each coordinate direction in 120575 theneighborhood of 119910119894119896 The process of generating local pointsis continued for each 119910119894119896 until either a better 119911119894119896 is found orthe 119868119897 trial is reached
Selection for the Next Iteration (Line 7) In this step members119909119894119896+1 isin 119878119896+1 are selected from 119910119894119896 and 119911119894119896 using (1) and thebest point is identified using (2)
3 Circle Detection Using EMO
31 Data Preprocessing In order to detect circle shapescandidate images must be preprocessed first by the well-known Canny algorithm which yields a single-pixel edge-only image Then the (119909119894 119910119894) coordinates for each edge pixel119901119894 are stored inside the edge vector119875 = 1199011 1199012 119901119873119901 with119873119901 being the total number of edge pixels
32 Particle Representation In order to construct each par-ticle 119862 (circle candidate) the indexes 1198901 1198902 and 1198903 whichrepresent three edge points previously stored inside the vector119875 must be grouped assuming that the circlersquos contour con-nects them Therefore the circle 119862 = 1199011198901 1199011198902 1199011198903 passingover such points may be considered as a potential solutionfor the detection problem Considering the configuration ofthe edge points shown in Figure 1 the circle center (1199090 1199100)and the radius 119903 of 119862 can be characterized as follows
(119909 minus 1199090)2+ (119910 minus 1199100)
2= 1199032 (7)
where 1199090 and 1199100 are computed through the following equa-tions
1199090 =det (A)
4 ((1199091198902 minus 1199091198901) (1199101198903 minus 1199101198901) minus (1199091198903 minus 1199091198901) (1199101198902 minus 1199101198901))
1199100 =det (B)
4 ((1199091198902 minus 1199091198901) (1199101198903 minus 1199101198901) minus (1199091198903 minus 1199091198901) (1199101198902 minus 1199101198901))
(8)
Figure 1 Circle candidate (charged particle) built from the combi-nation of points 1199011198901 1199011198902 and 1199011198903
with det(A) anddet(B) representing determinants ofmatricesA and B respectively considering
A = [11990921198902+ 11991021198902minus (11990921198901+ 11991021198901) 2 sdot (1199101198901 minus 1199101198901)
11990921198903+ 11991021198903minus (11990921198901+ 11991021198901) 2 sdot (1199101198903 minus 1199101198901)
]
B = [2 sdot (1199091198902 minus 1199091198901) 1199092
1198902+ 11991021198902minus (11990921198901+ 11991021198901)
2 sdot (1199091198903 minus 1199091198901) 11990921198903+ 11991021198903minus (11990921198901+ 11991021198901)]
(9)
the radius 119903 can therefore be calculated using
119903 = radic(1199090 minus 119909119890119889)2
+ (1199100 minus 119910119890119889)2
(10)
where 119889 isin 1 2 3 and (119909119890119889 119910119890119889) are the coordinates ofany of the three selected points which define the particle119862 Figure 1 illustrates main parameters defined by (7)ndash(10)Therefore the shaping parameters for the circle [11990901199100 119903]can be represented as a transformation 119879 of the edge vectorindexes 1198901 1198902 and 1198903
[1199090 1199100 119903] = 119879 (1198901 1198902 1198903) (11)
By exploring each index as a particle it is possible to sweepthe continuous space while looking for shape parameters bymeans of the EMO algorithm This approach reduces thesearch space by eliminating unfeasible solutions
33 Objective Function In order to model the fitness func-tion the circumference coordinates of the circle candidate119862 are calculated as a virtual shape which in turn must bevalidated that is if it really exists in the edge image Thecircumference coordinates are grouped within the test set119867 = ℎ1 ℎ2 ℎ119873119904 with 119873119904 representing the numberof points over which the existence of an edge point whichcorresponds to 119862 must be verified
The test 119867 is generated by the midpoint circle algorithm(MCA) [22] which is a well-known algorithm to determinethe required points for drawing a circle MCA requires
Computational and Mathematical Methods in Medicine 5
as inputs only the radius 119903 and the center point (1199090 1199100)
considering only the first octant over the circle equation 1199092 +
1199102 = 1199032 It draws a curve starting at point (119903 0) and proceedsupwards left by using integer additions and subtractionsThe MCA aims to calculate the required points 119867 in orderto represent a circle candidate Although the algorithm isconsidered as the quickest providing a subpixel precision it isimportant to assure that points lying outside the image planemust not be considered in119867
The objective function 119869(119862) represents thematching errorproduced between the pixels 119867 of the circle candidate 119862
(particle) and the pixels that actually exist in the edge-onlyimage yielding
119869 (119862) = 1 minussum119873119904
119907=1119864 (ℎ119907)
119873119904 (12)
where 119864(ℎ119907) is a function that verifies the pixel existence inℎ119907 where ℎ119907 isin 119867 and 119873119904 is the number of elements of 119867Hence the function 119864(ℎ119907) is defined as
119864 (ℎ119907) = 1 if the test pixel ℎ119907 is an edge point0 otherwise
(13)
A value of 119869(119862) near to zero implies a better responsefrom the ldquocircularityrdquo operator Figure 2 shows the procedureto evaluate a candidate solution 119862 with its representation asa virtual shape 119867 Figure 2(a) shows the original edge mapwhile Figure 2(b) presents the virtual shape 119867 representingthe particle 119862 = 1199011198901 1199011198902 1199011198903 In Figure 2(c) the virtualshape119867 is compared to the original image point by point inorder to find coincidences between virtual and edge pointsThe 119901 individual has been built from points 1199011198901 1199011198902 and1199011198903 which are shown in Figure 2(a) The virtual shape 119867obtained by MCA gathers 56 points (119873119904 = 56) with only18 of them existing in both images (shown as blue pointsplus red points in Figure 2(c)) and yieldingsum119873119904
ℎ=1119864(ℎ119907) = 18
therefore 119869(119862) asymp 067
34 EMO Implementation The implementation of the pro-posed algorithm can be summarized into the following steps
Step 1 The Canny filter is applied to find the edges and storethem in the 119875 = 1199011 1199012 119901119873119901 vector The index 119896 is set to1
Step 2 119898 initial particles are generated (1198621198861 119886 isin [1119898])Particles belonging to a seriously small or to a quite big radiusare eliminated (collinear points are discarded)
Step 3 The objective function 119869(119862119886119896) is evaluated to deter-mine the best particle 119862119861 (where 119862119861 larr arg min119869(119862119886119896))
Step 4 The charge between particles is calculated usingexpression (3) and its vector force is calculated through (4)and (5) The particle with a better objective function holds abigger charge and therefore a bigger attraction force
(a)
(b)
(c)
Figure 2 Procedure to evaluate the objective function 119869(119862) Theimage shown by (a) presents the original edge image while (b)portraits the virtual shape 119867 corresponding to 119862 The image in (c)shows coincidences between both images through blue or red pixelswhile the virtual shape is also depicted in green
Step 5 The particles are moved according to their forcemagnitude The new particlersquos position 119862119910
119886is calculated by
expression (6) 119862119861 is not moved because it has the biggestforce and it attracts other particles to itself
Step 6 For each 119862119910119886 a maximum of 119868119897 points are generated at
each coordinate direction in the 120575 neighborhood of 119862119910119886 The
process of generating local points is continued for each 119862119910119886
until either a better 119862119911119886is found or the 119899 times 119868119897 trial is reached
Step 7 The new particles 119862119886119896+1 are selected from 119862119910119886and 119862119911
119886
using (1)
6 Computational and Mathematical Methods in Medicine
Repelled
Attracted
Figure 3 An analogy to the Coulombrsquos law
Step 8 The 119896 index is increased If 119896 = 119872119860119883119868119879119864119877 or if119869(119862119886119896) value is as smaller as the predefined threshold valuethen the algorithm is stopped and the flow jumps to Step 9Otherwise it jumps to Step 3
Step 9 The best 119862119861 particle is selected from the last iteration
Step 10 From the original edge map the algorithm markspoints corresponding to 119862119861 In case of multicircle detectionit jumps to Step 2
Step 11 Finally the best particle 119862119861119873119888
from each circle isused to draw (over the original image) the detected circlesconsidering119873119888 as the number of detected circles
Figure 3 shows an analogy to Coulombrsquos lawThe originalfigures to be detected are represented by a solid black linewhile the shapes with discontinuous gray lines represent thecandidate circles Since the candidate circles 1198621119896 and 1198623119896present a high value in the fitness function 119869(119862119886119896) they arerepelled (blue lines) moving away the shapes In contrastthe circle candidate 1198622119896 that holds a small value of 119869(119862119886119896)is attracted (red line) to the circular shape contained in theimage
4 The White Blood Cell Detector
In order to detect WBC the proposed detector combines theEMO-based circle detector presented in Section 3 with a newobjective function
41 Image Preprocessing To employ the proposed detectorsmear images must be preprocessed to obtain two newimages the segmented image and its corresponding edgemapThe segmented image is produced by using a segmenta-tion strategy whereas the edge map is generated by a borderextractor algorithm Both images are considered by the newobjective function to measure the resemblance of a candidatecircle with an actual WBC
The goal of the segmentation strategy is to isolate thewhite blood cells (WBCs) from other structures such as
red blood cells and background pixels Information of colorbrightness and gradients is commonly used within a thresh-olding scheme to generate the labels to classify each pixelAlthough a simple histogram thresholding can be used tosegment the WBCs in this work the diffused expectation-maximization (DEM) has been used to assure better results[23]
DEM is an expectation-maximization- (EM-) based algo-rithm which has been used to segment complex medicalimages [24] In contrast to classical EM algorithms DEMconsiders the spatial correlations among pixels as a part ofthe minimization criteria Such adaptation allows to segmentobjects in spite of noisy and complex conditions
For the WBCs segmentation the DEM has been config-ured considering three different classes (119870 = 3) 119892(nablaℎ119894119896) =
|nablaℎ119894119896|minus95 120582 = 01 and 119898 = 10 iterations These values
have been found as the best configuration set according to[23] As a final result of the DEM operation three differentthresholding points are obtained the first corresponds to theWBCs the second to the red blood cells whereas the thirdrepresents the pixels classified as background Figure 4(b)presents the segmentation results obtained by the DEMapproach employed at this work considering Figure 4(a) asthe original image
Once the segmented image has been produced the edgemap is computed The purpose of the edge map is to obtain asimple image representation that preserves object structuresOptimization-based circle detectors [17ndash20] operate directlyover the edge map in order to recognize circular shapesSeveral algorithms can be used to extract the edge maphowever in this work the morphological edge detectionprocedure [25] has been used to accomplish such a taskMorphological edge detection is a traditional method toextract borders from binary images in which original images(119868119861) are eroded by a simple structure element (119868119864) Then theeroded image is inverted (119868119864) and compared with the originalimage (119868119864 and 119868119861) in order to detect pixels which are present inboth images Such pixels compose the computed edge mapfrom 119868119861 Figure 4(c) shows the edge map obtained by usingthe morphological edge detection procedure
Other example is presented in Figure 8 It represents acomplex example with an image showing seriously deformedcells Despite such imperfections the proposed approach caneffectively detect the cells as it is shown in Figure 8(d)
42 The Modified EMO-Based Circle Detector The circledetection approach uses the encoding of three edge pointsthat represent candidate circles in the image In the originalEMO-based circle detector the quality of each individual iscalculated by using an objective function which evaluates theexistence of a candidate circle considering only informationfrom the edge map (shape structures) The better a candidatecircle approximates the actual edge-circle themore the objec-tive function value decreasesTherefore the detection perfor-mance depends on the quality of the edgemap that is obtainedfrom the original images However since smear imagespresent different imaging conditions and staining intensitiesthey produce edge maps partially damaged by noisy pixels
Computational and Mathematical Methods in Medicine 7
(a) (b)
(c)
Figure 4 Preprocessing process (a) original smear image (b) segmented image obtained by DEM and (c) the edge map obtained by usingthe morphological edge detection procedure
Under such conditions the use of the EMO-based circledetector cannot be directly applied to WBC detection
In order to use the EMO-based circle detector withinthe context of WBC detection it is necessary to change thefitness function presented in (11) In thiswork a newobjectivefunction has been derived to measure the resemblance of acandidate circle to an actual WBC based on the informationfrom the edge map and the segmented image Such newobjective function takes into consideration not only the infor-mation provided by the edge map but also the relationshipamong the pixels falling inside the candidate circle which iscontained in the segmented image validating the existenceof the WBC This new function 119869(119862) is thus calculated asfollows
119869New (119862) = 2 minussum119873119904
119907=1119864 (ℎ119907)
119873119904minus119882119901
119861119901 (14)
where ℎ119907 and 119873119904 keep the same meaning than (11) and 119882119901
is the amount of white pixel falling inside the candidatecircle represented by 119862 Likewise 119861119901 corresponds to the totalnumber of black pixels falling inside 119862
To illustrate the functionality of the new objective func-tion Figure 5 presents a detection procedure which considersa complex image Figure 5(a) shows the original smear imagecontaining a WBC and a stain produced by the coloringprocess Figures 5(b) and 5(c) represent the segmented imageand the edge map respectively Since the stain containedin the smear image (Figure 5(a)) possesses similar proper-ties than a WBC it remains as a part of the segmented
image (Figure 5(b)) and the edge map (Figure 5(c)) Suchan inconsistency produces big detection errors in case theEMO-based circle detector is used without modificationFigure 5(d) presents detection results obtained by the originalEMO-based circle detector As the original objective functionconsiders only the number of coincidences between thecandidate circle and the edge map circle candidates thatmatch with a higher number of edge pixels are chosen asthe best circle instances In Figure 5(d) the detected circlepresents a coincidence of 37 different pixels in the edge mapSuch coincidence is considered as the best possible underthe restrictions of the original objective function On theother hand when the modified objective function is used inthe recognition procedure the accuracy and the robustnessof the detection are both significantly improved By usingthe new objective function information from the segmentedimage is employed to refine the solution that is providedby coincidences with the edge map Figure 5(e) presents thedetection result that has been produced by the modifiedEMO-based circle detector In the figure the detected circlematches with only 32 pixels of the edge map However it isconsidered as the best instance due to the relationship of itsinternal pixels (the white pixels aremuchmore than the blackpixels) Finally Figure 5(f) shows final detection results overthe original smear image
Table 1 presents the parameters for the EMO algorithmused in this workThey have been kept for all test images afterbeing experimentally defined
8 Computational and Mathematical Methods in Medicine
(a) (b) (c)
(d) (e) (f)
Figure 5WBC detection procedure (a) Smear image (b) Segmented image (c) Edge map (d) Detected circle by using the original objectivefunction Red points show the coincidences between the candidate circle and the edge map (e) Detected circle by using the new objectivefunction Yellow points represent the edge pixels without coincidence (f) Final result
Table 1 EMO parameters used for leukocytes detection in medicalimages119898 119899 119872119860119883119868119879119864119877 120575 119871119868119878119879119864119877
50 3 5 4 4
Under such assumptions the complete process to detectWBCs is implemented as follows
Step 1 Segment the WBCs using the DEM algorithm
Step 2 Get the edge map from the segmented image by usingthe morphological edge detection method
Step 3 Start the circle detector based on EMO over the edgemap while saving best circles (Section 33)
Step 4 Define parameter values for each circle that identifythe WBCs
43 Numerical Example In order to present the algorithmrsquosstep-by-step operation a numerical example has been set byapplying the proposed method to detect a single leukocytelying inside of a simple image Figure 6(a) shows the imageused in the example After applying the threshold operationtheWBC is located besides few other pixels which are merelynoise (see Figure 6(b)) Then the edge map is subsequentlycomputed and stored pixel by pixel inside the vector 119875Figure 6(c) shows the resulting image after such procedure
The EMO-based circle detector is executed using infor-mation of the edge map and the segmented image (for thesake of easiness it only considers a population of three parti-cles) Like all evolutionary approaches EMO is a population-based optimizer that attacks the starting point problem by
sampling the search space at multiple randomly choseninitial particles By taking three random pixels from vector 119875three different particles are constructed Figure 6(d) depictsthe initial particle distribution Since the particle 11986220 holdsthe best fitness value 119869New(11986220) (it does possess a bettercoincidence with the edge map and a god pixel relationship)it is considered as the best particle 119862119861 Then the charge ofeach particle is calculated through (3) and the forces exertedover each particle are computed Figure 6(e) shows the forcesexerted over the 11986230 particle Since the 11986230 particle is theworst particle in terms of fitness value it is attracted byparticles 11986210 and 11986220 11986531 and 11986532 represent the existentattracting forces of 11986230 with respect to 11986210 and 11986220 whereas1198653 corresponds to the resultant force Considering 1198653 as thefinal force exerted over 11986230 the position of 11986230 is modifiedusing (6) Figure 6(f) depicts the new position11986231 of particle11986230 (the second subindex means the iteration number) Ifthe same procedure is applied over all the particles (exceptfor 11986220 which is the best particle) it yields positions shownin Figure 6(g) Therefore after 20 iterations all particlesconverge to the same position presented in Figure 6(h)whereas Figure 6(i) depicts the final result
5 Experimental Results
Experimental tests have been developed in order to evaluatethe performance of the WBC detector It was tested overmicroscope images from blood smears holding a 600 times 500
pixel resolution They correspond to supporting images onthe leukemia diagnosis The images show several complexconditions such as deformed cells and overlapping withpartial occlusions The robustness of the algorithm has beentested under such demanding conditions
Computational and Mathematical Methods in Medicine 9
(a) (b) (c)
(d) (e) (f)
(g) (h) (i)
Figure 6 Detection numerical example (a) The image used as example (b) Segmented image (c) Edge map (d) Initial particles (e) Forcesexerted over 11986230 (f) New position of 11986230 (g) Positions of all particles after the first generation (h) Final particle configuration after 20generations (i) Final result overlapped the original image
Figure 7(a) shows an example image employed in thetest It was used as input image for the WBC detectorFigure 7(b) presents the segmented WBCs obtained by theDEM algorithm Figures 7(c) and 7(d) present the edgemap and the white blood cells after detection respectivelyThe results show that the proposed algorithm can effec-tively detect and mark blood cells despite cell occlusiondeformation or overlapping Other parameters may also becalculated through the algorithm the total area coveredby white blood cells and relationships between several cellsizes
6 Comparisons to Other Methods
Acomprehensive set of smear-blood test images is used to testthe performance of the proposed approach We have appliedthe proposed EMO-based detector to test images in order tocompare its performance to otherWBC detection algorithmssuch as the boundary support vectors (BSVs) approach [2]the iterative Otsu (IO) method [3] the Wang algorithm [4]and the Genetic algorithm-based (GAB) detector [17] In allcases the algorithms are tuned according to the value setwhich is originally proposed by their own references
61 Detection Comparison To evaluate the detection per-formance of the proposed detection method Table 2 tab-ulates the comparative leukocyte detection performance ofthe BSV approach the IO method the Wang algorithmthe BGA detector and the proposed method in terms ofdetection rates and false alarms The experimental data setincludes 30 images which are collected from the Cellavisionreference library (httpwwwcellavisioncom) Such imagescontain 426 leukocytes (222 bright leukocytes and 204 darkleukocytes according to smear conditions) which have beendetected and counted by a human expert Such values act asground truth for all the experiments For the comparisonthe detection rate (DR) is defined as the ratio between thenumber of leukocytes correctly detected and the numberof leukocytes determined by the expert The false alarmrate (FAR) is defined as the ratio between the number ofnonleukocyte objects that have been wrongly identified asleukocytes and the number leukocytes which have beenactually determined by the expert
Experimental results show that the proposed EMOmethod which achieves 9648 leukocyte detection accu-racy with 375 false alarm rate is compared favorablyagainst other WBC detection algorithms such as the BSV
10 Computational and Mathematical Methods in Medicine
(a) (b)
(c) (d)
Figure 7 Resulting images of the first test after applying the WBC detector (a) original image (b) image segmented by the DEM algorithm(c) edge map and (d) the white detected blood cells
approach the IO method the Wang algorithm and the BGAdetector
62 Robustness Comparison Images of blood smear are oftendeteriorated by noise due to various sources of interferenceand other phenomena that affect the measurement processesin imaging and data acquisition systems Therefore thedetection results depend on the algorithmrsquos ability to copewith different kinds of noises In order to demonstratethe robustness in the WBC detection the proposed EMOapproach is compared to the BSV approach the IO methodthe Wang algorithm and the BGA detector under noisyenvironments In the test two different experiments havebeen studied The first inquest explores the performanceof each algorithm when the detection task is accomplishedover images corrupted by salt and pepper noise The secondexperiment considers images polluted by Gaussian noise Saltand Pepper andGaussian noise are selected for the robustnessanalysis because they represent the most compatible noisetypes commonly found in images of blood smear [26]The comparison considers the complete set of 30 imagespresented in Section 61 containing 426 leukocytes whichhave been detected and counted by a human expert Theadded noise is produced by MatLab considering two noiselevels of 5 and 10 for salt and pepper noise whereas 120590 = 5
and 120590 = 10 are used for the case of Gaussian noiseFigure 9 shows only two images with different noise types asexample The outcomes in terms of the detection rate (DR)and the false alarm rate (FAR) are reported for each noisetype in Tables 3 and 4 The results show that the proposedEMO algorithm presents the best detection performanceachieving in the worst case a DR of 8779 and 8920 undercontaminated conditions of salt and pepper and Gaussiannoise respectively On the other hand the EMO detectorpossesses the least degradation performance presenting aFAR value of 821 and 751
63 Stability Comparison In order to compare the stabilityperformance of the proposed method its results are com-pared to those reported by Wang et al in [4] which isconsidered as an accurate technique for the detection ofWBC
The Wang algorithm is an energy-minimizing methodwhich is guided by internal constraint elements and influ-enced by external image forces producing the segmentationof WBCs at a closed contour As external forces the Wangapproach uses edge information which is usually representedby the gradient magnitude of the image Therefore thecontour is attracted to pixels with large image gradients thatis strong edges At each iteration the Wang method finds
Computational and Mathematical Methods in Medicine 11
(a) (b)
(c) (d)
Figure 8 Resulting images of the second test after applying theWBCdetector (a) original image (b) image segmented by theDEMalgorithm(c) edge map and (d) the white detected blood cells
(a) (b)
Figure 9 Examples of images included in the experimental set for robustness comparison (a) Image contaminated with 10 of salt andpepper noise and (b) image polluted with 120590 = 10 of Gaussian noise
a new contour configurationwhichminimizes the energy thatcorresponds to external forces and constraint elements
In the comparison the net structure and its operationalparameters corresponding to theWang algorithm follow theconfiguration suggested in [4] while the parameters for theEMO algorithm are taken from Table 1
Figure 10 shows the performance of both methods con-sidering a test image with only two white blood cells Sincethe Wang method uses gradient information in order toappropriately find a new contour configuration it needs to beexecuted iteratively in order to detect each structure (WBC)Figure 10(b) shows the results after the Wang approach has
12 Computational and Mathematical Methods in Medicine
Table 2 Comparative leukocyte detection performance of the BSV approach the IO method the Wang algorithm the BGA detector andthe proposed EMOmethod over the data set which contains 30 images and 426 leukocytes
Leukocyte type Method Leukocytes detected Missing False alarms DR FAR
Bright leukocytes (222)
BSV 104 118 67 4685 3018IO 175 47 55 7883 2477
Wang 186 36 42 8378 1892BGA 177 45 22 7973 991EMO 211 11 10 9504 450
Dark leukocytes (204)
BSV 98 106 54 4804 2647IO 166 38 49 8137 2402
Wang 181 23 38 8872 1863BGA 170 34 19 8333 931EMO 200 4 6 9804 294
Overall (426)
BSV 202 224 121 4742 2840IO 341 85 104 8005 2441
Wang 367 59 80 8615 1878BGA 347 79 41 8145 962EMO 411 15 16 9648 375
Table 3 Comparative WBC detection among methods that considers the complete data set of 30 images corrupted by different levels of saltand pepper noise
Noise level Method Leukocytes detected Missing False alarms DR FAR
5 salt and peppernoise426 leukocytes
BSV 148 278 114 3474 2676IO 270 156 106 6338 2488
Wang 250 176 118 5868 2770BGA 306 120 103 7183 2418EMO 390 36 30 9155 704
10 salt and peppernoise426 leukocytes
BSV 101 325 120 2371 2817IO 240 186 78 5634 1831
Wang 184 242 123 4319 2887BGA 294 132 83 6901 1948EMO 374 52 35 8779 821
been applied considering only 200 iterations FurthermoreFigure 10(c) shows results after applying the EMO methodwhich has been proposed in this paper
The Wang algorithm uses the fuzzy cellular neuralnetwork (FCNN) as an optimization approach It employsgradient information and internal states in order to find abetter contour configuration In each iteration the FCNNtries as contour points different new pixel positions whichmust be located nearby the original contour position Suchfact might cause the contour solution to remain trapped intoa local minimum In order to avoid such a problem theWangmethod applies a considerable number of iterations so that anear optimal contour configuration can be found Howeverwhen the number of iterations increases the possibility tocover other structures increases too Thus if the image hasa complex background (as smear images) the method getsconfused so that finding the correct contour configurationfrom the gradient magnitude is not easy Therefore a draw-back of Wangrsquos method is related to its optimal iterationnumber (instability) Such number must be determinedexperimentally as it depends on the image context and its
complexity Figure 11(a) shows the result of applying 400cycles of Wangrsquos algorithm while Figure 11(b) presents thedetection of the same cell shapes after 1000 iterations usingthe proposed algorithm From Figure 11(a) it can be seen thatthe contour produced byWangrsquos algorithm degenerates as theiteration process continues wrongly covering other shapeslying nearby
In order to compare the accuracy of both methods theestimated WBC area which has been approximated by bothapproaches is compared to the actual WBC size consideringdifferent degrees of evolution that is the cycle numberfor each algorithm The comparison acknowledges only oneWBC because it is the only detected shape inWangrsquos methodTable 5 shows the averaged results over twenty repetitions foreach experiment
7 Conclusions
This paper has presented an algorithm for the automaticdetection of white blood cells that are embedded into compli-cated and cluttered smear images by considering the complete
Computational and Mathematical Methods in Medicine 13
Table 4 Comparative WBC detection among methods that considers the complete data set of 30 images corrupted by different levels ofGaussian noise
Noise level Method Leukocytes detected Missing False alarms DR FAR
120590 = 5 Gaussian noise426 Leukocytes
BSV 172 254 77 4037 1807IO 309 117 71 7253 1667
Wang 301 125 65 7066 1526BGA 345 81 61 8098 1432EMO 397 29 21 9319 493
120590 = 10 Gaussian noise426 Leukocytes
BSV 143 283 106 3357 2488IO 281 145 89 6596 2089
Wang 264 162 102 6197 2394BGA 308 118 85 7230 1995EMO 380 46 32 8920 751
(a) (b)
(c)
Figure 10 Comparison of the EMO and Wangrsquos method for white blood cell detection in medical images (a) Original image (b) Detectionusing the Wangrsquos method (c) Detection after applying the EMOmethod
process as a circle detection problem The approach is basedon a nature-inspired technique called the electromagnetism-like optimization (EMO) which is a heuristic method thatfollows electromagnetism principles for solving complexoptimization problemsThe EMO algorithm is based on elec-tromagnetic attraction and repulsion forces among chargedparticles whose charge represents the fitness solution for eachparticle (a given solution) The algorithm uses the encodingof three noncollinear edge points as candidate circles overan edge map A new objective function has been derived to
measure the resemblance of a candidate circle to an actualWBC based on the information from the edge map andsegmentation results Guided by the values of such objectivefunction the set of encoded candidate circles (chargedparticles) are evolved by using the EMO algorithm so thatthey can fit into the actual blood cells that are contained inthe edge map
The performance of the EMO-method has been com-pared to other existingWBCdetectors (the boundary supportvectors (BSV) approach [2] the iterative Otsu (IO) method
14 Computational and Mathematical Methods in Medicine
(a) (b)
Figure 11 Result comparison for the white blood cells detection showing (a)Wangrsquos algorithm after 400 cycles and (b) EMOdetector methodconsidering 1000 cycles
Table 5 Error in cellrsquos size estimation after applying the EMOalgorithm and theWangrsquos method to detect one leukocite embeddedinto a blood-smear image The error is averaged over twentyexperiments
Algorithm Iterations Error
Wang60 70200 1400 121
EMO proposed60 822200 101400 108
[3] the Wang algorithm [4] and the Genetic algorithm-based (GAB) detector [19]) considering several images whichexhibit different complexity levels Experimental resultsdemonstrate the high performance of the proposed methodin terms of detection accuracy robustness and stability
Acknowledgments
The second author acknowledges The National Council ofScience and Technology of Mexico (CONACyT) for partiallysupport this research under the doctoral grant number215517
References
[1] J Liu and K C Tsui ldquoToward nature-inspired computingrdquoCommunications of the ACM vol 49 no 10 pp 59ndash64 2006
[2] M Wang and R Chu ldquoA novel white blood cell detectionmethod based on boundary support vectorsrdquo in Proceedings ofIEEE International Conference on Systems Man and Cybernetics(SMC rsquo09) pp 2595ndash2598 San Antonio Tex USA October2009
[3] J Wu P Zeng Y Zhou and C Olivier ldquoA novel colorimage segmentation method and its application to white bloodcell image analysisrdquo in Proceedings of the 8th InternationalConference on Signal Processing (ICSP rsquo06) November 2006
[4] S Wang F L Korris and D Fu ldquoApplying the improved fuzzycellular neural network IFCNN to white blood cell detectionrdquoNeurocomputing vol 70 no 7ndash9 pp 1348ndash1359 2007
[5] G Karkavitsas and M Rangoussi ldquoObject localization in medi-cal images using genetic algorithmsrdquoWorld Academy of ScienceEngineering and Technology vol 2 pp 499ndash502 2007
[6] H Muammar and M Nixon ldquoApproaches to extending theHough transformrdquo in Proceedings of the International Confer-ence on Acoustics Speech and Signal Processing (ICASSP rsquo89)vol 3 pp 1556ndash1559 May 1989
[7] T Atherton and D Kerbyson ldquoUsing phase to represent radiusin the coherent circle Hough transformrdquo in Proceedings of IEEColloquium on the Hough Transform pp 1ndash4 May 1993
[8] M A Fischler and R C Bolles ldquoRandom sample consensus aparadigm for model fitting with applications to image analysisand automated cartographyrdquo Communications of the ACM vol24 no 6 pp 381ndash395 1981
[9] D Shaked O Yaron and N Kiryati ldquoDeriving stopping rulesfor the probabilistic Hough transform by sequential analysisrdquoComputer Vision and Image Understanding vol 63 no 3 pp512ndash526 1996
[10] L Xu E Oja and P Kultanen ldquoA new curve detection methodrandomized Hough transform (RHT)rdquo Pattern RecognitionLetters vol 11 no 5 pp 331ndash338 1990
[11] J H Han L T Koczy and T Poston ldquoFuzzy Hough transformrdquoinProceedings of the 2nd IEEE International Conference on FuzzySystems vol 2 pp 803ndash808 April 1993
[12] J M Becker S Grousson and D Coltuc ldquoFrom Hough trans-form to integral geometryrdquo in Proceedings of IEEE InternationalGeoscience and Remote Sensing Symposium (IGARSS rsquo02) vol 3pp 1444ndash1446 June 2002
[13] V Ayala-Ramirez C H Garcia-Capulin A Perez-Garcia andR E Sanchez-Yanez ldquoCircle detection on images using geneticalgorithmsrdquo Pattern Recognition Letters vol 27 no 6 pp 652ndash657 2006
[14] E Cuevas N Ortega-Sanchez D Zaldivar and M Perez-Cisneros ldquoCircle detection by harmony search optimizationrdquoJournal of Intelligent amp Robotic Systems vol 66 no 3 pp 359ndash376 2012
[15] E Cuevas D Zaldivar M Perez-Cisneros and M Ramırez-Ortegon ldquoCircle detection using discrete differential evolution
Computational and Mathematical Methods in Medicine 15
optimizationrdquo Pattern Analysis amp Applications vol 14 no 1 pp93ndash107 2011
[16] E Cuevas D Oliva D Zaldivar M Perez-Cisneros and HSossa ldquoCircle detection using electro-magnetismoptimizationrdquoInformation Sciences vol 182 no 1 pp 40ndash55 2012
[17] G Karkavitsas and M Rangoussi ldquoObject localization in med-ical images using genetic algorithmsrdquo International Journal ofInformation and Communication Engineering vol 1 no 4 pp204ndash207 2005
[18] S Birbil and S C Fang ldquoAn electromagnetism-like mechanismfor global optimizationrdquo Journal of Global Optimization vol 25no 3 pp 263ndash282 2003
[19] A M A C Rocha and E M G P Fernandes ldquoHybridizingthe electromagnetism-like algorithm with descent search forsolving engineering design problemsrdquo International Journal ofComputer Mathematics vol 86 no 10-11 pp 1932ndash1946 2009
[20] S Birbil S C Fang and R L Sheu ldquoOn the convergence ofa population-based global optimization algorithmrdquo Journal ofGlobal Optimization vol 30 no 2-3 pp 301ndash318 2004
[21] E W Cowan Basic Electromagnetism Academic Press NewYork NY USA 1968
[22] J Bresenham ldquoLinear algorithm for incremental digital displayof circular arcsrdquo Communications of the ACM vol 20 no 2 pp100ndash106 1977
[23] G Boccignone M Ferraro and P Napoletano ldquoDiffusedexpectation maximisation for image segmentationrdquo ElectronicsLetters vol 40 no 18 pp 1107ndash1108 2004
[24] G Boccignone P Napoletano V Caggiano and M Ferraro ldquoAmultiresolution diffused expectation-maximization algorithmfor medical image segmentationrdquo Computers in Biology andMedicine vol 37 no 1 pp 83ndash96 2007
[25] R C Gonzalez and R E Woods Digital Image ProcessingAddison Wesley Reading Mass USA 1992
[26] G Landi and E L Piccolomini ldquoAn efficient method fornonnegatively constrained Total Variation-based denoising ofmedical images corrupted by Poisson noiserdquo ComputerizedMedical Imaging and Graphics vol 36 no 1 pp 38ndash46 2012
Submit your manuscripts athttpwwwhindawicom
Hindawi Publishing Corporationhttpwwwhindawicom Volume 2013
Oxidative Medicine and Cellular Longevity
Hindawi Publishing Corporation httpwwwhindawicom Volume 2013Hindawi Publishing Corporation httpwwwhindawicom Volume 2013
The Scientific World Journal
International Journal of
EndocrinologyHindawi Publishing Corporationhttpwwwhindawicom
Volume 2013
ISRN Anesthesiology
Hindawi Publishing Corporationhttpwwwhindawicom Volume 2013
OncologyJournal of
Hindawi Publishing Corporationhttpwwwhindawicom Volume 2013
PPARRe sea rch
Hindawi Publishing Corporationhttpwwwhindawicom Volume 2013
OphthalmologyJournal of
Hindawi Publishing Corporationhttpwwwhindawicom Volume 2013
ISRN Allergy
Hindawi Publishing Corporationhttpwwwhindawicom Volume 2013
BioMed Research International
Hindawi Publishing Corporationhttpwwwhindawicom Volume 2013
ObesityJournal of
Hindawi Publishing Corporationhttpwwwhindawicom Volume 2013
ISRN Addiction
Hindawi Publishing Corporationhttpwwwhindawicom Volume 2013
Hindawi Publishing Corporationhttpwwwhindawicom Volume 2013
Computational and Mathematical Methods in Medicine
ISRN AIDS
Hindawi Publishing Corporationhttpwwwhindawicom Volume 2013
Clinical ampDevelopmentalImmunology
Hindawi Publishing Corporationhttpwwwhindawicom
Volume 2013
Diabetes ResearchJournal of
Hindawi Publishing Corporationhttpwwwhindawicom Volume 2013
Evidence-Based Complementary and Alternative Medicine
Volume 2013Hindawi Publishing Corporationhttpwwwhindawicom
Hindawi Publishing Corporationhttpwwwhindawicom Volume 2013
Gastroenterology Research and Practice
Hindawi Publishing Corporationhttpwwwhindawicom Volume 2013
ISRN Biomarkers
Hindawi Publishing Corporationhttpwwwhindawicom Volume 2013
MEDIATORSINFLAMMATION
of
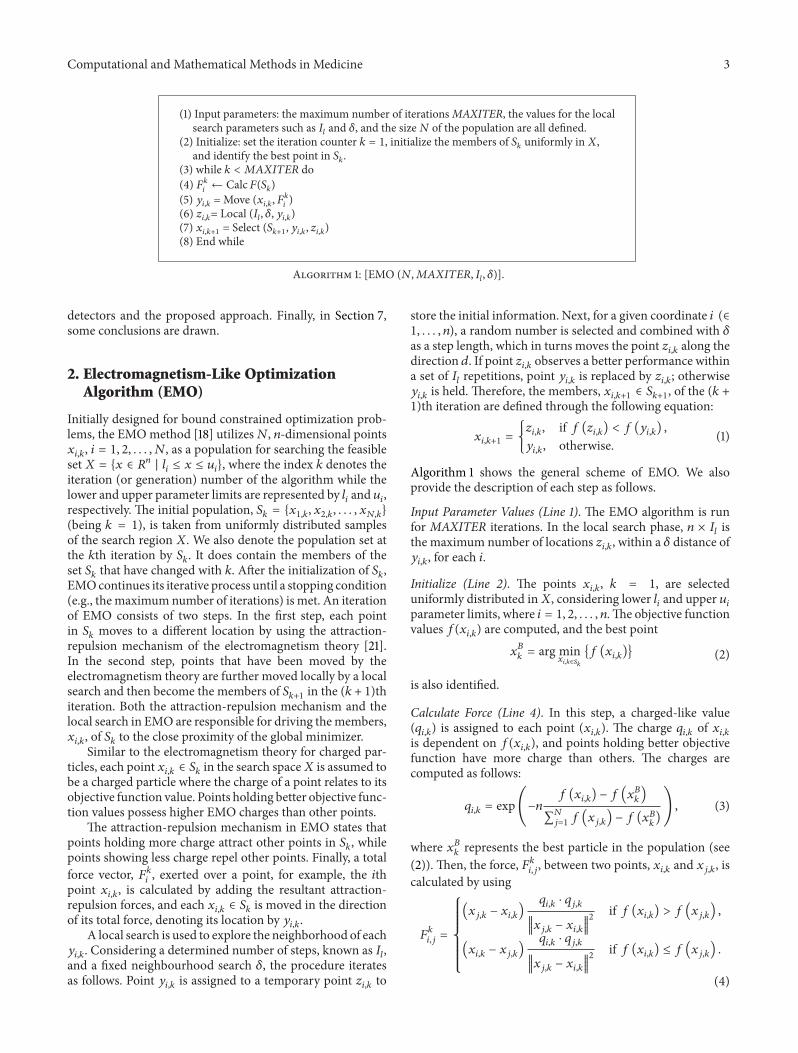
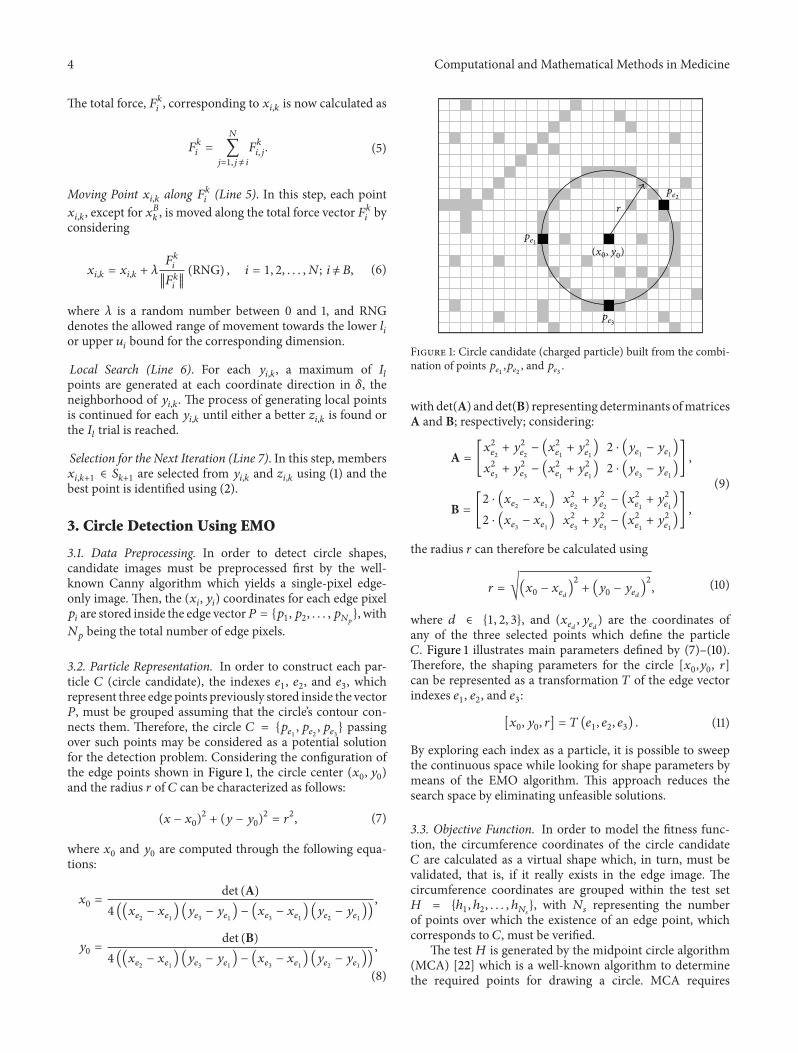
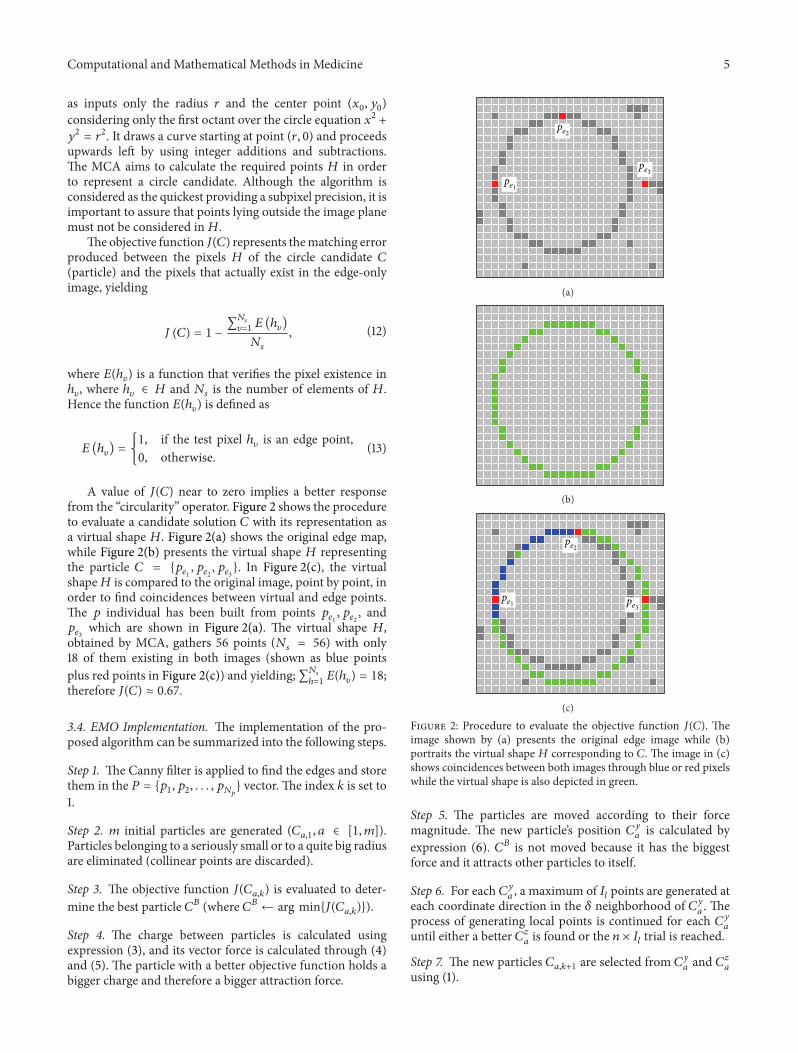
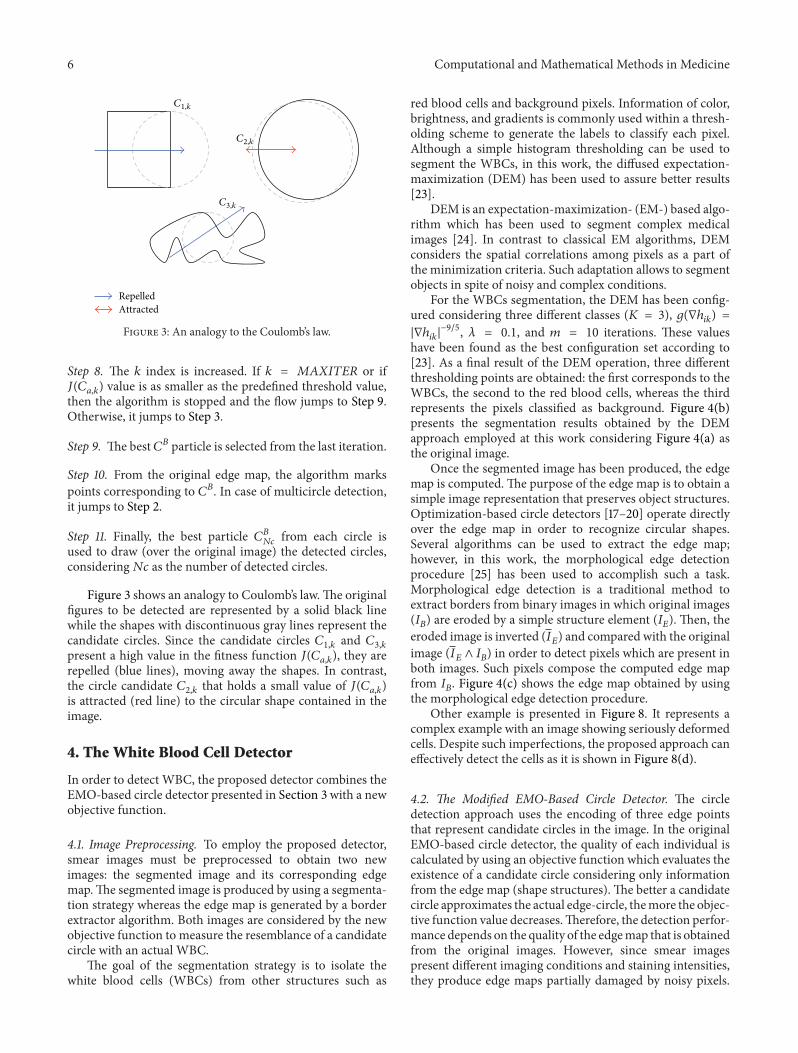
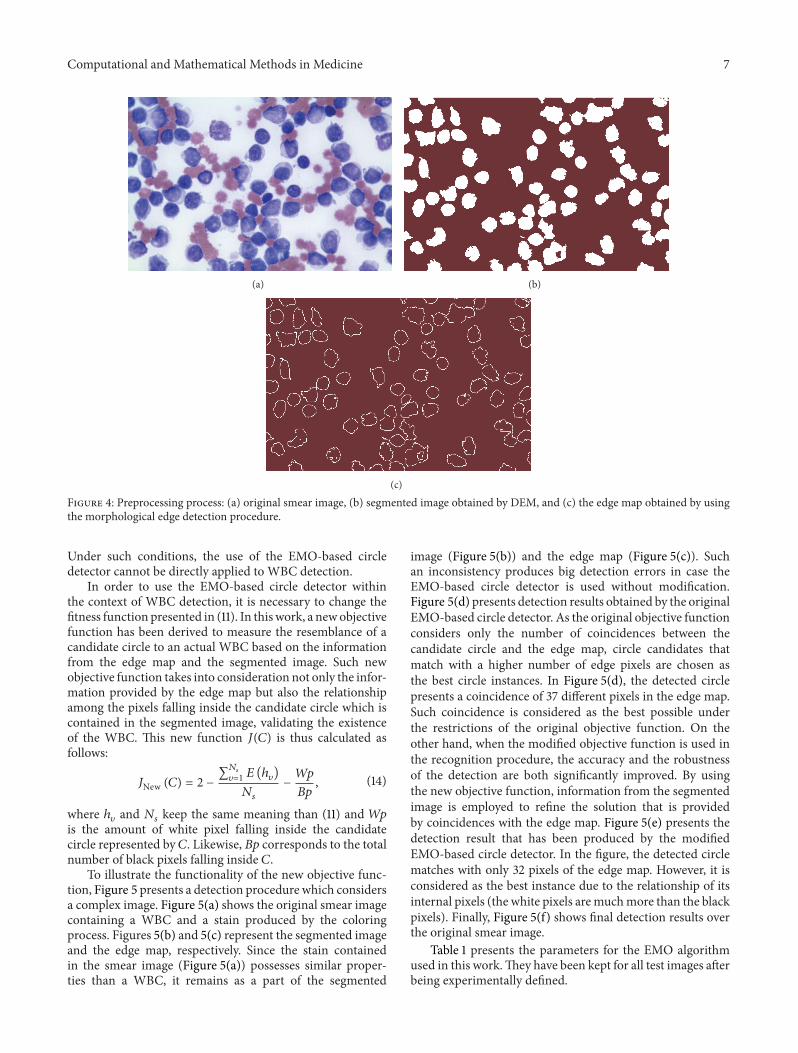
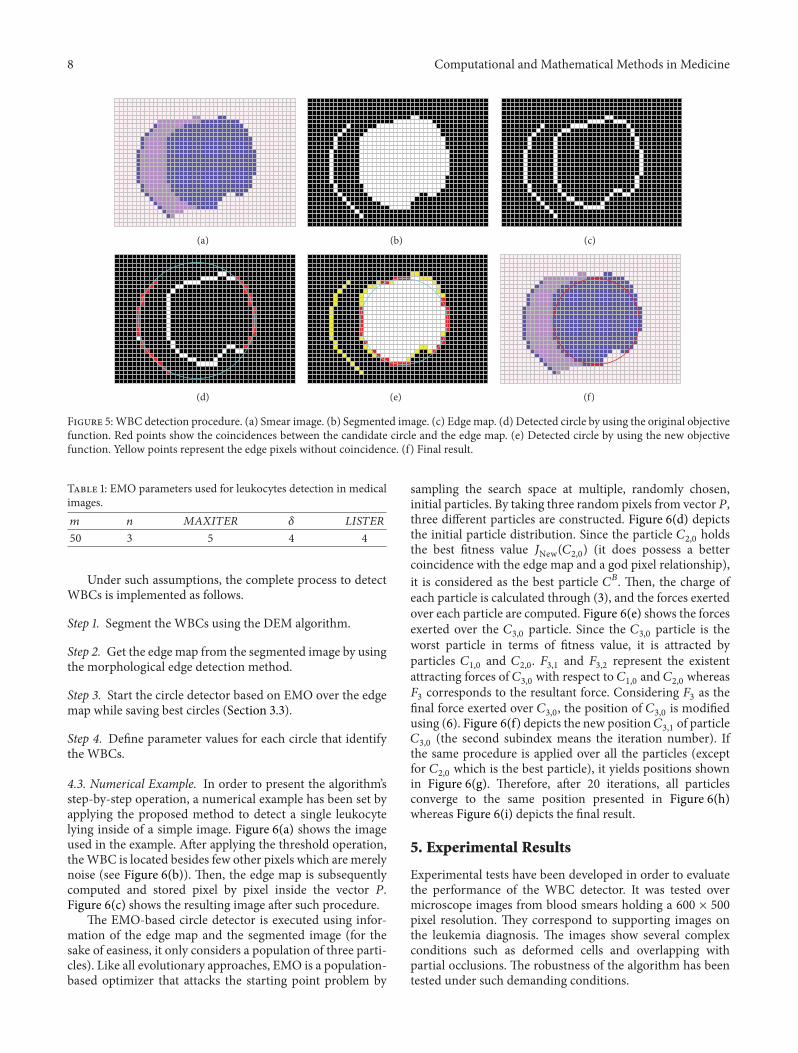
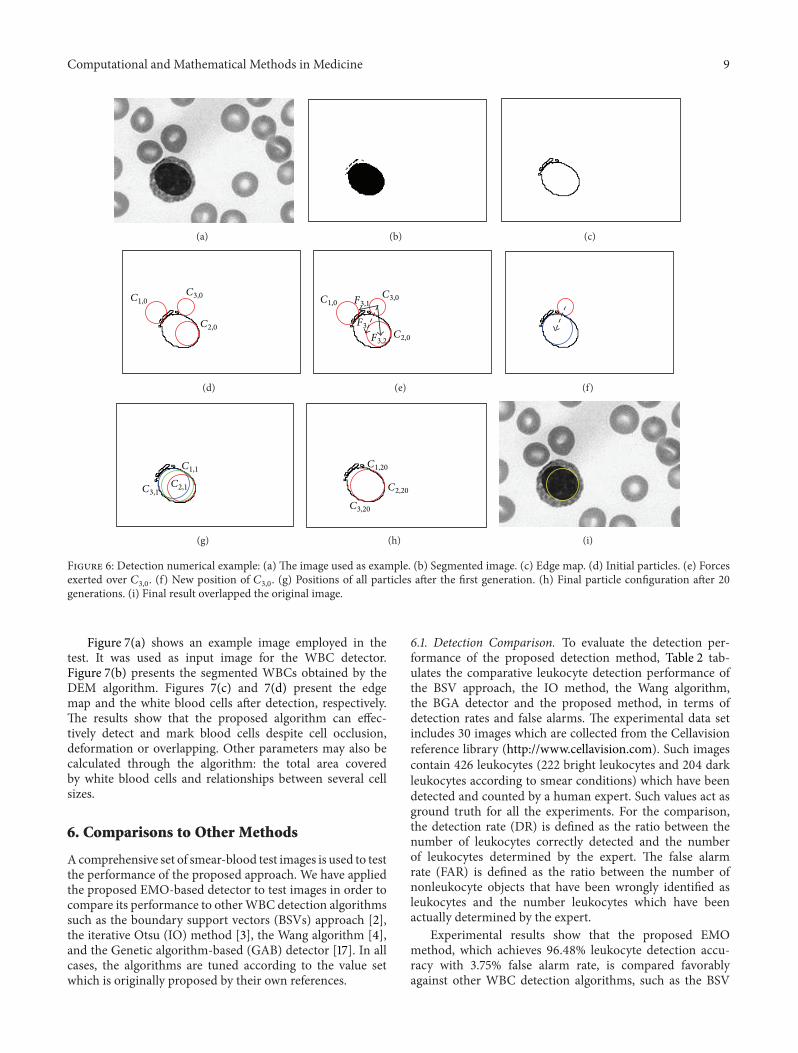
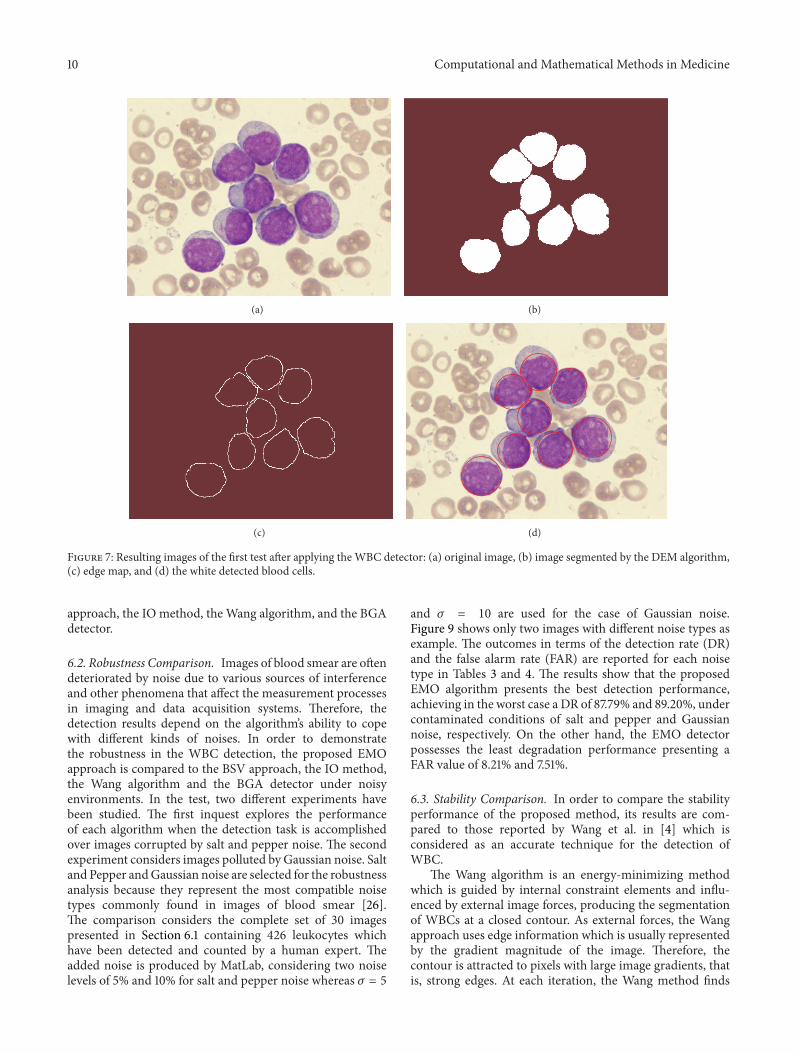
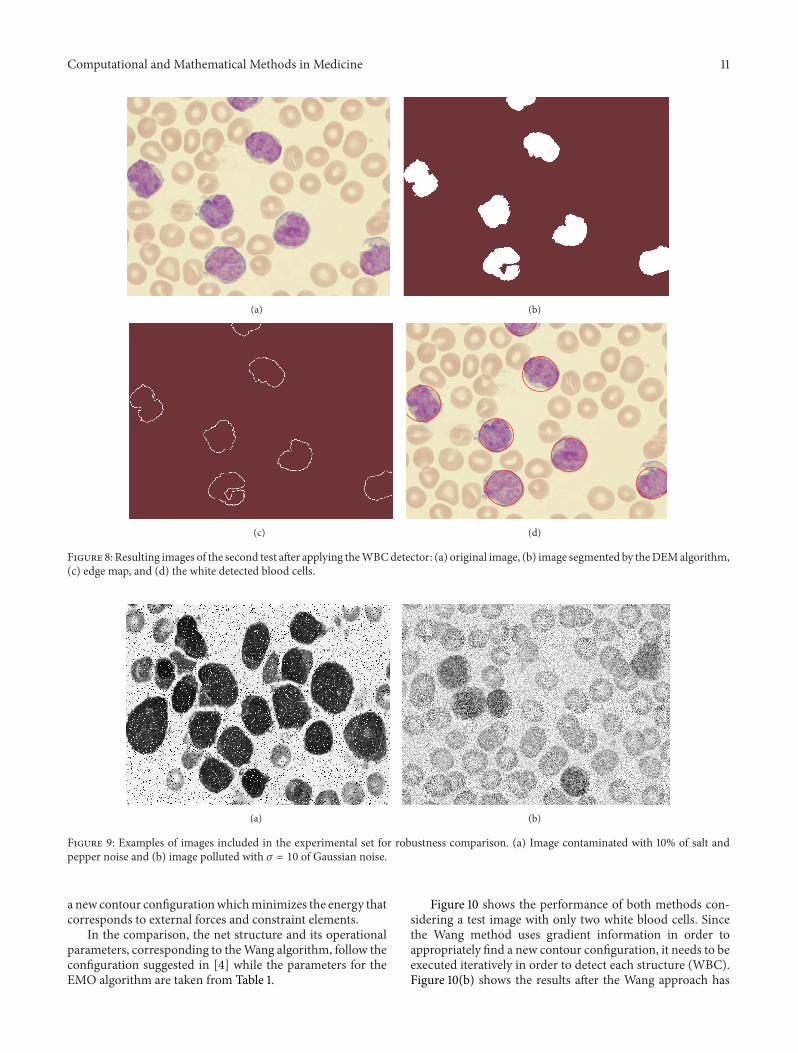
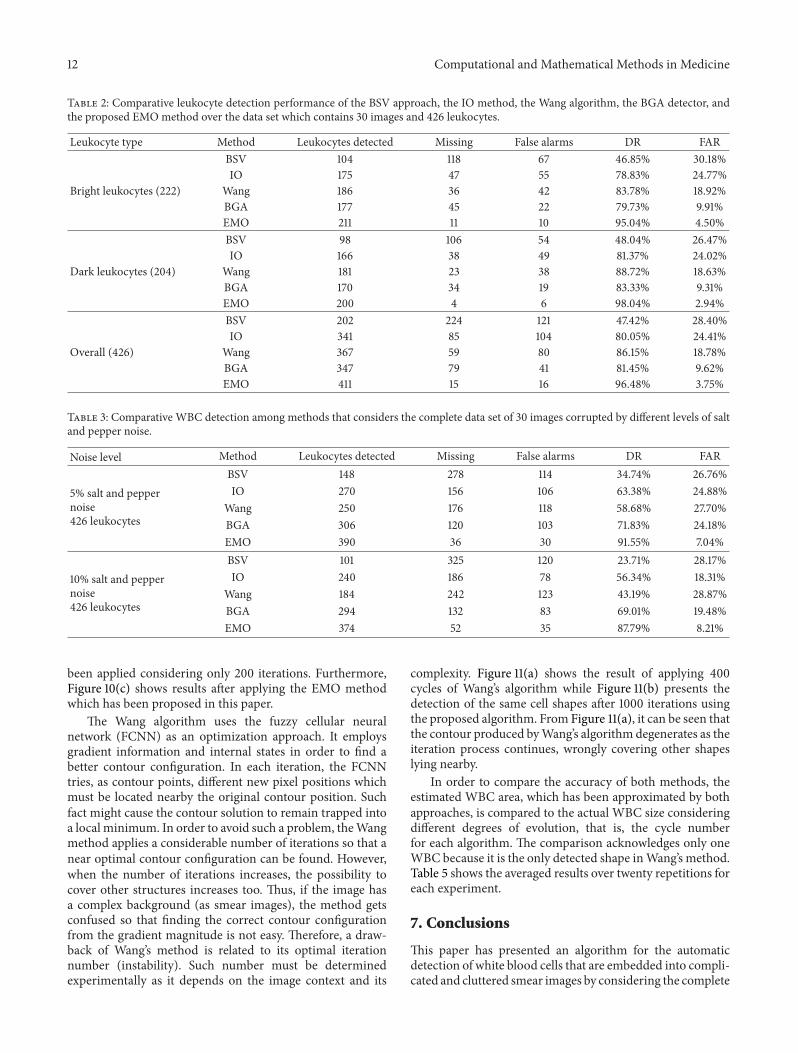
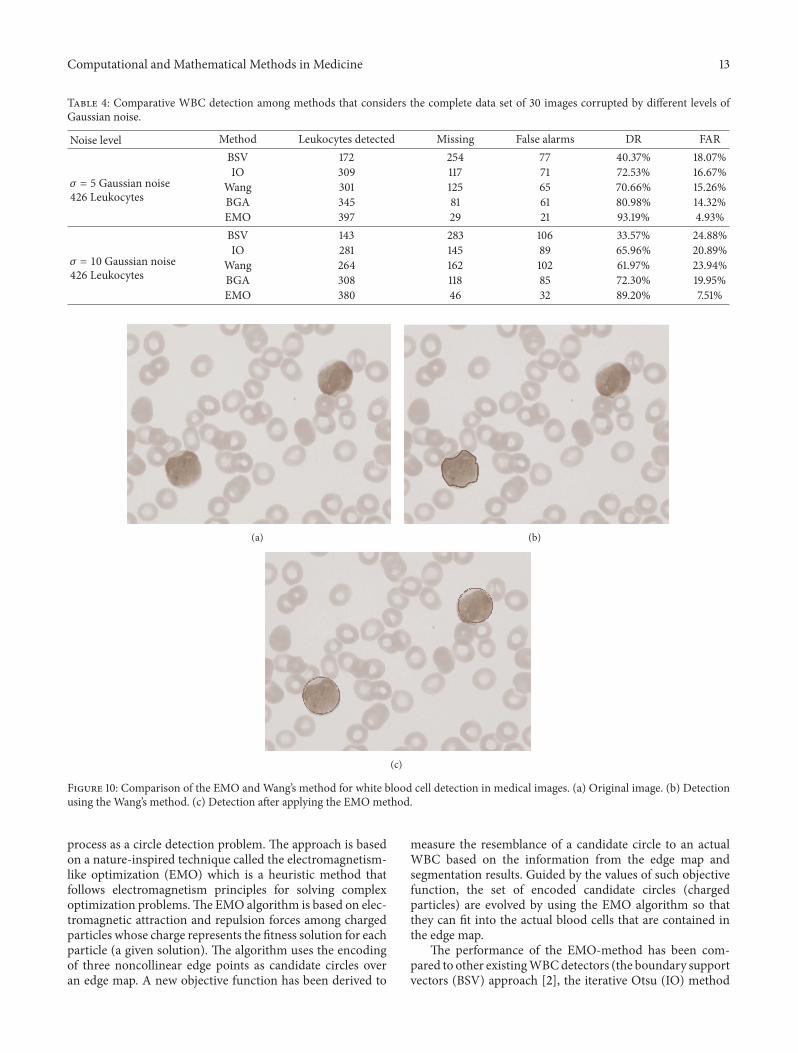
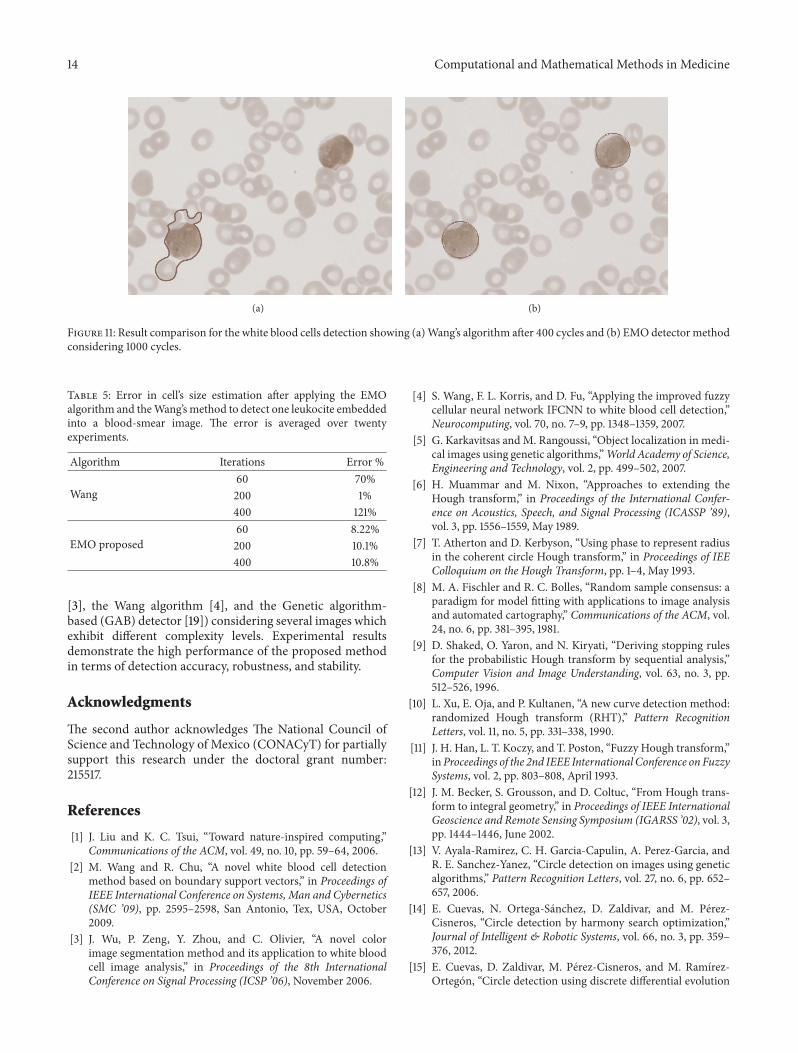