Embed Size (px)
Citation preview

2018 Fleet Management Compensation Survey
The objective of this survey is to measure the median salary for a Fleet Manager, Director,
Supervisor, and Professional in 2018 and analyze the driving factors that contribute to
earning a specific annual salary range. This report highlights these factors.

Page | 2 FleetAnswers.com | Spring 2018
Executive Summary About 200 Fleet professionals from North America participated in this survey effort. Of those surveyed, 52% of participants are Fleet Managers, 31% are Fleet Directors, 11% are Fleet Supervisors, and 6% are fleet professionals who are coordinators/advisors/analysts.
The survey sought to measure the median salary for fleet managers, directors, and supervisors in 2018, and analyze the driving forces that determine salaries. Compensation information for fleet professionals --a category that includes fleet administrators, assistants, coordinators, analysts, and advisers --was also included in the survey.
The largest proportion of fleet managers earned an annual base income between $100K - $120K, while the greatest proportion of fleet directors earned an annual base income between $130K - $150K. The largest proportion of fleet supervisors earned an annual base income between $90K - $100K.
The year 2018 appears to be a good one for many fleet professionals. In the survey, 65% of respondents reported receiving a pay raise and 34% of them saw no changes in their base annual salary compared to 2017. Of those who received a pay raise in 2018, 84% of them saw their base salary increased by 2 – 4%.
Compensation Package: Benefits & Incentives
Almost all fleet respondents received medical insurance, and a large percentage of them received dental, vision, and life insurance as part of their benefits. However, less than half of them received 401K and matching 401(K). Only 35% of fleet respondents reported receiving performance-based monetary incentives as part of their compensation package for 2018. The highest proportion of respondents who received monetary incentives was fleet directors. Compared to other industries, more than 65% of respondents working in utilities, route delivery, contracting, and cable received some form of performance-based monetary incentives. Of those who received performance-based monetary incentives in their compensation package, most of them received an incentive-based compensation that equaled 1 – 5% of their annual base salary, regardless of job positions. Education and Certification
The largest proportion of fleet managers, directors and professionals reported a bachelor's degree as their highest level of education attained. Highest level of education attained has a noticeable impact on job positions. The largest proportion of fleet directors and fleet managers have a bachelor’s degree, while the largest proportion of fleet supervisors have a high school diploma as their highest level of education.

Page | 3 FleetAnswers.com | Spring 2018
A higher proportion of fleet directors have a master’s degree compared to fleet managers and fleet supervisors.
Only 29% of respondents obtained a fleet certification such as APWA and CAFM. A higher proportion of fleet directors, managers, and supervisors with at least 10 years of experience have a fleet certificate compared to those who do not.
While fleet certifications did not have a noticeable impact on annual median salary, respondents’ highest level of education attained did influence median salary.
Fleet respondents with a college degree/diploma (e.g. Bachelor’s, Master’s/MBA) reported earning a higher median salary range compared to those with an associate degree, trade school, or high school diploma, regardless of job positions.
Roles and Responsibilities
More than half of fleet respondents manage fewer than 25 staff including drivers, mechanics, and administrative support staff. A higher proportion of fleet directors managed more than 500 staff compared to fleet managers and supervisors, and a higher proportion of fleet supervisors managed fewer than 25 people compared to other job positions.
The largest proportion of fleet respondents managed either 1,001 – 2,500 vehicles and units or less than 500 vehicles and units. The amount of fleet size was related to job position with a higher proportion of fleet directors managing a fleet size of more than 10,000 vehicles and units compared to fleet managers and supervisors.
As expected, the annual median salary of respondents generally increased with the number of vehicles managed.
The majority of fleet respondents were responsible for developing policies, procedures, and practices, sourcing and negotiating with vendors, and scheduling PM. Other than developing an annual budget, job positions had little impact on the proportion of responsibilities fleet respondents have in addition to fleet management.
The proportion of responsibilities fleet respondents have in addition to fleet management had little impact on annual median salary.
Workplace quality
In the survey, 76% of fleet directors, managers, supervisors, and professionals reported being satisfied or very satisfied with their job.
Workplace culture had the most impact on overall job satisfaction compared to other factors. The majority of respondents felt that better work-life balance and improved relationship and support from upper management would greatly improve overall job satisfaction.

Page | 4 FleetAnswers.com | Spring 2018
Comparison and Breakdown of Income
In this report are income breakdown according to job positions (e.g. director, manager, & supervisor) across the following categories:
• Performance-based monetary incentives
• Benefits and leave options
• Industry (e.g. Federal, City, Utility, Delivery, State, Private, etc.)
• Region (e.g. Western, Southern, Midwestern, and Eastern areas)
• Education & certification
• Roles & responsibilities
• Number of states fleet operate in
• Number of fleet operations
• Years of experience
• Vehicles & people managed
• Job satisfactions and reasons
• Demographics
Want specific information and do not see it in this report? Want us to drill down to your specific industry, job position, or other variables? Have a question? Reach out to us at [email protected]
Visit FleetAnswers for Industry Trends, Fleet Survey Reports, Case Studies, Sample Policies & Procedures, and Best Practices.

Page | 5 FleetAnswers.com | Spring 2018
Table of Contents
Executive Summary ................................................................................................................ 2
2018 Annual Salary ................................................................................................................... 6
Annual Base Salary: Comparing 2018 to 2017 ........................................................................ 7
Benefits in Compensation Package ....................................................................................... 9
Performance-Based Monetary Incentives ............................................................................ 10
Education & Fleet Certifications ............................................................................................ 12
Fleet Certifications ............................................................................................................... 12
Education ............................................................................................................................. 13
Fleet Locations & Operations ................................................................................................. 15
Region ................................................................................................................................... 15
Number of States Fleet Operate in ...................................................................................... 17
Number of Operational Locations ....................................................................................... 19
Management Responsibilities ................................................................................................20
Number of People Managed .................................................................................................20
Number of Vehicles or Units Managed ................................................................................ 21
Additional Responsibilities Beyond Fleet Management ...................................................... 23
Organizations & Departments Other than Fleet ................................................................ 25
Workplace Quality .................................................................................................................. 25
Job Satisfaction .................................................................................................................... 25
Career Development & Leadership Programs .................................................................... 26
Workplace Vision Board ...................................................................................................... 30
Characteristics of Respondents .............................................................................................. 32
Age ........................................................................................................................................ 32
Industry ................................................................................................................................ 33
Years of Fleet Experience ..................................................................................................... 34
Gender .................................................................................................................................. 35

Page | 6 FleetAnswers.com | Spring 2018
2018 Annual Salary
Overall, the largest proportion of fleet managers earned an annual base income between
$100K and $120K, and the largest proportion of fleet directors1 earned an income between
$130K and $150K.
The largest proportion of fleet supervisors earned an income between $90K - $100K, and
the largest proportion of fleet professionals (e.g. analysts, assistants, coordinators) make
less than $60K.
Median Annual Salary: Base Income
Fleet Supervisor Fleet Manager Fleet Director
Range $90K - $100K $100K - $110K $120K - $130K
1 Participants included in the fleet director category includes vice presidents, associate/assistant directors, and national/principal/chief management level. Participants included in the fleet manager category includes shop managers, administrators, superintendents. Participants included in the fleet supervisor category includes crew/work leader, shop foreman, and lead mechanics.
Page | 7 FleetAnswers.com | Spring 2018
Annual Base Salary: Comparing 2018 to 2017
When asked about the salary difference between 2018 and 2017, 65% of fleet directors,
managers, and supervisors received an increase in base annual salary in 2018, while 34% of
them saw no change in their base annual salary compared to 2017.
Regardless of job positions, more than half of all fleet directors (65%), managers (70%)
and supervisors (73%) received a pay increase in their base salary in 2018.
Except for fleet respondents working for the state, more than 50% of fleet respondents
working for the city (72%), county (58%), and utility2 (75%) companies received an
increase in their base annual salary in 2018.
On the other hand, 62% of fleet respondents working for the state saw no change in their
base annual salary from 2017 to 2018.
2 Utility category includes gas, electric, water, or a combination.
65%2%
34%
Increase Decrease Remain the Same

Page | 8 FleetAnswers.com | Spring 2018
Of the fleet survey respondents who received a pay increase in 2018, 70% of them
indicated it was either fully related or partially related to cost-of-living adjustments.
Of those who said that their salary increased in 2018, 84% of them said it increased by 2-
4%, followed by 9% of them who said their salary increased by 1%.

Page | 9 FleetAnswers.com | Spring 2018
Compensation Package: Benefits3 & Incentives The following section highlights benefits included in fleet respondents’ compensation
package in 2018 as well as performance-based monetary incentives.
Benefits in Compensation Package Fleet directors, managers, supervisors, and professionals reported that they received
benefits in addition to their base annual salary. Almost all fleet respondents received
medical insurance in their compensation package, followed by dental insurance and
vision insurance.
Close to 2% of respondents reported that they did not receive any types of benefits,
although these respondents received leave options as part of their compensation package.
3 Benefits received in addition to an annual base salary

Page | 10 FleetAnswers.com | Spring 2018
The majority of fleet directors, managers, supervisors, and professionals reported
receiving paid time off, statutory holidays, and sick leave as part of their leave options.
Only 34% of fleet respondents received all types of leave options.
Performance-Based Monetary Incentives4
Regardless of job positions, more than half of all fleet directors, managers, supervisors,
and professionals do not receive performance-based monetary incentives (e.g. bonuses,
commissions) as part of their 2018 compensation package.
Only 35% of fleet respondents reported receiving monetary incentives as part of their
package for 2018.
4 Incentives received in addition to an annual salary

Page | 11 FleetAnswers.com | Spring 2018
The highest proportion of fleet respondents who received monetary incentives are fleet
directors. Compared to other industries, more than 65% of fleet respondents working in
utilities, route delivery, contracting, and cable received some form of performance-based
monetary incentives.
Of those who received performance-based monetary incentives in their compensation
package, most of them received an incentive-based compensation that equaled 1 – 5% of
their annual base salary, regardless of job positions.

Page | 12 FleetAnswers.com | Spring 2018
Education & Fleet Certifications
The following section highlights the impact of education and fleet certifications on
median annual salary range.
Fleet Certifications According to the survey, 29% of fleet directors, managers, and supervisors have fleet
certification (such as APWA and CAFM) whereas 71% of them have not obtained fleet
certification. Fleet certification has little to no clear impact on annual median salary
range.
Of those who have obtained a fleet certification, an overwhelming majority of them work
in city fleets.
Fleet experience appears to have an impact on certification. A higher proportion of fleet
directors, managers, and supervisors with at least 10 years of experience have a fleet
certificate compared to those who do not.

Page | 13 FleetAnswers.com | Spring 2018
Education5
The largest proportion of fleet directors, managers, supervisors, and professionals have a
Bachelor’s Degree, followed by an Associate’s Degree, as the highest level of education
attained.
The largest proportion of fleet directors (39%) and fleet managers (36%) have a Bachelor’s
Degree, while the largest proportion of fleet supervisors (35%) reported having a high
school diploma as their highest level of education.
A higher proportion of fleet director reported having a Master’s Degree and MBA
compared to fleet managers and fleet supervisors.
Similarly, a higher proportion of fleet supervisors reported obtaining a trade school
certificate as their highest level of education compared to fleet directors and managers.
5 People who selected "some college" or "some university" as their highest education obtained was recoded as high school diploma. A few ‘other’ responses were recoded as Bachelor’s Degree or High School Diploma based on their responses. Fleet respondents who selected ‘others’ as their highest education reported that they received business or technical certificates.

Page | 14 FleetAnswers.com | Spring 2018
Fleet respondents reported earning different levels of income based on qualifications.
Fleet respondents with a college degree/diploma (e.g. Bachelor’s, Master’s/MBA) reported
earning a higher median salary range compared to those who with an Associate degree,
trade school or high school diploma, regardless of job position.
Fleet directors with a college degree (including Master’s degree) reported earning the
highest median income range of $130K - $140K compared to those with other types of
education experience.
Fleet managers with a Master’s degree reported earning the highest median income of
$120K - $130K compared to those with other types of education experience.
Similarly, fleet supervisors with a Master’s degree reported earning the highest median
income of 100K – 110K.

Page | 15 FleetAnswers.com | Spring 2018
Median Annual Salary Range: By Highest Level of Education Attained
Fleet Director Fleet Manager Fleet Supervisor
Trade School $70K - $80K $90K - $100K $70K - $80K
High School $80K - $90K $80K - $90K $80K - $90K
Associate Degree $130K - $140K $90K - $100K $90K - $100K
Bachelor’s Degree $130K - $140K $100K - $110K $95K - $105K
Master’s Degree $130K - $140K $120K - $130K ---
MBA Degree $110K - $120K $110K - $120K $100K - $110K
Fleet Locations & Operations
The following section highlights the impact of respondents’ geographical region and
operational locations on median annual salary range.
Region
Fleet directors, managers, supervisors, and professionals located in the western region
earn the highest salaries, followed by those in the northeastern region, compared to other
regions in North America.

Page | 16 FleetAnswers.com | Spring 2018
Median Annual Salary Range: By Region6
Fleet Director Fleet Manager Fleet Supervisor
Western Region $145K - $155K $105K - $115K $90K - $100K
Midwest Region $90K - $100K $80K - $90K $80K - $90K
Northeast Region $140K - $150K $100K - $110K $80K - $90K
Southern Region $90K - $100K $90K - $100K $80K - $90K
Canadian Region $140 - $150K $100K - $110K --
6 Each state was categorized into four regions based on geographical locations. The west region includes pacific and mountain states. Midwest region includes states in west north central and east north central. The northeast region includes middle Atlantic, New England, Delaware, Maryland and DC. The south region includes west south central, east south central, and south Atlantic states.
0%
2%
4%
6%
8%
10%
12%
14%
16%Region: Annual Salary Breakdown
West Midwest Northeast South Canada

Page | 17 FleetAnswers.com | Spring 2018
Number of States Fleet Operate in
The majority of fleet directors, managers, supervisors, and professionals manage fleets that operate in 1 state. Of the respondents, 15% reported operating fleets in 2 – 5 states, and only 10% of fleet respondents operate fleet in more than 40 states. The distribution of states that fleets operated in was related to their job position, with a higher proportion of fleet directors (20%) managing fleets that operate in 40 or more states compared to fleet managers (6%) and supervisors (0%).

Page | 18 FleetAnswers.com | Spring 2018
A large number, 85% and 95% of fleet managers and fleet supervisors respectively, manage fleets that operate in less than 5 states.

Page | 19 FleetAnswers.com | Spring 2018
Number of Operational Locations
Most fleet directors, managers, and supervisors manage fleets that operate in 1 – 10
locations, followed by fleets that operate in more than 50 locations. Less than 10% of
fleets operate in 11 – 20 locations.
Similarly, the distribution of locations that fleets operated in was related to their job
positions.
A higher proportion of fleet directors (22%) manage fleets with more than 50 operational
locations compared to other job positions. The report showed that 70% of fleet
supervisors manage fleets with less than 10 locations compared to 67% of fleet managers
and 63% of fleet directors.
Median Annual Salary Range: By Number of Operating Locations
Fleet Director Fleet Manager Fleet Supervisor
1 – 10 locations $90K - $100K $90K - $100K $80K - $90K
11 – 30 locations $125K - $135K $105K - $115K $90K - $100K
More than 31 locations $150K - $160K $100K - $110K $100K - $110K

Page | 20 FleetAnswers.com | Spring 2018
Management Responsibilities
The following section highlights the impact of different facets of management
responsibilities on median annual salary range.
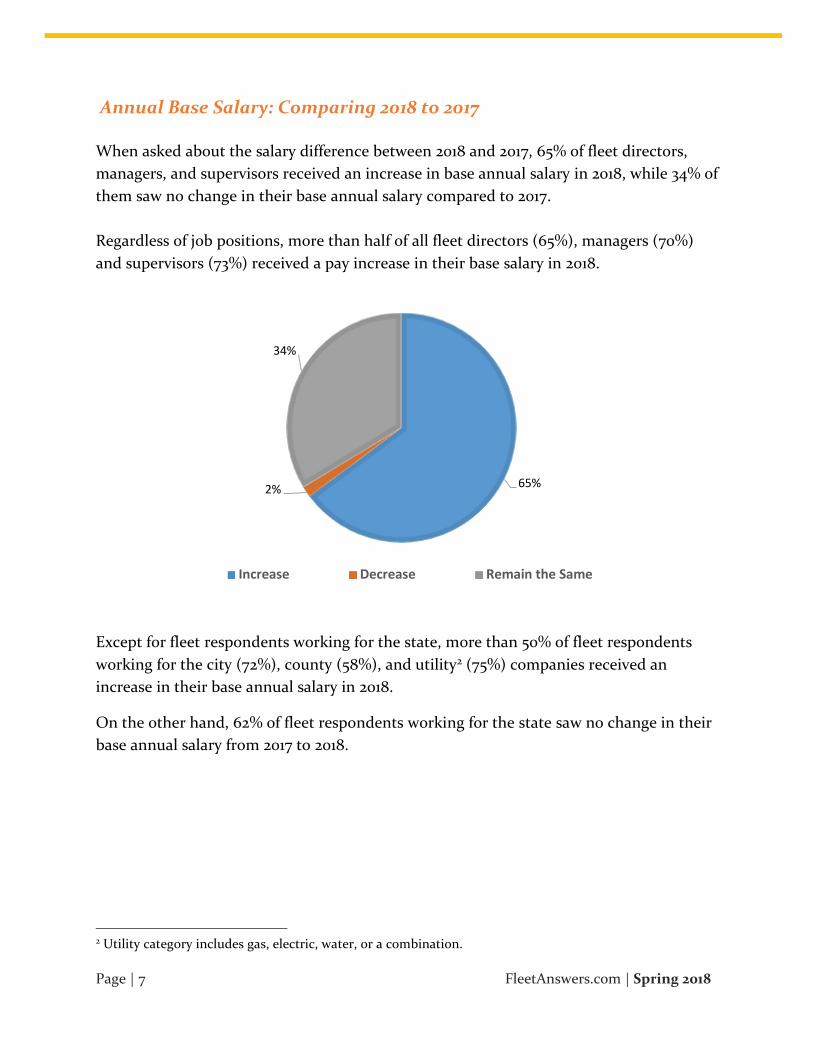
Number of People Managed
More than half of the fleet respondents manage fewer than 25 staff (e.g. drivers,
mechanics, administrative support).
As expected, the distribution of number of people managed is related to job position.
A higher proportion of fleet directors (8%) managed more than 500 staff compared to
fleet managers (1%) and supervisors (0%), and a higher proportion of fleet supervisors
(80%) managed fewer than 25 people compared to other job positions.
Page | 21 FleetAnswers.com | Spring 2018
Number of Vehicles or Units Managed
The largest proportion of fleet directors, managers, and supervisors managed less than
500 vehicles and units (28%), and 1,001 - 2,500 vehicles and units (28%).

Page | 22 FleetAnswers.com | Spring 2018
Similar to the distribution of number of people managed, the distribution of fleet size was
related to job position.
A higher proportion of fleet directors (10%) managed a fleet size of more than 10,000
vehicles and units compared to fleet managers (1%) and supervisors (0%). A higher
proportion of fleet supervisors (40%) managed a fleet size of less than 500 vehicles and
units compared to other job positions.
Annual median salary range of fleet directors, managers, and supervisors generally
increases with the number of vehicles managed.
Fleet directors, managers, and supervisors who manage a fleet size of less than 500
vehicles and units earn a salary range of $90K – 100K, $85K - $95K, and $70K - $80K
respectively.
Fleet directors, managers, and supervisors who manage a fleet size of 1,000 – 2,500
vehicles and units earn an annual salary range of $115K - $125K, $100K - $110K, and $90K -
$100K respectively.

Page | 23 FleetAnswers.com | Spring 2018
Median Annual Salary Range: By Number of Vehicles Managed
No. of Vehicles/Units Fleet Director Fleet Manager Fleet Supervisor
Less than 500 $90K - $100K $85K - $95K $70K - $80K
501 – 1,000 $90K - $100K $90K - $100K $80K - $90K
1,001 – 2,500 $115K - $125K $100K - $110K $90K - $100K
2,501 – 5,000 $140K - $150K $105K - $115K $100K - $110K
5,001 – 10,000 More than 170K $105K - $115K ---
More than 10,000 $140K - $150K $110K - $120K ---
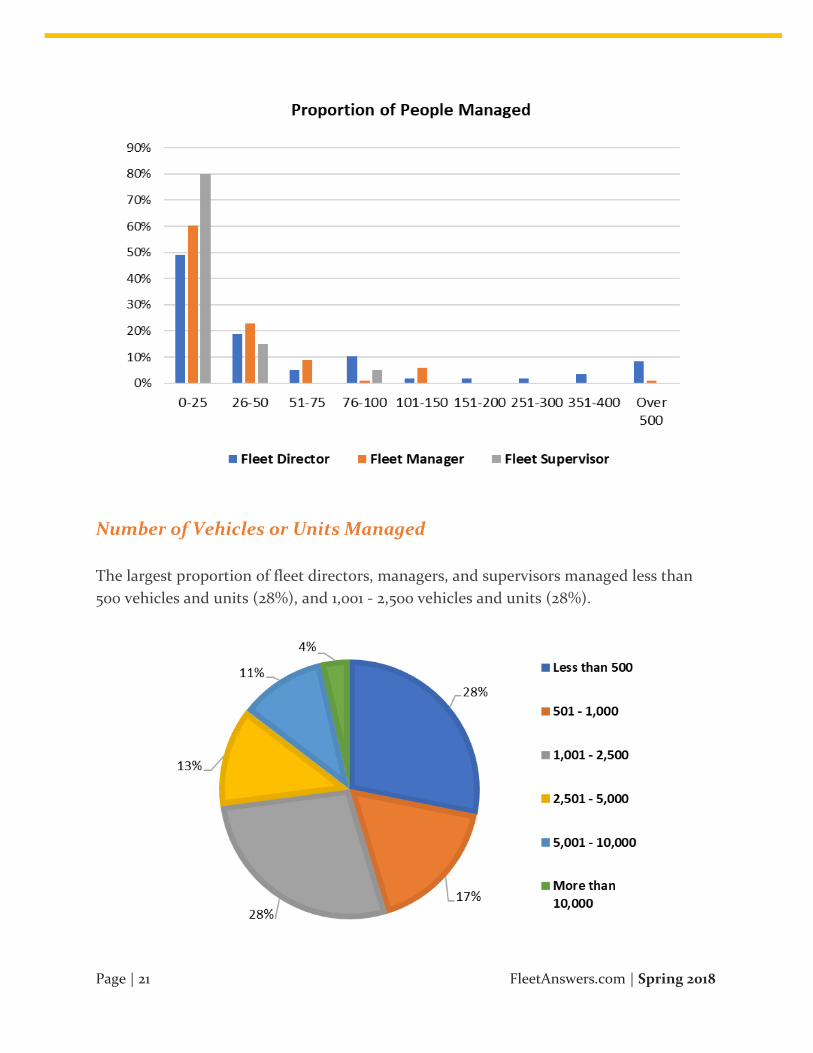
Additional Responsibilities Beyond Fleet Management
The majority of fleet respondents were responsible for developing policies, procedures
and practices (90%), sourcing and negotiating with vendors (85%), and scheduling PM
(80%).
Page | 24 FleetAnswers.com | Spring 2018
Except for developing an annual budget, job positions had little impact on the proportion
of responsibilities fleet respondents have in addition to fleet management.
Similarly, the proportion of responsibilities had little impact on annual median salary
range.
Only 15% of fleet respondents had ‘other’ management responsibilities in addition to fleet
management. They reported being responsible for EV charging station infrastructure,
communication strategies, safety coordination, procurement and contract management,
different types of reporting and other administrative management.

Page | 25 FleetAnswers.com | Spring 2018
Organizations & Departments Other than Fleet
Only 29% of fleet directors, managers, and supervisors have management responsibility
for organizations and departments other than fleet. With the exception of fleet
supervisors, the additional responsibility of managing non-fleet departments and
organizations had little impact on annual median salary range.
Workplace Quality
The following section highlights the reasons that contribute to job satisfaction, types and
availability of career development and training programs, and changes that would
improve job satisfaction.
Job Satisfaction
A majority (76%) of fleet directors, managers, supervisors, and professionals reported
being satisfied or very satisfied with their job. Only 10% of respondents reported being
dissatisfied with their job.
Page | 26 FleetAnswers.com | Spring 2018
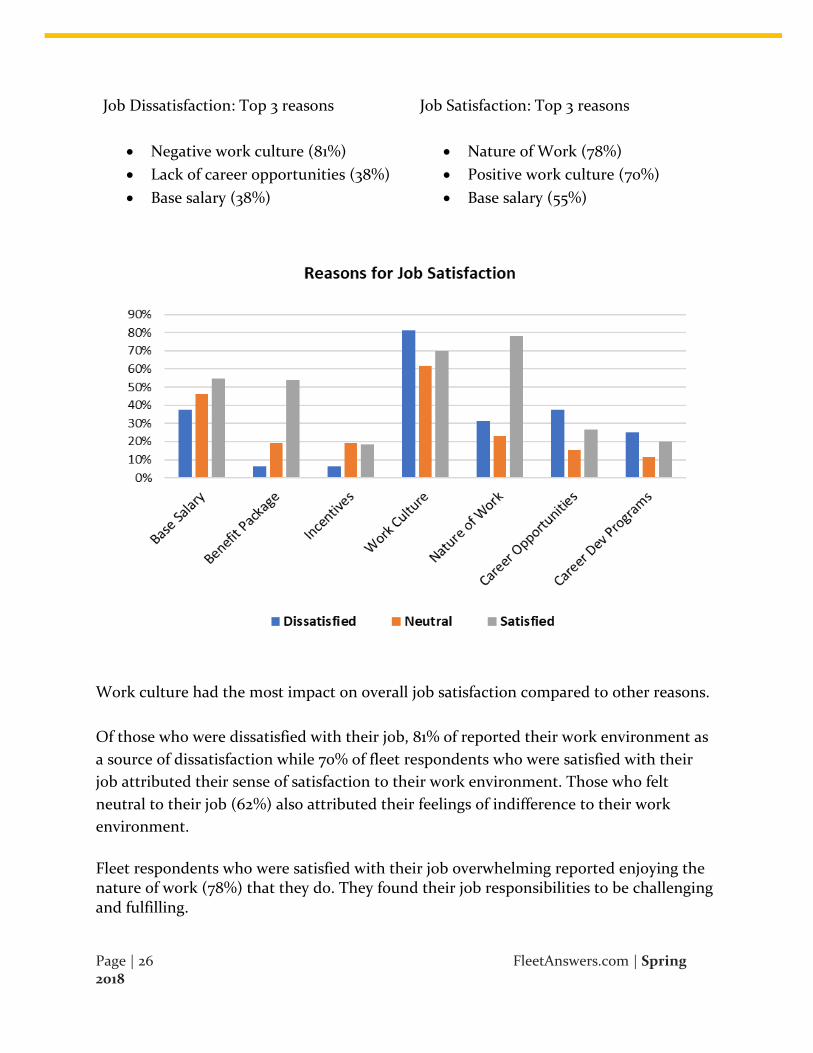
Job Dissatisfaction: Top 3 reasons
• Negative work culture (81%)
• Lack of career opportunities (38%)
• Base salary (38%)
Job Satisfaction: Top 3 reasons
• Nature of Work (78%)
• Positive work culture (70%)
• Base salary (55%)
Work culture had the most impact on overall job satisfaction compared to other reasons.
Of those who were dissatisfied with their job, 81% of reported their work environment as
a source of dissatisfaction while 70% of fleet respondents who were satisfied with their
job attributed their sense of satisfaction to their work environment. Those who felt
neutral to their job (62%) also attributed their feelings of indifference to their work
environment.
Fleet respondents who were satisfied with their job overwhelming reported enjoying the nature of work (78%) that they do. They found their job responsibilities to be challenging and fulfilling.

Page | 27 FleetAnswers.com | Spring 2018
Career Development & Leadership Programs
Only 17% of fleet directors, managers, supervisors, and professionals reported working for
companies that provided career development, training, or leadership courses.
Some of these courses include leadership and management training, skills training, safety
training, and project management. In addition to courses and programs, a small number
of respondents reported receiving financial support for workplace training, accreditation,
higher education, and fleet conferences or seminars.
Fleet respondents were asked to list types of career development courses they wished
were being provided by their company.
According to the word cloud7, which is a visual representation of words with the highest
frequency, fleet leadership development courses and programs are what many fleet
respondents wished their company provided.
7 The more times a specific word appears in the open-ended answers, the bigger and bolder
it will appear in the word cloud.

Page | 28 FleetAnswers.com | Spring 2018
The types of programs and courses fleet respondents wished were provided by their
companies fell into several categories8:
• Skill trainings
Fleet respondents reported wanting training to keep up with technological changes,
technical, and software skills, as well as financial support for professional fleet
certifications.
• Fleet management training & mentorship
Fleet respondents reported wanting continuing education related to fleet management,
coaching related to fleet management, and peer mentorship. Several respondents also
wanted fleet training programs that would lead to career advancement opportunities.
• General management training
Fleet respondents wanted leadership development programs that would enhance
individual leadership and management skills. They also wished for tuition support for
MBA courses and specific management courses (e.g. project management, budgeting).
8 Content analysis was used to categorize the fleet respondents’ open-ended answers into themes/categories to provide more details than the word cloud.
Page | 29 FleetAnswers.com | Spring 2018
• Workplace training
Fleet respondents wanted training related to shifting demographics such as managing
team dynamics with millennial work force, minorities, and across different organizations.
• Mechanics & technician training
Fleet respondents wanted more tailored training programs for shop mechanics and
technicians to keep them updated on new technology and developments.

Page | 30 FleetAnswers.com | Spring 2018
Workplace Vision Board
Fleet respondents were asked what they would change about their current job experience
to increase overall job satisfaction.
According to the word cloud, which is a visual representation of words with the highest
frequency, most respondents indicated that an improvement in work-life balance would
lead to higher job satisfaction.

Page | 31 FleetAnswers.com | Spring 2018
The types of changes fleet respondents would make so that their current job experience
could be more satisfactory fell into several categories9:
• Work life balance
Most fleet respondents wanted to be able to use their paid-time-off and to be able to
spend more time with their family.
• Management support & dynamics
Most fleet respondents wanted management team to be able to adapt to changes,
increase open communication, have fewer red tape issues and internal politics, and
provide support in the form of increased staff, investment in software, and better
facilities.
• Career development & advancement opportunities
Fleet respondents wanted networking opportunities, leadership development, skills
training, and more opportunities for career advancement.
• Team dynamics
Fleet respondents wanted open communication and respect for one another within the
team, and fewer conflicts.
• Proper compensation & recognition
Fleet respondents wanted a pay raise or a job promotion for taking on more
responsibilities, performance-based incentives, and to partake in decision making.
Interestingly, only a handful of respondents felt that they would be more satisfied with
their job if they had a higher salary. Instead, most respondents felt that better work-life
balance where they could find time to use their PTO and have family time without
disruption during their time off would greatly improve their job satisfaction.
Others wanted better work distribution, so that they don’t feel overloaded. In addition,
many respondents felt that improved dynamics and support from the management team
would greatly improve their overall job satisfaction. They listed more interaction,
leadership, respect, and fewer red tape issues as some of the ways upper management can
improve work culture.
9 Content analysis was used to categorize the fleet respondents’ open-ended answers into themes/categories to provide more details than the word cloud.

Page | 32 FleetAnswers.com | Spring 2018
Characteristics of Respondents
The following section highlights the impact of age, industry, years of fleet experience, and
age on median annual salary.
Age
Regardless of gender, the largest proportion of fleet directors, managers, supervisors, and
professionals are between the ages of 56 and 60 years.
They reported a median annual income range of $100K - $110K. Nearly 85% of respondents
are between ages of 46 and 65 year.
Age of fleet professionals affects income distribution. The distribution of median salary
range is similar across different age groups.

Page | 33 FleetAnswers.com | Spring 2018
The largest proportion of fleet directors, managers, and superiors between the ages of 46 – 60 earned an annual salary range of $90K – $100K. The largest proportion of older fleet professionals between the ages of 61 – 65 earned an annual salary range of $100K – $110K.
Industry
29% of respondents are city fleet professionals, while utility10 fleet professionals account
for 24% of respondents.
Fleet respondents working in the utility sector earned the highest median annual salary
compared to those working for the city, state, or county.
Median Annual Salary Range: By Main Industries
County City State Utility
90K – 100K 90K – 100K 80K – 90K 110K – 120K
10 The utility category includes gas, electric, water, or combination. The truckload category includes LTL, parcel carriers, and full truckload carriers. The ‘others’ category includes telecom, cable, refuse, lease, international, university, school buses, and fire department.

Page | 34 FleetAnswers.com | Spring 2018
Years of Fleet Experience
A majority (80%) of fleet directors, managers, supervisors, and professionals have more
than 10 years of fleet management experience. The largest proportion of fleet survey
respondents have between 10 – 15 years.
A majority of female fleet respondents have 5 -15 years of fleet experiences, whereas a
majority of male fleet respondents have 10-20 years of experience and 26-30 years of fleet
experiences.
Fleet Directors who have more than 30 years of experience have the highest median
annual salary range from 140K - 150K.
Fleet managers who have more than 26 years of experience have the highest median
annual salary range of 110K – 120K.
Fleet supervisors with 26 to 30 years make an annual salary range of 90K – 100K.

Page | 35 FleetAnswers.com | Spring 2018
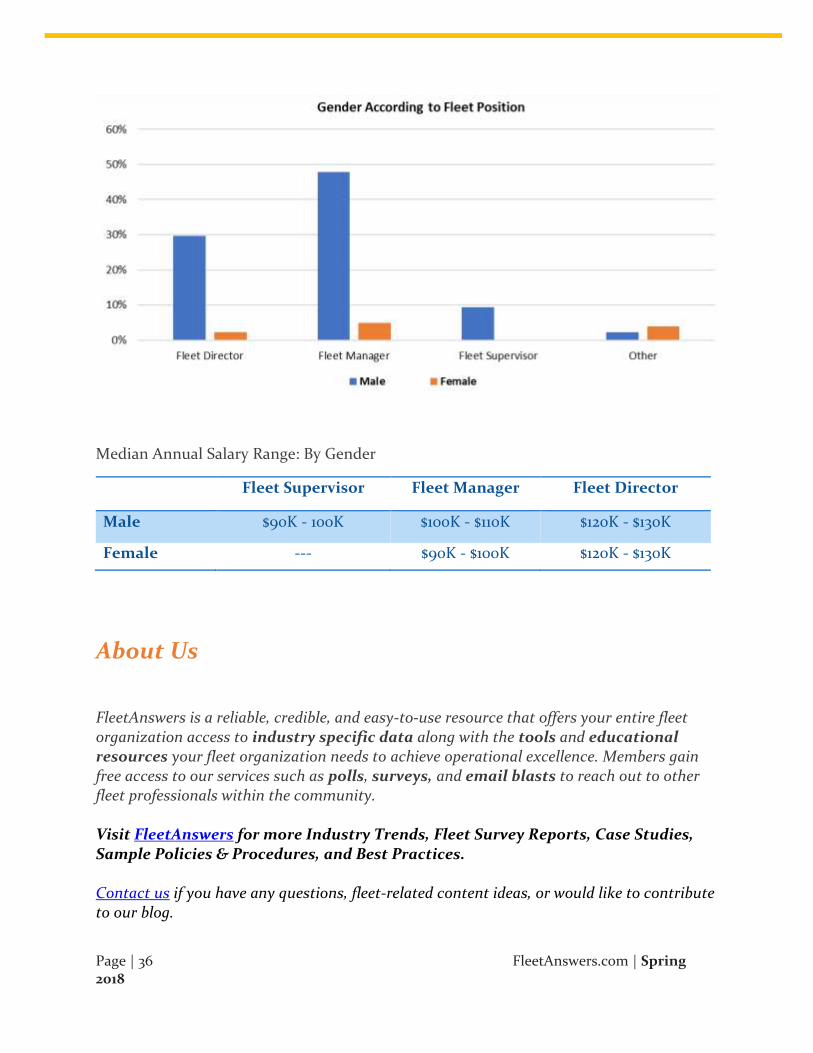
Gender Just 11% of fleet managers, directors, supervisors, and professionals are female, while 89%
are male.
At 2%, job positions at the fleet director level had the lowest representation of women.
The highest representation of females was found in job positions such as fleet managers,
analysts, assistants, and coordinators.
Page | 36 FleetAnswers.com | Spring 2018
Median Annual Salary Range: By Gender
Fleet Supervisor Fleet Manager Fleet Director
Male $90K - 100K $100K - $110K $120K - $130K
Female --- $90K - $100K $120K - $130K
About Us
FleetAnswers is a reliable, credible, and easy-to-use resource that offers your entire fleet organization access to industry specific data along with the tools and educational resources your fleet organization needs to achieve operational excellence. Members gain free access to our services such as polls, surveys, and email blasts to reach out to other fleet professionals within the community. Visit FleetAnswers for more Industry Trends, Fleet Survey Reports, Case Studies, Sample Policies & Procedures, and Best Practices. Contact us if you have any questions, fleet-related content ideas, or would like to contribute to our blog.