Embed Size (px)
Citation preview
Elmbridge Borough Council
2019 Air Quality Annual Status Report (ASR) In fulfilment of Part IV of the Environment Act 1995 Local Air Quality Management
Elmbridge Borough Council
Local Authority Officer
Paul Leadbeater
Department Environmental Services
Address
Elmbridge Borough Council Council Offices High Street Esher KT10 9SD
Telephone 01372474750
E-mail [email protected]
Report Reference number
PBA46316/ASR2019
Date July 2019
Elmbridge Borough Council
Registered Office: Buckingham Court Kingsmead Business Park, London Road, High Wycombe, Buckinghamshire, HP11 1JU Office Address: 10 Queen Square, Bristol, BS1 4NT T: +44 (0)117 332 7840 E: [email protected]
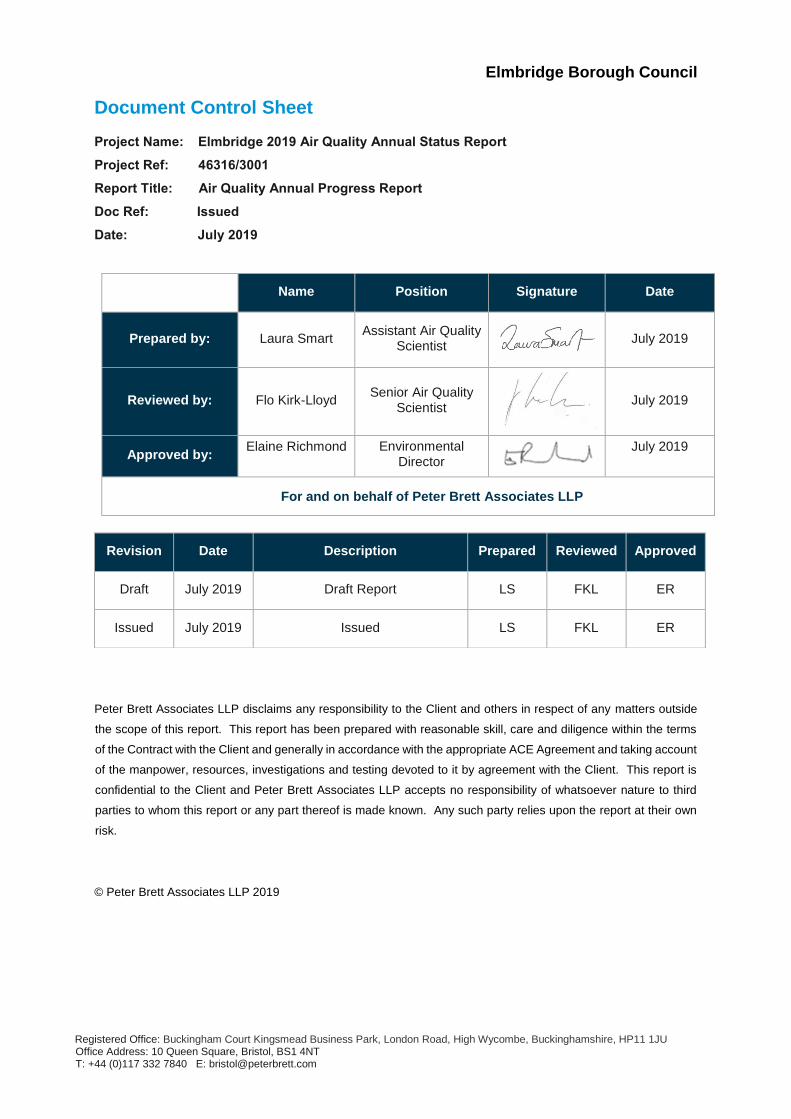
Document Control Sheet
Project Name: Elmbridge 2019 Air Quality Annual Status Report
Project Ref: 46316/3001
Report Title: Air Quality Annual Progress Report
Doc Ref: Issued
Date: July 2019
Name Position Signature Date
Prepared by: Laura Smart Assistant Air Quality
Scientist
July 2019
Reviewed by: Flo Kirk-Lloyd Senior Air Quality
Scientist
July 2019
Approved by: Elaine Richmond Environmental
Director
July 2019
For and on behalf of Peter Brett Associates LLP
Peter Brett Associates LLP disclaims any responsibility to the Client and others in respect of any matters outside
the scope of this report. This report has been prepared with reasonable skill, care and diligence within the terms
of the Contract with the Client and generally in accordance with the appropriate ACE Agreement and taking account
of the manpower, resources, investigations and testing devoted to it by agreement with the Client. This report is
confidential to the Client and Peter Brett Associates LLP accepts no responsibility of whatsoever nature to third
parties to whom this report or any part thereof is made known. Any such party relies upon the report at their own
risk.
© Peter Brett Associates LLP 2019
Revision Date Description Prepared Reviewed Approved
Draft July 2019 Draft Report LS FKL ER
Issued July 2019 Issued LS FKL ER
Elmbridge Borough Council
LAQM Annual Status Report 2019 i
Executive Summary: Air Quality in Our Area
The following Annual Status Report (ASR) was prepared and written by Peter Brett
Associates (PBA), now part of Stantec, on behalf of Elmbridge Borough Council in
accordance with Local Air Quality Management (LAQM) Technical Guidance (TG)
2016, published by Defra on behalf of the devolved administrations.
Air Quality in Elmbridge
This report is designed to provide a summary for those living and working within the
Borough of Elmbridge about the state of air quality in the area. It also provides progress
on the actions that Elmbridge Borough Council (the Council) and others, including the
public, are taking or could take to improve air quality.
Air pollution is associated with a number of adverse health impacts. It is recognised as
a contributing factor in the onset of heart disease and cancer. Air pollution particularly
affects the most vulnerable in society: children and older people, and those with heart
and lung conditions. In addition, there is often a strong correlation with equalities issues
as areas with poor air quality are frequently the less affluent areas1,2.
In its most recent report, the Committee on the Medical Effects of Air Pollutants
(COMEAP) advised that the range of estimates of the annual mortality burden of
human-made air pollution in the UK is estimated as an effect equivalent to 28,000 to
36,000 deaths3 . A conservative estimate for one type of air pollution (particulates) is
that it reduces life expectancy in the UK by six months on average, worth £16 billion
per year4.
Actions to Improve Air Quality
Measures to improve air quality have been included in the Council’s Development
Management Plan and air quality is an important consideration for all planning
applications within the Borough’s seven Air Quality Management Areas (AQMAs).
The Council works to understand local air quality through an appropriate monitoring
network within its administrative boundary.
1 Environmental equity, air quality, socioeconomic status and respiratory health, 2010 2 Report to Defra. Air quality and social deprivation in the UK: an environmental inequalities analysis, 2006 3 COMEAP. Associations of long-term average concentration of nitrogen oxide with mortality, 2018. 4 Defra. Abatement cost guidance for valuing changes in air quality, May 2013
Elmbridge Borough Council
LAQM Annual Status Report 2019 ii
The Surrey Air Quality Study Group, formed in May 2016, has developed into the
Surrey Air Alliance (SAA) made up of officer representatives from all eleven District
and Borough Councils, and Surrey County Council’s (SCC) Highways and Public
Health services.
The Council continues to be an active member of the SAA and assist in the delivery of
the SAA workplan. A key workplan task on which the Council has taken the lead is the
Surrey-wide air quality modelling project. The air quality modelling project will be used
to establish a clear baseline for key pollutants (NO2, PM10 and PM2.5) across Surrey.
The modelling, undertaken by Cambridge Environmental Research Consultants
(CERC), has recently been completed and the final reports will follow in 2019. The
information will assist in the review of current AQMA’s and alert to any potential areas
that require investigating.
The second workplan project Elmbridge is involved in is directed at raising awareness
of air quality within schools close to AQMAs. In Spring 2018 the SAA was awarded
£145,188 from the Defra AQ Grant Fund to undertake an engagement and behaviour
change programme with up to 40 schools across Surrey that were within 2km of an
AQMA. The aim being to give school children an increased awareness of the health
impacts of poor air quality and, where the AQMA is close to the school, to understand
what they could do to improve local air quality and reduce exposure, seeking to change
behaviours.
A total of seven schools within Elmbridge have taken part in a range of activities from
theatre performances, cycle training, anti-idling campaigns and workshops on
monitoring NO2.
The project was supported by a successful media campaign that included advertising
on local radio. Social media posts were viewed 175,827 times, with 83% of residents
saying the campaign discouraged them from using the car. An example of one of the
posters promoting “scoot to school” is provided below.

Elmbridge Borough Council
LAQM Annual Status Report 2019 iii
Both of these SAA projects are funded, the remaining actions will progress as
resources allow.
In the Council’s Service Delivery Plan for 2019/2020, a Council objective is to improve
local air quality for a healthier community. An action to raise public awareness included
a bespoke animation on air quality as part of the Councils “Love Elmbridge” campaign.
See: https://www.elmbridge.gov.uk/news/love-elmbridge/
The Council’s Environmental Services Team continues to use three electric pool cars
for staff work travel, which are increasingly being used by other parts of the Council.
They also utilise the planning regime to increase the provision of electric vehicle
charging points within the Borough.
The airAlert pollution warning service for residents continues to be funded and
promoted to those living and working within the Borough
Elmbridge Borough Council
LAQM Annual Status Report 2019 iv
As part of its commitment to make Elmbridge a sustainable place, the Council is
considering extending its fleet of electric staff pool cars and the feasibility of introducing
electric vehicle charging points in a number of its car parks. As part of an upgrade to
Holly Hedge car park in Cobham the OLEV funded rapid charger, now four years old,
will be replaced in 2019 with two twin fast charging points; a significant increase in
charging provision. In 2019, the Council took the decision to significantly reduce the
cost of parking permits for fully electric vehicles.
Conclusions and Priorities
Air quality monitoring has shown continued improvements at many locations across
the Borough. However, further action is still required as exceedances of the annual
mean NO2 objective have been identified at four monitoring locations in 2018. Three
of these sites are located within the Esher AQMA (Esher 1, Esher 7 and Esher 8),
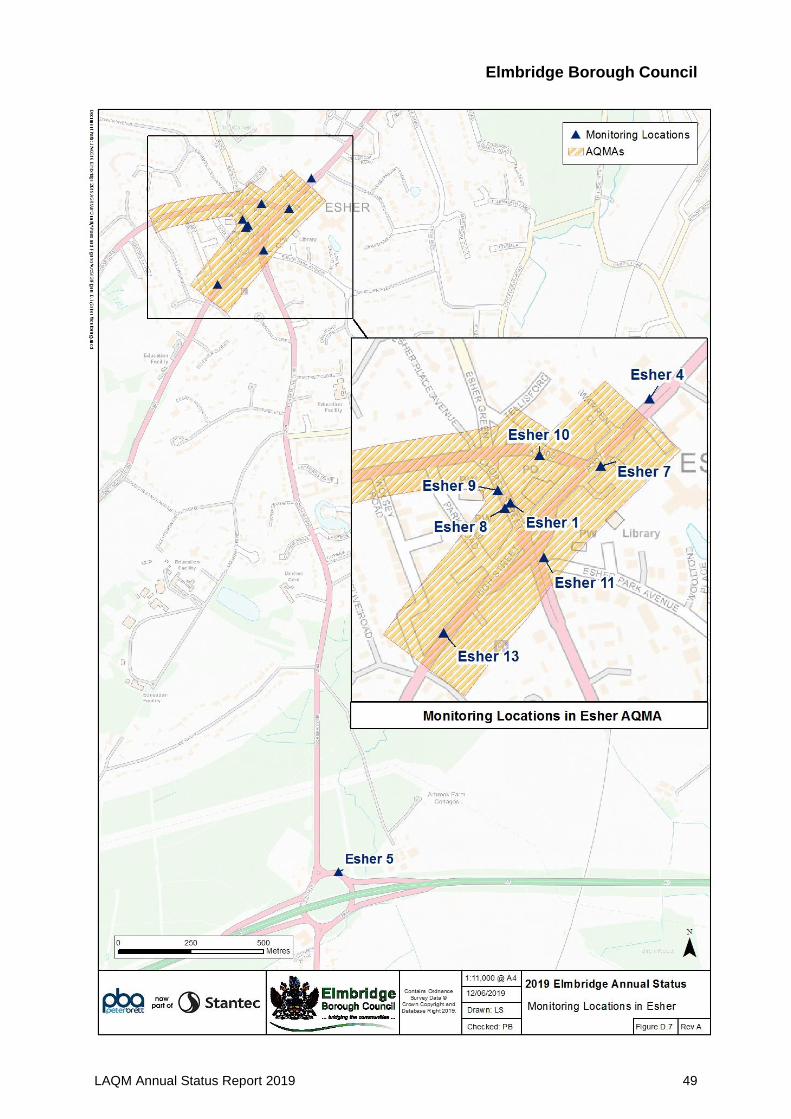
whilst one site (Esher 5) is not within an AQMA. The Esher 5 monitoring site is located
at the Copsem Lane Roundabout, where Copsem Lane adjoins the A3 Esher Bypass
(Figure D.7). The completion of the modelling project will allow a review of existing
AQMAs that have shown levels below the objective in addition to alerting to any
potential areas for further investigation under LAQM.
The areas prioritised for action in 2019/20 are:
• Working in partnership with the SAA to conclude the modelling project and
provide a better understanding of air quality in Surrey;
• Reviewing existing AQMA’s and investigate any potential areas for further
investigation identified by the modelling project.
• Seeking provision of infrastructure through the planning process for the
promotion and support of low emission vehicle usage;
• Utilising development management control within the Borough’s AQMAs to
avoid introducing more people to poor air quality or additional sources of
pollution;
• Working collaboratively with other Surrey authorities, SCC Public Health team,
Surrey’s Clinical Commissioning Groups, SCC Local Highway and Transport
Authority, in addition to actively participating in the SAA.
• Promoting air quality, raising awareness and seeking to change behaviours
Elmbridge Borough Council
LAQM Annual Status Report 2019 v
• Increasing electric vehicle charging points in Council car parks and exploring
further incentives for electric vehicle users.
Local Engagement and How to get Involved
As part of the approach of local engagement we will use messages like the following:
• As the majority of air pollution is associated with traffic, consider alternatives to
using your car; public transport, walking or cycling will help reduce emissions.
• When purchasing a new car, consider vehicles with lower exhaust emissions,
such as hybrid or electric vehicles. Information on electric car grants is available
at www.gov.uk/plug-in-car-van-grants.
• If you are carrying out building works, consider future-proofing your home by
installing an electric vehicle charge point. A fast (7kW) charger is recommended
and there are grants available which can bring the cost down to under £300.
More information can be found at:
https://www.gov.uk/government/collections/plug-in-vehicle-chargepoint-grants.
• If installing or replacing an existing wood burning stove, consider purchasing
one that has been approved for use in smoke control areas by DEFRA or an
Eco-design ready stove to help reduce
emissionshttps://www.elmbridge.gov.uk/pollution/local-air-quality/
• Air pollution can cause short term (acute) and long term (chronic) health
problems. The most sensitive groups are adults and young children with
Elmbridge Borough Council
LAQM Annual Status Report 2019 vi
respiratory conditions and adults with heart conditions. If you feel that you are
in one of the higher risk groups or have particular concerns regarding air quality,
you can sign up to our airAlert information service. For more information visit
the airAlert website at:
http://www.airalert.info/Surrey/Default.aspx.
Elmbridge Borough Council
LAQM Annual Status Report 2019 vii
Table of Contents
Executive Summary: Air Quality in Our Area .......................................................... i
Air Quality in Elmbridge ...................................................................................................... i
Actions to Improve Air Quality ............................................................................................. i
Conclusions and Priorities ................................................................................................ iv
Local Engagement and How to get Involved ...................................................................... v
1 Local Air Quality Management ........................................................................ 1
2 Actions to Improve Air Quality ........................................................................ 2
2.1 Air Quality Management Areas .............................................................................. 2
2.2 Progress and Impact of Measures to address Air Quality in Elmbridge .................. 6
2.3 PM2.5 – Local Authority Approach to Reducing Emissions and/or
Concentrations.................................................................................................................13
3 Air Quality Monitoring Data and Comparison with Air Quality
Objectives and National Compliance .................................................................... 14
3.1 Summary of Monitoring Undertaken .....................................................................14
3.1.1 Automatic Monitoring Sites .......................................................................................... 14
3.1.2 Non-Automatic Monitoring Sites................................................................................... 14
3.2 Individual Pollutants .............................................................................................14
3.2.1 Nitrogen Dioxide (NO2)................................................................................................. 15
3.2.2 Particulate Matter (PM10) .............................................................................................. 16
3.2.3 Particulate Matter (PM2.5) ............................................................................................. 16
3.2.4 Sulphur Dioxide (SO2) .................................................................................................. 16
Appendix A: Monitoring Results ........................................................................... 17
Appendix B: Full Monthly Diffusion Tube Results for 2018 ................................ 32
Appendix C: Supporting Technical Information / Air Quality Monitoring
Data QA/QC ............................................................................................................. 36
Appendix D: Maps of Monitoring Locations and AQMAs ................................... 42
................................................................................................................................. 46
Appendix E: Summary of Air Quality Objectives in England .............................. 51
Glossary of Terms .................................................................................................. 52
References .............................................................................................................. 53
Elmbridge Borough Council
LAQM Annual Status Report 2019 viii
List of Tables
Table 2.1 – Declared Air Quality Management Areas .................................................. 3 Table 2.2 – Progress on Measures to Improve Air Quality .......................................... 8
Table A.1 – Details of Automatic Monitoring Sites ..................................................... 17 Table A.2 – Details of Non-Automatic Monitoring Sites ............................................. 18 Table A.3 – Annual Mean NO2 Monitoring Results .................................................... 23 Table A.4 – 1-Hour Mean NO2 Monitoring Results .................................................... 31
Table B.1 – NO2 Monthly Diffusion Tube Results – 2018 .......................................... 32 Table E.1 – Air Quality Objectives in England ........................................................... 51
List of Figures
Figure A.1 – Trends in Annual Mean NO2 Concentrations at Esher .......................... 27
Figure A.2: Trends in Annual Mean NO2 Concentrations at Hinchley Wood ............. 27
Figure A.3: Trends in Annual Mean NO2 Concentrations at Molesey ........................ 28 Figure A.4: Trends in Annual Mean NO2 Concentrations at Hampton Court ............. 28 Figure A.5: Trends in Annual Mean NO2 Concentrations at Walton-on-Thames ....... 29 Figure A.6: Trends in Annual Mean NO2 Concentrations at Weybridge .................... 29
Figure A.7: Trends in Annual Mean NO2 Concentrations at Cobham ........................ 30
Elmbridge Borough Council
LAQM Annual Status Report 2019 1
1 Local Air Quality Management
This report provides an overview of air quality in Elmbridge during 2018. It fulfils the
requirements of Local Air Quality Management (LAQM) as set out in Part IV of the
Environment Act (1995) and the relevant Policy and Technical Guidance documents.
The LAQM process places an obligation on all local authorities to regularly review and
assess air quality in their areas, and to determine whether or not the air quality
objectives are likely to be achieved. Where an exceedance is considered likely, the
local authority must declare an Air Quality Management Area (AQMA) and prepare an
Air Quality Action Plan (AQAP) setting out the measures it intends to put in place in
pursuit of the objectives. This Annual Status Report (ASR) is an annual requirement
showing the strategies employed by the Council to improve air quality and any progress
that has been made.
The statutory air quality objectives applicable to LAQM in England can be found in
Table E.1 in Appendix E.
Elmbridge Borough Council
LAQM Annual Status Report 2019 2
2 Actions to Improve Air Quality
2.1 Air Quality Management Areas
Air Quality Management Areas (AQMAs) are declared when there is an exceedance
or likely exceedance of an air quality objective. After declaration, the authority needs
to prepare an Air Quality Action Plan (AQAP) within 12-18 months setting out measures
it intends to put in place in pursuit of compliance with the objectives.
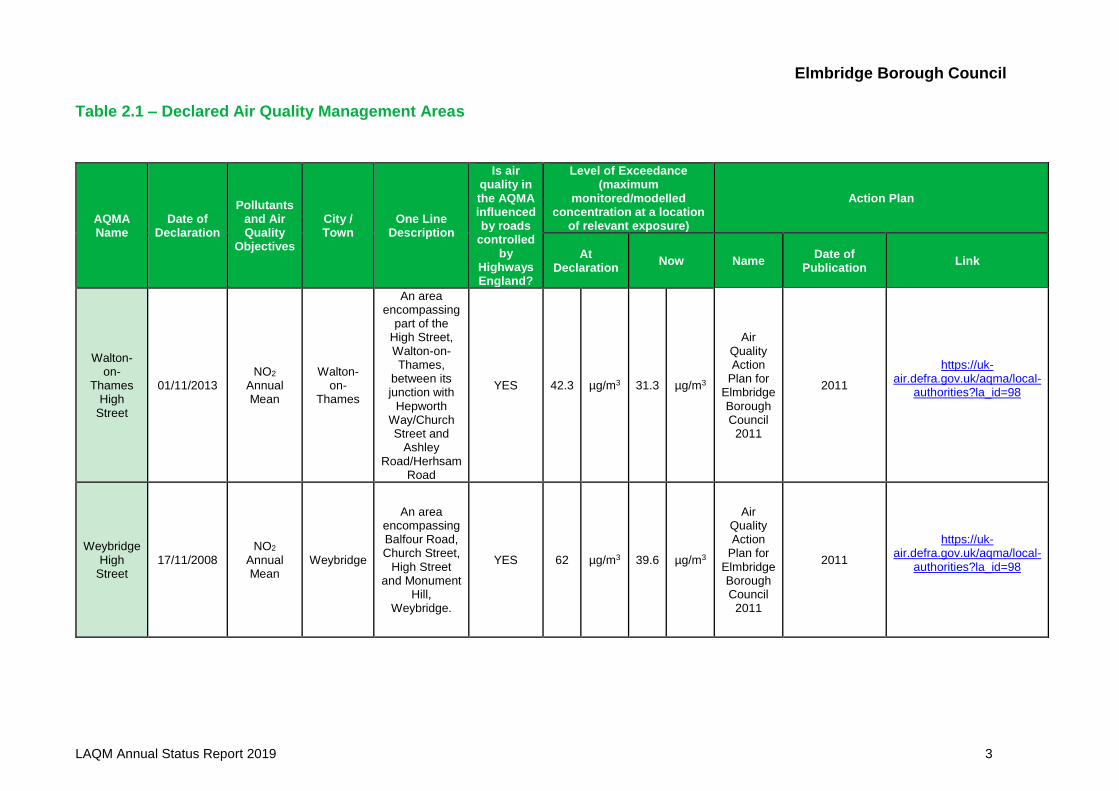
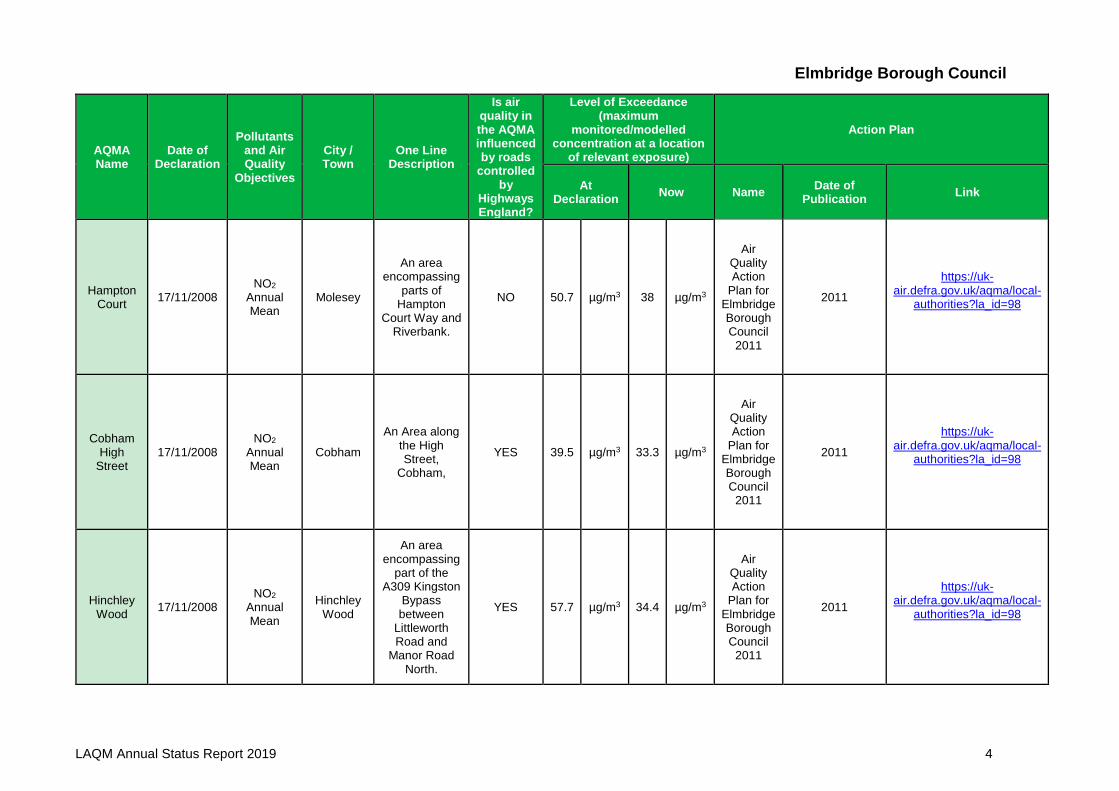
A summary of AQMAs declared by Elmbridge Borough Council (the Council) can be
found in Table 2.1. Further information related to declared or revoked AQMAs,
including maps of AQMA boundaries are available online at https://uk-
air.defra.gov.uk/aqma/local-authorities?la_id=98 .
The Public Health Outcomes Framework data tool, compiled by Public Health England,
quantifies the proportion of the population living within an AQMA. The tool is available
online at https://fingertips.phe.org.uk/profile/public-health-outcomes-
framework/data#page/0/gid/1000049/pat/6/par/E12000008/ati/102/are/E10000030.
The latest data available for 2017 shows that in England, the proportion of the
population living within an AQMA is 0.2%, and in Surrey it is 0.5%. There is no data
available for the proportion of the population living within an AQMA in Elmbridge.
Elmbridge Borough Council
LAQM Annual Status Report 2019 3
Table 2.1 – Declared Air Quality Management Areas
AQMA Name
Date of Declaration
Pollutants and Air Quality
Objectives
City / Town
One Line Description
Is air quality in the AQMA influenced by roads
controlled by
Highways England?
Level of Exceedance (maximum
monitored/modelled concentration at a location
of relevant exposure)
Action Plan
At Declaration
Now Name Date of
Publication Link
Walton-on-
Thames High
Street
01/11/2013 NO2
Annual Mean
Walton-on-
Thames
An area encompassing
part of the High Street, Walton-on-Thames,
between its junction with
Hepworth Way/Church Street and
Ashley Road/Herhsam
Road
YES 42.3 µg/m3 31.3 µg/m3
Air Quality Action
Plan for Elmbridge Borough Council
2011
2011
https://uk-air.defra.gov.uk/aqma/local-
authorities?la_id=98
Weybridge High
Street 17/11/2008
NO2
Annual Mean
Weybridge
An area encompassing Balfour Road, Church Street,
High Street and Monument
Hill, Weybridge.
YES 62 µg/m3 39.6 µg/m3
Air Quality Action
Plan for Elmbridge Borough Council
2011
2011
https://uk-air.defra.gov.uk/aqma/local-
authorities?la_id=98
Elmbridge Borough Council
LAQM Annual Status Report 2019 4
AQMA Name
Date of Declaration
Pollutants and Air Quality
Objectives
City / Town
One Line Description
Is air quality in the AQMA influenced by roads
controlled by
Highways England?
Level of Exceedance (maximum
monitored/modelled concentration at a location
of relevant exposure)
Action Plan
At Declaration
Now Name Date of
Publication Link
Hampton Court
17/11/2008 NO2
Annual Mean
Molesey
An area encompassing
parts of Hampton
Court Way and Riverbank.
NO 50.7 µg/m3 38 µg/m3
Air Quality Action
Plan for Elmbridge Borough Council
2011
2011
https://uk-air.defra.gov.uk/aqma/local-
authorities?la_id=98
Cobham High
Street 17/11/2008
NO2 Annual Mean
Cobham
An Area along the High Street,
Cobham,
YES 39.5 µg/m3 33.3 µg/m3
Air Quality Action
Plan for Elmbridge Borough Council
2011
2011
https://uk-air.defra.gov.uk/aqma/local-
authorities?la_id=98
Hinchley Wood
17/11/2008 NO2
Annual Mean
Hinchley Wood
An area encompassing
part of the A309 Kingston
Bypass between
Littleworth Road and
Manor Road North.
YES 57.7 µg/m3 34.4 µg/m3
Air Quality Action
Plan for Elmbridge Borough Council
2011
2011
https://uk-air.defra.gov.uk/aqma/local-
authorities?la_id=98
Elmbridge Borough Council
LAQM Annual Status Report 2019 5
AQMA Name
Date of Declaration
Pollutants and Air Quality
Objectives
City / Town
One Line Description
Is air quality in the AQMA influenced by roads
controlled by
Highways England?
Level of Exceedance (maximum
monitored/modelled concentration at a location
of relevant exposure)
Action Plan
At Declaration
Now Name Date of
Publication Link
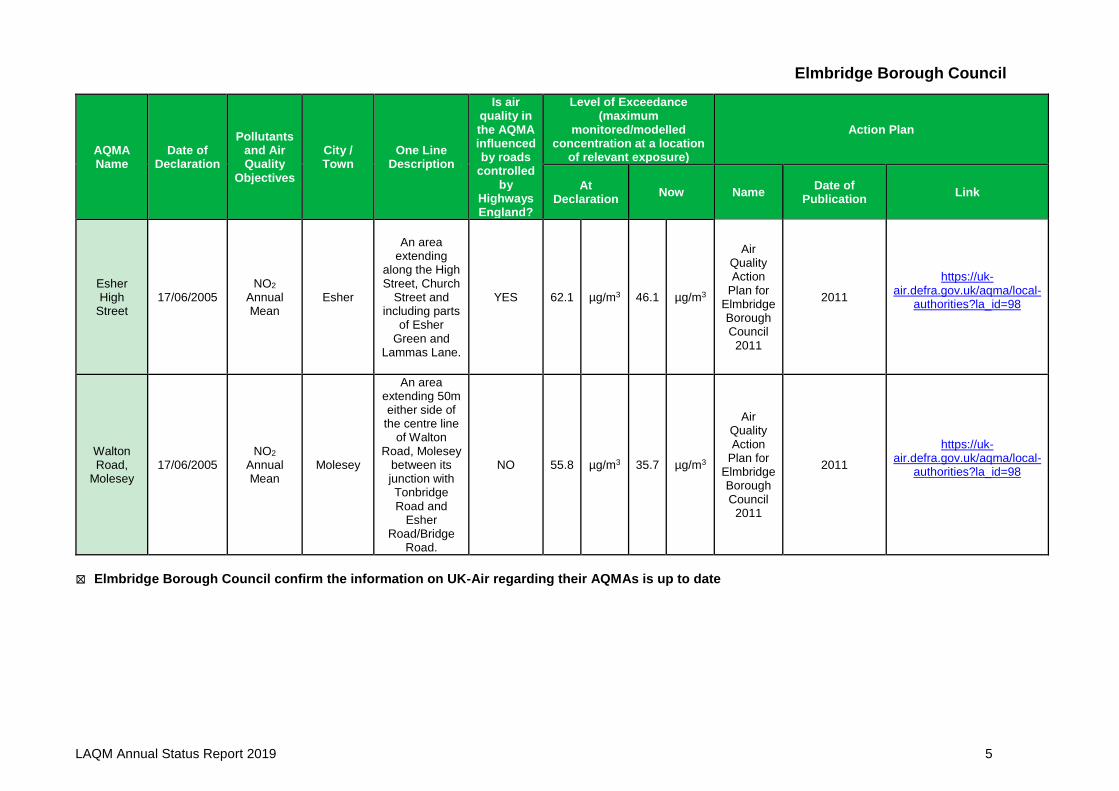
Esher High
Street 17/06/2005
NO2 Annual Mean
Esher
An area extending
along the High Street, Church
Street and including parts
of Esher Green and
Lammas Lane.
YES 62.1 µg/m3 46.1 µg/m3
Air Quality Action
Plan for Elmbridge Borough Council
2011
2011
https://uk-air.defra.gov.uk/aqma/local-
authorities?la_id=98
Walton Road,
Molesey 17/06/2005
NO2 Annual Mean
Molesey
An area extending 50m either side of
the centre line of Walton
Road, Molesey between its junction with Tonbridge Road and
Esher Road/Bridge
Road.
NO 55.8 µg/m3 35.7 µg/m3
Air Quality Action
Plan for Elmbridge Borough Council
2011
2011
https://uk-air.defra.gov.uk/aqma/local-
authorities?la_id=98
☒ Elmbridge Borough Council confirm the information on UK-Air regarding their AQMAs is up to date
Elmbridge Borough Council
LAQM Annual Status Report 2019 6
2.2 Progress and Impact of Measures to address Air Quality in Elmbridge
Defra’s appraisal of last year’s ASR stated that the conclusions reached by the Council
were acceptable for all sources and pollutants. The following recommendations were
made to help inform future reports:
• The report could include links to Public Health Outcomes Frameworks;
• The Council could look at deriving a local bias adjustment factor, for comparison
with the national factor;
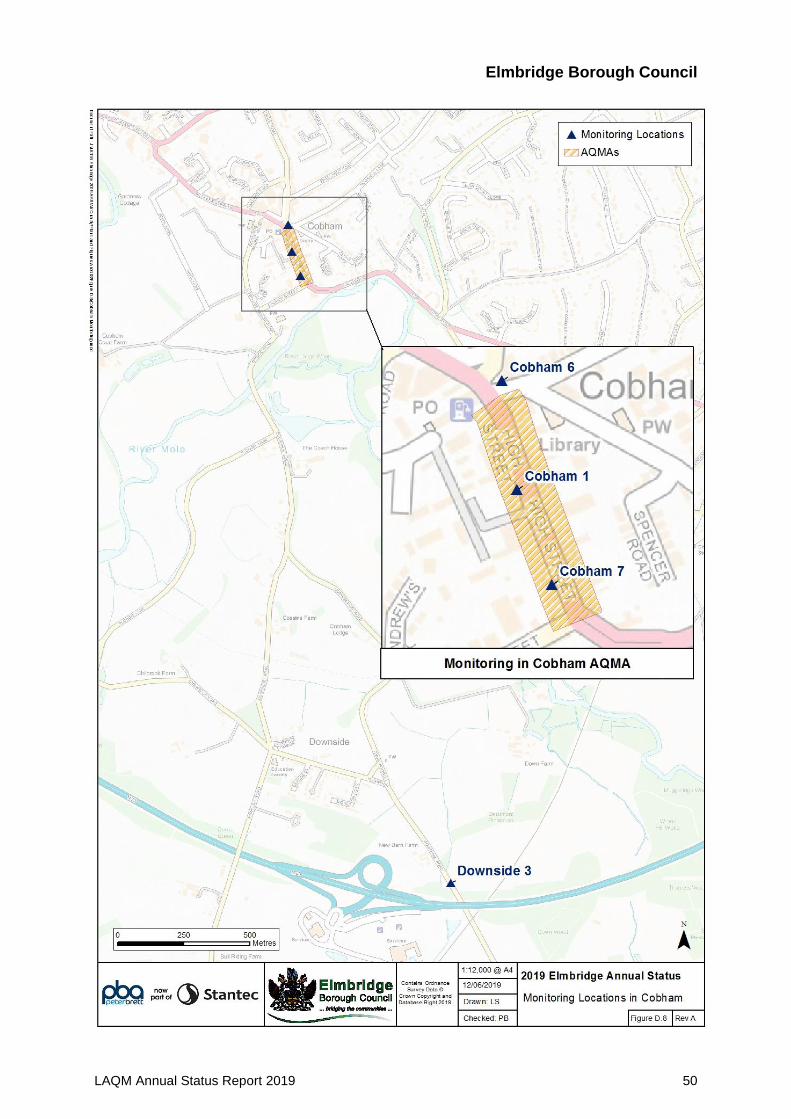
• Annual mean NO2 concentrations have been well below the objective in the
Cobham AQMA for a number of years now. The Council should consider a
detailed assessment of the area to inform possible revocation of the AQMA; and
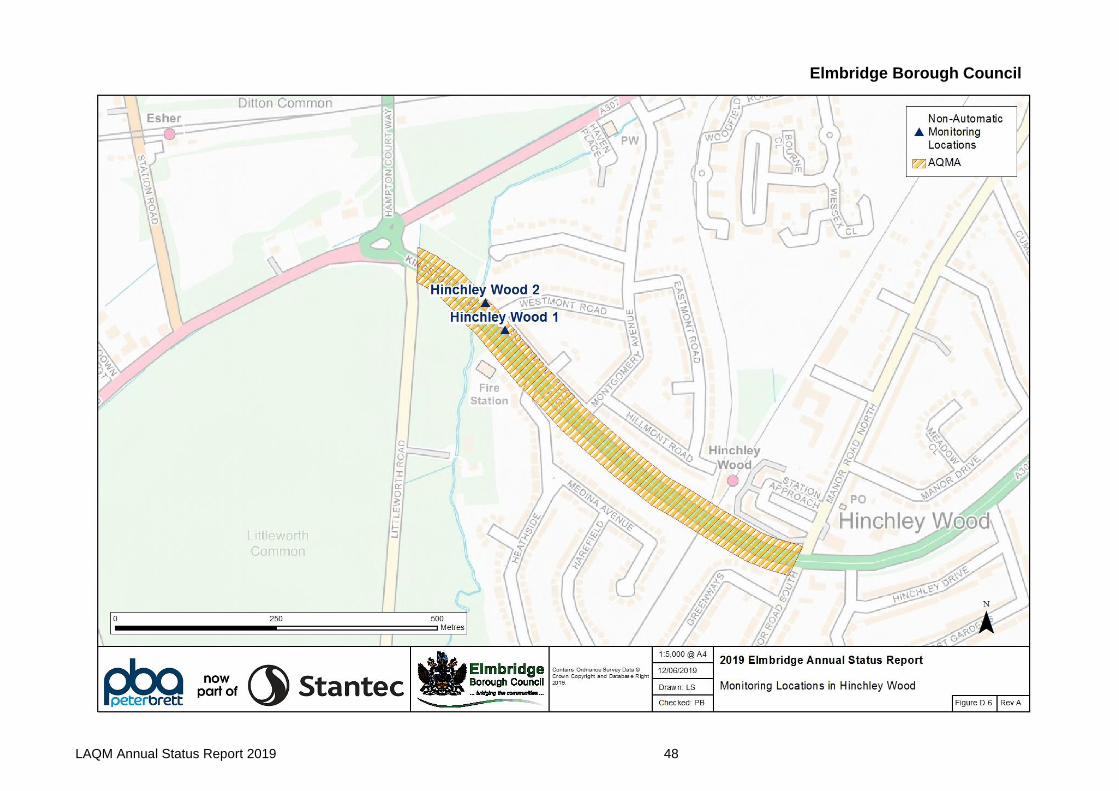
• There are no current exceedances within Hinchley Wood AQMA, Walton-on-
Thames AQMA and Molesey AQMA. It is recommended that monitoring
continues until there are three years of results below 10% of the objective level,
prior to considerations for revocation.
The 2019 ASR has addressed these comments in the following ways:
• Links to the Public Health Outcomes Framework have been provided. Data on
mortality burden of PM2.5 and percentage of the population living within an
AQMA have been summarised;
• A local bias adjustment factor has been calculated and compared against the
national bias adjustment factor (Appendix C provides further details). The local
bias adjustment factor has been applied to the 2018 non-automatic monitoring
data;
• Surrey-wide modelling of pollutants has been undertaken and this can be used
to inform the detailed assessment of the Cobham AQMA; and
• Monitoring was continued in the Hinchley Wood, Walton-on-Thames and
Molesey AQMAs throughout 2018.
The Council has taken forward a number of direct measures during the current
reporting year of 2018 in pursuit of improving local air quality. Details of all measures
Elmbridge Borough Council
LAQM Annual Status Report 2019 7
completed, in progress or planned are set out in Table 2.2. Key completed measures
are:
• Assisting in delivery of the SAA workplan and leading on the Surrey-wide
modelling project for key pollutants;
• Modelling of target pollutant levels to be carried out as part of a Surrey-wide
exercise (PM10, PM2.5 and NO2);
• Providing support to the production of an Electric Vehicle Charging Strategy for
Surrey, and adoption of the Strategy in Elmbridge; and
• Reducing parking permit charges for electric vehicles.
The Council expects the following measures to be completed over the course of the
next reporting year:
• Adoption of a revised Air Quality Action Plan;
• Continue to support he Surrey Schools Air Quality Programme project;
• Installation of electric vehicle charging points in at least two main town car parks
• Use the results of the Surrey Wide modelling project to review existing AQMA’s
and explore the need to declare any new AQMA’s
• Explore further parking incentives for electric vehicle owners
• Promotion of air quality, raising awareness and seeking to change behaviours
Elmbridge Borough Council
LAQM Annual Status Report 2019 8
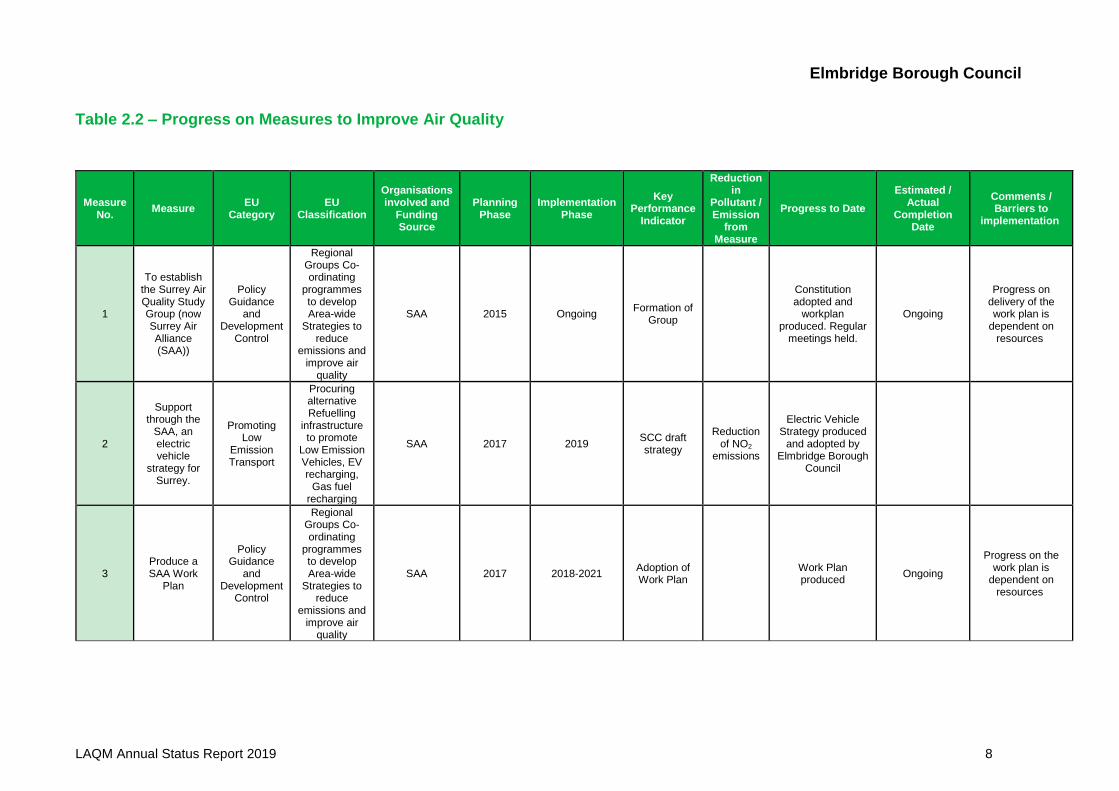
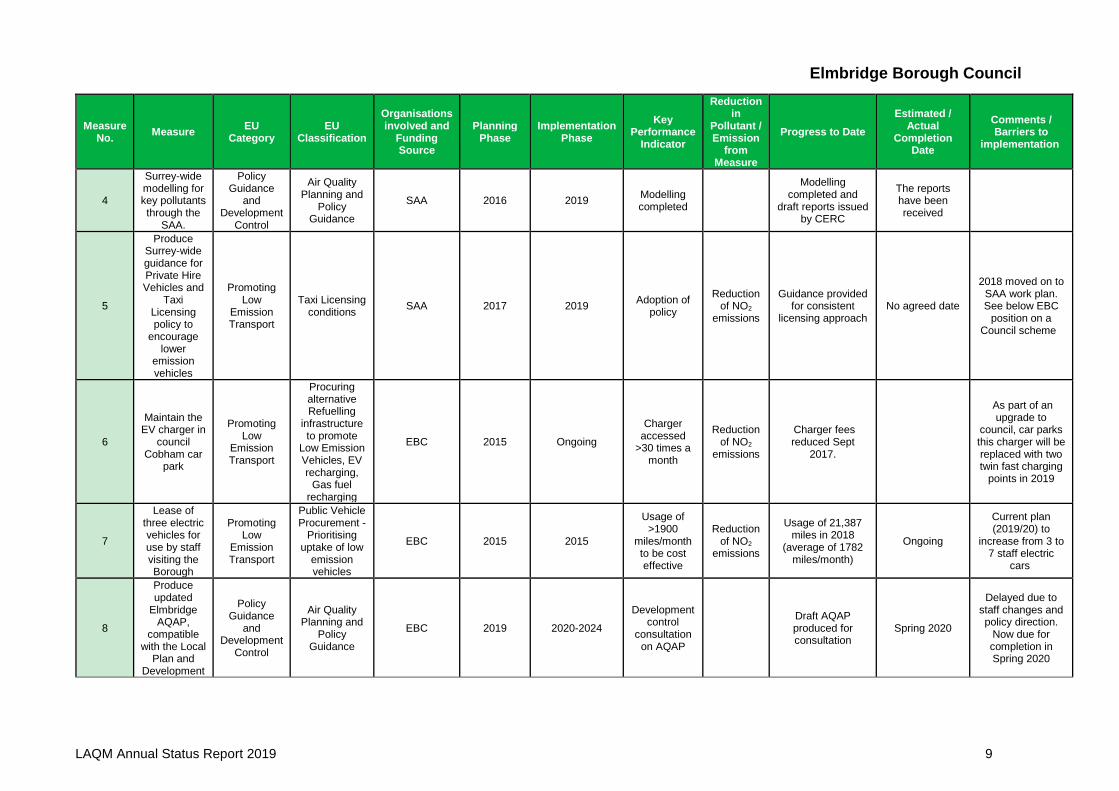
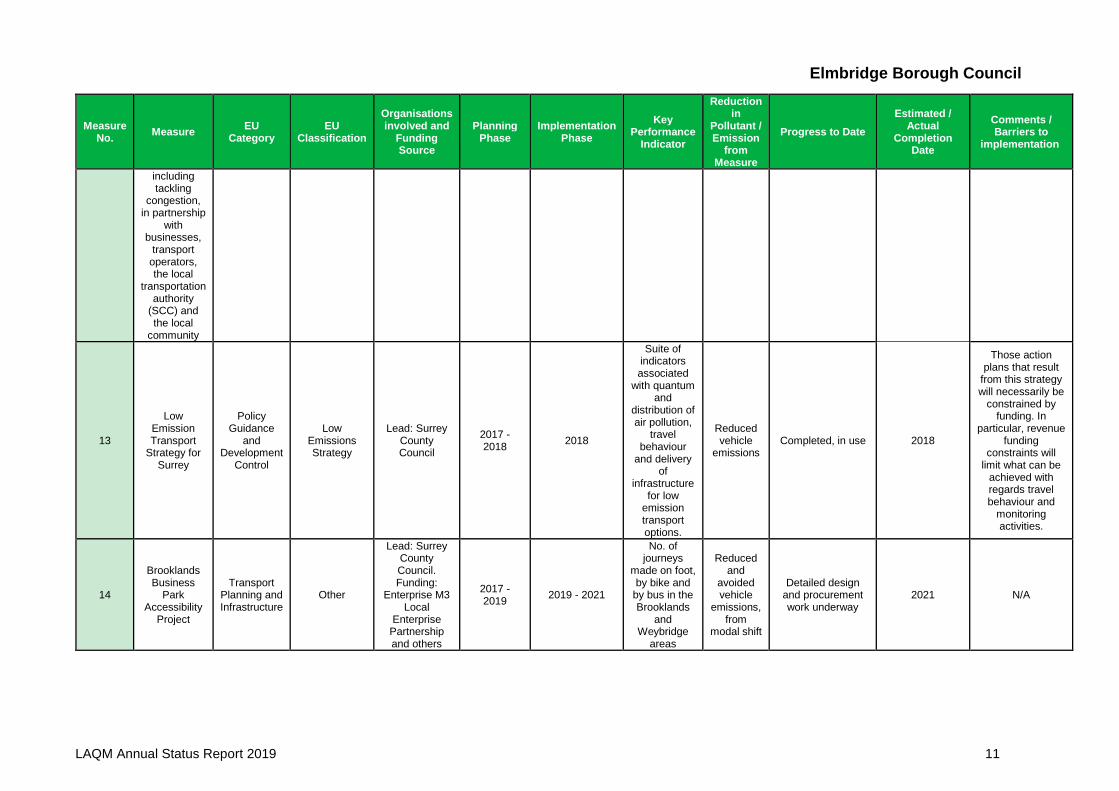
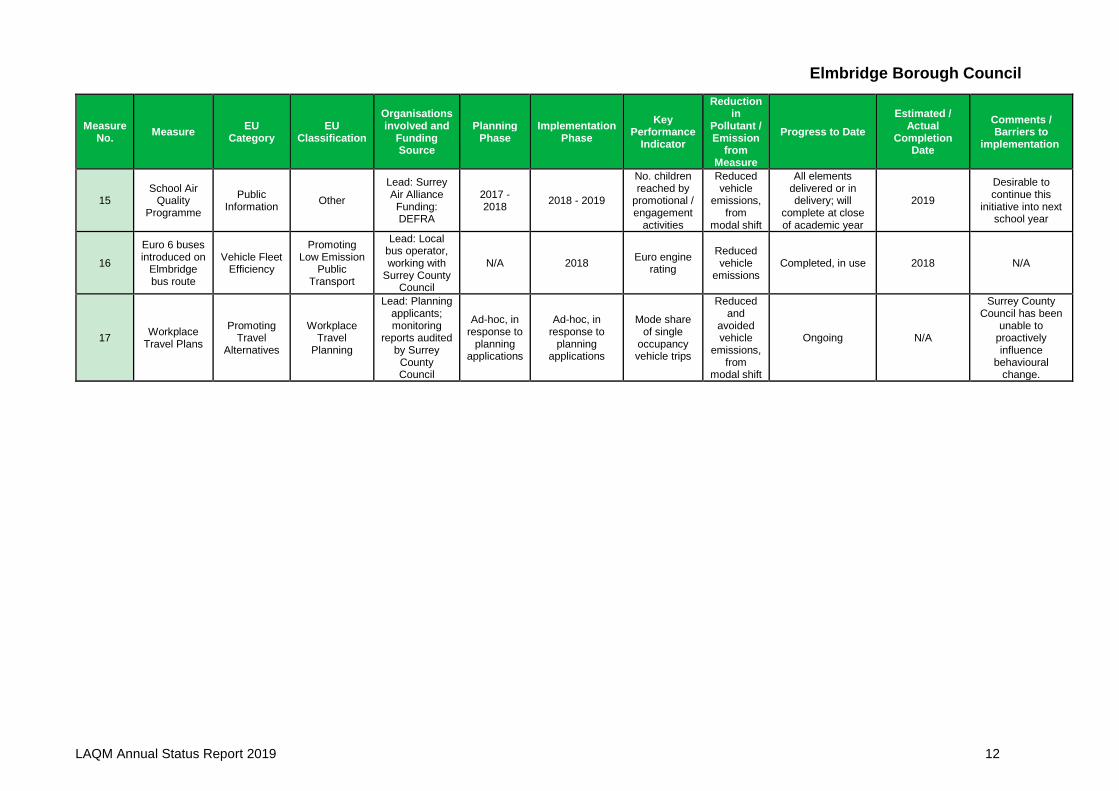
Table 2.2 – Progress on Measures to Improve Air Quality
Measure No.
Measure EU
Category EU
Classification
Organisations involved and
Funding Source
Planning Phase
Implementation Phase
Key Performance
Indicator
Reduction in
Pollutant / Emission
from Measure
Progress to Date
Estimated / Actual
Completion Date
Comments / Barriers to
implementation
1
To establish the Surrey Air Quality Study Group (now Surrey Air Alliance (SAA))
Policy Guidance
and Development
Control
Regional Groups Co-ordinating
programmes to develop Area-wide
Strategies to reduce
emissions and improve air
quality
SAA 2015 Ongoing Formation of
Group
Constitution adopted and
workplan produced. Regular
meetings held.
Ongoing
Progress on delivery of the work plan is
dependent on resources
2
Support through the
SAA, an electric vehicle
strategy for Surrey.
Promoting Low
Emission Transport
Procuring alternative Refuelling
infrastructure to promote
Low Emission Vehicles, EV recharging,
Gas fuel recharging
SAA 2017 2019 SCC draft strategy
Reduction of NO2
emissions
Electric Vehicle Strategy produced
and adopted by Elmbridge Borough
Council
3 Produce a SAA Work
Plan
Policy Guidance
and Development
Control
Regional Groups Co-ordinating
programmes to develop Area-wide
Strategies to reduce
emissions and improve air
quality
SAA 2017 2018-2021 Adoption of Work Plan
Work Plan produced
Ongoing
Progress on the work plan is
dependent on resources
Elmbridge Borough Council
LAQM Annual Status Report 2019 9
Measure No.
Measure EU
Category EU
Classification
Organisations involved and
Funding Source
Planning Phase
Implementation Phase
Key Performance
Indicator
Reduction in
Pollutant / Emission
from Measure
Progress to Date
Estimated / Actual
Completion Date
Comments / Barriers to
implementation
4
Surrey-wide modelling for key pollutants through the
SAA.
Policy Guidance
and Development
Control
Air Quality Planning and
Policy Guidance
SAA 2016 2019 Modelling completed
Modelling completed and
draft reports issued by CERC
The reports have been received
5
Produce Surrey-wide guidance for Private Hire Vehicles and
Taxi Licensing policy to
encourage lower
emission vehicles
Promoting Low
Emission Transport
Taxi Licensing conditions
SAA 2017 2019 Adoption of
policy
Reduction of NO2
emissions
Guidance provided for consistent
licensing approach No agreed date
2018 moved on to SAA work plan. See below EBC
position on a Council scheme
6
Maintain the EV charger in
council Cobham car
park
Promoting Low
Emission Transport
Procuring alternative Refuelling
infrastructure to promote
Low Emission Vehicles, EV recharging,
Gas fuel recharging
EBC 2015 Ongoing
Charger accessed
>30 times a month
Reduction of NO2
emissions
Charger fees reduced Sept
2017.
As part of an upgrade to
council, car parks this charger will be replaced with two twin fast charging
points in 2019
7
Lease of three electric vehicles for use by staff visiting the Borough
Promoting Low
Emission Transport
Public Vehicle Procurement -
Prioritising uptake of low
emission vehicles
EBC 2015 2015
Usage of >1900
miles/month to be cost effective
Reduction of NO2
emissions
Usage of 21,387 miles in 2018
(average of 1782 miles/month)
Ongoing
Current plan (2019/20) to
increase from 3 to 7 staff electric
cars
8
Produce updated
Elmbridge AQAP,
compatible with the Local
Plan and Development
Policy Guidance
and Development
Control
Air Quality Planning and
Policy Guidance
EBC 2019 2020-2024
Development control
consultation on AQAP
Draft AQAP produced for consultation
Spring 2020
Delayed due to staff changes and policy direction.
Now due for completion in Spring 2020
Elmbridge Borough Council
LAQM Annual Status Report 2019 10
Measure No.
Measure EU
Category EU
Classification
Organisations involved and
Funding Source
Planning Phase
Implementation Phase
Key Performance
Indicator
Reduction in
Pollutant / Emission
from Measure
Progress to Date
Estimated / Actual
Completion Date
Comments / Barriers to
implementation
Management Plan.
9
Use of a tiered fee
structure for taxi licensing
to benefit operators with lower emission vehicles
Promoting Low
Emission Transport
Taxi emission incentives
EBC 2019 2019
Possible Inclusion in Hackney
carriage and private hire licensing
policy
Reduction of NO2
emissions Consultation phase 2020
Taxi policy under review.
Consultation in progress July -October 2019.
10
Use of the EBC website to promote
public awareness of
the Elmbridge
AQMAs and air quality in
general.
Public Information
Via the Internet
SCC and Surrey Local Authorities
2017 Ongoing Latest ASR available on
website
Standard information
compiled by the SAA
Completed Together with
on-going updating
Completed Summer 2018,
ongoing updating required.
Love Elmbridge Campaign
includes air quality advice and bespoke
animation.
11
Install electric vehicle
charging points in at least two
main town car parks
Promoting Low
Emission Transport
Procuring alternative Refuelling
infrastructure to promote
Low Emission Vehicles, EV recharging,
Gas fuel recharging
EBC 2019 2020 Charging
points installed
Reduction of NO2
emissions Dec-19 On going
12
Devise a medium-term action plan to reduce traffic
emissions through a series of
measures
Traffic Management
UTC, Congestion
management, traffic
reduction
EBC / SCC 2019 2019 Action Plan produced
Reduction of NO2
emissions Mar-20
Elmbridge Borough Council
LAQM Annual Status Report 2019 11
Measure No.
Measure EU
Category EU
Classification
Organisations involved and
Funding Source
Planning Phase
Implementation Phase
Key Performance
Indicator
Reduction in
Pollutant / Emission
from Measure
Progress to Date
Estimated / Actual
Completion Date
Comments / Barriers to
implementation
including tackling
congestion, in partnership
with businesses,
transport operators, the local
transportation authority
(SCC) and the local
community
13
Low Emission Transport
Strategy for Surrey
Policy Guidance
and Development
Control
Low Emissions Strategy
Lead: Surrey County Council
2017 - 2018
2018
Suite of indicators associated
with quantum and
distribution of air pollution,
travel behaviour
and delivery of
infrastructure for low
emission transport options.
Reduced vehicle
emissions Completed, in use 2018
Those action plans that result
from this strategy will necessarily be
constrained by funding. In
particular, revenue funding
constraints will limit what can be
achieved with regards travel behaviour and
monitoring activities.
14
Brooklands Business
Park Accessibility
Project
Transport Planning and Infrastructure
Other
Lead: Surrey County Council. Funding:
Enterprise M3 Local
Enterprise Partnership and others
2017 - 2019
2019 - 2021
No. of journeys
made on foot, by bike and
by bus in the Brooklands
and Weybridge
areas
Reduced and
avoided vehicle
emissions, from
modal shift
Detailed design and procurement work underway
2021 N/A
Elmbridge Borough Council
LAQM Annual Status Report 2019 12
Measure No.
Measure EU
Category EU
Classification
Organisations involved and
Funding Source
Planning Phase
Implementation Phase
Key Performance
Indicator
Reduction in
Pollutant / Emission
from Measure
Progress to Date
Estimated / Actual
Completion Date
Comments / Barriers to
implementation
15 School Air
Quality Programme
Public Information
Other
Lead: Surrey Air Alliance Funding: DEFRA
2017 - 2018
2018 - 2019
No. children reached by
promotional / engagement
activities
Reduced vehicle
emissions, from
modal shift
All elements delivered or in delivery; will
complete at close of academic year
2019
Desirable to continue this
initiative into next school year
16
Euro 6 buses introduced on
Elmbridge bus route
Vehicle Fleet Efficiency
Promoting Low Emission
Public Transport
Lead: Local bus operator, working with
Surrey County Council
N/A 2018 Euro engine
rating
Reduced vehicle
emissions Completed, in use 2018 N/A
17 Workplace
Travel Plans
Promoting Travel
Alternatives
Workplace Travel
Planning
Lead: Planning applicants; monitoring
reports audited by Surrey County Council
Ad-hoc, in response to
planning applications
Ad-hoc, in response to
planning applications
Mode share of single
occupancy vehicle trips
Reduced and
avoided vehicle
emissions, from
modal shift
Ongoing N/A
Surrey County Council has been
unable to proactively influence
behavioural change.
Elmbridge Borough Council
LAQM Annual Status Report 2019 13
2.3 PM2.5 – Local Authority Approach to Reducing Emissions and/or Concentrations
As detailed in Policy Guidance LAQM.PG16 (Chapter 7), local authorities are expected
to work towards reducing emissions and/or concentrations of PM2.5 (particulate matter
with an aerodynamic diameter of 2.5µm or less). There is clear evidence that PM2.5
has a significant impact on human health, including premature mortality, allergic
reactions and cardiovascular diseases.
The Public Health Outcomes Framework data tool compiled by Public Health England
quantifies the mortality burden of PM2.5 within England, as well as on county and local
authority scales. The tool is available online at
https://fingertips.phe.org.uk/profile/public-health-outcomes-
framework/data#page/0/gid/1000049/pat/6/par/E12000008/ati/102/are/E10000030.
The latest available data for 2017 shows that the percentage of mortality attributable
to PM2.5 pollution across England is 5.1%. The percentage within Surrey is 5.7% and
within Elmbridge is 5.9%. Elmbridge has a higher percentage of mortality attributable
to PM2.5 pollution when compared to England and Surrey as a whole.
Given the implementation of the Technical Guidance LAQM.TG16 and Policy
Guidance LAQM.PG16, the Council is working towards defining a strategy to reduce
emissions or concentration of PM2.5. However, existing measures to improve air quality
already in place can help reduce levels of PM2.5, such as:
• Allocating Council funding to carry out PM2.5 dispersion modelling to gain a
better understanding of the current situation;
• Promoting travel alternatives;
• Promoting low emission transport;
• Implementing Surrey County Council’s Transport Plan (LTP3) and Air
Quality Strategy (January 2016).
The Surrey-wide dispersion modelling of PM2.5 concentrations has recently been
completed and the reports are expected to be finalised during 2019. The reports will
provide information on PM2.5 source apportionment and mortality burden, as well as
modelled PM2.5 concentrations across Elmbridge.
Elmbridge Borough Council
LAQM Annual Status Report 2019 14
3 Air Quality Monitoring Data and Comparison with Air Quality Objectives and National Compliance
3.1 Summary of Monitoring Undertaken
This section sets out what monitoring has taken place in 2018, and how it compares
with the national objectives.
3.1.1 Automatic Monitoring Sites
The Council undertook automatic (continuous) monitoring at two sites during 2018,
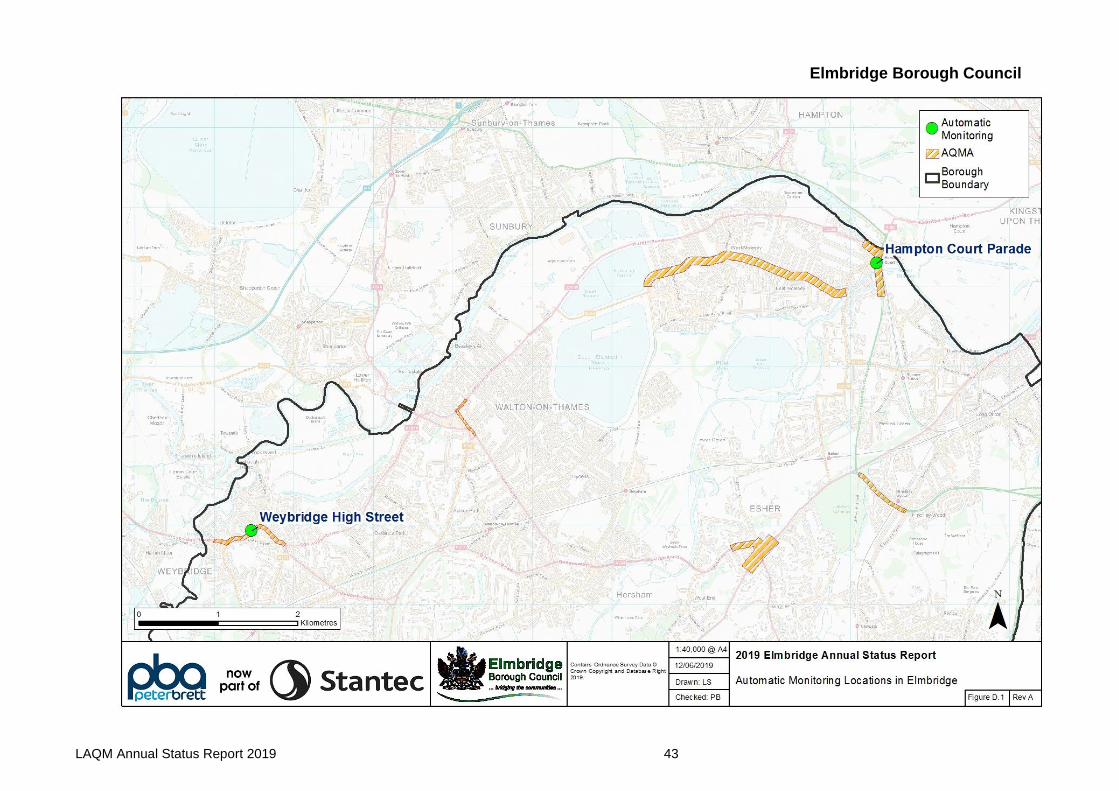
Weybridge High Street and Hampton Court Parade. Table A.1 in Appendix A provides
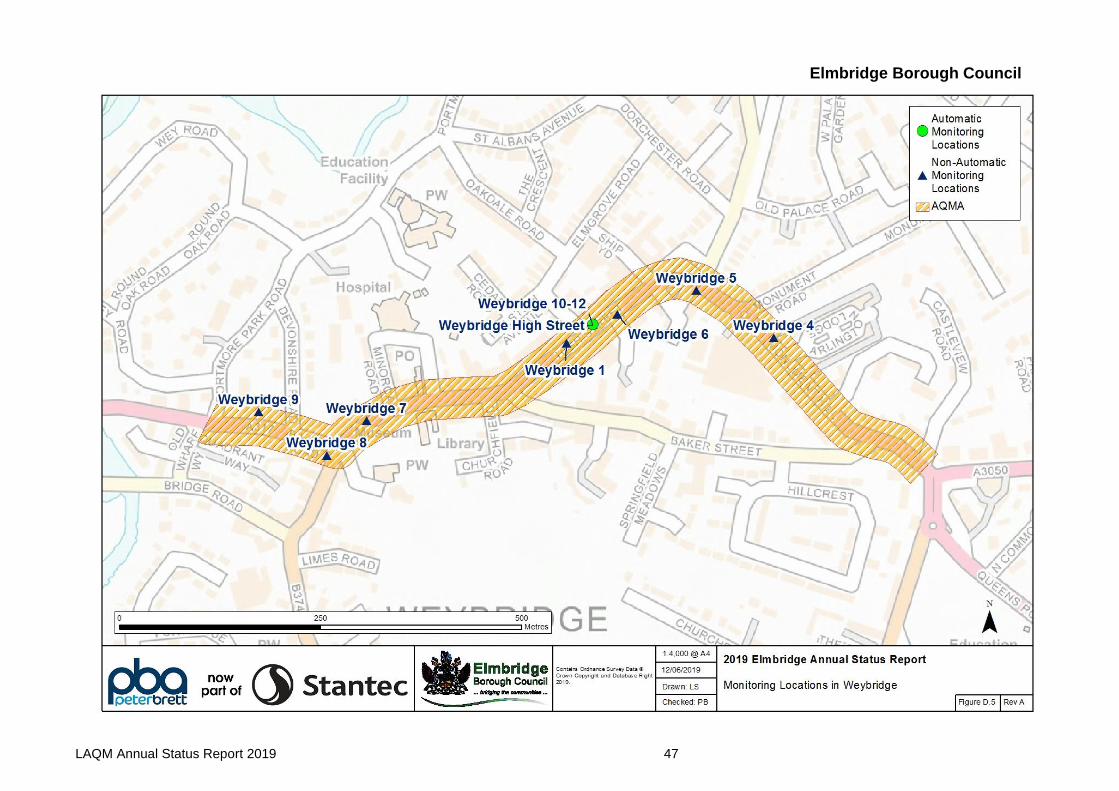
details of the sites and their locations are shown in Figure D.1.
Further details on how the monitors are calibrated and how the data has been adjusted
are included in Appendix C.
3.1.2 Non-Automatic Monitoring Sites
The Council undertook non-automatic (passive) monitoring of NO2 at 40 sites during
2018. Triplicate diffusion tubes are co-located with the Hampton Court Parade and
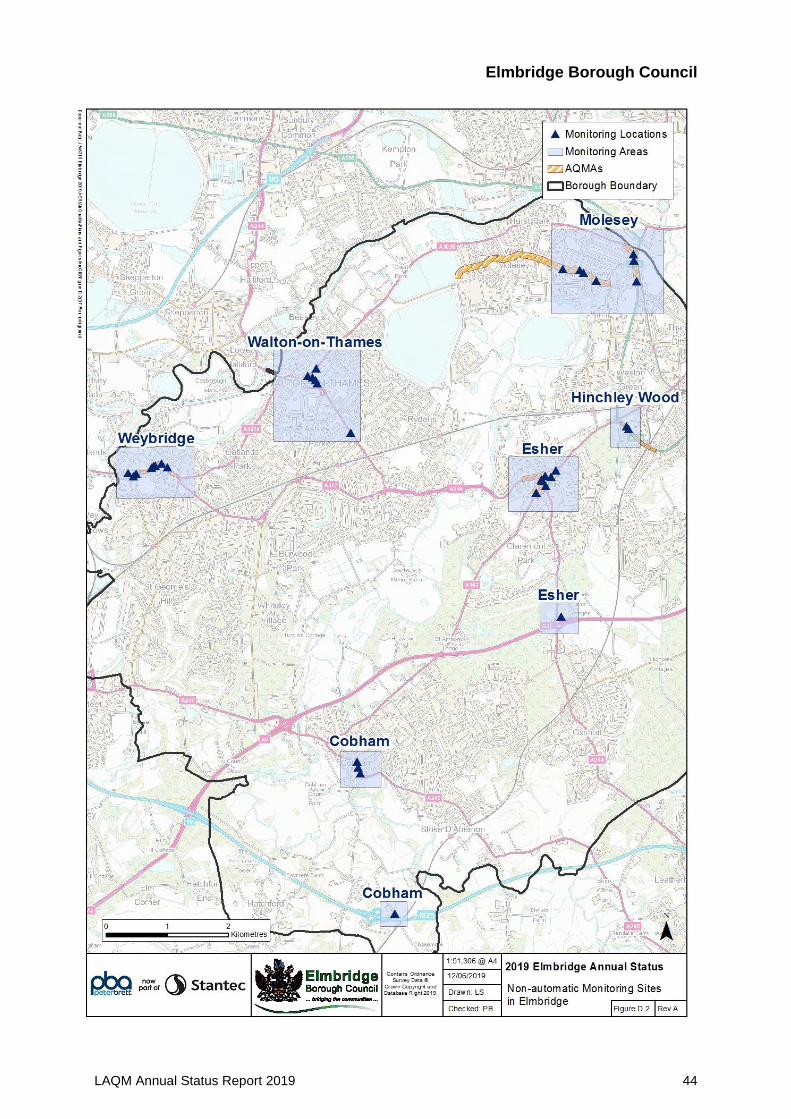
Weybridge High Street automatic monitors (from January 2013). Table A.1 in Appendix
A provides the details of the sites and their locations are shown in Figure D.2.
Further details on Quality Assurance/Quality Control (QA/QC) and bias adjustment for
the diffusion tubes are included in Appendix C.
3.2 Individual Pollutants
The air quality monitoring results presented in this section are, where relevant,
adjusted for bias, annualisation and distance correction. Further details on adjustments
are provided in Appendix C.
Reflecting feedback under the LAQM review process, the UK Government has decided
to retain Benzene, 1,3-Butadiene, Carbon Monoxide and Lead in the Regulations for
England. However, in recognition of the fact that the objectives for these pollutants
have been met for several years and are well below limit values, local authorities in
England do not have to report on these pollutants unless local circumstances indicate
otherwise; there are no such local circumstances in Elmbridge.
Elmbridge Borough Council
LAQM Annual Status Report 2019 15
3.2.1 Nitrogen Dioxide (NO2)
Table A.3 in Appendix A compares the ratified and adjusted monitored NO2 annual
mean concentrations for the past five years with the annual air quality objectives.
Table A.4 in Appendix A compares the ratified continuous monitored NO2 hourly mean
concentrations for the past five years with the hourly NO2 objective of 200µg/m3 (not
to be exceeded more than 18 times per year).
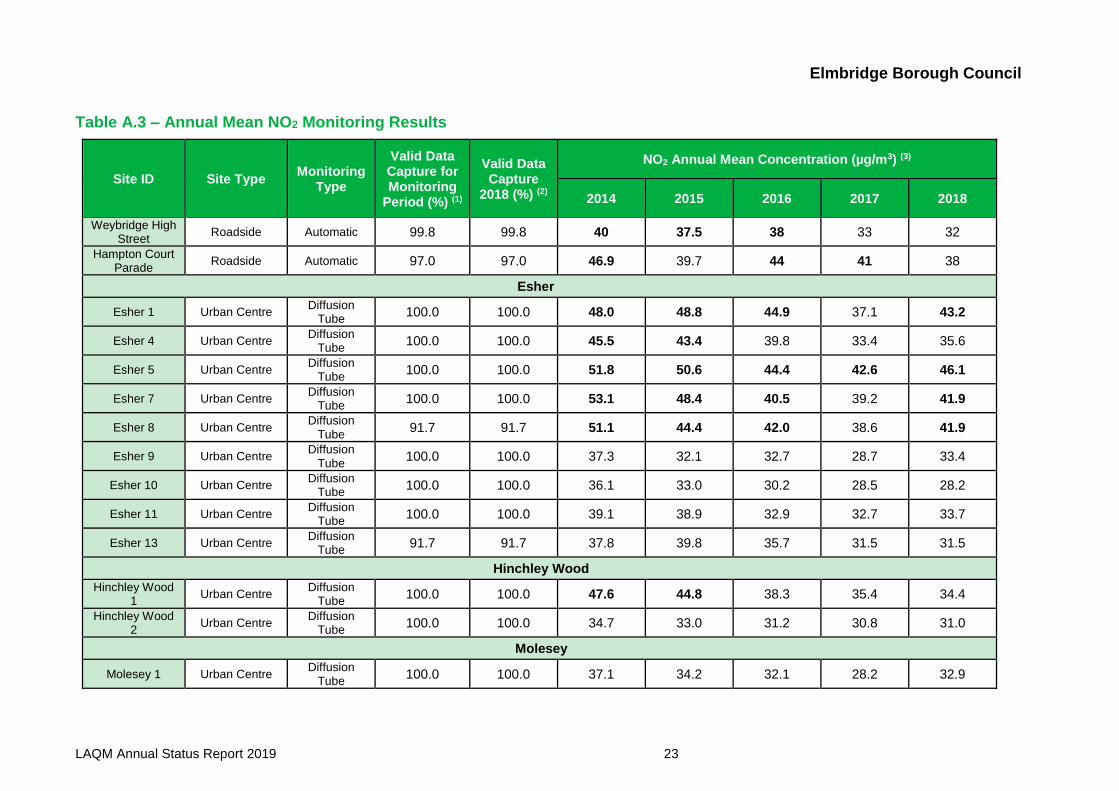
Automatic Monitoring
During 2018, the Council undertook automatic monitoring of NO2 concentrations at
Weybridge High Street and Hampton Court Parade. Annual mean NO2 concentrations
at both automatic monitoring sites met the objective. NO2 concentrations at both the
Hampton Court Parade and Weybridge High Street automatic monitoring locations
reduced in 2018 compared to previous years. Data capture during 2018 was good
(>90%) at both analysers.
Hourly mean concentrations at Hampton Court Parade were below the objective
throughout 2018. At Weybridge High Street, the hourly mean objective was exceeded
twice during 2018, however up to 18 exceedances per year are permitted.
Non-Automatic Monitoring
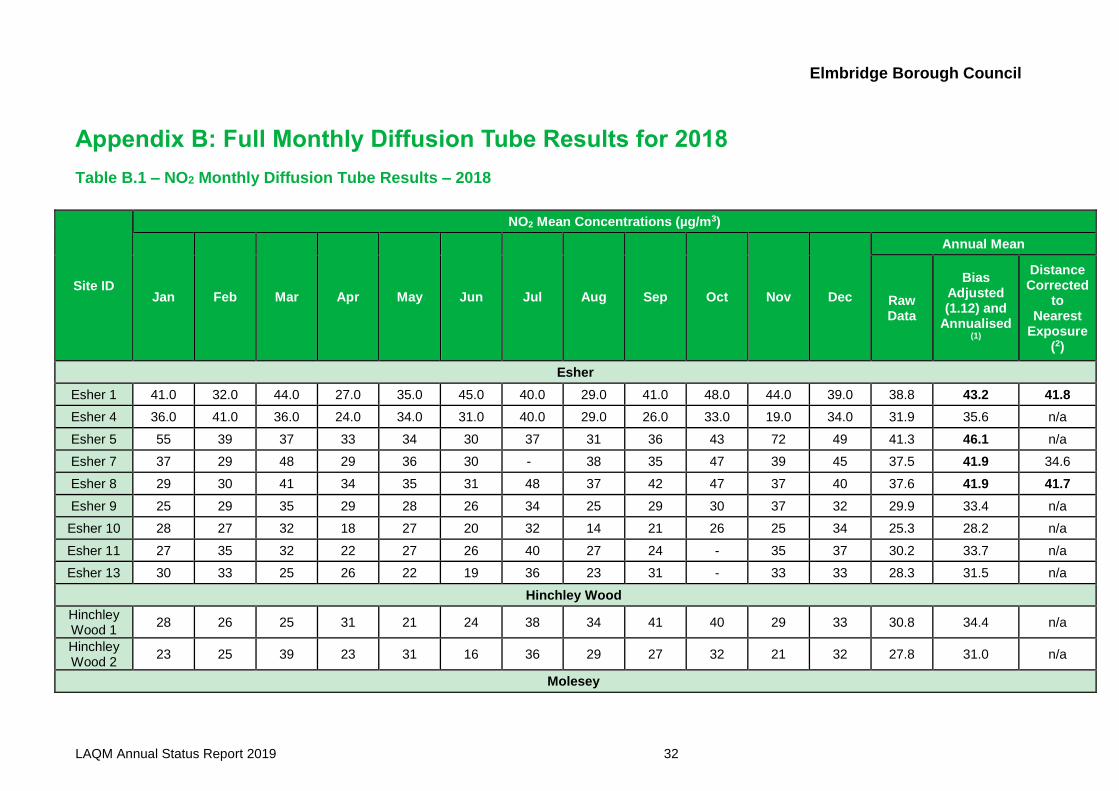
For diffusion tubes, the full 2018 dataset of monthly mean values is provided in Table
B.1, in Appendix B.
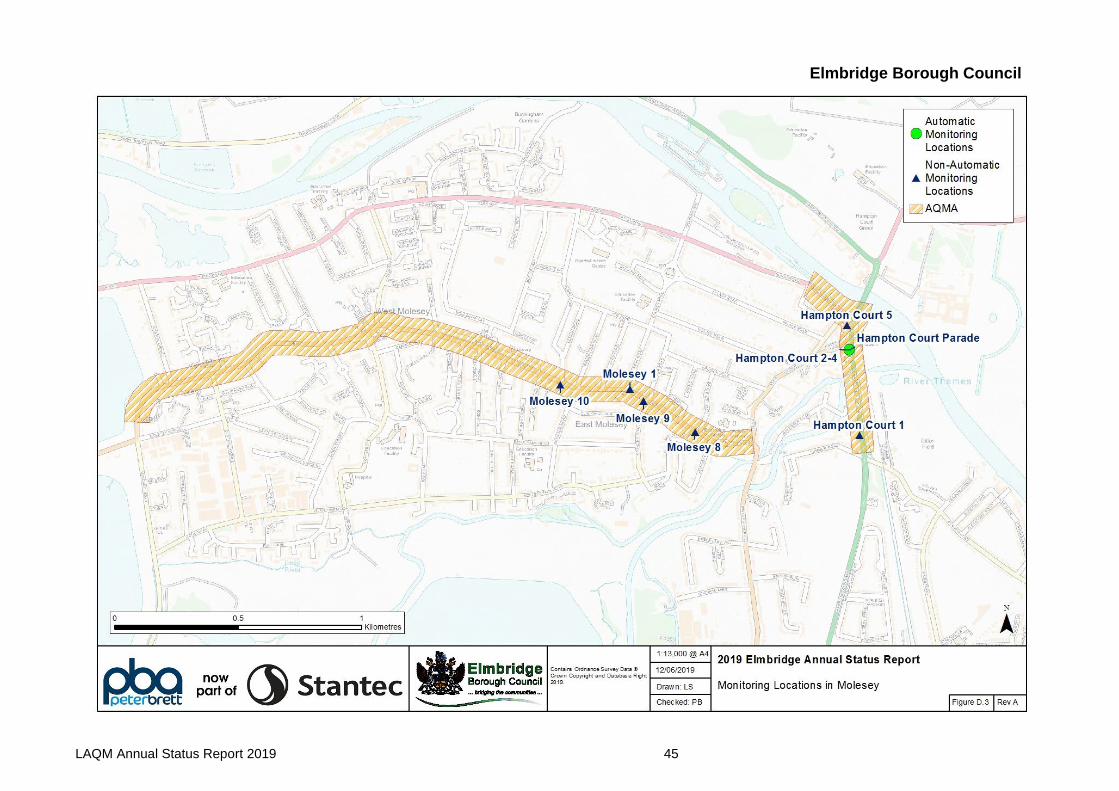
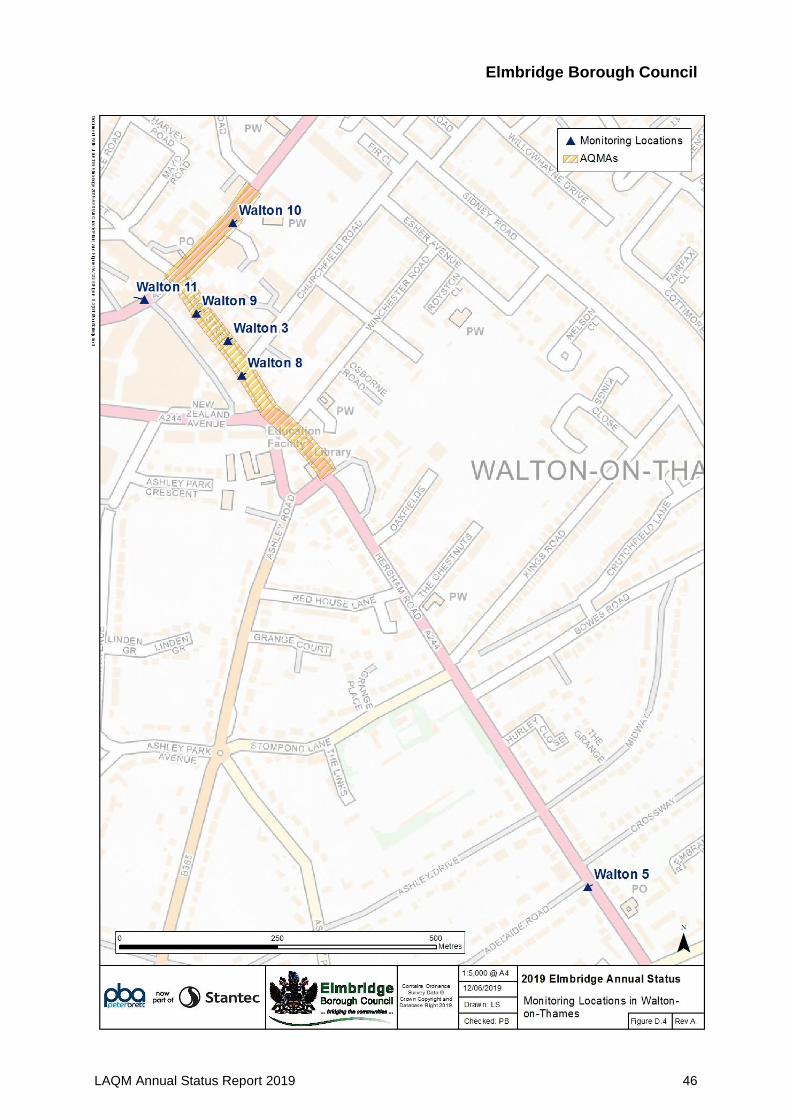
In 2018, exceedances of the annual mean NO2 objective were measured at the Esher
1, Esher 5, Esher 7 and Esher 8 monitoring sites. Esher 1, Esher 7 and Esher 8 are all
located within the Esher AQMA (shown in Figure D.7). Esher 5 recorded the highest
NO2 concentration in 2018 (46.1 µg/m3) and is located outside the Esher AQMA at the
Copsem Lane Roundabout, where Copsem Lane adjoins the A3 Esher Bypass (Figure
D.7). However, this monitoring site is not considered to be representative of relevant
exposure as the closest residential properties are located more than 100 m from this
monitoring site.
Distance correction has been carried out in order to estimate concentrations at the
nearest locations of relevent exposure in the vicinity of Esher 1, Esher 7 and Esher 8
monitoring sites. Once distance corrected, exceedances of the annual mean objective
Elmbridge Borough Council
LAQM Annual Status Report 2019 16
remain at the nearest locations of relevent exposure to Esher 1 (41.8 µg/m3) and Esher
8 (41.7 µg/m3).
During 2018, there were no measured concentrations greater than 60µg/m3, and
therefore it is considered unlikely that the hourly mean objective is exceeded within the
Borough.
In 2018, NO2 concentrations worsened at 29 sites, and improved or remained stable
at 11 sites in Elmbridge when compared with 2017 concentrations. Data trends for all
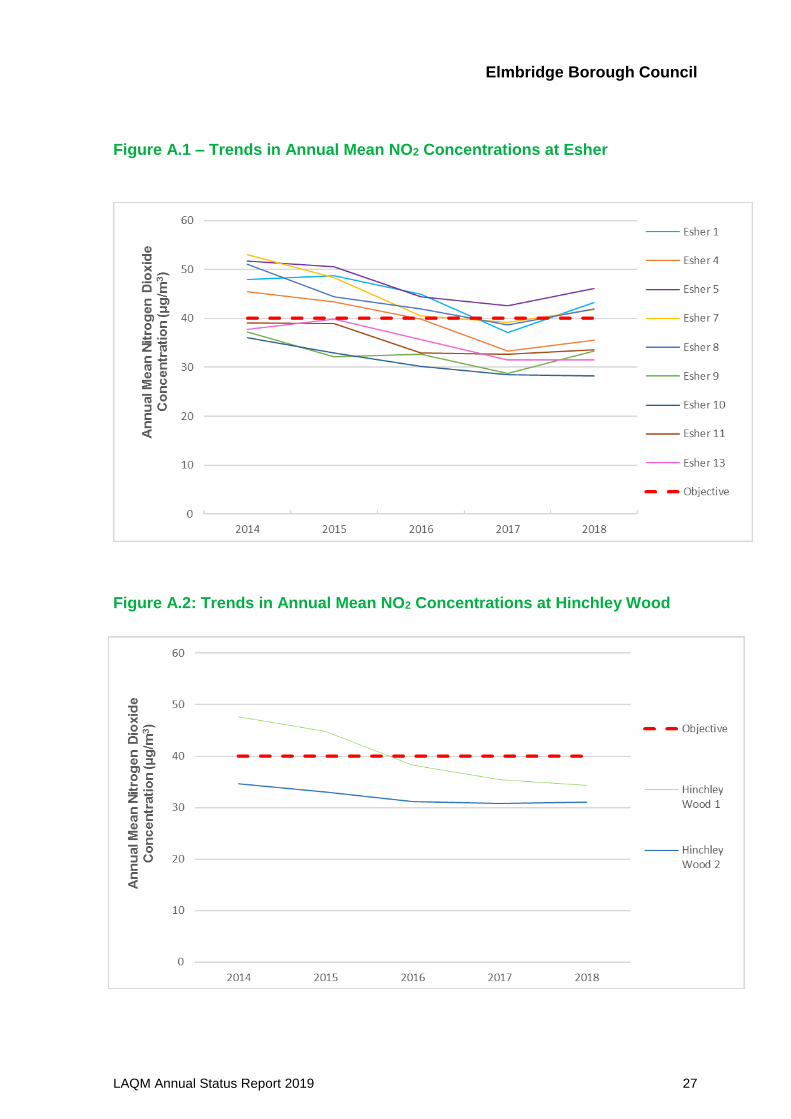
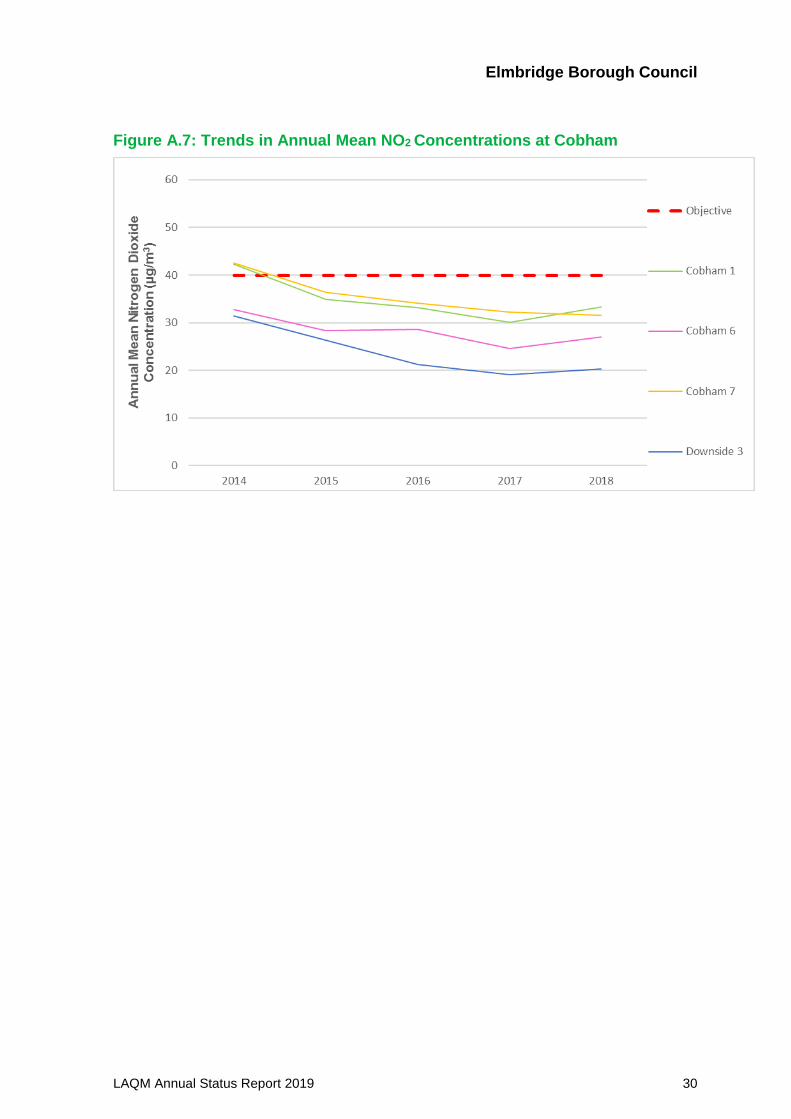
current sites for the past five years are provided in Appendix A, Figures A.1 – A.7.
Overall, between 2014 and 2018, concentrations have fluctuated, however a general
decrease in concentrations is evident across all sites since 2014.
3.2.2 Particulate Matter (PM10)
PM10 is not currently monitored but has been included within the modelling exercise
undertaken by CERC. The modelling report is expected to be finalised in 2019, and
results from the modelling exercise will be discussed in the 2020 Annual Status Report.
3.2.3 Particulate Matter (PM2.5)
PM2.5 is not currently monitored but has been included within the modelling exercise
undertaken by CERC. The modelling report is expected to be finalised in 2019, and
results from the modelling exercise will be discussed in the 2020 Annual Status Report.
3.2.4 Sulphur Dioxide (SO2)
SO2 is not currently monitored by Elmbridge Borough Council.
Elmbridge Borough Council
LAQM Annual Status Report 2019 17
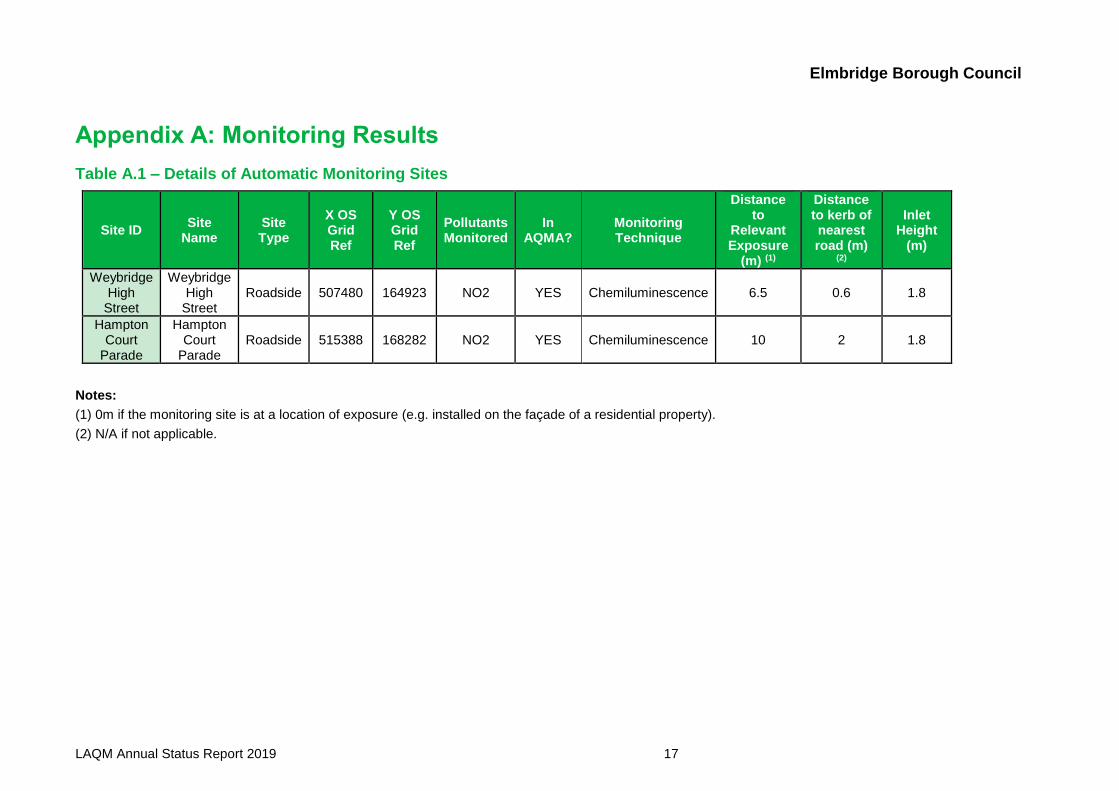
Appendix A: Monitoring Results
Table A.1 – Details of Automatic Monitoring Sites
Site ID Site
Name Site Type
X OS Grid Ref
Y OS Grid Ref
Pollutants Monitored
In AQMA?
Monitoring Technique
Distance to
Relevant Exposure
(m) (1)
Distance to kerb of nearest road (m)
(2)
Inlet Height
(m)
Weybridge High
Street
Weybridge High
Street Roadside 507480 164923 NO2 YES Chemiluminescence 6.5 0.6 1.8
Hampton Court
Parade
Hampton Court
Parade Roadside 515388 168282 NO2 YES Chemiluminescence 10 2 1.8
Notes:
(1) 0m if the monitoring site is at a location of exposure (e.g. installed on the façade of a residential property).
(2) N/A if not applicable.
Elmbridge Borough Council
LAQM Annual Status Report 2019 18
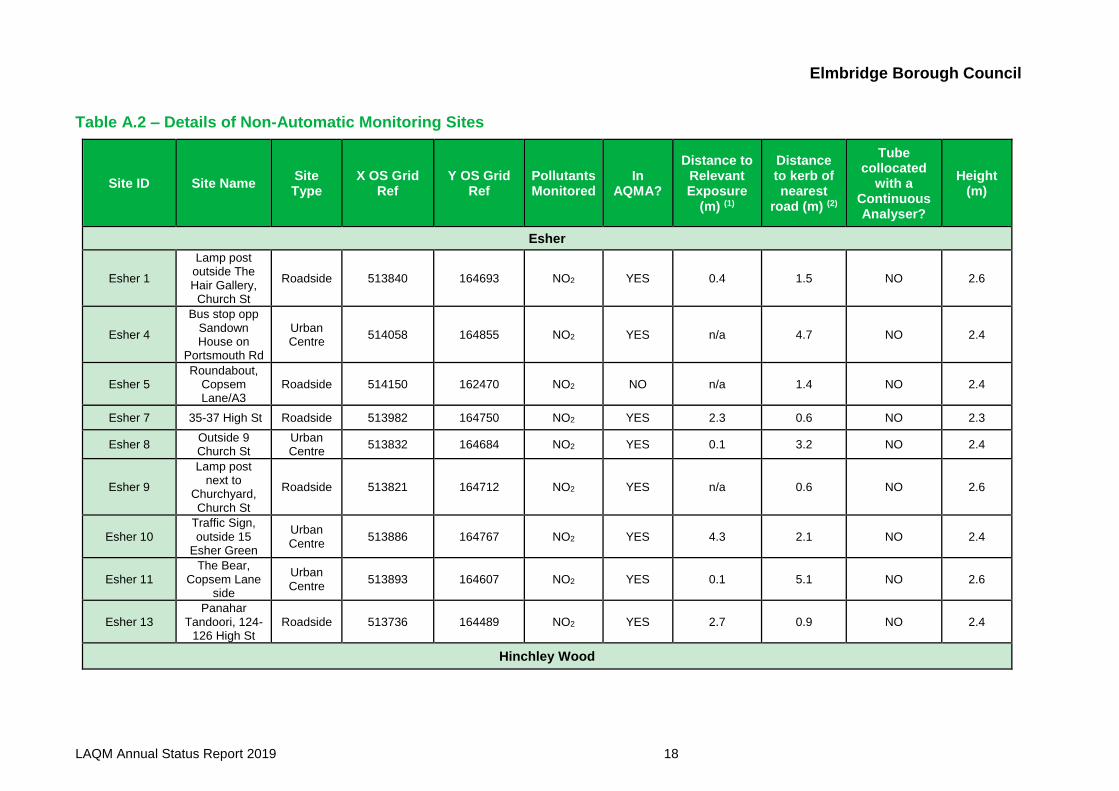
Table A.2 – Details of Non-Automatic Monitoring Sites
Site ID Site Name Site Type
X OS Grid Ref
Y OS Grid Ref
Pollutants Monitored
In AQMA?
Distance to Relevant Exposure
(m) (1)
Distance to kerb of nearest
road (m) (2)
Tube collocated
with a Continuous Analyser?
Height (m)
Esher
Esher 1
Lamp post outside The Hair Gallery,
Church St
Roadside 513840 164693 NO2 YES 0.4 1.5 NO 2.6
Esher 4
Bus stop opp Sandown House on
Portsmouth Rd
Urban Centre
514058 164855 NO2 YES n/a 4.7 NO 2.4
Esher 5 Roundabout,
Copsem Lane/A3
Roadside 514150 162470 NO2 NO n/a 1.4 NO 2.4
Esher 7 35-37 High St Roadside 513982 164750 NO2 YES 2.3 0.6 NO 2.3
Esher 8 Outside 9 Church St
Urban Centre
513832 164684 NO2 YES 0.1 3.2 NO 2.4
Esher 9
Lamp post next to
Churchyard, Church St
Roadside 513821 164712 NO2 YES n/a 0.6 NO 2.6
Esher 10 Traffic Sign, outside 15
Esher Green
Urban Centre
513886 164767 NO2 YES 4.3 2.1 NO 2.4
Esher 11 The Bear,
Copsem Lane side
Urban Centre
513893 164607 NO2 YES 0.1 5.1 NO 2.6
Esher 13 Panahar
Tandoori, 124-126 High St
Roadside 513736 164489 NO2 YES 2.7 0.9 NO 2.4
Hinchley Wood

Elmbridge Borough Council
LAQM Annual Status Report 2019 19
Site ID Site Name Site Type
X OS Grid Ref
Y OS Grid Ref
Pollutants Monitored
In AQMA?
Distance to Relevant Exposure
(m) (1)
Distance to kerb of nearest
road (m) (2)
Tube collocated
with a Continuous Analyser?
Height (m)
Hinchley Wood 1
Kingston By Pass (opp Fire
Station)
Urban Centre
515248 165535 NO2 YES n/a 4.5 NO 2.4
Hinchley Wood 2
Lamp post outside gate. Brooklands, Westmont
Road, Esher
Urban Centre
515218 165578 NO2 YES 3.5 9.8 NO 1.9
Molesey
Molesey 1 113 Walton
Rd. Roadside 514450 168134 NO2 YES n/a 1.1 NO 2.5
Molesey 8 44-46 Walton
Rd Urban Centre
514716 167960 NO2 YES 0.1 2.6 NO 2.5
Molesey 9 Tesco, Walton
Rd Urban Centre
514507 168086 NO2 YES 4.2 2.6 NO 2.4
Molesey 10 Molesey Mart 264 Walton
RD
Urban Centre
514169 168152 NO2 YES 0.1 4.9 NO 2.4
Hampton Court
Hampton Court 1
Lamp post nr bus stop,
entrance to Summer Road,
Hampton Court Way
Roadside 515379 167946 NO2 YES n/a 0.9 NO 2.2
Hampton Court 2
Air Quality Station,
Hampton Court Parade
Roadside 515338 168292 NO2 YES 10 1.9 YES 1.7
Hampton Court 3
Air Quality Station,
Hampton Court Parade
Roadside 515338 168292 NO2 YES 10 1.9 YES 1.7
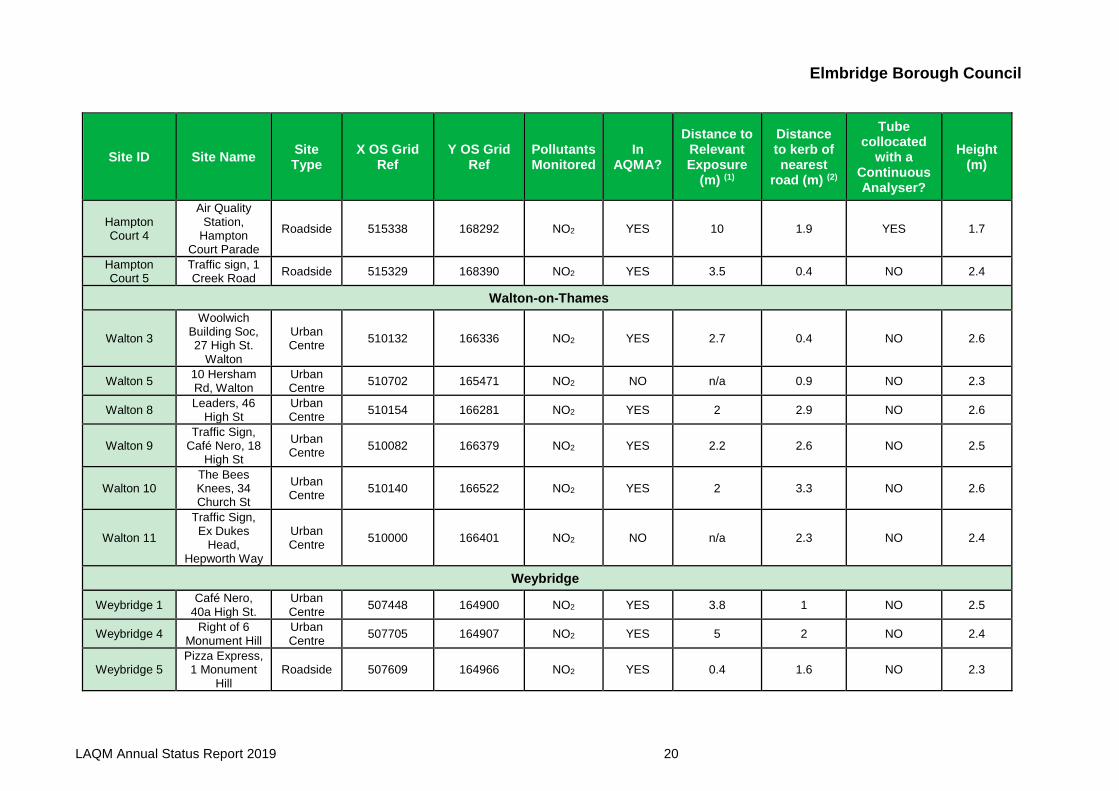
Elmbridge Borough Council
LAQM Annual Status Report 2019 20
Site ID Site Name Site Type
X OS Grid Ref
Y OS Grid Ref
Pollutants Monitored
In AQMA?
Distance to Relevant Exposure
(m) (1)
Distance to kerb of nearest
road (m) (2)
Tube collocated
with a Continuous Analyser?
Height (m)
Hampton Court 4
Air Quality Station,
Hampton Court Parade
Roadside 515338 168292 NO2 YES 10 1.9 YES 1.7
Hampton Court 5
Traffic sign, 1 Creek Road
Roadside 515329 168390 NO2 YES 3.5 0.4 NO 2.4
Walton-on-Thames
Walton 3
Woolwich Building Soc, 27 High St.
Walton
Urban Centre
510132 166336 NO2 YES 2.7 0.4 NO 2.6
Walton 5 10 Hersham Rd, Walton
Urban Centre
510702 165471 NO2 NO n/a 0.9 NO 2.3
Walton 8 Leaders, 46
High St Urban Centre
510154 166281 NO2 YES 2 2.9 NO 2.6
Walton 9 Traffic Sign,
Café Nero, 18 High St
Urban Centre
510082 166379 NO2 YES 2.2 2.6 NO 2.5
Walton 10 The Bees Knees, 34 Church St
Urban Centre
510140 166522 NO2 YES 2 3.3 NO 2.6
Walton 11
Traffic Sign, Ex Dukes
Head, Hepworth Way
Urban Centre
510000 166401 NO2 NO n/a 2.3 NO 2.4
Weybridge
Weybridge 1 Café Nero,
40a High St. Urban Centre
507448 164900 NO2 YES 3.8 1 NO 2.5
Weybridge 4 Right of 6
Monument Hill Urban Centre
507705 164907 NO2 YES 5 2 NO 2.4
Weybridge 5 Pizza Express, 1 Monument
Hill Roadside 507609 164966 NO2 YES 0.4 1.6 NO 2.3
Elmbridge Borough Council
LAQM Annual Status Report 2019 21
Site ID Site Name Site Type
X OS Grid Ref
Y OS Grid Ref
Pollutants Monitored
In AQMA?
Distance to Relevant Exposure
(m) (1)
Distance to kerb of nearest
road (m) (2)
Tube collocated
with a Continuous Analyser?
Height (m)
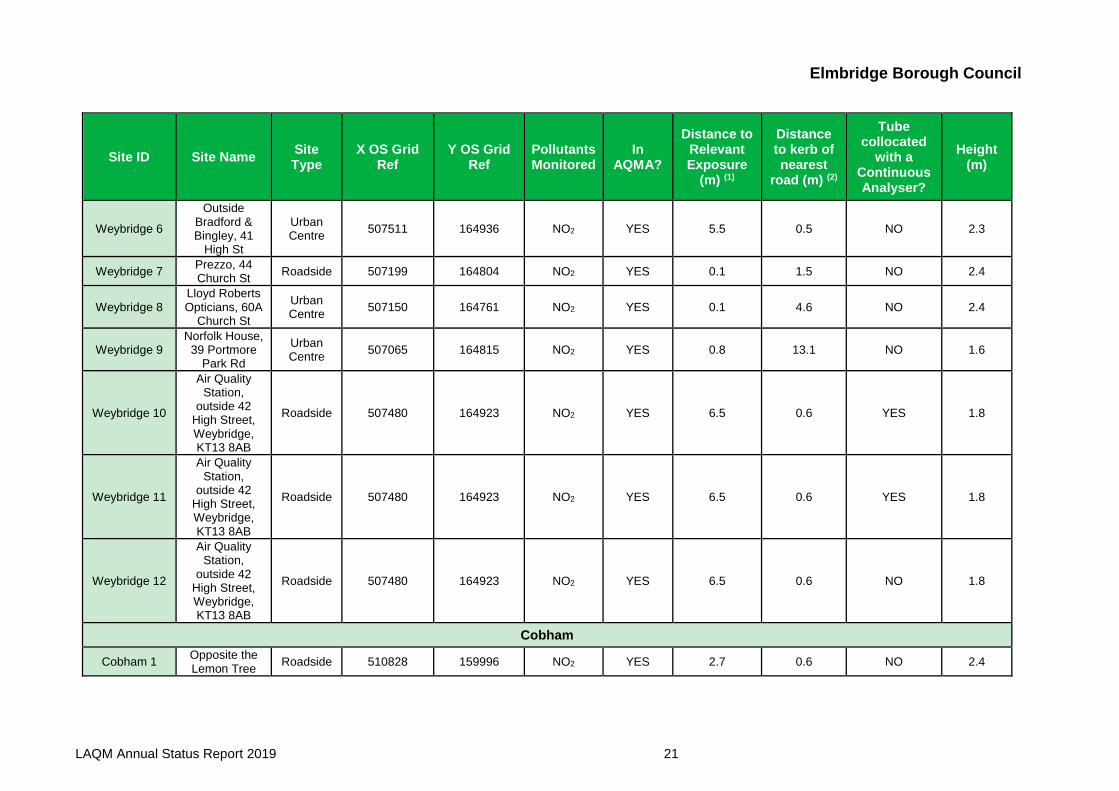
Weybridge 6
Outside Bradford & Bingley, 41
High St
Urban Centre
507511 164936 NO2 YES 5.5 0.5 NO 2.3
Weybridge 7 Prezzo, 44 Church St
Roadside 507199 164804 NO2 YES 0.1 1.5 NO 2.4
Weybridge 8 Lloyd Roberts Opticians, 60A
Church St
Urban Centre
507150 164761 NO2 YES 0.1 4.6 NO 2.4
Weybridge 9 Norfolk House,
39 Portmore Park Rd
Urban Centre
507065 164815 NO2 YES 0.8 13.1 NO 1.6
Weybridge 10
Air Quality Station,
outside 42 High Street, Weybridge, KT13 8AB
Roadside 507480 164923 NO2 YES 6.5 0.6 YES 1.8
Weybridge 11
Air Quality Station,
outside 42 High Street, Weybridge, KT13 8AB
Roadside 507480 164923 NO2 YES 6.5 0.6 YES 1.8
Weybridge 12
Air Quality Station,
outside 42 High Street, Weybridge, KT13 8AB
Roadside 507480 164923 NO2 YES 6.5 0.6 NO 1.8
Cobham
Cobham 1 Opposite the Lemon Tree
Roadside 510828 159996 NO2 YES 2.7 0.6 NO 2.4
Elmbridge Borough Council
LAQM Annual Status Report 2019 22
Site ID Site Name Site Type
X OS Grid Ref
Y OS Grid Ref
Pollutants Monitored
In AQMA?
Distance to Relevant Exposure
(m) (1)
Distance to kerb of nearest
road (m) (2)
Tube collocated
with a Continuous Analyser?
Height (m)
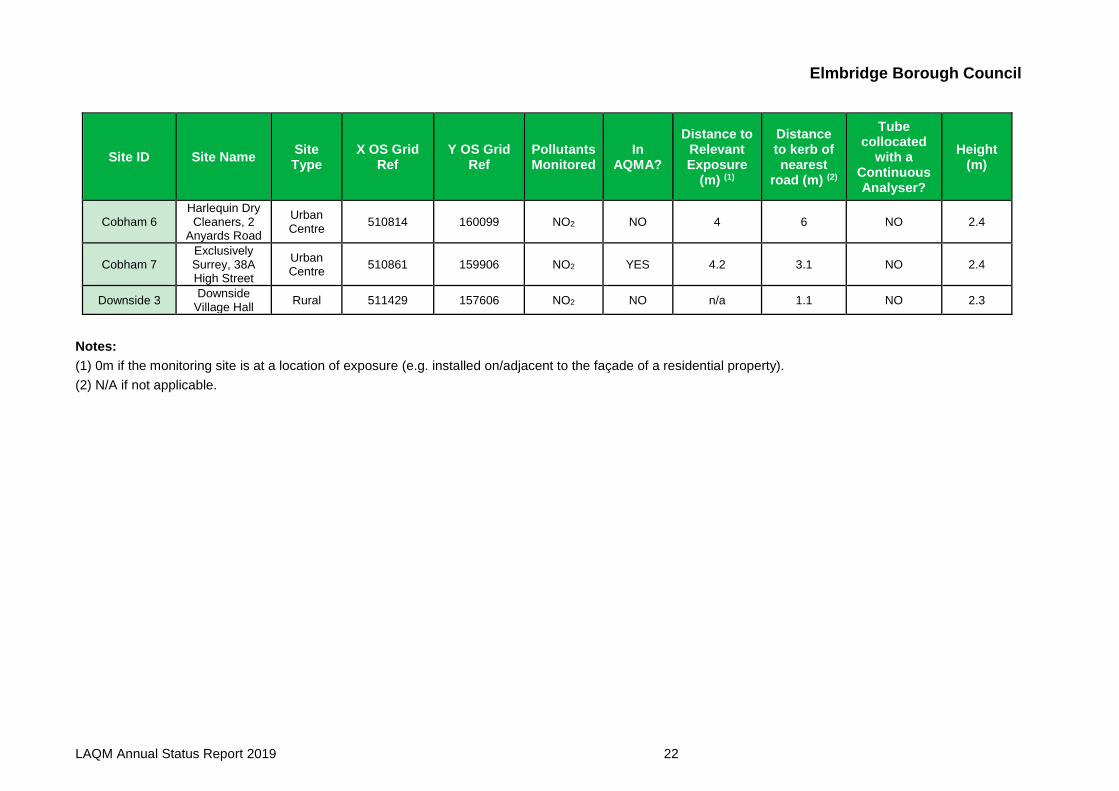
Cobham 6 Harlequin Dry Cleaners, 2
Anyards Road
Urban Centre
510814 160099 NO2 NO 4 6 NO 2.4
Cobham 7 Exclusively Surrey, 38A High Street
Urban Centre
510861 159906 NO2 YES 4.2 3.1 NO 2.4
Downside 3 Downside
Village Hall Rural 511429 157606 NO2 NO n/a 1.1 NO 2.3
Notes:
(1) 0m if the monitoring site is at a location of exposure (e.g. installed on/adjacent to the façade of a residential property).
(2) N/A if not applicable.
Elmbridge Borough Council
LAQM Annual Status Report 2019 23
Table A.3 – Annual Mean NO2 Monitoring Results
Site ID Site Type Monitoring
Type
Valid Data Capture for Monitoring
Period (%) (1)
Valid Data Capture
2018 (%) (2)
NO2 Annual Mean Concentration (µg/m3) (3)
2014 2015 2016 2017 2018
Weybridge High Street
Roadside Automatic 99.8 99.8 40 37.5 38 33 32
Hampton Court Parade
Roadside Automatic 97.0 97.0 46.9 39.7 44 41 38
Esher
Esher 1 Urban Centre Diffusion
Tube 100.0 100.0 48.0 48.8 44.9 37.1 43.2
Esher 4 Urban Centre Diffusion
Tube 100.0 100.0 45.5 43.4 39.8 33.4 35.6
Esher 5 Urban Centre Diffusion
Tube 100.0 100.0 51.8 50.6 44.4 42.6 46.1
Esher 7 Urban Centre Diffusion
Tube 100.0 100.0 53.1 48.4 40.5 39.2 41.9
Esher 8 Urban Centre Diffusion
Tube 91.7 91.7 51.1 44.4 42.0 38.6 41.9
Esher 9 Urban Centre Diffusion
Tube 100.0 100.0 37.3 32.1 32.7 28.7 33.4
Esher 10 Urban Centre Diffusion
Tube 100.0 100.0 36.1 33.0 30.2 28.5 28.2
Esher 11 Urban Centre Diffusion
Tube 100.0 100.0 39.1 38.9 32.9 32.7 33.7
Esher 13 Urban Centre Diffusion
Tube 91.7 91.7 37.8 39.8 35.7 31.5 31.5
Hinchley Wood
Hinchley Wood 1
Urban Centre Diffusion
Tube 100.0 100.0 47.6 44.8 38.3 35.4 34.4
Hinchley Wood 2
Urban Centre Diffusion
Tube 100.0 100.0 34.7 33.0 31.2 30.8 31.0
Molesey
Molesey 1 Urban Centre Diffusion
Tube 100.0 100.0 37.1 34.2 32.1 28.2 32.9
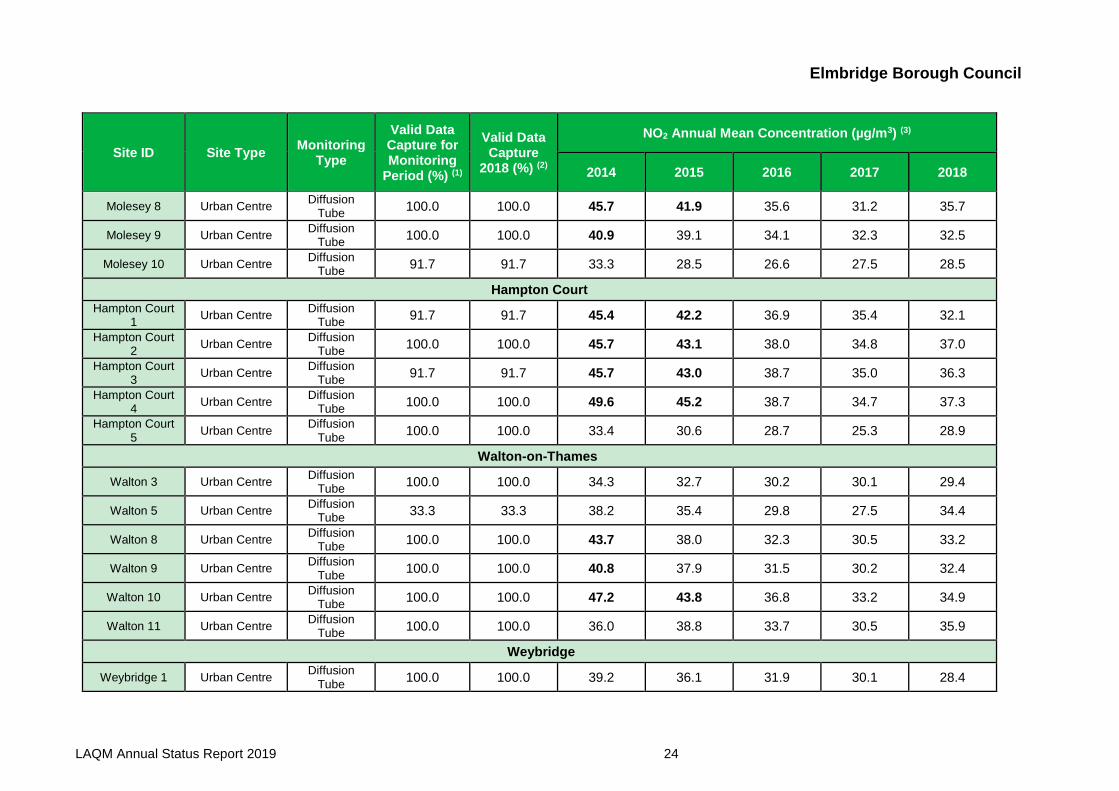
Elmbridge Borough Council
LAQM Annual Status Report 2019 24
Site ID Site Type Monitoring
Type
Valid Data Capture for Monitoring
Period (%) (1)
Valid Data Capture
2018 (%) (2)
NO2 Annual Mean Concentration (µg/m3) (3)
2014 2015 2016 2017 2018
Molesey 8 Urban Centre Diffusion
Tube 100.0 100.0 45.7 41.9 35.6 31.2 35.7
Molesey 9 Urban Centre Diffusion
Tube 100.0 100.0 40.9 39.1 34.1 32.3 32.5
Molesey 10 Urban Centre Diffusion
Tube 91.7 91.7 33.3 28.5 26.6 27.5 28.5
Hampton Court
Hampton Court 1
Urban Centre Diffusion
Tube 91.7 91.7 45.4 42.2 36.9 35.4 32.1
Hampton Court 2
Urban Centre Diffusion
Tube 100.0 100.0 45.7 43.1 38.0 34.8 37.0
Hampton Court 3
Urban Centre Diffusion
Tube 91.7 91.7 45.7 43.0 38.7 35.0 36.3
Hampton Court 4
Urban Centre Diffusion
Tube 100.0 100.0 49.6 45.2 38.7 34.7 37.3
Hampton Court 5
Urban Centre Diffusion
Tube 100.0 100.0 33.4 30.6 28.7 25.3 28.9
Walton-on-Thames
Walton 3 Urban Centre Diffusion
Tube 100.0 100.0 34.3 32.7 30.2 30.1 29.4
Walton 5 Urban Centre Diffusion
Tube 33.3 33.3 38.2 35.4 29.8 27.5 34.4
Walton 8 Urban Centre Diffusion
Tube 100.0 100.0 43.7 38.0 32.3 30.5 33.2
Walton 9 Urban Centre Diffusion
Tube 100.0 100.0 40.8 37.9 31.5 30.2 32.4
Walton 10 Urban Centre Diffusion
Tube 100.0 100.0 47.2 43.8 36.8 33.2 34.9
Walton 11 Urban Centre Diffusion
Tube 100.0 100.0 36.0 38.8 33.7 30.5 35.9
Weybridge
Weybridge 1 Urban Centre Diffusion
Tube 100.0 100.0 39.2 36.1 31.9 30.1 28.4
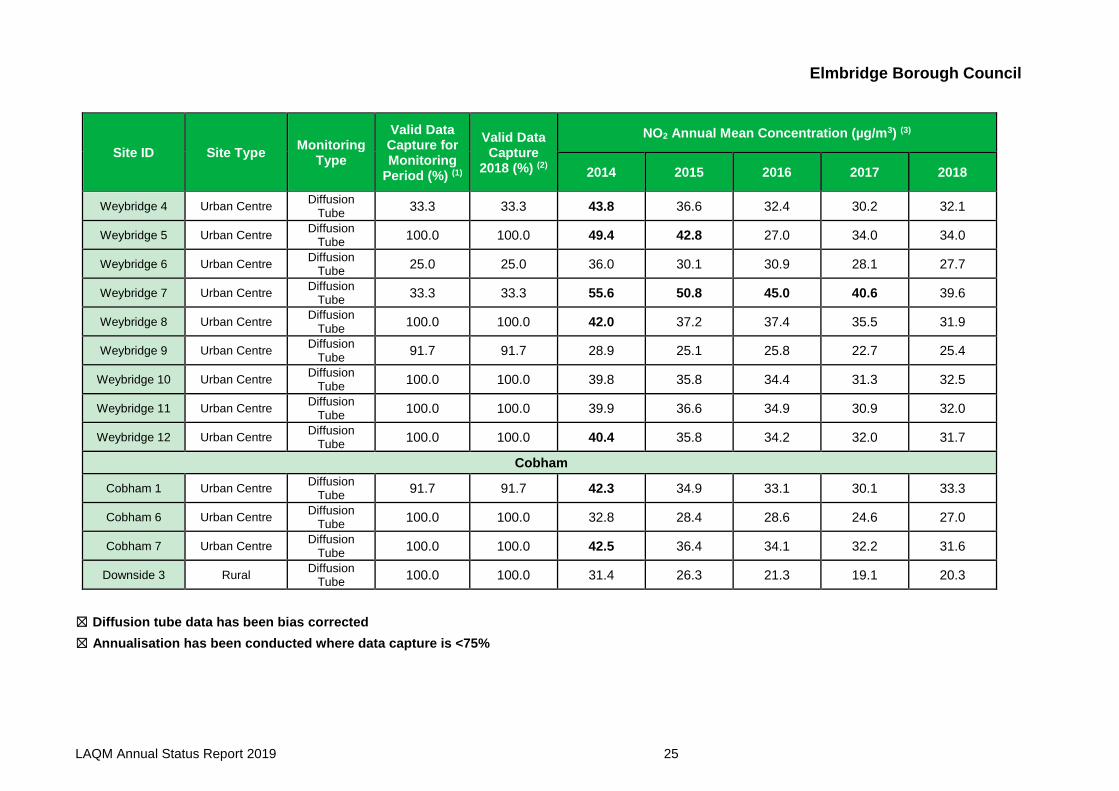
Elmbridge Borough Council
LAQM Annual Status Report 2019 25
Site ID Site Type Monitoring
Type
Valid Data Capture for Monitoring
Period (%) (1)
Valid Data Capture
2018 (%) (2)
NO2 Annual Mean Concentration (µg/m3) (3)
2014 2015 2016 2017 2018
Weybridge 4 Urban Centre Diffusion
Tube 33.3 33.3 43.8 36.6 32.4 30.2 32.1
Weybridge 5 Urban Centre Diffusion
Tube 100.0 100.0 49.4 42.8 27.0 34.0 34.0
Weybridge 6 Urban Centre Diffusion
Tube 25.0 25.0 36.0 30.1 30.9 28.1 27.7
Weybridge 7 Urban Centre Diffusion
Tube 33.3 33.3 55.6 50.8 45.0 40.6 39.6
Weybridge 8 Urban Centre Diffusion
Tube 100.0 100.0 42.0 37.2 37.4 35.5 31.9
Weybridge 9 Urban Centre Diffusion
Tube 91.7 91.7 28.9 25.1 25.8 22.7 25.4
Weybridge 10 Urban Centre Diffusion
Tube 100.0 100.0 39.8 35.8 34.4 31.3 32.5
Weybridge 11 Urban Centre Diffusion
Tube 100.0 100.0 39.9 36.6 34.9 30.9 32.0
Weybridge 12 Urban Centre Diffusion
Tube 100.0 100.0 40.4 35.8 34.2 32.0 31.7
Cobham
Cobham 1 Urban Centre Diffusion
Tube 91.7 91.7 42.3 34.9 33.1 30.1 33.3
Cobham 6 Urban Centre Diffusion
Tube 100.0 100.0 32.8 28.4 28.6 24.6 27.0
Cobham 7 Urban Centre Diffusion
Tube 100.0 100.0 42.5 36.4 34.1 32.2 31.6
Downside 3 Rural Diffusion
Tube 100.0 100.0 31.4 26.3 21.3 19.1 20.3
☒ Diffusion tube data has been bias corrected
☒ Annualisation has been conducted where data capture is <75%
Elmbridge Borough Council
LAQM Annual Status Report 2019 26
Notes:
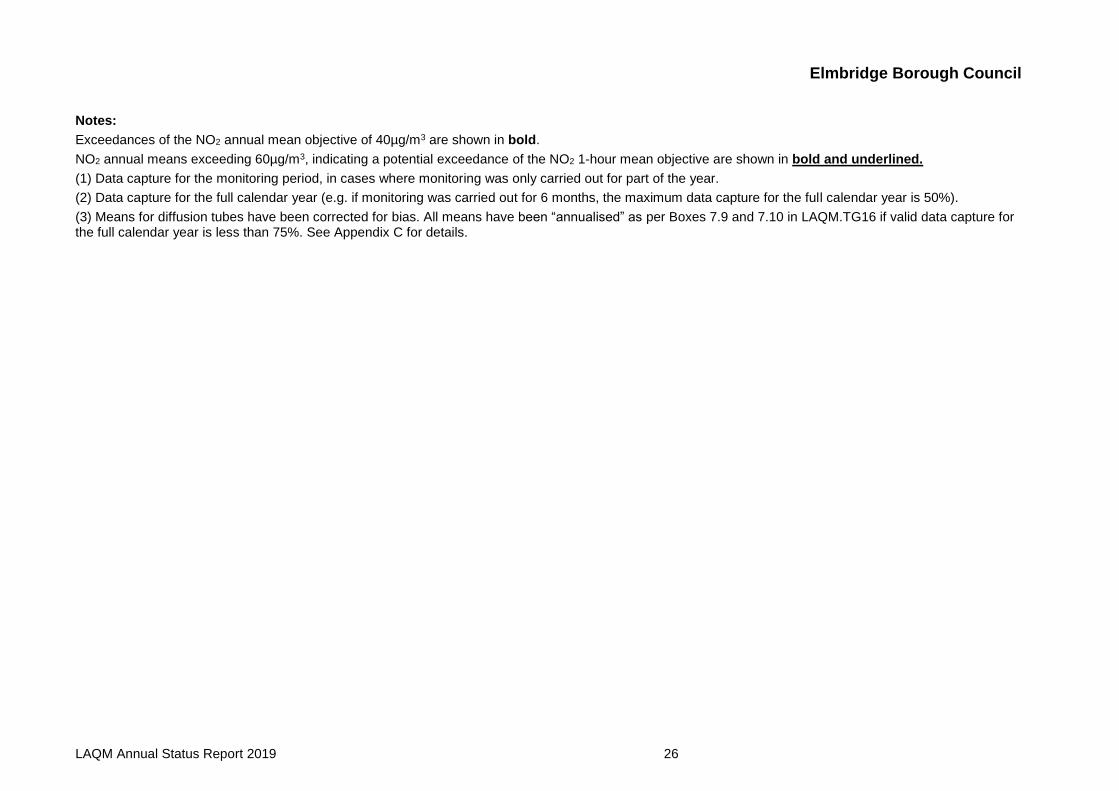
Exceedances of the NO2 annual mean objective of 40µg/m3 are shown in bold.
NO2 annual means exceeding 60µg/m3, indicating a potential exceedance of the NO2 1-hour mean objective are shown in bold and underlined.
(1) Data capture for the monitoring period, in cases where monitoring was only carried out for part of the year.
(2) Data capture for the full calendar year (e.g. if monitoring was carried out for 6 months, the maximum data capture for the full calendar year is 50%).
(3) Means for diffusion tubes have been corrected for bias. All means have been “annualised” as per Boxes 7.9 and 7.10 in LAQM.TG16 if valid data capture for the full calendar year is less than 75%. See Appendix C for details.
Elmbridge Borough Council
LAQM Annual Status Report 2019 27
Figure A.1 – Trends in Annual Mean NO2 Concentrations at Esher
Figure A.2: Trends in Annual Mean NO2 Concentrations at Hinchley Wood

Elmbridge Borough Council
LAQM Annual Status Report 2019 28
Figure A.3: Trends in Annual Mean NO2 Concentrations at Molesey
Figure A.4: Trends in Annual Mean NO2 Concentrations at Hampton Court

Elmbridge Borough Council
LAQM Annual Status Report 2019 29
Figure A.5: Trends in Annual Mean NO2 Concentrations at Walton-on-Thames
Figure A.6: Trends in Annual Mean NO2 Concentrations at Weybridge
Elmbridge Borough Council
LAQM Annual Status Report 2019 30
Figure A.7: Trends in Annual Mean NO2 Concentrations at Cobham

Elmbridge Borough Council
LAQM Annual Status Report 2019 31
Table A.4 – 1-Hour Mean NO2 Monitoring Results
Site ID Site Type Monitoring
Type
Valid Data Capture for Monitoring Period (%) (1)
Valid Data Capture
2018 (%) (2)
NO2 1-Hour Means > 200µg/m3 (3)
2014 2015 2016 2017 2018
Weybridge High Street
Roadside Automatic 99.8 99.8 0 0 0 0 2
Hampton Court Parade
Roadside Automatic 96.3 96.3 0 0 2 0 0
Notes:
Exceedances of the NO2 1-hour mean objective (200µg/m3 not to be exceeded more than 18 times/year) are shown in bold.
(1) Data capture for the monitoring period, in cases where monitoring was only carried out for part of the year.
(2) Data capture for the full calendar year (e.g. if monitoring was carried out for 6 months, the maximum data capture for the full calendar year is 50%).
(3) If the period of valid data is less than 85%, the 99.8th percentile of 1-hour means is provided in brackets.
Elmbridge Borough Council
LAQM Annual Status Report 2019 32
Appendix B: Full Monthly Diffusion Tube Results for 2018
Table B.1 – NO2 Monthly Diffusion Tube Results – 2018
Site ID
NO2 Mean Concentrations (µg/m3)
Jan Feb Mar Apr May Jun Jul Aug Sep Oct Nov Dec
Annual Mean
Raw Data
Bias Adjusted (1.12) and
Annualised (1)
Distance Corrected
to Nearest
Exposure (2)
Esher
Esher 1 41.0 32.0 44.0 27.0 35.0 45.0 40.0 29.0 41.0 48.0 44.0 39.0 38.8 43.2 41.8
Esher 4 36.0 41.0 36.0 24.0 34.0 31.0 40.0 29.0 26.0 33.0 19.0 34.0 31.9 35.6 n/a
Esher 5 55 39 37 33 34 30 37 31 36 43 72 49 41.3 46.1 n/a
Esher 7 37 29 48 29 36 30 - 38 35 47 39 45 37.5 41.9 34.6
Esher 8 29 30 41 34 35 31 48 37 42 47 37 40 37.6 41.9 41.7
Esher 9 25 29 35 29 28 26 34 25 29 30 37 32 29.9 33.4 n/a
Esher 10 28 27 32 18 27 20 32 14 21 26 25 34 25.3 28.2 n/a
Esher 11 27 35 32 22 27 26 40 27 24 - 35 37 30.2 33.7 n/a
Esher 13 30 33 25 26 22 19 36 23 31 - 33 33 28.3 31.5 n/a
Hinchley Wood
Hinchley Wood 1
28 26 25 31 21 24 38 34 41 40 29 33 30.8 34.4 n/a
Hinchley Wood 2
23 25 39 23 31 16 36 29 27 32 21 32 27.8 31.0 n/a
Molesey
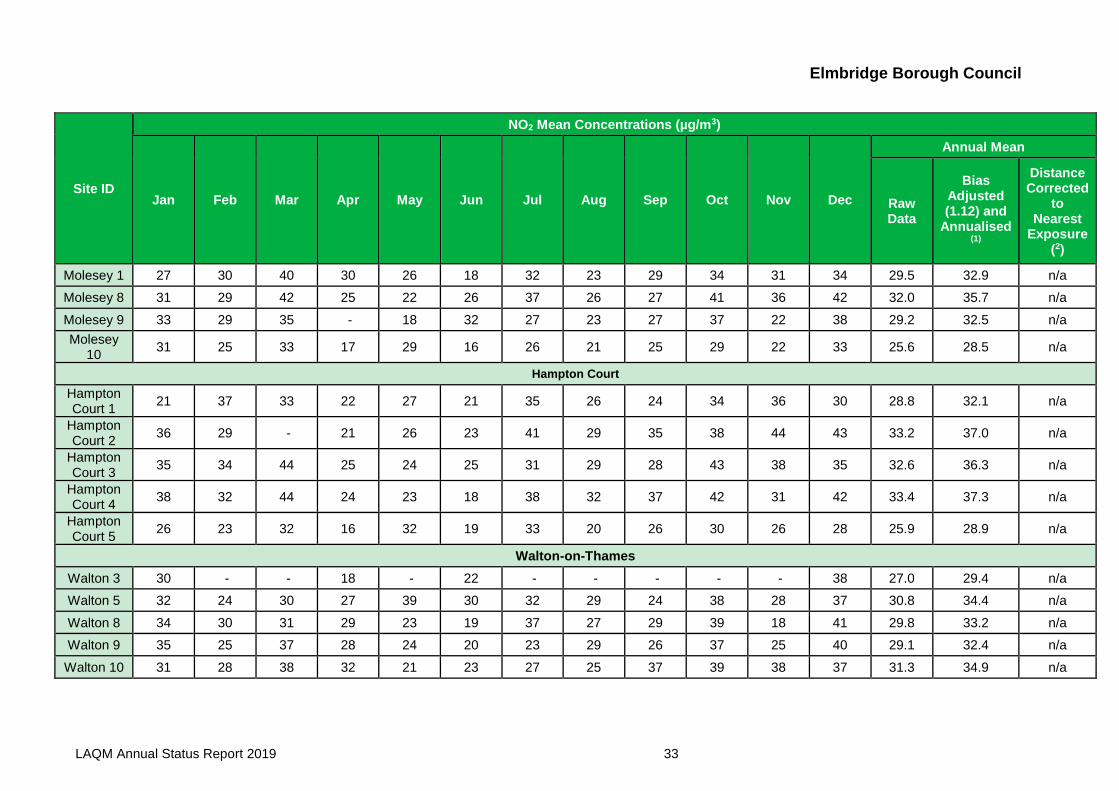
Elmbridge Borough Council
LAQM Annual Status Report 2019 33
Site ID
NO2 Mean Concentrations (µg/m3)
Jan Feb Mar Apr May Jun Jul Aug Sep Oct Nov Dec
Annual Mean
Raw Data
Bias Adjusted (1.12) and
Annualised (1)
Distance Corrected
to Nearest
Exposure (2)
Molesey 1 27 30 40 30 26 18 32 23 29 34 31 34 29.5 32.9 n/a
Molesey 8 31 29 42 25 22 26 37 26 27 41 36 42 32.0 35.7 n/a
Molesey 9 33 29 35 - 18 32 27 23 27 37 22 38 29.2 32.5 n/a
Molesey 10
31 25 33 17 29 16 26 21 25 29 22 33 25.6 28.5 n/a
Hampton Court
Hampton Court 1
21 37 33 22 27 21 35 26 24 34 36 30 28.8 32.1 n/a
Hampton Court 2
36 29 - 21 26 23 41 29 35 38 44 43 33.2 37.0 n/a
Hampton Court 3
35 34 44 25 24 25 31 29 28 43 38 35 32.6 36.3 n/a
Hampton Court 4
38 32 44 24 23 18 38 32 37 42 31 42 33.4 37.3 n/a
Hampton Court 5
26 23 32 16 32 19 33 20 26 30 26 28 25.9 28.9 n/a
Walton-on-Thames
Walton 3 30 - - 18 - 22 - - - - - 38 27.0 29.4 n/a
Walton 5 32 24 30 27 39 30 32 29 24 38 28 37 30.8 34.4 n/a
Walton 8 34 30 31 29 23 19 37 27 29 39 18 41 29.8 33.2 n/a
Walton 9 35 25 37 28 24 20 23 29 26 37 25 40 29.1 32.4 n/a
Walton 10 31 28 38 32 21 23 27 25 37 39 38 37 31.3 34.9 n/a
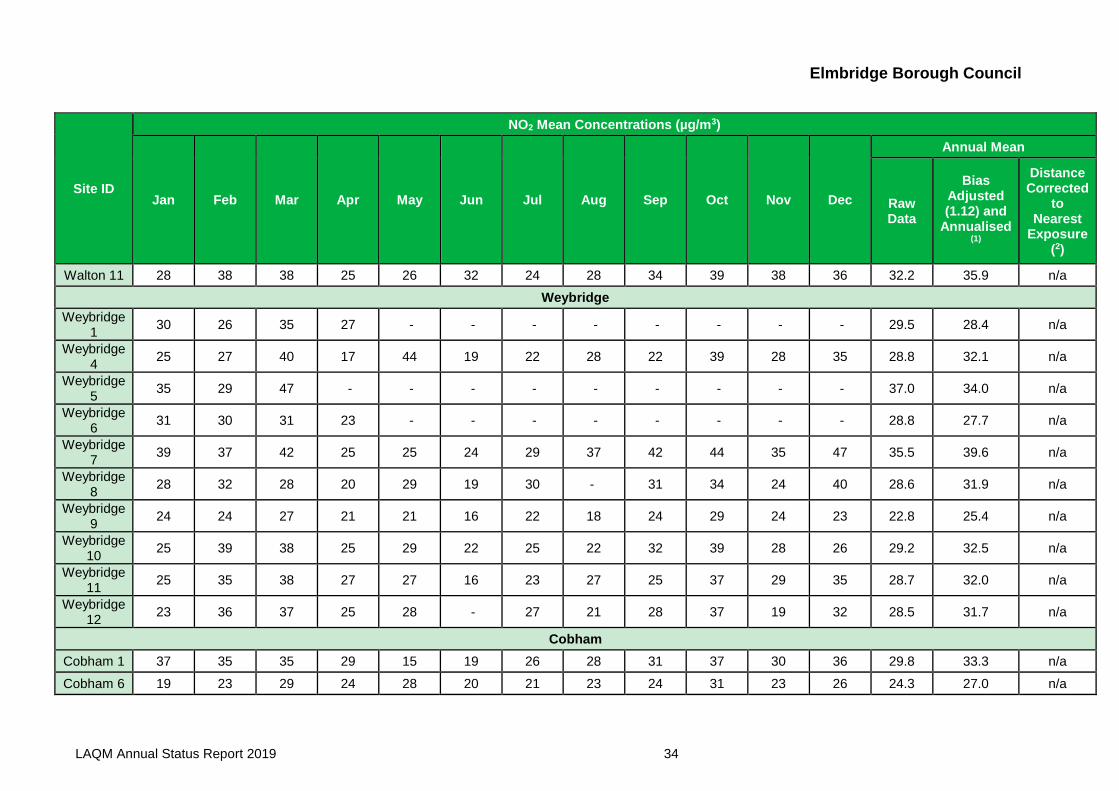
Elmbridge Borough Council
LAQM Annual Status Report 2019 34
Site ID
NO2 Mean Concentrations (µg/m3)
Jan Feb Mar Apr May Jun Jul Aug Sep Oct Nov Dec
Annual Mean
Raw Data
Bias Adjusted (1.12) and
Annualised (1)
Distance Corrected
to Nearest
Exposure (2)
Walton 11 28 38 38 25 26 32 24 28 34 39 38 36 32.2 35.9 n/a
Weybridge
Weybridge 1
30 26 35 27 - - - - - - - - 29.5 28.4 n/a
Weybridge 4
25 27 40 17 44 19 22 28 22 39 28 35 28.8 32.1 n/a
Weybridge 5
35 29 47 - - - - - - - - - 37.0 34.0 n/a
Weybridge 6
31 30 31 23 - - - - - - - - 28.8 27.7 n/a
Weybridge 7
39 37 42 25 25 24 29 37 42 44 35 47 35.5 39.6 n/a
Weybridge 8
28 32 28 20 29 19 30 - 31 34 24 40 28.6 31.9 n/a
Weybridge 9
24 24 27 21 21 16 22 18 24 29 24 23 22.8 25.4 n/a
Weybridge 10
25 39 38 25 29 22 25 22 32 39 28 26 29.2 32.5 n/a
Weybridge 11
25 35 38 27 27 16 23 27 25 37 29 35 28.7 32.0 n/a
Weybridge 12
23 36 37 25 28 - 27 21 28 37 19 32 28.5 31.7 n/a
Cobham
Cobham 1 37 35 35 29 15 19 26 28 31 37 30 36 29.8 33.3 n/a
Cobham 6 19 23 29 24 28 20 21 23 24 31 23 26 24.3 27.0 n/a
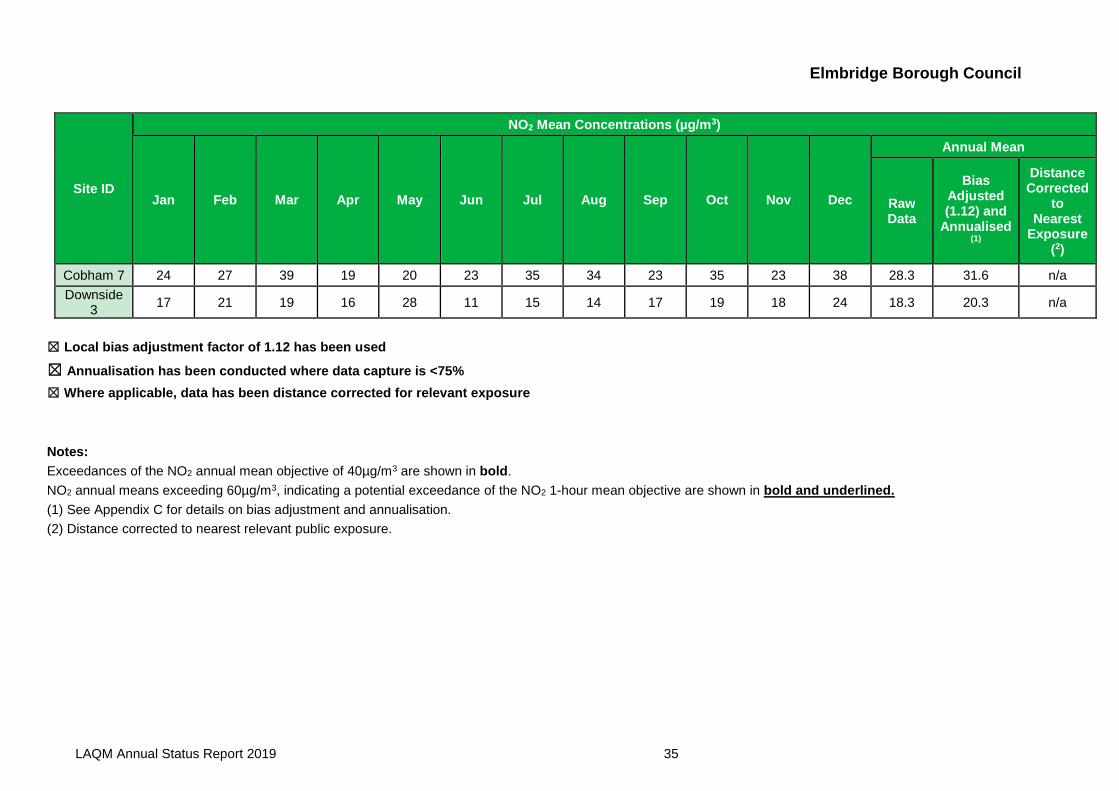
Elmbridge Borough Council
LAQM Annual Status Report 2019 35
Site ID
NO2 Mean Concentrations (µg/m3)
Jan Feb Mar Apr May Jun Jul Aug Sep Oct Nov Dec
Annual Mean
Raw Data
Bias Adjusted (1.12) and
Annualised (1)
Distance Corrected
to Nearest
Exposure (2)
Cobham 7 24 27 39 19 20 23 35 34 23 35 23 38 28.3 31.6 n/a
Downside 3
17 21 19 16 28 11 15 14 17 19 18 24 18.3 20.3 n/a
☒ Local bias adjustment factor of 1.12 has been used
☒ Annualisation has been conducted where data capture is <75%
☒ Where applicable, data has been distance corrected for relevant exposure
Notes:
Exceedances of the NO2 annual mean objective of 40µg/m3 are shown in bold.
NO2 annual means exceeding 60µg/m3, indicating a potential exceedance of the NO2 1-hour mean objective are shown in bold and underlined.
(1) See Appendix C for details on bias adjustment and annualisation.
(2) Distance corrected to nearest relevant public exposure.
Elmbridge Borough Council
LAQM Annual Status Report 2019 36
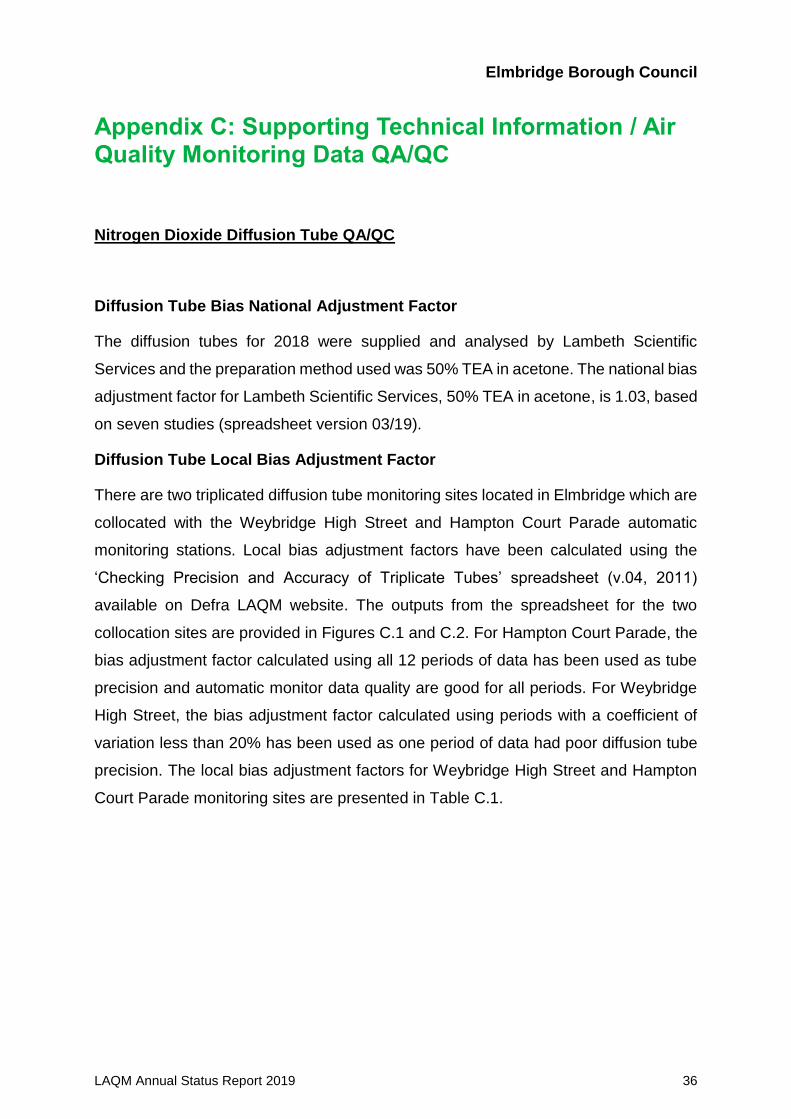
Appendix C: Supporting Technical Information / Air Quality Monitoring Data QA/QC
Nitrogen Dioxide Diffusion Tube QA/QC
Diffusion Tube Bias National Adjustment Factor
The diffusion tubes for 2018 were supplied and analysed by Lambeth Scientific
Services and the preparation method used was 50% TEA in acetone. The national bias
adjustment factor for Lambeth Scientific Services, 50% TEA in acetone, is 1.03, based
on seven studies (spreadsheet version 03/19).
Diffusion Tube Local Bias Adjustment Factor
There are two triplicated diffusion tube monitoring sites located in Elmbridge which are
collocated with the Weybridge High Street and Hampton Court Parade automatic
monitoring stations. Local bias adjustment factors have been calculated using the
‘Checking Precision and Accuracy of Triplicate Tubes’ spreadsheet (v.04, 2011)
available on Defra LAQM website. The outputs from the spreadsheet for the two
collocation sites are provided in Figures C.1 and C.2. For Hampton Court Parade, the
bias adjustment factor calculated using all 12 periods of data has been used as tube
precision and automatic monitor data quality are good for all periods. For Weybridge
High Street, the bias adjustment factor calculated using periods with a coefficient of
variation less than 20% has been used as one period of data had poor diffusion tube
precision. The local bias adjustment factors for Weybridge High Street and Hampton
Court Parade monitoring sites are presented in Table C.1.

Elmbridge Borough Council
LAQM Annual Status Report 2019 37
Figure C.1 – Local Bias Adjustment Factor Correction Output – Weybridge High Street
Figure C.2 – Local Bias Adjustment Factor Correction Output – Hampton Court Parade

Elmbridge Borough Council
LAQM Annual Status Report 2019 38
Table C.1 – Local Bias Adjustment Factors
Location
Diffusion Tube Data
Capture (%)
Automatic Monitor Data Capture (%)
Diffusion Tube Annual Mean (µg/m3)
Automatic Monitor
Annual Mean (µg/m3)
Ratio
Weybridge High Street
100 99.8 29 33 1.11
Hampton Court Parade
100 97 33 38 1.13
Justification for Choice of Factor Applied
The diffusion tube data has been corrected using a bias adjustment factor, which is
an estimate of the difference between diffusion tube and continuous
monitoring concentrations; the latter is assumed to be a more accurate method of
monitoring. The Defra Technical Guidance LAQM.TG(16) provides guidance with
regard to the application of a bias adjustment factor to correct diffusion tube monitoring.
Triplicate co-location studies can be used to determine a local bias factor based on the
comparison of diffusion tube results with data taken from NOx/NO2 continuous
analysers. Alternatively, the national database of diffusion tube co-location surveys
provides bias factors for the relevant laboratory and preparation method.
The Defra Technical Guidance LAQM.TG(16) recommends the use of a local bias
adjustment factor where available and relevant to diffusion tube sites.
A local bias adjustment factor of 1.13 has been derived for the Hampton Court Parade
site. The measurements obtained from automatic monitor and diffusion tubes at this
site have good data capture and overall data precision.
A local bias adjustment factor of 1.11 has been derived for the Weybridge High Street
site. The measurements obtained from the automatic monitor and diffusion tubes at
this site also had good data capture and overall data precision.
Given the agreement between the local bias adjustment factors, the good data capture
and data precision for the Weybridge High Street and Hampton Court Parade sites, an
averaged local bias adjustment factor of 1.12 obtained from these two sites has been
used to bias adjust the diffusion tube data for 2018.
Elmbridge Borough Council
LAQM Annual Status Report 2019 39
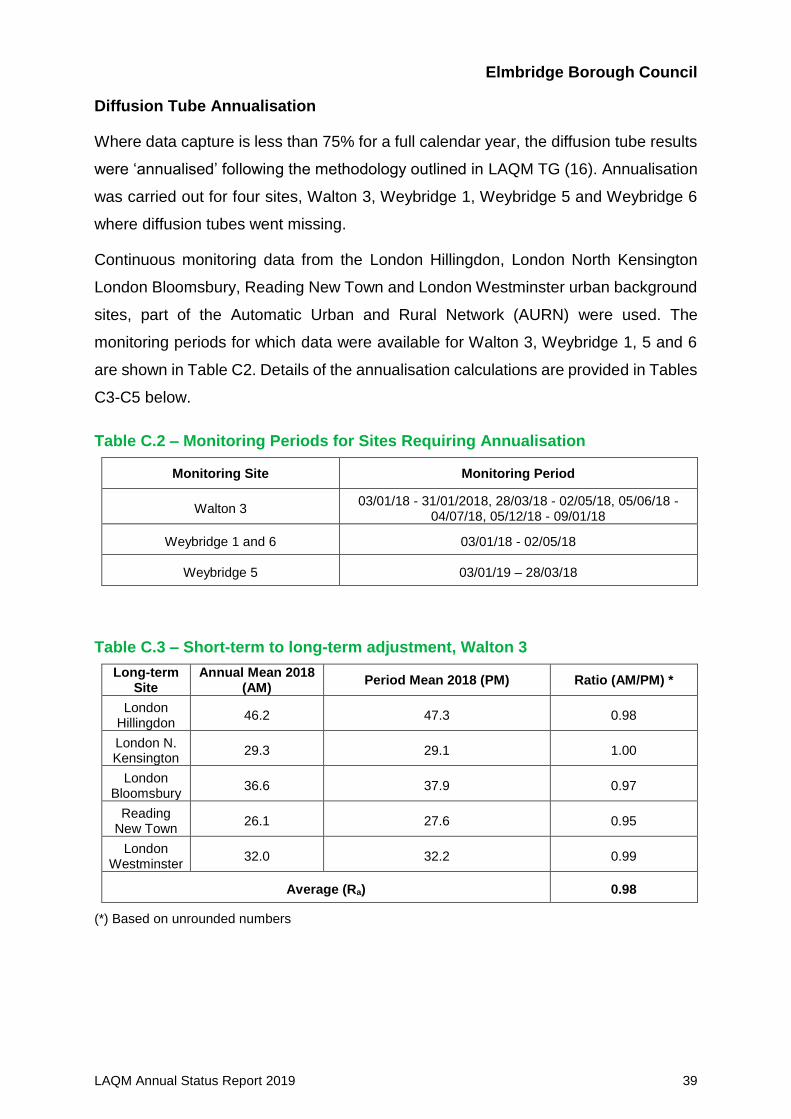
Diffusion Tube Annualisation
Where data capture is less than 75% for a full calendar year, the diffusion tube results
were ‘annualised’ following the methodology outlined in LAQM TG (16). Annualisation
was carried out for four sites, Walton 3, Weybridge 1, Weybridge 5 and Weybridge 6
where diffusion tubes went missing.
Continuous monitoring data from the London Hillingdon, London North Kensington
London Bloomsbury, Reading New Town and London Westminster urban background
sites, part of the Automatic Urban and Rural Network (AURN) were used. The
monitoring periods for which data were available for Walton 3, Weybridge 1, 5 and 6
are shown in Table C2. Details of the annualisation calculations are provided in Tables
C3-C5 below.
Table C.2 – Monitoring Periods for Sites Requiring Annualisation
Monitoring Site Monitoring Period
Walton 3 03/01/18 - 31/01/2018, 28/03/18 - 02/05/18, 05/06/18 -
04/07/18, 05/12/18 - 09/01/18
Weybridge 1 and 6 03/01/18 - 02/05/18
Weybridge 5 03/01/19 – 28/03/18
Table C.3 – Short-term to long-term adjustment, Walton 3
Long-term Site
Annual Mean 2018 (AM)
Period Mean 2018 (PM) Ratio (AM/PM) *
London Hillingdon
46.2 47.3 0.98
London N. Kensington
29.3 29.1 1.00
London Bloomsbury
36.6 37.9 0.97
Reading New Town
26.1 27.6 0.95
London Westminster
32.0 32.2 0.99
Average (Ra) 0.98
(*) Based on unrounded numbers
Elmbridge Borough Council
LAQM Annual Status Report 2019 40
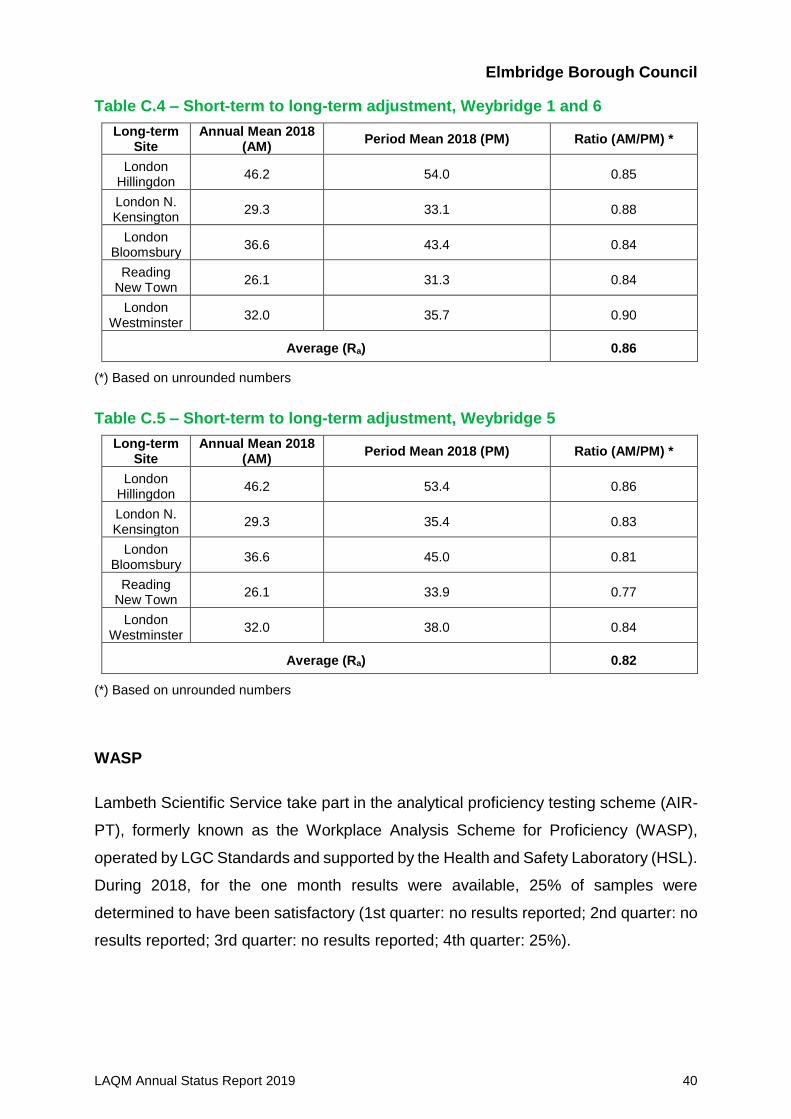
Table C.4 – Short-term to long-term adjustment, Weybridge 1 and 6
Long-term Site
Annual Mean 2018 (AM)
Period Mean 2018 (PM) Ratio (AM/PM) *
London Hillingdon
46.2 54.0 0.85
London N. Kensington
29.3 33.1 0.88
London Bloomsbury
36.6 43.4 0.84
Reading New Town
26.1 31.3 0.84
London Westminster
32.0 35.7 0.90
Average (Ra) 0.86
(*) Based on unrounded numbers
Table C.5 – Short-term to long-term adjustment, Weybridge 5
Long-term Site
Annual Mean 2018 (AM)
Period Mean 2018 (PM) Ratio (AM/PM) *
London Hillingdon
46.2 53.4 0.86
London N. Kensington
29.3 35.4 0.83
London Bloomsbury
36.6 45.0 0.81
Reading New Town
26.1 33.9 0.77
London Westminster
32.0 38.0 0.84
Average (Ra) 0.82
(*) Based on unrounded numbers
WASP
Lambeth Scientific Service take part in the analytical proficiency testing scheme (AIR-
PT), formerly known as the Workplace Analysis Scheme for Proficiency (WASP),
operated by LGC Standards and supported by the Health and Safety Laboratory (HSL).
During 2018, for the one month results were available, 25% of samples were
determined to have been satisfactory (1st quarter: no results reported; 2nd quarter: no
results reported; 3rd quarter: no results reported; 4th quarter: 25%).
Elmbridge Borough Council
LAQM Annual Status Report 2019 41
Automatic Monitoring QA/QC
All monitoring data are ratified by Air Quality Data Management (AQDM) in accordance
with the LAQM TG (16) standards.
Elmbridge Borough Council
LAQM Annual Status Report 2019 42
Appendix D: Maps of Monitoring Locations and AQMAs
Elmbridge Borough Council
LAQM Annual Status Report 2019 43
Elmbridge Borough Council
LAQM Annual Status Report 2019 44
Elmbridge Borough Council
LAQM Annual Status Report 2019 45
Elmbridge Borough Council
LAQM Annual Status Report 2019 46
Elmbridge Borough Council
LAQM Annual Status Report 2019 47
Elmbridge Borough Council
LAQM Annual Status Report 2019 48
Elmbridge Borough Council
LAQM Annual Status Report 2019 49
Elmbridge Borough Council
LAQM Annual Status Report 2019 50
Elmbridge Borough Council
LAQM Annual Status Report 2019 51
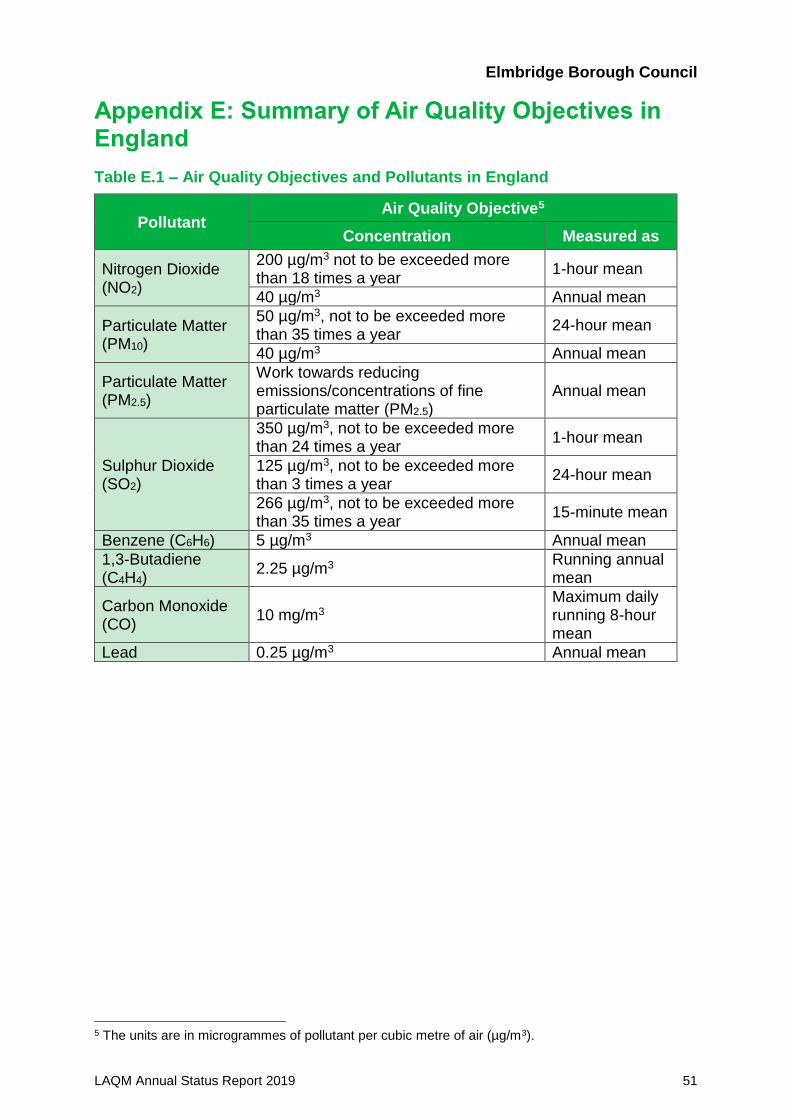
Appendix E: Summary of Air Quality Objectives in England
Table E.1 – Air Quality Objectives and Pollutants in England
Pollutant Air Quality Objective5
Concentration Measured as
Nitrogen Dioxide (NO2)
200 µg/m3 not to be exceeded more than 18 times a year
1-hour mean
40 µg/m3 Annual mean
Particulate Matter (PM10)
50 µg/m3, not to be exceeded more than 35 times a year
24-hour mean
40 µg/m3 Annual mean
Particulate Matter (PM2.5)
Work towards reducing emissions/concentrations of fine particulate matter (PM2.5)
Annual mean
Sulphur Dioxide (SO2)
350 µg/m3, not to be exceeded more than 24 times a year
1-hour mean
125 µg/m3, not to be exceeded more than 3 times a year
24-hour mean
266 µg/m3, not to be exceeded more than 35 times a year
15-minute mean
Benzene (C6H6) 5 µg/m3 Annual mean
1,3-Butadiene (C4H4)
2.25 µg/m3 Running annual mean
Carbon Monoxide (CO)
10 mg/m3 Maximum daily running 8-hour mean
Lead 0.25 µg/m3 Annual mean
5 The units are in microgrammes of pollutant per cubic metre of air (µg/m3).
Elmbridge Borough Council
LAQM Annual Status Report 2019 52
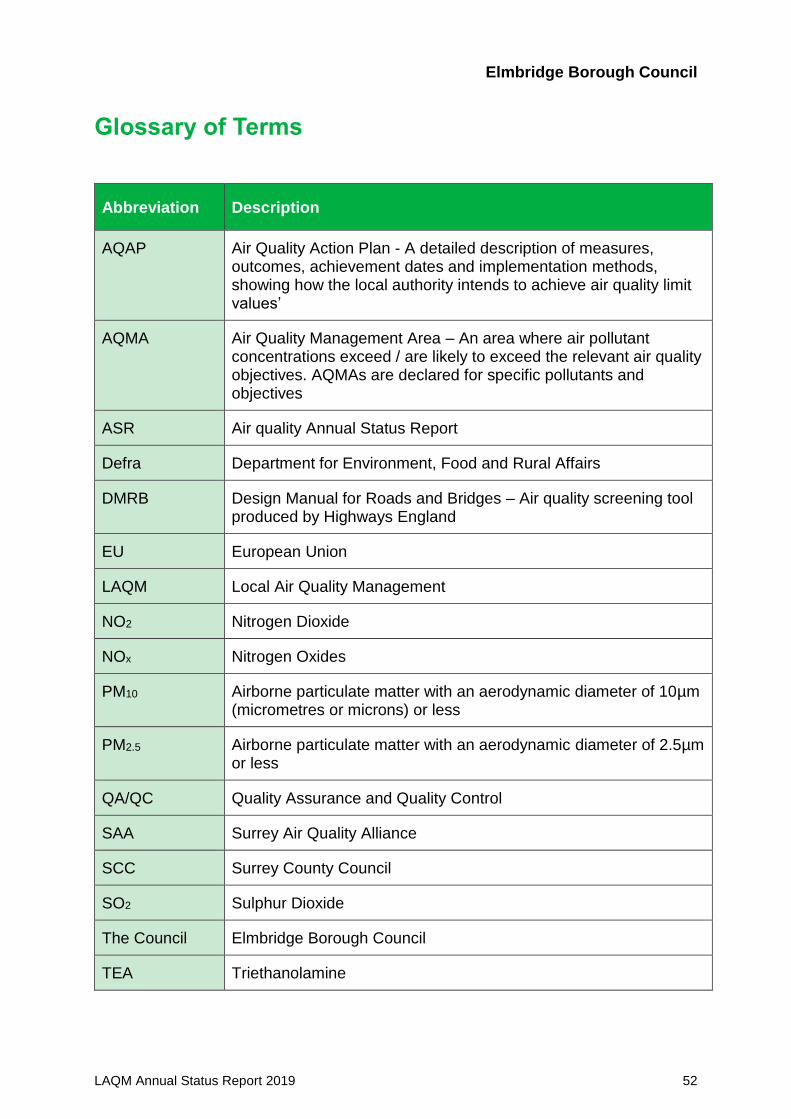
Glossary of Terms
Abbreviation Description
AQAP Air Quality Action Plan - A detailed description of measures, outcomes, achievement dates and implementation methods, showing how the local authority intends to achieve air quality limit values’
AQMA Air Quality Management Area – An area where air pollutant concentrations exceed / are likely to exceed the relevant air quality objectives. AQMAs are declared for specific pollutants and objectives
ASR Air quality Annual Status Report
Defra Department for Environment, Food and Rural Affairs
DMRB Design Manual for Roads and Bridges – Air quality screening tool produced by Highways England
EU European Union
LAQM Local Air Quality Management
NO2 Nitrogen Dioxide
NOx Nitrogen Oxides
PM10 Airborne particulate matter with an aerodynamic diameter of 10µm (micrometres or microns) or less
PM2.5 Airborne particulate matter with an aerodynamic diameter of 2.5µm or less
QA/QC Quality Assurance and Quality Control
SAA Surrey Air Quality Alliance
SCC Surrey County Council
SO2 Sulphur Dioxide
The Council Elmbridge Borough Council
TEA Triethanolamine
Elmbridge Borough Council
LAQM Annual Status Report 2019 53
References
Department for Environment, Food and Rural Affairs (Defra), 2016. Local Air Quality
Management Technical Guidance (LAQM.TG16). Available at:
http://laqm.defra.gov.uk/supporting-guidance.html
Department for Environment, Food and Rural Affairs (Defra), 2016. Local Air Quality
Management Policy Guidance (LAQM PG16). Available at:
http://laqm.defra.gov.uk/supporting-guidance.html
Department for Environment, Food and Rural Affairs (Defra), 2007. Air Quality
Strategy for England, Scotland Wales and Northern Ireland, 2007.
Elmbridge Borough Council, 2018. 2018 Air Quality Annual Status Report (ASR).
Available at: http://www.elmbridge.gov.uk/pollution/local-air-quality/
Spreadsheet of Diffusion Tube Bias Adjustment Factors, version 03/19. Available at:
https://laqm.defra.gov.uk/bias-adjustment-factors/national-bias.html