Embed Size (px)
Citation preview
As 2015 approaches and we transition from Missouri’s traditional MAP testing to the Smarter Balanced Assessments, many teachers and administrators have been asking for information. What is the implementation timeline? What kinds of items will be on the test? What do assessment items look like? How are the tests scored? How will technology be utilized? While not every detail is known, information is available. First, an implementation time line:
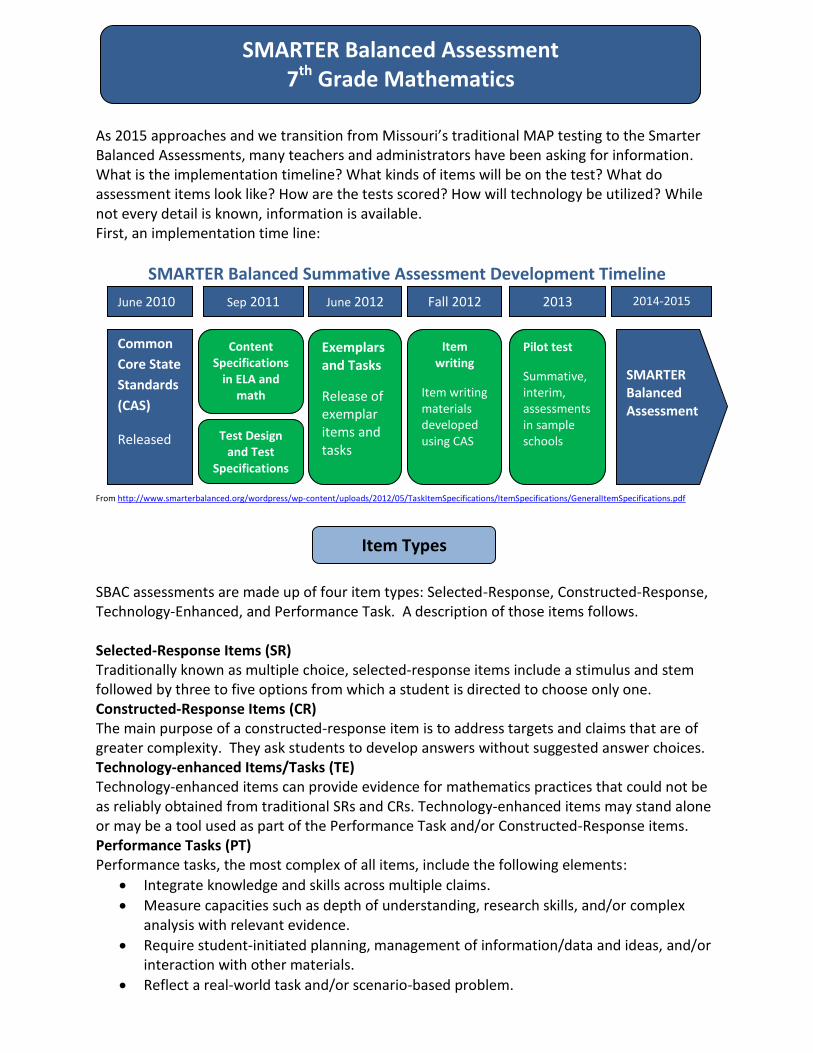
SMARTER Balanced Summative Assessment Development Timeline From http://www.smarterbalanced.org/wordpress/wp-content/uploads/2012/05/TaskItemSpecifications/ItemSpecifications/GeneralItemSpecifications.pdf
SBAC assessments are made up of four item types: Selected-Response, Constructed-Response, Technology-Enhanced, and Performance Task. A description of those items follows. Selected-Response Items (SR) Traditionally known as multiple choice, selected-response items include a stimulus and stem followed by three to five options from which a student is directed to choose only one. Constructed-Response Items (CR) The main purpose of a constructed-response item is to address targets and claims that are of greater complexity. They ask students to develop answers without suggested answer choices. Technology-enhanced Items/Tasks (TE) Technology-enhanced items can provide evidence for mathematics practices that could not be as reliably obtained from traditional SRs and CRs. Technology-enhanced items may stand alone or may be a tool used as part of the Performance Task and/or Constructed-Response items. Performance Tasks (PT) Performance tasks, the most complex of all items, include the following elements:
Integrate knowledge and skills across multiple claims.
Measure capacities such as depth of understanding, research skills, and/or complex analysis with relevant evidence.
Require student-initiated planning, management of information/data and ideas, and/or interaction with other materials.
Reflect a real-world task and/or scenario-based problem.
June 2010 Sep 2011 June 2012 Fall 2012 2013 2014-2015
Common
Core State
Standards
(CAS)
Released
Content Specifications
in ELA and math
Test Design and Test
Specifications
Exemplars and Tasks
Release of exemplar items and tasks
Item writing
Item writing materials developed using CAS
Pilot test
Summative, interim, assessments in sample schools
SMARTER Balanced Assessment
SMARTER Balanced Assessment 7th Grade Mathematics
Item Types
Allow for multiple approaches.
Represent content that is relevant and meaningful to students.
Allow for demonstration of important knowledge and skills.
Require scoring that focuses on the essence of the Claim(s) for which the task was written.
Seem feasible for the school/classroom environment.
The Smarter Balanced summative assessments in mathematics are designed to measure the full range of student abilities in the Common Core State Standards or Core Academic Standards (CAS). Evidence will be gathered in support of four major claims: (1) Concepts and Procedures, (2) Problem Solving, (3) Communicating Reasoning, and (4) Modeling and Data Analysis. Students will receive an overall mathematics composite score. For the enhanced assessment, students will receive a score for each of three major claim areas. (Math claims 2 and 4 are combined for the purposes of score reporting.) Claim 1 — Students can explain and apply mathematical concepts and interpret and carry out mathematical procedures with precision and fluency. Claim 2 — Students can solve a range of complex, well-posed problems in pure and applied mathematics, making productive use of knowledge and problem-solving strategies. Claim 3 — Students can clearly and precisely construct viable arguments to support their own reasoning and to critique the reasoning of others. Claim 4 — Students can analyze complex, real-world scenarios and can construct and use mathematical models to interpret and solve problems.
Distracter: the incorrect response options to an SR item. Distracter Analysis: the item writer‘s analysis of the options or rationale for inclusion of specific options. Item: the entire item, including the stimulus, question/prompt, answer/options, scoring criteria, and metadata. Key: the correct response(s) to an item. Options: the responses to a selected-response (SR) item from which the student selects one or more answers. Scoring Rubric: the descriptions for each score point for an item/task that scores more than one point for a correct response. Stem: the statement of the question or prompt to which the student responds. Stimulus: the text, source (e.g., video clip), and/or graphic about which the item is written. The stimulus provides the context of the item/task to which the student must respond. Task: similar to an item, yet typically more involved and usually associated with constructed-response, extended-response, and performance tasks. Top-Score Response: one example of a complete and correct response to an item/task. Additional information (including Scoring Rubrics) is available at: http://www.smarterbalanced.org/wordpress/wp-content/uploads/2012/03/DRAFTMathItemSpecsShowcase2.pdf http://www.smarterbalanced.org/wordpress/wp-content/uploads/2012/05/TaskItemSpecifications/ItemSpecifications/GeneralItemSpecifications.pdf
Claims
Glossary

Additional Sample Items are available:
3RD GRADE SAMPLE ELA ITEMS
4TH GRADE SAMPLE ELA ITEMS
5TH GRADE SAMPLE ELA ITEMS
6TH GRADE SAMPLE ELA ITEMS
7TH GRADE SAMPLE ELA ITEMS
8TH GRADE SAMPLE ELA ITEMS
9TH GRADE SAMPLE ELA ITEMS
10TH GRADE SAMPLE ELA ITEMS
3RD
GRADE SAMPLE
MATHEMATICS ITEMS
4TH
GRADE SAMPLE MATHEMATICS ITEMS
HIGH SCHOOL SAMPLE MATHEMATICS ITEMS
6TH
GRADE SAMPLE MATHEMATICS ITEMS
8TH
GRADE SAMPLE MATHEMATICS ITEMS
5TH
GRADE SAMPLE MATHEMATICS ITEMS
11TH GRADE SAMPLE ELA ITEMS
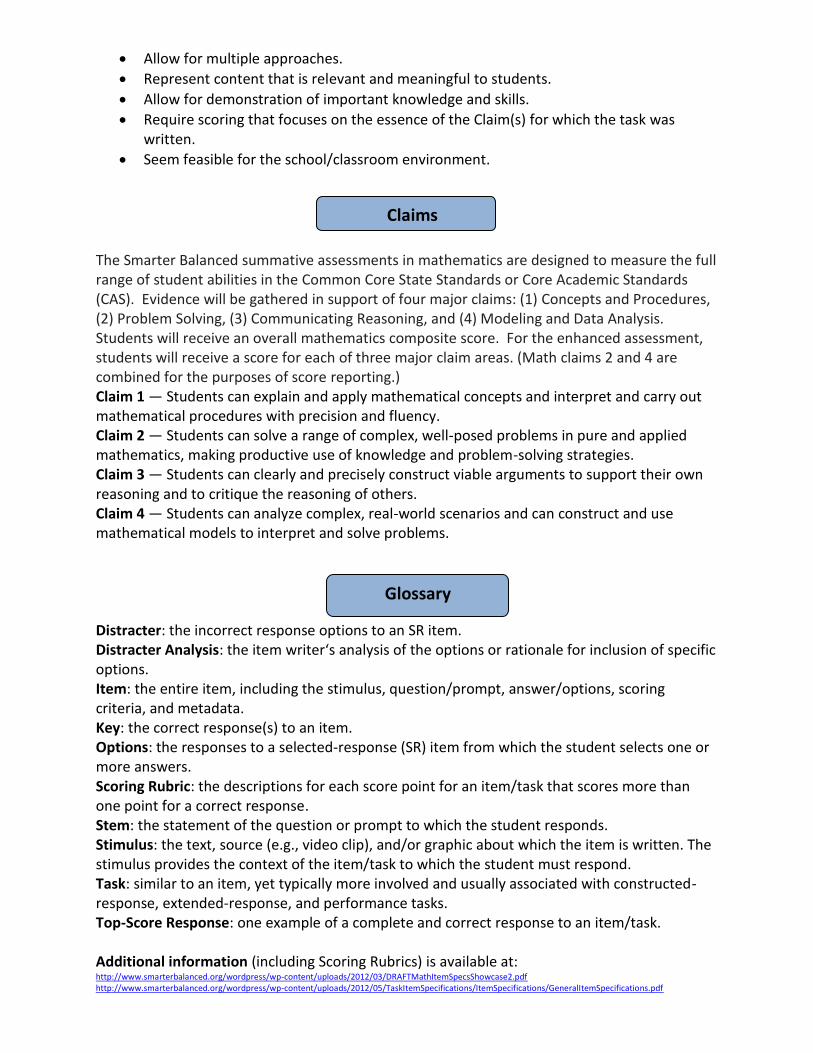
Grade 07 Mathematics Sample CR Item
MAT.07.CR.1.0000G.F.488 Sample Item ID: MAT.07.CR.1.0000G.F.488
Grade: 07 Claim(s): Claim 1: Concepts and Procedures
Students can explain and apply mathematical concepts and carry out mathematical procedures with precision and fluency.
Assessment Target(s): 1 F: Solve real-life and mathematical problems involving angle measure, area, surface area, and volume.
Content Domain: Geometry Standard(s): 7.G.6
Mathematical Practice(s): 1, 5 DOK: 2
Item Type: CR Score Points: 1
Difficulty: M Key: 72
Stimulus/Source: Target-Specific Attributes
(e.g., Accessibility Issues): Notes: The answer box will accept up to 5 characters, including a
decimal point (.) or fraction bar (/).
Version 1.0
Grade 07 Mathematics Sample CR Item
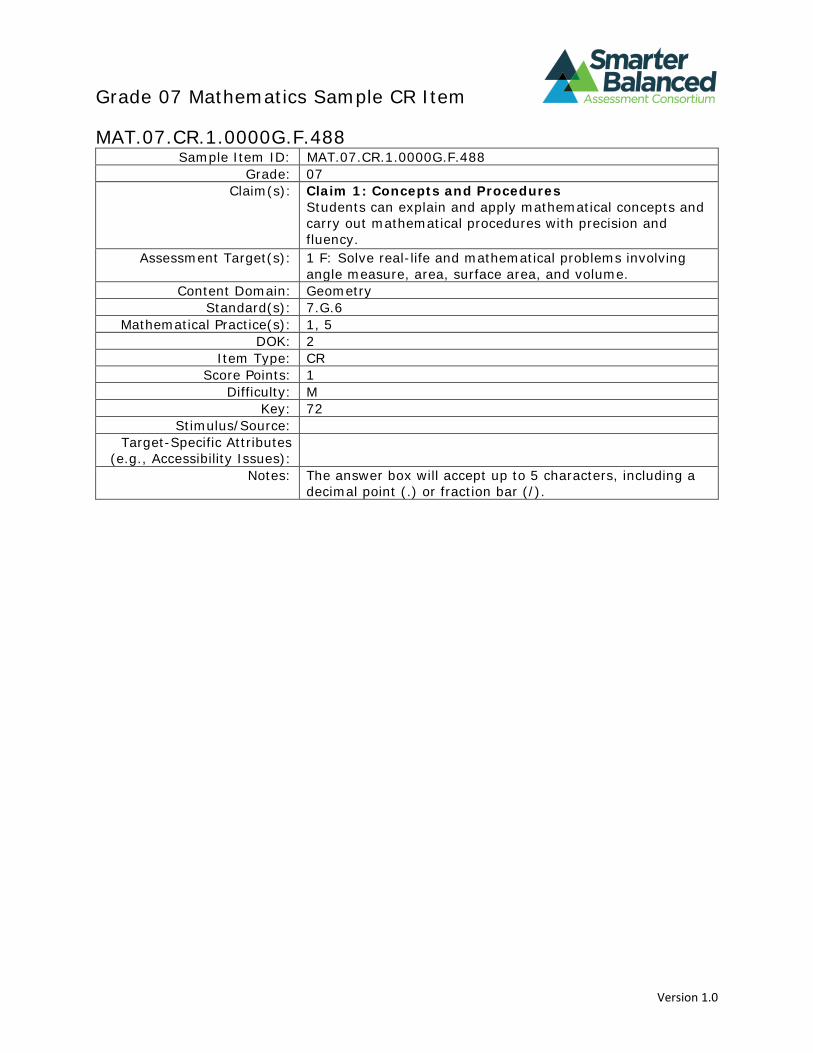
Look at the triangular prism below. Each triangular face of the prism has a base of 3 centimeters (cm) and a height of 4 cm. The length of the prism is 12 cm.
What is the volume, in cm3, of this triangular prism?
cm3
Key:
72 cm3
1V = ( × 3 × 4) × 12 = 6 × 12 = 722
Version 1.0
Grade 7 Mathematics Sample CR Item
MAT.07.CR.1.000EE.C.296 Sample Item ID: MAT.07.CR.1.000EE.C.296
Grade: 07 Claim(s): Claim 1: Concepts and Procedures
Students can explain and apply mathematical concepts and carry out mathematical procedures with precision and fluency.
Assessment Target(s): 1 C: Use properties of operations to generate equivalent expressions.
Content Domain: Expressions and Equations Standard(s): 7.EE.1
Mathematical Practice(s): 1, 2 DOK: 2
Item Type: CR Score Points: 2
Difficulty: H Key: a is -6, b is 48
Stimulus/Source: Target-Specific Attributes
(e.g., accessibility issues): Notes: Response boxes will accept up to 5 character entries of
numeric values and symbols +, -, ., and /.
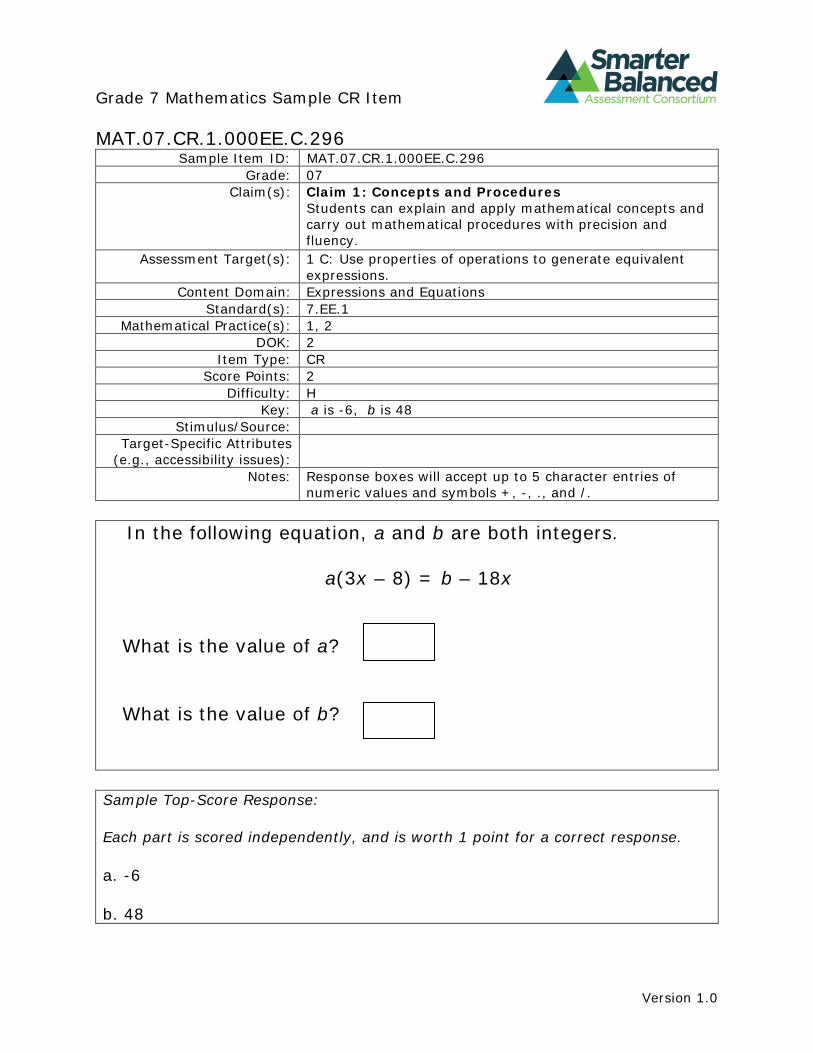
In the following equation, a and b are both integers.
a(3x – 8) = b – 18x
What is the value of a?
What is the value of b?
Sample Top-Score Response:
Each part is scored independently, and is worth 1 point for a correct response.
a. -6
b. 48
Version 1.0

Grade 7 Mathematics Sample CR Item
MAT.07.CR.1.000EE.D.165 Sample Item ID: MAT.07.CR.1.000EE.D.165
Grade: 07
Claim(s):
Claim 1: Concepts and Procedures Students can explain and apply mathematical concepts and carry out mathematical procedures with precision and fluency.
Assessment Target(s): 1 D: Solve real-life and mathematical problems using numerical and algebraic expressions and equations.
Content Domain: Expressions and Equations Standard(s): 7.EE.4
Mathematical Practice(s): 1, 4, 6 DOK: 2
Item Type: TE Score Points: 3
Difficulty: M Key: See Sample Top-Score Response.
Stimulus/Source: Target-Specific Attributes
(e.g., accessibility issues):
Notes: TE Template: Selecting points and ranges on a number line; Part of this item requires AI scoring.
David wants to buy 2 pineapples and some bananas.
• The price of 1 pineapple is $2.99. • The price of bananas is $0.67 per pound.
David wants to spend less than $10.00. Write an inequality that represents the number of pounds of bananas, b, David can buy.
On the number line below, draw a graph that represents the number of pounds of bananas David can buy.
Version 1.0
Grade 7 Mathematics Sample CR Item
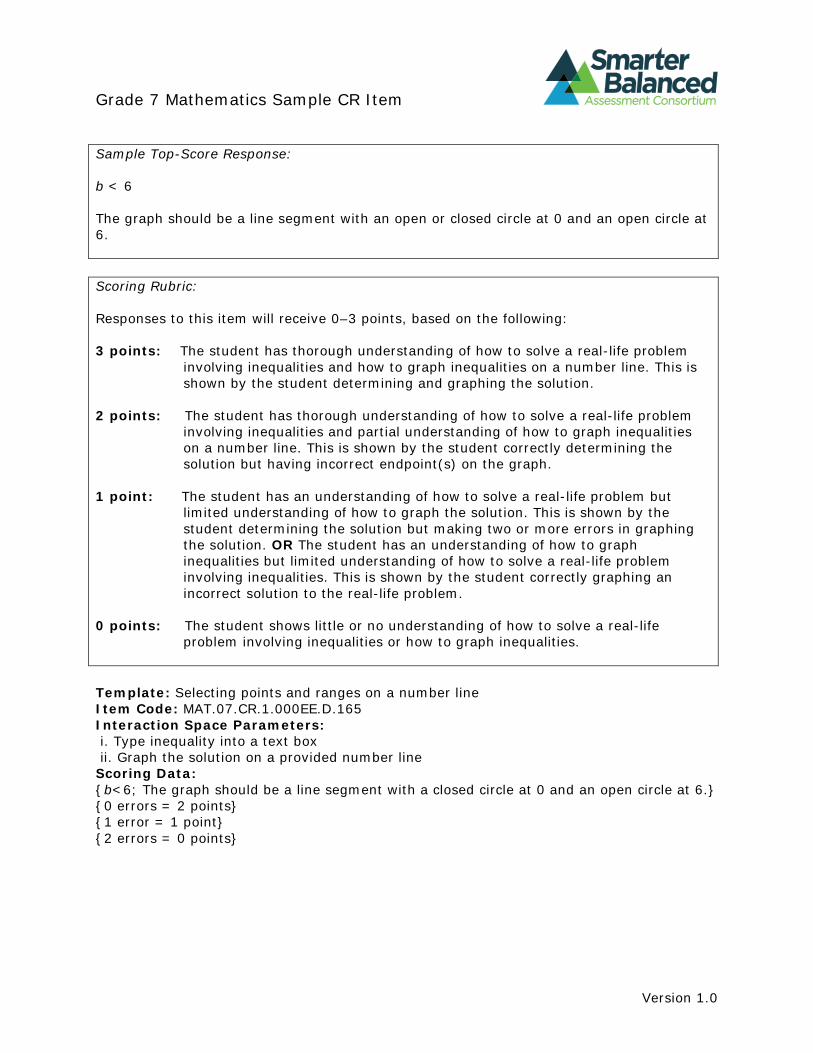
Sample Top-Score Response:
b < 6
The graph should be a line segment with an open or closed circle at 0 and an open circle at 6.
Scoring Rubric:
Responses to this item will receive 0–3 points, based on the following:
3 points: The student has thorough understanding of how to solve a real-life problem involving inequalities and how to graph inequalities on a number line. This is shown by the student determining and graphing the solution.
2 points: The student has thorough understanding of how to solve a real-life problem involving inequalities and partial understanding of how to graph inequalities on a number line. This is shown by the student correctly determining the solution but having incorrect endpoint(s) on the graph.
1 point: The student has an understanding of how to solve a real-life problem but limited understanding of how to graph the solution. This is shown by the student determining the solution but making two or more errors in graphing the solution. OR The student has an understanding of how to graph inequalities but limited understanding of how to solve a real-life problem involving inequalities. This is shown by the student correctly graphing an incorrect solution to the real-life problem.
0 points: The student shows little or no understanding of how to solve a real-life problem involving inequalities or how to graph inequalities.
Template: Selecting points and ranges on a number line Item Code: MAT.07.CR.1.000EE.D.165 Interaction Space Parameters: i. Type inequality into a text box ii. Graph the solution on a provided number line
Scoring Data: {b<6; The graph should be a line segment with a closed circle at 0 and an open circle at 6.} {0 errors = 2 points} {1 error = 1 point} {2 errors = 0 points}
Version 1.0
Grade 7 Mathematics Sample CR Item
MAT.07.CR.2.000EE.D.158 Sample Item ID: MAT.07.CR.2.000EE.D.158
Grade: 07
Primary Claim:
Claim 2: Problem Solving Students can solve a range of well-posed problems in pure and applied mathematics, making productive use of knowledge and problem-solving strategies.
Secondary Claim(s):
Claim 1: Concepts and Procedures Students can explain and apply mathematical concepts and carry out mathematical procedures with precision and fluency.
Primary Content Domain: Expressions and Equations Secondary Content Domain(s):
Assessment Target(s):
2 D: Identify important quantities in a practical situation and map their relationships (e.g., using diagrams, two-way tables, graphs, flowcharts, or formulas).
2 A: Apply mathematics to solve well-posed problems arising in everyday life, society, and the workplace.
1 D: Solve real-life and mathematical problems using numerical and algebraic expressions and equations.
Standard(s): 7.EE.1, 7.EE.2, 7.EE.4, 6.EE.7 Mathematical Practice(s): 1, 2, 3, 4, 7
DOK: 2 Item Type: CR
Score Points: 3 Difficulty: M
Key: See Sample Top-Score Response. Stimulus/Source:
Target-Specific Attributes (e.g., accessibility issues): Calculator may be used
Notes:
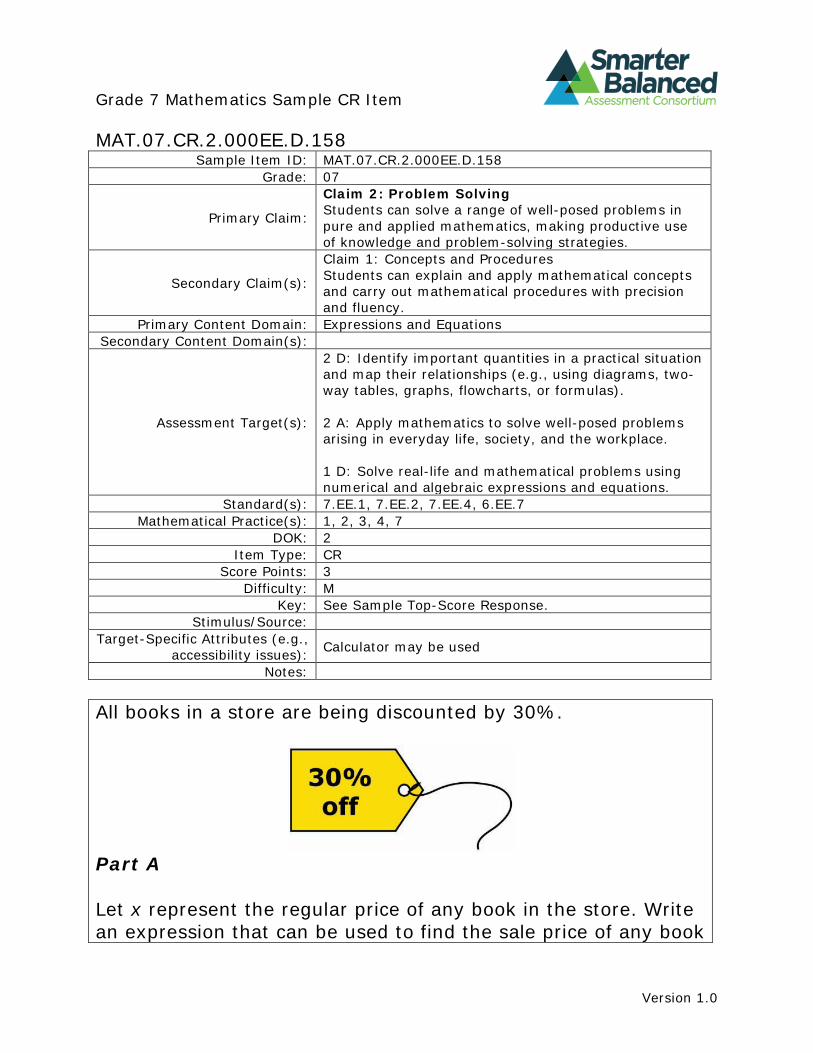
All books in a store are being discounted by 30%.
Part A
Let x represent the regular price of any book in the store. Write an expression that can be used to find the sale price of any book
Version 1.0
Grade 7 Mathematics Sample CR Item
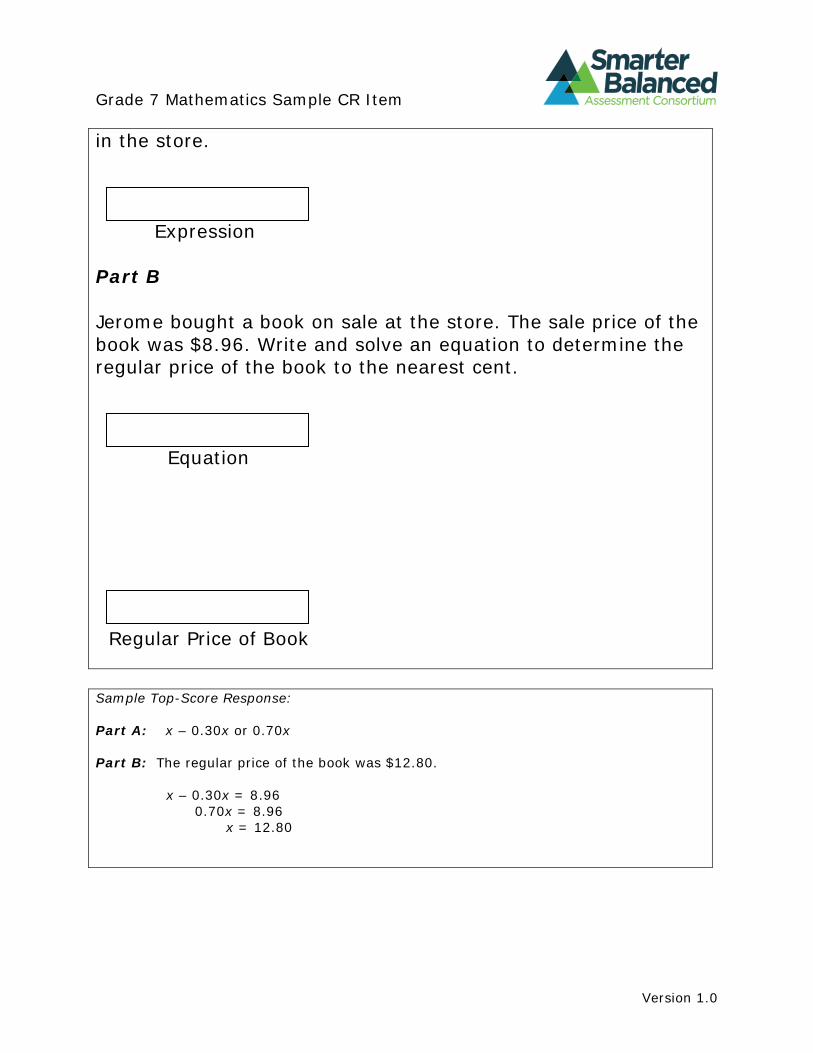
in the store.
Expression
Part B
Jerome bought a book on sale at the store. The sale price of the book was $8.96. Write and solve an equation to determine the regular price of the book to the nearest cent.
Equation
Regular Price of Book
Sample Top-Score Response:
Part A: x – 0.30x or 0.70x
Part B: The regular price of the book was $12.80.
x – 0.30x = 8.96 0.70x = 8.96
x = 12.80
Version 1.0
Grade 7 Mathematics Sample CR Item
Scoring Rubric:
Responses to this item will receive 0–2 points, based on the following:
3 points: The student is able to create both an expression and equation related to sale and regular prices of a book, and solve the equation correctly.
2 points: The student is able to create both an expression and equation related to sale and regular prices of a book, but makes a minor error in solving the equation. OR The student is able to use alternate strategies to find a correct answer for the price of the book, but doesn’t know how to correctly show the expression or equation.
1 point: The student can write either the expression or the equation correctly, but not both. The student is not able to get the correct answer for the price of the book.
0 points: The student shows inconsistent or no understanding of writing expressions, or of solving an equation for real-life problems.
Version 1.0
Grade 7 Mathematics Sample ER Item
MAT.07.ER.2.0000G.A.295 Sample Item ID: MAT.07.ER.2.0000G.A.295
Grade: 07 Primary Claim: Claim 2: Problem Solving
Students can solve a range of well-posed problems in pure and applied mathematics, making productive use of knowledge and problem-solving strategies.
Secondary Claim(s): Claim 1: Concepts and Procedures Students can explain and apply mathematical concepts and carry out mathematical procedures with precision and fluency.
Primary Content Domain: Geometry Secondary Content Domain(s): Measurement and Data
Assessment Target(s): 2 A: Apply Mathematics to solve well-posed problems arising in everyday life, society, and the workplace.
1 F: Solve real-life and mathematical problems involving angle measure, area, surface area, and volume.
1 I (Gr 4): Solve problems involving measurement and conversion of measurements from a larger unit to a smaller unit.
Standard(s): 7.G.4, 4.MD.3 Mathematical Practice(s): 1, 2, 3
DOK: 2 Item Type: ER
Score Points: 2 Difficulty: M
Key: See Sample Top-Score Response. Stimulus/Source:
Target-Specific Attributes (e.g., accessibility issues):
Notes: Part of PT set
Version 1.0
Grade 7 Mathematics Sample ER Item
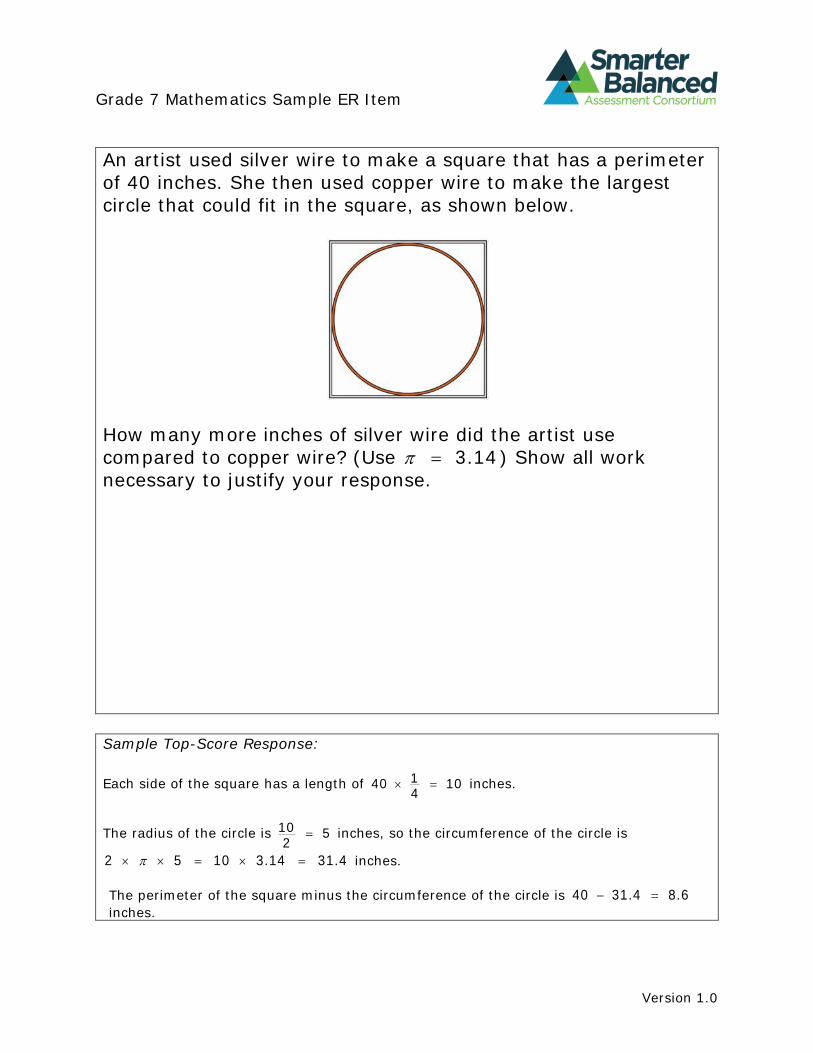
An artist used silver wire to make a square that has a perimeter of 40 inches. She then used copper wire to make the largest circle that could fit in the square, as shown below.
How many more inches of silver wire did the artist use compared to copper wire? (Use π = 3.14) Show all work necessary to justify your response.
Sample Top-Score Response:
1Each side of the square has a length of 40 × = 10 inches. 4
The radius of the circle is 10 = 5 inches, so the circumference of the circle is 2
2 × π × 5 = 10 × 3.14 = 31.4 inches.
The perimeter of the square minus the circumference of the circle is 40 − 31.4 = 8.6 inches.
Version 1.0
Grade 7 Mathematics Sample ER Item
Scoring Rubric:
Responses to this item will receive 0–2 points, based on the following:
2 points: The student shows thorough understanding of how to solve a real-world problem involving circumference. The student determines the correct answer to the problem and provides clear justification for the answer.
1 point: The student shows partial understanding of how to solve a real-world problem involving circumference. The student determines the correct answer to the problem without providing justification for the answer. OR The student provides a correct strategy with an incorrect or missing answer.
0 points: The student shows limited or no understanding of how to solve a real-world problem involving circumference. The student does not provide a correct answer or strategy.
Version 1.0
Grade 7 Mathematics Sample ER Item
MAT.07.ER.2.0000G.F.501 Sample Item ID: MAT.07.ER.2.0000G.F.501
Grade: 07 Primary Claim: Claim 2: Problem Solving
Students can solve a range of well-posed problems in pure and applied mathematics, making productive use of knowledge and problem-solving strategies.
Secondary Claim(s): Primary Content Domain: Geometry
Secondary Content Domain(s): Ratios and Proportional Relationships Assessment Target(s): 2 F: Solve real-life and mathematical problems involving
angle measure, area, surface area, and volume.
2 A: Analyze proportional relationships and use them to solve real-world and mathematical problems.
Standard(s): 7.G.4, 7.RP.3 Mathematical Practice(s): 1, 2, 6
DOK: 2 Item Type: ER
Score Points: 4 Difficulty: H
Key: See Sample Top-Score Response. Stimulus/Source:
Target-Specific Attributes (e.g., accessibility issues):
Notes: Part of PT set
Version 1.0
Grade 7 Mathematics Sample ER Item
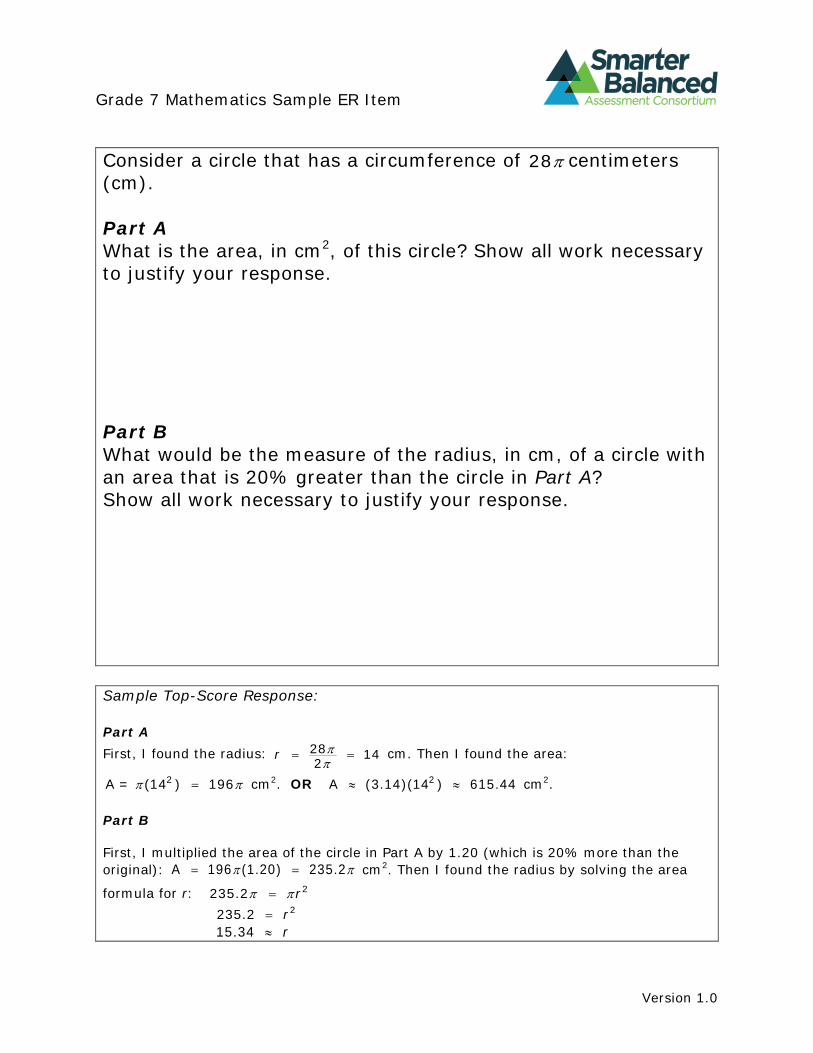
Consider a circle that has a circumference of 28π centimeters (cm).
Part A What is the area, in cm2, of this circle? Show all work necessary to justify your response.
Part B What would be the measure of the radius, in cm, of a circle with an area that is 20% greater than the circle in Part A? Show all work necessary to justify your response.
Sample Top-Score Response:
Part A First, I found the radius: r = 28
2 π π
= 14 cm. Then I found the area:
2 2 2 2A = π (14 ) = 196π cm . OR A ≈ (3.14)(14 ) ≈ 615.44 cm .
Part B
First, I multiplied the area of the circle in Part A by 1.20 (which is 20% more than the original): A = 196 (1.20) π = 235.2 π cm2. Then I found the radius by solving the area
2formula for r: 235.2 π = π r 2235.2 = r
15.34 ≈ r
Version 1.0
Grade 7 Mathematics Sample ER Item
Scoring Rubric:
Responses to this item will receive 0–4 points, based on the following:
4 points: The student shows a thorough understanding of how to solve a real-world problem involving the area and circumference of a circle by using proportional relationships. The student correctly answers both parts and shows sufficient work to justify both answers.
3 points: The student shows a solid understanding of how to solve a real-world problem involving the area and circumference of a circle by using proportional relationships. The student correctly answers both parts but only shows sufficient work to justify one answer. OR The student shows sufficient strategy to justify both answers, but makes a computational error that leads to one incorrect answer.
2 points: The student shows a partial understanding of how to solve a real-world problem involving the area and circumference of a circle by using proportional relationships. The student correctly answers Part A and shows sufficient work to justify the answer. OR The student correctly answers Part B based on an incorrect answer to Part A and shows sufficient work to justify the answer. OR The student shows sufficient strategy to justify both answers, but makes minor computational errors that lead to two incorrect answers.
1 point: The student shows a limited understanding of how to solve a real-life problem involving the area and circumference of a circle by using proportional relationships. The student correctly answers Part A. OR The student correctly answers Part B based on an incorrect answer to Part A. OR The student shows sufficient strategy to justify an answer to one part, but either answers incorrectly or does not provide an answer.
0 points: The student shows inconsistent or no understanding of how to solve a real-life problem involving the area and circumference of a circle by using proportional relationships.
Version 1.0
Grade 7 Mathematics Sample ER Item
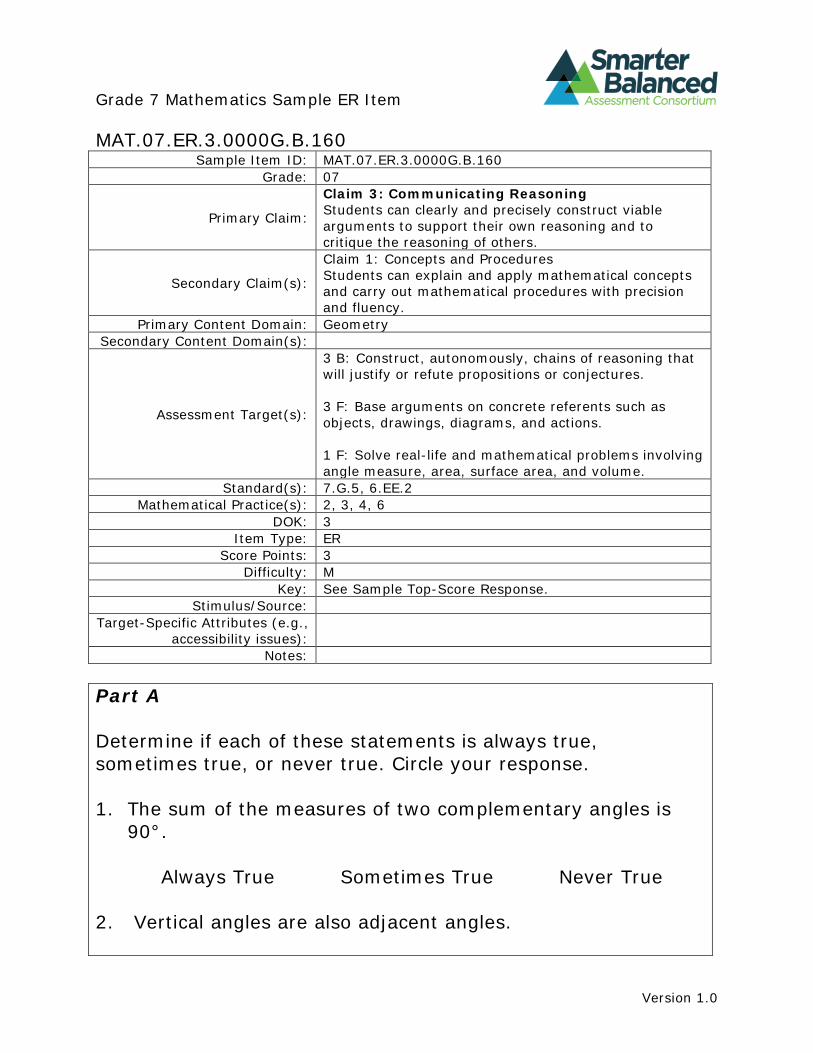
MAT.07.ER.3.0000G.B.160 Sample Item ID: MAT.07.ER.3.0000G.B.160
Grade: 07
Primary Claim:
Claim 3: Communicating Reasoning Students can clearly and precisely construct viable arguments to support their own reasoning and to critique the reasoning of others.
Secondary Claim(s):
Claim 1: Concepts and Procedures Students can explain and apply mathematical concepts and carry out mathematical procedures with precision and fluency.
Primary Content Domain: Geometry Secondary Content Domain(s):
Assessment Target(s):
3 B: Construct, autonomously, chains of reasoning that will justify or refute propositions or conjectures.
3 F: Base arguments on concrete referents such as objects, drawings, diagrams, and actions.
1 F: Solve real-life and mathematical problems involving angle measure, area, surface area, and volume.
Standard(s): 7.G.5, 6.EE.2 Mathematical Practice(s): 2, 3, 4, 6
DOK: 3 Item Type: ER
Score Points: 3 Difficulty: M
Key: See Sample Top-Score Response. Stimulus/Source:
Target-Specific Attributes (e.g., accessibility issues):
Notes:
Part A
Determine if each of these statements is always true, sometimes true, or never true. Circle your response.
1. The sum of the measures of two complementary angles is 90°.
Always True Sometimes True Never True
2. Vertical angles are also adjacent angles.
Version 1.0
Grade 7 Mathematics Sample ER Item
Always True Sometimes True Never True
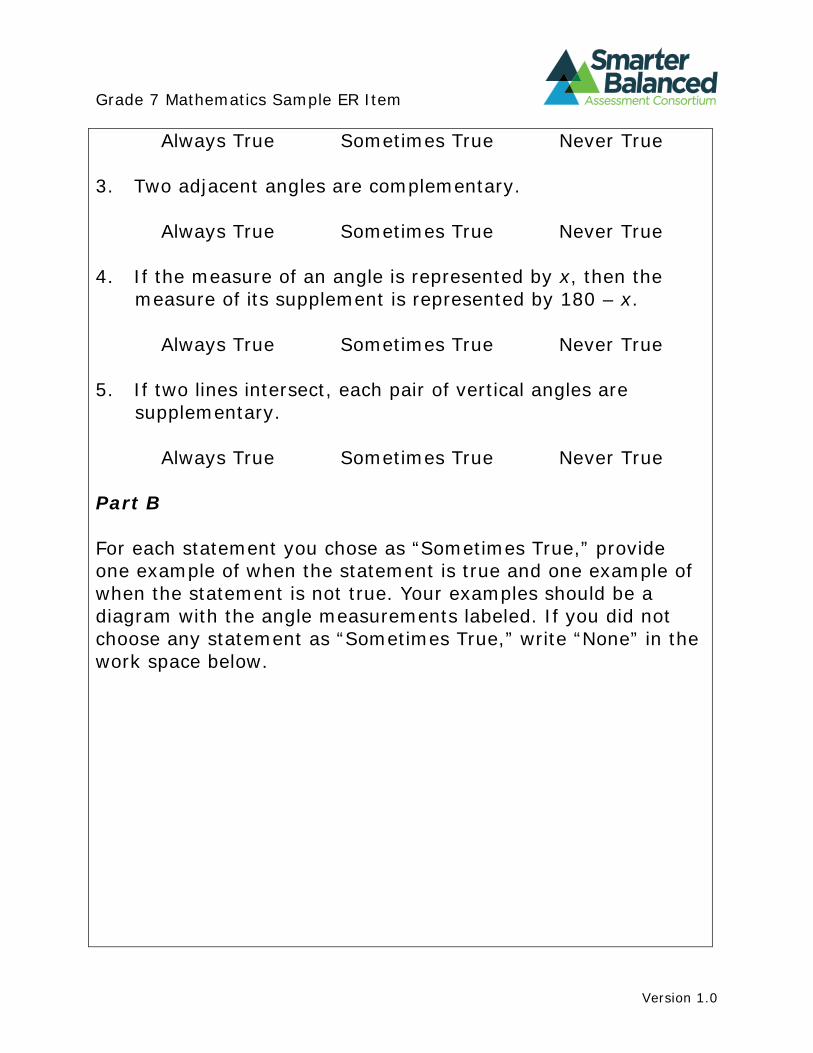
3. Two adjacent angles are complementary.
Always True Sometimes True Never True
4. If the measure of an angle is represented by x, then the measure of its supplement is represented by 180 – x.
Always True Sometimes True Never True
5. If two lines intersect, each pair of vertical angles are supplementary.
Always True Sometimes True Never True
Part B
For each statement you chose as “Sometimes True,” provide one example of when the statement is true and one example of when the statement is not true. Your examples should be a diagram with the angle measurements labeled. If you did not choose any statement as “Sometimes True,” write “None” in the work space below.
Version 1.0
Grade 7 Mathematics Sample ER Item
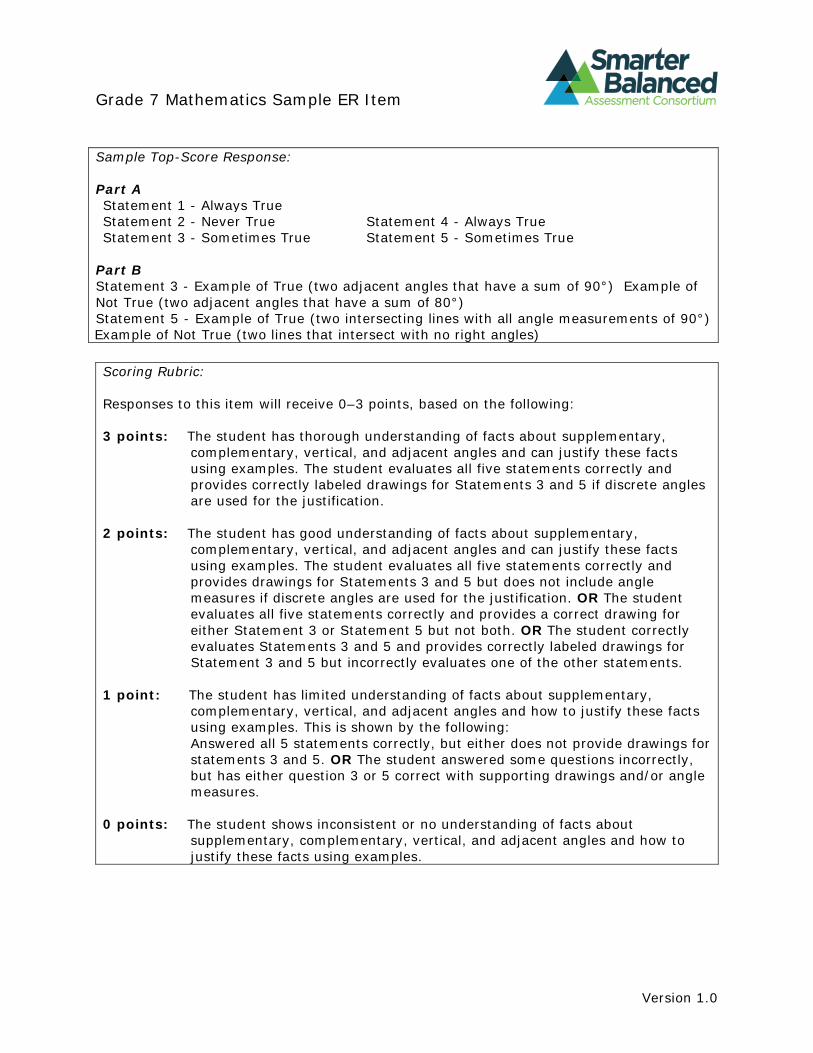
Sample Top-Score Response:
Part A Statement 1 - Always True Statement 2 - Never True Statement 4 - Always True Statement 3 - Sometimes True Statement 5 - Sometimes True
Part B Statement 3 - Example of True (two adjacent angles that have a sum of 90°) Example of Not True (two adjacent angles that have a sum of 80°) Statement 5 - Example of True (two intersecting lines with all angle measurements of 90°) Example of Not True (two lines that intersect with no right angles)
Scoring Rubric:
Responses to this item will receive 0–3 points, based on the following:
3 points: The student has thorough understanding of facts about supplementary, complementary, vertical, and adjacent angles and can justify these facts using examples. The student evaluates all five statements correctly and provides correctly labeled drawings for Statements 3 and 5 if discrete angles are used for the justification.
2 points: The student has good understanding of facts about supplementary, complementary, vertical, and adjacent angles and can justify these facts using examples. The student evaluates all five statements correctly and provides drawings for Statements 3 and 5 but does not include angle measures if discrete angles are used for the justification. OR The student evaluates all five statements correctly and provides a correct drawing for either Statement 3 or Statement 5 but not both. OR The student correctly evaluates Statements 3 and 5 and provides correctly labeled drawings for Statement 3 and 5 but incorrectly evaluates one of the other statements.
1 point: The student has limited understanding of facts about supplementary, complementary, vertical, and adjacent angles and how to justify these facts using examples. This is shown by the following: Answered all 5 statements correctly, but either does not provide drawings for statements 3 and 5. OR The student answered some questions incorrectly, but has either question 3 or 5 correct with supporting drawings and/or angle measures.
0 points: The student shows inconsistent or no understanding of facts about supplementary, complementary, vertical, and adjacent angles and how to justify these facts using examples.
Version 1.0
Grade 7 Mathematics Sample ER Item
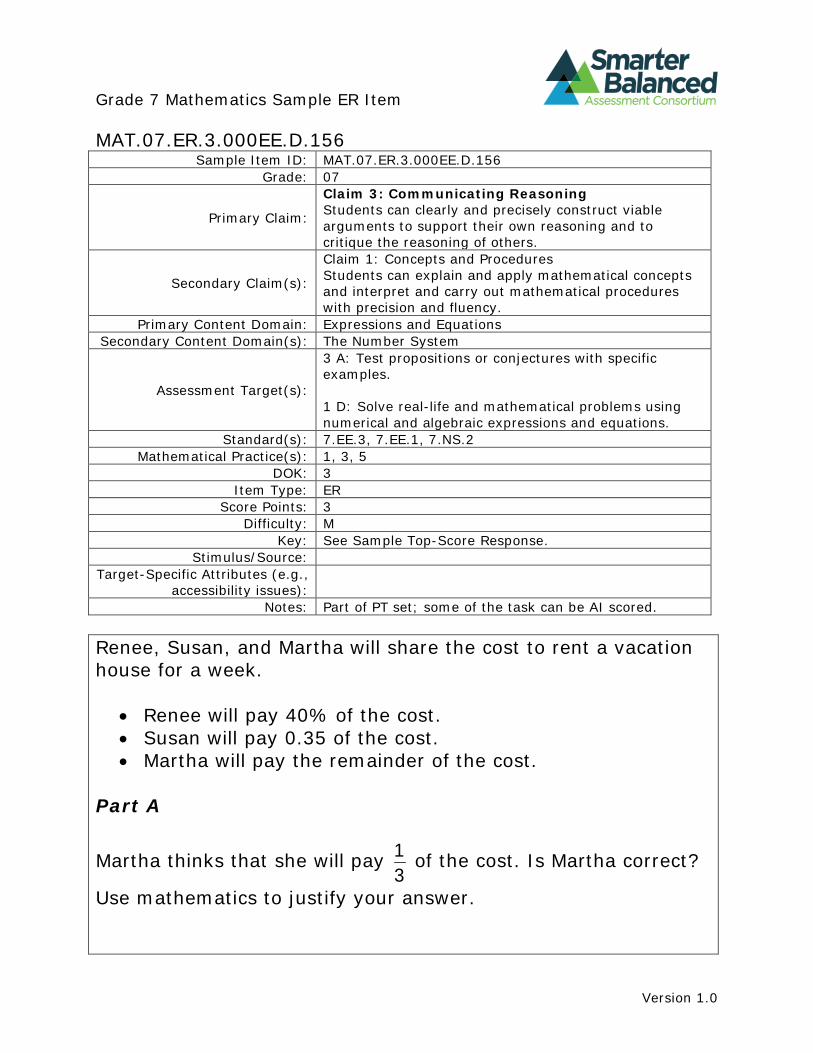
MAT.07.ER.3.000EE.D.156 Sample Item ID: MAT.07.ER.3.000EE.D.156
Grade: 07
Primary Claim:
Claim 3: Communicating Reasoning Students can clearly and precisely construct viable arguments to support their own reasoning and to critique the reasoning of others.
Secondary Claim(s):
Claim 1: Concepts and Procedures Students can explain and apply mathematical concepts and interpret and carry out mathematical procedures with precision and fluency.
Primary Content Domain: Expressions and Equations Secondary Content Domain(s): The Number System
Assessment Target(s):
3 A: Test propositions or conjectures with specific examples.
1 D: Solve real-life and mathematical problems using numerical and algebraic expressions and equations.
Standard(s): 7.EE.3, 7.EE.1, 7.NS.2 Mathematical Practice(s): 1, 3, 5
DOK: 3 Item Type: ER
Score Points: 3 Difficulty: M
Key: See Sample Top-Score Response. Stimulus/Source:
Target-Specific Attributes (e.g., accessibility issues):
Notes: Part of PT set; some of the task can be AI scored.
Renee, Susan, and Martha will share the cost to rent a vacation house for a week.
• Renee will pay 40% of the cost. • Susan will pay 0.35 of the cost. • Martha will pay the remainder of the cost.
Part A
Martha thinks that she will pay 1 of the cost. Is Martha correct? 3
Use mathematics to justify your answer.
Version 1.0
Grade 7 Mathematics Sample ER Item
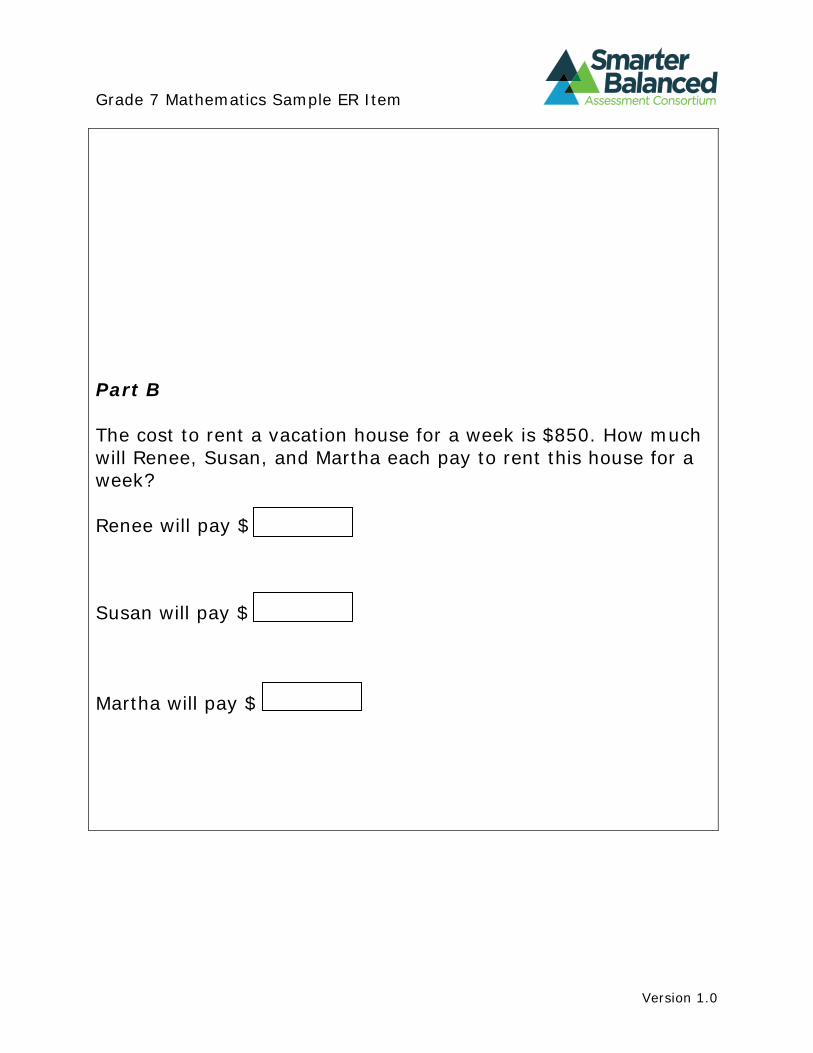
Part B
The cost to rent a vacation house for a week is $850. How much will Renee, Susan, and Martha each pay to rent this house for a week?
Renee will pay $
Susan will pay $
Martha will pay $
Version 1.0
Grade 7 Mathematics Sample ER Item
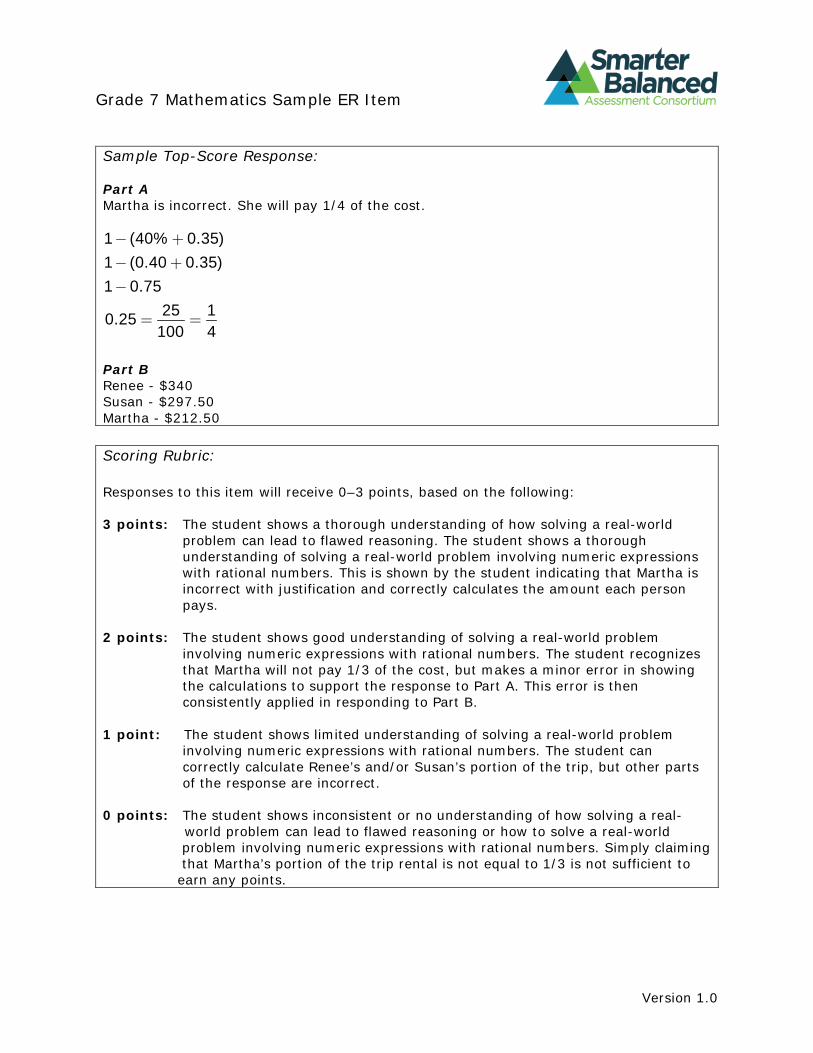
Sample Top-Score Response:
Part A Martha is incorrect. She will pay 1/4 of the cost.
1 (40% . )0 35 1 ( .0 40 . )0 35 1 0 75 .
25 10 25 . 100 4
Part B Renee - $340 Susan - $297.50 Martha - $212.50
Scoring Rubric:
Responses to this item will receive 0–3 points, based on the following:
3 points: The student shows a thorough understanding of how solving a real-world problem can lead to flawed reasoning. The student shows a thorough understanding of solving a real-world problem involving numeric expressions with rational numbers. This is shown by the student indicating that Martha is incorrect with justification and correctly calculates the amount each person pays.
2 points: The student shows good understanding of solving a real-world problem involving numeric expressions with rational numbers. The student recognizes that Martha will not pay 1/3 of the cost, but makes a minor error in showing the calculations to support the response to Part A. This error is then consistently applied in responding to Part B.
1 point: The student shows limited understanding of solving a real-world problem involving numeric expressions with rational numbers. The student can correctly calculate Renee’s and/or Susan’s portion of the trip, but other parts of the response are incorrect.
0 points: The student shows inconsistent or no understanding of how solving a real-world problem can lead to flawed reasoning or how to solve a real-world problem involving numeric expressions with rational numbers. Simply claiming that Martha’s portion of the trip rental is not equal to 1/3 is not sufficient to earn any points.
Version 1.0
Grade 7 Mathematics Sample ER Item
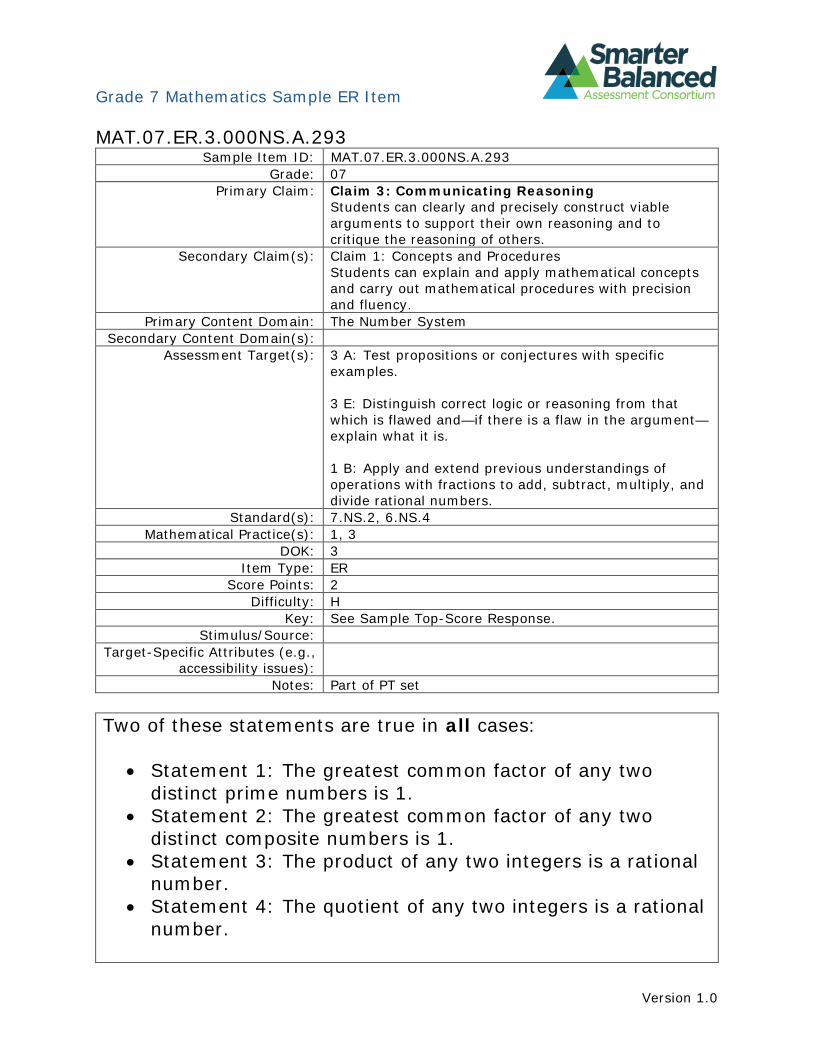
MAT.07.ER.3.000NS.A.293 Sample Item ID: MAT.07.ER.3.000NS.A.293
Grade: 07 Primary Claim: Claim 3: Communicating Reasoning
Students can clearly and precisely construct viable arguments to support their own reasoning and to critique the reasoning of others.
Secondary Claim(s): Claim 1: Concepts and Procedures Students can explain and apply mathematical concepts and carry out mathematical procedures with precision and fluency.
Primary Content Domain: The Number System Secondary Content Domain(s):
Assessment Target(s): 3 A: Test propositions or conjectures with specific examples.
3 E: Distinguish correct logic or reasoning from that which is flawed and—if there is a flaw in the argument— explain what it is.
1 B: Apply and extend previous understandings of operations with fractions to add, subtract, multiply, and divide rational numbers.
Standard(s): 7.NS.2, 6.NS.4 Mathematical Practice(s): 1, 3
DOK: 3 Item Type: ER
Score Points: 2 Difficulty: H
Key: See Sample Top-Score Response. Stimulus/Source:
Target-Specific Attributes (e.g., accessibility issues):
Notes: Part of PT set
Two of these statements are true in all cases:
• Statement 1: The greatest common factor of any two distinct prime numbers is 1.
• Statement 2: The greatest common factor of any two distinct composite numbers is 1.
• Statement 3: The product of any two integers is a rational number.
• Statement 4: The quotient of any two integers is a rational number.
Version 1.0
Grade 7 Mathematics Sample ER Item
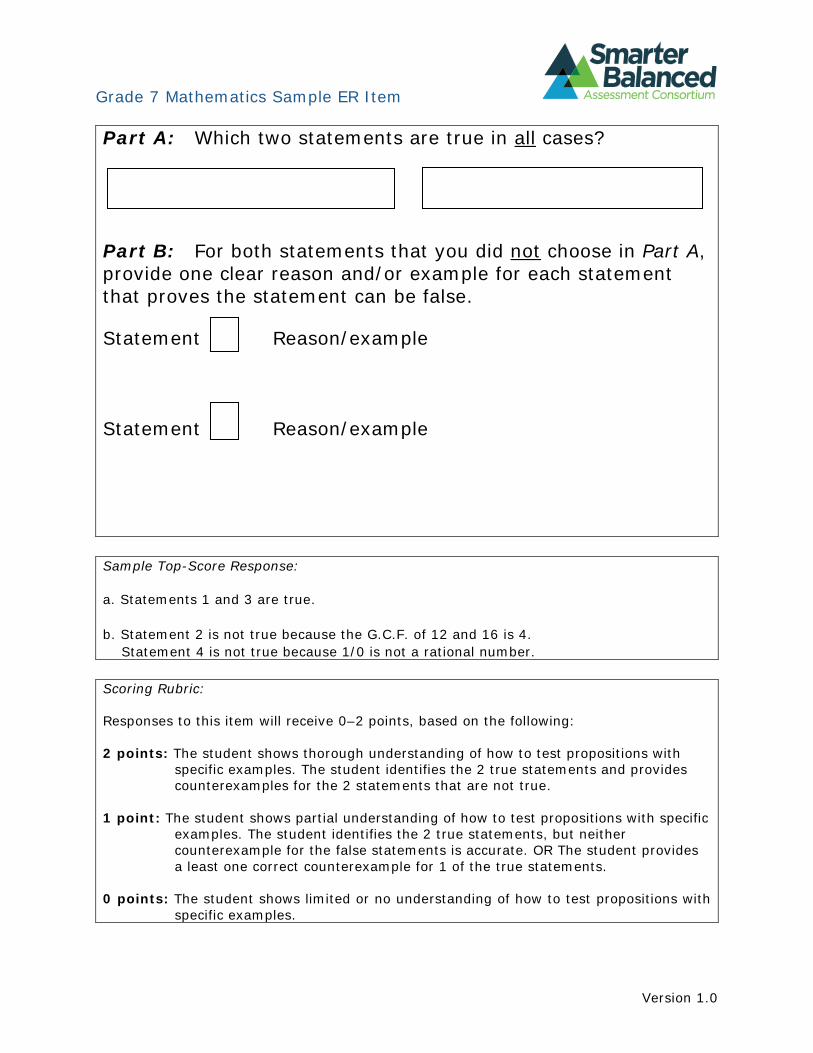
Part A: Which two statements are true in all cases?
Part B: For both statements that you did not choose in Part A, provide one clear reason and/or example for each statement that proves the statement can be false.
Statement Reason/example
Statement Reason/example
Sample Top-Score Response:
a. Statements 1 and 3 are true.
b. Statement 2 is not true because the G.C.F. of 12 and 16 is 4. Statement 4 is not true because 1/0 is not a rational number.
Scoring Rubric:
Responses to this item will receive 0–2 points, based on the following:
2 points: The student shows thorough understanding of how to test propositions with specific examples. The student identifies the 2 true statements and provides counterexamples for the 2 statements that are not true.
1 point: The student shows partial understanding of how to test propositions with specific examples. The student identifies the 2 true statements, but neither counterexample for the false statements is accurate. OR The student provides a least one correct counterexample for 1 of the true statements.
0 points: The student shows limited or no understanding of how to test propositions with specific examples.
Version 1.0
Grade 7 Mathematics Sample ER Item
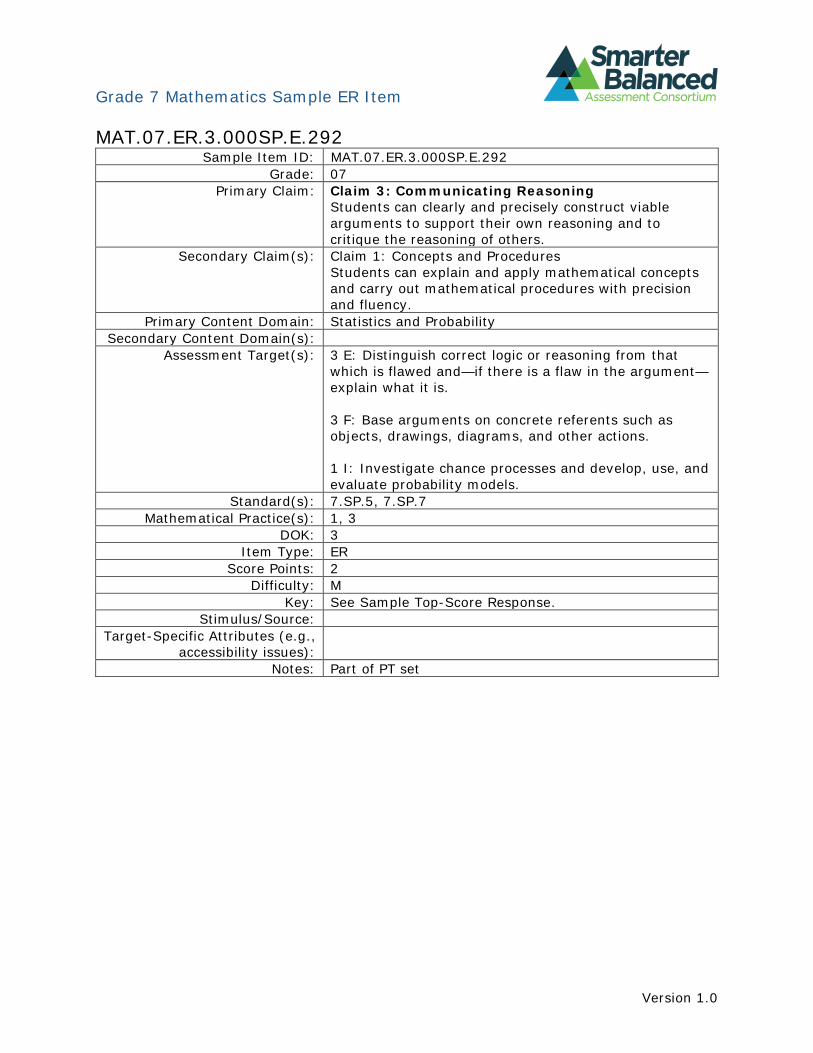
MAT.07.ER.3.000SP.E.292 Sample Item ID: MAT.07.ER.3.000SP.E.292
Grade: 07 Primary Claim: Claim 3: Communicating Reasoning
Students can clearly and precisely construct viable arguments to support their own reasoning and to critique the reasoning of others.
Secondary Claim(s): Claim 1: Concepts and Procedures Students can explain and apply mathematical concepts and carry out mathematical procedures with precision and fluency.
Primary Content Domain: Statistics and Probability Secondary Content Domain(s):
Assessment Target(s): 3 E: Distinguish correct logic or reasoning from that which is flawed and—if there is a flaw in the argument— explain what it is.
3 F: Base arguments on concrete referents such as objects, drawings, diagrams, and other actions.
1 I: Investigate chance processes and develop, use, and evaluate probability models.
Standard(s): 7.SP.5, 7.SP.7 Mathematical Practice(s): 1, 3
DOK: 3 Item Type: ER
Score Points: 2 Difficulty: M
Key: See Sample Top-Score Response. Stimulus/Source:
Target-Specific Attributes (e.g., accessibility issues):
Notes: Part of PT set
Version 1.0
Grade 7 Mathematics Sample ER Item
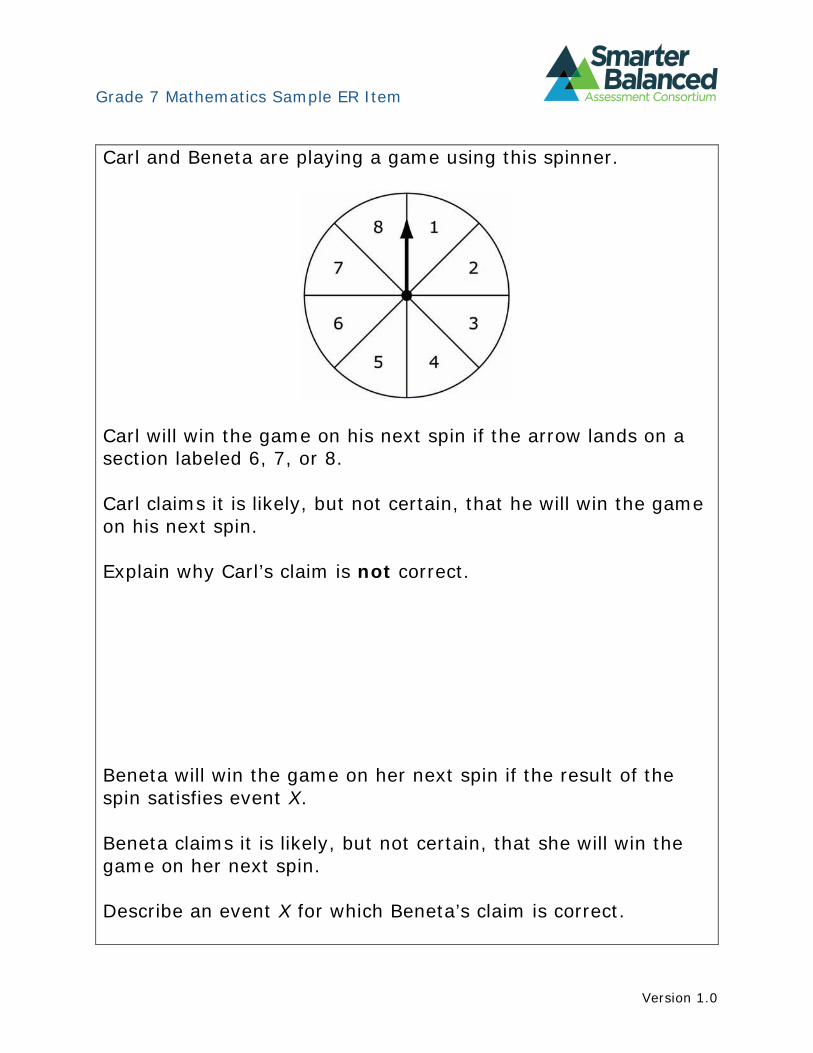
Carl and Beneta are playing a game using this spinner.
Carl will win the game on his next spin if the arrow lands on a section labeled 6, 7, or 8.
Carl claims it is likely, but not certain, that he will win the game on his next spin.
Explain why Carl’s claim is not correct.
Beneta will win the game on her next spin if the result of the spin satisfies event X.
Beneta claims it is likely, but not certain, that she will win the game on her next spin.
Describe an event X for which Beneta’s claim is correct.
Version 1.0
Grade 7 Mathematics Sample ER Item
Sample Top-Score Response:
Carl’s claim is incorrect. The probability that Carl will spin a 6 or higher is 0.375. This means that it is more likely that Carl will spin a number less than 6 on his next turn.
For Beneta, event X could be “the arrow lands on a section labeled with a number greater than 2.”
Scoring Rubric:
Responses to this item will receive 0–2 points, based on the following:
2 points: The student shows thorough understanding of how to use understanding of likelihood and probability to critique the reasoning of others. The student explains why Carl’s claim is incorrect and describes an appropriate event for Beneta.
1 point: The student shows partial understanding of how to use understanding of likelihood and probability to critique the reasoning of others. The student explains why Carl’s claim is incorrect. OR The student describes an appropriate event for Beneta.
0 points: The student shows inconsistent or no understanding of how to use likelihood and probability to critique the reasoning of others. The student fails to provide a correct explanation or event.
Version 1.0
Grade 7 Mathematics Sample PT Form
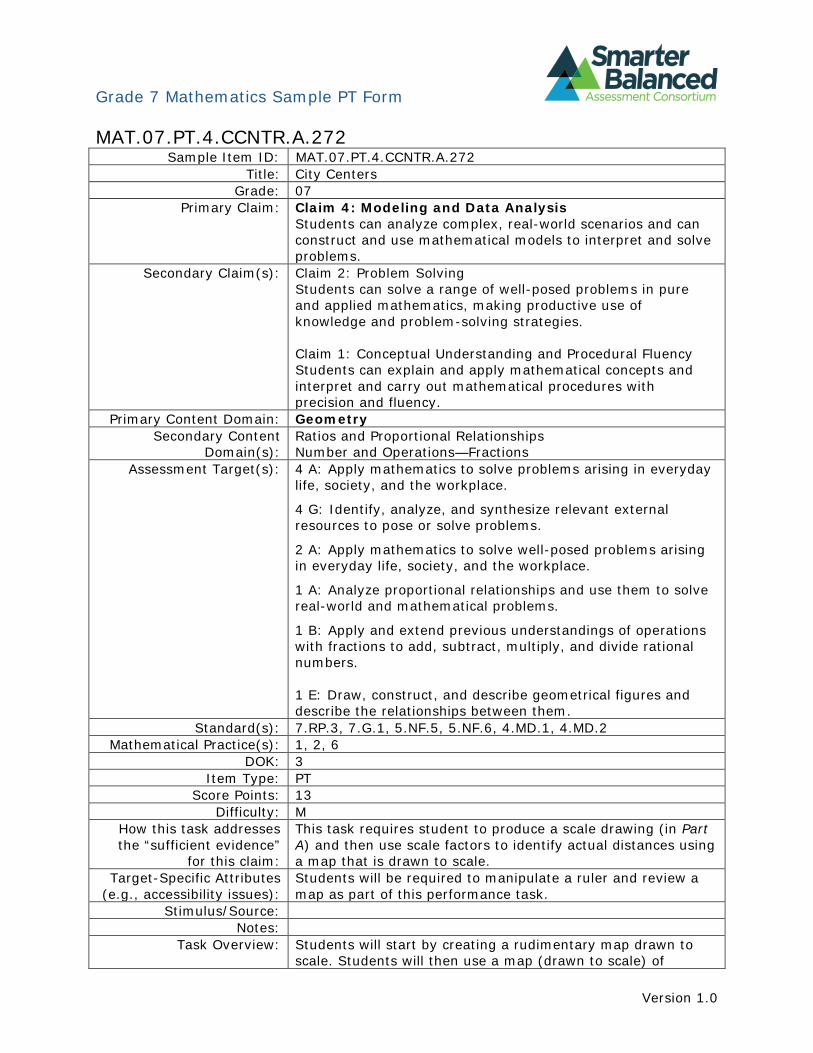
MAT.07.PT.4.CCNTR.A.272 Sample Item ID: MAT.07.PT.4.CCNTR.A.272
Title: City Centers Grade: 07
Primary Claim: Claim 4: Modeling and Data Analysis Students can analyze complex, real-world scenarios and can construct and use mathematical models to interpret and solve problems.
Secondary Claim(s): Claim 2: Problem Solving Students can solve a range of well-posed problems in pure and applied mathematics, making productive use of knowledge and problem-solving strategies.
Claim 1: Conceptual Understanding and Procedural Fluency Students can explain and apply mathematical concepts and interpret and carry out mathematical procedures with precision and fluency.
Primary Content Domain: Geometry Secondary Content
Domain(s): Ratios and Proportional Relationships Number and Operations—Fractions
Assessment Target(s): 4 A: Apply mathematics to solve problems arising in everyday life, society, and the workplace.
4 G: Identify, analyze, and synthesize relevant external resources to pose or solve problems.
2 A: Apply mathematics to solve well-posed problems arising in everyday life, society, and the workplace.
1 A: Analyze proportional relationships and use them to solve real-world and mathematical problems.
1 B: Apply and extend previous understandings of operations with fractions to add, subtract, multiply, and divide rational numbers.
1 E: Draw, construct, and describe geometrical figures and describe the relationships between them.
Standard(s): 7.RP.3, 7.G.1, 5.NF.5, 5.NF.6, 4.MD.1, 4.MD.2 Mathematical Practice(s): 1, 2, 6
DOK: 3 Item Type: PT
Score Points: 13 Difficulty: M
How this task addresses the “sufficient evidence”
for this claim:
This task requires student to produce a scale drawing (in Part A) and then use scale factors to identify actual distances using a map that is drawn to scale.
Target-Specific Attributes (e.g., accessibility issues):
Students will be required to manipulate a ruler and review a map as part of this performance task.
Stimulus/Source: Notes:
Task Overview: Students will start by creating a rudimentary map drawn to scale. Students will then use a map (drawn to scale) of
Version 1.0

Grade 7 Mathematics Sample PT Form
Washington, D.C., to plan a walking route and a bus route. Teacher Preparation /
Resource Requirements: See prework below. The teacher is required to make copies and find materials prior to the administration of this task.
Teacher Responsibilities During Administration:
Teachers will monitor student activity during the administration of this performance task.
Time Requirements: A total of 120 minutes over two sessions. Complete Parts A, B, and C in Session 1. Complete Parts D and E in Session 2.
Prework:
Prior to starting the task, teachers will need to— • collect enough rulers for the class,
1• collect enough -inch graph paper for the class, and
4 • print enough copies of the map of the National Mall (see below) for the class.
Printable scale map of the National Mall: http://wikitravel.org/upload/shared//6/64/National_Mall_map.png
City Centers
Scale drawings and maps of cities can be very helpful for determining distances between important landmarks. With the right map and a little planning, vacations to places like Washington, D.C., can be both fun and informative.
Part A
Using the ruler and graph paper provided by your teacher, create a scale drawing of a city center. Use the information below to create your drawing.
• The scale for your drawing is 1 inch = 2 miles. • Use dots to represent the buildings on your map. • Place City Hall near the top left of the paper. • Draw two streets moving away from City Hall. The two
streets should be at 90 angles. • Along one street, place the Post Office two miles away from
Version 1.0
Grade 7 Mathematics Sample PT Form
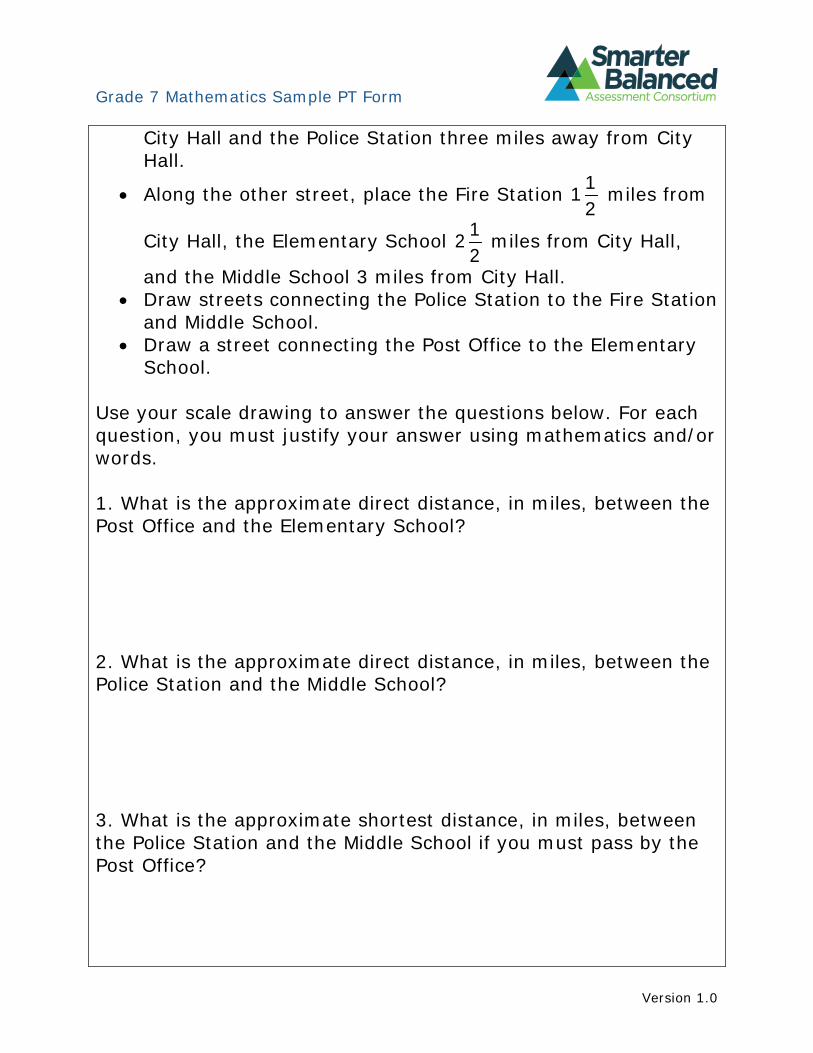
City Hall and the Police Station three miles away from City Hall.
1• Along the other street, place the Fire Station 1 miles from
2 1City Hall, the Elementary School 2 miles from City Hall, 2
and the Middle School 3 miles from City Hall. • Draw streets connecting the Police Station to the Fire Station
and Middle School. • Draw a street connecting the Post Office to the Elementary
School.
Use your scale drawing to answer the questions below. For each question, you must justify your answer using mathematics and/or words.
1. What is the approximate direct distance, in miles, between the Post Office and the Elementary School?
2. What is the approximate direct distance, in miles, between the Police Station and the Middle School?
3. What is the approximate shortest distance, in miles, between the Police Station and the Middle School if you must pass by the Post Office?
Version 1.0
Grade 7 Mathematics Sample PT Form
Part B
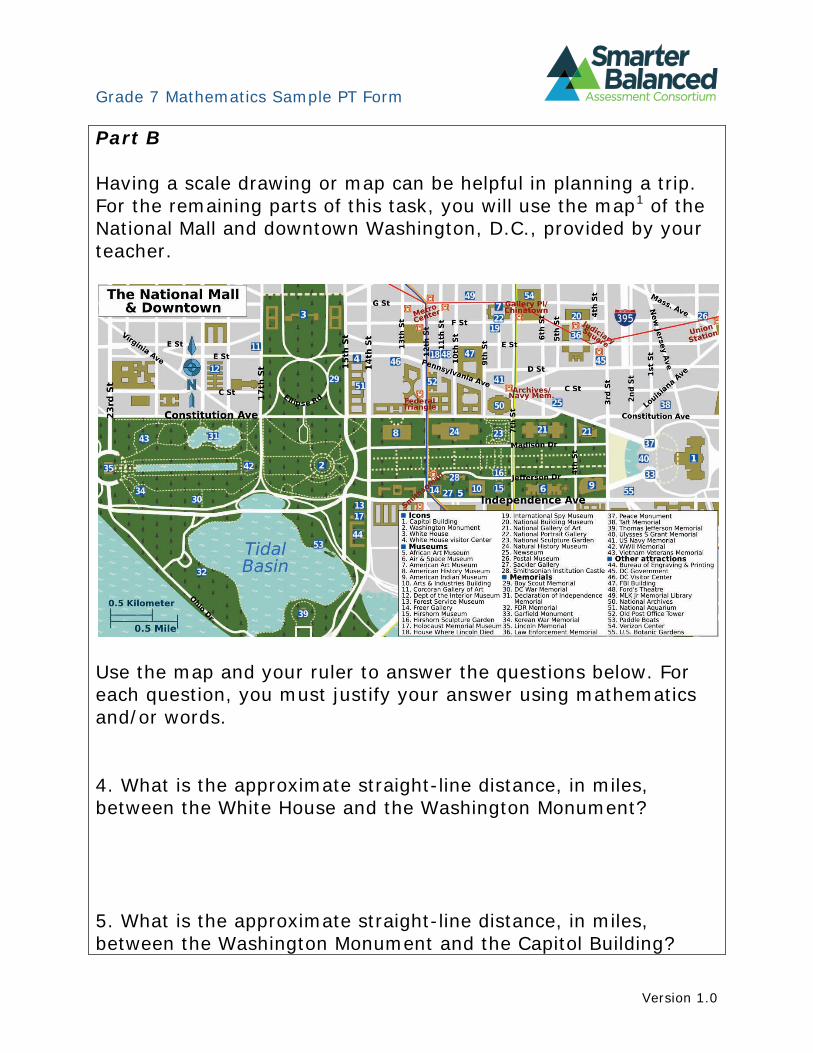
Having a scale drawing or map can be helpful in planning a trip. For the remaining parts of this task, you will use the map1 of the National Mall and downtown Washington, D.C., provided by your teacher.
Use the map and your ruler to answer the questions below. For each question, you must justify your answer using mathematics and/or words.
4. What is the approximate straight-line distance, in miles, between the White House and the Washington Monument?
5. What is the approximate straight-line distance, in miles, between the Washington Monument and the Capitol Building?
Version 1.0
Grade 7 Mathematics Sample PT Form
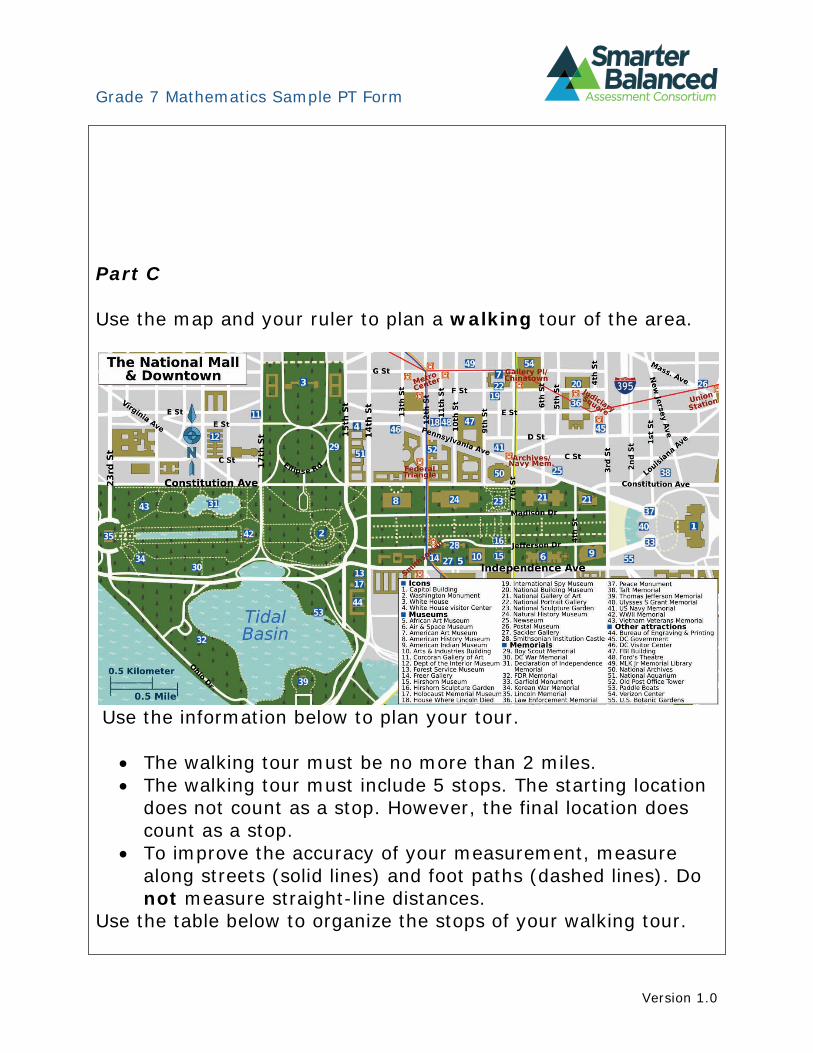
Part C
Use the map and your ruler to plan a walking tour of the area.
Use the information below to plan your tour.
• The walking tour must be no more than 2 miles. • The walking tour must include 5 stops. The starting location
does not count as a stop. However, the final location does count as a stop.
• To improve the accuracy of your measurement, measure along streets (solid lines) and foot paths (dashed lines). Do not measure straight-line distances.
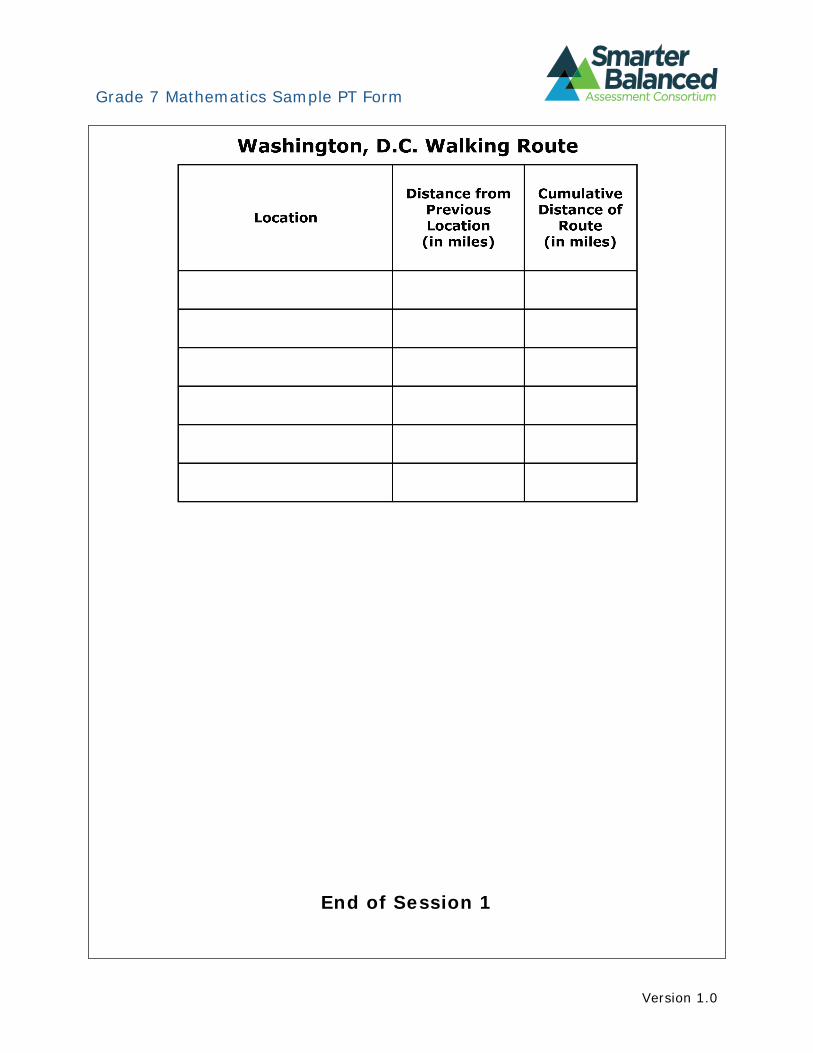
Use the table below to organize the stops of your walking tour.
Version 1.0
Grade 7 Mathematics Sample PT Form
End of Session 1
Version 1.0
Grade 7 Mathematics Sample PT Form
Session 2
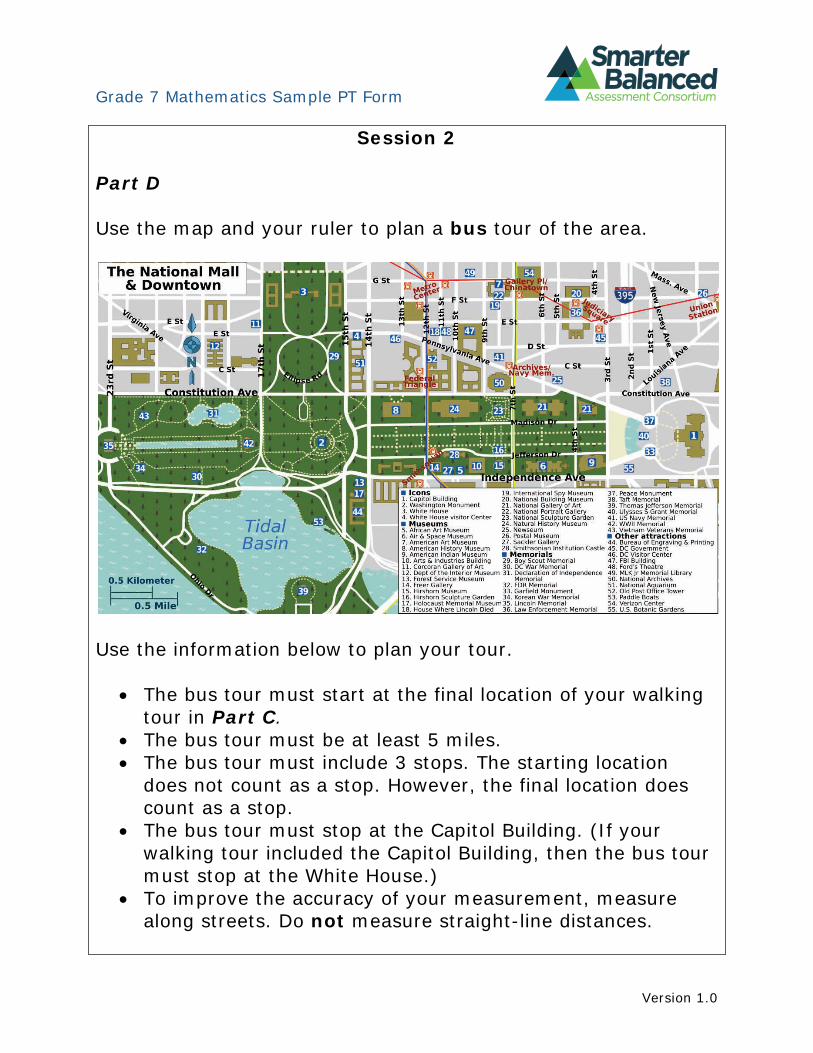
Part D
Use the map and your ruler to plan a bus tour of the area.
Use the information below to plan your tour.
• The bus tour must start at the final location of your walking tour in Part C.
• The bus tour must be at least 5 miles. • The bus tour must include 3 stops. The starting location
does not count as a stop. However, the final location does count as a stop.
• The bus tour must stop at the Capitol Building. (If your walking tour included the Capitol Building, then the bus tour must stop at the White House.)
• To improve the accuracy of your measurement, measure along streets. Do not measure straight-line distances.
Version 1.0
Grade 7 Mathematics Sample PT Form
Describe your bus tour in the space provided. Your response must include the:
• starting location • location of each stop • distance between each stop • ending location • total distance, in miles, traveled
Part E
Using the bus tour route you developed in Part D, create a table that displays the morning bus schedule. Use the information below to develop the schedule.
• The bus schedule will show the time that the bus leaves each stop.
• The morning bus run starts at 9 a.m. • The morning bus run ends at 12 p.m. The bus will not start a
route if it will end after 12 p.m. • The bus will start at one end of the route, go to the other
end, and then return to the starting point. • The bus will spend 10 minutes at each stop that forms the
end of the route. The bus will spend 5 minutes at each stop in the middle of the route.
• The bus will travel between stops at an average rate of 20 miles per hour.
Version 1.0
Grade 7 Mathematics Sample PT Form
Below the table you created, show how you calculated the amount of time the bus will spend traveling between stops.
End of Session 2
Version 1.0
Grade 7 Mathematics Sample PT Form
Sample Top-Score Response:
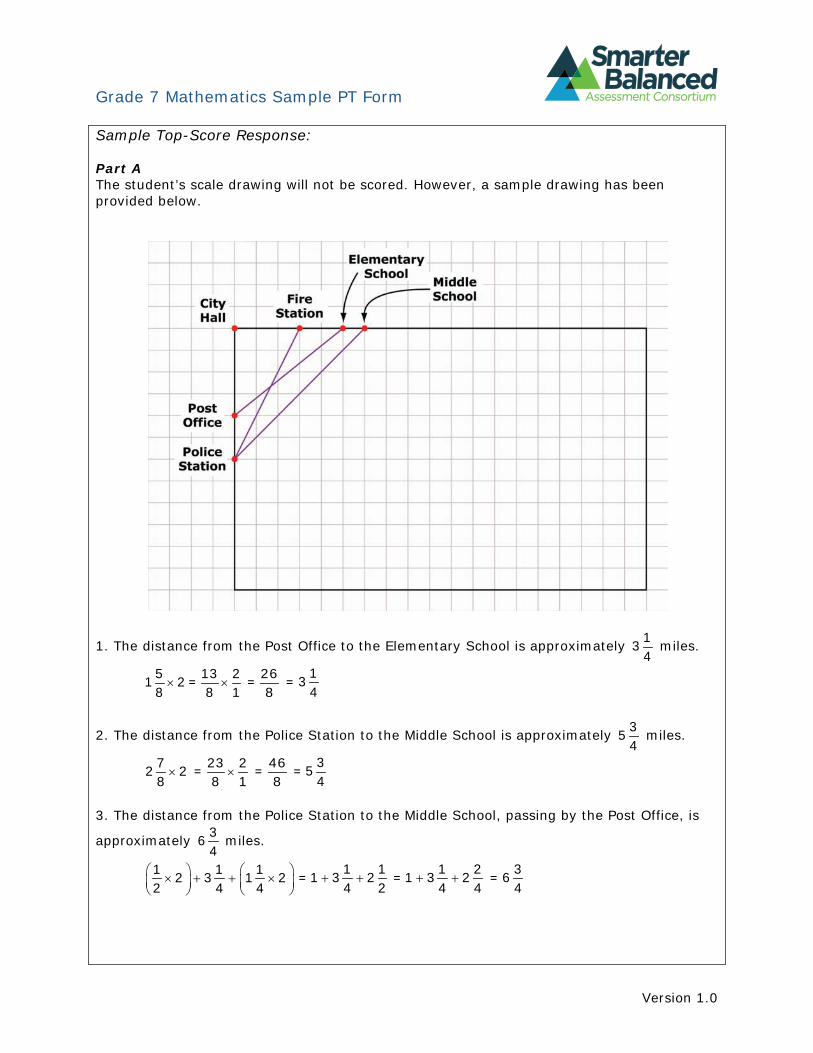
Part A The student’s scale drawing will not be scored. However, a sample drawing has been provided below.
11. The distance from the Post Office to the Elementary School is approximately 3 miles. 4
5 13 2 26 11 × 2 = × = = 3 8 8 1 8 4
32. The distance from the Police Station to the Middle School is approximately 5 miles. 4
7 23 2 46 32 × 2 = × = = 5 8 8 1 8 4
3. The distance from the Police Station to the Middle School, passing by the Post Office, is 3approximately 6 miles. 4
1 1 1 1 1 1 2 3 = 1 3 + 2 = 1 3+ + 2 = 6× 2 + 3 + 1 × 2 + 2 4 4 4 2 4 4 4
Version 1.0
Grade 7 Mathematics Sample PT Form
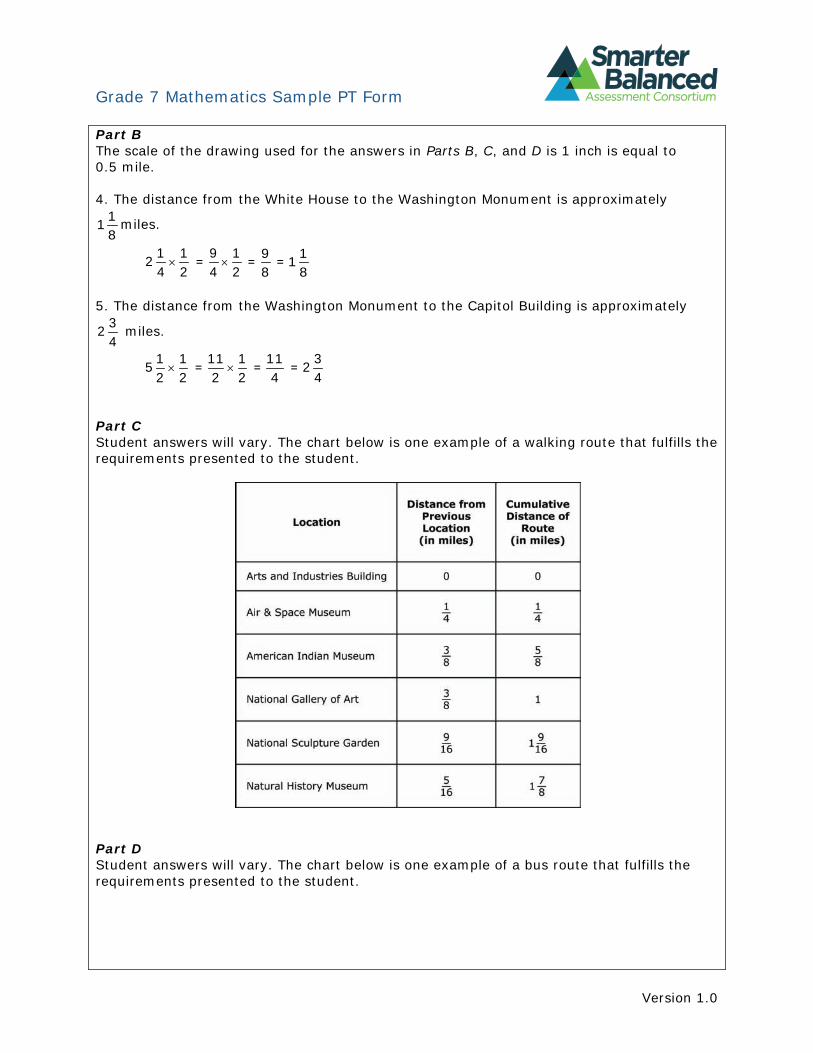
Part B The scale of the drawing used for the answers in Parts B, C, and D is 1 inch is equal to 0.5 mile.
4. The distance from the White House to the Washington Monument is approximately 11 miles. 8
1 1 9 1 9 12 × = × = = 14 2 4 2 8 8
5. The distance from the Washington Monument to the Capitol Building is approximately 32 miles. 4
1 1 11 1 11 35 × = × = = 22 2 2 2 4 4
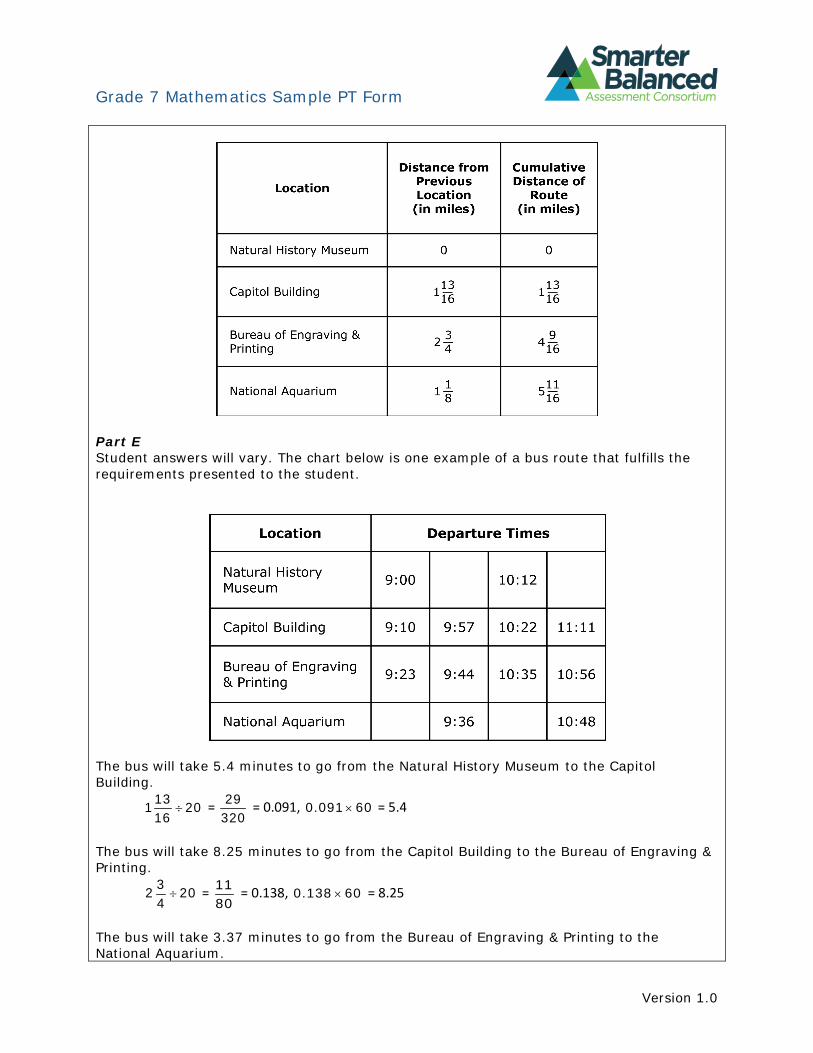
Part C Student answers will vary. The chart below is one example of a walking route that fulfills the requirements presented to the student.
Part D Student answers will vary. The chart below is one example of a bus route that fulfills the requirements presented to the student.
Version 1.0
Grade 7 Mathematics Sample PT Form
Part E Student answers will vary. The chart below is one example of a bus route that fulfills the requirements presented to the student.
The bus will take 5.4 minutes to go from the Natural History Museum to the Capitol Building.
13 291 ÷ 20 = = 0.091, 0.091× 60 = 5.4 16 320
The bus will take 8.25 minutes to go from the Capitol Building to the Bureau of Engraving & Printing.
3 112 ÷ 20 = = 0.138, 0.138 × 60 = 8.25 4 80
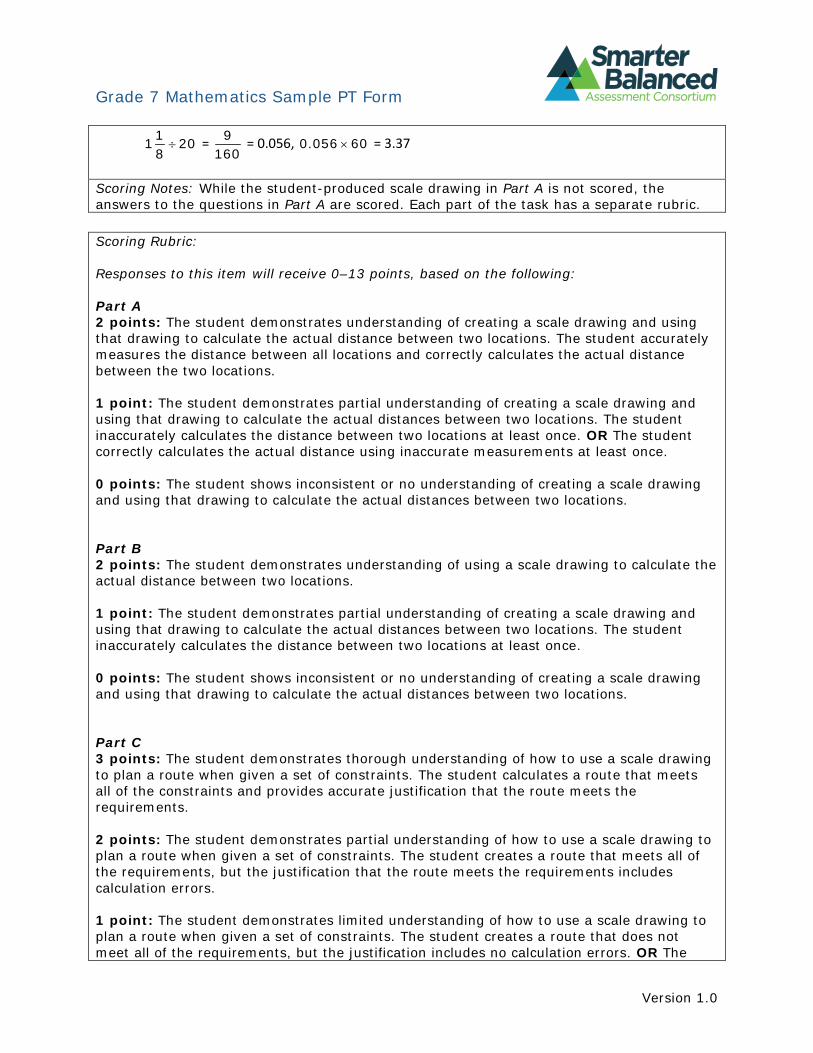
The bus will take 3.37 minutes to go from the Bureau of Engraving & Printing to the National Aquarium.
Version 1.0
Grade 7 Mathematics Sample PT Form
11 208 ÷ = 9
160 = 0.056, 0.056 × 60 = 3.37
Scoring Notes: While the student-produced scale drawing in Part A is not scored, the answers to the questions in Part A are scored. Each part of the task has a separate rubric.
Scoring Rubric:
Responses to this item will receive 0–13 points, based on the following:
Part A 2 points: The student demonstrates understanding of creating a scale drawing and using that drawing to calculate the actual distance between two locations. The student accurately measures the distance between all locations and correctly calculates the actual distance between the two locations.
1 point: The student demonstrates partial understanding of creating a scale drawing and using that drawing to calculate the actual distances between two locations. The student inaccurately calculates the distance between two locations at least once. OR The student correctly calculates the actual distance using inaccurate measurements at least once.
0 points: The student shows inconsistent or no understanding of creating a scale drawing and using that drawing to calculate the actual distances between two locations.
Part B 2 points: The student demonstrates understanding of using a scale drawing to calculate the actual distance between two locations.
1 point: The student demonstrates partial understanding of creating a scale drawing and using that drawing to calculate the actual distances between two locations. The student inaccurately calculates the distance between two locations at least once.
0 points: The student shows inconsistent or no understanding of creating a scale drawing and using that drawing to calculate the actual distances between two locations.
Part C 3 points: The student demonstrates thorough understanding of how to use a scale drawing to plan a route when given a set of constraints. The student calculates a route that meets all of the constraints and provides accurate justification that the route meets the requirements.
2 points: The student demonstrates partial understanding of how to use a scale drawing to plan a route when given a set of constraints. The student creates a route that meets all of the requirements, but the justification that the route meets the requirements includes calculation errors.
1 point: The student demonstrates limited understanding of how to use a scale drawing to plan a route when given a set of constraints. The student creates a route that does not meet all of the requirements, but the justification includes no calculation errors. OR The
Version 1.0
Grade 7 Mathematics Sample PT Form
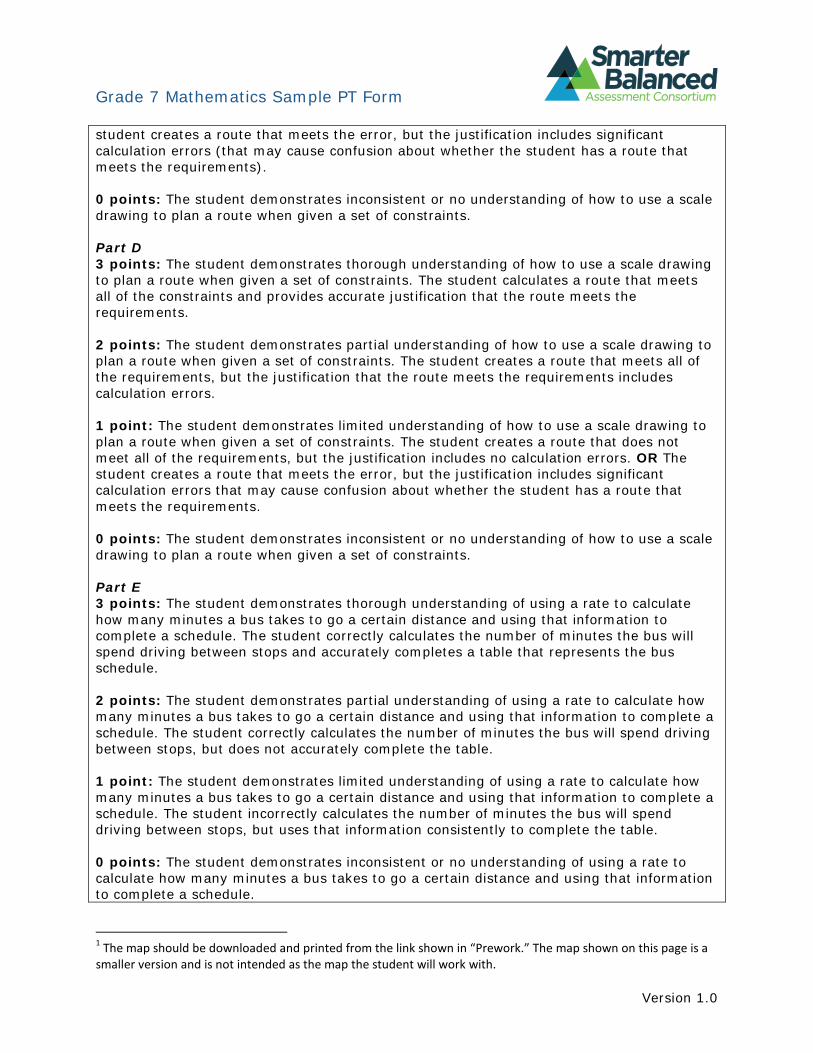
student creates a route that meets the error, but the justification includes significant calculation errors (that may cause confusion about whether the student has a route that meets the requirements).
0 points: The student demonstrates inconsistent or no understanding of how to use a scale drawing to plan a route when given a set of constraints.
Part D 3 points: The student demonstrates thorough understanding of how to use a scale drawing to plan a route when given a set of constraints. The student calculates a route that meets all of the constraints and provides accurate justification that the route meets the requirements.
2 points: The student demonstrates partial understanding of how to use a scale drawing to plan a route when given a set of constraints. The student creates a route that meets all of the requirements, but the justification that the route meets the requirements includes calculation errors.
1 point: The student demonstrates limited understanding of how to use a scale drawing to plan a route when given a set of constraints. The student creates a route that does not meet all of the requirements, but the justification includes no calculation errors. OR The student creates a route that meets the error, but the justification includes significant calculation errors that may cause confusion about whether the student has a route that meets the requirements.
0 points: The student demonstrates inconsistent or no understanding of how to use a scale drawing to plan a route when given a set of constraints.
Part E 3 points: The student demonstrates thorough understanding of using a rate to calculate how many minutes a bus takes to go a certain distance and using that information to complete a schedule. The student correctly calculates the number of minutes the bus will spend driving between stops and accurately completes a table that represents the bus schedule.
2 points: The student demonstrates partial understanding of using a rate to calculate how many minutes a bus takes to go a certain distance and using that information to complete a schedule. The student correctly calculates the number of minutes the bus will spend driving between stops, but does not accurately complete the table.
1 point: The student demonstrates limited understanding of using a rate to calculate how many minutes a bus takes to go a certain distance and using that information to complete a schedule. The student incorrectly calculates the number of minutes the bus will spend driving between stops, but uses that information consistently to complete the table.
0 points: The student demonstrates inconsistent or no understanding of using a rate to calculate how many minutes a bus takes to go a certain distance and using that information to complete a schedule.
1 The map should be downloaded and printed from the link shown in “Prework.” The map shown on this page is a smaller version and is not intended as the map the student will work with.
Version 1.0
Grade 7 Mathematics Sample PT Form
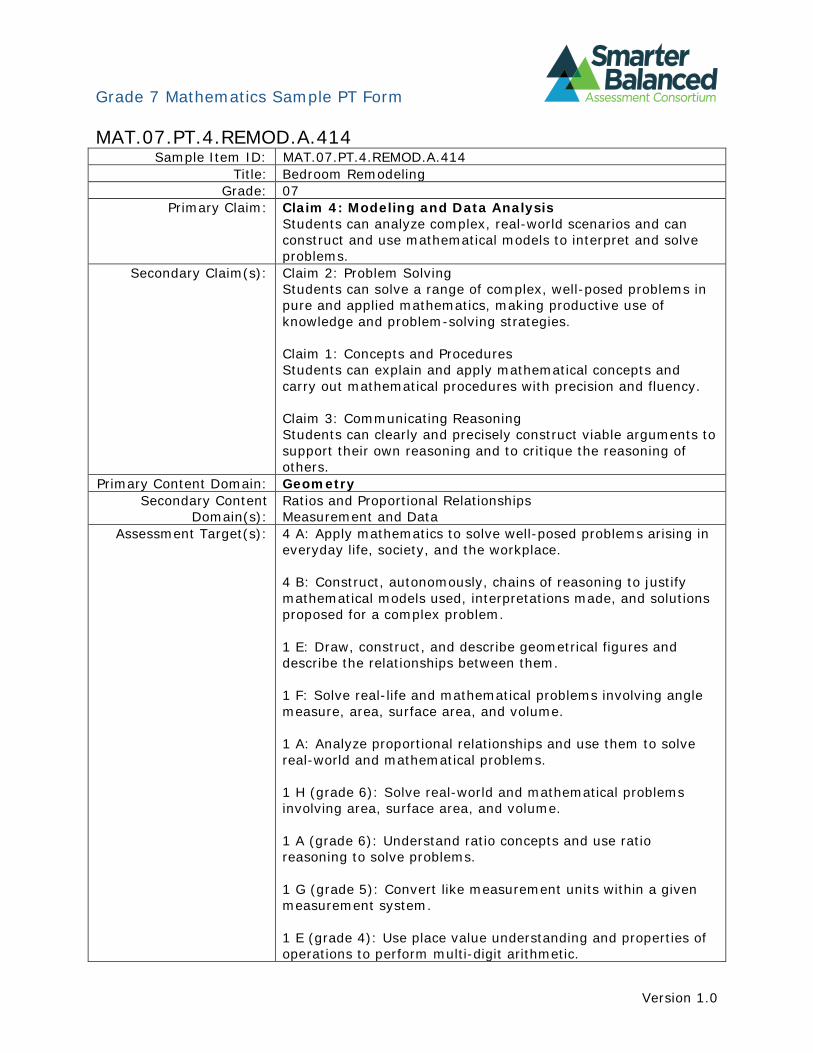
MAT.07.PT.4.REMOD.A.414 Sample Item ID: MAT.07.PT.4.REMOD.A.414
Title: Bedroom Remodeling Grade: 07
Primary Claim: Claim 4: Modeling and Data Analysis Students can analyze complex, real-world scenarios and can construct and use mathematical models to interpret and solve problems.
Secondary Claim(s): Claim 2: Problem Solving Students can solve a range of complex, well-posed problems in pure and applied mathematics, making productive use of knowledge and problem-solving strategies.
Claim 1: Concepts and Procedures Students can explain and apply mathematical concepts and carry out mathematical procedures with precision and fluency.
Claim 3: Communicating Reasoning Students can clearly and precisely construct viable arguments to support their own reasoning and to critique the reasoning of others.
Primary Content Domain: Geometry Secondary Content
Domain(s): Ratios and Proportional Relationships Measurement and Data
Assessment Target(s): 4 A: Apply mathematics to solve well-posed problems arising in everyday life, society, and the workplace.
4 B: Construct, autonomously, chains of reasoning to justify mathematical models used, interpretations made, and solutions proposed for a complex problem.
1 E: Draw, construct, and describe geometrical figures and describe the relationships between them.
1 F: Solve real-life and mathematical problems involving angle measure, area, surface area, and volume.
1 A: Analyze proportional relationships and use them to solve real-world and mathematical problems.
1 H (grade 6): Solve real-world and mathematical problems involving area, surface area, and volume.
1 A (grade 6): Understand ratio concepts and use ratio reasoning to solve problems.
1 G (grade 5): Convert like measurement units within a given measurement system.
1 E (grade 4): Use place value understanding and properties of operations to perform multi-digit arithmetic.
Version 1.0
Grade 7 Mathematics Sample PT Form
3 F: Base arguments on concrete referents such as objects, drawings, diagrams, and actions.
2 A: Apply mathematics to solve well-posed problems arising in everyday life, society, and the workplace.
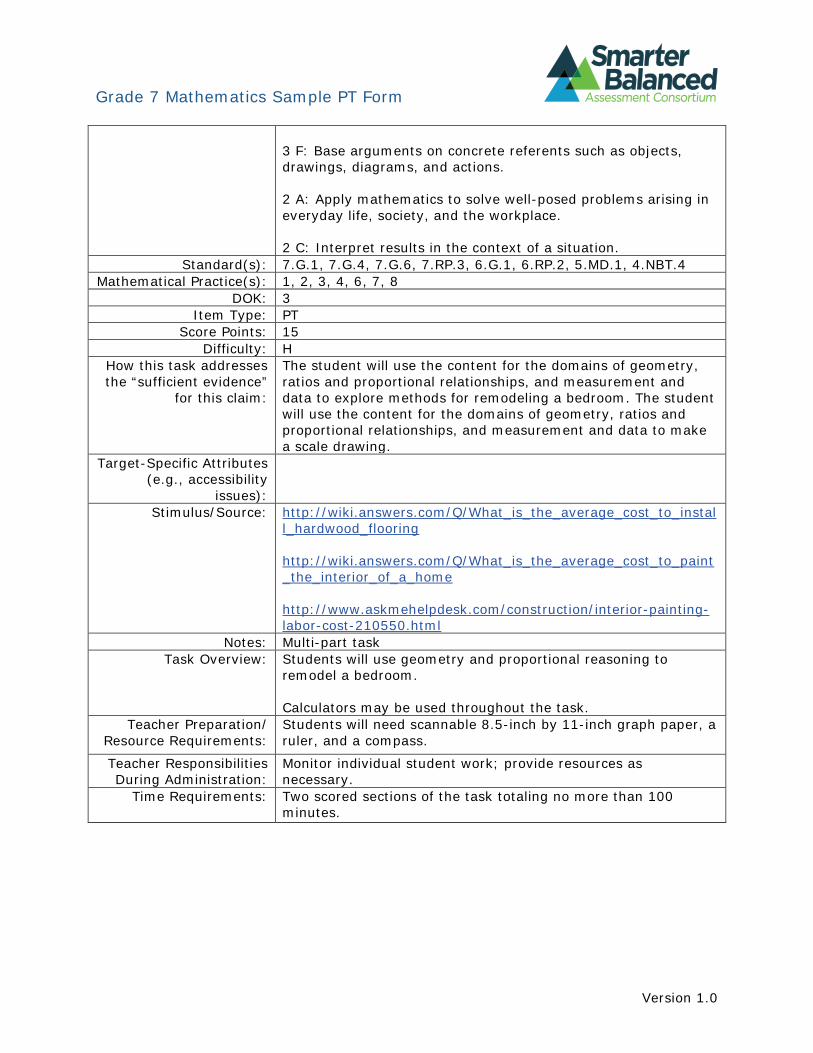
2 C: Interpret results in the context of a situation. Standard(s): 7.G.1, 7.G.4, 7.G.6, 7.RP.3, 6.G.1, 6.RP.2, 5.MD.1, 4.NBT.4
Mathematical Practice(s): 1, 2, 3, 4, 6, 7, 8 DOK: 3
Item Type: PT Score Points: 15
Difficulty: H How this task addresses the “sufficient evidence”
for this claim:
The student will use the content for the domains of geometry, ratios and proportional relationships, and measurement and data to explore methods for remodeling a bedroom. The student will use the content for the domains of geometry, ratios and proportional relationships, and measurement and data to make a scale drawing.
Target-Specific Attributes (e.g., accessibility
issues): Stimulus/Source: http://wiki.answers.com/Q/What_is_the_average_cost_to_instal
l_hardwood_flooring
http://wiki.answers.com/Q/What_is_the_average_cost_to_paint _the_interior_of_a_home
http://www.askmehelpdesk.com/construction/interior-painting-labor-cost-210550.html
Notes: Multi-part task Task Overview: Students will use geometry and proportional reasoning to
remodel a bedroom.
Calculators may be used throughout the task. Teacher Preparation/
Resource Requirements: Students will need scannable 8.5-inch by 11-inch graph paper, a ruler, and a compass.
Teacher Responsibilities During Administration:
Monitor individual student work; provide resources as necessary.
Time Requirements: Two scored sections of the task totaling no more than 100 minutes.
Version 1.0
Grade 7 Mathematics Sample PT Form
Prework: (Prior to the start of Session 1)
In preparation for this task, the teacher will guide a brief class discussion about the considerations that need to be made when remodeling a bedroom. The teacher will explain that “wood flooring” is any product manufactured from timber that is designed as a permanent covering for a floor. The teacher will explain that a “coat of paint” is a thin layer of paint covering a surface. The teacher will explain that for some types of paint, more than one coat of paint may be applied to the surface that is being painted. The teacher will explain that the budget for a remodeling project must account for the cost of all materials used as well as the cost of labor.
Prework: (Prior to the start of Session 2)
The teacher will explain that a “floor plan” for a room is a scale diagram showing the view from above of the relationship between the pieces of furniture in the room. The teacher will explain that an “heirloom” is a valued possession passed down through the generations of a family.
Version 1.0
Grade 7 Mathematics Sample PT Form
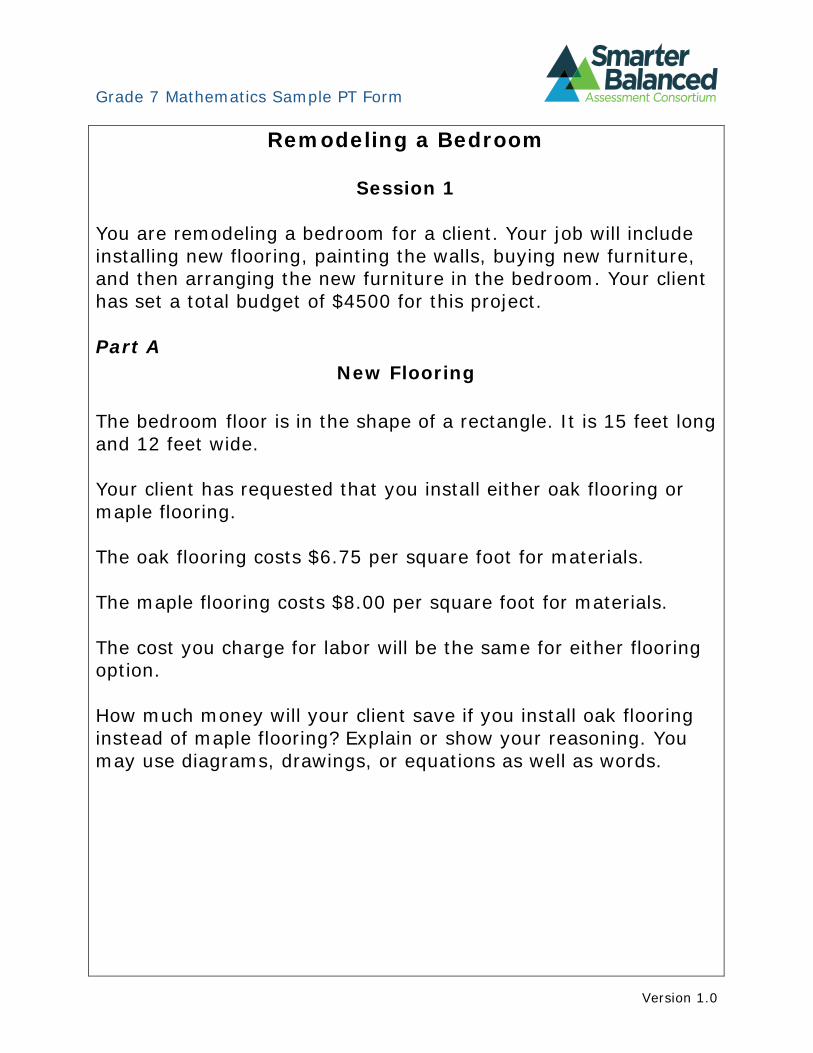
Remodeling a Bedroom
Session 1
You are remodeling a bedroom for a client. Your job will include installing new flooring, painting the walls, buying new furniture, and then arranging the new furniture in the bedroom. Your client has set a total budget of $4500 for this project.
Part A New Flooring
The bedroom floor is in the shape of a rectangle. It is 15 feet long and 12 feet wide.
Your client has requested that you install either oak flooring or maple flooring.
The oak flooring costs $6.75 per square foot for materials.
The maple flooring costs $8.00 per square foot for materials.
The cost you charge for labor will be the same for either flooring option.
How much money will your client save if you install oak flooring instead of maple flooring? Explain or show your reasoning. You may use diagrams, drawings, or equations as well as words.
Version 1.0
Grade 7 Mathematics Sample PT Form
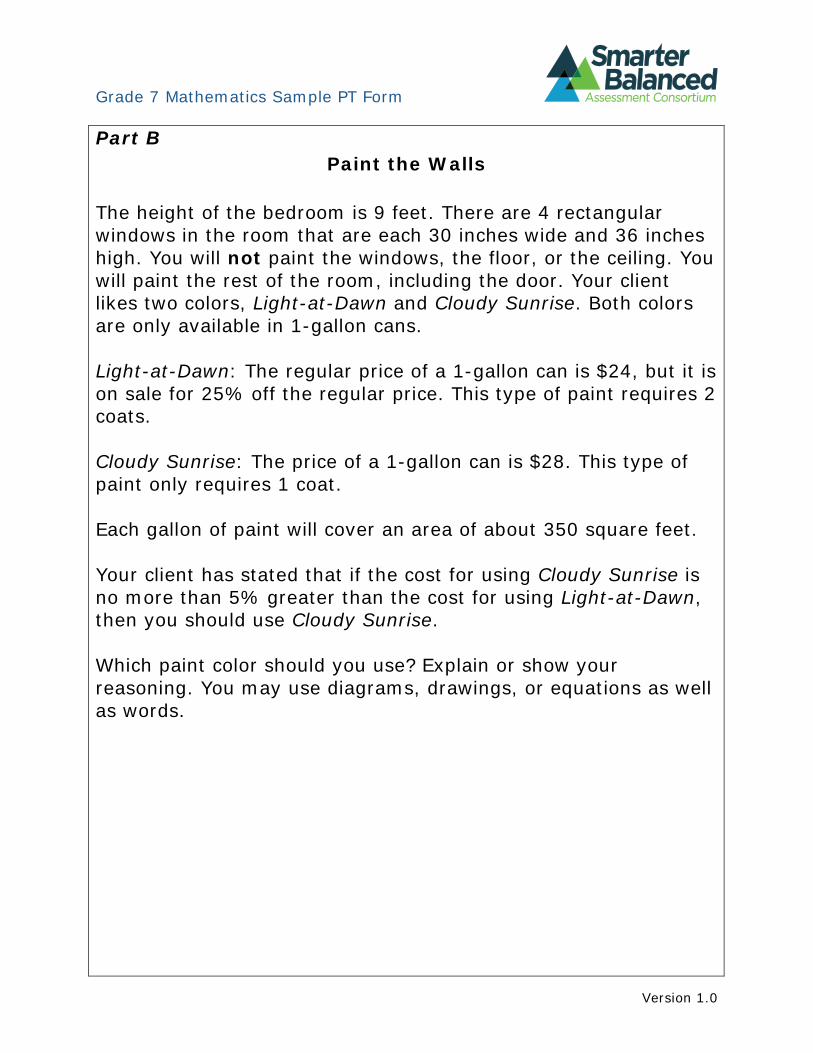
Part B Paint the Walls
The height of the bedroom is 9 feet. There are 4 rectangular windows in the room that are each 30 inches wide and 36 inches high. You will not paint the windows, the floor, or the ceiling. You will paint the rest of the room, including the door. Your client likes two colors, Light-at-Dawn and Cloudy Sunrise. Both colors are only available in 1-gallon cans.
Light-at-Dawn: The regular price of a 1-gallon can is $24, but it is on sale for 25% off the regular price. This type of paint requires 2 coats.
Cloudy Sunrise: The price of a 1-gallon can is $28. This type of paint only requires 1 coat.
Each gallon of paint will cover an area of about 350 square feet.
Your client has stated that if the cost for using Cloudy Sunrise is no more than 5% greater than the cost for using Light-at-Dawn, then you should use Cloudy Sunrise.
Which paint color should you use? Explain or show your reasoning. You may use diagrams, drawings, or equations as well as words.
Version 1.0
Grade 7 Mathematics Sample PT Form
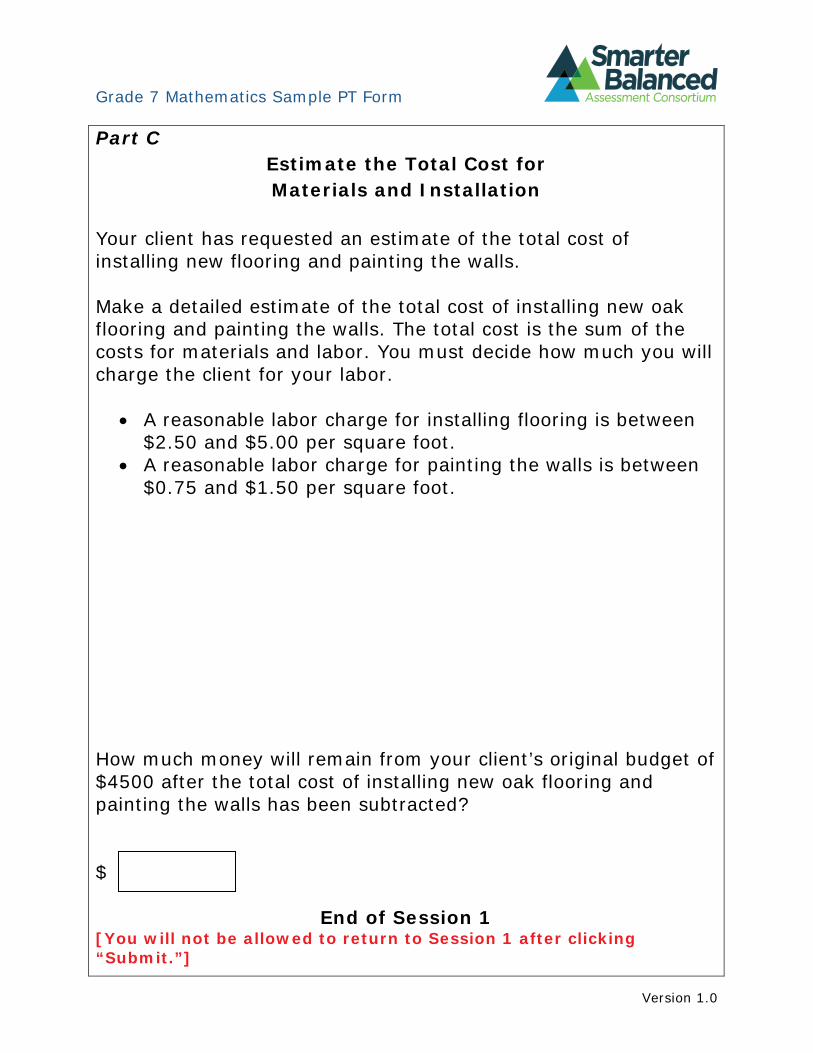
Part C Estimate the Total Cost for Materials and Installation
Your client has requested an estimate of the total cost of installing new flooring and painting the walls.
Make a detailed estimate of the total cost of installing new oak flooring and painting the walls. The total cost is the sum of the costs for materials and labor. You must decide how much you will charge the client for your labor.
• A reasonable labor charge for installing flooring is between $2.50 and $5.00 per square foot.
• A reasonable labor charge for painting the walls is between $0.75 and $1.50 per square foot.
How much money will remain from your client’s original budget of $4500 after the total cost of installing new oak flooring and painting the walls has been subtracted?
$
End of Session 1 [You will not be allowed to return to Session 1 after clicking “Submit.”]
Version 1.0
Grade 7 Mathematics Sample PT Form
Session 2
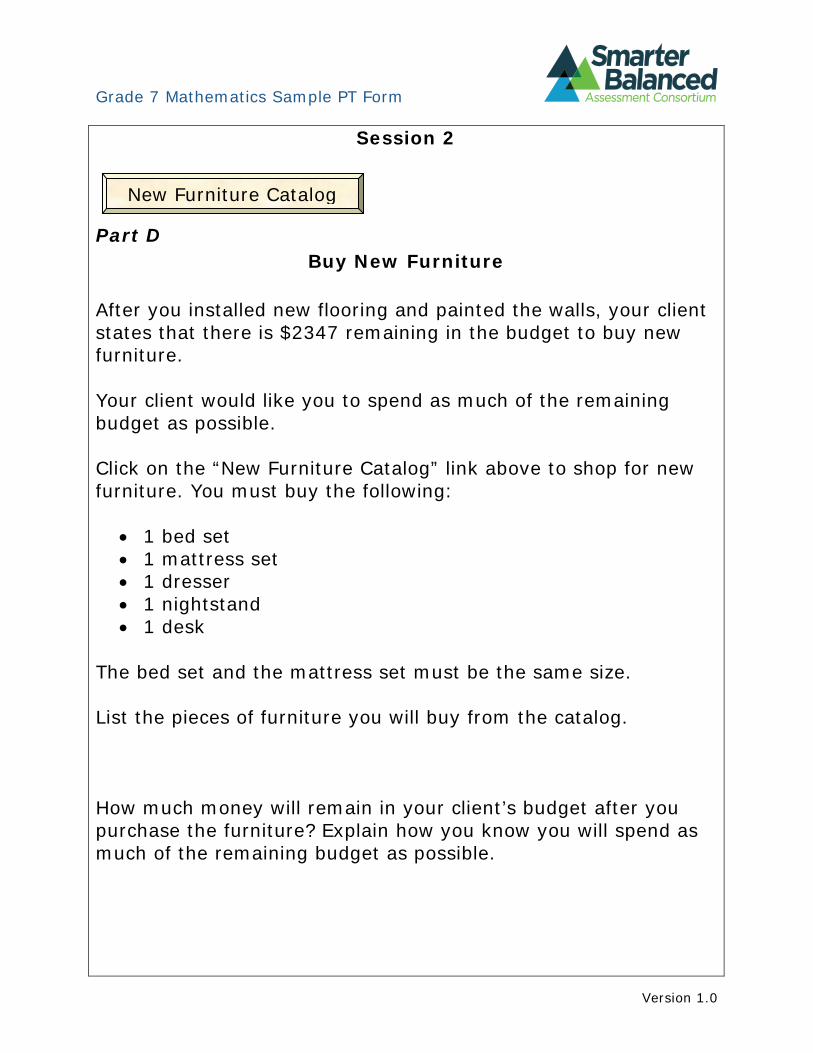
Part D Buy New Furniture
After you installed new flooring and painted the walls, your client states that there is $2347 remaining in the budget to buy new furniture.
Your client would like you to spend as much of the remaining budget as possible.
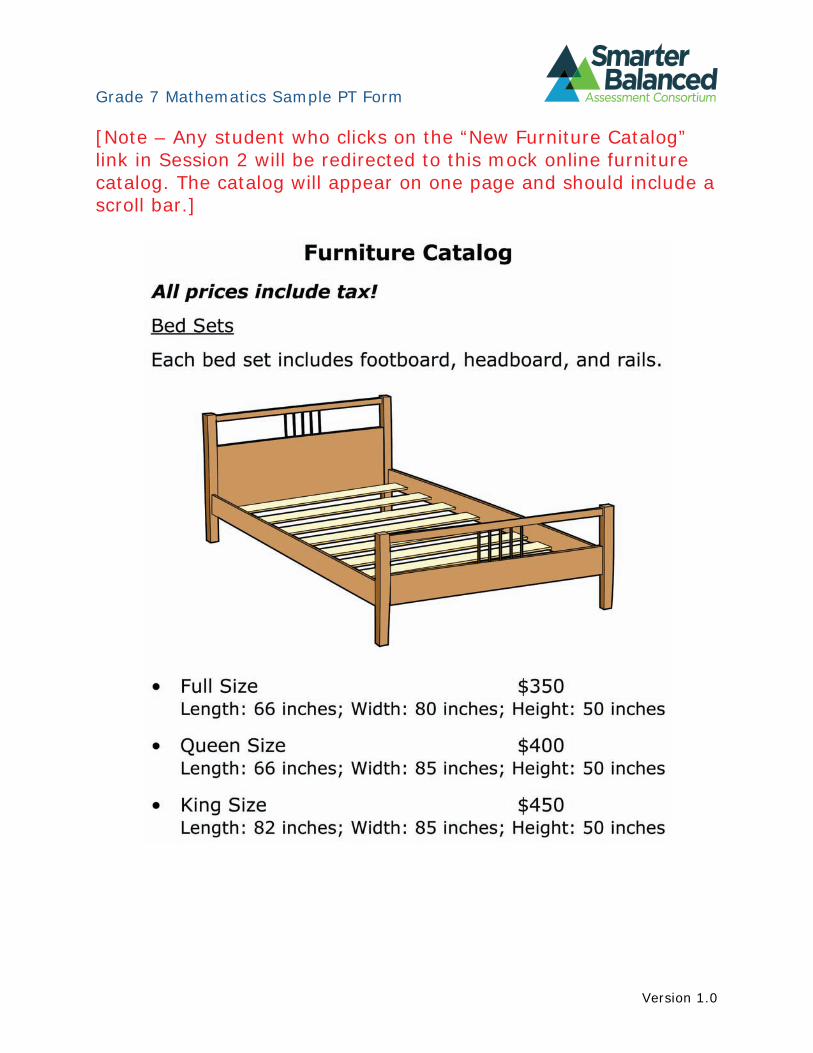
Click on the “New Furniture Catalog” link above to shop for new furniture. You must buy the following:
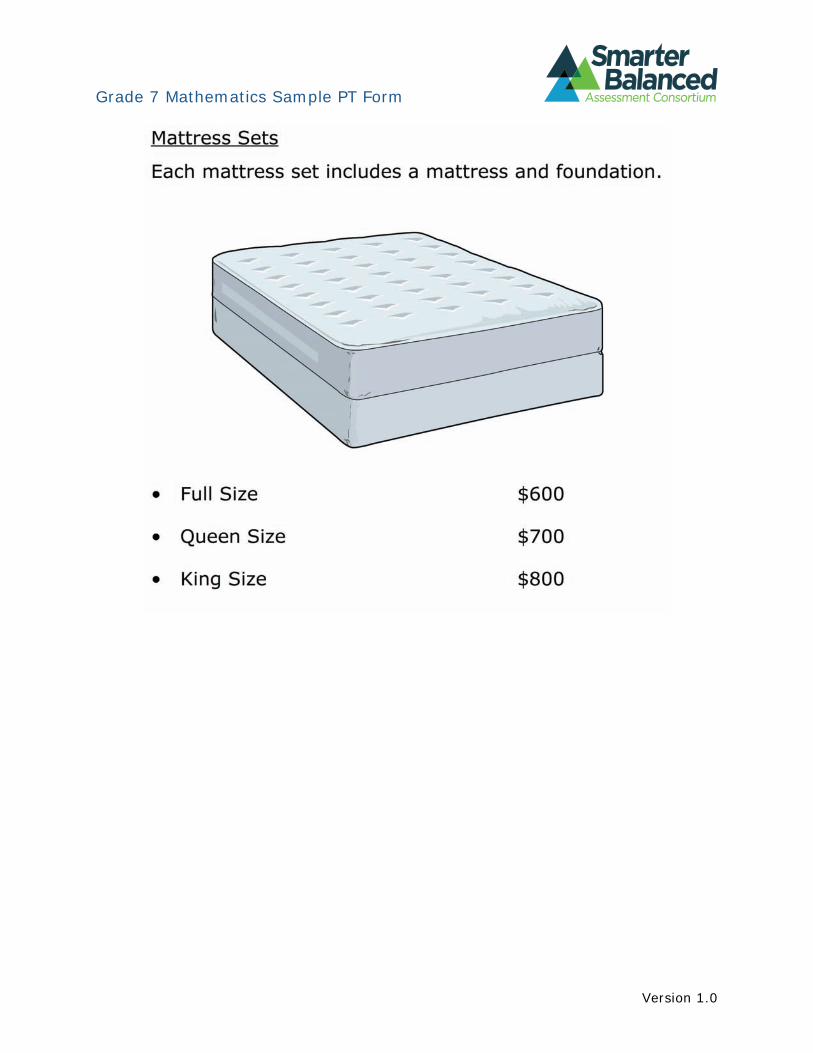
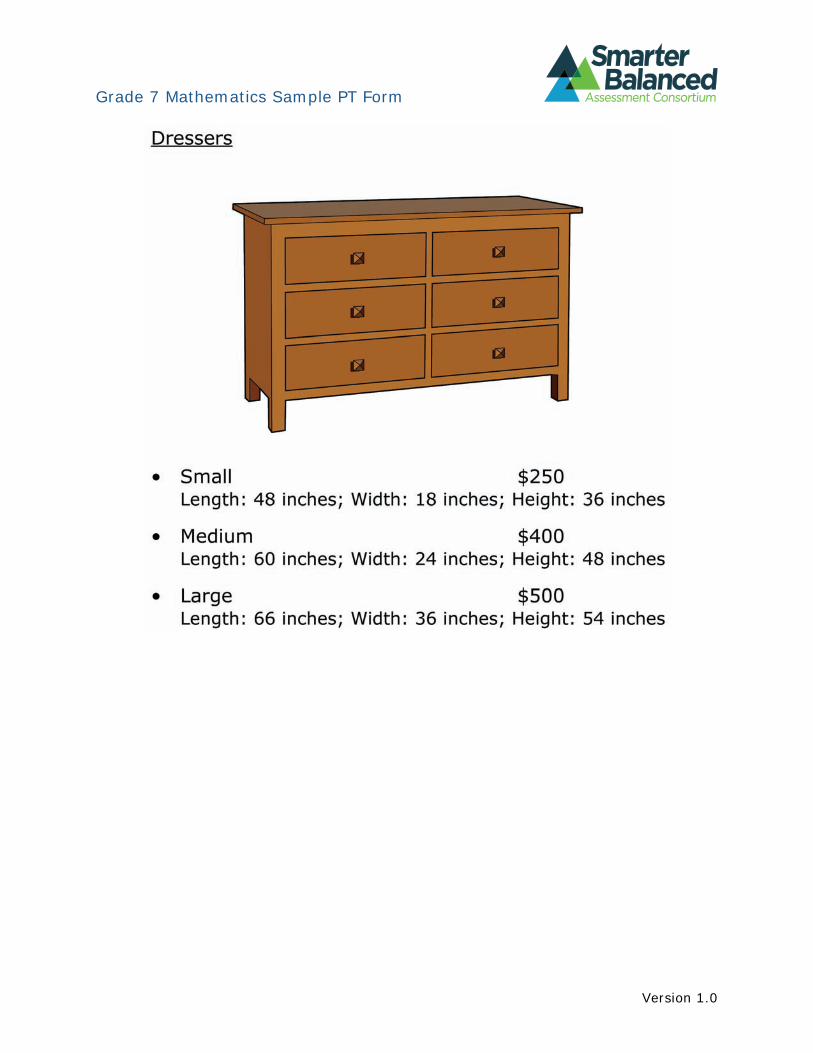
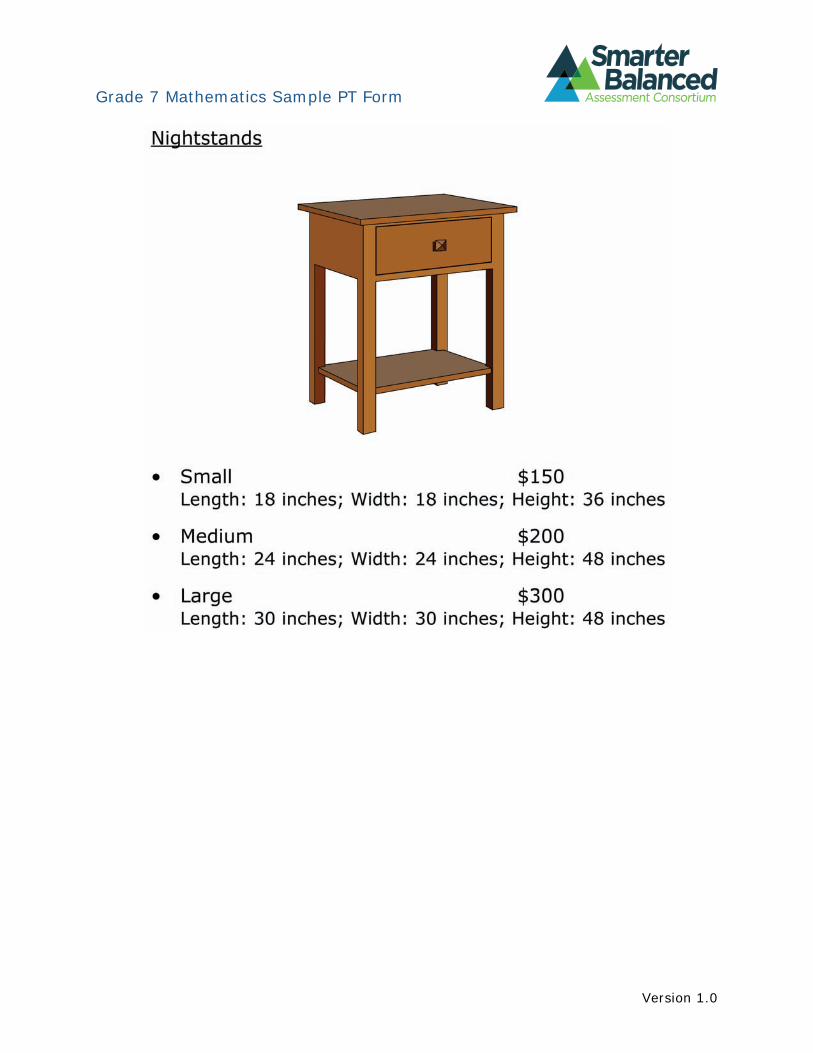
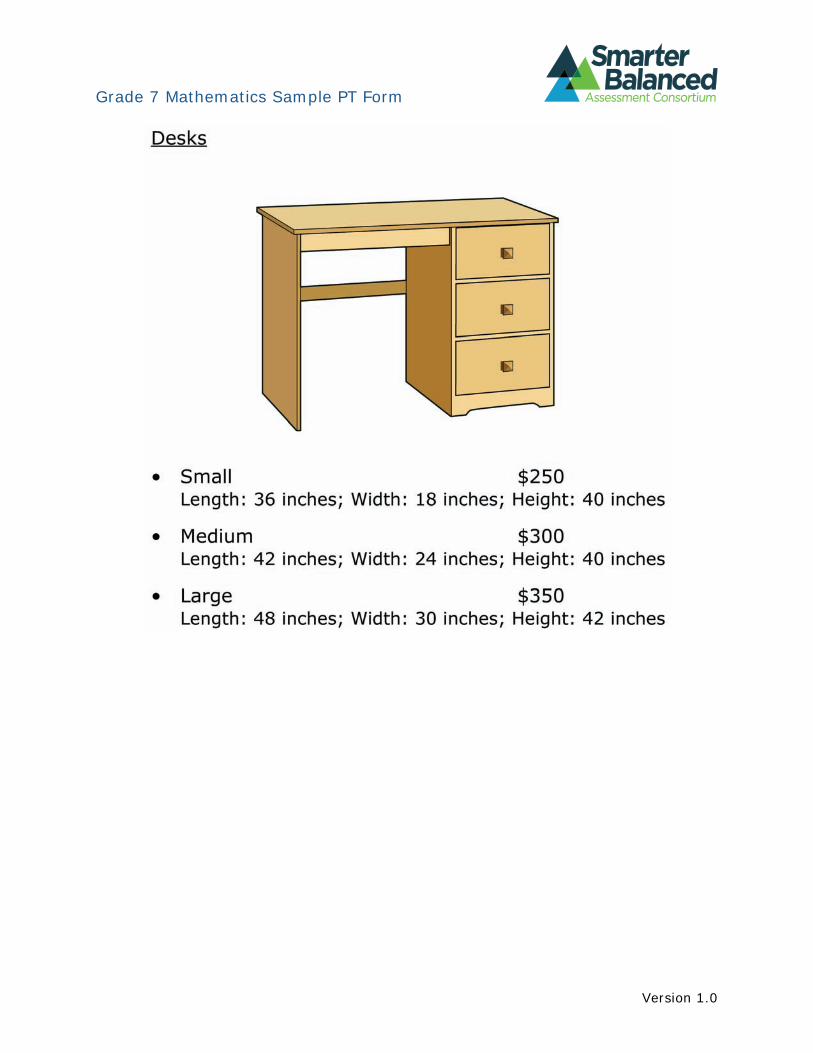
• 1 bed set • 1 mattress set • 1 dresser • 1 nightstand • 1 desk
The bed set and the mattress set must be the same size.
List the pieces of furniture you will buy from the catalog.
How much money will remain in your client’s budget after you purchase the furniture? Explain how you know you will spend as much of the remaining budget as possible.
New Furniture Catalog
Version 1.0
Grade 7 Mathematics Sample PT Form
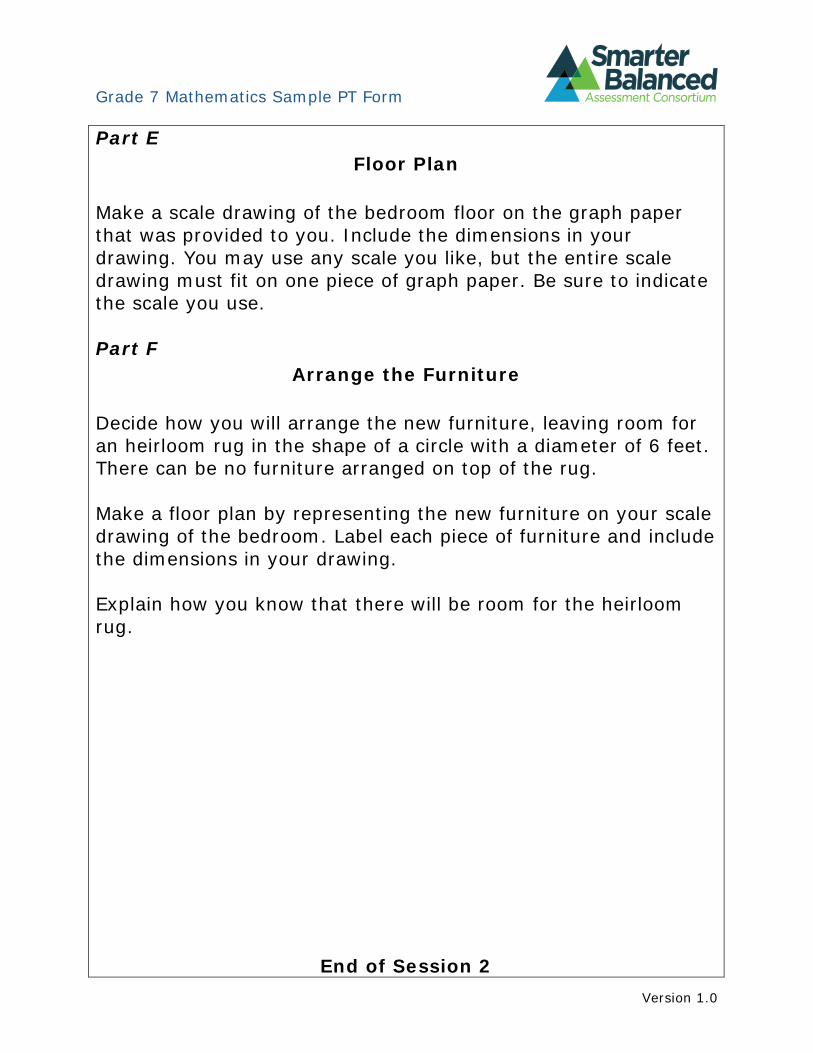
Part E Floor Plan
Make a scale drawing of the bedroom floor on the graph paper that was provided to you. Include the dimensions in your drawing. You may use any scale you like, but the entire scale drawing must fit on one piece of graph paper. Be sure to indicate the scale you use.
Part F Arrange the Furniture
Decide how you will arrange the new furniture, leaving room for an heirloom rug in the shape of a circle with a diameter of 6 feet. There can be no furniture arranged on top of the rug.
Make a floor plan by representing the new furniture on your scale drawing of the bedroom. Label each piece of furniture and include the dimensions in your drawing.
Explain how you know that there will be room for the heirloom rug.
End of Session 2
Version 1.0

Grade 7 Mathematics Sample PT Form
Sample Top-Score Response:
Session 1
Part A: The total area of the floor is 15 × 12 = 180 square feet.
The cost of the oak flooring will be 180 × 6.75 = $1215
The cost of the maple flooring will be 180 × 8 = $1440
The client will save $1440 − $1215 = $225 if I install oak flooring.
Part B: The total wall area to be painted is (2 × 15 × 9 + 2 × 12 × 9) − (4 × 2.5 × 3) = 456 square feet.
Light-at-Dawn: The interior decorator will need to buy 3 gallons of paint for a total cost of 3 × 0.75 × 24 = $54 .
Cloudy Sunrise: The interior decorator will need to buy 2 gallons of paint for a total cost of $56.
I can use Cloudy Sunrise. 5454−56 ≅ 0.037 , so Cloudy Sunrise will only cost about 3.7%
more than Light-at-Dawn.
Part C:
I will charge the client $3.00 per square foot to install the flooring and $0.75 per square foot to paint the walls.
The total cost to install oak flooring and paint the walls will be $2153.00. The cost to install the oak flooring will be 1215 + 180 × 3 = $1755 The cost to paint the walls will be 56 + 0.75 × 456 = $398 1755 + 398 = $2153
The client will have $2347.00 left in the budget.
Session 2:
Part D:
I will purchase a king-size bed set, a king-size mattress set, a large dresser, a medium nightstand, and a large desk.
There will be $47.00 left in the client’s budget. There is not enough money remaining in the budget to upgrade to a large nightstand, and there is no other combination of furniture that is closer to $2347 without going over.
Version 1.0
Grade 7 Mathematics Sample PT Form
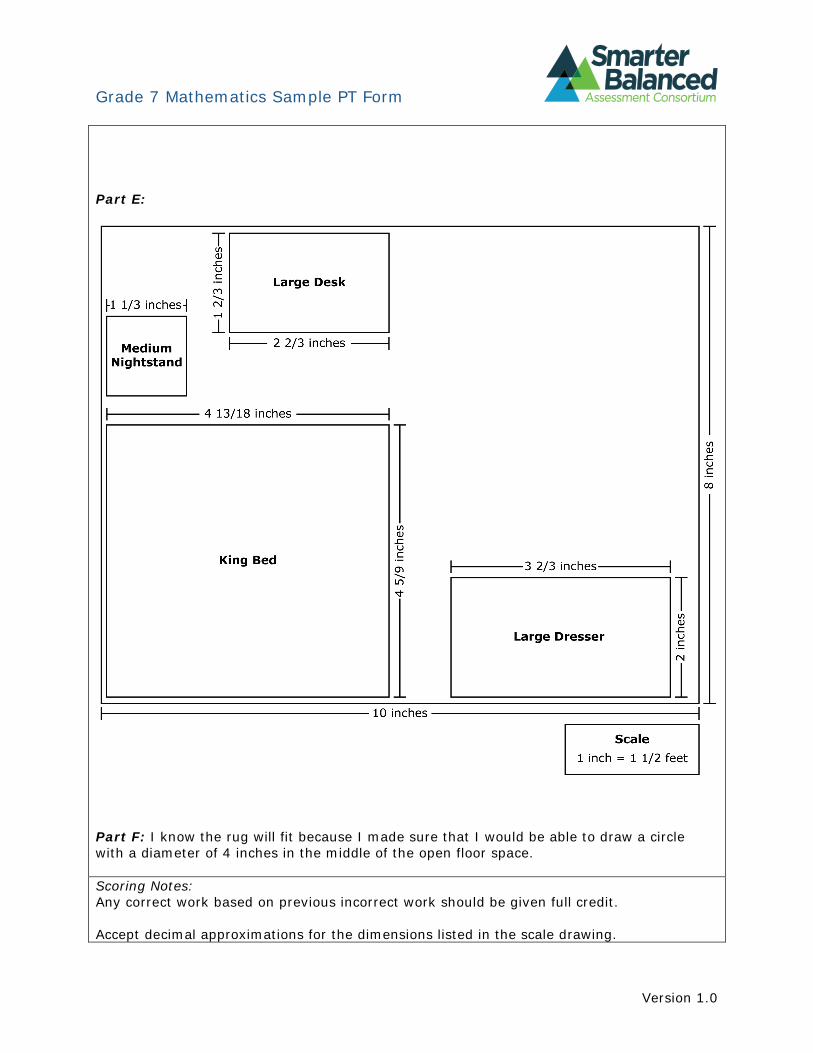
Part E:
Part F: I know the rug will fit because I made sure that I would be able to draw a circle with a diameter of 4 inches in the middle of the open floor space.
Scoring Notes: Any correct work based on previous incorrect work should be given full credit.
Accept decimal approximations for the dimensions listed in the scale drawing.
Version 1.0
Grade 7 Mathematics Sample PT Form
Scoring Rubric:
Part A: Responses to this part will receive 0–3 points, based on the following:
3 points: The student shows thorough understanding of solving real-world problems involving area and unit rates. The student correctly determines the total cost for both flooring options and correctly determines the amount saved by using oak flooring.
2 points: The student shows strong understanding of solving real-world problems involving area and unit rates. The student determines the total cost for both flooring options and determines the amount saved by using oak flooring but makes a computational error in his or her work.
1 point: The student shows partial understanding of solving real-world problems involving area and unit rates. The student determines the total cost for both flooring options and determines the amount saved by using oak flooring but makes multiple computational errors in his or her work. OR The student correctly determines the total cost for one flooring option.
0 points: The student shows inconsistent or no understanding of solving real-world problems involving area and unit rates.
Part B: Responses to this part will receive 0–4 points, based on the following:
4 points: The student shows thorough understanding of solving real-world problems involving surface area and percent increase. The student correctly determines the total cost for both paint options and correctly determines the percent increase between them.
3 points: The student shows strong understanding of solving real-world problems involving surface area and percent increase. The student determines the total cost for both paint options and determines the percent increase between them but makes a computational error in his or her work.
2 points: The student shows partial understanding of solving real-world problems involving surface area and percent increase. The student determines the total cost for both paint options and determines the percent increase between them but makes multiple computational errors in his or her work. OR The student correctly determines the total cost for one paint option.
1 point: The student shows limited understanding of solving real-world problems involving surface area and percent increase. The student determines the total area of the wall that will be painted.
0 points: The student shows inconsistent or no understanding of solving real-world problems involving surface area and percent increase.
Part C: Responses to this part will receive 0–2 points, based on the following:
Version 1.0
Grade 7 Mathematics Sample PT Form
2 points: The student shows thorough understanding of solving real-world problems involving unit rates. The student makes a reasonable estimate of the total cost to install oak flooring and paint the walls and correctly determines the amount of money that remains from the original budget.
1 point: The student shows partial understanding of solving real-world problems involving unit rates. The student makes a reasonable estimate of the total cost to install oak flooring and paint the walls but makes a computational error in his or her work.
0 points: The student shows inconsistent or no understanding of solving real-world problems involving unit rates.
Part D: Responses to this part will receive 0–2 points, based on the following:
2 points: The student shows thorough understanding of adding and subtracting multi-digit numbers. The student provides a complete list of furniture that uses the maximum amount of the remaining budget without exceeding the remaining budget and correctly determines the amount of money that remains.
1 point: The student shows partial understanding of adding and subtracting multi-digit numbers. The student provides a complete list of furniture that does not use the maximum amount of the remaining budget. OR The student provides a complete list of furniture that exceeds the remaining budget. OR The student does not correctly determine the amount of money that remains.
0 points: The student shows inconsistent or no understanding of adding and subtracting multi-digit numbers.
Parts E and F: Responses to these parts will receive 0–4 points, based on the following:
4 points: The student shows thorough understanding of making scale drawings. The student makes a correctly scaled drawing of the room and furniture. The student’s drawing includes correct labels and dimensions, as well as the scale. The student correctly explains why the rug will be able to fit in the room based on his or her drawing.
3 points: The student shows strong understanding of making scale drawings. The student makes a scaled drawing of the room and furniture that is mostly correct but includes one incorrectly scaled piece of furniture. The student’s drawing includes correct labels and dimensions as well as the scale. The student correctly explains why the rug will be able to fit in the room based on his or her drawing. OR The student makes a correctly scaled drawing of the room and furniture. The student’s drawing is missing one or two labels or dimensions but includes the scale. The student correctly explains why the rug will be able to fit in the room based on his or her drawing.
2 points: The student shows partial understanding of making scale drawings. The student makes a scaled drawing of the room and furniture that is generally correct but includes two incorrectly scaled pieces of furniture. The student’s drawing of the furniture may be missing labels and dimensions but includes the scale. The student correctly explains why the rug will be able to fit in the room based on his or her drawing. OR The student makes a scaled drawing of the room and furniture that is mostly correct and that includes the scale;
Version 1.0
Grade 7 Mathematics Sample PT Form
however, the drawing includes one incorrectly scaled piece of furniture and is missing one or two labels or dimensions. The student does not explain why the rug will be able to fit in the room based on his or her drawing.
1 point: The student shows limited understanding of making scale drawings. The student makes a correctly scaled drawing of the room and at least one piece of furniture. OR The student correctly explains why the rug will be able to fit in the room based on his or her drawing.
0 points: The student shows inconsistent or no understanding of making scale drawings. Merely stating that the rug will fit is not enough to earn the student any credit.
Version 1.0
Grade 7 Mathematics Sample PT Form
[Note – Any student who clicks on the “New Furniture Catalog” link in Session 2 will be redirected to this mock online furniture catalog. The catalog will appear on one page and should include a scroll bar.]
Version 1.0
Grade 7 Mathematics Sample PT Form
Version 1.0
Grade 7 Mathematics Sample PT Form
Version 1.0
Grade 7 Mathematics Sample PT Form
Version 1.0
Grade 7 Mathematics Sample PT Form
Version 1.0
Grade 7 Mathematics Sample PT Form
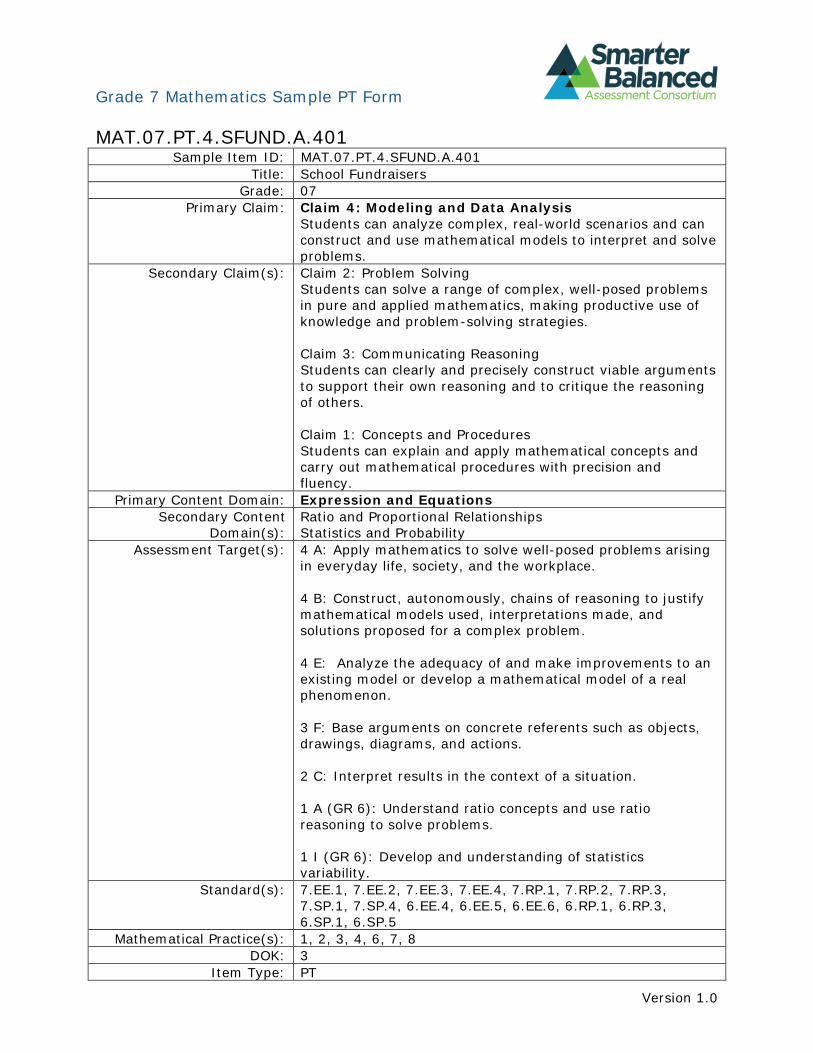
MAT.07.PT.4.SFUND.A.401 Sample Item ID: MAT.07.PT.4.SFUND.A.401
Title: School Fundraisers Grade: 07
Primary Claim: Claim 4: Modeling and Data Analysis Students can analyze complex, real-world scenarios and can construct and use mathematical models to interpret and solve problems.
Secondary Claim(s): Claim 2: Problem Solving Students can solve a range of complex, well-posed problems in pure and applied mathematics, making productive use of knowledge and problem-solving strategies.
Claim 3: Communicating Reasoning Students can clearly and precisely construct viable arguments to support their own reasoning and to critique the reasoning of others.
Claim 1: Concepts and Procedures Students can explain and apply mathematical concepts and carry out mathematical procedures with precision and fluency.
Primary Content Domain: Expression and Equations Secondary Content
Domain(s): Ratio and Proportional Relationships Statistics and Probability
Assessment Target(s): 4 A: Apply mathematics to solve well-posed problems arising in everyday life, society, and the workplace.
4 B: Construct, autonomously, chains of reasoning to justify mathematical models used, interpretations made, and solutions proposed for a complex problem.
4 E: Analyze the adequacy of and make improvements to an existing model or develop a mathematical model of a real phenomenon.
3 F: Base arguments on concrete referents such as objects, drawings, diagrams, and actions.
2 C: Interpret results in the context of a situation.
1 A (GR 6): Understand ratio concepts and use ratio reasoning to solve problems.
1 I (GR 6): Develop and understanding of statistics variability.
Standard(s): 7.EE.1, 7.EE.2, 7.EE.3, 7.EE.4, 7.RP.1, 7.RP.2, 7.RP.3, 7.SP.1, 7.SP.4, 6.EE.4, 6.EE.5, 6.EE.6, 6.RP.1, 6.RP.3, 6.SP.1, 6.SP.5
Mathematical Practice(s): 1, 2, 3, 4, 6, 7, 8 DOK: 3
Item Type: PT
Version 1.0
Grade 7 Mathematics Sample PT Form
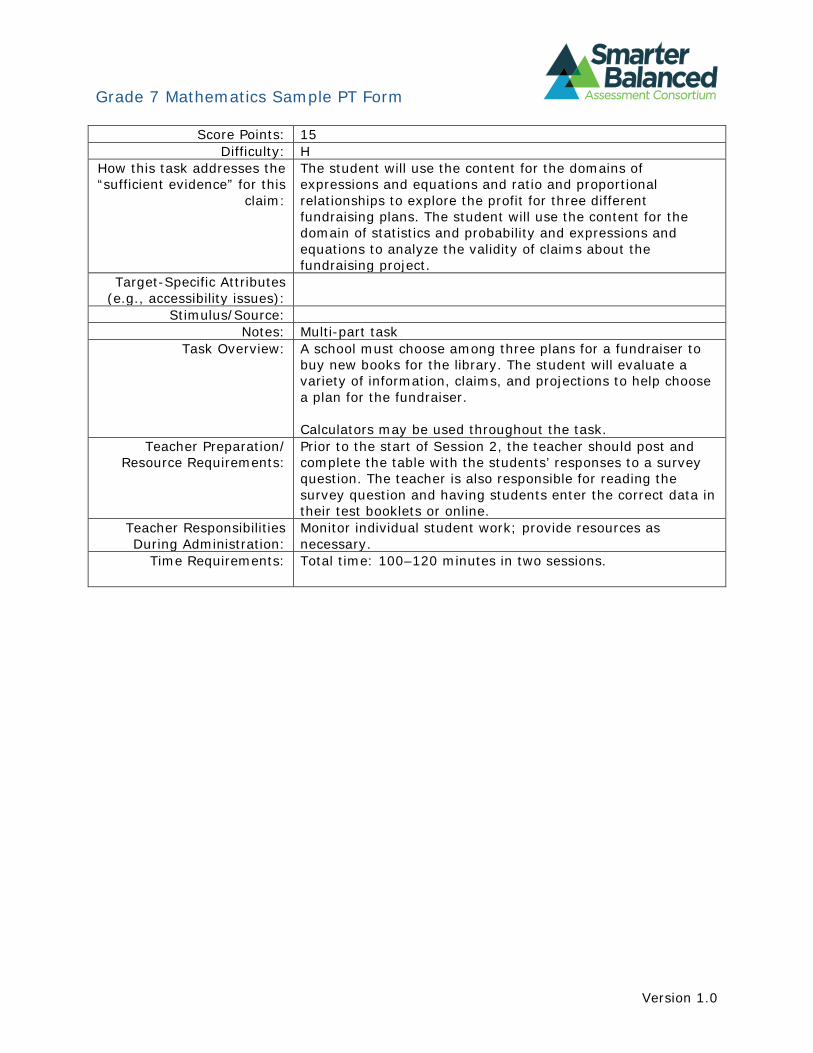
Score Points: 15 Difficulty: H
How this task addresses the “sufficient evidence” for this
claim:
The student will use the content for the domains of expressions and equations and ratio and proportional relationships to explore the profit for three different fundraising plans. The student will use the content for the domain of statistics and probability and expressions and equations to analyze the validity of claims about the fundraising project.
Target-Specific Attributes (e.g., accessibility issues):
Stimulus/Source: Notes: Multi-part task
Task Overview: A school must choose among three plans for a fundraiser to buy new books for the library. The student will evaluate a variety of information, claims, and projections to help choose a plan for the fundraiser.
Calculators may be used throughout the task. Teacher Preparation/
Resource Requirements: Prior to the start of Session 2, the teacher should post and complete the table with the students’ responses to a survey question. The teacher is also responsible for reading the survey question and having students enter the correct data in their test booklets or online.
Teacher Responsibilities During Administration:
Monitor individual student work; provide resources as necessary.
Time Requirements: Total time: 100–120 minutes in two sessions.
Version 1.0
Grade 7 Mathematics Sample PT Form
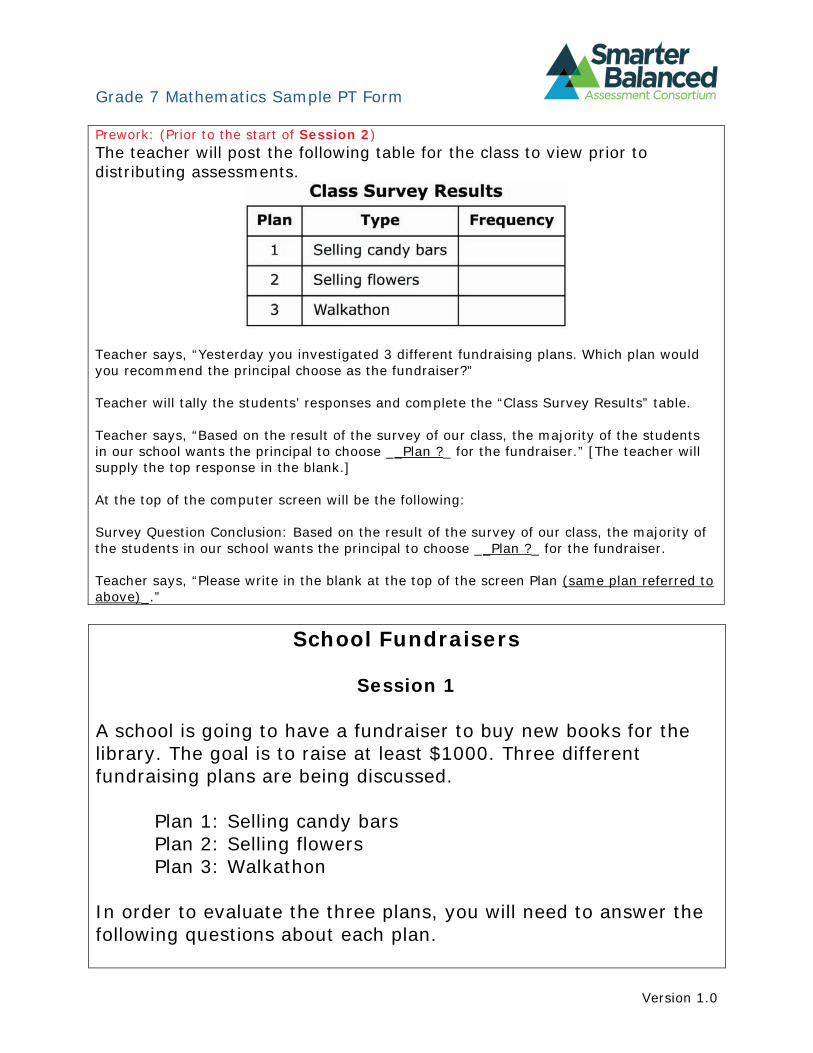
Prework: (Prior to the start of Session 2) The teacher will post the following table for the class to view prior to distributing assessments.
Teacher says, “Yesterday you investigated 3 different fundraising plans. Which plan would you recommend the principal choose as the fundraiser?”
Teacher will tally the students’ responses and complete the “Class Survey Results” table.
Teacher says, “Based on the result of the survey of our class, the majority of the students in our school wants the principal to choose __Plan ?_ for the fundraiser.” [The teacher will supply the top response in the blank.]
At the top of the computer screen will be the following:
Survey Question Conclusion: Based on the result of the survey of our class, the majority of the students in our school wants the principal to choose __Plan ?_ for the fundraiser.
Teacher says, “Please write in the blank at the top of the screen Plan (same plan referred to above)_.”
School Fundraisers
Session 1
A school is going to have a fundraiser to buy new books for the library. The goal is to raise at least $1000. Three different fundraising plans are being discussed.
Plan 1: Selling candy bars Plan 2: Selling flowers Plan 3: Walkathon
In order to evaluate the three plans, you will need to answer the following questions about each plan.
Version 1.0
Grade 7 Mathematics Sample PT Form
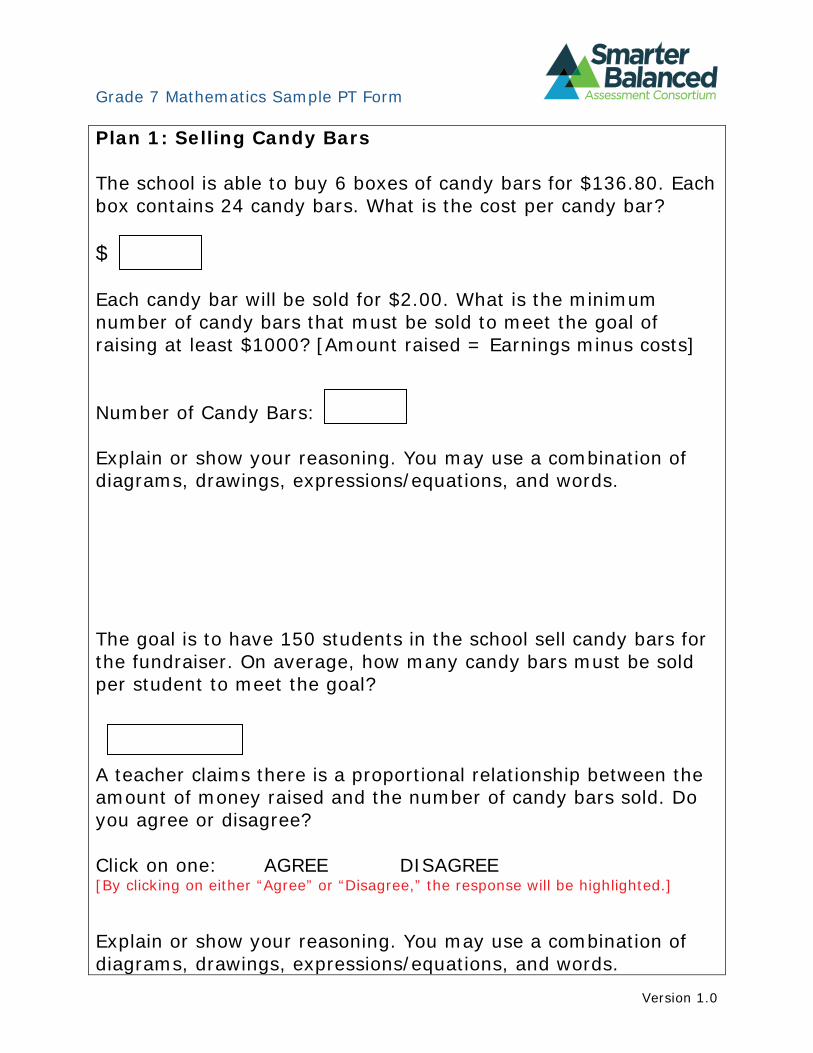
Plan 1: Selling Candy Bars
The school is able to buy 6 boxes of candy bars for $136.80. Each box contains 24 candy bars. What is the cost per candy bar?
$
Each candy bar will be sold for $2.00. What is the minimum number of candy bars that must be sold to meet the goal of raising at least $1000? [Amount raised = Earnings minus costs]
Number of Candy Bars:
Explain or show your reasoning. You may use a combination of diagrams, drawings, expressions/equations, and words.
The goal is to have 150 students in the school sell candy bars for the fundraiser. On average, how many candy bars must be sold per student to meet the goal?
A teacher claims there is a proportional relationship between the amount of money raised and the number of candy bars sold. Do you agree or disagree?
Click on one: AGREE DISAGREE [By clicking on either “Agree” or “Disagree,” the response will be highlighted.]
Explain or show your reasoning. You may use a combination of diagrams, drawings, expressions/equations, and words.
Version 1.0
Grade 7 Mathematics Sample PT Form
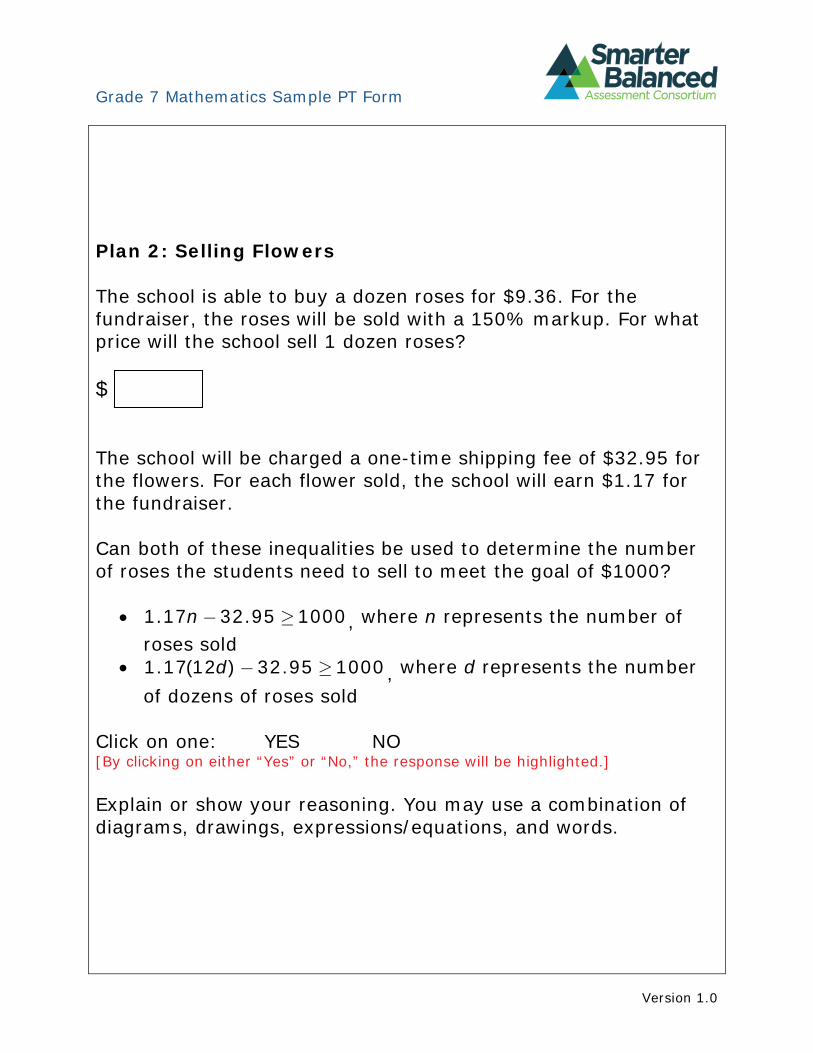
Plan 2: Selling Flowers
The school is able to buy a dozen roses for $9.36. For the fundraiser, the roses will be sold with a 150% markup. For what price will the school sell 1 dozen roses?
$
The school will be charged a one-time shipping fee of $32.95 for the flowers. For each flower sold, the school will earn $1.17 for the fundraiser.
Can both of these inequalities be used to determine the number of roses the students need to sell to meet the goal of $1000?
• 1.17 n 32.95 1000 where n represents the number of , roses sold
d where d represents the number • 1.17(12 ) 32.95 1000, of dozens of roses sold
Click on one: YES NO [By clicking on either “Yes” or “No,” the response will be highlighted.]
Explain or show your reasoning. You may use a combination of diagrams, drawings, expressions/equations, and words.
Version 1.0
Grade 7 Mathematics Sample PT Form
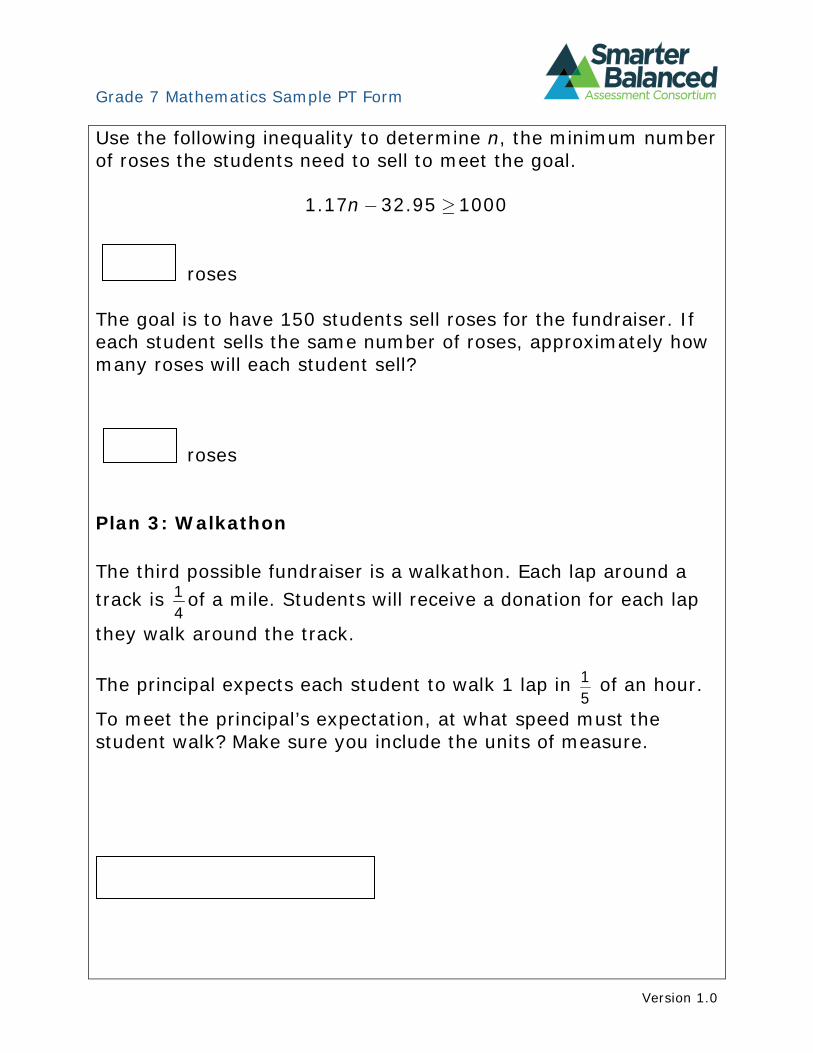
Use the following inequality to determine n, the minimum number of roses the students need to sell to meet the goal.
1.17 n 32.95 1000
roses
The goal is to have 150 students sell roses for the fundraiser. If each student sells the same number of roses, approximately how many roses will each student sell?
roses
Plan 3: Walkathon
The third possible fundraiser is a walkathon. Each lap around a track is 1 of a mile. Students will receive a donation for each lap
4 they walk around the track.
The principal expects each student to walk 1 lap in 1 of an hour. 5
To meet the principal’s expectation, at what speed must the student walk? Make sure you include the units of measure.
Version 1.0
Grade 7 Mathematics Sample PT Form
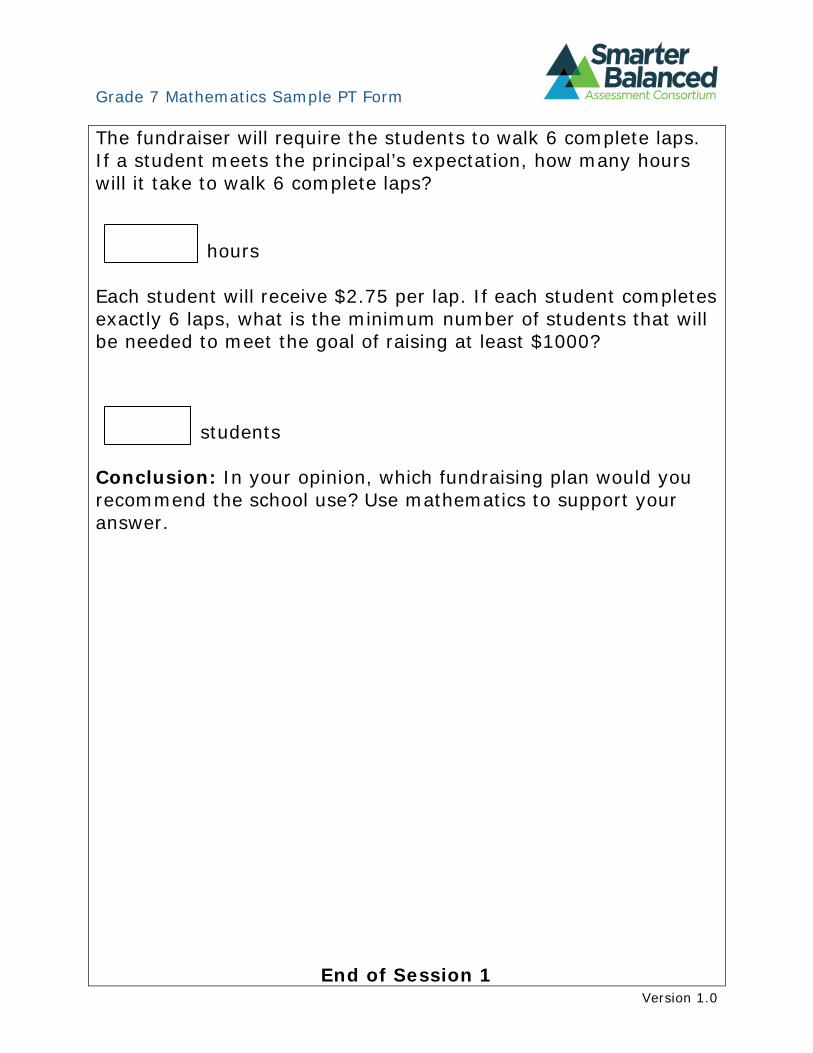
The fundraiser will require the students to walk 6 complete laps. If a student meets the principal’s expectation, how many hours will it take to walk 6 complete laps?
hours
Each student will receive $2.75 per lap. If each student completes exactly 6 laps, what is the minimum number of students that will be needed to meet the goal of raising at least $1000?
students
Conclusion: In your opinion, which fundraising plan would you recommend the school use? Use mathematics to support your answer.
End of Session 1 Version 1.0
Grade 7 Mathematics Sample PT Form
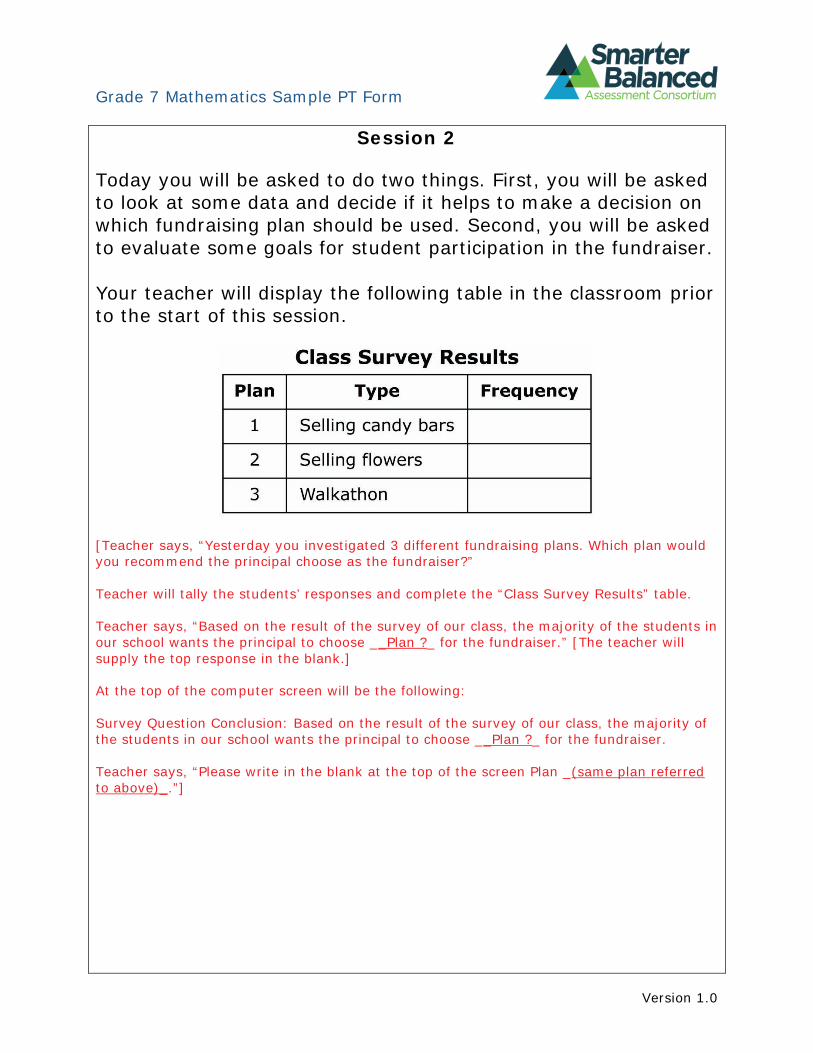
Session 2
Today you will be asked to do two things. First, you will be asked to look at some data and decide if it helps to make a decision on which fundraising plan should be used. Second, you will be asked to evaluate some goals for student participation in the fundraiser.
Your teacher will display the following table in the classroom prior to the start of this session.
[Teacher says, “Yesterday you investigated 3 different fundraising plans. Which plan would you recommend the principal choose as the fundraiser?”
Teacher will tally the students’ responses and complete the “Class Survey Results” table.
Teacher says, “Based on the result of the survey of our class, the majority of the students in our school wants the principal to choose __Plan ?_ for the fundraiser.” [The teacher will supply the top response in the blank.]
At the top of the computer screen will be the following:
Survey Question Conclusion: Based on the result of the survey of our class, the majority of the students in our school wants the principal to choose __Plan ?_ for the fundraiser.
Teacher says, “Please write in the blank at the top of the screen Plan _(same plan referred to above)_.”]
Version 1.0
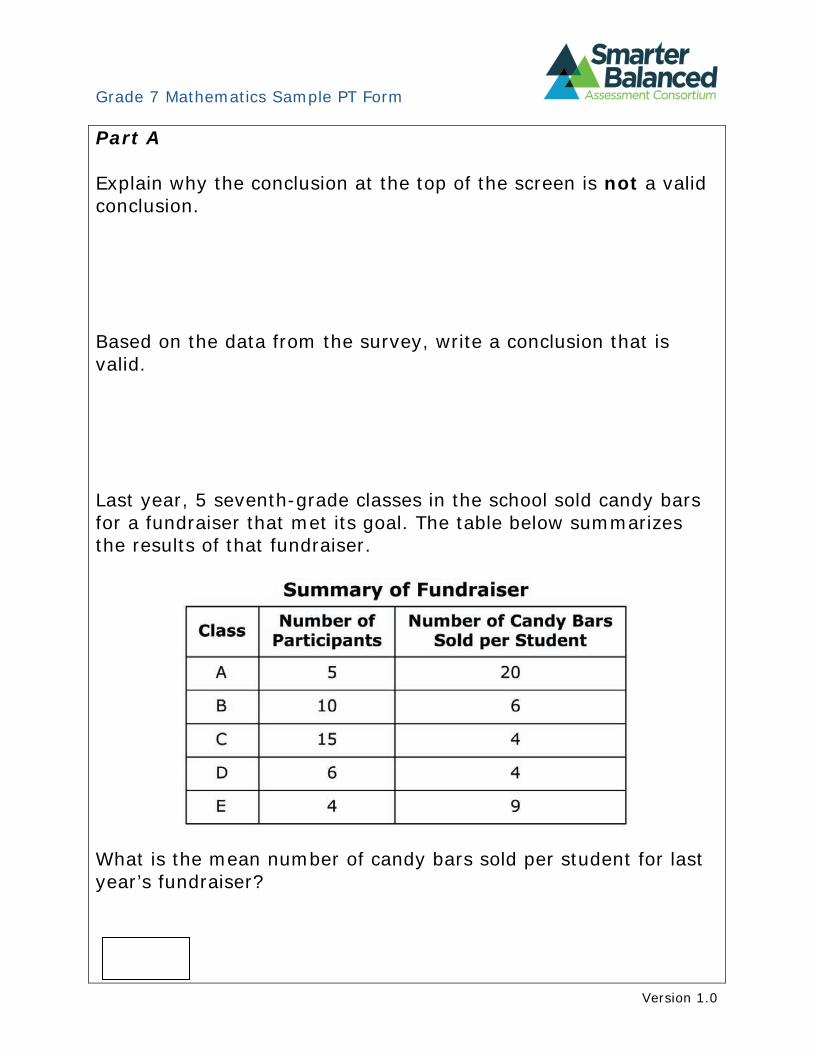
Grade 7 Mathematics Sample PT Form
Part A
Explain why the conclusion at the top of the screen is not a valid conclusion.
Based on the data from the survey, write a conclusion that is valid.
Last year, 5 seventh-grade classes in the school sold candy bars for a fundraiser that met its goal. The table below summarizes the results of that fundraiser.
What is the mean number of candy bars sold per student for last year’s fundraiser?
Version 1.0
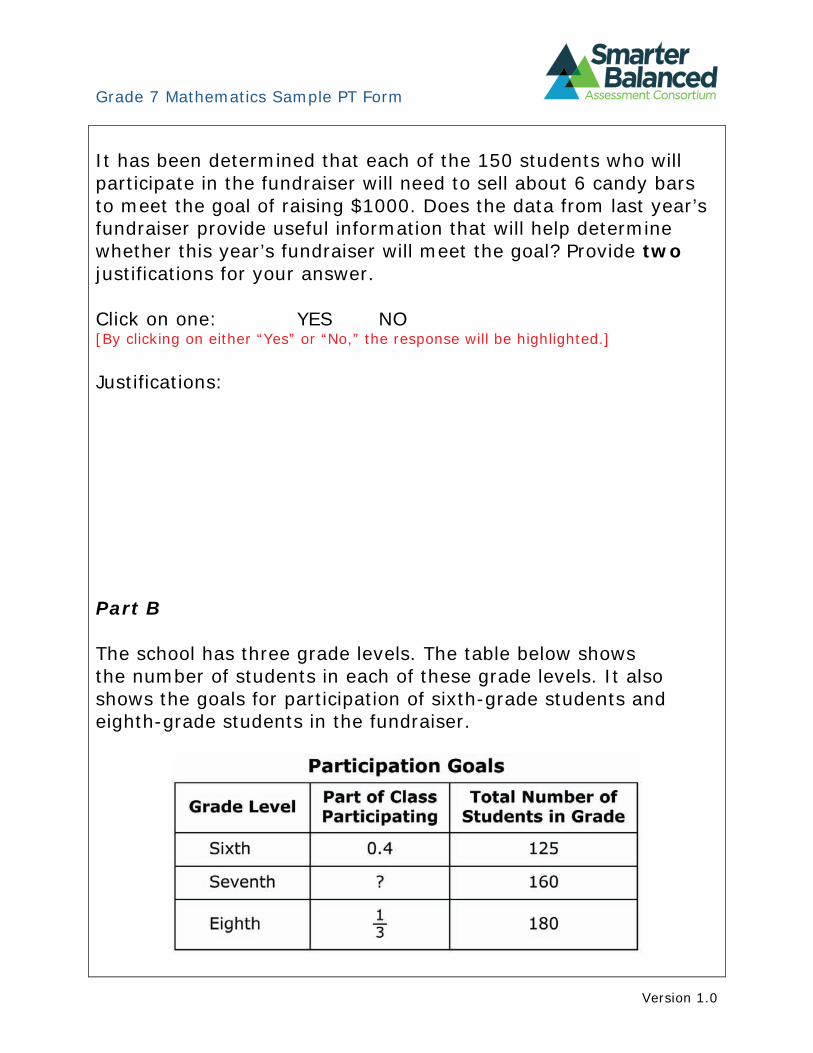
Grade 7 Mathematics Sample PT Form
It has been determined that each of the 150 students who will participate in the fundraiser will need to sell about 6 candy bars to meet the goal of raising $1000. Does the data from last year’s fundraiser provide useful information that will help determine whether this year’s fundraiser will meet the goal? Provide two justifications for your answer.
Click on one: YES NO [By clicking on either “Yes” or “No,” the response will be highlighted.]
Justifications:
Part B
The school has three grade levels. The table below shows the number of students in each of these grade levels. It also shows the goals for participation of sixth-grade students and eighth-grade students in the fundraiser.
Version 1.0
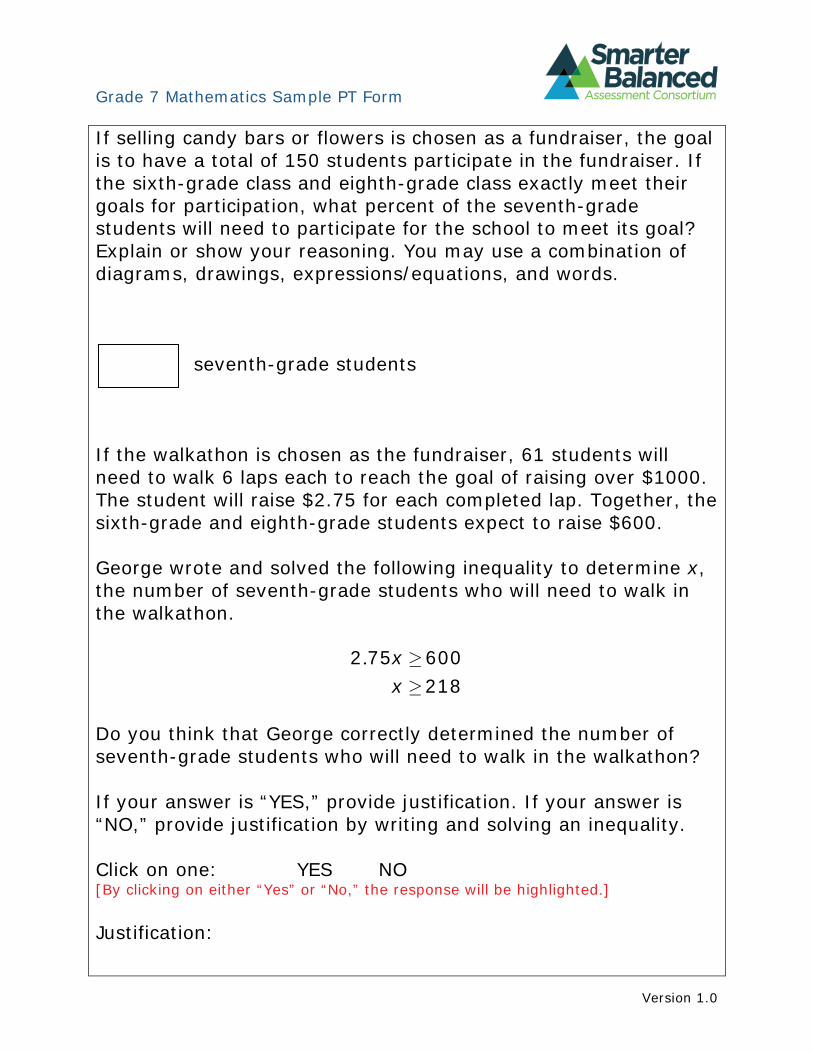
Grade 7 Mathematics Sample PT Form
If selling candy bars or flowers is chosen as a fundraiser, the goal is to have a total of 150 students participate in the fundraiser. If the sixth-grade class and eighth-grade class exactly meet their goals for participation, what percent of the seventh-grade students will need to participate for the school to meet its goal? Explain or show your reasoning. You may use a combination of diagrams, drawings, expressions/equations, and words.
seventh-grade students
If the walkathon is chosen as the fundraiser, 61 students will need to walk 6 laps each to reach the goal of raising over $1000. The student will raise $2.75 for each completed lap. Together, the sixth-grade and eighth-grade students expect to raise $600.
George wrote and solved the following inequality to determine x, the number of seventh-grade students who will need to walk in the walkathon.
. x 6002 75 x 218
Do you think that George correctly determined the number of seventh-grade students who will need to walk in the walkathon?
If your answer is “YES,” provide justification. If your answer is “NO,” provide justification by writing and solving an inequality.
Click on one: YES NO [By clicking on either “Yes” or “No,” the response will be highlighted.]
Justification:
Version 1.0
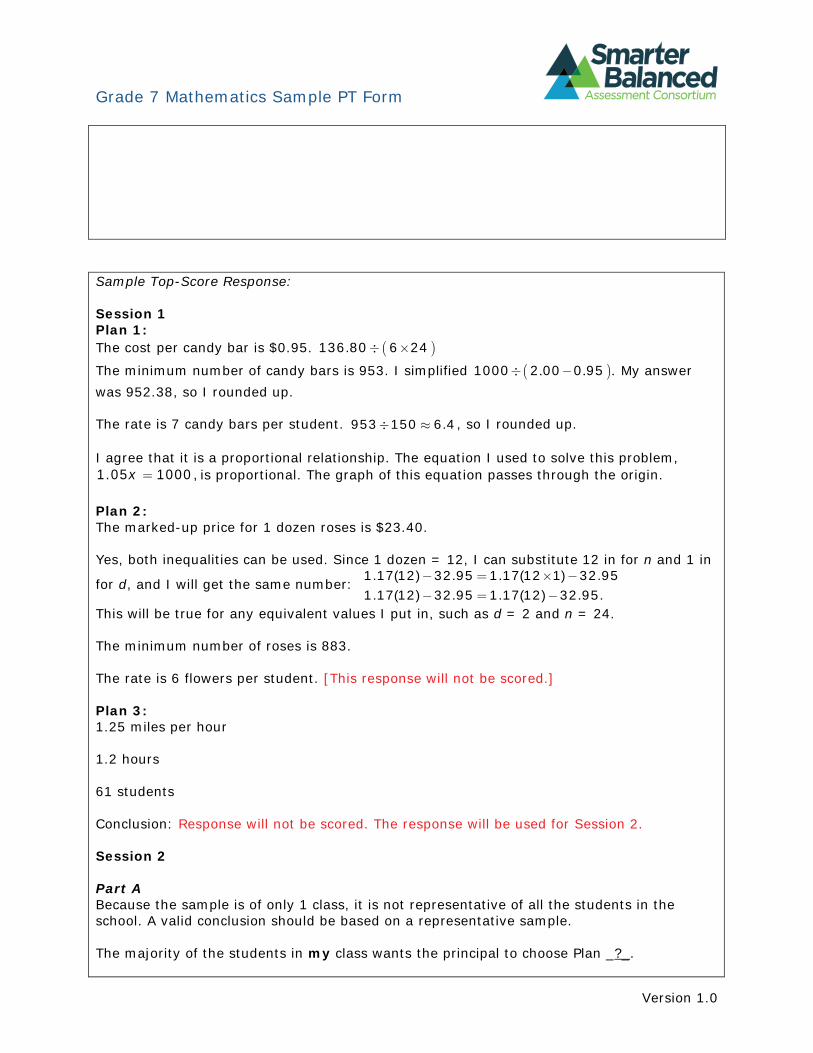
Grade 7 Mathematics Sample PT Form
Sample Top-Score Response:
Session 1 Plan 1: The cost per candy bar is $0.95. 136 80 6 24. The minimum number of candy bars is 953. I simplified 1000 . 0 95 .2 00 . My answer was 952.38, so I rounded up.
The rate is 7 candy bars per student. 953 150 . 6 4, so I rounded up.
I agree that it is a proportional relationship. The equation I used to solve this problem, 1.05 x 1000, is proportional. The graph of this equation passes through the origin.
Plan 2: The marked-up price for 1 dozen roses is $23.40.
Yes, both inequalities can be used. Since 1 dozen = 12, I can substitute 12 in for n and 1 in 1 17 12 ( ) 32 95 . ( 1. 1 17 12 ) 32 95 . .for d, and I will get the same number: 1 17 12 ) 32 95 . ( ) 32 95 . ( . 1 17 12 . .
This will be true for any equivalent values I put in, such as d = 2 and n = 24.
The minimum number of roses is 883.
The rate is 6 flowers per student. [This response will not be scored.]
Plan 3: 1.25 miles per hour
1.2 hours
61 students
Conclusion: Response will not be scored. The response will be used for Session 2.
Session 2
Part A Because the sample is of only 1 class, it is not representative of all the students in the school. A valid conclusion should be based on a representative sample.
The majority of the students in my class wants the principal to choose Plan _?_.
Version 1.0
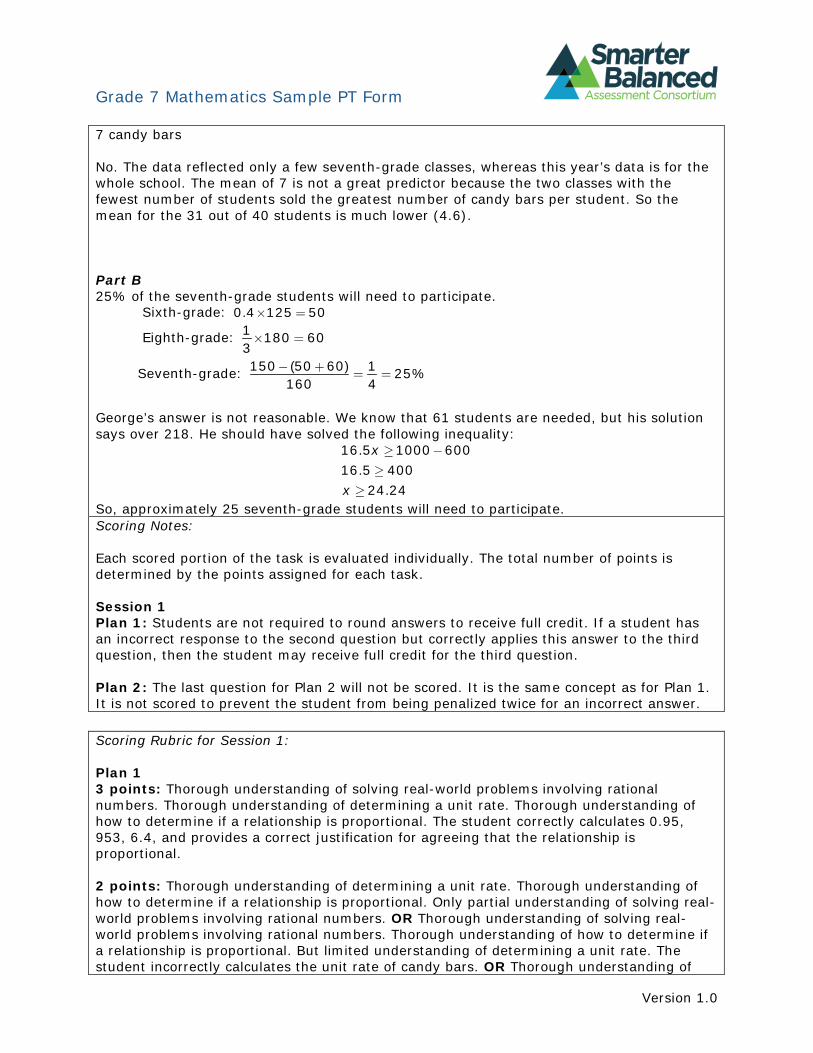
Grade 7 Mathematics Sample PT Form
7 candy bars
No. The data reflected only a few seventh-grade classes, whereas this year’s data is for the whole school. The mean of 7 is not a great predictor because the two classes with the fewest number of students sold the greatest number of candy bars per student. So the mean for the 31 out of 40 students is much lower (4.6).
Part B 25% of the seventh-grade students will need to participate.
Sixth-grade: 0 4 125 50.
Eighth-grade: 1 180 603
Seventh-grade: 150 50 60 1 25160 4 ( ) %
George’s answer is not reasonable. We know that 61 students are needed, but his solution says over 218. He should have solved the following inequality:
16 5 1000 600 16 5 400
24 24
x
x
.
. .
So, approximately 25 seventh-grade students will need to participate. Scoring Notes:
Each scored portion of the task is evaluated individually. The total number of points is determined by the points assigned for each task.
Session 1 Plan 1: Students are not required to round answers to receive full credit. If a student has an incorrect response to the second question but correctly applies this answer to the third question, then the student may receive full credit for the third question.
Plan 2: The last question for Plan 2 will not be scored. It is the same concept as for Plan 1. It is not scored to prevent the student from being penalized twice for an incorrect answer.
Scoring Rubric for Session 1:
Plan 1 3 points: Thorough understanding of solving real-world problems involving rational numbers. Thorough understanding of determining a unit rate. Thorough understanding of how to determine if a relationship is proportional. The student correctly calculates 0.95, 953, 6.4, and provides a correct justification for agreeing that the relationship is proportional.
2 points: Thorough understanding of determining a unit rate. Thorough understanding of how to determine if a relationship is proportional. Only partial understanding of solving real-world problems involving rational numbers. OR Thorough understanding of solving real-world problems involving rational numbers. Thorough understanding of how to determine if a relationship is proportional. But limited understanding of determining a unit rate. The student incorrectly calculates the unit rate of candy bars. OR Thorough understanding of
Version 1.0
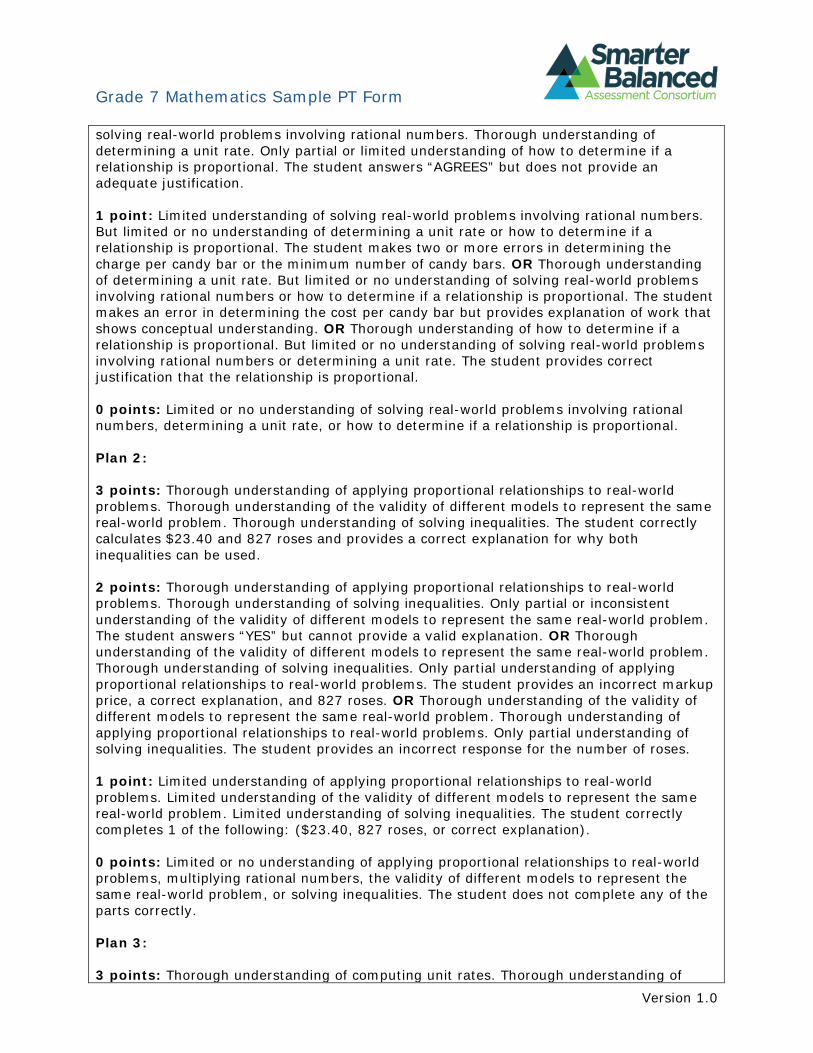
Grade 7 Mathematics Sample PT Form
solving real-world problems involving rational numbers. Thorough understanding of determining a unit rate. Only partial or limited understanding of how to determine if a relationship is proportional. The student answers “AGREES” but does not provide an adequate justification.
1 point: Limited understanding of solving real-world problems involving rational numbers. But limited or no understanding of determining a unit rate or how to determine if a relationship is proportional. The student makes two or more errors in determining the charge per candy bar or the minimum number of candy bars. OR Thorough understanding of determining a unit rate. But limited or no understanding of solving real-world problems involving rational numbers or how to determine if a relationship is proportional. The student makes an error in determining the cost per candy bar but provides explanation of work that shows conceptual understanding. OR Thorough understanding of how to determine if a relationship is proportional. But limited or no understanding of solving real-world problems involving rational numbers or determining a unit rate. The student provides correct justification that the relationship is proportional.
0 points: Limited or no understanding of solving real-world problems involving rational numbers, determining a unit rate, or how to determine if a relationship is proportional.
Plan 2:
3 points: Thorough understanding of applying proportional relationships to real-world problems. Thorough understanding of the validity of different models to represent the same real-world problem. Thorough understanding of solving inequalities. The student correctly calculates $23.40 and 827 roses and provides a correct explanation for why both inequalities can be used.
2 points: Thorough understanding of applying proportional relationships to real-world problems. Thorough understanding of solving inequalities. Only partial or inconsistent understanding of the validity of different models to represent the same real-world problem. The student answers “YES” but cannot provide a valid explanation. OR Thorough understanding of the validity of different models to represent the same real-world problem. Thorough understanding of solving inequalities. Only partial understanding of applying proportional relationships to real-world problems. The student provides an incorrect markup price, a correct explanation, and 827 roses. OR Thorough understanding of the validity of different models to represent the same real-world problem. Thorough understanding of applying proportional relationships to real-world problems. Only partial understanding of solving inequalities. The student provides an incorrect response for the number of roses.
1 point: Limited understanding of applying proportional relationships to real-world problems. Limited understanding of the validity of different models to represent the same real-world problem. Limited understanding of solving inequalities. The student correctly completes 1 of the following: ($23.40, 827 roses, or correct explanation).
0 points: Limited or no understanding of applying proportional relationships to real-world problems, multiplying rational numbers, the validity of different models to represent the same real-world problem, or solving inequalities. The student does not complete any of the parts correctly.
Plan 3:
3 points: Thorough understanding of computing unit rates. Thorough understanding of
Version 1.0
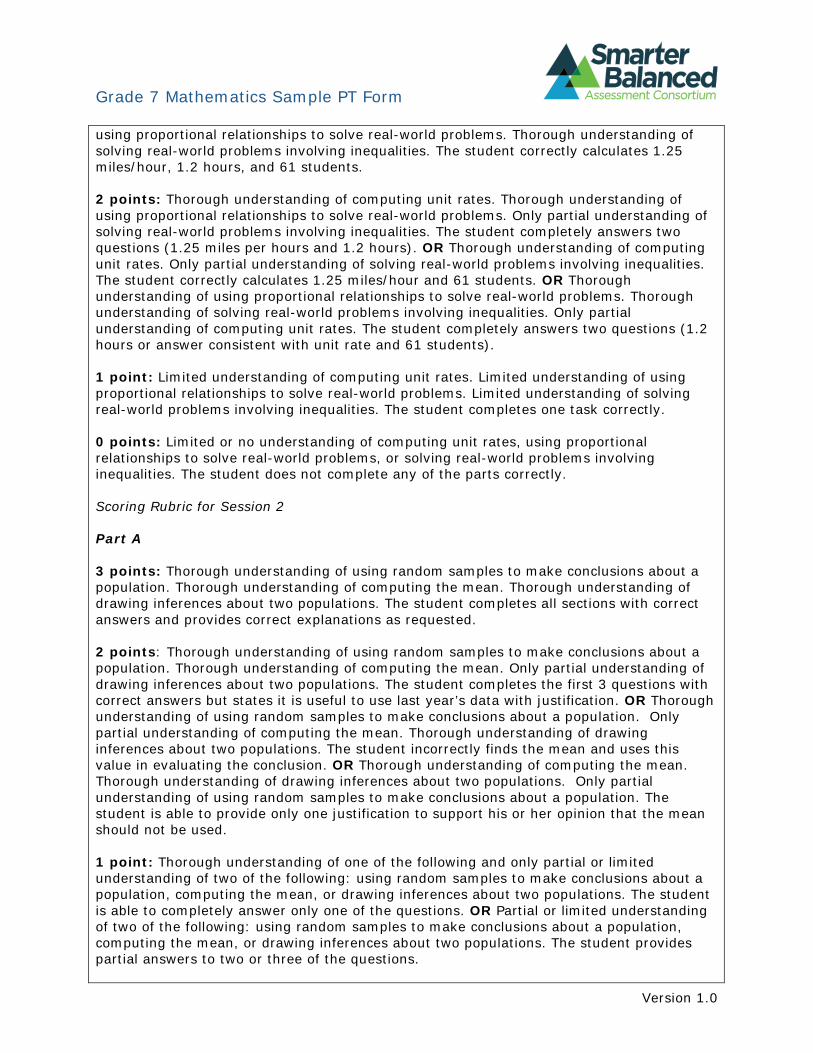
Grade 7 Mathematics Sample PT Form
using proportional relationships to solve real-world problems. Thorough understanding of solving real-world problems involving inequalities. The student correctly calculates 1.25 miles/hour, 1.2 hours, and 61 students.
2 points: Thorough understanding of computing unit rates. Thorough understanding of using proportional relationships to solve real-world problems. Only partial understanding of solving real-world problems involving inequalities. The student completely answers two questions (1.25 miles per hours and 1.2 hours). OR Thorough understanding of computing unit rates. Only partial understanding of solving real-world problems involving inequalities. The student correctly calculates 1.25 miles/hour and 61 students. OR Thorough understanding of using proportional relationships to solve real-world problems. Thorough understanding of solving real-world problems involving inequalities. Only partial understanding of computing unit rates. The student completely answers two questions (1.2 hours or answer consistent with unit rate and 61 students).
1 point: Limited understanding of computing unit rates. Limited understanding of using proportional relationships to solve real-world problems. Limited understanding of solving real-world problems involving inequalities. The student completes one task correctly.
0 points: Limited or no understanding of computing unit rates, using proportional relationships to solve real-world problems, or solving real-world problems involving inequalities. The student does not complete any of the parts correctly.
Scoring Rubric for Session 2
Part A
3 points: Thorough understanding of using random samples to make conclusions about a population. Thorough understanding of computing the mean. Thorough understanding of drawing inferences about two populations. The student completes all sections with correct answers and provides correct explanations as requested.
2 points: Thorough understanding of using random samples to make conclusions about a population. Thorough understanding of computing the mean. Only partial understanding of drawing inferences about two populations. The student completes the first 3 questions with correct answers but states it is useful to use last year’s data with justification. OR Thorough understanding of using random samples to make conclusions about a population. Only partial understanding of computing the mean. Thorough understanding of drawing inferences about two populations. The student incorrectly finds the mean and uses this value in evaluating the conclusion. OR Thorough understanding of computing the mean. Thorough understanding of drawing inferences about two populations. Only partial understanding of using random samples to make conclusions about a population. The student is able to provide only one justification to support his or her opinion that the mean should not be used.
1 point: Thorough understanding of one of the following and only partial or limited understanding of two of the following: using random samples to make conclusions about a population, computing the mean, or drawing inferences about two populations. The student is able to completely answer only one of the questions. OR Partial or limited understanding of two of the following: using random samples to make conclusions about a population, computing the mean, or drawing inferences about two populations. The student provides partial answers to two or three of the questions.
Version 1.0
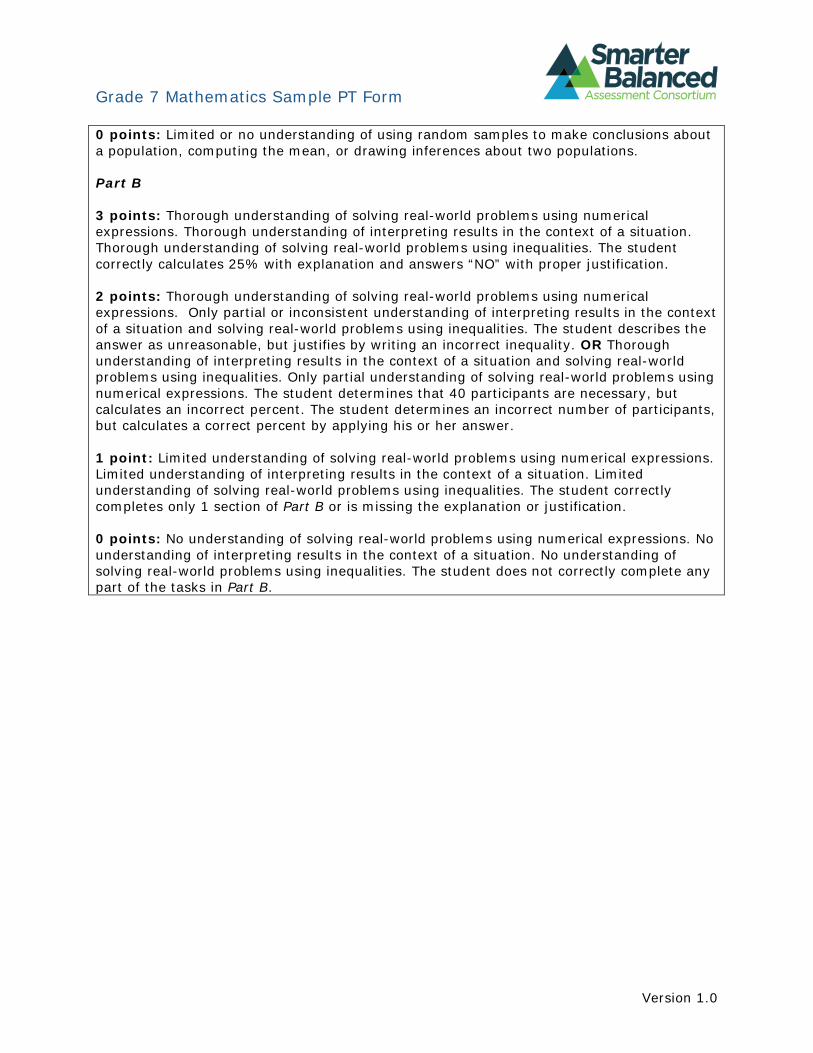
Grade 7 Mathematics Sample PT Form
0 points: Limited or no understanding of using random samples to make conclusions about a population, computing the mean, or drawing inferences about two populations.
Part B
3 points: Thorough understanding of solving real-world problems using numerical expressions. Thorough understanding of interpreting results in the context of a situation. Thorough understanding of solving real-world problems using inequalities. The student correctly calculates 25% with explanation and answers “NO” with proper justification.
2 points: Thorough understanding of solving real-world problems using numerical expressions. Only partial or inconsistent understanding of interpreting results in the context of a situation and solving real-world problems using inequalities. The student describes the answer as unreasonable, but justifies by writing an incorrect inequality. OR Thorough understanding of interpreting results in the context of a situation and solving real-world problems using inequalities. Only partial understanding of solving real-world problems using numerical expressions. The student determines that 40 participants are necessary, but calculates an incorrect percent. The student determines an incorrect number of participants, but calculates a correct percent by applying his or her answer.
1 point: Limited understanding of solving real-world problems using numerical expressions. Limited understanding of interpreting results in the context of a situation. Limited understanding of solving real-world problems using inequalities. The student correctly completes only 1 section of Part B or is missing the explanation or justification.
0 points: No understanding of solving real-world problems using numerical expressions. No understanding of interpreting results in the context of a situation. No understanding of solving real-world problems using inequalities. The student does not correctly complete any part of the tasks in Part B.
Version 1.0
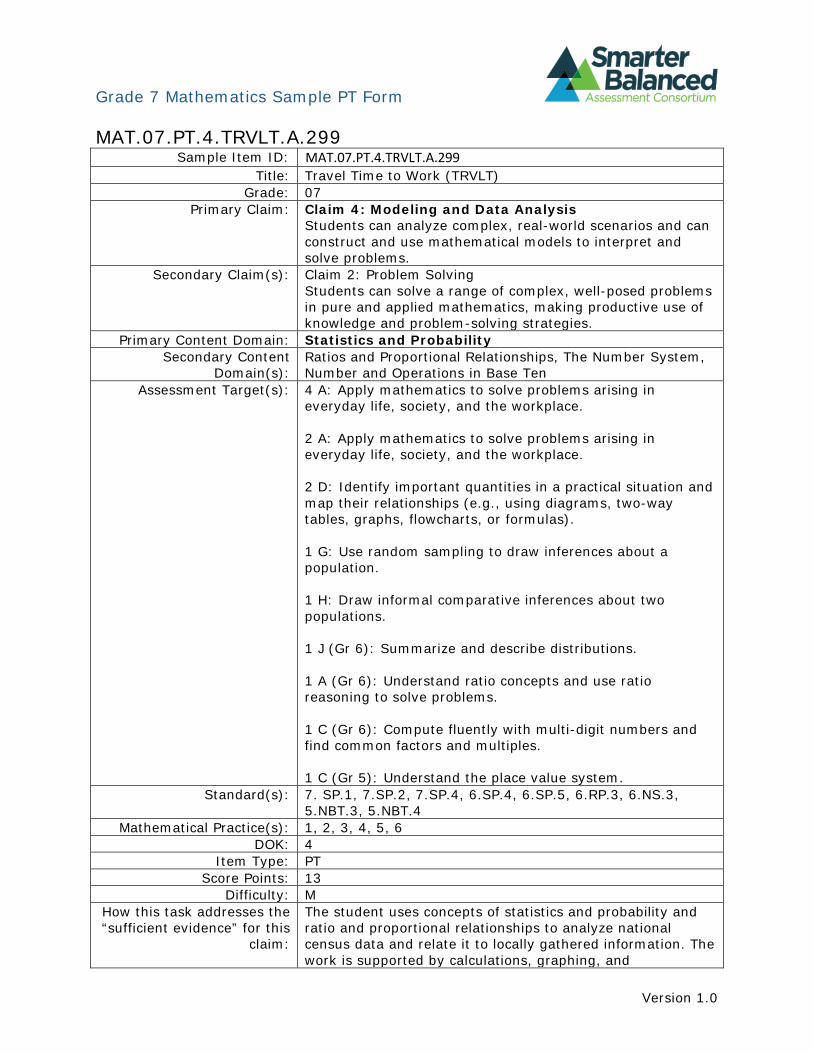
Grade 7 Mathematics Sample PT Form
MAT.07.PT.4.TRVLT.A.299 Sample Item ID: MAT.07.PT.4.TRVLT.A.299
Title: Travel Time to Work (TRVLT) Grade: 07
Primary Claim: Claim 4: Modeling and Data Analysis Students can analyze complex, real-world scenarios and can construct and use mathematical models to interpret and solve problems.
Secondary Claim(s): Claim 2: Problem Solving Students can solve a range of complex, well-posed problems in pure and applied mathematics, making productive use of knowledge and problem-solving strategies.
Primary Content Domain: Statistics and Probability Secondary Content
Domain(s): Ratios and Proportional Relationships, The Number System, Number and Operations in Base Ten
Assessment Target(s): 4 A: Apply mathematics to solve problems arising in everyday life, society, and the workplace.
2 A: Apply mathematics to solve problems arising in everyday life, society, and the workplace.
2 D: Identify important quantities in a practical situation and map their relationships (e.g., using diagrams, two-way tables, graphs, flowcharts, or formulas).
1 G: Use random sampling to draw inferences about a population.
1 H: Draw informal comparative inferences about two populations.
1 J (Gr 6): Summarize and describe distributions.
1 A (Gr 6): Understand ratio concepts and use ratio reasoning to solve problems.
1 C (Gr 6): Compute fluently with multi-digit numbers and find common factors and multiples.
1 C (Gr 5): Understand the place value system. Standard(s): 7. SP.1, 7.SP.2, 7.SP.4, 6.SP.4, 6.SP.5, 6.RP.3, 6.NS.3,
5.NBT.3, 5.NBT.4 Mathematical Practice(s): 1, 2, 3, 4, 5, 6
DOK: 4 Item Type: PT
Score Points: 13 Difficulty: M
How this task addresses the “sufficient evidence” for this
claim:
The student uses concepts of statistics and probability and ratio and proportional relationships to analyze national census data and relate it to locally gathered information. The work is supported by calculations, graphing, and
Version 1.0
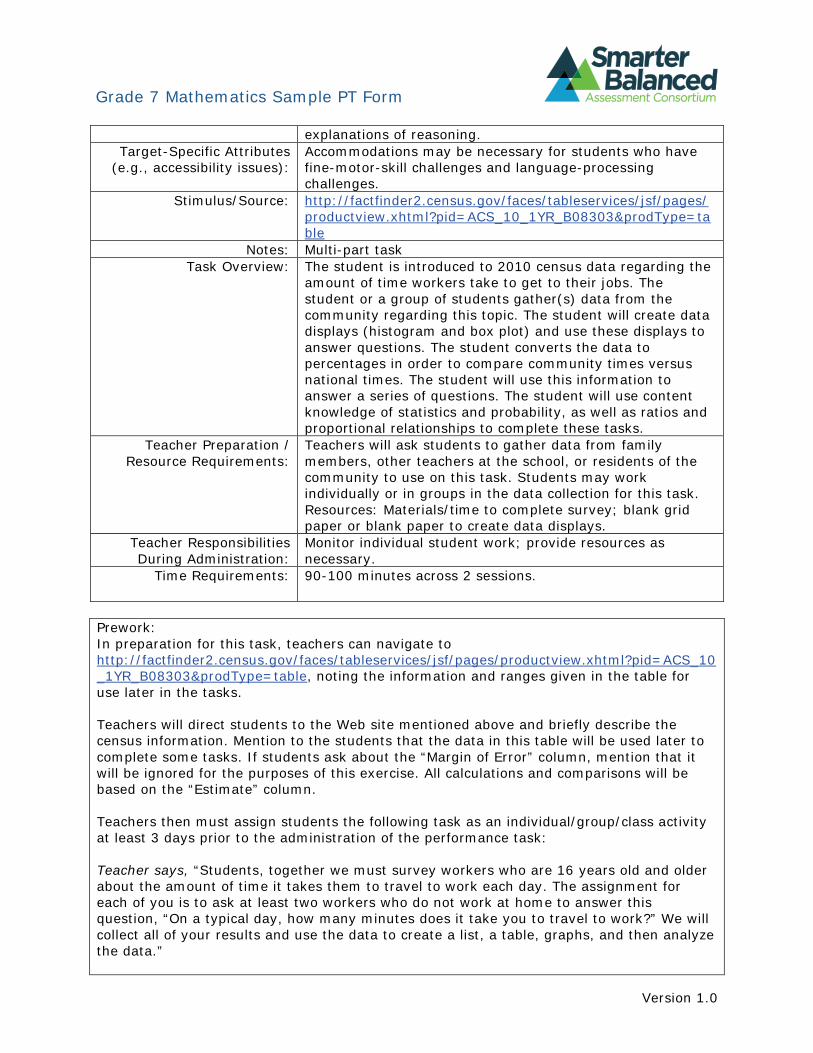
Grade 7 Mathematics Sample PT Form
explanations of reasoning. Target-Specific Attributes
(e.g., accessibility issues): Accommodations may be necessary for students who have fine-motor-skill challenges and language-processing challenges.
Stimulus/Source: http://factfinder2.census.gov/faces/tableservices/jsf/pages/ productview.xhtml?pid=ACS_10_1YR_B08303&prodType=ta ble
Notes: Multi-part task Task Overview: The student is introduced to 2010 census data regarding the
amount of time workers take to get to their jobs. The student or a group of students gather(s) data from the community regarding this topic. The student will create data displays (histogram and box plot) and use these displays to answer questions. The student converts the data to percentages in order to compare community times versus national times. The student will use this information to answer a series of questions. The student will use content knowledge of statistics and probability, as well as ratios and proportional relationships to complete these tasks.
Teacher Preparation / Resource Requirements:
Teachers will ask students to gather data from family members, other teachers at the school, or residents of the community to use on this task. Students may work individually or in groups in the data collection for this task. Resources: Materials/time to complete survey; blank grid paper or blank paper to create data displays.
Teacher Responsibilities During Administration:
Monitor individual student work; provide resources as necessary.
Time Requirements: 90-100 minutes across 2 sessions.
Prework: In preparation for this task, teachers can navigate to http://factfinder2.census.gov/faces/tableservices/jsf/pages/productview.xhtml?pid=ACS_10 _1YR_B08303&prodType=table, noting the information and ranges given in the table for use later in the tasks.
Teachers will direct students to the Web site mentioned above and briefly describe the census information. Mention to the students that the data in this table will be used later to complete some tasks. If students ask about the “Margin of Error” column, mention that it will be ignored for the purposes of this exercise. All calculations and comparisons will be based on the “Estimate” column.
Teachers then must assign students the following task as an individual/group/class activity at least 3 days prior to the administration of the performance task:
Teacher says, “Students, together we must survey workers who are 16 years old and older about the amount of time it takes them to travel to work each day. The assignment for each of you is to ask at least two workers who do not work at home to answer this question, “On a typical day, how many minutes does it take you to travel to work?” We will collect all of your results and use the data to create a list, a table, graphs, and then analyze the data.”
Version 1.0
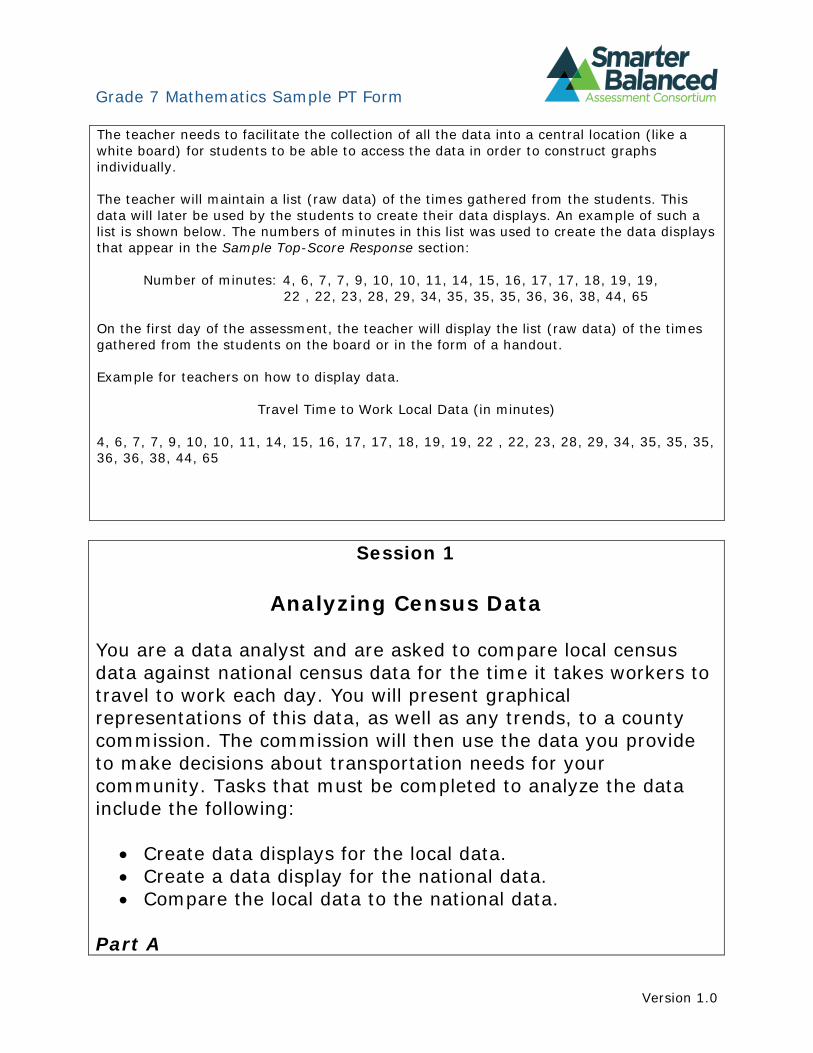
Grade 7 Mathematics Sample PT Form
The teacher needs to facilitate the collection of all the data into a central location (like a white board) for students to be able to access the data in order to construct graphs individually.
The teacher will maintain a list (raw data) of the times gathered from the students. This data will later be used by the students to create their data displays. An example of such a list is shown below. The numbers of minutes in this list was used to create the data displays that appear in the Sample Top-Score Response section:
Number of minutes: 4, 6, 7, 7, 9, 10, 10, 11, 14, 15, 16, 17, 17, 18, 19, 19, 22 , 22, 23, 28, 29, 34, 35, 35, 35, 36, 36, 38, 44, 65
On the first day of the assessment, the teacher will display the list (raw data) of the times gathered from the students on the board or in the form of a handout.
Example for teachers on how to display data.
Travel Time to Work Local Data (in minutes)
4, 6, 7, 7, 9, 10, 10, 11, 14, 15, 16, 17, 17, 18, 19, 19, 22 , 22, 23, 28, 29, 34, 35, 35, 35, 36, 36, 38, 44, 65
Session 1
Analyzing Census Data
You are a data analyst and are asked to compare local census data against national census data for the time it takes workers to travel to work each day. You will present graphical representations of this data, as well as any trends, to a county commission. The commission will then use the data you provide to make decisions about transportation needs for your community. Tasks that must be completed to analyze the data include the following:
• Create data displays for the local data. • Create a data display for the national data. • Compare the local data to the national data.
Part A
Version 1.0
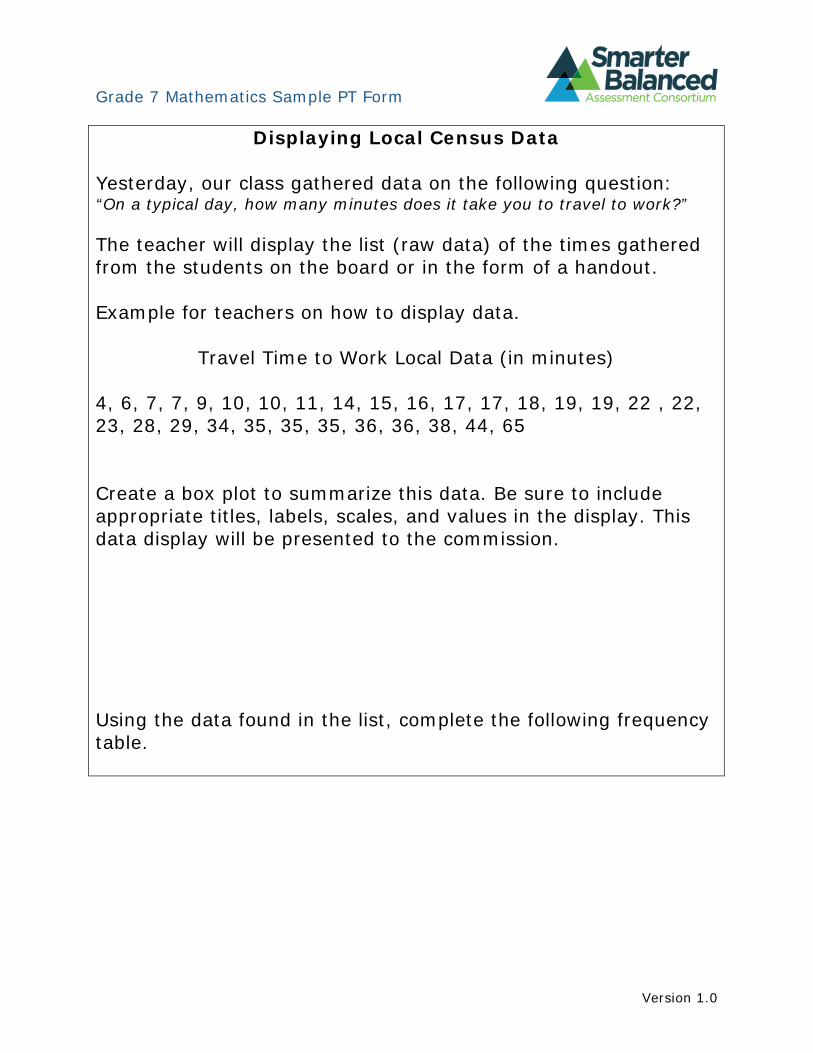
Grade 7 Mathematics Sample PT Form
Displaying Local Census Data
Yesterday, our class gathered data on the following question: “On a typical day, how many minutes does it take you to travel to work?”
The teacher will display the list (raw data) of the times gathered from the students on the board or in the form of a handout.
Example for teachers on how to display data.
Travel Time to Work Local Data (in minutes)
4, 6, 7, 7, 9, 10, 10, 11, 14, 15, 16, 17, 17, 18, 19, 19, 22 , 22, 23, 28, 29, 34, 35, 35, 35, 36, 36, 38, 44, 65
Create a box plot to summarize this data. Be sure to include appropriate titles, labels, scales, and values in the display. This data display will be presented to the commission.
Using the data found in the list, complete the following frequency table.
Version 1.0
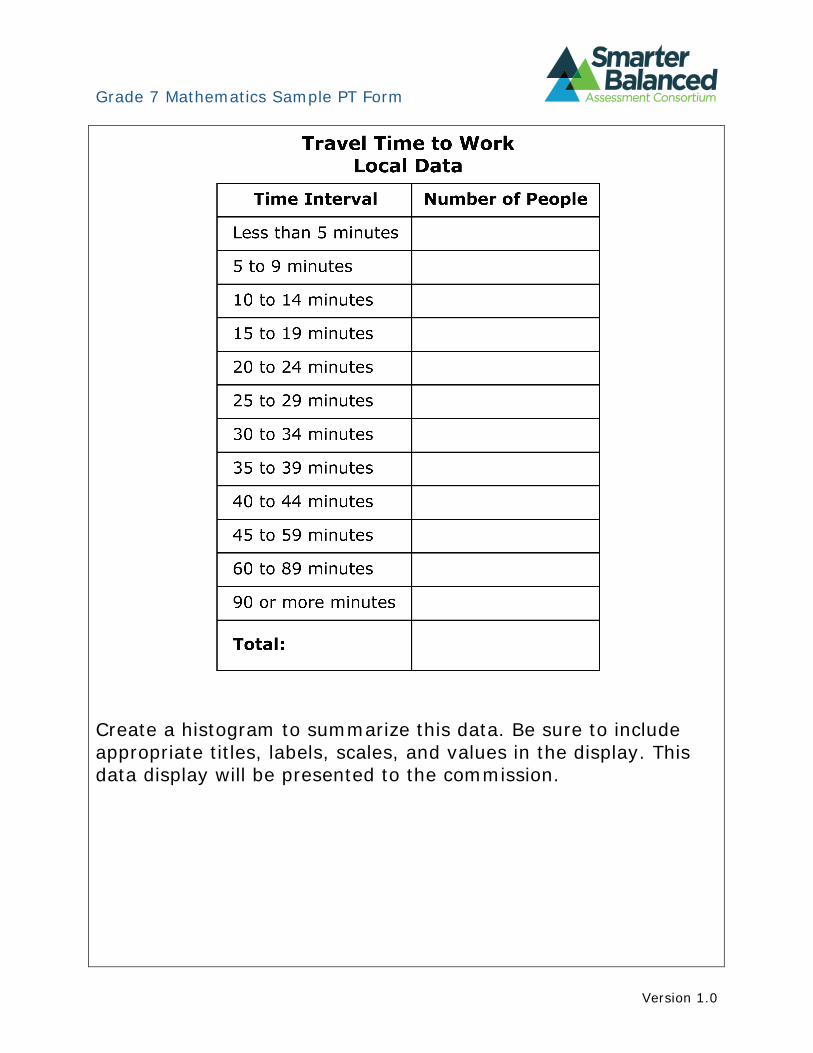
Grade 7 Mathematics Sample PT Form
Create a histogram to summarize this data. Be sure to include appropriate titles, labels, scales, and values in the display. This data display will be presented to the commission.
Version 1.0
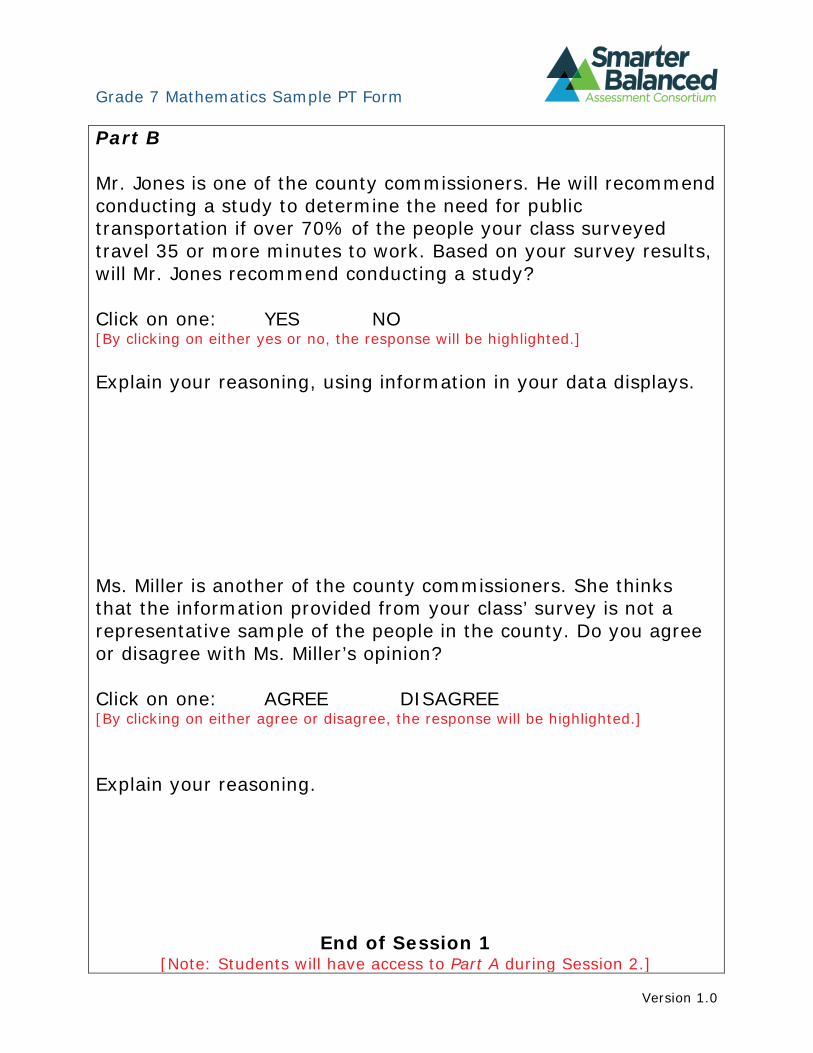
Grade 7 Mathematics Sample PT Form
Part B
Mr. Jones is one of the county commissioners. He will recommend conducting a study to determine the need for public transportation if over 70% of the people your class surveyed travel 35 or more minutes to work. Based on your survey results, will Mr. Jones recommend conducting a study?
Click on one: YES NO [By clicking on either yes or no, the response will be highlighted.]
Explain your reasoning, using information in your data displays.
Ms. Miller is another of the county commissioners. She thinks that the information provided from your class’ survey is not a representative sample of the people in the county. Do you agree or disagree with Ms. Miller’s opinion?
Click on one: AGREE DISAGREE [By clicking on either agree or disagree, the response will be highlighted.]
Explain your reasoning.
End of Session 1 [Note: Students will have access to Part A during Session 2.]
Version 1.0
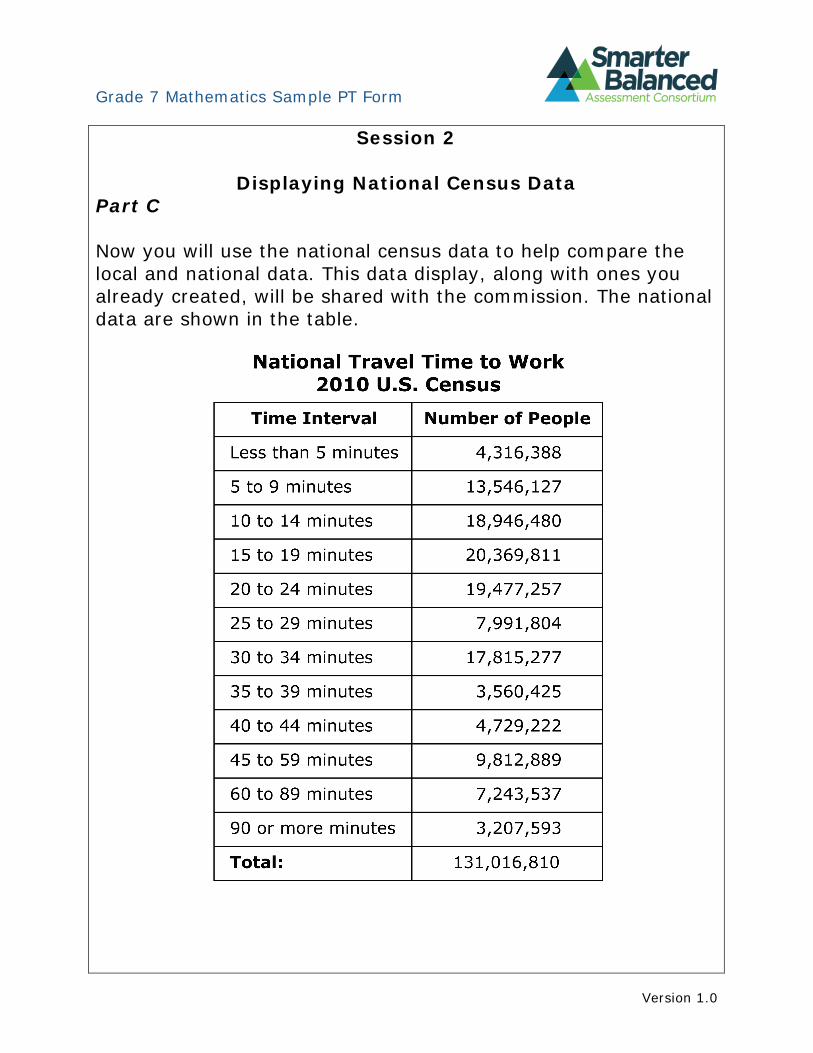
Grade 7 Mathematics Sample PT Form
Session 2
Displaying National Census Data Part C
Now you will use the national census data to help compare the local and national data. This data display, along with ones you already created, will be shared with the commission. The national data are shown in the table.
Version 1.0
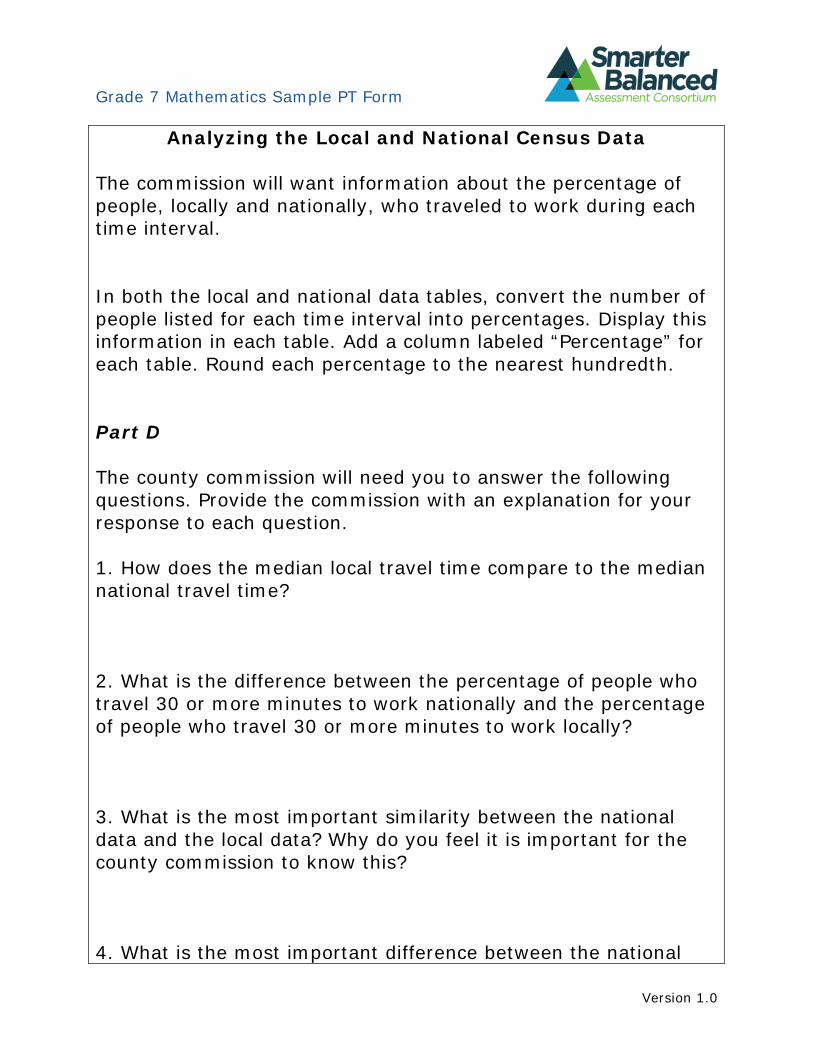
Grade 7 Mathematics Sample PT Form
Analyzing the Local and National Census Data
The commission will want information about the percentage of people, locally and nationally, who traveled to work during each time interval.
In both the local and national data tables, convert the number of people listed for each time interval into percentages. Display this information in each table. Add a column labeled “Percentage” for each table. Round each percentage to the nearest hundredth.
Part D
The county commission will need you to answer the following questions. Provide the commission with an explanation for your response to each question.
1. How does the median local travel time compare to the median national travel time?
2. What is the difference between the percentage of people who travel 30 or more minutes to work nationally and the percentage of people who travel 30 or more minutes to work locally?
3. What is the most important similarity between the national data and the local data? Why do you feel it is important for the county commission to know this?
4. What is the most important difference between the national
Version 1.0
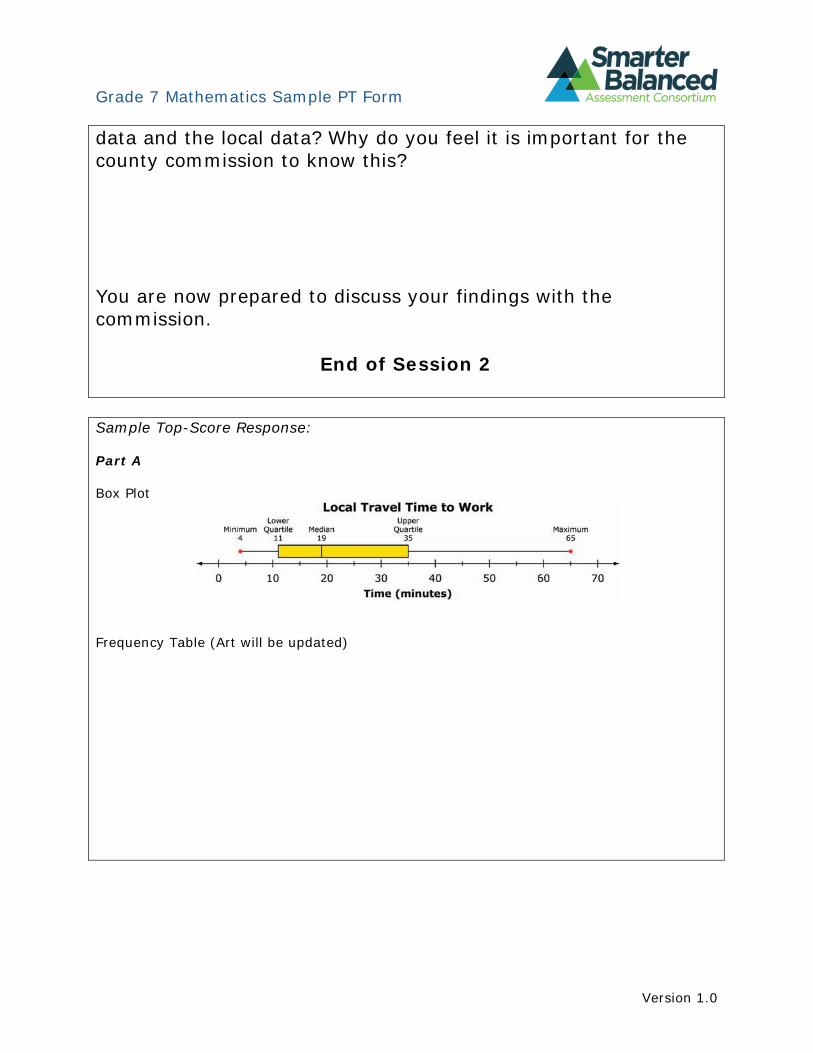
Grade 7 Mathematics Sample PT Form
data and the local data? Why do you feel it is important for the county commission to know this?
You are now prepared to discuss your findings with the commission.
End of Session 2
Sample Top-Score Response:
Part A
Box Plot
Frequency Table (Art will be updated)
Version 1.0
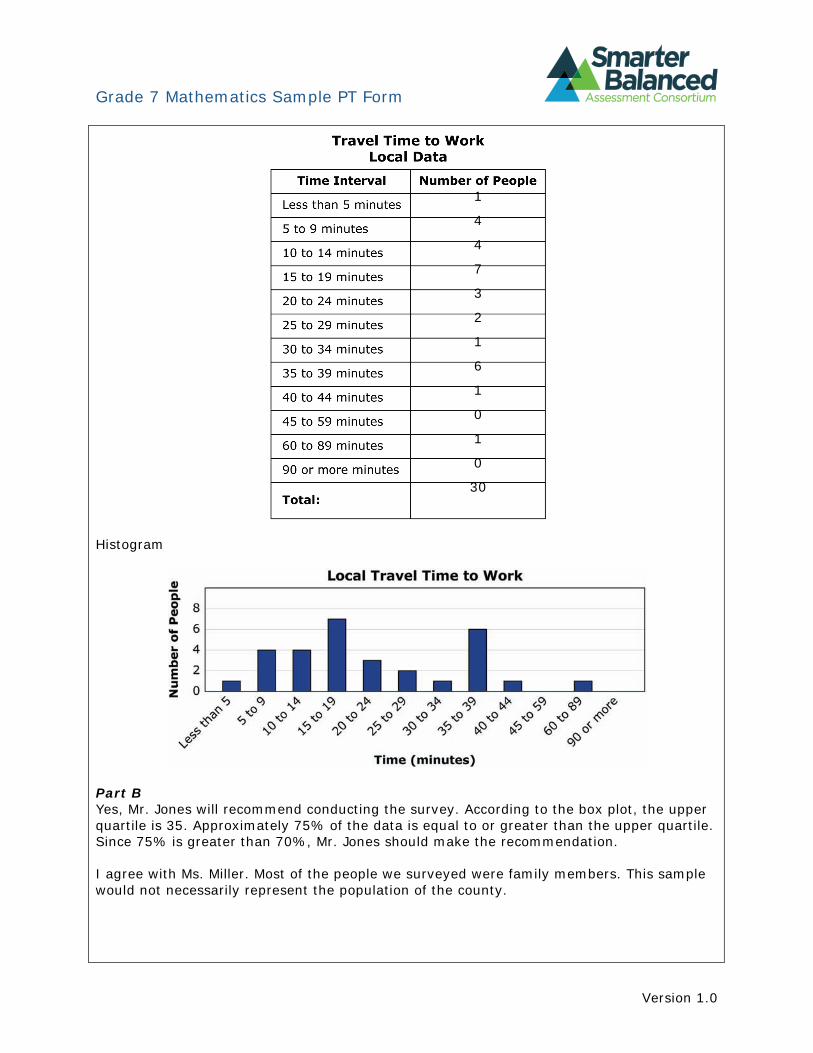
Grade 7 Mathematics Sample PT Form
Histogram
1
4
4
7
3
2
1
6
1
0
1
0
30
Part B Yes, Mr. Jones will recommend conducting the survey. According to the box plot, the upper quartile is 35. Approximately 75% of the data is equal to or greater than the upper quartile. Since 75% is greater than 70%, Mr. Jones should make the recommendation.
I agree with Ms. Miller. Most of the people we surveyed were family members. This sample would not necessarily represent the population of the county.
Version 1.0
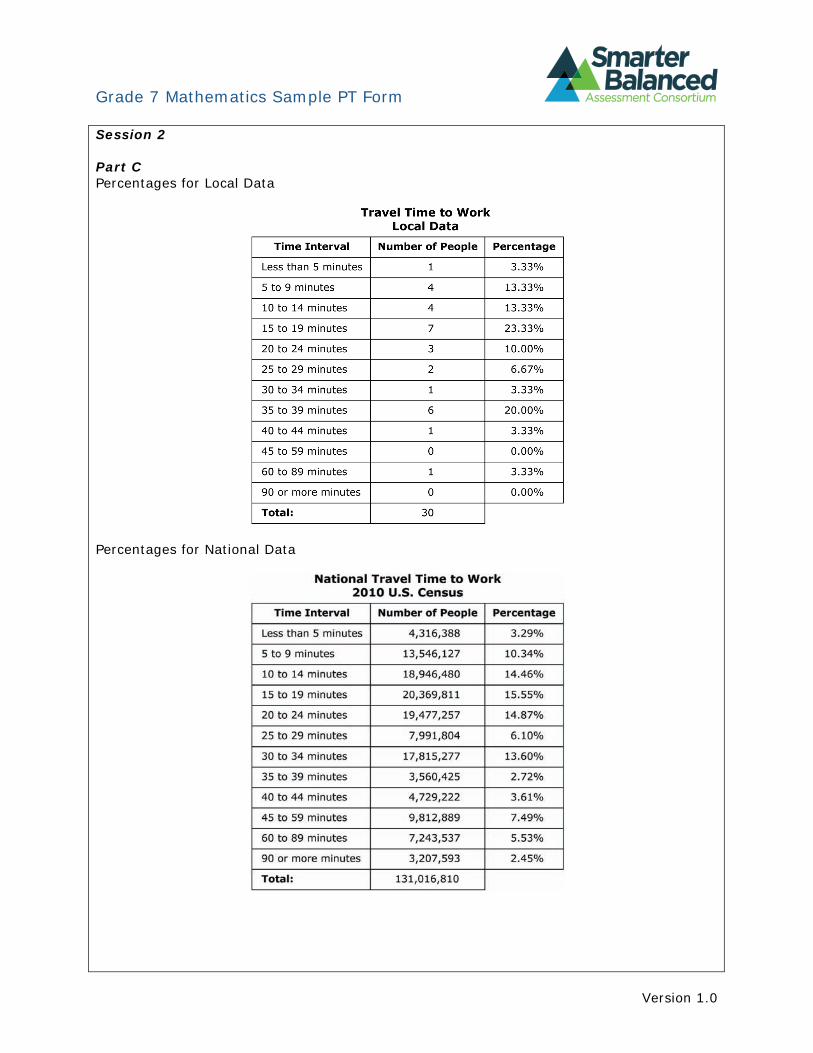
Grade 7 Mathematics Sample PT Form
Session 2
Part C Percentages for Local Data
Percentages for National Data
Version 1.0
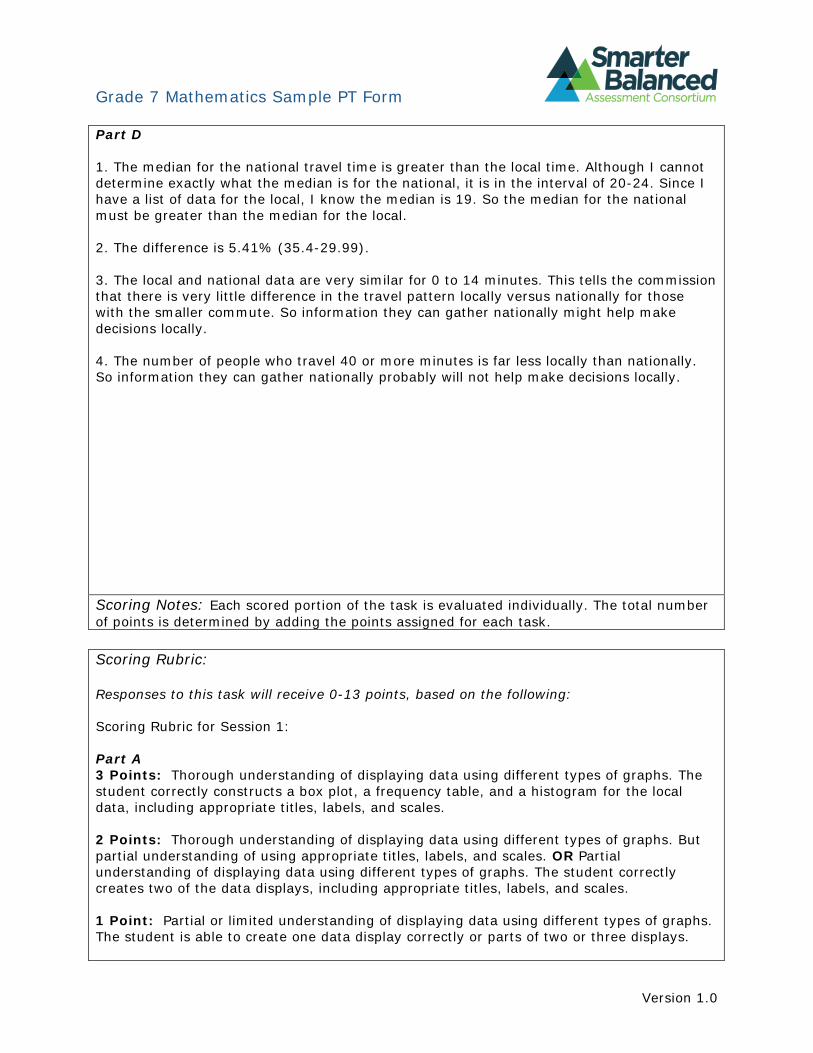
Grade 7 Mathematics Sample PT Form
Part D
1. The median for the national travel time is greater than the local time. Although I cannot determine exactly what the median is for the national, it is in the interval of 20-24. Since I have a list of data for the local, I know the median is 19. So the median for the national must be greater than the median for the local.
2. The difference is 5.41% (35.4-29.99).
3. The local and national data are very similar for 0 to 14 minutes. This tells the commission that there is very little difference in the travel pattern locally versus nationally for those with the smaller commute. So information they can gather nationally might help make decisions locally.
4. The number of people who travel 40 or more minutes is far less locally than nationally. So information they can gather nationally probably will not help make decisions locally.
Scoring Notes: Each scored portion of the task is evaluated individually. The total number of points is determined by adding the points assigned for each task.
Scoring Rubric:
Responses to this task will receive 0-13 points, based on the following:
Scoring Rubric for Session 1:
Part A 3 Points: Thorough understanding of displaying data using different types of graphs. The student correctly constructs a box plot, a frequency table, and a histogram for the local data, including appropriate titles, labels, and scales.
2 Points: Thorough understanding of displaying data using different types of graphs. But partial understanding of using appropriate titles, labels, and scales. OR Partial understanding of displaying data using different types of graphs. The student correctly creates two of the data displays, including appropriate titles, labels, and scales.
1 Point: Partial or limited understanding of displaying data using different types of graphs. The student is able to create one data display correctly or parts of two or three displays.
Version 1.0
Grade 7 Mathematics Sample PT Form
0 Points: Little or no understanding of displaying data using different types of graphs. The student provides incorrect or partial displays for all three displays.
Part B 3 Points: Thorough understanding of using data to draw inferences about a population. Thorough understanding of making conclusions about a population based on random samples. The student completes both sections with correct answers and provides correct explanations as requested.
2 Points: Thorough understanding of using data to draw inferences about a population. But partial understanding of making conclusions about a population based on random samples. The student provides a correct explanation for recommending the survey and agrees with Ms. Miller, but an incomplete explanation for this agreement. OR Thorough understanding of making conclusions about a population based on random samples. But partial understanding of using data to draw inferences about a population. The student provides a correct explanation to decide if the survey is representative and recommends the survey, but an incomplete explanation for this recommendation.
1 Point: Partial or limited understanding of using data to draw inferences about a population. Partial or limited understanding of making conclusions about a population based on random samples. The student provides only one correct answer but with a weak explanation.
0 Points: Little or no understanding of using data to draw inferences about a population. Little or no understanding of making conclusions about a population based on random samples.
Scoring Rubric for Session 2
Part C 2 Points: Thorough understanding of converting values displayed in a table to percentages. The student correctly converts the percentages and displays them in both tables. Two or three minor errors are allowable.
1 Point: Inconsistent understanding of converting values displayed in a table to percentages. The student does not convert all the percentages or makes numerous errors in the conversions.
0 Points: Limited or no understanding of converting values displayed in a table to percentages.
Part D 5 Points: Thorough understanding of drawing informal comparative inferences about two populations. Thorough understanding of computing with multi-digit decimals. The student correctly compares the medians and provides proper justification for a similarity and a difference. The student correctly calculates the difference in the percentages.
4 Points: Thorough understanding of drawing informal comparative inferences about two populations. But limited understanding of computing with multi-digit decimals. The student correctly compares the medians and provides proper justification for a similarity and a difference. The student incorrectly calculates the difference in the percentages. OR Thorough understanding of computing with multi-digit decimals. Inconsistent understanding
Version 1.0
Grade 7 Mathematics Sample PT Form
of drawing informal comparative inferences about two populations. The student correctly calculates the difference in the percentages. The student correctly compares the median but provides either proper justification for a similarity or a difference. OR Thorough understanding of computing with multi-digit decimals. Inconsistent understanding of drawing informal comparative inferences about two populations. The student correctly calculates the difference in the percentages. The student provides proper justification for a similarity and a difference but incorrectly compares the medians.
3 Points: Thorough understanding of computing with multi-digit decimals. But partial understanding of drawing informal comparative inferences about two populations. The student correctly calculates the difference in the percentages. The student provides one correct inference with explanation and one correct inference with weak explanation. OR Inconsistent understanding of drawing informal comparative inferences about two populations. Inconsistent understanding of computing with multi-digit decimals. The student provides proper justification for a similarity or a difference but incorrectly compares the medians. The student calculates the difference in the percentages with one minor error.
2 Points: Inconsistent understanding of drawing informal comparative inferences about two populations. No understanding of computing with multi-digit decimals. The student provides one correct inference with explanation and one correct inference with weak explanation. The student provides an incorrect difference. OR Limited understanding of drawing informal comparative inferences about two populations. Limited understanding of computing with multi-digit decimals. The student provides one correct inference with explanation. The student calculates the difference in the percentages with one minor error.
1 Point: Limited understanding of drawing informal comparative inferences about two populations. No understanding of computing with multi-digit decimals. The student provides one correct inference with explanation. The student provides an incorrect difference. OR Thorough understanding of computing with multi-digit decimals. No understanding of drawing informal comparative inferences about two populations. The student correctly calculates the difference in the percentages. The student does not provide any correct inferences about two populations.
0 Points: Little or no understanding of drawing informal comparative inferences about two populations. Little or no understanding of computing with multi-digit decimals. The student does not provide any correct response.
Version 1.0
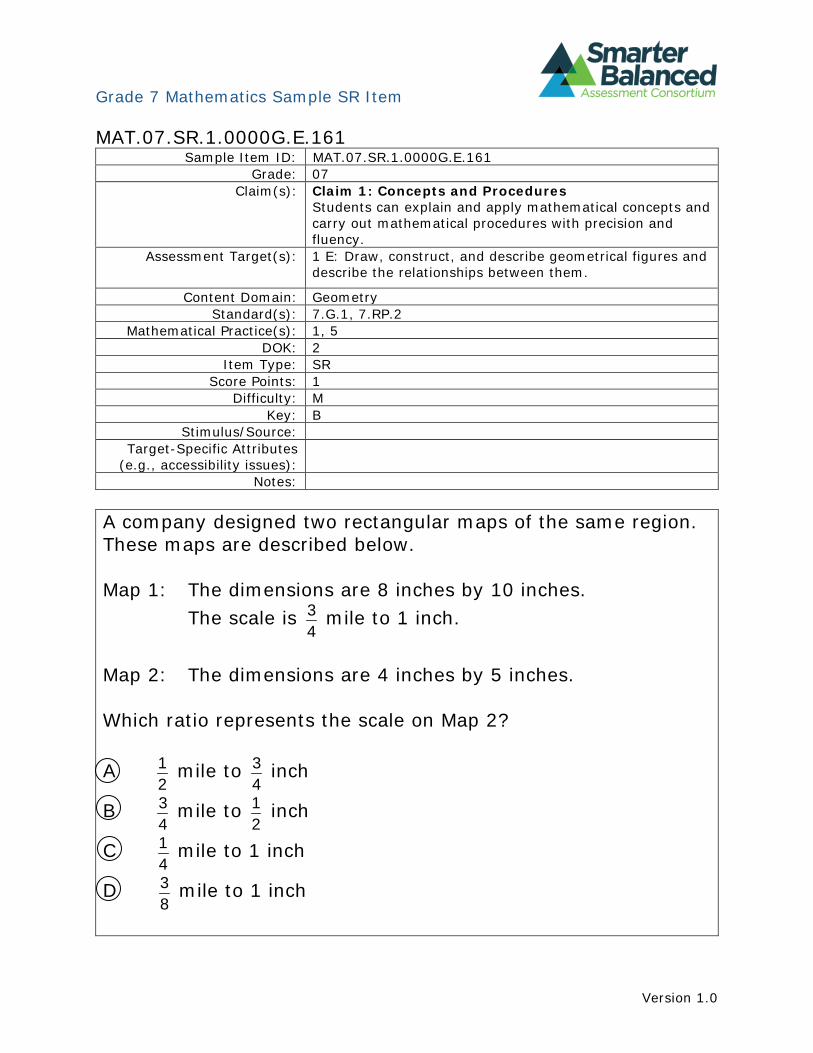
Grade 7 Mathematics Sample SR Item
MAT.07.SR.1.0000G.E.161 Sample Item ID: MAT.07.SR.1.0000G.E.161
Grade: 07 Claim(s): Claim 1: Concepts and Procedures
Students can explain and apply mathematical concepts and carry out mathematical procedures with precision and fluency.
Assessment Target(s): 1 E: Draw, construct, and describe geometrical figures and describe the relationships between them.
Content Domain: Geometry Standard(s): 7.G.1, 7.RP.2
Mathematical Practice(s): 1, 5 DOK: 2
Item Type: SR Score Points: 1
Difficulty: M Key: B
Stimulus/Source: Target-Specific Attributes
(e.g., accessibility issues): Notes:
A company designed two rectangular maps of the same region. These maps are described below.
Map 1: The dimensions are 8 inches by 10 inches. The scale is 3 mile to 1 inch.
4
Map 2: The dimensions are 4 inches by 5 inches.
Which ratio represents the scale on Map 2?
1 mile to 3 inch 2 4
A
B
C
D
3 mile to 1 inch 4 2 1 mile to 1 inch 4 3 mile to 1 inch 8
Version 1.0
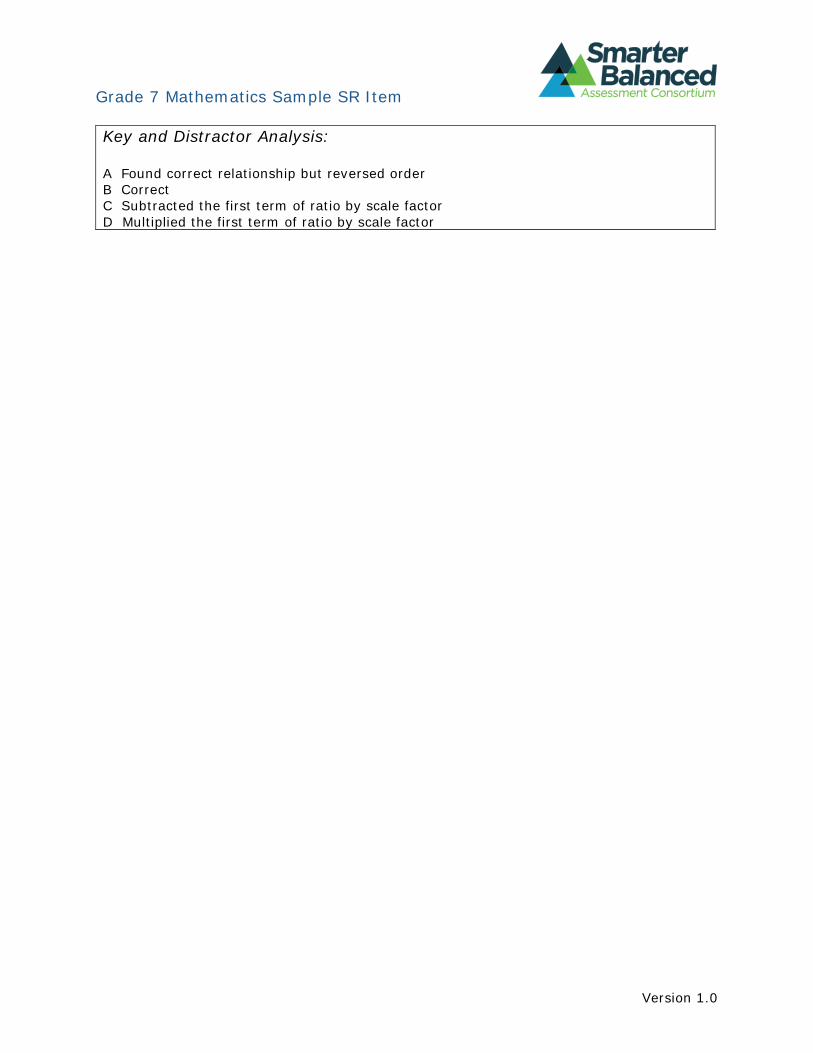
Grade 7 Mathematics Sample SR Item
Key and Distractor Analysis:
A Found correct relationship but reversed order B Correct C Subtracted the first term of ratio by scale factor D Multiplied the first term of ratio by scale factor
Version 1.0
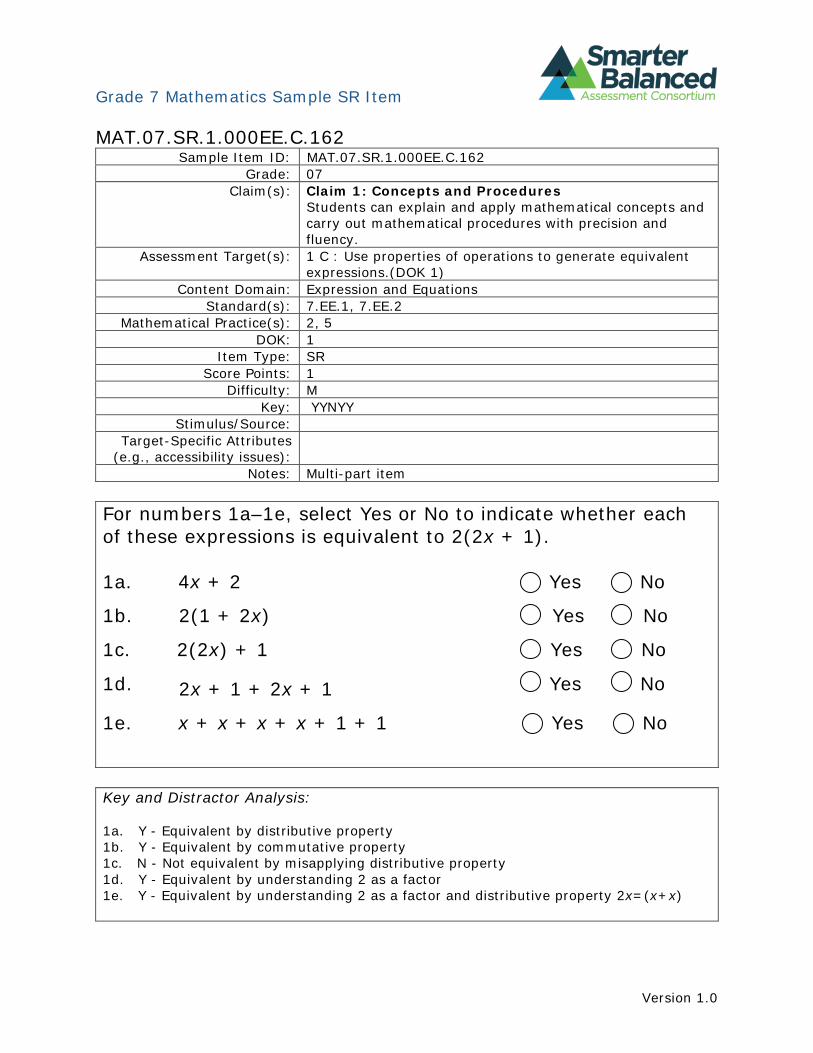
Grade 7 Mathematics Sample SR Item
MAT.07.SR.1.000EE.C.162 Sample Item ID: MAT.07.SR.1.000EE.C.162
Grade: 07 Claim(s): Claim 1: Concepts and Procedures
Students can explain and apply mathematical concepts and carry out mathematical procedures with precision and fluency.
Assessment Target(s): 1 C : Use properties of operations to generate equivalent expressions.(DOK 1)
Content Domain: Expression and Equations Standard(s): 7.EE.1, 7.EE.2
Mathematical Practice(s): 2, 5 DOK: 1
Item Type: SR Score Points: 1
Difficulty: M Key: YYNYY
Stimulus/Source: Target-Specific Attributes
(e.g., accessibility issues): Notes: Multi-part item
For numbers 1a–1e, select Yes or No to indicate whether each of these expressions is equivalent to 2(2x + 1).
1a. 4x + 2 Yes No
1b. 2(1 + 2x) Yes No
1c. 2(2x) + 1 Yes No
1d. Yes No 2x + 1 + 2x + 1
1e. x + x + x + x + 1 + 1 Yes No
Key and Distractor Analysis:
1a. Y - Equivalent by distributive property 1b. Y - Equivalent by commutative property 1c. N - Not equivalent by misapplying distributive property 1d. Y - Equivalent by understanding 2 as a factor 1e. Y - Equivalent by understanding 2 as a factor and distributive property 2x=(x+x)
Version 1.0
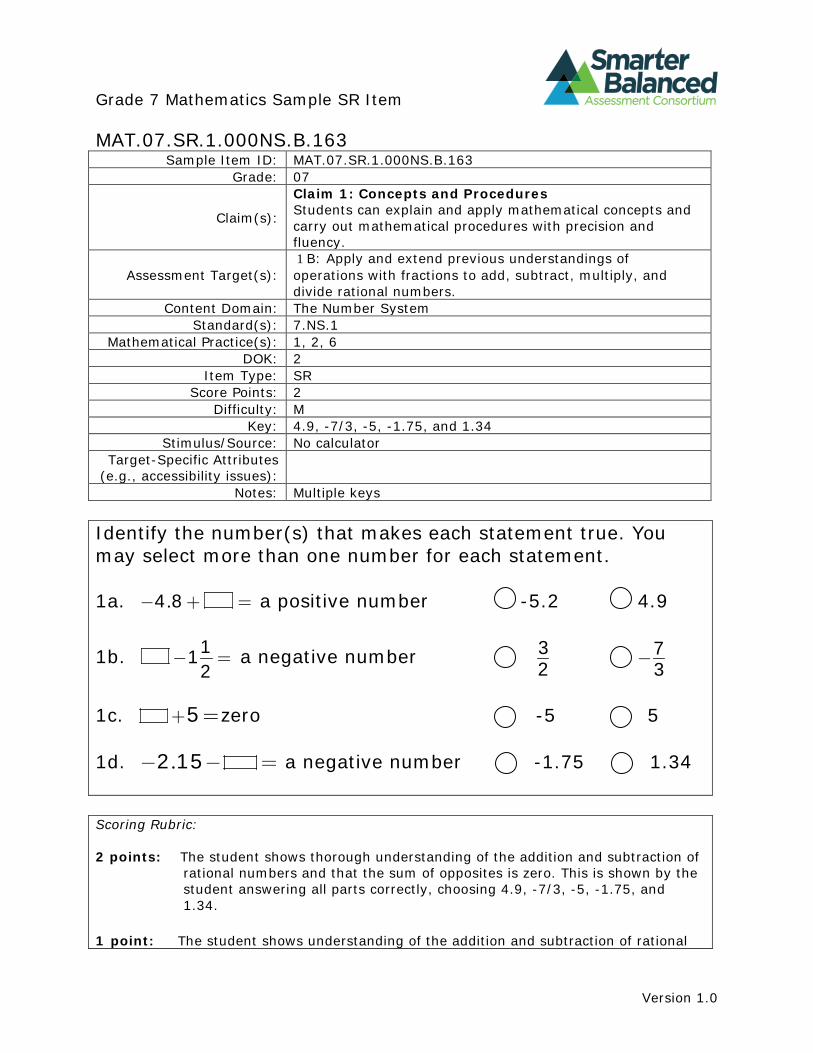
Grade 7 Mathematics Sample SR Item
MAT.07.SR.1.000NS.B.163 Sample Item ID: MAT.07.SR.1.000NS.B.163
Grade: 07
Claim(s):
Claim 1: Concepts and Procedures Students can explain and apply mathematical concepts and carry out mathematical procedures with precision and fluency.
Assessment Target(s): 1 B: Apply and extend previous understandings of operations with fractions to add, subtract, multiply, and divide rational numbers.
Content Domain: The Number System Standard(s): 7.NS.1
Mathematical Practice(s): 1, 2, 6 DOK: 2
Item Type: SR Score Points: 2
Difficulty: M Key: 4.9, -7/3, -5, -1.75, and 1.34
Stimulus/Source: No calculator Target-Specific Attributes
(e.g., accessibility issues): Notes: Multiple keys
73
32
Identify the number(s) that makes each statement true. You may select more than one number for each statement.
1a. . a positive number 4 8 -5.2 4.9
1b. 11 a negative number 2
1c. 5zero -5 5
1d. . a negative number -1.75 1.34 2 15
Scoring Rubric:
2 points: The student shows thorough understanding of the addition and subtraction of rational numbers and that the sum of opposites is zero. This is shown by the student answering all parts correctly, choosing 4.9, -7/3, -5, -1.75, and 1.34.
1 point: The student shows understanding of the addition and subtraction of rational
Version 1.0
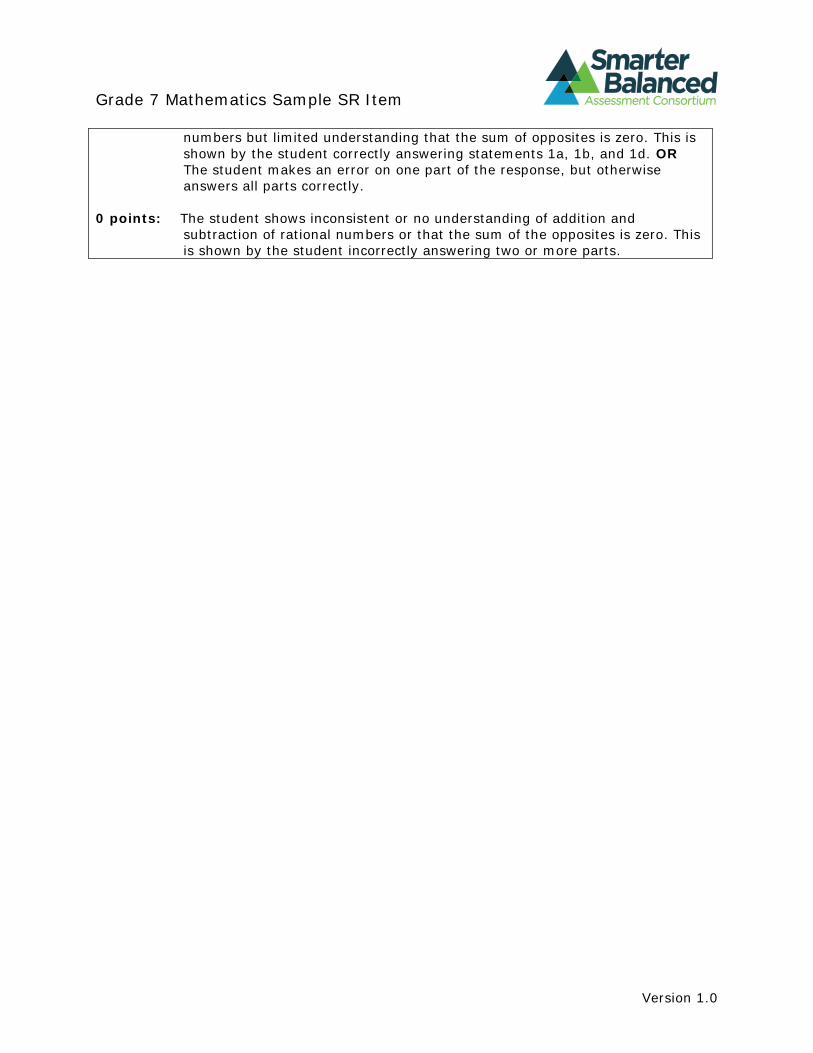
Grade 7 Mathematics Sample SR Item
numbers but limited understanding that the sum of opposites is zero. This is shown by the student correctly answering statements 1a, 1b, and 1d. OR The student makes an error on one part of the response, but otherwise answers all parts correctly.
0 points: The student shows inconsistent or no understanding of addition and subtraction of rational numbers or that the sum of the opposites is zero. This is shown by the student incorrectly answering two or more parts.
Version 1.0
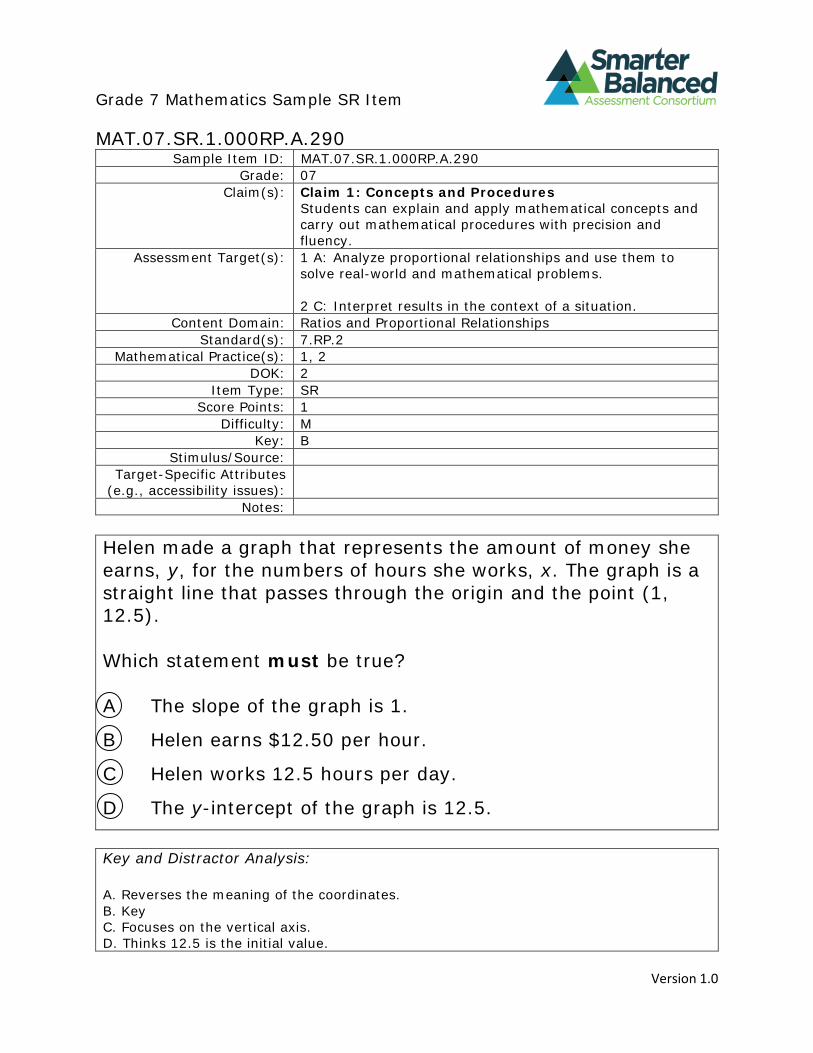
C
Grade 7 Mathematics Sample SR Item
MAT.07.SR.1.000RP.A.290 Sample Item ID: MAT.07.SR.1.000RP.A.290
Grade: 07 Claim(s): Claim 1: Concepts and Procedures
Students can explain and apply mathematical concepts and carry out mathematical procedures with precision and fluency.
Assessment Target(s): 1 A: Analyze proportional relationships and use them to solve real-world and mathematical problems.
2 C: Interpret results in the context of a situation. Content Domain: Ratios and Proportional Relationships
Standard(s): 7.RP.2 Mathematical Practice(s): 1, 2
DOK: 2 Item Type: SR
Score Points: 1 Difficulty: M
Key: B Stimulus/Source:
Target-Specific Attributes (e.g., accessibility issues):
Notes:
Helen made a graph that represents the amount of money she earns, y, for the numbers of hours she works, x. The graph is a straight line that passes through the origin and the point (1, 12.5).
Which statement must be true?
The slope of the graph is 1.
Helen earns $12.50 per hour.
Helen works 12.5 hours per day.
The y-intercept of the graph is 12.5.
A
B
D
Key and Distractor Analysis:
A. Reverses the meaning of the coordinates. B. Key C. Focuses on the vertical axis. D. Thinks 12.5 is the initial value.
Version 1.0
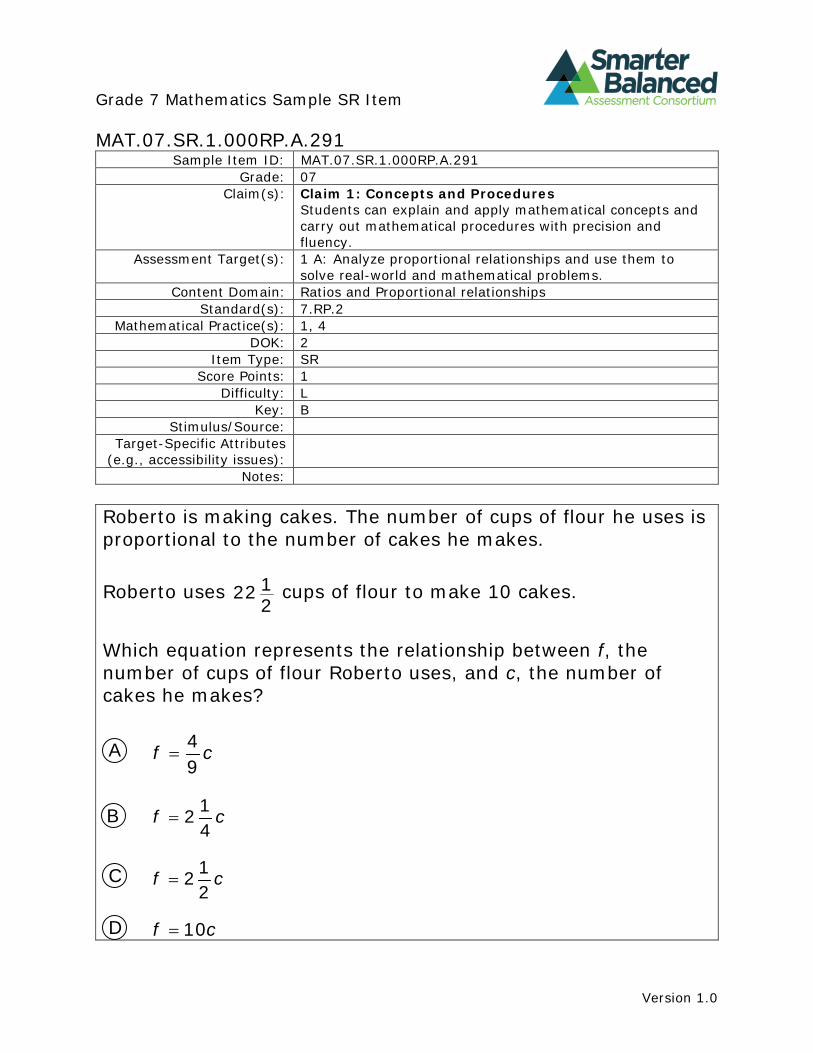
Grade 7 Mathematics Sample SR Item
MAT.07.SR.1.000RP.A.291 Sample Item ID: MAT.07.SR.1.000RP.A.291
Grade: 07 Claim(s): Claim 1: Concepts and Procedures
Students can explain and apply mathematical concepts and carry out mathematical procedures with precision and fluency.
Assessment Target(s): 1 A: Analyze proportional relationships and use them to solve real-world and mathematical problems.
Content Domain: Ratios and Proportional relationships Standard(s): 7.RP.2
Mathematical Practice(s): 1, 4 DOK: 2
Item Type: SR Score Points: 1
Difficulty: L Key: B
Stimulus/Source: Target-Specific Attributes
(e.g., accessibility issues): Notes:
Roberto is making cakes. The number of cups of flour he uses is proportional to the number of cakes he makes.
Roberto uses 22 12
cups of flour to make 10 cakes.
Which equation represents the relationship between f, the number of cups of flour Roberto uses, and c, the number of cakes he makes?
A 4 9
f c=
B 12 4
f c=
C 12 2
f c=
D 10f c=
Version 1.0
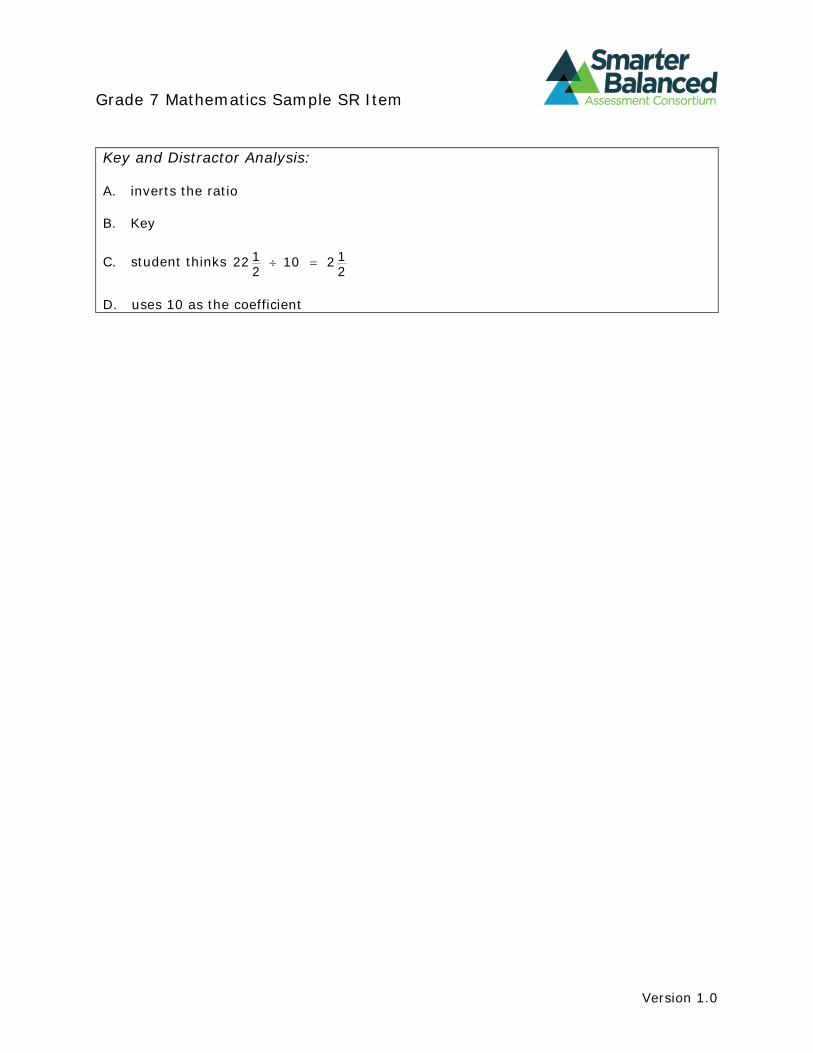
Grade 7 Mathematics Sample SR Item
Key and Distractor Analysis:
A. inverts the ratio
B. Key
1 1C. student thinks 22 ÷ 10 = 22 2
D. uses 10 as the coefficient
Version 1.0
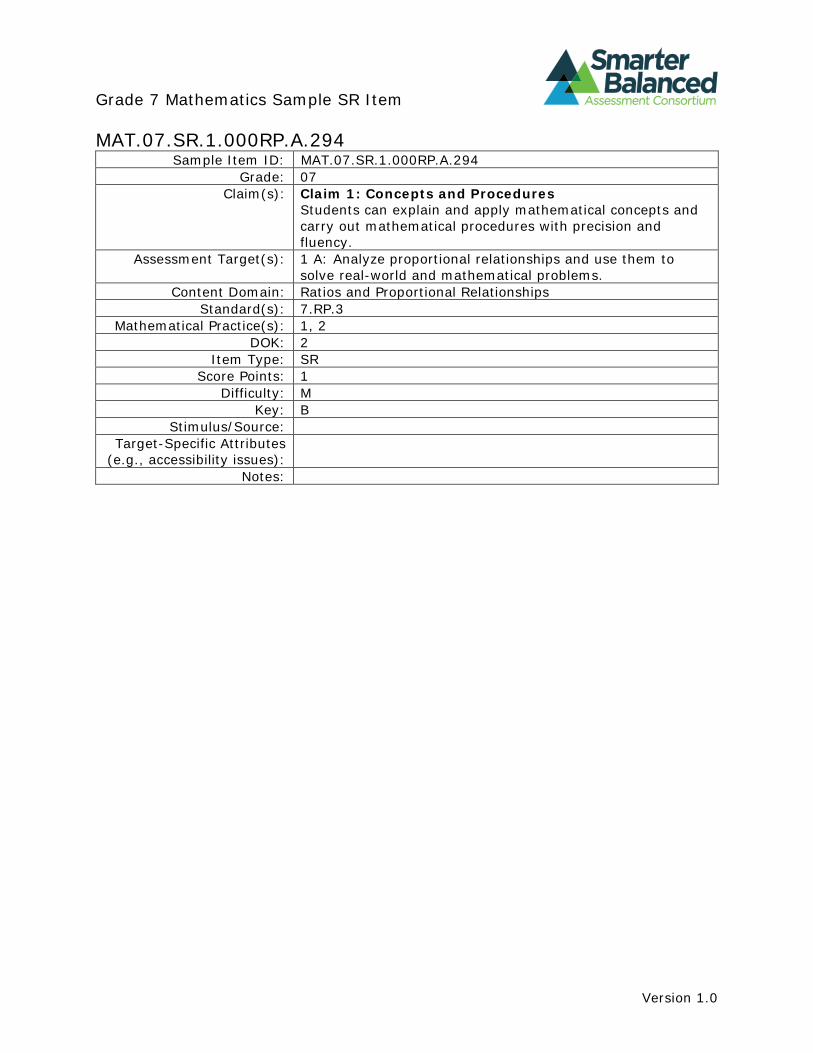
Grade 7 Mathematics Sample SR Item
MAT.07.SR.1.000RP.A.294 Sample Item ID: MAT.07.SR.1.000RP.A.294
Grade: 07 Claim(s): Claim 1: Concepts and Procedures
Students can explain and apply mathematical concepts and carry out mathematical procedures with precision and fluency.
Assessment Target(s): 1 A: Analyze proportional relationships and use them to solve real-world and mathematical problems.
Content Domain: Ratios and Proportional Relationships Standard(s): 7.RP.3
Mathematical Practice(s): 1, 2 DOK: 2
Item Type: SR Score Points: 1
Difficulty: M Key: B
Stimulus/Source: Target-Specific Attributes
(e.g., accessibility issues): Notes:
Version 1.0
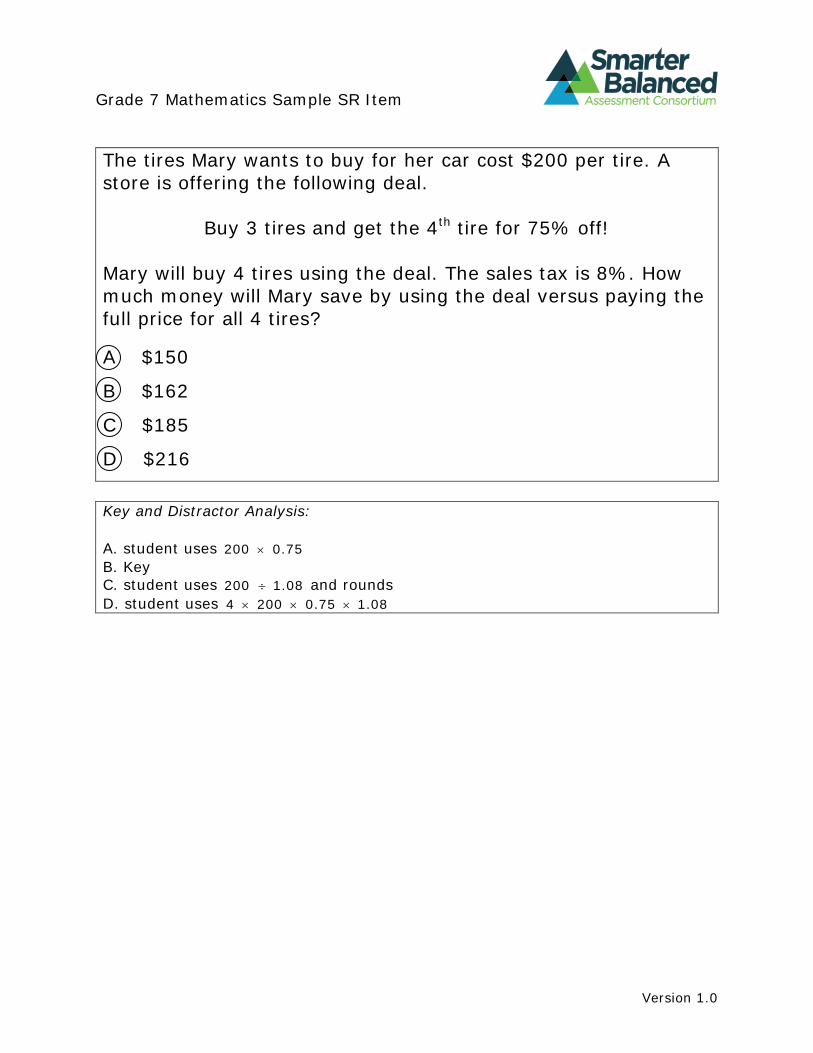
C
Grade 7 Mathematics Sample SR Item
The tires Mary wants to buy for her car cost $200 per tire. A store is offering the following deal.
Buy 3 tires and get the 4th tire for 75% off!
Mary will buy 4 tires using the deal. The sales tax is 8%. How much money will Mary save by using the deal versus paying the full price for all 4 tires?
A
B
D
$150
$162
$185
$216
Key and Distractor Analysis:
A. student uses 200 × 0.75 B. Key C. student uses 200 ÷ 1.08 and rounds D. student uses 4 × 200 × 0.75 × 1.08
Version 1.0
Grade 7 Mathematics Sample SR Item
MAT.07.SR.1.000SP.G.289 Sample Item ID: MAT.07.SR.1.000SP.G.289
Grade: 07 Claim(s): Claim 1: Concepts and Procedures
Students can explain and apply mathematical concepts and carry out mathematical procedures with precision and fluency.
Assessment Target(s): 1 G: Use random sampling to draw inferences about a population.
Content Domain: Statistics and Probability Standard(s): 7.SP.1
Mathematical Practice(s): 1, 2, 3 DOK: 2
Item Type: SR Score Points: 1
Difficulty: M Key: C
Stimulus/Source: Data table Target-Specific Attributes
(e.g., accessibility issues): Notes:
Version 1.0
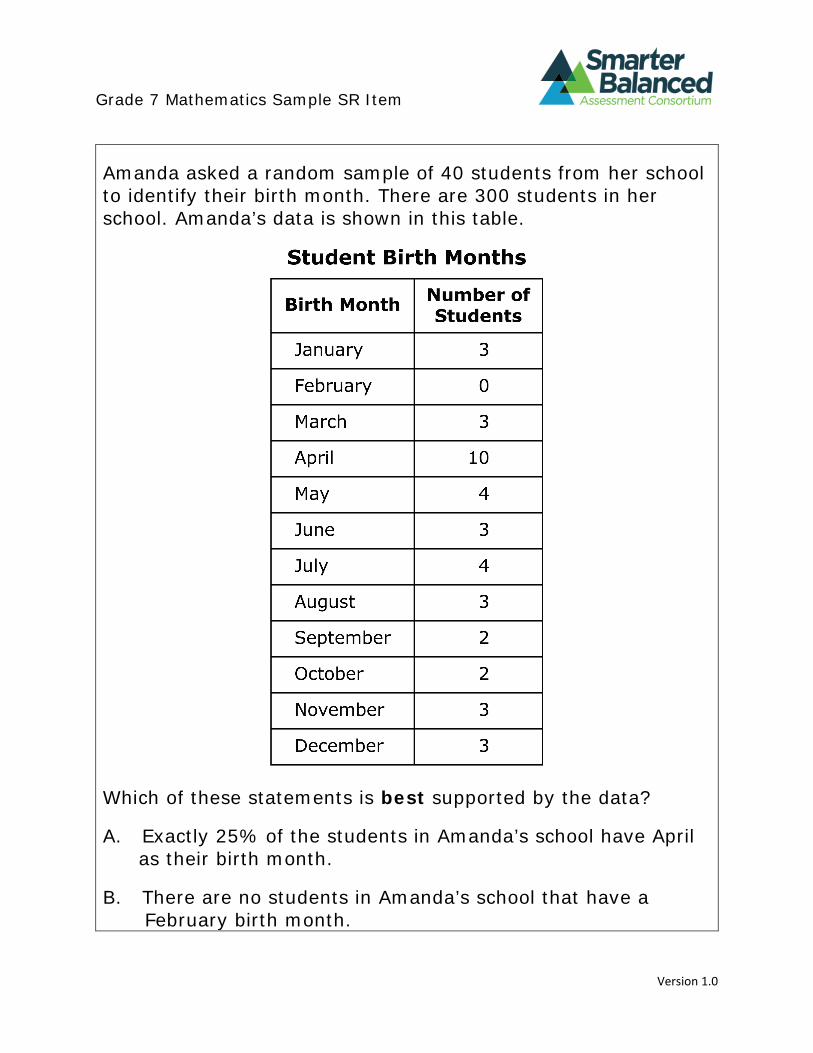
Grade 7 Mathematics Sample SR Item
Amanda asked a random sample of 40 students from her school to identify their birth month. There are 300 students in her school. Amanda’s data is shown in this table.
Which of these statements is best supported by the data?
A. Exactly 25% of the students in Amanda’s school have April as their birth month.
B. There are no students in Amanda’s school that have a February birth month.
Version 1.0
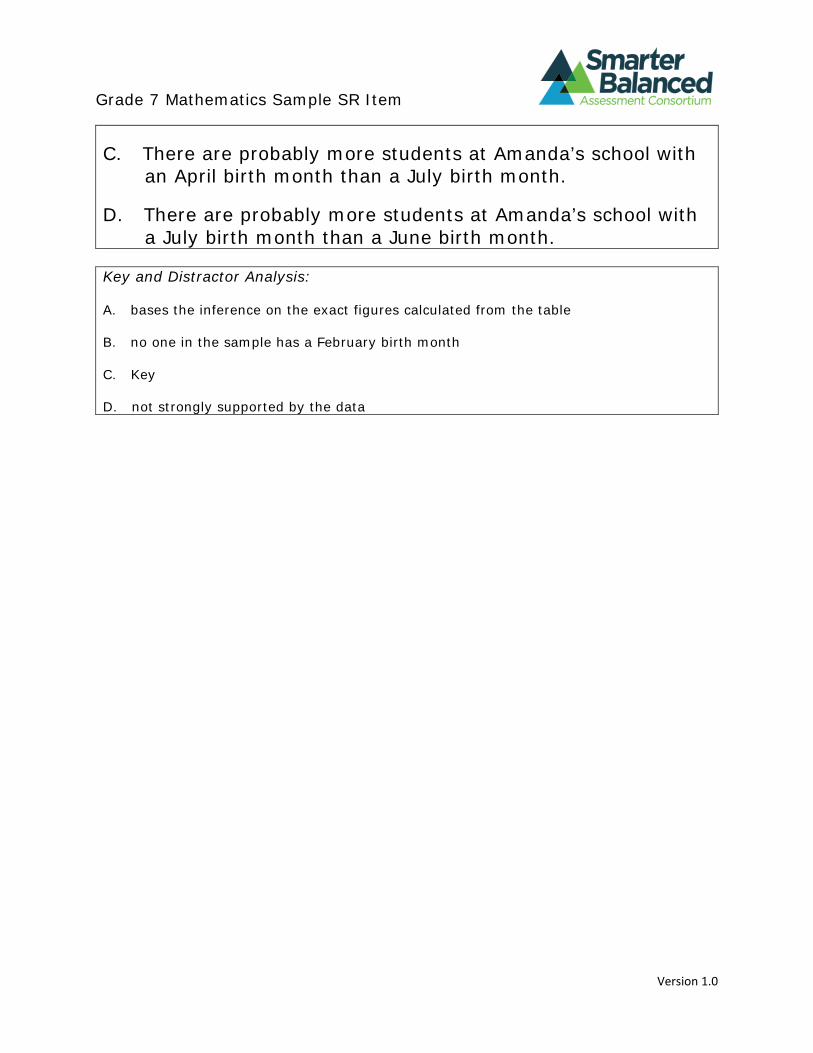
Grade 7 Mathematics Sample SR Item
C. There are probably more students at Amanda’s school with an April birth month than a July birth month.
D. There are probably more students at Amanda’s school with a July birth month than a June birth month.
Key and Distractor Analysis:
A. bases the inference on the exact figures calculated from the table
B. no one in the sample has a February birth month
C. Key
D. not strongly supported by the data
Version 1.0
Grade 7 Mathematics Sample SR Item
MAT.07.SR.1.000SP.H.164 Sample Item ID: MAT.07.SR.1.000SP.H.164
Grade: 07
Claim(s):
Claim 1: Concepts and Procedures Students can explain and apply mathematical concepts and carry out mathematical procedures with precision and fluency.
Assessment Target(s): 1 H: Draw informal comparative inferences about two populations.
Content Domain: Statistics and Probability Standard(s): 7.SP.4
Mathematical Practice(s): 2, 3, 5 DOK: 2
Item Type: SR Score Points: 1
Difficulty: M Key: B
Stimulus/Source: Target-Specific Attributes
(e.g., accessibility issues): Notes:
Version 1.0
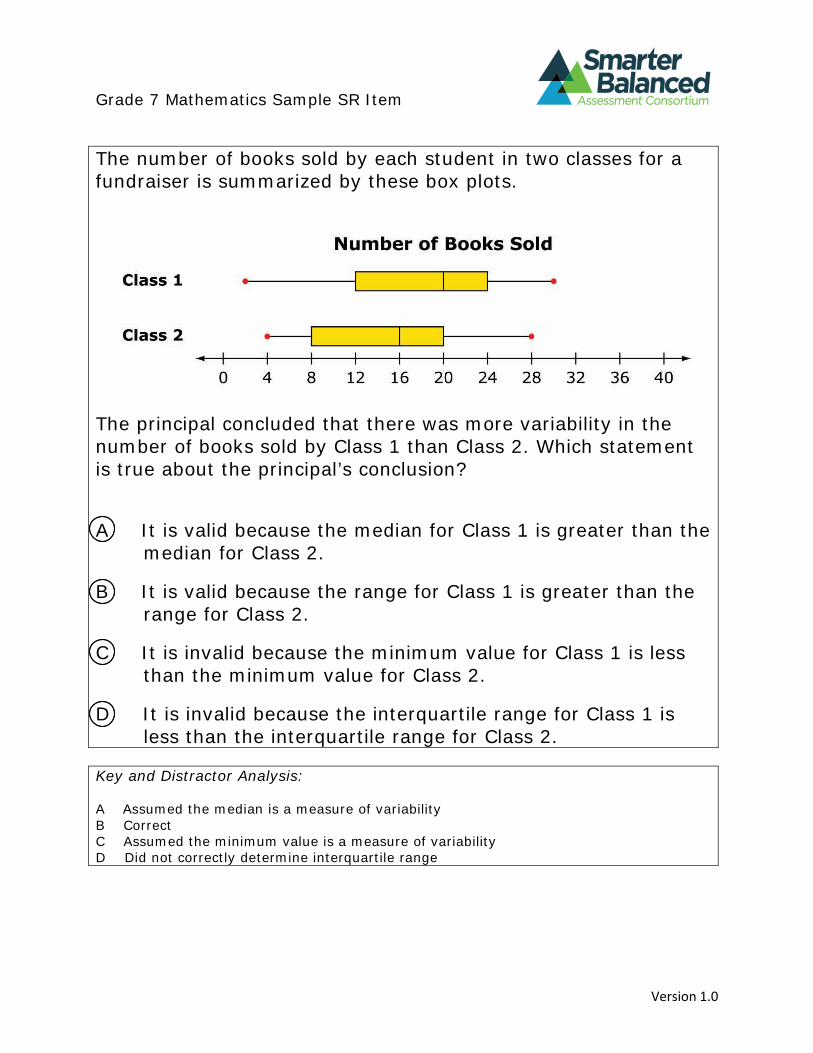
Grade 7 Mathematics Sample SR Item
The number of books sold by each student in two classes for a fundraiser is summarized by these box plots.
The principal concluded that there was more variability in the number of books sold by Class 1 than Class 2. Which statement is true about the principal’s conclusion?
A
B
C
D
It is valid because the median for Class 1 is greater than the median for Class 2.
It is valid because the range for Class 1 is greater than the range for Class 2.
It is invalid because the minimum value for Class 1 is less than the minimum value for Class 2.
It is invalid because the interquartile range for Class 1 is less than the interquartile range for Class 2.
Key and Distractor Analysis:
A Assumed the median is a measure of variability B Correct C Assumed the minimum value is a measure of variability D Did not correctly determine interquartile range
Version 1.0
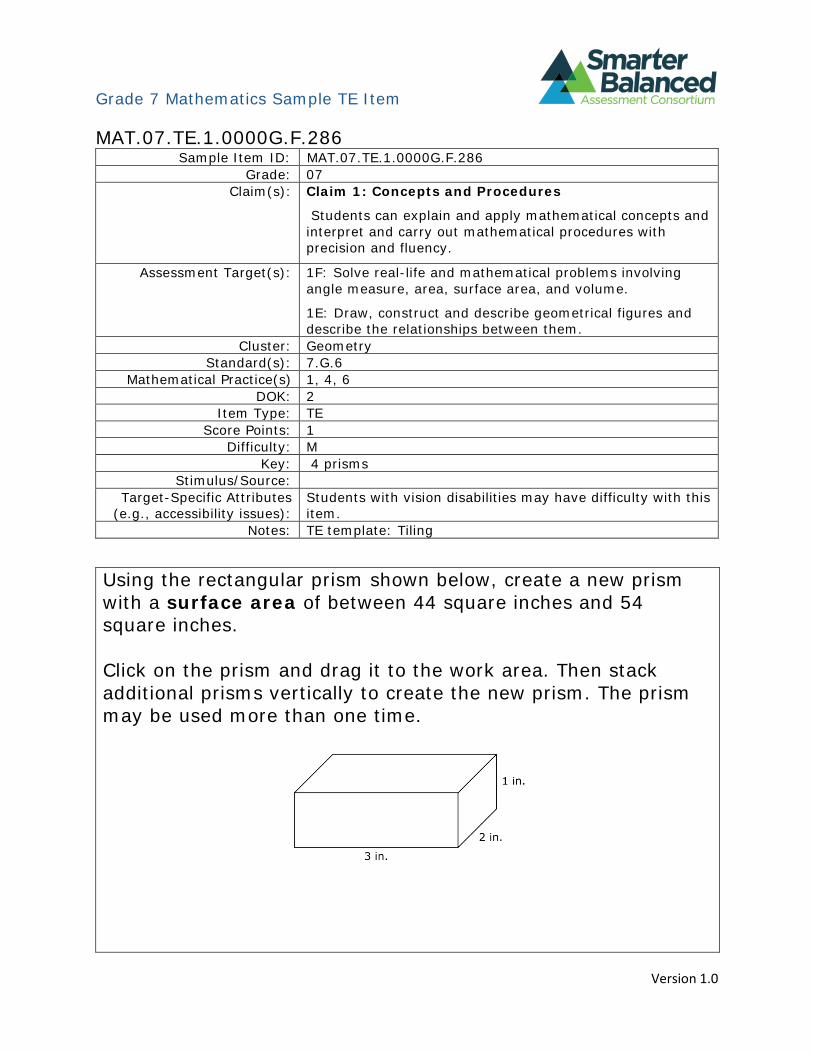
Grade 7 Mathematics Sample TE Item
MAT.07.TE.1.0000G.F.286 Sample Item ID: MAT.07.TE.1.0000G.F.286
Grade: 07 Claim(s): Claim 1: Concepts and Procedures
Students can explain and apply mathematical concepts and interpret and carry out mathematical procedures with precision and fluency.
Assessment Target(s): 1F: Solve real-life and mathematical problems involving angle measure, area, surface area, and volume.
1E: Draw, construct and describe geometrical figures and describe the relationships between them.
Cluster: Geometry Standard(s): 7.G.6
Mathematical Practice(s) 1, 4, 6 DOK: 2
Item Type: TE Score Points: 1
Difficulty: M Key: 4 prisms
Stimulus/Source: Target-Specific Attributes
(e.g., accessibility issues): Students with vision disabilities may have difficulty with this item.
Notes: TE template: Tiling
Using the rectangular prism shown below, create a new prism with a surface area of between 44 square inches and 54 square inches.
Click on the prism and drag it to the work area. Then stack additional prisms vertically to create the new prism. The prism may be used more than one time.
Version 1.0
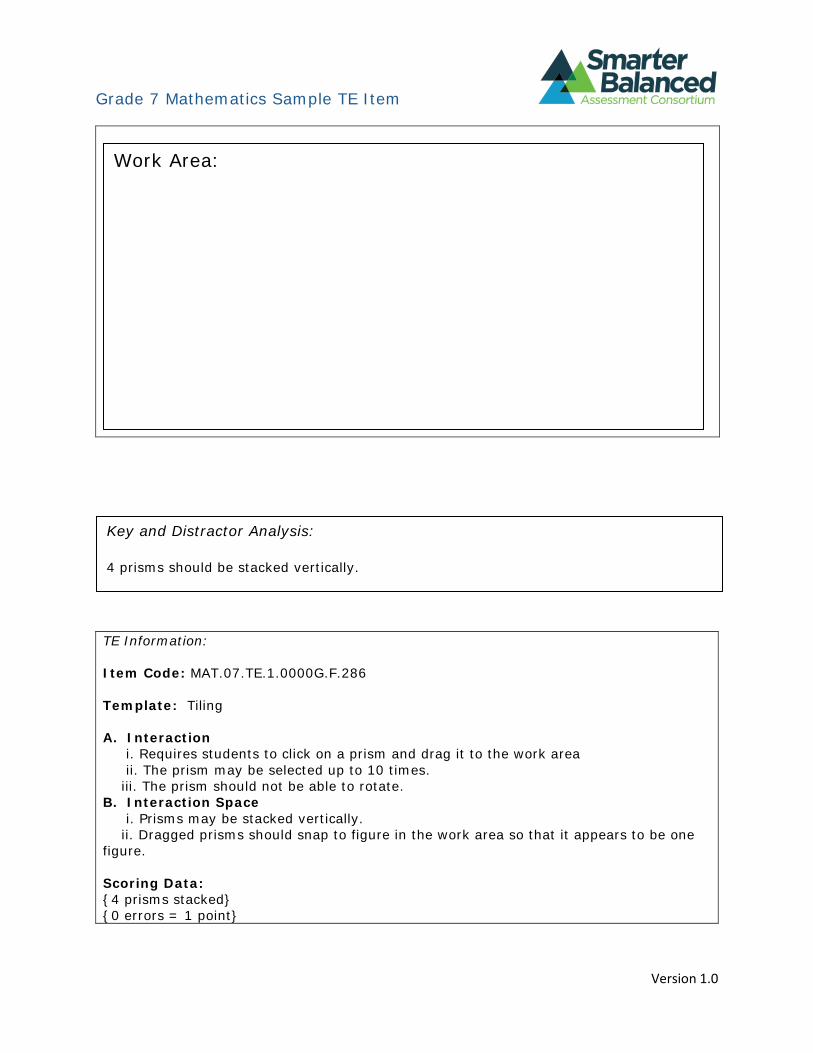
Grade 7 Mathematics Sample TE Item
Work Area:
Key and Distractor Analysis:
4 prisms should be stacked vertically.
TE Information:
Item Code: MAT.07.TE.1.0000G.F.286
Template: Tiling
A. Interaction i. Requires students to click on a prism and drag it to the work area ii. The prism may be selected up to 10 times. iii. The prism should not be able to rotate.
B. Interaction Space i. Prisms may be stacked vertically. ii. Dragged prisms should snap to figure in the work area so that it appears to be one
figure.
Scoring Data: {4 prisms stacked} {0 errors = 1 point}
Version 1.0

Grade 7 Mathematics Sample TE Item
MAT.07.TE.1.000RP.A.287 Sample Item ID: MAT.07.TE.1.000RP.A.287
Grade: 07
Claim(s):
Claim 1: Concepts and Procedures Students can explain and apply mathematical concepts and carry out mathematical procedures with precision and fluency.
Assessment Target(s): 1 A: Analyze proportional relationships and use them to solve real-world and mathematical problems.
Content Domain: Ratios and Proportional Relationships Standard(s): 7.RP.2
Mathematical Practice(s): 2, 4, 5 DOK: 2
Item Type: TE Score Points: 1
Difficulty: M Key: Graph of y=2x
Stimulus/Source: Target-Specific Attributes
(e.g., accessibility issues): Notes: TE Template: Single Line
Version 1.0
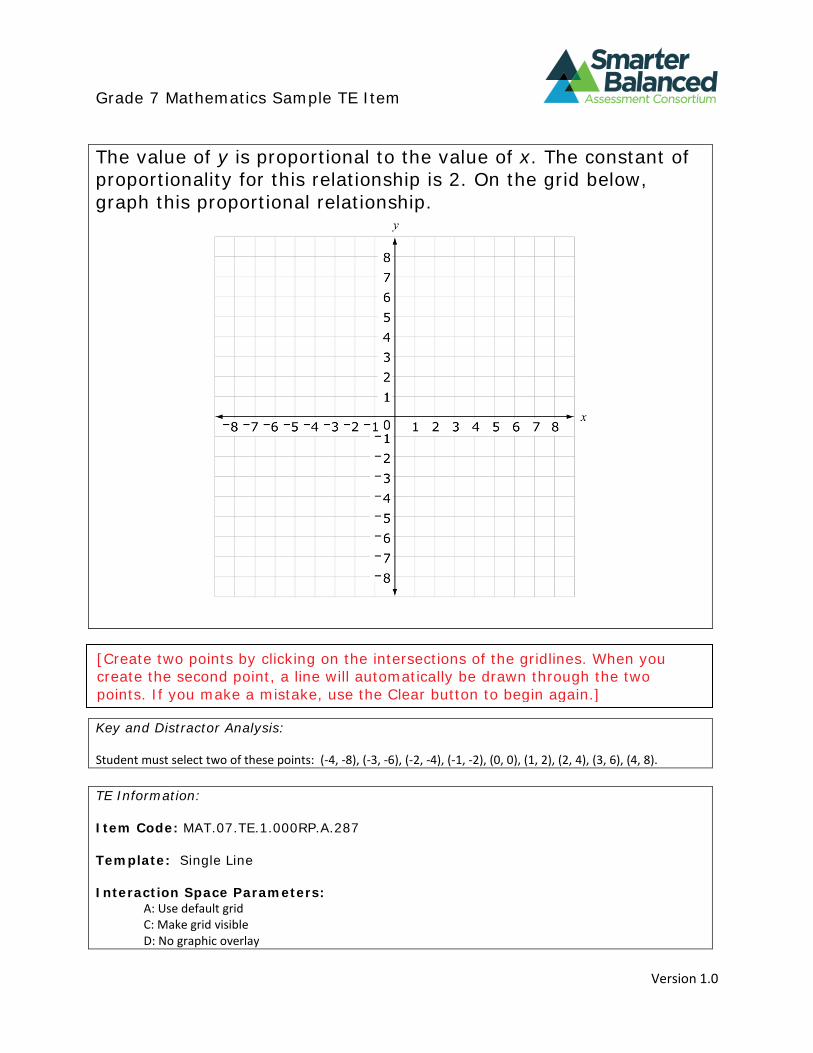
Grade 7 Mathematics Sample TE Item
The value of y is proportional to the value of x. The constant of proportionality for this relationship is 2. On the grid below, graph this proportional relationship.
[Create two points by clicking on the intersections of the gridlines. When you create the second point, a line will automatically be drawn through the two points. If you make a mistake, use the Clear button to begin again.]
Key and Distractor Analysis:
Student must select two of these points: (-4, -8), (-3, -6), (-2, -4), (-1, -2), (0, 0), (1, 2), (2, 4), (3, 6), (4, 8).
TE Information:
Item Code: MAT.07.TE.1.000RP.A.287
Template: Single Line
Interaction Space Parameters: A: Use default grid C: Make grid visible D: No graphic overlay
Version 1.0
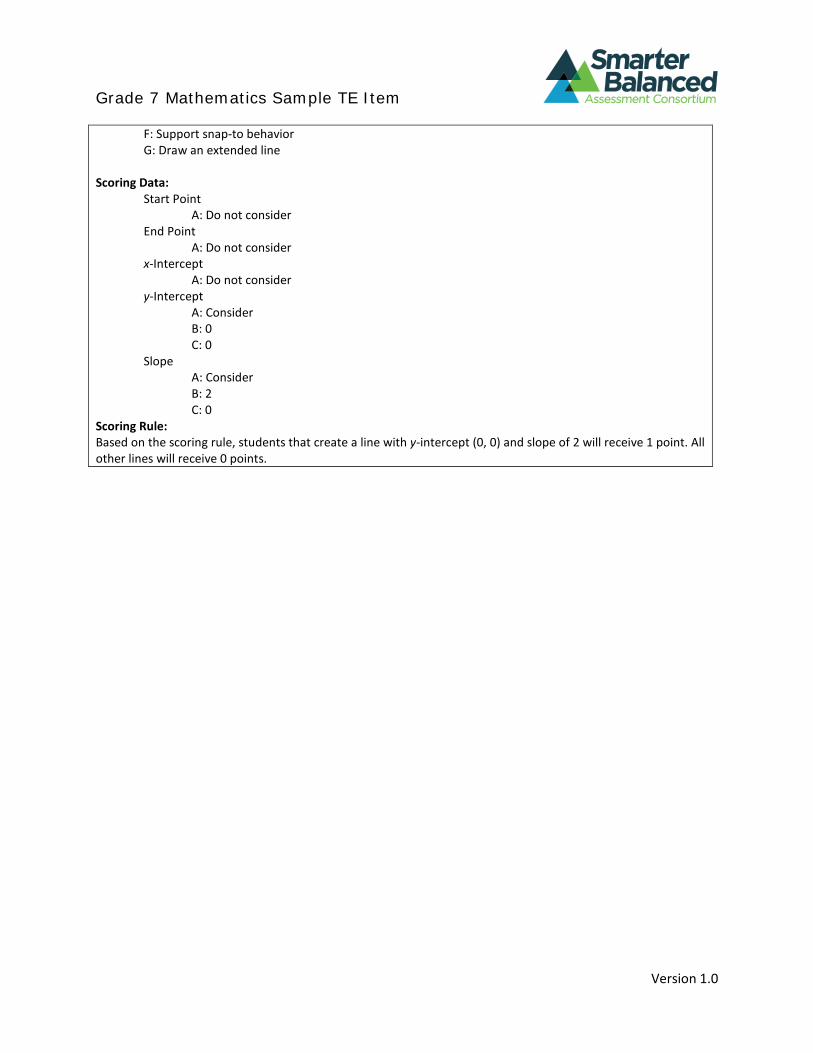
Grade 7 Mathematics Sample TE Item
F: Support snap-to behavior G: Draw an extended line
Scoring Data: Start Point
A: Do not consider End Point
A: Do not consider x-Intercept
A: Do not consider y-Intercept
A: Consider B: 0 C: 0
Slope A: Consider B: 2 C: 0
Scoring Rule: Based on the scoring rule, students that create a line with y-intercept (0, 0) and slope of 2 will receive 1 point. All other lines will receive 0 points.
Version 1.0