Embed Size (px)
Citation preview

89 BEECHWOOD AVENUE
Functional Servicing and
Stormwater Management Report
Project Location: 89 Beechwood Avenue
Guelph, Ontario
Prepared for: 89 Beechwood Inc.
c/o Acorn Developments Guelph, ON N1G 4P5
Prepared by: MTE Consultants Inc.
520 Bingemans Centre Drive Kitchener, ON N2B 3X9
July 7, 2017
MTE File No.: 42186-100
TABLE OF CONTENTS
1.0 INTRODUCTION ................................................................................................... 1
2.0 EXISTING CONDITIONS ...................................................................................... 1
2.1 EXISTING TOPOGRAPHY ........................................................................................ 1 2.2 EXISTING SERVICING ............................................................................................ 3
2.2.1 Water ........................................................................................................... 3 2.2.2 Sanitary ....................................................................................................... 3
2.2.3 Storm ........................................................................................................... 3
2.3 EXISTING SOILS INFORMATION ............................................................................... 3 2.4 REVIEWING AGENCIES .......................................................................................... 4
3.0 PROPOSED GRADING AND SERVICING STRATEGY ...................................... 4
3.1 PROPOSED GRADING ............................................................................................ 4 3.2 PROPOSED SERVICING .......................................................................................... 4
3.2.1 Water ........................................................................................................... 4 3.2.2 Sanitary ....................................................................................................... 5 3.2.3 Storm ........................................................................................................... 5
4.0 CONCEPTUAL STORM WATER MANAGEMENT DESIGN ................................ 8
4.1 SWM CRITERIA .................................................................................................... 8
4.2 WATER QUANTITY CONTROL ................................................................................. 8 4.3 WATER QUALITY CONTROL ................................................................................. 11
4.4 WATER BALANCE ANALYSIS ................................................................................ 11 4.4.1 Surface Runoff & Evapotranspiration ........................................................ 14
4.4.2 Infiltration ................................................................................................... 15
4.5 EROSION & SEDIMENT CONTROL ......................................................................... 17
5.0 CONCLUSIONS .................................................................................................. 17
FIGURES
FIGURE 1.0 SITE LOCATION PLAN ........................................................................ 2
FIGURE 2.0 CONCEPTUAL GRADING DESIGN ..................................................... 6 FIGURE 3.0 CONCEPTUAL SERVICING DESIGN .................................................. 7 FIGURE 4.0 PRE-DEVELOPMENT SWM CATCHMENT AREA .............................. 9
FIGURE 5.0 POST-DEVELOPMENT SWM CATCHMENT AREA .......................... 10
FIGURE 6.0 PRE DEVELOPMENT WATER BALANCE ........................................ 12 FIGURE 7.0 POST DEVELOPMENT WATER BALANCE ...................................... 13 FIGURE 8.0 MONTHLY SURFACE RUNOFF AND INFILTRATION VOLUMES….16
M:\42186\100\Reports\MTE Reports\42186-100_rpt_2017-07-07_FSR.docx
TABLES
TABLE 4.1 CATCHMENT PARAMETERS ............................................................. 8
TABLE 4.2 SUMMARY OF FLOWS ..................................................................... 11
TABLE 4.3 PRE-DEVELOPMENT WATER BALANCE ........................................ 11
TABLE 4.4 POST-DEVELOPMENT WATER BALANCE ...................................... 14
TABLE 4.5 ANNUAL WATER BALANCE VOLUMES (M³/YEAR) ......................... 14
APPENDICES
APPENDIX A STORMCEPTOR OUTPUT APPENDIX B WATER BALANCE ANALYSIS DESIGN SHEET APPENDIX C MIDUSS OUTPUT
Functional Servicing Report
89 Beechwood
-1- MTE File No. 42186-100
July 7, 2017
1.0 INTRODUCTION MTE Consultants Inc. (MTE) has been retained by 89 Beechwood Inc. c/o Acorn Developments to complete a Functional Servicing and Stormwater Management Report for a new residential development to be constructed at 89 Beechwood Avenue (herein referred to as ‘the Site’) in the City of Guelph in support of the Zoning By-Law Amendment Application. The current zoning of the site is Park Zone 5 (P.5). The property is proposed to be re-zoned as R.3 Residential Townhouse Zoning. The Site is legally described as Registered Plan 274, Lot 21, Division A in the City of Guelph. The property is bounded to the north by Beechwood Avenue, to the east by the Ismailia Centre, to the south by Howitt Creek, and to the west by an existing park. For the exact location of the Site refer to Figure 1.0. The proposed development for the Site is the construction of a 3-Storey, 34 stacked unit townhouse building complex with underground parking. There is an existing building on Site which houses the Optimist Club, and will be demolished as part of the development of the Site. The purpose of this study is to support the Official Plan Amendment and Zoning By-Law Amendment Applications. This will be accomplished by reviewing the opportunities and constraints for the subject property with respect to servicing, grading, and stormwater management; reviewing the requirements of the reviewing agencies; describing the development concept; and demonstrating the functional serviceability of the property. A Hydrogeology Study has been prepared by MTE Consultants Inc. in support of this report and the EIS prepared by NRSI. Pending approval of the Zoning By-Law Amendment application, detailed design of the site will commence and be submitted to the City of Guelph in support of Site Plan Approval. 2.0 EXISTING CONDITIONS 2.1 Existing Topography The Site encompasses an area of 0.40 ha and currently comprises of the Guelph Optimist Club building, an existing asphalt parking lot, an existing asphalt basketball court, and green space. In the existing condition, surface runoff from the Site drains from the northwest corner of the site to the southeast corner, towards Howitt Creek. There is an elevation difference of approximately 4.0 metres between the northwest and southeast corner of the property. The Site is approximately 60% impervious in the existing condition.
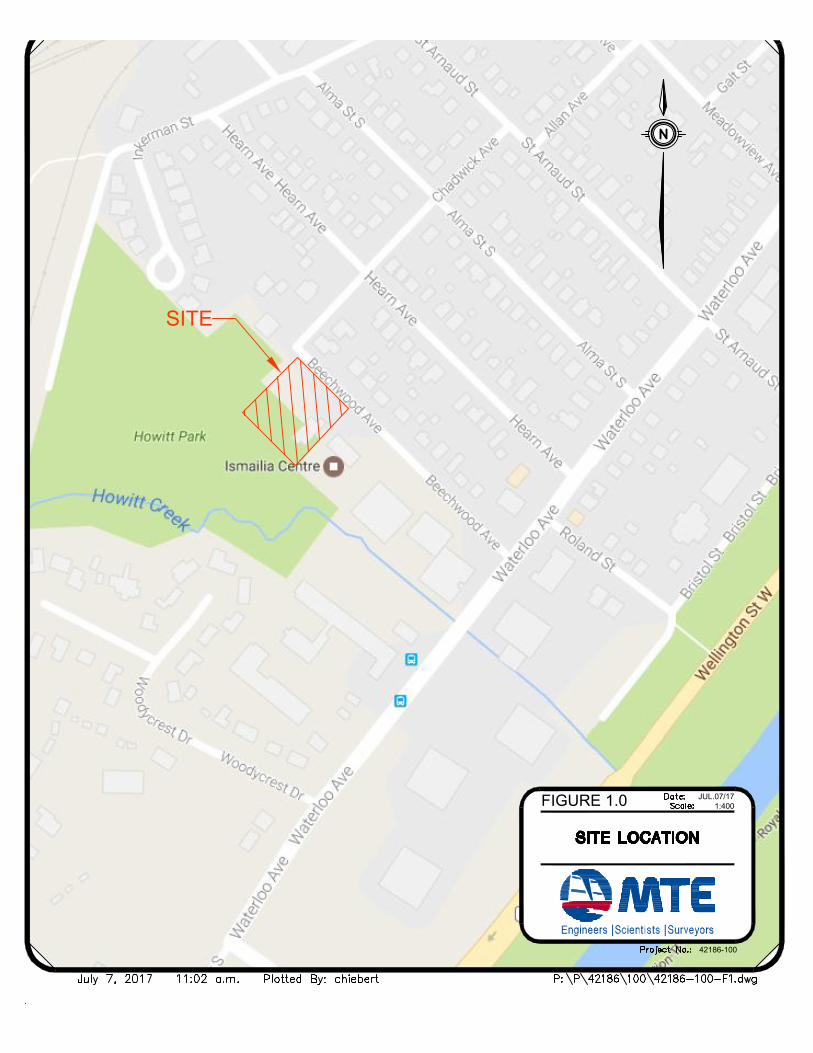
FIGURE 1.0
42186-100
JUL.07/171:400
SITE
Functional Servicing Report
89 Beechwood
-3- MTE File No. 42186-100
July 7, 2017
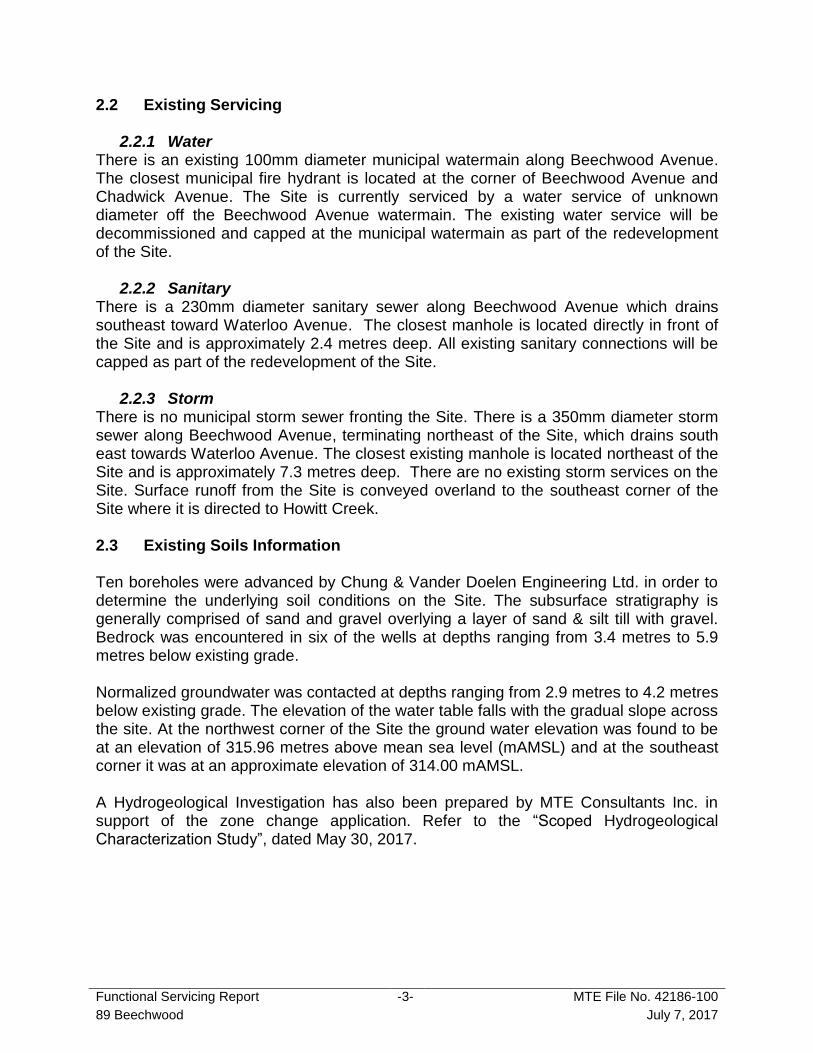
2.2 Existing Servicing
2.2.1 Water There is an existing 100mm diameter municipal watermain along Beechwood Avenue. The closest municipal fire hydrant is located at the corner of Beechwood Avenue and Chadwick Avenue. The Site is currently serviced by a water service of unknown diameter off the Beechwood Avenue watermain. The existing water service will be decommissioned and capped at the municipal watermain as part of the redevelopment of the Site.
2.2.2 Sanitary There is a 230mm diameter sanitary sewer along Beechwood Avenue which drains southeast toward Waterloo Avenue. The closest manhole is located directly in front of the Site and is approximately 2.4 metres deep. All existing sanitary connections will be capped as part of the redevelopment of the Site.
2.2.3 Storm There is no municipal storm sewer fronting the Site. There is a 350mm diameter storm sewer along Beechwood Avenue, terminating northeast of the Site, which drains south east towards Waterloo Avenue. The closest existing manhole is located northeast of the Site and is approximately 7.3 metres deep. There are no existing storm services on the Site. Surface runoff from the Site is conveyed overland to the southeast corner of the Site where it is directed to Howitt Creek. 2.3 Existing Soils Information Ten boreholes were advanced by Chung & Vander Doelen Engineering Ltd. in order to determine the underlying soil conditions on the Site. The subsurface stratigraphy is generally comprised of sand and gravel overlying a layer of sand & silt till with gravel. Bedrock was encountered in six of the wells at depths ranging from 3.4 metres to 5.9 metres below existing grade. Normalized groundwater was contacted at depths ranging from 2.9 metres to 4.2 metres below existing grade. The elevation of the water table falls with the gradual slope across the site. At the northwest corner of the Site the ground water elevation was found to be at an elevation of 315.96 metres above mean sea level (mAMSL) and at the southeast corner it was at an approximate elevation of 314.00 mAMSL. A Hydrogeological Investigation has also been prepared by MTE Consultants Inc. in support of the zone change application. Refer to the “Scoped Hydrogeological Characterization Study”, dated May 30, 2017.

Functional Servicing Report
89 Beechwood
-4- MTE File No. 42186-100
July 7, 2017
2.4 Reviewing Agencies Grading, servicing and stormwater management designs as well as this Functional Servicing and SWM Report will be required for submission to the City of Guelph in support of the Zoning By-Law Amendment and the Site Plan Applications. The City will also be responsible for the review and approval of site plans, site grading, servicing, stormwater management, lighting and landscape design and ultimately issuing building permits. A submission will be made to the Guelph Environmental Advisory Committee and NRSI for their review and approval with respect to issues pertaining to ecology, hydrology and the Hydrogeology study prepared by MTE Consultants Inc. As the site falls within GRCA Regulation limit, the site engineering design will also be submitted to the GRCA for their review and approval. A ‘Fill Permit’ will be required. As there is no existing storm outlet to the municipal storm sewer, MOE approval will be required for the storm outlet proposed at the rear of the Site. 3.0 PROPOSED GRADING AND SERVICING STRATEGY Preliminary grading and servicing strategies for the proposed development have been developed based on the topographic survey, plan and profile information, and Conceptual Site Plan prepared by Martin Simmons Architects, dated April 26, 2017. 3.1 Proposed Grading The proposed development is a 34 unit, stacked townhouse complex complete with a driveway access off of Beechwood Avenue and a shared underground parking garage. The proposed grading strategy will respect the existing grades along all property lines. The building encompasses the majority of the Site area aside from the common drive aisle along the east property line to the parking garage entrance. Re-grading will involve directing the runoff away from the proposed building and directing the runoff generated on the common drive isle to the onsite storm sewer. There will be a shared outdoor amenity space above the parking garage. The runoff collected in this area can be considered “clean” water, and will be collected with area drains and infiltrated. 3.2 Proposed Servicing
3.2.1 Water A new connection to the 100mm diameter municipal watermain along Beechwood Avenue will be required in order to service the proposed building. The required private water service size will be determined during detailed design. The water service will connect central to the building fronting Beechwood Avenue. It is anticipated that the existing fire hydrant located at the corner of Beechwood Avenue and Chadwick Avenue will be sufficient for the proposed building. If required, a fire flow analysis will be completed at the detailed design stage to ensure that adequate flow and pressure will be available at the existing hydrant.
Functional Servicing Report
89 Beechwood
-5- MTE File No. 42186-100
July 7, 2017
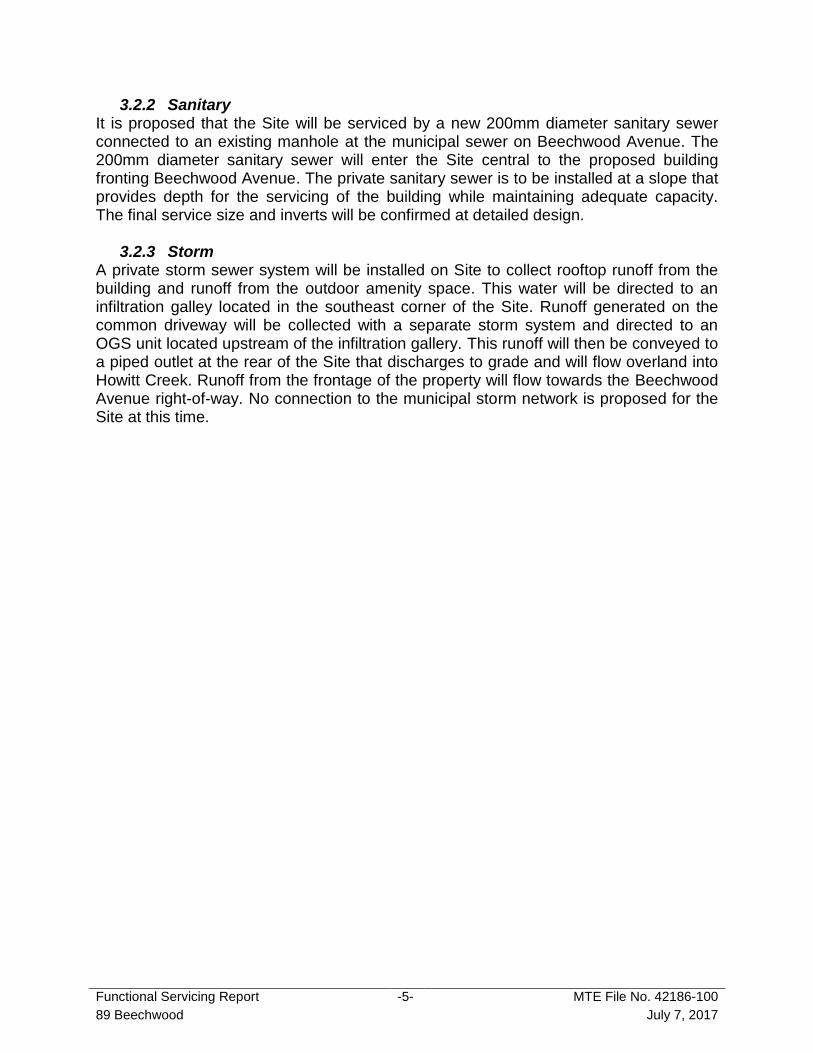
3.2.2 Sanitary It is proposed that the Site will be serviced by a new 200mm diameter sanitary sewer connected to an existing manhole at the municipal sewer on Beechwood Avenue. The 200mm diameter sanitary sewer will enter the Site central to the proposed building fronting Beechwood Avenue. The private sanitary sewer is to be installed at a slope that provides depth for the servicing of the building while maintaining adequate capacity. The final service size and inverts will be confirmed at detailed design.
3.2.3 Storm A private storm sewer system will be installed on Site to collect rooftop runoff from the building and runoff from the outdoor amenity space. This water will be directed to an infiltration galley located in the southeast corner of the Site. Runoff generated on the common driveway will be collected with a separate storm system and directed to an OGS unit located upstream of the infiltration gallery. This runoff will then be conveyed to a piped outlet at the rear of the Site that discharges to grade and will flow overland into Howitt Creek. Runoff from the frontage of the property will flow towards the Beechwood Avenue right-of-way. No connection to the municipal storm network is proposed for the Site at this time.
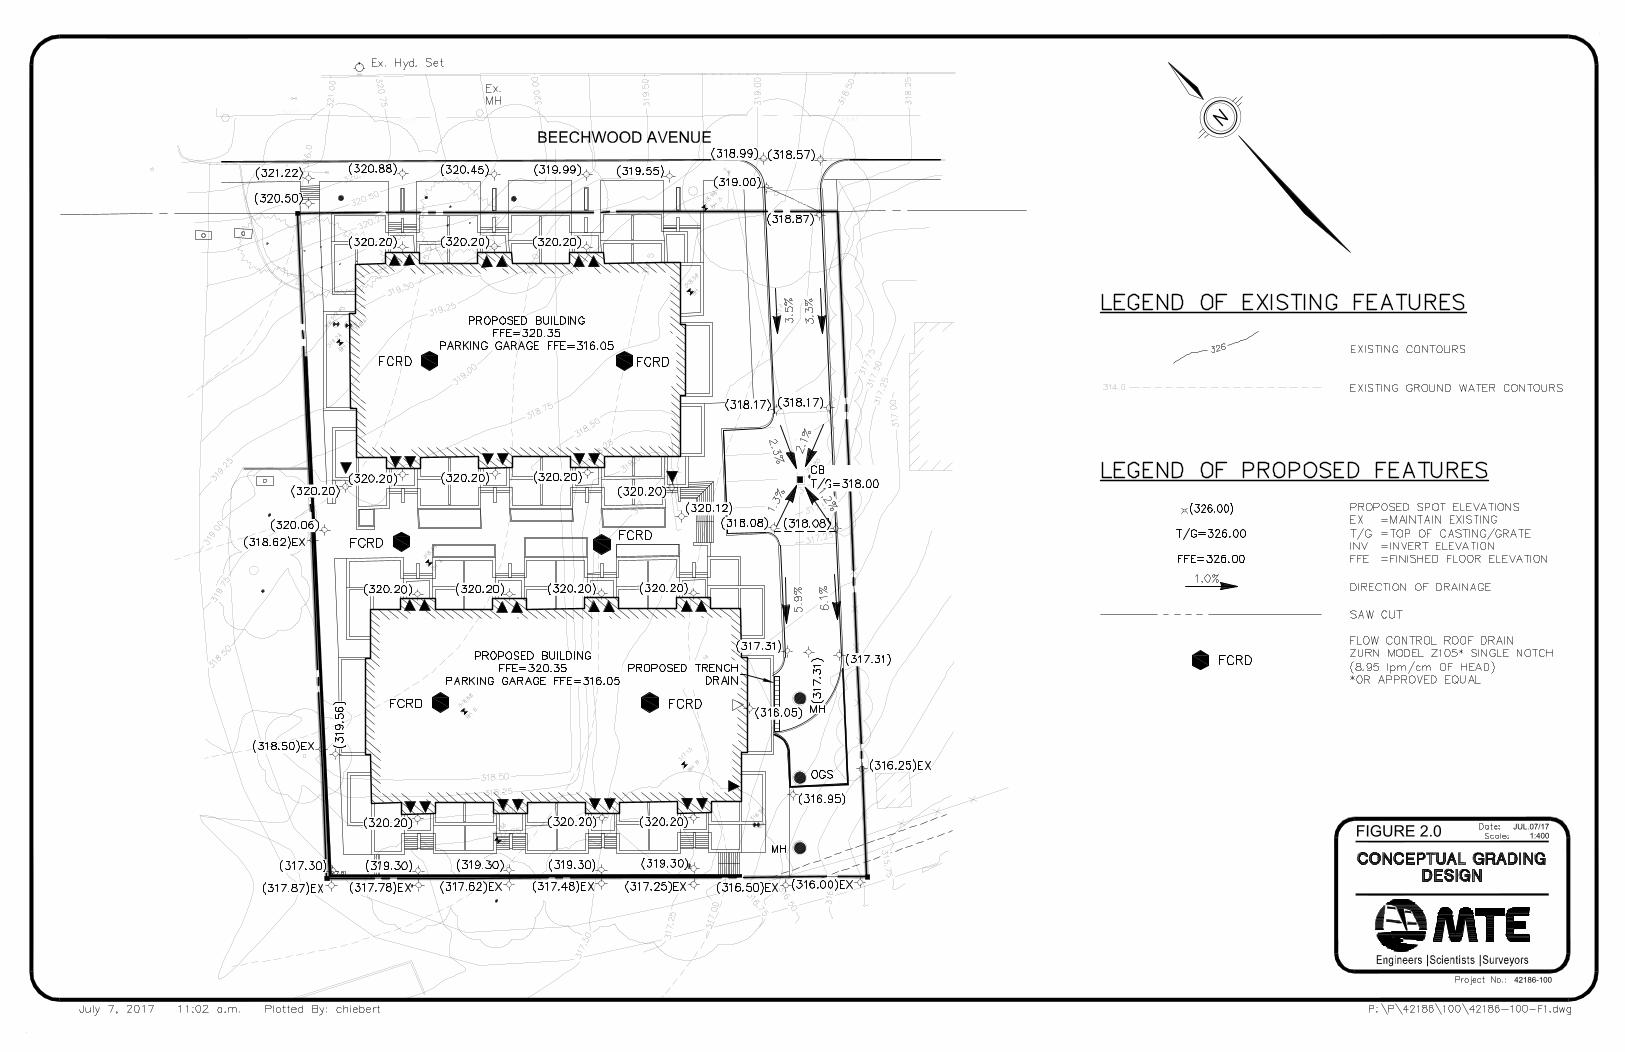
FIGURE 2.0 JUL.07/171:400
42186-100
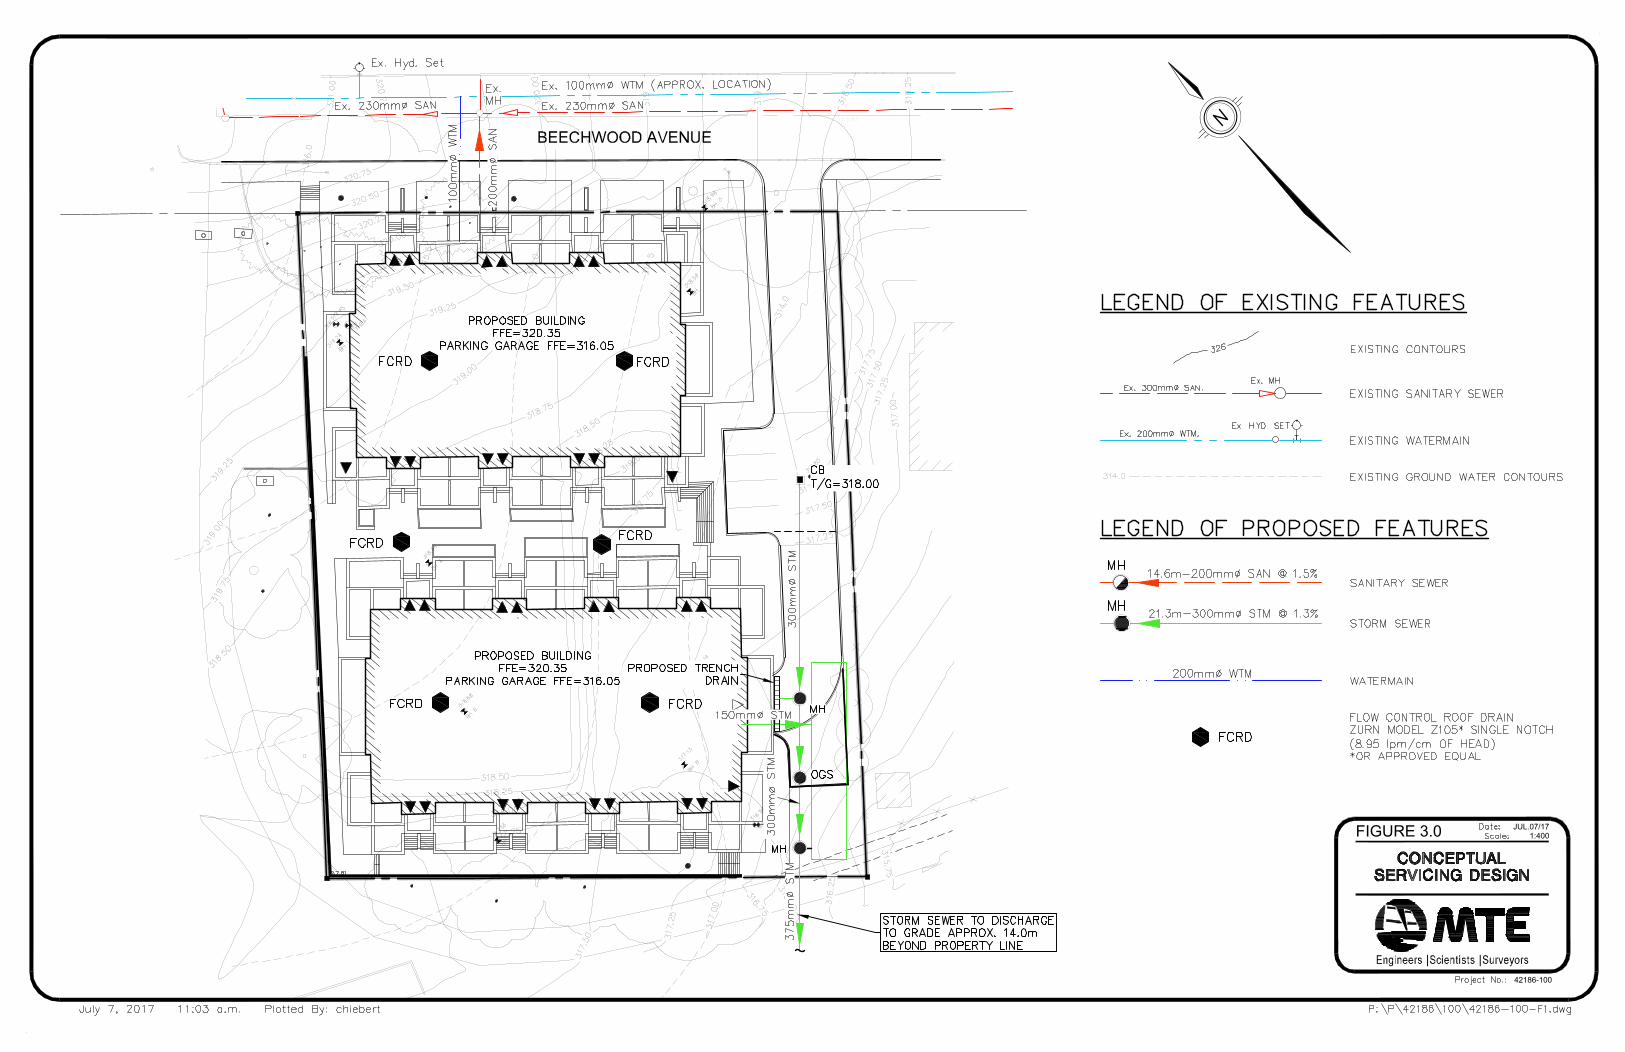
FIGURE 3.0 JUL.07/171:400
42186-100
Functional Servicing Report
89 Beechwood
-8- MTE File No. 42186-100
July 7, 2017
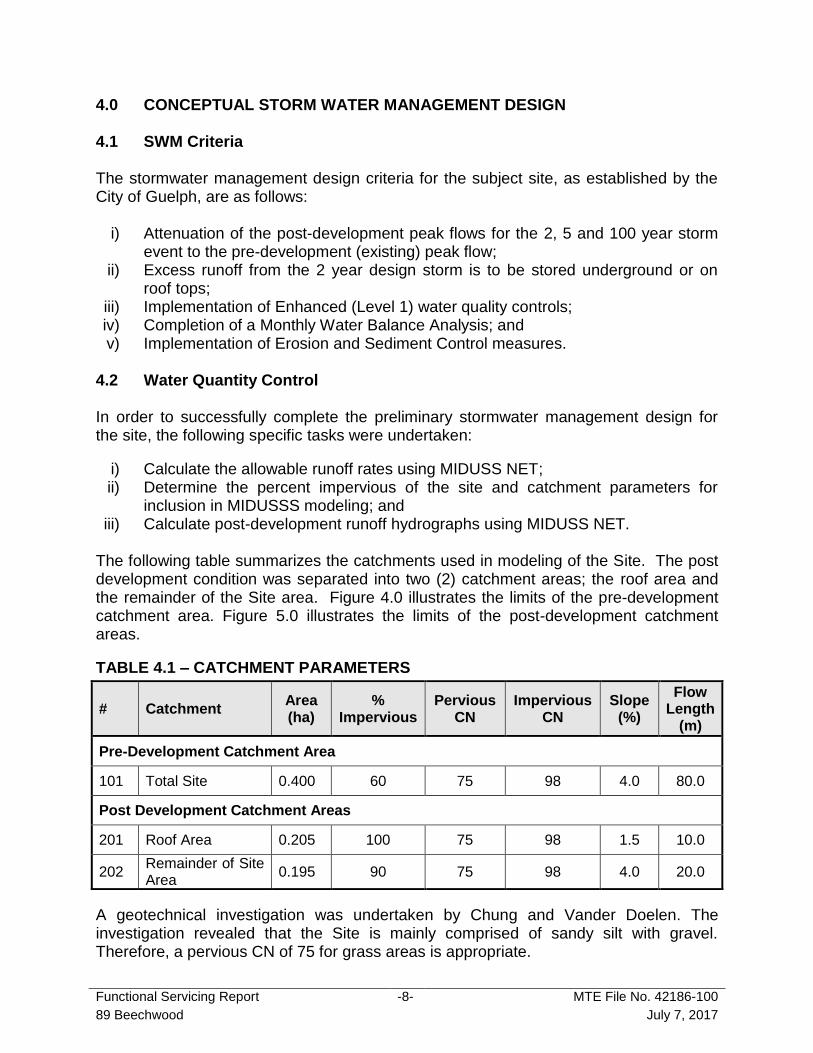
4.0 CONCEPTUAL STORM WATER MANAGEMENT DESIGN 4.1 SWM Criteria
The stormwater management design criteria for the subject site, as established by the City of Guelph, are as follows:
i) Attenuation of the post-development peak flows for the 2, 5 and 100 year storm event to the pre-development (existing) peak flow;
ii) Excess runoff from the 2 year design storm is to be stored underground or on roof tops;
iii) Implementation of Enhanced (Level 1) water quality controls; iv) Completion of a Monthly Water Balance Analysis; and v) Implementation of Erosion and Sediment Control measures.
4.2 Water Quantity Control In order to successfully complete the preliminary stormwater management design for the site, the following specific tasks were undertaken:
i) Calculate the allowable runoff rates using MIDUSS NET; ii) Determine the percent impervious of the site and catchment parameters for
inclusion in MIDUSSS modeling; and iii) Calculate post-development runoff hydrographs using MIDUSS NET.
The following table summarizes the catchments used in modeling of the Site. The post development condition was separated into two (2) catchment areas; the roof area and the remainder of the Site area. Figure 4.0 illustrates the limits of the pre-development catchment area. Figure 5.0 illustrates the limits of the post-development catchment areas.
TABLE 4.1 – CATCHMENT PARAMETERS
# Catchment Area (ha)
% Impervious
Pervious CN
Impervious CN
Slope (%)
Flow Length
(m)
Pre-Development Catchment Area
101 Total Site 0.400 60 75 98 4.0 80.0
Post Development Catchment Areas
201 Roof Area 0.205 100 75 98 1.5 10.0
202 Remainder of Site Area
0.195 90 75 98 4.0 20.0
A geotechnical investigation was undertaken by Chung and Vander Doelen. The investigation revealed that the Site is mainly comprised of sandy silt with gravel. Therefore, a pervious CN of 75 for grass areas is appropriate.
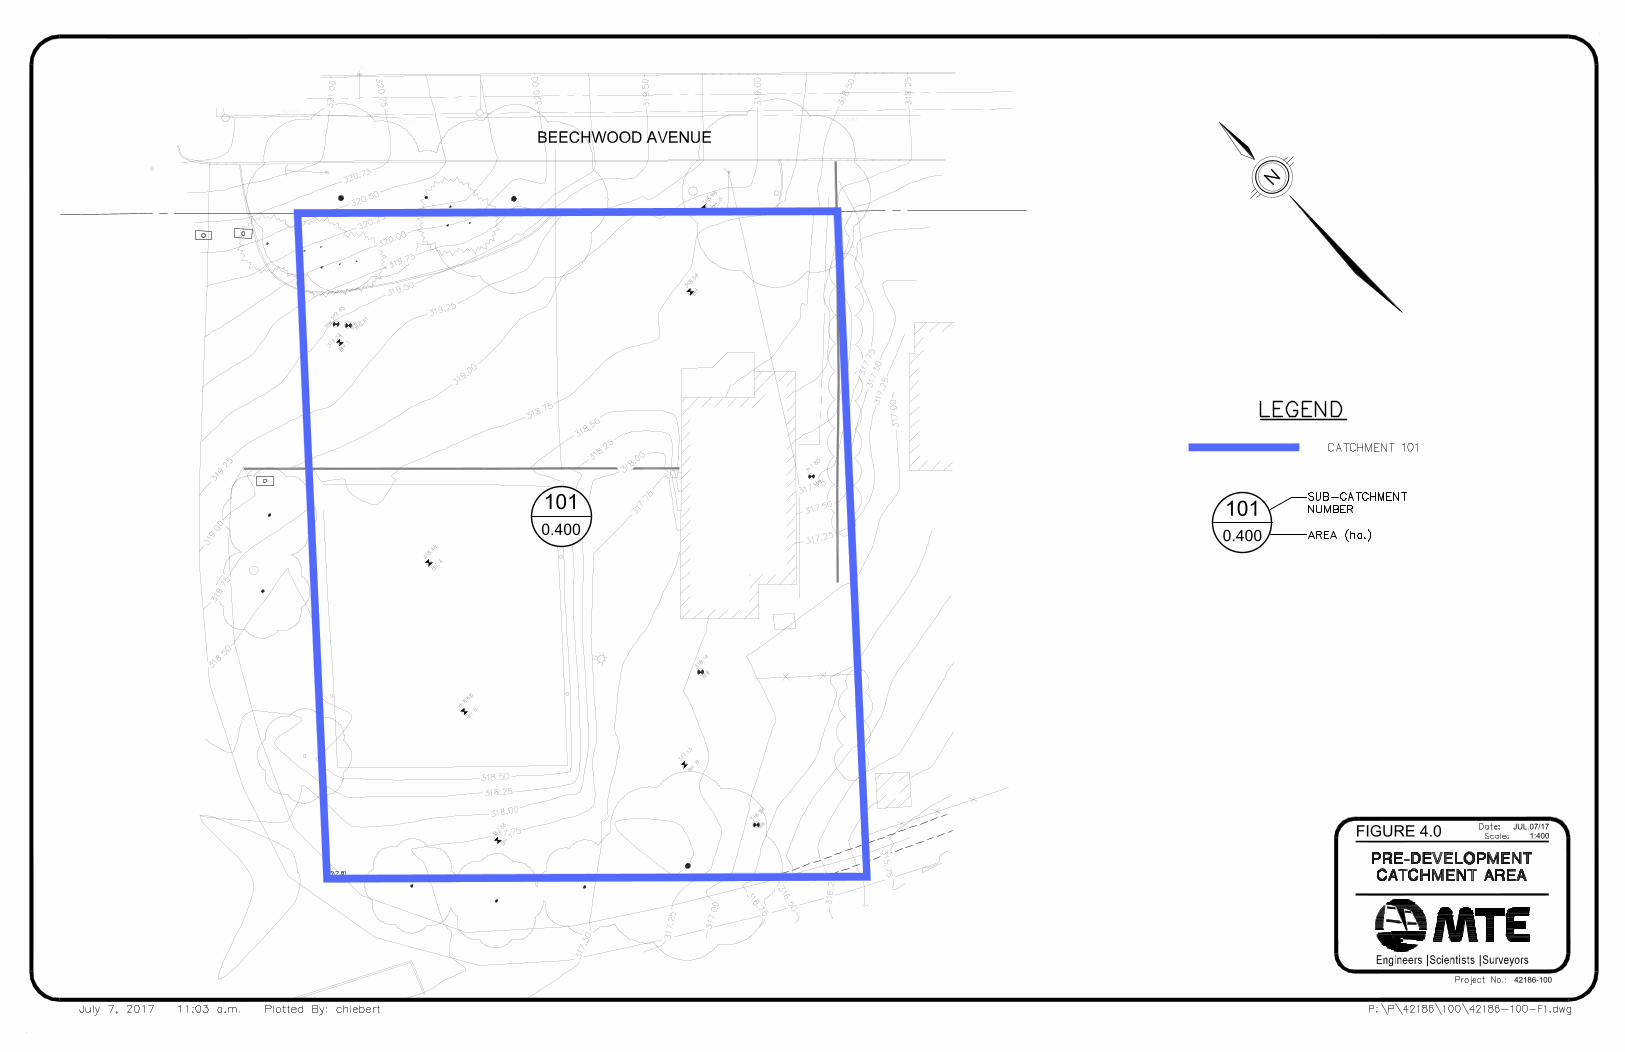
FIGURE 4.0 JUL.07/171:400
42186-100
1010.400
1010.400
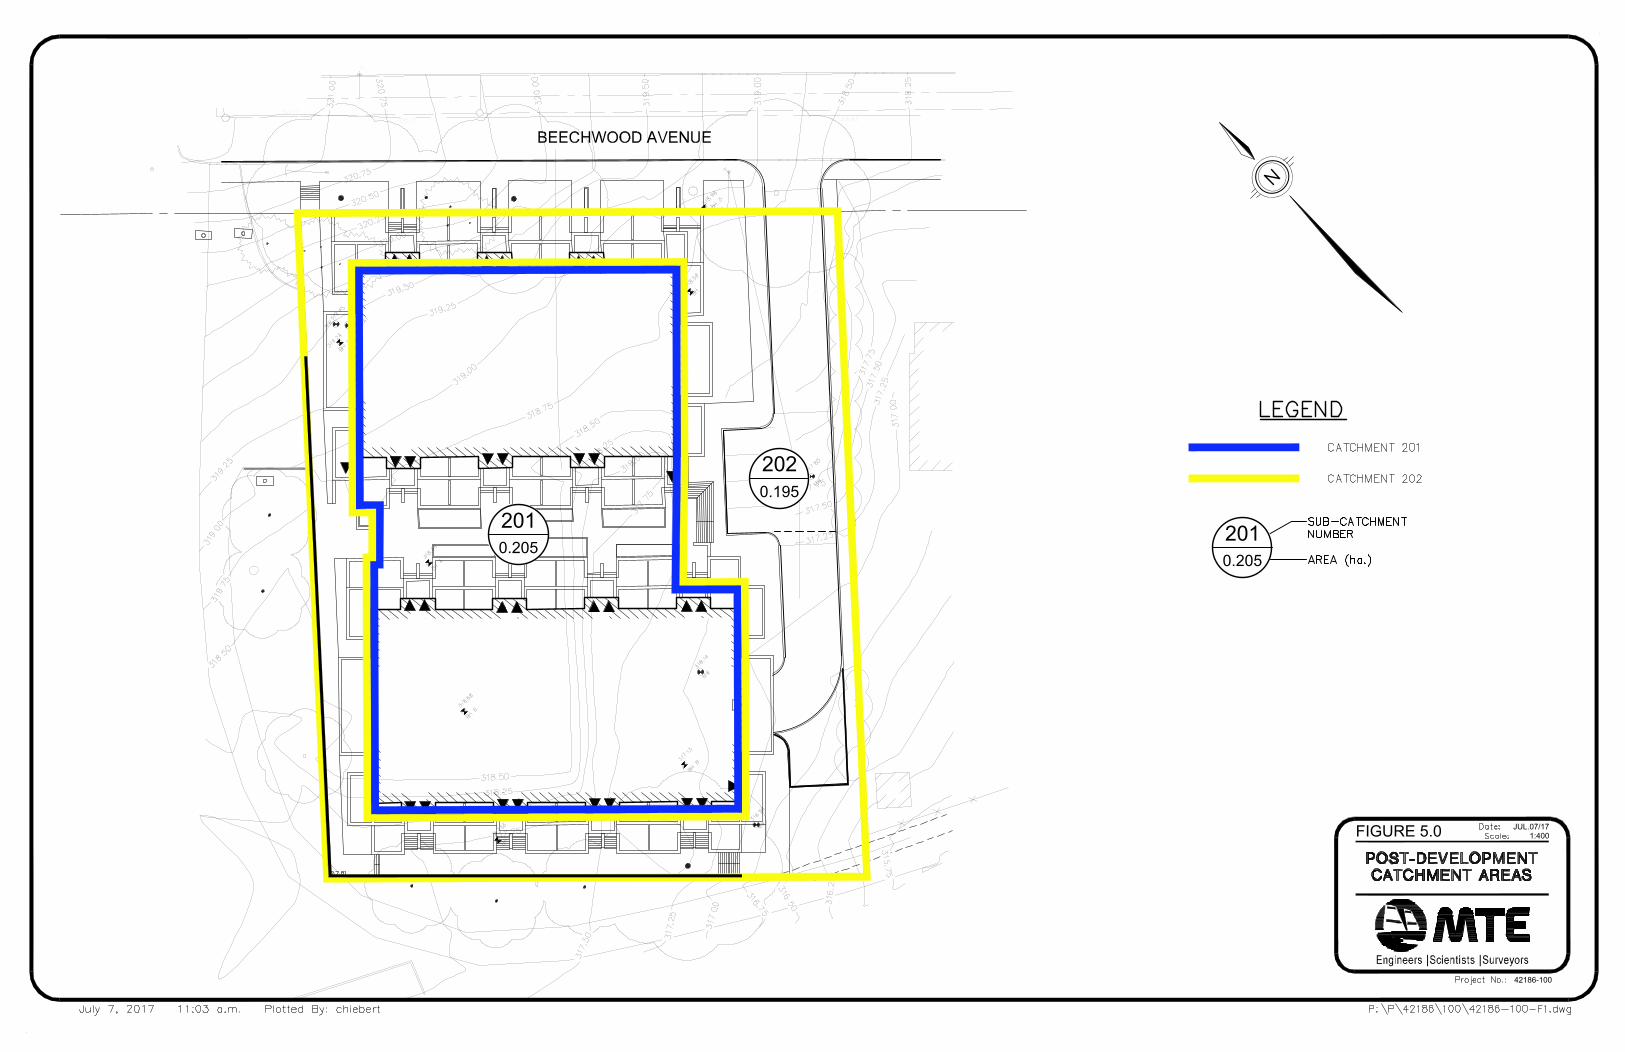
FIGURE 5.0 JUL.07/171:400
42186-100
2010.205
2010.205
2020.195
Functional Servicing Report
89 Beechwood
-11- MTE File No. 42186-100
July 7, 2017
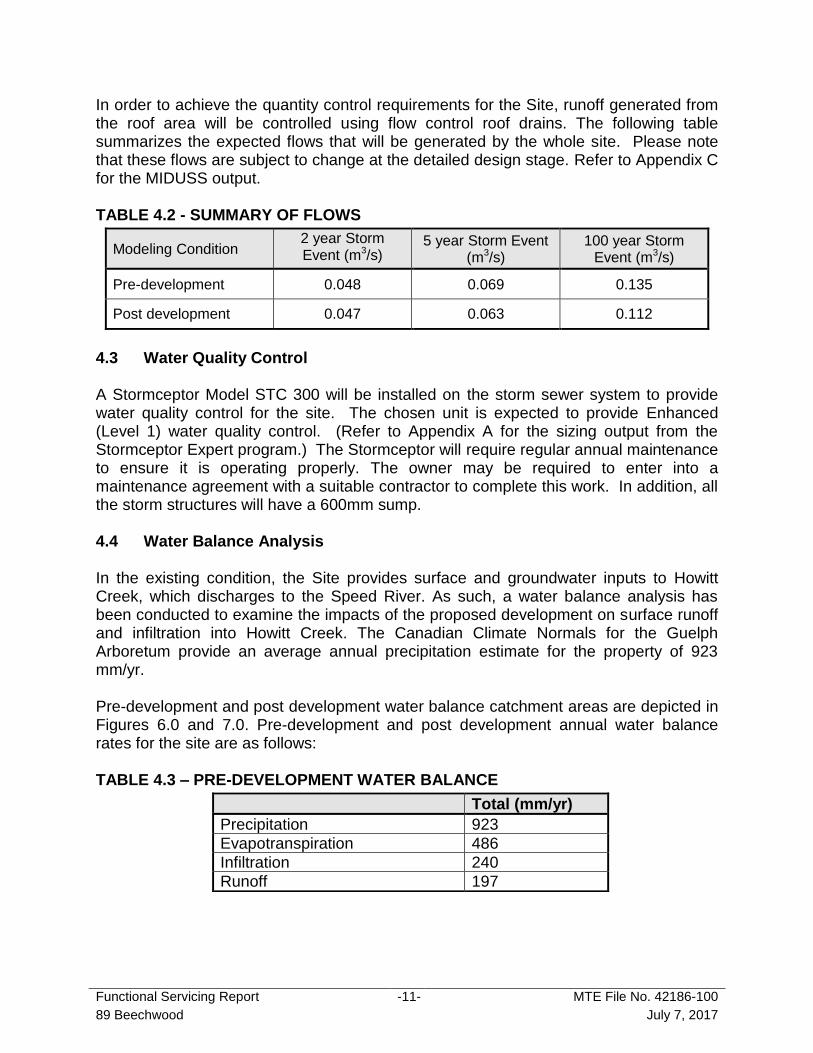
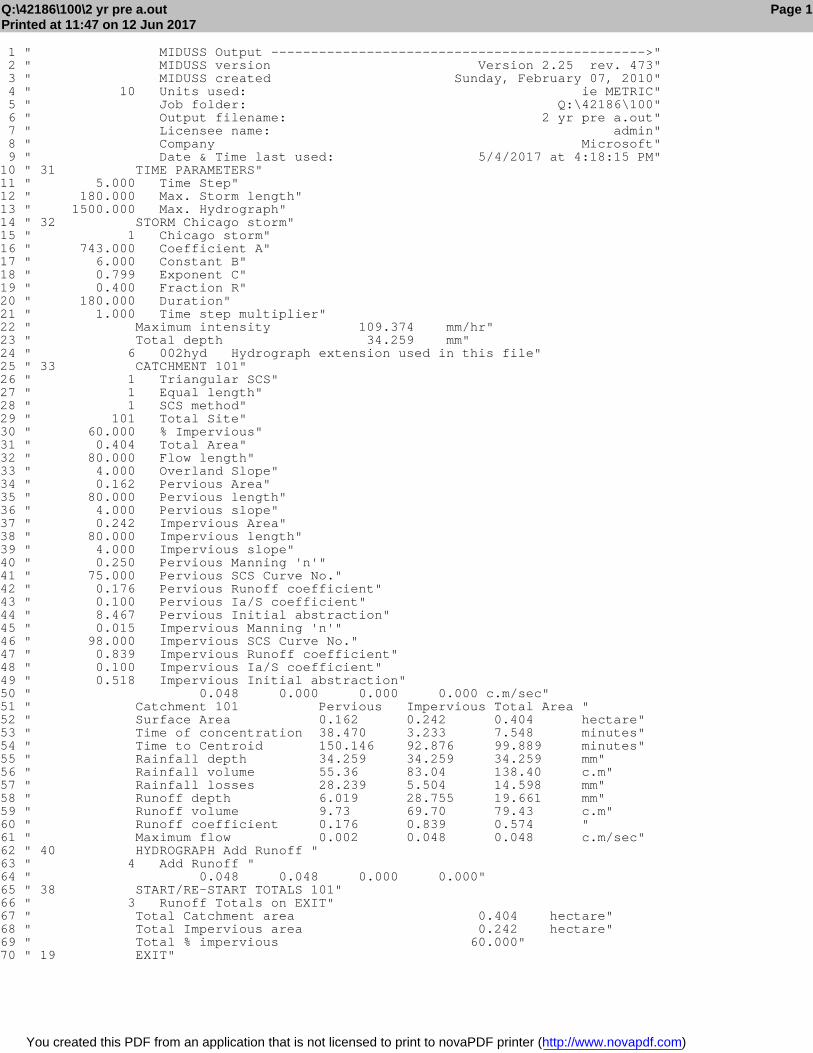
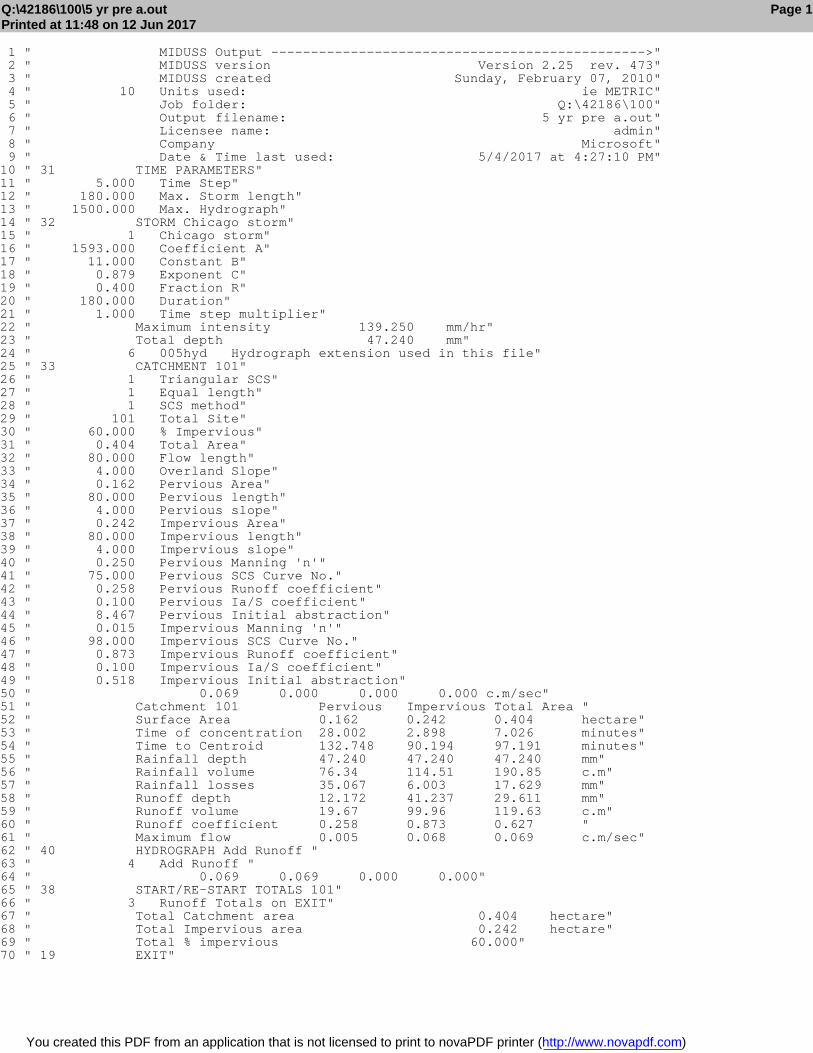
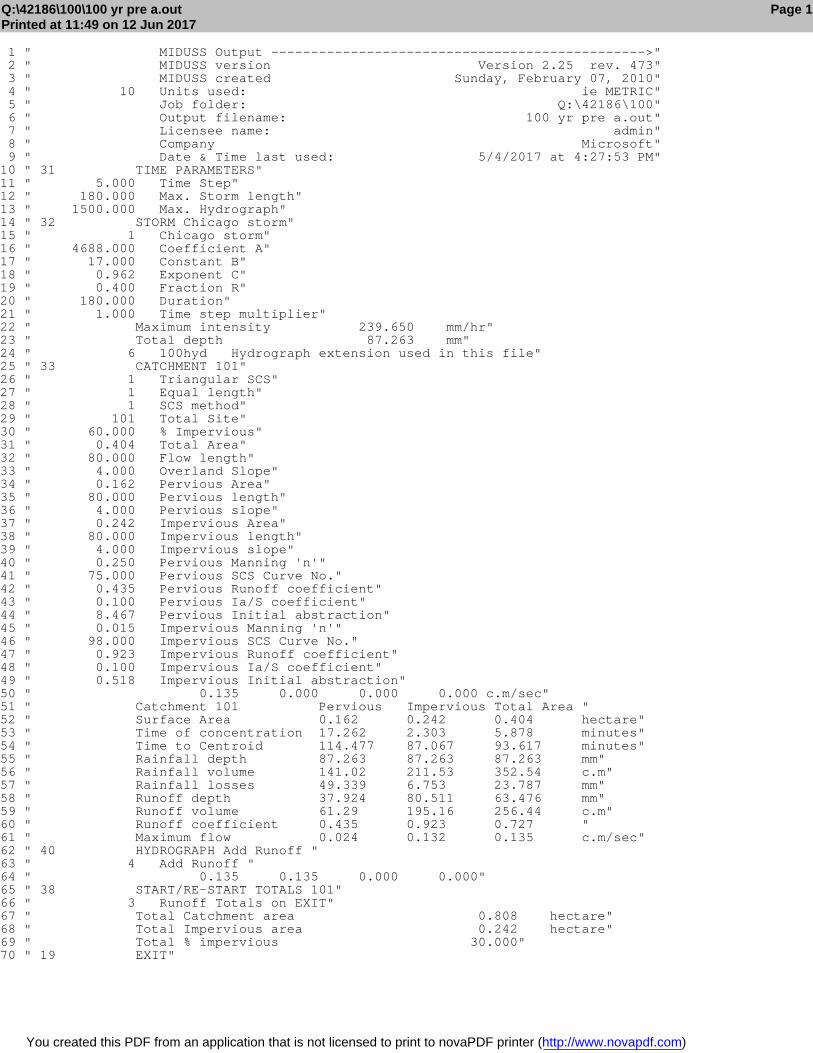
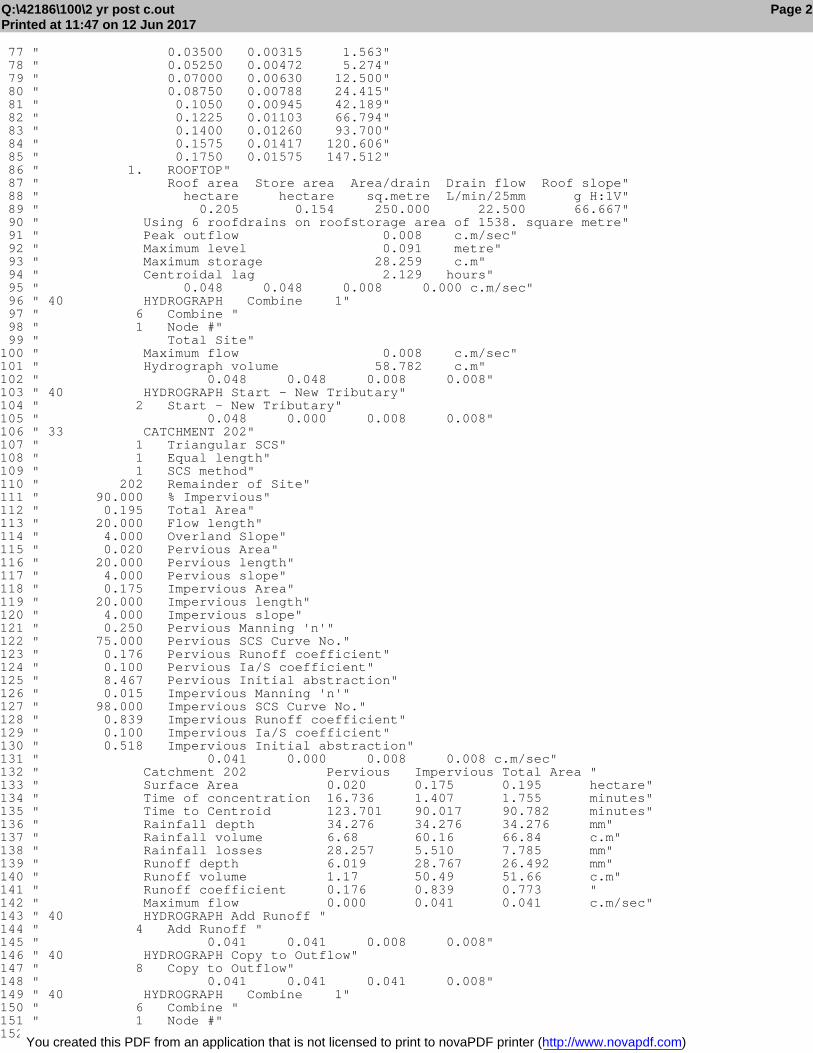
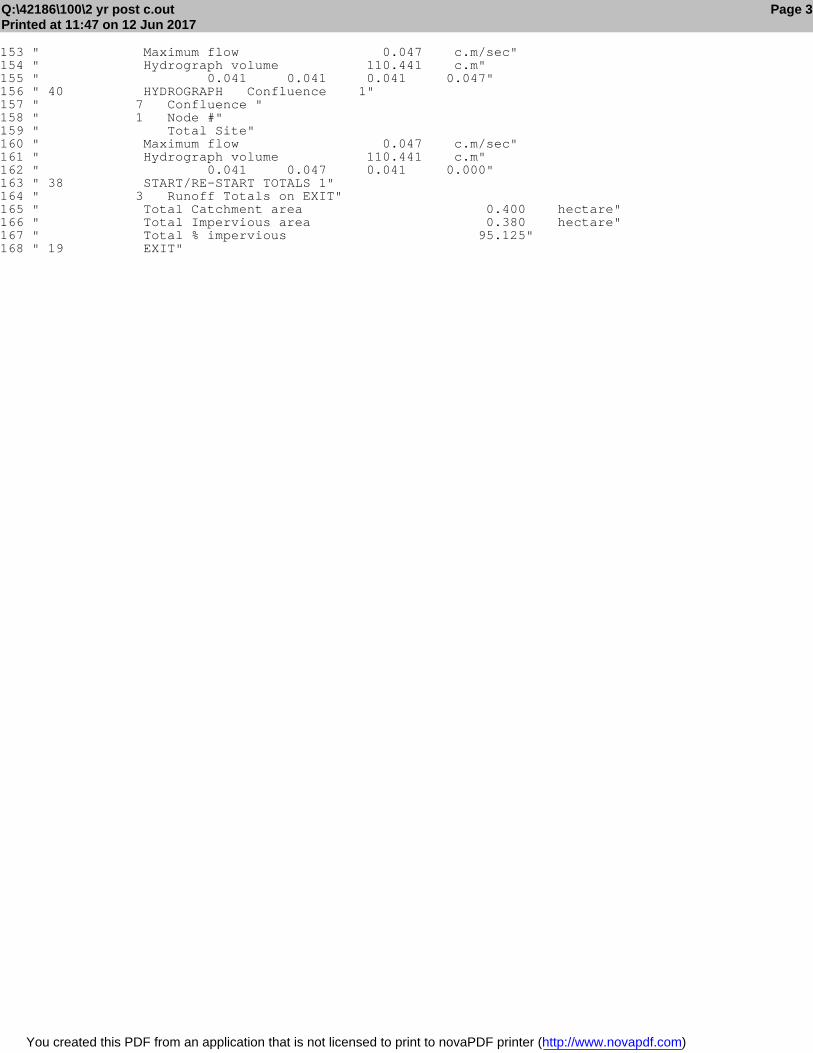
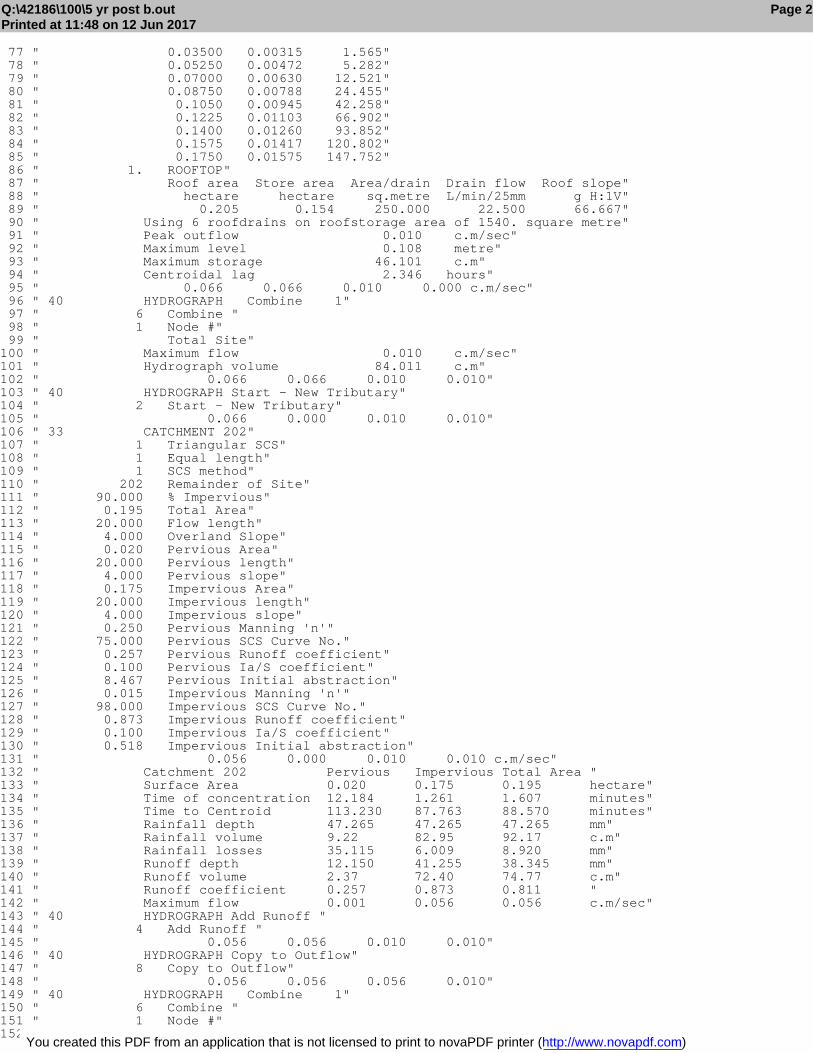
In order to achieve the quantity control requirements for the Site, runoff generated from the roof area will be controlled using flow control roof drains. The following table summarizes the expected flows that will be generated by the whole site. Please note that these flows are subject to change at the detailed design stage. Refer to Appendix C for the MIDUSS output. TABLE 4.2 - SUMMARY OF FLOWS
Modeling Condition 2 year Storm Event (m3/s)
5 year Storm Event (m3/s)
100 year Storm Event (m3/s)
Pre-development 0.048 0.069 0.135
Post development 0.047 0.063 0.112
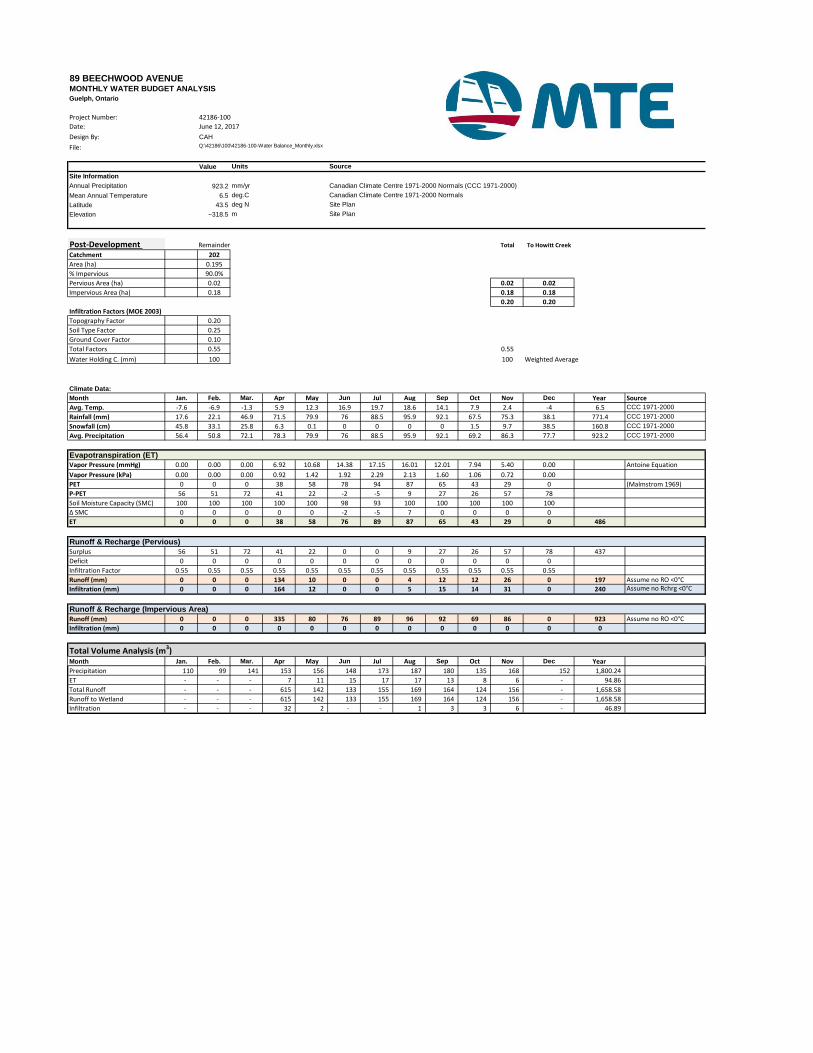
4.3 Water Quality Control A Stormceptor Model STC 300 will be installed on the storm sewer system to provide water quality control for the site. The chosen unit is expected to provide Enhanced (Level 1) water quality control. (Refer to Appendix A for the sizing output from the Stormceptor Expert program.) The Stormceptor will require regular annual maintenance to ensure it is operating properly. The owner may be required to enter into a maintenance agreement with a suitable contractor to complete this work. In addition, all the storm structures will have a 600mm sump. 4.4 Water Balance Analysis In the existing condition, the Site provides surface and groundwater inputs to Howitt Creek, which discharges to the Speed River. As such, a water balance analysis has been conducted to examine the impacts of the proposed development on surface runoff and infiltration into Howitt Creek. The Canadian Climate Normals for the Guelph Arboretum provide an average annual precipitation estimate for the property of 923 mm/yr. Pre-development and post development water balance catchment areas are depicted in Figures 6.0 and 7.0. Pre-development and post development annual water balance rates for the site are as follows: TABLE 4.3 – PRE-DEVELOPMENT WATER BALANCE
Total (mm/yr)
Precipitation 923
Evapotranspiration 486
Infiltration 240
Runoff 197
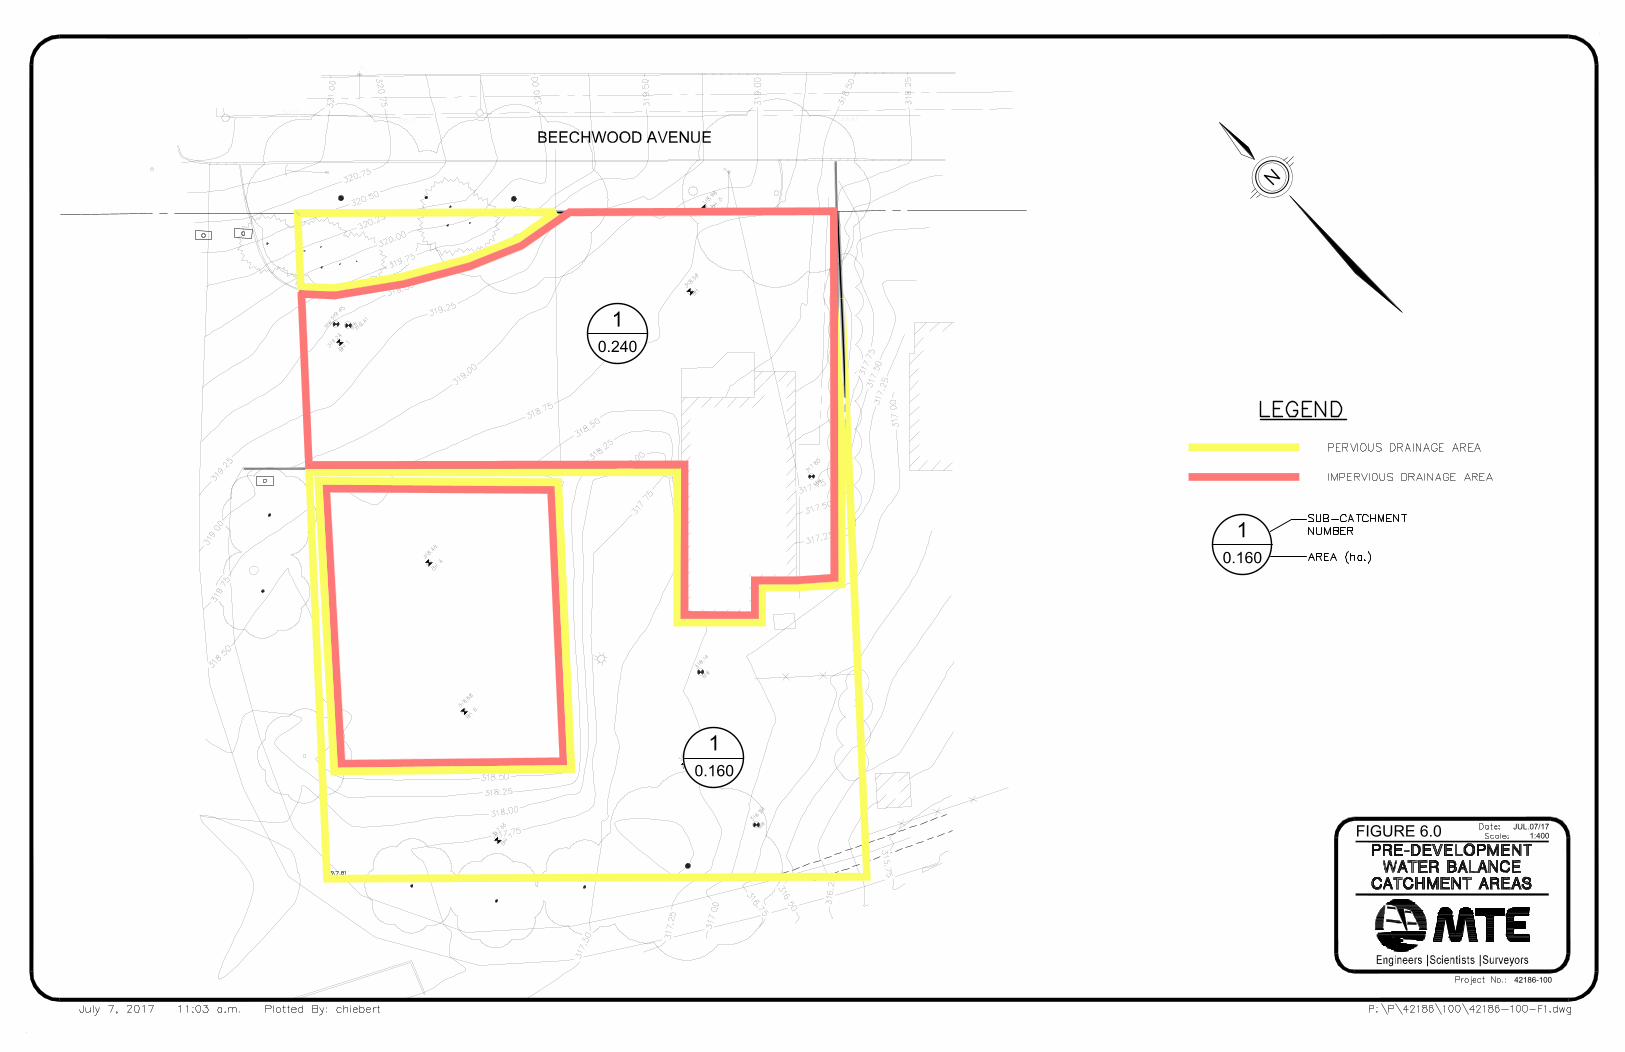
FIGURE 6.0 JUL.07/171:400
42186-100
10.160
10.160
10.240
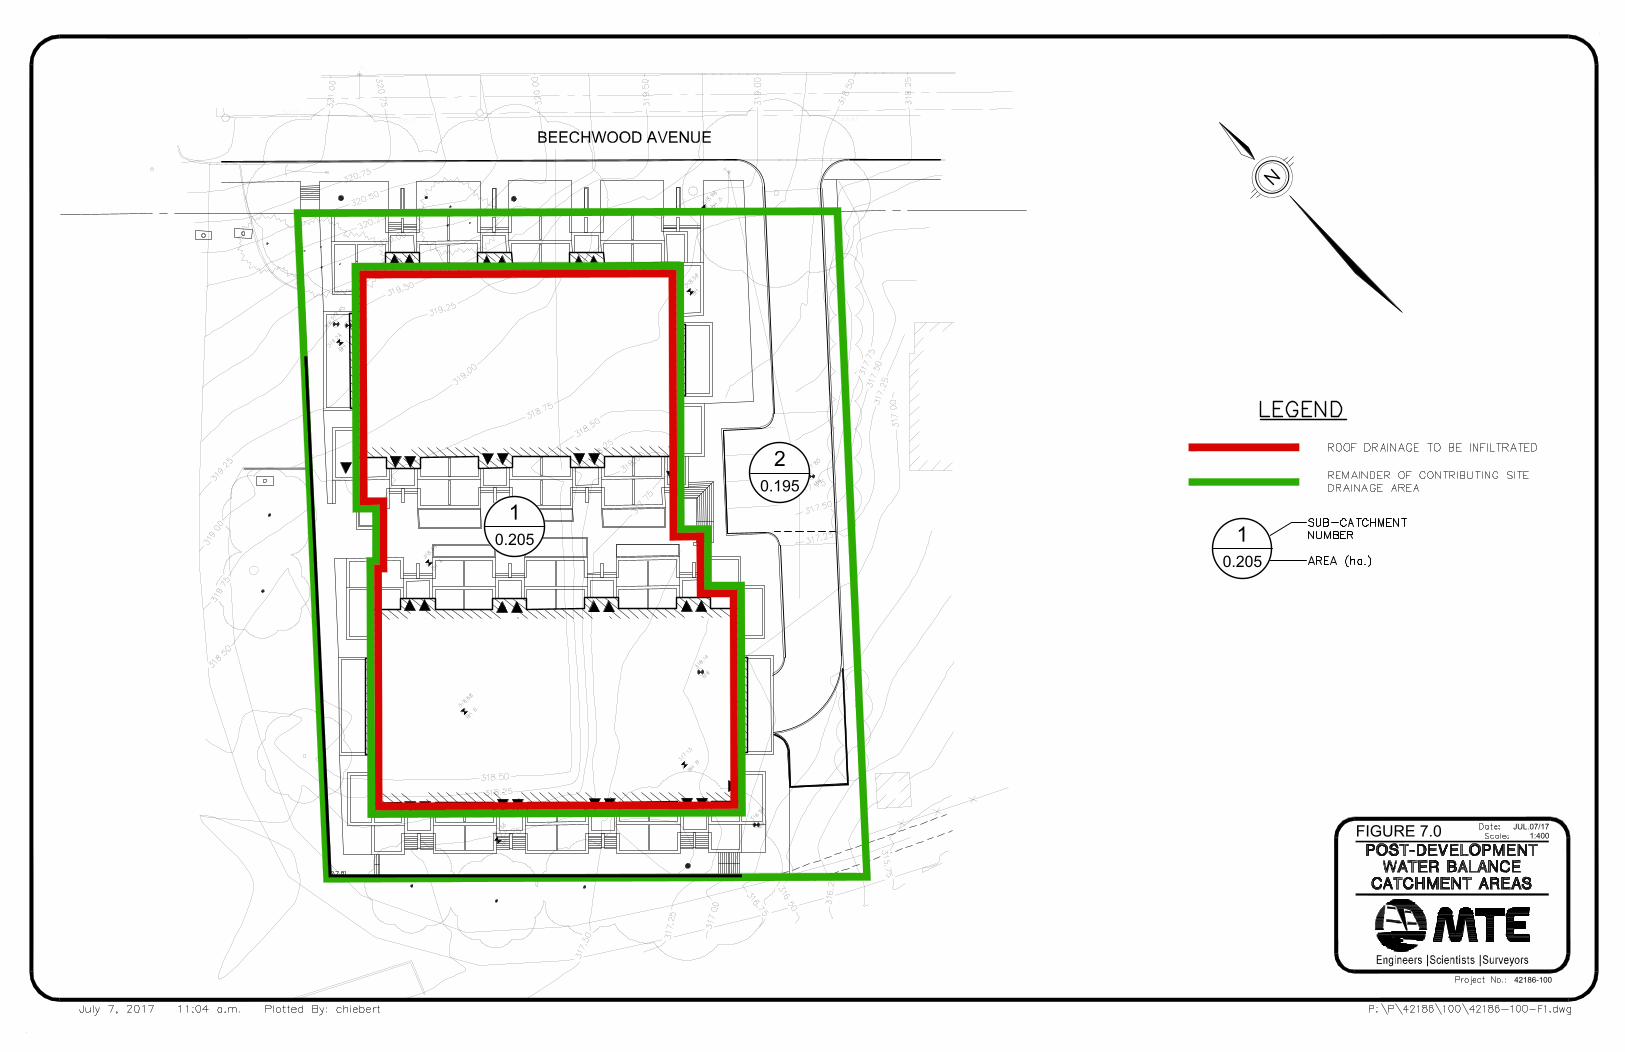
FIGURE 7.0 JUL.07/171:400
42186-100
10.205
10.205
20.195
Functional Servicing Report
89 Beechwood
-14- MTE File No. 42186-100
July 7, 2017
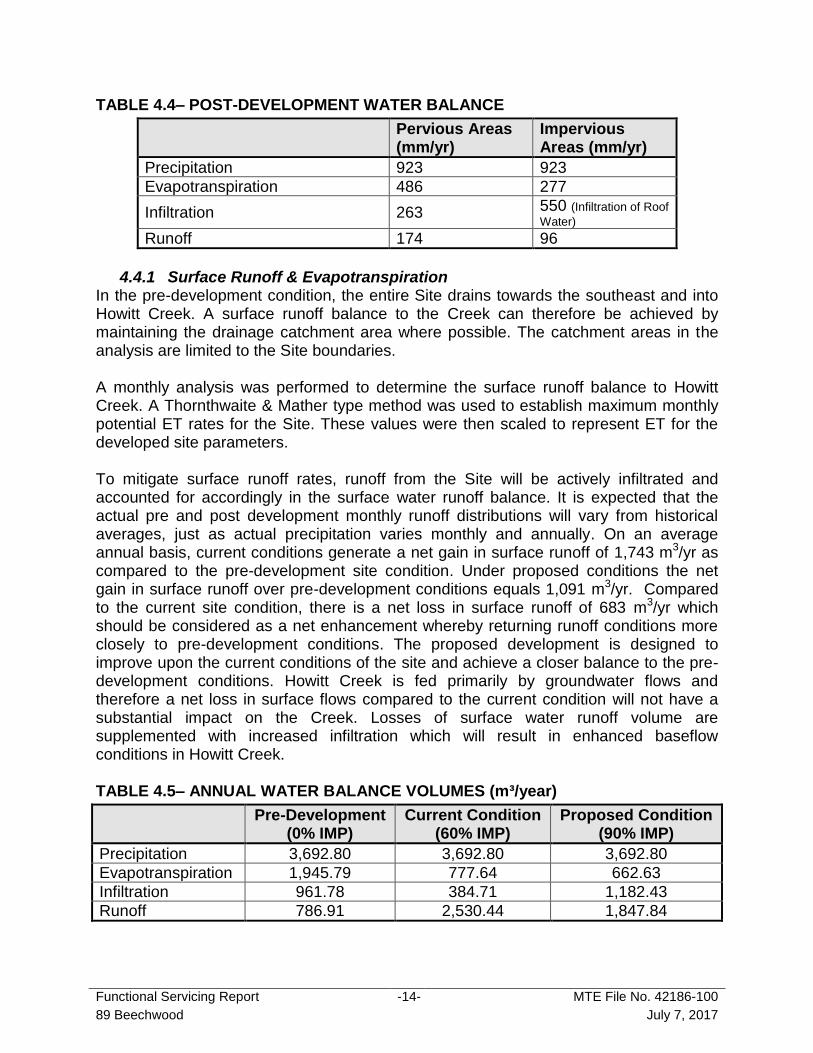
TABLE 4.4– POST-DEVELOPMENT WATER BALANCE
Pervious Areas (mm/yr)
Impervious Areas (mm/yr)
Precipitation 923 923
Evapotranspiration 486 277
Infiltration 263 550 (Infiltration of Roof
Water) Runoff 174 96
4.4.1 Surface Runoff & Evapotranspiration
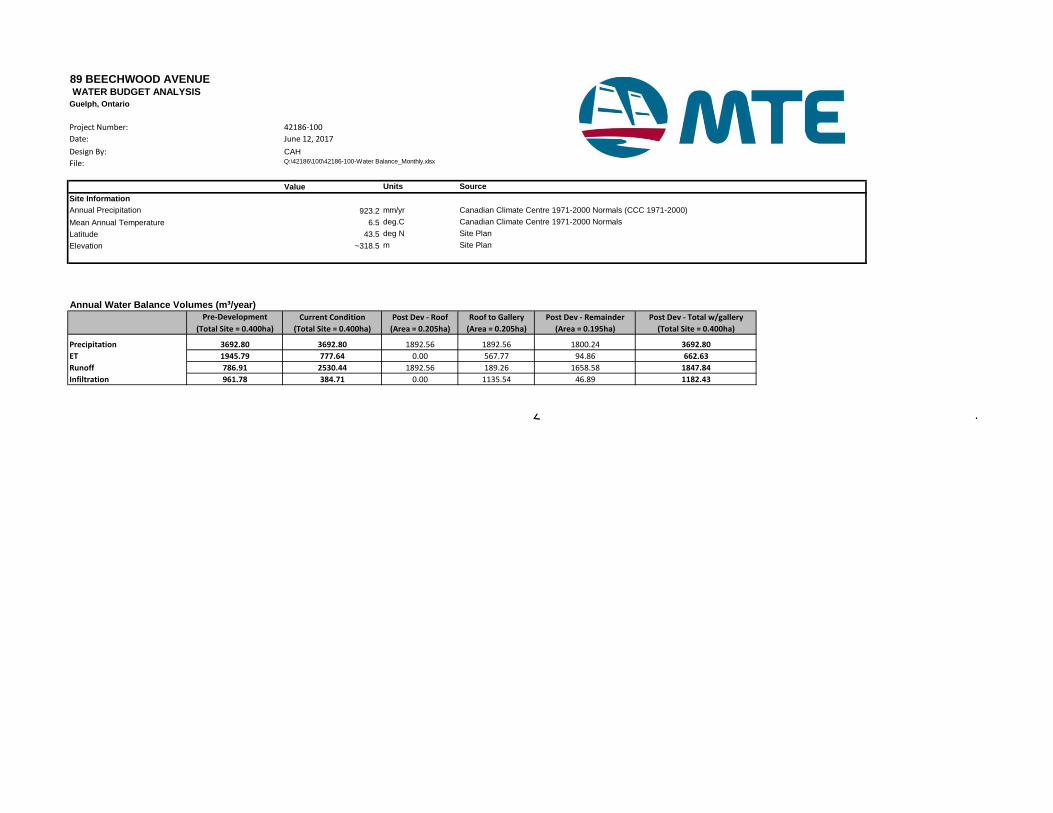
In the pre-development condition, the entire Site drains towards the southeast and into Howitt Creek. A surface runoff balance to the Creek can therefore be achieved by maintaining the drainage catchment area where possible. The catchment areas in the analysis are limited to the Site boundaries. A monthly analysis was performed to determine the surface runoff balance to Howitt Creek. A Thornthwaite & Mather type method was used to establish maximum monthly potential ET rates for the Site. These values were then scaled to represent ET for the developed site parameters. To mitigate surface runoff rates, runoff from the Site will be actively infiltrated and accounted for accordingly in the surface water runoff balance. It is expected that the actual pre and post development monthly runoff distributions will vary from historical averages, just as actual precipitation varies monthly and annually. On an average annual basis, current conditions generate a net gain in surface runoff of 1,743 m3/yr as compared to the pre-development site condition. Under proposed conditions the net gain in surface runoff over pre-development conditions equals 1,091 m3/yr. Compared to the current site condition, there is a net loss in surface runoff of 683 m3/yr which should be considered as a net enhancement whereby returning runoff conditions more closely to pre-development conditions. The proposed development is designed to improve upon the current conditions of the site and achieve a closer balance to the pre-development conditions. Howitt Creek is fed primarily by groundwater flows and therefore a net loss in surface flows compared to the current condition will not have a substantial impact on the Creek. Losses of surface water runoff volume are supplemented with increased infiltration which will result in enhanced baseflow conditions in Howitt Creek. TABLE 4.5– ANNUAL WATER BALANCE VOLUMES (m³/year)
Pre-Development (0% IMP)
Current Condition (60% IMP)
Proposed Condition (90% IMP)
Precipitation 3,692.80 3,692.80 3,692.80
Evapotranspiration 1,945.79 777.64 662.63
Infiltration 961.78 384.71 1,182.43
Runoff 786.91 2,530.44 1,847.84
Functional Servicing Report
89 Beechwood
-15- MTE File No. 42186-100
July 7, 2017
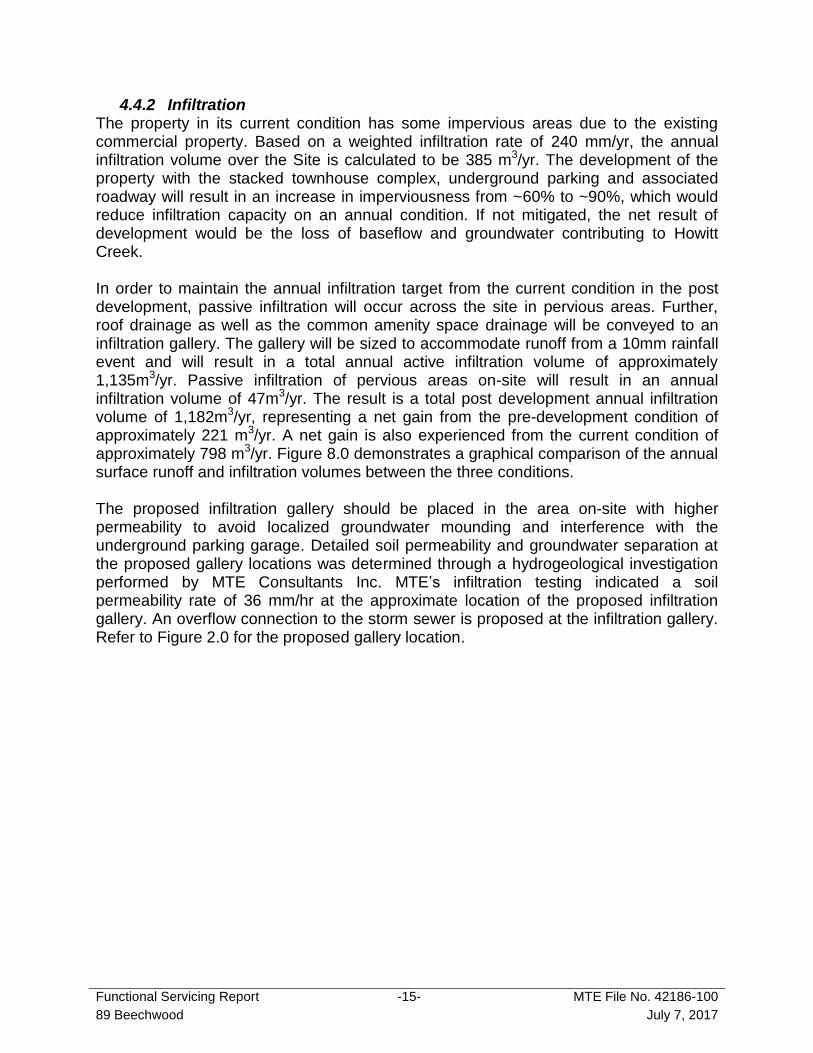
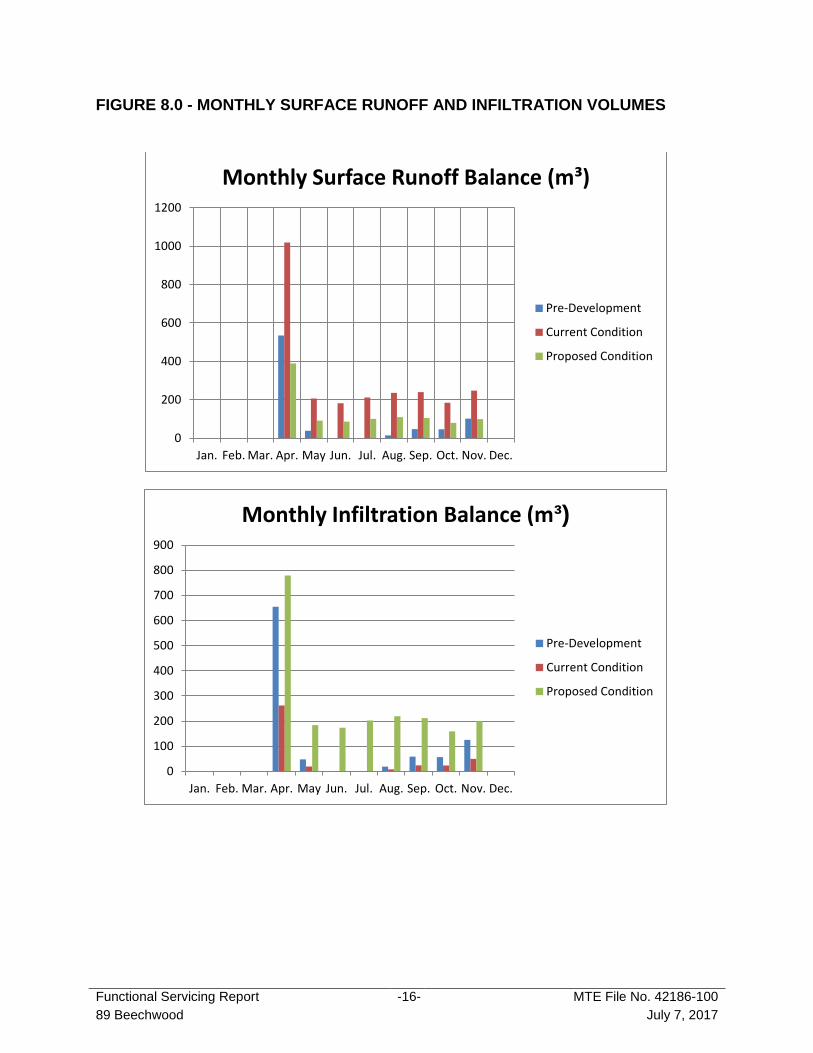
4.4.2 Infiltration The property in its current condition has some impervious areas due to the existing commercial property. Based on a weighted infiltration rate of 240 mm/yr, the annual infiltration volume over the Site is calculated to be 385 m3/yr. The development of the property with the stacked townhouse complex, underground parking and associated roadway will result in an increase in imperviousness from ~60% to ~90%, which would reduce infiltration capacity on an annual condition. If not mitigated, the net result of development would be the loss of baseflow and groundwater contributing to Howitt Creek. In order to maintain the annual infiltration target from the current condition in the post development, passive infiltration will occur across the site in pervious areas. Further, roof drainage as well as the common amenity space drainage will be conveyed to an infiltration gallery. The gallery will be sized to accommodate runoff from a 10mm rainfall event and will result in a total annual active infiltration volume of approximately 1,135m3/yr. Passive infiltration of pervious areas on-site will result in an annual infiltration volume of 47m3/yr. The result is a total post development annual infiltration volume of 1,182m3/yr, representing a net gain from the pre-development condition of approximately 221 m3/yr. A net gain is also experienced from the current condition of approximately 798 m3/yr. Figure 8.0 demonstrates a graphical comparison of the annual surface runoff and infiltration volumes between the three conditions. The proposed infiltration gallery should be placed in the area on-site with higher permeability to avoid localized groundwater mounding and interference with the underground parking garage. Detailed soil permeability and groundwater separation at the proposed gallery locations was determined through a hydrogeological investigation performed by MTE Consultants Inc. MTE’s infiltration testing indicated a soil permeability rate of 36 mm/hr at the approximate location of the proposed infiltration gallery. An overflow connection to the storm sewer is proposed at the infiltration gallery. Refer to Figure 2.0 for the proposed gallery location.
Functional Servicing Report
89 Beechwood
-16- MTE File No. 42186-100
July 7, 2017
FIGURE 8.0 - MONTHLY SURFACE RUNOFF AND INFILTRATION VOLUMES
0
200
400
600
800
1000
1200
Jan. Feb. Mar. Apr. May Jun. Jul. Aug. Sep. Oct. Nov. Dec.
Monthly Surface Runoff Balance (m³)
Pre-Development
Current Condition
Proposed Condition
0
100
200
300
400
500
600
700
800
900
Jan. Feb. Mar. Apr. May Jun. Jul. Aug. Sep. Oct. Nov. Dec.
Monthly Infiltration Balance (m³)
Pre-Development
Current Condition
Proposed Condition
Functional Servicing Report
89 Beechwood
-17- MTE File No. 42186-100
July 7, 2017
4.5 Erosion & Sediment Control
Precautions will need to be taken during construction to limit erosion and sedimentation. Typically, the following measures are recommended during construction for erosion and sedimentation control:
i) Erosion and sedimentation facilities are to be installed prior to any area grading operations;
ii) All erosion control measures are to be inspected and monitored by the contractor and repairs are to be completed as required;
iii) All materials and equipment used for the purpose of site preparation and project completion should be operated and stored in a manner that prevents any deleterious substance from leaving the site; and
iv) To minimize the amount of mud being tracked onto the road way, a mud mat should be installed at the primary construction entrance.
5.0 CONCLUSIONS Based on the foregoing analysis, it is concluded that:
i) The proposed grading design will respect the natural topography of the Site to achieve a reasonable cut/fill balance where possible.
ii) Existing municipal infrastructure for water and sanitary is available along Beechwood Avenue.
iii) A 100mm diameter water service connection off of Beechwood Avenue will service the proposed development. All existing water services will be decommissioned and capped at the municipal water main as part of the redevelopment of the Site.
iv) A 200mm diameter sanitary service connection off of Beechwood Avenue will service the proposed development. All existing sanitary services will be decommissioned and capped at the property line as part of the redevelopment of the Site.
v) The SWM criteria for quantity control will be provided through the installation of FCRD’s.
vi) Enhanced (Level 1) stormwater quality control will be provided through the installation of an oil-grit separator.
vii) A monthly surface runoff and infiltration water balance analysis has been conducted for the development area. The proposed development will result in a net gain in monthly and annual surface runoff and infiltration on the site over pre-development conditions.
viii) Erosion and sediment control measures be installed as recommended. ix) Additional grading, servicing and stormwater management details will be
provided during detailed design for the final Site Plan.
APPENDIX A
STORMCEPTOR OUTPUT
Project Information & LocationProject Name 89 Beechwood Avenue Project Number 42186-100
City Guelph State/ Province Ontario
Country Canada Date 6/2/2017
Designer Information EOR Information (optional)
Name Chelsea Hiebert Name
Company MTE Consultants Inc. Company
Phone # 519-743-6500 Phone #
Email [email protected] Email
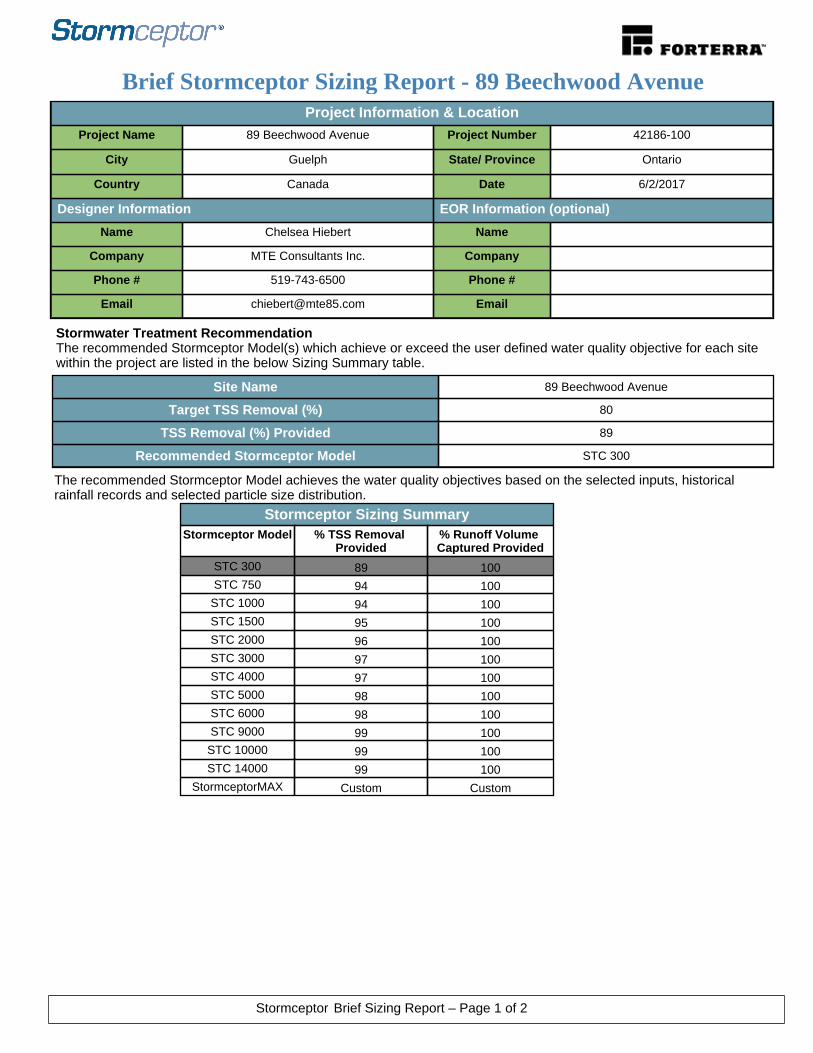
Brief Stormceptor Sizing Report - 89 Beechwood Avenue
Site Name 89 Beechwood Avenue
Target TSS Removal (%) 80
TSS Removal (%) Provided 89
Recommended Stormceptor Model STC 300
Stormceptor Sizing SummaryStormceptor Model % TSS Removal
Provided% Runoff Volume Captured Provided
STC 300 89 100STC 750 94 100
STC 1000 94 100STC 1500 95 100STC 2000 96 100STC 3000 97 100STC 4000 97 100STC 5000 98 100STC 6000 98 100STC 9000 99 100
STC 10000 99 100STC 14000 99 100
StormceptorMAX Custom Custom
The recommended Stormceptor Model achieves the water quality objectives based on the selected inputs, historical rainfall records and selected particle size distribution.
Stormwater Treatment Recommendation The recommended Stormceptor Model(s) which achieve or exceed the user defined water quality objective for each site within the project are listed in the below Sizing Summary table.
Stormceptor Brief Sizing Report – Page 1 of 2
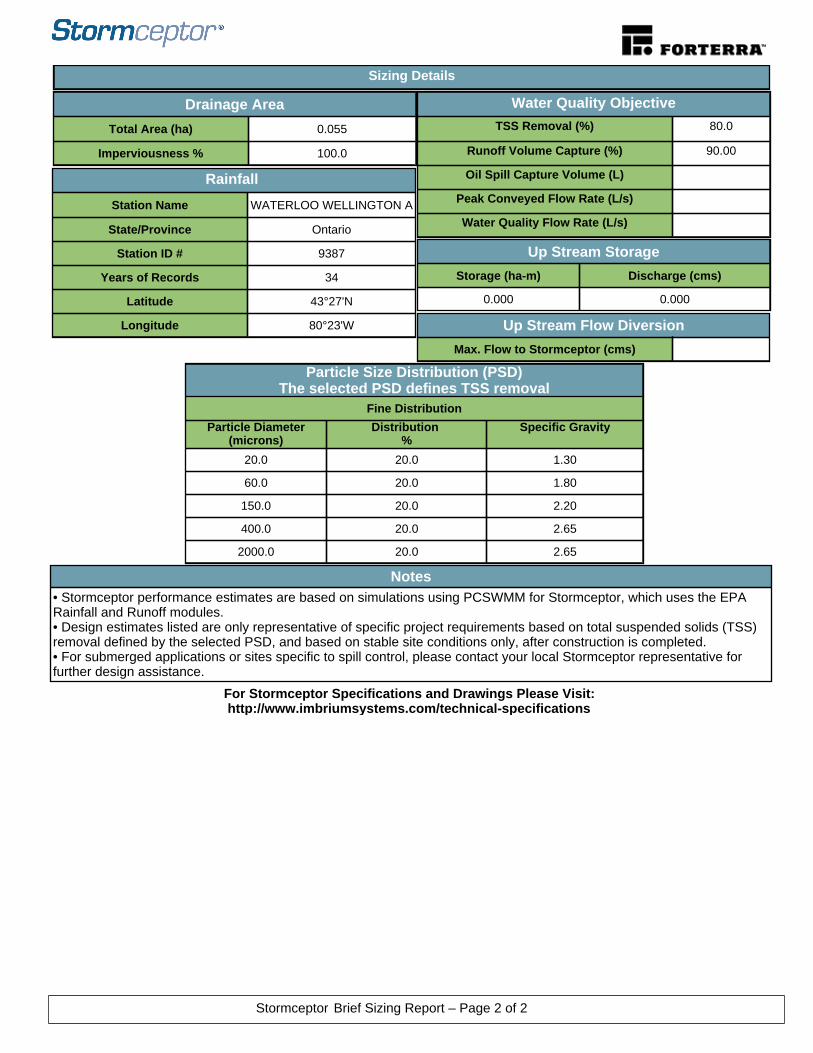
Notes• Stormceptor performance estimates are based on simulations using PCSWMM for Stormceptor, which uses the EPA Rainfall and Runoff modules.• Design estimates listed are only representative of specific project requirements based on total suspended solids (TSS) removal defined by the selected PSD, and based on stable site conditions only, after construction is completed.• For submerged applications or sites specific to spill control, please contact your local Stormceptor representative for further design assistance.
Drainage Area
Total Area (ha) 0.055
Imperviousness % 100.0
Water Quality Objective
TSS Removal (%) 80.0
Runoff Volume Capture (%) 90.00
Oil Spill Capture Volume (L)
Peak Conveyed Flow Rate (L/s)
Water Quality Flow Rate (L/s)
Rainfall
Station Name WATERLOO WELLINGTON A
State/Province Ontario
Station ID # 9387
Years of Records 34
Latitude 43°27'N
Longitude 80°23'W
Up Stream Storage
Storage (ha-m) Discharge (cms)
0.000 0.000
Particle Size Distribution (PSD)The selected PSD defines TSS removal
Fine Distribution
Particle Diameter(microns)
Distribution %
Specific Gravity
20.0 20.0 1.30
60.0 20.0 1.80
150.0 20.0 2.20
400.0 20.0 2.65
2000.0 20.0 2.65
Up Stream Flow Diversion
Max. Flow to Stormceptor (cms)
Sizing Details
For Stormceptor Specifications and Drawings Please Visit: http://www.imbriumsystems.com/technical-specifications
Stormceptor Brief Sizing Report – Page 2 of 2

APPENDIX B
WATER BALANCE ANALYSIS DESIGN SHEETS
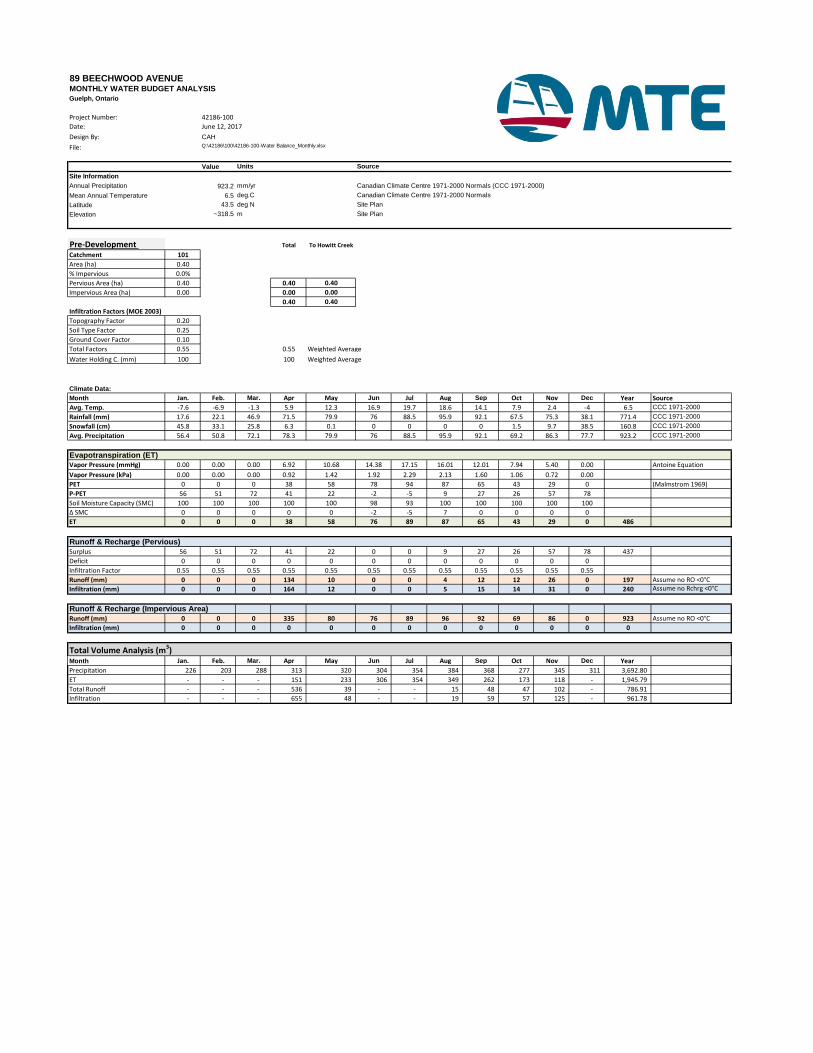
89 BEECHWOOD AVENUEMONTHLY WATER BUDGET ANALYSIS
Guelph, Ontario
Project Number: 42186-100
Date:
Design By: CAH
File:
Value Units Source
Site Information
Annual Precipitation 923.2 mm/yr Canadian Climate Centre 1971-2000 Normals (CCC 1971-2000)
Mean Annual Temperature 6.5 deg.C Canadian Climate Centre 1971-2000 Normals
Latitude 43.5 deg N Site Plan
Elevation ~318.5 m Site Plan
Pre-Development Total To Howitt Creek
Catchment 101
Area (ha) 0.40
% Impervious 0.0%
Pervious Area (ha) 0.40 0.40 0.40
Impervious Area (ha) 0.00 0.00 0.00
0.40 0.40
Infiltration Factors (MOE 2003)
Topography Factor 0.20
Soil Type Factor 0.25
Ground Cover Factor 0.10
Total Factors 0.55 0.55 Weighted Average
Water Holding C. (mm) 100 100 Weighted Average
Climate Data:
Month Jan. Feb. Mar. Apr May Jun Jul Aug Sep Oct Nov Dec Year Source
Avg. Temp. -7.6 -6.9 -1.3 5.9 12.3 16.9 19.7 18.6 14.1 7.9 2.4 -4 6.5 CCC 1971-2000
Rainfall (mm) 17.6 22.1 46.9 71.5 79.9 76 88.5 95.9 92.1 67.5 75.3 38.1 771.4 CCC 1971-2000
Snowfall (cm) 45.8 33.1 25.8 6.3 0.1 0 0 0 0 1.5 9.7 38.5 160.8 CCC 1971-2000
Avg. Precipitation 56.4 50.8 72.1 78.3 79.9 76 88.5 95.9 92.1 69.2 86.3 77.7 923.2 CCC 1971-2000
Evapotranspiration (ET)
Vapor Pressure (mmHg) 0.00 0.00 0.00 6.92 10.68 14.38 17.15 16.01 12.01 7.94 5.40 0.00 Antoine Equation
Vapor Pressure (kPa) 0.00 0.00 0.00 0.92 1.42 1.92 2.29 2.13 1.60 1.06 0.72 0.00
PET 0 0 0 38 58 78 94 87 65 43 29 0 (Malmstrom 1969)
P-PET 56 51 72 41 22 -2 -5 9 27 26 57 78
Soil Moisture Capacity (SMC) 100 100 100 100 100 98 93 100 100 100 100 100
Δ SMC 0 0 0 0 0 -2 -5 7 0 0 0 0
ET 0 0 0 38 58 76 89 87 65 43 29 0 486
Runoff & Recharge (Pervious)
Surplus 56 51 72 41 22 0 0 9 27 26 57 78 437
Deficit 0 0 0 0 0 0 0 0 0 0 0 0
Infiltration Factor 0.55 0.55 0.55 0.55 0.55 0.55 0.55 0.55 0.55 0.55 0.55 0.55
Runoff (mm) 0 0 0 134 10 0 0 4 12 12 26 0 197 Assume no RO <0°C
Infiltration (mm) 0 0 0 164 12 0 0 5 15 14 31 0 240 Assume no Rchrg <0°C
Runoff & Recharge (Impervious Area)
Runoff (mm) 0 0 0 335 80 76 89 96 92 69 86 0 923 Assume no RO <0°C
Infiltration (mm) 0 0 0 0 0 0 0 0 0 0 0 0 0
Total Volume Analysis (m3)Month Jan. Feb. Mar. Apr May Jun Jul Aug Sep Oct Nov Dec Year
Precipitation 226 203 288 313 320 304 354 384 368 277 345 311 3,692.80
ET - - - 151 233 306 354 349 262 173 118 - 1,945.79
Total Runoff - - - 536 39 - - 15 48 47 102 - 786.91
Infiltration - - - 655 48 - - 19 59 57 125 - 961.78
June 12, 2017
Q:\42186\100\42186-100-Water Balance_Monthly.xlsx

89 BEECHWOOD AVENUEMONTHLY WATER BUDGET ANALYSIS
Guelph, Ontario
Project Number: 42186-100
Date:
Design By: CAH
File:
Value Units Source
Site Information
Annual Precipitation 923.2 mm/yr Canadian Climate Centre 1971-2000 Normals (CCC 1971-2000)
Mean Annual Temperature 6.5 deg.C Canadian Climate Centre 1971-2000 Normals
Latitude 43.5 deg N Site Plan
Elevation ~318.5 m Site Plan
Current Condition - Optimist Club Total To Howitt Creek
Catchment 101
Area (ha) 0.40
% Impervious 60.0%
Pervious Area (ha) 0.16 0.16 0.16
Impervious Area (ha) 0.24 0.24 0.24
0.40 0.40
Infiltration Factors (MOE 2003)
Topography Factor 0.20
Soil Type Factor 0.25
Ground Cover Factor 0.10
Total Factors 0.55 0.55 Weighted Average
Water Holding C. (mm) 100 100 Weighted Average
Climate Data:
Month Jan. Feb. Mar. Apr May Jun Jul Aug Sep Oct Nov Dec Year Source
Avg. Temp. -7.6 -6.9 -1.3 5.9 12.3 16.9 19.7 18.6 14.1 7.9 2.4 -4 6.5 CCC 1971-2000
Rainfall (mm) 17.6 22.1 46.9 71.5 79.9 76 88.5 95.9 92.1 67.5 75.3 38.1 771.4 CCC 1971-2000
Snowfall (cm) 45.8 33.1 25.8 6.3 0.1 0 0 0 0 1.5 9.7 38.5 160.8 CCC 1971-2000
Avg. Precipitation 56.4 50.8 72.1 78.3 79.9 76 88.5 95.9 92.1 69.2 86.3 77.7 923.2 CCC 1971-2000
Evapotranspiration (ET)
Vapor Pressure (mmHg) 0.00 0.00 0.00 6.92 10.68 14.38 17.15 16.01 12.01 7.94 5.40 0.00 Antoine Equation
Vapor Pressure (kPa) 0.00 0.00 0.00 0.92 1.42 1.92 2.29 2.13 1.60 1.06 0.72 0.00
PET 0 0 0 38 58 78 94 87 65 43 29 0 (Malmstrom 1969)
P-PET 56 51 72 41 22 -2 -5 9 27 26 57 78
Soil Moisture Capacity (SMC) 100 100 100 100 100 98 93 100 100 100 100 100
Δ SMC 0 0 0 0 0 -2 -5 7 0 0 0 0
ET 0 0 0 38 58 76 89 87 65 43 29 0 486
Runoff & Recharge (Pervious)
Surplus 56 51 72 41 22 0 0 9 27 26 57 78 437
Deficit 0 0 0 0 0 0 0 0 0 0 0 0
Infiltration Factor 0.55 0.55 0.55 0.55 0.55 0.55 0.55 0.55 0.55 0.55 0.55 0.55
Runoff (mm) 0 0 0 134 10 0 0 4 12 12 26 0 197 Assume no RO <0°C
Infiltration (mm) 0 0 0 164 12 0 0 5 15 14 31 0 240 Assume no Rchrg <0°C
Runoff & Recharge (Impervious Area)
Runoff (mm) 0 0 0 335 80 76 89 96 92 69 86 0 923 Assume no RO <0°C
Infiltration (mm) 0 0 0 0 0 0 0 0 0 0 0 0 0
Total Volume Analysis (m3)Month Jan. Feb. Mar. Apr May Jun Jul Aug Sep Oct Nov Dec Year
Precipitation 226 203 288 313 320 304 354 384 368 277 345 311 3,692.80
ET - - - 60 93 122 142 140 105 69 47 - 778.32
Total Runoff - - - 1,019 207 182 212 236 240 185 248 - 2,530.44
Infiltration - - - 262 19 - - 8 23 23 50 - 384.71
June 12, 2017
Q:\42186\100\42186-100-Water Balance_Monthly.xlsx
89 BEECHWOOD AVENUEMONTHLY WATER BUDGET ANALYSIS
Guelph, Ontario
Project Number: 42186-100
Date:
Design By: CAH
File:
Value Units Source
Site Information
Annual Precipitation 923.2 mm/yr Canadian Climate Centre 1971-2000 Normals (CCC 1971-2000)
Mean Annual Temperature 6.5 deg.C Canadian Climate Centre 1971-2000 Normals
Latitude 43.5 deg N Site Plan
Elevation ~318.5 m Site Plan
Post-Development Roof Total To Howitt Creek
Catchment 201
Area (ha) 0.205
% Impervious 100.0%
Pervious Area (ha) 0.00 0.00 0.00
Impervious Area (ha) 0.21 0.21 0.21
0.21 0.21
Infiltration Factors (MOE 2003)
Topography Factor 0.30
Soil Type Factor 0.25
Ground Cover Factor 0.10
Total Factors 0.65 0.65
Water Holding C. (mm) 100 100 Weighted Average
Climate Data:
Month Jan. Feb. Mar. Apr May Jun Jul Aug Sep Oct Nov Dec Year Source
Avg. Temp. -7.6 -6.9 -1.3 5.9 12.3 16.9 19.7 18.6 14.1 7.9 2.4 -4 6.5 CCC 1971-2000
Rainfall (mm) 17.6 22.1 46.9 71.5 79.9 76 88.5 95.9 92.1 67.5 75.3 38.1 771.4 CCC 1971-2000
Snowfall (cm) 45.8 33.1 25.8 6.3 0.1 0 0 0 0 1.5 9.7 38.5 160.8 CCC 1971-2000
Avg. Precipitation 56.4 50.8 72.1 78.3 79.9 76 88.5 95.9 92.1 69.2 86.3 77.7 923.2 CCC 1971-2000
Evapotranspiration (ET)
Vapor Pressure (mmHg) 0.00 0.00 0.00 6.92 10.68 14.38 17.15 16.01 12.01 7.94 5.40 0.00 Antoine Equation
Vapor Pressure (kPa) 0.00 0.00 0.00 0.92 1.42 1.92 2.29 2.13 1.60 1.06 0.72 0.00
PET 0 0 0 38 58 78 94 87 65 43 29 0 (Malmstrom 1969)
P-PET 56 51 72 41 22 -2 -5 9 27 26 57 78
Soil Moisture Capacity (SMC) 100 100 100 100 100 98 93 100 100 100 100 100
Δ SMC 0 0 0 0 0 -2 -5 7 0 0 0 0
ET 0 0 0 38 58 76 89 87 65 43 29 0 486
Runoff & Recharge (Pervious)
Surplus 56 51 72 41 22 0 0 9 27 26 57 78 437
Deficit 0 0 0 0 0 0 0 0 0 0 0 0
Infiltration Factor 0.65 0.65 0.65 0.65 0.65 0.65 0.65 0.65 0.65 0.65 0.65 0.65
Runoff (mm) 0 0 0 104 8 0 0 3 9 9 20 0 153 Assume no RO <0°C
Infiltration (mm) 0 0 0 193 14 0 0 6 17 17 37 0 284 Assume no Rchrg <0°C
Runoff (mm) 0 0 0 335 80 76 89 96 92 69 86 0 923 Assume no RO <0°C
Infiltration (mm) 0 0 0 0 0 0 0 0 0 0 0 0 0
Total Volume Analysis (m3)Month Jan. Feb. Mar. Apr May Jun Jul Aug Sep Oct Nov Dec Year
Precipitation 116 104 148 161 164 156 181 197 189 142 177 159 1,892.56
ET - - - - - - - - - - - - -
Total Runoff - - - 687 164 156 181 197 189 142 177 - 1,892.56
Runoff to Wetland - - - 687 164 156 181 197 189 142 177 - 1,892.56
Infiltration - - - - - - - - - - - - -
June 12, 2017
Q:\42186\100\42186-100-Water Balance_Monthly.xlsx
Runoff & Recharge (Impervious Area)
89 BEECHWOOD AVENUEMONTHLY WATER BUDGET ANALYSIS
Guelph, Ontario
Project Number: 42186-100
Date:
Design By: CAH
File:
Value Units Source
Site Information
Annual Precipitation 923.2 mm/yr Canadian Climate Centre 1971-2000 Normals (CCC 1971-2000)
Mean Annual Temperature 6.5 deg.C Canadian Climate Centre 1971-2000 Normals
Latitude 43.5 deg N Site Plan
Elevation ~318.5 m Site Plan
Post-Development Remainder Total To Howitt Creek
Catchment 202
Area (ha) 0.195
% Impervious 90.0%
Pervious Area (ha) 0.02 0.02 0.02
Impervious Area (ha) 0.18 0.18 0.18
0.20 0.20
Infiltration Factors (MOE 2003)
Topography Factor 0.20
Soil Type Factor 0.25
Ground Cover Factor 0.10
Total Factors 0.55 0.55
Water Holding C. (mm) 100 100 Weighted Average
Climate Data:
Month Jan. Feb. Mar. Apr May Jun Jul Aug Sep Oct Nov Dec Year Source
Avg. Temp. -7.6 -6.9 -1.3 5.9 12.3 16.9 19.7 18.6 14.1 7.9 2.4 -4 6.5 CCC 1971-2000
Rainfall (mm) 17.6 22.1 46.9 71.5 79.9 76 88.5 95.9 92.1 67.5 75.3 38.1 771.4 CCC 1971-2000
Snowfall (cm) 45.8 33.1 25.8 6.3 0.1 0 0 0 0 1.5 9.7 38.5 160.8 CCC 1971-2000
Avg. Precipitation 56.4 50.8 72.1 78.3 79.9 76 88.5 95.9 92.1 69.2 86.3 77.7 923.2 CCC 1971-2000
Evapotranspiration (ET)
Vapor Pressure (mmHg) 0.00 0.00 0.00 6.92 10.68 14.38 17.15 16.01 12.01 7.94 5.40 0.00 Antoine Equation
Vapor Pressure (kPa) 0.00 0.00 0.00 0.92 1.42 1.92 2.29 2.13 1.60 1.06 0.72 0.00
PET 0 0 0 38 58 78 94 87 65 43 29 0 (Malmstrom 1969)
P-PET 56 51 72 41 22 -2 -5 9 27 26 57 78
Soil Moisture Capacity (SMC) 100 100 100 100 100 98 93 100 100 100 100 100
Δ SMC 0 0 0 0 0 -2 -5 7 0 0 0 0
ET 0 0 0 38 58 76 89 87 65 43 29 0 486
Runoff & Recharge (Pervious)
Surplus 56 51 72 41 22 0 0 9 27 26 57 78 437
Deficit 0 0 0 0 0 0 0 0 0 0 0 0
Infiltration Factor 0.55 0.55 0.55 0.55 0.55 0.55 0.55 0.55 0.55 0.55 0.55 0.55
Runoff (mm) 0 0 0 134 10 0 0 4 12 12 26 0 197 Assume no RO <0°C
Infiltration (mm) 0 0 0 164 12 0 0 5 15 14 31 0 240 Assume no Rchrg <0°C
Runoff (mm) 0 0 0 335 80 76 89 96 92 69 86 0 923 Assume no RO <0°C
Infiltration (mm) 0 0 0 0 0 0 0 0 0 0 0 0 0
Total Volume Analysis (m3)Month Jan. Feb. Mar. Apr May Jun Jul Aug Sep Oct Nov Dec Year
Precipitation 110 99 141 153 156 148 173 187 180 135 168 152 1,800.24
ET - - - 7 11 15 17 17 13 8 6 - 94.86
Total Runoff - - - 615 142 133 155 169 164 124 156 - 1,658.58
Runoff to Wetland - - - 615 142 133 155 169 164 124 156 - 1,658.58
Infiltration - - - 32 2 - - 1 3 3 6 - 46.89
June 12, 2017
Q:\42186\100\42186-100-Water Balance_Monthly.xlsx
Runoff & Recharge (Impervious Area)

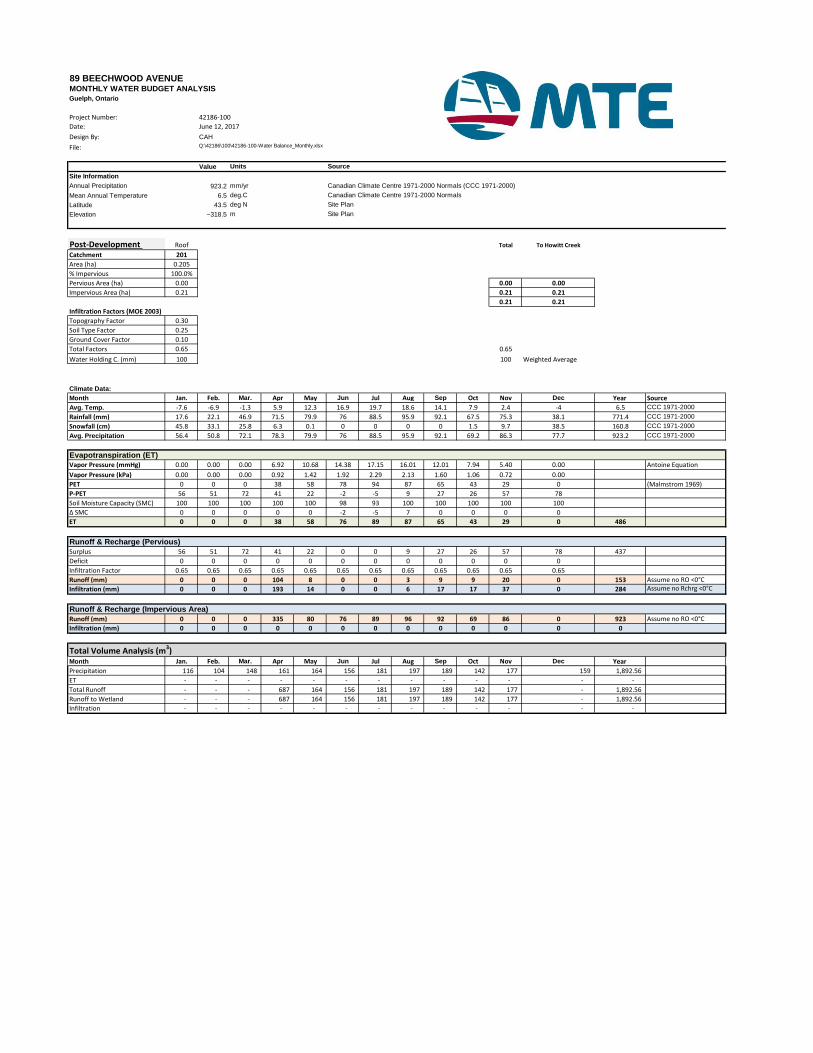
89 BEECHWOOD AVENUEMONTHLY WATER BUDGET ANALYSIS
Guelph, Ontario
Project Number: 42186-100
Date:
Design By: CAH
File:
Value Units Source
Site Information
Annual Precipitation 923.2 mm/yr Canadian Climate Centre 1971-2000 Normals (CCC 1971-2000)
Mean Annual Temperature 6.5 deg.C Canadian Climate Centre 1971-2000 Normals
Latitude 43.5 deg N Site Plan
Elevation ~318.5 m Site Plan
Post-Development Roof Remainder Total To Howitt Creek
Catchment 201 202
Area (ha) 0.205 0.195
% Impervious 100.0% 90.0%
Pervious Area (ha) 0.00 0.02 0.02 0.02
Impervious Area (ha) 0.21 0.18 0.38 0.38
0.40 0.40
Infiltration Factors (MOE 2003)
Topography Factor 0.30 0.20
Soil Type Factor 0.25 0.25
Ground Cover Factor 0.10 0.10
Total Factors 0.65 0.55 0.60
Water Holding C. (mm) 100 100 100 Weighted Average
Climate Data:
Month Jan. Feb. Mar. Apr May Jun Jul Aug Sep Oct Nov Dec Year Source
Avg. Temp. -7.6 -6.9 -1.3 5.9 12.3 16.9 19.7 18.6 14.1 7.9 2.4 -4 6.5 CCC 1971-2000
Rainfall (mm) 17.6 22.1 46.9 71.5 79.9 76 88.5 95.9 92.1 67.5 75.3 38.1 771.4 CCC 1971-2000
Snowfall (cm) 45.8 33.1 25.8 6.3 0.1 0 0 0 0 1.5 9.7 38.5 160.8 CCC 1971-2000
Avg. Precipitation 56.4 50.8 72.1 78.3 79.9 76 88.5 95.9 92.1 69.2 86.3 77.7 923.2 CCC 1971-2000
Evapotranspiration (ET)
Vapor Pressure (mmHg) 0.00 0.00 0.00 6.92 10.68 14.38 17.15 16.01 12.01 7.94 5.40 0.00 Antoine Equation
Vapor Pressure (kPa) 0.00 0.00 0.00 0.92 1.42 1.92 2.29 2.13 1.60 1.06 0.72 0.00
PET 0 0 0 38 58 78 94 87 65 43 29 0 (Malmstrom 1969)
P-PET 56 51 72 41 22 -2 -5 9 27 26 57 78
Soil Moisture Capacity (SMC) 100 100 100 100 100 98 93 100 100 100 100 100
Δ SMC 0 0 0 0 0 -2 -5 7 0 0 0 0
ET 0 0 0 38 58 76 89 87 65 43 29 0 486
Runoff & Recharge (Pervious)
Surplus 56 51 72 41 22 0 0 9 27 26 57 78 437
Deficit 0 0 0 0 0 0 0 0 0 0 0 0
Infiltration Factor 0.60 0.60 0.60 0.60 0.60 0.60 0.60 0.60 0.60 0.60 0.60 0.60
Runoff (mm) 0 0 0 119 9 0 0 3 11 10 23 0 174 Assume no RO <0°C
Infiltration (mm) 0 0 0 179 13 0 0 5 16 16 34 0 263 Assume no Rchrg <0°C
Runoff (mm) 0 0 0 335 80 76 89 96 92 69 86 0 923 Assume no RO <0°C
Infiltration (mm) 0 0 0 0 0 0 0 0 0 0 0 0 0
Total Volume Analysis (m3)Month Jan. Feb. Mar. Apr May Jun Jul Aug Sep Oct Nov Dec Year
Precipitation 226 203 288 313 320 304 354 384 368 277 345 311 3,692.80
ET - - - 7 11 15 17 17 13 8 6 - 94.86
Total Runoff - - - 1,299 306 289 337 366 353 265 333 - 3,546.77
Runoff to Wetland - - - 1,299 306 289 337 366 353 265 333 - 3,546.77
Infiltration - - - 35 3 - - 1 3 3 7 - 51.26
June 12, 2017
Q:\42186\100\42186-100-Water Balance_Monthly.xlsx
Runoff & Recharge (Impervious Area)
89 BEECHWOOD AVENUE WATER BUDGET ANALYSIS
Guelph, Ontario
Project Number: 42186-100
Date: June 12, 2017
Design By: CAH
File: Q:\42186\100\42186-100-Water Balance_Monthly.xlsx
Value Units Source
Site Information
Annual Precipitation 923.2 mm/yr Canadian Climate Centre 1971-2000 Normals (CCC 1971-2000)
Mean Annual Temperature 6.5 deg.C Canadian Climate Centre 1971-2000 Normals
Latitude 43.5 deg N Site Plan
Elevation ~318.5 m Site Plan
Pre-Development Current Condition Post Dev - Roof Roof to Gallery Post Dev - Remainder Post Dev - Total w/gallery
(Total Site = 0.400ha) (Total Site = 0.400ha) (Area = 0.205ha) (Area = 0.205ha) (Area = 0.195ha) (Total Site = 0.400ha)
Precipitation 3692.80 3692.80 1892.56 1892.56 1800.24 3692.80
ET 1945.79 777.64 0.00 567.77 94.86 662.63
Runoff 786.91 2530.44 1892.56 189.26 1658.58 1847.84
Infiltration 961.78 384.71 0.00 1135.54 46.89 1182.43
Annual Water Balance Volumes (m³/year)

APPENDIX C
MIDUSS OUTPUT

PRE-DEVELOPMENT
Q:\42186\100\2 yr pre a.out Page 1Printed at 11:47 on 12 Jun 2017
1 " MIDUSS Output ----------------------------------------------->" 2 " MIDUSS version Version 2.25 rev. 473" 3 " MIDUSS created Sunday, February 07, 2010" 4 " 10 Units used: ie METRIC" 5 " Job folder: Q:\42186\100" 6 " Output filename: 2 yr pre a.out" 7 " Licensee name: admin" 8 " Company Microsoft" 9 " Date & Time last used: 5/4/2017 at 4:18:15 PM"10 " 31 TIME PARAMETERS"11 " 5.000 Time Step"12 " 180.000 Max. Storm length"13 " 1500.000 Max. Hydrograph"14 " 32 STORM Chicago storm"15 " 1 Chicago storm"16 " 743.000 Coefficient A"17 " 6.000 Constant B"18 " 0.799 Exponent C"19 " 0.400 Fraction R"20 " 180.000 Duration"21 " 1.000 Time step multiplier"22 " Maximum intensity 109.374 mm/hr"23 " Total depth 34.259 mm"24 " 6 002hyd Hydrograph extension used in this file"25 " 33 CATCHMENT 101"26 " 1 Triangular SCS"27 " 1 Equal length"28 " 1 SCS method"29 " 101 Total Site"30 " 60.000 % Impervious"31 " 0.404 Total Area"32 " 80.000 Flow length"33 " 4.000 Overland Slope"34 " 0.162 Pervious Area"35 " 80.000 Pervious length"36 " 4.000 Pervious slope"37 " 0.242 Impervious Area"38 " 80.000 Impervious length"39 " 4.000 Impervious slope"40 " 0.250 Pervious Manning 'n'"41 " 75.000 Pervious SCS Curve No."42 " 0.176 Pervious Runoff coefficient"43 " 0.100 Pervious Ia/S coefficient"44 " 8.467 Pervious Initial abstraction"45 " 0.015 Impervious Manning 'n'"46 " 98.000 Impervious SCS Curve No."47 " 0.839 Impervious Runoff coefficient"48 " 0.100 Impervious Ia/S coefficient"49 " 0.518 Impervious Initial abstraction"50 " 0.048 0.000 0.000 0.000 c.m/sec"51 " Catchment 101 Pervious Impervious Total Area "52 " Surface Area 0.162 0.242 0.404 hectare"53 " Time of concentration 38.470 3.233 7.548 minutes"54 " Time to Centroid 150.146 92.876 99.889 minutes"55 " Rainfall depth 34.259 34.259 34.259 mm"56 " Rainfall volume 55.36 83.04 138.40 c.m"57 " Rainfall losses 28.239 5.504 14.598 mm"58 " Runoff depth 6.019 28.755 19.661 mm"59 " Runoff volume 9.73 69.70 79.43 c.m"60 " Runoff coefficient 0.176 0.839 0.574 "61 " Maximum flow 0.002 0.048 0.048 c.m/sec"62 " 40 HYDROGRAPH Add Runoff "63 " 4 Add Runoff "64 " 0.048 0.048 0.000 0.000"65 " 38 START/RE-START TOTALS 101"66 " 3 Runoff Totals on EXIT"67 " Total Catchment area 0.404 hectare"68 " Total Impervious area 0.242 hectare"69 " Total % impervious 60.000"70 " 19 EXIT"
You created this PDF from an application that is not licensed to print to novaPDF printer (http://www.novapdf.com)
Q:\42186\100\5 yr pre a.out Page 1Printed at 11:48 on 12 Jun 2017
1 " MIDUSS Output ----------------------------------------------->" 2 " MIDUSS version Version 2.25 rev. 473" 3 " MIDUSS created Sunday, February 07, 2010" 4 " 10 Units used: ie METRIC" 5 " Job folder: Q:\42186\100" 6 " Output filename: 5 yr pre a.out" 7 " Licensee name: admin" 8 " Company Microsoft" 9 " Date & Time last used: 5/4/2017 at 4:27:10 PM"10 " 31 TIME PARAMETERS"11 " 5.000 Time Step"12 " 180.000 Max. Storm length"13 " 1500.000 Max. Hydrograph"14 " 32 STORM Chicago storm"15 " 1 Chicago storm"16 " 1593.000 Coefficient A"17 " 11.000 Constant B"18 " 0.879 Exponent C"19 " 0.400 Fraction R"20 " 180.000 Duration"21 " 1.000 Time step multiplier"22 " Maximum intensity 139.250 mm/hr"23 " Total depth 47.240 mm"24 " 6 005hyd Hydrograph extension used in this file"25 " 33 CATCHMENT 101"26 " 1 Triangular SCS"27 " 1 Equal length"28 " 1 SCS method"29 " 101 Total Site"30 " 60.000 % Impervious"31 " 0.404 Total Area"32 " 80.000 Flow length"33 " 4.000 Overland Slope"34 " 0.162 Pervious Area"35 " 80.000 Pervious length"36 " 4.000 Pervious slope"37 " 0.242 Impervious Area"38 " 80.000 Impervious length"39 " 4.000 Impervious slope"40 " 0.250 Pervious Manning 'n'"41 " 75.000 Pervious SCS Curve No."42 " 0.258 Pervious Runoff coefficient"43 " 0.100 Pervious Ia/S coefficient"44 " 8.467 Pervious Initial abstraction"45 " 0.015 Impervious Manning 'n'"46 " 98.000 Impervious SCS Curve No."47 " 0.873 Impervious Runoff coefficient"48 " 0.100 Impervious Ia/S coefficient"49 " 0.518 Impervious Initial abstraction"50 " 0.069 0.000 0.000 0.000 c.m/sec"51 " Catchment 101 Pervious Impervious Total Area "52 " Surface Area 0.162 0.242 0.404 hectare"53 " Time of concentration 28.002 2.898 7.026 minutes"54 " Time to Centroid 132.748 90.194 97.191 minutes"55 " Rainfall depth 47.240 47.240 47.240 mm"56 " Rainfall volume 76.34 114.51 190.85 c.m"57 " Rainfall losses 35.067 6.003 17.629 mm"58 " Runoff depth 12.172 41.237 29.611 mm"59 " Runoff volume 19.67 99.96 119.63 c.m"60 " Runoff coefficient 0.258 0.873 0.627 "61 " Maximum flow 0.005 0.068 0.069 c.m/sec"62 " 40 HYDROGRAPH Add Runoff "63 " 4 Add Runoff "64 " 0.069 0.069 0.000 0.000"65 " 38 START/RE-START TOTALS 101"66 " 3 Runoff Totals on EXIT"67 " Total Catchment area 0.404 hectare"68 " Total Impervious area 0.242 hectare"69 " Total % impervious 60.000"70 " 19 EXIT"
You created this PDF from an application that is not licensed to print to novaPDF printer (http://www.novapdf.com)
Q:\42186\100\100 yr pre a.out Page 1Printed at 11:49 on 12 Jun 2017
1 " MIDUSS Output ----------------------------------------------->" 2 " MIDUSS version Version 2.25 rev. 473" 3 " MIDUSS created Sunday, February 07, 2010" 4 " 10 Units used: ie METRIC" 5 " Job folder: Q:\42186\100" 6 " Output filename: 100 yr pre a.out" 7 " Licensee name: admin" 8 " Company Microsoft" 9 " Date & Time last used: 5/4/2017 at 4:27:53 PM"10 " 31 TIME PARAMETERS"11 " 5.000 Time Step"12 " 180.000 Max. Storm length"13 " 1500.000 Max. Hydrograph"14 " 32 STORM Chicago storm"15 " 1 Chicago storm"16 " 4688.000 Coefficient A"17 " 17.000 Constant B"18 " 0.962 Exponent C"19 " 0.400 Fraction R"20 " 180.000 Duration"21 " 1.000 Time step multiplier"22 " Maximum intensity 239.650 mm/hr"23 " Total depth 87.263 mm"24 " 6 100hyd Hydrograph extension used in this file"25 " 33 CATCHMENT 101"26 " 1 Triangular SCS"27 " 1 Equal length"28 " 1 SCS method"29 " 101 Total Site"30 " 60.000 % Impervious"31 " 0.404 Total Area"32 " 80.000 Flow length"33 " 4.000 Overland Slope"34 " 0.162 Pervious Area"35 " 80.000 Pervious length"36 " 4.000 Pervious slope"37 " 0.242 Impervious Area"38 " 80.000 Impervious length"39 " 4.000 Impervious slope"40 " 0.250 Pervious Manning 'n'"41 " 75.000 Pervious SCS Curve No."42 " 0.435 Pervious Runoff coefficient"43 " 0.100 Pervious Ia/S coefficient"44 " 8.467 Pervious Initial abstraction"45 " 0.015 Impervious Manning 'n'"46 " 98.000 Impervious SCS Curve No."47 " 0.923 Impervious Runoff coefficient"48 " 0.100 Impervious Ia/S coefficient"49 " 0.518 Impervious Initial abstraction"50 " 0.135 0.000 0.000 0.000 c.m/sec"51 " Catchment 101 Pervious Impervious Total Area "52 " Surface Area 0.162 0.242 0.404 hectare"53 " Time of concentration 17.262 2.303 5.878 minutes"54 " Time to Centroid 114.477 87.067 93.617 minutes"55 " Rainfall depth 87.263 87.263 87.263 mm"56 " Rainfall volume 141.02 211.53 352.54 c.m"57 " Rainfall losses 49.339 6.753 23.787 mm"58 " Runoff depth 37.924 80.511 63.476 mm"59 " Runoff volume 61.29 195.16 256.44 c.m"60 " Runoff coefficient 0.435 0.923 0.727 "61 " Maximum flow 0.024 0.132 0.135 c.m/sec"62 " 40 HYDROGRAPH Add Runoff "63 " 4 Add Runoff "64 " 0.135 0.135 0.000 0.000"65 " 38 START/RE-START TOTALS 101"66 " 3 Runoff Totals on EXIT"67 " Total Catchment area 0.808 hectare"68 " Total Impervious area 0.242 hectare"69 " Total % impervious 30.000"70 " 19 EXIT"
You created this PDF from an application that is not licensed to print to novaPDF printer (http://www.novapdf.com)

POST-DEVELOPMENT

Q:\42186\100\2 yr post c.out Page 1Printed at 11:47 on 12 Jun 2017
1 " MIDUSS Output ----------------------------------------------->" 2 " MIDUSS version Version 2.25 rev. 473" 3 " MIDUSS created Sunday, February 07, 2010" 4 " 10 Units used: ie METRIC" 5 " Job folder: Q:\42186\100" 6 " Output filename: 2 yr post c.out" 7 " Licensee name: admin" 8 " Company Microsoft" 9 " Date & Time last used: 5/31/2017 at 4:02:17 PM" 10 " 31 TIME PARAMETERS" 11 " 5.000 Time Step" 12 " 180.000 Max. Storm length" 13 " 1500.000 Max. Hydrograph" 14 " 32 STORM Chicago storm" 15 " 1 Chicago storm" 16 " 743.000 Coefficient A" 17 " 6.000 Constant B" 18 " 0.799 Exponent C" 19 " 0.400 Fraction R" 20 " 180.000 Duration" 21 " 1.000 Time step multiplier" 22 " Maximum intensity 109.401 mm/hr" 23 " Total depth 34.276 mm" 24 " 6 002hyd Hydrograph extension used in this file" 25 " 33 CATCHMENT 201" 26 " 1 Triangular SCS" 27 " 1 Equal length" 28 " 1 SCS method" 29 " 201 Roof Area" 30 " 100.000 % Impervious" 31 " 0.205 Total Area" 32 " 10.000 Flow length" 33 " 1.500 Overland Slope" 34 " 0.000 Pervious Area" 35 " 10.000 Pervious length" 36 " 1.500 Pervious slope" 37 " 0.205 Impervious Area" 38 " 10.000 Impervious length" 39 " 1.500 Impervious slope" 40 " 0.250 Pervious Manning 'n'" 41 " 75.000 Pervious SCS Curve No." 42 " 0.000 Pervious Runoff coefficient" 43 " 0.100 Pervious Ia/S coefficient" 44 " 8.467 Pervious Initial abstraction" 45 " 0.015 Impervious Manning 'n'" 46 " 98.000 Impervious SCS Curve No." 47 " 0.835 Impervious Runoff coefficient" 48 " 0.100 Impervious Ia/S coefficient" 49 " 0.518 Impervious Initial abstraction" 50 " 0.048 0.000 0.000 0.000 c.m/sec" 51 " Catchment 201 Pervious Impervious Total Area " 52 " Surface Area 0.000 0.205 0.205 hectare" 53 " Time of concentration 14.819 1.246 1.246 minutes" 54 " Time to Centroid 0.000 89.766 89.766 minutes" 55 " Rainfall depth 34.276 34.276 34.276 mm" 56 " Rainfall volume 0.00 70.27 70.27 c.m" 57 " Rainfall losses 34.276 5.642 5.642 mm" 58 " Runoff depth 0.000 28.635 28.635 mm" 59 " Runoff volume 0.00 58.70 58.70 c.m" 60 " Runoff coefficient 0.000 0.835 0.835 " 61 " Maximum flow 0.000 0.048 0.048 c.m/sec" 62 " 40 HYDROGRAPH Add Runoff " 63 " 4 Add Runoff " 64 " 0.048 0.048 0.000 0.000" 65 " 54 POND DESIGN" 66 " 0.048 Current peak flow c.m/sec" 67 " 0.024 Target outflow c.m/sec" 68 " 58.7 Hydrograph volume c.m" 69 " 11. Number of stages" 70 " 0.000 Minimum water level metre" 71 " 0.175 Maximum water level metre" 72 " 0.000 Starting water level metre" 73 " 0 Keep Design Data: 1 = True; 0 = False" 74 " Level Discharge Volume" 75 " 0.000 0.000 0.000" 76 " 0.01750 0.00158 0.1953"
You created this PDF from an application that is not licensed to print to novaPDF printer (http://www.novapdf.com)
Q:\42186\100\2 yr post c.out Page 2Printed at 11:47 on 12 Jun 2017
77 " 0.03500 0.00315 1.563" 78 " 0.05250 0.00472 5.274" 79 " 0.07000 0.00630 12.500" 80 " 0.08750 0.00788 24.415" 81 " 0.1050 0.00945 42.189" 82 " 0.1225 0.01103 66.794" 83 " 0.1400 0.01260 93.700" 84 " 0.1575 0.01417 120.606" 85 " 0.1750 0.01575 147.512" 86 " 1. ROOFTOP" 87 " Roof area Store area Area/drain Drain flow Roof slope" 88 " hectare hectare sq.metre L/min/25mm g H:1V" 89 " 0.205 0.154 250.000 22.500 66.667" 90 " Using 6 roofdrains on roofstorage area of 1538. square metre" 91 " Peak outflow 0.008 c.m/sec" 92 " Maximum level 0.091 metre" 93 " Maximum storage 28.259 c.m" 94 " Centroidal lag 2.129 hours" 95 " 0.048 0.048 0.008 0.000 c.m/sec" 96 " 40 HYDROGRAPH Combine 1" 97 " 6 Combine " 98 " 1 Node #" 99 " Total Site"100 " Maximum flow 0.008 c.m/sec"101 " Hydrograph volume 58.782 c.m"102 " 0.048 0.048 0.008 0.008"103 " 40 HYDROGRAPH Start - New Tributary"104 " 2 Start - New Tributary"105 " 0.048 0.000 0.008 0.008"106 " 33 CATCHMENT 202"107 " 1 Triangular SCS"108 " 1 Equal length"109 " 1 SCS method"110 " 202 Remainder of Site"111 " 90.000 % Impervious"112 " 0.195 Total Area"113 " 20.000 Flow length"114 " 4.000 Overland Slope"115 " 0.020 Pervious Area"116 " 20.000 Pervious length"117 " 4.000 Pervious slope"118 " 0.175 Impervious Area"119 " 20.000 Impervious length"120 " 4.000 Impervious slope"121 " 0.250 Pervious Manning 'n'"122 " 75.000 Pervious SCS Curve No."123 " 0.176 Pervious Runoff coefficient"124 " 0.100 Pervious Ia/S coefficient"125 " 8.467 Pervious Initial abstraction"126 " 0.015 Impervious Manning 'n'"127 " 98.000 Impervious SCS Curve No."128 " 0.839 Impervious Runoff coefficient"129 " 0.100 Impervious Ia/S coefficient"130 " 0.518 Impervious Initial abstraction"131 " 0.041 0.000 0.008 0.008 c.m/sec"132 " Catchment 202 Pervious Impervious Total Area "133 " Surface Area 0.020 0.175 0.195 hectare"134 " Time of concentration 16.736 1.407 1.755 minutes"135 " Time to Centroid 123.701 90.017 90.782 minutes"136 " Rainfall depth 34.276 34.276 34.276 mm"137 " Rainfall volume 6.68 60.16 66.84 c.m"138 " Rainfall losses 28.257 5.510 7.785 mm"139 " Runoff depth 6.019 28.767 26.492 mm"140 " Runoff volume 1.17 50.49 51.66 c.m"141 " Runoff coefficient 0.176 0.839 0.773 "142 " Maximum flow 0.000 0.041 0.041 c.m/sec"143 " 40 HYDROGRAPH Add Runoff "144 " 4 Add Runoff "145 " 0.041 0.041 0.008 0.008"146 " 40 HYDROGRAPH Copy to Outflow"147 " 8 Copy to Outflow"148 " 0.041 0.041 0.041 0.008"149 " 40 HYDROGRAPH Combine 1"150 " 6 Combine "151 " 1 Node #"152 " Total Site"
You created this PDF from an application that is not licensed to print to novaPDF printer (http://www.novapdf.com)
Q:\42186\100\2 yr post c.out Page 3Printed at 11:47 on 12 Jun 2017
153 " Maximum flow 0.047 c.m/sec"154 " Hydrograph volume 110.441 c.m"155 " 0.041 0.041 0.041 0.047"156 " 40 HYDROGRAPH Confluence 1"157 " 7 Confluence "158 " 1 Node #"159 " Total Site"160 " Maximum flow 0.047 c.m/sec"161 " Hydrograph volume 110.441 c.m"162 " 0.041 0.047 0.041 0.000"163 " 38 START/RE-START TOTALS 1"164 " 3 Runoff Totals on EXIT"165 " Total Catchment area 0.400 hectare"166 " Total Impervious area 0.380 hectare"167 " Total % impervious 95.125"168 " 19 EXIT"
You created this PDF from an application that is not licensed to print to novaPDF printer (http://www.novapdf.com)

Q:\42186\100\5 yr post b.out Page 1Printed at 11:48 on 12 Jun 2017
1 " MIDUSS Output ----------------------------------------------->" 2 " MIDUSS version Version 2.25 rev. 473" 3 " MIDUSS created Sunday, February 07, 2010" 4 " 10 Units used: ie METRIC" 5 " Job folder: Q:\42186\100" 6 " Output filename: 5 yr post b.out" 7 " Licensee name: admin" 8 " Company Microsoft" 9 " Date & Time last used: 5/31/2017 at 4:04:37 PM" 10 " 31 TIME PARAMETERS" 11 " 5.000 Time Step" 12 " 180.000 Max. Storm length" 13 " 1500.000 Max. Hydrograph" 14 " 32 STORM Chicago storm" 15 " 1 Chicago storm" 16 " 1593.000 Coefficient A" 17 " 11.000 Constant B" 18 " 0.879 Exponent C" 19 " 0.400 Fraction R" 20 " 180.000 Duration" 21 " 1.000 Time step multiplier" 22 " Maximum intensity 139.288 mm/hr" 23 " Total depth 47.265 mm" 24 " 6 005hyd Hydrograph extension used in this file" 25 " 33 CATCHMENT 201" 26 " 1 Triangular SCS" 27 " 1 Equal length" 28 " 1 SCS method" 29 " 201 Roof Area" 30 " 100.000 % Impervious" 31 " 0.205 Total Area" 32 " 10.000 Flow length" 33 " 1.500 Overland Slope" 34 " 0.000 Pervious Area" 35 " 10.000 Pervious length" 36 " 1.500 Pervious slope" 37 " 0.205 Impervious Area" 38 " 10.000 Impervious length" 39 " 1.500 Impervious slope" 40 " 0.250 Pervious Manning 'n'" 41 " 75.000 Pervious SCS Curve No." 42 " 0.000 Pervious Runoff coefficient" 43 " 0.100 Pervious Ia/S coefficient" 44 " 8.467 Pervious Initial abstraction" 45 " 0.015 Impervious Manning 'n'" 46 " 98.000 Impervious SCS Curve No." 47 " 0.867 Impervious Runoff coefficient" 48 " 0.100 Impervious Ia/S coefficient" 49 " 0.518 Impervious Initial abstraction" 50 " 0.066 0.000 0.000 0.000 c.m/sec" 51 " Catchment 201 Pervious Impervious Total Area " 52 " Surface Area 0.000 0.205 0.205 hectare" 53 " Time of concentration 10.788 1.117 1.117 minutes" 54 " Time to Centroid 111.495 87.559 87.559 minutes" 55 " Rainfall depth 47.265 47.265 47.265 mm" 56 " Rainfall volume 0.00 96.89 96.89 c.m" 57 " Rainfall losses 35.098 6.267 6.267 mm" 58 " Runoff depth 12.166 40.997 40.997 mm" 59 " Runoff volume 0.00 84.04 84.04 c.m" 60 " Runoff coefficient 0.000 0.867 0.867 " 61 " Maximum flow 0.000 0.066 0.066 c.m/sec" 62 " 40 HYDROGRAPH Add Runoff " 63 " 4 Add Runoff " 64 " 0.066 0.066 0.000 0.000" 65 " 54 POND DESIGN" 66 " 0.066 Current peak flow c.m/sec" 67 " 0.024 Target outflow c.m/sec" 68 " 84.0 Hydrograph volume c.m" 69 " 11. Number of stages" 70 " 0.000 Minimum water level metre" 71 " 0.175 Maximum water level metre" 72 " 0.000 Starting water level metre" 73 " 0 Keep Design Data: 1 = True; 0 = False" 74 " Level Discharge Volume" 75 " 0.000 0.000 0.000" 76 " 0.01750 0.00158 0.1956"
You created this PDF from an application that is not licensed to print to novaPDF printer (http://www.novapdf.com)
Q:\42186\100\5 yr post b.out Page 2Printed at 11:48 on 12 Jun 2017
77 " 0.03500 0.00315 1.565" 78 " 0.05250 0.00472 5.282" 79 " 0.07000 0.00630 12.521" 80 " 0.08750 0.00788 24.455" 81 " 0.1050 0.00945 42.258" 82 " 0.1225 0.01103 66.902" 83 " 0.1400 0.01260 93.852" 84 " 0.1575 0.01417 120.802" 85 " 0.1750 0.01575 147.752" 86 " 1. ROOFTOP" 87 " Roof area Store area Area/drain Drain flow Roof slope" 88 " hectare hectare sq.metre L/min/25mm g H:1V" 89 " 0.205 0.154 250.000 22.500 66.667" 90 " Using 6 roofdrains on roofstorage area of 1540. square metre" 91 " Peak outflow 0.010 c.m/sec" 92 " Maximum level 0.108 metre" 93 " Maximum storage 46.101 c.m" 94 " Centroidal lag 2.346 hours" 95 " 0.066 0.066 0.010 0.000 c.m/sec" 96 " 40 HYDROGRAPH Combine 1" 97 " 6 Combine " 98 " 1 Node #" 99 " Total Site"100 " Maximum flow 0.010 c.m/sec"101 " Hydrograph volume 84.011 c.m"102 " 0.066 0.066 0.010 0.010"103 " 40 HYDROGRAPH Start - New Tributary"104 " 2 Start - New Tributary"105 " 0.066 0.000 0.010 0.010"106 " 33 CATCHMENT 202"107 " 1 Triangular SCS"108 " 1 Equal length"109 " 1 SCS method"110 " 202 Remainder of Site"111 " 90.000 % Impervious"112 " 0.195 Total Area"113 " 20.000 Flow length"114 " 4.000 Overland Slope"115 " 0.020 Pervious Area"116 " 20.000 Pervious length"117 " 4.000 Pervious slope"118 " 0.175 Impervious Area"119 " 20.000 Impervious length"120 " 4.000 Impervious slope"121 " 0.250 Pervious Manning 'n'"122 " 75.000 Pervious SCS Curve No."123 " 0.257 Pervious Runoff coefficient"124 " 0.100 Pervious Ia/S coefficient"125 " 8.467 Pervious Initial abstraction"126 " 0.015 Impervious Manning 'n'"127 " 98.000 Impervious SCS Curve No."128 " 0.873 Impervious Runoff coefficient"129 " 0.100 Impervious Ia/S coefficient"130 " 0.518 Impervious Initial abstraction"131 " 0.056 0.000 0.010 0.010 c.m/sec"132 " Catchment 202 Pervious Impervious Total Area "133 " Surface Area 0.020 0.175 0.195 hectare"134 " Time of concentration 12.184 1.261 1.607 minutes"135 " Time to Centroid 113.230 87.763 88.570 minutes"136 " Rainfall depth 47.265 47.265 47.265 mm"137 " Rainfall volume 9.22 82.95 92.17 c.m"138 " Rainfall losses 35.115 6.009 8.920 mm"139 " Runoff depth 12.150 41.255 38.345 mm"140 " Runoff volume 2.37 72.40 74.77 c.m"141 " Runoff coefficient 0.257 0.873 0.811 "142 " Maximum flow 0.001 0.056 0.056 c.m/sec"143 " 40 HYDROGRAPH Add Runoff "144 " 4 Add Runoff "145 " 0.056 0.056 0.010 0.010"146 " 40 HYDROGRAPH Copy to Outflow"147 " 8 Copy to Outflow"148 " 0.056 0.056 0.056 0.010"149 " 40 HYDROGRAPH Combine 1"150 " 6 Combine "151 " 1 Node #"152 " Total Site"
You created this PDF from an application that is not licensed to print to novaPDF printer (http://www.novapdf.com)

Q:\42186\100\5 yr post b.out Page 3Printed at 11:48 on 12 Jun 2017
153 " Maximum flow 0.063 c.m/sec"154 " Hydrograph volume 158.783 c.m"155 " 0.056 0.056 0.056 0.063"156 " 40 HYDROGRAPH Confluence 1"157 " 7 Confluence "158 " 1 Node #"159 " Total Site"160 " Maximum flow 0.063 c.m/sec"161 " Hydrograph volume 158.783 c.m"162 " 0.056 0.063 0.056 0.000"163 " 38 START/RE-START TOTALS 1"164 " 3 Runoff Totals on EXIT"165 " Total Catchment area 0.400 hectare"166 " Total Impervious area 0.380 hectare"167 " Total % impervious 95.125"168 " 19 EXIT"
You created this PDF from an application that is not licensed to print to novaPDF printer (http://www.novapdf.com)
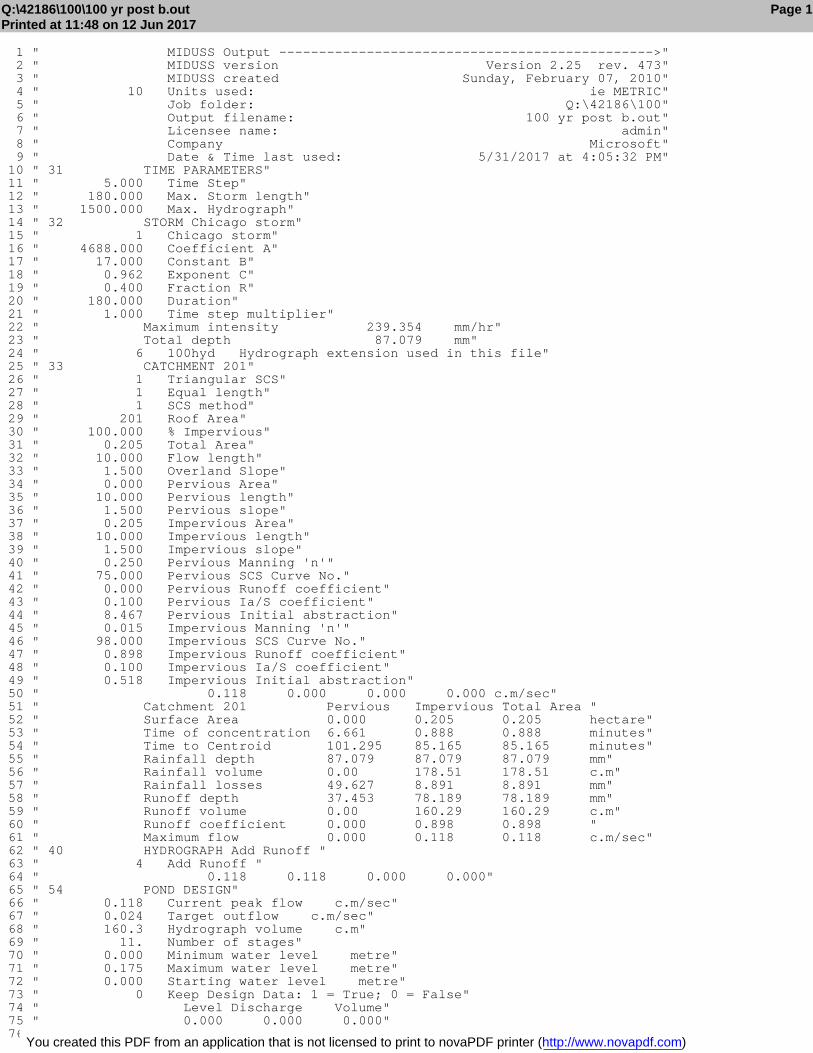
Q:\42186\100\100 yr post b.out Page 1Printed at 11:48 on 12 Jun 2017
1 " MIDUSS Output ----------------------------------------------->" 2 " MIDUSS version Version 2.25 rev. 473" 3 " MIDUSS created Sunday, February 07, 2010" 4 " 10 Units used: ie METRIC" 5 " Job folder: Q:\42186\100" 6 " Output filename: 100 yr post b.out" 7 " Licensee name: admin" 8 " Company Microsoft" 9 " Date & Time last used: 5/31/2017 at 4:05:32 PM" 10 " 31 TIME PARAMETERS" 11 " 5.000 Time Step" 12 " 180.000 Max. Storm length" 13 " 1500.000 Max. Hydrograph" 14 " 32 STORM Chicago storm" 15 " 1 Chicago storm" 16 " 4688.000 Coefficient A" 17 " 17.000 Constant B" 18 " 0.962 Exponent C" 19 " 0.400 Fraction R" 20 " 180.000 Duration" 21 " 1.000 Time step multiplier" 22 " Maximum intensity 239.354 mm/hr" 23 " Total depth 87.079 mm" 24 " 6 100hyd Hydrograph extension used in this file" 25 " 33 CATCHMENT 201" 26 " 1 Triangular SCS" 27 " 1 Equal length" 28 " 1 SCS method" 29 " 201 Roof Area" 30 " 100.000 % Impervious" 31 " 0.205 Total Area" 32 " 10.000 Flow length" 33 " 1.500 Overland Slope" 34 " 0.000 Pervious Area" 35 " 10.000 Pervious length" 36 " 1.500 Pervious slope" 37 " 0.205 Impervious Area" 38 " 10.000 Impervious length" 39 " 1.500 Impervious slope" 40 " 0.250 Pervious Manning 'n'" 41 " 75.000 Pervious SCS Curve No." 42 " 0.000 Pervious Runoff coefficient" 43 " 0.100 Pervious Ia/S coefficient" 44 " 8.467 Pervious Initial abstraction" 45 " 0.015 Impervious Manning 'n'" 46 " 98.000 Impervious SCS Curve No." 47 " 0.898 Impervious Runoff coefficient" 48 " 0.100 Impervious Ia/S coefficient" 49 " 0.518 Impervious Initial abstraction" 50 " 0.118 0.000 0.000 0.000 c.m/sec" 51 " Catchment 201 Pervious Impervious Total Area " 52 " Surface Area 0.000 0.205 0.205 hectare" 53 " Time of concentration 6.661 0.888 0.888 minutes" 54 " Time to Centroid 101.295 85.165 85.165 minutes" 55 " Rainfall depth 87.079 87.079 87.079 mm" 56 " Rainfall volume 0.00 178.51 178.51 c.m" 57 " Rainfall losses 49.627 8.891 8.891 mm" 58 " Runoff depth 37.453 78.189 78.189 mm" 59 " Runoff volume 0.00 160.29 160.29 c.m" 60 " Runoff coefficient 0.000 0.898 0.898 " 61 " Maximum flow 0.000 0.118 0.118 c.m/sec" 62 " 40 HYDROGRAPH Add Runoff " 63 " 4 Add Runoff " 64 " 0.118 0.118 0.000 0.000" 65 " 54 POND DESIGN" 66 " 0.118 Current peak flow c.m/sec" 67 " 0.024 Target outflow c.m/sec" 68 " 160.3 Hydrograph volume c.m" 69 " 11. Number of stages" 70 " 0.000 Minimum water level metre" 71 " 0.175 Maximum water level metre" 72 " 0.000 Starting water level metre" 73 " 0 Keep Design Data: 1 = True; 0 = False" 74 " Level Discharge Volume" 75 " 0.000 0.000 0.000" 76 " 0.01750 0.00158 0.1956"
You created this PDF from an application that is not licensed to print to novaPDF printer (http://www.novapdf.com)

Q:\42186\100\100 yr post b.out Page 2Printed at 11:48 on 12 Jun 2017
77 " 0.03500 0.00315 1.565" 78 " 0.05250 0.00472 5.282" 79 " 0.07000 0.00630 12.521" 80 " 0.08750 0.00788 24.455" 81 " 0.1050 0.00945 42.258" 82 " 0.1225 0.01103 66.902" 83 " 0.1400 0.01260 93.852" 84 " 0.1575 0.01417 120.802" 85 " 0.1750 0.01575 147.752" 86 " 1. ROOFTOP" 87 " Roof area Store area Area/drain Drain flow Roof slope" 88 " hectare hectare sq.metre L/min/25mm g H:1V" 89 " 0.205 0.154 250.000 22.500 66.667" 90 " Using 6 roofdrains on roofstorage area of 1540. square metre" 91 " Peak outflow 0.013 c.m/sec" 92 " Maximum level 0.146 metre" 93 " Maximum storage 102.747 c.m" 94 " Centroidal lag 2.897 hours" 95 " 0.118 0.118 0.013 0.000 c.m/sec" 96 " 40 HYDROGRAPH Combine 1" 97 " 6 Combine " 98 " 1 Node #" 99 " Total Site"100 " Maximum flow 0.013 c.m/sec"101 " Hydrograph volume 160.238 c.m"102 " 0.118 0.118 0.013 0.013"103 " 40 HYDROGRAPH Start - New Tributary"104 " 2 Start - New Tributary"105 " 0.118 0.000 0.013 0.013"106 " 33 CATCHMENT 202"107 " 1 Triangular SCS"108 " 1 Equal length"109 " 1 SCS method"110 " 202 Remainder of Site"111 " 90.000 % Impervious"112 " 0.195 Total Area"113 " 20.000 Flow length"114 " 4.000 Overland Slope"115 " 0.020 Pervious Area"116 " 20.000 Pervious length"117 " 4.000 Pervious slope"118 " 0.175 Impervious Area"119 " 20.000 Impervious length"120 " 4.000 Impervious slope"121 " 0.250 Pervious Manning 'n'"122 " 75.000 Pervious SCS Curve No."123 " 0.432 Pervious Runoff coefficient"124 " 0.100 Pervious Ia/S coefficient"125 " 8.467 Pervious Initial abstraction"126 " 0.015 Impervious Manning 'n'"127 " 98.000 Impervious SCS Curve No."128 " 0.907 Impervious Runoff coefficient"129 " 0.100 Impervious Ia/S coefficient"130 " 0.518 Impervious Initial abstraction"131 " 0.103 0.000 0.013 0.013 c.m/sec"132 " Catchment 202 Pervious Impervious Total Area "133 " Surface Area 0.020 0.175 0.195 hectare"134 " Time of concentration 7.523 1.003 1.331 minutes"135 " Time to Centroid 102.290 85.311 86.165 minutes"136 " Rainfall depth 87.079 87.079 87.079 mm"137 " Rainfall volume 16.98 152.82 169.80 c.m"138 " Rainfall losses 49.418 8.064 12.199 mm"139 " Runoff depth 37.661 79.016 74.880 mm"140 " Runoff volume 7.34 138.67 146.02 c.m"141 " Runoff coefficient 0.432 0.907 0.860 "142 " Maximum flow 0.004 0.101 0.103 c.m/sec"143 " 40 HYDROGRAPH Add Runoff "144 " 4 Add Runoff "145 " 0.103 0.103 0.013 0.013"146 " 40 HYDROGRAPH Copy to Outflow"147 " 8 Copy to Outflow"148 " 0.103 0.103 0.103 0.013"149 " 40 HYDROGRAPH Combine 1"150 " 6 Combine "151 " 1 Node #"152 " Total Site"
You created this PDF from an application that is not licensed to print to novaPDF printer (http://www.novapdf.com)

Q:\42186\100\100 yr post b.out Page 3Printed at 11:48 on 12 Jun 2017
153 " Maximum flow 0.112 c.m/sec"154 " Hydrograph volume 306.254 c.m"155 " 0.103 0.103 0.103 0.112"156 " 40 HYDROGRAPH Confluence 1"157 " 7 Confluence "158 " 1 Node #"159 " Total Site"160 " Maximum flow 0.112 c.m/sec"161 " Hydrograph volume 306.254 c.m"162 " 0.103 0.112 0.103 0.000"163 " 38 START/RE-START TOTALS 1"164 " 3 Runoff Totals on EXIT"165 " Total Catchment area 0.400 hectare"166 " Total Impervious area 0.380 hectare"167 " Total % impervious 95.125"168 " 19 EXIT"
You created this PDF from an application that is not licensed to print to novaPDF printer (http://www.novapdf.com)