Embed Size (px)
Citation preview

Absolute Strategy Research
1
April 2015 | www.IRPJournal.comIRP

April 2015 | www.IRPJournal.com
2
IRP Contents
CONTENTSAbsolute Strategy Research - US Equities set for a 5-10% Correction
Management CV, Inc. - Fanuc: Like Father, Like Son
Crossborder Capital Limited - Global Liquidity Falling
Ned Davis Research - Silly P/E or How Not to Time European Equities
Idea-Driven Equities Analyses - : Cashing in on B2C market growth:
PostNL (AMS:PNL)
Storm Research - 1982 & Counting
WaveTrack International - The 3rd Phase of the ‘Inflation-Pop’
Providentia Capital - Harnessing volatile relationships
for portfolio construction
Graham Bishop - Grexit, Brexit, Capital Markets Union and BASEL
03
07
09
11
13
15
17
19
21

3
April 2015 | www.IRPJournal.comIRP Absolute Strategy ResearchApril 2015 | www.IRPJournal.comIRP
Chart 1 US Activity Surprise Suggest GDP Growth Downgrade
Source: ASR Ltd. / Bloomberg LLP / Consensus Economics / Thomson Reuters Datastream
US EQUITIESSET FOR A
5-10%CORRECTION IN Q2
By Ian Harnett and David Bowers, Co-Founders Absolute Strategy Research
US equities have been the driving force in Global Equity markets for the last three years. However, we believe this leadership may be set to change and that Q2 will see a
5%-10% correction in US stocks.
Since the start of 2015, local currency returns for markets such as the Eurozone and Japan, where QE has been a major stimulus via weakening exchange rates, have been strong performers, up 17% and almost 14% respectively, with the global picture held
down largely by the meagre 1% gains in the US market.
We are increasingly worried that rather than simply being a drag on global equity market performance, the US economy could trigger a Q2 reversal in US equities.
Chart 1 shows how US activity surprises over the last three months have been the weakest recorded since the slowdown of 2011/12.

4
“…we doubt that the Fed will be in a rush to raise rates in June.”
Ian HarnettManaging Director &
Chief Investment Strategist
David BowersManaging Director &
Head of Research
Absolute Strategy ResearchApril 2015 | www.IRPJournal.comIRP
Absolute Strategy Research
5
April 2015 | www.IRPJournal.comIRP
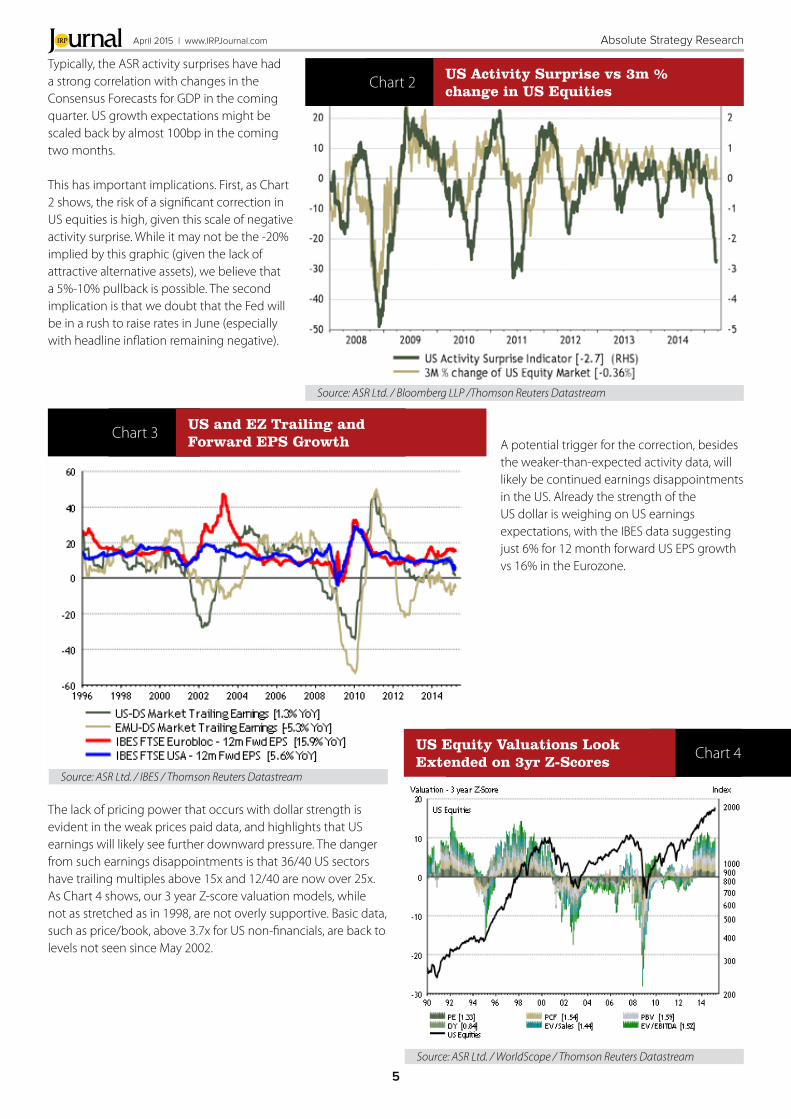
Typically, the ASR activity surprises have had a strong correlation with changes in the Consensus Forecasts for GDP in the coming quarter. US growth expectations might be scaled back by almost 100bp in the coming two months.
This has important implications. First, as Chart 2 shows, the risk of a significant correction in US equities is high, given this scale of negative activity surprise. While it may not be the -20% implied by this graphic (given the lack of attractive alternative assets), we believe that a 5%-10% pullback is possible. The second implication is that we doubt that the Fed will be in a rush to raise rates in June (especially with headline inflation remaining negative).
The lack of pricing power that occurs with dollar strength is evident in the weak prices paid data, and highlights that US earnings will likely see further downward pressure. The danger from such earnings disappointments is that 36/40 US sectors have trailing multiples above 15x and 12/40 are now over 25x. As Chart 4 shows, our 3 year Z-score valuation models, while not as stretched as in 1998, are not overly supportive. Basic data, such as price/book, above 3.7x for US non-financials, are back to levels not seen since May 2002.
A potential trigger for the correction, besides the weaker-than-expected activity data, will likely be continued earnings disappointments in the US. Already the strength of the US dollar is weighing on US earnings expectations, with the IBES data suggesting just 6% for 12 month forward US EPS growth vs 16% in the Eurozone.
Chart 2
Chart 4
Chart 3
US Activity Surprise vs 3m % change in US Equities
US Equity Valuations Look Extended on 3yr Z-Scores
US and EZ Trailing and Forward EPS Growth
Source: ASR Ltd. / Bloomberg LLP /Thomson Reuters Datastream
Source: ASR Ltd. / WorldScope / Thomson Reuters Datastream
Source: ASR Ltd. / IBES / Thomson Reuters Datastream

Absolute Strategy ResearchApril 2015 | www.IRPJournal.comIRP
One way of playing such a rebalancing is to look for European stocks with high international earnings, which benefit from dollar strength. These have already significantly outperformed US ‘international’ stocks, which are negatively impacted by the strong US dollar and we expect this to continue. Despite a modest pullback in the USD over the past couple of weeks, we do not expect a reversal while the ECB is easing and the Fed is moving towards tightening.
The ASR US Surprise Indicator is already signalling a 100bp reduction in US Consensus GDP forecasts in Q2. Weak domestic capex and activity, in addition to the stronger dollar, will likely lead to US earnings disappointment, exposing some extended valuations. Our conclusion therefore is that the US market is increasingly at risk of a 5%-10% correction in the coming months as earnings disappoint, in the face of some demanding valuations. The good news is that such a correction would make it less likely that that Fed would raise rates in June. Also, global equities, especially Japan and Eurozone equities, look well placed to withstand such a pull back if it occurs.
The question for global investors is whether, if the US market comes under further pressure, Eurozone and Japanese equities can outperform in local and common currency terms? As Chart 5 shows, European equities have beaten US equities since the start of 2015 even in common currency terms. And although in local currency terms performance has been spectacular, we believe there is still significant scope for Eurozone equities to continue to gain if the US falters.
Chart 6
Chart 5
European vs US International Earners & EUR/USD
Eurozone/US Equity Performance and ASR SBI
Source: ASR Ltd. / Thomson Reuters Datastream
Source: ASR Ltd. / Thomson Reuters Datastream
To see the full report from Absolute Strategy Research contact:
Richard Mylles
+44 207-073-0753
www.absolute-strategy.com
6

Like Father, Like Son - Fanuc Corp. ADS (OTC: FANUY)
LIKE FATHER,LIKE SONFANUCCORP. ADS (OTC: FANUY)Renny Ponvert
CEO, Management CV, Inc.
Founder, Honorary Chairman and recently named Chief of Robotics Research Institute, Dr. Seiuemon.
Inaba (88) built Japan-based Fanuc Corporation (short for: Fuji Automatic Numerical Control) into a dominant automation firm over 3 decades and into the world’s leading producer of industrial robots and NC devices. At age 21, he joined Fuji Tsushinki Seizo, the predecessor of Fujitsu, and at age 30, he was selected by a distant relative who sat on the Board to run the new control-device Company after its spinoff from Fujitsu. We think Inaba, who is known to regularly put in 11 hour days, is still calling the shots at this Company. We credit CEO Yoshiharu Inaba’s (66) father, Seiuemon, with effectively targeting the growing demand for robots that weld cars, assemble electronics and package food in China. We note, positively, that China specifically targeted robotics as a key sector for development in its 5 year economic plan for
April 2015 | www.IRPJournal.comIRP
7

8
Like Father, Like Son - Fanuc Corp. ADS (OTC: FANUY) April 2015 | www.IRPJournal.comIRP
To see the full report from Management CV contact:
Renny Ponvert
301 455 5886
www.managementcv.com
We also think that, given this management team’s particularly weak ownership stake, the Board’s long-term incentive plan (LTIP) is poorly aligned with shareholder interests. And given the fact that all members of management hold a seat on the Board, we think that the LTIP is not likely to change in a meaningful way that we would consider shareholder friendly.
CAPITAL ALLOCATION PRACTICES We think that capital allocation under CEO Inaba and his father has been ambiguous; however, it has turned out to be shareholder friendly. Revenue fell from ¥498 billion in 2013 to ¥451 billion in 2014, and other key operating metrics have also been declining since 2012. With an ROE of 9.7%, and an ROA of 8.7%, management’s effectiveness is subpar versus industry peers. We think that the slow recovery of the Chinese market and a stagnant Japanese market have had a negative impact on performance. We also think management has been slow to address operating weakness, though we credit them for recent steps to improve operating efficiencies by establishing laboratory and sales divisions under the supervision of each division, namely FA, Robots and ROBOMACHINEs. In addition, new factories were built for machining Robot and ROBOMACHINE parts at the Company’s headquarters. We think the balance sheet is solid with ¥823.7 billion in cash and equivalents and no long-term debt as of fiscal year 2014. Management paid an annual dividend of ¥170.06 in 2014 and has been regularly paying dividends since 2008. The Board paid out ¥31.1 billion in dividends in 2014, down from ¥39.1 billion in 2013. Management has also returned cash to shareholders via repurchases in the last couple of years. In 2012, 2013, and 2014 management bought back ¥304 million, ¥246 million, and ¥665 million worth of Fanuc shares, respectively
Copyright 2014 Management CV, Inc.
“We think the balance sheet is solid with ¥823.7 billion in cash and equivalents and no long-term debt”2011-2015. We like Fanuc’s 36% operating margin and credit Honorary Chairman Inaba for designing tool plants that can run mostly unattended. We note, however, a pattern of nepotism that we view as cautionary.
In addition to Seiuemon Inaba’s son, Yoshiharu, who is CEO of Fanuc, we note that Kiyonori Inaba (36), Seiuemon Inaba’s grandson, is the General Manager of the ROBOT division of FANUC. Honorary Chairman Inaba, who earned a PhD in engineering from the Tokyo Institute of Technology, is said to run his company with almost military-like precision, and that most of his decisions are final. We think there is significant key man risk at the Company. While we like the tenure and industry experience of the management team, we think they are mostly new to their roles and that their performance thus far has been unimpressive.
EXECUTIVE TEAM SKILLS FIT We like this team’s industry experience and long tenures. We note that most of the Fanuc team members are new to their roles. Yoshiharu Inaba was named CEO of Fanuc in June 2003. CEO Inaba joined the Company in September 1983 and was promoted to Managing Director in 1992 and then to Senior Managing Director in 1995. He was promoted to President, Chief Director of Marketing and Representative Director of Fanuc in January 2012 and in 2013 was named General Manager of the FA Business Division. Inaba holds a PhD in Engineering from the University of Tokyo and a Bachelor’s degree in Mechanical Engineering from the Tokyo Institute of Technology. Before joining Fanuc, he worked for Isuzu Motors. We note that in 2014, Forbes named Fanuc one of the top 100 innovative companies in the world. That’s the 4th consecutive year that Forbes has recognized Fanuc as a top innovator. Hiroyuki Uchida (56) was named Senior EVP of Fanuc and General Manager of the ROBOMACHINE Business Division in October 2013. We note that the division he leads saw a 55% decrease in revenue in 2014. EVP Uchida joined Fanuc in 1982. We like his long tenure and record of progression within Fanuc. We note, negatively, that he is currently the President of Organo Corporation, a publicly traded Japanese water treatment engineering company. We think his dual roles are a distraction and take too much time away from his duties as Senior EVP of Fanuc.
COMPENSATION & ALIGNMENT ANALYSIS We think that the compensation levels are low by US standards but in-line with large-cap Japanese peers. The 18 members of the Board were paid a total of ¥2.086 billion (about $18.2 million) in fiscal year 2014, which we think is low for a Company with a market capitalization of about ¥4.76 trillion. We note that all members of management are on the Board. Individual compensation levels are not disclosed.

9
Global Liquidity Falling: Latest GLI™ Data April 2015 | www.IRPJournal.comIRP
GLOBAL LIQUIDITY FALLING:
Latest GLI™ DataL
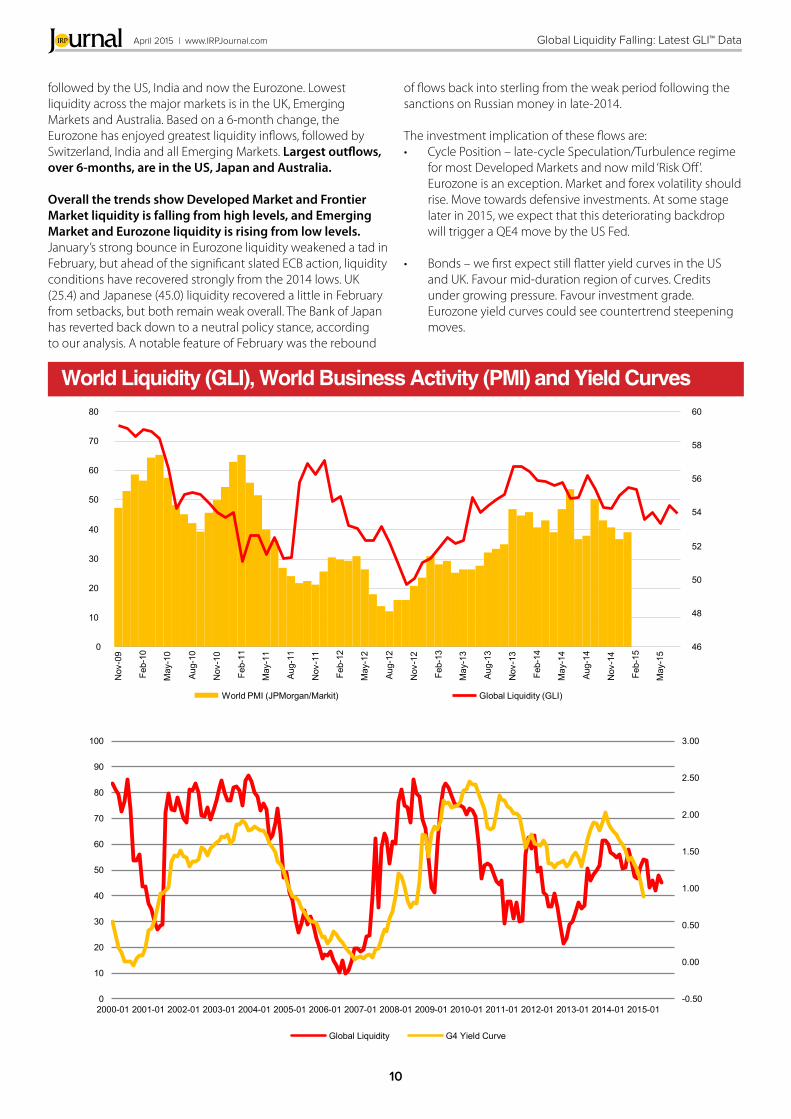
atest February 2015 Global Liquidity data highlights a further decline. Our GLI™ (Global Liquidity Index) fell to 39.6 from 41.7 (‘normal’ range 0-100) and the index has been at or below average now for six months.
Measured in equivalent US dollar terms, net monthly outflows of Global Liquidity average US$1 trillion over this period, or around 6% of total funds. Falling Global Liquidity warns of future financial and economic risk. Current levels of liquidity do not yet signal recession but they do point to economic slowdown over coming months and greater market volatility. Consistent with this picture, Treasury yield curves should continue to flatten and corporate credit spreads widen. Our models are still flagging a mild ‘Risk Off’ regime.
The most worrying aspect of the February data is the sharp fall in US private sector liquidity through the month. This reflects movements in corporate cash flows, which have been the mainstay underpinning Wall Street now for over two years. We must stress that, at an index of 72.2, US private sector liquidity remains relatively high, but it is falling and currently stands more than 10 index points below its August 2014 peak. This dip is consistent with recent downgrades of US earnings guidance. On top, February saw accelerated capital outflows from the US dollar. The Fed remains slightly tight at an index of 43.6.
Outside of the US, there is more evidence of policy easing moves. Emerging Market Central Bank Liquidity rose to an index score of 62.6 in February, or its highest value since the 2008 Financial Crisis. India’s Reserve Bank eased further last month to an index of 70.0, paced by China 65.8 and Brazil 50.7. China’s People’s Bank is definitively easing, according to our assessment. This is further evidence that Emerging Market Central Banks have broken away from the old-Bretton Woods II policy-regime of pegging to the US dollar, and instead are allowing currency weakness. The sliding Chinese RMB may be the confirming signal. A higher gold price should also be expected on a 6-12 month view, as a result of this acceleration in Central Bank money-printing. The index trend towards rising Central Bank Liquidity and falling Private Sector Liquidity is a typical signal of paper currency weakness. The gap in these indexes is now 3.9 index points, or down from 16.6 six months ago.
Among major markets, Switzerland still enjoys the best liquidity,
Michael HowellManaging Director
Crossborder Capital Limited
To see the full report from Crossborder Capital contact:
Michael Howell
T: +44 020 7868 4104
www.liquidity.com
“Current levels of liquidity do not yet signal recession but they do
point to economic slowdown over coming months and
greater market volatility”
April 2015 | www.IRPJournal.com
10
IRP Global Liquidity Falling: Latest GLI™ Data
World Liquidity (GLI), World Business Activity (PMI) and Yield Curves
0
10
20
30
40
50
60
70
80
Nov
-09
Feb-
10
May
-10
Aug-
10
Nov
-10
Feb-
11
May
-11
Aug-
11
Nov
-11
Feb-
12
May
-12
Aug-
12
Nov
-12
Feb-
13
May
-13
Aug-
13
Nov
-13
Feb-
14
May
-14
Aug-
14
Nov
-14
Feb-
15
May
-15
46
48
50
52
54
56
58
60
World PMI (JPMorgan/Markit) Global Liquidity (GLI)
-0.50
0.00
0.50
1.00
1.50
2.00
2.50
3.00
0
10
20
30
40
50
60
70
80
90
100
2000-01 2001-01 2002-01 2003-01 2004-01 2005-01 2006-01 2007-01 2008-01 2009-01 2010-01 2011-01 2012-01 2013-01 2014-01 2015-01
Global Liquidity G4 Yield Curve
followed by the US, India and now the Eurozone. Lowest liquidity across the major markets is in the UK, Emerging Markets and Australia. Based on a 6-month change, the Eurozone has enjoyed greatest liquidity inflows, followed by Switzerland, India and all Emerging Markets. Largest outflows, over 6-months, are in the US, Japan and Australia.
Overall the trends show Developed Market and Frontier Market liquidity is falling from high levels, and Emerging Market and Eurozone liquidity is rising from low levels. January’s strong bounce in Eurozone liquidity weakened a tad in February, but ahead of the significant slated ECB action, liquidity conditions have recovered strongly from the 2014 lows. UK (25.4) and Japanese (45.0) liquidity recovered a little in February from setbacks, but both remain weak overall. The Bank of Japan has reverted back down to a neutral policy stance, according to our analysis. A notable feature of February was the rebound
of flows back into sterling from the weak period following the sanctions on Russian money in late-2014.
The investment implication of these flows are: • Cycle Position – late-cycle Speculation/Turbulence regime
for most Developed Markets and now mild ‘Risk Off’. Eurozone is an exception. Market and forex volatility should rise. Move towards defensive investments. At some stage later in 2015, we expect that this deteriorating backdrop will trigger a QE4 move by the US Fed.
• Bonds – we first expect still flatter yield curves in the US and UK. Favour mid-duration region of curves. Credits under growing pressure. Favour investment grade. Eurozone yield curves could see countertrend steepening moves.

11
THE SILLY P/E OR HOW NOT
TO TIME THE EUROPEAN
EQUITIESN
o other valuation metrics get as much attention as the cyclically adjusted price-to-earnings ratio, or Shiller P/E. The indicator’s appeal comes from its no-nonsense approach to investing, which boils down to: (1) buy
low, sell high; (2) value drives price over the long-term; and (3) inflation should not fool investors.
Because of the ratio’s academic pedigree and Nobel cachet, market commentators rarely feel the need to check the indicator’s track record and often quote the Shiller P/E out of context. For example, Euro-bulls point to low relative and absolute Shiller P/Es as a reason to overweight the region.
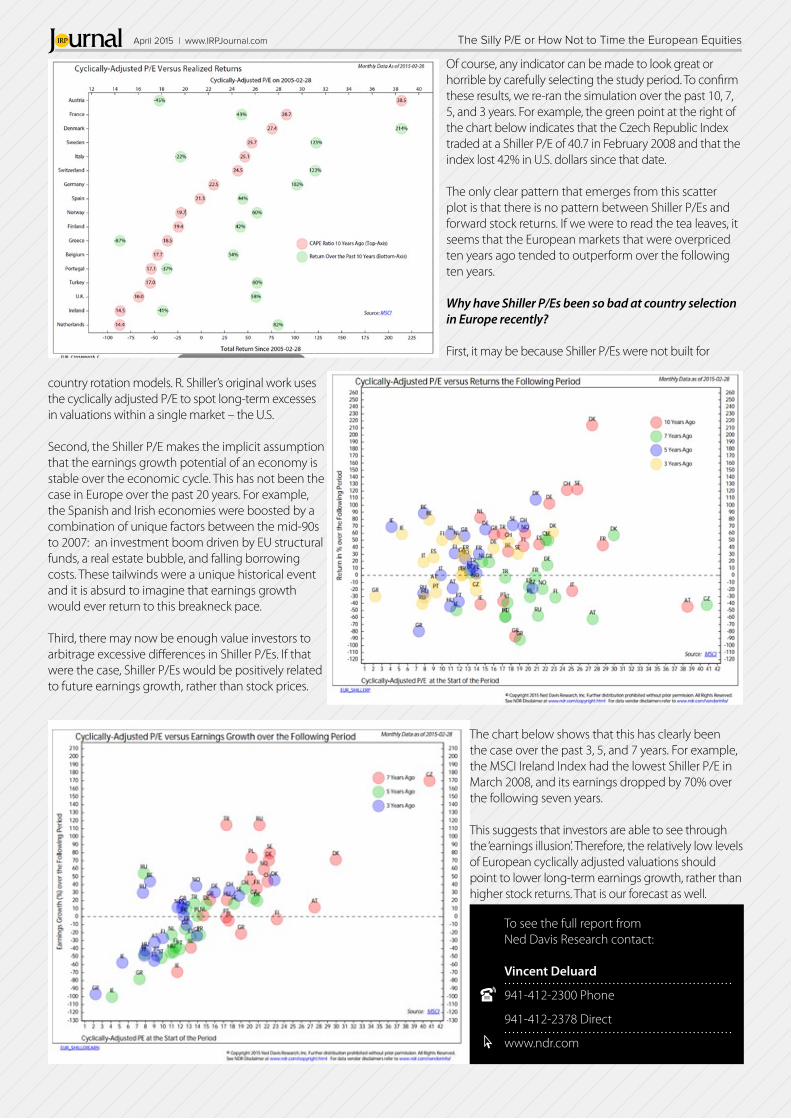
The chart below takes the perspective of an investor who would have built a country portfolio based on the level of Shiller P/Es in February 2005, slept for 10 years, and just woken up. He would be pleased to see the cheapest market (the Netherlands) posted gains of 82%. He would also be pleased that the most expensive market (Austria) lost 45%. But the rest of his country allocation would not have worked well. July 2004 Shiller P/Es would have overweighed Greece, Portugal, and Ireland – not exactly the best call getting into the sovereign debt crisis. Conversely, Denmark, the best performer over the period, would have been underweighted because of its high Shiller P/E in July 2004.
1. In the 03/14 Featured Report, Ed Clissold observed that: “the Shiller P/E has not worked any better than other metrics. Since 1993, it has done worse”.
Vincent DeluardEuropean Strategist.
Ned Davis Research, Inc.
“Euro-bulls point to low relative and absolute Shiller P/Es as a reason to overweight the region.”
The Silly P/E or How Not to Time the European EquitiesApril 2015 | www.IRPJournal.comIRP
12
Of course, any indicator can be made to look great or horrible by carefully selecting the study period. To confirm these results, we re-ran the simulation over the past 10, 7, 5, and 3 years. For example, the green point at the right of the chart below indicates that the Czech Republic Index traded at a Shiller P/E of 40.7 in February 2008 and that the index lost 42% in U.S. dollars since that date.
The only clear pattern that emerges from this scatter plot is that there is no pattern between Shiller P/Es and forward stock returns. If we were to read the tea leaves, it seems that the European markets that were overpriced ten years ago tended to outperform over the following ten years.
Why have Shiller P/Es been so bad at country selection in Europe recently?
First, it may be because Shiller P/Es were not built for
country rotation models. R. Shiller’s original work uses the cyclically adjusted P/E to spot long-term excesses in valuations within a single market – the U.S. Second, the Shiller P/E makes the implicit assumption that the earnings growth potential of an economy is stable over the economic cycle. This has not been the case in Europe over the past 20 years. For example, the Spanish and Irish economies were boosted by a combination of unique factors between the mid-90s to 2007: an investment boom driven by EU structural funds, a real estate bubble, and falling borrowing costs. These tailwinds were a unique historical event and it is absurd to imagine that earnings growth would ever return to this breakneck pace.
Third, there may now be enough value investors to arbitrage excessive differences in Shiller P/Es. If that were the case, Shiller P/Es would be positively related to future earnings growth, rather than stock prices.
The chart below shows that this has clearly been the case over the past 3, 5, and 7 years. For example, the MSCI Ireland Index had the lowest Shiller P/E in March 2008, and its earnings dropped by 70% over the following seven years.
This suggests that investors are able to see through the ‘earnings illusion’. Therefore, the relatively low levels of European cyclically adjusted valuations should point to lower long-term earnings growth, rather than higher stock returns. That is our forecast as well.
To see the full report from Ned Davis Research contact:
Vincent Deluard
941-412-2300 Phone
941-412-2378 Direct
www.ndr.com
The Silly P/E or How Not to Time the European EquitiesApril 2015 | www.IRPJournal.comIRP
13
CASHING IN ON B2C MARKET GROWTH: POSTNL (AMS:PNL) A
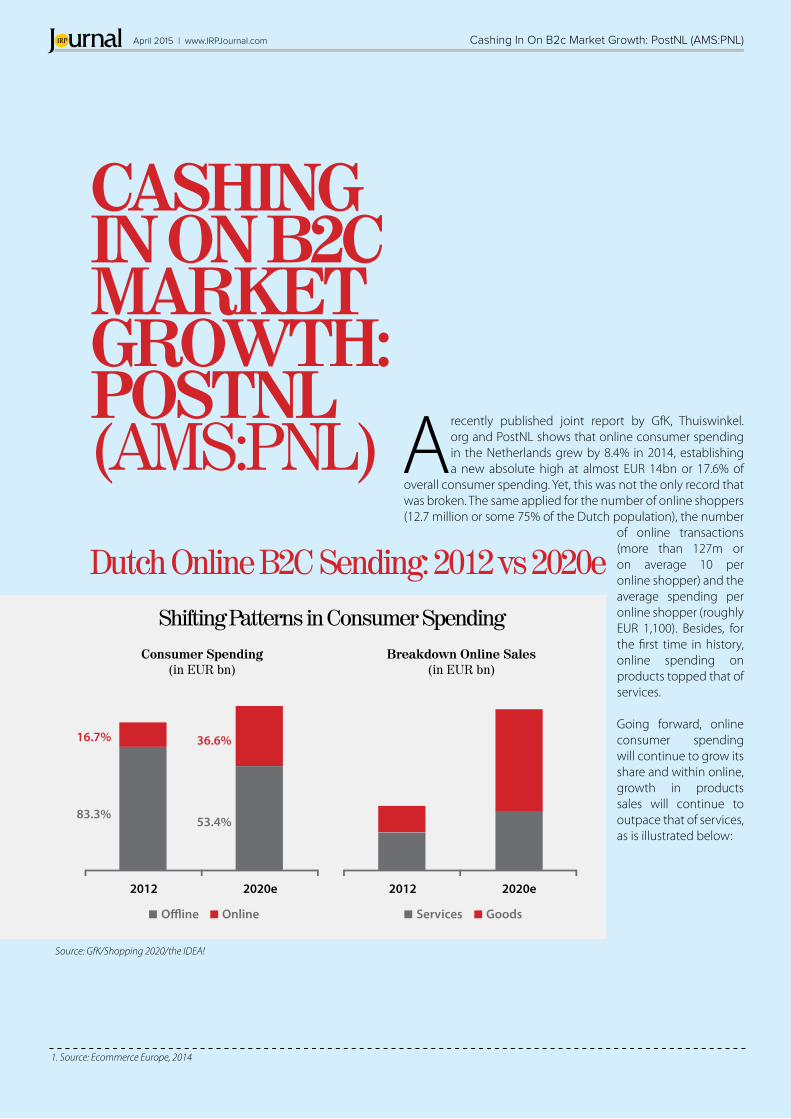
recently published joint report by GfK, Thuiswinkel.org and PostNL shows that online consumer spending in the Netherlands grew by 8.4% in 2014, establishing a new absolute high at almost EUR 14bn or 17.6% of
overall consumer spending. Yet, this was not the only record that was broken. The same applied for the number of online shoppers (12.7 million or some 75% of the Dutch population), the number
of online transactions (more than 127m or on average 10 per online shopper) and the average spending per online shopper (roughly EUR 1,100). Besides, for the first time in history, online spending on products topped that of services.
Going forward, online consumer spending will continue to grow its share and within online, growth in products sales will continue to outpace that of services, as is illustrated below:
2012
16.7%
83.3%
36.6%
53.4%
Consumer Spending(in EUR bn)
Breakdown Online Sales(in EUR bn)
20122020e
Online
2020e
Services Goods
Source: GfK/Shopping 2020/the IDEA!
1. Source: Ecommerce Europe, 2014
Cashing In On B2c Market Growth: PostNL (AMS:PNL)April 2015 | www.IRPJournal.comIRP
April 2015 | www.IRPJournal.com
14
IRP Cashing In On B2c Market Growth: PostNL (AMS:PNL)
As impressive as these numbers may look, Dutch online B2C spending is relatively modest in an international perspective. In 2013, online B2C spending in Europe amounted to EUR 363.1bn . The Netherlands accounted for less than 3% of that. The same applies for online B2C spending growth, where the Dutch merely outranked the Finns. Last but not least, the handicap of a relatively small home market is reflected in the fact that none of the Dutch e-tailers managed to establish a real international footprint like e.g., Amazon or Zalando. Instead, there merely are a limited number of ‘national champions’, with BOL.com (owned by Royal Ahold NV) and privately owned RFS Holding and Coolblue as the most important examples.
Now does that mean the Dutch market has nothing to offer for investors looking for exposure to the ecommerce revolution?
Not necessarily. In a recent study we published on this topic, we did come up with a candidate: former mail incumbent PostNL. After all, all these online purchased goods will have to find their way to the buyers.
Of course we are aware of what has been happening in the UK, where parcel delivery firm Citilink was forced to throw in the towel, partly due to the overcapacity in the sector and partly also by the fact that companies like Amazon have increasingly been taking control over their own distribution (e.g., parcel lockers).
We believe the situation in the Netherlands to be different, because of the following reasons:
1. The Dutch prefer delivery over pick-upA 2013 survey by GfK showed that 91.2% of the Dutch online shoppers prefer to collect their purchases through end-to-end (E2E) delivery (at home, via one’s neighbours or at work). As far as the remainder 8.8% of the shoppers are concerned, more than half (4.6%) prefer to pick-up one’s orders at a PostNL service point instead of in a shop or a parcel locker. In surrounding countries, pick-up rates vary between 30% and 50%.
2. PostNL holds an estimated 80% share in the E2E delivery segment for B2C parcels In an operationally geared environment, this creates a major advantage; not only in terms of relative costs but also in terms of being better suited to match the delivery moment with the receiving clients’ preferences (e.g., evening delivery). With its dominance on its home market, PostNL clearly differentiates from most of its peers.
3. PostNL’s pick-up network is second to noneEven if there would be a shift towards pick-up, PostNL has both the most (nearly 2.5 times the number of its nearest rival) and the best pick-up locations.
4. Parcel volumes to outpace online spending growthLast year, online spending on products exceeded that for services for the first time. Besides, the average value per transaction is still dropping. This means that B2C online volume growth will outpace growth in spending by en estimated factor of between 1.3 and 1.5 times.
With its new logistics infrastructure for parcels nearing completion, providing PostNL with an incremental 30% capacity and increased efficiency and flexibility, the company is ready to benefit from the further growth potential of ecommerce, both in the Netherlands and in Belgium. For investors this creates an opportunity to tap into this growth potential and at a significant valuation discount to both the e-tailers and most of PostNL’s peers.
“PostNL holds an estimated 80% share in the E2E delivery segment for B2C parcels”
Henk Slotboom, RBAIdea-Driven Equities Analyses
To see the full report from Idea-Driven Equities Analyses contact:
Henk Slotboom, RBA
+31 343 840 151
www.theidea.nl
15
April 2015 | www.IRPJournal.comIRP 1982 & Counting ShinMaywa Industries
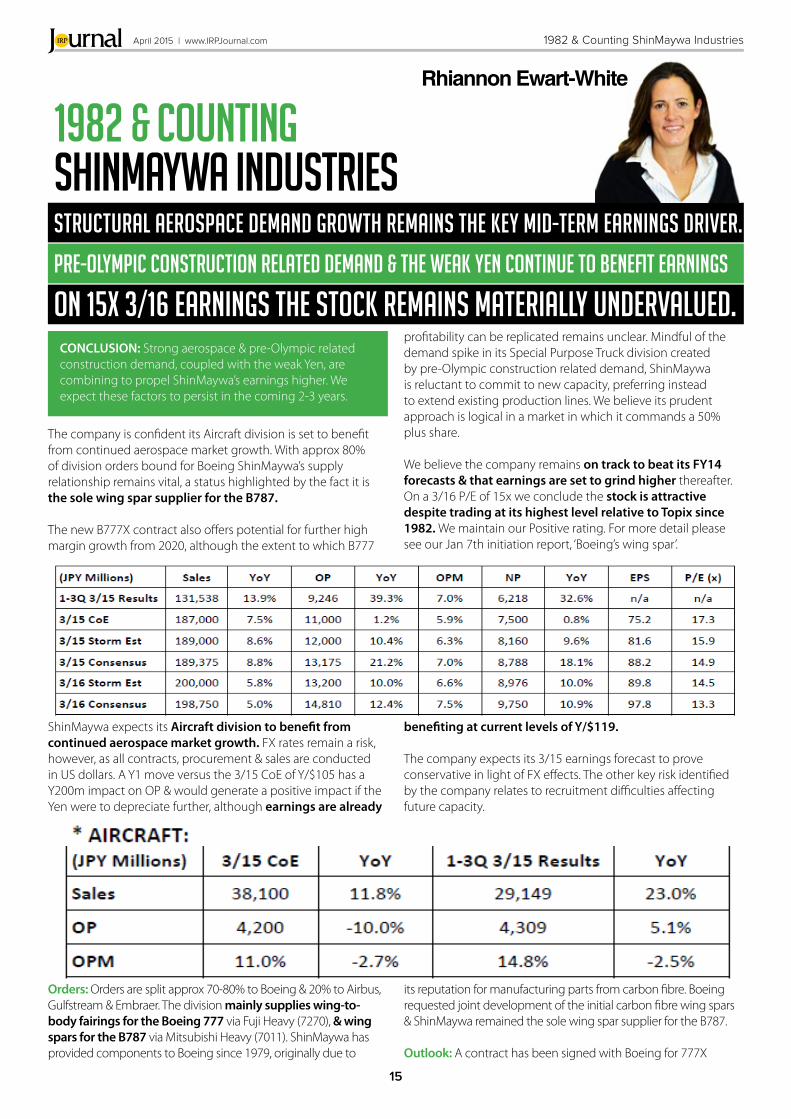
1982 & CountingShinMaywa Industries Structural aerospace demand growth remains the key mid-term earnings driver.
Pre-Olympic construction related demand & the weak Yen continue to benefit earnings
On 15x 3/16 earnings the stock remains materially undervalued. CONCLUSION: Strong aerospace & pre-Olympic related construction demand, coupled with the weak Yen, are combining to propel ShinMaywa’s earnings higher. We expect these factors to persist in the coming 2-3 years.
The company is confident its Aircraft division is set to benefit from continued aerospace market growth. With approx 80% of division orders bound for Boeing ShinMaywa’s supply relationship remains vital, a status highlighted by the fact it is the sole wing spar supplier for the B787.
The new B777X contract also offers potential for further high margin growth from 2020, although the extent to which B777
ShinMaywa expects its Aircraft division to benefit from continued aerospace market growth. FX rates remain a risk, however, as all contracts, procurement & sales are conducted in US dollars. A Y1 move versus the 3/15 CoE of Y/$105 has a Y200m impact on OP & would generate a positive impact if the Yen were to depreciate further, although earnings are already
profitability can be replicated remains unclear. Mindful of the demand spike in its Special Purpose Truck division created by pre-Olympic construction related demand, ShinMaywa is reluctant to commit to new capacity, preferring instead to extend existing production lines. We believe its prudent approach is logical in a market in which it commands a 50% plus share.
We believe the company remains on track to beat its FY14 forecasts & that earnings are set to grind higher thereafter. On a 3/16 P/E of 15x we conclude the stock is attractive despite trading at its highest level relative to Topix since 1982. We maintain our Positive rating. For more detail please see our Jan 7th initiation report, ‘Boeing’s wing spar’.
benefiting at current levels of Y/$119.
The company expects its 3/15 earnings forecast to prove conservative in light of FX effects. The other key risk identified by the company relates to recruitment difficulties affecting future capacity.
Orders: Orders are split approx 70-80% to Boeing & 20% to Airbus, Gulfstream & Embraer. The division mainly supplies wing-to-body fairings for the Boeing 777 via Fuji Heavy (7270), & wing spars for the B787 via Mitsubishi Heavy (7011). ShinMaywa has provided components to Boeing since 1979, originally due to
its reputation for manufacturing parts from carbon fibre. Boeing requested joint development of the initial carbon fibre wing spars & ShinMaywa remained the sole wing spar supplier for the B787.
Outlook: A contract has been signed with Boeing for 777X
Rhiannon Ewart-White
April 2015 | www.IRPJournal.com
16
IRP 1982 & Counting ShinMaywa Industries
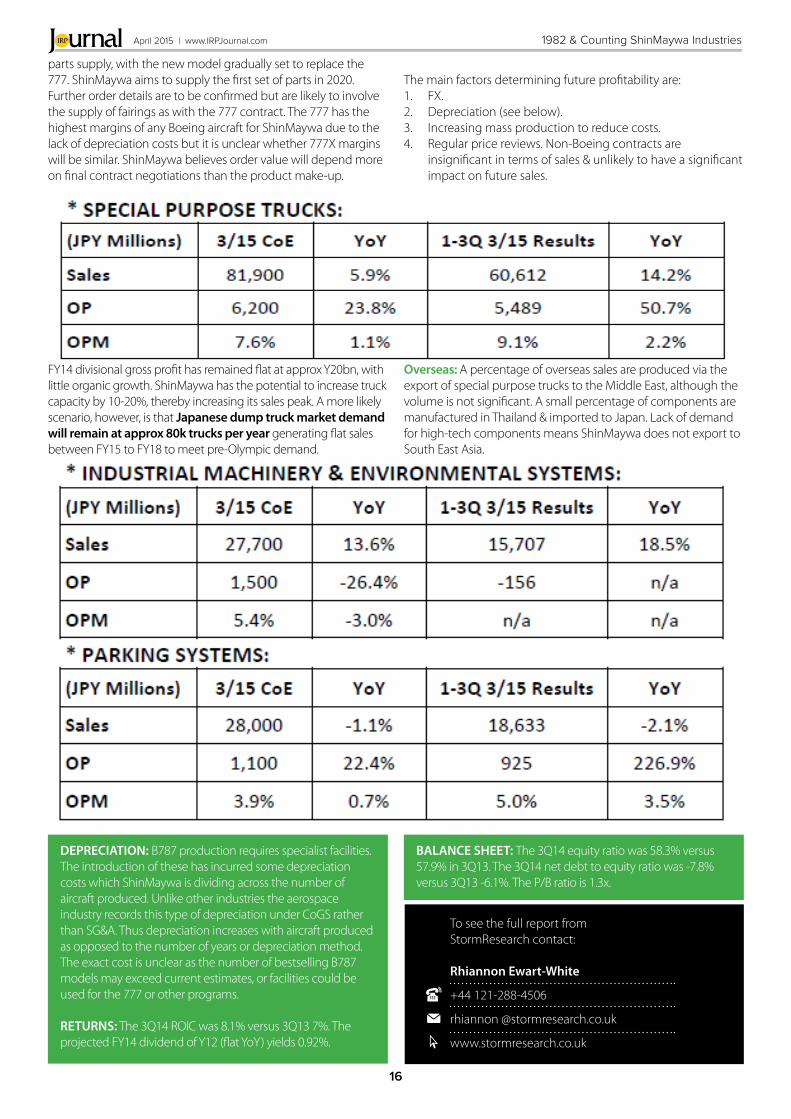
FY14 divisional gross profit has remained flat at approx Y20bn, with little organic growth. ShinMaywa has the potential to increase truck capacity by 10-20%, thereby increasing its sales peak. A more likely scenario, however, is that Japanese dump truck market demand will remain at approx 80k trucks per year generating flat sales between FY15 to FY18 to meet pre-Olympic demand.
DEPRECIATION: B787 production requires specialist facilities. The introduction of these has incurred some depreciation costs which ShinMaywa is dividing across the number of aircraft produced. Unlike other industries the aerospace industry records this type of depreciation under CoGS rather than SG&A. Thus depreciation increases with aircraft produced as opposed to the number of years or depreciation method. The exact cost is unclear as the number of bestselling B787 models may exceed current estimates, or facilities could be used for the 777 or other programs.
RETURNS: The 3Q14 ROIC was 8.1% versus 3Q13 7%. The projected FY14 dividend of Y12 (flat YoY) yields 0.92%.
BALANCE SHEET: The 3Q14 equity ratio was 58.3% versus 57.9% in 3Q13. The 3Q14 net debt to equity ratio was -7.8% versus 3Q13 -6.1%. The P/B ratio is 1.3x.
Overseas: A percentage of overseas sales are produced via the export of special purpose trucks to the Middle East, although the volume is not significant. A small percentage of components are manufactured in Thailand & imported to Japan. Lack of demand for high-tech components means ShinMaywa does not export to South East Asia.
parts supply, with the new model gradually set to replace the 777. ShinMaywa aims to supply the first set of parts in 2020. Further order details are to be confirmed but are likely to involve the supply of fairings as with the 777 contract. The 777 has the highest margins of any Boeing aircraft for ShinMaywa due to the lack of depreciation costs but it is unclear whether 777X margins will be similar. ShinMaywa believes order value will depend more on final contract negotiations than the product make-up.
The main factors determining future profitability are: 1. FX. 2. Depreciation (see below). 3. Increasing mass production to reduce costs. 4. Regular price reviews. Non-Boeing contracts are
insignificant in terms of sales & unlikely to have a significant impact on future sales.
To see the full report from StormResearch contact:
Rhiannon Ewart-White
+44 121-288-4506
rhiannon @stormresearch.co.uk
www.stormresearch.co.uk
17
THE 3rd PHASE OF THE
‘INFLATION-POP’T
he Elliott Wave Principle (EWP) is categorised as a ‘causal-deterministic’ methodology for financial price-forecasting and it’s an invaluable tool for identifying directional trends within each of the major asset classes,
stocks, bonds, currencies & commodities. It’s described as a deterministic system because it has inherent ‘predictive’ qualities based on pattern repetition – this evolves in a flowing, seamless process of growth/decay, action/reaction, trend/counter-trend.
The EWP attracts widespread attention because it has a proven track-record for predicting major trend developments
across a wide spectrum of markets. But its application of the methodology has been abused mainly as a result of unregulated activity and this has resulted in the criticism that it is too interpretive, subjective to form part of a fund manager’s decision-making process. Contrary to this, the EWP can be approached from a ‘quantitative’ standpoint where its application is governed by strict guidelines of pattern identification modelled from geometric ratio and proportional measurements. Once this is applied, the subjectivity can be replaced by a more quantitative, objective approach to enhance its integrity.
The 3rd Phase Of The ‘Inflation-Pop’April 2015 | www.IRPJournal.comIRP

18
DOES THE EWP ACTUALLY WORK?Without doubt, yes, but consistency is the key. First though, a thorough study of historical price-data must begin the process. Once this has been completed, the current price activity can be incorporated into the developing picture, or pattern. In this example, an extract from our archives published in January 2004 forecast two significant directional price changes for the Dow Jones Industrial Average (DJIA) 30-share index several years in advance. The first forecast a price advance to 14169.80, a gain of +34% per cent, but then a ‘reversal-signature’ that confirms the beginning of a massive decline with downside targets to 6411.30, a depreciation of -54% per cent.
What of the Future?Since Central Banks began financial stimulus following the lows that formed in the aftermath of the ‘financial-crisis’, the price action of the varying markets began tracing-out specific Elliott Wave patterns. These patterns are typically repeating within many stock indices and equities with variations visible in commodities, both energy, base & precious metals. Through cross-referencing and a logical elimination process, a path of future price direction and amplitude is plotted. The results are quite amazing and could be considered ‘contrarian’. But this shouldn’t be a factor to dissuade from the quantitative approach.
The pattern unfolding from the financial-crisis lows is unfolding into three distinct phases – an initial upswing, then a corrective downswing, and finally another upswing to record highs. This varies for certain commodities, specifically precious metal equity mining companies, but the common denominator that binds each asset class together indicates a 3rd phase representing a huge commodity upswing is about to begin this year. The entire process is termed the ‘Inflation-Pop’ scenario depicting a brief 2-3 year period of accelerating price rises.
The ‘inflation-pop’ is not conjecture, a figment of opinion, a preconceived idea but a realistic representation of an up-coming phenomenon based upon Natural Laws, the application of the alternating sequence of action/reaction processes. Our analysis suggests that many global stock markets that have a commodity element will join in the underlying upsurge to record highs during the next 2-3 year period. So far, these asset
classes and many of the underlying commodities have yet to hit rock bottom, but they are approaching major lows.
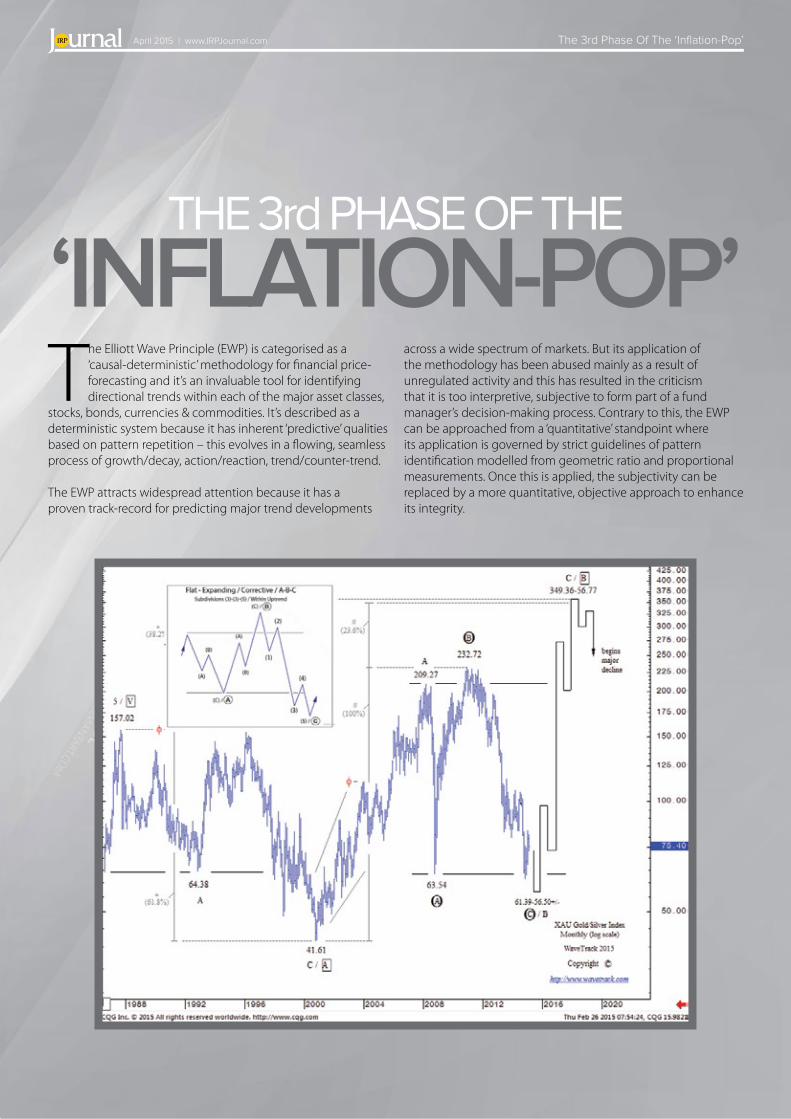
One archetypal example can be seen manifesting in the XAU Gold/Silver Miners index. The index has undergone a massive, multi-year decline that began in March 2008 from the 209.27 level – see fig #1. From this high, it underwent three significant price-swings, the first as a decline that unfolded during the financial-crisis, to a low at 63.54, the second a recovery to a new record high that traded in Dec.’10 to 232.72 and a third sequence, a decline to a current downside projection of 61.39-56.50+/-. As at this precise time, levels are still somewhat away at 75.40 and so these downside targets are forecast into the April/May ’15 time-zone. For comparison, match the (inset) archetypal tutorial pattern to the action just described – you’ll discover a perfect match, both in structure and in geometric amplitude measurement.
The consequences are huge, because once this pattern has ended, it will then begin a multi-year upswing that ultimately projects into record highs through the application of the longer-term trend that took effect way back in the 1980’s. This forecast points towards multiple gains of 6:1 with upside price targets to 350.00-55.00 – impressive but again realistic when compared to the accuracy of the Dow Jones (DJIA) forecast shown earlier.
This same application of the EWP is applied to each of the asset classes and our analysis covers all the major stock index markets traded around the world, including our benchmark S&P 500, but also those of Europe, Asia and many Emerging Markets. Our database also includes analysis of many currency pairs and crosses utilising 350-years of historical data, long-dated interest rates and all the major commodities, including Crude/Brent Oil, Copper and Gold-Silver-Platinum.
Copyright © 2015 | WaveTrack International GmbH
“Our analysis suggests that many global stock markets that have a commodity element will
join in the underlying upsurge to record highs during the next
2-3 year period.”
Peter Goodburn, CFTe, MSTAManaging DirectorWaveTrack International
For more information about WaveTrack International contact:
Peter Goodburn, CFTe, MSTA
+49 (0)89 210 207 10
www.wavetrack.com
The 3rd Phase Of The ‘Inflation-Pop’April 2015 | www.IRPJournal.comIRP

19
New Approaches To Harnessing Volatile Relationships for Portfolio ConstructionApril 2015 | www.IRPJournal.comIRP
A variety of investors currently face a common set of challenges for building robust and well diversified portfolios, due to changes in uncertainty (volatility of volatility), stretched relationships between markets (volatility of
correlations) and unusual behaviours between risks (correlation of volatilities). All of this against the backdrop of increasing regulatory requirements, including the AIFMD and UCITS. It appears that
Over the last decade the team at Providentia Analytics have developed various tools to analyse the ever changing economic and market landscape, so as to empower portfolio managers. They can be considered various types of lenses to view the market. One of the tools, named ‘Correlation Elasticity’, can examine any relationship between economic or market variables, treating it like a piece of elastic; asking (i) how flexible is it and (ii) how stretched is it currently? For instance, the charts
By harnessing powerful computational analytics, the exercise above can be undertaken for thousands of relationships, between equities, fixed income, currencies, commodities, funds, or any aspects of a given investment universe. Such an approach can identify alpha opportunities from dislocated relationships, where instruments may be behaving in a counter-intuitive way, resulting in much lower correlations relative to history. Furthermore, this lens can be focussed on the high end of correlation distributions to provide an early warning
Gulamabbas Lakha,CFAChief Executive Officer
Providentia Analytics
Modelling dynamic relationships
Using ‘big data’ to identify dislocations
below relate to the quarterly correlation between US bonds and equities over time. The histogram on the right provides an indication of the distribution of that correlation, showing first that the relationship is quite flexible, ranging from highly
system for concentration risks, style drift, or declining quality of diversification.
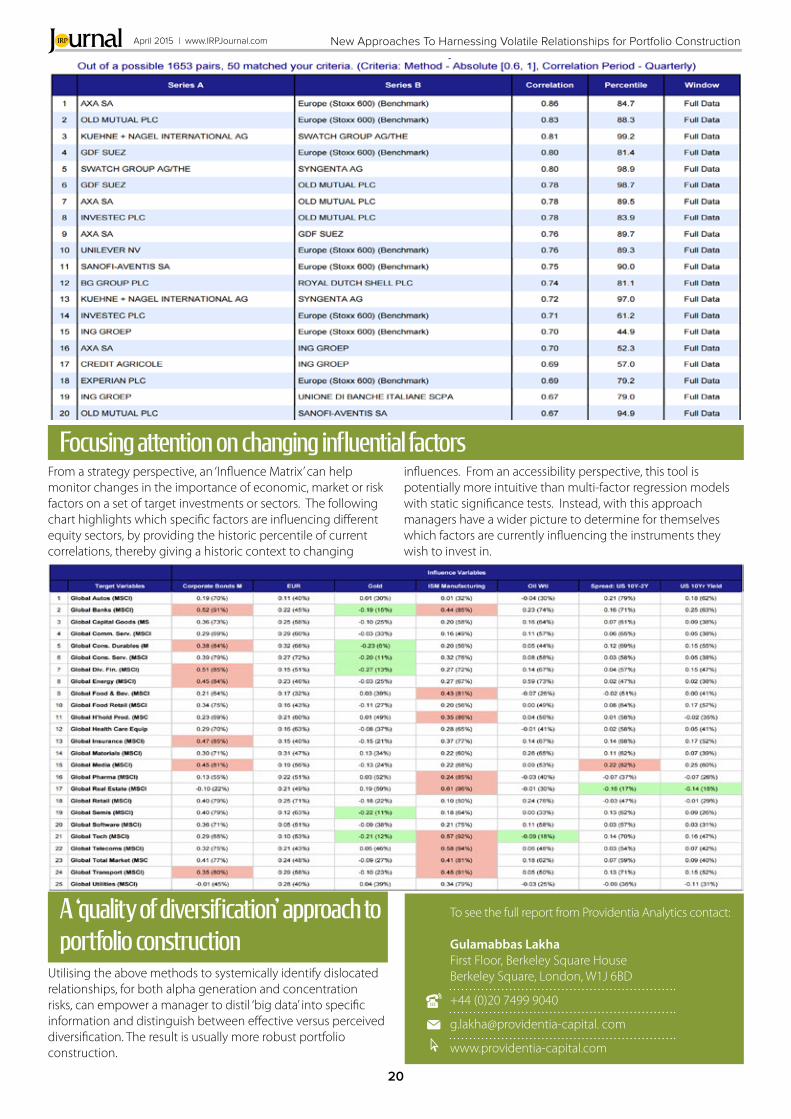
The following image of what we call a ‘Diversification Matrix’ shows the results of examining all the cross relationships of an institutional European equities portfolio with just under sixty holdings (1653 in total). The results enable the manager to focus attention on potential concentration risks from a few specific holdings.
correlated to highly uncorrelated; and second that at that point in time it was rather stretched (as indicated by the dark blue bar on the extreme left).
It is important to stress that mean reversion assumptions should not be made, since dislocations can persist or indeed extend. Rather, the role of fundamental judgement, empowered by such quantitative information, can be harnessed for structuring
better informed trades for alpha generation. In addition, such tools can be used for dynamic stress tests regarding exposure to commodity, currency, interest rate or other macro risks (also useful for regulatory reporting).
in the midst of this hurricane of activity and potential confusion, investment managers need to stand in the relative stillness of the eye of the storm and methodically distil vast amounts of data into useful specific information, resulting in implementable strategies for alpha generation within a risk framework that responds to the changing demands upon it over time. This central objective is seductively intuitive yet all too often illusive.
April 2015 | www.IRPJournal.com
20
IRP
From a strategy perspective, an ‘Influence Matrix’ can help monitor changes in the importance of economic, market or risk factors on a set of target investments or sectors. The following chart highlights which specific factors are influencing different equity sectors, by providing the historic percentile of current correlations, thereby giving a historic context to changing
Utilising the above methods to systemically identify dislocated relationships, for both alpha generation and concentration risks, can empower a manager to distil ‘big data’ into specific information and distinguish between effective versus perceived diversification. The result is usually more robust portfolio construction.
Focusing attention on changing influential factors
A ‘quality of diversification’ approach to portfolio construction
influences. From an accessibility perspective, this tool is potentially more intuitive than multi-factor regression models with static significance tests. Instead, with this approach managers have a wider picture to determine for themselves which factors are currently influencing the instruments they wish to invest in.
To see the full report from Providentia Analytics contact:
Gulamabbas LakhaFirst Floor, Berkeley Square HouseBerkeley Square, London, W1J 6BD
+44 (0)20 7499 9040
g.lakha@providentia-capital. com
www.providentia-capital.com
New Approaches To Harnessing Volatile Relationships for Portfolio Construction

21
April 2015 | www.IRPJournal.comIRP Grexit, Brexit, Capital Markets Union and BASEL
1.POLITICALThe Eurogroup gave Greece some breathing space after several meetings and Graham Bishop commented that the good news appears to continue. However, he said the right analogy of the situation is a game of chicken between a Fiat 500 and a
50-ton ̀ main battle tank’ - the relative weights are roughly comparable to the economic weights. Other political news of the month included the French government overriding parliament to ram through reforms. On Brexit, a new survey from Ipsos MORI showed that 45% of British business leaders want to return to being part of an economic community, without political links, but just 1% would be happy to leave the EU.
3.BANKINGThe FSB Chair wrote to G20 Finance Ministers and Central Bank Governors about “finishing the post-crisis agenda and moving forward”. Nonetheless, a House of Lords report concluded that the EU financial regulatory framework has
been radically transformed in the wake of the financial crisis.
Commissioner Hill is sticking by the bank trading reform. Reuters informed that “there are no plans to scrap a draft European Union law on reining in trading risks at big banks but some of the proposed rules could be softened.” Daniele
Nouy of the ECB warned in an interview with the Financial Times that Europe’s big banks will need to raise capital. Relevant documents published in February include EBF’s response to consultation on draft RTS on contractual recognition of bail-in; the BCBS’ Guidance on accounting for expected credit losses; the EBA’s advice on the definition of eligible capital; EBF’s response to the FSB’s consultative document on Total Loss Absorbing Capacity and EBF’s response to EBA consultation on draft guidelines on product oversight and governance arrangements for retail banking products.
2. ECONOMICThe European Commission’s Winter Economic Forecast showed, for the first time since 2007, the economies of all European Union Member States should grow again this year.
Mario Draghi told the European Parliament that a deeper Monetary Union is needed to face important shocks.
4. SECURITIESThe European Commission launched its much-trailed Green Paper on Capital Markets Union (CMU).
Several bodies responded to the paper. The FRC and IASB support the goal of the proposed CMU. AFME commented: “CMU is an essential reform project to revive the EU economy.”
Grexit, Brexit, Capital Markets
Union and BASEL
Graham Bishop

April 2015 | www.IRPJournal.com
22
IRP Grexit, Brexit, Capital Markets Union and BASEL
5.ASSET MANAGEMENTThe European Commission recommended that pension funds should benefit from a further two-year exemption from central clearing requirements. PensionsEurope welcomed this news.
PensionsEurope also commented on EIOPA’s plans for further work on solvency of IORPs, whilst the Investment Association discussed the comprehensive disclosure of costs and charges.
7.CORPORATE GOVERNANCE AND ACCOUNTING The European Commission recom-mended that pension funds should benefit from a further two-year exemption from central clearing requirements. PensionsEurope wel-
comed this news.
PensionsEurope also commented on EIOPA’s plans for further work on solvency of IORPs, whilst the Investment Association discussed the comprehensive disclosure of costs and charges.
6. INSURANCEInsurance Europe responded to the IAIS consultation on a risk-based global Insurance Capital Standard. Commercial Risk Europe assured that Solvency II is at risk due to budget cuts at EIOPA - which explained the
implications of the cuts for 2015.
EBF and Insurance Europe also agree that CMU must unlock the latent potential of EU financial markets. According to EFAMA, the European Commission’s Green Paper highlights the clear need for a CMU focused primarily on investors. The Investment Association also responded saying that “the potential benefits of a deep, retail CMU are enormous, in terms of a virtuous cycle of investment driving growth, leading to better financial security for citizens and a vibrant economy.” On a similar note, ACCA shared the view that to create a supportive environment - especially for small businesses - it is crucial to both remove cross-border investment obstacles and to lower the cost of capital in order to have it flowing again and put to productive use. Prominent think-tanks also expressed their views. Brookings gave its initial impressions and indicated that “the core idea is to build up the role of financial markets in Europe and to diversify away from a financial system that remains very bank-centric.”
Nevertheless, CEPS noted in its paper Which union for capital markets? that “despite years of harmonising regulation and a single currency, Europe’s capital markets remain fragmented.” The Commission also launched consultations on securitisation and a review of the Prospectus Directive. On the subject, AFME published a report arguing that further reform of post trade regulations is necessary to achieve integrated and efficient European capital markets. In relation to the Prospectus Directive, the OECD published a report warning over “aggressive interpretation” of bond covenants, and trade bodies launched a guide on best practices for the EU corporate private placement market. Other news on securities included the EU Council’s announcement it will back the European Commission proposal to fight against the manipulation of financial benchmarks. Reuters reported that the United Kingdom will apply EU rules on dealing with payments by fund managers for investment research from brokers. Traders Magazine published an article on what’s causing the delays in new OTC derivatives rules. “The 18-month stalemate is raising costs and risk for buyside firms and increasing concentration levels among remaining CCPs,” the article reads. ESMA’s revised 2015 Work Programme was also released in February. The organisation will lack sufficient resources to execute all the tasks that were initially planned for 2015.
To see the full report from Graham Bishop contact:
Graham Bishop
+44 1424 777123
www.grahambishop.com

Absolute Strategy Research
23
April 2015 | www.IRPJournal.comIRP


![Grammar Review #4. Select the correct sentence. A] A strategist behind the scenes create a candidate's public image. B] A strategist behind the scenes](https://img.pdfslide.net/doc/110x75/56649f145503460f94c28927/grammar-review-4-select-the-correct-sentence-a-a-strategist-behind-the.jpg)