Embed Size (px)
Citation preview
HAL Id: in2p3-00012141http://hal.in2p3.fr/in2p3-00012141
Submitted on 27 Feb 2003
HAL is a multi-disciplinary open accessarchive for the deposit and dissemination of sci-entific research documents, whether they are pub-lished or not. The documents may come fromteaching and research institutions in France orabroad, or from public or private research centers.
L’archive ouverte pluridisciplinaire HAL, estdestinée au dépôt et à la diffusion de documentsscientifiques de niveau recherche, publiés ou non,émanant des établissements d’enseignement et derecherche français ou étrangers, des laboratoirespublics ou privés.
A facility for the test of large area muon chambers athigh rate
S. Agosteo, S. Altieri, G. Belli, A. Bonifas, V. Carabelli, L. Gatignon, N.Hessey, M. Maggi, J P. Peigneux, H. Reithler, et al.
To cite this version:S. Agosteo, S. Altieri, G. Belli, A. Bonifas, V. Carabelli, et al.. A facility for the test of large areamuon chambers at high rate. Nuclear Instruments and Methods in Physics Research Section A:Accelerators, Spectrometers, Detectors and Associated Equipment, Elsevier, 2000, 452, pp.94-104.<in2p3-00012141>
EUROPEAN ORGANIZATION FOR NUCLEAR RESEARCH
CERN–EP–2000–031February 16, 2000
A facility for the test of large area muon chambers at high rates
S.Agosteo1), S.Altieri 2), G.Belli2), A. Bonifas 3), V. Carabelli2), L.Gatignon3),N. Hessey4)9), M. Maggi5), J.-P. Peigneux6), H. Reithler7)8), M. Silari3), P.Vitulo2)
and M. Wegner7)
Submitted to Nucl. Instr. and Methods A
Abstract
Operation of large area muon detectors at the future Large Hadron Collider (LHC) will becharacterized by large sustained hit rates over the whole area, reaching the range of kHz/cm2.We describe a dedicated test zone built at CERN to test the performance and the aging ofthe muon chambers currently under development. A radioactive source delivers photonscausing the sustained rate of random hits, while a narrow beam of high energy muons isused to directly calibrate the detector performance. A system of remotely controlled leadfilters serves to vary the rate of photons over four orders of magnitude, to allow the studyof performance as a function of rate.
1) Dip. di Ingegneria Nucleare, Politecnico di Milano, via Ponzio 34/3, I-20133 Milano, Italy2) I.N.F.N. Sezione di Pavia and Dip. di Fısica Nucleare e Teorica, Universita di Pavia, Via Bassi 6, I-27100
Pavia, Italy3) CERN, CH-1211 Geneva 23, Switzerland4) Universitat Munchen, D-80333 Munchen, Germany5) I.N.F.N. Sezione di Bari and Dip. Interateneo di Fısica, Universita di Bari, Via Amendola 173, I-70126 Bari,
Italy6) LAPP, BP 110, F-74941 Annecy-le-Vieux, France7) III. Physikalisches Institut A, RWTH Aachen, D-52056 Aachen, Germany8) On temporary leave of absence to CERN, CH-1211 Geneva 23, Switzerland9) Present address: NIKHEF, Kruislaan 409, NL-1098SJ Amsterdam, The Netherlands

1 IntroductionRecently the construction of a 14 TeV proton-proton collider at CERN (Large Hadron
Collider, LHC) [1] and of four large detectors [2, 3, 4, 5, 6, 7, 8] for its exploitation were approved.The main focus of the research at this energy is on very rare events — e.g. some signatures forthe Higgs particle are expected at the level of 10−14. Therefore the collider is designed for a highluminosity of 1034 cm−2s−1, with beam crossings as close as 25 ns. This translates into multipleinteractions per beam crossing and, taking into account the average multiplicity of particles perinteraction, into a total production of about 1,400 particles at the center of the detector every25 ns, most of them showering in the calorimeter section of the detector. The large area muonchambers (about 5 to 20 m2 each) surrounding the calorimeter will be flooded by sustained hitrates ranging from about 1Hz/cm2 to several 103 Hz/cm2. In their majority these hits stemfrom secondary reactions of low energy (about a few MeV) neutrons producing a photon thatconverts inside the chamber. These neutrons emerge from the calorimeter, but in part also fromthe shielding of the beam lines.
Muon chambers are usually tested with cosmic rays, i.e. over the whole area but at very lowrate, or at test beams for high rates. Such test beams illuminate typically an area of 10×10 cm2,at less than 20% duty cycle. Only less than 0.1% of the chamber area is thus exposed, andfurthermore the detector can recover during the long pause after each spill of particles. In orderto be able to study performance and aging effects under realistic LHC-like conditions, a dedicatedtest beam featuring sustained, uniform and adjustable high rates over large areas was needed.
We describe here a facility meeting these requirements, which was built at CERN in 1997and has already been extensively used (see e.g. [4]). Since it was not achievable with a muon beamalone, a composite solution was adopted. A radioactive photon source delivering the desired rateof random hits is complemented by a low intensity narrow beam of high energy muons, whichgive calibration measurements with tracks.
2 The Gamma Irradiation FacilityThe Gamma Irradiation Facility (GIF) is a test area in which large area high-energy
particle detectors are exposed to a particle beam in the presence of an adjustable high backgroundflux of photons, simulating the background conditions that these detectors will suffer in theiroperating environment at the Large Hadron Collider at CERN. The GIF is situated in theSPS West Area at the downstream end of the X5 test beam. The zone is surrounded by aconcrete wall, 8m high and 80 cm thick. Access is possible through three entry points, namelytwo access doors for personnel and one large gate for material. A crane allows installation ofheavy equipment in the area. A schematic layout of the GIF zone is shown in Fig. 1. The photonsare produced by a strong radioactive source, which we will call the irradiator, see Fig. 2, 3, 4.It is installed in the upstream part of the zone, 5 m away from the end, and housed inside alead container, which includes a precisely shaped collimator, designed to permit irradiation of a6m×6m area at 5 m distance from the source. A thin lens-shaped lead filter, mounted at the exitface of the source housing, renders the outcoming flux uniform in the vertical plane orthogonalto the beam direction. At 4 m distance from the source the flux of 662 keV photons on the axisis 0.86 × 105 cm−2s−1. The conversion probability in a single cell of gas-filled muon detectors istypically in the range of 2% to 0.3%.
The control of the photon rate is achieved by further lead filters, which allow the maximumrate to be limited, and to vary the rate within a range of four orders of magnitude.
A second irradiation area is available at 90 degrees to the main axis. This area is definedby a separate collimator which allows irradiation of detectors with a high flux over a smallerarea, e.g. crystal calorimeters. It can be activated or isolated by means of a separate shutter.If opened, this channel provides a flux of 4.4 × 106 cm−2s−1 photons at 1 m distance from thesource. The two facilities can thus operate separately or in parallel. The collimators and thelateral shutter are shown schematically in Fig. 2.
1
1.6 m
2.4 m2.4 m
Cha
mbe
r
Cha
mbe
rDoor 125
Doo
r 12
5
gate Door 115Emergency Stop;Movement Sensor
Irradiator Display
Irradiator Display
checkpoint
PPEPPE
HR
_990
625
PP
X
MuonBeam
Beam Ch.Scint..
0 m
IronConcrete
Dump (Fe)
8.4mmax.
662 keV
Photons
Source + Filters
Pho
ton
Flu
xM
onito
r
0.645.06 m
3.55
m0.
372.
00
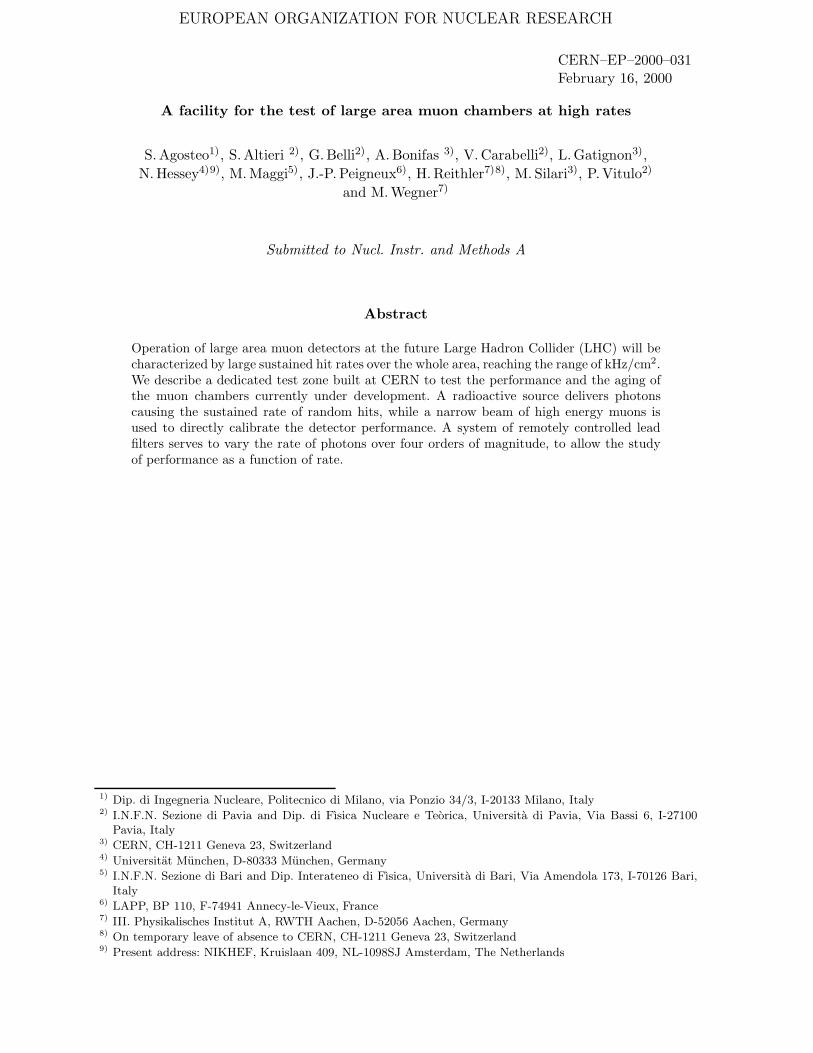
Figure 1: Layout of the test beam zone called X5c GIF at CERN. Photons from the radioactivesource flood the detectors, producing a sustained high rate of random hits over the whole area.Calibration with tracks is done with a narrow beam of high energy muons. When displacingthe detector transversally to scan different points with the muon beam, the photon flux stillencircles the full detector area.
2.1 Photon sourceThe Gamma irradiator is housed in a rectangular container, 400 mm wide and 900 mm
high, shown in more detail in Fig. 3. The active element (Fig. 4) is a radioactive 137Cs source1)
with a half-life of 30 years, the strength of which was measured on the 5th March 1997 to be740 GBq (implying e.g. 695 GBq in December 1999), which emits a 662 keV photon in 85% ofthe decays. All numbers given here refer to the strength of 740 GBq. The 137Cs isotope waspreferred above 60Co because of its long half-life of 30 years and hence less variation of thephoton flux over the expected lifetime of this facility. Also its lower photon energy (662 keV)leads to a twice higher conversion efficiency in the detectors tested. A lead shield of 140 mmthickness serves as radiobiological protection2) . The lead is contained in a 5 mm thick steelenvelope. The principal collimator hole provides a pyramidal aperture of 74◦ × 74◦ solid angle.This provides a photon flux in a pyramidal volume of 5m maximum length along the axis. Acommercial pneumatic system raises the source to the irradiation position, or lowers it to theshielded position (Fig. 3). In case of pressure drop, the source falls naturally, by its own weight,into its protection container. The components of the protection system add a further 2.3 mm ofstainless steel around the actual source, also in the direction of the main aperture, thus reducingthe activity to about 88.5% of its nominal value.
2.2 Adjustable photon fluxThe pointlike radiation source delivers a flux of photons of fixed rate, which is uniform
over a spherical surface. In contrast to this, for the systematic test of flat large area detectorsthe rate should be uniform over a plane and should be adjustable; some detectors with limitedrate capability may even need a safe protection against too high rates. These three features areall implemented at GIF, with the help of specially shaped lead filters. Each filter is mounted
1) Radiactive material from Amersham-Buchler GmbH & Co KG, Gieselweg 1, D-38110 Braunschweig, Germany.2) Protection system from STS GmbH, Harxbutteler Str. 2, D-38110 Braunschweig, Germany.
2
H.R
. 990
525
Muon Beam
Photons
a
b
c
4 3 2
1 2 3
4
5 6
7
37o
11 o
89
1011
12
0.12 m 0.37 m
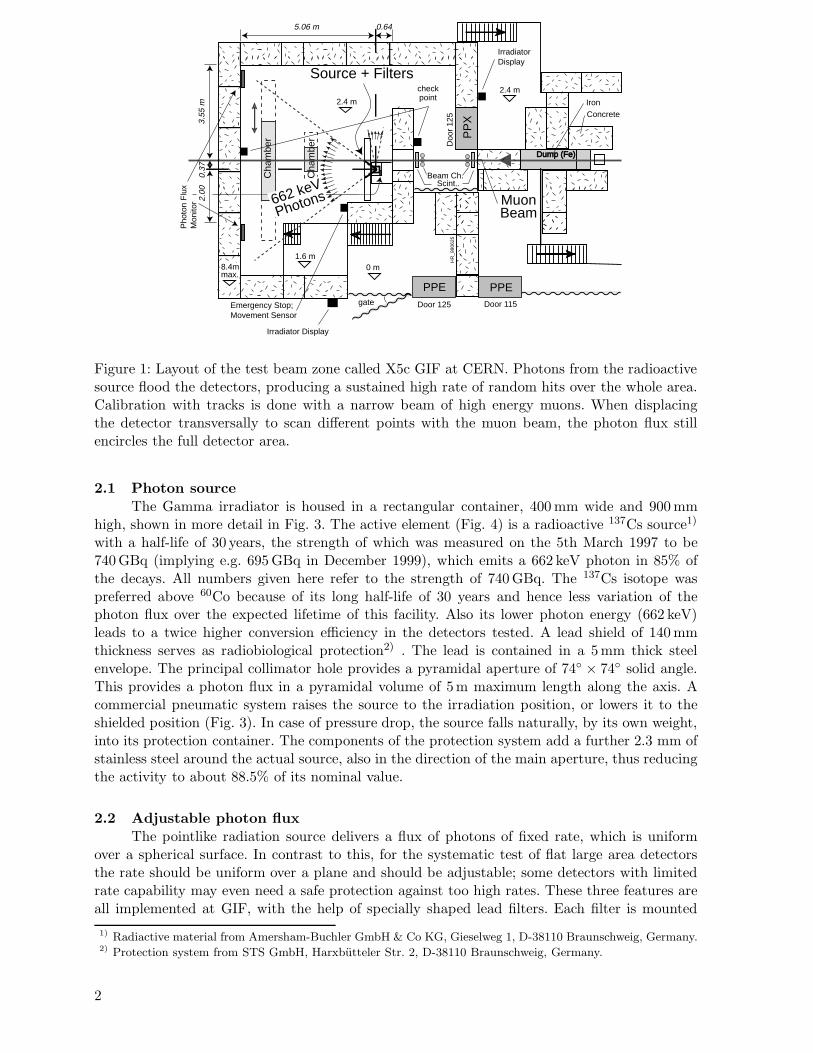
Figure 2: Horizontal cut of the source and of the set of lens-shaped lead filters which vary theactual photon rate. The absorption factor for the direct photons is the number quoted in laterfigures, and can range from 1 to 10,000 for the movable filters. 1-3: The three planes of movablefilters. 4: Lateral outlet. 5: The central three filters consist of the collimator frame only, i.e. donot absorb. 6: The three filters in use. 7: Lateral outlet with shutter. 8: Lead block housing thesource. 9: Thin fixed filter for angular correction. 10: Fixed filter to limit the max. photon flux.11: Position of filters when moved to the left. 12: Concrete wall and floor.
H.R
. 990
523
Muon Beam
Photons
123
456
7
82.4 m
3.66 m
37o
3.01 m
0.15 m
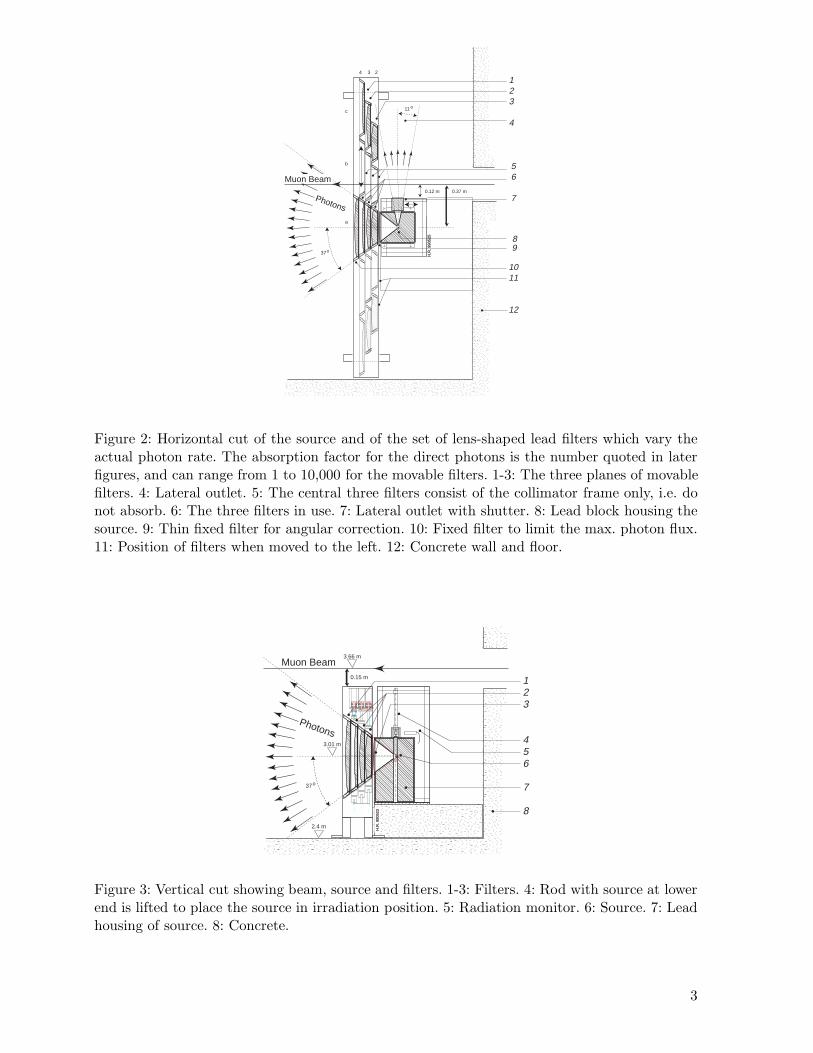
Figure 3: Vertical cut showing beam, source and filters. 1-3: Filters. 4: Rod with source at lowerend is lifted to place the source in irradiation position. 5: Radiation monitor. 6: Source. 7: Leadhousing of source. 8: Concrete.
3
welding
stainless steel
2 x 1 mm
Cs-137 as sulfate
8.3 mm O x 8 mm
glass
O 12.45 mm
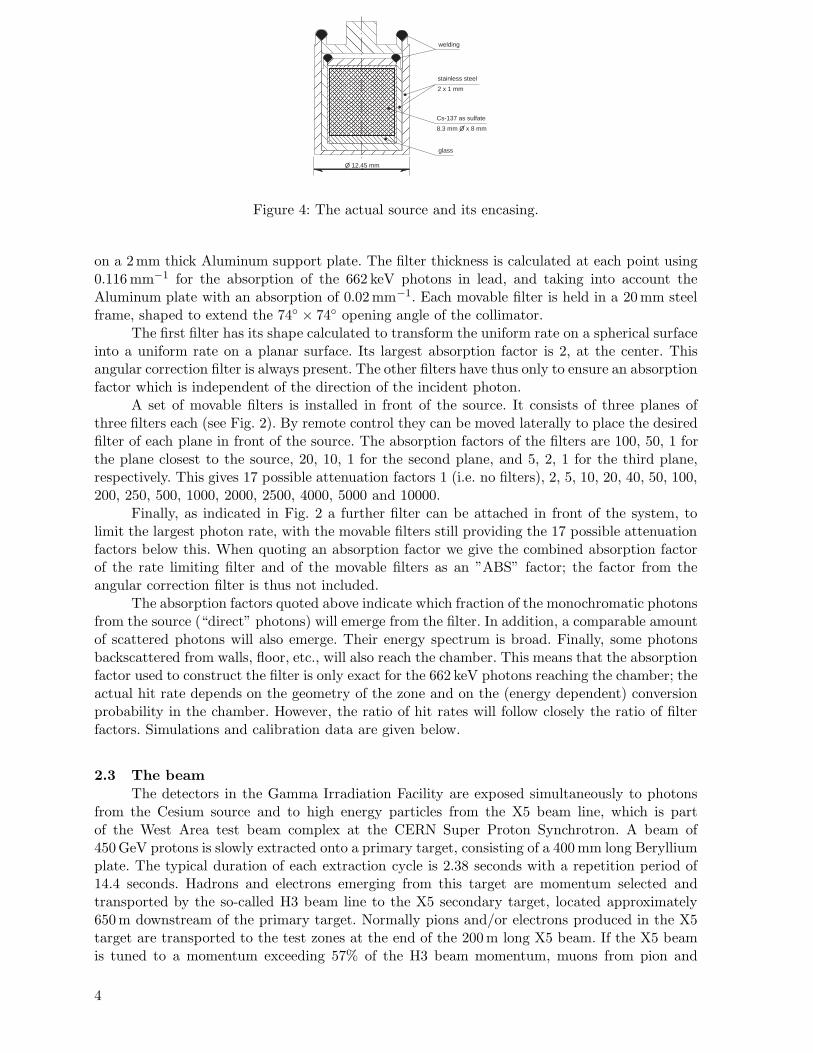
Figure 4: The actual source and its encasing.
on a 2mm thick Aluminum support plate. The filter thickness is calculated at each point using0.116 mm−1 for the absorption of the 662 keV photons in lead, and taking into account theAluminum plate with an absorption of 0.02 mm−1. Each movable filter is held in a 20 mm steelframe, shaped to extend the 74◦ × 74◦ opening angle of the collimator.
The first filter has its shape calculated to transform the uniform rate on a spherical surfaceinto a uniform rate on a planar surface. Its largest absorption factor is 2, at the center. Thisangular correction filter is always present. The other filters have thus only to ensure an absorptionfactor which is independent of the direction of the incident photon.
A set of movable filters is installed in front of the source. It consists of three planes ofthree filters each (see Fig. 2). By remote control they can be moved laterally to place the desiredfilter of each plane in front of the source. The absorption factors of the filters are 100, 50, 1 forthe plane closest to the source, 20, 10, 1 for the second plane, and 5, 2, 1 for the third plane,respectively. This gives 17 possible attenuation factors 1 (i.e. no filters), 2, 5, 10, 20, 40, 50, 100,200, 250, 500, 1000, 2000, 2500, 4000, 5000 and 10000.
Finally, as indicated in Fig. 2 a further filter can be attached in front of the system, tolimit the largest photon rate, with the movable filters still providing the 17 possible attenuationfactors below this. When quoting an absorption factor we give the combined absorption factorof the rate limiting filter and of the movable filters as an ”ABS” factor; the factor from theangular correction filter is thus not included.
The absorption factors quoted above indicate which fraction of the monochromatic photonsfrom the source (“direct” photons) will emerge from the filter. In addition, a comparable amountof scattered photons will also emerge. Their energy spectrum is broad. Finally, some photonsbackscattered from walls, floor, etc., will also reach the chamber. This means that the absorptionfactor used to construct the filter is only exact for the 662 keV photons reaching the chamber; theactual hit rate depends on the geometry of the zone and on the (energy dependent) conversionprobability in the chamber. However, the ratio of hit rates will follow closely the ratio of filterfactors. Simulations and calibration data are given below.
2.3 The beamThe detectors in the Gamma Irradiation Facility are exposed simultaneously to photons
from the Cesium source and to high energy particles from the X5 beam line, which is partof the West Area test beam complex at the CERN Super Proton Synchrotron. A beam of450 GeV protons is slowly extracted onto a primary target, consisting of a 400 mm long Berylliumplate. The typical duration of each extraction cycle is 2.38 seconds with a repetition period of14.4 seconds. Hadrons and electrons emerging from this target are momentum selected andtransported by the so-called H3 beam line to the X5 secondary target, located approximately650 m downstream of the primary target. Normally pions and/or electrons produced in the X5target are transported to the test zones at the end of the 200 m long X5 beam. If the X5 beamis tuned to a momentum exceeding 57% of the H3 beam momentum, muons from pion and
4
kaon decays along the last part of the H3 beam will be transported along the X5 beam. TheGamma Irradiation Facility is located at the downstream end of the X5 beam line, just behindthe final dump (2.4 m of iron followed by 1.6 m of concrete) which only muons penetrate. Duringtypical operation of the West Area complex the muon momentum is around 100 GeV and the fluxabout 104 µ− per SPS cycle, traversing a 10×10 cm2 area. After traversal of the X5 dump, thesemuons are tagged by a scintillator and their impact position and angle measured by two delaywire chambers [9], separated by 2.4 m, each having 200 µm space resolution. A further beamchamber has been added downstream of the GIF zone to improve the measurement precision atthe position of the detectors under test. Two pairs of scintillators, 3m apart, provide a triggersignal with a timing precision better than 0.5 ns.
On special request, the final dump of the X5 beam can be opened and a tertiary electron orpion beam of momentum between 5 and 200 GeV can be transported into the Gamma IrradiationFacility. The electron beam is typically limited to 100 GeV. It is possible to provide 200 GeVelectrons as a secondary beam, but at the cost of being bound to run electrons of the sameenergy in the parallel beam line X7. The intrinsic momentum resolution of these beams is 0.8%.Typical fluxes in the GIF range from 102 to 104 particles per pulse, with a RMS spot size downto about 1 cm2. This mode of operation allows calorimeters to be tested and calibrated in thepresence of strong background radiations from the source.
Outside the scheduled running periods of the accelerator, a dedicated set of counters hasbeen used to provide a trigger for cosmic rays traversing the detectors.
2.4 Controls and safetyThe irradiator is controlled from a single console located in the irradiator control room
next to the GIF area. All safety functions related to the zone are grouped in this console. Thiscomprises search boxes, infrared detectors to signal presence inside the zone, smoke detectors,explosive gas detectors, emergency stops, doors not closed properly, compressed air pressure.Two radiation detectors — one close to the source and one far away — monitor continuouslythe radiation levels inside the zone and are connected to the irradiator control. Any detectedanomaly forces the source back into its shielded position and vetoes any further extraction of thesource into irradiation position. All changes of state are registered and logged by software and incase of malfunctioning alarms are sent to the central control room. A unique “Manual Veto” keydefines the conditions for access or irradiation. An acoustical signal warns when the source isbeing opened. Light signals indicate the state of the installation. The source can only be broughtinto irradiation position after having executed the required safety procedures. All veto signalsfrom the Gamma Irradiator are combined into a single contact which is then delivered to thecentral SPS Experimental Areas access control system. In case the final dump of the X5 beamis opened in order to provide electron or pion beams into the GIF, the access condition for theGIF is logically combined with the access conditions for the X5 beam areas in a standard way.
Automatic logging on files is also used for all other parameters of the source, of the muonbeam settings and on the actual beam intensity sensed. It is a key feature for runs operatedremotely or even in unattended mode, as needed for the very long aging tests and when thebeam control is given to another zone upstream GIF.
3 Radiation field3.1 Simulations and measurements
To provide the experimenters with reference data on the expected gamma flux, a seriesof simulations has been performed. They show how collimators, filters and surrounding wallsmodify the photon distributions in energy and angle.
3.2 Direct and scattered photonsFirst, the effect of a narrow beam of 662 keV photons impinging on a single flat lead
absorber was studied. In the simulation done with the code GEANT [10] for this simplified
5
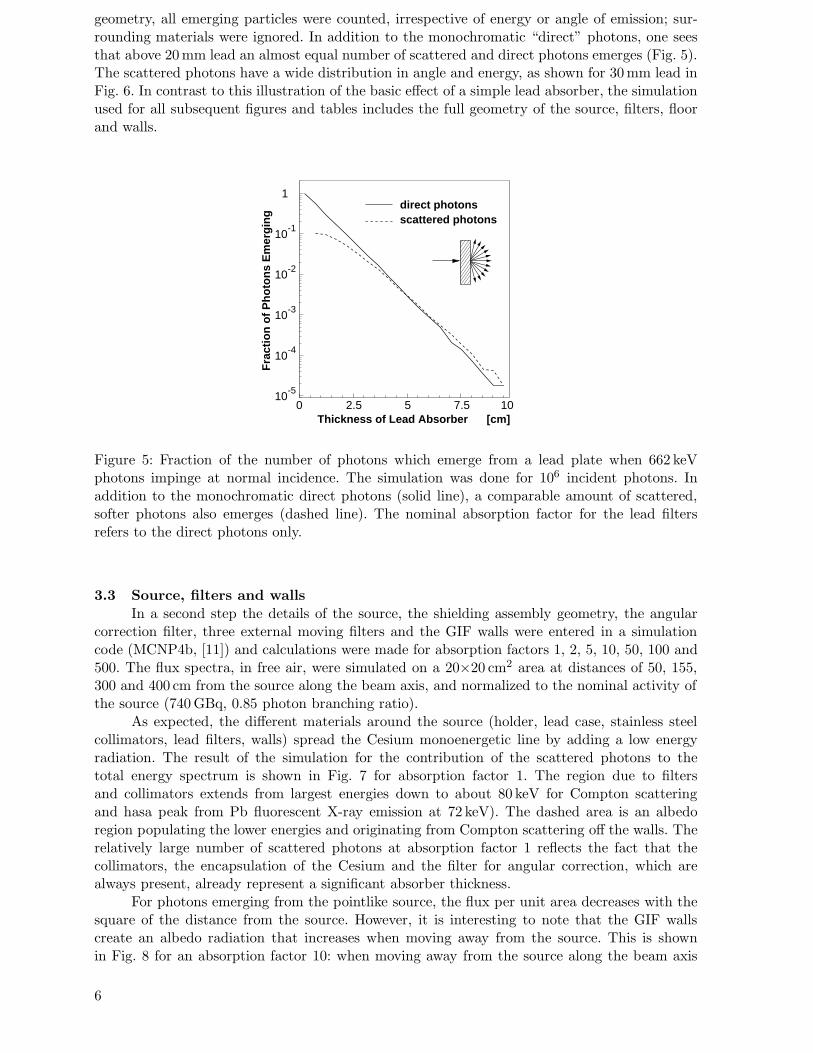
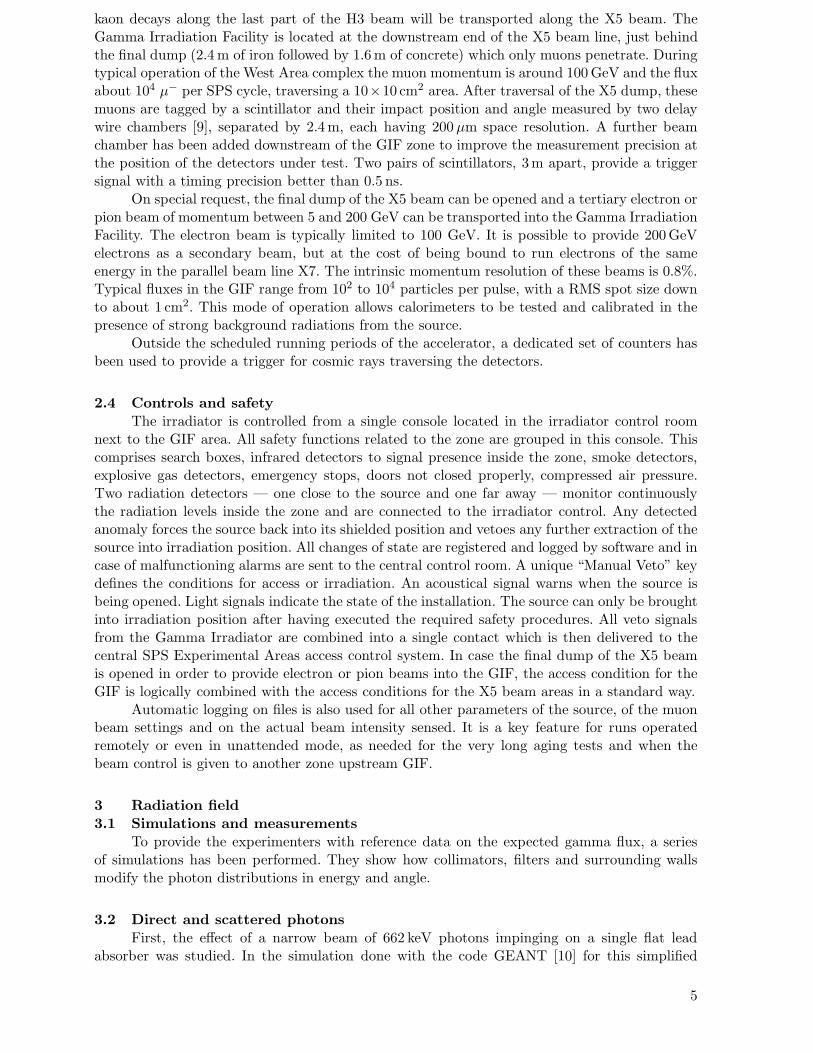
geometry, all emerging particles were counted, irrespective of energy or angle of emission; sur-rounding materials were ignored. In addition to the monochromatic “direct” photons, one seesthat above 20 mm lead an almost equal number of scattered and direct photons emerges (Fig. 5).The scattered photons have a wide distribution in angle and energy, as shown for 30 mm lead inFig. 6. In contrast to this illustration of the basic effect of a simple lead absorber, the simulationused for all subsequent figures and tables includes the full geometry of the source, filters, floorand walls.
Thickness of Lead Absorber [cm]
Fra
ctio
n o
f P
ho
ton
s E
mer
gin
g
10-5
10-4
10-3
10-2
10-1
1
0 2.5 5 7.5
direct photonsscattered photons
10
Figure 5: Fraction of the number of photons which emerge from a lead plate when 662 keVphotons impinge at normal incidence. The simulation was done for 106 incident photons. Inaddition to the monochromatic direct photons (solid line), a comparable amount of scattered,softer photons also emerges (dashed line). The nominal absorption factor for the lead filtersrefers to the direct photons only.
3.3 Source, filters and wallsIn a second step the details of the source, the shielding assembly geometry, the angular
correction filter, three external moving filters and the GIF walls were entered in a simulationcode (MCNP4b, [11]) and calculations were made for absorption factors 1, 2, 5, 10, 50, 100 and500. The flux spectra, in free air, were simulated on a 20×20 cm2 area at distances of 50, 155,300 and 400 cm from the source along the beam axis, and normalized to the nominal activity ofthe source (740 GBq, 0.85 photon branching ratio).
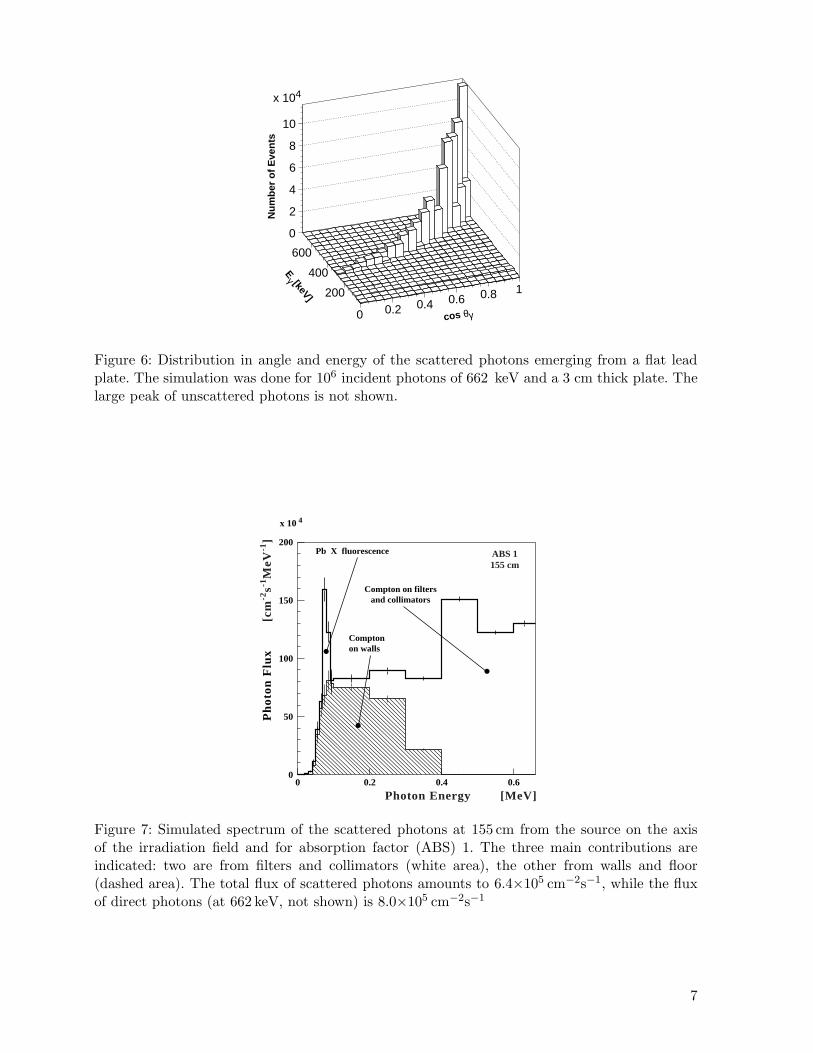
As expected, the different materials around the source (holder, lead case, stainless steelcollimators, lead filters, walls) spread the Cesium monoenergetic line by adding a low energyradiation. The result of the simulation for the contribution of the scattered photons to thetotal energy spectrum is shown in Fig. 7 for absorption factor 1. The region due to filtersand collimators extends from largest energies down to about 80 keV for Compton scatteringand hasa peak from Pb fluorescent X-ray emission at 72 keV). The dashed area is an albedoregion populating the lower energies and originating from Compton scattering off the walls. Therelatively large number of scattered photons at absorption factor 1 reflects the fact that thecollimators, the encapsulation of the Cesium and the filter for angular correction, which arealways present, already represent a significant absorber thickness.
For photons emerging from the pointlike source, the flux per unit area decreases with thesquare of the distance from the source. However, it is interesting to note that the GIF wallscreate an albedo radiation that increases when moving away from the source. This is shownin Fig. 8 for an absorption factor 10: when moving away from the source along the beam axis
6
cos θγ
Eγ [keV]
0 0.2 0.4 0.6 0.8 1200
400
600
0
2
4
6
8
10
x 104
Nu
mb
er o
f E
ven
ts
Figure 6: Distribution in angle and energy of the scattered photons emerging from a flat leadplate. The simulation was done for 106 incident photons of 662 keV and a 3 cm thick plate. Thelarge peak of unscattered photons is not shown.
0
50
100
150
200
x 10 4
0 0.2 0.4 0.6
Pb X fluorescence
Compton on walls
Compton on filtersand collimators
Photon Energy [MeV]
ABS 1155 cm
Ph
oton
Flu
x[c
m-2
s-1M
eV-1
]
Figure 7: Simulated spectrum of the scattered photons at 155 cm from the source on the axisof the irradiation field and for absorption factor (ABS) 1. The three main contributions areindicated: two are from filters and collimators (white area), the other from walls and floor(dashed area). The total flux of scattered photons amounts to 6.4×105 cm−2s−1, while the fluxof direct photons (at 662 keV, not shown) is 8.0×105 cm−2s−1
7
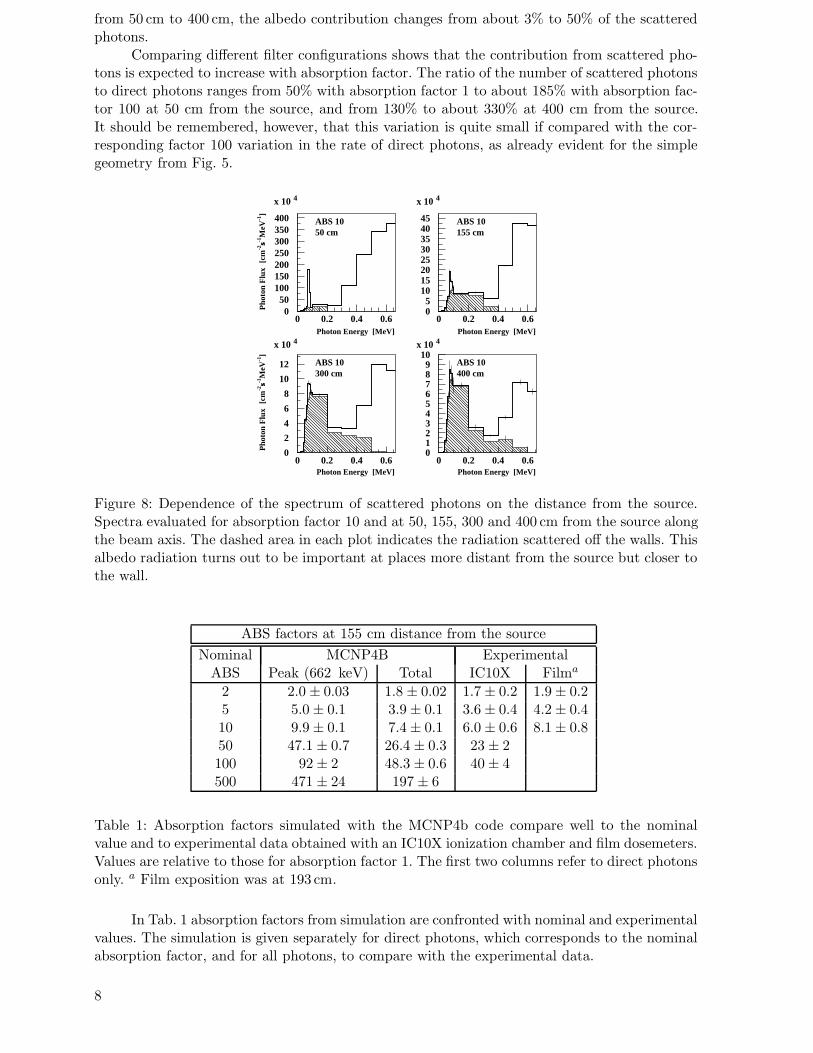
from 50 cm to 400 cm, the albedo contribution changes from about 3% to 50% of the scatteredphotons.
Comparing different filter configurations shows that the contribution from scattered pho-tons is expected to increase with absorption factor. The ratio of the number of scattered photonsto direct photons ranges from 50% with absorption factor 1 to about 185% with absorption fac-tor 100 at 50 cm from the source, and from 130% to about 330% at 400 cm from the source.It should be remembered, however, that this variation is quite small if compared with the cor-responding factor 100 variation in the rate of direct photons, as already evident for the simplegeometry from Fig. 5.
0 0.2 0.4 0.6
0 0.2 0.4 0.6
ABS 1050 cm
ABS 10155 cm
ABS 10300 cm
ABS 10400 cm
050
100150200250300350400
x 10 4 x 10 4
x 10 4 x 10 4Photon Energy [MeV] Photon Energy [MeV]
Photon Energy [MeV] Photon Energy [MeV]
05
1015202530354045
0 0.2 0.4 0.6
0
2
4
6
8
10
12
0 0.2 0.4 0.60123456789
10
-2s-1
MeV
-1]
[cm
sP
hoto
n F
lux
-2s-1
MeV
-1]
[cm
sP
hoto
n F
lux
Figure 8: Dependence of the spectrum of scattered photons on the distance from the source.Spectra evaluated for absorption factor 10 and at 50, 155, 300 and 400 cm from the source alongthe beam axis. The dashed area in each plot indicates the radiation scattered off the walls. Thisalbedo radiation turns out to be important at places more distant from the source but closer tothe wall.
ABS factors at 155 cm distance from the sourceNominal MCNP4B Experimental
ABS Peak (662 keV) Total IC10X Filma
2 2.0 ± 0.03 1.8 ± 0.02 1.7 ± 0.2 1.9 ± 0.25 5.0 ± 0.1 3.9 ± 0.1 3.6 ± 0.4 4.2 ± 0.410 9.9 ± 0.1 7.4 ± 0.1 6.0 ± 0.6 8.1 ± 0.850 47.1 ± 0.7 26.4 ± 0.3 23 ± 2100 92 ± 2 48.3 ± 0.6 40 ± 4500 471 ± 24 197 ± 6
Table 1: Absorption factors simulated with the MCNP4b code compare well to the nominalvalue and to experimental data obtained with an IC10X ionization chamber and film dosemeters.Values are relative to those for absorption factor 1. The first two columns refer to direct photonsonly. a Film exposition was at 193 cm.
In Tab. 1 absorption factors from simulation are confronted with nominal and experimentalvalues. The simulation is given separately for direct photons, which corresponds to the nominalabsorption factor, and for all photons, to compare with the experimental data.
8
The experimental data were taken with an ionization chamber3) and with film dosemeters4).This kind of ionization chamber and the films are sensitive to the total radiation and hence shouldbe compared with the simulated total number of photons. The agreement in Tab. 1 is withinthe experimental errors.
As an additional test of the validity of the simulation the dose rate in air, as measured withthe ionization chamber at 117 cm from the source was compared with the value obtained fromthe simulation with the MNCP4b code for a source activity of 740 GBq. The former resulted in21±1 mGy/h, in very good agreement with the calculated value of 22.1±0.5 mGy/h.
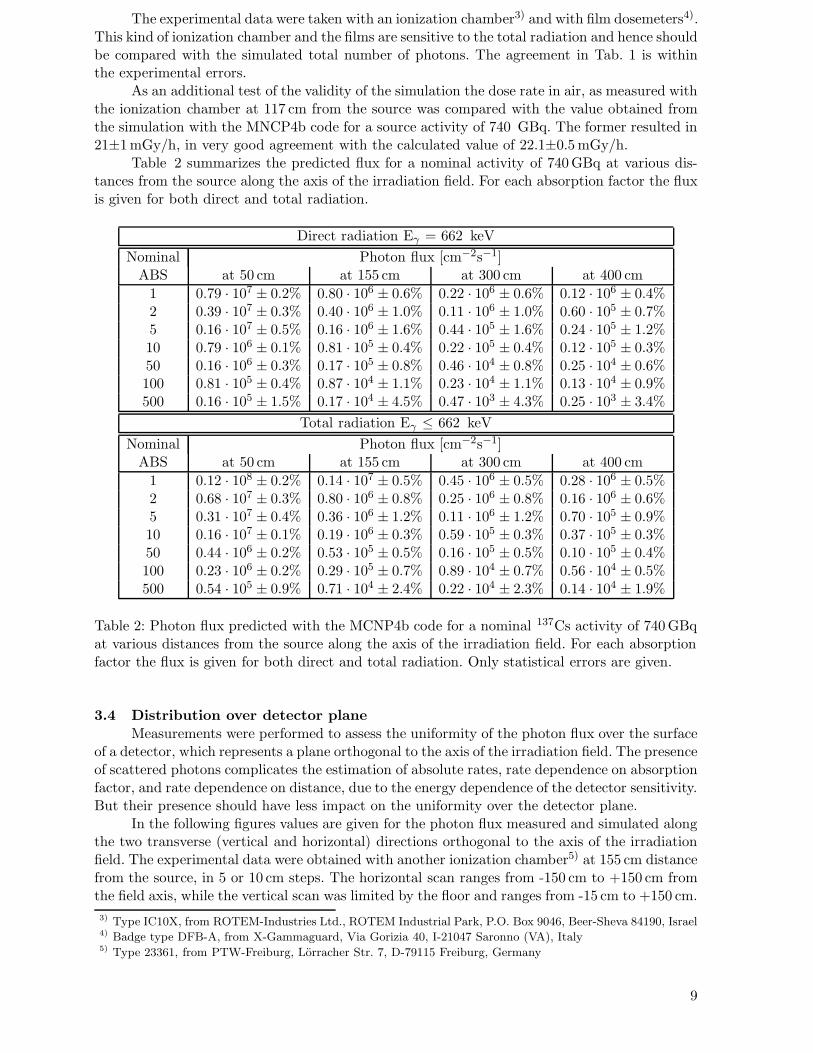
Table 2 summarizes the predicted flux for a nominal activity of 740 GBq at various dis-tances from the source along the axis of the irradiation field. For each absorption factor the fluxis given for both direct and total radiation.
Direct radiation Eγ = 662 keVNominal Photon flux [cm−2s−1]
ABS at 50 cm at 155 cm at 300 cm at 400 cm1 0.79 · 107 ± 0.2% 0.80 · 106 ± 0.6% 0.22 · 106 ± 0.6% 0.12 · 106 ± 0.4%2 0.39 · 107 ± 0.3% 0.40 · 106 ± 1.0% 0.11 · 106 ± 1.0% 0.60 · 105 ± 0.7%5 0.16 · 107 ± 0.5% 0.16 · 106 ± 1.6% 0.44 · 105 ± 1.6% 0.24 · 105 ± 1.2%10 0.79 · 106 ± 0.1% 0.81 · 105 ± 0.4% 0.22 · 105 ± 0.4% 0.12 · 105 ± 0.3%50 0.16 · 106 ± 0.3% 0.17 · 105 ± 0.8% 0.46 · 104 ± 0.8% 0.25 · 104 ± 0.6%100 0.81 · 105 ± 0.4% 0.87 · 104 ± 1.1% 0.23 · 104 ± 1.1% 0.13 · 104 ± 0.9%500 0.16 · 105 ± 1.5% 0.17 · 104 ± 4.5% 0.47 · 103 ± 4.3% 0.25 · 103 ± 3.4%
Total radiation Eγ ≤ 662 keVNominal Photon flux [cm−2s−1]
ABS at 50 cm at 155 cm at 300 cm at 400 cm1 0.12 · 108 ± 0.2% 0.14 · 107 ± 0.5% 0.45 · 106 ± 0.5% 0.28 · 106 ± 0.5%2 0.68 · 107 ± 0.3% 0.80 · 106 ± 0.8% 0.25 · 106 ± 0.8% 0.16 · 106 ± 0.6%5 0.31 · 107 ± 0.4% 0.36 · 106 ± 1.2% 0.11 · 106 ± 1.2% 0.70 · 105 ± 0.9%10 0.16 · 107 ± 0.1% 0.19 · 106 ± 0.3% 0.59 · 105 ± 0.3% 0.37 · 105 ± 0.3%50 0.44 · 106 ± 0.2% 0.53 · 105 ± 0.5% 0.16 · 105 ± 0.5% 0.10 · 105 ± 0.4%100 0.23 · 106 ± 0.2% 0.29 · 105 ± 0.7% 0.89 · 104 ± 0.7% 0.56 · 104 ± 0.5%500 0.54 · 105 ± 0.9% 0.71 · 104 ± 2.4% 0.22 · 104 ± 2.3% 0.14 · 104 ± 1.9%
Table 2: Photon flux predicted with the MCNP4b code for a nominal 137Cs activity of 740 GBqat various distances from the source along the axis of the irradiation field. For each absorptionfactor the flux is given for both direct and total radiation. Only statistical errors are given.
3.4 Distribution over detector planeMeasurements were performed to assess the uniformity of the photon flux over the surface
of a detector, which represents a plane orthogonal to the axis of the irradiation field. The presenceof scattered photons complicates the estimation of absolute rates, rate dependence on absorptionfactor, and rate dependence on distance, due to the energy dependence of the detector sensitivity.But their presence should have less impact on the uniformity over the detector plane.
In the following figures values are given for the photon flux measured and simulated alongthe two transverse (vertical and horizontal) directions orthogonal to the axis of the irradiationfield. The experimental data were obtained with another ionization chamber5) at 155 cm distancefrom the source, in 5 or 10 cm steps. The horizontal scan ranges from -150 cm to +150 cm fromthe field axis, while the vertical scan was limited by the floor and ranges from -15 cm to +150 cm.3) Type IC10X, from ROTEM-Industries Ltd., ROTEM Industrial Park, P.O. Box 9046, Beer-Sheva 84190, Israel4) Badge type DFB-A, from X-Gammaguard, Via Gorizia 40, I-21047 Saronno (VA), Italy5) Type 23361, from PTW-Freiburg, Lorracher Str. 7, D-79115 Freiburg, Germany
9
The dose in air at each point was then normalized to the value at the central point. Care wastaken to have the axis of the cylindrical ionization chamber of about 4 cm diameter orientedvertically for the horizontal scan, hence subtending the same cross section of particles flux atevery angle. Correspondingly, the chamber axis was horizontal during the vertical scan. Thesimulation results are obtained for elements of 20×20 cm−2s−1(or smaller) area with surfacenormal to the axis of the irradiation field, and of 4 cm thickness.The angular dependence shouldthus be similar for ionization chamber and simulation cells.
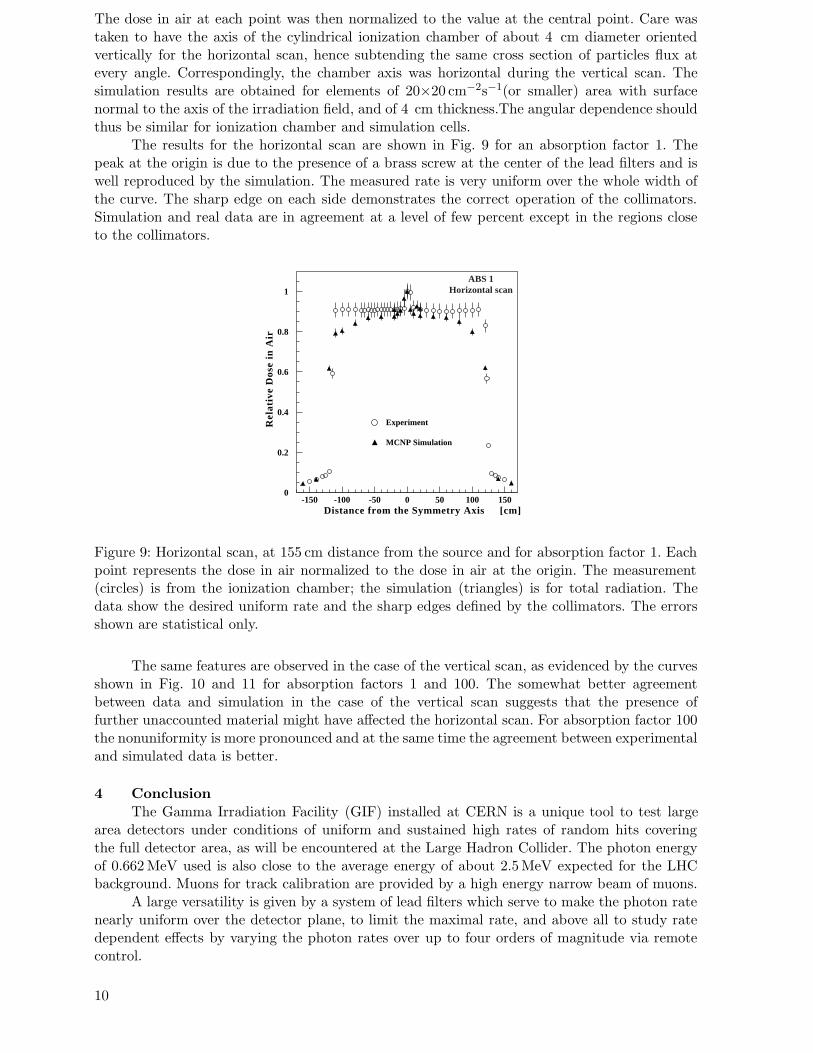
The results for the horizontal scan are shown in Fig. 9 for an absorption factor 1. Thepeak at the origin is due to the presence of a brass screw at the center of the lead filters and iswell reproduced by the simulation. The measured rate is very uniform over the whole width ofthe curve. The sharp edge on each side demonstrates the correct operation of the collimators.Simulation and real data are in agreement at a level of few percent except in the regions closeto the collimators.
0
0.2
0.4
0.6
0.8
1
-150 -100 -50 0 50 100 150Distance from the Symmetry Axis [cm]
Rel
ativ
e D
ose
in A
ir
Experiment
MCNP Simulation
ABS 1Horizontal scan
Figure 9: Horizontal scan, at 155 cm distance from the source and for absorption factor 1. Eachpoint represents the dose in air normalized to the dose in air at the origin. The measurement(circles) is from the ionization chamber; the simulation (triangles) is for total radiation. Thedata show the desired uniform rate and the sharp edges defined by the collimators. The errorsshown are statistical only.
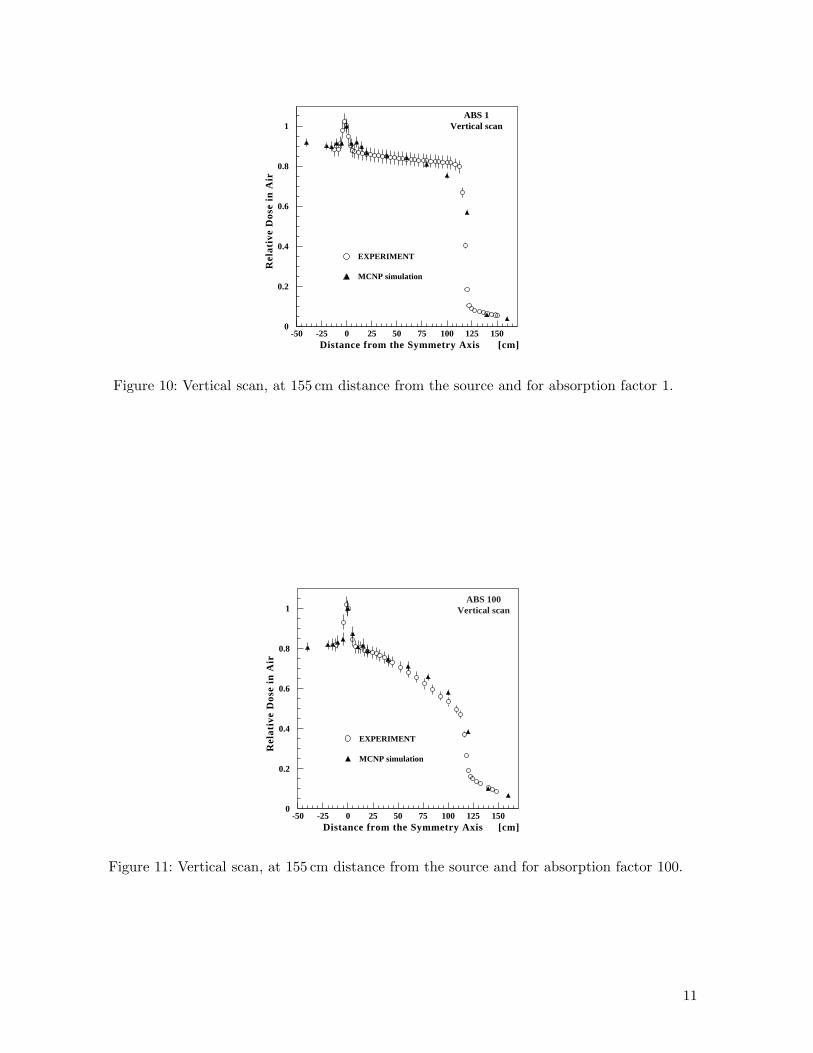
The same features are observed in the case of the vertical scan, as evidenced by the curvesshown in Fig. 10 and 11 for absorption factors 1 and 100. The somewhat better agreementbetween data and simulation in the case of the vertical scan suggests that the presence offurther unaccounted material might have affected the horizontal scan. For absorption factor 100the nonuniformity is more pronounced and at the same time the agreement between experimentaland simulated data is better.
4 ConclusionThe Gamma Irradiation Facility (GIF) installed at CERN is a unique tool to test large
area detectors under conditions of uniform and sustained high rates of random hits coveringthe full detector area, as will be encountered at the Large Hadron Collider. The photon energyof 0.662 MeV used is also close to the average energy of about 2.5 MeV expected for the LHCbackground. Muons for track calibration are provided by a high energy narrow beam of muons.
A large versatility is given by a system of lead filters which serve to make the photon ratenearly uniform over the detector plane, to limit the maximal rate, and above all to study ratedependent effects by varying the photon rates over up to four orders of magnitude via remotecontrol.
10
0
0.2
0.4
0.6
0.8
1
-50 -25 0 25 50 75 100 125 150
EXPERIMENT
MCNP simulation
ABS 1Vertical scan
Distance from the Symmetry Axis [cm]
Rel
ativ
e D
ose
in A
ir
Figure 10: Vertical scan, at 155 cm distance from the source and for absorption factor 1.
0
0.2
0.4
0.6
0.8
1
-50 -25 0 25 50 75 100 125 150
EXPERIMENT
MCNP simulation
ABS 100Vertical scan
Distance from the Symmetry Axis [cm]
Rel
ativ
e D
ose
in A
ir
Figure 11: Vertical scan, at 155 cm distance from the source and for absorption factor 100.
11
The presence of massive objects like filters, walls, floor, equipment, is at the origin ofscattered photons in addition to the original monochromatic ”direct” photons. The scatteredphotons make simple precise predictions very difficult, since they will depend on details of theactual geometry and on an eventual spectral dependence of the detector response. Therefore itis adequate to quote the absorption factor of the filters with respect to the direct photons. Sincethe number of scattered photons is comparable to the number of direct photons over the widerange of absorption factors used, simple predictions can nevertheless be made to within a factor2.
With a series of measurements and calculations the main characteristics of the radiationfield were studied. Experimental data demonstrate the uniformity of the photon rate over theplane of a detector and the correctness of the nominal filter factors. The simulation allowedto study the main contributions to the radiation field and to predict rates and spectra. Con-frontation between experiment and simulation confirmed that the simulation is able to producedetailed and precise predictions.
Finally, the GIF is intensively serving all four LHC collaborations for performance andaging tests of large muon chambers under LHC conditions.
5 AcknowledgementsWe would like to acknowledge the strong support given by CERN and in part by RWTH
Aachen, which made the construction of this facility possible. Special thanks go to M. Clement,I. Crotty, J. Drecourt, M. Grill, C. Ferrari and T.Reynes for construction and installation of GIF;K.Bosseler, J.Grooten, K.D. Lohmann, F. Lutz, R.Pahlke, W. Reuter and J. Spanggaard for thefilter system; L. Ulrici for help with the radiation measurements; A. Cojan and M. Claytonfor software control; M.Hauschild, H. Taureg, M. Hoefert and G. Stevenson for safety-relateddiscussions and authorisations, as well as to the members of the transport, electrical, gas andnetworking services at CERN.
12
References[1] The LHC Study Group: The Large Hadron Collider - Conceptual Design, CERN/AC/95-
05(LHC), 1995.[2] CMS Collaboration: The Compact Muon Solenoid, Technical Proposal, CERN/LHCC 94-
38, 1994.[3] ATLAS Collaboration: ATLAS Technical Proposal for a General-Purpose pp Experiment
at the Large Hadron Collider at CERN, CERN/LHCC 94-43, 1994.[4] CMS Collaboration: The Muon Project, Technical Design Report, CERN/LHCC 97-32,
1997.[5] ATLAS
Collaboration: ATLAS Muon Spectrometer Technical Design Report, CERN/LHCC/97-22, 1997.
[6] ALICE Collaboration: A Large Ion Collider Experiment, Technical Proposal, CERN/LHCC95-71, 1995.
[7] ALICE Collaboration: Technical Design Report of the Dimuon Forward Spectrometer,CERN/LHCC 99-22 / ALICE TDR 5, 1994.
[8] LHCb Collaboration: A Large Collider Beauty experiment for precision measurements ofCP-violation and rare decays, Technical Proposal, CERN/LHCC 98-4, 1998.
[9] A. Manarin and G. Vismara, The Delay Wire Chamber (DWC) description, CERN reportLEP/BI-TA/Note 83-3, 1985.
[10] CERN Application Software Group: GEANT, Detector Description and Simulation Tool,Version 3.21, CERN Program library W5013.
[11] J.F. Briestmeister, Ed., MCNP - A General Monte Carlo N-Particle Transport Code, LosAlamos National Laboratories report LA-12625-M Version 4B, Los Alamos, New Mexico,1997.
13