Embed Size (px)
Citation preview

Advanced Ocular
Assessment
Prepared by
Prof. Dr. Mohamed Khafagy
A.Professor of Ophthalmology Faculty of Medicine,
Cairo University
Second Year
2018-2019

Acknowledgments
This two-year curriculum was developed through a participatory and collaborative approach between the
Academic faculty staff affiliated to Egyptian Universities as Alexandria University, Ain Shams University, Cairo
University , Mansoura University, Al-Azhar University, Tanta University, Beni Souef University , Port Said
University, Suez Canal University and MTI University and the Ministry of Health and Population(General
Directorate of Technical Health Education (THE). The design of this course draws on rich discussions through
workshops. The outcome of the workshop was course specification with Indented learning outcomes and the
course contents, which served as a guide to the initial design.
We would like to thank Prof.Sabah Al- Sharkawi the General Coordinator of General Directorate of Technical
Health Education, Dr. Azza Dosoky the Head of Central Administration of HR Development, Dr. Seada
Farghly the General Director of THE and all share persons working at General Administration of the THE for
their time and critical feedback during the development of this course.
Special thanks to the Minister of Health and Population Dr. Hala Zayed and Former Minister of Health
Prof. Ahmed Emad Edin Rady for their decision to recognize and professionalize health education by issuing a
decree to develop and strengthen the technical health education curriculum for pre-service training within the
technical health institutes.

ذىصف هقشس دساس
تااخ الوقشس -1
القاساخ الورطىسج لوشض العىى اسن الوقشس : الشهض الكىدي :
Advanced Ocular Assessment
الثاح الفشقح /الوسرىي :
الرخصص : الثصشاخ
عول 6ظشي 3عذد الىحذاخ الذساسح :
To provide training for the Ophthalmic Technician in advanced هذف الوقشس: -2
ophthalmic assessment procedures to perform them in a clinical
setting under the appropriate supervision of an Ophthalmology
specialist.
الوسرهذف هي ذذسس الوقشس : -3
ا. الوعلىهاخ
:والوفاهن
By the end of this course the trainee will be able to:
Describe the equipment used in advanced assessment of eye
patients and explain its value in patient service.
Identify different sources of errors affecting the results of
ophthalmic equipment and how to minimize them.
Know the different types of low vision aids equipment and
their proper use with the patients.
الزهح : الوهاساخ -ب
By the end of this course the trainee will be able to:
Apply the advanced ocular assessment techniques accurately
and guide the patient properly during examination.
Compare the different methods used to examine the eye and
interpret their results accordingly.
Confirm the results of different ocular assessment techniques
and report them correctly.
الوهاساخ الوهح -ج
الخاصح تالوقشس:
By the end of this course the trainee will be able to:
Assess visual acuity of a low vision patient and recommend
Low vison aid use accordingly.
Perform and record in-office ocular assessments such as:
Tonometry, color vision, pachymetry, Amsler Grid, automated
or manual lensemeter and automated or manual Keratometer.
Carry out ocular ultrasound and Biometry and IOL
calculations and document it accurately.
Investigate and analyze the eye suing corneal topography,
automated perimetry, fundus photography and optical
coherence tomography (OCT).
الوهاساخ -د
العاهح :
By the end of this course the trainee will be able to:
Operate computers and medical software.
Respond to patients‟ inquiries and frequent questions.
Provide proper advice concerning advanced ocular testing.
هحرىي الوقشس: -4
1. Low Vision
Definition of low vision
Measuring visual acuity of a low vision patient
Calculation of required magnification
Types of low vision devices (optical and non-optical)
Advantages and disadvantages of different low vision
devices
2. Supplementary Tests
Color Vision
Stereoacuity and glare
Tonometry
Pachymetry

Lensometry
Keratometry
Manual perimetry, Tangent screens and confrontation field
tests.
Automated perimetry
Internal eye examination:
direct ophthalmoscopy
indirect ophthalmoscopy
slit lamp lenses
3. Ophthalmic Imaging:
external eye and slit lamp photography
A-scan Ocular Ultrasound and IOL calculation
B-scan Ocular Ultrasound
corneal topography
fundus photography
Scanning computer ophthalmic diagnostic imaging
(optical coherence tomography [OCT], GDx, HRT)
ة الرعلن والرعلنأساا -5
Academic Lectures.
Assignments.
Practical hands–on training.
أسالة الرعلن والرعلن -6
للطالب روي القذساخ
.الوحذودج
Extra tutoring hours.
Small number training sessions.
Supportive feed-back.
Involve in projects and helpful assignments.
Forming peer support groups.
اخرثاساخ ظشح ذقىن الطالب -7
اخرثاساخ عولح
األسالة الوسرخذهح -أ
(Essay & MCQاخرثاساخ ظشح )
(Slide show) اخرثاس عول عل صىس وسائط هرعذدج
عل االجهضج ارظام حضىس الرذسثاخ العولح
Mid-term assessment (MCQ) by 7 الرىقد -بth
week
Final assessment (Essay, MCQ & Slide show) by 15th
week
ذىصع الذسجاخ -ج
دسجح 90دسجح والصغشي 150الهاح العظو
دسجح 20اعوال سح
دسجح 40العول
دسجح 90اخرثاس ذحشش
الذساسح والوشاجع :قائوح الكرة -8
Ophthalmic Medical Assisting, An Independent Study Course, (E. Newmark &
M.A. O’Hara, 6th Edition, 2012, AAO).
The Ophthalmic Assistant, 9th Edition, (H.A. Stein, R.M. Stein and M.I.
Freeman, Eighth Edition, 2013, Elsevier Inc.)
Fundamentals for Ophthalmic Technical Personnel, (B. Cassin, 1995, W.B.
Sanders Company.
----- هزكشاخ -أ
----- كرة هلضهح -ب
. Certified Ophthalmic Assistant Exam Review Manual, (J كرة هقرشحح -ج
K. Ledford, Slack.)
دوساخ علوح أو -د
ششاخ ...... الخ
International Council of Ophthalmology website:
www.icoph.org/resources.html
American Academy of Ophthalmology website:
Eyewiki.aao.org
American Academy of Optometry website and journal:
www.aaopt.org

Course Description .............................................................................................. vi
Chapter 1: Low Vision..........................................................................................9
Chapter 2: Supplementary Vision Testing.........................................................22
Chapter 3: Ophthalmic Imaging ......................................................................... 47
Bibliography and Recommended Readings......................................................60
Appendices ....................................................................................................... 61
لىصاسج الصحح والسكاى وحزس تعهحقىق الشش والرألف
Contents

This course aims to provide training for the Ophthalmic Technician in advanced ophthalmic
assessment procedures to perform them in a clinical setting under the appropriate supervision of an
Ophthalmology specialist.
Core Knowledge
By the end of this course, students should be able to:
Describe the equipment used in advanced assessment of eye patients and explain its value in
patient service.
Identify different sources of errors affecting the results of ophthalmic equipment and how to
minimize them.
Know the different types of low vision aids equipment and their proper use with the patients.
Investigate and analyze the eye suing corneal topography, automated perimetry, fundus
photography and optical coherence tomography (OCT).
Core Skills
By the end of this course, students should be able to:
Apply the advanced ocular assessment techniques accurately and guide the patient properly
during examination.
Compare the different methods used to examine the eye and interpret their results accordingly.
Confirm the results of different ocular assessment techniques and report them correctly.
Assess visual acuity of a low vision patient and recommend Low vison aid use accordingly.
Perform and record in-office ocular assessments such as: Tonometry, color vision,
pachymetry, Amsler Grid, automated or manual lensemeter and automated or manual
Keratometer.
Course Description


Course Overview
Methods of Teaching/Training with
Number of Total Hours per Topic
ID
Topics
Inte
ract
ive
Lec
ture
Fie
ld W
ork
Cla
ss
Ass
ign
men
ts
Res
earch
Lab
1 Low Vision
21 2 4 8
2 Supplementary Vision Testing
21 10 8 8
3 Ophthalmic Imaging
21 12 12 8
TOTAL HOURS (108) 63 24
24 24
Objectives
Defining low vision
Measuring visual acuity of a low vision patient
Calculation of required magnification
Types and advantages of different low vision devices (optical and non-optical)
Introduction and Definition of Low Vision
Low Vision
Because of disease, developmental abnormalities or trauma, certain patients do not obtain satisfactory
vision even when their ametropia is fully corrected. A low vision patient is a patient with subnormal
visual acuity or abnormal visual field, that can‟t be corrected by spectacles or contact lenses (usually less
than 6/24).
Vision rehabilitation is a necessary part of complete eye care. Many patients have been told that their
vision cannot be improved, which has caused them to believe that they will be forced to leave their work
or their special interests, or both. Seeing a visually impaired person reading after losing hope that
something can be done is a more striking event than seeing a postoperative cataract patient read the 6/6
line. To an adult, this may mean the opportunity for resuming or gaining work. Children can be given the
opportunity to have proper education and allow them to participate with other children in the classroom.
For the elderly person can prevent depression because of inability to read, write, or keep up hobbies. The
rehabilitation of a low vision patient could be very satisfying, for both the patient and the provider.
Low Vision Aids are prescribed to patients who cannot carry out their routine activities even with
glasses. These are special types of spectacles, which are prescribed to patients with very poor vision.
Low Vision

Low vision aids are usually indicated in the following conditions:
A. Retinal and optic nerve diseases such as:
1. Macular lesions and dystrophies.
2. Advanced glaucoma.
3. Diabetic retinopathy.
4. Optic atrophy.
5. Pathological myopia.
6. Toxic and strabismic amblyopia.
B. Corneal diseases as in:
1. Corneal opacities.
2. Irregular astigmatism.
Measuring Visual acuity of a Low Vision Patient
Visual Acuity testing:
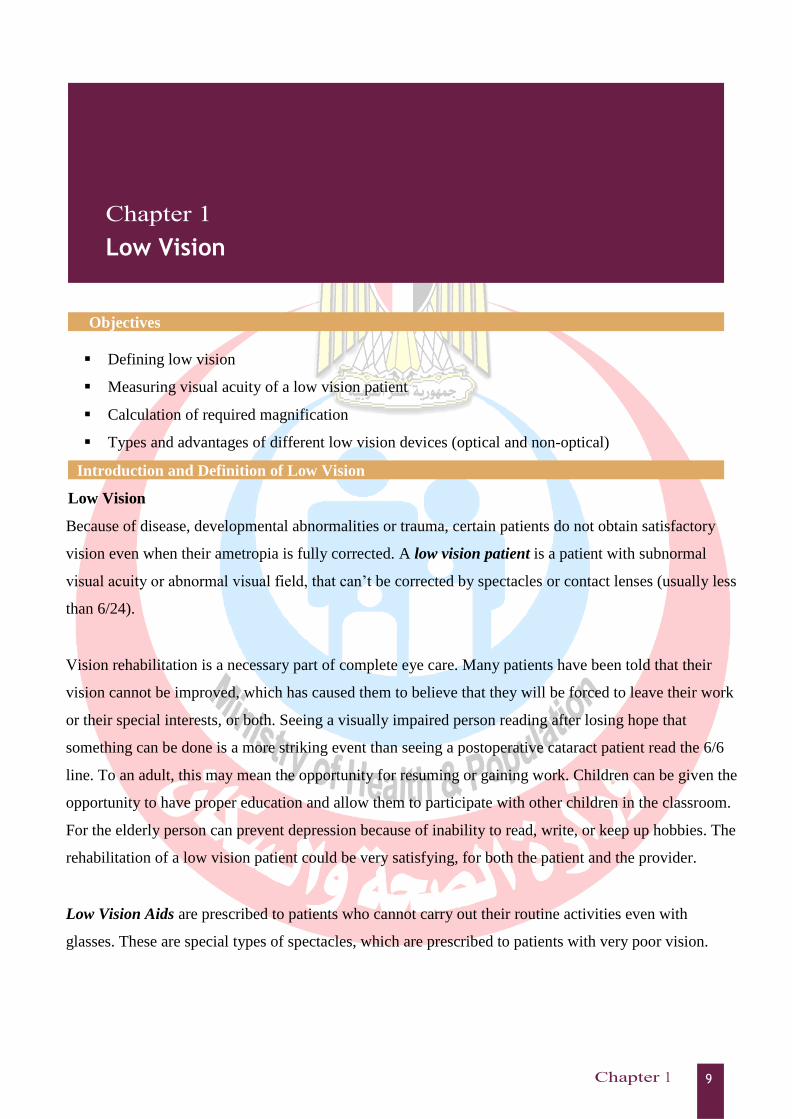
It is important in the eye examination to test visual acuity accurately. Low vision patients are
better tested using specific low vision eye charts for both distance and near acuity (Figure 1)
that are different from the eye charts used in a regular eye examination as most charts and
projectors have no test print between 6/30 and 6/60 or beyond 6/60. Hence, the partially
sighted patient should be tested at 3 m instead of at 6 m with Snellen charts or specially
designed test charts (ETDRS). Afterwards the result is multiplied by 2 to convert it to standard
notations; for example, 3/24 = 6/48. If the acuity is less than 3/60 (i.e. 6/120), the chart is
brought closer to the patient until the 60 letter is identified (2/60, 1/60). „Counting fingers‟ is
not preferable to be used as a visual acuity test. (See appendix 1 for details on how to measure
visual acuity in a low vision patient).
Refraction:
A careful refraction is important because correction of a basic refractive error will improve the
patient‟s vision and will also work as baseline acuity for the prescription of other optical
magnifying devices. A good refraction and an increase in a bifocal add is often the best
solution for a patient with early vision loss. A patient with high myopia may be able to read
without glasses, but need a new prescription for distance. Once a good refraction is obtained,
the reading add is determined.
In a patient with a visual impairment, every small improvement in vision offers the
opportunity for improved function. Refracting a low-vision patient may require more patience
than with other patients, but the principles are the same. It is important for the patient to see
the chart and more than one letter or number. When checking between two lenses, give the
patient more time to see and answer than a patient with normal vision; patients with
nystagmus need extra time to focus before determining their choice.
Bailey-Lovie Acuity Chart Early Treatment of Diabetic Retinopathy Study (ETDRS) Chart
MN Read Low Vision Acuity Chart Lighthouse Near Visual Acuity Chart
Figure 1: Examples of specialized Low vision charts.
Advantages of Spectacles:
Spectacles allow the patient to function hands free.
They provide a large reading field, but with a close and fixed working distance.
Spectacles allow the inclusion of shades to reduce glare and improve contrast.
They allow adding prisms to assist the patient in finding an area of the retina
that offers improved vision.
They can offer the incorporation of high adds for magnification. These lenses
need base-in prism to reduce the demand on convergence.
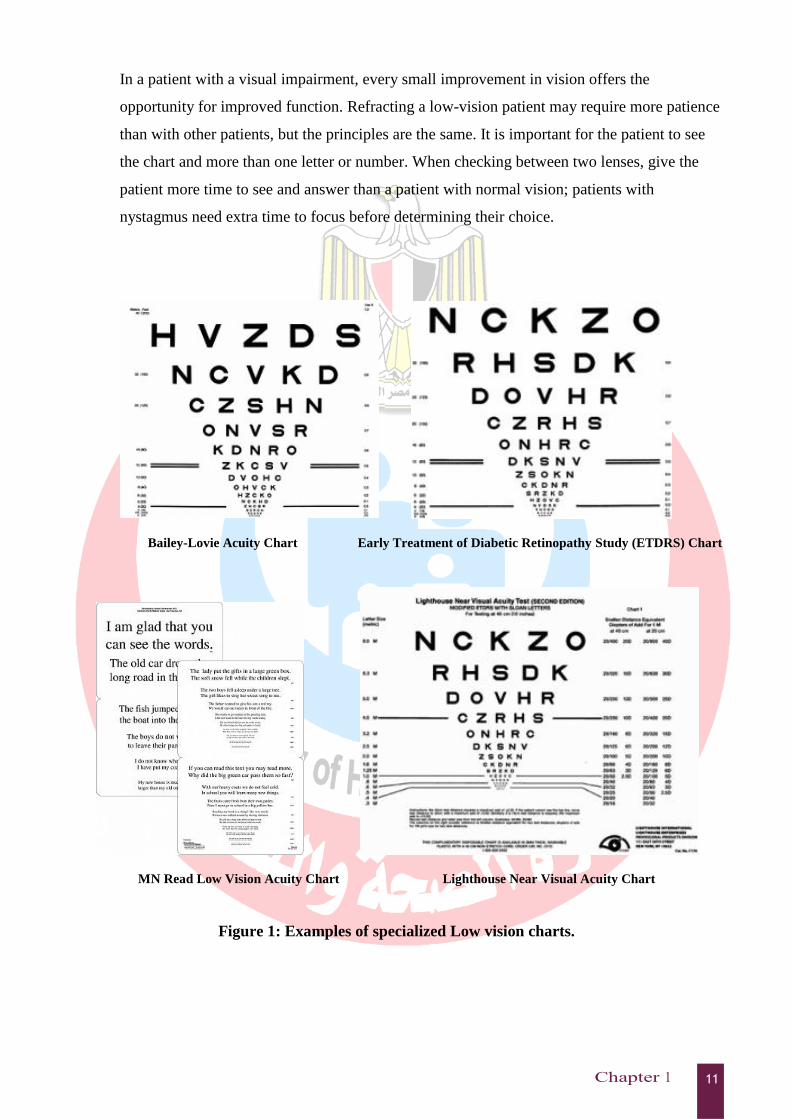
Field of vision testing (chapter 2 ): (Central & peripheral)
The Amsler Grid Test (Central field): The Amsler Grid test looks like a
piece of white graph paper with darker horizontal and vertical lines that form a
square grid (Figure 2-left). Wavy, distorted, missing or broken lines, or holes
or black spots in the grid can indicate macular problems (figure 2- right).
The Amsler Grid The Amsler Grid of a patient with macular degeneration
Figure 2: Amsler Grid.
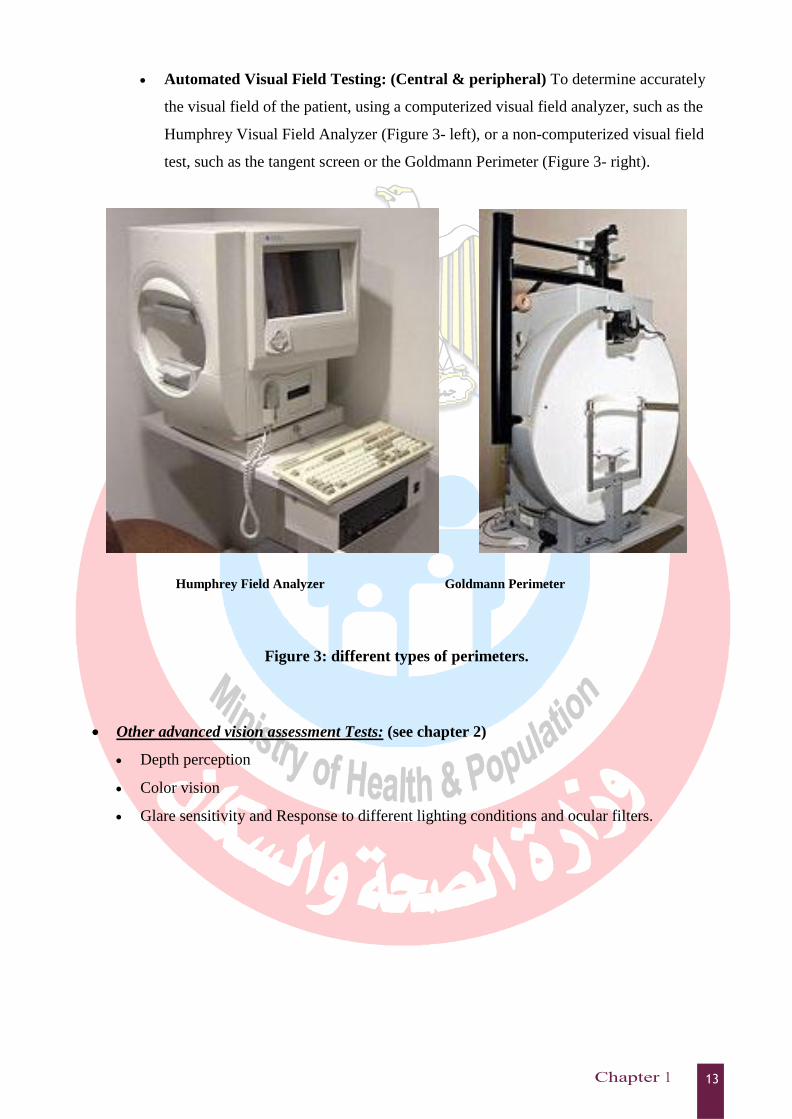
Automated Visual Field Testing: (Central & peripheral) To determine accurately
the visual field of the patient, using a computerized visual field analyzer, such as the
Humphrey Visual Field Analyzer (Figure 3- left), or a non-computerized visual field
test, such as the tangent screen or the Goldmann Perimeter (Figure 3- right).
Humphrey Field Analyzer Goldmann Perimeter
Figure 3: different types of perimeters.
Other advanced vision assessment Tests: (see chapter 2)
Depth perception
Color vision
Glare sensitivity and Response to different lighting conditions and ocular filters.

Calculation of required magnification
Kestenbaum's rule
A. In Kestenbaum's rule, first we calculate the power of the lens required by the patient by
dividing the denominator of the Snellen acuity by the numerator. For example, a person
with 6/60 vision needs a +10 (60/6) diopter lens to read J5 (6/18) print. If we need the
patient to read J1 (6/6) print this number is doubled i.e. the same patient will need +20 D
for J1 print.
B. Magnification achieved is calculated by multiplying the reading distance in meters by the
power of the lens.
If we chose a focal length of 25 cm (0.25 meters) the magnification achieved with
a + 10 diopter lens would be 2.5x (10 x 0.25= 2.5), i.e. divide the power of the
lens by 4 for a focal length of 25 cm. Thus , the degree of magnification achieved
by a + 10 D lens would be 10/4 or 2.5x, a +8 D lens gives 2x magnification and a
+20 D lens 5x magnification.
C. This could be used as a rule of thumb, with further refinement for a specific task
requirement by a patient. Children and young adults would need less than a +5.00 lens
because of accommodation, and usually the weakest lens that would enable reading of J5
on the near-vision chart is added to his spectacle distance correction. In addition, word
and text charts are helpful in assessing magnification requirements of these patients.
D. For viewing distant objects, telescopes or binoculars can be useful. Although
Kestenbaum‟s rule is helpful, the patient usually will have to try two or three aids before
matching an aid to the desired activity or task.
Types and advantages of different low vision devices (optical and non-optical)
Many vision rehabilitation devices are now available to assist patients with glare, photophobia,
mobility, and normal daily functioning. Any device that improves a patient‟s vision, even a small
improvement, should be considered for patient use as it may help him return to normal daily activities.
These devices could be optical or non-optical.
Optical Low vision Aids:
A. Magnifying glasses:
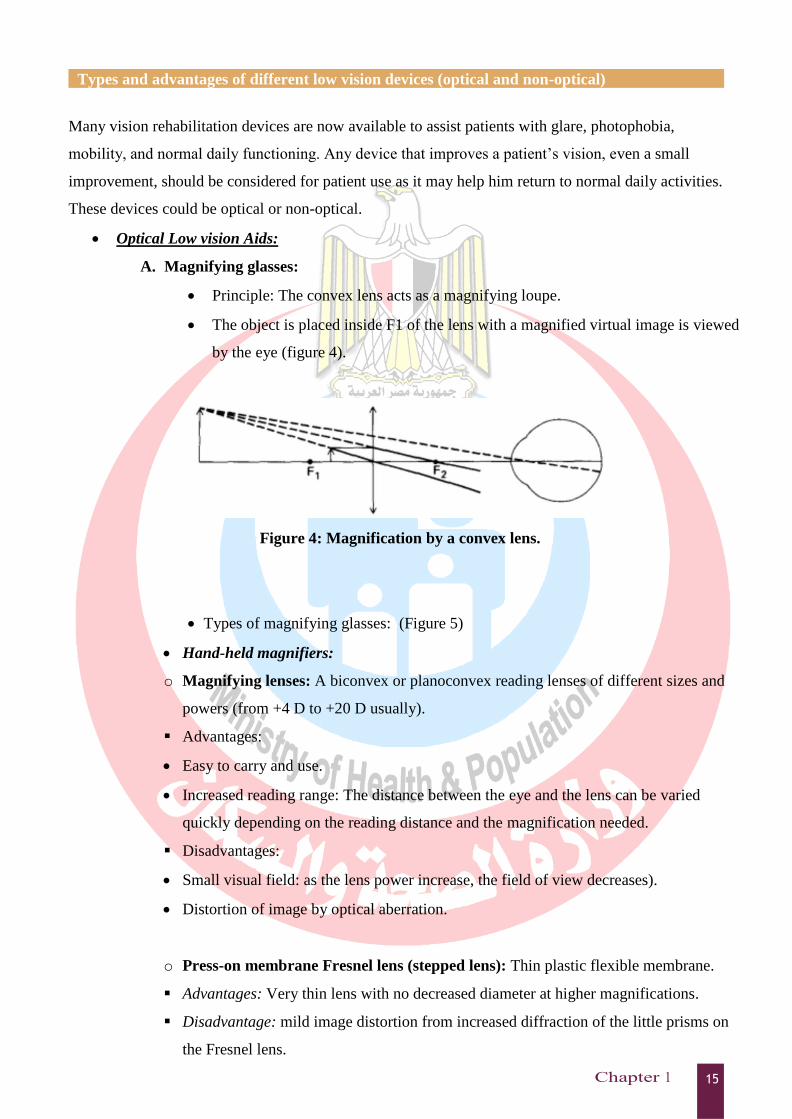
Principle: The convex lens acts as a magnifying loupe.
The object is placed inside F1 of the lens with a magnified virtual image is viewed
by the eye (figure 4).
Figure 4: Magnification by a convex lens.
Types of magnifying glasses: (Figure 5)
Hand-held magnifiers:
o Magnifying lenses: A biconvex or planoconvex reading lenses of different sizes and
powers (from +4 D to +20 D usually).
Advantages:
Easy to carry and use.
Increased reading range: The distance between the eye and the lens can be varied
quickly depending on the reading distance and the magnification needed.
Disadvantages:
Small visual field: as the lens power increase, the field of view decreases).
Distortion of image by optical aberration.
o Press-on membrane Fresnel lens (stepped lens): Thin plastic flexible membrane.
Advantages: Very thin lens with no decreased diameter at higher magnifications.
Disadvantage: mild image distortion from increased diffraction of the little prisms on
the Fresnel lens.

Stand magnifiers :
o Stand magnifiers rest the magnifier directly on the material to be seen.
o The power of these magnifiers can be up to 60 D and some are illuminated.
o The stand magnifier helps the patient in writing by placing the pen or pencil under the
magnifier between the legs of the stand (Figure 5- upper right).
o It is best for older patients with tremors, and for younger children trying to keep their
position while reading.
Neck-held magnifiers: Are resting on the chest leaving the hands free (Figure 5- lower
left).
Spectacle-born high-plus reading lenses: (+4 D to +20 D.)
o Forms:
Single vision forms: Monocular or binocular.
Bifocal forms: Bifocals with high powers up to +32 D (8x). Lens decentration or add a
prism base-in is usually needed especially in case of powers higher than 5 D.
Dome convex lens: Dome-shaped convex lens which has high converging power that
is laid on print and produces magnification of the letters (Figure 5- upper left).
Convex cylindrical lenses: a Bar-shaped lens which has no refractive power or only a
low converging power in its long axis and high converging power in cross section is
laid on a line of print and produces vertical magnification of the letters (Figure 5-
lower right).

Figure 5: different types of optical low visual aids.

B. Telescopic lenses: Galilean or Astronomical telescopic system (Figure 5-upper left).
o Principle: Telescopes allow magnification of an object in the distance by
increasing the retinal image size.
o Forms:
Hand-held or spectacle-mounted.
Binocular or monocular.
Some are fixed but most can be focused.
o Advantages:
Allow the magnification at a greater distance than ordinary magnifying
lenses so could provide vital support for distance viewing, giving the
patient greater flexibility.
A simple telescopic spectacle without a casing is available and is
lightweight and relatively inexpensive.
Telescopes allow the spotting of street signs, classroom materials, bus
signs, shows and movies and speakers in a classroom or lecture.
o Disadvantages:
Small field of view (patients cannot wear a telescopic device when
walking).
Poor contrast or illumination
Limited depth of focus.
C. Projection devices: They are useful for reading and writing (Figure 6)
Principles:
Projection magnifiers: form an enlarged image on a translucent screen at
a variable distance.
Closed-circuit television magnification system (CC-TV): Project a
magnified image onto a screen.
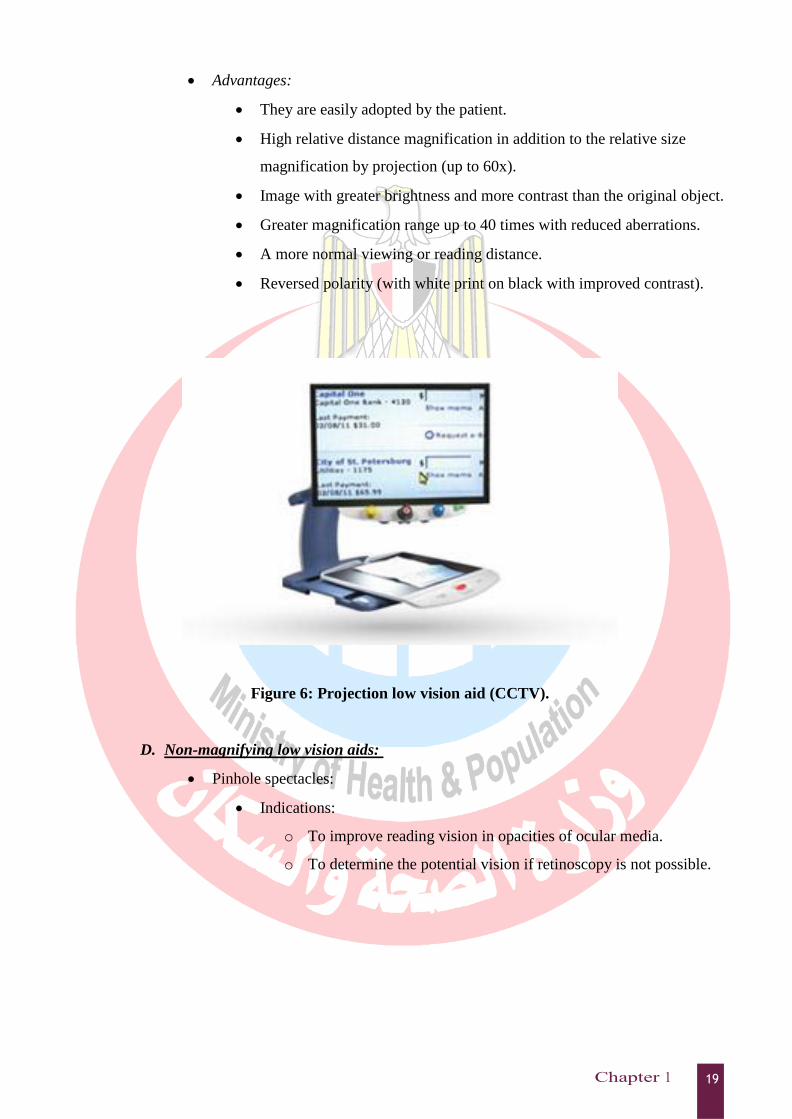
Advantages:
They are easily adopted by the patient.
High relative distance magnification in addition to the relative size
magnification by projection (up to 60x).
Image with greater brightness and more contrast than the original object.
Greater magnification range up to 40 times with reduced aberrations.
A more normal viewing or reading distance.
Reversed polarity (with white print on black with improved contrast).
Figure 6: Projection low vision aid (CCTV).
D. Non-magnifying low vision aids:
Pinhole spectacles:
Indications:
o To improve reading vision in opacities of ocular media.
o To determine the potential vision if retinoscopy is not possible.
Reading slit (typoscope):
Black device with a rectangular opening to read one or more lines at a time
in: Early cataracts due to increased contrast.
Training of centric viewing in macular diseases.
Colored Filters (figure 5 – upper left):
Could be used for patients with glare and Photo-sensitivity problems such
as in Albinism and Cone dystrophy.
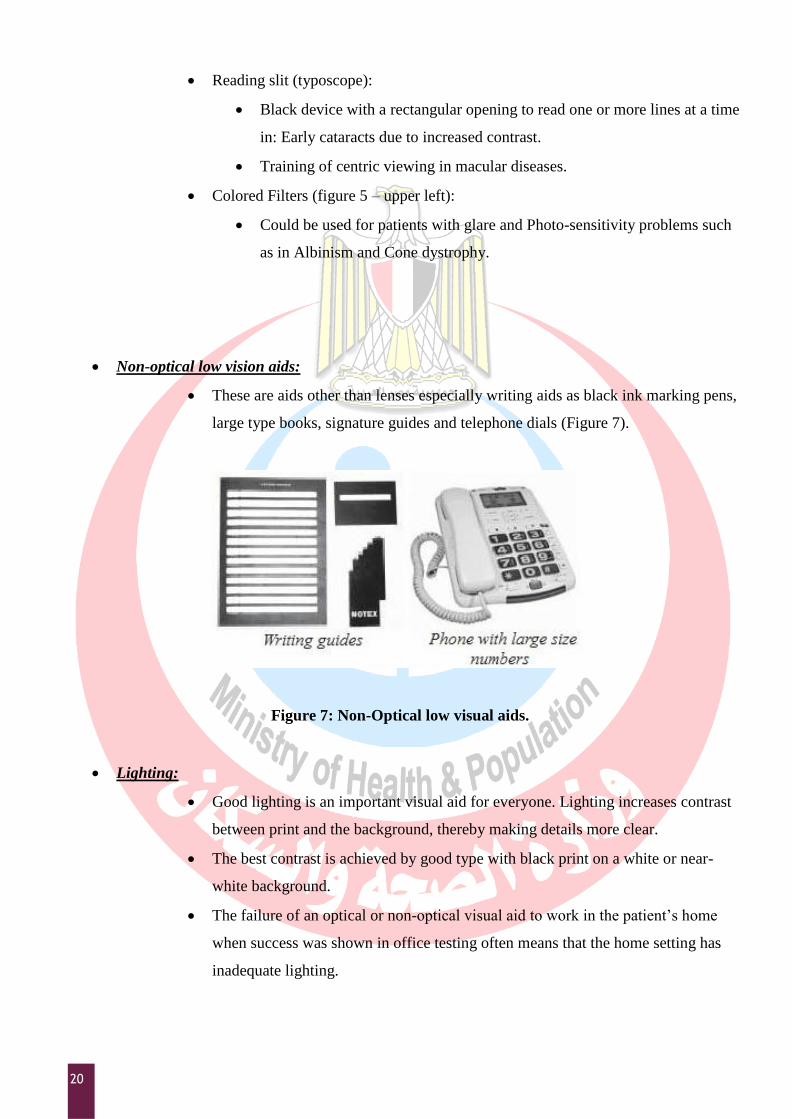
Non-optical low vision aids:
These are aids other than lenses especially writing aids as black ink marking pens,
large type books, signature guides and telephone dials (Figure 7).
Figure 7: Non-Optical low visual aids.
Lighting:
Good lighting is an important visual aid for everyone. Lighting increases contrast
between print and the background, thereby making details more clear.
The best contrast is achieved by good type with black print on a white or near-
white background.
The failure of an optical or non-optical visual aid to work in the patient‟s home
when success was shown in office testing often means that the home setting has
inadequate lighting.

Selection of low-vision aids:
No single visual aid is best, because each patient must be considered in terms of
functional loss, age, interests, motivation, and the type of activity for which the aid is
intended.
For example; an old person with a tremor may benefit from a stand magnifier or
spectacles. High-tech devices might be essential for someone at work to keep his job.
Patients who have recently lost vision may need time to accept this. A multidisciplinary
approach to the care of these patients is very helpful.
Low-vision rehabilitation includes besides low visual aids orientation and mobility
(O&M) training (learning how to work in the kitchen safely, and how to navigate the
home) and Psychological and social support through psychologists and social workers to
educate the patient, his family and social circles to deal with the new environment of this
disability.

22
Objectives
Describe different ancillary ocular testing technique
Know the basics of Operation of different clinical equipment in eye clinic.
Overview
Advanced ocular assessment techniques studied in this chapter include:
Color Vision
Stereoacuity and glare
Tonometry
Pachymetry
Lensometry
Keratometry
Perimetry.
Ophthalmoscopy:
• direct ophthalmoscopy
• indirect ophthalmoscopy
• Slit lamp lenses
Color Vision
Color depends on:
o Hue: object will have a particular hue because it reflects or transmits light of a certain
wavelength.
o Saturation: it is an index of the purity of a hue i.e. the shade or the amount of black
color given to a hue.
o Brightness: this depends on the light intensity.
Color is perceived by the cones Located mainly in the central retina i.e macula.
Normal cones have three photosensitive pigments: red, green, blue.
Supplementary Ocular Testing

23
Color vision defects arise from a deficiency or absence of one or more visual pigments. Defects
in color vision may be congenital or acquired.
o Congenital color defects occur in about 8–10% of males and in only 0.4% of females.
This defect is transmitted through the female and appears predominantly in the male (X-
linked pattern of inheritance).
o Acquired color blindness may occur after diseases of the optic nerve or central retina.
Clinically, persons with abnormal color vision fall into three major categories:
o The trichromat has all three cone pigments intact and has normal color vision. The
anomalous trichromat has a partial deficiency of one of the three cone pigments:
Protanomaly: deficient mainly in red visual pigment and poor red-green
discrimination.
Deuteranomaly: deficient mainly in green visual pigment and poor purple-green
discrimination.
Tritanomaly: deficient mainly in blue visual pigment and poor blue-yellow
discrimination.
o The dichromat has a complete deficiency in one cone pigment but the other two visual
pigments are intact. Also three types
Protanopia: in which red is absent.
Deuteranopia: in which green is absent.
Tritanopia: in which blue is absent.
o The monochromat has only one type of cone pigment (e.g blue monochromatism has
only the blue visual pigment) (very rare).
In the majority of patients, the color deficiency is in the red–green area of the spectrum. With
the deficiency in red, this color appears less bright than for the normal individual and thus
mixtures of colors containing red are often confused with other colors.

24
Color vision testing is important to assess the following:
o Evaluate color blindness and degrees of color blindness
o Macular diseases.
o Chloroquine Toxicity
o Cone Dystrophy
o Optic nerve diseases e.g. in Multiple Sclerosis.
Color Vision is tested by a group of specialized test:
o Color plates (easy to use but crude): (Appendix 2)
Ishahara color plates test (Figure 8- above): These are a series of
pseudoisochromatic plates that determine total color blindness and red-green
blindness. They consist of dotted numbers of one color against a background of
another color.
Hardy-Rand-Ritter plates (Figure 8- below): Same concept as Ishahra plates but
more accurate in determining red-green and yellow-blue anomalies.
o Color matching tests (difficult to apply but more accurate):
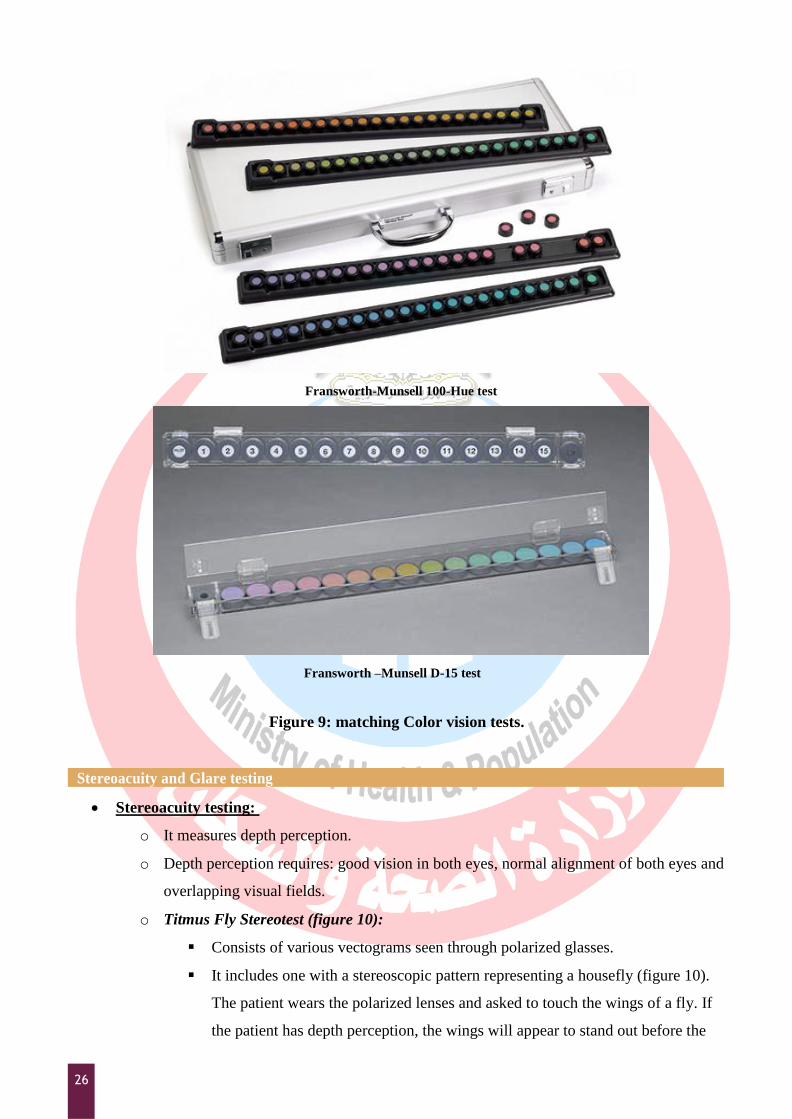
Fransworth-Munsell 100-Hue test (FM-100) (Figure 9-above): Has 85 rainbow
colored caps in four trays. Patients are asked to arrange the caps and then the
trays are scored. It is time consuming and difficult to score.
FM D-15 test (figure 8-right): same as FM-100 but with 15 pastel chips to be
arranged in a color sequence and scored. It is easier to score and less time
consuming than FM-100.

25
Ishihara pseudoisochromatic plates
Hardy-Rand-Ritter plates
Figure 8: Color vision testing plates.
26
Fransworth-Munsell 100-Hue test
Fransworth –Munsell D-15 test
Figure 9: matching Color vision tests.
Stereoacuity and Glare testing
Stereoacuity testing:
o It measures depth perception.
o Depth perception requires: good vision in both eyes, normal alignment of both eyes and
overlapping visual fields.
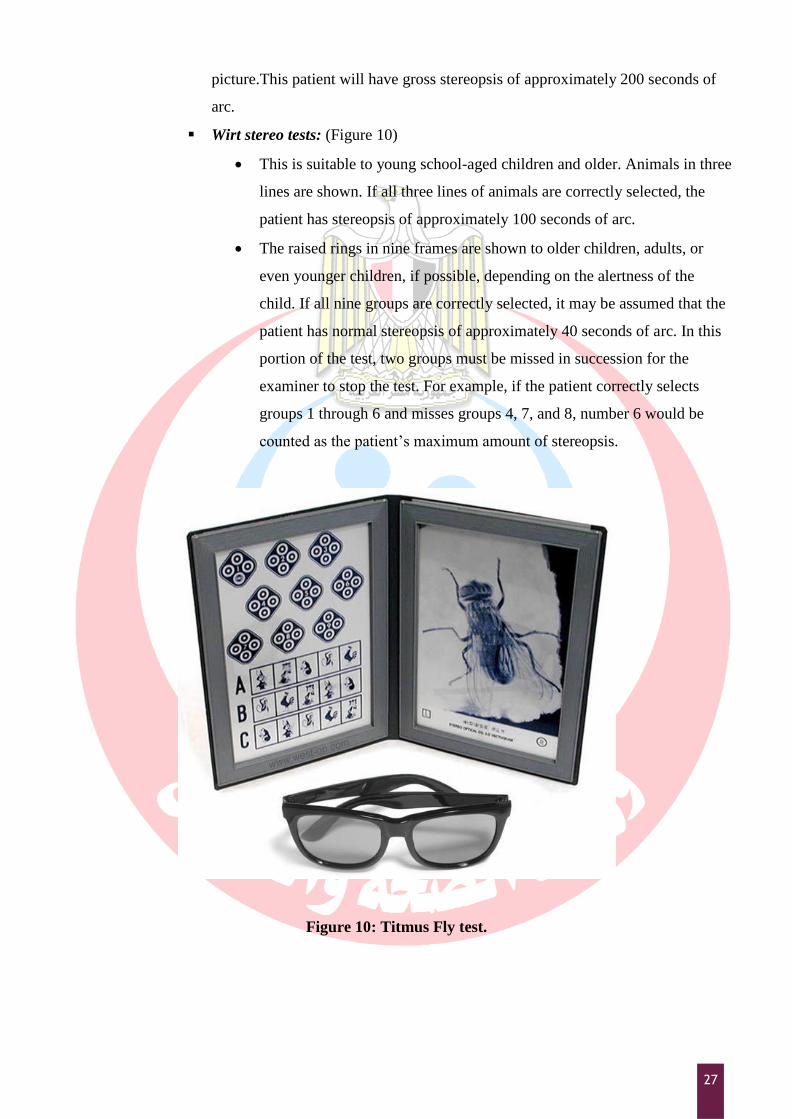
o Titmus Fly Stereotest (figure 10):
Consists of various vectograms seen through polarized glasses.
It includes one with a stereoscopic pattern representing a housefly (figure 10).
The patient wears the polarized lenses and asked to touch the wings of a fly. If
the patient has depth perception, the wings will appear to stand out before the
27
picture.This patient will have gross stereopsis of approximately 200 seconds of
arc.
Wirt stereo tests: (Figure 10)
This is suitable to young school-aged children and older. Animals in three
lines are shown. If all three lines of animals are correctly selected, the
patient has stereopsis of approximately 100 seconds of arc.
The raised rings in nine frames are shown to older children, adults, or
even younger children, if possible, depending on the alertness of the
child. If all nine groups are correctly selected, it may be assumed that the
patient has normal stereopsis of approximately 40 seconds of arc. In this
portion of the test, two groups must be missed in succession for the
examiner to stop the test. For example, if the patient correctly selects
groups 1 through 6 and misses groups 4, 7, and 8, number 6 would be
counted as the patient‟s maximum amount of stereopsis.
Figure 10: Titmus Fly test.

28
o Worth 4-dot test:
A clinical test for suppression that tests fusion and binocularity.
The test involves an illuminated target and a pair of modified eyeglasses (figure
below). The flashlight target has 4 lighted dots: 1 white, 1 red and 2 green.
The eyeglasses have a red filter on the right side and a green filter on the other
side.
The patient wears the spectacles and views the 4-dot target. In this configuration,
the right eye will see 2 red dots, the left eye will see 3 green dots.
Patients capable of fusion will fuse the 2 images and report a total of 4 dots, with
the fourth white dot perceived as either green or red. Sometimes it is perceived
as alternating between red and green. Either way, the patient sees only 4 dots
because he or she is "fusing" the white dot with both eyes.
Patients with suppression will report either 2 dots (left eye suppression) or 3 dots
(right eye suppression). Suppression causes the brain to ignore images from one
eye. Therefore, patients with suppression will only see the dots with the non-
suppressed eye.
Five dots is the diplopic or double vision response unless the patient has
alternating suppression. To distinguish between diplopia and alternating
suppression, ask the patient if all 5 dots are seen simultaneously. A person with
rapidly alternating suppression will see 3 then 2 then 3 then 2 dots.

29
Figure 11: Worth 4-dot Test. (RE= Right eye. LE = Left eye)
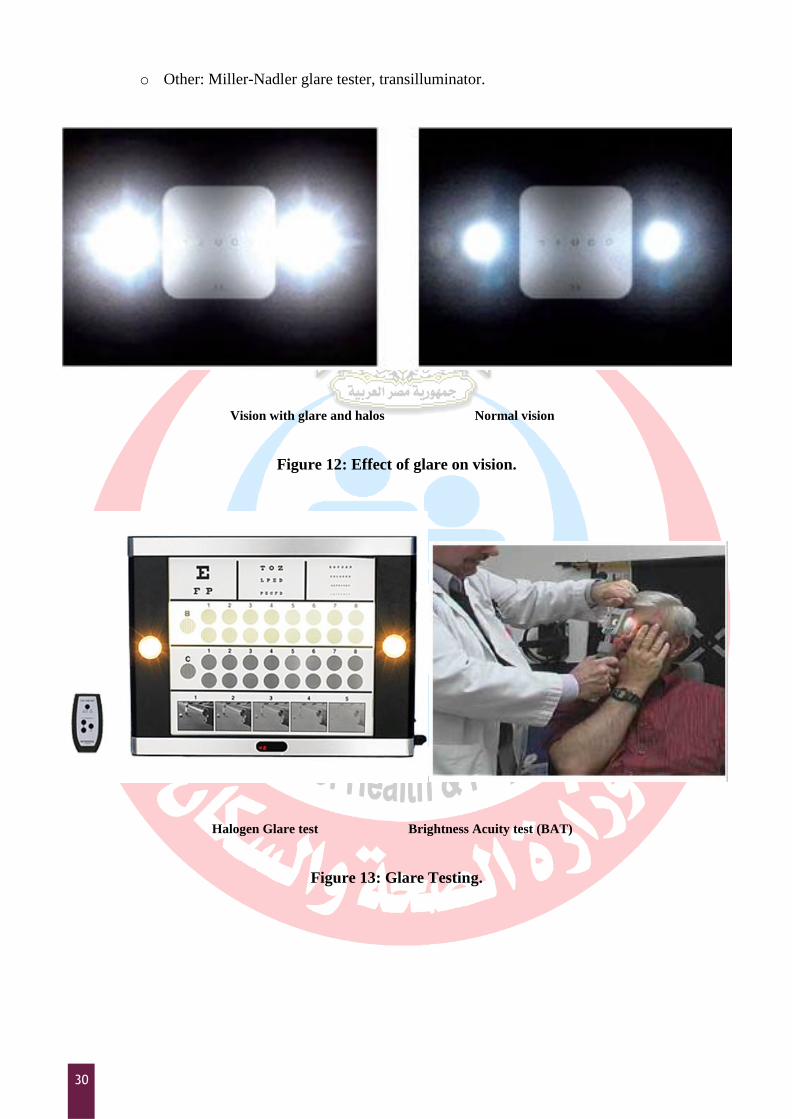
Glare Testing:
o Corneal and Lenticular opacities may induce glare (Figure 12).
o The effects of glare on vision can be measured by Halogen Glare test (figure 13-left) or
by BAT (Brightness Acuity Test) (figure 13-right):
The patient looks at Snellen charts arranged on a halogen light chart either
directly or through a specific BAT machine.
The patient reads the letters and his visual acuity (VA) is recorded.
The examiner then turns on the lights that shine directly into the patient‟s eyes.
With the lights on, the patient is instructed to read the letters on the chart.
The acuity is measured after glare testing is recorded.
With high-beam light, this usually falls off considerably if there are glare-causing
opacities present.
30
o Other: Miller-Nadler glare tester, transilluminator.
Vision with glare and halos Normal vision
Figure 12: Effect of glare on vision.
Halogen Glare test Brightness Acuity test (BAT)
Figure 13: Glare Testing.

31
Tonometry
Measuring intraocular pressure (IOP), or tonometry, is an essential part of all eye examinations for
adults and children to detect undiagnosed glaucoma. Intraocular pressure (IOP) is determined largely by
the outflow of aqueous humor from the eye: the greater the resistance to outflow, the higher the IOP.
IOP varies among individuals within a range from 10 to 21 mm Hg and the mean IOP is 15 mm Hg. The
tools used to measure the IOP are called tonometers.
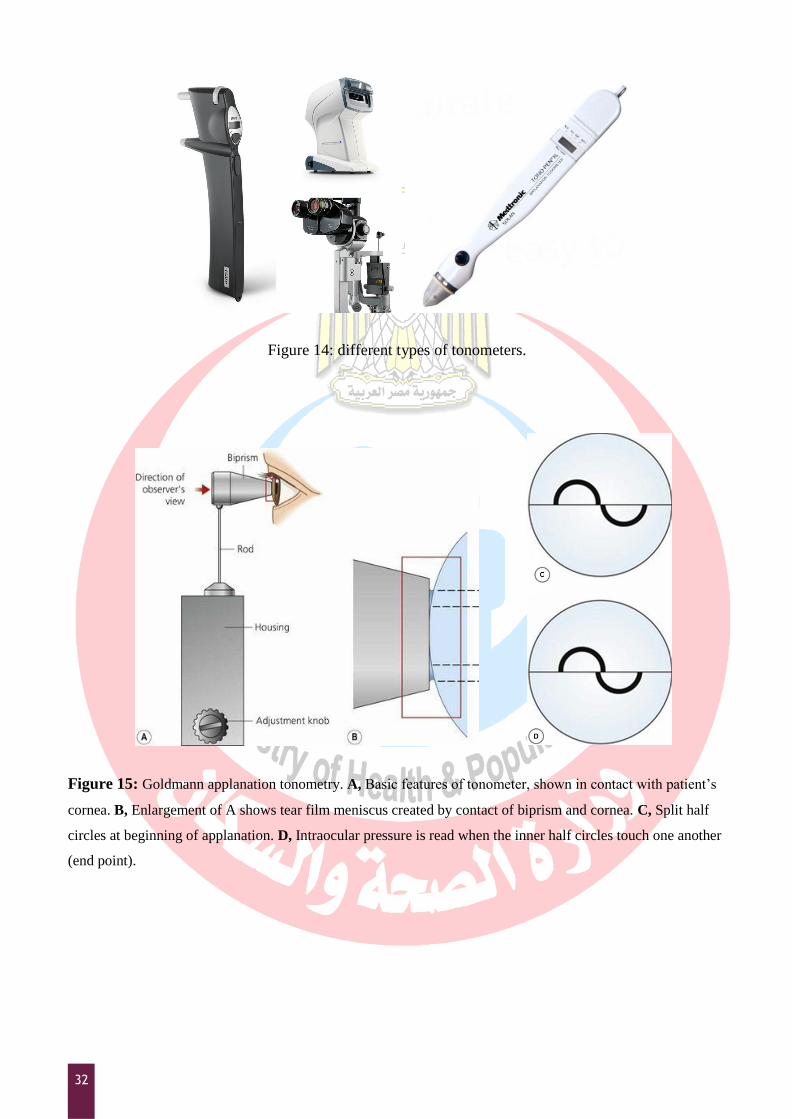
Types of Tonometers (Figure 14): (Appendix 3)
o Applanation Tonometer (The Gold standard):
A specific known area of the cornea is flattened and the amount of force needed
to flatten this area is measured.
Examples: Goldmann Applanation Tonometer (Figure 15), Perkins hand held
tonometer.
o Indentation Tonometers:
Measures the force necessary to indent the surface of the central cornea.
Schiøtz tonometry tends to be less accurate in myopic patients or patients with
thyroid eye disease due to poor scleral rigidty; applanation tonometry is more
accurate in these patients.
Examples: Schiøtz Indentation Tonometer (figure 16). The Tonopen (Figure 14-
right).
o Non-contact Tonometer:
Measures the jet of air needed to flatten the central cornea.
Examples: Air-puff tonometer, Ocular Response Analyzer (ORA).
32
Figure 14: different types of tonometers.
Figure 15: Goldmann applanation tonometry. A, Basic features of tonometer, shown in contact with patient‟s
cornea. B, Enlargement of A shows tear film meniscus created by contact of biprism and cornea. C, Split half
circles at beginning of applanation. D, Intraocular pressure is read when the inner half circles touch one another
(end point).
33
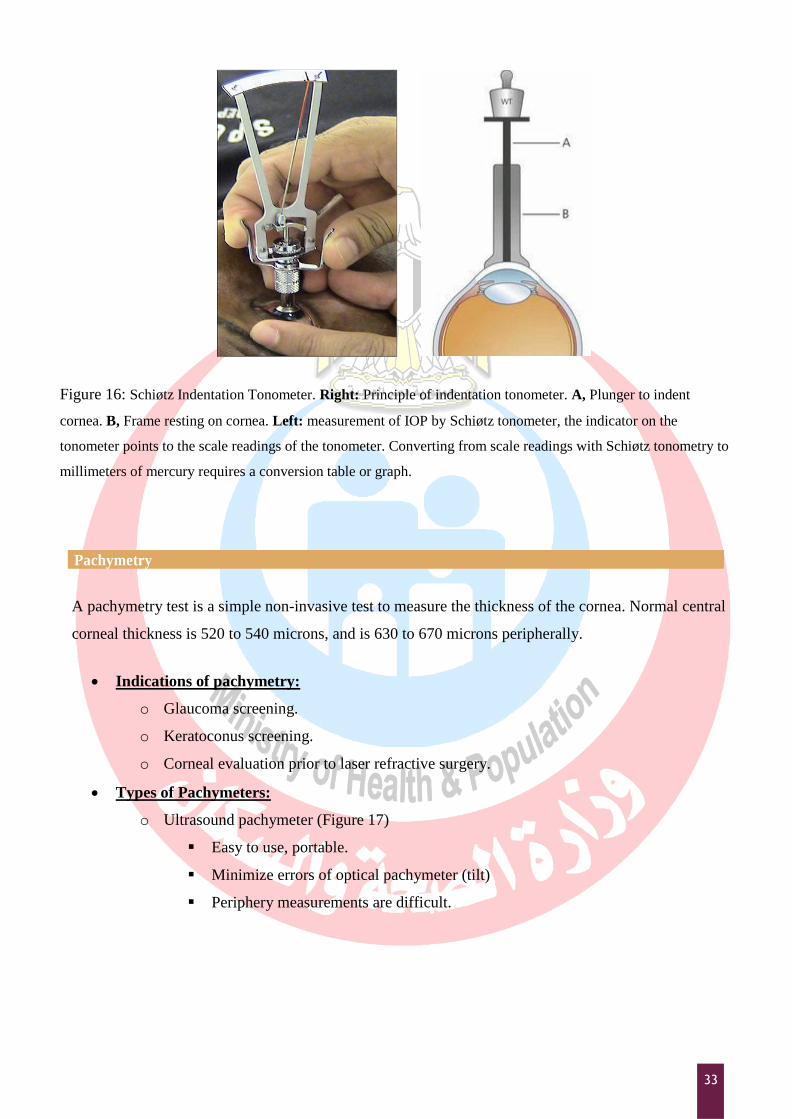
Figure 16: Schiøtz Indentation Tonometer. Right: Principle of indentation tonometer. A, Plunger to indent
cornea. B, Frame resting on cornea. Left: measurement of IOP by Schiøtz tonometer, the indicator on the
tonometer points to the scale readings of the tonometer. Converting from scale readings with Schiøtz tonometry to
millimeters of mercury requires a conversion table or graph.
Pachymetry
A pachymetry test is a simple non-invasive test to measure the thickness of the cornea. Normal central
corneal thickness is 520 to 540 microns, and is 630 to 670 microns peripherally.
Indications of pachymetry:
o Glaucoma screening.
o Keratoconus screening.
o Corneal evaluation prior to laser refractive surgery.
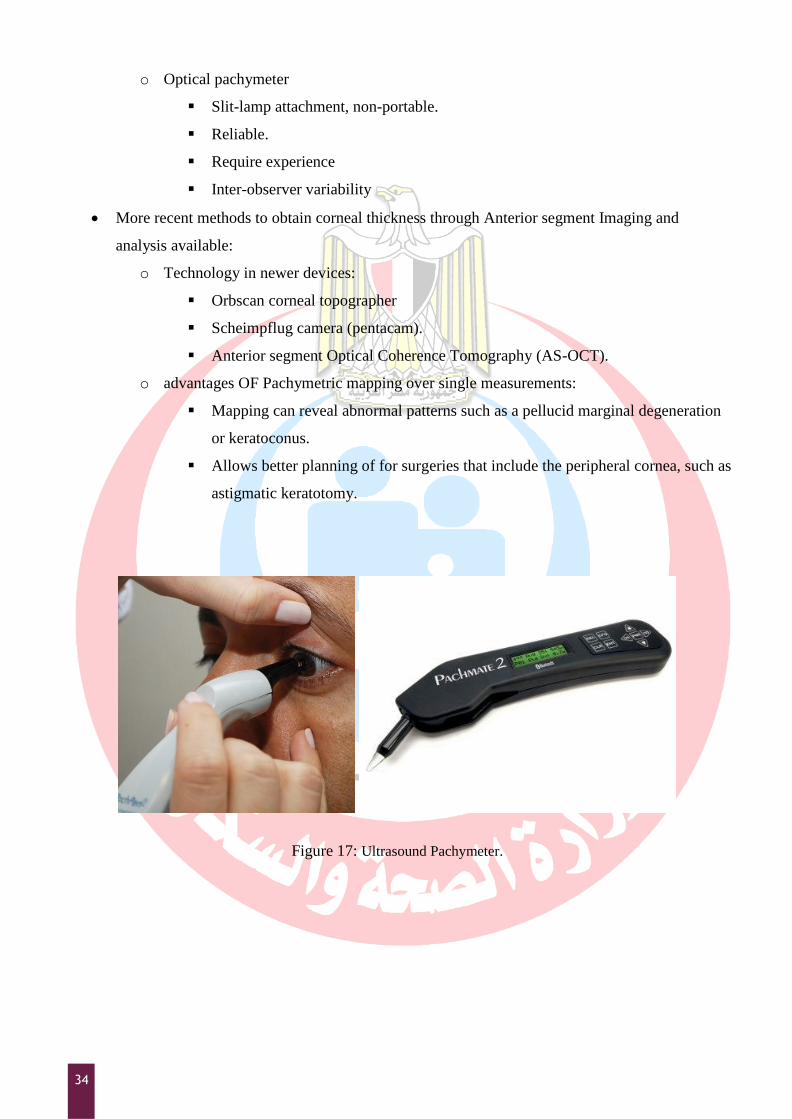
Types of Pachymeters:
o Ultrasound pachymeter (Figure 17)
Easy to use, portable.
Minimize errors of optical pachymeter (tilt)
Periphery measurements are difficult.
34
o Optical pachymeter
Slit-lamp attachment, non-portable.
Reliable.
Require experience
Inter-observer variability
More recent methods to obtain corneal thickness through Anterior segment Imaging and
analysis available:
o Technology in newer devices:
Orbscan corneal topographer
Scheimpflug camera (pentacam).
Anterior segment Optical Coherence Tomography (AS-OCT).
o advantages OF Pachymetric mapping over single measurements:
Mapping can reveal abnormal patterns such as a pellucid marginal degeneration
or keratoconus.
Allows better planning of for surgeries that include the peripheral cornea, such as
astigmatic keratotomy.
Figure 17: Ultrasound Pachymeter.

35
Lensometry
A lensemeter (Vertexometer, Focimeter) measures the power of a spherocylinderical lens, records its
optical center of the lens, the power and axis of the correcting cylinder. It can also measure the prism
and bifocal or trifocal adds to a lens. Lensometry performed on a patient's eyeglasses before refraction
can provide a starting point for the current refraction. This information is also useful in revealing
changes in refractive error. Lensometry also serves to confirm that a patient's new glasses have been
made in accordance with the doctor's prescription.
Types of Lensemeter:
o Automated and digital lensemeter: quick, easy to use and accurate (Figure 18-left).
o Manual lensemeter: are accurate but require some skill (Figure 18-right) (Appendix 4).
Automated lensemeter Manual lensemeter
Figure 18: Lensemeter.

36
Keratometry
A Keratometer (or the Ophthalmometer) measures the central curvature of the anterior cornea. It
provides an objective, quantitative measurement of corneal astigmatism, measuring the curvature. It
measures the corneal power in two meridians in diopters. These readings are called K-readings. The
average cornea has a power of 42-44 D.
Principle of keratometry
The Keratometer uses the first Purkinje image and consists essentially of a target that is
imaged by the cornea and telescoped to observe this image. It measures the size of image
reflected from corneal surface, because cornea acts as convex mirror.
The size of the image depends on the distance of the object and the curvature of the cornea.
For a fixed distance of the object the size of the image depends on the curvature of the cornea.
Similarly for a given size of the image distance of the object is different depending on the
curvature of the cornea.
Keratometry determines corneal curvature by measuring the size of a reflected “mire” (Figure
19-right). Doubling of image avoids problems from eye movements. Radius scale is
determined and diopter scale is derived from the radius using the formula for surface power
D= (n-l)/r
Where n=1.3375, the “standardized” refractive index for the cornea.
Keratometer measures only the central 3mm of the corneal diameter.
Indications of Keratometry:
o Contact lens fitting.
o IOL calculations
o Keratoconus screening
o Irregular cornea detection.
37
Types of Keratometer:
o Automated Keratometer:
Portable, stand alone or as part of newest models of autorefractometers.
Easy to use, quick and accurate.
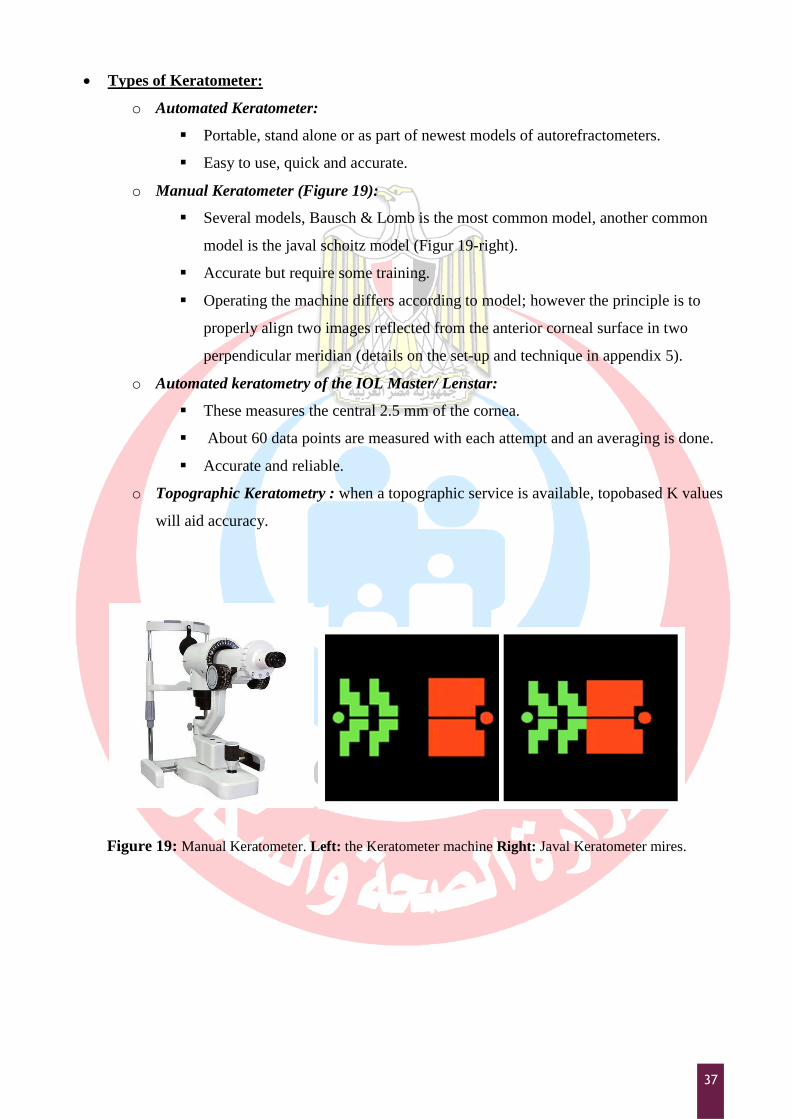
o Manual Keratometer (Figure 19):
Several models, Bausch & Lomb is the most common model, another common
model is the javal schoitz model (Figur 19-right).
Accurate but require some training.
Operating the machine differs according to model; however the principle is to
properly align two images reflected from the anterior corneal surface in two
perpendicular meridian (details on the set-up and technique in appendix 5).
o Automated keratometry of the IOL Master/ Lenstar:
These measures the central 2.5 mm of the cornea.
About 60 data points are measured with each attempt and an averaging is done.
Accurate and reliable.
o Topographic Keratometry : when a topographic service is available, topobased K values
will aid accuracy.
Figure 19: Manual Keratometer. Left: the Keratometer machine Right: Javal Keratometer mires.

38
Perimetry
Visual field is the portion of space in which objects are visible at the same moment during steady
fixation of gaze in one direction.
Normal Visual Field
The normal monocular visual field is a slightly irregular oval, which measures, from fixation,
approximately 60° upward and 60° inward, 70° downward and 100° to 110° outward.
The field of the two eyes together or the binocular field is a combination of the right and left
monocular fields. The whole binocular field forms a rough oval extending to about 200° laterally
and 130° vertically (Figure 20).
the normal field may be considered from a practical point of view as being made up of two
portions:
The central field: that portion of the visual field within 30° radius of fixation
The peripheral field: The peripheral field makes up the remainder of the visual field
Physiological blind spot
This is an area of absolute scotoma (non-seeing area) within the boundaries of the normal visual
field, and it corresponds to the region of the optic nerve head. It is located approximately 15°
temporal to the fixation point and about 1.5° below the horizontal meridian. The normal
measurement of the blind spot is approximately 5.5mm horizontally and 7.5mm vertically.
Traquair's concept
Traquair's definition of the visual field is that it is an island of vision in the sea of Blindness. The
peak of the island represents the point of highest acuity, the fovea, while the 'bottomless pit '
represents the blind spot, the optic disc.

39
Figure 20: The binocular field of vision
We refer to Traquair's concept as the “hill of vision”, the outline of the various contours of this
hill may be projected upon a map as contour lines, which, in the nomenclature of perimetry are
termed isopters. The central point from which these isopters are measured corresponds to the
visual axis and is known as the point of fixation.
The isopters or contour lines are designated by the size and brightness of the stimulus and the
distance at which it is viewed by the observer, expressed as a fraction. Thus isopter for a 1 mm.
test object observed by the patient at a distance of 2 meters is expressed by the fraction 1/2000
and designates the specific area of the visual field within which the normal person should be able
to see this stimulus.
The visual pathways
The receptor: Is the neural epithelium of the rods and cones
The first-order neuron: Is the bipolar cell with its axons in the inner layers of retina
The second order neuron: Is the ganglion cell of the retina. Its axon passes into the nerve-fiber
layer and along the optic nerve to the lateral geniculate body.
The third-order neuron: Originates in the cells of lateral geniculate body, and then travels by
way of the optic radiations to the occipital cortex (Area 17).

40
The visual pathways thus consist of:
o Two optic nerves
o An optic chiasma
o Two optic tracts
o Two lateral geniculate bodies
o Two optic radiations
o Visual cortex on each side
Figure 21: the Visual Pathway
Principle
The nasal field represents the temporal retina and the temporal field represents the nasal retina.
In general, the fibers from the peripheral retina enter the periphery of the optic nerve, and the
fibers near the optic disc enter the central part of the nerve.
The fibers from the macular area forms the papillo-macular bundle, which has a separate course,
partial decussation occurs where the nasal fibres cross at the chiasm.
The fibers of the temporal half enter the chiasm and pass to the optic tract on the same side, and
then to the lateral geniculate body. The fibers from the nasal half enter the chiasm, decussate, and
then pass to the optic tract of the opposite side, then to the lateral geniculate body.

41
The third-order neurons pass by the optic radiation into the corresponding occipital lobe. It
follows that a lesion of the optic radiation, optic tract, or occipital lobe will cause blindness of the
temporal half of the opposite side. Projecting this outward, such lesion will cause loss of vision in
the opposite half of the visual field, a condition known as hemianopia.
Indications for visual field testing:
o Glaucoma screening and management
o Diagnosis and monitoring of retina, optic nerve and visual pathway diseases.
Methods for visual field testing:
o Clinical Methods (Appendix 6) :
Amsler grid (Central field).
Confrontation method (Peripheral field).
These methods are easy and need no special equipment, but may miss subtle
lesions
o Perimetry (systematic measurement of visual field function):
Manual (kinetic) Goldmann perimetry:
a trained examiner moves the stimulus;
stimulus brightness is held constant.
The limits of the visual field are mapped to lights of different sizes and
brightness.
Automated threshold static perimetry:
A computer program controls the test.
It keeps the size and location of a target constant.
It varies the brightness until the dimmest target the patient can see at
each of the test locations is determined.
The automated program tests the central 24° or 30° of the visual field
using a six degree spaced grid (figure 22).
Sources of error during testing for visual field:
o Machine related errors:
Calibration error.
Recording and printing results problems.

42
o Patient related problems:
Problems with positioning and comfort.
Special situation, e.g. low vision, wheelchairs.
Patient concentration problem: following instructions, errors in catch trials,
fixation losses, & fluctuation.
o Operator related problems:
Error in correcting lens (power and positioning)
Error in stimulus selection
Error in Patient preparation e.g. pupillary dilatation affects the results.
Error in test selection
Abnormal Visual Field
Three basic defects of visual fields are:
Contraction
Depression (Generalized or localized depression)
Scotoma:
o An area of partial or complete blindness within the confines of a normal or a
relatively normal visual field (i.e.). it is a defective field surrounded by a normal
field.
- Types of scotoma
Absolute scotoma: An absolute scotoma will have the same field defect
size regardless of the target size and brightness.
Relative scotoma: Relative scotoma has field defects that change with the
target size and have sloping borders that indicates an active or on going
field defect.
Positive scotoma: Patient complaints of non-seeing area (e.g.)
Central scotomata.
Negative scotoma: Examiner detects the non-seeing area (e.g.)
blind spot enlargement
- Scotomata may be unilateral or bilateral.
43
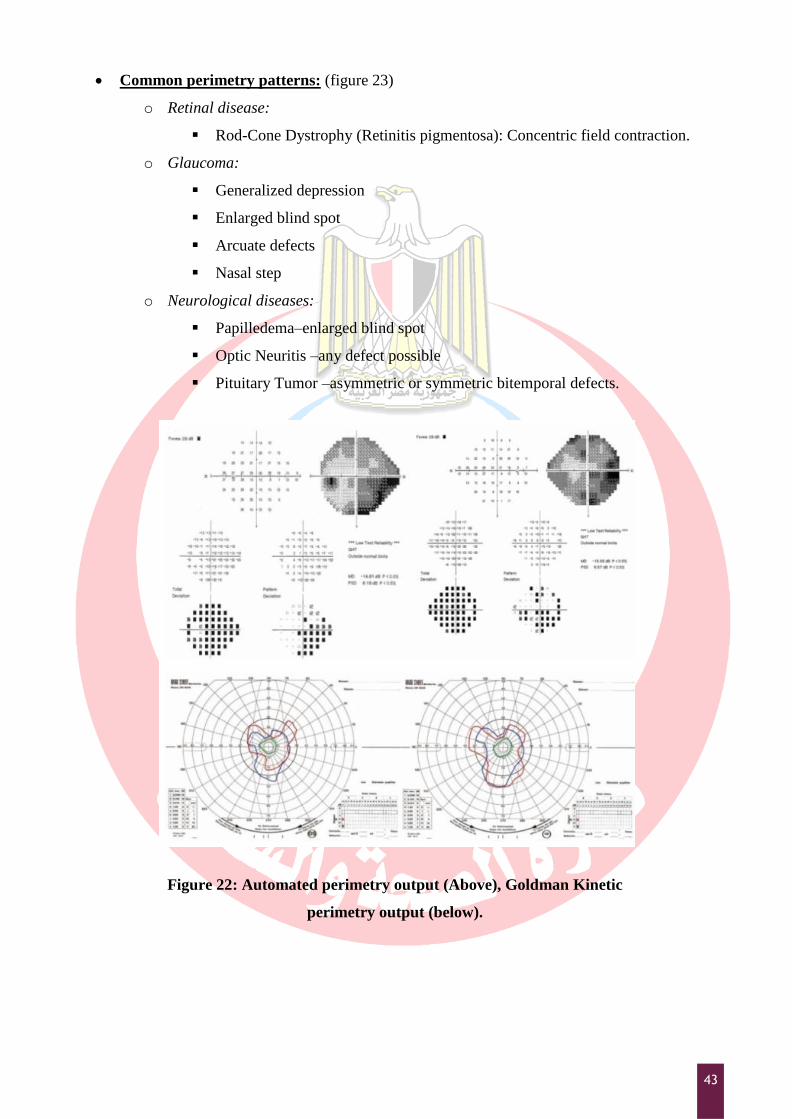
Common perimetry patterns: (figure 23)
o Retinal disease:
Rod-Cone Dystrophy (Retinitis pigmentosa): Concentric field contraction.
o Glaucoma:
Generalized depression
Enlarged blind spot
Arcuate defects
Nasal step
o Neurological diseases:
Papilledema–enlarged blind spot
Optic Neuritis –any defect possible
Pituitary Tumor –asymmetric or symmetric bitemporal defects.
Figure 22: Automated perimetry output (Above), Goldman Kinetic
perimetry output (below).

44
Figure 23: Automated perimetry defects with corresponding visual
pathway lesions.

45
Ophthalmoscopy
The Ophthalmoscopy is examination of the interior of the eye i.e. the fundus. This is usually done by
eye specialists.
Types of Ophthalmoscopy:
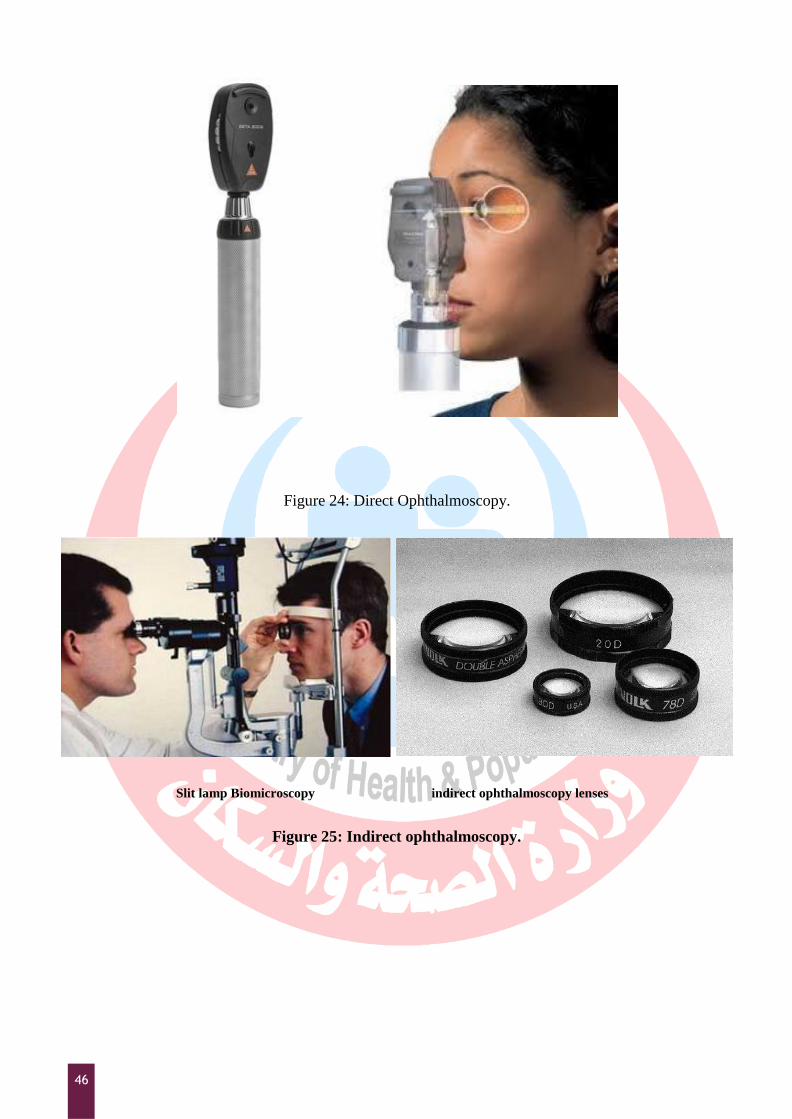
o Direct ophthalmoscopy: (Figure 24)
A satisfactory examination of the posterior pole (Macula & Optic Nerve) can
usually be made through an undilated pupil, provided that the media (aqueous,
lens, vitreous) are clear.
A greater extent of the peripheral posterior segment can be examined through a
dilated pupil.
Ophthalmoscopy is best done in a darkened room.
Advantages:
Greater magnification (x15)
Easier to use with small or undilated pupils
Mechanically easier to use (handheld device).
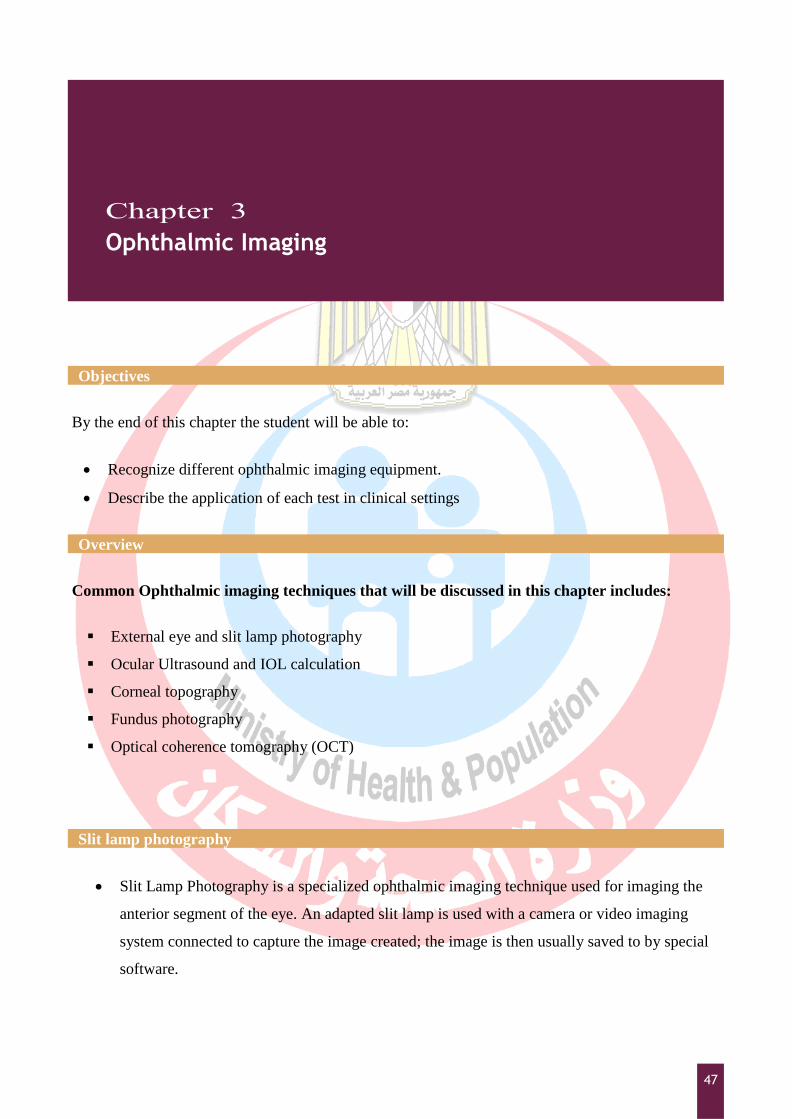
o Indirect Ophthalmoscopy:
The Indirect binocular Ophthalmoscope with +20 D lens (Figure 25-right):
a head-mounted, prism-directed light source is used coupled with use of
double aspheric (+14, +20, or +28) diopter condensing lenses to see an
inverted retinal image.
Allows binocular vision and depth perception.
Wider field of view of a given retinal area.
Easy to use in the operating room.
Better view of the periphery of the fundus (with scleral indentation).
Strong illumination.
Slit lamp Biomicroscopy: (figure 25-left)
By +78 or +90 D lens (figure 20-right)
Easy with undilated pupil and convenient to both doctor and patient.
Best for examining the macula and posterior pole.
46
Figure 24: Direct Ophthalmoscopy.
Slit lamp Biomicroscopy indirect ophthalmoscopy lenses
Figure 25: Indirect ophthalmoscopy.
47
Objectives
By the end of this chapter the student will be able to:
Recognize different ophthalmic imaging equipment.
Describe the application of each test in clinical settings
Overview
Common Ophthalmic imaging techniques that will be discussed in this chapter includes:
External eye and slit lamp photography
Ocular Ultrasound and IOL calculation
Corneal topography
Fundus photography
Optical coherence tomography (OCT)
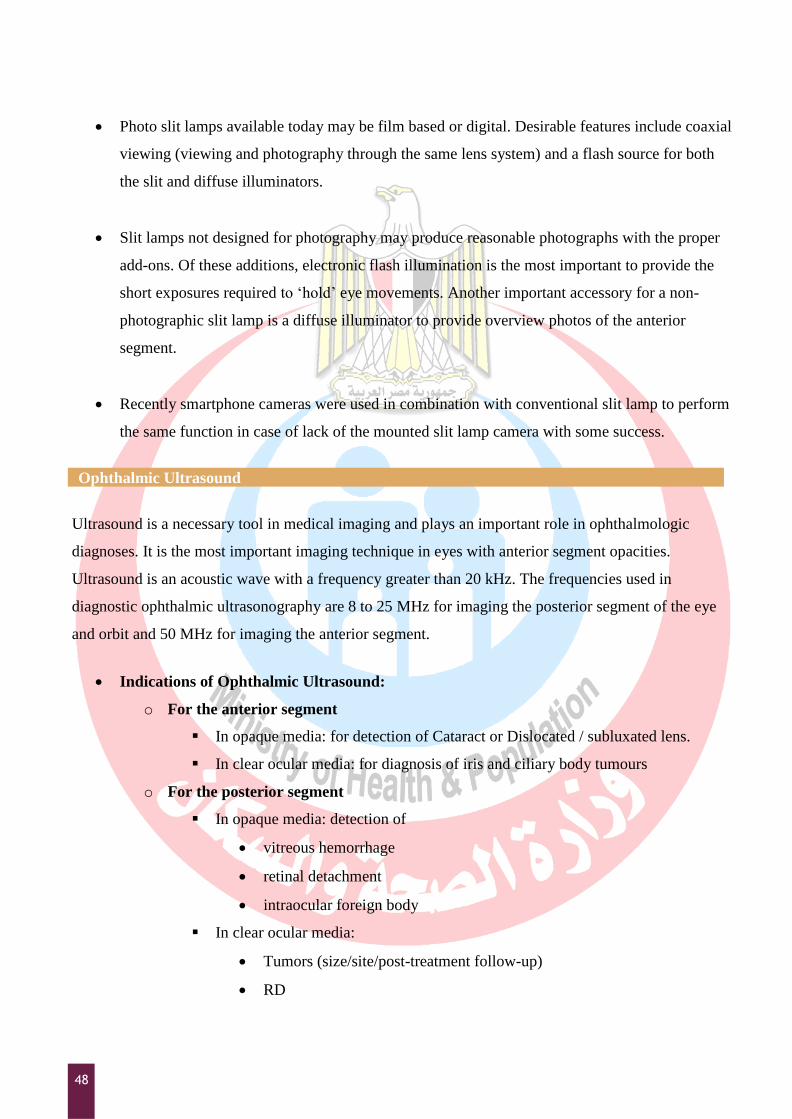
Slit lamp photography
Slit Lamp Photography is a specialized ophthalmic imaging technique used for imaging the
anterior segment of the eye. An adapted slit lamp is used with a camera or video imaging
system connected to capture the image created; the image is then usually saved to by special
software.
Ophthalmic Imaging
48
Photo slit lamps available today may be film based or digital. Desirable features include coaxial
viewing (viewing and photography through the same lens system) and a flash source for both
the slit and diffuse illuminators.
Slit lamps not designed for photography may produce reasonable photographs with the proper
add-ons. Of these additions, electronic flash illumination is the most important to provide the
short exposures required to „hold‟ eye movements. Another important accessory for a non-
photographic slit lamp is a diffuse illuminator to provide overview photos of the anterior
segment.
Recently smartphone cameras were used in combination with conventional slit lamp to perform
the same function in case of lack of the mounted slit lamp camera with some success.
Ophthalmic Ultrasound
Ultrasound is a necessary tool in medical imaging and plays an important role in ophthalmologic
diagnoses. It is the most important imaging technique in eyes with anterior segment opacities.
Ultrasound is an acoustic wave with a frequency greater than 20 kHz. The frequencies used in
diagnostic ophthalmic ultrasonography are 8 to 25 MHz for imaging the posterior segment of the eye
and orbit and 50 MHz for imaging the anterior segment.
Indications of Ophthalmic Ultrasound:
o For the anterior segment
In opaque media: for detection of Cataract or Dislocated / subluxated lens.
In clear ocular media: for diagnosis of iris and ciliary body tumours
o For the posterior segment
In opaque media: detection of
vitreous hemorrhage
retinal detachment
intraocular foreign body
In clear ocular media:
Tumors (size/site/post-treatment follow-up)
RD

49
o Biometry
Pre-operative scanning is done to determine IOL power (Ocular biometry).
Post-operative verification is done to determine the eye length when the
refraction differs from surgeon's expectations.
o Orbital examination
Exophthalmos
Palpable orbital mass
Principle:
o It is based on the physical principles of pulse-echo technology:
It uses piezoelectric crystal transducers to produce ultrasonic wave-front pulses
and recover echoes for electronic display and processing.
The sound waves, like light waves, pass through certain tissues and are reflected
by others. When the sound wave meets firm tissue, the waves are reflected off its
surface.
The longer an impulse takes to return, the further it is placed on the display. This
time can be converted to distance with a known speed of sound in the tissue
through which the sound is traveling. Each tissue has a characteristic speed at
which the sound travels through it. The height of the spike on the graph relates to
the intensity of the returned echo.
o The frequency most commonly used in ocular imaging is 10 MHz. the higher-frequency
ultrasound provides higher resolution with decreased penetration. The maximum
penetration that can be achieved for a 10 MHz system is approximately 50 mm. For a
60 MHz system, penetration is only 5 mm.
o The rebounding waves are received by a transducer, which turns the sound energy into
electrical impulses that are amplified and displayed on an oscilloscope in a visible
pattern called an ultrasonogram or echogram.
Types of Ophthalmic ultrasound:
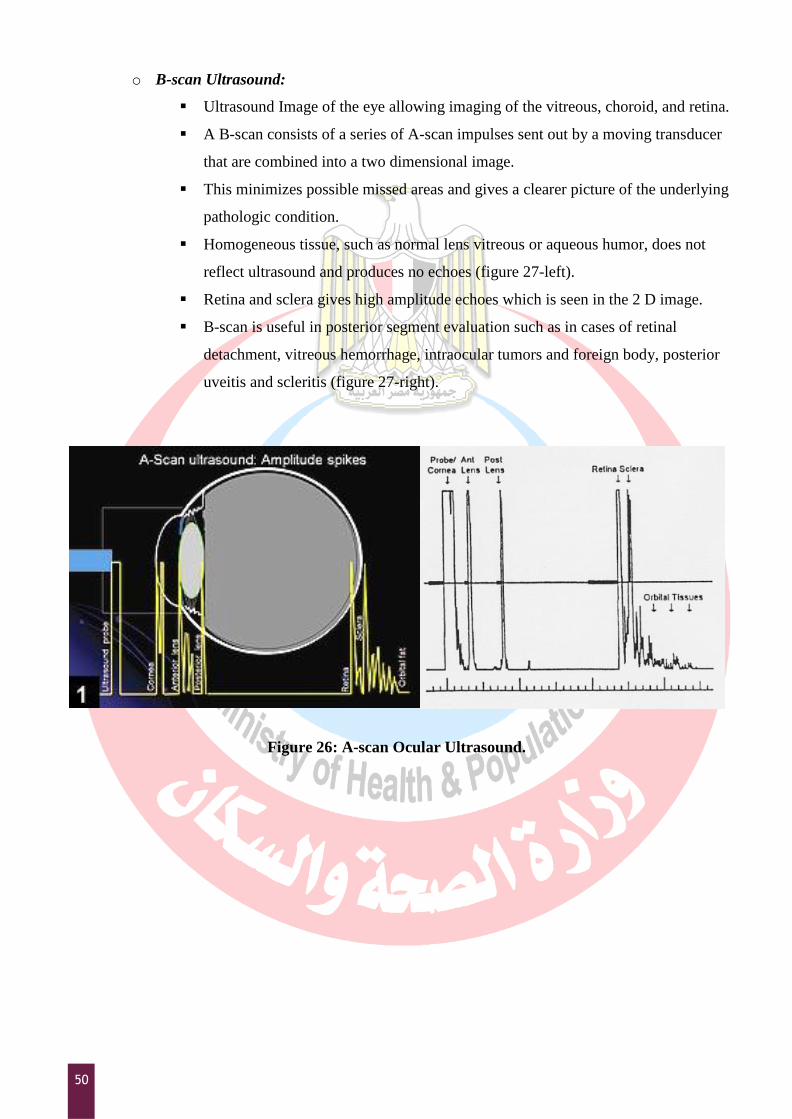
o A-scan ultrasound (Ocular biometry)
A-scan is a single-beam, linear wave that is directed in a probing manner to detect
interference along its pathway (Figure 26).
It is used in combination of B-scans and to measure the axial length of the eye
(length of the eye from front of cornea to front of retina in mm) in IOL calculation
(Biometry) (see Appendix 7 for more details on ocular biometry and IOL
calculation).
50
o B-scan Ultrasound:
Ultrasound Image of the eye allowing imaging of the vitreous, choroid, and retina.
A B-scan consists of a series of A-scan impulses sent out by a moving transducer
that are combined into a two dimensional image.
This minimizes possible missed areas and gives a clearer picture of the underlying
pathologic condition.
Homogeneous tissue, such as normal lens vitreous or aqueous humor, does not
reflect ultrasound and produces no echoes (figure 27-left).
Retina and sclera gives high amplitude echoes which is seen in the 2 D image.
B-scan is useful in posterior segment evaluation such as in cases of retinal
detachment, vitreous hemorrhage, intraocular tumors and foreign body, posterior
uveitis and scleritis (figure 27-right).
Figure 26: A-scan Ocular Ultrasound.

51
Normal B-scan Ultrasound Retinal detachment
Figure 27: B-scan Ocular Ultrasound.
Corneal Topography
Topography provides a color-coded representation of the cornea‟s shape and monitors corneal
curvature changes from the apex to the periphery.
Principle:
o It is based on the principles of keratometry and photokeratoscopy combined with the
capability of modern computers and software technology.
o It accurately analyzes the radius of curvature (mm) and corresponding refractive power
(diopter) at 6000–8000 points on the corneal surface from inside the 1 mm optical zone to
outside the 9–11 mm optical zone.
o a complete color-coded map is obtained (figure 28):
Cool colors such as blue and green represent flatter areas of the cornea
Warmer colors of orange and red represent steeper areas.
o Newer machines like Orbscan or Pentacam are able to provide a map of the anterior and
posterior cornea, white to white measurement, anterior chamber depth and corneal
pachymetry:
The Orbscan:
It takes multiple cross-sectional scans of the cornea with an advanced
placido disc system
It is able to analyze:
a. The elevation and curvature measurements on both the anterior and
posterior surfaces of the cornea

52
b. White to white measurement
c. Anterior chamber depth
d. Angle kappa
e. Corneal pachymetry values.
Galilei G2:
It merges two technologies – the rotating Schempflug and the Placido– into
one measurement, leading to accurate values of the posterior and anterior
surfaces.
The dual Scheimpflug approach offers very accurate pachymetry readings
and needs to rotate only 180 degrees.
The Oculus Pentacam (Figure 29):
It is a rotating Scheimpflug camera that generates Scheimpflug images in
three dimensions, with the dot matrix fine-meshed in the center due to the
rotation.
It takes a maximum of 2 seconds to generate a complete image of the
anterior segment.
Any eye movement is detected by a second camera and corrected in the
process.
The topography and pachymetry of the entire anterior and posterior
surfaces of the cornea from limbus to limbus are calculated.
The analysis of the anterior eye segment includes calculation of the
chamber angle, chamber volume and height.
Images of the iris, anterior and posterior surfaces of the lens are also
generated. The densitometry of the lens is automatically qualified.
Value:
o The topographic maps provide the ability to monitor corneal curvature changes from the
apex to the periphery that helps in:
Pre-operative preparation for refractive surgery.
Screening and diagnosis of a corneal pathology.
Contact lens fitting.
53
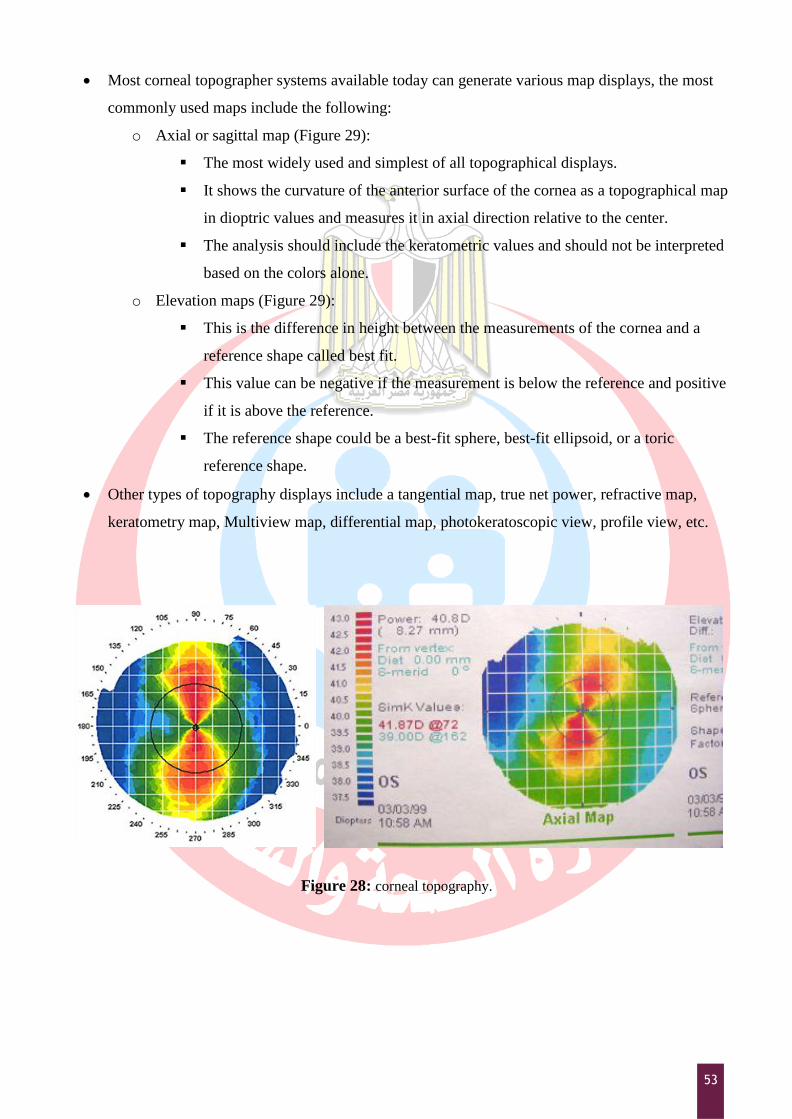
Most corneal topographer systems available today can generate various map displays, the most
commonly used maps include the following:
o Axial or sagittal map (Figure 29):
The most widely used and simplest of all topographical displays.
It shows the curvature of the anterior surface of the cornea as a topographical map
in dioptric values and measures it in axial direction relative to the center.
The analysis should include the keratometric values and should not be interpreted
based on the colors alone.
o Elevation maps (Figure 29):
This is the difference in height between the measurements of the cornea and a
reference shape called best fit.
This value can be negative if the measurement is below the reference and positive
if it is above the reference.
The reference shape could be a best-fit sphere, best-fit ellipsoid, or a toric
reference shape.
Other types of topography displays include a tangential map, true net power, refractive map,
keratometry map, Multiview map, differential map, photokeratoscopic view, profile view, etc.
Figure 28: corneal topography.
54
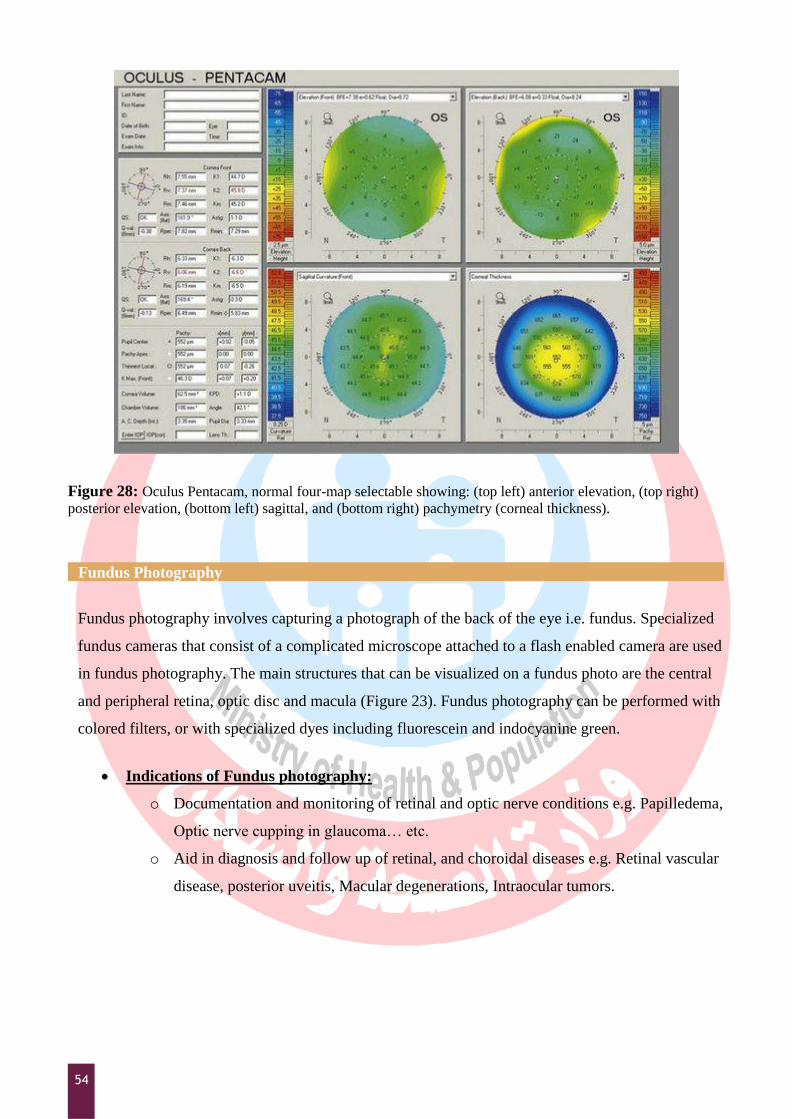
Figure 28: Oculus Pentacam, normal four-map selectable showing: (top left) anterior elevation, (top right)
posterior elevation, (bottom left) sagittal, and (bottom right) pachymetry (corneal thickness).
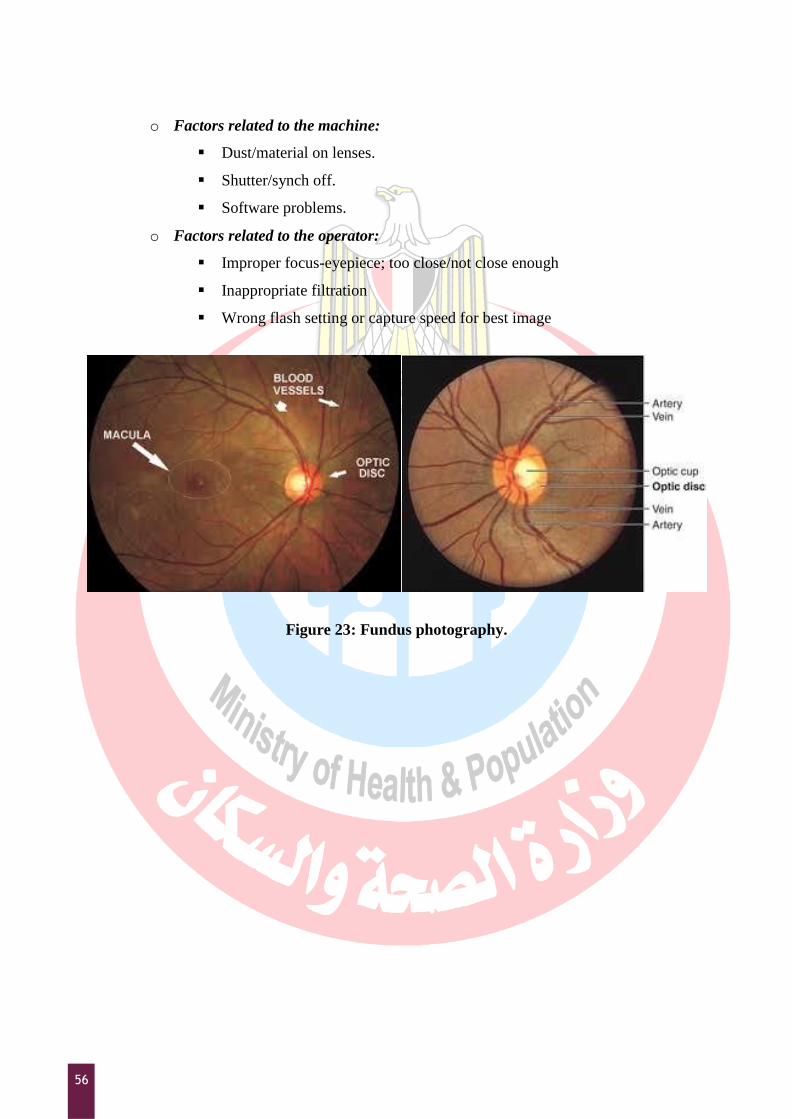
Fundus Photography
Fundus photography involves capturing a photograph of the back of the eye i.e. fundus. Specialized
fundus cameras that consist of a complicated microscope attached to a flash enabled camera are used
in fundus photography. The main structures that can be visualized on a fundus photo are the central
and peripheral retina, optic disc and macula (Figure 23). Fundus photography can be performed with
colored filters, or with specialized dyes including fluorescein and indocyanine green.
Indications of Fundus photography:
o Documentation and monitoring of retinal and optic nerve conditions e.g. Papilledema,
Optic nerve cupping in glaucoma… etc.
o Aid in diagnosis and follow up of retinal, and choroidal diseases e.g. Retinal vascular
disease, posterior uveitis, Macular degenerations, Intraocular tumors.

55
Intravenous Fluorescein Angiography (IVFA):
o It is a diagnostic test that is used to capture the blood flow in the back of the eye,
allowing physicians to diagnose different types of retinal disease.
o Principle:
For fluorescein angiography, a fundus camera must be equipped with a rapid-
recycling, high-output power supply and an exciter and barrier filter
combination.
The exciter filter is placed in the path of the light and allows only a specific
wavelength of blue light (approximately 490 nm) to strike the fundus.
When fluorescein is introduced into the circulation of the eye, the blue light
excites the fluorescein molecules to a higher state of activity, causing them to
emit a greenish-yellow light of a higher wavelength (approximately 520 nm),
creating the fluorescence that we record.
The barrier filter is positioned to filter out the blue exciter light and allow only
the excited yellow-green light of actual fluorescence to strike the image sensor.
o It is particularly helpful in the diagnosis and management of Diabetic Retinopathy,
Macular Degeneration, and Vein/Artery Occlusions.
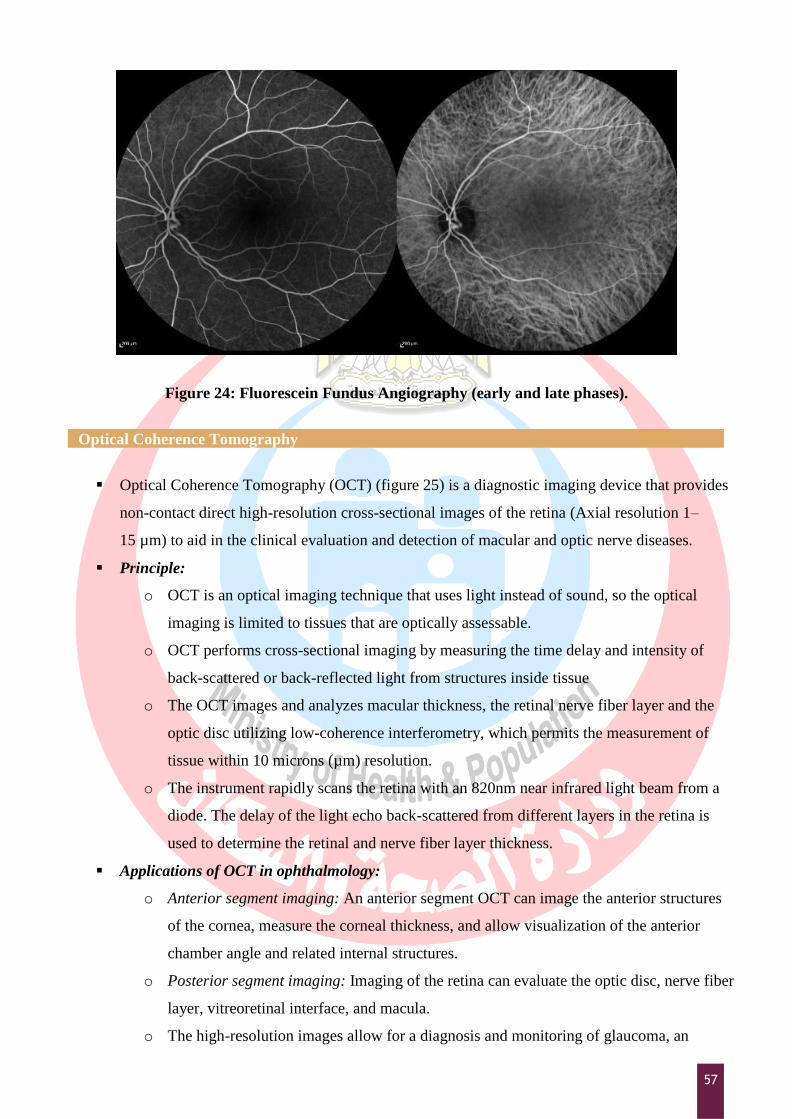
o Phases of IVFA: (Figure 24) (steps of the procedure in Appendix 8)
Early phase: 10-20 seconds after injection, choroidal circulation appear in this
phase as well as the transit of blood flow from arteries to veins.
Middle phase: 1-2 minutes after injection, the fluorescein dye fills the veins and
then its brightness starts to fade away
Late phase: after 3 minutes from injection, shows elimination of the dye from
the eye gradually.
Sources of Error or hazards during Photography:
o Factors related to the patient:
Poor dilatation of the pupil
Media opacity (corneal or lenticular opacity)
Uncooperative patient (Excessive blinking, poor centration or alignment)
o Factors related to the dye:
Extravasation of the dye (improper injection into vein)
Side effects (nausea/ vomiting).
Rash and dermatitis.
Dark color of sweat and body fluids.
Allergic reaction (most serious).
56
o Factors related to the machine:
Dust/material on lenses.
Shutter/synch off.
Software problems.
o Factors related to the operator:
Improper focus-eyepiece; too close/not close enough
Inappropriate filtration
Wrong flash setting or capture speed for best image
Figure 23: Fundus photography.
57
Figure 24: Fluorescein Fundus Angiography (early and late phases).
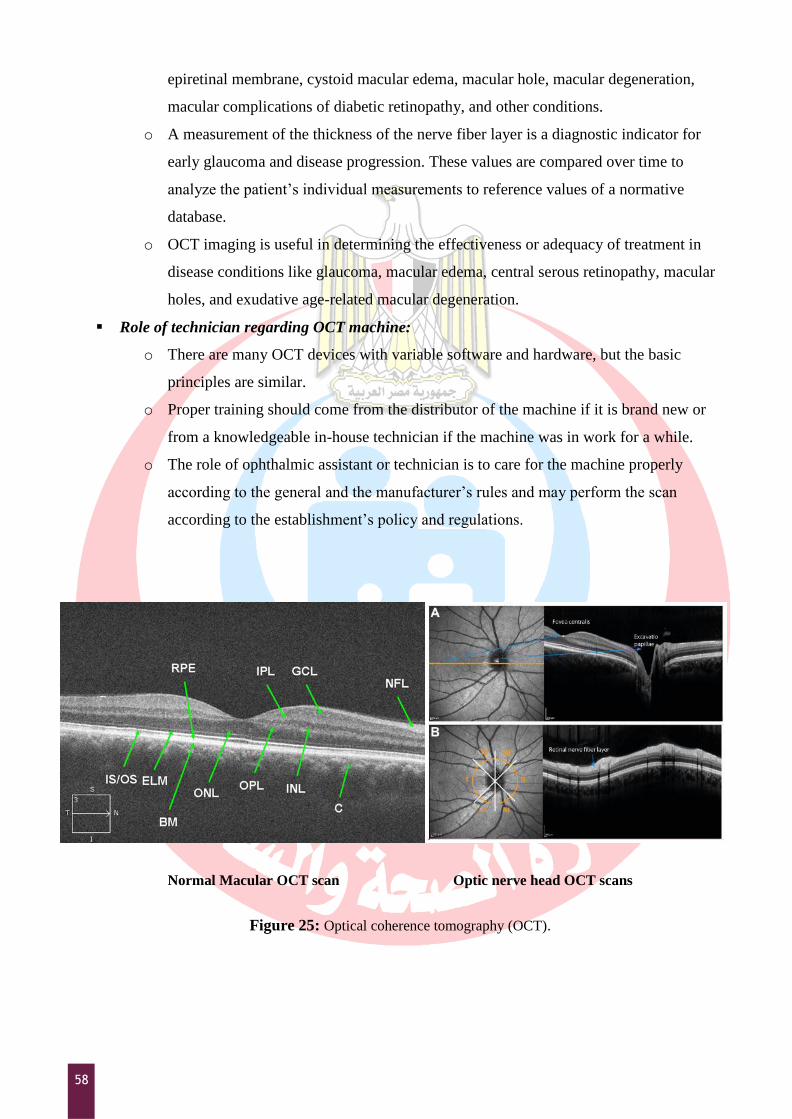
Optical Coherence Tomography
Optical Coherence Tomography (OCT) (figure 25) is a diagnostic imaging device that provides
non-contact direct high-resolution cross-sectional images of the retina (Axial resolution 1–
15 µm) to aid in the clinical evaluation and detection of macular and optic nerve diseases.
Principle:
o OCT is an optical imaging technique that uses light instead of sound, so the optical
imaging is limited to tissues that are optically assessable.
o OCT performs cross-sectional imaging by measuring the time delay and intensity of
back-scattered or back-reflected light from structures inside tissue
o The OCT images and analyzes macular thickness, the retinal nerve fiber layer and the
optic disc utilizing low-coherence interferometry, which permits the measurement of
tissue within 10 microns (µm) resolution.
o The instrument rapidly scans the retina with an 820nm near infrared light beam from a
diode. The delay of the light echo back-scattered from different layers in the retina is
used to determine the retinal and nerve fiber layer thickness.
Applications of OCT in ophthalmology:
o Anterior segment imaging: An anterior segment OCT can image the anterior structures
of the cornea, measure the corneal thickness, and allow visualization of the anterior
chamber angle and related internal structures.
o Posterior segment imaging: Imaging of the retina can evaluate the optic disc, nerve fiber
layer, vitreoretinal interface, and macula.
o The high-resolution images allow for a diagnosis and monitoring of glaucoma, an
58
epiretinal membrane, cystoid macular edema, macular hole, macular degeneration,
macular complications of diabetic retinopathy, and other conditions.
o A measurement of the thickness of the nerve fiber layer is a diagnostic indicator for
early glaucoma and disease progression. These values are compared over time to
analyze the patient‟s individual measurements to reference values of a normative
database.
o OCT imaging is useful in determining the effectiveness or adequacy of treatment in
disease conditions like glaucoma, macular edema, central serous retinopathy, macular
holes, and exudative age-related macular degeneration.
Role of technician regarding OCT machine:
o There are many OCT devices with variable software and hardware, but the basic
principles are similar.
o Proper training should come from the distributor of the machine if it is brand new or
from a knowledgeable in-house technician if the machine was in work for a while.
o The role of ophthalmic assistant or technician is to care for the machine properly
according to the general and the manufacturer‟s rules and may perform the scan
according to the establishment‟s policy and regulations.
Normal Macular OCT scan Optic nerve head OCT scans
Figure 25: Optical coherence tomography (OCT).

59
Figure 25: Above: OCT of Pigment epithelial detachment in Exudative Age related macular degeneration Below:
OCT of Cystoid macular edema with subfoveal neurosensory retinal detachment.

60
Ophthalmic Medical Assisting, An Independent Study Course, E. Newmark & M.A.
O’Hara, 6th Edition, 2012, AAO.
The Ophthalmic Assistant, 9th Edition, H.A. Stein, R.M. Stein and M.I. Freeman, Eighth
Edition, 2013, Elsevier Inc.
Fundamentals for Ophthalmic Technical Personnel, B. Cassin, 1995, W.B. Sanders
Company.
Clinical Optics, 3rd
edition, AR. Elkington et al., 1999, Blackwell Science, Tokyo, Japan.
Introducing ophthalmology: a primer for office staff. American Academy of Ophthalmology,
2013.
Duane's Clinical Ophthalmology, W. Tasman, & EA. Jaeger (Eds.), 2007 Ed. New York:
Lippincott-Raven.
Delmar's comprehensive medical assisting: administrative and clinical competencies. Lindh,
Wilburta Q., Marilyn Pooler, Carol D. Tamparo, Barbara M. Dahl, and Julie
Morris. Cengage Learning, 2013.
Today's Medical Assistant: Clinical and Administrative Procedures. Bonewit-West, Kathy, Sue
A. Hunt, and Edith Applegate. Elsevier Health Sciences, 2012.
Practical Ophthalmology-A Manual for Beginning Residents, 7ed. American Academy of
Ophthalmology, 2015.
Book Coordinator ; Mostafa Fathallah
General Directorate of Technical Education for Healt
لىصاسج الصحح والسكاى وحزس تعهحقىق الشش والرألف
Biblography and Recommended Readings

61
Appendix 1 - Testing Acuity for Patients with Low Vision
1. If the patient is unable to resolve the largest optotype on the distance acuity chart from the
standard testing distance, ask the patient to stand or sit 3 meters from the well-illuminated test
chart.
2. A projected chart is less desirable to use in this situation than a printed wall chart. A low-
vision test chart, if available, is preferable for these patients.
3. Occlude the eye not being tested.
4. Repeatedly halve the testing distance (up to 1 meter) and retest the distance visual acuity at
each stage until the patient successfully identifies half the optotypes on a line.
5. Note the corresponding acuity measurement shown at that line of the chart.
6. Record the acuity value for each eye separately, with correction and without correction, as
would be done for standard distance acuity testing, recording the distance at which the patient
successfully reads the chart as the numerator of the Snellen acuity designation; for example,
5/60.
7. If the patient is unable to resolve the largest optotypes on the chart from a distance of 1 meter,
display 2 or more fingers of 1 hand and ask the patient to count the number of fingers
displayed. Record the longest distance at which counting is done accurately; for example, CF
at 50 cm.
8. If the patient cannot count fingers, move your hand horizontally or vertically before the
patient at a distance of approximately 50 cm. Record the distance at which the patient
reported seeing your hand movement; for example, HM at 50 cm. If the patient cannot detect
your hand motion, shine a penlight toward the patient's face from approximately 30 cm and
turn it on and off to determine if light perception is present.
9. If the patient cannot see the light, dim the room lights and shine the brightest light available

62
(usually the indirect ophthalmoscope) toward the patient's eye again. If the patient cannot see
even the brightest light, record the response as NLP (no light percept ion). If the patient can
see the light, record the response as LP (light percept ion). No record of distance is required.
10. If light is perceived from straight ahead, move the light sequentially into each of the 4
quadrants of the visual field. Turn the penlight on and off in each field, and ask if the patient
can see the light. If the patient correctly identifies the direction from which the light is
coming, record the response as LP with projection. Specify the quadrant(s) in which light
projection is present. If the patient is unable to identify any direct ion but is able to discern
light in the straight-ahead position, record the response as LP without projection.
11. If the light can be seen from straight ahead, colored filters can be placed in front of the light
and the patient is asked to identify the color of the light. Record whether color percept ion is
present.
12. Repeat steps 1-10 for the fellow eye, as appropriate.
Appendix 2 – Color vision testing
1. Evaluation of color vision is often performed with pseudoisochromatic color plates.
2. The patient should wear glasses during color vision testing if they are normally worn for near
vision.
3. Each eye is tested separately.
4. Patients are instructed to look at a book of these plates, which display patterns of colored and
gray dots.
5. The color plates are presented consecutively under good illumination, preferably natural light.
6. Patients with normal color vision can easily detect numbers and figures composed of, and
embedded in, the multicolored dots.
7. Patients with color vision deficits cannot distinguish the numbers and figures.
8. Results are recorded according to the detailed instructions provided with the plates. Usually, a
fraction is specified, with the numerator equivalent to the number of correct responses and the
denominator the total plates presented.
9. The type of color defect can be determined by recording the specific errors and using the
instructions provided with the plates.
10. Various combinations of colors are used to identify the nature of the color vision deficit.
Appendix 3 – Technique of Tonometry
1. Technique of Schiøtz tonometry:
o After the instillation of local anesthesia, such as one drop of Benoxinate, the patient is

63
placed in a supine position and asked to look directly upward.
o The physician separates the lids to keep them from contacting the eyeball, taking care not
to exert pressure on the globe.
o The instrument is placed gently in a vertical position directly over the cornea, and the
plunger is allowed to exert its full weight.
o With the instrument held steady, the pointer will stay fixed at a single scale, with slight
oscillations 0.5 mm in either direction because of alterations in the internal pressure caused
by the arterial pulse in the eye.
o If the reading with the 5.5-g weight is between 3 and 6 on the scale, this reading may be
used. Readings below 3 with this instrument are inaccurate, and a 7.5-g weight should be
added and the reading taken again.
o If the reading is still below 3, the 10-g weight should be used.
o If the patient squeezes his or her lids, this will raise the IOP; note should be made of this,
because a falsely high pressure may be recorded.
2. Applanation tonometry:
o This very accurate method for measuring IOP may be performed with a Goldmann
applanation tonometer mounted on a routine slit lamp biomicroscope or with a handheld
applanation tonometer (Perkins Tonometer).
o After local anesthesia is introduced, fluorescein paper strips are inserted into the lower
conjunctival sac to place dye in the tear film.
o The tonometer scale is set at 10 and the head is then brought gently against the anterior
corneal surface with the patient looking straight ahead.
o On contact and with the cobalt blue light in place, two fluorescein semicircles are seen
through the microscope, one higher than the other; the top with the outer curve up and the
bottom with the outer curve down.
o The semicircles should be equal in size and in the middle of the field of view. Their steady
pulsation indicates that the instrument is in the correct position.
o Pressure on the eye is increased by turning the calibrated dial of the tonometer until the
inner border of each semicircle just touches and overlaps with each pulsation.
o The pressure reading is determined directly by reading from the measuring drum and
multiplied by 10 (in mm Hg).
3. The Tonopen:
o It is an electronic tonometer that has its greatest use in patients with corneal scarring or
altered corneal shape such that conventional Schiøtz or applanation tonometers cannot be
employed with any accuracy.
o The soft tip of a blunt pencil-like device connected by wire to an electronic recorder is

64
quickly touched to the anesthetized cornea.
o Pressure is calculated by the jump in scale readings from baseline noncontact curve to that
of the momentary touch flattening the cornea or indicated directly on a digital screen.
o The tonopen is portable and battery operated, but expensive to buy.
4. The air puff noncontact tonometer:
o It is a reasonably accurate electronic tonometer.
o It has the advantage of use without topical anesthetic.
o The patient sits with the head in a slitlamp-like device, and a 3 ms (millisecond) puff of air
(a blink takes 10 ms) is blown against the cornea.
o The indentation pattern is detected by the tonometer eye.
o The pressure is calculated by the amount of corneal flattening by the fixed air puff pressure
and displayed on digital readout.
o This machine can be used in glaucoma-screening programs.
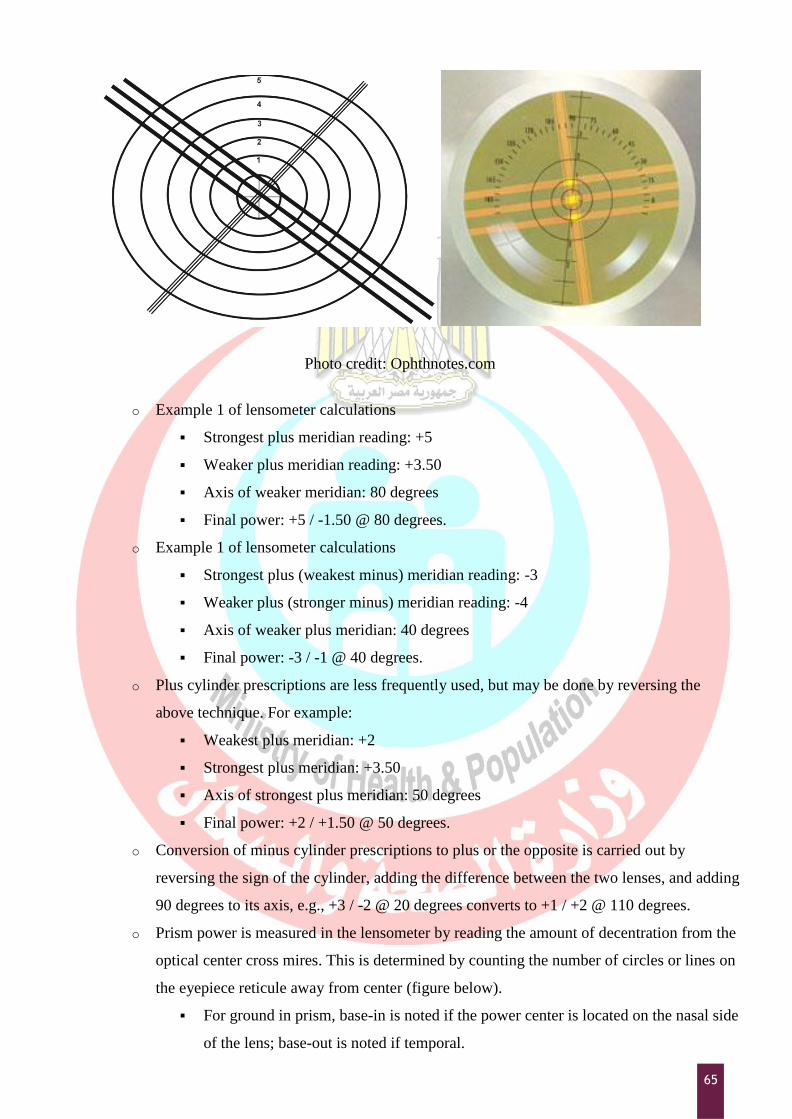
Appendix 4 – Manual Lensometry
o The lens to be measured is placed on the lensometer stage, and the power wheel is turned
until the target mires are in focus.
o The mires cross each other at right angles; there are three lines in one meridian and one in
the other (Figure below).
o If the mires all focus simultaneously at a given power, no cylinder is present and the lens is
completely spherical. The power is read directly off of the power wheel.
o The second wheel on the lensometer is an axis wheel, which can be rotated to turn the
mires until they are lined up along the principal meridians of a lens containing a cylinder.
o Alignment is correct when the crossing lines are perfectly straight (not broken).
o The power wheel is then turned to focus the strongest plus power of the lens (single line
meridian). When this is focused using the greatest plus power (or least minus power), the
spherical power component is recorded.
o The power wheel is turned again to bring the weaker (more minus) meridian into focus
(three-line target) and the cylindrical power component is noted as well as the axis of that
meridian, which is read directly from the axis wheel.
o The lens prescription is the strongest plus power minus the difference in power between
the two settings, and the axis of the cylinder is that of the more minus meridian, as
indicated on the axis of the wheel.
65
Photo credit: Ophthnotes.com
o Example 1 of lensometer calculations
Strongest plus meridian reading: +5
Weaker plus meridian reading: +3.50
Axis of weaker meridian: 80 degrees
Final power: +5 / -1.50 @ 80 degrees.
o Example 1 of lensometer calculations
Strongest plus (weakest minus) meridian reading: -3
Weaker plus (stronger minus) meridian reading: -4
Axis of weaker plus meridian: 40 degrees
Final power: -3 / -1 @ 40 degrees.
o Plus cylinder prescriptions are less frequently used, but may be done by reversing the
above technique. For example:
Weakest plus meridian: +2
Strongest plus meridian: +3.50
Axis of strongest plus meridian: 50 degrees
Final power: +2 / +1.50 @ 50 degrees.
o Conversion of minus cylinder prescriptions to plus or the opposite is carried out by
reversing the sign of the cylinder, adding the difference between the two lenses, and adding
90 degrees to its axis, e.g., +3 / -2 @ 20 degrees converts to +1 / +2 @ 110 degrees.
o Prism power is measured in the lensometer by reading the amount of decentration from the
optical center cross mires. This is determined by counting the number of circles or lines on
the eyepiece reticule away from center (figure below).
For ground in prism, base-in is noted if the power center is located on the nasal side
of the lens; base-out is noted if temporal.

66
For induced prism, the difference between the patient's pupillary distance and the
lens optical centers determines the amount of induced prismatic effect. Prentice's
rule calculates the amount of induced prism.
Appendix 5 – Manual keratometry
The object used is an illuminated circle with plus and minus images as shown in figure (figures below).
The two prisms inside the instrument give two additional images one displaced horizontally and another
displaced vertically. Three images are seen as in figure while taking the reading the pluses and minuses
coincide.
Keratometer set-up
1. Focus the eye piece
- Set the adjustable eye piece so that it extends as for as possible
- Place a white paper in front of the instrument objective to retro

67
- illuminates the reticle
- Adjust the eye piece until the reticle is first seen in sharp focus
2. Ask the patient to remove his glasses
3. Adjust height of chair and instrument to a comfortable position for both patients and examiner
4. Unlock instrument controls (B& L. Keratometry)
5. Instruct patient to palace his chin in the chin rest and forehead against the forehead rest
6. Raise or lower the chin rest until the patient‟s outer canthus is aligned with the hash mark on
upright support or the pointer on the side of the instrument
Step- by-step procedure
1. From outside the instrument, roughly align the telescope with the patient‟s eye.
2. Instruct the patient to look at the image of his eye in the keratometer.
3. Look into the keratometer and align it by moving it from side to side or up and down until you can
see the image of the mires (circle with plus and minus) on the patient‟s cornea.
4. Focus the mires and align them with the reticle in the lower right and head circle.
5. Lock the instrument (B&L Keratometer only).
6. Adjust horizontal and vertical power wheels until mires are in close apposition.
7. Rotate the telescope to align spurs ( plus and minus signs) on the mires to 2 major meridians of the
patient‟s cornea.
8. Adjust the horizontal power wheel until the vertical mires are co-incident.
9. Adjust the vertical power wheel until the horizontal mires are co- incident.
10. Readjust focus and / re-center reticle as needed.
11. When mires are not clear lubricating drops can be used aand Keratometry can be performed again.
Recording
1. Recording for each eye separately
2. Record the power and meridian for horizontal meridian first (the primary meridan)
3. Write a slash mark after the primary meridian and record the power and meridian for the vertical
meridian (the secondary meridian)
4. Record the amount of corneal astigmatism in diopters
5. Record the type of astigmatism:
WR-With the rule
AR-Against the rule
OBL-Oblique

68
6. Record the conditions of the mires e.g. MCAR- Mires Clear And Regular / MIAD- Mires Irregular
And Distorted
Example:
OD 42.50 at 180/ 43.50 at 90; 1.0D WR,MCAR
OS 47.37 at 180/ 41.37 at 90; 6.0D AR, Mires distorted
OD 41.75 at 180 / 43.75 at 70; 2.0D irregular astig; mires distorted
OS 43.12 at 135 / 41.87 at 45; 1.25D OBL; MCAR
OD 42.00/43.00 at 90; 1.0D WR MCAR
OS 42.00/42.00 at 90; sphere MCAR
(Meridia are expected to be 90 degree apart; therefore if only the meridian is recording the position of the
other can be assumed to be 90 degrees away).
To obtain proper focus, rotate the focus knob until the bottom-right circles converge to form a fused
image.(figure below)
To locate the proper axis, rotate the keratometer until the pluses between the two bottom circles are in the
same plane.(fig 10.8)
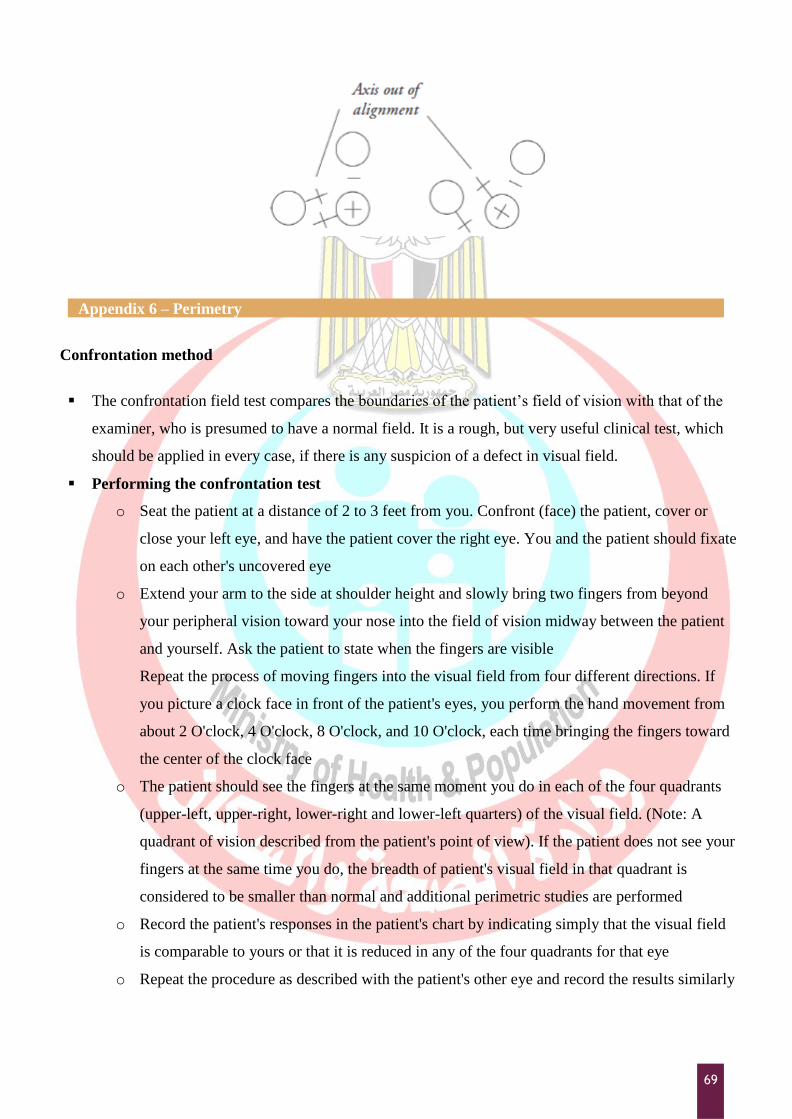
69
Appendix 6 – Perimetry
Confrontation method
The confrontation field test compares the boundaries of the patient‟s field of vision with that of the
examiner, who is presumed to have a normal field. It is a rough, but very useful clinical test, which
should be applied in every case, if there is any suspicion of a defect in visual field.
Performing the confrontation test
o Seat the patient at a distance of 2 to 3 feet from you. Confront (face) the patient, cover or
close your left eye, and have the patient cover the right eye. You and the patient should fixate
on each other's uncovered eye
o Extend your arm to the side at shoulder height and slowly bring two fingers from beyond
your peripheral vision toward your nose into the field of vision midway between the patient
and yourself. Ask the patient to state when the fingers are visible
Repeat the process of moving fingers into the visual field from four different directions. If
you picture a clock face in front of the patient's eyes, you perform the hand movement from
about 2 O'clock, 4 O'clock, 8 O'clock, and 10 O'clock, each time bringing the fingers toward
the center of the clock face
o The patient should see the fingers at the same moment you do in each of the four quadrants
(upper-left, upper-right, lower-right and lower-left quarters) of the visual field. (Note: A
quadrant of vision described from the patient's point of view). If the patient does not see your
fingers at the same time you do, the breadth of patient's visual field in that quadrant is
considered to be smaller than normal and additional perimetric studies are performed
o Record the patient's responses in the patient's chart by indicating simply that the visual field
is comparable to yours or that it is reduced in any of the four quadrants for that eye
o Repeat the procedure as described with the patient's other eye and record the results similarly

70
Tangent Screen (Bjerrum screen)
Estimation of defects of central fields using tangent screen is termed as campimetry or scotometry. It
is done to evaluate the central and para central area (30 degree) of the visual field. The tangent screen
is 1 metre or 2 metres square. Accordingly the patient is seated at a distance of 1m or 2m
respectively.
The screen has a white object for fixation in its centre, around which are marked concentric circles
from 5 degree to 30 degree. The patient fixates on the central dot with one eye occluded.
A white target (1-10 mm diameter) is brought in from the periphery towards the centre in various
meridians. Initially, the blind spot is charted, which is normally located about 15 degree temporal to
the fixation point on a 1 m tangent screen. It will fall outside the 1m tangent screen at 2m. Doubling
the testing distance and doubling the target size will double the scotoma size.
Note: Fixation targets should be capable of variation from 1 to 100 mm. Circles of varying size are
used for fixation when testing for small central scotomas
White tape may be attached to the two upper corners of the screen so that they cross in the center
when testing the large, dense, central scotomas. The patient fixates where they think the tapes will
cross even though they cannot see the actual crossing point
Performing the tangent screen examination
o For a tangent screen examination, it is essential that the patient wears his glasses if he has a
refractive error. This is not essential in perimetric examinations
o The examiner usually stands to one side and keeps his/her eye on the patient's eye to ensure
that the fixation is absolutely maintained
o The test object, the size of which is correlated with the patient's visual acuity, is moved from
the periphery towards the centre
o The patient indicates when they see the test object either by making a verbal response, such
as ''yes'', or by tapping a coin
o At all times the fixation of the patient should be checked
o The easiest way is to map out the patient's blind spot first, which is smaller and closer to the
fixation point
o Check the patient's responses by rotating the test object out of view so that it is not visible to
the patient at all
o Be careful when transferring the information from the felt screen to the chart because errors
can occur
o Make sure you understand the proper degree of eccentricities and meridian placements on the
stitched chart and the recording diagrams
o Mark the areas of scatter with a cross hatch and record the target size

71
o Evaluate each scotoma for depth with smaller and larger targets
Amsler grid test
The Amsler grid test determines the presence and location of defects in the central portion of the
visual field. The Amsler grid is a printed square of evenly spaced horizontal and vertical lines in a
grid pattern, with a dot in the centre. The chart grid and dot may be either white on a black
background or black on a white background.
Performing the Amsler grid test
o Have the patient hold a white-on-black test card about 16 inches away with one hand and
cover one eye with the other hand, an occluder, or a patch
o Direct the patient to stare at the centre dot and to report if any portions of the grid are
blurred, distorted, or absent. The patient should not move the gaze from the centre dot, so
that the presence of any distortion can be assessed
o If they answer yes, you may repeat the test with black-on-white Amsler recording chart, on
which you ask the patient to mark the location of visual difficulties.
o If test results are normal, state so in the patient's record. If abnormal, state so, and include
the Amsler recording chart in patient's record. The patient with abnormal findings is a
likely candidate for further studies. The patient may also repeat this convenient procedure
independently at home and report changes to the ophthalmologist's office (the patient
should perform the test monocularly, always at the same 16-inch distance and under the
same illumination)
Perimeters
The screen may be either an arc or a bowl of a radius of 330 mm.
Lister's perimeter: A rotatable arc, capable of being revolved round a pivot, and along which a
test object can be moved.
Goldmann perimeter:
o A hemispherical bowl over which a target (a spot of light of adjustable size and
illumination) can be directed.
o The Goldmann perimeter is more standardised and preferable for glaucoma examinations,
as, both the central and peripheral visual fields can be recorded.
o The targets of the perimeter consists of circular white discs (or a spot of light) of diameters
ranging from 1-10 mm. The isopters represent the limits of the field of vision with each
target, and are accordingly labeled 1/330 (1 mm target at 330 mm distance, the radius of
perimeter), 2/330. 10/330, etc.
o Coloured discs or coloured spots of light are especially used for estimation of a differential
field loss to colour. In normal conditions, the blue field is largest, slightly smaller is the
white, and then followed by the yellow, red and green.

72
Automated perimeter
Automated perimetry was developed to standardize visual field testing and to increase the
reliability of visual tests. Various manufacturers make automated perimeters based upon
computerized projection systems and a LED (light emitting diodes) system. Automated perimeters
can perform screening and diagnostic field tests and can use kinetic and static methods. These
perimeters are most often used for static threshold testing.
The most widely used automated perimeter is the Humphrey Field Analyzer which has become the
standard for visual field testing.
Appendix 7 – Tips on Ocular biometry
Handling a scan
o Always check the instrument before usage
o Wash and dry hands before working
o Administer 1 drop of Benoxinate anesthetic eye drops.
o Allow 2 to 5 minutes for the local anesthetic to act
o Explain to the patient that you will be touching his/her eye with an instrument, but they
will not feel it. Ensure them the instrument will not hurt the eye
o Applanate the cornea using the hand held ultrasound transducer probe. This is repeated
three times.
o Ask the patient to look straight ahead (for IOL power calculation)
o Record the readings for each eye separately in the patient's chart
The technicians role is to
o Explain the procedure and its importance to the patient in their language
o Reassure the patient, if the patient is uncooperative
o Communicate well with the patient to reduce anxiety and clear their doubts
o Be gentle while applanating the cornea for A scan- too much pressure will give inaccurate
measurement
o Handle equipment with care
Maintenance
o Keep the instrument covered when not in use
o The instrument can be cleaned with a soft clean cloth

73
Appendix 8 – Fluorescein Angiography
To produce an angiogram the following steps are recommended:
1. Set the image capture software to record for fluorescein angiography. This will set the camera and
computer to process the image in black and white, and it also raises the ISO setting, since the
fluorescein filters absorb a lot of light.
2. Set the flash intensity to the level used for color photography.
3. Introduce the green or „red-free‟ filter into the light path.
4. Position the patient at the camera and take a stereo photograph of the area to be studied with the
green filter in place.
5. Set the image capture software and the camera to its fluorescein angiography settings. This may
automatically increase the flash output to the level required for fluorescein angiography, or you
may have to do these setting changes manually.
6. When the needle is correctly inserted into the patient‟s vein, check the patient‟s head position and
viewing through the camera‟s viewfinder, to again ensure proper alignment and focus.
7. Initiate the rapid injection of the fluorescein and simultaneously activate the timer.
8. At 5–7 seconds following the start of the injection, the exposure sequence should commence. The
average arm-to-retina circulation time in an adult is between 8 and 15 seconds. In a child, it can
occur within 4–7 seconds and requires earlier initiation.
9. After the rapid-sequence documentation of the initial circulation of fluorescein through the full
arteriovenous phase, the frequency of exposures may be reduced considerably since further
development in the angiographic pattern will occur much more slowly beyond this point. (An
understanding of the hemodynamics of the choroidal and retinal circulation, as well as the
appearance of fluorescein angiographic characteristics of the various lesions studied, will improve
judgment.)
10. Intermediate or recirculation phase: photographs should be taken at approximately 1–3 minutes
after injection.
11. A late photograph, approximately 8 minutes after injection, is also recommended. Certain
conditions are not delineated until this point and the time interval can also be used to monitor the
patient for any signs of adverse effects from the fluorescein angiographic procedure. Stereo
fluorescein photography can be incorporated at any stage of the angiogram by use of the procedure
described for stereo photography.