Embed Size (px)
Citation preview
~ 1 ~
University of Halmstad
School of Business and Engineering
Master International Marketing
Advertising management influence
effectiveness of online advertising
--A study of white-collar workers in online
advertising context
Master’s Dissertation in International Marketing
Authors: Jin Ma 870705-T044
Handan Liu 800218-T157
Supervisor: Gabriel Baffour Awuah
~ 2 ~
ACKNOWLEDGEMENT
This dissertation has been written during the spring semester of 2010 at Halmstad
University.
First of all, we would like to sincerely acknowledge to our supervisor Mr. Gabriel
Baffour Awuah. We have learned a great deal from his constructive suggestions and
valuable assistance for our dissertation, both in the seminars and supervisions.
Secondly, we want to express our gratitude towards all the students in the other two
seminar groups, particularly our opponents who also provide us with helpful advices.
Thirdly, we are extraordinary thankful to our friends who take part in our research as
respondents. We appreciate their time to complete the questionnaires which constitute
our emprical data.
Last but not least, we are much obliged to our parents for the spiritual support they
provide during the whole thesis-writing process. Despite the far distance between
China and Sweden, they always offer us with courage and confidence via phones and
online communication tools.
Halmstad, 2010
Jin Ma and Handan Liu
~ 3 ~
ABSTRACT
Online advertising which is a new form of communication provides interactivity
between advertisers and consumers.
This dissertation is focusing on how advertising management influence the
effectiveness of online advertising.The theoretical framework of this study mainly
contains the advertising management and effectiveness of effects model.These two
models are combined together in an analytical model where a connection between the
two theories is explained that will be used as a foundation in gathering and analyzing
the empirical findings. The quatitative research strategy is appliedd in this dissertation.
Based on the questionnaies of white-collar workers, the empirical data was collected.
The conclusion which can be drawn from this study is that there is clear evidence that
good management will improve cognitive,affective and conative degree of consumer
behavior.
Key words: Online advertising, interactivity, advertising mangement, hirachy of
effectiveness.
~ 4 ~
TABLE OF CONTENTS
1 Introduction ........................................................................................................................................... 6
1.1 Background................................................................................................................................. 6
1.2 Problem discussion ..................................................................................................................... 7
1.3 Research Purpose ....................................................................................................................... 8
1.4 Research Question...................................................................................................................... 8
1.5 Delimitation ................................................................................................................................ 8
1.6 Definitions .................................................................................................................................. 9
1.7 Previous studies and Earlier Research ........................................................................................ 9
2 Theoretical framework ........................................................................................................................ 11
2.1 Main steps in the management of advertising communication ............................................... 11
2.2 Hierarchy of effectiveness model ............................................................................................. 13
2.3 Traditional advertising VS online advertising ........................................................................... 14
2.4 Why the authors combine the preceding two models ............................................................. 17
2.5 Description of analytical framework ........................................................................................ 18
2.6 Hypotheses ............................................................................................................................... 22
3 Methodology ....................................................................................................................................... 23
3.1 Research strategy and approach .............................................................................................. 23
3.2 Data collection .......................................................................................................................... 25
3.3 Sampling ................................................................................................................................... 27
3.4 Data analysis ............................................................................................................................. 28
3.5 Validity and Reliability .............................................................................................................. 29
4 Empirical finding .................................................................................................................................. 30
~ 5 ~
4.1 Sampling, source of data .......................................................................................................... 30
4.2 Questions regard to cognitive ................................................................................................... 30
4.3 Questions regard to affective .................................................................................................... 33
4.4 Questions regard to conative .................................................................................................... 35
4.5 Questions regard to management.............................................................................................. 37
5 Analysis ................................................................................................................................................ 40
5.1 The correlation between management and cognitive................................................................ 40
5.2 The correlation between management and affective................................................................. 44
5.3 The correlation between management and conative ................................................................. 47
6 Conclusions .......................................................................................................................................... 52
6.1 Conclusion and discussion ........................................................................................................ 52
6.2 Implications .............................................................................................................................. 53
6.3 Further Research ...................................................................................................................... 53
References .............................................................................................................................................. 54
~ 6 ~
1 INTRODUCTION
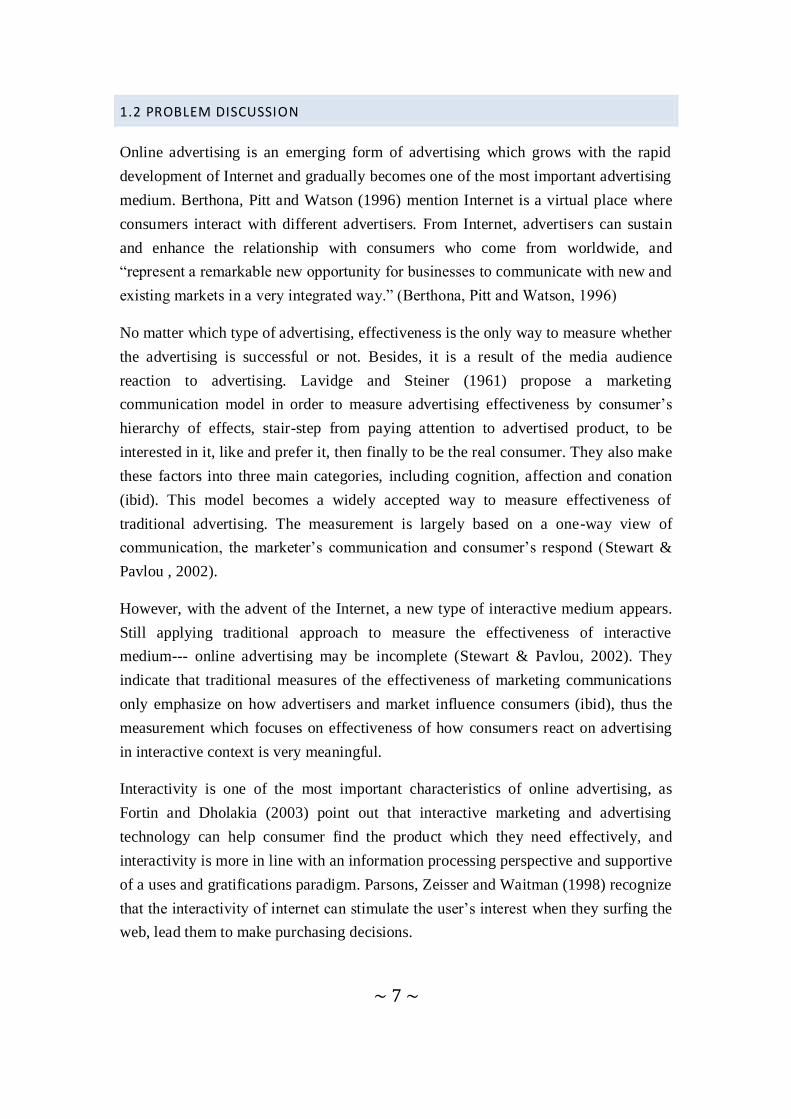
1.1 BACKGROUND
Advertising has been existed for many decades. It is one means of promotional mix
which has its ultimate function to set up channels of information and persuasion to
sell goods and services or promote an idea (Belch & Belch, 1998; Aaker, 1991). As an
integral part of social and economic systems and one of the rapidly growing industries,
advertising determines the GDP (Gross domestic product), of a country to a
considerable extent during the late 1980s (Belch & Belch, 1998; Daniels, 1995).
Advertising is considered to be one of the marketing communication tools.
Communication is the process of giving or an exchange of information and the
science of transmitting information as well (Smith, 1993). In the world‟s complicated
society, advertising has developed into a significant communication system which
connects both consumers and businesses (Belch & Belch, 1998).
Advertising communication can be conveyed through various mass media which
include traditional media such as TV, broadcasting, magazines and newspapers (Belch
& Belch, 1998). In addition, Internet industry becomes a new medium for businesses,
especially provides a new living space for the growth and development of enterprises
(Jim Hamill, 1997). Therefore, online advertising which is a new type of advertising
has been explored since the information explosion dynasty is coming. It is also one of
the marketing communication tools (Doole and Lowe, 2008). When it comes to the
effects of advertising, they are considered to be an investment in a long term process
(Lavidge & Steiner, 1961).
According to Robinson et al. (2007), online advertising has grown significantly since
its beginning in 1994. From the article of E-Marketer, it is estimated that Internet
spending in China will reach $1.7 billion in 2009 and $3.5 billion in 2012, with a 24%
growth rate annually from 2007 till now (E-Marketer, 2009). Although in USA,the
amount of 2009 will be $25.7 billion (ibid), China has the most Internet users in the
world. Hence, online advertising opens up a door for companies to communicate with
customers and potential customers (Hofacker, 2000), which would be helpful for them
to promote sales in the fierce competition. Meanwhile, the advertiser should consider
how the consumers will interpret and respond to it (Belch & Belch, 1998), as
consumers are the receiver side of the communication.
~ 7 ~
1.2 PROBLEM DISCUSSION
Online advertising is an emerging form of advertising which grows with the rapid
development of Internet and gradually becomes one of the most important advertising
medium. Berthona, Pitt and Watson (1996) mention Internet is a virtual place where
consumers interact with different advertisers. From Internet, advertisers can sustain
and enhance the relationship with consumers who come from worldwide, and
“represent a remarkable new opportunity for businesses to communicate with new and
existing markets in a very integrated way.” (Berthona, Pitt and Watson, 1996)
No matter which type of advertising, effectiveness is the only way to measure whether
the advertising is successful or not. Besides, it is a result of the media audience
reaction to advertising. Lavidge and Steiner (1961) propose a marketing
communication model in order to measure advertising effectiveness by consumer‟s
hierarchy of effects, stair-step from paying attention to advertised product, to be
interested in it, like and prefer it, then finally to be the real consumer. They also make
these factors into three main categories, including cognition, affection and conation
(ibid). This model becomes a widely accepted way to measure effectiveness of
traditional advertising. The measurement is largely based on a one-way view of
communication, the marketer‟s communication and consumer‟s respond (Stewart &
Pavlou , 2002).
However, with the advent of the Internet, a new type of interactive medium appears.
Still applying traditional approach to measure the effectiveness of interactive
medium--- online advertising may be incomplete (Stewart & Pavlou, 2002). They
indicate that traditional measures of the effectiveness of marketing communications
only emphasize on how advertisers and market influence consumers (ibid), thus the
measurement which focuses on effectiveness of how consumers react on advertising
in interactive context is very meaningful.
Interactivity is one of the most important characteristics of online advertising, as
Fortin and Dholakia (2003) point out that interactive marketing and advertising
technology can help consumer find the product which they need effectively, and
interactivity is more in line with an information processing perspective and supportive
of a uses and gratifications paradigm. Parsons, Zeisser and Waitman (1998) recognize
that the interactivity of internet can stimulate the user‟s interest when they surfing the
web, lead them to make purchasing decisions.
~ 8 ~
Since the characteristics of interactivity are different from traditional advertising,
consumers can look for the information that they want to know by clicking the
hyperlink or using search engine. As Stewart and Pavlou (2002) mention that
consumers have more influence on the process of communication by their actions:
selecting, searching for, using, and responding. Thus, advertisers must deal with this
influence which consumers have on the interaction, and they have to change their
previous approach of traditional advertising, which means that they should consider
consumer behavior in almost the whole decision-making process.
1.3 RESEARCH PURPOSE
Compared with traditional advertising, online advertising is different that consumer
behavior affects steps of the online advertising management process. This paper
focuses on the influence of advertising management on effectiveness of online
advertising, based on the interactivity between consumers and advertisers. From
consumers‟ perspective, authors take white-collar workers as research target to
analyze the above-mentioned point of view.
1.4 RESEARCH QUESTION
The authors‟ main research question is as follows:
How does advertising management influence online advertising effectiveness?
1.5 DELIMITATION
The authors‟ research is delimitated to Chinese white-collar workers. As is known to
all, white-collar workers use the Internet frequently. Meanwhile, Chinese enterprises
prefer the online advertising for its saving of money. Therefore, it is worth taking
Chinese white-collars as research target to analyze their behavior on influencing
online advertising.
Meanwhile, from the authors‟ point of view, advertisers in this paper only refer to the
advertising department of the company, which provides products and services.
~ 9 ~
The definition of „Good management‟ in this research is confined to effective
communication. As Tyagi and Kumar (2004) state, there are several major steps in
developing effective communications, which includes:
“(1) identify the target audience; (2) determine the communication
objectives; (3) design the message; (4) select communication
channels; (5) develop the total promotion budget; (6) decide on the
promotion mix; (7) measure the promotion’s results; and (8) manage
and coordinate the total marketing communication process”
(Tyagi &Kumar, 2004, p.74).
1.6 DEFINITIONS
In this dissertation, the definitions of the terms which are going to be frequently used
are as follows:
Advertising is: “the nonpersonal communication of information usually paid for and
usually persuasive in nature about products, services or ideas by identified sponsors
through the various media." (Bovee and Arens, 1992, p. 7)
Since Internet has become a communication platform, the frequent use of Internet
advertising emerges naturally. Online advertising, which is based on Internet
advertising, is a new medium with “the use of Internet and related digital technologies
to achieve marketing objectives…” (Chaffey et al., 2006)
There are several kinds of online advertising. Practically, online advertising is “the
use of a company web site in conjunction with online promotional techniques such as
search engines, banner advertising, direct e-mail and links or services from other web
sites to acquire new customers and provide services to existing customers…”(Chaffey
et al., 2006)
Newhagen and Rafaeli (1996) define interactivity as “a communication that reflects
back on itself, feeds on, and responds to the past”. Therefore, in the authors‟ research,
interactivity is defined as the communication between consumers and advertisers, for
example, advertiser affect consumer‟s habit and behaviors, while consumer also affect
advertiser‟s management.
1.7 PREVIOUS STUDIES AND EARLIER RESEARCH
~ 10 ~
Internet advertising, which is a relatively new medium, has received attention from
both academics and practitioners, particularly from effectiveness aspect.
Teo etal. (2003) proposes a research model in order to investigate the influences of
interactivity level on web user‟s attitude towards commercial web sites. Afterwards,
the model has been tested and the results reveal that the increased level of interactivity
has positive effects on web user‟s perceived satisfaction, effectiveness, efficiency,
value, and overall attitude towards a Web site (Teo et al., 2003).
In the article of Bezjizn-Avery et al. (1998), the authors discuss that there are two
ways that can measure the effectiveness of the interactive media. One of them is the
persuasiveness of the media which indicates that whether consumers are positive in
affect, preferences, and purchase intensions (Bezjizn-Avery etal, 1998). The research
also provides practical suggestions on how to design effective online ads to fully
utilize the advantages of the online medium (ibid). Meanwhile, Patsioura et al. (2009)
have formulated an advertising effectiveness model for corporate advertising web
sites.
A great number of researchers, like Tyagi and Kumar (2004), have discussed the
subject of advertising management, from advertisers‟ perspective. However, the
authors‟ study focuses on how advertising management influences advertising
effectiveness, in the context of online advertising.
~ 11 ~
2 THEORETICAL FRAMEWORK
2.1 MAIN STEPS IN THE MANAGEMENT OF ADVERTISING COMMUNICATION
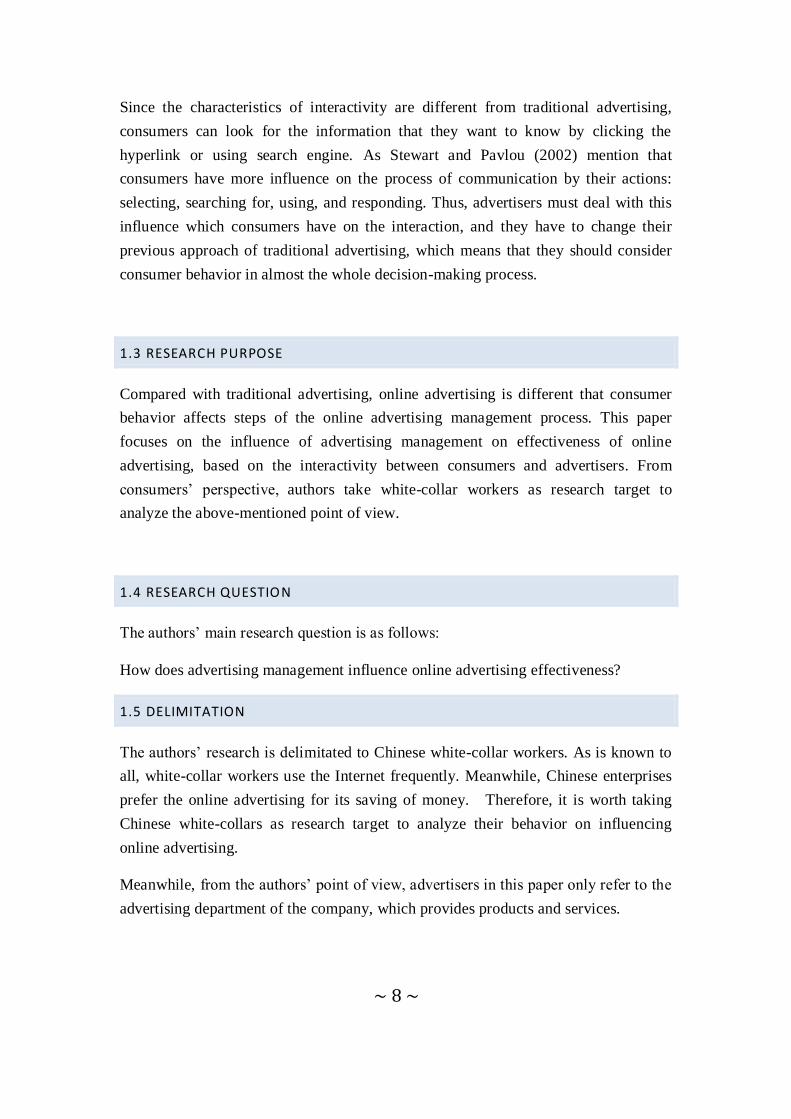
Figure 1 Main steps in the management of advertising communication.
Source from: Usunier and Lee, 2009, pp.377.
Brand awareness
Brand image
Increase sales
Provoke first trial/rebuy
Build consumer loyalty
Problem to be solved
Implementation and
control
Creative strategy
Communication
objectives Target(s)
Media strategy
Identify the target
Sociodemographics
Consumer habits
How is the product used?
Let know
Let like
Let act
Copy strategy
Classical USP
“Star strategy”
One or several creations
Availability of media
Calculation of the optimal
Coverage of the audience
Agency/advertiser relationships
Pre- and post–testing /evaluation
~ 12 ~
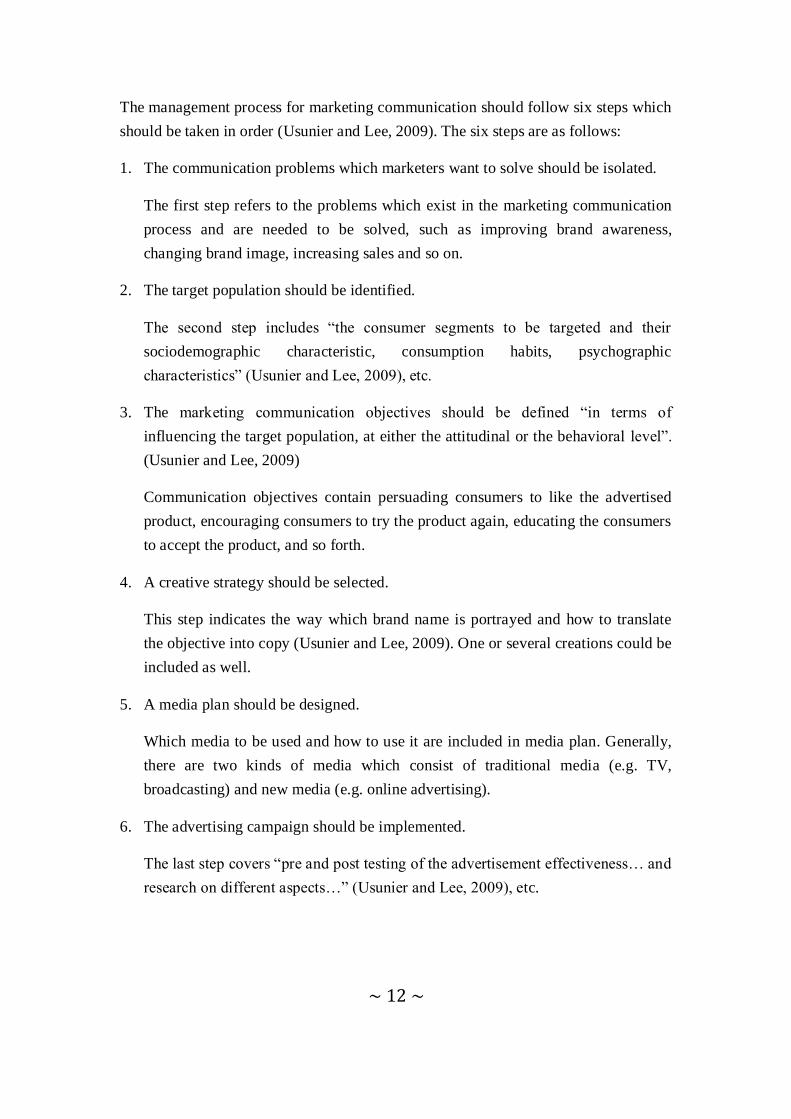
The management process for marketing communication should follow six steps which
should be taken in order (Usunier and Lee, 2009). The six steps are as follows:
1. The communication problems which marketers want to solve should be isolated.
The first step refers to the problems which exist in the marketing communication
process and are needed to be solved, such as improving brand awareness,
changing brand image, increasing sales and so on.
2. The target population should be identified.
The second step includes “the consumer segments to be targeted and their
sociodemographic characteristic, consumption habits, psychographic
characteristics” (Usunier and Lee, 2009), etc.
3. The marketing communication objectives should be defined “in terms of
influencing the target population, at either the attitudinal or the behavioral level”.
(Usunier and Lee, 2009)
Communication objectives contain persuading consumers to like the advertised
product, encouraging consumers to try the product again, educating the consumers
to accept the product, and so forth.
4. A creative strategy should be selected.
This step indicates the way which brand name is portrayed and how to translate
the objective into copy (Usunier and Lee, 2009). One or several creations could be
included as well.
5. A media plan should be designed.
Which media to be used and how to use it are included in media plan. Generally,
there are two kinds of media which consist of traditional media (e.g. TV,
broadcasting) and new media (e.g. online advertising).
6. The advertising campaign should be implemented.
The last step covers “pre and post testing of the advertisement effectiveness… and
research on different aspects…” (Usunier and Lee, 2009), etc.
~ 13 ~
2.2 HIERARCHY OF EFFECTIVENESS MODEL
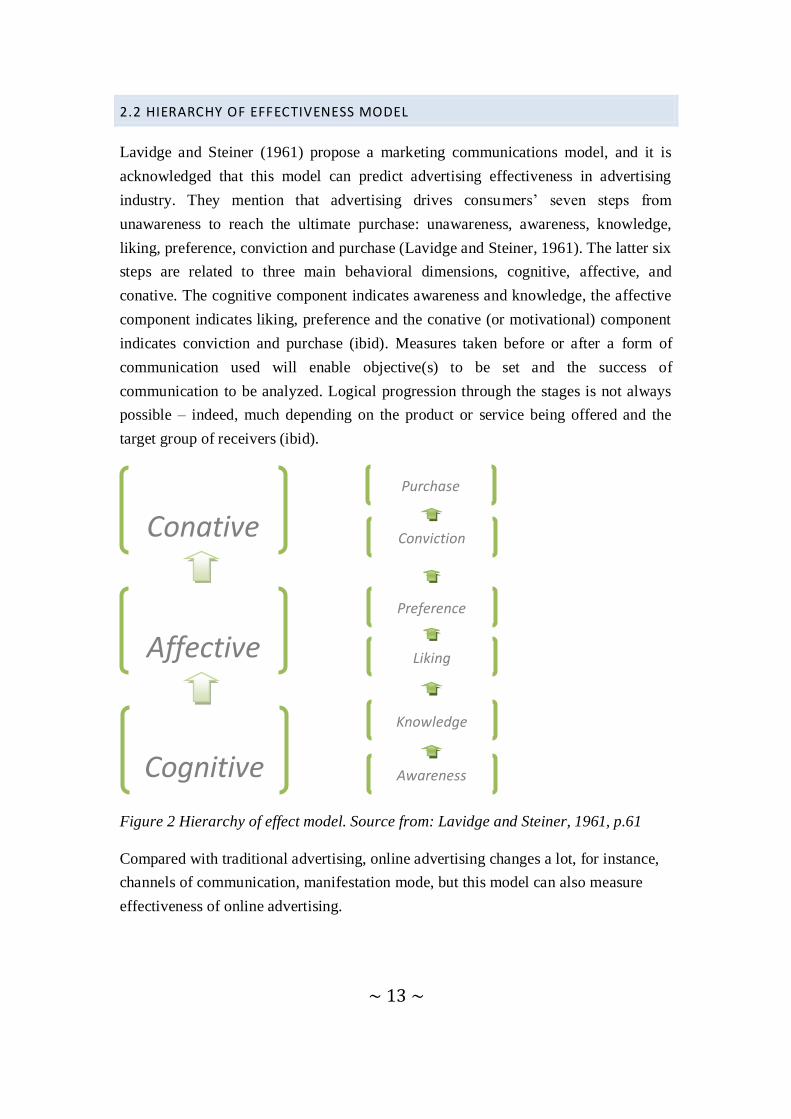
Lavidge and Steiner (1961) propose a marketing communications model, and it is
acknowledged that this model can predict advertising effectiveness in advertising
industry. They mention that advertising drives consumers‟ seven steps from
unawareness to reach the ultimate purchase: unawareness, awareness, knowledge,
liking, preference, conviction and purchase (Lavidge and Steiner, 1961). The latter six
steps are related to three main behavioral dimensions, cognitive, affective, and
conative. The cognitive component indicates awareness and knowledge, the affective
component indicates liking, preference and the conative (or motivational) component
indicates conviction and purchase (ibid). Measures taken before or after a form of
communication used will enable objective(s) to be set and the success of
communication to be analyzed. Logical progression through the stages is not always
possible – indeed, much depending on the product or service being offered and the
target group of receivers (ibid).
Figure 2 Hierarchy of effect model. Source from: Lavidge and Steiner, 1961, p.61
Compared with traditional advertising, online advertising changes a lot, for instance,
channels of communication, manifestation mode, but this model can also measure
effectiveness of online advertising.
Cognitive
Affective
Conative
Awareness
Purchase
Conviction
Preference
Liking
Knowledge
~ 14 ~
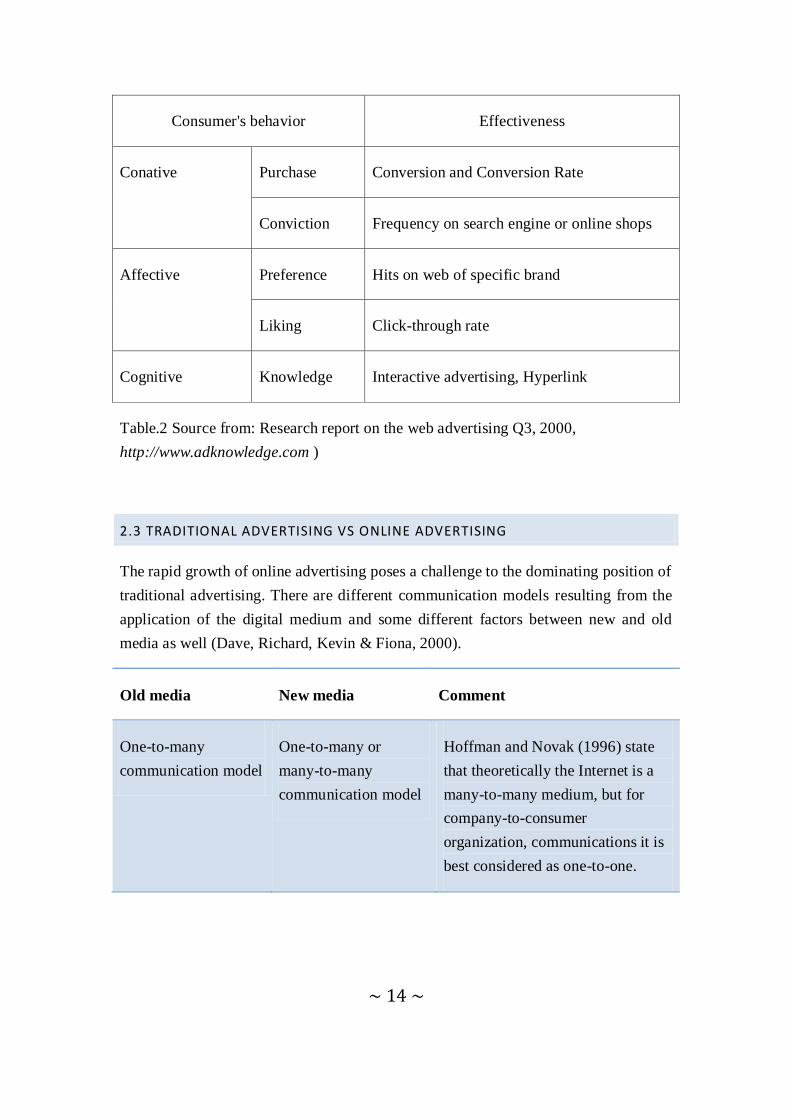
Consumer's behavior Effectiveness
Conative Purchase Conversion and Conversion Rate
Conviction Frequency on search engine or online shops
Affective Preference Hits on web of specific brand
Liking Click-through rate
Cognitive Knowledge Interactive advertising, Hyperlink
Table.2 Source from: Research report on the web advertising Q3, 2000,
http://www.adknowledge.com )
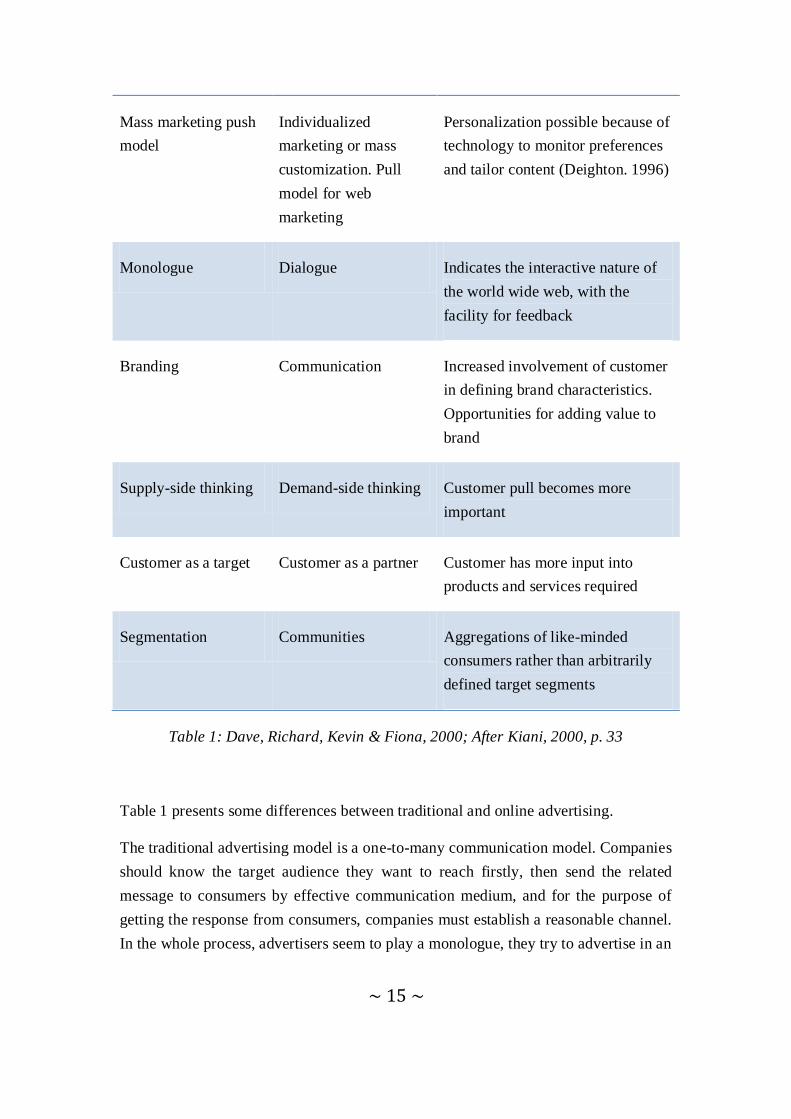
2.3 TRADITIONAL ADVERTISING VS ONLINE ADVERTISING
The rapid growth of online advertising poses a challenge to the dominating position of
traditional advertising. There are different communication models resulting from the
application of the digital medium and some different factors between new and old
media as well (Dave, Richard, Kevin & Fiona, 2000).
Old media New media Comment
One-to-many
communication model
One-to-many or
many-to-many
communication model
Hoffman and Novak (1996) state
that theoretically the Internet is a
many-to-many medium, but for
company-to-consumer
organization, communications it is
best considered as one-to-one.
~ 15 ~
Mass marketing push
model
Individualized
marketing or mass
customization. Pull
model for web
marketing
Personalization possible because of
technology to monitor preferences
and tailor content (Deighton. 1996)
Monologue Dialogue Indicates the interactive nature of
the world wide web, with the
facility for feedback
Branding Communication Increased involvement of customer
in defining brand characteristics.
Opportunities for adding value to
brand
Supply-side thinking Demand-side thinking Customer pull becomes more
important
Customer as a target Customer as a partner Customer has more input into
products and services required
Segmentation Communities Aggregations of like-minded
consumers rather than arbitrarily
defined target segments
Table 1: Dave, Richard, Kevin & Fiona, 2000; After Kiani, 2000, p. 33
Table 1 presents some differences between traditional and online advertising.
The traditional advertising model is a one-to-many communication model. Companies
should know the target audience they want to reach firstly, then send the related
message to consumers by effective communication medium, and for the purpose of
getting the response from consumers, companies must establish a reasonable channel.
In the whole process, advertisers seem to play a monologue, they try to advertise in an
~ 16 ~
impressive way, select a suitable medium, describe the advantage of certain brand, in
order to give a strong impression on the audience, as Janoschka and Anja (2004, p 32)
point out, and advertising is purposeful, advertising campaign intends to give
audience a good image, and it can help firm increase on sales and profit. In most
situations, traditional advertising tries to change or influence consumers‟ attitudes, to
persuade consumers to buy product A instead of product B (Janoschka & Anja, 2004;
Jefkins & Yadin 2000: 15). The consumer is a negative receiver in this whole process
which means that consumer cannot respond immediately.
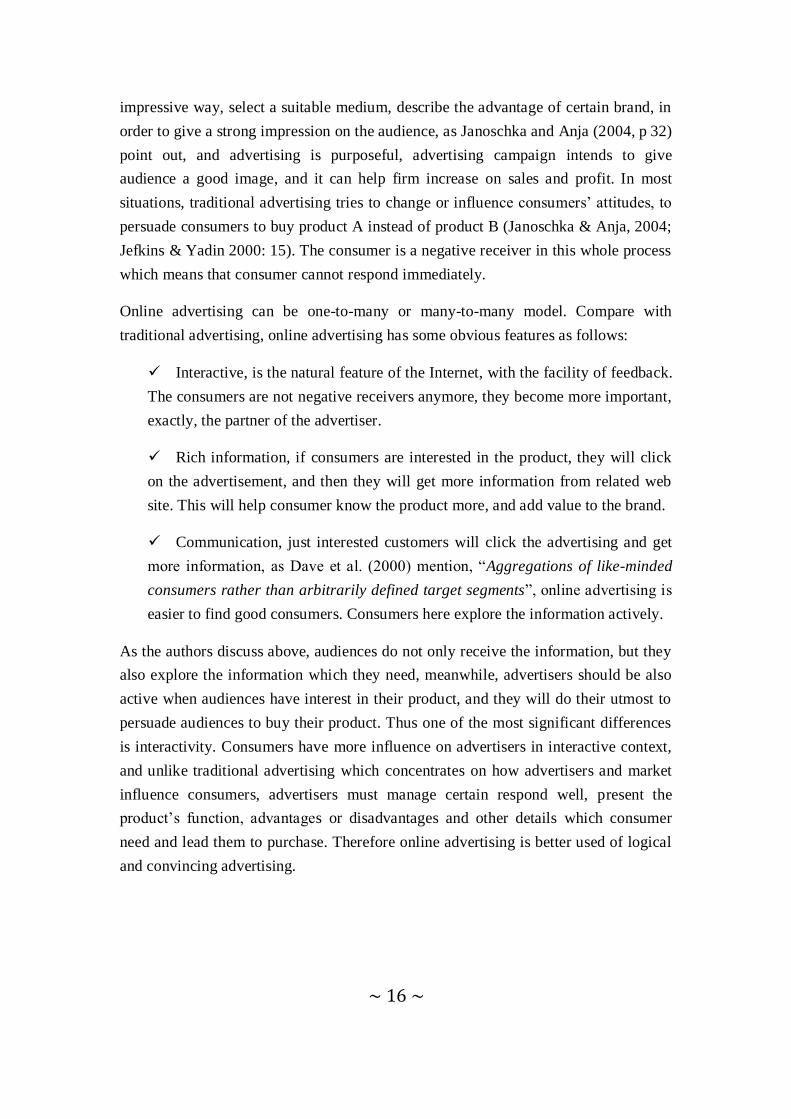
Online advertising can be one-to-many or many-to-many model. Compare with
traditional advertising, online advertising has some obvious features as follows:
Interactive, is the natural feature of the Internet, with the facility of feedback.
The consumers are not negative receivers anymore, they become more important,
exactly, the partner of the advertiser.
Rich information, if consumers are interested in the product, they will click
on the advertisement, and then they will get more information from related web
site. This will help consumer know the product more, and add value to the brand.
Communication, just interested customers will click the advertising and get
more information, as Dave et al. (2000) mention, “Aggregations of like-minded
consumers rather than arbitrarily defined target segments”, online advertising is
easier to find good consumers. Consumers here explore the information actively.
As the authors discuss above, audiences do not only receive the information, but they
also explore the information which they need, meanwhile, advertisers should be also
active when audiences have interest in their product, and they will do their utmost to
persuade audiences to buy their product. Thus one of the most significant differences
is interactivity. Consumers have more influence on advertisers in interactive context,
and unlike traditional advertising which concentrates on how advertisers and market
influence consumers, advertisers must manage certain respond well, present the
product‟s function, advantages or disadvantages and other details which consumer
need and lead them to purchase. Therefore online advertising is better used of logical
and convincing advertising.
~ 17 ~
2.4 WHY THE AUTHORS COMBINE THE PRECEDING TWO MODELS
Compared with traditional medium, the key characteristics of online advertising is
interactivity, which means consumers are not passive affected by advertiser anymore,
and for now, consumer‟s behavior can affect advertiser immediately. If consumers are
interested in online advertising, they will read the advertisement carefully, click on
the advertisement, enter advertiser‟s website, and get more information about the
product, and even place the order online. It can be found that consumers occupy
initiatively in the whole process, with all behavior depending on their own motivation
and desire, all of these elements have a great influence on advertising effectiveness.
With the help of Hierarchy of effectiveness model, consumers‟ behavior can be
divided into 6 steps after consumers‟ watch online advertising: awareness,
knowledge, liking, preference, conviction and purchase (Lavidge and Steiner, 1961).
Therefore, being aware of the existence of the product, searching for related
information on the website, getting more knowledge of it, beginning to like it till have
passion for it, ensure the purchase necessary and finally do it. All above should be
explored in online advertising context.
Usunier and Lee (2009) point out an empirical model of the whole process of
advertising management. The model starts with problem that the company would like
to solve, and ends up with how advertising affect in the communication process, and
tries to find a good solution to achieve the aims.
After looking into these two models above, the authors of this study find that there is
a very close relationship between them; the most influential factor is interactivity. It is
argued that “researchers have noted that the quest for improving interactivity guides
future technological development for the Web” (Ha & James, 1998; Robb et. al, 1997).
On account of interactivity can expand the role of consumer participation, it can help
advertiser to build a stable relationship with consumers, and stable relationship can
help advertiser increase sales and promote development (Hoffman et al, 1995).
In this paper, the authors develop three main hypotheses describing the relationship
between these two models, after that, the authors test the hypothesis by questionnaires,
aiming to find out how advertising management influences online advertising
effectiveness.
~ 18 ~
Interactivity
Online Advertising
Advertiser Consumer
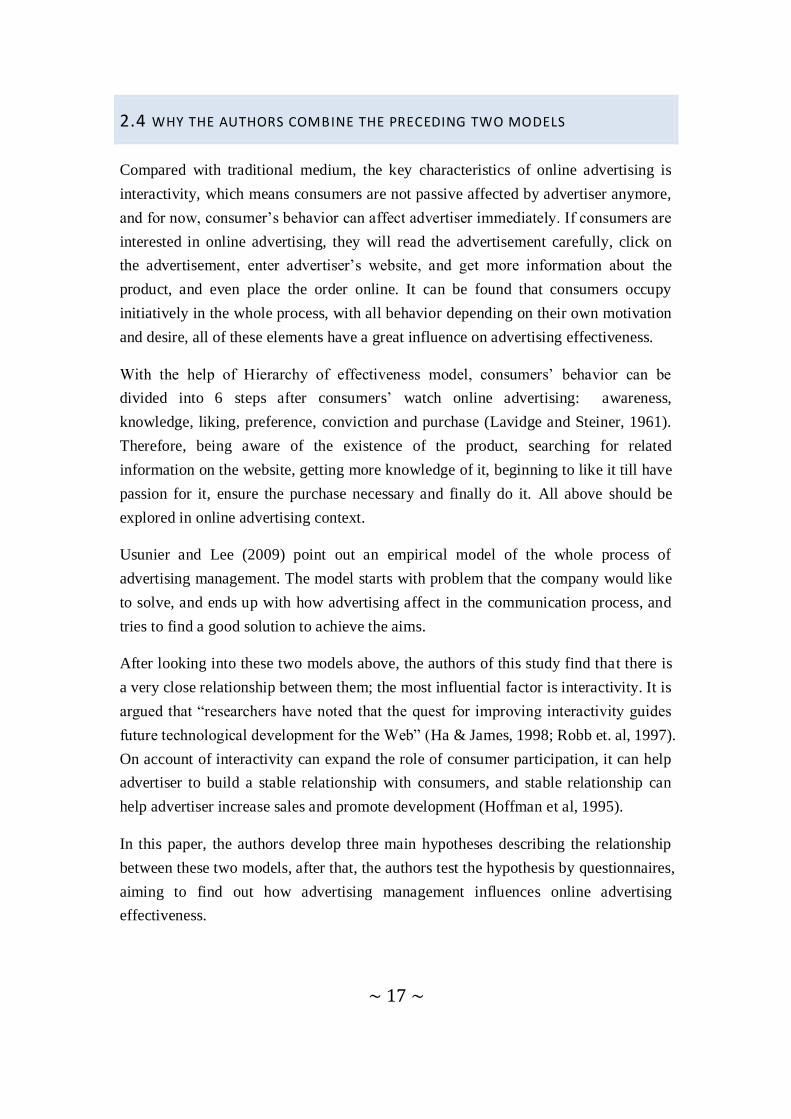
2.5 DESCRIPTION OF ANALYTICAL FRAMEWORK
Figure 3 The interactivity between consumer and advertiser in the online advertising
communication (Usunier and Lee,2009,p.377;Lavidge and Steiner, 1961, p.61),
suggested by the authors
Based on the model of the six main steps in the management of advertising
communication which is proposed by Usunier and Lee (2009), the authors of this
paper make some modifications. As the authors discussed, Internet is the medium in
online advertising process. In other words, the media strategy, which is definite in the
study, is performed as online advertising. Therefore, there are five steps in advertising
management which includes Problem to be solved, Target(s), Communication
objectives, Creative strategy, Implementation and control accordingly.
Problem to be solved
Problem to be solved
Targets
Communication objectives
Creative strategy
Implementation and control
Conative
Affective
Cognitive
~ 19 ~
Through advertising, marketers are willing to solve problems that exist in the
marketing process. Basically, one of the major objectives of online advertising is to
generate sales directly, as marketers can sell products or services directly to the
consumer (Belch & Belch, 1998). Besides, creating and maintaining brand awareness
is also the goal of advertising in the case of low interest or involvement (McMahan,
1980). Aaker (1996) argues that there are four components that form brand equity:
brand awareness, perceived quality, brand loyalty and brand associations. Among
them, brand awareness and brand loyalty are two key problems that need to be solved
in online advertising.
Brand awareness means the strength of the brand‟s presence in the target‟s mind. In
order to be successful in an industry which focuses on the same product, the brand
must dominate others (Aaker, 1996). It can be presumed that awareness will help
advertisers to keep the brand in the consumer's evoked set, hence rise up the
possibility that the brand will be purchased (Hoyer & Brown, 1990).
Brand loyalty could drive long-term success (ibid). Lots of researchers have studied
on brand loyalty, especially the relationship between brand loyalty and repeat
purchasing behavior which could be called as rebuy. In situations involving common,
repeat-purchase products, consumers may choose a brand on the basis of a simple
heuristic (e.g., brand awareness, pricing, and packaging) and then evaluate the brand
subsequent to purchase (Hoyer & Brown, 1990)
Jacoby and Kyner (1973) build up a conceptual definition of brand loyalty. The
definition is delivered by six necessary and sufficient conditions.
They are:
“(1) the biased (i.e., nonrandom), (2) behavioral response (i.e., purchase), (3)
expressed over time, (4) by some decision-making unit, (5) with respect to one or
more alternative brands out of a set of such brands and (6) is a function of
psychological (decision-making, evaluative) processes.”
Target(s)
It is hard to determine the certain audience who are watching traditional
advertisement, e.g. advertisement on TV. In contrast, online advertising has the ability
to target specific audience, along with the least waste coverage (Belch & Belch, 1998).
~ 20 ~
For instance, by means of world-wide biggest search engine Google, advertisers can
decide to target customers in any state, city or region, at the same time, the online
advertisement is only shown to customers reading about or searching for related
products or services (Google, Ad Words). Therefore, with the exact target, advertisers
can reach the most potential consumers who are more probable to make purchasing
decisions through online advertising.
Under online advertising context, the target audiences act as receivers who process
the message they receive with the foundation of personal experience and personal
characteristics (Tyagi &Kumar, 2004). The significant personal characteristics
comprise comprehension, level of involvement and psychological noise (Tyagi
&Kumar, 2004).
According to Tyagi and Kumar (2004), comprehension refers to the quantity of
consumer‟s motivation and the message. The consumer‟s level of involvement is
pivotal in the attention which is paid to the online advertisement (Tyagi &Kumar,
2004).
Psychological noise is a barrier that occurs to online advertisement reception (ibid).
Sometimes advertisers can become a victim of psychological voice due to different
kinds of reasons. In order to deal with noise, the advertisers should repeat showing
advertisements several times to ensure that the advertising message is received (ibid).
Communication objectives
Since communication objectives are the impacts of target population, whatever on
attitude and behavior, there are possible objectives including the following parts:
increasing consumers in the target market who associate specific features, benefits, or
advantages with brand; increasing the number of consumers in the target audience
who prefer the product over the competition‟s; attracting current users of the product
to use it more frequently or in more situations; attracting consumer who have never
used the brand to try it (Usunier and Lee, 2009; Belch & Belch, 1998).
In this part there is no evident difference between traditional advertising and online
advertising, in that both of them have the purpose of letting consumers know, like and
act with the advertised product. Nevertheless, the biggest distinction is the
interactivity between consumers and advertisers. As the authors explained earlier, in
~ 21 ~
traditional advertising process, advertisers merely send the unilateral information. It
becomes difficult to receive the response of consumers at once, as advertisers do not
know what information consumers need.
With the help of hierarchy of effectiveness model (Lavidge and Steiner, 1961),
cognitive, affective and conative are 3 steps of consumers‟ behavior, if the advertiser
wants to convince consumer to buy the product, they must let consumer know the
function of product, or what merits the product has. In other words, the advertiser
cannot skip the cognitive part, enter into the affective part directly. Meanwhile,
consumers‟ attitude will also affect communication objectives. Lutz (1985) points out
that the belief in the advertised product itself is the attitude of personal preference.
Consumer‟s likeness or dislikenness of advertising will definitely affect their behavior.
As Mitchell & Olson (1981) conduct, the attitude of consumer affects consumer‟s
perceptions of brands, and determines whether they will purchase or not.
Creative strategy
A creative strategy is “a policy or guiding principle which specifies the general nature
and character of messages to be designed” (Frazer, 1983). Every successful
advertisement could have creativity in its management process. It could be also
referred to the capacity of collecting creative ideas that can be applied to solve the
problems (Belch & Belch, 1998). Besides, a creative strategy focuses on what the
advertising message interprets or communicates and guides all of the messages used
in the advertising campaign in the developing process (Lee and Johnson, 2005).
There are several alternative creative strategies which are suitable in different
conditions. Take the unique selling-proposition approach (USP) for example, it is
most useful when difference cannot be readily matched by competitors (Frazer, 1983).
Under this circumstance, competitive implications are achieved. An advertiser can
obtain strong persuasive advantage and may force competitors to choose more
aggressive strategy (e.g. positioning), meanwhile, the advertiser makes a superiority
claim based on a unique product attribute which stands for a meaningful, distinctive
consumer benefit (Frazer, 1983; Lee and Johnson, 2005).
However, creative person or team should obtain knowledge from everyone who is
related to the product, including engineers, salespeople and consumers (Belch &
Belch, 1998). According to Griffin (1993), there are 8 points that are considered to be
essential parts of the creative strategy. The target audience and the audience‟s
problem: like what they miss or lack, are two of them. Inputs to the creative process
~ 22 ~
could be considered from two aspects which both need information from target
audience (Belch & Belch, 1998).
Implementation and control
During the communication process, the receiver‟s reaction to the message is called a
response (Belch & Belch, 1998). Based on this definition, feedback which is a part of
the receiver‟s response will be sent back to the sender (Belch & Belch, 1998). In
online advertising, new pattern of communication is interactive so that the audiences
can provide direct feedback (Tyagi &Kumar, 2004, p72). It is helpful for sender to
monitor and control the message. Feedback which is based on research analyzes the
recall of ads, message comprehension and other responses and with feedback, the
advertiser can know better about the reasons of success or failure and adjust the
advertisements as well (Belch & Belch, 1998).
Numerous appeals can be considered as the basis of advertising messages, as they can
be used in adverting development and issues that appear in effective advertising
communication (Belch & Belch, 1998). Generally, the appeals are divided into two
categories: informational appeals and emotional appeals. The first appeal concentrates
on consumer‟s practical and functional need for product and emphasize on the
benefits of owning a specific brand (Belch & Belch, 1998). The second appeal
focuses on consumer‟s social or psychological needs for a product because the
motivation of consumer‟s buying a product is emotional (ibid).
A variety of criteria can evaluate the creative approach proposed by the advertiser.
Belch and Belch (1998) discuss some basic criteria in terms of questions, such as: is
the creative approach consistent with the advertising objectives and creative strategy? ,
and is the creative approach communicate a convincing message to the consumer?
2.6 HYPOTHESES
The authors formulate 3 hypotheses from the analytical framework (see Figure 3)z
discussed previously.
Consumers‟ behavior can be divided into 3 steps according to gradual advance:
cognitive, affective and conative phases (Lavidge and Steiner, 1961). If the
advertisers want to lead consumers to purchase through their good management, they
will let consumers be aware of the function of product or the merits of the product
firstly. Therefore, hypothesis 1 is proposed as follows:
~ 23 ~
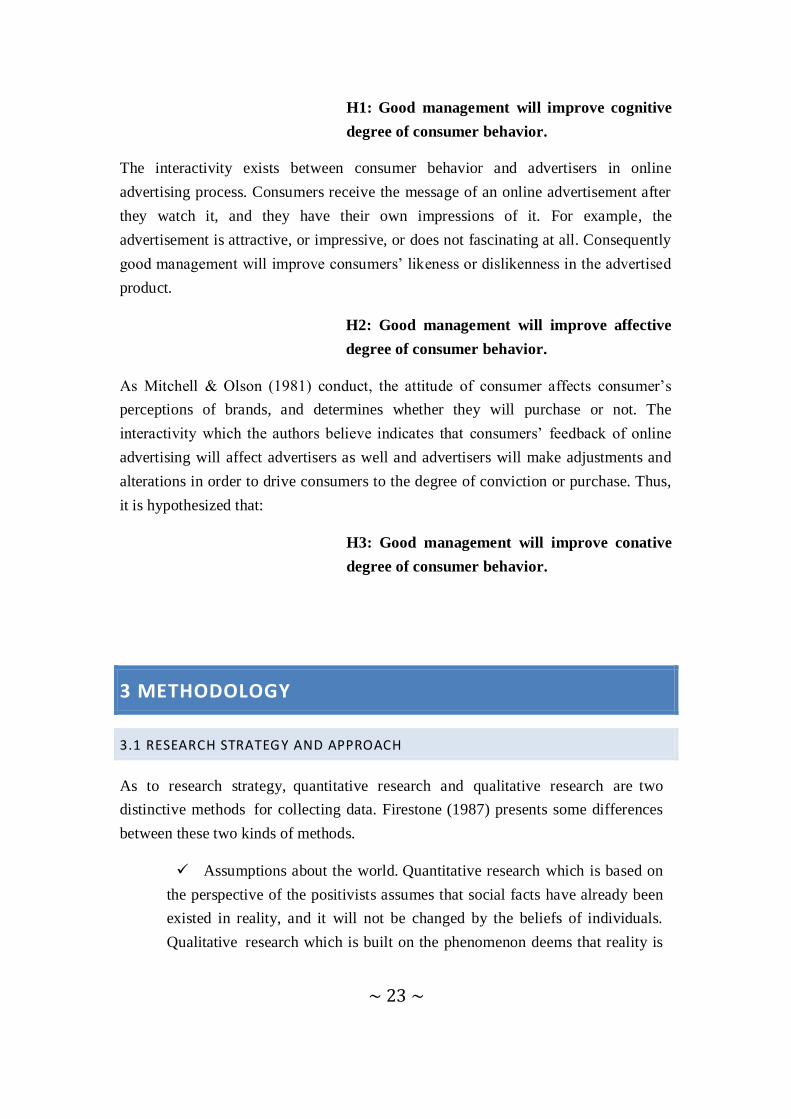
H1: Good management will improve cognitive
degree of consumer behavior.
The interactivity exists between consumer behavior and advertisers in online
advertising process. Consumers receive the message of an online advertisement after
they watch it, and they have their own impressions of it. For example, the
advertisement is attractive, or impressive, or does not fascinating at all. Consequently
good management will improve consumers‟ likeness or dislikenness in the advertised
product.
H2: Good management will improve affective
degree of consumer behavior.
As Mitchell & Olson (1981) conduct, the attitude of consumer affects consumer‟s
perceptions of brands, and determines whether they will purchase or not. The
interactivity which the authors believe indicates that consumers‟ feedback of online
advertising will affect advertisers as well and advertisers will make adjustments and
alterations in order to drive consumers to the degree of conviction or purchase. Thus,
it is hypothesized that:
H3: Good management will improve conative
degree of consumer behavior.
3 METHODOLOGY
3.1 RESEARCH STRATEGY AND APPROACH
As to research strategy, quantitative research and qualitative research are two
distinctive methods for collecting data. Firestone (1987) presents some differences
between these two kinds of methods.
Assumptions about the world. Quantitative research which is based on
the perspective of the positivists assumes that social facts have already been
existed in reality, and it will not be changed by the beliefs of individuals.
Qualitative research which is built on the phenomenon deems that reality is
~ 24 ~
socially constructed through individual or collective definitions of the
situation (Firestone, 1987; Taylor & Bogdan, 1984).
Purpose. Quantitative research tries to explain the essential reason of
social facts by measurement and quantitative analysis. Qualitative research
attempt to understand social phenomenon by analyzing actor‟s perspectives
and behaviors.
Approach. Experimental or correlational designs are always applied in
quantitative research in order to reduce errors, bias, and other noises, so that
clearly perceiving of social facts can be attained (Firestone, 1987; Cronbach,
1975). Qualitative research study which is on the basis of the research of
ethnography helps the reader understand the definitions of the situation
(Firestone, 1987; Goodenough, 1971).
Researcher role. The ideal quantitative researcher is detached to bias.
The qualitative researcher becomes "'immersed" in the phenomenon of
interest (Firestone, 1987; Powdermaker, 1966).
To sum up, qualitative research can be construed as a research strategy that usually
emphasizes on words rather than quantification in the collection and analysis of data
(Bryman and Bell 2007). However, quantitative research which entails a deductive
approach can be construed as a research strategy that focuses on quantification in the
collection and analysis of data (ibid).
The quantitative research strategy and a deductive research approach are used in this
study, which is adapted to provide a deep understanding for how good management
affects online advertising effectiveness. Deductive theory refers to the commonest
view of the nature of the relationship between theory and research (Bryman and Bell
2007).
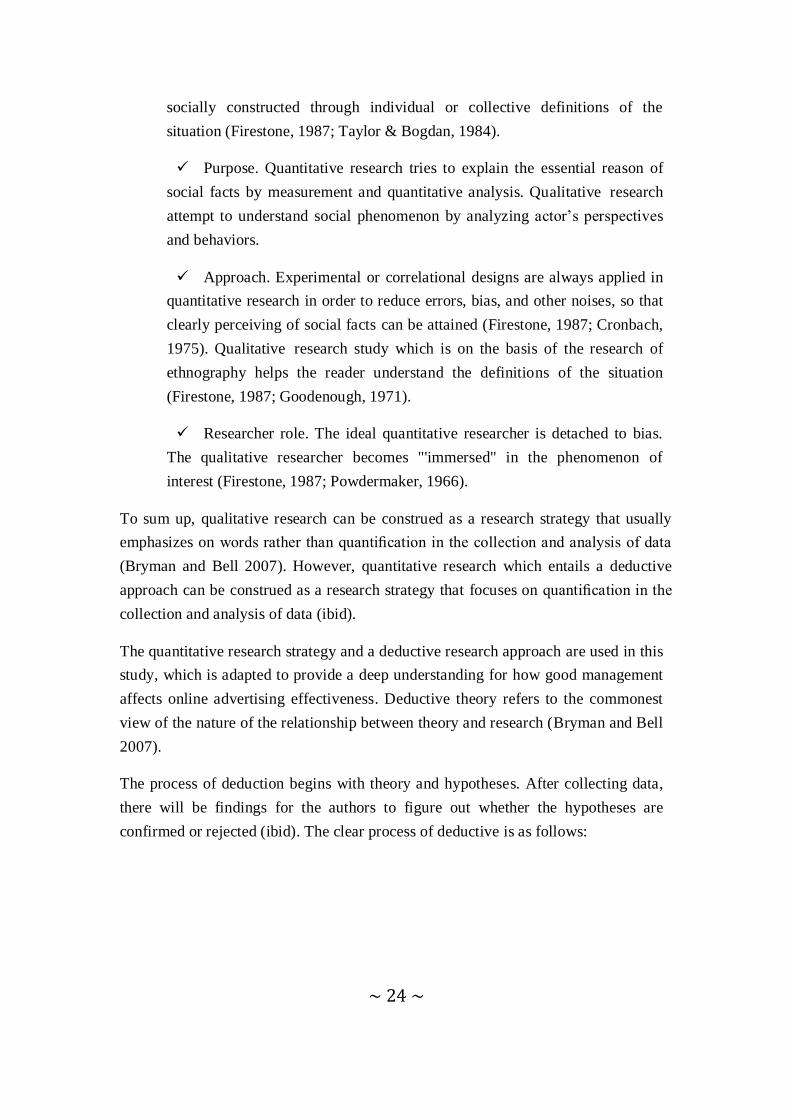
The process of deduction begins with theory and hypotheses. After collecting data,
there will be findings for the authors to figure out whether the hypotheses are
confirmed or rejected (ibid). The clear process of deductive is as follows:
~ 25 ~
Figure 3.1 The process of deduction, Bryman and Bell (2007), p.11, fig 3.1.
3.2 DATA COLLECTION
Both primary and secondary data are collected in this study. There are various
sources for collecting secondary data, such as books which are borrowed from the
school library, marketing journals which are searched from databases, and reports
from official websites. As Bryman & Bell (2007, pp 326) presents, it is possible to
use secondary data combined with primary data, such as experts‟ evaluations.
The primary data is collected for analyzing the research question. A questionnaire is
designed according to the analytical framework and sent to white-collar workers.
In this study, a self-completion questionnaire is designed and surveyed on the internet.
The reason lies in the fact that Bryman & Bell (2007) states as follows: no interview
available, self-completion questionnaire and structured interview are very similar in
business research (ibid). It is impossible to interview so many consumers in the
authors‟ research, thus self-completion questionnaire is chosen by the authors;
questionnaire is convenient to responder because they can finish the questionnaires in
different places and time when they want.
Bryman & Bell (2007) also mention that web survey is a format which has low costs,
faster response and attractive element. Thus it is suitable for the authors because the
authors are both student in Sweden now, at the same time, it is very hard to pay a lot of
~ 26 ~
money and time to hand out all the questionnaires to Chinese white-collar workers
through traditional ways, such as post, face to face and so forth.
The authors use a special professional website Askform to distribute questionnaire, the
hyperlink of the questionnaire is
http://www.askform.cn/68210-74366.aspx
Totally twenty questions in Chinese are posted in the questionnaire, with the English
version in the appendix. The authors sent this hyperlink to their friends and family
members who are all white-collar workers.
White-collar workers in the authors research refers to persons who engaged in
mental work and usually they work in office, such as engineer, teacher, office clerk
and so forth.
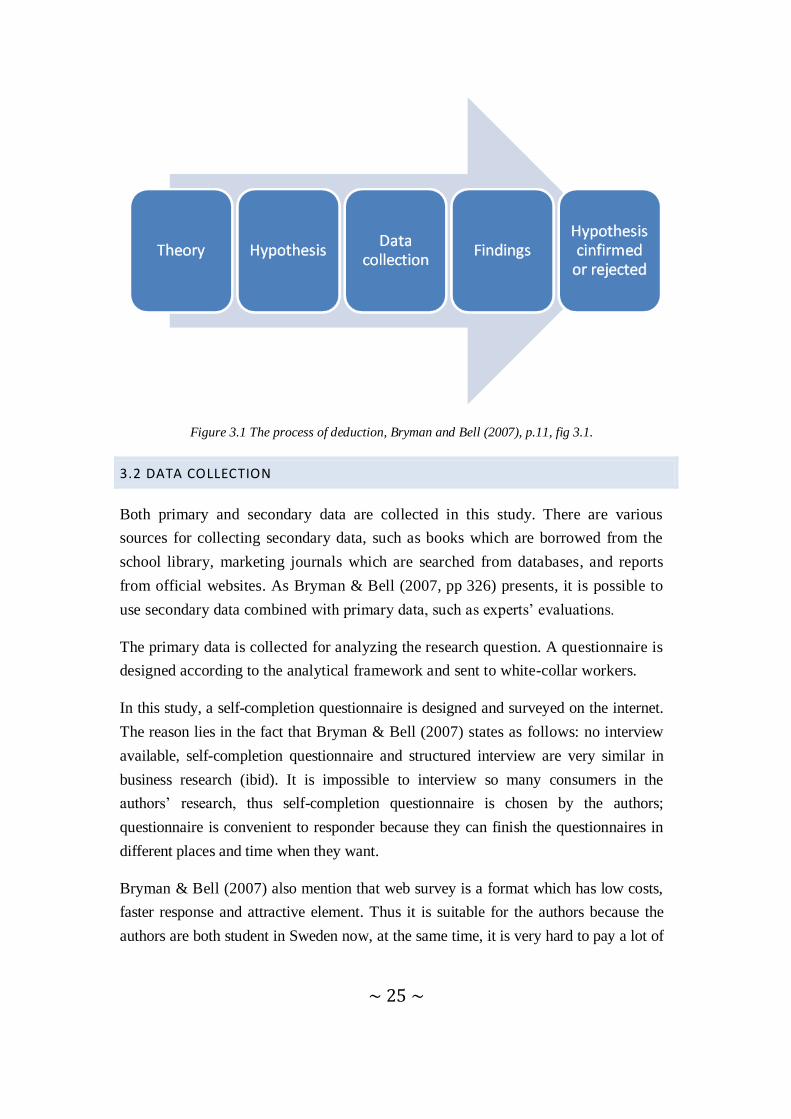
The process of questionnaire distribution and collection presents in Figure 3.2
Figure 3.2 The process of questionnaire distribution and collection
The Likert scale, which is commonly used in questionnaires and survey research, is
a psychometric scale (Uebersax, 2006). When it comes to a Likert questionnaire
item, the respondents state their level of agreement from five levels: Strongly agree,
Somewhat agree, Neither agree or disagree, Somewhat disagree, and Strongly
disagree (Uebersax, 2006; Likert, 1932). Meanwhile, Likert scale is adopted for
~ 27 ~
computer analysis (Bryman & Bell, 2007). Therefore, the authors use Likert scale
while designing questionnaires.
3.3 SAMPLING
Bryman and Bell (2007) indicate that sample means “the segment of the population
that is selected for investigation”. It is a subset of the population. The method of
selection may be based on a probability or a non-probability approach.”
Probability sample are defined as “one for which every unit in a finite population has
a positive probability of selection, not necessarily equal to that of other units
(Schreuder, Gregoire & Weyer, 1999).” The main types of probability sample are
simple random sample and systematic sample. If simple random sample is used, each
unit will has equal chance of being included in the overall sample. When choosing
systematic sample, units should be selected directly from the sampling frame, without
resorting to a table of random numbers.
Non-probability approach is defined as “essentially an umbrella term to capture all
forms of sampling that are not conducted according to the canons of probability
sampling outline above. (Bryman and Bell ,2007, PP 197).” It includes convenience
sampling which is simply available for researchers; snowball sampling which makes
initial contact with a small group of people who are relevant to research, and then let
these people to contact with other relevant people; and quota sampling which
produces a sample of relevant categories, afterwards chooses equal number from each
category (Bryman and Bell , 2007).
As a matter of fact, sample choosing could be time consuming and costly, so,
consideration of sampling size are likely to be affected by matters of time and cost at
such a juncture (Bryman & Bell, 2007).
After comparing two approaches, the authors adopt non-probability which is a set of
snowball sampling in this study. They try to send the questionnaire to their friends
who are white-collar workers, and their friends help the authors send the hyperlink of
the questionnaire to other white-collar friends. In order to avoid repeatability, before
answering the questionnaire, there is a “name” with blank for the respondents to fill in.
Take limitation of time and money as well as return rate into consideration, and
convenience sampling method was used to collect the primary data. More than three
hundred questionnaires were distributed and 145 effective samples were collected.
~ 28 ~
The respondents were from Shanghai, Hangzhou, Ningbo, Peking and other China's
major cities.
3.4 DATA ANALYSIS
The software SPSS will also be used in analyzing data which are collected from
questionnaires. The mean value, standard deviation, descriptive and factor analysis will
be adapted to measure and compare different answers. Other kinds of analysis index
will be applied in future analysis such as Cronbach‟s alpha and Pearson‟s Correlation.
Cronbach‟s alpha
Cronbach's alpha is an index of reliability associated with the variation accounted for
by the true score of the underlying construct, and construct is the hypothetical variable
that is being measured (Hatcher, 1994). Cronbach‟s alpha is used to measure the
correlation between the variables and get the reliability of the results. Reliability
coefficient normally ranges between 0 and 1, and George and Mallery (2003) discuss
the rules of thumb as follows:
“ > .9 – Excellent,
> .8 – Good,
> .7 – Acceptable,
> .6 – Questionable,
> .5 – Poor, and
< .5 – Unacceptable” (George and Mallery, 2003, p. 231).
Pearson‟s Correlation
Pearson‟s Correlation is used to evaluate the linear relationship between two variables.
The correlations are between -1 and 1. When the correlation is below 0, there is a
negative correlation; when it is over 1, there is a positive correlation; when it equals 0,
there is no correlation between two variables at all (Hunt, 1986).
~ 29 ~
With the use of Pearson‟s correlation, some internal connections with each statement
in each hypothesis will be evaluated. Therefore, which statement affect the hypothesis
more will be identified (Hunt, 1986).
3.5 VALIDITY AND RELIABILITY
Reliability and validity are the most prominent criteria for the evaluation of business
and management research (Bryman & Bell, 2007).
Validity is “whether or not an indicator that is devised to gauge a concept really
measures that concept”, and it focuses on if theory data are close to the phenomenon
(ibid). According to the statistical report on the development of Internet which is
conducted by China Internet Network Information Center in 2008, besides students,
white-collar workers are the second largest group which constitutes the Internet users
proportion (CINIC, 2009). Therefore, the respondents of this research are white-collar
workers. The authors send out questionnaires which are designed on the basis of the
analytical framework. Hence the primary data are gathered from white-collar workers
directly. In addition, the questions are easy to be understood since it is clear and
intelligible.
Reliability means the degree of stability of concepts measurement and includes four
aspects: stability; correlation which is a measure of the strength of the relationship
between two variables; internal reliability which shows whether or not the
respondents‟ scores on any indicator tend to be related to their scores on other
indicators; and inter-observer consistency (Bryman & Bell, 2007, ch6). In this paper,
some classic and empirical theory and data has be used, and it is also tested in
previous researches. Furthermore, both authors are participating throughout the
investigation.
~ 30 ~
4 EMPIRICAL FINDING
4.1 SAMPLING, SOURCE OF DATA
In this paper, the authors combine two models which are management of online
advertising communication model and Hierarchy of effectiveness model. These two
models are applied to measure how advertisers communicate with consumers and how
advertisers affect consumers separately.
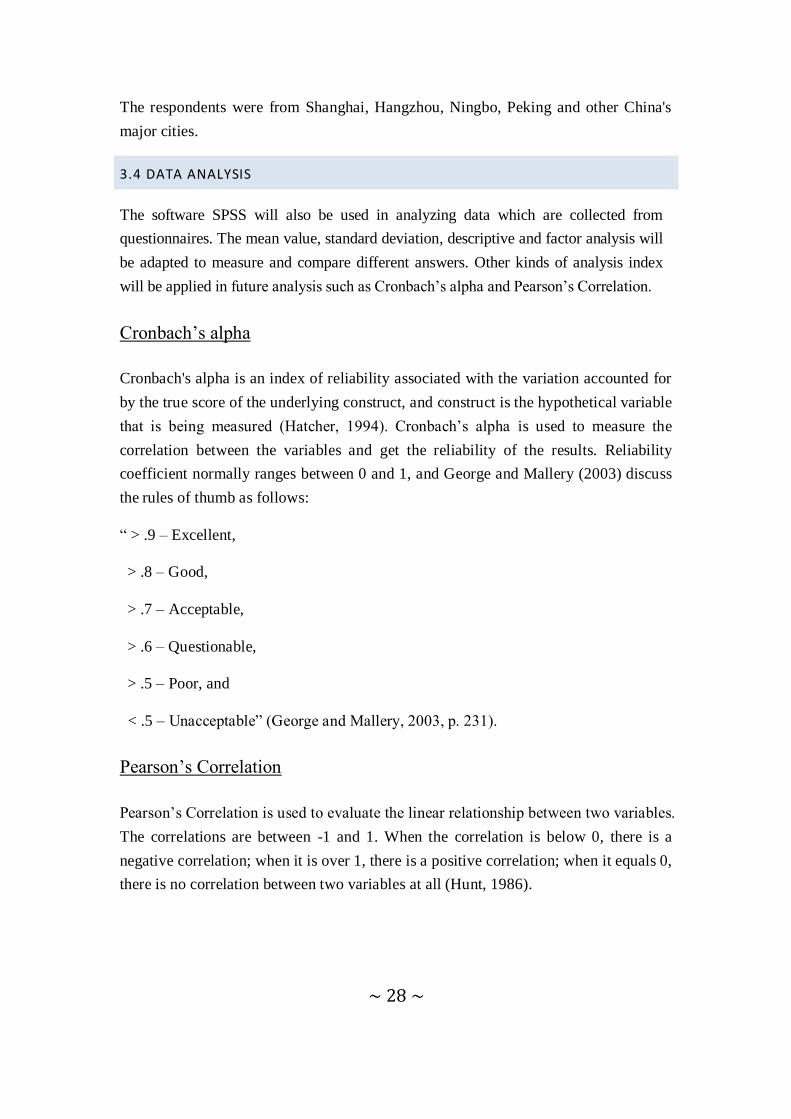
The proportion of white-collar workers who come from different positions is as figure
4.1.
Figure 4.1 the proportion of white-collar workers’ position
4.2 QUESTIONS REGARD TO COGNITIVE
~ 31 ~
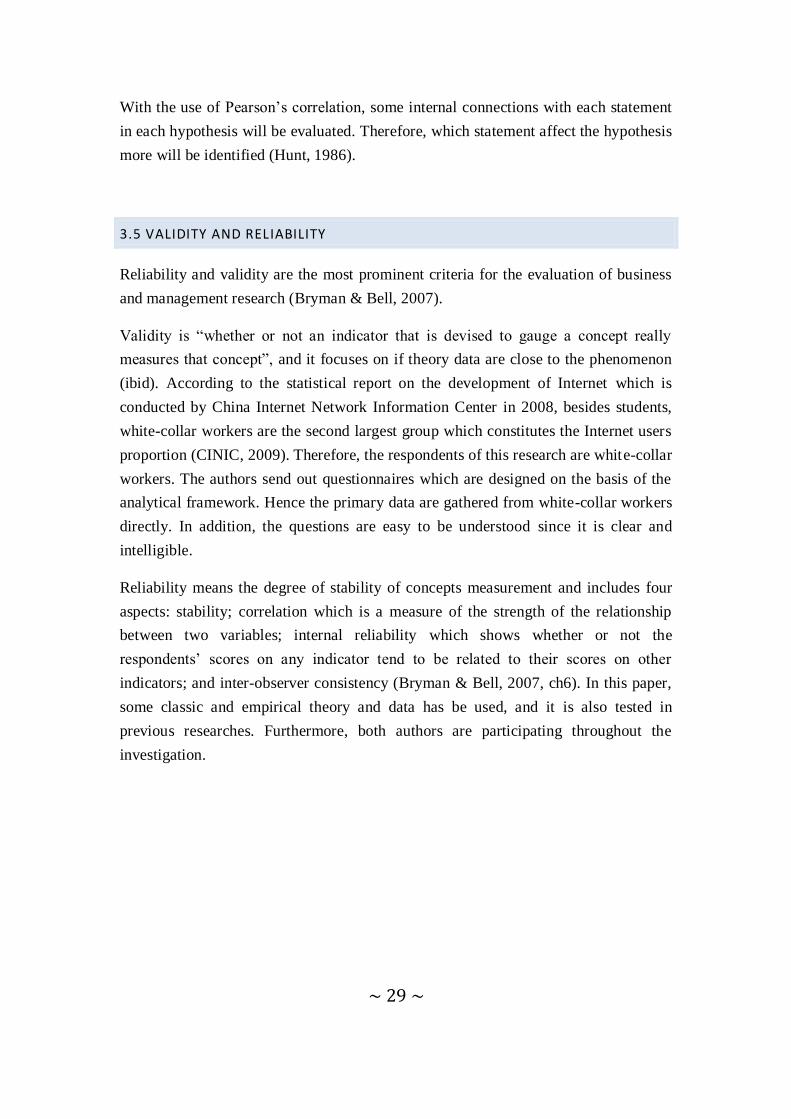
4.2.1 Before I watch the advertisement, I already have awareness of the advertised
product (Q1, awareness).
Figure 4.2.1 Question concerning awareness
It seems that many respondents did not know the advertised product before they
watch the advertisement. The mean 2.92 indicates that there are also some people who
have already known the product before, and the ratio is much closer to half and half.
Meanwhile, the standard deviation 1.038 presents that there are not too many
differences among consumers.
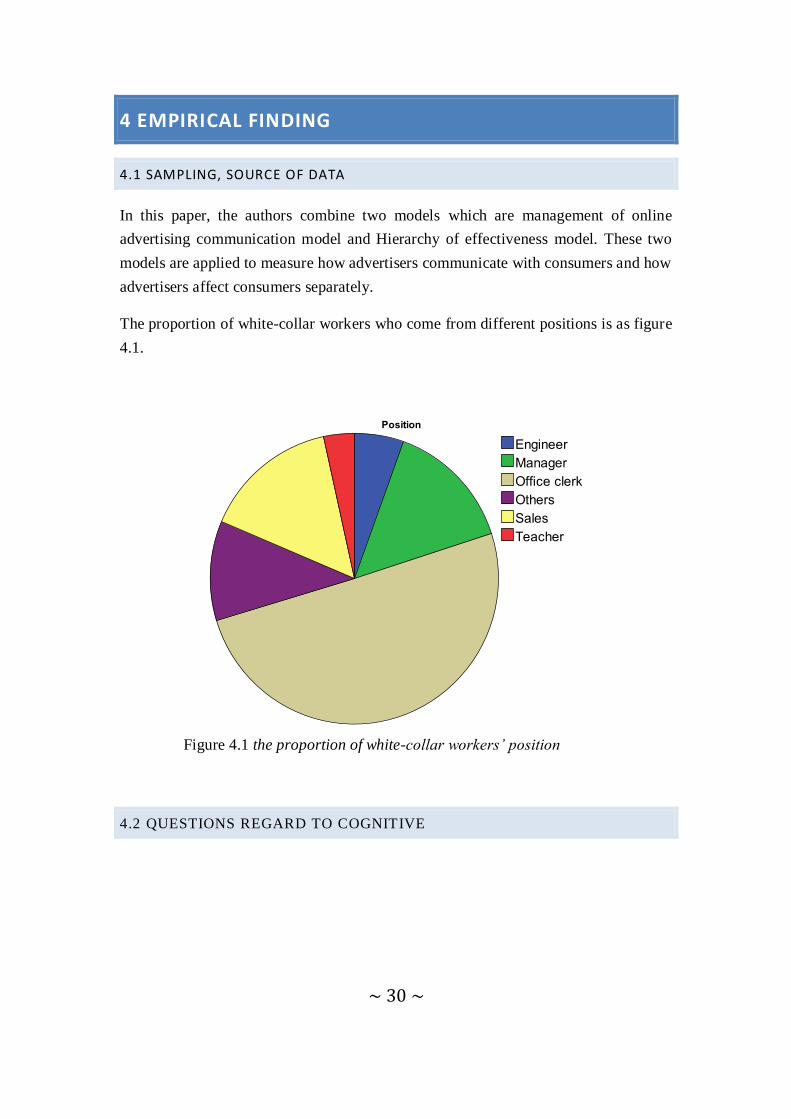
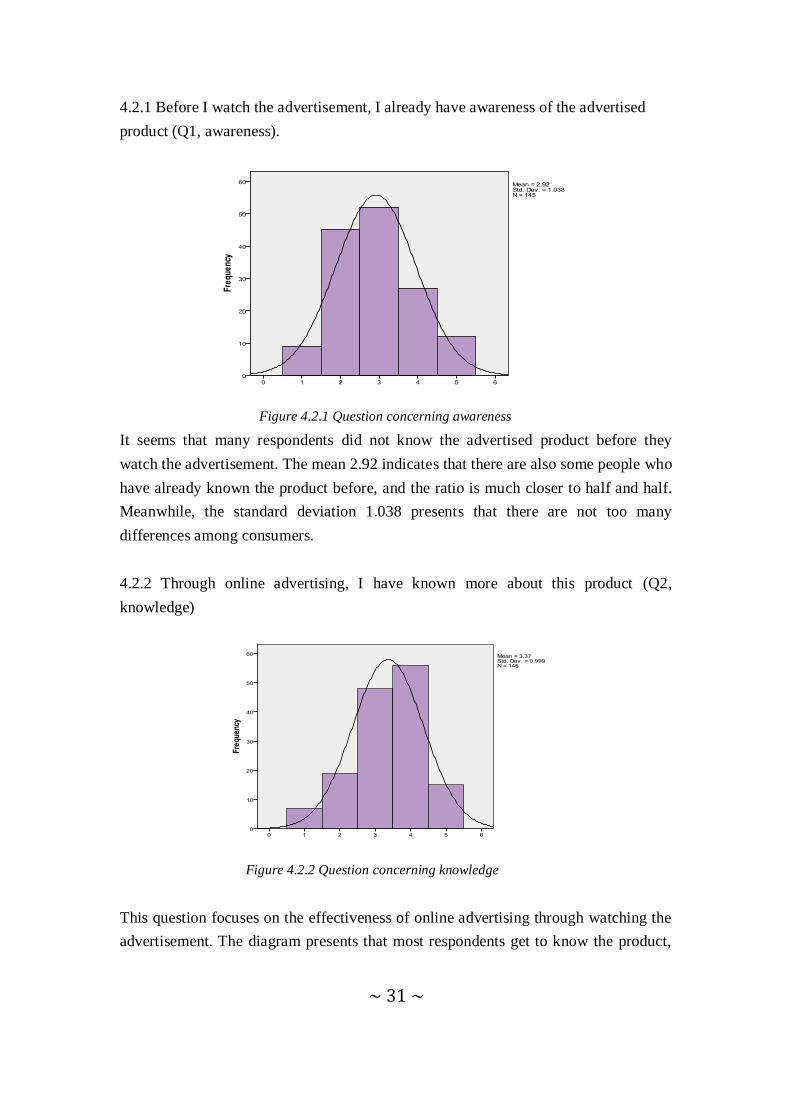
4.2.2 Through online advertising, I have known more about this product (Q2,
knowledge)
Figure 4.2.2 Question concerning knowledge
This question focuses on the effectiveness of online advertising through watching the
advertisement. The diagram presents that most respondents get to know the product,
~ 32 ~
such as its function, performance, sales information and so forth. The mean is better
than 3 indicates that most respondents agree that online advertisement can help them
get knowledge of the product, while some people do not agree with it. They just
watch the advertisement, and do not get any new knowledge.
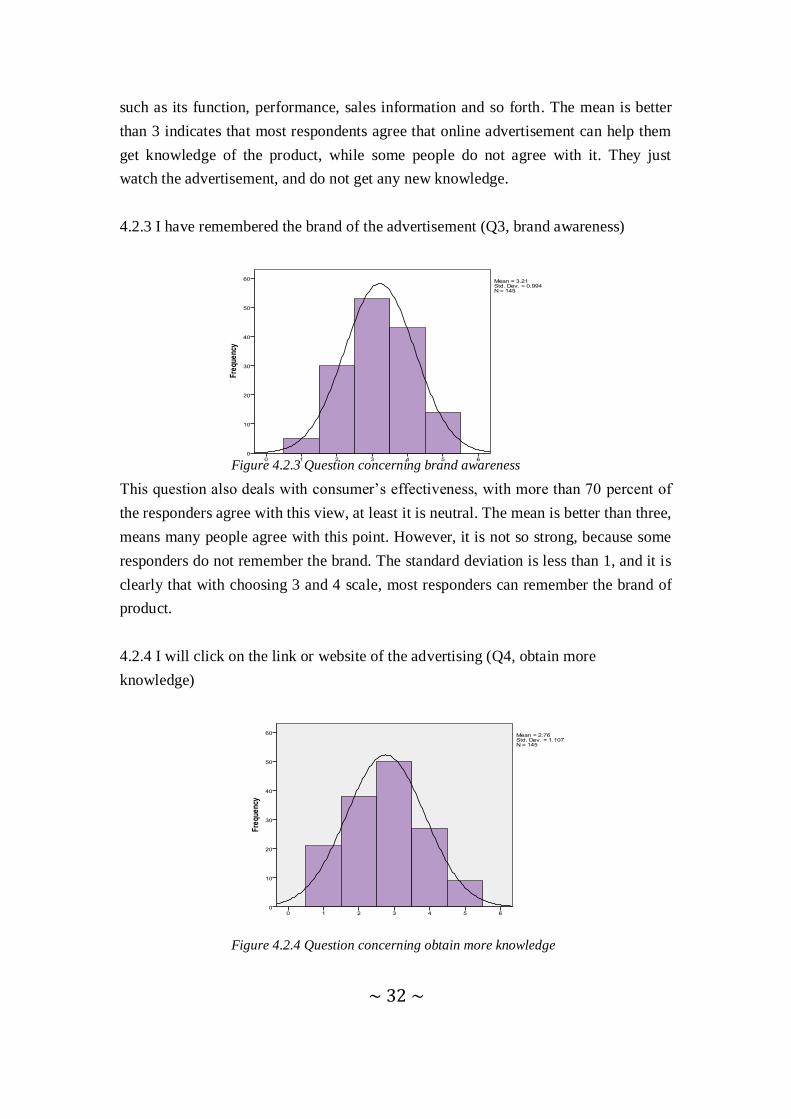
4.2.3 I have remembered the brand of the advertisement (Q3, brand awareness)
Figure 4.2.3 Question concerning brand awareness
This question also deals with consumer‟s effectiveness, with more than 70 percent of
the responders agree with this view, at least it is neutral. The mean is better than three,
means many people agree with this point. However, it is not so strong, because some
responders do not remember the brand. The standard deviation is less than 1, and it is
clearly that with choosing 3 and 4 scale, most responders can remember the brand of
product.
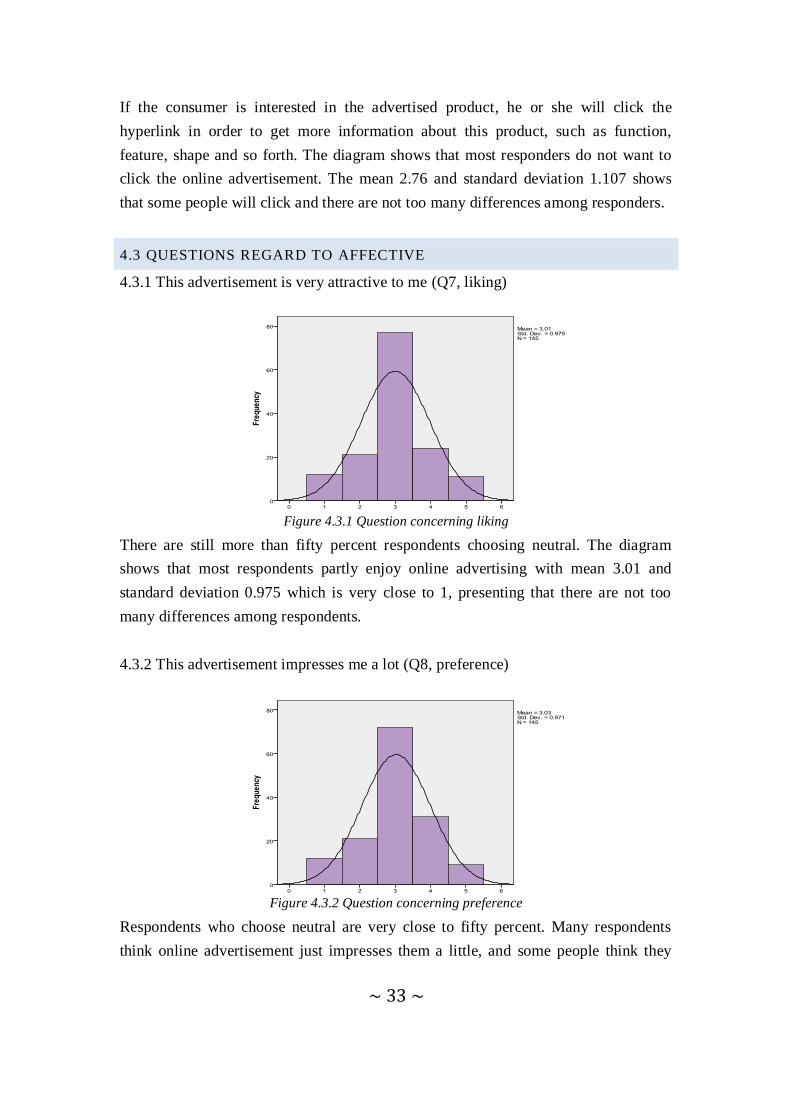
4.2.4 I will click on the link or website of the advertising (Q4, obtain more
knowledge)
Figure 4.2.4 Question concerning obtain more knowledge
~ 33 ~
If the consumer is interested in the advertised product, he or she will click the
hyperlink in order to get more information about this product, such as function,
feature, shape and so forth. The diagram shows that most responders do not want to
click the online advertisement. The mean 2.76 and standard deviation 1.107 shows
that some people will click and there are not too many differences among responders.
4.3 QUESTIONS REGARD TO AFFECTIVE
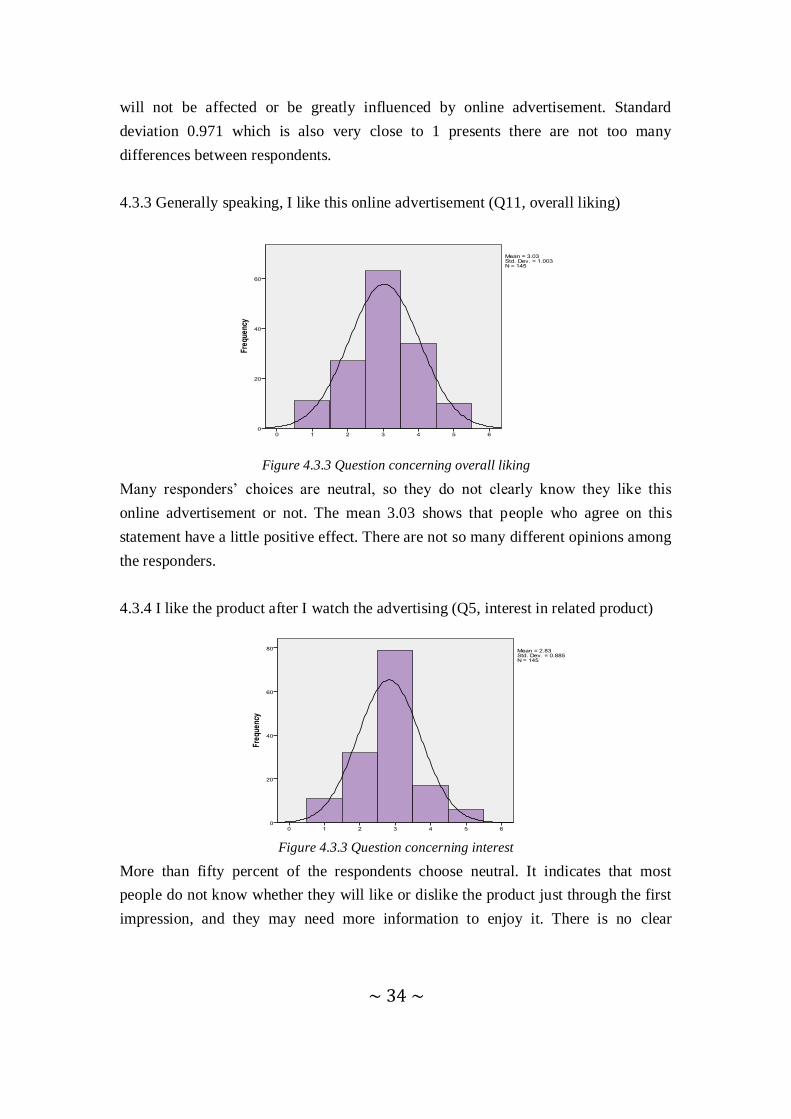
4.3.1 This advertisement is very attractive to me (Q7, liking)
Figure 4.3.1 Question concerning liking
There are still more than fifty percent respondents choosing neutral. The diagram
shows that most respondents partly enjoy online advertising with mean 3.01 and
standard deviation 0.975 which is very close to 1, presenting that there are not too
many differences among respondents.
4.3.2 This advertisement impresses me a lot (Q8, preference)
Figure 4.3.2 Question concerning preference
Respondents who choose neutral are very close to fifty percent. Many respondents
think online advertisement just impresses them a little, and some people think they
~ 34 ~
will not be affected or be greatly influenced by online advertisement. Standard
deviation 0.971 which is also very close to 1 presents there are not too many
differences between respondents.
4.3.3 Generally speaking, I like this online advertisement (Q11, overall liking)
Figure 4.3.3 Question concerning overall liking
Many responders‟ choices are neutral, so they do not clearly know they like this
online advertisement or not. The mean 3.03 shows that people who agree on this
statement have a little positive effect. There are not so many different opinions among
the responders.
4.3.4 I like the product after I watch the advertising (Q5, interest in related product)
Figure 4.3.3 Question concerning interest
More than fifty percent of the respondents choose neutral. It indicates that most
people do not know whether they will like or dislike the product just through the first
impression, and they may need more information to enjoy it. There is no clear
~ 35 ~
evidence to get the results of responders will like the product after they saw the
advertising.
4.4 QUESTIONS REGARD TO CONATIVE
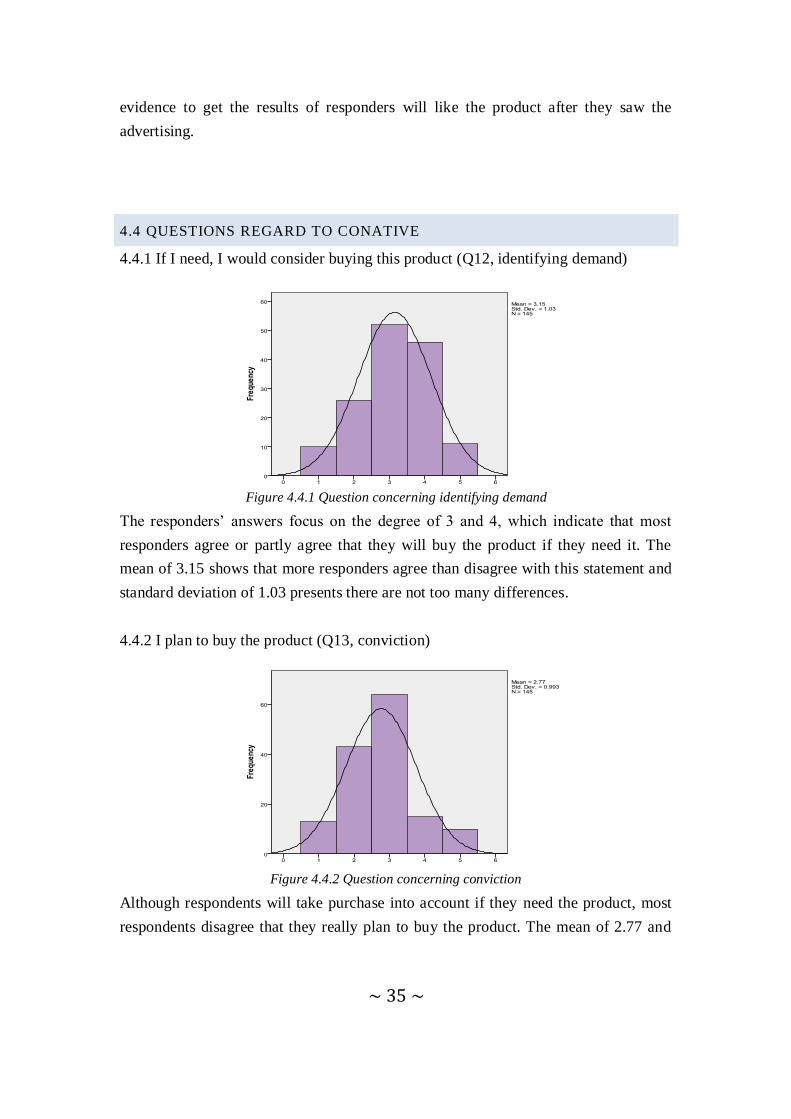
4.4.1 If I need, I would consider buying this product (Q12, identifying demand)
Figure 4.4.1 Question concerning identifying demand
The responders‟ answers focus on the degree of 3 and 4, which indicate that most
responders agree or partly agree that they will buy the product if they need it. The
mean of 3.15 shows that more responders agree than disagree with this statement and
standard deviation of 1.03 presents there are not too many differences.
4.4.2 I plan to buy the product (Q13, conviction)
Figure 4.4.2 Question concerning conviction
Although respondents will take purchase into account if they need the product, most
respondents disagree that they really plan to buy the product. The mean of 2.77 and
~ 36 ~
standard deviation of 0.993 indicate that most respondents agree that they do not have
specific plans to buy the product.
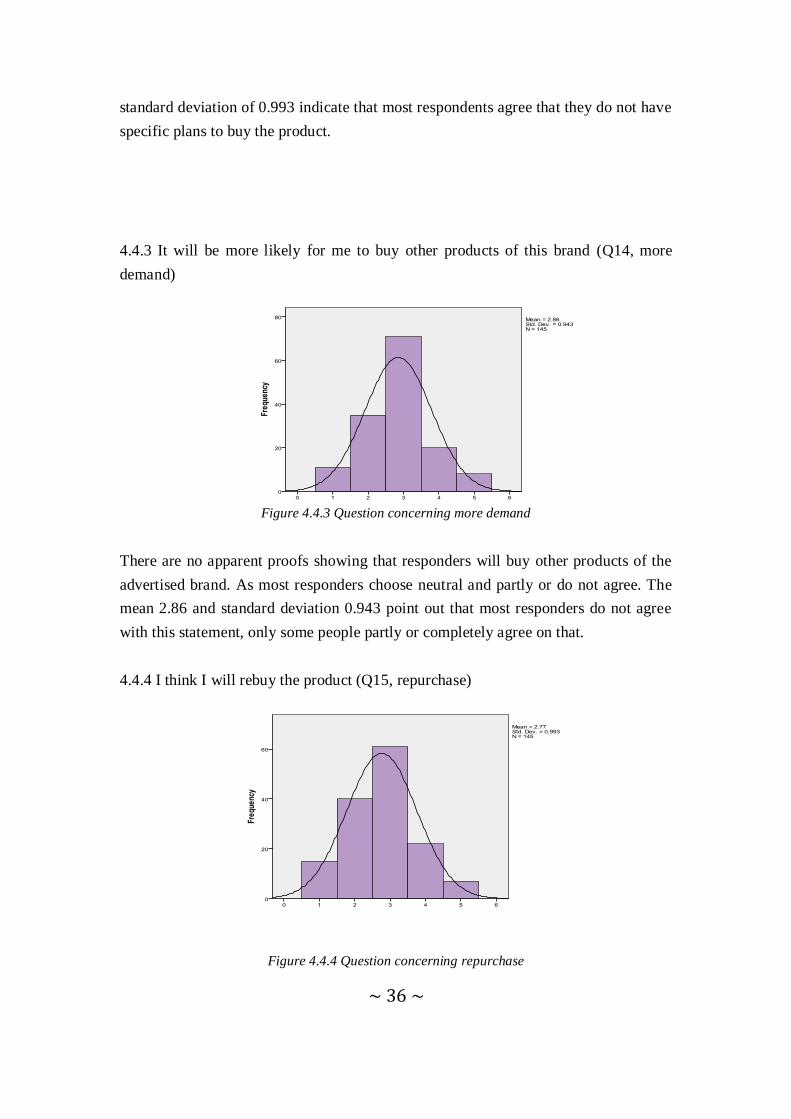
4.4.3 It will be more likely for me to buy other products of this brand (Q14, more
demand)
Figure 4.4.3 Question concerning more demand
There are no apparent proofs showing that responders will buy other products of the
advertised brand. As most responders choose neutral and partly or do not agree. The
mean 2.86 and standard deviation 0.943 point out that most responders do not agree
with this statement, only some people partly or completely agree on that.
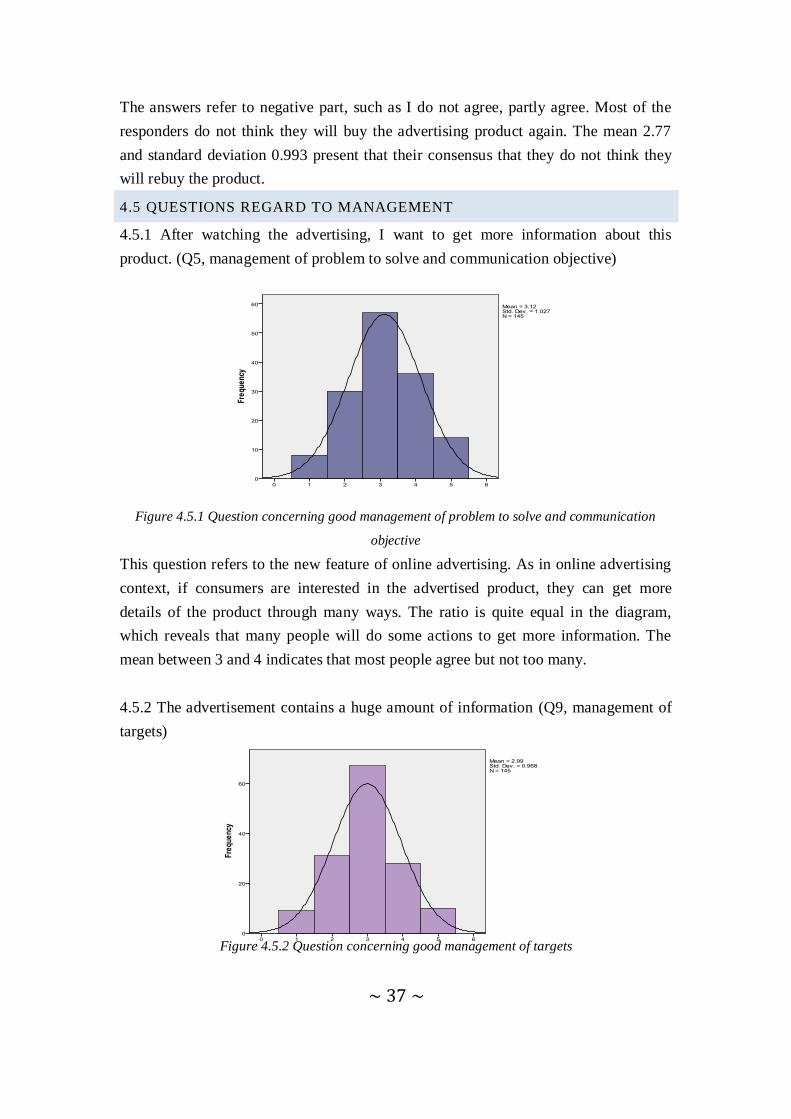
4.4.4 I think I will rebuy the product (Q15, repurchase)
Figure 4.4.4 Question concerning repurchase
~ 37 ~
The answers refer to negative part, such as I do not agree, partly agree. Most of the
responders do not think they will buy the advertising product again. The mean 2.77
and standard deviation 0.993 present that their consensus that they do not think they
will rebuy the product.
4.5 QUESTIONS REGARD TO MANAGEMENT
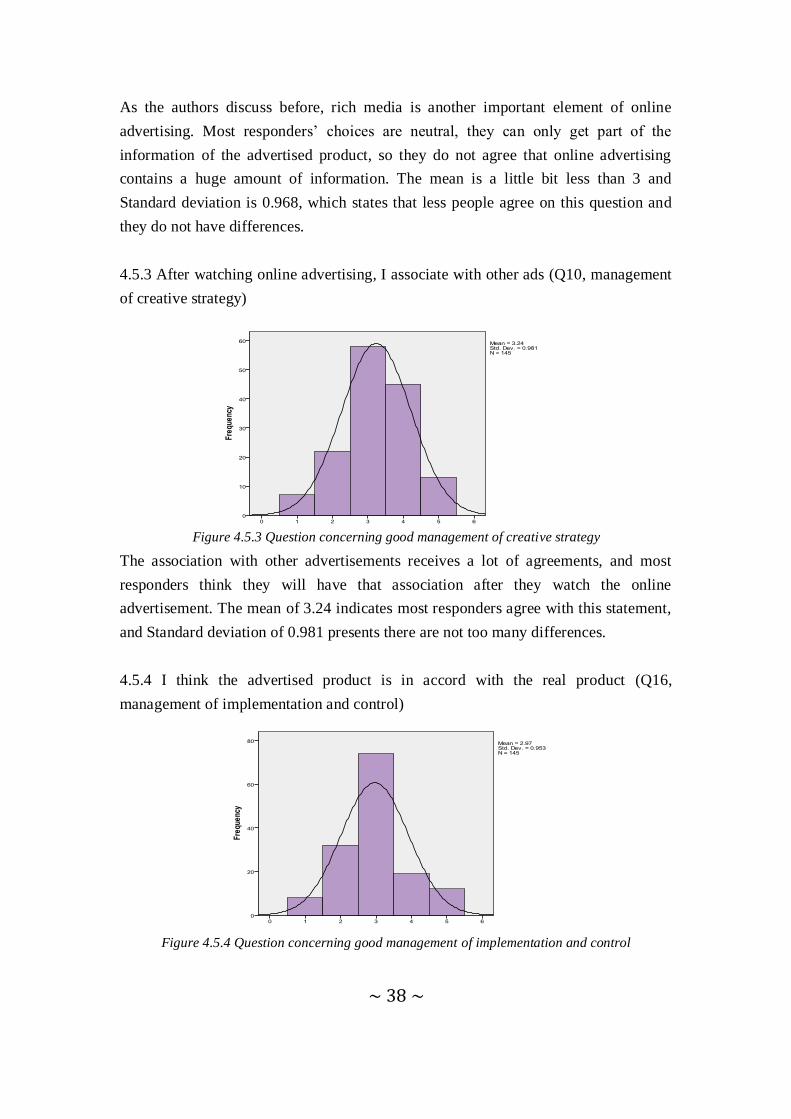
4.5.1 After watching the advertising, I want to get more information about this
product. (Q5, management of problem to solve and communication objective)
Figure 4.5.1 Question concerning good management of problem to solve and communication
objective
This question refers to the new feature of online advertising. As in online advertising
context, if consumers are interested in the advertised product, they can get more
details of the product through many ways. The ratio is quite equal in the diagram,
which reveals that many people will do some actions to get more information. The
mean between 3 and 4 indicates that most people agree but not too many.
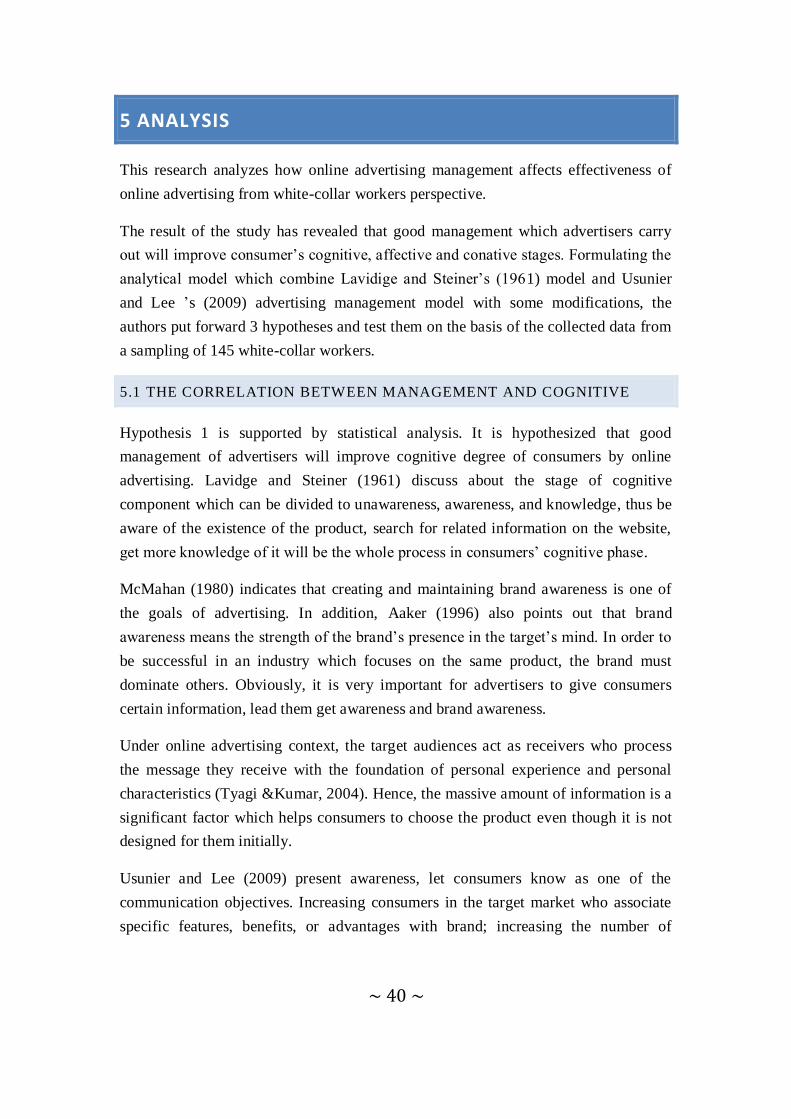
4.5.2 The advertisement contains a huge amount of information (Q9, management of
targets)
Figure 4.5.2 Question concerning good management of targets
~ 38 ~
As the authors discuss before, rich media is another important element of online
advertising. Most responders‟ choices are neutral, they can only get part of the
information of the advertised product, so they do not agree that online advertising
contains a huge amount of information. The mean is a little bit less than 3 and
Standard deviation is 0.968, which states that less people agree on this question and
they do not have differences.
4.5.3 After watching online advertising, I associate with other ads (Q10, management
of creative strategy)
Figure 4.5.3 Question concerning good management of creative strategy
The association with other advertisements receives a lot of agreements, and most
responders think they will have that association after they watch the online
advertisement. The mean of 3.24 indicates most responders agree with this statement,
and Standard deviation of 0.981 presents there are not too many differences.
4.5.4 I think the advertised product is in accord with the real product (Q16,
management of implementation and control)
Figure 4.5.4 Question concerning good management of implementation and control

~ 39 ~
More than fifty percent consumers choose neutral, most responders do not agree with
advertised product will be in accord with the real product, so there is no clear
evidence to get the results. The mean of 2.97 indicates less responder agrees with this
statement, and Standard deviation of 0.953 presents there are not too many
differences.
~ 40 ~
5 ANALYSIS
This research analyzes how online advertising management affects effectiveness of
online advertising from white-collar workers perspective.
The result of the study has revealed that good management which advertisers carry
out will improve consumer‟s cognitive, affective and conative stages. Formulating the
analytical model which combine Lavidige and Steiner‟s (1961) model and Usunier
and Lee ‟s (2009) advertising management model with some modifications, the
authors put forward 3 hypotheses and test them on the basis of the collected data from
a sampling of 145 white-collar workers.
5.1 THE CORRELATION BETWEEN MANAGEMENT AND COGNITIVE
Hypothesis 1 is supported by statistical analysis. It is hypothesized that good
management of advertisers will improve cognitive degree of consumers by online
advertising. Lavidge and Steiner (1961) discuss about the stage of cognitive
component which can be divided to unawareness, awareness, and knowledge, thus be
aware of the existence of the product, search for related information on the website,
get more knowledge of it will be the whole process in consumers‟ cognitive phase.
McMahan (1980) indicates that creating and maintaining brand awareness is one of
the goals of advertising. In addition, Aaker (1996) also points out that brand
awareness means the strength of the brand‟s presence in the target‟s mind. In order to
be successful in an industry which focuses on the same product, the brand must
dominate others. Obviously, it is very important for advertisers to give consumers
certain information, lead them get awareness and brand awareness.
Under online advertising context, the target audiences act as receivers who process
the message they receive with the foundation of personal experience and personal
characteristics (Tyagi &Kumar, 2004). Hence, the massive amount of information is a
significant factor which helps consumers to choose the product even though it is not
designed for them initially.
Usunier and Lee (2009) present awareness, let consumers know as one of the
communication objectives. Increasing consumers in the target market who associate
specific features, benefits, or advantages with brand; increasing the number of
~ 41 ~
consumers in the target audience can also be included in communication objectives
(Usunier and Lee, 2009; Belch, 1998).
Since creative strategy focuses on what the advertising message interprets or
communicates and guides all of the messages used in the advertising campaign in the
developing process (Lee and Johnson, 2005). Thus the information from consumers‟
reaction in the context of implication and control has a significant impact on the
whole advertising management process. Besides, advertisers can measure the
information which consumers need by consumers‟ direct feedback such as telephone,
forum of web or some other technical means such as click rate and so forth.
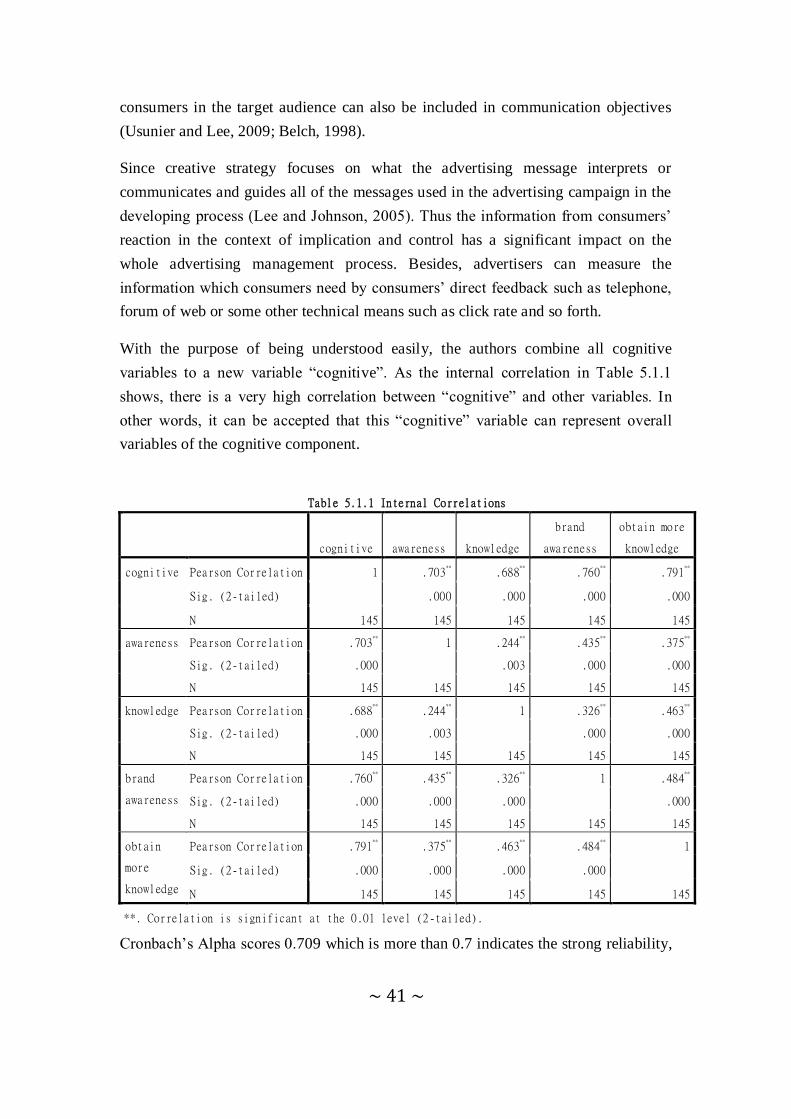
With the purpose of being understood easily, the authors combine all cognitive
variables to a new variable “cognitive”. As the internal correlation in Table 5.1.1
shows, there is a very high correlation between “cognitive” and other variables. In
other words, it can be accepted that this “cognitive” variable can represent overall
variables of the cognitive component.
Table 5.1.1 Internal Correlations
cognitive awareness knowledge
brand
awareness
obtain more
knowledge
cognitive Pearson Correlation 1 .703** .688
** .760
** .791
**
Sig. (2-tailed) .000 .000 .000 .000
N 145 145 145 145 145
awareness Pearson Correlation .703** 1 .244
** .435
** .375
**
Sig. (2-tailed) .000 .003 .000 .000
N 145 145 145 145 145
knowledge Pearson Correlation .688** .244
** 1 .326
** .463
**
Sig. (2-tailed) .000 .003 .000 .000
N 145 145 145 145 145
brand
awareness
Pearson Correlation .760** .435
** .326
** 1 .484
**
Sig. (2-tailed) .000 .000 .000 .000
N 145 145 145 145 145
obtain
more
knowledge
Pearson Correlation .791** .375
** .463
** .484
** 1
Sig. (2-tailed) .000 .000 .000 .000
N 145 145 145 145 145
**. Correlation is significant at the 0.01 level (2-tailed).
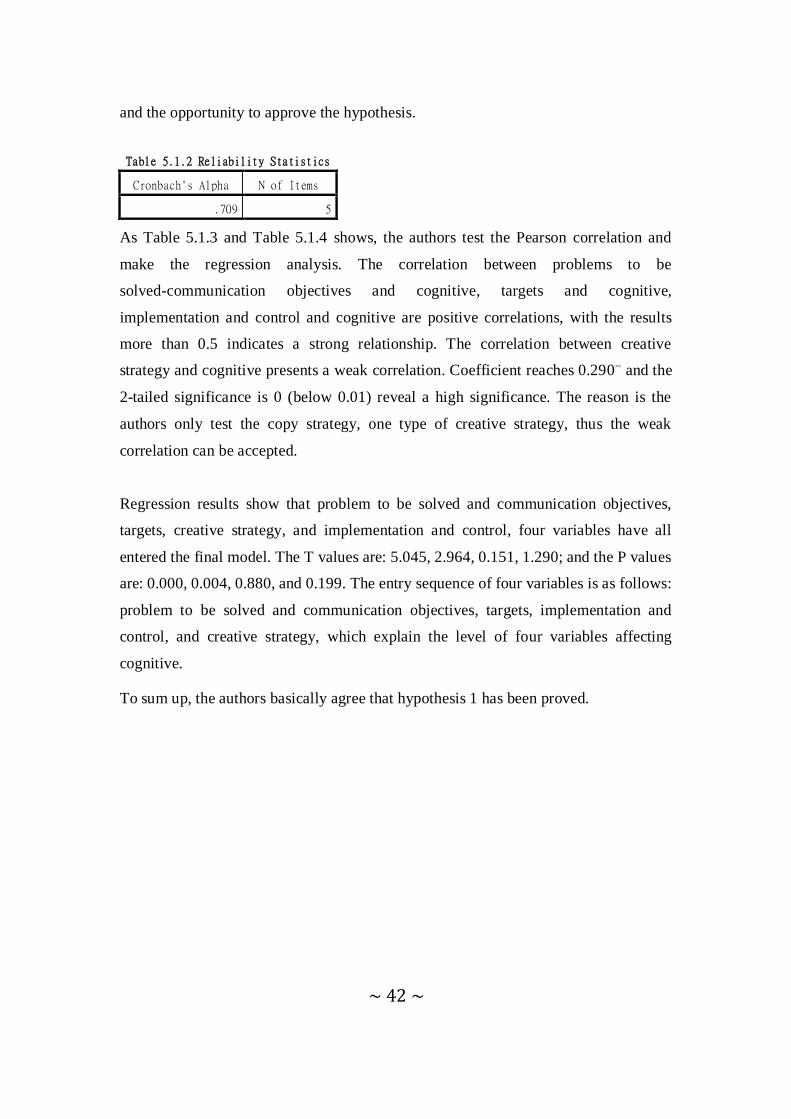
Cronbach‟s Alpha scores 0.709 which is more than 0.7 indicates the strong reliability,
~ 42 ~
and the opportunity to approve the hypothesis.
Table 5.1.2 Reliability Statistics
Cronbach's Alpha N of Items
.709 5
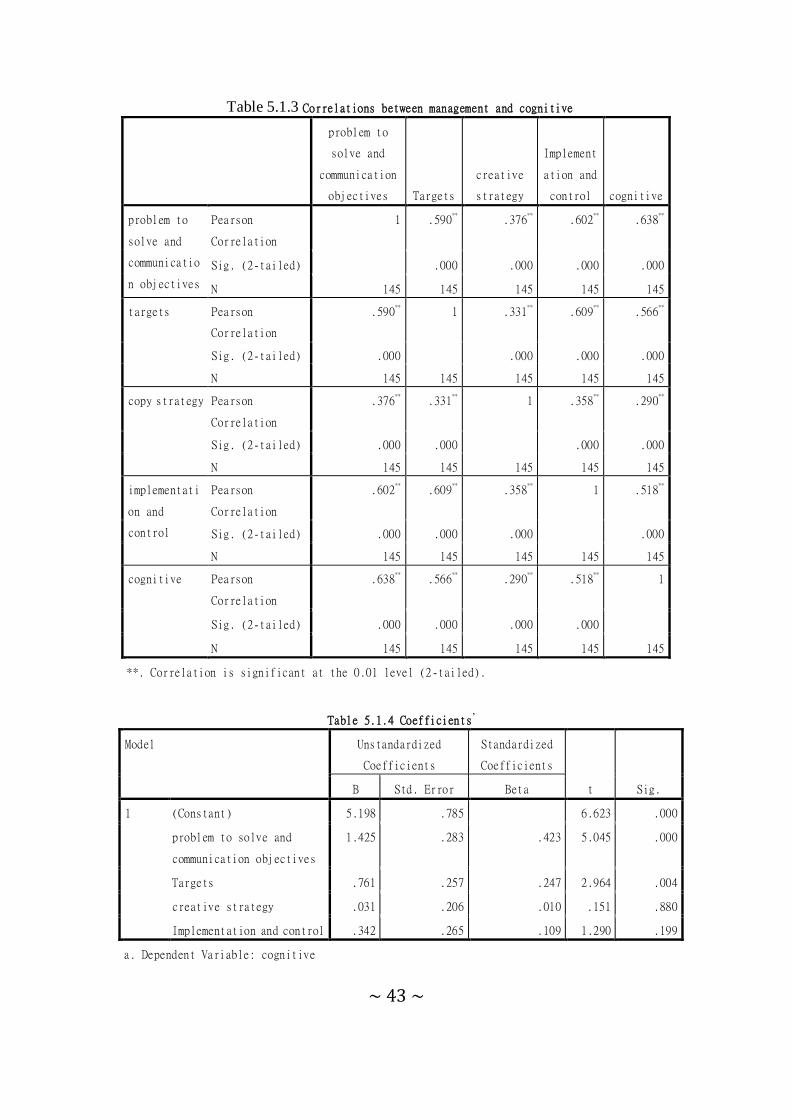
As Table 5.1.3 and Table 5.1.4 shows, the authors test the Pearson correlation and
make the regression analysis. The correlation between problems to be
solved-communication objectives and cognitive, targets and cognitive,
implementation and control and cognitive are positive correlations, with the results
more than 0.5 indicates a strong relationship. The correlation between creative
strategy and cognitive presents a weak correlation. Coefficient reaches 0.290** and the
2-tailed significance is 0 (below 0.01) reveal a high significance. The reason is the
authors only test the copy strategy, one type of creative strategy, thus the weak
correlation can be accepted.
Regression results show that problem to be solved and communication objectives,
targets, creative strategy, and implementation and control, four variables have all
entered the final model. The T values are: 5.045, 2.964, 0.151, 1.290; and the P values
are: 0.000, 0.004, 0.880, and 0.199. The entry sequence of four variables is as follows:
problem to be solved and communication objectives, targets, implementation and
control, and creative strategy, which explain the level of four variables affecting
cognitive.
To sum up, the authors basically agree that hypothesis 1 has been proved.
~ 43 ~
Table 5.1.3 Correlations between management and cognitive
problem to
solve and
communication
objectives Targets
creative
strategy
Implement
ation and
control cognitive
problem to
solve and
communicatio
n objectives
Pearson
Correlation
1 .590** .376
** .602
** .638
**
Sig. (2-tailed) .000 .000 .000 .000
N 145 145 145 145 145
targets Pearson
Correlation
.590** 1 .331
** .609
** .566
**
Sig. (2-tailed) .000 .000 .000 .000
N 145 145 145 145 145
copy strategy Pearson
Correlation
.376** .331
** 1 .358
** .290
**
Sig. (2-tailed) .000 .000 .000 .000
N 145 145 145 145 145
implementati
on and
control
Pearson
Correlation
.602** .609
** .358
** 1 .518
**
Sig. (2-tailed) .000 .000 .000 .000
N 145 145 145 145 145
cognitive Pearson
Correlation
.638** .566
** .290
** .518
** 1
Sig. (2-tailed) .000 .000 .000 .000
N 145 145 145 145 145
**. Correlation is significant at the 0.01 level (2-tailed).
Table 5.1.4 Coefficients’
Model Unstandardized
Coefficients
Standardized
Coefficients
t Sig. B Std. Error Beta
1 (Constant) 5.198 .785 6.623 .000
problem to solve and
communication objectives
1.425 .283 .423 5.045 .000
Targets .761 .257 .247 2.964 .004
creative strategy .031 .206 .010 .151 .880
Implementation and control .342 .265 .109 1.290 .199
a. Dependent Variable: cognitive
~ 44 ~
5.2 THE CORRELATION BETWEEN MANAGEMENT AND AFFECTIVE
Hypothesis 2 is supported by statistical analysis. It is hypothesized that good
management of advertisers will improve affective degree of consumers by online
advertising.
Lavidge and Steiner (1961) deem that if you want to move consumer from cognitive
stage to affective stage, you must let them clearly know the related information in
order to persuade them to like you product.
However, what kinds of information persuade consumers to like the product becomes
an issue. Aaker (1996) argued that perceived quality can been one element to
persuade consumers, and building brand loyalty and brand associations are the
problems company must be noted. In order to let consumers like the product is also
one of the communication objectives of advertisement (Usunier and Lee, 2009).
Hence, advertisers should know what consumers would like.
Advertisers should obtain knowledge from everyone who is related to the product,
including engineers, salespeople and consumers (Belch, 1998). The certain
information of what consumers want is also significant here. Brand loyalty will be
built if advertisers can lead consumers to have preference of the product, and this
could drive long-term success (Hoyer & Brown, 1990).
Feedback which is based on researches analyzes the recall of advertisement, message
comprehension and other responses; with feedback, advertisers can know better about
the reasons of success or failure and adjust the advertisements as well (Belch, 1998).
If advertisers can manage the feedback well, consumer would like or even prefer the
product.
As Dave et al. (2000) point out that internet is one-to-many or many-to-many
communication media, as the interactive nature of the World Wide Web provides the
facility for feedback. Advertisement is not a monologue anymore, it becomes the
dialogue (ibid), the management of communication can lead consumer to like and
prefer advertised product, thus good management is meaningful.
In this study, the authors test the correlation between management and affective
degree, in order to find relationship of two variables. The authors simplify four
variables which are related to affective degree into one variable called “affective”.
The internal correlation are presented in table 5.2.1, and from it we can see there is a
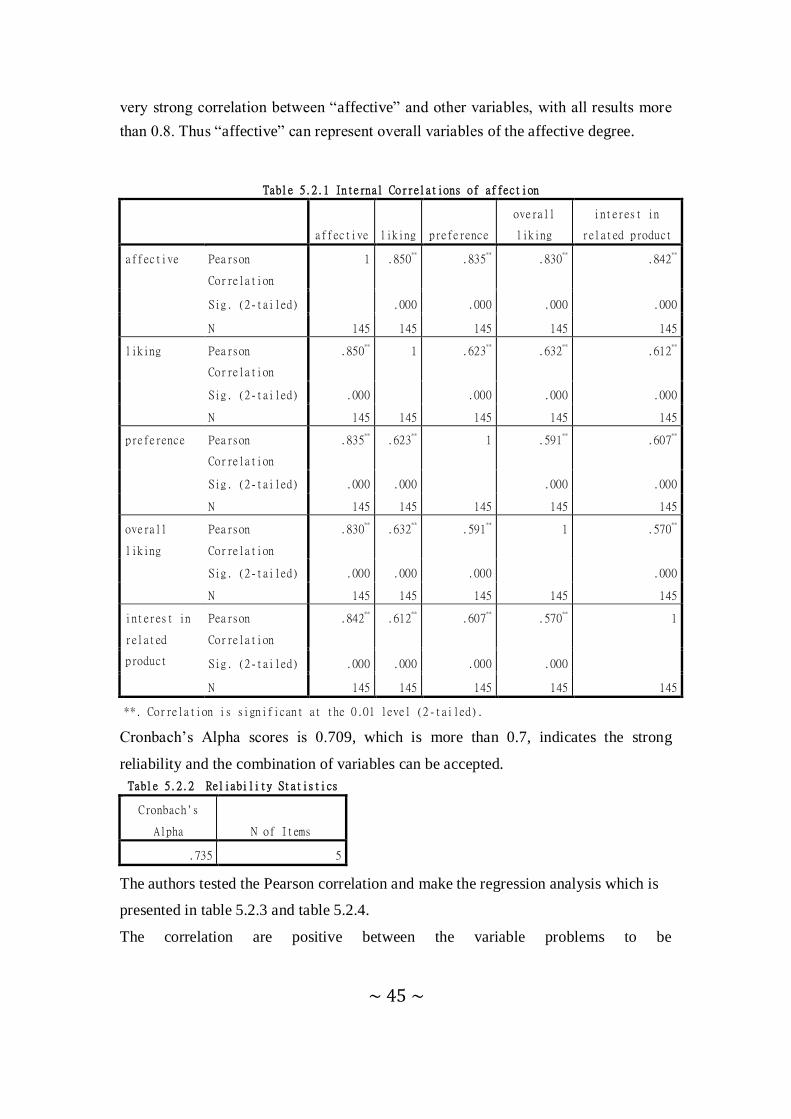
~ 45 ~
very strong correlation between “affective” and other variables, with all results more
than 0.8. Thus “affective” can represent overall variables of the affective degree.
Table 5.2.1 Internal Correlations of affection
affective liking preference
overall
liking
interest in
related product
affective Pearson
Correlation
1 .850** .835
** .830
** .842
**
Sig. (2-tailed) .000 .000 .000 .000
N 145 145 145 145 145
liking Pearson
Correlation
.850** 1 .623
** .632
** .612
**
Sig. (2-tailed) .000 .000 .000 .000
N 145 145 145 145 145
preference Pearson
Correlation
.835** .623
** 1 .591
** .607
**
Sig. (2-tailed) .000 .000 .000 .000
N 145 145 145 145 145
overall
liking
Pearson
Correlation
.830** .632
** .591
** 1 .570
**
Sig. (2-tailed) .000 .000 .000 .000
N 145 145 145 145 145
interest in
related
product
Pearson
Correlation
.842** .612
** .607
** .570
** 1
Sig. (2-tailed) .000 .000 .000 .000
N 145 145 145 145 145
**. Correlation is significant at the 0.01 level (2-tailed).
Cronbach‟s Alpha scores is 0.709, which is more than 0.7, indicates the strong
reliability and the combination of variables can be accepted.
Table 5.2.2 Reliability Statistics
Cronbach's
Alpha N of Items
.735 5
The authors tested the Pearson correlation and make the regression analysis which is
presented in table 5.2.3 and table 5.2.4.
The correlation are positive between the variable problems to be
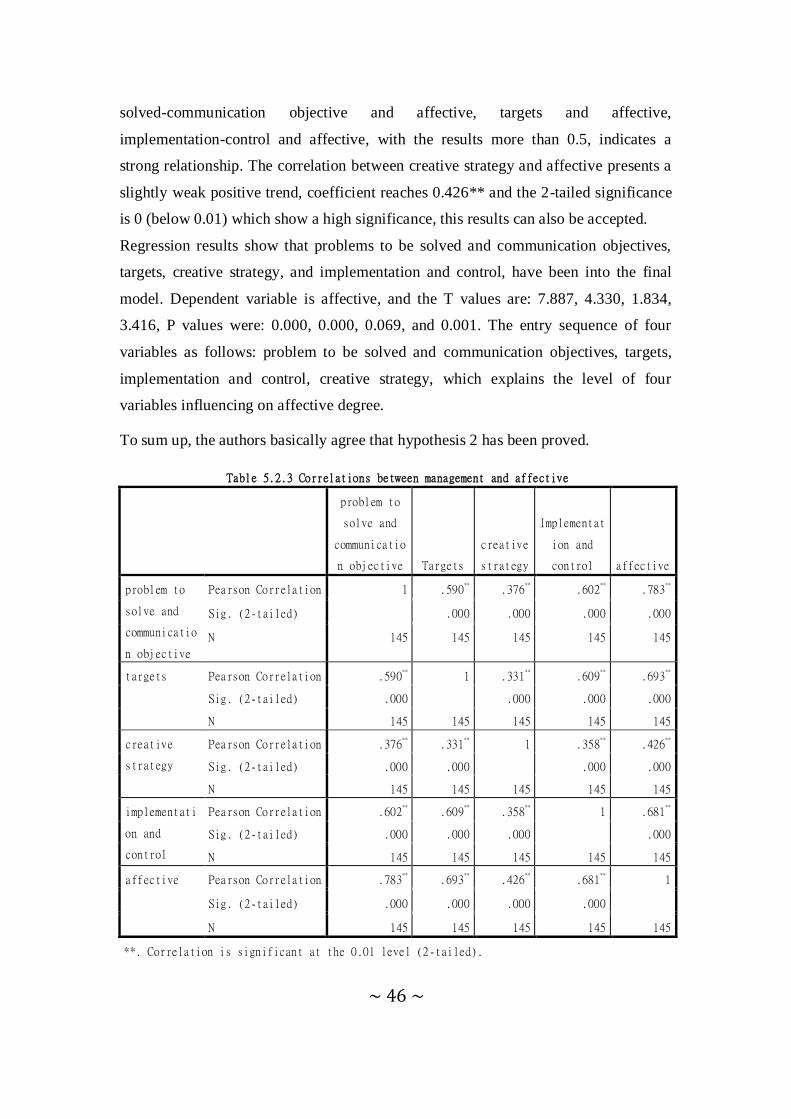
~ 46 ~
solved-communication objective and affective, targets and affective,
implementation-control and affective, with the results more than 0.5, indicates a
strong relationship. The correlation between creative strategy and affective presents a
slightly weak positive trend, coefficient reaches 0.426** and the 2-tailed significance
is 0 (below 0.01) which show a high significance, this results can also be accepted.
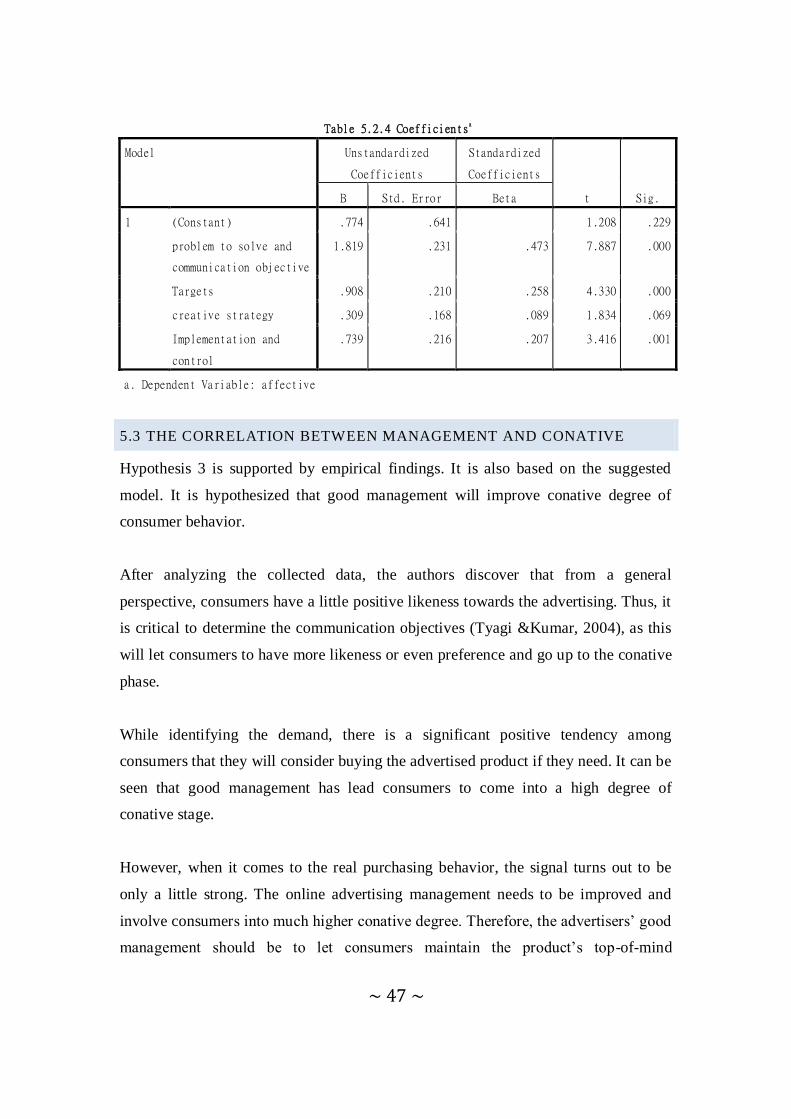
Regression results show that problems to be solved and communication objectives,
targets, creative strategy, and implementation and control, have been into the final
model. Dependent variable is affective, and the T values are: 7.887, 4.330, 1.834,
3.416, P values were: 0.000, 0.000, 0.069, and 0.001. The entry sequence of four
variables as follows: problem to be solved and communication objectives, targets,
implementation and control, creative strategy, which explains the level of four
variables influencing on affective degree.
To sum up, the authors basically agree that hypothesis 2 has been proved.
Table 5.2.3 Correlations between management and affective
problem to
solve and
communicatio
n objective Targets
creative
strategy
Implementat
ion and
control affective
problem to
solve and
communicatio
n objective
Pearson Correlation 1 .590** .376
** .602
** .783
**
Sig. (2-tailed) .000 .000 .000 .000
N 145 145 145 145 145
targets Pearson Correlation .590** 1 .331
** .609
** .693
**
Sig. (2-tailed) .000 .000 .000 .000
N 145 145 145 145 145
creative
strategy
Pearson Correlation .376** .331
** 1 .358
** .426
**
Sig. (2-tailed) .000 .000 .000 .000
N 145 145 145 145 145
implementati
on and
control
Pearson Correlation .602** .609
** .358
** 1 .681
**
Sig. (2-tailed) .000 .000 .000 .000
N 145 145 145 145 145
affective Pearson Correlation .783** .693
** .426
** .681
** 1
Sig. (2-tailed) .000 .000 .000 .000
N 145 145 145 145 145
**. Correlation is significant at the 0.01 level (2-tailed).
~ 47 ~
Table 5.2.4 Coefficientsa
Model Unstandardized
Coefficients
Standardized
Coefficients
t Sig. B Std. Error Beta
1 (Constant) .774 .641 1.208 .229
problem to solve and
communication objective
1.819 .231 .473 7.887 .000
Targets .908 .210 .258 4.330 .000
creative strategy .309 .168 .089 1.834 .069
Implementation and
control
.739 .216 .207 3.416 .001
a. Dependent Variable: affective
5.3 THE CORRELATION BETWEEN MANAGEMENT AND CONATIVE
Hypothesis 3 is supported by empirical findings. It is also based on the suggested
model. It is hypothesized that good management will improve conative degree of
consumer behavior.
After analyzing the collected data, the authors discover that from a general
perspective, consumers have a little positive likeness towards the advertising. Thus, it
is critical to determine the communication objectives (Tyagi &Kumar, 2004), as this
will let consumers to have more likeness or even preference and go up to the conative
phase.
While identifying the demand, there is a significant positive tendency among
consumers that they will consider buying the advertised product if they need. It can be
seen that good management has lead consumers to come into a high degree of
conative stage.
However, when it comes to the real purchasing behavior, the signal turns out to be
only a little strong. The online advertising management needs to be improved and
involve consumers into much higher conative degree. Therefore, the advertisers‟ good
management should be to let consumers maintain the product‟s top-of-mind
~ 48 ~
awareness (Tyagi &Kumar, 2004; Kotler, 1961). Moreover, the good management
should be to remind consumers that the advertised product maybe needed in the near
future (Tyagi &Kumar, 2004; Kotler, 1961), as the consumers have already admitted
that if they need, they will consider buying it.
Moreover, consumers‟ repurchase behavior seems to be extremely weak. As most
responders state that they do not think the advertised product will be in accord with
the real product. Even worse, they do not have more demand of the brand. Therefore,
the problems which are going to be solved in online advertising should be focused on
dealing with repurchase behavior and lead consumers to more demand. In online
advertising context, it is important to identify the problems to be solved and then
through implementation and control of advertisers, conative degree can be improved.
Meanwhile, consumers are also a little worried about the real product is not
conforming to the advertised one. When advertisers get to know consumers‟ concern
and worry, they can make a good management that ensures the consumers about the
truth of online advertising.
The authors also test the correlation between management and conative degree, in
order to find relationship between them. The authors use one general variable
“conative” which combines the other four variables to test correlation between
management and conative degree. The internal correlation is in the table 5.3.1, with
the results of correlation more than 0.8. It can be accepted that “conative” can
represent overall variable of the conative degree.
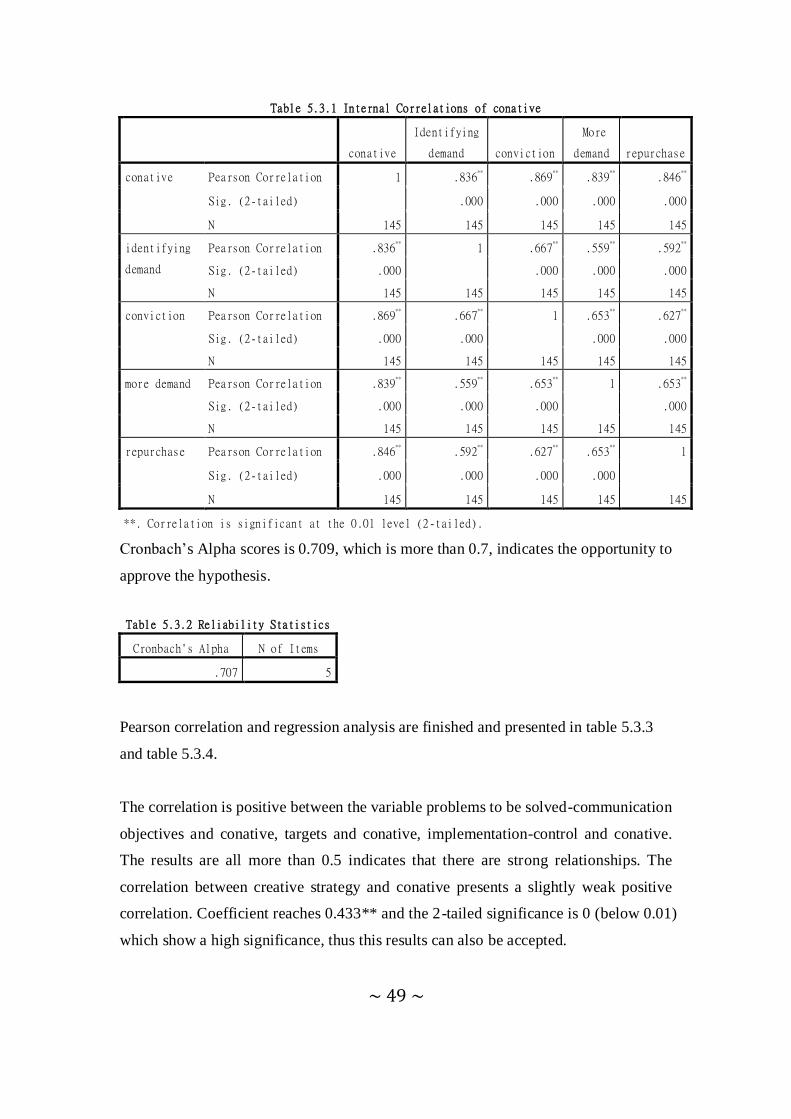
~ 49 ~
Table 5.3.1 Internal Correlations of conative
conative
Identifying
demand conviction
More
demand repurchase
conative Pearson Correlation 1 .836** .869
** .839
** .846
**
Sig. (2-tailed) .000 .000 .000 .000
N 145 145 145 145 145
identifying
demand
Pearson Correlation .836** 1 .667
** .559
** .592
**
Sig. (2-tailed) .000 .000 .000 .000
N 145 145 145 145 145
conviction Pearson Correlation .869** .667
** 1 .653
** .627
**
Sig. (2-tailed) .000 .000 .000 .000
N 145 145 145 145 145
more demand Pearson Correlation .839** .559
** .653
** 1 .653
**
Sig. (2-tailed) .000 .000 .000 .000
N 145 145 145 145 145
repurchase Pearson Correlation .846** .592
** .627
** .653
** 1
Sig. (2-tailed) .000 .000 .000 .000
N 145 145 145 145 145
**. Correlation is significant at the 0.01 level (2-tailed).
Cronbach‟s Alpha scores is 0.709, which is more than 0.7, indicates the opportunity to
approve the hypothesis.
Table 5.3.2 Reliability Statistics
Cronbach's Alpha N of Items
.707 5
Pearson correlation and regression analysis are finished and presented in table 5.3.3
and table 5.3.4.
The correlation is positive between the variable problems to be solved-communication
objectives and conative, targets and conative, implementation-control and conative.
The results are all more than 0.5 indicates that there are strong relationships. The
correlation between creative strategy and conative presents a slightly weak positive
correlation. Coefficient reaches 0.433** and the 2-tailed significance is 0 (below 0.01)
which show a high significance, thus this results can also be accepted.
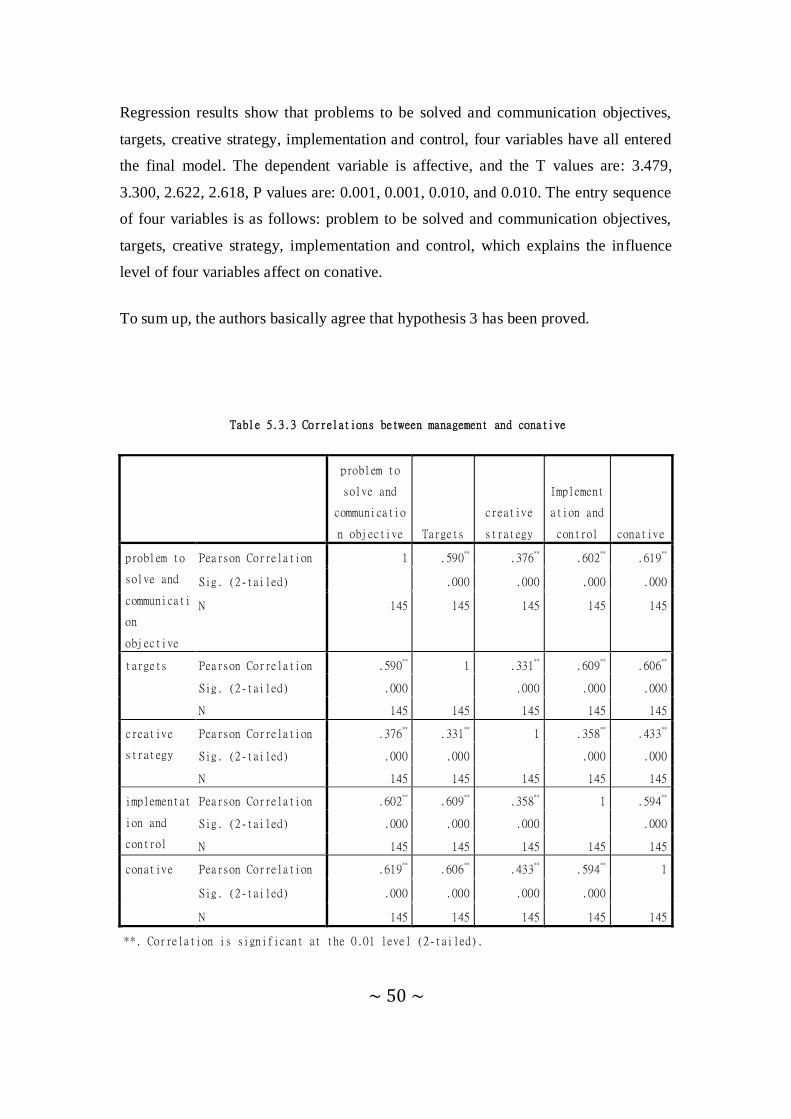
~ 50 ~
Regression results show that problems to be solved and communication objectives,
targets, creative strategy, implementation and control, four variables have all entered
the final model. The dependent variable is affective, and the T values are: 3.479,
3.300, 2.622, 2.618, P values are: 0.001, 0.001, 0.010, and 0.010. The entry sequence
of four variables is as follows: problem to be solved and communication objectives,
targets, creative strategy, implementation and control, which explains the influence
level of four variables affect on conative.
To sum up, the authors basically agree that hypothesis 3 has been proved.
Table 5.3.3 Correlations between management and conative
problem to
solve and
communicatio
n objective Targets
creative
strategy
Implement
ation and
control conative
problem to
solve and
communicati
on
objective
Pearson Correlation 1 .590** .376
** .602
** .619
**
Sig. (2-tailed) .000 .000 .000 .000
N 145 145 145 145 145
targets Pearson Correlation .590** 1 .331
** .609
** .606
**
Sig. (2-tailed) .000 .000 .000 .000
N 145 145 145 145 145
creative
strategy
Pearson Correlation .376** .331
** 1 .358
** .433
**
Sig. (2-tailed) .000 .000 .000 .000
N 145 145 145 145 145
implementat
ion and
control
Pearson Correlation .602** .609
** .358
** 1 .594
**
Sig. (2-tailed) .000 .000 .000 .000
N 145 145 145 145 145
conative Pearson Correlation .619** .606
** .433
** .594
** 1
Sig. (2-tailed) .000 .000 .000 .000
N 145 145 145 145 145
**. Correlation is significant at the 0.01 level (2-tailed).
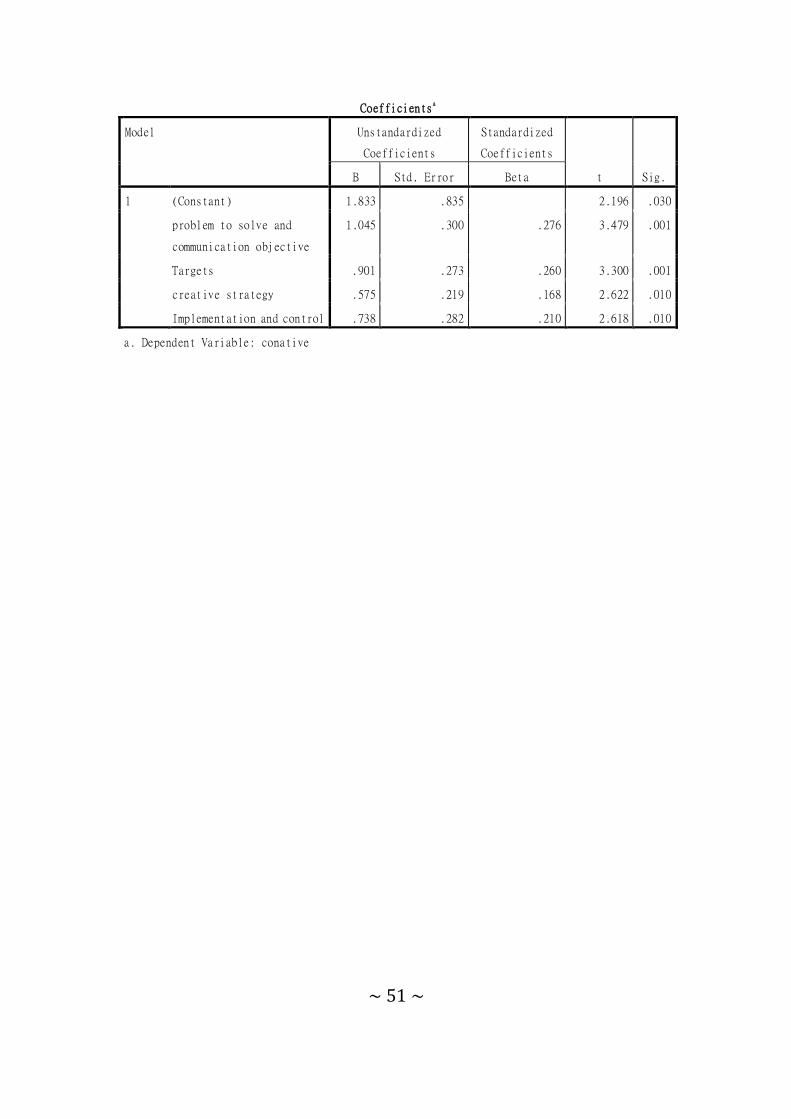
~ 51 ~
Coefficientsa
Model Unstandardized
Coefficients
Standardized
Coefficients
t Sig. B Std. Error Beta
1 (Constant) 1.833 .835 2.196 .030
problem to solve and
communication objective
1.045 .300 .276 3.479 .001
Targets .901 .273 .260 3.300 .001
creative strategy .575 .219 .168 2.622 .010
Implementation and control .738 .282 .210 2.618 .010
a. Dependent Variable: conative
~ 52 ~
6 CONCLUSIONS
6.1 CONCLUSION AND DISCUSSION
The most significant difference between traditional and online advertising is that there
is interactivity in online advertising medium as Internet has an interact nature (Dave
et al., 2000).
Generally speaking, in the authors‟ research, it has been proved that under online
advertising context, good management of problems to be solved and communication
objectives, targets, creative strategy, and implementation and control will influence
cognitive, affective and conative degree of consumer behavior. Copy strategy which
is one of creative strategy (Usunier and Lee, 2009) has a relatively weak improvement
on cognitive degree of consumer behavior. Thus it can be predicted that creative
strategy in online advertising context is not as critical as it is in traditional advertising.
When it comes to cognitive and affective degree of consumer behavior, the influence
level of online advertising management is problems to be solved and communication
objectives, targets, implementation and control and creative strategy. However,
creative strategy lies in the last but one in conative while implementation and control
lies in the last one. Since in conative phase, consumers have already got the liking and
preference of the product, and creative strategy can drive them to real purchase.
In the context of online advertising, good management drives consumer behavior
from unawareness to awareness. After consumers watch the online advertisement,
they want to get more information. However, they do not want to click on the
hyperlink. The reason lies in Internet environment in China. It has reported that
although people highly approve Internet which is used as an information channel and
a communication tool, they have a comparatively low attitude towards Internet trust
and safety (CINIC, 2009). One of the main reasons might be that the relatively small
scale of China‟s Internet Economy. Meanwhile, the phenomenon that Internet
increasingly immerses in life brings about social isolation. Besides, the virus of the
website is also serious (ibid).
In this study, although consumers will take buying the product into account if they
need, they will not plan to buy the product. It can be seen that white-collar workers‟
behavior is very rational. To remind them that the product might be used in the future
(Tyagi &Kumar, 2004; Kotler, 1961) is a critical job for advertisers. Through this way,
good management can improve conative degree of consumer behavior.
~ 53 ~
6.2 IMPLICATIONS
Interactivity is a fundamental factor to analyze consumers and advertisers in the
online advertising context. Compared with traditional advertising, online advertising
has its own advantages to receive feedback from consumers immediately (Tyagi
&Kumar, 2004) so that it will be much easier for online advertiser to control and
monitor management process by taking actions of adjustments and alterations.
In order to improve cognitive, affective and conative degree, the advertisers need to
monitor the online advertising management in an effective way, which is called good
management in this study. Therefore, each step of online advertising management
should be paid attention to and none of them can be omitted.
6.3 FURTHER RESEARCH
Some issues in online advertising area, which might be suitable for future research,
came into the authors‟ mind in the process of completing the dissertation.
Future research could focus on disparate directions regarding to the management of
online advertising and the effectiveness of it. In addition, it can explore how
advertisers adjust their management according to consumers‟ response.
An analysis of countries which also involves a remarkable growth of online
advertising development could be researched. For instance, the country USA which
has different cultures from China can be a sample.
Since different countries under diverse cultures may have different management and
the respondents‟ answers could be totally different, a comparison studies of how
advertisers in China and USA experience different cultures through online
advertising.
~ 54 ~
REFERENCES
Aaker, D.A. (1991). Managing Brand Equity: Capitalizing on the Value of a Brand
Name, The Free Press, New York, NY.
Aaker, D.A. (1996). Building strong brands, The free press, New York
Ajzen, I., & Fishbein, M. (1980). Understanding attitudes and predicting social
behavior control. Englewood Cliffs, NJ: Prentice-Hall Inc.
Bezjizn-Avery, A., Calder ,B., and Iacobucci, D. (1998). New media interactive
advertising vs. traditional advertising. Journal of Advertising Research. Pp.23-32
Belch, G. E., & Belch, M.A. (1998). Advertising and Promotion, 4th Edition, NY:
McGraw-Hill.
Bovee, C.L., & Arens, W.F. (1992). Contemporary advertising. Boston: Richard D.
Irwin, Inc.
Briggs, R., & Hollis, N. (1997). Advertising on the Web: Is there response before
click-through? Journal of Advertising Research, 37(2), 33–45.
Bryman, A., and Bell, E. (2007). Business research methods (second edition).
New York: Oxford University press Inc.
~ 55 ~
Chaffey, D., Mayer, R., Johnston, K., & Ellis-Chadwick, F. (2006). Internet
Marketing: Strategy, Implementation and Practice (third edition), Prentice Hall -
Financial Times, Harlow, ISBN 0-273-69405-7.
Cronbach, L. J. (1975). Beyond the two disciplines of scientific psychology.
American Psychologist, 30, 116-127.
Daniels, P.W. (1995). The internationalisation of advertising services in a changing
regulatory environment. The Service Industries Journal. Vol. 15, pp. 276-295
David W Stewart, Paul A Pavlou, (2002). From consumer response to active
consumer: Measuring the effectiveness of interactive media, Academy of Marketing
Science Journal. Greenvale: Fall 2002. Vol. 30, Iss. 4; pg. 376, 21 pgs
Doole, I., and Lowe, R. (2008). International marketing strategy-analysis,
development and implementaiton, Cengage Learning EMEA, England
Firestone W. A. (1987). Meaning in Method: The Rhetoric of Quantitative and
Qualitative Research, Educational Researcher, Vol. 16, No. 7 (Oct., 1987), pp.
16-21
Fortin,D.R. and Dholakia, R.R., (2003). Interactivity and vividness effects on social
presence and involvement with a web-based advertisement, Journal of Business
Research 58 (2005) 387– 396
Frazer, C.F. (1983), Creative strategy: A management perspective. Journal of
advertising, 12(1), 36-41.
~ 56 ~
George, D., & Mallery, P. (2003). SPSS for Windows step by step: A simple guide and
reference. 11.0 update (4th ed.). Boston: Allyn & Bacon.
Griffin, T. (1993), International marketing communications. Oxford:
Butterworth-Heinemann. Hall,
Ha, Louisa and James, E. Lincoln (1998). Interactivity reexamined: A baseline
analysis of early business Web sites. Journal of Broadcasting & Electronic Media;
Fall98, Vol. 42 Issue 4, p456, 18p
Hatcher, L. (1994). A step-by-step approach to using the SAS(R) system for factor
analysis and structural equation modeling. Cary, NC: SAS Institute.
Hofacker. C.F. (2000). Internet Marketing, 3rd Edition, John Wiley & John Wiley &
Sons,US
Hoffman, Donna L; Novak, Thomas P (1996). Marketing in hypermedia
computer-mediated environments: Conceptual foundations, Journal of Marketing; Jul
1996; 60, 3; ABI/INFORM Global. pp. 50-68
Hoffman, Donna L., Thomas P. Novak, and Patrali Chatterjee (1995). Commercial
Scenarios for the Web: Opportunities and Challenges, Journal of Computer-Mediated
Communication [online], Vol. 1, Issue 3.
Hoyer, W.D., & Brown, S.P. (1990). Effects of brand awareness on choice for a
common, repeat-purchase product. The Journal of Consumer Research, 17(2),
141-148.
~ 57 ~
Hunt R.J. (1986).Percent Agreement, Pearson's Correlation, and Kappa as Measures
of Inter-examiner Reliability, Journal of Dental Research, Vol. 65, No. 2, 128-130
Jacoby, J. and Kyner, D.B.(1973). Brand Loyalty vs. Repeat Purchasing Behavior.
Journal of Marketing research, Vol.X, p.1-9
Janoschka & Anja. Web Advertising, (2004). New forms of communication on the
Internet. Philadelphia, PA, USA: John Benjamins Publishing Company, pp. 32.
Jim,H. (1997). The Internet and international marketing. International Marketing
Review, Vol. 14 No. 5, pp. 300-323.
Lavidge, R.J. & Steiner, G.A. (1961). A model for predictive measurements of
advertising effectiveness. Journal of Marketing Vol. 25, Issue 4: 59-62
Lee, M., and Johnson, C. (2005), Principles of advertising: a global perspective (2nd
edition). New York: The Haworth Press
Likert, Rensis (1932). A Technique for the Measurement of Attitudes. Archives of
Psychology, 140, pp. 1–55.
Lutz, J. R. (1985). Affective and cognitive antecedents of attitude toward the ad: A
conceptual framework. In L. F. Alwitt, & A. A. Mitchell (Eds.), Psychological
processes and advertising effects (pp. 45–63). New York: Erlbaum.
McMahon, Harry W. (1980). TV Loses the 'Name Game' but Wins Big in Personality.
Advertising Age, 12(1), p.54.
~ 58 ~
Mitchell, A. A., & Olson, J. C. (1981). Are product attribute beliefs characteristics
associated with purchasing involvement. Journal of Marketing, 49(1), 72–82.
Newhagen J, Rafaeli S. (1996). Why communication researchers should study the
Internet: a dialogue. J Commun 1996;46:4– 13
Parsons, A., M. Zeisser, and R. Waitman (1998). “Organizing Today for the Digital
Marketing of Tomorrow.” Journal of Interactive Marketing, 12(1): 31-46.
Pierre Berthona, Leyland Pitt and Richard T. Watson (1996), Marketing
Communication And The World Wide Web, Business Horizons, Volume 39, Issue 5,
September-October 1996, Pages 24-32
Powdermaker, H. (1966). Stranger and friend: The way of the anthropologist. New
York: W.W. Norton.
Sandhusen, R. L. (2000). Marketing. New York: Barron‟s Educational Series.
Schreuder, H. T. , Gregoire, T. G., Weyer, J. P. (1999). For what applications can
probability an non-probabillitysampling be used? USDA Forest Service, Rocky
Mountain Research Station, Fort Collins, CO, U.S.A.; 2 York University, New Haven,
Connecticut, U.S.A.
Schwartz, E. I. (1998). Webonomics: Nine Essential Principles for Growing Your
Business on the World Wide Web. New York: Broadway
~ 59 ~
Smith, P.R. (1993). Marketing Communications. An Integrated Approach. Kogan
Page limited. London.
Taylor, S.J., & Bogdan, R. (1984). Qualitative research methods: The search for
meanings (2nd Ed.). New York: John Wiley.
Teo, H., Oh, L., Liu, C., Wei, K. (2003). An empirical study of the effects of
interactivity on web user attitude. International Journal of Human–Computer Studies
58, 281–305.
Tyagi, C.L., & Kumar, Arun. (2004). Advertising Management. Boston: Atlantic.
Uebersax, John S. (2006). Likert Scales: Dispelling the Confusion. Statistical
Methods for Rater Agreement. Accessed May 17th, 2010, from
http://www.john-uebersax.com/stat/likert.html
Internet Resource:
China Online Ad Spending. April 2, 2009. Downloaded from
http://www.emarketer.com/Article.aspx?R=1007009, on April 6th
, 2010.
Research report on the web advertising Q3, 2000, downloaded from
http://www.adknowledge.com,on March 15, 2010.

~ 60 ~
Appendix I:
Questionnaire:
Online advertising usually refers to search engines, banner advertising, direct e-mail
and links or services from other web sites. Please pick up ONE type of online
advertising you have seen recently and rate the following questions from 1-5. (1=I do
not agree, 2=I partly agree, 3=neutral, 4= I agree, 5=I completely agree)
Please notice that all of the information in this questionnaire will be treated
confidentially.
Information of yourself:
Name: ____ Sex: ____ Position: ____
1. Before I watch the online advertisement, I already have awareness of the advertised
product.
1____ 2____ 3____ 4____ 5____
2. Through online advertising, I have known more about this product.
1____ 2____ 3____ 4____ 5____
3. I have remembered the brand of the online advertisement.
1____ 2____ 3____ 4____ 5____
4. After watching the online advertisement, I want to get more information about this
product.
1____ 2____ 3____ 4____ 5____
5. I will click on the link or website of the online advertisement.
1____ 2____ 3____ 4____ 5____

~ 61 ~
6. I like this product after I watch the online advertisement.
1____ 2____ 3____ 4____ 5____
7. This online advertisement is very attractive to me.
1____ 2____ 3____ 4____ 5____
8. This online advertisement impresses me a lot.
1____ 2____ 3____ 4____ 5____
9. The online advertisement contains a huge amount of information.
1____ 2____ 3____ 4____ 5____
10. After watching the online advertisement, I associate with other online ads.
1____ 2____ 3____ 4____ 5____
11. Generally speaking, I like this online advertisement. ____
1____ 2____ 3____ 4____ 5____
12. If I need, I would consider buying this product.
1____ 2____ 3____ 4____ 5____
13. I plan to buy the product.
1____ 2____ 3____ 4____ 5____

~ 62 ~
14. It will be more likely for me to buy other products of this brand.
1____ 2____ 3____ 4____ 5____
15. I think I will rebuy the product.
1____ 2____ 3____ 4____ 5____
16. I think the advertised product is in accord with the real product.
1____ 2____ 3____ 4____ 5____
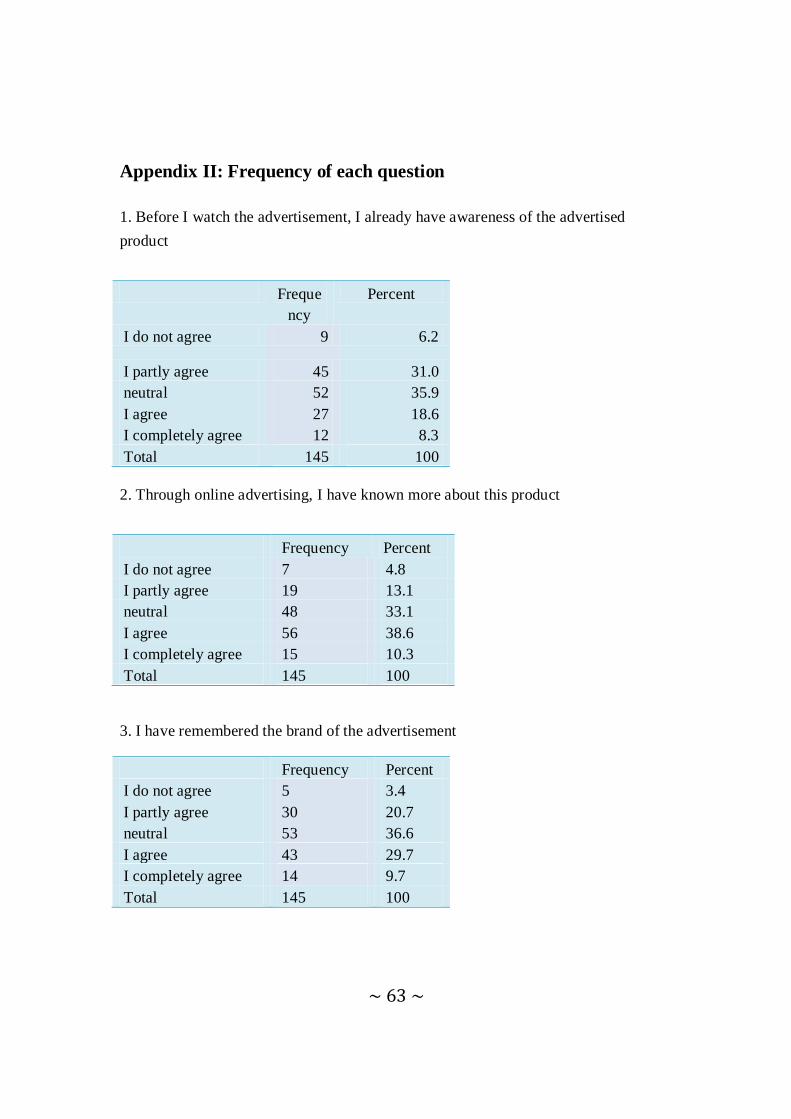
~ 63 ~
Appendix II: Frequency of each question
1. Before I watch the advertisement, I already have awareness of the advertised
product
2. Through online advertising, I have known more about this product
3. I have remembered the brand of the advertisement
Freque
ncy
Percent
I do not agree 9 6.2
I partly agree 45 31.0
neutral 52 35.9
I agree 27 18.6
I completely agree 12 8.3
Total 145 100
Frequency Percent
I do not agree 7 4.8
I partly agree 19 13.1
neutral 48 33.1
I agree 56 38.6
I completely agree 15 10.3
Total 145 100
Frequency Percent
I do not agree 5 3.4
I partly agree 30 20.7
neutral 53 36.6
I agree 43 29.7
I completely agree 14 9.7
Total 145 100
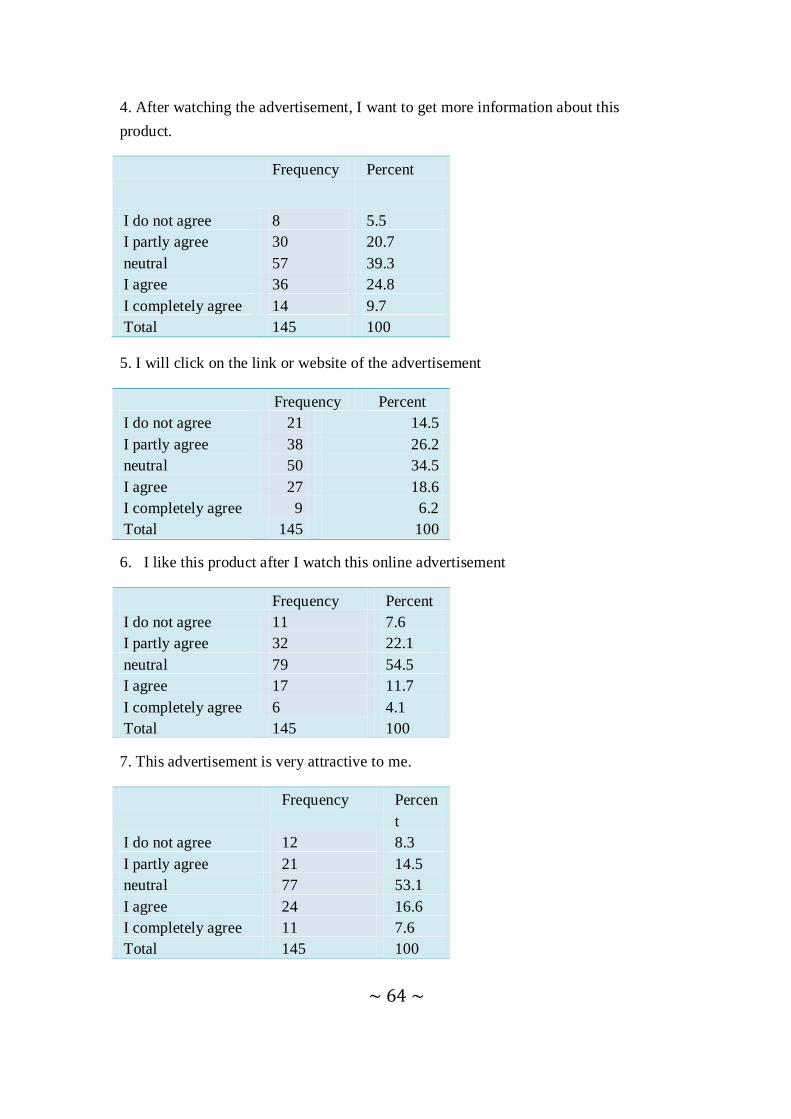
~ 64 ~
4. After watching the advertisement, I want to get more information about this
product.
Frequency Percent
I do not agree 8 5.5
I partly agree 30 20.7
neutral 57 39.3
I agree 36 24.8
I completely agree 14 9.7
Total 145 100
5. I will click on the link or website of the advertisement
6. I like this product after I watch this online advertisement
7. This advertisement is very attractive to me.
Frequency Percent
I do not agree 21 14.5
I partly agree 38 26.2
neutral 50 34.5
I agree 27 18.6
I completely agree 9 6.2
Total 145 100
Frequency Percent
I do not agree 11 7.6
I partly agree 32 22.1
neutral 79 54.5
I agree 17 11.7
I completely agree 6 4.1
Total 145 100
Frequency Percen
t
I do not agree 12 8.3
I partly agree 21 14.5
neutral 77 53.1
I agree 24 16.6
I completely agree 11 7.6
Total 145 100
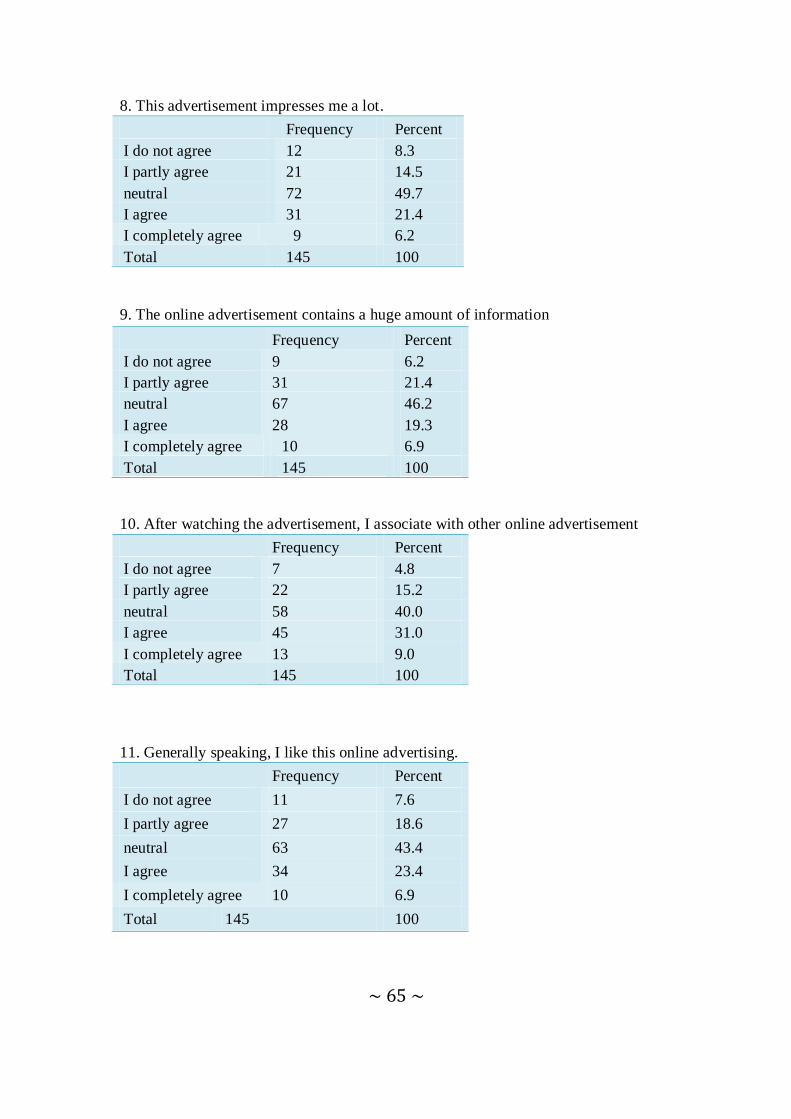
~ 65 ~
8. This advertisement impresses me a lot.
9. The online advertisement contains a huge amount of information
10. After watching the advertisement, I associate with other online advertisement
11. Generally speaking, I like this online advertising.
Frequency Percent
I do not agree 12 8.3
I partly agree 21 14.5
neutral 72 49.7
I agree 31 21.4
I completely agree 9 6.2
Total 145 100
Frequency Percent
I do not agree 9 6.2
I partly agree 31 21.4
neutral 67 46.2
I agree 28 19.3
I completely agree 10 6.9
Total 145 100
Frequency Percent
I do not agree 7 4.8
I partly agree 22 15.2
neutral 58 40.0
I agree 45 31.0
I completely agree 13 9.0
Total 145 100
Frequency Percent
I do not agree 11 7.6
I partly agree 27 18.6
neutral 63 43.4
I agree 34 23.4
I completely agree 10 6.9
Total 145 100
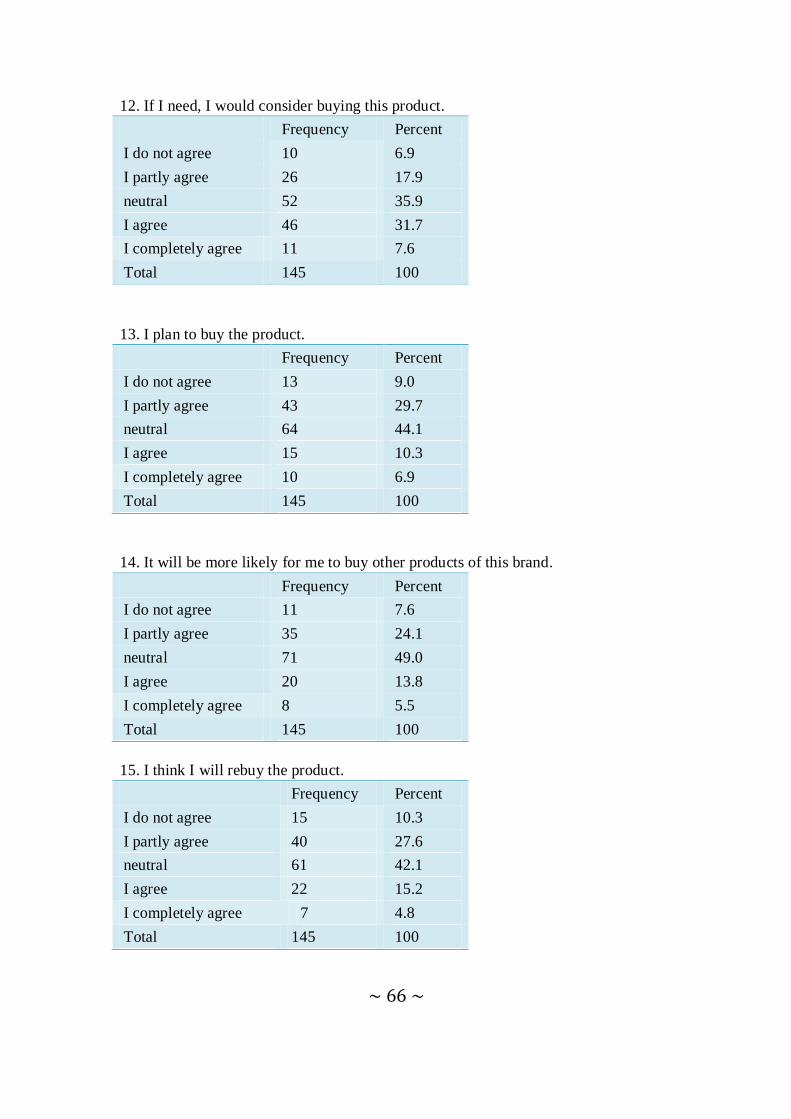
~ 66 ~
12. If I need, I would consider buying this product.
13. I plan to buy the product.
14. It will be more likely for me to buy other products of this brand.
15. I think I will rebuy the product.
Frequency Percent
I do not agree 10 6.9
I partly agree 26 17.9
neutral 52 35.9
I agree 46 31.7
I completely agree 11 7.6
Total 145 100
Frequency Percent
I do not agree 13 9.0
I partly agree 43 29.7
neutral 64 44.1
I agree 15 10.3
I completely agree 10 6.9
Total 145 100
Frequency Percent
I do not agree 11 7.6
I partly agree 35 24.1
neutral 71 49.0
I agree 20 13.8
I completely agree 8 5.5
Total 145 100
Frequency Percent
I do not agree 15 10.3
I partly agree 40 27.6
neutral 61 42.1
I agree 22 15.2
I completely agree 7 4.8
Total 145 100
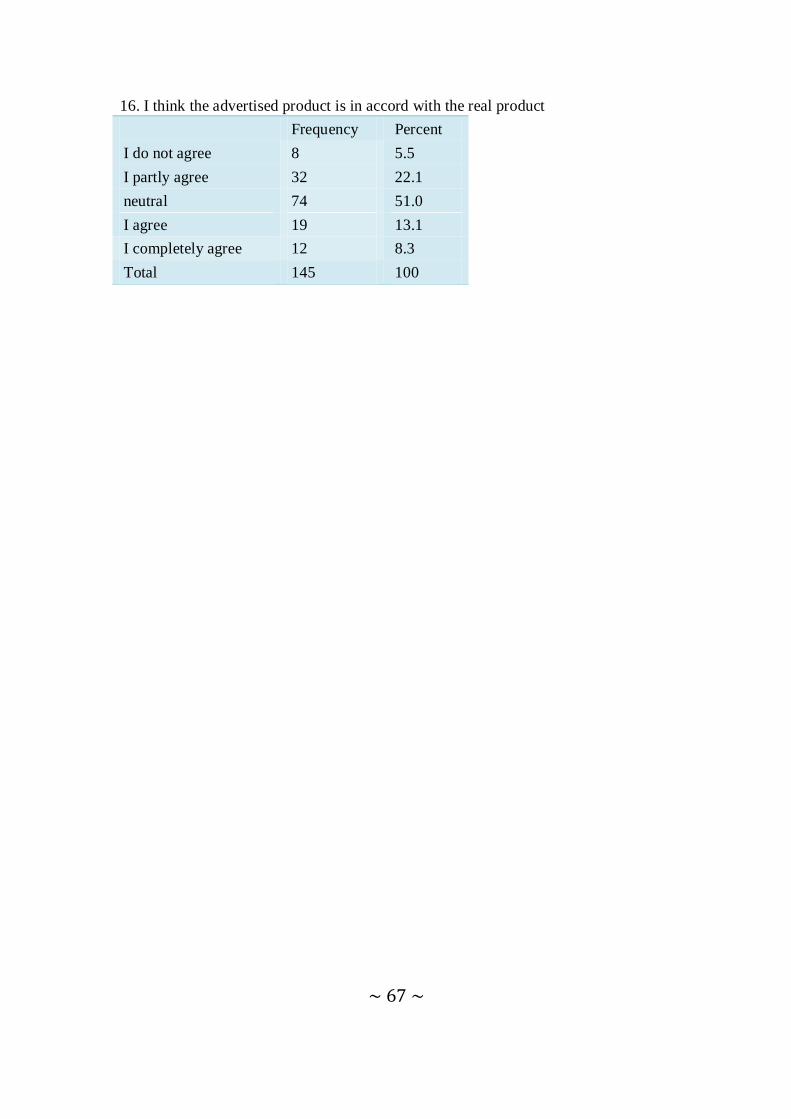
~ 67 ~
16. I think the advertised product is in accord with the real product
Frequency Percent
I do not agree 8 5.5
I partly agree 32 22.1
neutral 74 51.0
I agree 19 13.1
I completely agree 12 8.3
Total 145 100