Embed Size (px)
Citation preview

39
2Agricultural Market Accessand Related Issues
Agriculture will challenge negotiators of a US-Pakistan FTA. Pakistanwill want to protect a key sector that provides employment and suste-nance for the majority of its population, and US producers will want max-imum access to a market with high growth potential. But empiricalstudies suggest that commerce stimulated by bilateral free trade will notdisplace major segments of agriculture in Pakistan. Trade expansion willaffect some commodities that are accustomed to high protection, but longphaseout periods should allow adequate time for adjustment in truly sen-sitive items. Pakistan will emphasize assistance to build its capacity toensure clean and safe agricultural shipments.
A US-Pakistan FTA could result in a solid relationship that fostersagricultural trade by eventually eliminating tariffs and tariff-rate quotas(TRQs) and reducing uncertainties and risks. Following the establishedUS approach to other FTAs, subsidies will not be part of the negotiation.To be sure, US agricultural subsidies have a major impact on world tradeand commodity prices, and are a legitimate concern to trading partners.However, US doctrine insists that subsidies can only be negotiated multi-laterally.
Agricultural aspects of the negotiations for a US-Pakistan FTA areconsidered in three sections in this chapter. The first presents a briefdiscussion of Pakistan’s agricultural sector and bilateral trade patterns.The second examines tariffs, TRQs, agricultural subsidies, and otherbarriers. The third section addresses sanitary and phytosanitary (SPS)matters. We conclude with our recommendations for the negotiations inthese areas.
1366.ch02.qxd 10/10/06 9:17 AM Page 39
Peterson Institute for International Economics | www.petersoninstitute.org

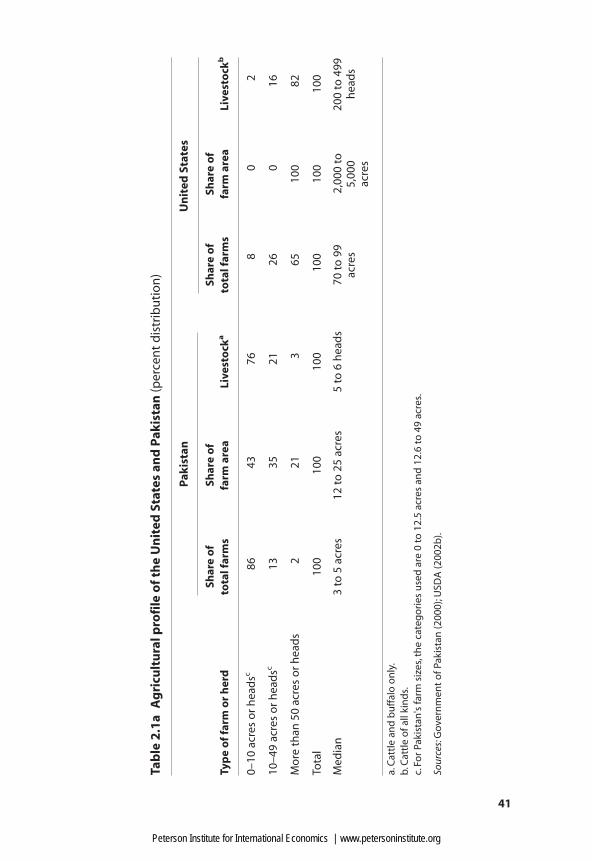
1. Conversely, in the United States all farmland is controlled by farm units well over 50acres—the median size is over 2,000 acres—while most of the livestock is held in large herdsof well over 50 animals (table 2.1a).
2. In 2002, about 47 million Pakistanis lived below the national poverty line, of which 34million lived in rural areas (World Bank 2004a).
3. Pakistan is emerging, however, as a wheat exporter, particularly of wheat flour.
40 SUSTAINING REFORM WITH A US-PAKISTAN FTA
Pakistan’s Agricultural Sector and Bilateral Trade
With more than 65 percent of its population living in rural areas, Pakistanremains an agrarian society. Agriculture accounts for nearly 23 percent ofthe country’s GDP and employs 42 percent of its labor force. Pakistan’sagricultural sector is also composed largely of small farm and livestockunits. In fact, farms of fewer than 49 acres constitute about 80 percent ofthe farm area, while the median herd has just a few animals (table 2.1a).1
While these features underscore the economic importance of agricul-ture in Pakistan, the sector’s special sensitivity results from the high inci-dence of poverty in rural areas. According to 2002 World Bank data, 72percent of Pakistan’s poor live in rural areas.2 Agriculture provides, di-rectly or indirectly, their main source of income. Milk, butter, and wheatare especially sensitive, as they furnish the livelihood of most people.
Livestock (including byproducts such as meats, milk, and eggs) con-tributes almost half of all value added in agriculture. The largest num-bers of livestock are buffalo and cattle, although poultry flocks havegrown rapidly in recent years (table 2.1b). Livestock production facesdaunting development problems: lack of commercial farms, low produc-tivity due to poor animal nutrition, weak infrastructure, lack of financing,and recently, avian flu. For these reasons, dairy items and poultry meatsare the most sensitive animal products in Pakistan. Yet despite these prob-lems, Pakistan is mostly self-sufficient in animal products.
A few major crops—sugarcane, wheat, cotton, and rice (table 2.1b)—contribute most of the remaining value added (some 34 percent) to thecountry’s total agricultural GDP. Pakistan is the world’s fourth-largestproducer of cotton, the fifth in sugarcane, and the twelfth in paddy rice.The country’s top exports (e.g., textiles and clothing, rice, and sugar) arebased on these crops, but it also imports large quantities of cotton andnondurum wheat.3 As the leading food staple and an important source offarm income, wheat is the most sensitive crop in Pakistan and benefitsfrom specific governmental support (e.g., state purchases). Other “minorcrops” are produced in Pakistan, but their contribution is declining. No-table exceptions are fruits, dates, and corn. In fact, Pakistan is among thetop 10 world producers of mangoes, apricots, tropical fruit, dates, onions,
1366.ch02.qxd 10/10/06 9:17 AM Page 40
Peterson Institute for International Economics | www.petersoninstitute.org
Tab
le 2
.1a
Ag
ricu
ltu
ral p
rofi
le o
f th
e U
nit
ed S
tate
s an
d P
akis
tan
(per
cen
t d
istr
ibu
tio
n)
Pak
ista
nU
nit
ed S
tate
s
Shar
e o
fSh
are
of
Shar
e o
fSh
are
of
Typ
e o
f fa
rm o
r h
erd
tota
l far
ms
farm
are
aLi
vest
ock
ato
tal f
arm
sfa
rm a
rea
Live
sto
ckb
0–10
acr
es o
r h
ead
sc86
4376
80
2
10–4
9 ac
res
or
hea
dsc
1335
2126
016
Mo
re t
han
50
acre
s o
r h
ead
s2
213
6510
082
Tota
l10
010
010
010
010
010
0
Med
ian
3 to
5 a
cres
12 t
o 2
5 ac
res
5 to
6 h
ead
s70
to
99
2,00
0 to
200
to 4
99ac
res
5,00
0 h
ead
sac
res
a.C
attl
e an
d b
uff
alo
on
ly.
b.C
attl
e o
f all
kin
ds.
c.Fo
r Pa
kist
an's
farm
siz
es,t
he
cate
go
ries
use
d a
re 0
to
12.
5 ac
res
and
12.
6 to
49
acre
s.
Sour
ces:
Gov
ern
men
t o
f Pak
ista
n (2
000)
;USD
A (2
002b
).
41
1366.ch02.qxd 10/10/06 9:17 AM Page 41
Peterson Institute for International Economics | www.petersoninstitute.org

peas, and pulses (Food and Agriculture Organization’s FAOSTAT data-base, 2005).
Pakistan’s food processing industry (food, beverages, and tobacco)contributes 4 percent of GDP and employs 2 percent of the country’s laborforce.4 While these sectors are relatively large components of the nation’smanufacturing base (comprising 22 percent of manufacturing value addedand 13 percent of the manufacturing labor force), they face important de-velopment challenges, such as the absence of a sophisticated canning andpackaging industry, coupled with weak transportation and storage facili-ties. Pakistan has welcomed joint ventures with foreign firms to raise stan-dards. EU and Swiss investors have strengthened Pakistan production ofpoultry, cereals, biscuits, breads, fruit juices, and dairy. US firms dominatePakistan’s small soft drink and fast foods sectors and have a stake insoups, noodles, mayonnaise, and canola and sunflower oil. Pakistan’s im-ports of processed foods are small and limited to a few supermarkets thatcater to the country’s elite and the armed forces (Promopak 2001).
42 SUSTAINING REFORM WITH A US-PAKISTAN FTA
Table 2.1b Pakistan’s agricultural production
Product 2000–2001 2004–05
Selected livestock population (millions of heads)a
Buffalo 23.3 26.3Cattle 22.4 24.2Goats 49.2 56.7Poultry 292.4 366.0Sheep 24.2 24.9
Animal products (millions of metric tons)All meatsb 2.0 2.3Milk 26.2 29.4
Major crops (millions of metric tons)Sugarcane 43.6 45.3Wheat 19.0 21.1Cotton (bales) 10.7 14.6Rice 4.8 5.0Corn 1.6 2.8
a. Ranked according to the Food and Agriculture Organization's (FAO) livestock unit conversionfactors: cattle and buffalo (0.50); sheep and goats (0.10); and poultry (0.01).b. Beef, mutton, and poultry.
Sources: FAO (2005); Government of Pakistan (2005a).
4. The government retains a small role in the food processing sector (i.e., vegetable gheeand breakfast cereal production), while sugar production is “almost entirely owned bypoliticians operating a cartel” (The Economist, 2006, 5).
1366.ch02.qxd 10/10/06 9:17 AM Page 42
Peterson Institute for International Economics | www.petersoninstitute.org

Exports
For decades, Pakistan’s agriculture has suffered development policiesthat established unfavorable relative prices and reduced investment in-centives. In addition, geopolitical tensions effectively cut off agriculturalexports to the Indian market. But priorities are now shifting. The govern-ment believes that the revitalization of agriculture can play a major rolein raising the incomes of the poor and in diversifying national exports.Pakistan’s total agricultural exports have increased rapidly in recentyears, particularly in value terms (table 2.2). Export volume increasedsignificantly during 1996–2000, but gains were small in 2000–2004.
Pakistan is strategically placed in a net food-importing region. About54 percent of its agricultural exports are shipped to the Persian Gulf coun-tries and Afghanistan (table 2.2).5 Other important markets include theUnited Kingdom, India, some eastern African countries, China, and theAssociation for Southeast Asian Nations (ASEAN) (table 2.2). Progress inbilateral and regional negotiations could create new opportunities forPakistani farmers in these and other regional markets.
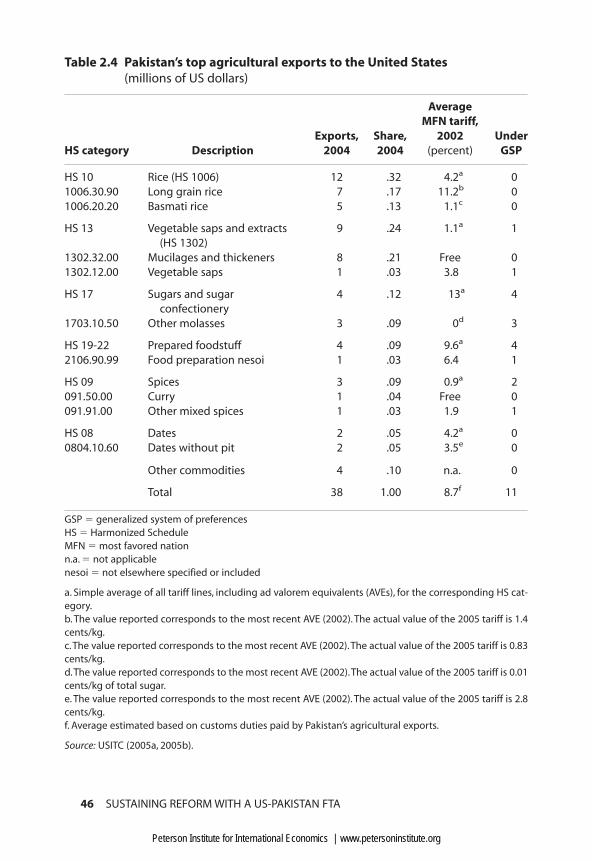
Agricultural exports to the United States are very small—$38 millionin 2004 (table 2.3), or just under 3 percent of Pakistan’s total agriculturalexports (table 2.2). Table 2.4 lists the principal product categories: rice,vegetable saps, sugars, spices, and dates. While total export values to theUS market are barely significant, some commodities have performed well.Rice exports have doubled in volume and value; but fresh fruits (man-goes, tangerines, guava, and apricots) and shrimp perform rather poorlyin the US market compared with Canada and the United Kingdom.6
Imports
While Pakistan is a significant producer of many agricultural products,the size of its domestic market creates substantial import needs for spe-cific products, with the result that, on balance, Pakistan is a net agricul-tural importer. In 2004 Pakistan exported $1.3 billion in agriculturalproducts and imported about $2.5 billion. The import figure is low in
AGRICULTURAL MARKET ACCESS AND RELATED ISSUES 43
5. Agricultural exports represent almost 30 percent of Pakistan’s exports to Saudi Arabia,the United Arab Emirates, and Kuwait. The share of agriculture in total Pakistan exports isonly 8 percent.
6. Shrimp exports (not technically an agricultural product) were the object of trade litiga-tion with environmental overtones. In 1996 the government of Pakistan challenged in theWTO a US import ban on the importation of shrimp. The US import ban reflected US regu-lation requiring devices and measures that reduce the mortality of sea turtles. After somemodifications to the original provisions, the WTO Appellate Body sustained the US regula-tion under Article XX of the GATT 1994.
1366.ch02.qxd 10/10/06 9:17 AM Page 43
Peterson Institute for International Economics | www.petersoninstitute.org

relation to the total population: Pakistanis spent only $15 per capita peryear in foreign foods and fibers (including raw cotton). Trade barriers un-doubtedly depressed imports, but consumer preferences for fresh foods,the relatively small urban population, and low income levels are impor-tant factors in the equation.
44 SUSTAINING REFORM WITH A US-PAKISTAN FTA
Table 2.2 Pakistan’s total agricultural exports(millions of US dollars)
Country/region 1996 2000 2004
Middle Easta 255 320 462United Arab Emirates 119 151 236Saudi Arabia 63 62 73
Economic Cooperation Organizationb 60 89 249Afghanistan 6 78 203Iran 49 9 45
EU-15c 122 147 166United Kingdom 36 62 56Netherlands 53 38 31
Africad 147 141 157
SAFTAe 72 107 89India 29 47 43
North Asiaf 68 59 76China and Hong Kong 26 26 37
ASEANg 31 41 59
Other partners 80 60 64
Total 835 964 1,322
ASEAN � Association of Southeast Asian NationsSAFTA � South Asian Free Trade Area
a. Middle East includes Bahrain, Egypt, Iraq, Jordan, Kuwait, Lebanon, Oman, Qatar, Saudi Arabia,Syria, United Arab Emirates, and Yemen.b. The Economic Cooperation Organization comprises Afghanistan, Azerbaijan, Iran, Kazakhstan,Kyrgyz Republic, Tajikistan, Turkey, Turkmenistan, and Uzbekistan.c. European Union excluding the 10 new members.d. All African countries excluding Egypt.e. SAFTA comprises Bangladesh, Bhutan, India, Maldives, Nepal, and Sri Lanka.f. North Asia comprises China, Hong Kong, Japan, North and South Korea, and Taiwan.g. ASEAN includes Brunei Darussalam, Cambodia, Indonesia, Laos, Malaysia, Myanmar, Philippines,Singapore, Thailand, and Vietnam.
Note: Agriculture is defined as sections 0, 1, 2 (2.2 only), and 4 of the Standard International TradeClassification (SITC) Rev. 3. Includes commodities and food, beverages and tobacco, and oils of an-imal and vegetable origin.
Source: UN Statistics Division (2005).
1366.ch02.qxd 10/10/06 9:17 AM Page 44
Peterson Institute for International Economics | www.petersoninstitute.org

Pakistan’s agricultural imports are highly concentrated in a few prod-ucts and countries. Animal and vegetable oils, raw cotton, oilseeds, cere-als, and tea account for more than 85 percent of the country’s imports(table 2.5). Malaysia, the United States, Indonesia, and Australia providethe bulk of Pakistan’s imports (table 2.6). The country’s current rapidGDP growth rates—if sustained—will expand import demand, especiallyfor animal protein and packaged foods.7
Current levels of US agricultural exports to Pakistan, about one-sixthof total US exports to the country, total around $300 million,8 and as table2.5 illustrates, are highly concentrated in primary commodities or semi-processed products, namely cotton and cereals.
The United States remains the leading supplier of high-quality cot-ton. The United States is the main corn supplier to Pakistan, and has tra-ditionally been the main wheat supplier as well, although Australianwheat has successfully challenged US wheat over the past decade.9 In
AGRICULTURAL MARKET ACCESS AND RELATED ISSUES 45
Table 2.3 Agricultural and total trade between the United States and Pakistan
Category 1996 1998 2000 2002 2004
Agricultural trade (millions of US dollars)US exports 345 188 56 194 300US imports 43 29 32 31 38Trade balance 302 159 24 163 261
Total trade (millions of US dollars)US exports 1,277 726 462 694 1,811US imports 1,266 1,691 2,167 2,305 2,874Trade balance 11 –965 –1,705 –1,611 –1,063
Shares of agriculture (percent)In total bilateral trade 15 9 3 7 7In US exports to Pakistan 27 26 12 28 17In US imports from Pakistan 3 2 1 1 1
Source: USITC (2005a).
7. The UN Food and Agriculture Organization (FAO 2003) projects almost a doubling inconsumption of milk, meats, and eggs between 2000 and 2015. It also estimates that, in 2015,domestic production of these products will match or exceed domestic consumption.
8. Estimates of bilateral trade differ substantially across sources. While the USITC estimates2004 US exports to Pakistan at $300 million, UN Comtrade reports $400 million. Differencesresult from conflicting estimates of trade in cereals and animal and vegetable oils. Table 2.5presents trade estimates from each source.
9. According to the Commerce Department, Australian wheat has made inroads into themarket through “predatory pricing, cheap freight and credit, and other non-market tactics”(US Commercial Service 2001). As indicated in the text, political factors may have damagedthe reputation of US producers as reliable suppliers.
1366.ch02.qxd 10/10/06 9:17 AM Page 45
Peterson Institute for International Economics | www.petersoninstitute.org
46 SUSTAINING REFORM WITH A US-PAKISTAN FTA
Table 2.4 Pakistan’s top agricultural exports to the United States (millions of US dollars)
Average MFN tariff,
Exports, Share, 2002 UnderHS category Description 2004 2004 (percent) GSP
HS 10 Rice (HS 1006) 12 .32 4.2a 01006.30.90 Long grain rice 7 .17 11.2b 01006.20.20 Basmati rice 5 .13 1.1c 0
HS 13 Vegetable saps and extracts 9 .24 1.1a 1(HS 1302)
1302.32.00 Mucilages and thickeners 8 .21 Free 01302.12.00 Vegetable saps 1 .03 3.8 1
HS 17 Sugars and sugar 4 .12 13a 4confectionery
1703.10.50 Other molasses 3 .09 .0d 3
HS 19-22 Prepared foodstuff 4 .09 9.6a 42106.90.99 Food preparation nesoi 1 .03 6.4 1
HS 09 Spices 3 .09 0.9a 2091.50.00 Curry 1 .04 Free 0091.91.00 Other mixed spices 1 .03 1.9 1
HS 08 Dates 2 .05 4.2a 00804.10.60 Dates without pit 2 .05 3.5e 0
Other commodities 4 .10 n.a. 0
Total 38 1.00 8.7f 11
GSP � generalized system of preferencesHS � Harmonized ScheduleMFN � most favored nationn.a. � not applicablenesoi � not elsewhere specified or included
a. Simple average of all tariff lines, including ad valorem equivalents (AVEs), for the corresponding HS cat-egory.b. The value reported corresponds to the most recent AVE (2002). The actual value of the 2005 tariff is 1.4cents/kg.c.The value reported corresponds to the most recent AVE (2002).The actual value of the 2005 tariff is 0.83cents/kg.d.The value reported corresponds to the most recent AVE (2002).The actual value of the 2005 tariff is 0.01cents/kg of total sugar.e. The value reported corresponds to the most recent AVE (2002). The actual value of the 2005 tariff is 2.8cents/kg.f. Average estimated based on customs duties paid by Pakistan’s agricultural exports.
Source: USITC (2005a, 2005b).
1366.ch02.qxd 10/10/06 9:17 AM Page 46
Peterson Institute for International Economics | www.petersoninstitute.org
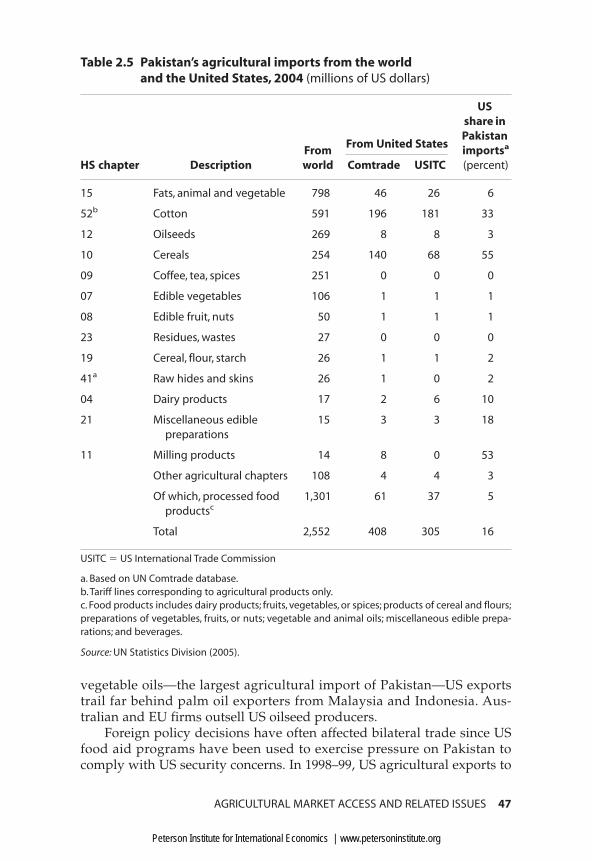
vegetable oils—the largest agricultural import of Pakistan—US exportstrail far behind palm oil exporters from Malaysia and Indonesia. Aus-tralian and EU firms outsell US oilseed producers.
Foreign policy decisions have often affected bilateral trade since USfood aid programs have been used to exercise pressure on Pakistan tocomply with US security concerns. In 1998–99, US agricultural exports to
AGRICULTURAL MARKET ACCESS AND RELATED ISSUES 47
Table 2.5 Pakistan’s agricultural imports from the world and the United States, 2004 (millions of US dollars)
US share in
From United StatesPakistan
From importsa
HS chapter Description world Comtrade USITC (percent)
15 Fats, animal and vegetable 798 46 26 6
52b Cotton 591 196 181 33
12 Oilseeds 269 8 8 3
10 Cereals 254 140 68 55
09 Coffee, tea, spices 251 0 0 0
07 Edible vegetables 106 1 1 1
08 Edible fruit, nuts 50 1 1 1
23 Residues, wastes 27 0 0 0
19 Cereal, flour, starch 26 1 1 2
41a Raw hides and skins 26 1 0 2
04 Dairy products 17 2 6 10
21 Miscellaneous edible 15 3 3 18preparations
11 Milling products 14 8 0 53
Other agricultural chapters 108 4 4 3
Of which, processed food 1,301 61 37 5productsc
Total 2,552 408 305 16
USITC � US International Trade Commission
a. Based on UN Comtrade database.b. Tariff lines corresponding to agricultural products only.c. Food products includes dairy products; fruits, vegetables, or spices; products of cereal and flours;preparations of vegetables, fruits, or nuts; vegetable and animal oils; miscellaneous edible prepa-rations; and beverages.
Source: UN Statistics Division (2005).
1366.ch02.qxd 10/10/06 9:17 AM Page 47
Peterson Institute for International Economics | www.petersoninstitute.org

Pakistan, particularly exports of wheat, were sharply curtailed when theUnited States sanctioned both India and Pakistan after they detonatednuclear bombs (table 2.3).10 The US reputation as a reliable source—par-ticularly for wheat—was damaged in this episode.
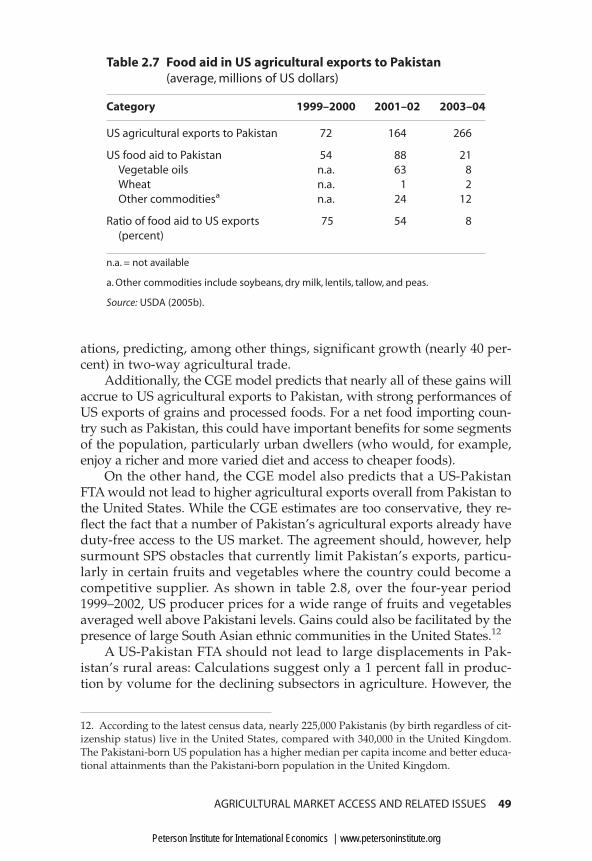
Historically, Pakistan has been a prominent recipient of agriculturalexports under US food aid programs, but such exports have declinedsince 2002. US food aid shipments to Pakistan in 2004 were only $24 mil-lion—about a third of average values recorded in earlier years and only 8percent of total US agricultural exports to Pakistan that year (table 2.7).11
Eligible food and commodities vary year to year, but vegetable oils haveaccounted for the largest share of shipments to Pakistan in recent years.
Impact of a US-Pakistan FTA: The CGE Model
The computable general equilibrium (CGE) and gravity models provide areassuring view of the political feasibility of the US-Pakistan FTA negoti-
48 SUSTAINING REFORM WITH A US-PAKISTAN FTA
Table 2.6 Pakistan’s total agricultural imports, selected sources (millions of US dollars)
Source country 1996 2000 2004
Malaysia 583 346 454
United States 437 71 405
Indonesia 71 62 282
Australia 101 227 241
Brazil, Canada, and Argentina 125 125 162
Kenya 105 144 146
India and Sri Lanka 172 115 118
Total 1,946 1,656 2,552
Note: Agriculture is defined as sections 0, 1, 2 (2.1, 2.2, 2.3, and 2.6.3 only), and 4 of SITC Rev. 3.
Source: UN Statistics Division (2005).
10. The United States imposed sanctions on India on May 13, 1998, and on Pakistan on May30, 1998, pursuant to section 102 of the Arms Export Control Act (also known as the GlennAmendment). In 1996 Pakistan was the top 25th export market for US agricultural exports;when the full effect of sanctions was felt in 1999, the country dropped to the 62nd position.
11. US food aid shipments to Pakistan were large between 2000 and 2002, partly on accountof a drought that curtailed Pakistani agricultural production.
1366.ch02.qxd 10/10/06 9:17 AM Page 48
Peterson Institute for International Economics | www.petersoninstitute.org
ations, predicting, among other things, significant growth (nearly 40 per-cent) in two-way agricultural trade.
Additionally, the CGE model predicts that nearly all of these gains willaccrue to US agricultural exports to Pakistan, with strong performances ofUS exports of grains and processed foods. For a net food importing coun-try such as Pakistan, this could have important benefits for some segmentsof the population, particularly urban dwellers (who would, for example,enjoy a richer and more varied diet and access to cheaper foods).
On the other hand, the CGE model also predicts that a US-PakistanFTA would not lead to higher agricultural exports overall from Pakistan tothe United States. While the CGE estimates are too conservative, they re-flect the fact that a number of Pakistan’s agricultural exports already haveduty-free access to the US market. The agreement should, however, helpsurmount SPS obstacles that currently limit Pakistan’s exports, particu-larly in certain fruits and vegetables where the country could become acompetitive supplier. As shown in table 2.8, over the four-year period1999–2002, US producer prices for a wide range of fruits and vegetablesaveraged well above Pakistani levels. Gains could also be facilitated by thepresence of large South Asian ethnic communities in the United States.12
A US-Pakistan FTA should not lead to large displacements in Pak-istan’s rural areas: Calculations suggest only a 1 percent fall in produc-tion by volume for the declining subsectors in agriculture. However, the
AGRICULTURAL MARKET ACCESS AND RELATED ISSUES 49
Table 2.7 Food aid in US agricultural exports to Pakistan (average, millions of US dollars)
Category 1999–2000 2001–02 2003–04
US agricultural exports to Pakistan 72 164 266
US food aid to Pakistan 54 88 21Vegetable oils n.a. 63 8Wheat n.a. 1 2Other commoditiesa n.a. 24 12
Ratio of food aid to US exports 75 54 8(percent)
n.a. = not available
a. Other commodities include soybeans, dry milk, lentils, tallow, and peas.
Source: USDA (2005b).
12. According to the latest census data, nearly 225,000 Pakistanis (by birth regardless of cit-izenship status) live in the United States, compared with 340,000 in the United Kingdom.The Pakistani-born US population has a higher median per capita income and better educa-tional attainments than the Pakistani-born population in the United Kingdom.
1366.ch02.qxd 10/10/06 9:17 AM Page 49
Peterson Institute for International Economics | www.petersoninstitute.org

50 SUSTAINING REFORM WITH A US-PAKISTAN FTA
Table 2.8 Ratio of average producer prices, 1999–2002(based on prices in US dollars per ton;Pakistan price � 100)
Product India United States
Fruits and vegetablesBananas 79 498Dates n.a. 348Fruits, fresh nes 84 381Grapes 55 74Lemons 62 92Mangoesa 111 227Oranges 357 161Tangerines n.a. 326Potatoes 115 108Onions, dry 94 208
Major cropsCorn 82 55Cotton lintb 215 173Rice, paddy 82 70Soybeans 81 67Sugar cane 96 151Tobacco 86 666Wheat 103 74
Animal products (live weight)Cattle meat n.a. 68Chicken meat 125 96Sheep meat 295 356
Milk and other animal productsCow milk, whole fresh 72 104Hen eggs 65 110Wool 155 157
n.a. = not applicablenes = not elsewhere specified
a. US price corresponds to import unit price.b. Quality differences distinguish all farm products, but in the case of cotton, thequality difference between US fiber and Pakistan fiber is sharp. Hence the higherUS price index is a misleading indicator of bilateral comparative advantage.
Note: FAOSTAT producer prices refer to the national average prices of individualcommodities comprising all grades, kinds, and varieties received by farmers whenthey participate in their capacity as sellers of their own products at the farm gateor first point of sale. Pakistan, however, reported wholesale prices.
Source: FAO (2005).
1366.ch02.qxd 10/10/06 9:17 AM Page 50
Peterson Institute for International Economics | www.petersoninstitute.org
impact could be noticeable in the food processing sector, where the CGEcalculations indicate a 5 percent decline. The drop might be mitigated byincreased foreign investment and joint ventures.
Tariffs, TRQs, and Other Barriers
This section examines the principal trade policy measures that limit agri-cultural imports in both countries. The analysis for Pakistan centers ontariffs for two reasons: They are the country’s principal trade policy in-strument (WTO 2002a), and they are the focus of all US negotiating effortswith developing countries. US protection entails instruments besides tar-iffs, such as TRQs, antidumping measures, SPS measures, and subsidies.
Pakistan
In recent years, Pakistan has made significant efforts to lower and sim-plify its tariff structure (WTO 2002a). The simple average tariff for agri-cultural imports, using the WTO definition, dropped from 44 to 19percent between 1996 and 2006. In overall terms, Pakistan’s level of tariffprotection for agricultural products is similar to that for manufacturedproducts. While the government does not apply TRQs, it maintains im-port bans on imports from India and Israel.
The extent of tariff dispersion in agriculture was simplified by assign-ing nearly all products to one of five duty categories: 5, 10, 15, 20, and 25percent. About half of all agricultural tariff lines fall in the first two cate-gories (5 and 10 percent tariffs). However, tariffs of 25 percent affect closeto a third of tariff lines in agriculture.13 The 2002 WTO Trade Policy Reviewidentifies tariff escalation as a feature of the Pakistani tariff schedule (WTO2002a). Table 2.9 shows that 2005 applied tariffs are particularly high fordairy products (HS 4); fruits (HS 8); certain food preparations based onmeat (HS 16); and processed foods such as fruit juices, soups and broths,pasta, sauces and condiments, foods from roasted cereals, and honey (HS19–22). Poultry meats and some instances exported final products (e.g.,dates, fruits, and spices) also obtain above-average protection.14
AGRICULTURAL MARKET ACCESS AND RELATED ISSUES 51
13. We define agricultural products to mean HS chapters 1 through 24, plus selected lines inHS chapters corresponding to hides, wool, and cotton (HS 41, 50, 52). Fish and forestryproducts were excluded.
14. The following reassurance was extended by Minister of Finance Omar Ayub Khan in the2005–06 budget speech: “[The] Agriculture Sector enjoys primary importance in our econ-omy. Therefore we have proposed reduction[s] in many tariff lines pertaining to agriculture.At the same time it has been ensured that such reductions do not adversely affect the exist-ing protections available to our developing dairy, poultry, and fish farming sectors.”
1366.ch02.qxd 10/10/06 9:17 AM Page 51
Peterson Institute for International Economics | www.petersoninstitute.org

52 SUSTAINING REFORM WITH A US-PAKISTAN FTA
Table 2.9 Pakistan’s applied MFN tariffs for agricultural products, 2005
SimpleNumber of linesaverage Standard
HS Ad Non ad tariff deviationchapter Item valorem valorem (percent)a (percent)
01 Live animals 32 0 6.9 5.902 Meat, edible offal 58 0 15.8 8.404 Dairy products 31 0 21.6 7.005 Animal products nes 23 0 7.6 6.906 Live trees, plants 14 0 9.3 6.207 Edible vegetables 67 0 8.6 4.508 Edible fruit, nuts 61 0 20.2 7.909 Coffee, tea, spices 38 0 9.1 4.210 Cereals 17 0 7.1 2.511 Milling products 30 0 14.3 3.412 Oilseed 49 0 5.8 3.113 Lac, gums, resins, 15 0 17.0 4.114 Vegetable plaiting 11 1 15.0 7.115 Fats, animal and 17 38 14.1 7.3
vegetable16 Meat, fish, preparations 28 0 20.5 1.617 Sugars 26 0 13.3 6.318 Cocoa and cocoa
preparations 12 0 15.0 10.419 Cereal, flour, starch 20 0 22.1 3.320 Vegetable, fruit, 52 0 22.7 4.0
preparations21 Miscellaneous edible 24 0 19.4 7.0
preparations22 Beverages, vinegar 23 0 76.0 31.023 Residues, wastes 26 0 11.3 4.624 Tobacco 10 0 19.0 9.741b Raw hides and skins 14 0 6.3 5.243b Furskins 6 0 5.0 .050b Silk 5 0 5.0 .051b Wool, animal hair 17 0 5.0 .052b Cotton 7 0 7.1 2.753b Vegetable textile 6 0 5.0 .0
Totals and averages 739 39 15.6 6.0
MFN � most favored nationnes � not elsewhere specified
a. Ad valorem tariff lines only.b. Tariff lines corresponding to agricultural products only.
Source: Pakistan Central Board of Revenue (2005a).
1366.ch02.qxd 10/10/06 9:17 AM Page 52
Peterson Institute for International Economics | www.petersoninstitute.org
Two product categories are highly sensitive in Pakistan and conse-quently are granted differential treatment: animal and vegetable oils andalcoholic beverages. The government applies specific duties and sur-charges on imports of vegetable and animal oil (HS 15)—its top agricul-tural import from the world and an important US export to Pakistan(table 2.5).15 For religious reasons, imports of beer, wine, and spirits facetariff peaks ranging from 50 to 100 percent (table 2.10).16 As a Muslimcountry, Pakistan bans the consumption of alcoholic beverages; however,the Census of Manufacturing Industries 2000/01 reports the existence of alimited number of local breweries. Elimination of the high tariffs on veg-etable oils and alcoholic beverages could in part explain the significantexpansion in US exports of processed foods predicted by the CGE model.
Almost 90 percent of US agricultural exports to Pakistan are subject totariffs below 10 percent.17 The bulk of US exports to Pakistan are concen-trated in three products—wheat, corn, and raw cotton (table 2.11)—thatserve either as basic food staples or as inputs for manufactured exports.Though other factors also come into play to limit US exports—geographicdistance, competitive suppliers, and income levels—high tariffs restrict spe-cific US exports such as vegetable oils, poultry, and certain processed foods.
While applied tariffs are generally moderate, bound tariffs are an-other matter. The 2002 WTO Trade Policy Review (WTO 2002a) reports thatPakistan has bound 90 percent of its agricultural tariff lines with a simpleaverage of 97 percent. The gap between the average bound and averageapplied rates is nearly three times larger than the gap for manufacturedproducts. Pakistani authorities argue that the gap permits necessary flex-ibility to deal with temporary imbalances. At the same time, the gap ob-viously introduces uncertainty for exporters.
Pakistan is actively pursuing bilateral negotiations that have in-volved, or will involve, the concession of preferential access for agricul-tural products. To date, only one FTA has been concluded, with SriLanka. A limited agreement with Iran and early harvest agreements withChina and Malaysia may serve as preludes for true FTAs.18 The latter
AGRICULTURAL MARKET ACCESS AND RELATED ISSUES 53
15. The 2002 WTO Trade Policy Review states that no ad valorem equivalent was reported forthose tariff lines. However, Pakistan tariffs on edible oil could reach as high as 40 percent.
16. According to the 2005/06 Import Policy Order, imports of wines and spirits (HS2203–09) and brewing and distilling machinery are altogether prohibited in Pakistan, al-though the items are nevertheless subject to listed tariffs of 100 percent. Religious reasonsare also cited in the case of the prohibition of imports of pork; however, listed tariff rates aremuch lower for pork products—around 25 percent.
17. However, wheat faces other charges such as regulatory duties. For the current year theregulatory duty for wheat imports was established at 415 rupees per 40 kilograms.
18. The early harvest agreement between Pakistan and China includes reciprocal duty-freetreatment for a few agricultural products, mostly fruits and vegetables (HS chapters 7 and8). The early harvest agreement between Pakistan and Malaysia reduces tariffs on palmnuts but not on palm oil.
1366.ch02.qxd 10/10/06 9:17 AM Page 53
Peterson Institute for International Economics | www.petersoninstitute.org

54 SUSTAINING REFORM WITH A US-PAKISTAN FTA
Table 2.10 Pakistan’s highest tariff peaks and specific tariffsin agriculture, 2005
HS 4-digit Average Number ofcategory Description tariff tariff linesa
Peaks above 25 percent2203 Beer made from malt 100 12204 Wine of fresh grapes, including fortified
wines 100 42205 Vermouth and other wine flavored with
plants or other substances 100 22206 Fermented beverages and mixtures nesoi 100 12207 Undenatured ethyl alcohol of more than
80 percent volume 75 22208 Undenatured ethyl alcohol of less than
80 percent volume 100 7
Specific tariffs1404 Vegetable products nesoi—betel leaves Rs.150/Kg 11507 Soybean oil and its fractions Rs. 9,625/ MT 21508 Groundnut oil and its fractions Rs. 13,725/MT 21509 Olive oil and its fractions Rs. 9,625/ MT 41510 Other oils and their fractions Rs. 10,200/MT 11511 Palm oil and its fractions Rs. 9,840/ MT 51512 Sunflower seed, safflower, or cotton seed
oil and their fractions Rs. 16,225/MT 41513 Coconut or babassu oil and their fractions Rs. 10,150/ MT 41514 Rape, colza, or mustard oil and their
fractions Rs. 13,525/MT 41515 Other fixed vegetable fats and oils and
their fractions Rs. 11,925/ MT 81516 Animal or vegetable fats and oils and
their fractions Rs. 10,200/MT 31517 Margarine; edible mixtures of animal or
vegetable fats or oils Rs. 10,800/MT 21518 Animal or vegetable fats and oils and
their fractions, nesoi Rs. 10,800/MT 1
MT � metric tonsnesoi � not elsewhere specified or includedRs. � Pakistan rupees
a. Number of tariff lines with high peaks (above 25 percent) or specific tariffs.
Source: Pakistan Central Board of Revenue (2005a).
1366.ch02.qxd 10/10/06 9:17 AM Page 54
Peterson Institute for International Economics | www.petersoninstitute.org

two agreements provide substantial preferential access for a number ofhighly protected products such as vegetables and fruits.
In recent years, Pakistan and India have also taken steps to normalizetrading relations and increase bilateral trade. India has granted Pakistanmost favored nation (MFN) status unilaterally. Pakistan has not recipro-cated, but has allowed increased imports, some of which (live animals,
AGRICULTURAL MARKET ACCESS AND RELATED ISSUES 55
Table 2.11 Top US agricultural exports to Pakistan(millions of US dollars and percent)
2005 HS 8-digit
2004tariff
category Description Exports Share (percent)
HS 5201 Raw cotton (not carded or 181 0.64 5.0a
combed)5201.00.10 Cotton, staple length under 135 0.48 5.0
28.58 mm5201.00.20 Other cotton, staple length 20 0.07 5.0
� 34.9 mm5201.00.90 Other cotton, staple length 16 0.06 5.0
� 34.9 mm5201.00.10 Raw cotton, staple length 10 0.03 5.0
under 25.4 mm
HS 10 Cereals 64 0.23 7.1b
1001.90.20 White wheat 54 0.19 10.01005.10.00 Yellow corn 10 0.03 5.0
HS 15 Oils and fats 26 0.09 14.1b
1515.90.80 Other vegetable fats and oils 16 0.06 Rs.10,800/ton1502.00.00 Animal fat, inedible tallow 8 0.03 10.01507.10.00 Soybean oil, crude 2 0.01 Rs. 9,050/ton
Other commodities 13 0.05 n.a.
Total 283 1.00 7.8c
n.a. � not applicableRs. � Pakistan rupees
a. Simple average of all tariff lines for the corresponding HS category.b. Excludes lines with specific tariffs.c. Trade-weighted average for US exports based on values reported in this table. For tariff lineswith specific duties we assumed an ad valorem equivalent equal to the highest ad valorem dutyapplied by Pakistan in agricultural products (25 percent). For other commodities, we assumed avalue equivalent to Pakistan’s MFN average tariff for agricultural products (15.6 percent).
Sources: USITC (2005a, 2005b); Pakistan Central Board of Revenue (2005a).
1366.ch02.qxd 10/10/06 9:17 AM Page 55
Peterson Institute for International Economics | www.petersoninstitute.org

garlic, onions, potatoes, and tomatoes) enjoy duty-free access.19 In De-cember 2004, both countries agreed to normalize trade relations in thecontext of the South Asian Free Trade Area (SAFTA) initiative. A strongSAFTA could lead to interregional specialization in agricultural products(e.g., cotton, rice, sugars, fruits and vegetables, and processed foods), andwould surely alter Pakistan’s import patterns for the better.
The government of Pakistan also restricts certain exports as a way ofmanaging the price level for key products, including agricultural inputsused in manufactured exports. Export restrictions currently in force target cotton and wheat, while hides face export taxes. Restrictions onwheat exports aim in principle to ensure food security, as wheat is a cen-tral staple of the population. However, in recent years, Pakistan has be-come an exporter of wheat products. Cotton exports are regulated on thebasis of types and grades. In addition to the export taxes on hides, ex-ports of livestock must meet certain procedures and conditions. Previ-ous US bilateral FTAs have typically addressed export controls and taxesand state trading organizations with a view to curtailing their role.
The Trading Corporation of Pakistan (TCP) is responsible for stabi-lizing the prices of certain commodities (e.g., cotton and sugarcane) atthe lower end in the local market, although other government bodiesalso attempt to fix prices (e.g., provincial governments have a role inpricing sugar cane). TCP interventions are announced on the basis ofminimum prices to provide a “fair return to growers” (Akhatar 2005).However, the TCP’s role in actual procurement varies from commodityto commodity. For example, the TCP’s 2001–02 and 2004–05 interven-tions in the cotton market failed to sustain the price announced by thegovernment, but still had a positive impact on market sentiment (Ordenet al. 2006). The TCP may also leverage its power as a buyer to ensurethe production of contamination-free cotton. TCP authorities view a sta-ble cotton market as a precondition to increased production of bettergrades and staple lengths, which may eventually translate into greaterforeign earnings from cotton exports.
The TCP also plays a role in the imports of other sensitive commodi-ties (e.g., sugar and wheat) by encouraging production through the oper-ation of procurement depots that buy and sell at administered prices.20
Through these depots, the government intervenes in the market andholds large wheat stocks. At moments of low stock, the TCP may import
56 SUSTAINING REFORM WITH A US-PAKISTAN FTA
19. Appendix G of the Import Policy Order 2004/2005 lists all importable items from India.Notable exclusions in agriculture are all meats (HS 2), fish (HS 3), dairy items (HS 4), freshfruits (HS 8), and most processed foods (HS 19–24).
20. USDA GAIN Report PK5017 mentions that the government increased its procurementprice to reach a target of 22 million tons of production.
1366.ch02.qxd 10/10/06 9:17 AM Page 56
Peterson Institute for International Economics | www.petersoninstitute.org

wheat from the United States or Australia.21 The government also setsminimum procurement prices and quality checks for basmati rice.
Reports by different US agencies raise other specific concerns aboutthe Pakistani trade regime. A US Trade Representative report makesclaims of misconduct in customs valuation procedures (USTR 2005a). TheUS Department of Agriculture (USDA) mentions that the difficulty of col-lecting sales and income taxes from domestic firms, contrasted with theease of imposing them on imports, makes these taxes “tantamount toplacing a differential tax on imports.”
United States
Agriculture remains the most highly protected sector in the United States.Certain products enjoy exceptional levels of protection through high tar-iffs, TRQs, and other instruments, such as antidumping measures andsafeguards. Foreign reports also frequently cite US export subsidies foragricultural products.
High US tariffs and strict TRQs are compounded by the application ofspecific tariffs on more than 700 agricultural tariff lines (table 2.12). Ac-cording to the 2004 WTO Trade Policy Review (WTO 2004a), the US simpleaverage applied MFN tariff in 2002, including ad valorem equivalents,was 5.2 percent on all merchandise but 9.8 percent on agricultural prod-ucts. Tariff dispersion is very high in selected agricultural chapters andtariff escalation is clearly a feature for certain agricultural products. UStariff peaks are evident on agricultural products that undergo a greater ex-tent of transformation; table 2.13 shows that some of the highest US tariffpeaks are found on tobacco, peanuts, sugars and sugar confectionery,dairy products, and food products (HS 18–21). Phaseout schedules in USbilateral FTAs prolong the incidence of tariff escalation, because many ofthe highest tariff peaks enjoy the longest phaseout periods. Pakistani offi-cials have a record of attacking tariff escalation, and in a US-Pakistan nego-tiation they will raise specific grievances, such as the high tariffs on dates.22
AGRICULTURAL MARKET ACCESS AND RELATED ISSUES 57
21. US producers have complained that the TCP’s tender specifications placed US farmers ata disadvantage vis-à-vis Australian competitors. In a recent trip to the United States, the chairof the TCP pledged to review these specifications (“Pakistan Officials in US on Wheat TradeVisit,” Kansas Wheat Commission News Archive, www.kswheat.com [accessed July 2006]).
22. Pakistani views on tariff escalation are laid out in the statement discussing an early EU pro-posal on agriculture in WTO Doha negotiations (WTO document G/AG/NG/W/90). The advalorem equivalent for US MFN tariffs on imports of fresh or dried dates is about 4 percent onaverage and does not exceed 8 percent. The US MFN tariff on prepared or preserved dates,however, is 22.4 percent. In the US-Australia FTA, most tariffs on fresh dates were phased out ei-ther immediately or over four years. But preserved dates will only reach duty-free treatment 18years after the agreement entered into force. The pattern is seen in other US FTAs but the differ-ential margins in the phaseout schedules are narrower (e.g., five years in the US-Morocco FTA).
1366.ch02.qxd 10/10/06 9:17 AM Page 57
Peterson Institute for International Economics | www.petersoninstitute.org

58 SUSTAINING REFORM WITH A US-PAKISTAN FTA
Table 2.12 US applied MFN tariffs for agricultural products, 2002
Number of lines Simpleaverage Standard
HS Ad Non ad tariff deviationchapter Product description valorem valorem (percent)a (percent)
01 Live animals 20 8 1.1 2.0
02 Meat, edible offal 54 45 6.1 8.1
04 Dairy products 125 126 12.4 5.0
05 Animal products nes 20 1 0.6 1.4
06 Live trees, plants 20 8 2.9 2.5
07 Edible vegetables 78 89 9.0 7.4
08 Edible fruits, nuts 55 63 5.3 7.7
09 Coffee, tea, spices 40 7 0.7 1.7
10 Cereals 7 14 2.2 4.1
11 Milling products 19 19 4.2 4.2
12 Oilseed 37 24 8.2 34.0
13 Lac, gums, resins 14 1 0.7 1.3
14 Vegetable plaiting 11 2 1.1 1.6
15 Fats, animal and vegetable 37 31 3.6 5.3
16 Meat, fish, preparations 81 9 4.2 5.5
17 Sugars 32 34 6.4 2.9
18 Cocoa and cocoa 44 34 5.8 3.6preparations
19 Cereal, flour, starch 52 18 9.0 5.9
20 Vegetable, fruit, 106 77 11.1 21.5preparations
21 Miscellaneous edible 50 39 7.8 5.4preparations
22 Beverages, vinegar 37 36 1.5 4.8
23 Residues, wastes 24 13 1.8 2.7
24 Tobacco 27 29 90.7 156.3
41b Raw hides and skins 122 n.a. 2.4 1.6
43b Furskins 22 n.a. 2.3 2.1
50b Silk 13 n.a. 1.5 1.6
51b Wool, animal hair 73 26 6.1 8.0
52b Cotton 221 12 9.0 3.7
Totals and averages 1,441 765 9.8 9.4
MFN � most favored nationn.a. � not available
a. Includes ad valorem equivalents.b. All lines considered, including agricultural and nonagricultural products.
1366.ch02.qxd 10/10/06 9:17 AM Page 58
Peterson Institute for International Economics | www.petersoninstitute.org

AGRICULTURAL MARKET ACCESS AND RELATED ISSUES 59
Table 2.13 US tariff peaks in agriculture, 2002
Number oftariff lines Averageabove 15 peaka
HS chapter Product description percent (percent)
52 Cotton (HS 5201–5203 only) 3 34.5
24 Tobacco and manufactured tobacco 14 187.5substitutes
23 Residues and prepared animal feed 1 17.0
22 Beverages, spirits, and vinegar 7 25.3
21 Miscellaneous edible preparations 23 33.8
20 Preparations of vegetables, fruit, nuts, or 24 36.2other
19 Preparations of cereals, flour, starch, or milk 24 32.2
18 Cocoa and cocoa preparations 16 31.7
17 Sugar and sugar confectionery 12 49.0
16 Preparations of meat, fish, crustaceans, 5 36.5or other
15 Animal or vegetable fats, oils, and waxes 3 18.7
12 Oilseeds and oleaginous fruits and other 2 147.8
8 Edible fruit and nuts; peel of citrus fruit 7 23.8or melons
7 Edible vegetables and certain roots 16 22.1and tubers
4 Dairy items 117 35.6Of which:
Cheese 83 33.4Milk and cream 14 30.9Other dairy 20 47.8
3 Fish, crustaceans, mollusks, and other 2 15.0
2 Meat and edible meat offal 7 25.0
a. Average of all tariff lines above 15 percent within 4-digit category, based on ad valorem equivalents.
Note: Tariff peaks are defined as tariffs above 15 percent on an ad valorem equivalent basis.
Source: USITC (2005a, 2005b).
1366.ch02.qxd 10/10/06 9:17 AM Page 59
Peterson Institute for International Economics | www.petersoninstitute.org

Certain Pakistani agricultural exports, particularly spices, certainsugars, and processed foods, do however benefit from generalized sys-tem of preferences (GSP) duty-free access. About 30 to 40 percent of Pak-istan’s agricultural exports to the United States entered through the GSPbetween 1999 and 2003. Apart from GSP benefits, other Pakistani exports,such as curry and certain vegetable saps, also enjoy duty-free MFN ac-cess to the United States. Overall, just over 60 percent of existing Pak-istani agricultural exports already enjoy duty-free access to the USmarket.
US tariffs remain an immediate obstacle for existing exports of Pak-istani rice (specific tariffs have an ad valorem equivalent (AVE) as high as11 percent) and dates (table 2.4). These products and tobacco are thelargest contributors to the US Treasury among Pakistan’s limited agricul-tural exports.
Rice accounts for nearly 50 percent of Pakistan’s total agricultural ex-ports to the world, but the United States remains an elusive market: In2004, less than 2 percent of Pakistan’s exports of rice were destined to theUnited States, mostly to supply ethnic communities. Securing preferen-tial market access for rice exports will be an important objective for Pak-istan in its negotiation with the United States, but other concerns, such asthe ongoing dispute over the patenting of the basmati name, will arise aswell.23
US tariffs are also applied on imports of certain fresh and processedfruits such as cantaloupes, tangerines, oranges, apricots, and dried man-goes (although for Pakistan SPS barriers are probably more important inthe case of fresh fruits). Tariff escalation is quite strong in both fruits andvegetables. Harvest periods in Pakistan for a few fruits and vegetablescoincide with seasonal high tariffs in the United States; for example, wa-termelons are harvested in March through June, a period when the UStariff jumps from 9 to 17 percent. Many preparations based on fruits andvegetables (HS 20, excluding items based on peanuts) face two-digit tar-iffs and selective GSP access (typically granted to least-developed coun-tries and not to Pakistan). High US tariffs also restrict US imports of fruitjuices, jams, pastes, jellies, purées, and fruits and vegetables otherwisepreserved.
The highest US tariffs on agricultural imports are generally leviedunder US Section 22 TRQs (table 2.14). Certain out-of-quota tariffs areprohibitive, such as those on tobacco (350 percent), peanuts (140 percent),peanut butter and paste (132 percent), and butter oil and substitutes (98percent). Table 2.15 lists US TRQs. Pakistan has been granted special
60 SUSTAINING REFORM WITH A US-PAKISTAN FTA
23. Pakistan and US rice producers from Texas have an ongoing dispute over the patentingof “basmati.” So far Pakistan is winning: The US Patent and Trademark Office ruled that USproducers had not proven that their rice qualities were significantly different from “priorart” and hence rejected 13 out of 16 claims.
1366.ch02.qxd 10/10/06 9:17 AM Page 60
Peterson Institute for International Economics | www.petersoninstitute.org

AGRICULTURAL MARKET ACCESS AND RELATED ISSUES 61
Table 2.14 US tariff-rate quotas, 2002 (tons unless otherwise stated)
Average out-of-quota Bound import Fill ratioProduct description tariff rate (percent)a quota (percent)b
Beef: Fresh, chilled, or frozen 26.4 696,621 83
Cream (hectolitres) 26.8 6,695 65
Evaporated/condensed milk 26.6 6,857 87
Nonfat dried milk 52.6 5,261 98
Dried whole milk 53.8 3,321 96
Dried whey/buttermilk 6.8 296 22
Butter 59.5 6,977 98
Butter oil and substitutes 98.0 6,080 100
Dairy mixtures 37.0 4,105 100
Blue cheese 39.0 2,911 97
Cheddar cheese 30.5 13,256 98
American-type cheese 58.4 3,523 99
Edam and Gouda cheese 50.3 6,816 98
Italian-type cheese 48.1 13,481 99
Swiss/Emmenthal cheese 42.4 34,475 83
Gruyere cheese 46.7 7,855 86
Other cheese 35.7 48,628 99
Lowfat cheese 32.9 5,475 65
Peanuts 139.8 52,906 100
Chocolate crumbs 15.1 26,168 79
Infant formula containing 64.8 100 100oligosaccharides
Place-packed stuffed olives 2.0 2,700 31
Green olives, other 2.7 550 69
Green whole olives 4.3 4,400 19
Mandarin oranges (Satsuma) 0.4 40,000 100
Peanut butter and pastec 131.8 20,000 78
Ice cream (hectolitres) 30.4 5,668 57
Raw cane sugar 48.8 1,117,000 81
Other cane or beet sugars or 49.8 22,000 151syrups
Other mixtures over 10 percent 19.6 64,709 99sugar
(table continues next page)
1366.ch02.qxd 10/10/06 9:17 AM Page 61
Peterson Institute for International Economics | www.petersoninstitute.org
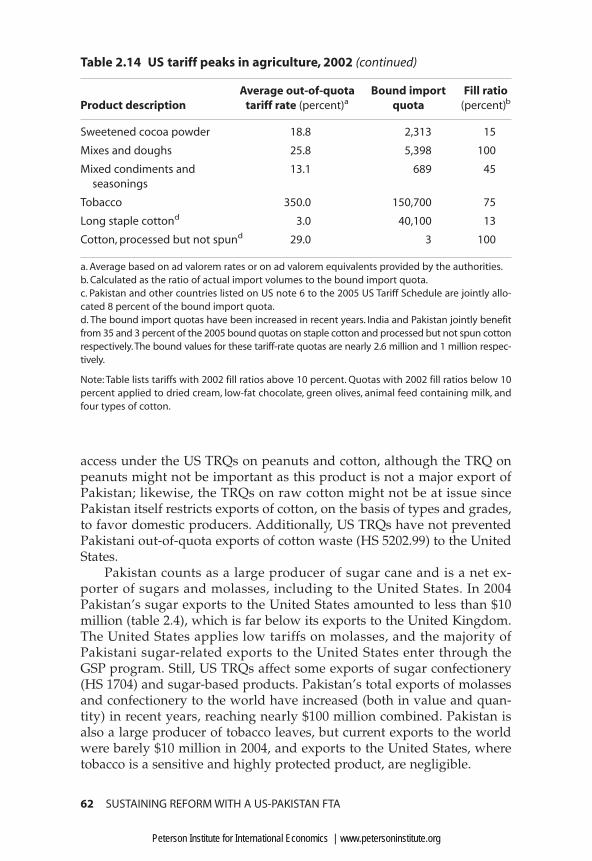
access under the US TRQs on peanuts and cotton, although the TRQ onpeanuts might not be important as this product is not a major export ofPakistan; likewise, the TRQs on raw cotton might not be at issue sincePakistan itself restricts exports of cotton, on the basis of types and grades,to favor domestic producers. Additionally, US TRQs have not preventedPakistani out-of-quota exports of cotton waste (HS 5202.99) to the UnitedStates.
Pakistan counts as a large producer of sugar cane and is a net ex-porter of sugars and molasses, including to the United States. In 2004Pakistan’s sugar exports to the United States amounted to less than $10million (table 2.4), which is far below its exports to the United Kingdom.The United States applies low tariffs on molasses, and the majority ofPakistani sugar-related exports to the United States enter through theGSP program. Still, US TRQs affect some exports of sugar confectionery(HS 1704) and sugar-based products. Pakistan’s total exports of molassesand confectionery to the world have increased (both in value and quan-tity) in recent years, reaching nearly $100 million combined. Pakistan isalso a large producer of tobacco leaves, but current exports to the worldwere barely $10 million in 2004, and exports to the United States, wheretobacco is a sensitive and highly protected product, are negligible.
62 SUSTAINING REFORM WITH A US-PAKISTAN FTA
Table 2.14 US tariff peaks in agriculture, 2002 (continued)
Average out-of-quota Bound import Fill ratioProduct description tariff rate (percent)a quota (percent)b
Sweetened cocoa powder 18.8 2,313 15
Mixes and doughs 25.8 5,398 100
Mixed condiments and 13.1 689 45seasonings
Tobacco 350.0 150,700 75
Long staple cottond 3.0 40,100 13
Cotton, processed but not spund 29.0 3 100
a. Average based on ad valorem rates or on ad valorem equivalents provided by the authorities.b. Calculated as the ratio of actual import volumes to the bound import quota.c. Pakistan and other countries listed on US note 6 to the 2005 US Tariff Schedule are jointly allo-cated 8 percent of the bound import quota.d. The bound import quotas have been increased in recent years. India and Pakistan jointly benefitfrom 35 and 3 percent of the 2005 bound quotas on staple cotton and processed but not spun cottonrespectively. The bound values for these tariff-rate quotas are nearly 2.6 million and 1 million respec-tively.
Note: Table lists tariffs with 2002 fill ratios above 10 percent. Quotas with 2002 fill ratios below 10percent applied to dried cream, low-fat chocolate, green olives, animal feed containing milk, andfour types of cotton.
1366.ch02.qxd 10/10/06 9:17 AM Page 62
Peterson Institute for International Economics | www.petersoninstitute.org

63
Tab
le 2
.15
FTA
max
imu
m p
has
eou
t te
rms
for
sele
cted
ag
ricu
ltu
ral p
rod
uct
s
NA
FTA
:U
nit
ed S
tate
s–U
nit
ed S
tate
s–U
nit
ed S
tate
s–U
nit
ed S
tate
s–U
nit
ed S
tate
s–U
nit
ed S
tate
s–P
rod
uct
Mex
ico
Au
stra
liaB
ahra
inC
AFT
A-D
Ra
Ch
ileM
oro
cco
Jord
an
Bee
fM
exic
o:I
MM
Au
stra
lia:I
MM
Bah
rain
:IM
MC
AFT
A-6
:Tar
iffs
→15
yC
hile
:TRQ
→4y
Mo
rocc
o:T
RQs
��
18y
Jord
an:T
ariff
s→
10y
US:
IMM
US:
TRQ
→18
yU
S:TR
Q →
10y
US:
TRQ
s →
15y
US:
TRQ
→4y
US:
TRQ
→15
yU
S:Ta
riff
s →
10y
Exce
pt
Mex
ico
:W
TO T
RQ a
nd
Exce
pt
DR:
TRQ
s →
15y
Bee
f off
al
pre
fere
nti
al
TRQ
SFG
��
18y
(US)
Pou
ltry
Mex
ico
:TRQ
A
ust
ralia
:Zer
oB
ahra
in:I
MM
CA
FTA
-6:T
RQ →
20y
Ch
ile:T
RQ →
10y
Mo
rocc
o:T
RQ
→25
yJo
rdan
:Tar
iffs
→10
y→
10y
US:
Tari
ffs
US:
Tari
ffs
US:
Zer
oU
S:TR
Q →
10y
US:
Tari
ffs
→10
yU
S:Ta
riff
s →
5yU
S:IM
M→
4y→
5ySF
G (C
AFT
A-6
)SF
G (C
hile
)SF
G (M
oro
cco
)
Turk
eyM
exic
o:T
RQ
Au
stra
lia:Z
ero
Bah
rain
:IM
MC
AFT
A-6
:Tar
iffs
→10
yC
hile
:TRQ
→10
yM
oro
cco
:TRQ
→19
y Jo
rdan
:Tar
iffs
→10
y→
10y
US:
Tari
ffs
US:
Tari
ffs
US:
Zer
oU
S:TR
Q →
10y
US:
Tari
ffs
→10
yU
S:Ta
riff
s →
10y
US:
IMM
→4y
→5y
SFG
(US,
Ch
ile)
SFG
(Mo
rocc
o)
Pork
Mex
ico
:TRQ
A
ust
ralia
:Zer
oB
ahra
in:I
MM
bC
AFT
A-6
:TRQ
→15
yC
hile
:IM
Mn
.a.
Jord
an:T
ariff
s→
10y
→10
yU
S:IM
MU
S:IM
MU
S:IM
MU
S:IM
MU
S:IM
MU
S:IM
MSF
G (C
AFT
A-6
)SF
G (M
exic
o)
Co
rnM
exic
o:T
RQ
Au
stra
lia:Z
ero
Bah
rain
:Zer
oC
AFT
A-6
:TRQ
s �
�15
yC
hile
:Tar
iffs
Mo
rocc
o:T
ariff
s →
5yJo
rdan
:IM
M→
15y
US:
IMM
US:
IMM
US:
Zer
o→
4yU
S:IM
MU
S:IM
MU
S:IM
MSF
G (C
AFT
A-6
)U
S:IM
M
Soyb
ean
s,M
exic
o:T
ariff
s A
ust
ralia
:IM
MB
ahra
in:Z
ero
CA
FTA
-6:I
MM
Ch
ile:I
MM
Mo
rocc
o:T
ariff
s →
5yJo
rdan
:Tar
iffs
→10
ym
eal,
→10
yU
S:IM
MU
S:IM
MU
S:Z
ero
US:
IMM
US:
IMM
US:
IMM
and
US:
IMM
flou
r
Soyb
ean
M
exic
o:T
ariff
s A
ust
ralia
:IM
MB
ahra
in:I
MM
CA
FTA
-6:T
ariff
s →
15y
Ch
ile:T
ariff
s →
12y
Mo
rocc
o:T
ariff
s →
10y
Jord
an:T
ariff
s→
10y
oils
→10
yU
S:Ta
riff
s →
10y
US:
Tari
ffs
→10
yU
S:Z
ero
US:
Tari
ffs
→12
yU
S:Ta
riff
s →
10y
US:
Tari
ffs
→5y
US:
Tari
ffs
→4y
SFG
:(C
AFT
A-6
)
(tab
le c
onti
nues
nex
t pag
e)
1366.ch02.qxd 10/10/06 9:17 AM Page 63
Peterson Institute for International Economics | www.petersoninstitute.org

64
Tab
le 2
.15
FTA
max
imu
m p
has
eou
t te
rms
for
sele
cted
ag
ricu
ltu
ral p
rod
uct
s (c
onti
nued
)
NA
FTA
:U
nit
ed S
tate
s–U
nit
ed S
tate
s–U
nit
ed S
tate
s–U
nit
ed S
tate
s–U
nit
ed S
tate
s–U
nit
ed S
tate
s–P
rod
uct
Mex
ico
Au
stra
liaB
ahra
inC
AFT
A–D
RC
hile
Mo
rocc
oJo
rdan
Wh
eat
Mex
ico
:Tar
iffs
Au
stra
lia:Z
ero
Bah
rain
:Zer
oC
AFT
A-6
:Zer
oC
hile
:IM
MM
oro
cco
:TRQ
s �
�15
yJo
rdan
:IM
M→
10y
US:
IMM
US:
IMM
US:
Zer
oU
S:IM
MU
S:IM
MU
S:IM
MU
S:Ta
riff
s →
10y
Exce
pt
CA
FTA
-6:
Ch
ile:P
rice
ban
d
Wh
eat
flou
r →
12y
tari
ffs
→15
yW
hea
t flo
ur
tari
ffs
→12
ySF
G (C
hile
)
Ric
eM
exic
o:T
ariff
s A
ust
ralia
:Zer
oB
ahra
in:Z
ero
CA
FTA
-6:T
RQ →
18-2
0yC
hile
:Tar
iffs
→12
yM
oro
cco
:Tar
iffs
→10
yJo
rdan
:IM
M→
10y
US:
IMM
US:
IMM
US:
Zer
oU
S:IM
MU
S:IM
MU
S:Ta
riff
s →
5yU
S:Ta
riff
s →
10y
Exce
pt
par
bo
iled
ric
e SF
G (C
AFT
A-6
)SF
G (C
hile
)(U
S) t
ariff
s →
4y
Oth
er
Mex
ico
:TRQ
A
ust
ralia
:Zer
oB
ahra
in:I
MM
CA
FTA
-6:T
ariff
s →
15y
Ch
ile:I
MM
Mo
rocc
o:T
ariff
s →
15 y
Jord
an:T
ariff
s →
4yg
rain
s→
10y
US:
IMM
US:
IMM
US:
Zer
oU
S:IM
MU
S:IM
MU
S:IM
MU
S:IM
M
Nu
tsM
exic
o:I
MM
Au
stra
lia:Z
ero
Bah
rain
:IM
MC
AFT
A-6
:Tar
iffs
→10
yC
hile
:IM
MM
oro
cco
:Tar
iffs
→5y
Jord
an:T
ariff
s→
10y
US:
IMM
US:
Tari
ffs
→4y
US:
IMM
US:
Zer
oU
S:Ta
riff
s →
4yU
S:Ta
riff
s →
10y
US:
Tari
ffs
→4y
Exce
pt
US:
Exce
pt
Mo
rocc
o:
alm
on
ds
TRQ
alm
on
ds
(15y
)Ta
riff
s →
10y
SFG
(Mo
rocc
o)
Pean
uts
M
exic
o:Z
ero
Au
stra
lia:I
MM
Bah
rain
:Zer
oC
AFT
A-6
:IM
MC
hile
:Tar
iffs
→8y
Mo
rocc
o:T
ariff
s →
10y
Jord
an:T
ariff
s→
10y
and
US:
TRQ
→15
yU
S:TR
Q →
18y
US:
TRQ
→10
yU
S:TR
Q →
15y
US:
Tari
ffs
→12
yU
S:TR
Q →
15y
US:
TRQ
→10
yp
ean
ut
Exce
pt
Gu
atem
ala
bu
tter
and
Nic
arag
ua
Tari
ffs
→5-
10y
SFG
(US)
Raw
M
exic
o:T
ariff
s A
ust
ralia
:Zer
oB
ahra
in:I
MM
CA
FTA
-6:I
MM
Ch
ile:I
MM
Mo
rocc
o:I
MM
cott
on
→10
yU
S:TR
Q →
18y
US:
TRQ
→10
yU
S:Ta
riff
s →
15y
US:
Tari
ffs
→12
yU
S:TR
Q →
15y
US:
TRQ
→10
yU
S:TR
Q →
10y
1366.ch02.qxd 10/10/06 9:17 AM Page 64
Peterson Institute for International Economics | www.petersoninstitute.org

65
Milk
an
dM
exic
o:T
RQ
Au
stra
lia:I
MM
Bah
rain
:IM
MC
AFT
A-6
:TRQ
→20
yC
hile
:Tar
iffs
→8y
Mo
rocc
o:T
ariff
s →
15y
Jord
an:T
ariff
s→
10y
crea
ms
→10
yU
S:TR
Q �
�18
y,U
S:TR
Q →
10y
US:
TRQ
→20
yU
S:TR
Q →
12y
US:
TRQ
→15
yU
S:TR
Q →
10y
US:
TRQ
→10
ySa
me
tari
ffs
SFG
(all
par
ties
)
Ch
eese
Mex
ico
:TRQ
A
ust
ralia
:IM
MB
ahra
in:I
MM
CA
FTA
-6:T
RQ →
20y
Ch
ile:T
ariff
s →
4yM
oro
cco
:Tar
iffs
→10
yJo
rdan
:Tar
iffs
→5y
→10
yU
S:TR
Q �
�18
y,U
S:TR
Q →
10y
US:
TRQ
→20
yU
S:TR
Q →
12y
US:
TRQ
→15
yU
S:TR
Q →
10y
US:
TRQ
→10
ySa
me
tari
ffs
SFG
(all
par
ties
)
Bu
tter
M
exic
o:n
.a.
Au
stra
lia:I
MM
Bah
rain
:IM
MC
AFT
A-6
:TRQ
→20
yC
hile
:Tar
iffs
→4y
Mo
rocc
o:T
ariff
s →
8yJo
rdan
:IM
MU
S:n
.a.
US:
TRQ
��
18y,
US:
TRQ
→10
yU
S:TR
Q →
20y
US:
TRQ
→12
yU
S:TR
Q →
15y
US:
TRQ
→10
ySa
me
tari
ffs
SFG
(all
par
ties
)
Fru
its
Mex
ico
:Tar
iffs
Au
stra
lia:Z
ero
Bah
rain
:IM
MC
AFT
A-6
:Tar
iffs
→15
yC
hile
:IM
MM
oro
cco
:Tar
iffs
→10
yJo
rdan
:Tar
iffs
→10
y→
10y
US:
Tari
ffs
→18
yU
S:Ta
riff
s →
10y
US:
Zer
oU
S:Ta
riff
s →
12y
US:
Tari
ffs
→18
yU
S:Ta
riff
s →
10y
US:
TRQ
s →
10y
SFG
(US)
Exce
pt
Mo
rocc
o:
Exce
pt
Mex
ico
:TR
Q a
pp
les
TRQ
ap
ple
sSF
G (U
S,M
exic
o)
SFG
(US)
SFG
(US)
Fru
it
Mex
ico
:TRQ
A
ust
ralia
:IM
MB
ahra
in:I
MM
CA
FTA
-6:T
ariff
s →
15y
Ch
ile:IM
MM
oro
cco
:Tar
iffs
→10
yJo
rdan
:Tar
iffs
→10
yju
ices
→15
yU
S:Ta
riff
s →
18y
US:
Tari
ffs
→10
yU
S:Z
ero
US:
Tari
ffs
→12
yU
S:Ta
riff
s →
15y
US:
Tari
ffs
→4y
US:
TRQ
→15
yEx
cep
tio
ns
(US)
Exce
pti
on
s (U
S)SF
G (U
S)SF
G (U
S)SF
G (U
S)
Vege
tab
les
Mex
ico
:Tar
iffs
Au
stra
lia:Z
ero
Bah
rain
:IM
MC
AFT
A-6
:Tar
iffs
→15
yC
hile
:Tar
iffs
→12
yM
oro
cco
:Tar
iffs
→15
yJo
rdan
:Tar
iffs
→10
y→
10y
US:
Tari
ffs
→18
yU
S:Ta
riff
s →
10y
US:
Zer
o
US:
Tari
ffs
→12
yU
S:Ta
riff
s →
18y
US:
Tari
ffs
→10
yU
S:TR
Qs
→10
yEx
cep
t U
S:Ex
cep
t C
ost
a R
ica
Exce
pt
US:
Exce
pt
US:
Exce
pt
Mex
ico
:TR
Q a
voca
do
s TR
Qs
��
20y
TRQ
avo
cad
os
TRQ
on
ion
s,g
arlic
,TR
Q p
ota
toes
(on
ion
s,p
ota
toes
)SF
G (U
S)to
mat
o p
rod
uct
s (1
5y)
SFG
(US,
Mex
ico
)SF
G (U
S)SF
G (U
S,M
oro
cco
)
Sug
ar a
nd
M
exic
o:T
RQ
Au
stra
lia:I
MM
Bah
rain
:IM
MC
AFT
A-6
:TRQ
→15
yC
hile
:Tar
iffs
→12
yM
oro
cco
:Tar
iffs
→18
yJo
rdan
:Tar
iffs
→10
ysu
gar
→15
yU
S:N
o c
han
ge
US:
TRQ
→10
yU
S:TR
Q �
�15
yU
S:TR
Q →
12y
US:
TRQ
→15
yU
S:TR
Q →
10y
pro
duc
tsU
S:TR
Q →
15y
(tab
le c
onti
nues
nex
t pag
e)
1366.ch02.qxd 10/10/06 9:17 AM Page 65
Peterson Institute for International Economics | www.petersoninstitute.org

66
Tab
le 2
.15
FTA
max
imu
m p
has
eou
t te
rms
for
sele
cted
ag
ricu
ltu
ral p
rod
uct
s (c
onti
nued
)
NA
FTA
:U
nit
ed S
tate
s–U
nit
ed S
tate
s–U
nit
ed S
tate
s–U
nit
ed S
tate
s–U
nit
ed S
tate
s–U
nit
ed S
tate
s–P
rod
uct
Mex
ico
Au
stra
liaB
ahra
inC
AFT
A-D
RC
hile
Mo
rocc
oJo
rdan
Tob
acco
Mex
ico
:Tar
iffs
Au
stra
lia:Z
ero
Bah
rain
:Tar
iffs
CA
FTA
-6:T
ariff
s →
15y
Ch
ile:I
MM
Mo
rocc
o:T
ariff
s →
10y
Jord
an:E
xclu
ded
→10
yU
S:TR
Q →
18y
US:
TRQ
→10
yU
S:TR
Q →
15y
US:
TRQ
→12
yU
S:TR
Q →
15y
US:
Excl
ud
edU
S:Ta
riff
s →
10y
Dis
tille
dM
exic
o:T
ariff
s A
ust
ralia
:IM
MB
ahra
in:T
ariff
sC
AFT
A-6
:Tar
iffs
→10
yC
hile
:Tar
iffs
→2y
Mo
rocc
o:T
ariff
s →
15y
US:
Tari
ffs
→10
ysp
irit
s→
8yU
S:Ta
riff
s →
18y
→10
yU
S:Z
ero
US:
Tari
ffs
→12
yU
S:Ta
riff
s →
15y
and
US:
Tari
ffs
→10
yU
S:Ta
riff
s →
5yb
eer
Win
eM
exic
o:T
ariff
sA
ust
ralia
:IM
MB
ahra
in:T
ariff
s C
AFT
A-6
:Tar
iffs
→5y
Ch
ile:T
ariff
s →
12y
Mo
rocc
o:T
ariff
s →
10y
→10
yU
S:Ta
riff
s→11
y→
10y
US:
Zer
oU
S:Ta
riff
s →
12y
US:
Tari
ffs
→11
yU
S:Ta
riff
s →
10y
US:
Tari
ffs
→10
yU
S:Ta
riff
s →
5y
CA
FTA
-DR
�C
entr
al A
mer
ican
Fre
e Tr
ade
Ag
reem
ent–
Do
min
ican
Rep
ub
licEx
cep
t �
Pro
du
ct e
xcep
tio
n t
o t
he
ph
aseo
ut.
IMM
�Im
med
iate
du
ty-f
ree
trea
tmen
tn
.a.�
no
t av
aila
ble
Sam
e T
� In
-qu
ota
tar
iff w
ill r
emai
n a
t it
s p
re-F
TA r
ate.
Sam
e TR
Q �
Tar
iff-r
ate
qu
ota
will
rem
ain
at
its
pre
-FTA
leve
l.SF
G �
Co
un
try
reta
ins
rig
ht
to in
voke
sp
ecia
l saf
egu
ard
s o
n t
his
pro
du
ct.
Tari
ffs
→8y
� T
ariff
s to
be
ph
ased
ou
t in
8 y
ears
.TR
Qs
→4y
/5y/
10y/
15y/
18y/
20y
� T
ariff
rat
e q
uo
tas
will
be
elim
inat
ed in
4,5
,10,
15,1
8,20
yea
rs.
TRQ
,SFG
,Tar
iffs
��
15y/
18y/
20y
� T
RQs
(or
spec
ial s
afeg
uar
ds
or
tari
ffs)
will
ou
tliv
e th
e 15
-yea
r/18
-yea
r/20
-yea
r p
has
eou
t p
erio
d.
Zer
o �
Zer
o d
uty
bef
ore
th
e FT
A.
a.U
S “z
ero”
du
ty fo
r C
AFT
A p
rod
uct
s re
flect
s p
refe
ren
ces
gra
nte
d in
US
un
ilate
ral p
rog
ram
s.b.
Bah
rain
will
co
nti
nu
e to
pro
hib
it t
he
imp
ort
atio
n o
f liv
e sw
ines
pro
vid
ed t
hat
su
ch p
roh
ibit
ion
is n
ot
inco
nsi
sten
t w
ith
th
e te
rms
of t
his
ag
reem
ent
or
the
WTO
ag
reem
ent.
No
te:T
his
tab
le d
oes
no
t re
flect
th
e “s
tan
dar
d p
has
eou
t”tr
eatm
ent
of e
ach
co
mm
od
ity
bu
t ra
ther
iden
tifie
s th
e m
axim
um
ph
aseo
ut
allo
wed
by
the
Un
ited
Sta
tes
or
any
of i
tsp
artn
ers.
1366.ch02.qxd 10/10/06 9:17 AM Page 66
Peterson Institute for International Economics | www.petersoninstitute.org

Pakistan’s agricultural exports have not been targeted by US an-tidumping or safeguard measures in recent years, although other coun-tries have voiced concern over US licensing systems, invoice requirements,customs fees, and other charges. More recently, foreign governments haveobjected to higher transaction costs and delays associated with the Home-land Security Act of 2002.
With the noteworthy exceptions of the Mexican and Chilean FTA pacts,most US bilateral FTAs do not promise full elimination of agricultural bar-riers. In recent FTA negotiations with developing countries, the UnitedStates has granted and requested notable exceptions to the free trade bench-mark. For example, Morocco’s TRQs on certain US beef, wheat and certainpasta products, and poultry will generally extend beyond 20 years, andwill last indefinitely for some specific tariff lines. Similarly, the CentralAmerican Free Trade Agreement–Dominican Republic (CAFTA-DR) in-cludes virtually permanent exceptions to free trade on sugar and ethanolfor imports by the United States, fresh potatoes and onions for imports byCosta Rica, and white corn for imports by the other Central American coun-tries. Table 2.15 illustrates some of the maximum phaseouts allowed in se-lected US FTAs. However, it should be emphasized that the average USpreferential agricultural tariffs, both in unilateral preference schemes andin bilateral FTAs, are significantly lower than the MFN rates (table 2.16).
Pakistan already benefits from preferential access to the US marketthrough the GSP. However, GSP margins of preference for agriculturalproducts are narrower than those in bilateral FTAs.24 A few simple aver-ages help illustrate this point. In 2002, for agriculture only, the simple av-erage US MFN tariff stood at 9.6 percent, while the figure for GSP was 8.4percent, and the figure for the North American Free Trade Agreement(US-Mexico) was 2.7 percent.
As developing countries—including Pakistan—have abandoned poli-cies that deliberately imposed an antiagricultural bias in their economies,they have become more aware of the harmful impact of Organization forEconomic Cooperation and Development (OECD) subsidy programs.Such programs, especially those maintained by the United States and theEuropean Union, have become a justified target not only for developingcountries but also for NGOs and the world community at large. US, EU,and Chinese support policies jointly depress world prices for many com-modities produced in Pakistan, most importantly cotton, followed bycorn, rice, and wheat. Agricultural subsidy programs thus constitute animportant irritant in relations between the United States and Pakistan(see box 2.1 on page 74). In previous FTAs, however, the United Stateshas not accepted terms that might limit its agricultural subsidy programs,
AGRICULTURAL MARKET ACCESS AND RELATED ISSUES 67
24. GSP rates are also less stable, as they are subject to renewal as well as compliance withlabor standards and other requirements.
1366.ch02.qxd 10/10/06 9:17 AM Page 67
Peterson Institute for International Economics | www.petersoninstitute.org
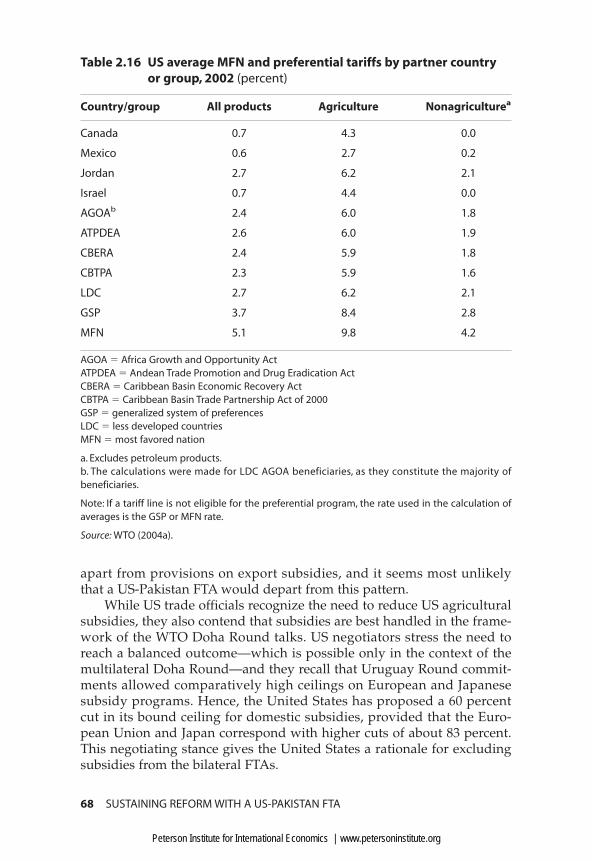
apart from provisions on export subsidies, and it seems most unlikelythat a US-Pakistan FTA would depart from this pattern.
While US trade officials recognize the need to reduce US agriculturalsubsidies, they also contend that subsidies are best handled in the frame-work of the WTO Doha Round talks. US negotiators stress the need toreach a balanced outcome—which is possible only in the context of themultilateral Doha Round—and they recall that Uruguay Round commit-ments allowed comparatively high ceilings on European and Japanesesubsidy programs. Hence, the United States has proposed a 60 percentcut in its bound ceiling for domestic subsidies, provided that the Euro-pean Union and Japan correspond with higher cuts of about 83 percent.This negotiating stance gives the United States a rationale for excludingsubsidies from the bilateral FTAs.
68 SUSTAINING REFORM WITH A US-PAKISTAN FTA
Table 2.16 US average MFN and preferential tariffs by partner countryor group, 2002 (percent)
Country/group All products Agriculture Nonagriculturea
Canada 0.7 4.3 0.0
Mexico 0.6 2.7 0.2
Jordan 2.7 6.2 2.1
Israel 0.7 4.4 0.0
AGOAb 2.4 6.0 1.8
ATPDEA 2.6 6.0 1.9
CBERA 2.4 5.9 1.8
CBTPA 2.3 5.9 1.6
LDC 2.7 6.2 2.1
GSP 3.7 8.4 2.8
MFN 5.1 9.8 4.2
AGOA � Africa Growth and Opportunity ActATPDEA � Andean Trade Promotion and Drug Eradication ActCBERA � Caribbean Basin Economic Recovery ActCBTPA � Caribbean Basin Trade Partnership Act of 2000GSP � generalized system of preferences LDC � less developed countriesMFN � most favored nation
a. Excludes petroleum products.b. The calculations were made for LDC AGOA beneficiaries, as they constitute the majority of beneficiaries.
Note: If a tariff line is not eligible for the preferential program, the rate used in the calculation of averages is the GSP or MFN rate.
Source: WTO (2004a).
1366.ch02.qxd 10/10/06 9:17 AM Page 68
Peterson Institute for International Economics | www.petersoninstitute.org

With respect to subsidies, the OECD (2003) concludes, “Agriculturalpolicy in the United States is characterized by levels of support below theOECD average.” The OECD also notes a long-term tendency toward re-duced support payments. However, support under the Farm Act of 2002is higher, and the extent of market orientation is lower, than when theFarm Act of 1996 was in force.
The producer support estimate (PSE) indicators measure the price-raising effect of border barriers as well as government subsidies. Aftertwo years of substantial decline, the PSE increased sharply in 2004 to alevel of about $46 billion (mainly because of higher direct subsidies), butstill below the record levels of 1999 and 2000 (table 2.17).
The US government’s export subsidy programs are frequently men-tioned in foreign reports. However, in 2002, the latest figures reported bythe WTO, the United States distributed only $32 million, much lower thanthe $594 million cap agreed under the WTO agreement. Reported exportsubsidy figures, however, do not include US export finance, insurance,and guarantee programs, which also play a role in promoting exports. USagricultural exports to Pakistan have obtained, and still qualify for, sup-port under some of these programs.25 According to the 2004 WTO Trade
AGRICULTURAL MARKET ACCESS AND RELATED ISSUES 69
25. According to the USDA, allocations of guaranteed export credit under the GSM-102program amounted to $92 million for Pakistan in 2004. The total value of officially sup-ported export credits for agricultural shipments was $3.4 billion in 2002.
Table 2.17 US production, consumption, and support of the agricultural sector, 2004
Indicator Billions of US dollars
Total value of production (at farm gate) 225.4Total value of agricultural exportsa 61.4Total value of agricultural importsa 54.0
Total support estimate 108.7(48)b
Producer support estimate 46.5(21)
Of which, market price supports 16.2(5)
General services support estimate 34.1(15)
Transfers to consumers from taxpayers 28.0(12)
a. 2003 cost, insurance, and freight (c.i.f.) import values.b. Percent share of production in parentheses.
Source: OECD PSE/CSE database, 2004.
1366.ch02.qxd 10/10/06 9:17 AM Page 69
Peterson Institute for International Economics | www.petersoninstitute.org

Policy Review (WTO 2004a, 111), “Government-guaranteed export financ-ing confers an export advantage, because the interest rate charged doesnot reflect the actual risk of the transaction, but rather the credit rating ofthe underlying guarantee.”
Sanitary and Phytosanitary Measures
SPS measures are sometimes viewed as behind-the-border trade barriers.While not necessarily imposed with protectionist intent, SPS standardscan become effective barriers to exports for countries, such as Pakistan,that lack the capacity to ensure compliance. The 2004 WTO Trade PolicyReview (WTO 2004a, 47), for example, cites “actions targeted to safeguardconsumer health [as] one of the most frequent reasons behind most USquantitative restriction and controls on trade.” The 2002 WTO Trade PolicyReview (WTO 2002a) mentions that some Pakistani measures have like-wise led to “occasional discrimination” against foreign products.
Approaches to SPS Issues in Other FTAs
SPS issues have received secondary attention in US FTA negotiations withdeveloping countries.26 The United States has concentrated on outstand-ing SPS issues rather than raising new issues related to rights and obliga-tions that go beyond the WTO SPS agreement. By contrast, US partners,particularly those that already benefit from duty-free access under a uni-lateral preferential scheme, often put a higher priority on SPS issues.
Negotiators often deal with outstanding SPS issues before submittingthe pact for legislative approval. The US-Chile FTA and CAFTA-DR pre-sent valuable precedents of progress in removing barriers in this area thatallow for an optimistic assessment of the potential accomplishments of a US-Pakistan FTA. Certain institutional issues were tackled duringCAFTA-DR negotiations, and the United States pledged technical assis-tance from the relevant US agencies. That scenario could be repeated, es-pecially since Pakistan has a record of requesting technical cooperationwith respect to the application of WTO SPS measures, as well as to deal-ing with specific issues such as fruit fly and aflatoxin as SPS problems af-fecting key Pakistani agricultural exports, namely fruits (citrus andmango) and rice respectively.27
70 SUSTAINING REFORM WITH A US-PAKISTAN FTA
26. However, a major stumbling block to CAFTA’s implementation is whether CentralAmerican countries will accept USDA certification of meat products to satisfy local SPSstandards.
27. Two irradiation plants were established in November 2005. Governmental agencies aredesigning a strategy for the dairy sector.
1366.ch02.qxd 10/10/06 9:17 AM Page 70
Peterson Institute for International Economics | www.petersoninstitute.org
Studies by the International Trade Center (2001) and US CommercialService (2001) claim that the lack of modern food processing, preserva-tion and distribution systems, and the lack of grading and inspectionservices constitute serious obstacles to the marketing of Pakistan’s poul-try, milk, fruits, and vegetables. These deficiencies damage more than aquarter of total fruit production. Progress is under way. The 2003–04 tradepolicy of Pakistan announced programs for fruit and vegetable treatmentand processing plants (apples, potatoes, onions, and dates), and the es-tablishment of a national certification program for organic products. For-eign cooperation has facilitated access to food processing (vaportreatment plants) and packaging technology.
Outstanding SPS Issues for the US-Pakistan FTA
US agencies do not currently identify specific concerns about PakistaniSPS measures, and Pakistan has notified very few SPS measures to theWTO Sanitary and Phytosanitary Committee. From a US perspective, themost recent bilateral SPS issue of relevance was successfully resolved in2002, when Pakistan eliminated SPS-related barriers that limited US ex-ports of apples and cotton (USDA 2002a). US exports of cotton to Pak-istan subsequently boomed.
Pakistan import bans on beef and poultry from countries that reportedinfections of BSE (or avian influenza) do no affect imports from the UnitedStates. However, recognition of US inspection systems for fruits, meatsand dairy items exported to Pakistan will be an important US interest. Another area that could attract US interest is labeling requirements.
Products derived from biotechnology do not face hurdles in Pakistan.Genetically modified (GM) soybean and soybean oil are currently importedinto Pakistan, and the USDA (2005) does not report specific biotechnology-related trade barriers. Pakistan currently does not grow biotech crops(James 2005), but it expects to increase its reliance on GM seeds.
No US SPS measure notified to the WTO has attracted a responsefrom Pakistan. Still, cargo rejection reports show that some Pakistan agri-cultural exports fail to meet US requirements. Pakistan’s agricultural ex-ports have been rejected (among other reasons) for failure to comply withlabeling requirements; salmonella and filthy conditions; and the use ofcolor additives or pesticides prohibited in the United States.28 Rejectedproducts included citrus, mango, rice, and processed foods such as fruitjuices and biscuits.
AGRICULTURAL MARKET ACCESS AND RELATED ISSUES 71
28. Neither the United States nor the European Union systematically tracks the volume orvalue of rejected cargo. The value estimated by Jaffe and Henson (2005) is low, but these au-thors also argue that border rejections represent only a small part of the constraints on tradeassociated with food safety and agricultural health measures.
1366.ch02.qxd 10/10/06 9:17 AM Page 71
Peterson Institute for International Economics | www.petersoninstitute.org

In April 2005 the United States expanded import eligibility for certainfruits and vegetables. Pakistan was not listed among the countries thatbenefited from the legislation. The legislation applied principles of re-gionalization to zones free of fruit flies and established treatment condi-tions that would serve to qualify certain imports. Similar issues should beof interest to Pakistan. As of December 2005, the USDA Animal and PlantHealth Inspection Service (APHIS) was conducting pest-risk assessmentson mango and tangerine imports from Pakistan. The trade policy speechof 2003–04 announced a number of policy measures aimed at promotingthe export of fresh fruits and vegetables, including the establishment of anational certification for organic products. But while exports of fruitshave expanded rapidly since 1990, surpassing $100 million in 2004, ex-ports of vegetables have not shown much improvement.
Recommendations
In previous FTAs with developing countries, the United States has recog-nized the special sensitivity of agriculture and strived for a balance be-tween development needs and free trade principles. A US-Pakistan FTAwill undoubtedly follow the same pattern. Properly managed adjustment,with long phaseout periods for sensitive products, should be feasible.Our recommendations follow.
For Sensitive Products
A US-Pakistan FTA should expand market access for Pakistani refinedsugar and confectionery producers, on roughly similar conditions asgranted under CAFTA-DR to Costa Rica, the Dominican Republic, orHonduras. Pakistan may establish a reciprocal duty-free TRQ for USsugar, high fructose corn syrup (HFCS), and confectionery.
Pakistan should grant duty-free TRQ access for US poultry meats.After an 18-year transition period, all imports should be free. Wheatand corn should qualify for linear tariff elimination within 10 years,and parallel elimination of other charges. However, during the tran-sition period the TCP should retain its ability to set procurementprices and restrict exports of these sensitive commodities. The UnitedStates should eliminate immediately its tariffs on these products.
With regards to the dairy products, US producers will want to estab-lish the “right precedent” for other negotiations and Pakistan willwant to protect sensitive items such as milk and butter. The UnitedStates and Pakistan should establish large initial duty-free TRQs, with a linear expansion and free trade at the end of a 15-year transi-tion period.
72 SUSTAINING REFORM WITH A US-PAKISTAN FTA
1366.ch02.qxd 10/10/06 9:17 AM Page 72
Peterson Institute for International Economics | www.petersoninstitute.org

AGRICULTURAL MARKET ACCESS AND RELATED ISSUES 73
Beyond the dairy complex, standard US negotiating approach in-volves TRQs on raw cotton and tobacco. Peanuts, dried onions ortomato paste—products that occasionally qualify for TRQs—shouldinstead qualify for 10-year linear phaseouts. Pakistan should provideimmediate duty-free access on raw cotton and commit to a full dereg-ulation of the market within a reasonable period. As highlighted inbox 2.1, cotton is an important cash crop and has important implica-tions in poverty reduction.29 Pakistan should eliminate tariffs on to-bacco over 15 years. It may reciprocate on other products.
US requests for extending TRQ protection for its sensitive productsshould be balanced with Pakistan’s requests for extended protectionfor vegetable oils. Pakistan should grant significant initial preferences(e.g., initial 50 percent tariff cut), particularly on soybean oils.
Other Products
While the list of sensitive items is by no means exhaustive, both coun-tries should strive to eliminate their remaining tariffs within 10 years.Vegetables, fruits and nuts, and spices are areas of considerable interestto Pakistan, with different sensitivities on both sides. With few excep-tions, the United States should eliminate tariffs on fruits, vegetables,and spices immediately. Pakistan should reciprocate, but it may re-quest 10-year phaseout periods for some processed items (e.g., freshfruits, jams, juices, and prepared vegetables), but US beef should qual-ify for immediate duty-free access in Pakistan.
Pakistan should eliminate tariff peaks established for religious rea-sons but retain the right to establish regulatory measures that are con-sistent with the WTO agreement.
For all other products, regulatory duties and other customs chargesshould be reviewed and streamlined.
SPS Issues
The United States should accelerate regulatory changes to allow theimportation of fruits and vegetables from Pakistan. Meanwhile, Pak-istan should recognize USDA certification for animal products, in-cluding beef, poultry products, and dairy items.
The United States should extend to Pakistan targeted technical assis-tance to upgrade its domestic SPS regulatory framework. TheCAFTA-DR framework should provide the model.
29. Tariffs should not be an obstacle since Pakistan has liberalized cotton imports unilater-ally. Tackling the role of the TCP will be more difficult.
1366.ch02.qxd 10/10/06 9:17 AM Page 73
Peterson Institute for International Economics | www.petersoninstitute.org
74 SUSTAINING REFORM WITH A US-PAKISTAN FTA
Box 2.1 US cotton subsidies
Unlike many agricultural products, cotton generally faces low tariff barriers; there-
fore, most of the gains from liberalization for cotton producers are crucially related
to the elimination of subsidies. EU, US, and Chinese cotton producers receive the
bulk of world cotton subsidies. Mid-range estimates suggest that worldwide sub-
sidies and other barriers drive down world cotton prices by 10 to 20 percent.1
There is however considerable debate as to each country’s role in distorting world
cotton prices. Estimates depend on the assumptions built into each model. Some
models conclude that US subsidies, by virtue of being the largest in absolute dol-
lar terms, are particularly damaging. Other models assume fragmented world mar-
kets and conclude that EU cotton subsidies—the highest in the world per unit of
cotton production—more directly affect producers in poor African countries.
In September 2004 a WTO panel determined that certain US support policies
for cotton were inconsistent with US WTO obligations and that they adversely af-
fect the world price of cotton.2 Furthermore, the panel rejected the US categoriza-
tion of certain subsidy programs as “minimally trade-distorting.” The US-Brazil
Upland Cotton dispute was closely followed in Islamabad, and Pakistan partici-
pated as a third party in the dispute. World cotton prices affect the supply deci-
sions of Pakistan’s textile industry, which increasingly relies on US cotton.The mills
push back low world cotton prices to Pakistani farmers, particularly sharecroppers
and cotton pickers, with adverse implications for the government’s poverty reduc-
tion efforts and price support mechanisms.3
Anderson and Valenzuela (2006) found that Pakistan’s cotton production and
exports could increase 5 and 60 percent respectively as a result of a successful
conclusion of the WTO Doha Round and full US compliance with the WTO panel.
Orden et al. (2006) estimate that a 20 percent increase in real cotton prices would
lift almost two million Pakistanis out of poverty and reduce the poverty rate
among Pakistan’s sharecropper households that produce cotton by 40 to 60 per-
cent.4 The findings in these two reports illustrate some of the real benefits await-
ing a successful conclusion of the WTO Doha Round, keeping in mind of course
that other market forces—including world demand for cotton and synthetic fibers,
and the rupee/dollar exchange rate—play a larger role in price determination.5
The Upland cotton case reminded US congress members that inaction on subsi-
dies will come at a price: poor prospects for the WTO Doha Round and strong
prospects of further litigation in Geneva. Uruguay, for example, is already consid-
ering the establishment of a panel to review the impact of US subsidy programs
on rice. Hence, the US Congress is currently under pressure to reassess the terms
of many subsidy programs, and eliminate those that cause “serious prejudice” to
other WTO members (Schnepf 2005).6
(box continues on next page)
1366.ch02.qxd 10/10/06 9:17 AM Page 74
Peterson Institute for International Economics | www.petersoninstitute.org
AGRICULTURAL MARKET ACCESS AND RELATED ISSUES 75
Box 2.1 (continued)
The United States has stated its commitment to comply with the ruling on the
Upland cotton case. Administrative changes on export credit guarantee programs
were announced in June 2005, and a week later the United States proposed legis-
lation relating to the export credit guarantee and step 2 programs. In February
2006 the US Congress repealed two parts of the Step 2 program. Ensuring full
compliance with the ruling will demand further congressional action in 2006, but
the largest repercussions of the case will be seen when the 2007 farm bill is
drafted. Brazilian authorities, however, have expressed doubts about the United
States’ full compliance with the ruling.
1 Orden et al. (2006) conduct a literature review of studies that estimate the impact of subsi-
dies on world cotton prices.2 These findings apply to subsidy programs contingent on market prices for the years
1999–2002. However, the panel reported no numeric estimate of the impact.3 Note that US and Pakistani cotton participate in differentiated markets due to dissimilar
qualities. Cotlook “A” and “B” cotton price indexes have moved in tandem but price differen-
tials have expanded in recent years. However, Gillson et al. (2004) list Pakistan among the
group of countries that stand to gain from full elimination of cotton subsidies.4 The overall impact for Pakistan’s agriculture could be much larger than suggested by those
estimates. According to Food and Agriculture Organization estimates, 7 million rural Pak-
istani households were involved in cotton production in 2001. However, Anderson and Valen-
zuela (2006) calculate a negative net welfare effect for Pakistan as a whole from the
elimination of cotton subsidies.5 Likewise other factors could contribute to improving the situation of poor cotton farmers
in Pakistan.The introduction (and local adaptation) of genetically modified cotton—increas-
ingly a preferred choice of American, Australian, Chinese, and Indian cotton farmers but still
not available in Pakistan—is one prominent example. Aksoy and Beghin (2004) report that
the majority of benefits from growing Bt cotton in China went to farmers; and while these
findings are not replicated by similar studies in the other producing countries, Anderson and
Valenzuela (2006) find large welfare gains for Pakistan as a whole from adoption of geneti-
cally modified cotton.6 These include mostly wheat, corn, barley, cotton, rice, soybeans, and peanuts.
Source: Baily and Lawrence (2004).
1366.ch02.qxd 10/10/06 9:17 AM Page 75
Peterson Institute for International Economics | www.petersoninstitute.org