Embed Size (px)
Citation preview

International Research Journal of Engineering and Technology [IRJET] e-ISSN: 2395-0056
Volume: 07 Issue: 07 | July 2020 www.irjet.net p-ISSN: 2395-0072
© 2020, IRJET | Impact Factor value: 7.529 | ISO 9001:2008 Certified Journal | Page 1
ANALYSIS OF A NATURALLY VENTILATED INSTITUTE BUILDING BASED
ON INDOOR COMFORT
Kamalesvari S1, Chitra S2, Shruthilaxmi J3, Ashika P4, Sheetal Amraotkar5
1234 Post Graduate Student, M.Arch Sustainable, Dept. of Architecture, Sathyabama Institute of Science and Technology, Chennai, India.
5Associate Professor, Dept. of Architecture, Sathyabama Institute of Science and Technology, Chennai, India.
---------------------------------------------------------------------***---------------------------------------------------------------------Abstract - Indoor comfort has always been at an urge of research and discussion over the past decade because of the ever-
growing population and subsequent need for suitable built structures. Institutes play a major part in the fast-growing development
holding up a massive population for considerably longer occupancy hours. Considering the importance of indoor comfort in a free-
running building, a generic case study was selected in an institutional campus located in a hot-humid climate to evaluate indoor
comfort. The analysis was carried out based on its architectural design parameters and its impact on the climatic parameters
through field survey and subjective analysis based on sensation and preference. The study proves that in a naturally ventilated
building, especially in a tropical climate where humidity and wind are the primary parameters of concern people tend to adapt to
the immediate surrounding showing a higher range of comfort than that of the prescribed standards.
Key Words: Adaptive comfort, Hot-Humid, Thermal comfort, Thermal preference, Thermal sensation, Tropical
climate, Visual comfort
1. INTRODUCTION The world population is estimated to have increased by 400% over the 20th century [1]. With the growing population, the built space is increasing dramatically which acts as a major contributor to greenhouse gases, leading to an increase in energy consumption [2][3]. In the current scenario people spend more than 90% of the time indoor, especially, students spend about 1/3rd of the day in educational structure with high occupancy density [3][4]. Such densely occupied buildings (institutes) require a better-designed space as the performance of the occupants and the energy consumption is highly influenced by the indoor (classroom) thermal and visual comfort [3] [5] [6]. From various researches, it is also evident that passive strategies play an important role in achieving a comfortable indoor condition and also performs as a tool for energy conservation [7] Indoor comfort primarily depends on the principle parameters such as thermal comfort, thermal sensation and visual comfort. Thermal comfort is defined as "that condition of mind, which expresses satisfaction with the thermal environment" (ISO Standard 7730 & ASHRAE 55). It plays an important role in the physiological & psychological state of an individual. Thermal comfort is influenced by various factors such as air temperature, radiant temperature, relative humidity, wind velocity, clothing and metabolic rate [8]. For humans to perform any activity productively thermal comfort needs to be optimum. Numerous researches have been carried out to study the thermal comfort of classrooms and have proven that it has a direct impact on students learning potential [5] [9] [10]. Apart from thermal comfort, thermal sensation also is an important aspect to be considered in a naturally ventilated building. The temperature we sense is not the actual air temperature but what the receptors in our skin sense, referred to as thermal sensation [11]. Other than ambient air temperature the humidity content and the velocity of the air can fundamentally change this sensation [12]. Also, acclimatization increases the acceptance and adaptability of an individual to the local climatic condition creating a comfort band beyond the upper limit [13]. One other parameter that contributes to indoor comfort, particularly in institute building, is visual comfort [14]. To define visual comfort two different approaches are usually considered: the most widely accepted approach is the “NON-annoyance approach” based on the assumption that “comfort is not discomfort”. The second one is “well-being approach” that is induced by well-being and satisfaction. Glare, difficulty in performing a visual task, annoyance, stress, and physical symptoms such as headaches, pains, sore, itchy, watering eyes are indicators of visual discomfort [15] Knowing the importance of indoor comfort, this paper illustrates the design strategies obtained in a generic free-running block of an institute building and its analysis over the indoor comfort parameters.

International Research Journal of Engineering and Technology [IRJET] e-ISSN: 2395-0056
Volume: 07 Issue: 07 | July 2020 www.irjet.net p-ISSN: 2395-0072
© 2020, IRJET | Impact Factor value: 7.529 | ISO 9001:2008 Certified Journal | Page 2
2. BACKGROUND LITERATURE To explore the importance of comfortable indoor conditions and its effect on students learning capability further investigation was carried out by reviewing previous researches based on the indoor thermal comfort model of a free-running building. A high comfort temperature range (25 °C–30 °C) has been reported from the thermal comfort study carried out in the tropical climate of India [16]. A neutral temperature of 29.2 °C in summer season has been observed in a thermal comfort field study carried out in a naturally ventilated apartment [17]. Research on adaptive comfort, specifically in warm and hot climates, has revealed that occupants in naturally ventilated buildings are more tolerant towards high fluctuations encountered in indoor environmental conditions [16] [18] [19] [20]. In naturally ventilated building, occupants use several adaptive opportunities and controls such as changing clothing level, operable windows, doors, blinds, curtains, fans & fan regulators for adaptive adjustments to make themselves comfortable in the changing thermal environment [20]. In the study, it has been found that students preferred warmer temperature than a neutral temperature [6]
From a study conducted in an educational building in the subtropical climate of Taiwan it has been found out that air temperature, air movement and mean radiant temperature have a significant influence on student’s thermal sensation, where humidity doesn’t significantly influence the sensation [21][22]. A study carried out in Kharagpur makes it evident that the comfort zone is broader than 10°C and there is a high correlation between indoor comfort temperature and outdoor conditions [6]. Earlier studies also indicate that the students prefer high air velocity in warmer conditions and the authors observed that there is considerable improvement in acceptability at higher velocity [6]
Table -1 gives a summary of recent studies conducted in naturally ventilated buildings in India, briefing out the building
typology, climate, season and the comfort band.
Table -1: Summary of acceptable comfort band in naturally ventilated building
Researchers Climate Season Building type Comfort band
Sharma & Ali -
1986 [16]
Composite All Seasons Residential 25oC – 30oC
Indraganti -2010
[17]
Composite All Seasons Residential 26oC – 32.5oC
Singh et al. – 2010
[23]
Warm & Humid All Seasons Residential 22.8oC – 29.1oC
Cool & Humid All Seasons Residential 21.1oC – 27.6oC
Cold & Cloudy All Seasons Residential 18.9oC – 26.2oC
Pellegrino et al,
2012 [24]
Hot & Humid Summer
season
University 24.9oC – 32.5oC
Mishra &
Ramgopal - 2014
[6]
Composite Summer
season
Students
dormitories/Laboratory
19.4oC – 33.7oC
Dhaka et al. -
2015 [25]
Composite All Seasons Residential and Students
dormitories
16.7oC – 34.8oC
Kumar et al. -
2016 [26]
Composite All Seasons Residential and Students
dormitories
25.2oC – 30.6oC
Indraganti et al.-
2014 [27]
Composite All Seasons Offices 22.4oC – 30.2oC

International Research Journal of Engineering and Technology [IRJET] e-ISSN: 2395-0056
Volume: 07 Issue: 07 | July 2020 www.irjet.net p-ISSN: 2395-0072
© 2020, IRJET | Impact Factor value: 7.529 | ISO 9001:2008 Certified Journal | Page 3
Manu et al. - 2015
[28]
All climatic zones All Seasons Offices 19.6oC – 28.5oC
Mishra &
Ramgopal - 2015
[29]
Composite Autumn and
Spring
University 22.1oC – 31.5oC
From the literature survey the importance of thermal comfort study in classrooms is evident as thermal comfort conditions affect the well-being and learning curve of students. [20]
3. AREA OF STUDY Spread over an area of 426 km2, Chennai is the capital of Tamil Nadu. Situated at an elevation of 16m above the MSL, the city lies
on the geographical coordinates of 13.0827° N latitude and 80.2707° E longitude with “Warm-Humid / Hot-Humid climate” (Fig-
1). Holding a variation of three seasons, the climate is characterized to have high air temperature and relative humidity due to
increased radiation level and its proximity to the east coast respectively. The field survey was conducted on an institutional
building at Sathyabama Institute of Science and Technology on 20th of March 2019 (summer month), a period of discomfort.
Fig -1: ECBC Climate zone map of India
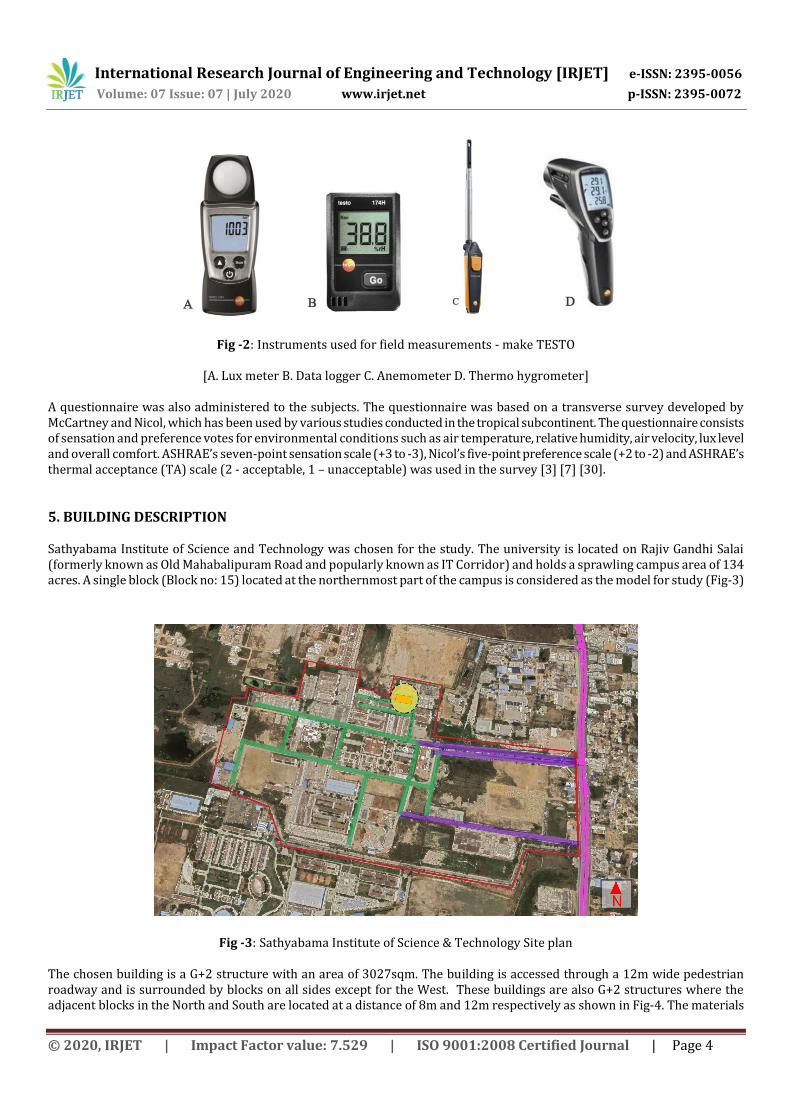
4. METHODOLOGY As the aim of this study was to determine the indoor comfort and to analyze the extent of adaptability, subjective responses of the occupants were also studied in addition to the field measurements. Outdoor environmental data was collected from the local meteorological station and field study was conducted for measuring the indoor environment. The variables measured were air temperature, relative humidity, air velocity, surface temperature and lux. A set of handheld and calibrated digital instruments from Testo were used in this study to measure the above-mentioned parameters. Indoor air temperature and humidity were measured using mini data logger, air velocity, surface temperature and lux were measured using a thermal anemometer, infrared thermometer and light intensity lux meter respectively (Fig-2). These instruments were placed at a height of 1m above and away from the surfaces. The measurements were taken thrice a day at 8.30am, 11.30am and 2.30pm.
International Research Journal of Engineering and Technology [IRJET] e-ISSN: 2395-0056
Volume: 07 Issue: 07 | July 2020 www.irjet.net p-ISSN: 2395-0072
© 2020, IRJET | Impact Factor value: 7.529 | ISO 9001:2008 Certified Journal | Page 4
Fig -2: Instruments used for field measurements - make TESTO
[A. Lux meter B. Data logger C. Anemometer D. Thermo hygrometer]
A questionnaire was also administered to the subjects. The questionnaire was based on a transverse survey developed by McCartney and Nicol, which has been used by various studies conducted in the tropical subcontinent. The questionnaire consists of sensation and preference votes for environmental conditions such as air temperature, relative humidity, air velocity, lux level and overall comfort. ASHRAE’s seven-point sensation scale (+3 to -3), Nicol’s five-point preference scale (+2 to -2) and ASHRAE’s thermal acceptance (TA) scale (2 - acceptable, 1 – unacceptable) was used in the survey [3] [7] [30].
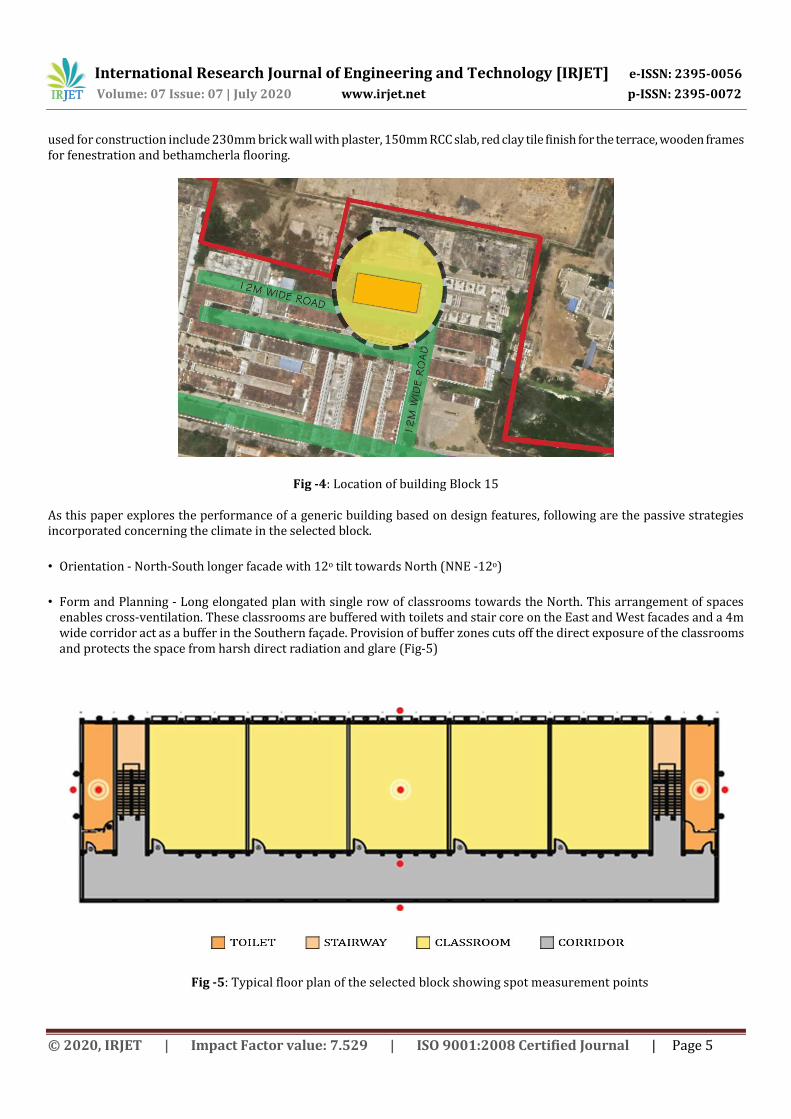
5. BUILDING DESCRIPTION Sathyabama Institute of Science and Technology was chosen for the study. The university is located on Rajiv Gandhi Salai (formerly known as Old Mahabalipuram Road and popularly known as IT Corridor) and holds a sprawling campus area of 134 acres. A single block (Block no: 15) located at the northernmost part of the campus is considered as the model for study (Fig-3)
Fig -3: Sathyabama Institute of Science & Technology Site plan
The chosen building is a G+2 structure with an area of 3027sqm. The building is accessed through a 12m wide pedestrian roadway and is surrounded by blocks on all sides except for the West. These buildings are also G+2 structures where the adjacent blocks in the North and South are located at a distance of 8m and 12m respectively as shown in Fig-4. The materials
International Research Journal of Engineering and Technology [IRJET] e-ISSN: 2395-0056
Volume: 07 Issue: 07 | July 2020 www.irjet.net p-ISSN: 2395-0072
© 2020, IRJET | Impact Factor value: 7.529 | ISO 9001:2008 Certified Journal | Page 5
used for construction include 230mm brick wall with plaster, 150mm RCC slab, red clay tile finish for the terrace, wooden frames for fenestration and bethamcherla flooring.
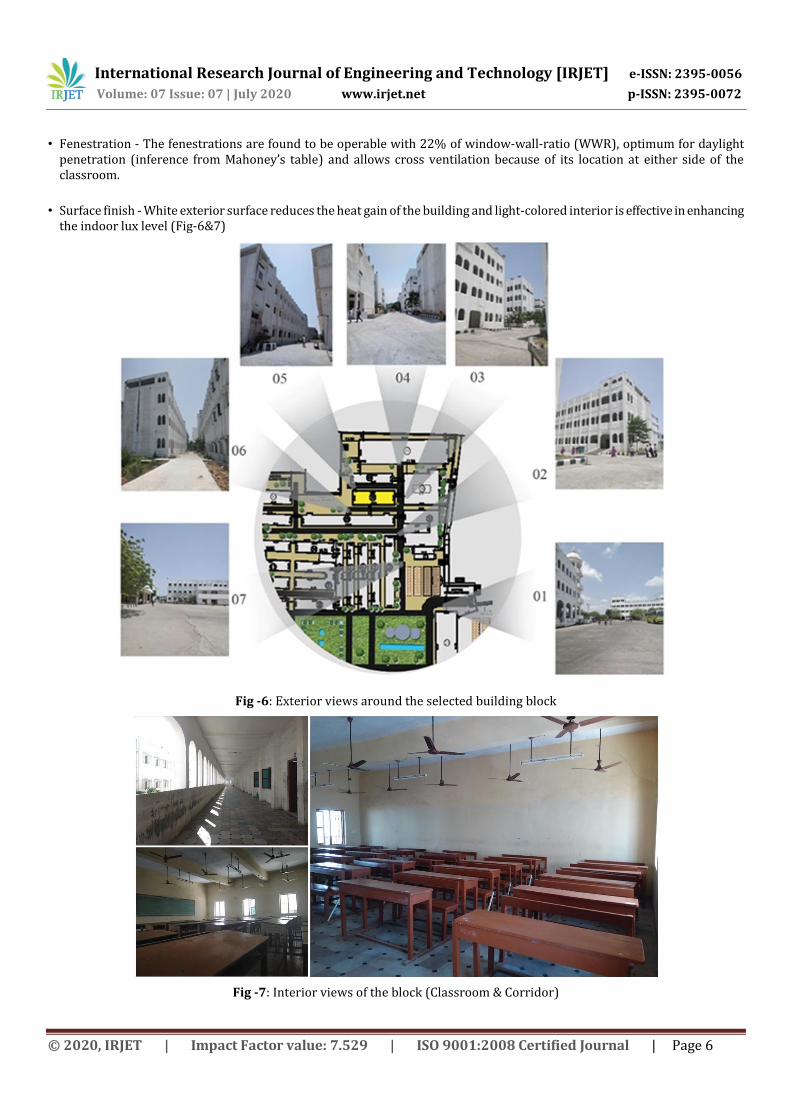
Fig -4: Location of building Block 15 As this paper explores the performance of a generic building based on design features, following are the passive strategies incorporated concerning the climate in the selected block.
• Orientation - North-South longer facade with 12o tilt towards North (NNE -12o)
• Form and Planning - Long elongated plan with single row of classrooms towards the North. This arrangement of spaces enables cross-ventilation. These classrooms are buffered with toilets and stair core on the East and West facades and a 4m wide corridor act as a buffer in the Southern façade. Provision of buffer zones cuts off the direct exposure of the classrooms and protects the space from harsh direct radiation and glare (Fig-5)
Fig -5: Typical floor plan of the selected block showing spot measurement points
International Research Journal of Engineering and Technology [IRJET] e-ISSN: 2395-0056
Volume: 07 Issue: 07 | July 2020 www.irjet.net p-ISSN: 2395-0072
© 2020, IRJET | Impact Factor value: 7.529 | ISO 9001:2008 Certified Journal | Page 6
• Fenestration - The fenestrations are found to be operable with 22% of window-wall-ratio (WWR), optimum for daylight penetration (inference from Mahoney’s table) and allows cross ventilation because of its location at either side of the classroom.
• Surface finish - White exterior surface reduces the heat gain of the building and light-colored interior is effective in enhancing the indoor lux level (Fig-6&7)
Fig -6: Exterior views around the selected building block
Fig -7: Interior views of the block (Classroom & Corridor)

International Research Journal of Engineering and Technology [IRJET] e-ISSN: 2395-0056
Volume: 07 Issue: 07 | July 2020 www.irjet.net p-ISSN: 2395-0072
© 2020, IRJET | Impact Factor value: 7.529 | ISO 9001:2008 Certified Journal | Page 7
6. SAMPLE SIZE AND PROFILE OF THE SUBJECTS A total of 43 students (42% male, 58% female) participated in the survey and belong to an age group of 18-21 years. The subjects were all Indian nationals and were well acclimatized to the hot-humid climate of Chennai for about a year. Each subject participated in the survey after they had settled in the classroom for more than 30 minutes. Metabolic rates and clothing insulation were estimated using standard lists [31]. For clothing insulation, the student generally wore shirts/t-shirts, trousers/jeans and some female students wore cotton salwar. The metabolic activity of the subjects was almost sedentary, i.e., the subjects were mostly seated and were performing light work activity.
7. RESULTS AND DISCUSSIONS
7.1. Quantitative Analysis 7.1.1. Air Temperature Analysis
In an adaptive thermal comfort model, the correlation between indoor and outdoor temperature acts as an integral part. Chart-1 represents the field survey measurements of the same. The observation reflects the lack of night flushing and heat dissipation during the non-occupancy hours, found to be evident with higher indoor air temperature than outdoor air temperature at 8:30am. During the latter part of the day the effect of UHI is reflected in the readings recorded in the ground floor at 2:30pm. Presence of corridor in the south acts as a buffer. Hence there is a reduction in temperature at the southern façade of the classroom. Incorporation of passive strategy has positively contributed to the enhancement of indoor thermal comfort.
Chart -1: Graph Showing Indoor and Outdoor Air Temperature
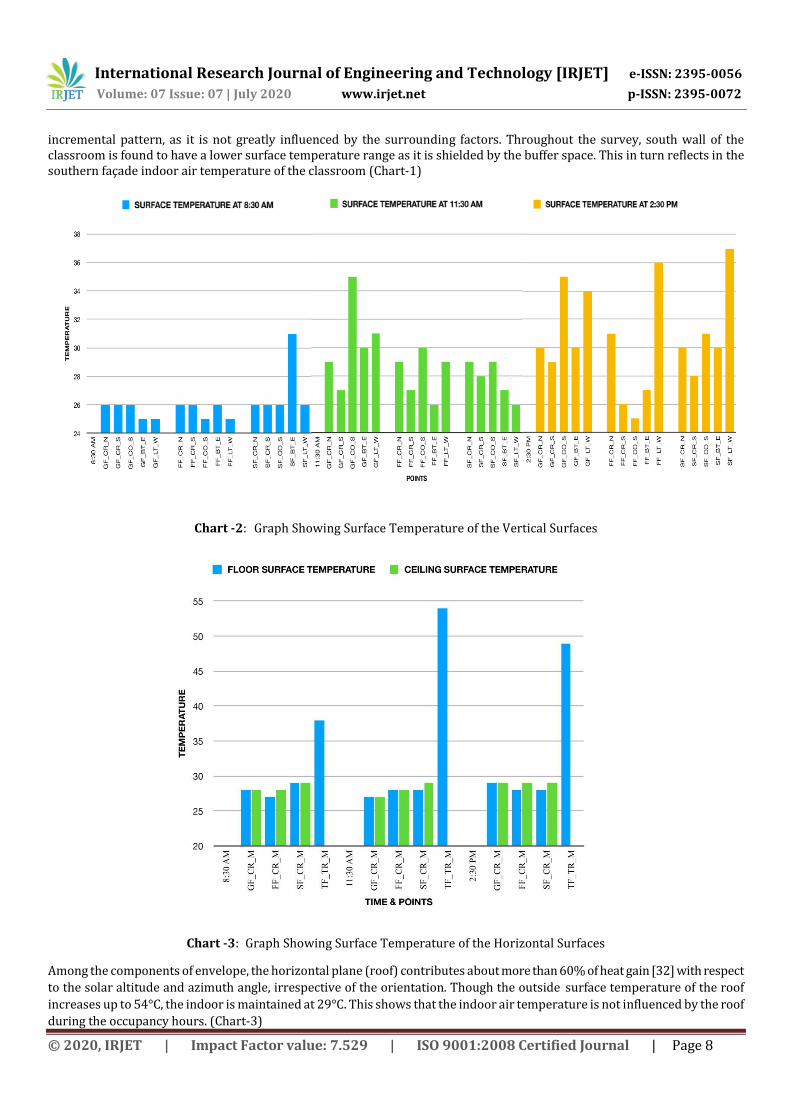
7.1.2. Surface Temperature Analysis The envelope of the building acts as an immediate insulation element to the corresponding indoor. Chart-2 represents the observed surface temperature reading of all the directions. The shade provided by the tree facilitates the ground and first floor, whereas shoots up the surface temperature of the second floor eastern wall (31°C). The corridor wall (south) at the ground floor reaches the maximum (35°C) at 11:30am because of the UHI effect caused by the pavers. The west wall is found to follow an
LEGEND FOR CHARTS
GF - Ground Floor CR - Class Room LT - Ladies Toilet N - North E - East
FF - First Floor CO - Corridor TR - Terrace M - Middle W - West
SF - Second Floor BT - Boys Toilet S - South
International Research Journal of Engineering and Technology [IRJET] e-ISSN: 2395-0056
Volume: 07 Issue: 07 | July 2020 www.irjet.net p-ISSN: 2395-0072
© 2020, IRJET | Impact Factor value: 7.529 | ISO 9001:2008 Certified Journal | Page 8
incremental pattern, as it is not greatly influenced by the surrounding factors. Throughout the survey, south wall of the classroom is found to have a lower surface temperature range as it is shielded by the buffer space. This in turn reflects in the southern façade indoor air temperature of the classroom (Chart-1)
Chart -2: Graph Showing Surface Temperature of the Vertical Surfaces
Chart -3: Graph Showing Surface Temperature of the Horizontal Surfaces
Among the components of envelope, the horizontal plane (roof) contributes about more than 60% of heat gain [32] with respect
to the solar altitude and azimuth angle, irrespective of the orientation. Though the outside surface temperature of the roof
increases up to 54°C, the indoor is maintained at 29°C. This shows that the indoor air temperature is not influenced by the roof
during the occupancy hours. (Chart-3)
International Research Journal of Engineering and Technology [IRJET] e-ISSN: 2395-0056
Volume: 07 Issue: 07 | July 2020 www.irjet.net p-ISSN: 2395-0072
© 2020, IRJET | Impact Factor value: 7.529 | ISO 9001:2008 Certified Journal | Page 9
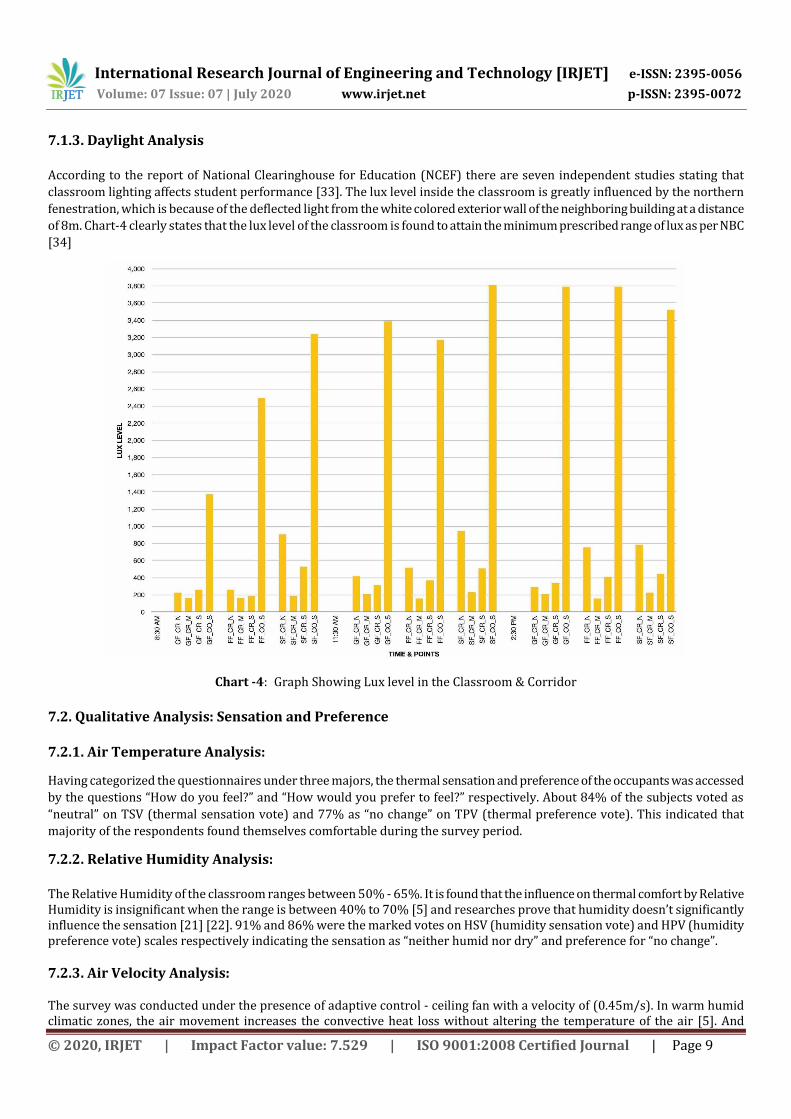
7.1.3. Daylight Analysis According to the report of National Clearinghouse for Education (NCEF) there are seven independent studies stating that
classroom lighting affects student performance [33]. The lux level inside the classroom is greatly influenced by the northern
fenestration, which is because of the deflected light from the white colored exterior wall of the neighboring building at a distance
of 8m. Chart-4 clearly states that the lux level of the classroom is found to attain the minimum prescribed range of lux as per NBC
[34]
Chart -4: Graph Showing Lux level in the Classroom & Corridor
7.2. Qualitative Analysis: Sensation and Preference 7.2.1. Air Temperature Analysis:
Having categorized the questionnaires under three majors, the thermal sensation and preference of the occupants was accessed
by the questions “How do you feel?” and “How would you prefer to feel?” respectively. About 84% of the subjects voted as
“neutral” on TSV (thermal sensation vote) and 77% as “no change” on TPV (thermal preference vote). This indicated that
majority of the respondents found themselves comfortable during the survey period.
7.2.2. Relative Humidity Analysis: The Relative Humidity of the classroom ranges between 50% - 65%. It is found that the influence on thermal comfort by Relative Humidity is insignificant when the range is between 40% to 70% [5] and researches prove that humidity doesn’t significantly influence the sensation [21] [22]. 91% and 86% were the marked votes on HSV (humidity sensation vote) and HPV (humidity preference vote) scales respectively indicating the sensation as “neither humid nor dry” and preference for “no change”.
7.2.3. Air Velocity Analysis:
The survey was conducted under the presence of adaptive control - ceiling fan with a velocity of (0.45m/s). In warm humid climatic zones, the air movement increases the convective heat loss without altering the temperature of the air [5]. And
International Research Journal of Engineering and Technology [IRJET] e-ISSN: 2395-0056
Volume: 07 Issue: 07 | July 2020 www.irjet.net p-ISSN: 2395-0072
© 2020, IRJET | Impact Factor value: 7.529 | ISO 9001:2008 Certified Journal | Page 10
according to Nicol [35] the acceptable air velocity for hot and warm countries can be up to 1.5m/s. The survey on AVS (air velocity sensation) and AVP (air velocity preference) provided results of about 88% and 72% respectively. An increased positive voting on both temperature and air velocity is due to the fact that the comfort temperature increases for different air speeds as illustrated by Nicol’s [36] This research coincides with Indraganti’s analysis [17] that an addition of about 2oC can be added to the predicted comfort band.
7.2.4. Daylight Analysis:
As observed from Chart-4, the lux level is found to range within the standards. Hence the sensation and preference votes of “neither bright nor dim” and “no change” with a percentage of 82% and 75% is obtained.
As an overall observation from the subjective survey, maximum numbers of respondents were found to be comfortable by stating the preference of “no change” and an acceptability of 86%. Being an institute building survey was conducted among male (42%) and female (58%) students. Due to the need for cooler ambience by the male students, the deviation from neutrality occurred. This result is found to be consistent with the findings of study conducted on similar circumstances [5] [10]
8. CONCLUSION An investigation of indoor comfort (thermal and visual) of a free-running institute block in a hot-humid climate has been
carried out on 20th March 2019. Field survey was conducted with the help of handheld instruments as a part of quantitative
analysis to determine the climatic parameters such as temperature, humidity, wind and 43 subjects between the age group of
18-21 were involved in subjective analysis based on sensation and preference. The chosen building holds few passive strategies
such as north-south longer facade with 12o tilt towards the north, linear elongated plan with a single row of classrooms
towards the north, classrooms buffered with toilets and stair core on the east and west facades and a 4m wide corridor (buffer)
in the southern façade. The field measurements prove that UHI and lack of night flushing were the parameters that caused
discomfort but the subjective analysis clearly shows that the students were comfortable during the occupancy hours as they
were well acclimatized to the local climate. About 84% of the people voted “neutral” on thermal sensation vote and 77% as “no
change” in thermal preference vote. They tend to adapt to their surrounding with the help of adaptive measures such as change
of clothing style, use of fans or operation of windows based on their comfort level. Hence a broader comfort zone has been
evident. As the lux level tends to fall within the prescribed standards (NBC), the classrooms are found to satisfy the visual
comfort with sensation and preference vote of 82% (neither bright nor dim) and 75% (no change) respectively. The output
discussed in the paper elaborates on the results and analysis of a single day of field survey and a cumulative subjective survey
of the month of March as the other months of summer are found to have less occupancy density. Proving the effectual aspect of
adaptability it is evident that the hours of discomfort during the summer months are quite insignificant.
Holding a major part among the ever-growing structures naturally ventilated institutes are at an urge of a comfortable indoor
environment. With the help of appropriate design and taking adaptive measures as guiding principles, indoor comfort can be
achieved. Further research may include the output of winter months for a comparative analysis of the existing condition and
adaptability based on seasons where simulations can also be incorporated as a tool for analysis.
REFERENCES [1] Future Population Growth, https://ourworldindata.org/future-population-growth accessed on 12 /12/19
[2] Zahra Sadat Zomorodian, Mohammad Tahsildoost, Mohammadreza Hafezi, “Thermal Comfort in Educational Buildings: A Review Article,” Renewable and Sustainable Energy Reviews, vol. 59, Jun. 2016, pp. 895 – 906, doi:10.1016/j.rser.2016.01.033.
[3] Gyanesh Gupta, Dhram Buddi, Sanjay Kumar, Hari kumar Singh, Afjaul Ansari, Vikas Sharma, “Thermal comfort assessment for naturally ventilated classrooms during summer in composite climate of Jaipur,” International Journal for Research in Applied Science & Engineering Technology [IJRASET], vol. 4 [XII], Dec. 2016, pp. 541 – 550.
[4] Manoj Kumar Singh, Sanjay Kumar, Ryozo Ooka, Hom B. Rijal, Gyanesh Gupta, Anuj Kumar, “Status of Thermal Comfort in Naturally Ventilated Classrooms during summer season in the Composite climate of India,” Building and Environment, vol. 128, Jan. 2018, pp. 287 – 304, doi:10.1016/j.buildenv.2017.11.031.
[5] Silay Emir, “The Evaluation of Thermal Comfort on Primary Schools in Hot-Humid Climates: A Case Study for Antalya,” European Journal of Sustainable Development, vol. 5 [1], 2016, pp. 52 – 62, doi:10.14207/ejsd.2016.v5n1p53.
International Research Journal of Engineering and Technology [IRJET] e-ISSN: 2395-0056
Volume: 07 Issue: 07 | July 2020 www.irjet.net p-ISSN: 2395-0072
© 2020, IRJET | Impact Factor value: 7.529 | ISO 9001:2008 Certified Journal | Page 11
[6] Asit Kumar Mishra, Maddali Ramgopal, “Thermal Comfort in undergraduate laboratories – A field study in Kharagpur, India,” Building and Environment, vol. 71, Jan. 2014, pp. 223 – 232, doi:10.1016/j.buildenv.2013.10.006.
[7] Danny Harvey, “Reducing Energy Use in the Buildings Sector: Measures, Costs, and Examples,” Energy Efficiency, vol. 2, May. 2009, pp. 139 – 163, doi: 10.1007/s12053-009-9041-2.
[8] Julia Raish, Thermal Comfort: Designing for People. Center for Sustainable Development, The University of Texas at Austin: School of Architecture
[9] Nyuk Hien Wong, Shan Shan Khoo, “Thermal Comfort in Classrooms in the Tropics,” Energy and Buildings, vol. 4 [35], May. 2003, pp 337 – 351, doi: 10.1016/S0378-7788[02]00109-3.
[10] Lilly Rose Amirtham, Ebin Horrison, Surya Rajkumar “Study on the Microclimatic Conditions and Thermal Comfort in an Institutional Campus in Hot Humid Climate” Proceedings of 30th International Plea Conference, Ahmedabad, Dec. 2014, 361 – 368.
[11] Hui Zhang. “Human Thermal sensation and comfort in transient and non-uniform thermal environments. UC Berkeley: Center for the Built Environment, 2003”.
[12] Air velocity, https://shodhganga.inflibnet.ac.in/bitstream/10603/76840/11/11_chapter%203.pdf accessed on 22/02/20
[13] Appah-Dankyi James, Koranteng Christian. “An assessment of thermal comfort in a warm and humid school building at Accra, Ghana.” Advances in Applied Science Research, 2012; 3 [1], 535-547
[14] Zahra Sadat Zomorodian, Mehdi Azizkhani, Liliana Beltran, “Evaluation of Thermal and Visual Comfort in University Classrooms: The Cases of Two LEED Silver Certified Buildings,” Proceedings of Second International Conference on Energy and Indoor Environment for Hot Climates, At Doha, Qatar, 2017.
[15] Paola Iacomussi, Michela Radis, Giuseppe Rossi, Laura Rossi, “Visual Comfort with LED Lighting,” Energy Procedia, vol. 78, Nov. 2015, pp 729 – 734, doi:10.1016/j.egypro.2015.11.082.
[16] M. R. Sharma, Sharafat Ali, “Tropical Summer Index – A study of thermal comfort on Indian subjects,” Building and Environment, vol. 21 [1], 1986, pp. 11 – 24, doi: 10.1016/0360-1323[86]90004-1.
[17] Madhavi Indraganti, “Behavioural adaptation and the use of environmental controls in summer for thermal comfort in apartments in India,” Energy and Buildings, vol. 42 [7], Jul. 2010, pp. 1019 – 1025, doi:10.1016/j.enbuild.2010.01.014.
[18] J. F. Nicol, “An analysis of some observations of thermal comfort in Roorkee, India and Baghdad, Iraq,” Annals of Human Biology, vol. 1 [4], Oct. 1974, pp. 411 – 426, doi: 10.1080/03014467400000441.
[19] Henry Feriadi, Nyuk Hien Wong, “Thermal Comfort for naturally ventilated houses in Indonesia,” Energy and Buildings, vol. 36 [7], Jul. 2004, pp. 614 – 626, doi:10.1016/j.enbuild.2004.01.011.
[20] Sanjay Kumar, Manoj Kumar Singh, Vivian Loftness, Jyotirmay Mathur, Sanjay Mathur, “Thermal comfort assessment and characteristics of occupant’s behaviour in naturally ventilated buildings in composite climate of India,” Energy for Sustainable Development, vol. 33, 201 6, pp. 108 – 121, doi:10.1016/j.esd.2016.06.002.
[21] Ruey-Lung Hwang, Tzu-Ping Lin, Chen-Peng Chen, Nai-Jung Kuo, “Investigating the adaptive model of thermal comfort for naturally ventilated school buildings in Taiwan,” International Journal of Biometeorology, vol. 53 [2], Mar. 2009, pp. 189 – 200, doi:10.1007/s00484-008-0203-2.
[22] Ruey-Lung Hwang, Tzu-Ping Lin, Nai-Jung Kuo, “Field experiments on thermal comfort in campus classrooms in Taiwan,” Energy and Buildings, vol. 38 [1], Jan. 2006, pp. 53 – 62, doi:10.1016/j.enbuild.2005.05.001.
[23] M.K. Singh, S. Mahapatra, S.K. Atreya, Thermal performance study and comfort temperature in vernacular buildings of North eEast India, Build. Environ. 45 [2010] 320e329.
[24] M. Pellegrino, M. Simonetti, L. Fournier, A field survey in Calcutta: Architectural issues, thermal comfort and adaptive mechanisms in hot humid climates, In: The changing context of comfort in an unpredictable world, Cumberland Lodge, Windsor, UK, 12-15 April 2012. London: Network for comfort and energy use in Buildings.
[25] S. Dhaka, J. Mathur, A. Wagner, G. Agarwal, V. Garg, Evaluation of thermal environmental conditions and thermal perception at naturally ventilated hostels of undergraduate students in composite climate, Build. Environ. 66 [8] [2013] 42e53.
[26] S. Kumar, M.K. Singh, V. Loftness, J. Mathur, S. Mathur, Thermal comfort assessment and characteristics of occupant's behavior in naturally ventilated buildings in composite climate of India, Energy Sustain. Dev. 33 [2016] 108e121.
[27] M. Indraganti, R. Ooka, H.B. Rijal, G.S. Brager, Adaptive model of thermal comfort for offices in hot and humid climates of India, Build. Environ. 74 [2014] 39e53.
[28] S. Manu, Y. Shukla, R. Rawal, L.E. Thomas, R. de Dear, Field studies of thermal comfort across multiple climate zones for the subcontinent: India Model for Adaptive Comfort [IMAC], Build. Environ. 98 [2016] 55e70.
[29] Mishra A, Ramgopal M. A comparison of student performance between conditioned and naturally ventilated classrooms, Building and Environment, 2015, 84: 181–188.
[30] McCartney, K., & Fergus Nicol, J. [2002]. Developing an adaptive control algorithm for Europe. Energy And Buildings, 34[6], 623-635. https://doi.org/10.1016/s0378-7788[02]00013-0
[31] Madhavi Indraganti, “Using the Adaptive Model of Thermal Comfort for Obtaining Indoor Neutral Temperature: Findings from a field study in Hyderabad, India,” Building and Environment, vol. 45 [3], March. 2010, pp. 519-536, doi:10.1016/j.buildenv.2009.07.006.
[32] Heat gain, https://www.archdaily.com/870492/ksm-architecture-studio-ksm-architecture accessed on 25/03/20

International Research Journal of Engineering and Technology [IRJET] e-ISSN: 2395-0056
Volume: 07 Issue: 07 | July 2020 www.irjet.net p-ISSN: 2395-0072
© 2020, IRJET | Impact Factor value: 7.529 | ISO 9001:2008 Certified Journal | Page 12
[33] NCEF, http://www.ijsce.org/wp-content/uploads/papers/v4i6/F2451014615.pdf accessed on 25/03/20
[34] BIS, National Building code of India, Bureau of Indian standards, New Delhi, 2005.
[35] Nicol JF. “An analysis of some observations of thermal comfort in Roorkie, India and Baghadad, Iraq”. Ann Hum Biol 1974; 1[4]:411–26.
[36] Nicol, F. [2004]. Adaptive thermal comfort standards in the hot–humid tropics. Energy and Buildings, 36[7], 628-637. https://doi.org/10.1016/j.enbuild.2004.01.016
BIOGRAPHIES Ar. Kamalesvari S,
Post Graduate Student, Department of Architecture[Sustainable], Sathyabama Institute of Science and Technology, Chennai, Tamil Nadu, India.
Ar. Chitra S, Post Graduate Student, Department of Architecture[Sustainable], Sathyabama Institute of Science and Technology, Chennai, Tamil Nadu, India.
Ar. Shruthilaxmi J, Post Graduate Student, Department of Architecture[Sustainable], Sathyabama Institute of Science and Technology, Chennai, Tamil Nadu, India.
Ar. Ashika P, Post Graduate Student, Department of Architecture[Sustainable], Sathyabama Institute of Science and Technology, Chennai, Tamil Nadu, India.
Ar. Sheetal Amraotkar, Associate Professor, Department of Architecture[Sustainable], Sathyabama Institute of Science and Technology, Chennai, Tamil Nadu, India, B.Arch, M.Arch [Landscape Architecture], LEED AP Neighborhood development.
2nd Author Photo
4th Author Photo
3rd Author Photo
Author Photo