Embed Size (px)
Citation preview
Analysis of the Relationship between Financial Education and Mathematics
on the basis of the Program School 2.0
Sergi Jiménez-Martín Cristina Vilaplana Prieto
Abstract:
This article analyses the relationship between performances in Mathematics and Financial Education, subject to their
participation in Program School 2.0. We consider the possibility of heterogeneous effects of Financial Education over
Mathematics scores and estimate a bivariate probit model with mixed effects using data from PISA (2012) for Spain.
The effect of Financial Education on Mathematics is more intense in Communities that have not participated in the
Program School 2.0 as compared to those Communities with total participation. For students in Communities with total
participation it becomes clear that learning operates like an osmosis system, in a manner that knowledge/skills from
Financial Education are transferred to the field of Mathematics with a clearly positive effect. However, there are other
students that “do" well in Financial Education but obtain less satisfactory results in Mathematics. It is observed that the
probability that Financial Education score lies within Levels 4 or 5 is higher when it is included with the subject of
Mathematics as compared to its inclusion within other subjects (Economics, Social Sciences or Humanities). The use of
computers/tablets (at home or at school) only reveals positive effects over Mathematics and Financial Education when
they are used occasionally (1-2 times/week).
Keywords: Mathematics, Financial Education, ICT, bivariate probit
JEL Codes: I20, I21.
Contact information
Sergi Jiménez-Martín
Departament d’ Economia i Empesa
Universitat Pompeu Fabra
C/ Ramón Trias Fargas, 25-27
08005 Barcelona
Email: [email protected]
Teléfono: 93 542 1667
Cristina Prieto Vilaplana
Facultad de Economía y Empresa
Dpto. Fundamentos de Análisis Económico
Campus de Espinardo, s/n
Universidad de Murcia
30100 Murcia
Email: [email protected]
Teléfono: 868 88 78 72
1.Introduction
Adopting habits for prudent savings and investment are the basis for enjoying economic prosperity. In
contrast, fallout after borrowing money and the accumulation of debt not only poses a threat to a family's
economic stability, but it can also endanger economic progress on a national level (Mandell, 2008). The
recent economic and financial crisis has demonstrated that economic recovery requires the participation of
all economic stakeholders (Lester and Williams, 2010).
Financial Education enables the individual to acquire a series of very useful skills for adulthood and this should
be a component of student learning. Studies have indicated that people who have received Financial
Education show a greater tendency to manage their savings before retirement (Cole et al., 2010), participate
more in the stock markets, depict better optimizing behaviors for their stock portfolios (Van Rooij et al.,
2011), and they take greater care when choosing mortgages or loans with lower interests and fees (Lusardi
and Tufano, 2009).
Nowadays, students face a greater number of financial decisions than we could have ever imaged. For
example: (i) the use of mobile phones means having to decide between either pre-paid plan or a contract
and the responsibility to monitor their own consumption, (ii) the preference of receiving money instead of a
gift on their birthday or some other important date, (iii) the management of money periodically, whether or
not it is given to them by their parents on a regular basis for expenses such as going out with friends, clothes,
trinkets, etc. Moreover, ICTs (Information and Communication Technologies) play an important role in the
lives of students and it is also required that they are prepared to make financial decisions involving the use
of new technologies.
Even though PISA (2012) is the first worldwide survey to analyze the importance of Financial Education as a
tool to solve real life problems, the OECD (2005) report had already indicated that the skills and abilities
developed from Financial Education are so important and that it should be included within the curriculum of
all schools. As indicated by Varcoe et al. (2005), Hinojosa et al., (2009) and Lusardi and Mitchell (2009), the
incorporation of Financial Education into the academic curriculum has a positive impact on young people and
facilitates the development of skills in the areas of savings, loans, investments, critical thinking and problem
solving. Moreover, Pinto et al. (2005) analyzed four elements (family, friends, schools and communication
media) in order to determine which of these exerted the greatest influence on the adoption of financial
culture by students. They found that parents and schools were the two most important forces, since students
spend much of their day at school and it is there where the core of financial learning should be found.
This article shall analyze the relationship between performances in Mathematics and Financial Education,
subject to their participation in School Program 2.0. The decision to consider simultaneous performances
between the two subjects has a dual motive. First, PISA (2012) evaluates performance in Mathematics and
some studies such as of Suiter and McCorkle (2008) have found that the melding of Mathematics and
Financial Education favor the development of responsible financial behaviors. Second, the majority of
problems that students need to resolve on the PISA-Financial questionnaire (and responding to real-life
situations) requires the completion of numerical calculations. [Table 1 in the Appendix shows three examples
of PISA-Financial problems.]
In addition to linking Mathematics and Financial Education skills, this paper aims at introducing a third
analytical element: the influence of ICT in schools in regards to School Program 2.0. A different degree of
implementation of this Program will allow for the analysis of how ICT affects the results in Mathematics and
Financial Education, as well as the correlation between both.
2. The Program School 2.0
In July 2009, the Education Sector Conference adopted an investment of €98,182,419 for the implemention
of School Project 2.0 (Resolution of 3 August, 2009, of the Technical Secretariat General, for which it
published the Agreement of the Council of Ministers of 31 July, 2009). The allocation of these funds was to
co-finance 50% of the following activities, within the Autonomous Communities:
1 The transformation of all 5th and 6th Primary Education (5thEP and 6thEP) and all 1st and 2nd
Compulsory Secondary Education (1stESO and 2ndESO) classrooms into digital classrooms at public
schools.
2 The provision of computers for personal use of all students within these school grades, enrolled at
schools receiving public funding, in a ratio of 1 to 1.
3 Conducting teacher training activities to ensure the effective use of program resources.
4 The development of digital content that may be used by teachers.
The variability for the allocation to each Community has been determined not only by the number of students
enrolled in these courses, but also for its total or partial participation in School Program 2.0. For partial
participation, a proportional amount was assigned to the number of participating students and classrooms.
According to the CEAPA (2010) report and information issued by the Deputy Directorate of Territorial
Cooperation with data provided by the Autonomous Communities, the Autonomous Communities'
participation in School Program 2.0 was not homogeneous and three levels of participation were discernible.
Table 2 shows the participation of the Autonomous Communities in School Program 2.0 and the academic
grade level in which the program was implemented.
1. Communities fully participating (TP): Andalusia, Aragon, Cantabria, Castile-Leon, Castilla-La Mancha,
Catalonia, Extremadura, Galicia, Navarra, Basque Country, La Rioja, Ceuta and Melilla.
2. Communities partially participating (PP): Asturias, Balearic and Canary Islands.
3. Non-participating Communities (NP): Madrid, Murcia and the Valencian Community. As they have not
participated in School Program 2.0, they do not appear in Table 1.
When considering whether PISA (2012) is an adequate instrument with which to evaluate the results of
School Program 2.0, one needs to consider whether sufficient time has elapsed so that students are capable
of being evaluated by PISA. Pisa 2012 was conducted during the first semester of 2012 for students born in
1996. This implies that if a student has not repeated any grade level, he or she should be studying at 4thESO.
If he or she had repeated a grade level, then he or she would be in 3rdESO, and 2ndESO for repeating two
grade levels. Table 3 shows the development of students who participated in the School Program 2.0,
according to the year of program implementation and the grade level in which the student began to
participate in the this program.
3.Econometric model
It has been proposed to calculate the relationship between Financial Education and Mathematics using a
bivariate probit model using endogenous variables (Greene and Hensher, 2010). To solve any issue regarding
endogeneity, the traditionally proposed solution using an econometrics approach had been the use of
instrumental variables. However, when a system of equations is established, whereby the dependent
variables are categorical, more sophisticated techniques are required (Angrist, 2001).
We considered two latent variables ���∗ and ����∗ that denote "knowledge in Financial Education" and
"knowledge in Mathematics”, respectively. The simultaneous analysis of the results in Mathematics and in
Financial Education forces us to consider the interaction between these variables. Both variables are
influenced by observable characteristics (family group, resources available at home and at the center) and
unobservable characteristics (innate aptitudes of students, their level of motivation).
Also, one must keep in mind that the relationship between Mathematics and Financial Education can flow in
both directions. On the one hand, Financial Education can provide a more applied perspective for certain
mathematical concepts, so it can be useful to reduce the degree of abstraction that is so often argued as a
difficulty by students when dealing with exact sciences. Moreover, students with a greater ability for
numerical reasoning may find it easy and attractive to choose the field of Financial Education.
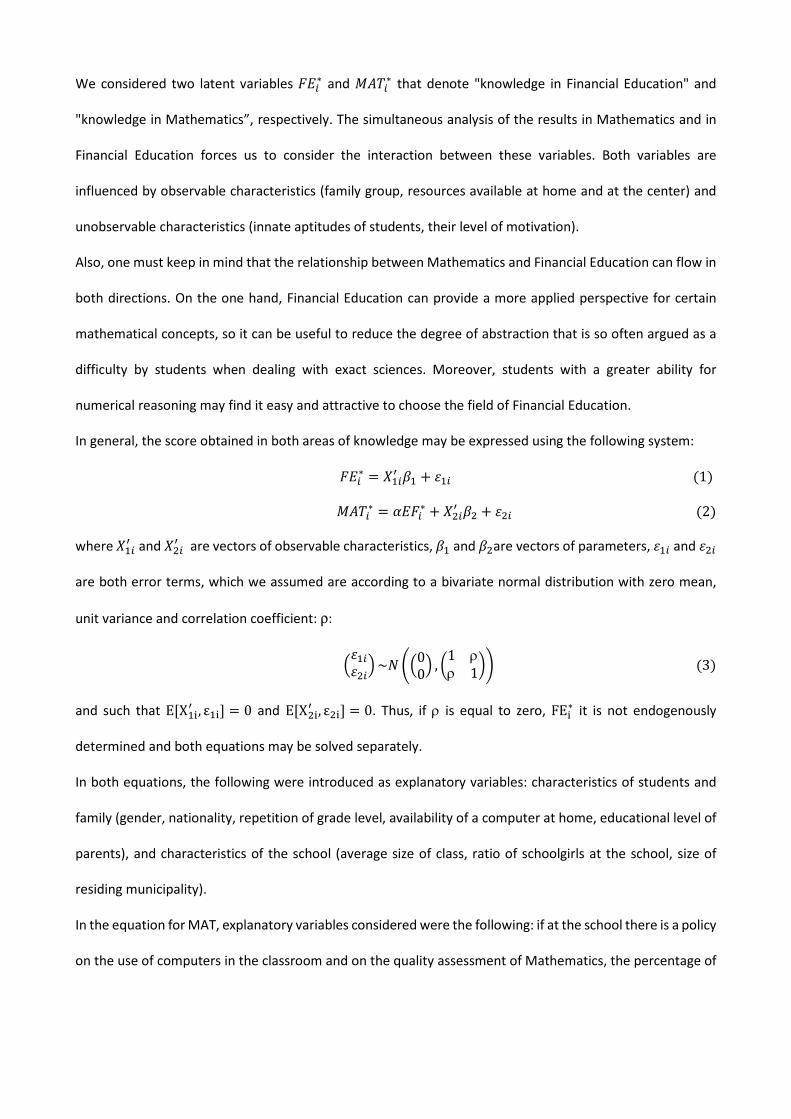
In general, the score obtained in both areas of knowledge may be expressed using the following system:
���∗ = �� � + �� (1) ����∗ = ����∗ + ��� �� + ��� (2)
where �� and ��� are vectors of observable characteristics, � and ��are vectors of parameters, �� and ��� are both error terms, which we assumed are according to a bivariate normal distribution with zero mean,
unit variance and correlation coefficient: ρ:
������� ~� ��00� , �1 ρ
ρ 1�� (3)
and such that E[X$� , ε$] = 0 and E[X�$� , ε�$] = 0. Thus, if ρ is equal to zero, FE$∗ it is not endogenously
determined and both equations may be solved separately.
In both equations, the following were introduced as explanatory variables: characteristics of students and
family (gender, nationality, repetition of grade level, availability of a computer at home, educational level of
parents), and characteristics of the school (average size of class, ratio of schoolgirls at the school, size of
residing municipality).
In the equation for MAT, explanatory variables considered were the following: if at the school there is a policy
on the use of computers in the classroom and on the quality assessment of Mathematics, the percentage of
teachers1 with ISCED5A qualifications, if the student has a computer in the classroom and the frequency of
ICT use to do homework.
In the equation for FE, explanatory variables introduced were the following: if the contents of Financial
Education are compulsory, if it is delivered from within a specific subject (Mathematics, Economics, Social
Sciences and Humanities), the length of time Financial Education has been delivered, if teaching staff of
Financial Education belong to the school’s faculty and if the teachers have received specific training.
To analyze the relationship between FE and MAT, we have considered the interaction between the use of
computers in Mathematics class and the inclusion of Financial Education within this subject, and also the
interaction between the use of ICT for the completion of Mathematics homework and the inclusion of
Financial Education within Mathematics.
With regard to the student environment, two instrumental variables were introduced taking as a reference,
evidence from the literature on Financial Education. On the one hand, several authors (Pinto et al. 2005;
Williams, 2010; Lamana et al., 2012) have shown that just as parents exert a significant influence on eating
habits, the utilization of specific vocabulary or the pleasure of reading, they also play an important role in
their children’s level of Financial Education. Students that receive information about financial issues at home
have a higher propensity to delve into these concepts when compared to other students who lack this family
support. Moreover, Chen and Volpe (1998) found that most students with financial knowledge have had work
experience or were working part time. The variables being defined are as follows: (i) a binary variable that
takes value 1, if the student indicates talking to his/her parents almost every day or 1-2 times a week about
financial issues (savings, household spending, banks, etc.) and (ii) a binary variable that takes value 1, if the
student indicates earning money by working (tutoring, babysitting) or helping out in a family business.
The parameter � represents the effect of ���∗ on ����∗ and its interpretation should not be confused with
the correlation coefficient. On one hand, the error terms (�� and ���) refer to unobservable characteristics
to the researcher, so that a significant correlation coefficient (ρ) indicates that the assumption of exogeneity
of ���∗ with respect to ����∗ cannot be accepted. On the other hand, the coefficient measures the direct
1 The variable proportion of teachers with ISCED5A qualifications is less than one in 22.48% of cases.
effect of ���∗ over ����∗, and may influence the magnitude of ρ by reducing the number of unobservable
elements within the error term.
However, we did not observe the level of knowledge in Mathematics and in Financial Education (FE$∗ or
MAT$∗), rather the results of PISA (FE$ and MAT$ ). PISA (2012) scores are based on calculations on a metric
scale, with a 500 point average for all OECD countries and a standard deviation of 100 points. For a better
understanding of what the resulting PISA scores mean, these are usually divided into proficiency levels.
The variable ��� is an ordered variable that classifies the PISA-Financial results into 5 levels2: (1) "Lowest
performers": less than 400.33 points; (2) "Moderate performers": between 400.33 and 475.10 points; (3)
"Moderate performers": between 475.10 and 549.86 points; (4) "Strong performers": between 549.86 and
624.63 points and (5) "Top performers": over 624.63 points.
The variable ���� is another ordered variable that classifies the PISA-Mathematics results into 6 Levels: (1)
“Very Low performers": less than 357.7 points; (2) "Low performers": between 357.5 and 420.1 points; (3)
"Moderate performers": between 420.1 and 482.4 points; (4) "Moderate" performers ": between 482.4 and
544.7 points; (5) "Strong performers": between 544.7 and 607 points and (6) "Top performers": over 607. (In
fact, there are two levels of "top performers”, from 607 to 669.3 and above 669.3, but due to a reduced
number of observations above 669.3, we have combined both categories as being "top performers").
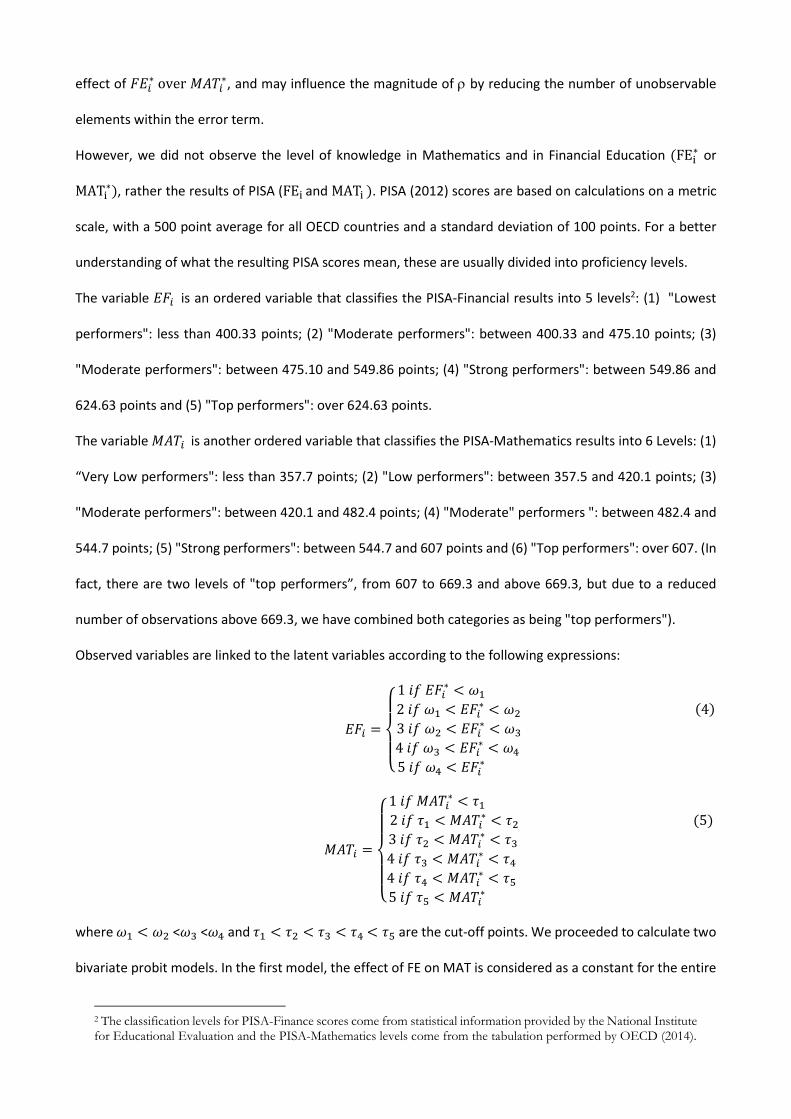
Observed variables are linked to the latent variables according to the following expressions:
��� =/0102 1 34 ���∗ < 6 2 34 6 < ���∗ < 6� (4)3 34 6� < ���∗ < 68 4 34 68 < ���∗ < 69 5 34 69 < ���∗
���� =/001002
1 34 ����∗ < ; 2 34 ; < ����∗ < ;� (5)3 34 ;� < ����∗ < ;8 4 34 ;8 < ����∗ < ;9 4 34 ;9 < ����∗ < ;< 5 34 ;< < ����∗
where 6 < 6� <68 <69 and ; < ;� < ;8 < ;9 < ;< are the cut-off points. We proceeded to calculate two
bivariate probit models. In the first model, the effect of FE on MAT is considered as a constant for the entire
2 The classification levels for PISA-Finance scores come from statistical information provided by the National Institute for Educational Evaluation and the PISA-Mathematics levels come from the tabulation performed by OECD (2014).
sample, and therefore, a standard order bivariate probit model was calculated. The second alternative,
bivariate probit with mixed effects, introduces heterogeneity into the parameter �, assuming that if follows
a normal distribution with a mean of => and standard deviation of ?>.
Since students have different preferences for different subjects (in this case FE and MAT), and given that
successful learning is influenced by the way in which concepts are presented (teaching methodologies) and
the availabilify of resources, the final acquisition of relevant skills may be very heterogeneous. Modeling the
effect of EF on MAT, using a statistical distribution, can contemplate different student profiles (i.e, some
students with ability for applying the skills gained in FE into better results in MAT, whereas, others show with
greater difficulty in cross-curriculum learning in MAT from skills learned in EF).
Both models are calculated using maximum likelihood. Assuming that the errors �� and ��� are normally
distributed, it is efficient to use maximum likelihood calculation. The log-likelihood function may be
expressed as:
@AB = ∑ ∑ ∑ D(��� = E, ���� = F)@A PrH��� = E, ���� = FI<JK<LKM�K ) (7)
Although both equations are convex overall and the likelihood function is non-linear, any identification of
the model may be weak. For this reason, we have followed the recommendation to introduce identification
restrictions, so that at least one variable included in X$� must be excluded from X�$� (Sajaia, 2008). With
regard to the computational aspects, the calculation for the first model was done using the command
proposed by Sajaia (2008), while the second model adapted the routine proposed by Buscha and Conte
(2010).
4.Data
PISA is a cross-sectional study, conducted every three years that commenced in 2000 for 15 year old students,
with the purpose of evaluating their performance in the areas of mathematics, reading and science, as well
as cross-curriculum problem solving skills. PISA does not consider the students' knowledge in these areas in
isolation, rather in relation to their ability to apply them to real world situations. In addition to the general
module and the CBA module (computer based assessment), a third type of test was conducted to measure
Financial Education.
PISA(2012) defines Financial Education as "The knowledge and understanding of financial concepts and risks,
and the skills, motivation and confidence to apply such knowledge and understanding in order to make
effective decisions across a range of financial contexts, to improve the financial well-being of individuals and
society, and to enable participation in economic life.” (OECD, 2014).
The sample for Spain contains 1,108 observations, although only 765 observations correspond to students
attending to public schools. Regarding participation in School Program 2.0, there are 167 observations for
non-participating communities (NP), 532 for totally participating Communities (TP) and 66 for partially
participating Communities (PP). Due to the small number of observations for PP, they will not be included in
the present analysis.
Tables 4 to 7 show the cross tabulation for the scores in Mathematics and Financial Education in Communities
with total participation in School Program 2.0 and non-participating Communities, and for repeating and non-
repeating students. Scores in Mathematics and Financial Education have been tabulated according to the
levels proposed by the OECD (2014).
For non repeater students we appreciate: (1) The percentage of students with Levels 4 or 5 in both subjects
is 26.54% for TP Communities compared to 31.95% for NP Communities. (2) Similar concentration of students
with low scores in both Communities, since the percentage of students who have a Level 1 or 2 in Financial
Education or lower than 1, Level 1 or Level 2 in Mathematics is 9.23% for TP Communities compared to
10.30% for NP Communities. (3) There are some cases that are somewhat atypical in TP Communities: high
performance in Financial Education but, very low in Mathematics (0.56% of Students with a Level 3 in
Financial Education, but only Level 1 in Mathematics; 0.56% of students with a Level 4 in Financial Education
and only a Level 2 in Mathematics), or vice versa, a high performance in Mathematics, but very low in
Financial Education (0.28% with a Level 1 in Financial Education and Level 4 in Mathematics).
The tabulations for repeater students show that: (1) The percentage of students in the highest levels is similar
for both communities: 14.37% in TP and 14.49% in NP, with Levels 3, 4 or 5 in Mathematics and Levels 4 or 5
in Financial Education; (2) 68.40% of TP Communities compared to 50.87% of NP Communities are found
withing Levels 1 or 2 for Financial Education and lower than Level 1, Level 1 or Level 2 in Mathematics.

5.Results
Tables 8 and 9 show the results of the models with and withoud mixed effects for TP and NP Communities.
The correlation coefficient is always significant and positive, indicating that those unobservable variables that
increase Mathematics scores are positively correlated with the unobservable variable, which increase the
score in Financial Education and vice versa.
Regarding the validation of the model with mixed effects, the mean (µ) and standard deviation (σ) are
significantly different from zero for both types of Communities. This result confirms the existence of
substantial heterogeneity in the effect of Financial Education on the results in Mathematics.
In both types of Communities, it is observed that non-repeating students (boys) and those who have a
computer at home tend to obtain higher scores in Mathematics. However, having a computer/tablet for
personal use in the classroom has a negative effect on Mathematics scores.
For the model with mixed effects for TP Communities, schools that have a policy on the use of computers in
the classroom and for quality assessment in Mathematics tend to score higher for this subject.
With regard to the placement of Financial Education in the teaching project, a positive effect is observed
when there is an obligation to teach this subject and when this subject has been delivered for more than two
years at the school. The latter result may be related to the existence of learning outcomes within the teaching
plans, since with an increased number of years of “running”, teachers know better how to reach students.
Talking with parents about issues related to Financial Education or having work are significant positive
variables, with the first variable having great influence on the score for Financial Education. These results
confirm the evidence obtained by the previous literature.
The fact that teaching faculty corresponds to the school teachers instead of professionals from public, private
or NGOs is not significant for TP Communities, but it is (positively) for NP Communities. The percentage of
teachers who have received specific training in Financial Education during the past year is not significant for
TP Communities, however, it is for NP Communities.
5.1.Impact of Financial Education on Mathematics Score (mixed effects)
When comparing the effect of Financial Education on Mathematics between the two types of Communities
and models, it is observed that: (1) Financial Education always has a significant and positive effect on the
subject of Mathematics, (2) For the mixed-effects model, the standard deviation of the effect is significant,
which confirms the suitability of calculating this model. The variability of the effect is greater in TP
Communities (0.257 for NP and 0.653 for TP); (2) For both Communities, the effect is much greater for the
model with mixed effects: 1.410 comparted to 1.291 for NP and 1.222 compared to 1.215 for TP.
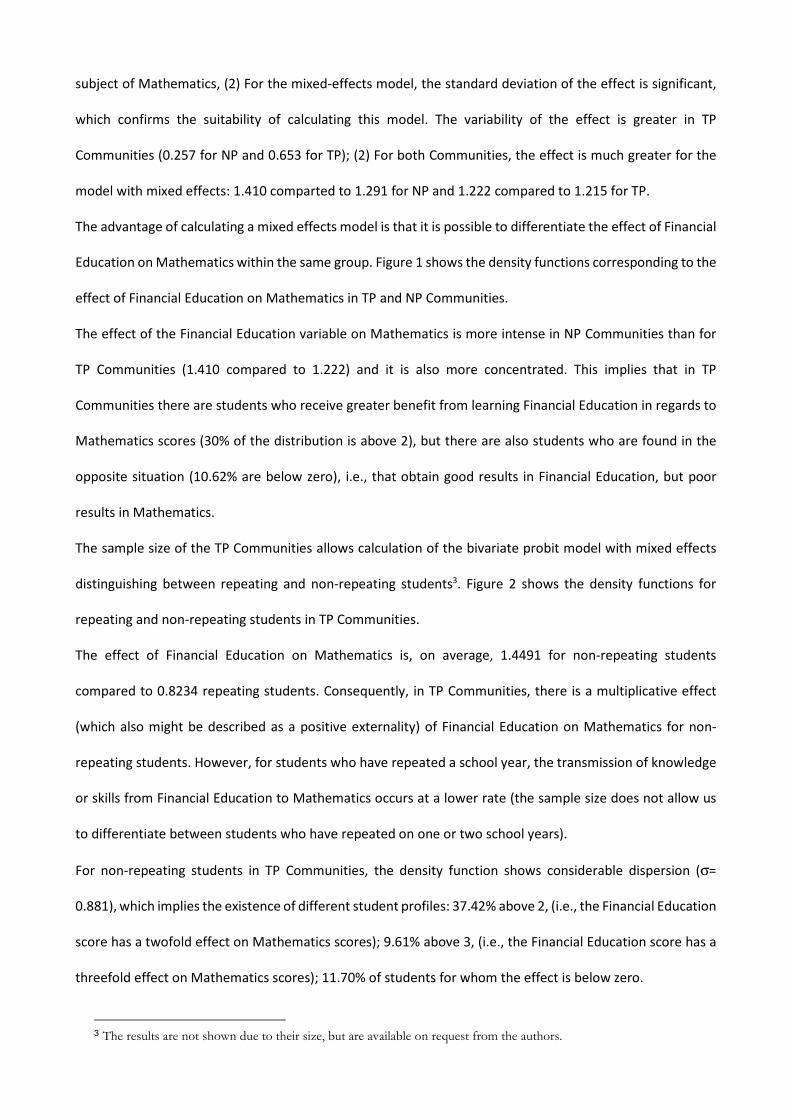
The advantage of calculating a mixed effects model is that it is possible to differentiate the effect of Financial
Education on Mathematics within the same group. Figure 1 shows the density functions corresponding to the
effect of Financial Education on Mathematics in TP and NP Communities.
The effect of the Financial Education variable on Mathematics is more intense in NP Communities than for
TP Communities (1.410 compared to 1.222) and it is also more concentrated. This implies that in TP
Communities there are students who receive greater benefit from learning Financial Education in regards to
Mathematics scores (30% of the distribution is above 2), but there are also students who are found in the
opposite situation (10.62% are below zero), i.e., that obtain good results in Financial Education, but poor
results in Mathematics.
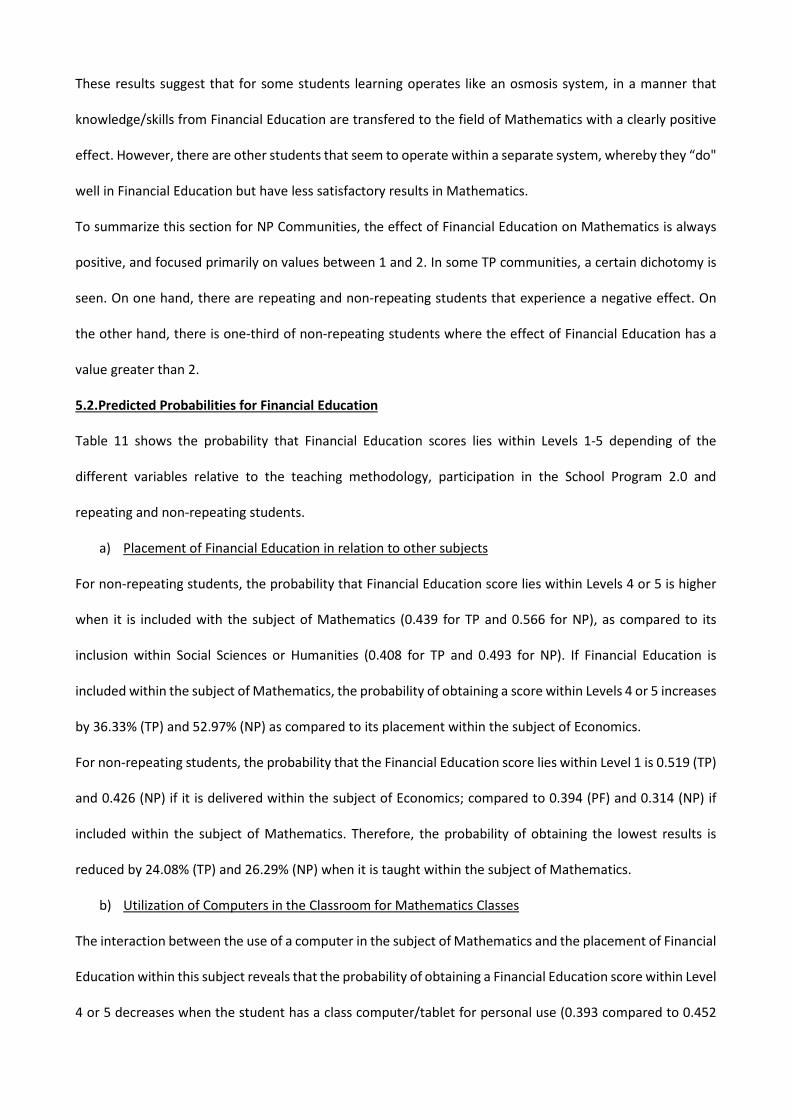
The sample size of the TP Communities allows calculation of the bivariate probit model with mixed effects
distinguishing between repeating and non-repeating students3. Figure 2 shows the density functions for
repeating and non-repeating students in TP Communities.
The effect of Financial Education on Mathematics is, on average, 1.4491 for non-repeating students
compared to 0.8234 repeating students. Consequently, in TP Communities, there is a multiplicative effect
(which also might be described as a positive externality) of Financial Education on Mathematics for non-
repeating students. However, for students who have repeated a school year, the transmission of knowledge
or skills from Financial Education to Mathematics occurs at a lower rate (the sample size does not allow us
to differentiate between students who have repeated on one or two school years).
For non-repeating students in TP Communities, the density function shows considerable dispersion (σ=
0.881), which implies the existence of different student profiles: 37.42% above 2, (i.e., the Financial Education
score has a twofold effect on Mathematics scores); 9.61% above 3, (i.e., the Financial Education score has a
threefold effect on Mathematics scores); 11.70% of students for whom the effect is below zero.
3 The results are not shown due to their size, but are available on request from the authors.
These results suggest that for some students learning operates like an osmosis system, in a manner that
knowledge/skills from Financial Education are transfered to the field of Mathematics with a clearly positive
effect. However, there are other students that seem to operate within a separate system, whereby they “do"
well in Financial Education but have less satisfactory results in Mathematics.
To summarize this section for NP Communities, the effect of Financial Education on Mathematics is always
positive, and focused primarily on values between 1 and 2. In some TP communities, a certain dichotomy is
seen. On one hand, there are repeating and non-repeating students that experience a negative effect. On
the other hand, there is one-third of non-repeating students where the effect of Financial Education has a
value greater than 2.
5.2.Predicted Probabilities for Financial Education
Table 11 shows the probability that Financial Education scores lies within Levels 1-5 depending of the
different variables relative to the teaching methodology, participation in the School Program 2.0 and
repeating and non-repeating students.
a) Placement of Financial Education in relation to other subjects
For non-repeating students, the probability that Financial Education score lies within Levels 4 or 5 is higher
when it is included with the subject of Mathematics (0.439 for TP and 0.566 for NP), as compared to its
inclusion within Social Sciences or Humanities (0.408 for TP and 0.493 for NP). If Financial Education is
included within the subject of Mathematics, the probability of obtaining a score within Levels 4 or 5 increases
by 36.33% (TP) and 52.97% (NP) as compared to its placement within the subject of Economics.
For non-repeating students, the probability that the Financial Education score lies within Level 1 is 0.519 (TP)
and 0.426 (NP) if it is delivered within the subject of Economics; compared to 0.394 (PF) and 0.314 (NP) if
included within the subject of Mathematics. Therefore, the probability of obtaining the lowest results is
reduced by 24.08% (TP) and 26.29% (NP) when it is taught within the subject of Mathematics.
b) Utilization of Computers in the Classroom for Mathematics Classes
The interaction between the use of a computer in the subject of Mathematics and the placement of Financial
Education within this subject reveals that the probability of obtaining a Financial Education score within Level
4 or 5 decreases when the student has a class computer/tablet for personal use (0.393 compared to 0.452
for TP and 0.398 compared to 0.518 for NP). In percentage terms, the use of computers in the subject of
Mathematics implies a lower score in Financial Education by 15.26% for TP and 30.15% for NP. The fact that
the reduction (in percentage terms) is higher in NP Communities may indicate different styles of teaching
methodology applied to ICTs among the Communities that have participated or have not participated in
School Program 2.0.
For repeating students in TP Communities there are no significant differences in the distribution by Financial
Education levels based on the use of computers in the classroom. In contrast, for NP Communities, the
probability that the score for Financial Education lies into the lowest Levels (1 or 2) is 0.289 when using a
computer compared to 0.204 when not used, which represents a reduction of 29.41%. As already mentioned,
these differences according to Communities hint at the existence of differences in the use that is given to ICT
as a learning tool.
c) Utilization of a Computer to do Mathematics Homework
The relationship between the use of a computer for Mathematics homework and the inclusion of Financial
Education within this subject reveals different patterns of behavior in terms of the participation in School
Program 2.0 and grade repetition.
For non-repeating students, the highest probability of obtaining a score within Level 4 or 5 for Financial
Education corresponds to the use of a computer 1-2 times/week for TP Communities compared to a use of
1-2 times/month or less for NP Communities. For TP Communities, the probability drops to a minimum
(0.130) for the use of a computer every day, increases to 0.374 when used almost every day, and peaks
(0.497) at 1-2 times/week and decreases again to 0.430 when rarely used. For NP Communities, the
probability of obtaining better results in Financial Education shows an inverse relationship with the frequency
of use for 0.222 for everyday, 0.451 for almost everyday, 0.600 for 1-2 times/week and 0.6778 for 1-2
times/month or less.
For repeating students, the greatest probability to achieve a score within Level 1 in Financial Education
corresponds to the daily use of a computer in TP Communities or almost everyday in NP Communities.
5.3.Simulation of the Effects of an Increased Score in Financial Education
Tables 11 and 12 show the effects on Mathematics scores resulting from improved scores in Financial
Education. For non-repeating students, an increase in Financial Education scores by 5 points increases the
probability that Mathematics scores lies within the highest level (level 5) by 5.74% for TP Communities and
8.17% for NP Communities. If the scores for Financial Education increase by 10 points, the probability that
Mathematics scores would lies within Level 5 raises by 11.82% and 15.22%, respectively.
For repeating students, the effects caused by an increase in Financial Education scores on Mathematics
scores are more intense for NP Communities. For example, a 10-points increase in Financial Education, raises
the probability that Mathematics scores lies within Level 5 by 12.99 in TP and by 19.76 in NP Communities.
The differences between repeating and non-repeating students are particularly evident to encourage an
increase of 20 points in Financial Education. The probability that the Mathematics score lies within Level 5
increases by 21% for non-repeating students (for both types of Communities). However, for repeating
students, the probability increases to 28.65% for TP Communities and 65.49% for NP Communities.
6.Conclusions
This work has confirmed the importance of young people to understand Financial Education concepts, not
only because it involves a significant improvement for scores in this area, but also because it holds, to a great
extent, a beneficial effect on the skills acquired within the subject of Mathematics. In fact, this result holds
the answer to all those that have questioned - how is it possible to deliver a "new subject" into certain
academic curricula that are already highly saturated? In regards to the placement of Financial Education,
within the subjects of Economics, this work has shown that a greater benefit is obtained when the contents
of Financial Education are taught in conjunction with the contents of the subject of Mathematics.
Regarding the influence of ICT on the skills for both subjects, the benefit of having a computer for personal
use by students is observed, both for school and home use. However, it only has a positive effect on
performance when it is used occasionally (1-2 times/week for homework). However, we must interpret the
results with certain caution, as not much time has passed since the implementation of these new teaching
methodologies, so we should expect to see a "learning effect" over time.
Three relevant aspects are highlighted as areas for short-term improvements. First, reflecting the importance
of the school having a policy or procedure manual regarding the use of computers in class, given that as PISA
(2012) data indicates less than half of schools have one. Second, the encouragement teacher training, as only
a small percentage of teachers have received specific training on how to impart knowledge of Financial
Education. Thirdly, it has been verified that 100% of students in Communities that have not participated in
School Program 2.0 have experienced a positive effect of Financial Education on Mathematics, meanwhile
Communities with total participation had approximately 10% of students with mixed results in both areas.
Given that the analysis included variables related to the student, his/her family, the use of ICT as a teaching
methodology, and the means of explaining how Financial Education in relation to other subjects, we must
consider whichother variables (motivational, linguistic, procedural) are hindering student learning, since
these deficiencies in their education could imply a major detriment to his/her subsequent development as
an adult.
References
ANGRIST, J. (2001). Estimation of limited dependent variable models with dummy endogenous
regressors: simple strategies for empirical practice. Journal of Business and Economic Statistics 19(1), 2-28.
BUSCHA, F., CONTE, A. (2010). The impact of truancy on educational attainment: a bivariate ordered
probit estimator with mixed effects. JENA Economic Research Papers N0. 062.
CEAPA, (2010). Incidencias y recortes presupuestarios. Inicio de curso 2010-2011. Confederación
Española de Asociaciones de Padres y Madres de Alumnos.
CHEN, H., VOLPE, R. P. (1998). An analysis of personal financial literacy among college students. Financial
Services Review, 7, 107-128.
COLE, S., SAMPSON, T., ZIA, B. (2011). Prices or knowledge? What drives demand for financial services
in emerging markets? The Journal of Finance, 66, 1933-1967.
GREENE, W., HENSHER, D. (2010). Modelling ordered choices. Cambridge University Press.
HINOJOSA, T., MILLER, S., SWANLUND, A., HALLBERG, K., BROWN, M., O’BRIEN, B. (2009). The Stock
Market Game study: a brief report. Washington, DC: FINRA Investor Education Foundation.
LAMANA, M.A., RIEDMANN, A.C., STRAHM, A. (2012). Marriages, families and relationships: making
choices in a diverse society (11th ed.). Belmong, CA: Wadwsworth, Cengage Learning.
LESTER, W.F., WILLIAMS, V.J. (2010). Interactive investor education: an exploratory impact study in non-
traditional learning environments. Business Education Innovation Journal, 2, 44-52.
LUSARDI, A., MITCHELL, O.S. (2009). How ordinary consumers make complex economic decisions:
financial literacy and retirement readiness. Working Paper 15350. National Bureau of Economic Research.
LUSARDI, A., TUFFANO, P. (2009). Debt literacy, financial experiences and overindebtedness. NBER
Working Paper No. 14808.
MANDELL, L. (2008). In overcoming the saving slump: how to increase the effectiveness of financial
education and saving programs. Financial Literacy in High School, 20, 257-279.
MARTIN, F.S., (2007). A literature review on the effectiveness of financial education. Working Paper 07-
03. Federal Reserve Bank of Richmond.
OECD (2005). Reconmmendation on principles and good practices fro financial education and
awareness. OECD. Directorate for Financial and Entreprise Affairs.
OECD (2014). PISA 2012 Results: what students know and can do. Student performance in mathematics,
reading and science. (Volume 1, Revised Edition, February 2014), PISA, OECD Publishing.
http://dx.doi.org/10.1787/9789264208780-en
PINTO, M.B., MANSFIELD, P.M., PARENTE, D.H. (2005). Information learned from socialization agents:
its relationship to credit card use. Family and Consumer Sciences Research Journal, 33, 357-367.
SAJAIA, X. (2008). Maximum likelihood estimation of a bivariate ordered probit model: implementation
and Monte Carlo simulations. The Stata Journal 3(2), 311-328.
SUITER, M., McCORKLE, S. (2008). Money Math lessons for life. The Curators of the University of
Missouri.
VAN ROOIJ, M.A., LUSARDI, A., ALESSIE, R. (2011). Financial literacy and stock market participation.
Journal of Financial Economics, 110, 449-472.
VARCOE, K., MARTIN, A., DEVITTO, Z., GO, C. (2005). Using a financial education curriculum for teens.
Financial Counseling and Planning, 16, 63-71.
WILLIAMS, S. (2010) Parental influence on the financial literacy of their school-aged children: an
exploratory study. Exceptional Children, Journal of Special Education, I, 23-33.
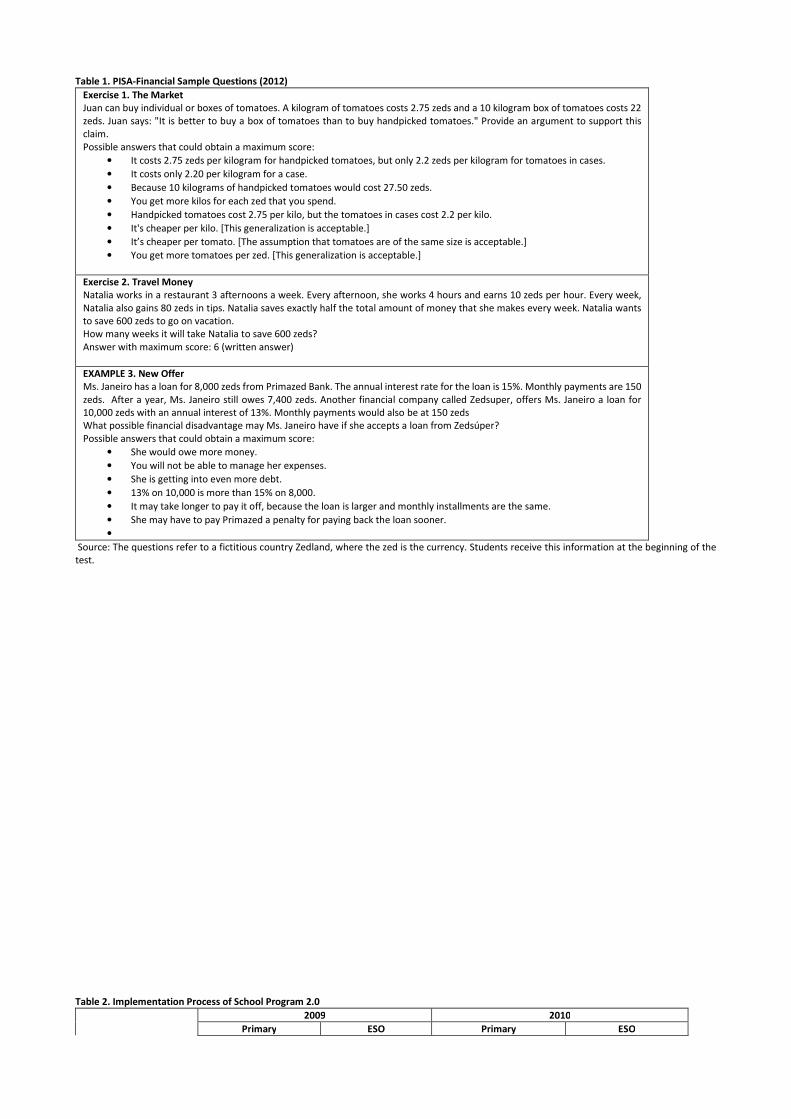
Table 1. PISA-Financial Sample Questions (2012)
Exercise 1. The Market
Juan can buy individual or boxes of tomatoes. A kilogram of tomatoes costs 2.75 zeds and a 10 kilogram box of tomatoes costs 22
zeds. Juan says: "It is better to buy a box of tomatoes than to buy handpicked tomatoes." Provide an argument to support this
claim.
Possible answers that could obtain a maximum score:
• It costs 2.75 zeds per kilogram for handpicked tomatoes, but only 2.2 zeds per kilogram for tomatoes in cases.
• It costs only 2.20 per kilogram for a case.
• Because 10 kilograms of handpicked tomatoes would cost 27.50 zeds.
• You get more kilos for each zed that you spend.
• Handpicked tomatoes cost 2.75 per kilo, but the tomatoes in cases cost 2.2 per kilo.
• It's cheaper per kilo. [This generalization is acceptable.]
• It’s cheaper per tomato. [The assumption that tomatoes are of the same size is acceptable.]
• You get more tomatoes per zed. [This generalization is acceptable.]
Exercise 2. Travel Money
Natalia works in a restaurant 3 afternoons a week. Every afternoon, she works 4 hours and earns 10 zeds per hour. Every week,
Natalia also gains 80 zeds in tips. Natalia saves exactly half the total amount of money that she makes every week. Natalia wants
to save 600 zeds to go on vacation.
How many weeks it will take Natalia to save 600 zeds?
Answer with maximum score: 6 (written answer)
EXAMPLE 3. New Offer
Ms. Janeiro has a loan for 8,000 zeds from Primazed Bank. The annual interest rate for the loan is 15%. Monthly payments are 150
zeds. After a year, Ms. Janeiro still owes 7,400 zeds. Another financial company called Zedsuper, offers Ms. Janeiro a loan for
10,000 zeds with an annual interest of 13%. Monthly payments would also be at 150 zeds
What possible financial disadvantage may Ms. Janeiro have if she accepts a loan from Zedsúper?
Possible answers that could obtain a maximum score:
• She would owe more money.
• You will not be able to manage her expenses.
• She is getting into even more debt.
• 13% on 10,000 is more than 15% on 8,000.
• It may take longer to pay it off, because the loan is larger and monthly installments are the same.
• She may have to pay Primazed a penalty for paying back the loan sooner.
•
Source: The questions refer to a fictitious country Zedland, where the zed is the currency. Students receive this information at the beginning of the
test.
Table 2. Implementation Process of School Program 2.0
2009 2010
Primary ESO Primary ESO

5th 6th 1st 2nd 5th 6th 1st 2nd
Andalusia X X X X X X
Aragon X X X X X X X X
Asturias X X X X (10 IES)
Balearic Islands X X X X (20 IES)
Canary Islands X (60%) X (40%) X X (70%)
Cantabria X X X (25%) X
Castile-Leon X X X (50%) X (50%)
Castilla-La Mancha X X X
Catalonia X X X X X X
Extremadura X X X X X
Galicia X X X X X X
Navarre X X X X
The Basque Country X X X X
La Rioja X X X X X X X X
Ceuta X X X X
Melilla X X X X
Table 3. Identification of the Students who had participated in School Project 2.0 and who are Capable of Participating in PISA 2012
• If they participated in School Program 2.0 in 2009/2010 (year of birth of student in brackets)
Year
2009/10
Year
2010/11
Year
2011/12
Participation in PISA 2012?
5thEP
[2001]
6thEP
[2000]
1stESO
[1999]
If not repeated ⇒ Born in 1999⇒ Not in PISA 2012
If repeated a grade level ⇒ Born in 1998⇒ Not in PISA 2012
If repeated two grade levels ⇒ Born in 1997⇒ Not in PISA 2012
6thEP
[2000]
1stESO
[1999]
2ndESO
[1998]
If not repeated a grade level ⇒ Born in 1998⇒ Not in PISA 2012
If repeated a grade level ⇒ Born in 1997⇒ Not in PISA 2012
If repeated two grade levels ⇒⇒⇒⇒ Born in 1996⇒⇒⇒⇒ Is in PISA 2012
1stESO
[1999]
2ndESO
[1998]
3rdESO
[1997]
If not repeated a grade level ⇒ Born in 1997⇒ Not in PISA 2012
If repeated a grade level ⇒⇒⇒⇒ Born in 1996⇒⇒⇒⇒ In PISA 2012
If repeated two grade levels ⇒ Born in 1995⇒ Not in PISA 2012
2ndESO
[1998]
3rdESO
[1997]
4thESO
[1996]
If not repeated a grade level ⇒⇒⇒⇒ Born in 1996⇒⇒⇒⇒ In PISA 2012
If repeated a grade level ⇒ Born in 1995⇒ Not in PISA 2012
If repeated two grade levels ⇒ Born in 1994⇒ Not in PISA 2012
• If they participated in School Program 2.0 in 2010/2011 (year of birth of student in brackets)
Year
2010/11
Year
2011/12
5thEP
[2001]
6thEP
[2000]
If not repeated a grade level ⇒ Born in 2000⇒ Not in PISA 2012
If repeated a grade level ⇒ Born in 1999⇒ Not in PISA 2012
If repeated two grade levels ⇒ Born in 1998⇒ Not in PISA 2012
6thEP
[2000]
1stESO
[1999]
If not repeated ⇒ Born in 1999⇒ Not in PISA 2012
If repeated a grade level ⇒ Born in 1998⇒ Not in PISA 2012
If repeated two grade levels ⇒ Born in 1997⇒ Not in PISA 2012
1stESO
[1999]
2ndESO
[1998]
If not repeated a grade level ⇒ Born in 1998⇒ Not in PISA 2012
If repeated a grade level ⇒ Born in 1997⇒ Not in PISA 2012
If repeated two grade levels ⇒⇒⇒⇒ Born in 1996⇒⇒⇒⇒ In PISA 2012
2ndESO
[1998]
3rdESO
[1997]
If not repeated a grade level ⇒ Born in 1997⇒ Not in PISA 2012
If repeated a grade level ⇒⇒⇒⇒ Born in 1996⇒⇒⇒⇒ In PISA 2012
If repeated two grade levels ⇒ Born in 1995⇒ Not in PISA 2012
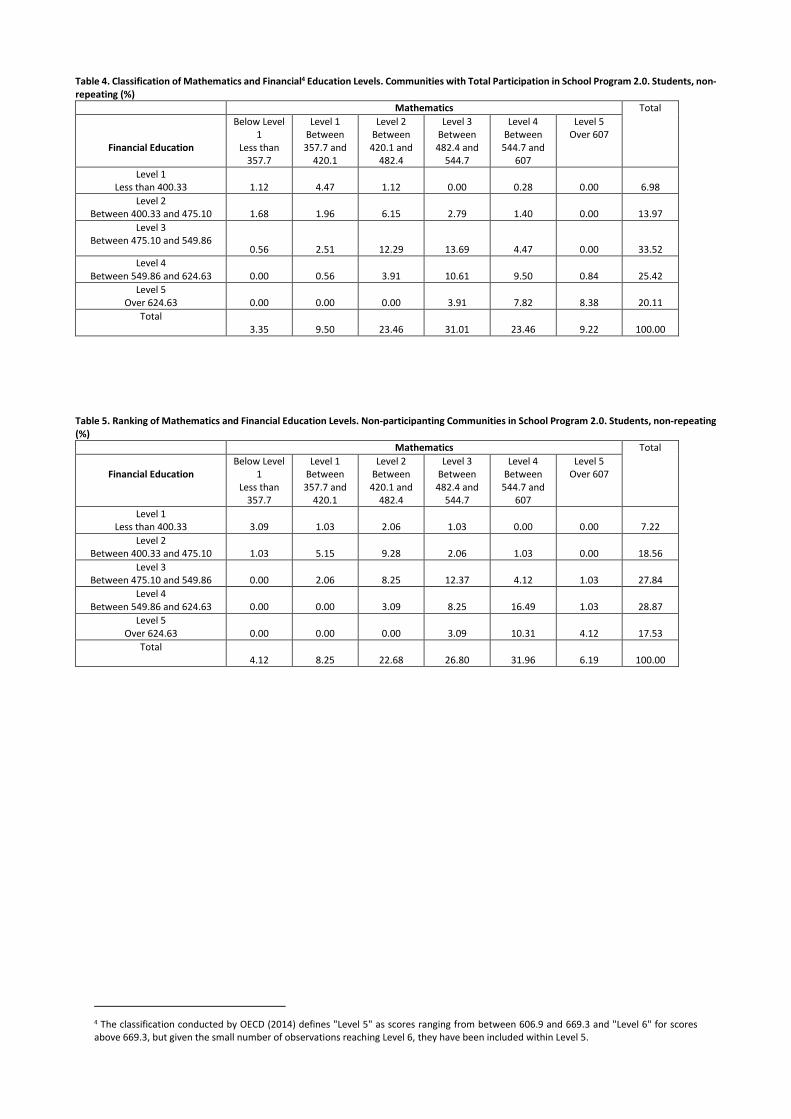
Table 4. Classification of Mathematics and Financial4 Education Levels. Communities with Total Participation in School Program 2.0. Students, non-
repeating (%)
Mathematics Total
Financial Education
Below Level
1
Less than
357.7
Level 1
Between
357.7 and
420.1
Level 2
Between
420.1 and
482.4
Level 3
Between
482.4 and
544.7
Level 4
Between
544.7 and
607
Level 5
Over 607
Level 1
Less than 400.33 1.12 4.47 1.12 0.00 0.28 0.00 6.98
Level 2
Between 400.33 and 475.10 1.68 1.96 6.15 2.79 1.40 0.00 13.97
Level 3
Between 475.10 and 549.86 0.56 2.51 12.29 13.69 4.47 0.00 33.52
Level 4
Between 549.86 and 624.63 0.00 0.56 3.91 10.61 9.50 0.84 25.42
Level 5
Over 624.63 0.00 0.00 0.00 3.91 7.82 8.38 20.11
Total
3.35 9.50 23.46 31.01 23.46 9.22 100.00
Table 5. Ranking of Mathematics and Financial Education Levels. Non-participanting Communities in School Program 2.0. Students, non-repeating
(%)
Mathematics Total
Financial Education
Below Level
1
Less than
357.7
Level 1
Between
357.7 and
420.1
Level 2
Between
420.1 and
482.4
Level 3
Between
482.4 and
544.7
Level 4
Between
544.7 and
607
Level 5
Over 607
Level 1
Less than 400.33 3.09 1.03 2.06 1.03 0.00 0.00 7.22
Level 2
Between 400.33 and 475.10 1.03 5.15 9.28 2.06 1.03 0.00 18.56
Level 3
Between 475.10 and 549.86 0.00 2.06 8.25 12.37 4.12 1.03 27.84
Level 4
Between 549.86 and 624.63 0.00 0.00 3.09 8.25 16.49 1.03 28.87
Level 5
Over 624.63 0.00 0.00 0.00 3.09 10.31 4.12 17.53
Total
4.12 8.25 22.68 26.80 31.96 6.19 100.00
4 The classification conducted by OECD (2014) defines "Level 5" as scores ranging from between 606.9 and 669.3 and "Level 6" for scores
above 669.3, but given the small number of observations reaching Level 6, they have been included within Level 5.
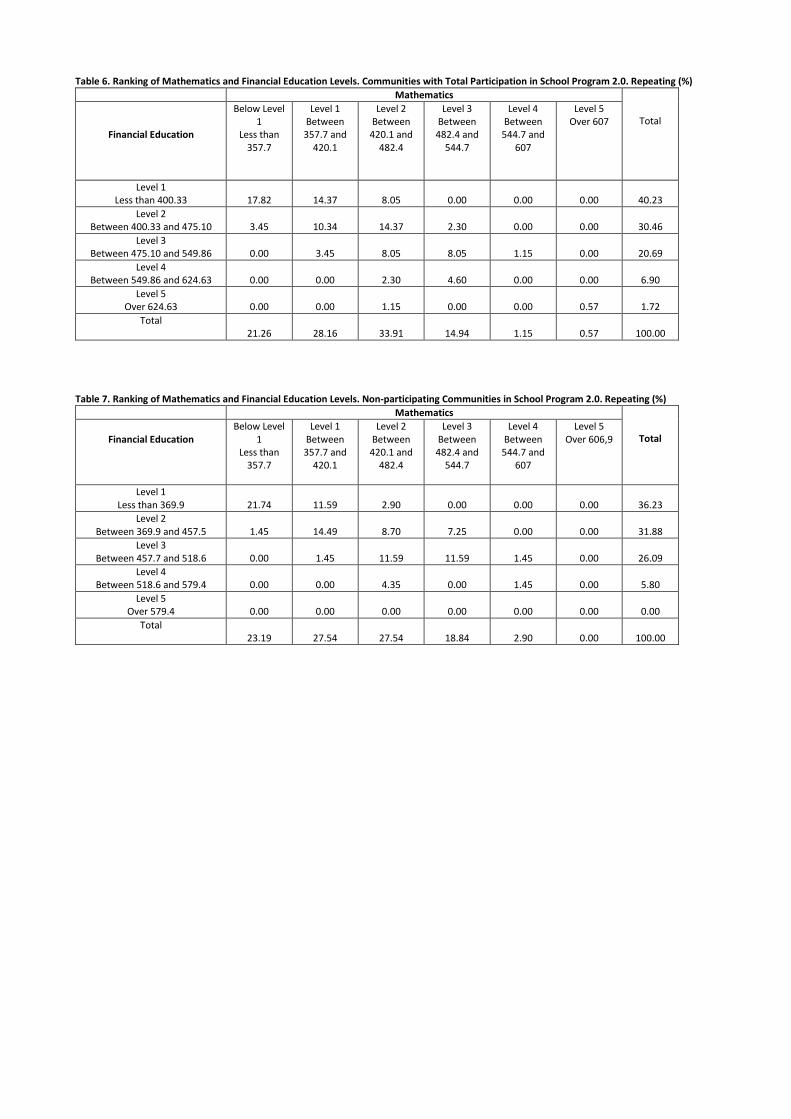
Table 6. Ranking of Mathematics and Financial Education Levels. Communities with Total Participation in School Program 2.0. Repeating (%)
Mathematics
Total
Financial Education
Below Level
1
Less than
357.7
Level 1
Between
357.7 and
420.1
Level 2
Between
420.1 and
482.4
Level 3
Between
482.4 and
544.7
Level 4
Between
544.7 and
607
Level 5
Over 607
Level 1
Less than 400.33 17.82 14.37 8.05 0.00 0.00 0.00 40.23
Level 2
Between 400.33 and 475.10 3.45 10.34 14.37 2.30 0.00 0.00 30.46
Level 3
Between 475.10 and 549.86 0.00 3.45 8.05 8.05 1.15 0.00 20.69
Level 4
Between 549.86 and 624.63 0.00 0.00 2.30 4.60 0.00 0.00 6.90
Level 5
Over 624.63 0.00 0.00 1.15 0.00 0.00 0.57 1.72
Total
21.26 28.16 33.91 14.94 1.15 0.57 100.00
Table 7. Ranking of Mathematics and Financial Education Levels. Non-participating Communities in School Program 2.0. Repeating (%)
Mathematics
Total
Financial Education
Below Level
1
Less than
357.7
Level 1
Between
357.7 and
420.1
Level 2
Between
420.1 and
482.4
Level 3
Between
482.4 and
544.7
Level 4
Between
544.7 and
607
Level 5
Over 606,9
Level 1
Less than 369.9 21.74 11.59 2.90 0.00 0.00 0.00 36.23
Level 2
Between 369.9 and 457.5 1.45 14.49 8.70 7.25 0.00 0.00 31.88
Level 3
Between 457.7 and 518.6 0.00 1.45 11.59 11.59 1.45 0.00 26.09
Level 4
Between 518.6 and 579.4 0.00 0.00 4.35 0.00 1.45 0.00 5.80
Level 5
Over 579.4 0.00 0.00 0.00 0.00 0.00 0.00 0.00
Total
23.19 27.54 27.54 18.84 2.90 0.00 100.00

Table 8. Estimation of Bivariate Ordered Probit Model for Mathematics and Financial Education Scores.
Communities with Total Participation
Without Mixed Effects With Mixed Effects
Coef Std.D Coef Std.D
Mathematics
Financial Education Score 1.215 0.069 ***
Student (boy) 0.457 0.103 *** 0.433 0.193 ***
Immigrant -0.149 0.077 ** -0.339 0.090 ***
Non-repeating 0.175 0.041 ** 0.334 0.045 ***
Use of Computers Policy 0.224 0.100 ** 0.180 0.032 ***
Mathematics Quality Policy 0.011 0.163 0.050 0.028 *
Average Class Size 0.005 0.007 -0.006 0.008
Ratio of Schoolgirls -0.928 0.360 ** -0.599 0.413
Ratio of ISCED5A Teachers 0.142 0.110 0.181 0.143 **
Computer/tablet at home 0.349 0.117 *** 0.431 0.218 **
Computer/tablet at school -0.136 0.010 *** -0.146 0.035 ***
ICT for homework ***
1-2 times/week 0.230 0.113 ** 0.141 0.148
Almost every day -0.068 0.011 *** -0.245 0.105 **
Everyday -0.440 0.241 ** -0.695 0.288 ***
Financial Education
Non-repeating 1.198 0.121 *** 1.250 0.236 ***
Student (boy) 0.363 0.091 *** 0.315 0.102 ***
Immigrant -0.305 0.162 * -0.238 0.108 *
Student talks to parents 0.092 0.011 *** 0.172 0.011 ***
Student works 0.041 0.071 ** 0.102 0.026 ***
Computer/tablet at home 0.454 0.205 *** 0.239 0.146 ***
Subject, less than 2 years ago 0.304 0.154 ** 0.572 0.192 **
Subject, more than 2 years ago 0.407 0.202 ** 0.635 0.188 **
Compulsory subject 0.276 0.155 * 0.664 0.207 *
Explanation
Cross-curricular subject -0.342 0.126 *** -0.403 0.177 ***
Within Economics Subject -0.331 0.013 ** -0.420 0.137 **
Within Mathematics Subject 0.270 0.065 *** 0.221 0.103 ***
Within Science or Humanities Subjects -0.128 0.050 ** -0.093 0.177 **
Teacher Training Courses 0.042 0.139 0.086 0.135
Teacher: Teacher from School 0.175 0.147 0.260 0.156
Average Class Size -0.016 0.006 ** -0.023 0.175 **
Ratio of Schoolgirls -0.066 0.281 -0.017 0.007
Interaction: Computer/tablet at school and Finan.
within Math. -0.485 0.056 *** -0.602 0.289 ***
Interaction: ICT for homework and in Financial
Education within Mathematics
1-2 times/week 0.207 0.062 ** 0.326 0.173 **
Almost every day -0.192 0.082 ** -0.047 0.200 **
Everyday -0.804 0.323 ** -0.147 0.278 **
Constant -0.736 0.245 *** -0.935 0.445 ***
µ(mixed effect) 1.222 0.254 ***
σ(mixed effect) 0.653 0.287 ***
ρ 0.627 0.149 *** 0.351 0.178 ***
Log likelihood -1,174.959 -1,147.912
N 532 532
Source: Compilation by authors. All cut-off points are significant at 5%. In both equations, the size of the residing municipality and the highest
educational level of the father/mother have been included as an explanatory variable. Omitted variables: schoolgirls, repeating students, national,
use computer for homework 1-2 times/month or less frequently, non-compulsory Financial Education, Financial Education subject not available. (***:
Significant at 1%; **: significant at 5%; *: significant at 10%).
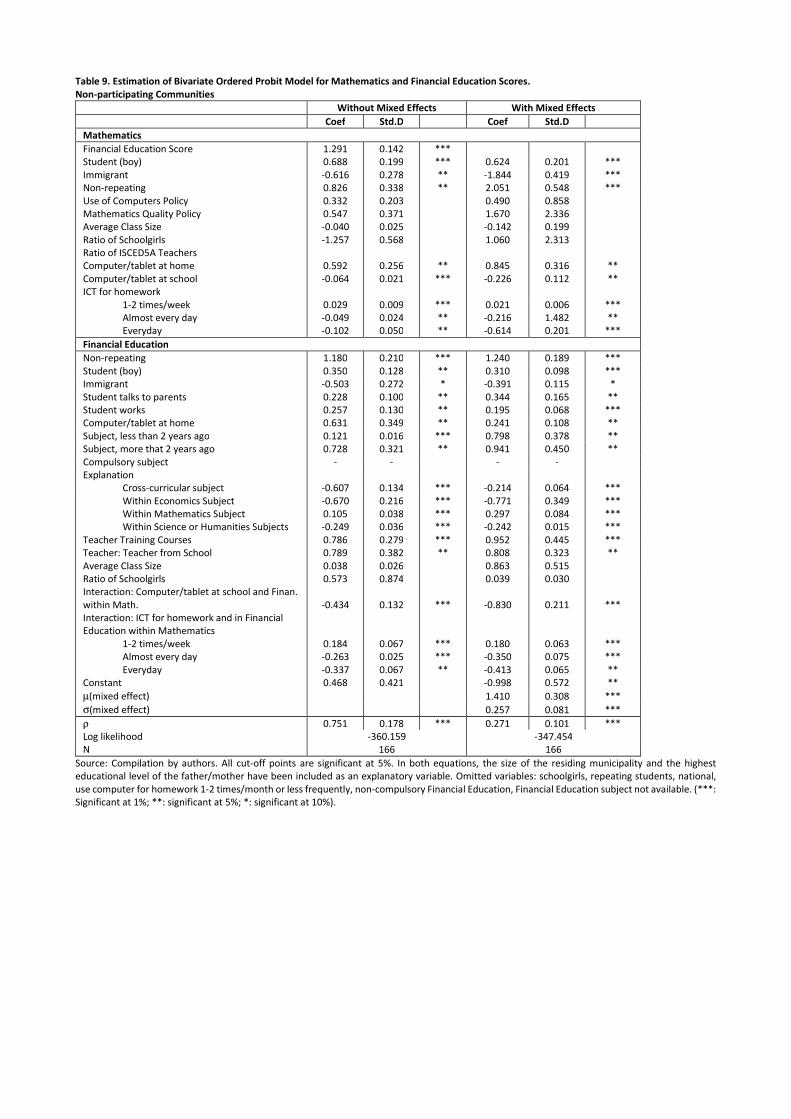
Table 9. Estimation of Bivariate Ordered Probit Model for Mathematics and Financial Education Scores.
Non-participating Communities
Without Mixed Effects With Mixed Effects
Coef Std.D Coef Std.D
Mathematics
Financial Education Score 1.291 0.142 ***
Student (boy) 0.688 0.199 *** 0.624 0.201 ***
Immigrant -0.616 0.278 ** -1.844 0.419 ***
Non-repeating 0.826 0.338 ** 2.051 0.548 ***
Use of Computers Policy 0.332 0.203 0.490 0.858
Mathematics Quality Policy 0.547 0.371 1.670 2.336
Average Class Size -0.040 0.025 -0.142 0.199
Ratio of Schoolgirls -1.257 0.568 1.060 2.313
Ratio of ISCED5A Teachers
Computer/tablet at home 0.592 0.256 ** 0.845 0.316 **
Computer/tablet at school -0.064 0.021 *** -0.226 0.112 **
ICT for homework
1-2 times/week 0.029 0.009 *** 0.021 0.006 ***
Almost every day -0.049 0.024 ** -0.216 1.482 **
Everyday -0.102 0.050 ** -0.614 0.201 ***
Financial Education
Non-repeating 1.180 0.210 *** 1.240 0.189 ***
Student (boy) 0.350 0.128 ** 0.310 0.098 ***
Immigrant -0.503 0.272 * -0.391 0.115 *
Student talks to parents 0.228 0.100 ** 0.344 0.165 **
Student works 0.257 0.130 ** 0.195 0.068 ***
Computer/tablet at home 0.631 0.349 ** 0.241 0.108 **
Subject, less than 2 years ago 0.121 0.016 *** 0.798 0.378 **
Subject, more that 2 years ago 0.728 0.321 ** 0.941 0.450 **
Compulsory subject - - - -
Explanation
Cross-curricular subject -0.607 0.134 *** -0.214 0.064 ***
Within Economics Subject -0.670 0.216 *** -0.771 0.349 ***
Within Mathematics Subject 0.105 0.038 *** 0.297 0.084 ***
Within Science or Humanities Subjects -0.249 0.036 *** -0.242 0.015 ***
Teacher Training Courses 0.786 0.279 *** 0.952 0.445 ***
Teacher: Teacher from School 0.789 0.382 ** 0.808 0.323 **
Average Class Size 0.038 0.026 0.863 0.515
Ratio of Schoolgirls 0.573 0.874 0.039 0.030
Interaction: Computer/tablet at school and Finan.
within Math. -0.434 0.132 *** -0.830 0.211 ***
Interaction: ICT for homework and in Financial
Education within Mathematics
1-2 times/week 0.184 0.067 *** 0.180 0.063 ***
Almost every day -0.263 0.025 *** -0.350 0.075 ***
Everyday -0.337 0.067 ** -0.413 0.065 **
Constant 0.468 0.421 -0.998 0.572 **
µ(mixed effect) 1.410 0.308 ***
σ(mixed effect) 0.257 0.081 ***
ρ 0.751 0.178 *** 0.271 0.101 ***
Log likelihood -360.159 -347.454
N 166 166
Source: Compilation by authors. All cut-off points are significant at 5%. In both equations, the size of the residing municipality and the highest
educational level of the father/mother have been included as an explanatory variable. Omitted variables: schoolgirls, repeating students, national,
use computer for homework 1-2 times/month or less frequently, non-compulsory Financial Education, Financial Education subject not available. (***:
Significant at 1%; **: significant at 5%; *: significant at 10%).
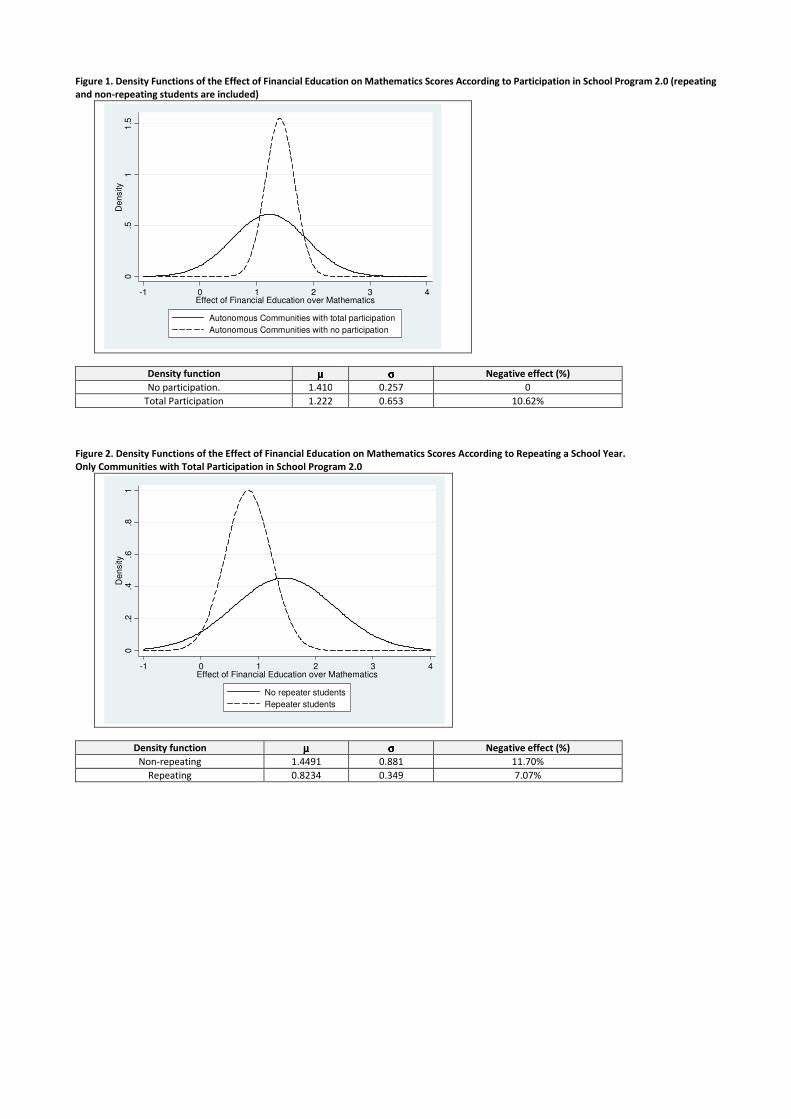
Figure 1. Density Functions of the Effect of Financial Education on Mathematics Scores According to Participation in School Program 2.0 (repeating
and non-repeating students are included)
Density function µµµµ σσσσ Negative effect (%)
No participation. 1.410 0.257 0
Total Participation 1.222 0.653 10.62%
Figure 2. Density Functions of the Effect of Financial Education on Mathematics Scores According to Repeating a School Year.
Only Communities with Total Participation in School Program 2.0
Density function µµµµ σσσσ Negative effect (%)
Non-repeating 1.4491 0.881 11.70%
Repeating 0.8234 0.349 7.07%
0.5
11
.5D
en
sity
-1 0 1 2 3 4Effect of Financial Education over Mathematics
Autonomous Communities with total participation
Autonomous Communities with no participation
0.2
.4.6
.81
Den
sity
-1 0 1 2 3 4Effect of Financial Education over Mathematics
No repeater students
Repeater students
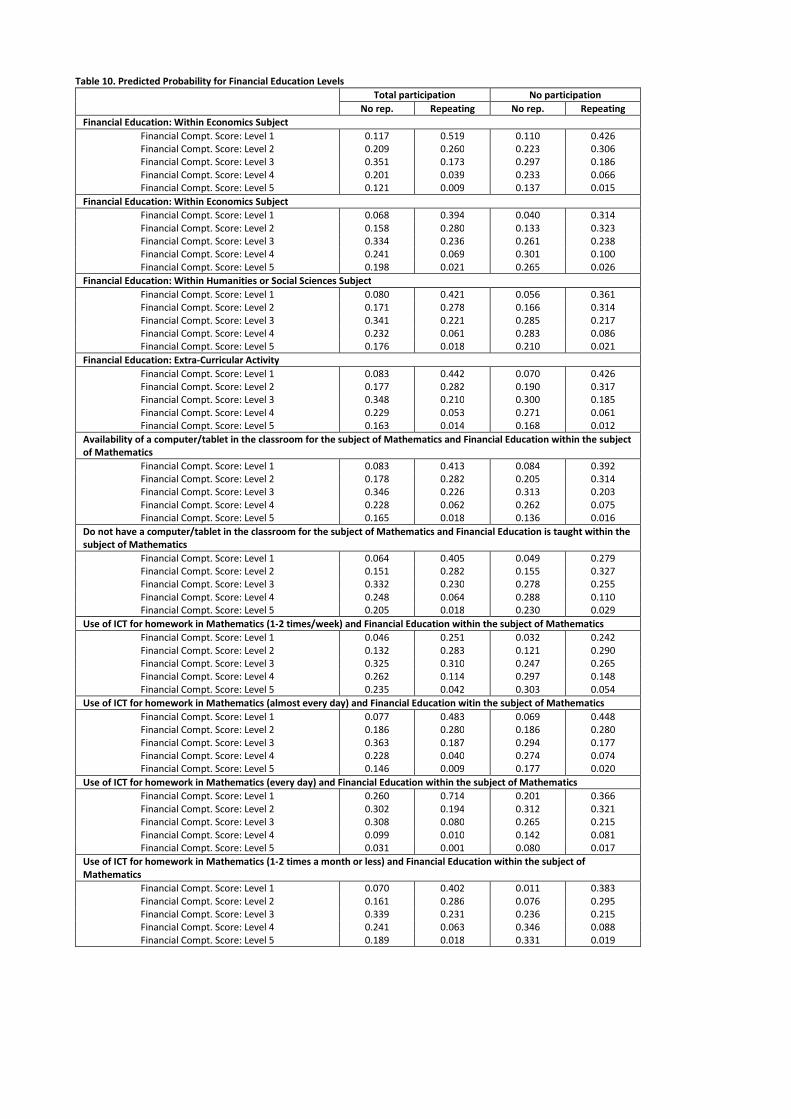
Table 10. Predicted Probability for Financial Education Levels
Total participation No participation
No rep. Repeating No rep. Repeating
Financial Education: Within Economics Subject
Financial Compt. Score: Level 1 0.117 0.519 0.110 0.426
Financial Compt. Score: Level 2 0.209 0.260 0.223 0.306
Financial Compt. Score: Level 3 0.351 0.173 0.297 0.186
Financial Compt. Score: Level 4 0.201 0.039 0.233 0.066
Financial Compt. Score: Level 5 0.121 0.009 0.137 0.015
Financial Education: Within Economics Subject
Financial Compt. Score: Level 1 0.068 0.394 0.040 0.314
Financial Compt. Score: Level 2 0.158 0.280 0.133 0.323
Financial Compt. Score: Level 3 0.334 0.236 0.261 0.238
Financial Compt. Score: Level 4 0.241 0.069 0.301 0.100
Financial Compt. Score: Level 5 0.198 0.021 0.265 0.026
Financial Education: Within Humanities or Social Sciences Subject
Financial Compt. Score: Level 1 0.080 0.421 0.056 0.361
Financial Compt. Score: Level 2 0.171 0.278 0.166 0.314
Financial Compt. Score: Level 3 0.341 0.221 0.285 0.217
Financial Compt. Score: Level 4 0.232 0.061 0.283 0.086
Financial Compt. Score: Level 5 0.176 0.018 0.210 0.021
Financial Education: Extra-Curricular Activity
Financial Compt. Score: Level 1 0.083 0.442 0.070 0.426
Financial Compt. Score: Level 2 0.177 0.282 0.190 0.317
Financial Compt. Score: Level 3 0.348 0.210 0.300 0.185
Financial Compt. Score: Level 4 0.229 0.053 0.271 0.061
Financial Compt. Score: Level 5 0.163 0.014 0.168 0.012
Availability of a computer/tablet in the classroom for the subject of Mathematics and Financial Education within the subject
of Mathematics
Financial Compt. Score: Level 1 0.083 0.413 0.084 0.392
Financial Compt. Score: Level 2 0.178 0.282 0.205 0.314
Financial Compt. Score: Level 3 0.346 0.226 0.313 0.203
Financial Compt. Score: Level 4 0.228 0.062 0.262 0.075
Financial Compt. Score: Level 5 0.165 0.018 0.136 0.016
Do not have a computer/tablet in the classroom for the subject of Mathematics and Financial Education is taught within the
subject of Mathematics
Financial Compt. Score: Level 1 0.064 0.405 0.049 0.279
Financial Compt. Score: Level 2 0.151 0.282 0.155 0.327
Financial Compt. Score: Level 3 0.332 0.230 0.278 0.255
Financial Compt. Score: Level 4 0.248 0.064 0.288 0.110
Financial Compt. Score: Level 5 0.205 0.018 0.230 0.029
Use of ICT for homework in Mathematics (1-2 times/week) and Financial Education within the subject of Mathematics
Financial Compt. Score: Level 1 0.046 0.251 0.032 0.242
Financial Compt. Score: Level 2 0.132 0.283 0.121 0.290
Financial Compt. Score: Level 3 0.325 0.310 0.247 0.265
Financial Compt. Score: Level 4 0.262 0.114 0.297 0.148
Financial Compt. Score: Level 5 0.235 0.042 0.303 0.054
Use of ICT for homework in Mathematics (almost every day) and Financial Education witin the subject of Mathematics
Financial Compt. Score: Level 1 0.077 0.483 0.069 0.448
Financial Compt. Score: Level 2 0.186 0.280 0.186 0.280
Financial Compt. Score: Level 3 0.363 0.187 0.294 0.177
Financial Compt. Score: Level 4 0.228 0.040 0.274 0.074
Financial Compt. Score: Level 5 0.146 0.009 0.177 0.020
Use of ICT for homework in Mathematics (every day) and Financial Education within the subject of Mathematics
Financial Compt. Score: Level 1 0.260 0.714 0.201 0.366
Financial Compt. Score: Level 2 0.302 0.194 0.312 0.321
Financial Compt. Score: Level 3 0.308 0.080 0.265 0.215
Financial Compt. Score: Level 4 0.099 0.010 0.142 0.081
Financial Compt. Score: Level 5 0.031 0.001 0.080 0.017
Use of ICT for homework in Mathematics (1-2 times a month or less) and Financial Education within the subject of
Mathematics
Financial Compt. Score: Level 1 0.070 0.402 0.011 0.383
Financial Compt. Score: Level 2 0.161 0.286 0.076 0.295
Financial Compt. Score: Level 3 0.339 0.231 0.236 0.215
Financial Compt. Score: Level 4 0.241 0.063 0.346 0.088
Financial Compt. Score: Level 5 0.189 0.018 0.331 0.019
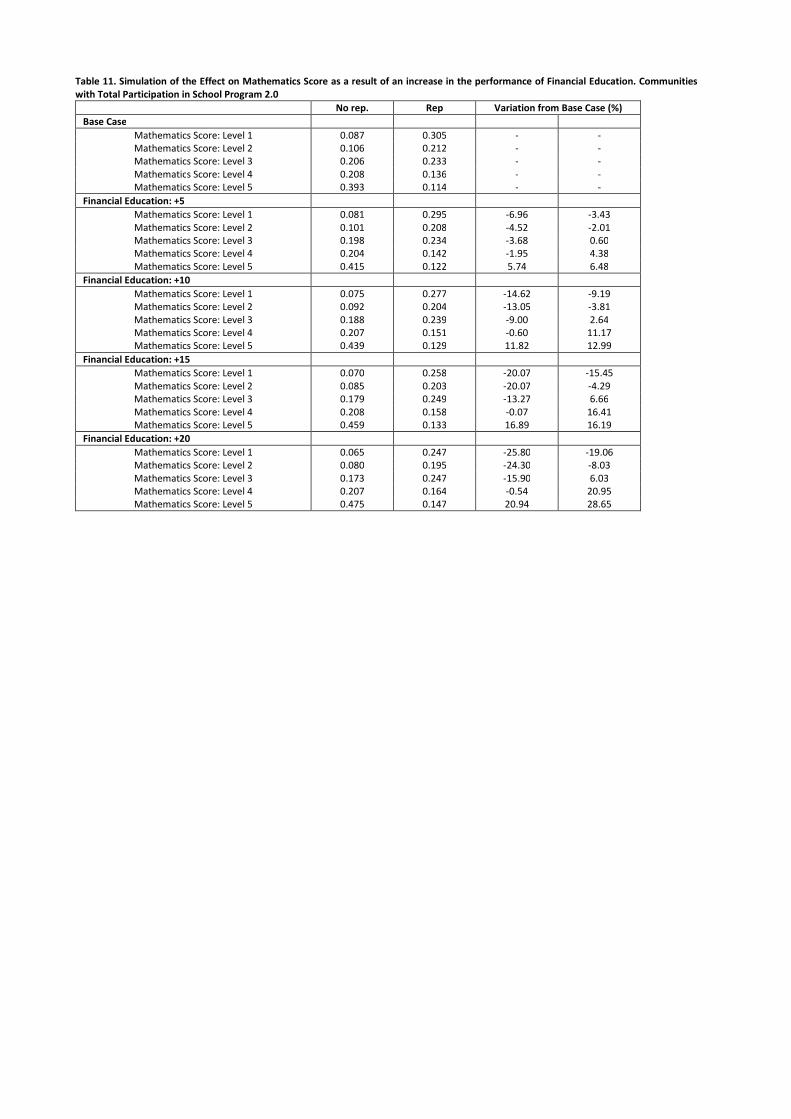
Table 11. Simulation of the Effect on Mathematics Score as a result of an increase in the performance of Financial Education. Communities
with Total Participation in School Program 2.0
No rep. Rep Variation from Base Case (%)
Base Case
Mathematics Score: Level 1 0.087 0.305 - -
Mathematics Score: Level 2 0.106 0.212 - -
Mathematics Score: Level 3 0.206 0.233 - -
Mathematics Score: Level 4 0.208 0.136 - -
Mathematics Score: Level 5 0.393 0.114 - -
Financial Education: +5
Mathematics Score: Level 1 0.081 0.295 -6.96 -3.43
Mathematics Score: Level 2 0.101 0.208 -4.52 -2.01
Mathematics Score: Level 3 0.198 0.234 -3.68 0.60
Mathematics Score: Level 4 0.204 0.142 -1.95 4.38
Mathematics Score: Level 5 0.415 0.122 5.74 6.48
Financial Education: +10
Mathematics Score: Level 1 0.075 0.277 -14.62 -9.19
Mathematics Score: Level 2 0.092 0.204 -13.05 -3.81
Mathematics Score: Level 3 0.188 0.239 -9.00 2.64
Mathematics Score: Level 4 0.207 0.151 -0.60 11.17
Mathematics Score: Level 5 0.439 0.129 11.82 12.99
Financial Education: +15
Mathematics Score: Level 1 0.070 0.258 -20.07 -15.45
Mathematics Score: Level 2 0.085 0.203 -20.07 -4.29
Mathematics Score: Level 3 0.179 0.249 -13.27 6.66
Mathematics Score: Level 4 0.208 0.158 -0.07 16.41
Mathematics Score: Level 5 0.459 0.133 16.89 16.19
Financial Education: +20
Mathematics Score: Level 1 0.065 0.247 -25.80 -19.06
Mathematics Score: Level 2 0.080 0.195 -24.30 -8.03
Mathematics Score: Level 3 0.173 0.247 -15.90 6.03
Mathematics Score: Level 4 0.207 0.164 -0.54 20.95
Mathematics Score: Level 5 0.475 0.147 20.94 28.65

Table 12. Simulation of the Effect on Mathematics Score as a result of an increase in the performance of Financial Education. Communities
Not Participating in School Program 2.0
Non-repeating Rep Change from base case (%)
Base Case
Mathematics Score: Level 1 0.070 0.247 - -
Mathematics Score: Level 2 0.110 0.239 - -
Mathematics Score: Level 3 0.192 0.271 - -
Mathematics Score: Level 4 0.220 0.161 - -
Mathematics Score: Level 5 0.407 0.083 - -
Financial Education: +5
Mathematics Score: Level 1 0.067 0.244 -4.54 -1.29
Mathematics Score: Level 2 0.102 0.229 -7.25 -4.00
Mathematics Score: Level 3 0.176 0.262 -8.26 -3.24
Mathematics Score: Level 4 0.214 0.170 -2.82 5.70
Mathematics Score: Level 5 0.441 0.095 8.17 14.90
Financial Education: +10
Mathematics Score: Level 1 0.058 0.239 -16.82 -3.10
Mathematics Score: Level 2 0.091 0.221 -17.14 -7.53
Mathematics Score: Level 3 0.172 0.262 -10.53 -3.27
Mathematics Score: Level 4 0.210 0.179 -4.65 11.26
Mathematics Score: Level 5 0.469 0.099 15.02 19.76
Financial Education: +15
Mathematics Score: Level 1 0.057 0.222 -18.55 -10.15
Mathematics Score: Level 2 0.089 0.206 -19.66 -13.68
Mathematics Score: Level 3 0.170 0.264 -11.42 -2.58
Mathematics Score: Level 4 0.208 0.191 -5.47 18.62
Mathematics Score: Level 5 0.476 0.117 16.86 42.00
Financial Education: +20
Mathematics Score: Level 1 0.053 0.201 -24.53 -18.51
Mathematics Score: Level 2 0.085 0.193 -23.02 -19.20
Mathematics Score: Level 3 0.165 0.264 -14.41 -2.55
Mathematics Score: Level 4 0.202 0.205 -8.04 27.53
Mathematics Score: Level 5 0.495 0.137 21.60 65.49