Embed Size (px)
Citation preview

Anatomy and Physiology
in the Frog (Rana pipiens) of Vision
HUMBERTO R. MATURANA, J. Y. LETTVIN, W. S. McCULLOCH,
and W. H. PITTS
From the Research Labor~o~ of Elcc~onics, M~sachusctts Institute of T~hnology, Cam~idgc
I. INTRODUCTION
Frogs arc essentially dependent on vision. They fccd on worms, flies, and
other insects which they catch directly with the mouth or by striking them with the tongue; for this they use only visual clues. Furthermore, frogs prey only on moving insects, and their attention is never attracted by stationary
creatures or objects. Nor do they respond with feeding behavior to a large moving object, instead it provokes an escape reaction. For them, a form deprived of movement SCClnS to bc behaviorally meaningless. Frogs, then,
appear to recognize their prey and select it for attack from among all other environmental objects because it exhibits a number of features such as move- ment, a certain size, some contrast, and, perhaps, also a certain color. Further- more, this ability of frogs to recognize their prey and to snap at it is not altered
by changes in the general environment. Just as wc arc able to read and to recognize shapes under the most varied conditions, so arc frogs able to scc their prey and to fccd upon it under the bright light of midday or under the twilight of morning or evening, whether this bc in their natural environment
or in a small cage in the laboratory.
How is this accomplished? How do frogs recognize the universals, prey and enemy?
To survive, a frog needs to react rapidly, either to catch a prey or to escape an enemy. To do this, the pat tern of light and dark that is the original image formed on the retina has to be anaJyzed, sooner or later, to select from it the features which define the universals.
In these circumstances we can ask: Does the retina perform an analysis and abstract the meaningful parameters that will permit the recognition of the universals or is this analysis performed only later in the visual centers? Any
This work was supported in part by the United States Army (Signal Corps), the United States Air Force (Oflicc of Scientific Research, Air Research and Development Command), and the United States Navy (Office of Naval Research). Dr. NIaturana is on leave from the Univcrslty of Chile.
The Journal of General Physiology

13o M E C H A N I S M S O F V I S I O N
mechanism that permits the recognition of prey and enemy in as direct a manner as possible is of great advantage in survival.
According to the old argument of the parsimony of nature it would seem a waste of organization to have the complex structure of the retina act as a repeater that transmits to the brain, intact, the pattern of light and dark formed on the receptors. The complex shapes of the ganglion cells that relate them in various specific ways to the bipolars (themselves of several morphologi- cal kinds) make repeater action hardly believable. Furthermore, the structure of the frog's visual centers (tectal lobes), with only one-fifteenth of the total number of nerve cells of the retina (see below), appears more adapted to handle an already simplified image than to handle the complete raw data initially registered by the receptors. Thus, for anatomical reasons, the retina should be expected to perform the first step in the analysis of the visual image and to transmit the abstracted information to the visual centers. Tha t this is so, has been directly or implicitly suggested by the works of numerous authors such as Cajal and Polyak from their studies of the ana tomy of the retina, and Hartline, Granit, Barlow, Kuffler, and others, from their studies of the func- tional properties of the ganglion cells.
Hartl ine showed (1938 and 1940), by recording from isolated fibres in the retina of an excised eye of the frog, that the ganglion cells could be grouped in three classes according to their response to a small spot of light shone on their receptive fields. These classes were: on cells, which respond with a pro- longed but delayed discharge to the on of the spot of light; on-off cells, which respond with small bursts of high frequency to the make and break of that light; and off cells, which respond with a prolonged and immediate discharge to the off of that light. These observations were the first to show that the ganglion cells perform several complex operations on the visual image.
More recently, Barlow (1953) showed that in the frog the on-off ganglion cells have a more complex organization in their receptive fields than the off cells and are affected by an inhibitory area that surrounds the zone from which on-off responses can be obtained. Tha t is, the response to on at the center is diminished by on in the surround, and off is diminished by off. In the cat the cell responds exclusively either to on or off at its center and to the opposite stimulus at its periphery. In any case, these fibres in the frog, and their homo- logues in the cat, act on concentric differences. Furthermore, Kuffler ob- served in the cat a great variability in the characteristics of the response of such cells according to the size of the stimulating spot of light, its intensity, and the background illumination. In addition, Barlow et al. (1957) showed that in the cat the organization of the receptive field also changes with dark adaptation. Because of these observations, Barlow et al., and Kuffler, have questioned the constancy of function of the ganglion cells in the cat and have suggested that it may also be questionable in the frog.

MATURANA, LETTVIN, MCICIULLOCIH, PIT'rg Anatomy and Physiology of Vision in Frog : 3:
Spots of light are not natural stimuli for the frog in the way that a fly or worm is. Their use has given valuable information about the internal or- ganization of the receptive fields, but on the whole it seems not to have led directly to the discovery of natural invariants in the function of ganglion cells. Rather, all of this has suggested that, although the ganglion cells inte- grate the function of many receptors and bipolars, they repeat to some extent, but in a coarser and inconstant manner, the original pattern of light and dark of the visual image weighted by local differences. Nevertheless, the perception of universals that is obvious in the behavior of the frog demands the presence of some functional invariants in the activity of the components of its visual system. Considering the anatomical arguments presented above (and some others to be mentioned in the discussion) we thought that these invariants should appear in the function of the ganglion cells, although up to now they had not been found in the protean nature of the receptive fields.
In order to find these invariants, and hence the analytic functions of the ganglion ceils, we adopted a naturalistic approach and studied them in terms of their response to real objects of the natural environment. We added this question: Do the natural functions of the ganglion cells (the operations that these perform on the visual image) remain constant in spite of the changes in the organization of the receptive fields that may occur with changes in the visible environment?
For our ends we recorded directly the activity of single ganglion cells from their axons in the optic nerve and from their terminals in the colliculi. As stimuli we used dark and light objects of various sizes and shapes moved in the visual field against a clear or dark background or against a color photo- graph of the natural environment of the frog.
We found with this approach that the ganglion cells form five natural classes, four of which perform on the visual image complex analytical opera- tions which remain invariant under the most varied environmental conditions, while the fifth measures the light intensity. Three of the analytical classes coincide with those described originally by Hartline (1938), and their func- tions with respect to the real objects could have been predicted to some extent from analysis with spots of light. The fourth class is new and could not have been easily found or predicted with such an analysis. The five classes form five populations uniformly distributed in the eighth layer of the retina. All of these ganglion cells project to the superficial neuropil of the tectum, where the terminals separate according to function in well registered layers.
We show that the function of the retina in the frog is not to transmit in- formation about the point-to-point pattern of distribution of light and dark in the image, but to analyze this image at every point in terms of four arbitrary contexts (local variations of light intensity, moving edges, curvatures, and standing contrasts) and a measure of illumination, and to transmit this in-
A
MECHANISMS OF VISION
formation to the colliculi, where the five functions are stratified into different congruent layers of terminals. We present these findings in detail and discuss them in relation to the known anatomy of the retina and tectum.
II. M E T H O D S
In this study we used only the common American frog, Rana pipiens. In order to expose the optic nerve and colliculi of this animal it is necessary to remove the top of the skull (frontoparietal bone) and the bone and cartilage above the
~32
B
7"x 7" I ° 3" 7" • . O •
I" x 20* 7 ° x 20 °
W 40oeoeoOeOoeoeeeee
oeeeeeeee°oeeeoeaj
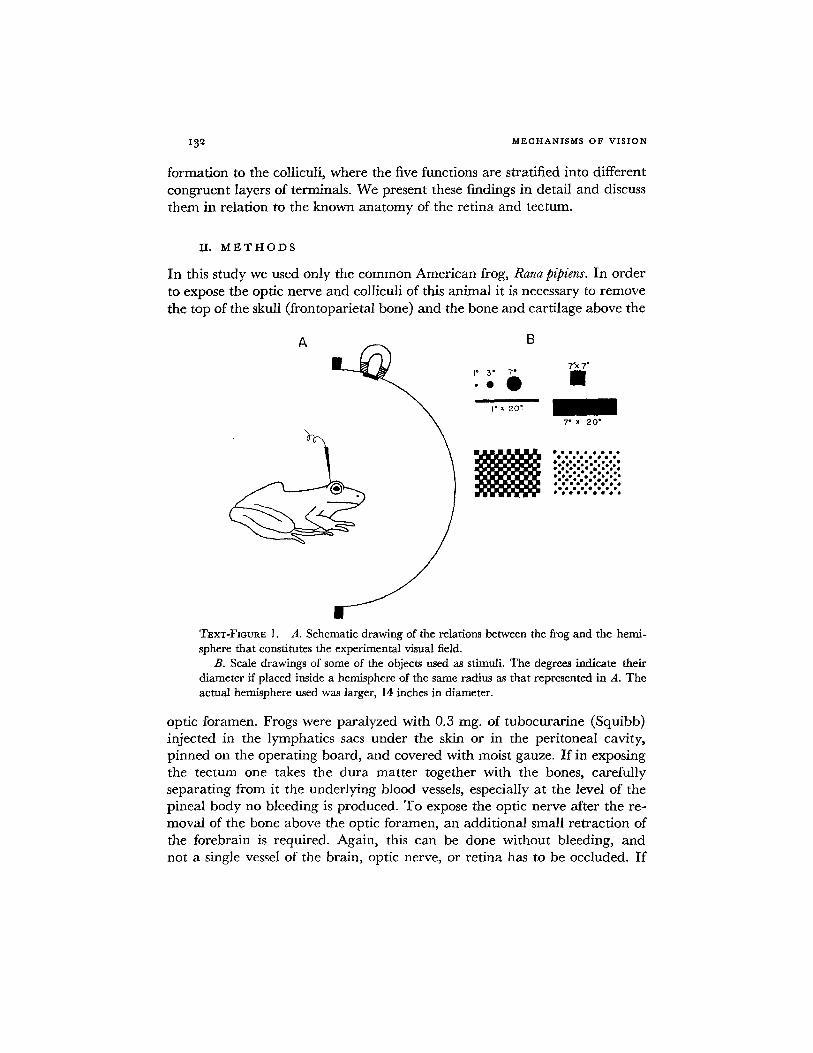
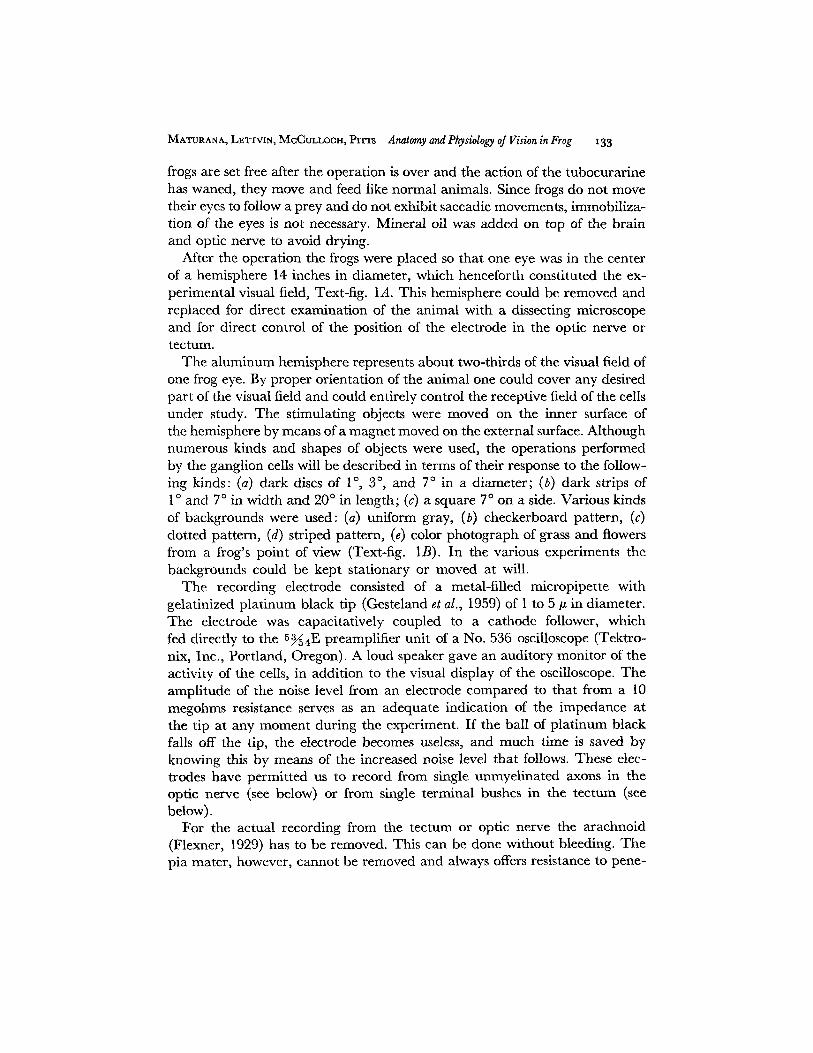
TExT-FmuRS I. A. Schematic drawing of the relations between the frog and the hemi- sphere that constitutes the experimental visual field.
B. Scale drawings of some of the objects used as stimuli. The degrees indicate their diameter if placed inside a hemisphere of the same radius as that represented in A. The actual hemisphere used was larger, 14 inches in diameter.
optic foramen. Frogs were paralyzed with 0.3 mg. of tubocurarine (Squibb) injected in the lymphatics sacs under the skin or in the peritoneal cavity, pinned on the operating board, and covered with moist gauze. I f in exposing the tectum one takes the dura matter together with the bones, carefully separating from it the underlying blood vessels, especially at the level of the pineal body no bleeding is produced. To expose the optic nerve after the re- moval of the bone above the optic foramen, an additional small retraction of the forebrain is required. Again, this can be done without bleeding, and not a single vessel of the brain, optic nerve, or retina has to be occluded. I f
MATURANA, LETTVIN, MCCULLOCH, PITTS Anatomy and Physiology of Vision in Frog 133
frogs are set free after the operation is over and the action of the tubocurarine has waned, they move and feed like normal animals. Since frogs do not move their eyes to follow a prey and do not exhibit saccadic movements, immobiliza- tion of the eyes is not necessary. Mineral oil was added on top of the brain and optic nerve to avoid drying.
After the operation the frogs were placed so that one eye was in the center of a hemisphere 14 inches in diameter, which henceforth constituted the ex- perimental visual field, Text-fig. 1A. This hemisphere could be removed and replaced for direct examination of the animal with a dissecting microscope and for direct control of the position of the electrode in the optic nerve or tectum.
The aluminum hemisphere represents about two-thirds of the visual field of one frog eye. By proper orientation of the animal one could cover any desired part of the visual field and could entirely control the receptive field of the cells under study. The stimulating objects were moved on the inner surface of the hemisphere by means of a magnet moved on the external surface. Although numerous kinds and shapes of objects were used, the operations performed by the ganglion cells will be described in terms of their response to the follow- ing kinds: (a) dark discs of 1 °, 3 °, and 7 ° in a diameter; (b) dark strips of 1 ° and 7 ° in width and 20 ° in length; (c) a square 7 ° on a side. Various kinds of backgrounds were used: (a) uniform gray, (b) checkerboard pattern, (c) dotted pattern, (d) striped pattern, (e) color photograph of grass and flowers from a frog's point of view (Text-fig. 1B). In the various experiments the backgrounds could be kept stationary or moved at will.
The recording electrode consisted of a metal-filled micropipette with gelatinized platinum black tip (Gesteland et al., 1959) of 1 to 5/z in diameter. The electrode was capacitatively coupled to a cathode follower, which fed directly to the 5 ~ 4 E preamplifier unit of a No. 536 oscilloscope (Tektro- nix, Inc., Portland, Oregon). A loud speaker gave an auditory monitor of the activity of the cells, in addition to the visual display of the oscilloscope. The amplitude of the noise level from an electrode compared to that from a 10 megohms resistance serves as an adequate indication of the impedance at the tip at any moment during the experiment. If the ball of plat inum black falls off the tip, the electrode becomes useless, and much time is saved by knowing this by means of the increased noise level that follows. These elec- trodes have permitted us to record from single unmyelinated axons in the optic nerve (see below) or from single terminal bushes in the tectum (see below).
For the actual recording from the tectum or optic nerve the arachnoid (Flexner, 1929) has to be removed. This can be done without bleeding. The pia mater, however, cannot be removed and always offers resistance to pene-
I34 M E C H A N I S M S O F V I S I O N
tration; this resistance has to be overcome by gently tapping the electrode holder. In the optic nerve the pia mater (Flexner, 1929) offers greater re- sistance and has to be cut open to let the electrode penetrate.
For the histological study of the retina, optic nerve, and tectum, several standard techniques were used, such as: vital stain with methylene blue, Golgi rapid method, and Holmes' and Weigert's stains. For the electron microscopy the optic nerves were fixed with 1 per cent OsO4 in veronal- acetate buffer (pH 7.3-7.4) (Michaelis, 1931) for 2 hours at 0°C. The tissues were imbedded in methacrylate and examined with an RCA MU-2 electron microscope (Maturana, 1958).
The drawings of ganglion and tectal cells were made under direct observa- tion with a camera lucida. For counting the retinal and tectal cells the Aber- crombie procedure (Abercrombie, 1946) was used.
I l L A N A T O M Y
In this section we shall summarize the relevant information about the anatomy of the retina, the optic nerve, and the tectum of the frog.
(a) Retina The retina of the frog (Rana pipiens) has no fovea but a some- what thickened area centralis (Walls, 1942). This area centralis is hardly notice- able and does not appear to alter the fundamental uniformity of cellular and plexiform layers. The gross ratios of 2 to 3 receptors to 5 to 7 bipolars and horizontal cells per ganglion cell remain constant from central to peripheral areas, although the thickness of the retina varies from about 230 # for the thickest part to 200 # for the marked thinning just before the very rim where the retina ends. Most of this variation in thickness occurs in the layer of bipolar cells and in the inner plexiform (from 66 to 50/a and from 50 to 45/~, respectively) (Maturana, unpublished observations).
The bipolars constitute several morphological types that differ in their mode of dendritic contact with the receptors (rods and cones) and in the depth of penetration and stratification of the terminal branching of their axons in the internal plexiform (Cajal, 1955). See our Text-fig. 2. Some bipolars barely penetrate the plexiform, while others reach the boundary of the 8th layer passing through its entire thickness (about 50 /~), and still others end at one or two levels in it. The ganglion cells also form several morphologically discontinuous groups that differ in the pattern of branching and the level of stratification of their dendrites in the internal plexiform. (Cajal, 1955; Maturana, unpublished observations.) See our Text-fig. 3.
To each level of stratification of the axonal terminals of the bipolars corre- sponds a level of stratification of the dendrites of some ganglion cells, so that several fundamental strata of axodendritic synapses are formed where dif-

MATURANA, LETTVIN, McCuLLOCH, PITTS Anatomy and Physiology of Vision in Frog 135
ferent combinations of bipolars and ganglion cells occur. As a result of this arrangement each type of ganglion cell can synapse only with certain types of bipolars, and the converse is also true. This is a general occurrence in the retina of vertebrates (Cajal, 1955; Polyak, 1941). The relative numbers of the various types of bipolars and ganglion cells along the retina are not yet known; but, for reasons to be presented later, it seems to us that they should
"',f:
so-, r .o . , . . . . . . . - ~ f , - . . : :..." :..." :. . . ' . . . .~... , . . . . .
T~xT-FIGuP, E 2. Semischematic drawing of some typical ganglion cells and bipolar and of their relations, in the retina of frogs. This drawing is based on our own observa tions of ganglion cells and bipolars stained with methylene blue and some of the draw ings of Cajal (1955). The receptors have been drawn only to indicate their presence, since it is not clear how they are related to the different types of bipolars.
not vary markedly, in spite of the slight variations in cell densities suggested by the changes in thickness of the layers.
There are about 450,000 ganglion ceils in each eye of the frog. These cells lie side by side, many of them in direct contact with each other, forming a single layer of cell bodies uniformly distributed along the retina. The great majority of these cells (96 per cent) have a small perikaryon, 7 to 10 /z in diameter. The rest may have cell bodies as large as approximately 20 # in diameter (Maturana, 1959). As expected, the largest ganglion cells have the
I36 M E C H A N I S M S O F V I S I O N
A
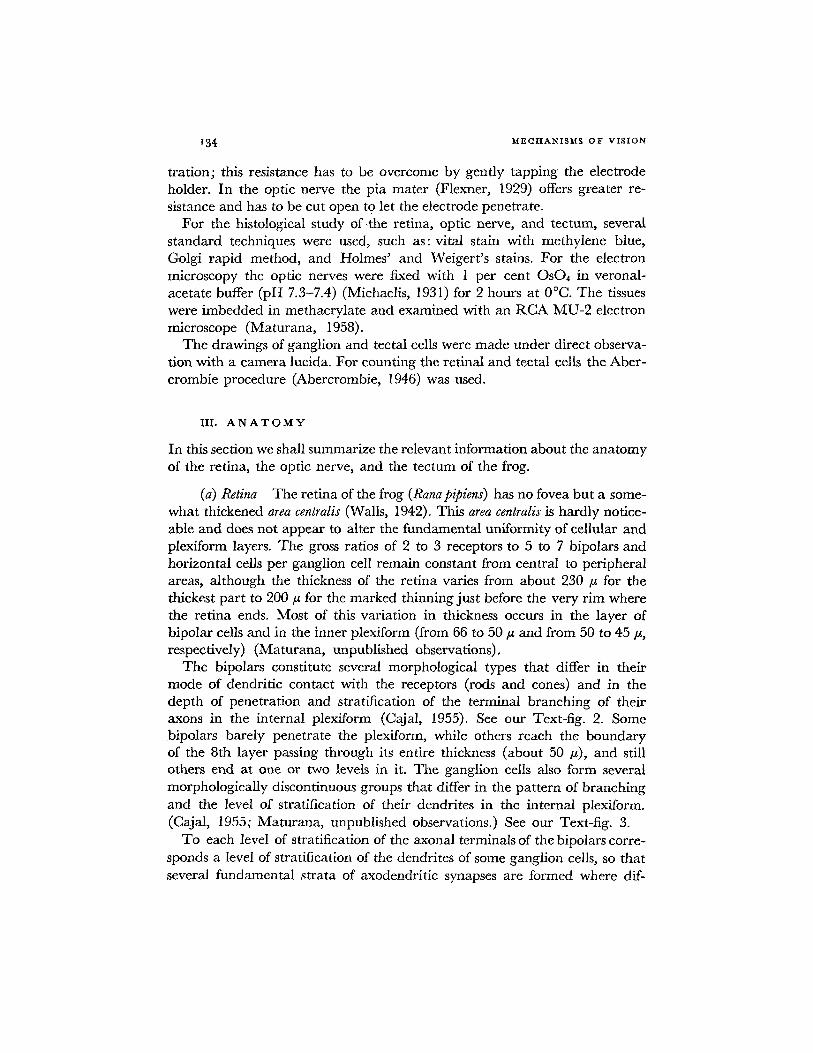
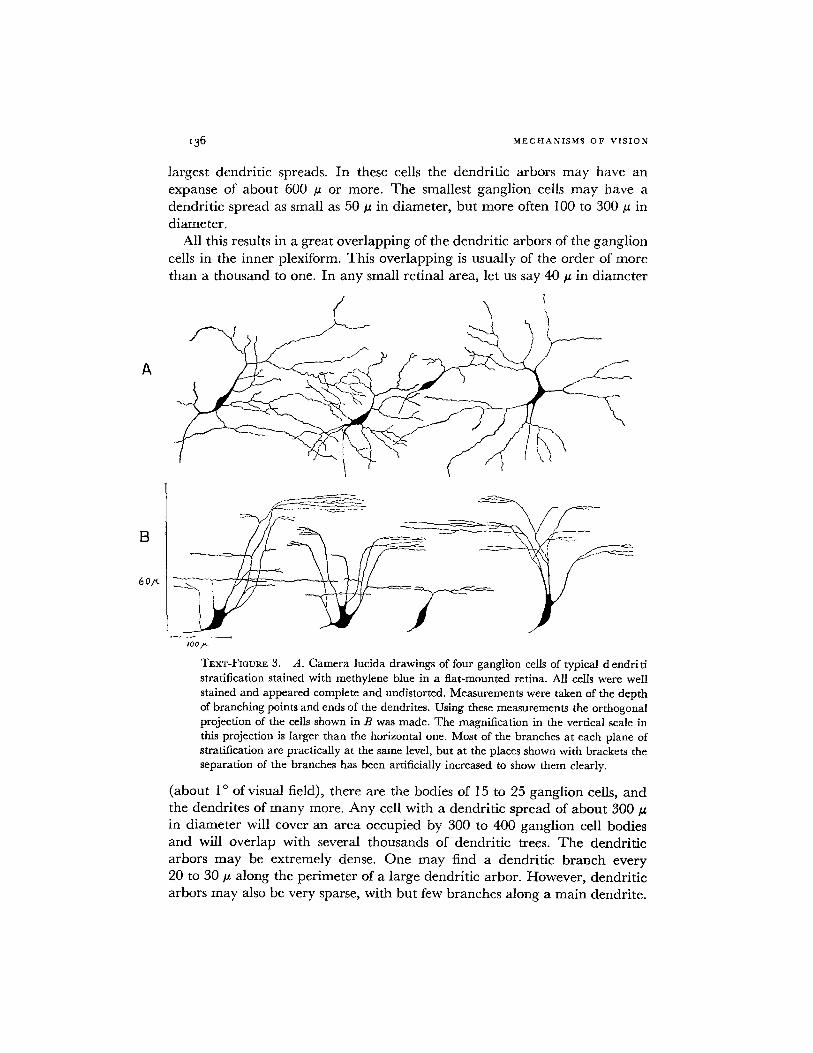
la rges t dendr i t i c spreads. In these cells the dendr i t i c a rbors m a y h a v e an expanse of a b o u t 600 # or more . T h e smallest gang l ion cells m a y h a v e a dendr i t i c sp read as smal l as 50 # in d i ame te r , bu t m o r e of ten 100 to 300 # in d i ame te r .
All this results in a g rea t o v e r l a p p i n g of the dendr i t ic a rbors of the gang l ion cells in the inner plexiform. This o v e r l a p p i n g is usual ly of the o rde r of m o r e
t h a n a t housand to one. I n a n y small re t ina l a rea , let us say 40/~ in d i a m e t e r
B
6O2-
) /00.,~._
TExT-FIGURE 3. A. Camera lucida drawings of four ganglion cells of typical d endriti stratification stained with methylene blue in a flat-mounted retina. All cells were well stained and appeared complete and undistorted. Measurements were taken of the depth of branching points and ends of the dendrites. Using these measurements the orthogonal projection of the cells shown in B was made. The magnification in the vertical scale in this projection is larger than the horizontal one. Most of the branches at each plane of stratification are practically at the same level, but at the places shown with brackets the separation of the branches has been artificially increased to show them clearly.
( abou t 1 o of visual field), there are the bodies of 15 to 25 gang l ion cells, a n d the dendr i tes of m a n y more . A n y cell wi th a dendr i t i c sp r ead of a b o u t 300 /z in d i a m e t e r will cover an a r ea occup ied by 300 to 400 gang l ion cell bodies a n d will ove r l ap wi th several thousands of dendr i t i c trees. T h e dendr i t i c a rbors m a y be e x t r e m e l y dense. O n e m a y find a dendr i t i c b r a n c h eve ry 20 to 30 # a long the p e r i m e t e r of a la rge dendr i t ic a rbor . H o w e v e r , dendr i t i c a rbors m a y also be very sparse, wi th bu t few b ranches a long a m a i n dendr i t e .
MATURANA, LETTVIN, I~CCULLOCI-I, PITTS Anatomy and Physiology of Vision in Frog i37
This varies with the type of ganglion cell. (Text-fig. 3.) The bipolars have more restricted dendritic fields (20 to 80/z in diameter) but because of their great number these also overlap profusely.
To the extent that there are several times more bipolars than ganglion cells and that the latter can have such large dendritic arbors, a ganglion cell is potentially related to hundreds of bipolars and thereby to hundreds and thousands of receptors. Conversely, because of the great overlapping of dendritic arbors, any receptor throngh the bipolars below it must be related to hundreds of ganglion cells. Thus many ganglion cells of different morpho- logical types are looking at the same point of the visual field and through the same receptors.
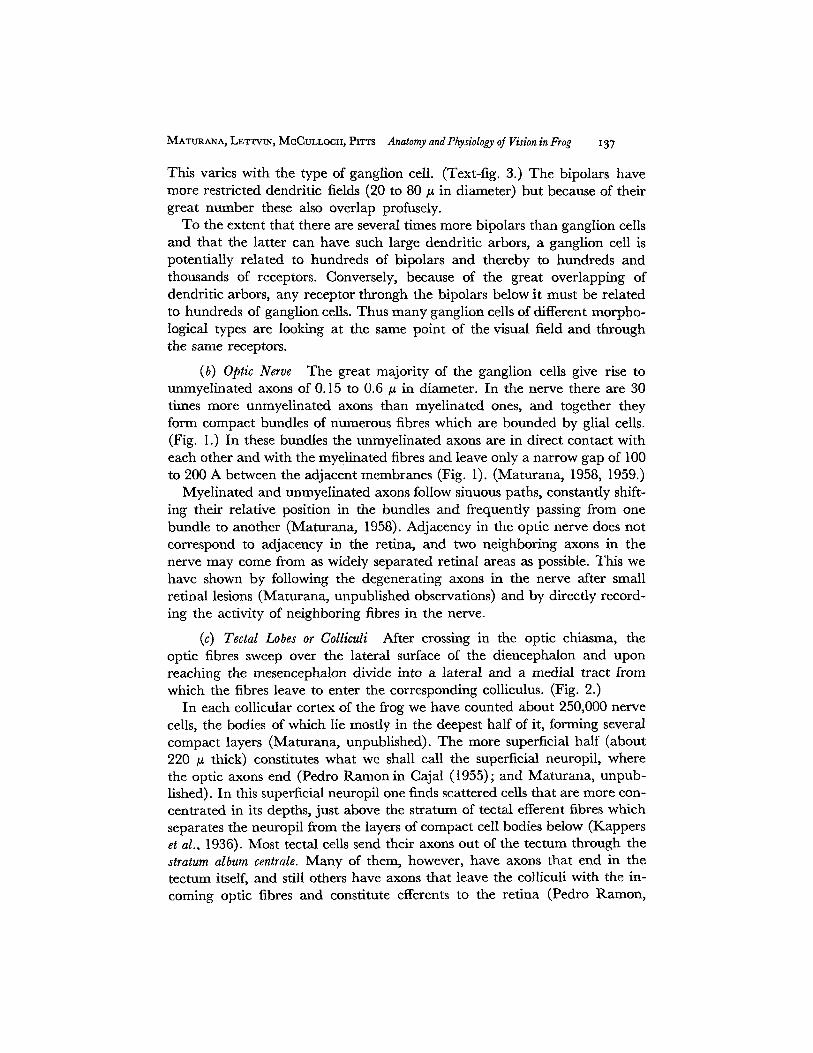
(b) Optic Nerve The great majority of the ganglion cells give rise to unmyelinated axons of 0.15 to 0.6/z in diameter. In the nerve there are 30 times more unmyelinated axons than myelinated ones, and together they form compact bundles of numerous fibres which are bounded by glial ceils. (Fig. I.) In these bundles the unmyelinated axons are in direct contact with each other and with the myelinated fibres and leave only a narrow gap of 100 to 200 A between the adjacent membranes (Fig. 1). (Maturana, 1958, 1959.)
Myelinated and unmyelinated axons follow sinuous paths, constantly shift- ing their relative position in the bundles and frequently passing from one bundle to another (Maturana, 1958). Adjacency in the optic nerve does not correspond to adjacency in the retina, and two neighboring axons in the nerve may come from as widely separated retinal areas as possible. This we have shown by following the degenerating axons in the nerve after small retinal lesions (Maturana, unpublished observations) and by directly record- ing the activity of neighboring fibres in the nerve.
(c) Tectal Lobes or Colliculi After crossing in the optic chiasma, the optic fibres sweep over the lateral surface of the diencephalon and upon reaching the mesencephalon divide into a lateral and a medial tract from which the fibres leave to enter the corresponding colliculus. (Fig. 2.)
In each collicular cortex of the frog we have counted about 250,000 nerve ceils, the bodies of which lie mostly in the deepest half of it, forming several compact layers (Maturana, unpublished). The more superficial haft (about 220 /z thick) constitutes what we shall call the superficial neuropil, where the optic axons end (Pedro Ramon in Cajal (1955); and Maturana, unpub- lished). In this superficial neuropil one finds scattered cells that are more con- centrated in its depths, just above the stratum of tectal efferent fibres which separates the neuropil from the layers of compact cell bodies below (Kappers et al., 1936). Most tectal ceils send their axons out of the rectum through the stratum album centrale. Many of them, however, have axons that end in the rectum itself, and still others have axons that leave the colliculi with the in- coming optic fibres and constitute efferents to the retina (Pedro Ramon,
z38 M E C H A N I S M S O F V I S I O N
Text-fig. 4; Maturana, 1958). The terminals of the optic axons do not pene- trate below the stratum album centrale (Maturana, unpublished).
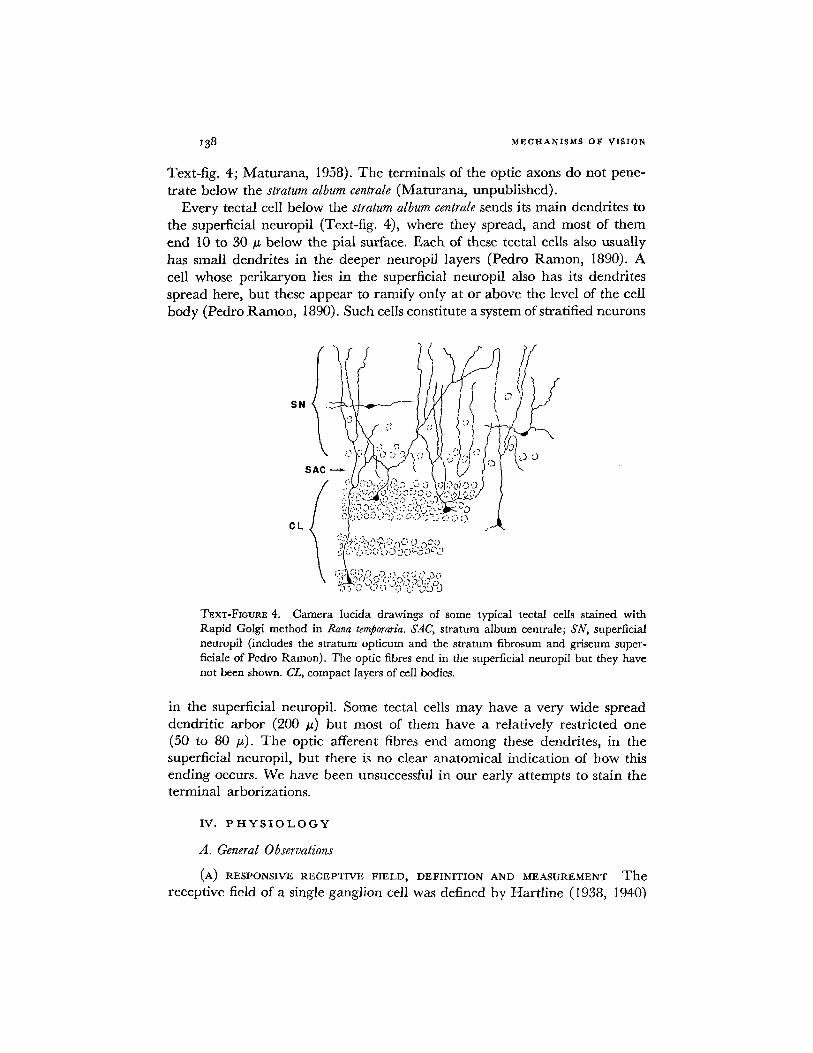
Every tectal cell below the stratum album centrale sends its main dendrites to the superficial neuropil (Text-fig. 4), where they spread, and most of them end 10 to 30/z below the pial surface. Each of these tectal cells also usually has small dendrites in the deeper neuropil layers (Pedro Ramon, 1890). A cell whose perikaryon lies in the superficial neuropil also has its dendrites spread here, but these appear to ramify only at or above the level of the cell body (Pedro Ramon, 1890). Such ceils constitute a system of stratified neurons
SN
SAC
k:x~;.'-, .-o..:. . ,-, v J 6 0
TEXT-FIGURE 4. Camera lucida drawings of some typical tectal cells stained with Rapid Golgi method in Rana teraporaria. SAC, stratum album centrale; SN, superficial neuropil (includes the stratum opticum and the stratum fibrosum and griseum super- ficiale of Pedro Ramon). The optic fibres end in the superficial neuropil but they have not been shown. CL, compact layers of cell bodies.
in the superficial neuropil. Some tectal cells may have a very wide spread dendritic arbor (200 #) but most of them have a relatively restricted one (50 to 80 #). The optic afferent fibres end among these dendrites, in the superficial neuropil, but there is no clear anatomical indication of how this ending occurs. We have been unsuccessful in our early attempts to stain the terminal arborizations.
IV. P H Y S I O L O G Y
A. General Observations
(A) RESPONSIVE RECEPTIVE FIELD, DEFINITION AND MEASUREMENT The receptive field of a single ganglion cell was defined by Harfline (1938, 1940)

MATURANA, LETTVIN, McCuLLOCH, PITTS Anatomy and Physiology of Vision in Frog 139
as the area of the retina within which stimulation causes it to discharge. More recently, Kuffler (1953) suggested that the definition should be modified to include in the receptive field all areas that can influence the response, whether these be inhibitory or excitatory influences, even if the areas by themselves do not set up discharges. We have adopted this definition (Lettvin et al., 1959) bu t to avoid ambiguity we also use the expression responsive receptive
field R R F to indicate that part of the receptive field from which responses can be elicited by any kind of visual stimulation. In the present study the R R F ' s were measured by mapping where the response begins to an approaching dark object of 1 ° in diameter against a clear background.
It has become clear from the works of Hartline (1938, 1940), Barlow (1953), and Kuffler (1953) that what a ganglion cell responds to at any moment represents the integrated activity of its whole receptive field. Thus, the RRF at any moment represents functionally the whole receptive field, independently of how it is stimu- lated, but it is possible that its characteristics (i.e., size and shape) vary with the background conditions and the stimulus species employed for its exploration. For these reasons the unsubscripted expression RRF implies nothing about the pro- cedure employed for stimulation.
(B) R•CORDING IN THe. OPTIC NERVE When recording in the optic nerve one finds that, as the electrode penetrates, it comes across structures that offer great electrical resistance (judged by the increase in the noise level) which must be passed before impinging on a group of axons. At the moment of passage, the noise level diminishes and one can record several different tri- phasic spikes simultaneously. This probably corresponds to the penetration of a bundle; possibly the previous high electrical resistance is due to the glial membrane which surrounds that bundle. By properly adjusting the electrode one can magnify one or another of these various spikes so that it can be studied independently. Spikes from blocked myelinated fibres may be as large as 4 or 5 my., but the majority of the spikes we recorded were from non-blocked axons and were usually only a few hundred microvolts peak to peak. If the relative noise level is too high these spikes are completely lost, and the elec- trode records very little. Only if one has a very low impedance electrode (about 10 s ohms) can one succeed in recording from the optic nerve with any degree of constancy and reliability.
Since the fibres are highly intermingled in the optic nerve it is not possible to predict where the R R F ' s will be located. Furthermore, under light adapta- tion there is little or no spontaneous activity and one must continuously search the visual field with various moving objects to verify that one is recording from a live fibre and to locate its cell body on the retina. Since not all ganglion cells respond to changes of general illumination, and most of them respond only to very small objects, this search is usually tedious.
When one is recording simultaneously from several fibres, one can easily

I4O MECHANISMS OF VISION
show that they come from widely dispersed points of the retina and that they may belong to any of five functional groups (see below). The axons that sub- serve similar functions are not necessarily grouped together any more than fibres from the same retinal location.
(C) SHAPE OF THE SPIKES Spikes are mostly triphasic with a big negative deflection, as expected from non-blocked fibres. These spikes can be optimized by the proper positioning of the electrode and may last unchanged for several hours, even from unmyelinated axons. Biphasic or monophasic spikes with a large first or second deflection, which typically correspond to the action po- tentials of blocked axons, last only a short time, say half an hour, and usually cannot be fully studied.
(D) EVIDENCE FOR SINGLE-FIBRE RECORDING T O t h e e x t e n t t h a t t h e
axons in the optic nerve form compact bundles, one could ask if it is possible that the bundles are firing in unison. Tha t this is not the case is shown by the following observations: (a) Although one can record from several units simultaneously (as expected from the bundle arrangement), the spikes of each unit are of uniform size and do not vary in step-like fashion with fatigue. (b) Each unit subserves one invariable function (see below) and has a single R R F not larger than 12-15 °, with the majority of them having R R F ' s of 3-7 ° or less. (One degree is about 48 ~ on the retina.) (c) The axons follow a simuous path, and two particular fibres remain in contact for only a short length (a micron or a few microns at most); every fibre continuously passes from one bundle to another. The conjoined activity of the bundle, then, could not represent an or~;ginal functional unity but should result from the inter- action of the axons in the bundle. If this is so, a unit should have a multiplicity of receptive fields, but such is not the case.
(E) RECORDING FROM SINGLE UNMYELINATED AXONS IN THE OPTIC NERVE AS shown above, the majority of the fibres in the optic nerve are unmyelinated. The speed of conduction of these axons was measured by Bishop in 1933, who, using the whole optic nerve of Rana catesbeiana, found a large component of slow fibres conducting at speeds of 0.5 (or less) m./second, which he rightly interpreted as unmyelinated.
In order to determine whether we were recording from fibres of all sizes or only from a selected group of them, we measured the speed of conduction of single axons by stimulating (electrically) antidromically from the optic tracts, or dromically from the retina or nerve, while we recorded from single fibres either at the nerve or tectum. This method has the advantage of per- mitting the determination of the function of the fibre, as well as its speed of conduction. In this way we found not only that we could record from all fibres, unmyelinated (which conduct at about 0.5 m. /second or less) and
MATURANA, LETTVIN, MeCULLOCH, PIT~ Anatomy and Physiology of Vision in Frog 141
myelinated ones (two groups which conduct at about 2 and 8 m./second) but also, that there is some correlation between conduction velocity and func- tion. (See below.) It could be argued that to the extent that we did not en- tirely exclude the retina or rectum from the preparations we cannot be certain that the slow fibres do not correspond to secondary activity originating in these centers. The constancy of our velocity measurements and their correlation with function, independently of whether we measured them by dromic (retina and optic nerve) or antidromic (optic tracts) stimulation of the optic fibres, render this criticism highly improbable. Thus we properly sup- pose that we had access to all of the kinds of fibres in the optic nerve and hence to the whole population of ganglion cells.
(F) RETINAL PROJECTION ON THE TECTUM It has been shown by Gaze (I 958) that there is a well defined and constant point-to-point representation of the retina on the tactum. For each locus in the retina there is exactly one locus (in this case, a maximum of response) on the colliculus, and contiguous loci on the retina are also contiguous on the tectum. In this representation the retinal map is somewhat distorted.
We have confirmed these observations of Gaze, and in addition we have found that the ganglion cells form five natural classes according to their function with respect to the visual image, and that the axons of the cells of each class end in a separate layer in the superficial tectal neuropil. Two of them are mixed (3 and 5), however, so that in the end we have four funda- mental layers or strata of terminals. Each one of these four layers of terminals forms a continuous map of the retina in the tectum with respect to the func- tion or operation performed by the corresponding ganglion cells. The four layers are congruent and in registration; to any point on the tectum the terminals of all layers come from the same locus in the retina. Thus the elec- trode, in each passage through the superficial neuropil, from the surface to the depth, records in succession from all of the terminals that subserve each one of the five operations for the same retinal locus. Since each layer of terminals has a certain thickness, the electrode can be positioned at will in any of them to record simultaneously from several ganglion ceils of any desired function in isolation from all the others (save for Classes 3 and 5 that end in the same layer). This is in striking contrast with recording from the optic nerve or from the optic tracts in the brain. There one records simultane- ously from fibres of various functions that usually come from widely separated retinal loci. Thus, the fibres which in the retina originate from adjacent ganglion cells usually separate their paths in the optic nerve and optic tracts and congregate again at their terminals, not only according to their points of origin but also according to their functions.
This orderly and precise projection of the retina on the colliculus in four
I42 MECHANISMS OF VISION
func t iona l ly d i f ferent layers in regis t ra t ion is a striking fea ture of the or- gan iza t ion of the visual system of the frog.
(G) RECORDING FROM THE TERMINALS OF THE OPTIC AXONS IN THE TECTUM
T h u s far we have refer red to record ing f rom the terminals of the opt ic fibres in the tectal cor tex wi th no fur ther comment . This s t a t emen t requires an addi t iona l explanat ion .
In the t e c tum we never r ecord f rom passing axons; tha t is, we never r ecord f rom fibres whose R R F ' s are located in a d i f ferent place f rom the locus cor re - sponding to the par t i cu la r tectal poin t in question. Any shift of the e lec t rode in any d i rec t ion on the surface of the colliculus always results in a change of re t ina l locus. T h e r e are numerous passing axons at all levels in the superficial tec ta l neuropi l , bu t for some reason (possibly the absence of glial boundar ies , M a t u r a n a , 1958) we do no t record f rom them. T h e useful resul t is tha t in the t e c t u m we can record only f rom the t e rmina l arbors of the optic axons. T h e several reasons in suppor t of this s t a t emen t can be summar i zed as follows:
i. In the superficial neuropil we record almost exclusively triphasic spikes (and only rarely initially negative biphasic transients). The units that exhibit them are extremely numerous (20 or more per penetration) and the triphasic spikes have the same functional properties as the units recorded from the optic nerve or from the retina: they have small and stable RRF's (up to 15 ° in the largest diameter), and according to the depth, they belong to one or another of the five functional classes already mentioned and to be described later. Unless the majority of the axons in the optic nerve are efferent fibres (which is extremely unlikely, see above--and Mat- urana, 1959) this coincidence in function must mean that in the tectum these triphasic spikes are recorded from optic fibres and not from axons of tectal origin. On the other hand, the biphasic spikes with an initial negative deflection can only be of local origin; in other words, these spikes have to originate in elements near the tip, that is, tectal cells. For each penetration of the neuropil we find at most four or five of these units. They have characteristics entirely different from the retinal axons--notably, they have very large RRF's (from 50 ° upwards) and have such different operational properties that they cannot be confused with the retinal units.
e. Thus, we know with reasonable certainty that in the colliculus we record mainly from optic axons that we can easily recognize and differentiate from the ac- tivity of local cells, but we also know that we record only from regions of these axons that disclose the point-to-point projection of the retina on the tectum for which they are instrumental. Since any displacement of the electrode along the tectal surface results in a change of retinal locus, we cannot, with this method, trace or find the path followed by the optic axons in the neuropil to reach the tectal points at which we record from them. It follows from this that, when we record from the optic axons, we cannot be recording from any arbitrary point along their path but we are recording from unique parts of them--parts that bear a constant and specific topographic relationship to the collicular surface. It is unlikely that any point along

MATURANA, LET'rvn~, McCtrLLOCrI, PITX'S Anatomy and Physiology of Vision in Frog 143
the optic axons should have unique properties singling it out in this way, with the exception of branching points. Since at branching points the signals would be in- creased in proportion to the number of branches, it would be easier to record from them than from other points along the axons. Branching points, however, do not exist along the optic nerve in the tectum---only at their ending region (Maturana,
TExT-FIGuRE 5. Drawing of the tectal cortex of anurans by Pedro Ramon, taken from Cajal (1955). Notice the various types of tectal ceils here represented and their axons marked a. Most of the axons leave the tectum through the stratum album centrale (7) after giving some branches to the superficial neuropil (8 to 14).
unpublished observations). Then it is only at the terminals, where the axons re- peatedly branch, that the optic fibres have unique properties, and it is more prob- able that in the tectum we record from these and not from any other axonal parts.
3- I t could be argued that we may be recording from tectal cells that exactly repeat the activity of the retinal ganglion cells. This would mean a tremendous cellular waste. In each tectum there are about 250,000 cells, (Maturana, unpub-
144 MECHANISMS OF VISION
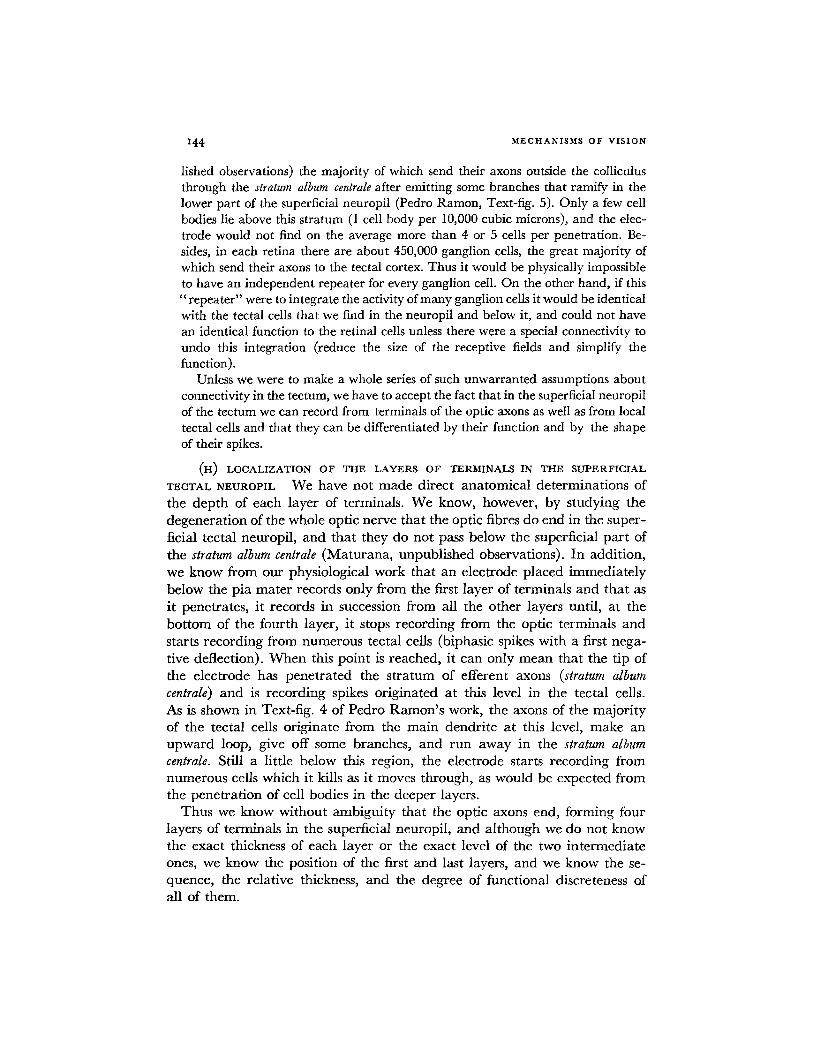
Iished observations) the majority of which send their axons outside the colliculus through the stratum album centrale after emitting some branches that ramify in the lower part of the superficial neuropil (Pedro Ramon, Text-fig. 5). Only a few cell bodies lie above this stratum (1 cell body per 10,000 cubic microns), and the elec- trode would not find on the average more than 4 or 5 cells per penetration. Be- sides, in each retina there are about 450,000 ganglion cells, the great majority of which send their axons to the tectal cortex. Thus it would be physically impossible to have an independent repeater for every ganglion cell. On the other hand, if this "repeater" were to integrate the activity of many ganglion cells it would be identical with the tectal cells that we find in the neuropil and below it, and could not have an identical function to the retinal cells unless there were a special connectivity to undo this integration (reduce the size of the receptive fields and simplify the function).
Unless we were to make a whole series of such unwarranted assumptions about connectivity in the tectum, we have to accept the fact that in the superficial neuropil of the tectum we can record from terminals of the optic axons as well as from local tectal cells and that they can be differentiated by their function and by the shape of their spikes.
(H) LOCALIZATION OF THE LAYERS OF TERMINALS IN THE SUPERFICIAL
TECTAL NEUROPIL We have not made direct anatomical determinations of the depth of each layer of terminals. We know, however, by studying the degeneration of the whole optic nerve that the optic fibres do end in the super- ficial tectal neuropil, and that they do not pass below the superficial part of the stratum album centrale (Maturana, unpublished observations). In addition, we know from our physiological work that an electrode placed immediately below the pia mater records only from the first layer of terminals and that as it penetrates, it records in succession from all the other layers until, at the bottom of the fourth layer, it stops recording from the optic terminals and starts recording from numerous tectal ceils (biphasic spikes with a first nega- tive deflection). When this point is reached, it can only mean that the tip of the electrode has penetrated the stratum of efferent axons (stratum album centrale) and is recording spikes originated at this level in the tectal cells. As is shown in Text-fig. 4 of Pedro Ramon's work, the axons of the majority of the tectal cells originate from the main dendrite at this level, make an upward loop, give off some branches, and run away in the stratum album centrale. Still a little below this region, the electrode starts recording from numerous cells which it kills as it moves through, as would be expected from the penetration of cell bodies in the deeper layers.
Thus we know without ambiguity that the optic axons end, forming four layers of terminals in the superficial neuropil, and although we do not know the exact thickness of each layer or the exact level of the two intermediate ones, we know the position of the first and last layers, and we know the se- quence, the relative thickness, and the degree of functional discreteness of all of them.
MATORANA, LETTVIN, ]V[CICUI.LOGIt, PrrI3 Anatomy and Physiology of Vision in Frog 145
B. Operations Performed by the Ganglion Cells
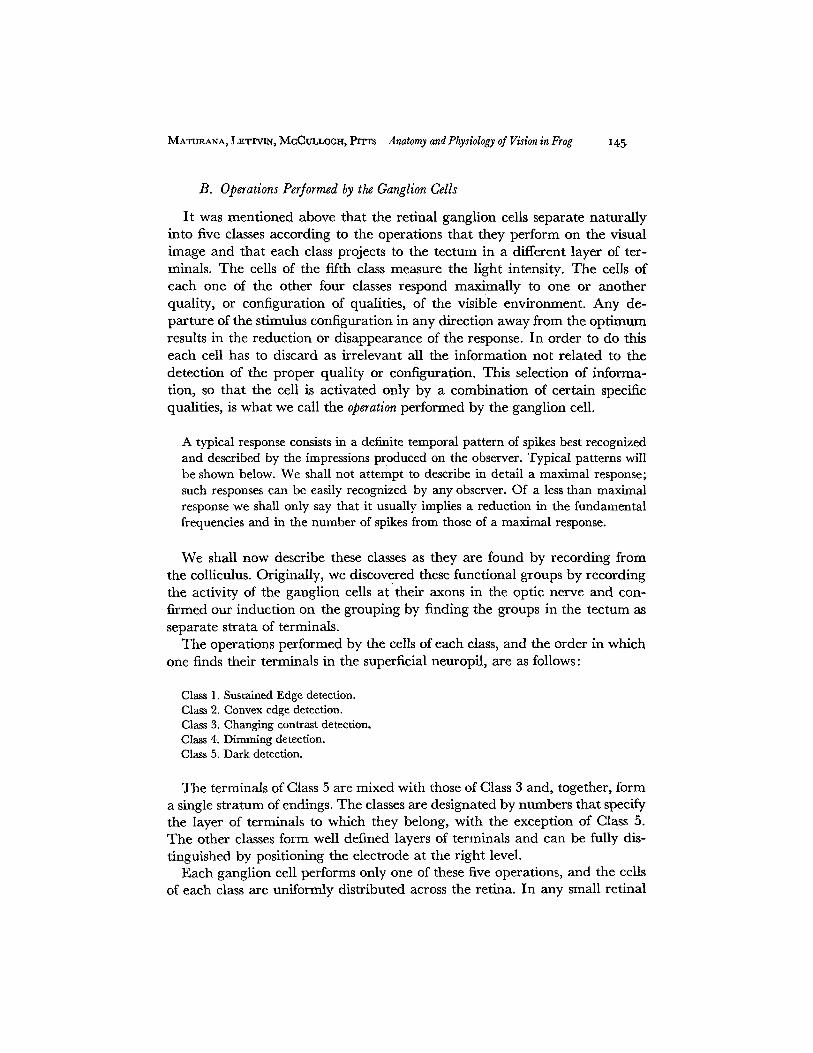
I t was mentioned above that the retinal ganglion cells separate natural ly into five classes according to the operations that they perform on the visual image and that each class projects to the tectum in a different layer of ter- minals. The cells of the fifth class measure the light intensity. The cells of each one of the other four classes respond maximally to one or another quality, or configuration of qualities, of the visible environment. Any de- parture of the stimulus configuration in any direction away from the opt imum results in the reduction or disappearance of the response. In order to do this each cell has to discard as irrelevant all the information not related to the detection of the proper quality or configuration. This selection of informa- tion, so that the cell is activated only by a combination of certain specific qualities, is what we call the operation performed by the ganglion cell.
A typical response consists in a definite temporal pattern of spikes best recognized and described by the impressions produced on the observer. Typical patterns will be shown below. We shall not attempt to describe in detail a maximal response; such responses can be easily recognized by any observer. Of a less than maximal response we shall only say that it usually implies a reduction in the fundamental frequencies and in the number of spikes from those of a maximal response.
We shall now describe these classes as they are found by recording from the colliculus. Originally, we discovered these functional groups by recording the activity of the ganglion cells at their axons in the optic nerve and con- firmed our induction on the grouping by finding the groups in the tectum as separate strata of terminals.
The operations performed by the cells of each class, and the order in which one finds their terminals in the superficial neuropil, are as follows:
Class 1. Sustained Edge detection. Class 2. Convex edge detection. Class 3. Changing contrast detection. Class 4. Dimming detection. Class 5. Dark detection.
The terminals of Class 5 are mixed with those of Class 3 and, together, form a single stratum of endings. The classes are designated by numbers that specify the layer of terminals to which they belong, with the exception of Class 5. The other classes form well defined layers of terminals and can be fully dis- tinguished by positioning the electrode at the right level.
Each ganglion cell performs only one of these five operations, and the cells of each class are uniformly distributed across the retina. In any small retinal
~46 MECHANISMS OF VISION
TExT-FIOURE 6
MATURANA, LETTVIN, MGCuLLOCH, PITTS Anatomy and Physiology of Vision in Frog 147
a r e a one f inds r ep re sen t a t i ve s o f all classes in p r o p o r t i o n to the i r g e n e r a l r e l a -
t ive f requenc ies .
F r o m o u r m e a s u r e m e n t s o f c o n d u c t i o n ve loc i t y in s ingle f ibres w e k n o w
t h a t the o p e r a t i o n s for Classes 1 a n d 2 a re p e r f o r m e d b y smal l g a n g l i o n cells
w i t h u n m y e l i n a t e d axons t h a t c o n d u c t a t speeds o f 0 .5 m . / s e c o n d or be low.
T h e o p e r a t i o n s for Classes 3 a n d 4 a re p e r f o r m e d b y cells w i t h m y e l i n a t e d
a x o n s c o n d u c t i n g a t speeds f r o m 1 to 8 m . / s e c o n d , t he fastest be ing those o f
the f o u r t h class. W e h a v e n o t m e a s u r e d the speed of c o n d u c t i o n o f the f ibres
o f Class 5. T h e l aye r s eg rega t i on o f the op t i c f ibres a t the i r t e r m i n a l s in t e r m s
o f f u n c t i o n co inc ides w i t h the i r s e g rega t i on in t e rms o f c o n d u c t i o n v e l o c i t y ;
t he slowest ends a t the sur face a n d the fastest ends in t he d e p t h o f the neu rop i l .
T h e size of the P, R F ' s also increases f r o m Class 1 to 4, c h a n g i n g f r o m a b o u t 1 o
to a b o u t 14 ° in d i a m e t e r .
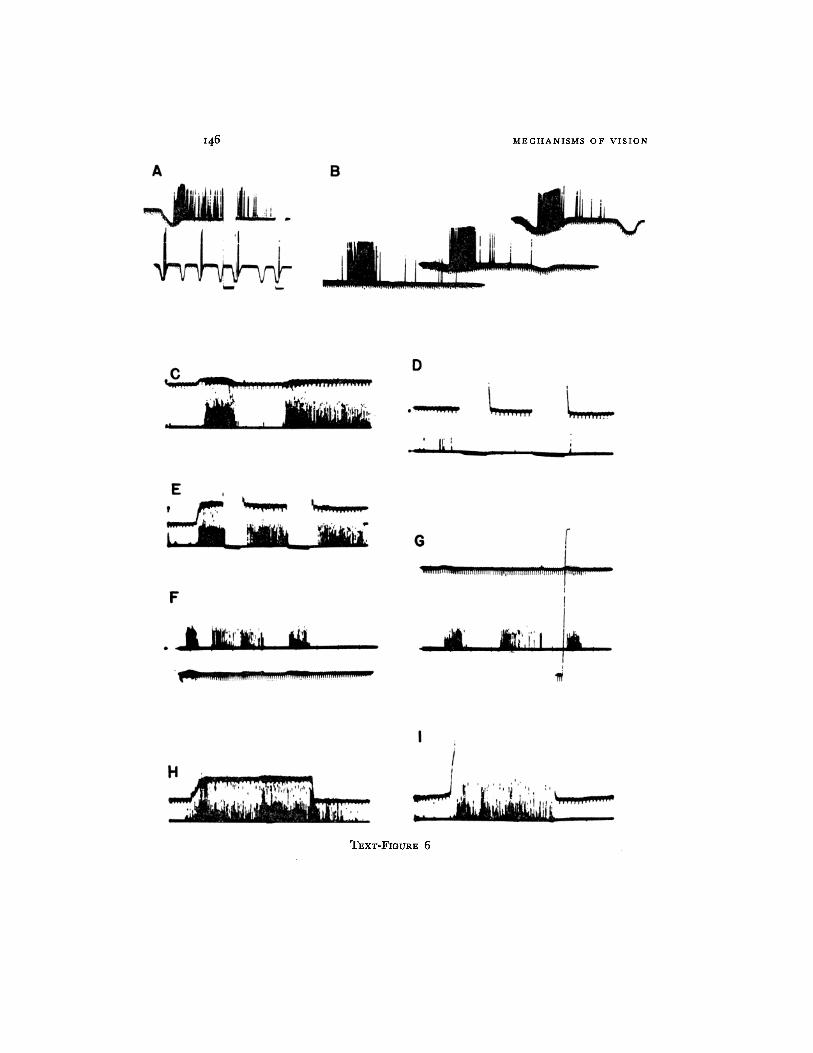
TEXT-FIGURE 6. Class 1. Sustained edge detection. A and B are single-fibre re- cordings from the optic nerve (shaped spikes). A photocell is looking to the RRF of the unit. A downward deflection of the base line indicates a darkening of the field produced by the moving object. Records of Text-figs. 6 to 11, with the exception of Text-fig. 10, were taken with a Polaroid camera. The spikes are clipped just above the noise level and brightened on the screen if not mentioned otherwise. The records in Text-fig. 10 were taken with a Grass camera.
A. Upper trace: the object (dark disc, 7 ° in diameter) is brought into the RRF and stops, eliciting a sustained response. This response is suppressed during a transient dark- ening but reappears with the return of light. The continued presence of the object in the RRF is indicated by the maintained lowering of the base line. Lower trace, response to fast movement. This cell was directional, and the passage of the object in one direction, only, produced a maximal response; the reverse movement was ineffective.
B. The.same unit as in A, showing the invariance of its response to movement (in this case, slow' movement) at various levels of illumination. Upper trace, bright light. Lower trace, dim light (300-to-1 ratio). Time marks, 20/second.
Records from C to I show the responses of several units recorded simultaneously at the first layer oi terminal in the tectum. A photomultiplier with a logarithmic response fo- cnsed at the corresponding locus in the visual field monitors the trace with the time mark (5/second); reduction of illumination produces an upward deflection. Object: dark disc, 1 ° in diameter.
C. At left, burst of activity in response to slow movement; at right, sustained response to the object stopping in the RRF.
D. Absence of response to the on and off of light. E. Sustained response elicited by a small object (3 ° in diameter) stopping in the RRF.
Two transient darkenings suppress the response transitorily but do not erase it. F and G. Invariance of the response under bright light (F) and under dim light (G).
In (G) the vertical line indicates the full range from bright light to darkness (object, 1 ° in diameter).
H. Response to a small object (3 ° in diameter) slowly moving through the locus in the visual field.
I. Response to a band 7 ° X 20 ° moved edge-first through the locus. All units have responded, but less strongly than in H.

i48 MECHANISMS OF VISION
The first four operations are independent of the general illumination or na- ture of the background as long as there is enough light for objects to be visible. Nor do these operations change after dark adaptation. For general illumina- tion we used a l O0-watt bulb that could be positioned at a variable distance from the experimental visual field to illuminate it at any desired intensity. In addition, we had a variable resistance in series with the light, with which we could vary the intensity continuously. Changes in the general intensity of the source of light do not change the ratio of light reflected by the object and the background unless there is an important change in color in the light source. As will be seen, this ratio constitutes an essential parameter in the vision of real objects--the absolute luminance of the object being of secondary signifi- cance in terms of the operations performed by the cells.
(A) CLASS I. SUSTAINED EDGE DETECTION (TEXT-FIG. 6) This operation is served by cells with small RRF's, 1 ° to 3 ° in diameter, which project to the tectum by means of unmyelinated axons. The terminals of these fibres are the first that are encountered by the electrode at the surface, immediately below the pia mater.
These cells do not respond to general changes of illumination, whether sudden on or off or just gradual increase or decrease of the light intensity. On the other hand, the sharp edge of an object, lighter or darker than the back- ground, moved through the RRF's, produces a burst of activity. If the edge is stopped in the R R F the cell produces a maintained discharge, at highest initial frequencies of about 30 to 40 spikes per second which fall to a lower rate (10 and 15 per second) and may last for minutes or perhaps indefinitely. This response to the moving or standing edge is independent of the shape of the object or of the curvature of the edge. However, it is not entirely inde- pendent of size because large objects, more than 20 ° in diameter give a response somewhat smaller than small objects, Text-fig. 6G and H. Together with the optimal size there is an optimal speed for the maximal response to movement, as well as an optimal position for the maximal response to an edge stopped in the RRF. The sustained edge discharge can be suppressed by a step to complete darkness, Text-fig. 6A and E. If the lights are turned on again without removing the edge, the response reappears after a short pause. I f the edge is removed during the period of darkness, on reillumination the cell remains inactive. If during darkness an edge is imported into the R R F of a previously silent cell, at the turning on of the lights the cell begins a sustained response (after a short delay).
These cells, we repeat, react to a sharp moving or a standing edge with a burst of activity and a maintained nonerasable response, respectively; the duration and frequency of the response depends upon the speed and the posi- tion of the edge in the RRF. Some of these cells, however, are not fully
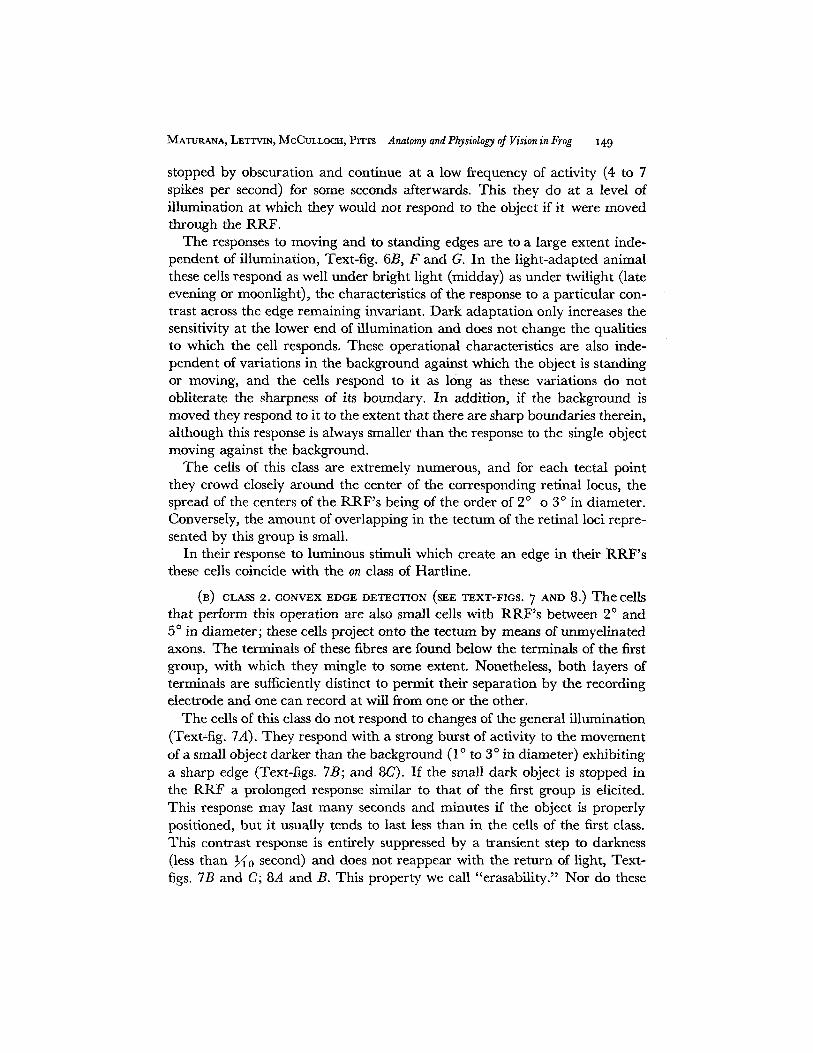
MATURANA, LETTVIN, MCCULLOCH, PITTS Anatomy and Physiology o] Vision in Frog x 49
stopped by obscuration and continue at a low frequency of activity (4 to 7 spikes per second) for some seconds afterwards. This they do at a level of illumination at which they would not respond to the object if it were moved through the RRF.
The responses to moving and to standing edges are to a large extent inde- pendent of illumination, Text-fig. 6B, F and G. In the light-adapted animal these cells respond as well under bright light (midday) as under twilight (late evening or moonlight), the characteristics of the response to a particular con- trast across the edge remaining invariant. Dark adaptation only increases the sensitivity at the lower end of illumination and does not change the qualities to which the cell responds. These operational characteristics are also inde- pendent of variations in the background against which the object is standing or moving, and the cells respond to it as 10ng as these variations do not obliterate the sharpness of its boundary. In addition, if the background is moved they respond to it to the extent that there are sharp boundaries therein, although this response is always smaller than the response to the single object moving against the background.
The cells of this class are extremely numerous, and for each tectal point they crowd closely around the center of the corresponding retinal locus, the spread of the centers of the RRF's being of the order of 2 ° o 3 ° in diameter. Conversely, the amount of overlapping in the tectum of the retinal loci repre- sented by this group is small.
In their response to luminous stimuli which create an edge in their RRF's these cells coincide with the on class of Hartline.
(B) CLASS 2. CONVEX EDGE DETECTION (SEE TEXT-FIGS. 7 AND 8.) The cells that perform this operation are also small cells with RRF's between 2 ° and 5 ° in diameter; these cells project onto the tectum by means of unmyelinated axons. The terminals of these fibres are found below the terminals of the first group, with which they mingle to some extent. Nonetheless, both layers of terminals are sufficiently distinct to permit their separation by the recording electrode and one can record at will from one or the other.
The cells of this class do not respond to changes of the general illumination (Text-fig. 7A). They respond with a strong burst of activity to the movement of a small object darker than the background (1 o to 3 ° in diameter) exhibiting a sharp edge (Text-figs. 7B; and 8C). If the small dark object is stopped in the R R F a prolonged response similar to that of the first group is elicited. This response may last many seconds and minutes if the object is properly positioned, but it usually tends to last less than in the cells of the first class. This contrast response is entirely suppressed by a transient step to darkness (less than }1/0 second) and does not reappear with the return of light, Text- figs. 7B and C; 8A and B. This property we call "erasability." Nor do these

"f [50
D
M E C H A N I S M S O F V I S I O N
B
C II:l~l]l~lllrll
MATURANA, LETTVIN, McCuLLOCH, PITT~ Anatomy and Physiology of Vision in Frog 151
cells respond at the on of l ight w h e n an object is impor t ed into the R R F dur - ing darkness. For the response to occur they thus requ i re tha t the object be seen dur ing its m o v e m e n t and stop in the R K F , pre-exist ing contrasts being ineffective. In cont radis t inc t ion wi th Class 1, these fibres do no t r espond to the s t ra ight edge of a da rk b a n d 2 ° or m o r e wide m o v e d across the R R F or s topped there , Text-figs. 7E; and 8C. This r e m a r k a b l e fa i lure to respond to the s t ra ight edge of the b a n d is i n d e p e n d e n t of the d i rec t ion or speed of m o v e m e n t of the edge.
Is this a ques t ion of size of the objec t or cu rva tu r e of the edge? As said above, these cells respond s t rongly to small mov ing objects, bu t in addi t ion they also respond strongly to the corner of a large one, Text-figs. 7F; and 8A. F u r t h e r - more , the length of the s t ra ight b a n d can be r educed to a length jus t longer t han the d i ame te r of the R R F (5 ° to 7 °) w i thou t p rovoking a response when m o v e d across it wi th the edge first. I f the edge has a percept ib le convex i ty or a pro jec t ing angle, a response immedia te ly appears . In general , the g rea te r the ne t positive cu rva tu re ( reciprocal of the radius) of the edge, the larger is the response. Small objects tha t can be ent i re ly enclosed in the R R F are more effective, b u t for each gangl ion cell the op t imal object d i ame te r is a b o u t hal f the d i ame te r of its R R F . O n the o ther hand , a ve ry n a r r o w s t ra ight b a n d (1 o and less in d iamete r ) elicits some response, a l though never as large as tha t of a small cu rved object . Thus it is no t just a ques t ion of size of the
TExT-FIouRE 7. Class 2. Convex edge detectors. Single-fibre recording from the tectum (shaped spikes). A photomultiplier monitored the same sweep in which the spikes are registered; an upward deflection of the base line indicates a reduction of illumination.
A. Off and on of the general illumination; no response. B. Burst of activity in response to a small dark moving object (1 o in diameter). (7. Upper trace, sustained response to the same object stopped in the RRF. Lower
trace, the sustained response was elicited by the small object stopping in the RRF but was erased by a transient darkening of the general visual field.
D. Invariance of the response to movement under changes of illumination. The small object was moved slowly through the R_KF shortly after the level of illumination was set. The records are not aligned because the movement did not start at the same instant after the beginning of the sweep. Most of the differences in the response are due to slight changes in the speed and path followed by the moving object. Lower trace, bright light. Upper trace, dim light (1000-to-1 ratio).
E. Absence of response to a straight edge: Upper trace, response to the small object (disc, 1 ° in diameter) moved in steps through the RRF. Lower trace, absence of response to a dark band 7 ° X 20 ° moved long-edge first. The greater upward deflection of the second trace indicates the greater darkening of the visual field that it produced, as com- pared with the small object.
F. Response to a corner. Upper trace, response to a corner of the dark band (7 ° X 20 °) moved across the RRF. Lower trace, absence of response to the straight edge. The dark- ening produced by the corner is almost as large as that produced by the band. Time marks, 5/second.

I52 M E C H A N I S M S O F V I S I O N
object ; the activi ty of these cells appears fundamenta l ly as a funct ion of the
positive cu rva tu re of an edge darker than the background . This curved edge,
however , has to move centr ipetal ly in the R R F . Centr ifugal movement s of
wi thdrawal or of passing the center of the R R F produce little or no response
and m a y even stop a sustained response.
I n ag reemen t with this, these cells respond very little or not at all to a l ight
object moved against a da rk background . However , if the l ight object casts a
sharp shadow it becomes immedia te ly effective. I n general, the m a g n i t u d e
TEXT-FIGURE 8. Class 2. Convex edge detectors. Recording from several units at the second layer of terminals in the tectum.
A. Contrast response to a small dark disc 10 °, in diameter stopped in the RRF and erased by a transient darkening. One or two units were not fully erased.
B. Sustained response, but not erased as in A. Time marks for A and B, 5/second. C. The same group of units; absence of response to a straight edge. Upper trace, small
dark object (I o in diameter) is moved across the locus in the visual field. Lower trace, movement of a dark band (7 ° X 20 °) long-edge first, as in Text-fig. 7 E.
D. The same group of units; response to a corner. Other details are the same as in Text-fig. 7/7. Time marks for C and D, 20~second.
of the contras t is not as significant as its sharpness and its curva ture , but the object needs to be darker than the b a c k g r o u n d or edged by a darker shadow.
I f a g roup of small dots (1 ° or less in d iameter) is moved across the R R F of
these cells, they respond little or not a t all as the first dots reach it, and if there is a n y response it subsides quickly as long as the whole dot ted pa t t e rn moves or stands in f ront of it. T h e same absence of response is found to a
MATURANA, LETTVIN, MCCULLOCH, PITT$ Anatomy and Physiology of Vision in Frog x53
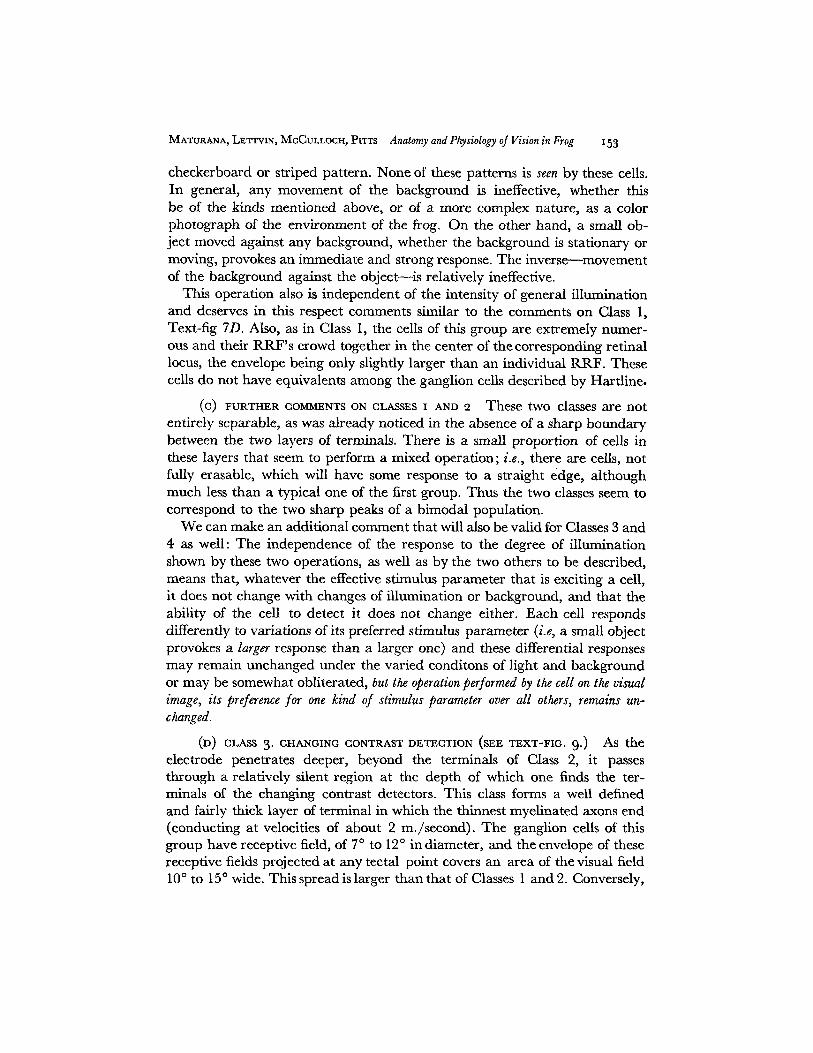
checkerboard or striped pattern. None of these patterns is seen by these cells. In general, any movement of the background is ineffective, whether this be of the kinds mentioned above, or of a more complex nature, as a color photograph of the environment of the frog. On the other hand, a small ob- ject moved against any background, whether the background is stationary or moving, provokes an immediate and strong response. The inverse--movement of the background against the object--is relatively ineffective.
This operation also is independent of the intensity of general illumination and deserves in this respect comments similar to the comments on Glass 1, Text-fig 7D. Also, as in Class 1, the ceils of this group are extremely numer- ous and their RI~_F's crowd together in the center of the corresponding retinal locus, the envelope being only slightly larger than an individual RRF. These cells do not have equivalents among the ganglion cells described by Hartline.
(C) FURTHER COMMENTS ON CLASSES I AND 2 These two classes are not entirely separable, as was already noticed in the absence of a sharp boundary between the two layers of terminals. There is a small proportion of cells in these layers that seem to perform a mixed operation; i.e., there are cells, not fully erasable, which will have some response to a straight edge, al though much less than a typical one of the first group. Thus the two classes seem to correspond to the two sharp peaks of a bimodal population.
We can make an additional comment that will also be valid for Classes 3 and 4 as well: The independence of the response to the degree of illumination shown by these two operations, as well as by the two others to be described, means that, whatever the effective stimulus parameter that is exciting a cell, it does not change with changes of illumination or background, and that the ability of the cell to detect it does not change either. Each cell responds differently to variations of its preferred stimulus parameter (i.e, a small object provokes a larger response than a larger one) and these differential responses may remain unchanged under the varied conditons of light and background or may be somewhat obliterated, but the operation performed by the cell on the visual image, its preference for one kind of stimulus parameter over all others, remains un- changed.
(D) CLASS 3. CHANOING CONTRAST DETECTION (SEE TEXT-FIG. 9-) As the electrode penetrates deeper, beyond the terminals of Class 2, it passes through a relatively silent region at the depth of which one finds the ter- minals of the changing contrast detectors. This class forms a well defined and fairly thick layer of terminal in which the thinnest myelinated axons end (conducting at velocities of about 2 m./second). The ganglion ceils of this group have receptive field, of 7 ° to 12 ° in diameter, and the envelope of these receptive fields projected at any tectal point covers an area of the visual field 10 ° to 15 ° wide. This spread is larger than that of Classes 1 and 2. Conversely,
i
M E C H A N I S M S O F V I S I O N
the retinal loci represented on the tectum by means of these fibres show a correspondingly greater overlapping in terms of area than in the case of the first two classes.
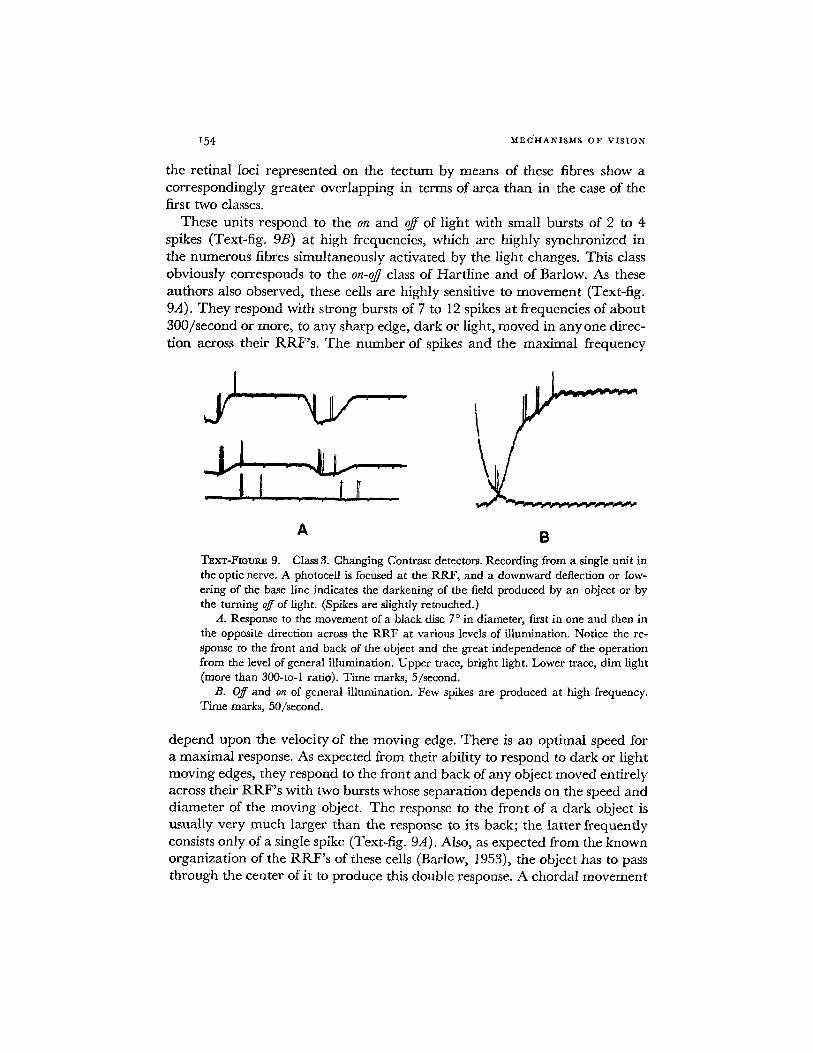
These units respond to the on and off of light with small bursts of 2 to 4 spikes (Text-fig. 9B) at high frequencies, which are tfighly synchronized in the numerous fibres simultaneously activated by the light changes. This class obviously corresponds to the on-~ class of Hartl ine and of Barlow. As these authors also observed, these cells are highly sensitive to movement (Text-fig. 9A). They respond with strong bursts of 7 to 12 spikes at frequencies of about 300/second or more, to any sharp edge, dark or light, moved in any one direc- tion across their RRF's . The number of spikes and the maximal frequency
I Y
x54
r .... l r l
A B TExT-FIouRE 9. Class 3. Changing Contrast detectors. Recording from a single unit in the optic nerve. A photocell is focused at the RRF, and a downward deflection or low- ering of the base line indicates the darkening of the field produced by an object or by the turning off of light. (Spikes are slightly retouched.)
A. Response to the movement of a black disc 7 ° in diameter, first in one and then in the opposite direction across the RRF at various levels of illumination. Notice the re- sponse to the front and back of the object and the great independence of the operation from the level of general illumination. Upper trace, bright light. Lower trace, dim light (more than 300-to-1 ratio). Time mares, 5/second.
B. Off and on of general illumination. Few spikes are produced at high frequency. Time marks, 50/second.
depend upon the velocity of the moving edge, There is an optimal speed for a maximal response. As expected from their ability to respond to dark or light moving edges, they respond to the front and back of any object moved entirely across their RRF 's with two bursts whose separation depends on the speed and diameter of the moving object. The response to the front of a dark object is usually very much larger than the response to its back; the latter frequently consists only of a single spike (Text-fig. 9A). Also, as expected from the known organization of the RRF 's of these cells (Barlow, 1953), the object has to pass through the center of it to produce this double response. A chordal movement
MATURANA, LET'IW'IN, McCuLLOCH, PITWS Anatomy and Physiology of Vision in Frog 155
produces only a single burst. If the moving object is small enough (about 3 ° or below) the two bursts appear as a single burst. We have not at tempted to differentiate between the responses of what may be predominantly on or off centered cells. In any case, the response to movement is always much greater than the response to changes of illumination (Text-fig. 9).
Differing from Classes 1 and 2, these cells never respond with sustained activity to a standing contrast, but some of them produce relatively long bursts in response to slow moving objects. This variety of cell is found prefer- entially at the surface of the third layer of terminals. Many of these units, in addition to this long burst in response to slow moving edges, have a sus- tained low frequency activity (4 to 7 spikes per second) under ordinary room
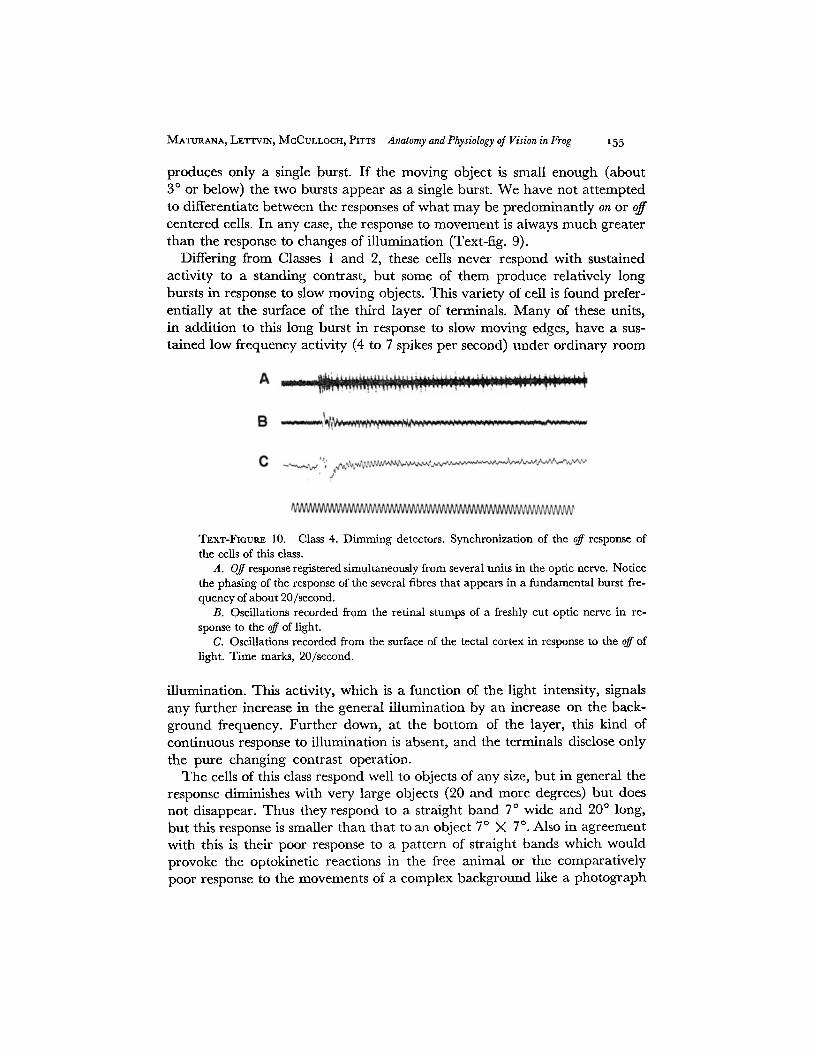
TExT-FmuRE 10. Class 4. Dimming detectors. Synchronization of the off response of the ceils of this class.
A. Off response registered simultaneously from several units in the optic nerve. Notice the phasing of the response of the several fibres that appears in a fundamental burst fre- quency of about 20/second.
B. Oscillations recorded from the retinal stumps of a freshly cut optic nerve in re- sponse to the off of light.
C. Oscillations recorded from the surface of the tectal cortex in response to the off of light. Time marks, 20/second.
illumination. This activity, which is a function of the light intensity, signals any further increase in the general illumination by an increase on the back- ground frequency. Further down, at the bottom of the layer, this kind of continuous response to illumination is absent, and the terminals disclose only the pure changing contrast operation.
The cells of this class respond well to objects of any size, but in general the response diminishes with very large objects (20 and more degrees) but does not disappear. Thus they respond to a straight band 7 ° wide and 20 ° long, but this response is smaller than that to an object 7 ° X 7 °. Also in agreement with this is their poor response to a pat tern of straight bands which would provoke the optokinetic reactions in the free animal or the comparatively poor response to the movements of a complex background like a photograph

156 M E C H A N I S M S OF V I S I O N
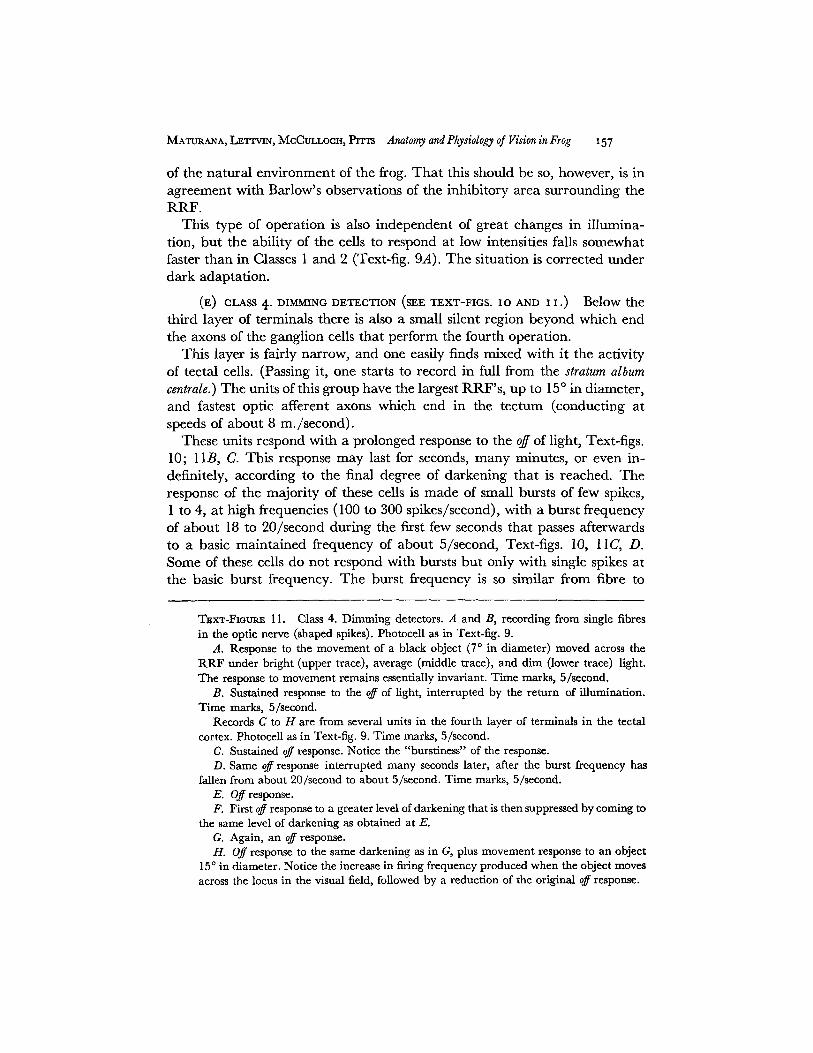
TEXT-FIOURE I I
MATURANA, LETTVIN, McCULLOCH, PITTS Anatomy and Physiology of Vision in Frog 157
of the na tu ra l env i ronment of the frog. T h a t this should be so, however, is in agreement wi th Barlow's observations of the inhibi tory area sur rounding the R R F .
This type of opera t ion is also independent of great changes in i l lumina- tion, bu t the abil i ty of the cells to respond at low intensities falls somewhat faster t han in Classes 1 and 2 (Text-fig. 9A). T h e si tuat ion is corrected under dark adapta t ion.
(E) CLASS 4" DIMMING DETECTION (SEE TEXT-FIGS. IO AND I I .) Below the thi rd layer of terminals there is also a small silent region beyond which end the axons of the gangl ion cells tha t perform the fourth operation.
This layer is fairly narrow, and one easily finds mixed wi th it the act ivi ty of tectal cells. (Passing it, one starts to record in full f rom the stratum album centrale.) The units of this group have the largest RRF ' s , up to 15 ° in diameter , and fastest optic afferent axons which end in the tec tum (conduct ing at speeds of about 8 m. / second) .
These units respond wi th a prolonged response to the off of light, Text-figs. 10; 11B, C. This response m a y last for seconds, m a n y minutes, or even in- definitely, according to the final degree of darkening tha t is reached. T h e response of the major i ty of these cells is m a d e of small bursts of few spikes, 1 to 4, a t h igh frequencies (100 to 300 spikes/second), wi th a burst f requency of abou t 18 to 20/second dur ing the first few seconds tha t passes af terwards to a basic ma in ta ined f requency of abou t 5/second, Text-figs. 10, 11C, D. Some of these ceils do not respond with bursts bu t only wi th single spikes at the basic burst frequency. T h e burst f requency is so similar f rom fibre to
TExT-FIouI~ 11. Class 4. Dimming detectors. A and B, recording from single fibres in the optic nerve (shaped spikes). Photocell as in Text-fig. 9.
A. Response to the movement of a black object (7 ° in diameter) moved across the RRF under bright (upper trace), average (middle trace), and dim (lower trace) light. The response to movement remains essentially invariant. Time marks, 5/second.
B. Sustained response to the off of light, interrupted by the return of illumination. Time marks, 5/second.
Records C to H are from several units in the fourth layer of terminals in the tectal cortex. Photocell as in Text-fig. 9. Time marks, 5/second.
C. Sustained off response. Notice the "burstiness" of the response. D. Same off response interrupted many seconds later, after the burst frequency has
fallen from about 20/second to about 5/second. Time marks, 5/second. E. Off response. F. First off response to a greater level of darkening that is then suppressed by coming to
the same level of darkening as obtained at E. G. Again, an off response. H. Off: response to the same darkening as in G, plus movement response to an object
15 ° in diameter. Notice the increase in firing frequency produced when the object moves across the locus in the visual field, followed by a reduction of the original off response.

158 M E C H A N I S M S O F V I S I O N
fibre that when one records from several of them simultaneously the burst quality of the response at about 20/second appears the more remarkable. The phasing breaks only many seconds after the onset of the response. This phasing can also be shown by recording the slow potentials from the surface of the tectum, Text-fig. 10C.
I t is possible to show that this phasing is of retinal origin, and not the result of an efferent control, by cutting the optic nerve. In these circumstances one can record the integrated activity of all off units by recording from the cut end of the nerve. Such an experiment shows, in addition, that the phasing is not a local phenomenon but that all of the off units tend to fire together, pro- ducing a sequence of slow waves about 20/second during the first few seconds after the off of light, Text-fig. 10B.
These units obviously correspond to the off cell group of Hartl ine and of Barlow, and, as expected from their observations, they also respond to any moving object independently of size, shape, or contrast, in proportion to the d imming that this object produces when passing across their RRF's. The movement, however, is an essential component of the stimulus parameters, since the object which is ineffective as a static stimulus is effective if moved across the RRF (Hartline, 1940). This response is larger to a darkening in the center of the R R F than to one in the periphery. Thus the response to dimming, whether through movement or change of lighting, is weighted by the distance of the change from the center of the field. If the dimming is large enough, an object brought into the field and stopped may elicit a continuous response. This maintained response is not comparable to that of Classes 1 and 2 be- cause it does not arise from contrast but from dimming. The response to the indirectly illuminated moving object remains constant under bright or dim light (more than 1000-to-1 ratio) and even increases at the lower end of il- lumination, Text-fig. 11A. Thus, it is the percentage of dimming produced by the moving object that essentially controls the response. Dark adaptation (even a short one) appears to increase the threshold for the sustained off response but maintains or increases the sensitivity to the dimming produced by movement or by sudden darkening, Text-fig. 11E to H. A short further darkening produced on a cell having a sustained off response in dim light, whether this is produced by a moving dark object or by a transient step to absolute darkness, produces an increased activity during the extra dimming and then either a permanent or partial erasure of the earlier off response at the return to that lower level of illumination, Text-fig. 11H. As time goes by the sensitivity to the on of light which suppresses the off response increases and a smaller step to light is required to stop a continuing off response. Text-fig. l lF .
These cells are the least numerous of the four classes and have the largest retinal area representation for each tectal point. In other words, at each tectal

MATURANA, LETTVIN, McCuLLOCH, PITTS Anatomy and Physiology o/Vision in Frog 159
point the centers of their R R F ' s spread in a retinal area of about 20 ° in diameter, centered around the same focal point as the other classes. Conversely, the retinal map formed on the tectum by these cells exhibits the greatest areal overlapping of the RRF's .
(~) CLASS 5- DARK 9ET~.CTION Mixed with the terminals of Class 3 are the terminals of the dark detectors. These units are continuously active, even under bright light, but their activity is inversely proportional to the light in- tensity and increases to a maximum in darkness. They do not respond fast to sharp changes of illumination nor to movement, and it is very very difficult to determine the areas of their R R F ' s which are large. These cells act as a counterpart to those on-off cells that measure high light intensity with a con- tinuous on discharge.
(G) GENERAL COMMENTS In the first two classes one frequently finds di- rectional responses. Such responses are maximal or occur only to movement in one direction, and are smallest or absent with reverse movement, Text-fig. 6A and B. The preferred directions are not correlated to any specific axis of the eye or the body. The cells that exhibit this characteristic have elongated RRF's , with the functional center at one end. These elongated R R F ' s are highly reminiscent of the elongated and pear-shaped outlines of the dendritic arbors of some ganglion cells, (Text-fig. 4) and suggest a direct relationship between the outline of the dendritic trees and the outlines of the R R F ' s in general.
The recording from the optic nerve or tectum shows clearly that all classes of units are essentially uniformly distributed across the retina. In other words, our impression is that the units of each class occur with more or less the same frequency in all retinal quadrants - - in the area centralis and in the periphery.
In addition, we should insist on the unity, clarity, and distinctness of the different operations, which are emphasized by the separation of the terminals of each in the tectum. However, the borderline cases, found only in border- line regions between adjacent layers, suggest some kind of continuity between the various groups. Also, the continuous increase in unit conduction velocity from the surface to the depth of the neuropil suggests a correlation between function, speed of conduction of the optic axons (fibre diameter), and depth of ending. This correlation may be determined by purely morphological factors.
V . D I C U S S I O N S
M a n y of the consequences of these findings are self-evident and answer di- rectly some of the questions presented in the introduction. Other questions, such as those referring to the interpretation of the raw data, have been dis-
,60 M E C H A N I S M S O F V I S I O N
cussed at length in the presentation of the results (Physiology A). In the pres- ent discussion, then, we shall consider only some points that seem to deserve additional consideration.
(a) Analytical Function of the Retina This study has shown that in the frog the retina performs several complex analytical operations on the visual image and that it transmits to the brain a highly selected and transformed representation. The retina does this in terms of kinds of operations (that we deem natural functions of the ganglion cells because they occur under condi- tions that reproduce the natural visual environment), four of which can be fully described in purely qualitative terms with respect to what they abstract invariantly under illumination. In other words, four of the five kinds of ganglion cells under natural conditions are activated only by a limited and optimal combination of qualities in the visible environment. This we think is a fundamental point. We think that to at tempt to describe the functions of these cells in quantitative terms of light distribution is, at present, likely to be misleading and to miss the biological point.
Stimulus quantification is exceedingly difficult if the significant parameters are relations between variables (i.e., ratios of light intensity across a boundary) and not absolute values. It is not possible to decide a priori what environ- mental variables should be studied quantitatively without the risk of consider- ing an entirely irrelevant one, as would have been the case in the study of the luminosity responses of all ganglion cells. As the operations performed by four of the five classes of ganglion cells are essentially independent of changes in illumination, to study luminosity responses cannot contribute further in- sight into their natural functions and can only inform about what we would consider accidental properties of these cells. Such an approach may contribute to an understanding of how the operations arise in the retina, but not to a description of them. The operations have to be found experimentally first and have to be fully described before any at tempt at quantification is made.
It could be argued that it is always possible to find an expression to define the qualities of the environment to which the cells respond and that it then should be possible to quantify their response to the stimulus thus defined. Nevertheless, the ganglion cells respond maximally to a certain optimal con- figuration of the stimulus parameters (i.e., speed and size) and the response declines when this optimal configuration is varied in any way. A response less than maximal indicates only the departure from this opt imum stimulus but not the direction of departure. In this sense a response less than maximal is ambiguous and not a quantitative expression of the variations of the stimulus configuration. Different departures from the opt imum produce the same re- duction in the response.
(b) Discreteness and Constancy of the Operations Performed by the Ganglion Cells It has also been shown that the character of the operation performed by each

MATURANA, LETTVIN, MCCULLOCH, PITTS Anatomy and Physiology of Vision in Frog x6I
group of ganglion cells remains distinct and constant under all the variations of background and illumination employed in this study, including a reproduc- tion of the usual visible environment of the frog. Our conclusion that the functions described are natural operations performed by the ganglion cells appears legitimate. We did not attempt an exhaustive study of the properties of the receptive fields in the original sense (i.e., using spots of light) to deter- mine variations in all four classes under the diverse backgrounds and condi- tions of light and dark adaptation used. We do not know, then, with certainty, in the frog, whether the receptive fields of all or some classes exhibit the same variations and fluidity found in some ganglion cells of the cat (Kuffier, 1953). Our observations with spots of light, however, indicate that marked changes in the size of the RR_F's do occur under the short dark adaptations that we have used (10 to 40 minutes). Nevertheless, the natural operations performed by the ganglion cells remain invariant under changes of illumination and background.
The ganglion cells can be considered as emitting parcels of information about particular useful aspects of the visual image, which aspects depend on the class to which the cell belongs.
At this point it is obvious that the next fundamental question is: How do these operations arise in the retina? At any moment the activity of a ganglion cell necessarily implies summation, facilitation, inhibition, and so forth. However, although these synaptic properties participate in realizing the operation by the ganglion cell, the particular arrangements cannot be de- duced from the study of the operation alone. On the other hand, at the level of the retina the study of synaptic interactions within the receptive field is fully relevant for understanding how the operations arise.
(c) Transformation of the Visual Image The image initially formed on the receptors is a mosaic of luminous points which, because of the minuteness of the receptors can be considered to describe, with sufficient resolution, the pattern of light distribution in the visual field. The map of the image trans- mitted to the tectum by the ganglion cells is entirely different.
The activity of each ganglion cell is the result of the activity in a whole neighborhood of numerous receptors, and measures a particular quality in that neighborhood. This quality may be said to be centered around a point in the visual field. Because of the great overlapping of the dendritic arbors numerous different ganglion cells are performing their corresponding opera- tions on the same visual neighborhood around any given point of the visual image. These cells that look at the same point in the visual image project at the same locus in the tectum. As a result, the visual field is mapped on the tectum in terms of the given special contexts and not in terms of luminous points. This involves a transformation of the visual image from a matrix of discrete point measurements of light intensities into a matrix of overlapping contexts.

z62 M E C H A N I S M S O F V I S I O N
Such a transformation establishes the systems of finite differencing in space whereby local continuity and curvature of boundaries are taken, thus giving rise at the same time to the notion of local extension. Further operations, say finite differencing in these various contexts by tectal cells, allow the brain to perceive various complex patterns of different sizes as unit things. Wha t is im- portant here is that it is necessary to go from a discrete-point space to a space in which any point is described in terms of how it is related to what is around it, and that this step is first accomplished in the retina.
Let us consider an example. Suppose for the moment that there is a fly in the visual field of a frog, 1 or 2 inches away from it. At this distance the image will ocupy a small area in the retina. In this area many cells of all four classes will be activated, principally Classes 1 and 2 and perhaps some of Class 4, if the fly has stopped; and these, plus Class 3, will be activated if the fly moves. All of the first three classes will be active in a bursty manner because of the type of motion of the fly when walking, and Classes 1 and 2 will show the maintained responses typical of them when the fly stops. As a result of the overlapping and relatively large size of the R R F ' s the activity provoked in each class of ganglion cells by the image of the fly will extend over many contiguous units of each class (depending on the size of the image) and will be transmitted to the brain as a dense cluster of properties of one sort sur- rounded by a space of no signaled properties or properties of a different sort. Here the further operations performed by the tectal cells should allow the inference of unit objects from these various patterns of activity.
(d) Resolution The passage of the image from the receptors to the ganglion cells with their dendritic overlapping is frequently considered to imply a loss of resolution. This to some extent appears to be emphasized by the differences in cell number between receptors and ganglion cells. The present study shows that the problem cannot be presented in these terms. To the extent that there is in the retina a description of the image in one space (luminous points) that is transformed into a description of it in a different space (four qualitative contexts), there is also a change in the space to which the expression "resolution" applies and in the units that have to be resolved.
An analogy will make this point clear. Suppose that we were to have a retina in which there were 26 distinct types of output fibres, one for each letter of the alphabet, and their dendritic collectors had a great overlap. The output of this retina will display a seen text with some accuracy. Implied in the out- put of the fibres of the letter A is that the resolution of the retinal image is fine enough to distinguish A. The area over which an A occurs is naturally large with respect to the grain of resolution of the receptors and an ou tpu t fibre sees that whole area as a unit. Can we say that the output fibres have lost resolution because the unit areas are larger than that of the receptors?

MATURANA, LETTVIN, MCCULLOCH, PITTS Anatomy and Physiology of Vision in Frog 163
Certainly not. For if we blur the A until it cannot be resolved by the receptors the output of the A fibre disappears. Thus resolution is not reasonably meas- ured by comparing areas seen. If one insists in talking about it, the resolution of ganglion cells must be discussed in terms of the particular space in which they operate; in this example, the alphabet.
It is obvious that in this process of selection of stimulus qualities by the ganglion cells during the image transformation at the retina a large a m o u n t of information is thrown away. Biological systems, however, are not interested in total amounts of information but only in that which is specifically relevant to the system.
(e) Tectal Projection and Contextual Optimum The transformation of the visual image that takes place in the retina becomes more meaningful when considered in the context of the anatomical relations between retina and tectum.
As emphasized above, the retinal projection on the tectum provides that each class of ganglion cells has unique relationships with the superficial tectal neuropil. It is also a consequence of this projection that at each tectal point all five classes of ganglion cells from a single retinal locus are repre- sented in registration. In this way any point of the visual image is uniquely defined by a combination of the four contexts, including their t reatment of time, and two statements of average brightness that constitute the output of the retina, plus two spatial coordinates on the surface of the tectum that define spatial position with respect to the animal. These contexts in which the visual image is analyzed and the projection of the retina on the tectum are developmentally determined and appear to be the same in all individuals of the species. Thus, given certain physiological laws yet unknown, that govern the activity of the tectal cells and the manner in which they integrate the in- formation received from the retina, the activity in any class of ganglion cells has a constant functional meaning, independent of how this activity arises in the retina. This is a physiological a priori (Magnus, 1930) almost in the sense of the specific energies of Johannes Mfiller. Rather than a priori it would be better to say that the function of a ganglion cell represents a contextual optimum which is determined in part by the operation performed by the cell and in part by the tectum. The same can be said about the visual determination of the spatial relations. The point-to-point projection of the retina on the tectum and its full reconstitution after regeneration of the optic nerve (Gaze, 1959; Maturana et al., 1959) clearly indicate that the tectal loci represent in a pre- determined way the spatial relations between the animal and its visual field. In other words, there is in the tectum a functional and spatial representation of the visible world of the frog which is independent of whether or not an eye is connected to it. And, furthermore, the frog has the means to ensure that
I64 M E C H A N I S M S O F V I S I O N
when the eye connects with the tectum it does so in the right way, so that the representation of the visible environment transmitted by the eye coincides with the genetically determined representation of the world built into the tectum.
The existence of these contextual optima in the visual system had been sug- gested on anatomical grounds by Polyak (I 941). Functionally, their existence in the visual system of the frog could have been inferred from the studies of Sperry (1951) on visual recovery after regeneration of the optic nerve. But it was not until the demonstration of the precise retinal projection on the tectum (presented here) and its full recovery after regeneration of the optic nerves (Gaze, 1959; Maturana et al., 1959) that it became clear that in this case the anatomy of the system entirely determined the representation. Biologically, of course, it is essential that these contextual optima should coin- cide in some meaningful way with the objective causes of activity of the ganglion cells. To secure, or better, to create this coincidence is the task of evolution.
In a system like this, a unique combination of the four qualitative contexts in a certain spatial relation may define a class of objects. To the extent that the four qualitative operations are uniformly distributed across the retina this combination would be independent of position, orientation, and other conditions of the visual environment. Obviously, this is a way in which the universals "prey" and "enemy" can be recognized or inferred directly with- out requiring a scanning operation. We do not yet know how the recognition of such unique combinations of contexts is made at the tectum, but this can be studied experimentally. At present we think that the same anatomical principles that govern the output of the retinal ganglion cells will govern the activity of any ganglion cells. For this reason, the analysis of how the operations performed by the ganglion cells arise in the retina seems the next logical step. And we are now engaged in this study.
(f) Tectal Anatomy The point-to-point projection of the retina on the visual centers (tectum in fish, amphibia, reptiles and birds, lateral geniculate body in mammals) is well known on anatomical ground (for references see: Hamidi and Whitteridge, 1954; Gaze, 1958; Le Gros Clark and Penman, 1934). However, the separation of this projection in a system of registered layers is a more recent finding. This was observed by Le Gros Clark and Pen- man (1934) by studying with anatomical methods the point-to-point projec- tion of the retina on the lateral geniculate body of mammals. They observed that each retinal locus projected simultaneously to the three corresponding layers of the lateral geniculate on registered points arranged along a single radial line. Le Gros Clark (1941, 1942) later suggested that this simultaneous representation of each locus in three layers implied a functional separation of
MATURANA, LETTVIN, MC(]ULLOGH, PITTS Anatomy and Physiology of Vision in Frog 16 5
the terminals and that to each layer corresponded a single chromatic function. It has been suggested recently by De Valois et al. (1958) that this is not the case and that the layer separation of the terminals in the lateral geniculate body of the monkey is not based on color but corresponds to a separation of the on, on-off, and off functions. (De Valois did not characterize the functions of these cells with respect to real objects.) In birds, a similar separation of the optic terminals in a system of well registered layers is suggested by the observa- tion of Hamdi and Whitteridge (1954), who found electrically that in the retinal projection on the tectum the locus in the visual field remains constant from the surface to the depth of the tectal cortex.
In the frog it is not possible to identify the three loose layers through which the myelinated fibres course across the superficial tectal neuropil with any of the layers of terminals described above. Pedro Ramon (Text-fig. 4) shows in his drawing at least three layers of tei minals of the optic fibres in the super- ficial neuropil. We have not been able to stain them adequately, and we can not offer new direct anatomical evidence of their stratification. There are, however, a few anatomical comments that can be made on the basis of the physiological observations presented above.
Our observations indicate the existence of four functionally different layers of terminals which can be clearly separated by the position of the electrode. We observe, however, only two marked hiatuses--between the second and third and between the third and fourth layers of terminals. We do not know whether these silent regions result from the absence of terminals and repre- sent really non-synaptic strata, or whether afferent fibers which come from different sources end in these silent regions. If the latter is the case, one shouId not necessarily expect that the neuropil would be obviously stratified. The optic terminals and those from other sources could themselves be separated in functional strata in a continuous neuropil. The observed segregation of the optic fibres in terms of conduction velocity suggests that the layering of the terminals is somehow related to the diameter of the afferent axons.
The envelope of RRF's seen at any point along the surface of the tectum increases in diameter from the surface to the depth of the neuropil, with a consequent increase in overlapping. This suggests that the terminal arbors themselves increase in horizontal spread in this direction. This whole arrange- ment insures that the finest axons, those of the first and second class, connect with the more superficial dendrites of the tectal cells. These contacts occur at the region of maximal dendritic overlapping and branching in these ceils. The other afferents would connect at different levels along the tectal den- drites, but the deeper ones are mainly related to the large trunks, near the origin of the axons. The tectal cells which are distributed at various levels in the superficial neuropil have their dendrites branching at one stratum or
x66 M E C H A N I S M S O F V I S I O N
only at a few higher strata and can be in contact only with the afferents that end at their level of branching. There are numerous types of tectal cells, but these are not well known. Pedro Ramon (Text-fig. 4, 1890) indicates several of them in his drawings, but more needs to be done. What is significant here is that the features already described indicate that the different kinds of tectal cells are differently related to the visual input and may thus perform different operations on it. How that is done or what these operations may be cannot be predicted a priori and has to be found by directly studying the output of each class of tectal cell.
(g) Shape and Function Relationships in the Retinal Cells The complexity of the neural organization of the retina as disclosed by works of Cajal (1955), Polyak (1941), and others, is frequently mentioned in a very general way to account for the origin of the multiple properties of the receptive fields of the ganglion cells (Hartline, 1938; Kuffier, 1953). The lack of knowledge about the specific physiological significance of the various anatomical characteristics of the retina does not even allow speculation about inhibitory and excitatory pathways. There are, however, several anatomical features that seem to us not to have been fully appreciated in their functional significance. These refer mainly to the dendritic and axonal stratification of the various types of receptors, bipolars, and ganglion cells, which results in a different pattern of connections for each morphological kind. In what follows we propose to emphasize what we think is the functional significance of this anatomy in an a t tempt to understand the organization of the retina in a manner that can be submitted to an experimental analysis.
The existence of different patterns of connections between the different types of cells in the retina has been described by Cajal (1955) and Polyak (1941). But these authors were, on the whole, concerned with the search for pathways that would transmit in as direct a manner as possible the informa- tion registered at the receptors, especially at the cones. This search implied the conception that the information registered at the receptors required no fundamental transformation before its transmission to the brain. We have shown above that this is not the case and that the transformation of the image appears as a fundamental function of the retina. It is, then, the integrative ability of the ganglion cells that is significant. It is the capacity of these cells to combine the information impinging on them into an operation, and not the possibility of private pathways for the receptors, that should guide the ana- tomical inquiry.
As we mentioned above ( I I I a) the ganglion cells in the retina have their dendrites branching in a system of multiple strata in an inner plexiform layer that is about 60/~ thick. They rarely go into the bipolar layer. This branching is not erratic, and there are several morphological types that differ funda-
MATURANA, LExaarlN, McCtmLOOI-I, PITTS Anatomy and Physiology of Vision in Frog 16 7
mentally in the level or levels of stratification of their dendrites in the inner plexiform, Text-fig. 3. The same occurs with the bipolars, and these also con- stitute several clear morphological classes that differ in the spread of their dendritic branching at the external plexiform and in the depth of penetration and level of ramification of their axons in the inner plexfform. The receptors themselves (rods and cones) differ in the mode and depth of branching of their synaptic regions, a condition that results in a great deal of differential connection between them and the various bipolars (Cajal, 1955; Polyak, 1941). From all of this is follows that each morphological cell type has a differ- ent pattern of connectivity entirely determined by its shape. (Also see Polyak, 1941).
At any small retinal locus, let us say 300 ~ in diameter (6 ° across), where there are several hundreds of bipolars, the ganglion ceils of similar dendritic stratification type will be similarly related to the bipolars of the locus. They will not necessarily be connected to the same bipolars, but they will be re- lated fundamental ly to the same kinds of bipolars, and through these they will be related in the same manner to the receptors. The ganglion cells of another stratification type, that branch at different levels from the type men- tioned above, will connect in a different manner to the same bipolars that connect with the first type or to different kinds of bipolars altogether (Text- fig. 2), and so on, with other types of ganglion ceils present in the same locus. Thus, because of this stratified differentiation at each locus the receptors and bipolars will of necessity be instrumental in the activity of numerous ganglion ceils of several types simultaneously. The constancy of the patterns of con- nectivity will depend upon the constancy of the morphological cell types. If in each layer all types of cells are uniformly distributed along the retina the pat- terns of connection of each kind of cell will remain constant and the different loci will be anatomically equivalent?
As an example let us assume that a class of receptors A is depolarized when illuminated and a class of receptors B is depolarized when darkened, both on a logarithmic scale. Let us also assume that these two classes also differ in stratification at their synaptic terminals. If this is so, different kinds of bi- polars will connect with different combinations of receptors and by simple adding can perform several operations (multiply and take ratios) on spatial and temporal differences of light intensity. In this way, bipolars connecting only to A receptors will be activated when these are illuminated, and we can assume that their activity will be suppressed in the dark. Contrariwise, the bipolars connected only to the other class of receptors (B) will be activated when these are darkened and will be silent otherwise. A bipolar connected to
t We have not mentioned the horizontal and amacrine ceils, but the same arguments apply to them.

168 M E C H A N I S M S O F V I S I O N
several of both kinds of receptors will summate their activity and be active only if its A's and B's are differently illuminated in the right way. These bi- polars will respond to an edge that sets a contrast--will measure ratios of il- lumination across a boundary. Thus, each kind of bipolar will have a different function according to how it is connected with the receptors.
As the bipolars also differ in their stratification in the inner plexiform it is easy to see that each stratum of branching of the bipolars in this plexiform will have a different functional significance in the same manner that each stratum of optic terminals in the tectum has a different function. Thus, for example, we may have a stratum of terminals of the bipolars with an on function, another with an off function, and a third with a ratio function. Now it is easy to see that in these circumstances the different patterns of connections of the ganglion cells with the bipolars will result in each type of ganglion cell performing a different operation by combining in a different manner the different bipolar functions. Some ganglion cells will branch mainly in the on stratum, some in the off stratum, some in the ratio stratum, and other ganglion cells will com- bine these functions in different ways. In this manner all of the operations performed by the retinal ganglion cells could be realized, the shape of the dendritic arbor determining the function of each cell. Intermediate functional types would result from intermediate or nontypical shapes. The uniform dis- tribution of the operations in the retina would be the result of the uniform dis- tribution of the cellular types in each layer. Non-uniformities in the distribu- tion of cell types would result in non-uniformities in the distribution of functions.
This conclusion that the anatomy of the system, that the shape of the cells by determining their connectivity, fundamentally determines their function is, of course, not new and has been emphasized by many authors, especially Cajal (1955), Polyak (1941), and Lorente de N6 (1933 and 1934), and it ap- pears now to some extent as a truism. We consider, however, that this is not a useless repetition because in connection with the functional analysis the statement of the possible functional significance of the retinal anatomy is less general than usual and allows for an experimental test. The fundamental prediction from the anatomical discussion above is that the different synaptic strata in the inner plexiform should have different functional significances in the same manner in which the different layers of terminals of the optic fibres in the tectum have different functional significances. This should be demon- strable by a suitable functional analysis of the inner plexiform. Once this is made, a complete study of the shapes of the ganglion, bipolar, and receptor cells should permit the final correlation between function and form. This study should also show a correlation between the distribution of operations and the distribution of cell types in the retina. We are now attempting to find this correlation.

MATURANA, LETTVIN, McCuLLOGH, PITTS Anatomy and Physiology of Vision in Frog 16 9
VI. S U M M A R Y
1. We studied the function of the retinal ganglion cells of Rana pipiens in response to light and dark objects of various sizes and shapes moved in the visual field against various kinds of backgrounds (including a color photo- graph of the natural environment of the frog). We recorded from axons in the optic nerve and from terminals in the tectal lobes in nonanaesthesized frogs in which the tectum and/or the optic nerve had been exposed.
2. The ganglion ceils form five natural classes. Four of them act on the visual image to perform complex analytical operations that remain invariant under changes of the general illumination and changes of the general outlook of the visible environment; the fifth class measures the light intensity. These operations of the ganglion ceils are briefly described by their names:
Class I. Sustained edge detection--with non-erasable holding. Class 2. Convex edge detection--with erasable holding. Class 3. Changing contrast detection. Class 4. Dimming detection. Class 5. Darkness detection.
The cells of Classes 1 to 4 respond to moving objects; the ceils of Class 5 do not seem to do so. The ceils of Class 1 respond only to a sharp edge in their receptive field; they respond with bursts of activity when the edge moves across their receptive field and with a sustained response if the edge is stopped in the middle of it. This sustained response is not erased by a transient darkening of the field. The cells of Class 2 have a response fundamentally similar to the ceils of Class 1, but they respond only to convex dark edges and their sustained response to a convex object stopped in the receptive field is erased by a tran- sient darkening of the visual field. The ceils of Class 3 respond with small bursts only to changing pattern and do not exhibit a sustained response to a standing pattern. The ceils of Class 4 respond to any adequate darkening of the recep- tive field with a prolonged off discharge; they also respond to a moving object in proportion to the percentage of darkening that the object produces during movement.
3. The five classes of ganglion cells form five populations uniformly dis- tributed across the eighth layer in the retina with great overlapping of re- ceptive fields. The axons of the cells of each class end in a separate layer of terminals in the superficial neuropil of the tectal lobes. However, two of them are mixed (the terminals of Class 5 end in the strata of terminals of Class 3), so that they really form four fundamental layers of terminals. Each of these four layers of terminals in the tectum forms a continuous map of the retina with respect to the operation performed by the corresponding ganglion cells.

I7o M E C H A N I S M S O F V I S I O N
The four layers are in registration, and at any point on a tectal lobe the ter- minals of all layers come from the same locus in the retina.
4. We have shown that the function of the retina in the frog is not to trans- mit information about the point-to-point pattern of distribution of light and dark in the image formed on it. On the contrary, we find that its function is mainly to analyze this image at every point in terms of four qualitative con- texts (standing edges, curvatures, changing contrasts, and local lessening of light intensity) and a measure of illumination and to send this information to the colliculi, where these functions are separated in the four congruent layers of terminals.
5. The retina transforms the visual image from a mosaic of luminous points to a system of overlapping qualitative contexts in which any point is described in terms of how it is related to what is around it. Such transformation probably arises from intraretinal summing and differencing of the receptor activity, whereby local continuity and curvature of boundary are taken, giving rise at the same time to the notion of local extension.
6. Since the transformation of the image constitutes the fundamental func- tion of the retina, it is then the integrative ability of the ganglion cells that is significant, and it is this capacity of the ganglion cells to combine the informa- tion impinging upon them into an operation, and not the possibility of private pathways for the receptors, which should guide the anatomical inquiry. We are at present engaged in such an inquiry in order to find a correlation between the different morphological types of ganglion cells (types differing by the stratification of their dendrites in the inner plexiform) and the operations that they perform.
REFERENCES
ABERCROMBIE, IV[., 1946, Anat. Rec., 94, 239. BARLOW, H. B., 1953, Summation and inhibition in the frog's retina, J. Physiol.,
119, 69. BARLOW, H. B., FITZHUCH, R. and KUFFLER, S. W., 1957, Change of organization
in the receptive fields of the cat's retina during dark adaptation, jr. Physiol., 137, 338.
BISHOp, G. H., 1933, Fibre groups in the optic nerve, Am. J. Physiol., 106, 461. CAJAL, S. RAMON Y, 1955, Histologie du Syst~me Nerveux de l'homme et des ver-
tdbrds, II, Madrid, Instituto Ramon y Cajal. D~ VALOIS, R. L., SMITH, C. J., KAROLY, A. J., and KITAI, S. T., 1958, Electrical re-
sponses of primate visual system. I. Different layers of macaque lateral genicula to nucleus, J. Comp. and Physiol. Psychol., 51, 662.
FLEXNER, L. B., 1929, The development of the meninges in amphibia. A study of the normal and experimental animal, Carnegie Institution of Washington, Contrib. Ern- bryol., 20, 31.
MATURANA, LI~TTVIN, I~¢[cCULLOGH, PITTS Anatomy and Physiology of Vision in Frog I7I
GAZE, R. M., 1958, The representation of the retina on the optic lobe of the frog, Quart. J. Exp. Physiol., 43,209.
GAZE, R. M. 1959, Regeneration of the optic nerve in Xenopus laevi, J. Physiol., 146, 40P.
G~STELAND, R. C., HOWLAND, B., LETTVm, J. Y., and PITTS, W. H., 1959, Comments on microelectrodes, Proc. Inst. Radio Engin.
HAMIDI, F. A., and Whitteridge, D., 1954, The representation of the retina on the optic tectum of the pigeon, Quart. J. exp. Physiol., 39, 111.
HARTLmE, H. K., 1938, The response of single optic nerve fibres of the vertebrate eye to illumination of the retina, Am. J. Physiol., 121, 400.
HARTLmE, H. K., 1940, The receptive fields of the optic nerve fibres, Am. J. Physiol., 130, 690.
KAPPER$, A. U. C., HUBER, G. C., and CROSBY, E. C., 1936, The comparative anatomy of the nervous system of vertebrates including man, New York, The MacMillan Company.
KUFFLER, S. W., 1953, Discharge patterns and functional organization of mam- malian retina, J. Neurophysiol., 16, 37.
LE GROS CLARK, W. E., 1941, Observations on the association fibre system of the visual cortex and the central representation of the retina, J. Anat., 75, 225.
I~ GROS CLARK, W. E., 1942, The anatomy of cortical vision, Tr. Ophth. Soc., 62, 229.
LE GRos CLARK, W. E., and PENMAN, G. G., 1934, The projection of the retina in the lateral geniculate body, Pro¢. Roy. Soc., London, Series B, 114, 291.
LETTVIN, J. Y., MATURANA, H. R., McCuLLOCH, W. S., and PITTS, W. H. 1959, What the frog's eye tells the frog's brain, Proc. Inst. Radio Engin.
LORENTE DE N6, R., 1933, Studies on the structure of the cerebral cortex. I. The area entorhinalis, o r. Psychol. und Neurol., 45,381.
LORENTE DE N6, R., 1934, Studies on the structure of the cerebral cortex. II. Con- tinuation of the study of ammonic system, J. Psychol. und Neurol., 46, 113.
MAGNUS, R., 1930, The physiological a priori. Lane lectures on experimental pharma- cology and medicine, Stanford University Press, 331-337.
MATURANA, H. R., 1958, The fine structure of the optic nerve and tectum of Anurans. An electron microscope study, Ph.D., Thesis, Harvard University.
MATURANA, H. R., 1959, Number of fibres in the optic nerve and the number of ganglion cells in the retina of Anurans, Nature, 183, 1406.
MATUgANA, H. R., LETTWN, J. Y., MfiCuLLOCH, W. S., and PITTS, W. H., 1959, Physiological evidence that cut optic nerve fibres in the frog regenerate to their proper places in the tectum, Science, in press.
MmHAELIS, L., 1931, Der Acetat-Veronal Puffer, Biochem. Z., 234, I39. POLYAK, S. L., 1941, The Retina, Chicago, University of Chicago Press. RAMON "Z CAJAL, PEDRO, 1890, Investigaciones de histologia comparada de los centros
opticos de distintos vertebrados, Doctoral Thesis, Universidad de Zaragoza. SPERRY, R., 1951, Mechanisms of neural maturation, in Handbook of Experimental
Psychology, (S. S. Stevens, editor), New York, John Wiley and Sons. WALLS, C. L., 1942, The vertebrate eye and its adaptive ration, Cranbrook Institute
of Science.
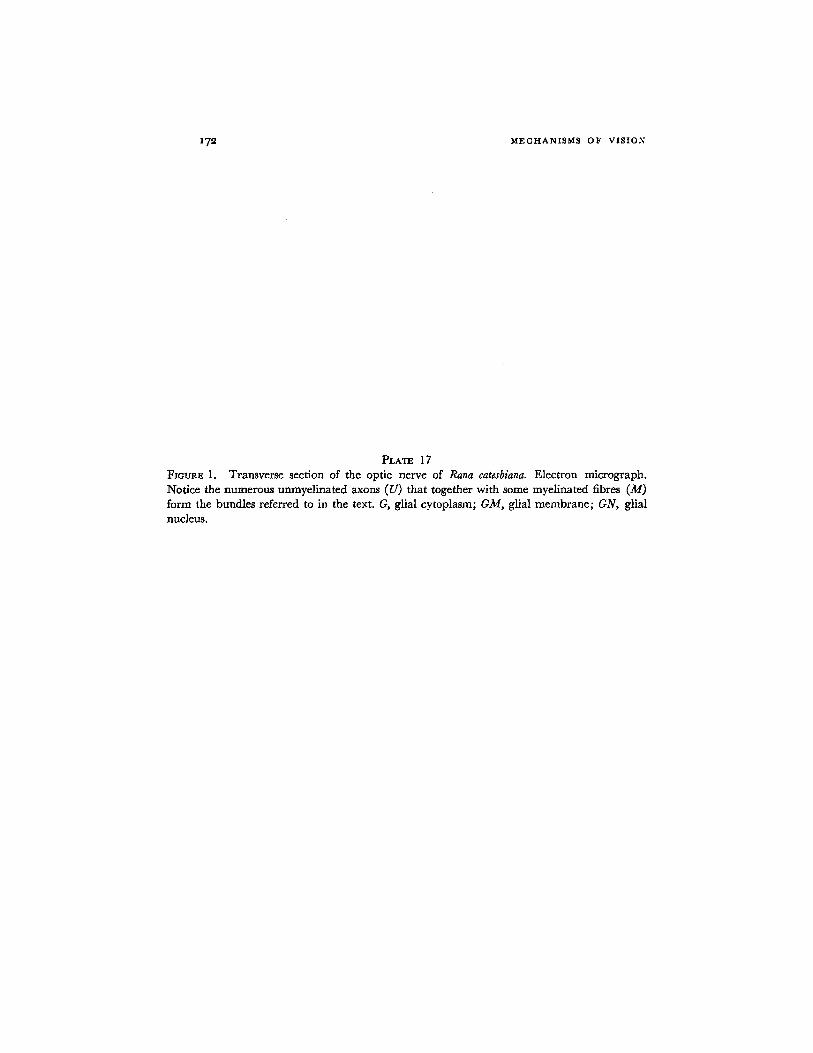
MECHANISMS OF VISION
PLATE 17 FIotmE 1. Transverse section of the optic nerve of Rana catesbiana. Electron micrograph. Notice the numerous unmyelinated axons (U) that together with some myelinated fibres (M) form the bundles referred to in the text. G, glial cytoplasm; GM, glial membrane; GN, glial nucleus.
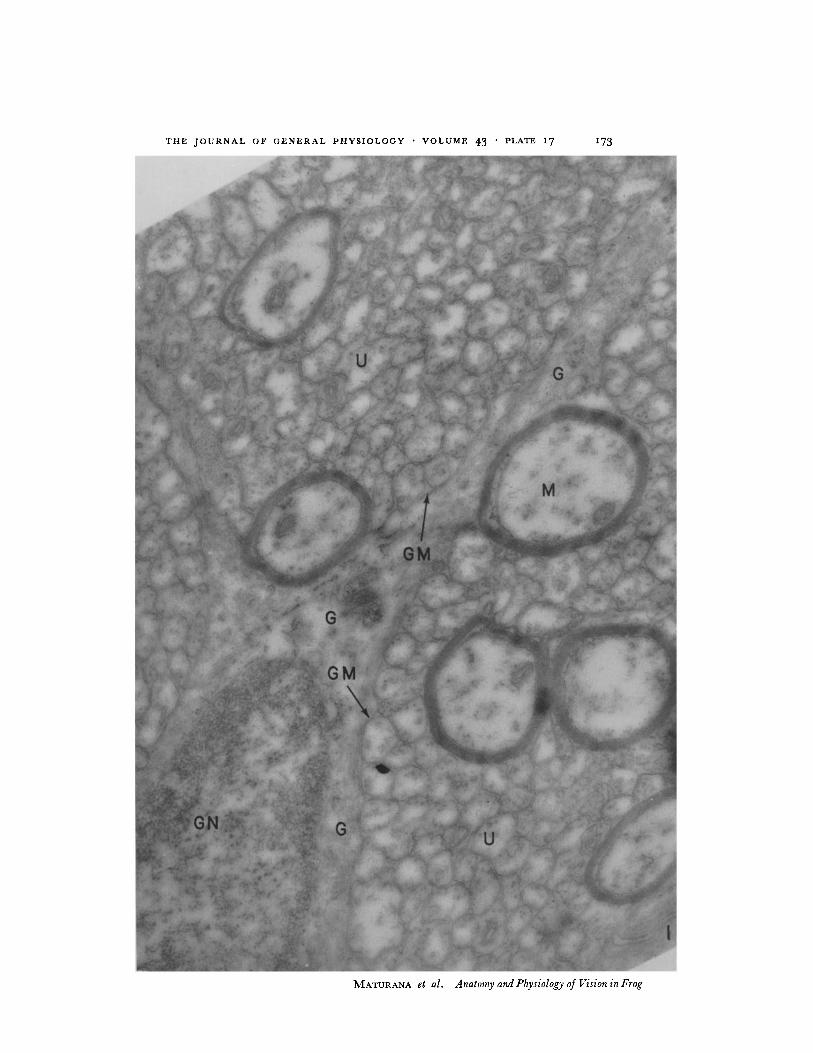
T H E J O U R N A L O F G E N E R A L P H Y S I O L O G Y • V O L U M E 43 . P L A T E 17 I73
MATURANA et al. Anatomy and Physiology of Vision in Frog

I74 MECHANISMS OF VISION
PLATE 18 FIGURE 2. Transverse section through the midbrain of the frog Rana pipiens. ,'140, medial optic tract; LO, lateral optic tract; SAC, stratum album centrale; SA T, superficial neuropil; CL, strata of compact cell bodies or stratum griseum centrale.
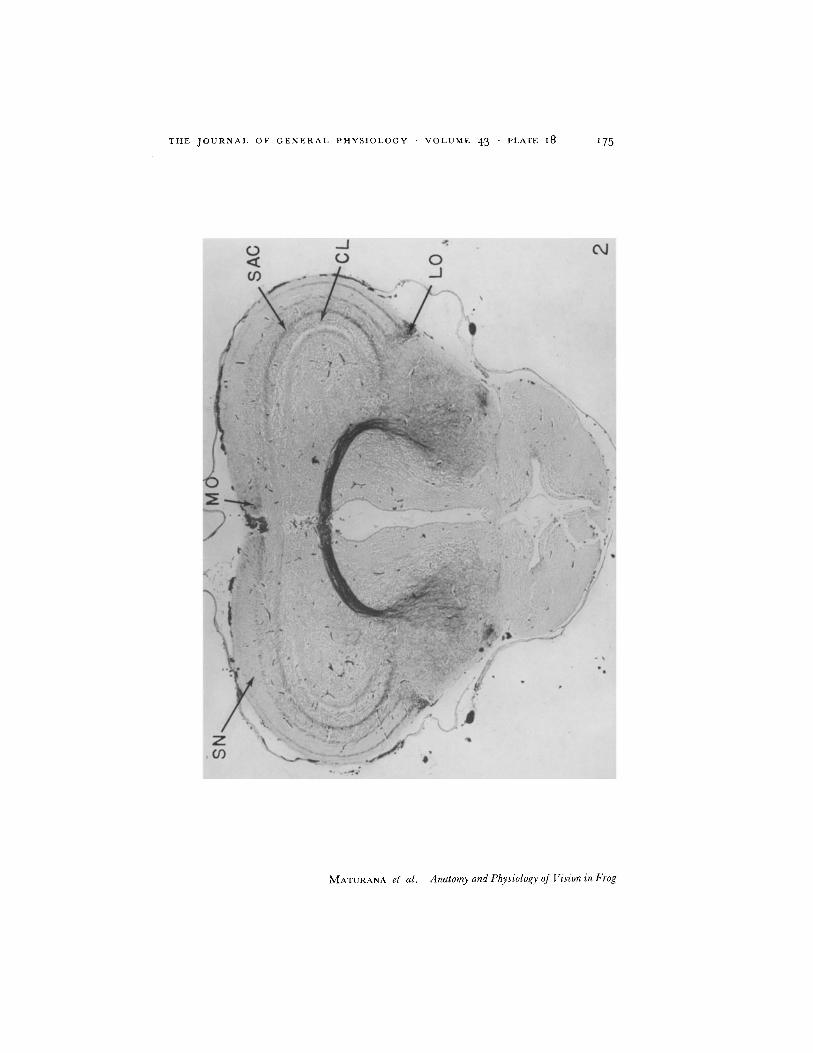
T H E J O U R N A L O F G E N E R A L P H Y S I O L O G Y • V O L U M E 43 ' P L A T E I 8 175
MATURANA et at. Anatomy and Physiology of Vision in Frog